UNITED STATES
SECURITIES AND EXCHANGE COMMISSION
Washington, D.C. 20549
FORM N-CSR
CERTIFIED SHAREHOLDER REPORT OF REGISTERED
MANAGEMENT INVESTMENT COMPANIES
Investment Company Act file number 811-05201
Thornburg Investment Trust
(Exact name of registrant as specified in charter)
c/o Thornburg Investment Management, Inc.
2300 North Ridgetop Road, Santa Fe, New Mexico 87506
(Address of principal executive offices) (Zip code)
Garrett Thornburg, 2300 North Ridgetop Road, Santa Fe, New Mexico 87506
(Name and address of agent for service)
Registrant’s telephone number, including area code: 505-984-0200
Date of fiscal year end: September 30, 2016
Date of reporting period: September 30, 2016
Item 1. Reports to Stockholders
The following annual reports are attached hereto, in order:
Thornburg Low Duration Municipal Fund
Thornburg Limited Term Municipal Fund
Thornburg Intermediate Municipal Fund
Thornburg Strategic Municipal Income Fund
Thornburg California Limited Term Municipal Fund
Thornburg New Mexico Intermediate Municipal Fund
Thornburg New York Intermediate Municipal Fund
Thornburg Limited Term U.S. Government Fund
Thornburg Limited Term Income Fund
Thornburg Low Duration Income Fund
Thornburg Strategic Income Fund
Thornburg Value Fund
Thornburg International Value Fund
Thornburg Core Growth Fund
Thornburg International Growth Fund
Thornburg Investment Income Builder Fund
Thornburg Global Opportunities Fund
Thornburg Developing World Fund
Thornburg Better World International Fund
Thornburg Capital Management Fund
Annual Report
September 30, 2016
THORNBURG
LOW DURATION
MUNICIPAL
FUND

About Thornburg Investment Management
It’s more than what we do.
It’s how we do it.
At Thornburg, we are very different in how we think, invest, and are structured We believe this difference is
what makes us successful in helping individuals reach their long-term financial goals
How we
How we How we’re
Flexible Perspective Our perspective on investment opportunities is more flexible than most, viewing a wide range of opportunities beyond conventional boundaries to find hidden value.
Collaboration Collectively, we hone ideas via borderless cross-pollination for better judgment and better results.
Portfolio Construction Disciplined construction guided more by our convictions than convention.
CONVICTION Thorough analysis and our relative-value framework lead to conviction in our securities selection.
UNCONVENTIONAL Active management means we seek the best value for our clients rather than using conventional benchmarks as our starting point.
Structured for Excellence How we think and how we invest is made possible by how we’re structured.
TEAM APPROACH FAR FROM THE HERD ACCESS & TRANSPARENCY
2 Annual Report
Annual Report
Thornburg Low Duration Municipal Fund
September 30, 2016
| | | | |
Share Class | | NASDAQ Symbol | | CUSIP |
Class A | | TLMAX | | 885-216-788 |
Class I | | TLMIX | | 885-216-770 |
Minimum investments for Class I shares may be higher than those for Class A shares. Class I shares may not be available to all investors.
Investments carry risks, including possible loss of principal. Portfolios investing in bonds have the same interest rate, inflation, and credit risks that are associated with the underlying bonds. The value of bonds will fluctuate relative to changes in interest rates, decreasing when interest rates rise. Unlike bonds, bond funds have ongoing fees and expenses. Please see the Fund’s prospectus for a discussion of the risks associated with an investment in the Fund. Investments in the Fund are not FDIC insured, nor are they bank deposits or guaranteed by a bank or any other entity.
The laddering strategy does not assure or guarantee better performance and cannot eliminate the risk of investment losses.
Diversification does not assure or guarantee better performance and cannot eliminate the risk of investment losses.
Annual Report 3
| | |
| LETTER TO SHAREHOLDERS | | |
| |
Thornburg Low Duration Municipal Fund | | September 30, 2016 (Unaudited) |
October 13, 2016
Dear Fellow Shareholder:
We are pleased to present the annual report for Thornburg Low Duration Municipal Fund. The net asset value (NAV) of the Class A shares decreased by 1 cent to $12.34 per share during the fiscal year ended September 30, 2016. If you were with us for the entire period, you received dividends of 2.889 cents per share. If you reinvested your dividends, you received 2.892 cents per share. Dividends were higher for Class I shares to account for varying class-specific expenses. The Class A shares of your Fund underperformed the index with a 0.15% total return (without sales charge) for the fiscal year ended September 30, 2016, compared to the 0.71% total return for the BofA Merrill Lynch 1-3 Year U.S. Municipal Securities Index. The Fund generated 1.18% more price return and 1.74% less income than the index after accounting for the different treatment of bonds priced above and below par by the index versus the Fund.
The market’s returns were a result of increasing short-term rates and decreasing long-term rates, shown in Figure 1.
U.S. Economy, Fed Policy, and the Election
The U.S. economy grew at a paltry average rate of 1%, as measured by nominal gross domestic product, for the first three quarters of 2016, much lower than the almost 3% average rate for 2015.
On the employment front, the economy added approximately 200,000 jobs per month for the Fund’s 2016 fiscal year. The May jobs number was a little scary, adding only 24,000 that month. The unemployment rate ticked up to 5.0% in September of 2016 from 4.9% in August, as more previously non-participating workers returned to the labor market.
Inflation has held stable, although it did move up slightly. The Core Personal Consumption Expenditure Index (Core PCE) for August moved up to 1.7% from 1.6% in July, although well below the U.S. Federal Reserve Board’s (the Fed) 2.0% target.
So, all in all, the economy is still growing, jobs are being added and inflation is well behaved. This isn’t a bad scenario for municipal bond investors, except that, at current valuations and 10-year AAA municipal general obligation bonds yielding 1.64%, municipal bond investors are generally not keeping up with inflation.
Elsewhere, the Fed increased the federal funds rate 0.25% in December of 2015. Although many pundits want to blame the credit markets rout on that event, they would be wrong. Oil prices, as measured by WTI crude futures, hit a low of $34.54 on January 20, 2016. Energy producers are a highly leveraged segment of the market, whether through bank loans or other forms of debt. As market participants began to question their ability to service these loans or debt, credit spreads began to widen and the impact of these loans on the financial stability of some banks came into question. The municipal market avoided this distress because bond issuance from energy-producing states was a small fraction of the $3.8 trillion municipal bond market.
This early-2016 market turbulence, followed by the May jobs report and the “Brexit” vote in Great Britain, gave the Fed enough pause not to follow their December rate increase with another. So far through 2016, the central bank has insisted that they may increase rates again and again. Last year we said, “Regardless, waiting for the Fed to raise short-term interest rates is akin to Waiting for Godot.” Well, we are still waiting. Meanwhile, the Fed is assuring the markets that the next meeting is “live” and they may raise short-term interest rates again!
The 2016 U.S. presidential race featured two major party candidates with unprecedented high unfavorable ratings with the electorate. At the time of this writing, the election’s result is weeks away. Regardless of the winner, however, the president historically has had very little impact on the course of the economy. Although there is a pattern that if the economy is doing well, the current administration likes
Figure I | 12-Month Change in Rates for AAA Rated General Obligation Municipal Bonds
(as of September 30, 2016)

4 Annual Report
LETTER TO SHAREHOLDERS,
CONTINUED
| | |
| |
Thornburg Low Duration Municipal Fund | | September 30, 2016 (Unaudited) |
to take all the credit; if the economy is not doing well, the current administration blames the previous one. A victory for either candidate could still benefit the municipal bond market, however, as both stumped for large increases in infrastructure spending—with one particularly calling for higher taxes which would lend support to the municipal bond market. If this gets through Congress, it could mean a higher level of municipal bond issuance and ultimately high growth rates for the economy; both occurrences would put upward pressure on municipal bond yields.
The Municipal Bond Market
The value metrics we use at Thornburg all suggest that the municipal bond market is pricing-in the rosiest of scenarios going forward. The main reason for this is that global central banks, with their overly accommodative monetary policies, have pushed investors further out on the risk spectrum in search of yield. That is why, depending on the fund, we have our portfolios positioned in the lower end of their respective risk spectrums. This means that durations (a measure of price sensitivity to changes in interest rates) are low and credit quality is higher than in the past. We continually ask ourselves: are investors getting paid to take risk? The answer we come up with is no!
Inside the Risk Metrics
Let’s first look at real yields, which is how much yield over inflation investors are being paid to own municipal bonds. As mentioned earlier, 10-year AAA general obligation bonds are yielding 1.64% and Core PCE is running at 1.70%, so investors are earning less than inflation. Over the last 20 years, investors have earned an average of 2% over inflation for the opportunity to invest in a 10-year AAA general obligation municipal bond.
The second thing to consider is credit spreads, which reflect the incremental yield an investor earns from owning a lower-rated credit versus a higher-rated credit, and which are now very narrow. As of September 30, 2016, an investor earned about 1% more for owning a 10-year BBB revenue bond versus a 10-year AAA general obligation bond. That is slightly higher than the average 0.75% an investor earned between 1994 and 2007. In 2007, approximately 50% of the new issue municipal bond market was insured by AAA/AAA municipal bond insurers. Today, there are no AAA/AAA municipal bond insurers, and insurance coverage generally accounts for only 6% to 8% of the new issue municipal bond market. On top of that, the security covenants of some current lower-quality investment grade securities are the most lax in years. This is a great time to be an issuer of lower-quality investment grade municipal bonds but not a great time to be an investor in them.
Finally, the slope of the yield curve, which tracks how much incremental yield an investor earns by owning securities with longer maturities, is also quite flat. Currently, investors are earning 0.78% more for owning a 10-year AAA general obligation municipal bond, versus a 1-year AAA general obligation municipal bond. Since 1994, an investor earned on average almost 1.6% to extend maturities from one to 10 years. The stretch for income is causing investors to absorb more risk at lower and lower relative yields.
Aside from valuations, the credit picture for the majority of the U.S. is pretty bright. Except for energy producing states, most regions are showing positive trends along such measures as:
Pensions are still a troubling issue. That is, 35 states reported a pension funding ratio of under 80% in 2014—the Mendoza line between a well-funded state pension and the “other kind.” As the worst career hitter in major league baseball history (.200 batting average), Mario Mendoza Aizpuru’s name ubiquitously symbolizes futility.
Liquidity
Market liquidity is still a concern. The latest example of this is what is happening to yields on Variable Rate Demand Notes (VRDNs). These are securities that are normally held in money market funds and bond fund reserve positions. They can be put back to an intermediary on a daily basis and are relatively secure. Leading up to the finalization of the Securities and Exchange Commisson’s money market fund reform in October of 2016, money market funds were and are repositioning themselves to be compliant with the new regulations. As such, they have had to divest themselves of VRDNs. Intermediaries do not want to hold them on their balance sheets (very expensive), so they raise the yields to clear the market. What used to yield 0.01% in March now yields, as of the time of this writing, 0.90%, or more than a 3-year AA security. This is serendipity for managers like Thornburg holding higher reserves because of concern over market liquidity; for issuers in the VRDN market, it’s not so much.
Main Reason to Own Municipal Bonds
One of the best risk-mitigating tools an investor has is diversification. By splitting a portfolio into several asset classes, an investor may reduce the volatility of the resulting portfolio’s returns. This is because the returns of various asset classes are not always correlated. There are times when this is not the
Annual Report 5
LETTER TO SHAREHOLDERS,
CONTINUED
| | |
| |
Thornburg Low Duration Municipal Fund | | September 30, 2016 (Unaudited) |
case, such as the 2008 financial crisis when all correlations went to one. For the long-term investor, however, we believe the benefits of diversification stand firm. When added to a portfolio of stocks, municipal bonds tend to reduce the volatility of that combined portfolio. Funds such as Thornburg Low Duration Municipal Fund may be a viable choice in a total diversified portfolio of stocks and bonds.
Conclusion
We continue to run this portfolio as an actively managed laddered portfolio. Laddering a portfolio is a simple way to diversify its investment along its entire investment universe. While past performance does not guarantee future results, our study showed that this structure outperformed other structures around 60% of the time and added 0.15% to 0.25% of total return annually.* Our view is that the current investment environment is not compensating investors enough to take on extra risk, so we have positioned our portfolios at the lower end of their risk spectrums. Know that the co-managers of this Fund are invested alongside you.
Thank you for your continued trust in us.
Sincerely,
| | | | |
 | |  | | |
| | |
| Christopher Ryon,CFA | | Nicholos Venditti,CFA | | |
Portfolio Manager Managing Director | | Portfolio Manager Managing Director | | |
| * | We examined three hypothetical portfolios of bonds from December 1997 to December 2015. One using a laddering strategy, one using a barbell strategy, and a third using a bullet strategy. For the laddering strategy, the BofA Merrill Lynch 1–12 Year Municipal Index was used as a proxy, since, similar to a ladder, it contains bonds relatively evenly spread across all maturities within the index. The barbell strategy is a duration management technique wherein bonds are clustered at the two extremes of a maturity range. For the barbell strategy, the BofA Merrill Lynch 1–3 Year Municipal Index and BofA Merrill Lynch 8–12 Year Municipal Index were combined. The two indices were weighted in such a way as to give them the same duration as the broader 1–12 Year Index, and each year the portfolio was re-weighted back to the original index weights. This was done to make the two portfolios duration-neutral so that the impact of the strategy chosen could be isolated. The bullet strategy invests at the duration midpoint of the portfolio, therefore the BofA Merrill Lynch 6–8 Year Index was used to represent the bullet strategy. For additional information, see www.thornburg.com/whyladder. Past performance does not guarantee future results. |
The matters discussed in this report may constitute forward-looking statements made pursuant to the safe harbor provisions of the Securities Litigation Reform Act of 1995. These include any advisor or portfolio manager prediction, assessment, analysis or outlook for individual securities, industries, investment styles, market sectors and/or markets. These statements involve risks and uncertainties. In addition to the general risks described for each fund in its current prospectus, other factors bearing on these reports include the accuracy of the advisor’s or portfolio manager’s forecasts and predictions, the appropriateness of the investment strategies designed by the advisor or portfolio manager and the ability of the advisor or portfolio manager to implement their strategies efficiently and successfully. Any one or more of these factors, as well as other risks affecting the securities markets generally, could cause the actual results of any fund to differ materially as compared to its benchmarks.
The views expressed by the portfolio managers reflect their professional opinions and are subject to change. Under no circumstances does the information contained within represent a recommendation to buy or sell any security.
6 Annual Report
| | |
| PERFORMANCE SUMMARY | | |
| |
Thornburg Low Duration Municipal Fund | | September 30, 2016 (Unaudited) |
Average Annual Total Returns
| | | | | | | | |
| | | 1-Yr | | | Since
Incep. | |
A Shares (Incep: 12/30/13) | | | | | | | | |
Without sales charge | | | 0.15 | % | | | 0.28 | % |
With sales charge | | | -1.36 | % | | | -0.28 | % |
I Shares (Incep: 12/30/13) | | | 0.36 | % | | | 0.48 | % |
30-day Yields, A Shares
(with sales charge)
| | | | |
Annualized Distribution Yield | | | 0.30 | % |
| |
SEC Yield | | | 0.60 | % |
Growth of A Hypothetical $10,000 Investment
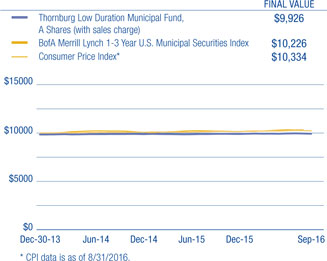
Performance data shown represents past performance and is no guarantee of future results. Investment return and principal value will fluctuate so shares, when redeemed, may be worth more or less than their original cost. Current performance may be lower or higher than quoted. For performance current to the most recent month end, visit thornburg.com or call 800-847-0200. The performance information does not reflect the deduction of taxes that a shareholder would pay on distributions or the redemption of Fund shares. Returns reflect the reinvestment of dividends and capital gains. Class A shares are sold with a maximum sales charge of 1.50%. There is no sales charge for Class I shares.
As disclosed in the most recent prospectus, the total annual fund operating expenses are as follows: A shares, 2.85%; I shares, 0.82%. Thornburg Investment Management and/or Thornburg Securities Corporation have contractually agreed to waive fees and reimburse expenses through at least February 1, 2017, for some of the share classes, resulting in net expense ratios of the following: A shares, 0.70%; I shares, 0.50%. For more detailed information on fund expenses and waivers/reimbursements, please see the Fund’s prospectus. Without fee waivers and expense reimbursements, the Annualized Distribution yield would have been negative 1.10%, and the SEC yield would have been negative 0.81%. Unsubsidized yields may be disproportionately negative due to the size of net assets and fixed expenses.
Glossary
BofA Merrill Lynch 1-3 Year Municipal Securities Index – A subset of the BofA Merrill Lynch U.S. Municipal Securities Index including all securities with a remaining term to final maturity less than 3 years.
The BofA Merrill Lynch indices used in the Ladder vs Barbell & Bullet study are model portfolios of municipal obligations throughout the United States, with maturities ranging either from one to three years, six to eight years, eight to twelve years, or one to twelve years. These indices are subsets of the BofA Merrill Lynch U.S. Municipal Securities Index, which is comprised of U.S. dollar denominated investment grade tax-exempt debt publicly issued by U.S. states and territories, and their political subdivisions, in the U.S. domestic market. Qualifying securities must have at least a one-year remaining term to final maturity, a fixed coupon schedule and an investment grade rating.
Unless otherwise noted, index returns reflect the reinvestment of income dividends and capital gains, if any, but do not reflect fees, brokerage commissions or other expenses of investing. Investors may not make direct investments into any index. The performance of any index is not indicative of the performance of any particular investment.
Annualized Distribution Yield – The distribution yield reflects actual distributions made to shareholders. The annualized distribution yield is calculated by summing the last 30 days of income at a given month end and annualizing to a 360-day year. The result is divided by the ending maximum offering price.
Bond Credit Ratings (Credit Quality) – A bond credit rating assesses the financial ability of a debt issuer to make timely payments of principal and interest. Ratings of AAA (the highest), AA, A, and BBB are investment-grade quality. Ratings of BB, B, CCC, CC, C and D (the lowest) are considered below investment grade, speculative grade, or junk bonds.
Core Personal Consumption Expenditure Index (Core PCE) – A measure of the Personal Consumption Expenditure Index that excludes the more volatile and seasonal food and energy prices.
Credit Spread/Quality Spread – The difference between the yields of securities with different credit qualities.
Duration – A bond’s sensitivity to interest rates. Effective duration incorporates the embedded option features, such as call provisions. Bonds with longer durations experience greater price volatility than bonds with shorter durations.
General Obligation Bond (GO) – A municipal bond backed by the credit and “taxing power” of the issuing jurisdiction rather than the revenue from a given project.
Gross Domestic Product (GDP) – A country’s income minus foreign investments: the total value of all goods and services produced within a country in a year, minus net income from investments in other countries.
Laddering – Involves building a portfolio of bonds with staggered maturities so that a portion matures each year. Money that comes in from maturing bonds is typically invested in bonds with longer maturities at the far end of the portfolio.
Revenue Bond – A bond on which the debt service is payable solely from the revenue generated from the operation of the project being financed or a category of facilities, or from other non-tax sources.
SEC Yield – SEC yield is computed in accordance with SEC standards measuring the net investment income per share over a specified 30-day period expressed as a percentage of the maximum offering price of the Fund’s shares at the end of the period.
Variable Rate Demand Note (VRDN) – VRDNs are long-term, floating-rate municipal securities. These highly liquid securities are payable on demand, typically either daily or weekly, meaning the investor can request repayment of the entire debt amount. The coupon rate will adjust on a periodic basis, either daily or weekly.
West Texas Intermediate (WTI) – A grade of crude oil used as a benchmark in oil pricing.
Yield Curve – A line that plots the interest rates, at a set point in time, of bonds having equal credit quality, but differing maturity dates.
Annual Report 7
| | |
| FUND SUMMARY | | |
| |
Thornburg Low Duration Municipal Fund | | September 30, 2016 (Unaudited) |
Objectives And Strategies
The Fund seeks current income exempt from federal income tax, consistent with preservation of capital (may be subject to Alternative Minimum Tax).
This Fund invests principally in a laddered portfolio of municipal bonds with a dollar-weighted average duration of normally no more than three years. Laddering involves building a portfolio of bonds with staggered maturities so that a portion of the portfolio matures each year. Cash from maturing bonds, if not needed for other purposes, is typically invested in bonds with longer maturities at the far end of the ladder. We regard the strategy as a good compromise for managing different types of risk.
Portfolio Ladder
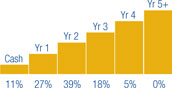
Percent of portfolio maturing in each year. Cash includes cash equivalents and other.
Security Credit Ratings†
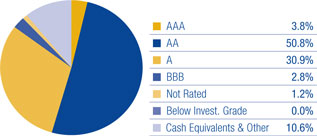
A bond credit rating assesses the financial ability of a debt issuer to make timely payments of principal and interest. Ratings of AAA (the highest), AA, A, and BBB are investment-grade quality. Ratings of BB, B, CCC, CC, C and D (the lowest) are considered below investment grade, speculative grade, or junk bonds. Credit quality ratings for Thornburg’s municipal portfolios used the highest rating available from either Standard & Poor’s or Moody’s Investors Service.
Key Portfolio Attributes
| | | | |
Number of Bonds | | | 85 | |
| |
Effective Duration | | | 1.2 Yrs | |
| |
Average Maturity | | | 1.3 Yrs | |
There is no guarantee that the Fund will meet its investment objectives.
All data is subject to change. Charts may not add up to 100% due to rounding.
8 Annual Report
| | |
| SCHEDULE OF INVESTMENTS | | |
| |
Thornburg Low Duration Municipal Fund | | September 30, 2016 |
| | | | | | | | | | | | |
Issuer-Description | | Credit Rating†
S&P/ Moody’s | | | Principal
Amount | | | Value | |
ARIZONA — 1.12% | | | | | | | | | | | | |
Arizona HFA, 3.00% due 12/1/2016 (Scottsdale Lincoln Hospitals) | | | NR/A2 | | | $ | 480,000 | | | $ | 481,680 | |
| | | |
ARKANSAS — 0.73% | | | | | | | | | | | | |
Board of Trustees of the University of Arkansas, 4.00% due 11/1/2018 (Fayetteville Campus) | | | NR/Aa2 | | | | 295,000 | | | | 313,750 | |
| | | |
CALIFORNIA — 10.73% | | | | | | | | | | | | |
Bay Area Toll Authority, 1.00% due 4/1/2047 put 7/1/2017 (San Francisco Bay Area Toll Bridge) | | | AA/Aa3 | | | | 250,000 | | | | 250,050 | |
California Statewide Communities Development Authority, 5.25% due 7/1/2017 (St. Joseph Health System; Insured: AGM) (ETM) | | | AA/A1 | | | | 100,000 | | | | 103,363 | |
City of Chula Vista, 1.65% due 7/1/2018 (San Diego Gas & Electric Co.) | | | A+/Aa2 | | | | 1,000,000 | | | | 1,000,760 | |
City of Los Angeles GO, 3.00% due 6/29/2017 (Cash Flow Management) | | | SP-1+/Mig1 | | | | 500,000 | | | | 508,795 | |
County of Los Angeles GO, 3.00% due 6/30/2017 (Cash Management Program) | | | SP-1+/Mig1 | | | | 500,000 | | | | 508,410 | |
County of Los Angeles Redevelopment Refunding Authority, 3.00% due 12/15/2016 (Covina Revitalization-Redevelopment Project) | | | A-/NR | | | | 575,000 | | | | 577,346 | |
Jurupa Public Financing Authority, 4.00% due 9/1/2017 | | | BBB+/NR | | | | 100,000 | | | | 102,474 | |
Riverside County Public Financing Authority, 4.00% due 9/1/2017 (Hemet Project) | | | A+/NR | | | | 485,000 | | | | 498,629 | |
Successor Agency to the Redevelopment Agency of Carson, 4.00% due 10/1/2016 (Carson Merged and Amended Project Area) | | | AA-/NR | | | | 425,000 | | | | 425,038 | |
Successor Agency to the Redevelopment Agency of the City of Chino, 5.00% due 9/1/2017 (Merged Chino Areas 2001 and 2003 and Central City Redevelopment Projects; Insured: BAM) | | | AA/NR | | | | 300,000 | | | | 311,253 | |
Successor Agency to the Redevelopment Agency of the Richmond Community, 4.00% due 9/1/2017 (Harbour and Merged Area Redevelopment Projects; Insured: BAM) | | | AA/NR | | | | 300,000 | | | | 308,475 | |
| | | |
COLORADO — 2.91% | | | | | | | | | | | | |
City of Aurora COP, 3.00% due 12/1/2016 (Aurora Municipal Center) | | | AA-/Aa2 | | | | 530,000 | | | | 531,818 | |
City of Aurora COP, 5.00% due 12/1/2019 (Sports Park and E-911 Projects) | | | AA-/Aa2 | | | | 365,000 | | | | 408,041 | |
Regional Transportation District COP, 5.00% due 6/1/2017 (FasTracks Transportation System) | | | A/Aa3 | | | | 300,000 | | | | 308,013 | |
| | | |
CONNECTICUT — 2.35% | | | | | | | | | | | | |
State of Connecticut GO Floating Rate Note, 1.59% due 6/15/2018 (Various Capital Projects) | | | AA-/Aa3 | | | | 1,000,000 | | | | 1,004,790 | |
| | | |
FLORIDA — 6.69% | | | | | | | | | | | | |
County of Osceola, 5.00% due 10/1/2017 (Transportation Capital Improvements; Insured: AMBAC) | | | A+/A1 | | | | 150,000 | | | | 155,772 | |
Florida Municipal Power Agency, 5.25% due 10/1/2018 (Stanton Project) | | | NR/A1 | | | | 1,000,000 | | | | 1,083,440 | |
Hillsborough County IDA, 5.65% due 5/15/2018 (Tampa Electric Co.) | | | BBB+/A3 | | | | 200,000 | | | | 213,974 | |
Orange County School Board COP, 5.00% due 8/1/2018 (Educational Facilities) | | | NR/Aa2 | | | | 1,000,000 | | | | 1,074,540 | |
Volusia County Educational Facilities Authority, 2.00% due 10/15/2016 (Embry-Riddle Aeronautical University, Inc.) | | | NR/Baa1 | | | | 105,000 | | | | 105,052 | |
Volusia County Educational Facilities Authority, 3.00% due 10/15/2017 (Embry-Riddle Aeronautical University, Inc.) | | | NR/Baa1 | | | | 105,000 | | | | 107,124 | |
Volusia County Educational Facilities Authority, 3.00% due 10/15/2018 (Embry-Riddle Aeronautical University, Inc.) | | | NR/Baa1 | | | | 120,000 | | | | 124,547 | |
| | | |
GEORGIA — 0.47% | | | | | | | | | | | | |
City of Atlanta, 5.25% due 12/1/2016 (Atlantic Station; Insured: AGM) | | | AA/A3 | | | | 200,000 | | | | 201,356 | |
| | | |
GUAM — 1.39% | | | | | | | | | | | | |
Government of Guam, 3.00% due 11/15/2017 (Various Capital Projects) | | | A/NR | | | | 300,000 | | | | 304,839 | |
Government of Guam, 4.00% due 11/15/2018 (Economic Development) | | | A/NR | | | | 275,000 | | | | 288,805 | |
| | | |
IDAHO — 1.18% | | | | | | | | | | | | |
State of Idaho GO, 2.00% due 6/30/2017 | | | SP-1+/Mig1 | | | | 500,000 | | | | 504,155 | |
| | | |
ILLINOIS — 8.66% | | | | | | | | | | | | |
Chicago Park District GO, 5.00% due 1/1/2020 (Capital Improvement Plan) | | | AA+/Ba1 | | | | 500,000 | | | | 551,650 | |
City of Rockford GO, 3.00% due 12/15/2016 (New Fire Station Construction; Insured: AGM) | | | AA/A1 | | | | 250,000 | | | | 251,127 | |
Illinois Educational Facilities Authority, 4.75% due 11/1/2036 put 11/1/2016 (Field Museum of Natural History) | | | A/A2 | | | | 100,000 | | | | 100,281 | |
Illinois Finance Authority, 5.00% due 11/15/2017 (Rush University Medical Center) | | | A+/A1 | | | | 1,000,000 | | | | 1,043,530 | |
Illinois Finance Authority, 5.00% due 8/15/2018 (Silver Cross Hospital and Medical Centers) | | | NR/Baa1 | | | | 500,000 | | | | 531,750 | |
Illinois Finance Authority, 5.00% due 11/15/2018 (Rush University Medical Center) | | | A+/A1 | | | | 500,000 | | | | 540,235 | |
State of Illinois, 4.00% due 6/15/2019 (Build Illinois Program) | | | AAA/Baa2 | | | | 520,000 | | | | 560,004 | |
Town of Cicero GO, 5.00% due 1/1/2018 (Cicero and Laramie Development Areas; Insured: AGM) | | | AA/A2 | | | | 125,000 | | | | 130,743 | |
Annual Report 9
| | |
| SCHEDULE OF INVESTMENTS, CONTINUED | | |
| |
Thornburg Low Duration Municipal Fund | | September 30, 2016 |
| | | | | | | | | | | | |
Issuer-Description | | Credit Rating†
S&P/ Moody’s | | | Principal
Amount | | | Value | |
INDIANA — 2.70% | | | | | | | | | | | | |
City of Evansville, 5.00% due 1/1/2018 (Waterworks District; Insured: BAM) | | | AA/NR | | | $ | 810,000 | | | $ | 848,767 | |
Hammond Multi-School Building Corp., 4.00% due 7/15/2017 (Educational Facilities) (State Aid Withholding) | | | AA+/NR | | | | 300,000 | | | | 306,930 | |
| | | |
KANSAS — 6.57% | | | | | | | | | | | | |
Kansas DFA, 5.00% due 12/1/2016 (Department of Commerce Impact Program) | | | A+/A3 | | | | 400,000 | | | | 402,744 | |
Kansas DFA, 5.00% due 12/1/2018 (Department of Commerce Impact Program) | | | A+/A3 | | | | 1,250,000 | | | | 1,345,237 | |
Topeka Public Building Commission, 5.00% due 6/1/2018 (10th and Jackson Projects; Insured: Natl-Re) | | | AA-/A3 | | | | 1,000,000 | | | | 1,065,530 | |
| | | |
KENTUCKY — 2.60% | | | | | | | | | | | | |
Commonwealth of Kentucky State Property and Buildings Commission, 5.00% due 11/1/2019 (Project No. 112) | | | A/Aa3 | | | | 1,000,000 | | | | 1,114,350 | |
| | | |
LOUISIANA — 2.59% | | | | | | | | | | | | |
City of New Orleans, 5.00% due 12/1/2017 (Water System Facilities Capital Improvement Program) | | | A-/NR | | | | 100,000 | | | | 104,434 | |
City of New Orleans GO, 4.00% due 12/1/2016 (Public Improvements) | | | AA-/A3 | | | | 1,000,000 | | | | 1,005,510 | |
| | | |
MASSACHUSETTS — 1.83% | | | | | | | | | | | | |
City of Quincy GO, 2.00% due 6/16/2017 (Capital Improvements) | | | SP-1+/NR | | | | 500,000 | | | | 503,950 | |
Massachusetts Educational Financing Authority, 5.50% due 1/1/2017 | | | AA/NR | | | | 275,000 | | | | 278,061 | |
| | | |
MICHIGAN — 6.34% | | | | | | | | | | | | |
Berkley School District GO, 4.00% due 5/1/2018 (Educational Facilities; Insured: Q-SBLF) | | | AA-/NR | | | | 1,000,000 | | | | 1,046,600 | |
Charles Stewart Mott Community College GO, 5.00% due 5/1/2018 (Higher Education Facilities) | | | A+/NR | | | | 750,000 | | | | 794,715 | |
Michigan Finance Authority, 4.00% due 11/15/2016 (Sparrow Clinton Hospital Cancer Center and Sparrow Ionia Hospital) | | | A+/A1 | | | | 150,000 | | | | 150,581 | |
Michigan Finance Authority, 5.00% due 5/1/2018 (School District of the City of Detroit; Insured: Q-SBLF) | | | AA-/NR | | | | 250,000 | | | | 264,675 | |
Michigan State Hospital Finance Authority, 5.00% due 11/15/2016 (Ascension Health) | | | AA+/Aa2 | | | | 200,000 | | | | 201,054 | |
Northville Public Schools GO, 5.00% due 5/1/2017 (Educational Facilities; Insured: Q-SBLF) | | | NR/Aa1 | | | | 250,000 | | | | 256,007 | |
| | | |
NEVADA — 0.84% | | | | | | | | | | | | |
City of Reno GO, 5.00% due 6/1/2017 (Fire Protection Projects) | | | A-/A1 | | | | 200,000 | | | | 205,424 | |
Washoe County School District GO, 5.25% due 6/1/2017 (Educational Facilities; Insured: AGM) | | | AA/Aa3 | | | | 150,000 | | | | 154,389 | |
| | | |
NEW JERSEY — 1.68% | | | | | | | | | | | | |
Essex County Improvement Authority GO, 4.00% due 10/1/2017 (County Correctional Facility) | | | NR/Aa2 | | | | 545,000 | | | | 560,413 | |
New Jersey Health Care Facilities Financing Authority, 5.00% due 1/1/2018 (Hackensack University Medical Center; Insured: AGM) | | | AA/A2 | | | | 150,000 | | | | 157,198 | |
| | | |
NEW YORK — 5.91% | | | | | | | | | | | | |
City of New York GO, 5.00% due 8/1/2017 (Capital Projects) | | | AA/Aa2 | | | | 500,000 | | | | 517,340 | |
City of New York GO, 5.00% due 8/1/2019 (Capital Projects) | | | AA/Aa2 | | | | 450,000 | | | | 500,022 | |
Lake Placid Central School District GO, 5.00% due 6/15/2017 (Educational Facilities; Insured: Natl-Re) (State Aid Withholding) | | | NR/Aa3 | | | | 200,000 | | | | 205,618 | |
Monroe County Industrial Development Corp., 4.00% due 1/15/2018 (Monroe Community College Association; Insured: AGM) | | | AA/A2 | | | | 200,000 | | | | 206,426 | |
New York City Municipal Water Finance Authority, 0.75% due 6/15/2048 put 10/3/2016 (Water & Sewer System; SPA: | | | | | | | | | | | | |
Mizuho Bank, Ltd.) (daily demand notes) | | | AA+/Aa1 | | | | 600,000 | | | | 600,000 | |
New York State Housing Finance Agency, 0.74% due 11/1/2046 put 10/3/2016 (160 Madison Avenue Housing; LOC: PNC Bank, N.A.) (daily demand notes) | | | NR/A1 | | | | 500,000 | | | | 500,000 | |
| | | |
NORTH DAKOTA — 1.75% | | | | | | | | | | | | |
North Dakota Housing Finance Agency, 0.85% due 1/1/2017 (Housing Mortgage Finance Program) | | | NR/Aa1 | | | | 750,000 | | | | 749,693 | |
| | | |
OHIO — 0.47% | | | | | | | | | | | | |
City of Cleveland, 3.00% due 10/1/2016 (Public Facilities) | | | AA/A1 | | | | 200,000 | | | | 200,012 | |
| | | |
OKLAHOMA — 3.21% | | | | | | | | | | | | |
Oklahoma DFA, 5.00% due 8/15/2018 (INTEGRIS Health) | | | AA-/Aa3 | | | | 270,000 | | | | 290,798 | |
Tulsa County Industrial Authority, 5.50% due 9/1/2018 (Jenks Public Schools) | | | AA-/NR | | | | 1,000,000 | | | | 1,083,060 | |
| | | |
OREGON — 1.18% | | | | | | | | | | | | |
State of Oregon GO, 2.00% due 6/30/2017 (Cash Management) | | | SP-1+/Mig1 | | | | 500,000 | | | | 504,460 | |
10 Annual Report
| | |
| SCHEDULE OF INVESTMENTS, CONTINUED | | |
| |
Thornburg Low Duration Municipal Fund | | September 30, 2016 |
| | | | | | | | | | | | |
Issuer-Description | | Credit Rating†
S&P/ Moody’s | | | Principal
Amount | | | Value | |
PENNSYLVANIA — 9.82% | | | | | | | | | | | | |
City of Philadelphia, 5.00% due 10/1/2017 (Pennsylvania Gas Works) | | | A/Baa1 | | | $ | 200,000 | | | $ | 207,880 | |
City of Philadelphia, 5.00% due 7/1/2018 (Pennsylvania Gas Works) | | | AA/A2 | | | | 350,000 | | | | 373,943 | |
Cumberland County Municipal Authority, 3.00% due 1/1/2017 (Diakon Lutheran Social Ministries) | | | NR/NR | | | | 500,000 | | | | 502,370 | |
East Allegheny School District GO, 2.00% due 4/1/2017 (Insured: BAM) (State Aid Withholding) | | | AA/Ba1 | | | | 300,000 | | | | 301,365 | |
Lancaster County Hospital Authority, 5.00% due 11/1/2018 (Masonic Villages) | | | A/NR | | | | 1,500,000 | | | | 1,618,035 | |
Lehigh County IDA, 0.90% due 2/15/2027 put 8/15/2017 (PPL Electric Utilities Corp.) | | | A/A1 | | | | 1,000,000 | | | | 999,040 | |
Wilson School District GO, 3.00% due 6/1/2017 (State Aid Withholding) | | | AA/NR | | | | 200,000 | | | | 202,816 | |
| | | |
SOUTH CAROLINA — 2.67% | | | | | | | | | | | | |
City of North Charleston Public Facilities Corp. COP, 5.00% due 10/1/2017 (Convention Center Complex) | | | AA-/NR | | | | 300,000 | | | | 310,779 | |
Kershaw County Public Schools Foundation, 4.00% due 12/1/2017 (Kershaw County School District) | | | A-/A1 | | | | 500,000 | | | | 516,220 | |
Piedmont Municipal Power Agency, 5.00% due 1/1/2018 (Catawba Project) | | | AA/A3 | | | | 300,000 | | | | 314,706 | |
| | | |
TEXAS — 6.77% | | | | | | | | | | | | |
City of Houston, 4.00% due 9/1/2017 (Convention & Entertainment Facilities Department) | | | A-/A2 | | | | 200,000 | | | | 205,396 | |
City of Houston, 4.00% due 9/1/2018 (Convention & Entertainment Facilities Department) | | | A-/A2 | | | | 675,000 | | | | 712,024 | |
City of Houston Higher Education Finance Corp., 5.00% due 8/15/2018 (KIPP Program; Guaranty: PSF) | | | AAA/NR | | | | 970,000 | | | | 1,042,401 | |
Coastal Water Authority, 4.00% due 12/15/2017 (City of Houston Projects) | | | AA/NR | | | | 905,000 | | | | 938,575 | |
| | | |
WASHINGTON — 2.84% | | | | | | | | | | | | |
King County Public Hospital District No. 2 GO, 5.00% due 12/1/2018 (Evergreen Health) | | | NR/Aa3 | | | | 835,000 | | | | 907,745 | |
Ocean Beach School District No. 101 GO, 4.00% due 12/1/2017 (Educational Facilities) | | | NR/A2 | | | | 300,000 | | | | 310,398 | |
| | | |
WEST VIRGINIA — 0.47% | | | | | | | | | | | | |
Mason County, 1.625% due 10/1/2022 put 10/1/2018 (Appalachian Power Company) | | | BBB+/Baa1 | | | | 200,000 | | | | 201,042 | |
| | | |
WISCONSIN — 0.47% | | | | | | | | | | | | |
Wisconsin Health & Educational Facilities Authority, 1.25% due 8/15/2025 put 8/15/2017 (Aurora Health Care, Inc.) | | | NR/A2 | | | | 200,000 | | | | 200,112 | |
| | | | | | | | | | | | |
TOTAL INVESTMENTS — 96.94% (Cost $41,463,027) | | | | | | | | | | $ | 41,504,454 | |
OTHER ASSETS LESS LIABILITIES — 3.06% | | | | | | | | | | | 1,309,022 | |
| | | | | | | | | | | | |
NET ASSETS — 100.00% | | | | | | | | | | $ | 42,813,476 | |
| | | | | | | | | | | | |
Footnote Legend
| † | Credit ratings are unaudited. Rating changes may have occurred subsequent to the reporting period end. Bonds issued with a maturity of one year or less are assigned Moody’s ratings from MIG-1 to MIG-4 and Standard and Poor’s ratings from SP-1+ to SP-3 with MIG-1 and SP-1+ being the strongest ratings. |
Portfolio Abbreviations
To simplify the listings of securities, abbreviations are used per the table below:
| | |
| AGM | | Insured by Assured Guaranty Municipal Corp. |
| AMBAC | | Insured by American Municipal Bond Assurance Corp. |
| BAM | | Insured by Build America Mutual Insurance Co. |
| COP | | Certificates of Participation |
| DFA | | Development Finance Authority |
| ETM | | Escrowed to Maturity |
| | |
| GO | | General Obligation |
| HFA | | Health Facilities Authority |
| IDA | | Industrial Development Authority |
| Natl-Re | | Insured by National Public Finance Guarantee Corp. |
| PSF | | Guaranteed by Permanent School Fund |
| Q-SBLF | | Insured by Qualified School Bond Loan Fund |
Annual Report 11
| | |
| STATEMENT OF ASSETS AND LIABILITIES | | |
| |
Thornburg Low Duration Municipal Fund | | September 30, 2016 |
| | | | |
ASSETS | | | | |
Investments at value (cost $41,463,027) (Note 3) | | $ | 41,504,454 | |
Cash | | | 105,371 | |
Receivable for investments sold | | | 800,034 | |
Interest receivable | | | 451,901 | |
Prepaid expenses and other assets | | | 13,546 | |
| | | | |
Total Assets | | | 42,875,306 | |
| | | | |
| |
LIABILITIES | | | | |
Payable for fund shares redeemed | | | 932 | |
Payable to investment advisor and other affiliates (Note 4) | | | 4,705 | |
Accounts payable and accrued expenses | | | 55,667 | |
Dividends payable | | | 526 | |
| | | | |
Total Liabilities | | | 61,830 | |
| | | | |
| |
NET ASSETS | | $ | 42,813,476 | |
| | | | |
NET ASSETS CONSIST OF | | | | |
Net unrealized appreciation on investments | | $ | 41,427 | |
Accumulated net realized gain (loss) | | | (23,333 | ) |
Net capital paid in on shares of beneficial interest | | | 42,795,382 | |
| | | | |
| | $ | 42,813,476 | |
| | | | |
| |
NET ASSET VALUE | | | | |
Class A Shares: | | | | |
Net asset value and redemption price per share ($4,241,042 applicable to 343,625 shares of beneficial interest outstanding - Note 5) | | $ | 12.34 | |
Maximum sales charge, 1.50% of offering price | | | 0.19 | |
| | | | |
Maximum offering price per share | | $ | 12.53 | |
| | | | |
| |
Class I Shares: | | | | |
Net asset value, offering and redemption price per share ($38,572,434 applicable to 3,125,633 shares of beneficial interest outstanding - Note 5) | | $ | 12.34 | |
| | | | |
| * | Redemption price per share is equal to net asset value less any applicable contingent deferred sales charge. |
See notes to financial statements.
12 Annual Report
| | |
| STATEMENT OF OPERATIONS | | |
| |
Thornburg Low Duration Municipal Fund | | Year Ended September 30, 2016 |
| | | | |
INVESTMENT INCOME | | | | |
Interest income (net of premium amortized of $1,084,389) | | $ | 423,239 | |
| | | | |
| |
EXPENSES | | | | |
Investment advisory fees (Note 4) | | | 181,950 | |
Administration fees (Note 4) | | | | |
Class A Shares | | | 5,233 | |
Class I Shares | | | 20,650 | |
Distribution and service fees (Note 4) | | | | |
Class A Shares | | | 8,415 | |
Transfer agent fees | | | | |
Class A Shares | | | 27,871 | |
Class I Shares | | | 15,686 | |
Registration and filing fees | | | | |
Class A Shares | | | 26,224 | |
Class I Shares | | | 26,445 | |
Custodian fees (Note 2) | | | 21,861 | |
Professional fees | | | 47,064 | |
Accounting fees (Note 4) | | | 2,075 | |
Trustee fees | | | 2,137 | |
Other expenses | | | 5,580 | |
| | | | |
Total Expenses | | | 391,191 | |
Less: | | | | |
Fees waived by investment advisor (Note 4) | | | (34,946 | ) |
Expenses reimbursed by investment advisor (Note 4) | | | (122,082 | ) |
| | | | |
Net Expenses | | | 234,163 | |
| | | | |
Net Investment Income | | | 189,076 | |
| | | | |
REALIZED AND UNREALIZED GAIN (LOSS) | | | | |
Net realized gain (loss) on investments | | | (18,130 | ) |
Net change in unrealized appreciation (depreciation) on investments | | | (17,236 | ) |
| | | | |
Net Realized and Unrealized Loss | | | (35,366 | ) |
| | | | |
Net Increase in Net Assets Resulting from Operations | | $ | 153,710 | |
| | | | |
See notes to financial statements.
Annual Report 13
| | |
| STATEMENTS OF CHANGES IN NET ASSETS | | |
| |
Thornburg Low Duration Municipal Fund | | |
| | | | | | | | |
| | | Year Ended
September 30, 2016 | | | Year Ended
September 30, 2015 | |
INCREASE (DECREASE) IN NET ASSETS FROM | | | | | | | | |
| | |
OPERATIONS | | | | | | | | |
Net investment income | | $ | 189,076 | | | $ | 112,321 | |
Net realized gain (loss) on investments | | | (18,130 | ) | | | (5,203 | ) |
Net unrealized appreciation (depreciation) on investments | | | (17,236 | ) | | | 24,676 | |
| | | | | | | | |
| | |
Net Increase (Decrease) in Net Assets Resulting from Operations | | | 153,710 | | | | 131,794 | |
| | |
DIVIDENDS TO SHAREHOLDERS | | | | | | | | |
From net investment income | | | | | | | | |
Class A Shares | | | (9,876 | ) | | | (4,414 | ) |
Class I Shares | | | (179,200 | ) | | | (107,907 | ) |
| | |
FUND SHARE TRANSACTIONS (NOTE 5) | | | | | | | | |
Class A Shares | | | 971,622 | | | | 519,307 | |
Class I Shares | | | (3,150,597 | ) | | | 29,065,721 | |
| | | | | | | | |
Net Increase (Decrease) in Net Assets | | | (2,214,341 | ) | | | 29,604,501 | |
| | |
NET ASSETS | | | | | | | | |
Beginning of Year | | | 45,027,817 | | | | 15,423,316 | |
| | | | | | | | |
| | |
End of Year | | $ | 42,813,476 | | | $ | 45,027,817 | |
| | | | | | | | |
See notes to financial statements.
14 Annual Report
| | |
| NOTES TO FINANCIAL STATEMENTS | | |
| |
Thornburg Low Duration Municipal Fund | | September 30, 2016 |
NOTE 1 – ORGANIZATION
Thornburg Low Duration Municipal Fund (the “Fund”) is a diversified series of Thornburg Investment Trust (the “Trust”). The Trust is organized as a Massachusetts business trust under a Declaration of Trust dated June 3, 1987 and is registered as a diversified, open-end management investment company under the Investment Company Act of 1940, as amended. The Fund is currently one of twenty separate series of the Trust. Each series is considered to be a separate entity for financial reporting and tax purposes and bears expenses directly attributable to it. The Fund’s investment objective is to seek current income exempt from federal income tax, as is consistent, in the view of Thornburg Investment Management, Inc., the Trust’s investment advisor (the “Advisor”).
The Fund currently offers two classes of shares of beneficial interest: Class A and Institutional Class (“Class I”). Each class of shares of the Fund represents an interest in the same portfolio of investments, except that (i) Class A shares are sold subject to a front-end sales charge collected at the time the shares are purchased and bear a service fee, (ii) Class I shares are sold at net asset value without a sales charge at the time of purchase and may be subject to a service fee, and (iii) the respective classes may have different reinvestment privileges and conversion rights. Additionally, the Fund may allocate among its classes certain expenses, to the extent allocable to specific classes, including transfer agent fees, government registration fees, certain printing and postage costs, and administrative and legal expenses. Currently, class specific expenses of the Fund are limited to service and distribution fees, administration fees, and certain registration and transfer agent expenses.
The following is a summary of significant accounting policies followed by the Fund in the preparation of its financial statements. The Fund prepares its financial statements in conformity with United States generally accepted accounting principles (“GAAP”), including investment company accounting and reporting guidance in the Financial Accounting Standards Board (the “FASB”) Accounting Standard Codification Topic 946.
NOTE 2 – SIGNIFICANT ACCOUNTING POLICIES
Security Valuation: All investments in securities held by the Fund are valued as described in Note 3.
Allocation of Income, Gains, Losses and Expenses: Net investment income (other than class specific expenses) and realized and unrealized gains and losses are allocated daily to each class of shares based upon the relative net asset value of outstanding shares (or the value of the dividend-eligible shares, as appropriate) of each class of shares at the beginning of the day (after adjusting for the current capital shares activity of the respective class). Expenses common to all Funds are allocated among the Funds comprising the Trust based upon their relative net asset values or other appropriate allocation methods. Operating expenses directly attributable to a specific class are charged against the operating income of that class.
Dividends and Distributions to Shareholders: Dividends and distributions to shareholders, which are determined in accordance with federal income tax regulations and may differ from GAAP, are recorded on the ex-dividend date. Ordinary income distributions, if any, are declared daily and paid monthly. Capital gain distributions, if any, are declared and paid annually and more often if deemed necessary by the Advisor. Dividends are paid and are reinvested in additional shares of the Fund at net asset value per share at the close of business on the ex-dividend date, or at the shareholder’s option, paid in cash.
Investment Income: Interest income is accrued as earned. Premiums and discounts are amortized and accreted, respectively, to call dates or maturity dates using the effective yield method of the respective investments, which is included in interest income on the Statement of Operations.
Custodian Fees: Custodian fees disclosed in the Statement of Operations may include interest expenses incurred by the Fund on any cash overdrafts of its custodian account during the period. Such cash overdrafts may result from the effects of failed trades in portfolio securities and from cash outflows resulting from unanticipated shareholder redemption activity. The Fund pays interest to its custodian on any such cash overdraft at a rate equal to 2.50% of the overdraft amount in excess of $50,000.
Investment Transactions: Investment transactions are accounted for on a trade date basis. Realized gains and losses from the sale of investments are recorded on an identified cost basis.
When-Issued and Delayed Delivery Transactions: The Fund may engage in when-issued or delayed delivery transactions. To the extent the Fund engages in such transactions, it will do so for the purpose of acquiring portfolio investments consistent with the Fund’s investment objectives and not for the purpose of investment leverage or to speculate on interest rate or market changes. At the time the Fund makes a commitment to purchase an investment on a when-issued or delayed delivery basis, the Fund will record the transaction and reflect the value in determining its net asset value. When effecting such transactions, assets of an amount sufficient to make payment for the portfolio investments to be purchased will be segregated on the Fund’s records on the trade date. Investments purchased on a when-issued or delayed delivery basis do not earn interest until the settlement date.
Annual Report 15
| | |
| NOTES TO FINANCIAL STATEMENTS, CONTINUED | | |
| |
Thornburg Low Duration Municipal Fund | | September 30, 2016 |
Guarantees and Indemnifications: Under the Trust’s organizational documents (and under separate agreements with the independent Trustees), its officers and Trustees are provided with an indemnification against certain liabilities arising out of the performance of their duties to the Fund. In the normal course of business the Trust may also enter into contracts with service providers that contain general indemnifications. The Trust’s maximum exposure under these arrangements is unknown. However, based on experience, the Trust expects the risk of loss to be remote.
Use of Estimates: The preparation of financial statements in conformity with GAAP requires management to make estimates and assumptions that affect the reported amounts of assets and liabilities and disclosure of contingent assets and liabilities at the date of the financial statements and the reported amounts of increases (decreases) in net assets from operations during the reporting period. Actual results could differ from those estimates.
Federal Income Taxes: It is the policy of the Trust to comply with the provisions of the Internal Revenue Code applicable to regulated investment companies and to distribute to shareholders substantially all investment company taxable income including net realized gains on investments (if any), and tax exempt income of the Fund. Therefore, no provision for federal income or excise tax is required.
The Fund files income tax returns in United States federal and applicable state jurisdictions. The statute of limitations on the Fund’s tax return filings generally remains open for the three years following a return’s filing date. The Fund has analyzed each uncertain tax position believed to be material in the preparation of the Fund’s financial statements for the fiscal year ended September 30, 2016, including open tax years, to assess whether it is more likely than not that the position would be sustained upon examination, based on the technical merits of the position. The Fund has not identified any such position for which an asset or liability must be reflected in the Statement of Assets and Liabilities.
At September 30, 2016, information on the tax components of capital was as follows:
| | | | |
Cost of investments for tax purposes | | $ | 41,463,027 | |
| | | | |
Gross unrealized appreciation on a tax basis | | $ | 66,634 | |
Gross unrealized depreciation on a tax basis | | | (25,207 | ) |
| | | | |
Net unrealized appreciation (depreciation) on investments (tax basis) | | $ | 41,427 | |
| | | | |
At September 30, 2016, the Fund had deferred tax basis capital losses occurring subsequent to October 31, 2015 through September 30, 2016 of $1,645. For tax purposes, such losses will be recognized in the year ending September 30, 2017.
At September 30, 2016, the Fund had cumulative tax basis capital losses of $21,688, (of which $1,073 are short-term and $20,615 are long-term) generated after September 30, 2011, which may be carried forward to offset future capital gains. To the extent such carryforwards are used, capital gain distributions may be reduced to the extent provided by regulations. Such capital loss carryforwards do not expire.
At September 30, 2016, the Fund had $526 of undistributed net tax basis tax-exempt income, no undistributed tax basis net ordinary income and no undistributed tax basis capital gains.
Distributions from tax exempt income paid by the Fund for the years ended September 30, 2016 and September 30, 2015 are excludable by shareholders from gross income for Federal income tax purposes.
The tax character of distributions paid during the years ended September 30, 2016, and September 30, 2015, was as follows:
| | | | | | | | |
| | | 2016 | | | 2015 | |
Distributions from: | | | | | | | | |
Tax exempt income | | $ | 189,076 | | | $ | 112,321 | |
Ordinary income | | | — | | | | — | |
| | | | | | | | |
Total | | $ | 189,076 | | | $ | 112,321 | |
| | | | | | | | |
NOTE 3 – SECURITY VALUATION
Valuation of the Fund’s portfolio investment securities is performed in accordance with policies and procedures adopted by and under the oversight of the Trustees.
The Trustees of the Trust have appointed the Advisor to assist the Trustees in obtaining market values for portfolio investments, evaluate and monitor professional pricing service providers appointed by the Trustees’ Audit Committee (the “Audit Committee”) to assist in determining fair values for portfolio investments, assist in calculating fair values for portfolio investments in certain circumstances, and to perform other functions in connection with the valuation of investments. The Advisor acts through its Valuation and Pricing Committee
16 Annual Report
| | |
| NOTES TO FINANCIAL STATEMENTS, CONTINUED | | |
| |
Thornburg Low Duration Municipal Fund | | September 30, 2016 |
(the “Committee”) and other employees of the Advisor. The Committee regularly reviews its own valuation calculations, as well as the valuations, valuation techniques and services furnished by pricing service providers, considers circumstances which may require valuation calculations by the Committee, and reviews previous valuation calculations. The Committee reports to the Audit Committee on the Committee’s activities, the performance of pricing service providers, and other matters relating to valuation of portfolio investments.
In those instances when the Committee assists in calculating a fair value for a portfolio investment, the Committee seeks to determine the price that the Fund would reasonably expect to receive upon a sale of the investment in an orderly transaction between market participants on the valuation date. The Committee customarily utilizes quotations from securities broker dealers in calculating valuations, but also may utilize prices obtained from pricing service providers or other methods approved by the Audit Committee. Because fair values calculated by the Committee are estimates, the calculation of a value for an investment may differ from the price that would be realized by the Fund upon a sale of the investment, and the difference could be material to the Fund’s financial statements. The Committee’s calculation of a fair value for an investment may also differ from the prices obtained by other persons (including other mutual funds) for the investment.
Valuation of Securities: Debt obligations held by the Fund which are not listed or traded on exchanges or for which no reported market exists are ordinarily valued at the valuation obtained from a pricing service provider approved by the Audit Committee.
In any case when a pricing service provider fails to provide a valuation for a debt obligation held by the Fund, the Committee calculates a fair value for the obligation using alternative methods under procedures approved by the Audit Committee. Additionally, in cases when management believes that a valuation obtained from a pricing service provider merits review for significant reasons, the Committee decides whether or not to use the valuation calculated by the pricing service provider or to use an alternative method approved by the Audit Committee to calculate a fair value for the obligation.
Valuation Hierarchy: The Fund categorizes its investments based upon the inputs used in valuing those investments, according to a three-level hierarchy established in guidance from FASB. Categorization of investments using this hierarchy is intended by the FASB to maximize the use of observable inputs in valuing investments and minimize the use of unobservable inputs by requiring that the most observable inputs be used when available. Observable inputs are those that market participants would use in valuing an investment based on available market information. Unobservable inputs are those that reflect assumptions about the information market participants would use in valuing an investment. An investment’s level within the hierarchy is based on the lowest level input that is deemed significant to the valuation. The methodologies and inputs used to value investments are not necessarily indications of the risk or liquidity associated with those investments.
Various inputs are used in calculating valuations for the Fund’s investments. These inputs are generally summarized according to the three-level hierarchy below:
Level 1: Quoted prices in active markets for identical investments.
Level 2: Other direct or indirect significant observable inputs (including quoted prices for similar investments in active markets and other observable inputs, such as interest rates, prepayment rates, credit risk, etc.).
Level 3: Significant unobservable inputs (including the Committee’s own assumptions in calculating the fair values of investments).
Valuations for debt obligations held by the Fund are typically calculated by pricing service providers approved by the Audit Committee and are characterized as Level 2 within the valuation hierarchy.
In a limited number of cases the Committee calculates a fair value for investments using broker quotations or other methods approved by the Audit Committee. When the Committee uses a single broker quotation to calculate a fair value for an investment without other significant observable inputs, or if a fair value is calculated using other significant inputs that are considered unobservable, the investment is characterized as Level 3 within the hierarchy. Other significant unobservable inputs used to calculate a fair value in these instances might include an income-based valuation approach which considers discounted anticipated future cash flows from the investment, and application of discounts due to the nature or duration of any restrictions on the disposition of the investment.
Valuations based upon the use of inputs from Levels 1, 2 or 3 may not represent the actual price received upon the disposition of an investment, and the Fund may receive a price that is lower than the valuation based upon these inputs when it sells the investment.
Annual Report 17
| | |
| NOTES TO FINANCIAL STATEMENTS, CONTINUED | | |
| |
Thornburg Low Duration Municipal Fund | | September 30, 2016 |
The following table displays a summary of the fair value hierarchy measurements of the Fund’s investments as of September 30, 2016. In any instance when valuation inputs from more than one level are used to determine the fair value of a specific investment, the investment is placed in the level of the table based upon the lowest level input that is significant in determining the fair value of the investment:
| | | | | | | | | | | | | | | | |
| | | Fair Value Measurements at September 30, 2016 | |
| | | Total | | | Level 1 | | | Level 2 | | | Level 3 | |
Assets | | | | | | | | | | | | | | | | |
Investments in Securities | | | | | | | | | | | | | | | | |
Municipal Bonds | | $ | 41,504,454 | | | $ | — | | | $ | 41,504,454 | | | $ | — | |
| | | | | | | | | | | | | | | | |
Total Investments in Securities | | $ | 41,504,454 | | | $ | — | | | $ | 41,504,454 | | | $ | — | |
In accordance with the guidance prescribed in Accounting Standards Update No. 2011-04, it is the policy of the Fund to recognize transfers between levels and the underlying events which caused the movement. The Fund recognized no transfers between levels for the year ended September 30, 2016.
NOTE 4 – INVESTMENT ADVISORY FEE AND OTHER TRANSACTIONS WITH AFFILIATES
Pursuant to an investment advisory agreement, the Advisor serves as the investment advisor and performs services for the Fund for which the fees are payable at the end of each month. Under the investment advisory agreement, the Fund pays the Advisor a management fee based on the daily net assets of the Fund at an annual rate as shown in the following table:
| | | | |
Daily Net Assets | | Fee Rate | |
Up to $1 billion | | | 0.400 | % |
Next $500 million | | | 0.300 | |
Next $500 million | | | 0.250 | |
Over $2 billion | | | 0.225 | |
The Fund’s effective management fee for the year ended September 30, 2016 was 0.40% of the Fund’s average dividend assets (before applicable management fee waiver of $34,496).
The Fund pays to the Advisor the costs of personnel who perform certain accounting services for the Fund. For the year ended September 30, 2016 the Fund paid $2,075 to the Advisor for these accounting services. The Trust has also entered into administrative service agreements with the Advisor, whereby the Advisor will perform certain administrative services for the shareholders of each class of the Fund’s shares, and for which fees will be payable at an annual rate of up to .125 of 1% per annum of the average daily net assets attributable to each class of shares. Total administrative service fees incurred by each class of shares of the Fund for the year ended September 30, 2016, are set forth in the Statement of Operations.
The Trust has an underwriting agreement with Thornburg Securities Corporation (the “Distributor”), an affiliate of the Advisor, which acts as the distributor of the Fund’s shares. For the year ended September 30, 2016, the Distributor has advised the Fund that it earned net commissions aggregating $41 from the sale of Class A shares of the Fund.
Pursuant to a service plan under Rule 12b-1 of the Investment Company Act of 1940, the Fund may pay to the Advisor or securities dealers and other financial institutions at the Advisor’s request an amount not to exceed .25 of 1% per annum of the average daily net assets attributable to Class A shares of the Fund to obtain various shareholder and distribution related services. For the year ended September 30, 2016, there were no 12b-1 service plan fees charged for Class I shares. The Advisor may pay out of its own resources additional expenses for distribution of the Fund’s shares and shareholder services.
The Advisor and Distributor have contractually agreed to waive fees and reimburse expenses incurred by the Fund so that actual expenses of certain share classes do not exceed levels as specified in the Fund’s most recent prospectus. The agreement may be terminated by the Fund at any time, but may not be terminated by the Advisor or Distributor before February 1, 2017, unless the Advisor ceases to be the investment advisor to the Trust or the Distributor ceases to be the distributor of the Fund prior to that date. The Advisor and Distributor retain the right to be repaid by the Fund for fee waivers and expense reimbursements if expenses fall below the contractual limit prior to the end of the fiscal year.
For the year ended September 30, 2016, the Advisor voluntarily waived Fund level investment advisory fees of $34,946. The Advisor contractually reimbursed certain class specific expenses, administrative fees, and distribution fees of $59,214 for Class A shares and $62,868 for Class I shares.
18 Annual Report
| | |
| NOTES TO FINANCIAL STATEMENTS, CONTINUED | | |
| |
Thornburg Low Duration Municipal Fund | | September 30, 2016 |
Certain officers and Trustees of the Trust are also officers or directors of the Advisor and Distributor. The compensation of independent Trustees is borne by the Trust.
The percentage of direct investments in the Fund held by appointed Trustees, Officers and the Advisor is approximately 75.65%.
The Fund may sell securities to an affiliated fund, or the Fund may purchase securities held by an affiliated fund, provided the affiliation is due solely to having a common investment advisor, common officers, or common trustees, and provided that all such transactions will comply with Rule 17a-7 under the 1940 Act. For the year ended September 30, 2016, the Fund had transactions with affiliated funds of $5,300,754 in sales.
NOTE 5 – SHARES OF BENEFICIAL INTEREST
At September 30, 2016, there were an unlimited number of shares with no par value of beneficial interest authorized. Transactions in shares of beneficial interest were as follows:
| | | | | | | | | | | | | | | | |
| | | Year Ended
September 30, 2016 | | | Year Ended
September 30, 2015 | |
| | | Shares | | | Amount | | | Shares | | | Amount | |
Class A Shares | | | | | | | | | | | | | | | | |
Shares sold | | | 179,515 | | | $ | 2,217,348 | | | | 172,222 | | | $ | 2,123,915 | |
Shares issued to shareholders in reinvestment of dividends | | | 796 | | | | 9,845 | | | | 350 | | | | 4,315 | |
Shares repurchased | | | (101,677 | ) | | | (1,255,571 | ) | | | (130,474 | ) | | | (1,608,923 | ) |
| | | | | | | | | | | | | | | | |
| | | | |
Net increase (decrease) | | | 78,634 | | | $ | 971,622 | | | | 42,098 | | | $ | 519,307 | |
| | | | | | | | | | | | | | | | |
| | | | |
Class I Shares | | | | | | | | | | | | | | | | |
Shares sold | | | 1,018,022 | | | $ | 12,579,199 | | | | 3,405,347 | | | $ | 42,016,558 | |
Shares issued to shareholders in reinvestment of dividends | | | 14,105 | | | | 174,307 | | | | 8,471 | | | | 104,442 | |
Shares repurchased | | | (1,287,521 | ) | | | (15,904,103 | ) | | | (1,059,361 | ) | | | (13,055,279 | ) |
| | | | | | | | | | | | | | | | |
| | | | |
Net increase (decrease) | | | (255,394 | ) | | $ | (3,150,597 | ) | | | 2,354,457 | | | $ | 29,065,721 | |
| | | | | | | | | | | | | | | | |
NOTE 6 – INVESTMENT TRANSACTIONS
For the year ended September 30, 2016, the Fund had purchase and sale transactions of investments (excluding short-term investments) of $12,291,626 and $8,333,000, respectively.
OTHER NOTES
Risks: The Fund’s investments subject it to risks including, but not limited to, management risk, interest rate risk, credit risk, market and economic risk, and liquidity risk. Please see the Fund’s prospectus for a discussion of the risks associated with an investment in the Fund.
Subsequent Events: Fund management believes no events have occurred between September 30, 2016 and the date of issuance of the financial statements that require adjustment to or disclosure in the accompanying financial statements.
Annual Report 19
FINANCIAL HIGHLIGHTS
Thornburg Low Duration Municipal Fund
| | | | | | | | | | | | | | | | | | | | | | | | | | | | | | | | | | | | | | | | | | | | | | | | |
| | | PER SHARE PERFORMANCE (for a share outstanding throughout the Year) | | RATIOS TO AVERAGE NET ASSETS | | | SUPPLEMENTAL DATA | |
Unless Otherwise Noted, Periods are
Fiscal Years Ended Sept. 30, | | Net Asset
Value
Beginning
of Year | | | Net
Investment
Income
(Loss)+ | | Net
Realized
&
Unrealized
Gain (loss)
on
Investments | | | Total from
Investment
Operations | | Dividends
from Net
Investment
Income | | | Dividends
from Net
Realized
Gains | | Total
Dividends | | | Net
Asset
Value
End of
Year | | Net
Investment
Income
(Loss)
(%) | | | Expenses,
After
Expense
Reductions
(%) | | | Expenses,
After
Expense
Reductions
and
Net of
Custody
Credits
(%) | | | Expenses,
Before
Expense
Reductions
(%) | | | Total
Return
(%)(a) | | Portfolio
Turnover
Rate
(%)(a) | | Net
Assets
at End
of
Year
(Thousands) | |
CLASS A SHARES | | | | | | | | | | | | | | | | | | | | | | | | | | | | | | | | | | | | | | | | | | |
2016(b) | | $ | 12.35 | | | 0.03 | | | (0.01 | ) | | 0.02 | | | (0.03 | ) | | — | | | (0.03 | ) | | $12.34 | | | 0.24 | | | | 0.70 | | | | 0.70 | | | | 2.19 | | | 0.15 | | 21.17 | | $ | 4,241 | |
2015(b) | | $ | 12.34 | | | 0.02 | | | 0.01 | | | 0.03 | | | (0.02 | ) | | — | | | (0.02 | ) | | $12.35 | | | 0.15 | | | | 0.67 | | | | 0.67 | | | | 2.85 | | | 0.22 | | 20.53 | | $ | 3,273 | |
2014(b)(c) | | $ | 12.31 | | | 0.02 | | | 0.03 | | | 0.05 | | | (0.02 | ) | | — | | | (0.02 | ) | | $12.34 | | | 0.20 | (d) | | | 0.66 | (d) | | | 0.65 | (d) | | | 3.14 | (d) | | 0.40 | | 4.54 | | $ | 2,751 | |
CLASS I SHARES | | | | | | | | | | | | | | | | | | | | | | | | | | | | | | | | | | | | | | | | | | |
2016 | | $ | 12.35 | | | 0.05 | | | (0.01 | ) | | 0.04 | | | (0.05 | ) | | — | | | (0.05 | ) | | $12.34 | | | 0.43 | | | | 0.50 | | | | 0.50 | | | | 0.72 | | | 0.36 | | 21.17 | | $ | 38,572 | |
2015 | | $ | 12.34 | | | 0.04 | | | 0.01 | | | 0.05 | | | (0.04 | ) | | — | | | (0.04 | ) | | $12.35 | | | 0.32 | | | | 0.50 | | | | 0.50 | | | | 0.82 | | | 0.40 | | 20.53 | | $ | 41,755 | |
2014(c) | | $ | 12.31 | | | 0.04 | | | 0.03 | | | 0.07 | | | (0.04 | ) | | — | | | (0.04 | ) | | $12.34 | | | 0.42 | (d) | | | 0.44 | (d) | | | 0.44 | (d) | | | 1.77 | (d) | | 0.56 | | 4.54 | | $ | 12,672 | |
| (a) | Not annualized for periods less than one year. |
| (b) | Sales loads are not reflected in computing total return. |
| (c) | Fund commenced operations on December 30, 2013. |
| + | Based on weighted average shares outstanding. |
See notes to financial statements.
| | | | |
| 20 Annual Report | | | | Annual Report 21 |
REPORT OF INDEPENDENT REGISTERED PUBLIC ACCOUNTING FIRM
Thornburg Low Duration Municipal Fund
To the Trustees and Shareholders of
Thornburg Low Duration Municipal Fund
In our opinion, the accompanying statement of assets and liabilities, including the schedule of investments in securities, and the related statements of operations and of changes in net assets and the financial highlights present fairly, in all material respects, the financial position of the Thornburg Low Duration Municipal Fund (the “Fund”) at September 30, 2016, the results of its operations for the year then ended, the changes in its net assets for each of the two years in the period then ended and the financial highlights for each of the periods presented, in conformity with accounting principles generally accepted in the United States of America. These financial statements and financial highlights (hereafter referred to as “financial statements”) are the responsibility of the Fund’s management. Our responsibility is to express an opinion on these financial statements based on our audits. We conducted our audits of these financial statements in accordance with the standards of the Public Company Accounting Oversight Board (United States). Those standards require that we plan and perform the audit to obtain reasonable assurance about whether the financial statements are free of material misstatement. An audit includes examining, on a test basis, evidence supporting the amounts and disclosures in the financial statements, assessing the accounting principles used and significant estimates made by management, and evaluating the overall financial statement presentation. We believe that our audits, which included confirmation of securities at September 30, 2016 by correspondence with the custodian, brokers, transfer agent, and the application of alternative procedures where securities purchased had not been received, provide a reasonable basis for our opinion.
PricewaterhouseCoopers LLP
New York, New York
November 18, 2016
22 Annual Report
| | |
| EXPENSE EXAMPLE | | |
| |
Thornburg Low Duration Municipal Fund | | September 30, 2016 (Unaudited) |
As a shareholder of the Fund, you incur two types of costs:
| | (1) | transaction costs, including |
(a) sales charges (loads) on purchase payments, for Class A shares;
(b) a deferred sales charge on redemptions of any part or all of a purchase of $1 million of Class A shares within 12 months of purchase;
| | (2) | ongoing costs, including management fees; distribution and/or service (12b-1) fees; and other Fund expenses. |
This example is intended to help you understand your ongoing costs (in dollars) of investing in the Fund and to compare these costs with the ongoing costs of investing in other mutual funds.
The example is based on a $1,000 investment beginning on April 1, 2016, and held until September 30, 2016.
| | | | | | | | | | | | |
| | | Beginning
Account Value
4/1/16 | | | Ending
Account Value
9/30/16 | | | Expenses paid
During period†
4/1/16–9/30/16 | |
CLASS A SHARES | | | | | | | | | | | | |
Actual | | $ | 1,000.00 | | | $ | 999.90 | | | $ | 3.50 | |
Hypothetical* | | $ | 1,000.00 | | | $ | 1,021.50 | | | $ | 3.54 | |
CLASS I SHARES | | | | | | | | | | | | |
Actual | | $ | 1,000.00 | | | $ | 1,001.70 | | | $ | 2.46 | |
Hypothetical* | | $ | 1,000.00 | | | $ | 1,022.54 | | | $ | 2.49 | |
| † | Expenses are equal to the annualized expense ratio for each class (A: 0.70%; I: 0.49%) multiplied by the average account value over the period, multiplied by 183/366 to reflect the one-half year period. |
| * | Hypothetical assumes a rate of return of 5% per year before expenses. |
ACTUAL EXPENSES
For each class of shares, the first line of the accompanying table provides information about actual account values and actual expenses. You may use the information in this line, together with the amount you invested, to estimate the expenses that you paid over the period. Simply divide your account value by $1,000 (for example, an $8,600 account value divided by $1,000 = 8.6), then multiply the result by the number in the first line for your class of shares under the heading entitled “Expenses Paid During Period” to estimate the expenses you paid on your account during this period.
HYPOTHETICAL EXAMPLE FOR COMPARISON PURPOSES
For each class of shares, the second line of the accompanying table provides information about hypothetical account values and hypothetical expenses based on the Fund’s actual expense ratio and an assumed rate of return of 5% per year before expenses, which is not the Fund’s actual return. The hypothetical account values and expenses may not be used to estimate the actual ending account balance or expenses you paid for the period. You may use this information to compare the ongoing costs of investing in the Fund and other funds. To do so, compare this 5% hypothetical example with the 5% hypothetical examples that appear in the shareholder reports of the other funds.
Please note that the expenses shown in the table are meant to highlight your ongoing costs only and do not reflect any transactional costs, such as sales charges (loads), redemption fees, or exchange fees. Therefore, the second line of the table for each class of shares is useful in comparing ongoing costs only, and will not help you determine the relative total costs of owning different funds. In addition, if these transactional costs were included, your costs would have been higher.
Annual Report 23
| | |
| TRUSTEES AND OFFICERS | | |
| |
Thornburg Low Duration Municipal Fund | | September 30, 2016 (Unaudited) |
| | | | | | |
Name, Age, Year Elected Position Held with Fund | | Principal Occupation(s) During Past Five Years | | Other
Directorships
Held by Trustee | |
INTERESTED TRUSTEES (1)(2)(4) | | | | |
| | |
Garrett Thornburg, 71 Trustee since 1987, Chairman of Trustees(3) | | Chairman and controlling shareholder of Thornburg Investment Management, Inc. (investment advisor); Chairman and controlling shareholder of Thornburg Securities Corporation (securities dealer); Chairman and CEO of Chamisa Energy, LLC; President of the Thornburg Foundation (nonprofit). | | | None | |
| | |
Brian J. McMahon, 61 Trustee since 2001, Vice Chairman of Trustees, Member of Governance & Nominating Committee & Operations Risk Oversight Committee(5) | | Chief Investment Officer, Managing Director, and Portfolio Manager and, until 2016, CEO and President of Thornburg Investment Management, Inc.; Vice President of Thornburg Securities Corporation. | | | None | |
| |
INDEPENDENT TRUSTEES (1)(2)(4) | | | | |
| | |
David A. Ater, 71 Trustee since 1994, Member of Audit Committee & Chairman of Governance & Nominating Committee | | Principal in Ater & Associates, Santa Fe, NM (developer, planner and broker of residential and commercial real estate); owner, developer and broker for various real estate projects. | | | None | |
| | |
David D. Chase, 75 Trustee since 2000, Chairman of Audit Committee | | Managing Member of CS Group, LLC, Santa Fe, NM (private investment fund – family office). | | | None | |
| | |
Sally Corning, 55 Trustee since 2012, Member of Audit Committee | | Partner in Sun Mountain Capital, Santa Fe, NM (private equity firm with investment programs encompassing venture capital, mezzanine debt, and growth equity). | | | None | |
| | |
Susan H. Dubin, 67 Trustee since 2004, Member of Audit Committee & Governance and Nominating Committee | | President of Dubin Investments, Ltd., Greenwich, CT (private investment fund); Director and officer of various charitable organizations. | | | None | |
| | |
David L. Gardner, 53 Trustee since 2015, Member of Operations Risk Oversight Committee | | Until 2012, head of EMEA (Europe, Middle East and Africa) Sales for iShares of Blackrock, Inc., EMEA Executive Committee Member and EMEA Operating Committee Member at Blackrock, Inc. | | | None | |
| | |
Owen D. Van Essen, 62 Trustee since 2004, Member of Governance & Nominating Committee & Chairman of Operations Risk Oversight Committee | | President of Dirks, Van Essen & Murray, Santa Fe, NM (newspaper mergers and acquisitions). | | | None | |
| | |
James W. Weyhrauch, 57 Trustee since 1996, Member of Audit Committee & Operations Risk Oversight Committee | | Real estate broker, Santa Fe Properties, Santa Fe, NM; Vice Chairman of Nambe LLC, Santa Fe, NM (manufacturing & design company). | | | None | |
24 Annual Report
| | |
| TRUSTEES AND OFFICERS, CONTINUED | | |
| |
Thornburg Low Duration Municipal Fund | | September 30, 2016 (Unaudited) |
| | | | | | |
Name, Age, Year Elected Position Held with Fund | | Principal Occupation(s) During Past Five Years | | Other
Directorships
Held by Trustee | |
OFFICERS OF THE FUND (WHO ARE NOT TRUSTEES) (1)(7) | | | | |
| | |
Nimish Bhatt, 53 Treasurer since 2016(6) | | Chief Financial Officer and Treasurer of Thornburg Investment Management, Inc. and Thornburg Securities Corporation since 2016; Senior Vice President (2004-2016), Chief Financial Officer (2011-2016), and Head of Fund Administration (2011-2016) of Calamos Asset Management, Inc., Calamos Investments LLC, Calamos Advisors LLC, and Calamos Wealth Management; Director of Calamos Global Funds plc (2007-2016). | | | Not applicable | |
| | |
Jason Brady, 42 President since 2016(6) | | CEO and President since 2016, Vice President from 2011 to 2016, Portfolio Manager and Managing Director of Thornburg Investment Management, Inc.; Vice President of Thornburg Securities Corporation since 2016. | | | Not applicable | |
| | |
Kathleen Brady, 56 Vice President since 2008 | | Tax Manager Fund Accounting of Thornburg Investment Management, Inc. | | | Not applicable | |
| | |
Connor Browne, 37 Vice President since 2006 | | Portfolio Manager, Vice President since 2013, and Managing Director of Thornburg Investment Management, Inc. | | | Not applicable | |
| | |
Tim Cunningham, 41 Vice President since 2014 | | Managing Director since 2011, Portfolio Manager since 2012, and Associate Portfolio Manager from 2009–2012 of Thornburg Investment Management, Inc. | | | Not applicable | |
| | |
Randy Dry, 42 Vice President since 2014 | | Vice President and Managing Director, Director of Institutional Group from 2014-2016, and since 2016, Chief Administrative Officer of Thornburg Investment Management, Inc. | | | Not applicable | |
| | |
Greg Dunn, 40 Vice President since 2014 | | Managing Director, Portfolio Manager since 2012, and Associate Portfolio Manager from 2009–2012 of Thornburg Investment Management, Inc. | | | Not applicable | |
| | |
Lon Erickson, 41 Vice President since 2008 | | Portfolio Manager and Managing Director of Thornburg Investment Management, Inc. | | | Not applicable | |
| | |
William V. Fries, 77 Vice President since 1995 | | Portfolio Manager, Vice President, and Managing Director of Thornburg Investment Management, Inc. | | | Not applicable | |
| | |
Thomas Garcia, 45 Vice President since 2006 | | Vice President since 2011, Managing Director, Head Equity Trader, and Associate Portfolio Manager of Thornburg Investment Management, Inc. | | | Not applicable | |
| | |
Rolf Kelly, 37 Vice President since 2016 | | Portfolio Manager and Managing Director since 2013 and Associate Portfolio Manager from 2011–2013 of Thornburg Investment Management, Inc. | | | Not applicable | |
| | |
Ben Kirby, 36 Vice President since 2014 | | Portfolio Manager and Managing Director since 2013 and Associate Portfolio Manager from 2011–2013 of Thornburg Investment Management, Inc. | | | Not applicable | |
| | |
Jeff Klingelhofer, 41 Vice President since 2016 | | Portfolio Manager and Managing Director since 2015, Associate Portfolio Manager from 2012–2015, and Fixed Income Analyst from 2010–2012 of Thornburg Investment Management, Inc. | | | Not applicable | |
| | |
Rob MacDonald, 40 Vice President since 2016 | | Managing Director since 2015, Portfolio Manager since 2014, and Associate Portfolio Manager from 2011–2014 of Thornburg Investment Management, Inc. | | | Not applicable | |
| | |
Leigh Moiola, 49 Vice President since 2001 | | Vice President, Managing Director, and Director of Marketing of Thornburg Investment Management, Inc.; Vice President of Thornburg Securities Corporation. | | | Not applicable | |
| | |
Christopher Ryon, 60 Vice President since 2008 | | Portfolio Manager and Managing Director of Thornburg Investment Management, Inc. | | | Not applicable | |
| | |
Nicholos Venditti, 35 Vice President since 2016 | | Portfolio Manager and Managing Director since 2015 and Associate Portfolio Manager from 2011–2015 of Thornburg Investment Management, Inc. | | | Not applicable | |
Annual Report 25
| | |
| TRUSTEES AND OFFICERS, CONTINUED | | |
| |
Thornburg Low Duration Municipal Fund | | September 30, 2016 (Unaudited) |
| | | | |
Name, Age, Year Elected Position Held with Fund | | Principal Occupation(s) During Past Five Years | | Other
Directorships
Held by Trustee |
| | |
Vinson Walden, 46 Vice President since 2004 | | Portfolio Manager and Managing Director of Thornburg Investment Management, Inc. | | Not applicable |
| | |
Lei Wang, 45 Vice President since 2006 | | Portfolio Manager and Managing Director of Thornburg Investment Management, Inc. | | Not applicable |
| | |
Sasha Wilcoxon, 42 Vice President since 2003 Secretary since 2007(6) | | Managing Director, Director of Mutual Fund Operations, and Vice President of Thornburg Investment Management, Inc.; Vice President of Thornburg Securities Corporation. | | Not applicable |
| | |
Charles Wilson, 41 Vice President since 2016 | | Portfolio Manager and Managing Director since 2014 and Associate Portfolio Manager from 2012–2014 of Thornburg Investment Management, Inc.; Co-Portfolio Manager of Marsico Capital Management from 2010–2012. | | Not applicable |
| | |
Di Zhou, 38 Vice President since 2016 | | Portfolio Manager and Managing Director since 2016, Associate Portfolio Manager from 2014–2016, and Equity Research Analyst from 2010–2014 of Thornburg Investment Management, Inc. | | Not applicable |
| (1) | Each person’s address is 2300 North Ridgetop Road, Santa Fe, New Mexico 87506. |
| (2) | The Fund is a separate investment “Fund” or “series” of Thornburg Investment Trust (the “Trust”), which comprises the Thornburg mutual fund complex and is organized as a Massachusetts business trust. Thornburg Investment Management, Inc. is the investment advisor to, and manages, all the Funds of the Trust. Each Trustee oversees all the Funds of the Trust. |
| (3) | Mr. Thornburg is considered an “interested” Trustee under the Investment Company Act of 1940 because he is the sole director and controlling shareholder of Thornburg Investment Management, Inc., the investment advisor to the Trust, and is the sole director and controlling shareholder of Thornburg Securities Corporation, the distributor of shares for the Trust. |
| (4) | The Bylaws of the Trust currently require that each Trustee shall retire by the end of the calendar year during which the Trustee reached the age of 75 years. Otherwise each Trustee serves in office until the election and qualification of a successor or until the Trustee sooner dies, resigns, retires or is removed. |
| (5) | Mr. McMahon is considered an “interested” Trustee under the Investment Company Act of 1940 because he is the chief investment officer of Thornburg Investment Management, Inc. |
| (6) | The Trust’s president, secretary, and treasurer each serves a one-year term or until the election and qualification of a successor; each other officer serves at the pleasure of the Trustees. |
| (7) | Assistant vice presidents, assistant secretaries, and assistant treasurers are not shown. |
The Statement of Additional Information for each Fund of the Trust includes additional information about the Trustees and is available, without charge and upon request, by calling 1-800-847-0200.
26 Annual Report
| | |
| OTHER INFORMATION | | |
| |
Thornburg Low Duration Municipal Fund | | September 30, 2016 (Unaudited) |
PORTFOLIO PROXY VOTING
Policies and Procedures:
The Trust has delegated to Thornburg Investment Management, Inc. (the “Advisor”) voting decisions respecting proxies for the Fund’s voting securities. The Advisor makes voting decisions in accordance with its Proxy Voting Policy. A description of the Policy is available (i) without charge, upon request, by calling the Advisor toll-free at 1-800-847-0200, (ii) on the Thornburg website at www.thornburg. com, and (iii) on the Securities and Exchange Commission’s website at www.sec.gov.
Information regarding how proxies were voted is available on or before August 31 of each year for the twelve months ending the preceding June 30. This information is available (i) without charge, upon request by calling the Advisor toll-free at 1-800-847-0200, (ii) on the Thornburg website at www.thornburg.com, and (iii) on the Securities and Exchange Commission’s website at www.sec.gov.
TAX INFORMATION
For the tax year ended September 30, 2016, dividends paid by the Fund of $189,076 (or the maximum allowed) are tax exempt dividends for federal income tax purposes. The information and the distributions reported herein may differ from the information and distributions reported to the shareholders for the calendar year ending December 31, 2016. Complete information will be reported in conjunction with your 2016 Form 1099.
AVAILABILITY OF QUARTERLY PORTFOLIO SCHEDULE
The Fund files with the Securities and Exchange Commission schedules of its portfolio holdings on Form N-Q for the first and third quarters of each fiscal year. The Fund’s Forms N-Q are available on the Commission’s website at www.sec.gov, or may be reviewed and copied at the Commission’s Public Reference Room in Washington, D.C. Information on the operation of the Public Reference Room may be obtained by calling 1-800-SEC-0330. The Fund also makes this information available on its website at www.thornburg. com/download or upon request by calling 1-800-847-0200.
STATEMENT RESPECTING RENEWAL OF INVESTMENT ADVISORY AGREEMENT
Thornburg Investment Management, Inc. (the “Advisor”) provides investment management services to Thornburg Low Duration Municipal Fund pursuant to an investment advisory agreement. The Trustees consider the renewal of this agreement annually, and most recently determined to renew the agreement on September 13, 2016.
In anticipation of their recent consideration of the advisory agreement’s renewal, the independent Trustees met in May 2016 to consider aspects of their annual evaluation of the Advisor’s service to all of the funds of Thornburg Investment Trust, to plan the annual evaluation of the Advisor’s performance and to specify the information the Advisor would present to the Trustees for their review. The independent Trustees met again in independent session in September to consider portions of the information submitted by the Advisor. The Advisor’s president and chief investment officer subsequently reviewed portions of the information with the Trustees and addressed questions from the Trustees at a full meeting session of the Trustees scheduled for that purpose, and the independent Trustees thereafter met in independent session to consider the Advisor’s presentation and various specific issues respecting their consideration of the advisory agreement’s renewal. Following these sessions, the Trustees met to consider renewal of the agreement, and the independent Trustees voted unanimously at that meeting to renew the agreement for an additional term of one year.
The information below summarizes certain factors considered by the Trustees in connection with the determination to renew the advisory agreement. In determining to renew the agreement, the Trustees considered a wide range of information and did not identify any single factor as controlling, and this summary does not describe all of the factors and other matters considered by the Trustees in making their determination.
Nature, Extent and Quality of Services. The Trustees considered presentations by the Advisor at meeting sessions scheduled for consideration of a continuation of the advisory agreement, and also noted their consideration of the reports the Trustees and their committees receive throughout the year on a wide variety of topics, and consideration they had given to a number of topics in previous years. Information identified by the Trustees in their evaluation as having been considered and contributing to their conclusions included Trustees’ assessments of the Advisor’s personnel developed in formal and informal meetings throughout the year, the Advisor’s staffing levels and measures to maintain staffing levels and improve competencies, the Advisor’s commitment to attract and retain high quality portfolio management expertise through competitive compensation levels, the Advisor’s collaborative approach to investment management, the Fund’s investment performance over different periods of time, portfolio managers’ cognizance of and strategies to address market and economic trends and conditions, the evaluation and selection of individual investments, the structuring and composition of the Fund’s portfolio, management of Fund liquidity requirements, cognizance of and efforts to achieve tax efficiency, responses to share sale and redemption activity, continuing enhancements to the Advisor’s electronic and information systems and the Advisor’s
Annual Report 27
| | |
| OTHER INFORMATION, CONTINUED | | |
| |
Thornburg Low Duration Municipal Fund | | September 30, 2016 (Unaudited) |
engagement of outside firms to assist in improving or replacing those systems, the Advisor’s evaluation and selection of firms providing portfolio trade execution to the Fund and the Advisor’s measures to obtain favorable trade execution, the Advisor’s performance of accounting and other services, the Advisor’s continued commitment to observance of compliance and regulatory requirements, the Advisor’s responsiveness to the Trustees, the quality and extent of written and oral reports to the Trustees over the course of the year, and other factors.
Investment Performance. The Trustees noted in their evaluation of the Fund’s investment performance the reports they had received in each regular meeting over the course of the year from the Advisor’s portfolio management personnel. The Trustees also noted in their evaluation their consideration of information provided to them at their request in anticipation of their annual evaluation of the Advisor’s services, including the Advisor’s written and oral explanations and commentary on the Fund’s performance in the context of the Fund’s objectives and reasonable expectations, and business, market and economic conditions, and comparative annualized total return data for the Fund, a broad-based securities index, and two mutual fund categories selected by independent mutual fund analyst firms that assign a percentage rank to the Fund’s investment performance for each period relative to each of the fund categories.
The Trustees noted that quarterly reports during the year and other information presented to them confirmed the Advisor’s continued conformity to the Fund’s stated investment objectives and policies.
The Fund commenced investment operations in late 2013, and performance data remain limited. The Trustees observed in reviewing available comparative performance data that the Fund’s annualized investment return fell in the fourth quartile of performance of a mutual fund category for the one-year period ended with the second quarter of the current year and fell in the third quartile of performance of the second mutual fund category for the same one-year period, but that investment performance was in line with expectations given market conditions.
Comparisons of Fee and Expense Levels. The Trustees recognized in their evaluation the clear disclosures of the Advisor’s fees and Fund expenses in the Fund’s prospectuses. Information noted by the Trustees as having been considered in this context included a variety of comparative data respecting the Fund’s fee and expense levels. This information included comparisons of the Fund’s advisory fee and overall Fund expenses to median and average fees and expenses charged to a category of mutual funds selected by an independent mutual fund analyst firm, comparisons of the advisory fee and other Fund expenses to the fee level and expenses for a representative share class of a fund peer group selected from the category by a second independent mutual fund analyst firm, the perspectives and advice from the second mutual fund analyst firm respecting comparisons of fund fee levels and expenses to fund peer groups, and other information. Comparative fee and expense data noted as having been considered by the Trustees showed that the advisory fee is currently reduced by fee waivers by the Advisor, but that the stated advisory fee (before fee waivers) for the Fund is comparable to the median and average fee levels for the fund category, the level of total expense for a representative share class of the Fund after fee waivers and expense reimbursements by the Advisor was comparable to the median and average levels of total expenses for the category, and that the level of total expense for a second representative share class after waivers and reimbursements was lower than the median and average levels for the category. Peer group data showed that the Fund’s stated advisory fee was comparable to the median level for the two peer groups, and that the total expense levels of the Fund’s two share classes were comparable to the median levels of their respective peer groups after waiver of fees and reimbursement of expenses.
The Trustees noted their consideration of information respecting the advisory fees charged by the Advisor to other investment management clients, including sub-advised mutual funds, together with information about fees charged by other advisors to different clients, analysis of the differences between the requirements of institutional clients and mutual funds, analysis of the differences between the requirements of a sub-advised mutual fund and a fund as to which the investment advisor is the primary advisor and sponsor, descriptions of distinguishing characteristics of the sub-advised funds served by the Advisor, and the consequently different investment management services provided to the different categories of clients and the differing contexts in which the fee levels for these arrangements are established. The Trustees confirmed their previous observations that the differences between the fees charged by the Advisor to different types of clients did not appear exceptional, and that the fee rates charged by an investment advisor to different categories of clients had limited relevance to the evaluation of the fee rate charged by that advisor to mutual funds as to which it is the primary advisor and sponsor.
Costs and Profitability of Advisor. The Trustees noted the costs incurred by the Advisor in initiating and managing the Fund and the Advisor’s waivers of fees and reimbursements of expenses for the Fund, and further noted that the Fund produces no profits for the Advisor.
Potential Economies of Scale. In reviewing the extent to which economies of scale would be realized by the Fund as it grows and whether fee levels reflect potential economies of scale, the Trustees considered the breakpoint structure for advisory fees chargeable to the Fund, comparisons of the fee breakpoint structure for the Fund with breakpoint structures (or the absence of such structures) for other funds in a peer group selected by an independent mutual fund analyst firm, the effects of the breakpoint structure and other expense factors realized by certain Funds of the Trust as their asset levels had increased, and the Advisor’s expenditures from its own profits and resources to maintain staffing levels, pay competitive levels of compensation, and add to its information retrieval and management systems to maintain or improve service levels. The information provided demonstrated to the Trustees that the Fund’s advisory fee breakpoint structure is reasonable in relation to the structures observed in the other funds in its peer group, and that shareholders
28 Annual Report
| | |
| OTHER INFORMATION, CONTINUED | | |
| |
Thornburg Low Duration Municipal Fund | | September 30, 2016 (Unaudited) |
may be expected to benefit from any economies of scale, due to the advisory agreement’s breakpoint fee structure for the Fund and other factors.
Potential Ancillary Benefits. In reviewing potential benefits to the Advisor because of its relationship to the Fund, the Trustees noted disclosures by the Advisor of its receipt of certain research services from broker dealers, and the benefits to both the Fund and the Advisor of the Advisor’s expansion of its staffing, compliance and systems capabilities and other resources to serve a broader variety of investment management clients. No unusual or unfair benefits to the Advisor from its relationship to the Fund were identified by the Trustees.
Summary of Conclusions. The Trustees concluded that the nature, extent and quality of the Advisor’s services performed under the advisory agreement remained sufficient. The Trustees further concluded that the absolute and relative investment performance of the Fund over pertinent holding periods on the whole was satisfactory in the context of its objectives and strategies, and that the Advisor had continued to actively and competently pursue the Fund’s stated investment objectives and adhere to the Fund’s investment policies.
The Trustees further concluded, based upon their consideration of the foregoing factors and other information, that the level of the advisory fee charged to the Fund by the Advisor is reasonable in relation to the services provided by the Advisor in view of the nature, extent and quality of those services, current fee waivers and expense reimbursements, the investment performance of the Fund after fees and expenses, the clear disclosure of fees and expenses in the Fund’s prospectus, comparisons of fees and expenses charged to the Fund to fees and expenses charged to other mutual funds, and the other factors considered.
Annual Report 29
TRUSTEES’ STATEMENT TO SHAREHOLDERS
Readopted September 12, 2016
The Trustees believe current and prospective shareholders should know how we discharge our responsibilities in supervising the Funds’ investment advisor and in reviewing the advisor’s contract for renewal. Since 2005, we have issued a statement which sets out clearly the three principal guidelines that we follow in supervising the Trust’s investment advisor on your behalf. In accordance with our customary practice, in September of this year we again reviewed our statement and concluded we should reissue this statement outlining the principal features of our supervision of the advisor’s performance of investment management services for the Funds.
We begin with the premise that each shareholder selected his or her Fund because its investments are managed by the investment advisor identified in the prospectus and in accordance with the objective and policies described in the prospectus. We realize, as each of you do, that if you believe that your Fund’s stated objective and policies no longer serve your personal investment goals, you can sell your shares and leave the Fund.
Therefore, we believe that our primary supervisory task – our principal obligation to you – is to assess the nature and quality of the advisor’s services, and to confirm that the advisor actively and competently pursues the Fund’s objective, in accordance with the policies set out in the prospectus. To do this, we meet regularly with management to review your Fund’s portfolio and to discuss the advisor’s specific actions and judgments in pursuing the Fund’s objective. We do not substitute our own judgment for the advisor’s decisions in selecting investments; the advisor is paid to exercise its informed judgment on investment decisions, and we seek to confirm, in reviewing the advisor’s performance, that the advisor is doing just that.
Second, we are conscious of costs and the effect that costs have on shareholders’ returns. We try to make sure that your Fund’s fees and costs are reasonable in relationship to the services rendered and that they are generally in line with those charged by other expert investment advisors, consistent with our belief that the Fund’s investors searched for and expect that expertise and attention and have decided to pay a reasonable price for it. We do not put the management contract “out to bid” as a matter of course, and we would not do so unless we had concluded that the advisor materially had failed to pursue the Fund’s objectives in accordance with its policies, or for other equally important reasons. We believe that any other approach would be inconsistent with your interests and contrary to your expectations when you bought shares of the Fund in the first place.
Finally, because we believe that most Thornburg Fund shareholders have invested with a long-term perspective, we try not to focus too much on the fashions of the moment and on short-term performance. The market will not favor any specific investment objective or set of policies at all times and under all economic circumstances. A fund will experience periods of both high and low returns relative to other funds and other investments. Even if one of our Funds is not favored by the market at a particular time, we believe that the advisor is nonetheless obliged to remain true to the Fund’s objective and policies, and we watch to see that it does so.
Trustees of Thornburg Investment Trust
30 Annual Report
THORNBURG FUNDS
Thornburg Investment Management is a privately-owned global investment firm that offers a range of solutions for retail and institutional investors. Founded in 1982 and headquartered in Santa Fe, New Mexico, we manage approximately $53 billion (as of September 30, 2016) across eight equity and 11 bond mutual funds, separate accounts for high-net-worth investors and institutional accounts, and five UCITS funds for non-U.S. investors.
The fund outlined in this report is one of many equity and fixed-income products available from Thornburg Investment Management.
Equity Funds
| | • | | Thornburg Core Growth Fund |
| | • | | Thornburg International Value Fund |
| | • | | Thornburg Better World International Fund |
| | • | | Thornburg International Growth Fund |
| | • | | Thornburg Developing World Fund |
| | • | | Thornburg Investment Income Builder Fund |
| | • | | Thornburg Global Opportunities Fund |
Fixed Income Funds
| | • | | Thornburg Low Duration Income Fund |
| | • | | Thornburg Limited Term U.S. Government Fund |
| | • | | Thornburg Limited Term Income Fund |
| | • | | Thornburg Strategic Income Fund |
| | • | | Thornburg Low Duration Municipal Fund |
| | • | | Thornburg Limited Term Municipal Fund |
| | • | | Thornburg Intermediate Municipal Fund |
| | • | | Thornburg California Limited Term Municipal Fund |
| | • | | Thornburg New Mexico Intermediate Municipal Fund |
| | • | | Thornburg New York Intermediate Municipal Fund |
| | • | | Thornburg Strategic Municipal Income Fund |
Before investing, carefully consider the Fund’s investment goals, risks, charges, and expenses. For a prospectus or summary prospectus containing this and other information, contact your financial advisor or visit thornburg.com. Read it carefully before investing.
For additional information, please visit thornburg.com
Thornburg Investment Management, Inc. 2300 North Ridgetop Road, Santa Fe, NM 87506
Annual Report 31

| | |
| To receive shareholder reports, prospectuses, and proxy statements electronically, go to www.thornburg.com/edelivery. | |  |
This Annual Report is submitted for the general information of shareholders of the Fund. It is not authorized for distribution to prospective investors in the Fund unless preceded or accompanied by an effective prospectus. | |
| | | | |
| Investment Advisor: | | Distributor: | | |
| Thornburg Investment Management® | | Thornburg Securities Corporation® | | |
| 800.847.0200 | | 800.847.0200 | | TH3172 |
2 Annual Report
Annual Report
Thornburg Limited Term Municipal Fund
September 30, 2016
| | | | |
Share Class | | NASDAQ Symbol | | CUSIP |
Class A | | LTMFX | | 885-215-459 |
Class C | | LTMCX | | 885-215-442 |
Class I | | LTMIX | | 885-215-434 |
Minimum investments for Class I shares may be higher than those for other classes. Class I shares may not be available to all investors.
Investments carry risks, including possible loss of principal. Portfolios investing in bonds have the same interest rate, inflation, and credit risks that are associated with the underlying bonds. The value of bonds will fluctuate relative to changes in interest rates, decreasing when interest rates rise. Unlike bonds, bond funds have ongoing fees and expenses. Please see the Fund’s prospectus for a discussion of the risks associated with an investment in the Fund. Investments in the Funds are not FDIC insured, nor are they bank deposits or guaranteed by a bank or any other entity.
The laddering strategy does not assure or guarantee better performance and cannot eliminate the risk of investment losses.
Diversification does not assure or guarantee better performance and cannot eliminate the risk of investment losses.
Annual Report 3
LETTER TO SHAREHOLDERS
| | |
| |
Thornburg Limited Term Municipal Fund | | September 30, 2016 (Unaudited) |
October 13, 2016
Dear Fellow Shareholder:
We are pleased to present the annual report for Thornburg Limited Term Municipal Fund. The net asset value (NAV) of the Class A shares increased by 11 cents to $14.63 per share during the fiscal year ended September 30, 2016. If you were with us for the entire period, you received dividends of 22.5 cents per share. If you reinvested your dividends, you received 22.7 cents per share. Dividends were lower for Class C shares and higher for Class I shares to account for varying class-specific expenses. The Class A shares of your Fund underperformed the index with a 2.32% total return (without sales charge) for the fiscal year ended September 30, 2016, compared to the 2.95% total return for the BofA Merrill Lynch 1-10 Year U.S. Municipal Securities Index. The Fund generated 0.83% more price return and 1.46% less income than the index after accounting for the different treatment of bonds priced above and below par by the index versus the Fund.
Drivers of the Fund’s price return relative to its benchmark include its interest rate sensitivity, as measured by the Fund’s duration. Also, differing allocations along the Fund’s investment universe added zero relative price performance. Sector allocations added 0.46% of relative price performance and its overweight to lower credit-quality securities contributed 0.12% of relative price performance. Other risk factors (and accounting differences) totaled another 0.25% of relative price performance for the period.
The market’s returns were a result of increasing short-term rates and decreasing long-term rates, shown in Figure 1.
U.S. Economy, Fed Policy, and the Election
The U.S. economy grew at a paltry average rate of 1%, as measured by nominal gross domestic product, for the first three quarters of 2016, much lower than the almost 3% average rate for 2015.
On the employment front, the economy added approximately 200,000 jobs per month for the Fund’s 2016 fiscal year. The May jobs number was a little scary, adding only 24,000 that month. The unemployment rate ticked up to 5.0% in September of 2016 from 4.9% in August, as more previously non-participating workers returned to the labor market.
Inflation has held stable, although it did move up slightly. The Core Personal Consumption Expenditure Index (Core PCE) for August moved up to 1.7% from 1.6% in July, although well below the U.S. Federal Reserve Board’s (the Fed) 2.0% target.
So, all in all, the economy is still growing, jobs are being added and inflation is well behaved. This isn’t a bad scenario for municipal bond investors, except that, at current valuations and 10-year AAA municipal general obligation bonds yielding 1.64%, municipal bond investors are generally not keeping up with inflation.
Elsewhere, the Fed increased the federal funds rate 0.25% in December of 2015. Although many pundits want to blame the credit markets rout on that event, they would be wrong. Oil prices, as measured by WTI crude futures, hit a low of $34.54 on January 20, 2016. Energy producers are a highly leveraged segment of the market, whether through bank loans or other forms of debt. As market participants began to question their ability to service these loans or debt, credit spreads began to widen and the impact of these loans on the financial stability of some banks came into question. The municipal market avoided this distress because bond issuance from energy-producing states was a small fraction of the $3.8 trillion municipal bond market.
This early-2016 market turbulence, followed by the May jobs report and the “Brexit” vote in Great Britain, gave the Fed enough pause not to follow their December rate increase with another. So far through 2016, the central bank has insisted that they may increase rates again and again. Last year we said, “Regardless, waiting for the Fed to raise short-term interest rates is akin to Waiting for Godot.” Well, we are still waiting. Meanwhile, the Fed is assuring the markets that the
Figure I | 12-Month Change in Rates for AAA Rated General Obligation Municipal Bonds
(as of September 30, 2016)
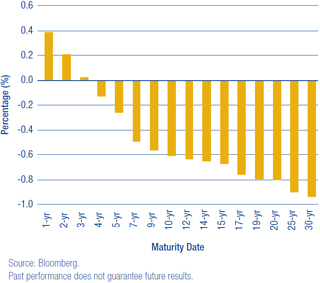
4 Annual Report
| | |
LETTER TO SHAREHOLDERS, CONTINUED | | |
| |
Thornburg Limited Term Municipal Fund | | September 30, 2016 (Unaudited) |
next meeting is “live” and they may raise short-term interest rates again!
The 2016 U.S. presidential race featured two major party candidates with unprecedented high unfavorable ratings with the electorate. At the time of this writing, the election’s result is weeks away. Regardless of the winner, however, the president historically has had very little impact on the course of the economy. Although there is a pattern that if the economy is doing well, the current administration likes to take all the credit; if the economy is not doing well, the current administration blames the previous one. A victory for either candidate could still benefit the municipal bond market, however, as both stumped for large increases in infrastructure spending—with one particularly calling for higher taxes which would lend support to the municipal bond market. If this gets through Congress, it could mean a higher level of municipal bond issuance and ultimately high growth rates for the economy; both occurrences would put upward pressure on municipal bond yields.
The Municipal Bond Market
The value metrics we use at Thornburg all suggest that the municipal bond market is pricing-in the rosiest of scenarios going forward. The main reason for this is that global central banks, with their overly accommodative monetary policies, have pushed investors further out on the risk spectrum in search of yield. That is why, depending on the fund, we have our portfolios positioned in the lower end of their respective risk spectrums. This means that durations (a measure of price sensitivity to changes in interest rates) are low and credit quality is higher than in the past. We continually ask ourselves: are investors getting paid to take risk? The answer we come up with is no!
Inside the Risk Metrics
Let’s first look at real yields, which is how much yield over inflation investors are being paid to own municipal bonds. As mentioned earlier, 10-year AAA general obligation bonds are yielding 1.64% and Core PCE is running at 1.70%, so investors are earning less than inflation. Over the last 20 years, investors have earned an average of 2% over inflation for the opportunity to invest in a 10-year AAA general obligation municipal bond.
The second thing to consider is credit spreads, which reflect the incremental yield an investor earns from owning a lower-rated credit versus a higher-rated credit, and which are now very narrow. As of September 30, 2016, an investor earned about 1% more for owning a 10-year BBB revenue bond versus a 10-year AAA general obligation bond. That is slightly higher than the average 0.75% an investor earned between 1994 and 2007. In 2007, approximately 50% of the new issue municipal bond market was insured by AAA/AAA municipal bond insurers. Today, there are no AAA/AAA municipal bond insurers, and insurance coverage generally accounts for only 6% to 8% of the new issue municipal bond market. On top of that, the security covenants of some current lower-quality investment grade securities are the most lax in years. This is a great time to be an issuer of lower-quality investment grade municipal bonds but not a great time to be an investor in them.
Finally, the slope of the yield curve, which tracks how much incremental yield an investor earns by owning securities with longer maturities, is also quite flat. Currently, investors are earning 0.78% more for owning a 10-year AAA general obligation municipal bond, versus a 1-year AAA general obligation municipal bond. Since 1994, an investor earned on average almost 1.60% to extend maturities from one to 10 years. The stretch for income is causing investors to absorb more risk at lower and lower relative yields.
Aside from valuations, the credit picture for the majority of the U.S. is pretty bright. Except for energy producing states, most regions are showing positive trends along such measures as:
Pensions are still a troubling issue. That is, 35 states reported a pension funding ratio of under 80% in 2014—the Mendoza line between a well-funded state pension and the “other kind.” As the worst career hitter in major league baseball history (.200 batting average), Mario Mendoza Aizpuru’s name ubiquitously symbolizes futility.
Liquidity
Market liquidity is still a concern. The latest example of this is what is happening to yields on Variable Rate Demand Notes (VRDNs). These are securities that are normally held in money market funds and bond fund reserve positions. They can be put back to an intermediary on a daily basis and are relatively secure. Leading up to the finalization of the Securities and Exchange Commission’s money market fund reform in October of 2016, money market funds were and are repositioning themselves to be compliant with the new regulations. As such, they have had to divest themselves of VRDNs. Intermediaries do not want to hold them on their balance sheets (very expensive), so they raise the yields to clear the market. What used to yield 0.01% in March now yields, as of the time of this writing, 0.90%, or more than a 3-year AA security. This is serendipity for managers like Thornburg holding higher reserves because of concern over market liquidity; for issuers in the VRDN market, it’s not so much.
Annual Report 5
| | |
LETTER TO SHAREHOLDERS, CONTINUED | | |
| |
Thornburg Limited Term Municipal Fund | | September 30, 2016 (Unaudited) |
Main Reason to Own Municipal Bonds
One of the best risk-mitigating tools an investor has is diversification. By splitting a portfolio into several asset classes, an investor may reduce the volatility of the resulting portfolio’s returns. This is because the returns of various asset classes are not always correlated. There are times when this is not the case, such as the 2008 financial crisis when all correlations went to one. For the long-term investor, however, we believe the benefits of diversification stand firm. When added to a portfolio of stocks, municipal bonds tend to reduce the volatility of that combined portfolio. Funds such as Thornburg Limited Term Municipal Fund may be a viable choice in a total diversified portfolio of stocks and bonds.
Conclusion
We continue to run this portfolio as an actively managed laddered portfolio. Laddering a portfolio is a simple way to diversify its investment along its entire investment universe. While past performance does not guarantee future results, our study showed that this structure outperformed other structures around 60% of the time and added 0.15% to 0.25% of total return annually.* Our view is that the current investment environment is not compensating investors enough to take on extra risk, so we have positioned our portfolios at the lower end of their risk spectrums. Know that the co-managers of this Fund are invested alongside you.
Thank you for your continued trust in us.
| | |
Sincerely, | | |
| |

| | 
|
Christopher Ryon, CFA | | Nicholos Venditti, CFA |
Portfolio Manager | | Portfolio Manager |
Managing Director | | Managing Director |
| * | We examined three hypothetical portfolios of bonds from December 1997 to December 2015. One using a laddering strategy, one using a barbell strategy, and a third using a bullet strategy. For the laddering strategy, the BofA Merrill Lynch 1–12 Year Municipal Index was used as a proxy, since, similar to a ladder, it contains bonds relatively evenly spread across all maturities within the index. The barbell strategy is a duration management technique wherein bonds are clustered at the two extremes of a maturity range. For the barbell strategy, the BofA Merrill Lynch 1–3 Year Municipal Index and BofA Merrill Lynch 8–12 Year Municipal Index were combined. The two indices were weighted in such a way as to give them the same duration as the broader 1–12 Year Index, and each year the portfolio was re-weighted back to the original index weights. This was done to make the two portfolios duration-neutral so that the impact of the strategy chosen could be isolated. The bullet strategy invests at the duration midpoint of the portfolio, therefore the BofA Merrill Lynch 6–8 Year Index was used to represent the bullet strategy. For additional information, see www.thornburg.com/whyladder. Past performance does not guarantee future results. |
The matters discussed in this report may constitute forward-looking statements made pursuant to the safe harbor provisions of the Securities Litigation Reform Act of 1995. These include any advisor or portfolio manager prediction, assessment, analysis or outlook for individual securities, industries, investment styles, market sectors and/or markets. These statements involve risks and uncertainties. In addition to the general risks described for each fund in its current prospectus, other factors bearing on these reports include the accuracy of the advisor’s or portfolio manager’s forecasts and predictions, the appropriateness of the investment strategies designed by the advisor or portfolio manager and the ability of the advisor or portfolio manager to implement their strategies efficiently and successfully. Any one or more of these factors, as well as other risks affecting the securities markets generally, could cause the actual results of any fund to differ materially as compared to its benchmarks.
The views expressed by the portfolio managers reflect their professional opinions and are subject to change. Under no circumstances does the information contained within represent a recommendation to buy or sell any security.
6 Annual Report
| | |
| PERFORMANCE SUMMARY | | |
| |
Thornburg Limited Term Municipal Fund | | September 30, 2016 (Unaudited) |
Average Annual Total Returns
| | | | | | | | | | | | | | | | | | | | |
| | | 1-Yr | | | 3-Yr | | | 5-Yr | | | 10-Yr | | | Since
Incep. | |
A Shares (Incep: 9/28/84) | | | | | | | | | | | | | | | | | | | | |
Without sales charge | | | 2.32 | % | | | 2.22 | % | | | 2.12 | % | | | 3.29 | % | | | 4.99 | % |
With sales charge | | | 0.79 | % | | | 1.70 | % | | | 1.81 | % | | | 3.13 | % | | | 4.94 | % |
C Shares (Incep: 9/1/94) | | | | | | | | | | | | | | | | | | | | |
Without sales charge | | | 2.07 | % | | | 1.97 | % | | | 1.87 | % | | | 3.02 | % | | | 3.44 | % |
With sales charge | | | 1.57 | % | | | 1.97 | % | | | 1.87 | % | | | 3.02 | % | | | 3.44 | % |
I Shares (Incep: 7/5/96) | | | 2.64 | % | | | 2.57 | % | | | 2.46 | % | | | 3.63 | % | | | 4.04 | % |
30-Day Yields, A Shares
(with sales charge)
| | | | |
Annualized Distribution Yield | | | 1.56 | % |
| |
SEC Yield | | | 0.69 | % |
Growth of a Hypothetical $10,000 Investment
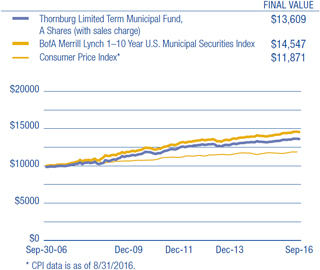
Performance data shown represents past performance and is no guarantee of future results. Investment return and principal value will fluctuate so shares, when redeemed, may be worth more or less than their original cost. Current performance may be lower or higher than quoted. For performance current to the most recent month end, visit thornburg.com or call 800-847-0200. The performance information does not reflect the deduction of taxes that a shareholder would pay on distributions or the redemption of Fund shares. Returns reflect the reinvestment of dividends and capital gains. Class A shares are sold with a maximum sales charge of 1.50%. Class C shares include a 0.50% CDSC for the first year only. There is no sales charge for Class I shares.
As disclosed in the most recent prospectus, the total annual fund operating expenses are as follows: A shares, 0.73%; C shares, 0.96%; I shares, 0.41%.
Glossary
BofA Merrill Lynch 1-10 Year Municipal Securities Index – A subset of the BofA Merrill Lynch U.S. Municipal Securities Index including all securities with a remaining term to final maturity less than 10 years.
The BofA Merrill Lynch indices used in the Ladder vs Barbell & Bullet study are model portfolios of municipal obligations throughout the United States, with maturities ranging either from one to three years, six to eight years, eight to twelve years, or one to twelve years. These indices are subsets of the BofA Merrill Lynch U.S. Municipal Securities Index, which is comprised of U.S. dollar denominated investment grade tax-exempt debt publicly issued by U.S. states and territories, and their political subdivisions, in the U.S. domestic market. Qualifying securities must have at least a one-year remaining term to final maturity, a fixed coupon schedule and an investment grade rating.
Unless otherwise noted, index returns reflect the reinvestment of income dividends and capital gains, if any, but do not reflect fees, brokerage commissions or other expenses of investing. Investors may not make direct investments into any index. The performance of any index is not indicative of the performance of any particular investment.
Annualized Distribution Yield – The distribution yield reflects actual distributions made to shareholders. The annualized distribution yield is calculated by summing the last 30 days of income at a given month end and annualizing to a 360-day year. The result is divided by the ending maximum offering price.
Bond Credit Ratings (Credit Quality) – A bond credit rating assesses the financial ability of a debt issuer to make timely payments of principal and interest. Ratings of AAA (the highest), AA, A, and BBB are investment-grade quality. Ratings of BB, B, CCC, CC, C and D (the lowest) are considered below investment grade, speculative grade, or junk bonds.
Core Personal Consumption Expenditure Index (Core PCE) – A measure of the Personal Consumption Expenditure Index that excludes the more volatile and seasonal food and energy prices.
Credit Spread/Quality Spread – The difference between the yields of securities with different credit qualities.
Duration – A bond’s sensitivity to interest rates. Effective duration incorporates the embedded option features, such as call provisions. Bonds with longer durations experience greater price volatility than bonds with shorter durations.
General Obligation Bond (GO) – A municipal bond backed by the credit and “taxing power” of the issuing jurisdiction rather than the revenue from a given project.
Gross Domestic Product (GDP) – A country’s income minus foreign investments: the total value of all goods and services produced within a country in a year, minus net income from investments in other countries.
Laddering – Involves building a portfolio of bonds with staggered maturities so that a portion matures each year. Money that comes in from maturing bonds is typically invested in bonds with longer maturities at the far end of the portfolio.
Revenue Bond – A bond on which the debt service is payable solely from the revenue generated from the operation of the project being financed or a category of facilities, or from other non-tax sources.
SEC Yield – SEC yield is computed in accordance with SEC standards measuring the net investment income per share over a specified 30-day period expressed as a percentage of the maximum offering price of the Fund’s shares at the end of the period.
Variable Rate Demand Note (VRDN) – VRDNs are long-term, floating-rate municipal securities. These highly liquid securities are payable on demand, typically either daily or weekly, meaning the investor can request repayment of the entire debt amount. The coupon rate will adjust on a periodic basis, either daily or weekly.
West Texas Intermediate (WTI) – A grade of crude oil used as a benchmark in oil pricing.
Yield Curve – A line that plots the interest rates, at a set point in time, of bonds having equal credit quality, but differing maturity dates.
Annual Report 7
| | |
| FUND SUMMARY | | |
| |
Thornburg Limited Term Municipal Fund | | September 30, 2016 (Unaudited) |
Objectives and Strategies
The Fund’s primary investment objective is to obtain as high a level of current income exempt from federal individual income tax as is consistent, in the view of the Fund’s investment advisor, with preservation of capital (may be subject to Alternative Minimum Tax).
The secondary goal of the Fund is to reduce expected changes in its share price compared to longer intermediate and long-term bond portfolios.
This Fund is a laddered portfolio of municipal bonds with a dollar-weighted average maturity of normally less than five years. Laddering involves building a portfolio of bonds with staggered maturities so that a portion of the portfolio matures each year. Cash from maturing bonds, if not needed for other purposes, is typically invested in bonds with longer maturities at the far end of the ladder. We regard the strategy as a good compromise for managing different types of risk.
Long-term Stability of Principal
Net Asset Value History of A Shares
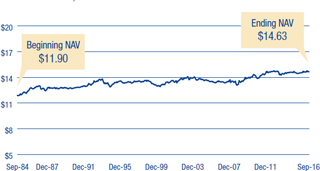
Security Credit Ratings
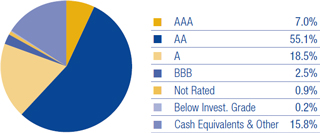
A bond credit rating assesses the financial ability of a debt issuer to make timely payments of principal and interest. Ratings of AAA (the highest), AA, A, and BBB are investment-grade quality. Ratings of BB, B, CCC, CC, C and D (the lowest) are considered below investment grade, speculative grade, or junk bonds. Credit quality ratings for Thornburg’s municipal portfolios used the highest rating available from either Standard & Poor’s or Moody’s Investors Service.
Portfolio Ladder
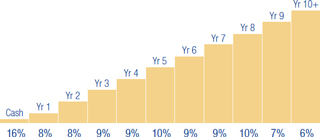
Percent of portfolio maturing in each year. Cash includes cash equivalents and other.
Key Portfolio Attributes
| | | | |
Number of Bonds | | | 1,987 | |
| |
Effective Duration | | | 3.5 Yrs | |
| |
Average Maturity | | | 4.2 Yrs | |
There is no guarantee that the Fund will meet its investment objectives.
All data is subject to change. Charts may not add up to 100% due to rounding.
8 Annual Report
SCHEDULE OF INVESTMENTS
| | |
| |
Thornburg Limited Term Municipal Fund | | September 30, 2016 |
| | | | | | | | | | | | |
Issuer-Description | | Credit Rating†
S&P/ Moody’s | | | Principal
Amount | | | Value | |
ALABAMA — 0.78% | | | | | | | | | | | | |
Alabama Public School & College Authority, 5.00% due 6/1/2019 (Education System Capital Improvements) | | | AA/Aa1 | | | $ | 770,000 | | | $ | 852,251 | |
Alabama Public School & College Authority, 5.00% due 6/1/2019 (Education System Capital Improvements) | | | AA/Aa1 | | | | 4,840,000 | | | | 5,357,009 | |
Alabama Public School & College Authority, 5.00% due 6/1/2020 (Education System Capital Improvements) | | | AA/Aa1 | | | | 5,085,000 | | | | 5,799,493 | |
Alabama Public School & College Authority, 5.00% due 6/1/2021 (Education System Capital Improvements) | | | AA/Aa1 | | | | 5,335,000 | | | | 6,259,876 | |
Alabama Public School & College Authority, 5.00% due 6/1/2022 (Education System Capital Improvements) | | | AA/Aa1 | | | | 5,605,000 | | | | 6,741,133 | |
Alabama Public School & College Authority, 5.00% due 6/1/2023 (Education System Capital Improvements) | | | AA/Aa1 | | | | 735,000 | | | | 903,271 | |
Alabama State Board of Education, 3.00% due 5/1/2017 (Calhoun Community College) | | | NR/A1 | | | | 2,070,000 | | | | 2,089,582 | |
Alabama State Board of Education, 3.00% due 5/1/2018 (Calhoun Community College) | | | NR/A1 | | | | 2,130,000 | | | | 2,182,803 | |
Alabama State Board of Education, 4.00% due 5/1/2019 (Calhoun Community College) | | | NR/A1 | | | | 2,195,000 | | | | 2,330,607 | |
Alabama State Board of Education, 4.00% due 5/1/2020 (Calhoun Community College) | | | NR/A1 | | | | 1,000,000 | | | | 1,085,380 | |
Alabama State Board of Education, 4.00% due 5/1/2021 (Calhoun Community College) | | | NR/A1 | | | | 1,000,000 | | | | 1,103,070 | |
Alabama State Board of Education, 4.00% due 5/1/2022 (Calhoun Community College) | | | NR/A1 | | | | 1,230,000 | | | | 1,376,911 | |
City of Birmingham GO, 5.00% due 2/1/2017 (Government Services) | | | AA/Aa2 | | | | 2,045,000 | | | | 2,073,937 | |
City of Birmingham GO, 4.00% due 8/1/2017 (Government Services) | | | AA/Aa2 | | | | 2,760,000 | | | | 2,831,705 | |
City of Birmingham GO, 5.00% due 2/1/2018 (Government Services) | | | AA/Aa2 | | | | 2,000,000 | | | | 2,109,180 | |
City of Mobile GO, 5.00% due 2/15/2019 (Capital Improvements) | | | A+/Aa2 | | | | 2,000,000 | | | | 2,112,000 | |
City of Mobile Industrial Development Board, 1.65% due 6/1/2034 put 3/20/2017 (Alabama Power Company Barry Plant Project) | | | A-/A1 | | | | 6,000,000 | | | | 6,018,540 | |
East Alabama Health Care Authority GO, 5.00% due 9/1/2021 | | | A/NR | | | | 1,245,000 | | | | 1,438,498 | |
East Alabama Health Care Authority GO, 5.00% due 9/1/2022 | | | A/NR | | | | 800,000 | | | | 931,904 | |
Montgomery Waterworks and Sanitation, 5.00% due 9/1/2019 | | | AAA/Aa1 | | | | 3,375,000 | | | | 3,629,441 | |
University of Alabama at Birmingham Hospital, 5.25% due 9/1/2017 | | | A+/A1 | | | | 2,500,000 | | | | 2,595,400 | |
University of Alabama at Birmingham Hospital, 5.00% due 9/1/2018 | | | A+/A1 | | | | 1,700,000 | | | | 1,825,222 | |
| | | |
ALASKA — 0.44% | | | | | | | | | | | | |
Alaska Housing Finance Corp., 5.00% due 12/1/2018 pre-refunded 12/1/2017 (State Capital Project; Insured: Natl-Re) | | | AA-/Aa2 | | | | 1,610,000 | | | | 1,688,761 | |
Alaska Housing Finance Corp., 5.00% due 12/1/2018 (State Capital Project; Insured: Natl-Re) | | | AA+/Aa2 | | | | 390,000 | | | | 408,763 | |
Alaska Industrial Development & Export Authority GO, 5.00% due 4/1/2017 (DeLong Mountain Transportation Project) | | | AA+/Aa3 | | | | 3,000,000 | | | | 3,060,960 | |
Alaska Industrial Development & Export Authority GO, 5.00% due 4/1/2018 (DeLong Mountain Transportation Project) | | | AA+/Aa3 | | | | 2,455,000 | | | | 2,599,207 | |
City of Valdez, 5.00% due 1/1/2021 (BP Pipelines (Alaska), Inc. Project) | | | A-/A2 | | | | 12,000,000 | | | | 13,675,920 | |
City of Valdez, 5.00% due 1/1/2021 (BP Pipelines (Alaska), Inc. Project) | | | A-/A2 | | | | 3,700,000 | | | | 4,216,742 | |
North Slope Borough GO, 5.00% due 6/30/2017 (ETM) | | | AA-/Aa2 | | | | 5,700,000 | | | | 5,875,503 | |
North Slope Borough GO, 5.00% due 6/30/2017 | | | AA-/Aa2 | | | | 3,100,000 | | | | 3,197,123 | |
| | | |
ARIZONA — 2.30% | | | | | | | | | | | | |
a Arizona Board of Regents, 5.00% due 8/1/2020 (University of Arizona SPEED) | | | A+/Aa3 | | | | 575,000 | | | | 658,145 | |
Arizona Board of Regents, 5.00% due 8/1/2023 (University of Arizona SPEED) | | | A+/Aa3 | | | | 800,000 | | | | 982,632 | |
Arizona Board of Regents, 5.00% due 8/1/2024 (University of Arizona SPEED) | | | A+/Aa3 | | | | 550,000 | | | | 687,462 | |
Arizona Board of Regents COP, 5.00% due 7/1/2018 (Arizona State University; Insured: Natl-Re) | | | AA-/A1 | | | | 1,285,000 | | | | 1,322,933 | |
Arizona Board of Regents COP, 3.00% due 9/1/2018 (Northern Arizona University Projects) | | | A/A2 | | | | 1,000,000 | | | | 1,035,790 | |
Arizona Board of Regents COP, 5.00% due 7/1/2019 (Arizona State University; Insured: Natl-Re) | | | AA-/A1 | | | | 3,735,000 | | | | 3,847,722 | |
Arizona Board of Regents COP, 3.00% due 9/1/2019 (Northern Arizona University Projects) | | | A/A2 | | | | 2,525,000 | | | | 2,649,280 | |
Arizona Board of Regents COP, 5.00% due 9/1/2019 (Arizona State University) | | | AA-/A1 | | | | 1,085,000 | | | | 1,201,713 | |
Arizona Board of Regents COP, 5.00% due 9/1/2020 (Northern Arizona University Projects) | | | A/A2 | | | | 1,000,000 | | | | 1,130,950 | |
Arizona Board of Regents COP, 5.00% due 9/1/2020 (Arizona State University) | | | AA-/A1 | | | | 3,170,000 | | | | 3,607,175 | |
Arizona Board of Regents COP, 5.00% due 9/1/2021 (Arizona State University) | | | AA-/A1 | | | | 4,020,000 | | | | 4,683,340 | |
Arizona Board of Regents COP, 5.00% due 6/1/2022 (Arizona State University) | | | A+/Aa3 | | | | 6,080,000 | | | | 7,271,984 | |
Arizona Board of Regents COP, 5.00% due 9/1/2022 (Northern Arizona University Projects) | | | A/A2 | | | | 2,500,000 | | | | 2,965,250 | |
Arizona Board of Regents COP, 5.00% due 9/1/2022 (Arizona State University) | | | AA-/A1 | | | | 4,380,000 | | | | 5,207,820 | |
Arizona Board of Regents COP, 5.00% due 9/1/2023 (Northern Arizona University Projects) | | | A/A2 | | | | 3,325,000 | | | | 3,965,827 | |
Arizona Board of Regents COP, 5.00% due 9/1/2023 (Arizona State University) | | | AA-/A1 | | | | 5,580,000 | | | | 6,738,017 | |
Arizona HFA, 5.25% due 1/1/2018 (Banner Health) | | | AA-/NR | | | | 3,500,000 | | | | 3,688,720 | |
Arizona HFA, 5.00% due 7/1/2018 (Dignity Health) | | | A/A3 | | | | 1,470,000 | | | | 1,569,490 | |
Arizona HFA, 5.00% due 7/1/2019 (Dignity Health) | | | A/A3 | | | | 1,365,000 | | | | 1,509,717 | |
Arizona HFA, 5.00% due 7/1/2020 (Dignity Health) | | | A/A3 | | | | 1,290,000 | | | | 1,424,908 | |
Arizona HFA, 5.00% due 12/1/2022 (Scottsdale Lincoln Hospitals) | | | NR/A2 | | | | 1,600,000 | | | | 1,941,024 | |
Arizona HFA, 5.00% due 12/1/2024 (Scottsdale Lincoln Hospitals) | | | NR/A2 | | | | 1,500,000 | | | | 1,887,525 | |
Arizona School Facilities Board, 5.00% due 7/1/2018 (State School Land Trust; Insured: AMBAC) | | | NR/NR | | | | 4,540,000 | | | | 4,834,964 | |
Arizona School Facilities Board COP, 5.25% due 9/1/2023 pre-refunded 9/1/2018 (School Site and Building Projects) | | | AA-/Aa3 | | | | 1,315,000 | | | | 1,424,566 | |
Arizona Transportation Board, 5.00% due 7/1/2019 | | | AA+/Aa2 | | | | 3,510,000 | | | | 3,899,364 | |
Arizona Transportation Board, 5.00% due 7/1/2021 | | | AA+/Aa2 | | | | 7,465,000 | | | | 8,813,254 | |
Arizona Transportation Board, 5.00% due 7/1/2022 | | | AA+/Aa2 | | | | 5,000,000 | | | | 5,901,800 | |
City of Glendale IDA, 5.00% due 5/15/2017 (Midwestern University) | | | A/NR | | | | 1,440,000 | | | | 1,474,186 | |
City of Phoenix Civic Improvement Corp., 5.00% due 7/1/2022 | | | AA+/Aa3 | | | | 1,250,000 | | | | 1,514,050 | |
City of Phoenix Civic Improvement Corp., 5.00% due 7/1/2023 | | | AA+/Aa3 | | | | 1,830,000 | | | | 2,265,046 | |
City of Phoenix Civic Improvement Corp., 5.00% due 7/1/2024 | | | AA+/Aa3 | | | | 2,000,000 | | | | 2,521,340 | |
Annual Report 9
| | |
| SCHEDULE OF INVESTMENTS, CONTINUED | | |
| |
Thornburg Limited Term Municipal Fund | | September 30, 2016 |
| | | | | | | | | | | | |
Issuer-Description | | Credit Rating†
S&P/ Moody’s | | | Principal
Amount | | | Value | |
City of Phoenix Civic Improvement Corp., 5.00% due 7/1/2025 | | | AA+/Aa3 | | | $ | 3,500,000 | | | $ | 4,478,215 | |
City of Tucson, 5.00% due 7/1/2022 (Street and Highway Projects) | | | AA+/A1 | | | | 2,135,000 | | | | 2,558,392 | |
City of Yuma Municipal Property Corp., 5.00% due 7/1/2018 pre-refunded 7/1/2017 (Water and Wastewater System; Insured: Syncora) | | | A+/A1 | | | | 2,130,000 | | | | 2,196,328 | |
Mohave County IDA, 7.50% due 5/1/2019 (Mohave Prison, LLC Expansion) | | | BBB+/NR | | | | 11,645,000 | | | | 11,712,425 | |
Pima County, 4.50% due 7/1/2017 (Ina & Roger Road Wastewater Reclamation Facilities; Insured: AGM) | | | AA/A2 | | | | 5,040,000 | | | | 5,180,011 | |
Pima County, 5.00% due 7/1/2017 (Ina & Roger Road Wastewater Reclamation Facilities) | | | AA/NR | | | | 2,750,000 | | | | 2,836,680 | |
Pima County, 3.00% due 7/1/2018 (Ina & Roger Road Wastewater Reclamation Facilities) | | | AA/NR | | | | 500,000 | | | | 518,480 | |
Pima County, 5.00% due 7/1/2018 (Ina & Roger Road Wastewater Reclamation Facilities; Insured: AGM) | | | AA/A2 | | | | 5,000,000 | | | | 5,358,350 | |
Pima County, 5.00% due 7/1/2018 (Ina & Roger Road Wastewater Reclamation Facilities) | | | AA/NR | | | | 2,000,000 | | | | 2,143,340 | |
Pima County, 5.00% due 7/1/2018 (Ina & Roger Road Wastewater Reclamation Facilities) | | | AA/NR | | | | 700,000 | | | | 750,169 | |
Pima County, 5.00% due 7/1/2020 (Ina & Roger Road Wastewater Reclamation Facilities) | | | AA/NR | | | | 500,000 | | | | 573,080 | |
Pima County, 3.00% due 7/1/2021 (Ina & Roger Road Wastewater Reclamation Facilities) | | | AA/NR | | | | 1,200,000 | | | | 1,301,796 | |
Pima County, 5.00% due 7/1/2021 (Ina & Roger Road Wastewater Reclamation Facilities) | | | AA/NR | | | | 400,000 | | | | 472,040 | |
Pima County, 3.00% due 7/1/2022 (Ina & Roger Road Wastewater Reclamation Facilities) | | | AA/NR | | | | 1,325,000 | | | | 1,451,789 | |
Pima County, 5.00% due 7/1/2022 (Ina & Roger Road Wastewater Reclamation Facilities) | | | AA/NR | | | | 500,000 | | | | 605,000 | |
Pima County COP, 5.00% due 12/1/2016 (Sewer System & Fleet Services Facilities Expansion) | | | A+/NR | | | | 600,000 | | | | 604,248 | |
Pima County COP, 5.00% due 12/1/2017 (Sewer System & Fleet Services Facilities Expansion) | | | A+/NR | | | | 1,395,000 | | | | 1,459,756 | |
Pima County COP, 5.00% due 12/1/2018 (Sewer System & Fleet Services Facilities Expansion) | | | A+/NR | | | | 2,700,000 | | | | 2,921,832 | |
Pima County COP, 5.00% due 12/1/2019 (Sewer System & Fleet Services Facilities Expansion) | | | A+/NR | | | | 1,500,000 | | | | 1,677,885 | |
Pima County COP, 5.00% due 12/1/2020 (Sewer System & Fleet Services Facilities Expansion) | | | A+/NR | | | | 765,000 | | | | 880,676 | |
Pima County COP, 5.00% due 12/1/2021 (Sewer System & Fleet Services Facilities Expansion) | | | A+/NR | | | | 1,220,000 | | | | 1,439,368 | |
Pima County COP, 5.00% due 12/1/2022 (Sewer System & Fleet Services Facilities Expansion) | | | A+/NR | | | | 1,275,000 | | | | 1,519,443 | |
Pinal County, 5.00% due 8/1/2019 (Detention and Training Facilities) | | | AA-/NR | | | | 1,115,000 | | | | 1,235,309 | |
Pinal County, 5.00% due 8/1/2021 (Detention and Training Facilities) | | | AA-/NR | | | | 1,775,000 | | | | 2,079,395 | |
Pinal County, 5.00% due 8/1/2023 (Detention and Training Facilities) | | | AA-/NR | | | | 1,100,000 | | | | 1,347,775 | |
Pinal County, 5.00% due 8/1/2024 (Detention and Training Facilities) | | | AA-/NR | | | | 700,000 | | | | 872,613 | |
Pinal County, 5.00% due 8/1/2025 (Hunt Highway (Phases III-V), Ironwood Drive, Public Safety Radio & Court Buildings) | | | AA-/NR | | | | 3,000,000 | | | | 3,729,840 | |
Pinal County, 5.00% due 8/1/2025 (Detention and Training Facilities) | | | AA-/NR | | | | 1,500,000 | | | | 1,889,895 | |
Scottsdale IDA, 5.00% due 9/1/2019 (Scottsdale Healthcare) | | | NR/A2 | | | | 6,885,000 | | | | 7,417,279 | |
State of Arizona Department of Administration, 5.00% due 7/1/2018 (State Lottery; Insured: AGM) | | | AA/A1 | | | | 8,370,000 | | | | 8,944,098 | |
State of Arizona Department of Administration, 5.00% due 7/1/2020 (State Lottery; Insured: AGM) | | | AA/A1 | | | | 8,705,000 | | | | 9,925,441 | |
| | | |
ARKANSAS — 0.29% | | | | | | | | | | | | |
Arkansas Development Finance Authority, 2.00% due 12/1/2016 (State Dept. of Environmental Quality Project) | | | AA-/NR | | | | 460,000 | | | | 460,856 | |
Board of Trustees of the University of Arkansas, 2.00% due 11/1/2016 (Fayetteville Campus Athletic Facilities) | | | NR/Aa2 | | | | 600,000 | | | | 600,624 | |
Board of Trustees of the University of Arkansas, 3.00% due 11/1/2023 (Fayetteville Campus Athletic Facilities) | | | NR/Aa2 | | | | 615,000 | | | | 679,692 | |
City of Fort Smith, 3.50% due 10/1/2016 (Water and Sewer System Construction; Insured: AGM) | | | AA/NR | | | | 1,370,000 | | | | 1,370,109 | |
City of Fort Smith, 3.50% due 10/1/2017 (Water and Sewer System Construction; Insured: AGM) | | | AA/NR | | | | 1,930,000 | | | | 1,978,115 | |
City of Fort Smith, 4.00% due 10/1/2018 (Water and Sewer System Construction; Insured: AGM) | | | AA/NR | | | | 1,000,000 | | | | 1,058,310 | |
City of Fort Smith, 4.00% due 10/1/2019 (Water and Sewer System Construction; Insured: AGM) | | | AA/NR | | | | 1,670,000 | | | | 1,809,044 | |
Jefferson County, 4.00% due 6/1/2017 (Jefferson Regional Medical Center; Insured: AGM) | | | AA/NR | | | | 1,375,000 | | | | 1,401,180 | |
Jefferson County, 1.55% due 10/1/2017 (Entergy Arkansas, Inc. Project) | | | A/A2 | | | | 10,000,000 | | | | 10,052,500 | |
Jefferson County, 4.50% due 6/1/2018 (Jefferson Regional Medical Center; Insured: AGM) | | | AA/NR | | | | 1,495,000 | | | | 1,576,791 | |
Jefferson County, 4.50% due 6/1/2019 (Jefferson Regional Medical Center; Insured: AGM) | | | AA/NR | | | | 1,580,000 | | | | 1,712,341 | |
| | | |
CALIFORNIA — 8.09% | | | | | | | | | | | | |
Alameda County COP, 5.00% due 12/1/2017 (Santa Rita Jail; Insured: AMBAC) | | | AA/NR | | | | 1,220,000 | | | | 1,278,072 | |
Alameda County Joint Powers Authority, 5.00% due 12/1/2021 (Alameda County Medical Center Highland Hospital) | | | AA/Aa3 | | | | 1,000,000 | | | | 1,192,480 | |
Alameda County Joint Powers Authority, 5.00% due 12/1/2022 (Alameda County Medical Center Highland Hospital) | | | AA/Aa3 | | | | 2,000,000 | | | | 2,442,280 | |
Alameda County Joint Powers Authority, 5.00% due 12/1/2023 (Alameda County Medical Center Highland Hospital) | | | AA/Aa3 | | | | 3,200,000 | | | | 3,995,104 | |
Anaheim Public Financing Authority, 0% due 9/1/2022 (Public Improvements; Insured: AGM) | | | AA/A2 | | | | 3,250,000 | | | | 2,918,922 | |
Brentwood Infrastructure Financing Authority, 4.00% due 11/1/2016 (Redevelopment Agency of the City of Brentwood; Insured: AGM) | | | AA/NR | | | | 325,000 | | | | 325,900 | |
Brentwood Infrastructure Financing Authority, 5.00% due 11/1/2017 (Redevelopment Agency of the City of Brentwood; Insured: AGM) | | | AA/NR | | | | 965,000 | | | | 1,007,518 | |
Brentwood Infrastructure Financing Authority, 5.25% due 11/1/2018 (Redevelopment Agency of the City of Brentwood: Insured: AGM) | | | AA/NR | | | | 1,020,000 | | | | 1,109,709 | |
Brentwood Infrastructure Financing Authority, 5.25% due 11/1/2019 (Redevelopment Agency of the City of Brentwood; Insured: AGM) | | | AA/NR | | | | 725,000 | | | | 816,742 | |
Cabrillo USD GO, 0% due 8/1/2021 (Educational Facilities; Insured: AMBAC) | | | NR/NR | | | | 1,000,000 | | | | 917,970 | |
California Educational Facilities Authority, 5.00% due 4/1/2017 (Pitzer College) | | | NR/A2 | | | | 1,460,000 | | | | 1,490,704 | |
California Educational Facilities Authority, 5.00% due 4/1/2021 (Chapman University) | | | NR/A2 | | | | 4,870,000 | | | | 5,652,171 | |
California HFFA, 5.50% due 2/1/2017 (Community Developmental Disabilities Program; Insured: California Mtg Insurance) | | | AA-/NR | | | | 2,575,000 | | | | 2,615,633 | |
California HFFA, 5.50% due 2/1/2019 (Community Developmental Disabilities Program; Insured: California Mtg Insurance) | | | AA-/NR | | | | 2,865,000 | | | | 3,167,286 | |
California HFFA, 5.75% due 2/1/2020 (Community Developmental Disabilities Program; Insured: California Mtg Insurance) | | | AA-/NR | | | | 1,975,000 | | | | 2,282,369 | |
California HFFA, 5.00% due 3/1/2020 (Dignity Health) | | | A/A3 | | | | 4,400,000 | | | | 4,999,720 | |
10 Annual Report
| | |
| SCHEDULE OF INVESTMENTS, CONTINUED | | |
| |
Thornburg Limited Term Municipal Fund | | September 30, 2016 |
| | | | | | | | | | |
Issuer-Description | | Credit Rating†
S&P/ Moody’s | | Principal
Amount | | | Value | |
California HFFA, 5.75% due 2/1/2021 (Community Developmental Disabilities Program; Insured: California Mtg Insurance) | | AA-/NR | | $ | 1,695,000 | | | $ | 2,031,254 | |
California HFFA, 5.00% due 3/1/2021 (Dignity Health) | | A/A3 | | | 3,450,000 | | | | 4,042,986 | |
California HFFA, 5.25% due 3/1/2022 (Dignity Health) | | A/A3 | | | 7,020,000 | | | | 8,277,352 | |
California HFFA, 5.00% due 7/1/2043 put 10/15/2020 (St. Joseph Health System) | | AA-/A1 | | | 5,000,000 | | | | 5,751,300 | |
California School Cash Reserve Program Authority, 2.00% due 6/30/2017 | | SP-1+/NR | | | 6,000,000 | | | | 6,051,240 | |
California State Economic Recovery GO, 5.00% due 7/1/2020 pre-refunded 7/1/2019 | | AA+/Aaa | | | 4,200,000 | | | | 4,668,342 | |
California State Housing Finance Agency, 2.50% due 12/1/2017 (One Santa Fe Apartments Multi-Family Housing; Collateralized: GNMA) | | NR/Aa1 | | | 895,000 | | | | 896,011 | |
California State Public Works Board, 5.00% due 9/1/2017 (Regents of University of California; Insured: Natl-Re) (ETM) | | AA+/Aaa | | | 3,000,000 | | | | 3,115,740 | |
California State Public Works Board, 5.00% due 11/1/2017 (California State University) (ETM) | | A+/Aaa | | | 3,000,000 | | | | 3,137,640 | |
California State Public Works Board, 5.00% due 11/1/2018 (California State University) (ETM) | | A+/Aaa | | | 2,700,000 | | | | 2,933,145 | �� |
California State Public Works Board, 5.00% due 4/1/2020 (California School for the Deaf Riverside Campus) | | A+/A1 | | | 1,585,000 | | | | 1,804,760 | |
California State Public Works Board, 5.00% due 6/1/2020 (Yuba City Courthouse) | | A+/A1 | | | 1,675,000 | | | | 1,917,406 | |
California State Public Works Board, 5.00% due 6/1/2020 (Coalinga State Hospital) | | A+/A1 | | | 5,685,000 | | | | 6,507,733 | |
California State Public Works Board, 5.00% due 10/1/2020 (California State University) | | A+/A1 | | | 1,000,000 | | | | 1,156,130 | |
California State Public Works Board, 5.00% due 11/1/2020 (Various Capital Projects) | | A+/A1 | | | 1,500,000 | | | | 1,738,305 | |
California State Public Works Board, 5.00% due 4/1/2021 (California School for the Deaf Riverside Campus) | | A+/A1 | | | 890,000 | | | | 1,043,365 | |
California State Public Works Board, 5.00% due 6/1/2021 (Yuba City Courthouse) | | A+/A1 | | | 1,250,000 | | | | 1,472,313 | |
California State Public Works Board, 5.00% due 6/1/2021 (Coalinga State Hospital) | | A+/A1 | | | 5,000,000 | | | | 5,889,250 | |
California State Public Works Board, 5.00% due 10/1/2021 (Various Capital Projects) | | A+/A1 | | | 1,000,000 | | | | 1,188,520 | |
California State Public Works Board, 5.00% due 11/1/2021 (Various Capital Projects) | | A+/A1 | | | 1,750,000 | | | | 2,084,425 | |
California State Public Works Board, 5.00% due 11/1/2021 (Laboratory Facility and San Diego Courthouse) | | A+/A1 | | | 750,000 | | | | 893,325 | |
California State Public Works Board, 5.00% due 4/1/2022 (California School for the Deaf Riverside Campus) | | A+/A1 | | | 500,000 | | | | 601,850 | |
California State Public Works Board, 5.00% due 6/1/2022 (Coalinga State Hospital) | | A+/A1 | | | 11,555,000 | | | | 13,969,186 | |
California State Public Works Board, 5.00% due 11/1/2022 (Laboratory Facility and San Diego Courthouse) | | A+/A1 | | | 10,075,000 | | | | 12,309,836 | |
California State Public Works Board, 5.00% due 6/1/2023 (Yuba City Courthouse) | | A+/A1 | | | 1,900,000 | | | | 2,349,179 | |
California State Public Works Board, 5.00% due 11/1/2024 (Laboratory Facility and San Diego Courthouse) | | A+/A1 | | | 2,050,000 | | | | 2,549,011 | |
California Statewide Communities Development Authority, 5.00% due 4/1/2019 (Kaiser Foundation Hospitals) | | AA-/NR | | | 27,000,000 | | | | 29,754,810 | |
California Statewide Communities Development Authority, 5.00% due 7/1/2020 pre-refunded 1/1/2019 (Aspire Public Schools; LOC: PCSD Guaranty Pool I, LLC) | | NR/NR | | | 1,280,000 | | | | 1,351,757 | |
Castaic Lake Water Agency COP, 0% due 8/1/2023 (Water System Improvement; Insured: AMBAC) | | AA+/NR | | | 10,125,000 | | | | 8,953,132 | |
Castaic USD GO, 0% due 5/1/2018 (Insured: Natl-Re) | | AA-/NR | | | 2,545,000 | | | | 2,413,703 | |
Central Valley Financing Authority, 5.00% due 7/1/2017 (Carson Ice) | | AA-/Aa3 | | | 600,000 | | | | 618,270 | |
Central Valley Financing Authority, 5.00% due 7/1/2019 (Carson Ice) | | AA-/Aa3 | | | 1,750,000 | | | | 1,938,055 | |
Chula Vista COP, 5.25% due 3/1/2018 (ETM) | | AA-/NR | | | 1,170,000 | | | | 1,243,277 | |
Chula Vista COP, 5.25% due 3/1/2019 (ETM) | | AA-/NR | | | 1,235,000 | | | | 1,364,230 | |
City of Los Angeles GO, 3.00% due 6/29/2017 (Cash Flow Management) | | SP-1+/Mig1 | | | 48,800,000 | | | | 49,658,392 | |
City of Redding COP, 5.00% due 6/1/2020 (Redding Power Plant-Generator Unit No. 6; Insured: AGM) | | NR/A2 | | | 3,955,000 | | | | 4,228,607 | |
Clovis USD GO, 0% due 8/1/2019 (Insured: Natl-Re) | | AA/A3 | | | 2,685,000 | | | | 2,585,682 | |
Community Facilities District No. 86-1 of the Irvine USD, 5.25% due 9/1/2018 (Educational Facilities; Insured: AGM) | | AA/NR | | | 3,000,000 | | | | 3,243,570 | |
Community Facilities District No. 86-1 of the Irvine USD, 5.25% due 9/1/2019 (Educational Facilities; Insured: AGM) | | AA/NR | | | 3,000,000 | | | | 3,361,290 | |
County of Los Angeles COP, 0% due 3/1/2017 (Disney Parking Garage and Walt Disney Concert Hall) | | AA/A1 | | | 1,075,000 | | | | 1,070,829 | |
County of Los Angeles COP, 0% due 9/1/2017 (Disney Parking Garage and Walt Disney Concert Hall; Insured: AMBAC) | | AA/A1 | | | 1,200,000 | | | | 1,189,224 | |
County of Los Angeles Redevelopment Refunding Authority, 5.00% due 6/1/2020 (Bunker Hill Project) | | AA/NR | | | 1,730,000 | | | | 1,971,076 | |
County of Los Angeles Redevelopment Refunding Authority, 5.00% due 12/1/2020 (Bunker Hill Project) | | AA/NR | | | 3,805,000 | | | | 4,401,890 | |
County of Los Angeles Redevelopment Refunding Authority, 5.00% due 6/1/2021 (Bunker Hill Project) | | AA/NR | | | 360,000 | | | | 421,578 | |
County of Los Angeles Redevelopment Refunding Authority, 5.00% due 12/1/2021 (Bunker Hill Project) | | AA/NR | | | 5,805,000 | | | | 6,887,052 | |
County of Los Angeles Redevelopment Refunding Authority, 5.00% due 6/1/2022 (Bunker Hill Project) | | AA/NR | | | 1,645,000 | | | | 1,969,476 | |
County of Los Angeles Redevelopment Refunding Authority, 5.00% due 12/1/2022 (Bunker Hill Project) | | AA/NR | | | 5,000,000 | | | | 6,053,100 | |
County of Los Angeles Redevelopment Refunding Authority, 5.00% due 6/1/2023 (Bunker Hill Project) | | AA/NR | | | 450,000 | | | | 550,508 | |
County of Los Angeles Redevelopment Refunding Authority, 5.00% due 12/1/2023 (Bunker Hill Project) | | AA/NR | | | 6,875,000 | | | | 8,493,237 | |
County of Los Angeles Redevelopment Refunding Authority, 5.00% due 6/1/2024 (Bunker Hill Project) | | AA/NR | | | 4,775,000 | | | | 5,931,600 | |
County of Los Angeles Redevelopment Refunding Authority, 5.00% due 12/1/2024 (Bunker Hill Project) | | AA/NR | | | 5,150,000 | | | | 6,453,310 | |
County of Monterey COP, 5.00% due 8/1/2018 (2009 Refinancing Project; Insured: AGM) | | AA/Aa3 | | | 2,260,000 | | | | 2,426,743 | |
b County of Riverside, 3.00% due 10/11/2017 | | NR/Mig1 | | | 4,050,000 | | | | 4,133,065 | |
County of Solano COP, 5.00% due 11/15/2017 (1999 Capital Improvement Program) | | AA-/Aa3 | | | 1,580,000 | | | | 1,652,064 | |
County of Ventura COP, 5.25% due 8/15/2017 (Healthcare Clinic Facilities) (ETM) | | AA+/NR | | | 1,635,000 | | | | 1,699,321 | |
Escondido Union High School District GO, 0% due 11/1/2020 (Insured: Natl-Re) | | AA-/A3 | | | 2,655,000 | | | | 2,500,240 | |
Irvine USD Community Facilities District No. 86-1, 5.25% due 9/1/2017 (Acquisition of Public Facilities; Insured: AGM) | | AA/NR | | | 5,000,000 | | | | 5,198,350 | |
Los Angeles Convention and Exhibition Center Authority, 5.00% due 8/15/2018 (ETM) | | A+/A1 | | | 2,295,000 | | | | 2,473,895 | |
Los Angeles County Public Works Financing Authority, 5.00% due 8/1/2018 (Multiple Capital Projects) | | AA/Aa3 | | | 4,000,000 | | | | 4,302,760 | |
Los Angeles County Public Works Financing Authority, 5.00% due 8/1/2019 (Multiple Capital Projects) | | AA/Aa3 | | | 17,935,000 | | | | 19,992,862 | |
Los Angeles USD COP, 5.00% due 10/1/2017 (Educational Facilities and Information Technology Infrastructure; Insured: AMBAC) | | A+/A1 | | | 2,445,000 | | | | 2,545,587 | |
Los Angeles USD COP, 5.50% due 12/1/2018 (Educational Facilities and Information Technology Infrastructure) | | A+/A1 | | | 4,600,000 | | | | 5,056,320 | |
Los Angeles USD COP, 5.50% due 12/1/2019 (Educational Facilities and Information Technology Infrastructure) | | A+/A1 | | | 7,040,000 | | | | 8,045,594 | |
Annual Report 11
| | |
| SCHEDULE OF INVESTMENTS, CONTINUED | | |
| |
Thornburg Limited Term Municipal Fund | | September 30, 2016 |
| | | | | | | | | | | | |
Issuer-Description | | Credit Rating†
S&P/ Moody’s | | | Principal
Amount | | | Value | |
Los Angeles USD GO, 5.00% due 7/1/2018 pre-refunded 7/1/2017 (Educational Facilities and Information Technology Infrastructure; Insured: AGM) | | | AA/Aa2 | | | $ | 4,000,000 | | | $ | 4,125,480 | |
Los Angeles USD GO, 5.00% due 7/1/2022 (Educational Facilities and Information Technology Infrastructure) | | | AA-/Aa2 | | | | 12,260,000 | | | | 14,941,262 | |
Los Angeles USD GO, 5.00% due 7/1/2023 (Educational Facilities and Information Technology Infrastructure) | | | AA-/Aa2 | | | | 11,950,000 | | | | 14,917,782 | |
Los Angeles USD GO, 5.00% due 7/1/2024 (Educational Facilities and Information Technology Infrastructure) | | | AA-/Aa2 | | | | 10,640,000 | | | | 13,556,850 | |
Metropolitan Water District of Southern California, 1.00% due 7/1/2030 | | | AAA/Aa1 | | | | 8,500,000 | | | | 8,500,000 | |
Metropolitan Water District of Southern California, 1.00% due 7/1/2036 | | | A-1+/Aa1 | | | | 12,000,000 | | | | 12,000,000 | |
Mount San Antonio Community College GO, 0% due 8/1/2017 (Insured: Natl-Re) (ETM) | | | AA/Aa2 | | | | 5,000,000 | | | | 4,963,450 | |
Needles USD GO, 0% due 8/1/2023 | | | AA-/A3 | | | | 1,005,000 | | | | 835,095 | |
North City West School Facilities Financing Authority, 5.00% due 9/1/2023 (Carmel Valley Educational Facilities; Insured: AGM) | | | AA/NR | | | | 4,545,000 | | | | 5,529,947 | |
Northern California Power Agency, 5.00% due 7/1/2017 (Hydroelectric Project) | | | A+/A1 | | | | 1,000,000 | | | | 1,031,680 | |
Northern California Power Agency, 5.00% due 6/1/2018 (Lodi Energy Center) | | | A-/A2 | | | | 4,480,000 | | | | 4,789,926 | |
Northern California Power Agency, 5.00% due 7/1/2019 (Hydroelectric Project) | | | A+/A1 | | | | 1,000,000 | | | | 1,111,800 | |
Northern California Power Agency, 5.00% due 7/1/2020 (Hydroelectric Project) | | | A+/A1 | | | | 1,325,000 | | | | 1,471,214 | |
Oakland State Building Authority, 2.00% due 12/1/2016 (Elihu M. Harris State Office Building) | | | A+/A1 | | | | 2,250,000 | | | | 2,254,748 | |
Oakland State Building Authority, 5.00% due 12/1/2018 (Elihu M. Harris State Office Building) | | | A+/A1 | | | | 7,240,000 | | | | 7,864,233 | |
Oakland USD GO, 5.00% due 8/1/2022 (Construction & Modernization Project; Insured: AGM) | | | AA/Aa3 | | | | 2,240,000 | | | | 2,724,467 | |
Oakland USD GO, 5.00% due 8/1/2023 (Construction & Modernization Project; Insured: AGM) | | | AA/Aa3 | | | | 1,290,000 | | | | 1,604,644 | |
Oakland USD GO, 5.00% due 8/1/2024 (Construction & Modernization Project; Insured: AGM) | | | AA/Aa3 | | | | 1,500,000 | | | | 1,900,365 | |
Oakland USD GO, 5.00% due 8/1/2025 (Construction & Modernization Project; Insured: AGM) | | | AA/Aa3 | | | | 1,750,000 | | | | 2,251,323 | |
Orange County Public Financing Authority, 5.00% due 7/1/2017 (Insured: Natl-Re) | | | AA/Aa3 | | | | 1,245,000 | | | | 1,283,284 | |
Palo Alto USD GO, 0% due 8/1/2019 | | | AAA/Aaa | | | | 1,000,000 | | | | 968,180 | |
Palomar Community College District GO, 0% due 8/1/2021 | | | AA-/Aa2 | | | | 2,560,000 | | | | 2,393,344 | |
Rocklin USD GO, 0% due 8/1/2022 (Insured: Natl-Re) | | | AA-/Aa2 | | | | 3,910,000 | | | | 3,545,275 | |
Sacramento City Financing Authority, 0% due 12/1/2019 (Merged Downtown & Oak Park; Insured: Natl-Re) | | | AA-/A3 | | | | 2,920,000 | | | | 2,786,965 | |
Sacramento City Financing Authority, 0% due 12/1/2021 (Merged Downtown & Oak Park; Insured: Natl-Re) | | | AA-/A3 | | | | 1,600,000 | | | | 1,467,808 | |
Sacramento City USD GO, 5.00% due 7/1/2021 (Educational Facilities Improvements) | | | A+/A1 | | | | 3,265,000 | | | | 3,851,361 | |
Sacramento Cogeneration Authority, 5.00% due 7/1/2017 (Procter & Gamble) | | | AA-/Aa3 | | | | 750,000 | | | | 773,528 | |
San Diego Convention Center Expansion Financing Authority, 5.00% due 4/15/2020 | | | AA-/NR | | | | 4,000,000 | | | | 4,536,080 | |
San Diego Convention Center Expansion Financing Authority, 5.00% due 4/15/2021 | | | AA-/NR | | | | 3,000,000 | | | | 3,491,880 | |
San Diego Convention Center Expansion Financing Authority, 5.00% due 4/15/2022 | | | AA-/NR | | | | 8,000,000 | | | | 9,547,920 | |
San Diego County Regional Transportation Commission, 0.87% due 4/1/2038 put 10/7/2016 (SPA: JPMorgan Chase Bank, N.A.) (weekly demand notes) | | | AAA/Aa2 | | | | 50,000,000 | | | | 50,000,000 | |
San Diego Redevelopment Agency, 4.50% due 9/1/2019 (Centre City Redevelopment; Insured: AMBAC) | | | NR/A2 | | | | 1,240,000 | | | | 1,243,906 | |
San Diego USD GO, 5.50% due 7/1/2020 (Educational System Capital Projects; Insured: Natl-Re) | | | AA-/Aa2 | | | | 10,000,000 | | | | 11,689,500 | |
San Francisco Building Authority, 2.00% due 12/1/2016 (San Francisco Civic Center Complex) | | | A+/A1 | | | | 5,000,000 | | | | 5,010,800 | |
San Francisco Building Authority, 5.00% due 12/1/2018 (San Francisco Civic Center Complex) | | | A+/A1 | | | | 13,130,000 | | | | 14,276,905 | |
San Joaquin Delta Community College District GO, 0% due 8/1/2019 (Insured: AGM) | | | AA/Aa2 | | | | 7,600,000 | | | | 7,083,048 | |
Santa Ana Financing Authority, 6.25% due 7/1/2018 (Police Administration & Holding Facility; Insured: Natl-Re) (ETM) | | | AA-/A3 | | | | 2,017,500 | | | | 2,206,984 | |
Santa Ana Financing Authority, 6.25% due 7/1/2018 (Police Administration & Holding Facility; Insured: Natl-Re) | | | AA-/A3 | | | | 2,017,500 | | | | 2,194,011 | |
Santa Ana USD GO, 0% due 8/1/2019 (Insured: Natl-Re) | | | AA-/A3 | | | | 3,425,000 | | | | 3,298,309 | |
Santa Fe Springs Community Development Commission, 0% due 9/1/2024 (Consolidated Redevelopment Project; Insured: Natl-Re) | | | AA-/A3 | | | | 7,000,000 | | | | 5,781,230 | |
South San Francisco USD GO, 4.00% due 6/15/2018 (Educational Facilities) (ETM) | | | SP-1+/NR | | | | 5,130,000 | | | | 5,407,123 | |
Southeast Resource Recovery Facilities Authority, 5.25% due 12/1/2017 (Insured: AMBAC) | | | AA-/A2 | | | | 2,000,000 | | | | 2,007,660 | |
State of California Economic Recovery GO, 5.00% due 7/1/2018 (ETM) | | | AA+/Aaa | | | | 3,105,000 | | | | 3,329,243 | |
State of California Economic Recovery GO, 5.00% due 7/1/2018 (ETM) | | | AA+/Aaa | | | | 895,000 | | | | 959,637 | |
State of California GO, 4.75% due 4/1/2018 (Various Purposes) | | | AA-/Aa3 | | | | 1,250,000 | | | | 1,323,313 | |
State of California GO, 5.00% due 9/1/2020 (Various Purposes) | | | AA-/Aa3 | | | | 10,000,000 | | | | 11,546,100 | |
State of California GO, 5.00% due 9/1/2021 (Various Purposes) | | | AA-/Aa3 | | | | 5,000,000 | | | | 5,940,900 | |
Tuolumne Wind Project Authority, 5.00% due 1/1/2018 | | | AA-/A2 | | | | 2,000,000 | | | | 2,104,220 | |
Tuolumne Wind Project Authority, 5.00% due 1/1/2019 | | | AA-/A2 | | | | 2,000,000 | | | | 2,183,840 | |
Tustin Community Redevelopment Agency, 4.00% due 9/1/2017 (Tustin Redevelopment) (ETM) | | | A/NR | | | | 935,000 | | | | 962,611 | |
Tustin Community Redevelopment Agency, 4.00% due 9/1/2019 pre-refunded 9/1/2018 (Tustin Redevelopment) | | | A/NR | | | | 1,010,000 | | | | 1,090,649 | |
Tustin Community Redevelopment Agency, 4.00% due 9/1/2020 pre-refunded 9/1/2018 (Tustin Redevelopment) | | | A/NR | | | | 1,050,000 | | | | 1,133,843 | |
West Contra Costa USD GO, 0% due 8/1/2022 (Educational Facilities; Insured: AGM) | | | AA/Aa3 | | | | 4,000,000 | | | | 3,590,840 | |
West Covina Redevelopment Agency, 6.00% due 9/1/2022 (Fashion Plaza) | | | NR/NR | | | | 6,075,000 | | | | 7,054,108 | |
| | | |
COLORADO — 1.01% | | | | | | | | | | | | |
City & County of Denver, 5.00% due 11/15/2016 (Airport System Capital Improvements; Insured: Natl-Re) | | | AA-/A1 | | | | 1,725,000 | | | | 1,734,022 | |
City & County of Denver, 5.00% due 11/15/2017 (Airport System Capital Improvements; Insured: Natl-Re) | | | AA-/A1 | | | | 1,000,000 | | | | 1,045,260 | |
City & County of Denver COP, 5.00% due 12/1/2020 (Buell Theatre Property) | | | AA+/Aa1 | | | | 3,065,000 | | | | 3,536,765 | |
City & County of Denver COP, 5.00% due 12/1/2021 (Buell Theatre Property) | | | AA+/Aa1 | | | | 3,825,000 | | | | 4,527,805 | |
City & County of Denver COP, 5.00% due 12/1/2023 (Buell Theatre Property) | | | AA+/Aa1 | | | | 1,720,000 | | | | 2,125,954 | |
City & County of Denver School District No. 1 COP, 4.00% due 12/15/2016 (Eastbridge Elementary and Conservatory Green K-8 Schools) | | | NR/Aa3 | | | | 350,000 | | | | 352,240 | |
12 Annual Report
| | |
| SCHEDULE OF INVESTMENTS, CONTINUED | | |
| |
Thornburg Limited Term Municipal Fund | | September 30, 2016 |
| | | | | | | | | | | | |
Issuer-Description | | Credit Rating†
S&P/ Moody’s | | | Principal
Amount | | | Value | |
City & County of Denver School District No. 1 COP, 4.00% due 12/15/2019 (Eastbridge Elementary and Conservatory Green K-8 Schools) | | | NR/Aa3 | | | $ | 400,000 | | | $ | 434,372 | |
City & County of Denver School District No. 1 COP, 4.00% due 12/15/2020 (Eastbridge Elementary and Conservatory Green K-8 Schools) | | | NR/Aa3 | | | | 600,000 | | | | 663,336 | |
City & County of Denver School District No. 1 COP, 5.00% due 12/15/2021 (Eastbridge Elementary and Conservatory Green K-8 Schools) | | | NR/Aa3 | | | | 1,000,000 | | | | 1,171,610 | |
City & County of Denver School District No. 1 COP, 5.00% due 12/15/2022 (Eastbridge Elementary and Conservatory Green K-8 Schools) | | | NR/Aa3 | | | | 1,030,000 | | | | 1,231,746 | |
City & County of Denver School District No. 1 COP, 5.00% due 12/15/2023 (Eastbridge Elementary and Conservatory Green K-8 Schools) | | | NR/Aa3 | | | | 1,180,000 | | | | 1,437,228 | |
City & County of Denver School District No. 1 GO, 4.00% due 12/1/2016 (Capital Projects) (State Aid Withholding) | | | AA/Aa2 | | | | 3,775,000 | | | | 3,795,951 | |
City of Longmont, 6.00% due 5/15/2019 | | | AA+/NR | | | | 3,215,000 | | | | 3,604,111 | |
Colorado Department of Corrections COP, 5.00% due 3/1/2017 (Colorado Penitentiary II) (ETM) | | | AA-/Aa2 | | | | 2,000,000 | | | | 2,035,340 | |
Colorado Department of Corrections COP, 5.00% due 3/1/2018 (Colorado Penitentiary II) (ETM) | | | AA-/Aa2 | | | | 1,590,000 | | | | 1,683,142 | |
Colorado Educational & Cultural Facilities Authority, 5.00% due 6/1/2018 (National Conference of State Legislatures) | | | A/A3 | | | | 1,625,000 | | | | 1,712,864 | |
Colorado Educational & Cultural Facilities Authority, 5.00% due 6/1/2020 (National Conference of State Legislatures) | | | A/A3 | | | | 1,805,000 | | | | 2,006,781 | |
Colorado Educational & Cultural Facilities Authority, 5.00% due 6/1/2021 (National Conference of State Legislatures) | | | A/A3 | | | | 1,000,000 | | | | 1,131,650 | |
Colorado HFA, 5.25% due 5/15/2017 (Northern Colorado Medical Center; Insured: AGM) (ETM) | | | AA/NR | | | | 1,185,000 | | | | 1,217,872 | |
Colorado HFA, 5.00% due 7/1/2017 (Catholic Health Initiatives) | | | A-/A3 | | | | 175,000 | | | | 180,100 | |
Colorado HFA, 5.25% due 5/15/2019 (Northern Colorado Medical Center; Insured: AGM) (ETM) | | | AA/NR | | | | 2,225,000 | | | | 2,472,909 | |
Colorado HFA, 5.00% due 5/15/2025 (Northern Colorado Medical Center) | | | A+/NR | | | | 565,000 | | | | 709,504 | |
Colorado HFA, 5.00% due 5/15/2026 (Northern Colorado Medical Center) | | | A+/NR | | | | 740,000 | | | | 940,940 | |
Denver Convention Center Hotel Authority, 5.25% due 12/1/2021 (Insured: Syncora) | | | BBB-/Baa3 | | | | 3,700,000 | | | | 3,713,246 | |
Denver Convention Center Hotel Authority, 5.25% due 12/1/2022 (Insured: Syncora) | | | BBB-/Baa3 | | | | 1,100,000 | | | | 1,104,499 | |
El Paso County COP, 4.00% due 12/1/2021 (Pikes Peak Regional Development Center) | | | AA/Aa2 | | | | 1,000,000 | | | | 1,120,000 | |
El Paso County COP, 5.00% due 12/1/2023 (Pikes Peak Regional Development Center) | | | AA/Aa2 | | | | 1,330,000 | | | | 1,612,864 | |
El Paso County Falcon School District No. 49 COP, 5.00% due 12/15/2020 | | | NR/Aa3 | | | | 350,000 | | | | 403,211 | |
El Paso County Falcon School District No. 49 COP, 5.00% due 12/15/2023 | | | NR/Aa3 | | | | 945,000 | | | | 1,156,019 | |
El Paso County Falcon School District No. 49 COP, 5.00% due 12/15/2024 | | | NR/Aa3 | | | | 655,000 | | | | 814,479 | |
Park Creek Metropolitan District, 5.00% due 12/1/2016 (Insured: AGM) (ETM) | | | AA/NR | | | | 1,035,000 | | | | 1,042,400 | |
Park Creek Metropolitan District, 5.00% due 12/1/2017 (Insured: AGM) (ETM) | | | AA/NR | | | | 1,525,000 | | | | 1,597,651 | |
Park Creek Metropolitan District, 5.50% due 12/1/2018 (Insured: AGM) (ETM) | | | AA/NR | | | | 1,200,000 | | | | 1,314,264 | |
Park Creek Metropolitan District, 5.50% due 12/1/2019 (Insured: AGM) (ETM) | | | AA/NR | | | | 1,000,000 | | | | 1,134,760 | |
Regents of the University of Colorado COP, 5.00% due 11/1/2016 (UCDHSC Fitzsimons Academic Facilities) | | | AA-/Aa2 | | | | 700,000 | | | | 702,562 | |
Regents of the University of Colorado COP, 5.00% due 11/1/2017 (UCDHSC Fitzsimons Academic Facilities) | | | AA-/Aa2 | | | | 850,000 | | | | 887,545 | |
Regional Transportation District COP, 5.00% due 6/1/2018 (FasTracks Transportation System) | | | A/Aa3 | | | | 1,750,000 | | | | 1,865,833 | |
Regional Transportation District COP, 5.00% due 6/1/2019 (FasTracks Transportation System) | | | A/Aa3 | | | | 4,730,000 | | | | 5,220,690 | |
Regional Transportation District COP, 5.00% due 6/1/2020 (FasTracks Transportation System) | | | A/Aa3 | | | | 3,655,000 | | | | 4,161,254 | |
Regional Transportation District COP, 5.50% due 6/1/2021 (FasTracks Transportation System) | | | A/Aa3 | | | | 2,370,000 | | | | 2,752,210 | |
Regional Transportation District COP, 5.00% due 6/1/2023 (North Metro Rail Line) | | | A/Aa3 | | | | 4,000,000 | | | | 4,911,720 | |
Regional Transportation District COP, 5.00% due 6/1/2024 (North Metro Rail Line) | | | A/Aa3 | | | | 4,000,000 | | | | 4,854,160 | |
| | | |
CONNECTICUT — 2.68% | | | | | | | | | | | | |
City of Hartford GO, 5.00% due 10/1/2022 (Various Public Improvements; Insured: AGM) | | | AA/Baa1 | | | | 1,765,000 | | | | 2,058,219 | |
City of Hartford GO, 5.00% due 7/1/2024 (Various Public Improvements; Insured: AGM) | | | AA/A2 | | | | 800,000 | | | | 946,632 | |
City of Hartford GO, 5.00% due 7/1/2025 (Various Public Improvements; Insured: AGM) | | | AA/A2 | | | | 1,020,000 | | | | 1,218,890 | |
City of West Haven GO, 4.00% due 8/1/2018 (Insured: AGM) | | | AA/A2 | | | | 2,080,000 | | | | 2,181,670 | |
Connecticut Housing Finance Authority, 0.87% due 11/15/2036 put 10/3/2016 (Housing Mortgage Financing Program; SPA: JPMorgan Chase Bank, N.A.) (daily demand notes) | | | AAA/Aaa | | | | 600,000 | | | | 600,000 | |
Connecticut Housing Finance Authority, 0.87% due 5/15/2039 put 10/3/2016 (Housing Mortgage Financing Program; SPA: JPMorgan Chase Bank, N.A.) (daily demand notes) | | | AAA/Aaa | | | | 33,745,000 | | | | 33,745,000 | |
State of Connecticut GO, 5.00% due 5/15/2023 (Various Capital Projects) | | | AA-/Aa3 | | | | 17,500,000 | | | | 21,201,950 | |
State of Connecticut GO, 5.00% due 6/15/2023 (Educational Facilities) | | | AA-/Aa3 | | | | 13,915,000 | | | | 16,886,827 | |
State of Connecticut GO, 5.00% due 9/1/2023 (Educational Facilities) | | | AA-/Aa3 | | | | 5,550,000 | | | | 6,763,674 | |
State of Connecticut GO, 5.00% due 5/15/2024 (Various Capital Projects) | | | AA-/Aa3 | | | | 20,000,000 | | | | 24,637,200 | |
State of Connecticut GO, 5.00% due 6/15/2024 (Educational Facilities) | | | AA-/Aa3 | | | | 19,385,000 | | | | 23,914,693 | |
State of Connecticut GO, 5.00% due 8/15/2024 (Various Capital Projects) | | | AA-/Aa3 | | | | 1,845,000 | | | | 2,237,634 | |
State of Connecticut GO, 5.00% due 5/15/2025 (Various Capital Projects) | | | AA-/Aa3 | | | | 12,500,000 | | | | 15,562,500 | |
State of Connecticut GO, 5.00% due 6/15/2025 (Educational Facilities) | | | AA-/Aa3 | | | | 11,015,000 | | | | 13,731,630 | |
State of Connecticut GO, 5.00% due 5/15/2026 (Various Capital Projects) | | | AA-/Aa3 | | | | 7,000,000 | | | | 8,816,570 | |
State of Connecticut GO, 5.00% due 6/15/2026 (Educational Facilities) | | | AA-/Aa3 | | | | 22,240,000 | | | | 27,554,915 | |
State of Connecticut GO Floating Rate Note, 1.61% due 9/15/2018 (Various Capital Projects) | | | AA-/Aa3 | | | | 725,000 | | | | 726,726 | |
State of Connecticut GO Floating Rate Note, 1.49% due 9/15/2024 put 9/15/2017 (Various Capital Projects) | | | AA/Aa3 | | | | 10,000,000 | | | | 10,009,400 | |
| | | |
DELAWARE — 0.03% | | | | | | | | | | | | |
Delaware Transportation Authority, 5.00% due 7/1/2020 (Transportation System) | | | AA+/Aa2 | | | | 500,000 | | | | 573,675 | |
Delaware Transportation Authority, 5.00% due 7/1/2022 (Transportation System) | | | AA+/Aa2 | | | | 1,440,000 | | | | 1,743,293 | |
Annual Report 13
| | |
| SCHEDULE OF INVESTMENTS, CONTINUED | | |
| |
Thornburg Limited Term Municipal Fund | | September 30, 2016 |
| | | | | | | | | | | | |
Issuer-Description | | Credit Rating†
S&P/ Moody’s | | | Principal
Amount | | | Value | |
DISTRICT OF COLUMBIA — 0.25% | | | | | | | | | | | | |
District of Columbia, 4.00% due 4/1/2017 (National Public Radio) (ETM) | | | AA-/A2 | | | $ | 1,830,000 | | | $ | 1,859,609 | |
District of Columbia, 5.00% due 4/1/2018 (National Public Radio) (ETM) | | | NR/NR | | | | 750,000 | | | | 796,613 | |
District of Columbia, 5.00% due 4/1/2018 (National Public Radio) | | | AA-/A2 | | | | 995,000 | | | | 1,053,904 | |
District of Columbia, 5.00% due 4/1/2019 (National Public Radio) | | | AA-/A2 | | | | 805,000 | | | | 882,087 | |
District of Columbia, 5.00% due 4/1/2020 (National Public Radio) | | | AA-/A2 | | | | 1,890,000 | | | | 2,137,722 | |
District of Columbia GO, 6.00% due 6/1/2018 (Insured: Natl-Re) | | | AA/Aa1 | | | | 5,000,000 | | | | 5,420,650 | |
District of Columbia GO, 5.25% due 6/1/2020 (Insured: Syncora) | | | AA/Aa1 | | | | 3,005,000 | | | | 3,462,391 | |
Metropolitan Washington Airports Authority, 0% due 10/1/2016 (Dulles Toll Road; Insured: AGM) | | | AA/A3 | | | | 4,000,000 | | | | 3,999,840 | |
| | | |
FLORIDA — 7.42% | | | | | | | | | | | | |
Alachua County School Board COP, 5.00% due 7/1/2022 (Educational Facilities) | | | A+/Aa3 | | | | 1,600,000 | | | | 1,882,416 | |
Alachua County School Board COP, 5.00% due 7/1/2023 (Educational Facilities) | | | A+/Aa3 | | | | 2,250,000 | | | | 2,700,337 | |
Broward County, 5.00% due 9/1/2017 (Port Facilities) | | | A-/A1 | | | | 2,820,000 | | | | 2,910,889 | |
Broward County, 4.00% due 10/1/2017 (Airport, Marina & Port Improvements) | | | A+/A1 | | | | 500,000 | | | | 515,210 | |
Broward County, 5.00% due 10/1/2017 (Airport, Marina & Port Improvements) | | | A+/A1 | | | | 1,000,000 | | | | 1,040,370 | |
Broward County, 5.50% due 9/1/2018 (Port Facilities) | | | A-/A1 | | | | 3,500,000 | | | | 3,763,165 | |
Broward County, 4.00% due 10/1/2018 (Airport, Marina & Port Improvements) | | | A+/A1 | | | | 425,000 | | | | 450,173 | |
Broward County, 5.00% due 10/1/2018 (Airport, Marina & Port Improvements) | | | A+/A1 | | | | 500,000 | | | | 539,505 | |
Broward County, 5.50% due 9/1/2019 (Port Facilities) | | | A-/A1 | | | | 2,800,000 | | | | 3,112,760 | |
Broward County, 5.00% due 10/1/2019 (Airport, Marina & Port Improvements) | | | A+/A1 | | | | 1,000,000 | | | | 1,115,980 | |
Broward County, 4.00% due 10/1/2020 (Airport, Marina & Port Improvements) | | | A+/A1 | | | | 1,660,000 | | | | 1,833,918 | |
Broward County, 5.00% due 10/1/2020 (Airport, Marina & Port Improvements) | | | A+/A1 | | | | 2,000,000 | | | | 2,299,960 | |
Broward County School Board COP, 5.00% due 7/1/2017 (Educational Facilities; Insured: Natl-Re) | | | AA-/Aa3 | | | | 1,000,000 | | | | 1,030,060 | |
Broward County School Board COP, 5.00% due 7/1/2021 (Educational Facilities) | | | A+/Aa3 | | | | 4,000,000 | | | | 4,677,880 | |
Broward County School Board COP, 5.00% due 7/1/2022 (Educational Facilities) | | | A+/Aa3 | | | | 4,580,000 | | | | 5,484,046 | |
Broward County School Board COP, 5.00% due 7/1/2023 (Educational Facilities) | | | A+/Aa3 | | | | 3,000,000 | | | | 3,669,750 | |
Broward County School Board COP, 5.00% due 7/1/2023 (Educational Facilities) | | | A+/Aa3 | | | | 2,000,000 | | | | 2,446,500 | |
Broward County School Board COP, 5.00% due 7/1/2024 (Educational Facilities) | | | A+/Aa3 | | | | 4,000,000 | | | | 4,969,720 | |
Broward County School Board COP, 5.00% due 7/1/2024 (Educational Facilities) | | | A+/Aa3 | | | | 2,000,000 | | | | 2,484,860 | |
Broward County School Board COP, 5.00% due 7/1/2025 (Educational Facilities) | | | A+/Aa3 | | | | 7,000,000 | | | | 8,790,320 | |
Broward County School Board COP, 5.00% due 7/1/2025 (Educational Facilities) | | | A+/Aa3 | | | | 5,000,000 | | | | 6,278,800 | |
City of Fort Myers, 5.00% due 12/1/2018 (Gulf Breeze Loan Program; Insured: Natl-Re) | | | AA-/Aa3 | | | | 2,195,000 | | | | 2,293,292 | |
City of Fort Myers, 5.00% due 10/1/2023 (Utility Systems Capital Projects) | | | A/Aa3 | | | | 3,360,000 | | | | 3,970,546 | |
City of Gainesville, 0.86% due 10/1/2026 put 10/3/2016 (Utilities System; SPA: Landesbank Hessen-Thueringen) (daily demand notes) | | | AA-/Aa2 | | | | 18,110,000 | | | | 18,110,000 | |
City of Gainesville, 0.87% due 10/1/2026 put 10/3/2016 (Utilities System; SPA: Landesbank Hessen-Thueringen) (daily demand notes) | | | AA-/Aa2 | | | | 26,885,000 | | | | 26,885,000 | |
City of Gainesville, 0.86% due 10/1/2042 put 10/7/2016 (Utilities System; LOC: Sumitomo Mitsui Banking) (weekly demand notes) | | | AA-/Aa2 | | | | 20,000,000 | | | | 20,000,000 | |
City of Hollywood Community Redevelopment Agency, 5.00% due 3/1/2017 (Beach Community Redevelopment Project; Insured: Syncora) (ETM) | | | NR/A3 | | | | 2,000,000 | | | | 2,035,180 | |
City of Hollywood Community Redevelopment Agency, 5.00% due 3/1/2024 pre-refunded 3/1/2017 (Beach Community Redevelopment Project; Insured: Syncora) | | | NR/A3 | | | | 4,850,000 | | | | 4,935,311 | |
City of Jacksonville, 5.00% due 10/1/2017 | | | AA-/Aa3 | | | | 1,000,000 | | | | 1,040,840 | |
City of Jacksonville, 5.00% due 10/1/2018 | | | AA-/Aa3 | | | | 1,050,000 | | | | 1,133,727 | |
City of Jacksonville, 5.00% due 10/1/2019 | | | AA-/Aa3 | | | | 500,000 | | | | 557,835 | |
City of Jacksonville, 5.00% due 10/1/2020 | | | AA-/Aa3 | | | | 1,000,000 | | | | 1,149,130 | |
a City of Jacksonville, 5.00% due 10/1/2023 | | | AA-/Aa3 | | | | 1,105,000 | | | | 1,359,946 | |
City of Lakeland, 5.00% due 10/1/2016 (Energy System; Insured: AGM) | | | AA/Aa3 | | | | 9,780,000 | | | | 9,781,174 | |
City of Lakeland, 5.00% due 10/1/2017 (Energy System; Insured: AGM) | | | AA/Aa3 | | | | 7,105,000 | | | | 7,402,415 | |
City of Lakeland, 5.00% due 10/1/2019 (Energy System; Insured: AGM) | | | AA/Aa3 | | | | 5,000,000 | | | | 5,598,850 | |
City of Lakeland, 5.00% due 11/15/2019 (Lakeland Regional Health Systems) | | | NR/A2 | | | | 5,655,000 | | | | 6,309,340 | |
City of Lakeland, 5.00% due 10/1/2020 (Energy System; Insured: AGM) | | | AA/Aa3 | | | | 1,695,000 | | | | 1,956,403 | |
City of Lakeland, 5.00% due 11/15/2025 (Lakeland Regional Health Systems) | | | NR/A2 | | | | 1,945,000 | | | | 2,422,575 | |
City of Lakeland, 5.00% due 11/15/2026 (Lakeland Regional Health Systems) | | | NR/A2 | | | | 1,925,000 | | | | 2,423,767 | |
City of Miami, 5.00% due 1/1/2018 (Street & Sidewalk Improvement Program; Insured: Natl-Re) | | | AA-/A2 | | | | 1,970,000 | | | | 2,060,502 | |
City of North Miami Beach, 5.00% due 8/1/2017 (North Miami Beach Water Project) | | | A+/NR | | | | 750,000 | | | | 773,543 | |
City of North Miami Beach, 3.00% due 8/1/2018 (North Miami Beach Water Project) | | | A+/NR | | | | 1,280,000 | | | | 1,320,128 | |
City of North Miami Beach, 5.00% due 8/1/2019 (North Miami Beach Water Project) | | | A+/NR | | | | 1,650,000 | | | | 1,817,888 | |
City of North Miami Beach, 5.00% due 8/1/2020 (North Miami Beach Water Project) | | | A+/NR | | | | 780,000 | | | | 882,164 | |
City of North Miami Beach, 5.00% due 8/1/2021 (North Miami Beach Water Project) | | | A+/NR | | | | 1,000,000 | | | | 1,159,280 | |
City of Port St. Lucie, 1.875% due 7/1/2017 (Tesoro Special Assessment District; Insured: AGM) | | | NR/A2 | | | | 250,000 | | | | 251,638 | |
City of Port St. Lucie, 2.00% due 7/1/2018 (Tesoro Special Assessment District; Insured: AGM) | | | NR/A2 | | | | 2,215,000 | | | | 2,251,437 | |
City of Tampa, 5.00% due 11/15/2016 (BayCare Health System) | | | NR/Aa2 | | | | 2,855,000 | | | | 2,870,274 | |
City of Tampa, 5.00% due 11/15/2017 (BayCare Health System) | | | NR/Aa2 | | | | 1,215,000 | | | | 1,270,270 | |
14 Annual Report
| | |
| SCHEDULE OF INVESTMENTS, CONTINUED | | |
| |
Thornburg Limited Term Municipal Fund | | September 30, 2016 |
| | | | | | | | | | |
Issuer-Description | | Credit Rating†
S&P/ Moody’s | | Principal
Amount | | | Value | |
Florida Higher Educational Facilities Financing Authority, 5.25% due 4/1/2017 (Nova Southeastern University) (ETM) | | A-/Baa1 | | $ | 1,325,000 | | | $ | 1,354,455 | |
Florida Higher Educational Facilities Financing Authority, 5.25% due 4/1/2018 (Nova Southeastern University) (ETM) | | A-/Baa1 | | | 2,630,000 | | | | 2,801,213 | |
Florida Higher Educational Facilities Financing Authority, 5.00% due 4/1/2019 (University of Tampa) | | A-/NR | | | 1,225,000 | | | | 1,335,311 | |
Florida Higher Educational Facilities Financing Authority, 5.00% due 4/1/2019 (Nova Southeastern University) | | A-/Baa1 | | | 1,035,000 | | | | 1,128,202 | |
Florida Higher Educational Facilities Financing Authority, 5.50% due 4/1/2019 (Nova Southeastern University) (ETM) | | A-/Baa1 | | | 1,705,000 | | | | 1,895,755 | |
Florida Higher Educational Facilities Financing Authority, 5.00% due 4/1/2020 (Nova Southeastern University) | | A-/Baa1 | | | 1,190,000 | | | | 1,333,776 | |
Florida Higher Educational Facilities Financing Authority, 5.00% due 4/1/2022 (University of Tampa) | | A-/NR | | | 620,000 | | | | 725,636 | |
Florida State Board of Governors, 4.00% due 7/1/2020 (University System Capital Improvements) | | AA/Aa2 | | | 4,055,000 | | | | 4,475,098 | |
Florida State Board of Governors, 4.00% due 7/1/2021 (University System Capital Improvements) | | AA/Aa2 | | | 4,215,000 | | | | 4,746,090 | |
Florida State Board of Governors, 4.00% due 7/1/2022 (University System Capital Improvements) | | AA/Aa2 | | | 4,385,000 | | | | 5,031,349 | |
Florida State Department of Transportation GO, 5.00% due 7/1/2018 | | AAA/Aa1 | | | 3,000,000 | | | | 3,122,520 | |
Highlands County HFA, 5.00% due 11/15/2016 (Adventist Health System Sunbelt Group) | | AA/Aa2 | | | 1,000,000 | | | | 1,005,350 | |
Highlands County HFA, 5.00% due 11/15/2017 (Adventist Health System Sunbelt Group) | | AA/Aa2 | | | 3,200,000 | | | | 3,346,304 | |
Highlands County HFA, 5.00% due 11/15/2019 (Adventist Health System Sunbelt Group) | | AA/Aa2 | | | 3,000,000 | | | | 3,359,880 | |
Hillsborough County, 5.00% due 11/1/2016 (Transportation Improvements; Insured: AMBAC) | | AA/A1 | | | 1,000,000 | | | | 1,003,660 | |
Hillsborough County, 5.00% due 11/1/2018 (Court Facilities) | | AA/A1 | | | 4,210,000 | | | | 4,559,809 | |
Hillsborough County, 5.00% due 11/1/2019 (Court Facilities) | | AA/A1 | | | 4,420,000 | | | | 4,954,953 | |
Hillsborough County, 5.00% due 11/1/2020 (Court Facilities) | | AA/A1 | | | 4,645,000 | | | | 5,362,792 | |
Hillsborough County, 5.00% due 11/1/2021 (Court Facilities) | | AA/A1 | | | 4,880,000 | | | | 5,785,142 | |
Hillsborough County, 5.00% due 11/1/2021 (Jail and Storm Water Projects) | | AA/A1 | | | 2,300,000 | | | | 2,726,604 | |
Hillsborough County, 5.00% due 11/1/2022 (Jail and Storm Water Projects) | | AA/A1 | | | 3,005,000 | | | | 3,652,217 | |
Hillsborough County IDA, 5.65% due 5/15/2018 (Tampa Electric Co.) | | BBB+/A3 | | | 3,200,000 | | | | 3,423,584 | |
Hillsborough County School Board COP, 5.25% due 7/1/2017 (Educational Facilities; Insured: Natl-Re) | | AA-/Aa2 | | | 1,300,000 | | | | 1,342,107 | |
Jacksonville Economic Development Commission, 6.00% due 9/1/2017 (Florida Proton Therapy Institute) | | NR/NR | | | 985,000 | | | | 1,027,069 | |
JEA, 4.00% due 10/1/2016 (Electric System) | | A+/Aa3 | | | 3,540,000 | | | | 3,540,319 | |
JEA, 5.00% due 10/1/2018 (Water and Sewer System) | | AAA/Aa2 | | | 1,500,000 | | | | 1,622,730 | |
JEA, 5.00% due 10/1/2023 (Electric System) | | A+/Aa3 | | | 1,395,000 | | | | 1,725,210 | |
JEA, 5.00% due 10/1/2024 (Electric System) | | A+/Aa3 | | | 1,200,000 | | | | 1,488,108 | |
JEA, 0.88% due 10/1/2038 put 10/3/2016 (Water and Sewer System; SPA: U.S. Bank, N.A.) (daily demand notes) | | AA+/Aa2 | | | 33,635,000 | | | | 33,635,000 | |
Kissimmee Utility Authority, 5.25% due 10/1/2016 (Electrical Systems; Insured: AGM) | | NR/A1 | | | 1,700,000 | | | | 1,700,221 | |
Lake County School Board COP, 5.25% due 6/1/2017 (Insured: AMBAC) | | A/NR | | | 2,000,000 | | | | 2,056,740 | |
Lake County School Board COP, 5.25% due 6/1/2018 (Insured: AMBAC) | | A/NR | | | 1,475,000 | | | | 1,578,722 | |
Lee County School Board COP, 5.00% due 8/1/2023 (School Facilities Improvements) | | AA-/Aa3 | | | 1,000,000 | | | | 1,225,250 | |
Lee County School Board COP, 5.00% due 8/1/2024 (School Facilities Improvements) | | AA-/Aa3 | | | 2,000,000 | | | | 2,475,900 | |
Manatee County, 5.00% due 10/1/2016 (County Capital Projects) | | NR/Aa2 | | | 1,000,000 | | | | 1,000,120 | |
Manatee County, 4.00% due 10/1/2017 (Public Utilities Improvements) | | NR/Aa2 | | | 1,000,000 | | | | 1,031,080 | |
Manatee County, 5.00% due 10/1/2018 (County Capital Projects) | | NR/Aa2 | | | 2,400,000 | | | | 2,591,112 | |
Manatee County, 5.00% due 10/1/2021 (County Capital Projects) | | NR/Aa2 | | | 2,775,000 | | | | 3,281,798 | |
Manatee County, 5.00% due 10/1/2024 (Public Utilities Improvements) | | NR/Aa2 | | | 500,000 | | | | 628,820 | |
Manatee County, 5.00% due 10/1/2025 (Public Utilities Improvements) | | NR/Aa2 | | | 470,000 | | | | 591,674 | |
Marion County School Board COP, 5.00% due 6/1/2018 (Insured: BAM) | | AA/A2 | | | 2,500,000 | | | | 2,659,100 | |
Marion County School Board COP, 5.00% due 6/1/2019 (Insured: BAM) | | AA/A2 | | | 2,635,000 | | | | 2,892,966 | |
Marion County School Board COP, 5.00% due 6/1/2020 (Insured: BAM) | | AA/A2 | | | 2,760,000 | | | | 3,106,021 | |
Marion County School Board COP, 5.00% due 6/1/2021 (Insured: BAM) | | AA/A2 | | | 2,505,000 | | | | 2,888,716 | |
Marion County School Board COP, 5.00% due 6/1/2024 (Insured: BAM) | | AA/A2 | | | 3,065,000 | | | | 3,714,872 | |
Miami Beach GO, 4.00% due 9/1/2019 | | AA+/Aa2 | | | 2,745,000 | | | | 2,971,957 | |
Miami Beach GO, 5.00% due 9/1/2020 | | AA+/Aa2 | | | 3,720,000 | | | | 4,259,586 | |
Miami Beach GO, 4.00% due 9/1/2021 | | AA+/Aa2 | | | 1,015,000 | | | | 1,144,991 | |
Miami Beach GO, 5.00% due 9/1/2022 | | AA+/Aa2 | | | 1,000,000 | | | | 1,168,640 | |
Miami-Dade County, 0% due 10/1/2016 (Professional Sports Franchise Facilities; Insured: AGM) | | AA/A1 | | | 3,535,000 | | | | 3,534,859 | |
Miami-Dade County, 0% due 10/1/2017 (Professional Sports Franchise Facilities; Insured: AGM) | | AA/A1 | | | 2,435,000 | | | | 2,393,775 | |
Miami-Dade County, 0% due 10/1/2018 (Professional Sports Franchise Facilities; Insured: AGM) | | AA/A1 | | | 5,385,000 | | | | 5,192,055 | |
Miami-Dade County, 0% due 10/1/2019 (Professional Sports Franchise Facilities; Insured: AGM) | | AA/A1 | | | 2,170,000 | | | | 2,047,156 | |
Miami-Dade County, 5.00% due 7/1/2023 (Transit System) | | AA/A1 | | | 1,000,000 | | | | 1,221,100 | |
Miami-Dade County, 5.00% due 7/1/2024 (Transit System) | | AA/A1 | | | 5,565,000 | | | | 6,898,151 | |
Miami-Dade County, 5.00% due 7/1/2025 (Transit System) | | AA/A1 | | | 3,650,000 | | | | 4,578,487 | |
Miami-Dade County, 5.00% due 10/1/2025 (Miami International Airport) | | A/A2 | | | 2,500,000 | | | | 3,107,975 | |
Miami-Dade County Expressway Authority, 5.00% due 7/1/2019 (Toll System; Insured: AGM) | | AA/A2 | | | 7,530,000 | | | | 8,308,903 | |
Miami-Dade County Expressway Authority, 5.00% due 7/1/2024 (Toll System) | | A/A2 | | | 2,000,000 | | | | 2,485,680 | |
Miami-Dade County Expressway Authority, 5.00% due 7/1/2025 (Toll System) | | A/A2 | | | 2,000,000 | | | | 2,465,240 | |
Miami-Dade County GO, 5.25% due 7/1/2018 (Building Better Communities) | | AA/Aa2 | | | 5,040,000 | | | | 5,418,504 | |
Miami-Dade County School Board COP, 5.00% due 10/1/2016 (Educational Facilities Improvements; Insured: AMBAC) | | A/A1 | | | 1,000,000 | | | | 1,000,120 | |
Miami-Dade County School Board COP, 5.00% due 5/1/2022 (Educational Facilities Improvements) | | A/A1 | | | 3,405,000 | | | | 4,039,998 | |
Miami-Dade County School Board COP, 5.00% due 5/1/2023 (Educational Facilities Improvements) | | A/A1 | | | 4,130,000 | | | | 4,974,874 | |
Miami-Dade County School Board COP, 5.00% due 5/1/2024 (Educational Facilities Improvements) | | A/A1 | | | 8,000,000 | | | | 9,769,600 | |
Miami-Dade County School Board COP, 5.00% due 5/1/2025 (Educational Facilities Improvements) | | A/A1 | | | 15,000,000 | | | | 18,560,850 | |
Annual Report 15
| | |
| SCHEDULE OF INVESTMENTS, CONTINUED | | |
| |
Thornburg Limited Term Municipal Fund | | September 30, 2016 |
| | | | | | | | | | |
Issuer-Description | | Credit Rating†
S&P/ Moody’s | | Principal
Amount | | | Value | |
Miami-Dade County School Board COP, 5.00% due 5/1/2031 put 5/1/2024 (Educational Facilities Improvements) | | A/A1 | | $ | 2,425,000 | | | $ | 2,951,201 | |
Orange County HFA, 6.25% due 10/1/2016 (Orlando Health, Inc.; Insured: Natl-Re) | | AA-/A2 | | | 820,000 | | | | 820,123 | |
Orange County HFA, 5.00% due 10/1/2017 (Orlando Health, Inc.) | | A/A2 | | | 1,980,000 | | | | 2,058,428 | |
Orange County HFA, 5.25% due 10/1/2019 (Orlando Health, Inc.) | | A/A2 | | | 6,050,000 | | | | 6,780,053 | |
Orange County HFA, 6.25% due 10/1/2021 (Orlando Health, Inc.; Insured: Natl-Re) | | AA-/A2 | | | 1,870,000 | | | | 2,113,081 | |
Orange County HFA, 5.375% due 10/1/2023 (Orlando Health, Inc.) | | A/A2 | | | 4,150,000 | | | | 4,664,102 | |
Orange County School Board COP, 5.00% due 8/1/2019 (Educational Facilities) | | NR/Aa2 | | | 1,000,000 | | | | 1,113,000 | |
Orange County School Board COP, 5.00% due 8/1/2020 (Educational Facilities) | | NR/Aa2 | | | 1,695,000 | | | | 1,944,334 | |
Orange County School Board COP, 5.00% due 8/1/2021 (Educational Facilities) | | NR/Aa2 | | | 2,100,000 | | | | 2,470,923 | |
Orange County School Board COP, 5.00% due 8/1/2022 (Educational Facilities) | | NR/Aa2 | | | 1,825,000 | | | | 2,199,599 | |
Orange County School Board COP, 5.00% due 8/1/2023 (Educational Facilities) | | NR/Aa2 | | | 1,540,000 | | | | 1,893,630 | |
Orange County School Board COP, 5.00% due 8/1/2024 (Educational Facilities) | | NR/Aa2 | | | 1,445,000 | | | | 1,802,031 | |
Orange County School Board COP, 5.00% due 8/1/2025 (Educational Facilities) | | NR/Aa2 | | | 1,190,000 | | | | 1,500,423 | |
Palm Beach County HFA, 5.00% due 12/1/2020 (Boca Raton Regional Hospital) | | BBB+/NR | | | 600,000 | | | | 680,520 | |
Palm Beach County School Board COP, 5.00% due 8/1/2018 (Educational Facilities) | | NR/Aa3 | | | 800,000 | | | | 857,504 | |
Palm Beach County School Board COP, 4.00% due 8/1/2019 (Educational Facilities) | | NR/Aa3 | | | 940,000 | | | | 1,015,031 | |
Palm Beach County School Board COP, 5.00% due 8/1/2020 (Educational Facilities) | | NR/Aa3 | | | 1,090,000 | | | | 1,242,829 | |
Palm Beach County School Board COP, 4.00% due 8/1/2021 (Educational Facilities) | | NR/Aa3 | | | 3,835,000 | | | | 4,304,059 | |
Palm Beach County School Board COP, 5.00% due 8/1/2022 (Educational Facilities) | | NR/Aa3 | | | 1,000,000 | | | | 1,199,300 | |
Palm Beach County School Board COP, 5.00% due 8/1/2022 (Educational Facilities) | | NR/Aa3 | | | 1,660,000 | | | | 1,990,838 | |
Palm Beach County School Board COP, 5.00% due 8/1/2023 (Educational Facilities) | | NR/Aa3 | | | 1,000,000 | | | | 1,226,710 | |
Palm Beach County School Board COP, 5.00% due 8/1/2023 (Educational Facilities) | | NR/Aa3 | | | 3,500,000 | | | | 4,293,485 | |
Palm Beach County School Board COP, 5.00% due 8/1/2024 (Educational Facilities) | | NR/Aa3 | | | 1,275,000 | | | | 1,592,156 | |
Palm Beach County School Board COP, 5.00% due 8/1/2024 (Educational Facilities) | | NR/Aa3 | | | 3,595,000 | | | | 4,489,256 | |
Polk County, 4.00% due 10/1/2020 (Water and Wastewater Utility Systems; Insured: AGM) | | A+/Aa3 | | | 3,100,000 | | | | 3,437,590 | |
Polk County, 3.00% due 10/1/2021 (Water and Wastewater Utility Systems; Insured: AGM) | | A+/Aa3 | | | 3,125,000 | | | | 3,370,469 | |
Polk County, 5.00% due 10/1/2023 (Water and Wastewater Utility Systems) | | A+/Aa3 | | | 1,420,000 | | | | 1,706,542 | |
Putnam County Development Authority, 5.35% due 3/15/2042 put 5/1/2018 (Seminole Project; Insured: AMBAC) | | A-/A3 | | | 4,225,000 | | | | 4,492,485 | |
Putnam County Development Authority, 5.35% due 3/15/2042 put 5/1/2018 (Seminole Project; Insured: AMBAC) | | A-/A3 | | | 10,200,000 | | | | 10,845,762 | |
Reedy Creek Improvement District, 5.00% due 10/1/2017 (Walt Disney World Resort Complex Utility Systems) | | A/A1 | | | 400,000 | | | | 415,576 | |
Reedy Creek Improvement District, 5.00% due 10/1/2018 (Walt Disney World Resort Complex Utility Systems) | | A/A1 | | | 755,000 | | | | 811,761 | |
Reedy Creek Improvement District, 5.00% due 10/1/2021 (Walt Disney World Resort Complex Utility Systems) | | A/A1 | | | 1,200,000 | | | | 1,400,748 | |
Reedy Creek Improvement District, 5.00% due 10/1/2022 (Walt Disney World Resort Complex Utility Systems) | | A/A1 | | | 625,000 | | | | 744,388 | |
Reedy Creek Improvement District, 5.00% due 6/1/2023 (Buena Vista Drive Corridor Improvements) | | AA-/Aa3 | | | 1,940,000 | | | | 2,385,754 | |
Reedy Creek Improvement District, 5.00% due 10/1/2023 (Walt Disney World Resort Complex Utility Systems) | | A/A1 | | | 750,000 | | | | 906,968 | |
Reedy Creek Improvement District GO, 5.00% due 6/1/2021 (Walt Disney World Resort Complex Utility Systems) | | AA-/Aa3 | | | 500,000 | | | | 586,725 | |
Reedy Creek Improvement District GO, 5.00% due 6/1/2023 (Walt Disney World Resort Complex Utility Systems) | | AA-/Aa3 | | | 860,000 | | | | 1,057,602 | |
Reedy Creek Improvement District GO, 5.00% due 6/1/2024 (Walt Disney World Resort Complex Utility Systems) | | AA-/Aa3 | | | 850,000 | | | | 1,061,846 | |
Reedy Creek Improvement District GO, 5.00% due 6/1/2025 (Walt Disney World Resort Complex Utility Systems) | | AA-/Aa3 | | | 2,000,000 | | | | 2,538,060 | |
South Florida Water Management District COP, 5.00% due 10/1/2017 (Everglades Restoration Plan) | | AA/Aa3 | | | 2,000,000 | | | | 2,084,140 | |
South Florida Water Management District COP, 5.00% due 10/1/2018 (Everglades Restoration Plan) | | AA/Aa3 | | | 2,500,000 | | | | 2,706,625 | |
South Florida Water Management District COP, 5.00% due 10/1/2019 (Everglades Restoration Plan) | | AA/Aa3 | | | 1,500,000 | | | | 1,679,190 | |
South Florida Water Management District COP, 5.00% due 10/1/2020 (Everglades Restoration Plan) | | AA/Aa3 | | | 1,780,000 | | | | 2,054,512 | |
South Florida Water Management District COP, 5.00% due 10/1/2021 (Everglades Restoration Plan) | | AA/Aa3 | | | 1,750,000 | | | | 2,071,020 | |
South Florida Water Management District COP, 5.00% due 10/1/2022 (Everglades Restoration Plan) | | AA/Aa3 | | | 2,000,000 | | | | 2,421,160 | |
a South Miami HFA, 5.00% due 8/15/2017 (Baptist Health) | | AA-/Aa3 | | | 4,610,000 | | | | 4,774,531 | |
Sunshine State Governmental Financing Commission, 5.00% due 9/1/2021 (Miami-Dade County Program; Insured: AGM) | | AA/Aa3 | | | 5,000,000 | | | | 5,880,450 | |
Sunshine State Governmental Financing Commission, 5.00% due 9/1/2021 (Miami-Dade County Program) | | AA-/Aa3 | | | 1,450,000 | | | | 1,704,577 | |
Sunshine State Governmental Financing Commission, 5.00% due 9/1/2022 (Miami-Dade County Program) | | AA-/Aa3 | | | 2,000,000 | | | | 2,406,780 | |
Sunshine State Governmental Financing Commission, 5.00% due 9/1/2023 (Miami-Dade County Program) | | AA-/Aa3 | | | 2,100,000 | | | | 2,580,291 | |
Sunshine State Governmental Financing Commission, 5.00% due 9/1/2024 (Miami-Dade County Program) | | AA-/Aa3 | | | 1,725,000 | | | | 2,111,900 | |
Tampa Bay Regional Water Supply Authority, 5.00% due 10/1/2017 | | AA+/Aa1 | | | 5,615,000 | | | | 5,847,180 | |
Tampa Bay Regional Water Supply Authority, 5.00% due 10/1/2018 | | AA+/Aa1 | | | 2,890,000 | | | | 3,123,136 | |
Tampa Bay Regional Water Supply Authority, 5.00% due 10/1/2019 | | AA+/Aa1 | | | 3,000,000 | | | | 3,355,980 | |
University of North Florida Foundation, Inc., 0.90% due 5/1/2028 put 10/3/2016 (Parking Facility; LOC: Wachovia Bank, N.A.) (daily demand notes) | | AA-/NR | | | 6,000,000 | | | | 6,000,000 | |
Volusia County Educational Facilities Authority, 5.00% due 10/15/2016 (Embry-Riddle Aeronautical University, Inc.; Insured: AGM) | | AA/A2 | | | 2,320,000 | | | | 2,323,967 | |
Volusia County Educational Facilities Authority, 4.00% due 10/15/2017 (Embry-Riddle Aeronautical University, Inc.; Insured: AGM) | | AA/A2 | | | 1,030,000 | | | | 1,060,509 | |
Volusia County Educational Facilities Authority, 5.00% due 10/15/2018 (Embry-Riddle Aeronautical University, Inc.; Insured: AGM) | | AA/A2 | | | 2,075,000 | | | | 2,232,534 | |
Volusia County Educational Facilities Authority, 5.00% due 10/15/2019 (Embry-Riddle Aeronautical University, Inc.; Insured: AGM) | | AA/A2 | | | 2,350,000 | | | | 2,611,014 | |
Volusia County Educational Facilities Authority, 5.00% due 10/15/2023 (Embry-Riddle Aeronautical University, Inc.) | | NR/Baa1 | | | 700,000 | | | | 844,088 | |
Volusia County Educational Facilities Authority, 5.00% due 10/15/2024 (Embry-Riddle Aeronautical University, Inc.) | | NR/Baa1 | | | 650,000 | | | | 796,179 | |
16 Annual Report
| | |
| SCHEDULE OF INVESTMENTS, CONTINUED | | |
| |
Thornburg Limited Term Municipal Fund | | September 30, 2016 |
| | | | | | | | | | | | |
Issuer-Description | | Credit Rating†
S&P/ Moody’s | | | Principal
Amount | | | Value | |
Volusia County Educational Facilities Authority, 5.00% due 10/15/2025 (Embry-Riddle Aeronautical University, Inc.) | | | NR/Baa1 | | | $ | 400,000 | | | $ | 490,236 | |
Volusia County School Board COP, 5.00% due 8/1/2024 (University High School, River Springs Middle School) | | | NR/Aa3 | | | | 1,000,000 | | | | 1,248,750 | |
| | | |
GEORGIA — 1.77% | | | | | | | | | | | | |
a Athens-Clarke County Unified Government Development Authority, 4.00% due 6/15/2017 (UGAREF Bolton Commons, LLC) | | | NR/Aa2 | | | | 495,000 | | | | 505,865 | |
Athens-Clarke County Unified Government Development Authority, 5.00% due 6/15/2019 (UGAREF Bolton Commons, LLC) | | | NR/Aa2 | | | | 400,000 | | | | 442,548 | |
Athens-Clarke County Unified Government Development Authority, 4.00% due 6/15/2020 (UGAREF Bolton Commons, LLC) | | | NR/Aa2 | | | | 395,000 | | | | 436,586 | |
Athens-Clarke County Unified Government Development Authority, 5.00% due 6/15/2022 (UGAREF Central Precinct, LLC) | | | NR/Aa2 | | | | 800,000 | | | | 960,336 | |
Athens-Clarke County Unified Government Development Authority, 5.00% due 6/15/2023 (UGAREF Central Precinct, LLC) | | | NR/Aa2 | | | | 470,000 | | | | 576,775 | |
Athens-Clarke County Unified Government Development Authority, 5.00% due 6/15/2024 (UGAREF Central Precinct, LLC) | | | NR/Aa2 | | | | 520,000 | | | | 648,768 | |
City of Atlanta, 5.00% due 11/1/2016 (Water & Wastewater System; Insured: AGM) | | | AA/Aa3 | | | | 3,215,000 | | | | 3,226,767 | |
City of Atlanta, 5.50% due 11/1/2016 (Water & Wastewater System; Insured: Natl-Re) | | | AA-/Aa3 | | | | 8,215,000 | | | | 8,248,599 | |
City of Atlanta, 5.25% due 12/1/2016 (Atlantic Station; Insured: AGM) | | | AA/A3 | | | | 3,650,000 | | | | 3,674,747 | |
City of Atlanta, 5.00% due 11/1/2017 (Water & Wastewater System; Insured: AGM) | | | AA/Aa3 | | | | 4,745,000 | | | | 4,954,587 | |
City of Atlanta, 5.00% due 1/1/2018 (Hartsfield-Jackson Atlanta International Airport) | | | NR/Aa3 | | | | 2,100,000 | | | | 2,207,268 | |
City of Atlanta, 5.00% due 1/1/2019 (Hartsfield-Jackson Atlanta International Airport) | | | NR/Aa3 | | | | 3,145,000 | | | | 3,423,018 | |
City of Atlanta, 6.00% due 11/1/2019 (Water & Wastewater System) | | | AA-/Aa3 | | | | 5,650,000 | | | | 6,496,370 | |
City of Atlanta, 5.00% due 1/1/2020 (Hartsfield-Jackson Atlanta International Airport) | | | NR/Aa3 | | | | 6,000,000 | | | | 6,768,180 | |
City of Atlanta, 5.25% due 1/1/2020 (Hartsfield-Jackson Atlanta International Airport) | | | NR/Aa3 | | | | 5,000,000 | | | | 5,666,300 | |
City of Atlanta, 5.00% due 1/1/2021 (Hartsfield-Jackson Atlanta International Airport) | | | NR/Aa3 | | | | 7,000,000 | | | | 7,898,590 | |
City of Atlanta, 5.50% due 1/1/2021 (Hartsfield-Jackson Atlanta International Airport) | | | NR/Aa3 | | | | 3,525,000 | | | | 4,153,155 | |
City of Atlanta, 5.00% due 11/1/2021 (Water & Wastewater System) | | | AA-/Aa3 | | | | 2,500,000 | | | | 2,963,700 | |
City of Atlanta, 5.00% due 11/1/2022 (Water & Wastewater System) | | | AA-/Aa3 | | | | 1,000,000 | | | | 1,215,380 | |
City of Atlanta, 5.00% due 1/1/2023 (Airport Passenger Facility) | | | AA-/Aa3 | | | | 1,000,000 | | | | 1,213,450 | |
a City of Atlanta, 5.00% due 11/1/2023 (Water & Wastewater System) | | | AA-/Aa3 | | | | 1,130,000 | | | | 1,404,059 | |
City of Atlanta, 5.00% due 1/1/2024 (Airport Passenger Facility) | | | AA-/Aa3 | | | | 1,350,000 | | | | 1,681,938 | |
City of Atlanta, 5.00% due 11/1/2024 (Water & Wastewater System) | | | AA-/Aa3 | | | | 1,000,000 | | | | 1,265,990 | |
City of Atlanta, 5.00% due 1/1/2025 (Airport Passenger Facility) | | | AA-/Aa3 | | | | 1,645,000 | | | | 2,054,605 | |
City of Atlanta, 5.00% due 1/1/2025 (Airport Passenger Facility) | | | AA-/Aa3 | | | | 2,500,000 | | | | 3,122,500 | |
City of Atlanta, 5.00% due 11/1/2025 (Water & Wastewater System) | | | AA-/Aa3 | | | | 1,000,000 | | | | 1,275,710 | |
Development Authority of Bartow County, 2.70% due 8/1/2043 put 8/23/2018 (Georgia Power Co. Plant Bowen Project) | | | A-/A3 | | | | 6,000,000 | | | | 6,170,880 | |
Fulton County Development Authority, 5.00% due 10/1/2022 (Georgia Tech Athletic Association) | | | NR/A2 | | | | 4,550,000 | | | | 5,453,675 | |
Fulton County Facilities Corp. COP, 5.00% due 11/1/2017 (Public Purpose Project) | | | AA/Aa2 | | | | 8,400,000 | | | | 8,768,172 | |
Fulton County Facilities Corp. COP, 5.00% due 11/1/2019 (Public Purpose Project) | | | AA/Aa2 | | | | 6,600,000 | | | | 7,373,850 | |
Gwinnett County School District GO, 4.50% due 10/1/2017 (Capital Projects) | | | AAA/Aaa | | | | 13,000,000 | | | | 13,483,470 | |
Hospital Authority of Gwinnett County, 5.00% due 7/1/2023 (Gwinnett Hospital System, Inc.; Insured: AGM) | | | NR/A2 | | | | 5,000,000 | | | | 5,533,050 | |
LaGrange-Troup County Hospital Authority, 5.00% due 7/1/2018 (West Georgia Health Foundation, Inc.) | | | A+/Aa2 | | | | 1,070,000 | | | | 1,106,294 | |
Main Street Natural Gas, Inc., 5.00% due 3/15/2018 (Georgia Gas) | | | BBB+/Baa1 | | | | 5,000,000 | | | | 5,227,300 | |
Municipal Electric Authority of Georgia, 6.60% due 1/1/2018 (Insured: Natl-Re) | | | AA-/A1 | | | | 655,000 | | | | 668,755 | |
State of Georgia GO, 5.00% due 7/1/2017 (Capital Projects) | | | AAA/Aaa | | | | 8,625,000 | | | | 8,897,550 | |
Valdosta and Lowndes County Hospital Authority, 5.00% due 10/1/2022 (South Medical Center) | | | AA-/Aa2 | | | | 1,500,000 | | | | 1,765,590 | |
| | | |
GUAM — 0.60% | | | | | | | | | | | | |
Government of Guam, 5.25% due 12/1/2016 (Layon Solid Waste Disposal Facility) (ETM) | | | BBB+/NR | | | | 5,610,000 | | | | 5,652,973 | |
Government of Guam, 5.25% due 12/1/2017 (Layon Solid Waste Disposal Facility) (ETM) | | | BBB+/NR | | | | 2,000,000 | | | | 2,103,400 | |
Government of Guam, 5.50% due 12/1/2018 (Layon Solid Waste Disposal Facility) (ETM) | | | BBB+/NR | | | | 3,000,000 | | | | 3,295,890 | |
Government of Guam, 5.00% due 11/15/2019 (Various Capital Projects) | | | A/NR | | | | 1,000,000 | | | | 1,101,450 | |
Government of Guam, 5.50% due 12/1/2019 (Layon Solid Waste Disposal Facility) (ETM) | | | BBB+/NR | | | | 2,000,000 | | | | 2,280,280 | |
Government of Guam, 5.00% due 11/15/2020 (Various Capital Projects) | | | A/NR | | | | 1,500,000 | | | | 1,690,620 | |
Government of Guam, 5.00% due 11/15/2021 (Various Capital Projects) | | | A/NR | | | | 2,210,000 | | | | 2,543,025 | |
Government of Guam, 5.00% due 11/15/2022 (Various Capital Projects) | | | A/NR | | | | 2,960,000 | | | | 3,474,596 | |
Government of Guam, 5.00% due 11/15/2023 (Various Capital Projects) | | | A/NR | | | | 6,280,000 | | | | 7,454,172 | |
Government of Guam, 5.00% due 11/15/2024 (Various Capital Projects) | | | A/NR | | | | 4,500,000 | | | | 5,411,385 | |
Guam Government Waterworks Authority, 5.25% due 7/1/2020 (Water & Wastewater System Improvements) | | | A-/Baa2 | | | | 300,000 | | | | 338,670 | |
Guam Government Waterworks Authority, 5.25% due 7/1/2022 (Water & Wastewater System Improvements) | | | A-/Baa2 | | | | 1,050,000 | | | | 1,235,797 | |
Guam Government Waterworks Authority, 5.25% due 7/1/2023 (Water & Wastewater System Improvements) | | | A-/Baa2 | | | | 645,000 | | | | 774,535 | |
Guam Power Authority, 5.00% due 10/1/2019 (Electric Power System; Insured: AGM) | | | AA/A2 | | | | 1,000,000 | | | | 1,100,840 | |
Guam Power Authority, 5.00% due 10/1/2020 (Electric Power System; Insured: AGM) | | | AA/A2 | | | | 1,500,000 | | | | 1,691,070 | |
Guam Power Authority, 5.00% due 10/1/2022 (Electric Power System; Insured: AGM) | | | AA/A2 | | | | 6,340,000 | | | | 7,453,938 | |
| | | |
HAWAII — 1.33% | | | | | | | | | | | | |
City and County of Honolulu GO, 5.00% due 11/1/2019 (Capital Improvements) | | | NR/Aa1 | | | | 3,620,000 | | | | 4,063,993 | |
City and County of Honolulu GO, 5.00% due 11/1/2020 (Capital Improvements) | | | NR/Aa1 | | | | 8,265,000 | | | | 9,568,473 | |
City and County of Honolulu GO, 5.00% due 11/1/2021 (Capital Improvements) | | | NR/Aa1 | | | | 2,770,000 | | | | 3,297,823 | |
City and County of Honolulu GO, 5.00% due 11/1/2022 (Capital Improvements) | | | NR/Aa1 | | | | 1,750,000 | | | | 2,134,160 | |
City and County of Honolulu GO, 5.00% due 11/1/2022 (Capital Improvements) | | | NR/Aa1 | | | | 6,695,000 | | | | 8,164,686 | |
County of Hawaii GO, 5.00% due 9/1/2021 (Capital Improvements) | | | AA-/Aa2 | | | | 1,500,000 | | | | 1,778,040 | |
Annual Report 17
| | |
| SCHEDULE OF INVESTMENTS, CONTINUED | | |
| |
Thornburg Limited Term Municipal Fund | | September 30, 2016 |
| | | | | | | | | | | | |
Issuer-Description | | Credit Rating†
S&P/ Moody’s | | | Principal
Amount | | | Value | |
County of Hawaii GO, 5.00% due 9/1/2021 (Capital Improvements) | | | AA-/Aa2 | | | $ | 2,165,000 | | | $ | 2,566,304 | |
County of Hawaii GO, 5.00% due 9/1/2022 (Capital Improvements) | | | AA-/Aa2 | | | | 1,250,000 | | | | 1,516,900 | |
County of Hawaii GO, 5.00% due 9/1/2022 (Capital Improvements) | | | AA-/Aa2 | | | | 1,000,000 | | | | 1,213,520 | |
County of Hawaii GO, 5.00% due 9/1/2023 (Capital Improvements) | | | AA-/Aa2 | | | | 1,000,000 | | | | 1,240,830 | |
County of Hawaii GO, 5.00% due 9/1/2023 (Capital Improvements) | | | AA-/Aa2 | | | | 800,000 | | | | 992,664 | |
County of Hawaii GO, 5.00% due 9/1/2023 (Capital Improvements) | | | AA-/Aa2 | | | | 1,500,000 | | | | 1,861,245 | |
County of Hawaii GO, 5.00% due 9/1/2023 (Capital Improvements) | | | AA-/Aa2 | | | | 1,000,000 | | | | 1,240,830 | |
County of Hawaii GO, 5.00% due 9/1/2023 (Capital Improvements) | | | AA-/Aa2 | | | | 1,000,000 | | | | 1,240,830 | |
County of Hawaii GO, 5.00% due 9/1/2024 (Capital Improvements) | | | AA-/Aa2 | | | | 2,000,000 | | | | 2,527,060 | |
County of Hawaii GO, 5.00% due 9/1/2024 (Capital Improvements) | | | AA-/Aa2 | | | | 1,430,000 | | | | 1,806,848 | |
County of Hawaii GO, 5.00% due 9/1/2024 (Capital Improvements) | | | AA-/Aa2 | | | | 1,515,000 | | | | 1,914,248 | |
County of Hawaii GO, 5.00% due 9/1/2025 (Capital Improvements) | | | AA-/Aa2 | | | | 2,000,000 | | | | 2,565,020 | |
County of Hawaii GO, 5.00% due 9/1/2025 (Capital Improvements) | | | AA-/Aa2 | | | | 1,255,000 | | | | 1,609,550 | |
County of Hawaii GO, 5.00% due 9/1/2026 (Capital Improvements) | | | AA-/Aa2 | | | | 1,500,000 | | | | 1,930,140 | |
County of Hawaii GO, 5.00% due 9/1/2026 (Capital Improvements) | | | AA-/Aa2 | | | | 2,085,000 | | | | 2,682,895 | |
County of Hawaii GO, 5.00% due 9/1/2026 (Capital Improvements) | | | AA-/Aa2 | | | | 500,000 | | | | 643,380 | |
State of Hawaii GO, 5.00% due 11/1/2017 (Hawaiian Home Lands Settlement) | | | AA+/Aa1 | | | | 12,000,000 | | | | 12,542,520 | |
State of Hawaii GO, 5.00% due 11/1/2018 (Hawaiian Home Lands Settlement) | | | AA+/Aa1 | | | | 20,000,000 | | | | 21,697,800 | |
State of Hawaii GO, 5.00% due 12/1/2019 (Hawaiian Home Lands Settlement) (ETM) | | | NR/NR | | | | 1,545,000 | | | | 1,740,582 | |
State of Hawaii GO, 5.00% due 12/1/2019 (Hawaiian Home Lands Settlement) | | | AA+/Aa1 | | | | 1,455,000 | | | | 1,637,399 | |
State of Hawaii GO, 5.00% due 12/1/2020 (Hawaiian Home Lands Settlement) | | | AA+/Aa1 | | | | 2,500,000 | | | | 2,900,300 | |
State of Hawaii GO, 5.00% due 12/1/2021 (Hawaiian Home Lands Settlement) | | | AA+/Aa1 | | | | 3,000,000 | | | | 3,576,060 | |
State of Hawaii GO, 5.00% due 12/1/2022 pre-refunded 12/1/2021 (Hawaiian Home Lands Settlement) | | | NR/NR | | | | 3,060,000 | | | | 3,665,727 | |
State of Hawaii GO, 5.00% due 12/1/2022 (Hawaiian Home Lands Settlement) | | | AA+/Aa1 | | | | 940,000 | | | | 1,117,641 | |
| | | |
IDAHO — 0.59% | | | | | | | | | | | | |
Idaho HFA, 5.00% due 12/1/2022 (Trinity Health Credit Group) | | | AA-/Aa3 | | | | 1,000,000 | | | | 1,213,800 | |
Idaho HFA, 5.00% due 12/1/2023 (Trinity Health Credit Group) | | | AA-/Aa3 | | | | 2,200,000 | | | | 2,726,262 | |
Idaho HFA, 5.00% due 12/1/2024 (Trinity Health Credit Group) | | | AA-/Aa3 | | | | 1,000,000 | | | | 1,257,480 | |
Regents of the University of Idaho, 5.25% due 4/1/2041 put 4/1/2021 | | | A+/Aa3 | | | | 13,160,000 | | | | 15,257,441 | |
State of Idaho GO, 2.00% due 6/30/2017 | | | SP-1+/Mig1 | | | | 25,825,000 | | | | 26,039,606 | |
| | | |
ILLINOIS — 6.55% | | | | | | | | | | | | |
Board of Education of the City of Chicago GO, 0% due 12/1/2020 (Educational Facilities; Insured: BHAC) | | | AA+/Aa1 | | | | 12,000,000 | | | | 10,552,200 | |
Board of Trustees of Southern Illinois University, 5.25% due 4/1/2020 (Housing & Auxiliary Facilities; Insured: Natl-re) | | | AA-/A3 | | | | 1,000,000 | | | | 1,119,500 | |
a Chicago Midway International Airport, 5.00% due 1/1/2022 | | | A/A3 | | | | 800,000 | | | | 949,360 | |
Chicago Midway International Airport, 5.00% due 1/1/2023 | | | A/A3 | | | | 1,900,000 | | | | 2,310,647 | |
Chicago Midway International Airport, 5.00% due 1/1/2024 | | | A/A3 | | | | 1,000,000 | | | | 1,209,830 | |
Chicago O’Hare International Airport, 5.00% due 1/1/2019 (2015 Airport Projects) | | | A/NR | | | | 3,000,000 | | | | 3,258,180 | |
Chicago O’Hare International Airport, 5.00% due 1/1/2020 (2015 Airport Projects) | | | A/NR | | | | 2,350,000 | | | | 2,635,595 | |
Chicago O’Hare International Airport, 5.00% due 1/1/2021 (2015 Airport Projects) | | | A/NR | | | | 3,000,000 | | | | 3,460,440 | |
Chicago O’Hare International Airport, 5.00% due 1/1/2022 (Capital Development Programs) | | | A/A2 | | | | 5,835,000 | | | | 6,704,415 | |
Chicago Park District GO, 4.00% due 1/1/2017 (Capital Improvement Plan) | | | AA+/NR | | | | 1,000,000 | | | | 1,006,460 | |
Chicago Park District GO, 4.00% due 1/1/2018 (Capital Improvement Plan) | | | AA+/NR | | | | 1,250,000 | | | | 1,288,138 | |
Chicago Park District GO, 4.00% due 1/1/2018 (Capital Improvement Plan) | | | AA+/NR | | | | 1,420,000 | | | | 1,463,324 | |
Chicago Park District GO, 4.00% due 1/1/2018 (Capital Improvement Plan) | | | AA+/NR | | | | 945,000 | | | | 973,832 | |
Chicago Park District GO, 5.00% due 1/1/2018 (Capital Improvement Plan) | | | AA+/Ba1 | | | | 1,150,000 | | | | 1,199,301 | |
Chicago Park District GO, 4.00% due 1/1/2019 (Capital Improvement Plan) | | | AA+/NR | | | | 1,745,000 | | | | 1,836,473 | |
Chicago Park District GO, 4.00% due 1/1/2019 (Capital Improvement Plan) | | | AA+/NR | | | | 820,000 | | | | 862,984 | |
Chicago Park District GO, 4.00% due 1/1/2020 (Capital Improvement Plan) | | | AA+/NR | | | | 2,730,000 | | | | 2,926,041 | |
Chicago Park District GO, 4.00% due 1/1/2020 (Capital Improvement Plan) | | | AA+/NR | | | | 815,000 | | | | 873,525 | |
Chicago Park District GO, 5.00% due 1/1/2020 (Capital Improvement Plan) | | | AA+/Ba1 | | | | 530,000 | | | | 584,749 | |
Chicago Park District GO, 5.00% due 1/1/2021 (Capital Improvement Plan) | | | AA+/NR | | | | 2,840,000 | | | | 3,211,642 | |
Chicago Park District GO, 5.00% due 1/1/2022 (Capital Improvement Plan) | | | AA+/NR | | | | 1,485,000 | | | | 1,714,863 | |
Chicago Park District GO, 5.00% due 1/1/2022 (Capital Improvement Plan) | | | AA+/NR | | | | 1,940,000 | | | | 2,240,293 | |
Chicago Park District GO, 5.00% due 1/1/2023 (Capital Improvement Plan) | | | AA+/NR | | | | 1,605,000 | | | | 1,889,727 | |
Chicago Park District GO, 5.00% due 1/1/2023 (Capital Improvement Plan) | | | AA+/NR | | | | 1,675,000 | | | | 1,972,145 | |
Chicago Park District GO, 5.00% due 1/1/2023 (Capital Improvement Plan) | | | AA+/NR | | | | 3,215,000 | | | | 3,785,341 | |
Chicago Park District GO, 5.00% due 1/1/2024 (Capital Improvement Plan) | | | AA+/NR | | | | 1,305,000 | | | | 1,556,395 | |
Chicago Park District GO, 5.00% due 1/1/2024 (Capital Improvement Plan) | | | AA+/NR | | | | 1,340,000 | | | | 1,598,138 | |
Chicago Park District GO, 5.00% due 1/1/2024 (Capital Improvement Plan) | | | AA+/NR | | | | 1,760,000 | | | | 2,099,046 | |
Chicago School Reform Board of Trustees of the Board of Education GO, 5.25% due 12/1/2021 (School District Capital Improvement Program; Insured: Natl-Re) | | | AA-/A3 | | | | 1,500,000 | | | | 1,661,955 | |
Chicago Transit Authority, 5.25% due 6/1/2017 (Federal Transit Program-Rail Systems; Insured: AGM) | | | A/A3 | | | | 3,000,000 | | | | 3,073,830 | |
Chicago Transit Authority, 5.50% due 6/1/2018 (Federal Transit Program-Rail Systems; Insured: AGM) | | | A/A3 | | | | 2,500,000 | | | | 2,661,125 | |
City of Chicago, 4.00% due 1/1/2017 (Wastewater Transmission System) | | | A/NR | | | | 2,000,000 | | | | 2,012,160 | |
City of Chicago, 4.00% due 1/1/2018 (Wastewater Transmission System) | | | A/Baa3 | | | | 1,475,000 | | | | 1,517,583 | |
18 Annual Report
| | |
| SCHEDULE OF INVESTMENTS, CONTINUED | | |
| |
Thornburg Limited Term Municipal Fund | | September 30, 2016 |
| | | | | | | | | | |
Issuer-Description | | Credit Rating†
S&P/ Moody’s | | Principal
Amount | | | Value | |
City of Chicago, 5.00% due 1/1/2018 (Wastewater Transmission System) | | A/NR | | $ | 2,500,000 | | | $ | 2,603,050 | |
City of Chicago, 5.00% due 1/1/2019 (Wastewater Transmission System) | | A/NR | | | 1,750,000 | | | | 1,875,860 | |
a City of Chicago, 5.00% due 1/1/2020 (Wastewater Transmission System) | | A/NR | | | 1,000,000 | | | | 1,099,970 | |
City of Chicago, 5.00% due 1/1/2020 (Project Fund; Insured: AGM) | | AA/A2 | | | 1,320,000 | | | | 1,338,071 | |
City of Chicago, 5.50% due 1/1/2020 (Wastewater Transmission System; Insured: BHAC) | | AA+/Aa1 | | | 1,250,000 | | | | 1,310,988 | |
City of Chicago, 5.00% due 1/1/2021 (Wastewater Transmission System) | | A/NR | | | 1,000,000 | | | | 1,123,430 | |
City of Chicago, 5.00% due 1/1/2021 (Riverwalk Expansion Project; Insured: AGM) | | BBB/Ba1 | | | 1,410,000 | | | | 1,508,940 | |
City of Chicago, 5.00% due 1/1/2022 (Wastewater Transmission System) | | A/NR | | | 2,000,000 | | | | 2,293,400 | |
City of Chicago, 5.00% due 1/1/2023 (Chicago Midway Airport) | | A/A3 | | | 6,215,000 | | | | 7,558,248 | |
City of Chicago, 5.00% due 1/1/2023 (Wastewater Transmission System) | | A/NR | | | 3,000,000 | | | | 3,497,640 | |
City of Chicago, 5.00% due 1/1/2023 (Riverwalk Expansion Project; Insured: AGM) | | BBB/Ba1 | | | 1,000,000 | | | | 1,089,390 | |
City of Chicago, 5.00% due 1/1/2024 (Project Fund) | | AA/Ba1 | | | 5,510,000 | | | | 5,841,812 | |
City of Chicago, 5.00% due 1/1/2024 (Chicago Midway Airport) | | A/A3 | | | 16,060,000 | | | | 19,127,781 | |
City of Chicago, 5.00% due 1/1/2024 (Wastewater Transmission System) | | A/NR | | | 6,250,000 | | | | 7,380,312 | |
City of Chicago, 5.00% due 1/1/2025 (Wastewater Transmission System) | | A/NR | | | 4,500,000 | | | | 5,371,065 | |
City of Chicago, 5.00% due 1/1/2026 (Project Fund) | | AA/Ba1 | | | 6,030,000 | | | | 6,354,836 | |
City of Chicago, 5.00% due 1/1/2027 (Project Fund) | | AA/Ba1 | | | 6,310,000 | | | | 6,637,994 | |
City of Chicago Board of Education GO, 5.00% due 12/1/2018 (Insured: Natl-Re) | | AA-/A3 | | | 1,000,000 | | | | 1,047,250 | |
City of Chicago Building Acquisition Certificates GO, 5.40% due 1/1/2018 (Parking Facility Improvements; Insured: AGM) | | AA/A2 | | | 1,110,000 | | | | 1,114,129 | |
City of Chicago GO, 5.44% due 1/1/2018 (Transportation Infrastructure Capital Projects; Insured: Natl-Re) | | AA-/A3 | | | 3,050,000 | | | | 3,083,885 | |
City of Chicago School Reform Board of Trustees GO, 5.25% due 12/1/2017 (Insured: Natl-Re) | | AA-/A3 | | | 4,100,000 | | | | 4,231,897 | |
City of Mount Vernon GO, 4.00% due 12/15/2019 (Various Municipal Capital Improvements; Insured: AGM) | | AA/A2 | | | 1,000,000 | | | | 1,083,960 | |
City of Mount Vernon GO, 4.00% due 12/15/2020 (Various Municipal Capital Improvements; Insured: AGM) | | AA/A2 | | | 785,000 | | | | 866,169 | |
City of Mount Vernon GO, 4.00% due 12/15/2021 (Various Municipal Capital Improvements; Insured: AGM) | | AA/A2 | | | 1,640,000 | | | | 1,797,686 | |
City of Quincy, 5.00% due 11/15/2016 (Blessing Hospital) | | A/A2 | | | 1,750,000 | | | | 1,757,980 | |
City of Quincy, 5.00% due 11/15/2017 (Blessing Hospital) | | A/A2 | | | 500,000 | | | | 520,100 | |
City of Waukegan GO, 5.00% due 12/30/2019 (Lakehurst Redevelopment Project; Insured: AGM) | | NR/A2 | | | 1,935,000 | | | | 2,137,962 | |
City of Waukegan GO, 5.00% due 12/30/2020 (Lakehurst Redevelopment Project; Insured: AGM) | | NR/A2 | | | 1,000,000 | | | | 1,131,660 | |
City of Waukegan GO, 5.00% due 12/30/2021 (Lakehurst Redevelopment Project; Insured: AGM) | | NR/A2 | | | 2,100,000 | | | | 2,426,067 | |
City of Waukegan GO, 5.00% due 12/30/2022 (Lakehurst Redevelopment Project; Insured: AGM) | | NR/A2 | | | 1,000,000 | | | | 1,176,700 | |
Community College District No. 516 GO, 4.50% due 12/15/2020 (Waubonsee Community College) | | NR/Aa1 | | | 1,325,000 | | | | 1,502,987 | |
Community College District No. 516 GO, 5.00% due 12/15/2021 (Waubonsee Community College) | | NR/Aa1 | | | 6,175,000 | | | | 7,316,510 | |
Community Consolidated School District No. 146 GO, 9.00% due 12/1/2016 (Tinley Park; Insured: Natl-Re) | | NR/Aa2 | | | 1,315,000 | | | | 1,332,108 | |
Community Consolidated School District No. 158 GO, 0% due 1/1/2017 (McHenry and Kane Counties; Insured: Natl-Re) (ETM) | | NR/A3 | | | 95,000 | | | | 94,767 | |
Community Consolidated School District No. 158 GO, 0% due 1/1/2017 (McHenry and Kane Counties; Insured: Natl-Re) | | NR/A3 | | | 1,090,000 | | | | 1,085,171 | |
Community Consolidated School District No. 93 GO, 2.00% due 1/1/2017 (Village of Carol Stream) | | AA+/NR | | | 370,000 | | | | 371,021 | |
Community High School District No. 127 GO, 9.00% due 2/1/2017 (Lake County-Grayslake Educational Facilities.; Insured: AGM) | | AA+/A2 | | | 2,025,000 | | | | 2,075,463 | |
Community High School District No. 127 GO, 7.375% due 2/1/2020 (Lake County-Grayslake Educational Facilities.; Insured: Syncora) | | AA+/NR | | | 1,000,000 | | | | 1,190,070 | |
Community Unit School District No. 200 GO, 5.25% due 10/1/2023 (DuPage County Educational Facilities; Insured: FSA) | | AA/Aa3 | | | 1,000,000 | | | | 1,115,640 | |
Community Unit School District No. 302 GO, 0% due 2/1/2021 (Kane & DeKalb County Educational Facilities; Insured: Natl-Re) | | NR/Aa3 | | | 3,165,000 | | | | 2,884,486 | |
Community Unit School District No. 428 GO, 0% due 1/1/2021 (DeKalb County Educational Facilities) | | AA-/Aa2 | | | 6,140,000 | | | | 5,632,590 | |
Cook County Community College District No. 508 GO, 5.00% due 12/1/2020 (City Colleges of Chicago) | | A+/NR | | | 720,000 | | | | 810,173 | |
Cook County Community College District No. 508 GO, 5.00% due 12/1/2021 (City Colleges of Chicago) | | A+/NR | | | 1,000,000 | | | | 1,140,540 | |
Cook County Community College District No. 508 GO, 5.00% due 12/1/2022 (City Colleges of Chicago) | | A+/NR | | | 1,250,000 | | | | 1,452,800 | |
Cook County Community College District No. 508 GO, 5.00% due 12/1/2023 (City Colleges of Chicago) | | A+/NR | | | 1,250,000 | | | | 1,465,463 | |
Cook County School District No. 97 GO, 9.00% due 12/1/2018 (Village of Oak Park; Insured: Natl-Re) | | NR/Aa2 | | | 4,000,000 | | | | 4,644,080 | |
Cook County Township High School District No. 227 GO, 5.00% due 12/1/2018 (Rich Township Educational Facilities; Insured: AGM) | | NR/Aa3 | | | 190,000 | | | | 191,381 | |
County of Cook GO, 5.00% due 11/15/2019 (Capital Improvement Plan) | | AA-/A2 | | | 3,690,000 | | | | 4,064,350 | |
County of Cook GO, 4.00% due 11/15/2020 (Capital Improvement Plan) | | AA-/A2 | | | 925,000 | | | | 1,004,772 | |
County of Cook GO, 5.00% due 11/15/2020 (Capital Improvement Plan) | | AA-/A2 | | | 3,590,000 | | | | 3,946,702 | |
County of Cook GO, 5.00% due 11/15/2020 (Capital Improvement Plan) | | AA-/A2 | | | 2,000,000 | | | | 2,251,600 | |
County of Cook GO, 4.00% due 11/15/2021 (Capital Improvement Plan) | | AA-/A2 | | | 2,000,000 | | | | 2,201,060 | |
County of Cook GO, 5.00% due 11/15/2021 (Capital Improvement Plan) | | AA-/A2 | | | 5,000,000 | | | | 5,745,500 | |
County of Cook GO, 5.00% due 11/15/2021 (Capital Improvement Plan) | | AA-/A2 | | | 2,105,000 | | | | 2,418,856 | |
County of Cook GO, 4.00% due 11/15/2022 (Capital Improvement Plan) | | AA-/A2 | | | 1,000,000 | | | | 1,111,620 | |
County of Cook GO, 5.00% due 11/15/2022 (Capital Improvement Plan) | | AA-/A2 | | | 1,500,000 | | | | 1,757,940 | |
Forest Preserve District of Cook County GO, 5.00% due 11/15/2021 | | AA/A2 | | | 1,500,000 | | | | 1,709,310 | |
Forest Preserve District of DuPage County GO, 5.00% due 11/1/2020 | | AAA/Aaa | | | 500,000 | | | | 574,810 | |
Forest Preserve District of DuPage County GO, 5.00% due 11/1/2021 | | AAA/Aaa | | | 1,425,000 | | | | 1,681,073 | |
Forest Preserve District of DuPage County GO, 5.00% due 11/1/2022 | | AAA/Aaa | | | 900,000 | | | | 1,083,510 | |
Forest Preserve District of DuPage County GO, 5.00% due 11/1/2023 | | AAA/Aaa | | | 1,300,000 | | | | 1,596,257 | |
Annual Report 19
| | |
| SCHEDULE OF INVESTMENTS, CONTINUED | | |
| |
Thornburg Limited Term Municipal Fund | | September 30, 2016 |
| | | | | | | | | | | | |
Issuer-Description | | Credit Rating†
S&P/ Moody’s | | | Principal
Amount | | | Value | |
Forest Preserve District of DuPage County GO, 5.00% due 11/1/2024 | | | AAA/Aaa | | | $ | 5,000,000 | | | $ | 6,236,500 | |
Illinois Educational Facilities Authority, 4.75% due 3/1/2030 put 3/1/2017 (Art Institute of Chicago) | | | AA-/NR | | | | 3,030,000 | | | | 3,068,542 | |
Illinois Educational Facilities Authority, 5.00% due 3/1/2030 put 3/1/2017 (Art Institute of Chicago) | | | NR/A1 | | | | 3,000,000 | | | | 3,041,280 | |
Illinois Educational Facilities Authority, 5.25% due 3/1/2034 put 3/1/2018 (Art Institute of Chicago) | | | NR/NR | | | | 3,600,000 | | | | 3,770,316 | |
Illinois Educational Facilities Authority, 3.40% due 11/1/2036 put 11/1/2017 (Field Museum of Natural History) | | | A/NR | | | | 1,300,000 | | | | 1,322,347 | |
Illinois Finance Authority, 5.00% due 11/15/2016 (Rush University Medical Center) | | | A+/A1 | | | | 1,750,000 | | | | 1,759,345 | |
Illinois Finance Authority, 5.00% due 12/1/2016 (Columbia College) (ETM) | | | BBB+/NR | | | | 1,710,000 | | | | 1,722,227 | |
Illinois Finance Authority, 5.00% due 11/1/2017 (Rush University Medical Center; Insured: Natl-Re) (ETM) | | | AA-/Aaa | | | | 1,000,000 | | | | 1,044,730 | |
Illinois Finance Authority, 5.00% due 12/1/2017 (Columbia College) (ETM) | | | BBB+/NR | | | | 1,395,000 | | | | 1,461,458 | |
Illinois Finance Authority, 5.50% due 11/1/2018 (Advocate Health Care) | | | AA/Aa2 | | | | 1,000,000 | | | | 1,066,330 | |
Illinois Finance Authority, 5.25% due 5/1/2019 (Educational Advancement Fund, Inc.) | | | NR/Baa3 | | | | 4,675,000 | | | | 4,685,893 | |
Illinois Finance Authority, 5.00% due 4/1/2020 (Advocate Health Care) | | | AA/Aa2 | | | | 1,315,000 | | | | 1,447,697 | |
Illinois Finance Authority, 5.00% due 11/15/2020 (Rush University Medical Center) | | | A+/A1 | | | | 250,000 | | | | 286,895 | |
Illinois Finance Authority, 5.00% due 11/15/2021 (Rush University Medical Center) | | | A+/A1 | | | | 250,000 | | | | 294,355 | |
Illinois Finance Authority, 4.00% due 12/1/2021 (Trinity Health) | | | AA-/Aa3 | | | | 1,000,000 | | | | 1,121,060 | |
Illinois Finance Authority, 5.00% due 11/15/2022 (Rush University Medical Center) | | | A+/A1 | | | | 250,000 | | | | 301,345 | |
Illinois Finance Authority, 5.00% due 8/1/2023 (Advocate Health Care) | | | AA/Aa2 | | | | 565,000 | | | | 691,447 | |
Illinois Finance Authority, 5.00% due 11/15/2023 (Rush University Medical Center) | | | A+/A1 | | | | 1,000,000 | | | | 1,229,030 | |
Illinois Finance Authority, 5.00% due 8/1/2024 (Advocate Health Care) | | | AA/Aa2 | | | | 800,000 | | | | 997,000 | |
Illinois Finance Authority, 5.00% due 11/15/2024 (Rush University Medical Center) | | | A+/A1 | | | | 500,000 | | | | 624,395 | |
Illinois Finance Authority, 5.00% due 8/1/2025 (Advocate Health Care) | | | AA/Aa2 | | | | 1,400,000 | | | | 1,735,468 | |
Illinois Finance Authority, 5.00% due 11/15/2025 (Rush University Medical Center) | | | A+/A1 | | | | 1,655,000 | | | | 2,073,698 | |
Illinois Finance Authority, 5.00% due 11/1/2030 put 1/15/2020 (Advocate Health Care) | | | AA/Aa2 | | | | 1,250,000 | | | | 1,404,888 | |
Illinois Finance Authority, 0.88% due 8/15/2042 put 10/3/2016 (Northwestern Memorial Hospital; SPA: JPMorgan Chase Bank, N.A.) (daily demand notes) | | | AA+/Aa2 | | | | 33,690,000 | | | | 33,690,000 | |
Illinois HFA, 0.86% due 8/15/2035 put 10/3/2016 (Evanston Hospital Corp.; SPA: JPMorgan Chase Bank, N.A.) (daily demand notes) | | | AA/Aa2 | | | | 19,300,000 | | | | 19,300,000 | |
Illinois State Toll Highway Authority, 5.00% due 1/1/2023 | | | AA-/Aa3 | | | | 4,000,000 | | | | 4,848,480 | |
Illinois State Toll Highway Authority, 5.00% due 1/1/2024 | | | AA-/Aa3 | | | | 6,500,000 | | | | 8,027,565 | |
Illinois State Toll Highway Authority, 5.00% due 1/1/2025 | | | AA-/Aa3 | | | | 6,500,000 | | | | 7,241,390 | |
Kane McHenry Cook & DeKalb Counties Unit School District No. 300 GO, 0% due 12/1/2021 (Insured: AMBAC) (ETM) | | | NR/Aa3 | | | | 765,000 | | | | 713,110 | |
Kane McHenry Cook & DeKalb Counties Unit School District No. 300 GO, 0% due 12/1/2021 (Insured: AMBAC) | | | NR/Aa3 | | | | 1,235,000 | | | | 1,104,708 | |
Kane McHenry Cook & DeKalb Counties Unit School District No. 300 GO, 5.00% due 1/1/2024 | | | AA/NR | | | | 7,150,000 | | | | 8,639,488 | |
McHenry County Conservation District GO, 5.00% due 2/1/2021 | | | AA+/Aa1 | | | | 2,325,000 | | | | 2,692,001 | |
McHenry County Conservation District GO, 5.00% due 2/1/2025 | | | AA+/Aa1 | | | | 2,000,000 | | | | 2,498,840 | |
Metropolitan Pier & Exposition Authority, 5.00% due 12/15/2020 (McCormick Place Expansion) | | | BBB-/NR | | | | 4,000,000 | | | | 4,477,520 | |
Railsplitter Tobacco Settlement Authority, 5.00% due 6/1/2019 | | | A/NR | | | | 22,000,000 | | | | 24,112,220 | |
Railsplitter Tobacco Settlement Authority, 5.125% due 6/1/2019 | | | A/NR | | | | 6,780,000 | | | | 7,453,118 | |
State of Illinois, 5.00% due 6/15/2021 pre-refunded 6/15/2019 (Build Illinois Bond Retirement & Interest Fund) | | | AAA/Baa2 | | | | 9,945,000 | | | | 11,022,839 | |
State of Illinois, 5.00% due 6/15/2023 (Build Illinois) | | | AAA/NR | | | | 5,825,000 | | | | 7,081,802 | |
State of Illinois, 5.00% due 6/15/2024 (Build Illinois) | | | AAA/NR | | | | 6,825,000 | | | | 8,436,928 | |
State of Illinois, 5.00% due 6/15/2025 (Build Illinois) | | | AAA/NR | | | | 8,825,000 | | | | 11,043,164 | |
State of Illinois, 5.00% due 6/15/2026 (Build Illinois) | | | AAA/NR | | | | 8,825,000 | | | | 11,162,566 | |
State of Illinois, 5.00% due 6/15/2027 (Build Illinois) | | | AAA/NR | | | | 5,825,000 | | | | 7,323,714 | |
Town of Cicero Cook County GO, 5.00% due 1/1/2019 (Cicero and Laramie Development Areas; Insured: AGM) | | | AA/A2 | | | | 2,000,000 | | | | 2,160,000 | |
Town of Cicero Cook County GO, 5.00% due 12/1/2019 (Cicero and Laramie Development Areas) | | | A+/NR | | | | 1,070,000 | | | | 1,173,148 | |
Town of Cicero Cook County GO, 5.00% due 1/1/2020 (Cicero and Laramie Development Areas; Insured: AGM) | | | AA/A2 | | | | 1,450,000 | | | | 1,610,979 | |
Town of Cicero Cook County GO, 5.00% due 1/1/2021 (Cicero and Laramie Development Areas; Insured: AGM) | | | AA/A2 | | | | 1,250,000 | | | | 1,420,163 | |
Town of Cicero GO, 5.00% due 1/1/2018 (Cicero and Laramie Development Areas; Insured: AGM) | | | AA/A2 | | | | 2,375,000 | | | | 2,484,108 | |
University of Illinois Board of Trustees, 0.86% due 1/15/2022 put 10/3/2016 (UIC South Campus Development; LOC: JPMorgan Chase Bank, N.A.) (daily demand notes) | | | AA+/Aa1 | | | | 15,410,000 | | | | 15,410,000 | |
University of Illinois Board of Trustees COP, 5.00% due 10/1/2019 (Insured: AGM) | | | AA/Aa3 | | | | 2,000,000 | | | | 2,080,760 | |
Village of Downers Grove GO, 3.00% due 1/1/2017 | | | AAA/NR | | | | 970,000 | | | | 974,278 | |
Village of Melrose Park, 5.20% due 7/1/2018 (Insured: Natl-Re) | | | AA-/A3 | | | | 1,190,000 | | | | 1,202,317 | |
Village of Tinley Park GO, 4.00% due 12/1/2022 | | | AA+/NR | | | | 625,000 | | | | 711,525 | |
Will & Kendall Counties Plainfield Community Consolidated School District 202 GO, 5.00% due 1/1/2023 (Capital Improvements; Insured: BAM) | | | AA/Aa3 | | | | 8,050,000 | | | | 9,688,175 | |
Will & Kendall Counties Plainfield Community Consolidated School District 202 GO, 5.00% due 1/1/2024 (Capital Improvements; Insured: BAM) | | | AA/Aa3 | | | | 4,580,000 | | | | 5,596,577 | |
Will & Kendall Counties Plainfield Community Consolidated School District 202 GO, 5.00% due 1/1/2025 (Capital Improvements; Insured: BAM) | | | AA/Aa3 | | | | 8,495,000 | | | | 10,512,138 | |
Will County Valley View Community Unit School District No. 365 GO, 0% due 11/1/2018 (Insured: AGM) | | | AA/Aa2 | | | | 3,370,000 | | | | 3,253,263 | |
| | | |
INDIANA — 1.59% | | | | | | | | | | | | |
Avon Community School Building Corp., 5.00% due 7/15/2017 (Insured: AMBAC) (State Aid Withholding) | | | AA+/NR | | | | 2,500,000 | | | | 2,580,600 | |
Board of Trustees for the Vincennes University, 4.00% due 6/1/2018 | | | NR/Aa3 | | | | 1,000,000 | | | | 1,047,970 | |
Board of Trustees for the Vincennes University, 5.00% due 6/1/2020 | | | NR/Aa3 | | | | 1,000,000 | | | | 1,140,450 | |
20 Annual Report
| | |
| SCHEDULE OF INVESTMENTS, CONTINUED | | |
| |
Thornburg Limited Term Municipal Fund | | September 30, 2016 |
| | | | | | | | | | |
Issuer-Description | | Credit Rating†
S&P/ Moody’s | | Principal
Amount | | | Value | |
City of Carmel Redevelopment Authority, 5.00% due 8/1/2021 (Road and Intersection Improvements) | | AA+/NR | | $ | 2,405,000 | | | $ | 2,808,848 | |
City of Carmel Redevelopment Authority, 5.00% due 8/1/2022 (Road and Intersection Improvements) | | AA+/NR | | | 2,510,000 | | | | 3,000,931 | |
City of Carmel Redevelopment District COP, 5.75% due 7/15/2022 pre-refunded 1/15/2021 (CFP Energy Center, LLC Installment Purchase Agreement) | | NR/NR | | | 2,970,000 | | | | 3,356,605 | |
City of Fort Wayne, 2.00% due 12/1/2016 (Waterworks Utility Improvements) | | NR/Aa3 | | | 1,160,000 | | | | 1,162,111 | |
City of Fort Wayne, 2.00% due 12/1/2017 (Waterworks Utility Improvements) | | NR/Aa3 | | | 1,175,000 | | | | 1,186,738 | |
Clay Multiple School Building Corp., 5.00% due 1/15/2017 (State Aid Withholding) | | AA+/NR | | | 1,000,000 | | | | 1,011,440 | |
Duneland School Building Corp., 0% due 2/1/2020 (State Aid Withholding) | | A/NR | | | 2,970,000 | | | | 2,820,401 | |
Duneland School Building Corp., 0% due 8/1/2020 (State Aid Withholding) | | A/NR | | | 3,470,000 | | | | 3,266,068 | |
Duneland School Building Corp., 0% due 2/1/2021 (State Aid Withholding) | | A/NR | | | 2,770,000 | | | | 2,584,493 | |
Duneland School Building Corp., 0% due 8/1/2021 (State Aid Withholding) | | A/NR | | | 3,270,000 | | | | 3,022,363 | |
Hamilton Southeastern Consolidated School Building Corp., 5.00% due 7/15/2021 (Educational Facilities; Insured: State Intercept) | | AA+/NR | | | 1,230,000 | | | | 1,443,036 | |
Hamilton Southeastern Consolidated School Building Corp., 5.00% due 7/15/2022 (Educational Facilities; Insured: State Intercept) | | AA+/NR | | | 885,000 | | | | 1,063,363 | |
Hamilton Southeastern Consolidated School Building Corp., 5.00% due 7/15/2023 (Educational Facilities; Insured: State Intercept) | | AA+/NR | | | 570,000 | | | | 697,794 | |
Hamilton Southeastern Consolidated School Building Corp., 5.00% due 1/15/2024 (Educational Facilities; Insured: State Intercept) | | AA+/NR | | | 525,000 | | | | 647,220 | |
Indiana Bond Bank, 5.25% due 10/15/2016 (Special Gas Program) | | NR/A3 | | | 1,545,000 | | | | 1,547,766 | |
Indiana Bond Bank, 5.00% due 10/15/2017 (Special Gas Program) | | NR/A3 | | | 5,000,000 | | | | 5,186,000 | |
Indiana Bond Bank, 5.00% due 8/1/2021 (Columbus Learning Center) | | AA/NR | | | 1,300,000 | | | | 1,509,690 | |
Indiana Finance Authority, 5.00% due 5/1/2017 (Parkview Health Systems) | | A+/Aa3 | | | 1,000,000 | | | | 1,023,010 | |
Indiana Finance Authority, 5.00% due 9/15/2017 (Marian University Health Sciences) | | BBB-/NR | | | 1,940,000 | | | | 1,987,297 | |
Indiana Finance Authority, 4.00% due 5/1/2018 (Community Health Network) | | A/A2 | | | 2,820,000 | | | | 2,948,677 | |
Indiana Finance Authority, 5.25% due 7/1/2018 (Wabash Correctional Facilities) | | AA+/Aa1 | | | 1,000,000 | | | | 1,074,010 | |
Indiana Finance Authority, 5.25% due 7/1/2018 (Rockville Correctional Facilities) (ETM) | | AA+/Aa1 | | | 2,150,000 | | | | 2,313,034 | |
Indiana Finance Authority, 5.00% due 9/15/2018 (Marian University Health Sciences) | | BBB-/NR | | | 1,790,000 | | | | 1,874,291 | |
Indiana Finance Authority, 5.00% due 11/1/2018 (Sisters of St. Francis Health Services, Inc.) | | NR/Aa3 | | | 1,250,000 | | | | 1,349,263 | |
Indiana Finance Authority, 5.00% due 11/1/2018 (Indianapolis Airport) | | AA+/Aa2 | | | 2,750,000 | | | | 2,970,165 | |
Indiana Finance Authority, 5.00% due 5/1/2019 (Community Health Network) | | A/A2 | | | 1,790,000 | | | | 1,960,605 | |
Indiana Finance Authority, 5.00% due 9/15/2019 (Marian University Health Sciences) | | BBB-/NR | | | 1,250,000 | | | | 1,332,300 | |
Indiana Finance Authority, 5.00% due 3/1/2020 (Indiana University Health System) | | AA-/Aa3 | | | 5,000,000 | | | | 5,668,250 | |
Indiana Finance Authority, 5.00% due 5/1/2020 (Community Health Network) | | A/A2 | | | 860,000 | | | | 971,129 | |
Indiana Finance Authority, 5.00% due 9/15/2020 (Marian University Health Sciences) | | BBB-/NR | | | 2,245,000 | | | | 2,428,821 | |
Indiana Finance Authority, 5.00% due 3/1/2021 (Indiana University Health System) | | AA-/Aa3 | | | 9,880,000 | | | | 11,517,610 | |
Indiana Finance Authority, 5.00% due 5/1/2021 (Community Health Network) | | A/A2 | | | 2,250,000 | | | | 2,611,102 | |
Indiana Finance Authority, 5.00% due 9/15/2021 (Marian University Health Sciences) | | BBB-/NR | | | 2,320,000 | | | | 2,544,599 | |
Indiana Finance Authority, 5.00% due 10/1/2021 (CWA Authority, Inc. Wastewater System Project) | | AA/NR | | | 500,000 | | | | 591,450 | |
Indiana Finance Authority, 5.00% due 3/1/2022 (Indiana University Health System) | | AA-/Aa3 | | | 3,240,000 | | | | 3,752,762 | |
Indiana Finance Authority, 5.00% due 5/1/2022 (Community Health Network) | | A/A2 | | | 1,230,000 | | | | 1,462,285 | |
a Indiana Finance Authority, 5.00% due 5/1/2022 (Parkview Regional Medical Center) | | A+/Aa3 | | | 1,135,000 | | | | 1,358,096 | |
Indiana Finance Authority, 5.00% due 10/1/2023 (CWA Authority, Inc. Wastewater System Project) | | AA/NR | | | 1,000,000 | | | | 1,235,210 | |
Indiana Finance Authority, 5.00% due 10/1/2024 (CWA Authority, Inc. Wastewater System Project) | | AA/NR | | | 500,000 | | | | 627,005 | |
Indiana HFFA, 5.00% due 10/1/2027 put 6/1/2017 (Ascension Health) | | NR/Aa3 | | | 6,590,000 | | | | 6,766,678 | |
Knox Middle School Building Corp., 0% due 1/15/2020 (Insured: Natl-Re) (State Aid Withholding) | | AA-/A3 | | | 1,295,000 | | | | 1,210,022 | |
Lake Central Multi-District School Building Corp., 4.00% due 1/15/2019 (Educational Facilities) (State Aid Withholding) | | AA+/A2 | | | 1,000,000 | | | | 1,061,880 | |
Lake Central Multi-District School Building Corp., 5.00% due 7/15/2019 (Educational Facilities) (State Aid Withholding) | | AA+/A2 | | | 1,680,000 | | | | 1,855,140 | |
Lake Central Multi-District School Building Corp., 4.00% due 1/15/2020 (Educational Facilities) (State Aid Withholding) | | AA+/A2 | | | 1,345,000 | | | | 1,458,343 | |
a Lake Central Multi-District School Building Corp., 5.00% due 7/15/2020 (Educational Facilities) (State Aid Withholding) | | AA+/A2 | | | 1,170,000 | | | | 1,330,852 | |
Lake Central Multi-District School Building Corp., 4.00% due 1/15/2021 (Educational Facilities) (State Aid Withholding) | | AA+/A2 | | | 1,250,000 | | | | 1,380,237 | |
Lake Central Multi-District School Building Corp., 5.00% due 7/15/2021 (Educational Facilities) (State Aid Withholding) | | AA+/A2 | | | 1,250,000 | | | | 1,457,575 | |
Lake Central Multi-District School Building Corp., 4.00% due 1/15/2022 (Educational Facilities) (State Aid Withholding) | | AA+/A2 | | | 1,455,000 | | | | 1,628,029 | |
Lake Central Multi-District School Building Corp., 5.00% due 7/15/2022 (Educational Facilities) (State Aid Withholding) | | AA+/A2 | | | 1,000,000 | | | | 1,193,220 | |
Metropolitan School District of Pike Township GO, 3.00% due 1/15/2017 (College Park Ancillary Rooms) (State Aid Withholding) | | AA+/NR | | | 2,115,000 | | | | 2,128,240 | |
Perry Township Multischool Building Corp., 4.00% due 1/15/2018 (Educational Facilities) (State Aid Withholding) | | AA+/NR | | | 1,000,000 | | | | 1,037,740 | |
Perry Township Multischool Building Corp., 3.00% due 1/10/2019 (Educational Facilities) (State Aid Withholding) | | AA+/NR | | | 1,000,000 | | | | 1,041,440 | |
Perry Township Multischool Building Corp., 4.00% due 7/10/2019 (Educational Facilities) (State Aid Withholding) | | AA+/NR | | | 1,000,000 | | | | 1,077,080 | |
Perry Township Multischool Building Corp., 5.00% due 7/10/2020 (Educational Facilities) (State Aid Withholding) | | AA+/NR | | | 2,090,000 | | | | 2,373,926 | |
Perry Township Multischool Building Corp., 5.00% due 7/10/2021 (Educational Facilities) (State Aid Withholding) | | AA+/NR | | | 1,000,000 | | | | 1,167,200 | |
Pike Township Multischool Building Corp., 4.00% due 1/15/2017 (Metropolitan School District of Pike Township) (State Aid Withholding) | | AA+/NR | | | 1,080,000 | | | | 1,089,904 | |
Whitko High School Building Corp., 4.00% due 7/15/2018 (School Corp. Capital Improvements) (State Aid Withholding) | | AA+/NR | | | 1,025,000 | | | | 1,076,957 | |
Zionsville Community Schools Building Corp., 5.00% due 7/15/2019 (Insured: AGM) (State Aid Withholding) | | AA/A2 | | | 1,100,000 | | | | 1,222,056 | |
Annual Report 21
| | |
| SCHEDULE OF INVESTMENTS, CONTINUED | | |
| |
Thornburg Limited Term Municipal Fund | | September 30, 2016 |
| | | | | | | | | | | | |
Issuer-Description | | Credit Rating†
S&P/ Moody’s | | | Principal
Amount | | | Value | |
IOWA — 0.34% | | | | | | | | | | | | |
Des Moines Independent Community School District, 4.00% due 6/1/2019 (School Infrastructure; Insured: AGM) | | | AA/A2 | | | $ | 3,870,000 | | | $ | 4,156,264 | |
Des Moines Independent Community School District, 4.00% due 6/1/2020 (School Infrastructure; Insured: AGM) | | | AA/A2 | | | | 3,990,000 | | | | 4,380,262 | |
Des Moines Independent Community School District, 4.00% due 6/1/2021 (School Infrastructure; Insured: AGM) | | | AA/A2 | | | | 4,125,000 | | | | 4,560,971 | |
Des Moines Independent Community School District, 4.00% due 6/1/2022 (School Infrastructure; Insured: AGM) | | | AA/A2 | | | | 2,140,000 | | | | 2,357,616 | |
Iowa Finance Authority, 5.00% due 2/15/2017 (Iowa Health System; Insured: AGM) | | | NR/Aa3 | | | | 1,600,000 | | | | 1,622,912 | |
Iowa Finance Authority, 5.00% due 8/15/2017 (Iowa Health System; Insured: AGM) (ETM) | | | NR/Aa3 | | | | 990,000 | | | | 1,026,333 | |
Iowa Finance Authority, 5.00% due 2/15/2018 (Iowa Health System; Insured: AGM) | | | NR/Aa3 | | | | 1,405,000 | | | | 1,479,114 | |
Iowa Finance Authority, 5.00% due 7/1/2022 (Genesis Health System) | | | NR/A1 | | | | 1,735,000 | | | | 2,084,377 | |
Iowa Finance Authority, 5.00% due 7/1/2023 (Genesis Health System) | | | NR/A1 | | | | 2,000,000 | | | | 2,455,140 | |
Iowa Finance Authority, 5.00% due 7/1/2024 (Genesis Health System) | | | NR/A1 | | | | 2,350,000 | | | | 2,864,509 | |
| | | |
KANSAS — 0.83% | | | | | | | | | | | | |
Johnson County USD No. 512 GO, 4.00% due 10/1/2016 (Shawnee Mission School District) | | | NR/Aaa | | | | 6,455,000 | | | | 6,455,581 | |
Johnson County USD No. 512 GO, 4.00% due 10/1/2017 (Shawnee Mission School District) | | | NR/Aaa | | | | 6,700,000 | | | | 6,910,313 | |
Kansas DFA, 5.00% due 4/1/2020 (National Bio and Agro-Defense Facility) | | | A+/Aa3 | | | | 6,980,000 | | | | 7,882,025 | |
Kansas DFA, 5.00% due 12/1/2020 (New Jobs Training; Insured: BAM) | | | AA/NR | | | | 1,500,000 | | | | 1,682,955 | |
Kansas DFA, 5.00% due 4/1/2021 (National Bio and Agro-Defense Facility) | | | A+/Aa3 | | | | 5,075,000 | | | | 5,886,442 | |
Kansas DFA, 5.00% due 4/1/2022 (National Bio and Agro-Defense Facility) | | | A+/Aa3 | | | | 2,730,000 | | | | 3,238,463 | |
Kansas DFA, 5.00% due 4/1/2023 (National Bio and Agro-Defense Facility) | | | A+/Aa3 | | | | 8,110,000 | | | | 9,826,157 | |
Kansas DFA, 5.00% due 4/1/2024 (National Bio and Agro-Defense Facility) | | | A+/Aa3 | | | | 9,275,000 | | | | 11,282,388 | |
Kansas DFA, 5.00% due 4/1/2025 (National Bio and Agro-Defense Facility) | | | A+/Aa3 | | | | 7,280,000 | | | | 8,804,286 | |
Unified Government of Wyandotte County-Kansas City, 5.00% due 9/1/2022 (Utility Systems Improvement) | | | A+/A3 | | | | 2,000,000 | | | | 2,403,000 | |
Unified Government of Wyandotte County-Kansas City, 5.00% due 9/1/2023 (Utility Systems Improvement) | | | A+/A3 | | | | 1,000,000 | | | | 1,226,500 | |
Unified Government of Wyandotte County-Kansas City, 5.00% due 9/1/2024 (Utility Systems Improvement) | | | A+/A3 | | | | 600,000 | | | | 748,290 | |
| | | |
KENTUCKY — 2.47% | | | | | | | | | | | | |
Commonwealth of Kentucky State Property and Buildings Commission, 5.00% due 11/1/2020 (Project No. 112) | | | A/Aa3 | | | | 10,000,000 | | | | 11,453,200 | |
Commonwealth of Kentucky State Property and Buildings Commission, 5.00% due 11/1/2021 (Project No. 112) | | | A/Aa3 | | | | 10,000,000 | | | | 11,711,100 | |
Commonwealth of Kentucky State Property and Buildings Commission, 5.00% due 11/1/2022 (Project No. 112) | | | A/Aa3 | | | | 30,000,000 | | | | 35,866,200 | |
Commonwealth of Kentucky State Property and Buildings Commission, 5.00% due 11/1/2023 (Project No. 112) | | | A/Aa3 | | | | 40,000,000 | | | | 48,350,400 | |
Commonwealth of Kentucky State Property and Buildings Commission, 5.00% due 11/1/2025 (Project No. 112) | | | A/Aa3 | | | | 25,000,000 | | | | 30,863,000 | |
Commonwealth of Kentucky State Property and Buildings Commission, 5.00% due 11/1/2026 (Project No. 112) | | | A/Aa3 | | | | 20,000,000 | | | | 25,016,200 | |
Kentucky Economic DFA, 0% due 10/1/2019 (Norton Healthcare, Inc.; Insured: Natl-Re) | | | AA-/A3 | | | | 5,000,000 | | | | 4,694,600 | |
Kentucky Economic DFA, 0% due 10/1/2020 (Norton Healthcare, Inc.; Insured: Natl-Re) | | | AA-/A3 | | | | 9,600,000 | | | | 8,792,352 | |
Kentucky Economic DFA, 0% due 10/1/2021 (Norton Healthcare, Inc.; Insured: Natl-Re) | | | AA-/A3 | | | | 2,885,000 | | | | 2,583,633 | |
Kentucky Economic DFA, 0% due 10/1/2023 (Norton Healthcare, Inc.; Insured: Natl-Re) | | | AA-/A3 | | | | 4,195,000 | | | | 3,550,816 | |
Lexington-Fayette Urban County Government Public Facilities Corp., 5.00% due 6/1/2022 (Eastern State Hospital) | | | A/Aa3 | | | | 6,165,000 | | | | 7,230,805 | |
Louisville/Jefferson County Metropolitan Government, 5.00% due 10/1/2024 (Norton Healthcare, Inc.) | | | A-/NR | | | | 1,000,000 | | | | 1,232,050 | |
Louisville/Jefferson County Metropolitan Government, 5.00% due 10/1/2025 (Norton Healthcare, Inc.) | | | A-/NR | | | | 1,200,000 | | | | 1,492,452 | |
Louisville/Jefferson County Metropolitan Government, 5.00% due 10/1/2026 (Norton Healthcare, Inc.) | | | A-/NR | | | | 3,000,000 | | | | 3,771,990 | |
| | | |
LOUISIANA — 2.42% | | | | | | | | | | | | |
City of Bossier, 4.00% due 12/1/2018 (Public Improvements; Insured: AGM) | | | AA/Aa3 | | | | 2,020,000 | | | | 2,144,614 | |
City of Bossier, 4.50% due 12/1/2021 (Public Improvements; Insured: AGM) | | | AA/Aa3 | | | | 2,240,000 | | | | 2,589,507 | |
City of Lafayette, 4.00% due 11/1/2016 (Utilities System Improvements) | | | AA-/A1 | | | | 1,395,000 | | | | 1,398,920 | |
City of Lafayette, 5.00% due 11/1/2019 (Utilities System Improvements) | | | AA-/A1 | | | | 1,000,000 | | | | 1,119,190 | |
City of New Orleans GO, 5.00% due 10/1/2016 (Audubon Park Aquarium) | | | A/NR | | | | 2,380,000 | | | | 2,380,262 | |
City of New Orleans GO, 4.00% due 12/1/2016 (Public Improvements) | | | AA-/A3 | | | | 3,000,000 | | | | 3,016,530 | |
City of New Orleans GO, 4.00% due 12/1/2017 (Public Improvements) | | | AA-/A3 | | | | 750,000 | | | | 776,602 | |
City of New Orleans GO, 4.00% due 10/1/2018 (Audubon Park Aquarium; Insured: AGM) | | | AA/NR | | | | 1,110,000 | | | | 1,162,858 | |
City of New Orleans GO, 4.00% due 12/1/2018 (Public Improvements) | | | AA-/A3 | | | | 700,000 | | | | 744,716 | |
City of New Orleans GO, 4.00% due 12/1/2019 (Public Improvements) | | | AA-/A3 | | | | 750,000 | | | | 816,937 | |
City of New Orleans GO, 5.00% due 12/1/2019 (Public Improvements; Insured: AGM) | | | AA-/A3 | | | | 3,080,000 | | | | 3,450,524 | |
City of New Orleans GO, 5.00% due 12/1/2020 (Public Improvements; Insured: AGM) | | | AA-/A3 | | | | 3,250,000 | | | | 3,748,582 | |
City of New Orleans GO, 5.00% due 12/1/2020 (Public Improvements) | | | AA-/A3 | | | | 1,315,000 | | | | 1,516,734 | |
City of New Orleans GO, 5.00% due 12/1/2021 (Public Improvements; Insured: AGM) | | | AA-/A3 | | | | 5,700,000 | | | | 6,738,426 | |
City of New Orleans GO, 5.00% due 12/1/2021 (Public Improvements) | | | AA-/A3 | | | | 1,200,000 | | | | 1,418,616 | |
City of Shreveport, 5.00% due 12/1/2020 (Water and Sewer System; Insured: BAM) | | | AA/A3 | | | | 7,770,000 | | | | 8,901,157 | |
City of Shreveport, 5.00% due 12/1/2021 (Water and Sewer System; Insured: BAM) | | | AA/A3 | | | | 8,185,000 | | | | 9,580,870 | |
City of Shreveport, 5.00% due 12/1/2022 (Water and Sewer System; Insured: BAM) | | | AA/A3 | | | | 6,460,000 | | | | 7,719,377 | |
City of Shreveport, 5.00% due 12/1/2023 (Water and Sewer System; Insured: BAM) | | | AA/A3 | | | | 4,245,000 | | | | 5,166,929 | |
City of Shreveport, 5.00% due 12/1/2024 (Water and Sewer System; Insured: BAM) | | | AA/A3 | | | | 4,490,000 | | | | 5,529,884 | |
Consolidated Sales Tax District A of the Parish of LaFourche, 4.00% due 3/1/2021 (Roads, Bridges & Drainage Works) | | | A/NR | | | | 1,990,000 | | | | 2,209,198 | |
Consolidated Sales Tax District A of the Parish of LaFourche, 4.00% due 3/1/2022 (Roads, Bridges & Drainage Works) | | | A/NR | | | | 1,545,000 | | | | 1,743,054 | |
East Baton Rouge Sewerage Commission, 5.00% due 2/1/2023 (Wastewater System Improvements) | | | AA-/Aa3 | | | | 450,000 | | | | 548,847 | |
East Baton Rouge Sewerage Commission, 5.00% due 2/1/2024 (Wastewater System Improvements) | | | AA-/Aa3 | | | | 1,000,000 | | | | 1,241,600 | |
22 Annual Report
| | |
| SCHEDULE OF INVESTMENTS, CONTINUED | | |
| |
Thornburg Limited Term Municipal Fund | | September 30, 2016 |
| | | | | | | | | | | | |
Issuer-Description | | Credit Rating†
S&P/ Moody’s | | | Principal
Amount | | | Value | |
East Baton Rouge Sewerage Commission, 5.00% due 2/1/2025 (Wastewater System Improvements) | | | AA-/Aa3 | | | $ | 700,000 | | | $ | 881,958 | |
Ernest N. Morial - New Orleans Exhibition Hall Authority, 5.00% due 7/15/2020 (Convention Center) | | | NR/A1 | | | | 1,000,000 | | | | 1,138,740 | |
Ernest N. Morial - New Orleans Exhibition Hall Authority, 5.00% due 7/15/2021 (Convention Center) | | | NR/A1 | | | | 780,000 | | | | 911,531 | |
Ernest N. Morial - New Orleans Exhibition Hall Authority, 5.00% due 7/15/2022 (Convention Center) | | | NR/A1 | | | | 1,000,000 | | | | 1,196,900 | |
Ernest N. Morial - New Orleans Exhibition Hall Authority, 5.00% due 7/15/2023 (Convention Center) | | | NR/A1 | | | | 1,000,000 | | | | 1,190,770 | |
Jefferson Sales Tax District Parish of Jefferson, 5.00% due 12/1/2018 (Sewerage Capital Project; Insured: AGM) | | | AA/A2 | | | | 2,000,000 | | | | 2,171,080 | |
Louisiana Energy & Power Authority, 5.00% due 1/1/2020 (Rodemacher Unit No. 2 Power) | | | A-/Baa1 | | | | 1,000,000 | | | | 1,119,150 | |
Louisiana Energy & Power Authority, 5.00% due 1/1/2021 (Rodemacher Unit No. 2 Power) | | | A-/Baa1 | | | | 1,000,000 | | | | 1,150,340 | |
Louisiana Energy & Power Authority, 5.00% due 6/1/2022 (LEPA Unit No. 1 Power; Insured: AGM) | | | AA/A2 | | | | 1,000,000 | | | | 1,201,380 | |
Louisiana Energy & Power Authority, 5.00% due 1/1/2023 (Rodemacher Unit No. 2 Power) | | | A-/Baa1 | | | | 1,640,000 | | | | 1,962,932 | |
Louisiana Energy & Power Authority, 5.00% due 6/1/2023 (LEPA Unit No. 1 Power; Insured: AGM) | | | AA/A2 | | | | 750,000 | | | | 921,795 | |
Louisiana Local Govt Environmental Facilities & Community Development Authority, 4.00% due 10/1/2016 (Town of Vinton Public Power Authority; Insured: AGM) | | | AA/NR | | | | 1,000,000 | | | | 1,000,080 | |
Louisiana Local Govt Environmental Facilities & Community Development Authority, 5.00% due 3/1/2017 (Independence Stadium) | | | A/NR | | | | 1,265,000 | | | | 1,283,178 | |
Louisiana Local Govt Environmental Facilities & Community Development Authority, 4.00% due 10/1/2017 (Town of Vinton Public Power Authority; Insured: AGM) | | | AA/NR | | | | 1,000,000 | | | | 1,024,690 | |
Louisiana Local Govt Environmental Facilities & Community Development Authority, 5.00% due 3/1/2018 (Independence Stadium) | | | A/NR | | | | 1,000,000 | | | | 1,048,140 | |
Louisiana Local Govt Environmental Facilities & Community Development Authority, 4.50% due 10/1/2018 (Town of Vinton Public Power Authority; Insured: AGM) | | | AA/NR | | | | 1,000,000 | | | | 1,058,560 | |
Louisiana Local Govt Environmental Facilities & Community Development Authority, 4.00% due 12/1/2018 (Bossier Parish Community College - Campus Facilities Project, Inc.) | | | AA-/NR | | | | 2,655,000 | | | | 2,817,619 | |
Louisiana Local Govt Environmental Facilities & Community Development Authority, 4.50% due 10/1/2019 (Town of Vinton Public Power Authority; Insured: AGM) | | | AA/NR | | | | 1,000,000 | | | | 1,083,160 | |
Louisiana Local Govt Environmental Facilities & Community Development Authority, 4.00% due 12/1/2019 (Bossier Parish Community College - Campus Facilities, Inc. Project) | | | AA-/NR | | | | 1,310,000 | | | | 1,423,865 | |
Louisiana Local Govt Environmental Facilities & Community Development Authority, 5.00% due 12/1/2020 (Bossier Parish Community College - Campus Facilities, Inc. Project) | | | AA-/NR | | | | 1,200,000 | | | | 1,377,936 | |
Louisiana Offshore Terminal Authority, 5.00% due 10/1/2018 (Deepwater Oil Port-Loop LLC) | | | BBB/NR | | | | 22,140,000 | | | | 23,620,059 | |
Louisiana Offshore Terminal Authority, 2.20% due 10/1/2040 put 10/1/2017 (Deepwater Oil Port-Loop LLC) | | | BBB/NR | | | | 6,000,000 | | | | 6,044,040 | |
Louisiana Public Facilities Authority, 5.00% due 5/15/2017 (Ochsner Clinic Foundation) (ETM) | | | NR/NR | | | | 285,000 | | | | 292,498 | |
Louisiana Public Facilities Authority, 5.00% due 5/15/2017 (Ochsner Clinic Foundation) | | | NR/Baa1 | | | | 750,000 | | | | 768,390 | |
Louisiana Public Facilities Authority, 5.00% due 5/15/2018 (Ochsner Clinic Foundation) | | | NR/Baa1 | | | | 1,450,000 | | | | 1,486,119 | |
Louisiana Public Facilities Authority, 5.00% due 5/15/2018 pre-refunded 5/15/2017 (Ochsner Clinic Foundation) | | | NR/NR | | | | 550,000 | | | | 564,471 | |
Louisiana Public Facilities Authority, 5.00% due 6/1/2022 (Hurricane Recovery Program) | | | NR/A1 | | | | 2,945,000 | | | | 3,488,824 | |
Louisiana Public Facilities Authority, 5.00% due 6/1/2023 (Hurricane Recovery Program) | | | NR/A1 | | | | 5,000,000 | | | | 6,032,050 | |
Louisiana State Office Facilities Corp., 5.00% due 5/1/2018 (State Capitol) | | | NR/A1 | | | | 2,500,000 | | | | 2,654,500 | |
Louisiana State Office Facilities Corp., 5.00% due 5/1/2021 (State Capitol) | | | NR/A1 | | | | 4,595,000 | | | | 5,193,407 | |
New Orleans Regional Transit Authority, 5.00% due 12/1/2017 (Streetcar Rail Lines; Insured: AGM) | | | AA/Aa3 | | | | 755,000 | | | | 788,779 | |
New Orleans Regional Transit Authority, 5.00% due 12/1/2019 (Streetcar Rail Lines; Insured: AGM) | | | AA/Aa3 | | | | 1,000,000 | | | | 1,116,600 | |
New Orleans Regional Transit Authority, 5.00% due 12/1/2021 (Streetcar Rail Lines; Insured: AGM) | | | AA/Aa3 | | | | 1,000,000 | | | | 1,140,850 | |
New Orleans Regional Transit Authority, 5.00% due 12/1/2022 (Streetcar Rail Lines; Insured: AGM) | | | AA/Aa3 | | | | 1,110,000 | | | | 1,269,052 | |
Parish of LaFourche, 5.00% due 1/1/2019 (Roads, Highways & Bridges) | | | AA-/NR | | | | 595,000 | | | | 645,926 | |
Parish of LaFourche, 5.00% due 1/1/2022 (Roads, Highways & Bridges) | | | AA-/NR | | | | 415,000 | | | | 488,783 | |
Parish of LaFourche, 5.00% due 1/1/2023 (Roads, Highways & Bridges) | | | AA-/NR | | | | 515,000 | | | | 618,783 | |
Parish of Orleans School District GO, 5.00% due 9/1/2018 (Insured: AGM) | | | AA/Aa3 | | | | 4,800,000 | | | | 5,130,480 | |
Parish of Orleans School District GO, 5.00% due 9/1/2020 (Insured: AGM) | | | AA/Aa3 | | | | 3,840,000 | | | | 4,348,109 | |
Parish of Plaquemines Law Enforcement District GO, 5.00% due 9/1/2019 | | | A+/NR | | | | 1,005,000 | | | | 1,092,736 | |
Parish of Plaquemines Law Enforcement District GO, 5.00% due 9/1/2021 pre-refunded 9/1/2019 | | | A+/NR | | | | 1,115,000 | | | | 1,246,537 | |
Parish of St. Charles, 4.00% due 12/1/2040 put 6/1/2022 (Valero Energy Corp. Refinery) | | | BBB/Baa2 | | | | 14,195,000 | | | | 15,703,645 | |
Parish of Terrebonne Hospital Service District No. 1, 4.00% due 4/1/2017 (Terrebonne General Medical Center) | | | A+/A2 | | | | 1,000,000 | | | | 1,014,580 | |
Parish of Terrebonne Hospital Service District No. 1, 5.00% due 4/1/2018 (Terrebonne General Medical Center) | | | A+/A2 | | | | 1,000,000 | | | | 1,057,510 | |
Parish of Terrebonne Hospital Service District No. 1, 5.00% due 4/1/2019 (Terrebonne General Medical Center) | | | A+/A2 | | | | 1,810,000 | | | | 1,977,208 | |
Parish of Terrebonne Hospital Service District No. 1, 5.00% due 4/1/2021 (Terrebonne General Medical Center) | | | A+/A2 | | | | 2,320,000 | | | | 2,607,077 | |
| | | |
MAINE — 0.08% | | | | | | | | | | | | |
Maine Governmental Facilities Authority, 5.00% due 10/1/2020 (Augusta & Machias Courthouses) | | | AA-/Aa3 | | | | 1,245,000 | | | | 1,426,982 | |
Maine Governmental Facilities Authority, 5.00% due 10/1/2021 (Augusta & Machias Courthouses) | | | AA-/Aa3 | | | | 1,315,000 | | | | 1,546,427 | |
Maine Governmental Facilities Authority, 5.00% due 10/1/2022 (Augusta & Machias Courthouses) | | | AA-/Aa3 | | | | 1,175,000 | | | | 1,412,855 | |
Maine Governmental Facilities Authority, 5.00% due 10/1/2023 (Augusta & Machias Courthouses) | | | AA-/Aa3 | | | | 1,445,000 | | | | 1,773,000 | |
| | | |
MARYLAND — 0.41% | | | | | | | | | | | | |
Maryland Economic Development Corp., 5.00% due 6/1/2021 (Public Health Laboratory) | | | AA+/Aa1 | | | | 8,725,000 | | | | 10,246,291 | |
Maryland Economic Development Corp., 4.00% due 6/1/2022 (Public Health Laboratory) | | | AA+/Aa1 | | | | 8,245,000 | | | | 9,221,868 | |
Prince George’s County GO, 5.00% due 9/15/2017 (Consolidated Public Improvements) | | | AAA/Aaa | | | | 12,340,000 | | | | 12,835,204 | |
Annual Report 23
| | |
| SCHEDULE OF INVESTMENTS, CONTINUED | | |
| |
Thornburg Limited Term Municipal Fund | | September 30, 2016 |
| | | | | | | | | | | | |
Issuer-Description | | Credit Rating†
S&P/ Moody’s | | | Principal
Amount | | | Value | |
MASSACHUSETTS — 1.14% | | | | | | | | | | | | |
Berkshire Wind Power Cooperative Corp., 5.00% due 7/1/2017 | | | A/NR | | | $ | 2,540,000 | | | $ | 2,614,981 | |
Berkshire Wind Power Cooperative Corp., 5.00% due 7/1/2018 | | | A/NR | | | | 2,825,000 | | | | 3,014,671 | |
Berkshire Wind Power Cooperative Corp., 5.00% due 7/1/2019 | | | A/NR | | | | 2,765,000 | | | | 3,049,408 | |
Berkshire Wind Power Cooperative Corp., 5.00% due 7/1/2020 | | | A/NR | | | | 2,965,000 | | | | 3,349,205 | |
City of Quincy GO, 2.00% due 6/16/2017 (Capital Improvements) | | | SP-1+/NR | | | | 6,870,000 | | | | 6,924,273 | |
Massachusetts Bay Transportation Authority, 0.69% due 7/1/2026 put 10/7/2016 (Capital Investment Program; SPA: JPMorgan Chase Bank, N.A.) (weekly demand notes) | | | AA+/Aa2 | | | | 7,000,000 | | | | 7,000,000 | |
Massachusetts Development Finance Agency, 3.00% due 7/1/2018 (Mount Auburn Hospital Health Records System) | | | A-/A3 | | | | 1,000,000 | | | | 1,033,060 | |
Massachusetts Development Finance Agency, 5.00% due 7/1/2022 (Mount Auburn Hospital Health Records System) | | | A-/A3 | | | | 2,750,000 | | | | 3,293,647 | |
Massachusetts Development Finance Agency, 5.00% due 7/1/2023 (CareGroup Healthcare) | | | A-/A3 | | | | 2,500,000 | | | | 3,045,575 | |
Massachusetts Development Finance Agency, 5.00% due 7/1/2023 (Mount Auburn Hospital Health Records System) | | | A-/A3 | | | | 4,000,000 | | | | 4,872,920 | |
Massachusetts Development Finance Agency, 5.25% due 10/1/2023 (Simmons College) | | | BBB+/Baa1 | | | | 595,000 | | | | 726,209 | |
Massachusetts Development Finance Agency, 5.00% due 7/1/2024 (CareGroup Healthcare) | | | A-/A3 | | | | 3,020,000 | | | | 3,731,089 | |
Massachusetts Development Finance Agency, 5.00% due 7/1/2024 (Mount Auburn Hospital Health Records System) | | | A-/A3 | | | | 6,050,000 | | | | 7,499,338 | |
Massachusetts Development Finance Agency, 5.00% due 7/1/2025 (CareGroup Healthcare) | | | A-/A3 | | | | 2,500,000 | | | | 3,135,950 | |
Massachusetts Development Finance Agency, 5.00% due 7/1/2025 (Mount Auburn Hospital Health Records System) | | | A-/A3 | | | | 2,465,000 | | | | 3,092,047 | |
Massachusetts Development Finance Agency, 5.00% due 7/1/2026 (CareGroup Healthcare) | | | A-/A3 | | | | 3,000,000 | | | | 3,809,070 | |
Massachusetts Development Finance Agency, 5.75% due 12/1/2042 pre-refunded 5/1/2019 (Dominion Energy Brayton Point Station Units 1 and 2) | | | BBB/Baa2 | | | | 2,000,000 | | | | 2,243,560 | |
Massachusetts Educational Financing Authority, 5.50% due 1/1/2017 | | | AA/NR | | | | 1,800,000 | | | | 1,820,034 | |
Massachusetts Educational Financing Authority, 5.50% due 1/1/2018 | | | AA/NR | | | | 11,170,000 | | | | 11,769,494 | |
Massachusetts Educational Financing Authority, 5.75% due 1/1/2020 | | | AA/NR | | | | 7,500,000 | | | | 8,495,250 | |
Massachusetts Health & Educational Facilities Authority, 5.00% due 7/1/2018 (UMass Memorial Health Care) | | | BBB+/Baa3 | | | | 4,290,000 | | | | 4,577,258 | |
Massachusetts Health & Educational Facilities Authority, 5.00% due 10/1/2019 (Berkshire Health Systems; Insured: AGM) | | | AA/A3 | | | | 1,350,000 | | | | 1,354,523 | |
| | | |
MICHIGAN — 3.61% | | | | | | | | | | | | |
Board of Governors of Wayne State University, 5.00% due 11/15/2022 (Educational Facilities and Equipment) | | | A+/Aa3 | | | | 425,000 | | | | 509,877 | |
Board of Governors of Wayne State University, 5.00% due 11/15/2023 (Educational Facilities and Equipment) | | | A+/Aa3 | | | | 305,000 | | | | 374,394 | |
Board of Governors of Wayne State University, 5.00% due 11/15/2024 (Educational Facilities and Equipment) | | | A+/Aa3 | | | | 515,000 | | | | 638,662 | |
Board of Governors of Wayne State University, 5.00% due 11/15/2025 (Educational Facilities and Equipment) | | | A+/Aa3 | | | | 625,000 | | | | 773,081 | |
Byron Center Michigan Public Schools, 4.00% due 5/1/2017 (Insured: AGM/Q-SBLF) | | | AA/NR | | | | 1,305,000 | | | | 1,328,895 | |
Byron Center Michigan Public Schools, 4.00% due 5/1/2018 (Insured: AGM/Q-SBLF) | | | AA/NR | | | | 1,935,000 | | | | 2,026,525 | |
Byron Center Michigan Public Schools, 4.00% due 5/1/2020 (Insured: AGM/Q-SBLF) | | | AA/NR | | | | 1,000,000 | | | | 1,100,700 | |
City of Battle Creek County of Calhoun GO, 5.00% due 5/1/2020 (Downtown Development; Insured: AMBAC) | | | AA/A1 | | | | 3,200,000 | | | | 3,393,760 | |
County of Genesee GO, 3.00% due 11/1/2016 (Water Supply System; Insured: BAM) | | | AA/A2 | | | | 615,000 | | | | 616,089 | |
County of Genesee GO, 5.00% due 11/1/2022 (Water Supply System; Insured: BAM) | | | AA/A2 | | | | 600,000 | | | | 708,804 | |
County of Livingston GO, 4.00% due 5/1/2018 (Howell Public Schools; Insured: Q-SBLF) | | | AA-/NR | | | | 1,000,000 | | | | 1,045,850 | |
County of Livingston GO, 4.00% due 5/1/2020 (Howell Public Schools; Insured: Q-SBLF) | | | AA-/NR | | | | 1,000,000 | | | | 1,096,510 | |
County of Livingston GO, 4.00% due 5/1/2021 (Howell Public Schools; Insured: Q-SBLF) | | | AA-/NR | | | | 1,000,000 | | | | 1,116,990 | |
Kalamazoo Hospital Finance Authority, 4.50% due 5/15/2017 (Bronson Methodist Hospital; Insured: AGM) | | | NR/A2 | | | | 1,830,000 | | | | 1,867,790 | |
Kalamazoo Hospital Finance Authority, 5.00% due 5/15/2018 (Bronson Methodist Hospital; Insured: AGM) | | | AA/A2 | | | | 1,520,000 | | | | 1,612,142 | |
Kalamazoo Hospital Finance Authority, 5.00% due 5/15/2018 (Bronson Methodist Hospital; Insured: AGM) | | | AA/A2 | | | | 2,500,000 | | | | 2,651,550 | |
Kalamazoo Hospital Finance Authority, 5.00% due 5/15/2020 (Bronson Methodist Hospital; Insured: AGM) | | | NR/A2 | | | | 1,735,000 | | | | 1,962,736 | |
Kalamazoo Hospital Finance Authority, 5.00% due 5/15/2021 (Bronson Methodist Hospital; Insured: AGM) | | | NR/A2 | | | | 2,350,000 | | | | 2,656,910 | |
Livonia Public Schools School District GO, 4.00% due 5/1/2020 (School Building & Site) | | | A/A3 | | | | 800,000 | | | | 864,520 | |
Livonia Public Schools School District GO, 5.00% due 5/1/2021 (School Building & Site) | | | A/A3 | | | | 900,000 | | | | 1,033,641 | |
Michigan Finance Authority, 4.00% due 8/1/2018 (Beaumont Health Credit Group) | | | A/A1 | | | | 500,000 | | | | 526,370 | |
Michigan Finance Authority, 5.00% due 8/1/2019 (Ypsilanti Community Schools) | | | A+/NR | | | | 1,150,000 | | | | 1,263,678 | |
Michigan Finance Authority, 5.00% due 8/1/2020 (Ypsilanti Community Schools) | | | A+/NR | | | | 1,220,000 | | | | 1,374,354 | |
Michigan Finance Authority, 5.00% due 8/1/2021 (Ypsilanti Community Schools) | | | A+/NR | | | | 1,295,000 | | | | 1,493,433 | |
Michigan Finance Authority, 5.00% due 8/1/2022 (Ypsilanti Community Schools) | | | A+/NR | | | | 1,375,000 | | | | 1,619,640 | |
Michigan Finance Authority, 5.00% due 12/1/2022 (Trinity Health Credit Group) | | | AA-/Aa3 | | | | 1,000,000 | | | | 1,208,540 | |
Michigan Finance Authority, 5.00% due 8/1/2023 (Beaumont Health Credit Group) | | | A/A1 | | | | 3,800,000 | | | | 4,644,892 | |
Michigan Finance Authority, 5.00% due 12/1/2023 (Trinity Health Credit Group) | | | AA-/Aa3 | | | | 2,500,000 | | | | 3,078,900 | |
Michigan Finance Authority, 5.00% due 8/1/2024 (Beaumont Health Credit Group) | | | A/A1 | | | | 7,000,000 | | | | 8,700,440 | |
Michigan Finance Authority, 5.00% due 12/1/2024 (Trinity Health Credit Group) | | | AA-/Aa3 | | | | 1,000,000 | | | | 1,248,810 | |
Michigan Finance Authority, 5.00% due 8/1/2025 (Beaumont Health Credit Group) | | | A/A1 | | | | 8,000,000 | | | | 9,870,720 | |
Michigan Municipal Bond Authority, 5.00% due 10/1/2020 (Clean Water Fund) | | | AAA/Aaa | | | | 35,000 | | | | 36,365 | |
Michigan State Building Authority, 5.50% due 10/15/2017 (Facilities Program) (ETM) | | | NR/NR | | | | 165,000 | | | | 173,070 | |
Michigan State Building Authority, 5.50% due 10/15/2017 (Facilities Program) | | | A+/Aa2 | | | | 3,460,000 | | | | 3,620,959 | |
Michigan State Building Authority, 5.50% due 10/15/2017 (ETM) | | | NR/NR | | | | 525,000 | | | | 550,625 | |
Michigan State Building Authority, 5.00% due 4/15/2023 (Facilities Program) | | | A+/Aa2 | | | | 1,000,000 | | | | 1,219,490 | |
Michigan State Building Authority, 5.00% due 4/15/2024 (Facilities Program) | | | A+/Aa2 | | | | 1,000,000 | | | | 1,241,540 | |
Michigan State Building Authority, 5.00% due 4/15/2025 (Facilities Program) | | | A+/Aa2 | | | | 1,555,000 | | | | 1,954,526 | |
Michigan State Building Authority, 5.00% due 4/15/2026 (Facilities Program) | | | A+/Aa2 | | | | 750,000 | | | | 952,553 | |
24 Annual Report
| | |
| SCHEDULE OF INVESTMENTS, CONTINUED | | |
| |
Thornburg Limited Term Municipal Fund | | September 30, 2016 |
| | | | | | | | | | | | |
Issuer-Description | | Credit Rating†
S&P/ Moody’s | | | Principal
Amount | | | Value | |
Michigan State Hospital Finance Authority, 5.00% due 11/15/2016 (Ascension Health) | | | AA+/Aa2 | | | $ | 3,330,000 | | | $ | 3,347,549 | |
Michigan State Hospital Finance Authority, 5.00% due 11/15/2017 (Sparrow Memorial Hospital) | | | A+/A1 | | | | 1,500,000 | | | | 1,565,820 | |
Michigan State Hospital Finance Authority, 5.50% due 11/15/2017 (Henry Ford Health System) (ETM) | | | A/A3 | | | | 1,530,000 | | | | 1,605,659 | |
Michigan State Hospital Finance Authority, 5.00% due 7/15/2018 pre-refunded 7/15/2017 (Oakwood Hospital) | | | A/A1 | | | | 1,000,000 | | | | 1,033,220 | |
Michigan State Hospital Finance Authority, 5.50% due 11/15/2018 (Henry Ford Health System) (ETM) | | | A/A3 | | | | 3,500,000 | | | | 3,820,600 | |
Michigan State Hospital Finance Authority, 6.00% due 12/1/2018 (Trinity Health) | | | AA-/Aa3 | | | | 2,000,000 | | | | 2,213,440 | |
Michigan State Hospital Finance Authority, 5.00% due 7/15/2019 pre-refunded 7/15/2017 (Oakwood Hospital) | | | A/A1 | | | | 2,000,000 | | | | 2,066,440 | |
Michigan State Hospital Finance Authority, 5.00% due 10/1/2026 put 6/1/2017 (Ascension Health) | | | NR/Aa3 | | | | 11,100,000 | | | | 11,399,922 | |
Michigan State Housing Development Authority, 4.00% due 10/1/2016 (Multi-Family Mtg Loan Financing) | | | AA/NR | | | | 1,715,000 | | | | 1,715,137 | |
Michigan Strategic Fund, 5.00% due 10/15/2017 (Michigan House of Representatives Facilities; Insured: AGM) | | | AA/Aa3 | | | | 2,000,000 | | | | 2,083,340 | |
Michigan Strategic Fund, 5.25% due 10/15/2019 (Michigan House of Representatives Facilities; Insured: AGM) | | | AA/Aa3 | | | | 2,550,000 | | | | 2,763,817 | |
Michigan Strategic Fund, 5.25% due 10/15/2020 (Michigan House of Representatives Facilities; Insured: AGM) | | | AA/Aa3 | | | | 4,025,000 | | | | 4,356,539 | |
Plymouth-Canton Community Schools GO, 4.00% due 5/1/2018 (Insured: Q-SBLF) | | | NR/Aa1 | | | | 1,500,000 | | | | 1,568,775 | |
Plymouth-Canton Community Schools GO, 4.00% due 5/1/2019 (Insured: Q-SBLF) | | | NR/Aa1 | | | | 1,000,000 | | | | 1,072,850 | |
Plymouth-Canton Community Schools GO, 5.00% due 5/1/2020 (Insured: Q-SBLF) | | | NR/Aa1 | | | | 1,000,000 | | | | 1,131,480 | |
Royal Oak Hospital Finance Authority, 5.25% due 8/1/2017 (William Beaumont Hospital) (ETM) | | | NR/A1 | | | | 5,855,000 | | | | 6,073,567 | |
Royal Oak Hospital Finance Authority, 5.00% due 9/1/2020 (William Beaumont Hospital) | | | A/A1 | | | | 1,200,000 | | | | 1,369,104 | |
Royal Oak Hospital Finance Authority, 5.00% due 9/1/2021 (William Beaumont Hospital) | | | A/A1 | | | | 2,500,000 | | | | 2,928,525 | |
Royal Oak Hospital Finance Authority, 5.00% due 9/1/2023 (William Beaumont Hospital) | | | A/A1 | | | | 1,240,000 | | | | 1,518,120 | |
Royal Oak Hospital Finance Authority, 5.00% due 9/1/2024 (William Beaumont Hospital) | | | A/A1 | | | | 2,000,000 | | | | 2,460,260 | |
School District of the City of Dearborn GO, 3.00% due 5/1/2019 (Insured: Q-SBLF) (State Aid Withholding) | | | NR/Aa1 | | | | 445,000 | | | | 466,111 | |
School District of the City of Dearborn GO, 4.00% due 5/1/2020 (Insured: Q-SBLF) (State Aid Withholding) | | | NR/Aa1 | | | | 350,000 | | | | 383,779 | |
School District of the City of Dearborn GO, 4.00% due 5/1/2021 (Insured: Q-SBLF) (State Aid Withholding) | | | NR/Aa1 | | | | 570,000 | | | | 636,684 | |
School District of the City of Dearborn GO, 4.00% due 5/1/2022 (Insured: Q-SBLF) (State Aid Withholding) | | | NR/Aa1 | | | | 535,000 | | | | 607,230 | |
School District of the City of Dearborn GO, 4.00% due 5/1/2023 (Insured: Q-SBLF) (State Aid Withholding) | | | NR/Aa1 | | | | 625,000 | | | | 719,819 | |
School District of the City of Detroit GO, 5.00% due 5/1/2020 (Wayne County School Building & Site; Insured: Q-SBLF) | | | AA-/Aa1 | | | | 2,200,000 | | | | 2,460,216 | |
School District of the City of Detroit GO, 5.00% due 5/1/2021 (Wayne County School Building & Site; Insured: Q-SBLF) | | | AA-/Aa1 | | | | 4,000,000 | | | | 4,571,120 | |
School District of the City of Detroit GO, 5.00% due 5/1/2022 (Wayne County School Building & Site; Insured: Q-SBLF) | | | AA-/Aa1 | | | | 3,000,000 | | | | 3,501,660 | |
Sparta Area Schools, Counties of Kent and Ottawa GO, 5.00% due 5/1/2017 (School Building & Site; Insured: Q-SBLF) | | | AA-/NR | | | | 1,085,000 | | | | 1,109,640 | |
Sparta Area Schools, Counties of Kent and Ottawa GO, 5.00% due 5/1/2018 (School Building & Site; Insured: Q-SBLF) | | | AA-/NR | | | | 1,285,000 | | | | 1,363,218 | |
Sparta Area Schools, Counties of Kent and Ottawa GO, 5.00% due 5/1/2020 (School Building & Site; Insured: Q-SBLF) | | | AA-/NR | | | | 1,335,000 | | | | 1,514,544 | |
St. Johns Public Schools GO, 5.00% due 5/1/2021 (Insured: Natl-Re/FGIC/Q-SBLF) | | | AA-/Aa2 | | | | 1,000,000 | | | | 1,161,300 | |
State Building Authority of the State of Michigan, 5.00% due 10/15/2016 (Higher Education Facilities Program) | | | A+/Aa2 | | | | 9,055,000 | | | | 9,071,299 | |
State Building Authority of the State of Michigan, 5.00% due 10/15/2020 (Higher Education Facilities Program) | | | A+/Aa2 | | | | 1,000,000 | | | | 1,153,010 | |
State Building Authority of the State of Michigan, 5.00% due 10/15/2021 (Higher Education Facilities Program) | | | A+/Aa2 | | | | 1,000,000 | | | | 1,181,960 | |
State Building Authority of the State of Michigan, 5.00% due 10/15/2022 (Higher Education Facilities Program) | | | A+/Aa2 | | | | 3,000,000 | | | | 3,625,290 | |
State Building Authority of the State of Michigan, 5.00% due 10/15/2023 (Higher Education Facilities Program) | | | A+/Aa2 | | | | 7,715,000 | | | | 9,496,316 | |
State of Michigan, 5.00% due 3/15/2025 (Jobs Today Highway Program & Governor’s Economic Stimulus Program) | | | AA/A2 | | | | 19,000,000 | | | | 23,763,870 | |
State of Michigan, 5.00% due 3/15/2026 (Jobs Today Highway Program & Governor’s Economic Stimulus Program) | | | AA/A2 | | | | 16,490,000 | | | | 20,853,749 | |
Utica Community Schools County of Macomb GO, 4.00% due 5/1/2018 (Technology Infrastructure Improvements; Insured: Q-SBLF) | | | AA-/NR | | | | 1,725,000 | | | | 1,804,091 | |
Utica Community Schools County of Macomb GO, 4.00% due 5/1/2019 (Technology Infrastructure Improvements; Insured: Q-SBLF) | | | AA-/NR | | | | 9,925,000 | | | | 10,648,036 | |
Warren Consolidated School District GO, 4.00% due 5/1/2017 (Insured: Q-SBLF) | | | AA-/NR | | | | 1,035,000 | | | | 1,053,402 | |
Warren Consolidated School District GO, 5.00% due 5/1/2018 (Insured: Q-SBLF) | | | AA-/NR | | | | 1,000,000 | | | | 1,061,260 | |
Warren Consolidated School District GO, 5.00% due 5/1/2020 (Insured: Q-SBLF) | | | AA-/NR | | | | 1,000,000 | | | | 1,128,600 | |
Warren Consolidated School District GO, 5.00% due 5/1/2021 (Insured: Q-SBLF) | | | AA-/NR | | | | 1,000,000 | | | | 1,159,040 | |
Wayne County Airport Authority, 5.00% due 12/1/2017 (Detroit Metropolitan Airport; Insured: Natl-Re) | | | AA-/A2 | | | | 1,000,000 | | | | 1,046,230 | |
Wayne County Airport Authority, 5.00% due 12/1/2017 (Detroit Metropolitan Airport) | | | A/A2 | | | | 2,420,000 | | | | 2,530,594 | |
Wayne County Airport Authority, 5.00% due 12/1/2019 (Detroit Metropolitan Airport) | | | A/A2 | | | | 12,645,000 | | | | 14,105,371 | |
Wayne County Airport Authority, 5.50% due 12/1/2019 (Detroit Metropolitan Airport) | | | A/A2 | | | | 2,600,000 | | | | 2,940,522 | |
Wayne County Airport Authority, 5.50% due 12/1/2020 (Detroit Metropolitan Airport) | | | A/A2 | | | | 4,395,000 | | | | 5,088,707 | |
Wayne County Airport Authority, 5.50% due 12/1/2020 (Detroit Metropolitan Airport) | | | A/A2 | | | | 3,115,000 | | | | 3,606,672 | |
Wayne State University, 5.00% due 11/15/2023 | | | A+/Aa3 | | | | 3,865,000 | | | | 4,715,261 | |
Wayne State University, 5.00% due 11/15/2024 | | | A+/Aa3 | | | | 4,840,000 | | | | 6,002,181 | |
Wayne State University, 5.00% due 11/15/2025 | | | A+/Aa3 | | | | 5,775,000 | | | | 7,230,531 | |
Wayne State University, 5.00% due 11/15/2026 | | | A+/Aa3 | | | | 3,000,000 | | | | 3,766,470 | |
Western Townships Utilities Authority GO, 5.00% due 1/1/2017 (Sewage Disposal System) | | | AA/NR | | | | 1,500,000 | | | | 1,515,045 | |
Western Townships Utilities Authority GO, 5.00% due 1/1/2018 (Sewage Disposal System) | | | AA/NR | | | | 1,500,000 | | | | 1,572,180 | |
| | | |
MINNESOTA — 0.89% | | | | | | | | | | | | |
City of Rochester, 4.00% due 11/15/2030 (Mayo Clinic) | | | AA/Aa2 | | | | 1,400,000 | | | | 1,488,690 | |
City of St. Cloud, 5.00% due 5/1/2017 (CentraCare Health System) | | | NR/A1 | | | | 2,920,000 | | | | 2,991,715 | |
City of St. Cloud, 5.00% due 5/1/2017 (CentraCare Health System) | | | NR/A1 | | | | 1,000,000 | | | | 1,024,560 | |
City of St. Cloud, 5.00% due 5/1/2018 (CentraCare Health System) | | | NR/A1 | | | | 3,105,000 | | | | 3,300,429 | |
City of St. Cloud, 5.00% due 5/1/2019 (CentraCare Health System) | | | NR/A1 | | | | 3,495,000 | | | | 3,844,081 | |
City of St. Cloud, 5.00% due 5/1/2020 (CentraCare Health System) | | | NR/A1 | | | | 3,310,000 | | | | 3,760,160 | |
Annual Report 25
| | |
| SCHEDULE OF INVESTMENTS, CONTINUED | | |
| |
Thornburg Limited Term Municipal Fund | | September 30, 2016 |
| | | | | | | | | | | | |
Issuer-Description | | Credit Rating†
S&P/ Moody’s | | | Principal
Amount | | | Value | |
City of St. Paul Housing & Redevelopment Authority, 5.00% due 2/1/2018 (Gillette Children’s Specialty Healthcare Project) | | | A-/NR | | | $ | 1,255,000 | | | $ | 1,309,994 | |
City of St. Paul Housing & Redevelopment Authority, 5.25% due 2/1/2020 (Gillette Children’s Specialty Healthcare Project) | | | A-/NR | | | | 2,010,000 | | | | 2,177,272 | |
City of St. Paul Housing & Redevelopment Authority, 5.25% due 5/15/2021 pre-refunded 11/15/2016 (Regions Hospital) | | | A/Aaa | | | | 1,070,000 | | | | 1,075,928 | |
County of Clay GO, 3.00% due 4/1/2018 (State-Aid Road Improvements) | | | AA/NR | | | | 1,225,000 | | | | 1,263,686 | |
Le Sueur-Henderson ISD No. 2397 GO, 3.00% due 4/1/2021 (Minnesota School District Credit Enhancement Program) | | | AA+/NR | | | | 1,125,000 | | | | 1,211,456 | |
Minneapolis-St. Paul Metropolitan Airports Commission, 5.00% due 1/1/2017 (Insured: AMBAC) (ETM) | | | AA-/NR | | | | 8,005,000 | | | | 8,090,013 | |
Minnesota Agricultural & Economic Development Board, 5.00% due 2/15/2017 (Essential Health; Insured: AGM) | | | AA/NR | | | | 2,500,000 | | | | 2,537,125 | |
Northern Municipal Power Agency, 5.00% due 1/1/2019 (Electric System) | | | A-/A3 | | | | 5,000,000 | | | | 5,438,500 | |
Northern Municipal Power Agency, 5.00% due 1/1/2020 (Electric System) | | | A-/A3 | | | | 3,500,000 | | | | 3,931,340 | |
Port Authority of the City of St. Paul, 5.00% due 12/1/2017 (Minnesota Andersen Office Building) | | | AA/Aa2 | | | | 4,945,000 | | | | 5,174,893 | |
Port Authority of the City of St. Paul, 4.00% due 12/1/2018 (Minnesota Freeman Office Building) | | | AA/Aa2 | | | | 3,925,000 | | | | 4,171,647 | |
Port Authority of the City of St. Paul, 5.00% due 12/1/2019 (Minnesota Freeman Office Building) | | | AA/Aa2 | | | | 2,000,000 | | | | 2,240,720 | |
Port Authority of the City of St. Paul, 5.00% due 12/1/2020 (Minnesota Freeman Office Building) | | | AA/Aa2 | | | | 2,675,000 | | | | 3,085,559 | |
Port Authority of the City of St. Paul, 5.00% due 12/1/2021 (Minnesota Andersen Office Building) | | | AA/Aa2 | | | | 965,000 | | | | 1,142,309 | |
Port Authority of the City of St. Paul, 5.00% due 12/1/2022 (Minnesota Andersen Office Building) | | | AA/Aa2 | | | | 1,250,000 | | | | 1,513,275 | |
St. Paul Housing and Redevelopment Authority, 5.00% due 7/1/2023 (HealthPartners) | | | A/A2 | | | | 1,000,000 | | | | 1,213,950 | |
St. Paul Housing and Redevelopment Authority, 5.00% due 7/1/2024 (HealthPartners) | | | A/A2 | | | | 600,000 | | | | 741,276 | |
St. Paul Housing and Redevelopment Authority, 5.00% due 7/1/2025 (HealthPartners) | | | A/A2 | | | | 250,000 | | | | 312,450 | |
State of Minnesota GO, 5.00% due 10/1/2016 | | | AA+/Aa1 | | | | 7,500,000 | | | | 7,500,900 | |
| | | |
MISSISSIPPI — 0.26% | | | | | | | | | | | | |
Lamar County School District GO, 3.50% due 6/1/2017 (Educational and Performing Arts Capital Projects) | | | A/NR | | | | 1,700,000 | | | | 1,727,506 | |
Mississippi Development Bank, 4.75% due 7/1/2017 (Canton GO Public Improvement Project) (ETM) | | | NR/NR | | | | 335,000 | | | | 340,826 | |
Mississippi Development Bank, 5.00% due 8/1/2018 (Department of Corrections) | | | AA-/NR | | | | 4,910,000 | | | | 5,248,053 | |
Mississippi Development Bank, 5.00% due 1/1/2020 (MDOT-Harrison County Highway) | | | AA-/Aa3 | | | | 1,500,000 | | | | 1,685,880 | |
Mississippi Development Bank, 5.00% due 1/1/2020 (MDOT-Madison County Highway) | | | AA-/Aa3 | | | | 1,000,000 | | | | 1,123,920 | |
Mississippi Development Bank, 5.00% due 1/1/2021 (MDOT-Harrison County Highway) | | | AA-/Aa3 | | | | 2,500,000 | | | | 2,890,425 | |
Mississippi Development Bank, 5.00% due 1/1/2021 (MDOT-Madison County Highway) | | | AA-/Aa3 | | | | 2,000,000 | | | | 2,312,340 | |
Mississippi Development Bank, 5.00% due 1/1/2022 (MDOT-Harrison County Highway) | | | AA-/Aa3 | | | | 1,000,000 | | | | 1,185,580 | |
Mississippi Development Bank, 5.00% due 1/1/2022 (MDOT-Madison County Highway) | | | AA-/Aa3 | | | | 1,000,000 | | | | 1,185,580 | |
Mississippi Development Bank, 5.00% due 1/1/2023 (MDOT-Harrison County Highway) | | | AA-/Aa3 | | | | 1,500,000 | | | | 1,821,180 | |
Mississippi Development Bank, 5.00% due 1/1/2023 (MDOT-Madison County Highway) | | | AA-/Aa3 | | | | 1,250,000 | | | | 1,517,650 | |
| | | |
MISSOURI — 1.18% | | | | | | | | | | | | |
Cass County COP, 4.00% due 5/1/2018 | | | A/NR | | | | 2,255,000 | | | | 2,341,434 | |
Cass County COP, 4.50% due 5/1/2019 | | | A/NR | | | | 1,270,000 | | | | 1,360,475 | |
Cass County COP, 5.00% due 5/1/2020 | | | A/NR | | | | 2,255,000 | | | | 2,510,041 | |
Cass County COP, 5.00% due 5/1/2021 | | | A/NR | | | | 1,750,000 | | | | 1,941,905 | |
Jackson County, 4.00% due 12/1/2016 (Parking Facility Projects) | | | NR/Aa3 | | | | 500,000 | | | | 502,765 | |
Jackson County, 4.00% due 12/1/2017 (Parking Facility Projects) | | | NR/Aa3 | | | | 500,000 | | | | 518,125 | |
Jackson County, 4.00% due 12/1/2019 (Parking Facility Projects) | | | NR/Aa3 | | | | 500,000 | | | | 544,925 | |
Jackson County, 4.00% due 12/1/2021 (Parking Facility Projects) | | | NR/Aa3 | | | | 1,000,000 | | | | 1,134,370 | |
Kansas City IDA, 5.00% due 9/1/2018 (Kansas City Redevelopment District) (ETM) | | | NR/NR | | | | 695,000 | | | | 749,467 | |
Kansas City IDA, 5.00% due 9/1/2018 (Kansas City Redevelopment District) | | | AA-/A1 | | | | 1,305,000 | | | | 1,397,681 | |
Kansas City Municipal Assistance Corp., 5.00% due 4/15/2018 (H. Roe Bartle Convention Center & Infrastructure Project; Insured: AMBAC) | | | AA/A1 | | | | 1,000,000 | | | | 1,057,930 | |
Kansas City Municipal Assistance Corp., 0% due 4/15/2021 (H. Roe Bartle Convention Center & Infrastructure Project; Insured: AMBAC) | | | AA-/A1 | | | | 10,055,000 | | | | 9,121,896 | |
Kansas City Municipal Assistance Corp., 0% due 4/15/2022 (H. Roe Bartle Convention Center & Infrastructure Project; Insured: AMBAC) | | | AA-/A1 | | | | 5,040,000 | | | | 4,469,018 | |
Missouri Development Finance Board, 5.00% due 6/1/2017 (City of Independence Electric System) | | | A/NR | | | | 1,525,000 | | | | 1,561,661 | |
Missouri Development Finance Board, 5.00% due 6/1/2018 (City of Independence Electric System) | | | A/NR | | | | 1,705,000 | | | | 1,805,271 | |
Missouri Development Finance Board, 4.00% due 6/1/2019 (City of Independence Electric System) | | | A/NR | | | | 1,000,000 | | | | 1,062,360 | |
Missouri Development Finance Board, 5.00% due 6/1/2019 (City of Independence Electric System) | | | A/NR | | | | 1,790,000 | | | | 1,948,218 | |
Missouri Development Finance Board, 4.00% due 6/1/2020 (City of Independence Electric System) | | | A/NR | | | | 1,265,000 | | | | 1,363,910 | |
Missouri Development Finance Board, 5.00% due 6/1/2020 (City of Independence Electric System) | | | A/NR | | | | 1,000,000 | | | | 1,113,550 | |
Missouri Development Finance Board, 4.00% due 6/1/2021 (City of Independence Electric System) | | | A/NR | | | | 2,465,000 | | | | 2,693,653 | |
Missouri Development Finance Board, 4.00% due 6/1/2022 (City of Independence Electric System) | | | A/NR | | | | 3,155,000 | | | | 3,491,733 | |
Missouri Health and Educational Facilities Authority, 5.00% due 5/15/2017 (Children’s Mercy Hospital) | | | A+/NR | | | | 1,000,000 | | | | 1,024,830 | |
Missouri Health and Educational Facilities Authority, 5.00% due 5/15/2019 (Children’s Mercy Hospital) | | | A+/NR | | | | 1,000,000 | | | | 1,099,670 | |
Missouri Health and Educational Facilities Authority, 5.00% due 5/15/2020 (Children’s Mercy Hospital) | | | A+/NR | | | | 1,000,000 | | | | 1,106,060 | |
Missouri Health and Educational Facilities Authority, 5.00% due 11/15/2020 (Saint Luke’s Health System, Inc.) | | | A+/A1 | | | | 1,400,000 | | | | 1,612,702 | |
Missouri Health and Educational Facilities Authority, 5.00% due 11/15/2021 (Saint Luke’s Health System, Inc.) | | | A+/A1 | | | | 1,710,000 | | | | 2,022,691 | |
Missouri Health and Educational Facilities Authority, 5.00% due 11/15/2023 (Saint Luke’s Health System, Inc.) | | | A+/A1 | | | | 2,000,000 | | | | 2,473,240 | |
Missouri Health and Educational Facilities Authority, 5.00% due 11/15/2024 (Saint Luke’s Health System, Inc.) | | | A+/A1 | | | | 1,585,000 | | | | 1,993,011 | |
Missouri Health and Educational Facilities Authority, 5.00% due 11/15/2026 (Saint Luke’s Health System, Inc.) | | | NR/NR | | | | 2,000,000 | | | | 2,534,940 | |
26 Annual Report
| | |
| SCHEDULE OF INVESTMENTS, CONTINUED | | |
| |
Thornburg Limited Term Municipal Fund | | September 30, 2016 |
| | | | | | | | | | | | |
Issuer-Description | | Credit Rating†
S&P/ Moody’s | | | Principal
Amount | | | Value | |
Missouri Health and Educational Facilities Authority, 0.88% due 9/1/2030 put 10/3/2016 (Washington University; SPA: JPMorgan Chase Bank, N.A.) (daily demand notes) | | | AAA/Aaa | | | $ | 5,000,000 | | | $ | 5,000,000 | |
Missouri Health and Educational Facilities Authority, 0.88% due 9/1/2030 put 10/3/2016 (Washington University; SPA: JPMorgan Chase Bank, N.A.) (daily demand notes) | | | AAA/Aaa | | | | 3,700,000 | | | | 3,700,000 | |
Platte County, 4.00% due 4/1/2017 (Community & Resource Centers) | | | NR/A1 | | | | 1,500,000 | | | | 1,520,085 | |
Platte County, 4.00% due 4/1/2018 (Community & Resource Centers) | | | NR/A1 | | | | 2,110,000 | | | | 2,193,071 | |
Platte County, 5.00% due 4/1/2019 (Community & Resource Centers) | | | NR/A1 | | | | 2,000,000 | | | | 2,177,240 | |
Platte County, 5.00% due 4/1/2021 (Community & Resource Centers) | | | NR/A1 | | | | 2,440,000 | | | | 2,796,752 | |
Southeast Missouri State University, 5.00% due 4/1/2018 (City of Cape Girardeau Campus System Facilities) | | | A/NR | | | | 1,165,000 | | | | 1,232,978 | |
Southeast Missouri State University, 5.00% due 4/1/2020 (City of Cape Girardeau Campus System Facilities) | | | A/NR | | | | 2,825,000 | | | | 3,189,030 | |
Special Administrative Board of the Transitional School District of the City of St. Louis GO, 4.00% due 4/1/2019 (State Aid Withholding) | | | AA+/NR | | | | 1,615,000 | | | | 1,726,790 | |
Special Administrative Board of the Transitional School District of the City of St. Louis GO, 4.00% due 4/1/2020 (State Aid Withholding) | | | AA+/NR | | | | 1,600,000 | | | | 1,746,304 | |
Special Administrative Board of the Transitional School District of the City of St. Louis GO, 4.00% due 4/1/2021 (State Aid Withholding) | | | AA+/NR | | | | 2,055,000 | | | | 2,284,523 | |
Special Administrative Board of the Transitional School District of the City of St. Louis GO, 4.00% due 4/1/2022 (State Aid Withholding) | | | AA+/NR | | | | 3,300,000 | | | | 3,727,713 | |
St. Louis Municipal Finance Corp., 5.00% due 2/15/2017 (City Justice Center) | | | A/A2 | | | | 2,000,000 | | | | 2,029,760 | |
St. Louis Municipal Finance Corp., 5.00% due 2/15/2018 (City Justice Center) | | | A/A2 | | | | 3,865,000 | | | | 4,069,536 | |
| | | |
NEBRASKA — 0.11% | | | | | | | | | | | | |
Douglas County Hospital Authority No. 3, 5.00% due 11/1/2022 (Nebraska Methodist Health System) | | | A-/NR | | | | 1,670,000 | | | | 1,976,011 | |
Douglas County Hospital Authority No. 3, 5.00% due 11/1/2023 (Nebraska Methodist Health System) | | | A-/NR | | | | 1,905,000 | | | | 2,291,467 | |
Douglas County Hospital Authority No. 3, 5.00% due 11/1/2024 (Nebraska Methodist Health System) | | | A-/NR | | | | 1,400,000 | | | | 1,704,696 | |
Douglas County Hospital Authority No. 3, 5.00% due 11/1/2025 (Nebraska Methodist Health System) | | | A-/NR | | | | 2,005,000 | | | | 2,462,521 | |
| | | |
NEVADA — 2.20% | | | | | | | | | | | | |
Carson City, 5.00% due 9/1/2019 (Carson Tahoe Regional Healthcare) | | | BBB+/NR | | | | 1,000,000 | | | | 1,093,390 | |
Carson City, 5.00% due 9/1/2020 (Carson Tahoe Regional Healthcare) | | | BBB+/NR | | | | 1,000,000 | | | | 1,121,230 | |
Carson City, 5.00% due 9/1/2022 (Carson Tahoe Regional Healthcare) | | | BBB+/NR | | | | 2,450,000 | | | | 2,863,805 | |
City of Las Vegas COP, 5.00% due 9/1/2017 (City Hall) | | | AA-/Aa3 | | | | 2,690,000 | | | | 2,777,452 | |
City of Las Vegas COP, 5.00% due 9/1/2017 (City Hall) | | | NR/NR | | | | 1,610,000 | | | | 1,672,065 | |
City of Las Vegas COP, 5.00% due 9/1/2018 (City Hall) | | | AA-/Aa3 | | | | 3,280,000 | | | | 3,491,002 | |
City of Las Vegas COP, 5.00% due 9/1/2018 (City Hall) | | | NR/NR | | | | 720,000 | | | | 776,282 | |
City of Las Vegas GO, 7.00% due 4/1/2017 (Performing Arts Center) | | | AA/Aa2 | | | | 1,825,000 | | | | 1,880,681 | |
City of Las Vegas GO, 7.00% due 4/1/2018 (Performing Arts Center) | | | AA/Aa2 | | | | 2,095,000 | | | | 2,281,685 | |
City of Reno, 5.25% due 6/1/2018 (Washoe Medical Center; Insured: AGM) | | | AA/A2 | | | | 1,000,000 | | | | 1,065,860 | |
Clark County School District GO, 5.00% due 6/15/2022 (Acquisition of Transportation & Technology Equipment) | | | AA-/A1 | | | | 2,560,000 | | | | 3,074,637 | |
Clark County School District GO, 5.00% due 6/15/2026 (Acquisition of Transportation & Technology Equipment) | | | AA-/A1 | | | | 12,180,000 | | | | 15,517,320 | |
Las Vegas Clark County Library District GO, 5.00% due 1/1/2018 | | | AA/Aa2 | | | | 6,535,000 | | | | 6,858,679 | |
Las Vegas Clark County Library District GO, 5.00% due 1/1/2019 | | | AA/Aa2 | | | | 3,000,000 | | | | 3,263,790 | |
Las Vegas Convention and Visitors Authority, 5.00% due 7/1/2023 | | | A+/A1 | | | | 800,000 | | | | 975,728 | |
Las Vegas Convention and Visitors Authority, 5.00% due 7/1/2024 | | | A+/A1 | | | | 3,155,000 | | | | 3,896,614 | |
Las Vegas Convention and Visitors Authority, 5.00% due 7/1/2025 | | | A+/A1 | | | | 1,250,000 | | | | 1,560,538 | |
Las Vegas Convention and Visitors Authority, 5.00% due 7/1/2026 | | | A+/A1 | | | | 1,000,000 | | | | 1,258,550 | |
Las Vegas Valley Water District GO, 5.00% due 6/1/2017 | | | AA/Aa1 | | | | 1,050,000 | | | | 1,079,190 | |
Las Vegas Valley Water District GO, 5.00% due 6/1/2019 | | | AA/Aa1 | | | | 1,000,000 | | | | 1,106,260 | |
Las Vegas Valley Water District GO, 5.00% due 6/1/2020 | | | AA/Aa1 | | | | 4,255,000 | | | | 4,859,465 | |
Las Vegas Valley Water District GO, 5.00% due 6/1/2020 | | | AA/Aa1 | | | | 5,080,000 | | | | 5,801,665 | |
Las Vegas Valley Water District GO, 5.00% due 6/1/2021 | | | AA/Aa1 | | | | 5,000,000 | | | | 5,876,800 | |
Las Vegas Valley Water District GO, 5.00% due 6/1/2023 | | | AA/Aa1 | | | | 15,995,000 | | | | 19,656,895 | |
Las Vegas Valley Water District GO, 5.00% due 6/1/2024 | | | AA/Aa1 | | | | 13,825,000 | | | | 17,277,241 | |
Las Vegas Valley Water District GO, 5.00% due 6/1/2025 | | | AA/Aa1 | | | | 7,505,000 | | | | 9,503,807 | |
Las Vegas Valley Water District GO, 5.00% due 12/1/2025 | | | AA/Aa1 | | | | 20,000,000 | | | | 25,400,200 | |
Las Vegas Valley Water District GO, 5.00% due 6/1/2026 | | | AA/Aa1 | | | | 18,630,000 | | | | 23,543,290 | |
Washoe County GO, 5.00% due 7/1/2021 (Reno-Sparks Convention & Visitors Authority) | | | AA/Aa2 | | | | 1,700,000 | | | | 2,002,702 | |
Washoe County GO, 5.00% due 7/1/2022 (Reno-Sparks Convention & Visitors Authority) | | | AA/Aa2 | | | | 2,500,000 | | | | 2,926,225 | |
| | | |
NEW HAMPSHIRE — 0.43% | | | | | | | | | | | | |
New Hampshire Health and Education Facilities Authority, 5.00% due 10/1/2016 (Southern New Hampshire Medical Center) | | | A-/NR | | | | 1,260,000 | | | | 1,260,139 | |
New Hampshire Health and Education Facilities Authority, 5.00% due 10/1/2017 (Southern New Hampshire Medical Center) | | | A-/NR | | | | 1,000,000 | | | | 1,036,130 | |
New Hampshire Health and Education Facilities Authority, 0.90% due 7/1/2033 put 10/3/2016 (University System of New Hampshire; SPA: Wells Fargo Bank, N.A.) (daily demand notes) | | | AA-/Aa3 | | | | 17,450,000 | | | | 17,450,000 | |
New Hampshire Health and Education Facilities Authority, 0.90% due 7/1/2035 put 10/3/2016 (University System of New Hampshire; SPA: State Street Bank & Trust Co.) (daily demand notes) | | | AA-/Aa3 | | | | 500,000 | | | | 500,000 | |
Annual Report 27
| | |
| SCHEDULE OF INVESTMENTS, CONTINUED | | |
| |
Thornburg Limited Term Municipal Fund | | September 30, 2016 |
| | | | | | | | | | | | |
Issuer-Description | | Credit Rating†
S&P/ Moody’s | | | Principal
Amount | | | Value | |
New Hampshire Municipal Bond Bank, 5.00% due 8/15/2017 (Insured: Natl-Re) | | | AA/Aa3 | | | $ | 3,130,000 | | | $ | 3,244,245 | |
New Hampshire Municipal Bond Bank, 5.25% due 8/15/2020 | | | AA+/Aa2 | | | | 1,000,000 | | | | 1,160,310 | |
New Hampshire Municipal Bond Bank, 5.25% due 8/15/2022 | | | AA+/Aa2 | | | | 2,770,000 | | | | 3,381,283 | |
New Hampshire Turnpike System, 5.00% due 2/1/2017 | | | A+/A1 | | | | 2,425,000 | | | | 2,459,435 | |
New Hampshire Turnpike System, 5.00% due 2/1/2018 | | | A+/A1 | | | | 1,295,000 | | | | 1,365,163 | |
New Hampshire Turnpike System, 5.00% due 2/1/2020 | | | A+/A1 | | | | 1,000,000 | | | | 1,129,490 | |
New Hampshire Turnpike System, 5.00% due 2/1/2021 | | | A+/A1 | | | | 1,260,000 | | | | 1,462,936 | |
| | | |
NEW JERSEY — 2.00% | | | | | | | | | | | | |
Burlington County Bridge Commission, 3.00% due 12/1/2016 (County Governmental Loan Program) | | | AA/Aa2 | | | | 1,000,000 | | | | 1,003,830 | |
Burlington County Bridge Commission, 5.00% due 12/1/2018 (County Governmental Loan Program) | | | AA/Aa2 | | | | 1,000,000 | | | | 1,086,740 | |
City of Jersey City GO, 4.00% due 8/1/2020 (Qualified General Improvement; Insured: BAM) (State Aid Withholding) | | | AA/A1 | | | | 2,650,000 | | | | 2,923,665 | |
City of Jersey City GO, 4.00% due 8/1/2021 (Qualified General Improvement; Insured: BAM) (State Aid Withholding) | | | AA/A1 | | | | 2,805,000 | | | | 3,152,287 | |
City of Jersey City GO, 5.00% due 8/1/2022 (Qualified General Improvement; Insured: BAM) (State Aid Withholding) | | | AA/A1 | | | | 2,530,000 | | | | 3,031,092 | |
City of Jersey City GO, 5.00% due 8/1/2023 (Qualified General Improvement; Insured: BAM) (State Aid Withholding) | | | AA/A1 | | | | 2,455,000 | | | | 3,000,845 | |
Essex County Improvement Authority, 5.50% due 10/1/2024 (County Correctional Facilities & Gibraltar Facilities; Insured: Natl-Re) | | | NR/Aa2 | | | | 5,000,000 | | | | 6,439,750 | |
Gloucester County Improvement Authority, 2.125% due 12/1/2029 put 12/1/2017 (Waste Management) | | | A-/NR | | | | 2,000,000 | | | | 2,023,820 | |
Hudson County COP, 6.25% due 12/1/2016 (Correctional Facility Lease-Purchase; Insured: Natl-Re) | | | AA-/A3 | | | | 550,000 | | | | 554,791 | |
Hudson County Improvement Authority, 4.75% due 10/1/2016 (Hudson County Lease; Insured: AGM) | | | AA/Aa3 | | | | 3,155,000 | | | | 3,155,347 | |
Hudson County Improvement Authority, 4.75% due 10/1/2017 (Hudson County Lease; Insured: AGM) | | | AA/Aa3 | | | | 4,065,000 | | | | 4,211,096 | |
Hudson County Improvement Authority, 4.75% due 10/1/2018 (Hudson County Lease; Insured: AGM) | | | AA/Aa3 | | | | 2,000,000 | | | | 2,140,900 | |
Hudson County Improvement Authority, 4.75% due 10/1/2019 (Hudson County Lease; Insured: AGM) | | | AA/Aa3 | | | | 4,390,000 | | | | 4,840,063 | |
Hudson County Improvement Authority, 5.375% due 10/1/2020 (Hudson County Lease; Insured: AGM) | | | AA/Aa3 | | | | 2,020,000 | | | | 2,334,049 | |
Monmouth County Improvement Authority, 5.00% due 12/1/2016 (Insured: AMBAC) | | | NR/NR | | | | 1,000,000 | | | | 1,006,370 | |
New Jersey EDA, 5.00% due 12/15/2016 (School Facilities Construction) (ETM) | | | NR/NR | | | | 6,795,000 | | | | 6,854,592 | |
New Jersey EDA, 5.00% due 12/15/2016 (School Facilities Construction) | | | A-/A3 | | | | 4,155,000 | | | | 4,188,697 | |
New Jersey EDA, 5.50% due 12/15/2019 (School Facilities Construction; Insured: AMBAC) | | | A-/A3 | | | | 5,525,000 | | | | 6,165,955 | |
New Jersey EDA, 5.00% due 9/1/2020 (School Facilities Construction) (ETM) | | | NR/NR | | | | 365,000 | | | | 419,911 | |
New Jersey EDA, 5.00% due 9/1/2020 (School Facilities Construction) | | | A-/A3 | | | | 135,000 | | | | 149,706 | |
New Jersey EDA, 5.00% due 6/15/2022 (School Facilities Construction) | | | A-/A3 | | | | 8,000,000 | | | | 9,091,520 | |
New Jersey EDA, 5.00% due 3/1/2023 (School Facilities Construction) | | | A-/A3 | | | | 8,015,000 | | | | 9,186,472 | |
New Jersey EDA, 5.00% due 6/15/2023 (School Facilities Construction) | | | A-/A3 | | | | 2,000,000 | | | | 2,299,720 | |
New Jersey EDA, 5.75% due 9/1/2023 pre-refunded 3/1/2021 (School Facilities Construction) | | | NR/A3 | | | | 4,955,000 | | | | 5,943,869 | |
New Jersey EDA, 5.75% due 9/1/2023 (School Facilities Construction) | | | A-/A3 | | | | 550,000 | | | | 632,539 | |
New Jersey EDA, 5.00% due 6/15/2024 (School Facilities Construction) | | | A-/A3 | | | | 4,250,000 | | | | 4,915,210 | |
New Jersey EDA, 5.00% due 3/1/2025 (School Facilities Construction) | | | A-/A3 | | | | 4,575,000 | | | | 5,195,736 | |
New Jersey EDA, 5.00% due 3/1/2026 (School Facilities Construction) | | | A-/A3 | | | | 11,150,000 | | | | 12,583,221 | |
New Jersey Health Care Facilities Financing Authority, 5.00% due 7/1/2023 (Virtua Health Issue) | | | AA-/NR | | | | 535,000 | | | | 651,373 | |
New Jersey Health Care Facilities Financing Authority, 5.00% due 7/1/2024 (Virtua Health Issue) | | | AA-/NR | | | | 1,000,000 | | | | 1,221,210 | |
New Jersey Higher Educational Assistance Authority, 5.00% due 12/1/2017 | | | AA/Aa2 | | | | 1,910,000 | | | | 1,988,043 | |
New Jersey Higher Educational Assistance Authority, 5.00% due 12/1/2018 | | | AA/Aa2 | | | | 3,000,000 | | | | 3,215,790 | |
New Jersey Higher Educational Assistance Authority, 5.25% due 12/1/2019 | | | AA/Aa2 | | | | 5,650,000 | | | | 6,263,420 | |
New Jersey Transit Corp., 5.00% due 9/15/2021 (Urban Public Transportation Capital Improvement) | | | A/A3 | | | | 3,395,000 | | | | 3,840,492 | |
New Jersey Transportation Trust Fund Authority, 5.00% due 6/15/2019 (State Transportation System) | | | A-/A3 | | | | 1,000,000 | | | | 1,087,630 | |
New Jersey Transportation Trust Fund Authority, 5.00% due 6/15/2020 (State Transportation System) | | | A-/A3 | | | | 1,000,000 | | | | 1,106,260 | |
New Jersey Transportation Trust Fund Authority, 5.00% due 6/15/2021 (State Transportation System) | | | A-/A3 | | | | 2,570,000 | | | | 2,887,087 | |
New Jersey Transportation Trust Fund Authority, 5.25% due 12/15/2022 (State Transportation System) | | | A-/A3 | | | | 2,000,000 | | | | 2,328,580 | |
New Jersey Transportation Trust Fund Authority, 5.25% due 12/15/2023 (State Transportation System; Insured: AMBAC) | | | A-/A3 | | | | 3,545,000 | | | | 4,180,618 | |
New Jersey Transportation Trust Fund Authority, 5.00% due 6/15/2024 (State Transportation System) | | | A-/A3 | | | | 1,660,000 | | | | 1,925,733 | |
New Jersey Transportation Trust Fund Authority, 2.04% due 6/15/2034 put 12/15/2021 (State Transportation System) | | | A-/A3 | | | | 4,000,000 | | | | 3,844,200 | |
Ocean Township Municipal Utility Authority, 6.00% due 8/1/2017 (Insured: Natl-Re) | | | AA-/A3 | | | | 780,000 | | | | 803,579 | |
Passaic Valley Sewer Commissioners GO, 5.625% due 12/1/2018 (Sewer System) | | | NR/A3 | | | | 1,210,000 | | | | 1,316,662 | |
Passaic Valley Sewer Commissioners GO, 5.75% due 12/1/2019 (Sewer System) | | | NR/A3 | | | | 2,000,000 | | | | 2,253,140 | |
Passaic Valley Sewer Commissioners GO, 5.75% due 12/1/2020 (Sewer System) | | | NR/A3 | | | | 4,250,000 | | | | 4,928,087 | |
Passaic Valley Sewer Commissioners GO, 5.75% due 12/1/2021 (Sewer System) | | | NR/A3 | | | | 4,500,000 | | | | 5,338,485 | |
Township of Wayne GO, 2.00% due 2/15/2018 (General Improvements and Water Utility System) | | | AA+/Aaa | | | | 1,295,000 | | | | 1,313,881 | |
| | | |
NEW MEXICO — 1.05% | | | | | | | | | | | | |
Albuquerque Municipal School District No. 12 GO, 5.00% due 8/1/2019 (Bernalillo and Sandoval Counties School Facilities) (State Aid Withholding) | | | AA/Aa1 | | | | 2,300,000 | | | | 2,564,362 | |
City of Farmington, 1.875% due 6/1/2032 put 9/1/2017 (El Paso Electric Co.-Four Corners Project) | | | BBB/Baa1 | | | | 3,000,000 | | | | 3,018,450 | |
City of Santa Fe, 4.50% due 5/15/2022 (El Castillo Retirement Residences) | | | BBB-/NR | | | | 2,585,000 | | | | 2,739,014 | |
Incorporated County of Los Alamos, 5.50% due 6/1/2017 | | | AA+/A1 | | | | 2,365,000 | | | | 2,437,416 | |
Incorporated County of Los Alamos, 5.50% due 6/1/2018 | | | AA+/A1 | | | | 2,205,000 | | | | 2,369,603 | |
New Mexico Educational Assistance Foundation, 4.00% due 9/1/2017 (Student Loans) | | | NR/Aaa | | | | 6,000,000 | | | | 6,172,860 | |
New Mexico Educational Assistance Foundation, 5.00% due 12/1/2018 (Student Loans) | | | AAA/Aaa | | | | 5,000,000 | | | | 5,433,350 | |
28 Annual Report
| | |
| SCHEDULE OF INVESTMENTS, CONTINUED | | |
| |
Thornburg Limited Term Municipal Fund | | September 30, 2016 |
| | | | | | | | | | | | |
Issuer-Description | | Credit Rating†
S&P/ Moody’s | | | Principal
Amount | | | Value | |
New Mexico Educational Assistance Foundation, 5.00% due 12/1/2021 (Student Loans) | | | AAA/Aaa | | | $ | 3,000,000 | | | $ | 3,453,840 | |
New Mexico Hospital Equipment Loan Council, 5.00% due 8/1/2024 (Presbyterian Healthcare Services) | | | AA/Aa3 | | | | 1,030,000 | | | | 1,285,347 | |
New Mexico Hospital Equipment Loan Council, 5.00% due 8/1/2025 (Presbyterian Healthcare Services) | | | AA/Aa3 | | | | 750,000 | | | | 949,560 | |
New Mexico Hospital Equipment Loan Council, 0.86% due 8/1/2034 put 10/7/2016 (Presbyterian Healthcare Services; SPA: JPMorgan Chase Bank, N.A.) (weekly demand notes) | | | AA/Aa3 | | | | 41,990,000 | | | | 41,990,000 | |
Regents of New Mexico State University, 5.00% due 4/1/2020 (Corbett Center Student Union & NMSU Golf Course) | | | AA-/Aa3 | | | | 3,095,000 | | | | 3,514,373 | |
Regents of New Mexico State University, 5.00% due 4/1/2021 (Corbett Center Student Union & NMSU Golf Course) | | | AA-/Aa3 | | | | 1,845,000 | | | | 2,155,846 | |
Regents of New Mexico State University, 5.00% due 4/1/2022 (Corbett Center Student Union & NMSU Golf Course) | | | AA-/Aa3 | | | | 1,250,000 | | | | 1,498,175 | |
Rio Rancho Public School District No. 94 GO, 4.00% due 8/1/2018 (State Aid Withholding) | | | NR/Aa1 | | | | 3,940,000 | | | | 4,167,181 | |
| | | |
NEW YORK — 12.06% | | | | | | | | | | | | |
City of Long Beach School District GO, 3.50% due 5/1/2022 (Insured: AGM) (State Aid Withholding) | | | AA/Aa2 | | | | 1,600,000 | | | | 1,724,304 | |
City of New York GO, 5.00% due 8/1/2021 (City Budget Financial Management) | | | AA/Aa2 | | | | 3,000,000 | | | | 3,539,160 | |
City of New York GO, 5.00% due 8/1/2021 (City Budget Financial Management) | | | AA/Aa2 | | | | 9,000,000 | | | | 10,617,480 | |
City of New York GO, 5.00% due 8/1/2021 (City Budget Financial Management) | | | AA/Aa2 | | | | 7,350,000 | | | | 8,670,942 | |
City of New York GO, 5.00% due 8/1/2021 (City Budget Financial Management) | | | AA/Aa2 | | | | 7,775,000 | | | | 9,172,323 | |
City of New York GO, 0.89% due 8/1/2022 put 10/3/2016 (Capital Projects; Insured: AGM; SPA: State Street Bank & Trust Co.) (daily demand notes) | | | AA/Aa2 | | | | 1,700,000 | | | | 1,700,000 | |
City of New York GO, 5.00% due 8/1/2022 (City Budget Financial Management) | | | AA/Aa2 | | | | 3,000,000 | | | | 3,631,890 | |
City of New York GO, 5.00% due 8/1/2022 (City Budget Financial Management) | | | AA/Aa2 | | | | 6,625,000 | | | | 8,020,424 | |
City of New York GO, 5.00% due 8/1/2022 (City Budget Financial Management) | | | AA/Aa2 | | | | 20,000,000 | | | | 24,212,600 | |
City of New York GO, 5.00% due 8/1/2022 (City Budget Financial Management) | | | AA/Aa2 | | | | 13,075,000 | | | | 15,828,987 | |
City of New York GO, 5.00% due 8/1/2023 (City Budget Financial Management) | | | AA/Aa2 | | | | 9,520,000 | | | | 11,789,854 | |
City of New York GO, 5.00% due 8/1/2023 (City Budget Financial Management) | | | AA/Aa2 | | | | 12,985,000 | | | | 16,081,014 | |
City of New York GO, 5.00% due 8/1/2024 (City Budget Financial Management) | | | AA/Aa2 | | | | 40,145,000 | | | | 50,670,216 | |
City of New York GO, 0.92% due 8/1/2035 put 10/3/2016 (Capital Projects) (daily demand notes) | | | AA/Aa2 | | | | 9,590,000 | | | | 9,590,000 | |
City of New York GO, 0.86% due 8/1/2038 put 10/3/2016 (City Budget Financial Management; SPA: JPMorgan Chase Bank, N.A.) (daily demand notes) | | | AA/Aa2 | | | | 5,800,000 | | | | 5,800,000 | |
City of New York GO, 0.86% due 3/1/2040 put 10/3/2016 (Capital Projects) (daily demand notes) | | | AA/Aa2 | | | | 11,100,000 | | | | 11,100,000 | |
City of Syracuse Industrial Development Agency, 0.86% due 7/1/2037 put 10/3/2016 (Syracuse University; LOC: JPMorgan Chase Bank, N.A.) (daily demand notes) | | | AA+/Aa1 | | | | 1,200,000 | | | | 1,200,000 | |
Erie County Individual Development Agency, 5.00% due 5/1/2017 (Buffalo School District) | | | AA/Aa2 | | | | 7,265,000 | | | | 7,449,967 | |
Erie County Individual Development Agency, 5.00% due 5/1/2018 (Buffalo School District) | | | AA/Aa2 | | | | 5,000,000 | | | | 5,329,450 | |
Metropolitan Transportation Authority, 5.00% due 11/15/2020 | | | AA-/A1 | | | | 12,955,000 | | | | 15,025,339 | |
Metropolitan Transportation Authority, 5.00% due 11/15/2020 | | | AA/NR | | | | 2,000,000 | | | | 2,324,460 | |
Metropolitan Transportation Authority, 5.00% due 11/15/2021 | | | AA-/A1 | | | | 24,325,000 | | | | 28,986,156 | |
Monroe County Industrial Development Corp., 5.00% due 6/1/2018 (St. John Fisher College) | | | A-/NR | | | | 1,425,000 | | | | 1,507,094 | |
Monroe County Industrial Development Corp., 5.00% due 6/1/2019 (St. John Fisher College) | | | A-/NR | | | | 1,030,000 | | | | 1,122,412 | |
Monroe County Industrial Development Corp., 5.00% due 6/1/2022 (St. John Fisher College) | | | A-/NR | | | | 2,000,000 | | | | 2,334,140 | |
a Nassau County IDA, 5.25% due 3/1/2018 (New York Institute of Technology) (ETM) | | | BBB+/Baa2 | | | | 1,260,000 | | | | 1,338,296 | |
Nassau County IDA, 5.25% due 3/1/2020 (New York Institute of Technology) (ETM) | | | BBB+/Baa2 | | | | 1,715,000 | | | | 1,960,245 | |
New York City Health and Hospital Corp. GO, 5.00% due 2/15/2019 (Healthcare Facilities Improvements) | | | A+/Aa3 | | | | 2,700,000 | | | | 2,950,479 | |
New York City Health and Hospital Corp. GO, 5.00% due 2/15/2021 (Healthcare Facilities Improvements) | | | A+/Aa3 | | | | 2,615,000 | | | | 2,966,848 | |
New York City Health and Hospital Corp. GO, 5.00% due 2/15/2020 (Healthcare Facilities Improvements) | | | A+/Aa3 | | | | 10,000,000 | | | | 11,332,200 | |
New York City Municipal Water Finance Authority, 0.88% due 6/15/2035 put 10/3/2016 (Water & Sewer System; SPA: Bayerische Landesbank) (daily demand notes) | | | AAA/Aa1 | | | | 43,055,000 | | | | 43,055,000 | |
New York City Municipal Water Finance Authority, 0.86% due 6/15/2043 put 10/3/2016 (Water and Sewer System; SPA: JPMorgan Chase Bank, N.A.) (daily demand notes) | | | AA+/Aa1 | | | | 24,500,000 | | | | 24,500,000 | |
New York City Municipal Water Finance Authority, 0.88% due 6/15/2043 put 10/3/2016 (Water & Sewer System; SPA: State Street Bank & Trust Co.) (daily demand notes) | | | AA+/Aa1 | | | | 1,900,000 | | | | 1,900,000 | |
New York City Municipal Water Finance Authority, 0.90% due 6/15/2044 put 10/3/2016 (Water & Sewer System; SPA: Mizuho Bank, Ltd.) (daily demand notes) | | | AAA/Aa1 | | | | 19,795,000 | | | | 19,795,000 | |
New York City Municipal Water Finance Authority, 0.88% due 6/15/2045 put 10/3/2016 (Water & Sewer System; SPA: CalPERS) (daily demand notes) | | | AAA/Aa1 | | | | 1,800,000 | | | | 1,800,000 | |
New York City Municipal Water Finance Authority, 0.88% due 6/15/2045 put 10/3/2016 (Water & Sewer System; SPA: U.S. Bank, N.A.) (daily demand notes) | | | AAA/Aa1 | | | | 4,300,000 | | | | 4,300,000 | |
New York City Municipal Water Finance Authority, 0.87% due 6/15/2048 put 10/3/2016 (Water & Sewer System; SPA: Mizuho Bank, Ltd.) (daily demand notes) | | | AA+/Aa1 | | | | 12,975,000 | | | | 12,975,000 | |
New York City Municipal Water Finance Authority, 0.86% due 6/15/2050 put 10/3/2016 (Water and Sewer System; SPA: JPMorgan Chase Bank, N.A.) (daily demand notes) | | | AA+/Aa1 | | | | 12,900,000 | | | | 12,900,000 | |
New York City Municipal Water Finance Authority, 0.86% due 6/15/2050 put 10/3/2016 (Water and Sewer System; SPA: JPMorgan Chase Bank, N.A.) (daily demand notes) | | | AA+/Aa1 | | | | 76,040,000 | | | | 76,040,000 | |
New York City Transitional Finance Authority, 5.00% due 11/1/2016 (City Capital Projects & WTC Recovery Costs) | | | AAA/Aa1 | | | | 5,000,000 | | | | 5,018,450 | |
New York City Transitional Finance Authority, 5.00% due 11/1/2016 (City Capital Projects & WTC Recovery Costs) | | | AAA/Aa1 | | | | 12,680,000 | | | | 12,726,789 | |
New York City Transitional Finance Authority, 5.00% due 1/15/2018 (School Financing Act) (State Aid Withholding) | | | AA/Aa2 | | | | 4,865,000 | | | | 5,122,456 | |
New York City Transitional Finance Authority, 5.00% due 11/1/2018 (City Capital Projects & WTC Recovery Costs) | | | AAA/Aa1 | | | | 1,500,000 | | | | 1,627,890 | |
New York City Transitional Finance Authority, 5.00% due 11/1/2018 (City Capital Projects & WTC Recovery Costs) | | | AAA/Aa1 | | | | 11,730,000 | | | | 12,730,100 | |
Annual Report 29
| | |
| SCHEDULE OF INVESTMENTS, CONTINUED | | |
| |
Thornburg Limited Term Municipal Fund | | September 30, 2016 |
| | | | | | | | | | |
Issuer-Description | | Credit Rating†
S&P/ Moody’s | | Principal
Amount | | | Value | |
New York City Transitional Finance Authority, 5.00% due 11/1/2018 (City Capital Projects & WTC Recovery Costs) | | AAA/Aa1 | | $ | 3,075,000 | | | $ | 3,337,174 | |
New York City Transitional Finance Authority, 5.00% due 11/1/2018 (City Capital Projects & WTC Recovery Costs) | | AAA/Aa1 | | | 1,645,000 | | | | 1,785,253 | |
New York City Transitional Finance Authority, 5.00% due 11/1/2018 (City Capital Projects & WTC Recovery Costs) | | AAA/Aa1 | | | 12,725,000 | | | | 13,809,933 | |
New York City Transitional Finance Authority, 5.00% due 11/1/2018 (City Capital Projects & WTC Recovery Costs) | | AAA/Aa1 | | | 2,000,000 | | | | 2,170,520 | |
New York City Transitional Finance Authority, 0.88% due 11/1/2022 put 10/3/2016 (World Trade Center Recovery; SPA: Landesbank Hessen-Thuringen) (daily demand notes) | | AAA/Aa1 | | | 600,000 | | | | 600,000 | |
New York City Transitional Finance Authority, 0.86% due 11/15/2022 put 10/7/2016 (City Capital Projects; SPA: JPMorgan Chase Bank, N.A.) (weekly demand notes) | | AAA/Aaa | | | 8,500,000 | | | | 8,500,000 | |
New York City Transitional Finance Authority, 0.86% due 11/1/2036 put 10/3/2016 (City Capital Projects; SPA: JPMorgan Chase Bank, N.A.) (daily demand notes) | | AAA/Aa1 | | | 3,950,000 | | | | 3,950,000 | |
New York City Transitional Finance Authority, 0.88% due 8/1/2039 put 10/3/2016 (City Capital Projects; SPA: State Street Bank & Trust Co.) (daily demand notes) | | AAA/Aa1 | | | 34,565,000 | | | | 34,565,000 | |
New York City Transitional Finance Authority, 0.88% due 8/1/2039 put 10/3/2016 (City Capital Projects; SPA: U.S. Bank, N.A.) (daily demand notes) | | AAA/Aa1 | | | 4,500,000 | | | | 4,500,000 | |
New York City Transitional Finance Authority, 0.90% due 11/1/2042 put 10/3/2016 (City Capital Projects; SPA: Barclays Bank plc) (daily demand notes) | | AAA/Aa1 | | | 16,800,000 | | | | 16,800,000 | |
New York City Transitional Finance Authority, 0.86% due 2/1/2045 put 10/3/2016 (City Capital Projects; SPA: JPMorgan Chase Bank, N.A.) (daily demand notes) | | AAA/Aa1 | | | 39,510,000 | | | | 39,510,000 | |
New York Local Government Assistance Corp., 0.79% due 4/1/2024 put 10/3/2016 (Elementary, Secondary Education and Community College Tuition Assistance Programs; SPA: JPMorgan Chase Bank N.A.) (daily demand notes) | | AAA/Aa1 | | | 49,345,000 | | | | 49,345,000 | |
New York State Dormitory Authority, 5.50% due 2/15/2017 (Mental Health Services Facilities) | | AA/NR | | | 9,000,000 | | | | 9,159,390 | |
New York State Dormitory Authority, 5.25% due 5/15/2017 (Court Facilities Lease; Insured: AMBAC) | | AA-/Aa2 | | | 4,945,000 | | | | 5,080,147 | |
New York State Dormitory Authority, 5.50% due 2/15/2018 (Mental Health Services Facilities) | | AA/NR | | | 5,280,000 | | | | 5,610,158 | |
New York State Dormitory Authority, 2.25% due 4/1/2018 (School Districts Financing Program) (State Aid Withholding) | | AA+/NR | | | 4,800,000 | | | | 4,888,560 | |
New York State Dormitory Authority, 5.00% due 4/1/2018 (School Districts Financing Program) (State Aid Withholding) | | AA+/NR | | | 325,000 | | | | 344,695 | |
New York State Dormitory Authority, 5.00% due 10/1/2018 (School Districts Financing Program; Insured: AGM) (State Aid Withholding) | | AA/A2 | | | 2,500,000 | | | | 2,702,975 | |
New York State Dormitory Authority, 5.00% due 10/1/2018 (School Districts Financing Program) (State Aid Withholding) | | NR/Aa3 | | | 1,395,000 | | | | 1,506,809 | |
New York State Dormitory Authority, 5.00% due 10/1/2018 (School Districts Financing Program) (State Aid Withholding) | | AA-/NR | | | 2,520,000 | | | | 2,722,507 | |
New York State Dormitory Authority, 5.00% due 4/1/2019 (School Districts Financing Program) (State Aid Withholding) | | AA+/NR | | | 610,000 | | | | 670,640 | |
New York State Dormitory Authority, 5.00% due 7/1/2019 (New York Department of Health; Insured: Natl-Re) | | AA/Aa2 | | | 6,975,000 | | | | 7,000,389 | |
New York State Dormitory Authority, 5.00% due 10/1/2019 (School Districts Financing Program; Insured: AGM) (State Aid Withholding) | | AA/A2 | | | 2,100,000 | | | | 2,350,530 | |
New York State Dormitory Authority, 5.00% due 10/1/2019 (School Districts Financing Program) (State Aid Withholding) | | NR/Aa3 | | | 1,585,000 | | | | 1,773,076 | |
New York State Dormitory Authority, 5.00% due 10/1/2019 (School Districts Financing Program) (State Aid Withholding) | | AA-/NR | | | 2,645,000 | | | | 2,957,189 | |
New York State Dormitory Authority, 5.00% due 12/15/2019 (Metropolitan Transportation Authority Service Contract) | | AAA/Aa1 | | | 60,000,000 | | | | 67,663,200 | |
New York State Dormitory Authority, 5.00% due 4/1/2020 (School Districts Financing Program) (State Aid Withholding) | | AA+/NR | | | 1,000,000 | | | | 1,135,310 | |
New York State Dormitory Authority, 5.00% due 7/1/2020 (NYSARC, Inc. Developmental Disability Programs) | | NR/Aa2 | | | 1,000,000 | | | | 1,131,930 | |
New York State Dormitory Authority, 5.00% due 10/1/2020 (School Districts Financing Program; Insured: AGM) (State Aid Withholding) | | AA/A2 | | | 2,100,000 | | | | 2,425,647 | |
New York State Dormitory Authority, 5.00% due 10/1/2020 (School Districts Financing Program) (State Aid Withholding) | | NR/Aa3 | | | 1,000,000 | | | | 1,152,520 | |
New York State Dormitory Authority, 5.00% due 10/1/2020 (School Districts Financing Program) (State Aid Withholding) | | AA-/NR | | | 2,775,000 | | | | 3,194,719 | |
New York State Dormitory Authority, 5.00% due 10/1/2020 (School Districts Financing Program; Insured: AGM) | | AA/NR | | | 1,250,000 | | | | 1,443,838 | |
New York State Dormitory Authority, 5.00% due 4/1/2021 (School Districts Financing Program) (State Aid Withholding) | | AA+/NR | | | 450,000 | | | | 525,060 | |
New York State Dormitory Authority, 5.00% due 10/1/2021 (School Districts Financing Program; Insured: AGM) (State Aid Withholding) | | AA/A2 | | | 1,250,000 | | | | 1,483,975 | |
New York State Dormitory Authority, 5.00% due 10/1/2021 (School Districts Financing Program) (State Aid Withholding) | | NR/Aa3 | | | 750,000 | | | | 884,783 | |
New York State Dormitory Authority, 5.00% due 10/1/2021 (School Districts Financing Program; Insured: AGM) | | AA/NR | | | 1,100,000 | | | | 1,305,898 | |
New York State Dormitory Authority, 5.00% due 10/1/2022 (School Districts Financing Program) (State Aid Withholding) | | AA+/NR | | | 300,000 | | | | 363,849 | |
New York State Dormitory Authority, 5.00% due 10/1/2022 (School Districts Financing Program; Insured: AGM) | | AA/NR | | | 1,800,000 | | | | 2,195,586 | |
New York State Dormitory Authority, 5.00% due 10/1/2023 (School Districts Financing Program; Insured: AGM) | | AA/NR | | | 2,500,000 | | | | 3,112,500 | |
New York State Dormitory Authority, 5.25% due 10/1/2023 (School Districts Financing Program; Insured: AGM) (State Aid Withholding) | | AA/A1 | | | 2,000,000 | | | | 2,394,840 | |
New York State Dormitory Authority, 5.00% due 10/1/2024 (School Districts Financing Program; Insured: AGM) | | AA/NR | | | 2,000,000 | | | | 2,529,880 | |
New York State Dormitory Authority, 0.86% due 7/1/2033 put 10/3/2016 (University of Rochester; LOC: HSBC Bank USA, N.A.) (daily demand notes) | | AAA/Aa1 | | | 5,565,000 | | | | 5,565,000 | |
New York State Dormitory Authority, 0.75% due 5/15/2039 put 10/3/2016 (Court Facilities Lease; LOC: Mizuho Bank, Ltd.) (daily demand notes) | | AA-/Aa2 | | | 30,975,000 | | | | 30,975,000 | |
New York State Housing Finance Agency, 0.88% due 11/1/2046 put 10/3/2016 (160 Madison Avenue Housing; LOC: PNC Bank, N.A.) (daily demand notes) | | NR/A1 | | | 9,300,000 | | | | 9,300,000 | |
New York State Thruway Authority, 5.00% due 5/1/2019 (New NY Bridge) | | A-/A3 | | | 5,000,000 | | | | 5,512,900 | |
New York State Thruway Authority, 5.00% due 1/1/2020 (Governor Thomas E. Dewey Thruway) | | A/A2 | | | 2,000,000 | | | | 2,255,380 | |
New York State Thruway Authority, 5.00% due 1/1/2021 (Governor Thomas E. Dewey Thruway) | | A/A2 | | | 2,500,000 | | | | 2,907,375 | |
New York State Thruway Authority, 5.00% due 1/1/2022 (Governor Thomas E. Dewey Thruway) | | A/A2 | | | 3,000,000 | | | | 3,587,040 | |
New York State Thruway Authority, 5.00% due 1/1/2024 (Governor Thomas E. Dewey Thruway) | | A/A2 | | | 1,000,000 | | | | 1,251,350 | |
New York State Thruway Authority, 5.00% due 3/15/2024 (Highway, Bridge, Multi-Modal and MTA Projects) | | AAA/Aa1 | | | 18,300,000 | | | | 21,429,849 | |
30 Annual Report
| | |
| SCHEDULE OF INVESTMENTS, CONTINUED | | |
| |
Thornburg Limited Term Municipal Fund | | September 30, 2016 |
| | | | | | | | | | | | |
Issuer-Description | | Credit Rating†
S&P/ Moody’s | | | Principal
Amount | | | Value | |
New York State Thruway Authority, 5.00% due 1/1/2025 (Governor Thomas E. Dewey Thruway) | | | A/A2 | | | $ | 2,000,000 | | | $ | 2,550,320 | |
Suffolk County Economic Development Corp., 5.00% due 7/1/2020 (Catholic Health Services) | | | BBB+/Baa1 | | | | 5,000,000 | | | | 5,673,400 | |
Suffolk County Economic Development Corp., 5.00% due 7/1/2021 (Catholic Health Services) | | | BBB+/Baa1 | | | | 5,000,000 | | | | 5,824,750 | |
Suffolk County Economic Development Corp., 5.00% due 7/1/2022 (Catholic Health Services) | | | BBB+/Baa1 | | | | 5,000,000 | | | | 5,799,850 | |
The Port Authority of New York and New Jersey GO, 5.00% due 8/15/2017 (Insured: AGM) | | | AA/Aa3 | | | | 4,725,000 | | | | 4,896,470 | |
Tobacco Settlement Financing Corp., 5.00% due 6/1/2018 | | | AA/NR | | | | 3,725,000 | | | | 3,974,240 | |
Triborough Bridge & Tunnel Authority, 4.00% due 11/15/2017 (MTA Bridges & Tunnels) | | | AA-/Aa3 | | | | 750,000 | | | | 776,430 | |
Triborough Bridge & Tunnel Authority, 5.00% due 11/15/2021 (MTA Bridges & Tunnels) | | | AA-/Aa3 | | | | 5,140,000 | | | | 6,119,273 | |
United Nations Development Corp., 5.00% due 7/1/2017 (One, Two and Three U.N. Plaza) | | | NR/A1 | | | | 3,000,000 | | | | 3,093,660 | |
United Nations Development Corp., 5.00% due 7/1/2019 (One, Two and Three U.N. Plaza) | | | NR/A1 | | | | 4,000,000 | | | | 4,424,080 | |
West Seneca Central School District GO, 5.00% due 11/15/2022 (Insured: BAM) (State Aid Withholding) | | | AA/A2 | | | | 1,000,000 | | | | 1,214,520 | |
| | | |
NORTH CAROLINA — 2.12% | | | | | | | | | | | | |
Charlotte-Mecklenburg Hospital Authority, 5.00% due 1/15/2017 (Carolinas HealthCare System) | | | AA-/Aa3 | | | | 2,000,000 | | | | 2,023,700 | |
Charlotte-Mecklenburg Hospital Authority, 4.00% due 1/15/2019 (Carolinas HealthCare System) | | | AA-/Aa3 | | | | 600,000 | | | | 640,488 | |
Charlotte-Mecklenburg Hospital Authority, 3.00% due 1/15/2021 (Carolinas HealthCare System) | | | AA-/Aa3 | | | | 1,595,000 | | | | 1,715,901 | |
Charlotte-Mecklenburg Hospital Authority, 4.00% due 1/15/2022 (Carolinas HealthCare System) | | | AA-/Aa3 | | | | 845,000 | | | | 961,154 | |
Charlotte-Mecklenburg Hospital Authority, 5.00% due 1/15/2023 (Carolinas HealthCare System) | | | AA-/Aa3 | | | | 1,400,000 | | | | 1,695,554 | |
Charlotte-Mecklenburg Hospital Authority, 5.00% due 1/15/2024 (Carolinas HealthCare System) | | | AA-/Aa3 | | | | 2,855,000 | | | | 3,484,585 | |
Charlotte-Mecklenburg Hospital Authority, 0.86 % due 1/15/2037 put 10/3/2016 (Carolinas HealthCare System; SPA: JPMorgan Chase Bank, N.A.) (daily demand notes) | | | AA-/Aa3 | | | | 8,505,000 | | | | 8,505,000 | |
City of Charlotte COP, 5.00% due 12/1/2020 (Equipment Acquisition & Public Facilities) | | | AA+/Aa1 | | | | 1,000,000 | | | | 1,155,690 | |
City of Charlotte COP, 5.00% due 12/1/2021 (Equipment Acquisition & Public Facilities) | | | AA+/Aa1 | | | | 1,100,000 | | | | 1,305,139 | |
City of Charlotte COP, 5.00% due 12/1/2022 (Equipment Acquisition & Public Facilities) | | | AA+/Aa1 | | | | 2,405,000 | | | | 2,919,454 | |
City of Charlotte COP, 5.00% due 12/1/2023 (Equipment Acquisition & Public Facilities) | | | AA+/Aa1 | | | | 2,145,000 | | | | 2,659,478 | |
City of Charlotte COP, 5.00% due 12/1/2025 (Equipment Acquisition & Public Facilities) | | | AA+/Aa1 | | | | 2,290,000 | | | | 2,927,925 | |
City of Charlotte GO, 4.00% due 12/1/2016 (Equipment Acquisition & Public Facilities) | | | AAA/Aaa | | | | 5,315,000 | | | | 5,344,764 | |
County of Buncombe, 5.00% due 6/1/2022 (Primary, Middle School & Community College Facilities) | | | AA+/Aa2 | | | | 1,000,000 | | | | 1,202,700 | |
County of Buncombe, 5.00% due 6/1/2023 (Primary, Middle School & Community College Facilities) | | | AA+/Aa2 | | | | 750,000 | | | | 921,705 | |
County of Buncombe, 5.00% due 6/1/2024 (Primary, Middle School & Community College Facilities) | | | AA+/Aa2 | | | | 600,000 | | | | 751,302 | |
County of Catawba, 4.00% due 10/1/2016 | | | AA-/Aa2 | | | | 1,000,000 | | | | 1,000,090 | |
County of Catawba, 4.00% due 10/1/2017 | | | AA-/Aa2 | | | | 1,000,000 | | | | 1,030,770 | |
County of Dare, 4.00% due 6/1/2017 (Educational Facility Capital Projects) | | | AA/Aa3 | | | | 400,000 | | | | 408,228 | |
County of Dare, 4.00% due 6/1/2018 (Educational Facility Capital Projects) | | | AA/Aa3 | | | | 425,000 | | | | 446,123 | |
County of Dare, 4.00% due 6/1/2019 (Educational Facility Capital Projects) | | | AA/Aa3 | | | | 500,000 | | | | 538,765 | |
County of Dare, 4.00% due 6/1/2020 (Educational Facility Capital Projects) | | | AA/Aa3 | | | | 765,000 | | | | 843,106 | |
County of Dare, 5.00% due 6/1/2021 (Educational Facility Capital Projects) | | | AA/Aa3 | | | | 1,225,000 | | | | 1,432,613 | |
County of Dare, 4.00% due 6/1/2022 (Educational Facility Capital Projects) | | | AA/Aa3 | | | | 490,000 | | | | 559,850 | |
County of Dare, 5.00% due 6/1/2024 (Educational Facility Capital Projects) | | | AA/Aa3 | | | | 700,000 | | | | 850,388 | |
County of Mecklenburg GO, 5.00% due 12/1/2018 (County Debt Restructuring) | | | AAA/Aaa | | | | 3,015,000 | | | | 3,285,626 | |
County of Randolph, 5.00% due 10/1/2020 | | | A+/Aa3 | | | | 500,000 | | | | 572,875 | |
County of Randolph, 5.00% due 10/1/2021 | | | A+/Aa3 | | | | 1,065,000 | | | | 1,251,300 | |
County of Randolph, 5.00% due 10/1/2021 | | | A+/Aa3 | | | | 500,000 | | | | 587,465 | |
County of Randolph, 5.00% due 10/1/2022 | | | A+/Aa3 | | | | 1,945,000 | | | | 2,338,726 | |
County of Randolph, 5.00% due 10/1/2023 | | | A+/Aa3 | | | | 550,000 | | | | 674,845 | |
County of Randolph, 5.00% due 10/1/2023 | | | A+/Aa3 | | | | 400,000 | | | | 490,796 | |
North Carolina Eastern Municipal Power Agency, 6.00% due 1/1/2018 (Insured: AMBAC) (ETM) | | | NR/NR | | | | 7,500,000 | | | | 7,983,150 | |
North Carolina Eastern Municipal Power Agency, 6.00% due 1/1/2018 (Insured: BHAC/AMBAC) (ETM) | | | AA+/Aa1 | | | | 5,965,000 | | | | 6,337,574 | |
North Carolina Eastern Municipal Power Agency, 5.25% due 1/1/2019 pre-refunded 1/1/2018 (Insured: AGM) | | | AA/A3 | | | | 3,105,000 | | | | 3,273,229 | |
North Carolina Eastern Municipal Power Agency, 5.00% due 1/1/2021 (ETM) | | | NR/NR | �� | | | 5,000,000 | | | | 5,832,900 | |
North Carolina Eastern Municipal Power Agency, 5.00% due 1/1/2022 (ETM) | | | NR/NR | | | | 4,715,000 | | | | 5,656,303 | |
North Carolina Infrastructure Finance Corp. COP, 5.00% due 5/1/2026 pre-refunded 5/1/2017 (North Carolina Capital Improvements; Insured: AGM) | | | AA+/Aa1 | | | | 3,000,000 | | | | 3,074,580 | |
North Carolina Medical Care Commission, 5.00% due 6/1/2020 (Duke University Health System) | | | AA/Aa2 | | | | 2,000,000 | | | | 2,287,240 | |
North Carolina Medical Care Commission, 5.00% due 6/1/2021 (Duke University Health System) | | | AA/Aa2 | | | | 2,000,000 | | | | 2,354,700 | |
North Carolina Medical Care Commission, 5.00% due 6/1/2022 (Duke University Health System) | | | AA/Aa2 | | | | 1,800,000 | | | | 2,173,428 | |
North Carolina Medical Care Commission, 5.00% due 6/1/2023 (Duke University Health System) | | | AA/Aa2 | | | | 1,425,000 | | | | 1,754,474 | |
North Carolina Medical Care Commission, 5.00% due 6/1/2024 (Duke University Health System) | | | AA/Aa2 | | | | 2,300,000 | | | | 2,879,991 | |
North Carolina Medical Care Commission, 5.00% due 6/1/2025 (Duke University Health System) | | | AA/Aa2 | | | | 4,000,000 | | | | 5,081,360 | |
North Carolina Medical Care Commission, 5.00% due 6/1/2026 (Duke University Health System) | | | AA/Aa2 | | | | 1,600,000 | | | | 2,060,160 | |
North Carolina Municipal Power Agency, 5.25% due 1/1/2017 (Catawba Electric) (ETM) | | | NR/NR | | | | 1,120,000 | | | | 1,132,712 | |
North Carolina Municipal Power Agency, 5.25% due 1/1/2017 (Catawba Electric) | | | A/A2 | | | | 2,000,000 | | | | 2,022,340 | |
North Carolina Municipal Power Agency, 4.00% due 1/1/2018 (Catawba Electric) (ETM) | | | NR/NR | | | | 3,250,000 | | | | 3,378,115 | |
North Carolina Municipal Power Agency, 4.00% due 1/1/2018 (Catawba Electric) | | | A/A2 | | | | 11,750,000 | | | | 12,198,145 | |
North Carolina Municipal Power Agency, 5.00% due 1/1/2019 (Catawba Electric) | | | A/A2 | | | | 3,280,000 | | | | 3,572,248 | |
North Carolina Municipal Power Agency, 5.00% due 1/1/2019 (Catawba Electric) (ETM) | | | NR/NR | | | | 1,220,000 | | | | 1,331,569 | |
North Carolina Municipal Power Agency, 4.00% due 1/1/2020 (Catawba Electric) (ETM) | | | NR/NR | | | | 945,000 | | | | 1,037,412 | |
Annual Report 31
| | |
| SCHEDULE OF INVESTMENTS, CONTINUED | | |
| |
Thornburg Limited Term Municipal Fund | | September 30, 2016 |
| | | | | | | | | | | | |
Issuer-Description | | Credit Rating†
S&P/ Moody’s | | | Principal
Amount | | | Value | |
North Carolina Municipal Power Agency, 4.00% due 1/1/2020 (Catawba Electric) | | | A/A2 | | | $ | 605,000 | | | $ | 662,124 | |
North Carolina Municipal Power Agency, 5.00% due 1/1/2020 (Catawba Electric) | | | A/A2 | | | | 720,000 | | | | 810,950 | |
North Carolina Municipal Power Agency, 5.00% due 1/1/2020 (Catawba Electric) (ETM) | | | NR/NR | | | | 280,000 | | | | 316,425 | |
North Carolina Municipal Power Agency, 4.00% due 1/1/2022 (Catawba Electric) | | | A/A2 | | | | 1,000,000 | | | | 1,139,920 | |
State of North Carolina, 5.00% due 11/1/2019 (State Capital Projects and Correctional Facilities) | | | AA+/Aa1 | | | | 23,635,000 | | | | 26,533,833 | |
State of North Carolina GO, 5.00% due 6/1/2017 (Various Capital Improvements) | | | AAA/Aaa | | | | 6,070,000 | | | | 6,240,870 | |
Winston-Salem State University, 4.00% due 4/1/2017 (Student Housing and Student Services Facilities) | | | A-/A3 | | | | 645,000 | | | | 653,637 | |
Winston-Salem State University, 5.00% due 4/1/2019 (Student Housing and Student Services Facilities) | | | A-/A3 | | | | 815,000 | | | | 887,225 | |
Winston-Salem State University, 5.00% due 4/1/2022 (Student Housing and Student Services Facilities) | | | A-/A3 | | | | 945,000 | | | | 1,107,086 | |
| | | |
NORTH DAKOTA — 0.05% | | | | | | | | | | | | |
County of Ward, 4.00% due 4/1/2020 (Insured: AGM) | | | AA/A2 | | | | 2,445,000 | | | | 2,672,092 | |
North Dakota Public Finance Authority, 4.00% due 6/1/2017 (City of Fargo Flood Mitigation Projects) | | | A+/NR | | | | 1,460,000 | | | | 1,489,667 | |
| | | |
OHIO — 4.58% | | | | | | | | | | | | |
Akron, Bath & Copley Joint Township Hospital District, 5.00% due 11/15/2021 (Children’s Hospital Medical Center) | | | NR/A1 | | | | 1,000,000 | | | | 1,176,340 | |
American Municipal Power, Inc., 5.25% due 2/15/2018 (AMP Combined Hydroelectric Projects) | | | A/A2 | | | | 5,500,000 | | | | 5,819,935 | |
American Municipal Power, Inc., 5.25% due 2/15/2019 (AMP Combined Hydroelectric Projects) | | | A/A2 | | | | 5,595,000 | | | | 6,145,380 | |
American Municipal Power, Inc., 5.00% due 2/15/2020 (AMP Fremont Energy Center) | | | A/A1 | | | | 1,865,000 | | | | 2,105,492 | |
American Municipal Power, Inc., 5.00% due 2/15/2021 (AMP Fremont Energy Center) | | | A/A1 | | | | 1,300,000 | | | | 1,509,014 | |
American Municipal Power, Inc., 5.00% due 2/15/2022 (AMP Fremont Energy Center) | | | A/A1 | | | | 2,750,000 | | | | 3,266,725 | |
Cincinnati City School District Board of Education GO, 5.25% due 12/1/2023 (Educational Facilities; Insured: Natl-Re) | | | AA-/Aa2 | | | | 2,690,000 | | | | 3,381,169 | |
City of Akron, 5.00% due 12/1/2021 (Community Learning Centers) | | | AA+/NR | | | | 4,120,000 | | | | 4,879,275 | |
City of Akron GO, 5.00% due 12/1/2019 (Various Municipal Capital Projects) | | | AA-/NR | | | | 1,685,000 | | | | 1,893,232 | |
City of Cleveland, 3.00% due 10/1/2016 (Public Facilities) | | | AA/A1 | | | | 690,000 | | | | 690,041 | |
City of Cleveland, 4.00% due 10/1/2018 (Parks & Recreation Facilities) | | | AA/A1 | | | | 500,000 | | | | 527,930 | |
City of Cleveland, 5.00% due 5/15/2019 (Police & Fire Pension Payment) | | | AA/A1 | | | | 1,750,000 | | | | 1,921,552 | |
City of Cleveland, 4.00% due 10/1/2019 (Public Facilities) | | | AA/A1 | | | | 600,000 | | | | 649,218 | |
City of Cleveland, 4.00% due 10/1/2019 (Parks & Recreation Facilities) | | | AA/A1 | | | | 520,000 | | | | 562,656 | |
City of Cleveland, 5.00% due 5/15/2020 (Police & Fire Pension Payment) | | | AA/A1 | | | | 1,605,000 | | | | 1,817,053 | |
City of Cleveland, 5.00% due 10/1/2020 (Parks & Recreation Facilities) | | | AA/A1 | | | | 545,000 | | | | 623,513 | |
City of Cleveland, 5.00% due 10/1/2020 (Public Facilities) | | | AA/A1 | | | | 510,000 | | | | 583,471 | |
City of Cleveland, 5.00% due 5/15/2021 (Police & Fire Pension Payment) | | | AA/A1 | | | | 750,000 | | | | 872,168 | |
City of Cleveland, 5.00% due 10/1/2021 (Parks & Recreation Facilities) | | | AA/A1 | | | | 570,000 | | | | 669,106 | |
City of Cleveland, 5.00% due 10/1/2022 (Parks & Recreation Facilities) | | | AA/A1 | | | | 600,000 | | | | 718,404 | |
City of Cleveland, 5.00% due 10/1/2022 (Public Facilities) | | | AA/A1 | | | | 905,000 | | | | 1,083,593 | |
City of Cleveland, 5.00% due 11/15/2022 (Parks & Recreation Facilities) | | | AA/A1 | | | | 1,030,000 | | | | 1,236,371 | |
City of Cleveland, 5.00% due 10/1/2023 (Parks & Recreation Facilities) | | | AA/A1 | | | | 630,000 | | | | 767,869 | |
City of Cleveland, 5.00% due 10/1/2023 (Public Facilities) | | | AA/A1 | | | | 1,155,000 | | | | 1,407,760 | |
City of Cleveland COP, 5.00% due 11/15/2016 (Cleveland Stadium) | | | A/A2 | | | | 2,200,000 | | | | 2,211,308 | |
City of Cleveland COP, 4.75% due 11/15/2020 (Cleveland Stadium) | | | A/A2 | | | | 2,000,000 | | | | 2,237,740 | |
City of Cleveland GO, 5.50% due 10/1/2016 (City Capital Projects; Insured: AMBAC) | | | AA/A1 | | | | 7,710,000 | | | | 7,711,002 | |
City of Cleveland GO, 2.00% due 12/1/2018 (City Capital Projects) | | | AA/A1 | | | | 700,000 | | | | 715,407 | |
City of Cleveland GO, 5.50% due 10/1/2019 (City Capital Projects; Insured: AMBAC) | | | AA/A1 | | | | 1,260,000 | | | | 1,425,312 | |
City of Cleveland GO, 3.00% due 12/1/2020 (Municipal Street System Improvements) | | | AA/A1 | | | | 675,000 | | | | 725,308 | |
City of Cleveland GO, 3.00% due 12/1/2021 (Municipal Street System Improvements) | | | AA/A1 | | | | 2,305,000 | | | | 2,496,453 | |
City of Cleveland GO, 4.00% due 12/1/2022 (Municipal Street System Improvements) | | | AA/A1 | | | | 3,330,000 | | | | 3,839,590 | |
City of Cleveland GO, 4.00% due 12/1/2023 (Municipal Street System Improvements) | | | AA/A1 | | | | 3,395,000 | | | | 3,974,017 | |
City of Cleveland GO, 5.00% due 12/1/2024 (Municipal Street System Improvements) | | | AA/A1 | | | | 3,730,000 | | | | 4,690,661 | |
City of Cleveland GO, 5.00% due 12/1/2025 (Municipal Street System Improvements) | | | AA/A1 | | | | 3,555,000 | | | | 4,514,246 | |
City of Cleveland GO, 5.00% due 12/1/2026 (Municipal Street System Improvements) | | | AA/A1 | | | | 3,610,000 | | | | 4,546,398 | |
City of Toledo, 5.00% due 11/15/2018 (Water System Improvements) | | | AA-/Aa3 | | | | 1,175,000 | | | | 1,274,147 | |
City of Toledo, 5.00% due 11/15/2019 (Water System Improvements) | | | AA-/Aa3 | | | | 2,260,000 | | | | 2,535,200 | |
City of Toledo, 5.00% due 11/15/2020 (Water System Improvements) | | | AA-/Aa3 | | | | 2,000,000 | | | | 2,311,060 | |
City of Toledo, 5.00% due 11/15/2021 (Water System Improvements) | | | AA-/Aa3 | | | | 2,000,000 | | | | 2,371,460 | |
City of Toledo, 5.00% due 11/15/2022 (Water System Improvements) | | | AA-/Aa3 | | | | 3,255,000 | | | | 3,949,552 | |
City of Toledo, 5.00% due 11/15/2023 (Water System Improvements) | | | AA-/Aa3 | | | | 1,750,000 | | | | 2,148,510 | |
Cleveland Package Facilities, 5.25% due 9/15/2021 (Insured: AGM) | | | AA/A2 | | | | 2,035,000 | | | | 2,357,507 | |
Cleveland Package Facilities, 5.25% due 9/15/2021 (Insured: AGM) (ETM) | | | AA/A2 | | | | 965,000 | | | | 1,159,669 | |
Cleveland State University, 5.00% due 6/1/2019 (Campus Capital Projects) | | | A+/A1 | | | | 1,000,000 | | | | 1,103,790 | |
Cleveland State University, 5.00% due 6/1/2020 (Campus Capital Projects) | | | A+/A1 | | | | 700,000 | | | | 796,866 | |
Cleveland State University, 5.00% due 6/1/2021 (Campus Capital Projects) | | | A+/A1 | | | | 1,000,000 | | | | 1,169,480 | |
Cleveland State University, 5.00% due 6/1/2022 (Campus Capital Projects) | | | A+/A1 | | | | 2,000,000 | | | | 2,377,240 | |
Cleveland-Cuyahoga County Port Authority, 5.00% due 10/1/2019 (Cleveland Museum of Art) | | | AA+/NR | | | | 2,000,000 | | | | 2,227,880 | |
County of Clermont, 4.00% due 8/1/2019 (Sanitary Sewer System) | | | NR/Aa3 | | | | 1,420,000 | | | | 1,496,680 | |
County of Cuyahoga COP, 5.00% due 12/1/2019 (Convention Hotel Project) | | | AA-/Aa3 | | | | 2,585,000 | | | | 2,892,408 | |
County of Cuyahoga COP, 5.00% due 12/1/2022 (Convention Hotel Project) | | | AA-/Aa3 | | | | 9,725,000 | | | | 11,758,886 | |
32 Annual Report
| | |
| SCHEDULE OF INVESTMENTS, CONTINUED | | |
| |
Thornburg Limited Term Municipal Fund | | September 30, 2016 |
| | | | | | | | | | | | |
Issuer-Description | | Credit Rating†
S&P/ Moody’s | | | Principal
Amount | | | Value | |
County of Cuyahoga COP, 5.00% due 12/1/2023 (Convention Hotel Project) | | | AA-/Aa3 | | | $ | 5,645,000 | | | $ | 6,960,793 | |
County of Cuyahoga COP, 5.00% due 12/1/2024 (Convention Hotel Project) | | | AA-/Aa3 | | | | 11,515,000 | | | | 14,235,419 | |
County of Hamilton, 5.00% due 12/1/2018 | | | AA-/A1 | | | | 1,900,000 | | | | 2,060,816 | |
County of Hamilton, 5.00% due 12/1/2019 | | | AA-/A1 | | | | 3,000,000 | | | | 3,365,730 | |
County of Hamilton, 5.00% due 12/1/2020 | | | AA-/A1 | | | | 1,200,000 | | | | 1,386,204 | |
County of Hamilton, 5.00% due 12/1/2022 | | | AA-/A1 | | | | 2,250,000 | | | | 2,728,215 | |
County of Hamilton, 5.00% due 12/1/2023 | | | AA-/A1 | | | | 2,200,000 | | | | 2,722,896 | |
County of Hamilton, 5.00% due 12/1/2024 | | | AA-/A1 | | | | 3,200,000 | | | | 4,023,936 | |
County of Hamilton, 5.00% due 12/1/2025 | | | AA-/A1 | | | | 3,400,000 | | | | 4,315,484 | |
County of Hamilton, 5.00% due 12/1/2026 | | | AA-/A1 | | | | 3,000,000 | | | | 3,839,190 | |
County of Montgomery, 0.90% due 11/15/2045 put 10/3/2016 (Premier Health Partners; LOC: Barclays Bank plc) (daily demand notes) | | | NR/Aa2 | | | | 6,175,000 | | | | 6,175,000 | |
County of Montgomery, 0.90% due 11/15/2045 put 10/3/2016 (Premier Health Partners; LOC: Barclays Bank plc) (daily demand notes) | | | NR/Aa2 | | | | 43,825,000 | | | | 43,825,000 | |
County of Scioto, 5.00% due 2/15/2022 | | | NR/A2 | | | | 1,110,000 | | | | 1,317,459 | |
County of Scioto, 5.00% due 2/15/2023 | | | NR/A2 | | | | 2,020,000 | | | | 2,442,483 | |
County of Scioto, 5.00% due 2/15/2024 | | | NR/A2 | | | | 1,640,000 | | | | 2,019,693 | |
County of Scioto, 5.00% due 2/15/2025 | | | NR/A2 | | | | 1,695,000 | | | | 2,114,546 | |
Deerfield Township, 5.00% due 12/1/2017 | | | NR/A1 | | | | 1,000,000 | | | | 1,038,520 | |
Franklin County Convention Facilities Authority, 5.00% due 12/1/2021 (Greater Columbus Convention Center) | | | AA/Aaa | | | | 1,000,000 | | | | 1,183,740 | |
Franklin County Convention Facilities Authority, 5.00% due 12/1/2022 (Greater Columbus Convention Center) | | | AA/Aaa | | | | 500,000 | | | | 604,650 | |
Franklin County Convention Facilities Authority, 5.00% due 12/1/2024 (Greater Columbus Convention Center) | | | AA/Aaa | | | | 1,000,000 | | | | 1,248,020 | |
Garfield Heights City School District GO, 5.375% due 12/15/2016 (School Improvements; Insured: Natl-Re) | | | NR/A2 | | | | 1,625,000 | | | | 1,638,861 | |
Kent State University, 5.00% due 5/1/2020 pre-refunded 5/1/2019 (Insured: AGC) | | | AA/Aa3 | | | | 915,000 | | | | 1,008,943 | |
Kent State University, 5.00% due 5/1/2020 (Insured: AGC) | | | AA/Aa3 | | | | 85,000 | | | | 93,850 | |
Ohio Higher Educational Facility Commission, 0.90% due 1/1/2043 put 10/3/2016 (Cleveland Clinic Health System; SPA: Barclays Bank plc) (daily demand notes) | | | AA-/Aa2 | | | | 73,550,000 | | | | 73,550,000 | |
Ohio State Air Quality Development Authority, 5.625% due 6/1/2018 (FirstEnergy Nuclear Generation Corp.) | | | BB+/Baa2 | | | | 5,000,000 | | | | 5,139,450 | |
Ohio State Building Authority, 5.00% due 10/1/2020 | | | AA/Aa2 | | | | 1,700,000 | | | | 1,910,477 | |
Ohio State Water Development Authority, 3.625% due 10/1/2033 put 4/1/2020 (FirstEnergy Nuclear Generation Corp.) | | | BB-/Ba2 | | | | 2,000,000 | | | | 1,771,860 | |
Penta Career Center COP, 4.00% due 4/1/2017 (School District Facilities) | | | NR/Aa3 | | | | 1,550,000 | | | | 1,572,444 | |
RiverSouth Authority, 5.00% due 12/1/2019 (RiverSouth Area Redevelopment) | | | AA+/Aa2 | | | | 2,500,000 | | | | 2,796,475 | |
State of Ohio, 4.00% due 12/15/2018 (Major New Street Infrastructure Project) | | | AA/Aa2 | | | | 1,000,000 | | | | 1,067,040 | |
State of Ohio, 4.00% due 12/15/2019 (Major New Street Infrastructure Project) | | | AA/Aa2 | | | | 1,000,000 | | | | 1,093,270 | |
State of Ohio, 5.00% due 10/1/2020 (Cultural and Sports Capital Facilities) | | | AA/Aa2 | | | | 3,845,000 | | | | 4,408,677 | |
State of Ohio, 5.00% due 12/15/2020 (Major New Street Infrastructure Project) | | | AA/Aa2 | | | | 1,000,000 | | | | 1,157,410 | |
State of Ohio, 5.00% due 12/15/2020 (Major New Street Infrastructure Project) | | | AA/Aa2 | | | | 1,000,000 | | | | 1,157,410 | |
State of Ohio, 5.00% due 12/15/2021 (Major New Street Infrastructure Project) | | | AA/Aa2 | | | | 2,500,000 | | | | 2,969,075 | |
State of Ohio, 5.00% due 12/15/2024 (Major New Street Infrastructure Project) | | | AA/Aa2 | | | | 2,000,000 | | | | 2,520,160 | |
State of Ohio, 5.00% due 12/15/2025 (Major New Street Infrastructure Project) | | | AA/Aa2 | | | | 3,000,000 | | | | 3,838,320 | |
State of Ohio, 5.00% due 12/15/2026 (Major New Street Infrastructure Project) | | | AA/Aa2 | | | | 1,000,000 | | | | 1,282,150 | |
State of Ohio GO, 5.50% due 9/15/2019 (Common Schools Capital Facilities) | | | AA+/Aa1 | | | | 4,150,000 | | | | 4,699,958 | |
University of Akron Ohio, 5.00% due 1/1/2018 (Insured: AGM) | | | AA/A1 | | | | 3,415,000 | | | | 3,586,774 | |
Youngstown City School District GO, 3.00% due 12/1/2016 (Educational Facilities) (State Aid Withholding) | | | NR/Aa2 | | | | 1,440,000 | | | | 1,444,853 | |
Youngstown City School District GO, 4.00% due 12/1/2017 (Educational Facilities) (State Aid Withholding) | | | NR/Aa2 | | | | 1,480,000 | | | | 1,529,018 | |
Youngstown City School District GO, 4.00% due 12/1/2018 (Educational Facilities) (State Aid Withholding) | | | NR/Aa2 | | | | 1,545,000 | | | | 1,638,658 | |
Youngstown City School District GO, 4.00% due 12/1/2019 (Educational Facilities) (State Aid Withholding) | | | NR/Aa2 | | | | 1,605,000 | | | | 1,742,581 | |
Youngstown City School District GO, 4.00% due 12/1/2020 (Educational Facilities) (State Aid Withholding) | | | NR/Aa2 | | | | 1,670,000 | | | | 1,849,274 | |
Youngstown City School District GO, 4.00% due 12/1/2021 (Educational Facilities) (State Aid Withholding) | | | NR/Aa2 | | | | 1,735,000 | | | | 1,910,998 | |
Youngstown City School District GO, 4.00% due 12/1/2022 (Educational Facilities) (State Aid Withholding) | | | NR/Aa2 | | | | 1,805,000 | | | | 1,978,118 | |
Youngstown City School District GO, 4.00% due 12/1/2023 (Educational Facilities) (State Aid Withholding) | | | NR/Aa2 | | | | 1,700,000 | | | | 1,853,595 | |
| | | |
OKLAHOMA — 0.72% | | | | | | | | | | | | |
Canadian County Educational Facilities Authority, 4.00% due 9/1/2019 (Mustang Public Schools) | | | A+/NR | | | | 1,410,000 | | | | 1,518,838 | |
Canadian County Educational Facilities Authority, 4.50% due 9/1/2020 (Mustang Public Schools) | | | A+/NR | | | | 2,690,000 | | | | 3,003,627 | |
Canadian County Educational Facilities Authority, 4.50% due 9/1/2021 (Mustang Public Schools) | | | A+/NR | | | | 2,290,000 | | | | 2,603,684 | |
Cleveland County Educational Facilities Authority, 5.00% due 6/1/2023 (Moore Public Schools) | | | A+/NR | | | | 5,355,000 | | | | 6,539,633 | |
Cleveland County ISD No. 29 GO, 1.50% due 3/1/2017 (Norman School District) | | | NR/Aa3 | | | | 3,630,000 | | | | 3,638,930 | |
b Oklahoma Capitol Improvement Authority, 5.00% due 7/1/2023 (State Highway Capital Improvement) | | | AA/NR | | | | 325,000 | | | | 396,955 | |
b Oklahoma Capitol Improvement Authority, 5.00% due 7/1/2024 (State Highway Capital Improvement) | | | AA/NR | | | | 800,000 | | | | 992,440 | |
Oklahoma County Finance Authority, 5.00% due 9/1/2017 (Western Heights Public Schools) | | | A+/NR | | | | 4,075,000 | | | | 4,215,506 | |
Oklahoma County Finance Authority, 4.00% due 9/1/2018 (Western Heights Public Schools) | | | A+/NR | | | | 250,000 | | | | 263,468 | |
Oklahoma County Finance Authority, 5.00% due 9/1/2018 (Western Heights Public Schools) | | | A+/NR | | | | 2,120,000 | | | | 2,270,986 | |
Oklahoma County Finance Authority, 5.00% due 9/1/2020 (Western Heights Public Schools) | | | A+/NR | | | | 2,000,000 | | | | 2,267,620 | |
Oklahoma DFA, 5.00% due 8/15/2017 (INTEGRIS Health) (ETM) | | | AA-/NR | | | | 4,375,000 | | | | 4,535,956 | |
Oklahoma DFA, 5.00% due 8/15/2018 (INTEGRIS Health) (ETM) | | | AA-/NR | | | | 500,000 | | | | 538,195 | |
Oklahoma DFA, 5.00% due 8/15/2022 (INTEGRIS Health) | | | AA-/Aa3 | | | | 1,000,000 | | | | 1,206,120 | |
Annual Report 33
| | |
| SCHEDULE OF INVESTMENTS, CONTINUED | | |
| |
Thornburg Limited Term Municipal Fund | | September 30, 2016 |
| | | | | | | | | | | | |
Issuer-Description | | Credit Rating†
S&P/ Moody’s | | | Principal
Amount | | | Value | |
Oklahoma DFA, 5.00% due 8/15/2023 (INTEGRIS Health) | | | AA-/Aa3 | | | $ | 1,500,000 | | | $ | 1,837,095 | |
Oklahoma DFA, 5.00% due 8/15/2024 (INTEGRIS Health) | | | AA-/Aa3 | | | | 1,225,000 | | | | 1,524,598 | |
Oklahoma DFA, 5.00% due 8/15/2025 (INTEGRIS Health) | | | AA-/Aa3 | | | | 1,000,000 | | | | 1,263,990 | |
Oklahoma State Industrial Authority, 5.25% due 7/1/2017 (Medical Research Foundation) (ETM) | | | NR/A2 | | | | 1,075,000 | | | | 1,110,905 | |
Tulsa County Industrial Authority, 5.50% due 9/1/2018 (Jenks Public Schools) | | | AA-/NR | | | | 4,210,000 | | | | 4,559,683 | |
Tulsa County Industrial Authority, 4.50% due 9/1/2020 (Broken Arrow Public Schools) | | | AA-/NR | | | | 1,585,000 | | | | 1,781,413 | |
Tulsa County Industrial Authority, 4.50% due 9/1/2021 (Broken Arrow Public Schools) | | | AA-/NR | | | | 8,775,000 | | | | 10,060,625 | |
Tulsa Parking Authority, 3.00% due 7/1/2017 | | | AA-/NR | | | | 1,470,000 | | | | 1,490,198 | |
| | | |
OREGON — 1.20% | | | | | | | | | | | | |
Oregon Facilities Authority, 4.50% due 3/15/2018 (Legacy Health System) | | | AA-/A1 | | | | 1,100,000 | | | | 1,154,120 | |
Polk County Dallas School District No. 2 GO, 0% due 6/15/2017 (Capital Improvements) | | | AA+/NR | | | | 2,270,000 | | | | 2,254,450 | |
a Polk County Dallas School District No. 2 GO, 0% due 6/15/2019 (Capital Improvements) | | | AA+/NR | | | | 515,000 | | | | 499,437 | |
Polk County Dallas School District No. 2 GO, 0% due 6/15/2021 (Capital Improvements) | | | AA+/NR | | | | 1,475,000 | | | | 1,382,754 | |
State of Oregon GO, 2.00% due 6/30/2017 (Cash Management) | | | SP-1+/Mig1 | | | | 89,625,000 | | | | 90,424,455 | |
| | | |
PENNSYLVANIA — 5.04% | | | | | | | | | | | | |
Adams County IDA, 5.00% due 8/15/2017 (Gettysburg College) | | | A/A2 | | | | 1,340,000 | | | | 1,385,064 | |
Adams County IDA, 5.00% due 8/15/2019 (Gettysburg College) | | | A/A2 | | | | 1,765,000 | | | | 1,952,108 | |
Allegheny County Higher Education Building Authority, 5.00% due 3/1/2020 (Duquesne University of the Holy Spirit) | | | A/A2 | | | | 250,000 | | | | 281,315 | |
Allegheny County Higher Education Building Authority, 5.00% due 3/1/2023 (Duquesne University of the Holy Spirit) | | | A/A2 | | | | 300,000 | | | | 361,455 | |
Allegheny County Higher Education Building Authority, 5.00% due 3/1/2024 (Duquesne University of the Holy Spirit) | | | A/A2 | | | | 500,000 | | | | 614,235 | |
Allegheny County Higher Education Building Authority, 5.00% due 3/1/2025 (Duquesne University of the Holy Spirit) | | | A/A2 | | | | 1,145,000 | | | | 1,426,544 | |
Allegheny County Hospital Development Authority, 5.00% due 6/15/2017 (University of Pittsburgh Medical Center) | | | A+/Aa3 | | | | 3,000,000 | | | | 3,086,490 | |
Allegheny County Hospital Development Authority, 5.00% due 9/1/2017 (University of Pittsburgh Medical Center) | | | A+/Aa3 | | | | 1,875,000 | | | | 1,943,869 | |
Allegheny County Hospital Development Authority, 5.00% due 5/15/2018 (University of Pittsburgh Medical Center) | | | A+/Aa3 | | | | 5,915,000 | | | | 6,302,314 | |
Allegheny County Hospital Development Authority, 5.00% due 6/15/2018 (University of Pittsburgh Medical Center) | | | A+/Aa3 | | | | 3,310,000 | | | | 3,537,761 | |
Allegheny County Hospital Development Authority, 5.00% due 9/1/2018 (University of Pittsburgh Medical Center) | | | A+/Aa3 | | | | 3,100,000 | | | | 3,334,298 | |
Allegheny County Sanitary Authority, 4.00% due 12/1/2018 (2015 Capital Project) | | | A/A1 | | | | 650,000 | | | | 689,377 | |
Allegheny County Sanitary Authority, 5.00% due 12/1/2023 (2015 Capital Project) | | | A/A1 | | | | 14,500,000 | | | | 17,846,600 | |
Allegheny County Sanitary Authority, 5.00% due 12/1/2024 (2015 Capital Project) | | | A/A1 | | | | 4,650,000 | | | | 5,819,010 | |
Allegheny County Sanitary Authority, 5.00% due 12/1/2025 (2015 Capital Project; Insured: BAM) | | | AA/A1 | | | | 1,000,000 | | | | 1,265,390 | |
Altoona Area School District GO, 3.25% due 12/1/2016 (Insured: AGM) (State Aid Withholding) | | | AA/NR | | | | 1,475,000 | | | | 1,480,487 | |
Altoona Area School District GO, 3.00% due 12/1/2022 (Insured: AGM) (State Aid Withholding) | | | AA/NR | | | | 1,335,000 | | | | 1,435,272 | |
Athens Area School District GO, 3.00% due 4/15/2018 (Insured: AGM) (State Aid Withholding) | | | NR/A2 | | | | 2,600,000 | | | | 2,677,558 | |
Athens Area School District GO, 3.00% due 4/15/2019 (Insured: AGM) (State Aid Withholding) | | | NR/A2 | | | | 2,680,000 | | | | 2,756,058 | |
City of Philadelphia, 5.00% due 6/15/2017 (Water and Wastewater System; Insured: AGM) | | | AA/A1 | | | | 5,570,000 | | | | 5,731,474 | |
City of Philadelphia, 5.00% due 10/1/2017 (Pennsylvania Gas Works) | | | A/Baa1 | | | | 400,000 | | | | 415,760 | |
City of Philadelphia, 5.00% due 7/1/2018 (Pennsylvania Gas Works) | | | AA/A2 | | | | 1,395,000 | | | | 1,490,432 | |
City of Philadelphia, 5.00% due 8/1/2023 (Pennsylvania Gas Works) | | | A/Baa1 | | | | 3,750,000 | | | | 4,537,800 | |
City of Philadelphia, 5.00% due 8/1/2024 (Pennsylvania Gas Works) | | | A/Baa1 | | | | 4,000,000 | | | | 4,917,000 | |
City of Philadelphia, 5.00% due 8/1/2025 (Pennsylvania Gas Works) | | | A/Baa1 | | | | 1,900,000 | | | | 2,359,097 | |
City of Pittsburgh GO, 5.00% due 9/1/2022 (Insured: BAM) | | | AA/A1 | | | | 1,100,000 | | | | 1,321,650 | |
Commonwealth of Pennsylvania GO, 5.00% due 9/15/2022 (Capital Facilities) | | | AA-/Aa3 | | | | 25,000,000 | | | | 29,842,500 | |
Commonwealth of Pennsylvania GO, 5.00% due 8/15/2023 (Capital Facilities) | | | AA-/Aa3 | | | | 19,125,000 | | | | 23,245,290 | |
Commonwealth of Pennsylvania GO, 5.00% due 9/15/2023 (Capital Facilities) | | | AA-/Aa3 | | | | 25,000,000 | | | | 30,435,500 | |
Commonwealth of Pennsylvania GO, 5.00% due 8/15/2024 (Capital Facilities) | | | AA-/Aa3 | | | | 15,500,000 | | | | 19,153,970 | |
Commonwealth of Pennsylvania GO, 5.00% due 8/15/2025 (Capital Facilities) | | | AA-/Aa3 | | | | 14,825,000 | | | | 18,579,283 | |
Commonwealth of Pennsylvania GO, 5.00% due 9/15/2025 (Capital Facilities) | | | AA-/Aa3 | | | | 25,000,000 | | | | 31,374,000 | |
Commonwealth of Pennsylvania GO, 5.00% due 9/15/2026 (Capital Facilities) | | | AA-/Aa3 | | | | 25,000,000 | | | | 31,673,000 | |
Commonwealth of Pennsylvania State Public School Building Authority, 5.00% due 10/1/2016 (Harrisburg Area Community College) | | | A-/NR | | | | 1,390,000 | | | | 1,390,153 | |
Economy Borough Municipal Authority, 3.00% due 12/15/2016 (Beaver County Sewer System; Insured: BAM) | | | AA/NR | | | | 505,000 | | | | 507,045 | |
Economy Borough Municipal Authority, 3.00% due 12/15/2018 (Beaver County Sewer System; Insured: BAM) | | | AA/NR | | | | 435,000 | | | | 451,365 | |
Economy Borough Municipal Authority, 4.00% due 12/15/2020 (Beaver County Sewer System; Insured: BAM) | | | AA/NR | | | | 605,000 | | | | 668,344 | |
Economy Borough Municipal Authority, 4.00% due 12/15/2022 (Beaver County Sewer System; Insured: BAM) | | | AA/NR | | | | 1,180,000 | | | | 1,340,315 | |
Lancaster County Hospital Authority, 3.00% due 11/1/2016 (Masonic Villages Project) | | | A/NR | | | | 1,550,000 | | | | 1,552,712 | |
Lancaster County Hospital Authority, 4.00% due 11/1/2017 (Masonic Villages Project) | | | A/NR | | | | 865,000 | | | | 891,019 | |
Lancaster County Hospital Authority, 5.00% due 11/1/2018 (Masonic Villages Project) | | | A/NR | | | | 1,105,000 | | | | 1,191,952 | |
Lancaster County Solid Waste Management Authority, 5.00% due 12/15/2023 (Harrisburg Resource Recovery Facility) | | | AA-/NR | | | | 2,680,000 | | | | 3,240,093 | |
Lancaster County Solid Waste Management Authority, 5.25% due 12/15/2024 (Harrisburg Resource Recovery Facility) | | | AA-/NR | | | | 4,770,000 | | | | 5,879,454 | |
Lehigh County IDA, 0.90% due 2/15/2027 put 8/15/2017 (PPL Electric Utilities Corp.) | | | A/A1 | | | | 1,360,000 | | | | 1,358,694 | |
Lehigh County IDA, 0.90% due 9/1/2029 put 9/1/2017 (PPL Electric Utilities Corp.) | | | A/A1 | | | | 15,000,000 | | | | 14,981,550 | |
Luzerne County GO, 5.00% due 11/15/2021 (Insured: AGM) | | | AA/NR | | | | 2,680,000 | | | | 3,081,008 | |
Luzerne County GO, 5.00% due 11/15/2022 (Insured: AGM) | | | AA/NR | | | | 2,560,000 | | | | 2,985,754 | |
Luzerne County GO, 5.00% due 11/15/2023 (Insured: AGM) | | | AA/NR | | | | 2,600,000 | | | | 3,070,808 | |
Luzerne County GO, 5.00% due 11/15/2024 (Insured: AGM) | | | AA/NR | | | | 4,000,000 | | | | 4,770,400 | |
34 Annual Report
| | |
| SCHEDULE OF INVESTMENTS, CONTINUED | | |
| |
Thornburg Limited Term Municipal Fund | | September 30, 2016 |
| | | | | | | | | | | | |
Issuer-Description | | Credit Rating†
S&P/ Moody’s | | | Principal
Amount | | | Value | |
Monroeville Finance Authority, 5.00% due 2/15/2021 (University of Pittsburgh Medical Center) | | | A+/Aa3 | | | $ | 2,400,000 | | | $ | 2,783,088 | |
Monroeville Finance Authority, 5.00% due 2/15/2022 (University of Pittsburgh Medical Center) | | | A+/Aa3 | | | | 1,250,000 | | | | 1,485,775 | |
Montgomery County Higher Education & Health Authority, 5.00% due 6/1/2022 (Abington Memorial Hospital) | | | A/NR | | | | 3,000,000 | | | | 3,573,390 | |
Northampton Borough Municipal Authority, 4.00% due 5/15/2021 (Water System; Insured: AGM) | | | NR/A1 | | | | 500,000 | | | | 548,665 | |
Northampton Borough Municipal Authority, 4.00% due 5/15/2022 (Water System; Insured: AGM) | | | NR/A1 | | | | 1,185,000 | | | | 1,317,850 | |
Northampton Borough Municipal Authority, 3.00% due 5/15/2023 (Water System; Insured: AGM) | | | NR/A1 | | | | 1,255,000 | | | | 1,328,518 | |
Norwin School District GO, 4.00% due 4/1/2018 (Insured: AGM) (State Aid Withholding) | | | AA/A1 | | | | 1,835,000 | | | | 1,911,428 | |
Pennsylvania Higher Educational Facilities Authority, 5.00% due 5/15/2019 (University of Pittsburgh Medical Center) | | | A+/Aa3 | | | | 5,600,000 | | | | 6,166,608 | |
Pennsylvania Higher Educational Facilities Authority, 5.00% due 5/15/2020 (University of Pittsburgh Medical Center) | | | A+/Aa3 | | | | 5,100,000 | | | | 5,792,988 | |
Pennsylvania Higher Educational Facilities Authority, 4.00% due 10/1/2022 (Shippensburg University Student Services, Inc. Student Housing) | | | BBB-/Baa3 | | | | 1,825,000 | | | | 1,975,654 | |
Pennsylvania Higher Educational Facilities Authority, 5.00% due 11/1/2023 (Saint Joseph’s University) | | | A-/NR | | | | 1,075,000 | | | | 1,228,542 | |
Philadelphia Authority for Industrial Development, 5.00% due 8/1/2020 (Mast Charter School) | | | BBB/NR | | | | 420,000 | | | | 448,363 | |
Philadelphia Parking Authority, 5.00% due 9/1/2017 | | | A/A1 | | | | 1,020,000 | | | | 1,053,640 | |
Philadelphia School District GO, 4.50% due 9/1/2017 (State Aid Withholding) | | | NR/A2 | | | | 2,270,000 | | | | 2,326,932 | |
Philadelphia School District GO, 5.00% due 9/1/2019 (State Aid Withholding) | | | NR/A2 | | | | 18,410,000 | | | | 19,926,432 | |
Philadelphia School District GO, 5.00% due 9/1/2019 (State Aid Withholding) | | | NR/A2 | | | | 4,210,000 | | | | 4,556,778 | |
Philadelphia School District GO, 5.25% due 9/1/2021 (State Aid Withholding) | | | NR/A2 | | | | 2,265,000 | | | | 2,492,247 | |
Pittsburgh Water and Sewer Authority, 5.00% due 9/1/2023 | | | A/A2 | | | | 2,520,000 | | | | 3,079,667 | |
Pittsburgh Water and Sewer Authority, 5.00% due 9/1/2024 | | | A/A2 | | | | 7,365,000 | | | | 9,000,693 | |
Pittsburgh Water and Sewer Authority, 5.00% due 9/1/2024 | | | A/A2 | | | | 2,395,000 | | | | 2,926,906 | |
Plum Borough School District GO, 3.00% due 9/15/2017 (Insured: BAM) (State Aid Withholding) | | | AA/NR | | | | 240,000 | | | | 244,315 | |
Plum Borough School District GO, 4.00% due 9/15/2018 (Insured: BAM) (State Aid Withholding) | | | AA/NR | | | | 740,000 | | | | 780,478 | |
Plum Borough School District GO, 4.00% due 9/15/2019 (Insured: BAM) (State Aid Withholding) | | | AA/NR | | | | 1,205,000 | | | | 1,300,641 | |
Plum Borough School District GO, 4.00% due 9/15/2019 (Insured: BAM) (State Aid Withholding) | | | AA/NR | | | | 390,000 | | | | 420,954 | |
Plum Borough School District GO, 4.00% due 9/15/2019 (Insured: BAM) (State Aid Withholding) | | | AA/NR | | | | 395,000 | | | | 426,351 | |
Plum Borough School District GO, 4.00% due 9/15/2020 (Insured: BAM) (State Aid Withholding) | | | AA/NR | | | | 1,455,000 | | | | 1,606,626 | |
Plum Borough School District GO, 4.00% due 9/15/2021 (Insured: BAM) (State Aid Withholding) | | | AA/NR | | | | 1,610,000 | | | | 1,808,127 | |
Plum Borough School District GO, 5.00% due 9/15/2022 (Insured: BAM) (State Aid Withholding) | | | AA/NR | | | | 1,410,000 | | | | 1,677,815 | |
Plum Borough School District GO, 5.00% due 9/15/2023 (Insured: BAM) (State Aid Withholding) | | | AA/NR | | | | 1,495,000 | | | | 1,806,498 | |
Plum Borough School District GO, 5.00% due 9/15/2023 (Insured: BAM) (State Aid Withholding) | | | AA/NR | | | | 470,000 | | | | 567,929 | |
Plum Borough School District GO, 5.00% due 9/15/2024 (Insured: BAM) (State Aid Withholding) | | | AA/NR | | | | 1,885,000 | | | | 2,308,107 | |
Wayne County Hospital and HFA, 2.00% due 7/1/2017 (Wayne Memorial Hospital; Insured: AGM) | | | AA/NR | | | | 1,000,000 | | | | 1,007,630 | |
Wayne County Hospital and HFA, 2.00% due 7/1/2018 (Wayne Memorial Hospital; Insured: AGM) | | | AA/NR | | | | 625,000 | | | | 635,831 | |
Wayne County Hospital and HFA, 3.00% due 7/1/2019 (Wayne Memorial Hospital; Insured: AGM) | | | AA/NR | | | | 1,185,000 | | | | 1,224,591 | |
| | | |
RHODE ISLAND — 1.46% | | | | | | | | | | | | |
Rhode Island Clean Water Finance Agency, 5.00% due 10/1/2018 (Public Drinking Water Supply or Treatment Facilities) | | | AAA/NR | | | | 870,000 | | | | 940,096 | |
Rhode Island Clean Water Finance Agency, 5.00% due 10/1/2019 (Public Drinking Water Supply or Treatment Facilities) | | | AAA/NR | | | | 1,250,000 | | | | 1,398,325 | |
Rhode Island Clean Water Finance Agency, 5.00% due 10/1/2020 (Public Drinking Water Supply or Treatment Facilities) | | | AAA/NR | | | | 1,300,000 | | | | 1,501,318 | |
Rhode Island Clean Water Finance Agency, 5.00% due 10/1/2021 (Public Drinking Water Supply or Treatment Facilities) | | | AAA/NR | | | | 2,000,000 | | | | 2,374,360 | |
Rhode Island Clean Water Finance Agency, 5.00% due 10/1/2022 (Public Drinking Water Supply or Treatment Facilities) | | | AAA/NR | | | | 2,280,000 | | | | 2,777,017 | |
Rhode Island Clean Water Finance Agency, 5.00% due 10/1/2023 (Public Drinking Water Supply or Treatment Facilities) | | | AAA/NR | | | | 2,380,000 | | | | 2,958,150 | |
Rhode Island Convention Center Authority, 5.00% due 5/15/2018 (Convention Center and Parking Projects) | | | AA-/A1 | | | | 5,890,000 | | | | 6,253,236 | |
Rhode Island Convention Center Authority, 5.00% due 5/15/2019 (Convention Center and Parking Projects) | | | AA-/A1 | | | | 7,310,000 | | | | 8,016,658 | |
Rhode Island Convention Center Authority, 5.00% due 5/15/2020 (Convention Center and Parking Projects) | | | AA-/A1 | | | | 5,890,000 | | | | 6,645,805 | |
Rhode Island Health and Educational Building Corp., 5.00% due 9/15/2020 (University of Rhode Island Auxiliary Enterprise) | | | A+/A1 | | | | 750,000 | | | | 854,025 | |
b Rhode Island Health and Educational Building Corp., 5.00% due 9/15/2020 (University of Rhode Island) | | | A+/A1 | | | | 355,000 | | | | 403,923 | |
b Rhode Island Health and Educational Building Corp., 5.00% due 9/15/2022 (University of Rhode Island) | | | A+/A1 | | | | 465,000 | | | | 554,057 | |
Rhode Island Health and Educational Building Corp., 5.00% due 9/15/2023 (University of Rhode Island Auxiliary Enterprise) | | | A+/A1 | | | | 1,400,000 | | | | 1,692,712 | |
b Rhode Island Health and Educational Building Corp., 5.00% due 9/15/2025 (University of Rhode Island) | | | A+/A1 | | | | 500,000 | | | | 623,515 | |
State of Rhode Island and Providence Plantations COP, 5.00% due 10/1/2019 (Kent County Courthouse) | | | AA-/Aa3 | | | | 600,000 | | | | 667,236 | |
State of Rhode Island and Providence Plantations COP, 5.00% due 10/1/2019 (Training School) | | | AA-/Aa3 | | | | 1,575,000 | | | | 1,746,061 | |
State of Rhode Island and Providence Plantations COP, 5.00% due 10/1/2020 (Kent County Courthouse) | | | AA-/Aa3 | | | | 1,375,000 | | | | 1,574,251 | |
State of Rhode Island and Providence Plantations COP, 5.00% due 10/1/2020 (Training School) | | | AA-/Aa3 | | | | 1,405,000 | | | | 1,608,598 | |
State of Rhode Island and Providence Plantations COP, 5.00% due 10/1/2021 (Kent County Courthouse) | | | AA-/Aa3 | | | | 2,000,000 | | | | 2,345,640 | |
State of Rhode Island and Providence Plantations COP, 5.00% due 10/1/2021 (Training School) | | | AA-/Aa3 | | | | 3,540,000 | | | | 4,151,783 | |
State of Rhode Island and Providence Plantations COP, 5.00% due 4/1/2022 (Energy Conservation) | | | AA-/Aa3 | | | | 2,020,000 | | | | 2,392,710 | |
State of Rhode Island and Providence Plantations COP, 5.00% due 10/1/2022 (Kent County Courthouse) | | | AA-/Aa3 | | | | 2,100,000 | | | | 2,514,414 | |
State of Rhode Island and Providence Plantations COP, 5.00% due 10/1/2022 (Training School) | | | AA-/Aa3 | | | | 3,620,000 | | | | 4,334,371 | |
State of Rhode Island and Providence Plantations COP, 5.00% due 10/1/2023 (Kent County Courthouse) | | | AA-/Aa3 | | | | 1,500,000 | | | | 1,829,370 | |
State of Rhode Island and Providence Plantations COP, 5.00% due 10/1/2023 (Training School) | | | AA-/Aa3 | | | | 1,705,000 | | | | 2,079,384 | |
State of Rhode Island and Providence Plantations COP, 5.00% due 11/1/2024 (Information Technology) | | | AA-/Aa3 | | | | 3,010,000 | | | | 3,722,768 | |
State of Rhode Island and Providence Plantations GO, 5.00% due 10/1/2019 (Consolidated Capital Development Loan) | | | AA/Aa2 | | | | 5,000,000 | | | | 5,599,650 | |
State of Rhode Island and Providence Plantations GO, 5.00% due 8/1/2020 (Consolidated Capital Development Loan) | | | AA/Aa2 | | | | 8,365,000 | | | | 9,605,111 | |
State of Rhode Island and Providence Plantations GO, 4.00% due 10/15/2020 (Consolidated Capital Development Loan) | | | AA/Aa2 | | | | 1,200,000 | | | | 1,340,352 | |
State of Rhode Island and Providence Plantations GO, 5.00% due 8/1/2021 (Consolidated Capital Development Loan) | | | AA/Aa2 | | | | 16,535,000 | | | | 19,505,182 | |
Annual Report 35
| | |
| SCHEDULE OF INVESTMENTS, CONTINUED | | |
| |
Thornburg Limited Term Municipal Fund | | September 30, 2016 |
| | | | | | | | | | | | |
Issuer-Description | | Credit Rating†
S&P/ Moody’s | | | Principal
Amount | | | Value | |
State of Rhode Island and Providence Plantations GO, 4.00% due 10/15/2021 (Consolidated Capital Development Loan) | | | AA/Aa2 | | | $ | 1,000,000 | | | $ | 1,135,890 | |
State of Rhode Island and Providence Plantations GO, 5.00% due 8/1/2022 (Consolidated Capital Development Loan) | | | AA/Aa2 | | | | 9,825,000 | | | | 11,825,861 | |
State of Rhode Island and Providence Plantations GO, 4.00% due 10/15/2022 (Consolidated Capital Development Loan) | | | AA/Aa2 | | | | 1,000,000 | | | | 1,154,310 | |
| | | |
SOUTH CAROLINA — 0.83% | | | | | | | | | | | | |
b Beaufort-Jasper Water & Sewer Authority, 5.00% due 3/1/2019 (Waterworks & Sewer System) | | | AA/Aa1 | | | | 1,000,000 | | | | 1,084,410 | |
b Beaufort-Jasper Water & Sewer Authority, 5.00% due 3/1/2021 (Waterworks & Sewer System) | | | AA/Aa1 | | | | 750,000 | | | | 864,540 | |
b Beaufort-Jasper Water & Sewer Authority, 5.00% due 3/1/2022 (Waterworks & Sewer System) | | | AA/Aa1 | | | | 1,000,000 | | | | 1,182,680 | |
b Beaufort-Jasper Water & Sewer Authority, 5.00% due 3/1/2023 (Waterworks & Sewer System) | | | AA/Aa1 | | | | 1,000,000 | | | | 1,211,040 | |
b Beaufort-Jasper Water & Sewer Authority, 5.00% due 3/1/2024 (Waterworks & Sewer System) | | | AA/Aa1 | | | | 1,000,000 | | | | 1,234,970 | |
b Beaufort-Jasper Water & Sewer Authority, 5.00% due 3/1/2025 (Waterworks & Sewer System) | | | AA/Aa1 | | | | 1,000,000 | | | | 1,254,680 | |
Berkeley County School District, 5.00% due 12/1/2020 (School Facility Equipment Acquisition) | | | AA-/NR | | | | 550,000 | | | | 627,627 | |
Berkeley County School District, 5.00% due 12/1/2021 (School Facility Equipment Acquisition) | | | AA-/NR | | | | 1,000,000 | | | | 1,166,750 | |
Berkeley County School District, 5.00% due 12/1/2024 (School Facility Equipment Acquisition) | | | AA-/NR | | | | 2,000,000 | | | | 2,444,320 | |
Charleston County, 5.00% due 12/1/2022 (South Aviation Ave. Construction) | | | AA+/NR | | | | 1,810,000 | | | | 2,201,955 | |
Charleston County, 5.00% due 12/1/2023 (South Aviation Ave. Construction) | | | AA+/NR | | | | 2,460,000 | | | | 3,055,714 | |
City of Charleston Public Facilities Corp., 5.00% due 9/1/2019 (City of Charleston Project) | | | AA+/Aa1 | | | | 390,000 | | | | 434,132 | |
City of Charleston Public Facilities Corp., 5.00% due 9/1/2020 (City of Charleston Project) | | | AA+/Aa1 | | | | 700,000 | | | | 801,150 | |
City of Charleston Public Facilities Corp., 5.00% due 9/1/2021 (City of Charleston Project) | | | AA+/Aa1 | | | | 460,000 | | | | 539,723 | |
City of Charleston Public Facilities Corp., 5.00% due 9/1/2022 (City of Charleston Project) | | | AA+/Aa1 | | | | 425,000 | | | | 510,102 | |
City of Charleston Public Facilities Corp., 5.00% due 9/1/2023 (City of Charleston Project) | | | AA+/Aa1 | | | | 345,000 | | | | 422,718 | |
City of Charleston Public Facilities Corp., 5.00% due 9/1/2025 (City of Charleston Project) | | | AA+/Aa1 | | | | 930,000 | | | | 1,172,451 | |
City of North Charleston Public Facilities Corp. COP, 5.00% due 10/1/2016 (Convention Center Complex) | | | AA-/NR | | | | 1,560,000 | | | | 1,560,172 | |
a City of North Charleston Public Facilities Corp. COP, 5.00% due 10/1/2017 (Convention Center Complex) | | | AA-/NR | | | | 710,000 | | | | 735,510 | |
Greenville County School District, 5.50% due 12/1/2016 (Building Equity Sooner for Tomorrow) | | | AA/Aa2 | | | | 3,500,000 | | | | 3,527,965 | |
Greenwood County, 5.00% due 10/1/2022 (Self Regional Healthcare) | | | A+/A1 | | | | 1,000,000 | | | | 1,180,720 | |
Greenwood Fifty Facilities School District, 5.00% due 12/1/2016 (Insured: AGM) (ETM) | | | AA/A1 | | | | 1,000,000 | | | | 1,007,230 | |
Oconee County, 0.89% due 2/1/2017 put 10/3/2016 (Duke Energy Corp.) (daily demand notes) | | | A-/A1 | | | | 1,800,000 | | | | 1,800,000 | |
Piedmont Municipal Power Agency, 5.00% due 1/1/2017 | | | A-/A3 | | | | 130,000 | | | | 131,334 | |
Piedmont Municipal Power Agency, 6.75% due 1/1/2019 (Insured: Natl-Re) | | | NR/A3 | | | | 3,800,000 | | | | 4,260,256 | |
SCAGO Educational Facilities Corp., 5.00% due 12/1/2021 (School District of Pickens County) | | | A/A1 | | | | 1,810,000 | | | | 2,130,515 | |
SCAGO Educational Facilities Corp., 5.00% due 12/1/2022 (School District of Pickens County) | | | A/A1 | | | | 500,000 | | | | 601,975 | |
SCAGO Educational Facilities Corp., 5.00% due 12/1/2023 (School District of Pickens County) | | | A/A1 | | | | 1,000,000 | | | | 1,228,520 | |
SCAGO Educational Facilities Corp., 5.00% due 12/1/2024 (School District of Pickens County) | | | A/A1 | | | | 1,010,000 | | | | 1,257,884 | |
SCAGO Educational Facilities Corp., 5.00% due 12/1/2025 (School District of Pickens County) | | | A/A1 | | | | 1,000,000 | | | | 1,236,540 | |
York County Rock Hill School District No. 3 GO, 3.00% due 9/29/2017 | | | SP-1+/Mig1 | | | | 24,465,000 | | | | 24,953,077 | |
| | | |
SOUTH DAKOTA — 0.31% | | | | | | | | | | | | |
South Dakota Building Authority, 5.00% due 6/1/2022 | | | AA+/Aa1 | | | | 500,000 | | | | 602,210 | |
South Dakota Building Authority, 5.00% due 6/1/2024 | | | AA+/Aa1 | | | | 1,000,000 | | | | 1,225,770 | |
South Dakota Health & Educational Facilities Authority, 2.00% due 11/1/2016 (Sanford Health) | | | A+/A1 | | | | 400,000 | | | | 400,428 | |
South Dakota Health & Educational Facilities Authority, 5.00% due 4/1/2017 (Prairie Lakes Health) | | | A+/NR | | | | 2,215,000 | | | | 2,253,917 | |
South Dakota Health & Educational Facilities Authority, 5.00% due 9/1/2017 (Regional Health) | | | NR/A1 | | | | 1,100,000 | | | | 1,139,985 | |
South Dakota Health & Educational Facilities Authority, 3.00% due 11/1/2017 (Sanford Health) | | | A+/A1 | | | | 450,000 | | | | 459,580 | |
South Dakota Health & Educational Facilities Authority, 5.00% due 4/1/2018 (Prairie Lakes Health) | | | A+/NR | | | | 2,290,000 | | | | 2,395,386 | |
South Dakota Health & Educational Facilities Authority, 5.00% due 9/1/2018 (Regional Health) | | | NR/A1 | | | | 1,275,000 | | | | 1,370,179 | |
South Dakota Health & Educational Facilities Authority, 5.00% due 9/1/2018 (Regional Health) | | | NR/A1 | | | | 1,000,000 | | | | 1,073,860 | |
South Dakota Health & Educational Facilities Authority, 4.00% due 11/1/2018 (Sanford Health) | | | A+/A1 | | | | 800,000 | | | | 848,048 | |
South Dakota Health & Educational Facilities Authority, 5.00% due 4/1/2019 (Prairie Lakes Health) | | | A+/NR | | | | 2,440,000 | | | | 2,617,510 | |
South Dakota Health & Educational Facilities Authority, 5.00% due 9/1/2020 (Regional Health) | | | NR/A1 | | | | 1,000,000 | | | | 1,144,640 | |
South Dakota Health & Educational Facilities Authority, 5.00% due 7/1/2021 (Avera Health) | | | AA-/A1 | | | | 1,670,000 | | | | 1,955,537 | |
South Dakota Health & Educational Facilities Authority, 5.00% due 11/1/2021 (Sanford Health) | | | A+/A1 | | | | 350,000 | | | | 412,268 | |
South Dakota Health & Educational Facilities Authority, 5.00% due 11/1/2022 (Sanford Health) | | | A+/A1 | | | | 1,070,000 | | | | 1,290,024 | |
South Dakota Health & Educational Facilities Authority, 5.00% due 11/1/2024 (Sanford Health) | | | A+/A1 | | | | 400,000 | | | | 497,156 | |
South Dakota Health & Educational Facilities Authority, 5.00% due 11/1/2025 (Sanford Health) | | | A+/A1 | | | | 965,000 | | | | 1,210,477 | |
South Dakota Housing Development Authority, 4.00% due 11/1/2016 (Single Family Mtg) | | | NR/Aa3 | | | | 1,040,000 | | | | 1,042,621 | |
South Dakota Housing Development Authority, 4.00% due 11/1/2017 (Single Family Mtg) | | | NR/Aa3 | | | | 1,055,000 | | | | 1,085,226 | |
South Dakota Housing Development Authority, 4.00% due 11/1/2018 (Single Family Mtg) | | | NR/Aa3 | | | | 1,165,000 | | | | 1,227,863 | |
| | | |
TENNESSEE — 1.32% | | | | | | | | | | | | |
Clarksville Natural Gas Acquisition Corp., 5.00% due 12/15/2019 | | | NR/Baa1 | | | | 6,000,000 | | | | 6,612,000 | |
Metropolitan Government of Nashville and Davidson County GO, 5.00% due 1/1/2024 | | | AA/Aa2 | | | | 7,000,000 | | | | 8,759,450 | |
Metropolitan Government of Nashville and Davidson County GO, 5.00% due 1/1/2025 | | | AA/Aa2 | | | | 13,400,000 | | | | 17,027,514 | |
Metropolitan Government of Nashville and Davidson County GO, 5.00% due 1/1/2026 | | | AA/Aa2 | | | | 6,150,000 | | | | 7,947,707 | |
Metropolitan Government of Nashville and Davidson County GO, 5.00% due 1/1/2027 | | | AA/Aa2 | | | | 18,295,000 | | | | 23,604,209 | |
State of Tennessee GO, 4.00% due 8/1/2017 | | | AAA/Aaa | | | | 3,250,000 | | | | 3,337,425 | |
State of Tennessee GO, 4.00% due 8/1/2018 | | | AAA/Aaa | | | | 2,000,000 | | | | 2,115,900 | |
36 Annual Report
| | |
| SCHEDULE OF INVESTMENTS, CONTINUED | | |
| |
Thornburg Limited Term Municipal Fund | | September 30, 2016 |
| | | | | | | | | | | | |
Issuer-Description | | Credit Rating†
S&P/ Moody’s | | | Principal
Amount | | | Value | |
State of Tennessee GO, 5.00% due 8/1/2018 | | | AAA/Aaa | | | $ | 2,000,000 | | | $ | 2,152,260 | |
State of Tennessee GO, 5.00% due 8/1/2019 | | | AAA/Aaa | | | | 3,000,000 | | | | 3,346,920 | |
State of Tennessee GO, 5.00% due 8/1/2019 | | | AAA/Aaa | | | | 2,000,000 | | | | 2,231,280 | |
State of Tennessee GO, 5.00% due 8/1/2020 | | | AAA/Aaa | | | | 2,000,000 | | | | 2,306,580 | |
State of Tennessee GO, 5.00% due 8/1/2020 | | | AAA/Aaa | | | | 2,000,000 | | | | 2,306,580 | |
Tennessee Energy Acquisition Corp., 5.00% due 2/1/2017 | | | BBB+/A3 | | | | 5,000,000 | | | | 5,063,100 | |
Tennessee Energy Acquisition Corp., 5.25% due 9/1/2017 | | | BBB+/A3 | | | | 11,000,000 | | | | 11,388,520 | |
Tennessee Energy Acquisition Corp., 5.25% due 9/1/2018 | | | BBB+/A3 | | | | 5,000,000 | | | | 5,356,350 | |
Tennessee Energy Acquisition Corp., 5.25% due 9/1/2020 | | | BBB+/A3 | | | | 1,190,000 | | | | 1,352,411 | |
| | | |
TEXAS — 9.79% | | | | | | | | | | | | |
Austin Community College Public Facilities Corp., 5.25% due 8/1/2017 (Round Rock Campus) (ETM) | | | AA/Aa2 | | | | 1,500,000 | | | | 1,555,845 | |
Bexar County Hospital District GO, 5.00% due 2/15/2022 (University Health System) | | | AA+/Aa1 | | | | 1,250,000 | | | | 1,490,688 | |
Bexar County Hospital District GO, 5.00% due 2/15/2023 (University Health System) | | | AA+/Aa1 | | | | 1,250,000 | | | | 1,525,013 | |
Bexar County Hospital District GO, 5.00% due 2/15/2024 (University Health System) | | | AA+/Aa1 | | | | 1,500,000 | | | | 1,862,580 | |
Bexar County Hospital District GO, 5.00% due 2/15/2025 (University Health System) | | | AA+/Aa1 | | | | 2,355,000 | | | | 2,964,757 | |
Bexar County Hospital District GO, 5.00% due 2/15/2026 (University Health System) | | | AA+/Aa1 | | | | 1,500,000 | | | | 1,909,395 | |
Bexar County Hospital District GO, 5.00% due 2/15/2027 (University Health System) | | | AA+/Aa1 | | | | 1,500,000 | | | | 1,894,815 | |
Capital Area Cultural Education Facilities Finance Corp., 5.00% due 4/1/2018 (Roman Catholic Diocese of Austin) | | | NR/Baa1 | | | | 1,370,000 | | | | 1,440,774 | |
Cities of Dallas and Fort Worth, 5.25% due 11/1/2023 (DFW International Airport Terminal Renewal & Improvement Program) | | | A+/A2 | | | | 3,000,000 | | | | 3,579,420 | |
City of Austin, 5.00% due 11/15/2022 (Water and Wastewater System) | | | AA/Aa2 | | | | 2,640,000 | | | | 3,139,884 | |
City of Austin, 5.00% due 11/15/2025 (Water and Wastewater System) | | | AA/Aa2 | | | | 2,485,000 | | | | 3,182,042 | |
City of Austin, 5.00% due 11/15/2026 (Water and Wastewater System) | | | AA/Aa2 | | | | 3,330,000 | | | | 4,315,846 | |
City of Beaumont, 5.00% due 9/1/2023 (Waterworks & Sewer System Improvements; Insured: AGM) | | | AA/A2 | | | | 5,000,000 | | | | 6,158,350 | |
City of Beaumont, 5.00% due 9/1/2024 (Waterworks & Sewer System Improvements; Insured: AGM) | | | AA/A2 | | | | 2,500,000 | | | | 3,064,400 | |
City of Beaumont GO, 5.00% due 3/1/2022 | | | AA-/Aa2 | | | | 1,000,000 | | | | 1,189,180 | |
City of Beaumont GO, 5.00% due 3/1/2023 | | | AA-/Aa2 | | | | 1,000,000 | | | | 1,215,270 | |
City of Beaumont GO, 5.00% due 3/1/2024 | | | AA-/Aa2 | | | | 1,500,000 | | | | 1,858,035 | |
City of Beaumont GO, 5.00% due 3/1/2025 | | | AA-/Aa2 | | | | 3,060,000 | | | | 3,840,881 | |
City of Beaumont GO, 5.00% due 3/1/2026 | | | AA-/Aa2 | | | | 1,930,000 | | | | 2,456,562 | |
City of Brownsville, 5.00% due 9/1/2020 (Water, Wastewater & Electric Utilities Systems) | | | A+/A2 | | | | 1,500,000 | | | | 1,719,435 | |
City of Brownsville, 5.00% due 9/1/2022 (Water, Wastewater & Electric Utilities Systems) | | | A+/A2 | | | | 1,300,000 | | | | 1,562,769 | |
City of Brownsville, 5.00% due 9/1/2022 (Water, Wastewater & Electric Utilities Systems) | | | A+/A2 | | | | 1,520,000 | | | | 1,827,238 | |
City of Brownsville, 5.00% due 9/1/2023 (Water, Wastewater & Electric Utilities Systems) | | | A+/A2 | | | | 2,380,000 | | | | 2,915,571 | |
City of Bryan, 5.00% due 7/1/2019 (Electric System Improvements) | | | A+/A2 | | | | 8,000,000 | | | | 8,236,800 | |
City of Bryan, 5.00% due 7/1/2026 (Electric System Improvements) | | | A+/NR | | | | 535,000 | | | | 678,738 | |
City of Denton GO, 5.00% due 2/15/2017 | | | AA+/Aa2 | | | | 3,675,000 | | | | 3,732,955 | |
City of Denton GO, 5.00% due 2/15/2019 | | | AA+/Aa2 | | | | 3,990,000 | | | | 4,368,332 | |
City of Denton GO, 5.00% due 2/15/2020 | | | AA+/Aa2 | | | | 4,195,000 | | | | 4,587,820 | |
City of Houston, 5.00% due 7/1/2017 (Airport System) | | | AA-/Aa3 | | | | 1,600,000 | | | | 1,648,096 | |
City of Houston, 5.00% due 7/1/2018 (Airport System) | | | AA-/Aa3 | | | | 1,000,000 | | | | 1,068,050 | |
City of Houston, 0% due 9/1/2020 (Convention & Entertainment Facilities; Insured: AGM/AMBAC) | | | AA/A2 | | | | 3,650,000 | | | | 3,345,699 | |
City of Houston, 5.00% due 9/1/2020 (Convention & Entertainment Facilities) | | | A-/A2 | | | | 650,000 | | | | 743,210 | |
City of Houston, 4.00% due 5/15/2021 (Combined Utility System) | | | AA/Aa2 | | | | 13,545,000 | | | | 15,252,889 | |
City of Houston, 5.00% due 9/1/2021 (Convention & Entertainment Facilities) | | | A-/A2 | | | | 1,500,000 | | | | 1,749,840 | |
City of Houston, 5.00% due 11/15/2021 (Combined Utility System) | | | NR/Aa2 | | | | 5,455,000 | | | | 6,495,050 | |
City of Houston, 5.00% due 5/15/2022 (Combined Utility System) | | | AA/Aa2 | | | | 3,000,000 | | | | 3,611,580 | |
City of Houston, 5.00% due 9/1/2022 (Convention & Entertainment Facilities) | | | A-/A2 | | | | 600,000 | | | | 712,650 | |
City of Houston, 5.00% due 11/15/2022 (Combined Utility System) | | | NR/Aa2 | | | | 7,110,000 | | | | 8,650,453 | |
City of Houston, 5.00% due 11/15/2022 (Combined Utility System) | | | AA/Aa2 | | | | 7,535,000 | | | | 9,177,479 | |
City of Houston, 5.00% due 5/15/2023 (Combined Utility System) | | | AA/Aa2 | | | | 4,445,000 | | | | 5,469,973 | |
City of Houston, 5.00% due 11/15/2023 (Combined Utility System) | | | NR/Aa2 | | | | 7,400,000 | | | | 9,200,494 | |
City of Houston, 5.00% due 11/15/2023 (Combined Utility System) | | | AA/Aa2 | | | | 5,000,000 | | | | 6,220,350 | |
City of Houston, 5.00% due 5/15/2024 (Combined Utility System) | | | AA/Aa2 | | | | 7,250,000 | | | | 9,095,052 | |
City of Houston, 5.00% due 9/1/2024 (Convention & Entertainment Facilities) | | | A-/A2 | | | | 1,215,000 | | | | 1,490,684 | |
City of Houston, 5.00% due 11/15/2024 (Combined Utility System) | | | NR/Aa2 | | | | 11,525,000 | | | | 14,543,052 | |
City of Houston, 5.00% due 11/15/2024 (Combined Utility System) | | | AA/Aa2 | | | | 5,000,000 | | | | 6,326,800 | |
City of Houston, 5.00% due 11/15/2025 (Combined Utility System) | | | NR/Aa2 | | | | 16,000,000 | | | | 20,456,960 | |
City of Houston GO, 5.00% due 3/1/2020 (Public Improvements) | | | AA/Aa3 | | | | 4,000,000 | | | | 4,514,440 | |
City of Houston GO, 5.00% due 3/1/2025 (Public Improvements) | | | AA/Aa3 | | | | 23,570,000 | | | | 29,584,828 | |
City of Houston GO, 5.00% due 3/1/2026 (Public Improvements) | | | AA/Aa3 | | | | 10,455,000 | | | | 13,307,438 | |
City of Laredo, 5.00% due 3/15/2021 (Sports Venues; Insured: AGM) | | | AA/A1 | | | | 600,000 | | | | 694,890 | |
City of Laredo, 5.00% due 3/15/2022 (Sports Venues; Insured: AGM) | | | AA/A1 | | | | 2,000,000 | | | | 2,366,680 | |
City of Laredo, 5.00% due 3/15/2023 (Sports Venues; Insured: AGM) | | | AA/A1 | | | | 1,500,000 | | | | 1,808,670 | |
City of Laredo, 5.00% due 3/15/2024 (Sports Venues; Insured: AGM) | | | AA/A1 | | | | 300,000 | | | | 366,759 | |
City of Laredo GO, 3.00% due 2/15/2017 (City Infrastructure Improvements) | | | AA/Aa2 | | | | 300,000 | | | | 302,433 | |
City of Laredo GO, 3.00% due 2/15/2017 (Acquire & Purchase Personal Property) | | | AA/Aa2 | | | | 685,000 | | | | 690,555 | |
Annual Report 37
| | |
| SCHEDULE OF INVESTMENTS, CONTINUED | | |
| |
Thornburg Limited Term Municipal Fund | | September 30, 2016 |
| | | | | | | | | | |
Issuer-Description | | Credit Rating†
S&P/ Moody’s | | Principal
Amount | | | Value | |
City of Laredo GO, 4.00% due 2/15/2018 (City Infrastructure Improvements) | | AA/Aa2 | | $ | 175,000 | | | $ | 182,322 | |
City of Laredo GO, 4.00% due 2/15/2018 (Acquire & Purchase Personal Property) | | AA/Aa2 | | | 675,000 | | | | 703,242 | |
City of Laredo GO, 5.00% due 2/15/2018 pre-refunded 2/15/2017 (City Infrastructure Improvements; Insured: Natl-Re) | | AA/Aa2 | | | 2,000,000 | | | | 2,031,160 | |
City of Laredo GO, 4.00% due 2/15/2019 (City Infrastructure Improvements) | | AA/Aa2 | | | 65,000 | | | | 69,593 | |
City of Laredo GO, 4.00% due 2/15/2019 (Acquire & Purchase Personal Property) | | AA/Aa2 | | | 305,000 | | | | 326,551 | |
City of Laredo GO, 4.00% due 2/15/2020 (City Infrastructure Improvements) | | AA/Aa2 | | | 110,000 | | | | 120,693 | |
City of Laredo GO, 5.00% due 2/15/2020 (Acquire & Purchase Personal Property) | | AA/Aa2 | | | 735,000 | | | | 830,756 | |
City of Laredo GO, 5.00% due 2/15/2021 (City Infrastructure Improvements) | | AA/Aa2 | | | 125,000 | | | | 145,475 | |
City of Laredo GO, 5.00% due 2/15/2021 (Acquire & Purchase Personal Property) | | AA/Aa2 | | | 775,000 | | | | 901,945 | |
City of Laredo GO, 5.00% due 2/15/2022 (City Infrastructure Improvements) | | AA/Aa2 | | | 150,000 | | | | 179,130 | |
City of Laredo GO, 5.00% due 2/15/2022 (Acquire & Purchase Personal Property) | | AA/Aa2 | | | 810,000 | | | | 967,302 | |
City of Laredo GO, 5.00% due 2/15/2023 (City Infrastructure Improvements) | | AA/Aa2 | | | 275,000 | | | | 335,737 | |
City of Laredo GO, 5.00% due 2/15/2023 (Acquire & Purchase Personal Property) | | AA/Aa2 | | | 855,000 | | | | 1,043,835 | |
City of Laredo GO, 5.00% due 2/15/2024 (Acquire & Purchase Personal Property) | | AA/Aa2 | | | 900,000 | | | | 1,121,013 | |
City of Laredo GO, 5.00% due 2/15/2024 (City Infrastructure Improvements) | | AA/Aa2 | | | 445,000 | | | | 554,279 | |
City of Laredo GO, 5.00% due 2/15/2025 (City Infrastructure Improvements) | | AA/Aa2 | | | 380,000 | | | | 479,951 | |
City of Laredo GO, 5.00% due 2/15/2025 (Acquire & Purchase Personal Property) | | AA/Aa2 | | | 945,000 | | | | 1,193,563 | |
City of Laredo GO, 5.00% due 2/15/2026 (City Infrastructure Improvements) | | AA/Aa2 | | | 1,000,000 | | | | 1,282,860 | |
City of Laredo GO, 5.00% due 2/15/2026 (Acquire & Purchase Personal Property) | | AA/Aa2 | | | 995,000 | | | | 1,276,446 | |
City of Laredo GO, 5.00% due 2/15/2027 (City Infrastructure Improvements) | | AA/Aa2 | | | 500,000 | | | | 635,105 | |
City of Lubbock GO, 5.00% due 2/15/2020 (Waterworks System) | | AA+/Aa2 | | | 2,325,000 | | | | 2,632,853 | |
City of Lubbock GO, 5.00% due 2/15/2020 (Waterworks System) | | AA+/Aa2 | | | 2,000,000 | | | | 2,264,820 | |
City of Lubbock GO, 5.00% due 2/15/2021 (Waterworks System) | | AA+/Aa2 | | | 7,490,000 | | | | 8,737,759 | |
City of Lubbock GO, 5.00% due 2/15/2022 (Waterworks System) | | AA+/Aa2 | | | 2,895,000 | | | | 3,467,226 | |
City of Lubbock GO, 5.00% due 2/15/2023 (Waterworks System) | | AA+/Aa2 | | | 500,000 | | | | 611,455 | |
City of Lubbock GO, 5.00% due 2/15/2023 (Waterworks System) | | AA+/Aa2 | | | 4,180,000 | | | | 5,111,764 | |
City of Lubbock GO, 5.00% due 2/15/2024 (Waterworks System) | | AA+/Aa2 | | | 4,460,000 | | | | 5,541,149 | |
City of Lubbock GO, 5.00% due 2/15/2024 (Waterworks System) | | AA+/Aa2 | | | 4,440,000 | | | | 5,516,300 | |
City of Lubbock GO, 5.00% due 2/15/2025 (Waterworks System) | | AA+/Aa2 | | | 7,735,000 | | | | 9,742,000 | |
City of Lubbock GO, 5.00% due 2/15/2025 (Waterworks System) | | AA+/Aa2 | | | 5,725,000 | | | | 7,210,466 | |
City of Olmos Park Higher Education Facilities Corp., 5.00% due 12/1/2020 (University of the Incarnate Word) | | NR/A3 | | | 3,620,000 | | | | 4,141,968 | |
City of Olmos Park Higher Education Facilities Corp., 5.00% due 12/1/2021 (University of the Incarnate Word) | | NR/A3 | | | 1,000,000 | | | | 1,169,460 | |
City of San Antonio, 5.00% due 2/1/2022 (CPS Energy) | | AA/Aa1 | | | 20,000,000 | | | | 23,929,800 | |
City of San Antonio, 5.00% due 5/15/2023 (San Antonio Water System) | | AA/Aa2 | | | 1,500,000 | | | | 1,841,625 | |
City of San Antonio, 5.25% due 2/1/2024 (CPS Energy) | | AA/Aa1 | | | 7,000,000 | | | | 8,884,120 | |
City of San Antonio, 5.00% due 5/15/2024 (San Antonio Water System) | | AA/Aa2 | | | 1,500,000 | | | | 1,876,830 | |
City of San Antonio, 5.00% due 5/15/2025 (San Antonio Water System) | | AA/Aa2 | | | 1,000,000 | | | | 1,269,000 | |
City of San Antonio, 5.00% due 5/15/2026 (San Antonio Water System) | | AA/Aa2 | | | 1,200,000 | | | | 1,545,360 | |
City of San Antonio, 3.00% due 12/1/2045 put 12/1/2020 (CPS Energy) | | AA-/Aa2 | | | 36,000,000 | | | | 38,467,800 | |
City of San Antonio GO, 5.00% due 2/1/2023 (San Antonio Water System) | | AAA/Aaa | | | 13,880,000 | | | | 17,015,631 | |
City of San Antonio GO, 5.00% due 2/1/2024 (San Antonio Water System) | | AAA/Aaa | | | 14,595,000 | | | | 18,269,729 | |
City of San Antonio GO, 5.00% due 2/1/2025 (San Antonio Water System) | | AAA/Aaa | | | 15,340,000 | | | | 19,497,447 | |
City of San Antonio GO, 5.00% due 2/1/2026 (San Antonio Water System) | | AAA/Aaa | | | 14,135,000 | | | | 18,263,268 | |
City of San Antonio Public Facilities Corp., 5.00% due 9/15/2022 (Convention Center Refinancing & Expansion) | | AA+/Aa2 | | | 1,450,000 | | | | 1,746,424 | |
City of Weslaco GO, 5.25% due 2/15/2019 pre-refunded 2/15/2017 (Waterworks and Sewer System; Insured: Natl-Re) | | AA-/A2 | | | 2,835,000 | | | | 2,882,458 | |
Clifton Higher Education Finance Corp., 5.00% due 8/15/2017 (IDEA Public Schools) | | BBB/NR | | | 315,000 | | | | 324,598 | |
Clifton Higher Education Finance Corp., 5.00% due 8/15/2018 (IDEA Public Schools) | | BBB/NR | | | 325,000 | | | | 345,449 | |
Clifton Higher Education Finance Corp., 5.00% due 8/15/2019 (IDEA Public Schools) | | BBB/NR | | | 445,000 | | | | 486,025 | |
Clifton Higher Education Finance Corp., 5.00% due 8/15/2023 (IDEA Public Schools) | | BBB/NR | | | 1,100,000 | | | | 1,277,969 | |
Corpus Christi Business and Job Development Corp., 5.00% due 3/1/2021 (Seawall Project) | | A+/A1 | | | 625,000 | | | | 718,788 | |
Dallas Area Rapid Transit, 5.00% due 12/1/2026 | | AA+/Aa2 | | | 2,245,000 | | | | 2,864,193 | |
Dallas Convention Center Hotel Development Corp., 0% due 1/1/2018 | | A/A1 | | | 5,240,000 | | | | 5,118,589 | |
Dallas Convention Center Hotel Development Corp., 5.00% due 1/1/2019 | | A/A1 | | | 5,200,000 | | | | 5,622,032 | |
Dallas County Utility & Reclamation District, 5.00% due 2/15/2017 (Insured: AMBAC) | | A-/A3 | | | 1,160,000 | | | | 1,177,539 | |
Dallas County Utility & Reclamation District, 5.00% due 2/15/2017 (Insured: AMBAC) | | A-/A3 | | | 1,260,000 | | | | 1,279,051 | |
Dallas County Utility & Reclamation District, 5.00% due 2/15/2018 (Insured: AMBAC) | | A-/A3 | | | 1,935,000 | | | | 1,965,960 | |
Dallas County Utility & Reclamation District, 5.00% due 2/15/2018 (Insured: AMBAC) | | A-/A3 | | | 2,035,000 | | | | 2,067,560 | |
Dallas County Utility & Reclamation District, 5.00% due 2/15/2019 (Insured: AMBAC) | | A-/A3 | | | 2,175,000 | | | | 2,209,800 | |
Dallas ISD GO, 5.00% due 2/15/2036 put 2/15/2022 (Educational Facilities Improvements; Guaranty: PSF) | | AAA/Aaa | | | 3,975,000 | | | | 4,727,030 | |
Grayson County GO, 1.625% due 1/1/2017 (State Highway Toll System) | | AA/Aa2 | | | 1,200,000 | | | | 1,202,280 | |
Grayson County GO, 4.00% due 1/1/2020 (State Highway Toll System) | | AA/Aa2 | | | 2,000,000 | | | | 2,182,780 | |
Grayson County GO, 5.00% due 1/1/2022 (State Highway Toll System) | | AA/Aa2 | | | 3,000,000 | | | | 3,558,420 | |
Guadalupe-Blanco River Authority, 5.625% due 10/1/2017 (AEP Texas Central Co.) | | BBB+/Baa1 | | | 5,000,000 | | | | 5,218,850 | |
Gulf Coast Waste Disposal Authority, 4.00% due 10/1/2016 (Bayport Area Wastewater Treatment System; Insured: AGM) | | AA/A2 | | | 500,000 | | | | 500,045 | |
Gulf Coast Waste Disposal Authority, 4.00% due 10/1/2017 (Bayport Area Wastewater Treatment System; Insured: AGM) | | AA/A2 | | | 800,000 | | | | 822,744 | |
Gulf Coast Waste Disposal Authority, 5.00% due 10/1/2019 (Bayport Area Wastewater Treatment System; Insured: AGM) | | AA/A2 | | | 1,000,000 | | | | 1,108,300 | |
38 Annual Report
| | |
| SCHEDULE OF INVESTMENTS, CONTINUED | | |
| |
Thornburg Limited Term Municipal Fund | | September 30, 2016 |
| | | | | | | | | | |
Issuer-Description | | Credit Rating†
S&P/ Moody’s | | Principal
Amount | | | Value | |
Gulf Coast Waste Disposal Authority, 5.00% due 10/1/2020 (Bayport Area Wastewater Treatment System; Insured: AGM) | | AA/A2 | | $ | 2,000,000 | | | $ | 2,269,700 | |
Gulf Coast Waste Disposal Authority, 5.00% due 10/1/2022 (Bayport Area Wastewater Treatment System; Insured: AGM) | | AA/A2 | | | 1,635,000 | | | | 1,933,731 | |
Gulf Coast Waste Disposal Authority, 5.00% due 10/1/2023 (Bayport Area Wastewater Treatment System; Insured: AGM) | | AA/NR | | | 500,000 | | | | 607,945 | |
Gulf Coast Waste Disposal Authority, 5.00% due 10/1/2024 (Bayport Area Wastewater Treatment System; Insured: AGM) | | AA/NR | | | 350,000 | | | | 432,317 | |
Gulf Coast Waste Disposal Authority, 5.00% due 10/1/2025 (Bayport Area Wastewater Treatment System; Insured: AGM) | | AA/NR | | | 1,000,000 | | | | 1,252,830 | |
Harris County Cultural Education Facilities Finance Corp., 3.00% due 10/1/2016 (Texas Children’s Hospital) | | AA/Aa2 | | | 5,590,000 | | | | 5,590,335 | |
Harris County Cultural Education Facilities Finance Corp., 5.00% due 11/15/2018 (Texas Medical Center Central Heating & Cooling Services Corp.) | | AA/Aa3 | | | 2,365,000 | | | | 2,559,876 | |
Harris County Cultural Education Facilities Finance Corp., 5.00% due 11/15/2019 (Texas Medical Center Central Heating & Cooling Services Corp.) | | AA/Aa3 | | | 1,000,000 | | | | 1,119,140 | |
Harris County Cultural Education Facilities Finance Corp., 5.00% due 12/1/2022 (Memorial Hermann Health) | | A+/A1 | | | 200,000 | | | | 243,422 | |
Harris County Cultural Education Facilities Finance Corp., 5.00% due 12/1/2023 (Memorial Hermann Health) | | A+/A1 | | | 400,000 | | | | 495,072 | |
Harris County Cultural Education Facilities Finance Corp., 5.00% due 12/1/2024 (Memorial Hermann Health) | | A+/A1 | | | 3,000,000 | | | | 3,775,050 | |
Harris County Cultural Education Facilities Finance Corp., 5.00% due 12/1/2025 (Memorial Hermann Health) | | A+/A1 | | | 2,845,000 | | | | 3,552,864 | |
Harris County GO, 5.00% due 10/1/2017 (Texas Permanent Improvement) | | AAA/Aaa | | | 3,500,000 | | | | 3,645,810 | |
Harris County GO, 5.00% due 10/1/2018 (Texas Permanent Improvement) | | AAA/Aaa | | | 3,000,000 | | | | 3,243,900 | |
Harris County GO, 5.00% due 10/1/2019 (Texas Permanent Improvement) | | AAA/Aaa | | | 700,000 | | | | 784,168 | |
Harris County GO, 5.00% due 10/1/2020 (Texas Permanent Improvement) | | AAA/Aaa | | | 500,000 | | | | 577,430 | |
Harris County Health Facilities Development Corp., 7.00% due 12/1/2027 pre-refunded 12/1/2018 (Memorial Hermann Health; LOC: JPMorgan Chase Bank, N.A.) | | NR/NR | | | 1,245,000 | | | | 1,408,107 | |
Harris County Hospital District, 5.00% due 2/15/2017 (Insured: Natl-Re) | | AA-/A2 | | | 1,500,000 | | | | 1,523,190 | |
Harris County-Houston Sports Authority, 5.00% due 11/15/2022 (Insured: AGM) | | AA/A2 | | | 5,410,000 | | | | 6,534,739 | |
Harris County-Houston Sports Authority, 5.00% due 11/15/2023 (Insured: AGM) | | AA/A2 | | | 9,975,000 | | | | 12,289,798 | |
Harris County-Houston Sports Authority, 5.00% due 11/15/2024 (Insured: AGM) | | AA/A2 | | | 7,930,000 | | | | 9,910,597 | |
Hays County GO, 5.00% due 2/15/2022 | | AA/NR | | | 750,000 | | | | 892,643 | |
Hays County GO, 5.00% due 2/15/2023 | | AA/NR | | | 1,500,000 | | | | 1,821,090 | |
Hays County GO, 5.00% due 2/15/2024 | | AA/NR | | | 1,300,000 | | | | 1,608,997 | |
Hays County GO, 5.00% due 2/15/2025 | | AA/NR | | | 500,000 | | | | 627,070 | |
Houston Higher Education Finance Corp., 5.00% due 8/15/2017 (KIPP, Inc.; Guaranty: PSF) | | AAA/NR | | | 925,000 | | | | 957,865 | |
Houston Higher Education Finance Corp., 5.00% due 8/15/2019 (KIPP, Inc.; Guaranty: PSF) | | AAA/NR | | | 1,020,000 | | | | 1,134,495 | |
Houston Higher Education Finance Corp., 5.875% due 5/15/2021 (Cosmos Foundation, Inc.) | | BBB/NR | | | 1,410,000 | | | | 1,575,393 | |
Houston Higher Education Finance Corp., 5.00% due 8/15/2021 (KIPP, Inc.; Guaranty: PSF) | | AAA/NR | | | 300,000 | | | | 353,277 | |
Houston Higher Education Finance Corp., 5.00% due 8/15/2022 (KIPP, Inc.; Guaranty: PSF) | | AAA/NR | | | 1,185,000 | | | | 1,425,721 | |
Katy ISD GO, 5.00% due 2/15/2023 (Educational Facilities Improvements; Guaranty: PSF) | | AAA/Aaa | | | 1,500,000 | | | | 1,846,215 | |
Katy ISD GO, 5.00% due 2/15/2024 (Educational Facilities Improvements; Guaranty: PSF) | | AAA/Aaa | | | 2,385,000 | | | | 2,997,229 | |
Katy ISD GO, 5.00% due 2/15/2025 (Educational Facilities Improvements; Guaranty: PSF) | | AAA/Aaa | | | 2,830,000 | | | | 3,607,741 | |
Katy ISD GO, 5.00% due 2/15/2026 (Educational Facilities Improvements; Guaranty: PSF) | | AAA/Aaa | | | 2,955,000 | | | | 3,824,184 | |
Keller ISD GO, 5.00% due 8/15/2023 | | AAA/Aaa | | | 1,715,000 | | | | 2,119,620 | |
Keller ISD GO, 5.00% due 8/15/2024 | | AAA/Aaa | | | 3,250,000 | | | | 4,106,765 | |
Keller ISD GO, 5.00% due 8/15/2025 | | AAA/Aaa | | | 7,140,000 | | | | 9,156,407 | |
Keller ISD GO, 5.00% due 8/15/2026 | | AAA/Aaa | | | 8,425,000 | | | | 10,783,073 | |
Laredo Community College District GO, 5.00% due 8/1/2019 (School Facilities Improvements) | | AA-/Aa3 | | | 880,000 | | | | 974,433 | |
Laredo Community College District GO, 5.00% due 8/1/2020 (School Facilities Improvements) | | AA-/Aa3 | | | 1,360,000 | | | | 1,551,787 | |
Laredo Community College District GO, 5.00% due 8/1/2022 (School Facilities Improvements) | | AA-/Aa3 | | | 655,000 | | | | 783,917 | |
Laredo Community College District GO, 5.00% due 8/1/2023 (School Facilities Improvements) | | AA-/Aa3 | | | 610,000 | | | | 743,419 | |
Laredo Community College District GO, 5.00% due 8/1/2024 (School Facilities Improvements) | | AA-/Aa3 | | | 715,000 | | | | 884,305 | |
Lower Colorado River Authority, 5.00% due 5/15/2025 pre-refunded 5/15/2022 | | NR/NR | | | 55,000 | | | | 66,391 | |
Lower Colorado River Authority, 5.00% due 5/15/2025 | | A/A2 | | | 8,020,000 | | | | 9,595,850 | |
New Caney ISD GO, 5.00% due 2/15/2024 (Guaranty: PSF) | | AAA/Aaa | | | 865,000 | | | | 1,053,458 | |
North East ISD GO, 2.00% due 8/1/2044 put 8/1/2019 (Educational Facilities; Guaranty: PSF) | | AAA/Aaa | | | 10,445,000 | | | | 10,692,964 | |
North Harris County Regional Water Authority, 5.00% due 12/15/2020 (Regional Water Production Design, Acquisition and Construction) | | AA-/NR | | | 1,000,000 | | | | 1,156,480 | |
North Harris County Regional Water Authority, 5.00% due 12/15/2021 (Regional Water Production Design, Acquisition and Construction) | | AA-/NR | | | 1,000,000 | | | | 1,185,370 | |
North Harris County Regional Water Authority, 5.00% due 12/15/2023 (Regional Water Production Design, Acquisition and Construction) | | AA-/NR | | | 1,000,000 | | | | 1,233,990 | |
North Harris County Regional Water Authority, 5.00% due 12/15/2025 (Regional Water Production Design, Acquisition and Construction) | | AA-/NR | | | 2,000,000 | | | | 2,528,160 | |
North Harris County Regional Water Authority, 5.00% due 12/15/2026 (Regional Water Production Design, Acquisition and Construction) | | AA-/NR | | | 1,490,000 | | | | 1,909,331 | |
North Texas Tollway Authority, 5.00% due 1/1/2024 | | A/A1 | | | 12,000,000 | | | | 14,810,880 | |
Northside ISD GO, 2.00% due 6/1/2039 put 6/1/2019 (Educational Facilities; Guaranty: PSF) | | NR/Aaa | | | 2,135,000 | | | | 2,183,230 | |
Pasadena ISD GO, 3.00% due 2/15/2044 put 8/15/2019 (Educational Facilities; Guaranty: PSF) | | AAA/Aaa | | | 8,775,000 | | | | 9,227,702 | |
Round Rock ISD GO, 5.00% due 8/1/2017 (Educational Facilities Improvements; Guaranty: PSF) | | NR/Aaa | | | 1,290,000 | | | | 1,335,318 | |
Round Rock ISD GO, 5.00% due 8/1/2018 (Educational Facilities Improvements; Guaranty: PSF) | | NR/Aaa | | | 1,075,000 | | | | 1,155,410 | |
Round Rock ISD GO, 5.00% due 8/1/2019 (Educational Facilities Improvements; Guaranty: PSF) | | NR/Aaa | | | 1,500,000 | | | | 1,669,800 | |
Annual Report 39
| | |
| SCHEDULE OF INVESTMENTS, CONTINUED | | |
| |
Thornburg Limited Term Municipal Fund | | September 30, 2016 |
| | | | | | | | | | | | |
Issuer-Description | | Credit Rating†
S&P/ Moody’s | | | Principal
Amount | | | Value | |
Round Rock ISD GO, 5.00% due 8/1/2020 (Educational Facilities Improvements; Guaranty: PSF) | | | NR/Aaa | | | $ | 1,000,000 | | | $ | 1,150,220 | |
Round Rock ISD GO, 5.00% due 8/1/2021 (Educational Facilities Improvements; Guaranty: PSF) | | | NR/Aaa | | | | 2,000,000 | | | | 2,368,220 | |
Round Rock ISD GO, 5.00% due 8/1/2022 (Educational Facilities Improvements; Guaranty: PSF) | | | NR/Aaa | | | | 670,000 | | | | 812,489 | |
Round Rock ISD GO, 5.00% due 8/1/2024 (Educational Facilities Improvements; Guaranty: PSF) | | | NR/Aaa | | | | 2,305,000 | | | | 2,910,477 | |
Round Rock ISD GO, 5.00% due 8/1/2025 (Educational Facilities Improvements; Guaranty: PSF) | | | NR/Aaa | | | | 1,000,000 | | | | 1,281,470 | |
Round Rock ISD GO, 5.00% due 8/1/2026 (Educational Facilities Improvements; Guaranty: PSF) | | | NR/Aaa | | | | 1,575,000 | | | | 2,003,432 | |
Sam Rayburn Municipal Power Agency, 5.00% due 10/1/2017 | | | BBB+/NR | | | | 1,000,000 | | | | 1,039,500 | |
Sam Rayburn Municipal Power Agency, 5.00% due 10/1/2019 | | | BBB+/NR | | | | 2,565,000 | | | | 2,844,790 | |
Sam Rayburn Municipal Power Agency, 5.00% due 10/1/2020 | | | BBB+/NR | | | | 1,620,000 | | | | 1,840,822 | |
San Antonio Public Facilities Corp., 5.00% due 9/15/2020 (Convention Center Refinancing & Expansion) | | | AA+/Aa2 | | | | 915,000 | | | | 1,050,072 | |
San Juan Higher Education Finance Authority, 5.125% due 8/15/2020 (IDEA Public Schools) | | | BBB/NR | | | | 1,115,000 | | | | 1,211,247 | |
Tarrant County Cultural Education Facilities Finance Corp., 5.00% due 8/15/2017 (Scott & White Memorial Hospital) (ETM) | | | AA-/Aa3 | | | | 2,000,000 | | | | 2,073,520 | |
Tarrant Regional Water District, 2.00% due 3/1/2020 | | | AAA/NR | | | | 800,000 | | | | 825,648 | |
Tarrant Regional Water District, 5.00% due 3/1/2021 | | | AAA/NR | | | | 1,000,000 | | | | 1,168,100 | |
Tarrant Regional Water District, 5.00% due 3/1/2022 | | | AAA/NR | | | | 650,000 | | | | 778,986 | |
Tarrant Regional Water District, 5.00% due 3/1/2023 | | | AAA/NR | | | | 700,000 | | | | 857,899 | |
Tarrant Regional Water District, 5.00% due 3/1/2024 | | | AAA/NR | | | | 1,000,000 | | | | 1,249,000 | |
Tarrant Regional Water District, 5.00% due 3/1/2025 | | | AAA/NR | | | | 1,500,000 | | | | 1,896,195 | |
Tarrant Regional Water District, 5.00% due 3/1/2026 | | | AAA/NR | | | | 2,000,000 | | | | 2,563,580 | |
Tarrant Regional Water District, 5.00% due 3/1/2027 | | | AAA/NR | | | | 2,000,000 | | | | 2,540,340 | |
Texas Municipal Power Agency, 5.00% due 9/1/2017 (Insured: AGM) | | | AA/A2 | | | | 10,000,000 | | | | 10,364,500 | |
Texas Transportation Commission, 5.00% due 8/15/2022 (Central Texas Turnpike System) | | | BBB+/Baa1 | | | | 400,000 | | | | 476,220 | |
Texas Transportation Commission, 5.00% due 8/15/2023 (Central Texas Turnpike System) | | | BBB+/Baa1 | | | | 730,000 | | | | 887,147 | |
Texas Transportation Commission, 5.00% due 8/15/2024 (Central Texas Turnpike System) | | | BBB+/Baa1 | | | | 1,000,000 | | | | 1,229,960 | |
University of Texas System, 5.00% due 8/15/2025 (Campus Improvements) | | | AAA/Aaa | | | | 7,000,000 | | | | 9,024,680 | |
University of Texas System, 5.00% due 8/15/2026 (Campus Improvements) | | | AAA/Aaa | | | | 3,750,000 | | | | 4,898,437 | |
Uptown Development Authority, 5.00% due 9/1/2017 (Infrastructure Improvements) | | | BBB/NR | | | | 1,580,000 | | | | 1,632,156 | |
Uptown Development Authority, 5.00% due 9/1/2018 (Infrastructure Improvements) | | | BBB/NR | | | | 1,870,000 | | | | 1,996,281 | |
Uptown Development Authority, 5.00% due 9/1/2019 (Infrastructure Improvements) | | | BBB/NR | | | | 1,945,000 | | | | 2,136,952 | |
Walnut Creek Special Utility District, 4.00% due 1/10/2020 (Water System Improvements; Insured: BAM) | | | AA/NR | | | | 520,000 | | | | 563,654 | |
Walnut Creek Special Utility District, 4.00% due 1/10/2021 (Water System Improvements; Insured: BAM) | | | AA/NR | | | | 445,000 | | | | 490,279 | |
Walnut Creek Special Utility District, 5.00% due 1/10/2022 (Water System Improvements; Insured: BAM) | | | AA/NR | | | | 525,000 | | | | 613,751 | |
Walnut Creek Special Utility District, 5.00% due 1/10/2024 (Water System Improvements; Insured: BAM) | | | AA/NR | | | | 750,000 | | | | 907,185 | |
West Harris County Regional Water Authority, 5.00% due 12/15/2020 (Insured: Natl-Re) | | | AA-/A1 | | | | 2,140,000 | | | | 2,235,958 | |
Ysleta ISD, 5.00% due 8/15/2017 (Public School Finance System; Guaranty: PSF) | | | AAA/Aaa | | | | 2,190,000 | | | | 2,270,373 | |
| | | |
U.S. VIRGIN ISLANDS — 0.06% | | | | | | | | | | | | |
Virgin Islands Public Finance Authority, 6.75% due 10/1/2019 (Diageo Project) | | | NR/B2 | | | | 4,920,000 | | | | 5,089,888 | |
| | | |
UTAH — 0.53% | | | | | | | | | | | | |
Utah Transit Authority, 5.00% due 6/15/2022 (Integrated Mass Transit System) | | | A+/A1 | | | | 710,000 | | | | 852,731 | |
Utah Transit Authority, 5.00% due 6/15/2023 (Integrated Mass Transit System) | | | A+/A1 | | | | 775,000 | | | | 951,623 | |
Utah Transit Authority, 5.00% due 6/15/2024 (Integrated Mass Transit System) | | | A+/A1 | | | | 825,000 | | | | 1,029,295 | |
Utah Transit Authority, 5.00% due 6/15/2025 (Integrated Mass Transit System) | | | A+/A1 | | | | 1,235,000 | | | | 1,558,397 | |
Weber County, 0.85% due 2/15/2035 put 10/3/2016 (IHC Health Services, Inc.; SPA: The Bank of NY Mellon) (daily demand notes) | | | AA+/Aa1 | | | | 38,000,000 | | | | 38,000,000 | |
| | | |
VERMONT — 0.23% | | | | | | | | | | | | |
Vermont Colleges GO, 4.00% due 7/1/2017 | | | A-/NR | | | | 1,865,000 | | | | 1,908,548 | |
Vermont EDA, 5.00% due 12/15/2020 (Vermont Public Service Corp.) | | | NR/NR | | | | 14,250,000 | | | | 16,324,657 | |
| | | |
VIRGINIA — 0.17% | | | | | | | | | | | | |
Fairfax County GO, 5.00% due 10/1/2016 (Public Facilities and Improvements) (State Aid Withholding) | | | AAA/Aaa | | | | 1,100,000 | | | | 1,100,132 | |
Fairfax County IDA, 4.00% due 5/15/2022 (Inova Health System) | | | AA+/Aa2 | | | | 5,500,000 | | | | 6,328,905 | |
Fairfax County IDA, 5.00% due 5/15/2022 (Inova Health System) | | | AA+/Aa2 | | | | 5,000,000 | | | | 6,036,650 | |
| | | |
WASHINGTON — 1.81% | | | | | | | | | | | | |
Chelan County Public Utility District No.1, 0.49% due 7/1/2032 put 10/3/2016 (SPA: Union Bank) (daily demand notes) | | | AA/Aa3 | | | | 4,100,000 | | | | 4,100,000 | |
Energy Northwest, 5.00% due 7/1/2017 (Bonneville Power Administration Project 1) | | | AA-/Aa1 | | | | 5,000,000 | | | | 5,157,600 | |
Energy Northwest, 5.00% due 7/1/2017 (Bonneville Power Administration Project 3) | | | AA-/Aa1 | | | | 5,470,000 | | | | 5,642,414 | |
Energy Northwest, 5.00% due 7/1/2018 pre-refunded 7/1/2017 (Bonneville Power Administration Project 3) | | | NR/NR | | | | 185,000 | | | | 190,846 | |
Energy Northwest, 5.00% due 7/1/2018 (Bonneville Power Administration Project 3) | | | AA-/Aa1 | | | | 290,000 | | | | 298,941 | |
Energy Northwest, 5.00% due 7/1/2018 (Nine Canyon Wind Project Phase I-III) | | | NR/A2 | | | | 1,000,000 | | | | 1,068,230 | |
Energy Northwest, 5.00% due 7/1/2019 (Nine Canyon Wind Project Phase I-III) | | | NR/A2 | | | | 2,000,000 | | | | 2,208,020 | |
Energy Northwest, 5.00% due 7/1/2020 (Nine Canyon Wind Project Phase I-III) | | | NR/A2 | | | | 2,000,000 | | | | 2,263,080 | |
Energy Northwest, 5.00% due 7/1/2021 (Nine Canyon Wind Project Phase I-III) | | | NR/A2 | | | | 2,000,000 | | | | 2,319,900 | |
Energy Northwest, 5.00% due 7/1/2022 (Nine Canyon Wind Project Phase I-III) | | | NR/A2 | | | | 1,000,000 | | | | 1,187,350 | |
40 Annual Report
| | |
| SCHEDULE OF INVESTMENTS, CONTINUED | | |
| |
Thornburg Limited Term Municipal Fund | | September 30, 2016 |
| | | | | | | | | | | | |
Issuer-Description | | Credit Rating†
S&P/ Moody’s | | | Principal
Amount | | | Value | |
Energy Northwest, 5.00% due 7/1/2023 (Nine Canyon Wind Project Phase I-III) | | | NR/A2 | | | $ | 1,000,000 | | | $ | 1,208,260 | |
Energy Northwest, 5.00% due 7/1/2025 (Nine Canyon Wind Project Phase I-III) | | | NR/A2 | | | | 850,000 | | | | 1,054,196 | |
King County Federal Way School District No. 210 GO, 4.125% due 12/1/2019 pre-refunded 12/1/2017 (Insured: Natl-Re) | | | AA+/Aa1 | | | | 2,000,000 | | | | 2,077,880 | |
Marysville School District No. 25 GO, 4.00% due 12/1/2017 (Snohomish County Educational Facilities) (State Aid Withholding) | | | NR/Aa1 | | | | 1,000,000 | | | | 1,034,900 | |
Marysville School District No. 25 GO, 4.00% due 12/1/2018 (Snohomish County Educational Facilities) (State Aid Withholding) | | | NR/Aa1 | | | | 1,100,000 | | | | 1,171,819 | |
Marysville School District No. 25 GO, 5.00% due 12/1/2019 (Snohomish County Educational Facilities) (State Aid Withholding) | | | NR/Aa1 | | | | 1,390,000 | | | | 1,562,847 | |
Marysville School District No. 25 GO, 5.00% due 12/1/2020 (Snohomish County Educational Facilities) (State Aid Withholding) | | | NR/Aa1 | | | | 1,625,000 | | | | 1,881,588 | |
Marysville School District No. 25 GO, 5.00% due 12/1/2021 (Snohomish County Educational Facilities) (State Aid Withholding) | | | NR/Aa1 | | | | 1,750,000 | | | | 2,080,225 | |
Marysville School District No. 25 GO, 5.00% due 12/1/2022 (Snohomish County Educational Facilities) (State Aid Withholding) | | | NR/Aa1 | | | | 2,620,000 | | | | 3,180,444 | |
Marysville School District No. 25 GO, 5.00% due 12/1/2023 (Snohomish County Educational Facilities) (State Aid Withholding) | | | NR/Aa1 | | | | 1,700,000 | | | | 2,092,819 | |
Port of Seattle, 5.50% due 9/1/2018 (Insured: Natl-Re) | | | AA-/A2 | | | | 5,000,000 | | | | 5,422,300 | |
Seattle Municipal Light & Power, 5.00% due 2/1/2017 | | | AA/Aa2 | | | | 2,000,000 | | | | 2,028,280 | |
Skagit County Public Hospital District No. 1, 4.00% due 12/1/2016 (Skagit Regional Health) | | | NR/Baa2 | | | | 1,000,000 | | | | 1,004,090 | |
Skagit County Public Hospital District No. 1, 5.00% due 12/1/2018 (Skagit Regional Health) | | | NR/Baa2 | | | | 800,000 | | | | 854,856 | |
Skagit County Public Hospital District No. 1, 5.00% due 12/1/2019 (Skagit Regional Health) | | | NR/Baa2 | | | | 835,000 | | | | 917,030 | |
Skagit County Public Hospital District No. 1, 5.00% due 12/1/2021 (Skagit Regional Health) | | | NR/Baa2 | | | | 1,160,000 | | | | 1,328,629 | |
Skagit County Public Hospital District No. 1, 5.00% due 12/1/2022 (Skagit Regional Health) | | | NR/Baa2 | | | | 500,000 | | | | 581,800 | |
Skagit County Public Hospital District No. 1, 5.375% due 12/1/2022 (Skagit Regional Health) | | | NR/Baa2 | | | | 500,000 | | | | 501,675 | |
Skagit County Public Hospital District No. 1, 5.00% due 12/1/2023 (Skagit Regional Health) | | | NR/Baa2 | | | | 750,000 | | | | 883,560 | |
Skagit County Public Hospital District No. 1 GO, 4.00% due 12/1/2017 (Skagit Regional Health) | | | NR/A1 | | | | 1,000,000 | | | | 1,034,460 | |
Skagit County Public Hospital District No. 1 GO, 4.00% due 12/1/2018 (Skagit Regional Health) | | | NR/A1 | | | | 1,270,000 | | | | 1,349,007 | |
Skagit County Public Hospital District No. 1 GO, 5.00% due 12/1/2019 (Skagit Regional Health) | | | NR/A1 | | | | 1,695,000 | | | | 1,900,519 | |
Skagit County Public Hospital District No. 1 GO, 5.00% due 12/1/2020 (Skagit Regional Health) | | | NR/A1 | | | | 1,570,000 | | | | 1,815,014 | |
Skagit County Public Hospital District No. 1 GO, 5.00% due 12/1/2021 (Skagit Regional Health) | | | NR/A1 | | | | 3,135,000 | | | | 3,722,812 | |
Skagit County Public Hospital District No. 1 GO, 5.00% due 12/1/2022 (Skagit Regional Health) | | | NR/A1 | | | | 3,635,000 | | | | 4,424,195 | |
Skagit County Public Hospital District No. 2 GO, 4.00% due 12/1/2018 (Island Hospital) | | | NR/A1 | | | | 1,000,000 | | | | 1,059,100 | |
Skagit County Public Hospital District No. 2 GO, 4.00% due 12/1/2019 (Island Hospital) | | | NR/A1 | | | | 1,000,000 | | | | 1,083,010 | |
Skagit County Public Hospital District No. 2 GO, 4.00% due 12/1/2020 (Island Hospital) | | | NR/A1 | | | | 1,000,000 | | | | 1,104,290 | |
Skagit County Public Hospital District No. 2 GO, 4.00% due 12/1/2021 (Island Hospital) | | | NR/A1 | | | | 1,000,000 | | | | 1,122,650 | |
Skagit County Public Hospital District No. 2 GO, 5.00% due 12/1/2022 (Island Hospital) | | | NR/A1 | | | | 1,700,000 | | | | 2,035,648 | |
State of Washington COP, 5.00% due 7/1/2017 (State Agency Real Property Projects) (State Aid Withholding) | | | NR/Aa2 | | | | 2,555,000 | | | | 2,634,154 | |
State of Washington COP, 5.00% due 7/1/2018 (State Agency Real Property Projects) (State Aid Withholding) | | | NR/Aa2 | | | | 2,670,000 | | | | 2,857,007 | |
State of Washington COP, 5.00% due 7/1/2019 (State and Local Agency Real and Personal Property Projects) (State Aid Withholding) | | | NR/Aa2 | | | | 1,000,000 | | | | 1,107,170 | |
State of Washington COP, 5.00% due 7/1/2020 (State and Local Agency Real and Personal Property Projects) (State Aid Withholding) | | | NR/Aa2 | | | | 3,290,000 | | | | 3,755,173 | |
State of Washington COP, 5.00% due 7/1/2021 (State and Local Agency Real and Personal Property Projects) (State Aid Withholding) | | | NR/Aa2 | | | | 3,125,000 | | | | 3,665,625 | |
State of Washington COP, 5.00% due 7/1/2022 (State and Local Agency Real and Personal Property Projects) (State Aid Withholding) | | | NR/Aa2 | | | | 3,000,000 | | | | 3,601,350 | |
State of Washington GO, 0% due 1/1/2018 (Stadium and Exhibition Center; Insured: Natl-Re) | | | AA+/Aa1 | | | | 4,000,000 | | | | 3,948,840 | |
State of Washington GO, 0% due 1/1/2019 (Stadium and Exhibition Center; Insured: Natl-Re) | | | AA+/Aa1 | | | | 3,000,000 | | | | 2,923,500 | |
State of Washington GO, 0% due 12/1/2019 (Public Highway, Bridge, Ferry Capital and Operating Costs; Insured: Natl-Re) | | | AA+/Aa1 | | | | 3,030,000 | | | | 2,918,466 | |
State of Washington GO, 5.00% due 7/1/2025 (Capital Projects) | | | AA+/Aa1 | | | | 10,475,000 | | | | 13,236,524 | |
Tacoma School District No.10 GO, 5.00% due 12/1/2017 (Pierce County Capital Projects) | | | AA+/Aa1 | | | | 2,280,000 | | | | 2,389,850 | |
Tacoma School District No.10 GO, 5.00% due 12/1/2018 (Pierce County Capital Projects) | | | AA+/Aa1 | | | | 4,000,000 | | | | 4,349,520 | |
Tacoma School District No.10 GO, 5.00% due 12/1/2019 (Pierce County Capital Projects) | | | AA+/Aa1 | | | | 2,000,000 | | | | 2,250,720 | |
Tacoma School District No.10 GO, 5.00% due 12/1/2020 (Pierce County Capital Projects) | | | AA+/Aa1 | | | | 2,500,000 | | | | 2,900,300 | |
Washington Health Care Facilities Authority, 5.00% due 7/1/2017 (Overlake Hospital Medical Center) | | | A/A2 | | | | 1,245,000 | | | | 1,282,711 | |
Washington Health Care Facilities Authority, 5.00% due 8/15/2017 (MultiCare Health Systems) | | | AA-/Aa3 | | | | 1,000,000 | | | | 1,035,420 | |
Washington Health Care Facilities Authority, 5.25% due 8/1/2018 (Highline Medical Center; Insured: FHA 242) (ETM) | | | NR/NR | | | | 7,935,000 | | | | 8,282,315 | |
Washington Health Care Facilities Authority, 5.00% due 8/15/2018 (MultiCare Health Systems) | | | AA-/Aa3 | | | | 2,000,000 | | | | 2,151,720 | |
Washington Health Care Facilities Authority, 5.00% due 7/1/2019 (Overlake Hospital Medical Center) | | | A/A2 | | | | 1,050,000 | | | | 1,159,515 | |
Washington Health Care Facilities Authority, 4.75% due 7/1/2020 (Overlake Hospital Medical Center) | | | A/A2 | | | | 1,000,000 | | | | 1,106,940 | |
| | | |
WEST VIRGINIA — 0.09% | | | | | | | | | | | | |
Mason County, 1.625% due 10/1/2022 put 10/1/2018 (Appalachian Power Company) | | | BBB+/Baa1 | | | | 3,300,000 | | | | 3,317,193 | |
West Virginia Higher Education Policy Commission, 5.00% due 4/1/2020 (Higher Education Facilities) | | | A+/Aa3 | | | | 1,000,000 | | | | 1,130,700 | |
West Virginia Higher Education Policy Commission, 5.00% due 4/1/2021 (Higher Education Facilities) | | | A+/Aa3 | | | | 1,000,000 | | | | 1,162,740 | |
West Virginia Higher Education Policy Commission, 5.00% due 4/1/2022 (Higher Education Facilities) | | | A+/Aa3 | | | | 1,500,000 | | | | 1,783,740 | |
Annual Report 41
| | |
| SCHEDULE OF INVESTMENTS, CONTINUED | | |
| |
Thornburg Limited Term Municipal Fund | | September 30, 2016 |
| | | | | | | | | | | | |
Issuer-Description | | Credit Rating†
S&P/ Moody’s | | | Principal
Amount | | | Value | |
WISCONSIN — 0.55% | | | | | | | | | | | | |
Wisconsin Health & Educational Facilities Authority, 5.00% due 4/15/2017 (Aurora Health Care, Inc.) | | | NR/A2 | | | $ | 1,295,000 | | | $ | 1,322,286 | |
Wisconsin Health & Educational Facilities Authority, 5.00% due 7/1/2017 (Agnesian Healthcare, Inc.) | | | A/A2 | | | | 1,000,000 | | | | 1,027,610 | |
Wisconsin Health & Educational Facilities Authority, 5.00% due 7/15/2017 (Aurora Health Care, Inc.) | | | NR/A2 | | | | 5,025,000 | | | | 5,168,765 | |
Wisconsin Health & Educational Facilities Authority, 5.00% due 7/1/2018 (Agnesian Healthcare, Inc.) | | | A/A2 | | | | 1,855,000 | | | | 1,971,179 | |
Wisconsin Health & Educational Facilities Authority, 5.00% due 7/1/2019 (Agnesian Healthcare, Inc.) | | | A/A2 | | | | 1,000,000 | | | | 1,094,870 | |
Wisconsin Health & Educational Facilities Authority, 5.00% due 7/1/2020 (Agnesian Healthcare, Inc.) | | | A/A2 | | | | 2,110,000 | | | | 2,375,987 | |
Wisconsin Health & Educational Facilities Authority, 5.00% due 8/15/2020 (ProHealth Care, Inc.) | | | A+/A1 | | | | 1,075,000 | | | | 1,226,682 | |
Wisconsin Health & Educational Facilities Authority, 5.00% due 8/15/2021 (ProHealth Care, Inc.) | | | A+/A1 | | | | 2,575,000 | | | | 3,018,312 | |
Wisconsin Health & Educational Facilities Authority, 5.00% due 8/15/2022 (ProHealth Care, Inc.) | | | A+/A1 | | | | 1,600,000 | | | | 1,868,880 | |
Wisconsin Health & Educational Facilities Authority, 5.00% due 12/1/2022 (UnityPoint Health) | | | NR/Aa3 | | | | 1,000,000 | | | | 1,213,800 | |
Wisconsin Health & Educational Facilities Authority, 5.00% due 11/15/2024 (Ascension Health Alliance System) | | | AA+/Aa2 | | | | 625,000 | | | | 788,125 | |
Wisconsin Health & Educational Facilities Authority, 1.25% due 8/15/2025 put 8/15/2017 (Aurora Health Care, Inc.) | | | NR/A2 | | | | 1,800,000 | | | | 1,801,008 | |
Wisconsin Health & Educational Facilities Authority, 5.00% due 11/15/2025 (Ascension Health Alliance System) | | | AA+/Aa2 | | | | 1,215,000 | | | | 1,552,867 | |
Wisconsin Health & Educational Facilities Authority, 5.00% due 11/15/2026 (Ascension Health Alliance System) | | | AA+/Aa2 | | | | 2,000,000 | | | | 2,547,040 | |
Wisconsin Health & Educational Facilities Authority, 5.00% due 11/15/2043 put 6/1/2021 (Ascension Health Alliance System) | | | AA+/Aa2 | | | | 10,000,000 | | | | 11,684,000 | |
WPPI Energy, 5.00% due 7/1/2021 (Power Supply System) | | | A/A1 | | | | 4,100,000 | | | | 4,825,905 | |
| | | | | | | | | | | | |
TOTAL INVESTMENTS — 98.06% (Cost $7,520,296,038) | | | | | | | | | | $ | 7,791,009,426 | |
OTHER ASSETS LESS LIABILITIES — 1.94% | | | | | | | | | | | 154,122,140 | |
| | | | | | | | | | | | |
NET ASSETS — 100.00% | | | | | | | | | | $ | 7,945,131,566 | |
| | | | | | | | | | | | |
Footnote Legend
| † | Credit ratings are unaudited. Rating changes may have occurred subsequent to the reporting period end. Bonds issued with a maturity of one year or less are assigned Moody’s ratings from MIG-1 to MIG-4 and Standard and Poor’s ratings from SP-1+ to SP-3 with MIG-1 and SP-1+ being the strongest ratings. |
| a | Segregated as collateral for a when-issued security. |
Portfolio Abbreviations
To simplify the listings of securities, abbreviations are used per the table below:
| | |
| AGC | | Insured by Associated General Contractors |
| AGM | | Insured by Assured Guaranty Municipal Corp. |
| AMBAC | | Insured by American Municipal Bond Assurance Corp. |
| BAM | | Insured by Build America Mutual Insurance Co. |
| BHAC | | Insured by Berkshire Hathaway Assurance Corp. |
| CalPERS | | California Public Employees’ Retirement System |
| COP | | Certificates of Participation |
| DFA | | Development Finance Authority |
| EDA | | Economic Development Authority |
| ETM | | Escrowed to Maturity |
| FGIC | | Insured by Financial Guaranty Insurance Co. |
| FHA | | Insured by Federal Housing Administration |
| FSA | | Insured by Financial Security Assurance Co. |
| | |
| GNMA | | Collateralized by Government National Mortgage Association |
| GO | | General Obligation |
| HFA | | Health Facilities Authority |
| HFFA | | Health Facilities Financing Authority |
| IDA | | Industrial Development Authority |
| ISD | | Independent School District |
| JEA | | Jacksonville Electric Authority |
| Mtg | | Mortgage |
| Natl-Re | | Insured by National Public Finance Guarantee Corp. |
| PSF | | Guaranteed by Permanent School Fund |
| Q-SBLF | | Insured by Qualified School Bond Loan Fund |
| Syncora | | Insured by Syncora Guarantee Inc. |
| USD | | Unified School District |
See notes to financial statements.
42 Annual Report
| | |
| STATEMENT OF ASSETS AND LIABILITIES | | |
| |
Thornburg Limited Term Municipal Fund | | September 30, 2016 |
| | | | |
ASSETS | | | | |
Investments at value (cost $7,520,296,038) (Note 3) | | $ | 7,791,009,426 | |
Cash | | | 40,302,740 | |
Receivable for investments sold | | | 114,622,822 | |
Receivable for fund shares sold | | | 17,632,688 | |
Interest receivable | | | 79,746,457 | |
Prepaid expenses and other assets | | | 178,215 | |
| | | | |
Total Assets | | | 8,043,492,348 | |
| | | | |
| |
LIABILITIES | | | | |
Payable for investments purchased | | | 81,303,073 | |
Payable for fund shares redeemed | | | 12,690,086 | |
Payable to investment advisor and other affiliates (Note 4) | | | 2,816,306 | |
Accounts payable and accrued expenses | | | 590,626 | |
Dividends payable | | | 960,691 | |
| | | | |
Total Liabilities | | | 98,360,782 | |
| | | | |
| |
NET ASSETS | | $ | 7,945,131,566 | |
| | | | |
NET ASSETS CONSIST OF | | | | |
Distribution in excess of net investment income | | $ | (947,051 | ) |
Net unrealized appreciation on investments | | | 270,713,388 | |
Accumulated net realized gain (loss) | | | (2,167,237 | ) |
Net capital paid in on shares of beneficial interest | | | 7,677,532,466 | |
| | | | |
| | $ | 7,945,131,566 | |
| | | | |
NET ASSET VALUE | | | | |
Class A Shares: | | | | |
Net asset value and redemption price per share ($1,697,329,300 applicable to 115,986,354 shares of beneficial interest outstanding - Note 5) | | $ | 14.63 | |
Maximum sales charge, 1.50% of offering price | | | 0.22 | |
| | | | |
Maximum offering price per share | | $ | 14.85 | |
| | | | |
| |
Class C Shares: | | | | |
Net asset value and offering price per share* ($741,636,915 applicable to 50,586,697 shares of beneficial interest outstanding - Note 5) | | $ | 14.66 | |
| | | | |
| |
Class I Shares: | | | | |
Net asset value, offering and redemption price per share ($5,506,165,351 applicable to 376,209,316 shares of beneficial interest outstanding - Note 5) | | $ | 14.64 | |
| | | | |
| * | Redemption price per share is equal to net asset value less any applicable contingent deferred sales charge. |
See notes to financial statements.
Annual Report 43
STATEMENT OF OPERATIONS
| | |
| |
Thornburg Limited Term Municipal Fund | | Year Ended September 30, 2016 |
| | | | |
INVESTMENT INCOME | | | | |
Interest income (net of premium amortized of $102,152,940) | | $ | 171,335,308 | |
| | | | |
| |
EXPENSES | | | | |
Investment advisory fees (Note 4) | | | 19,805,097 | |
Administration fees (Note 4) | | | | |
Class A Shares | | | 2,129,348 | |
Class C Shares | | | 922,894 | |
Class I Shares | | | 2,569,120 | |
Distribution and service fees (Note 4) | | | | |
Class A Shares | | | 4,258,696 | |
Class C Shares | | | 3,696,023 | |
Transfer agent fees | | | | |
Class A Shares | | | 1,018,365 | |
Class C Shares | | | 343,992 | |
Class I Shares | | | 3,701,972 | |
Registration and filing fees | | | | |
Class A Shares | | | 64,990 | |
Class C Shares | | | 33,899 | |
Class I Shares | | | 198,918 | |
Custodian fees (Note 2) | | | 586,251 | |
Professional fees | | | 141,765 | |
Accounting fees (Note 4) | | | 267,755 | |
Trustee fees | | | 332,585 | |
Other expenses | | | 302,006 | |
| | | | |
Total Expenses | | | 40,373,676 | |
| | | | |
Net Investment Income | | | 130,961,632 | |
| | | | |
REALIZED AND UNREALIZED GAIN (LOSS) | | | | |
Net realized gain (loss) on investments | | | (1,591,144 | ) |
Net change in unrealized appreciation (depreciation) on investments | | | 56,431,868 | |
| | | | |
Net Realized and Unrealized Gain | | | 54,840,724 | |
| | | | |
Net Increase in Net Assets Resulting from Operations | | $ | 185,802,356 | |
| | | | |
See notes to financial statements.
44 Annual Report
| | |
| STATEMENTS OF CHANGES IN NET ASSETS | | |
| |
Thornburg Limited Term Municipal Fund | | |
| | | | | | | | |
| | | Year Ended
September 30, 2016 | | | Year Ended
September 30, 2015 | |
INCREASE (DECREASE) IN NET ASSETS FROM | | | | | | | | |
| | |
OPERATIONS | | | | | | | | |
Net investment income | | $ | 130,961,632 | | | $ | 126,221,554 | |
Net realized gain (loss) on investments | | | (1,591,144 | ) | | | (246,405 | ) |
Net unrealized appreciation (depreciation) on investments | | | 56,431,868 | | | | (27,314,650 | ) |
| | | | | | | | |
| | |
Net Increase (Decrease) in Net Assets Resulting from Operations | | | 185,802,356 | | | | 98,660,499 | |
| | |
DIVIDENDS TO SHAREHOLDERS | | | | | | | | |
From net investment income | | | | | | | | |
Class A Shares | | | (26,222,114 | ) | | | (28,555,079 | ) |
Class C Shares | | | (9,606,259 | ) | | | (9,883,065 | ) |
Class I Shares | | | (95,133,259 | ) | | | (87,783,410 | ) |
| | |
FUND SHARE TRANSACTIONS (NOTE 5) | | | | | | | | |
Class A Shares | | | (15,604,952 | ) | | | (157,979,365 | ) |
Class C Shares | | | 5,714,401 | | | | (16,433,151 | ) |
Class I Shares | | | 637,192,599 | | | | 432,554,387 | |
| | | | | | | | |
Net Increase in Net Assets | | | 682,142,772 | | | | 230,580,816 | |
| | |
NET ASSETS | | | | | | | | |
Beginning of Year | | | 7,262,988,794 | | | | 7,032,407,978 | |
| | | | | | | | |
| | |
End of Year | | $ | 7,945,131,566 | | | $ | 7,262,988,794 | |
| | | | | | | | |
| | |
Distribution in excess of net investment income | | $ | (947,051 | ) | | $ | (947,051 | ) |
See notes to financial statements.
Annual Report 45
| | |
| NOTES TO FINANCIAL STATEMENTS | | |
| |
Thornburg Limited Term Municipal Fund | | September 30, 2016 |
NOTE 1 – ORGANIZATION
Thornburg Limited Term Municipal Fund (the “Fund”) is a diversified series of Thornburg Investment Trust (the “Trust”). The Trust is organized as a Massachusetts business trust under a Declaration of Trust dated June 3, 1987 and is registered as a diversified, open-end management investment company under the Investment Company Act of 1940, as amended. The Fund is currently one of twenty separate series of the Trust. Each series is considered to be a separate entity for financial reporting and tax purposes and bears expenses directly attributable to it. The Fund’s primary investment objective is to obtain as high a level of current income exempt from federal individual income taxes as is consistent, in the view of Thornburg Investment Management, Inc., the Trust’s investment advisor (the “Advisor”), with the preservation of capital. The Fund’s secondary objective is to reduce expected changes in its share price compared to longer intermediate and long-term bond portfolios.
The Fund currently offers three classes of shares of beneficial interest: Class A, Class C, and Institutional Class (“Class I”). Each class of shares of the Fund represents an interest in the same portfolio of investments, except that (i) Class A shares are sold subject to a front-end sales charge collected at the time the shares are purchased and bear a service fee, (ii) Class C shares are sold at net asset value without a sales charge at the time of purchase, but are subject to a contingent deferred sales charge upon redemption within one year of purchase, and bear both a service fee and a distribution fee, (iii) Class I shares are sold at net asset value without a sales charge at the time of purchase and may be subject to a service fee, and (iv) the respective classes may have different reinvestment privileges and conversion rights. Additionally, the Fund may allocate among its classes certain expenses, to the extent allocable to specific classes, including transfer agent fees, government registration fees, certain printing and postage costs, and administrative and legal expenses. Currently, class specific expenses of the Fund are limited to service and distribution fees, administration fees, and certain registration and transfer agent expenses.
The following is a summary of significant accounting policies followed by the Fund in the preparation of its financial statements. The Fund prepares its financial statements in conformity with United States generally accepted accounting principles (“GAAP”), including investment company accounting and reporting guidance in the Financial Accounting Standards Board (the “FASB”) Accounting Standard Codification Topic 946.
NOTE 2 – SIGNIFICANT ACCOUNTING POLICIES
Security Valuation: All investments in securities held by the Fund are valued as described in Note 3.
Allocation of Income, Gains, Losses and Expenses: Net investment income (other than class specific expenses) and realized and unrealized gains and losses are allocated daily to each class of shares based upon the relative net asset value of outstanding shares (or the value of the dividend-eligible shares, as appropriate) of each class of shares at the beginning of the day (after adjusting for the current capital shares activity of the respective class). Expenses common to all Funds are allocated among the Funds comprising the Trust based upon their relative net asset values or other appropriate allocation methods. Operating expenses directly attributable to a specific class are charged against the operating income of that class.
Dividends and Distributions to Shareholders: Dividends and distributions to shareholders, which are determined in accordance with federal income tax regulations and may differ from GAAP, are recorded on the ex-dividend date. Ordinary income distributions, if any, are declared daily and paid monthly. Capital gain distributions, if any, are declared and paid annually and more often if deemed necessary by the Advisor. Dividends are paid and are reinvested in additional shares of the Fund at net asset value per share at the close of business on the ex-dividend date, or at the shareholder’s option, paid in cash.
Investment Income: Interest income is accrued as earned. Premiums and discounts are amortized and accreted, respectively, to call dates or maturity dates using the effective yield method of the respective investments, which is included in interest income on the Statement of Operations.
Custodian Fees: Custodian fees disclosed in the Statement of Operations may include interest expenses incurred by the Fund on any cash overdrafts of its custodian account during the period. Such cash overdrafts may result from the effects of failed trades in portfolio securities and from cash outflows resulting from unanticipated shareholder redemption activity. The Fund pays interest to its custodian on any such cash overdraft at a rate equal to 2.50% of the overdraft amount in excess of $50,000.
Investment Transactions: Investment transactions are accounted for on a trade date basis. Realized gains and losses from the sale of investments are recorded on an identified cost basis.
When-Issued and Delayed Delivery Transactions: The Fund may engage in when-issued or delayed delivery transactions. To the extent the Fund engages in such transactions, it will do so for the purpose of acquiring portfolio investments consistent with the Fund’s investment objectives and not for the purpose of investment leverage or to speculate on interest rate or market changes. At the time the Fund makes a commitment to purchase an investment on a when-issued or delayed delivery basis, the Fund will record the transaction and reflect the value in determining its net asset value. When effecting such transactions, assets of an amount sufficient to make payment
46 Annual Report
| | |
| NOTES TO FINANCIAL STATEMENTS, CONTINUED | | |
| |
Thornburg Limited Term Municipal Fund | | September 30, 2016 |
for the portfolio investments to be purchased will be segregated on the Fund’s records on the trade date. Investments purchased on a when-issued or delayed delivery basis do not earn interest until the settlement date.
Guarantees and Indemnifications: Under the Trust’s organizational documents (and under separate agreements with the independent Trustees), its officers and Trustees are provided with an indemnification against certain liabilities arising out of the performance of their duties to the Fund. In the normal course of business the Trust may also enter into contracts with service providers that contain general indemnifications. The Trust’s maximum exposure under these arrangements is unknown. However, based on experience, the Trust expects the risk of loss to be remote.
Use of Estimates: The preparation of financial statements in conformity with GAAP requires management to make estimates and assumptions that affect the reported amounts of assets and liabilities and disclosure of contingent assets and liabilities at the date of the financial statements and the reported amounts of increases (decreases) in net assets from operations during the reporting period. Actual results could differ from those estimates.
Federal Income Taxes: It is the policy of the Trust to comply with the provisions of the Internal Revenue Code applicable to regulated investment companies and to distribute to shareholders substantially all investment company taxable income including net realized gains on investments (if any), and tax exempt income of the Fund. Therefore, no provision for federal income or excise tax is required.
The Fund files income tax returns in United States federal and applicable state jurisdictions. The statute of limitations on the Fund’s tax return filings generally remains open for the three years following a return’s filing date. The Fund has analyzed each uncertain tax position believed to be material in the preparation of the Fund’s financial statements for the fiscal year ended September 30, 2016, including open tax years, to assess whether it is more likely than not that the position would be sustained upon examination, based on the technical merits of the position. The Fund has not identified any such position for which an asset or liability must be reflected in the Statement of Assets and Liabilities.
At September 30, 2016, information on the tax components of capital was as follows:
| | | | |
Cost of investments for tax purposes | | $ | 7,520,296,038 | |
| | | | |
Gross unrealized appreciation on a tax basis | | $ | 272,552,830 | |
Gross unrealized depreciation on a tax basis | | | (1,839,442 | ) |
| | | | |
Net unrealized appreciation (depreciation) on investments (tax basis) | | $ | 270,713,388 | |
| | | | |
At September 30, 2016, the Fund had deferred tax basis capital losses occurring subsequent to October 31, 2015 through September 30, 2016 of $1,594,821. For tax purposes, such losses will be recognized in the year ending September 30, 2017.
At September 30, 2016, the Fund had cumulative tax basis capital losses of $572,416, (of which $233,596 are short-term and $338,820 are long-term) generated after September 30, 2011, which may be carried forward to offset future capital gains. To the extent such carryforwards are used, capital gain distributions may be reduced to the extent provided by regulations. Such capital loss carryforwards do not expire.
At September 30, 2016, the Fund had $192,444 of capital loss carryforwards generated prior to September 30, 2011 which expired.
In order to account for permanent book to tax differences, the Fund decreased accumulated net realized loss by $192,444 and decreased net capital paid in on shares of beneficial interest by $192,444. Reclassifications have no impact on the net asset value of the Fund and resulted primarily from the expiration of capital loss carryforwards.
At September 30, 2016, the Fund had $13,640 of undistributed net tax-exempt income, no undistributed tax basis net ordinary income and no undistributed tax basis capital gains.
Distributions from tax exempt income paid by the Fund for the years ended September 30, 2016 and September 30, 2015 are excludable by shareholders from gross income for federal income tax purposes.
The tax character of distributions paid during the years ended September 30, 2016, and September 30, 2015, was as follows:
| | | | | | | | |
| | | 2016 | | | 2015 | |
Distributions from: | | | | | | | | |
Tax exempt income | | $ | 130,923,029 | | | $ | 126,053,407 | |
Ordinary income | | | 38,603 | | | | 168,147 | |
| | | | | | | | |
Total | | $ | 130,961,632 | | | $ | 126,221,554 | |
| | | | | | | | |
Annual Report 47
| | |
| NOTES TO FINANCIAL STATEMENTS, CONTINUED | | |
| |
Thornburg Limited Term Municipal Fund | | September 30, 2016 |
NOTE 3 – SECURITY VALUATION
Valuation of the Fund’s portfolio investment securities is performed in accordance with policies and procedures adopted by and under the oversight of the Trustees.
The Trustees of the Trust have appointed the Advisor to assist the Trustees in obtaining market values for portfolio investments, evaluate and monitor professional pricing service providers appointed by the Trustees’ Audit Committee (the “Audit Committee”) to assist in determining fair values for portfolio investments, assist in calculating fair values for portfolio investments in certain circumstances, and to perform other functions in connection with the valuation of investments. The Advisor acts through its Valuation and Pricing Committee (the “Committee”) and other employees of the Advisor. The Committee regularly reviews its own valuation calculations, as well as the valuations, valuation techniques and services furnished by pricing service providers, considers circumstances which may require valuation calculations by the Committee, and reviews previous valuation calculations. The Committee reports to the Audit Committee on the Committee’s activities, the performance of pricing service providers, and other matters relating to valuation of portfolio investments.
In those instances when the Committee assists in calculating a fair value for a portfolio investment, the Committee seeks to determine the price that the Fund would reasonably expect to receive upon a sale of the investment in an orderly transaction between market participants on the valuation date. The Committee customarily utilizes quotations from securities broker dealers in calculating valuations, but also may utilize prices obtained from pricing service providers or other methods approved by the Audit Committee. Because fair values calculated by the Committee are estimates, the calculation of a value for an investment may differ from the price that would be realized by the Fund upon a sale of the investment, and the difference could be material to the Fund’s financial statements. The Committee’s calculation of a fair value for an investment may also differ from the prices obtained by other persons (including other mutual funds) for the investment.
Valuation of Securities: Debt obligations held by the Fund which are not listed or traded on exchanges or for which no reported market exists are ordinarily valued at the valuation obtained from a pricing service provider approved by the Audit Committee.
In any case when a pricing service provider fails to provide a valuation for a debt obligation held by the Fund, the Committee calculates a fair value for the obligation using alternative methods under procedures approved by the Audit Committee. Additionally, in cases when management believes that a valuation obtained from a pricing service provider merits review for significant reasons, the Committee decides whether or not to use the valuation calculated by the pricing service provider or to use an alternative method approved by the Audit Committee to calculate a fair value for the obligation.
Valuation Hierarchy: The Fund categorizes its investments based upon the inputs used in valuing those investments, according to a three-level hierarchy established in guidance from FASB. Categorization of investments using this hierarchy is intended by the FASB to maximize the use of observable inputs in valuing investments and minimize the use of unobservable inputs by requiring that the most observable inputs be used when available. Observable inputs are those that market participants would use in valuing an investment based on available market information. Unobservable inputs are those that reflect assumptions about the information market participants would use in valuing an investment. An investment’s level within the hierarchy is based on the lowest level input that is deemed significant to the valuation. The methodologies and inputs used to value investments are not necessarily indications of the risk or liquidity associated with those investments.
Various inputs are used in calculating valuations for the Fund’s investments. These inputs are generally summarized according to the three-level hierarchy below:
Level 1: Quoted prices in active markets for identical investments.
Level 2: Other direct or indirect significant observable inputs (including quoted prices for similar investments in active markets and other observable inputs, such as interest rates, prepayment rates, credit risk, etc.).
Level 3: Significant unobservable inputs (including the Committee’s own assumptions in calculating the fair values of investments).
Valuations for debt obligations held by the Fund are typically calculated by pricing service providers approved by the Audit Committee and are characterized as Level 2 within the valuation hierarchy.
In a limited number of cases the Committee calculates a fair value for investments using broker quotations or other methods approved by the Audit Committee. When the Committee uses a single broker quotation to calculate a fair value for an investment without other significant observable inputs, or if a fair value is calculated using other significant inputs that are considered unobservable, the investment is characterized as Level 3 within the hierarchy. Other significant unobservable inputs used to calculate a fair value in these instances might include an income-based valuation approach which considers discounted anticipated future cash flows from the investment, and application of discounts due to the nature or duration of any restrictions on the disposition of the investment.
48 Annual Report
| | |
| NOTES TO FINANCIAL STATEMENTS, CONTINUED | | |
| |
Thornburg Limited Term Municipal Fund | | September 30, 2016 |
Valuations based upon the use of inputs from Levels 1, 2 or 3 may not represent the actual price received upon the disposition of an investment, and the Fund may receive a price that is lower than the valuation based upon these inputs when it sells the investment.
The following table displays a summary of the fair value hierarchy measurements of the Fund’s investments as of September 30, 2016. In any instance when valuation inputs from more than one level are used to determine the fair value of a specific investment, the investment is placed in the level of the table based upon the lowest level input that is significant in determining the fair value of the investment:
| | | | | | | | | | | | | | | | |
| | | Fair Value Measurements at September 30, 2016 | |
| | | Total | | | Level 1 | | | Level 2 | | | Level 3 | |
Assets | | | | | | | | | | | | | | | | |
Investments in Securities | | | | | | | | | | | | | | | | |
Municipal Bonds | | $ | 7,791,009,426 | | | $ | — | | | $ | 7,791,009,426 | | | $ | — | |
| | | | | | | | | | | | | | | | |
Total Investments in Securities | | $ | 7,791,009,426 | | | $ | — | | | $ | 7,791,009,426 | | | $ | — | |
In accordance with the guidance prescribed in Accounting Standards Update No. 2011-04, it is the policy of the Fund to recognize transfers between levels and the underlying events which caused the movement. The Fund recognized no transfers between levels for the year ended September 30, 2016.
NOTE 4 – INVESTMENT ADVISORY FEE AND OTHER TRANSACTIONS WITH AFFILIATES
Pursuant to an investment advisory agreement, the Advisor serves as the investment advisor and performs services for the Fund for which the fees are payable at the end of each month. Under the investment advisory agreement, the Fund pays the Advisor a management fee based on the daily net assets of the Fund at an annual rate as shown in the following table:
| | | | |
Daily Net Assets | | Fee Rate | |
Up to $500 million | | | 0.500 | % |
Next $500 million | | | 0.400 | |
Next $500 million | | | 0.300 | |
Next $500 million | | | 0.250 | |
Over $2 billion | | | 0.225 | |
The Fund’s effective management fee for the year ended September 30, 2016 was 0.261% of the Fund’s average dividend assets.
The Fund pays to the Advisor the costs of personnel who perform certain accounting services for the Fund. For the year ended September 30, 2016 the Fund paid $267,755 to the Advisor for these accounting services. The Trust has also entered into administrative service agreements with the Advisor, whereby the Advisor will perform certain administrative services for the shareholders of each class of the Fund’s shares, and for which fees will be payable at an annual rate of up to .125 of 1% per annum of the average daily net assets attributable to each class of shares. Total administrative service fees incurred by each class of shares of the Fund for the year ended September 30, 2016, are set forth in the Statement of Operations.
The Trust has an underwriting agreement with Thornburg Securities Corporation (the “Distributor”), an affiliate of the Advisor, which acts as the distributor of the Fund’s shares. For the year ended September 30, 2016, the Distributor has advised the Fund that it earned net commissions aggregating $9,580 from the sale of Class A shares, and collected contingent deferred sales charges aggregating $44,570 from redemptions of Class C shares of the Fund.
Pursuant to a service plan under Rule 12b-1 of the Investment Company Act of 1940, the Fund may pay to the Advisor or securities dealers and other financial institutions at the Advisor’s request an amount not to exceed .25 of 1% per annum of the average daily net assets attributable to Class A and Class C shares of the Fund to obtain various shareholder and distribution related services. For the year ended September 30, 2016, there were no 12b-1 service plan fees charged for Class I shares. The Advisor may pay out of its own resources additional expenses for distribution of the Fund’s shares and shareholder services.
The Trust has also adopted a distribution plan pursuant to Rule 12b-1, applicable only to the Fund’s Class C shares under which the Fund compensates the Distributor for services in promoting the sale of Class C shares of the Fund at an annual rate of up to .25 of 1% per annum of the average daily net assets attributable to Class C shares. Total fees incurred by each class of shares of the Fund under their respective service and distribution plans for the year ended September 30, 2016, are set forth in the Statement of Operations.
Certain officers and Trustees of the Trust are also officers or directors of the Advisor and Distributor. The compensation of independent Trustees is borne by the Trust.
Annual Report 49
| | |
| NOTES TO FINANCIAL STATEMENTS, CONTINUED | | |
| |
Thornburg Limited Term Municipal Fund | | September 30, 2016 |
The Fund may sell securities to an affiliated fund, or the Fund may purchase securities held by an affiliated fund, provided the affiliation is due solely to having a common investment advisor, common officers, or common trustees, and provided that all such transactions will comply with Rule 17a-7 under the 1940 Act. For the year ended September 30, 2016, the Fund had transactions with affiliated funds of $12,902,740 in purchases.
NOTE 5 – SHARES OF BENEFICIAL INTEREST
At September 30, 2016, there were an unlimited number of shares with no par value of beneficial interest authorized. Transactions in shares of beneficial interest were as follows:
| | | | | | | | | | | | | | | | |
| | | Year Ended
September 30, 2016 | | | Year Ended
September 30, 2015 | |
| | | Shares | | | Amount | | | Shares | | | Amount | |
Class A Shares | | | | | | | | | | | | | | | | |
Shares sold | | | 24,409,105 | | | $ | 356,976,557 | | | | 19,409,135 | | | $ | 282,189,980 | |
Shares issued to shareholders in reinvestment of dividends | | | 1,617,427 | | | | 23,656,616 | | | | 1,764,554 | | | | 25,651,510 | |
Shares repurchased | | | (27,099,577 | ) | | | (396,238,125 | ) | | | (32,078,869 | ) | | | (465,820,855 | ) |
| | | | | | | | | | | | | | | | |
| | | | |
Net increase (decrease) | | | (1,073,045 | ) | | $ | (15,604,952 | ) | | | (10,905,180 | ) | | $ | (157,979,365 | ) |
| | | | | | | | | | | | | | | | |
| | | | |
Class C Shares | | | | | | | | | | | | | | | | |
Shares sold | | | 7,967,832 | | | $ | 116,744,198 | | | | 6,892,790 | | | $ | 100,433,041 | |
Shares issued to shareholders in reinvestment of dividends | | | 565,864 | | | | 8,292,917 | | | | 580,603 | | | | 8,455,627 | |
Shares repurchased | | | (8,145,288 | ) | | | (119,322,714 | ) | | | (8,611,331 | ) | | | (125,321,819 | ) |
| | | | | | | | | | | | | | | | |
| | | | |
Net increase (decrease) | | | 388,408 | | | $ | 5,714,401 | | | | (1,137,938 | ) | | $ | (16,433,151 | ) |
| | | | | | | | | | | | | | | | |
| | | | |
Class I Shares | | | | | | | | | | | | | | | | |
Shares sold | | | 114,131,595 | | | $ | 1,669,936,548 | | | | 99,672,701 | | | $ | 1,449,480,327 | |
Shares issued to shareholders in reinvestment of dividends | | | 5,957,028 | | | | 87,156,964 | | | | 5,492,589 | | | | 79,846,726 | |
Shares repurchased | | | (76,565,919 | ) | | | (1,119,900,913 | ) | | | (75,505,844 | ) | | | (1,096,772,666 | ) |
| | | | | | | | | | | | | | | | |
| | | | |
Net increase (decrease) | | | 43,522,704 | | | $ | 637,192,599 | | | | 29,659,446 | | | $ | 432,554,387 | |
| | | | | | | | | | | | | | | | |
NOTE 6 – INVESTMENT TRANSACTIONS
For the year ended September 30, 2016, the Fund had purchase and sale transactions of investments (excluding short-term investments) of $1,651,555,842 and $944,878,762, respectively.
OTHER NOTES
Risks: The Fund’s investments subject it to risks including, but not limited to, management risk, interest rate risk, credit risk, market and economic risk, and liquidity risk. Please see the Fund’s prospectus for a discussion of the risks associated with an investment in the Fund.
Subsequent Events: Fund management believes no events have occurred between September 30, 2016 and the date of issuance of the financial statements that require adjustment to or disclosure in the accompanying financial statements.
50 Annual Report
This page intentionally left blank.
Annual Report 51
FINANCIAL HIGHLIGHTS
Thornburg Limited Term Municipal Fund
| | | | | | | | | | | | | | | | | | | | | | | | | | | | | | | | | | | | | | | | | | | | | | | | | | | | |
| | | PER SHARE PERFORMANCE (for a share outstanding throughout the Year) | | RATIOS TO AVERAGE NET ASSETS | | | SUPPLEMENTAL DATA | |
Unless
Otherwise Noted,
Periods
are
Fiscal
Years
Ended
Sept. 30, | | Net Asset
Value
Beginning
of Year | | | Net
Investment
Income (Loss)+ | | Net
Realized
&
Unrealized
Gain (Loss)
on
Investments | | | Total from
Investment
Operations | | | Dividends
from Net
Investment
Income | | | Dividends
from Net
Realized
Gains | | Total
Dividends | | | Net
Asset
Value
End
of
Year | | Net
Investment
Income
(Loss)
(%) | | | Expenses,
After Expense
Reductions(%) | | | Expenses,
After
Expense
Reductions
and
Net of
Custody
Credits(%) | | | Expenses,
Before
Expense
Reductions
(%) | | | Total
Return
(%)(a) | | | Portfolio
Turnover
Rate (%)(a) | | Net
Assets
at End
of
Year
(Thousands) | |
CLASS A SHARES | | | | | | | | | | | | | | | | | | | | | | | | | | | | | | | | | | | | | | | | | | | | | | |
2016(b) | | $ | 14.52 | | | 0.22 | | | 0.11 | | | | 0.33 | | | | (0.22 | ) | | — | | | (0.22 | ) | | $14.63 | | | 1.54 | | | | 0.72 | | | | 0.72 | | | | 0.72 | | | | 2.32 | | | 14.53 | | $ | 1,697,329 | |
2015(b) | | $ | 14.58 | | | 0.23 | | | (0.06 | ) | | | 0.17 | | | | (0.23 | ) | | — | | | (0.23 | ) | | $14.52 | | | 1.56 | | | | 0.73 | | | | 0.73 | | | | 0.73 | | | | 1.15 | | | 18.56 | | $ | 1,700,127 | |
2014(b) | | $ | 14.38 | | | 0.26 | | | 0.20 | | | | 0.46 | | | | (0.26 | ) | | — | | | (0.26 | ) | | $14.58 | | | 1.78 | | | | 0.72 | | | | 0.71 | | | | 0.72 | | | | 3.20 | | | 14.46 | | $ | 1,865,213 | |
2013(b) | | $ | 14.70 | | | 0.26 | | | (0.32 | ) | | | (0.06 | ) | | | (0.26 | ) | | — | | | (0.26 | ) | | $14.38 | | | 1.81 | | | | 0.71 | | | | 0.71 | | | | 0.71 | | | | (0.39 | ) | | 17.47 | | $ | 2,178,317 | |
2012(b) | | $ | 14.39 | | | 0.31 | | | 0.31 | | | | 0.62 | | | | (0.31 | ) | | — | | | (0.31 | ) | | $14.70 | | | 2.13 | | | | 0.72 | | | | 0.72 | | | | 0.72 | | | | 4.36 | | | 12.72 | | $ | 2,131,540 | |
CLASS C SHARES | | | | | | | | | | | | | | | | | | | | | | | | | | | | | | | | | | | | | | | | | | | | | | |
2016 | | $ | 14.55 | | | 0.19 | | | 0.11 | | | | 0.30 | | | | (0.19 | ) | | — | | | (0.19 | ) | | $14.66 | | | 1.30 | | | | 0.96 | | | | 0.96 | | | | 0.96 | | | | 2.07 | | | 14.53 | | $ | 741,637 | |
2015 | | $ | 14.60 | | | 0.19 | | | (0.05 | ) | | | 0.14 | | | | (0.19 | ) | | — | | | (0.19 | ) | | $14.55 | | | 1.32 | | | | 0.96 | | | | 0.96 | | | | 0.96 | | | | 0.98 | | | 18.56 | | $ | 730,395 | |
2014 | | $ | 14.41 | | | 0.22 | | | 0.19 | | | | 0.41 | | | | (0.22 | ) | | — | | | (0.22 | ) | | $14.60 | | | 1.52 | | | | 0.97 | | | | 0.96 | | | | 0.97 | | | | 2.87 | | | 14.46 | | $ | 749,648 | |
2013 | | $ | 14.72 | | | 0.23 | | | (0.31 | ) | | | (0.08 | ) | | | (0.23 | ) | | — | | | (0.23 | ) | | $14.41 | | | 1.55 | | | | 0.97 | | | | 0.97 | | | | 0.97 | | | | (0.58 | ) | | 17.47 | | $ | 795,052 | |
2012 | | $ | 14.41 | | | 0.27 | | | 0.31 | | | | 0.58 | | | | (0.27 | ) | | — | | | (0.27 | ) | | $14.72 | | | 1.85 | | | | 0.99 | | | | 0.99 | | | | 0.99 | | | | 4.08 | | | 12.72 | | $ | 777,026 | |
CLASS I SHARES | | | | | | | | | | | | | | | | | | | | | | | | | | | | | | | | | | | | | | | | | | | | | | |
2016 | | $ | 14.53 | | | 0.27 | | | 0.11 | | | | 0.38 | | | | (0.27 | ) | | — | | | (0.27 | ) | | $14.64 | | | 1.85 | | | | 0.41 | | | | 0.41 | | | | 0.41 | | | | 2.64 | | | 14.53 | | $ | 5,506,166 | |
2015 | | $ | 14.58 | | | 0.27 | | | (0.05 | ) | | | 0.22 | | | | (0.27 | ) | | — | | | (0.27 | ) | | $14.53 | | | 1.88 | | | | 0.41 | | | | 0.41 | | | | 0.41 | | | | 1.54 | | | 18.56 | | $ | 4,832,467 | |
2014 | | $ | 14.38 | | | 0.30 | | | 0.20 | | | | 0.50 | | | | (0.30 | ) | | — | | | (0.30 | ) | | $14.58 | | | 2.09 | | | | 0.40 | | | | 0.40 | | | | 0.40 | | | | 3.53 | | | 14.46 | | $ | 4,417,547 | |
2013 | | $ | 14.70 | | | 0.31 | | | (0.32 | ) | | | (0.01 | ) | | | (0.31 | ) | | — | | | (0.31 | ) | | $14.38 | | | 2.15 | | | | 0.37 | | | | 0.37 | | | | 0.37 | | | | (0.05 | ) | | 17.47 | | $ | 3,502,580 | |
2012 | | $ | 14.39 | | | 0.36 | | | 0.31 | | | | 0.67 | | | | (0.36 | ) | | — | | | (0.36 | ) | | $14.70 | | | 2.46 | | | | 0.39 | | | | 0.39 | | | | 0.39 | | | | 4.71 | | | 12.72 | | $ | 3,084,872 | |
| (a) | Not annualized for periods less than one year. |
| (b) | Sales loads are not reflected in computing total return. |
| + | Based on weighted average shares outstanding. |
See notes to financial statements.
| | | | |
| 52 Annual Report | | | | Annual Report 53 |
REPORT OF INDEPENDENT REGISTERED PUBLIC ACCOUNTING FIRM
Thornburg Limited Term Municipal Fund
To the Trustees and Shareholders of
Thornburg Limited Term Municipal Fund
In our opinion, the accompanying statement of assets and liabilities, including the schedule of investments in securities, and the related statements of operations and of changes in net assets and the financial highlights present fairly, in all material respects, the financial position of the Thornburg Limited Term Municipal Fund (the “Fund”) at September 30, 2016, the results of its operations for the year then ended, the changes in its net assets for each of the two years in the period then ended and the financial highlights for each of the five years in the period then ended, in conformity with accounting principles generally accepted in the United States of America. These financial statements and financial highlights (hereafter referred to as “financial statements”) are the responsibility of the Fund’s management. Our responsibility is to express an opinion on these financial statements based on our audits. We conducted our audits of these financial statements in accordance with the standards of the Public Company Accounting Oversight Board (United States). Those standards require that we plan and perform the audit to obtain reasonable assurance about whether the financial statements are free of material misstatement. An audit includes examining, on a test basis, evidence supporting the amounts and disclosures in the financial statements, assessing the accounting principles used and significant estimates made by management, and evaluating the overall financial statement presentation. We believe that our audits, which included confirmation of securities at September 30, 2016 by correspondence with the custodian, brokers, transfer agent, and the application of alternative procedures where securities purchased had not been received, provide a reasonable basis for our opinion.
PricewaterhouseCoopers LLP
New York, New York
November 18, 2016
54 Annual Report
| | |
| EXPENSE EXAMPLE | | |
| |
Thornburg Limited Term Municipal Fund | | September 30, 2016 (Unaudited) |
As a shareholder of the Fund, you incur two types of costs:
| | (1) | transaction costs, including |
(a) sales charges (loads) on purchase payments, for Class A shares;
(b) a deferred sales charge on redemptions of any part or all of a purchase of $1 million of Class A shares within 12 months of purchase;
(c) a deferred sales charge on redemptions of Class C shares within 12 months of purchase;
| | (2) | ongoing costs, including management fees; distribution and/or service (12b-1) fees; and other Fund expenses. |
This example is intended to help you understand your ongoing costs (in dollars) of investing in the Fund and to compare these costs with the ongoing costs of investing in other mutual funds.
The example is based on a $1,000 investment beginning on April 1, 2016, and held until September 30, 2016.
| | | | | | | | | | | | |
| | | Beginning
Account Value
4/1/16 | | | Ending
Account Value
9/30/16 | | | Expenses paid
During period†
4/1/16–9/30/16 | |
Class A Shares | | | | | | | | | | | | |
Actual | | $ | 1,000.00 | | | $ | 1,009.10 | | | $ | 3.59 | |
Hypothetical* | | $ | 1,000.00 | | | $ | 1,021.43 | | | $ | 3.61 | |
Class C Shares | | | | | | | | | | | | |
Actual | | $ | 1,000.00 | | | $ | 1,007.90 | | | $ | 4.80 | |
Hypothetical* | | $ | 1,000.00 | | | $ | 1,020.22 | | | $ | 4.83 | |
Class I Shares | | | | | | | | | | | | |
Actual | | $ | 1,000.00 | | | $ | 1,011.30 | | | $ | 2.04 | |
Hypothetical* | | $ | 1,000.00 | | | $ | 1,022.97 | | | $ | 2.06 | |
| † | Expenses are equal to the annualized expense ratio for each class (A: 0.71%; C: 0.96%; I: 0.41%) multiplied by the average account value over the period, multiplied by 183/366 to reflect the one-half year period. |
| * | Hypothetical assumes a rate of return of 5% per year before expenses. |
ACTUAL EXPENSES
For each class of shares, the first line of the accompanying table provides information about actual account values and actual expenses. You may use the information in this line, together with the amount you invested, to estimate the expenses that you paid over the period. Simply divide your account value by $1,000 (for example, an $8,600 account value divided by $1,000 = 8.6), then multiply the result by the number in the first line for your class of shares under the heading entitled “Expenses Paid During Period” to estimate the expenses you paid on your account during this period.
HYPOTHETICAL EXAMPLE FOR COMPARISON PURPOSES
For each class of shares, the second line of the accompanying table provides information about hypothetical account values and hypothetical expenses based on the Fund’s actual expense ratio and an assumed rate of return of 5% per year before expenses, which is not the Fund’s actual return. The hypothetical account values and expenses may not be used to estimate the actual ending account balance or expenses you paid for the period. You may use this information to compare the ongoing costs of investing in the Fund and other funds. To do so, compare this 5% hypothetical example with the 5% hypothetical examples that appear in the shareholder reports of the other funds.
Please note that the expenses shown in the table are meant to highlight your ongoing costs only and do not reflect any transactional costs, such as sales charges (loads), redemption fees, or exchange fees. Therefore, the second line of the table for each class of shares is useful in comparing ongoing costs only, and will not help you determine the relative total costs of owning different funds. In addition, if these transactional costs were included, your costs would have been higher.
Annual Report 55
| | |
| TRUSTEES AND OFFICERS | | |
| |
Thornburg Limited Term Municipal Fund | | September 30, 2016 (Unaudited) |
| | | | | | |
Name, Age, Year Elected Position Held with Fund | | Principal Occupation(s) During Past Five Years | | Other
Directorships
Held by Trustee | |
INTERESTED TRUSTEES (1)(2)(4) | | | | |
| | |
Garrett Thornburg, 71 Trustee since 1987, Chairman of Trustees(3) | | Chairman and controlling shareholder of Thornburg Investment Management, Inc. (investment advisor); Chairman and controlling shareholder of Thornburg Securities Corporation (securities dealer); Chairman and CEO of Chamisa Energy, LLC; President of the Thornburg Foundation (nonprofit). | | | None | |
| | |
Brian J. McMahon, 61 Trustee since 2001, Vice Chairman of Trustees, Member of Governance & Nominating Committee & Operations Risk Oversight Committee(5) | | Chief Investment Officer, Managing Director, and Portfolio Manager and, until 2016, CEO and President of Thornburg Investment Management, Inc.; Vice President of Thornburg Securities Corporation. | | | None | |
| |
INDEPENDENT TRUSTEES (1)(2)(4) | | | | |
| | |
David A. Ater, 71 Trustee since 1994, Member of Audit Committee & Chairman of Governance & Nominating Committee | | Principal in Ater & Associates, Santa Fe, NM (developer, planner and broker of residential and commercial real estate); owner, developer and broker for various real estate projects. | | | None | |
| | |
David D. Chase, 75 Trustee since 2000, Chairman of Audit Committee | | Managing Member of CS Group, LLC, Santa Fe, NM (private investment fund – family office). | | | None | |
| | |
Sally Corning, 55 Trustee since 2012, Member of Audit Committee | | Partner in Sun Mountain Capital, Santa Fe, NM (private equity firm with investment programs encompassing venture capital, mezzanine debt, and growth equity). | | | None | |
| | |
Susan H. Dubin, 67 Trustee since 2004, Member of Audit Committee & Governance and Nominating Committee | | President of Dubin Investments, Ltd., Greenwich, CT (private investment fund); Director and officer of various charitable organizations. | | | None | |
| | |
David L. Gardner, 53 Trustee since 2015, Member of Operations Risk Oversight Committee | | Until 2012, head of EMEA (Europe, Middle East and Africa) Sales for iShares of Blackrock, Inc., EMEA Executive Committee Member and EMEA Operating Committee Member at Blackrock, Inc. | | | None | |
| | |
Owen D. Van Essen, 62 Trustee since 2004, Member of Governance & Nominating Committee & Chairman of Operations Risk Oversight Committee | | President of Dirks, Van Essen & Murray, Santa Fe, NM (newspaper mergers and acquisitions). | | | None | |
| | |
James W. Weyhrauch, 57 Trustee since 1996, Member of Audit Committee & Operations Risk Oversight Committee | | Real estate broker, Santa Fe Properties, Santa Fe, NM; Vice Chairman of Nambe LLC, Santa Fe, NM (manufacturing & design company). | | | None | |
56 Annual Report
| | |
| TRUSTEES AND OFFICERS, CONTINUED | | |
| |
Thornburg Limited Term Municipal Fund | | September 30, 2016 (Unaudited) |
| | | | | | |
Name, Age, Year Elected Position Held with Fund | | Principal Occupation(s) During Past Five Years | | Other
Directorships
Held by Trustee | |
OFFICERS OF THE FUND (WHO ARE NOT TRUSTEES)(1)(7) | | | | |
| | |
Nimish Bhatt, 53 Treasurer since 2016(6) | | Chief Financial Officer and Treasurer of Thornburg Investment Management, Inc. and Thornburg Securities Corporation since 2016; Senior Vice President (2004-2016), Chief Financial Officer (2011-2016), and Head of Fund Administration (2011-2016) of Calamos Asset Management, Inc., Calamos Investments LLC, Calamos Advisors LLC, and Calamos Wealth Management; Director of Calamos Global Funds plc (2007-2016). | | | Not applicable | |
| | |
Jason Brady, 42 President since 2016(6) | | CEO and President since 2016, Vice President from 2011 to 2016, Portfolio Manager and Managing Director of Thornburg Investment Management, Inc.; Vice President of Thornburg Securities Corporation since 2016. | | | Not applicable | |
| | |
Kathleen Brady, 56 Vice President since 2008 | | Tax Manager Fund Accounting of Thornburg Investment Management, Inc. | | | Not applicable | |
| | |
Connor Browne, 37 Vice President since 2006 | | Portfolio Manager, Vice President since 2013, and Managing Director of Thornburg Investment Management, Inc. | | | Not applicable | |
| | |
Tim Cunningham, 41 Vice President since 2014 | | Managing Director since 2011, Portfolio Manager since 2012, and Associate Portfolio Manager from 2009–2012 of Thornburg Investment Management, Inc. | | | Not applicable | |
| | |
Randy Dry, 42 Vice President since 2014 | | Vice President and Managing Director, Director of Institutional Group from 2014–2016, and since 2016, Chief Administrative Officer of Thornburg Investment Management, Inc. | | | Not applicable | |
| | |
Greg Dunn, 40 Vice President since 2014 | | Managing Director, Portfolio Manager since 2012, and Associate Portfolio Manager from 2009–2012 of Thornburg Investment Management, Inc. | | | Not applicable | |
| | |
Lon Erickson, 41 Vice President since 2008 | | Portfolio Manager and Managing Director of Thornburg Investment Management, Inc. | | | Not applicable | |
| | |
William V. Fries, 77 Vice President since 1995 | | Portfolio Manager, Vice President, and Managing Director of Thornburg Investment Management, Inc. | | | Not applicable | |
| | |
Thomas Garcia, 45 Vice President since 2006 | | Vice President since 2011, Managing Director, Head Equity Trader, and Associate Portfolio Manager of Thornburg Investment Management, Inc. | | | Not applicable | |
| | |
Rolf Kelly, 37 Vice President since 2016 | | Portfolio Manager and Managing Director since 2013 and Associate Portfolio Manager from 2011–2013 of Thornburg Investment Management, Inc. | | | Not applicable | |
| | |
Ben Kirby, 36 Vice President since 2014 | | Portfolio Manager and Managing Director since 2013 and Associate Portfolio Manager from 2011–2013 of Thornburg Investment Management, Inc. | | | Not applicable | |
| | |
Jeff Klingelhofer, 41 Vice President since 2016 | | Portfolio Manager and Managing Director since 2015, Associate Portfolio Manager from 2012–2015, and Fixed Income Analyst from 2010–2012 of Thornburg Investment Management, Inc. | | | Not applicable | |
| | |
Rob MacDonald, 40 Vice President since 2016 | | Managing Director since 2015, Portfolio Manager since 2014, and Associate Portfolio Manager from 2011–2014 of Thornburg Investment Management, Inc. | | | Not applicable | |
| | |
Leigh Moiola, 49 Vice President since 2001 | | Vice President, Managing Director, and Director of Marketing of Thornburg Investment Management, Inc.; Vice President of Thornburg Securities Corporation. | | | Not applicable | |
| | |
Christopher Ryon, 60 Vice President since 2008 | | Portfolio Manager and Managing Director of Thornburg Investment Management, Inc. | | | Not applicable | |
| | |
Nicholos Venditti, 35 Vice President since 2016 | | Portfolio Manager and Managing Director since 2015 and Associate Portfolio Manager from 2011–2015 of Thornburg Investment Management, Inc. | | | Not applicable | |
Annual Report 57
| | |
| TRUSTEES AND OFFICERS, CONTINUED | | |
| |
Thornburg Limited Term Municipal Fund | | September 30, 2016 (Unaudited) |
| | | | |
Name, Age, Year Elected Position Held with Fund | | Principal Occupation(s) During Past Five Years | | Other
Directorships
Held by Trustee |
| | |
Vinson Walden, 46 Vice President since 2004 | | Portfolio Manager and Managing Director of Thornburg Investment Management, Inc. | | Not applicable |
| | |
Lei Wang, 45 Vice President since 2006 | | Portfolio Manager and Managing Director of Thornburg Investment Management, Inc. | | Not applicable |
| | |
Sasha Wilcoxon, 42 Vice President since 2003 Secretary since 2007(6) | | Managing Director, Director of Mutual Fund Operations, and Vice President of Thornburg Investment Management, Inc.; Vice President of Thornburg Securities Corporation. | | Not applicable |
| | |
Charles Wilson, 41 Vice President since 2016 | | Portfolio Manager and Managing Director since 2014 and Associate Portfolio Manager from 2012–2014 of Thornburg Investment Management, Inc.; Co-Portfolio Manager of Marsico Capital Management from 2010–2012. | | Not applicable |
| | |
Di Zhou, 38 Vice President since 2016 | | Portfolio Manager and Managing Director since 2016, Associate Portfolio Manager from 2014–2016, and Equity Research Analyst from 2010–2014 of Thornburg Investment Management, Inc. | | Not applicable |
| (1) | Each person’s address is 2300 North Ridgetop Road, Santa Fe, New Mexico 87506. |
| (2) | The Fund is a separate investment “Fund” or “series” of Thornburg Investment Trust (the “Trust”), which comprises the Thornburg mutual fund complex and is organized as a Massachusetts business trust. Thornburg Investment Management, Inc. is the investment advisor to, and manages, all the Funds of the Trust. Each Trustee oversees all the Funds of the Trust. |
| (3) | Mr. Thornburg is considered an “interested” Trustee under the Investment Company Act of 1940 because he is the sole director and controlling shareholder of Thornburg Investment Management, Inc., the investment advisor to the Trust, and is the sole director and controlling shareholder of Thornburg Securities Corporation, the distributor of shares for the Trust. |
| (4) | The Bylaws of the Trust currently require that each Trustee shall retire by the end of the calendar year during which the Trustee reached the age of 75 years. Otherwise each Trustee serves in office until the election and qualification of a successor or until the Trustee sooner dies, resigns, retires or is removed. |
| (5) | Mr. McMahon is considered an “interested” Trustee under the Investment Company Act of 1940 because he is the chief investment officer of Thornburg Investment Management, Inc. |
| (6) | The Trust’s president, secretary, and treasurer each serves a one-year term or until the election and qualification of a successor; each other officer serves at the pleasure of the Trustees. |
| (7) | Assistant vice presidents, assistant secretaries, and assistant treasurers are not shown. |
The Statement of Additional Information for each Fund of the Trust includes additional information about the Trustees and is available, without charge and upon request, by calling 1-800-847-0200.
58 Annual Report
| | |
| OTHER INFORMATION | | |
| |
Thornburg Limited Term Municipal Fund | | September 30, 2016 (Unaudited) |
PORTFOLIO PROXY VOTING
Policies and Procedures:
The Trust has delegated to Thornburg Investment Management, Inc. (the “Advisor”) voting decisions respecting proxies for the Fund’s voting securities. The Advisor makes voting decisions in accordance with its Proxy Voting Policy. A description of the Policy is available (i) without charge, upon request, by calling the Advisor toll-free at 1-800-847-0200, (ii) on the Thornburg website at www.thornburg. com, and (iii) on the Securities and Exchange Commission’s website at www.sec.gov.
Information regarding how proxies were voted is available on or before August 31 of each year for the twelve months ending the preceding June 30. This information is available (i) without charge, upon request by calling the Advisor toll-free at 1-800-847-0200, (ii) on the Thornburg website at www.thornburg.com, and (iii) on the Securities and Exchange Commission’s website at www.sec.gov.
TAX INFORMATION
For the tax year ended September 30, 2016, dividends paid by the Fund of $130,923,029 (or the maximum allowed) are tax exempt dividends and $38,603 are taxable ordinary investment income dividends for federal income tax purposes. The information and the distributions reported herein may differ from the information and distributions reported to the shareholders for the calendar year ending December 31, 2016. Complete information will be reported in conjunction with your 2016 Form 1099.
AVAILABILITY OF QUARTERLY PORTFOLIO SCHEDULE
The Fund files with the Securities and Exchange Commission schedules of its portfolio holdings on Form N-Q for the first and third quarters of each fiscal year. The Fund’s Forms N-Q are available on the Commission’s website at www.sec.gov, or may be reviewed and copied at the Commission’s Public Reference Room in Washington, D.C. Information on the operation of the Public Reference Room may be obtained by calling 1-800-SEC-0330. The Fund also makes this information available on its website at www.thornburg. com/download or upon request by calling 1-800-847-0200.
STATEMENT RESPECTING RENEWAL OF INVESTMENT ADVISORY AGREEMENT
Thornburg Investment Management, Inc. (the “Advisor”) provides investment management services to Thornburg Limited Term Municipal Fund pursuant to an investment advisory agreement. The Trustees consider the renewal of this agreement annually, and most recently determined to renew the agreement on September 13, 2016.
In anticipation of their recent consideration of the advisory agreement’s renewal, the independent Trustees met in May 2016 to consider aspects of their annual evaluation of the Advisor’s service to all of the funds of Thornburg Investment Trust, to plan the annual evaluation of the Advisor’s performance and to specify the information the Advisor would present to the Trustees for their review. The independent Trustees met again in independent session in September to consider portions of the information submitted by the Advisor. The Advisor’s president and chief investment officer subsequently reviewed portions of the information with the Trustees and addressed questions from the Trustees at a full meeting session of the Trustees scheduled for that purpose, and the independent Trustees thereafter met in independent session to consider the Advisor’s presentation and various specific issues respecting their consideration of the advisory agreement’s renewal. Following these sessions, the Trustees met to consider renewal of the agreement, and the independent Trustees voted unanimously at that meeting to renew the agreement for an additional term of one year.
The information below summarizes certain factors considered by the Trustees in connection with the determination to renew the advisory agreement. In determining to renew the agreement, the Trustees considered a wide variety of information and did not identify any single factor as controlling, and this summary does not describe all of the factors and other matters considered by the Trustees in making their determination.
Nature, Extent and Quality of Services. The Trustees considered presentations by the Advisor at meeting sessions scheduled for consideration of a continuation of the advisory agreement, and also noted their consideration of the reports the Trustees and their committees receive throughout the year on a wide variety of topics, and consideration they had given to a number of topics in previous years. Information identified by the Trustees in their evaluation as having been considered and contributing to their conclusions included Trustees’ assessments of the Advisor’s personnel developed in formal and informal meetings throughout the year, the Advisor’s staffing levels and measures to maintain staffing levels and improve competencies, the Advisor’s commitment to attract and retain high quality portfolio management expertise through competitive compensation levels, the Advisor’s collaborative approach to investment management, the Fund’s investment performance over different periods of time, portfolio managers’ cognizance of and strategies to address market and economic trends and conditions, the evaluation and selection of individual investments, the structuring and composition of the Fund’s portfolio, management of Fund liquidity requirements, cognizance of and efforts to achieve tax efficiency, responses to share sale and redemption activity, continuing enhancements to the Advisor’s electronic and information systems and the Advisor’s
Annual Report 59
| | |
| OTHER INFORMATION, CONTINUED | | |
| |
Thornburg Limited Term Municipal Fund | | September 30, 2016 (Unaudited) |
engagement of outside firms to assist in improving or replacing those systems, the Advisor’s evaluation and selection of firms providing portfolio trade execution to the Fund and the Advisor’s measures to obtain favorable trade execution, the Advisor’s performance of accounting and other services, the Advisor’s continued commitment to observance of compliance and regulatory requirements, the Advisor’s responsiveness to the Trustees, the quality and extent of written and oral reports to the Trustees over the course of the year, and other factors.
Investment Performance. The Trustees noted in their evaluation of the Fund’s investment performance the reports they had received in each regular meeting over the course of the year from the Advisor’s portfolio personnel. The Trustees also noted in their evaluation their consideration of information provided to them at their request in anticipation of their annual evaluation of the Advisor’s services, including the following items of information respecting the investment performance of the Fund: (1) the Fund’s absolute investment performance and achievement of stated objectives; (2) the Advisor’s written and oral explanations and commentary on the Fund’s performance in the context of the Fund’s objectives and reasonable expectations, and business, market and economic conditions, (3) performance data for the most recent ten calendar years, comparing the Fund’s annual investment returns to a fund category selected by an independent mutual fund analyst firm, and to a broad-based securities index, (4) the Fund’s investment performance for the three-month, year-to-date, one-year, three-year, five-year and ten-year periods ending with the second quarter of the current year, comparing the Fund’s annualized returns to two mutual fund categories selected by independent mutual fund analyst firms and to a broad-based securities index, and assigning a percentage rank to the Fund’s performance for each period relative to each of the fund categories, and (5) comparative measures of correlation to equity indices, portfolio volatility, risk and return.
The Trustees noted that quarterly reports during the year and other information presented to them confirmed the Advisor’s continued conformity to the Fund’s stated investment objectives and policies.
The Trustees observed in evaluating comparative performance data for the ten most recent calendar years that the Fund’s investment return for the most recent calendar year was comparable to the return of the securities index and higher than the average return of the fund category considered, that the Fund’s returns for the preceding nine calendar years exceeded or were comparable to the returns of the index in eight of the nine years, and that the Fund’s returns exceeded or were comparable to the average returns of the fund category in all nine years. Other quantitative data noted by the Trustees as having been considered in their evaluation showed that the Fund’s annualized investment returns fell in the top decile of investment performance of the first of two fund categories for the one-year, three-year, five-year and ten-year periods ended with the second quarter of the current year, and that the Fund’s annualized investment returns fell in or near the top quartile of investment performance of the second fund category for the one-year, three-year, five-year and ten-year periods ended with the second quarter. Measures of portfolio volatility, risk and relative return considered by the Trustees demonstrated that the Fund’s performance relative to these measures continued to fulfill expectations in current conditions. The Trustees attached additional significance to the performance data of the Fund from the perspective of longer term shareholders.
Comparisons of Fee and Expense Levels. The Trustees recognized in their evaluation the clear disclosures of the Advisor’s fees and expenses in the Fund’s prospectus. Information also noted by the Trustees as having been considered included a variety of comparative data respecting the Fund’s fee and expense levels. This information included comparisons of the Fund’s advisory fee and overall Fund expenses to median and average fees and expenses charged to a category of mutual funds selected by an independent mutual fund analyst firm, comparisons of the advisory fee and other Fund expenses to the fee levels and expenses for two representative share classes of fund peer groups selected from the category by a second independent mutual fund analyst firm, the perspectives and advice from the second mutual fund analyst firm respecting comparisons of fund fee levels and expenses to fund peer groups, and other information. Comparative fee and expense data noted as having been considered by the Trustees showed that the advisory fee for the Fund was comparable to the median and average fee levels for the fund category, the level of total expense for a representative share class of the Fund was slightly higher than the median and comparable to the average levels for the category, and that the level of total expense for a second representative share class was lower than the median and average levels for the category. Peer group data showed that the Fund’s advisory fee level was comparable to the median fee levels for two fund peer groups and the total expense levels for two representative share classes were comparable to the median total expense levels for their respective peer groups.
The Trustees noted their consideration of information respecting the advisory fees charged by the Advisor to other investment management clients, including sub-advised mutual funds, together with information about fees charged by other advisors to different clients, analysis of the differences between the requirements of institutional clients and mutual funds, analysis of the differences between the requirements of a sub-advised mutual fund and a fund as to which the investment advisor is the primary advisor and sponsor, descriptions of distinguishing characteristics of the sub-advised funds served by the Advisor, and the consequently different investment management services provided to the different categories of clients and the differing contexts in which the fee levels for these arrangements are established. The Trustees confirmed their previous observations that the differences between the fees charged by the Advisor to different types of clients did not appear exceptional, and that the fee rates charged by an investment advisor to different categories of clients had limited relevance to the evaluation of the fee rate charged by that advisor to mutual funds as to which it is the primary advisor and sponsor.
Costs and Profitability of Advisor. In reviewing the profitability of the Advisor’s services to the Fund the Trustees considered an analysis of the Advisor’s costs and the profitability to the Advisor of its services, together with data respecting the overall profitability of a selection
60 Annual Report
| | |
| OTHER INFORMATION, CONTINUED | | |
| |
Thornburg Limited Term Municipal Fund | | September 30, 2016 (Unaudited) |
of other investment management firms. The Trustees noted that a portion of the Advisor’s profits are an important element in the compensation of shareholder employees. The Trustees considered in this regard information from the Advisor respecting investment of its profits to maintain staffing levels, pay competitive levels of compensation, and add to its information retrieval and management systems to maintain or improve service levels. The Trustees also considered the contribution of the Advisor’s cost management to its profitability, and the relationship of the Advisor’s financial resources and profitability in previous years to its ability to attract necessary personnel, invest in systems and other assets required for its service to the Fund, and maintain or improve service levels for the Fund notwithstanding fluctuations in revenues and profitability. The information considered did not indicate to the Trustees that the Advisor’s profitability was excessive.
Potential Economies of Scale. In reviewing the extent to which economies of scale would be realized by the Fund as it grows and whether fee levels reflect potential economies of scale, the Trustees considered the breakpoint structure for advisory fees chargeable to the Fund, comparisons of the fee breakpoint structure for the Fund with breakpoint structures (or the absence of such structures) for other funds in a peer group selected by an independent mutual fund analyst firm, the effects of the breakpoint structure and other expense factors realized by certain Funds of the Trust as their asset levels had increased, and the Advisor’s expenditures from its own profits and resources to maintain staffing levels, pay competitive levels of compensation, and add to its information retrieval and management systems to maintain or improve service levels. The information provided demonstrated to the Trustees that the Fund’s advisory fee breakpoint structure is reasonable in relation to the structures observed in the other funds in its peer group, and that shareholders may be expected to benefit from any economies of scale, due to the advisory agreement’s breakpoint fee structure for the Fund and other factors.
Potential Ancillary Benefits to the Advisor. In reviewing potential benefits to the Advisor because of its relationship to the Fund, the Trustees noted disclosures by the Advisor of its receipt of certain research services from broker dealers, and the benefits to both the Fund and the Advisor of the Advisor’s expansion of its staffing, compliance and systems capabilities and other resources to serve a broader variety of investment management clients. No unusual or unfair benefits to the Advisor from its relationship to the Fund were identified by the Trustees.
Summary of Conclusions. The Trustees concluded that the nature, extent and quality of the Advisor’s services performed under the advisory agreement remained sufficient. The Trustees further concluded that the absolute and relative investment performance of the Fund over a range of pertinent holding periods on the whole was satisfactory in the context of its objectives and strategies, and that the Advisor had continued to actively and competently pursue the Fund’s stated investment objectives and adhere to the Fund’s investment policies.
The Trustees further concluded, based upon their consideration of the foregoing factors and other information, that the level of the advisory fee charged to the Fund by the Advisor is reasonable in relation to the services provided by the Advisor in view of the nature, extent and quality of those services, the investment performance of the Fund after fees and expenses, the clear disclosure of fees and expenses in the Fund’s prospectus, comparisons of fees and expenses charged to the Fund to fees and expenses charged to other mutual funds, and the other factors considered.
Annual Report 61
TRUSTEES’ STATEMENT TO SHAREHOLDERS
Readopted September 12, 2016
The Trustees believe current and prospective shareholders should know how we discharge our responsibilities in supervising the Funds’ investment advisor and in reviewing the advisor’s contract for renewal. Since 2005, we have issued a statement which sets out clearly the three principal guidelines that we follow in supervising the Trust’s investment advisor on your behalf. In accordance with our customary practice, in September of this year we again reviewed our statement and concluded we should reissue this statement outlining the principal features of our supervision of the advisor’s performance of investment management services for the Funds.
We begin with the premise that each shareholder selected his or her Fund because its investments are managed by the investment advisor identified in the prospectus and in accordance with the objective and policies described in the prospectus. We realize, as each of you do, that if you believe that your Fund’s stated objective and policies no longer serve your personal investment goals, you can sell your shares and leave the Fund.
Therefore, we believe that our primary supervisory task – our principal obligation to you – is to assess the nature and quality of the advisor’s services, and to confirm that the advisor actively and competently pursues the Fund’s objective, in accordance with the policies set out in the prospectus. To do this, we meet regularly with management to review your Fund’s portfolio and to discuss the advisor’s specific actions and judgments in pursuing the Fund’s objective. We do not substitute our own judgment for the advisor’s decisions in selecting investments; the advisor is paid to exercise its informed judgment on investment decisions, and we seek to confirm, in reviewing the advisor’s performance, that the advisor is doing just that.
Second, we are conscious of costs and the effect that costs have on shareholders’ returns. We try to make sure that your Fund’s fees and costs are reasonable in relationship to the services rendered and that they are generally in line with those charged by other expert investment advisors, consistent with our belief that the Fund’s investors searched for and expect that expertise and attention and have decided to pay a reasonable price for it. We do not put the management contract “out to bid” as a matter of course, and we would not do so unless we had concluded that the advisor materially had failed to pursue the Fund’s objectives in accordance with its policies, or for other equally important reasons. We believe that any other approach would be inconsistent with your interests and contrary to your expectations when you bought shares of the Fund in the first place.
Finally, because we believe that most Thornburg Fund shareholders have invested with a long-term perspective, we try not to focus too much on the fashions of the moment and on short-term performance. The market will not favor any specific investment objective or set of policies at all times and under all economic circumstances. A fund will experience periods of both high and low returns relative to other funds and other investments. Even if one of our Funds is not favored by the market at a particular time, we believe that the advisor is nonetheless obliged to remain true to the Fund’s objective and policies, and we watch to see that it does so.
Trustees of Thornburg Investment Trust
62 Annual Report
THORNBURG FUNDS
Thornburg Investment Management is a privately-owned global investment firm that offers a range of solutions for retail and institutional investors. Founded in 1982 and headquartered in Santa Fe, New Mexico, we manage approximately $53 billion (as of September 30, 2016) across eight equity and 11 bond mutual funds, separate accounts for high-net-worth investors and institutional accounts, and five UCITS funds for non-U.S. investors.
The fund outlined in this report is one of many equity and fixed-income products available from Thornburg Investment Management.
Equity Funds
| | • | | Thornburg Core Growth Fund |
| | • | | Thornburg International Value Fund |
| | • | | Thornburg Better World International Fund |
| | • | | Thornburg International Growth Fund |
| | • | | Thornburg Developing World Fund |
| | • | | Thornburg Investment Income Builder Fund |
| | • | | Thornburg Global Opportunities Fund |
Fixed Income Funds
| | • | | Thornburg Low Duration Income Fund |
| | • | | Thornburg Limited Term U.S. Government Fund |
| | • | | Thornburg Limited Term Income Fund |
| | • | | Thornburg Strategic Income Fund |
| | • | | Thornburg Low Duration Municipal Fund |
| | • | | Thornburg Limited Term Municipal Fund |
| | • | | Thornburg Intermediate Municipal Fund |
| | • | | Thornburg California Limited Term Municipal Fund |
| | • | | Thornburg New Mexico Intermediate Municipal Fund |
| | • | | Thornburg New York Intermediate Municipal Fund |
| | • | | Thornburg Strategic Municipal Income Fund |
Before investing, carefully consider the Fund’s investment goals, risks, charges, and expenses. For a prospectus or summary prospectus containing this and other information, contact your financial advisor or visit thornburg.com. Read it carefully before investing.
For additional information, please visit thornburg.com
Thornburg Investment Management, Inc. 2300 North Ridgetop Road, Santa Fe, NM 87506
Annual Report 63

| | |
| To receive shareholder reports, prospectuses, and proxy statements electronically, go to www.thornburg.com/edelivery. | |  |
This Annual Report is submitted for the general information of shareholders of the Fund. It is not authorized for distribution to prospective investors in the Fund unless preceded or accompanied by an effective prospectus. | |
| | | | |
| Investment Advisor: | | Distributor: | | |
| Thornburg Investment Management® | | Thornburg Securities Corporation® | | |
| 800.847.0200 | | 800.847.0200 | | TH858 |
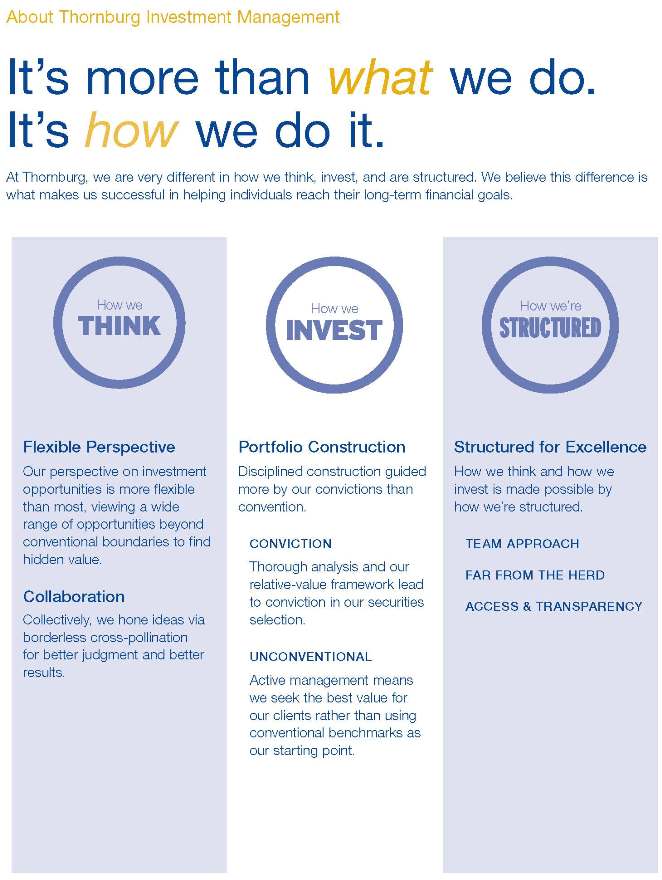
2 Annual Report
Annual Report
Thornburg Intermediate Municipal Fund
September 30, 2016
| | | | |
Share Class | | NASDAQ Symbol | | CUSIP |
Class A | | THIMX | | 885-215-202 |
Class C | | THMCX | | 885-215-780 |
Class I | | THMIX | | 885-215-673 |
Minimum investments for Class I shares may be higher than those for other classes. Class I shares may not be available to all investors.
Investments carry risks, including possible loss of principal. Portfolios investing in bonds have the same interest rate, inflation, and credit risks that are associated with the underlying bonds. The value of bonds will fluctuate relative to changes in interest rates, decreasing when interest rates rise. Unlike bonds, bond funds have ongoing fees and expenses. Please see the Fund’s prospectus for a discussion of the risks associated with an investment in the Fund. Investments in the Fund are not FDIC insured, nor are they bank deposits or guaranteed by a bank or any other entity.
The laddering strategy does not assure or guarantee better performance and cannot eliminate the risk of investment losses.
Diversification does not assure or guarantee better performance and cannot eliminate the risk of investment losses.
Annual Report 3
LETTER TO SHAREHOLDERS
| | |
| |
Thornburg Intermediate Municipal Fund | | September 30, 2016 (Unaudited) |
October 13, 2016
Dear Fellow Shareholder:
We are pleased to present the annual report for Thornburg Intermediate Municipal Fund. The net asset value (NAV) of the Class A shares increased by 30 cents to $14.47 per share during the fiscal year ended September 30, 2016. If you were with us for the entire period, you received dividends of 28.8 cents per share. If you reinvested your dividends, you received 29.0 cents per share. Dividends were lower for Class C shares and higher for Class I shares to account for varying class-specific expenses. The Class A shares of your Fund underperformed the index with a 4.17% total return (without sales charge) for the fiscal year ended September 30, 2016, compared to the 4.99% total return for the BofA Merrill Lynch 3-15 Year U.S. Municipal Securities Index. The Fund generated 0.57% more price return and 1.39% less income than the index after accounting for the different treatment of bonds priced above and below par by the index versus the Fund.
Drivers of the Fund’s price return relative to its benchmark include its interest rate sensitivity, as measured by the Fund’s duration. Also, differing allocations along the Fund’s investment universe subtracted 0.19% of relative price performance. Sector allocations subtracted 0.01% of relative price performance and its overweight to lower credit-quality securities contributed 0.41% of relative price performance. Other risk factors totaled another 0.36% of relative price performance for the period.
The market’s returns were a result of increasing short-term rates, and decreasing long-term rates, shown in Figure 1.
U.S. Economy, Fed Policy, and the Election
The U.S. economy grew at a paltry average rate of 1%, as measured by nominal gross domestic product, for the first three quarters of 2016, much lower than the almost 3% average rate for 2015.
On the employment front, the economy added approximately 200,000 jobs per month for the Fund’s 2016 fiscal year. The May jobs number was a little scary, adding only 24,000 that month. The unemployment rate ticked up to 5.0% in September of 2016 from 4.9% in August, as more previously non-participating workers returned to the labor market.
Inflation has held stable, although it did move up slightly. The Core Personal Consumption Expenditure Index (Core PCE) for August moved up to 1.7% from 1.6% in July, although well below the U.S. Federal Reserve Board’s (the Fed) 2% target.
So, all in all, the economy is still growing, jobs are being added, and inflation is well behaved. This isn’t a bad scenario for municipal bond investors, except that, at current valuations and 10-year AAA municipal general obligation bonds yielding 1.64%, municipal bond investors are generally not keeping up with inflation.
Elsewhere, the Fed increased the federal funds rate 0.25% in December of 2015. Although many pundits want to blame the credit markets rout on that event, they would be wrong. Oil prices, as measured by WTI crude futures, hit a low of $34.54 on January 20, 2016. Energy producers are a highly leveraged segment of the market, whether through bank loans or other forms of debt. As market participants began to question their ability to service these loans or debt, credit spreads began to widen and the impact of these loans on the financial stability of some banks came into question. The municipal market avoided this distress because bond issuance from energy-producing states was a small fraction of the $3.8 trillion municipal bond market.
This early-2016 market turbulence, followed by the May jobs report and the “Brexit” vote in Great Britain, gave the Fed enough pause not to follow their December rate increase with another. So far through 2016, the central bank has insisted that they may increase rates again and again. Last year we said, “Regardless, waiting for the Fed to raise short-term interest rates is akin to Waiting for Godot.” Well, we are still waiting. Meanwhile, the Fed is assuring the markets that the next meeting is “live” and they may raise short-term interest rates again!
Figure I | 12-Month Change in Rates for AAA Rated General Obligation Municipal Bonds
(as of September 30, 2016)
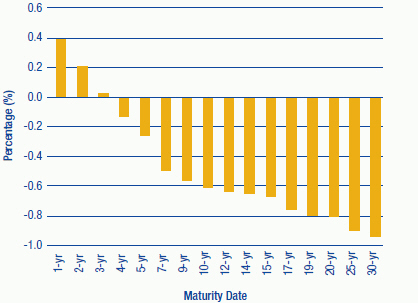
Source: Bloomberg.
Past performance does not guarantee future results.
4 Annual Report
| | |
LETTER TO SHAREHOLDERS, CONTINUED | | |
| |
Thornburg Intermediate Municipal Fund | | September 30, 2016 (Unaudited) |
The 2016 U.S. presidential race featured two major party candidates with unprecedented high unfavorable ratings with the electorate. At the time of this writing, the election’s result is weeks away. Regardless of the winner, however, the president historically has had very little impact on the course of the economy. Although there is a pattern that if the economy is doing well, the current administration likes to take all the credit; if the economy is not doing well, the current administration blames the previous one. A victory for either candidate could still benefit the municipal bond market, however, as both stumped for large increases in infrastructure spending—with one particularly calling for higher taxes which would lend support to the municipal bond market. If this gets through Congress, it could mean a higher level of municipal bond issuance and ultimately high growth rates for the economy; both occurrences would put upward pressure on municipal bond yields.
The Municipal Bond Market
The value metrics we use at Thornburg all suggest that the municipal bond market is pricing-in the rosiest of scenarios going forward. The main reason for this is that global central banks, with their overly accommodative monetary policies, have pushed investors further out on the risk spectrum in search of yield. That is why, depending on the fund, we have our portfolios positioned in the lower end of their respective risk spectrums. This means that durations (a measure of price sensitivity to changes in interest rates) are low and credit quality is higher than in the past. We continually ask ourselves: are investors getting paid to take risk? The answer we come up with is no!
Inside the Risk Metrics
Let’s first look at real yields, which is how much yield over inflation investors are being paid to own municipal bonds. As mentioned earlier, 10-year AAA general obligation bonds are yielding 1.64% and Core PCE is running at 1.70%, so investors are earning less than inflation. Over the last 20 years, investors have earned an average of 2% over inflation for the opportunity to invest in a 10-year AAA general obligation municipal bond.
The second thing to consider is credit spreads, which reflect the incremental yield an investor earns from owning a lower-rated credit versus a higher-rated credit, and which are now very narrow. As of September 30, 2016, an investor earned about 1% more for owning a 10-year BBB revenue bond versus a 10-year AAA general obligation bond. That is slightly higher than the average 0.75% an investor earned between 1994 and 2007. In 2007, approximately 50% of the new issue municipal bond market was insured by AAA/AAA municipal bond insurers. Today, there are no AAA/AAA municipal bond insurers, and insurance coverage generally accounts for only 6% to 8% of the new issue municipal bond market. On top of that, the security covenants of some current lower-quality investment grade securities are the most lax in years. This is a great time to be an issuer of lower-quality investment grade municipal bonds but not a great time to be an investor in them.
Finally, the slope of the yield curve, which tracks how much incremental yield an investor earns by owning securities with longer maturities, is also quite flat. Currently, investors are earning 0.78% more for owning a 10-year AAA general obligation municipal bond, versus a 1-year AAA general obligation municipal bond. Since 1994, an investor earned on average almost 1.60% to extend maturities from one to 10 years. The stretch for income is causing investors to absorb more risk at lower and lower relative yields.
Aside from valuations, the credit picture for the majority of the U.S. is pretty bright. Except for energy producing states, most regions are showing positive trends along such measures as:
Pensions are still a troubling issue. That is, 35 states reported a pension funding ratio of under 80% in 2014—the Mendoza line between a well-funded state pension and the “other kind.” As the worst career hitter in major league baseball history (.200 batting average), Mario Mendoza Aizpuru’s name ubiquitously symbolizes futility.
Liquidity
Market liquidity is still a concern. The latest example of this is what is happening to yields on Variable Rate Demand Notes (VRDNs). These are securities that are normally held in money market funds and bond fund reserve positions. They can be put back to an intermediary on a daily basis and are relatively secure. Leading up to the finalization of the Securities and Exchange Commission’s money market fund reform in October of 2016, money market funds were and are repositioning themselves to be compliant with the new regulations. As such, they have had to divest themselves of VRDNs. Intermediaries do not want to hold them on their balance sheets (very expensive), so they raise the yields to clear the market. What used to yield 0.01% in March now yields, as of the time of this writing, 0.90%, or more than a 3-year AA security. This is serendipity for managers like Thornburg holding higher reserves because of concern over market liquidity; for issuers in the VRDN market, it’s not so much.
Annual Report 5
| | |
LETTER TO SHAREHOLDERS, CONTINUED | | |
| |
Thornburg Intermediate Municipal Fund | | September 30, 2016 (Unaudited) |
Main Reason to Own Municipal Bonds
One of the best risk-mitigating tools an investor has is diversification. By splitting a portfolio into several asset classes, an investor may reduce the volatility of the resulting portfolio’s returns. This is because the returns of various asset classes are not always correlated. There are times when this is not the case, such as the 2008 financial crisis when all correlations went to one. For the long-term investor, however, we believe the benefits of diversification stand firm. When added to a portfolio of stocks, municipal bonds tend to reduce the volatility of that combined portfolio. Funds such as Thornburg Intermediate Municipal Fund may be a viable choice in a total diversified portfolio of stocks and bonds.
Conclusion
We continue to run this portfolio as an actively managed laddered portfolio. Laddering a portfolio is a simple way to diversify its investment along its entire investment universe. While past performance does not guarantee future results, our study showed that this structure outperformed other structures around 60% of the time and added 0.15% to 0.25% of total return annually.* Our view is that the current investment environment is not compensating investors enough to take on extra risk, so we have positioned our portfolios at the lower end of their risk spectrums. Know that the co-managers of this Fund are invested alongside you.
Thank you for your continued trust in us.
| | |
| Sincerely, | | |
| |
 | |  |
| Christopher Ryon,CFA | | Nicholos Venditti,CFA |
| Portfolio Manager | | Portfolio Manager |
| Managing Director | | Managing Director |
| * | We examined three hypothetical portfolios of bonds from December 1997 to December 2015. One using a laddering strategy, one using a barbell strategy, and a third using a bullet strategy. For the laddering strategy, the BofA Merrill Lynch 1–12 Year Municipal Index was used as a proxy, since, similar to a ladder, it contains bonds relatively evenly spread across all maturities within the index. The barbell strategy is a duration management technique wherein bonds are clustered at the two extremes of a maturity range. For the barbell strategy, the BofA Merrill Lynch 1–3 Year Municipal Index and BofA Merrill Lynch 8–12 Year Municipal Index were combined. The two indices were weighted in such a way as to give them the same duration as the broader 1–12 Year Index, and each year the portfolio was re-weighted back to the original index weights. This was done to make the two portfolios duration-neutral so that the impact of the strategy chosen could be isolated. The bullet strategy invests at the duration midpoint of the portfolio, therefore the BofA Merrill Lynch 6–8 Year Index was used to represent the bullet strategy. For additional information, see www.thornburg.com/whyladder. Past performance does not guarantee future results. |
The matters discussed in this report may constitute forward-looking statements made pursuant to the safe harbor provisions of the Securities Litigation Reform Act of 1995. These include any advisor or portfolio manager prediction, assessment, analysis or outlook for individual securities, industries, investment styles, market sectors and/or markets. These statements involve risks and uncertainties. In addition to the general risks described for each fund in its current prospectus, other factors bearing on these reports include the accuracy of the advisor’s or portfolio manager’s forecasts and predictions, the appropriateness of the investment strategies designed by the advisor or portfolio manager and the ability of the advisor or portfolio manager to implement their strategies efficiently and successfully. Any one or more of these factors, as well as other risks affecting the securities markets generally, could cause the actual results of any fund to differ materially as compared to its benchmarks.
The views expressed by the portfolio managers reflect their professional opinions and are subject to change. Under no circumstances does the information contained within represent a recommendation to buy or sell any security.
6 Annual Report
| | |
| PERFORMANCE SUMMARY | | |
| |
Thornburg Intermediate Municipal Fund | | September 30, 2016 (Unaudited) |
Average Annual Total Returns
| | | | | | | | | | | | | | | | | | | | |
| | | 1-Yr | | | 3-Yr | | | 5-Yr | | | 10-Yr | | | Since
Incep. | |
A Shares (Incep: 7/22/91) | | | | | | | | | | | | | | | | | | | | |
Without sales charge | | | 4.17 | % | | | 3.92 | % | | | 3.67 | % | | | 4.03 | % | | | 4.93 | % |
With sales charge | | | 2.09 | % | | | 3.22 | % | | | 3.25 | % | | | 3.82 | % | | | 4.84 | % |
C Shares (Incep: 9/1/94) | | | | | | | | | | | | | | | | | | | | |
Without sales charge | | | 3.84 | % | | | 3.59 | % | | | 3.34 | % | | | 3.73 | % | | | 4.11 | % |
With sales charge | | | 3.24 | % | | | 3.59 | % | | | 3.34 | % | | | 3.73 | % | | | 4.11 | % |
I Shares (Incep: 7/5/96) | | | 4.57 | % | | | 4.24 | % | | | 3.99 | % | | | 4.36 | % | | | 4.67 | % |
30-Day Yields, A Shares
(with sales charge)
| | | | |
Annualized Distribution Yield | | | 1.99 | % |
SEC Yield | | | 0.89 | % |
Growth of a Hypothetical $10,000 Investment
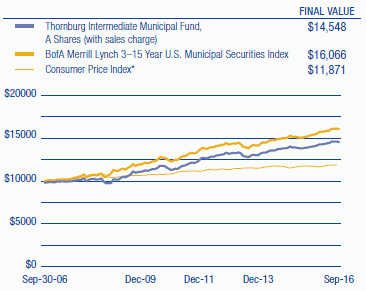
| | * | CPI data is as of 8/31/2016. |
Performance data shown represents past performance and is no guarantee of future results. Investment return and principal value will fluctuate so shares, when redeemed, may be worth more or less than their original cost. Current performance may be lower or higher than quoted. For performance current to the most recent month end, visit thornburg.com or call 800-847-0200. The performance information does not reflect the deduction of taxes that a shareholder would pay on distributions or the redemption of Fund shares. Returns reflect the reinvestment of dividends and capital gains. Class A shares are sold with a maximum sales charge of 2.00%. Class C shares include a 0.60% CDSC for the first year only. There is no sales charge for Class I shares.
As disclosed in the most recent prospectus, the total annual fund operating expenses are as follows: A shares, 0.92%; C shares, 1.28%; I shares, 0.62%. Thornburg Investment Management and/or Thornburg Securities Corporation have contractually agreed to waive fees and reimburse expenses through at least February 1, 2017, for some of the share classes, resulting in net expense ratios of the following: C shares, 1.24%. For more detailed information on fund expenses and waivers/reimbursements please see the Fund’s prospectus.
Glossary
BofA Merrill Lynch 3-15 Year U.S. Municipal Securities Index – A subset of the BofA Merrill Lynch U.S. Municipal Securities Index including all securities with a remaining term to final maturity greater than or equal to 3 years and less than 15 years.
The BofA Merrill Lynch indices used in the Ladder vs Barbell & Bullet study are model portfolios of municipal obligations throughout the United States, with maturities ranging either from one to three years, six to eight years, eight to twelve years, or one to twelve years. These indices are subsets of the BofA Merrill Lynch U.S. Municipal Securities Index, which is comprised of U.S. dollar denominated investment grade tax-exempt debt publicly issued by U.S. states and territories, and their political subdivisions, in the U.S. domestic market. Qualifying securities must have at least a one-year remaining term to final maturity, a fixed coupon schedule and an investment grade rating.
Unless otherwise noted, index returns reflect the reinvestment of income dividends and capital gains, if any, but do not reflect fees, brokerage commissions or other expenses of investing. Investors may not make direct investments into any index. The performance of any index is not indicative of the performance of any particular investment.
Annualized Distribution Yield – The distribution yield reflects actual distributions made to shareholders. The annualized distribution yield is calculated by summing the last 30 days of income at a given month end and annualizing to a 360-day year. The result is divided by the ending maximum offering price.
Bond Credit Ratings (Credit Quality) – A bond credit rating assesses the financial ability of a debt issuer to make timely payments of principal and interest. Ratings of AAA (the highest), AA, A, and BBB are investment-grade quality. Ratings of BB, B, CCC, CC, C and D (the lowest) are considered below investment grade, speculative grade, or junk bonds.
Core Personal Consumption Expenditure Index (Core PCE) – A measure of the Personal Consumption Expenditure Index that excludes the more volatile and seasonal food and energy prices.
Credit Spread/Quality Spread – The difference between the yields of securities with different credit qualities.
Duration – A bond’s sensitivity to interest rates. Effective duration incorporates the embedded option features, such as call provisions. Bonds with longer durations experience greater price volatility than bonds with shorter durations.
General Obligation Bond (GO) – A municipal bond backed by the credit and “taxing power” of the issuing jurisdiction rather than the revenue from a given project.
Gross Domestic Product (GDP) – A country’s income minus foreign investments: the total value of all goods and services produced within a country in a year, minus net income from investments in other countries.
Laddering – Involves building a portfolio of bonds with staggered maturities so that a portion matures each year. Money that comes in from maturing bonds is typically invested in bonds with longer maturities at the far end of the portfolio.
Revenue Bond – A bond on which the debt service is payable solely from the revenue generated from the operation of the project being financed or a category of facilities, or from other non-tax sources.
SEC Yield – SEC yield is computed in accordance with SEC standards measuring the net investment income per share over a specified 30-day period expressed as a percentage of the maximum offering price of the Fund’s shares at the end of the period.
Variable Rate Demand Note (VRDN) – VRDNs are long-term, floating-rate municipal securities. These highly liquid securities are payable on demand, typically either daily or weekly, meaning the investor can request repayment of the entire debt amount. The coupon rate will adjust on a periodic basis, either daily or weekly.
West Texas Intermediate (WTI) – A grade of crude oil used as a benchmark in oil pricing.
Yield Curve – A line that plots the interest rates, at a set point in time, of bonds having equal credit quality, but differing maturity dates.
Annual Report 7
| | |
| FUND SUMMARY | | |
| |
Thornburg Intermediate Municipal Fund | | September 30, 2016 (Unaudited) |
Objectives and Strategies
The Fund’s primary investment goal is to obtain as high a level of current income exempt from federal individual income tax as is consistent, in the view of the Fund’s investment advisor, with preservation of capital (may be subject to Alternative Minimum Tax).
The secondary goal of the Fund is to reduce expected changes in its share price compared to long-term bond portfolios.
This Fund invests principally in a laddered portfolio of municipal bonds with a dollar-weighted average maturity of normally three to ten years. Laddering involves building a portfolio of bonds with staggered maturities so that a portion of the portfolio matures each year. Cash from maturing bonds, if not needed for other purposes, is typically invested in bonds with longer maturities at the far end of the ladder. We regard the strategy as a good compromise for managing different types of risk.
Long-term Stability of Principal
Net Asset Value History of A Shares
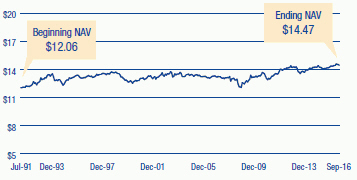
Security Credit Ratings
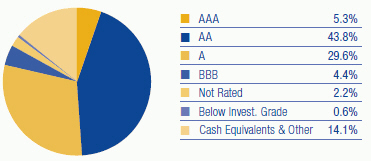
A bond credit rating assesses the financial ability of a debt issuer to make timely payments of principal and interest. Ratings of AAA (the highest), AA, A, and BBB are investment-grade quality. Ratings of BB, B, CCC, CC, C and D (the lowest) are considered below investment grade, speculative grade, or junk bonds. Credit quality ratings for Thornburg’s municipal portfolios used the highest rating available from either Standard & Poor’s or Moody’s Investors Service.
Key Portfolio Attributes
| | | | |
Number of Bonds | | | 538 | |
Effective Duration | | | 4.8 Yrs | |
Average Maturity | | | 7.9 Yrs | |
Portfolio Ladder
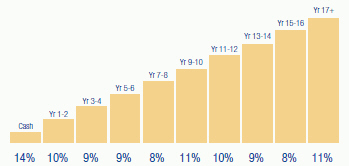
Percent of portfolio maturing in each year. Cash includes cash equivalents and other.
There is no guarantee that the Fund will meet its investment objectives.
All data is subject to change. Charts may not add up to 100% due to rounding.
8 Annual Report
| | |
| SCHEDULE OF INVESTMENTS | | |
| |
Thornburg Intermediate Municipal Fund | | September 30, 2016 |
| | | | | | | | | | | | |
Issuer-Description | | Credit Rating†
S&P/ Moody’s | | | Principal
Amount | | | Value | |
ALABAMA — 1.24% | | | | | | | | | | | | |
Alabama Capital Region Solid Waste Disposal Authority, 4.00% due 6/15/2017 (Montgomery Materials Recovery Facility) (AMT) | | | AA/NR | | | $ | 750,000 | | | $ | 762,525 | |
Alabama Capital Region Solid Waste Disposal Authority, 4.00% due 6/15/2019 (Montgomery Materials Recovery Facility) (AMT) | | | AA/NR | | | | 815,000 | | | | 860,485 | |
Alabama Capital Region Solid Waste Disposal Authority, 5.00% due 6/15/2020 (Montgomery Materials Recovery Facility) (AMT) | | | AA/NR | | | | 845,000 | | | | 934,443 | |
Alabama Capital Region Solid Waste Disposal Authority, 5.00% due 6/15/2021 (Montgomery Materials Recovery Facility) (AMT) | | | AA/NR | | | | 890,000 | | | | 1,000,725 | |
Alabama Capital Region Solid Waste Disposal Authority, 5.00% due 6/15/2022 (Montgomery Materials Recovery Facility) (AMT) | | | AA/NR | | | | 930,000 | | | | 1,055,690 | |
Alabama Capital Region Solid Waste Disposal Authority, 5.00% due 6/15/2023 (Montgomery Materials Recovery Facility) (AMT) | | | AA/NR | | | | 980,000 | | | | 1,099,521 | |
Alabama Public School & College Authority, 5.00% due 6/1/2021 (Educational Facilities) | | | AA/Aa1 | | | | 775,000 | | | | 909,354 | |
Alabama Public School & College Authority, 5.00% due 6/1/2026 (Educational Facilities) | | | AA/Aa1 | | | | 4,380,000 | | | | 5,346,841 | |
Board of Trustees of the University of Alabama, 5.25% due 9/1/2025 (Birmingham Hospital) | | | A+/A1 | | | | 2,000,000 | | | | 2,160,640 | |
City of Mobile Industrial Development Board, 1.65% due 6/1/2034 put 3/20/2017 (Alabama Power Company Barry Plant Project) | | | A-/A1 | | | | 2,000,000 | | | | 2,006,180 | |
East Alabama Health Care Authority GO, 5.00% due 9/1/2027 (Health Care Facilities Capital Improvements) | | | A/NR | | | | 1,250,000 | | | | 1,416,025 | |
Montgomery Water Works & Sanitary Sewer Board, 5.00% due 9/1/2017 | | | AAA/Aa1 | | | | 2,185,000 | | | | 2,268,139 | |
| | | |
ALASKA — 0.18% | | | | | | | | | | | | |
Alaska Housing Finance Corp. GO, 5.00% due 12/1/2021 (State Capital Project) | | | AA+/Aa2 | | | | 500,000 | | | | 580,095 | |
City of Valdez, 5.00% due 1/1/2021 (BP Pipelines (Alaska), Inc. Project) | | | A-/A2 | | | | 2,000,000 | | | | 2,279,320 | |
| | | |
ARIZONA — 1.52% | | | | | | | | | | | | |
Arizona Board of Regents, 5.00% due 8/1/2024 (University of Arizona SPEED) | | | A+/Aa3 | | | | 1,635,000 | | | | 1,910,596 | |
Arizona Board of Regents, 5.00% due 8/1/2029 (University of Arizona SPEED) | | | A+/Aa3 | | | | 1,000,000 | | | | 1,220,480 | |
Arizona HFA, 5.00% due 7/1/2017 (Dignity Health) | | | A/A3 | | | | 1,450,000 | | | | 1,492,702 | |
Arizona HFA, 5.00% due 12/1/2031 (Scottsdale Lincoln Hospitals) | | | NR/A2 | | | | 2,500,000 | | | | 3,016,575 | |
Arizona State University Energy Management LLC, 5.00% due 7/1/2017 (Tempe Campus Project) | | | AA-/A1 | | | | 465,000 | | | | 478,480 | |
City of Flagstaff GO, 3.00% due 7/1/2020 (Urban Trail, Street and Utilities Improvements) | | | AA/Aa2 | | | | 700,000 | | | | 747,159 | |
City of Flagstaff GO, 4.00% due 7/1/2022 (Urban Trail, Street and Utilities Improvements) | | | AA/Aa2 | | | | 420,000 | | | | 483,416 | |
City of Flagstaff GO, 4.00% due 7/1/2023 (Urban Trail, Street and Utilities Improvements) | | | AA/Aa2 | | | | 200,000 | | | | 233,816 | |
City of Phoenix Civic Improvement Corp., 5.00% due 7/1/2017 (Insured: Natl-Re) | | | AA+/Aa3 | | | | 1,000,000 | | | | 1,031,290 | |
County of Pima IDA, 5.00% due 12/1/2030 (Providence Day School Project) | | | BBB+/NR | | | | 2,000,000 | | | | 2,174,400 | |
Salt Verde Financial Corp., 5.25% due 12/1/2022 (Salt River Project Agricultural Improvement and Power District) | | | BBB+/Baa1 | | | | 2,000,000 | | | | 2,384,400 | |
Salt Verde Financial Corp., 5.25% due 12/1/2028 (Salt River Project Agricultural Improvement and Power District) | | | BBB+/Baa1 | | | | 770,000 | | | | 982,597 | |
State of Arizona, 5.00% due 7/1/2019 (Insured: AGM) | | | AA/A1 | | | | 7,280,000 | | | | 8,047,676 | |
| | | |
ARKANSAS — 0.28% | | | | | | | | | | | | |
Board of Trustees of the University of Arkansas, 5.00% due 11/1/2031 (Fayetteville Campus) | | | NR/Aa2 | | | | 1,000,000 | | | | 1,211,310 | |
Board of Trustees of the University of Arkansas, 5.00% due 11/1/2032 (Fayetteville Campus) | | | NR/Aa2 | | | | 655,000 | | | | 790,703 | |
Board of Trustees of the University of Arkansas, 5.00% due 11/1/2033 (Fayetteville Campus) | | | NR/Aa2 | | | | 1,000,000 | | | | 1,200,620 | |
Board of Trustees of the University of Arkansas, 5.00% due 11/1/2034 (Fayetteville Campus) | | | NR/Aa2 | | | | 1,000,000 | | | | 1,196,540 | |
| | | |
CALIFORNIA — 6.56% | | | | | | | | | | | | |
Alameda County Joint Powers Authority, 5.25% due 12/1/2027 (Alameda County Medical Center Highland Hospital) | | | AA/Aa3 | | | | 1,000,000 | | | | 1,242,890 | |
Alameda County Joint Powers Authority, 5.25% due 12/1/2028 (Alameda County Medical Center Highland Hospital) | | | AA/Aa3 | | | | 1,150,000 | | | | 1,435,499 | |
Alameda County Joint Powers Authority, 5.25% due 12/1/2029 (Alameda County Medical Center Highland Hospital) | | | AA/Aa3 | | | | 1,500,000 | | | | 1,863,000 | |
Brentwood Infrastructure Financing Authority, 5.00% due 11/1/2026 (Insured: AGM) | | | AA/NR | | | | 2,000,000 | | | | 2,302,500 | |
California Educational Facilities Authority, 5.50% due 4/1/2029 (Pitzer College) | | | NR/A2 | | | | 3,000,000 | | | | 3,383,610 | |
California HFFA, 5.00% due 11/15/2022 (Children’s Hospital Los Angeles) | | | BBB+/Baa2 | | | | 1,000,000 | | | | 1,167,100 | |
California HFFA, 5.00% due 3/1/2026 (Adventist Health System/West) | | | A/NR | | | | 3,020,000 | | | | 3,645,472 | |
California HFFA, 5.25% due 3/1/2027 (Dignity Health) | | | A/A3 | | | | 5,250,000 | | | | 6,130,950 | |
California Infrastructure & Economic Development Bank, 5.75% due 8/15/2029 (King City Joint Union High School District) | | | AA-/NR | | | | 1,500,000 | | | | 1,729,035 | |
California Pollution Control Financing Authority, 5.25% due 6/1/2023 put 12/1/2017 (Solid Waste Disposal-Republic Services, Inc.) (AMT) | | | BBB+/Baa3 | | | | 2,000,000 | | | | 2,093,620 | |
California State Public Works Board, 5.00% due 6/1/2017 (University of California Multiple Campus Capital Projects; Insured: Natl-Re) (ETM) | | | AA+/Aaa | | | | 2,000,000 | | | | 2,056,220 | |
California State Public Works Board, 5.00% due 4/1/2028 (Corrections & Rehabilitation and Judicial Council) | | | A+/A1 | | | | 2,500,000 | | | | 2,970,700 | |
California Statewide Community Development Authority, 6.25% due 8/15/2028 pre-refunded 8/15/2018 (Enloe Medical Center; Insured: California Mtg Insurance) | | | AA-/NR | | | | 1,050,000 | | | | 1,155,809 | |
California Statewide Community Development Authority, 6.00% due 7/1/2030 pre-refunded 1/1/2019 (Aspire Public Schools) | | | NR/NR | | | | 7,015,000 | | | | 7,802,644 | |
Carson Redevelopment Agency, 6.25% due 10/1/2022 (Redevelopment Project Area No. 1) | | | A-/NR | | | | 1,620,000 | | | | 1,856,698 | |
Carson Redevelopment Agency, 6.375% due 10/1/2024 (Redevelopment Project Area No. 1) | | | A-/NR | | | | 1,300,000 | | | | 1,494,714 | |
Chico Redevelopment Agency, 5.00% due 4/1/2030 (Chico Amended & Merged Redevelopment; Insured: AMBAC) | | | A+/NR | | | | 5,500,000 | | | | 5,515,345 | |
City of Los Angeles GO, 3.00% due 6/29/2017 (Cash Flow Management) | | | SP-1+/Mig1 | | | | 9,750,000 | | | | 9,921,502 | |
Corona-Norco USD COP, 5.00% due 4/15/2018 (Insured: AGM) | | | AA/A1 | | | | 1,245,000 | | | | 1,322,377 | |
Corona-Norco USD COP, 5.00% due 4/15/2021 (Insured: AGM) | | | AA/A1 | | | | 1,000,000 | | | | 1,134,030 | |
Annual Report 9
| | |
| SCHEDULE OF INVESTMENTS, CONTINUED | | |
| |
Thornburg Intermediate Municipal Fund | | September 30, 2016 |
| | | | | | | | | | |
Issuer-Description | | Credit Rating†
S&P/ Moody’s | | Principal
Amount | | | Value | |
County of Los Angeles GO, 3.00% due 6/30/2017 (Cash Management Program) | | SP-1+/Mig1 | | $ | 4,500,000 | | | $ | 4,575,690 | |
Delano Financing Authority, 5.00% due 12/1/2025 (City of Delano Police Station and Woollomes Avenue Bridge) | | A-/NR | | | 2,555,000 | | | | 2,856,541 | |
El Camino Hospital District, 6.25% due 8/15/2017 (Insured: AMBAC) (ETM) | | NR/NR | | | 155,000 | | | | 162,378 | |
Franklin-McKinley School District GO, 5.25% due 8/1/2027 (Insured: Natl-Re) | | NR/A1 | | | 1,000,000 | | | | 1,284,080 | |
Fresno USD GO, 6.00% due 8/1/2026 (Educational Facilities and Improvements; Insured: Natl-Re) | | AA-/A3 | | | 1,165,000 | | | | 1,502,302 | |
Jurupa Public Financing Authority, 5.50% due 9/1/2025 (Eastvale Community Services; Insured: AGM) | | AA/NR | | | 1,195,000 | | | | 1,493,475 | |
Jurupa Public Financing Authority, 5.50% due 9/1/2027 (Eastvale Community Services; Insured: AGM) | | AA/NR | | | 1,335,000 | | | | 1,650,087 | |
Los Angeles Regional Airport Improvement Corp., 5.00% due 1/1/2017 (LAX Fuel Corp.; Insured: AGM) (AMT) | | AA/A2 | | | 1,120,000 | | | | 1,131,603 | |
M-S-R Energy Authority, 6.125% due 11/1/2029 | | BBB+/NR | | | 2,500,000 | | | | 3,324,300 | |
North City West School Facilities Financing Authority, 5.00% due 9/1/2024 (Carmel Valley Schools; Insured: AGM) | | AA/NR | | | 1,080,000 | | | | 1,315,883 | |
Oakland USD GO, 5.00% due 8/1/2032 (County of Alameda Educational Facilities) | | AA-/Aa3 | | | 1,000,000 | | | | 1,221,910 | |
Oakland USD GO, 5.00% due 8/1/2033 (County of Alameda Educational Facilities) | | AA-/Aa3 | | | 1,000,000 | | | | 1,216,540 | |
Oakland USD GO, 5.00% due 8/1/2034 (County of Alameda Educational Facilities) | | AA-/Aa3 | | | 1,000,000 | | | | 1,212,080 | |
Redwood City Redevelopment Agency, 0% due 7/15/2023 (Redevelopment Area A-2; Insured: AMBAC) | | A-/NR | | | 2,065,000 | | | | 1,734,786 | |
San Jose Redevelopment Agency, 5.25% due 8/1/2027 (Merged Area Redevelopment Project) | | A/A2 | | | 2,400,000 | | | | 2,701,800 | |
San Jose Redevelopment Agency, 5.375% due 8/1/2028 (Merged Area Redevelopment Project) | | A/A2 | | | 1,175,000 | | | | 1,325,847 | |
San Mateo Union High School District GO, 0% due 9/1/2019 (Educational Facilities; Insured: Natl-Re) | | AA+/Aaa | | | 3,000,000 | | | | 2,893,080 | |
Saratoga Union School District GO, 0% due 9/1/2023 (Insured: Natl-Re) | | AA+/Aa2 | | | 900,000 | | | | 795,411 | |
State of California GO, 5.25% due 9/1/2026 (Kindergarten University Facilities) | | AA-/Aa3 | | | 5,000,000 | | | | 6,014,900 | |
Tuolumne Wind Project Authority, 5.875% due 1/1/2029 pre-refunded 1/1/2019 (Tuolumne Co.) | | AA-/A2 | | | 3,000,000 | | | | 3,333,480 | |
Turlock Irrigation District, 5.00% due 1/1/2021 | | AA-/A2 | | | 1,750,000 | | | | 1,975,855 | |
William S. Hart Union High School District GO, 0% due 9/1/2021 (Educational Facilities) | | AA/A2 | | | 800,000 | | | | 739,552 | |
| | | |
COLORADO — 0.74% | | | | | | | | | | |
Denver Convention Center Hotel Authority, 5.25% due 12/1/2023 (Insured: Syncora) | | BBB-/Baa3 | | | 2,530,000 | | | | 2,540,348 | |
Housing Authority of the City and County of Denver, 5.20% due 11/1/2027 pre-refunded 11/1/2017 (Three Towers Rehabilitation; Insured: AGM) (AMT) | | NR/Aaa | | | 1,220,000 | | | | 1,277,425 | |
Housing Authority of the City and County of Denver, 5.20% due 11/1/2027 (Three Towers Rehabilitation; Insured: AGM) (AMT) | | NR/A2 | | | 1,335,000 | | | | 1,384,582 | |
Park Creek Metropolitan District, 5.25% due 12/1/2020 pre-refunded 12/1/2019 (Insured: AGM) | | AA/NR | | | 1,120,000 | | | | 1,264,872 | |
Regional Transportation District COP, 5.50% due 6/1/2022 (FasTracks Transportation System) | | A/Aa3 | | | 3,000,000 | | | | 3,476,820 | |
Regional Transportation District COP, 5.00% due 6/1/2028 (North Metro Rail Line) | | A/Aa3 | | | 1,550,000 | | | | 1,832,224 | |
| | | |
CONNECTICUT — 1.60% | | | | | | | | | | |
City of Hartford GO, 5.00% due 7/1/2031 (Various Public Improvements; Insured: AGM) | | AA/A2 | | | 1,700,000 | | | | 1,950,087 | |
Connecticut Health & Educational Facilities Authority, 5.75% due 7/1/2029 pre-refunded 7/1/2019 (Ethel Walker School) | | BBB/NR | | | 1,350,000 | | | | 1,524,838 | |
State of Connecticut GO, 5.00% due 5/15/2026 (Various Capital Projects) | | AA-/Aa3 | | | 5,000,000 | | | | 6,297,550 | |
State of Connecticut GO, 5.00% due 5/15/2027 (Various Capital Projects) | | AA-/Aa3 | | | 5,500,000 | | | | 6,880,170 | |
State of Connecticut GO Floating Rate Note, 1.59% due 6/15/2018 (Various Capital Projects) | | AA-/Aa3 | | | 6,820,000 | | | | 6,852,668 | |
State of Connecticut GO Floating Rate Note, 1.36% due 9/15/2017 (Various Capital Projects) | | AA-/Aa3 | | | 2,000,000 | | | | 2,001,320 | |
| | | |
DISTRICT OF COLUMBIA — 0.57% | | | | | | | | | | |
District of Columbia, 5.00% due 2/15/2017 (Association of American Medical Colleges; Insured: AMBAC) (ETM) | | NR/NR | | | 1,000,000 | | | | 1,015,650 | |
Metropolitan Airports Authority, 0% due 10/1/2023 (Dulles Toll Road; Insured: AGM) | | AA/A3 | | | 4,890,000 | | | | 4,119,092 | |
Metropolitan Airports Authority, 0% due 10/1/2024 (Dulles Toll Road; Insured: AGM) | | AA/A3 | | | 5,000,000 | | | | 4,045,350 | |
| | | |
FLORIDA — 5.95% | | | | | | | | | | |
Broward County School Board COP, 5.00% due 7/1/2030 (Educational Facilities) | | A+/Aa3 | | | 1,250,000 | | | | 1,513,388 | |
Broward County School Board COP, 5.00% due 7/1/2032 (Educational Facilities) | | A+/Aa3 | | | 2,000,000 | | | | 2,397,760 | |
City of Hollywood Community Redevelopment Agency, 5.00% due 3/1/2021 pre-refunded 3/1/2017 (Beach Community Redevelopment; Insured: Syncora) | | NR/A3 | | | 3,000,000 | | | | 3,052,770 | |
City of Jacksonville, 5.00% due 10/1/2026 (Better Jacksonville Plan) | | A+/A1 | | | 2,075,000 | | | | 2,449,579 | |
City of Lakeland, 5.00% due 10/1/2018 (Electric Power System Smart Grid Project; Insured: AGM) | | AA/Aa3 | | | 2,000,000 | | | | 2,164,480 | |
City of Lakeland, 5.25% due 10/1/2027 (Electric Power System Smart Grid Project; Insured: AGM) | | AA/Aa3 | | | 3,680,000 | | | | 4,893,443 | |
City of Lakeland, 5.00% due 11/15/2028 (Lakeland Regional Health Systems) | | NR/A2 | | | 2,775,000 | | | | 3,428,512 | |
City of Lakeland, 5.25% due 10/1/2036 (Electric Power System Smart Grid Project; Insured: AGM) | | AA/Aa3 | | | 2,770,000 | | | | 3,856,172 | |
Escambia County HFA, 5.95% due 7/1/2020 (Florida Health Care Facility Loan Program; Insured: AMBAC) | | NR/NR | | | 1,395,000 | | | | 1,485,675 | |
Florida Department of Management Services, 5.00% due 9/1/2018 (Financing or Acquisition of State-Owned Office Buildings; Insured: AMBAC) | | AA+/Aa2 | | | 500,000 | | | | 501,825 | |
Florida State Department of Children & Families COP, 5.00% due 10/1/2018 (South Florida Evaluation Treatment Center) | | AA+/NR | | | 2,090,000 | | | | 2,097,545 | |
Florida State Department of Children & Families COP, 5.00% due 10/1/2019 (South Florida Evaluation Treatment Center) | | AA+/NR | | | 2,255,000 | | | | 2,263,141 | |
Florida State Municipal Loan Council, 5.00% due 10/1/2020 pre-refunded 10/1/2017 (Insured: Natl-Re) | | AA-/A3 | | | 580,000 | | | | 604,192 | |
Florida State Municipal Loan Council, 5.00% due 10/1/2020 pre-refunded 10/1/2017 (Insured: Natl-Re) | | AA-/A3 | | | 420,000 | | | | 436,472 | |
Florida State Municipal Loan Council, 5.00% due 10/1/2024 pre-refunded 10/1/2017 (Insured: Natl-Re) | | AA-/A3 | | | 1,285,000 | | | | 1,338,597 | |
Florida State Municipal Loan Council, 5.00% due 10/1/2024 pre-refunded 10/1/2017 (Insured: Natl-Re) | | AA-/A3 | | | 950,000 | | | | 985,511 | |
Lake County School Board COP, 5.00% due 6/1/2026 (School District Facility Projects) | | A/NR | | | 1,210,000 | | | | 1,417,600 | |
Manatee County, 5.00% due 10/1/2026 (Public Utilities System Improvements) | | NR/Aa2 | | | 370,000 | | | | 461,309 | |
10 Annual Report
| | |
| SCHEDULE OF INVESTMENTS, CONTINUED | | |
| |
Thornburg Intermediate Municipal Fund | | September 30, 2016 |
| | | | | | | | | | | | |
Issuer-Description | | Credit Rating†
S&P/ Moody’s | | | Principal
Amount | | | Value | |
Manatee County, 5.00% due 10/1/2027 (Public Utilities System Improvements) | | | NR/Aa2 | | | $ | 470,000 | | | $ | 580,779 | |
Manatee County, 5.00% due 10/1/2028 (Public Utilities System Improvements) | | | NR/Aa2 | | | | 1,030,000 | | | | 1,263,738 | |
Manatee County, 5.00% due 10/1/2031 (Public Utilities System Improvements) | | | NR/Aa2 | | | | 2,675,000 | | | | 3,232,203 | |
Manatee County, 5.00% due 10/1/2033 (Public Utilities System Improvements) | | | NR/Aa2 | | | | 1,535,000 | | | | 1,840,312 | |
Miami-Dade County, 5.00% due 10/1/2028 (Miami International Airport) | | | A/A2 | | | | 1,000,000 | | | | 1,216,910 | |
Miami-Dade County, 5.00% due 10/1/2029 (Miami International Airport) | | | A/A2 | | | | 1,335,000 | | | | 1,615,817 | |
Miami-Dade County, 5.00% due 10/1/2030 (Miami International Airport) | | | A/A2 | | | | 1,000,000 | | | | 1,206,060 | |
Miami-Dade County, 5.00% due 10/1/2031 (Miami International Airport) | | | A/A2 | | | | 2,000,000 | | | | 2,400,740 | |
Miami-Dade County Educational Facilities Authority, 5.25% due 4/1/2024 (University of Miami; Insured: AMBAC) | | | A-/A3 | | | | 1,000,000 | | | | 1,236,970 | |
Miami-Dade County GO, 5.00% due 10/1/2023 (Seaport Properties) | | | AA/Aa2 | | | | 1,040,000 | | | | 1,232,722 | |
Miami-Dade County GO, 6.25% due 7/1/2026 pre-refunded 7/1/2018 (Building Better Communities) | | | AA/Aa2 | | | | 2,130,000 | | | | 2,328,878 | |
Miami-Dade County School Board COP, 5.00% due 10/1/2021 (Insured: AMBAC) | | | A/A1 | | | | 3,035,000 | | | | 3,570,738 | |
Miami-Dade County School Board COP, 5.25% due 5/1/2022 pre-refunded 5/1/2018 (Insured: AGM) | | | AA/A1 | | | | 2,600,000 | | | | 2,779,426 | |
Miami-Dade County School Board COP, 5.00% due 5/1/2030 | | | A/A1 | | | | 3,250,000 | | | | 3,895,580 | |
Orange County HFA, 6.25% due 10/1/2016 (Orlando Health, Inc.; Insured: Natl-Re) | | | AA-/A2 | | | | 795,000 | | | | 795,119 | |
Orange County HFA, 5.125% due 10/1/2026 (Orlando Health, Inc.) | | | A/A2 | | | | 2,000,000 | | | | 2,212,100 | |
Palm Beach County HFA, 5.00% due 12/1/2025 (Boca Raton Regional Hospital) | | | BBB+/NR | | | | 500,000 | | | | 604,905 | |
Reedy Creek Improvement District GO, 5.00% due 6/1/2032 (District-Wide Transportation, additional Buena Vista Corridor Improvements and District Facilities) | | | AA-/Aa3 | | | | 3,965,000 | | | | 4,896,022 | |
Reedy Creek Improvement District GO, 5.00% due 6/1/2033 (District-Wide Transportation, additional Buena Vista Corridor Improvements and District Facilities) | | | AA-/Aa3 | | | | 7,300,000 | | | | 8,957,246 | |
Sarasota County Public Hospital Board, 5.198% due 10/1/2021 (Sarasota Memorial Hospital; Insured: Natl-Re) | | | AA-/A1 | | | | 2,000,000 | | | | 2,084,060 | |
School Board of Broward County COP, 5.00% due 7/1/2026 (Educational Facilities and Equipment) | | | A+/Aa3 | | | | 3,000,000 | | | | 3,520,560 | |
School Board of Broward County COP, 5.00% due 7/1/2027 (Educational Facilities and Equipment) | | | A+/Aa3 | | | | 2,000,000 | | | | 2,335,140 | |
South Miami HFA, 5.00% due 8/15/2022 (Baptist Health Group) | | | AA-/Aa3 | | | | 1,500,000 | | | | 1,553,130 | |
Sunshine State Governmental Finance Commission, 5.00% due 9/1/2028 (Miami-Dade County Program) | | | AA-/Aa3 | | | | 3,500,000 | | | | 4,232,270 | |
| | | |
GEORGIA — 2.08% | | | | | | | | | | | | |
Athens-Clarke County Unified Government Development Authority, 5.00% due 6/15/2024 (UGAREF Bolton Commons, LLC) | | | NR/Aa2 | | | | 485,000 | | | | 591,365 | |
Athens-Clarke County Unified Government Development Authority, 5.00% due 6/15/2025 (UGAREF Bolton Commons, LLC) | | | NR/Aa2 | | | | 510,000 | | | | 618,069 | |
Athens-Clarke County Unified Government Development Authority, 5.00% due 6/15/2027 (UGAREF Bolton Commons, LLC) | | | NR/Aa2 | | | | 735,000 | | | | 878,274 | |
Athens-Clarke County Unified Government Development Authority, 5.00% due 6/15/2028 (UGAREF Bolton Commons, LLC) | | | NR/Aa2 | | | | 590,000 | | | | 701,138 | |
City of Atlanta, 5.50% due 11/1/2022 (Water & Wastewater System; Insured: Natl-Re) | | | AA-/Aa3 | | | | 530,000 | | | | 644,660 | |
City of Atlanta, 5.50% due 11/1/2024 (Water & Wastewater System; Insured: AGM) | | | AA/Aa3 | | | | 5,000,000 | | | | 5,619,150 | |
Clarke County Hospital Authority, 5.00% due 1/1/2023 (Athens Regional Medical Center) | | | AA/Aa1 | | | | 2,060,000 | | | | 2,445,756 | |
Clarke County Hospital Authority, 5.00% due 1/1/2024 (Athens Regional Medical Center) | | | AA/Aa1 | | | | 2,310,000 | | | | 2,718,154 | |
Clarke County Hospital Authority, 5.00% due 1/1/2025 (Athens Regional Medical Center) | | | AA/Aa1 | | | | 525,000 | | | | 613,709 | |
Clarke County Hospital Authority, 5.00% due 1/1/2026 (Athens Regional Medical Center) | | | AA/Aa1 | | | | 725,000 | | | | 843,530 | |
Development Authority of Fulton County, 5.00% due 10/1/2019 (Georgia Tech Athletic Assoc.) | | | NR/A2 | | | | 3,000,000 | | | | 3,342,750 | |
Gwinnett County School District GO, 4.50% due 10/1/2017 (Capital Projects) | | | AAA/Aaa | | | | 7,000,000 | | | | 7,260,330 | |
Municipal Electric Authority of Georgia, 6.60% due 1/1/2018 (Insured: Natl-Re) | | | AA-/A1 | | | | 665,000 | | | | 678,965 | |
State of Georgia GO, 5.00% due 12/1/2016 (Various Capital Outlay Projects) | | | AAA/Aaa | | | | 4,790,000 | | | | 4,824,919 | |
Valdosta and Lowndes County Hospital Authority, 5.00% due 10/1/2024 (South Medical Center) | | | AA-/Aa2 | | | | 1,200,000 | | | | 1,398,228 | |
| | | |
GUAM — 2.60% | | | | | | | | | | | | |
Government of Guam, 5.00% due 11/15/2031 (Various Capital Projects) | | | A/NR | | | | 5,500,000 | | | | 6,444,075 | |
Government of Guam, 5.00% due 11/15/2032 (Various Capital Projects) | | | A/NR | | | | 12,000,000 | | | | 13,986,360 | |
Government of Guam, 5.00% due 11/15/2033 (Various Capital Projects) | | | A/NR | | | | 10,500,000 | | | | 12,210,660 | |
Guam Power Authority, 5.00% due 10/1/2023 (Electric Power System; Insured: AGM) | | | AA/A2 | | | | 2,000,000 | | | | 2,385,820 | |
Guam Power Authority, 5.00% due 10/1/2024 (Electric Power System; Insured: AGM) | | | AA/A2 | | | | 2,000,000 | | | | 2,369,800 | |
Guam Power Authority, 5.00% due 10/1/2025 (Electric Power System; Insured: AGM) | | | AA/A2 | | | | 2,500,000 | | | | 2,956,000 | |
Guam Waterworks Authority, 5.25% due 7/1/2024 (Water and Wastewater System) | | | A-/Baa2 | | | | 1,000,000 | | | | 1,189,010 | |
| | | |
HAWAII — 1.15% | | | | | | | | | | | | |
County of Hawaii GO, 5.00% due 9/1/2033 | | | AA-/Aa2 | | | | 1,250,000 | | | | 1,541,488 | |
State of Hawaii GO, 5.00% due 12/1/2016 | | | AA+/Aa1 | | | | 4,915,000 | | | | 4,950,830 | |
State of Hawaii GO, 5.00% due 12/1/2027 pre-refunded 12/1/2021 | | | NR/NR | | | | 3,635,000 | | | | 4,354,548 | |
State of Hawaii GO, 5.00% due 12/1/2027 | | | AA+/Aa1 | | | | 6,365,000 | | | | 7,489,505 | |
| | | |
IDAHO — 0.32% | | | | | | | | | | | | |
State of Idaho GO, 2.00% due 6/30/2017 | | | SP-1+/Mig1 | | | | 5,000,000 | | | | 5,041,550 | |
| | | |
ILLINOIS — 6.04% | | | | | | | | | | | | |
Board of Trustees of Southern Illinois University, 5.25% due 4/1/2019 (Housing & Auxiliary Facilities; Insured: Natl-Re) | | | AA-/A3 | | | | 1,000,000 | | | | 1,088,680 | |
Chicago O’Hare International Airport, 5.00% due 1/1/2019 (2015 Airport Projects) | | | A/NR | | | | 1,000,000 | | | | 1,086,060 | |
Annual Report 11
| | |
| SCHEDULE OF INVESTMENTS, CONTINUED | | |
| |
Thornburg Intermediate Municipal Fund | | September 30, 2016 |
| | | | | | | | | | | | |
Issuer-Description | | Credit Rating†
S&P/ Moody’s | | | Principal
Amount | | | Value | |
Chicago O’Hare International Airport, 5.00% due 1/1/2020 (2015 Airport Projects) | | | A/NR | | | $ | 1,000,000 | | | $ | 1,121,530 | |
Chicago O’Hare International Airport, 5.00% due 1/1/2021 (2015 Airport Projects) | | | A/NR | | | | 1,000,000 | | | | 1,153,480 | |
Chicago Park District GO, 5.00% due 1/1/2025 (Capital Improvement Plan) | | | AA+/NR | | | | 1,000,000 | | | | 1,179,380 | |
Chicago Park District GO, 5.00% due 1/1/2027 (Capital Improvement Plan) | | | AA+/NR | | | | 1,945,000 | | | | 2,251,668 | |
Chicago Park District GO, 5.00% due 1/1/2028 (Capital Improvement Plan) | | | AA+/NR | | | | 3,450,000 | | | | 3,949,802 | |
Chicago Park District GO, 5.00% due 1/1/2029 (Capital Improvement Plan) | | | AA+/NR | | | | 1,995,000 | | | | 2,262,988 | |
Chicago Park District GO, 5.00% due 1/1/2030 (Capital Improvement Plan) | | | AA+/NR | | | | 3,500,000 | | | | 3,940,930 | |
Chicago Transit Authority, 5.00% due 12/1/2018 (Bombardier Transit Rail System) | | | AA/A1 | | | | 1,500,000 | | | | 1,601,580 | |
City of Chicago, 5.00% due 1/1/2028 (Wastewater Transmission System) | | | A/NR | | | | 5,365,000 | | | | 6,315,624 | |
City of Chicago, 5.00% due 1/1/2029 (Wastewater Transmission System) | | | A/NR | | | | 2,500,000 | | | | 2,922,725 | |
City of Chicago, 5.75% due 11/1/2030 (Water System; Insured: AMBAC) | | | AA+/Aa1 | | | | 1,270,000 | | | | 1,632,483 | |
City of Chicago, 5.00% due 1/1/2032 (Midway Airport) | | | A/A3 | | | | 4,805,000 | | | | 5,572,935 | |
City of Chicago, 5.00% due 1/1/2033 (Midway Airport) | | | A/A3 | | | | 5,000,000 | | | | 5,788,350 | |
City of Chicago, 5.25% due 1/1/2034 (Midway Airport) | | | A/A3 | | | | 4,700,000 | | | | 5,449,603 | |
City of Chicago GO, 5.00% due 1/1/2020 (Municipal Facilities Projects; Insured: AMBAC) | | | BBB+/Ba1 | | | | 1,000,000 | | | | 1,007,710 | |
City of Chicago GO, 5.00% due 12/1/2022 (Modern Schools Across Chicago Program; Insured: AMBAC) | | | BBB+/Ba1 | | | | 415,000 | | | | 417,905 | |
City of Chicago GO, 5.00% due 12/1/2024 (Modern Schools Across Chicago Program; Insured: AMBAC) | | | BBB+/Ba1 | | | | 500,000 | | | | 503,465 | |
City of Mount Vernon GO, 4.00% due 12/15/2025 (Various Municipal Capital Improvements; Insured: AGM) | | | AA/A2 | | | | 1,900,000 | | | | 2,037,009 | |
City of Waukegan GO, 5.00% due 12/30/2016 (Insured: AGM) | | | NR/A2 | | | | 1,500,000 | | | | 1,513,665 | |
City of Waukegan GO, 5.00% due 12/30/2017 (Insured: AGM) | | | NR/A2 | | | | 1,680,000 | | | | 1,751,434 | |
City of Waukegan GO, 5.00% due 12/30/2018 (Insured: AGM) | | | NR/A2 | | | | 2,000,000 | | | | 2,148,260 | |
Community College District No. 525 GO, 6.25% due 6/1/2024 (Joliet Junior College) | | | AA/NR | | | | 500,000 | | | | 541,005 | |
Cook County Community College District No. 508 GO, 5.25% due 12/1/2026 (City Colleges of Chicago) | | | A+/NR | | | | 1,000,000 | | | | 1,163,220 | |
Cook County GO, 5.25% due 11/15/2024 | | | AA-/A2 | | | | 3,000,000 | | | | 3,376,530 | |
Cook County School District No. 104 GO, 0% due 12/1/2022 (Argo Summit Elementary School Facilities; Insured: AGM) (ETM) | | | NR/NR | | | | 2,000,000 | | | | 1,826,820 | |
Forest Preserve District of DuPage County GO, 4.00% due 11/1/2022 (Land Acquisition and Development) | | | AAA/NR | | | | 750,000 | | | | 864,158 | |
Illinois Educational Facilities Authority, 5.00% due 11/1/2016 (Rush University Medical Center) (ETM) | | | AA-/Aaa | | | | 1,000,000 | | | | 1,003,650 | |
Illinois Educational Facilities Authority, 5.75% due 11/1/2028 pre-refunded 11/1/2018 (Rush University Medical Center) | | | AA-/Aaa | | | | 1,000,000 | | | | 1,100,220 | |
Illinois Finance Authority, 5.00% due 11/1/2016 (Central DuPage Health) | | | AA+/Aa2 | | | | 2,000,000 | | | | 2,006,800 | |
Illinois Finance Authority, 5.00% due 11/1/2017 (Central DuPage Health) | | | AA+/Aa2 | | | | 2,000,000 | | | | 2,081,880 | |
Illinois Finance Authority, 5.00% due 8/1/2022 (Bradley University; Insured: Syncora) | | | A/NR | | | | 1,000,000 | | | | 1,030,490 | |
Illinois Finance Authority, 6.125% due 11/1/2023 pre-refunded 11/1/2018 (Advocate Health Care Network) | | | AA/Aa2 | | | | 5,175,000 | | | | 5,733,641 | |
Illinois Finance Authority, 5.00% due 8/15/2024 (Silver Cross Hospital and Medical Centers) | | | NR/Baa1 | | | | 1,000,000 | | | | 1,199,640 | |
Illinois Finance Authority, 5.00% due 11/15/2033 (Rush University Medical Center) | | | A+/A1 | | | | 1,000,000 | | | | 1,192,860 | |
Illinois HFA, 5.70% due 2/20/2021 (Midwest Care Center I, Inc.; Collateralized: GNMA) | | | NR/Aa1 | | | | 430,000 | | | | 431,849 | |
Illinois Toll Highway Authority, 5.00% due 1/1/2037 (Move Illinois Program) | | | AA-/Aa3 | | | | 5,550,000 | | | | 6,581,745 | |
McHenry & Lake Counties Community Consolidated School District No. 15 GO, 0% due 1/1/2017 (Insured: AGM) (ETM) | | | NR/Aa2 | | | | 45,000 | | | | 44,894 | |
McHenry & Lake Counties Community Consolidated School District No. 15 GO, 0% due 1/1/2017 (Insured: AGM) | | | NR/Aa2 | | | | 955,000 | | | | 951,868 | |
Metropolitan Pier & Exposition Authority, 5.00% due 12/15/2022 (McCormick Place Expansion Project) | | | BBB-/NR | | | | 1,000,000 | | | | 1,158,020 | |
Niles Park District GO, 2.00% due 12/1/2016 (Parks and Recreation Projects) | | | NR/Aa2 | | | | 330,000 | | | | 330,545 | |
Niles Park District GO, 3.00% due 12/1/2017 (Parks and Recreation Projects) | | | NR/Aa2 | | | | 340,000 | | | | 347,524 | |
Niles Park District GO, 3.00% due 12/1/2018 (Parks and Recreation Projects) | | | NR/Aa2 | | | | 350,000 | | | | 363,804 | |
Niles Park District GO, 3.00% due 12/1/2019 (Parks and Recreation Projects) | | | NR/Aa2 | | | | 360,000 | | | | 379,897 | |
Niles Park District GO, 3.00% due 12/1/2020 (Parks and Recreation Projects) | | | NR/Aa2 | | | | 370,000 | | | | 395,674 | |
State of Illinois, 5.00% due 6/15/2018 | | | AAA/NR | | | | 2,000,000 | | | | 2,135,500 | |
Tazewell County School District GO, 9.00% due 12/1/2024 (Insured: Natl-Re) | | | NR/Aa3 | | | | 1,205,000 | | | | 1,822,165 | |
Village of Tinley Park GO, 4.00% due 12/1/2021 | | | AA+/NR | | | | 585,000 | | | | 657,417 | |
Village of Tinley Park GO, 5.00% due 12/1/2024 | | | AA+/NR | | | | 870,000 | | | | 1,057,694 | |
| | | |
INDIANA — 2.81% | | | | | | | | | | | | |
Board of Trustees for the Vincennes University, 5.375% due 6/1/2022 | | | NR/Aa3 | | | | 895,000 | | | | 1,044,214 | |
City of Carmel Redevelopment Authority, 0% due 2/1/2021 (Performing Arts Center) | | | AA+/Aa1 | | | | 2,000,000 | | | | 1,861,240 | |
City of Carmel Redevelopment District COP, 6.50% due 7/15/2035 pre-refunded 1/15/2021 (Performing Arts Center) | | | NR/NR | | | | 2,730,000 | | | | 3,317,769 | |
City of Petersburg, 5.40% due 8/1/2017 (Indianapolis Power and Light Company; Insured: Natl-Re/IBC) | | | AA-/A2 | | | | 1,325,000 | | | | 1,373,018 | |
Clay Multi-School Building Corp., 5.00% due 1/15/2018 (State Aid Withholding) | | | AA+/NR | | | | 1,735,000 | | | | 1,821,299 | |
Fort Wayne Redevelopment Authority, 5.00% due 8/1/2023 pre-refunded 2/1/2017 (Harrison Square; Insured: AGM) | | | NR/Aa2 | | | | 2,290,000 | | | | 2,322,358 | |
Franklin Township Multi-School Building Corp., 5.00% due 7/10/2017 (Franklin Central High School) (State Aid Withholding) | | | AA+/NR | | | | 630,000 | | | | 649,958 | |
Hobart Building Corp., 6.50% due 7/15/2019 (Insured: Natl-Re) (State Aid Withholding) (ETM) | | | AA+/A3 | | | | 1,000,000 | | | | 1,129,520 | |
Indiana Bond Bank, 5.25% due 10/15/2020 (Natural Gas Utility Improvements) | | | NR/A3 | | | | 5,340,000 | | | | 6,066,187 | |
Indiana Bond Bank, 5.25% due 4/1/2023 (Hendricks Regional Health Financing Program; Insured: AMBAC) | | | AA/NR | | | | 2,000,000 | | | | 2,425,440 | |
Indiana Finance Authority, 5.00% due 3/1/2019 (Indiana University Health) | | | AA-/Aa3 | | | | 5,000,000 | | | | 5,481,950 | |
Indiana Finance Authority, 5.00% due 11/1/2021 (Sisters of St. Francis Health Services, Inc.) | | | NR/Aa3 | | | | 605,000 | | | | 654,743 | |
Indiana Finance Authority, 5.25% due 9/15/2022 (Marian University) | | | BBB-/NR | | | | 2,480,000 | | | | 2,732,861 | |
Indiana Finance Authority, 5.25% due 9/15/2023 (Marian University) | | | BBB-/NR | | | | 2,605,000 | | | | 2,865,578 | |
Indiana Health and Educational Facility Financing Authority, 4.10% due 11/15/2046 put 11/3/2016 (Ascension Health Senior Credit Group) | | | AA+/Aa2 | | | | 1,000,000 | | | | 1,003,090 | |
12 Annual Report
| | |
| SCHEDULE OF INVESTMENTS, CONTINUED | | |
| |
Thornburg Intermediate Municipal Fund | | September 30, 2016 |
| | | | | | | | | | |
Issuer-Description | | Credit Rating†
S&P/ Moody’s | | Principal
Amount | | | Value | |
Indiana HFFA, 5.00% due 11/15/2034 (Ascension Health Credit Group) | | NR/Aa2 | | $ | 1,325,000 | | | $ | 1,603,356 | |
Indiana HFFA, 5.00% due 11/15/2035 (Ascension Health Credit Group) | | NR/Aa2 | | | 5,000,000 | | | | 6,027,700 | |
Indiana HFFA, 5.00% due 11/15/2036 (Ascension Health Credit Group) | | NR/Aa2 | | | 2,000,000 | | | | 2,402,020 | |
| | | |
IOWA — 0.30% | | | | | | | | | | |
Iowa Finance Authority, 5.00% due 2/15/2030 (UnityPoint Health) | | NR/Aa3 | | | 2,250,000 | | | | 2,656,530 | |
Iowa Finance Authority, 5.00% due 2/15/2032 (UnityPoint Health) | | NR/Aa3 | | | 1,850,000 | | | | 2,166,480 | |
| | | |
KANSAS — 0.04% | | | | | | | | | | |
Kansas DFA, 5.00% due 6/1/2020 (Wichita State University) | | NR/Aa3 | | | 575,000 | | | | 653,792 | |
| | | |
KENTUCKY — 2.05% | | | | | | | | | | |
Commonwealth of Kentucky State Property and Buildings Commission, 5.00% due 11/1/2019 (Project No. 112) | | A/Aa3 | | | 5,870,000 | | | | 6,541,235 | |
Commonwealth of Kentucky State Property and Buildings Commission, 5.00% due 11/1/2020 (Project No. 112) | | A/Aa3 | | | 4,385,000 | | | | 5,022,228 | |
Commonwealth of Kentucky State Property and Buildings Commission, 5.00% due 11/1/2021 (Project No. 112) | | A/Aa3 | | | 5,990,000 | | | | 7,014,949 | |
Commonwealth of Kentucky State Property and Buildings Commission, 5.00% due 11/1/2022 (Project No. 112) | | A/Aa3 | | | 6,960,000 | | | | 8,320,958 | |
Commonwealth of Kentucky State Property and Buildings Commission, 5.00% due 11/1/2023 (Project No. 112) | | A/Aa3 | | | 2,440,000 | | | | 2,949,374 | |
Louisville/Jefferson County Metro Government, 5.25% due 10/1/2026 (Norton Suburban Hospital and Kosair Children’s Hospital) | | A-/NR | | | 2,320,000 | | | | 2,835,852 | |
| | | |
LOUISIANA — 2.43% | | | | | | | | | | |
City of New Orleans, 6.00% due 6/1/2024 pre-refunded 6/1/2019 (Sewerage System; Insured: AGM) | | AA/A3 | | | 750,000 | | | | 850,545 | |
City of New Orleans GO, 4.00% due 12/1/2016 (Public Improvements) | | AA-/A3 | | | 2,320,000 | | | | 2,332,783 | |
East Baton Rouge Sewerage Commission, 5.00% due 2/1/2030 | | AA-/Aa3 | | | 1,170,000 | | | | 1,420,216 | |
East Baton Rouge Sewerage Commission, 5.00% due 2/1/2031 | | AA-/Aa3 | | | 2,655,000 | | | | 3,207,081 | |
East Baton Rouge Sewerage Commission, 5.00% due 2/1/2032 | | AA-/Aa3 | | | 3,000,000 | | | | 3,611,160 | |
Law Enforcement District of the Parish of Plaquemines, 5.00% due 9/1/2023 pre-refunded 9/1/2019 | | A+/NR | | | 1,230,000 | | | | 1,375,103 | |
Law Enforcement District of the Parish of Plaquemines, 5.00% due 9/1/2025 pre-refunded 9/1/2019 | | A+/NR | | | 1,350,000 | | | | 1,509,260 | |
Law Enforcement District of the Parish of Plaquemines, 5.15% due 9/1/2027 pre-refunded 9/1/2019 | | A+/NR | | | 1,490,000 | | | | 1,672,197 | |
Law Enforcement District of the Parish of Plaquemines, 5.30% due 9/1/2029 pre-refunded 9/1/2019 | | A+/NR | | | 1,650,000 | | | | 1,858,874 | |
Louisiana Energy and Power Authority, 5.25% due 6/1/2029 (LEPA Unit No. 1; Insured: AGM) | | AA/A2 | | | 1,000,000 | | | | 1,195,690 | |
Louisiana Energy and Power Authority, 5.25% due 6/1/2030 (LEPA Unit No. 1; Insured: AGM) | | AA/A2 | | | 2,955,000 | | | | 3,523,276 | |
Louisiana Energy and Power Authority, 5.25% due 6/1/2031 (LEPA Unit No. 1; Insured: AGM) | | AA/A2 | | | 2,145,000 | | | | 2,550,169 | |
Louisiana Public Facilities Authority, 5.00% due 7/1/2022 (Black & Gold Facilities; Insured: CIFG) | | AA/A3 | | | 1,590,000 | | | | 1,633,598 | |
New Orleans Aviation Board, 5.25% due 1/1/2018 (Insured: AGM) (AMT) | | AA/A2 | | | 1,000,000 | | | | 1,050,960 | |
New Orleans Aviation Board, 5.25% due 1/1/2020 (Insured: AGM) | | AA/A2 | | | 2,000,000 | | | | 2,096,280 | |
New Orleans Regional Transit Authority, 5.00% due 12/1/2023 (Insured: AGM) | | AA/Aa3 | | | 1,000,000 | | | | 1,138,930 | |
New Orleans Regional Transit Authority, 5.00% due 12/1/2024 (Insured: AGM) | | AA/Aa3 | | | 1,000,000 | | | | 1,140,820 | |
Office Facilities Corp., 5.00% due 3/1/2019 (Louisiana State Capitol Complex Program) | | AA-/A1 | | | 390,000 | | | | 425,658 | |
Parish of Lafourche, 5.00% due 1/1/2024 (Roads, Highways and Bridges) | | AA-/NR | | | 1,065,000 | | | | 1,294,912 | |
Parish of Lafourche, 5.00% due 1/1/2025 (Roads, Highways and Bridges) | | AA-/NR | | | 2,620,000 | | | | 3,224,093 | |
Terrebonne Parish Hospital Service District 1, 5.00% due 4/1/2028 (General Medical Center) | | A+/A2 | | | 1,500,000 | | | | 1,659,540 | |
| | | |
MARYLAND — 0.52% | | | | | | | | | | |
County of Montgomery GO, 5.00% due 12/1/2016 (Consolidated Public Improvements) | | AAA/Aaa | | | 8,300,000 | | | | 8,360,507 | |
| | | |
MASSACHUSETTS — 1.71% | | | | | | | | | | |
Massachusetts Bay Transportation Authority, 5.25% due 7/1/2030 (Transportation Capital Program) | | AAA/Aa1 | | | 1,000,000 | | | | 1,358,800 | |
Massachusetts Development Finance Agency, 5.00% due 7/1/2019 (CareGroup Healthcare System) | | A-/A3 | | | 2,800,000 | | | | 3,092,040 | |
Massachusetts Development Finance Agency, 5.00% due 7/1/2020 (CareGroup Healthcare System) | | A-/A3 | | | 5,000,000 | | | | 5,697,050 | |
Massachusetts Development Finance Agency, 5.00% due 7/1/2021 (CareGroup Healthcare System) | | A-/A3 | | | 2,330,000 | | | | 2,729,572 | |
Massachusetts Development Finance Agency, 5.50% due 10/1/2025 (Simmons College) | | BBB+/Baa1 | | | 460,000 | | | | 563,371 | |
Massachusetts Development Finance Agency, 5.50% due 10/1/2028 (Simmons College) | | BBB+/Baa1 | | | 1,330,000 | | | | 1,603,342 | |
Massachusetts Development Finance Agency, 5.00% due 7/1/2033 (CareGroup Healthcare System) | | A-/A3 | | | 5,000,000 | | | | 6,042,050 | |
Massachusetts Development Finance Agency, 5.00% due 7/1/2034 (CareGroup Healthcare System) | | A-/A3 | | | 2,320,000 | | | | 2,794,625 | |
Massachusetts Development Finance Agency, 5.00% due 7/1/2036 (CareGroup Healthcare System) | | A-/A3 | | | 1,750,000 | | | | 2,089,710 | |
Massachusetts Educational Financing Authority, 5.50% due 1/1/2022 (Higher Education Student Loans) | | AA/NR | | | 1,130,000 | | | | 1,263,769 | |
| | | |
MICHIGAN — 5.17% | | | | | | | | | | |
Board of Governors of Wayne State University, 5.00% due 11/15/2031 (Educational Facilities and Equipment) | | A+/Aa3 | | | 1,010,000 | | | | 1,212,677 | |
City of Troy GO, 5.00% due 10/1/2016 (Public Safety Facilities and City Hall) | | AAA/NR | | | 1,060,000 | | | | 1,060,117 | |
City of Troy GO, 5.00% due 11/1/2025 (Downtown Development Authority-Community Center Facilities) | | AAA/NR | | | 300,000 | | | | 355,209 | |
County of Genesee, 5.00% due 11/1/2024 (Water Supply System; Insured: BAM) | | AA/A2 | | | 610,000 | | | | 722,935 | |
County of Genesee, 5.00% due 11/1/2025 (Water Supply System; Insured: BAM) | | AA/A2 | | | 345,000 | | | | 410,319 | |
County of Genesee, 5.25% due 11/1/2026 (Water Supply System; Insured: BAM) | | AA/A2 | | | 900,000 | | | | 1,077,894 | |
Annual Report 13
| | |
| SCHEDULE OF INVESTMENTS, CONTINUED | | |
| |
Thornburg Intermediate Municipal Fund | | September 30, 2016 |
| | | | | | | | | | |
Issuer-Description | | Credit Rating†
S&P/ Moody’s | | Principal
Amount | | | Value | |
County of Genesee, 5.25% due 11/1/2027 (Water Supply System; Insured: BAM) | | AA/A2 | | $ | 1,375,000 | | | $ | 1,640,389 | |
County of Genesee, 5.25% due 11/1/2028 (Water Supply System; Insured: BAM) | | AA/A2 | | | 645,000 | | | | 764,331 | |
County of Genesee, 5.00% due 11/1/2029 (Water Supply System; Insured: BAM) | | AA/A2 | | | 1,210,000 | | | | 1,410,049 | |
County of Genesee, 5.00% due 11/1/2030 (Water Supply System; Insured: BAM) | | AA/A2 | | | 1,195,000 | | | | 1,389,665 | |
County of Genesee, 5.125% due 11/1/2032 (Water Supply System; Insured: BAM) | | AA/A2 | | | 750,000 | | | | 873,060 | |
Detroit City School District GO, 5.25% due 5/1/2026 (School Building & Site Improvement; Insured: AGM/Q-SBLF) | | AA/Aa1 | | | 3,150,000 | | | | 3,916,710 | |
Detroit City School District GO, 5.25% due 5/1/2027 (School Building & Site Improvement; Insured: AGM/Q-SBLF) | | AA/Aa1 | | | 1,100,000 | | | | 1,375,583 | |
Kalamazoo Hospital Finance Authority, 5.00% due 5/15/2019 (Bronson Hospital; Insured: AGM) | | AA/A2 | | | 2,000,000 | | | | 2,134,560 | |
Kalamazoo Hospital Finance Authority, 5.00% due 5/15/2022 (Bronson Hospital; Insured: AGM) | | NR/A2 | | | 2,470,000 | | | | 2,790,729 | |
Kalamazoo Hospital Finance Authority, 5.25% due 5/15/2026 (Bronson Hospital) | | NR/A2 | | | 1,285,000 | | | | 1,488,094 | |
Michigan Finance Authority, 5.00% due 4/1/2026 (Government Loan Program) | | A+/NR | | | 1,580,000 | | | | 1,792,115 | |
Michigan Finance Authority, 5.00% due 8/1/2031 (Beaumont Health Credit Group) | | A/A1 | | | 19,080,000 | | | | 22,738,972 | |
Michigan Finance Authority, 5.00% due 8/1/2032 (Beaumont Health Credit Group) | | A/A1 | | | 12,000,000 | | | | 14,206,800 | |
Michigan Public School Academy, 8.00% due 8/1/2035 (Will Carleton Charter School) | | NR/NR | | | 910,000 | | | | 958,103 | |
Michigan State Hospital Finance Authority, 5.00% due 11/15/2024 pre-refunded 11/15/2017 (Edward W. Sparrow Hospital Association) | | NR/NR | | | 1,520,000 | | | | 1,591,562 | |
Michigan State Hospital Finance Authority, 5.00% due 11/15/2024 (Edward W. Sparrow Hospital Association) | | A+/A1 | | | 620,000 | | | | 647,044 | |
Michigan State Hospital Finance Authority, 5.00% due 7/15/2025 pre-refunded 7/15/2017 (Oakwood Health System) | | A/A1 | | | 3,000,000 | | | | 3,099,660 | |
Michigan State Hospital Finance Authority, 5.625% due 11/15/2029 pre-refunded 11/15/2019 (Henry Ford Health System) | | A/A3 | | | 2,500,000 | | | | 2,833,725 | |
Michigan Strategic Fund, 5.25% due 10/15/2023 (Michigan House of Representatives Facilities; Insured: AGM) | | AA/Aa3 | | | 1,000,000 | | | | 1,080,260 | |
Royal Oak Hospital Finance Authority, 8.00% due 9/1/2029 pre-refunded 9/1/2018 (William Beaumont Hospital) | | NR/Aaa | | | 2,540,000 | | | | 2,883,789 | |
State of Michigan, 5.50% due 11/1/2020 (Trunk Line Fund; Insured: AGM) | | AA+/Aa2 | | | 1,500,000 | | | | 1,764,300 | |
State of Michigan, 5.00% due 3/15/2025 (Jobs Today Highway Program & Governor’s Economic Stimulus Program) | | AA/A2 | | | 5,000,000 | | | | 6,253,650 | |
| | | |
MINNESOTA — 0.30% | | | | | | | | | | |
Housing & Redevelopment Authority of the City of St. Paul, 5.25% due 5/15/2020 pre-refunded 11/15/2016 (HealthPartners Health System) | | A/Aaa | | | 1,965,000 | | | | 1,975,886 | |
Minnesota Agriculture & Economic Development Board, 5.50% due 2/15/2025 (Essentia Health; Insured: AGM) | | AA/NR | | | 2,500,000 | | | | 2,845,475 | |
| | | |
MISSISSIPPI — 0.59% | | | | | | | | | | |
Mississippi Development Bank, 5.00% due 7/1/2022 pre-refunded 7/1/2017 (City of Canton Parking Facilities) | | NR/NR | | | 1,935,000 | | | | 1,995,701 | |
Mississippi Development Bank, 5.25% due 8/1/2027 pre-refunded 8/1/2020 (Department of Corrections) | | AA-/NR | | | 3,415,000 | | | | 3,960,512 | |
Mississippi Development Bank GO, 5.00% due 3/1/2025 (Capital City Convention Center) | | A+/Baa2 | | | 2,850,000 | | | | 3,488,514 | |
| | | |
MISSOURI — 1.43% | | | | | | | | | | |
Missouri Development Finance Board, 5.00% due 4/1/2019 (Eastland Center) | | A-/NR | | | 1,000,000 | | | | 1,019,850 | |
Missouri Development Finance Board, 5.00% due 4/1/2021 (Eastland Center) | | A-/NR | | | 2,000,000 | | | | 2,039,700 | |
Missouri Development Finance Board, 5.125% due 4/1/2022 (Eastland Center) | | A-/NR | | | 2,000,000 | | | | 2,104,420 | |
Missouri Health and Educational Facilities Authority, 5.00% due 4/1/2019 (Webster University) | | NR/A2 | | | 2,235,000 | | | | 2,442,341 | |
Missouri Health and Educational Facilities Authority, 5.00% due 4/1/2021 (Webster University) | | NR/A2 | | | 2,520,000 | | | | 2,893,187 | |
Missouri Health and Educational Facilities Authority, 5.00% due 11/15/2022 (Saint Luke’s Health System) | | A+/A1 | | | 2,000,000 | | | | 2,423,800 | |
Missouri Health and Educational Facilities Authority, 0.88% due 9/1/2030 put 10/3/2016 (Washington University; SPA: JPMorgan Chase Bank, N.A.) (daily demand notes) | | AAA/Aaa | | | 1,100,000 | | | | 1,100,000 | |
Missouri Health and Educational Facilities Authority, 5.00% due 11/15/2034 (Saint Luke’s Health System) | | A+/A1 | | | 3,300,000 | | | | 4,001,778 | |
Missouri Health and Educational Facilities Authority, 5.00% due 11/15/2035 (Saint Luke’s Health System) | | A+/A1 | | | 1,000,000 | | | | 1,208,860 | |
Tax Increment Financing Commission of Kansas City, 5.25% due 3/1/2018 (Maincor Public Improvements) (ETM) | | NR/NR | | | 515,000 | | | | 536,120 | |
Tax Increment Financing Commission of Kansas City, 5.00% due 5/1/2022 (Union Hill Redevelopment Project) | | NR/NR | | | 2,915,000 | | | | 3,116,397 | |
| | | |
NEVADA — 0.83% | | | | | | | | | | |
Carson City, 5.00% due 9/1/2027 (Carson Tahoe Regional Medical Center) | | BBB+/NR | | | 2,450,000 | | | | 2,793,221 | |
Washoe County GO, 5.00% due 7/1/2026 (Reno Sparks Convention & Visitors Authority) | | AA/Aa2 | | | 5,000,000 | | | | 5,848,700 | |
Washoe County GO, 5.00% due 7/1/2029 (Reno Sparks Convention & Visitors Authority) | | AA/Aa2 | | | 2,000,000 | | | | 2,332,440 | |
Washoe County GO, 5.00% due 7/1/2032 (Reno Sparks Convention & Visitors Authority) | | AA/Aa2 | | | 2,000,000 | | | | 2,299,100 | |
| | | |
NEW HAMPSHIRE — 0.51% | | | | | | | | | | |
New Hampshire Health and Education Facilities Authority, 5.25% due 10/1/2023 (Southern New Hampshire Medical Center) | | A-/NR | | | 1,000,000 | | | | 1,045,310 | |
New Hampshire Municipal Bond Bank, 5.00% due 8/15/2026 | | AA+/Aa2 | | | 1,860,000 | | | | 2,283,392 | |
State of New Hampshire, 5.00% due 2/1/2022 (Turnpike System) | | A+/A1 | | | 2,250,000 | | | | 2,678,085 | |
State of New Hampshire, 5.00% due 2/1/2024 (Turnpike System) | | A+/A1 | | | 1,755,000 | | | | 2,078,955 | |
| | | |
NEW JERSEY — 2.29% | | | | | | | | | | |
Burlington County Bridge Commission, 4.00% due 12/1/2017 (County Governmental Loan Program) | | AA/Aa2 | | | 850,000 | | | | 880,830 | |
Cape May County Industrial Pollution Control Financing Authority, 6.80% due 3/1/2021 (Atlantic City Electric Company; Insured: Natl-Re) | | AA-/A3 | | | 560,000 | | | | 668,091 | |
14 Annual Report
| | |
| SCHEDULE OF INVESTMENTS, CONTINUED | | |
| |
Thornburg Intermediate Municipal Fund | | September 30, 2016 |
| | | | | | | | | | |
Issuer-Description | | Credit Rating†
S&P/ Moody’s | | Principal
Amount | | | Value | |
Essex County Improvement Authority, 5.50% due 10/1/2024 (County Correctional Facilities & Gibraltar Facilities; Insured: Natl-Re) | | NR/Aa2 | | $ | 2,500,000 | | | $ | 3,219,875 | |
New Jersey EDA, 5.00% due 3/1/2026 (School Facilities Construction) | | A-/A3 | | | 2,000,000 | | | | 2,257,080 | |
New Jersey EDA, 5.50% due 9/1/2026 (School Facilities Construction; Insured: AMBAC) | | A-/A3 | | | 3,000,000 | | | | 3,649,800 | |
New Jersey EDA, 5.50% due 9/1/2027 (School Facilities Construction; Insured: Natl-Re) | | AA-/A3 | | | 1,700,000 | | | | 2,134,061 | |
New Jersey EDA, 5.00% due 6/15/2029 (School Facilities Construction) | | A-/A3 | | | 12,890,000 | | | | 14,601,921 | |
New Jersey State Health Care Facilities Financing Authority, 5.00% due 7/1/2027 (Virtua Health) | | AA-/NR | | | 2,000,000 | | | | 2,395,720 | |
New Jersey State Health Care Facilities Financing Authority, 5.00% due 7/1/2028 (Virtua Health) | | AA-/NR | | | 1,000,000 | | | | 1,187,470 | |
New Jersey Transportation Trust Fund Authority, 2.04% due 6/15/2034 put 12/15/2021 (Transportation System Improvements) | | A-/A3 | | | 2,000,000 | | | | 1,922,100 | |
Passaic Valley Sewage Commissioners GO, 5.75% due 12/1/2022 | | NR/A3 | | | 3,000,000 | | | | 3,646,890 | |
| | | |
NEW MEXICO — 0.50% | | | | | | | | | | |
City of Farmington, 4.70% due 9/1/2024 (Arizona Public Service Co.-Four Corners Project) | | A-/A2 | | | 3,000,000 | | | | 3,334,500 | |
City of Las Cruces, 5.00% due 6/1/2030 (NMFA Loan) | | NR/Aa3 | | | 2,040,000 | | | | 2,298,570 | |
New Mexico Hospital Equipment Loan Council, 5.00% due 7/1/2032 (Haverland Carter Lifestyle Group) | | NR/NR | | | 2,130,000 | | | | 2,325,215 | |
| | | |
NEW YORK — 10.26% | | | | | | | | | | |
City of New York GO, 5.00% due 8/1/2027 (City Budget Financial Management) | | AA/Aa2 | | | 4,530,000 | | | | 5,579,103 | |
City of New York GO, 5.00% due 8/1/2030 (City Budget Financial Management) | | AA/Aa2 | | | 5,000,000 | | | | 6,119,350 | |
City of New York GO, 5.00% due 8/1/2031 (City Budget Financial Management) | | AA/Aa2 | | | 4,000,000 | | | | 4,859,760 | |
City of New York GO, 0.86% due 1/1/2036 put 10/3/2016 (Gowanus Canal Site; SPA: JPMorgan Chase Bank, N.A.) (daily demand notes) | | AA/Aa2 | | | 8,900,000 | | | | 8,900,000 | |
City of New York GO, 0.86% due 8/1/2038 put 10/3/2016 (City Budget Financial Management; SPA: JPMorgan Chase Bank, N.A.) (daily demand notes) | | AA/Aa2 | | | 2,000,000 | | | | 2,000,000 | |
City of New York GO, 0.86% due 3/1/2040 put 10/3/2016 (Capital Projects) (daily demand notes) | | AA/Aa2 | | | 7,300,000 | | | | 7,300,000 | |
County of Nassau GO, 5.00% due 4/1/2026 (Insured: BAM) | | AA/NR | | | 1,300,000 | | | | 1,578,226 | |
Erie County Industrial Development Agency, 5.00% due 5/1/2019 (City of Buffalo School District) | | AA/Aa2 | | | 3,000,000 | | | | 3,313,440 | |
Erie County Industrial Development Agency, 5.00% due 5/1/2027 (City of Buffalo School District) (State Aid Withholding) | | AA/Aa2 | | | 5,000,000 | | | | 6,094,750 | |
Lake Placid Central School District GO, 5.00% due 6/15/2017 (Educational Facilities; Insured: Natl-Re) (State Aid Withholding) | | NR/Aa3 | | | 305,000 | | | | 313,567 | |
Metropolitan Transportation Authority, 5.00% due 11/15/2016 | | AA-/A1 | | | 4,200,000 | | | | 4,222,554 | |
New York City Municipal Water Finance Authority, 0.86% due 6/15/2043 put 10/3/2016 (Water and Sewer System; SPA: JPMorgan Chase Bank, N.A.) (daily demand notes) | | AA+/Aa1 | | | 4,900,000 | | | | 4,900,000 | |
New York City Municipal Water Finance Authority, 0.86% due 6/15/2050 put 10/3/2016 (Water and Sewer System; SPA: JPMorgan Chase Bank, N.A.) (daily demand notes) | | AA+/Aa1 | | | 19,000,000 | | | | 19,000,000 | |
New York City Municipal Water Finance Authority, 0.86% due 6/15/2050 put 10/3/2016 (Water and Sewer System; SPA: JPMorgan Chase Bank, N.A.) (daily demand notes) | | AA+/Aa1 | | | 7,350,000 | | | | 7,350,000 | |
New York City Transitional Finance Authority, 5.00% due 11/1/2016 (City Capital Projects) (ETM) | | NR/NR | | | 1,315,000 | | | | 1,319,826 | |
New York City Transitional Finance Authority, 0.88% due 8/1/2031 put 10/3/2016 (City Capital Projects; SPA: Landesbank Hessen-Thuringen) (daily demand notes) | | AAA/Aaa | | | 25,000,000 | | | | 25,000,000 | |
New York Local Government Assistance Corp., 0.86% due 4/1/2024 put 10/3/2016 (Elementary, Secondary Education and Community College Tuition Assistance Programs; SPA: JPMorgan Chase Bank N.A.) (daily demand notes) | | AAA/Aa1 | | | 30,000,000 | | | | 30,000,000 | |
New York State Dormitory Authority, 5.00% due 7/1/2017 (Bishop Henry B. Hucles Nursing Home; Insured: SONYMA) | | NR/Aa1 | | | 850,000 | | | | 852,907 | |
New York State Dormitory Authority, 5.25% due 5/15/2021 (State University Educational Facilities) | | AA/Aa2 | | | 500,000 | | | | 580,130 | |
New York State Dormitory Authority, 5.00% due 7/1/2023 (Miriam Osborn Memorial Home Assoc.) | | NR/NR | | | 2,180,000 | | | | 2,360,984 | |
New York State Dormitory Authority, 5.00% due 12/15/2027 (Metropolitan Transportation Authority & State Urban Development Corp.) | | AAA/Aa1 | | | 2,500,000 | | | | 3,060,475 | |
New York State Dormitory Authority, 0.86% due 7/1/2033 put 10/3/2016 (University of Rochester; LOC: HSBC Bank USA, N.A.) (daily demand notes) | | AAA/Aa1 | | | 3,300,000 | | | | 3,300,000 | |
New York State Housing Finance Agency, 0.88% due 11/1/2046 put 10/3/2016 (160 Madison Avenue Housing Development; Insured: PNC Bank, N.A.) (daily demand notes) | | NR/A1 | | | 4,730,000 | | | | 4,730,000 | |
New York State Thruway Authority, 5.00% due 1/1/2030 (Multi-Year Highway and Bridge Capital Program) | | A/A2 | | | 7,480,000 | | | | 9,083,936 | |
United Nations Development Corp., 5.00% due 7/1/2025 (One, Two and Three U.N. Plaza) | | NR/A1 | | | 1,700,000 | | | | 1,870,000 | |
| | | |
NORTH CAROLINA — 0.61% | | | | | | | | | | |
Charlotte-Mecklenburg Hospital Authority, 3.00% due 1/15/2018 (Carolinas HealthCare System) | | AA-/Aa3 | | | 600,000 | | | | 615,744 | |
Charlotte-Mecklenburg Hospital Authority, 0.88% due 1/15/2026 put 10/3/2016 (Carolinas HealthCare System; LOC: U.S. Bank, N.A.) (daily demand notes) | | AAA/Aa1 | | | 2,840,000 | | | | 2,840,000 | |
Charlotte-Mecklenburg Hospital Authority, 5.00% due 1/15/2028 (Carolinas HealthCare System) | | AA-/Aa3 | | | 2,190,000 | | | | 2,627,672 | |
North Carolina Medical Care Commission, 5.00% due 6/1/2030 (Vidant Health) | | A+/A1 | | | 3,000,000 | | | | 3,628,020 | |
| | | |
NORTH DAKOTA — 0.06% | | | | | | | | | | |
County of Ward, 5.125% due 7/1/2021 (Trinity Health System) | | BBB-/NR | | | 1,000,000 | | | | 1,003,500 | |
| | | |
OHIO — 4.36% | | | | | | | | | | |
Akron, Bath and Copley Joint Township Hospital District, 5.00% due 11/15/2024 (Children’s Hospital Medical Center of Akron) | | NR/A1 | | | 1,000,000 | | | | 1,178,210 | |
Annual Report 15
| | |
| SCHEDULE OF INVESTMENTS, CONTINUED | | |
| |
Thornburg Intermediate Municipal Fund | | September 30, 2016 |
| | | | | | | | | | |
Issuer-Description | | Credit Rating†
S&P/ Moody’s | | Principal
Amount | | | Value | |
American Municipal Power, Inc., 5.25% due 2/15/2028 (AMP Fremont Energy Center) | | A/A1 | | $ | 4,000,000 | | | $ | 4,785,760 | |
Cincinnati City School District COP, 5.00% due 12/15/2031 (School Improvement Project) | | A+/Aa3 | | | 3,075,000 | | | | 3,642,184 | |
City of Cleveland, 3.00% due 10/1/2017 (Parks and Recreation Facilities) | | AA/A1 | | | 490,000 | | | | 499,384 | |
City of Cleveland, 5.00% due 11/15/2027 (Public Facilities Improvements) | | AA/A1 | | | 1,285,000 | | | | 1,583,313 | |
City of Cleveland, 5.00% due 10/1/2028 (Bridges and Roadways) | | AA/A1 | | | 2,420,000 | | | | 2,965,734 | |
City of Cleveland, 5.00% due 11/15/2028 (Public Facilities Improvements) | | AA/A1 | | | 1,000,000 | | | | 1,229,020 | |
City of Cleveland, 5.00% due 10/1/2029 (Bridges and Roadways) | | AA/A1 | | | 100,000 | | | | 121,958 | |
City of Cleveland, 5.00% due 11/15/2029 (Public Facilities Improvements) | | AA/A1 | | | 1,415,000 | | | | 1,730,531 | |
City of Cleveland, 5.00% due 11/15/2030 (Public Facilities Improvements) | | AA/A1 | | | 1,485,000 | | | | 1,808,062 | |
City of Cleveland GO, 5.00% due 12/1/2016 (Various Municipal Capital Improvements) | | AA/A1 | | | 2,390,000 | | | | 2,407,088 | |
City of Cleveland GO, 5.00% due 12/1/2024 (Various Municipal Capital Improvements) | | AA/A1 | | | 1,000,000 | | | | 1,223,630 | |
City of Cleveland GO, 5.00% due 12/1/2026 (Various Municipal Capital Improvements) | | AA/A1 | | | 1,230,000 | | | | 1,501,522 | |
Cleveland-Cuyahoga County Port Authority, 5.00% due 10/1/2021 (Cleveland Museum of Art) | | AA+/NR | | | 2,040,000 | | | | 2,349,631 | |
Cleveland-Cuyahoga County Port Authority, 5.00% due 7/1/2025 (County Administration Offices) | | AA-/Aa2 | | | 1,780,000 | | | | 2,222,205 | |
County of Allen, 5.00% due 5/1/2025 (Catholic Health Partners-Mercy Health West Facility) | | A+/A2 | | | 4,470,000 | | | | 5,278,221 | |
County of Allen, 5.00% due 5/1/2026 (Catholic Health Partners-Mercy Health West Facility) | | A+/A2 | | | 3,855,000 | | | | 4,528,700 | |
County of Cuyahoga COP, 5.00% due 12/1/2026 (Convention Center Hotel) | | AA-/Aa3 | | | 2,910,000 | | | | 3,536,232 | |
County of Hamilton, 5.00% due 12/1/2018 | | AA-/A1 | | | 1,000,000 | | | | 1,084,640 | |
County of Hamilton, 5.00% due 12/1/2021 | | AA-/A1 | | | 1,100,000 | | | | 1,303,225 | |
County of Hamilton, 5.00% due 12/1/2023 | | AA-/A1 | | | 1,000,000 | | | | 1,237,680 | |
County of Hamilton, 5.00% due 5/15/2028 (Cincinnati Children’s Hospital Medical Center) | | AA/Aa2 | | | 2,665,000 | | | | 3,248,901 | |
County of Hamilton, 5.00% due 5/15/2029 (Cincinnati Children’s Hospital Medical Center) | | AA/Aa2 | | | 1,000,000 | | | | 1,212,860 | |
County of Hamilton, 5.00% due 5/15/2031 (Cincinnati Children’s Hospital Medical Center) | | AA/Aa2 | | | 4,420,000 | | | | 5,304,884 | |
County of Montgomery, 0.90% due 11/15/2045 put 10/3/2016 (Premier Health Partners; LOC: Barclays Bank plc) (daily demand notes) | | NR/Aa2 | | | 700,000 | | | | 700,000 | |
County of Scioto, 5.00% due 2/15/2030 (Southern Ohio Medical Center) | | NR/A2 | | | 1,690,000 | | | | 2,069,591 | |
County of Scioto, 5.00% due 2/15/2032 (Southern Ohio Medical Center) | | NR/A2 | | | 925,000 | | | | 1,124,069 | |
County of Scioto, 5.00% due 2/15/2033 (Southern Ohio Medical Center) | | NR/A2 | | | 1,000,000 | | | | 1,211,480 | |
Deerfield Township, 5.00% due 12/1/2016 (Public Street Improvements-Duke Drive) | | NR/A1 | | | 1,035,000 | | | | 1,041,241 | |
Deerfield Township, 5.00% due 12/1/2025 (Public Street Improvements-Wilkens Blvd.) | | NR/A1 | | | 1,000,000 | | | | 1,038,860 | |
Lucas County Health Care Facility, 5.00% due 8/15/2021 (Sunset Retirement Community) | | NR/NR | | | 1,190,000 | | | | 1,260,936 | |
Lucas County Health Care Facility, 5.125% due 8/15/2025 (Sunset Retirement Community) | | NR/NR | | | 1,250,000 | | | | 1,429,800 | |
Ohio Air Quality Development Authority, 5.70% due 8/1/2020 (FirstEnergy Nuclear Generation Corp.) | | BB-/Ba2 | | | 3,000,000 | | | | 2,884,620 | |
Ohio Air Quality Development Authority, 3.625% due 12/1/2033 put 6/1/2020 (FirstEnergy Nuclear Generation Corp.) | | BB-/Ba2 | | | 1,000,000 | | | | 881,120 | |
| | | |
OKLAHOMA — 0.55% | | | | | | | | | | |
Oklahoma DFA, 5.00% due 8/15/2026 (INTEGRIS Health) | | AA-/Aa3 | | | 1,000,000 | | | | 1,253,950 | |
Oklahoma DFA, 5.00% due 8/15/2027 (INTEGRIS Health) | | AA-/Aa3 | | | 1,000,000 | | | | 1,245,620 | |
Oklahoma Industries Authority, 5.50% due 7/1/2023 pre-refunded 7/1/2018 (Oklahoma Medical Research Foundation) | | NR/A2 | | | 3,730,000 | | | | 4,025,602 | |
Oklahoma Municipal Power Authority, 5.00% due 1/1/2018 (Power Supply System Capital Projects; Insured: AGM) | | AA/A2 | | | 1,000,000 | | | | 1,049,400 | |
Tulsa County Industrial Authority, 5.00% due 12/15/2024 (St. Francis Health System, Inc.) | | AA+/Aa2 | | | 1,130,000 | | | | 1,140,125 | |
| | | |
OREGON — 1.26% | | | | | | | | | | |
State of Oregon GO, 2.00% due 6/30/2017 (Cash Management) | | SP-1+/Mig1 | | | 20,000,000 | | | | 20,178,400 | |
| | | |
PENNSYLVANIA — 6.57% | | | | | | | | | | |
Allegheny County Hospital Development Authority, 5.00% due 5/15/2019 (University of Pittsburgh Medical Center) | | A+/Aa3 | | | 2,500,000 | | | | 2,756,375 | |
Allegheny County IDA, 5.90% due 8/15/2026 (Propel Charter School-McKeesport) | | BBB-/NR | | | 905,000 | | | | 973,038 | |
Allegheny County IDA, 6.375% due 8/15/2035 (Propel Charter School-McKeesport) | | BBB-/NR | | | 1,130,000 | | | | 1,230,254 | |
Bethlehem Area School District GO, 5.00% due 10/15/2020 (Northampton and Lehigh Counties District; Insured: AGM) (State Aid Withholding) | | AA/NR | | | 380,000 | | | | 413,170 | |
Bethlehem Area School District GO, 5.00% due 10/15/2020 pre-refunded 04/15/2019 (Northampton and Lehigh Counties District; Insured: AGM) (State Aid Withholding) | | AA/NR | | | 95,000 | | | | 104,747 | |
City of Philadelphia, 5.00% due 8/1/2032 (Pennsylvania Gas Works) | | A/Baa1 | | | 1,000,000 | | | | 1,181,420 | |
City of Philadelphia, 5.00% due 8/1/2033 (Pennsylvania Gas Works) | | A/Baa1 | | | 800,000 | | | | 942,384 | |
City of Philadelphia, 5.00% due 8/1/2034 (Pennsylvania Gas Works) | | A/Baa1 | | | 500,000 | | | | 586,845 | |
Commonwealth of Pennsylvania GO, 5.00% due 3/15/2022 (Capital Facilities Projects) | | AA-/Aa3 | | | 12,485,000 | | | | 14,745,284 | |
Commonwealth of Pennsylvania GO, 5.00% due 9/15/2028 (Capital Facilities Projects) | | AA-/Aa3 | | | 15,000,000 | | | | 18,579,900 | |
County of Lehigh GO, 5.00% due 11/15/2016 | | NR/Aa1 | | | 5,725,000 | | | | 5,755,972 | |
County of Luzerne GO, 5.00% due 11/15/2029 (Insured: AGM) | | AA/NR | | | 3,000,000 | | | | 3,495,630 | |
Dallastown Area School District GO, 4.00% due 5/1/2021 (State Aid Withholding) | | AA/NR | | | 460,000 | | | | 511,718 | |
Lancaster County Solid Waste Management Authority, 5.25% due 12/15/2030 (Acquisition of Susquehanna Resource Management Facility) | | AA-/NR | | | 3,000,000 | | | | 3,580,380 | |
Lehigh County IDA, 0.90% due 2/15/2027 put 8/15/2017 (PPL Electric Utilities Corp.) | | A/A1 | | | 3,250,000 | | | | 3,246,880 | |
Monroeville Financing Authority, 5.00% due 2/15/2026 (University of Pittsburgh Medical Center) | | A+/Aa3 | | | 3,490,000 | | | | 4,387,733 | |
16 Annual Report
| | |
| SCHEDULE OF INVESTMENTS, CONTINUED | | |
| |
Thornburg Intermediate Municipal Fund | | September 30, 2016 |
| | | | | | | | | | |
Issuer-Description | | Credit Rating†
S&P/ Moody’s | | Principal
Amount | | | Value | |
Pennsylvania Economic DFA, 4.625% due 12/1/2018 (Colver Project; Insured: AMBAC) (AMT) | | BBB-/Ba1 | | $ | 7,470,000 | | | $ | 7,495,174 | |
Pennsylvania Higher Education Facilities Authority, 0% due 7/1/2020 (Insured: AMBAC) | | NR/NR | | | 2,032,839 | | | | 1,547,743 | |
Pennsylvania State Public School Building Authority GO, 5.00% due 6/1/2027 (Philadelphia School District; Insured: AGM) (State Aid Withholding) | | AA/A2 | | | 5,000,000 | | | | 5,940,650 | |
Pennsylvania Turnpike Commission, 5.35% due 12/1/2030 pre-refunded 12/1/2020 (Highway Improvements) | | NR/NR | | | 1,390,000 | | | | 1,635,363 | |
Pennsylvania Turnpike Commission, 5.35% due 12/1/2030 (Highway Improvements) | | A-/A3 | | | 2,610,000 | | | | 2,970,832 | |
Pittsburgh Water & Sewer Authority, 5.00% due 9/1/2030 (Water and Sewer System; Insured: AGM) | | A/A2 | | | 5,000,000 | | | | 5,925,700 | |
Pittsburgh Water & Sewer Authority, 5.00% due 9/1/2031 (Water and Sewer System; Insured: AGM) | | A/A2 | | | 3,740,000 | | | | 4,416,566 | |
Pittsburgh Water & Sewer Authority, 5.00% due 9/1/2031 (Water and Sewer System; Insured: AGM) | | A/A2 | | | 3,665,000 | | | | 4,327,998 | |
Plum Borough School District GO, 4.00% due 9/15/2020 (Insured: BAM) (State Aid Withholding) | | AA/NR | | | 405,000 | | | | 447,205 | |
Plum Borough School District GO, 4.00% due 9/15/2017 (Insured: BAM) (State Aid Withholding) | | AA/NR | | | 365,000 | | | | 374,961 | |
Plum Borough School District GO, 4.00% due 9/15/2018 (Insured: BAM) (State Aid Withholding) | | AA/NR | | | 355,000 | | | | 374,419 | |
Plum Borough School District GO, 4.00% due 9/15/2020 (Insured: BAM) (State Aid Withholding) | | AA/NR | | | 385,000 | | | | 425,121 | |
Plum Borough School District GO, 4.00% due 9/15/2021 (Insured: BAM) (State Aid Withholding) | | AA/NR | | | 425,000 | | | | 477,301 | |
Plum Borough School District GO, 5.00% due 9/15/2021 (Insured: BAM) (State Aid Withholding) | | AA/NR | | | 430,000 | | | | 503,431 | |
School District of Philadelphia GO, 5.00% due 9/1/2018 (School Reform Commission) (State Aid Withholding) | | NR/A2 | | | 5,250,000 | | | | 5,551,822 | |
| | | |
RHODE ISLAND — 0.33% | | | | | | | | | | |
State of Rhode Island and Providence Plantations COP, 5.00% due 10/1/2024 (Training School Project) | | AA-/Aa3 | | | 3,595,000 | | | | 4,389,675 | |
State of Rhode Island and Providence Plantations GO, 4.00% due 10/15/2023 (Consolidated Capital Development Loan) | | AA/Aa2 | | | 800,000 | | | | 917,152 | |
| | | |
SOUTH CAROLINA — 2.08% | | | | | | | | | | |
City of Myrtle Beach, 5.00% due 6/1/2028 (Municipal Sports Complex) | | AA-/A1 | | | 1,000,000 | | | | 1,195,220 | |
City of Myrtle Beach, 5.00% due 6/1/2030 (Municipal Sports Complex) | | AA-/A1 | | | 1,000,000 | | | | 1,182,330 | |
Greenwood Fifty School Facilities, Inc., 5.00% due 12/1/2025 pre-refunded 12/1/2017 (School District No. 50; Insured: AGM) | | AA/A1 | | | 2,400,000 | | | | 2,515,968 | |
Lexington County Health Services District, Inc., 5.00% due 11/1/2016 (Lexington Medical Center) | | AA-/A1 | | | 250,000 | | | | 250,910 | |
Lexington One School Facilities Corp., 5.00% due 12/1/2019 pre-refunded 12/1/2016 (School District No. 1) | | NR/Aa3 | | | 1,000,000 | | | | 1,007,170 | |
Oconee County, 0.89% due 2/1/2017 put 10/3/2016 (Duke Energy Corp.) (daily demand notes) | | A-/A1 | | | 20,700,000 | | | | 20,700,000 | |
SCAGO Educational Facilities Corp., 5.00% due 12/1/2017 pre-refunded 12/1/2016 (Colleton School District; Insured: AGM) | | NR/A3 | | | 1,000,000 | | | | 1,007,170 | |
Securing Assets for Education, 5.00% due 12/1/2019 pre-refunded 12/1/2016 (School District of Berkeley County) | | AA-/Aa3 | | | 2,000,000 | | | | 2,014,340 | |
South Carolina Housing Finance & Development Authority, 5.30% due 7/1/2023 (AMT) | | NR/Aa1 | | | 370,000 | | | | 376,660 | |
Sumter Two School Facilities, Inc., 5.00% due 12/1/2021 pre-refunded 12/1/2017 (School District No. 2; Insured: AGM) | | AA/A3 | | | 2,855,000 | | | | 2,993,639 | |
| | | |
SOUTH DAKOTA — 0.37% | | | | | | | | | | |
South Dakota Health and Educational Facilities Authority, 5.00% due 7/1/2023 (Avera Health) | | AA-/A1 | | | 1,575,000 | | | | 1,842,734 | |
South Dakota Health and Educational Facilities Authority, 5.00% due 11/1/2024 (Sanford Health) | | A+/A1 | | | 1,700,000 | | | | 1,892,185 | |
South Dakota Health and Educational Facilities Authority, 5.00% due 11/1/2028 (Sanford Health) | | A+/A1 | | | 800,000 | | | | 974,952 | |
South Dakota Health and Educational Facilities Authority, 5.00% due 11/1/2029 (Sanford Health) | | A+/A1 | | | 1,000,000 | | | | 1,211,850 | |
| | | |
TENNESSEE — 0.78% | | | | | | | | | | |
City of Memphis GO, 5.00% due 10/1/2016 (General Improvements; Insured: Natl-Re) | | AA/Aa2 | | | 1,000,000 | | | | 1,000,120 | |
Tennessee Energy Acquisition Corp., 5.00% due 2/1/2023 (The Gas Project) | | BBB+/A3 | | | 2,500,000 | | | | 2,955,600 | |
Tennessee Energy Acquisition Corp., 5.25% due 9/1/2023 (The Gas Project) | | BBB+/A3 | | | 7,000,000 | | | | 8,498,490 | |
| | | |
TEXAS — 11.79% | | | | | | | | | | |
Austin Community College District, 5.50% due 8/1/2023 pre-refunded 8/1/2018 (Round Rock Campus) | | AA/Aa2 | | | 2,180,000 | | | | 2,362,946 | |
Bexar County Health Facilities Development Corp., 5.00% due 7/1/2027 (Army Retirement Residence) | | BBB/NR | | | 1,530,000 | | | | 1,560,830 | |
Bexar Metropolitan Water District, 5.00% due 5/1/2021 pre-refunded 5/1/2017 (Waterworks System; Insured: Syncora) | | AA/A1 | | | 1,300,000 | | | | 1,332,214 | |
Bexar Metropolitan Water District, 5.00% due 5/1/2022 pre-refunded 5/1/2017 (Waterworks System; Insured: Syncora) | | AA/A1 | | | 2,300,000 | | | | 2,356,994 | |
City of Austin (Travis, Williamson and Hays Counties), 5.00% due 11/15/2033 (Water and Wastewater System) | | AA/Aa2 | | | 4,000,000 | | | | 4,974,560 | |
City of Austin (Travis, Williamson and Hays Counties), 5.00% due 11/15/2035 (Water and Wastewater System) | | AA/Aa2 | | | 8,185,000 | | | | 10,095,870 | |
City of Austin (Travis, Williamson and Hays Counties), 5.00% due 11/15/2036 (Water and Wastewater System) | | AA/Aa2 | | | 6,850,000 | | | | 8,428,445 | |
City of Brownsville, 5.00% due 9/1/2017 (Water, Wastewater & Electric Utilities Systems) | | A+/A2 | | | 500,000 | | | | 518,410 | |
City of Brownsville, 5.00% due 9/1/2020 (Water, Wastewater & Electric Utilities Systems) | | A+/A2 | | | 1,000,000 | | | | 1,146,290 | |
City of Galveston, 5.00% due 9/1/2021 (Galveston Island Convention Center; Insured: AGM) | | NR/A2 | | | 545,000 | | | | 627,480 | |
City of Galveston, 5.00% due 9/1/2024 (Galveston Island Convention Center; Insured: AGM) | | NR/A2 | | | 1,115,000 | | | | 1,338,033 | |
City of Houston, 5.00% due 9/1/2032 (Convention & Entertainment Facilities) | | A-/A2 | | | 3,560,000 | | | | 4,212,619 | |
City of Houston GO, 5.00% due 3/1/2020 (Public Improvements) | | AA/Aa3 | | | 5,000,000 | | | | 5,643,050 | |
City of Houston GO, 5.00% due 3/1/2021 (Public Improvements) | | AA/Aa3 | | | 5,000,000 | | | | 5,805,300 | |
City of Houston GO, 5.00% due 3/1/2023 (Public Improvements) | | AA/Aa3 | | | 5,000,000 | | | | 6,076,350 | |
City of Pharr Higher Education Finance Authority, 5.75% due 8/15/2024 (IDEA Public Schools) | | BBB/NR | | | 5,050,000 | | | | 5,552,576 | |
City of San Antonio, 5.00% due 7/1/2024 (Airport System Capital Improvements) (AMT) | | A/A2 | | | 2,065,000 | | | | 2,402,462 | |
City of San Antonio, 5.00% due 7/1/2025 (Airport System Capital Improvements) (AMT) | | A/A2 | | | 1,160,000 | | | | 1,339,684 | |
City of San Antonio, 5.00% due 5/15/2027 (Water System) | | AA/Aa2 | | | 2,575,000 | | | | 3,283,949 | |
City of San Antonio, 5.00% due 5/15/2033 (Water System) | | AA/Aa2 | | | 1,500,000 | | | | 1,849,320 | |
Annual Report 17
| | |
| SCHEDULE OF INVESTMENTS, CONTINUED | | |
| |
Thornburg Intermediate Municipal Fund | | September 30, 2016 |
| | | | | | | | | | |
Issuer-Description | | Credit Rating†
S&P/ Moody’s | | Principal
Amount | | | Value | |
City of San Antonio, 5.00% due 5/15/2034 (Water System) | | AA/Aa2 | | $ | 1,575,000 | | | $ | 1,934,147 | |
City of San Antonio, 3.00% due 12/1/2045 put 12/1/2019 (Electric and Gas Systems) | | AA-/Aa2 | | | 5,200,000 | | | | 5,488,132 | |
City of Texas City Industrial Development Corp., 7.375% due 10/1/2020 (ARCO Pipe Line Co. Project) | | A-/A2 | | | 2,705,000 | | | | 3,305,402 | |
Dallas Area Rapid Transit, 5.00% due 12/1/2034 | | AA+/Aa2 | | | 5,475,000 | | | | 6,685,577 | |
Dallas Area Rapid Transit, 5.00% due 12/1/2035 | | AA+/Aa2 | | | 4,000,000 | | | | 4,866,000 | |
Dallas Area Rapid Transit, 5.00% due 12/1/2036 | | AA+/Aa2 | | | 3,000,000 | | | | 3,641,220 | |
Dallas County Utilities & Reclamation District, 5.15% due 2/15/2022 (Insured: AMBAC) | | A-/A3 | | | 3,000,000 | | | | 3,049,470 | |
Dallas ISD GO, 5.00% due 2/15/2036 put 2/15/2022 (Educational Facilities Improvements; Guaranty: PSF) | | AAA/Aaa | | | 7,000,000 | | | | 8,324,330 | |
Harris County Cultural Education Facilities Finance Corp., 5.00% due 12/1/2028 (Memorial Hermann Health System) | | A+/A1 | | | 3,000,000 | | | | 3,674,280 | |
Houston Higher Education Finance Corp., 6.50% due 5/15/2031 pre-refunded 5/15/2021 (Cosmos Foundation, Inc.) | | NR/NR | | | 415,000 | | | | 517,007 | |
Houston Higher Education Finance Corp., 6.50% due 5/15/2031 (Cosmos Foundation, Inc.) | | BBB/NR | | | 360,000 | | | | 432,979 | |
Katy ISD GO, 5.00% due 2/15/2034 (Educational Facilities Improvements; Guaranty: PSF) | | AAA/Aaa | | | 7,560,000 | | | | 9,328,889 | |
Kimble County Hospital District GO, 5.00% due 8/15/2017 (Medical Facilities Improvements) | | NR/NR | | | 510,000 | | | | 525,193 | |
Kimble County Hospital District GO, 5.00% due 8/15/2018 (Medical Facilities Improvements) | | NR/NR | | | 525,000 | | | | 553,880 | |
La Vernia Higher Education Finance Corp., 5.75% due 8/15/2024 pre-refunded 8/15/2019 (Kipp, Inc.) | | BBB/NR | | | 3,000,000 | | | | 3,400,530 | |
Lower Colorado River Authority, 5.00% due 5/15/2026 pre-refunded 5/15/2022 | | NR/NR | | | 55,000 | | | | 66,391 | |
Lower Colorado River Authority, 5.00% due 5/15/2026 | | A/A2 | | | 9,415,000 | | | | 11,210,817 | |
North Central Texas Health Facilities Development Corp., 5.00% due 8/15/2019 (Children’s Medical Center of Dallas) | | NR/Aa2 | | | 270,000 | | | | 298,663 | |
North Texas Tollway Authority, 5.00% due 9/1/2017 (Special Projects System) | | AA+/NR | | | 450,000 | | | | 466,979 | |
North Texas Tollway Authority, 5.00% due 1/1/2020 (NTTA System) | | A/A1 | | | 2,000,000 | | | | 2,246,480 | |
North Texas Tollway Authority, 5.00% due 1/1/2022 (NTTA System) | | A/A1 | | | 4,000,000 | | | | 4,728,960 | |
North Texas Tollway Authority, 5.00% due 1/1/2023 (NTTA System) | | A/A1 | | | 6,375,000 | | | | 7,722,994 | |
Round Rock ISD GO, 5.00% due 8/1/2027 (Educational Facilities Improvements; Guaranty: PSF) | | NR/Aaa | | | 2,705,000 | | | | 3,412,926 | |
Round Rock ISD GO, 5.00% due 8/1/2028 (Educational Facilities Improvements; Guaranty: PSF) | | NR/Aaa | | | 2,840,000 | | | | 3,555,140 | |
Round Rock ISD GO, 5.00% due 8/1/2029 (Educational Facilities Improvements; Guaranty: PSF) | | NR/Aaa | | | 2,980,000 | | | | 3,708,461 | |
San Juan Higher Education Finance Authority, 5.75% due 8/15/2024 (IDEA Public Schools) | | BBB/NR | | | 1,590,000 | | | | 1,797,893 | |
Tarrant County Cultural Educational Facilities Finance Corp., 0.86% due 10/1/2041 put 10/3/2016 (Methodist Hospitals of Dallas; LOC: TD Bank, N.A.) (daily demand notes) | | AAA/Aa1 | | | 2,785,000 | | | | 2,785,000 | |
Tarrant Regional Water District, 5.00% due 3/1/2028 (Water Control and Improvement) | | AAA/NR | | | 2,000,000 | | | | 2,525,840 | |
Tarrant Regional Water District, 5.00% due 3/1/2029 (Water Control and Improvement) | | AAA/NR | | | 1,650,000 | | | | 2,069,281 | |
Texas Public Finance Authority Charter School Finance Corp., 5.00% due 8/15/2023 pre-refunded 8/15/2017 (IDEA Public Schools; Insured: ACA) | | BBB/NR | | | 3,000,000 | | | | 3,110,010 | |
Texas Public Finance Authority Charter School Finance Corp., 6.00% due 2/15/2030 pre-refunded 2/15/2020 (Cosmos Foundation, Inc.) | | BBB/NR | | | 1,750,000 | | | | 2,038,067 | |
Texas Public Finance Authority Charter School Finance Corp., 5.00% due 8/15/2030 pre-refunded 8/15/2017 (IDEA Public Schools; Insured: ACA) | | BBB/NR | | | 2,000,000 | | | | 2,073,340 | |
Texas Transportation Commission, 5.00% due 8/15/2024 (Central Texas Turnpike System) | | BBB+/Baa1 | | | 1,500,000 | | | | 1,844,940 | |
Texas Transportation Commission, 5.00% due 8/15/2025 (Central Texas Turnpike System) | | BBB+/Baa1 | | | 750,000 | | | | 914,640 | |
Trinity River Authority, 5.00% due 2/1/2025 (Red Oak Creek System) | | AA-/NR | | | 625,000 | | | | 781,388 | |
Trinity River Authority, 5.00% due 8/1/2025 (Ten Mile Creek System) | | AA-/NR | | | 2,275,000 | | | | 2,868,456 | |
Uptown Development Authority, 5.50% due 9/1/2029 (Infrastructure Improvements) | | BBB/NR | | | 1,250,000 | | | | 1,370,713 | |
| | | |
U.S. VIRGIN ISLANDS — 0.32% | | | | | | | | | | |
Virgin Islands Public Finance Authority, 6.625% due 10/1/2029 | | NR/B2 | | | 5,000,000 | | | | 5,173,000 | |
| | | |
UTAH — 0.08% | | | | | | | | | | |
Local Building Authority of Salt Lake Valley Fire Service Area, 5.25% due 4/1/2020 pre-refunded 4/1/2018 | | NR/Aa2 | | | 1,250,000 | | | | 1,330,988 | |
| | | |
VIRGINIA — 0.44% | | | | | | | | | | |
County of Hanover IDA, 6.00% due 10/1/2021 (FirstHealth Richmond Memorial Hospital) (ETM) | | AA-/NR | | | 590,000 | | | | 632,327 | |
Virginia Housing Development Authority GO, 4.85% due 4/1/2019 (Multi-Family Housing Development) (AMT) | | AAA/Aaa | | | 3,100,000 | | | | 3,176,570 | |
Virginia Housing Development Authority GO, 4.85% due 10/1/2019 (Multi-Family Housing Development) (AMT) | | AAA/Aaa | | | 3,100,000 | | | | 3,159,241 | |
| | | |
WASHINGTON — 2.11% | | | | | | | | | | |
City of Seattle, 5.00% due 2/1/2019 (Light and Power Improvements) | | AA/Aa2 | | | 3,000,000 | | | | 3,281,340 | |
King County Public Hospital District No. 2 GO, 5.00% due 12/1/2028 (EvergreenHealth Medical Center) | | NR/Aa3 | | | 1,015,000 | | | | 1,237,995 | |
King County Public Hospital District No. 2 GO, 5.00% due 12/1/2029 (EvergreenHealth Medical Center) | | NR/Aa3 | | | 2,930,000 | | | | 3,553,504 | |
King County Public Hospital District No. 2 GO, 5.00% due 12/1/2030 (EvergreenHealth Medical Center) | | NR/Aa3 | | | 600,000 | | | | 723,978 | |
King County Public Hospital District No. 2 GO, 5.00% due 12/1/2031 (EvergreenHealth Medical Center) | | NR/Aa3 | | | 2,040,000 | | | | 2,439,636 | |
Skagit County Public Hospital District No. 1 GO, 5.00% due 12/1/2025 (Skagit Regional Health) | | NR/A1 | | | 4,860,000 | | | | 5,807,457 | |
Skagit County Public Hospital District No. 1 GO, 5.00% due 12/1/2028 (Skagit Regional Health) | | NR/A1 | | | 3,000,000 | | | | 3,519,180 | |
Skagit County Public Hospital District No. 2 GO, 5.00% due 12/1/2027 (Island Hospital) | | NR/A1 | | | 2,445,000 | | | | 2,852,704 | |
Skagit County Public Hospital District No. 2 GO, 5.00% due 12/1/2028 (Island Hospital) | | NR/A1 | | | 2,195,000 | | | | 2,545,849 | |
Tacoma School District No.10 GO, 5.00% due 12/1/2019 (Pierce County Capital Projects) | | AA+/Aa1 | | | 1,000,000 | | | | 1,125,360 | |
Tacoma School District No.10 GO, 5.00% due 12/1/2020 (Pierce County Capital Projects) | | AA+/Aa1 | | | 1,000,000 | | | | 1,160,120 | |
18 Annual Report
| | |
| SCHEDULE OF INVESTMENTS, CONTINUED | | |
| |
Thornburg Intermediate Municipal Fund | | September 30, 2016 |
| | | | | | | | | | | | |
Issuer-Description | | Credit Rating†
S&P/ Moody’s | | | Principal
Amount | | | Value | |
Washington Health Care Facilities Authority, 5.25% due 8/15/2024 pre-refunded 8/15/2018 (MultiCare Systems; Insured: AGM) | | | AA/Aa3 | | | $ | 1,000,000 | | | $ | 1,080,440 | |
Washington Health Care Facilities Authority, 6.25% due 8/1/2028 pre-refunded 8/1/2018 (Highline Medical Centers; Insured: FHA 242) | | | NR/NR | | | | 3,985,000 | | | | 4,371,425 | |
| | | |
WISCONSIN — 2.29% | | | | | | | | | | | | |
Wisconsin Health & Educational Facilities Authority, 5.00% due 7/1/2021 (Agnesian Healthcare, Inc.) | | | A/A2 | | | | 2,170,000 | | | | 2,435,109 | |
Wisconsin Health & Educational Facilities Authority, 5.00% due 8/15/2023 (ProHealth Care, Inc.) | | | A+/A1 | | | | 1,980,000 | | | | 2,308,423 | |
Wisconsin Health & Educational Facilities Authority, 5.00% due 8/15/2024 (ProHealth Care, Inc.) | | | A+/A1 | | | | 2,460,000 | | | | 2,860,463 | |
Wisconsin Health & Educational Facilities Authority, 5.50% due 7/1/2025 (Agnesian Healthcare, Inc.) | | | A/A2 | | | | 5,000,000 | | | | 5,709,400 | |
Wisconsin Health & Educational Facilities Authority, 5.00% due 8/15/2025 (ProHealth Care, Inc.) | | | A+/A1 | | | | 3,180,000 | | | | 3,680,468 | |
Wisconsin Health & Educational Facilities Authority, 5.00% due 8/15/2026 (ProHealth Care, Inc.) | | | A+/A1 | | | | 3,305,000 | | | | 3,809,839 | |
Wisconsin Health & Educational Facilities Authority, 5.00% due 11/15/2035 (Ascension Health) | | | AA+/Aa2 | | | | 10,000,000 | | | | 12,126,600 | |
Wisconsin Health & Educational Facilities Authority, 5.00% due 11/15/2036 (Ascension Health) | | | AA+/Aa2 | | | | 3,000,000 | | | | 3,623,730 | |
| | | | | | | | | | | | |
TOTAL INVESTMENTS — 96.57% (Cost $1,453,308,567) | | | | | | | | | | $ | 1,541,473,154 | |
OTHER ASSETS LESS LIABILITIES — 3.43% | | | | | | | | | | | 54,684,431 | |
| | | | | | | | | | | | |
NET ASSETS — 100.00% | | | | | | | | | | $ | 1,596,157,585 | |
| | | | | | | | | | | | |
Footnote Legend
| † | Credit ratings are unaudited. Rating changes may have occurred subsequent to the reporting period end. Bonds issued with a maturity of one year or less are assigned Moody’s ratings from MIG-1 to MIG-4 and Standard and Poor’s ratings from SP-1+ to SP-3 with MIG-1 and SP-1+ being the strongest ratings. |
Portfolio Abbreviations
To simplify the listings of securities, abbreviations are used per the table below:
| | |
| ACA | | Insured by American Capital Access |
| AGM | | Insured by Assured Guaranty Municipal Corp. |
| AMBAC | | Insured by American Municipal Bond Assurance Corp. |
| AMT | | Alternative Minimum Tax |
| BAM | | Insured by Build America Mutual Insurance Co. |
| CIFG | | Insured by CIFG Assurance North America Inc. |
| COP | | Certificates of Participation |
| DFA | | Development Finance Authority |
| EDA | | Economic Development Authority |
| ETM | | Escrowed to Maturity |
| FHA | | Insured by Federal Housing Administration |
| GNMA | | Collateralized by Government National Mortgage Association |
| GO | | General Obligation |
|
| | |
| HFA | | Health Facilities Authority |
| HFFA | | Health Facilities Financing Authority |
| IBC | | Insured Bond Certificate |
| IDA | | Industrial Development Authority |
| ISD | | Independent School District |
| Mtg | | Mortgage |
| Natl-Re | | Insured by National Public Finance Guarantee Corp. |
| PSF | | Guaranteed by Permanent School Fund |
| Q-SBLF | | Insured by Qualified School Bond Loan Fund |
| SONYMA | | State of New York Mortgage Authority |
| Syncora | | Insured by Syncora Guarantee Inc. |
| USD | | Unified School District |
See notes to financial statements.
Annual Report 19
| | |
| STATEMENT OF ASSETS AND LIABILITIES | | |
| |
Thornburg Intermediate Municipal Fund | | September 30, 2016 |
| | | | |
ASSETS | | | | |
Investments at value (cost $1,453,308,567) (Note 3) | | $ | 1,541,473,154 | |
Cash | | | 1,131,275 | |
Receivable for investments sold | | | 35,183,742 | |
Receivable for fund shares sold | | | 4,572,086 | |
Interest receivable | | | 17,237,898 | |
Prepaid expenses and other assets | | | 64,201 | |
| | | | |
Total Assets | | | 1,599,662,356 | |
| | | | |
| |
LIABILITIES | | | | |
Payable for fund shares redeemed | | | 2,223,832 | |
Payable to investment advisor and other affiliates (Note 4) | | | 861,788 | |
Accounts payable and accrued expenses | | | 147,198 | |
Dividends payable | | | 271,953 | |
| | | | |
Total Liabilities | | | 3,504,771 | |
| | | | |
| |
NET ASSETS | | $ | 1,596,157,585 | |
| | | | |
NET ASSETS CONSIST OF | | | | |
Distribution in excess of net investment income | | $ | (3,781 | ) |
Net unrealized appreciation on investments | | | 88,164,587 | |
Accumulated net realized gain (loss) | | | (91,411 | ) |
Net capital paid in on shares of beneficial interest | | | 1,508,088,190 | |
| | | | |
| | $ | 1,596,157,585 | |
| | | | |
| |
NET ASSET VALUE | | | | |
Class A Shares: | | | | |
Net asset value and redemption price per share ($467,334,554 applicable to 32,285,913 shares of beneficial interest outstanding - Note 5) | | $ | 14.47 | |
Maximum sales charge, 2.00% of offering price | | | 0.30 | |
| | | | |
Maximum offering price per share | | $ | 14.77 | |
| | | | |
| |
Class C Shares: | | | | |
Net asset value and offering price per share* ($170,148,882 applicable to 11,739,432 shares of beneficial interest outstanding - Note 5) | | $ | 14.49 | |
| | | | |
| |
Class I Shares: | | | | |
Net asset value, offering and redemption price per share ($958,674,149 applicable to 66,314,180 shares of beneficial interest outstanding - Note 5) | | $ | 14.46 | |
| | | | |
| * | Redemption price per share is equal to net asset value less any applicable contingent deferred sales charge. |
See notes to financial statements.
20 Annual Report
| | |
| STATEMENT OF OPERATIONS | | |
| |
Thornburg Intermediate Municipal Fund | | Year Ended September 30, 2016 |
| | | | |
INVESTMENT INCOME | | | | |
Interest income (net of premium amortized of $12,990,843) | | $ | 43,091,304 | |
| | | | |
| |
EXPENSES | | | | |
Investment advisory fees (Note 4) | | | 6,653,953 | |
Administration fees (Note 4) | | | | |
Class A Shares | | | 563,310 | |
Class C Shares | | | 209,419 | |
Class I Shares | | | 430,572 | |
Distribution and service fees (Note 4) | | | | |
Class A Shares | | | 1,126,621 | |
Class C Shares | | | 1,006,717 | |
Transfer agent fees | | | | |
Class A Shares | | | 218,466 | |
Class C Shares | | | 83,743 | |
Class I Shares | | | 661,081 | |
Registration and filing fees | | | | |
Class A Shares | | | 94,435 | |
Class C Shares | | | 24,773 | |
Class I Shares | | | 119,309 | |
Custodian fees (Note 2) | | | 114,246 | |
Professional fees | | | 64,588 | |
Accounting fees (Note 4) | | | 51,906 | |
Trustee fees | | | 64,680 | |
Other expenses | | | 62,512 | |
| | | | |
Total Expenses | | | 11,550,331 | |
Less: | | | | |
Expenses reimbursed by investment advisor (Note 4) | | | (41,910 | ) |
| | | | |
Net Expenses | | | 11,508,421 | |
| | | | |
Net Investment Income | | | 31,582,883 | |
| | | | |
REALIZED AND UNREALIZED GAIN (LOSS) | | | | |
Net realized gain (loss) on investments | | | 87,293 | |
Net change in unrealized appreciation (depreciation) on investments | | | 29,544,061 | |
| | | | |
Net Realized and Unrealized Gain | | | 29,631,354 | |
| | | | |
Net Increase in Net Assets Resulting from Operations | | $ | 61,214,237 | |
| | | | |
See notes to financial statements.
Annual Report 21
| | |
| STATEMENTS OF CHANGES IN NET ASSETS | | |
| |
Thornburg Intermediate Municipal Fund | | |
| | | | | | | | |
| | | Year Ended
September 30, 2016 | | | Year Ended
September 30, 2015 | |
INCREASE (DECREASE) IN NET ASSETS FROM | | | | | | | | |
| | |
OPERATIONS | | | | | | | | |
Net investment income | | $ | 31,582,883 | | | $ | 28,604,238 | |
Net realized gain (loss) on investments | | | 87,293 | | | | (178,705 | ) |
Net unrealized appreciation (depreciation) on investments | | | 29,544,061 | | | | (6,311,268 | ) |
| | | | | | | | |
Net Increase (Decrease) in Net Assets Resulting from Operations | | | 61,214,237 | | | | 22,114,265 | |
| | |
DIVIDENDS TO SHAREHOLDERS | | | | | | | | |
From net investment income | | | | | | | | |
Class A Shares | | | (8,992,508 | ) | | | (8,826,286 | ) |
Class C Shares | | | (2,806,252 | ) | | | (2,839,671 | ) |
Class I Shares | | | (19,784,123 | ) | | | (16,938,281 | ) |
| | |
FUND SHARE TRANSACTIONS (NOTE 5) | | | | | | | | |
Class A Shares | | | 35,033,185 | | | | 7,597,943 | |
Class C Shares | | | 6,640,373 | | | | 3,649,607 | |
Class I Shares | | | 190,211,712 | | | | 137,108,465 | |
| | | | | | | | |
Net Increase in Net Assets | | | 261,516,624 | | | | 141,866,042 | |
| | |
NET ASSETS | | | | | | | | |
Beginning of Year | | | 1,334,640,961 | | | | 1,192,774,919 | |
| | | | | | | | |
End of Year | | $ | 1,596,157,585 | | | $ | 1,334,640,961 | |
| | | | | | | | |
Distribution in excess of net investment income | | $ | (3,781 | ) | | $ | (3,781 | ) |
See notes to financial statements.
22 Annual Report
| | |
| NOTES TO FINANCIAL STATEMENTS | | |
| |
Thornburg Intermediate Municipal Fund | | September 30, 2016 |
NOTE 1 – ORGANIZATION
Thornburg Intermediate Municipal Fund (the “Fund”) is a diversified series of Thornburg Investment Trust (the “Trust”). The Trust is organized as a Massachusetts business trust under a Declaration of Trust dated June 3, 1987 and is registered as a diversified, open-end management investment company under the Investment Company Act of 1940, as amended. The Fund is currently one of twenty separate series of the Trust. Each series is considered to be a separate entity for financial reporting and tax purposes and bears expenses directly attributable to it. The Fund’s primary investment objective is to obtain as high a level of current income exempt from federal individual income taxes as is consistent, in the view of Thornburg Investment Management, Inc., the Trust’s investment advisor (the “Advisor”), with the preservation of capital. The Fund’s secondary objective is to reduce expected changes in its share price compared to long-term bond portfolios.
The Fund currently offers three classes of shares of beneficial interest: Class A, Class C, and Institutional Class (“Class I”). Each class of shares of the Fund represents an interest in the same portfolio of investments, except that (i) Class A shares are sold subject to a front-end sales charge collected at the time the shares are purchased and bear a service fee, (ii) Class C shares are sold at net asset value without a sales charge at the time of purchase, but are subject to a contingent deferred sales charge upon redemption within one year of purchase, and bear both a service fee and a distribution fee, (iii) Class I shares are sold at net asset value without a sales charge at the time of purchase and may be subject to a service fee, and (iv) the respective classes may have different reinvestment privileges and conversion rights. Additionally, the Fund may allocate among its classes certain expenses, to the extent allocable to specific classes, including transfer agent fees, government registration fees, certain printing and postage costs, and administrative and legal expenses. Currently, class specific expenses of the Fund are limited to service and distribution fees, administration fees, and certain registration and transfer agent expenses.
The following is a summary of significant accounting policies followed by the Fund in the preparation of its financial statements. The Fund prepares its financial statements in conformity with United States generally accepted accounting principles (“GAAP”), including investment company accounting and reporting guidance in the Financial Accounting Standards Board (the “FASB”) Accounting Standard Codification Topic 946.
NOTE 2 – SIGNIFICANT ACCOUNTING POLICIES
Security Valuation: All investments in securities held by the Fund are valued as described in Note 3.
Allocation of Income, Gains, Losses and Expenses: Net investment income (other than class specific expenses) and realized and unrealized gains and losses are allocated daily to each class of shares based upon the relative net asset value of outstanding shares (or the value of the dividend-eligible shares, as appropriate) of each class of shares at the beginning of the day (after adjusting for the current capital shares activity of the respective class). Expenses common to all Funds are allocated among the Funds comprising the Trust based upon their relative net asset values or other appropriate allocation methods. Operating expenses directly attributable to a specific class are charged against the operating income of that class.
Dividends and Distributions to Shareholders: Dividends and distributions to shareholders, which are determined in accordance with federal income tax regulations and may differ from GAAP, are recorded on the ex-dividend date. Ordinary income distributions, if any, are declared daily and paid monthly. Capital gain distributions, if any, are declared and paid annually and more often if deemed necessary by the Advisor. Dividends are paid and are reinvested in additional shares of the Fund at net asset value per share at the close of business on the ex-dividend date, or at the shareholder’s option, paid in cash.
Investment Income: Interest income is accrued as earned. Premiums and discounts are amortized and accreted, respectively, to call dates or maturity dates using the effective yield method of the respective investments, which is included in interest income on the Statement of Operations.
Custodian Fees: Custodian fees disclosed in the Statement of Operations may include interest expenses incurred by the Fund on any cash overdrafts of its custodian account during the period. Such cash overdrafts may result from the effects of failed trades in portfolio securities and from cash outflows resulting from unanticipated shareholder redemption activity. The Fund pays interest to its custodian on any such cash overdraft at a rate equal to 2.50% of the overdraft amount in excess of $50,000.
Investment Transactions: Investment transactions are accounted for on a trade date basis. Realized gains and losses from the sale of investments are recorded on an identified cost basis.
When-Issued and Delayed Delivery Transactions: The Fund may engage in when-issued or delayed delivery transactions. To the extent the Fund engages in such transactions, it will do so for the purpose of acquiring portfolio investments consistent with the Fund’s investment objectives and not for the purpose of investment leverage or to speculate on interest rate or market changes. At the time the Fund makes a commitment to purchase an investment on a when-issued or delayed delivery basis, the Fund will record the transaction and reflect the value in determining its net asset value. When effecting such transactions, assets of an amount sufficient to make payment
Annual Report 23
| | |
| NOTES TO FINANCIAL STATEMENTS, CONTINUED | | |
| |
Thornburg Intermediate Municipal Fund | | September 30, 2016 |
for the portfolio investments to be purchased will be segregated on the Fund’s records on the trade date. Investments purchased on a when-issued or delayed delivery basis do not earn interest until the settlement date.
Guarantees and Indemnifications: Under the Trust’s organizational documents (and under separate agreements with the independent Trustees), its officers and Trustees are provided with an indemnification against certain liabilities arising out of the performance of their duties to the Fund. In the normal course of business the Trust may also enter into contracts with service providers that contain general indemnifications. The Trust’s maximum exposure under these arrangements is unknown. However, based on experience, the Trust expects the risk of loss to be remote.
Use of Estimates: The preparation of financial statements in conformity with GAAP requires management to make estimates and assumptions that affect the reported amounts of assets and liabilities and disclosure of contingent assets and liabilities at the date of the financial statements and the reported amounts of increases (decreases) in net assets from operations during the reporting period. Actual results could differ from those estimates.
Federal Income Taxes: It is the policy of the Trust to comply with the provisions of the Internal Revenue Code applicable to regulated investment companies and to distribute to shareholders substantially all investment company taxable income including net realized gains on investments (if any), and tax exempt income of the Fund. Therefore, no provision for federal income or excise tax is required.
The Fund files income tax returns in United States federal and applicable state jurisdictions. The statute of limitations on the Fund’s tax return filings generally remains open for the three years following a return’s filing date. The Fund has analyzed each uncertain tax position believed to be material in the preparation of the Fund’s financial statements for the fiscal year ended September 30, 2016, including open tax years, to assess whether it is more likely than not that the position would be sustained upon examination, based on the technical merits of the position. The Fund has not identified any such position for which an asset or liability must be reflected in the Statement of Assets and Liabilities.
At September 30, 2016, information on the tax components of capital was as follows:
| | | | |
Cost of investments for tax purposes | | $ | 1,453,308,567 | |
| | | | |
Gross unrealized appreciation on a tax basis | | $ | 88,612,999 | |
Gross unrealized depreciation on a tax basis | | | (448,412 | ) |
| | | | |
Net unrealized appreciation (depreciation) on investments (tax basis) | | $ | 88,164,587 | |
| | | | |
At September 30, 2016, the Fund had deferred tax basis capital losses occurring subsequent to October 31, 2015 through September 30, 2016 of $110. For tax purposes, such losses will be recognized in the year ending September 30, 2017.
At September 30, 2016, the Fund had cumulative tax basis capital losses of $91,303, (of which $0 are short-term and $91,303 are long-term) generated after September 30, 2011, which may be carried forward to offset future capital gains. To the extent such carry-forwards are used, capital gain distributions may be reduced to the extent provided by regulations. Such capital loss carryforwards do not expire.
At September 30, 2016, the Fund had $268,171 undistributed tax basis net tax-exempt income, no undistributed tax basis net ordinary income and no undistributed tax basis capital gains.
Distributions from tax exempt income paid by the Fund for the years ended September 30, 2016 and September 30, 2015 are excludable by shareholders from gross income for federal income tax purposes.
The tax character of distributions paid during the years ended September 30, 2016, and September 30, 2015, was as follows:
| | | | | | | | |
| | | 2016 | | | 2015 | |
Distributions from: | | | | | | | | |
Tax exempt income | | $ | 31,504,595 | | | $ | 28,499,857 | |
Ordinary income | | | 78,288 | | | | 104,381 | |
| | | | | | | | |
Total | | $ | 31,582,883 | | | $ | 28,604,238 | |
| | | | | | | | |
NOTE 3 – SECURITY VALUATION
Valuation of the Fund’s portfolio investment securities is performed in accordance with policies and procedures adopted by and under the oversight of the Trustees.
24 Annual Report
| | |
| NOTES TO FINANCIAL STATEMENTS, CONTINUED | | |
| |
Thornburg Intermediate Municipal Fund | | September 30, 2016 |
The Trustees of the Trust have appointed the Advisor to assist the Trustees in obtaining market values for portfolio investments, evaluate and monitor professional pricing service providers appointed by the Trustees’ Audit Committee (the “Audit Committee”) to assist in determining fair values for portfolio investments, assist in calculating fair values for portfolio investments in certain circumstances, and to perform other functions in connection with the valuation of investments. The Advisor acts through its Valuation and Pricing Committee (the “Committee”) and other employees of the Advisor. The Committee regularly reviews its own valuation calculations, as well as the valuations, valuation techniques and services furnished by pricing service providers, considers circumstances which may require valuation calculations by the Committee, and reviews previous valuation calculations. The Committee reports to the Audit Committee on the Committee’s activities, the performance of pricing service providers, and other matters relating to valuation of portfolio investments.
In those instances when the Committee assists in calculating a fair value for a portfolio investment, the Committee seeks to determine the price that the Fund would reasonably expect to receive upon a sale of the investment in an orderly transaction between market participants on the valuation date. The Committee customarily utilizes quotations from securities broker dealers in calculating valuations, but also may utilize prices obtained from pricing service providers or other methods approved by the Audit Committee. Because fair values calculated by the Committee are estimates, the calculation of a value for an investment may differ from the price that would be realized by the Fund upon a sale of the investment, and the difference could be material to the Fund’s financial statements. The Committee’s calculation of a fair value for an investment may also differ from the prices obtained by other persons (including other mutual funds) for the investment.
Valuation of Securities: Debt obligations held by the Fund which are not listed or traded on exchanges or for which no reported market exists are ordinarily valued at the valuation obtained from a pricing service provider approved by the Audit Committee.
In any case when a pricing service provider fails to provide a valuation for a debt obligation held by the Fund, the Committee calculates a fair value for the obligation using alternative methods under procedures approved by the Audit Committee. Additionally, in cases when management believes that a valuation obtained from a pricing service provider merits review for significant reasons, the Committee decides whether or not to use the valuation calculated by the pricing service provider or to use an alternative method approved by the Audit Committee to calculate a fair value for the obligation.
Valuation Hierarchy: The Fund categorizes its investments based upon the inputs used in valuing those investments, according to a three-level hierarchy established in guidance from FASB. Categorization of investments using this hierarchy is intended by the FASB to maximize the use of observable inputs in valuing investments and minimize the use of unobservable inputs by requiring that the most observable inputs be used when available. Observable inputs are those that market participants would use in valuing an investment based on available market information. Unobservable inputs are those that reflect assumptions about the information market participants would use in valuing an investment. An investment’s level within the hierarchy is based on the lowest level input that is deemed significant to the valuation. The methodologies and inputs used to value investments are not necessarily indications of the risk or liquidity associated with those investments.
Various inputs are used in calculating valuations for the Fund’s investments. These inputs are generally summarized according to the three-level hierarchy below:
Level 1: Quoted prices in active markets for identical investments.
Level 2: Other direct or indirect significant observable inputs (including quoted prices for similar investments in active markets and other observable inputs, such as interest rates, prepayment rates, credit risk, etc.).
Level 3: Significant unobservable inputs (including the Committee’s own assumptions in calculating the fair values of investments).
Valuations for debt obligations held by the Fund are typically calculated by pricing service providers approved by the Audit Committee and are characterized as Level 2 within the valuation hierarchy.
In a limited number of cases the Committee calculates a fair value for investments using broker quotations or other methods approved by the Audit Committee. When the Committee uses a single broker quotation to calculate a fair value for an investment without other significant observable inputs, or if a fair value is calculated using other significant inputs that are considered unobservable, the investment is characterized as Level 3 within the hierarchy. Other significant unobservable inputs used to calculate a fair value in these instances might include an income-based valuation approach which considers discounted anticipated future cash flows from the investment, and application of discounts due to the nature or duration of any restrictions on the disposition of the investment.
Valuations based upon the use of inputs from Levels 1, 2 or 3 may not represent the actual price received upon the disposition of an investment, and the Fund may receive a price that is lower than the valuation based upon these inputs when it sells the investment.
Annual Report 25
| | |
| NOTES TO FINANCIAL STATEMENTS, CONTINUED | | |
| |
Thornburg Intermediate Municipal Fund | | September 30, 2016 |
The following table displays a summary of the fair value hierarchy measurements of the Fund’s investments as of September 30, 2016. In any instance when valuation inputs from more than one level are used to determine the fair value of a specific investment, the investment is placed in the level of the table based upon the lowest level input that is significant in determining the fair value of the investment:
| | | | | | | | | | | | | | | | |
| | | Fair Value Measurements at September 30, 2016 | |
| | | Total | | | Level 1 | | | Level 2 | | | Level 3 | |
Assets | | | | | | | | | | | | | | | | |
Investments in Securities | | | | | | | | | | | | | | | | |
Municipal Bonds | | $ | 1,541,473,154 | | | $ | — | | | $ | 1,541,473,154 | | | $ | — | |
| | | | | | | | | | | | | | | | |
Total Investments in Securities | | $ | 1,541,473,154 | | | $ | — | | | $ | 1,541,473,154 | | | $ | — | |
In accordance with the guidance prescribed in Accounting Standards Update No. 2011-04, it is the policy of the Fund to recognize transfers between levels and the underlying events which caused the movement. The Fund recognized no transfers between levels for the year ended September 30, 2016.
NOTE 4 – INVESTMENT ADVISORY FEE AND OTHER TRANSACTIONS WITH AFFILIATES
Pursuant to an investment advisory agreement, the Advisor serves as the investment advisor and performs services for the Fund for which the fees are payable at the end of each month. Under the investment advisory agreement, the Fund pays the Advisor a management fee based on the daily net assets of the Fund at an annual rate as shown in the following table:
| | | | |
Daily Net Assets | | Fee Rate | |
Up to $500 million | | | 0.500 | % |
Next $500 million | | | 0.450 | |
Next $500 million | | | 0.400 | |
Next $500 million | | | 0.350 | |
Over $2 billion | | | 0.275 | |
The Fund’s effective management fee for the year ended September 30, 2016 was 0.45% of the Fund’s average dividend assets.
The Fund pays to the Advisor the costs of personnel who perform certain accounting services for the Fund. For the year ended September 30, 2016 the Fund paid $51,906 to the Advisor for these accounting services. The Trust has also entered into administrative service agreements with the Advisor, whereby the Advisor will perform certain administrative services for the shareholders of each class of the Fund’s shares, and for which fees will be payable at an annual rate of up to .125 of 1% per annum of the average daily net assets attributable to each class of shares. Total administrative service fees incurred by each class of shares of the Fund for the year ended September 30, 2016, are set forth in the Statement of Operations.
The Trust has an underwriting agreement with Thornburg Securities Corporation (the “Distributor”), an affiliate of the Advisor, which acts as the distributor of the Fund’s shares. For the year ended September 30, 2016, the Distributor has advised the Fund that it earned net commissions aggregating $6,413 from the sale of Class A shares, and collected contingent deferred sales charges aggregating $8,442 from redemptions of Class C shares of the Fund.
Pursuant to a service plan under Rule 12b-1 of the Investment Company Act of 1940, the Fund may reimburse to the Advisor an amount not to exceed .25 of 1% per annum of the average daily net assets attributable to Class A and Class C shares of the Fund for payments made by the Advisor to securities dealers and other financial institutions to obtain various shareholder and distribution related services. For the year ended September 30, 2016, there were no 12b-1 service plan fees charged for Class I shares. The Advisor may pay out of its own resources additional expenses for distribution of the Fund’s shares and shareholder services.
The Trust has also adopted a distribution plan pursuant to Rule 12b-1, applicable only to the Fund’s Class C shares, under which the Fund compensates the Distributor for services in promoting the sale of Class C shares of the Fund at an annual rate of up to .35 of 1% per annum of the average daily net assets attributable to Class C shares. Total fees incurred by each class of shares of the Fund under their respective service and distribution plans for the year ended September 30, 2016, are set forth in the Statement of Operations.
The Advisor and Distributor have contractually agreed to waive fees and reimburse expenses incurred by the Fund so that actual expenses of certain share classes do not exceed levels as specified in the Fund’s most recent prospectus. The agreement may be terminated by the Fund at any time, but may not be terminated by the Advisor or Distributor before February 1, 2017, unless the Advisor ceases to be the investment advisor to the Trust or the Distributor ceases to be the distributor of the Fund prior to that date. The Advisor and Distributor retain the right to be repaid by the Fund for fee waivers and expense reimbursements if expenses fall below the contractual limit prior to the end of the fiscal year.
26 Annual Report
| | |
| NOTES TO FINANCIAL STATEMENTS, CONTINUED | | |
| |
Thornburg Intermediate Municipal Fund | | September 30, 2016 |
For the year ended September 30, 2016 the Advisor contractually reimbursed certain class specific expenses, administrative fees, and distribution fees of $41,910 for Class C shares.
Certain officers and Trustees of the Trust are also officers or directors of the Advisor and Distributor. The compensation of independent Trustees is borne by the Trust.
The Fund may sell securities to an affiliated fund, or the Fund may purchase securities held by an affiliated fund, provided the affiliation is due solely to having a common investment advisor, common officers, or common trustees, and provided that all such transactions will comply with Rule 17a-7 under the 1940 Act. For the year ended September 30, 2016, the Fund had transactions with affiliated funds of $1,400,177 in purchases and $5,801,058 in sales.
NOTE 5 – SHARES OF BENEFICIAL INTEREST
At September 30, 2016, there were an unlimited number of shares with no par value of beneficial interest authorized. Transactions in shares of beneficial interest were as follows:
| | | | | | | | | | | | | | | | |
| | | Year Ended
September 30, 2016 | | | Year Ended
September 30, 2015 | |
| | | Shares | | | Amount | | | Shares | | | Amount | |
Class A Shares | | | | | | | | | | | | | | | | |
Shares sold | | | 9,279,089 | | | $ | 133,413,786 | | | | 4,268,461 | | | $ | 60,729,148 | |
Shares issued to shareholders in reinvestment of dividends | | | 574,357 | | | | 8,275,394 | | | | 567,704 | | | | 8,071,945 | |
Shares repurchased | | | (7,420,820 | ) | | | (106,655,995 | ) | | | (4,303,842 | ) | | | (61,203,150 | ) |
| | | | | | | | | | | | | | | | |
| | | | |
Net increase (decrease) | | | 2,432,626 | | | $ | 35,033,185 | | | | 532,323 | | | $ | 7,597,943 | |
| | | | | | | | | | | | | | | | |
| | | | |
Class C Shares | | | | | | | | | | | | | | | | |
Shares sold | | | 1,913,796 | | | $ | 27,572,239 | | | | 1,735,534 | | | $ | 24,731,966 | |
Shares issued to shareholders in reinvestment of dividends | | | 165,842 | | | | 2,392,143 | | | | 169,292 | | | | 2,410,060 | |
Shares repurchased | | | (1,617,751 | ) | | | (23,324,009 | ) | | | (1,651,624 | ) | | | (23,492,419 | ) |
| | | | | | | | | | | | | | | | |
| | | | |
Net increase (decrease) | | | 461,887 | | | $ | 6,640,373 | | | | 253,202 | | | $ | 3,649,607 | |
| | | | | | | | | | | | | | | | |
| | | | |
Class I Shares | | | | | | | | | | | | | | | | |
Shares sold | | | 25,331,370 | | | $ | 364,312,426 | | | | 20,039,316 | | | $ | 284,969,358 | |
Shares issued to shareholders in reinvestment of dividends | | | 1,211,588 | | | | 17,444,423 | | | | 1,036,238 | | | | 14,709,303 | |
Shares repurchased | | | (13,320,008 | ) | | | (191,545,137 | ) | | | (11,476,359 | ) | | | (162,570,196 | ) |
| | | | | | | | | | | | | | | | |
| | | | |
Net increase (decrease) | | | 13,222,950 | | | $ | 190,211,712 | | | | 9,599,195 | | | $ | 137,108,465 | |
| | | | | | | | | | | | | | | | |
NOTE 6 – INVESTMENT TRANSACTIONS
For the year ended September 30, 2016, the Fund had purchase and sale transactions of investments (excluding short-term investments) of $385,640,883 and $137,879,802, respectively.
OTHER NOTES
Risks: The Fund’s investments subject it to risks including, but not limited to, management risk, interest rate risk, credit risk, market and economic risk, and liquidity risk. Please see the Fund’s prospectus for a discussion of the risks associated with an investment in the Fund.
Subsequent Events: Fund management believes no events have occurred between September 30, 2016 and the date of issuance of the financial statements that require adjustment to or disclosure in the accompanying financial statements.
Annual Report 27
FINANCIAL HIGHLIGHTS
Thornburg Intermediate Municipal Fund
| | | | | | | | | | | | | | | | | | | | | | | | | | | | | | | | | | | | | | | | | | | | | | | | | | | | | | | | |
| | | PER SHARE PERFORMANCE (for a share outstanding throughout the Year) | | | RATIOS TO AVERAGE NET ASSETS | | | SUPPLEMENTAL DATA | |
Unless Otherwise Noted, Periods are Fiscal Years Ended Sept. 30, | | Net Asset
Value
Beginning
of Year | | | Net
Investment
Income
(Loss)+ | | | Net
Realized
&
Unrealized
Gain (Loss)
on
Investments | | | Total from
Investment
Operations | | | Dividends
from Net
Investment
Income | | | Dividends
from Net
Realized
Gains | | Total
Dividends | | | Net
Asset
Value
End
of
Year | | | Net
Investment
Income
(Loss)
(%) | | | Expenses,
After
Expense
Reductions
(%) | | | Expenses,
After
Expense
Reductions
and
Net of
Custody
Credits
(%) | | | Expenses,
Before
Expense
Reductions
(%) | | | Total
Return
(%)(a) | | | Portfolio
Turnover
Rate (%)(a) | | Net
Assets
at End
of
Year
(Thousands) | |
CLASS A SHARES | | | | | | | | | | | | | | | | | | | | | | | | | | | | | | | | | | | | | | | | | | | | | | | | | |
2016(b) | | $ | 14.17 | | | | 0.29 | | | | 0.30 | | | | 0.59 | | | | (0.29 | ) | | — | | | (0.29 | ) | | $ | 14.47 | | | | 2.00 | | | | 0.92 | | | | 0.92 | | | | 0.92 | | | | 4.17 | | | 10.80 | | $ | 467,335 | |
2015(b) | | $ | 14.23 | | | | 0.30 | | | | (0.06 | ) | | | 0.24 | | | | (0.30 | ) | | — | | | (0.30 | ) | | $ | 14.17 | | | | 2.09 | | | | 0.92 | | | | 0.92 | | | | 0.92 | | | | 1.68 | | | 13.49 | | $ | 423,113 | |
2014(b) | | $ | 13.76 | | | | 0.34 | | | | 0.47 | | | | 0.81 | | | | (0.34 | ) | | — | | | (0.34 | ) | | $ | 14.23 | | | | 2.43 | | | | 0.92 | | | | 0.92 | | | | 0.92 | | | | 5.95 | | | 14.85 | | $ | 417,369 | |
2013(b) | | $ | 14.22 | | | | 0.33 | | | | (0.46 | ) | | | (0.13 | ) | | | (0.33 | ) | | — | | | (0.33 | ) | | $ | 13.76 | | | | 2.37 | | | | 0.92 | | | | 0.92 | | | | 0.92 | | | | (0.91 | ) | | 29.18 | | $ | 429,941 | |
2012(b) | | $ | 13.59 | | | | 0.40 | | | | 0.63 | | | | 1.03 | | | | (0.40 | ) | | — | | | (0.40 | ) | | $ | 14.22 | | | | 2.88 | | | | 0.93 | | | | 0.93 | | | | 0.93 | | | | 7.69 | | | 16.94 | | $ | 456,527 | |
CLASS C SHARES | | | | | | | | | | | | | | | | | | | | | | | | | | | | | | | | | | | | | | | | | | | | | | | | | |
2016 | | $ | 14.19 | | | | 0.24 | | | | 0.30 | | | | 0.54 | | | | (0.24 | ) | | — | | | (0.24 | ) | | $ | 14.49 | | | | 1.68 | | | | 1.24 | | | | 1.24 | | | | 1.27 | | | | 3.84 | | | 10.80 | | $ | 170,149 | |
2015 | | $ | 14.25 | | | | 0.25 | | | | (0.06 | ) | | | 0.19 | | | | (0.25 | ) | | — | | | (0.25 | ) | | $ | 14.19 | | | | 1.77 | | | | 1.24 | | | | 1.24 | | | | 1.28 | | | | 1.35 | | | 13.49 | | $ | 160,042 | |
2014 | | $ | 13.78 | | | | 0.30 | | | | 0.47 | | | | 0.77 | | | | (0.30 | ) | | — | | | (0.30 | ) | | $ | 14.25 | | | | 2.11 | | | | 1.24 | | | | 1.24 | | | | 1.29 | | | | 5.61 | | | 14.85 | | $ | 157,126 | |
2013 | | $ | 14.24 | | | | 0.29 | | | | (0.46 | ) | | | (0.17 | ) | | | (0.29 | ) | | — | | | (0.29 | ) | | $ | 13.78 | | | | 2.05 | | | | 1.24 | | | | 1.24 | | | | 1.30 | | | | (1.22 | ) | | 29.18 | | $ | 159,727 | |
2012 | | $ | 13.61 | | | | 0.36 | | | | 0.63 | | | | 0.99 | | | | (0.36 | ) | | — | | | (0.36 | ) | | $ | 14.24 | | | | 2.56 | | | | 1.24 | | | | 1.24 | | | | 1.31 | | | | 7.36 | | | 16.94 | | $ | 170,071 | |
CLASS I SHARES | | | | | | | | | | | | | | | | | | | | | | | | | | | | | | | | | | | | | | | | | | | | | | | | | |
2016 | | $ | 14.15 | | | | 0.33 | | | | 0.31 | | | | 0.64 | | | | (0.33 | ) | | — | | | (0.33 | ) | | $ | 14.46 | | | | 2.30 | | | | 0.61 | | | | 0.61 | | | | 0.61 | | | | 4.57 | | | 10.80 | | $ | 958,674 | |
2015 | | $ | 14.22 | | | | 0.34 | | | | (0.07 | ) | | | 0.27 | | | | (0.34 | ) | | — | | | (0.34 | ) | | $ | 14.15 | | | | 2.39 | | | | 0.62 | | | | 0.62 | | | | 0.62 | | | | 1.91 | | | 13.49 | | $ | 751,486 | |
2014 | | $ | 13.75 | | | | 0.38 | | | | 0.47 | | | | 0.85 | | | | (0.38 | ) | | — | | | (0.38 | ) | | $ | 14.22 | | | | 2.73 | | | | 0.62 | | | | 0.61 | | | | 0.62 | | | | 6.28 | | | 14.85 | | $ | 618,280 | |
2013 | | $ | 14.20 | | | | 0.38 | | | | (0.45 | ) | | | (0.07 | ) | | | (0.38 | ) | | — | | | (0.38 | ) | | $ | 13.75 | | | | 2.68 | | | | 0.61 | | | | 0.61 | | | | 0.61 | | | | (0.53 | ) | | 29.18 | | $ | 449,501 | |
2012 | | $ | 13.58 | | | | 0.44 | | | | 0.63 | | | | 1.07 | | | | (0.45 | ) | | — | | | (0.45 | ) | | $ | 14.20 | | | | 3.18 | | | | 0.61 | | | | 0.61 | | | | 0.61 | | | | 7.96 | | | 16.94 | | $ | 365,443 | |
| (a) | Not annualized for periods less than one year. |
| (b) | Sales loads are not reflected in computing total return. |
| + | Based on weighted average shares outstanding. |
See notes to financial statements.
| | | | |
| 28 Annual Report | | | | Annual Report 29 |
REPORT OF INDEPENDENT REGISTERED PUBLIC ACCOUNTING FIRM
Thornburg Intermediate Municipal Fund
To the Trustees and Shareholders of
Thornburg Intermediate Municipal Fund
In our opinion, the accompanying statement of assets and liabilities, including the schedule of investments in securities, and the related statements of operations and of changes in net assets and the financial highlights present fairly, in all material respects, the financial position of the Thornburg Intermediate Municipal Fund (the “Fund”) at September 30, 2016, the results of its operations for the year then ended, the changes in its net assets for each of the two years in the period then ended and the financial highlights for each of the five years in the period then ended, in conformity with accounting principles generally accepted in the United States of America. These financial statements and financial highlights (hereafter referred to as “financial statements”) are the responsibility of the Fund’s management. Our responsibility is to express an opinion on these financial statements based on our audits. We conducted our audits of these financial statements in accordance with the standards of the Public Company Accounting Oversight Board (United States). Those standards require that we plan and perform the audit to obtain reasonable assurance about whether the financial statements are free of material misstatement. An audit includes examining, on a test basis, evidence supporting the amounts and disclosures in the financial statements, assessing the accounting principles used and significant estimates made by management, and evaluating the overall financial statement presentation. We believe that our audits, which included confirmation of securities at September 30, 2016 by correspondence with the custodian, brokers, transfer agent, and the application of alternative procedures where securities purchased had not been received, provide a reasonable basis for our opinion.
PricewaterhouseCoopers LLP
New York, New York
November 18, 2016
30 Annual Report
| | |
| EXPENSE EXAMPLE | | |
| |
Thornburg Intermediate Municipal Fund | | September 30, 2016 (Unaudited) |
As a shareholder of the Fund, you incur two types of costs:
| | (1) | transaction costs, including |
| | (a) | sales charges (loads) on purchase payments, for Class A shares; |
| | (b) | a deferred sales charge on redemptions of any part or all of a purchase of $1 million of Class A shares within 12 months of purchase; |
| | (c) | a deferred sales charge on redemptions of Class C shares within 12 months of purchase; |
| | (2) | ongoing costs, including management fees; distribution and/or service (12b-1) fees; and other Fund expenses. |
This example is intended to help you understand your ongoing costs (in dollars) of investing in the Fund and to compare these costs with the ongoing costs of investing in other mutual funds.
The example is based on a $1,000 investment beginning on April 1, 2016, and held until September 30, 2016.
| | | | | | | | | | | | |
| | | Beginning
Account Value
4/1/16 | | | Ending
Account Value
9/30/16 | | | Expenses Paid
During Period†
4/1/16–9/30/16 | |
Class A Shares | | | | | | | | | | | | |
Actual | | $ | 1,000.00 | | | $ | 1,016.20 | | | $ | 4.61 | |
Hypothetical* | | $ | 1,000.00 | | | $ | 1,020.43 | | | $ | 4.62 | |
Class C Shares | | | | | | | | | | | | |
Actual | | $ | 1,000.00 | | | $ | 1,014.50 | | | $ | 6.24 | |
Hypothetical* | | $ | 1,000.00 | | | $ | 1,018.80 | | | $ | 6.26 | |
Class I Shares | | | | | | | | | | | | |
Actual | | $ | 1,000.00 | | | $ | 1,017.70 | | | $ | 3.08 | |
Hypothetical* | | $ | 1,000.00 | | | $ | 1,021.95 | | | $ | 3.09 | |
| † | Expenses are equal to the annualized expense ratio for each class (A: 0.91%; C: 1.24%; I: 0.61%) multiplied by the average account value over the period, multiplied by 183/366 to reflect the one-half year period. |
| * | Hypothetical assumes a rate of return of 5% per year before expenses. |
ACTUAL EXPENSES
For each class of shares, the first line of the accompanying table provides information about actual account values and actual expenses. You may use the information in this line, together with the amount you invested, to estimate the expenses that you paid over the period. Simply divide your account value by $1,000 (for example, an $8,600 account value divided by $1,000 = 8.6), then multiply the result by the number in the first line for your class of shares under the heading entitled “Expenses Paid During Period” to estimate the expenses you paid on your account during this period.
HYPOTHETICAL EXAMPLE FOR COMPARISON PURPOSES
For each class of shares, the second line of the accompanying table provides information about hypothetical account values and hypothetical expenses based on the Fund’s actual expense ratio and an assumed rate of return of 5% per year before expenses, which is not the Fund’s actual return. The hypothetical account values and expenses may not be used to estimate the actual ending account balance or expenses you paid for the period. You may use this information to compare the ongoing costs of investing in the Fund and other funds. To do so, compare this 5% hypothetical example with the 5% hypothetical examples that appear in the shareholder reports of the other funds.
Please note that the expenses shown in the table are meant to highlight your ongoing costs only and do not reflect any transactional costs, such as sales charges (loads), redemption fees, or exchange fees. Therefore, the second line of the table for each class of shares is useful in comparing ongoing costs only, and will not help you determine the relative total costs of owning different funds. In addition, if these transactional costs were included, your costs would have been higher.
Annual Report 31
| | |
| TRUSTEES AND OFFICERS | | |
| |
Thornburg Intermediate Municipal Fund | | September 30, 2016 (Unaudited) |
| | | | |
Name, Age, Year Elected Position Held with Fund | | Principal Occupation(s) During Past Five Years | | Other
Directorships
Held by Trustee |
| INTERESTED TRUSTEES(1)(2)(4) | | |
| | |
Garrett Thornburg, 71 Trustee since 1987, Chairman of Trustees(3) | | Chairman and controlling shareholder of Thornburg Investment Management, Inc. (investment advisor); Chairman and controlling shareholder of Thornburg Securities Corporation (securities dealer); Chairman and CEO of Chamisa Energy, LLC; President of the Thornburg Foundation (nonprofit). | | None |
| | |
Brian J. McMahon, 61 Trustee since 2001, Vice Chairman of Trustees, Member of Governance & Nominating Committee & Operations Risk Oversight Committee(5) | | Chief Investment Officer, Managing Director, and Portfolio Manager and, until 2016, CEO and President of Thornburg Investment Management, Inc.; Vice President of Thornburg Securities Corporation. | | None |
| |
| INDEPENDENT TRUSTEES(1)(2)(4) | | |
| | |
David A. Ater, 71 Trustee since 1994, Member of Audit Committee & Chairman of Governance & Nominating Committee | | Principal in Ater & Associates, Santa Fe, NM (developer, planner and broker of residential and commercial real estate); owner, developer and broker for various real estate projects. | | None |
| | |
David D. Chase, 75 Trustee since 2000, Chairman of Audit Committee | | Managing Member of CS Group, LLC, Santa Fe, NM (private investment fund – family office). | | None |
| | |
Sally Corning, 55 Trustee since 2012, Member of Audit Committee | | Partner in Sun Mountain Capital, Santa Fe, NM (private equity firm with investment programs encompassing venture capital, mezzanine debt, and growth equity). | | None |
| | |
Susan H. Dubin, 67 Trustee since 2004, Member of Audit Committee & Governance and Nominating Committee | | President of Dubin Investments, Ltd., Greenwich, CT (private investment fund); Director and officer of various charitable organizations. | | None |
| | |
David L. Gardner, 53 Trustee since 2015, Member of Operations Risk Oversight Committee | | Until 2012, head of EMEA (Europe, Middle East and Africa) Sales for iShares of Blackrock, Inc., EMEA Executive Committee Member and EMEA Operating Committee Member at Blackrock, Inc. | | None |
| | |
Owen D. Van Essen, 62 Trustee since 2004, Member of Governance & Nominating Committee & Chairman of Operations Risk Oversight Committee | | President of Dirks, Van Essen & Murray, Santa Fe, NM (newspaper mergers and acquisitions). | | None |
| | |
James W. Weyhrauch, 57 Trustee since 1996, Member of Audit Committee & Operations Risk Oversight Committee | | Real estate broker, Santa Fe Properties, Santa Fe, NM; Vice Chairman of Nambe LLC, Santa Fe, NM (manufacturing & design company). | | None |
32 Annual Report
| | |
| TRUSTEES AND OFFICERS, CONTINUED | | |
| |
Thornburg Intermediate Municipal Fund | | September 30, 2016 (Unaudited) |
| | | | |
Name, Age, Year Elected Position Held with Fund | | Principal Occupation(s) During Past Five Years | | Other
Directorships
Held By Trustee |
| OFFICERS OF THE FUND (WHO ARE NOT TRUSTEES)(1)(7) | | |
| | |
Nimish Bhatt, 53 Treasurer since 2016(6) | | Chief Financial Officer and Treasurer of Thornburg Investment Management, Inc. and Thornburg Securities Corporation since 2016; Senior Vice President (2004-2016), Chief Financial Officer (2011-2016), and Head of Fund Administration (2011-2016) of Calamos Asset Management, Inc., Calamos Investments LLC, Calamos Advisors LLC, and Calamos Wealth Management; Director of Calamos Global Funds plc (2007-2016). | | Not applicable |
| | |
Jason Brady, 42 President since 2016(6) | | CEO and President since 2016, Vice President from 2011 to 2016, Portfolio Manager and Managing Director of Thornburg Investment Management, Inc.; Vice President of Thornburg Securities Corporation since 2016. | | Not applicable |
| | |
Kathleen Brady, 56 Vice President since 2008 | | Tax Manager Fund Accounting of Thornburg Investment Management, Inc. | | Not applicable |
| | |
Connor Browne, 37 Vice President since 2006 | | Portfolio Manager, Vice President since 2013, and Managing Director of Thornburg Investment Management, Inc. | | Not applicable |
| | |
Tim Cunningham, 41 Vice President since 2014 | | Managing Director since 2011, Portfolio Manager since 2012, and Associate Portfolio Manager from 2009–2012 of Thornburg Investment Management, Inc. | | Not applicable |
| | |
Randy Dry, 42 Vice President since 2014 | | Vice President and Managing Director, Director of Institutional Group from 2014-2016, and since 2016, Chief Administrative Officer of Thornburg Investment Management, Inc. | | Not applicable |
| | |
Greg Dunn, 40 Vice President since 2014 | | Managing Director, Portfolio Manager since 2012, and Associate Portfolio Manager from 2009–2012 of Thornburg Investment Management, Inc. | | Not applicable |
| | |
Lon Erickson, 41 Vice President since 2008 | | Portfolio Manager and Managing Director of Thornburg Investment Management, Inc. | | Not applicable |
| | |
William V. Fries, 77 Vice President since 1995 | | Portfolio Manager, Vice President, and Managing Director of Thornburg Investment Management, Inc. | | Not applicable |
| | |
Thomas Garcia, 45 Vice President since 2006 | | Vice President since 2011, Managing Director, Head Equity Trader, and Associate Portfolio Manager of Thornburg Investment Management, Inc. | | Not applicable |
| | |
Rolf Kelly, 37 Vice President since 2016 | | Portfolio Manager and Managing Director since 2013 and Associate Portfolio Manager from 2011–2013 of Thornburg Investment Management, Inc. | | Not applicable |
| | |
Ben Kirby, 36 Vice President since 2014 | | Portfolio Manager and Managing Director since 2013 and Associate Portfolio Manager from 2011–2013 of Thornburg Investment Management, Inc. | | Not applicable |
| | |
Jeff Klingelhofer, 41 Vice President since 2016 | | Portfolio Manager and Managing Director since 2015, Associate Portfolio Manager from 2012–2015, and Fixed Income Analyst from 2010–2012 of Thornburg Investment Management, Inc. | | Not applicable |
| | |
Rob MacDonald, 40 Vice President since 2016 | | Managing Director since 2015, Portfolio Manager since 2014, and Associate Portfolio Manager from 2011–2014 of Thornburg Investment Management, Inc. | | Not applicable |
| | |
Leigh Moiola, 49 Vice President since 2001 | | Vice President, Managing Director, and Director of Marketing of Thornburg Investment Management, Inc.; Vice President of Thornburg Securities Corporation. | | Not applicable |
| | |
Christopher Ryon, 60 Vice President since 2008 | | Portfolio Manager and Managing Director of Thornburg Investment Management, Inc. | | Not applicable |
| | |
Nicholos Venditti, 35 Vice President since 2016 | | Portfolio Manager and Managing Director since 2015 and Associate Portfolio Manager from 2011–2015 of Thornburg Investment Management, Inc. | | Not applicable |
Annual Report 33
| | |
| TRUSTEES AND OFFICERS, CONTINUED | | |
| |
Thornburg Intermediate Municipal Fund | | September 30, 2016 (Unaudited) |
| | | | |
Name, Age, Year Elected Position Held With Fund | | Principal Occupation(s) During Past Five Years | | Other
Directorships
Held by Trustee |
Vinson Walden, 46 Vice President since 2004 | | Portfolio Manager and Managing Director of Thornburg Investment Management, Inc. | | Not applicable |
| | |
Lei Wang, 45 Vice President since 2006 | | Portfolio Manager and Managing Director of Thornburg Investment Management, Inc. | | Not applicable |
| | |
Sasha Wilcoxon, 42 Vice President since 2003 Secretary since 2007(6) | | Managing Director, Director of Mutual Fund Operations, and Vice President of Thornburg Investment Management, Inc.; Vice President of Thornburg Securities Corporation. | | Not applicable |
| | |
Charles Wilson, 41 Vice President since 2016 | | Portfolio Manager and Managing Director since 2014 and Associate Portfolio Manager from 2012–2014 of Thornburg Investment Management, Inc.; Co-Portfolio Manager of Marsico Capital Management from 2010–2012. | | Not applicable |
| | |
Di Zhou, 38 Vice President since 2016 | | Portfolio Manager and Managing Director since 2016, Associate Portfolio Manager from 2014–2016, and Equity Research Analyst from 2010–2014 of Thornburg Investment Management, Inc. | | Not applicable |
| (1) | Each person’s address is 2300 North Ridgetop Road, Santa Fe, New Mexico 87506. |
| (2) | The Fund is a separate investment “Fund” or “series” of Thornburg Investment Trust (the “Trust”), which comprises the Thornburg mutual fund complex and is organized as a Massachusetts business trust. Thornburg Investment Management, Inc. is the investment advisor to, and manages, all the Funds of the Trust. Each Trustee oversees all the Funds of the Trust. |
| (3) | Mr. Thornburg is considered an “interested” Trustee under the Investment Company Act of 1940 because he is the sole director and controlling shareholder of Thornburg Investment Management, Inc., the investment advisor to the Trust, and is the sole director and controlling shareholder of Thornburg Securities Corporation, the distributor of shares for the Trust. |
| (4) | The Bylaws of the Trust currently require that each Trustee shall retire by the end of the calendar year during which the Trustee reached the age of 75 years. Otherwise each Trustee serves in office until the election and qualification of a successor or until the Trustee sooner dies, resigns, retires or is removed. |
| (5) | Mr. McMahon is considered an “interested” Trustee under the Investment Company Act of 1940 because he is the chief investment officer of Thornburg Investment Management, Inc. |
| (6) | The Trust’s president, secretary, and treasurer each serves a one-year term or until the election and qualification of a successor; each other officer serves at the pleasure of the Trustees. |
| (7) | Assistant vice presidents, assistant secretaries, and assistant treasurers are not shown. |
The Statement of Additional Information for each Fund of the Trust includes additional information about the Trustees and is available, without charge and upon request, by calling 1-800-847-0200.
34 Annual Report
| | |
| OTHER INFORMATION | | |
| |
Thornburg Intermediate Municipal Fund | | September 30, 2016 (Unaudited) |
PORTFOLIO PROXY VOTING
Policies and Procedures:
The Trust has delegated to Thornburg Investment Management, Inc. (the “Advisor”) voting decisions respecting proxies for the Fund’s voting securities. The Advisor makes voting decisions in accordance with its Proxy Voting Policy. A description of the Policy is available (i) without charge, upon request, by calling the Advisor toll-free at 1-800-847-0200, (ii) on the Thornburg website at www.thornburg. com, and (iii) on the Securities and Exchange Commission’s website at www.sec.gov.
Information regarding how proxies were voted is available on or before August 31 of each year for the twelve months ending the preceding June 30. This information is available (i) without charge, upon request by calling the Advisor toll-free at 1-800-847-0200, (ii) on the Thornburg website at www.thornburg.com, and (iii) on the Securities and Exchange Commission’s website at www.sec.gov.
TAX INFORMATION
For the tax year ended September 30, 2016, dividends paid by the Fund of $31,504,595 (or the maximum allowed) are tax exempt dividends and $78,288 are taxable ordinary investment income dividends for federal income tax purposes. The information and the distributions reported herein may differ from the information and distributions reported to the shareholders for the calendar year ending December 31, 2016. Complete information will be reported in conjunction with your 2016 Form 1099.
AVAILABILITY OF QUARTERLY PORTFOLIO SCHEDULE
The Fund files with the Securities and Exchange Commission schedules of its portfolio holdings on Form N-Q for the first and third quarters of each fiscal year. The Fund’s Forms N-Q are available on the Commission’s website at www.sec.gov, or may be reviewed and copied at the Commission’s Public Reference Room in Washington, D.C. Information on the operation of the Public Reference Room may be obtained by calling 1-800-SEC-0330. The Fund also makes this information available on its website at www.thornburg. com/download or upon request by calling 1-800-847-0200.
STATEMENT RESPECTING RENEWAL OF INVESTMENT ADVISORY AGREEMENT
Thornburg Investment Management, Inc. (the “Advisor”) provides investment management services to Thornburg Intermediate Municipal Fund pursuant to an investment advisory agreement. The Trustees consider the renewal of this agreement annually, and most recently determined to renew the agreement on September 13, 2016.
In anticipation of their recent consideration of the advisory agreement’s renewal, the independent Trustees met in May 2016 to consider aspects of their annual evaluation of the Advisor’s service to all of the funds of Thornburg Investment Trust, to plan the annual evaluation of the Advisor’s performance and to specify the information the Advisor would present to the Trustees for their review. The independent Trustees met again in independent session in September to consider portions of the information submitted by the Advisor. Representatives of the Advisor subsequently reviewed portions of the information with the Trustees and addressed questions from the Trustees at a full meeting session of the Trustees scheduled for that purpose, and the independent Trustees thereafter met in independent session to consider the Advisor’s presentation and various specific issues respecting their consideration of the advisory agreement’s renewal. Following these sessions, the Trustees met to consider renewal of the agreement, and the independent Trustees voted unanimously at that meeting to renew the agreement for an additional term of one year.
The information below summarizes certain factors considered by the Trustees in connection with the determination to renew the advisory agreement. In determining to renew the agreement, the Trustees considered a wide range of information and did not identify any single factor as controlling, and this summary does not describe all of the factors and other matters considered by the Trustees in making their determination.
Nature, Extent and Quality of Services. The Trustees considered presentations by the Advisor at meeting sessions scheduled for consideration of a continuation of the advisory agreement, and also noted their consideration of the reports the Trustees and their committees receive throughout the year on a wide variety of topics, and consideration they had given to a number of topics in previous years. Information identified by the Trustees in their evaluation as having been considered and contributing to their conclusions included Trustees’ assessments of the Advisor’s personnel developed in formal and informal meetings throughout the year, the Advisor’s staffing levels and measures to maintain staffing levels and improve competencies, the Advisor’s commitment to attract and retain high quality portfolio management expertise through competitive compensation levels, the Advisor’s collaborative approach to investment management, the Fund’s investment performance over different periods of time, portfolio managers’ cognizance of and strategies to address market and economic trends and conditions, the evaluation and selection of individual investments, the structuring and composition of the Fund’s portfolio, management of Fund liquidity requirements, cognizance of and efforts to achieve tax efficiency, responses to share sale and redemption activity, continuing enhancements to the Advisor’s electronic and information systems and the Advisor’s
Annual Report 35
| | |
| OTHER INFORMATION, CONTINUED | | |
| |
Thornburg Intermediate Municipal Fund | | September 30, 2016 (Unaudited) |
engagement of outside firms to assist in improving or replacing those systems, the Advisor’s evaluation and selection of firms providing portfolio trade execution to the Fund and the Advisor’s measures to obtain favorable trade execution, the Advisor’s performance of accounting and other services, the Advisor’s continued commitment to observance of compliance and regulatory requirements, the Advisor’s responsiveness to the Trustees, the quality and extent of written and oral reports to the Trustees over the course of the year, and other factors.
Investment Performance. The Trustees noted in their evaluation of the Fund’s investment performance the reports they had received in each regular meeting over the course of the year from the Advisor’s portfolio management personnel. The Trustees also noted in their evaluation their consideration of information provided to them at their request in anticipation of their annual evaluation of the Advisor’s services, including the following items of information respecting the investment performance of the Fund: (1) the Fund’s absolute investment performance and achievement of stated objectives; (2) the Advisor’s written and oral explanations and commentary on the Fund’s performance in the context of the Fund’s objectives and reasonable expectations, and business, market and economic conditions, (3) performance data for the most recent ten calendar years, comparing the Fund’s annual investment returns to a fund category selected by an independent mutual fund analyst firm, and to a broad-based securities index, (4) the Fund’s investment performance for the year-to-date, one-year, three-year, five-year and ten-year periods ending with the second quarter of the current year, comparing the Fund’s annualized returns to two mutual fund categories selected by independent mutual fund analyst firms and to a broad-based securities index, and assigning a percentage rank to the Fund’s performance for each period relative to each of the fund categories, and (5) comparative measures of correlation to equity indices, portfolio volatility, risk and return.
The Trustees noted that quarterly reports during the year and other information presented to them confirmed the Advisor’s continued conformity to the Fund’s stated investment objectives and policies.
The Trustees observed in reviewing comparative performance data for the ten most recent calendar years that the Fund’s investment return for the most recent calendar year was comparable to the return of the index and the average return for the fund category considered, that the Fund’s returns for the preceding nine calendar years exceeded or were comparable to the returns of the index in seven of the nine years, and that the Fund’s returns exceeded or were comparable to the average returns of the fund category in eight of nine years. Other quantitative data noted by the Trustees as having been considered in their evaluation showed that the Fund’s annualized investment returns fell near the midpoint of performance for the two fund categories for the one-year period ended with the second quarter of the current year, fell near the midpoint of one fund category and in the second quartile of performance of the second fund category for the three-year period, fell in the second quartile of performance of both fund categories for the five-year period, and fell in the top quartile of performance for both fund categories for the ten-year period. Measures of portfolio volatility, risk and relative return considered by the Trustees demonstrated that the Fund’s performance relative to these measures continued to fulfill expectations in current conditions. The Trustees attached additional significance to the performance of the Fund from the perspective of longer term shareholders.
Comparisons of Fee and Expense Levels. The Trustees observed the clear disclosures of the Advisor’s fees and Fund expenses in the Fund’s prospectuses. Information noted by the Trustees as having been considered in this context included a variety of comparative data respecting the Fund’s fee and expense levels. This information included comparisons of the Fund’s advisory fee and overall Fund expenses to median and average fees and expenses charged to a category of mutual funds selected by an independent mutual fund analyst firm, comparisons of the advisory fee and other Fund expenses to the fee levels and expenses for two representative share classes of fund peer groups selected from the category by a second independent mutual fund analyst firm, the perspectives and advice from the second mutual fund analyst firm respecting comparisons of fund fee levels and expenses to fund peer groups, and other information. Comparative fee and expense data noted as having been considered by the Trustees showed that the Fund’s advisory fee was slightly higher than the median fee level for the fund category, the level of total expense for one representative share class was slightly higher than the median and comparable to the average expense levels for the category, and that the total level of expense for a second share class was lower than the median and average levels for the category. Peer group data showed that the Fund’s advisory fee level for two representative share classes was comparable to the median fee levels for the share classes’ respective peer groups, the total expense level for one of the representative share classes fell at the top of the range of its peer group, and the total expense level for the second share class fell above the median of its peer group but within the range of other funds in its group. The Trustees did not find the differences significant in view of the other factors considered.
The Trustees noted their consideration of information respecting the advisory fees charged by the Advisor to other investment management clients, including sub-advised mutual funds, together with information about fees charged by other advisors to different clients, analysis of the differences between the requirements of institutional clients and mutual funds, analysis of the differences between the requirements of a sub-advised mutual fund and a fund as to which the investment advisor is the primary advisor and sponsor, descriptions of distinguishing characteristics of the sub-advised funds served by the Advisor, and the consequently different investment management services provided to the different categories of clients and the differing contexts in which the fee levels for these arrangements are established. The Trustees confirmed their previous observations that the differences between the fees charged by the Advisor to different types of clients did not appear exceptional, and that the fee rates charged by an investment advisor to different categories of clients had limited relevance to the evaluation of the fee rate charged by that advisor to mutual funds as to which it is the primary advisor and sponsor.
36 Annual Report
| | |
| OTHER INFORMATION, CONTINUED | | |
| |
Thornburg Intermediate Municipal Fund | | September 30, 2016 (Unaudited) |
Costs and Profitability of Advisor. In reviewing the profitability of the Advisor’s services to the Fund the Trustees considered an analysis of the Advisor’s costs and the profitability to the Advisor of its services, together with data respecting the overall profitability of a selection of other investment management firms. The Trustees noted that a portion of the Advisor’s profits are an important element in the compensation of shareholder employees. The Trustees considered in this regard information from the Advisor respecting investment of its profits to maintain staffing levels, pay competitive levels of compensation, and add to its information retrieval and management systems to maintain or improve service levels. The Trustees also considered the contribution of the Advisor’s cost management to its profitability, and the relationship of the Advisor’s financial resources and profitability in previous years to its ability to attract necessary personnel, invest in systems and other assets required for its service to the Fund, and maintain or improve service levels for the Fund notwithstanding fluctuations in revenues and profitability. The information considered did not indicate to the Trustees that the Advisor’s profitability was excessive.
Potential Economies of Scale. In reviewing the extent to which economies of scale would be realized by the Fund as it grows and whether fee levels reflect potential economies of scale, the Trustees considered the breakpoint structure for advisory fees chargeable to the Fund, comparisons of the fee breakpoint structure for the Fund with breakpoint structures (or the absence of such structures) for other funds in a peer group selected by an independent mutual fund analyst firm, the effects of the breakpoint structure and other expense factors realized by certain Funds of the Trust as their asset levels had increased, and the Advisor’s expenditures from its own profits and resources to maintain staffing levels, pay competitive levels of compensation, and add to its information retrieval and management systems to maintain or improve service levels. The information provided demonstrated to the Trustees that the Fund’s advisory fee breakpoint structure is reasonable in relation to the structures observed in the other funds in its peer group, and that shareholders may be expected to benefit from any economies of scale, due to the advisory agreement’s breakpoint fee structure for the Fund and other factors.
Potential Ancillary Benefits. In reviewing potential benefits to the Advisor because of its relationship to the Fund, the Trustees noted disclosures by the Advisor of its receipt of certain research services from broker dealers, and the benefits to both the Fund and the Advisor of the Advisor’s expansion of its staffing, compliance and systems capabilities and other resources to serve a broader variety of investment management clients. No unusual or unfair benefits to the Advisor from its relationship to the Fund were identified by the Trustees.
Summary of Conclusions. The Trustees concluded that the nature, extent and quality of the Advisor’s services performed under the advisory agreement remained sufficient. The Trustees further concluded that the absolute and relative investment performance of the Fund over a range of pertinent holding periods on the whole was satisfactory in the context of its objectives and strategies, and that the Advisor had continued to actively and competently pursue the Fund’s stated investment objectives and adhere to the Fund’s investment policies.
The Trustees further concluded, based upon their consideration of the foregoing factors and other information, that the level of the advisory fee charged to the Fund by the Advisor is reasonable in relation to the services provided by the Advisor in view of the nature, extent and quality of those services, the investment performance of the Fund after fees and expenses, the clear disclosure of fees and expenses in the Fund’s prospectuses, comparisons of fees and expenses charged to the Fund to fees and expenses charged to other mutual funds, and the other factors considered.
Annual Report 37
TRUSTEES’ STATEMENT TO SHAREHOLDERS
Readopted September 12, 2016
The Trustees believe current and prospective shareholders should know how we discharge our responsibilities in supervising the Funds’ investment advisor and in reviewing the advisor’s contract for renewal. Since 2005, we have issued a statement which sets out clearly the three principal guidelines that we follow in supervising the Trust’s investment advisor on your behalf. In accordance with our customary practice, in September of this year we again reviewed our statement and concluded we should reissue this statement outlining the principal features of our supervision of the advisor’s performance of investment management services for the Funds.
We begin with the premise that each shareholder selected his or her Fund because its investments are managed by the investment advisor identified in the prospectus and in accordance with the objective and policies described in the prospectus. We realize, as each of you do, that if you believe that your Fund’s stated objective and policies no longer serve your personal investment goals, you can sell your shares and leave the Fund.
Therefore, we believe that our primary supervisory task—our principal obligation to you—is to assess the nature and quality of the advisor’s services, and to confirm that the advisor actively and competently pursues the Fund’s objective, in accordance with the policies set out in the prospectus. To do this, we meet regularly with management to review your Fund’s portfolio and to discuss the advisor’s specific actions and judgments in pursuing the Fund’s objective. We do not substitute our own judgment for the advisor’s decisions in selecting investments; the advisor is paid to exercise its informed judgment on investment decisions, and we seek to confirm, in reviewing the advisor’s performance, that the advisor is doing just that.
Second, we are conscious of costs and the effect that costs have on shareholders’ returns. We try to make sure that your Fund’s fees and costs are reasonable in relationship to the services rendered and that they are generally in line with those charged by other expert investment advisors, consistent with our belief that the Fund’s investors searched for and expect that expertise and attention and have decided to pay a reasonable price for it. We do not put the management contract “out to bid” as a matter of course, and we would not do so unless we had concluded that the advisor materially had failed to pursue the Fund’s objectives in accordance with its policies, or for other equally important reasons. We believe that any other approach would be inconsistent with your interests and contrary to your expectations when you bought shares of the Fund in the first place.
Finally, because we believe that most Thornburg Fund shareholders have invested with a long-term perspective, we try not to focus too much on the fashions of the moment and on short-term performance. The market will not favor any specific investment objective or set of policies at all times and under all economic circumstances. A fund will experience periods of both high and low returns relative to other funds and other investments. Even if one of our Funds is not favored by the market at a particular time, we believe that the advisor is nonetheless obliged to remain true to the Fund’s objective and policies, and we watch to see that it does so.
Trustees of Thornburg Investment Trust
38 Annual Report
THORNBURG FUNDS
Thornburg Investment Management is a privately-owned global investment firm that offers a range of solutions for retail and institutional investors. Founded in 1982 and headquartered in Santa Fe, New Mexico, we manage approximately $53 billion (as of September 30, 2016) across eight equity and 11 bond mutual funds, separate accounts for high-net-worth investors and institutional accounts, and five UCITS funds for non-U.S. investors.
The fund outlined in this report is one of many equity and fixed-income products available from Thornburg Investment Management.
Equity Funds
| | • | | Thornburg Core Growth Fund |
| | • | | Thornburg International Value Fund |
| | • | | Thornburg Better World International Fund |
| | • | | Thornburg International Growth Fund |
| | • | | Thornburg Developing World Fund |
| | • | | Thornburg Investment Income Builder Fund |
| | • | | Thornburg Global Opportunities Fund |
Fixed Income Funds
| | • | | Thornburg Low Duration Income Fund |
| | • | | Thornburg Limited Term U.S. Government Fund |
| | • | | Thornburg Limited Term Income Fund |
| | • | | Thornburg Strategic Income Fund |
| | • | | Thornburg Low Duration Municipal Fund |
| | • | | Thornburg Limited Term Municipal Fund |
| | • | | Thornburg Intermediate Municipal Fund |
| | • | | Thornburg California Limited Term Municipal Fund |
| | • | | Thornburg New Mexico Intermediate Municipal Fund |
| | • | | Thornburg New York Intermediate Municipal Fund |
| | • | | Thornburg Strategic Municipal Income Fund |
Before investing, carefully consider the Fund’s investment goals, risks, charges, and expenses. For a prospectus or summary prospectus containing this and other information, contact your financial advisor or visit thornburg.com. Read it carefully before investing.
For additional information, please visit thornburg.com
Thornburg Investment Management, Inc. 2300 North Ridgetop Road, Santa Fe, NM 87506
Annual Report 39

| | |
To receive shareholder reports, prospectuses, and proxy statements electronically, go to www.thornburg.com/edelivery. | |  |
This Annual Report is submitted for the general information of shareholders of the Fund. It is not authorized for distribution to prospective investors in the Fund unless preceded or accompanied by an effective prospectus.
| | | | |
| Investment Advisor: | | Distributor: | | |
| Thornburg Investment Management® | | Thornburg Securities Corporation® | | |
| 800.847.0200 | | 800.847.0200 | | TH079 |
Annual Report
September 30, 2016
THORNBURG
STRATEGIC
MUNICIPAL
INCOME
FUND
INVESTMENT MANAGEMENT
About Thornburg Investment Management
It’s more than what we do.
It’s how we do it.
At Thornburg, we are very different in how we think, invest, and are structured. We believe this difference is
what makes us successful in helping individuals reach their long-term financial goals.
How we How we How we’re
Flexible Perspective Our perspective on investment opportunities is more flexible than most, viewing a wide range of opportunities beyond conventional boundaries to find hidden value.
Collaboration Collectively, we hone ideas via borderless cross-pollination for better judgment and better results.
Portfolio Construction Disciplined construction guided more by our convictions than convention.
CONVICTION Thorough analysis and our relative-value framework lead to conviction in our securities selection.
UNCONVENTIONAL Active management means we seek the best value for our clients rather than using conventional benchmarks as our starting point.
Structured for Excellence How we think and how we invest is made possible by how we’re structured. TEAM APPROACH FAR FROM THE HERD ACCESS & TRANSPARENCY
2 Annual Report
Annual Report
Thornburg Strategic Municipal Income Fund
September 30, 2016
| | | | |
Share Class | | NASDAQ Symbol | | CUSIP |
Class A | | TSSAX | | 885-216-101 |
Class C | | TSSCX | | 885-216-200 |
Class I | | TSSIX | | 885-216-309 |
Minimum investments for Class I shares may be higher than those for other classes. Class I shares may not be available to all investors.
Investments carry risks, including possible loss of principal. Portfolios investing in bonds have the same interest rate, inflation, and credit risks that are associated with the underlying bonds. The value of bonds will fluctuate relative to changes in interest rates, decreasing when interest rates rise. This effect is more pronounced for longer-term bonds. Unlike bonds, bond funds have ongoing fees and expenses. Investments in lower rated and unrated bonds may be more sensitive to default, downgrades, and market volatility; these investments may also be less liquid than higher rated bonds. Investments in derivatives are subject to the risks associated with the securities or other assets underlying the pool of securities, including illiquidity and difficulty in valuation. Please see the Fund’s prospectus for a discussion of the risks associated with an investment in the Fund. Investments in the Fund are not FDIC insured, nor are they bank deposits or guaranteed by a bank or any other entity.
Diversification does not assure or guarantee better performance and cannot eliminate the risk of investment losses.
Annual Report 3
| | |
| LETTER TO SHAREHOLDERS | | |
| |
Thornburg Strategic Municipal Income Fund | | September 30, 2016 (Unaudited) |
October 18, 2016
Dear Fellow Shareholder:
We are pleased to present the annual report for Thornburg Strategic Municipal Income Fund. The net asset value (NAV) of the Class A shares increased by 37 cents to $15.53 per share during the fiscal year ended September 30, 2016. If you were with us for the entire period, you received dividends of 32.6 cents per share. If you reinvested your dividends, you received 33.0 cents per share. Dividends were lower for Class C shares and higher for Class I shares to account for varying class-specific expenses. The Class A shares of your Fund underperformed the index with a 4.63% total return (without sales charge) for the fiscal year ended September 30, 2016, compared to the 5.88% total return for the BofA Merrill Lynch Municipal Master Index. The Fund generated 0.57% more price return and 1.82% less income than the index after accounting for the different treatment of bonds priced above and below par by the index versus the Fund.
Drivers of the Fund’s price return relative to its benchmark include its interest rate sensitivity, as measured by the Fund’s duration. Also, differing allocations along the Fund’s investment universe subtracted 0.67% of relative price performance. Sector allocations added 2.03% of relative price performance and its overweight to lower credit-quality securities subtracted 2.15% of relative price performance. Other risk factors (and accounting differences) totaled another 1.36% of relative price performance for the period.
The market’s returns were a result of increasing short-term rates and decreasing long-term rates, shown in Figure 1.
U.S. Economy, Fed Policy, and the Election
The U.S. economy grew at a paltry average rate of 1%, as measured by nominal gross domestic product, for the first three quarters of 2016, much lower than the almost 3% average rate for 2015.
On the employment front, the economy added approximately 200,000 jobs per month for the Fund’s 2016 fiscal year. The May jobs number was a little scary, adding only 24,000 that month. The unemployment rate ticked up to 5.0% in September of 2016 from 4.9% in August, as more previously non-participating workers returned to the labor market.
Inflation has held stable, although it did move up slightly. The Core Personal Consumption Expenditure Index (Core PCE) for August moved up to 1.7% from 1.6% in July, although well below the U.S. Federal Reserve Board’s (the Fed) 2.0% target.
So, all in all, the economy is still growing, jobs are being added and inflation is well behaved. This isn’t a bad scenario for municipal bond investors, except that, at current valuations and 10-year AAA municipal general obligation bonds yielding 1.64%, municipal bond investors are generally not keeping up with inflation.
Elsewhere, the Fed increased the federal funds rate 0.25% in December of 2015. Although many pundits want to blame the credit markets rout on that event, they would be wrong. Oil prices, as measured by WTI crude futures, hit a low of $34.54 on January 20, 2016. Energy producers are a highly leveraged segment of the market, whether through bank loans or other forms of debt. As market participants began to question their ability to service these loans or debt, credit spreads began to widen and the impact of these loans on the financial stability of some banks came into question. The municipal market avoided this distress because bond issuance from energy-producing states was a small fraction of the $3.8 trillion municipal bond market.
This early-2016 market turbulence, followed by the May jobs report and the “Brexit” vote in Great Britain, gave the Fed enough pause not to follow their December rate increase with another. So far through 2016, the central bank has insisted that they may increase rates again and again. Last year we said, “Regardless, waiting for the Fed to raise short-term interest rates is akin to Waiting for Godot.” Well, we are still waiting. Meanwhile, the Fed is assuring the markets that the next meeting is “live” and they may raise short-term interest rates again!
Figure I | 12-Month Change in Rates for AAA Rated General Obligation Municipal Bonds
(as of September 30, 2016)

4 Annual Report
| | |
LETTER TO SHAREHOLDERS, CONTINUED | | |
| |
Thornburg Strategic Municipal Income Fund | | September 30, 2016 (Unaudited) |
The 2016 U.S. presidential race featured two major party candidates with unprecedented high unfavorable ratings with the electorate. At the time of this writing, the election’s result is weeks away. Regardless of the winner, however, the president historically has had very little impact on the course of the economy. Although there is a pattern that if the economy is doing well, the current administration likes to take all the credit; if the economy is not doing well, the current administration blames the previous one. A victory for either candidate could still benefit the municipal bond market, however, as both stumped for large increases in infrastructure spending—with one particularly calling for higher taxes which would lend support to the municipal bond market. If this gets through Congress, it could mean a higher level of municipal bond issuance and ultimately high growth rates for the economy; both occurrences would put upward pressure on municipal bond yields.
The Municipal Bond Market
The value metrics we use at Thornburg all suggest that the municipal bond market is pricing-in the rosiest of scenarios going forward. The main reason for this is that global central banks, with their overly accommodative monetary policies, have pushed investors further out on the risk spectrum in search of yield. That is why, depending on the fund, we have our portfolios positioned in the lower end of their respective risk spectrums. This means that durations (a measure of price sensitivity to changes in interest rates) are low and credit quality is higher than in the past. We continually ask ourselves: are investors getting paid to take risk? The answer we come up with is no!
Inside the Risk Metrics
Let’s first look at real yields, which is how much yield over inflation investors are being paid to own municipal bonds. As mentioned earlier, 10-year AAA general obligation bonds are yielding 1.64% and Core PCE is running at 1.70%, so investors are earning less than inflation. Over the last 20 years, investors have earned an average of 2% over inflation for the opportunity to invest in a 10-year AAA general obligation municipal bond.
The second thing to consider is credit spreads, which reflect the incremental yield an investor earns from owning a lower-rated credit versus a higher-rated credit, and which are now very narrow. As of September 30, 2016, an investor earned about 1% more for owning a 10-year BBB revenue bond versus a 10-year AAA general obligation bond. That is slightly higher than the average 0.75% an investor earned between 1994 and 2007. In 2007, approximately 50% of the new issue municipal bond market was insured by AAA/AAA municipal bond insurers. Today, there are no AAA/AAA municipal bond insurers, and insurance coverage generally accounts for only 6% to 8% of the new issue municipal bond market. On top of that, the security covenants of some current lower-quality investment grade securities are the most lax in years. This is a great time to be an issuer of lower-quality investment grade municipal bonds but not a great time to be an investor in them.
Finally, the slope of the yield curve, which tracks how much incremental yield an investor earns by owning securities with longer maturities, is also quite flat. Currently, investors are earning 0.78% more for owning a 10-year AAA general obligation municipal bond, versus a 1-year AAA general obligation municipal bond. Since 1994, an investor earned on average almost 1.60% to extend maturities from one to 10 years. The stretch for income is causing investors to absorb more risk at lower and lower relative yields.
Aside from valuations, the credit picture for the majority of the U.S. is pretty bright. Except for energy producing states, most regions are showing positive trends along such measures as:
Pensions are still a troubling issue. That is, 35 states reported a pension funding ratio of under 80% in 2014—the Mendoza line between a well-funded state pension and the “other kind.” As the worst career hitter in major league baseball history (.200 batting average), Mario Mendoza Aizpuru’s name ubiquitously symbolizes futility.
Liquidity
Market liquidity is still a concern. The latest example of this is what is happening to yields on Variable Rate Demand Notes (VRDNs). These are securities that are normally held in money market funds and bond fund reserve positions. They can be put back to an intermediary on a daily basis and are relatively secure. Leading up to the finalization of the Securities and Exchange Commission’s money market fund reform in October of 2016, money market funds were and are repositioning themselves to be compliant with the new regulations. As such, they have had to divest themselves of VRDNs. Intermediaries do not want to hold them on their balance sheets (very expensive), so they raise the yields to clear the market. What used to yield 0.01% in March now yields, as of the time of this writing, 0.90%, or more than a 3-year AA security. This is serendipity for managers like Thornburg holding higher reserves because of concern over market liquidity; for issuers in the VRDN market, it’s not so much.
Annual Report 5
| | |
LETTER TO SHAREHOLDERS, CONTINUED | | |
| |
Thornburg Strategic Municipal Income Fund | | September 30, 2016 (Unaudited) |
Main Reason to Own Municipal Bonds
One of the best risk-mitigating tools an investor has is diversification. By splitting a portfolio into several asset classes, an investor may reduce the volatility of the resulting portfolio’s returns. This is because the returns of various asset classes are not always correlated. There are times when this is not the case, such as the 2008 financial crisis when all correlations went to one. For the long-term investor, however, we believe the benefits of diversification stand firm. When added to a portfolio of stocks, municipal bonds tend to reduce the volatility of that combined portfolio. Funds such as Thornburg Strategic Municipal Income Fund may be a viable choice in a total diversified portfolio of stocks and bonds.
Conclusion
We continue to run this portfolio in an opportunistic fashion, taking higher degrees of risk when our shareholders are getting paid to take those risks. We go where the value is! Unfortunately, in this environment we see very little reason to position the portfolio any place other than the low end of its relative risk spectrum. This view has cost us some relative performance in the near term but we feel this will correct itself in the long term. Know that the co-managers of this Fund are invested alongside you.
Thank you for your continued trust in us.
| | | | |
| Sincerely, | | | | |
| | |
 | |  | | |
| | |
| Christopher Ryon, CFA | | Nicholos Venditti, CFA | | |
| Portfolio Manager | | Portfolio Manager | | |
| Managing Director | | Managing Director | | |
The matters discussed in this report may constitute forward-looking statements made pursuant to the safe harbor provisions of the Securities Litigation Reform Act of 1995. These include any advisor or portfolio manager prediction, assessment, analysis or outlook for individual securities, industries, investment styles, market sectors and/or markets. These statements involve risks and uncertainties. In addition to the general risks described for each fund in its current prospectus, other factors bearing on these reports include the accuracy of the advisor’s or portfolio manager’s forecasts and predictions, the appropriateness of the investment strategies designed by the advisor or portfolio manager and the ability of the advisor or portfolio manager to implement their strategies efficiently and successfully. Any one or more of these factors, as well as other risks affecting the securities markets generally, could cause the actual results of any fund to differ materially as compared to its benchmarks.
The views expressed by the portfolio managers reflect their professional opinions and are subject to change. Under no circumstances does the information contained within represent a recommendation to buy or sell any security.
6 Annual Report
| | |
| PERFORMANCE SUMMARY | | |
| |
Thornburg Strategic Municipal Income Fund | | September 30, 2016 (Unaudited) |
Average Annual Total Returns
| | | | | | | | | | | | | | | | |
| | | 1-Yr | | | 3-Yr | | | 5-Yr | | | Since
Incep. | |
A Shares (Incep: 4/1/09) | | | | | | | | | | | | | | | | |
Without sales charge | | | 4.63 | % | | | 5.21 | % | | | 4.93 | % | | | 7.25 | % |
With sales charge | | | 2.54 | % | | | 4.51 | % | | | 4.51 | % | | | 6.96 | % |
C Shares (Incep: 4/1/09) | | | | | | | | | | | | | | | | |
Without sales charge | | | 4.32 | % | | | 4.89 | % | | | 4.62 | % | | | 6.94 | % |
With sales charge | | | 3.72 | % | | | 4.89 | % | | | 4.62 | % | | | 6.94 | % |
I Shares (Incep: 4/1/09) | | | 4.96 | % | | | 5.54 | % | | | 5.26 | % | | | 7.57 | % |
30-day Yields, A Shares
(with sales charge)
| | | | |
Annualized Distribution Yield | | | 1.96 | % |
| |
SEC Yield | | | 0.74 | % |
Growth of a Hypothetical $10,000 Investment
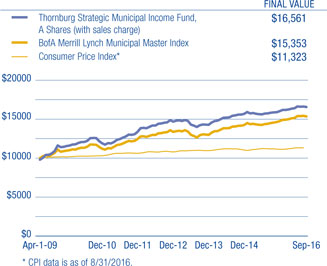
Performance data shown represents past performance and is no guarantee of future results. Investment return and principal value will fluctuate so shares, when redeemed, may be worth more or less than their original cost. Current performance may be lower or higher than quoted. For performance current to the most recent month end, visit thornburg.com or call 800-847-0200. The performance information does not reflect the deduction of taxes that a shareholder would pay on distributions or the redemption of Fund shares. Returns reflect the reinvestment of dividends and capital gains. Class A shares are sold with a maximum sales charge of 2.00%. Class C shares include a 0.60% CDSC for the first year only. There is no sales charge for Class I shares. As disclosed in the most recent prospectus, the total annual fund operating expenses are as follows: A shares, 1.31%; C shares, 1.70%; I shares, 0.93%. Thornburg Investment Management and/or Thornburg Securities Corporation have contractually agreed to waive fees and reimburse expenses through at least February 1, 2017, for some of the share classes, resulting in net expense ratios of the following: A shares, 1.25%; C shares, 1.55%. For more detailed information on fund expenses and waivers/reimbursements please see the Fund’s prospectus. Without the fee waivers and expense reimbursements , the Annualized Distribution yield would have been 1.96%, and the SEC yield would have been 0.74%.
Glossary
BofA Merrill Lynch Municipal Master Index – Tracks the performance of the investment-grade U.S. tax-exempt bond market. Qualifying bonds must have at least one year remaining term to maturity, a fixed coupon schedule, and an investment grade rating (based on average of Moody’s, S&P, and Fitch).
Unless otherwise noted, index returns reflect the reinvestment of income dividends and capital gains, if any, but do not reflect fees, brokerage commissions or other expenses of investing. Investors may not make direct investments into any index. The performance of any index is not indicative of the performance of any particular investment.
Annualized Distribution Yield – The distribution yield reflects actual distributions made to shareholders. The annualized distribution yield is calculated by summing the last 30 days of income at a given month end and annualizing to a 360-day year. The result is divided by the ending maximum otffering price.
Bond Credit Ratings (Credit Quality) – A bond credit rating assesses the financial ability of a debt issuer to make timely payments of principal and interest. Ratings of AAA (the highest), AA, A, and BBB are investment-grade quality. Ratings of BB, B, CCC, CC, C and D (the lowest) are considered below investment grade, speculative grade, or junk bonds.
Core Personal Consumption Expenditure Index (Core PCE) – A measure of the Personal Consumption Expenditure Index that excludes the more volatile and seasonal food and energy prices.
Credit Spread/Quality Spread – The difference between the yields of securities with different credit qualities.
Duration – A bond’s sensitivity to interest rates. Effective duration incorporates the embedded option features, such as call provisions. Bonds with longer durations experience greater price volatility than bonds with shorter durations.
General Obligation Bond (GO) – A municipal bond backed by the credit and “taxing power” of the issuing jurisdiction rather than the revenue from a given project.
Gross Domestic Product (GDP) – A country’s income minus foreign investments: the total value of all goods and services produced within a country in a year, minus net income from investments in other countries.
Revenue Bond – A bond on which the debt service is payable solely from the revenue generated from the operation of the project being financed or a category of facilities, or from other non-tax sources.
SEC Yield – SEC yield is computed in accordance with SEC standards measuring the net investment income per share over a specified 30-day period expressed as a percentage of the maximum offering price of the Fund’s shares at the end of the period.
Variable Rate Demand Note (VRDN) – VRDNs are long-term, floating-rate municipal securities. These highly liquid securities are payable on demand, typically either daily or weekly, meaning the investor can request repayment of the entire debt amount. The coupon rate will adjust on a periodic basis, either daily or weekly.
West Texas Intermediate (WTI) – A grade of crude oil used as a benchmark in oil pricing.
Yield Curve – A line that plots the interest rates, at a set point in time, of bonds having equal credit quality, but differing maturity dates.
Annual Report 7
| | |
| FUND SUMMARY | | |
| |
Thornburg Strategic Municipal Income Fund | | September 30, 2016 (Unaudited) |
Objectives and Strategies
The Fund seeks a high level of current income exempt from federal individual income tax (may be subject to Alternative Minimum Tax).
The Fund invests principally in a portfolio of municipal bonds issued by states and state agencies, local governments and their agencies, and by certain U.S. territories and possessions.
Not more than 50% of the portfolio is invested in bonds rated below investment grade (or of equivalent quality as determined in accordance with the prospectus) at the time of purchase. Also, the portfolio is typically diversified among sectors, issuers, credit qualities, geographic regions, and segments of the yield curve. The flexible nature of the Fund allows the team to adapt the portfolio’s duration and credit quality to our perception of future market conditions.
Key Portfolio Attributes
| | | | |
Number of Bonds | | | 222 | |
| |
Effective Duration | | | 5.0 Yrs | |
| |
Average Maturity | | | 10.1 Yrs | |
Security Credit Ratings
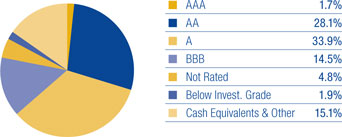
A bond credit rating assesses the financial ability of a debt issuer to make timely payments of principal and interest. Ratings of AAA (the highest), AA, A, and BBB are investment-grade quality. Ratings of BB, B, CCC, CC, C and D (the lowest) are considered below investment grade, speculative grade, or junk bonds. Credit quality ratings for Thornburg’s municipal portfolios used the highest rating available from either Standard & Poor’s or Moody’s Investors Service.
There is no guarantee that the Fund will meet its investment objectives.
All data is subject to change. Charts may not add up to 100% due to rounding.
8 Annual Report
| | |
| SCHEDULE OF INVESTMENTS | | |
| |
Thornburg Strategic Municipal Income Fund | | September 30, 2016 |
| | | | | | | | | | | | |
Issuer-Description | | Credit Rating†
S&P/ Moody’s | | | Principal
Amount | | | Value | |
ALABAMA — 0.33% | | | | | | | | | | | | |
City of Mobile Industrial Development Board, 1.65% due 6/1/2034 put 3/20/2017 (Alabama Power Company Barry Plant Project) | | | A-/A1 | | | $ | 1,000,000 | | | $ | 1,003,090 | |
| | | |
ARIZONA — 1.23% | | | | | | | | | | | | |
Arizona HFA, 5.00% due 12/1/2031 (Scottsdale Lincoln Hospitals) | | | NR/A2 | | | | 2,500,000 | | | | 3,016,575 | |
Pima County IDA, 5.125% due 12/1/2040 (Providence Day School) | | | BBB+/NR | | | | 710,000 | | | | 763,783 | |
| | | |
ARKANSAS — 0.39% | | | | | | | | | | | | |
University of Arkansas Board of Trustees, 5.00% due 11/1/2036 (Fayetteville Campus) | | | NR/Aa2 | | | | 1,000,000 | | | | 1,191,660 | |
| | | |
CALIFORNIA — 13.06% | | | | | | | | | | | | |
ABAG Finance Authority for Nonprofit Corporations, 5.00% due 7/1/2047 (Episcopal Senior Communities) | | | NR/NR | | | | 1,635,000 | | | | 1,820,540 | |
Benicia USD GO, 0% due 8/1/2026 (Benicia High School; Insured: AGM) | | | AA/A2 | | | | 830,000 | | | | 664,315 | |
California HFFA, 6.25% due 2/1/2026 (Community Program Developmental Disabilities; Insured: California Mtg Insurance) | | | AA-/NR | | | | 1,500,000 | | | | 1,812,960 | |
California HFFA, 5.00% due 11/15/2034 (Children’s Hospital Los Angeles) | | | BBB+/Baa2 | | | | 420,000 | | | | 474,944 | |
California Municipal Finance Authority, 8.50% due 11/1/2039 pre-refunded 11/1/2019 (Harbor Regional Center) | | | NR/A3 | | | | 1,000,000 | | | | 1,225,510 | |
California Pollution Control Financing Authority, 5.00% due 11/21/2045 (Poseidon Resources (Channelside) LP Desalination Project) (AMT) | | | NR/Baa3 | | | | 3,000,000 | | | | 3,348,300 | |
California School Cash Reserve Program Authority, 2.00% due 6/30/2017 | | | SP-1+/NR | | | | 1,000,000 | | | | 1,008,540 | |
California State Public Works Board, 5.00% due 4/1/2028 (Corrections & Rehabilitation and Judicial Council) | | | A+/A1 | | | | 1,000,000 | | | | 1,188,280 | |
California State Public Works Board, 6.25% due 4/1/2034 (Department of General Services-Office Buildings 8 and 9 Renovation) | | | A+/A1 | | | | 100,000 | | | | 113,031 | |
California Statewide Communities Development Authority, 5.00% due 7/1/2020 pre-refunded 1/1/2019 (Aspire Public Schools; LOC: PCSD Guaranty Pool I, LLC) | | | NR/NR | | | | 125,000 | | | | 132,007 | |
California Statewide Communities Development Authority, 6.125% due 7/1/2046 pre-refunded 1/1/2019 (Aspire Public Schools) | | | NR/NR | | | | 995,000 | | | | 1,109,475 | |
Calipatria USD GO, 0% due 8/1/2025 (Educational Facilities; Insured: ACA) | | | NR/NR | | | | 2,210,000 | | | | 1,618,737 | |
Carson Redevelopment Agency, 7.00% due 10/1/2036 (Project Area 1) | | | A-/NR | | | | 500,000 | | | | 583,460 | |
Chico Redevelopment Agency, 5.00% due 4/1/2030 (Chico Amended & Merged Redevelopment; Insured: AMBAC) | | | A+/NR | | | | 1,500,000 | | | | 1,504,185 | |
City of Los Angeles GO, 3.00% due 6/29/2017 (Cash Flow Management) | | | SP-1+/Mig1 | | | | 2,000,000 | | | | 2,035,180 | |
City of Moorpark Mobile Home Park, 6.15% due 5/15/2031 (Villa Del Arroyo) | | | A+/NR | | | | 1,000,000 | | | | 1,134,120 | |
City of Palm Springs Financing Authority, 5.25% due 6/1/2027 (Downtown Revitalization Project) | | | AA/NR | | | | 1,620,000 | | | | 1,922,162 | |
Corona-Norco USD COP, 5.00% due 4/15/2031 (Insured: AGM) | | | AA/A1 | | | | 1,750,000 | | | | 1,962,135 | |
County of El Dorado, 5.00% due 9/1/2026 (El Dorado Hills Development-Community Facilities) | | | A/NR | | | | 630,000 | | | | 740,515 | |
County of Los Angeles GO, 3.00% due 6/30/2017 (Cash Management Program) | | | SP-1+/Mig1 | | | | 3,000,000 | | | | 3,050,460 | |
Daly County Housing Development Finance Agency, 5.25% due 12/15/2023 (Franciscan Country Club Mobile Home Park Acquisition) | | | A+/NR | | | | 650,000 | | | | 679,224 | |
M-S-R Energy Authority, 6.50% due 11/1/2039 | | | BBB+/NR | | | | 1,000,000 | | | | 1,458,090 | |
Metropolitan Water District of Southern California, 1.00% due 7/1/2030 | | | AAA/Aa1 | | | | 4,000,000 | | | | 4,000,000 | |
Oakland USD GO, 5.00% due 8/1/2035 (County of Alameda Educational Facilities) | | | AA-/Aa3 | | | | 1,000,000 | | | | 1,207,640 | |
Redwood City Redevelopment Agency, 0% due 7/15/2021 (Redevelopment Project Area 2; Insured: AMBAC) | | | A-/NR | | | | 1,285,000 | | | | 1,145,051 | |
Riverside County Asset Leasing Corp., 0% due 6/1/2021 (Riverside County Hospital; Insured: Natl-Re) | | | AA-/A2 | | | | 535,000 | | | | 495,597 | |
San Francisco City & County Redevelopment Financing Authority, 0% due 8/1/2023 (Redevelopment Project; Insured: Natl-Re) | | | AA-/A2 | | | | 1,025,000 | | | | 885,549 | |
San Francisco City & County Redevelopment Financing Authority, 6.50% due 8/1/2039 pre-refunded 8/1/2019 (Mission Bay North Redevelopment) | | | A-/NR | | | | 250,000 | | | | 289,010 | |
San Francisco City & County Redevelopment Financing Authority, 6.75% due 8/1/2041 pre-refunded 2/1/2021 (Mission Bay North Redevelopment) | | | A-/NR | | | | 500,000 | | | | 621,570 | |
San Jose Redevelopment Agency, 5.50% due 8/1/2035 (Merged Area Redevelopment) | | | A/A2 | | | | 1,000,000 | | | | 1,127,540 | |
Southeast Resource Recovery Facilities Authority, 5.25% due 12/1/2016 (Insured: AMBAC) | | | AA-/A2 | | | | 225,000 | | | | 225,866 | |
Union Elementary School District, 0% due 9/1/2027 (Santa Clara County District Schools; Insured: Natl-Re) | | | AA+/NR | | | | 905,000 | | | | 699,954 | |
| | | |
COLORADO — 2.03% | | | | | | | | | | | | |
Denver Convention Center Hotel Authority, 5.125% due 12/1/2026 (Insured: Syncora) | | | BBB-/Baa3 | | | | 2,450,000 | | | | 2,457,644 | |
Denver Convention Center Hotel Authority, 5.00% due 12/1/2030 (Insured: Syncora) | | | BBB-/Baa3 | | | | 450,000 | | | | 451,062 | |
Denver Convention Center Hotel Authority, 5.00% due 12/1/2035 (Insured: Syncora) | | | BBB-/Baa3 | | | | 605,000 | | | | 606,295 | |
Eagle River Fire District, 6.625% due 12/1/2024 pre-refunded 12/1/2019 | | | NR/NR | | | | 225,000 | | | | 264,409 | |
Eagle River Fire District, 6.875% due 12/1/2030 pre-refunded 12/1/2019 | | | NR/NR | | | | 400,000 | | | | 473,172 | |
Public Authority for Colorado Energy, 5.75% due 11/15/2018 (Natural Gas Purchase) | | | BBB+/Baa1 | | | | 410,000 | | | | 432,533 | |
Public Authority for Colorado Energy, 6.50% due 11/15/2038 (Natural Gas Purchase) | | | BBB+/Baa1 | | | | 260,000 | | | | 376,347 | |
Regional Transportation District COP, 5.375% due 6/1/2031 (FasTracks Transportation System) | | | A/Aa3 | | | | 500,000 | | | | 566,980 | |
Regional Transportation District COP, 5.00% due 6/1/2044 (FasTracks Transportation System) | | | A/Aa3 | | | | 565,000 | | | | 648,264 | |
Annual Report 9
| | |
| SCHEDULE OF INVESTMENTS, CONTINUED | | |
| |
Thornburg Strategic Municipal Income Fund | | September 30, 2016 |
| | | | | | | | | | | | |
Issuer-Description | | Credit Rating†
S&P/ Moody’s | | | Principal
Amount | | | Value | |
CONNECTICUT — 2.89% | | | | | | | | | | | | |
Connecticut Health & Educational Facilities Authority, 6.00% due 7/1/2039 pre-refunded 7/1/2019 (Ethel Walker School) | | | BBB/NR | | | $ | 1,000,000 | | | $ | 1,136,290 | |
State of Connecticut GO, 5.00% due 5/15/2027 (Various Capital Projects) | | | AA-/Aa3 | | | | 3,000,000 | | | | 3,752,820 | |
State of Connecticut GO Floating Rate Note, 1.59% due 6/15/2018 (Various Capital Projects) | | | AA-/Aa3 | | | | 3,000,000 | | | | 3,014,370 | |
State of Connecticut GO Floating Rate Note, 1.36% due 9/15/2017 (Various Capital Projects) | | | AA-/Aa3 | | | | 1,000,000 | | | | 1,000,660 | |
| | | |
DELAWARE — 0.36% | | | | | | | | | | | | |
Delaware HFA, 5.00% due 7/1/2021 (Nanticoke Memorial Hospital) | | | BBB/NR | | | | 1,000,000 | | | | 1,114,660 | |
| | | |
DISTRICT OF COLUMBIA — 0.35% | | | | | | | | | | | | |
Metropolitan Washington Airports Authority, 0% due 10/1/2027 (Dulles Toll Road; Insured: AGM) | | | AA/A3 | | | | 1,500,000 | | | | 1,076,850 | |
| | | |
FLORIDA — 3.82% | | | | | | | | | | | | |
City of Miami GO, 5.00% due 1/1/2017 (Homeland Defense/Neighborhood Capital Improvements) | | | AA-/A1 | | | | 1,245,000 | | | | 1,256,454 | |
City of Miami GO, 5.00% due 1/1/2018 (Homeland Defense/Neighborhood Capital Improvements) | | | AA-/A1 | | | | 1,790,000 | | | | 1,870,174 | |
Florida Higher Educational Facilities Financing Authority, 5.00% due 4/1/2027 (Nova Southeastern University) | | | A-/Baa1 | | | | 1,000,000 | | | | 1,161,830 | |
Miami-Dade County Expressway Authority, 5.00% due 7/1/2022 (Toll System Five-Year Work Program) | | | A/A2 | | | | 625,000 | | | | 748,369 | |
Miami-Dade County Expressway Authority, 5.00% due 7/1/2024 (Toll System Five-Year Work Program) | | | A/A2 | | | | 625,000 | | | | 776,519 | |
Miami-Dade County School Board COP, 5.00% due 8/1/2027 (District School Facilities and Infrastructure) | | | A/A1 | | | | 1,100,000 | | | | 1,282,325 | |
Orange County, 0% due 10/1/2016 (County Correctional Facilities and Communications System; Insured: AMBAC) | | | NR/NR | | | | 410,000 | | | | 409,983 | |
Pinellas County Educational Facilities Authority, 5.25% due 10/1/2030 (Barry University) | | | BBB/NR | | | | 500,000 | | | | 564,015 | |
Sarasota County Public Hospital Board, 5.198% due 10/1/2021 (Sarasota Memorial Hospital; Insured: Natl-Re) | | | AA-/A1 | | | | 1,000,000 | | | | 1,042,030 | |
Tampa Sports Authority, 5.75% due 10/1/2020 (Tampa Bay Arena; Insured: Natl-Re) | | | AA-/NR | | | | 820,000 | | | | 883,394 | |
Volusia County Educational Facilities Authority, 5.00% due 10/15/2030 (Embry-Riddle Aeronautical University, Inc.) | | | NR/Baa1 | | | | 1,500,000 | | | | 1,781,730 | |
| | | |
GEORGIA — 0.86% | | | | | | | | | | | | |
City of Atlanta, 6.25% due 11/1/2034 pre-refunded 11/1/2019 (Water and Wastewater Capital Improvement Program) | | | AA-/Aa3 | | | | 500,000 | | | | 580,180 | |
Development Authority of Fulton County, 5.00% due 10/1/2019 (Georgia Tech Athletic Assoc.) | | | NR/A2 | | | | 1,000,000 | | | | 1,114,250 | |
Main Street Natural Gas, Inc., 5.00% due 3/15/2018 (Georgia Gas) | | | A-/A3 | | | | 515,000 | | | | 540,364 | |
Main Street Natural Gas, Inc., 5.50% due 9/15/2023 (Georgia Gas) | | | BBB+/NR | | | | 350,000 | | | | 422,632 | |
| | | |
GUAM — 3.40% | | | | | | | | | | | | |
Government of Guam, 5.00% due 11/15/2031 (Economic Development) | | | A/NR | | | | 2,000,000 | | | | 2,343,300 | |
Government of Guam, 5.00% due 11/15/2032 (Various Capital Projects) | | | A/NR | | | | 3,000,000 | | | | 3,496,590 | |
Government of Guam, 5.75% due 12/1/2034 pre-refunded 12/1/2019 (Layon Solid Waste Disposal Facility) | | | BBB+/NR | | | | 500,000 | | | | 574,300 | |
Government of Guam Department of Education COP, 6.875% due 12/1/2040 (John F. Kennedy High School) | | | B+/NR | | | | 1,000,000 | | | | 1,100,860 | |
Government of Guam GO, 7.00% due 11/15/2039 pre-refunded 11/15/2019 (Economic Development) | | | NR/NR | | | | 520,000 | | | | 615,836 | |
Guam Power Authority, 5.00% due 10/1/2027 (Electric Power System; Insured: AGM) | | | AA/A2 | | | | 1,000,000 | | | | 1,180,520 | |
Guam Waterworks Authority, 5.25% due 7/1/2024 (Water and Wastewater System) | | | A-/Baa2 | | | | 500,000 | | | | 594,505 | |
Guam Waterworks Authority, 5.00% due 7/1/2028 (Water and Wastewater System) | | | A-/Baa2 | | | | 500,000 | | | | 577,045 | |
| | | |
IDAHO — 0.33% | | | | | | | | | | | | |
State of Idaho GO, 2.00% due 6/30/2017 | | | SP-1+/Mig1 | | | | 1,000,000 | | | | 1,008,310 | |
| | | |
ILLINOIS — 8.59% | | | | | | | | | | | | |
Board of Education of the City of Chicago GO, 5.00% due 12/1/2020 (Education Capital Improvement Program; Insured: AGM) | | | AA/A2 | | | | 365,000 | | | | 373,359 | |
Chicago Park District GO, 5.00% due 1/1/2035 (Various Capital Projects) | | | AA+/NR | | | | 2,000,000 | | | | 2,214,900 | |
City of Chicago, 0% due 11/1/2018 (Water System Improvements; Insured: AMBAC) | | | A+/Baa1 | | | | 305,000 | | | | 294,316 | |
City of Chicago, 5.00% due 11/1/2029 (Water System Improvements) | | | A/Baa2 | | | | 200,000 | | | | 226,592 | |
City of Chicago, 5.00% due 1/1/2030 (Wastewater Transmission System) | | | A/NR | | | | 1,500,000 | | | | 1,742,805 | |
City of Chicago, 5.00% due 1/1/2031 (Riverwalk Expansion Project; Insured: AGM) | | | AA/A2 | | | | 500,000 | | | | 573,140 | |
City of Chicago GO, 5.00% due 1/1/2020 (Capital Projects; Insured: AGM) | | | AA/A2 | | | | 475,000 | | | | 476,648 | |
City of Chicago GO, 5.00% due 1/1/2026 (Debt Restructuring) | | | BBB+/NR | | | | 500,000 | | | | 541,945 | |
City of Chicago GO, 5.25% due 1/1/2035 (Various Infrastructure Projects) | | | BBB+/Ba1 | | | | 500,000 | | | | 520,020 | |
Cook County GO, 5.25% due 11/15/2033 | | | AA-/A2 | | | | 1,000,000 | | | | 1,095,190 | |
Illinois Finance Authority, 5.00% due 8/1/2029 (Advocate Health Care Network) | | | AA/Aa2 | | | | 2,195,000 | | | | 2,645,765 | |
Illinois Finance Authority, 5.00% due 8/15/2035 (Silver Cross Hospital & Medical Centers) | | | NR/Baa1 | | | | 2,355,000 | | | | 2,717,552 | |
Illinois Finance Authority, 5.75% due 11/15/2037 pre-refunded 11/15/2017 (OSF Healthcare System) | | | A/A2 | | | | 330,000 | | | | 348,110 | |
Illinois Finance Authority, 6.00% due 5/15/2039 (OSF Healthcare System) | | | A/A2 | | | | 1,545,000 | | | | 1,777,569 | |
Illinois Toll Highway Authority, 5.00% due 1/1/2037 (Move Illinois Program) | | | AA-/Aa3 | | | | 1,000,000 | | | | 1,185,900 | |
Kane, Cook, & DuPage Counties School District No. 46 GO, 5.00% due 1/1/2028 | | | AA-/NR | | | | 1,000,000 | | | | 1,178,650 | |
Kane, Cook, & DuPage Counties School District No. 46 GO, 5.00% due 1/1/2031 | | | AA-/NR | | | | 2,255,000 | | | | 2,612,170 | |
10 Annual Report
| | |
| SCHEDULE OF INVESTMENTS, CONTINUED | | |
| |
Thornburg Strategic Municipal Income Fund | | September 30, 2016 |
| | | | | | | | | | | | |
Issuer-Description | | Credit Rating†
S&P/ Moody’s | | | Principal
Amount | | | Value | |
Metropolitan Pier & Exposition Authority, 5.00% due 6/15/2050 (McCormick Place) | | | BBB-/Baa3 | | | $ | 1,500,000 | | | $ | 1,582,875 | |
Metropolitan Water Reclamation District of Greater Chicago GO, 5.25% due 12/1/2032 (Various Capital Improvement Projects) | | | AA+/Aa2 | | | | 40,000 | | | | 51,462 | |
State of Illinois, 5.00% due 6/15/2027 (Build Illinois) | | | AAA/NR | | | | 3,000,000 | | | | 3,771,870 | |
Village of Melrose Park GO, 6.75% due 12/15/2016 (Redevelopment Project Costs; Insured: Natl-Re) | | | A-/A3 | | | | 90,000 | | | | 90,896 | |
Will County School District No. 114 GO, 0% due 12/1/2023 (Educational Facilities; Insured: Natl-Re) | | | NR/A3 | | | | 570,000 | | | | 482,659 | |
| | | |
INDIANA — 1.72% | | | | | | | | | | | | |
City of Carmel Redevelopment District COP, 6.50% due 7/15/2035 pre-refunded 1/15/2021 (Performing Arts Center) | | | NR/NR | | | | 1,000,000 | | | | 1,215,300 | |
City of Whiting Environmental Facilities, 5.00% due 3/1/2046 (BP Products North America Inc. Project) (AMT) | | | A-/A2 | | | | 2,500,000 | | | | 2,962,350 | |
Indiana Finance Authority, 6.375% due 9/15/2041 (Marian University) | | | BBB-/NR | | | | 1,000,000 | | | | 1,133,210 | |
| | | |
KANSAS — 1.09% | | | | | | | | | | | | |
City of Wichita, 5.90% due 12/1/2016 (Brentwood Apartments) | | | B/NR | | | | 90,000 | | | | 89,942 | |
City of Wichita, 5.85% due 12/1/2025 (Brentwood Apartments) | | | B/NR | | | | 895,000 | | | | 850,456 | |
Unified Government of Wyandotte County/Kansas City, 5.00% due 9/1/2031 (Utility System Improvement) | | | A+/A3 | | | | 1,000,000 | | | | 1,206,500 | |
Unified Government of Wyandotte County/Kansas City, 5.00% due 9/1/2032 (Utility System Improvement) | | | A+/A3 | | | | 1,000,000 | | | | 1,202,470 | |
| | | |
KENTUCKY — 4.06% | | | | | | | | | | | | |
Commonwealth of Kentucky State Property and Buildings Commission, 5.00% due 11/1/2020 pre-refunded 11/1/2018 (Project No. 89; Insured: AGM) | | | AA/Aa3 | | | | 2,500,000 | | | | 2,711,525 | |
Commonwealth of Kentucky State Property and Buildings Commission, 5.00% due 11/1/2026 (Project No. 112) | | | A/Aa3 | | | | 5,000,000 | | | | 6,254,050 | |
County of Owen, 6.25% due 6/1/2039 (Kentucky-American Water Co. Project) | | | A/A3 | | | | 540,000 | | | | 599,362 | |
Kentucky Economic DFA, 0% due 10/1/2021 (Norton Healthcare, Inc.; Insured: Natl-Re) | | | AA-/A3 | | | | 715,000 | | | | 640,311 | |
Kentucky Economic DFA, 0% due 10/1/2022 (Norton Healthcare, Inc.; Insured: Natl-Re) | | | AA-/A3 | | | | 2,650,000 | | | | 2,313,159 | |
| | | |
LOUISIANA — 1.92% | | | | | | | | | | | | |
City of New Orleans, 5.00% due 12/1/2034 (Water System Facilities Improvement) | | | A-/NR | | | | 400,000 | | | | 466,072 | |
Louisiana Energy and Power Authority, 5.25% due 6/1/2038 (LEPA Unit No. 1; Insured: AGM) | | | AA/A2 | | | | 2,000,000 | | | | 2,339,880 | |
Louisiana Public Facilities Authority, 5.00% due 7/1/2032 (Black & Gold Facilities; Insured: CIFG) | | | AA/A3 | | | | 120,000 | | | | 123,213 | |
Louisiana Public Facilities Authority, 5.375% due 5/15/2043 pre-refunded 5/15/2017 (Ochsner Clinic Foundation) | | | NR/NR | | | | 140,000 | | | | 144,011 | |
Louisiana Public Facilities Authority, 5.375% due 5/15/2043 (Ochsner Clinic Foundation) | | | NR/Baa1 | | | | 360,000 | | | | 368,503 | |
Parish of St. Charles, 4.00% due 12/1/2040 put 6/1/2022 (Valero Energy Corp. Refinery) | | | BBB/Baa2 | | | | 2,250,000 | | | | 2,489,130 | |
| | | |
MARYLAND — 1.13% | | | | | | | | | | | | |
City of Baltimore, 5.00% due 7/1/2020 (Wastewater Projects) | | | AA/Aa2 | | | | 3,055,000 | | | | 3,500,297 | |
| | | |
MASSACHUSETTS — 0.29% | | | | | | | | | | | | |
Massachusetts Development Finance Agency, 5.00% due 7/1/2032 (Jordan Hospital and Milton Hospital) | | | A-/A3 | | | | 355,000 | | | | 426,841 | |
Massachusetts Development Finance Agency, 5.00% due 7/1/2033 (Jordan Hospital and Milton Hospital) | | | A-/A3 | | | | 200,000 | | | | 239,776 | |
Massachusetts Educational Financing Authority, 6.00% due 1/1/2028 | | | AA/NR | | | | 225,000 | | | | 238,930 | |
| | | |
MICHIGAN — 7.78% | | | | | | | | | | | | |
Board of Governors of Wayne State University, 5.00% due 11/15/2033 (Educational Facilities and Equipment) | | | A+/Aa3 | | | | 1,250,000 | | | | 1,491,637 | |
City of Kalamazoo Hospital Finance Authority, 5.00% due 5/15/2036 (Bronson Methodist Hospital) | | | NR/A2 | | | | 1,000,000 | | | | 1,105,480 | |
City of Kalamazoo Hospital Finance Authority, 5.25% due 5/15/2041 (Bronson Nursing and Rehabilitation Center) | | | NR/A2 | | | | 1,000,000 | | | | 1,134,340 | |
City of Troy GO, 5.25% due 11/1/2032 (Downtown Development Authority-Community Center Facilities) | | | AAA/NR | | | | 1,025,000 | | | | 1,216,214 | |
County of Genesee GO, 5.375% due 11/1/2038 (Water Supply System; Insured: BAM) | | | AA/A2 | | | | 1,000,000 | | | | 1,169,590 | |
Detroit City School District, 5.00% due 5/1/2025 (School Building & Site; Insured: Q-SBLF) | | | AA-/Aa1 | | | | 1,000,000 | | | | 1,156,100 | |
Detroit City School District GO, 5.25% due 5/1/2027 (School Building & Site; Insured: AGM) | | | AA/Aa1 | | | | 1,000,000 | | | | 1,250,530 | |
Livonia Public School District GO, 5.00% due 5/1/2036 (School Building & Site) | | | AA/A2 | | | | 225,000 | | | | 258,516 | |
Michigan Finance Authority, 5.00% due 4/1/2031 (State Dept. of Human Services Office Buildings) | | | A+/NR | | | | 1,000,000 | | | | 1,121,380 | |
Michigan Finance Authority, 5.00% due 8/1/2032 (Beaumont Health Credit Group) | | | A/A1 | | | | 5,000,000 | | | | 5,919,500 | |
Michigan Housing Development Authority, 3.375% due 11/1/2016 (AMT) | | | AA/NR | | | | 655,000 | | | | 656,127 | |
Michigan Public School Academy, 8.00% due 8/1/2035 (Will Carleton Charter School) | | | NR/NR | | | | 995,000 | | | | 1,047,596 | |
Michigan State Hospital Finance Authority, 5.00% due 7/15/2025 pre-refunded 7/15/2017 (Oakwood Southshore Medical Center) | | | A/A1 | | | | 650,000 | | | | 671,593 | |
Michigan State Hospital Finance Authority, 5.75% due 11/15/2039 pre-refunded 11/15/2019 (Henry Ford Health System) | | | A/A3 | | | | 1,000,000 | | | | 1,144,770 | |
Michigan Strategic Fund, 7.00% due 5/1/2021 (Detroit Edison Company; Insured: Natl-Re/AMBAC) | | | NR/NR | | | | 250,000 | | | | 311,893 | |
State of Michigan, 5.00% due 3/15/2025 (Jobs Today Highway Program & Governor’s Economic Stimulus Program) | | | AA/A2 | | | | 1,000,000 | | | | 1,250,730 | |
Wayne County Airport Authority, 5.00% due 12/1/2031 (Detroit Metropolitan Wayne County Airport) | | | A/A2 | | | | 650,000 | | | | 768,852 | |
Wayne County Airport Authority, 5.00% due 12/1/2033 (Detroit Metropolitan Wayne County Airport) | | | A/A2 | | | | 825,000 | | | | 971,850 | |
Wayne County Airport Authority, 5.00% due 12/1/2034 (Detroit Metropolitan Wayne County Airport) | | | A/A2 | | | | 1,140,000 | | | | 1,340,161 | |
Annual Report 11
| | |
| SCHEDULE OF INVESTMENTS, CONTINUED | | |
| |
Thornburg Strategic Municipal Income Fund | | September 30, 2016 |
| | | | | | | | | | | | |
Issuer-Description | | Credit Rating†
S&P/ Moody’s | | | Principal
Amount | | | Value | |
MINNESOTA — 0.18% | | | | | | | | | | | | |
St. Paul Housing & Redevelopment Authority, 5.25% due 5/15/2023 pre-refunded 11/15/2016 | | | A/Aaa | | | $ | 115,000 | | | $ | 115,637 | |
Washington County Housing Redevelopment Authority, 5.625% due 6/1/2037 pre-refunded 6/1/2017 (Birchwood and Woodbury Healthcare Facility Projects) | | | NR/NR | | | | 415,000 | | | | 428,139 | |
| | | |
MISSOURI — 2.35% | | | | | | | | | | | | |
St. Louis Municipal Finance Corp., 5.00% due 4/15/2024 (Refuse Facility and Municipal Garage) | | | A/NR | | | | 1,260,000 | | | | 1,524,348 | |
St. Louis Municipal Finance Corp., 5.00% due 4/15/2022 (Refuse Facility and Municipal Garage) | | | A/NR | | | | 805,000 | | | | 943,259 | |
St. Louis Municipal Finance Corp., 5.00% due 4/15/2023 (Refuse Facility and Municipal Garage) | | | A/NR | | | | 1,200,000 | | | | 1,434,444 | |
Tax Increment Financing Commission of Kansas City, 5.25% due 3/1/2018 (Maincor Public Improvements) (ETM) | | | NR/NR | | | | 650,000 | | | | 676,656 | |
Tax Increment Financing Commission of Kansas City, 6.00% due 5/1/2030 (Union Hill Redevelopment Project) | | | NR/NR | | | | 2,505,000 | | | | 2,673,136 | |
| | | |
NEBRASKA — 0.67% | | | | | | | | | | | | |
Douglas County Health Facilities, 5.00% due 11/1/2029 (Nebraska Methodist Health System) | | | A-/NR | | | | 950,000 | | | | 1,132,438 | |
Douglas County Health Facilities, 5.00% due 11/1/2030 (Nebraska Methodist Health System) | | | A-/NR | | | | 800,000 | | | | 949,488 | |
| | | |
NEW JERSEY — 2.80% | | | | | | | | | | | | |
Higher Education Student Assistance Authority, 5.75% due 12/1/2039 (NJCLASS Student Loan Program) (AMT) | | | A/A2 | | | | 750,000 | | | | 837,142 | |
New Jersey EDA, 5.00% due 3/1/2026 (School Facilities Construction) | | | A-/A3 | | | | 1,000,000 | | | | 1,128,540 | |
New Jersey EDA, 5.50% due 9/1/2027 (School Facilities Construction; Insured: Natl-Re) | | | AA-/A3 | | | | 1,000,000 | | | | 1,255,330 | |
New Jersey EDA, 5.00% due 6/15/2029 (School Facilities Construction) | | | A-/A3 | | | | 2,000,000 | | | | 2,265,620 | |
New Jersey Transit Corp., 5.00% due 9/15/2020 (Federal Transit Administration Section 5307 Urbanized Area Formula Funds) | | | A/A3 | | | | 1,000,000 | | | | 1,109,160 | |
New Jersey Transportation Trust Fund Authority, 2.04% due 6/15/2034 put 12/15/2021 (Transportation System Improvements) | | | A-/A3 | | | | 1,000,000 | | | | 961,050 | |
New Jersey Transportation Trust Fund Authority, 5.00% due 6/15/2042 (Transportation System Improvements) | | | A-/A3 | | | | 1,000,000 | | | | 1,088,830 | |
| | | |
NEW MEXICO — 1.24% | | | | | | | | | | | | |
City of Farmington, 4.70% due 9/1/2024 (Arizona Public Service Co.-Four Corners Project) | | | A-/A2 | | | | 1,000,000 | | | | 1,111,500 | |
New Mexico Hospital Equipment Loan Council, 5.00% due 7/1/2032 (Haverland Carter Lifestyle Group) | | | NR/NR | | | | 2,500,000 | | | | 2,729,125 | |
| | | |
NEW YORK — 9.60% | | | | | | | | | | | | |
City of New York GO, 5.00% due 8/1/2023 (City Budget Financial Management) | | | AA/Aa2 | | | | 3,000,000 | | | | 3,715,290 | |
City of New York GO, 5.00% due 8/1/2031 (City Budget Financial Management) | | | AA/Aa2 | | | | 2,000,000 | | | | 2,429,880 | |
City of New York GO, 0.86% due 3/1/2040 put 10/3/2016 (Capital Projects) (daily demand notes) | | | AA/Aa2 | | | | 8,950,000 | | | | 8,950,000 | |
City of Syracuse, 5.00% due 8/1/2017 (City Public and School Building Capital Projects; Insured: AGM) (State Aid Withholding) | | | AA/A1 | | | | 400,000 | | | | 401,452 | |
New York City Municipal Water Finance Authority, 0.87% due 6/15/2032 put 10/3/2016 (Water and Sewer System; SPA: State Street Bank & Trust Co.) (daily demand notes) | | | AA+/Aa1 | | | | 7,365,000 | | | | 7,365,000 | |
New York City Transitional Finance Authority, 0.88% due 11/1/2022 put 10/3/2016 (World Trade Center Recovery; SPA: Landesbank Hessen-Thuringen) (daily demand notes) | | | AAA/Aa1 | | | | 2,550,000 | | | | 2,550,000 | |
New York City Transitional Finance Authority, 0.88% due 8/1/2031 put 10/3/2016 (City Capital Projects; SPA: Landesbank Hessen-Thuringen) (daily demand notes) | | | AAA/Aaa | | | | 250,000 | | | | 250,000 | |
New York State Housing Finance Agency, 0.88% due 11/1/2046 put 10/3/2016 (160 Madison Avenue Housing; LOC: PNC Bank, N.A.) (daily demand notes) | | | NR/A1 | | | | 3,955,000 | | | | 3,955,000 | |
| | | |
NORTH CAROLINA — 0.59% | | | | | | | | | | | | |
North Carolina Medical Care Commission, 5.00% due 6/1/2029 (Vidant Health) | | | A+/A1 | | | | 1,500,000 | | | | 1,821,795 | |
| | | |
OHIO — 1.76% | | | | | | | | | | | | |
American Municipal Power, Inc., 5.25% due 2/15/2018 (AMP Combined Hydroelectric Projects) | | | A/A2 | | | | 500,000 | | | | 529,085 | |
City of Akron, 5.00% due 12/1/2031 (Community Learning Centers) | | | AA+/NR | | | | 625,000 | | | | 740,838 | |
Cleveland-Cuyahoga County Port Authority, 7.00% due 5/15/2040 (Flats East Development Project; LOC: FifthThird Bank) | | | BBB+/NR | | | | 950,000 | | | | 1,080,074 | |
County of Scioto, 5.00% due 2/15/2034 (Southern Ohio Medical Center) | | | NR/A2 | | | | 1,025,000 | | | | 1,237,954 | |
Ohio Air Quality Development Authority, 5.70% due 8/1/2020 (FirstEnergy Nuclear Generation Corp.) | | | BB-/Ba2 | | | | 1,000,000 | | | | 961,540 | |
Ohio Air Quality Development Authority, 3.625% due 10/1/2033 put 4/1/2020 (FirstEnergy Nuclear Generation Corp.) | | | BB-/Ba2 | | | | 1,000,000 | | | | 885,930 | |
| | | |
OREGON — 1.64% | | | | | | | | | | | | |
State of Oregon GO, 2.00% due 6/30/2017 (Cash Management) | | | SP-1+/Mig1 | | | | 5,000,000 | | | | 5,044,600 | |
| | | |
PENNSYLVANIA — 6.66% | | | | | | | | | | | | |
Allegheny County IDA, 6.75% due 8/15/2035 (Propel Charter School) | | | BBB-/NR | | | | 920,000 | | | | 1,017,778 | |
City of Philadelphia Gas Works, 5.00% due 10/1/2029 | | | A/Baa1 | | | | 1,000,000 | | | | 1,225,250 | |
12 Annual Report
| | |
| SCHEDULE OF INVESTMENTS, CONTINUED | | |
| |
Thornburg Strategic Municipal Income Fund | | September 30, 2016 |
| | | | | | | | | | | | |
Issuer-Description | | Credit Rating†
S&P/ Moody’s | | | Principal
Amount | | | Value | |
City of Philadelphia Gas Works, 5.00% due 10/1/2030 | | | A/Baa1 | | | $ | 1,000,000 | | | $ | 1,219,060 | |
City of Philadelphia Gas Works, 5.00% due 10/1/2031 | | | A/Baa1 | | | | 1,000,000 | | | | 1,212,160 | |
County of Luzerne GO, 5.00% due 11/15/2029 (Insured: AGM) | | | AA/NR | | | | 1,000,000 | | | | 1,165,210 | |
Cumberland County Municipal Authority, 4.00% due 1/1/2017 (Diakon Lutheran Social Ministries) | | | NR/NR | | | | 300,000 | | | | 302,178 | |
Cumberland County Municipal Authority, 5.00% due 1/1/2018 (Diakon Lutheran Social Ministries) | | | NR/NR | | | | 425,000 | | | | 444,903 | |
Lancaster County Hospital Authority, 5.00% due 11/1/2019 (Masonic Villages Project) | | | A/NR | | | | 2,675,000 | | | | 2,976,579 | |
Lehigh County IDA, 0.90% due 2/15/2027 put 8/15/2017 (PPL Electric Utilities Corp.) | | | A/A1 | | | | 5,500,000 | | | | 5,494,720 | |
Pennsylvania Economic DFA, 4.625% due 12/1/2018 (Colver Project; Insured: AMBAC) (AMT) | | | BBB-/Ba1 | | | | 1,800,000 | | | | 1,806,066 | |
Pennsylvania Turnpike Commission, 5.35% due 12/1/2030 pre-refunded 12/1/2020 (Highway Improvements) | | | NR/NR | | | | 695,000 | | | | 817,681 | |
Pennsylvania Turnpike Commission, 5.35% due 12/1/2030 (Highway Improvements) | | | A-/A3 | | | | 1,305,000 | | | | 1,485,416 | |
Philadelphia IDA, 6.00% due 8/1/2035 (Mast Charter School) | | | BBB/NR | | | | 1,000,000 | | | | 1,108,660 | |
Philadelphia School District GO, 4.50% due 9/1/2017 (Capital Improvements; Insured: BHAC) (State Aid Withholding) | | | AA+/Aa1 | | | | 250,000 | | | | 257,318 | |
| | | |
RHODE ISLAND — 0.25% | | | | | | | | | | | | |
Housing Authority of the City of Pawtucket, 5.50% due 9/1/2022 (Public Housing Development) | | | A+/NR | | | | 315,000 | | | | 372,273 | |
Housing Authority of the City of Pawtucket, 5.50% due 9/1/2024 (Public Housing Development) | | | A+/NR | | | | 350,000 | | | | 413,291 | |
| | | |
SOUTH CAROLINA — 0.37% | | | | | | | | | | | | |
Spartanburg County School District No. 1 GO, 4.00% due 3/1/2017 | | | AA/Aa1 | | | | 1,125,000 | | | | 1,140,131 | |
| | | |
SOUTH DAKOTA — 0.42% | | | | | | | | | | | | |
South Dakota Health & Educational Facilities Authority, 5.00% due 7/1/2027 (Avera Health) | | | AA-/A1 | | | | 400,000 | | | | 458,244 | |
South Dakota Health & Educational Facilities Authority, 5.50% due 11/1/2040 (Sanford Health) | | | A+/A1 | | | | 750,000 | | | | 835,560 | |
| | | |
TENNESSEE — 0.20% | | | | | | | | | | | | |
Tennessee Energy Acquisition Corp., 5.25% due 9/1/2024 | | | BBB+/A3 | | | | 500,000 | | | | 615,170 | |
| | | |
TEXAS — 8.48% | | | | | | | | | | | | |
Austin Convention Enterprises, Inc., 5.25% due 1/1/2024 (Austin Convention Center; Insured: Syncora) | | | BBB-/Ba1 | | | | 720,000 | | | | 725,818 | |
Austin Convention Enterprises, Inc., 5.00% due 1/1/2034 (Austin Convention Center; Insured: Syncora) | | | BBB-/Ba1 | | | | 795,000 | | | | 799,961 | |
City of Houston, 5.00% due 9/1/2025 (Convention & Entertainment Facilities Department) | | | A-/A2 | | | | 1,000,000 | | | | 1,233,240 | |
City of Houston, 5.00% due 9/1/2028 (Convention & Entertainment Facilities Department) | | | A-/A2 | | | | 325,000 | | | | 392,285 | |
City of Houston, 5.00% due 11/15/2028 (Combined Utility System) | | | AA/Aa2 | | | | 2,500,000 | | | | 3,087,775 | |
City of Houston, 5.00% due 9/1/2034 (Convention & Entertainment Facilities Department) | | | A-/A2 | | | | 1,550,000 | | | | 1,826,814 | |
City of Houston GO, 5.00% due 3/1/2032 (Public Improvements) | | | AA/Aa3 | | | | 3,000,000 | | | | 3,648,390 | |
City of Texas City Industrial Development Corp., 7.375% due 10/1/2020 (ARCO Pipe Line Co. Project) | | | A-/A2 | | | | 1,165,000 | | | | 1,423,583 | |
Harris County-Houston Sports Authority, 5.00% due 11/15/2030 | | | A-/A2 | | | | 2,000,000 | | | | 2,393,360 | |
Kimble County Hospital District, 6.25% due 8/15/2033 | | | NR/NR | | | | 500,000 | | | | 554,035 | |
La Vernia Higher Education Finance Corp., 6.25% due 8/15/2039 pre-refunded 8/15/2019 (Kipp, Inc.) | | | BBB/NR | | | | 1,000,000 | | | | 1,147,640 | |
Lower Colorado River Authority, 5.00% due 5/15/2026 pre-refunded 5/15/2022 | | | NR/NR | | | | 20,000 | | | | 24,142 | |
Lower Colorado River Authority, 5.00% due 5/15/2026 | | | A/A2 | | | | 2,980,000 | | | | 3,548,405 | |
San Antonio Energy Acquisition Public Facilities Corp., 5.50% due 8/1/2021 (Natural Gas Supply Agreement) | | | BBB+/A3 | | | | 40,000 | | | | 46,946 | |
San Juan Higher Education Finance Authority, 6.70% due 8/15/2040 pre-refunded 8/15/2020 (IDEA Public Schools) | | | BBB/NR | | | | 1,000,000 | | | | 1,207,310 | |
Texas Public Finance Authority Charter School Finance Corp., 5.00% due 8/15/2023 pre-refunded 8/15/2017 (IDEA Public Schools; Insured: ACA) | | | BBB/NR | | | | 155,000 | | | | 160,684 | |
Texas Public Finance Authority Charter School Finance Corp., 5.00% due 8/15/2030 pre-refunded 8/15/2017 (IDEA Public Schools; Insured: ACA) | | | BBB/NR | | | | 1,550,000 | | | | 1,606,839 | |
Texas Public Finance Authority Charter School Finance Corp., 6.20% due 2/15/2040 pre-refunded 2/15/2020 (Cosmos Foundation, Inc.) | | | BBB/NR | | | | 1,000,000 | | | | 1,171,230 | |
Texas Transportation Commission, 5.00% due 8/15/2034 (Central Texas Turnpike System) | | | BBB+/Baa1 | | | | 1,000,000 | | | | 1,169,880 | |
| | | |
U.S. VIRGIN ISLANDS — 0.17% | | | | | | | | | | | | |
Virgin Islands Public Finance Authority, 6.75% due 10/1/2037 | | | NR/B2 | | | | 500,000 | | | | 519,095 | |
| | | |
UTAH — 0.75% | | | | | | | | | | | | |
Herriman City, 4.75% due 11/1/2022 pre-refunded 5/1/2020 (Towne Center Access and Utility Improvements) | | | AA-/NR | | | | 1,000,000 | | | | 1,123,230 | |
Utah Transit Authority, 5.00% due 6/15/2033 (Integrated Mass Transit System) | | | A+/A1 | | | | 1,000,000 | | | | 1,194,520 | |
| | | |
VIRGINIA — 0.80% | | | | | | | | | | | | |
City of Lexington IDA, 5.25% due 1/1/2021 (Kendal at Lexington Residential Care Facility) | | | NR/NR | | | | 395,000 | | | | 399,385 | |
City of Lexington IDA, 5.375% due 1/1/2022 (Kendal at Lexington Residential Care Facility) | | | NR/NR | | | | 630,000 | | | | 637,188 | |
City of Lexington IDA, 5.375% due 1/1/2023 (Kendal at Lexington Residential Care Facility) | | | NR/NR | | | | 425,000 | | | | 429,849 | |
City of Lexington IDA, 5.375% due 1/1/2028 (Kendal at Lexington Residential Care Facility) | | | NR/NR | | | | 1,000,000 | | | | 1,011,410 | |
Annual Report 13
| | |
| SCHEDULE OF INVESTMENTS, CONTINUED | | |
| |
Thornburg Strategic Municipal Income Fund | | September 30, 2016 |
| | | | | | | | | | | | |
Issuer-Description | | Credit Rating†
S&P/ Moody’s | | | Principal
Amount | | | Value | |
WASHINGTON — 1.66% | | | | | | | | | | | | |
Skagit County Public Hospital District No. 1, 5.75% due 12/1/2028 (Skagit Valley Hospital) | | | NR/Baa2 | | | $ | 1,510,000 | | | $ | 1,585,107 | |
Washington Health Care Facilities Authority, 5.70% due 7/1/2038 (Overlake Hospital Medical Center) | | | A/A2 | | | | 1,000,000 | | | | 1,146,210 | |
Washington Health Care Facilities Authority, 5.75% due 1/1/2045 (Catholic Health Initiatives) | | | A-/A3 | | | | 2,000,000 | | | | 2,389,340 | |
| | | |
WISCONSIN — 0.32% | | | | | | | | | | | | |
Wisconsin Health & Educational Facilities Authority, 1.25% due 8/15/2025 put 8/15/2017 (Aurora Health Care, Inc.) | | | NR/A2 | | | | 1,000,000 | | | | 1,000,560 | |
| | | | | | | | | | | | |
TOTAL INVESTMENTS — 96.54% (Cost $276,527,921) | | | | | | | | | | $ | 297,817,625 | |
OTHER ASSETS LESS LIABILITIES — 3.46% | | | | | | | | | | | 10,671,406 | |
| | | | | | | | | | | | |
NET ASSETS — 100.00% | | | | | | | | | | $ | 308,489,031 | |
| | | | | | | | | | | | |
Footnote Legend
| † | Credit ratings are unaudited. Rating changes may have occurred subsequent to the reporting period end. Bonds issued with a maturity of one year or less are assigned Moody’s ratings from MIG-1 to MIG-4 and Standard and Poor’s ratings from SP-1+ to SP-3 with MIG-1 and SP-1+ being the strongest ratings. |
Portfolio Abbreviations
To simplify the listings of securities, abbreviations are used per the table below:
| | |
| ABAG | | Association of Bay Area Governments |
| ACA | | Insured by American Capital Access |
| AGM | | Insured by Assured Guaranty Municipal Corp. |
| AMBAC | | Insured by American Municipal Bond Assurance Corp. |
| AMT | | Alternative Minimum Tax |
| BAM | | Insured by Build America Mutual Insurance Co. |
| BHAC | | Insured by Berkshire Hathaway Assurance Corp. |
| CIFG | | Insured by CIFG Assurance North America Inc. |
| COP | | Certificates of Participation |
| DFA | | Development Finance Authority |
| EDA | | Economic Development Authority |
| | |
| ETM | | Escrowed to Maturity |
| GO | | General Obligation |
| HFA | | Health Facilities Authority |
| HFFA | | Health Facilities Financing Authority |
| IDA | | Industrial Development Authority |
| Mtg | | Mortgage |
| Natl-Re | | Insured by National Public Finance Guarantee Corp. |
| Q-SBLF | | Insured by Qualified School Bond Loan Fund |
| Syncora | | Insured by Syncora Guarantee Inc. |
| USD | | Unified School District |
See notes to financial statements.
14 Annual Report
| | |
| STATEMENT OF ASSETS AND LIABILITIES | | |
| |
Thornburg Strategic Municipal Income Fund | | September 30, 2016 |
| | | | |
ASSETS | | | | |
Investments at value (cost $276,527,921) (Note 3) | | $ | 297,817,625 | |
Cash | | | 454,547 | |
Receivable for investments sold | | | 7,115,199 | |
Receivable for fund shares sold | | | 931,365 | |
Interest receivable | | | 3,150,526 | |
Prepaid expenses and other assets | | | 24,773 | |
| | | | |
Total Assets | | | 309,494,035 | |
| | | | |
| |
LIABILITIES | | | | |
Payable for fund shares redeemed | | | 648,837 | |
Payable to investment advisor and other affiliates (Note 4) | | | 238,123 | |
Accounts payable and accrued expenses | | | 60,866 | |
Dividends payable | | | 57,178 | |
| | | | |
Total Liabilities | | | 1,005,004 | |
| | | | |
| |
NET ASSETS | | $ | 308,489,031 | |
| | | | |
NET ASSETS CONSIST OF | | | | |
Undistributed net investment income | | $ | 3,353 | |
Net unrealized appreciation on investments | | | 21,289,704 | |
Accumulated net realized gain (loss) | | | (79,190 | ) |
Net capital paid in on shares of beneficial interest | | | 287,275,164 | |
| | | | |
| | $ | 308,489,031 | |
| | | | |
| |
NET ASSET VALUE | | | | |
Class A Shares: | | | | |
Net asset value and redemption price per share ($79,058,490 applicable to 5,092,029 shares of beneficial interest outstanding - Note 5) | | $ | 15.53 | |
Maximum sales charge, 2.00% of offering price | | | 0.32 | |
| | | | |
Maximum offering price per share | | $ | 15.85 | |
| | | | |
| |
Class C Shares: | | | | |
Net asset value and offering price per share* ($38,772,985 applicable to 2,494,751 shares of beneficial interest outstanding - Note 5) | | $ | 15.54 | |
| | | | |
| |
Class I Shares: | | | | |
Net asset value, offering and redemption price per share ($190,657,556 applicable to 12,268,065 shares of beneficial interest outstanding - Note 5) | | $ | 15.54 | |
| | | | |
| * | Redemption price per share is equal to net asset value less any applicable contingent deferred sales charge. |
See notes to financial statements.
Annual Report 15
| | |
| STATEMENT OF OPERATIONS | | |
| |
Thornburg Strategic Municipal Income Fund | | Year Ended September 30, 2016 |
| | | | |
INVESTMENT INCOME | | | | |
Interest income (net of premium amortized of $1,730,687) | | $ | 9,330,028 | |
| | | | |
| |
EXPENSES | | | | |
Investment advisory fees (Note 4) | | | 2,086,245 | |
Administration fees (Note 4) | | | | |
Class A Shares | | | 90,093 | |
Class C Shares | | | 43,187 | |
Class I Shares | | | 85,771 | |
Distribution and service fees (Note 4) | | | | |
Class A Shares | | | 180,186 | |
Class C Shares | | | 207,136 | |
Transfer agent fees | | | | |
Class A Shares | | | 55,195 | |
Class C Shares | | | 23,610 | |
Class I Shares | | | 106,199 | |
Registration and filing fees | | | | |
Class A Shares | | | 23,668 | |
Class C Shares | | | 21,250 | |
Class I Shares | | | 27,175 | |
Custodian fees (Note 2) | | | 46,685 | |
Professional fees | | | 55,756 | |
Accounting fees (Note 4) | | | 11,499 | |
Trustee fees | | | 12,080 | |
Other expenses | | | 18,291 | |
| | | | |
Total Expenses | | | 3,094,026 | |
Less: | | | | |
Expenses reimbursed by investment advisor (Note 4) | | | (62,957 | ) |
| | | | |
Net Expenses | | | 3,031,069 | |
| | | | |
Net Investment Income | | | 6,298,959 | |
| | | | |
REALIZED AND UNREALIZED GAIN (LOSS) | | | | |
Net realized gain (loss) on investments | | | (14,740 | ) |
Net change in unrealized appreciation (depreciation) on investments | | | 6,349,988 | |
| | | | |
Net Realized and Unrealized Gain | | | 6,335,248 | |
| | | | |
Net Increase in Net Assets Resulting from Operations | | $ | 12,634,207 | |
| | | | |
See notes to financial statements.
16 Annual Report
| | |
| STATEMENTS OF CHANGES IN NET ASSETS | | |
| |
Thornburg Strategic Municipal Income Fund | | |
| | | | | | | | |
| | | Year Ended
September 30, 2016 | | | Year Ended
September 30, 2015 | |
INCREASE (DECREASE) IN NET ASSETS FROM | | | | | | | | |
| | |
OPERATIONS | | | | | | | | |
Net investment income | | $ | 6,298,959 | | | $ | 5,972,241 | |
Net realized gain (loss) on investments | | | (14,740 | ) | | | (64,450 | ) |
Net unrealized appreciation (depreciation) on investments | | | 6,349,988 | | | | (459,355 | ) |
| | | | | | | | |
| | |
Net Increase (Decrease) in Net Assets Resulting from Operations | | | 12,634,207 | | | | 5,448,436 | |
| | |
DIVIDENDS TO SHAREHOLDERS | | | | | | | | |
From net investment income | | | | | | | | |
Class A Shares | | | (1,518,969 | ) | | | (1,527,762 | ) |
Class C Shares | | | (621,799 | ) | | | (567,402 | ) |
Class I Shares | | | (4,158,191 | ) | | | (3,877,077 | ) |
From realized gains | | | | | | | | |
Class A Shares | | | — | | | | (46,826 | ) |
Class C Shares | | | — | | | | (20,477 | ) |
Class I Shares | | | — | | | | (107,131 | ) |
FUND SHARE TRANSACTIONS (NOTE 5) | | | | | | | | |
Class A Shares | | | 10,728,657 | | | | 5,512,992 | |
Class C Shares | | | 8,907,855 | | | | 2,985,965 | |
Class I Shares | | | 34,729,848 | | | | 15,285,881 | |
| | | | | | | | |
Net Increase in Net Assets | | | 60,701,608 | | | | 23,086,599 | |
| | |
NET ASSETS | | | | | | | | |
Beginning of Year | | | 247,787,423 | | | | 224,700,824 | |
| | | | | | | | |
| | |
End of Year | | $ | 308,489,031 | | | $ | 247,787,423 | |
| | | | | | | | |
Undistributed net investment income | | $ | 3,353 | | | $ | 3,353 | |
See notes to financial statements.
Annual Report 17
| | |
| NOTES TO FINANCIAL STATEMENTS | | |
| |
Thornburg Strategic Municipal Income Fund | | September 30, 2016 |
NOTE 1 – ORGANIZATION
Thornburg Strategic Municipal Income Fund (the “Fund”) is a diversified series of Thornburg Investment Trust (the “Trust”). The Trust is organized as a Massachusetts business trust under a Declaration of Trust dated June 3, 1987 and is registered as a diversified, open-end management investment company under the Investment Company Act of 1940, as amended. The Fund is currently one of twenty separate series of the Trust. Each series is considered to be a separate entity for financial reporting and tax purposes and bears expenses directly attributable to it. The Fund’s primary investment objective is to seek a high level of current income exempt from federal individual income tax, as is consistent in the view of Thornburg Investment Management, Inc., the Trust’s investment advisor (the “Advisor”).
The Fund currently offers three classes of shares of beneficial interest outstanding: Class A, Class C, and Institutional Class (“Class I”). Each class of shares of the Fund represents an interest in the same portfolio of investments, except that (i) Class A shares are sold subject to a front-end sales charge collected at the time the shares are purchased and bear a service fee, (ii) Class C shares are sold at net asset value without a sales charge at the time of purchase, but are subject to a contingent deferred sales charge upon redemption within one year of purchase, and bear both a service fee and a distribution fee, (iii) Class I shares are sold at net asset value without a sales charge at the time of purchase and may be subject to a service fee, and (iv) the respective classes may have different reinvestment privileges and conversion rights. Additionally, the Fund may allocate among its classes certain expenses, to the extent allocable to specific classes, including transfer agent fees, government registration fees, certain printing and postage costs, and administrative and legal expenses. Currently, class specific expenses of the Fund are limited to service and distribution fees, administration fees, and certain registration and transfer agent expenses.
The following is a summary of significant accounting policies followed by the Fund in the preparation of its financial statements. The Fund prepares its financial statements in conformity with United States generally accepted accounting principles (“GAAP”), including investment company accounting and reporting guidance in the Financial Accounting Standards Board (the “FASB”) Accounting Standard Codification Topic 946.
NOTE 2 – SIGNIFICANT ACCOUNTING POLICIES
Security Valuation: All investments in securities held by the Fund are valued as described in Note 3.
Allocation of Income, Gains, Losses and Expenses: Net investment income (other than class specific expenses) and realized and unrealized gains and losses are allocated daily to each class of shares based upon the relative net asset value of outstanding shares (or the value of the dividend-eligible shares, as appropriate) of each class of shares at the beginning of the day (after adjusting for the current capital shares activity of the respective class). Expenses common to all Funds are allocated among the Funds comprising the Trust based upon their relative net asset values or other appropriate allocation methods. Operating expenses directly attributable to a specific class are charged against the operating income of that class.
Dividends and Distributions to Shareholders: Dividends and distributions to shareholders, which are determined in accordance with federal income tax regulations and may differ from GAAP, are recorded on the ex-dividend date. Ordinary income distributions, if any, are declared daily and paid monthly. Capital gain distributions, if any, are declared and paid annually and more often if deemed necessary by the Advisor. Dividends are paid and are reinvested in additional shares of the Fund at net asset value per share at the close of business on the ex-dividend date, or at the shareholder’s option, paid in cash.
Investment Income: Interest income is accrued as earned. Premiums and discounts are amortized and accreted, respectively, to call dates or maturity dates using the effective yield method of the respective investments, which is included in interest income on the Statement of Operations.
Custodian Fees: Custodian fees disclosed in the Statement of Operations may include interest expenses incurred by the Fund on any cash overdrafts of its custodian account during the period. Such cash overdrafts may result from the effects of failed trades in portfolio securities and from cash outflows resulting from unanticipated shareholder redemption activity. The Fund pays interest to its custodian on any such cash overdraft at a rate equal to 2.50% of the overdraft amount in excess of $50,000.
Investment Transactions: Investment transactions are accounted for on a trade date basis. Realized gains and losses from the sale of investments are recorded on an identified cost basis.
When-Issued and Delayed Delivery Transactions: The Fund may engage in when-issued or delayed delivery transactions. To the extent the Fund engages in such transactions, it will do so for the purpose of acquiring portfolio investments consistent with the Fund’s investment objectives and not for the purpose of investment leverage or to speculate on interest rate or market changes. At the time the Fund makes a commitment to purchase an investment on a when-issued or delayed delivery basis, the Fund will record the transaction and reflect the value in determining its net asset value. When effecting such transactions, assets of an amount sufficient to make payment
18 Annual Report
| | |
| NOTES TO FINANCIAL STATEMENTS, CONTINUED | | |
| |
Thornburg Strategic Municipal Income Fund | | September 30, 2016 |
for the portfolio investments to be purchased will be segregated on the Fund’s records on the trade date. Investments purchased on a when-issued or delayed delivery basis do not earn interest until the settlement date.
Guarantees and Indemnifications: Under the Trust’s organizational documents (and under separate agreements with the independent Trustees), its officers and Trustees are provided with an indemnification against certain liabilities arising out of the performance of their duties to the Fund. In the normal course of business the Trust may also enter into contracts with service providers that contain general indemnifications. The Trust’s maximum exposure under these arrangements is unknown. However, based on experience, the Trust expects the risk of loss to be remote.
Use of Estimates: The preparation of financial statements in conformity with GAAP requires management to make estimates and assumptions that affect the reported amounts of assets and liabilities and disclosure of contingent assets and liabilities at the date of the financial statements and the reported amounts of increases (decreases) in net assets from operations during the reporting period. Actual results could differ from those estimates.
Federal Income Taxes: It is the policy of the Trust to comply with the provisions of the Internal Revenue Code applicable to regulated investment companies and to distribute to shareholders substantially all investment company taxable income including net realized gains on investments (if any), and tax exempt income of the Fund. Therefore, no provision for federal income or excise tax is required.
The Fund files income tax returns in United States federal and applicable state jurisdictions. The statute of limitations on the Fund’s tax return filings generally remains open for the three years following a return’s filing date. The Fund has analyzed each uncertain tax position believed to be material in the preparation of the Fund’s financial statements for the fiscal year ended September 30, 2016, including open tax years, to assess whether it is more likely than not that the position would be sustained upon examination, based on the technical merits of the position. The Fund has not identified any such position for which an asset or liability must be reflected in the Statement of Assets and Liabilities.
At September 30, 2016, information on the tax components of capital was as follows:
| | | | |
Cost of investments for tax purposes | | $ | 276,527,921 | |
| | | | |
Gross unrealized appreciation on a tax basis | | $ | 21,570,855 | |
Gross unrealized depreciation on a tax basis | | | (281,151 | ) |
| | | | |
Net unrealized appreciation (depreciation) on investments (tax basis) | | $ | 21,289,704 | |
| | | | |
At September 30, 2016, the Fund had deferred tax basis capital losses occurring subsequent to October 31, 2015 through September 30, 2016 of $50,792. For tax purposes, such losses will be recognized in the year ending September 30, 2017.
At September 30, 2016, the Fund had cumulative tax basis capital losses of $28,398, (of which $10,848 are short-term and $17,550 are long-term) generated after September 30, 2011, which may be carried forward to offset future capital gains. To the extent such carry-forwards are used, capital gain distributions may be reduced to the extent provided by regulations. Such capital loss carryforwards do not expire.
At September 30, 2016, the Fund had $60,531 of undistributed net tax-exempt income, no undistributed tax basis net ordinary income and no undistributed tax basis capital gains.
Distributions from tax exempt income paid by the Fund for the years ended September 30, 2016 and September 30, 2015 are excludable by shareholders from gross income for Federal income tax purposes.
The tax character of distributions paid during the years ended September 30, 2016, and September 30, 2015, was as follows:
| | | | | | | | |
| | | 2016 | | | 2015 | |
Distributions from: | | | | | | | | |
Tax exempt income | | $ | 6,207,463 | | | $ | 5,869,818 | |
Ordinary income | | | 91,496 | | | | 161,156 | |
Capital gains | | | — | | | | 115,701 | |
| | | | | | | | |
Total | | $ | 6,298,959 | | | $ | 6,146,675 | |
| | | | | | | | |
NOTE 3 – SECURITY VALUATION
Valuation of the Fund’s portfolio investment securities is performed in accordance with policies and procedures adopted by and under the oversight of the Trustees.
Annual Report 19
| | |
| NOTES TO FINANCIAL STATEMENTS, CONTINUED | | |
| |
Thornburg Strategic Municipal Income Fund | | September 30, 2016 |
The Trustees of the Trust have appointed the Advisor to assist the Trustees in obtaining market values for portfolio investments, evaluate and monitor professional pricing service providers appointed by the Trustees’ Audit Committee (the “Audit Committee”) to assist in determining fair values for portfolio investments, assist in calculating fair values for portfolio investments in certain circumstances, and to perform other functions in connection with the valuation of investments. The Advisor acts through its Valuation and Pricing Committee (the “Committee”) and other employees of the Advisor. The Committee regularly reviews its own valuation calculations, as well as the valuations, valuation techniques and services furnished by pricing service providers, considers circumstances which may require valuation calculations by the Committee, and reviews previous valuation calculations. The Committee reports to the Audit Committee on the Committee’s activities, the performance of pricing service providers, and other matters relating to valuation of portfolio investments.
In those instances when the Committee assists in calculating a fair value for a portfolio investment, the Committee seeks to determine the price that the Fund would reasonably expect to receive upon a sale of the investment in an orderly transaction between market participants on the valuation date. The Committee customarily utilizes quotations from securities broker dealers in calculating valuations, but also may utilize prices obtained from pricing service providers or other methods approved by the Audit Committee. Because fair values calculated by the Committee are estimates, the calculation of a value for an investment may differ from the price that would be realized by the Fund upon a sale of the investment, and the difference could be material to the Fund’s financial statements. The Committee’s calculation of a fair value for an investment may also differ from the prices obtained by other persons (including other mutual funds) for the investment.
Valuation of Securities: Debt obligations held by the Fund which are not listed or traded on exchanges or for which no reported market exists are ordinarily valued at the valuation obtained from a pricing service provider approved by the Audit Committee.
In any case when a pricing service provider fails to provide a valuation for a debt obligation held by the Fund, the Committee calculates a fair value for the obligation using alternative methods under procedures approved by the Audit Committee. Additionally, in cases when management believes that a valuation obtained from a pricing service provider merits review for significant reasons, the Committee decides whether or not to use the valuation calculated by the pricing service provider or to use an alternative method approved by the Audit Committee to calculate a fair value for the obligation.
Valuation Hierarchy: The Fund categorizes its investments based upon the inputs used in valuing those investments, according to a three-level hierarchy established in guidance from FASB. Categorization of investments using this hierarchy is intended by the FASB to maximize the use of observable inputs in valuing investments and minimize the use of unobservable inputs by requiring that the most observable inputs be used when available. Observable inputs are those that market participants would use in valuing an investment based on available market information. Unobservable inputs are those that reflect assumptions about the information market participants would use in valuing an investment. An investment’s level within the hierarchy is based on the lowest level input that is deemed significant to the valuation. The methodologies and inputs used to value investments are not necessarily indications of the risk or liquidity associated with those investments.
Various inputs are used in calculating valuations for the Fund’s investments. These inputs are generally summarized according to the three-level hierarchy below:
Level 1: Quoted prices in active markets for identical investments.
Level 2: Other direct or indirect significant observable inputs (including quoted prices for similar investments in active markets and other observable inputs, such as interest rates, prepayment rates, credit risk, etc.).
Level 3: Significant unobservable inputs (including the Committee’s own assumptions in calculating the fair values of investments).
Valuations for debt obligations held by the Fund are typically calculated by pricing service providers approved by the Audit Committee and are characterized as Level 2 within the valuation hierarchy.
In a limited number of cases the Committee calculates a fair value for investments using broker quotations or other methods approved by the Audit Committee. When the Committee uses a single broker quotation to calculate a fair value for an investment without other significant observable inputs, or if a fair value is calculated using other significant inputs that are considered unobservable, the investment is characterized as Level 3 within the hierarchy. Other significant unobservable inputs used to calculate a fair value in these instances might include an income-based valuation approach which considers discounted anticipated future cash flows from the investment, and application of discounts due to the nature or duration of any restrictions on the disposition of the investment.
Valuations based upon the use of inputs from Levels 1, 2 or 3 may not represent the actual price received upon the disposition of an investment, and the Fund may receive a price that is lower than the valuation based upon these inputs when it sells the investment.
20 Annual Report
| | |
| NOTES TO FINANCIAL STATEMENTS, CONTINUED | | |
| |
Thornburg Strategic Municipal Income Fund | | September 30, 2016 |
The following table displays a summary of the fair value hierarchy measurements of the Fund’s investments as of September 30, 2016. In any instance when valuation inputs from more than one level are used to determine the fair value of a specific investment, the investment is placed in the level of the table based upon the lowest level input that is significant in determining the fair value of the investment:
| | | | | | | | | | | | | | | | |
| | | Fair Value Measurements at September 30, 2016 | |
| | | Total | | | Level 1 | | | Level 2 | | | Level 3 | |
Assets | | | | | | | | | | | | | | | | |
Investments in Securities | | | | | | | | | | | | | | | | |
Municipal Bonds | | $ | 297,817,625 | | | $ | — | | | $ | 297,817,625 | | | $ | — | |
| | | | | | | | | | | | | | | | |
Total Investments in Securities | | $ | 297,817,625 | | | $ | — | | | $ | 297,817,625 | | | $ | — | |
In accordance with the guidance prescribed in Accounting Standards Update No. 2011-04, it is the policy of the Fund to recognize transfers between levels and the underlying events which caused the movement. The Fund recognized no transfers between levels for the year ended September 30, 2016.
NOTE 4 – INVESTMENT ADVISORY FEE AND OTHER TRANSACTIONS WITH AFFILIATES
Pursuant to an investment advisory agreement, the Advisor serves as the investment advisor and performs services for the Fund for which the fees are payable at the end of each month. Under the investment advisory agreement, the Fund pays the Advisor a management fee based on the daily net assets of the Fund at an annual rate as shown in the following table:
| | | | |
Daily Net Assets | | Fee Rate | |
Up to $500 million | | | 0.750 | % |
Next $500 million | | | 0.675 | |
Next $500 million | | | 0.625 | |
Next $500 million | | | 0.575 | |
Over $2 billion | | | 0.500 | |
The Fund’s effective management fee for the year ended September 30, 2016 was 0.75% of the Fund’s average dividend assets.
The Fund pays to the Advisor the costs of personnel who perform certain accounting services for the Fund. For the year ended September 30, 2016 the Fund paid $11,499 to the Advisor for these accounting services. The Trust has also entered into administrative service agreements with the Advisor, whereby the Advisor will perform certain administrative services for the shareholders of each class of the Fund’s shares, and for which fees will be payable at an annual rate of up to .125 of 1% per annum of the average daily net assets attributable to each class of shares. Total administrative service fees incurred by each class of shares of the Fund for the year ended September 30, 2016, are set forth in the Statement of Operations.
The Trust has an underwriting agreement with Thornburg Securities Corporation (the “Distributor”), an affiliate of the Advisor, which acts as the distributor of the Fund’s shares. For the year ended September 30, 2016, the Distributor has advised the Fund that it earned net commissions aggregating $935 from the sale of Class A shares, and collected contingent deferred sales charges aggregating $4,395 from redemptions of Class C shares of the Fund.
Pursuant to a service plan under Rule 12b-1 of the Investment Company Act of 1940, the Fund may reimburse to the Advisor an amount not to exceed .25 of 1% per annum of the average daily net assets attributable to Class A and Class C shares of the Fund for payments made by the Advisor to securities dealers and other financial institutions to obtain various shareholder and distribution related services. For the year ended September 30, 2016, there were no 12b-1 service plan fees charged for Class I shares. The Advisor may pay out of its own resources additional expenses for distribution of the Fund’s shares and shareholder services.
The Trust has also adopted a distribution plan pursuant to Rule 12b-1, applicable only to the Fund’s Class C shares, under which the Fund compensates the Distributor for services in promoting the sale of Class C shares of the Fund at an annual rate of up to .35 of 1% per annum of the average daily net assets attributable to Class C shares. Total fees incurred by each class of shares of the Fund under their respective service and distribution plans for the year ended September 30, 2016, are set forth in the Statement of Operations.
The Advisor and Distributor have contractually agreed to waive fees and reimburse expenses incurred by the Fund so that actual expenses of certain share classes do not exceed levels as specified in the Fund’s most recent prospectus. The agreement may be terminated by the Fund at any time, but may not be terminated by the Advisor or Distributor before February 1, 2017, unless the Advisor ceases to be the investment advisor to the Trust or the Distributor ceases to be the distributor of the Fund prior to that date. The Advisor and Distributor retain the right to be repaid by the Fund for fee waivers and expense reimbursements if expenses fall below the contractual limit prior to the end of the fiscal year.
Annual Report 21
| | |
| NOTES TO FINANCIAL STATEMENTS, CONTINUED | | |
| |
Thornburg Strategic Municipal Income Fund | | September 30, 2016 |
For the year ended September 30, 2016, the Advisor contractually reimbursed certain class specific expenses, administrative fees, and distribution fees of $26,190 for Class A shares and $36,767 for Class C shares.
Certain officers and Trustees of the Trust are also officers or directors of the Advisor and Distributor. The compensation of independent Trustees is borne by the Trust.
The percentage of direct investments in the Fund held by appointed Trustees, Officers, and the Advisor is approximately 8.75%.
The Fund may sell securities to an affiliated fund, or the Fund may purchase securities held by an affiliated fund, provided the affiliation is due solely to having a common investment advisor, common officers, or common trustees, and provided that all such transactions will comply with Rule 17a-7 under the 1940 Act. For the year ended September 30, 2016, the Fund had transactions with affiliated funds of $3,700,326 in purchases and $10,901,725 in sales.
NOTE 5 – SHARES OF BENEFICIAL INTEREST
At September 30, 2016, there were an unlimited number of shares with no par value of beneficial interest authorized. Transactions in shares of beneficial interest were as follows:
| | | | | | | | | | | | | | | | |
| | | Year Ended
September 30, 2016 | | | Year Ended
September 30, 2015 | |
| | | Shares | | | Amount | | | Shares | | | Amount | |
Class A Shares | | | | | | | | | | | | | | | | |
Shares sold | | | 1,882,295 | | | $ | 29,048,882 | | | | 1,498,078 | | | $ | 22,857,138 | |
Shares issued to shareholders in reinvestment of dividends | | | 91,530 | | | | 1,411,031 | | | | 95,940 | | | | 1,458,653 | |
Shares repurchased | | | (1,283,224 | ) | | | (19,731,256 | ) | | | (1,237,044 | ) | | | (18,802,799 | ) |
| | | | | | | | | | | | | | | | |
| | | | |
Net increase (decrease) | | | 690,601 | | | $ | 10,728,657 | | | | 356,974 | | | $ | 5,512,992 | |
| | | | | | | | | | | | | | | | |
| | | | |
Class C Shares | | | | | | | | | | | | | | | | |
Shares sold | | | 1,073,899 | | | $ | 16,569,930 | | | | 571,928 | | | $ | 8,720,448 | |
Shares issued to shareholders in reinvestment of dividends | | | 36,232 | | | | 559,203 | | | | 34,108 | | | | 519,034 | |
Shares repurchased | | | (531,309 | ) | | | (8,221,278 | ) | | | (411,444 | ) | | | (6,253,517 | ) |
| | | | | | | | | | | | | | | | |
| | | | |
Net increase (decrease) | | | 578,822 | | | $ | 8,907,855 | | | | 194,592 | | | $ | 2,985,965 | |
| | | | | | | | | | | | | | | | |
| | | | |
Class I Shares | | | | | | | | | | | | | | | | |
Shares sold | | | 5,173,837 | | | $ | 79,887,572 | | | | 3,149,898 | | | $ | 48,040,749 | |
Shares issued to shareholders in reinvestment of dividends | | | 235,073 | | | | 3,628,305 | | | | 235,896 | | | | 3,590,289 | |
Shares repurchased | | | (3,157,683 | ) | | | (48,786,029 | ) | | | (2,388,594 | ) | | | (36,345,157 | ) |
| | | | | | | | | | | | | | | | |
| | | | |
Net increase (decrease) | | | 2,251,227 | | | $ | 34,729,848 | | | | 997,200 | | | $ | 15,285,881 | |
| | | | | | | | | | | | | | | | |
NOTE 6 – INVESTMENT TRANSACTIONS
For the year ended September 30, 2016, the Fund had purchase and sale transactions of investments (excluding short-term investments) of $70,449,025 and $27,463,812, respectively.
OTHER NOTES
Risks: The Fund’s investments subject it to risks including, but not limited to, management risk, interest rate risk, credit risk, high yield risk, market and economic risk, liquidity risk, and derivatives risk. Please see the Fund’s prospectus for a discussion of the risks associated with an investment in the Fund.
Subsequent Events: Fund management believes no events have occurred between September 30, 2016 and the date of issuance of the financial statements that require adjustment to or disclosure in the accompanying financial statements.
22 Annual Report
This page intentionally left blank.
Annual Report 23
FINANCIAL HIGHLIGHTS
Thornburg Strategic Municipal Income Fund
| | | | | | | | | | | | | | | | | | | | | | | | | | | | | | | | | | | | | | | | | | | | | | | | | | | | |
| | | PER SHARE PERFORMANCE (for a share outstanding throughout the Year) | | RATIOS TO AVERAGE NET ASSETS | | | SUPPLEMENTAL DATA | |
Unless
Otherwise Noted,
Periods are
Fiscal
Years
Ended Sept. 30, | | Net Asset
Value
Beginning
of Year | | | Net
Investment
Income
(Loss)+ | | Net
Realized
&
Unrealized
Gain (Loss)
on
Investments | | | Total from
Investment
Operations | | | Dividends
from Net
Investment
Income | | | Dividends
from Net
Realized
Gains | | Total
Dividends | | | Net
Asset Value End of Year | | Net
Investment
Income
(Loss)
(%) | | | Expenses,
After
Expense
Reductions
(%) | | | Expenses,
After
Expense
Reductions
and
Net of
Custody
Credits
(%) | | | Expenses,
Before
Expense
Reductions
(%) | | | Total
Return
(%)(a) | | | Portfolio
Turnover
Rate
(%)(a) | | Net
Assets
at End
of
Year
(Thousands) | |
CLASS A SHARES | | | | | | | | | | | | | | | | | | | | | | | | | | | | | | | | | | | | | | | | | | | | | | |
2016(b) | | $ | 15.16 | | | 0.33 | | | 0.37 | | | | 0.70 | | | | (0.33 | ) | | — | | | (0.33 | ) | | $15.53 | | | 2.11 | | | | 1.25 | | | | 1.25 | | | | 1.29 | | | | 4.63 | | | 11.24 | | $ | 79,058 | |
2015(b) | | $ | 15.19 | | | 0.35 | | | (0.02 | ) | | | 0.33 | | | | (0.35 | ) | | (0.01) | | | (0.36 | ) | | $15.16 | | | 2.28 | | | | 1.25 | | | | 1.25 | | | | 1.31 | | | | 2.18 | | | 12.13 | | $ | 66,722 | |
2014(b) | | $ | 14.40 | | | 0.41 | | | 0.85 | | | | 1.26 | | | | (0.42 | ) | | (0.05) | | | (0.47 | ) | | $15.19 | | | 2.82 | | | | 1.25 | | | | 1.25 | | | | 1.31 | | | | 8.93 | | | 21.89 | | $ | 61,424 | |
2013(b) | | $ | 15.17 | | | 0.41 | | | (0.74 | ) | | | (0.33 | ) | | | (0.41 | ) | | (0.03) | | | (0.44 | ) | | $14.40 | | | 2.74 | | | | 1.25 | | | | 1.25 | | | | 1.31 | | | | (2.21 | ) | | 37.42 | | $ | 52,278 | |
2012(b) | | $ | 14.06 | | | 0.49 | | | 1.13 | | | | 1.62 | | | | (0.50 | ) | | (0.01) | | | (0.51 | ) | | $15.17 | | | 3.34 | | | | 1.25 | | | | 1.25 | | | | 1.31 | | | | 11.71 | | | 12.52 | | $ | 65,446 | |
CLASS C SHARES | | | | | | | | | | | | | | | | | | | | | | | | | | | | | | | | | | | | | | | | | | | | | | |
2016 | | $ | 15.17 | | | 0.28 | | | 0.37 | | | | 0.65 | | | | (0.28 | ) | | — | | | (0.28 | ) | | $15.54 | | | 1.80 | | | | 1.55 | | | | 1.55 | | | | 1.66 | | | | 4.32 | | | 11.24 | | $ | 38,773 | |
2015 | | $ | 15.20 | | | 0.30 | | | (0.02 | ) | | | 0.28 | | | | (0.30 | ) | | (0.01) | | | (0.31 | ) | | $15.17 | | | 1.98 | | | | 1.55 | | | | 1.55 | | | | 1.70 | | | | 1.87 | | | 12.13 | | $ | 29,073 | |
2014 | | $ | 14.41 | | | 0.37 | | | 0.84 | | | | 1.21 | | | | (0.37 | ) | | (0.05) | | | (0.42 | ) | | $15.20 | | | 2.53 | | | | 1.55 | | | | 1.55 | | | | 1.72 | | | | 8.60 | | | 21.89 | | $ | 26,168 | |
2013 | | $ | 15.18 | | | 0.37 | | | (0.74 | ) | | | (0.37 | ) | | | (0.37 | ) | | (0.03) | | | (0.40 | ) | | $14.41 | | | 2.44 | | | | 1.55 | | | | 1.55 | | | | 1.73 | | | | (2.50 | ) | | 37.42 | | $ | 21,344 | |
2012 | | $ | 14.07 | | | 0.45 | | | 1.12 | | | | 1.57 | | | | (0.45 | ) | | (0.01) | | | (0.46 | ) | | $15.18 | | | 3.04 | | | | 1.55 | | | | 1.55 | | | | 1.78 | | | | 11.38 | | | 12.52 | | $ | 23,521 | |
CLASS I SHARES | | | | | | | | | | | | | | | | | | | | | | | | | | | | | | | | | | | | | | | | | | | | | | |
2016 | | $ | 15.17 | | | 0.38 | | | 0.37 | | | | 0.75 | | | | (0.38 | ) | | — | | | (0.38 | ) | | $15.54 | | | 2.42 | | | | 0.93 | | | | 0.93 | | | | 0.93 | | | | 4.96 | | | 11.24 | | $ | 190,658 | |
2015 | | $ | 15.20 | | | 0.39 | | | (0.01 | ) | | | 0.38 | | | | (0.40 | ) | | (0.01) | | | (0.41 | ) | | $15.17 | | | 2.60 | | | | 0.93 | | | | 0.93 | | | | 0.93 | | | | 2.50 | | | 12.13 | | $ | 151,992 | |
2014 | | $ | 14.41 | | | 0.46 | | | 0.85 | | | | 1.31 | | | | (0.47 | ) | | (0.05) | | | (0.52 | ) | | $15.20 | | | 3.12 | | | | 0.94 | | | | 0.93 | | | | 0.94 | | | | 9.27 | | | 21.89 | | $ | 137,109 | |
2013 | | $ | 15.18 | | | 0.45 | | | (0.73 | ) | | | (0.28 | ) | | | (0.46 | ) | | (0.03) | | | (0.49 | ) | | $14.41 | | | 3.04 | | | | 0.95 | | | | 0.95 | | | | 0.96 | | | | (1.92 | ) | | 37.42 | | $ | 89,262 | |
2012 | | $ | 14.07 | | | 0.53 | | | 1.13 | | | | 1.66 | | | | (0.54 | ) | | (0.01) | | | (0.55 | ) | | $15.18 | | | 3.62 | | | | 0.95 | | | | 0.95 | | | | 0.95 | | | | 12.03 | | | 12.52 | | $ | 92,386 | |
| (a) | Not annualized for periods less than one year. |
| (b) | Sales loads are not reflected in computing total return. |
| + | Based on weighted average shares outstanding. |
See notes to financial statements.
| | | | |
| 24 Annual Report | | | | Annual Report 25 |
REPORT OF INDEPENDENT REGISTERED PUBLIC ACCOUNTING FIRM
Thornburg Strategic Municipal Income Fund
To the Trustees and Shareholders of
Thornburg Strategic Municipal Fund
In our opinion, the accompanying statement of assets and liabilities, including the schedule of investments in securities, and the related statements of operations and of changes in net assets and the financial highlights present fairly, in all material respects, the financial position of the Thornburg Strategic Municipal (the “Fund”) at September 30, 2016, the results of its operations for the year then ended, the changes in its net assets for each of the two years in the period then ended and the financial highlights for each of the five years in the period then ended, in conformity with accounting principles generally accepted in the United States of America. These financial statements and financial highlights (hereafter referred to as “financial statements”) are the responsibility of the Fund’s management. Our responsibility is to express an opinion on these financial statements based on our audits. We conducted our audits of these financial statements in accordance with the standards of the Public Company Accounting Oversight Board (United States). Those standards require that we plan and perform the audit to obtain reasonable assurance about whether the financial statements are free of material misstatement. An audit includes examining, on a test basis, evidence supporting the amounts and disclosures in the financial statements, assessing the accounting principles used and significant estimates made by management, and evaluating the overall financial statement presentation. We believe that our audits, which included confirmation of securities at September 30, 2016 by correspondence with the custodian, brokers, transfer agent, and the application of alternative procedures where securities purchased had not been received, provide a reasonable basis for our opinion.
PricewaterhouseCoopers LLP
New York, New York
November 18, 2016
26 Annual Report
| | |
| EXPENSE EXAMPLE | | |
| |
Thornburg Strategic Municipal Income Fund | | September 30, 2016 (Unaudited) |
As a shareholder of the Fund, you incur two types of costs:
| | (1) | transaction costs, including |
(a) sales charges (loads) on purchase payments, for Class A shares;
(b) a deferred sales charge on redemptions of any part or all of a purchase of $1 million of Class A shares within 12 months of purchase;
(c) a deferred sales charge on redemptions of Class C shares within 12 months of purchase;
| | (2) | ongoing costs, including management fees; distribution and/or service (12b-1) fees; and other Fund expenses. |
This example is intended to help you understand your ongoing costs (in dollars) of investing in the Fund and to compare these costs with the ongoing costs of investing in other mutual funds.
The example is based on a $1,000 investment beginning on April 1, 2016, and held until September 30, 2016.
| | | | | | | | | | | | |
| | | Beginning
Account Value
4/1/16 | | | Ending
Account Value
9/30/16 | | | Expenses paid
During period†
4/1/16–9/30/16 | |
Class A Shares | | | | | | | | | | | | |
Actual | | $ | 1,000.00 | | | $ | 1,019.60 | | | $ | 6.31 | |
Hypothetical* | | $ | 1,000.00 | | | $ | 1,018.75 | | | $ | 6.31 | |
Class C Shares | | | | | | | | | | | | |
Actual | | $ | 1,000.00 | | | $ | 1,017.40 | | | $ | 7.81 | |
Hypothetical* | | $ | 1,000.00 | | | $ | 1,017.25 | | | $ | 7.81 | |
Class I Shares | | | | | | | | | | | | |
Actual | | $ | 1,000.00 | | | $ | 1,020.60 | | | $ | 4.68 | |
Hypothetical* | | $ | 1,000.00 | | | $ | 1,020.37 | | | $ | 4.68 | |
| † | Expenses are equal to the annualized expense ratio for each class (A: 1.25%; C: 1.55%; I: 0.93%) multiplied by the average account value over the period, multiplied by 183/366 to reflect the one-half year period. |
| * | Hypothetical assumes a rate of return of 5% per year before expenses. |
ACTUAL EXPENSES
For each class of shares, the first line of the accompanying table provides information about actual account values and actual expenses. You may use the information in this line, together with the amount you invested, to estimate the expenses that you paid over the period. Simply divide your account value by $1,000 (for example, an $8,600 account value divided by $1,000 = 8.6), then multiply the result by the number in the first line for your class of shares under the heading entitled “Expenses Paid During Period” to estimate the expenses you paid on your account during this period.
HYPOTHETICAL EXAMPLE FOR COMPARISON PURPOSES
For each class of shares, the second line of the accompanying table provides information about hypothetical account values and hypothetical expenses based on the Fund’s actual expense ratio and an assumed rate of return of 5% per year before expenses, which is not the Fund’s actual return. The hypothetical account values and expenses may not be used to estimate the actual ending account balance or expenses you paid for the period. You may use this information to compare the ongoing costs of investing in the Fund and other funds. To do so, compare this 5% hypothetical example with the 5% hypothetical examples that appear in the shareholder reports of the other funds.
Please note that the expenses shown in the table are meant to highlight your ongoing costs only and do not reflect any transactional costs, such as sales charges (loads), redemption fees, or exchange fees. Therefore, the second line of the table for each class of shares is useful in comparing ongoing costs only, and will not help you determine the relative total costs of owning different funds. In addition, if these transactional costs were included, your costs would have been higher.
Annual Report 27
| | |
| TRUSTEES AND OFFICERS | | |
| |
Thornburg Strategic Municipal Income Fund | | September 30, 2016 (Unaudited) |
| | | | | | |
Name, Age, Year Elected Position Held with Fund | | Principal Occupation(s) During Past Five Years | | Other
Directorships
Held by Trustee | |
INTERESTED TRUSTEES(1)(2)(4) | | | | |
| | |
Garrett Thornburg, 71 Trustee since 1987, Chairman of Trustees(3) | | Chairman and controlling shareholder of Thornburg Investment Management, Inc. (investment advisor); Chairman and controlling shareholder of Thornburg Securities Corporation (securities dealer); Chairman and CEO of Chamisa Energy, LLC; President of the Thornburg Foundation (nonprofit). | | | None | |
| | |
Brian J. McMahon, 61 Trustee since 2001, Vice Chairman of Trustees, Member of Governance & Nominating Committee & Operations Risk Oversight Committee(5) | | Chief Investment Officer, Managing Director, and Portfolio Manager and, until 2016, CEO and President of Thornburg Investment Management, Inc.; Vice President of Thornburg Securities Corporation. | | | None | |
| |
INDEPENDENT TRUSTEES(1)(2)(4) | | | | |
| | |
David A. Ater, 71
Trustee since 1994,
Member of Audit Committee & Chairman of Governance & Nominating Committee | | Principal in Ater & Associates, Santa Fe, NM (developer, planner and broker of residential and commercial real estate); owner, developer and broker for various real estate projects. | | | None | |
| | |
David D. Chase, 75
Trustee since 2000,
Chairman of Audit Committee | | Managing Member of CS Group, LLC, Santa Fe, NM (private investment fund – family office). | | | None | |
| | |
Sally Corning, 55
Trustee since 2012,
Member of Audit Committee | | Partner in Sun Mountain Capital, Santa Fe, NM (private equity firm with investment programs encompassing venture capital, mezzanine debt, and growth equity). | | | None | |
| | |
Susan H. Dubin,
67 Trustee since 2004,
Member of Audit Committee & Governance and Nominating Committee | | President of Dubin Investments, Ltd., Greenwich, CT (private investment fund); Director and officer of various charitable organizations. | | | None | |
| | |
David L. Gardner, 53
Trustee since 2015,
Member of Operations Risk
Oversight Committee | | Until 2012, head of EMEA (Europe, Middle East and Africa) Sales for iShares of Blackrock, Inc., EMEA Executive Committee Member and EMEA Operating Committee Member at Blackrock, Inc. | | | None | |
| | |
Owen D. Van Essen, 62
Trustee since 2004,
Member of Governance & Nominating Committee & Chairman of Operations Risk Oversight Committee | | President of Dirks, Van Essen & Murray, Santa Fe, NM (newspaper mergers and acquisitions). | | | None | |
| | |
James W. Weyhrauch, 57
Trustee since 1996,
Member of Audit Committee & Operations Risk Oversight Committee | | Real estate broker, Santa Fe Properties, Santa Fe, NM; Vice Chairman of Nambe LLC, Santa Fe, NM (manufacturing & design company). | | | None | |
28 Annual Report
| | |
| TRUSTEES AND OFFICERS, CONTINUED | | |
| |
Thornburg Strategic Municipal Income Fund | | September 30, 2016 (Unaudited) |
| | | | | | |
Name, Age, Year Elected Position Held with Fund | | Principal Occupation(s) During Past Five Years | | Other
Directorships
Held by Trustee | |
OFFICERS OF THE FUND (WHO ARE NOT TRUSTEES)(1)(7) | | | | |
| | |
Nimish Bhatt, 53 Treasurer since 2016(6) | | Chief Financial Officer and Treasurer of Thornburg Investment Management, Inc. and Thornburg Securities Corporation since 2016; Senior Vice President (2004-2016), Chief Financial Officer (2011-2016), and Head of Fund Administration (2011-2016) of Calamos Asset Management, Inc., Calamos Investments LLC, Calamos Advisors LLC, and Calamos Wealth Management; Director of Calamos Global Funds plc (2007-2016). | | | Not applicable | |
| | |
Jason Brady, 42 President since 2016(6) | | CEO and President since 2016, Vice President from 2011 to 2016, Portfolio Manager and Managing Director of Thornburg Investment Management, Inc.; Vice President of Thornburg Securities Corporation since 2016. | | | Not applicable | |
| | |
Kathleen Brady, 56 Vice President since 2008 | | Tax Manager Fund Accounting of Thornburg Investment Management, Inc. | | | Not applicable | |
| | |
Connor Browne, 37 Vice President since 2006 | | Portfolio Manager, Vice President since 2013, and Managing Director of Thornburg Investment Management, Inc. | | | Not applicable | |
| | |
Tim Cunningham, 41 Vice President since 2014 | | Managing Director since 2011, Portfolio Manager since 2012, and Associate Portfolio Manager from 2009–2012 of Thornburg Investment Management, Inc. | | | Not applicable | |
| | |
Randy Dry, 42 Vice President since 2014 | | Vice President and Managing Director, Director of Institutional Group from 2014-2016, and since 2016, Chief Administrative Officer of Thornburg Investment Management, Inc. | | | Not applicable | |
| | |
Greg Dunn, 40 Vice President since 2014 | | Managing Director, Portfolio Manager since 2012, and Associate Portfolio Manager from 2009–2012 of Thornburg Investment Management, Inc. | | | Not applicable | |
| | |
Lon Erickson, 41 Vice President since 2008 | | Portfolio Manager and Managing Director of Thornburg Investment Management, Inc. | | | Not applicable | |
| | |
William V. Fries, 77 Vice President since 1995 | | Portfolio Manager, Vice President, and Managing Director of Thornburg Investment Management, Inc. | | | Not applicable | |
| | |
Thomas Garcia, 45 Vice President since 2006 | | Vice President since 2011, Managing Director, Head Equity Trader, and Associate Portfolio Manager of Thornburg Investment Management, Inc. | | | Not applicable | |
| | |
Rolf Kelly, 37 Vice President since 2016 | | Portfolio Manager and Managing Director since 2013 and Associate Portfolio Manager from 2011–2013 of Thornburg Investment Management, Inc. | | | Not applicable | |
| | |
Ben Kirby, 36 Vice President since 2014 | | Portfolio Manager and Managing Director since 2013 and Associate Portfolio Manager from 2011–2013 of Thornburg Investment Management, Inc. | | | Not applicable | |
| | |
Jeff Klingelhofer, 41 Vice President since 2016 | | Portfolio Manager and Managing Director since 2015, Associate Portfolio Manager from 2012–2015, and Fixed Income Analyst from 2010–2012 of Thornburg Investment Management, Inc. | | | Not applicable | |
| | |
Rob MacDonald, 40 Vice President since 2016 | | Managing Director since 2015, Portfolio Manager since 2014, and Associate Portfolio Manager from 2011–2014 of Thornburg Investment Management, Inc. | | | Not applicable | |
| | |
Leigh Moiola, 49 Vice President since 2001 | | Vice President, Managing Director, and Director of Marketing of Thornburg Investment Management, Inc.; Vice President of Thornburg Securities Corporation. | | | Not applicable | |
| | |
Christopher Ryon, 60 Vice President since 2008 | | Portfolio Manager and Managing Director of Thornburg Investment Management, Inc. | | | Not applicable | |
| | |
Nicholos Venditti, 35 Vice President since 2016 | | Portfolio Manager and Managing Director since 2015 and Associate Portfolio Manager from 2011–2015 of Thornburg Investment Management, Inc. | | | Not applicable | |
Annual Report 29
| | |
| TRUSTEES AND OFFICERS, CONTINUED | | |
| |
Thornburg Strategic Municipal Income Fund | | September 30, 2016 (Unaudited) |
| | | | |
Name, Age, Year Elected Position Held with Fund | | Principal Occupation(s) During Past Five Years | | Other
Directorships
Held by Trustee |
| | |
Vinson Walden, 46
Vice President since 2004 | | Portfolio Manager and Managing Director of Thornburg Investment Management, Inc. | | Not applicable |
| | |
Lei Wang, 45
Vice President since 2006 | | Portfolio Manager and Managing Director of Thornburg Investment Management, Inc. | | Not applicable |
| | |
Sasha Wilcoxon, 42
Vice President since 2003
Secretary since 2007(6) | | Managing Director, Director of Mutual Fund Operations, and Vice President of Thornburg Investment Management, Inc.; Vice President of Thornburg Securities Corporation. | | Not applicable |
| | |
Charles Wilson, 41
Vice President since 2016 | | Portfolio Manager and Managing Director since 2014 and Associate Portfolio Manager from 2012–2014 of Thornburg Investment Management, Inc.; Co-Portfolio Manager of Marsico Capital Management from 2010–2012. | | Not applicable |
| | |
Di Zhou, 38
Vice President since 2016 | | Portfolio Manager and Managing Director since 2016, Associate Portfolio Manager from 2014–2016, and Equity Research Analyst from 2010–2014 of Thornburg Investment Management, Inc. | | Not applicable |
| (1) | Each person’s address is 2300 North Ridgetop Road, Santa Fe, New Mexico 87506. |
| (2) | The Fund is a separate investment “Fund” or “series” of Thornburg Investment Trust (the “Trust”), which comprises the Thornburg mutual fund complex and is organized as a Massachusetts business trust. Thornburg Investment Management, Inc. is the investment advisor to, and manages, all the Funds of the Trust. Each Trustee oversees all the Funds of the Trust. |
| (3) | Mr. Thornburg is considered an “interested” Trustee under the Investment Company Act of 1940 because he is the sole director and controlling shareholder of Thornburg Investment Management, Inc., the investment advisor to the Trust, and is the sole director and controlling shareholder of Thornburg Securities Corporation, the distributor of shares for the Trust. |
| (4) | The Bylaws of the Trust currently require that each Trustee shall retire by the end of the calendar year during which the Trustee reached the age of 75 years. Otherwise each Trustee serves in office until the election and qualification of a successor or until the Trustee sooner dies, resigns, retires or is removed. |
| (5) | Mr. McMahon is considered an “interested” Trustee under the Investment Company Act of 1940 because he is the chief investment officer of Thornburg Investment Management, Inc. |
| (6) | The Trust’s president, secretary, and treasurer each serves a one-year term or until the election and qualification of a successor; each other officer serves at the pleasure of the Trustees. |
| (7) | Assistant vice presidents, assistant secretaries, and assistant treasurers are not shown. |
The Statement of Additional Information for each Fund of the Trust includes additional information about the Trustees and is available, without charge and upon request, by calling 1-800-847-0200.
30 Annual Report
| | |
| OTHER INFORMATION | | |
| |
Thornburg Strategic Municipal Income Fund | | September 30, 2016 (Unaudited) |
PORTFOLIO PROXY VOTING
Policies and Procedures:
The Trust has delegated to Thornburg Investment Management, Inc. (the “Advisor”) voting decisions respecting proxies for the Fund’s voting securities. The Advisor makes voting decisions in accordance with its Proxy Voting Policy. A description of the Policy is available (i) without charge, upon request, by calling the Advisor toll-free at 1-800-847-0200, (ii) on the Thornburg website at www.thornburg. com, and (iii) on the Securities and Exchange Commission’s website at www.sec.gov.
Information regarding how proxies were voted is available on or before August 31 of each year for the twelve months ending the preceding June 30. This information is available (i) without charge, upon request by calling the Advisor toll-free at 1-800-847-0200, (ii) on the Thornburg website at www.thornburg.com, and (iii) on the Securities and Exchange Commission’s website at www.sec.gov.
TAX INFORMATION
For the tax year ended September 30, 2016, dividends paid by the Fund of $6,207,463 (or the maximum allowed) are tax exempt dividends and $91,496 are taxable ordinary investment income dividends for federal income tax purposes. The information and the distributions reported herein may differ from the information and distributions reported to the shareholders for the calendar year ending December 31, 2016. Complete information will be reported in conjunction with your 2016 Form 1099.
AVAILABILITY OF QUARTERLY PORTFOLIO SCHEDULE
The Fund files with the Securities and Exchange Commission schedules of its portfolio holdings on Form N-Q for the first and third quarters of each fiscal year. The Fund’s Forms N-Q are available on the Commission’s website at www.sec.gov, or may be reviewed and copied at the Commission’s Public Reference Room in Washington, D.C. Information on the operation of the Public Reference Room may be obtained by calling 1-800-SEC-0330. The Fund also makes this information available on its website at www.thornburg. com/download or upon request by calling 1-800-847-0200.
STATEMENT RESPECTING RENEWAL OF INVESTMENT ADVISORY AGREEMENT
Thornburg Investment Management, Inc. (the “Advisor”) provides investment management services to Thornburg Strategic Municipal Income Fund pursuant to an investment advisory agreement. The Trustees consider the renewal of this agreement annually, and most recently determined to renew the agreement on September 13, 2016.
In anticipation of their recent consideration of the advisory agreement’s renewal, the independent Trustees met in May 2016 to consider aspects of their annual evaluation of the Advisor’s service to all of the funds of Thornburg Investment Trust, to plan the annual evaluation of the Advisor’s performance and to specify the information the Advisor would present to the Trustees for their review. The independent Trustees met again in independent session in September to consider portions of the information submitted by the Advisor. The Advisor’s president and chief investment officer subsequently reviewed portions of the information with the Trustees and addressed questions from the Trustees at a full meeting session of the Trustees scheduled for that purpose, and the independent Trustees thereafter met in independent session to consider the Advisor’s presentation and various specific issues respecting their consideration of the advisory agreement’s renewal. Following these sessions, the Trustees met to consider renewal of the agreement, and the independent Trustees voted unanimously at that meeting to renew the agreement for an additional term of one year.
The information below summarizes certain factors considered by the Trustees in connection with the determination to renew the advisory agreement. In determining to renew the agreement, the Trustees considered a wide range of information and did not identify any single factor as controlling, and this summary does not describe all of the factors and other matters considered by the Trustees in making their determination.
Nature, Extent and Quality of Services. The Trustees considered presentations by the Advisor at meeting sessions scheduled for consideration of a continuation of the advisory agreement, and also noted their consideration of the reports the Trustees and their committees receive throughout the year on a wide variety of topics, and consideration they had given to a number of topics in previous years. Information identified by the Trustees in their evaluation as having been considered and contributing to their conclusions included Trustees’ assessments of the Advisor’s personnel developed in formal and informal meetings throughout the year, the Advisor’s staffing levels and measures to maintain staffing levels and improve competencies, the Advisor’s commitment to attract and retain high quality portfolio management expertise through competitive compensation levels, the Advisor’s collaborative approach to investment management, the Fund’s investment performance over different periods of time, portfolio managers’ cognizance of and strategies to address market and economic trends and conditions, the evaluation and selection of individual investments, the structuring and composition of the Fund’s portfolio, management of Fund liquidity requirements, cognizance of and efforts to achieve tax efficiency, responses to share sale and redemption activity, continuing enhancements to the Advisor’s electronic and information systems and the Advisor’s
Annual Report 31
| | |
| OTHER INFORMATION, CONTINUED | | |
| |
Thornburg Strategic Municipal Income Fund | | September 30, 2016 (Unaudited) |
engagement of outside firms to assist in improving or replacing those systems, the Advisor’s evaluation and selection of firms providing portfolio trade execution to the Fund and the Advisor’s measures to obtain favorable trade execution, the Advisor’s performance of accounting and other services, the Advisor’s continued commitment to observance of compliance and regulatory requirements, the Advisor’s responsiveness to the Trustees, the quality and extent of written and oral reports to the Trustees over the course of the year, and other factors.
Investment Performance. The Trustees noted in their evaluation of the Fund’s investment performance the reports they had received in each regular meeting over the course of the year from the Advisor’s portfolio management personnel. The Trustees also noted in their evaluation their consideration of information provided to them at their request in anticipation of their annual evaluation of the Advisor’s services, including the following items of information respecting the investment performance of the Fund: (1) the Fund’s absolute investment performance and achievement of stated objectives; (2) the Advisor’s written and oral explanations and commentary on the Fund’s performance in the context of the Fund’s objectives and reasonable expectations, and business, market and economic conditions, (3) performance data for the six calendar years since the inception of the Fund’s investment operations, comparing the Fund’s annual investment returns to a fund category composed by an independent mutual fund analyst firm, and to a broad-based securities index, (4) the Fund’s investment performance for the three-month, year-to-date, one-year, three-year and five-year periods ending with the second quarter of the current year, comparing the Fund’s annualized returns to two mutual fund categories composed by independent mutual fund analyst firms and to a broad-based securities index, and assigning a percentage rank to the Fund’s performance for each period relative to each of the fund categories, and (5) comparative measures of correlation to equity indices, portfolio volatility, risk and return.
The Trustees noted that quarterly reports during the year and other information presented to them confirmed the Advisor’s continued conformity to the Fund’s stated investment objectives and policies.
The Trustees observed in reviewing comparative performance data for the six calendar years since the Fund’s inception that the Fund’s investment return for the most recent calendar year was comparable to the return of the securities index and the average return for the fund category, the Fund’s returns exceeded or were comparable to the returns of the index in all of the preceding five years, and that the Fund’s returns exceeded or were comparable to the average returns of the fund category in all of the preceding five years. Other quantitative data noted by the Trustees as having been considered in their evaluation showed that the Fund’s annualized investment returns fell in the second quartile of performance of the first fund category for the one-year period ended with the second quarter of the current year, fell in the top quartile of performance for the three-year period, and fell in the top decile of performance for the five-year period. Noted data also showed that the Fund’s annualized investment returns fell in the third quartile of performance of the second fund category for the one-year and three-year periods ended with the second quarter, and fell in the top quartile of performance for the five-year period. The Trustees attached additional significance to the performance of the Fund from the perspective of longer term shareholders.
Comparisons of Fee and Expense Levels. The Trustees recognized in their evaluation the clear disclosures of the Advisor’s fees and Fund expenses in the Fund’s prospectuses. Information noted by the Trustees as having been considered in this context included a variety of comparative data respecting the Fund’s fee and expense levels. This information included comparisons of the Fund’s advisory fee and overall Fund expenses to median and average fees and expenses charged to a category of mutual funds selected by an independent mutual fund analyst firm, comparisons of the advisory fee and other Fund expenses to the fee levels and expenses for two representative share classes of fund peer groups selected from the category by a second independent mutual fund analyst firm, the perspectives and advice from the second mutual fund analyst firm respecting comparisons of fund fee levels and expenses to fund peer groups, and other information. The Trustees noted the significant differences between the Fund and the available fund category and the limited size of the peer groups used for comparisons and the potentially reduced utility of those comparatives in evaluating the Fund’s fee and expense levels. Comparative fee and expense data considered by the Trustees showed that the advisory fee for the Fund was higher than the median fee level for the fund category, the level of total expense for a representative share class of the Fund was higher than the median and average expense levels for the category, and that the level of total expense for a second representative share class was also higher than the median and average levels for the category, but to a lesser degree. Data for the peer groups showed that the Fund’s advisory fee was higher than the median levels for two peer groups and at the top of the range for both groups, and that the total expense levels of the representative share classes were higher than the medians and at the top of the range of expense levels of their respective peer groups.
The Trustees noted their consideration of information respecting the advisory fees charged by the Advisor to other investment management clients, including sub-advised mutual funds, together with information about fees charged by other advisors to different clients, analysis of the differences between the requirements of institutional clients and mutual funds, analysis of the differences between the requirements of a sub-advised mutual fund and a fund as to which the investment advisor is the primary advisor and sponsor, descriptions of distinguishing characteristics of the sub-advised funds served by the Advisor, and the consequently different investment management services provided to the different categories of clients and the differing contexts in which the fee levels for these arrangements are established. The Trustees confirmed their previous observations that the differences between the fees charged by the Advisor to different types of clients did not appear exceptional, and that the fee rates charged by an investment advisor to different categories of clients had limited relevance to the evaluation of the fee rate charged by that advisor to mutual funds as to which it is the primary advisor and sponsor.
32 Annual Report
| | |
| OTHER INFORMATION, CONTINUED | | |
| |
Thornburg Strategic Municipal Income Fund | | September 30, 2016 (Unaudited) |
Costs and Profitability of Advisor. In reviewing the profitability of the Advisor’s services to the Fund the Trustees considered an analysis of the Advisor’s costs and the profitability to the Advisor of its services, together with data respecting the overall profitability of a selection of other investment management firms. The Trustees noted that a portion of the Advisor’s profits are an important element in the compensation of shareholder employees. The Trustees considered in this regard information from the Advisor respecting investment of its profits to maintain staffing levels, pay competitive levels of compensation, and add to its information retrieval and management systems to maintain or improve service levels. The Trustees also considered the contribution of the Advisor’s cost management to its profitability, and the relationship of the Advisor’s financial resources and profitability in previous years to its ability to attract necessary personnel, invest in systems and other assets required for its service to the Fund, and maintain or improve service levels for the Fund notwithstanding fluctuations in revenues and profitability. The information considered did not indicate to the Trustees that the Advisor’s profitability was excessive.
Potential Economies of Scale. In reviewing the extent to which economies of scale would be realized by the Fund as it grows and whether fee levels reflect potential economies of scale, the Trustees considered the breakpoint structure for advisory fees chargeable to the Fund, comparisons of the fee breakpoint structure for the Fund with breakpoint structures (or the absence of such structures) for other funds in a peer group selected by an independent mutual fund analyst firm, the effects of the breakpoint structure and other expense factors realized by certain Funds of the Trust as their asset levels had increased, and the Advisor’s expenditures from its own profits and resources to maintain staffing levels, pay competitive levels of compensation, and add to its information retrieval and management systems to maintain or improve service levels. The information provided demonstrated to the Trustees that the Fund’s advisory fee breakpoint structure is reasonable in relation to the structures observed in the other funds in its peer group, and that shareholders may be expected to benefit from any economies of scale, due to the advisory agreement’s breakpoint fee structure for the Fund and other factors.
Potential Ancillary Benefits. In reviewing potential benefits to the Advisor because of its relationship to the Fund, the Trustees noted disclosures by the Advisor of its receipt of certain research services from broker dealers, and the benefits to both the Fund and the Advisor of the Advisor’s expansion of its staffing, compliance and systems capabilities and other resources to serve a broader variety of investment management clients. No unusual or unfair benefits to the Advisor from its relationship to the Fund were identified by the Trustees.
Summary of Conclusions. The Trustees concluded that the nature, extent and quality of the Advisor’s services performed under the advisory agreement remained sufficient. The Trustees further concluded that the absolute and relative investment performance of the Fund over a range of pertinent holding periods on the whole was satisfactory in the context of its objectives and strategies, and that the Advisor had continued to actively and competently pursue the Fund’s stated investment objectives and adhere to the Fund’s investment policies.
The Trustees further concluded, based upon their consideration of the foregoing factors and other information, that the level of the advisory fee charged to the Fund by the Advisor is reasonable in relation to the services provided by the Advisor in view of the nature, extent and quality of those services, the investment performance of the Fund after fees and expenses, the clear disclosure of fees and expenses in the Fund’s prospectus, comparisons of fees and expenses charged to the Fund to fees and expenses charged to other mutual funds, and the other factors considered. The Trustees also observed, however, that notwithstanding the Fund had achieved positive investment returns in most years and provided satisfactory positive investment performance net of fees and expenses in most periods relative to a variety of comparatives, the Fund’s levels of advisory fees and total expenses relative to certain of the data considered indicated to the Trustees that some fee or expense reductions would be desirable. The Trustees accordingly requested, and the Advisor agreed to provide, a proposal for measures to reduce fees and expenses to lower levels.
Annual Report 33
TRUSTEES’ STATEMENT TO SHAREHOLDERS
Readopted September 12, 2016
The Trustees believe current and prospective shareholders should know how we discharge our responsibilities in supervising the Funds’ investment advisor and in reviewing the advisor’s contract for renewal. Since 2005, we have issued a statement which sets out clearly the three principal guidelines that we follow in supervising the Trust’s investment advisor on your behalf. In accordance with our customary practice, in September of this year we again reviewed our statement and concluded we should reissue this statement outlining the principal features of our supervision of the advisor’s performance of investment management services for the Funds.
We begin with the premise that each shareholder selected his or her Fund because its investments are managed by the investment advisor identified in the prospectus and in accordance with the objective and policies described in the prospectus. We realize, as each of you do, that if you believe that your Fund’s stated objective and policies no longer serve your personal investment goals, you can sell your shares and leave the Fund.
Therefore, we believe that our primary supervisory task – our principal obligation to you – is to assess the nature and quality of the advisor’s services, and to confirm that the advisor actively and competently pursues the Fund’s objective, in accordance with the policies set out in the prospectus. To do this, we meet regularly with management to review your Fund’s portfolio and to discuss the advisor’s specific actions and judgments in pursuing the Fund’s objective. We do not substitute our own judgment for the advisor’s decisions in selecting investments; the advisor is paid to exercise its informed judgment on investment decisions, and we seek to confirm, in reviewing the advisor’s performance, that the advisor is doing just that.
Second, we are conscious of costs and the effect that costs have on shareholders’ returns. We try to make sure that your Fund’s fees and costs are reasonable in relationship to the services rendered and that they are generally in line with those charged by other expert investment advisors, consistent with our belief that the Fund’s investors searched for and expect that expertise and attention and have decided to pay a reasonable price for it. We do not put the management contract “out to bid” as a matter of course, and we would not do so unless we had concluded that the advisor materially had failed to pursue the Fund’s objectives in accordance with its policies, or for other equally important reasons. We believe that any other approach would be inconsistent with your interests and contrary to your expectations when you bought shares of the Fund in the first place.
Finally, because we believe that most Thornburg Fund shareholders have invested with a long-term perspective, we try not to focus too much on the fashions of the moment and on short-term performance. The market will not favor any specific investment objective or set of policies at all times and under all economic circumstances. A fund will experience periods of both high and low returns relative to other funds and other investments. Even if one of our Funds is not favored by the market at a particular time, we believe that the advisor is nonetheless obliged to remain true to the Fund’s objective and policies, and we watch to see that it does so.
Trustees of Thornburg Investment Trust
34 Annual Report
THORNBURG FUNDS
Thornburg Investment Management is a privately-owned global investment firm that offers a range of solutions for retail and institutional investors. Founded in 1982 and headquartered in Santa Fe, New Mexico, we manage approximately $53 billion (as of September 30, 2016) across eight equity and 11 bond mutual funds, separate accounts for high-net-worth investors and institutional accounts, and five UCITS funds for non-U.S. investors.
The fund outlined in this report is one of many equity and fixed-income products available from Thornburg Investment Management.
Equity Funds
| | • | | Thornburg Core Growth Fund |
| | • | | Thornburg International Value Fund |
| | • | | Thornburg Better World International Fund |
| | • | | Thornburg International Growth Fund |
| | • | | Thornburg Developing World Fund |
| | • | | Thornburg Investment Income Builder Fund |
| | • | | Thornburg Global Opportunities Fund |
Fixed Income Funds
| | • | | Thornburg Low Duration Income Fund |
| | • | | Thornburg Limited Term U.S. Government Fund |
| | • | | Thornburg Limited Term Income Fund |
| | • | | Thornburg Strategic Income Fund |
| | • | | Thornburg Low Duration Municipal Fund |
| | • | | Thornburg Limited Term Municipal Fund |
| | • | | Thornburg Intermediate Municipal Fund |
| | • | | Thornburg California Limited Term Municipal Fund |
| | • | | Thornburg New Mexico Intermediate Municipal Fund |
| | • | | Thornburg New York Intermediate Municipal Fund |
| | • | | Thornburg Strategic Municipal Income Fund |
Before investing, carefully consider the Fund’s investment goals, risks, charges, and expenses. For a prospectus or summary prospectus containing this and other information, contact your financial advisor or visit thornburg.com. Read it carefully before investing.
For additional information, please visit thornburg.com
Thornburg Investment Management, Inc. 2300 North Ridgetop Road, Santa Fe, NM 87506
Annual Report 35

| | |
| To receive shareholder reports, prospectuses, and proxy statements electronically, go to www.thornburg.com/edelivery. | |  |
This Annual Report is submitted for the general information of shareholders of the Fund. It is not authorized for distribution to prospective investors in the Fund unless preceded or accompanied by an effective prospectus. | |
| | | | |
| Investment Advisor: | | Distributor: | | |
| Thornburg Investment Management® | | Thornburg Securities Corporation® | | |
| 800.847.0200 | | 800.847.0200 | | TH1978 |
2 Annual Report
Annual Report
Thornburg California Limited Term Municipal Fund
September 30, 2016
| | | | |
Share Class | | NASDAQ Symbol | | CUSIP |
Class A | | LTCAX | | 885-215-426 |
Class C | | LTCCX | | 885-215-418 |
Class I | | LTCIX | | 885-215-392 |
Minimum investments for Class I shares may be higher than those for other classes. Class I shares may not be available to all investors.
Investments carry risks, including possible loss of principal. Portfolios investing in bonds have the same interest rate, inflation, and credit risks that are associated with the underlying bonds. The value of bonds will fluctuate relative to changes in interest rates, decreasing when interest rates rise. Unlike bonds, bond funds have ongoing fees and expenses. Please see the Fund’s prospectus for a discussion of the risks associated with an investment in the Fund. Investments in the Funds are not FDIC insured, nor are they bank deposits or guaranteed by a bank or any other entity.
The laddering strategy does not assure or guarantee better performance and cannot eliminate the risk of investment losses.
Diversification does not assure or guarantee better performance and cannot eliminate the risk of investment losses.
Annual Report 3
LETTER TO SHAREHOLDERS
| | |
| |
Thornburg California Limited Term Municipal Fund | | September 30, 2016 (Unaudited) |
October 13, 2016
Dear Shareholder:
We are pleased to present the annual report for Thornburg California Limited Term Municipal Fund. The net asset value (NAV) of the Class A shares increased by 14 cents to $13.98 per share during the fiscal year ended September 30, 2016. If you were with us for the entire period, you received dividends of 17.9 cents per share. If you reinvested your dividends, you received 18.0 cents per share. Dividends were lower for Class C shares and higher for Class I shares to account for varying class-specific expenses. The Class A shares of your Fund underperformed the index with a 2.32% total return (without sales charge) for the fiscal year ended September 30, 2016, compared to the 2.95% total return for the BofA Merrill Lynch 1-10 Year U.S. Municipal Securities Index. The Fund generated 1.21% more price return and 1.84% less income than the index after accounting for the different treatment of bonds priced above and below par by the index versus the Fund.
Drivers of the Fund’s price return relative to its benchmark include its interest rate sensitivity, as measured by the Fund’s duration. Also, differing allocations along the Fund’s investment universe subtracted 0.78% of relative price performance. Sector allocations added 1.59% of relative price performance and its overweight to lower-credit-quality securities added 0.32% of relative price performance. Other risk factors (and accounting differences) totaled another 0.08% of relative price performance for the period.
The market’s returns were a result of increasing short-term rates and decreasing long-term rates, shown in Figure 1.
U.S. Economy, Fed Policy, and the Election
The U.S. economy grew at a paltry average rate of 1%, as measured by nominal gross domestic product (GDP), for the first three quarters of 2016, much lower than the almost 3% average rate for 2015.
On the employment front, the economy added approximately 200,000 jobs per month for the Fund’s 2016 fiscal year. The May jobs number was a little scary, adding only 24,000 that month. The unemployment rate ticked up to 5.0% in September of 2016 from 4.9% in August, as more previously non-participating workers returned to the labor market.
Inflation has held stable, although it did move up slightly. The Core Personal Consumption Expenditure Index (Core PCE) for August moved up to 1.7% from 1.6% in July, although well below the U.S. Federal Reserve Board’s (the Fed) 2.0% target.
So, all in all, the economy is still growing, jobs are being added and inflation is well behaved. This isn’t a bad scenario for municipal bond investors, except that, at current valuations and 10-year AAA municipal general obligation bonds yielding 1.64%, municipal bond investors are generally not keeping up with inflation.
Elsewhere, the Fed increased the federal funds rate 0.25% in December of 2015. Although many pundits want to blame the credit markets rout on that event, they would be wrong. Oil prices, as measured by WTI crude futures, hit a low of $34.54 on January 20, 2016. Energy producers are a highly leveraged segment of the market, whether through bank loans or other forms of debt. As market participants began to question their ability to service these loans or debt, credit spreads began to widen and the impact of these loans on the financial stability of some banks came into question. The municipal market avoided this distress because bond issuance from energy-producing states was a small fraction of the $3.8 trillion municipal bond market.
This early-2016 market turbulence, followed by the May jobs report and the “Brexit” vote in Great Britain, gave the Fed enough pause not to follow their December rate increase with another. So far through 2016, the central bank has insisted that they may increase rates again and again. Last year we said, “Regardless, waiting for the Fed to raise short-term interest rates is akin to Waiting for Godot.” Well, we are still waiting. Meanwhile, the Fed is assuring the markets that the next meeting is “live” and they may raise short-term interest rates again!
Figure I | 12-Month Change in Rates for AAA Rated General Obligation Municipal Bonds
(as of September 30, 2016)
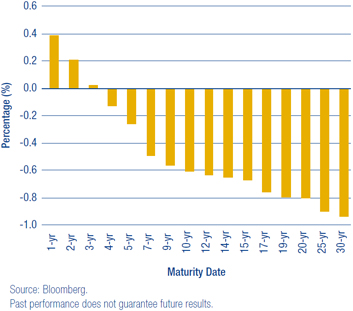
4 Annual Report
| | |
| LETTER TO SHAREHOLDERS, | | |
| |
CONTINUED | | |
| |
Thornburg California Limited Term Municipal Fund | | September 30, 2016 (Unaudited) |
The 2016 U.S. presidential race featured two major party candidates with unprecedented high unfavorable ratings with the electorate. At the time of this writing, the election’s result is weeks away. Regardless of the winner, however, the president historically has had very little impact on the course of the economy. Although there is a pattern that if the economy is doing well, the current administration likes to take all the credit; if the economy is not doing well, the current administration blames the previous one. A victory for either candidate could still benefit the municipal bond market, however, as both stumped for large increases in infrastructure spending – with one particularly calling for higher taxes which would lend support to the municipal bond market. If this gets through Congress, it could mean a higher level of municipal bond issuance and ultimately high growth rates for the economy; both occurrences would put upward pressure on municipal bond yields.
The Municipal Bond Market
The value metrics we use at Thornburg all suggest that the municipal bond market is pricing-in the rosiest of scenarios going forward. The main reason for this is that global central banks, with their overly accommodative monetary policies, have pushed investors further out on the risk spectrum in search of yield. That is why, depending on the fund, we have our portfolios positioned in the lower end of their respective risk spectrums. This means that durations (a measure of price sensitivity to changes in interest rates) are low and credit quality is higher than in the past. We continually ask ourselves: are investors getting paid to take risk? The answer we come up with is no!
Inside the Risk Metrics
Let’s first look at real yields, which is how much yield over inflation investors are being paid to own municipal bonds. As mentioned earlier, 10-year AAA general obligation bonds are yielding 1.64% and Core PCE is running at 1.70%, so investors are earning less than inflation. Over the last 20 years, investors have earned an average of 2% over inflation for the opportunity to invest in a 10-year AAA general obligation municipal bond.
The second thing to consider is credit spreads, which reflect the incremental yield an investor earns from owning a lower-rated credit versus a higher-rated credit, and which are now very narrow. As of September 30, 2016, an investor earned about 1% more for owning a 10-year BBB revenue bond versus a 10-year AAA general obligation bond. That is slightly higher than the average 0.75% an investor earned between 1994 and 2007. In 2007, approximately 50% of the new issue municipal bond market was insured by AAA/AAA municipal bond insurers. Today, there are no AAA/AAA municipal bond insurers, and insurance coverage generally accounts for only 6% to 8% of the new issue municipal bond market. On top of that, the security covenants of some current lower-quality investment grade securities are the most lax in years. This is a great time to be an issuer of lower-quality investment grade municipal bonds but not a great time to be an investor in them.
Finally, the slope of the yield curve, which tracks how much incremental yield an investor earns by owning securities with longer maturities, is also quite flat. Currently, investors are earning 0.78% more for owning a 10-year AAA general obligation municipal bond, versus a 1-year AAA general obligation municipal bond. Since 1994, an investor earned on average almost 1.60% to extend maturities from one to 10 years. The stretch for income is causing investors to absorb more risk at lower and lower relative yields.
The California Economy
California’s economy is booming, and Governor Jerry Brown is proving to be quite adept at managing this juggernaut. A June 6, 2016, Bloomberg article by Matthew A. Winkler, “California Makes America’s Economy Great,” summarizes the activity very nicely:
“If the state were stacked up against nations, California would be the seventh-largest economy, with an equivalent gross domestic product greater than Brazil’s. It’s not just big, but also booming. California had a 3.29 percent growth rate last year, more than five times that of No. 3 Japan, almost twice No. 4 Germany, about half again as much as No. 5 U.K., almost three times No. 6 France and a third more than No. 1 U.S. California last year created the most jobs of any state, 483,000, more than the second- and third-most-populous states Florida and Texas combined (they added 257,900 and 175,700) and at a faster rate than any of the world’s developed economies. The pace of employment growth was almost triple the rate of job creation for the 19 countries that make up the euro zone and more than 3.5 times that of Japan, according to data compiled by Bloomberg.
“The high taxes and ubiquitous regulation critics cite when assailing Golden State government are proving no impediment to business and investment. They may even be a benefit, as public policy and people’s preferences converge. Four of the world’s 10 largest companies are based in California. Two of them – Alphabet and Facebook – were conceived in the past 18 years. San Francisco-based Wells Fargo, the world’s largest bank by market capitalization, routinely outperforms any of its peers from Wall Street.
“California produces almost all of the country’s almonds, apricots, dates, figs, kiwifruit, nectarines, olives, pistachios, prunes and walnuts among dozens of crops that make it No. 1 in the U.S., with an equivalent GDP from agriculture, forestry and hunting totaling more than $37.7 billion, dwarfing No. 2 Iowa’s $12.1 billion, according to data compiled by
Annual Report 5
| | |
LETTER TO SHAREHOLDERS, CONTINUED | | |
| |
Thornburg California Limited Term Municipal Fund | | September 30, 2016 (Unaudited) |
Bloomberg. No state comes close to California in manufacturing totaling $255.6 billion. Texas is next with $239.1 billion. The trailing 12-month revenue from California technology companies totaled $732 billion, or 53 percent of all tech revenues in the U.S.”
As one can see, California’s economy has a lot going for it. It produces great technology and dietary roughage. The only thing that is in short supply is water. The high taxes have been one factor leading to the strong performance of California municipal bonds.
Pensions are still a troubling issue. California is ranked 25th most underfunded state pension system, with a 2014 funding level of 70.0%.
Some 35 states reported a pension funding ratio of under 80% in 2014 – the Mendoza line between a well-funded state pension and the “other kind.” As the worst career hitter in major league baseball history (.200 batting average), Mario Mendoza Aizpuru’s name ubiquitously symbolizes futility.
Liquidity
Market liquidity is still a concern. The latest example of this is what is happening to yields on Variable Rate Demand Notes (VRDNs). These are securities that are normally held in money market funds and bond fund reserve positions. They can be put back to an intermediary on a daily basis and are relatively secure. Leading up to the finalization of the Securities and Exchange Commission’s money market fund reform in October of 2016, money market funds were and are repositioning themselves to be compliant with the new regulations. As such, they have had to divest themselves of VRDNs. Intermediaries do not want to hold them on their balance sheets (very expensive), so they raise the yields to clear the market. What used to yield 0.01% in March now yields, as of the time of this writing, 0.90%, or more than a 3-year AA security. This is serendipity for managers like Thornburg holding higher reserves because of concern over market liquidity; for issuers in the VRDN market, it’s not so much.
Main Reason to Own Municipal Bonds
One of the best risk-mitigating tools an investor has is diversification. By splitting a portfolio into several asset classes, an investor may reduce the volatility of the resulting portfolio’s returns. This is because the returns of various asset classes are not always correlated. There are times when this is not the case, such as the 2008 financial crisis when all correlations went to one. For the long-term investor, however, we believe the benefits of diversification stand firm. When added to a portfolio of stocks, municipal bonds tend to reduce the volatility of that combined portfolio. Funds such as Thornburg California Limited Term Municipal Fund may be a viable choice in a total diversified portfolio of stocks and bonds.
Conclusion
We continue to run this portfolio as an actively managed laddered portfolio. Laddering a portfolio is a simple way to diversify its investment along its entire investment universe. While past performance does not guarantee future results, our study showed that this structure outperformed other structures around 60% of the time and added 0.15% to 0.25% of total return annually.* Our view is that the current investment environment is not compensating investors enough to take on extra risk, so we have positioned our portfolios at the lower end of their risk spectrums.
Thank you for your continued trust in us.
| | | | |
| Sincerely, | | | | |
| | |
 | |  | | |
| Christopher Ryon, CFA | | Nicholos Venditti, CFA | | |
| Portfolio Manager | | Portfolio Manager | | |
| Managing Director | | Managing Director | | |
| * | We examined three hypothetical portfolios of bonds from December 1997 to December 2015. One using a laddering strategy, one using a barbell strategy, and a third using a bullet strategy. For the laddering strategy, the BofA Merrill Lynch 1–12 Year Municipal Index was used as a proxy, since, similar to a ladder, it contains bonds relatively evenly spread across all maturities within the index. The barbell strategy is a duration management technique wherein bonds are clustered at the two extremes of a maturity range. For the barbell strategy, the BofA Merrill Lynch 1–3 Year Municipal Index and BofA Merrill Lynch 8–12 Year Municipal Index were combined. The two indices were weighted in such a way as to give them the same duration as the broader 1–12 Year Index, and each year the portfolio was re-weighted back to the original index weights. This was done to make the two portfolios duration-neutral so that the impact of the strategy chosen could be isolated. The bullet strategy invests at the duration midpoint of the portfolio, therefore the BofA Merrill Lynch 6–8 Year Index was used to represent the bullet strategy. For additional information, see www.thornburg.com/whyladder. Past performance does not guarantee future results. |
The matters discussed in this report may constitute forward-looking statements made pursuant to the safe harbor provisions of the Securities Litigation Reform Act of 1995. These include any advisor or portfolio manager prediction, assessment, analysis or outlook for individual securities, industries, investment styles, market sectors and/or markets. These statements involve risks and uncertainties. In addition to the general risks described for each fund in its current prospectus, other factors bearing on these reports include the accuracy of the advisor’s or portfolio manager’s forecasts and predictions, the appropriateness of the investment strategies designed by the advisor or portfolio manager and the ability of the advisor or portfolio manager to implement their strategies efficiently and successfully. Any one or more of these factors, as well as other risks affecting the securities markets generally, could cause the actual results of any fund to differ materially as compared to its benchmarks.
The views expressed by the portfolio managers reflect their professional opinions and are subject to change. Under no circumstances does the information contained within represent a recommendation to buy or sell any security.
6 Annual Report
| | |
| PERFORMANCE SUMMARY | | |
| |
Thornburg California Limited Term Municipal Fund | | September 30, 2016 (Unaudited) |
Average Annual Total Returns
| | | | | | | | | | | | | | | | |
| | | 1-Yr | | | 5-Yr | | | 10-Yr | | | Since
Incep. | |
A Shares (Incep: 2/19/87) | | | | | | | | | | | | | | | | |
Without sales charge | | | 2.32 | % | | | 2.53 | % | | | 3.38 | % | | | 4.39 | % |
With sales charge | | | 0.79 | % | | | 2.22 | % | | | 3.22 | % | | | 4.34 | % |
C Shares (Incep: 9/1/94) | | | | | | | | | | | | | | | | |
Without sales charge | | | 2.06 | % | | | 2.26 | % | | | 3.11 | % | | | 3.38 | % |
With sales charge | | | 1.56 | % | | | 2.26 | % | | | 3.11 | % | | | 3.38 | % |
I Shares (Incep: 4/1/97) | | | 2.64 | % | | | 2.86 | % | | | 3.72 | % | | | 3.89 | % |
30-Day Yields, A Shares
(with sales charge)
| | | | |
Annualized Distribution Yield | | | 1.28 | % |
| |
SEC Yield | | | 0.39 | % |
Growth of a Hypothetical $10,000 Investment
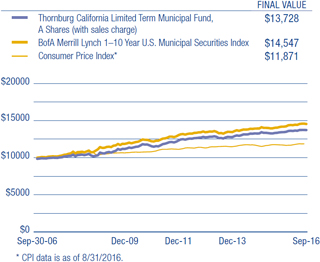
Performance data shown represents past performance and is no guarantee of future results. Investment return and principal value will fluctuate so shares, when redeemed, may be worth more or less than their original cost. Current performance may be lower or higher than quoted. For performance current to the most recent month end, visit thornburg.com or call 800-847-0200. The performance information does not reflect the deduction of taxes that a shareholder would pay on distributions or the redemption of Fund shares. Returns reflect there investment of dividends and capital gains. Class A shares are sold with a maximum sales charge of 1.50%. Class C shares include a 0.50% CDSC for the first year only. There is no sales charge for Class I shares.
As disclosed in the most recent prospectus, the total annual fund operating expenses are as follows: A shares, 0.94%; C shares, 1.18%; I shares, 0.63%.
Glossary
BofA Merrill Lynch 1-10 Year U.S. Municipal Securities Index – A subset of the BofA Merrill Lynch U.S. Municipal Securities Index including all securities with a remaining term to final maturity less than 10 years.
The BofA Merrill Lynch indices used in the Ladder vs Barbell & Bullet study are model portfolios of municipal obligations throughout the United States, with maturities ranging either from one to three years, six to eight years, eight to twelve years, or one to twelve years. These indices are subsets of the BofA Merrill Lynch U.S. Municipal Securities Index, which is comprised of U.S. dollar denominated investment grade tax-exempt debt publicly issued by U.S. states and territories, and their political subdivisions, in the U.S. domestic market. Qualifying securities must have at least a one-year remaining term to final maturity, a fixed coupon schedule and an investment grade rating.
Unless otherwise noted, index returns reflect the reinvestment of income dividends and capital gains, if any, but do not reflect fees, brokerage commissions or other expenses of investing. Investors may not make direct investments into any index. The performance of any index is not indicative of the performance of any particular investment.
Annualized Distribution Yield – The distribution yield reflects actual distributions made to shareholders. The annualized distribution yield is calculated by summing the last 30 days of income at a given month end and annualizing to a 360-day year. The result is divided by the ending maximum offering price.
Bond Credit Ratings (Credit Quality) – A bond credit rating assesses the financial ability of a debt issuer to make timely payments of principal and interest. Ratings of AAA (the highest), AA, A, and BBB are investment-grade quality. Ratings of BB, B, CCC, CC, C and D (the lowest) are considered below investment grade, speculative grade, or junk bonds.
Core Personal Consumption Expenditure Index (Core PCE) – A measure of the Personal Consumption Expenditure Index that excludes the more volatile and seasonal food and energy prices.
Credit Spread/Quality Spread – The difference between the yields of securities with different credit qualities.
Duration – A bond’s sensitivity to interest rates. Effective duration incorporates the embedded option features, such as call provisions. Bonds with longer durations experience greater price volatility than bonds with shorter durations.
General Obligation Bond (GO) – A municipal bond backed by the credit and “taxing power” of the issuing jurisdiction rather than the revenue from a given project.
Gross Domestic Product (GDP) – A country’s income minus foreign investments: the total value of all goods and services produced within a country in a year, minus net income from investments in other countries.
Laddering – Involves building a portfolio of bonds with staggered maturities so that a portion matures each year. Money that comes in from maturing bonds is typically invested in bonds with longer maturities at the far end of the portfolio.
Revenue Bond – A bond on which the debt service is payable solely from the revenue generated from the operation of the project being financed or a category of facilities, or from other non-tax sources.
SEC Yield – SEC yield is computed in accordance with SEC standards measuring the net investment income per share over a specified 30-day period expressed as a percentage of the maximum offering price of the Fund’s shares at the end of the period.
Variable Rate Demand Note (VRDN) – VRDNs are long-term, floating-rate municipal securities. These highly liquid securities are payable on demand, typically either daily or weekly, meaning the investor can request repayment of the entire debt amount. The coupon rate will adjust on a periodic basis, either daily or weekly.
West Texas Intermediate (WTI) – A grade of crude oil used as a benchmark in oil pricing.
Yield Curve – A line that plots the interest rates, at a set point in time, of bonds having equal credit quality, but differing maturity dates.
Annual Report 7
| | |
| FUND SUMMARY | | |
| |
Thornburg California Limited Term Municipal Fund | | September 30, 2016 (Unaudited) |
Objectives and Strategies
The Fund’s primary investment objective is to obtain as high a level of current income exempt from federal and California state individual income taxes as is consistent, in the view of the Fund’s investment advisor, with preservation of capital.
The secondary goal of the Fund is to reduce expected changes in its share price compared to longer intermediate and long-term bond portfolios.
The Fund offers California investors double tax-free yields (may be subject to Alternative Minimum Tax) in a laddered municipal bond portfolio with a dollar-weighted average maturity of normally less than five years. Laddering involves building a portfolio of bonds with staggered maturities so that a portion of the portfolio matures each year. Cash from maturing bonds, if not needed for other purposes, is typically invested in bonds with longer maturities at the far end of the ladder. We regard this strategy as a good compromise for managing different types of risk.
Long-Term Stability of Principal
Net Asset Value History of A Shares
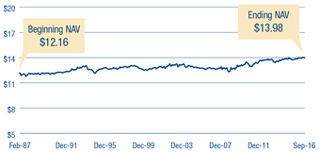
Key Portfolio Attributes
| | | | |
Number of Bonds | | | 401 | |
| |
Effective Duration | | | 3.4 Yrs | |
| |
Average Maturity | | | 4.8 Yrs | |
Security Credit Ratings
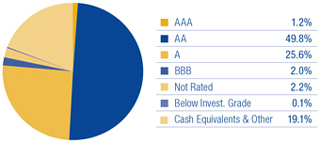
A bond credit rating assesses the financial ability of a debt issuer to make timely payments of principal and interest. Ratings of AAA (the highest), AA, A, and BBB are investment-grade quality. Ratings of BB, B, CCC, CC, C and D (the lowest) are considered below investment grade, speculative grade, or junk bonds. Credit quality ratings for Thornburg’s municipal portfolios used the highest rating available from either Standard & Poor’s or Moody’s Investors Service.
Portfolio Ladder
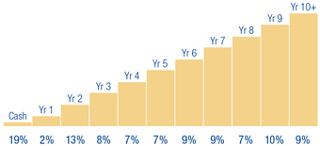
Percent of portfolio maturing in each year. Cash includes cash equivalents and other.
There is no guarantee that the Fund will meet its investment objectives.
All data is subject to change. Charts may not add up to 100% due to rounding.
8 Annual Report
| | |
| SCHEDULE OF INVESTMENTS | | |
| |
Thornburg California Limited Term Municipal Fund | | September 30, 2016 |
| | | | | | | | | | |
Issuer-Description | | Credit Rating†
S&P/ Moody’s | | Principal
Amount | | | Value | |
Alameda County COP, 5.625% due 12/1/2016 (Santa Rita Jail; Insured: AMBAC) | | AA/NR | | $ | 1,830,000 | | | $ | 1,844,988 | |
Alameda County Joint Powers Authority, 5.00% due 12/1/2018 (Alameda County Medical Center Highland Hospital) | | AA/Aa3 | | | 400,000 | | | | 434,756 | |
Alameda County Joint Powers Authority, 5.00% due 12/1/2019 (Alameda County Medical Center Highland Hospital) | | AA/Aa3 | | | 750,000 | | | | 844,185 | |
Alameda County Joint Powers Authority, 5.00% due 12/1/2020 (Alameda County Medical Center Highland Hospital) | | AA/Aa3 | | | 725,000 | | | | 841,624 | |
Alameda County Joint Powers Authority, 5.00% due 12/1/2021 (Public Facilities Capital Projects) | | AA/Aa3 | | | 1,000,000 | | | | 1,191,370 | |
Alameda County Joint Powers Authority, 5.00% due 12/1/2024 (Alameda County Medical Center Highland Hospital) | | AA/Aa3 | | | 2,500,000 | | | | 3,099,950 | |
Anaheim Public Financing Authority, 0% due 9/1/2022 (Public Improvements; Insured: AGM) | | AA/A2 | | | 3,000,000 | | | | 2,694,390 | |
Bay Area Toll Authority, 1.50% due 4/1/2047 put 4/2/2018 (San Francisco Bay Area Toll Bridge) | | AA/Aa3 | | | 1,200,000 | | | | 1,207,356 | |
a Bay Area Toll Authority, 1.54% due 4/1/2047 put 10/1/2019 (San Francisco Bay Area Toll Bridge) | | AA/Aa3 | | | 5,000,000 | | | | 5,000,850 | |
Bay Area Water Supply & Conservation Agency, 3.00% due 10/1/2016 (Regional Water System Improvements) | | AA-/Aa3 | | | 3,965,000 | | | | 3,965,238 | |
Bonita USD GO, 5.00% due 8/1/2024 (Educational Facilities) | | AA-/NR | | | 1,000,000 | | | | 1,215,120 | |
Brea Redevelopment Agency, 5.00% due 8/1/2019 (Redevelopment Project AB) | | AA-/NR | | | 2,000,000 | | | | 2,222,320 | |
Brentwood Infrastructure Financing Authority, 4.00% due 9/2/2017 (Residential Single Family Development; Insured: AGM) | | AA/NR | | | 920,000 | | | | 946,183 | |
Brentwood Infrastructure Financing Authority, 5.00% due 9/2/2020 (Residential Single Family Development; Insured: AGM) | | AA/NR | | | 1,760,000 | | | | 2,025,197 | |
Brentwood Infrastructure Financing Authority, 5.00% due 9/2/2021 (Residential Single Family Development; Insured: AGM) | | AA/NR | | | 925,000 | | | | 1,094,266 | |
Brentwood Infrastructure Financing Authority, 5.00% due 9/2/2022 (Residential Single Family Development; Insured: AGM) | | AA/NR | | | 850,000 | | | | 1,029,936 | |
Brentwood Infrastructure Financing Authority, 5.00% due 9/2/2023 (Residential Single Family Development; Insured: AGM) | | AA/NR | | | 2,690,000 | | | | 3,331,350 | |
Calexico USD COP, 6.75% due 9/1/2017 | | A-/NR | | | 840,000 | | | | 866,418 | |
California Educational Facilities Authority, 5.00% due 4/1/2018 (Pitzer College) | | NR/A2 | | | 1,540,000 | | | | 1,632,723 | |
California Educational Facilities Authority, 0% due 10/1/2019 (Loyola Marymount University; Insured: Natl-Re) | | NR/A2 | | | 2,025,000 | | | | 1,945,397 | |
California Educational Facilities Authority, 5.00% due 4/1/2020 (Pitzer College) | | NR/A2 | | | 1,445,000 | | | | 1,637,055 | |
California Educational Facilities Authority, 5.00% due 4/1/2022 (Chapman University) | | NR/A2 | | | 2,000,000 | | | | 2,326,700 | |
California HFFA, 5.50% due 10/1/2017 (Providence Health and Services) | | AA-/Aa3 | | | 1,100,000 | | | | 1,150,853 | |
California HFFA, 5.50% due 2/1/2018 (Community Program Developmental Disabilities; Insured: California Mtg Insurance) | | AA-/NR | | | 2,715,000 | | | | 2,882,706 | |
California HFFA, 6.00% due 10/1/2018 (Providence Health and Services) | | AA-/Aa3 | | | 1,000,000 | | | | 1,100,580 | |
California HFFA, 5.00% due 11/15/2018 (Children’s Hospital Los Angeles) | | BBB+/Baa2 | | | 1,235,000 | | | | 1,319,153 | |
California HFFA, 5.10% due 2/1/2019 (Episcopal Home; Insured: California Mtg Insurance) (ETM) | | AA-/NR | | | 785,000 | | | | 826,731 | |
California HFFA, 5.00% due 11/15/2020 (Children’s Hospital Los Angeles) | | BBB+/Baa2 | | | 1,190,000 | | | | 1,337,179 | |
California HFFA, 5.25% due 3/1/2022 (Dignity Health) | | A/A3 | | | 1,000,000 | | | | 1,179,110 | |
California HFFA, 1.45% due 8/15/2023 pre-refunded 3/15/2017 (Lucile Salter Packard Children’s Hospital) | | AA-/Aa3 | | | 2,410,000 | | | | 2,416,893 | |
California HFFA, 5.00% due 11/15/2023 (Children’s Hospital Los Angeles) | | BBB+/Baa2 | | | 1,000,000 | | | | 1,164,130 | |
California HFFA, 5.00% due 7/1/2024 (St. Joseph Health System) | | AA-/A1 | | | 1,000,000 | | | | 1,227,560 | |
California HFFA, 5.00% due 7/1/2034 put 10/18/2022 (St. Joseph Health System) | | AA-/A1 | | | 2,000,000 | | | | 2,432,600 | |
California HFFA, 5.00% due 7/1/2043 put 10/17/2017 (St. Joseph Health System) | | AA-/A1 | | | 3,000,000 | | | | 3,125,520 | |
California HFFA, 5.00% due 7/1/2043 put 10/15/2020 (St. Joseph Health System) | | AA-/A1 | | | 5,000,000 | | | | 5,751,300 | |
California Infrastructure and Economic Development Bank, 5.00% due 7/1/2018 (The Scripps Research Institute) | | NR/A1 | | | 200,000 | | | | 214,190 | |
California Infrastructure and Economic Development Bank, 5.00% due 7/1/2019 (The Scripps Research Institute) | | NR/A1 | | | 200,000 | | | | 221,724 | |
California Infrastructure and Economic Development Bank, 5.00% due 7/1/2020 (The Scripps Research Institute) | | NR/A1 | | | 200,000 | | | | 228,914 | |
California Infrastructure and Economic Development Bank, 5.00% due 7/1/2021 (The Scripps Research Institute) | | NR/A1 | | | 200,000 | | | | 235,512 | |
California Infrastructure and Economic Development Bank, 5.00% due 7/1/2022 (The Scripps Research Institute) | | NR/A1 | | | 200,000 | | | | 241,382 | |
California Infrastructure and Economic Development Bank, 5.00% due 7/1/2023 (The Scripps Research Institute) | | NR/A1 | | | 175,000 | | | | 216,094 | |
California Infrastructure and Economic Development Bank, 5.00% due 7/1/2024 (The Scripps Research Institute) | | NR/A1 | | | 200,000 | | | | 251,716 | |
California Infrastructure and Economic Development Bank, 5.00% due 7/1/2025 (The Scripps Research Institute) | | NR/A1 | | | 200,000 | | | | 254,958 | |
California Infrastructure and Economic Development Bank, 5.00% due 7/1/2026 (The Scripps Research Institute) | | NR/A1 | | | 200,000 | | | | 257,630 | |
California Infrastructure and Economic Development Bank, 5.00% due 7/1/2027 (The Scripps Research Institute) | | NR/A1 | | | 250,000 | | | | 319,080 | |
California Municipal Finance Authority, 5.00% due 10/1/2021 (Biola University Residential Hall and Parking Structure) | | NR/Baa1 | | | 150,000 | | | | 172,245 | |
California Municipal Finance Authority, 5.00% due 10/1/2022 (Biola University Residential Hall and Parking Structure) | | NR/Baa1 | | | 160,000 | | | | 187,566 | |
California Municipal Finance Authority, 5.00% due 10/1/2023 (Biola University Residential Hall and Parking Structure) | | NR/Baa1 | | | 125,000 | | | | 149,166 | |
California Pollution Control Financing Authority, 5.25% due 6/1/2023 put 12/1/2017 (Solid Waste Disposal-Republic Services, Inc.) (AMT) | | BBB+/Baa3 | | | 2,820,000 | | | | 2,952,004 | |
California State Housing Finance Agency, 3.05% due 12/1/2019 (Multi-Family Housing; Insured: FHA) | | NR/Aa1 | | | 735,000 | | | | 736,051 | |
California State Infrastructure & Economic Development Bank, 5.25% due 8/15/2020 (King City High School) | | AA-/NR | | | 1,000,000 | | | | 1,137,290 | |
California State Public Works Board, 5.00% due 11/1/2016 (California State University-J. Paul Leonard & Sutro Library) (ETM) | | A+/Aaa | | | 1,000,000 | | | | 1,003,700 | |
California State Public Works Board, 5.00% due 6/1/2020 (University of California; Insured: Natl-Re) (ETM) | | AA+/Aaa | | | 1,185,000 | | | | 1,359,503 | |
California State Public Works Board, 5.125% due 3/1/2021 (Various State Participating Agency Capital Projects) | | A+/A1 | | | 1,635,000 | | | | 1,857,425 | |
California State Public Works Board, 5.00% due 12/1/2021 (Judicial Council Projects) | | A+/A1 | | | 3,100,000 | | | | 3,700,408 | |
California State Public Works Board, 5.00% due 4/1/2022 (California School for the Deaf Riverside Campus) | | A+/A1 | | | 565,000 | | | | 680,091 | |
California State Public Works Board, 5.00% due 6/1/2022 (Yuba City Courthouse) | | A+/A1 | | | 1,950,000 | | | | 2,357,413 | |
California State Public Works Board, 5.00% due 9/1/2022 (Correctional and Rehabilitation Facilities) | | A+/A1 | | | 3,250,000 | | | | 3,954,307 | |
California State Public Works Board, 5.00% due 11/1/2022 (Correctional and Rehabilitation Facilities) | | A+/A1 | | | 1,500,000 | | | | 1,832,730 | |
California State Public Works Board, 5.00% due 12/1/2022 (Judicial Council Projects) | | A+/A1 | | | 1,200,000 | | | | 1,426,944 | |
California State Public Works Board, 5.00% due 3/1/2023 (Judicial Council Projects) | | A+/A1 | | | 1,400,000 | | | | 1,720,796 | |
California State Public Works Board, 5.00% due 6/1/2023 (Coalinga State Hospital) | | A+/A1 | | | 7,200,000 | | | | 8,902,152 | |
California State Public Works Board, 5.00% due 9/1/2023 (Correctional and Rehabilitation Facilities) | | A+/A1 | | | 3,600,000 | | | | 4,476,852 | |
California State Public Works Board, 5.00% due 11/1/2023 (Laboratory Facility and San Diego Courthouse) | | A+/A1 | | | 3,000,000 | | | | 3,744,810 | |
California State Public Works Board, 5.00% due 3/1/2024 (Judicial Council Projects) | | A+/A1 | | | 1,000,000 | | | | 1,221,660 | |
Annual Report 9
| | |
| SCHEDULE OF INVESTMENTS, CONTINUED | | |
| |
Thornburg California Limited Term Municipal Fund | | September 30, 2016 |
| | | | | | | | | | |
Issuer-Description | | Credit Rating†
S&P/ Moody’s | | Principal
Amount | | | Value | |
California State Public Works Board, 5.00% due 4/1/2024 (Correctional and Rehabilitation Facilities) | | A+/A1 | | $ | 3,350,000 | | | $ | 4,036,314 | |
California State Public Works Board, 5.00% due 9/1/2024 (Correctional and Rehabilitation Facilities) | | A+/A1 | | | 3,580,000 | | | | 4,530,562 | |
California State Public Works Board, 5.00% due 11/1/2024 (Laboratory Facility and San Diego Courthouse) | | A+/A1 | | | 4,000,000 | | | | 4,973,680 | |
California Statewide Communities Development Authority, 4.00% due 5/15/2017 (Irvine East Campus Apartments) | | NR/Baa1 | | | 2,000,000 | | | | 2,037,620 | |
California Statewide Communities Development Authority, 5.00% due 4/1/2019 (Kaiser Foundation Hospitals) | | AA-/NR | | | 3,715,000 | | | | 4,094,041 | |
California Statewide Communities Development Authority, 5.00% due 5/15/2019 (Irvine East Campus Apartments) | | NR/Baa1 | | | 655,000 | | | | 719,884 | |
California Statewide Communities Development Authority, 5.00% due 5/15/2020 (Irvine East Campus Apartments) | | NR/Baa1 | | | 565,000 | | | | 638,795 | |
California Statewide Communities Development Authority, 5.00% due 7/1/2020 pre-refunded 1/1/2019 (Aspire Public Schools; LOC: PCSD Guaranty Pool I, LLC) | | NR/NR | | | 890,000 | | | | 939,893 | |
California Statewide Communities Development Authority, 5.00% due 11/1/2020 (Cottage Health System) | | A+/NR | | | 100,000 | | | | 115,540 | |
California Statewide Communities Development Authority, 5.00% due 5/15/2021 (Irvine East Campus Apartments) | | NR/Baa1 | | | 760,000 | | | | 881,752 | |
California Statewide Communities Development Authority, 4.00% due 11/1/2021 (Cottage Health System) | | A+/NR | | | 150,000 | | | | 170,766 | |
California Statewide Communities Development Authority, 5.00% due 11/1/2022 (Cottage Health System) | | A+/NR | | | 125,000 | | | | 152,741 | |
California Statewide Communities Development Authority, 5.00% due 11/1/2023 (Cottage Health System) | | A+/NR | | | 150,000 | | | | 187,527 | |
California Statewide Communities Development Authority, 5.00% due 11/1/2024 (Cottage Health System) | | A+/NR | | | 200,000 | | | | 252,358 | |
California Statewide Communities Development Authority, 5.00% due 11/1/2025 (Cottage Health System) | | A+/NR | | | 135,000 | | | | 169,061 | |
Calipatria USD GO, 0% due 8/1/2025 (Educational Facilities; Insured: ACA) | | NR/NR | | | 4,555,000 | | | | 3,336,355 | |
Carson Redevelopment Agency, 6.00% due 10/1/2019 (Project Area 1) | | A-/NR | | | 1,050,000 | | | | 1,194,196 | |
Castaic USD GO, 0% due 5/1/2018 (Insured: Natl-Re) | | AA-/NR | | | 1,200,000 | | | | 1,138,092 | |
Central Valley Financing Authority, 5.25% due 7/1/2020 (Carson Ice) | | AA-/Aa3 | | | 500,000 | | | | 576,070 | |
Chabot-Las Positas Community College District GO, 4.00% due 8/1/2019 (Educational Facilities) | | AA-/Aa2 | | | 360,000 | | | | 391,990 | |
Chabot-Las Positas Community College District GO, 5.00% due 8/1/2020 (Educational Facilities) | | AA-/Aa2 | | | 485,000 | | | | 559,739 | |
Chabot-Las Positas Community College District GO, 5.00% due 8/1/2021 (Educational Facilities) | | AA-/Aa2 | | | 400,000 | | | | 475,416 | |
City and County of San Francisco COP, 5.00% due 11/1/2016 (525 Golden Gate Avenue-Public Utilities Commission Office Project) | | AA/Aa3 | | | 200,000 | | | | 200,736 | |
City and County of San Francisco COP, 5.00% due 9/1/2018 (City Office Buildings-Multiple Properties Project; Insured: Natl-Re) | | AA/Aa3 | | | 5,000 | | | | 5,018 | |
City and County of San Francisco COP, 5.00% due 11/1/2022 (525 Golden Gate Avenue-Public Utilities Commission Office Project) | | AA/Aa3 | | | 700,000 | | | | 780,871 | |
City of Antioch Public Financing Authority, 5.00% due 5/1/2022 (Municipal Facilities Project) | | AA-/NR | | | 500,000 | | | | 600,470 | |
City of Antioch Public Financing Authority, 5.00% due 5/1/2024 (Municipal Facilities Project) | | AA-/NR | | | 900,000 | | | | 1,127,520 | |
City of Burbank, 5.00% due 6/1/2017 (Burbank Water and Power System) | | AA-/A1 | | | 1,000,000 | | | | 1,027,320 | |
City of Burbank, 5.00% due 6/1/2018 (Burbank Water and Power System) | | AA-/A1 | | | 360,000 | | | | 384,210 | |
City of Burbank, 5.00% due 6/1/2020 (Burbank Water and Power System) | | AA-/A1 | | | 625,000 | | | | 713,506 | |
City of Chula Vista, 1.65% due 7/1/2018 (San Diego Gas & Electric Co.) | | A+/Aa2 | | | 3,500,000 | | | | 3,502,660 | |
a City of Chula Vista COP, 5.25% due 3/1/2020 (Capital Facilities Project) (ETM) | | AA-/NR | | | 1,300,000 | | | | 1,489,046 | |
City of Chula Vista COP, 5.00% due 10/1/2024 (Police Facility Project) | | AA-/A1 | | | 1,700,000 | | | | 2,127,822 | |
City of Clovis, 5.00% due 3/1/2021 (Water System Facilities; Insured: BAM) | | AA/A1 | | | 550,000 | | | | 639,612 | |
City of Clovis, 5.00% due 3/1/2022 (Water System Facilities; Insured: BAM) | | AA/A1 | | | 720,000 | | | | 859,255 | |
City of Clovis, 5.00% due 3/1/2023 (Water System Facilities; Insured: BAM) | | AA/A1 | | | 1,000,000 | | | | 1,218,470 | |
City of Folsom, 5.00% due 12/1/2016 (Community Facilities District No. 2) | | A+/NR | | | 1,100,000 | | | | 1,107,810 | |
City of Folsom, 5.00% due 12/1/2018 (Community Facilities District No. 2) | | A+/NR | | | 965,000 | | | | 1,047,942 | |
City of Los Angeles Community Facilities District No. 4, 4.00% due 9/1/2017 (Playa Vista - Phase 1) | | BBB+/NR | | | 500,000 | | | | 513,690 | |
City of Los Angeles COP, 3.00% due 11/1/2030 put 2/1/2018 (American Academy of Dramatic Arts; LOC: TD Bank, N.A.) | | NR/Aa2 | | | 2,490,000 | | | | 2,533,426 | |
City of Los Angeles GO, 3.00% due 6/29/2017 (Cash Flow Management) | | SP-1+/Mig1 | | | 4,000,000 | | | | 4,070,360 | |
City of Manteca, 3.00% due 12/1/2016 (Wastewater Quality Control Facility) | | AA-/Aa3 | | | 520,000 | | | | 521,903 | |
City of Manteca, 4.00% due 7/1/2018 (Water Supply System) | | AA-/A1 | | | 550,000 | | | | 579,282 | |
City of Manteca, 4.00% due 12/1/2018 (Wastewater Quality Control Facility) | | AA-/Aa3 | | | 375,000 | | | | 398,385 | |
City of Manteca, 5.00% due 7/1/2019 (Water Supply System) | | AA-/A1 | | | 400,000 | | | | 443,560 | |
City of Manteca, 5.00% due 7/1/2021 (Water Supply System) | | AA-/A1 | | | 1,000,000 | | | | 1,177,560 | |
City of Manteca, 5.00% due 7/1/2023 (Water Supply System) | | AA-/A1 | | | 650,000 | | | | 786,097 | |
City of Moorpark Mobile Home Park, 4.90% due 5/15/2017 (Villa Del Arroyo) | | A+/NR | | | 215,000 | | | | 218,143 | |
City of Porterville COP, 6.30% due 10/1/2018 (Public Service Capital Projects; Insured: AMBAC) (ETM) | | NR/NR | | | 470,000 | | | | 494,713 | |
City of Redding COP, 5.00% due 6/1/2020 (Redding Power Plant-Generator Unit No. 6; Insured: AGM) | | NR/A2 | | | 2,500,000 | | | | 2,672,950 | |
City of San Jose Financing Authority, 5.00% due 6/1/2019 (Civic Center Project) | | AA/Aa3 | | | 650,000 | | | | 720,161 | |
City of San Jose Financing Authority, 5.00% due 6/1/2020 (Civic Center Project) | | AA/Aa3 | | | 600,000 | | | | 685,782 | |
City of San Jose Financing Authority, 4.00% due 6/1/2021 (Civic Center Project) | | AA/Aa3 | | | 1,000,000 | | | | 1,129,600 | |
City of San Jose Financing Authority, 5.00% due 6/1/2022 (Civic Center Project) | | AA/Aa3 | | | 745,000 | | | | 897,822 | |
City of San Jose Financing Authority, 5.00% due 6/1/2023 (Civic Center Project) | | AA/Aa3 | | | 1,000,000 | | | | 1,232,640 | |
City of San Jose Financing Authority, 5.00% due 6/1/2024 (Civic Center Project) | | AA/Aa3 | | | 750,000 | | | | 928,478 | |
City of Santa Rosa, 4.00% due 9/1/2019 (Wastewater Enterprise) | | AA/Aa3 | | | 1,585,000 | | | | 1,727,856 | |
City of Santa Rosa, 4.00% due 9/1/2020 (Wastewater Enterprise) | | AA/Aa3 | | | 1,000,000 | | | | 1,118,430 | |
City of Santa Rosa, 5.00% due 9/1/2021 (Wastewater Enterprise) | | AA/Aa3 | | | 1,000,000 | | | | 1,191,880 | |
City of Torrance, 5.00% due 9/1/2020 (Torrance Memorial Medical Center) | | BBB+/A3 | | | 1,155,000 | | | | 1,316,815 | |
City of Torrance, 6.00% due 6/1/2022 (Torrance Memorial Medical Center) | | BBB+/A3 | | | 2,600,000 | | | | 2,633,150 | |
City of Vallejo, 5.00% due 5/1/2017 (Water Improvement Project; Insured: Natl-Re) | | AA-/A3 | | | 1,240,000 | | | | 1,244,464 | |
10 Annual Report
| | |
| SCHEDULE OF INVESTMENTS, CONTINUED | | |
| |
Thornburg California Limited Term Municipal Fund | | September 30, 2016 |
| | | | | | | | | | |
Issuer-Description | | Credit Rating†
S&P/ Moody’s | | Principal
Amount | | | Value | |
Community Development Commission of the City of Santa Fe Springs, 5.00% due 9/1/2018 (Redevelopment Project; Insured: Natl-Re) | | AA-/A3 | | $ | 1,235,000 | | | $ | 1,280,436 | |
Corona-Norco USD GO, 0% due 9/1/2017 (Insured: AGM) | | AA/Aa2 | | | 1,595,000 | | | | 1,578,316 | |
County of El Dorado Community Facilities District, 5.00% due 9/1/2019 (El Dorado Hills Development) | | A/NR | | | 1,700,000 | | | | 1,892,542 | |
County of Los Angeles GO, 3.00% due 6/30/2017 (Cash Management Program) | | SP-1+/Mig1 | | | 12,000,000 | | | | 12,201,840 | |
County of Los Angeles Redevelopment Refunding Authority, 5.00% due 6/1/2020 (Bunker Hill Project) | | AA/NR | | | 1,000,000 | | | | 1,139,350 | |
County of Los Angeles Redevelopment Refunding Authority, 5.00% due 6/1/2021 (Bunker Hill Project) | | AA/NR | | | 2,500,000 | | | | 2,927,625 | |
County of Los Angeles Redevelopment Refunding Authority, 5.00% due 6/1/2022 (Bunker Hill Project) | | AA/NR | | | 1,000,000 | | | | 1,197,250 | |
County of Los Angeles Redevelopment Refunding Authority, 5.00% due 6/1/2023 (Bunker Hill Project) | | AA/NR | | | 1,000,000 | | | | 1,223,350 | |
County of Los Angeles Redevelopment Refunding Authority, 5.00% due 6/1/2024 (Bunker Hill Project) | | AA/NR | | | 500,000 | | | | 621,110 | |
County of Monterey COP, 5.25% due 8/1/2021 (Natividad Medical Center; Insured: AGM) | | AA/Aa3 | | | 3,700,000 | | | | 4,200,684 | |
b County of Riverside, 3.00% due 10/11/2017 | | NR/Mig1 | | | 15,000,000 | | | | 15,307,650 | |
Delano Financing Authority, 5.00% due 12/1/2017 (Police Station and Capital Improvements) | | A-/NR | | | 1,085,000 | | | | 1,132,914 | |
Delano Financing Authority, 5.00% due 12/1/2018 (Police Station and Capital Improvements) | | A-/NR | | | 1,135,000 | | | | 1,220,806 | |
Delano Financing Authority, 5.00% due 12/1/2019 (Police Station and Capital Improvements) | | A-/NR | | | 1,195,000 | | | | 1,323,905 | |
Desert Sands USD COP, 4.00% due 3/1/2019 (Educational Facilities; Insured: BAM) | | AA/A1 | | | 1,000,000 | | | | 1,072,940 | |
Desert Sands USD COP, 5.00% due 3/1/2020 (Educational Facilities; Insured: BAM) | | AA/A1 | | | 700,000 | | | | 794,150 | |
Desert Sands USD COP, 5.00% due 3/1/2021 (Educational Facilities; Insured: BAM) | | AA/A1 | | | 1,080,000 | | | | 1,261,894 | |
El Dorado Irrigation District COP, 5.00% due 3/1/2025 (Water System Capital Improvements) | | AA-/Aa3 | | | 1,200,000 | | | | 1,534,704 | |
El Dorado Irrigation District COP, 5.00% due 3/1/2026 (Water System Capital Improvements) | | AA-/Aa3 | | | 1,500,000 | | | | 1,944,075 | |
Elk Grove Finance Authority, 4.00% due 9/1/2020 (Poppy Ridge CFD No. 2003-1 and East Franklin CFD No. 2002-1) | | A-/NR | | | 575,000 | | | | 636,140 | |
Elk Grove Finance Authority, 5.00% due 9/1/2021 (Poppy Ridge CFD No. 2003-1 and East Franklin CFD No. 2002-1) | | A-/NR | | | 450,000 | | | | 529,007 | |
Elk Grove Finance Authority, 5.00% due 9/1/2025 (Poppy Ridge CFD No. 2003-1 and East Franklin CFD No. 2002-1) | | A-/NR | | | 750,000 | | | | 944,115 | |
Emeryville Redevelopment Agency, 5.00% due 9/1/2022 (Emeryville and Shellmound Park Projects; Insured: AGM) | | AA/NR | | | 2,775,000 | | | | 3,370,459 | |
Emeryville Redevelopment Agency, 5.00% due 9/1/2023 (Emeryville and Shellmound Park Projects; Insured: AGM) | | AA/NR | | | 2,420,000 | | | | 3,005,809 | |
Emeryville Redevelopment Agency, 5.00% due 9/1/2024 (Emeryville and Shellmound Park Projects; Insured: AGM) | | AA/NR | | | 3,900,000 | | | | 4,929,990 | |
Folsom Cordova USD COP, 5.00% due 4/1/2021 (Educational Facilities; Insured: AGM) | | AA/NR | | | 1,000,000 | | | | 1,169,680 | |
Fresno County USD GO, 5.90% due 8/1/2017 (Educational Facilities; Insured: Natl-Re) | | AA-/A3 | | | 590,000 | | | | 613,529 | |
Fresno County USD GO, 5.90% due 8/1/2018 (Educational Facilities; Insured: Natl-Re) | | AA-/A3 | | | 630,000 | | | | 684,243 | |
Fresno County USD GO, 5.90% due 8/1/2019 (Educational Facilities; Insured: Natl-Re) | | AA-/A3 | | | 675,000 | | | | 762,311 | |
Fresno County USD GO, 5.00% due 2/1/2020 (Educational Facilities; Insured: Natl-Re) | | AA-/A3 | | | 2,510,000 | | | | 2,816,120 | |
Fresno County USD GO, 5.90% due 8/1/2020 (Educational Facilities; Insured: Natl-Re) | | AA-/A3 | | | 720,000 | | | | 843,970 | |
Golden Empire Schools Financing Authority, 1.34% due 5/1/2017 put 10/7/2016 (Kern High School District) (weekly demand notes) | | SP-1/Mig1 | | | 4,000,000 | | | | 3,999,120 | |
Government of Guam, 3.00% due 11/15/2017 (Various Capital Projects) | | A/NR | | | 300,000 | | | | 304,839 | |
Government of Guam, 5.00% due 11/15/2017 (Educational Facilities Improvements) | | A/NR | | | 1,720,000 | | | | 1,785,945 | |
Government of Guam, 5.00% due 11/15/2023 (Various Capital Projects) | | A/NR | | | 1,250,000 | | | | 1,483,712 | |
Government of Guam, 5.00% due 11/15/2025 (Various Capital Projects) | | A/NR | | | 4,175,000 | | | | 5,075,005 | |
Guam Power Authority, 5.00% due 10/1/2021 (Electric Power System; Insured: AGM) | | AA/A2 | | | 1,275,000 | | | | 1,469,348 | |
Hacienda La Puente USD COP, 3.00% due 6/1/2017 (Educational Facilities; Insured: AGM) | | AA/A1 | | | 160,000 | | | | 162,315 | |
Hacienda La Puente USD COP, 4.00% due 6/1/2018 (Educational Facilities; Insured: AGM) | | AA/A1 | | | 705,000 | | | | 741,004 | |
Hacienda La Puente USD COP, 5.00% due 6/1/2019 (Educational Facilities; Insured: AGM) | | AA/A1 | | | 875,000 | | | | 968,222 | |
Hacienda La Puente USD COP, 5.00% due 6/1/2020 (Educational Facilities; Insured: AGM) | | AA/A1 | | | 740,000 | | | | 845,798 | |
Hacienda La Puente USD COP, 5.00% due 6/1/2022 (Educational Facilities; Insured: AGM) | | AA/A1 | | | 575,000 | | | | 693,795 | |
Hacienda La Puente USD COP, 5.00% due 6/1/2023 (Educational Facilities; Insured: AGM) | | AA/A1 | | | 1,535,000 | | | | 1,896,523 | |
Hacienda La Puente USD COP, 5.00% due 6/1/2024 (Educational Facilities; Insured: AGM) | | AA/A1 | | | 880,000 | | | | 1,108,756 | |
Hacienda La Puente USD COP, 5.00% due 6/1/2025 (Educational Facilities; Insured: AGM) | | AA/A1 | | | 1,300,000 | | | | 1,663,025 | |
Hemet USD GO, 4.00% due 8/1/2018 (Insured: AGM) | | AA/NR | | | 1,335,000 | | | | 1,409,253 | |
Irvine Ranch Water District, 0.85% due 10/1/2041 put 10/3/2016 (Water and Sewer System Improvements; LOC: U.S. Bank, N.A.) (daily demand notes) | | AA-/Aa2 | | | 18,600,000 | | | | 18,600,000 | |
Irvine USD Community Facilities District No. 09-1, 0.85% due 9/1/2051 put 10/3/2016 (CFD No. 08-1 Project; LOC: U.S. Bank, N.A.) (daily demand notes) | | AA-/Aa2 | | | 4,156,000 | | | | 4,156,000 | |
Irvine USD Community Facilities District No. 09-1, 0.85% due 9/1/2053 put 10/3/2016 (CFD No. 08-1 Project; LOC: U.S. Bank, N.A.) (daily demand notes) | | AA-/Aa2 | | | 8,250,000 | | | | 8,250,000 | |
Irvine USD Community Facilities District No. 86-1, 5.25% due 9/1/2017 (Acquisition of Public Facilities; Insured: AGM) | | AA/NR | | | 250,000 | | | | 259,918 | |
Jurupa Public Financing Authority, 4.50% due 9/1/2018 (Community Services District-Eastvale Area; Insured: AGM) | | AA/NR | | | 870,000 | | | | 928,255 | |
Jurupa Public Financing Authority, 4.50% due 9/1/2019 (Community Services District-Eastvale Area; Insured: AGM) | | AA/NR | | | 905,000 | | | | 994,523 | |
Jurupa Public Financing Authority, 4.50% due 9/1/2020 (Community Services District-Eastvale Area; Insured: AGM) | | AA/NR | | | 945,000 | | | | 1,065,582 | |
Kern High School District GO, 4.00% due 8/1/2017 (Insured: AGM) | | A+/Aa2 | | | 500,000 | | | | 513,245 | |
Kern High School District GO, 4.00% due 8/1/2018 (Insured: AGM) | | A+/Aa2 | | | 500,000 | | | | 528,660 | |
La Quinta Redevelopment Agency, 5.00% due 9/1/2021 (Redevelopment Project Areas No. 1 and 2) | | AA-/NR | | | 1,000,000 | | | | 1,175,570 | |
La Quinta Redevelopment Agency, 5.00% due 9/1/2022 (Redevelopment Project Areas No. 1 and 2) | | AA-/NR | | | 2,000,000 | | | | 2,416,040 | |
La Quinta Redevelopment Agency, 5.00% due 9/1/2023 (Redevelopment Project Areas No. 1 and 2) | | AA-/NR | | | 1,500,000 | | | | 1,846,395 | |
Lodi Public Financing Authority, 3.00% due 10/1/2016 (City Police Building and Jail) | | A+/NR | | | 830,000 | | | | 830,050 | |
Lodi Public Financing Authority, 5.00% due 10/1/2020 (City Police Building and Jail) | | A+/NR | | | 965,000 | | | | 1,109,316 | |
Lodi Public Financing Authority, 5.00% due 10/1/2021 (City Police Building and Jail) | | A+/NR | | | 1,020,000 | | | | 1,204,926 | |
Annual Report 11
| | |
| SCHEDULE OF INVESTMENTS, CONTINUED | | |
| |
Thornburg California Limited Term Municipal Fund | | September 30, 2016 |
| | | | | | | | | | |
Issuer-Description | | Credit Rating†
S&P/ Moody’s | | Principal
Amount | | | Value | |
Lodi Public Financing Authority, 5.00% due 10/1/2022 (City Police Building and Jail) | | A+/NR | | $ | 1,040,000 | | | $ | 1,237,621 | |
Lodi Public Financing Authority, 5.00% due 10/1/2023 (City Police Building and Jail) | | A+/NR | | | 1,120,000 | | | | 1,333,147 | |
Los Angeles Convention & Exhibition Center Authority, 5.00% due 8/15/2017 (ETM) | | A+/A1 | | | 1,660,000 | | | | 1,721,553 | |
Los Angeles County Public Works Financing Authority, 5.25% due 10/1/2016 (Regional Park and Open Space District; Insured: AGM) | | AA/Aa1 | | | 700,000 | | | | 700,084 | |
Los Angeles County Public Works Financing Authority, 5.00% due 8/1/2018 (Multiple Capital Projects) | | AA/Aa3 | | | 2,060,000 | | | | 2,215,921 | |
Los Angeles County Sanitation District Financing Authority, 5.00% due 10/1/2016 (Capital Projects) | | AA+/Aa1 | | | 4,000,000 | | | | 4,000,480 | |
Los Angeles County Schools Pooled Financing Program COP, 5.00% due 6/1/2022 (Compton USD; Insured: AGM) | | AA/A2 | | | 1,500,000 | | | | 1,801,170 | |
Los Angeles County Schools Regionalized Business Services Corp. COP, 0% due 8/1/2021 (Insured: AMBAC) | | NR/NR | | | 2,135,000 | | | | 1,938,388 | |
Los Angeles Department of Airports, 5.50% due 5/15/2018 (Los Angeles International Airport) (AMT) | | AA/Aa3 | | | 2,000,000 | | | | 2,147,220 | |
Los Angeles Department of Water and Power, 5.00% due 7/1/2024 (Power System Capital Improvements) | | AA-/Aa2 | | | 1,000,000 | | | | 1,272,450 | |
Los Angeles Department of Water and Power, 5.00% due 7/1/2025 (Power System Capital Improvements) | | AA-/Aa2 | | | 500,000 | | | | 646,835 | |
Los Angeles Department of Water and Power, 5.00% due 7/1/2026 (Power System Capital Improvements) | | AA-/Aa2 | | | 300,000 | | | | 389,796 | |
Los Angeles Department of Water and Power, 0.81% due 7/1/2035 put 10/3/2016 (Power System Capital Improvements; SPA: Citibank, N.A.) (daily demand notes) | | AA-/Aa2 | | | 10,020,000 | | | | 10,020,000 | |
Los Angeles USD COP, 5.00% due 10/1/2016 (Educational Facilities and Information Technology Infrastructure; Insured: AMBAC) | | A+/A1 | | | 425,000 | | | | 425,051 | |
Los Angeles USD COP, 5.50% due 12/1/2018 (Educational Facilities and Information Technology Infrastructure) | | A+/A1 | | | 2,000,000 | | | | 2,198,400 | |
Los Angeles USD GO, 5.00% due 7/1/2022 (Educational Facilities and Information Technology Infrastructure) | | AA-/Aa2 | | | 6,360,000 | | | | 7,750,932 | |
Los Angeles USD GO, 5.00% due 7/1/2022 (Educational Facilities and Information Technology Infrastructure) | | AA-/Aa2 | | | 2,750,000 | | | | 3,351,425 | |
Los Angeles USD GO, 5.00% due 7/1/2023 (Educational Facilities and Information Technology Infrastructure) | | AA-/Aa2 | | | 3,000,000 | | | | 3,745,050 | |
a Los Angeles USD GO, 5.00% due 7/1/2024 (Educational Facilities and Information Technology Infrastructure) | | AA-/Aa2 | | | 3,000,000 | | | | 3,822,420 | |
Lynwood USD GO, 5.00% due 8/1/2023 (Insured: AGM) | | AA/A2 | | | 1,000,000 | | | | 1,236,960 | |
Manteca USD Community Facilities District No. 1989-2, 4.00% due 9/1/2018 (Educational Facilities; Insured: AGM) | | AA/A2 | | | 500,000 | | | | 528,735 | |
Manteca USD Community Facilities District No. 1989-2, 4.00% due 9/1/2019 (Educational Facilities; Insured: AGM) | | AA/A2 | | | 870,000 | | | | 943,585 | |
Manteca USD Community Facilities District No. 1989-2, 5.00% due 9/1/2020 (Educational Facilities; Insured: AGM) | | AA/A2 | | | 1,425,000 | | | | 1,634,047 | |
Manteca USD Community Facilities District No. 1989-2, 5.00% due 9/1/2021 (Educational Facilities; Insured: AGM) | | AA/A2 | | | 750,000 | | | | 884,033 | |
Manteca USD Community Facilities District No. 1989-2, 5.00% due 9/1/2023 (Educational Facilities; Insured: AGM) | | AA/A2 | | | 500,000 | | | | 615,465 | |
Mark West Union School District GO, 4.125% due 8/1/2020 (Educational Facilities; Insured: Natl-Re) | | AA/A3 | | | 1,275,000 | | | | 1,278,634 | |
Metropolitan Water District of Southern California, 0.96% due 7/1/2030 | | NR/NR | | | 9,500,000 | | | | 9,500,000 | |
Metropolitan Water District of Southern California, 1.00% due 7/1/2030 | | AAA/Aa1 | | | 5,000,000 | | | | 5,000,000 | |
Metropolitan Water District of Southern California, 1.00% due 7/1/2036 put 10/7/2016 (weekly demand notes) | | A-1+/Aa1 | | | 10,000,000 | | | | 9,995,800 | |
Milpitas Redevelopment Agency, 4.00% due 9/1/2017 (Redevelopment Project Area No. 1) | | AA-/NR | | | 1,000,000 | | | | 1,028,720 | |
Milpitas Redevelopment Agency, 5.00% due 9/1/2025 (Redevelopment Project Area No. 1) | | AA-/NR | | | 2,300,000 | | | | 2,932,201 | |
Modesto Irrigation District, 5.00% due 7/1/2022 (San Joaquin Valley Electric System) | | A+/A2 | | | 1,000,000 | | | | 1,214,960 | |
Moreno Valley Public Financing Authority, 5.00% due 11/1/2024 (Public Improvements) | | A+/NR | | | 1,455,000 | | | | 1,823,551 | |
Municipal Improvement Corp. of Los Angeles, 5.00% due 11/1/2017 (Capital Equipment) | | A+/A2 | | | 3,235,000 | | | | 3,381,837 | |
Municipal Improvement Corp. of Los Angeles, 5.00% due 3/1/2018 (Capital Equipment) | | A+/A2 | | | 4,765,000 | | | | 5,044,991 | |
a Municipal Improvement Corp. of Los Angeles, 5.00% due 11/1/2024 (Capital Equipment) | | A+/NR | | | 9,810,000 | | | | 12,424,954 | |
Municipal Improvement Corp. of Los Angeles, 5.00% due 11/1/2025 (Acquisition and Improvement of Real Property) | | A+/NR | | | 6,750,000 | | | | 8,684,482 | |
Murrieta Valley USD Public Financing Authority GO, 5.00% due 9/1/2023 (Educational Facilities; Insured: BAM) | | AA/NR | | | 1,080,000 | | | | 1,338,217 | |
Natomas USD GO, 5.00% due 8/1/2024 (Insured: BAM) | | AA/A1 | | | 2,425,000 | | | | 3,007,800 | |
North City West School Facilities Financing Authority, 5.00% due 9/1/2021 (Carmel Valley; Insured: AGM) | | AA/NR | | | 2,155,000 | | | | 2,549,171 | |
North City West School Facilities Financing Authority, 5.00% due 9/1/2022 (Carmel Valley; Insured: AGM) | | AA/NR | | | 2,260,000 | | | | 2,738,239 | |
Northern California Power Agency, 5.00% due 7/1/2017 (Hydroelectric Project) | | A+/A1 | | | 100,000 | | | | 103,168 | |
Northern California Power Agency, 5.00% due 7/1/2018 (Hydroelectric Project) | | A+/A1 | | | 1,250,000 | | | | 1,340,725 | |
Northern California Power Agency, 5.00% due 6/1/2019 (Lodi Energy Center) | | A-/A2 | | | 2,340,000 | | | | 2,593,890 | |
Oakland USD GO, 5.00% due 8/1/2022 (County of Alameda Educational Facilities) | | AA-/Aa3 | | | 745,000 | | | | 900,906 | |
Oakland USD GO, 5.00% due 8/1/2023 (County of Alameda Educational Facilities) | | AA-/Aa3 | | | 700,000 | | | | 865,354 | |
Oakland USD GO, 5.00% due 8/1/2025 (County of Alameda Educational Facilities) | | AA-/Aa3 | | | 1,300,000 | | | | 1,652,508 | |
Palomar Pomerado Health GO, 0% due 8/1/2019 (Insured: AGM) | | AA/A2 | | | 2,000,000 | | | | 1,917,360 | |
Palomar Pomerado Health GO, 0% due 8/1/2021 (Insured: Natl-Re) | | AA-/A2 | | | 2,850,000 | | | | 2,612,452 | |
Pasadena USD GO, 5.00% due 8/1/2024 (Educational Facilities Improvements) | | A+/Aa2 | | | 250,000 | | | | 316,728 | |
Pasadena USD GO, 5.00% due 8/1/2024 (2019 Crossover) | | A+/Aa2 | | | 800,000 | | | | 1,013,528 | |
Pasadena USD GO, 5.00% due 8/1/2025 (Educational Facilities Improvements) | | A+/Aa2 | | | 365,000 | | | | 469,912 | |
Pasadena USD GO, 5.00% due 8/1/2025 (2019 Crossover) | | A+/Aa2 | | | 1,000,000 | | | | 1,287,430 | |
Pasadena USD GO, 5.00% due 8/1/2026 (Educational Facilities Improvements) | | A+/Aa2 | | | 500,000 | | | | 653,790 | |
Pasadena USD GO, 5.00% due 8/1/2026 (2019 Crossover) | | A+/Aa2 | | | 1,000,000 | | | | 1,307,580 | |
Pomona Public Financing Authority, 2.00% due 6/1/2018 (Facilities Improvements) | | A+/NR | | | 500,000 | | | | 508,615 | |
Pomona Public Financing Authority, 3.00% due 6/1/2020 (Facilities Improvements) | | A+/NR | | | 250,000 | | | | 266,645 | |
Pomona Public Financing Authority, 4.00% due 6/1/2024 (Facilities Improvements; Insured: AGM) | | AA/NR | | | 450,000 | | | | 532,224 | |
Pomona Public Financing Authority, 4.00% due 6/1/2026 (Facilities Improvements; Insured: AGM) | | AA/NR | | | 275,000 | | | | 328,380 | |
Pomona USD GO, 6.10% due 2/1/2020 (Educational Facilities Improvements; Insured: Natl-Re) | | AA-/A3 | | | 465,000 | | | | 538,372 | |
Rancho Santa Fe Community Services District Financing Authority, 3.00% due 9/1/2018 | | A-/NR | | | 1,055,000 | | | | 1,094,731 | |
Rancho Santa Fe Community Services District Financing Authority, 3.00% due 9/1/2019 | | A-/NR | | | 750,000 | | | | 791,040 | |
Rancho Santa Fe Community Services District Financing Authority, 4.00% due 9/1/2020 | | A-/NR | | | 1,000,000 | | | | 1,106,330 | |
12 Annual Report
| | |
| SCHEDULE OF INVESTMENTS, CONTINUED | | |
| |
Thornburg California Limited Term Municipal Fund | | September 30, 2016 |
| | | | | | | | | | |
Issuer-Description | | Credit Rating†
S&P/ Moody’s | | Principal
Amount | | | Value | |
Rancho Santa Fe Community Services District Financing Authority, 4.00% due 9/1/2021 | | A-/NR | | $ | 550,000 | | | $ | 620,439 | |
Rancho Santa Fe Community Services District Financing Authority, 4.00% due 9/1/2022 | | A-/NR | | | 475,000 | | | | 545,110 | |
Rancho Santa Fe Community Services District Financing Authority, 4.00% due 9/1/2023 | | A-/NR | | | 650,000 | | | | 757,497 | |
Rancho Santa Fe Community Services District Financing Authority, 5.00% due 9/1/2024 | | A-/NR | | | 750,000 | | | | 937,470 | |
Rancho Santa Fe Community Services District Financing Authority, 5.00% due 9/1/2025 | | A-/NR | | | 900,000 | | | | 1,138,014 | |
Rancho Santa Fe Community Services District Financing Authority, 5.00% due 9/1/2026 | | A-/NR | | | 915,000 | | | | 1,167,467 | |
Redevelopment Agency of the City and County of San Francisco, 5.00% due 6/1/2020 (Yerba Buena Center Redevelopment Project Area; Insured: AGM) | | AA/A1 | | | 1,730,000 | | | | 1,969,172 | |
Redevelopment Agency of the City of Rialto, 5.00% due 9/1/2023 (Merged Project Area; Insured: BAM) | | AA/NR | | | 550,000 | | | | 677,012 | |
Redevelopment Agency of the City of Rialto, 5.00% due 9/1/2024 (Merged Project Area; Insured: BAM) | | AA/NR | | | 500,000 | | | | 624,980 | |
Regents of the University of California, 4.00% due 5/15/2017 (Campus Housing and Facilities) | | AA-/Aa3 | | | 1,250,000 | | | | 1,275,337 | |
Ridgecrest Redevelopment Agency, 5.00% due 6/30/2017 (Redevelopment Project) | | A-/NR | | | 1,055,000 | | | | 1,084,667 | |
Ridgecrest Redevelopment Agency, 5.25% due 6/30/2018 (Redevelopment Project) | | A-/NR | | | 1,050,000 | | | | 1,122,838 | |
Ridgecrest Redevelopment Agency, 5.50% due 6/30/2019 (Redevelopment Project) | | A-/NR | | | 1,050,000 | | | | 1,169,637 | |
Ridgecrest Redevelopment Agency, 5.50% due 6/30/2020 (Redevelopment Project) | | A-/NR | | | 1,040,000 | | | | 1,194,003 | |
Riverside County Infrastructure Financing Authority, 2.00% due 11/1/2016 (Capital Improvement Projects) | | AA-/NR | | | 1,500,000 | | | | 1,501,755 | |
Riverside County Infrastructure Financing Authority, 3.00% due 11/1/2017 (Capital Improvement Projects) | | AA-/NR | | | 1,000,000 | | | | 1,023,920 | |
Riverside County Infrastructure Financing Authority, 4.00% due 11/1/2018 (Capital Improvement Projects) | | AA-/NR | | | 1,000,000 | | | | 1,063,560 | |
Riverside County Infrastructure Financing Authority, 4.00% due 11/1/2019 (Capital Improvement Projects) | | AA-/NR | | | 1,700,000 | | | | 1,854,411 | |
Riverside County Infrastructure Financing Authority, 5.00% due 11/1/2020 (Capital Improvement Projects) | | AA-/NR | | | 605,000 | | | | 699,453 | |
Riverside County Infrastructure Financing Authority, 5.00% due 11/1/2021 (Capital Improvement Projects) | | AA-/NR | | | 500,000 | | | | 593,915 | |
Riverside County Palm Desert Financing Authority, 6.00% due 5/1/2022 pre-refunded 5/1/2018 (Palm Desert Sheriff’s Station Facilities) | | AA-/A2 | | | 2,600,000 | | | | 2,811,926 | |
Riverside County Public Financing Authority, 4.00% due 11/1/2017 (Capital Facilities Project) | | AA-/NR | | | 550,000 | | | | 568,304 | |
Riverside County Public Financing Authority, 5.00% due 11/1/2019 (Capital Facilities Project) | | AA-/NR | | | 2,000,000 | | | | 2,237,940 | |
Riverside County Public Financing Authority, 4.00% due 11/1/2020 (Capital Facilities Project) | | AA-/NR | | | 465,000 | | | | 517,350 | |
Riverside County Public Financing Authority, 5.00% due 11/1/2021 (Capital Facilities Project) | | AA-/NR | | | 1,000,000 | | | | 1,183,850 | |
Riverside County Public Financing Authority, 5.00% due 11/1/2025 (Capital Facilities Project) | | AA-/NR | | | 1,000,000 | | | | 1,271,410 | |
Riverside USD Financing Authority, 4.00% due 9/1/2017 (Educational Facilities; Insured: BAM) | | AA/NR | | | 285,000 | | | | 293,088 | |
Riverside USD Financing Authority, 5.00% due 9/1/2019 (Educational Facilities; Insured: BAM) | | AA/NR | | | 950,000 | | | | 1,059,155 | |
Riverside USD Financing Authority, 5.00% due 9/1/2022 (Educational Facilities; Insured: BAM) | | AA/NR | | | 215,000 | | | | 260,496 | |
Riverside USD Financing Authority, 5.00% due 9/1/2024 (Educational Facilities; Insured: BAM) | | AA/NR | | | 680,000 | | | | 857,269 | |
Riverside USD Financing Authority, 5.00% due 9/1/2025 (Educational Facilities; Insured: BAM) | | AA/NR | | | 350,000 | | | | 441,389 | |
Rosemead Community Development Commission, 5.00% due 10/1/2016 (Redevelopment Project Area No. 1; Insured: AMBAC) | | A/NR | | | 700,000 | | | | 700,084 | |
Roseville Natural Gas Financing Authority, 5.00% due 2/15/2017 | | BBB+/Baa1 | | | 1,390,000 | | | | 1,406,833 | |
Sacramento City Financing Authority, 0% due 11/1/2016 (Multiple Redevelopment Project Areas; Insured: Nat’l-Re) | | AA-/A3 | | | 3,200,000 | | | | 3,197,024 | |
Sacramento City Schools Joint Power Financing Authority, 5.00% due 3/1/2021 (Sacramento City USD Educational Facility Sublease; Insured: BAM) | | AA/NR | | | 830,000 | | | | 962,908 | |
Sacramento City Schools Joint Power Financing Authority, 5.00% due 3/1/2022 (Sacramento City USD Educational Facility Sublease; Insured: BAM) | | AA/NR | | | 775,000 | | | | 922,211 | |
Sacramento City Schools Joint Power Financing Authority, 5.00% due 3/1/2023 (Sacramento City USD Educational Facility Sublease; Insured: BAM) | | AA/NR | | | 815,000 | | | | 993,053 | |
Sacramento City Schools Joint Power Financing Authority, 5.00% due 3/1/2024 (Sacramento City USD Educational Facility Sublease; Insured: BAM) | | AA/NR | | | 765,000 | | | | 948,202 | |
Sacramento City Schools Joint Power Financing Authority, 5.00% due 3/1/2025 (Sacramento City USD Educational Facility Sublease; Insured: BAM) | | AA/NR | | | 2,175,000 | | | | 2,674,228 | |
Sacramento City USD GO, 5.00% due 7/1/2018 (Educational Facilities Improvements; Insured: AGM) | | AA/NR | | | 360,000 | | | | 385,866 | |
Sacramento City USD GO, 4.00% due 7/1/2019 (Educational Facilities Improvements) | | A+/A1 | | | 5,455,000 | | | | 5,904,383 | |
Sacramento City USD GO, 5.00% due 7/1/2019 (Educational Facilities Improvements; Insured: AGM) | | AA/NR | | | 635,000 | | | | 705,625 | |
Sacramento City USD GO, 5.00% due 7/1/2020 (Educational Facilities Improvements; Insured: AGM) | | AA/NR | | | 500,000 | | | | 573,475 | |
Sacramento City USD GO, 5.00% due 7/1/2021 (Educational Facilities Improvements) | | A+/A1 | | | 3,600,000 | | | | 4,246,524 | |
Sacramento City USD GO, 5.00% due 7/1/2021 (Educational Facilities Improvements; Insured: AGM) | | AA/NR | | | 400,000 | | | | 472,448 | |
Sacramento City USD GO, 5.00% due 7/1/2022 (Educational Facilities Improvements; Insured: AGM) | | AA/NR | | | 700,000 | | | | 849,170 | |
Sacramento Cogeneration Authority, 5.00% due 7/1/2019 (Procter & Gamble Project) | | AA-/Aa3 | | | 625,000 | | | | 693,788 | |
Salinas Valley Solid Waste Authority, 5.00% due 8/1/2023 (Insured: AGM) (AMT) | | AA/A2 | | | 1,530,000 | | | | 1,829,712 | |
San Diego Redevelopment Agency, 5.00% due 9/1/2018 (Centre City Redevelopment; Insured: AMBAC) | | NR/A2 | | | 3,215,000 | | | | 3,226,574 | |
San Diego Redevelopment Agency, 0% due 9/1/2019 (Centre City Redevelopment; Insured: AGM) | | AA/A2 | | | 1,910,000 | | | | 1,828,634 | |
San Diego USD GO, 3.00% due 7/1/2017 (Educational System Capital Projects) | | NR/Aa2 | | | 5,000,000 | | | | 5,083,500 | |
San Diego USD GO, 5.50% due 7/1/2020 (Educational System Capital Projects; Insured: Natl-Re) | | AA-/Aa2 | | | 1,390,000 | | | | 1,624,840 | |
San Diego USD GO, 5.00% due 7/1/2023 (Educational System Capital Projects) | | AA-/Aa2 | | | 5,000,000 | | | | 6,241,750 | |
San Diego USD GO, 5.00% due 7/1/2024 (Educational System Capital Projects) | | AA-/Aa2 | | | 3,000,000 | | | | 3,767,040 | |
San Francisco City and County Airports Commission, 5.00% due 5/1/2026 (San Francisco International Airport) | | A+/A1 | | | 5,000,000 | | | | 6,498,450 | |
San Francisco City and County Redevelopment Agency, 5.00% due 8/1/2019 (San Francisco Redevelopment Projects) | | A+/NR | | | 2,050,000 | | | | 2,277,283 | |
San Francisco City and County Redevelopment Agency, 5.00% due 8/1/2020 (San Francisco Redevelopment Projects) | | A+/NR | | | 1,685,000 | | | | 1,932,291 | |
San Francisco City and County Redevelopment Agency, 5.00% due 8/1/2021 (San Francisco Redevelopment Projects) | | A+/NR | | | 1,000,000 | | | | 1,179,200 | |
Annual Report 13
| | |
| SCHEDULE OF INVESTMENTS, CONTINUED | | |
| |
Thornburg California Limited Term Municipal Fund | | September 30, 2016 |
| | | | | | | | | | |
Issuer-Description | | Credit Rating†
S&P/ Moody’s | | Principal
Amount | | | Value | |
San Joaquin Delta Community College District GO, 0% due 8/1/2019 (Insured: AGM) | | AA/Aa2 | | $ | 5,000,000 | | | $ | 4,659,900 | |
San Mateo County Joint Powers Financing Authority, 5.00% due 6/15/2017 (Maple Street Correctional Center) | | AA+/Aa2 | | | 750,000 | | | | 772,455 | |
San Mateo County Joint Powers Financing Authority, 5.00% due 7/15/2018 (County Capital Projects) | | AA+/Aa2 | | | 800,000 | | | | 855,440 | |
San Mateo County Joint Powers Financing Authority, 5.00% due 6/15/2021 (Maple Street Correctional Center) | | AA+/Aa2 | | | 410,000 | | | | 484,501 | |
San Mateo County Joint Powers Financing Authority, 5.00% due 6/15/2022 (Maple Street Correctional Center) | | AA+/Aa2 | | | 1,000,000 | | | | 1,214,190 | |
San Mateo County Joint Powers Financing Authority, 5.00% due 6/15/2023 (Maple Street Correctional Center) | | AA+/Aa2 | | | 585,000 | | | | 728,062 | |
San Mateo Union High School District GO, 0% due 9/1/2019 (Educational Facilities; Insured: Natl-Re) | | AA+/Aaa | | | 2,000,000 | | | | 1,928,720 | |
Santa Ana Financing Authority, 6.25% due 7/1/2018 (Police Administration & Holding Facility; Insured: Natl-Re) (ETM) | | AA-/A3 | | | 1,000,000 | | | | 1,093,920 | |
Santa Ana Financing Authority, 6.25% due 7/1/2018 (Police Administration & Holding Facility; Insured: Natl-Re) | | AA-/A3 | | | 1,000,000 | | | | 1,087,490 | |
Santa Ana USD GO, 0% due 8/1/2020 (Insured: Natl-Re) | | AA-/A3 | | | 2,035,000 | | | | 1,923,991 | |
Santa Clara County Financing Authority, 4.00% due 5/15/2017 (Multiple Facilities Projects) (ETM) | | AA+/Aa3 | | | 1,000,000 | | | | 1,020,090 | |
Santa Clara County Financing Authority, 5.00% due 5/15/2025 (Multiple Facilities Projects) | | AA+/NR | | | 6,755,000 | | | | 8,722,191 | |
Semitropic Water Storage Improvement District, 5.00% due 12/1/2022 (Irrigation Water System; Insured: AGM) | | AA/A2 | | | 400,000 | | | | 488,168 | |
Semitropic Water Storage Improvement District, 5.00% due 12/1/2023 (Irrigation Water System; Insured: AGM) | | AA/A2 | | | 500,000 | | | | 623,845 | |
Semitropic Water Storage Improvement District, 5.00% due 12/1/2024 (Irrigation Water System; Insured: AGM) | | AA/A2 | | | 500,000 | | | | 635,315 | |
Semitropic Water Storage Improvement District, 5.00% due 12/1/2025 (Irrigation Water System; Insured: AGM) | | AA/A2 | | | 1,110,000 | | | | 1,428,370 | |
Sequoia Union High School District, 2.00% due 6/30/2017 (Capital Expenditures) | | NR/Mig1 | | | 9,225,000 | | | | 9,305,165 | |
Solano County COP, 5.00% due 11/15/2016 (Health & Social Services Headquarters) | | AA-/Aa3 | | | 1,000,000 | | | | 1,005,250 | |
a South San Francisco USD GO, 4.00% due 6/15/2018 (Educational Facilities) (ETM) | | SP-1+/NR | | | 5,000,000 | | | | 5,270,100 | |
Southeast Resource Recovery Facilities Authority, 5.25% due 12/1/2017 (Insured: AMBAC) | | AA-/A2 | | | 1,000,000 | | | | 1,003,830 | |
Southeast Resource Recovery Facilities Authority, 5.375% due 12/1/2018 (Insured: AMBAC) (AMT) | | AA-/A2 | | | 2,000,000 | | | | 2,007,860 | |
Southwestern Community College District GO, 4.00% due 8/1/2022 | | AA-/Aa2 | | | 265,000 | | | | 310,177 | |
Southwestern Community College District GO, 4.00% due 8/1/2023 | | AA-/Aa2 | | | 280,000 | | | | 333,043 | |
Southwestern Community College District GO, 4.00% due 8/1/2024 | | AA-/Aa2 | | | 390,000 | | | | 470,703 | |
Southwestern Community College District GO, 4.00% due 8/1/2025 | | AA-/Aa2 | | | 325,000 | | | | 396,432 | |
Southwestern Community College District GO, 4.00% due 8/1/2026 | | AA-/Aa2 | | | 410,000 | | | | 505,657 | |
State of California Department of Water Resources, 5.00% due 12/1/2016 (Central Valley Water System) (ETM) | | NR/NR | | | 5,000 | | | | 5,036 | |
State of California Department of Water Resources, 5.00% due 12/1/2016 (Central Valley Water System) | | AAA/Aa1 | | | 995,000 | | | | 1,002,423 | |
State of California Department of Water Resources, 5.00% due 5/1/2021 (Power Supply Program) | | AA/Aa1 | | | 1,000,000 | | | | 1,181,990 | |
State of California Economic Recovery GO, 5.00% due 7/1/2018 (ETM) | | AA+/Aaa | | | 2,330,000 | | | | 2,498,273 | |
State of California Economic Recovery GO, 5.00% due 7/1/2018 (ETM) | | AA+/Aaa | | | 670,000 | | | | 718,387 | |
State of California GO, 4.75% due 9/1/2018 (Various Capital Projects; Insured: AGM) | | AA/Aa3 | | | 145,000 | | | | 147,422 | |
State of California GO, 5.00% due 9/1/2020 (Various Capital Projects) | | AA-/Aa3 | | | 2,000,000 | | | | 2,309,220 | |
State of California GO, 0.80% due 5/1/2033 put 10/3/2016 (Kindergarten-University Facilities; LOC: JPMorgan Chase Bank, N.A.) (daily demand notes) | | AA+/Aa1 | | | 22,000,000 | | | | 22,000,000 | |
Successor Agency to the City Colton Redevelopment Agency, 5.00% due 8/1/2021 (Multiple Redevelopment Project Areas; Insured: BAM) | | AA/NR | | | 940,000 | | | | 1,105,543 | |
Successor Agency to the City Colton Redevelopment Agency, 5.00% due 8/1/2023 (Multiple Redevelopment Project Areas; Insured: BAM) | | AA/NR | | | 925,000 | | | | 1,136,732 | |
Successor Agency to the City Colton Redevelopment Agency, 5.00% due 8/1/2025 (Multiple Redevelopment Project Areas; Insured: BAM) | | AA/NR | | | 950,000 | | | | 1,199,736 | |
Successor Agency to the City of Riverside Redevelopment Agency, 5.00% due 9/1/2023 (Multiple Redevelopment Project Areas) | | AA-/NR | | | 1,735,000 | | | | 2,160,196 | |
Successor Agency to the City of Riverside Redevelopment Agency, 5.00% due 9/1/2024 (Multiple Redevelopment Project Areas) | | AA-/NR | | | 1,250,000 | | | | 1,581,187 | |
Successor Agency to the City of Sacramento Redevelopment Agency, 2.00% due 12/1/2016 (Multiple Redevelopment Project Areas) | | A/NR | | | 1,000,000 | | | | 1,001,830 | |
Successor Agency to the City of Sacramento Redevelopment Agency, 3.00% due 12/1/2017 (Multiple Redevelopment Project Areas) | | A/NR | | | 1,315,000 | | | | 1,344,916 | |
Successor Agency to the City of San Diego Redevelopment Agency, 5.00% due 9/1/2025 (Multiple Redevelopment Project Areas) | | AA-/NR | | | 2,745,000 | | | | 3,525,733 | |
Successor Agency to the City of San Diego Redevelopment Agency, 5.00% due 9/1/2026 (Multiple Redevelopment Project Areas) | | AA-/NR | | | 1,500,000 | | | | 1,911,825 | |
Successor Agency to the Community Development Agency of the City of Menlo Park, 3.00% due 10/1/2017 (Las Pulgas Community Development Project) | | A+/NR | | | 655,000 | | | | 668,965 | |
Successor Agency to the Community Development Agency of the City of Menlo Park, 5.00% due 10/1/2019 (Las Pulgas Community Development Project) | | A+/NR | | | 400,000 | | | | 446,456 | |
Successor Agency to the Community Development Agency of the City of Menlo Park, 5.00% due 10/1/2020 (Las Pulgas Community Development Project) | | A+/NR | | | 325,000 | | | | 374,364 | |
a Successor Agency to the Community Development Agency of the City of Menlo Park, 5.00% due 10/1/2021 (Las Pulgas Community Development Project; Insured: AGM) | | AA/NR | | | 1,250,000 | | | | 1,485,987 | |
Successor Agency to the Community Development Agency of the City of Menlo Park, 5.00% due 10/1/2022 (Las Pulgas Community Development Project; Insured: AGM) | | AA/NR | | | 900,000 | | | | 1,092,564 | |
Successor Agency to the Community Development Agency of the City of Menlo Park, 5.00% due 10/1/2025 (Las Pulgas Community Development Project; Insured: AGM) | | AA/NR | | | 500,000 | | | | 639,840 | |
14 Annual Report
| | |
| SCHEDULE OF INVESTMENTS, CONTINUED | | |
| |
Thornburg California Limited Term Municipal Fund | | September 30, 2016 |
| | | | | | | | | | | | |
Issuer-Description | | Credit Rating†
S&P/ Moody’s | | | Principal
Amount | | | Value | |
Successor Agency to the Community Redevelopment Agency of the City of Palmdale, 5.00% due 9/1/2024 (Merged Redevelopment Project Areas) | | | A+/NR | | | $ | 600,000 | | | $ | 752,850 | |
Successor Agency to the Community Redevelopment Agency of the City of Palmdale, 5.00% due 9/1/2025 (Merged Redevelopment Project Areas) | | | A+/NR | | | | 450,000 | | | | 569,997 | |
Successor Agency to the Community Redevelopment Agency of the City of Palmdale, 5.00% due 9/1/2026 (Merged Redevelopment Project Areas) | | | A+/NR | | | | 550,000 | | | | 705,573 | |
Successor Agency to the Poway Redevelopment Agency, 5.00% due 6/15/2025 (Paguay Redevelopment Project) | | | AA-/NR | | | | 4,665,000 | | | | 5,970,873 | |
Successor Agency to the Rancho Cucamonga Redevelopment Project, 5.00% due 9/1/2023 (Rancho Redevelopment Project Area; Insured: AGM) | | | AA/NR | | | | 1,000,000 | | | | 1,244,320 | |
Successor Agency to the Rancho Cucamonga Redevelopment Project, 5.00% due 9/1/2024 (Rancho Redevelopment Project Area: Insured: AGM) | | | AA/NR | | | | 2,000,000 | | | | 2,533,320 | |
Successor Agency to the Richmond County Redevelopment Agency, 5.00% due 9/1/2022 (Joint Powers Financing Authority & Harbour Redevelopment Project; Insured: BAM) | | | AA/NR | | | | 400,000 | | | | 483,208 | |
Successor Agency to the Richmond County Redevelopment Agency, 5.00% due 9/1/2023 (Joint Powers Financing Authority & Harbour Redevelopment Project; Insured: BAM) | | | AA/NR | | | | 400,000 | | | | 492,372 | |
Successor Agency to the Richmond County Redevelopment Agency, 5.00% due 9/1/2024 (Joint Powers Financing Authority & Harbour Redevelopment Project; Insured: BAM) | | | AA/NR | | | | 450,000 | | | | 562,482 | |
Successor Agency to the Tustin Community Redevelopment Agency, 5.00% due 9/1/2026 (Low and Moderate Income Housing) | | | AA-/NR | | | | 1,125,000 | | | | 1,458,180 | |
Temecula Valley USD Financing Authority, 4.00% due 9/1/2017 (Educational Facilities; Insured: BAM) | | | AA/NR | | | | 400,000 | | | | 411,352 | |
Temecula Valley USD Financing Authority, 5.00% due 9/1/2018 (Educational Facilities; Insured: BAM) | | | AA/NR | | | | 325,000 | | | | 350,015 | |
Temecula Valley USD Financing Authority, 5.00% due 9/1/2019 (Educational Facilities; Insured: BAM) | | | AA/NR | | | | 375,000 | | | | 418,088 | |
Temecula Valley USD Financing Authority, 5.00% due 9/1/2020 (Educational Facilities; Insured: BAM) | | | AA/NR | | | | 400,000 | | | | 460,232 | |
Temecula Valley USD Financing Authority, 5.00% due 9/1/2021 (Educational Facilities; Insured: BAM) | | | AA/NR | | | | 515,000 | | | | 609,199 | |
Temecula Valley USD Financing Authority, 5.00% due 9/1/2022 (Educational Facilities; Insured: BAM) | | | AA/NR | | | | 275,000 | | | | 333,193 | |
Temecula Valley USD Financing Authority, 5.00% due 9/1/2023 (Educational Facilities; Insured: BAM) | | | AA/NR | | | | 300,000 | | | | 371,502 | |
Temecula Valley USD Financing Authority, 5.00% due 9/1/2024 (Educational Facilities; Insured: BAM) | | | AA/NR | | | | 300,000 | | | | 378,207 | |
Temecula Valley USD Financing Authority, 5.00% due 9/1/2025 (Educational Facilities; Insured: BAM) | | | AA/NR | | | | 300,000 | | | | 378,333 | |
Trustees of the California State University, 5.00% due 11/1/2026 (Educational Facilities Improvements) | | | AA-/Aa2 | | | | 1,000,000 | | | | 1,306,540 | |
Tuolumne Wind Project Authority, 5.00% due 1/1/2018 | | | AA-/A2 | | | | 1,690,000 | | | | 1,778,066 | |
b Tuolumne Wind Project Authority, 5.00% due 1/1/2025 | | | AA-/NR | | | | 3,500,000 | | | | 4,455,605 | |
b Tuolumne Wind Project Authority, 5.00% due 1/1/2026 | | | AA-/NR | | | | 2,500,000 | | | | 3,220,025 | |
Turlock Irrigation District, 5.00% due 1/1/2019 | | | AA-/A2 | | | | 1,000,000 | | | | 1,091,920 | |
b Turlock Irrigation District, 5.00% due 1/1/2025 | | | A+/NR | | | | 1,000,000 | | | | 1,272,140 | |
b Turlock Irrigation District, 5.00% due 1/1/2026 | | | A+/NR | | | | 1,000,000 | | | | 1,284,050 | |
Ukiah USD GO, 0% due 8/1/2019 (Insured: Natl-Re) | | | AA-/A1 | | | | 2,000,000 | | | | 1,932,000 | |
Upper Lake Union High School District GO, 0% due 8/1/2020 (Insured: Natl-Re) | | | NR/A3 | | | | 1,050,000 | | | | 927,297 | |
Ventura County Public Financing Authority, 5.00% due 11/1/2023 (Office Building Purchase and Improvements) | | | AA+/Aa2 | | | | 500,000 | | | | 633,220 | |
Ventura County Public Financing Authority, 5.00% due 11/1/2024 (Office Building Purchase and Improvements) | | | AA+/Aa2 | | | | 1,060,000 | | | | 1,334,052 | |
Virgin Islands Public Finance Authority, 5.00% due 10/1/2017 | | | BBB-/B1 | | | | 1,440,000 | | | | 1,453,334 | |
Vista Redevelopment Agency, 5.00% due 9/1/2019 (Vista Redevelopment Project; Insured: AGM) | | | AA/NR | | | | 300,000 | | | | 333,978 | |
Vista Redevelopment Agency, 5.00% due 9/1/2020 (Vista Redevelopment Project; Insured: AGM) | | | AA/NR | | | | 275,000 | | | | 315,343 | |
Vista Redevelopment Agency, 5.00% due 9/1/2021 (Vista Redevelopment Project; Insured: AGM) | | | AA/NR | | | | 265,000 | | | | 312,358 | |
Vista Redevelopment Agency, 5.00% due 9/1/2022 (Vista Redevelopment Project; Insured: AGM) | | | AA/NR | | | | 335,000 | | | | 404,687 | |
Vista Redevelopment Agency, 5.00% due 9/1/2023 (Vista Redevelopment Project; Insured: AGM) | | | AA/NR | | | | 400,000 | | | | 493,556 | |
Walnut Improvement Agency, 4.00% due 3/1/2017 (City of Walnut Improvement Plan; Insured: BAM) | | | AA/NR | | | | 1,000,000 | | | | 1,013,030 | |
Walnut Improvement Agency, 4.00% due 3/1/2018 (City of Walnut Improvement Plan; Insured: BAM) | | | AA/NR | | | | 1,000,000 | | | | 1,042,950 | |
Walnut Improvement Agency, 5.00% due 3/1/2019 (City of Walnut Improvement Plan; Insured: BAM) | | | AA/NR | | | | 400,000 | | | | 437,848 | |
Washington USD Yolo County COP, 5.00% due 8/1/2017 (West Sacramento High School; Insured: AMBAC) | | | A/NR | | | | 725,000 | | | | 750,324 | |
Washington USD Yolo County COP, 5.00% due 8/1/2021 (West Sacramento High School; Insured: AMBAC) | | | A/NR | | | | 910,000 | | | | 937,928 | |
Washington USD Yolo County COP, 5.00% due 8/1/2022 (West Sacramento High School; Insured: AMBAC) | | | A/NR | | | | 2,010,000 | | | | 2,071,687 | |
Westminster Redevelopment Agency, 5.00% due 8/1/2024 (Commercial Redevelopment Project No. 1; Insured: AGM) | | | AA/A2 | | | | 1,205,000 | | | | 1,284,663 | |
| | | | | | | | | | | | |
TOTAL INVESTMENTS — 98.03% (Cost $694,073,137) | | | | | | | | | | $ | 723,351,171 | |
OTHER ASSETS LESS LIABILITIES — 1.97% | | | | | | | | | | | 14,562,982 | |
| | | | | | | | | | | | |
NET ASSETS — 100.00% | | | | | | | | | | $ | 737,914,153 | |
| | | | | | | | | | | | |
Annual Report 15
| | |
| SCHEDULE OF INVESTMENTS, CONTINUED | | |
| |
Thornburg California Limited Term Municipal Fund | | September 30, 2016 |
Footnote Legend
| † | Credit ratings are unaudited. Rating changes may have occurred subsequent to the reporting period end. Bonds issued with a maturity of one year or less are assigned Moody’s ratings from MIG-1 to MIG-4 and Standard and Poor’s ratings from SP-1+ to SP-3 with MIG-1 and SP-1+ being the strongest ratings. |
| a | Segregated as collateral for a when-issued security. |
Portfolio Abbreviations
To simplify the listings of securities, abbreviations are used per the table below:
| | |
| ACA | | Insured by American Capital Access |
| AGM | | Insured by Assured Guaranty Municipal Corp. |
| AMBAC | | Insured by American Municipal Bond Assurance Corp. |
| AMT | | Alternative Minimum Tax |
| BAM | | Insured by Build America Mutual Insurance Co. |
| COP | | Certificates of Participation |
| ETM | | Escrowed to Maturity |
| | |
| FHA | | Insured by Federal Housing Administration |
| GO | | General Obligation |
| HFFA | | Health Facilities Financing Authority |
| Mtg | | Mortgage |
| Natl-Re | | Insured by National Public Finance Guarantee Corp. |
| USD | | Unified School District |
See notes to financial statements.
16 Annual Report
| | |
| STATEMENT OF ASSETS AND LIABILITIES | | |
| |
Thornburg California Limited Term Municipal Fund | | September 30, 2016 |
| | | | |
ASSETS | | | | |
Investments at value (cost $694,073,137) (Note 3) | | $ | 723,351,171 | |
Cash | | | 3,665,598 | |
Receivable for investments sold | | | 31,087,238 | |
Receivable for fund shares sold | | | 1,489,057 | |
Interest receivable | | | 6,053,874 | |
Prepaid expenses and other assets | | | 3,891 | |
| | | | |
Total Assets | | | 765,650,829 | |
| | | | |
| |
LIABILITIES | | | | |
Payable for investments purchased | | | 25,501,285 | |
Payable for fund shares redeemed | | | 1,578,177 | |
Payable to investment advisor and other affiliates (Note 4) | | | 394,661 | |
Accounts payable and accrued expenses | | | 93,215 | |
Dividends payable | | | 169,338 | |
| | | | |
Total Liabilities | | | 27,736,676 | |
| | | | |
| |
NET ASSETS | | $ | 737,914,153 | |
| | | | |
NET ASSETS CONSIST OF | | | | |
Undistributed net investment income | | $ | 2,404 | |
Net unrealized appreciation on investments | | | 29,278,034 | |
Accumulated net realized gain (loss) | | | (15,790 | ) |
Net capital paid in on shares of beneficial interest | | | 708,649,505 | |
| | | | |
| | $ | 737,914,153 | |
| | | | |
NET ASSET VALUE | | | | |
Class A Shares: | | | | |
Net asset value and redemption price per share ($193,321,044 applicable to 13,831,057 shares of beneficial interest outstanding - Note 5) | | $ | 13.98 | |
Maximum sales charge, 1.50% of offering price | | | 0.21 | |
| | | | |
Maximum offering price per share | | $ | 14.19 | |
| | | | |
| |
Class C Shares: | | | | |
Net asset value and offering price per share* ($68,229,051 applicable to 4,877,445 shares of beneficial interest outstanding - Note 5) | | $ | 13.99 | |
| | | | |
| |
Class I Shares: | | | | |
Net asset value, offering and redemption price per share ($476,364,058 applicable to 34,048,352 shares of beneficial interest outstanding - Note 5) | | $ | 13.99 | |
| | | | |
| * | Redemption price per share is equal to net asset value less any applicable contingent deferred sales charge. |
See notes to financial statements.
Annual Report 17
| | |
| STATEMENT OF OPERATIONS | | |
| |
Thornburg California Limited Term Municipal Fund | | Year Ended September 30, 2016 |
| | | | |
INVESTMENT INCOME | | | | |
Interest income (net of premium amortized of $9,352,958) | | $ | 15,232,874 | |
| | | | |
| |
EXPENSES | | | | |
Investment advisory fees (Note 4) | | | 3,253,887 | |
Administration fees (Note 4) | | | | |
Class A Shares | | | 229,210 | |
Class C Shares | | | 83,639 | |
Class I Shares | | | 219,099 | |
Distribution and service fees (Note 4) | | | | |
Class A Shares | | | 458,420 | |
Class C Shares | | | 335,047 | |
Transfer agent fees | | | | |
Class A Shares | | | 93,623 | |
Class C Shares | | | 31,560 | |
Class I Shares | | | 280,785 | |
Registration and filing fees | | | | |
Class A Shares | | | 37 | |
Class C Shares | | | 33 | |
Class I Shares | | | 37 | |
Custodian fees (Note 2) | | | 69,183 | |
Professional fees | | | 54,807 | |
Accounting fees (Note 4) | | | 24,643 | |
Trustee fees | | | 30,326 | |
Other expenses | | | 28,857 | |
| | | | |
Total Expenses | | | 5,193,193 | �� |
| | | | |
Net Investment Income | | | 10,039,681 | |
| | | | |
REALIZED AND UNREALIZED GAIN (LOSS) | | | | |
Net realized gain (loss) on investments | | | 190,349 | |
Net change in unrealized appreciation (depreciation) on investments | | | 6,449,717 | |
| | | | |
Net Realized and Unrealized Gain | | | 6,640,066 | |
| | | | |
Net Increase in Net Assets Resulting from Operations | | $ | 16,679,747 | |
| | | | |
See notes to financial statements.
18 Annual Report
| | |
| STATEMENTS OF CHANGES IN NET ASSETS | | |
| |
Thornburg California Limited Term Municipal Fund | | |
| | | | | | | | |
| | | Year Ended
September 30, 2016 | | | Year Ended
September 30, 2015 | |
INCREASE (DECREASE) IN NET ASSETS FROM | | | | | | | | |
| | |
OPERATIONS | | | | | | | | |
Net investment income | | $ | 10,039,681 | | | $ | 9,704,464 | |
Net realized gain (loss) on investments | | | 190,349 | | | | (102,451 | ) |
Net unrealized appreciation (depreciation) on investments | | | 6,449,717 | | | | 94,220 | |
| | | | | | | | |
| | |
Net Increase (Decrease) in Net Assets Resulting from Operations | | | 16,679,747 | | | | 9,696,233 | |
| | |
DIVIDENDS TO SHAREHOLDERS | | | | | | | | |
From net investment income | | | | | | | | |
Class A Shares | | | (2,354,052 | ) | | | (2,333,303 | ) |
Class C Shares | | | (694,054 | ) | | | (735,680 | ) |
Class I Shares | | | (6,991,575 | ) | | | (6,635,481 | ) |
| | |
FUND SHARE TRANSACTIONS (NOTE 5) | | | | | | | | |
Class A Shares | | | 20,188,735 | | | | 11,239,731 | |
Class C Shares | | | 3,358,067 | | | | 1,372,807 | |
Class I Shares | | | 64,610,015 | | | | 46,488,377 | |
| | | | | | | | |
Net Increase in Net Assets | | | 94,796,883 | | | | 59,092,684 | |
| | |
NET ASSETS | | | | | | | | |
Beginning of Year | | | 643,117,270 | | | | 584,024,586 | |
| | | | | | | | |
| | |
End of Year | | $ | 737,914,153 | | | $ | 643,117,270 | |
| | | | | | | | |
Undistributed net investment income | | $ | 2,404 | | | $ | 2,404 | |
See notes to financial statements.
Annual Report 19
| | |
| NOTES TO FINANCIAL STATEMENTS | | |
| |
Thornburg California Limited Term Municipal Fund | | September 30, 2016 |
NOTE 1 – ORGANIZATION
Thornburg California Limited Term Municipal Fund (the “Fund”) is a diversified series of Thornburg Investment Trust (the “Trust”). The Trust is organized as a Massachusetts business trust under a Declaration of Trust dated June 3, 1987 and is registered as a diversified, open-end management investment company under the Investment Company Act of 1940, as amended. The Fund is currently one of twenty separate series of the Trust. Each series is considered to be a separate entity for financial reporting and tax purposes and bears expenses directly attributable to it. The Fund’s primary investment objective is to obtain as high a level of current income exempt from federal and California state individual income tax as is consistent, in the view of Thornburg Investment Management, Inc., the Trust’s investment advisor (the “Advisor”), with the preservation of capital. The Fund’s secondary objective is to reduce expected changes in its share price compared to longer intermediate and long-term bond portfolios.
The Fund currently offers three classes of shares of beneficial interest: Class A, Class C, and Institutional Class (“Class I”). Each class of shares of the Fund represents an interest in the same portfolio of investments, except that (i) Class A shares are sold subject to a front-end sales charge collected at the time the shares are purchased and bear a service fee, (ii) Class C shares are sold at net asset value without a sales charge at the time of purchase, but are subject to a contingent deferred sales charge upon redemption within one year of purchase, and bear both a service fee and a distribution fee, (iii) Class I shares are sold at net asset value without a sales charge at the time of purchase and may be subject to a service fee, and (iv) the respective classes may have different reinvestment privileges and conversion rights. Additionally, the Fund may allocate among its classes certain expenses, to the extent allocable to specific classes, including transfer agent fees, government registration fees, certain printing and postage costs, and administrative and legal expenses. Currently, class specific expenses of the Fund are limited to service and distribution fees, administration fees, and certain registration and transfer agent expenses.
The following is a summary of significant accounting policies followed by the Fund in the preparation of its financial statements. The Fund prepares its financial statements in conformity with United States generally accepted accounting principles (“GAAP”), including investment company accounting and reporting guidance in the Financial Accounting Standards Board (the “FASB”) Accounting Standard Codification Topic 946.
NOTE 2 – SIGNIFICANT ACCOUNTING POLICIES
Security Valuation: All investments in securities held by the Fund are valued as described in Note 3.
Allocation of Income, Gains, Losses and Expenses: Net investment income (other than class specific expenses) and realized and unrealized gains and losses are allocated daily to each class of shares based upon the relative net asset value of outstanding shares (or the value of the dividend-eligible shares, as appropriate) of each class of shares at the beginning of the day (after adjusting for the current capital shares activity of the respective class). Expenses common to all Funds are allocated among the Funds comprising the Trust based upon their relative net asset values or other appropriate allocation methods. Operating expenses directly attributable to a specific class are charged against the operating income of that class.
Dividends and Distributions to Shareholders: Dividends and distributions to shareholders, which are determined in accordance with federal income tax regulations and may differ from GAAP, are recorded on the ex-dividend date. Ordinary income distributions, if any, are declared daily and paid monthly. Capital gain distributions, if any, are declared and paid annually and more often if deemed necessary by the Advisor. Dividends are paid and are reinvested in additional shares of the Fund at net asset value per share at the close of business on the ex-dividend date, or at the shareholder’s option, paid in cash.
Investment Income: Interest income is accrued as earned. Premiums and discounts are amortized and accreted, respectively, to call dates or maturity dates using the effective yield method of the respective investments, which is included in interest income on the Statement of Operations.
Custodian Fees: Custodian fees disclosed in the Statement of Operations may include interest expenses incurred by the Fund on any cash overdrafts of its custodian account during the period. Such cash overdrafts may result from the effects of failed trades in portfolio securities and from cash outflows resulting from unanticipated shareholder redemption activity. The Fund pays interest to its custodian on any such cash overdraft at a rate equal to 2.50% of the overdraft amount in excess of $50,000.
Investment Transactions: Investment transactions are accounted for on a trade date basis. Realized gains and losses from the sale of investments are recorded on an identified cost basis.
When-Issued and Delayed Delivery Transactions: The Fund may engage in when-issued or delayed delivery transactions. To the extent the Fund engages in such transactions, it will do so for the purpose of acquiring portfolio investments consistent with the Fund’s investment objectives and not for the purpose of investment leverage or to speculate on interest rate or market changes. At the time the Fund makes a commitment to purchase an investment on a when-issued or delayed delivery basis, the Fund will record the transaction and reflect the value in determining its net asset value. When effecting such transactions, assets of an amount sufficient to make payment
20 Annual Report
| | |
| NOTES TO FINANCIAL STATEMENTS, CONTINUED | | |
| |
Thornburg California Limited Term Municipal Fund | | September 30, 2016 |
for the portfolio investments to be purchased will be segregated on the Fund’s records on the trade date. Investments purchased on a when-issued or delayed delivery basis do not earn interest until the settlement date.
Guarantees and Indemnifications: Under the Trust’s organizational documents (and under separate agreements with the independent Trustees), its officers and Trustees are provided with an indemnification against certain liabilities arising out of the performance of their duties to the Fund. In the normal course of business the Trust may also enter into contracts with service providers that contain general indemnifications. The Trust’s maximum exposure under these arrangements is unknown. However, based on experience, the Trust expects the risk of loss to be remote.
Use of Estimates: The preparation of financial statements in conformity with GAAP requires management to make estimates and assumptions that affect the reported amounts of assets and liabilities and disclosure of contingent assets and liabilities at the date of the financial statements and the reported amounts of increases (decreases) in net assets from operations during the reporting period. Actual results could differ from those estimates.
Federal Income Taxes: It is the policy of the Trust to comply with the provisions of the Internal Revenue Code applicable to regulated investment companies and to distribute to shareholders substantially all investment company taxable income including net realized gains on investments (if any), and tax exempt income of the Fund. Therefore, no provision for federal income or excise tax is required.
The Fund files income tax returns in United States federal and applicable state jurisdictions. The statute of limitations on the Fund’s tax return filings generally remains open for the three years following a return’s filing date. The Fund has analyzed each uncertain tax position believed to be material in the preparation of the Fund’s financial statements for the fiscal year ended September 30, 2016, including open tax years, to assess whether it is more likely than not that the position would be sustained upon examination, based on the technical merits of the position. The Fund has not identified any such position for which an asset or liability must be reflected in the Statement of Assets and Liabilities
At September 30, 2016, information on the tax components of capital was as follows:
| | | | |
Cost of investments for tax purposes | | $ | 694,073,137 | |
| | | | |
Gross unrealized appreciation on a tax basis | | $ | 29,482,518 | |
Gross unrealized depreciation on a tax basis | | | (204,484 | ) |
| | | | |
Net unrealized appreciation (depreciation) on investments (tax basis) | | $ | 29,278,034 | |
| | | | |
At September 30, 2016, the Fund had cumulative tax basis capital losses of $15,789, (of which $15,789 are short-term and $0 are long-term) generated after September 30, 2011, which may be carried forward to offset future capital gains. To the extent such carryforwards are used, capital gain distributions may be reduced to the extent provided by regulations. Such capital loss carryforwards do not expire.
During the year ended September 30, 2016, the Fund utilized $18,416 of short-term and $68,157 of long-term capital loss carryforwards generated after September 30, 2011.
At September 30, 2016, the Fund had $171,742 of undistributed net tax-exempt income, no undistributed tax basis net ordinary income and no undistributed tax basis capital gains.
Distributions from tax exempt income paid by the Fund for the years ended September 30, 2016 and September 30, 2015 are excludable by shareholders from gross income for federal income tax purposes.
The tax character of distributions paid during the years ended September 30, 2016, and September 30, 2015, was as follows:
| | | | | | | | |
| | | 2016 | | | 2015 | |
Distributions from: | | | | | | | | |
Tax exempt income | | $ | 10,039,668 | | | $ | 9,704,450 | |
Ordinary income | | | 13 | | | | 14 | |
| | | | | | | | |
Total | | $ | 10,039,681 | | | $ | 9,704,464 | |
| | | | | | | | |
NOTE 3 – SECURITY VALUATION
Valuation of the Fund’s portfolio investment securities is performed in accordance with policies and procedures adopted by and under the oversight of the Trustees.
The Trustees of the Trust have appointed the Advisor to assist the Trustees in obtaining market values for portfolio investments, evaluate and monitor professional pricing service providers appointed by the Trustees’ Audit Committee (the “Audit Committee”) to assist in
Annual Report 21
| | |
| NOTES TO FINANCIAL STATEMENTS, CONTINUED | | |
| |
Thornburg California Limited Term Municipal Fund | | September 30, 2016 |
determining fair values for portfolio investments, assist in calculating fair values for portfolio investments in certain circumstances, and to perform other functions in connection with the valuation of investments. The Advisor acts through its Valuation and Pricing Committee (the “Committee”) and other employees of the Advisor. The Committee regularly reviews its own valuation calculations, as well as the valuations, valuation techniques and services furnished by pricing service providers, considers circumstances which may require valuation calculations by the Committee, and reviews previous valuation calculations. The Committee reports to the Audit Committee on the Committee’s activities, the performance of pricing service providers, and other matters relating to valuation of portfolio investments.
In those instances when the Committee assists in calculating a fair value for a portfolio investment, the Committee seeks to determine the price that the Fund would reasonably expect to receive upon a sale of the investment in an orderly transaction between market participants on the valuation date. The Committee customarily utilizes quotations from securities broker dealers in calculating valuations, but also may utilize prices obtained from pricing service providers or other methods approved by the Audit Committee. Because fair values calculated by the Committee are estimates, the calculation of a value for an investment may differ from the price that would be realized by the Fund upon a sale of the investment, and the difference could be material to the Fund’s financial statements. The Committee’s calculation of a fair value for an investment may also differ from the prices obtained by other persons (including other mutual funds) for the investment.
Valuation of Securities: Debt obligations held by the Fund which are not listed or traded on exchanges or for which no reported market exists are ordinarily valued at the valuation obtained from a pricing service provider approved by the Audit Committee.
In any case when a pricing service provider fails to provide a valuation for a debt obligation held by the Fund, the Committee calculates a fair value for the obligation using alternative methods under procedures approved by the Audit Committee. Additionally, in cases when management believes that a valuation obtained from a pricing service provider merits review for significant reasons, the Committee decides whether or not to use the valuation calculated by the pricing service provider or to use an alternative method approved by the Audit Committee to calculate a fair value for the obligation.
Valuation Hierarchy: The Fund categorizes its investments based upon the inputs used in valuing those investments, according to a three-level hierarchy established in guidance from FASB. Categorization of investments using this hierarchy is intended by the FASB to maximize the use of observable inputs in valuing investments and minimize the use of unobservable inputs by requiring that the most observable inputs be used when available. Observable inputs are those that market participants would use in valuing an investment based on available market information. Unobservable inputs are those that reflect assumptions about the information market participants would use in valuing an investment. An investment’s level within the hierarchy is based on the lowest level input that is deemed significant to the valuation. The methodologies and inputs used to value investments are not necessarily indications of the risk or liquidity associated with those investments.
Various inputs are used in calculating valuations for the Fund’s investments. These inputs are generally summarized according to the three-level hierarchy below:
Level 1: Quoted prices in active markets for identical investments.
Level 2: Other direct or indirect significant observable inputs (including quoted prices for similar investments in active markets and other observable inputs, such as interest rates, prepayment rates, credit risk, etc.).
Level 3: Significant unobservable inputs (including the Committee’s own assumptions in calculating the fair values of investments).
Valuations for debt obligations held by the Fund are typically calculated by pricing service providers approved by the Audit Committee and are characterized as Level 2 within the valuation hierarchy.
In a limited number of cases the Committee calculates a fair value for investments using broker quotations or other methods approved by the Audit Committee. When the Committee uses a single broker quotation to calculate a fair value for an investment without other significant observable inputs, or if a fair value is calculated using other significant inputs that are considered unobservable, the investment is characterized as Level 3 within the hierarchy. Other significant unobservable inputs used to calculate a fair value in these instances might include an income-based valuation approach which considers discounted anticipated future cash flows from the investment, and application of discounts due to the nature or duration of any restrictions on the disposition of the investment.
Valuations based upon the use of inputs from Levels 1, 2 or 3 may not represent the actual price received upon the disposition of an investment, and the Fund may receive a price that is lower than the valuation based upon these inputs when it sells the investment.
22 Annual Report
| | |
| NOTES TO FINANCIAL STATEMENTS, CONTINUED | | |
| |
Thornburg California Limited Term Municipal Fund | | September 30, 2016 |
The following table displays a summary of the fair value hierarchy measurements of the Fund’s investments as of September 30, 2016. In any instance when valuation inputs from more than one level are used to determine the fair value of a specific investment, the investment is placed in the level of the table based upon the lowest level input that is significant in determining the fair value of the investment:
| | | | | | | | | | | | | | | | |
| | | Fair Value Measurements at September 30, 2016 | |
| | | Total | | | Level 1 | | | Level 2 | | | Level 3 | |
Assets | | | | | | | | | | | | | | | | |
Investments in Securities | | | | | | | | | | | | | | | | |
Municipal Bonds | | $ | 723,351,171 | | | $ | — | | | $ | 723,351,171 | | | $ | — | |
| | | | | | | | | | | | | | | | |
Total Investments in Securities | | $ | 723,351,171 | | | $ | — | | | $ | 723,351,171 | | | $ | — | |
In accordance with the guidance prescribed in Accounting Standards Update No. 2011-04, it is the policy of the Fund to recognize transfers between levels and the underlying events which caused the movement. The Fund recognized no transfers between levels for the year ended September 30, 2016.
NOTE 4 – INVESTMENT ADVISORY FEE AND OTHER TRANSACTIONS WITH AFFILIATES
Pursuant to an investment advisory agreement, the Advisor serves as the investment advisor and performs services for the Fund for which the fees are payable at the end of each month. Under the investment advisory agreement, the Fund pays the Advisor a management fee based on the daily net assets of the Fund at an annual rate as shown in the following table:
| | | | |
Daily Net Assets | | Fee Rate | |
Up to $500 million | | | 0.500 | % |
Next $500 million | | | 0.400 | |
Next $500 million | | | 0.300 | |
Next $500 million | | | 0.250 | |
Over $2 billion | | | 0.225 | |
The Fund’s effective management fee for the year ended September 30, 2016 was 0.473% of the Fund’s average dividend assets.
The Fund pays to the Advisor the costs of personnel who perform certain accounting services for the Fund. For the year ended September 30, 2016 the Fund paid $24,643 to the Advisor for these accounting services. The Trust has also entered into administrative service agreements with the Advisor, whereby the Advisor will perform certain administrative services for the shareholders of each class of the Fund’s shares, and for which fees will be payable at an annual rate of up to .125 of 1% per annum of the average daily net assets attributable to each class of shares. Total administrative service fees incurred by each class of shares of the Fund for the year ended September 30, 2016, are set forth in the Statement of Operations.
The Trust has an underwriting agreement with Thornburg Securities Corporation (the “Distributor”), an affiliate of the Advisor, which acts as the distributor of the Fund’s shares. For the year ended September 30, 2016, the Distributor has advised the Fund that it earned $2,570 from the sale of Class A shares, and collected contingent deferred sales charges aggregating $4,870 from redemptions of Class C shares of the Fund.
Pursuant to a service plan under Rule 12b-1 of the Investment Company Act of 1940, the Fund may pay to the Advisor or securities dealers and other financial institutions at the Advisor’s request an amount not to exceed .25 of 1% per annum of the average daily net assets attributable to Class A and Class C shares of the Fund to obtain various shareholder and distribution related services. For the year ended September 30, 2016, there were no 12b-1 service plan fees charged for Class I shares. The Advisor may pay out of its own resources additional expenses for distribution of the Fund’s shares and shareholder services.
The Trust has also adopted a distribution plan pursuant to Rule 12b-1, applicable only to the Fund’s Class C shares, under which the Fund compensates the Distributor for services in promoting the sale of Class C shares of the Fund at an annual rate of up to .25 of 1% per annum of the average daily net assets attributable to Class C shares. Total fees incurred by each class of shares of the Fund under their respective service and distribution plans for the year ended September 30, 2016, are set forth in the Statement of Operations.
Certain officers and Trustees of the Trust are also officers or directors of the Advisor and Distributor. The compensation of independent Trustees is borne by the Trust.
The Fund may sell securities to an affiliated fund, or the Fund may purchase securities held by an affiliated fund, provided the affiliation is due solely to having a common investment advisor, common officers, or common trustees, and provided that all such transactions will comply with Rule 17a-7 under the 1940 Act. For the year ended September 30, 2016, the Fund had transactions with affiliated funds of $4,000,299 in purchases.
Annual Report 23
| | |
| NOTES TO FINANCIAL STATEMENTS, CONTINUED | | |
| |
Thornburg California Limited Term Municipal Fund | | September 30, 2016 |
NOTE 5 – SHARES OF BENEFICIAL INTEREST
At September 30, 2016, there were an unlimited number of shares with no par value of beneficial interest authorized. Transactions in shares of beneficial interest were as follows:
| | | | | | | | | | | | | | | | |
| | | Year Ended
September 30, 2016 | | | Year Ended
September 30, 2015 | |
| | | Shares | | | Amount | | | Shares | | | Amount | |
Class A Shares | | | | | | | | | | | | | | | | |
Shares sold | | | 3,545,788 | | | $ | 49,447,106 | | | | 2,968,706 | | | $ | 41,089,831 | |
Shares issued to shareholders in reinvestment of dividends | | | 142,013 | | | | 1,981,364 | | | | 142,066 | | | | 1,965,359 | |
Shares repurchased | | | (2,238,533 | ) | | | (31,239,735 | ) | | | (2,302,492 | ) | | | (31,815,459 | ) |
| | | | | | | | | | | | | | | | |
| | | | |
Net increase (decrease) | | | 1,449,268 | | | $ | 20,188,735 | | | | 808,280 | | | $ | 11,239,731 | |
| | | | | | | | | | | | | | | | |
| | | | |
Class C Shares | | | | | | | | | | | | | | | | |
Shares sold | | | 1,011,365 | | | $ | 14,117,934 | | | | 839,501 | | | $ | 11,635,591 | |
Shares issued to shareholders in reinvestment of dividends | | | 38,417 | | | | 536,374 | | | | 41,674 | | | | 576,985 | |
Shares repurchased | | | (808,902 | ) | | | (11,296,241 | ) | | | (783,398 | ) | | | (10,839,769 | ) |
| | | | | | | | | | | | | | | | |
| | | | |
Net increase (decrease) | | | 240,880 | | | $ | 3,358,067 | | | | 97,777 | | | $ | 1,372,807 | |
| | | | | | | | | | | | | | | | |
| | | | |
Class I Shares | | | | | | | | | | | | | | | | |
Shares sold | | | 12,762,501 | | | $ | 178,298,927 | | | | 11,038,248 | | | $ | 152,815,141 | |
Shares issued to shareholders in reinvestment of dividends | | | 381,818 | | | | 5,333,769 | | | | 340,247 | | | | 4,711,496 | |
Shares repurchased | | | (8,518,649 | ) | | | (119,022,681 | ) | | | (8,019,859 | ) | | | (111,038,260 | ) |
| | | | | | | | | | | | | | | | |
| | | | |
Net increase (decrease) | | | 4,625,670 | | | $ | 64,610,015 | | | | 3,358,636 | | | $ | 46,488,377 | |
| | | | | | | | | | | | | | | | |
NOTE 6 – INVESTMENT TRANSACTIONS
For the year ended September 30, 2016, the Fund had purchase and sale transactions of investments (excluding short-term investments) of $211,535,665 and $99,305,814, respectively.
OTHER NOTES
Risks: The Fund’s investments subject it to risks including, but not limited to, management risk, interest rate risk, credit risk, market and economic risk, liquidity risk, and the risk of investing mainly in the obligations primarily originating in a single state. Please see the Fund’s prospectus for a discussion of the risks associated with an investment in the Fund.
Subsequent Events: Fund management believes no events have occurred between September 30, 2016 and the date of issuance of the financial statements that require adjustment to or disclosure in the accompanying financial statements.
24 Annual Report
This page intentionally left blank.
Annual Report 25
FINANCIAL HIGHLIGHTS
Thornburg California Limited Term Municipal Fund
| | | | | | | | | | | | | | | | | | | | | | | | | | | | | | | | | | | | | | | | | | | | | | | | | | | | | | |
| | | PER SHARE PERFORMANCE (for a share outstanding throughout the Year) | | | RATIOS TO AVERAGE NET ASSETS | | | SUPPLEMENTAL DATA | |
Unless
Otherwise
Noted,
Periods
are
Fiscal
Years
Ended
Sept. 30, | | Net Asset
Value
Beginning
of Year | | | Net
Investment
Income
(Loss)+ | | Net
Realized
&
Unrealized
Gain(Loss)
on
Investments | | | Total from
Investment
Operations | | | Dividends
from Net
Investment
Income | | | Dividends
from Net
Realized
Gains | | Total
Dividends | | | Net
Asset
Value
End
of
year | | | Net
Investment
Income
(Loss)
(%) | | | Expenses,
After
Expense
Reductions
(%) | | | Expenses,
After
Expense
Reductions
and
Net of
Custody
Credits
(%) | | | Expenses,
Before
Expense
Reductions
(%) | | | Total
Return
(%)(a) | | | Portfolio
Turnover
Rate (%)(a) | | Net
Assets
at End
of
Year
(Thousands) | |
CLASS A SHARES | | | | | | | | | | | | | | | | | | | | | | | | | | | | | | | | | | | | | | | | | |
2016(b) | | $ | 13.84 | | | 0.18 | | | 0.14 | | | | 0.32 | | | | (0.18 | ) | | — | | | (0.18 | ) | | $ | 13.98 | | | | 1.28 | | | | 0.93 | | | | 0.93 | | | | 0.93 | | | | 2.32 | | | 16.47 | | $ | 193,321 | |
2015(b) | | $ | 13.84 | | | 0.19 | | | — | (c) | | | 0.19 | | | | (0.19 | ) | | — | | | (0.19 | ) | | $ | 13.84 | | | | 1.39 | | | | 0.94 | | | | 0.94 | | | | 0.94 | | | | 1.40 | | | 14.43 | | $ | 171,344 | |
2014(b) | | $ | 13.54 | | | 0.23 | | | 0.30 | | | | 0.53 | | | | (0.23 | ) | | — | | | (0.23 | ) | | $ | 13.84 | | | | 1.67 | | | | 0.95 | | | | 0.94 | | | | 0.95 | | | | 3.93 | | | 16.85 | | $ | 160,151 | |
2013(b) | | $ | 13.75 | | | 0.24 | | | (0.20 | ) | | | 0.04 | | | | (0.24 | ) | | (0.01) | | | (0.25 | ) | | $ | 13.54 | | | | 1.75 | | | | 0.94 | | | | 0.94 | | | | 0.94 | | | | 0.28 | | | 17.57 | | $ | 159,058 | |
2012(b) | | $ | 13.41 | | | 0.29 | | | 0.34 | | | | 0.63 | | | | (0.29 | ) | | — | | | (0.29 | ) | | $ | 13.75 | | | | 2.15 | | | | 0.95 | | | | 0.95 | | | | 0.95 | | | | 4.78 | | | 13.06 | | $ | 150,155 | |
CLASS C SHARES | | | | | | | | | | | | | | | | | | | | | | | | | | | | | | | | | | | | | | | | | |
2016 | | $ | 13.85 | | | 0.14 | | | 0.14 | | | | 0.28 | | | | (0.14 | ) | | — | | | (0.14 | ) | | $ | 13.99 | | | | 1.04 | | | | 1.18 | | | | 1.18 | | | | 1.18 | | | | 2.06 | | | 16.47 | | $ | 68,229 | |
2015 | | $ | 13.85 | | | 0.16 | | | — | (c) | | | 0.16 | | | | (0.16 | ) | | — | | | (0.16 | ) | | $ | 13.85 | | | | 1.15 | | | | 1.18 | | | | 1.18 | | | | 1.18 | | | | 1.15 | | | 14.43 | | $ | 64,216 | |
2014 | | $ | 13.55 | | | 0.19 | | | 0.30 | | | | 0.49 | | | | (0.19 | ) | | — | | | (0.19 | ) | | $ | 13.85 | | | | 1.41 | | | | 1.21 | | | | 1.20 | | | | 1.21 | | | | 3.66 | | | 16.85 | | $ | 62,858 | |
2013 | | $ | 13.76 | | | 0.20 | | | (0.20 | ) | | | — | | | | (0.20 | ) | | (0.01) | | | (0.21 | ) | | $ | 13.55 | | | | 1.48 | | | | 1.21 | | | | 1.21 | | | | 1.21 | | | | 0.02 | | | 17.57 | | $ | 59,585 | |
2012 | | $ | 13.42 | | | 0.26 | | | 0.34 | | | | 0.60 | | | | (0.26 | ) | | — | | | (0.26 | ) | | $ | 13.76 | | | | 1.88 | | | | 1.22 | | | | 1.22 | | | | 1.22 | | | | 4.49 | | | 13.06 | | $ | 59,563 | |
CLASS I SHARES | | | | | | | | | | | | | | | | | | | | | | | | | | | | | | | | | | | | | | | | | |
2016 | | $ | 13.85 | | | 0.22 | | | 0.14 | | | | 0.36 | | | | (0.22 | ) | | — | | | (0.22 | ) | | $ | 13.99 | | | | 1.60 | | | | 0.62 | | | | 0.62 | | | | 0.62 | | | | 2.64 | | | 16.47 | | $ | 476,364 | |
2015 | | $ | 13.85 | | | 0.24 | | | — | (c) | | | 0.24 | | | | (0.24 | ) | | — | | | (0.24 | ) | | $ | 13.85 | | | | 1.70 | | | | 0.63 | | | | 0.63 | | | | 0.63 | | | | 1.72 | | | 14.43 | | $ | 407,557 | |
2014 | | $ | 13.55 | | | 0.27 | | | 0.30 | | | | 0.57 | | | | (0.27 | ) | | — | | | (0.27 | ) | | $ | 13.85 | | | | 1.99 | | | | 0.62 | | | | 0.62 | | | | 0.62 | | | | 4.27 | | | 16.85 | | $ | 361,015 | |
2013 | | $ | 13.76 | | | 0.28 | | | (0.19 | ) | | | 0.09 | | | | (0.29 | ) | | (0.01) | | | (0.30 | ) | | $ | 13.55 | | | | 2.08 | | | | 0.61 | | | | 0.61 | | | | 0.61 | | | | 0.62 | | | 17.57 | | $ | 254,869 | |
2012 | | $ | 13.42 | | | 0.33 | | | 0.35 | | | | 0.68 | | | | (0.34 | ) | | — | | | (0.34 | ) | | $ | 13.76 | | | | 2.46 | | | | 0.62 | | | | 0.62 | | | | 0.62 | | | | 5.12 | | | 13.06 | | $ | 196,071 | |
| (a) | Not annualized for periods less than one year. |
| (b) | Sales loads are not reflected in computing total return. |
| (c) | Net realized and unrealized gain (loss) on investments was less than $0.01 per share. |
| + | Based on weighted average shares outstanding. |
See notes to financial statements.
| | | | |
| 26 Annual Report | | | | Annual Report 27 |
REPORT OF INDEPENDENT REGISTERED PUBLIC ACCOUNTING FIRM
Thornburg California Limited Term Municipal Fund
To the Trustees and Shareholders of
Thornburg California Limited Term Municipal Fund
In our opinion, the accompanying statement of assets and liabilities, including the schedule of investments in securities, and the related statements of operations and of changes in net assets and the financial highlights present fairly, in all material respects, the financial position of the Thornburg California Limited Term Municipal Fund (the “Fund”) at September 30, 2016, the results of its operations for the year then ended, the changes in its net assets for each of the two years in the period then ended and the financial highlights for each of the five years in the period then ended, in conformity with accounting principles generally accepted in the United States of America. These financial statements and financial highlights (hereafter referred to as “financial statements”) are the responsibility of the Fund’s management. Our responsibility is to express an opinion on these financial statements based on our audits. We conducted our audits of these financial statements in accordance with the standards of the Public Company Accounting Oversight Board (United States). Those standards require that we plan and perform the audit to obtain reasonable assurance about whether the financial statements are free of material misstatement. An audit includes examining, on a test basis, evidence supporting the amounts and disclosures in the financial statements, assessing the accounting principles used and significant estimates made by management, and evaluating the overall financial statement presentation. We believe that our audits, which included confirmation of securities at September 30, 2016 by correspondence with the custodian, brokers, transfer agent, and the application of alternative procedures where securities purchased had not been received, provide a reasonable basis for our opinion.
PricewaterhouseCoopers LLP
New York, New York
November 18, 2016
28 Annual Report
| | |
| EXPENSE EXAMPLE | | |
| |
Thornburg California Limited Term Municipal Fund | | September 30, 2016 (Unaudited) |
As a shareholder of the Fund, you incur two types of costs:
| | (1) | transaction costs, including |
(a) sales charges (loads) on purchase payments, for Class A shares;
(b) a deferred sales charge on redemptions of any part or all of a purchase of $1 million of Class A shares within 12 months of purchase;
(c) a deferred sales charge on redemptions of Class C shares within 12 months of purchase;
| | (2) | ongoing costs, including management fees; distribution and/or service (12b-1) fees; and other Fund expenses. |
This example is intended to help you understand your ongoing costs (in dollars) of investing in the Fund and to compare these costs with the ongoing costs of investing in other mutual funds.
The example is based on a $1,000 investment beginning on April 1, 2016, and held until September 30, 2016.
| | | | | | | | | | | | |
| | | Beginning
Account Value
4/1/16 | | | Ending
Account Value
9/30/16 | | | Expenses paid
During period†
4/1/16–9/30/16 | |
Class A Shares | | | | | | | | | | | | |
Actual | | $ | 1,000.00 | | | $ | 1,009.20 | | | $ | 4.64 | |
Hypothetical* | | $ | 1,000.00 | | | $ | 1,020.39 | | | $ | 4.66 | |
Class C Shares | | | | | | | | | | | | |
Actual | | $ | 1,000.00 | | | $ | 1,007.90 | | | $ | 5.87 | |
Hypothetical* | | $ | 1,000.00 | | | $ | 1,019.16 | | | $ | 5.90 | |
Class I Shares | | | | | | | | | | | | |
Actual | | $ | 1,000.00 | | | $ | 1,010.00 | | | $ | 3.09 | |
Hypothetical* | | $ | 1,000.00 | | | $ | 1,021.92 | | | $ | 3.11 | |
| † | Expenses are equal to the annualized expense ratio for each class (A: 0.92%; C: 1.17%; I: 0.62%) multiplied by the average account value over the period, multiplied by 183/366 to reflect the one-half year period. |
| * | Hypothetical assumes a rate of return of 5% per year before expenses. |
ACTUAL EXPENSES
For each class of shares, the first line of the accompanying table provides information about actual account values and actual expenses. You may use the information in this line, together with the amount you invested, to estimate the expenses that you paid over the period. Simply divide your account value by $1,000 (for example, an $8,600 account value divided by $1,000 = 8.6), then multiply the result by the number in the first line for your class of shares under the heading entitled “Expenses Paid During Period” to estimate the expenses you paid on your account during this period.
HYPOTHETICAL EXAMPLE FOR COMPARISON PURPOSES
For each class of shares, the second line of the accompanying table provides information about hypothetical account values and hypothetical expenses based on the Fund’s actual expense ratio and an assumed rate of return of 5% per year before expenses, which is not the Fund’s actual return. The hypothetical account values and expenses may not be used to estimate the actual ending account balance or expenses you paid for the period. You may use this information to compare the ongoing costs of investing in the Fund and other funds. To do so, compare this 5% hypothetical example with the 5% hypothetical examples that appear in the shareholder reports of the other funds.
Please note that the expenses shown in the table are meant to highlight your ongoing costs only and do not reflect any transactional costs, such as sales charges (loads), redemption fees, or exchange fees. Therefore, the second line of the table for each class of shares is useful in comparing ongoing costs only, and will not help you determine the relative total costs of owning different funds. In addition, if these transactional costs were included, your costs would have been higher.
Annual Report 29
| | |
| TRUSTEES AND OFFICERS | | |
| |
Thornburg California Limited Term Municipal Fund | | September 30, 2016 (Unaudited) |
| | | | |
Name, Age, Position Held with Fund Year Elected | | Principal Occupation(s) During Past Five Years | | Other
Directorships
Held by Trustee |
INTERESTED TRUSTEES (1)(2)(4) | | |
| | |
Garrett Thornburg, 71 Trustee since 1987, Chairman of Trustees(3) | | Chairman and controlling shareholder of Thornburg Investment Management, Inc. (investment advisor); Chairman and controlling shareholder of Thornburg Securities Corporation (securities dealer); Chairman and CEO of Chamisa Energy, LLC; President of the Thornburg Foundation (nonprofit). | | None |
| | |
Brian J. McMahon, 61 Trustee since 2001, Vice Chairman of Trustees, Member of Governance & Nominating Committee & Operations Risk Oversight Committee(5) | | Chief Investment Officer, Managing Director, and Portfolio Manager and, until 2016, CEO and President of Thornburg Investment Management, Inc.; Vice President of Thornburg Securities Corporation. | | None |
| |
INDEPENDENT TRUSTEES (1)(2)(4) | | |
| | |
David A. Ater, 71 Trustee since 1994, Member of Audit Committee & Chairman of Governance & Nominating Committee | | Principal in Ater & Associates, Santa Fe, NM (developer, planner and broker of residential and commercial real estate); owner, developer and broker for various real estate projects. | | None |
| | |
David D. Chase, 75 Trustee since 2000, Chairman of Audit Committee | | Managing Member of CS Group, LLC, Santa Fe, NM (private investment fund – family office). | | None |
| | |
Sally Corning, 55 Trustee since 2012, Member of Audit Committee | | Partner in Sun Mountain Capital, Santa Fe, NM (private equity firm with investment programs encompassing venture capital, mezzanine debt, and growth equity). | | None |
| | |
Susan H. Dubin, 67 Trustee since 2004, Member of Audit Committee & Governance and Nominating Committee | | President of Dubin Investments, Ltd., Greenwich, CT (private investment fund); Director and officer of various charitable organizations. | | None |
| | |
David L. Gardner, 53 Trustee since 2015, Member of Operations Risk Oversight Committee | | Until 2012, head of EMEA (Europe, Middle East and Africa) Sales for iShares of Blackrock, Inc., EMEA Executive Committee Member and EMEA Operating Committee Member at Blackrock, Inc. | | None |
| | |
Owen D. Van Essen, 62 Trustee since 2004, Member of Governance & Nominating Committee & Chairman of Operations Risk Oversight Committee | | President of Dirks, Van Essen & Murray, Santa Fe, NM (newspaper mergers and acquisitions). | | None |
| | |
James W. Weyhrauch, 57 Trustee since 1996, Member of Audit Committee & Operations Risk Oversight Committee | | Real estate broker, Santa Fe Properties, Santa Fe, NM; Vice Chairman of Nambe LLC, Santa Fe, NM (manufacturing & design company). | | None |
30 Annual Report
| | |
| TRUSTEES AND OFFICERS, CONTINUED | | |
| |
Thornburg California Limited Term Municipal Fund | | September 30, 2016 (Unaudited) |
| | | | | | |
Name, Age, Year Elected Position Held with Fund | | Principal Occupation(s) During Past Five Years | | Other
Directorships
Held by Trustee | |
OFFICERS OF THE FUND (WHO ARE NOT TRUSTEES)(1)(7) | | | | |
| | |
Nimish Bhatt, 53 Treasurer since 2016(6) | | Chief Financial Officer and Treasurer of Thornburg Investment Management, Inc. and Thornburg Securities Corporation since 2016; Senior Vice President (2004-2016), Chief Financial Officer (2011-2016), and Head of Fund Administration (2011-2016) of Calamos Asset Management, Inc., Calamos Investments LLC, Calamos Advisors LLC, and Calamos Wealth Management; Director of Calamos Global Funds plc (2007-2016). | | | Not applicable | |
| | |
Jason Brady, 42 President since 2016(6) | | CEO and President since 2016, Vice President from 2011 to 2016, Portfolio Manager and Managing Director of Thornburg Investment Management, Inc.; Vice President of Thornburg Securities Corporation since 2016. | | | Not applicable | |
| | |
Kathleen Brady, 56 Vice President since 2008 | | Tax Manager Fund Accounting of Thornburg Investment Management, Inc. | | | Not applicable | |
| | |
Connor Browne, 37 Vice President since 2006 | | Portfolio Manager, Vice President since 2013, and Managing Director of Thornburg Investment Management, Inc. | | | Not applicable | |
| | |
Tim Cunningham, 41 Vice President since 2014 | | Managing Director since 2011, Portfolio Manager since 2012, and Associate Portfolio Manager from 2009–2012 of Thornburg Investment Management, Inc. | | | Not applicable | |
| | |
Randy Dry, 42 Vice President since 2014 | | Vice President and Managing Director, Director of Institutional Group from 2014-2016, and since 2016, Chief Administrative Officer of Thornburg Investment Management, Inc. | | | Not applicable | |
| | |
Greg Dunn, 40 Vice President since 2014 | | Managing Director, Portfolio Manager since 2012, and Associate Portfolio Manager from 2009–2012 of Thornburg Investment Management, Inc. | | | Not applicable | |
| | |
Lon Erickson, 41 Vice President since 2008 | | Portfolio Manager and Managing Director of Thornburg Investment Management, Inc. | | | Not applicable | |
| | |
William V. Fries, 77 Vice President since 1995 | | Portfolio Manager, Vice President, and Managing Director of Thornburg Investment Management, Inc. | | | Not applicable | |
| | |
Thomas Garcia, 45 Vice President since 2006 | | Vice President since 2011, Managing Director, Head Equity Trader, and Associate Portfolio Manager of Thornburg Investment Management, Inc. | | | Not applicable | |
| | |
Rolf Kelly, 37 Vice President since 2016 | | Portfolio Manager and Managing Director since 2013 and Associate Portfolio Manager from 2011–2013 of Thornburg Investment Management, Inc. | | | Not applicable | |
| | |
Ben Kirby, 36 Vice President since 2014 | | Portfolio Manager and Managing Director since 2013 and Associate Portfolio Manager from 2011–2013 of Thornburg Investment Management, Inc. | | | Not applicable | |
| | |
Jeff Klingelhofer, 41 Vice President since 2016 | | Portfolio Manager and Managing Director since 2015, Associate Portfolio Manager from 2012–2015, and Fixed Income Analyst from 2010–2012 of Thornburg Investment Management, Inc. | | | Not applicable | |
| | |
Rob MacDonald, 40 Vice President since 2016 | | Managing Director since 2015, Portfolio Manager since 2014, and Associate Portfolio Manager from 2011–2014 of Thornburg Investment Management, Inc. | | | Not applicable | |
| | |
Leigh Moiola, 49 Vice President since 2001 | | Vice President, Managing Director, and Director of Marketing of Thornburg Investment Management, Inc.; Vice President of Thornburg Securities Corporation. | | | Not applicable | |
| | |
Christopher Ryon, 60 Vice President since 2008 | | Portfolio Manager and Managing Director of Thornburg Investment Management, Inc. | | | Not applicable | |
| | |
Nicholos Venditti, 35 Vice President since 2016 | | Portfolio Manager and Managing Director since 2015 and Associate Portfolio Manager from 2011–2015 of Thornburg Investment Management, Inc. | | | Not applicable | |
Annual Report 31
| | |
| TRUSTEES AND OFFICERS, CONTINUED | | |
| |
Thornburg California Limited Term Municipal Fund | | September 30, 2016 (Unaudited) |
| | | | |
Name, Age, Year Elected Position Held with Fund | | Principal Occupation(s) During Past Five Years | | Other
Directorships
Held by Trustee |
| | |
Vinson Walden, 46 Vice President since 2004 | | Portfolio Manager and Managing Director of Thornburg Investment Management, Inc. | | Not applicable |
| | |
Lei Wang, 45 Vice President since 2006 | | Portfolio Manager and Managing Director of Thornburg Investment Management, Inc. | | Not applicable |
| | |
Sasha Wilcoxon, 42 Vice President since 2003 Secretary since 2007(6) | | Managing Director, Director of Mutual Fund Operations, and Vice President of Thornburg Investment Management, Inc.; Vice President of Thornburg Securities Corporation. | | Not applicable |
| | |
Charles Wilson, 41 Vice President since 2016 | | Portfolio Manager and Managing Director since 2014 and Associate Portfolio Manager from 2012–2014 of Thornburg Investment Management, Inc.; Co-Portfolio Manager of Marsico Capital Management from 2010–2012. | | Not applicable |
| | |
Di Zhou, 38 Vice President since 2016 | | Portfolio Manager and Managing Director since 2016, Associate Portfolio Manager from 2014–2016, and Equity Research Analyst from 2010–2014 of Thornburg Investment Management, Inc. | | Not applicable |
| (1) | Each person’s address is 2300 North Ridgetop Road, Santa Fe, New Mexico 87506. |
| (2) | The Fund is a separate investment “Fund” or “series” of Thornburg Investment Trust (the “Trust”), which comprises the Thornburg mutual fund complex and is organized as a Massachusetts business trust. Thornburg Investment Management, Inc. is the investment advisor to, and manages, all the Funds of the Trust. Each Trustee oversees all the Funds of the Trust. |
| (3) | Mr. Thornburg is considered an “interested” Trustee under the Investment Company Act of 1940 because he is the sole director and controlling shareholder of Thornburg Investment Management, Inc., the investment advisor to the Trust, and is the sole director and controlling shareholder of Thornburg Securities Corporation, the distributor of shares for the Trust. |
| (4) | The Bylaws of the Trust currently require that each Trustee shall retire by the end of the calendar year during which the Trustee reached the age of 75 years. Otherwise each Trustee serves in office until the election and qualification of a successor or until the Trustee sooner dies, resigns, retires or is removed. |
| (5) | Mr. McMahon is considered an “interested” Trustee under the Investment Company Act of 1940 because he is the chief investment officer of Thornburg Investment Management, Inc. |
| (6) | The Trust’s president, secretary, and treasurer each serves a one-year term or until the election and qualification of a successor; each other officer serves at the pleasure of the Trustees. |
| (7) | Assistant vice presidents, assistant secretaries, and assistant treasurers are not shown. |
The Statement of Additional Information for each Fund of the Trust includes additional information about the Trustees and is available, without charge and upon request, by calling 1-800-847-0200.
32 Annual Report
| | |
| OTHER INFORMATION | | |
| |
Thornburg California Limited Term Municipal Fund | | September 30, 2016 (Unaudited) |
PORTFOLIO PROXY VOTING
Policies and Procedures:
The Trust has delegated to Thornburg Investment Management, Inc. (the “Advisor”) voting decisions respecting proxies for the Fund’s voting securities. The Advisor makes voting decisions in accordance with its Proxy Voting Policy. A description of the Policy is available (i) without charge, upon request, by calling the Advisor toll-free at 1-800-847-0200, (ii) on the Thornburg website at www.thornburg.com, and (iii) on the Securities and Exchange Commission’s website at www.sec.gov.
Information regarding how proxies were voted is available on or before August 31 of each year for the twelve months ending the preceding June 30. This information is available (i) without charge, upon request by calling the Advisor toll-free at 1-800-847-0200, (ii) on the Thornburg website at www.thornburg.com, and (iii) on the Securities and Exchange Commission’s website at www.sec.gov.
TAX INFORMATION
For the tax year ended September 30, 2016, dividends paid by the Fund of $10,039,668 (or the maximum allowed) are tax exempt dividends and $13 are taxable ordinary investment income dividends for federal income tax purposes. The information and the distributions reported herein may differ from the information and distributions reported to the shareholders for the calendar year ending December 31, 2016. Complete information will be reported in conjunction with your 2016 Form 1099.
AVAILABILITY OF QUARTERLY PORTFOLIO SCHEDULE
The Fund files with the Securities and Exchange Commission schedules of its portfolio holdings on Form N-Q for the first and third quarters of each fiscal year. The Fund’s Forms N-Q are available on the Commission’s website at www.sec.gov, or may be reviewed and copied at the Commission’s Public Reference Room in Washington, D.C. Information on the operation of the Public Reference Room may be obtained by calling 1-800-SEC-0330. The Fund also makes this information available on its website at www.thornburg.com/download or upon request by calling 1-800-847-0200.
STATEMENT RESPECTING RENEWAL OF INVESTMENT ADVISORY AGREEMENT
Thornburg Investment Management, Inc. (the “Advisor”) provides investment management services to Thornburg California Limited Term Municipal Fund pursuant to an investment advisory agreement. The Trustees consider the renewal of this agreement annually, and most recently determined to renew the agreement on September 13, 2016.
In anticipation of their recent consideration of the advisory agreement’s renewal, the independent Trustees met in May 2016 to consider aspects of their annual evaluation of the Advisor’s service to all of the funds of Thornburg Investment Trust, to plan the annual evaluation of the Advisor’s performance and to specify the information the Advisor would present to the Trustees for their review. The independent Trustees met again in independent session in September to consider portions of the information submitted by the Advisor. The Advisor’s president and chief investment officer subsequently reviewed portions of the information with the Trustees and addressed questions from the Trustees at a full meeting session of the Trustees scheduled for that purpose, and the independent Trustees thereafter met in independent session to consider the Advisor’s presentation and various specific issues respecting their consideration of the advisory agreement’s renewal. Following these sessions, the Trustees met to consider renewal of the agreement, and the independent Trustees voted unanimously at that meeting to renew the agreement for an additional term of one year.
The information below summarizes certain factors considered by the Trustees in connection with the determination to renew the advisory agreement. In determining to renew the agreement, the Trustees considered a wide range of information and did not identify any single factor as controlling, and this summary does not describe all of the factors and other matters considered by the Trustees in making their determination.
Nature, Extent and Quality of Services. The Trustees considered presentations by the Advisor at meeting sessions scheduled for consideration of a continuation of the advisory agreement, and also noted their consideration of the reports the Trustees and their committees receive throughout the year on a wide variety of topics, and consideration they had given to a number of topics in previous years. Information identified by the Trustees in their evaluation as having been considered and contributing to their conclusions included Trustees’ assessments of the Advisor’s personnel developed in formal and informal meetings throughout the year, the Advisor’s staffing levels and measures to maintain staffing levels and improve competencies, the Advisor’s commitment to attract and retain high quality portfolio management expertise through competitive compensation levels, the Advisor’s collaborative approach to investment management, the Fund’s investment performance over different periods of time, portfolio managers’ cognizance of and strategies to address market and economic trends and conditions, the evaluation and selection of individual investments, the structuring and composition of the Fund’s portfolio, management of Fund liquidity requirements, cognizance of and efforts to achieve tax efficiency, responses to
Annual Report 33
| | |
| OTHER INFORMATION, CONTINUED | | |
| |
Thornburg California Limited Term Municipal Fund | | September 30, 2016 (Unaudited) |
share sale and redemption activity, continuing enhancements to the Advisor’s electronic and information systems and the Advisor’s engagement of outside firms to assist in improving or replacing those systems, the Advisor’s evaluation and selection of firms providing portfolio trade execution to the Fund and the Advisor’s measures to obtain favorable trade execution, the Advisor’s performance of accounting and other services, the Advisor’s continued commitment to observance of compliance and regulatory requirements, the Advisor’s responsiveness to the Trustees, the quality and extent of written and oral reports to the Trustees over the course of the year, and other factors.
Investment Performance. The Trustees noted in their evaluation of the Fund’s investment performance the reports they had received in each regular meeting over the course of the year from the Advisor’s portfolio management personnel. The Trustees also noted in their evaluation their consideration of information provided to them at their request in anticipation of their annual evaluation of the Advisor’s services, including the following items of information respecting the investment performance of the Fund: (1) the Fund’s absolute investment performance and achievement of stated objectives; (2) the Advisor’s written and oral explanations and commentary on the Fund’s performance in the context of the Fund’s objectives and reasonable expectations, and business, market and economic conditions, (3) performance data for the most recent ten calendar years, comparing the Fund’s annual investment returns to a fund category selected by an independent mutual fund analyst firm, and to a broad-based securities index, (4) the Fund’s investment performance for the three-month, year-to-date, one-year, three-year, five-year and ten-year periods ending with the second quarter of the current year, comparing the Fund’s annualized returns to two mutual fund categories selected by independent mutual fund analyst firms and to a broad-based securities index, and assigning a percentage rank to the Fund’s performance for each period relative to each of the fund categories, and (5) comparative measures of correlation to equity indices, portfolio volatility, risk and return.
The Trustees noted that quarterly reports during the year and other information presented to them confirmed the Advisor’s continued conformity to the Fund’s stated investment objectives and policies.
The Trustees observed in reviewing comparative performance data for the ten most recent calendar years that the Fund’s investment return for the most recent calendar year was comparable to the return of the securities index and higher than the average return for the fund category considered, that the Fund’s returns for the preceding nine calendar years exceeded or were comparable to the returns of the index in seven of the nine years, and that the Fund’s returns exceeded or were comparable to the average returns of the fund category in all nine years. Other quantitative data noted by the Trustees as having been considered showed that the Fund’s annualized investment returns fell in the second quartile of investment performance of the first of two fund categories for the one-year period ended with the second quarter of the current year, and fell in the top decile of performance for the three-year, five-year and ten-year periods. Noted data also showed that the Fund’s annualized investment returns fell in the top quartile of performance of the second fund category for the one-year, three-year and five-year periods ended with the second quarter of the current year, and fell in the top decile of performance for the ten-year period. Measures of portfolio volatility, risk and relative return considered by the Trustees demonstrated that the Fund’s performance relative to these measures continued to fulfill expectations in current conditions. The Trustees attached additional significance to the performance of the Fund from the perspective of longer term shareholders.
Comparisons of Fee and Expense Levels. The Trustees recognized in their evaluation the clear disclosures of the Advisor’s fees and Fund expenses in the Fund’s prospectuses. Information noted by the Trustees as having been considered in this context included a variety of comparative data respecting the Fund’s fee and expense levels. This information included comparisons of the Fund’s advisory fee and overall Fund expenses to median and average fees and expenses charged to a category of mutual funds selected by an independent mutual fund analyst firm, comparisons of the advisory fee and other Fund expenses to the fee levels and expenses for two representative share classes of fund peer groups selected from the category by a second independent mutual fund analyst firm, the perspectives and advice from the second mutual fund analyst firm respecting comparisons of fund fee levels and expenses to fund peer groups, and other information. Comparative fee and expense data noted as having been considered by the Trustees showed that the Fund’s advisory fee was comparable to the median and average fee levels for the fund category, that the level of total expense for a representative share class was slightly higher than the median and comparable to the average levels for the category, and that the level of total expense for a second representative share class was lower than the median and average levels for the category. Peer group data showed that the advisory fee level was comparable to the medians of the two peer groups considered, and that the total expense level of one representative share class was at the top of the range of levels for its peer group and the total expense level of the second representative share class was comparable to the median level of its peer group. The Trustees did not find the differences significant in view of the other factors considered.
The Trustees noted their consideration of information respecting the advisory fees charged by the Advisor to other investment management clients, including sub-advised mutual funds, together with information about fees charged by other advisors to different clients, analysis of the differences between the requirements of institutional clients and mutual funds, analysis of the differences between the requirements of a sub-advised mutual fund and a fund as to which the investment advisor is the primary advisor and sponsor, descriptions of distinguishing characteristics of the sub-advised funds served by the Advisor, and the consequently different investment management services provided to the different categories of clients and the differing contexts in which the fee levels for these arrangements are established. The Trustees confirmed their previous observations that the differences between the fees charged by the Advisor to different types of clients did not appear exceptional, and that the fee rates charged by an investment advisor to different categories
34 Annual Report
| | |
| OTHER INFORMATION, CONTINUED | | |
| |
Thornburg California Limited Term Municipal Fund | | September 30, 2016 (Unaudited) |
of clients had limited relevance to the evaluation of the fee rate charged by that advisor to mutual funds as to which it is the primary advisor and sponsor.
Costs and Profitability of Advisor. In reviewing the profitability of the Advisor’s services to the Fund the Trustees considered an analysis of the Advisor’s costs and the profitability to the Advisor of its services, together with data respecting the overall profitability of a selection of other investment management firms. The Trustees noted that a portion of the Advisor’s profits are an important element in the compensation of shareholder employees. The Trustees considered in this regard information from the Advisor respecting investment of its profits to maintain staffing levels, pay competitive levels of compensation, and add to its information retrieval and management systems to maintain or improve service levels. The Trustees also considered the contribution of the Advisor’s cost management to its profitability, and the relationship of the Advisor’s financial resources and profitability in previous years to its ability to attract necessary personnel, invest in systems and other assets required for its service to the Fund, and maintain or improve service levels for the Fund notwithstanding fluctuations in revenues and profitability. The information considered did not indicate to the Trustees that the Advisor’s profitability was excessive.
Potential Economies of Scale. In reviewing the extent to which economies of scale would be realized by the Fund as it grows and whether fee levels reflect potential economies of scale, the Trustees considered the breakpoint structure for advisory fees chargeable to the Fund, comparisons of the fee breakpoint structure for the Fund with breakpoint structures (or the absence of such structures) for other funds in a peer group selected by an independent mutual fund analyst firm, the effects of the breakpoint structure and other expense factors realized by certain Funds of the Trust as their asset levels had increased, and the Advisor’s expenditures from its own profits and resources to maintain staffing levels, pay competitive levels of compensation, and add to its information retrieval and management systems to maintain or improve service levels. The information provided demonstrated to the Trustees that the Fund’s advisory fee breakpoint structure is reasonable in relation to the structures observed in the other funds in its peer group, and that shareholders may be expected to benefit from any economies of scale, due to the advisory agreement’s breakpoint fee structure for the Fund and other factors.
Potential Ancillary Benefits. In reviewing potential benefits to the Advisor because of its relationship to the Fund, the Trustees noted disclosures by the Advisor of its receipt of certain research services from broker dealers, and the benefits to both the Fund and the Advisor of the Advisor’s expansion of its staffing, compliance and systems capabilities and other resources to serve a broader variety of investment management clients. No unusual or unfair benefits to the Advisor from its relationship to the Fund were identified by the Trustees.
Summary of Conclusions. The Trustees concluded that the nature, extent and quality of the Advisor’s services performed under the advisory agreement remained sufficient. The Trustees further concluded that the absolute and relative investment performance of the Fund over a range of pertinent holding periods on the whole was satisfactory in the context of its objectives and strategies, and that the Advisor had continued to actively and competently pursue the Fund’s stated investment objectives and adhere to the Fund’s investment policies.
The Trustees further concluded, based upon their consideration of the foregoing factors and other information, that the level of the advisory fee charged to the Fund by the Advisor is reasonable in relation to the services provided by the Advisor in view of the nature, extent and quality of those services, the investment performance of the Fund after fees and expenses, the clear disclosure of fees and expenses in the Fund’s prospectus, comparisons of fees and expenses charged to the Fund to fees and expenses charged to other mutual funds, and the other factors considered.
Annual Report 35
TRUSTEES’ STATEMENT TO SHAREHOLDERS
Readopted September 12, 2016
The Trustees believe current and prospective shareholders should know how we discharge our responsibilities in supervising the Funds’ investment advisor and in reviewing the advisor’s contract for renewal. Since 2005, we have issued a statement which sets out clearly the three principal guidelines that we follow in supervising the Trust’s investment advisor on your behalf. In accordance with our customary practice, in September of this year we again reviewed our statement and concluded we should reissue this statement outlining the principal features of our supervision of the advisor’s performance of investment management services for the Funds.
We begin with the premise that each shareholder selected his or her Fund because its investments are managed by the investment advisor identified in the prospectus and in accordance with the objective and policies described in the prospectus. We realize, as each of you do, that if you believe that your Fund’s stated objective and policies no longer serve your personal investment goals, you can sell your shares and leave the Fund.
Therefore, we believe that our primary supervisory task – our principal obligation to you – is to assess the nature and quality of the advisor’s services, and to confirm that the advisor actively and competently pursues the Fund’s objective, in accordance with the policies set out in the prospectus. To do this, we meet regularly with management to review your Fund’s portfolio and to discuss the advisor’s specific actions and judgments in pursuing the Fund’s objective. We do not substitute our own judgment for the advisor’s decisions in selecting investments; the advisor is paid to exercise its informed judgment on investment decisions, and we seek to confirm, in reviewing the advisor’s performance, that the advisor is doing just that.
Second, we are conscious of costs and the effect that costs have on shareholders’ returns. We try to make sure that your Fund’s fees and costs are reasonable in relationship to the services rendered and that they are generally in line with those charged by other expert investment advisors, consistent with our belief that the Fund’s investors searched for and expect that expertise and attention and have decided to pay a reasonable price for it. We do not put the management contract “out to bid” as a matter of course, and we would not do so unless we had concluded that the advisor materially had failed to pursue the Fund’s objectives in accordance with its policies, or for other equally important reasons. We believe that any other approach would be inconsistent with your interests and contrary to your expectations when you bought shares of the Fund in the first place.
Finally, because we believe that most Thornburg Fund shareholders have invested with a long-term perspective, we try not to focus too much on the fashions of the moment and on short-term performance. The market will not favor any specific investment objective or set of policies at all times and under all economic circumstances. A fund will experience periods of both high and low returns relative to other funds and other investments. Even if one of our Funds is not favored by the market at a particular time, we believe that the advisor is nonetheless obliged to remain true to the Fund’s objective and policies, and we watch to see that it does so.
Trustees of Thornburg Investment Trust
36 Annual Report
THORNBURG FUNDS
Thornburg Investment Management is a privately-owned global investment firm that offers a range of solutions for retail and institutional investors. Founded in 1982 and headquartered in Santa Fe, New Mexico, we manage approximately $53 billion (as of September 30, 2016) across eight equity and 11 bond mutual funds, separate accounts for high-net-worth investors and institutional accounts, and five UCITS funds for non-U.S. investors.
The fund outlined in this report is one of many equity and fixed-income products available from Thornburg Investment Management.
Equity Funds
| | • | | Thornburg Core Growth Fund |
| | • | | Thornburg International Value Fund |
| | • | | Thornburg Better World International Fund |
| | • | | Thornburg International Growth Fund |
| | • | | Thornburg Developing World Fund |
| | • | | Thornburg Investment Income Builder Fund |
| | • | | Thornburg Global Opportunities Fund |
Fixed Income Funds
| | • | | Thornburg Low Duration Income Fund |
| | • | | Thornburg Limited Term U.S. Government Fund |
| | • | | Thornburg Limited Term Income Fund |
| | • | | Thornburg Strategic Income Fund |
| | • | | Thornburg Low Duration Municipal Fund |
| | • | | Thornburg Limited Term Municipal Fund |
| | • | | Thornburg Intermediate Municipal Fund |
| | • | | Thornburg California Limited Term Municipal Fund |
| | • | | Thornburg New Mexico Intermediate Municipal Fund |
| | • | | Thornburg New York Intermediate Municipal Fund |
| | • | | Thornburg Strategic Municipal Income Fund |
Before investing, carefully consider the Fund’s investment goals, risks, charges, and expenses. For a prospectus or summary prospectus containing this and other information, contact your financial advisor or visit thornburg.com. Read it carefully before investing.
For additional information, please visit thornburg.com
Thornburg Investment Management, Inc. 2300 North Ridgetop Road, Santa Fe, NM 87506
Annual Report 37
This page intentionally left blank.
38 Annual Report
This page intentionally left blank.
Annual Report 39

| | | | |
| To receive shareholder reports, prospectuses, and proxy statements electronically, go to www.thornburg.com/edelivery. | | 
|
| This Annual Report is submitted for the general information of shareholders of the Fund. It is not authorized for distribution to prospective investors in the Fund unless preceded or accompanied by an effective prospectus. | |
| | | | |
| Investment Advisor: | | Distributor: | | |
| Thornburg Investment Management® | | Thornburg Securities Corporation® | | |
| 800.847.0200 | | 800.847.0200 | | TH859 |
Annual Report
September 30, 2016
THORNBURG
NEW MEXICO
INTERMEDIATE
MUNICIPAL
FUND
Thornburg
INVESTMENT MANAGEMENT
About Thornburg Investment Management
It’s more than what we do.
It’s how we do it.
At Thornburg, we are very different in how we think, invest, and are structured. We believe this difference is what makes us successful in helping individuals reach their long-term financial goals.
How we THINK Flexible Perspective Our perspective on investment opportunities is more flexible than most, viewing a wide range of opportunities beyond conventional boundaries to find hidden value. Collaboration Collectively, we hone ideas via borderless cross-pollination for better judgment and better results.
How we INVEST Portfolio Construction Disciplined construction guided more by our convictions than convention. CONVICTION Thorough analysis and our relative-value framework lead to conviction in our securities selection. UNCONVENTIONAL Active management means we seek the best value for our clients rather than using conventional benchmarks as our starting point.
How we’re STRUCTURED Structured for Excellence How we think and how we invest is made possible by how we’re structured. TEAM APPROACH FAR FROM THE HERD ACCESS & TRANSPARENCY
2 Annual Report
Annual Report
Thornburg New Mexico Intermediate Municipal Fund
September 30, 2016
| | | | |
Share Class | | NASDAQ Symbol | | CUSIP |
Class A | | THNMX | | 885-215-301 |
Class D | | THNDX | | 885-215-624 |
Class I | | THNIX | | 885-215-285 |
Minimum investments for Class I shares may be higher than those for other classes. Class I shares may not be available to all investors.
Investments carry risks, including possible loss of principal. Portfolios investing in bonds have the same interest rate, inflation, and credit risks that are associated with the underlying bonds. The value of bonds will fluctuate relative to changes in interest rates, decreasing when interest rates rise. Unlike bonds, bond funds have ongoing fees and expenses. Please see the Fund’s prospectus for a discussion of the risks associated with an investment in the Fund. Investments in the Funds are not FDIC insured, nor are they bank deposits or guaranteed by a bank or any other entity.
The laddering strategy does not assure or guarantee better performance and cannot eliminate the risk of investment losses.
Diversification does not assure or guarantee better performance and cannot eliminate the risk of investment losses.
Annual Report 3
| | |
| LETTER TO SHAREHOLDERS | | |
| |
Thornburg New Mexico Intermediate Municipal Fund | | September 30, 2016 (Unaudited) |
October 13, 2016
Dear Fellow Shareholder:
We are pleased to present the annual report for Thornburg New Mexico Intermediate Municipal Fund. The net asset value (NAV) of the Class A shares increased by 12 cents to $13.67 per share during the fiscal year ended September 30, 2016. If you were with us for the entire period, you received dividends of 29.9 cents per share. If you reinvested your dividends, you received 30.2 cents per share. Dividends were lower for Class D shares and higher for Class I shares to account for varying class-specific expenses. The Class A shares of your Fund underperformed the index with a 3.11% total return (without sales charge) for the fiscal year ended September 30, 2016, compared to the 4.99% total return for the BofA Merrill Lynch 3-15 Year U.S. Municipal Securities Index. The Fund generated 0.81% less price return and 1.07% less income than the index after accounting for the different treatment of bonds priced above and below par by the index versus the Fund.
Drivers of the Fund’s price return relative to its benchmark include its interest rate sensitivity, as measured by the Fund’s duration. Also, differing allocations along the Fund’s investment universe subtracted 0.41% of relative price performance. Sector allocations added 0.15% of relative price performance and its overweight to lower-credit-quality securities subtracted 0.21% of relative price performance. Other risk factors subtracted another 0.34% of relative price performance for the period.
The market’s returns were a result of increasing short-term rates and decreasing long-term rates, shown in Figure 1.
U.S. Economy, Fed Policy, and the Election
The U.S. economy grew at a paltry average rate of 1%, as measured by nominal gross domestic product, for the first three quarters of 2016, much lower than the almost 3% average rate for 2015.
On the employment front, the economy added approximately 200,000 jobs per month for the Fund’s 2016 fiscal year. The May jobs number was a little scary, adding only 24,000 that month. The unemployment rate ticked up to 5.0% in September of 2016 from 4.9% in August, as more previously non-participating workers returned to the labor market.
Inflation has held stable, although it did move up slightly. The Core Personal Consumption Expenditure Index (Core PCE) for August moved up to 1.7% from 1.6% in July, although well below the U.S. Federal Reserve Board’s (the Fed) 2% target.
So, all in all, the economy is still growing, jobs are being added and inflation is well behaved. This isn’t a bad scenario for municipal bond investors, except that, at current valuations and 10-year AAA municipal general obligation bonds yielding 1.64%, municipal bond investors are generally not keeping up with inflation.
Elsewhere, the Fed increased the federal funds rate 0.25% in December of 2015. Although many pundits want to blame the credit markets rout on that event, they would be wrong. Oil prices, as measured by WTI crude futures, hit a low of $34.54 on January 20, 2016. Energy producers are a highly leveraged segment of the market, whether through bank loans or other forms of debt. As market participants began to question their ability to service these loans or debt, credit spreads began to widen and the impact of these loans on the financial stability of some banks came into question. The municipal market avoided this distress because bond issuance from energy-producing states was a small fraction of the $3.8 trillion municipal bond market.
This early-2016 market turbulence, followed by the May jobs report and the “Brexit” vote in Great Britain, gave the Fed enough pause not to follow their December rate increase with another. So far through 2016, the central bank has insisted that they may increase rates again and again. Last year we said, “Regardless, waiting for the Fed to raise short-term interest rates is akin to Waiting for Godot.” Well, we are still waiting. Meanwhile, the Fed is assuring the markets that the next meeting is “live” and they may raise short-term interest rates again!
Figure I | 12-Month Change in Rates for AAA Rated General Obligation Municipal Bonds
(as of September 30, 2016)
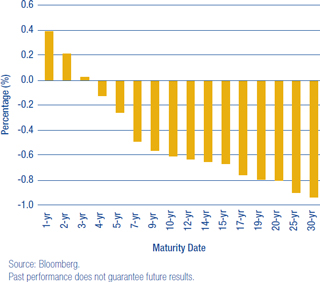
4 Annual Report
| | |
LETTER TO SHAREHOLDERS, CONTINUED | | |
| |
Thornburg New Mexico Intermediate Municipal Fund | | September 30, 2016 (Unaudited) |
The 2016 U.S. presidential race featured two major party candidates with unprecedented high unfavorable ratings with the electorate. At the time of this writing, the election’s result is weeks away. Regardless of the winner, however, the president historically has had very little impact on the course of the economy. Although there is a pattern that if the economy is doing well, the current administration likes to take all the credit; if the economy is not doing well, the current administration blames the previous one. A victory for either candidate could still benefit the municipal bond market, however, as both stumped for large increases in infrastructure spending—with one particularly calling for higher taxes which would lend support to the municipal bond market. If this gets through Congress, it could mean a higher level of municipal bond issuance and ultimately high growth rates for the economy; both occurrences would put upward pressure on municipal bond yields.
The Municipal Bond Market
The value metrics we use at Thornburg all suggest that the municipal bond market is pricing-in the rosiest of scenarios going forward. The main reason for this is that global central banks, with their overly accommodative monetary policies, have pushed investors further out on the risk spectrum in search of yield. That is why, depending on the fund, we have our portfolios positioned in the lower end of their respective risk spectrums. This means that durations (a measure of price sensitivity to changes in interest rates) are low and credit quality is higher than in the past. We continually ask ourselves: are investors getting paid to take risk? The answer we come up with is no!
Inside the Risk Metrics
Let’s first look at real yields, which is how much yield over inflation investors are being paid to own municipal bonds. As mentioned earlier, 10-year AAA general obligation bonds are yielding 1.64% and Core PCE is running at 1.70%, so investors are earning less than inflation. Over the last 20 years, investors have earned an average of 2.0% over inflation for the opportunity to invest in a 10-year AAA general obligation municipal bond.
The second thing to consider is credit spreads, which reflect the incremental yield an investor earns from owning a lower-rated credit versus a higher-rated credit, and which are now very narrow. As of September 30, 2016, an investor earned about 1% more for owning a 10-year BBB revenue bond versus a 10-year AAA general obligation bond. That is slightly higher than the average 0.75% an investor earned between 1994 and 2007. In 2007, approximately 50% of the new issue municipal bond market was insured by AAA/AAA municipal bond insurers. Today, there are no AAA/AAA municipal bond insurers, and insurance coverage generally accounts for only 6% to 8% of the new issue municipal bond market. On top of that, the security covenants of some current lower-quality investment grade securities are the most lax in years. This is a great time to be an issuer of lower-quality investment grade municipal bonds but not a great time to be an investor in them.
Finally, the slope of the yield curve, which tracks how much incremental yield an investor earns by owning securities with longer maturities, is also quite flat. Currently, investors are earning 0.78% more for owning a 10-year AAA general obligation municipal bond, versus a 1-year AAA general obligation municipal bond. Since 1994, an investor earned on average almost 1.60% to extend maturities from one to 10 years. The stretch for income is causing investors to absorb more risk at lower and lower relative yields.
The New Mexico Economy
New Mexico’s economy has been struggling a bit in the last year, as most energy dependent states have. Several statistics measured from the second quarter of 2015 through the second quarter of 2016 illustrate this struggle. Personal income is up 2.11%, which is in the middle of a distribution ranging from negative 2.41% to 4.94%. State tax revenues are down 3.77% in a distribution that is all over the place. Home prices are up 2.61%. The Bloomberg Economic Evaluation of States shows New Mexico’s overall reading as negative 0.27, while the lowest reading in the distribution is negative 15.51.
Pensions are still a troubling issue. New Mexico is 2014’s 23rd most underfunded pension system, with a 69.7% funding level.
Some 35 states reported a pension funding ratio of under 80% in 2014—the Mendoza line between a well-funded state pension and the “other kind.” As the worst career hitter in major league baseball history (.200 batting average), Mario Mendoza Aizpuru’s name ubiquitously symbolizes futility.
Liquidity
Market liquidity is still a concern. The latest example of this is what is happening to yields on Variable Rate Demand Notes (VRDNs). These are securities that are normally held in money market funds and bond fund reserve positions. They can be put back to an intermediary on a daily basis and are relatively secure. Leading up to the finalization of the Securities and Exchange Commission’s money market fund reform in October of 2016, money market funds were and are repositioning themselves to be compliant with the new regulations. As such they have had to divest themselves of VRDNs. Intermediaries do not want to hold them on their balance sheets (very expensive), so they raise the yields to clear the market. What used to yield 0.01% in March now yields, as of the time of this writing, 0.90%, or more than a 3-year AA security. This is serendipity for managers like Thornburg holding higher reserves because of concern over market liquidity; for issuers in the VRDN market, it’s not so much.
Annual Report 5
| | |
LETTER TO SHAREHOLDERS, CONTINUED | | |
| |
Thornburg New Mexico Intermediate Municipal Fund | | September 30, 2016 (Unaudited) |
Main Reason to Own Municipal Bonds
One of the best risk-mitigating tools an investor has is diversification. By splitting a portfolio into several asset classes, an investor may reduce the volatility of the resulting portfolio’s returns. This is because the returns of various asset classes are not always correlated. There are times when this is not the case, such as the 2008 financial crisis when all correlations went to one. For the long-term investor, however, we believe the benefits of diversification stand firm. When added to a portfolio of stocks, municipal bonds tend to reduce the volatility of that combined portfolio. Funds such as Thornburg New Mexico Intermediate Municipal Fund may be a viable choice in a total diversified portfolio of stocks and bonds.
Conclusion
We continue to run this portfolio as an actively managed laddered portfolio. Laddering a portfolio is a simple way to diversify its investment along its entire investment universe. While past performance does not guarantee future results, our study showed that this structure outperformed other structures around 60% of the time and added 0.15% to 0.25% of total return annually.* Our view is that the current investment environment is not compensating investors enough to take on extra risk, so we have positioned our portfolios at the lower end of their risk spectrums.
Thank you for your continued trust in us.
Sincerely,
| | | | |
 | |  | | |
Christopher Ryon, CFA | | Nicholos Venditti, CFA | | |
| Portfolio Manager | | Portfolio Manager | | |
| Managing Director | | Managing Director | | |
| * | We examined three hypothetical portfolios of bonds from December 1997 to December 2015. One using a laddering strategy, one using a barbell strategy, and a third using a bullet strategy. For the laddering strategy, the BofA Merrill Lynch 1–12 Year Municipal Index was used as a proxy, since, similar to a ladder, it contains bonds relatively evenly spread across all maturities within the index. The barbell strategy is a duration management technique wherein bonds are clustered at the two extremes of a maturity range. For the barbell strategy, the BofA Merrill Lynch 1–3 Year Municipal Index and BofA Merrill Lynch 8–12 Year Municipal Index were combined. The two indices were weighted in such a way as to give them the same duration as the broader 1–12 Year Index, and each year the portfolio was re-weighted back to the original index weights. This was done to make the two portfolios duration-neutral so that the impact of the strategy chosen could be isolated. The bullet strategy invests at the duration midpoint of the portfolio, therefore the BofA Merrill Lynch 6–8 Year Index was used to represent the bullet strategy. For additional information, see www.thornburg.com/whyladder. Past performance does not guarantee future results. |
The matters discussed in this report may constitute forward-looking statements made pursuant to the safe harbor provisions of the Securities Litigation Reform Act of 1995. These include any advisor or portfolio manager prediction, assessment, analysis or outlook for individual securities, industries, investment styles, market sectors and/or markets. These statements involve risks and uncertainties. In addition to the general risks described for each fund in its current prospectus, other factors bearing on these reports include the accuracy of the advisor’s or portfolio manager’s forecasts and predictions, the appropriateness of the investment strategies designed by the advisor or portfolio manager and the ability of the advisor or portfolio manager to implement their strategies efficiently and successfully. Any one or more of these factors, as well as other risks affecting the securities markets generally, could cause the actual results of any fund to differ materially as compared to its benchmarks.
The views expressed by the portfolio managers reflect their professional opinions and are subject to change. Under no circumstances does the information contained within represent a recommendation to buy or sell any security.
6 Annual Report
| | |
| PERFORMANCE SUMMARY | | |
| |
Thornburg New Mexico Intermediate Municipal Fund | | September 30, 2016 (Unaudited) |
Average Annual Total Returns
| | | | | | | | | | | | | | | | | | | | |
| | | 1-Yr | | | 3-Yr | | | 5-Yr | | | 10-Yr | | | Since
Incep. | |
A Shares (Incep: 6/18/91) | | | | | | | | | | | | | | | | | | | | |
Without sales charge | | | 3.11 | % | | | 3.36 | % | | | 2.63 | % | | | 3.47 | % | | | 4.49 | % |
With sales charge | | | 1.02 | % | | | 2.67 | % | | | 2.21 | % | | | 3.26 | % | | | 4.40 | % |
D Shares (Incep: 6/1/99) | | | 2.94 | % | | | 3.10 | % | | | 2.39 | % | | | 3.20 | % | | | 3.41 | % |
I Shares (Incep: 2/1/07) | | | 3.53 | % | | | 3.69 | % | | | 2.98 | % | | | — | | | | 3.89 | % |
30-day Yields, A Shares
(with sales charge)
| | | | |
Annualized Distribution Yield | | | 2.29 | % |
| |
SEC Yield | | | 0.68 | % |
Growth of a Hypothetical $10,000 Investment
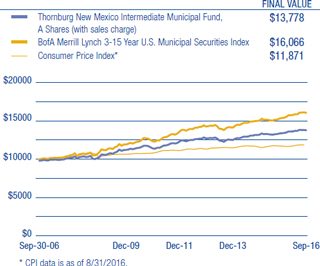
Performance data shown represents past performance and is no guarantee of future results. Investment return and principal value will fluctuate so shares, when redeemed, may be worth more or less than their original cost. Current performance may be lower or higher than quoted. For performance current to the most recent month end, visit thornburg.com or call 800-847-0200. The performance information does not reflect the deduction of taxes that a shareholder would pay on distributions or the redemption of Fund shares. Returns reflect the reinvestment of dividends and capital gains. Class A shares are sold with a maximum sales charge of 2.00%. There is no sales charge for Class D and Class I shares. As disclosed in the most recent prospectus, the total annual fund operating expenses are as follows: A shares, 0.98%; D shares, 1.20%; I shares, 0.65%.
Glossary
BofA Merrill Lynch 3-15 Year U.S. Municipal Securities Index – A subset of the BofA Merrill Lynch U.S. Municipal Securities Index including all securities with a remaining term to final maturity greater than or equal to 3 years and less than 15 years.
The BofA Merrill Lynch indices used in the Ladder vs Barbell & Bullet study are model portfolios of municipal obligations throughout the United States, with maturities ranging either from one to three years, six to eight years, eight to twelve years, or one to twelve years. These indices are subsets of the BofA Merrill Lynch U.S. Municipal Securities Index, which is comprised of U.S. dollar denominated investment grade tax-exempt debt publicly issued by U.S. states and territories, and their political subdivisions, in the U.S. domestic market. Qualifying securities must have at least a one-year remaining term to final maturity, a fixed coupon schedule and an investment grade rating.
Unless otherwise noted, index returns reflect the reinvestment of income dividends and capital gains, if any, but do not reflect fees, brokerage commissions or other expenses of investing. Investors may not make direct investments into any index. The performance of any index is not indicative of the performance of any particular investment.
Annualized Distribution Yield – The distribution yield reflects actual distributions made to shareholders. The annualized distribution yield is calculated by summing the last 30 days of income at a given month end and annualizing to a 360-day year. The result is divided by the ending maximum offering price.
Bloomberg Economic Evaluation of States (BEES) Index – A survey, updated quarterly, that examines the pace of states’ growth following the 18-month recession that officially ended in June 2009. The analysis examines six factors to measure the states and the District of Columbia against one another: unemployment, tax collections, residents’ personal income, housing prices, mortgage delinquencies and the stock-market performance of locally based companies.
Bond Credit Ratings (Credit Quality) – A bond credit rating assesses the financial ability of a debt issuer to make timely payments of principal and interest. Ratings of AAA (the highest), AA, A, and BBB are investment-grade quality. Ratings of BB, B, CCC, CC, C and D (the lowest) are considered below investment grade, speculative grade, or junk bonds.
Core Personal Consumption Expenditure Index (Core PCE) – A measure of the Personal Consumption Expenditure Index that excludes the more volatile and seasonal food and energy prices.
Credit Spread/Quality Spread – The difference between the yields of securities with different credit qualities.
Duration – A bond’s sensitivity to interest rates. Effective duration incorporates the embedded option features, such as call provisions. Bonds with longer durations experience greater price volatility than bonds with shorter durations.
General Obligation Bond (GO) – A municipal bond backed by the credit and “taxing power” of the issuing jurisdiction rather than the revenue from a given project.
Gross Domestic Product (GDP) – A country’s income minus foreign investments: the total value of all goods and services produced within a country in a year, minus net income from investments in other countries.
Laddering – Involves building a portfolio of bonds with staggered maturities so that a portion matures each year. Money that comes in from maturing bonds is typically invested in bonds with longer maturities at the far end of the portfolio.
Revenue Bond – A bond on which the debt service is payable solely from the revenue generated from the operation of the project being financed or a category of facilities, or from other non-tax sources.
SEC Yield – SEC yield is computed in accordance with SEC standards measuring the net investment income per share over a specified 30-day period expressed as a percentage of the maximum offering price of the Fund’s shares at the end of the period.
Variable Rate Demand Note (VRDN) – VRDNs are long-term, floating-rate municipal securities. These highly liquid securities are payable on demand, typically either daily or weekly, meaning the investor can request repayment of the entire debt amount. The coupon rate will adjust on a periodic basis, either daily or weekly.
West Texas Intermediate (WTI) – A grade of crude oil used as a benchmark in oil pricing.
Yield Curve – A line that plots the interest rates, at a set point in time, of bonds having equal credit quality, but differing maturity dates.
Annual Report 7
| | |
| FUND SUMMARY | | |
| |
Thornburg New Mexico Intermediate Municipal Fund | | September 30, 2016 (Unaudited) |
Objectives and Strategies
The Fund’s primary investment objective is to obtain as high a level of current income exempt from federal and New Mexico state individual income taxes as is consistent, in the view of the investment advisor, with preservation of capital.
The secondary goal of the Fund is to reduce expected changes in its share price compared to long-term bond portfolios.
This Fund offers New Mexico investors double tax-free yields (may be subject to Alternative Minimum Tax) in a laddered municipal bond portfolio with a dollar-weighted average maturity of normally three to ten years. Laddering involves building a portfolio of bonds with staggered maturities so that a portion of the portfolio matures each year. Cash from maturing bonds, if not needed for other purposes, is typically invested in bonds with longer maturities at the far end of the ladder. We regard the strategy as a good compromise for managing different types of risk.
Key Portfolio Attributes
| | | | |
Number of Bonds | | | 136 | |
| |
Effective Duration | | | 4.3 Yrs | |
| |
Average Maturity | | | 7.7 Yrs | |
Long-Term Stability of Principal
Net Asset Value History of A Shares
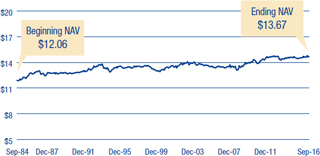
Security Credit Ratings
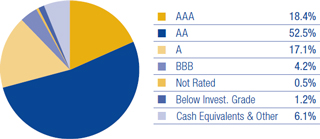
A bond credit rating assesses the financial ability of a debt issuer to make timely payments of principal and interest. Ratings of AAA (the highest), AA, A, and BBB are investment-grade quality. Ratings of BB, B, CCC, CC, C and D (the lowest) are considered below investment grade, speculative grade, or junk bonds. Credit quality ratings for Thornburg’s municipal portfolios used the highest rating available from either Standard & Poor’s or Moody’s Investors Service.
Portfolio Ladder
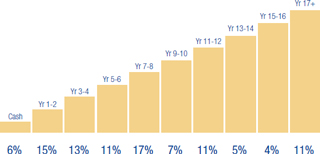
Percent of portfolio maturing in each year. Cash includes cash equivalents and other.
There is no guarantee that the Fund will meet its investment objectives.
All data is subject to change. Charts may not add up to 100% due to rounding.
8 Annual Report
| | |
| SCHEDULE OF INVESTMENTS | | |
| |
Thornburg New Mexico Intermediate Municipal Fund | | September 30, 2016 |
| | | | | | | | | | |
Issuer-Description | | Credit Rating†
S&P/ Moody’s | | Principal
Amount | | | Value | |
MUNICIPAL BONDS — 95.38% | | | | | | | | | | |
Albuquerque Bernalillo County Water Utility Authority, 5.00% due 7/1/2021 pre-refunded 7/1/2019 (New Mexico Utilities, Inc. Water System) | | AA+/Aa2 | | $ | 1,760,000 | | | $ | 1,955,237 | |
Albuquerque Bernalillo County Water Utility Authority, 5.50% due 7/1/2025 pre-refunded 7/1/2019 (New Mexico Utilities, Inc. Water System) | | AA+/Aa2 | | | 1,000,000 | | | | 1,124,490 | |
Albuquerque Bernalillo County Water Utility Authority, 5.00% due 7/1/2026 pre-refunded 7/1/2018 (San Juan-Chama Drinking Water Project) | | AA+/Aa2 | | | 1,420,000 | | | | 1,522,027 | |
Albuquerque Bernalillo County Water Utility Authority, 5.00% due 7/1/2026 (2005 NMFA Loan and Joint Water and Sewer System Improvements) | | AA+/Aa2 | | | 2,000,000 | | | | 2,485,700 | |
Albuquerque Bernalillo County Water Utility Authority, 5.00% due 7/1/2031 (2007 NMFA Loan and Joint Water and Sewer System Improvements) | | AA+/Aa2 | | | 500,000 | | | | 614,020 | |
Albuquerque Bernalillo County Water Utility Authority, 5.00% due 7/1/2032 (2007 NMFA Loan and Joint Water and Sewer System Improvements) | | AA+/Aa2 | | | 1,000,000 | | | | 1,222,680 | |
Albuquerque Municipal School District No. 12 GO, 5.00% due 8/1/2019 (Bernalillo and Sandoval Counties School Facilities) (State Aid Withholding) | | AA/Aa1 | | | 3,585,000 | | | | 3,997,060 | |
Albuquerque Municipal School District No. 12 GO, 4.00% due 8/1/2029 (Bernalillo and Sandoval Counties School Facilities) (State Aid Withholding) | | AA/Aa1 | | | 1,300,000 | | | | 1,450,215 | |
Bernalillo County, 5.00% due 4/1/2021 (Government Services; Insured: Natl-Re) | | AAA/Aa2 | | | 3,000,000 | | | | 3,279,300 | |
Bernalillo County, 5.25% due 10/1/2022 (Government Services; Insured: AMBAC) | | AAA/Aa2 | | | 3,170,000 | | | | 3,900,083 | |
Bernalillo County, 5.25% due 10/1/2023 (Government Services; Insured: AMBAC) | | AAA/Aa2 | | | 1,275,000 | | | | 1,601,349 | |
Bernalillo County, 5.25% due 10/1/2025 (Government Services; Insured: AMBAC) | | AAA/Aa2 | | | 3,850,000 | | | | 4,947,519 | |
Bernalillo County, 5.25% due 4/1/2027 (Government Services) | | AAA/Aa2 | | | 300,000 | | | | 377,868 | |
Bernalillo County, 5.70% due 4/1/2027 (Government Services) | | AAA/Aa2 | | | 3,000,000 | | | | 3,899,010 | |
Bernalillo County, 5.70% due 4/1/2027 (Government Services; Insured: Natl-Re) | | AAA/Aa2 | | | 815,000 | | | | 1,059,231 | |
Bernalillo County GO, 4.00% due 8/15/2019 (Capital Improvements) | | AAA/Aaa | | | 1,505,000 | | | | 1,636,432 | |
Carlsbad Municipal School District GO, 5.00% due 8/1/2018 (Educational Facilities) (State Aid Withholding) | | NR/Aa1 | | | 1,000,000 | | | | 1,075,850 | |
Carlsbad Municipal School District GO, 5.00% due 8/1/2023 (Educational Facilities) (State Aid Withholding) | | NR/Aa1 | | | 1,650,000 | | | | 2,043,624 | |
Central New Mexico Community College GO, 5.00% due 8/15/2020 (Campus Buildings Acquisition & Improvements) | | AA+/Aa1 | | | 1,375,000 | | | | 1,583,532 | |
Central New Mexico Community College GO, 5.00% due 8/15/2021 (Campus Buildings Acquisition & Improvements) | | AA+/Aa1 | | | 1,435,000 | | | | 1,699,743 | |
Central New Mexico Community College GO, 5.00% due 8/15/2022 (Campus Buildings Acquisition & Improvements) | | AA+/Aa1 | | | 1,100,000 | | | | 1,336,269 | |
Central New Mexico Community College GO, 4.00% due 8/15/2023 (Campus Buildings Acquisition & Improvements) | | AA+/Aa1 | | | 1,920,000 | | | | 2,152,531 | |
Cibola County, 5.00% due 6/1/2025 (County Building Improvements) | | NR/A2 | | | 360,000 | | | | 441,670 | |
Cibola County, 5.00% due 6/1/2025 (County Building Improvements) | | NR/NR | | | 355,000 | | | | 435,535 | |
City of Albuquerque, 5.00% due 7/1/2021 (Lodgers’ Tax Obligation Reserve Fund) | | AAA/Aa2 | | | 1,340,000 | | | | 1,481,692 | |
City of Albuquerque, 5.00% due 7/1/2021 (Lodgers’ Tax Obligation Reserve Fund) | | AAA/Aa2 | | | 3,000,000 | | | | 3,317,220 | |
City of Albuquerque, 5.00% due 7/1/2025 (I-25/Paseo del Norte Interchange) | | AAA/Aa2 | | | 540,000 | | | | 662,105 | |
City of Albuquerque, 5.00% due 7/1/2027 (I-25/Paseo del Norte Interchange) | | AAA/Aa2 | | | 555,000 | | | | 677,500 | |
City of Albuquerque, 5.00% due 7/1/2033 (City Infrastructure Improvements) | | AAA/Aa2 | | | 1,100,000 | | | | 1,337,127 | |
City of Albuquerque, 5.00% due 7/1/2034 (City Infrastructure Improvements) | | AAA/Aa2 | | | 1,200,000 | | | | 1,453,380 | |
City of Farmington, 5.00% due 6/1/2017 (San Juan Regional Medical Center) | | NR/A3 | | | 530,000 | | | | 543,616 | |
City of Farmington, 5.125% due 6/1/2018 (San Juan Regional Medical Center) | | NR/A3 | | | 570,000 | | | | 572,103 | |
City of Farmington, 5.125% due 6/1/2019 (San Juan Regional Medical Center) | | NR/A3 | | | 645,000 | | | | 647,367 | |
City of Farmington, 5.00% due 6/1/2022 (San Juan Regional Medical Center) | | NR/A3 | | | 2,825,000 | | | | 2,901,642 | |
City of Farmington, 4.70% due 5/1/2024 (Arizona Public Service Co.-Four Corners Project) | | A-/A2 | | | 965,000 | | | | 1,072,347 | |
City of Farmington, 4.70% due 9/1/2024 (Arizona Public Service Co.-Four Corners Project) | | A-/A2 | | | 4,000,000 | | | | 4,446,000 | |
City of Farmington, 1.875% due 4/1/2029 put 4/1/2020 (Southern California Edison Co.-Four Corners Project) | | A/Aa3 | | | 3,000,000 | | | | 3,056,280 | |
City of Gallup, 5.125% due 6/1/2017 (City Infrastructure Improvements) | | NR/NR | | | 140,000 | | | | 143,308 | |
City of Gallup, 5.00% due 8/15/2017 (Tri-State Generation & Transmission Assoc., Inc. Project; Insured: AMBAC) | | A/A3 | | | 3,540,000 | | | | 3,550,974 | |
City of Gallup, 5.125% due 6/1/2019 (City Infrastructure Improvements) | | NR/NR | | | 310,000 | | | | 334,254 | |
City of Las Cruces, 4.00% due 6/1/2021 (Joint Utility System) | | NR/Aa2 | | | 100,000 | | | | 113,195 | |
City of Las Cruces, 5.00% due 6/1/2021 (NMFA Loan) | | NR/Aa3 | | | 730,000 | | | | 825,812 | |
City of Las Cruces, 4.00% due 6/1/2022 (Joint Utility System) | | NR/Aa2 | | | 670,000 | | | | 771,264 | |
City of Las Cruces, 5.00% due 6/1/2022 (NMFA Loan) | | NR/Aa3 | | | 765,000 | | | | 868,719 | |
City of Las Cruces, 4.00% due 6/1/2023 (Joint Utility System) | | NR/Aa2 | | | 695,000 | | | | 811,927 | |
City of Las Cruces, 5.00% due 6/1/2023 (NMFA Loan) | | NR/Aa3 | | | 800,000 | | | | 906,920 | |
City of Las Cruces, 5.00% due 6/1/2024 (NMFA Loan) | | NR/Aa3 | | | 840,000 | | | | 950,653 | |
City of Las Cruces, 4.00% due 6/1/2025 (Joint Utility System) | | NR/Aa2 | | | 750,000 | | | | 894,157 | |
City of Las Cruces, 5.00% due 6/1/2030 (NMFA Loan) | | NR/Aa3 | | | 2,000,000 | | | | 2,253,500 | |
City of Las Cruces, 5.00% due 6/1/2037 (NMFA Loan) | | NR/Aa3 | | | 5,000,000 | | | | 5,609,900 | |
City of Rio Rancho, 2.00% due 5/15/2017 (Water and Wastewater System) | | AA-/Aa3 | | | 100,000 | | | | 100,635 | |
City of Rio Rancho GO, 5.00% due 8/1/2018 (City Road Improvements) | | NR/Aa2 | | | 615,000 | | | | 661,531 | |
City of Santa Fe, 4.00% due 6/1/2017 (Public Facility Capital Projects) | | AA+/NR | | | 100,000 | | | | 102,126 | |
City of Santa Fe, 4.50% due 5/15/2027 (El Castillo Retirement Residences) | | BBB-/NR | | | 3,275,000 | | | | 3,504,774 | |
City of Santa Fe, 5.00% due 5/15/2034 (El Castillo Retirement Residences) | | BBB-/NR | | | 1,465,000 | | | | 1,573,937 | |
City of Santa Fe GRT, 5.00% due 6/1/2028 (Public Facilities) | | AA+/NR | | | 930,000 | | | | 1,137,920 | |
City of Santa Fe GRT, 5.00% due 6/1/2029 (Public Facilities) | | AA+/NR | | | 950,000 | | | | 1,155,580 | |
Annual Report 9
| | |
| SCHEDULE OF INVESTMENTS, CONTINUED | | |
| |
Thornburg New Mexico Intermediate Municipal Fund | | September 30, 2016 |
| | | | | | | | | | |
Issuer-Description | | Credit Rating†
S&P/ Moody’s | | Principal
Amount | | | Value | |
Colfax County, 5.00% due 9/1/2019 (Government Center Facility) (ETM) | | A-/NR | | $ | 355,000 | | | $ | 380,464 | |
Colfax County, 5.50% due 9/1/2029 pre-refunded 9/1/2019 (Government Center Facility) | | A-/NR | | | 2,510,000 | | | | 2,837,530 | |
County of Los Alamos, 4.875% due 6/1/2018 (Public Facilities) | | AA+/A1 | | | 500,000 | | | | 532,165 | |
County of Los Alamos, 5.625% due 6/1/2023 pre-refunded 6/1/2018 (Public Facilities) | | AA+/A1 | | | 1,000,000 | | | | 1,078,800 | |
County of Los Alamos, 5.75% due 6/1/2024 pre-refunded 6/1/2018 (Public Facilities) | | AA+/A1 | | | 3,000,000 | | | | 3,242,610 | |
County of Los Alamos, 5.75% due 6/1/2025 pre-refunded 6/1/2018 (Public Facilities) | | AA+/A1 | | | 1,000,000 | | | | 1,080,870 | |
County of Taos, 3.00% due 4/1/2018 (County Educational Improvements; Insured: BAM) | | AA/NR | | | 1,000,000 | | | | 1,021,080 | |
Farmington Municipal School District No. 5 GO, 5.00% due 9/1/2019 (Educational Facilities) (State Aid Withholding) | | NR/Aa1 | | | 600,000 | | | | 670,470 | |
Government of Guam, 5.375% due 12/1/2024 pre-refunded 12/1/2019 (Layon Solid Waste Disposal Facility) | | BBB+/NR | | | 2,000,000 | | | | 2,273,840 | |
Government of Guam, 5.00% due 11/15/2031 (Economic Development) | | A/NR | | | 2,500,000 | | | | 2,929,125 | |
Government of Guam, 5.00% due 11/15/2033 (Economic Development) | | A/NR | | | 2,500,000 | | | | 2,907,300 | |
Grant County, 5.50% due 7/1/2020 (State Dept. of Health-Ft. Bayard Project) | | AA/Aa1 | | | 1,565,000 | | | | 1,683,330 | |
Grant County, 5.50% due 7/1/2021 (State Dept. of Health-Ft. Bayard Project) | | AA/Aa1 | | | 1,655,000 | | | | 1,780,135 | |
Grant County, 5.50% due 7/1/2022 (State Dept. of Health-Ft. Bayard Project) | | AA/Aa1 | | | 1,745,000 | | | | 1,876,939 | |
Guam Power Authority, 5.00% due 10/1/2026 (Electric Power System; Insured: AGM) | | AA/A2 | | | 2,000,000 | | | | 2,361,040 | |
Las Cruces School District No. 2 GO, 2.00% due 8/1/2018 (New Mexico SD Credit Enhancement Program) (State Aid Withholding) | | NR/Aa1 | | | 630,000 | | | | 642,373 | |
Los Alamos Public School District GO, 3.00% due 8/1/2018 (Educational Facilities) (State Aid Withholding) | | NR/Aa1 | | | 400,000 | | | | 415,608 | |
New Mexico Educational Assistance Foundation, 4.00% due 9/1/2017 (Student Loans) | | NR/Aaa | | | 1,150,000 | | | | 1,183,131 | |
New Mexico Educational Assistance Foundation, 5.00% due 12/1/2019 (Student Loans) | | AAA/Aaa | | | 1,000,000 | | | | 1,123,580 | |
New Mexico Educational Assistance Foundation, 5.00% due 12/1/2022 (Student Loans) | | AAA/Aaa | | | 3,000,000 | | | | 3,429,870 | |
New Mexico Finance Authority, 5.00% due 12/15/2017 (State Highway Infrastructure) | | AA/Aa2 | | | 250,000 | | | | 262,513 | |
New Mexico Finance Authority, 5.00% due 12/15/2018 pre-refunded 12/15/2016 (GRIP Transportation Projects) | | AAA/Aa1 | | | 150,000 | | | | 151,320 | |
New Mexico Finance Authority, 5.00% due 6/15/2022 (The Public Project Revolving Fund Program; Insured: Natl-Re) | | AA+/Aa2 | | | 1,300,000 | | | | 1,336,660 | |
New Mexico Finance Authority, 5.00% due 6/1/2024 (The Public Project Revolving Fund Program) | | AAA/Aa1 | | | 4,185,000 | | | | 5,271,426 | |
New Mexico Finance Authority, 5.00% due 6/15/2024 (The Public Project Revolving Fund Program; Insured: Natl-Re) | | AA+/Aa2 | | | 7,000,000 | | | | 7,197,400 | |
New Mexico Finance Authority, 5.00% due 6/15/2026 (State Highway Infrastructure) | | AA/Aa2 | | | 1,220,000 | | | | 1,517,033 | |
New Mexico Finance Authority, 5.00% due 6/15/2027 (State Highway Infrastructure) | | AA/Aa2 | | | 1,195,000 | | | | 1,474,164 | |
New Mexico Finance Authority, 5.00% due 6/15/2031 (The Public Project Revolving Fund Program) | | AA+/Aa2 | | | 1,000,000 | | | | 1,224,320 | |
New Mexico Hospital Equipment Loan Council, 6.00% due 8/1/2023 pre-refunded 8/1/2018 (Presbyterian Healthcare Services) | | AA/Aa3 | | | 6,000,000 | | | | 6,552,240 | |
New Mexico Hospital Equipment Loan Council, 5.00% due 8/1/2031 (Presbyterian Healthcare Services) | | AA/Aa3 | | | 600,000 | | | | 728,316 | |
New Mexico Hospital Equipment Loan Council, 5.00% due 7/1/2032 (Haverland Carter Lifestyle Group) | | NR/NR | | | 2,000,000 | | | | 2,183,300 | |
New Mexico Hospital Equipment Loan Council, 0.86% due 8/1/2034 put 10/7/2016 (Presbyterian Healthcare Services; SPA: Wells Fargo Bank, N.A.) (weekly demand notes) | | AA/Aa3 | | | 3,700,000 | | | | 3,700,000 | |
New Mexico Hospital Equipment Loan Council, 5.00% due 8/1/2039 (Presbyterian Healthcare Services) | | AA/Aa3 | | | 3,000,000 | | | | 3,272,910 | |
New Mexico Housing Authority, 5.30% due 12/1/2022 (El Paseo Apartments; Insured: AMBAC) (AMT) | | NR/NR | | | 595,000 | | | | 595,601 | |
New Mexico Institute of Mining and Technology, 5.00% due 7/1/2020 (Campus Buildings Acquisition & Improvements) | | A+/A1 | | | 590,000 | | | | 670,387 | |
New Mexico Institute of Mining and Technology, 5.00% due 7/1/2023 (Campus Buildings Acquisition & Improvements) | | A+/A1 | | | 685,000 | | | | 801,101 | |
New Mexico Institute of Mining and Technology, 5.00% due 7/1/2024 (Campus Buildings Acquisition & Improvements) | | A+/A1 | | | 525,000 | | | | 604,165 | |
New Mexico Institute of Mining and Technology, 5.00% due 7/1/2025 (Campus Buildings Acquisition & Improvements) | | A+/A1 | | | 505,000 | | | | 579,654 | |
New Mexico Institute of Mining and Technology, 5.00% due 7/1/2028 (Campus Buildings Acquisition & Improvements) | | A+/A1 | | | 1,500,000 | | | | 1,715,850 | |
New Mexico Mortgage Finance Authority, 5.25% due 7/1/2023 (HERO SFM Loan Program; Collateralized: GNMA/FNMA/FHLMC) (AMT) | | AA+/NR | | | 410,000 | | | | 424,658 | |
New Mexico Mortgage Finance Authority, 5.375% due 7/1/2023 (Saver SFM Loan Program; Collateralized: GNMA/FNMA/FHLMC) (AMT) | | AA+/NR | | | 210,000 | | | | 210,853 | |
New Mexico Mortgage Finance Authority, 4.625% due 3/1/2028 (NIBP SFM Loan Program; Collateralized: GNMA/FNMA/FHLMC) | | AA+/NR | | | 1,060,000 | | | | 1,124,119 | |
New Mexico Mortgage Finance Authority, 5.50% due 7/1/2028 (HERO SFM Loan Program; Collateralized: GNMA/FNMA/FHLMC) (AMT) | | AA+/NR | | | 900,000 | | | | 927,081 | |
New Mexico Mortgage Finance Authority, 5.60% due 7/1/2028 (Saver SFM Loan Program; Collateralized: GNMA/FNMA/FHLMC) (AMT) | | AA+/NR | | | 190,000 | | | | 196,158 | |
New Mexico Mortgage Finance Authority, 5.40% due 9/1/2029 (Saver SFM Loan Program; Collateralized: GNMA/FNMA/FHLMC) | | AA+/NR | | | 480,000 | | | | 509,112 | |
Regents of the University of New Mexico, 6.00% due 6/1/2021 (Campus Buildings Acquisition & Improvements) | | AA/Aa2 | | | 370,000 | | | | 412,062 | |
Regents of the University of New Mexico, 0.83% due 6/1/2026 put 10/7/2016 (Campus Buildings Acquisition & Improvements) (weekly demand notes) | | AA/Aa2 | | | 1,000,000 | | | | 1,000,000 | |
Regents of the University of New Mexico, 0.83% due 6/1/2030 put 10/7/2016 (Campus Buildings Acquisition & Improvements; SPA: U.S. Bank, N.A.) (weekly demand notes) | | AA/Aa2 | | | 1,950,000 | | | | 1,950,000 | |
Regents of the University of New Mexico, 4.50% due 6/1/2034 (Campus Buildings Acquisition & Improvements) | | AA/Aa2 | | | 1,500,000 | | | | 1,766,100 | |
Regents of the University of New Mexico, 4.50% due 6/1/2035 (Campus Buildings Acquisition & Improvements) | | AA/Aa2 | | | 1,500,000 | | | | 1,759,035 | |
Regents of the University of New Mexico, 4.50% due 6/1/2036 (Campus Buildings Acquisition & Improvements) | | AA/Aa2 | | | 1,500,000 | | | | 1,754,820 | |
Rio Rancho Public School District No. 94 GO, 3.00% due 8/1/2017 (State Aid Withholding) | | NR/Aa1 | | | 2,530,000 | | | | 2,576,805 | |
San Juan County, 4.00% due 6/15/2017 (County Capital Improvements) | | A+/A2 | | | 500,000 | | | | 510,475 | |
San Juan County, 5.00% due 6/15/2028 (County Capital Improvements) | | A+/A1 | | | 1,280,000 | | | | 1,550,886 | |
San Juan County, 5.00% due 6/15/2030 (County Capital Improvements) | | A+/A1 | | | 1,365,000 | | | | 1,636,717 | |
10 Annual Report
| | |
| SCHEDULE OF INVESTMENTS, CONTINUED | | |
| |
Thornburg New Mexico Intermediate Municipal Fund | | September 30, 2016 |
| | | | | | | | | | | | |
Issuer-Description | | Credit Rating†
S&P/ Moody’s | | | Principal
Amount | | | Value | |
Santa Fe Community College District GO, 4.00% due 8/1/2018 (Campus Buildings Acquisition & Improvements) | | | NR/Aa2 | | | $ | 1,000,000 | | | $ | 1,057,480 | |
Santa Fe County, 5.00% due 2/1/2018 (County Correctional System; Insured: AGM) | | | AA/A2 | | | | 400,000 | | | | 410,692 | |
Santa Fe County, 5.00% due 6/1/2025 pre-refunded 6/1/2018 (County Courthouse and Other Public Facilities) | | | AA+/Aa2 | | | | 1,400,000 | | | | 1,495,606 | |
Santa Fe County, 5.00% due 6/1/2026 pre-refunded 6/1/2018 (County Courthouse and Other Public Facilities) | | | AA+/Aa2 | | | | 1,535,000 | | | | 1,639,825 | |
Santa Fe County, 6.00% due 2/1/2027 (County Correctional System; Insured: AGM) | | | AA/A2 | | | | 1,520,000 | | | | 1,916,218 | |
Santa Fe County GRT, 5.00% due 6/1/2025 (County Buildings & Facilities) | | | AA+/NR | | | | 1,250,000 | | | | 1,593,325 | |
Santa Fe County GRT, 5.00% due 6/1/2026 (County Buildings & Facilities) | | | AA+/NR | | | | 640,000 | | | | 809,965 | |
Santa Fe County GRT, 5.00% due 6/1/2027 (County Buildings & Facilities) | | | AA+/NR | | | | 275,000 | | | | 342,716 | |
Santa Fe Public School District GO, 3.00% due 8/1/2017 (Santa Fe County School Facilities) (State Aid Withholding) | | | AA/Aa1 | | | | 400,000 | | | | 407,468 | |
Santa Fe Public School District GO, 5.00% due 8/1/2022 (Santa Fe County School Facilities) (State Aid Withholding) | | | AA/Aa1 | | | | 2,205,000 | | | | 2,670,586 | |
State of New Mexico, 5.00% due 7/1/2020 (Educational Facilities) | | | AA-/Aa2 | | | | 4,000,000 | | | | 4,584,640 | |
State of New Mexico, 5.00% due 7/1/2022 pre-refunded 7/1/2019 (Capital Improvements) | | | AA-/Aa2 | | | | 350,000 | | | | 388,826 | |
State of New Mexico, 5.00% due 7/1/2023 (Educational Facilities) | | | AA-/Aa2 | | | | 2,000,000 | | | | 2,472,540 | |
State of New Mexico, 5.00% due 7/1/2025 (Educational Facilities) | | | AA-/Aa2 | | | | 2,000,000 | | | | 2,557,060 | |
State of New Mexico GO, 5.00% due 3/1/2018 (Capital Improvements) | | | AA+/Aaa | | | | 1,000,000 | | | | 1,058,620 | |
Taos Municipal School District No. 1 GO, 5.00% due 9/1/2021 (Educational Facilities) (State Aid Withholding) | | | NR/Aa1 | | | | 520,000 | | | | 615,841 | |
Town of Silver City, 2.00% due 12/1/2016 (Joint Utility System Improvement; Insured: BAM) | | | AA/NR | | | | 125,000 | | | | 125,214 | |
Town of Silver City, 2.00% due 12/1/2018 (Joint Utility System Improvement; Insured: BAM) | | | AA/NR | | | | 260,000 | | | | 265,151 | |
Town of Silver City, 2.00% due 12/1/2019 (Joint Utility System Improvement; Insured: BAM) | | | AA/NR | | | | 265,000 | | | | 273,106 | |
Town of Silver City, 4.00% due 6/1/2029 (Public Facility Capital Projects) | | | A+/NR | | | | 1,000,000 | | | | 1,068,050 | |
Town of Silver City, 4.25% due 6/1/2032 (Public Facility Capital Projects) | | | A+/NR | | | | 1,050,000 | | | | 1,121,872 | |
Village of Los Ranchos de Albuquerque, 4.50% due 9/1/2040 (Albuquerque Academy) | | | A/NR | | | | 3,000,000 | | | | 3,216,840 | |
Virgin Islands Public Finance Authority, 6.625% due 10/1/2029 (Diageo Project) | | | NR/B2 | | | | 2,500,000 | | | | 2,586,500 | |
Zuni Public School District, 5.00% due 8/1/2028 (Teacher Housing Projects) | | | A/NR | | | | 1,600,000 | | | | 1,851,024 | |
| | | | | | | | | | | | |
TOTAL INVESTMENTS — 95.38% (Cost $207,236,324) | | | | | | | | | | $ | 220,407,106 | |
OTHER ASSETS LESS LIABILITIES — 4.62% | | | | | | | | | | | 10,668,095 | |
| | | | | | | | | | | | |
NET ASSETS — 100.00% | | | | | | | | | | $ | 231,075,201 | |
| | | | | | | | | | | | |
Footnote Legend
| † | Credit ratings are unaudited. Rating changes may have occurred subsequent to the reporting period end. Bonds issued with a maturity of one year or less are assigned Moody’s ratings from MIG-1 to MIG-4 and Standard and Poor’s ratings from SP-1+ to SP-3 with MIG-1 and SP-1+ being the strongest ratings. |
Portfolio Abbreviations
To simplify the listings of securities, abbreviations are used per the table below:
| | |
| AGM | | Insured by Assured Guaranty Municipal Corp. |
| AMBAC | | Insured by American Municipal Bond Assurance Corp. |
| AMT | | Alternative Minimum Tax |
| BAM | | Insured by Build America Mutual Insurance Co. |
| ETM | | Escrowed to Maturity |
| FHLMC | | Insured by Federal Home Loan Mortgage Corp. |
| | |
| FNMA | | Collateralized by Federal National Mortgage Association |
| GNMA | | Collateralized by Government National Mortgage Association |
| GO | | General Obligation |
| GRT | | Gross Receipts Tax |
| Natl-Re | | Insured by National Public Finance Guarantee Corp. |
See notes to financial statements.
Annual Report 11
| | |
| STATEMENT OF ASSETS AND LIABILITIES | | |
| |
Thornburg New Mexico Intermediate Municipal Fund | | September 30, 2016 |
| | | | |
ASSETS | | | | |
Investments at value (cost $207,236,324) (Note 3) | | $ | 220,407,106 | |
Cash | | | 7,457,584 | |
Receivable for fund shares sold | | | 986,974 | |
Interest receivable | | | 2,698,434 | |
Prepaid expenses and other assets | | | 2,262 | |
| | | | |
Total Assets | | | 231,552,360 | |
| | | | |
| |
LIABILITIES | | | | |
Payable for fund shares redeemed | | | 212,978 | |
Payable to investment advisor and other affiliates (Note 4) | | | 153,670 | |
Accounts payable and accrued expenses | | | 67,347 | |
Dividends payable | | | 43,164 | |
| | | | |
Total Liabilities | | | 477,159 | |
| | | | |
| |
NET ASSETS | | $ | 231,075,201 | |
| | | | |
NET ASSETS CONSIST OF | | | | |
Distribution in excess of net investment income | | $ | (25,896 | ) |
Net unrealized appreciation on investments | | | 13,170,782 | |
Accumulated net realized gain (loss) | | | (1,154,384 | ) |
Net capital paid in on shares of beneficial interest | | | 219,084,699 | |
| | | | |
| | $ | 231,075,201 | |
| | | | |
NET ASSET VALUE | | | | |
Class A Shares: | | | | |
Net asset value and redemption price per share ($136,742,749 applicable to 10,001,600 shares of beneficial interest outstanding - Note 5) | | $ | 13.67 | |
Maximum sales charge, 2.00% of offering price | | | 0.28 | |
| | | | |
Maximum offering price per share | | $ | 13.95 | |
| | | | |
| |
Class D Shares: | | | | |
Net asset value, offering and redemption price per share ($28,488,816 applicable to 2,082,693 shares of beneficial interest outstanding - Note 5) | | $ | 13.68 | |
| | | | |
| |
Class I Shares: | | | | |
Net asset value, offering and redemption price per share ($65,843,636 applicable to 4,818,289 shares of beneficial interest outstanding - Note 5) | | $ | 13.67 | |
| | | | |
| * | Redemption price per share is equal to net asset value less any applicable contingent deferred sales charge. |
See notes to financial statements.
12 Annual Report
| | |
| STATEMENT OF OPERATIONS | | |
| |
Thornburg New Mexico Intermediate Municipal Fund | | Year Ended September 30, 2016 |
| | | | |
INVESTMENT INCOME | | | | |
Interest income (net of premium amortized of $2,220,368) | | $ | 7,228,948 | |
| | | | |
| |
EXPENSES | | | | |
Investment advisory fees (Note 4) | | | 1,146,738 | |
Administration fees (Note 4) | | | | |
Class A Shares | | | 173,429 | |
Class D Shares | | | 36,095 | |
Class I Shares | | | 30,863 | |
Distribution and service fees (Note 4) | | | | |
Class A Shares | | | 346,858 | |
Class D Shares | | | 141,953 | |
Transfer agent fees | | | | |
Class A Shares | | | 63,981 | |
Class D Shares | | | 13,108 | |
Class I Shares | | | 23,750 | |
Registration and filing fees | | | | |
Class A Shares | | | 1,398 | |
Class D Shares | | | 716 | |
Class I Shares | | | 497 | |
Custodian fees (Note 2) | | | 19,462 | |
Professional fees | | | 49,410 | |
Accounting fees (Note 4) | | | 8,326 | |
Trustee fees | | | 10,279 | |
Other expenses | | | 16,921 | |
| | | | |
Total Expenses | | | 2,083,784 | |
| | | | |
Net Investment Income | | | 5,145,164 | |
| | | | |
REALIZED AND UNREALIZED GAIN (LOSS) | | | | |
Net realized gain (loss) on investments | | | (8,510 | ) |
Net change in unrealized appreciation (depreciation) on investments | | | 2,102,714 | |
| | | | |
Net Realized and Unrealized Gain | | | 2,094,204 | |
| | | | |
Net Increase in Net Assets Resulting from Operations | | $ | 7,239,368 | |
| | | | |
See notes to financial statements.
Annual Report 13
| | |
| STATEMENTS OF CHANGES IN NET ASSETS | | |
| |
Thornburg New Mexico Intermediate Municipal Fund | | |
| | | | | | | | |
| | | Year Ended
September 30, 2016 | | | Year Ended
September 30, 2015 | |
INCREASE (DECREASE) IN NET ASSETS FROM | | | | | | | | |
| | |
OPERATIONS | | | | | | | | |
Net investment income | | $ | 5,145,164 | | | $ | 5,657,203 | |
Net realized gain (loss) on investments | | | (8,510 | ) | | | (9,565 | ) |
Net unrealized appreciation (depreciation) on investments | | | 2,102,714 | | | | (890,859 | ) |
| | | | | | | | |
| | |
Net Increase (Decrease) in Net Assets Resulting from Operations | | | 7,239,368 | | | | 4,756,779 | |
| | |
DIVIDENDS TO SHAREHOLDERS | | | | | | | | |
From net investment income | | | | | | | | |
Class A Shares | | | (3,030,645 | ) | | | (3,516,957 | ) |
Class D Shares | | | (560,708 | ) | | | (676,838 | ) |
Class I Shares | | | (1,553,811 | ) | | | (1,463,408 | ) |
| | |
FUND SHARE TRANSACTIONS (NOTE 5) | | | | | | | | |
Class A Shares | | | (4,494,643 | ) | | | (3,515,955 | ) |
Class D Shares | | | (727,598 | ) | | | 637,262 | |
Class I Shares | | | 7,352,843 | | | | 20,817,817 | |
| | | | | | | | |
Net Increase in Net Assets | | | 4,224,806 | | | | 17,038,700 | |
| | |
NET ASSETS | | | | | | | | |
Beginning of Year | | | 226,850,395 | | | | 209,811,695 | |
| | | | | | | | |
End of Year | | $ | 231,075,201 | | | $ | 226,850,395 | |
| | | | | | | | |
Distribution in excess of net investment income | | $ | (25,896 | ) | | $ | (25,896 | ) |
See notes to financial statements.
14 Annual Report
| | |
| NOTES TO FINANCIAL STATEMENTS | | |
| |
Thornburg New Mexico Intermediate Municipal Fund | | September 30, 2016 |
NOTE 1 – ORGANIZATION
Thornburg New Mexico Intermediate Municipal Fund (the “Fund”) is a non-diversified series of Thornburg Investment Trust (the “Trust”). The Trust is organized as a Massachusetts business trust under a Declaration of Trust dated June 3, 1987 and is registered as a diversified, open-end management investment company under the Investment Company Act of 1940, as amended. The Fund is currently one of twenty separate series of the Trust. Each series is considered to be a separate entity for financial reporting and tax purposes and bears expenses directly attributable to it. The Fund’s primary investment objective is to obtain as high a level of current income exempt from federal and New Mexico state individual income tax as is consistent, in the view of Thornburg Investment Management, Inc., the Trust’s investment advisor (the “Advisor”), with the preservation of capital. The Fund’s secondary objective is to reduce expected changes in its share price compared to long-term bond portfolios.
The Fund currently offers three classes of shares of beneficial interest: Class A, Class D, and Institutional Class (“Class I”). Each class of shares of the Fund represents an interest in the same portfolio of investments, except that (i) Class A shares are sold subject to a front-end sales charge collected at the time the shares are purchased and bear a service fee, (ii) Class D shares are sold at net asset value without a sales charge at the time of purchase or redemption, and bear both a service fee and a distribution fee, (iii) Class I shares are sold at net asset value without a sales charge at the time of purchase and may be subject to a service fee, and (iv) the respective classes may have different reinvestment privileges and conversion rights. Additionally, the Fund may allocate among its classes certain expenses, to the extent allocable to specific classes, including transfer agent fees, government registration fees, certain printing and postage costs, and administrative and legal expenses. Currently, class specific expenses of the Fund are limited to service and distribution fees, administration fees, and certain registration and transfer agent expenses.
The following is a summary of significant accounting policies followed by the Fund in the preparation of its financial statements. The Fund prepares its financial statements in conformity with United States generally accepted accounting principles (“GAAP”), including investment company accounting and reporting guidance in the Financial Accounting Standards Board (the “FASB”) Accounting Standard Codification Topic 946.
NOTE 2 – SIGNIFICANT ACCOUNTING POLICIES
Security Valuation: All investments in securities held by the Fund are valued as described in Note 3.
Allocation of Income, Gains, Losses and Expenses: Net investment income (other than class specific expenses) and realized and unrealized gains and losses are allocated daily to each class of shares based upon the relative net asset value of outstanding shares (or the value of the dividend-eligible shares, as appropriate) of each class of shares at the beginning of the day (after adjusting for the current capital shares activity of the respective class). Expenses common to all Funds are allocated among the Funds comprising the Trust based upon their relative net asset values or other appropriate allocation methods. Operating expenses directly attributable to a specific class are charged against the operating income of that class.
Dividends and Distributions to Shareholders: Dividends and distributions to shareholders, which are determined in accordance with federal income tax regulations and may differ from GAAP, are recorded on the ex-dividend date. Ordinary income distributions, if any, are declared daily and paid monthly. Capital gain distributions, if any, are declared and paid annually and more often if deemed necessary by the Advisor. Dividends are paid and are reinvested in additional shares of the Fund at net asset value per share at the close of business on the ex-dividend date, or at the shareholder’s option, paid in cash.
Investment Income: Interest income is accrued as earned. Premiums and discounts are amortized and accreted, respectively, to call dates or maturity dates using the effective yield method of the respective investments, which is included in interest income on the Statement of Operations.
Custodian Fees: Custodian fees disclosed in the Statement of Operations may include interest expenses incurred by the Fund on any cash overdrafts of its custodian account during the period. Such cash overdrafts may result from the effects of failed trades in portfolio securities and from cash outflows resulting from unanticipated shareholder redemption activity. The Fund pays interest to its custodian on any such cash overdraft at a rate equal to 2.50% of the overdraft amount in excess of $50,000.
Investment Transactions: Investment transactions are accounted for on a trade date basis. Realized gains and losses from the sale of investments are recorded on an identified cost basis.
When-Issued and Delayed Delivery Transactions: The Fund may engage in when-issued or delayed delivery transactions. To the extent the Fund engages in such transactions, it will do so for the purpose of acquiring portfolio investments consistent with the Fund’s investment objectives and not for the purpose of investment leverage or to speculate on interest rate or market changes. At the time the Fund makes a commitment to purchase an investment on a when-issued or delayed delivery basis, the Fund will record the transaction and reflect the value in determining its net asset value. When effecting such transactions, assets of an amount sufficient to make payment for the portfolio investments to be purchased will be segregated on the Fund’s records on the trade date. Investments purchased on a when-issued or delayed delivery basis do not earn interest until the settlement date.
Annual Report 15
| | |
| NOTES TO FINANCIAL STATEMENTS, CONTINUED | | |
| |
Thornburg New Mexico Intermediate Municipal Fund | | September 30, 2016 |
Guarantees and Indemnifications: Under the Trust’s organizational documents (and under separate agreements with the independent Trustees), its officers and Trustees are provided with an indemnification against certain liabilities arising out of the performance of their duties to the Fund. In the normal course of business the Trust may also enter into contracts with service providers that contain general indemnifications. The Trust’s maximum exposure under these arrangements is unknown. However, based on experience, the Trust expects the risk of loss to be remote.
Use of Estimates: The preparation of financial statements in conformity with GAAP requires management to make estimates and assumptions that affect the reported amounts of assets and liabilities and disclosure of contingent assets and liabilities at the date of the financial statements and the reported amounts of increases (decreases) in net assets from operations during the reporting period. Actual results could differ from those estimates.
Federal Income Taxes: It is the policy of the Trust to comply with the provisions of the Internal Revenue Code applicable to regulated investment companies and to distribute to shareholders substantially all investment company taxable income including net realized gains on investments (if any), and tax exempt income of the Fund. Therefore, no provision for federal income or excise tax is required.
The Fund files income tax returns in United States federal and applicable state jurisdictions. The statute of limitations on the Fund’s tax return filings generally remains open for the three years following a return’s filing date. The Fund has analyzed each uncertain tax position believed to be material in the preparation of the Fund’s financial statements for the fiscal year ended September 30, 2016, including open tax years, to assess whether it is more likely than not that the position would be sustained upon examination, based on the technical merits of the position. The Fund has not identified any such position for which an asset or liability must be reflected in the Statement of Assets and Liabilities.
At September 30, 2016, information on the tax components of capital was as follows:
| | | | |
Cost of investments for tax purposes | | $ | 207,236,324 | |
| | | | |
Gross unrealized appreciation on a tax basis | | $ | 13,221,253 | |
Gross unrealized depreciation on a tax basis | | | (50,471 | ) |
| | | | |
Net unrealized appreciation (depreciation) on investments (tax basis) | | $ | 13,170,782 | |
| | | | |
At September 30, 2016, the Fund had deferred tax basis capital losses occurring subsequent to October 31, 2015 through September 30, 2016 of $6,818. For tax purposes, such losses will be recognized in the year ending September 30, 2017.
At September 30, 2016, the Fund had cumulative tax basis capital losses of $1,147,566, (of which $87,413 are short-term and $1,060,153 are long-term) generated after September 30, 2011, which may be carried forward to offset future capital gains. To the extent such carryforwards are used, capital gain distributions may be reduced to the extent provided by regulations. Such capital loss carryforwards do not expire.
At September 30, 2016, the Fund had $17,268 of undistributed tax basis net tax-exempt income, no undistributed tax basis net ordinary income and no undistributed tax basis capital gains.
Distributions from tax exempt income paid by the Fund for the years ended September 30, 2016 and September 30, 2015 are excludable by shareholders from gross income for Federal income tax purposes.
The tax character of distributions paid during the years ended September 30, 2016, and September 30, 2015, was as follows:
| | | | | | | | |
| | | 2016 | | | 2015 | |
Distributions from: | | | | | | | | |
Tax exempt income | | $ | 5,145,148 | | | $ | 5,657,159 | |
Ordinary income | | | 16 | | | | 44 | |
| | | | | | | | |
Total | | $ | 5,145,164 | | | $ | 5,657,203 | |
| | | | | | | | |
NOTE 3 – SECURITY VALUATION
Valuation of the Fund’s portfolio investment securities is performed in accordance with policies and procedures adopted by and under the oversight of the Trustees.
The Trustees of the Trust have appointed the Advisor to assist the Trustees in obtaining market values for portfolio investments, evaluate and monitor professional pricing service providers appointed by the Trustees’ Audit Committee (the “Audit Committee”) to assist in determining fair values for portfolio investments, assist in calculating fair values for portfolio investments in certain circumstances,
16 Annual Report
| | |
| NOTES TO FINANCIAL STATEMENTS, CONTINUED | | |
| |
Thornburg New Mexico Intermediate Municipal Fund | | September 30, 2016 |
and to perform other functions in connection with the valuation of investments. The Advisor acts through its Valuation and Pricing Committee (the “Committee”) and other employees of the Advisor. The Committee regularly reviews its own valuation calculations, as well as the valuations, valuation techniques and services furnished by pricing service providers, considers circumstances which may require valuation calculations by the Committee, and reviews previous valuation calculations. The Committee reports to the Audit Committee on the Committee’s activities, the performance of pricing service providers, and other matters relating to valuation of portfolio investments.
In those instances when the Committee assists in calculating a fair value for a portfolio investment, the Committee seeks to determine the price that the Fund would reasonably expect to receive upon a sale of the investment in an orderly transaction between market participants on the valuation date. The Committee customarily utilizes quotations from securities broker dealers in calculating valuations, but also may utilize prices obtained from pricing service providers or other methods approved by the Audit Committee. Because fair values calculated by the Committee are estimates, the calculation of a value for an investment may differ from the price that would be realized by the Fund upon a sale of the investment, and the difference could be material to the Fund’s financial statements. The Committee’s calculation of a fair value for an investment may also differ from the prices obtained by other persons (including other mutual funds) for the investment.
Valuation of Securities: Debt obligations held by the Fund which are not listed or traded on exchanges or for which no reported market exists are ordinarily valued at the valuation obtained from a pricing service provider approved by the Audit Committee.
In any case when a pricing service provider fails to provide a valuation for a debt obligation held by the Fund, the Committee calculates a fair value for the obligation using alternative methods under procedures approved by the Audit Committee. Additionally, in cases when management believes that a valuation obtained from a pricing service provider merits review for significant reasons, the Committee decides whether or not to use the valuation calculated by the pricing service provider or to use an alternative method approved by the Audit Committee to calculate a fair value for the obligation.
Valuation Hierarchy: The Fund categorizes its investments based upon the inputs used in valuing those investments, according to a three-level hierarchy established in guidance from FASB. Categorization of investments using this hierarchy is intended by the FASB to maximize the use of observable inputs in valuing investments and minimize the use of unobservable inputs by requiring that the most observable inputs be used when available. Observable inputs are those that market participants would use in valuing an investment based on available market information. Unobservable inputs are those that reflect assumptions about the information market participants would use in valuing an investment. An investment’s level within the hierarchy is based on the lowest level input that is deemed significant to the valuation. The methodologies and inputs used to value investments are not necessarily indications of the risk or liquidity associated with those investments.
Various inputs are used in calculating valuations for the Fund’s investments. These inputs are generally summarized according to the three-level hierarchy below:
Level 1: Quoted prices in active markets for identical investments.
Level 2: Other direct or indirect significant observable inputs (including quoted prices for similar investments in active markets and other observable inputs, such as interest rates, prepayment rates, credit risk, etc.).
Level 3: Significant unobservable inputs (including the Committee’s own assumptions in calculating the fair values of investments).
Valuations for debt obligations held by the Fund are typically calculated by pricing service providers approved by the Audit Committee and are characterized as Level 2 within the valuation hierarchy.
In a limited number of cases the Committee calculates a fair value for investments using broker quotations or other methods approved by the Audit Committee. When the Committee uses a single broker quotation to calculate a fair value for an investment without other significant observable inputs, or if a fair value is calculated using other significant inputs that are considered unobservable, the investment is characterized as Level 3 within the hierarchy. Other significant unobservable inputs used to calculate a fair value in these instances might include an income-based valuation approach which considers discounted anticipated future cash flows from the investment, and application of discounts due to the nature or duration of any restrictions on the disposition of the investment.
Valuations based upon the use of inputs from Levels 1, 2 or 3 may not represent the actual price received upon the disposition of an investment, and the Fund may receive a price that is lower than the valuation based upon these inputs when it sells the investment.
The following table displays a summary of the fair value hierarchy measurements of the Fund’s investments as of September 30, 2016. In any instance when valuation inputs from more than one level are used to determine the fair value of a specific investment,
Annual Report 17
| | |
| NOTES TO FINANCIAL STATEMENTS, CONTINUED | | |
| |
Thornburg New Mexico Intermediate Municipal Fund | | September 30, 2016 |
the investment is placed in the level of the table based upon the lowest level input that is significant in determining the fair value of the investment:
| | | | | | | | | | | | | | | | |
| | | Fair Value Measurements at September 30, 2016 | |
| | | Total | | | Level 1 | | | Level 2 | | | Level 3 | |
Assets | | | | | | | | | | | | | | | | |
Investments in Securities | | | | | | | | | | | | | | | | |
Municipal Bonds | | $ | 220,407,106 | | | $ | — | | | $ | 220,407,106 | | | $ | — | |
| | | | | | | | | | | | | | | | |
Total Investments in Securities | | $ | 220,407,106 | | | $ | — | | | $ | 220,407,106 | | | $ | — | |
In accordance with the guidance prescribed in Accounting Standards Update No. 2011-04, it is the policy of the Fund to recognize transfers between levels and the underlying events which caused the movement. The Fund recognized no transfers between levels for the year ended September 30, 2016.
NOTE 4 – INVESTMENT ADVISORY FEE AND OTHER TRANSACTIONS WITH AFFILIATES
Pursuant to an investment advisory agreement, the Advisor serves as the investment advisor and performs services for the Fund for which the fees are payable at the end of each month. Under the investment advisory agreement, the Fund pays the Advisor a management fee based on the daily net assets of the Fund at an annual rate as shown in the following table:
| | | | |
Daily Net Assets | | Fee Rate | |
Up to $500 million | | | 0.500 | % |
Next $500 million | | | 0.450 | |
Next $500 million | | | 0.400 | |
Next $500 million | | | 0.350 | |
Over $2 billion | | | 0.275 | |
The Fund’s effective management fee for the year ended September 30, 2016 was 0.50% of the Fund’s average dividend assets.
The Fund pays to the Advisor the costs of personnel who perform certain accounting services for the Fund. For the year ended September 30, 2016 the Fund paid $8,326 to the Advisor for these accounting services. The Trust has also entered into administrative service agreements with the Advisor, whereby the Advisor will perform certain administrative services for the shareholders of each class of the Fund’s shares, and for which fees will be payable at an annual rate of up to .125 of 1% per annum of the average daily net assets attributable to each class of shares. Total administrative service fees incurred by each class of shares of the Fund for the year ended September 30, 2016, are set forth in the Statement of Operations.
The Trust has an underwriting agreement with Thornburg Securities Corporation (the “Distributor”), an affiliate of the Advisor, which acts as the distributor of the Fund’s shares. For the year ended September 30, 2016, the Distributor has advised the Fund that it earned net commissions aggregating $1,743 from the sale of Class A shares.
Pursuant to a service plan under Rule 12b-1 of the Investment Company Act of 1940, the Fund may pay to the Advisor or securities dealers and other financial institutions at the Advisor’s request an amount not to exceed .25 of 1% per annum of the average daily net assets attributable to Class A and Class D shares of the Fund to obtain various shareholder and distribution related services. For the year ended September 30, 2016, there were no 12b-1 service plan fees charged for Class I shares. The Advisor may pay out of its own resources additional expenses for distribution of the Fund’s shares and shareholder services.
The Trust has also adopted a distribution plan pursuant to Rule 12b-1, applicable only to the Fund’s Class D shares, under which the Fund compensates the Distributor for services in promoting the sale of Class D shares of the Fund at an annual rate of up to .25 of 1% per annum of the average daily net assets attributable to Class D shares. Total fees incurred by each class of shares of the Fund under their respective service and distribution plans for the year ended September 30, 2016, are set forth in the Statement of Operations.
Certain officers and Trustees of the Trust are also officers or directors of the Advisor and Distributor. The compensation of independent Trustees is borne by the Trust.
The percentage of direct investments in the Fund held by appointed Trustees, Officers, and the Advisor is approximately 10.18%.
The Fund may sell securities to an affiliated fund, or the Fund may purchase securities held by an affiliated fund, provided the affiliation is due solely to having a common investment advisor, common officers, or common trustees, and provided that all such transactions will comply with Rule 17a-7 under the 1940 Act. For the year ended September 30, 2016, the Fund had no transactions with affiliated funds.
18 Annual Report
| | |
| NOTES TO FINANCIAL STATEMENTS, CONTINUED | | |
| |
Thornburg New Mexico Intermediate Municipal Fund | | September 30, 2016 |
NOTE 5 – SHARES OF BENEFICIAL INTEREST
At September 30, 2016, there were an unlimited number of shares with no par value of beneficial interest authorized. Transactions in shares of beneficial interest were as follows:
| | | | | | | | | | | | | | | | |
| | | Year Ended
September 30, 2016 | | | Year Ended
September 30, 2015 | |
| | | Shares | | | Amount | | | Shares | | | Amount | |
Class A Shares | | | | | | | | | | | | | | | | |
Shares sold | | | 915,431 | | | $ | 12,528,291 | | | | 745,966 | | | $ | 10,124,128 | |
Shares issued to shareholders in reinvestment of dividends | | | 188,232 | | | | 2,574,787 | | | | 223,380 | | | | 3,036,783 | |
Shares repurchased | | | (1,432,981 | ) | | | (19,597,721 | ) | | | (1,226,723 | ) | | | (16,676,866 | ) |
| | | | | | | | | | | | | | | | |
| | | | |
Net increase (decrease) | | | (329,318 | ) | | $ | (4,494,643 | ) | | | (257,377 | ) | | $ | (3,515,955 | ) |
| | | | | | | | | | | | | | | | |
| | | | |
Class D Shares | | | | | | | | | | | | | | | | |
Shares sold | | | 309,896 | | | $ | 4,243,840 | | | | 381,666 | | | $ | 5,181,343 | |
Shares issued to shareholders in reinvestment of dividends | | | 38,634 | | | | 528,742 | | | | 48,673 | | | | 661,799 | |
Shares repurchased | | | (402,304 | ) | | | (5,500,180 | ) | | | (383,942 | ) | | | (5,205,880 | ) |
| | | | | | | | | | | | | | | | |
| | | | |
Net increase (decrease) | | | (53,774 | ) | | $ | (727,598 | ) | | | 46,397 | | | $ | 637,262 | |
| | | | | | | | | | | | | | | | |
| | | | |
Class I Shares | | | | | | | | | | | | | | | | |
Shares sold | | | 673,041 | | | $ | 9,199,727 | | | | 1,680,477 | | | $ | 22,851,550 | |
Shares issued to shareholders in reinvestment of dividends | | | 105,479 | | | | 1,442,583 | | | | 99,465 | | | | 1,350,685 | |
Shares repurchased | | | (241,095 | ) | | | (3,289,467 | ) | | | (248,971 | ) | | | (3,384,418 | ) |
| | | | | | | | | | | | | | | | |
| | | | |
Net increase (decrease) | | | 537,425 | | | $ | 7,352,843 | | | | 1,530,971 | | | $ | 20,817,817 | |
| | | | | | | | | | | | | | | | |
NOTE 6 – INVESTMENT TRANSACTIONS
For the year ended September 30, 2016, the Fund had purchase and sale transactions of investments (excluding short-term investments) of $21,899,425 and $14,700,000, respectively.
OTHER NOTES
Risks: The Fund’s investments subject it to risks including, but not limited to, management risk, interest rate risk, credit risk, market and economic risk, liquidity risk, diversification risk, and the risk of investing mainly in the obligations primarily originating in a single state. Please see the Fund’s prospectus for a discussion of the risks associated with an investment in the Fund.
Subsequent Events: Fund management believes no events have occurred between September 30, 2016 and the date of issuance of the financial statements that require adjustment to or disclosure in the accompanying financial statements.
Annual Report 19
FINANCIAL HIGHLIGHTS
Thornburg New Mexico Intermediate Municipal Fund
| | | | | | | | | | | | | | | | | | | | | | | | | | | | | | | | | | | | | | | | | | | | | | | | | | | | | | |
| | | PER SHARE PERFORMANCE (for a share outstanding throughout the Year) | | | RATIOS TO AVERAGE NET ASSETS | | | SUPPLEMENTAL DATA | |
Unless
Otherwise
Noted,
Periods
are
Fiscal
Years
Ended
Sept. 30, | | Net Asset
Value
Beginning
of Year | | | Net
Investment
Income (Loss)+ | | Net
Realized
&
Unrealized
Gain(Loss)
on
Investments | | | Total from
Investment
Operations | | | Dividends
from Net
Investment
Income | | | Dividends
from Net
Realized
Gains | | Total
Dividends | | | Net
Asset
Value
End
of
Year | | | Net
Investment
Income
(Loss)
(%) | | | Expenses,
After
Expense
Reductions
(%) | | | Expenses,
After
Expense
Reductions
and
Net of
Custody
Credits
(%) | | | Expenses,
Before
Expense
Reductions
(%) | | | Total
Return
(%)(a) | | | Portfolio
Turnover
Rate (%)(a) | | Net
Assets
at End
of
Year
(Thousands) | |
CLASS A SHARES | | | | | | | | | | | | | | | | | | | | | | | | | | | | | | | | | | | | | | | | | | | | | | | | |
2016(b) | | $ | 13.55 | | | 0.30 | | | 0.12 | | | | 0.42 | | | | (0.30 | ) | | — | | | (0.30 | ) | | $ | 13.67 | | | | 2.18 | | | | 0.97 | | | | 0.97 | | | | 0.97 | | | | 3.11 | | | 6.80 | | $ | 136,743 | |
2015(b) | | $ | 13.60 | | | 0.34 | | | (0.05 | ) | | | 0.29 | | | | (0.34 | ) | | — | | | (0.34 | ) | | $ | 13.55 | | | | 2.50 | | | | 0.98 | | | | 0.98 | | | | 0.98 | | | | 2.15 | | | 19.01 | | $ | 139,939 | |
2014(b) | | $ | 13.35 | | | 0.39 | | | 0.25 | | | | 0.64 | | | | (0.39 | ) | | — | | | (0.39 | ) | | $ | 13.60 | | | | 2.87 | | | | 0.97 | | | | 0.97 | | | | 0.97 | | | | 4.83 | | | 10.79 | | $ | 143,994 | |
2013(b) | | $ | 13.95 | | | 0.38 | | | (0.60 | ) | | | (0.22 | ) | | | (0.38 | ) | | — | | | (0.38 | ) | | $ | 13.35 | | | | 2.76 | | | | 0.96 | | | | 0.95 | | | | 0.96 | | | | (1.61 | ) | | 11.78 | | $ | 148,499 | |
2012(b) | | $ | 13.72 | | | 0.41 | | | 0.24 | | | | 0.65 | | | | (0.41 | ) | | (0.01) | | | (0.42 | ) | | $ | 13.95 | | | | 2.95 | | | | 0.95 | | | | 0.95 | | | | 0.95 | | | | 4.80 | | | 11.66 | | $ | 187,578 | |
CLASS D SHARES | | | | | | | | | | | | | | | | | | | | | | | | | | | | | | | | | | | | | | | | | | | | | | | | |
2016 | | $ | 13.55 | | | 0.28 | | | 0.12 | | | | 0.40 | | | | (0.27 | ) | | — | | | (0.27 | ) | | $ | 13.68 | | | | 1.94 | | | | 1.21 | | | | 1.21 | | | | 1.21 | | | | 2.94 | | | 6.80 | | $ | 28,489 | |
2015 | | $ | 13.61 | | | 0.31 | | | (0.06 | ) | | | 0.25 | | | | (0.31 | ) | | — | | | (0.31 | ) | | $ | 13.55 | | | | 2.27 | | | | 1.20 | | | | 1.20 | | | | 1.20 | | | | 1.84 | | | 19.01 | | $ | 28,953 | |
2014 | | $ | 13.36 | | | 0.35 | | | 0.25 | | | | 0.60 | | | | (0.35 | ) | | — | | | (0.35 | ) | | $ | 13.61 | | | | 2.60 | | | | 1.23 | | | | 1.23 | | | | 1.23 | | | | 4.55 | | | 10.79 | | $ | 28,438 | |
2013 | | $ | 13.96 | | | 0.34 | | | (0.59 | ) | | | (0.25 | ) | | | (0.35 | ) | | — | | | (0.35 | ) | | $ | 13.36 | | | | 2.51 | | | | 1.21 | | | | 1.21 | | | | 1.22 | | | | (1.85 | ) | | 11.78 | | $ | 28,858 | |
2012 | | $ | 13.72 | | | 0.37 | | | 0.26 | | | | 0.63 | | | | (0.38 | ) | | (0.01) | | | (0.39 | ) | | $ | 13.96 | | | | 2.71 | | | | 1.18 | | | | 1.18 | | | | 1.22 | | | | 4.62 | | | 11.66 | | $ | 31,984 | |
CLASS I SHARES | | | | | | | | | | | | | | | | | | | | | | | | | | | | | | | | | | | | | | | | | | | | | | | | |
2016 | | $ | 13.54 | | | 0.35 | | | 0.12 | | | | 0.47 | | | | (0.34 | ) | | — | | | (0.34 | ) | | $ | 13.67 | | | | 2.52 | | | | 0.63 | | | | 0.63 | | | | 0.63 | | | | 3.53 | | | 6.80 | | $ | 65,843 | |
2015 | | $ | 13.59 | | | 0.38 | | | (0.05 | ) | | | 0.33 | | | | (0.38 | ) | | — | | | (0.38 | ) | | $ | 13.54 | | | | 2.80 | | | | 0.65 | | | | 0.65 | | | | 0.65 | | | | 2.48 | | | 19.01 | | $ | 57,958 | |
2014 | | $ | 13.35 | | | 0.43 | | | 0.24 | | | | 0.67 | | | | (0.43 | ) | | — | | | (0.43 | ) | | $ | 13.59 | | | | 3.19 | | | | 0.65 | | | | 0.64 | | | | 0.65 | | | | 5.09 | | | 10.79 | | $ | 37,380 | |
2013 | | $ | 13.95 | | | 0.43 | | | (0.61 | ) | | | (0.18 | ) | | | (0.42 | ) | | — | | | (0.42 | ) | | $ | 13.35 | | | | 3.09 | | | | 0.61 | | | | 0.61 | | | | 0.61 | | | | (1.29 | ) | | 11.78 | | $ | 25,590 | |
2012 | | $ | 13.71 | | | 0.46 | | | 0.25 | | | | 0.71 | | | | (0.46 | ) | | (0.01) | | | (0.47 | ) | | $ | 13.95 | | | | 3.30 | | | | 0.61 | | | | 0.61 | | | | 0.61 | | | | 5.24 | | | 11.66 | | $ | 38,099 | |
| (a) | Not annualized for periods less than one year. |
| (b) | Sales loads are not reflected in computing total return. |
| + | Based on weighted average shares outstanding. |
See notes to financial statements.
| | | | |
| 20 Annual Report | | | | Annual Report 21 |
REPORT OF INDEPENDENT REGISTERED PUBLIC ACCOUNTING FIRM
Thornburg New Mexico Intermediate Municipal Fund
To the Trustees and Shareholders of
Thornburg New Mexico Intermediate Municipal Fund
In our opinion, the accompanying statement of assets and liabilities, including the schedule of investments in securities, and the related statements of operations and of changes in net assets and the financial highlights present fairly, in all material respects, the financial position of the Thornburg New Mexico Intermediate Municipal Fund (the “Fund”) at September 30, 2016, the results of its operations for the year then ended, the changes in its net assets for each of the two years in the period then ended and the financial highlights for each of the five years in the period then ended, in conformity with accounting principles generally accepted in the United States of America. These financial statements and financial highlights (hereafter referred to as “financial statements”) are the responsibility of the Fund’s management. Our responsibility is to express an opinion on these financial statements based on our audits. We conducted our audits of these financial statements in accordance with the standards of the Public Company Accounting Oversight Board (United States). Those standards require that we plan and perform the audit to obtain reasonable assurance about whether the financial statements are free of material misstatement. An audit includes examining, on a test basis, evidence supporting the amounts and disclosures in the financial statements, assessing the accounting principles used and significant estimates made by management, and evaluating the overall financial statement presentation. We believe that our audits, which included confirmation of securities at September 30, 2016 by correspondence with the custodian, brokers, transfer agent, and the application of alternative procedures where securities purchased had not been received, provide a reasonable basis for our opinion.
PricewaterhouseCoopers LLP
New York, New York
November 18, 2016
22 Annual Report
| | |
| EXPENSE EXAMPLE | | |
| |
Thornburg New Mexico Intermediate Municipal Fund | | September 30, 2016 (Unaudited) |
As a shareholder of the Fund, you incur two types of costs:
| | (1) | transaction costs, including |
(a) sales charges (loads) on purchase payments, for Class A shares;
(b) a deferred sales charge on redemptions of any part or all of a purchase of $1 million of Class A shares within 12 months of purchase;
| | (2) | ongoing costs, including management fees; distribution and/or service (12b-1) fees; and other Fund expenses. |
This example is intended to help you understand your ongoing costs (in dollars) of investing in the Fund and to compare these costs with the ongoing costs of investing in other mutual funds.
The example is based on a $1,000 investment beginning on April 1, 2016, and held until September 30, 2016.
| | | | | | | | | | | | |
| | | Beginning
Account Value
4/1/16 | | | Ending
Account Value
9/30/16 | | | Expenses paid
During period†
4/1/16–9/30/16 | |
CLASS A SHARES | | | | | | | | | | | | |
Actual | | $ | 1,000.00 | | | $ | 1,010.90 | | | $ | 4.81 | |
Hypothetical* | | $ | 1,000.00 | | | $ | 1,020.22 | | | $ | 4.83 | |
CLASS D SHARES | | | | | | | | | | | | |
Actual | | $ | 1,000.00 | | | $ | 1,009.70 | | | $ | 5.99 | |
Hypothetical* | | $ | 1,000.00 | | | $ | 1,019.04 | | | $ | 6.02 | |
CLASS I SHARES | | | | | | | | | | | | |
Actual | | $ | 1,000.00 | | | $ | 1,012.60 | | | $ | 3.16 | |
Hypothetical* | | $ | 1,000.00 | | | $ | 1,021.86 | | | $ | 3.17 | |
| † | Expenses are equal to the annualized expense ratio for each class (A: 0.96%; D: 1.19%; I: 0.63%) multiplied by the average account value over the period, multiplied by 183/366 to reflect the one-half year period. |
| * | Hypothetical assumes a rate of return of 5% per year before expenses. |
ACTUAL EXPENSES
For each class of shares, the first line of the accompanying table provides information about actual account values and actual expenses. You may use the information in this line, together with the amount you invested, to estimate the expenses that you paid over the period. Simply divide your account value by $1,000 (for example, an $8,600 account value divided by $1,000 = 8.6), then multiply the result by the number in the first line for your class of shares under the heading entitled “Expenses Paid During Period” to estimate the expenses you paid on your account during this period.
HYPOTHETICAL EXAMPLE FOR COMPARISON PURPOSES
For each class of shares, the second line of the accompanying table provides information about hypothetical account values and hypothetical expenses based on the Fund’s actual expense ratio and an assumed rate of return of 5% per year before expenses, which is not the Fund’s actual return. The hypothetical account values and expenses may not be used to estimate the actual ending account balance or expenses you paid for the period. You may use this information to compare the ongoing costs of investing in the Fund and other funds. To do so, compare this 5% hypothetical example with the 5% hypothetical examples that appear in the shareholder reports of the other funds.
Please note that the expenses shown in the table are meant to highlight your ongoing costs only and do not reflect any transactional costs, such as sales charges (loads), redemption fees, or exchange fees. Therefore, the second line of the table for each class of shares is useful in comparing ongoing costs only, and will not help you determine the relative total costs of owning different funds. In addition, if these transactional costs were included, your costs would have been higher.
Annual Report 23
| | |
| TRUSTEES AND OFFICERS | | |
| |
Thornburg New Mexico Intermediate Municipal Fund | | September 30, 2016 (Unaudited) |
| | | | |
Name, Age, Year Elected Position Held with Fund | | Principal Occupation(s) During Past Five Years | | Other
Directorships
Held by Trustee |
INTERESTED TRUSTEES (1)(2)(4) | | |
| | |
Garrett Thornburg, 71 Trustee since 1987, Chairman of Trustees(3) | | Chairman and controlling shareholder of Thornburg Investment Management, Inc. (investment advisor); Chairman and controlling shareholder of Thornburg Securities Corporation (securities dealer); Chairman and CEO of Chamisa Energy, LLC; President of the Thornburg Foundation (nonprofit). | | None |
| | |
Brian J. McMahon, 61 Trustee since 2001, Vice Chairman of Trustees, Member of Governance & Nominating Committee & Operations Risk Oversight Committee(5) | | Chief Investment Officer, Managing Director, and Portfolio Manager and, until 2016, CEO and President of Thornburg Investment Management, Inc.; Vice President of Thornburg Securities Corporation. | | None |
| |
INDEPENDENT TRUSTEES (1)(2)(4) | | |
| | |
David A. Ater, 71 Trustee since 1994, Member of Audit Committee & Chairman of Governance & Nominating Committee | | Principal in Ater & Associates, Santa Fe, NM (developer, planner and broker of residential and commercial real estate); owner, developer and broker for various real estate projects. | | None |
| | |
David D. Chase, 75 Trustee since 2000, Chairman of Audit Committee | | Managing Member of CS Group, LLC, Santa Fe, NM (private investment fund – family office). | | None |
| | |
Sally Corning, 55 Trustee since 2012, Member of Audit Committee | | Partner in Sun Mountain Capital, Santa Fe, NM (private equity firm with investment programs encompassing venture capital, mezzanine debt, and growth equity). | | None |
| | |
Susan H. Dubin, 67 Trustee since 2004, Member of Audit Committee & Governance and Nominating Committee | | President of Dubin Investments, Ltd., Greenwich, CT (private investment fund); Director and officer of various charitable organizations. | | None |
| | |
David L. Gardner, 53 Trustee since 2015, Member of Operations Risk Oversight Committee | | Until 2012, head of EMEA (Europe, Middle East and Africa) Sales for iShares of Blackrock, Inc., EMEA Executive Committee Member and EMEA Operating Committee Member at Blackrock, Inc. | | None |
| | |
Owen D. Van Essen, 62 Trustee since 2004, Member of Governance & Nominating Committee & Chairman of Operations Risk Oversight Committee | | President of Dirks, Van Essen & Murray, Santa Fe, NM (newspaper mergers and acquisitions). | | None |
| | |
James W. Weyhrauch, 57 Trustee since 1996, Member of Audit Committee & Operations Risk Oversight Committee | | Real estate broker, Santa Fe Properties, Santa Fe, NM; Vice Chairman of Nambe LLC, Santa Fe, NM (manufacturing & design company). | | None |
24 Annual Report
| | |
| TRUSTEES AND OFFICERS, CONTINUED | | |
| |
Thornburg New Mexico Intermediate Municipal Fund | | September 30, 2016 (Unaudited) |
| | | | | | |
Name, Age, Year Elected Position Held with Fund | | Principal Occupation(s) During Past Five Years | | Other
Directorships
Held by Trustee | |
OFFICERS OF THE FUND (WHO ARE NOT TRUSTEES)(1)(7) | | | | |
| | |
Nimish Bhatt, 53 Treasurer since 2016(6) | | Chief Financial Officer and Treasurer of Thornburg Investment Management, Inc. and Thornburg Securities Corporation since 2016; Senior Vice President (2004-2016), Chief Financial Officer (2011-2016), and Head of Fund Administration (2011-2016) of Calamos Asset Management, Inc., Calamos Investments LLC, Calamos Advisors LLC, and Calamos Wealth Management; Director of Calamos Global Funds plc (2007-2016). | | | Not applicable | |
| | |
Jason Brady, 42 President since 2016(6) | | CEO and President since 2016, Vice President from 2011 to 2016, Portfolio Manager and Managing Director of Thornburg Investment Management, Inc.; Vice President of Thornburg Securities Corporation since 2016. | | | Not applicable | |
| | |
Kathleen Brady, 56 Vice President since 2008 | | Tax Manager Fund Accounting of Thornburg Investment Management, Inc. | | | Not applicable | |
| | |
Connor Browne, 37 Vice President since 2006 | | Portfolio Manager, Vice President since 2013, and Managing Director of Thornburg Investment Management, Inc. | | | Not applicable | |
| | |
Tim Cunningham, 41 Vice President since 2014 | | Managing Director since 2011, Portfolio Manager since 2012, and Associate Portfolio Manager from 2009–2012 of Thornburg Investment Management, Inc. | | | Not applicable | |
| | |
Randy Dry, 42 Vice President since 2014 | | Vice President and Managing Director, Director of Institutional Group from 2014-2016, and since 2016, Chief Administrative Officer of Thornburg Investment Management, Inc. | | | Not applicable | |
| | |
Greg Dunn, 40 Vice President since 2014 | | Managing Director, Portfolio Manager since 2012, and Associate Portfolio Manager from 2009–2012 of Thornburg Investment Management, Inc. | | | Not applicable | |
| | |
Lon Erickson, 41 Vice President since 2008 | | Portfolio Manager and Managing Director of Thornburg Investment Management, Inc. | | | Not applicable | |
| | |
William V. Fries, 77 Vice President since 1995 | | Portfolio Manager, Vice President, and Managing Director of Thornburg Investment Management, Inc. | | | Not applicable | |
| | |
Thomas Garcia, 45 Vice President since 2006 | | Vice President since 2011, Managing Director, Head Equity Trader, and Associate Portfolio Manager of Thornburg Investment Management, Inc. | | | Not applicable | |
| | |
Rolf Kelly, 37 Vice President since 2016 | | Portfolio Manager and Managing Director since 2013 and Associate Portfolio Manager from 2011–2013 of Thornburg Investment Management, Inc. | | | Not applicable | |
| | |
Ben Kirby, 36 Vice President since 2014 | | Portfolio Manager and Managing Director since 2013 and Associate Portfolio Manager from 2011–2013 of Thornburg Investment Management, Inc. | | | Not applicable | |
| | |
Jeff Klingelhofer, 41 Vice President since 2016 | | Portfolio Manager and Managing Director since 2015, Associate Portfolio Manager from 2012–2015, and Fixed Income Analyst from 2010–2012 of Thornburg Investment Management, Inc. | | | Not applicable | |
| | |
Rob MacDonald, 40 Vice President since 2016 | | Managing Director since 2015, Portfolio Manager since 2014, and Associate Portfolio Manager from 2011–2014 of Thornburg Investment Management, Inc. | | | Not applicable | |
| | |
Leigh Moiola, 49 Vice President since 2001 | | Vice President, Managing Director, and Director of Marketing of Thornburg Investment Management, Inc.; Vice President of Thornburg Securities Corporation. | | | Not applicable | |
| | |
Christopher Ryon, 60 Vice President since 2008 | | Portfolio Manager and Managing Director of Thornburg Investment Management, Inc. | | | Not applicable | |
| | |
Nicholos Venditti, 35 Vice President since 2016 | | Portfolio Manager and Managing Director since 2015 and Associate Portfolio Manager from 2011–2015 of Thornburg Investment Management, Inc. | | | Not applicable | |
Annual Report 25
| | |
| TRUSTEES AND OFFICERS, CONTINUED | | |
| |
Thornburg New Mexico Intermediate Municipal Fund | | September 30, 2016 (Unaudited) |
| | | | |
Name, Age, Year Elected Position Held with Fund | | Principal Occupation(s) During Past Five Years | | Other
Directorships
Held by Trustee |
| | |
Vinson Walden, 46 Vice President since 2004 | | Portfolio Manager and Managing Director of Thornburg Investment Management, Inc. | | Not applicable |
| | |
Lei Wang, 45 Vice President since 2006 | | Portfolio Manager and Managing Director of Thornburg Investment Management, Inc. | | Not applicable |
| | |
Sasha Wilcoxon, 42 Vice President since 2003 Secretary since 2007(6) | | Managing Director, Director of Mutual Fund Operations, and Vice President of Thornburg Investment Management, Inc.; Vice President of Thornburg Securities Corporation. | | Not applicable |
| | |
Charles Wilson, 41 Vice President since 2016 | | Portfolio Manager and Managing Director since 2014 and Associate Portfolio Manager from 2012–2014 of Thornburg Investment Management, Inc.; Co-Portfolio Manager of Marsico Capital Management from 2010–2012. | | Not applicable |
| | |
Di Zhou, 38 Vice President since 2016 | | Portfolio Manager and Managing Director since 2016, Associate Portfolio Manager from 2014–2016, and Equity Research Analyst from 2010–2014 of Thornburg Investment Management, Inc. | | Not applicable |
| (1) | Each person’s address is 2300 North Ridgetop Road, Santa Fe, New Mexico 87506. |
| (2) | The Fund is a separate investment “Fund” or “series” of Thornburg Investment Trust (the “Trust”), which comprises the Thornburg mutual fund complex and is organized as a Massachusetts business trust. Thornburg Investment Management, Inc. is the investment advisor to, and manages, all the Funds of the Trust. Each Trustee oversees all the Funds of the Trust. |
| (3) | Mr. Thornburg is considered an “interested” Trustee under the Investment Company Act of 1940 because he is the sole director and controlling shareholder of Thornburg Investment Management, Inc., the investment advisor to the Trust, and is the sole director and controlling shareholder of Thornburg Securities Corporation, the distributor of shares for the Trust. |
| (4) | The Bylaws of the Trust currently require that each Trustee shall retire by the end of the calendar year during which the Trustee reached the age of 75 years. Otherwise each Trustee serves in office until the election and qualification of a successor or until the Trustee sooner dies, resigns, retires or is removed. |
| (5) | Mr. McMahon is considered an “interested” Trustee under the Investment Company Act of 1940 because he is the chief investment officer of Thornburg Investment Management, Inc. |
| (6) | The Trust’s president, secretary, and treasurer each serves a one-year term or until the election and qualification of a successor; each other officer serves at the pleasure of the Trustees. |
| (7) | Assistant vice presidents, assistant secretaries, and assistant treasurers are not shown. |
The Statement of Additional Information for each Fund of the Trust includes additional information about the Trustees and is available, without charge and upon request, by calling 1-800-847-0200.
26 Annual Report
| | |
| OTHER INFORMATION | | |
| |
Thornburg New Mexico Intermediate Municipal Fund | | September 30, 2016 (Unaudited) |
PORTFOLIO PROXY VOTING
Policies and Procedures:
The Trust has delegated to Thornburg Investment Management, Inc. (the “Advisor”) voting decisions respecting proxies for the Fund’s voting securities. The Advisor makes voting decisions in accordance with its Proxy Voting Policy. A description of the Policy is available (i) without charge, upon request, by calling the Advisor toll-free at 1-800-847-0200, (ii) on the Thornburg website at www.thornburg. com, and (iii) on the Securities and Exchange Commission’s website at www.sec.gov.
Information regarding how proxies were voted is available on or before August 31 of each year for the twelve months ending the preceding June 30. This information is available (i) without charge, upon request by calling the Advisor toll-free at 1-800-847-0200, (ii) on the Thornburg website at www.thornburg.com, and (iii) on the Securities and Exchange Commission’s website at www.sec.gov.
TAX INFORMATION
For the tax year ended September 30, 2016, dividends paid by the Fund of $5,145,148 (or the maximum allowed) are tax exempt dividends and $16 are taxable ordinary investment income dividends for federal income tax purposes. The information and the distributions reported herein may differ from the information and distributions reported to the shareholders for the calendar year ending December 31, 2016. Complete information will be reported in conjunction with your 2016 Form 1099.
AVAILABILITY OF QUARTERLY PORTFOLIO SCHEDULE
The Fund files with the Securities and Exchange Commission schedules of its portfolio holdings on Form N-Q for the first and third quarters of each fiscal year. The Fund’s Forms N-Q are available on the Commission’s website at www.sec.gov, or may be reviewed and copied at the Commission’s Public Reference Room in Washington, D.C. Information on the operation of the Public Reference Room may be obtained by calling 1-800-SEC-0330. The Fund also makes this information available on its website at www.thornburg. com/download or upon request by calling 1-800-847-0200.
STATEMENT RESPECTING RENEWAL OF INVESTMENT ADVISORY AGREEMENT
Thornburg Investment Management, Inc. (the “Advisor”) provides investment management services to Thornburg New Mexico Intermediate Municipal Fund pursuant to an investment advisory agreement. The Trustees consider the renewal of this agreement annually, and most recently determined to renew the agreement on September 13, 2016.
In anticipation of their recent consideration of the advisory agreement’s renewal, the independent Trustees met in May 2016 to consider aspects of their annual evaluation of the Advisor’s service to all of the funds of Thornburg Investment Trust, to plan the annual evaluation of the Advisor’s performance and to specify the information the Advisor would present to the Trustees for their review. The independent Trustees met again in independent session in September to consider portions of the information submitted by the Advisor. Representatives of the Advisor subsequently reviewed portions of the information with the Trustees and addressed questions from the Trustees at a full meeting session of the Trustees scheduled for that purpose, and the independent Trustees thereafter met in independent session to consider the Advisor’s presentation and various specific issues respecting their consideration of the advisory agreement’s renewal. Following these sessions, the Trustees met to consider renewal of the agreement, and the independent Trustees voted unanimously at that meeting to renew the agreement for an additional term of one year.
The information below summarizes certain factors considered by the Trustees in connection with the determination to renew the advisory agreement. In determining to renew the agreement, the Trustees considered a wide range of information and did not identify any single factor as controlling, and this summary does not describe all of the factors and other matters considered by the Trustees in making their determination.
Nature, Extent and Quality of Services. The Trustees considered presentations by the Advisor at meeting sessions scheduled for consideration of a continuation of the advisory agreement, and also noted their consideration of the reports the Trustees and their committees receive throughout the year on a wide variety of topics, and consideration they had given to a number of topics in previous years. Information identified by the Trustees in their evaluation as having been considered and contributing to their conclusions included Trustees’ assessments of the Advisor’s personnel developed in formal and informal meetings throughout the year, the Advisor’s staffing levels and measures to maintain staffing levels and improve competencies, the Advisor’s commitment to attract and retain high quality portfolio management expertise through competitive compensation levels, the Advisor’s collaborative approach to investment management, the Fund’s investment performance over different periods of time, portfolio managers’ cognizance of and strategies to address market and economic trends and conditions, the evaluation and selection of individual investments, the structuring and composition of the Fund’s portfolio, management of Fund liquidity requirements, cognizance of and efforts to achieve tax efficiency, responses to share sale and redemption activity, continuing enhancements to the Advisor’s electronic and information systems and the Advisor’s
Annual Report 27
| | |
| OTHER INFORMATION, CONTINUED | | |
| |
Thornburg New Mexico Intermediate Municipal Fund | | September 30, 2016 (Unaudited) |
engagement of outside firms to assist in improving or replacing those systems, the Advisor’s evaluation and selection of firms providing portfolio trade execution to the Fund and the Advisor’s measures to obtain favorable trade execution, the Advisor’s performance of accounting and other services, the Advisor’s continued commitment to observance of compliance and regulatory requirements, the Advisor’s responsiveness to the Trustees, the quality and extent of written and oral reports to the Trustees over the course of the year, and other factors.
Investment Performance. The Trustees noted in their evaluation of the Fund’s investment performance the reports they had received in each regular meeting over the course of the year from the Advisor’s portfolio management personnel. The Trustees also noted in their evaluation their consideration of information provided to them at their request in anticipation of their annual evaluation of the Advisor’s services, including the following items of information respecting the investment performance of the Fund: (1) the Fund’s absolute investment performance and achievement of stated objectives; (2) the Advisor’s written and oral explanations and commentary on the Fund’s performance in the context of the Fund’s objectives and reasonable expectations, and business, market and economic conditions, (3) performance data for the most recent ten calendar years, comparing the Fund’s annual investment returns to a fund category selected by an independent mutual fund analyst firm, and to a broad-based securities index, (4) the Fund’s investment performance for the three-month, year-to-date, one-year, three-year, five-year and ten-year periods ending with the second quarter of the current year, comparing the Fund’s annualized returns to two mutual fund categories selected by independent mutual fund analyst firms and to a broad-based securities index, and assigning a percentage rank to the Fund’s performance for each period relative to each of the fund categories, and (5) comparative measures of correlation to equity indices, portfolio volatility, risk and return.
The Trustees noted that quarterly reports during the year and other information presented to them confirmed the Advisor’s continued conformity to the Fund’s stated investment objectives and policies.
The Trustees observed in reviewing comparative performance data for the ten most recent calendar years that the Fund’s investment return for the most recent calendar year was comparable to the return of the index and the average return for the fund category considered, that the Fund’s returns for the preceding nine calendar years were comparable to the returns of the index in five of the nine years, and that the Fund’s returns exceeded or were comparable to the average returns of the fund category in seven of nine years. Other quantitative data noted by the Trustees as having been considered in their evaluation showed that the Fund’s annualized investment returns fell in the fourth quartile of performance of two fund categories for the one-year period ended with the second quarter of the current year, fell in the third quartile for the three-year and five-year periods, and for the ten-year period fell in the second quartile of the first fund category and fell in the third quartile of the second fund category. Information provided to the Trustees indicated that the comparability of indices and fund categories to the Fund is limited for a number of reasons, including the characteristics of investments available to a fund investing primarily in New Mexico. Measures of portfolio volatility, risk and relative return considered by the Trustees demonstrated that the Fund’s performance relative to these measures continued to fulfill expectations in current conditions. The Trustees attached additional significance to the performance data of the Fund from the perspective of longer term shareholders.
Comparisons of Fee and Expense Levels. The Trustees recognized in their evaluation the clear disclosures of the Advisor’s fees and Fund expenses in the Fund’s prospectuses. Information noted by the Trustees as having been considered in this context included a variety of comparative data respecting the Fund’s fee and expense levels. This information included comparisons of the Fund’s advisory fee and overall Fund expenses to median and average fees and expenses charged to a category of mutual funds selected by an independent mutual fund analyst firm, comparisons of the advisory fee and other Fund expenses to the fee levels and expenses for two representative share classes of fund peer groups selected from the category by a second independent mutual fund analyst firm, the perspectives and advice from the second mutual fund analyst firm respecting comparisons of fund fee levels and expenses to fund peer groups, and other information. Comparative fee and expense data noted as having been considered by the Trustees showed that the advisory fee for the Fund was slightly higher than the median and average fee levels for the fund category, the level of total expense for a representative share class was slightly higher than the median and comparable to the average expense levels for the category, and that the level of total expense for a second representative share class was lower than the median and average total expense levels for the category. Peer group data showed that the Fund’s advisory fee level for two representative share classes was comparable to the fee levels for the share classes’ respective peer groups, the total expense level for one of the representative share classes fell at the top of the range of its peer group, and the total expense level for the second share class was comparable to the median of its peer group. The Trustees did not find the differences significant in view of the other factors considered.
The Trustees noted their consideration of information respecting the advisory fees charged by the Advisor to other investment management clients, including sub-advised mutual funds, together with information about fees charged by other advisors to different clients, analysis of the differences between the requirements of institutional clients and mutual funds, analysis of the differences between the requirements of a sub-advised mutual fund and a fund as to which the investment advisor is the primary advisor and sponsor, descriptions of distinguishing characteristics of the sub-advised funds served by the Advisor, and the consequently different investment management services provided to the different categories of clients and the differing contexts in which the fee levels for these arrangements are established. The Trustees confirmed their previous observations that the differences between the fees charged by the Advisor to different types of clients did not appear exceptional, and that the fee rates charged by an investment advisor to different categories of clients had limited relevance to the evaluation of the fee rate charged by that advisor to mutual funds as to which it is the primary advisor and sponsor.
28 Annual Report
| | |
| OTHER INFORMATION, CONTINUED | | |
| |
Thornburg New Mexico Intermediate Municipal Fund | | September 30, 2016 (Unaudited) |
Costs and Profitability of Advisor. In reviewing the profitability of the Advisor’s services to the Fund the Trustees considered an analysis of the Advisor’s costs and the profitability to the Advisor of its services, together with data respecting the overall profitability of a selection of other investment management firms. The Trustees noted that a portion of the Advisor’s profits are an important element in the compensation of shareholder employees. The Trustees considered in this regard information from the Advisor respecting investment of its profits to maintain staffing levels, pay competitive levels of compensation, and add to its information retrieval and management systems to maintain or improve service levels. The Trustees also considered the contribution of the Advisor’s cost management to its profitability, and the relationship of the Advisor’s financial resources and profitability in previous years to its ability to attract necessary personnel, invest in systems and other assets required for its service to the Fund, and maintain or improve service levels for the Fund notwithstanding fluctuations in revenues and profitability. The information considered did not indicate to the Trustees that the Advisor’s profitability was excessive.
Potential Economies of Scale. In reviewing the extent to which economies of scale would be realized by the Fund as it grows and whether fee levels reflect potential economies of scale, the Trustees considered the breakpoint structure for advisory fees chargeable to the Fund, comparisons of the fee breakpoint structure for the Fund with breakpoint structures (or the absence of such structures) for other funds in a peer group selected by an independent mutual fund analyst firm, the effects of the breakpoint structure and other expense factors realized by certain Funds of the Trust as their asset levels had increased, and the Advisor’s expenditures from its own profits and resources to maintain staffing levels, pay competitive levels of compensation, and add to its information retrieval and management systems to maintain or improve service levels. The information provided demonstrated to the Trustees that the Fund’s advisory fee breakpoint structure is reasonable in relation to the structures observed in the other funds in its peer group, and that shareholders may be expected to benefit from any economies of scale, due to the advisory agreement’s breakpoint fee structure for the Fund and other factors.
Potential Ancillary Benefits. In reviewing potential benefits to the Advisor because of its relationship to the Fund, the Trustees noted disclosures by the Advisor of its receipt of certain research services from broker dealers, and the benefits to both the Fund and the Advisor of the Advisor’s expansion of its staffing, compliance and systems capabilities and other resources to serve a broader variety of investment management clients. No unusual or unfair benefits to the Advisor from its relationship to the Fund were identified by the Trustees.
Summary of Conclusions. The Trustees concluded that the nature, extent and quality of the Advisor’s services performed under the advisory agreement remained sufficient. The Trustees further concluded that the absolute and relative investment performance of the Fund over a range of pertinent holding periods on the whole was satisfactory in the context of its objectives and strategies, and that the Advisor had continued to actively and competently pursue the Fund’s stated investment objectives and adhere to the Fund’s investment policies.
The Trustees further concluded, based upon their consideration of the foregoing factors and other information, that the level of the advisory fee charged to the Fund by the Advisor is reasonable in relation to the services provided by the Advisor in view of the nature, extent and quality of those services, the investment performance of the Fund after fees and expenses, the clear disclosure of fees and expenses in the Fund’s prospectus, comparisons of fees and expenses charged to the Fund to fees and expenses charged to other mutual funds, and the other factors considered.
Annual Report 29
TRUSTEES’ STATEMENT TO SHAREHOLDERS
Readopted September 12, 2016
The Trustees believe current and prospective shareholders should know how we discharge our responsibilities in supervising the Funds’ investment advisor and in reviewing the advisor’s contract for renewal. Since 2005, we have issued a statement which sets out clearly the three principal guidelines that we follow in supervising the Trust’s investment advisor on your behalf. In accordance with our customary practice, in September of this year we again reviewed our statement and concluded we should reissue this statement outlining the principal features of our supervision of the advisor’s performance of investment management services for the Funds.
We begin with the premise that each shareholder selected his or her Fund because its investments are managed by the investment advisor identified in the prospectus and in accordance with the objective and policies described in the prospectus. We realize, as each of you do, that if you believe that your Fund’s stated objective and policies no longer serve your personal investment goals, you can sell your shares and leave the Fund.
Therefore, we believe that our primary supervisory task – our principal obligation to you – is to assess the nature and quality of the advisor’s services, and to confirm that the advisor actively and competently pursues the Fund’s objective, in accordance with the policies set out in the prospectus. To do this, we meet regularly with management to review your Fund’s portfolio and to discuss the advisor’s specific actions and judgments in pursuing the Fund’s objective. We do not substitute our own judgment for the advisor’s decisions in selecting investments; the advisor is paid to exercise its informed judgment on investment decisions, and we seek to confirm, in reviewing the advisor’s performance, that the advisor is doing just that.
Second, we are conscious of costs and the effect that costs have on shareholders’ returns. We try to make sure that your Fund’s fees and costs are reasonable in relationship to the services rendered and that they are generally in line with those charged by other expert investment advisors, consistent with our belief that the Fund’s investors searched for and expect that expertise and attention and have decided to pay a reasonable price for it. We do not put the management contract “out to bid” as a matter of course, and we would not do so unless we had concluded that the advisor materially had failed to pursue the Fund’s objectives in accordance with its policies, or for other equally important reasons. We believe that any other approach would be inconsistent with your interests and contrary to your expectations when you bought shares of the Fund in the first place.
Finally, because we believe that most Thornburg Fund shareholders have invested with a long-term perspective, we try not to focus too much on the fashions of the moment and on short-term performance. The market will not favor any specific investment objective or set of policies at all times and under all economic circumstances. A fund will experience periods of both high and low returns relative to other funds and other investments. Even if one of our Funds is not favored by the market at a particular time, we believe that the advisor is nonetheless obliged to remain true to the Fund’s objective and policies, and we watch to see that it does so.
Trustees of Thornburg Investment Trust
30 Annual Report
THORNBURG FUNDS
Thornburg Investment Management is a privately-owned global investment firm that offers a range of solutions for retail and institutional investors. Founded in 1982 and headquartered in Santa Fe, New Mexico, we manage approximately $53 billion (as of September 30, 2016) across eight equity and 11 bond mutual funds, separate accounts for high-net-worth investors and institutional accounts, and five UCITS funds for non-U.S. investors.
The fund outlined in this report is one of many equity and fixed-income products available from Thornburg Investment Management.
Equity Funds
| | • | | Thornburg Core Growth Fund |
| | • | | Thornburg International Value Fund |
| | • | | Thornburg Better World International Fund |
| | • | | Thornburg International Growth Fund |
| | • | | Thornburg Developing World Fund |
| | • | | Thornburg Investment Income Builder Fund |
| | • | | Thornburg Global Opportunities Fund |
Fixed Income Funds
| | • | | Thornburg Low Duration Income Fund |
| | • | | Thornburg Limited Term U.S. Government Fund |
| | • | | Thornburg Limited Term Income Fund |
| | • | | Thornburg Strategic Income Fund |
| | • | | Thornburg Low Duration Municipal Fund |
| | • | | Thornburg Limited Term Municipal Fund |
| | • | | Thornburg Intermediate Municipal Fund |
| | • | | Thornburg California Limited Term Municipal Fund |
| | • | | Thornburg New Mexico Intermediate Municipal Fund |
| | • | | Thornburg New York Intermediate Municipal Fund |
| | • | | Thornburg Strategic Municipal Income Fund |
Before investing, carefully consider the Fund’s investment goals, risks, charges, and expenses. For a prospectus or summary prospectus containing this and other information, contact your financial advisor or visit thornburg.com. Read it carefully before investing.
For additional information, please visit thornburg.com
Thornburg Investment Management, Inc. 2300 North Ridgetop Road, Santa Fe, NM 87506
Annual Report 31

| | |
| To receive shareholder reports, prospectuses, and proxy statements electronically, go to www.thornburg.com/edelivery. | |  |
This Annual Report is submitted for the general information of shareholders of the Fund. It is not authorized for distribution to prospective investors in the Fund unless preceded or accompanied by an effective prospectus. | |
| | | | |
| Investment Advisor: | | Distributor: | | |
| Thornburg Investment Management® | | Thornburg Securities Corporation® | | |
| 800.847.0200 | | 800.847.0200 | | TH080 |
Annual Report
September 30, 2016
THORNBURG
NEW YORK
INTERMEDIATE
MUNICIPAL
FUND
Investment Management

About Thornburg Investment Management
It’s more than what we do.
It’s how we do it.
At Thornburg, we are very different in how we think, invest, and are structured We believe this difference is what makes us successful in helping individuals reach their long-term financial goals.
How we How we How we’re
Flexible Perspective Our perspective on investment opportunities is more flexible than most, viewing a wide range of opportunities beyond conventional boundaries to find hidden value.
Collaboration Collectively, we hone ideas via borderless cross-pollination for better judgment and better results.
Portfolio Construction Disciplined construction guided more by our convictions than convention.
CONVICTION Thorough analysis and our relative-value framework lead to conviction in our securities selection.
UNCONVENTIONAL Active management means we seek the best value for our clients rather than using conventional benchmarks as our starting point.
Structured for Excellence How we think and how we invest is made possible by how we’re structured.
TEAM APPROACH FAR FROM THE HERD ACCESS & TRANSPARENCY
2 Annual Report
Annual Report
Thornburg New York Intermediate Municipal Fund
September 30, 2016
| | | | |
Share Class | | NASDAQ Symbol | | CUSIP |
Class A | | THNYX | | 885-215-665 |
Class I | | TNYIX | | 885-216-705 |
Minimum investments for Class I shares may be higher than those for Class A. Class I shares may not be available to all investors.
Investments carry risks, including possible loss of principal. Portfolios investing in bonds have the same interest rate, inflation, and credit risks that are associated with the underlying bonds. The value of bonds will fluctuate relative to changes in interest rates, decreasing when interest rates rise. Unlike bonds, bond funds have ongoing fees and expenses. Please see the Fund’s prospectus for a discussion of the risks associated with an investment in the Fund. Investments in the Funds are not FDIC insured, nor are they bank deposits or guaranteed by a bank or any other entity.
The laddering strategy does not assure or guarantee better performance and cannot eliminate the risk of investment losses.
Diversification does not assure or guarantee better performance and cannot eliminate the risk of investment losses.
Annual Report 3
| | |
| LETTER TO SHAREHOLDERS | | |
| |
Thornburg New York Intermediate Municipal Fund | | September 30, 2016 (Unaudited) |
October 13, 2016
Dear Shareholder:
We are pleased to present the annual report for Thornburg New York Intermediate Municipal Fund. The net asset value (NAV) of the Class A shares increased by 22 cents to $13.40 per share during the fiscal year ended September 30, 2016. If you were with us for the entire period, you received dividends of 29.2 cents per share. If you reinvested your dividends, you received 29.5 cents per share. Dividends were higher for Class I shares to account for varying class-specific expenses. The Class A shares of your Fund underperformed the index with a 3.91% total return (without sales charge) for the fiscal year ended September 30, 2016, compared to the 4.99% total return for the BofA Merrill Lynch 3-15 Year U.S. Municipal Securities Index. The Fund generated 0.06% more price return and 1.14% less income than the index after accounting for the different treatment of bonds priced above and below par by the index versus the Fund.
Drivers of the Fund’s price return relative to its benchmark include its interest rate sensitivity, as measured by the Fund’s duration. Also, differing allocations along the Fund’s investment universe subtracted 0.19% of relative price performance. Sector allocations added 0.75% of relative price performance and its overweight to lower credit-quality securities subtracted 0.64% of relative price performance. Other risk factors totaled another 0.14% of relative price performance for the period.
The market’s returns were a result of increasing short-term rates and decreasing long-term rates, shown in Figure 1.
U.S. Economy, Fed Policy, and the Election
The U.S. economy grew at a paltry average rate of 1%, as measured by nominal gross domestic product, for the first three quarters of 2016, much lower than the almost 3% average rate for 2015.
On the employment front, the economy added approximately 200,000 jobs per month for the Fund’s 2016 fiscal year. The May jobs number was a little scary, adding only 24,000 that month. The unemployment rate ticked up to 5.0% in September of 2016 from 4.9% in August, as more previously non-participating workers returned to the labor market.
Inflation has held stable, although it did move up slightly. The Core Personal Consumption Expenditure Index (Core PCE) for August moved up to 1.7% from 1.6% in July, although well below the U.S. Federal Reserve Board’s (the Fed) 2.0% target.
So, all in all, the economy is still growing, jobs are being added, and inflation is well behaved. This isn’t a bad scenario for municipal bond investors, except that, at current valuations and 10-year AAA municipal general obligation bonds yielding 1.64%, municipal bond investors are generally not keeping up with inflation.
Elsewhere, the Fed increased the federal funds rate 0.25% in December of 2015. Although many pundits want to blame the credit markets rout on that event, they would be wrong. Oil prices, as measured by WTI crude futures, hit a low of $34.54 on January 20, 2016. Energy producers are a highly leveraged segment of the market, whether through bank loans or other forms of debt. As market participants began to question their ability to service these loans or debt, credit spreads began to widen and the impact of these loans on the financial stability of some banks came into question. The municipal market avoided this distress because bond issuance from energy-producing states was a small fraction of the $3.8 trillion municipal bond market.
This early-2016 market turbulence, followed by the May jobs report and the “Brexit” vote in Great Britain, gave the Fed enough pause not to follow their December rate increase with another. So far through 2016, the central bank has insisted that they may increase rates again and again. Last year we said, “Regardless, waiting for the Fed to raise short-term interest rates is akin to Waiting for Godot.” Well, we are still waiting. Meanwhile, the Fed is assuring the markets that the next meeting is “live” and they may raise short-term interest rates again!
Figure I | 12-Month Change in Rates for AAA Rated General Obligation Municipal Bonds
(as of September 30, 2016)
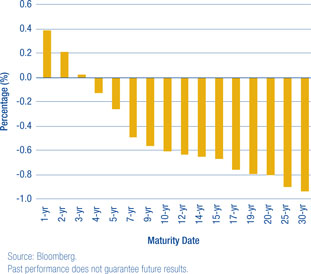
4 Annual Report
| | |
| LETTER TO SHAREHOLDERS, | | |
| |
CONTINUED | | |
| |
Thornburg New York Intermediate Municipal Fund | | September 30, 2016 (Unaudited) |
The 2016 U.S. presidential race featured two major party candidates with unprecedented high unfavorable ratings with the electorate. At the time of this writing, the election’s result is weeks away. Regardless of the winner, however, the president historically has had very little impact on the course of the economy. Although there is a pattern that if the economy is doing well, the current administration likes to take all the credit; if the economy is not doing well, the current administration blames the previous one. A victory for either candidate could still benefit the municipal bond market, however, as both stumped for large increases in infrastructure spending—with one particularly calling for higher taxes which would lend support to the municipal bond market. If this gets through Congress, it could mean a higher level of municipal bond issuance and ultimately high growth rates for the economy; both occurrences would put upward pressure on municipal bond yields.
The Municipal Bond Market
The value metrics we use at Thornburg all suggest that the municipal bond market is pricing-in the rosiest of scenarios going forward. The main reason for this is that global central banks, with their overly accommodative monetary policies, have pushed investors further out on the risk spectrum in search of yield. That is why, depending on the fund, we have our portfolios positioned in the lower end of their respective risk spectrums. This means that durations (a measure of price sensitivity to changes in interest rates) are low and credit quality is higher than in the past. We continually ask ourselves: are investors getting paid to take risk? The answer we come up with is no!
Inside the Risk Metrics
Let’s first look at real yields, which is how much yield over inflation investors are being paid to own municipal bonds. As mentioned earlier, 10-year AAA general obligation bonds are yielding 1.64% and Core PCE is running at 1.70%, so investors are earning less than inflation. Over the last 20 years, investors have earned an average of 2% over inflation for the opportunity to invest in a 10-year AAA general obligation municipal bond.
The second thing to consider is credit spreads, which reflect the incremental yield an investor earns from owning a lower-rated credit versus a higher-rated credit, and which are now very narrow. As of September 30, 2016, an investor earned about 1% more for owning a 10-year BBB revenue bond versus a 10-year AAA general obligation bond. That is slightly higher than the average 0.75% an investor earned between 1994 and 2007. In 2007, approximately 50% of the new issue municipal bond market was insured by AAA/AAA municipal bond insurers. Today, there are no AAA/AAA municipal bond insurers, and insurance coverage generally accounts for only 6% to 8% of the new issue municipal bond market. On top of that, the security covenants of some current lower-quality investment grade securities are the most lax in years. This is a great time to be an issuer of lower-quality investment grade municipal bonds but not a great time to be an investor in them.
Finally, the slope of the yield curve, which tracks how much incremental yield an investor earns by owning securities with longer maturities, is also quite flat. Currently, investors are earning 0.78% more for owning a 10-year AAA general obligation municipal bond, versus a 1-year AAA general obligation municipal bond. Since 1994, an investor earned on average almost 1.60% to extend maturities from one to 10 years. The stretch for income is causing investors to absorb more risk at lower and lower relative yields.
The New York Economy
New York’s economy has been doing well in the last year. Several statistics measured from the second quarter of 2015 through the second quarter of 2016 illustrate this performance. Personal income is up 2.69%, which is in the middle of a distribution ranging from negative 2.41% to 4.94%. State tax revenues are down 3.63% in a distribution that is all over the place. Home prices are up 3.26%. The Bloomberg Economic Evaluation of States shows New York’s overall reading as 1.45, while the lowest reading in the distribution is negative 15.51.
Nationally, pensions are still a troubling issue, but not in New York. The state’s pension system is funded at 88.7%, well above the Pew Center for the States Mendoza line of 80%. The Mendoza line falls between a well-funded state pension and the “other kind.” As the worst career hitter in major league baseball history (.200 batting average), Mario Mendoza Aizpuru’s name ubiquitously symbolizes futility.
Liquidity
Market liquidity is still a concern. The latest example of this is what is happening to yields on Variable Rate Demand Notes (VRDNs). These are securities that are normally held in money market funds and bond fund reserve positions. They can be put back to an intermediary on a daily basis and are relatively secure. Leading up to the finalization of the Securities and Exchange Commission’s money market fund reform in October of 2016, money market funds were and are repositioning themselves to be compliant with the new regulations. As such, they have had to divest themselves of VRDNs. Intermediaries do not want to hold them on their balance sheets (very expensive), so they raise the yields to clear the market. What used to yield 0.01% in March now yields,
Annual Report 5
| | |
| LETTER TO SHAREHOLDERS, | | |
| |
CONTINUED | | |
| |
Thornburg New York Intermediate Municipal Fund | | September 30, 2016 (Unaudited) |
as of the time of this writing, 0.90%, or more than a 3-year AA security. This is serendipity for managers like Thornburg holding higher reserves because of concern over market liquidity; for issuers in the VRDN market, it’s not so much.
Main Reason to Own Municipal Bonds
One of the best risk-mitigating tools an investor has is diversification. By splitting a portfolio into several asset classes, an investor may reduce the volatility of the resulting portfolio’s returns. This is because the returns of various asset classes are not always correlated. There are times when this is not the case, such as the 2008 financial crisis when all correlations went to one. For the long-term investor, however, we believe the benefits of diversification stand firm. When added to a portfolio of stocks, municipal bonds tend to reduce the volatility of that combined portfolio. Funds such as Thornburg New York Intermediate Municipal Fund may be a viable choice in a total diversified portfolio of stocks and bonds.
Conclusion
We continue to run this portfolio as an actively managed laddered portfolio. Laddering a portfolio is a simple way to diversify its investment along its entire investment universe. While past performance does not guarantee future results, our study showed that this structure outperformed other structures around 60% of the time and added 0.15% to 0.25% of total return annually.* Our view is that the current investment environment is not compensating investors enough to take on extra risk, so we have positioned our portfolios at the lower end of their risk spectrums.
Thank you for your continued trust in us.
Sincerely,
| | | | |
 | |  | | |
| | |
| Christopher Ryon,CFA | | Nicholos Venditti,CFA | | |
| Portfolio Manager | | Portfolio Manager | | |
| Managing Director | | Managing Director | | |
| * | We examined three hypothetical portfolios of bonds from December 1997 to December 2015. One using a laddering strategy, one using a barbell strategy, and a third using a bullet strategy. For the laddering strategy, the BofA Merrill Lynch 1–12 Year Municipal Index was used as a proxy, since, similar to a ladder, it contains bonds relatively evenly spread across all maturities within the index. The barbell strategy is a duration management technique wherein bonds are clustered at the two extremes of a maturity range. For the barbell strategy, the BofA Merrill Lynch 1–3 Year Municipal Index and BofA Merrill Lynch 8–12 Year Municipal Index were combined. The two indices were weighted in such a way as to give them the same duration as the broader 1–12 Year Index, and each year the portfolio was re-weighted back to the original index weights. This was done to make the two portfolios duration-neutral so that the impact of the strategy chosen could be isolated. The bullet strategy invests at the duration midpoint of the portfolio, therefore the BofA Merrill Lynch 6–8 Year Index was used to represent the bullet strategy. For additional information, see www.thornburg.com/whyladder. Past performance does not guarantee future results. |
The matters discussed in this report may constitute forward-looking statements made pursuant to the safe harbor provisions of the Securities Litigation Reform Act of 1995. These include any advisor or portfolio manager prediction, assessment, analysis or outlook for individual securities, industries, investment styles, market sectors and/or markets. These statements involve risks and uncertainties. In addition to the general risks described for each fund in its current prospectus, other factors bearing on these reports include the accuracy of the advisor’s or portfolio manager’s forecasts and predictions, the appropriateness of the investment strategies designed by the advisor or portfolio manager and the ability of the advisor or portfolio manager to implement their strategies efficiently and successfully. Any one or more of these factors, as well as other risks affecting the securities markets generally, could cause the actual results of any fund to differ materially as compared to its benchmarks.
The views expressed by the portfolio managers reflect their professional opinions and are subject to change. Under no circumstances does the information contained within represent a recommendation to buy or sell any security.
6 Annual Report
| | |
| PERFORMANCE SUMMARY | | |
| |
Thornburg New York Intermediate Municipal Fund | | September 30, 2016 (Unaudited) |
Average Annual Total Returns
| | | | | | | | | | | | | | | | | | | | |
| | | 1-Yr | | | 3-Yr | | | 5-Yr | | | 10-Yr | | | Since
Incep. | |
A Shares (Incep: 9/5/97) | | | | | | | | | | | | | | | | | | | | |
Without sales charge | | | 3.91 | % | | | 3.45 | % | | | 3.15 | % | | | 3.82 | % | | | 4.05 | % |
With sales charge | | | 1.83 | % | | | 2.77 | % | | | 2.74 | % | | | 3.62 | % | | | 3.94 | % |
I Shares (Incep: 2/1/10) | | | 4.25 | % | | | 3.78 | % | | | 3.50 | % | | | — | | | | 4.08 | % |
30-day Yields, A Shares
(with sales charge)
| | | | |
Annualized Distribution Yield | | | 2.62 | % |
| |
SEC Yield | | | 0.85 | % |
Growth of a Hypothetical $10,000 Investment
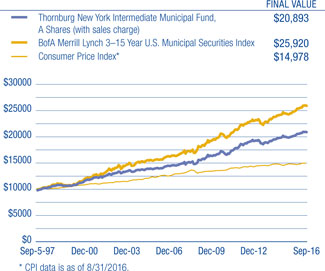
Performance data shown represents past performance and is no guarantee of future results. Investment return and principal value will fluctuate so shares, when redeemed, may be worth more or less than their original cost. Current performance may be lower or higher than quoted. For performance current to the most recent month end, visit thornburg.com or call 800-847-0200. The performance information does not reflect the deduction of taxes that a shareholder would pay on distributions or the redemption of Fund shares. Returns reflect the reinvestment of dividends and capital gains. Class A shares are sold with a maximum sales charge of 2.00%. There is no sales charge for Class I shares. As disclosed in the most recent prospectus, the total annual fund operating expenses are as follows: A shares, 1.05%; I shares, 0.76%. Thornburg Investment Management and/or Thornburg Securities Corporation have contractually agreed to waive fees and reimburse expenses through at least February 1, 2017, for all share classes, resulting in net expense ratios of the following: A shares, 0.99%; I shares, 0.67%. For more detailed information on fund expenses and waivers/reimbursements please see the Fund’s prospectus. Without the fee waivers and expense reimbursements , the Annualized Distribution yield would have been 2.54%, and the SEC yield would have been 0.77%.
Glossary
BofA Merrill Lynch 3-15 Year U.S. Municipal Securities Index – A subset of the BofA Merrill Lynch U.S. Municipal Securities Index including all securities with a remaining term to final maturity greater than or equal to 3 years and less than 15 years.
The BofA Merrill Lynch indices used in the Ladder vs Barbell & Bullet study are model portfolios of municipal obligations throughout the United States, with maturities ranging either from one to three years, six to eight years, eight to twelve years, or one to twelve years. These indices are subsets of the BofA Merrill Lynch U.S. Municipal Securities Index, which is comprised of U.S. dollar denominated investment grade tax-exempt debt publicly issued by U.S. states and territories, and their political subdivisions, in the U.S. domestic market. Qualifying securities must have at least a one-year remaining term to final maturity, a fixed coupon schedule and an investment grade rating.
Unless otherwise noted, index returns reflect the reinvestment of income dividends and capital gains, if any, but do not reflect fees, brokerage commissions or other expenses of investing. Investors may not make direct investments into any index. The performance of any index is not indicative of the performance of any particular investment.
Annualized Distribution Yield – The distribution yield reflects actual distributions made to shareholders. The annualized distribution yield is calculated by summing the last 30 days of income at a given month end and annualizing to a 360-day year. The result is divided by the ending maximum offering price.
Bloomberg Economic Evaluation of States (BEES) Index – A survey, updated quarterly, that examines the pace of states’ growth following the 18-month recession that officially ended in June 2009. The analysis examines six factors to measure the states and the District of Columbia against one another: unemployment, tax collections, residents’ personal income, housing prices, mortgage delinquencies and the stock-market performance of locally based companies.
Bond Credit Ratings (Credit Quality) – A bond credit rating assesses the financial ability of a debt issuer to make timely payments of principal and interest. Ratings of AAA (the highest), AA, A, and BBB are investment-grade quality. Ratings of BB, B, CCC, CC, C and D (the lowest) are considered below investment grade, speculative grade, or junk bonds.
Core Personal Consumption Expenditure Index (Core PCE) – A measure of the Personal Consumption Expenditure Index that excludes the more volatile and seasonal food and energy prices.
Credit Spread/Quality Spread – The difference between the yields of securities with different credit qualities.
Duration – A bond’s sensitivity to interest rates. Effective duration incorporates the embedded option features, such as call provisions. Bonds with longer durations experience greater price volatility than bonds with shorter durations.
General Obligation Bond (GO) – A municipal bond backed by the credit and “taxing power” of the issuing jurisdiction rather than the revenue from a given project.
Gross Domestic Product (GDP) – A country’s income minus foreign investments: the total value of all goods and services produced within a country in a year, minus net income from investments in other countries.
Laddering – Involves building a portfolio of bonds with staggered maturities so that a portion matures each year. Money that comes in from maturing bonds is typically invested in bonds with longer maturities at the far end of the portfolio.
Revenue Bond – A bond on which the debt service is payable solely from the revenue generated from the operation of the project being financed or a category of facilities, or from other non-tax sources.
SEC Yield – SEC yield is computed in accordance with SEC standards measuring the net investment income per share over a specified 30-day period expressed as a percentage of the maximum offering price of the Fund’s shares at the end of the period.
Variable Rate Demand Note (VRDN) – VRDNs are long-term, floating-rate municipal securities. These highly liquid securities are payable on demand, typically either daily or weekly, meaning the investor can request repayment of the entire debt amount. The coupon rate will adjust on a periodic basis, either daily or weekly.
West Texas Intermediate (WTI) – A grade of crude oil used as a benchmark in oil pricing. Yield Curve – A line that plots the interest rates, at a set point in time, of bonds having equal credit quality, but differing maturity dates.
Annual Report 7
| | |
| FUND SUMMARY | | |
| |
Thornburg New York Intermediate Municipal Fund | | September 30, 2016 (Unaudited) |
Objectives and Strategies
The Fund’s primary investment objective is to obtain as high a level of current income exempt from federal, New York State and New York City individual income taxes as is consistent, in the view of the Fund’s investment advisor, with preservation of capital.
The secondary goal of the Fund is to reduce expected changes in its share price compared to long-term bond portfolios.
The Fund offers New York investors double (or for New York City residents triple) tax-free yields in a laddered municipal bond portfolio with a dollar-weighted average maturity of normally three to ten years (may be subject to Alternative Minimum Tax). Laddering involves building a portfolio of bonds with staggered maturities so that a portion of the portfolio matures each year. Cash from maturing bonds, if not needed for other purposes, is typically invested in bonds with longer maturities at the far end of the ladder. We regard the strategy as a good compromise for managing different types of risk.
Key Portfolio Attributes
| | | | |
Number of Bonds | | | 76 | |
| |
Effective Duration | | | 4.6 Yrs | |
| |
Average Maturity | | | 8.0 Yrs | |
Long-term Stability of Principal
Net Asset Value History of A Shares
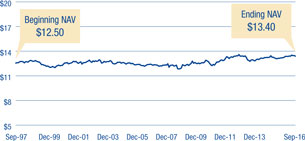
Security Credit Ratings
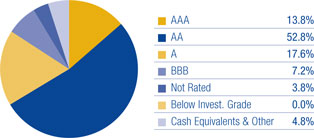
A bond credit rating assesses the financial ability of a debt issuer to make timely payments of principal and interest. Ratings of AAA (the highest), AA, A, and BBB are investment-grade quality. Ratings of BB, B, CCC, CC, C and D (the lowest) are considered below investment grade, speculative grade, or junk bonds. Credit quality ratings for Thornburg’s municipal portfolios used the highest rating available from either Standard & Poor’s or Moody’s Investors Service.
Portfolio Ladder
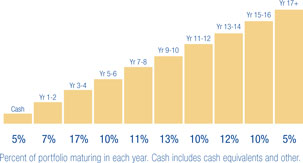
Percent of portfolio maturing in each year. Cash includes cash equivalents and other.
There is no guarantee that the Fund will meet its investment objectives.
All data is subject to change. Charts may not add up to 100% due to rounding.
8 Annual Report
| | |
| SCHEDULE OF INVESTMENTS | | |
| |
Thornburg New York Intermediate Municipal Fund | | September 30, 2016 |
| | | | | | | | | | |
Issuer-Description | | Credit Rating†
S&P/ Moody’s | | Principal
Amount | | | Value | |
Arlington Central School District GO, 5.00% due 5/15/2022 (Educational Facilities) (State Aid Withholding) | | NR/Aa2 | | $ | 350,000 | | | $ | 423,626 | |
Brooklyn Arena Local Development Corp., 5.00% due 7/15/2030 (Barclays Center Project) | | NR/Baa3 | | | 1,500,000 | | | | 1,838,385 | |
City of New York GO, 5.00% due 8/1/2019 (City Budget Financial Management) | | AA/Aa2 | | | 1,000,000 | | | | 1,111,160 | |
City of New York GO, 0.89% due 8/1/2020 put 10/3/2016 (Capital Projects; Insured: AGM; SPA: State Street Bank & Trust Co.) (daily demand notes) | | AA/Aa2 | | | 500,000 | | | | 500,000 | |
City of New York GO, 5.00% due 8/1/2023 (City Budget Financial Management) | | AA/Aa2 | | | 1,000,000 | | | | 1,238,430 | |
City of New York GO, 5.00% due 8/1/2025 (City Budget Financial Management) | | AA/Aa2 | | | 400,000 | | | | 413,784 | |
City of New York GO, 5.00% due 8/1/2030 (City Budget Financial Management) | | AA/Aa2 | | | 1,000,000 | | | | 1,210,560 | |
County of Nassau GO, 5.00% due 4/1/2026 (Insured: BAM) | | AA/NR | | | 1,000,000 | | | | 1,214,020 | |
Dutchess County Local Development Corp., 5.00% due 7/1/2021 (Health Quest Systems, Inc.; Insured: AGM) | | AA/A2 | | | 535,000 | | | | 607,476 | |
Dutchess County Local Development Corp., 5.00% due 7/1/2022 (Health Quest Systems, Inc.; Insured: AGM) | | AA/A2 | | | 510,000 | | | | 578,692 | |
Erie County Industrial Development Agency, 5.25% due 5/1/2025 (Buffalo City School District) | | AA/Aa2 | | | 1,000,000 | | | | 1,111,490 | |
Government of Guam, 5.375% due 12/1/2024 (Layon Solid Waste Disposal Facility) | | BBB+/NR | | | 1,000,000 | | | | 1,136,920 | |
Government of Guam, 5.00% due 11/15/2033 (Various Capital Projects) | | A/NR | | | 2,000,000 | | | | 2,325,840 | |
Guam Waterworks Authority, 5.00% due 7/1/2028 (Water and Wastewater System) | | A-/Baa2 | | | 500,000 | | | | 577,045 | |
Hempstead Town Local Development Corp., 5.00% due 7/1/2028 (Hofstra University) | | A/A3 | | | 500,000 | | | | 572,930 | |
Long Island Power Authority, 5.00% due 9/1/2022 (Electric System Capital Improvements) | | A-/A3 | | | 395,000 | | | | 474,427 | |
Long Island Power Authority, 5.25% due 9/1/2029 (Electric System Capital Improvements) | | AA/A3 | | | 645,000 | | | | 832,895 | |
Metropolitan Transportation Authority, 6.25% due 11/15/2023 pre-refunded 11/15/2018 | | NR/NR | | | 800,000 | | | | 891,184 | |
Metropolitan Transportation Authority, 6.25% due 11/15/2023 | | AA-/A1 | | | 200,000 | | | | 222,526 | |
Monroe County Industrial Development Corp., 5.00% due 1/15/2028 (Monroe Community College Association, Inc.; Insured: AGM) | | AA/A2 | | | 250,000 | | | | 298,708 | |
Monroe County Industrial Development Corp., 5.00% due 1/15/2029 (Monroe Community College Association, Inc.; Insured: AGM) | | AA/A2 | | | 300,000 | | | | 356,253 | |
Nassau County IDA, 4.75% due 3/1/2026 (New York Institute of Technology) | | BBB+/Baa2 | | | 1,000,000 | | | | 1,126,230 | |
Nassau County Sewer & Storm Water Finance Authority, 5.00% due 10/1/2021 (Sewerage and Storm Water Resource Facilities) | | AAA/Aa3 | | | 275,000 | | | | 327,434 | |
Nassau County Sewer & Storm Water Finance Authority, 5.00% due 10/1/2028 (Sewerage and Storm Water Resource Facilities) | | AAA/Aa3 | | | 400,000 | | | | 501,948 | |
Nassau County Sewer & Storm Water Finance Authority, 5.00% due 10/1/2031 (Sewerage and Storm Water Resource Facilities) | | AAA/Aa3 | | | 1,000,000 | | | | 1,237,510 | |
New York City Health and Hospitals Corp. GO, 5.00% due 2/15/2020 (Healthcare Facilities Improvements) | | A+/Aa3 | | | 770,000 | | | | 872,579 | |
New York City Health and Hospitals Corp. GO, 5.00% due 2/15/2025 (Healthcare Facilities Improvements) | | A+/Aa3 | | | 1,000,000 | | | | 1,126,240 | |
New York City Municipal Water Finance Authority, 0.87% due 6/15/2032 put 10/3/2016 (Water and Sewer System; SPA: State Street Bank & Trust Co.) (daily demand notes) | | AA+/Aa1 | | | 700,000 | | | | 700,000 | |
New York City Municipal Water Finance Authority, 5.00% due 6/15/2032 (Water and Sewer System) | | AA+/Aa1 | | | 1,000,000 | | | | 1,231,460 | |
New York City Municipal Water Finance Authority, 0.86% due 6/15/2050 put 10/3/2016 (Water and Sewer System; SPA: JPMorgan Chase Bank, N.A.) (daily demand notes) | | AA+/Aa1 | | | 1,100,000 | | | | 1,100,000 | |
New York City Transitional Finance Authority, 5.00% due 1/15/2020 (Educational Facilities) (State Aid Withholding) | | AA/Aa2 | | | 1,000,000 | | | | 1,095,610 | |
New York City Transitional Finance Authority, 0.86% due 2/1/2045 put 10/3/2016 (City Capital Projects; SPA: JPMorgan Chase Bank, N.A.) (daily demand notes) | | AAA/Aa1 | | | 1,000,000 | | | | 1,000,000 | |
New York City Trust for Cultural Resources, 5.25% due 12/1/2018 (Lincoln Center for the Performing Arts) | | A+/A2 | | | 175,000 | | | | 190,668 | |
New York City Trust for Cultural Resources, 4.00% due 4/1/2025 (The Museum of Modern Art) | | AA/Aa2 | | | 500,000 | | | | 600,555 | |
New York Municipal Bond Bank Agency, 5.00% due 4/15/2018 (Insured: AGM) | | AA/A2 | | | 1,000,000 | | | | 1,059,840 | |
New York State Dormitory Authority, 5.00% due 10/1/2023 (School District Financing Program; Insured: AGM) (State Aid Withholding) | | AA/A2 | | | 400,000 | | | | 416,716 | |
New York State Dormitory Authority, 5.50% due 2/15/2017 (Mental Health Services Facilities) | | AA/NR | | | 1,000,000 | | | | 1,017,710 | |
New York State Dormitory Authority, 5.00% due 10/1/2018 (School District Financing Program; Insured: AGM) | | AA/Aa3 | | | 680,000 | | | | 706,806 | |
New York State Dormitory Authority, 5.25% due 10/1/2018 (School District Financing Program; Insured: AGM) | | AA/Aa3 | | | 775,000 | | | | 841,603 | |
New York State Dormitory Authority, 5.00% due 7/1/2020 (NYSARC, Inc. Developmental Disability Programs) | | NR/Aa2 | | | 1,175,000 | | | | 1,330,018 | |
New York State Dormitory Authority, 4.00% due 10/1/2020 (School District Financing Program; Insured: AGM) (State Aid Withholding) | | AA/A1 | | | 325,000 | | | | 360,526 | |
New York State Dormitory Authority, 5.25% due 7/1/2022 (St. John’s University; Insured: Natl-Re) | | AA-/A3 | | | 1,000,000 | | | | 1,221,980 | |
New York State Dormitory Authority, 5.00% due 1/15/2023 (Municipal Health Facilities) | | AA-/Aa3 | | | 1,000,000 | | | | 1,052,910 | |
New York State Dormitory Authority, 5.00% due 10/1/2023 (School District Financing Program) (State Aid Withholding) | | AA-/NR | | | 575,000 | | | | 714,138 | |
New York State Dormitory Authority, 5.00% due 7/1/2024 (Bishop Henry B. Hucles Nursing Home; Insured: SONYMA) | | NR/Aa1 | | | 1,000,000 | | | | 1,002,890 | |
New York State Dormitory Authority, 5.00% due 7/1/2024 (Miriam Osborn Memorial Home Assoc.) | | NR/NR | | | 1,540,000 | | | | 1,671,732 | |
New York State Dormitory Authority, 5.00% due 10/1/2024 (School District Financing Program; Insured: AGM) (State Aid Withholding) | | AA/Aa3 | | | 1,000,000 | | | | 1,179,840 | |
New York State Dormitory Authority, 5.00% due 7/1/2025 (Miriam Osborn Memorial Home Assoc.) | | NR/NR | | | 1,105,000 | | | | 1,193,024 | |
New York State Dormitory Authority, 5.00% due 7/1/2027 (Interagency Council Pooled Loan Program) | | NR/Aa2 | | | 1,000,000 | | | | 1,172,560 | |
New York State Dormitory Authority, 5.00% due 7/1/2027 (Columbia University Teachers College) | | A+/A1 | | | 750,000 | | | | 879,240 | |
New York State Dormitory Authority, 5.25% due 7/1/2027 (Health Quest Systems; Insured: AGM) | | AA/A3 | | | 500,000 | | | | 515,180 | |
New York State Dormitory Authority, 5.00% due 12/15/2027 (Metropolitan Transportation Authority & State Urban Development Corp.) | | AAA/Aa1 | | | 2,500,000 | | | | 3,060,475 | |
New York State Dormitory Authority, 5.00% due 10/1/2028 (School District Financing Program; Insured: AGM) | | AA/NR | | | 200,000 | | | | 247,164 | |
Annual Report 9
| | |
| SCHEDULE OF INVESTMENTS, CONTINUED | | |
| |
Thornburg New York Intermediate Municipal Fund | | September 30, 2016 |
| | | | | | | | | | | | |
Issuer-Description | | Credit Rating†
S&P/ Moody’s | | | Principal
Amount | | | Value | |
New York State Dormitory Authority, 5.25% due 5/1/2030 pre-refunded 5/1/2019 (North Shore Long Island Jewish Medical) | | | A-/A3 | | | $ | 1,000,000 | | | $ | 1,111,490 | |
New York State Dormitory Authority, 5.00% due 7/1/2034 (Pratt Institute) | | | NR/A3 | | | | 1,000,000 | | | | 1,182,120 | |
New York State Thruway Authority, 5.00% due 5/1/2019 (New NY Bridge) | | | A-/A3 | | | | 2,000,000 | | | | 2,205,160 | |
New York State Thruway Authority, 5.00% due 4/1/2022 pre-refunded 10/01/17 (Multi-Year Highway and Bridge Capital Program) | | | AA/NR | | | | 1,000,000 | | | | 1,041,450 | |
New York State Thruway Authority, 5.00% due 1/1/2028 (Multi-Year Highway and Bridge Capital Program) | | | A/A2 | | | | 500,000 | | | | 620,450 | |
New York State Urban Development Corp., 5.25% due 1/1/2021 | | | AA/NR | | | | 1,000,000 | | | | 1,097,250 | |
New York Transportation Development Corp., 5.00% due 7/1/2034 (Laguardia Airport Terminal Redevelopment) (AMT) | | | NR/Baa3 | | | | 250,000 | | | | 288,495 | |
Onondaga Civic Development Corp., 5.00% due 7/1/2021 (Le Moyne College) | | | NR/Baa2 | | | | 1,000,000 | | | | 1,111,360 | |
Onondaga Civic Development Corp., 5.50% due 12/1/2031 (State University of New York Upstate Medical University) | | | A+/NR | | | | 1,000,000 | | | | 1,195,110 | |
Port Authority New York & New Jersey, 5.00% due 8/15/2022 (Insured: AGM) | | | AA/Aa3 | | | | 1,000,000 | | | | 1,035,940 | |
Sales Tax Asset Receivable Corp., 5.00% due 10/15/2029 (New York Local Government Assistance Corp.) | | | AAA/Aa1 | | | | 250,000 | | | | 314,985 | |
Sales Tax Asset Receivable Corp., 5.00% due 10/15/2030 (New York Local Government Assistance Corp.) | | | AAA/Aa1 | | | | 1,000,000 | | | | 1,258,170 | |
Sales Tax Asset Receivable Corp., 5.00% due 10/15/2031 (New York Local Government Assistance Corp.) | | | AAA/Aa1 | | | | 1,000,000 | | | | 1,253,880 | |
Syracuse Industrial Development Agency, 5.25% due 5/1/2026 (Syracuse City School District) | | | AA/Aa2 | | | | 2,150,000 | | | | 2,525,175 | |
Town of Amherst Development Corp., 5.00% due 10/1/2020 (University at Buffalo Foundation Facility-Student Housing; Insured: AGM) | | | AA/A2 | | | | 1,000,000 | | | | 1,136,940 | |
Triborough Bridge & Tunnel Authority GO, 5.00% due 11/15/2025 pre-refunded 11/15/2017 (MTA Bridges and Tunnels) | | | AA-/Aa3 | | | | 1,410,000 | | | | 1,476,707 | |
Triborough Bridge & Tunnel Authority GO, 5.00% due 11/15/2028 (MTA Bridges and Tunnels) | | | AA-/Aa3 | | | | 1,000,000 | | | | 1,228,630 | |
Triborough Bridge & Tunnel Authority GO, 5.00% due 11/15/2029 (MTA Bridges and Tunnels) | | | AA-/Aa3 | | | | 1,000,000 | | | | 1,218,770 | |
United Nations Development Corp., 5.00% due 7/1/2019 (One, Two and Three U.N. Plaza) | | | NR/A1 | | | | 230,000 | | | | 254,385 | |
United Nations Development Corp., 5.00% due 7/1/2025 (One, Two and Three U.N. Plaza) | | | NR/A1 | | | | 710,000 | | | | 781,000 | |
Utility Debt Securitization Authority, 5.00% due 12/15/2029 (Long Island Power Authority-Electric Service) | | | AAA/Aaa | | | | 1,000,000 | | | | 1,235,290 | |
Utility Debt Securitization Authority, 5.00% due 12/15/2030 (Long Island Power Authority-Electric Service) | | | AAA/Aaa | | | | 1,000,000 | | | | 1,229,890 | |
West Seneca Central School District GO, 5.00% due 11/15/2023 (Facilities Improvements; Insured: BAM) (State Aid Withholding) | | | AA/A2 | | | | 1,300,000 | | | | 1,611,571 | |
| | | | | | | | | | | | |
TOTAL INVESTMENTS — 98.17% (Cost $69,473,613) | | | | | | | | | | $ | 75,105,155 | |
OTHER ASSETS LESS LIABILITIES — 1.83% | | | | | | | | | | | 1,402,108 | |
| | | | | | | | | | | | |
NET ASSETS — 100.00% | | | | | | | | | | $ | 76,507,263 | |
| | | | | | | | | | | | |
Footnote Legend
| † | Credit ratings are unaudited. Rating changes may have occurred subsequent to the reporting period end. Bonds issued with a maturity of one year or less are assigned Moody’s ratings from MIG-1 to MIG-4 and Standard and Poor’s ratings from SP-1+ to SP-3 with MIG-1 and SP-1+ being the strongest ratings. |
Portfolio Abbreviations
To simplify the listings of securities, abbreviations are used per the table below:
| | |
| AGM | | Insured by Assured Guaranty Municipal Corp. |
| AMT | | Alternative Minimum Tax |
| BAM | | Insured by Build America Mutual Insurance Co. |
| GO | | General Obligation |
| IDA | | Industrial Development Authority |
| Natl-Re | | Insured by National Public Finance Guarantee Corp. |
| SONYMA | | State of New York Mortgage Authority |
See notes to financial statements.
| | |
| STATEMENT OF ASSETS AND LIABILITIES | | |
| |
Thornburg New York Intermediate Municipal Fund | | September 30, 2016 |
| | | | |
ASSETS | | | | |
Investments at value (cost $69,473,613) (Note 3) | | $ | 75,105,155 | |
Cash | | | 364,011 | |
Receivable for investments sold | | | 125,000 | |
Receivable for fund shares sold | | | 136,645 | |
Interest receivable | | | 969,176 | |
Prepaid expenses and other assets | | | 1,164 | |
| | | | |
Total Assets | | | 76,701,151 | |
| | | | |
| |
LIABILITIES | | | | |
Payable for fund shares redeemed | | | 68,914 | |
Payable to investment advisor and other affiliates (Note 4) | | | 41,363 | |
Accounts payable and accrued expenses | | | 59,814 | |
Dividends payable | | | 23,797 | |
| | | | |
Total Liabilities | | | 193,888 | |
| | | | |
| |
NET ASSETS | | $ | 76,507,263 | |
| | | | |
NET ASSETS CONSIST OF | | | | |
Distribution in excess of net investment income | | $ | (16,847 | ) |
Net unrealized appreciation on investments | | | 5,631,542 | |
Accumulated net realized gain (loss) | | | (492,868 | ) |
Net capital paid in on shares of beneficial interest | | | 71,385,436 | |
| | | | |
| | $ | 76,507,263 | |
| | | | |
| |
NET ASSET VALUE | | | | |
Class A Shares: | | | | |
Net asset value and redemption price per share ($45,008,864 applicable to 3,358,294 shares of beneficial interest outstanding - Note 5) | | $ | 13.40 | |
Maximum sales charge, 2.00% of offering price | | | 0.27 | |
| | | | |
Maximum offering price per share | | $ | 13.67 | |
| | | | |
| |
Class I Shares: | | | | |
Net asset value, offering and redemption price per share ($31,498,399 applicable to 2,350,190 shares of beneficial interest outstanding - Note 5) | | $ | 13.40 | |
| | | | |
| * | Redemption price per share is equal to net asset value less any applicable contingent deferred sales charge. |
See notes to financial statements.
Annual Report 11
| | |
| STATEMENT OF OPERATIONS | | |
| |
Thornburg New York Intermediate Municipal Fund | | Year Ended September 30, 2016 |
| | | | |
INVESTMENT INCOME | | | | |
Interest income (net of premium amortized of $681,348) | | $ | 2,466,061 | |
| | | | |
| |
EXPENSES | | | | |
Investment advisory fees (Note 4) | | | 392,357 | |
Administration fees (Note 4) | | | | |
Class A Shares | | | 59,148 | |
Class I Shares | | | 15,576 | |
Distribution and service fees (Note 4) | | | | |
Class A Shares | | | 118,296 | |
Transfer agent fees | | | | |
Class A Shares | | | 34,982 | |
Class I Shares | | | 28,581 | |
Registration and filing fees | | | | |
Class A Shares | | | 183 | |
Class I Shares | | | 183 | |
Professional fees | | | 47,581 | |
Accounting fees (Note 4) | | | 2,929 | |
Trustee fees | | | 3,510 | |
Other expenses | | | 8,184 | |
| | | | |
Total Expenses | | | 711,510 | |
Less: | | | | |
Expenses reimbursed by investment advisor (Note 4) | | | (60,690 | ) |
| | | | |
Net Expenses | | | 650,820 | |
| | | | |
Net Investment Income | | | 1,815,241 | |
| | | | |
REALIZED AND UNREALIZED GAIN (LOSS) | | | | |
Net realized gain (loss) on investments | | | (13,529 | ) |
Net change in unrealized appreciation (depreciation) on investments | | | 1,336,245 | |
| | | | |
Net Realized and Unrealized Gain | | | 1,322,716 | |
| | | | |
Net Increase in Net Assets Resulting from Operations | | $ | 3,137,957 | |
| | | | |
See notes to financial statements.
12 Annual Report
| | |
| STATEMENTS OF CHANGES IN NET ASSETS | | |
| |
Thornburg New York Intermediate Municipal Fund | | |
| | | | | | | | |
| | | Year Ended
September 30, 2016 | | | Year Ended
September 30, 2015 | |
INCREASE (DECREASE) IN NET ASSETS FROM | | | | | | | | |
| | |
OPERATIONS | | | | | | | | |
Net investment income | | $ | 1,815,241 | | | $ | 1,811,546 | |
Net realized gain (loss) on investments | | | (13,529 | ) | | | (51,436 | ) |
Net unrealized appreciation (depreciation) on investments | | | 1,336,245 | | | | (179,372 | ) |
| | | | | | | | |
Net Increase (Decrease) in Net Assets Resulting from Operations | | | 3,137,957 | | | | 1,580,738 | |
| | |
DIVIDENDS TO SHAREHOLDERS | | | | | | | | |
From net investment income | | | | | | | | |
Class A Shares | | | (1,033,774 | ) | | | (1,122,691 | ) |
Class I Shares | | | (781,467 | ) | | | (688,855 | ) |
| | |
FUND SHARE TRANSACTIONS (NOTE 5) | | | | | | | | |
Class A Shares | | | (5,647,817 | ) | | | (4,324,129 | ) |
Class I Shares | | | 745,159 | | | | 6,419,536 | |
| | | | | | | | |
Net Increase (Decrease) in Net Assets | | | (3,579,942 | ) | | | 1,864,599 | |
| | |
NET ASSETS | | | | | | | | |
Beginning of Year | | | 80,087,205 | | | | 78,222,606 | |
| | | | | | | | |
| | |
End of Year | | $ | 76,507,263 | | | $ | 80,087,205 | |
| | | | | | | | |
Distribution in excess of net investment income | | $ | (16,847 | ) | | $ | (16,847 | ) |
See notes to financial statements.
Annual Report 13
| | |
| NOTES TO FINANCIAL STATEMENTS | | |
| |
Thornburg New York Intermediate Municipal Fund | | September 30, 2016 |
NOTE 1 – ORGANIZATION
Thornburg New York Intermediate Municipal Fund (the “Fund”) is a non-diversified series of Thornburg Investment Trust (the “Trust”). The Trust is organized as a Massachusetts business trust under a Declaration of Trust dated June 3, 1987 and is registered as a diversified, open-end management investment company under the Investment Company Act of 1940, as amended. The Fund is currently one of twenty separate series of the Trust. Each series is considered to be a separate entity for financial reporting and tax purposes and bears expenses directly attributable to it. The Fund’s primary investment objective is to obtain as high a level of current income exempt from federal, New York State, and New York City individual income tax as is consistent, in the view of Thornburg Investment Management, Inc., the Trust’s investment advisor (the “Advisor”), with the preservation of capital. The Fund’s secondary objective is to reduce expected changes in its share price compared to long-term bond portfolios. The Fund will invest primarily in municipal obligations within the state of New York.
The Fund currently offers two classes of shares of beneficial interest: Class A and Institutional Class (“Class I”) shares. Each class of shares of the Fund represents an interest in the same portfolio of investments, except that (i) Class A shares are sold subject to a front-end sales charge collected at the time the shares are purchased and bear a service fee and (ii) Class I shares are sold at net asset value without a sales charge at the time of purchase and may be subject to a service fee, and (iii) the respective classes may have different reinvestment privileges and conversion rights. Additionally, the Fund may allocate among its classes certain expenses, to the extent allocable to specific classes, including transfer agent fees, government registration fees, certain printing and postage costs, and administrative and legal expenses. Currently, class specific expenses of the Fund are limited to service and distribution fees, administration fees, and certain registration and transfer agent expenses.
The following is a summary of significant accounting policies followed by the Fund in the preparation of its financial statements. The Fund prepares its financial statements in conformity with United States generally accepted accounting principles (“GAAP”), including investment company accounting and reporting guidance in the Financial Accounting Standards Board (the “FASB”) Accounting Standard Codification Topic 946.
NOTE 2 – SIGNIFICANT ACCOUNTING POLICIES
Security Valuation: All investments in securities held by the Fund are valued as described in Note 3.
Allocation of Income, Gains, Losses and Expenses: Net investment income (other than class specific expenses) and realized and unrealized gains and losses are allocated daily to each class of shares based upon the relative net asset value of outstanding shares (or the value of the dividend-eligible shares, as appropriate) of each class of shares at the beginning of the day (after adjusting for the current capital shares activity of the respective class). Expenses common to all Funds are allocated among the Funds comprising the Trust based upon their relative net asset values or other appropriate allocation methods. Operating expenses directly attributable to a specific class are charged against the operating income of that class.
Dividends and Distributions to Shareholders: Dividends and distributions to shareholders, which are determined in accordance with federal income tax regulations and may differ from GAAP, are recorded on the ex-dividend date. Ordinary income distributions, if any, are declared daily and paid monthly. Capital gain distributions, if any, are declared and paid annually and more often if deemed necessary by the Advisor. Dividends are paid and are reinvested in additional shares of the Fund at net asset value per share at the close of business on the ex-dividend date, or at the shareholder’s option, paid in cash.
Investment Income: Interest income is accrued as earned. Premiums and discounts are amortized and accreted, respectively, to call dates or maturity dates using the effective yield method of the respective investments, which is included in interest income on the Statement of Operations.
Custodian Fees: Custodian fees disclosed in the Statement of Operations may include interest expenses incurred by the Fund on any cash overdrafts of its custodian account during the period. Such cash overdrafts may result from the effects of failed trades in portfolio securities and from cash outflows resulting from unanticipated shareholder redemption activity. The Fund pays interest to its custodian on any such cash overdraft at a rate equal to 2.50% of the overdraft amount in excess of $50,000.
Investment Transactions: Investment transactions are accounted for on a trade date basis. Realized gains and losses from the sale of investments are recorded on an identified cost basis.
When-Issued and Delayed Delivery Transactions: The Fund may engage in when-issued or delayed delivery transactions. To the extent the Fund engages in such transactions, it will do so for the purpose of acquiring portfolio investments consistent with the Fund’s investment objectives and not for the purpose of investment leverage or to speculate on interest rate or market changes. At the time the Fund makes a commitment to purchase an investment on a when-issued or delayed delivery basis, the Fund will record the transaction and reflect the value in determining its net asset value. When effecting such transactions, assets of an amount sufficient to make payment
14 Annual Report
| | |
| NOTES TO FINANCIAL STATEMENTS, CONTINUED | | |
| |
Thornburg New York Intermediate Municipal Fund | | September 30, 2016 |
for the portfolio investments to be purchased will be segregated on the Fund’s records on the trade date. Investments purchased on a when-issued or delayed delivery basis do not earn interest until the settlement date.
Guarantees and Indemnifications: Under the Trust’s organizational documents (and under separate agreements with the independent Trustees), its officers and Trustees are provided with an indemnification against certain liabilities arising out of the performance of their duties to the Fund. In the normal course of business the Trust may also enter into contracts with service providers that contain general indemnifications. The Trust’s maximum exposure under these arrangements is unknown. However, based on experience, the Trust expects the risk of loss to be remote.
Use of Estimates: The preparation of financial statements in conformity with GAAP requires management to make estimates and assumptions that affect the reported amounts of assets and liabilities and disclosure of contingent assets and liabilities at the date of the financial statements and the reported amounts of increases (decreases) in net assets from operations during the reporting period. Actual results could differ from those estimates.
Federal Income Taxes: It is the policy of the Trust to comply with the provisions of the Internal Revenue Code applicable to regulated investment companies and to distribute to shareholders substantially all investment company taxable income including net realized gains on investments (if any), and tax exempt income of the Fund. Therefore, no provision for federal income or excise tax is required.
The Fund files income tax returns in United States federal and applicable state jurisdictions. The statute of limitations on the Fund’s tax return filings generally remains open for the three years following a return’s filing date. The Fund has analyzed each uncertain tax position believed to be material in the preparation of the Fund’s financial statements for the fiscal year ended September 30, 2016, including open tax years, to assess whether it is more likely than not that the position would be sustained upon examination, based on the technical merits of the position. The Fund has not identified any such position for which an asset or liability must be reflected in the Statement of Assets and Liabilities.
At September 30, 2016, information on the tax components of capital was as follows:
| | | | |
Cost of investments for tax purposes | | $ | 69,473,613 | |
| | | | |
Gross unrealized appreciation on a tax basis | | $ | 5,632,227 | |
Gross unrealized depreciation on a tax basis | | | (685 | ) |
| | | | |
Net unrealized appreciation (depreciation) on investments (tax basis) | | $ | 5,631,542 | |
| | | | |
At September 30, 2016, the Fund had deferred tax basis capital losses occurring subsequent to October 31, 2015 through September 30, 2016 of $13,529. For tax purposes, such losses will be recognized in the year ending September 30, 2017.
At September 30, 2016, the Fund had cumulative tax basis capital losses of $479,338, (of which $127,505 are short-term and $351,833 are long-term) generated after September 30, 2011, which may be carried forward to offset future capital gains. To the extent such carryforwards are used, capital gain distributions may be reduced to the extent provided by regulations. Such capital loss carryforwards do not expire.
At September 30, 2016, the Fund had $6,950 of undistributed net tax-exempt income, no undistributed tax basis net ordinary income, and no undistributed tax basis capital gains.
The tax character of distributions paid during the year ended September 30, 2016, and September 30, 2015, was as follows:
| | | | | | | | |
| | | 2016 | | | 2015 | |
Distributions from: | | | | | | | | |
Tax exempt income | | $ | 1,815,241 | | | $ | 1,811,546 | |
Ordinary income | | | — | | | | — | |
| | | | | | | | |
Total | | $ | 1,815,241 | | | $ | 1,811,546 | |
| | | | | | | | |
NOTE 3 – SECURITY VALUATION
Valuation of the Fund’s portfolio investment securities is performed in accordance with policies and procedures adopted by and under the oversight of the Trustees.
The Trustees of the Trust have appointed, the Advisor to assist the Trustees in obtaining market values for portfolio investments, evaluate and monitor professional pricing service providers appointed by the Trustees’ Audit Committee (the “Audit Committee”) to assist in determining fair values for portfolio investments, assist in calculating fair values for portfolio investments in certain circumstances, and to perform other functions in connection with the valuation of investments. The Advisor acts through its Valuation and Pricing
Annual Report 15
| | |
| NOTES TO FINANCIAL STATEMENTS, CONTINUED | | |
| |
Thornburg New York Intermediate Municipal Fund | | September 30, 2016 |
Committee (the “Committee”) and other employees of the Advisor. The Committee regularly reviews its own valuation calculations, as well as the valuations, valuation techniques and services furnished by pricing service providers, considers circumstances which may require valuation calculations by the Committee, and reviews previous valuation calculations. The Committee reports to the Audit Committee on the Committee’s activities, the performance of pricing service providers, and other matters relating to valuation of portfolio investments.
In those instances when the Committee assists in calculating a fair value for a portfolio investment, the Committee seeks to determine the price that the Fund would reasonably expect to receive upon a sale of the investment in an orderly transaction between market participants on the valuation date. The Committee customarily utilizes quotations from securities broker dealers in calculating valuations, but also may utilize prices obtained from pricing service providers or other methods approved by the Audit Committee. Because fair values calculated by the Committee are estimates, the calculation of a value for an investment may differ from the price that would be realized by the Fund upon a sale of the investment, and the difference could be material to the Fund’s financial statements. The Committee’s calculation of a fair value for an investment may also differ from the prices obtained by other persons (including other mutual funds) for the investment.
Valuation of Securities: Debt obligations held by the Fund which are not listed or traded on exchanges or for which no reported market exists are ordinarily valued at the valuation obtained from a pricing service provider approved by the Audit Committee.
In any case when a pricing service provider fails to provide a valuation for a debt obligation held by the Fund, the Committee calculates a fair value for the obligation using alternative methods under procedures approved by the Audit Committee. Additionally, in cases when management believes that a valuation obtained from a pricing service provider merits review for significant reasons, the Committee decides whether or not to use the valuation calculated by the pricing service provider or to use an alternative method approved by the Audit Committee to calculate a fair value for the obligation.
Valuation Hierarchy: The Fund categorizes its investments based upon the inputs used in valuing those investments, according to a three-level hierarchy established in guidance from the FASB. Categorization of investments using this hierarchy is intended by the FASB to maximize the use of observable inputs in valuing investments and minimize the use of unobservable inputs by requiring that the most observable inputs be used when available. Observable inputs are those that market participants would use in valuing an investment based on available market information. Unobservable inputs are those that reflect assumptions about the information market participants would use in valuing an investment. An investment’s level within the hierarchy is based on the lowest level input that is deemed significant to the valuation. The methodologies and inputs used to value investments are not necessarily indications of the risk or liquidity associated with those investments.
Various inputs are used in calculating valuations for the Fund’s investments. These inputs are generally summarized according to the three-level hierarchy below:
Level 1: Quoted prices in active markets for identical investments.
Level 2: Other direct or indirect significant observable inputs (including quoted prices for similar investments in active markets and other observable inputs, such as interest rates, prepayment rates, credit risk, etc.).
Level 3: Significant unobservable inputs (including the Committee’s own assumptions in calculating the fair values of investments).
Valuations for debt obligations held by the Fund are typically calculated by pricing service providers approved by the Audit Committee and are characterized as Level 2 within the valuation hierarchy.
In a limited number of cases the Committee calculates a fair value for investments using broker quotations or other methods approved by the Audit Committee. When the Committee uses a single broker quotation to calculate a fair value for an investment without other significant observable inputs, or if a fair value is calculated using other significant inputs that are considered unobservable, the investment is characterized as Level 3 within the hierarchy. Other significant unobservable inputs used to calculate a fair value in these instances might include an income-based valuation approach which considers discounted anticipated future cash flows from the investment, and application of discounts due to the nature or duration of any restrictions on the disposition of the investment.
Valuations based upon the use of inputs from Levels 1, 2 or 3 may not represent the actual price received upon the disposition of an investment, and the Fund may receive a price that is lower than the valuation based upon these inputs when it sells the investment.
16 Annual Report
| | |
| NOTES TO FINANCIAL STATEMENTS, CONTINUED | | |
| |
Thornburg New York Intermediate Municipal Fund | | September 30, 2016 |
The following table displays a summary of the fair value hierarchy measurements of the Fund’s investments as of September 30, 2016. In any instance when valuation inputs from more than one level are used to determine the fair value of a specific investment, the investment is placed in the level of the table based upon the lowest level input that is significant in determining the fair value of the investment:
| | | | | | | | | | | | | | | | |
| | | Fair Value Measurements at September 30, 2016 | |
| | | Total | | | Level 1 | | | Level 2 | | | Level 3 | |
Assets | | | | | | | | | | | | | | | | |
Investments in Securities | | | | | | | | | | | | | | | | |
Municipal Bonds | | $ | 75,105,155 | | | $ | — | | | $ | 75,105,155 | | | $ | — | |
| | | | | | | | | | | | | | | | |
Total Investments in Securities | | $ | 75,105,155 | | | $ | — | | | $ | 75,105,155 | | | $ | — | |
In accordance with the guidance prescribed in Accounting Standards Update No. 2011-04, it is the policy of the Fund to recognize transfers between levels and the underlying events which caused the movement. The Fund recognized no transfers between levels for the year ended September 30, 2016.
NOTE 4 – INVESTMENT ADVISORY FEE AND OTHER TRANSACTIONS WITH AFFILIATES
Pursuant to an investment advisory agreement, the Advisor serves as the investment advisor and performs services for the Fund for which the fees are payable at the end of each month. Under the investment advisory agreement, the Fund pays the Advisor a management fee based on the daily net assets of the Fund at an annual rate as shown in the following table:
| | | | |
Daily Net Assets | | Fee Rate | |
Up to $500 million | | | 0.500 | % |
Next $500 million | | | 0.450 | |
Next $500 million | | | 0.400 | |
Next $500 million | | | 0.350 | |
Over $2 billion | | | 0.275 | |
The Fund’s effective management fee for the year ended September 30, 2016 was 0.50% of the Fund’s average dividend assets.
The Fund pays to the Advisor the costs of personnel who perform certain accounting services for the Fund. For the year ended September 30, 2016 the Fund paid $2,929 to the Advisor for these accounting services. The Trust has also entered into administrative service agreements with the Advisor, whereby the Advisor will perform certain administrative services for the shareholders of each class of the fund shares, and for which fees will be payable at an annual rate of up to .125 of 1% per annum of the average daily net assets attributable to each class of shares. Total administrative service fees incurred by each class of shares of the Fund for the year ended September 30, 2016, are set forth in the Statement of Operations.
The Trust has an underwriting agreement with Thornburg Securities Corporation (the “Distributor”), an affiliate of the Advisor, which acts as the distributor of the Fund’s shares. For the year ended September 30, 2016, the Distributor has advised the Fund that it earned net commissions aggregating $369 from the sale of Class A shares.
Pursuant to a service plan under Rule 12b-1 of the Investment Company Act of 1940, the Fund may pay to the Advisor or securities dealers and other financial institutions at the Advisor’s request an amount not to exceed .25 of 1% per annum of the average daily net assets attributable to Class A shares of the Fund to obtain various shareholder and distribution related services. For the year ended September 30, 2016, there were no 12b-1 service plan fees charged for Class I shares. The Advisor may pay out of its own resources additional expenses for distribution of the Fund’s shares and shareholder services.
The Advisor and Distributor have contractually agreed to waive fees and reimburse expenses incurred by the Fund so that actual expenses of certain share classes do not exceed levels as specified in the Fund’s most recent prospectus. The agreement may be terminated by the Fund at any time, but may not be terminated by the Advisor or Distributor before February 1, 2017, unless the Advisor ceases to be the investment advisor to the Trust or the Distributor ceases to be the distributor of the Fund prior to that date. The Advisor and Distributor retain the right to be repaid by the Fund for fee waivers and expense reimbursements if expenses fall below the contractual limit prior to the end of the fiscal year.
For the year ended September 30, 2016, the Advisor contractually reimbursed certain class specific expenses, administrative fees, and distribution fees of $26,710 for Class A shares and $33,980 for Class I shares.
Certain officers and Trustees of the Trust are also officers or directors of the Advisor and Distributor. The compensation of independent Trustees is borne by the Trust.
Annual Report 17
| | |
| NOTES TO FINANCIAL STATEMENTS, CONTINUED | | |
| |
Thornburg New York Intermediate Municipal Fund | | September 30, 2016 |
The Fund may sell securities to an affiliated fund, or the Fund may purchase securities held by an affiliated fund, provided the affiliation is due solely to having a common investment advisor, common officers, or common trustees, and provided that all such transactions will comply with Rule 17a-7 under the 1940 Act. For the year ended September 30, 2016, the Fund had transactions with affiliated funds of $500,067 in sales.
NOTE 5 – SHARES OF BENEFICIAL INTEREST
At September 30, 2016, there were an unlimited number of shares with no par value of beneficial interest authorized. Transactions in shares of beneficial interest were as follows:
| | | | | | | | | | | | | | | | |
| | | Year Ended
September 30, 2016 | | | Year Ended
September 30, 2015 | |
| | | Shares | | | Amount | | | Shares | | | Amount | |
Class A Shares | | | | | | | | | | | | | | | | |
Shares sold | | | 249,737 | | | $ | 3,332,694 | | | | 419,229 | | | $ | 5,533,635 | |
Shares issued to shareholders in reinvestment of dividends | | | 60,467 | | | | 808,135 | | | | 67,191 | | | | 887,864 | |
Shares repurchased | | | (733,326 | ) | | | (9,788,646 | ) | | | (813,285 | ) | | | (10,745,628 | ) |
| | | | | | | | | | | | | | | | |
| | | | |
Net increase (decrease) | | | (423,122 | ) | | $ | (5,647,817 | ) | | | (326,865 | ) | | $ | (4,324,129 | ) |
| | | | | | | | | | | | | | | | |
| | | | |
Class I Shares | | | | | | | | | | | | | | | | |
Shares sold | | | 602,854 | | | $ | 8,053,470 | | | | 858,058 | | | $ | 11,351,074 | |
Shares issued to shareholders in reinvestment of dividends | | | 58,096 | | | | 776,695 | | | | 51,871 | | | | 685,089 | |
Shares repurchased | | | (605,034 | ) | | | (8,085,006 | ) | | | (425,508 | ) | | | (5,616,627 | ) |
| | | | | | | | | | | | | | | | |
| | | | |
Net increase (decrease) | | | 55,916 | | | $ | 745,159 | | | | 484,421 | | | $ | 6,419,536 | |
| | | | | | | | | | | | | | | | |
NOTE 6 – INVESTMENT TRANSACTIONS
For the year ended September 30, 2016, the Fund had purchase and sale transactions of investments (excluding short-term investments) of $4,997,612 and $6,440,010, respectively.
OTHER NOTES
Risks: The Fund’s investments subject it to risks including, but not limited to, management risk, interest rate risk, credit risk, market and economic risk, liquidity risk, diversification risk, and the risk of investing mainly in the obligations primarily originating in a single state. Please see the Fund’s prospectus for a discussion of the risks associated with an investment in the Fund.
Subsequent Events: Fund management believes no events have occurred between September 30, 2016 and the date of issuance of the financial statements that require adjustment to or disclosure in the accompanying financial statements.
18 Annual Report
This page intentionally left blank.
Annual Report 19
FINANCIAL HIGHLIGHTS
Thornburg New York Intermediate Municipal Fund
| | | | | | | | | | | | | | | | | | | | | | | | | | | | | | | | | | | | | | | | | | | | | | | | | | |
| | | PER SHARE PERFORMANCE (for a share outstanding throughout the Year) | | RATIOS TO AVERAGE NET ASSETS | | | SUPPLEMENTAL DATA | |
Unless
Otherwise
Noted,
Periods
are
Fiscal
Years
Ended
Sept. 30, | | Net Asset
Value
Beginning
of Year | | | Net
Investment
Income
(Loss)+ | | Net
Realized
&
Unrealized
Gain (Loss)
on
Investments | | | Total from
Investment
Operations | | | Dividends
from Net
Investment
Income | | | Dividends
from Net
Realized
Gains | | Total
Dividends | | | Net
Asset
Value
End
of Year | | Net
Investment
Income
(Loss)
(%) | | | Expenses,
After
Expense
Reductions
(%) | | | Expenses,
After
Expense
Reductions
and Net of
Custody
Credits
(%) | | | Expenses,
Before
Expense
Reductions
(%) | | | Total
Return
(%)(a) | | Portfolio
Turnover
Rate
(%)(a) | | Net
Assets
at End
of
Year
(Thousands) | |
Class A Shares | | | | | | | | | | | | | | | | | | | | | | | | | | | | | | | | | | | | | | | | | | | | |
2016(b) | | $ | 13.18 | | | 0.29 | | | 0.22 | | | | 0.51 | | | | (0.29 | ) | | — | | | (0.29 | ) | | $13.40 | | | 2.18 | | | | 0.96 | | | | 0.96 | | | | 1.03 | | | 3.91 | | 7.02 | | $ | 45,009 | |
2015(b) | | $ | 13.22 | | | 0.29 | | | (0.04 | ) | | | 0.25 | | | | (0.29 | ) | | — | | | (0.29 | ) | | $13.18 | | | 2.16 | | | | 0.98 | | | | 0.98 | | | | 1.05 | | | 1.87 | | 7.72 | | $ | 49,845 | |
2014(b) | | $ | 12.93 | | | 0.30 | | | 0.29 | | | | 0.59 | | | | (0.30 | ) | | — | | | (0.30 | ) | | $13.22 | | | 2.27 | | | | 0.99 | | | | 0.99 | | | | 1.05 | | | 4.59 | | 14.12 | | $ | 54,301 | |
2013(b) | | $ | 13.44 | | | 0.34 | | | (0.51 | ) | | | (0.17 | ) | | | (0.34 | ) | | — | | | (0.34 | ) | | $12.93 | | | 2.54 | | | | 0.99 | | | | 0.99 | | | | 1.05 | | | (1.32) | | 11.31 | | $ | 54,061 | |
2012(b) | | $ | 12.93 | | | 0.37 | | | 0.51 | | | | 0.88 | | | | (0.37 | ) | | — | | | (0.37 | ) | | $13.44 | | | 2.80 | | | | 0.99 | | | | 0.99 | | | | 1.05 | | | 6.90 | | 13.37 | | $ | 55,862 | |
Class I Shares | | | | | | | | | | | | | | | | | | | | | | | | | | | | | | | | | | | | | | | | | | | | |
2016 | | $ | 13.18 | | | 0.33 | | | 0.22 | | | | 0.55 | | | | (0.33 | ) | | — | | | (0.33 | ) | | $13.40 | | | 2.51 | | | | 0.63 | | | | 0.63 | | | | 0.72 | | | 4.25 | | 7.02 | | $ | 31,498 | |
2015 | | $ | 13.22 | | | 0.33 | | | (0.04 | ) | | | 0.29 | | | | (0.33 | ) | | — | | | (0.33 | ) | | $13.18 | | | 2.47 | | | | 0.67 | | | | 0.67 | | | | 0.76 | | | 2.19 | | 7.72 | | $ | 30,242 | |
2014 | | $ | 12.93 | | | 0.33 | | | 0.30 | | | | 0.63 | | | | (0.34 | ) | | — | | | (0.34 | ) | | $13.22 | | | 2.57 | | | | 0.67 | | | | 0.67 | | | | 0.73 | | | 4.93 | | 14.12 | | $ | 23,922 | |
2013 | | $ | 13.44 | | | 0.38 | | | (0.51 | ) | | | (0.13 | ) | | | (0.38 | ) | | — | | | (0.38 | ) | | $12.93 | | | 2.86 | | | | 0.67 | | | | 0.67 | | | | 0.74 | | | (1.00) | | 11.31 | | $ | 7,060 | |
2012 | | $ | 12.92 | | | 0.41 | | | 0.52 | | | | 0.93 | | | | (0.41 | ) | | — | | | (0.41 | ) | | $13.44 | | | 3.12 | | | | 0.67 | | | | 0.67 | | | | 0.77 | | | 7.33 | | 13.37 | | $ | 4,707 | |
| (a) | Not annualized for periods less than one year. |
| (b) | Sales loads are not reflected in computing total return. |
| + | Based on weighted average shares outstanding. |
See notes to financial statements.
| | | | |
| 20 Annual Report | | | | Annual Report 21 |
REPORT OF INDEPENDENT REGISTERED PUBLIC ACCOUNTING FIRM
Thornburg New York Intermediate Municipal Fund
To the Trustees and Shareholders of
Thornburg New York Intermediate Fund
In our opinion, the accompanying statement of assets and liabilities, including the schedule of investments in securities, and the related statements of operations and of changes in net assets and the financial highlights present fairly, in all material respects, the financial position of the Thornburg New York Intermediate Fund (the “Fund”) at September 30, 2016, the results of its operations for the year then ended, the changes in its net assets for each of the two years in the period then ended and the financial highlights for each of the five years in the period then ended, in conformity with accounting principles generally accepted in the United States of America. These financial statements and financial highlights (hereafter referred to as “financial statements”) are the responsibility of the Fund’s management. Our responsibility is to express an opinion on these financial statements based on our audits. We conducted our audits of these financial statements in accordance with the standards of the Public Company Accounting Oversight Board (United States). Those standards require that we plan and perform the audit to obtain reasonable assurance about whether the financial statements are free of material misstatement. An audit includes examining, on a test basis, evidence supporting the amounts and disclosures in the financial statements, assessing the accounting principles used and significant estimates made by management, and evaluating the overall financial statement presentation. We believe that our audits, which included confirmation of securities at September 30, 2016 by correspondence with the custodian, brokers, transfer agent, and the application of alternative procedures where securities purchased had not been received, provide a reasonable basis for our opinion.
PricewaterhouseCoopers LLP
New York, New York
November 18, 2016
22 Annual Report
| | |
| EXPENSE EXAMPLE | | |
| |
Thornburg New York Intermediate Municipal Fund | | September 30, 2016 (Unaudited) |
As a shareholder of the Fund, you incur two types of costs:
| | (1) | transaction costs, including |
(a) sales charges (loads) on purchase payments, for Class A shares;
(b) a deferred sales charge on redemptions of any part or all of a purchase of $1 million of Class A shares within 12 months of purchase;
| | (2) | ongoing costs, including management fees; distribution and/or service (12b-1) fees; and other Fund expenses. |
This example is intended to help you understand your ongoing costs (in dollars) of investing in the Fund and to compare these costs with the ongoing costs of investing in other mutual funds.
The example is based on a $1,000 investment beginning on April 1, 2016, and held until September 30, 2016.
| | | | | | | | | | | | |
| | | Beginning
Account Value
4/1/16 | | | Ending
Account Value
9/30/16 | | | Expenses paid
During period†
4/1/16–9/30/16 | |
Class A Shares | | | | | | | | | | | | |
Actual | | $ | 1,000.00 | | | $ | 1,014.30 | | | $ | 4.65 | |
Hypothetical* | | $ | 1,000.00 | | | $ | 1,020.38 | | | $ | 4.66 | |
Class I Shares | | | | | | | | | | | | |
Actual | | $ | 1,000.00 | | | $ | 1,015.90 | | | $ | 3.03 | |
Hypothetical* | | $ | 1,000.00 | | | $ | 1,022.00 | | | $ | 3.03 | |
| † | Expenses are equal to the annualized expense ratio for each class (A: 0.92%; I: 0.60%) multiplied by the average account value over the period, multiplied by 183/366 to reflect the one-half year period. |
| * | Hypothetical assumes a rate of return of 5% per year before expenses. |
ACTUAL EXPENSES
For each class of shares, the first line of the accompanying table provides information about actual account values and actual expenses. You may use the information in this line, together with the amount you invested, to estimate the expenses that you paid over the period. Simply divide your account value by $1,000 (for example, an $8,600 account value divided by $1,000 = 8.6), then multiply the result by the number in the first line for your class of shares under the heading entitled “Expenses Paid During Period” to estimate the expenses you paid on your account during this period.
HYPOTHETICAL EXAMPLE FOR COMPARISON PURPOSES
For each class of shares, the second line of the accompanying table provides information about hypothetical account values and hypothetical expenses based on the Fund’s actual expense ratio and an assumed rate of return of 5% per year before expenses, which is not the Fund’s actual return. The hypothetical account values and expenses may not be used to estimate the actual ending account balance or expenses you paid for the period. You may use this information to compare the ongoing costs of investing in the Fund and other funds. To do so, compare this 5% hypothetical example with the 5% hypothetical examples that appear in the shareholder reports of the other funds.
Please note that the expenses shown in the table are meant to highlight your ongoing costs only and do not reflect any transactional costs, such as sales charges (loads), redemption fees, or exchange fees. Therefore, the second line of the table for each class of shares is useful in comparing ongoing costs only, and will not help you determine the relative total costs of owning different funds. In addition, if these transactional costs were included, your costs would have been higher.
Annual Report 23
| | |
| TRUSTEES AND OFFICERS | | |
| |
Thornburg New York Intermediate Municipal Fund | | September 30, 2016 (Unaudited) |
| | | | | | |
Name, Age, Year Elected Position Held With Fund | | Principal Occupation(s) During Past Five Years | | Other
Directorships
Held by Trustee | |
INTERESTED TRUSTEES (1)(2)(4) | | | | |
| | |
Garrett Thornburg, 71 Trustee since 1987, Chairman of Trustees(3) | | Chairman and controlling shareholder of Thornburg Investment Management, Inc. (investment advisor); Chairman and controlling shareholder of Thornburg Securities Corporation (securities dealer); Chairman and CEO of Chamisa Energy, LLC; President of the Thornburg Foundation (nonprofit). | | | None | |
| | |
Brian J. McMahon, 61 Trustee since 2001, Vice Chairman of Trustees, Member of Governance & Nominating Committee & Operations Risk Oversight Committee(5) | | Chief Investment Officer, Managing Director, and Portfolio Manager and, until 2016, CEO and President of Thornburg Investment Management, Inc.; Vice President of Thornburg Securities Corporation. | | | None | |
| |
INDEPENDENT TRUSTEES (1)(2)(4) | | | | |
| | |
David A. Ater, 71 Trustee since 1994, Member of Audit Committee & Chairman of Governance & Nominating Committee | | Principal in Ater & Associates, Santa Fe, NM (developer, planner and broker of residential and commercial real estate); owner, developer and broker for various real estate projects. | | | None | |
| | |
David D. Chase, 75 Trustee since 2000, Chairman of Audit Committee | | Managing Member of CS Group, LLC, Santa Fe, NM (private investment fund – family office). | | | None | |
| | |
Sally Corning, 55 Trustee since 2012, Member of Audit Committee | | Partner in Sun Mountain Capital, Santa Fe, NM (private equity firm with investment programs encompassing venture capital, mezzanine debt, and growth equity). | | | None | |
| | |
Susan H. Dubin, 67 Trustee since 2004, Member of Audit Committee & Governance and Nominating Committee | | President of Dubin Investments, Ltd., Greenwich, CT (private investment fund); Director and officer of various charitable organizations. | | | None | |
| | |
David L. Gardner, 53 Trustee since 2015, Member of Operations Risk Oversight Committee | | Until 2012, head of EMEA (Europe, Middle East and Africa) Sales for iShares of Blackrock, Inc., EMEA Executive Committee Member and EMEA Operating Committee Member at Blackrock, Inc. | | | None | |
| | |
Owen D. Van Essen, 62 Trustee since 2004, Member of Governance & Nominating Committee & Chairman of Operations Risk Oversight Committee | | President of Dirks, Van Essen & Murray, Santa Fe, NM (newspaper mergers and acquisitions). | | | None | |
| | |
James W. Weyhrauch, 57 Trustee since 1996, Member of Audit Committee & Operations Risk Oversight Committee | | Real estate broker, Santa Fe Properties, Santa Fe, NM; Vice Chairman of Nambe LLC, Santa Fe, NM (manufacturing & design company). | | | None | |
24 Annual Report
| | |
| TRUSTEES AND OFFICERS, CONTINUED | | |
| |
Thornburg New York Intermediate Municipal Fund | | September 30, 2016 (Unaudited) |
| | | | | | |
Name, Age, Year Elected Position Held With Fund | | Principal Occupation(s) During Past Five Years | | Other
Directorships
Held by Trustee | |
OFFICERS OF THE FUND (WHO ARE NOT TRUSTEES) (1)(7) | | | | |
| | |
Nimish Bhatt, 53 Treasurer since 2016(6) | | Chief Financial Officer and Treasurer of Thornburg Investment Management, Inc. and Thornburg Securities Corporation since 2016; Senior Vice President (2004-2016), Chief Financial Officer (2011-2016), and Head of Fund Administration (2011-2016) of Calamos Asset Management, Inc., Calamos Investments LLC, Calamos Advisors LLC, and Calamos Wealth Management; Director of Calamos Global Funds plc (2007-2016). | | | Not applicable | |
| | |
Jason Brady, 42 President since 2016(6) | | CEO and President since 2016, Vice President from 2011 to 2016, Portfolio Manager and Managing Director of Thornburg Investment Management, Inc.; Vice President of Thornburg Securities Corporation since 2016. | | | Not applicable | |
| | |
Kathleen Brady, 56 Vice President since 2008 | | Tax Manager Fund Accounting of Thornburg Investment Management, Inc. | | | Not applicable | |
| | |
Connor Browne, 37 Vice President since 2006 | | Portfolio Manager, Vice President since 2013, and Managing Director of Thornburg Investment Management, Inc. | | | Not applicable | |
| | |
Tim Cunningham, 41 Vice President since 2014 | | Managing Director since 2011, Portfolio Manager since 2012, and Associate Portfolio Manager from 2009–2012 of Thornburg Investment Management, Inc. | | | Not applicable | |
| | |
Randy Dry, 42 Vice President since 2014 | | Vice President and Managing Director, Director of Institutional Group from 2014-2016, and since 2016, Chief Administrative Officer of Thornburg Investment Management, Inc. | | | Not applicable | |
| | |
Greg Dunn, 40 Vice President since 2014 | | Managing Director, Portfolio Manager since 2012, and Associate Portfolio Manager from 2009–2012 of Thornburg Investment Management, Inc. | | | Not applicable | |
| | |
Lon Erickson, 41 Vice President since 2008 | | Portfolio Manager and Managing Director of Thornburg Investment Management, Inc. | | | Not applicable | |
| | |
William V. Fries, 77 Vice President since 1995 | | Portfolio Manager, Vice President, and Managing Director of Thornburg Investment Management, Inc. | | | Not applicable | |
| | |
Thomas Garcia, 45 Vice President since 2006 | | Vice President since 2011, Managing Director, Head Equity Trader, and Associate Portfolio Manager of Thornburg Investment Management, Inc. | | | Not applicable | |
| | |
Rolf Kelly, 37 Vice President since 2016 | | Portfolio Manager and Managing Director since 2013 and Associate Portfolio Manager from 2011–2013 of Thornburg Investment Management, Inc. | | | Not applicable | |
| | |
Ben Kirby, 36 Vice President since 2014 | | Portfolio Manager and Managing Director since 2013 and Associate Portfolio Manager from 2011–2013 of Thornburg Investment Management, Inc. | | | Not applicable | |
| | |
Jeff Klingelhofer, 41 Vice President since 2016 | | Portfolio Manager and Managing Director since 2015, Associate Portfolio Manager from 2012–2015, and Fixed Income Analyst from 2010–2012 of Thornburg Investment Management, Inc. | | | Not applicable | |
| | |
Rob MacDonald, 40 Vice President since 2016 | | Managing Director since 2015, Portfolio Manager since 2014, and Associate Portfolio Manager from 2011–2014 of Thornburg Investment Management, Inc. | | | Not applicable | |
| | |
Leigh Moiola, 49 Vice President since 2001 | | Vice President, Managing Director, and Director of Marketing of Thornburg Investment Management, Inc.; Vice President of Thornburg Securities Corporation. | | | Not applicable | |
| | |
Christopher Ryon, 60 Vice President since 2008 | | Portfolio Manager and Managing Director of Thornburg Investment Management, Inc. | | | Not applicable | |
| | |
Nicholos Venditti, 35 Vice President since 2016 | | Portfolio Manager and Managing Director since 2015 and Associate Portfolio Manager from 2011–2015 of Thornburg Investment Management, Inc. | | | Not applicable | |
Annual Report 25
| | |
| TRUSTEES AND OFFICERS, CONTINUED | | |
| |
Thornburg New York Intermediate Municipal Fund | | September 30, 2016 (Unaudited) |
| | | | |
Name, Age, Year Elected Position Held With Fund | | Principal Occupation(s) During Past Five Years | | Other
Directorships
Held by Trustee |
| | |
Vinson Walden, 46 Vice President since 2004 | | Portfolio Manager and Managing Director of Thornburg Investment Management, Inc. | | Not applicable |
| | |
Lei Wang, 45 Vice President since 2006 | | Portfolio Manager and Managing Director of Thornburg Investment Management, Inc. | | Not applicable |
| | |
Sasha Wilcoxon, 42 Vice President since 2003 Secretary since 2007(6) | | Managing Director, Director of Mutual Fund Operations, and Vice President of Thornburg Investment Management, Inc.; Vice President of Thornburg Securities Corporation. | | Not applicable |
| | |
Charles Wilson, 41 Vice President since 2016 | | Portfolio Manager and Managing Director since 2014 and Associate Portfolio Manager from 2012–2014 of Thornburg Investment Management, Inc.; Co-Portfolio Manager of Marsico Capital Management from 2010–2012. | | Not applicable |
| | |
Di Zhou, 38 Vice President since 2016 | | Portfolio Manager and Managing Director since 2016, Associate Portfolio Manager from 2014–2016, and Equity Research Analyst from 2010–2014 of Thornburg Investment Management, Inc. | | Not applicable |
| (1) | Each person’s address is 2300 North Ridgetop Road, Santa Fe, New Mexico 87506. |
| (2) | The Fund is a separate investment “Fund” or “series” of Thornburg Investment Trust (the “Trust”), which comprises the Thornburg mutual fund complex and is organized as a Massachusetts business trust. Thornburg Investment Management, Inc. is the investment advisor to, and manages, all the Funds of the Trust. Each Trustee oversees all the Funds of the Trust. |
| (3) | Mr. Thornburg is considered an “interested” Trustee under the Investment Company Act of 1940 because he is the sole director and controlling shareholder of Thornburg Investment Management, Inc., the investment advisor to the Trust, and is the sole director and controlling shareholder of Thornburg Securities Corporation, the distributor of shares for the Trust. |
| (4) | The Bylaws of the Trust currently require that each Trustee shall retire by the end of the calendar year during which the Trustee reached the age of 75 years. Otherwise each Trustee serves in office until the election and qualification of a successor or until the Trustee sooner dies, resigns, retires or is removed. |
| (5) | Mr. McMahon is considered an “interested” Trustee under the Investment Company Act of 1940 because he is the chief investment officer of Thornburg Investment Management, Inc. |
| (6) | The Trust’s president, secretary, and treasurer each serves a one-year term or until the election and qualification of a successor; each other officer serves at the pleasure of the Trustees. |
| (7) | Assistant vice presidents, assistant secretaries, and assistant treasurers are not shown. |
The Statement of Additional Information for each Fund of the Trust includes additional information about the Trustees and is available, without charge and upon request, by calling 1-800-847-0200.
26 Annual Report
| | |
| OTHER INFORMATION | | |
| |
Thornburg New York Intermediate Municipal Fund | | September 30, 2016 (Unaudited) |
PORTFOLIO PROXY VOTING
Policies and Procedures:
The Trust has delegated to Thornburg Investment Management, Inc. (the “Advisor”) voting decisions respecting proxies for the Fund’s voting securities. The Advisor makes voting decisions in accordance with its Proxy Voting Policy. A description of the Policy is available (i) without charge, upon request, by calling the Advisor toll-free at 1-800-847-0200, (ii) on the Thornburg website at www.thornburg. com, and (iii) on the Securities and Exchange Commission’s website at www.sec.gov.
Information regarding how proxies were voted is available on or before August 31 of each year for the twelve months ending the preceding June 30. This information is available (i) without charge, upon request by calling the Advisor toll-free at 1-800-847-0200, (ii) on the Thornburg website at www.thornburg.com, and (iii) on the Securities and Exchange Commission’s website at www.sec.gov.
TAX INFORMATION
For the tax year ended September 30, 2016, dividends paid by the Fund of $1,815,241 (or the maximum allowed) are tax exempt dividends for federal income tax purposes. The information and the distributions reported herein may differ from the information and distributions reported to the shareholders for the calendar year ending December 31, 2016. Complete information will be reported in conjunction with your 2016 Form 1099.
AVAILABILITY OF QUARTERLY PORTFOLIO SCHEDULE
The Fund files with the Securities and Exchange Commission schedules of its portfolio holdings on Form N-Q for the first and third quarters of each fiscal year. The Fund’s Forms N-Q are available on the Commission’s website at www.sec.gov, or may be reviewed and copied at the Commission’s Public Reference Room in Washington, D.C. Information on the operation of the Public Reference Room may be obtained by calling 1-800-SEC-0330. The Fund also makes this information available on its website at www.thornburg. com/download or upon request by calling 1-800-847-0200.
STATEMENT RESPECTING RENEWAL OF INVESTMENT ADVISORY AGREEMENT
Thornburg Investment Management, Inc. (the “Advisor”) provides investment management services to Thornburg New York Intermediate Municipal Fund pursuant to an investment advisory agreement. The Trustees consider the renewal of this agreement annually, and most recently determined to renew the agreement on September 13, 2016.
In anticipation of their recent consideration of the advisory agreement’s renewal, the independent Trustees met in May 2016 to consider aspects of their annual evaluation of the Advisor’s service to all of the funds of Thornburg Investment Trust, to plan the annual evaluation of the Advisor’s performance and to specify the information the Advisor would present to the Trustees for their review. The independent Trustees met again in independent session in September to consider portions of the information submitted by the Advisor. The Advisor’s president and chief investment officer subsequently reviewed portions of the information with the Trustees and addressed questions from the Trustees at a full meeting session of the Trustees scheduled for that purpose, and the independent Trustees thereafter met in independent session to consider the Advisor’s presentation and various specific issues respecting their consideration of the advisory agreement’s renewal. Following these sessions, the Trustees met to consider renewal of the agreement, and the independent Trustees voted unanimously at that meeting to renew the agreement for an additional term of one year.
The information below summarizes certain factors considered by the Trustees in connection with the determination to renew the advisory agreement. In determining to renew the agreement, the Trustees considered a wide range of information and did not identify any single factor as controlling, and this summary does not describe all of the factors and other matters considered by the Trustees in making their determination.
Nature, Extent and Quality of Services. The Trustees considered presentations by the Advisor at meeting sessions scheduled for consideration of a continuation of the advisory agreement, and also noted their consideration of the reports the Trustees and their committees receive throughout the year on a wide variety of topics, and consideration they had given to a number of topics in previous years. Information identified by the Trustees in their evaluation as having been considered and contributing to their conclusions included Trustees’ assessments of the Advisor’s personnel developed in formal and informal meetings throughout the year, the Advisor’s staffing levels and measures to maintain staffing levels and improve competencies, the Advisor’s commitment to attract and retain high quality portfolio management expertise through competitive compensation levels, the Advisor’s collaborative approach to investment management, the Fund’s investment performance over different periods of time, portfolio managers’ cognizance of and strategies to address market and economic trends and conditions, the evaluation and selection of individual investments, the structuring and composition of the Fund’s portfolio, management of Fund liquidity requirements, cognizance of and efforts to achieve tax efficiency, responses to share sale and redemption activity, continuing enhancements to the Advisor’s electronic and information systems and the Advisor’s
Annual Report 27
| | |
| OTHER INFORMATION, CONTINUED | | |
| |
Thornburg New York Intermediate Municipal Fund | | September 30, 2016 (Unaudited) |
engagement of outside firms to assist in improving or replacing those systems, the Advisor’s evaluation and selection of firms providing portfolio trade execution to the Fund and the Advisor’s measures to obtain favorable trade execution, the Advisor’s performance of accounting and other services, the Advisor’s continued commitment to observance of compliance and regulatory requirements, the Advisor’s responsiveness to the Trustees, the quality and extent of written and oral reports to the Trustees over the course of the year, and other factors.
Investment Performance. The Trustees noted in their evaluation of the Fund’s investment performance the reports they had received in each regular meeting over the course of the year from the Advisor’s portfolio management personnel. The Trustees also noted in their evaluation their consideration of information provided to them at their request in anticipation of their annual evaluation of the Advisor’s services, including the following items of information respecting the investment performance of the Fund: (1) the Fund’s absolute investment performance and achievement of stated objectives; (2) the Advisor’s written and oral explanations and commentary on the Fund’s performance in the context of the Fund’s objectives and reasonable expectations, and business, market and economic conditions, (3) performance data for the most recent ten calendar years, comparing the Fund’s annual investment returns to a fund category selected by an independent mutual fund analyst firm, and to a broad-based securities index, (4) the Fund’s investment performance for the three-month, year-to-date, one-year, three-year, five-year and ten-year periods ending with the second quarter of the current year, comparing the Fund’s annualized returns to two mutual fund categories selected by independent mutual fund analyst firms and to a broad-based securities index, and assigning a percentage rank to the Fund’s performance for each period relative to each of the fund categories, and (5) comparative measures of correlation to equity indices, portfolio volatility, risk and return.
The Trustees noted that quarterly reports during the year and other information presented to them confirmed the Advisor’s continued conformity to the Fund’s stated investment objectives and policies.
The Trustees observed in reviewing comparative performance data for the ten most recent calendar years that the Fund’s investment return for the most recent calendar year was comparable to the return of the index and the average return for the fund category considered, that the Fund’s returns for the preceding nine calendar years were comparable to the returns of the index in six of the nine years, and that the Fund’s returns exceeded or were comparable to the average returns of the fund category in eight of nine years. Other quantitative data noted by the Trustees as having been considered in their evaluation showed that the Fund’s annualized investment returns fell in the fourth quartile of investment performance of the first of two fund categories for the three-year period ended with the second quarter of the current year, fell in the third quartile of investment performance for the one-year and five-year periods ended with the second quarter of the current year, and fell above the midpoint of performance for the fund category for the ten-year period. The data further showed that the Fund’s annualized investment returns fell near the midpoint of performance for the second fund category for the one-year and three-year periods ended with the second quarter of the current year, and fell in the second quartile of performance of the second fund category for the five-year and ten-year periods. Measures of portfolio volatility, risk and relative return considered by the Trustees demonstrated that the Fund’s performance relative to these measures continued to fulfill expectations in current conditions. The Trustees attached additional significance to the performance data of the Fund from the perspective of longer term shareholders.
Comparisons of Fee and Expense Levels. The Trustees recognized in their evaluation the clear disclosures of the Advisor’s fees and Fund expenses in the Fund’s prospectus. Information noted by the Trustees as having been considered in this context included a variety of comparative data respecting the Fund’s fee and expense levels. This information included comparisons of the Fund’s advisory fee and overall Fund expenses to median and average fees and expenses charged to a category of mutual funds selected by an independent mutual fund analyst firm, comparisons of the advisory fee and other Fund expenses to the fee levels and expenses for a representative share class of a fund peer group selected from the category by a second independent mutual fund analyst firm, the perspectives and advice from the second mutual fund analyst firm respecting comparisons of fund fee levels and expenses to fund peer groups, and other information. Comparative fee and expense data noted as having been considered by the Trustees showed that the Fund’s advisory fee was comparable to the median and average fee levels for the fund category, the level of total expense for a representative share class of the Fund was slightly higher than the median and comparable to the average expense levels for the category, and that the level of total expense for a second representative share class was comparable to the median and lower than the average expense levels for the category. Peer group data showed that the Fund’s advisory fee level was comparable to the medians of the two peer groups considered, the total expense level of one representative share class fell at the top of the range for its peer group, and that the total expense level of the second representative share class was comparable to the median of its peer group. The Trustees did not find the differences significant in view of the other factors considered.
The Trustees noted their consideration of information respecting the advisory fees charged by the Advisor to other investment management clients, including sub-advised mutual funds, together with information about fees charged by other advisors to different clients, analysis of the differences between the requirements of institutional clients and mutual funds, analysis of the differences between the requirements of a sub-advised mutual fund and a fund as to which the investment advisor is the primary advisor and sponsor, descriptions of distinguishing characteristics of the sub-advised funds served by the Advisor, and the consequently different investment management services provided to the different categories of clients and the differing contexts in which the fee levels for these arrangements are established. The Trustees confirmed their previous observations that the differences between the fees charged by the Advisor to different types of clients did not appear exceptional, and that the fee rates charged by an investment advisor to different categories
28 Annual Report
| | |
| OTHER INFORMATION, CONTINUED | | |
| |
Thornburg New York Intermediate Municipal Fund | | September 30, 2016 (Unaudited) |
of clients had limited relevance to the evaluation of the fee rate charged by that advisor to mutual funds as to which it is the primary advisor and sponsor.
Costs and Profitability of Advisor. In reviewing the profitability of the Advisor’s services to the Fund the Trustees considered an analysis of the Advisor’s costs and the profitability to the Advisor of its services, together with data respecting the overall profitability of a selection of other investment management firms. The Trustees noted that a portion of the Advisor’s profits are an important element in the compensation of shareholder employees. The Trustees considered in this regard information from the Advisor respecting investment of its profits to maintain staffing levels, pay competitive levels of compensation, and add to its information retrieval and management systems to maintain or improve service levels. The Trustees also considered the contribution of the Advisor’s cost management to its profitability, and the relationship of the Advisor’s financial resources and profitability in previous years to its ability to attract necessary personnel, invest in systems and other assets required for its service to the Fund, and maintain or improve service levels for the Fund notwithstanding fluctuations in revenues and profitability. The information considered did not indicate to the Trustees that the Advisor’s profitability was excessive.
Potential Economies of Scale. In reviewing the extent to which economies of scale would be realized by the Fund as it grows and whether fee levels reflect potential economies of scale, the Trustees considered the breakpoint structure for advisory fees chargeable to the Fund, comparisons of the fee breakpoint structure for the Fund with breakpoint structures (or the absence of such structures) for other funds in a peer group selected by an independent mutual fund analyst firm, the effects of the breakpoint structure and other expense factors realized by certain Funds of the Trust as their asset levels had increased, and the Advisor’s expenditures from its own profits and resources to maintain staffing levels, pay competitive levels of compensation, and add to its information retrieval and management systems to maintain or improve service levels. The information provided demonstrated to the Trustees that the Fund’s advisory fee breakpoint structure is reasonable in relation to the structures observed in the other funds in its peer group, and that shareholders may be expected to benefit from any economies of scale, due to the advisory agreement’s breakpoint fee structure for the Fund and other factors.
Potential Ancillary Benefits. In reviewing potential benefits to the Advisor because of its relationship to the Fund, the Trustees noted disclosures by the Advisor of its receipt of certain research services from broker dealers, and the benefits to both the Fund and the Advisor of the Advisor’s expansion of its staffing, compliance and systems capabilities and other resources to serve a broader variety of investment management clients. No unusual or unfair benefits to the Advisor from its relationship to the Fund were identified by the Trustees.
Summary of Conclusions. The Trustees concluded that the nature, extent and quality of the Advisor’s services performed under the advisory agreement remained sufficient. The Trustees further concluded that the absolute and relative investment performance of the Fund over a range of pertinent holding periods on the whole was satisfactory in the context of its objectives and strategies, and that the Advisor had continued to actively and competently pursue the Fund’s stated investment objectives and adhere to the Fund’s investment policies.
The Trustees further concluded, based upon their consideration of the foregoing factors and other information, that the level of the advisory fee charged to the Fund by the Advisor is reasonable in relation to the services provided by the Advisor in view of the nature, extent and quality of those services, the investment performance of the Fund after fees and expenses, the clear disclosure of fees and expenses in the Fund’s prospectus, comparisons of fees and expenses charged to the Fund to fees and expenses charged to other mutual funds, and the other factors considered.
Annual Report 29
TRUSTEES’ STATEMENT TO SHAREHOLDERS
Readopted September 12, 2016
The Trustees believe current and prospective shareholders should know how we discharge our responsibilities in supervising the Funds’ investment advisor and in reviewing the advisor’s contract for renewal. Since 2005, we have issued a statement which sets out clearly the three principal guidelines that we follow in supervising the Trust’s investment advisor on your behalf. In accordance with our customary practice, in September of this year we again reviewed our statement and concluded we should reissue this statement outlining the principal features of our supervision of the advisor’s performance of investment management services for the Funds.
We begin with the premise that each shareholder selected his or her Fund because its investments are managed by the investment advisor identified in the prospectus and in accordance with the objective and policies described in the prospectus. We realize, as each of you do, that if you believe that your Fund’s stated objective and policies no longer serve your personal investment goals, you can sell your shares and leave the Fund.
Therefore, we believe that our primary supervisory task – our principal obligation to you – is to assess the nature and quality of the advisor’s services, and to confirm that the advisor actively and competently pursues the Fund’s objective, in accordance with the policies set out in the prospectus. To do this, we meet regularly with management to review your Fund’s portfolio and to discuss the advisor’s specific actions and judgments in pursuing the Fund’s objective. We do not substitute our own judgment for the advisor’s decisions in selecting investments; the advisor is paid to exercise its informed judgment on investment decisions, and we seek to confirm, in reviewing the advisor’s performance, that the advisor is doing just that.
Second, we are conscious of costs and the effect that costs have on shareholders’ returns. We try to make sure that your Fund’s fees and costs are reasonable in relationship to the services rendered and that they are generally in line with those charged by other expert investment advisors, consistent with our belief that the Fund’s investors searched for and expect that expertise and attention and have decided to pay a reasonable price for it. We do not put the management contract “out to bid” as a matter of course, and we would not do so unless we had concluded that the advisor materially had failed to pursue the Fund’s objectives in accordance with its policies, or for other equally important reasons. We believe that any other approach would be inconsistent with your interests and contrary to your expectations when you bought shares of the Fund in the first place.
Finally, because we believe that most Thornburg Fund shareholders have invested with a long-term perspective, we try not to focus too much on the fashions of the moment and on short-term performance. The market will not favor any specific investment objective or set of policies at all times and under all economic circumstances. A fund will experience periods of both high and low returns relative to other funds and other investments. Even if one of our Funds is not favored by the market at a particular time, we believe that the advisor is nonetheless obliged to remain true to the Fund’s objective and policies, and we watch to see that it does so.
Trustees of Thornburg Investment Trust
30 Annual Report
THORNBURG FUNDS
Thornburg Investment Management is a privately-owned global investment firm that offers a range of solutions for retail and institutional investors. Founded in 1982 and headquartered in Santa Fe, New Mexico, we manage approximately $53 billion (as of September 30, 2016) across eight equity and 11 bond mutual funds, separate accounts for high-net-worth investors and institutional accounts, and five UCITS funds for non-U.S. investors.
The fund outlined in this report is one of many equity and fixed-income products available from Thornburg Investment Management.
Equity Funds
| | • | | Thornburg Core Growth Fund |
| | • | | Thornburg International Value Fund |
| | • | | Thornburg Better World International Fund |
| | • | | Thornburg International Growth Fund |
| | • | | Thornburg Developing World Fund |
| | • | | Thornburg Investment Income Builder Fund |
| | • | | Thornburg Global Opportunities Fund |
Fixed Income Funds
| | • | | Thornburg Low Duration Income Fund |
| | • | | Thornburg Limited Term U.S. Government Fund |
| | • | | Thornburg Limited Term Income Fund |
| | • | | Thornburg Strategic Income Fund |
| | • | | Thornburg Low Duration Municipal Fund |
| | • | | Thornburg Limited Term Municipal Fund |
| | • | | Thornburg Intermediate Municipal Fund |
| | • | | Thornburg California Limited Term Municipal Fund |
| | • | | Thornburg New Mexico Intermediate Municipal Fund |
| | • | | Thornburg New York Intermediate Municipal Fund |
| | • | | Thornburg Strategic Municipal Income Fund |
Before investing, carefully consider the Fund’s investment goals, risks, charges, and expenses. For a prospectus or summary prospectus containing this and other information, contact your financial advisor or visit thornburg.com. Read it carefully before investing.
For additional information, please visit thornburg.com
Thornburg Investment Management, Inc. 2300 North Ridgetop Road, Santa Fe, NM 87506
Annual Report 31

| | |
| To receive shareholder reports, prospectuses, and proxy statements electronically, go to www.thornburg.com/edelivery. | |  |
This Annual Report is submitted for the general information of shareholders of the Fund. It is not authorized for distribution to prospective investors in the Fund unless preceded or accompanied by an effective prospectus. | |
| | | | |
| Investment Advisor: | | Distributor: | | |
| Thornburg Investment Management® | | Thornburg Securities Corporation® | | |
| 800.847.0200 | | 800.847.0200 | | TH860 |
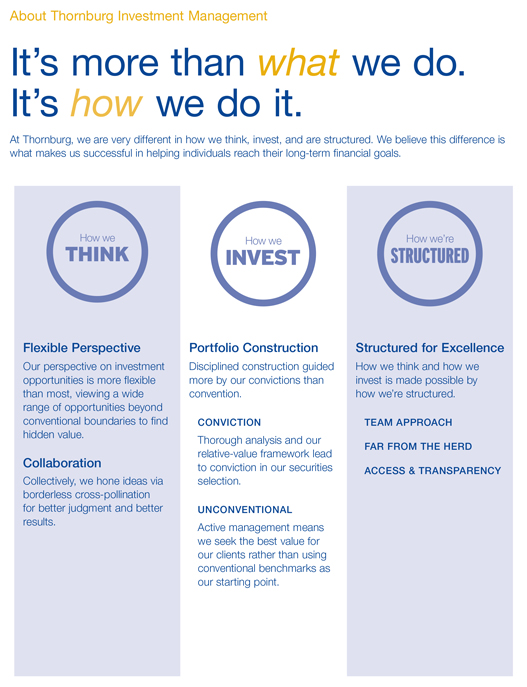
2 Annual Reports
Annual Reports
Thornburg Limited Term U.S. Government Fund
Thornburg Limited Term Income Fund
Thornburg Low Duration Income Fund
September 30, 2016
| | | | |
Limited Term U.S. Government Fund | | NASDAQ Symbols | | CUSIPS |
Class A | | LTUSX | | 885-215-103 |
Class C | | LTUCX | | 885-215-830 |
Class I | | LTUIX | | 885-215-699 |
Class R3 | | LTURX | | 885-215-491 |
Class R4 | | LTUGX | | 885-216-747 |
Class R5 | | LTGRX | | 885-216-861 |
| | |
Limited Term Income Fund | | | | |
Class A | | THIFX | | 885-215-509 |
Class C | | THICX | | 885-215-764 |
Class I | | THIIX | | 885-215-681 |
Class R3 | | THIRX | | 885-215-483 |
Class R4 | | THRIX | | 885-216-762 |
Class R5 | | THRRX | | 885-216-853 |
| | |
Low Duration Income Fund | | | | |
Class A | | TLDAX | | 885-216-812 |
Class I | | TLDIX | | 885-216-796 |
Class I, R3, R4, R5 shares may not be available to all investors. Minimum investments for Class I shares may be higher than those for other classes.
Investments carry risks, including possible loss of principal. Portfolios investing in bonds have the same interest rate, inflation, and credit risks that are associated with the underlying bonds. The value of bonds will fluctuate relative to changes in interest rates, decreasing when interest rates rise. Unlike bonds, bond funds have ongoing fees and expenses. Investments in mortgage backed securities (MBS) may bear additional risk. Please see the Fund’s prospectus for a discussion of the risks associated with an investment in the Fund. Investments in the Funds are not FDIC insured, nor are they bank deposits or guaranteed by a bank or any other entity.
The laddering strategy does not assure or guarantee better performance and cannot eliminate the risk of investment losses.
Annual Reports 3
| | |
| LETTER TO SHAREHOLDERS | | |
| |
| | September 30, 2016 (Unaudited) |
October 17, 2016
Dear Fellow Shareholder:
We are pleased to present the annual report for Thornburg Limited Term U.S. Government Fund, Thornburg Limited Term Income Fund, and Thornburg Low Duration Income Fund for the fiscal year ended September 30, 2016. The net asset value (NAV) of a Class A share of Limited Term U.S. Government Fund decreased by one cent in the period to $13.25, and if you were invested for the entire period, you received dividends of 19.5 cents per share. If you reinvested your dividends, you received 19.7 cents per share. The NAV of a Class A share of Limited Term Income Fund increased 19 cents in the period to $13.51. If you were invested for the entire period, you received dividends of 25.3 cents per share. If you reinvested your dividends, you received 25.5 cents per share. The NAV of a Class A share of Low Duration Income Fund increased eight cents to $12.46 per share. If you were invested for the entire period, you received dividends of 11.69 cents per share. If you reinvested your dividends, you received 11.74 cents per share. Dividends per share varied for other share classes to account for class-specific expenses.
Combining income and change in price, Class A shares of Thornburg Limited Term U.S. Government Fund produced a total return of 1.41% (without sales charge) over the 12-month period. The Bloomberg Barclays Intermediate Government Bond Index produced a total return of 2.44% over the same period. The average return for the Lipper Short-Intermediate U.S. Government category was 0.98%. Class A shares of Thornburg Limited Term Income Fund produced a total return of 3.36% (without sales charge) over the year ended September 30, 2016. The Bloomberg Barclays Intermediate Government/ Credit Bond Index produced a 3.52% total return over the same time period. The average return for the Lipper Short-Intermediate Investment-Grade Debt category was 2.81%. Class A shares of Thornburg Low Duration Income Fund produced a total return of 1.60% (without sales charge) over the year ended September 30, 2016. The Bloomberg Barclays U.S. 1-3 Aggregate Bond Year Index produced a 1.33% total return over the same time period. The average return for the Lipper Short Investment-Grade Debt category was 1.91%. The indices reflect no deduction for fees, expenses, or taxes.
In late 2015, the U.S. Federal Reserve (the Fed) finally increased its target federal funds rate by 25 basis points (0.25%) and suggested it would move the target rate higher throughout 2016. However, as financial markets reacted with caution and bouts of volatility to weaker than expected and/or inconsistent U.S. and global economic data, the Fed continuously balked at increasing further such that the target fed funds range remains 0.25% to 0.50%. The recovery has not been robust, but both real U.S. gross domestic product (GDP) growth and U.S. inflation are notably positive. The economy is also near full employment, and though inflation remains below the Fed’s 2% target, unemployment has fallen to levels historically associated with a more rapid increase in wage gains. So while some monetary accommodation may still be appropriate, interest rates appear to be too low for this point in the cycle.
With the specter of higher interest rates looming, China slowdown fears mounting, and commodity prices falling, risk markets began 2016 on a one-way move lower from January 1 to February 11. Then, China suggested additional fiscal stimulus and global central banks “promised” continued monetary accommodation such that the market turmoil proved short-lived. From there, credit market strength persisted, not even Brexit could derail it. Yes, market volatility immediately spiked and risk assets sold off after the United Kingdom voted to leave the European Union on June 23. The British pound fell over 10%. The S&P 500 Index declined 5.4%. Corporate spreads increased 11 basis points. However, by the third day post-Brexit, the financial market damage was largely erased. Investors continued to gobble up yield offered by spread products—corporates, mortgage-backed securities, asset-backed securities (ABS), etc.—despite so-so economic and company fundamentals, believing global central banks are perpetually willing and able to apply liquidity liberally and, thus, protecting them from negative outcomes.
With lower compensation for risk prevailing generally, we increased the quality of the portfolios, holding more cash and buying bonds such as highly liquid, short life, senior tranches of credit card and auto loan ABS. That also includes reducing duration risk. The 10-year U.S. Treasury hit a low of 1.35% post-Brexit and ended the period at 1.60%, which is not very attractive. The term premium is significantly negative, and given prevailing inflation levels, the real rate is 0% at best. As such, in Limited Term Income Fund and Low Duration Income Fund, we’ve added some additional short maturity (0.5-year to two-year) corporate floating rate bonds and floating rate tranches of ABS. We’ve focused on high-quality securities where we’ve assessed the credit risk as low because while the securities offer interesting relative value in this market, at 1% to 1.25%, the absolute yield does not contemplate a lot of adverse scenarios (nor perhaps should it as a short-term, high-quality investment). Even in Limited Term U.S. Government Fund we have added some floating rate paper when it was available, although opportunities for this portfolio are very limited.
These investments exemplify a core principle of how we think about managing the portfolios: when our shareholders are not paid appropriately to take a risk, we don’t take it. As risk-free rates fell over the last few years, we decreased duration. As credit spreads declined, we decreased credit risk in the Funds. While this shorter duration and high-credit quality positioning hurt the Funds’ performance somewhat on a relative basis this
4 Annual Reports
| | |
LETTER TO SHAREHOLDERS, CONTINUED | | |
| |
| | September 30, 2016 (Unaudited) |
year, we believe it’s appropriate for the medium/long term. We continue to focus on areas that represent value and on building portfolios we hope will be better insulated from volatility. It is through our focus on fundamentally oriented, bottom-up analysis at the security level that we are able to find compelling opportunities to continue to put capital to work. As we move further through the economic cycle, it is more important that we focus intensely on understanding each credit, its risk/return profile, and whether, how, and why it fits into each portfolio we manage.
Looking forward, we continue to see a low-growth world. Global economic data, including inflation, has been just OK. Corporate earnings have been disappointing, even declining in the U.S. for several quarters. Corporate credit metrics continue to deteriorate. Continued central bank accommodation seems to be the only major pillar on which quite lofty asset valuations rest. In May 2013, then Fed Chairman Ben Bernanke told the market that U.S. quantitative easing was coming to an end, and the result was the so-called “taper tantrum.” It’s uncertain what would happen if the European Central Bank and Bank of Japan were to pull back the reins of their quantitative easing programs while the Fed continues ahead with a rate-hike cycle, albeit a shallow one. The world, and markets, will also have to endure a U.S. election, an Italian referendum, French and German elections next year, and Brexit negotiations in the near term. The market also doesn’t seem to be concerned about inflation despite some increasing indications of price and wage pressures.
In sum, it seems to be a time to be defensive rather than offensive. As such, the Funds continue to hold significant cash and/or short, highly liquid U.S. Treasuries. We cannot predict exactly when the markets will sell off and offer us more attractive buying opportunities, but we can be ready for it and believe the Funds are well positioned.
Thank you very much for investing in the Funds.
Sincerely,
| | | | |
 | |  | |  |
Jason Brady, CFA Portfolio Manager President, CEO, and Managing Director | | Lon R. Erickson, CFA Portfolio Manager Managing Director | | Jeff Klingelhofer, CFA Portfolio Manager Managing Director |
The matters discussed in this report may constitute forward-looking statements made pursuant to the safe harbor provisions of the Securities Litigation Reform Act of 1995. These include any advisor or portfolio manager prediction, assessment, analysis or outlook for individual securities, industries, investment styles, market sectors and/or markets. These statements involve risks and uncertainties. In addition to the general risks described for each fund in its current prospectus, other factors bearing on these reports include the accuracy of the advisor’s or portfolio manager’s forecasts and predictions, the appropriateness of the investment strategies designed by the advisor or portfolio manager and the ability of the advisor or portfolio manager to implement their strategies efficiently and successfully. Any one or more of these factors, as well as other risks affecting the securities markets generally, could cause the actual results of any fund to differ materially as compared to its benchmarks.
The views expressed by the portfolio managers reflect their professional opinions and are subject to change. Under no circumstances does the information contained within represent a recommendation to buy or sell any security.
Annual Reports 5
| | |
| PERFORMANCE SUMMARY | | |
| |
| | September 30, 2016 (Unaudited) |
Average Annual Returns
| | | | | | | | | | | | | | | | | | | | |
| | | 1-Yr | | | 3-Yr | | | 5-Yr | | | 10-Yr | | | Since
Incep. | |
Limited Term U.S. Government Fund | | | | | | | | | | | | | | | | | | | | |
A Shares (Incep: 11/16/87) | | | | | | | | | | | | | | | | | | | | |
Without sales charge | | | 1.41 | % | | | 1.44 | % | | | 1.04 | % | | | 3.03 | % | | | 5.00 | % |
With sales charge | | | -0.10 | % | | | 0.94 | % | | | 0.74 | % | | | 2.88 | % | | | 4.94 | % |
C Shares (Incep: 9/1/94) | | | | | | | | | | | | | | | | | | | | |
Without sales charge | | | 1.13 | % | | | 1.14 | % | | | 0.77 | % | | | 2.74 | % | | | 3.91 | % |
With sales charge | | | 0.63 | % | | | 1.14 | % | | | 0.77 | % | | | 2.74 | % | | | 3.91 | % |
I Shares (Incep: 7/5/96) | | | 1.83 | % | | | 1.79 | % | | | 1.38 | % | | | 3.36 | % | | | 4.40 | % |
R3 Shares (Incep: 7/1/03) | | | 1.34 | % | | | 1.37 | % | | | 0.96 | % | | | 2.96 | % | | | 2.61 | % |
R4 Shares (Incep: 2/1/14) | | | 1.33 | % | | | — | | | | — | | | | — | | | | 1.38 | % |
R5 Shares (Incep: 5/1/12) | | | 1.80 | % | | | 1.77 | % | | | — | | | | — | | | | 1.22 | % |
Limited Term Income Fund | | | | | | | | | | | | | | | | | | | | |
A Shares (Incep: 10/1/92) | | | | | | | | | | | | | | | | | | | | |
Without sales charge | | | 3.36 | % | | | 2.74 | % | | | 3.17 | % | | | 4.53 | % | | | 5.13 | % |
With sales charge | | | 1.83 | % | | | 2.24 | % | | | 2.86 | % | | | 4.37 | % | | | 5.06 | % |
C Shares (Incep: 9/1/94) | | | | | | | | | | | | | | | | | | | | |
Without sales charge | | | 3.13 | % | | | 2.54 | % | | | 2.94 | % | | | 4.28 | % | | | 4.83 | % |
With sales charge | | | 2.63 | % | | | 2.54 | % | | | 2.94 | % | | | 4.28 | % | | | 4.83 | % |
I Shares (Incep: 7/5/96) | | | 3.73 | % | | | 3.13 | % | | | 3.55 | % | | | 4.90 | % | | | 5.36 | % |
R3 Shares (Incep: 7/1/03) | | | 3.23 | % | | | 2.63 | % | | | 3.07 | % | | | 4.48 | % | | | 3.90 | % |
R4 Shares (Incep: 2/1/14) | | | 3.23 | % | | | — | | | | — | | | | — | | | | 2.37 | % |
R5 Shares (Incep: 5/1/12) | | | 3.60 | % | | | 2.98 | % | | | — | | | | — | | | | 2.96 | % |
Low Duration Income Fund | | | | | | | | | | | | | | | | | | | | |
A Shares (Incep: 12/30/13) | | | | | | | | | | | | | | | | | | | | |
Without sales charge | | | 1.60 | % | | | — | | | | — | | | | — | | | | 1.31 | % |
With sales charge | | | 0.06 | % | | | — | | | | — | | | | — | | | | 0.75 | % |
I Shares (Incep: 12/30/13) | | | 1.81 | % | | | — | | | | — | | | | — | | | | 1.48 | % |
30-Day Yields
(with sales charge)
| | | | |
Thornburg Limited Term U.S. Government Fund, A Shares | | | | |
Annualized Distribution Yield | | | 0.72 | % |
| |
SEC Yield | | | 0.76 | % |
| |
Thornburg Limited Term Income Fund, A Shares | | | | |
Annualized Distribution Yield | | | 1.57 | % |
| |
SEC Yield | | | 1.15 | % |
| |
Thornburg Low Duration Income Fund, A Shares | | | | |
Annualized Distribution Yield | | | 0.75 | % |
| |
SEC Yield | | | 1.03 | % |
Growth of a Hypothetical $10,000 Investment
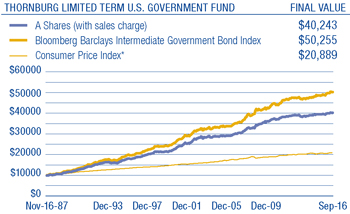

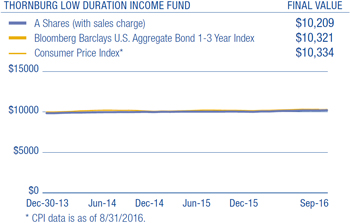
Performance data shown represents past performance and is no guarantee of future results. Investment return and principal value will fluctuate so shares, when redeemed, may be worth more or less than their original cost. Current performance may be lower or higher than quoted. For performance current to the most recent month end, visit thornburg.com or call 800-847-0200. The performance information does not reflect the deduction of taxes that a shareholder would pay on distributions or the redemption of Fund shares. Returns reflect the reinvestment of dividends and capital gains. Class A shares are sold with a maximum sales charge of 1.50%. Class C shares include a 0.50% CDSC for the first year only. There is no sales charge for Class I, Class R3, Class R4, and Class R5 shares. As disclosed in the most recent prospectus, the total annual fund operating expenses are as follows: Limited Term U.S. Government Fund A shares, 0.92%; C shares, 1.21%; I shares, 0.62%; R3 shares, 1.35%; R4 shares, 1.13%; R5 shares 2.02%; Limited Term Income Fund A shares, 0.87%; C shares, 1.10%; I shares, 0.52%; R3 shares, 1.11%; R4 shares, 1.66%; R5 shares 0.67%; and Low Duration Income Fund A shares, 2.10%; I shares, 1.89%. Thornburg Investment Management and/or Thornburg Securities Corporation have contractually agreed to waive fees and reimburse expenses through at least February 1, 2017, for some of the share classes, resulting in net expense ratios of the following: For Limited Term U.S. Government Fund R3 shares, 0.99%; R4 shares, 0.99%; R5 shares, 0.67%. Limited Term Income Fund R3 shares, 0.99%; R4 shares, 0.99%. Low Duration Income Fund A shares, 0.70%; I shares, 0.50% For more detailed information on fund expenses and waivers/reimbursements please see the Fund’s prospectus. Without the fee waivers and expense reimbursements, the Annualized Distribution yield for Low Duration Income Fund A shares would have been negative 0.07%, and the SEC yield would have been 0.21%. Unsubsidized yields may be disproportionately negative due to the size of net assets and fixed expenses.
6 Annual Reports
| | |
| Glossary | | |
| |
| | September 30, 2016 (Unaudited) |
Bloomberg Barclays Intermediate Government Bond Index – An unmanaged, market-weighted index generally representative of all public obligations of the U.S. Government, its agencies and instrumentalities having maturities from one up to ten years.
Bloomberg Barclays Intermediate Government/Credit Bond Index – An unmanaged, market-weighted index generally representative of intermediate government and investment-grade corporate debt securities having maturities from one up to ten years.
Bloomberg Barclays U.S. 1-3 Yr Aggregate Bond Index – Measures the investment grade, U.S. dollar-denominated, fixed-rate taxable bond market with maturities between 1 and 3 years, including Treasuries, government-related and corporate securities, MBS (agency fixed-rate and hybrid ARM passthroughs), ABS, and CMBS.
S&P 500 Index – An unmanaged broad measure of the U.S. stock market.
Unless otherwise noted, index returns reflect the reinvestment of income dividends and capital gains, if any, but do not reflect fees, brokerage commissions or other expenses of investing. Investors may not make direct investments into any index. The performance of any index is not indicative of the performance of any particular investment.
Asset-backed Security (ABS) – A security whose value and income payments are derived from and collateralized (or “backed”) by a specified pool of underlying assets. The pool of assets is typically a group of small and illiquid assets that are unable to be sold individually. Pooling the assets into financial instruments allows them to be sold to general investors, a process called securitization, and allows the risk of investing in the underlying assets to be diversified because each security will represent a fraction of the total value of the diverse pool of underlying assets.
Basis Point (bp) – A unit equal to 1/100th of 1%. 1% = 100 basis points (bps).
Bond Credit Ratings (Credit Quality) – A bond credit rating assesses the financial ability of a debt issuer to make timely payments of principal and interest. Ratings of AAA (the highest), AA, A, and BBB are investment-grade quality. Ratings of BB, B, CCC, CC, C and D (the lowest) are considered below investment grade, speculative grade, or junk bonds.
Credit Spread/Quality Spread – The difference between the yields of securities with different credit qualities.
Duration – A bond’s sensitivity to interest rates. Effective duration incorporates the embedded option features, such as call provisions. Bonds with longer durations experience greater price volatility than bonds with shorter durations.
Gross Domestic Product (GDP) – A country’s income minus foreign investments: the total value of all goods and services produced within a country in a year, minus net income from investments in other countries.
Laddering – Laddering involves building a portfolio of bonds with staggered maturities so that a portion matures each year. Money that comes in from maturing bonds is typically invested in bonds with longer maturities at the far end of the portfolio.
Lipper Short-Intermediate U.S. Government Funds – Funds that invest primarily in securities issued or guaranteed by the U.S. government, its agencies, or its instrumentalities, with dollar-weighted average maturities of one to five years.
Lipper Short-Intermediate Investment-Grade Debt Funds – Funds that invest primarily in investment-grade debt issues (rated in the top four grades) with dollar-weighted average maturities of one to five years.
Lipper Short Investment-Grade Debt Funds – Funds that invest primarily in investment-grade debt issues (rated in the top four grades) with dollar-weighted average maturities of less than three years.
Quantitative Easing (QE) – An unconventional monetary policy in which a central bank purchases financial assets from the market in order to lower interest rates and increase the money supply.
Riskless (or risk-free) Interest Rate – The theoretical rate of return of an investment with zero risk. The risk-free rate represents the interest that an investor would expect from an absolutely risk-free investment over a given period of time. Though a truly risk-free asset exists only in theory, in practice most professionals and academics use short-dated government bonds, such as a three-month U.S. Treasury bill.
Term Premium – The excess yield that investors require to commit to holding a long-term bond instead of a series of shorter-term bonds.
Treasuries – U.S. Treasury securities, such as bills, notes and bonds, are negotiable debt obligations of the U.S. government. These debt obligations are backed by the “full faith and credit” of the government and issued at various schedules and maturities. Income from Treasury securities is exempt from state and local, but not federal, taxes.
Annual Reports 7
| | |
| FUND SUMMARY | | |
| |
Thornburg Limited Term U.S. Government Fund | | September 30, 2016 (Unaudited) |
Objectives and Strategies
The Fund’s primary objective is to obtain as high a level of current income as is consistent, in the view of the Fund’s investment advisor, with the safety of capital. As a secondary goal, the Fund seeks to reduce changes in its share price compared to longer term portfolios.
This Fund is a laddered portfolio primarily composed of short/ intermediate debt obligations at least 80% of which are issued by the U.S. Government, its agencies, or its instrumentalities, with a dollar-weighted average maturity of normally less than five years.
Long-Term Stability of Principal
Net Asset Value History of A Shares
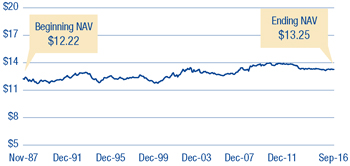
Key Portfolio Attributes
| | | | |
Number of Bonds | | | 163 | |
| |
Effective Duration | | | 2.4 Yrs | |
| |
Average Maturity | | | 3.4 Yrs | |
Types of Holdings
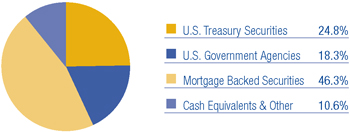
Portfolio Ladder
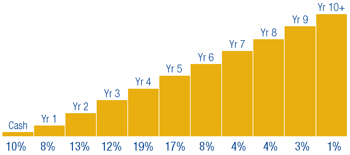
Percent of portfolio maturing in each year. Cash includes cash equivalents.
There is no guarantee that the Fund will meet its investment objectives.
All data is subject to change. Charts may not add up to 100% due to rounding.
8 Annual Reports
| | |
| SCHEDULE OF INVESTMENTS | | |
| |
Thornburg Limited Term U.S. Government Fund | | September 30, 2016 |
| | | | | | | | |
Issuer-Description | | Principal
Amount | | | Value | |
U.S. TREASURY SECURITIES — 24.82% | | | | | | | | |
a BAMLL-DB Trust, Series 2012-OSI Class C, 5.81%, 4/13/2029 | | $ | 800,000 | | | $ | 811,289 | |
a BAMLL-DB Trust, Series 2012-OSI Class D, 6.786%, 4/13/2029 | | | 3,150,000 | | | | 3,204,576 | |
United States Treasury Notes, 4.625%, 2/15/2017 | | | 4,000,000 | | | | 4,061,282 | |
United States Treasury Notes, 0.875%, 7/15/2017 | | | 3,000,000 | | | | 3,005,426 | |
United States Treasury Notes, 0.50%, 7/31/2017 | | | 5,400,000 | | | | 5,395,022 | |
United States Treasury Notes, 2.25%, 11/30/2017 | | | 7,500,000 | | | | 7,633,020 | |
United States Treasury Notes, 2.625%, 1/31/2018 | | | 6,700,000 | | | | 6,866,752 | |
United States Treasury Notes, 0.75%, 4/30/2018 | | | 4,750,000 | | | | 4,750,250 | |
United States Treasury Notes, 1.125%, 6/15/2018 | | | 4,000,000 | | | | 4,024,719 | |
United States Treasury Notes, 3.625%, 2/15/2020 | | | 1,000,000 | | | | 1,087,477 | |
United States Treasury Notes, 1.375%, 2/29/2020 | | | 2,500,000 | | | | 2,532,812 | |
United States Treasury Notes, 1.625%, 6/30/2020 | | | 4,000,000 | | | | 4,087,562 | |
United States Treasury Notes, 0.125%, 4/15/2021 | | | 2,944,689 | | | | 3,007,595 | |
United States Treasury Notes, 2.25%, 4/30/2021 | | | 6,000,000 | | | | 6,294,234 | |
United States Treasury Notes Inflationary Index, 0.125%, 4/15/2020 | | | 3,072,733 | | | | 3,132,852 | |
United States Treasury Notes Inflationary Index, 0.625%, 7/15/2021 | | | 2,669,450 | | | | 2,803,448 | |
United States Treasury Notes Inflationary Index, 0.125%, 7/15/2022 | | | 5,232,600 | | | | 5,358,503 | |
United States Treasury Notes Inflationary Index, 0.125%, 1/15/2023 | | | 2,606,550 | | | | 2,649,876 | |
United States Treasury Notes Inflationary Index, 0.375%, 7/15/2025 | | | 8,879,763 | | | | 9,178,739 | |
United States Treasury Notes Inflationary Index, 0.625%, 1/15/2026 | | | 3,190,415 | | | | 3,359,317 | |
| | | | | | | | |
TOTAL U.S. TREASURY SECURITIES (Cost $81,762,357) | | | | | | | 83,244,751 | |
| | | | | | | | |
| | |
U.S. GOVERNMENT AGENCIES — 18.25% | | | | | | | | |
Federal Home Loan Bank, 5.00%, 12/8/2017 | | | 3,000,000 | | | | 3,152,287 | |
Federal Home Loan Mtg Corp., 4.875%, 6/13/2018 | | | 3,000,000 | | | | 3,203,586 | |
Federal National Mtg Assoc., 1.875%, 12/28/2020 | | | 2,000,000 | | | | 2,057,007 | |
b HNA Group 2015 LLC, (Guaranty: Export-Import Bank of the United States), 2.291%, 6/30/2027 | | | 2,774,633 | | | | 2,863,421 | |
Mortgage-Linked Amortizing Notes, Series 2012-1 Class A10, 2.06%, 1/15/2022 | | | 492,949 | | | | 501,823 | |
New Valley Generation I, Tennessee Valley Authority, 7.299%, 3/15/2019 | | | 1,286,774 | | | | 1,384,584 | |
c Petroleos Mexicanos Floating Rate Note, (Guaranty: Export-Import Bank of the United States), 1.03%, 4/15/2025 | | | 3,062,500 | | | | 3,019,545 | |
c Petroleos Mexicanos, (Guaranty: Export-Import Bank of the United States), 1.70%, 12/20/2022 | | | 3,396,250 | | | | 3,395,571 | |
c Petroleos Mexicanos, (Guaranty: Export-Import Bank of the United States), 2.46%, 12/15/2025 | | | 2,375,000 | | | | 2,438,971 | |
Private Export Funding Corp., (Guaranty: Export-Import Bank of the United States), 5.45%, 9/15/2017 | | | 3,000,000 | | | | 3,129,804 | |
c Reliance Industries Ltd., (Guaranty: Export-Import Bank of the United States), 2.512%, 1/15/2026 | | | 3,325,000 | | | | 3,422,363 | |
c Reliance Industries Ltd., (Guaranty: Export-Import Bank of the United States), 2.06%, 1/15/2026 | | | 3,325,000 | | | | 3,353,947 | |
Small Business Administration Participation Certificates, Series 2001-20D Class 1, 6.35%, 4/1/2021 | | | 809,224 | | | | 866,493 | |
Small Business Administration Participation Certificates, Series 2001-20F Class 1, 6.44%, 6/1/2021 | | | 450,124 | | | | 480,660 | |
Small Business Administration Participation Certificates, Series 2002-20A Class 1, 6.14%, 1/1/2022 | | | 323,854 | | | | 347,945 | |
Small Business Administration Participation Certificates, Series 2002-20K Class 1, 5.08%, 11/1/2022 | | | 310,913 | | | | 331,729 | |
Small Business Administration Participation Certificates, Series 2005-20H Class 1, 5.11%, 8/1/2025 | | | 262,353 | | | | 284,551 | |
Small Business Administration Participation Certificates, Series 2007-20D Class 1, 5.32%, 4/1/2027 | | | 750,520 | | | | 828,430 | |
Small Business Administration Participation Certificates, Series 2007-20F Class 1, 5.71%, 6/1/2027 | | | 446,835 | | | | 501,084 | |
Small Business Administration Participation Certificates, Series 2007-20I Class 1, 5.56%, 9/1/2027 | | | 1,307,618 | | | | 1,461,984 | |
Small Business Administration Participation Certificates, Series 2007-20K Class 1, 5.51%, 11/1/2027 | | | 904,747 | | | | 1,009,184 | |
Small Business Administration Participation Certificates, Series 2008-20G Class 1, 5.87%, 7/1/2028 | | | 2,273,489 | | | | 2,577,495 | |
Small Business Administration Participation Certificates, Series 2011-20G Class 1, 3.74%, 7/1/2031 | | | 2,276,511 | | | | 2,468,361 | |
Small Business Administration Participation Certificates, Series 2011-20K Class 1, 2.87%, 11/1/2031 | | | 2,673,697 | | | | 2,792,282 | |
Small Business Administration Participation Certificates, Series 2015-20G Class 1, 2.88%, 7/1/2035 | | | 2,382,924 | | | | 2,480,796 | |
Small Business Administration Participation Certificates, Series 2015-20I Class 1, 2.82%, 9/1/2035 | | | 2,624,119 | | | | 2,720,471 | |
Ulani MSN 35940 LLC, (Guaranty: Export-Import Bank of the United States), 2.227%, 5/16/2025 | | | 3,645,833 | | | | 3,708,662 | |
Union 13 Leasing LLC, (Guaranty: Export-Import Bank of the United States), 1.87%, 6/28/2024 | | | 2,017,383 | | | | 2,025,805 | |
c Washington Aircraft 2 Co. Ltd. Floating Rate Note, (Guaranty: Export-Import Bank of the United States), 1.07%, 6/26/2024 | | | 4,466,336 | | | | 4,404,812 | |
| | | | | | | | |
TOTAL U.S. GOVERNMENT AGENCIES (Cost $59,677,465) | | | | | | | 61,213,653 | |
| | | | | | | | |
| | |
MORTGAGE BACKED — 46.34% | | | | | | | | |
Federal Home Loan Mtg Corp. Multi-Family Structured Pass Through, Series KLH3 Class A Floating Rate Note, 1.222%, 11/25/2022 | | | 3,200,000 | | | | 3,202,051 | |
Federal Home Loan Mtg Corp. Whole Loan Securities, Series 2016-SC01 Class 2A, 3.50%, 7/25/2046 | | | 2,797,308 | | | | 2,855,101 | |
Federal Home Loan Mtg Corp., CMO Series 1321 Class TE, 7.00%, 8/15/2022 | | | 138,238 | | | | 149,081 | |
Federal Home Loan Mtg Corp., CMO Series 2420 Class MC, 6.00%, 2/15/2017 | | | 6,462 | | | | 6,500 | |
Federal Home Loan Mtg Corp., CMO Series 2527 Class BP, 5.00%, 11/15/2017 | | | 77,718 | | | | 78,982 | |
Federal Home Loan Mtg Corp., CMO Series 2529 Class MB, 5.00%, 11/15/2017 | | | 74,677 | | | | 76,046 | |
Federal Home Loan Mtg Corp., CMO Series 2553 Class GB, 5.00%, 1/15/2018 | | | 60,633 | | | | 61,787 | |
Federal Home Loan Mtg Corp., CMO Series 2558 Class BD, 5.00%, 1/15/2018 | | | 303,341 | | | | 309,098 | |
Federal Home Loan Mtg Corp., CMO Series 2622 Class PE, 4.50%, 5/15/2018 | | | 172,019 | | | | 175,502 | |
Annual Reports 9
| | |
| SCHEDULE OF INVESTMENTS, CONTINUED | | |
| |
Thornburg Limited Term U.S. Government Fund | | September 30, 2016 |
| | | | | | | | |
Issuer-Description | | Principal
Amount | | | Value | |
Federal Home Loan Mtg Corp., CMO Series 2641 Class WE, 4.50%, 1/15/2033 | | $ | 44,716 | | | $ | 45,593 | |
Federal Home Loan Mtg Corp., CMO Series 2642 Class JE, 5.00%, 9/15/2032 | | | 39,777 | | | | 39,843 | |
Federal Home Loan Mtg Corp., CMO Series 2649 Class QH, 4.50%, 7/15/2018 | | | 90,841 | | | | 93,093 | |
Federal Home Loan Mtg Corp., CMO Series 2814 Class GB, 5.00%, 6/15/2019 | | | 24,702 | | | | 25,530 | |
Federal Home Loan Mtg Corp., CMO Series 2827 Class BU, 3.50%, 7/15/2019 | | | 332,557 | | | | 338,152 | |
Federal Home Loan Mtg Corp., CMO Series 3291 Class BY, 4.50%, 3/15/2022 | | | 790,459 | | | | 822,209 | |
Federal Home Loan Mtg Corp., CMO Series 3589 Class CA, 4.00%, 10/15/2021 | | | 36,180 | | | | 36,291 | |
Federal Home Loan Mtg Corp., CMO Series 3640 Class EL, 4.00%, 3/15/2020 | | | 519,156 | | | | 534,854 | |
Federal Home Loan Mtg Corp., CMO Series 3704 Class DC, 4.00%, 11/15/2036 | | | 549,757 | | | | 590,260 | |
Federal Home Loan Mtg Corp., CMO Series 3867 Class VA, 4.50%, 3/15/2024 | | | 1,865,186 | | | | 2,050,195 | |
Federal Home Loan Mtg Corp., CMO Series 3922 Class PQ, 2.00%, 4/15/2041 | | | 1,123,957 | | | | 1,128,147 | |
Federal Home Loan Mtg Corp., CMO Series 4050 Class MV, 3.50%, 8/15/2023 | | | 2,312,029 | | | | 2,456,562 | |
Federal Home Loan Mtg Corp., CMO Series 4097 Class TE, 1.75%, 5/15/2039 | | | 2,311,044 | | | | 2,304,712 | |
Federal Home Loan Mtg Corp., CMO Series 4105 Class FG, 0.924%, 9/15/2042 | | | 2,329,894 | | | | 2,320,632 | |
Federal Home Loan Mtg Corp., CMO Series 4120 Class TC, 1.50%, 10/15/2027 | | | 2,760,469 | | | | 2,737,564 | |
Federal Home Loan Mtg Corp., CMO Series 4120 Class UE, 2.00%, 10/15/2027 | | | 2,795,140 | | | | 2,818,639 | |
Federal Home Loan Mtg Corp., CMO Series K018 Class A1, 1.781%, 10/25/2020 | | | 1,347,373 | | | | 1,355,544 | |
Federal Home Loan Mtg Corp., CMO Series K035 Class A1, 2.615%, 3/25/2023 | | | 3,095,965 | | | | 3,208,374 | |
Federal Home Loan Mtg Corp., CMO Series K037 Class A1, 2.592%, 4/25/2023 | | | 1,695,568 | | | | 1,753,121 | |
Federal Home Loan Mtg Corp., CMO Series K038 Class A1, 2.604%, 10/25/2023 | | | 5,205,750 | | | | 5,394,398 | |
Federal Home Loan Mtg Corp., CMO Series K042 Class A1, 2.267%, 6/25/2024 | | | 2,232,953 | | | | 2,287,462 | |
Federal Home Loan Mtg Corp., CMO Series K709 Class A2, 2.086%, 3/25/2019 | | | 3,000,000 | | | | 3,053,722 | |
Federal Home Loan Mtg Corp., CMO Series K716 Class A1, 2.413%, 8/25/2047 | | | 1,599,521 | | | | 1,636,628 | |
Federal Home Loan Mtg Corp., CMO Series KF15 Class A, 1.195%, 2/25/2023 | | | 2,999,332 | | | | 3,002,186 | |
Federal Home Loan Mtg Corp., CMO Series KLH1 Class A, 1.222%, 11/25/2022 | | | 2,000,000 | | | | 2,001,282 | |
Federal Home Loan Mtg Corp., CMO Series KP02 Class A2, 2.355%, 4/25/2021 | | | 3,000,000 | | | | 3,079,901 | |
Federal Home Loan Mtg Corp., CMO Series KS03 Class A2, 2.79%, 6/25/2022 | | | 2,500,000 | | | | 2,593,116 | |
Federal Home Loan Mtg Corp., CMO Series SC02 Class 2A, 3.50%, 9/25/2045 | | | 2,257,111 | | | | 2,333,176 | |
Federal Home Loan Mtg Corp., Pool AK6768, 3.00%, 3/1/2027 | | | 2,197,239 | | | | 2,309,247 | |
Federal Home Loan Mtg Corp., Pool B14155, 3.50%, 5/1/2019 | | | 135,600 | | | | 143,323 | |
Federal Home Loan Mtg Corp., Pool D98887, 3.50%, 1/1/2032 | | | 1,253,086 | | | | 1,337,914 | |
Federal Home Loan Mtg Corp., Pool E96575, 4.50%, 6/1/2018 | | | 172,239 | | | | 176,383 | |
Federal Home Loan Mtg Corp., Pool G12079, 4.50%, 4/1/2019 | | | 224,562 | | | | 231,815 | |
Federal Home Loan Mtg Corp., Pool G12140, 4.00%, 2/1/2020 | | | 65,693 | | | | 67,725 | |
Federal Home Loan Mtg Corp., Pool G13804, 5.00%, 3/1/2025 | | | 531,829 | | | | 575,946 | |
Federal Home Loan Mtg Corp., Pool G18435, 2.50%, 5/1/2027 | | | 2,686,370 | | | | 2,783,751 | |
Federal Home Loan Mtg Corp., Pool J11371, 4.50%, 12/1/2024 | | | 536,628 | | | | 577,249 | |
Federal Home Loan Mtg Corp., Pool J13583, 3.50%, 11/1/2025 | | | 911,467 | | | | 966,226 | |
Federal Home Loan Mtg Corp., Pool J14888, 3.50%, 4/1/2026 | | | 974,750 | | | | 1,031,788 | |
Federal Home Loan Mtg Corp., Pool T61943, 3.50%, 8/1/2045 | | | 1,081,361 | | | | 1,129,642 | |
Federal Home Loan Mtg Corp., REMIC Series 4072 Class VA, 3.50%, 10/15/2023 | | | 2,022,668 | | | | 2,148,166 | |
Federal National Mtg Assoc., CMO Series 1993-32 Class H, 6.00%, 3/25/2023 | | | 17,008 | | | | 18,409 | |
Federal National Mtg Assoc., CMO Series 2003-15 Class CY, 5.00%, 3/25/2018 | | | 47,969 | | | | 48,892 | |
Federal National Mtg Assoc., CMO Series 2003-4 Class PE, 5.00%, 2/25/2018 | | | 131,553 | | | | 134,253 | |
Federal National Mtg Assoc., CMO Series 2003-9 Class DB, 5.00%, 2/25/2018 | | | 58,481 | | | | 59,588 | |
Federal National Mtg Assoc., CMO Series 2009-17 Class AH, 0.922%, 3/25/2039 | | | 451,325 | | | | 400,930 | |
Federal National Mtg Assoc., CMO Series 2009-49 Class KA, 5.00%, 2/25/2024 | | | 15,075 | | | | 15,141 | |
Federal National Mtg Assoc., CMO Series 2009-52 Class AJ, 4.00%, 7/25/2024 | | | 200,265 | | | | 205,748 | |
Federal National Mtg Assoc., CMO Series 2009-70 Class NK, 4.50%, 8/25/2019 | | | 83,283 | | | | 85,076 | |
Federal National Mtg Assoc., CMO Series 2009-78 Class A, 4.50%, 8/25/2019 | | | 127,441 | | | | 130,427 | |
Federal National Mtg Assoc., CMO Series 2011-103 Class VA, 4.00%, 12/25/2022 | | | 1,813,235 | | | | 1,839,304 | |
Federal National Mtg Assoc., CMO Series 2011-110 Class JV, 4.00%, 1/25/2023 | | | 2,030,441 | | | | 2,049,702 | |
Federal National Mtg Assoc., CMO Series 2011-118 Class V, 4.00%, 10/25/2029 | | | 396,308 | | | | 398,266 | |
Federal National Mtg Assoc., CMO Series 2011-124 Class QA, 2.00%, 12/25/2041 | | | 909,216 | | | | 910,946 | |
Federal National Mtg Assoc., CMO Series 2011-45 Class VA, 4.00%, 3/25/2024 | | | 2,556,390 | | | | 2,683,039 | |
Federal National Mtg Assoc., CMO Series 2011-63 Class MV, 3.50%, 7/25/2024 | | | 2,592,687 | | | | 2,708,472 | |
Federal National Mtg Assoc., CMO Series 2011-70 Class CA, 3.00%, 8/25/2026 | | | 4,659,175 | | | | 4,708,375 | |
Federal National Mtg Assoc., CMO Series 2011-72 Class KV, 3.50%, 11/25/2022 | | | 1,403,671 | | | | 1,448,136 | |
Federal National Mtg Assoc., CMO Series 2012-36 Class CV, 4.00%, 6/25/2023 | | | 2,589,327 | | | | 2,735,093 | |
Federal National Mtg Assoc., CMO Series 2013-81 Class FW Floating Rate Note, 0.825%, 1/25/2043 | | | 3,486,781 | | | | 3,454,803 | |
Federal National Mtg Assoc., CMO Series 2013-92 Class FA, 1.075%, 9/25/2043 | | | 2,419,767 | | | | 2,421,241 | |
Federal National Mtg Assoc., CMO Series 2015-AB5 Class A10, 3.15%, 9/25/2035 | | | 2,457,657 | | | | 2,555,963 | |
Federal National Mtg Assoc., Pool 044003, 8.00%, 6/1/2017 | | | 323 | | | | 328 | |
Federal National Mtg Assoc., Pool 076388, 9.25%, 9/1/2018 | | | 969 | | | | 975 | |
Federal National Mtg Assoc., Pool 252648, 6.50%, 5/1/2022 | | | 26,587 | | | | 29,143 | |
Federal National Mtg Assoc., Pool 342947, 7.25%, 4/1/2024 | | | 59,739 | | | | 67,217 | |
Federal National Mtg Assoc., Pool 443909, 6.50%, 9/1/2018 | | | 8,356 | | | | 9,612 | |
10 Annual Reports
| | |
| SCHEDULE OF INVESTMENTS, CONTINUED | | |
| |
Thornburg Limited Term U.S. Government Fund | | September 30, 2016 |
| | | | | | | | |
Issuer-Description | | Principal
Amount | | | Value | |
Federal National Mtg Assoc., Pool 555207, 7.00%, 11/1/2017 | | $ | 1,555 | | | $ | 1,611 | |
Federal National Mtg Assoc., Pool 726308, 4.00%, 7/1/2018 | | | 106,187 | | | | 109,621 | |
Federal National Mtg Assoc., Pool 889906, 4.00%, 7/1/2023 | | | 199,788 | | | | 210,834 | |
Federal National Mtg Assoc., Pool 895572, 3.07%, 6/1/2036 | | | 271,039 | | | | 287,411 | |
Federal National Mtg Assoc., Pool 930986, 4.50%, 4/1/2019 | | | 226,312 | | | | 233,536 | |
Federal National Mtg Assoc., Pool AA2870, 4.00%, 3/1/2024 | | | 521,325 | | | | 552,222 | |
Federal National Mtg Assoc., Pool AB7997, 2.50%, 2/1/2023 | | | 969,001 | | | | 1,003,976 | |
Federal National Mtg Assoc., Pool AB8447, 2.50%, 2/1/2028 | | | 2,211,546 | | | | 2,292,406 | |
Federal National Mtg Assoc., Pool AD8191, 4.00%, 9/1/2025 | | | 844,477 | | | | 898,181 | |
Federal National Mtg Assoc., Pool AJ1752, 3.50%, 9/1/2026 | | | 2,354,287 | | | | 2,498,395 | |
Federal National Mtg Assoc., Pool AK6518, 3.00%, 3/1/2027 | | | 2,173,548 | | | | 2,296,914 | |
Federal National Mtg Assoc., Pool AU2669, 2.50%, 10/1/2028 | | | 2,215,245 | | | | 2,302,470 | |
Federal National Mtg Assoc., Pool MA0045, 4.00%, 4/1/2019 | | | 156,369 | | | | 161,427 | |
Federal National Mtg Assoc., Pool MA0071, 4.50%, 5/1/2019 | | | 123,228 | | | | 127,162 | |
Federal National Mtg Assoc., Pool MA0125, 4.50%, 7/1/2019 | | | 101,638 | | | | 104,974 | |
Federal National Mtg Assoc., Pool MA0380, 4.00%, 4/1/2020 | | | 271,623 | | | | 280,408 | |
Federal National Mtg Assoc., Pool MA1582, 3.50%, 9/1/2043 | | | 4,957,243 | | | | 5,285,079 | |
Federal National Mtg Assoc., Pool MA1585, 2.00%, 9/1/2023 | | | 2,313,021 | | | | 2,351,421 | |
Federal National Mtg Assoc., Pool MA1625, 3.00%, 10/1/2023 | | | 2,556,308 | | | | 2,684,223 | |
Federal National Mtg Assoc., Pool MA2322, 2.50%, 7/1/2025 | | | 1,979,940 | | | | 2,051,404 | |
Federal National Mtg Assoc., Pool MA2353, 3.00%, 8/1/2035 | | | 2,926,573 | | | | 3,072,444 | |
Federal National Mtg Assoc., Pool MA2480, 4.00%, 12/1/2035 | | | 3,200,029 | | | | 3,478,032 | |
Federal National Mtg Assoc., Pool MA2499, 2.50%, 1/1/2026 | | | 3,224,334 | | | | 3,340,713 | |
Government National Mtg Assoc., CMO Series 2010-160 Class VY, 4.50%, 1/20/2022 | | | 540,856 | | | | 580,319 | |
Government National Mtg Assoc., Pool 003550, 5.00%, 5/20/2019 | | | 114,565 | | | | 119,099 | |
Government National Mtg Assoc., Pool 714631, 5.691%, 10/20/2059 | | | 400,531 | | | | 413,390 | |
Government National Mtg Assoc., Pool 721652, 5.044%, 5/20/2061 | | | 3,112,987 | | | | 3,258,090 | |
Government National Mtg Assoc., Pool 751388, 5.307%, 1/20/2061 | | | 2,205,065 | | | | 2,364,448 | |
Government National Mtg Assoc., Pool 751392, 5.00%, 2/20/2061 | | | 4,673,971 | | | | 5,187,736 | |
Government National Mtg Assoc., Pool 757313, 4.307%, 12/20/2060 | | | 3,155,941 | | | | 3,245,568 | |
Government National Mtg Assoc., Pool 894205, 2.00%, 8/20/2039 | | | 365,780 | | | | 376,287 | |
Government National Mtg Assoc., Pool MA0100, 2.50%, 5/20/2042 | | | 1,436,767 | | | | 1,472,909 | |
Government National Mtg Assoc., Pool MA0907, 2.00%, 4/20/2028 | | | 3,184,862 | | | | 3,230,022 | |
| | | | | | | | |
TOTAL MORTGAGE BACKED (Cost $153,817,074) | | | | | | | 155,426,320 | |
| | | | | | | | |
| | |
SHORT TERM INVESTMENTS — 7.52% | | | | | | | | |
Bank of New York Tri-Party Repurchase Agreement 0.40% dated 9/30/2016 due 10/3/2016, repurchase price $15,000,500 collateralized by 15 U.S. Government debt securities, having an average coupon of 1.63%, a minimum credit rating of BBB-, maturity dates from 2/25/2024 to 2/20/2042, and having an aggregate market value of $15,285,899 at 9/30/2016 | | | 15,000,000 | | | | 15,000,000 | |
Federal Home Loan Discount Note, 0.23%, 10/12/2016 | | | 1,700,000 | | | | 1,699,881 | |
Federal Home Loan Discount Note, 0.21%, 10/25/2016 | | | 1,000,000 | | | | 999,860 | |
Federal Home Loan Discount Note, 0.22%, 10/28/2016 | | | 2,500,000 | | | | 2,499,587 | |
United States Treasury Bill, 0.236%, 10/6/2016 | | | 2,500,000 | | | | 2,499,918 | |
United States Treasury Bill, 0.207%, 10/13/2016 | | | 2,500,000 | | | | 2,499,820 | |
| | | | | | | | |
TOTAL SHORT TERM INVESTMENTS (Cost $25,199,066) | | | | | | | 25,199,066 | |
| | | | | | | | |
TOTAL INVESTMENTS — 96.93% (Cost $320,455,962) | | | | | | $ | 325,083,790 | |
OTHER ASSETS LESS LIABILITIES — 3.07% | | | | | | | 10,299,519 | |
| | | | | | | | |
NET ASSETS — 100.00% | | | | | | $ | 335,383,309 | |
| | | | | | | | |
Footnote Legend
| a | Securities exempt from registration under Rule 144A of the Securities Act of 1933, as amended. These securities may only be resold in the ordinary course of business in transactions exempt from registration, normally to qualified institutional buyers. As of September 30, 2016, the aggregate value of these securities in the Fund’s portfolio was $4,015,865, representing 1.2% of the Fund’s net assets. |
| b | Security currently fair valued by the Valuation and Pricing Committee using procedures approved by the Trustees’ Audit Committee. |
| c | Yankee bond denominated in U.S. dollars and is issued in the U.S. by foreign banks and corporations. |
Portfolio Abbreviations
To simplify the listings of securities, abbreviations are used per the table below:
| | |
| CMO | | Collateralized Mortgage Obligation |
| Mtg | | Mortgage |
| | |
| REMIC | | Real Estate Mortgage Investment Conduit |
| VA | | Veterans Affairs |
| | |
| See notes to financial statements. | | |
Annual Reports 11
| | |
| Fund Summary | | |
| |
Thornburg Limited Term Income Fund | | September 30, 2016 (Unaudited) |
Objectives and Strategies
The Fund’s primary objective is to obtain as high a level of current income as is consistent, in the view of the Fund’s investment advisor, with the preservation of capital. As a secondary goal, the Fund seeks to reduce changes in its share price compared to longer term portfolios.
This Fund is a laddered portfolio primarily composed of short/ intermediate debt obligations which are investment grade or judged by the advisor to be of equivalent quality, with a dollar-weighted average maturity of normally less than five years.
Long-Term Stability of Principal
Net Asset Value History of A Shares
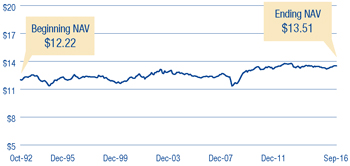
Key Portfolio Attributes
| | | | |
Number of Bonds | | | 584 | |
| |
Effective Duration | | | 2.4 Yrs | |
| |
Average Maturity | | | 3.2 Yrs | |
Security Credit Ratings
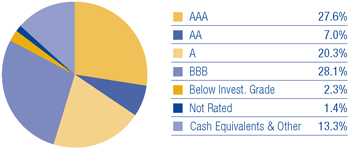
Credit quality ratings for Thornburg’s global fixed income portfolios used ratings from Moody’s Investors Service. Where Moody’s ratings are not available, we have used Standard & Poor’s ratings. Where neither rating is available, we have used ratings from other NRSROs. U.S.-backed securities are included in AAA.
Portfolio Ladder
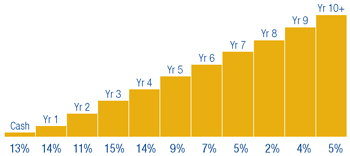
Percent of portfolio maturing in each year. Cash includes cash equivalents.
There is no guarantee that the Fund will meet its investment objectives.
All data is subject to change. Charts may not add up to 100% due to rounding.
12 Annual Reports
| | |
| SCHEDULE OF INVESTMENTS | | |
| |
Thornburg Limited Term Income Fund | | September 30, 2016 |
| | | | | | | | | | | | |
Issuer-Description | | Credit Rating†
S&P/ Moody’s | | | Principal
Amount | | | Value | |
U.S. TREASURY SECURITIES — 2.17% | | | | | | | | | | | | |
United States Treasury Notes, 3.00% due 2/28/2017 | | | NR/Aaa | | | $ | 2,000,000 | | | $ | 2,020,589 | |
United States Treasury Notes, 0.875% due 6/15/2017 | | | NR/Aaa | | | | 14,900,000 | | | | 14,927,821 | |
United States Treasury Notes, 0.875% due 7/15/2017 | | | NR/Aaa | | | | 36,500,000 | | | | 36,566,014 | |
United States Treasury Notes, 0.75% due 4/30/2018 | | | NR/Aaa | | | | 6,875,000 | | | | 6,875,362 | |
United States Treasury Notes, 1.625% due 3/31/2019 | | | NR/Aaa | | | | 15,000,000 | | | | 15,286,054 | |
United States Treasury Notes, 1.50% due 5/31/2019 | | | NR/Aaa | | | | 10,000,000 | | | | 10,167,188 | |
United States Treasury Notes Inflationary Index, 0.125% due 4/15/2020 | | | NR/Aaa | | | | 17,016,160 | | | | 17,349,088 | |
| | | | | | | | | | | | |
TOTAL U.S. TREASURY SECURITIES (Cost $102,156,808) | | | | | | | | | | | 103,192,116 | |
| | | | | | | | | | | | |
| | | |
U.S. GOVERNMENT AGENCIES — 5.14% | | | | | | | | | | | | |
Alex Alpha, LLC, (Guaranty: Export-Import Bank of the United States), 1.617% due 8/15/2024 | | | NR/NR | | | | 3,478,261 | | | | 3,458,139 | |
Altitude Investments 12, LLC, (Guaranty: Export-Import Bank of the United States), 2.454% due 12/9/2025 | | | NR/NR | | | | 5,575,153 | | | | 5,723,882 | |
a CoBank, ACB Floating Rate Note, (Federal Farm Credit Banks), 1.45% due 6/15/2022 | | | A-/NR | | | | 27,800,000 | | | | 26,371,525 | |
b Durrah MSN 35603, (Guaranty: Export-Import Bank of the United States), 1.684% due 1/22/2025 | | | NR/NR | | | | 10,899,760 | | | | 10,847,158 | |
DY8 Leasing, LLC, (Guaranty: Export-Import Bank of the United States), 2.627% due 4/29/2026 | | | NR/NR | | | | 4,164,063 | | | | 4,308,668 | |
Export Leasing (2009), LLC, (Guaranty: Export-Import Bank of the United States), 1.859% due 8/28/2021 | | | NR/NR | | | | 4,528,654 | | | | 4,550,898 | |
b Gate Capital Cayman One Ltd., (Guaranty: Export-Import Bank of the United States), 1.839% due 3/27/2021 | | | NR/NR | | | | 7,407,064 | | | | 7,441,211 | |
Helios Leasing I, LLC, (Guaranty: Export-Import Bank of the United States), 1.562% due 9/28/2024 | | | NR/NR | | | | 4,130,189 | | | | 4,090,605 | |
b Micron Semiconductor Ltd., (Guaranty: Export-Import Bank of the United States), 1.258% due 1/15/2019 | | | NR/NR | | | | 2,150,000 | | | | 2,140,890 | |
Mortgage-Linked Amortizing Notes, Series 2012-1 Class A10, 2.06% due 1/15/2022 | | | AA+/NR | | | | 677,805 | | | | 690,007 | |
b MSN 41079 and 41084 Ltd., (Guaranty: Export-Import Bank of the United States), 1.717% due 7/13/2024 | | | NR/NR | | | | 8,291,421 | | | | 8,273,113 | |
b Petroleos Mexicanos Floating Rate Note, (Guaranty: Export-Import Bank of the United States), 1.03% due 4/15/2025 | | | NR/NR | | | | 9,065,000 | | | | 8,937,854 | |
b Petroleos Mexicanos, (Guaranty: Export-Import Bank of the United States), 1.70% due 12/20/2022 | | | NR/NR | | | | 6,760,000 | | | | 6,758,648 | |
b Petroleos Mexicanos, (Guaranty: Export-Import Bank of the United States), 2.46% due 12/15/2025 | | | NR/NR | | | | 7,125,000 | | | | 7,316,912 | |
Private Export Funding Corp., (Guaranty: Export-Import Bank of the United States), 5.45% due 9/15/2017 | | | NR/Aaa | | | | 3,000,000 | | | | 3,129,804 | |
Private Export Funding Corp., (Guaranty: Export-Import Bank of the United States), 3.55% due 1/15/2024 | | | NR/Aaa | | | | 10,000,000 | | | | 11,098,040 | |
b Reliance Industries Ltd., (Guaranty: Export-Import Bank of the United States), 2.512% due 1/15/2026 | | | NR/NR | | | | 6,175,000 | | | | 6,355,816 | |
b Reliance Industries Ltd., (Guaranty: Export-Import Bank of the United States), 2.06% due 1/15/2026 | | | NR/NR | | | | 1,425,000 | | | | 1,437,406 | |
Sandalwood 2013, LLC, (Guaranty: Export-Import Bank of the United States), 2.821% due 2/12/2026 | | | NR/NR | | | | 5,706,785 | | | | 5,957,119 | |
Santa Rosa Leasing, LLC, (Guaranty: Export-Import Bank of the United States), 1.693% due 8/15/2024 | | | NR/NR | | | | 4,112,334 | | | | 4,100,359 | |
Santa Rosa Leasing, LLC, (Guaranty: Export-Import Bank of the United States), 1.472% due 11/3/2024 | | | NR/NR | | | | 11,328,064 | | | | 11,183,359 | |
Small Business Administration Participation Certificates, Series 2001-20J Class 1, 5.76% due 10/1/2021 | | | NR/NR | | | | 234,096 | | | | 249,381 | |
Small Business Administration Participation Certificates, Series 2008-20D Class 1, 5.37% due 4/1/2028 | | | NR/NR | | | | 1,272,602 | | | | 1,416,834 | |
Small Business Administration Participation Certificates, Series 2009-20E Class 1, 4.43% due 5/1/2029 | | | NR/NR | | | | 1,151,570 | | | | 1,257,693 | |
Small Business Administration Participation Certificates, Series 2009-20K Class 1, 4.09% due 11/1/2029 | | | NR/NR | | | | 6,581,928 | | | | 7,116,813 | |
Small Business Administration Participation Certificates, Series 2011-20E Class 1, 3.79% due 5/1/2031 | | | NR/NR | | | | 8,633,948 | | | | 9,361,832 | |
Small Business Administration Participation Certificates, Series 2011-20F Class 1, 3.67% due 6/1/2031 | | | NR/NR | | | | 1,416,757 | | | | 1,536,189 | |
Small Business Administration Participation Certificates, Series 2011-20G Class 1, 3.74% due 7/1/2031 | | | NR/NR | | | | 9,106,042 | | | | 9,873,443 | |
Small Business Administration Participation Certificates, Series 2011-20I Class 1, 2.85% due 9/1/2031 | | | NR/NR | | | | 12,256,303 | | | | 12,786,405 | |
Small Business Administration Participation Certificates, Series 2011-20K Class 1, 2.87% due 11/1/2031 | | | NR/NR | | | | 10,407,364 | | | | 10,868,959 | |
Small Business Administration Participation Certificates, Series 2012-20D Class 1, 2.67% due 4/1/2032 | | | NR/NR | | | | 10,308,306 | | | | 10,647,767 | |
Small Business Administration Participation Certificates, Series 2012-20J Class 1, 2.18% due 10/1/2032 | | | NR/NR | | | | 8,221,354 | | | | 8,317,699 | |
Small Business Administration Participation Certificates, Series 2012-20K Class 1, 2.09% due 11/1/2032 | | | NR/NR | | | | 4,984,057 | | | | 5,037,241 | |
a,c U.S. Department of Transportation, 6.001% due 12/7/2021 | | | NR/NR | | | | 3,000,000 | | | | 3,540,000 | |
Union 13 Leasing, LLC, (Guaranty: Export-Import Bank of the United States), 1.682% due 12/19/2024 | | | NR/NR | | | | 10,618,031 | | | | 10,562,658 | |
b Washington Aircraft 2 Co. Ltd. Floating Rate Note, (Guaranty: Export-Import Bank of the United States), 1.287% due 6/26/2024 | | | NR/NR | | | | 7,896,754 | | | | 7,787,976 | |
| | | | | | | | | | | | |
TOTAL U.S. GOVERNMENT AGENCIES (Cost $242,134,986) | | | | | | | | | | | 244,532,303 | |
| | | | | | | | | | | | |
| | | |
OTHER GOVERNMENT — 1.56% | | | | | | | | | | | | |
a,b Carpintero Finance Ltd., (Guaranty: Export Credits Guarantee Department of the United Kingdom), 2.004% due 9/18/2024 | | | NR/NR | | | | 7,947,188 | | | | 8,014,548 | |
a,b Carpintero Finance Ltd., (Guaranty: Export Credits Guarantee Department of the United Kingdom), 2.581% due 11/11/2024 | | | NR/NR | | | | 11,220,132 | | | | 11,577,449 | |
a,b Government of Bermuda, 5.603% due 7/20/2020 | | | A+/A2 | | | | 3,000,000 | | | | 3,378,750 | |
a,b Government of Bermuda, 4.138% due 1/3/2023 | | | A+/A2 | | | | 4,000,000 | | | | 4,282,340 | |
a,b Khadrawy Ltd., (Guaranty: Export Credit Guarantee Department of the United Kingdom), 2.471% due 3/31/2025 | | | NR/NR | | | | 5,363,429 | | | | 5,417,064 | |
a,b Korea National Oil Corp., 4.00% due 10/27/2016 | | | AA/Aa2 | | | | 2,000,000 | | | | 2,003,440 | |
a,b Korea National Oil Corp., 2.75% due 1/23/2019 | | | AA/Aa2 | | | | 5,000,000 | | | | 5,122,700 | |
b North American Development Bank, 4.375% due 2/11/2020 | | | NR/Aa1 | | | | 15,500,000 | | | | 16,908,485 | |
a,b Seven and Seven Ltd. Floating Rate Note, (Guaranty: Export-Import Bank of Korea), 2.235% due 9/11/2019 | | | NR/NR | | | | 13,380,000 | | | | 13,337,465 | |
a,b State of Qatar, 3.125% due 1/20/2017 | | | AA/Aa2 | | | | 4,000,000 | | | | 4,016,000 | |
| | | | | | | | | | | | |
TOTAL OTHER GOVERNMENT (Cost $72,466,579) | | | | | | | | | | | 74,058,241 | |
| | | | | | | | | | | | |
Annual Reports 13
| | |
| SCHEDULE OF INVESTMENTS, CONTINUED | | |
| |
Thornburg Limited Term Income Fund | | September 30, 2016 |
| | | | | | | | | | | | |
Issuer-Description | | Credit Rating†
S&P/ Moody’s | | | Principal
Amount | | | Value | |
MORTGAGE BACKED — 3.96% | | | | | | | | | | | | |
Federal Home Loan Mtg Corp. Multi-Family Structured Pass Through, Series KLH3 Class A Floating Rate Note, 1.222% due 11/25/2022 | | | NR/NR | | | $ | 18,800,000 | | | $ | 18,812,049 | |
Federal Home Loan Mtg Corp. Whole Loan Securities, Series 2016-SC01 Class 2A, 3.50% due 7/25/2046 | | | NR/NR | | | | 10,723,014 | | | | 10,944,555 | |
Federal Home Loan Mtg Corp., CMO Interest Only Series K008 Class X1, 1.781% due 6/25/2020 | | | NR/NR | | | | 35,786,413 | | | | 1,599,742 | |
Federal Home Loan Mtg Corp., CMO Interest Only Series K710 Class X1, 1.892% due 5/25/2019 | | | NR/NR | | | | 46,730,455 | | | | 1,759,028 | |
Federal Home Loan Mtg Corp., CMO Series 2528 Class HN, 5.00% due 11/15/2017 | | | NR/NR | | | | 43,863 | | | | 44,616 | |
Federal Home Loan Mtg Corp., CMO Series 2627 Class GY, 4.50% due 6/15/2018 | | | NR/NR | | | | 344,121 | | | | 351,304 | |
Federal Home Loan Mtg Corp., CMO Series 2628 Class AB, 4.50% due 6/15/2018 | | | NR/NR | | | | 85,605 | | | | 87,386 | |
Federal Home Loan Mtg Corp., CMO Series 2682 Class JG, 4.50% due 10/15/2023 | | | NR/NR | | | | 727,830 | | | | 765,216 | |
Federal Home Loan Mtg Corp., CMO Series 2814 Class GB, 5.00% due 6/15/2019 | | | NR/NR | | | | 24,702 | | | | 25,530 | |
Federal Home Loan Mtg Corp., CMO Series 2827 Class BU, 3.50% due 7/15/2019 | | | NR/NR | | | | 399,068 | | | | 405,783 | |
Federal Home Loan Mtg Corp., CMO Series 3195 Class PD, 6.50% due 7/15/2036 | | | NR/NR | | | | 1,094,177 | | | | 1,224,262 | |
Federal Home Loan Mtg Corp., CMO Series 3291 Class BY, 4.50% due 3/15/2022 | | | NR/NR | | | | 1,053,946 | | | | 1,096,279 | |
Federal Home Loan Mtg Corp., CMO Series 3504 Class PC, 4.00% due 1/15/2039 | | | NR/NR | | | | 95,810 | | | | 99,502 | |
Federal Home Loan Mtg Corp., CMO Series 3589 Class CA, 4.00% due 10/15/2021 | | | NR/NR | | | | 54,269 | | | | 54,436 | |
Federal Home Loan Mtg Corp., CMO Series 3919 Class VB, 4.00% due 8/15/2024 | | | NR/NR | | | | 4,028,531 | | | | 4,388,296 | |
Federal Home Loan Mtg Corp., CMO Series 3922 Class PQ, 2.00% due 4/15/2041 | | | NR/NR | | | | 1,685,935 | | | | 1,692,220 | |
Federal Home Loan Mtg Corp., CMO Series 4050 Class MV, 3.50% due 8/15/2023 | | | NR/NR | | | | 2,641,565 | | | | 2,806,698 | |
Federal Home Loan Mtg Corp., CMO Series 4079 Class WV, 3.50% due 3/15/2027 | | | NR/NR | | | | 2,904,045 | | | | 3,098,906 | |
Federal Home Loan Mtg Corp., CMO Series 4097 Class TE, 1.75% due 5/15/2039 | | | NR/NR | | | | 6,933,131 | | | | 6,914,136 | |
Federal Home Loan Mtg Corp., CMO Series 4120 Class TC, 1.50% due 10/15/2027 | | | NR/NR | | | | 3,584,493 | | | | 3,554,750 | |
Federal Home Loan Mtg Corp., CMO Series K038 Class A1, 2.604% due 10/25/2023 | | | NR/NR | | | | 12,146,751 | | | | 12,586,929 | |
Federal Home Loan Mtg Corp., CMO Series K039 Class A1, 2.683% due 12/25/2023 | | | NR/NR | | | | 6,136,011 | | | | 6,381,874 | |
Federal Home Loan Mtg Corp., CMO Series K716 Class A1, 2.413% due 8/25/2047 | | | NR/Aaa | | | | 4,918,527 | | | | 5,032,631 | |
Federal Home Loan Mtg Corp., Multi-Family Structured Pass Through, Series K710 Class A2, 1.883% due 5/25/2019 | | | NR/NR | | | | 7,605,000 | | | | 7,711,721 | |
Federal Home Loan Mtg Corp., Pool D98887, 3.50% due 1/1/2032 | | | NR/NR | | | | 4,194,700 | | | | 4,478,662 | |
Federal Home Loan Mtg Corp., Pool J17504, 3.00% due 12/1/2026 | | | NR/NR | | | | 2,187,376 | | | | 2,308,366 | |
Federal Home Loan Mtg Corp., REMIC Series 3838 Class GV, 4.00% due 3/15/2024 | | | NR/NR | | | | 7,816,402 | | | | 8,453,716 | |
Federal Home Loan Mtg Corp., REMIC Series 4072 Class VA, 3.50% due 10/15/2023 | | | NR/NR | | | | 2,035,359 | | | | 2,161,644 | |
Federal National Mtg Assoc., CMO Series 2003-4 Class PE, 5.00% due 2/25/2018 | | | NR/NR | | | | 132,569 | | | | 135,290 | |
Federal National Mtg Assoc., CMO Series 2003-74 Class KN, 4.50% due 8/25/2018 | | | NR/NR | | | | 62,268 | | | | 63,321 | |
Federal National Mtg Assoc., CMO Series 2005-48 Class AR, 5.50% due 2/25/2035 | | | NR/NR | | | | 255,885 | | | | 268,447 | |
Federal National Mtg Assoc., CMO Series 2007-42 Class PA, 5.50% due 4/25/2037 | | | NR/NR | | | | 391,360 | | | | 419,018 | |
Federal National Mtg Assoc., CMO Series 2009-17 Class AH, 0.922% due 3/25/2039 | | | NR/NR | | | | 752,209 | | | | 668,217 | |
Federal National Mtg Assoc., CMO Series 2009-49 Class KA, 5.00% due 2/25/2024 | | | NR/NR | | | | 35,175 | | | | 35,328 | |
Federal National Mtg Assoc., CMO Series 2009-5 Class A, 4.50% due 12/25/2023 | | | NR/NR | | | | 408,684 | | | | 417,380 | |
Federal National Mtg Assoc., CMO Series 2009-52 Class AJ, 4.00% due 7/25/2024 | | | NR/NR | | | | 333,775 | | | | 342,914 | |
Federal National Mtg Assoc., CMO Series 2009-70 Class NK, 4.50% due 8/25/2019 | | | NR/NR | | | | 208,208 | | | | 212,689 | |
Federal National Mtg Assoc., CMO Series 2011-103 Class VA, 4.00% due 12/25/2022 | | | NR/NR | | | | 1,796,312 | | | | 1,822,137 | |
Federal National Mtg Assoc., CMO Series 2011-15 Class VA, 4.00% due 4/25/2022 | | | NR/NR | | | | 1,101,471 | | | | 1,140,197 | |
Federal National Mtg Assoc., CMO Series 2012-129 Class LA, 3.50% due 12/25/2042 | | | NR/NR | | | | 9,418,921 | | | | 9,872,107 | |
Federal National Mtg Assoc., CMO Series 2012-36 Class CV, 4.00% due 6/25/2023 | | | NR/NR | | | | 2,362,114 | | | | 2,495,089 | |
Federal National Mtg Assoc., CMO Series 2013-81 Class FW Floating Rate Note, 0.825% due 1/25/2043 | | | NR/NR | | | | 12,669,109 | | | | 12,552,917 | |
Federal National Mtg Assoc., Pool 357384, 4.50% due 5/1/2018 | | | NR/NR | | | | 43,856 | | | | 44,911 | |
Federal National Mtg Assoc., Pool 897936, 5.50% due 8/1/2021 | | | NR/NR | | | | 467,476 | | | | 500,386 | |
Federal National Mtg Assoc., Pool AB7997, 2.50% due 2/1/2023 | | | NR/NR | | | | 5,275,445 | | | | 5,465,855 | |
Federal National Mtg Assoc., Pool AK6518, 3.00% due 3/1/2027 | | | NR/NR | | | | 3,031,823 | | | | 3,203,903 | |
Federal National Mtg Assoc., Pool MA1278, 2.50% due 12/1/2022 | | | NR/NR | | | | 6,970,164 | | | | 7,221,743 | |
Federal National Mtg Assoc., Pool MA1585, 2.00% due 9/1/2023 | | | NR/NR | | | | 8,760,567 | | | | 8,906,007 | |
Federal National Mtg Assoc., Pool MA1691, 3.00% due 12/1/2023 | | | NR/NR | | | | 7,673,833 | | | | 8,057,825 | |
Government National Mtg Assoc., CMO Series 2009-68 Class DP, 4.50% due 11/16/2038 | | | NR/NR | | | | 404,587 | | | | 430,142 | |
Government National Mtg Assoc., Pool 714631, 5.691% due 10/20/2059 | | | NR/NR | | | | 1,081,434 | | | | 1,116,153 | |
Government National Mtg Assoc., Pool 721652, 5.044% due 5/20/2061 | | | NR/NR | | | | 4,538,594 | | | | 4,750,147 | |
Government National Mtg Assoc., Pool 731491, 5.156% due 12/20/2060 | | | NR/NR | | | | 2,657,023 | | | | 2,846,552 | |
Government National Mtg Assoc., Pool 751388, 5.307% due 1/20/2061 | | | NR/NR | | | | 3,465,102 | | | | 3,715,560 | |
Government National Mtg Assoc., Pool 783299, 4.50% due 2/15/2022 | | | NR/NR | | | | 1,169,111 | | | | 1,204,272 | |
Government National Mtg Assoc., Pool 827148, 2.00% due 2/20/2024 | | | NR/NR | | | | 18,915 | | | | 19,280 | |
Government National Mtg Assoc., Pool MA0100, 2.50% due 5/20/2042 | | | NR/NR | | | | 1,451,280 | | | | 1,487,787 | |
| | | | | | | | | | | | |
TOTAL MORTGAGE BACKED (Cost $186,722,340) | | | | | | | | | | | 188,255,811 | |
| | | | | | | | | | | | |
| | | |
ASSET BACKED SECURITIES — 23.53% | | | | | | | | | | | | |
ADVANCE RECEIVABLES — 0.29% | | | | | | | | | | | | |
a SPS Servicer Advance Receivables Trust, Series 2015-T3 Class AT3, 2.92% due 7/15/2047 | | | NR/NR | | | | 13,875,000 | | | | 13,906,885 | |
| | | | | | | | | | | | |
| | | | | | | | | | | 13,906,885 | |
| | | | | | | | | | | | |
14 Annual Reports
| | |
| SCHEDULE OF INVESTMENTS, CONTINUED | | |
| |
Thornburg Limited Term Income Fund | | September 30, 2016 |
| | | | | | | | | | |
Issuer-Description | | Credit Rating†
S&P/ Moody’s | | Principal
Amount | | | Value | |
AUTO RECEIVABLES — 3.88% | | | | | | | | | | |
a Avis Budget Rental Car Funding AESOP, LLC, Series 2012-3A Class A, 2.10% due 3/20/2019 | | NR/Aaa | | $ | 10,200,000 | | | $ | 10,213,318 | |
a Avis Budget Rental Car Funding AESOP, LLC, Series 2015-2A Class A, 2.63% due 12/20/2021 | | NR/Aaa | | | 6,000,000 | | | | 6,081,542 | |
Capital Auto Receivables Asset Trust, Series 2016-3 Class A2A, 1.36% due 4/22/2019 | | AAA/Aaa | | | 3,625,000 | | | | 3,625,188 | |
a Chesapeake Funding II, LLC, Series 2016-1A Class A1, 2.11% due 3/15/2028 | | NR/Aaa | | | 13,800,000 | | | | 13,823,387 | |
a Chrysler Capital Auto Receivables Trust, Series 2013-BA Class A4, 1.27% due 3/15/2019 | | AAA/Aaa | | | 11,521,350 | | | | 11,529,563 | |
a Drive Auto Receivables Trust, Series 2016-BA Class A2, 1.38% due 8/15/2018 | | AAA/Aaa | | | 12,390,192 | | | | 12,386,366 | |
a Exeter Automobile Receivables Trust, Series 2015-1A Class B, 2.84% due 3/16/2020 | | A/NR | | | 14,250,000 | | | | 14,145,553 | |
Ford Credit Auto Owner Trust, Series 2013-C Class A4, 1.25% due 10/15/2018 | | AAA/NR | | | 1,157,609 | | | | 1,158,257 | |
a Ford Credit Auto Owner Trust, Series 2014-2 Class A, 2.31% due 4/15/2026 | | NR/Aaa | | | 18,000,000 | | | | 18,448,537 | |
a Ford Credit Auto Owner Trust, Series 2015-1 Class A, 2.12% due 7/15/2026 | | AAA/NR | | | 9,900,000 | | | | 10,055,988 | |
a Foursight Capital Automobile Receivables Trust, Series 2016-1 Class A2, 2.87% due 10/15/2021 | | A/NR | | | 4,900,000 | | | | 4,883,784 | |
a GM Financial Automobile Leasing Trust, Series 2014-2A Class A4, 1.62% due 2/20/2018 | | NR/Aaa | | | 13,400,000 | | | | 13,439,736 | |
a Hertz Vehicle Financing, LLC, Series 2013-1A Class A2, 1.83% due 8/25/2019 | | NR/Aaa | | | 10,275,000 | | | | 10,247,254 | |
a Hertz Vehicle Financing, LLC, Series 2015-2A Class A, 2.02% due 9/25/2019 | | NR/Aaa | | | 15,000,000 | | | | 14,971,149 | |
Nissan Auto Receivables Owner Trust, Series 2016-B Class A2B Floating Rate Note, 0.824% due 4/15/2019 | | NR/Aaa | | | 11,900,000 | | | | 11,913,607 | |
a OSCAR US Funding Trust, Series 2014-1A Class A3, 1.72% due 4/15/2019 | | AA+/Aaa | | | 8,284,023 | | | | 8,217,602 | |
a OSCAR US Funding Trust, Series 2015-1A Class A2A, 1.30% due 2/15/2018 | | AA+/Aaa | | | 3,268,575 | | | | 3,261,744 | |
a,c OSCAR US Funding Trust, Series 2016-2A Class A3, 2.73% due 12/15/2020 | | AAA/Aaa | | | 7,430,000 | | | | 7,429,361 | |
World Omni Auto Receivables Trust, Series 2014-B Class A4, 1.68% due 12/15/2020 | | AAA/NR | | | 8,400,000 | | | | 8,462,079 | |
| | | | | | | | | | |
| | | | | | | | | 184,294,015 | |
| | | | | | | | | | |
| | | |
COMMERCIAL MTG TRUST — 4.43% | | | | | | | | | | |
a BAMLL-DB Trust, Series 2012-OSI Class A2FX, 3.352% due 4/13/2029 | | NR/Aaa | | | 41,300,776 | | | | 41,519,331 | |
a Barclays Commercial Mortgage Securities, LLC, Series 2015-STP Class A, 3.323% due 9/10/2028 | | AAA/NR | | | 5,900,000 | | | | 6,089,358 | |
a Bayview Commercial Asset Trust, Series 2004-3 Class A2 Floating Rate Note, 0.945% due 1/25/2035 | | NR/Aa2 | | | 2,885,598 | | | | 2,581,614 | |
a BHMS Mtg Trust, Series 2014-ATLS Class AFL Floating Rate Note, 2.023% due 7/5/2033 | | NR/NR | | | 10,000,000 | | | | 9,981,678 | |
a CFCRE Commercial Mtg Trust, Series 2011-C1 Class A4, 4.961% due 4/15/2044 | | NR/Aaa | | | 11,877,000 | | | | 13,038,343 | |
Citigroup Commercial Mortgage Trust, Series 2004-HYB2 Class B1, 2.951% due 3/25/2034 | | CCC/Caa2 | | | 209,538 | | | | 171,632 | |
COMM Mortgage Trust, Series 2016-DC2 Class A1, 1.82% due 2/10/2049 | | NR/Aaa | | | 23,143,479 | | | | 23,403,840 | |
a DBUBS Mortgage Trust CMO, Series 2011-LC1A Class A1, 3.742% due 11/10/2046 | | NR/Aaa | | | 66,419 | | | | 66,936 | |
a DBUBS Mortgage Trust CMO, Series 2011-LC2A Class A1FL, 1.869% due 7/12/2044 | | NR/Aaa | | | 4,514,795 | | | | 4,544,230 | |
Deutsche Bank Commercial Mortgage Trust, Series 2016-C1 Class A1, 1.676% due 5/10/2049 | | NR/Aaa | | | 5,930,042 | | | | 5,971,352 | |
a FREMF Mortgage Trust, Series 2013-KF02 Class B Floating Rate Note, 3.522% due 12/25/2045 | | NR/Baa3 | | | 1,269,891 | | | | 1,289,777 | |
a GAHR Commercial Mortgage Trust, Series 2015-NRF Class BFX, 3.495% due 12/15/2034 | | AA-/NR | | | 24,880,000 | | | | 25,730,090 | |
a Hilton USA Trust, Series 2013-HLT Class BFX, 3.367% due 11/5/2030 | | AA-/Aaa | | | 18,500,000 | | | | 18,513,372 | |
a JPMorgan Chase Commercial Mortgage, Series 2014-BXH Class A Floating Rate Note, 1.424% due 4/15/2027 | | AAA/NR | | | 19,900,000 | | | | 19,464,875 | |
a Madison Avenue Trust, Series 2015-11MD Class A, 3.673% due 9/10/2035 | | AAA/NR | | | 12,000,000 | | | | 12,999,078 | |
a Morgan Stanley Re-REMIC Trust, Series 2009-GG10 Class A4A, 5.988% due 8/12/2045 | | NR/Aaa | | | 5,859,187 | | | | 5,923,431 | |
a Wells Fargo Commercial Mtg Trust, Series 2013-120B Class A, 2.80% due 3/18/2028 | | AAA/NR | | | 15,000,000 | | | | 15,110,659 | |
WFRBS Commercial Mortgage Trust, Series 2014-C22 Class A1, 1.479% due 9/15/2057 | | NR/Aaa | | | 4,210,143 | | | | 4,196,619 | |
| | | | | | | | | | |
| | | | | | | | | 210,596,215 | |
| | | | | | | | | | |
| | | |
CREDIT CARD — 2.84% | | | | | | | | | | |
Barclays Dryrock Issuance Trust, Series 2015-4 Class A, 1.72% due 8/16/2021 | | AAA/NR | | | 13,630,000 | | | | 13,720,561 | |
Barclays Dryrock Issuance Trust, Series 2016-1 Class A, 1.52% due 5/16/2022 | | AAA/NR | | | 10,365,000 | | | | 10,407,671 | |
Cabela’s Master Credit Card Trust, Series 2015-1A Class A2 Floating Rate Note, 1.064% due 3/15/2023 | | AAA/NR | | | 15,665,000 | | | | 15,589,996 | |
Cabela’s Master Credit Card Trust, Series 2016-1 Class A2 Floating Rate Note, 1.374% due 6/15/2022 | | AAA/NR | | | 15,000,000 | | | | 15,173,316 | |
Capital One Multi-Asset Execution Trust, Series 2016-A1 Class A1 Floating Rate Note, 0.974% due 2/15/2022 | | AAA/NR | | | 39,050,000 | | | | 39,287,498 | |
Synchrony Credit Card Master Note Trust, Series 2014-1 Class A, 1.61% due 11/15/2020 | | AAA/Aaa | | | 14,613,000 | | | | 14,684,098 | |
Synchrony Credit Card Master Note Trust, Series 2015-2 Class A, 1.60% due 4/15/2021 | | AAA/NR | | | 7,400,000 | | | | 7,435,465 | |
Synchrony Credit Card Master Note Trust, Series 2016-1 Class A, 2.04% due 3/15/2022 | | NR/Aaa | | | 8,400,000 | | | | 8,514,097 | |
a,b Turquoise Card Backed Securities plc, Series 2012-1A Class A Floating Rate Note, 1.324% due 6/17/2019 | | NR/Aaa | | | 10,000,000 | | | | 10,012,610 | |
| | | | | | | | | | |
| | | | | | | | | 134,825,312 | |
| | | | | | | | | | |
| | | |
OTHER ASSET BACKED — 9.31% | | | | | | | | | | |
a 321 Henderson Receivables, LLC, Series 2014-1A Class A, 3.96% due 3/15/2063 | | NR/Aaa | | | 17,249,432 | | | | 17,765,915 | |
a Alterna Funding I, LLC, Series 2014-1A, 1.639% due 2/15/2021 | | NR/NR | | | 2,586,481 | | | | 2,521,819 | |
Appalachian Consumer Rate Relief Funding, LLC, Series 2013-1 Class A1, 2.008% due 2/1/2024 | | AAA/Aaa | | | 11,101,984 | | | | 11,277,002 | |
a Ascentium Equipment Receivables, LLC, Series 2015-1A Class B, 2.26% due 6/10/2021 | | NR/Aaa | | | 5,920,000 | | | | 5,942,395 | |
a BCC Funding Corp., Series 2016-1 Class A1, 1.10% due 9/20/2017 | | NR/NR | | | 26,630,000 | | | | 26,630,250 | |
a CLI Funding V, LLC, Series 2014-2A Class A, 3.38% due 10/18/2029 | | A/NR | | | 8,074,930 | | | | 7,726,209 | |
a,b Cronos Containers Program Ltd., Series 2013-1A Class A, 3.08% due 4/18/2028 | | A+/NR | | | 6,583,333 | | | | 6,399,308 | |
a Dell Equipment Finance Trust, Series 2015-2 Class A3, 1.72% due 9/22/2020 | | AAA/Aaa | | | 9,875,000 | | | | 9,906,811 | |
a Dell Equipment Finance Trust, Series 2016-1 Class A3, 1.65% due 7/22/2021 | | AAA/Aaa | | | 6,800,000 | | | | 6,782,731 | |
a Diamond Resorts Owner Trust, Series 2014-1 Class A, 2.54% due 5/20/2027 | | A+/NR | | | 19,396,723 | | | | 19,412,514 | |
a Dominos Pizza Master Issuer, LLC, Series 2012-1A Class A2, 5.216% due 1/25/2042 | | BBB+/Baa1 | | | 17,905,968 | | | | 18,387,643 | |
Annual Reports 15
| | |
| SCHEDULE OF INVESTMENTS, CONTINUED | | |
| |
Thornburg Limited Term Income Fund | | September 30, 2016 |
| | | | | | | | | | | | |
Issuer-Description | | Credit Rating†
S&P/ Moody’s | | | Principal
Amount | | | Value | |
Entergy New Orleans Storm Recovery Funding I, LLC, Series 2015-1 Class A, 2.67% due 6/1/2027 | | | AAA/Aa1 | | | $ | 14,089,850 | | | $ | 14,625,196 | |
a Fairway Outdoor Funding, LLC, Series 2012-1A Class A2, 4.212% due 10/15/2042 | | | NR/NR | | | | 6,224,096 | | | | 6,314,091 | |
GE Dealer Floorplan Master Note Trust, Series 2012-2 Class A Floating Rate Note, 1.282% due 4/22/2019 | | | NR/Aaa | | | | 14,900,000 | | | | 14,929,450 | |
a GTP Acquisition Partners I, LLC, Series 2015-1 Class A, 2.35% due 6/15/2045 | | | NR/Aaa | | | | 9,900,000 | | | | 9,861,390 | |
Harley-Davidson Motorcycle Trust, Series 2015-2 Class A4, 1.66% due 12/15/2022 | | | AAA/Aaa | | | | 22,544,000 | | | | 22,681,117 | |
a HERO Funding Trust, Series 2015-1A Class A, 3.84% due 9/21/2040 | | | NR/NR | | | | 15,570,642 | | | | 15,477,389 | |
a Hertz Fleet Lease Funding LP, Series 2016-1 Class A1 Floating Rate Note, 1.618% due 4/10/2030 | | | NR/Aaa | | | | 19,800,000 | | | | 19,846,304 | |
a Navistar Financial Dealer Note Master Owner Trust II, Series 2014-1 Class A Floating Rate Note, 1.274% due 10/25/2019 | | | NR/Aaa | | | | 17,730,000 | | | | 17,734,427 | |
a Navistar Financial Dealer Note Master Owner Trust II, Series 2015-1 Class A Floating Rate Note, 1.925% due 6/25/2020 | | | NR/Aaa | | | | 15,259,000 | | | | 15,234,145 | |
a Navitas Equipment Receivables, LLC, Series 2015-1 Class A2, 2.12% due 11/15/2018 | | | NR/A1 | | | | 6,682,536 | | | | 6,690,928 | |
Northwest Airlines, Inc., 7.027% due 5/1/2021 | | | A/A2 | | | | 3,913,456 | | | | 4,441,773 | |
a,c Northwind Holdings, LLC, Series 2007-1A Class A1 Floating Rate Note, 1.622% due 12/1/2037 | | | A/Baa1 | | | | 2,406,250 | | | | 2,237,813 | |
a OnDeck Asset Securitization Trust II, LLC, Series 2016-1A Class A, 4.21% due 5/17/2020 | | | BBB+/NR | | | | 6,400,000 | | | | 6,392,089 | |
a OneMain Financial Issuance Trust, Series 2016-2A Class A, 4.10% due 3/20/2028 | | | A+/NR | | | | 22,900,000 | | | | 23,571,730 | |
a PFS Financing Corp., Series 2014-BA Class A Floating Rate Note, 1.124% due 10/15/2019 | | | AAA/Aaa | | | | 6,000,000 | | | | 5,976,533 | |
a PFS Financing Corp., Series 2015-AA Class A Floating Rate Note, 1.144% due 4/15/2020 | | | AAA/Aaa | | | | 7,400,000 | | | | 7,349,071 | |
a PFS Tax Lien Trust, Series 2014-1, 1.44% due 5/15/2029 | | | AAA/NR | | | | 1,562,322 | | | | 1,553,851 | |
a SBA Tower Trust, Series 2012-1 Class C, 2.933% due 12/15/2042 | | | NR/A2 | | | | 11,198,000 | | | | 11,260,187 | |
a SBA Tower Trust, Series 2014-1A Class C, 2.898% due 10/15/2044 | | | NR/A2 | | | | 17,900,000 | | | | 18,151,552 | |
a SBA Tower Trust, Series 2015-1 Class C, 3.156% due 10/15/2045 | | | NR/A2 | | | | 5,000,000 | | | | 5,048,600 | |
a SBA Tower Trust, Series 2016-1 Class C, 2.877% due 7/15/2046 | | | NR/A2 | | | | 9,500,000 | | | | 9,661,032 | |
a Sierra Receivables Funding Co., LLC, Series 2012-1A Class A, 2.84% due 11/20/2028 | | | A+/NR | | | | 1,098,218 | | | | 1,100,646 | |
a Sierra Receivables Funding Co., LLC, Series 2012-2A Class A, 2.05% due 6/20/2031 | | | A/NR | | | | 1,960,214 | | | | 1,963,957 | |
a Sierra Receivables Funding Co., LLC, Series 2014-1A Class A, 2.07% due 3/20/2030 | | | A/NR | | | | 4,423,741 | | | | 4,389,417 | |
a Sierra Receivables Funding Co., LLC, Series 2015-1A Class A, 2.40% due 3/22/2032 | | | A/NR | | | | 4,604,294 | | | | 4,626,137 | |
a Sierra Receivables Funding Co., LLC, Series 2015-3A Class A, 2.58% due 9/20/2032 | | | A/NR | | | | 9,140,787 | | | | 9,176,498 | |
a Sonic Capital, LLC, Series 2016-1A Class A2, 4.472% due 5/20/2046 | | | BBB/NR | | | | 9,368,667 | | | | 9,514,278 | |
a Springleaf Funding Trust, Series 2015-AA Class A, 3.16% due 11/15/2024 | | | A+/NR | | | | 13,000,000 | | | | 13,161,184 | |
a Tax Ease Funding, LLC, Series 2016-1A Class A, 3.131% due 6/15/2028 | | | NR/NR | | | | 11,581,765 | | | | 11,552,327 | |
a Westgate Resorts, Series 2016-1A Class A, 3.50% due 12/20/2028 | | | NR/NR | | | | 15,499,678 | | | | 15,425,653 | |
| | | | | | | | | | | | |
| | | | | | | | | | | 442,701,362 | |
| | | | | | | | | | | | |
| | | |
RESIDENTIAL MTG TRUST — 0.77% | | | | | | | | | | | | |
a B2R Mortgage Trust, Series 2015-2 Class A, 3.336% due 11/15/2048 | | | NR/NR | | | | 9,693,087 | | | | 9,897,864 | |
a Citigroup Mortgage Loan Trust, Inc., Series 2014-A Class A, 4.00% due 1/25/2035 | | | AA/NR | | | | 3,925,649 | | | | 4,086,957 | |
Countrywide Home Loan, Series 2004-HYB2 Class 1A, 3.096% due 7/20/2034 | | | A/B1 | | | | 243,197 | | | | 244,816 | |
a FDIC Trust, Series 2013-R1 Class A, 1.15% due 3/25/2033 | | | NR/NR | | | | 3,174,206 | | | | 3,150,688 | |
Merrill Lynch Mortgage Investors Trust, Series 2003-E Class B3, 2.775% due 10/25/2028 | | | CCC/Ca | | | | 964,220 | | | | 235,556 | |
Merrill Lynch Mortgage Investors Trust, Series 2004-A4 Class M1, 2.855% due 8/25/2034 | | | CCC/NR | | | | 680,683 | | | | 609,116 | |
a Nationstar HECM Loan Trust, Series 16-1A Class A, 2.981% due 2/25/2026 | | | NR/Aaa | | | | 5,946,748 | | | | 5,942,407 | |
Option One Mortgage Loan Trust, Series 2005-5 Class A3 Floating Rate Note, 0.735% due 12/25/2035 | | | AA+/Aa2 | | | | 473,367 | | | | 471,516 | |
Popular ABS Mortgage Pass-Through Trust, Series 2005-4 Class AF5, 5.537% due 9/25/2035 | | | A+/A1 | | | | 1,142,631 | | | | 1,158,101 | |
Residential Asset Mortgage Products, Inc., Series 2003-SL1 Class A31, 7.125% due 4/25/2031 | | | AA+/NR | | | | 1,346,908 | | | | 1,434,431 | |
a Shellpoint Asset Funding Trust, Series 2013-1 Class A1, 3.75% due 7/25/2043 | | | NR/NR | | | | 7,134,974 | | | | 7,491,401 | |
Structured Asset Securities Corp., Series 2003-9A Class 2A2, 2.816% due 3/25/2033 | | | AA+/NR | | | | 1,477,412 | | | | 1,449,596 | |
Structured Asset Securities Corp., Series 2004-3 Class 3A1, 5.50% due 3/25/2019 | | | A+/Ba2 | | | | 231,318 | | | | 233,526 | |
Washington Mutual Mortgage, Series 2003-S13 Class 21A1, 4.50% due 12/25/2018 | | | AA+/NR | | | | 180,951 | | | | 180,978 | |
Wells Fargo Asset Securities Corp., Series 2005-AR1 Class 1B1, 2.77% due 2/25/2035 | | | D/C | | | | 386,081 | | | | 60,012 | |
| | | | | | | | | | | | |
| | | | | | | | | | | 36,646,965 | |
| | | | | | | | | | | | |
| | | |
STUDENT LOAN — 2.01% | | | | | | | | | | | | |
Navient Student Loan Trust, Series 2014-1 Class A3 Floating Rate Note, 1.035% due 6/25/2031 | | | NR/A1 | | | | 10,750,000 | | | | 10,381,757 | |
a Navient Student Loan Trust, Series 2015-AA Class A2B Floating Rate Note, 1.724% due 12/15/2028 | | | NR/Aaa | | | | 7,000,000 | | | | 7,058,868 | |
a Nelnet Student Loan Trust, Series 2013-1A Class A Floating Rate Note, 1.125% due 6/25/2041 | | | NR/Aaa | | | | 9,073,720 | | | | 8,870,643 | |
a Pennsylvania Higher Education Assistance Agency, Series 2012-1A Class A1 Floating Rate Note, 1.075% due 5/25/2057 | | | AA+/NR | | | | 3,116,841 | | | | 3,070,157 | |
SLM Student Loan Trust, Series 2003-C Class A2 Floating Rate Note, 1.24% due 9/15/2020 | | | A-/Aaa | | | | 790,031 | | | | 777,140 | |
a SLM Student Loan Trust, Series 2011-A Class A3 Floating Rate Note, 3.024% due 1/15/2043 | | | AAA/Aaa | | | | 13,650,000 | | | | 14,043,090 | |
a SLM Student Loan Trust, Series 2011-B Class A2, 3.74% due 2/15/2029 | | | AAA/Aaa | | | | 4,721,310 | | | | 4,846,431 | |
SLM Student Loan Trust, Series 2013-6 Class A2 Floating Rate Note, 1.025% due 2/25/2021 | | | NR/Aaa | | | | 2,949,269 | | | | 2,945,324 | |
SLM Student Loan Trust, Series 2013-6 Class A3 Floating Rate Note, 1.175% due 6/25/2055 | | | NR/Aaa | | | | 24,700,000 | | | | 24,473,019 | |
a Social Professional Loan Program, LLC, Series 2014-A Class A1 Floating Rate Note, 2.125% due 6/25/2025 | | | A/NR | | | | 2,409,490 | | | | 2,456,111 | |
a Social Professional Loan Program, LLC, Series 2014-A Class A2, 3.02% due 10/25/2027 | | | A/NR | | | | 11,902,547 | | | | 12,131,707 | |
a Social Professional Loan Program, LLC, Series 2014-B Class A1 Floating Rate Note, 1.775% due 8/25/2032 | | | A/A2 | | | | 3,259,221 | | | | 3,290,562 | |
a Social Professional Loan Program, LLC, Series 2014-B Class A2, 2.55% due 8/27/2029 | | | A/A2 | | | | 1,130,039 | | | | 1,145,995 | |
| | | | | | | | | | | | |
| | | | | | | | | | | 95,490,804 | |
| | | | | | | | | | | | |
TOTAL ASSET BACKED SECURITIES (Cost $1,115,205,237) | | | | | | | | | | | 1,118,461,558 | |
| | | | | | | | | | | | |
16 Annual Reports
| | |
| SCHEDULE OF INVESTMENTS, CONTINUED | | |
| |
Thornburg Limited Term Income Fund | | September 30, 2016 |
| | | | | | | | | | | | |
Issuer-Description | | Credit Rating†
S&P/ Moody’s | | | Principal
Amount | | | Value | |
CORPORATE BONDS — 46.67% | | | | | | | | | | | | |
AUTOMOBILES & COMPONENTS — 1.34% | | | | | | | | | | | | |
Automobiles — 1.34% | | | | | | | | | | | | |
a Daimler Finance North America, LLC, 2.45% due 5/18/2020 | | | A-/A3 | | | $ | 9,850,000 | | | $ | 10,057,934 | |
a Daimler Finance North America, LLC, 1.60% due 8/3/2017 | | | A-/A3 | | | | 3,000,000 | | | | 3,006,639 | |
a Daimler Finance North America, LLC, 3.875% due 9/15/2021 | | | A-/A3 | | | | 5,000,000 | | | | 5,433,610 | |
a Hyundai Capital America, 2.40% due 10/30/2018 | | | A-/Baa1 | | | | 9,950,000 | | | | 10,088,205 | |
a Hyundai Capital America, 2.00% due 3/19/2018 | | | A-/Baa1 | | | | 4,950,000 | | | | 4,978,116 | |
a,b Hyundai Capital Services, Inc. Floating Rate Note, 1.657% due 3/18/2017 | | | A-/Baa1 | | | | 5,000,000 | | | | 5,002,855 | |
a Nissan Motor Acceptance Corp., 1.95% due 9/12/2017 | | | A-/A3 | | | | 14,900,000 | | | | 14,957,633 | |
a Volkswagen Group of America, Inc., 1.65% due 5/22/2018 | | | BBB+/A3 | | | | 10,000,000 | | | | 9,968,170 | |
| | | | | | | | | | | | |
| | | | | | | | | | | 63,493,162 | |
| | | | | | | | | | | | |
BANKS — 3.42% | | | | | | | | | | | | |
Banks — 3.42% | | | | | | | | | | | | |
a,b Banco BTG Pactual SA/Cayman Islands N.A., 4.00% due 1/16/2020 | | | NR/Ba3 | | | | 7,000,000 | | | | 6,597,500 | |
a,b Banco Latinoamericano de Comercio Exterior, S.A., 3.75% due 4/4/2017 | | | BBB/NR | | | | 4,000,000 | | | | 4,025,000 | |
Bank of America Corp. Floating Rate Note, 1.716% due 4/1/2019 | | | BBB+/Baa1 | | | | 8,000,000 | | | | 8,048,024 | |
Bank of America Corp. Floating Rate Note, 1.72% due 1/15/2019 | | | BBB+/Baa1 | | | | 4,225,000 | | | | 4,252,082 | |
Bank of America Corp. Floating Rate Note, 1.285% due 6/5/2017 | | | A/A1 | | | | 7,000,000 | | | | 7,012,012 | |
a,b Bank of China Hong Kong, 3.75% due 11/8/2016 | | | A+/Aa3 | | | | 4,000,000 | | | | 4,009,780 | |
Citigroup, Inc., 2.50% due 7/29/2019 | | | BBB+/Baa1 | | | | 2,925,000 | | | | 2,984,524 | |
Citigroup, Inc. Floating Rate Note, 2.255% due 9/1/2023 | | | BBB+/Baa1 | | | | 14,000,000 | | | | 14,067,004 | |
a,b DNB Bank ASA, 3.20% due 4/3/2017 | | | A+/Aa2 | | | | 10,000,000 | | | | 10,091,350 | |
Fifth Third Bank, 2.30% due 3/15/2019 | | | A-/A3 | | | | 3,800,000 | | | | 3,867,321 | |
First Tennessee Bank, 2.95% due 12/1/2019 | | | BBB-/Baa3 | | | | 7,000,000 | | | | 7,094,178 | |
JPMorgan Chase & Co. Floating Rate Note, 2.322% due 3/1/2021 | | | A-/A3 | | | | 7,000,000 | | | | 7,173,537 | |
Manufacturers and Traders Trust Co., 2.30% due 1/30/2019 | | | A/A2 | | | | 10,000,000 | | | | 10,167,200 | |
b Mitsubishi UFJ Financial Group, Inc. Floating Rate Note, 2.722% due 3/1/2021 | | | A/A1 | | | | 9,500,000 | | | | 9,844,793 | |
a,b Mizuho Bank Ltd., 2.45% due 4/16/2019 | | | A/A1 | | | | 7,000,000 | | | | 7,113,680 | |
a,b Mizuho Bank Ltd. Floating Rate Note, 1.886% due 10/20/2018 | | | A/A1 | | | | 5,000,000 | | | | 5,028,605 | |
National City Bank Floating Rate Note, 1.203% due 6/7/2017 | | | A-/A3 | | | | 5,000,000 | | | | 5,000,850 | |
b Royal Bank of Scotland Group plc, 9.50% due 3/16/2022 | | | BB+/NR | | | | 12,000,000 | | | | 12,364,176 | |
b Santander UK plc Floating Rate Note, 2.336% due 3/14/2019 | | | A/A1 | | | | 9,900,000 | | | | 10,066,864 | |
a,b Sberbank of Russia, 5.50% due 2/26/2024 | | | NR/NR | | | | 1,030,000 | | | | 1,039,012 | |
a Sovereign Bank, 12.18% due 6/30/2020 | | | BBB+/A3 | | | | 2,945,211 | | | | 3,782,506 | |
b Sumitomo Mitsui Banking Corp. Floating Rate Note, 1.455% due 7/23/2018 | | | A/A1 | | | | 14,700,000 | | | | 14,744,291 | |
Wells Fargo & Co. Floating Rate Note, 1.843% due 12/7/2020 | | | A/A2 | | | | 4,400,000 | | | | 4,422,748 | |
| | | | | | | | | | | | |
| | | | | | | | | | | 162,797,037 | |
| | | | | | | | | | | | |
| | | |
CAPITAL GOODS — 1.64% | | | | | | | | | | | | |
Aerospace & Defense — 0.27% | | | | | | | | | | | | |
Exelis, Inc., 5.55% due 10/1/2021 | | | BBB-/Baa3 | | | | 11,338,000 | | | | 12,919,651 | |
Construction & Engineering — 0.19% | | | | | | | | | | | | |
URS Corp., 3.85% due 4/1/2017 | | | BB-/NR | | | | 8,895,000 | | | | 8,935,721 | |
Electrical Equipment — 0.15% | | | | | | | | | | | | |
Hubbell, Inc., 3.35% due 3/1/2026 | | | A/A3 | | | | 7,000,000 | | | | 7,345,506 | |
Industrial Conglomerates — 0.67% | | | | | | | | | | | | |
a,b Hutchison Whampoa Ltd., 3.50% due 1/13/2017 | | | A-/A3 | | | | 5,000,000 | | | | 5,030,725 | |
Roper Technologies, Inc., 3.00% due 12/15/2020 | | | BBB/Baa2 | | | | 4,770,000 | | | | 4,958,487 | |
Roper Technologies, Inc., 3.125% due 11/15/2022 | | | BBB/Baa2 | | | | 6,000,000 | | | | 6,179,106 | |
a,b Siemens Financieringsmaatschappij N.V., 2.90% due 5/27/2022 | | | A+/A1 | | | | 12,000,000 | | | | 12,564,228 | |
a,b Smiths Group plc, 7.20% due 5/15/2019 | | | BBB+/Baa2 | | | | 3,000,000 | | | | 3,356,067 | |
Machinery — 0.26% | | | | | | | | | | | | |
Aeroquip Vickers, Inc., 6.875% due 4/9/2018 | | | A-/NR | | | | 1,500,000 | | | | 1,583,870 | |
Ingersoll Rand Co., 6.391% due 11/15/2027 | | | BBB/Baa2 | | | | 3,000,000 | | | | 3,558,984 | |
Stanley Black & Decker, Inc., 2.451% due 11/17/2018 | | | A-/Baa2 | | | | 6,900,000 | | | | 7,049,626 | |
Trading Companies & Distributors — 0.10% | | | | | | | | | | | | |
a Aviation Capital Group Corp., 7.125% due 10/15/2020 | | | A-/NR | | | | 3,912,000 | | | | 4,616,160 | |
| | | | | | | | | | | | |
| | | | | | | | | | | 78,098,131 | |
| | | | | | | | | | | | |
Annual Reports 17
| | |
| SCHEDULE OF INVESTMENTS, CONTINUED | | |
| |
Thornburg Limited Term Income Fund | | September 30, 2016 |
| | | | | | | | | | | | |
Issuer-Description | | Credit Rating†
S&P/ Moody’s | | | Principal
Amount | | | Value | |
COMMERCIAL & PROFESSIONAL SERVICES — 0.31% | | | | | | | | | | | | |
Professional Services — 0.31% | | | | | | | | | | | | |
Dun & Bradstreet, Inc., 4.00% due 6/15/2020 | | | BBB-/NR | | | $ | 7,175,000 | | | $ | 7,487,313 | |
Verisk Analytics, Inc., 4.00% due 6/15/2025 | | | BBB-/Baa3 | | | | 6,930,000 | | | | 7,358,565 | |
| | | | | | | | | | | | |
| | | | | | | | | | | 14,845,878 | |
| | | | | | | | | | | | |
| | | |
CONSUMER DURABLES & APPAREL — 0.33% | | | | | | | | | | | | |
Household Durables — 0.23% | | | | | | | | | | | | |
Tupperware Brands Corp., 4.75% due 6/1/2021 | | | BBB-/Baa3 | | | | 10,000,000 | | | | 10,940,190 | |
Leisure Products — 0.10% | | | | | | | | | | | | |
Mattel, Inc., 2.35% due 8/15/2021 | | | BBB/Baa1 | | | | 4,780,000 | | | | 4,845,911 | |
| | | | | | | | | | | | |
| | | | | | | | | | | 15,786,101 | |
| | | | | | | | | | | | |
CONSUMER SERVICES — 0.43% | | | | | | | | | | | | |
Diversified Consumer Services — 0.32% | | | | | | | | | | | | |
George Washington University, 4.411% due 9/15/2017 | | | A+/A1 | | | | 1,650,000 | �� | | | 1,689,894 | |
Rensselaer Polytechnic I, 5.60% due 9/1/2020 | | | A-/A3 | | | | 10,925,000 | | | | 12,340,869 | |
University of Chicago, 3.065% due 10/1/2024 | | | AA-/Aa2 | | | | 1,325,000 | | | | 1,348,732 | |
Hotels, Restaurants & Leisure — 0.11% | | | | | | | | | | | | |
Marriott International, Inc., 3.125% due 10/15/2021 | | | BBB/Baa2 | | | | 5,000,000 | | | | 5,215,390 | |
| | | | | | | | | | | | |
| | | | | | | | | | | 20,594,885 | |
| | | | | | | | | | | | |
| | | |
DIVERSIFIED FINANCIALS — 6.69% | | | | | | | | | | | | |
Capital Markets — 4.45% | | | | | | | | | | | | |
Ares Capital Corp., 4.875% due 11/30/2018 | | | BBB/NR | | | | 18,000,000 | | | | 18,789,660 | |
a Ares Finance Co., LLC, 4.00% due 10/8/2024 | | | BBB+/NR | | | | 5,000,000 | | | | 4,844,245 | |
a,b BTG Investments LP, 4.50% due 4/17/2018 | | | NR/NR | | | | 18,500,000 | | | | 17,251,250 | |
b Credit Suisse Group AG - New York, 1.70% due 4/27/2018 | | | A/A2 | | | | 9,325,000 | | | | 9,332,115 | |
b Credit Suisse Group Funding (Guernsey) Ltd., 3.80% due 9/15/2022 | | | BBB+/Baa3 | | | | 7,000,000 | | | | 7,151,081 | |
a,b Credit Suisse Group Funding (Guernsey) Ltd., 4.55% due 4/17/2026 | | | BBB+/Baa3 | | | | 7,000,000 | | | | 7,349,888 | |
b Credit Suisse Group Funding (Guernsey) Ltd., 3.125% due 12/10/2020 | | | BBB+/Baa3 | | | | 10,000,000 | | | | 10,130,970 | |
b Deutsche Bank AG, 2.95% due 8/20/2020 | | | BBB+/Baa2 | | | | 8,600,000 | | | | 8,287,338 | |
FS Investment Corp., 4.00% due 7/15/2019 | | | BBB/NR | | | | 12,000,000 | | | | 12,205,416 | |
Goldman Sachs Group, Inc. Floating Rate Note, 2.05% due 9/15/2020 | | | BBB+/A3 | | | | 17,900,000 | | | | 18,001,278 | |
Goldman Sachs Group, Inc. Floating Rate Note, 1.735% due 10/23/2019 | | | BBB+/A3 | | | | 14,722,000 | | | | 14,801,764 | |
a,b IPIC GMTN Ltd., 5.00% due 11/15/2020 | | | AA/Aa2 | | | | 1,000,000 | | | | 1,113,750 | |
a,b IPIC GMTN Ltd., 3.75% due 3/1/2017 | | | AA/Aa2 | | | | 3,000,000 | | | | 3,027,078 | |
a,b IPIC GMTN Ltd., 5.50% due 3/1/2022 | | | AA/Aa2 | | | | 3,500,000 | | | | 4,071,270 | |
Legg Mason, Inc., 2.70% due 7/15/2019 | | | BBB/Baa1 | | | | 1,660,000 | | | | 1,687,777 | |
Legg Mason, Inc., 4.75% due 3/15/2026 | | | BBB/Baa1 | | | | 5,000,000 | | | | 5,402,470 | |
a,b Macquarie Bank Ltd., 1.60% due 10/27/2017 | | | A/A2 | | | | 5,000,000 | | | | 5,007,610 | |
Merrill Lynch & Co., 1.309% due 5/2/2017 | | | BBB/Baa3 | | | | 5,000,000 | | | | 5,002,390 | |
Morgan Stanley, 2.80% due 6/16/2020 | | | BBB+/A3 | | | | 1,350,000 | | | | 1,384,922 | |
Morgan Stanley Floating Rate Note, 1.874% due 1/27/2020 | | | BBB+/A3 | | | | 925,000 | | | | 934,642 | |
State Street Corp. Floating Rate Note, 1.701% due 8/18/2020 | | | A/A1 | | | | 9,475,000 | | | | 9,564,236 | |
a,b SumitG Guaranteed Secured Obligation Issuer D.A.C, 2.251% due 11/2/2020 | | | NR/Aa2 | | | | 15,000,000 | | | | 15,062,505 | |
TD Ameritrade Holding Corp., 2.95% due 4/1/2022 | | | A/A3 | | | | 2,550,000 | | | | 2,657,125 | |
The Bank of New York Mellon Corp. Floating Rate Note, 1.674% due 8/17/2020 | | | A/A1 | | | | 4,525,000 | | | | 4,584,916 | |
a,b UBS AG Jersey Floating Rate Note, 2.297% due 9/24/2020 | | | A-/Baa2 | | | | 10,800,000 | | | | 10,964,009 | |
b UBS AG Stamford, 1.80% due 3/26/2018 | | | A+/A1 | | | | 3,000,000 | | | | 3,005,970 | |
b UBS AG Stamford, 2.375% due 8/14/2019 | | | A+/A1 | | | | 9,500,000 | | | | 9,690,589 | |
| | | |
Consumer Finance — 0.39% | | | | | | | | | | | | |
Capital One Bank (USA), N.A., 2.30% due 6/5/2019 | | | BBB+/Baa1 | | | | 3,000,000 | | | | 3,034,773 | |
Synchrony Financial, 3.00% due 8/15/2019 | | | BBB-/NR | | | | 1,950,000 | | | | 1,996,069 | |
Western Union Co., 3.65% due 8/22/2018 | | | BBB/Baa2 | | | | 2,000,000 | | | | 2,062,544 | |
Western Union Co., 3.35% due 5/22/2019 | | | BBB/Baa2 | | | | 11,350,000 | | | | 11,629,017 | |
| | | |
Diversified Financial Services — 1.85% | | | | | | | | | | | | |
a Athene Global Funding, 2.875% due 10/23/2018 | | | A-/NR | | | | 13,925,000 | | | | 13,893,766 | |
General Electric Capital Corp. Floating Rate Note, 1.007% due 12/28/2018 | | | AA-/A1 | | | | 4,850,000 | | | | 4,786,125 | |
General Electric Capital Corp. Floating Rate Note, 1.85% due 3/15/2023 | | | AA-/A1 | | | | 7,725,000 | | | | 7,751,775 | |
Intercontinental Exchange, Inc., 4.00% due 10/15/2023 | | | A/A2 | | | | 11,257,000 | | | | 12,367,207 | |
Moody’s Corp., 4.875% due 2/15/2024 | | | BBB+/NR | | | | 17,000,000 | | | | 19,338,860 | |
Moody’s Corp., 2.75% due 7/15/2019 | | | BBB+/NR | | | | 4,875,000 | | | | 5,014,674 | |
18 Annual Reports
| | |
| SCHEDULE OF INVESTMENTS, CONTINUED | | |
| |
Thornburg Limited Term Income Fund | | September 30, 2016 |
| | | | | | | | | | | | |
Issuer-Description | | Credit Rating†
S&P/ Moody’s | | | Principal
Amount | | | Value | |
National Rural Utilities Cooperative Finance Corp., 10.375% due 11/1/2018 | | | A/A1 | | | $ | 2,000,000 | | | $ | 2,364,922 | |
S&P Global, Inc., 4.00% due 6/15/2025 | | | NR/Baa1 | | | | 8,000,000 | | | | 8,666,696 | |
S&P Global, Inc., 2.50% due 8/15/2018 | | | NR/Baa1 | | | | 2,950,000 | | | | 2,996,575 | |
S&P Global, Inc., 3.30% due 8/14/2020 | | | NR/Baa1 | | | | 2,450,000 | | | | 2,571,838 | |
a USAA Capital Corp., 2.25% due 12/13/2016 | | | AA/Aa1 | | | | 8,000,000 | | | | 8,021,224 | |
| | | | | | | | | | | | |
| | | | | | | | | | | 317,802,329 | |
| | | | | | | | | | | | |
| | | |
ENERGY — 5.29% | | | | | | | | | | | | |
Energy Equipment & Services — 0.31% | | | | | | | | | | | | |
b Ensco plc, 4.70% due 3/15/2021 | | | BBB-/B1 | | | | 5,000,000 | | | | 4,485,000 | |
Oceaneering International, Inc., 4.65% due 11/15/2024 | | | BBB/Baa3 | | | | 10,000,000 | | | | 10,066,840 | |
a,b,d Schahin II Finance Co. (SPV) Ltd., 5.875% due 9/25/2023 | | | NR/NR | | | | 4,082,733 | | | | 489,928 | |
| | | |
Oil, Gas & Consumable Fuels — 4.98% | | | | | | | | | | | | |
a,b BG Energy Capital plc, 2.875% due 10/15/2016 | | | A/NR | | | | 5,000,000 | | | | 5,002,520 | |
Buckeye Partners LP, 4.15% due 7/1/2023 | | | BBB-/Baa3 | | | | 7,000,000 | | | | 7,130,536 | |
a Chevron Phillips Chemical Co., LLC, Floating Rate Note, 1.507% due 5/1/2020 | | | A-/A2 | | | | 24,900,000 | | | | 24,175,734 | |
a,b CNPC General Capital Ltd., 2.75% due 4/19/2017 | | | A+/A1 | | | | 5,000,000 | | | | 5,034,820 | |
a,b CNPC General Capital Ltd., 2.75% due 5/14/2019 | | | A+/A1 | | | | 5,000,000 | | | | 5,112,305 | |
a,b CNPC General Capital Ltd. Floating Rate Note, 1.717% due 5/14/2017 | | | A+/A1 | | | | 5,000,000 | | | | 5,002,085 | |
a Colorado Interstate Gas Co., LLC/Colorado Interstate Issuing Corp., 4.15% due 8/15/2026 | | | BBB-/Baa3 | | | | 10,000,000 | | | | 9,914,200 | |
Energen Corp., 4.625% due 9/1/2021 | | | BB/B2 | | | | 10,000,000 | | | | 9,850,000 | |
Exxon Mobil Corp., 2.222% due 3/1/2021 | | | AA+/Aaa | | | | 4,925,000 | | | | 5,032,513 | |
Exxon Mobil Corp. Floating Rate Note, 1.622% due 3/1/2019 | | | AA+/Aaa | | | | 6,625,000 | | | | 6,689,415 | |
Exxon Mobil Corp. Floating Rate Note, 1.429% due 2/28/2018 | | | AA+/Aaa | | | | 6,950,000 | | | | 7,000,957 | |
a Florida Gas Transmission Co., LLC, 3.875% due 7/15/2022 | | | BBB/Baa2 | | | | 9,000,000 | | | | 9,330,462 | |
a Florida Gas Transmission Co., LLC, 4.35% due 7/15/2025 | | | BBB/Baa2 | | | | 4,200,000 | | | | 4,376,270 | |
Gulf South Pipeline Co., LP, 4.00% due 6/15/2022 | | | BBB-/Baa2 | | | | 13,690,000 | | | | 13,264,460 | |
a Gulfstream Natural Gas System, LLC, 4.60% due 9/15/2025 | | | BBB/Baa2 | | | | 9,000,000 | | | | 9,436,626 | |
a,b Harvest Operations Corp., 2.125% due 5/14/2018 | | | AA/Aa2 | | | | 7,000,000 | | | | 7,065,023 | |
HollyFrontier Corp., 5.875% due 4/1/2026 | | | BBB-/Baa3 | | | | 25,000,000 | | | | 27,081,575 | |
Marathon Petroleum Corp., 2.70% due 12/14/2018 | | | BBB/Baa2 | | | | 7,900,000 | | | | 8,070,474 | |
a Northern Natural Gas Co., 5.75% due 7/15/2018 | | | A/A2 | | | | 50,000 | | | | 53,597 | |
NuStar Logistics LP, 4.75% due 2/1/2022 | | | BB+/Ba1 | | | | 5,000,000 | | | | 4,950,000 | |
b Petroleos Mexicanos Floating Rate Note, 2.699% due 7/18/2018 | | | BBB+/Baa3 | | | | 10,000,000 | | | | 10,100,000 | |
b Sasol Financing International plc, 4.50% due 11/14/2022 | | | BBB/Baa2 | | | | 4,000,000 | | | | 4,112,200 | |
a Semco Energy, Inc., 5.15% due 4/21/2020 | | | A-/A2 | | | | 3,000,000 | | | | 3,323,709 | |
a,b Sinopec Group Overseas Development Ltd., 2.75% due 5/17/2017 | | | A+/Aa3 | | | | 6,000,000 | | | | 6,049,308 | |
a Texas Gas Transmission, LLC, 4.50% due 2/1/2021 | | | BBB-/Baa2 | | | | 11,015,000 | | | | 11,414,161 | |
a Transcontinental Gas Pipe Line Co., LLC, 7.85% due 2/1/2026 | | | BBB-/Baa2 | | | | 11,000,000 | | | | 14,241,051 | |
Williams Partners LP, 4.50% due 11/15/2023 | | | BBB-/Baa3 | | | | 11,610,000 | | | | 12,032,697 | |
Williams Partners LP, 3.60% due 3/15/2022 | | | BBB-/Baa3 | | | | 1,800,000 | | | | 1,831,266 | |
| | | | | | | | | | | | |
| | | | | | | | | | | 251,719,732 | |
| | | | | | | | | | | | |
| | | |
FOOD & STAPLES RETAILING — 0.42% | | | | | | | | | | | | |
Food & Staples Retailing — 0.42% | | | | | | | | | | | | |
a Whole Foods Market, Inc., 5.20% due 12/3/2025 | | | BBB-/Baa3 | | | | 18,175,000 | | | | 19,739,777 | |
| | | | | | | | | | | | |
| | | | | | | | | | | 19,739,777 | |
| | | | | | | | | | | | |
| | | |
FOOD, BEVERAGE & TOBACCO — 2.11% | | | | | | | | | | | | |
Beverages — 1.18% | | | | | | | | | | | | |
Anheuser-Busch InBev Finance Inc., 3.30% due 2/1/2023 | | | A-/A3 | | | | 9,650,000 | | | | 10,185,662 | |
Anheuser-Busch InBev Finance Inc. Floating Rate Note, 2.017% due 2/1/2021 | | | A-/A3 | | | | 7,550,000 | | | | 7,748,859 | |
Coca Cola Enterprises, Inc., 5.71% due 3/18/2037 | | | AA-/NR | | | | 3,380,000 | | | �� | 4,189,916 | |
a,b Coca Cola Icecek Uretim A.S., 4.75% due 10/1/2018 | | | NR/Baa3 | | | | 5,000,000 | | | | 5,175,410 | |
a,b JB y Compania, S.A. de C.V., 3.75% due 5/13/2025 | | | BBB/NR | | | | 11,750,000 | | | | 11,960,113 | |
Molson Coors Brewing Co., 2.10% due 7/15/2021 | | | BBB-/Baa3 | | | | 6,670,000 | | | | 6,731,384 | |
PepsiCo, Inc., 3.10% due 7/17/2022 | | | A/A1 | | | | 9,250,000 | | | | 9,896,557 | |
| | | |
Food Products — 0.46% | | | | | | | | | | | | |
General Mills, Inc., 1.40% due 10/20/2017 | | | BBB+/A3 | | | | 4,600,000 | | | | 4,610,851 | |
Ingredion, Inc., 1.80% due 9/25/2017 | | | BBB/Baa2 | | | | 12,150,000 | | | | 12,176,499 | |
Mead Johnson Nutrition Co., 3.00% due 11/15/2020 | | | BBB-/Baa1 | | | | 1,900,000 | | | | 1,978,875 | |
Mead Johnson Nutrition Co., 4.125% due 11/15/2025 | | | BBB-/Baa1 | | | | 3,000,000 | | | | 3,252,588 | |
| | | |
Tobacco — 0.47% | | | | | | | | | | | | |
Altria Group, Inc., 2.625% due 1/14/2020 | | | A-/A3 | | | | 4,900,000 | | | | 5,069,035 | |
a,b B.A.T. International Finance plc, 2.125% due 6/7/2017 | | | A-/A3 | | | | 8,000,000 | | | | 8,046,672 | |
Annual Reports 19
| | |
| SCHEDULE OF INVESTMENTS, CONTINUED | | |
| |
Thornburg Limited Term Income Fund | | September 30, 2016 |
| | | | | | | | | | | | |
Issuer-Description | | Credit Rating†
S&P/ Moody’s | | | Principal
Amount | | | Value | |
a,b B.A.T. International Finance plc, 3.95% due 6/15/2025 | | | A-/A3 | | | $ | 3,000,000 | | | $ | 3,314,367 | |
Reynolds American, Inc., 6.875% due 5/1/2020 | | | BBB/Baa3 | | | | 5,000,000 | | | | 5,855,100 | |
| | | | | | | | | | | | |
| | | | | | | | | | | 100,191,888 | |
| | | | | | | | | | | | |
| | | |
HEALTH CARE EQUIPMENT & SERVICES — 0.63% | | | | | | | | | | | | |
Health Care Providers & Services — 0.63% | | | | | | | | | | | | |
Catholic Health Initiatives, 1.60% due 11/1/2017 | | | A-/A3 | | | | 1,900,000 | | | | 1,903,701 | |
Catholic Health Initiatives, 2.95% due 11/1/2022 | | | A-/A3 | | | | 7,000,000 | | | | 7,082,530 | |
UnitedHealth Group, Inc., 3.35% due 7/15/2022 | | | A+/A3 | | | | 5,000,000 | | | | 5,369,055 | |
UnitedHealth Group, Inc., 3.75% due 7/15/2025 | | | A+/A3 | | | | 5,000,000 | | | | 5,490,800 | |
Wellpoint, Inc., 2.25% due 8/15/2019 | | | A/Baa2 | | | | 10,000,000 | | | | 10,128,710 | |
| | | | | | | | | | | | |
| | | | | | | | | | | 29,974,796 | |
| | | | | | | | | | | | |
| | | |
HOUSEHOLD & PERSONAL PRODUCTS — 0.11% | | | | | | | | | | | | |
Household Products — 0.11% | | | | | | | | | | | | |
Edgewell Personal Care, 4.70% due 5/24/2022 | | | BB+/Ba2 | | | | 2,000,000 | | | | 2,067,500 | |
a,b Kimberly-Clark de Mexico, 3.80% due 4/8/2024 | | | A-/NR | | | | 3,000,000 | | | | 3,103,086 | |
| | | | | | | | | | | | |
| | | | | | | | | | | 5,170,586 | |
| | | | | | | | | | | | |
| | | |
INSURANCE — 3.48% | | | | | | | | | | | | |
Insurance — 3.48% | | | | | | | | | | | | |
CNA Financial Corp., 4.50% due 3/1/2026 | | | BBB/Baa2 | | | | 20,000,000 | | | | 21,658,100 | |
a,b DaVinciRe Holdings Ltd., 4.75% due 5/1/2025 | | | A/Baa2 | | | | 10,000,000 | | | | 10,280,390 | |
a Forethought Financial Group, Inc., 8.625% due 4/15/2021 | | | BBB-/Baa3 | | | | 2,270,000 | | | | 2,609,955 | |
Hanover Insurance Group, Inc., 4.50% due 4/15/2026 | | | BBB/Baa3 | | | | 10,000,000 | | | | 10,392,880 | |
Horace Mann Educators Corp., 4.50% due 12/1/2025 | | | BBB/Baa3 | | | | 4,800,000 | | | | 4,990,349 | |
Infinity Property & Casualty Corp., 5.00% due 9/19/2022 | | | BBB/Baa2 | | | | 3,000,000 | | | | 3,183,228 | |
Kemper Corp., 4.35% due 2/15/2025 | | | BBB-/Baa3 | | | | 7,540,000 | | | | 7,745,525 | |
a,b Lancashire Holdings Ltd., 5.70% due 10/1/2022 | | | BBB/Baa2 | | | | 11,000,000 | | | | 11,877,228 | |
Marsh & McLennan Companies, Inc., 3.30% due 3/14/2023 | | | A-/Baa1 | | | | 3,000,000 | | | | 3,144,498 | |
a MassMutual Global Funding, LLC, 2.00% due 4/5/2017 | | | AA+/Aa2 | | | | 8,000,000 | | | | 8,032,736 | |
b Montpelier Re Holdings Ltd., 4.70% due 10/15/2022 | | | BBB+/NR | | | | 5,000,000 | | | | 5,168,950 | |
a Pricoa Global Funding I, 1.35% due 8/18/2017 | | | AA-/A1 | | | | 10,000,000 | | | | 9,998,660 | |
a Principal Life Global Funding II, 1.50% due 9/11/2017 | | | A+/A1 | | | | 6,950,000 | | | | 6,967,514 | |
a Principal Life Global Funding II, 2.375% due 9/11/2019 | | | A+/A1 | | | | 2,450,000 | | | | 2,502,067 | |
a Principal Life Global Funding II, 2.20% due 4/8/2020 | | | A+/A1 | | | | 7,000,000 | | | | 7,084,441 | |
Reinsurance Group of America, Inc., 3.95% due 9/15/2026 | | | A-/Baa1 | | | | 3,765,000 | | | | 3,938,996 | |
a Reliance Standard Life Insurance Co., 3.05% due 1/20/2021 | | | A/A2 | | | | 3,975,000 | | | | 4,091,770 | |
a Reliance Standard Life Insurance Co., 2.50% due 1/15/2020 | | | A/A2 | | | | 15,000,000 | | | | 15,201,870 | |
a Reliance Standard Life Insurance Co., 2.50% due 4/24/2019 | | | A/A2 | | | | 9,900,000 | | | | 10,065,875 | |
a,b Sirius International Group Ltd., 6.375% due 3/20/2017 | | | BBB/Baa3 | | | | 6,335,000 | | | | 6,435,365 | |
b Trinity Acquisition plc, 4.40% due 3/15/2026 | | | BBB/Baa3 | | | | 9,815,000 | | | | 10,279,279 | |
| | | | | | | | | | | | |
| | | | | | | | | | | 165,649,676 | |
| | | | | | | | | | | | |
| | | |
MATERIALS — 1.42% | | | | | | | | | | | | |
Chemicals — 0.52% | | | | | | | | | | | | |
Airgas, Inc., 3.05% due 8/1/2020 | | | A-/A3 | | | | 4,950,000 | | | | 5,136,981 | |
a Incitec Pivot Finance, LLC, 6.00% due 12/10/2019 | | | BBB/Baa3 | | | | 4,538,000 | | | | 4,915,040 | |
a,b Office Cherifien des Phosphates, 5.625% due 4/25/2024 | | | BBB-/NR | | | | 8,555,000 | | | | 9,291,586 | |
a,b Yara International ASA, 3.80% due 6/6/2026 | | | BBB/Baa2 | | | | 5,000,000 | | | | 5,160,575 | |
| | | |
Construction Materials — 0.01% | | | | | | | | | | | | |
CRH America, Inc., 8.125% due 7/15/2018 | | | BBB+/Baa2 | | | | 650,000 | | | | 719,038 | |
| | | |
Metals & Mining — 0.89% | | | | | | | | | | | | |
a,b Anglo American Capital plc, 2.625% due 9/27/2017 | | | BB/Ba2 | | | | 9,700,000 | | | | 9,675,750 | |
b Anglogold Holdings plc, 5.375% due 4/15/2020 | | | BB+/Baa3 | | | | 9,100,000 | | | | 9,481,381 | |
b Anglogold Holdings plc, 5.125% due 8/1/2022 | | | BB+/Baa3 | | | | 6,500,000 | | | | 6,741,930 | |
a,b Glencore Finance Canada Ltd., 4.95% due 11/15/2021 | | | BBB-/Baa3 | | | | 5,000,000 | | | | 5,288,050 | |
a,b Newcrest Finance Property Ltd., 4.20% due 10/1/2022 | | | BBB-/Baa3 | | | | 10,459,000 | | | | 10,896,333 | |
| | | | | | | | | | | | |
| | | | | | | | | | | 67,306,664 | |
| | | | | | | | | | | | |
| | | |
MEDIA — 0.11% | | | | | | | | | | | | |
Media — 0.11% | | | | | | | | | | | | |
The Washington Post Co., 7.25% due 2/1/2019 | | | BB+/Ba1 | | | | 5,000,000 | | | | 5,412,500 | |
| | | | | | | | | | | | |
| | | | | | | | | | | 5,412,500 | |
| | | | | | | | | | | | |
20 Annual Reports
| | |
| SCHEDULE OF INVESTMENTS, CONTINUED | | |
| |
Thornburg Limited Term Income Fund | | September 30, 2016 |
| | | | | | | | | | | | |
Issuer-Description | | Credit Rating†
S&P/ Moody’s | | | Principal
Amount | | | Value | |
PHARMACEUTICALS, BIOTECHNOLOGY & LIFE SCIENCES — 1.25% | | | | | | | | | | | | |
Biotechnology — 0.42% | | | | | | | | | | | | |
Biogen, Inc., 3.625% due 9/15/2022 | | | A-/Baa1 | | | $ | 5,000,000 | | | $ | 5,355,475 | |
Gilead Sciences, Inc., 2.50% due 9/1/2023 | | | A/A3 | | | | 4,695,000 | | | | 4,744,767 | |
Gilead Sciences, Inc., 2.55% due 9/1/2020 | | | A/A3 | | | | 4,820,000 | | | | 4,978,588 | |
Gilead Sciences, Inc., 3.25% due 9/1/2022 | | | A/A3 | | | | 4,650,000 | | | | 4,937,672 | |
| | | |
Pharmaceuticals — 0.83% | | | | | | | | | | | | |
b Actavis Funding SCS, 1.85% due 3/1/2017 | | | BBB/Baa3 | | | | 2,000,000 | | | | 2,005,072 | |
b Actavis Funding SCS, 2.35% due 3/12/2018 | | | BBB/Baa3 | | | | 1,720,000 | | | | 1,737,735 | |
b Actavis Funding SCS, 3.45% due 3/15/2022 | | | BBB/Baa3 | | | | 5,000,000 | | | | 5,249,190 | |
b Actavis Funding SCS, 3.80% due 3/15/2025 | | | BBB/Baa3 | | | | 5,000,000 | | | | 5,291,770 | |
b Actavis Funding SCS Floating Rate Note, 2.10% due 3/12/2020 | | | BBB/Baa3 | | | | 4,940,000 | | | | 5,023,120 | |
a EMD Finance, LLC Floating Rate Note, 1.207% due 3/17/2017 | | | A/Baa1 | | | | 9,550,000 | | | | 9,554,078 | |
a,b Mylan N.V., 3.00% due 12/15/2018 | | | BBB-/Baa3 | | | | 4,900,000 | | | | 5,008,030 | |
Zoetis, Inc., 3.45% due 11/13/2020 | | | BBB-/Baa2 | | | | 1,925,000 | | | | 2,012,239 | |
Zoetis, Inc., 4.50% due 11/13/2025 | | | BBB-/Baa2 | | | | 3,000,000 | | | | 3,363,102 | |
| | | | | | | | | | | | |
| | | | | | | | | | | 59,260,838 | |
| | | | | | | | | | | | |
| | | |
REAL ESTATE — 1.24% | | | | | | | | | | | | |
Equity Real Estate Investment Trusts — 0.96% | | | | | | | | | | | | |
Alexandria Real Estate Equities, Inc., 3.90% due 6/15/2023 | | | BBB-/Baa2 | | | | 11,700,000 | | | | 12,265,988 | |
Alexandria Real Estate Equities, Inc., 3.95% due 1/15/2027 | | | BBB-/Baa2 | | | | 3,975,000 | | | | 4,158,808 | |
Commonwealth REIT (HRPT Properties), 6.25% due 6/15/2017 | | | BBB-/Baa3 | | | | 4,000,000 | | | | 4,033,888 | |
EPR Properties, 5.25% due 7/15/2023 | | | BBB-/Baa2 | | | | 4,041,000 | | | | 4,338,971 | |
Washington REIT, 4.95% due 10/1/2020 | | | BBB/Baa2 | | | | 19,100,000 | | | | 20,619,940 | |
| | | |
Real Estate Management & Development — 0.28% | | | | | | | | | | | | |
Jones Lang LaSalle, Inc., 4.40% due 11/15/2022 | | | BBB+/Baa2 | | | | 3,000,000 | | | | 3,211,428 | |
a,b Vonovia Finance B.V., 3.20% due 10/2/2017 | | | BBB+/NR | | | | 10,000,000 | | | | 10,120,000 | |
| | | | | | | | | | | | |
| | | | | | | | | | | 58,749,023 | |
| | | | | | | | | | | | |
| | | |
RETAILING — 0.42% | | | | | | | | | | | | |
Multiline Retail — 0.42% | | | | | | | | | | | | |
Family Dollar Stores, Inc., 5.00% due 2/1/2021 | | | BBB/Ba1 | | | | 18,475,000 | | | | 19,906,813 | |
| | | | | | | | | | | | |
| | | | | | | | | | | 19,906,813 | |
| | | | | | | | | | | | |
| | | |
SEMICONDUCTORS & SEMICONDUCTOR EQUIPMENT — 0.11% | | | | | | | | | | | | |
Semiconductors & Semiconductor Equipment — 0.11% | | | | | | | | | | | | |
Intel Corp., 3.10% due 7/29/2022 | | | A+/A1 | | | | 5,000,000 | | | | 5,340,450 | |
| | | | | | | | | | | | |
| | | | | | | | | | | 5,340,450 | |
| | | | | | | | | | | | |
| | | |
SOFTWARE & SERVICES — 2.64% | | | | | | | | | | | | |
Information Technology Services — 1.09% | | | | | | | | | | | | |
Broadridge Financial Solutions, Inc., 3.95% due 9/1/2020 | | | BBB+/Baa1 | | | | 8,000,000 | | | | 8,500,304 | |
Fidelity National Information Services, Inc., 2.85% due 10/15/2018 | | | BBB/Baa3 | | | | 4,850,000 | | | | 4,977,356 | |
Fiserv, Inc., 2.70% due 6/1/2020 | | | BBB/Baa2 | | | | 6,900,000 | | | | 7,114,673 | |
SAIC, Inc., 4.45% due 12/1/2020 | | | BBB-/Ba1 | | | | 2,000,000 | | | | 2,079,400 | |
Total System Services, Inc., 2.375% due 6/1/2018 | | | BBB-/Baa3 | | | | 20,915,000 | | | | 21,086,148 | |
Total System Services, Inc., 3.75% due 6/1/2023 | | | BBB-/Baa3 | | | | 5,000,000 | | | | 5,130,885 | |
Total System Services, Inc., 3.80% due 4/1/2021 | | | BBB-/Baa3 | | | | 2,950,000 | | | | 3,130,416 | |
| | | |
Internet Software & Services — 0.39% | | | | | | | | | | | | |
eBay, Inc., 2.50% due 3/9/2018 | | | BBB+/Baa1 | | | | 4,885,000 | | | | 4,954,084 | |
Lender Processing Services, Inc./Black Knight Lending Solutions, Inc., 5.75% due 4/15/2023 | | | BBB/Baa3 | | | | 8,175,000 | | | | 8,604,187 | |
a,b Tencent Holdings Ltd., 2.00% due 5/2/2017 | | | A/A2 | | | | 5,000,000 | | | | 5,014,875 | |
| | | |
Software — 1.16% | | | | | | | | | | | | |
Autodesk, Inc., 3.125% due 6/15/2020 | | | BBB/Baa2 | | | | 1,945,000 | | | | 2,003,340 | |
Autodesk, Inc., 4.375% due 6/15/2025 | | | BBB/Baa2 | | | | 1,000,000 | | | | 1,059,408 | |
CA Technologies, Inc., 2.875% due 8/15/2018 | | | BBB+/Baa2 | | | | 4,082,000 | | | | 4,159,876 | |
CA Technologies, Inc., 3.60% due 8/1/2020 | | | BBB+/Baa2 | | | | 13,905,000 | | | | 14,548,371 | |
CDK Global, Inc., 3.30% due 10/15/2019 | | | BBB-/Baa3 | | | | 5,000,000 | | | | 5,076,750 | |
Oracle Corp., 2.50% due 5/15/2022 | | | AA-/A1 | | | | 9,400,000 | | | | 9,648,940 | |
Oracle Corp., 1.90% due 9/15/2021 | | | AA-/A1 | | | | 11,825,000 | | | | 11,855,000 | |
Oracle Corp., 2.40% due 9/15/2023 | | | AA-/A1 | | | | 6,650,000 | | | | 6,703,333 | |
| | | | | | | | | | | | |
| | | | | | | | | | | 125,647,346 | |
| | | | | | | | | | | | |
Annual Reports 21
| | |
| SCHEDULE OF INVESTMENTS, CONTINUED | | |
| |
Thornburg Limited Term Income Fund | | September 30, 2016 |
| | | | | | | | | | | | |
Issuer-Description | | Credit Rating†
S&P/ Moody’s | | | Principal
Amount | | | Value | |
TECHNOLOGY HARDWARE & EQUIPMENT — 1.99% | | | | | | | | | | | | |
Communications Equipment — 0.96% | | | | | | | | | | | | |
Cisco Systems, Inc. Floating Rate Note, 1.411% due 2/21/2018 | | | AA-/A1 | | | $ | 9,850,000 | | | $ | 9,907,022 | |
b Ericsson LM, 4.125% due 5/15/2022 | | | BBB+/Baa1 | | | | 19,215,000 | | | | 20,688,348 | |
Juniper Networks, Inc., 3.30% due 6/15/2020 | | | BBB/Baa2 | | | | 4,825,000 | | | | 5,003,081 | |
Juniper Networks, Inc., 3.125% due 2/26/2019 | | | BBB/Baa2 | | | | 10,000,000 | | | | 10,266,950 | |
| | | |
Computers & Peripherals — 0.12% | | | | | | | | | | | | |
Lexmark International, Inc., 5.125% due 3/15/2020 | | | BBB-/Baa3 | | | | 5,375,000 | | | | 5,630,119 | |
| | | |
Electronic Equipment, Instruments & Components — 0.50% | | | | | | | | | | | | |
Ingram Micro, Inc., 4.95% due 12/15/2024 | | | BBB-/Baa3 | | | | 5,596,000 | | | | 5,662,990 | |
Trimble Navigation, Ltd., 4.75% due 12/1/2024 | | | BBB-/Baa2 | | | | 17,000,000 | | | | 17,879,155 | |
| | | |
Technology, Hardware, Storage & Peripherals — 0.41% | | | | | | | | | | | | |
Apple, Inc. Floating Rate Note, 1.637% due 2/22/2019 | | | AA+/Aa1 | | | | 4,950,000 | | | | 5,026,923 | |
Apple, Inc. Floating Rate Note, 1.947% due 2/23/2021 | | | AA+/Aa1 | | | | 9,050,000 | | | | 9,323,907 | |
a Hewlett Packard Enterprise Co. Floating Rate Note, 2.583% due 10/5/2018 | | | BBB/Baa2 | | | | 4,900,000 | | | | 4,982,399 | |
| | | | | | | | | | | | |
| | | | | | | | | | | 94,370,894 | |
| | | | | | | | | | | | |
| | | |
TELECOMMUNICATION SERVICES — 2.68% | | | | | | | | | | | | |
Diversified Telecommunication Services — 1.74% | | | | | | | | | | | | |
AT&T, Inc., 1.561% due 6/30/2020 | | | BBB+/Baa1 | | | | 4,950,000 | | | | 4,992,793 | |
AT&T, Inc., 1.739% due 11/27/2018 | | | BBB+/Baa1 | | | | 11,350,000 | | | | 11,481,024 | |
AT&T, Inc., 3.60% due 2/17/2023 | | | BBB+/Baa1 | | | | 8,000,000 | | | | 8,432,752 | |
AT&T, Inc., 3.00% due 6/30/2022 | | | BBB+/Baa1 | | | | 4,500,000 | | | | 4,626,486 | |
AT&T, Inc., 4.45% due 4/1/2024 | | | BBB+/Baa1 | | | | 10,000,000 | | | | 10,991,520 | |
Michigan Bell Telephone Co., 7.85% due 1/15/2022 | | | BBB+/NR | | | | 3,000,000 | | | | 3,648,477 | |
a,b Ooredoo International Finance Ltd., 3.375% due 10/14/2016 | | | A-/A2 | | | | 500,000 | | | | 500,255 | |
Qwest Corp., 6.75% due 12/1/2021 | | | BBB-/Ba1 | | | | 3,000,000 | | | | 3,341,250 | |
Verizon Communications, Inc., 3.45% due 3/15/2021 | | | BBB+/Baa1 | | | | 9,600,000 | | | | 10,228,694 | |
Verizon Communications, Inc., 3.50% due 11/1/2024 | | | BBB+/Baa1 | | | | 4,683,000 | | | | 4,995,230 | |
Verizon Communications, Inc., 3.00% due 11/1/2021 | | | BBB+/Baa1 | | | | 5,000,000 | | | | 5,231,765 | |
Verizon Communications, Inc., 2.625% due 2/21/2020 | | | BBB+/Baa1 | | | | 4,997,000 | | | | 5,138,965 | |
Verizon Communications, Inc. Floating Rate Note, 2.606% due 9/14/2018 | | | BBB+/Baa1 | | | | 1,825,000 | | | | 1,872,932 | |
Verizon Communications, Inc. Floating Rate Note, 1.627% due 6/17/2019 | | | BBB+/Baa1 | | | | 6,970,000 | | | | 7,038,369 | |
| | | |
Wireless Telecommunication Services — 0.94% | | | | | | | | | | | | |
a Crown Castle Towers, LLC, 6.113% due 1/15/2040 | | | NR/A2 | | | | 6,970,000 | | | | 7,724,498 | |
a Unison Ground Lease Funding, LLC, 6.392% due 4/15/2040 | | | NR/NR | | | | 9,640,000 | | | | 10,413,698 | |
a Unison Ground Lease Funding, LLC, 5.349% due 4/15/2040 | | | NR/NR | | | | 2,470,000 | | | | 2,510,479 | |
b Vodafone Group plc, 1.25% due 9/26/2017 | | | BBB+/Baa1 | | | | 24,245,000 | | | | 24,185,115 | |
| | | | | | | | | | | | |
| | | | | | | | | | | 127,354,302 | |
| | | | | | | | | | | | |
| | | |
TRANSPORTATION — 1.91% | | | | | | | | | | | | |
Air Freight & Logistics — 0.02% | | | | | | | | | | | | |
a FedEx Corp. 2012 Pass-Through Trust, 2.625% due 1/15/2018 | | | BBB/Baa1 | | | | 1,134,764 | | | | 1,139,904 | |
| | | |
Airlines — 0.47% | | | | | | | | | | | | |
American Airlines Group, Inc., 4.95% due 7/15/2024 | | | A/NR | | | | 5,819,148 | | | | 6,328,324 | |
American Airlines Group, Inc., 3.60% due 3/22/2029 | | | AA/Aa3 | | | | 9,763,466 | | | | 10,349,274 | |
US Airways, 6.25% due 10/22/2024 | | | A/A3 | | | | 5,087,843 | | | | 5,761,982 | |
| | | |
Road & Rail — 1.34% | | | | | | | | | | | | |
a,b Asciano Finance Ltd., 5.00% due 4/7/2018 | | | BBB-/Baa3 | | | | 2,000,000 | | | | 2,068,680 | |
a BNSF Railway Co., 3.442% due 6/16/2028 | | | AA/Aa2 | | | | 14,435,810 | | | | 14,826,592 | |
a,b LeasePlan Corp. NV, 2.50% due 5/16/2018 | | | BBB-/Baa1 | | | | 10,000,000 | | | | 10,014,920 | |
a Penske Truck Leasing Co., LP/PTL Finance Corp., 3.375% due 2/1/2022 | | | BBB-/Baa3 | | | | 20,000,000 | | | | 20,798,440 | |
a TTX Co., 5.453% due 1/2/2022 | | | NR/NR | | | | 4,005,296 | | | | 4,331,808 | |
a TTX Co., 2.25% due 2/1/2019 | | | A+/Baa1 | | | | 5,000,000 | | | | 5,064,875 | |
a TTX Co., 4.15% due 1/15/2024 | | | A+/Baa1 | | | | 6,000,000 | | | | 6,445,554 | |
| | | |
Transportation Infrastructure — 0.08% | | | | | | | | | | | | |
a,b Mexico City Airport Trust, 4.25% due 10/31/2026 | | | BBB+/Baa1 | | | | 3,750,000 | | | | 3,759,375 | |
| | | | | | | | | | | | |
| | | | | | | | | | | 90,889,728 | |
| | | | | | | | | | | | |
22 Annual Reports
| | |
| SCHEDULE OF INVESTMENTS, CONTINUED | | |
| |
Thornburg Limited Term Income Fund | | September 30, 2016 |
| | | | | | | | | | | | |
Issuer-Description | | Credit Rating†
S&P/ Moody’s | | | Principal
Amount | | | Value | |
UTILITIES — 6.70% | | | | | | | | | | | | |
Electric Utilities — 5.11% | | | | | | | | | | | | |
Appalachian Power Co., 3.40% due 6/1/2025 | | | BBB+/Baa1 | | | $ | 7,000,000 | | | $ | 7,458,178 | |
Cleveland Electric Illuminating Co., 7.88% due 11/1/2017 | | | BBB+/Baa1 | | | | 15,359,000 | | | | 16,333,697 | |
Duke Energy Corp. Floating Rate Note, 1.226% due 4/3/2017 | | | BBB+/Baa1 | | | | 39,371,000 | | | | 39,412,103 | |
Duke Energy Florida Project Finance, LLC, 1.196% due 3/1/2022 | | | AAA/Aaa | | | | 12,250,000 | | | | 12,224,202 | |
a,b Electricite de France S.A., 2.15% due 1/22/2019 | | | A-/A3 | | | | 4,900,000 | | | | 4,969,624 | |
a,b Electricite de France S.A. Floating Rate Note, 1.156% due 1/20/2017 | | | A-/A3 | | | | 18,700,000 | | | | 18,708,621 | |
a,b Enel Finance International S.A., 6.25% due 9/15/2017 | | | BBB/Baa2 | | | | 11,000,000 | | | | 11,484,880 | |
Entergy Louisiana, LLC, 4.80% due 5/1/2021 | | | A/A2 | | | | 4,300,000 | | | | 4,806,377 | |
Entergy Texas, Inc., 7.125% due 2/1/2019 | | | A/Baa1 | | | | 2,000,000 | | | | 2,243,576 | |
Exelon Corp., 1.55% due 6/9/2017 | | | BBB-/Baa2 | | | | 2,950,000 | | | | 2,952,221 | |
Exelon Corp., 2.85% due 6/15/2020 | | | BBB-/Baa2 | | | | 2,950,000 | | | | 3,058,814 | |
a Jersey Central Power & Light Co., 4.30% due 1/15/2026 | | | BBB-/Baa2 | | | | 15,000,000 | | | | 15,973,365 | |
a,b Korea Western Power Co., Ltd., 2.875% due 10/10/2018 | | | NR/Aa2 | | | | 10,000,000 | | | | 10,239,600 | |
a Monongahela Power Co., 5.70% due 3/15/2017 | | | BBB+/A3 | | | | 4,785,000 | | | | 4,875,594 | |
a Monongahela Power Co., 4.10% due 4/15/2024 | | | BBB+/A3 | | | | 8,000,000 | | | | 8,788,448 | |
NextEra Energy Capital Holdings, Inc., 1.586% due 6/1/2017 | | | BBB+/Baa1 | | | | 6,715,000 | | | | 6,727,174 | |
Northern States Power Company-Wisconsin, 3.30% due 6/15/2024 | | | A/Aa3 | | | | 10,000,000 | | | | 10,573,580 | |
Public Service Co. of New Mexico, 5.35% due 10/1/2021 | | | BBB+/Baa2 | | | | 3,000,000 | | | | 3,360,552 | |
a Rochester Gas & Electric, 5.90% due 7/15/2019 | | | A/A2 | | | | 11,732,000 | | | | 13,063,840 | |
Southern Power Co., 2.375% due 6/1/2020 | | | BBB+/Baa1 | | | | 9,693,000 | | | | 9,878,737 | |
a,b State Grid Overseas Investment (2014) Ltd., 2.75% due 5/7/2019 | | | AA-/Aa3 | | | | 9,000,000 | | | | 9,255,366 | |
a Steelriver Transmission Co., LLC, 4.71% due 6/30/2017 | | | NR/Baa1 | | | | 2,871,574 | | | | 2,904,476 | |
The Southern Co., 2.45% due 9/1/2018 | | | BBB+/Baa2 | | | | 4,825,000 | | | | 4,918,383 | |
Toledo Edison Co., 7.25% due 5/1/2020 | | | BBB+/Baa1 | | | | 167,000 | | | | 189,518 | |
a,b Transelec S.A., 4.25% due 1/14/2025 | | | BBB/Baa1 | | | | 6,000,000 | | | | 6,304,284 | |
UIL Holdings Corp., 4.625% due 10/1/2020 | | | BBB+/Baa2 | | | | 11,660,000 | | | | 12,482,263 | |
| | | |
Gas Utilities — 0.75% | | | | | | | | | | | | |
AGL Capital Corp., 3.50% due 9/15/2021 | | | A-/Baa1 | | | | 9,925,000 | | | | 10,474,170 | |
a,b APT Pipelines Ltd., 3.875% due 10/11/2022 | | | BBB/Baa2 | | | | 5,500,000 | | | | 5,718,625 | |
Spire, Inc., 2.55% due 8/15/2019 | | | BBB+/Baa2 | | | | 2,350,000 | | | | 2,394,424 | |
Spire, Inc. Floating Rate Note, 1.567% due 8/15/2017 | | | BBB+/Baa2 | | | | 16,900,000 | | | | 16,855,655 | |
| | | |
Independent Power & Renewable Electricity Producers — 0.14% | | | | | | | | | | | | |
a Midland Cogeneration Venture, 6.00% due 3/15/2025 | | | BBB-/NR | | | | 6,279,152 | | | | 6,764,876 | |
| | | |
Multi-Utilities — 0.70% | | | | | | | | | | | | |
Dominion Gas Holdings, LLC, 2.50% due 12/15/2019 | | | BBB+/A2 | | | | 3,900,000 | | | | 4,005,179 | |
Dominion Gas Holdings, LLC, 2.80% due 11/15/2020 | | | BBB+/A2 | | | | 5,000,000 | | | | 5,173,185 | |
a Enable Oklahoma Intrastate Transmission, LLC, 6.25% due 3/15/2020 | | | BB+/Baa3 | | | | 3,640,000 | | | | 3,904,428 | |
a,b Korea Hydro & Nuclear Power Co. Ltd., 2.875% due 10/2/2018 | | | AA/Aa2 | | | | 7,000,000 | | | | 7,187,852 | |
a Niagara Mohawk Power Corp., 4.881% due 8/15/2019 | | | A-/A2 | | | | 10,000,000 | | | | 10,888,760 | |
SCANA Corp., 4.125% due 2/1/2022 | | | BBB/Baa3 | | | | 2,000,000 | | | | 2,090,712 | |
| | | | | | | | | | | | |
| | | | | | | | | | | 318,645,339 | |
| | | | | | | | | | | | |
TOTAL CORPORATE BONDS (Cost $2,155,874,665) | | | | | | | | | | | 2,218,747,875 | |
| | | | | | | | | | | | |
| | | |
CONVERTIBLE BONDS — 0.42% | | | | | | | | | | | | |
REAL ESTATE — 0.42% | | | | | | | | | | | | |
Equity Real Estate Investment Trusts — 0.42% | | | | | | | | | | | | |
a IAS Operating Partnership LP, 5.00% due 3/15/2018 | | | NR/NR | | | | 19,950,000 | | | | 19,950,000 | |
| | | | | | | | | | | | |
| | | | | | | | | | | 19,950,000 | |
| | | | | | | | | | | | |
TOTAL CONVERTIBLE BONDS (Cost $19,950,000) | | | | | | | | | | | 19,950,000 | |
| | | | | | | | | | | | |
| | | |
MUNICIPAL BONDS — 2.56% | | | | | | | | | | | | |
American Municipal Power Ohio, Inc., 5.072% due 2/15/2018 (Meldahl Hydroelectric) | | | A/A3 | | | | 5,000,000 | | | | 5,219,700 | |
Anaheim California Public Financing Authority, 5.316% due 9/1/2017 (Anaheim Public Improvements; Insured: Natl-Re/FGIC) | | | AA-/A1 | | | | 520,000 | | | | 531,929 | |
Anaheim California Public Financing Authority, 5.486% due 9/1/2020 (Anaheim Public Improvements; Insured: Natl-Re) | | | AA-/A1 | | | | 3,270,000 | | | | 3,475,356 | |
Brentwood California Infrastructure Financing Authority, 6.16% due 10/1/2019 (Civic Center) | | | AA/NR | | | | 2,110,000 | | | | 2,273,926 | |
California HFFA, 6.76% due 2/1/2019 (Community Program for Persons with Developmental Disabilities) | | | AA-/NR | | | | 3,905,000 | | | | 4,225,679 | |
California School Finance Authority, 5.041% due 7/1/2020 (LOC: City National Bank) | | | AA+/NR | | | | 4,000,000 | | | | 4,456,000 | |
Camden County Improvement Authority, 5.47% due 7/1/2018 (Cooper Medical School of Rowan University) | | | A/A2 | | | | 2,140,000 | | | | 2,272,937 | |
Camden County Improvement Authority, 5.62% due 7/1/2019 (Cooper Medical School of Rowan University) | | | A/A2 | | | | 3,025,000 | | | | 3,303,149 | |
Annual Reports 23
| | |
| SCHEDULE OF INVESTMENTS, CONTINUED | | |
| |
Thornburg Limited Term Income Fund | | September 30, 2016 |
| | | | | | | | | | | | |
Issuer-Description | | Credit Rating†
S&P/ Moody’s | | | Principal
Amount | | | Value | |
Carson Redevelopment Agency, 4.511% due 10/1/2016 (Low and Moderate Income Housing) | | | A-/NR | | | $ | 1,375,000 | | | $ | 1,375,083 | |
City and County of San Francisco Redevelopment Financing Authority, 8.00% due 8/1/2019 (San Francisco Redevelopment Projects) | | | AA-/A2 | | | | 6,500,000 | | | | 7,208,825 | |
City of Fort Collins Colorado Electric Utility Enterprise, 4.92% due 12/1/2020 (Fort Collins Smart Grid) | | | AA-/NR | | | | 2,250,000 | | | | 2,423,520 | |
City of Riverside California, 5.61% due 8/1/2017 (City Sewer System) | | | A+/A1 | | | | 2,000,000 | | | | 2,075,140 | |
Connecticut Housing Finance Authority, 5.071% due 11/15/2019 (Housing Mtg Finance Program) | | | AAA/Aaa | | | | 1,820,000 | | | | 1,886,721 | |
Denver Public Schools COP, 2.018% due 12/15/2019 (School District No. 1 Educational Facilities) | | | NR/Aa3 | | | | 3,000,000 | | | | 3,045,030 | |
JobsOhio Beverage System, 2.217% due 1/1/2019 (State Liquor Enterprise) | | | AA/Aa3 | | | | 11,245,000 | | | | 11,500,824 | |
Kentucky Asset/Liability Commission, 2.099% due 4/1/2019 (Commonwealth of Kentucky and Teachers’ Retirement System Funding Obligations) | | | A/Aa3 | | | | 3,000,000 | | | | 3,032,190 | |
Los Angeles County Public Works Financing Authority, 5.591% due 8/1/2020 (Los Angeles County & USC Medical Center Projects) | | | AA/Aa3 | | | | 3,000,000 | | | | 3,433,560 | |
Louisiana Local Government Environmental Facilities and Community Development Authority, 1.66% due 2/1/2022 (Louisiana Utilities Restoration) | | | AAA/Aaa | | | | 5,523,600 | | | | 5,575,798 | |
Municipal Improvement Corp. of Los Angeles, 6.165% due 11/1/2020 (Recovery Zone Economic Development) | | | A+/A2 | | | | 11,885,000 | | | | 13,521,564 | |
New York City Transitional Finance Authority, 4.075% due 11/1/2020 (World Trade Center Recovery) | | | AAA/Aa1 | | | | 2,500,000 | | | | 2,756,075 | |
Oklahoma Development Finance Authority, 8.00% due 5/1/2020 (Cleveland County Industrial Authority (CCIA) - Hitachi Norman, Oklahoma Project) | | | NR/NR | | | | 4,560,000 | | | | 4,657,812 | |
Orleans Parish School Board GO, 4.40% due 2/1/2021 (Educational Facilities Improvements; Insured: AGM) | | | AA/A2 | | | | 10,000,000 | | | | 11,103,800 | |
Redevelopment Agency of the City of Redlands, 5.818% due 8/1/2022 (Redlands Redevelopment; Insured: AMBAC) (ETM) | | | NR/NR | | | | 1,495,000 | | | | 1,620,954 | |
Redevelopment Agency of the County of San Bernardino, 7.135% due 9/1/2020 (San Sevaine Redevelopment Project) | | | BBB/NR | | | | 1,045,000 | | | | 1,125,549 | |
Rutgers State University GO, 2.342% due 5/1/2019 (New Brunswick, Newark and Camden Campus Facilities ) | | | A+/Aa3 | | | | 3,485,000 | | | | 3,552,051 | |
Rutgers State University GO, 3.028% due 5/1/2021 (New Brunswick, Newark and Camden Campus Facilities) | | | A+/Aa3 | | | | 1,500,000 | | | | 1,557,255 | |
Sandoval County, New Mexico, 1.452% due 6/1/2017 | | | A+/NR | | | | 1,000,000 | | | | 1,003,040 | |
Tampa-Hillsborough County Florida Expressway Authority, 2.22% due 7/1/2018 (Electronic Tolling Program) | | | A/A2 | | | | 2,000,000 | | | | 2,013,360 | |
Tampa-Hillsborough County Florida Expressway Authority, 2.49% due 7/1/2019 (Electronic Tolling Program) | | | A/A2 | | | | 2,500,000 | | | | 2,529,925 | |
Tampa-Hillsborough County Florida Expressway Authority, 2.84% due 7/1/2020 (Electronic Tolling Program) | | | A/A2 | | | | 1,750,000 | | | | 1,792,017 | |
Wallenpaupack Area School District GO, 3.80% due 9/1/2019 (Pike and Wayne Counties Educational Facilities) (State Aid Withholding) | | | AA/NR | | | | 3,000,000 | | | | 3,052,800 | |
Wallenpaupack Area School District GO, 4.00% due 9/1/2020 (Pike and Wayne Counties Educational Facilities) (State Aid Withholding) | | | AA/NR | | | | 2,750,000 | | | | 2,815,092 | |
Yuba Levee Financing Authority, 6.375% due 9/1/2021 (Yuba County Levee Financing Project) | | | AA/NR | | | | 1,000,000 | | | | 1,041,420 | |
| | | | | | | | | | | | |
TOTAL MUNICIPAL BONDS (Cost $114,426,057) | | | | | | | | | | | 121,458,081 | |
| | | | | | | | | | | | |
| | | |
SHORT TERM INVESTMENTS — 12.53% | | | | | | | | | | | | |
a B.A.T. International Finance plc, 0.68% due 10/4/2016 | | | NR/NR | | | | 33,000,000 | | | | 32,998,130 | |
Bank of New York Tri-Party Repurchase Agreement 0.48% dated 9/30/2016 due 10/3/2016, repurchase price $115,004,600 collateralized by 34 corporate debt securities, having an average coupon of 3.02%, a minimum credit rating of BBB-, maturity dates from 10/6/2016 to 11/15/2045, and having an aggregate market value of $123,355,575 at 9/30/2016 | | | NR/NR | | | | 115,000,000 | | | | 115,000,000 | |
a Canadian National Railway Co., 0.48% due 10/24/2016 | | | NR/NR | | | | 14,000,000 | | | | 13,995,707 | |
a Cummins, Inc., 0.40% due 10/5/2016 | | | NR/NR | | �� | | 4,000,000 | | | | 3,999,822 | |
Farmer Mac Discount Note, 0.27% due 10/11/2016 | | | NR/NR | | | | 3,300,000 | | | | 3,299,752 | |
Federal Home Loan Bank Discount Note, 0.07% due 10/7/2016 | | | NR/NR | | | | 13,000,000 | | | | 12,999,848 | |
Federal Home Loan Discount Note, 0.22% due 10/24/2016 | | | NR/NR | | | | 4,000,000 | | | | 3,999,438 | |
Federal Home Loan Discount Note, 0.22% due 10/21/2016 | | | NR/NR | | | | 24,783,000 | | | | 24,779,971 | |
Federal Home Loan Discount Note, 0.275% due 10/12/2016 | | | NR/NR | | | | 10,000,000 | | | | 9,999,160 | |
Federal Home Loan Discount Note, 0.263% due 10/5/2016 | | | NR/NR | | | | 14,000,000 | | | | 13,999,591 | |
a Illinois Tool Works, Inc., 0.38% due 10/5/2016 | | | NR/NR | | | | 10,279,000 | | | | 10,278,566 | |
a Illinois Tool Works, Inc., 0.38% due 10/6/2016 | | | NR/NR | | | | 5,000,000 | | | | 4,999,736 | |
b Inter-American Development Bank Discount Note, 0.24% due 10/28/2016 | | | NR/NR | | | | 20,700,000 | | | | 20,696,274 | |
a Intercontinental Exchange, Inc., 0.43% due 10/5/2016 | | | NR/NR | | | | 7,000,000 | | | | 6,999,666 | |
a Intercontinental Exchange, Inc., 0.43% due 10/6/2016 | | | NR/NR | | | | 9,000,000 | | | | 8,999,462 | |
b International Bank for Reconstruction & Development Discount Note, 0.28% due 10/7/2016 | | | NR/NR | | | | 19,600,000 | | | | 19,599,085 | |
b International Bank for Reconstruction & Development Discount Note, 0.10% due 10/3/2016 | | | NR/NR | | | | 45,000,000 | | | | 44,999,750 | |
b International Finance Corp. Discount Note, 0.23% due 10/24/2016 | | | NR/NR | | | | 20,000,000 | | | | 19,997,061 | |
a Kentucky Utilities Co., 0.62% due 10/5/2016 | | | NR/NR | | | | 5,000,000 | | | | 4,999,656 | |
a Louisville Gas & Electric Co., 0.62% due 10/6/2016 | | | NR/NR | | | | 10,000,000 | | | | 9,999,139 | |
a Louisville Gas & Electric Co., 0.62% due 10/7/2016 | | | NR/NR | | | | 8,000,000 | | | | 7,999,187 | |
a Ralph Lauren Corp., 0.39% due 10/4/2016 | | | NR/NR | | | | 30,000,000 | | | | 29,999,025 | |
a St Jude Medical, Inc., 0.65% due 10/7/2016 | | | NR/NR | | | | 25,000,000 | | | | 24,997,292 | |
a Sysco Corp., 0.60% due 10/3/2016 | | | NR/NR | | | | 33,000,000 | | | | 32,998,973 | |
United States Treasury Bill, 0.207% due 10/13/2016 | | | NR/NR | | | | 15,000,000 | | | | 14,998,967 | |
United States Treasury Bill, 0.082% due 10/6/2016 | | | NR/NR | | | | 50,000,000 | | | | 49,999,431 | |
Wisconsin Gas Co., 0.40% due 10/3/2016 | | | NR/NR | | | | 22,000,000 | | | | 21,999,511 | |
24 Annual Reports
| | |
| SCHEDULE OF INVESTMENTS, CONTINUED | | |
| |
Thornburg Limited Term Income Fund | | September 30, 2016 |
| | | | | | | | | | | | |
Issuer-Description | | Credit Rating†
S&P/ Moody’s | | | Principal
Amount | | | Value | |
Wisconsin Public Service Corp., 0.60% due 10/3/2016 | | | NR/NR | | | $ | 21,000,000 | | | $ | 20,999,300 | |
Wisconsin Public Service Corp., 0.66% due 10/6/2016 | | | NR/NR | | | | 5,200,000 | | | | 5,199,523 | |
| | | | | | | | | | | | |
TOTAL SHORT TERM INVESTMENTS (Cost $595,831,023) | | | | | | | | | | | 595,831,023 | |
| | | | | | | | | | | | |
TOTAL INVESTMENTS — 98.54% (Cost $4,604,767,695) | | | | | | | | | | $ | 4,684,487,008 | |
OTHER ASSETS LESS LIABILITIES — 1.46% | | | | | | | | | | | 69,383,849 | |
| | | | | | | | | | | | |
NET ASSETS — 100.00% | | | | | | | | | | $ | 4,753,870,857 | |
| | | | | | | | | | | | |
Footnote Legend
| † | Credit ratings are unaudited. Rating changes may have occurred subsequent to the reporting period end. Bonds issued with a maturity of one year or less are assigned Moody’s ratings from MIG-1 to MIG-4 and Standard and Poor’s ratings from SP-1+ to SP-3 with MIG-1 and SP-1+ being the strongest ratings. |
| a | Securities exempt from registration under Rule 144A of the Securities Act of 1933, as amended. These securities may only be resold in the ordinary course of business in transactions exempt from registration, normally to qualified institutional buyers. As of September 30, 2016, the aggregate value of these securities in the Fund’s portfolio was $1,920,814,396, representing 40.41% of the Fund’s net assets. |
| b | Yankee bond denominated in U.S. dollars and is issued in the U.S. by foreign banks and corporations. |
| c | Security currently fair valued by the Valuation and Pricing Committee using procedures approved by the Trustees’ Audit Committee. |
Portfolio Abbreviations
To simplify the listings of securities, abbreviations are used per the table below:
| | |
| AGM | | Insured by Assured Guaranty Municipal Corp. |
| AMBAC | | Insured by American Municipal Bond Assurance Corp. |
| CMO | | Collateralized Mortgage Obligation |
| COP | | Certificates of Participation |
| ETM | | Escrowed to Maturity |
| FGIC | | Insured by Financial Guaranty Insurance Co. |
| GO | | General Obligation |
| | |
| HFFA | | Health Facilities Financing Authority |
| Mtg | | Mortgage |
| Natl-Re | | Insured by National Public Finance Guarantee Corp. |
| REIT | | Real Estate Investment Trust |
| REMIC | | Real Estate Mortgage Investment Conduit |
| SPV | | Special Purpose Vehicle |
| VA | | Veterans Affairs |
See notes to financial statements.
Annual Reports 25
| | |
| FUND SUMMARY | | |
| |
Thornburg Low Duration Income Fund | | September 30, 2016 (Unaudited) |
Objectives and Strategies
The Fund’s objective is to seek current income, consistent with preservation of capital.
The Fund invests in debt obligations issued by the U.S. Government, its agencies, or its instrumentalities, and in debt obligations rated at the time of purchase in one of the four highest credit ratings categories or, if no credit rating is available, judged to be of comparable quality by the Fund’s advisor. The Fund aims to reduce changes in its share value compared to longer duration fixed income portfolios by maintaining a laddered portfolio of investments with a dollar-weighted average duration of normally no more than three years.
Portfolio Ladder
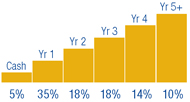
Percent of portfolio maturing in each year. Cash includes cash equivalents.
SECURITY CREDIT RATINGS
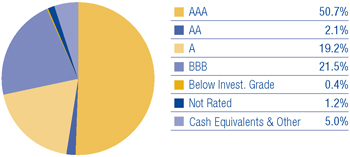
Credit quality ratings for Thornburg’s global fixed income portfolios used ratings from Moody’s Investors Service. Where Moody’s ratings are not available, we have used Standard & Poor’s ratings. Where neither rating is available, we have used ratings from other NRSROs. U.S.-backed securities are included in AAA.
Key Portfolio Attributes
| | | | |
Number of Bonds | | | 197 | |
| |
Effective Duration | | | 1.4 Yrs | |
| |
Average Maturity | | | 2.0 Yrs | |
There is no guarantee that the Fund will meet its investment objective.
All data is subject to change. Charts may not add up to 100% due to rounding.
26 Annual Reports
| | |
| SCHEDULE OF INVESTMENTS | | |
| |
Thornburg Low Duration Income Fund | | September 30, 2016 |
| | | | | | | | | | | | |
Issuer-Description | | Credit Rating†
S&P/ Moody’s | | | Principal
Amount | | | Value | |
U.S. TREASURY SECURITIES — 22.85% | | | | | | | | | | | | |
United States Treasury Notes, 0.625% due 2/15/2017 | | | NR/Aaa | | | $ | 750,000 | | | $ | 750,551 | |
United States Treasury Notes, 2.75% due 5/31/2017 | | | NR/Aaa | | | | 750,000 | | | | 760,415 | |
United States Treasury Notes, 0.875% due 6/15/2017 | | | NR/Aaa | | | | 100,000 | | | | 100,187 | |
United States Treasury Notes, 0.875% due 7/15/2017 | | | NR/Aaa | | | | 500,000 | | | | 500,904 | |
United States Treasury Notes, 0.50% due 7/31/2017 | | | NR/Aaa | | | | 1,400,000 | | | | 1,398,709 | |
United States Treasury Notes, 0.625% due 8/31/2017 | | | NR/Aaa | | | | 200,000 | | | | 199,937 | |
United States Treasury Notes, 0.75% due 12/31/2017 | | | NR/Aaa | | | | 800,000 | | | | 800,269 | |
United States Treasury Notes, 0.75% due 4/30/2018 | | | NR/Aaa | | | | 125,000 | | | | 125,007 | |
United States Treasury Notes, 1.00% due 5/15/2018 | | | NR/Aaa | | | | 200,000 | | | | 200,805 | |
United States Treasury Notes, 0.125% due 4/15/2019 | | | NR/Aaa | | | | 231,089 | | | | 235,002 | |
United States Treasury Notes, 0.125% due 4/15/2021 | | | NR/Aaa | | | | 355,394 | | | | 362,986 | |
United States Treasury Notes Inflationary Index, 0.125% due 4/15/2020 | | | NR/Aaa | | | | 488,143 | | | | 497,694 | |
United States Treasury Notes Inflationary Index, 0.375% due 7/15/2025 | | | NR/Aaa | | | | 304,449 | | | | 314,700 | |
| | | | | | | | | | | | |
TOTAL U.S. TREASURY SECURITIES (Cost $6,211,867) | | | | | | | | | | | 6,247,166 | |
| | | | | | | | | | | | |
| | | |
U.S. GOVERNMENT AGENCIES — 1.74% | | | | | | | | | | | | |
Export Leasing (2009), LLC, (Guaranty: Export-Import Bank of the United States), 1.859% due 8/28/2021 | | | NR/NR | | | | 65,633 | | | | 65,955 | |
a Micron Semiconductor Ltd., (Guaranty: Export-Import Bank of the United States), 1.258% due 1/15/2019 | | | NR/NR | | | | 50,000 | | | | 49,788 | |
a Petroleos Mexicanos Floating Rate Note, (Guaranty: Export-Import Bank of the United States), 1.03% due 4/15/2025 | | | NR/NR | | | | 87,500 | | | | 86,273 | |
a Petroleos Mexicanos, (Guaranty: Export-Import Bank of the United States), 1.70% due 12/20/2022 | | | NR/NR | | | | 65,000 | | | | 64,987 | |
Small Business Administration Participation Certificates, Series 2005-20K Class 1, 5.36% due 11/1/2025 | | | NR/NR | | | | 38,826 | | | | 42,382 | |
a Washington Aircraft 2 Co. Ltd. Floating Rate Note, (Guaranty: Export-Import Bank of the United States), 1.07% due 6/26/2024 | | | NR/NR | | | | 169,823 | | | | 167,483 | |
| | | | | | | | | | | | |
TOTAL U.S. GOVERNMENT AGENCIES (Cost $477,393) | | | | | | | | | | | 476,868 | |
| | | | | | | | | | | | |
| | | |
MORTGAGE BACKED — 2.56% | | | | | | | | | | | | |
Federal Home Loan Mtg Corp., CMO Series K716 Class A1, 2.413% due 8/25/2047 | | | NR/Aaa | | | | 79,976 | | | | 81,831 | |
Federal Home Loan Mtg Corp., Multi-Family Structured Pass Through, Series K710 Class A2, 1.883% due 5/25/2019 | | | NR/NR | | | | 275,000 | | | | 278,859 | |
Federal National Mtg Assoc. Pool AS3705, 2.50% due 11/1/2024 | | | NR/NR | | | | 106,070 | | | | 109,898 | |
Freddie Home Loan Mtg Corp., Series 2586 Class AF, 5.00% due 3/15/2018 | | | NR/NR | | | | 224,041 | | | | 228,797 | |
| | | | | | | | | | | | |
TOTAL MORTGAGE BACKED (Cost $698,006) | | | | | | | | | | | 699,385 | |
| | | | | | | | | | | | |
| | | |
ASSET BACKED SECURITIES — 28.00% | | | | | | | | | | | | |
ADVANCE RECEIVABLES — 0.46% | | | | | | | | | | | | |
b SPS Servicer Advance Receivables Trust, Series 2015-T3 Class AT3, 2.92% due 7/15/2047 | | | NR/NR | | | | 125,000 | | | | 125,287 | |
| | | | | | | | | | | | |
| | | | | | | | | | | 125,287 | |
| | | | | | | | | | | | |
| | | |
AUTO RECEIVABLES — 6.12% | | | | | | | | | | | | |
Ally Auto Receivables Trust, Series 15-1 Class A3, 1.39% due 9/16/2019 | | | AAA/Aaa | | | | 150,000 | | | | 150,284 | |
Ally Auto Receivables Trust, Series 15-2 Class A3, 1.49% due 11/15/2019 | | | AAA/Aaa | | | | 100,000 | | | | 100,316 | |
b Avis Budget Rental Car Funding AESOP, LLC, Series 2012-3A Class A, 2.10% due 3/20/2019 | | | NR/Aaa | | | | 100,000 | | | | 100,131 | |
Capital Auto Receivables Asset Trust, Series 2016-3 Class A2A, 1.36% due 4/22/2019 | | | AAA/Aaa | | | | 100,000 | | | | 100,005 | |
b Chesapeake Funding II, LLC, Series 2016-1A Class A1, 2.11% due 3/15/2028 | | | NR/Aaa | | | | 200,000 | | | | 200,339 | |
b Chrysler Capital Auto Receivables Trust, Series 2013-BA Class A4, 1.27% due 3/15/2019 | | | AAA/Aaa | | | | 175,283 | | | | 175,408 | |
b Drive Auto Receivables Trust, Series 2016-BA Class A2, 1.38% due 8/15/2018 | | | AAA/Aaa | | | | 167,435 | | | | 167,383 | |
b Ford Credit Auto Owner Trust, Series 2015-1 Class A, 2.12% due 7/15/2026 | | | AAA/NR | | | | 100,000 | | | | 101,576 | |
b Foursight Capital Automobile Receivables Trust, Series 2016-1 Class A2, 2.87% due 10/15/2021 | | | A/NR | | | | 100,000 | | | | 99,669 | |
b GM Financial Automobile Leasing Trust, Series 2014-2A Class A4, 1.62% due 2/20/2018 | | | NR/Aaa | | | | 100,000 | | | | 100,297 | |
b Hertz Vehicle Financing, LLC, Series 2013-1A Class A2, 1.83% due 8/25/2019 | | | NR/Aaa | | | | 125,000 | | | | 124,662 | |
Nissan Auto Receivables Owner Trust, Series 2016-B Class A2B Floating Rate Note, 0.824% due 4/15/2019 | | | NR/Aaa | | | | 100,000 | | | | 100,114 | |
b OSCAR US Funding Trust, Series 2014-1A Class A3, 1.72% due 4/15/2019 | | | AA+/Aaa | | | | 83,677 | | | | 83,006 | |
b,c OSCAR US Funding Trust, Series 2016-2A Class A3, 2.73% due 12/15/2020 | | | AAA/Aaa | | | | 70,000 | | | | 69,994 | |
| | | | | | | | | | | | |
| | | | | | | | | | | 1,673,184 | |
| | | | | | | | | | | | |
| | | |
COMMERCIAL MTG TRUST — 5.11% | | | | | | | | | | | | |
b BAMLL-DB Trust, Series 2012-OSI Class A2FX, 3.352% due 4/13/2029 | | | NR/Aaa | | | | 399,814 | | | | 401,930 | |
b Barclays Commercial Mortgage Securities, LLC, Series 2015-STP Class A, 3.323% due 9/10/2028 | | | AAA/NR | | | | 100,000 | | | | 103,209 | |
COMM Mortgage Trust, Series 2016-DC2 Class A1, 1.82% due 2/10/2049 | | | NR/Aaa | | | | 122,228 | | | | 123,603 | |
b DBUBS Mortgage Trust CMO, Series 2011-LC1A Class A1, 3.742% due 11/10/2046 | | | NR/Aaa | | | | 1,230 | | | | 1,240 | |
b DBUBS Mortgage Trust CMO, Series 2011-LC2A Class A1FL, 1.869% due 7/12/2044 | | | NR/Aaa | | | | 45,952 | | | | 46,252 | |
Deutsche Bank Commercial Mortgage Trust, Series 2016-C1 Class A1, 1.676% due 5/10/2049 | | | NR/Aaa | | | | 143,284 | | | | 144,282 | |
b FREMF Mortgage Trust, Series 2013-KF02 Class B Floating Rate Note, 3.496% due 12/25/2045 | | | NR/Baa3 | | | | 22,085 | | | | 22,431 | |
b GAHR Commercial Mortgage Trust, Series 2015-NRF Class BFX, 3.495% due 12/15/2034 | | | AA-/NR | | | | 100,000 | | | | 103,417 | |
b JPMorgan Chase Commercial Mortgage, Series 2014-BXH Class A Floating Rate Note, 1.408% due 4/15/2027 | | | AAA/NR | | | | 100,000 | | | | 97,813 | |
Annual Reports 27
| | |
| SCHEDULE OF INVESTMENTS, CONTINUED | | |
| |
Thornburg Low Duration Income Fund | | September 30, 2016 |
| | | | | | | | | | | | |
Issuer-Description | | Credit Rating†
S&P/ Moody’s | | | Principal
Amount | | | Value | |
Morgan Stanley BAML Trust, Series 2012-C6 Class A2, 1.868% due 11/15/2045 | | | NR/Aaa | | | $ | 96,195 | | | $ | 96,492 | |
b Morgan Stanley Re-REMIC Trust, Series 2009-GG10 Class A4A, 5.988% due 8/12/2045 | | | NR/Aaa | | | | 143,146 | | | | 144,716 | |
WFRBS Commercial Mortgage Trust, Series 2014-C22 Class A1, 1.479% due 9/15/2057 | | | NR/Aaa | | | | 113,139 | | | | 112,776 | |
| | | | | | | | | | | | |
| | | | | | | | | | | 1,398,161 | |
| | | | | | | | | | | | |
| | | |
CREDIT CARD — 3.28% | | | | | | | | | | | | |
Barclays Dryrock Issuance Trust, Series 2015-4 Class A, 1.72% due 8/16/2021 | | | AAA/NR | | | | 100,000 | | | | 100,664 | |
Barclays Dryrock Issuance Trust, Series 2016-1 Class A, 1.52% due 5/16/2022 | | | AAA/NR | | | | 135,000 | | | | 135,556 | |
b Cabela’s Master Credit Card Trust, Series 2013-2A Class A1, 2.17% due 8/16/2021 | | | AAA/NR | | | | 150,000 | | | | 152,369 | |
Cabela’s Master Credit Card Trust, Series 2015-1A Class A2 Floating Rate Note, 1.064% due 3/15/2023 | | | AAA/NR | | | | 75,000 | | | | 74,641 | |
Capital One Multi-Asset Execution Trust, Series 2016-A1 Class A1 Floating Rate Note, 0.974% due 2/15/2022 | | | AAA/NR | | | | 230,000 | | | | 231,399 | |
Synchrony Credit Card Master Note Trust, Series 2014-1 Class A, 1.61% due 11/15/2020 | | | AAA/Aaa | | | | 100,000 | | | | 100,487 | |
Synchrony Credit Card Master Note Trust, Series 2016-1 Class A, 2.04% due 3/15/2022 | | | NR/Aaa | | | | 100,000 | | | | 101,358 | |
| | | | | | | | | | | | |
| | | | | | | | | | | 896,474 | |
| | | | | | | | | | | | |
| | | |
OTHER ASSET BACKED — 9.73% | | | | | | | | | | | | |
b Alterna Funding I, LLC, Series 2014-1A, 1.639% due 2/15/2021 | | | NR/NR | | | | 37,485 | | | | 36,548 | |
b Ascentium Equipment Receivables, LLC, Series 2015-1A Class B, 2.26% due 6/10/2021 | | | NR/Aaa | | | | 50,000 | | | | 50,189 | |
b BAMLL-DB Trust, Series 2012-OSI Class A, 2.343% due 4/13/2029 | | | NR/Aaa | | | | 119,358 | | | | 119,386 | |
b BCC Funding Corp., Series 2016-1 Class A1, 1.10% due 9/20/2017 | | | NR/NR | | | | 150,000 | | | | 150,002 | |
b CLI Funding, LLC, Series 2014-1A Class A, 3.29% due 6/18/2029 | | | A/NR | | | | 76,300 | | | | 74,346 | |
b Dell Equipment Finance Trust, Series 2015-2 Class A3, 1.72% due 9/22/2020 | | | AAA/Aaa | | | | 125,000 | | | | 125,403 | |
b Dell Equipment Finance Trust, Series 2016-1 Class A3, 1.65% due 7/22/2021 | | | AAA/Aaa | | | | 200,000 | | | | 199,492 | |
b Diamond Resorts Owner Trust, Series 2014-1 Class A, 2.54% due 5/20/2027 | | | A+/NR | | | | 135,479 | | | | 135,589 | |
b Dominos Pizza Master Issuer, LLC, Series 2012-1A Class A2, 5.216% due 1/25/2042 | | | BBB+/Baa1 | | | | 146,516 | | | | 150,457 | |
b Enterprise Fleet Financing LLC, Series 2016-2 Class A1, 0.85% due 7/20/2017 | | | A-1+/NR | | | | 140,667 | | | | 140,307 | |
GE Dealer Floorplan Master Note Trust, Series 2012-2 Class A Floating Rate Note, 1.282% due 4/22/2019 | | | NR/Aaa | | | | 100,000 | | | | 100,198 | |
b GTP Acquisition Partners I, LLC, Series 2015-1 Class A, 2.35% due 6/15/2045 | | | NR/Aaa | | | | 100,000 | | | | 99,610 | |
Harley-Davidson Motorcycle Trust, Series 2015-2 Class A4, 1.66% due 12/15/2022 | | | AAA/Aaa | | | | 100,000 | | | | 100,608 | |
b Hertz Fleet Lease Funding LP, Series 2016-1 Class A1 Floating Rate Note, 1.618% due 4/10/2030 | | | NR/Aaa | | | | 200,000 | | | | 200,468 | |
MVW Owner Trust, Series 2013-1X Class A, 2.15% due 4/22/2030 | | | A+/NR | | | | 37,296 | | | | 37,231 | |
b Navistar Financial Dealer Note Master Owner Trust II, Series 2014-1 Class A Floating Rate Note, 1.274% due 10/25/2019 | | | NR/Aaa | | | | 100,000 | | | | 100,025 | |
b Navistar Financial Dealer Note Master Owner Trust II, Series 2015-1 Class A Floating Rate Note, 1.924% due 6/25/2020 | | | NR/Aaa | | | | 71,000 | | | | 70,884 | |
b OnDeck Asset Securitization Trust II, LLC, Series 2016-1A Class A, 4.21% due 5/17/2020 | | | BBB+/NR | | | | 100,000 | | | | 99,876 | |
b OneMain Financial Issuance Trust, Series 2016-2A Class A, 4.10% due 3/20/2028 | | | A+/NR | | | | 100,000 | | | | 102,933 | |
b PFS Financing Corp., Series 2015-AA Class A Floating Rate Note, 1.144% due 4/15/2020 | | | AAA/Aaa | | | | 100,000 | | | | 99,312 | |
b PFS Tax Lien Trust, Series 2014-1, 1.44% due 5/15/2029 | | | AAA/NR | | | | 31,884 | | | | 31,711 | |
b SBA Tower Trust, Series 2012-1 Class C, 2.933% due 12/15/2042 | | | NR/A2 | | | | 100,000 | | | | 100,555 | |
b SBA Tower Trust, Series 2014-1A Class C, 2.898% due 10/15/2044 | | | NR/A2 | | | | 100,000 | | | | 101,405 | |
b Sierra Receivables Funding Co., LLC, Series 2012-1A Class A, 2.84% due 11/20/2028 | | | A+/NR | | | | 16,724 | | | | 16,761 | |
b Sierra Receivables Funding Co., LLC, Series 2014-1A Class A, 2.07% due 3/20/2030 | | | A/NR | | | | 26,022 | | | | 25,820 | |
b Sierra Receivables Funding Co., LLC, Series 2015-3A Class A, 2.58% due 9/20/2032 | | | A/NR | | | | 57,489 | | | | 57,714 | |
b Tax Ease Funding, LLC, Series 2016-1A Class A, 3.131% due 6/15/2028 | | | NR/NR | | | | 135,196 | | | | 134,852 | |
| | | | | | | | | | | | |
| | | | | | | | | | | 2,661,682 | |
| | | | | | | | | | | | |
| | | |
RESIDENTIAL MTG TRUST — 0.61% | | | | | | | | | | | | |
b B2R Mortgage Trust, Series 2015-2 Class A, 3.336% due 11/15/2048 | | | NR/NR | | | | 97,910 | | | | 99,978 | |
b Nationstar HECM Loan Trust, Series 16-1A Class A, 2.981% due 2/25/2026 | | | NR/Aaa | | | | 66,444 | | | | 66,396 | |
| | | | | | | | | | | | |
| | | | | | | | | | | 166,374 | |
| | | | | | | | | | | | |
| | | |
STUDENT LOAN — 2.69% | | | | | | | | | | | | |
b Navient Student Loan Trust, Series 2015-AA Class A1, 1.024% due 12/15/2021 | | | NR/Aaa | | | | 20,595 | | | | 20,580 | |
b Pennsylvania Higher Education Assistance Agency, Series 2012-1A Class A1 Floating Rate Note, 1.075% due 5/25/2057 | | | AA+/NR | | | | 56,670 | | | | 55,821 | |
b SLM Student Loan Trust, Series 2011-A Class A3 Floating Rate Note, 3.024% due 1/15/2043 | | | AAA/Aaa | | | | 100,000 | | | | 102,880 | |
SLM Student Loan Trust, Series 2013-4 Class A Floating Rate Note, 1.074% due 6/25/2027 | | | NR/Baa3 | | | | 62,689 | | | | 60,509 | |
SLM Student Loan Trust, Series 2013-6 Class A2 Floating Rate Note, 1.025% due 2/25/2021 | | | NR/Aaa | | | | 128,111 | | | | 127,939 | |
b SLM Student Loan Trust, Series 2013-B Class A2B Floating Rate Note, 1.624% due 6/17/2030 | | | AAA/NR | | | | 200,000 | | | | 200,098 | |
b Social Professional Loan Program, LLC, Series 2014-A Class A1 Floating Rate Note, 2.124% due 6/25/2025 | | | A/NR | | | | 116,349 | | | | 118,601 | |
b Social Professional Loan Program, LLC, Series 2014-B Class A2, 2.55% due 8/27/2029 | | | A/A2 | | | | 47,085 | | | | 47,750 | |
| | | | | | | | | | | 734,178 | |
| | | | | | | | | | | | |
TOTAL ASSET BACKED SECURITIES (Cost $7,650,416) | | | | | | | | | | | 7,655,340 | |
| | | | | | | | | | | | |
| | | |
CORPORATE BONDS — 38.67% | | | | | | | | | | | | |
AUTOMOBILES & COMPONENTS — 1.30% | | | | | | | | | | | | |
Automobiles — 1.30% | | | | | | | | | | | | |
b Daimler Finance North America, LLC, 2.45% due 5/18/2020 | | | A-/A3 | | | | 150,000 | | | | 153,166 | |
b Hyundai Capital America, 2.00% due 3/19/2018 | | | A-/Baa1 | | | | 50,000 | | | | 50,284 | |
28 Annual Reports
| | |
| SCHEDULE OF INVESTMENTS, CONTINUED | | |
| |
Thornburg Low Duration Income Fund | | September 30, 2016 |
| | | | | | | | | | | | |
Issuer-Description | | Credit Rating†
S&P/ Moody’s | | | Principal
Amount | | | Value | |
b Hyundai Capital America, 2.40% due 10/30/2018 | | | A-/Baa1 | | | $ | 50,000 | | | $ | 50,695 | |
b Nissan Motor Acceptance Corp., 1.95% due 9/12/2017 | | | A-/A3 | | | | 100,000 | | | | 100,387 | |
| | | | | | | | | | | | |
| | | | | | | | | | | 354,532 | |
| | | | | | | | | | | | |
| | | |
BANKS — 3.63% | | | | | | | | | | | | |
Banks — 3.63% | | | | | | | | | | | | |
Bank of America Corp. Floating Rate Note, 1.72% due 1/15/2019 | | | BBB+/Baa1 | | | | 100,000 | | | | 100,641 | |
Citigroup, Inc., 1.70% due 4/27/2018 | | | BBB+/Baa1 | | | | 75,000 | | | | 75,081 | |
Citigroup, Inc., 2.50% due 7/29/2019 | | | BBB+/Baa1 | | | | 75,000 | | | | 76,526 | |
Fifth Third Bank, 2.30% due 3/15/2019 | | | A-/A3 | | | | 200,000 | | | | 203,543 | |
JPMorgan Chase & Co., 1.957% due 10/29/2020 | | | A-/A3 | | | | 125,000 | | | | 127,340 | |
a Mitsubishi UFJ Financial Group, Inc. Floating Rate Note, 2.722% due 3/1/2021 | | | A/A1 | | | | 200,000 | | | | 207,259 | |
a Santander UK plc Floating Rate Note, 2.336% due 3/14/2019 | | | A/A1 | | | | 100,000 | | | | 101,686 | |
Wells Fargo & Co. Floating Rate Note, 1.843% due 12/7/2020 | | | A/A2 | | | | 100,000 | | | | 100,517 | |
| | | | | | | | | | | | |
| | | | | | | | | | | 992,593 | |
| | | | | | | | | | | | |
| | | |
CAPITAL GOODS — 1.12% | | | | | | | | | | | | |
Construction & Engineering — 0.37% | | | | | | | | | | | | |
URS Corp., 3.85% due 4/1/2017 | | | BB-/NR | | | | 100,000 | | | | 100,458 | |
Industrial Conglomerates — 0.38% | | | | | | | | | | | | |
Roper Technologies, Inc., 3.00% due 12/15/2020 | | | BBB/Baa2 | | | | 100,000 | | | | 103,951 | |
Machinery — 0.37% | | | | | | | | | | | | |
Stanley Black & Decker, Inc., 2.451% due 11/17/2018 | | | A-/Baa2 | | | | 100,000 | | | | 102,169 | |
| | | | | | | | | | | | |
| | | | | | | | | | | 306,578 | |
| | | | | | | | | | | | |
| | | |
COMMERCIAL & PROFESSIONAL SERVICES — 0.29% | | | | | | | | | | | | |
Professional Services — 0.29% | | | | | | | | | | | | |
Dun & Bradstreet, Inc., 4.00% due 6/15/2020 | | | BBB-/NR | | | | 75,000 | | | | 78,265 | |
| | | | | | | | | | | | |
| | | | | | | | | | | 78,265 | |
| | | | | | | | | | | | |
| | | |
CONSUMER DURABLES & APPAREL — 0.46% | | | | | | | | | | | | |
Leisure Products — 0.46% | | | | | | | | | | | | |
Mattel, Inc., 2.35% due 8/15/2021 | | | BBB/Baa1 | | | | 125,000 | | | | 126,724 | |
| | | | | | | | | | | | |
| | | | | | | | | | | 126,724 | |
| | | | | | | | | | | | |
| | | |
CONSUMER SERVICES — 0.37% | | | | | | | | | | | | |
Diversified Consumer Services — 0.37% | | | | | | | | | | | | |
George Washington University, 4.411% due 9/15/2017 | | | A+/A1 | | | | 100,000 | | | | 102,418 | |
| | | | | | | | | | | | |
| | | | | | | | | | | 102,418 | |
| | | | | | | | | | | | |
| | | |
DIVERSIFIED FINANCIALS — 4.17% | | | | | | | | | | | | |
Capital Markets — 2.76% | | | | | | | | | | | | |
a Deutsche Bank AG, 2.95% due 8/20/2020 | | | BBB+/Baa2 | | | | 75,000 | | | | 72,273 | |
Goldman Sachs Group, Inc. Floating Rate Note, 2.05% due 9/15/2020 | | | BBB+/A3 | | | | 100,000 | | | | 100,566 | |
Goldman Sachs Group, Inc. Floating Rate Note, 1.735% due 10/23/2019 | | | BBB+/A3 | | | | 50,000 | | | | 50,271 | |
Legg Mason, Inc., 2.70% due 7/15/2019 | | | BBB/Baa1 | | | | 100,000 | | | | 101,673 | |
Morgan Stanley, 2.80% due 6/16/2020 | | | BBB+/A3 | | | | 50,000 | | | | 51,293 | |
Morgan Stanley Floating Rate Note, 1.874% due 1/27/2020 | | | BBB+/A3 | | | | 75,000 | | | | 75,782 | |
State Street Corp. Floating Rate Note, 1.701% due 8/18/2020 | | | A/A1 | | | | 100,000 | | | | 100,942 | |
a,b UBS AG Jersey Floating Rate Note, 2.297% due 9/24/2020 | | | A-/Baa2 | | | | 200,000 | | | | 203,037 | |
| | | |
Consumer Finance — 0.19% | | | | | | | | | | | | |
Synchrony Financial, 3.00% due 8/15/2019 | | | BBB-/NR | | | | 50,000 | | | | 51,181 | |
| | | |
Diversified Financial Services — 1.22% | | | | | | | | | | | | |
b Athene Global Funding, 2.875% due 10/23/2018 | | | A-/NR | | | | 75,000 | | | | 74,832 | |
Intercontinental Exchange, Inc., 2.75% due 12/1/2020 | | | A/A2 | | | | 100,000 | | | | 103,824 | |
Moody’s Corp., 2.75% due 7/15/2019 | | | BBB+/NR | | | | 50,000 | | | | 51,433 | |
S&P Global, Inc., 2.50% due 8/15/2018 | | | NR/Baa1 | | | | 50,000 | | | | 50,789 | |
S&P Global, Inc., 3.30% due 8/14/2020 | | | NR/Baa1 | | | | 50,000 | | | | 52,486 | |
| | | | | | | | | | | | |
| | | | | | | | | | | 1,140,382 | |
| | | | | | | | | | | | |
| | | |
ENERGY — 2.50% | | | | | | | | | | | | |
Oil, Gas & Consumable Fuels — 2.50% | | | | | | | | | | | | |
b Chevron Phillips Chemical Co., LLC, Floating Rate Note, 1.507% due 5/1/2020 | | | A-/A2 | | | | 100,000 | | | | 97,091 | |
Annual Reports 29
| | |
| SCHEDULE OF INVESTMENTS, CONTINUED | | |
| |
Thornburg Low Duration Income Fund | | September 30, 2016 |
| | | | | | | | | | | | |
Issuer-Description | | Credit Rating†
S&P/ Moody’s | | | Principal
Amount | | | Value | |
Exxon Mobil Corp., 2.222% due 3/1/2021 | | | AA+/Aaa | | | $ | 75,000 | | | $ | 76,637 | |
Exxon Mobil Corp. Floating Rate Note, 1.622% due 3/1/2019 | | | AA+/Aaa | | | | 75,000 | | | | 75,729 | |
Exxon Mobil Corp. Floating Rate Note, 1.429% due 2/28/2018 | | | AA+/Aaa | | | | 50,000 | | | | 50,367 | |
b Kern River Funding Corp., 4.893% due 4/30/2018 | | | A/A2 | | | | 73,425 | | | | 76,877 | |
Marathon Petroleum Corp., 2.70% due 12/14/2018 | | | BBB/Baa2 | | | | 100,000 | | | | 102,158 | |
a Statoil ASA, 3.125% due 8/17/2017 | | | A+/Aa3 | | | | 200,000 | | | | 203,215 | |
| | | | | | | | | | | | |
| | | | | | | | | | | 682,074 | |
| | | | | | | | | | | | |
| | | |
FOOD & STAPLES RETAILING — 0.16% | | | | | | | | | | | | |
Food & Staples Retailing — 0.16% | | | | | | | | | | | | |
Smith’s 1994-A3 Pass Through Trust, 9.20% due 7/2/2018 | | | BBB/A2 | | | | 41,538 | | | | 44,868 | |
| | | | | | | | | | | | |
| | | | | | | | | | | 44,868 | |
| | | | | | | | | | | | |
| | | |
FOOD, BEVERAGE & TOBACCO — 3.34% | | | | | | | | | | | | |
Beverages — 1.11% | | | | | | | | | | | | |
Anheuser-Busch InBev Finance Inc. Floating Rate Note, 2.017% due 2/1/2021 | | | A-/A3 | | | | 150,000 | | | | 153,951 | |
Molson Coors Brewing Co., 2.10% due 7/15/2021 | | | BBB-/Baa3 | | | | 150,000 | | | | 151,380 | |
| | | |
Food Products — 1.85% | | | | | | | | | | | | |
General Mills, Inc., 1.40% due 10/20/2017 | | | BBB+/A3 | | | | 50,000 | | | | 50,118 | |
Ingredion, Inc., 1.80% due 9/25/2017 | | | BBB/Baa2 | | | | 100,000 | | | | 100,218 | |
Kraft Heinz Foods Co., 1.60% due 6/30/2017 | | | BBB-/Baa3 | | | | 250,000 | | | | 250,506 | |
Mead Johnson Nutrition Co., 3.00% due 11/15/2020 | | | BBB-/Baa1 | | | | 100,000 | | | | 104,151 | |
| | | |
Tobacco — 0.38% | | | | | | | | | | | | |
Altria Group, Inc., 2.625% due 1/14/2020 | | | A-/A3 | | | | 100,000 | | | | 103,450 | |
| | | | | | | | | | | | |
| | | | | | | | | | | 913,774 | |
| | | | | | | | | | | | |
| | | |
HEALTH CARE EQUIPMENT & SERVICES — 2.01% | | | | | | | | | | | | |
Health Care Equipment & Supplies — 0.91% | | | | | | | | | | | | |
Medtronic, Inc., 0.919% due 2/27/2017 | | | A/A3 | | | | 250,000 | | | | 250,091 | |
| | | |
Health Care Providers & Services — 1.10% | | | | | | | | | | | | |
Catholic Health Initiatives, 1.60% due 11/1/2017 | | | A-/A3 | | | | 100,000 | | | | 100,195 | |
b Roche Holding, Inc. Floating Rate Note, 0.971% due 9/30/2019 | | | AA/A1 | | | | 200,000 | | | | 199,915 | |
| | | | | | | | | | | | |
| | | | | | | | | | | 550,201 | |
| | | | | | | | | | | | |
| | | |
INSURANCE — 0.84% | | | | | | | | | | | | |
Insurance — 0.84% | | | | | | | | | | | | |
b Principal Life Global Funding II, 1.50% due 9/11/2017 | | | A+/A1 | | | | 50,000 | | | | 50,126 | |
b Principal Life Global Funding II, 2.375% due 9/11/2019 | | | A+/A1 | | | | 50,000 | | | | 51,063 | |
b Reliance Standard Life Insurance Co., 3.05% due 1/20/2021 | | | A/A2 | | | | 25,000 | | | | 25,734 | |
b Reliance Standard Life Insurance Co., 2.50% due 4/24/2019 | | | A/A2 | | | | 100,000 | | | | 101,675 | |
| | | | | | | | | | | | |
| | | | | | | | | | | 228,598 | |
| | | | | | | | | | | | |
| | | |
MATERIALS — 0.19% | | | | | | | | | | | | |
Chemicals — 0.19% | | | | | | | | | | | | |
Airgas, Inc., 3.05% due 8/1/2020 | | | A-/A3 | | | | 50,000 | | | | 51,889 | |
| | | | | | | | | | | | |
| | | | | | | | | | | 51,889 | |
| | | | | | | | | | | | |
| | | |
PHARMACEUTICALS, BIOTECHNOLOGY & LIFE SCIENCES — 2.49% | | | | | | | | | | | | |
Biotechnology — 0.38% | | | | | | | | | | | | |
Gilead Sciences, Inc., 2.55% due 9/1/2020 | | | A/A3 | | | | 100,000 | | | | 103,290 | |
| | | |
Pharmaceuticals — 2.11% | | | | | | | | | | | | |
a Actavis Funding SCS, 2.35% due 3/12/2018 | | | BBB/Baa3 | | | | 60,000 | | | | 60,619 | |
a Actavis Funding SCS Floating Rate Note, 2.10% due 3/12/2020 | | | BBB/Baa3 | | | | 60,000 | | | | 61,009 | |
b EMD Finance, LLC Floating Rate Note, 1.207% due 3/17/2017 | | | A/Baa1 | | | | 275,000 | | | | 275,117 | |
a,b Mylan N.V., 3.00% due 12/15/2018 | | | BBB-/Baa3 | | | | 100,000 | | | | 102,205 | |
Zoetis, Inc., 3.45% due 11/13/2020 | | | BBB-/Baa2 | | | | 75,000 | | | | 78,399 | |
| | | | | | | | | | | | |
| | | | | | | | | | | 680,639 | |
| | | | | | | | | | | | |
| | | |
REAL ESTATE — 0.37% | | | | | | | | | | | | |
Equity Real Estate Investment Trusts — 0.37% | | | | | | | | | | | | |
Select Income REIT, 2.85% due 2/1/2018 | | | BBB-/Baa2 | | | | 100,000 | | | | 100,594 | |
| | | | | | | | | | | | |
| | | | | | | | | | | 100,594 | |
| | | | | | | | | | | | |
30 Annual Reports
| | |
| SCHEDULE OF INVESTMENTS, CONTINUED | | |
| |
Thornburg Low Duration Income Fund | | September 30, 2016 |
| | | | | | | | | | | | |
Issuer-Description | | Credit Rating†
S&P/ Moody’s | | | Principal
Amount | | | Value | |
SOFTWARE & SERVICES — 3.41% | | | | | | | | | | | | |
Information Technology Services — 1.50% | | | | | | | | | | | | |
Fidelity National Information Services, Inc., 2.85% due 10/15/2018 | | | BBB/Baa3 | | | $ | 150,000 | | | $ | 153,939 | |
Fiserv, Inc., 2.70% due 6/1/2020 | | | BBB/Baa2 | | | | 100,000 | | | | 103,111 | |
Total System Services, Inc., 3.80% due 4/1/2021 | | | BBB-/Baa3 | | | | 50,000 | | | | 53,058 | |
Total System Services, Inc., 2.375% due 6/1/2018 | | | BBB-/Baa3 | | | | 100,000 | | | | 100,818 | |
| | | |
Internet Software & Services — 0.43% | | | | | | | | | | | | |
eBay, Inc., 2.50% due 3/9/2018 | | | BBB+/Baa1 | | | | 115,000 | | | | 116,627 | |
| | | |
Software — 1.48% | | | | | | | | | | | | |
Autodesk, Inc., 3.125% due 6/15/2020 | | | BBB/Baa2 | | | | 100,000 | | | | 102,999 | |
CA Technologies, Inc., 2.875% due 8/15/2018 | | | BBB+/Baa2 | | | | 125,000 | | | | 127,385 | |
Oracle Corp., 1.90% due 9/15/2021 | | | AA-/A1 | | | | 175,000 | | | | 175,444 | |
| | | | | | | | | | | | |
| | | | | | | | | | | 933,381 | |
| | | | | | | | | | | | |
| | | |
TECHNOLOGY HARDWARE & EQUIPMENT — 1.68% | | | | | | | | | | | | |
Communications Equipment — 0.93% | | | | | | | | | | | | |
Cisco Systems, Inc. Floating Rate Note, 1.411% due 2/21/2018 | | | AA-/A1 | | | | 150,000 | | | | 150,868 | |
Juniper Networks, Inc., 3.30% due 6/15/2020 | | | BBB/Baa2 | | | | 100,000 | | | | 103,691 | |
| | | |
Technology, Hardware, Storage & Peripherals — 0.75% | | | | | | | | | | | | |
Apple, Inc. Floating Rate Note, 1.637% due 2/22/2019 | | | AA+/Aa1 | | | | 50,000 | | | | 50,777 | |
Apple, Inc. Floating Rate Note, 1.947% due 2/23/2021 | | | AA+/Aa1 | | | | 50,000 | | | | 51,513 | |
b Hewlett Packard Enterprise Co. Floating Rate Note, 2.583% due 10/5/2018 | | | BBB/Baa2 | | | | 100,000 | | | | 101,682 | |
| | | | | | | | | | | | |
| | | | | | | | | | | 458,531 | |
| | | | | | | | | | | | |
| | | |
TELECOMMUNICATION SERVICES — 2.37% | | | | | | | | | | | | |
Diversified Telecommunication Services — 1.64% | | | | | | | | | | | | |
AT&T, Inc., 2.45% due 6/30/2020 | | | BBB+/Baa1 | | | | 100,000 | | | | 101,848 | |
AT&T, Inc., 1.561% due 6/30/2020 | | | BBB+/Baa1 | | | | 50,000 | | | | 50,432 | |
AT&T, Inc., 1.739% due 11/27/2018 | | | BBB+/Baa1 | | | | 50,000 | | | | 50,577 | |
Verizon Communications, Inc. Floating Rate Note, 1.627% due 6/17/2019 | | | BBB+/Baa1 | | | | 100,000 | | | | 100,981 | |
Verizon Communications, Inc. Floating Rate Note, 2.606% due 9/14/2018 | | | BBB+/Baa1 | | | | 140,000 | | | | 143,677 | |
| | | |
Wireless Telecommunication Services — 0.73% | | | | | | | | | | | | |
a Vodafone Group plc, 1.25% due 9/26/2017 | | | BBB+/Baa1 | | | | 200,000 | | | | 199,506 | |
| | | | | | | | | | | | |
| | | | | | | | | | | 647,021 | |
| | | | | | | | | | | | |
| | | |
TRANSPORTATION — 1.12% | | | | | | | | | | | | |
Air Freight & Logistics — 0.11% | | | | | | | | | | | | |
b FedEx Corp. 2012 Pass-Through Trust, 2.625% due 1/15/2018 | | | BBB/Baa1 | | | | 29,097 | | | | 29,228 | |
| | | |
Airlines — 0.63% | | | | | | | | | | | | |
American Airlines Group, Inc., 4.95% due 7/15/2024 | | | A/NR | | | | 159,823 | | | | 173,808 | |
| | | |
Road & Rail — 0.38% | | | | | | | | | | | | |
b Penske Truck Leasing Co. LP/PTL Finance Corp., 3.20% due 7/15/2020 | | | BBB-/Baa3 | | | | 100,000 | | | | 103,480 | |
| | | | | | | | | | | | |
| | | | | | | | | | | 306,516 | |
| | | | | | | | | | | | |
| | | |
UTILITIES — 6.85% | | | | | | | | | | | | |
Electric Utilities — 6.02% | | | | | | | | | | | | |
Cleveland Electric Illuminating Co., 7.88% due 11/1/2017 | | | BBB+/Baa1 | | | | 185,000 | | | | 196,740 | |
Commonwealth Edison Co., 6.15% due 9/15/2017 | | | A-/A2 | | | | 165,000 | | | | 172,457 | |
Duke Energy Corp. Floating Rate Note, 1.034% due 4/3/2017 | | | BBB+/Baa1 | | | | 200,000 | | | | 200,209 | |
Duke Energy Florida Project Finance, LLC, 1.196% due 3/1/2022 | | | AAA/Aaa | | | | 250,000 | | | | 249,472 | |
a,b Electricite de France S.A., 2.15% due 1/22/2019 | | | A-/A3 | | | | 100,000 | | | | 101,421 | |
a,b Electricite de France S.A. Floating Rate Note, 1.156% due 1/20/2017 | | | A-/A3 | | | | 215,000 | | | | 215,099 | |
a,b Enel Finance International S.A., 6.25% due 9/15/2017 | | | BBB/Baa2 | | | | 100,000 | | | | 104,408 | |
Exelon Corp., 1.55% due 6/9/2017 | | | BBB-/Baa2 | | | | 50,000 | | | | 50,038 | |
Exelon Corp., 2.85% due 6/15/2020 | | | BBB-/Baa2 | | | | 50,000 | | | | 51,844 | |
NextEra Energy Capital Holdings, Inc., 1.586% due 6/1/2017 | | | BBB+/Baa1 | | | | 100,000 | | | | 100,181 | |
Southern Power Co., 2.375% due 6/1/2020 | | | BBB+/Baa1 | | | | 100,000 | | | | 101,916 | |
The Southern Co., 2.45% due 9/1/2018 | | | BBB+/Baa2 | | | | 100,000 | | | | 101,935 | |
| | | |
Gas Utilities — 0.36% | | | | | | | | | | | | |
Spire, Inc. Floating Rate Note, 1.567% due 8/15/2017 | | | BBB+/Baa2 | | | | 100,000 | | | | 99,738 | |
Annual Reports 31
| | |
| SCHEDULE OF INVESTMENTS, CONTINUED | | |
| |
Thornburg Low Duration Income Fund | | September 30, 2016 |
| | | | | | | | | | | | |
Issuer-Description | | Credit Rating†
S&P/ Moody’s | | | Principal
Amount | | | Value | |
Multi-Utilities — 0.47% | | | | | | | | | | | | |
Dominion Gas Holdings, LLC, 2.50% due 12/15/2019 | | | BBB+/A2 | | | $ | 100,000 | | | $ | 102,698 | |
Dominion Resources, Inc., 1.25% due 3/15/2017 | | | BBB/Baa2 | | | | 25,000 | | | | 24,979 | |
| | | | | | | | | | | | |
| | | | | | | | | | | 1,873,135 | |
| | | | | | | | | | | | |
TOTAL CORPORATE BONDS (Cost $10,442,865) | | | | | | | | | | | 10,572,714 | |
| | | | | | | | | | | | |
| | | |
CONVERTIBLE BONDS — 0.18% | | | | | | | | | | | | |
REAL ESTATE — 0.18% | | | | | | | | | | | | |
Equity Real Estate Investment Trusts — 0.18% | | | | | | | | | | | | |
b IAS Operating Partnership LP, 5.00% due 3/15/2018 | | | NR/NR | | | | 50,000 | | | | 50,000 | |
| | | | | | | | | | | | |
TOTAL CONVERTIBLE BONDS (Cost $48,442) | | | | | | | | | | | 50,000 | |
| | | | | | | | | | | | |
| | | |
MUNICIPAL BONDS — 0.99% | | | | | | | | | | | | |
JobsOhio Beverage System, 2.217% due 1/1/2019 (State Liquor Enterprise) | | | AA/Aa3 | | | | 100,000 | | | | 102,275 | |
Louisiana Local Government Environmental Facilities and Community Development Authority, 1.66% due 2/1/2022 (Louisiana Utilities Restoration) | | | AAA/Aaa | | | | 66,151 | | | | 66,776 | |
Sandoval County, New Mexico, 1.452% due 6/1/2017 | | | A+/NR | | | | 100,000 | | | | 100,304 | |
| | | | | | | | | | | | |
TOTAL MUNICIPAL BONDS (Cost $264,084) | | | | | | | | | | | 269,355 | |
| | | | | | | | | | | | |
| | | |
SHORT TERM INVESTMENTS — 4.99% | | | | | | | | | | | | |
d Thornburg Capital Management Fund | | | | | | | 136,327 | | | | 1,363,270 | |
| | | | | | | | | | | | |
TOTAL SHORT TERM INVESTMENTS (Cost $1,363,270) | | | | | | | | | | | 1,363,270 | |
| | | | | | | | | | | | |
TOTAL INVESTMENTS — 99.98% (Cost $27,156,343) | | | | | | | | | | $ | 27,334,098 | |
OTHER ASSETS LESS LIABILITIES — 0.02% | | | | | | | | | | | 6,814 | |
| | | | | | | | | | | | |
NET ASSETS — 100.00% | | | | | | | | | | $ | 27,340,912 | |
| | | | | | | | | | | | |
Footnote Legend
| † | Credit ratings are unaudited. Rating changes may have occurred subsequent to the reporting period end. Bonds issued with a maturity of one year or less are assigned Moody’s ratings from MIG-1 to MIG-4 and Standard and Poor’s ratings from SP-1+ to SP-3 with MIG-1 and SP-1+ being the strongest ratings. |
| a | Yankee bond denominated in U.S. dollars and is issued in the U.S. by foreign banks and corporations. |
| b | Securities exempt from registration under Rule 144A of the Securities Act of 1933, as amended. These securities may only be resold in the ordinary course of business in transactions exempt from registration, normally to qualified institutional buyers. As of September 30, 2016, the aggregate value of these securities in the Fund’s portfolio was $7,874,400, representing 28.8% of the Fund’s net assets. |
| c | Security currently fair valued by the Valuation and Pricing Committee using procedures approved by the Trustees’ Audit Committee. |
| d | Investment in Affiliates - Shown below are holdings of voting securities of each portfolio company which is considered “affiliated” to the Fund under the Investment Company Act of 1940, including companies for which the Fund’s holding represented 5% or more of the company’s voting securities, and a series of the Thornburg Investment Trust in which the Fund invested for cash management purposes during the period: |
| | | | | | | | | | | | | | | | | | | | | | | | | | | | |
Issuer | | Shares/
Principal
September 30,
2015 | | | Gross
Additions | | | Gross
Reductions | | | Shares/
Principal
September 30,
2016 | | | Market
Value
September 30,
2016 | | | Investment
Income | | | Realized
Gain (Loss) | |
Thornburg Capital Management Fund | | | 307,812 | | | | 2,012,386 | | | | 2,183,871 | | | | 136,327 | | | $ | 1,363,270 | | | $ | 11,389 | | | $ | — | |
| | | | | | | | | | | | | | | | | | | | | | | | | | | | |
Total non-controlled affiliated issuers - 4.99% of net assets | | | $ | 1,363,270 | | | $ | 11,389 | | | $ | — | |
| | | | | | | | | | | | | | | | | | | | | | | | | | | | |
Portfolio Abbreviations
To simplify the listings of securities, abbreviations are used per the table below:
| | |
| CMO | | Collateralized Mortgage Obligation |
| Mtg | | Mortgage |
| REIT | | Real Estate Investment Trust |
| SBA | | Small Business Administration |
See notes to financial statements.
32 Annual Reports
| | |
| STATEMENTS OF ASSETS AND LIABILITIES | | |
| |
| | September 30, 2016 |
| | | | | | | | | | | | |
| | | Thornburg
Limited Term U.S.
Government Fund | | | Thornburg
Limited Term
Income Fund | | | Thornburg
Low Duration
Income Fund | |
ASSETS | | | | | | | | | | | | |
Investments at value (Note 3) | | | | | | | | | | | | |
Non-affiliated issuers (cost $320,455,962, $4,604,767,695, and $25,793,073, respectively) | | $ | 325,083,790 | | | $ | 4,684,487,008 | | | $ | 25,970,828 | |
Non-controlled affiliated issuer (cost $0, $0, and $1,363,270, respectively) | | | — | | | | — | | | | 1,363,270 | |
Cash | | | 9,260,334 | | | | 32,821,234 | | | | 1,931 | |
Receivable for investments sold | | | — | | | | 145,000 | | | | — | |
Receivable for fund shares sold | | | 498,225 | | | | 24,202,487 | | | | 17 | |
Receivable from investment advisor | | | — | | | | — | | | | 2,236 | |
Dividends receivable | | | — | | | | — | | | | 901 | |
Interest receivable | | | 1,042,697 | | | | 24,874,971 | | | | 78,943 | |
Prepaid expenses and other assets | | | 74,867 | | | | 132,886 | | | | 16,806 | |
| | | | | | | | | | | | |
Total Assets | | | 335,959,913 | | | | 4,766,663,586 | | | | 27,434,932 | |
| | | | | | | | | | | | |
| | | |
LIABILITIES | | | | | | | | | | | | |
Payable for investments purchased | | | — | | | | — | | | | 901 | |
Payable for fund shares redeemed | | | 347,295 | | | | 9,468,591 | | | | 6,581 | |
Payable to investment advisor and other affiliates (Note 4) | | | 169,424 | | | | 2,136,261 | | | | — | |
Accounts payable and accrued expenses | | | — | | | | 376,679 | | | | 85,717 | |
Dividends payable | | | 59,885 | | | | 811,198 | | | | 821 | |
| | | | | | | | | | | | |
Total Liabilities | | | 576,604 | | | | 12,792,729 | | | | 94,020 | |
| | | | | | | | | | | | |
| | | |
NET ASSETS | | $ | 335,383,309 | | | $ | 4,753,870,857 | | | $ | 27,340,912 | |
| | | | | | | | | | | | |
NET ASSETS CONSIST OF | | | | | | | | | | | | |
Undistributed (distribution in excess of) net investment income | | $ | (72,544 | ) | | $ | (502,475 | ) | | $ | 1,695 | |
Net unrealized appreciation on investments | | | 4,627,828 | | | | 79,719,313 | | | | 177,755 | |
Accumulated net realized gain (loss) | | | (9,444,330 | ) | | | (2,571,511 | ) | | | (7,521 | ) |
Net capital paid in on shares of beneficial interest | | | 340,272,355 | | | | 4,677,225,530 | | | | 27,168,983 | |
| | | | | | | | | | | | |
| | $ | 335,383,309 | | | $ | 4,753,870,857 | | | $ | 27,340,912 | |
| | | | | | | | | | | | |
Annual Reports 33
| | |
| STATEMENTS OF ASSETS AND LIABILITIES, CONTINUED |
| |
| | September 30, 2016 |
| | | | | | | | | | | | |
| | | Thornburg
Limited Term U.S.
Government Fund | | | Thornburg
Limited Term
Income Fund | | | Thornburg
Low Duration
Income Fund | |
NET ASSET VALUE | | | | | | | | | | | | |
Class A Shares:* | | | | | | | | | | | | |
Net asset value and redemption price per share ($111,873,997, $1,111,441,039, and $10,235,024 applicable to 8,440,211, 82,238,882, and 821,716 shares of beneficial interest outstanding - Note 5) | | $ | 13.25 | | | $ | 13.51 | | | $ | 12.46 | |
Maximum sales charge, 1.50% of offering price | | | 0.20 | | | | 0.21 | | | | 0.19 | |
| | | | | | | | | | | | |
Maximum offering price per share | | $ | 13.45 | | | $ | 13.72 | | | $ | 12.65 | |
| | | | | | | | | | | | |
| | | |
Class C Shares: | | | | | | | | | | | | |
Net asset value and offering price per share** ($48,368,951 and $667,680,092 applicable to 3,627,432 and 49,483,736 shares of beneficial interest outstanding - Note 5) | | $ | 13.33 | | | $ | 13.49 | | | $ | — | |
| | | | | | | | | | | | |
| | | |
Class I Shares: | | | | | | | | | | | | |
Net asset value, offering and redemption price per share ($144,437,047, $2,792,249,017, and $17,105,888 applicable to 10,896,562, 206,573,248, and 1,373,595 shares of beneficial interest outstanding - Note 5) | | $ | 13.26 | | | $ | 13.52 | | | $ | 12.45 | |
| | | | | | | | | | | | |
| | | |
Class R3 Shares: | | | | | | | | | | | | |
Net asset value, offering and redemption price per share ($28,036,543 and $104,309,197 applicable to 2,113,966 and 7,712,537 shares of beneficial interest outstanding - Note 5) | | $ | 13.26 | | | $ | 13.52 | | | $ | — | |
| | | | | | | | | | | | |
| | | |
Class R4 Shares: | | | | | | | | | | | | |
Net asset value, offering and redemption price per share ($2,096,792 and $6,327,511 applicable to 158,223 and 468,462 shares of beneficial interest outstanding - Note 5) | | $ | 13.25 | | | $ | 13.51 | | | $ | — | |
| | | | | | | | | | | | |
| | | |
Class R5 Shares: | | | | | | | | | | | | |
Net asset value, offering and redemption price per share ($569,979 and $71,864,001 applicable to 42,935 and 5,318,049 shares of beneficial interest outstanding - Note 5) | | $ | 13.28 | | | $ | 13.51 | | | $ | — | |
| | | | | | | | | | | | |
| * | Class B shares were converted to Class A shares on August 29, 2016. |
| ** | Redemption price per share is equal to net asset value less any applicable contingent deferred sales charge. |
See notes to financial statements.
34 Annual Reports
| | |
| STATEMENTS OF OPERATIONS | | |
| |
| | Year Ended September 30, 2016 |
| | | | | | | | | | | | |
| | | Thornburg
Limited Term U.S.
Government Fund | | | Thornburg
Limited Term
Income Fund | | | Thornburg
Low Duration
Income Fund | |
INVESTMENT INCOME | | | | | | | | | | | | |
Dividend income non-controlled affiliated issuer | | $ | — | | | $ | — | | | $ | 11,389 | |
Interest income (net of premium amortized of $819,235, $8,446,939, and $68,510 and net of paydown losses of $913,323, $2,899,359, and $9,597, respectively) | | | 6,295,092 | | | | 112,892,580 | | | | 354,784 | |
| | | | | | | | | | | | |
Total Income | | | 6,295,092 | | | | 112,892,580 | | | | 366,173 | |
| | | |
EXPENSES | | | | | | | | | | | | |
Investment advisory fees (Note 4) | | | 1,181,685 | | | | 14,609,966 | | | | 91,362 | |
Administration fees (Note 4) | | | | | | | | | | | | |
Class A Shares | | | 136,974 | | | | 1,328,038 | | | | 13,121 | |
Class B Shares | | | 188 | | | | — | | | | — | |
Class C Shares | | | 62,089 | | | | 795,401 | | | | — | |
Class I Shares | | | 65,137 | | | | 1,159,376 | | | | 6,172 | |
Class R3 Shares | | | 27,744 | | | | 157,661 | | | | — | |
Class R4 Shares | | | 1,772 | | | | 6,544 | | | | — | |
Class R5 Shares | | | 914 | | | | 36,451 | | | | — | |
Distribution and service fees (Note 4) | | | | | | | | | | | | |
Class A Shares | | | 273,949 | | | | 2,656,076 | | | | 21,072 | |
Class B Shares | | | 1,496 | | | | — | | | | — | |
Class C Shares | | | 248,503 | | | | 3,187,805 | | | | — | |
Class R3 Shares | | | 110,902 | | | | 625,165 | | | | — | |
Class R4 Shares | | | 3,553 | | | | 13,117 | | | | — | |
Transfer agent fees | | | | | | | | | | | | |
Class A Shares | | | 91,686 | | | | 1,156,410 | | | | 28,305 | |
Class B Shares | | | 3,901 | | | | — | | | | — | |
Class C Shares | | | 51,786 | | | | 500,010 | | | | — | |
Class I Shares | | | 90,385 | | | | 1,708,544 | | | | 4,967 | |
Class R3 Shares | | | 35,690 | | | | 118,319 | | | | — | |
Class R4 Shares | | | 4,882 | | | | 42,157 | | | | — | |
Class R5 Shares | | | 7,199 | | | | 196,084 | | | | — | |
Registration and filing fees | | | | | | | | | | | | |
Class A Shares | | | 24,803 | | | | 44,458 | | | | 26,191 | |
Class B Shares | | | 14,028 | | | | — | | | | — | |
Class C Shares | | | 19,741 | | | | 31,233 | | | | — | |
Class I Shares | | | 33,790 | | | | 189,908 | | | | 26,412 | |
Class R3 Shares | | | 19,228 | | | | 19,090 | | | | — | |
Class R4 Shares | | | 22,147 | | | | 21,997 | | | | — | |
Class R5 Shares | | | 21,337 | | | | 22,037 | | | | — | |
Custodian fees (Note 2) | | | 74,116 | | | | 402,152 | | | | 44,277 | |
Professional fees | | | 54,698 | | | | 121,435 | | | | 62,377 | |
Accounting fees (Note 4) | | | 10,674 | | | | 149,440 | | | | 702 | |
Trustee fees | | | 13,941 | | | | 185,150 | | | | 1,036 | |
Other expenses | | | 10,565 | | | | 245,535 | | | | 2,484 | |
| | | | | | | | | | | | |
Total Expenses | | | 2,719,503 | | | | 29,729,559 | | | | 328,478 | |
Less: | | | | | | | | | | | | |
Fees waived by investment advisor (Note 4) | | | — | | | | — | | | | (90,941 | ) |
Expenses reimbursed by investment advisor (Note 4) | | | (141,467 | ) | | | (277,116 | ) | | | (106,739 | ) |
| | | | | | | | | | | | |
Net Expenses | | | 2,578,036 | | | | 29,452,443 | | | | 130,798 | |
| | | | | | | | | | | | |
Net Investment Income | | $ | 3,717,056 | | | $ | 83,440,137 | | | $ | 235,375 | |
| | | | | | | | | | | | |
Annual Reports 35
| | |
| STATEMENTS OF OPERATIONS, CONTINUED | | |
| |
| | Year Ended September 30, 2016 |
| | | | | | | | | | | | |
| | | Thornburg
Limited Term U.S.
Government Fund | | | Thornburg
Limited Term
Income Fund | | | Thornburg
Low Duration
Income Fund | |
REALIZED AND UNREALIZED GAIN (LOSS) | | | | | | | | | | | | |
Net realized gain (loss) on non-affiliated issuer investments | | $ | 431,056 | | | $ | 368,703 | | | $ | 3,535 | |
Net change in unrealized appreciation (depreciation) on non-affiliated issuer investments | | | 624,568 | | | | 67,630,273 | | | | 163,252 | |
| | | | | | | | | | | | |
Net Realized and Unrealized Gain | | | 1,055,624 | | | | 67,998,976 | | | | 166,787 | |
| | | | | | | | | | | | |
Net Increase in Net Assets Resulting from Operations | | $ | 4,772,680 | | | $ | 151,439,113 | | | $ | 402,162 | |
| | | | | | | | | | | | |
See notes to financial statements.
36 Annual Reports
| | |
| STATEMENTS OF CHANGES IN NET ASSETS | | |
| |
Thornburg Limited Term U.S. Government Fund | | |
| | | | | | | | |
| | | Year Ended
September 30, 2016 | | | Year Ended
September 30, 2015 | |
INCREASE (DECREASE) IN NET ASSETS FROM | | | | | | | | |
| | |
OPERATIONS | | | | | | | | |
Net investment income | | $ | 3,717,056 | | | $ | 3,153,913 | |
Net realized gain (loss) on investments | | | 431,056 | | | | 185,164 | |
Net unrealized appreciation (depreciation) on investments | | | 624,568 | | | | 1,226,277 | |
| | | | | | | | |
| | |
Net Increase (Decrease) in Net Assets Resulting from Operations | | | 4,772,680 | | | | 4,565,354 | |
| | |
DIVIDENDS TO SHAREHOLDERS | | | | | | | | |
From net investment income | | | | | | | | |
Class A Shares | | | (1,621,961 | ) | | | (1,998,645 | ) |
Class B Shares | | | (213 | ) | | | (1,634 | ) |
Class C Shares | | | (599,665 | ) | | | (673,384 | ) |
Class I Shares | | | (2,370,502 | ) | | | (1,613,526 | ) |
Class R3 Shares | | | (314,773 | ) | | | (223,583 | ) |
Class R4 Shares | | | (20,171 | ) | | | (2,013 | ) |
Class R5 Shares | | | (31,611 | ) | | | (40,628 | ) |
| | |
FUND SHARE TRANSACTIONS (NOTE 5) | | | | | | | | |
Class A Shares | | | 6,979,231 | | | | (28,020,798 | ) |
Class B Shares* | | | (146,065 | ) | | | (569,272 | ) |
Class C Shares | | | 1,598,490 | | | | (4,206,537 | ) |
Class I Shares | | | 31,721,059 | | | | 43,553,428 | |
Class R3 Shares | | | 11,722,796 | | | | 2,569,073 | |
Class R4 Shares | | | 1,392,817 | | | | 689,938 | |
Class R5 Shares | | | (1,602,542 | ) | | | 313,658 | |
| | | | | | | | |
Net Increase in Net Assets | | | 51,479,570 | | | | 14,341,431 | |
| | |
NET ASSETS | | | | | | | | |
Beginning of Year | | | 283,903,739 | | | | 269,562,308 | |
| | | | | | | | |
| | |
End of Year | | $ | 335,383,309 | | | $ | 283,903,739 | |
| | | | | | | | |
| | |
Undistributed (distribution in excess of) net investment income | | $ | (72,544 | ) | | $ | 40,558 | |
| * | Class B shares converted to Class A shares on August 29, 2016. |
See notes to financial statements.
Annual Reports 37
| | |
| STATEMENTS OF CHANGES IN NET ASSETS | | |
| |
Thornburg Limited Term Income Fund | | |
| | | | | | | | |
| | | Year Ended
September 30, 2016 | | | Year Ended
September 30, 2015 | |
INCREASE (DECREASE) IN NET ASSETS FROM | | | | | | | | |
| | |
OPERATIONS | | | | | | | | |
Net investment income | | $ | 83,440,137 | | | $ | 72,828,989 | |
Net realized gain (loss) on investments | | | 368,703 | | | | 2,898,742 | |
Net unrealized appreciation (depreciation) on investments | | | 67,630,273 | | | | (26,307,541 | ) |
| | | | | | | | |
| | |
Net Increase (Decrease) in Net Assets Resulting from Operations | | | 151,439,113 | | | | 49,420,190 | |
| | |
DIVIDENDS TO SHAREHOLDERS | | | | | | | | |
From net investment income | | | | | | | | |
Class A Shares | | | (20,118,725 | ) | | | (19,108,273 | ) |
Class C Shares | | | (10,624,842 | ) | | | (10,876,303 | ) |
Class I Shares | | | (52,073,916 | ) | | | (42,187,380 | ) |
Class R3 Shares | | | (2,231,397 | ) | | | (2,507,503 | ) |
Class R4 Shares | | | (92,837 | ) | | | (45,910 | ) |
Class R5 Shares | | | (1,551,920 | ) | | | (693,620 | ) |
From realized gains | | | | | | | | |
Class A Shares | | | — | | | | (4,830,351 | ) |
Class C Shares | | | — | | | | (3,183,519 | ) |
Class I Shares | | | — | | | | (8,807,696 | ) |
Class R3 Shares | | | — | | | | (673,050 | ) |
Class R4 Shares | | | — | | | | (477 | ) |
Class R5 Shares | | | — | | | | (93,460 | ) |
| | |
FUND SHARE TRANSACTIONS (NOTE 5) | | | | | | | | |
Class A Shares | | | 117,352,214 | | | | 82,366,188 | |
Class C Shares | | | 46,797,603 | | | | 25,363,704 | |
Class I Shares | | | 773,360,293 | | | | 426,827,856 | |
Class R3 Shares | | | (70,153,200 | ) | | | 54,628,845 | |
Class R4 Shares | | | 2,318,125 | | | | 3,896,559 | |
Class R5 Shares | | | (25,337,098 | ) | | | 79,873,082 | |
| | | | | | | | |
Net Increase in Net Assets | | | 909,083,413 | | | | 629,368,882 | |
| | |
NET ASSETS | | | | | | | | |
Beginning of Year | | | 3,844,787,444 | | | | 3,215,418,562 | |
| | | | | | | | |
| | |
End of Year | | $ | 4,753,870,857 | | | $ | 3,844,787,444 | |
| | | | | | | | |
| | |
Distribution in excess of net investment income | | $ | (502,475 | ) | | $ | (83,528 | ) |
See notes to financial statements.
38 Annual Reports
| | |
| STATEMENTS OF CHANGES IN NET ASSETS | | |
| |
Thornburg Low Duration Income Fund | | |
| | | | | | | | |
| | | Year Ended
September 30, 2016 | | | Year Ended
September 30, 2015 | |
INCREASE (DECREASE) IN NET ASSETS FROM | | | | | | | | |
| | |
OPERATIONS | | | | | | | | |
Net investment income | | $ | 235,375 | | | $ | 103,665 | |
Net realized gain (loss) on investments | | | 3,535 | | | | (1,200 | ) |
Net unrealized appreciation (depreciation) on investments | | | 163,252 | | | | (10,894 | ) |
| | | | | | | | |
| | |
Net Increase (Decrease) in Net Assets Resulting from Operations | | | 402,162 | | | | 91,571 | |
| | |
DIVIDENDS TO SHAREHOLDERS | | | | | | | | |
From net investment income | | | | | | | | |
Class A Shares | | | (98,936 | ) | | | (62,161 | ) |
Class I Shares | | | (145,144 | ) | | | (41,488 | ) |
| | |
FUND SHARE TRANSACTIONS (NOTE 5) | | | | | | | | |
Class A Shares | | | 230,729 | | | | 3,274,840 | |
Class I Shares | | | 8,956,507 | | | | 4,356,593 | |
| | | | | | | | |
Net Increase in Net Assets | | | 9,345,318 | | | | 7,619,355 | |
| | |
NET ASSETS | | | | | | | | |
Beginning of Year | | | 17,995,594 | | | | 10,376,239 | |
| | | | | | | | |
| | |
End of Year | | $ | 27,340,912 | | | $ | 17,995,594 | |
| | | | | | | | |
| | |
Undistributed net investment income | | $ | 1,695 | | | $ | 2,542 | |
See notes to financial statements.
Annual Reports 39
| | |
| NOTES TO FINANCIAL STATEMENTS | | |
| |
| | September 30, 2016 |
NOTE 1 – ORGANIZATION
Thornburg Limited Term U.S. Government Fund (the “Government Fund”), Thornburg Limited Term Income Fund (the “Income Fund”) and Thornburg Low Duration Income Fund (the “Low Duration Fund”), collectively the (“Funds”), are diversified series of Thornburg Investment Trust (the “Trust”). The Trust is organized as a Massachusetts business trust under a Declaration of Trust dated June 3, 1987 and is registered as a diversified, open-end management investment company under the Investment Company Act of 1940, as amended. The Funds are currently three of twenty separate series of the Trust. Each series is considered to be a separate entity for financial reporting and tax purposes and bears expenses directly attributable to it. The Funds’ primary objectives are to obtain as high a level of current income as is consistent, in the view of Thornburg Investment Management, Inc., the Trust’s investment advisor (the “Advisor”), with the preservation of capital. As a secondary objective, the Government Fund and the Income Fund seek to reduce changes in their share prices compared to longer term portfolios.
The Government Fund currently has six classes of shares of beneficial interest: Class A, Class C, Institutional Class (“Class I”), and Retirement Classes (“Class R3,” “Class R4,” and “Class R5”). The Fund converted outstanding Class B shares into Class A shares on August 29, 2016. There was no contingent deferred sales charge for this redemption.
The Income Fund currently offers six classes of shares of beneficial interest outstanding, Class A, Class C, Institutional Class (“Class I”), and Retirement Classes (“Class R3,” “Class R4,” and “Class R5”).
The Low Duration Fund currently offers two classes of shares of beneficial interest outstanding, Class A and Institutional Class (“Class I”).
Each class of shares of the Funds represents an interest in the same portfolio of investments, except that (i) Class A shares are sold subject to a front-end sales charge collected at the time the shares are purchased and bear a service fee, (ii) Class B shares were sold at net asset value without a sales charge at the time of purchase, but were subject to a contingent deferred sales charge upon redemption and bear both a service fee and distribution fee, (iii) Class C shares are sold at net asset value without a sales charge at the time of purchase, but are subject to a contingent deferred sales charge upon redemption within one year of purchase, and bear both a service fee and a distribution fee, (iv) Class I shares are sold at net asset value without a sales charge at the time of purchase and may be subject to a service fee, (v) Class R3 shares are sold at net asset value without a sales charge, but bear both a service fee and a distribution fee, (vi) Class R4 shares are sold at net asset value without a sales charge at the time of purchase but bear a service fee, (vii) Class R5 shares are sold at net asset value without a sales charge at the time of purchase and may be subject to a service fee, and (viii) the respective classes may have different reinvestment privileges and conversion rights. Additionally, each Fund may allocate among its classes certain expenses, to the extent allocable to specific classes, including transfer agent fees, government registration fees, certain printing and postage costs, and administrative and legal expenses. Currently, class specific expenses of the Funds are limited to distribution and service fees, administration fees, and certain registration and transfer agent expenses.
The following is a summary of significant accounting policies followed by the Funds in the preparation of its financial statements. Each Fund prepares its financial statements in conformity with United States generally accepted accounting principles (“GAAP”), including investment company accounting and reporting guidance in the Financial Accounting Standards Board (the “FASB”) Accounting Standard Codification Topic 946.
NOTE 2 – SIGNIFICANT ACCOUNTING POLICIES
Security Valuation: All investments in securities held by the Fund are valued as described in Note 3.
Allocation of Income, Gains, Losses and Expenses: Net investment income (other than class specific expenses) and realized and unrealized gains and losses are allocated daily to each class of shares based upon the relative net asset value of outstanding shares (or the value of the dividend-eligible shares, as appropriate) of each class of shares at the beginning of the day (after adjusting for the current capital shares activity of the respective class). Expenses common to all Funds are allocated among the Funds comprising the Trust based upon their relative net asset values or other appropriate allocation methods. Operating expenses directly attributable to a specific class are charged against the operating income of that class.
Dividends and Distributions to Shareholders: Dividends and distributions to shareholders, which are determined in accordance with federal income tax regulations and may differ from GAAP, are recorded on the ex-dividend date. Ordinary income distributions, if any, are declared daily and paid monthly. Capital gain distributions, if any, are declared and paid annually and more often if deemed necessary by the Advisor. Dividends are paid and are reinvested in additional shares of the Fund at net asset value per share at the close of business on the ex-dividend date, or at the shareholder’s option, paid in cash.
Investment Income: Interest income is accrued as earned. Premiums and discounts are amortized or accreted, respectively, to call dates or maturity dates using the effective yield method of the respective investments, which is included in interest income on the Statement of Operations. Dividend income is recorded on the ex-dividend date.
40 Annual Reports
| | |
| NOTES TO FINANCIAL STATEMENTS, CONTINUED | | |
| |
| | September 30, 2016 |
Custodian Fees: Custodian fees disclosed in the Statement of Operations may include interest expenses incurred by the Fund on any cash overdrafts of its custodian account during the period. Such cash overdrafts may result from the effects of failed trades in portfolio securities and from cash outflows resulting from unanticipated shareholder redemption activity. The Fund pays interest to its custodian on any such cash overdraft at a rate equal to 2.50% of the overdraft amount in excess of $50,000.
Investment Transactions: Investment transactions are accounted for on a trade date basis. Realized gains and losses from the sale of investments are recorded on an identified cost basis.
When-Issued and Delayed Delivery Transactions: The Fund may engage in when-issued or delayed delivery transactions. To the extent the Fund engages in such transactions, it will do so for the purpose of acquiring portfolio investments consistent with the Fund’s investment objectives and not for the purpose of investment leverage or to speculate on interest rate or market changes. At the time the Fund makes a commitment to purchase an investment on a when-issued or delayed delivery basis, the Fund will record the transaction and reflect the value in determining its net asset value. When effecting such transactions, assets of an amount sufficient to make payment for the portfolio investments to be purchased will be segregated on the Fund’s records on the trade date. Investments purchased on a when-issued or delayed delivery basis do not earn interest until the settlement date.
Guarantees and Indemnifications: Under the Trust’s organizational documents (and under separate agreements with the independent Trustees), its officers and Trustees are provided with an indemnification against certain liabilities arising out of the performance of their duties to each Fund. In the normal course of business the Trust may also enter into contracts with service providers that contain general indemnifications. The Trust’s maximum exposure under these arrangements is unknown. However, based on experience, the Trust expects the risk of loss to be remote.
Use of Estimates: The preparation of financial statements in conformity with GAAP requires management to make estimates and assumptions that affect the reported amounts of assets and liabilities and disclosure of contingent assets and liabilities at the date of the financial statements and the reported amounts of increases (decreases) in net assets from operations during the reporting period. Actual results could differ from those estimates.
Federal Income Taxes: It is the policy of the Trust to comply with the provisions of the Internal Revenue Code applicable to regulated investment companies and to distribute to shareholders substantially all investment company taxable income including net realized gains on investments (if any), and tax exempt income of the Fund. Therefore, no provision for federal income or excise tax is required.
The Fund files income tax returns in United States federal and applicable state jurisdictions. The statute of limitations on the Fund’s tax return filings generally remains open for the three years following a return’s filing date. The Fund has analyzed each uncertain tax position believed to be material in the preparation of the Fund’s financial statements for the fiscal year ended September 30, 2016, including open tax years, to assess whether it is more likely than not that the position would be sustained upon examination, based on the technical merits of the position. The Fund has not identified any such position for which an asset or liability must be reflected in the Statement of Assets and Liabilities.
At September 30, 2016, information on the tax components of capital was as follows:
| | | | | | | | | | | | |
| | | Government Fund | | | Income Fund | | | Low Duration Fund | |
Cost of investments for tax purposes | | $ | 320,469,349 | | | $ | 4,605,086,797 | | | $ | 27,156,737 | |
| | | | | | | | | | | | |
Gross unrealized appreciation on a tax basis | | $ | 5,214,495 | | | $ | 93,565,760 | | | $ | 214,557 | |
Gross unrealized depreciation on a tax basis | | | (600,054 | ) | | | (14,165,549 | ) | | | (37,196 | ) |
| | | | | | | | | | | | |
Net unrealized appreciation (depreciation) on investments (tax basis) | | $ | 4,614,441 | | | $ | 79,400,211 | | | $ | 177,361 | |
| | | | | | | | | | | | |
Temporary book tax adjustments to the cost of investments and net unrealized appreciation (depreciation) for tax purposes result primarily from deferral of outstanding wash sale losses and outstanding Treasury Inflation-Protected Securities (“TIPS”) deflation adjustments.
At September 30, 2016, the Funds had deferred tax basis capital losses occurring subsequent to October 31, 2015 through September 30, 2016 as follows. For tax purposes, such losses will be recognized in the year ending September 30, 2017:
| | | | | | | | | | | | |
| | | Government Fund | | | Income Fund | | | Low Duration Fund | |
Deferred tax basis capital losses | | $ | 562,103 | | | $ | — | | | $ | 4,028 | |
| | | | | | | | | | | | |
Annual Reports 41
| | |
| NOTES TO FINANCIAL STATEMENTS, CONTINUED | | |
| |
| | September 30, 2016 |
At September 30, 2016, the Government Fund had cumulative tax basis capital losses of $8,758,031, (of which $2,091,263 are short-term and $6,666,768 are long-term) generated after September 30, 2011, which may be carried forward to offset future capital gains. To the extent such carryforwards are used, capital gain distributions may be reduced to the extent provided by regulations. Such capital loss carryforwards do not expire, but are required to be utilized to offset future gains prior to the utilization of losses generated prior to October 1, 2011.
At September 30, 2016, the Government Fund had cumulative tax basis capital losses generated prior to October 1, 2011 which may expire prior to utilization.
Capital loss carryforwards generated prior to October 31, 2011 expire as follows:
| | | | |
2018 | | $ | 17,316 | |
2019 | | | 106,151 | |
| | | | |
| | $ | 123,467 | |
| | | | |
At September 30, 2016, the Income Fund had cumulative tax basis capital losses of $2,252,409, (of which $0 are short-term and $2,252,409 are long-term) generated after September 30, 2011, which may be carried forward to offset future capital gains. To the extent such carryforwards are used, capital gain distributions may be reduced to the extent provided by regulations. Such capital loss carryforwards do not expire.
At September 30, 2016, the Low Duration Fund had cumulative tax basis capital losses of $3,471, (of which $0 are short-term and $3,471 are long-term) generated after September 30, 2011, which may be carried forward to offset future capital gains. To the extent such carryforwards are used, capital gain distributions may be reduced to the extent provided by regulations. Such capital loss carry-forwards do not expire.
In order to account for permanent book to tax differences, the Government Fund decreased distribution in excess of net investment income by $1,128,738, increased accumulated net realized gain (loss) by $1,110,135, and decreased net capital paid in on shares of beneficial interest by $18,603. The Income Fund decreased distribution in excess of net investment income by $2,834,553 and decreased accumulated net realized gain (loss) by $2,834,553. The Low Duration Fund increased distribution in excess of net investment income by $7,858 and decreased accumulated net realized gain (loss) by $7,858. Reclassifications have no impact upon the net asset value of the Funds and result primarily from paydown gains and losses and redesignation of distributions.
At September 30, 2016, the Funds had undistributed tax basis ordinary investment income and undistributed tax basis capital gains as follows:
| | | | | | | | | | | | |
| | | Government Fund | | | Income Fund | | | Low Duration Fund | |
Undistributed tax basis ordinary investment income | | $ | — | | | $ | 308,723 | | | $ | 2,888 | |
Undistributed tax basis capital gains | | $ | — | | | $ | — | | | $ | — | |
The tax character of distributions paid for the Funds during the years ended September 30, 2016, and September 30, 2015, was as follows:
| | | | | | | | | | | | | | | | | | | | | | | | |
| | | Government Fund | | | Income Fund | | | Low Duration Fund | |
| | | 2016 | | | 2015 | | | 2016 | | | 2015 | | | 2016 | | | 2015 | |
Distributions from: | | | | | | | | | | | | | | | | | | | | | | | | |
Ordinary income | | $ | 4,940,293 | | | $ | 4,553,413 | | | $ | 86,693,637 | | | $ | 78,665,311 | | | $ | 244,080 | | | $ | 103,649 | |
Return of capital | | | 18,603 | | | | — | | | | — | | | | — | | | | — | | | | — | |
Capital gains | | | — | | | | — | | | | — | | | | 14,342,231 | | | | — | | | | — | |
| | | | | | | | | | | | | | | | | | | | | | | | |
Total | | $ | 4,958,896 | | | $ | 4,553,413 | | | $ | 86,693,637 | | | $ | 93,007,542 | | | $ | 244,080 | | | $ | 103,649 | |
| | | | | | | | | | | | | | | | | | | | | | | | |
NOTE 3 – SECURITY VALUATION
Valuation of the Fund’s portfolio investment securities is performed in accordance with policies and procedures adopted by and under the oversight of the Trustees.
The Trustees of the Trust have appointed the Advisor to assist the Trustees in obtaining market values for portfolio investments, evaluate and monitor professional pricing service providers appointed by the Trustees’ Audit Committee (the “Audit Committee”) to assist in determining fair values for portfolio investments, assist in calculating fair values for portfolio investments in certain circumstances, and to perform other functions in connection with the valuation of investments. The Advisor acts through its Valuation and Pricing
42 Annual Reports
| | |
| NOTES TO FINANCIAL STATEMENTS, CONTINUED | | |
| |
| | September 30, 2016 |
Committee (the “Committee”) and other employees of the Advisor. The Committee regularly reviews its own valuation calculations, as well as the valuations, valuation techniques and services furnished by pricing service providers, considers circumstances which may require valuation calculations by the Committee, and reviews previous valuation calculations. The Committee reports to the Audit Committee on the Committee’s activities, the performance of pricing service providers, and other matters relating to valuation of portfolio investments.
In those instances when the Committee assists in calculating a fair value for a portfolio investment, the Committee seeks to determine the price that the Fund would reasonably expect to receive upon a sale of the investment in an orderly transaction between market participants on the valuation date. The Committee customarily utilizes quotations from securities broker dealers in calculating valuations, but also may utilize prices obtained from pricing service providers or other methods approved by the Audit Committee. Because fair values calculated by the Committee are estimates, the calculation of a value for an investment may differ from the price that would be realized by the Fund upon a sale of the investment, and the difference could be material to the Fund’s financial statements. The Committee’s calculation of a fair value for an investment may also differ from the prices obtained by other persons (including other mutual funds) for the investment.
Valuation of Securities: Debt obligations held by the Funds which are not listed or traded on exchanges or for which no reported market exists are ordinarily valued at the valuation obtained from a pricing service provider approved by the Audit Committee.
In any case when a pricing service provider fails to provide a valuation for a debt obligation held by the Funds, the Committee calculates a fair value for the obligation using alternative methods under procedures approved by the Audit Committee. Additionally, in cases when management believes that a valuation obtained from a pricing service provider merits review for significant reasons, the Committee decides whether or not to use the valuation calculated by the pricing service provider or to use an alternative method approved by the Audit Committee to calculate a fair value for the obligation.
Valuation Hierarchy: The Funds categorize investments based upon the inputs used in valuing those investments, according to a three-level hierarchy established in guidance from FASB. Categorization of investments using this hierarchy is intended by the FASB to maximize the use of observable inputs in valuing investments and minimize the use of unobservable inputs by requiring that the most observable inputs be used when available. Observable inputs are those that market participants would use in valuing an investment based on available market information. Unobservable inputs are those that reflect assumptions about the information market participants would use in valuing an investment. An investment’s level within the hierarchy is based on the lowest level input that is deemed significant to the valuation. The methodologies and inputs used to value investments are not necessarily indications of the risk or liquidity associated with those investments.
Various inputs are used in calculating valuations for a Fund’s investments. These inputs are generally summarized according to the three-level hierarchy below:
Level 1: Quoted prices in active markets for identical investments.
Level 2: Other direct or indirect significant observable inputs (including quoted prices for similar investments in active markets and other observable inputs, such as interest rates, prepayment rates, credit risk, etc.).
Level 3: Significant unobservable inputs (including the Committee’s own assumptions in calculating the fair values of investments).
Valuations for debt obligations held by a Fund are typically calculated by pricing service providers approved by the Audit Committee and are characterized as Level 2 within the valuation hierarchy.
In a limited number of cases the Committee calculates a fair value for investments using broker quotations or other methods approved by the Audit Committee. When the Committee uses a single broker quotation to calculate a fair value for an investment without other significant observable inputs, or if a fair value is calculated using other significant inputs that are considered unobservable, the investment is characterized as Level 3 within the hierarchy. Other significant unobservable inputs used to calculate a fair value in these instances might include an income-based valuation approach which considers discounted anticipated future cash flows from the investment and application of discounts due to the nature or duration of any restrictions on the disposition of the investment.
Valuations based upon the use of inputs from Levels 1, 2 or 3 may not represent the actual price received upon the disposition of an investment, and a Fund may receive a price that is lower than the valuation based upon these inputs when it sells the investment.
Annual Reports 43
| | |
| NOTES TO FINANCIAL STATEMENTS, CONTINUED | | |
| |
| | September 30, 2016 |
GOVERNMENT FUND
The following table displays a summary of the fair value hierarchy measurements of the Government Fund’s investments as of September 30, 2016. In any instance when valuation inputs from more than one level are used to determine the fair value of a specific investment, the investment is placed in the level of the table based upon the lowest level input that is significant in determining the fair value of the investment:
| | | | | | | | | | | | | | | | |
| | | Fair Value Measurements At September 30, 2016 | |
| | | Total | | | Level 1 | | | Level 2 | | | Level 3(a) | |
Assets | | | | | | | | | | | | | | | | |
Investments in Securities | | | | | | | | | | | | | | | | |
U.S. Treasury Securities | | $ | 83,244,751 | | | $ | 79,228,886 | | | $ | 4,015,865 | | | $ | — | |
U.S. Government Agencies | | | 61,213,653 | | | | — | | | | 58,350,232 | | | | 2,863,421 | |
Mortgage Backed | | | 155,426,320 | | | | — | | | | 155,426,320 | | | | — | |
Short Term Investments | | | 25,199,066 | | | | — | | | | 25,199,066 | | | | — | |
| | | | | | | | | | | | | | | | |
Total Investments in Securities | | $ | 325,083,790 | | | $ | 79,228,886 | | | $ | 242,991,483 | | | $ | 2,863,421 | |
| (a) | In accordance with the guidance prescribed in Accounting Standards Update (“ASU”) No. 2011-04, a portfolio security characterized as a Level 3 investment was fair valued by the Committee using a yield of 1.70% based upon a third party vendor projection of discounted cash flows. |
In accordance with the guidance prescribed in ASU No. 2011-04, it is the policy of the Fund to recognize transfers between levels and those underlying events which caused the movement. The Fund recognized no transfers between Levels 1 and 2 for the year ended September 30, 2016.
A rollforward of fair value measurements using significant unobservable inputs (Level 3) for the year ended September 30, 2016 is as follows:
| | | | | | | | |
| | | U.S. Government Agencies | | | Total(d) | |
Beginning Balance 9/30/2015 | | $ | 2,108,287 | | | $ | 2,108,287 | |
Accrued Discounts (Premiums) | | | 425 | | | | 425 | |
Net Realized Gain (Loss)(a) | | | 226,696 | | | | 226,696 | |
Gross Purchases | | | 3,000,000 | | | | 3,000,000 | |
Gross Sales | | | (2,375,038 | ) | | | (2,375,038 | ) |
Net Change in Unrealized Appreciation (Depreciation)(b)(c) | | | (96,949 | ) | | | (96,949 | ) |
Transfers into Level 3 | | | — | | | | — | |
Transfers out of Level 3 | | | — | | | | — | |
| | | | | | | | |
Ending Balance 9/30/2016 | | $ | 2,863,421 | | | $ | 2,863,421 | |
| (a) | Amount of net realized gain (loss) from investments recognized in income is included in the Fund’s Statement of Operations for the year ended September 30, 2016. |
| (b) | Amount of net change in unrealized appreciation (depreciation) on investments recognized in income is included in the Fund’s Statement of Operations for the year ended September 30, 2016. |
| (c) | The net change in unrealized appreciation (depreciation) attributable to securities owned at September 30, 2016, which were valued using significant unobservable inputs, was $88,788. This is included within net change in unrealized appreciation (depreciation) on investments in the Fund’s the Statement of Operations for the year ended September 30, 2016. |
| (d) | Level 3 investments represent 0.85% of total net assets at the year ended September 30, 2016. Significant fluctuations of the unobservable inputs applied to portfolio securities characterized as Level 3 investments could be expected to increase or decrease the fair value of these portfolio securities. |
44 Annual Reports
| | |
| NOTES TO FINANCIAL STATEMENTS, CONTINUED | | |
| |
| | September 30, 2016 |
INCOME FUND
The following table displays a summary of the fair value hierarchy measurements of the Income Fund’s investments as of September 30, 2016. In any instance when valuation inputs from more than one level are used to determine the fair value of a specific investment, the investment is placed in the level of the table based upon the lowest level input that is significant in determining the fair value of the investment:
| | | | | | | | | | | | | | | | |
| | | Fair Value Measurements At September 30, 2016 | |
| | | Total | | | Level 1 | | | Level 2 | | | Level 3(a) | |
Assets | | | | | | | | | | | | | | | | |
Investments in Securities | | | | | | | | | | | | | | | | |
U.S. Treasury Securities | | $ | 103,192,116 | | | $ | 103,192,116 | | | $ | — | | | $ | — | |
U.S. Government Agencies | | | 244,532,303 | | | | — | | | | 240,992,303 | | | | 3,540,000 | |
Other Government | | | 74,058,241 | | | | — | | | | 74,058,241 | | | | — | |
Mortgage Backed | | | 188,255,811 | | | | — | | | | 188,255,811 | | | | — | |
Asset Backed Securities | | | 1,118,461,558 | | | | — | | | | 1,108,794,384 | | | | 9,667,174 | |
Corporate Bonds | | | 2,218,747,875 | | | | — | | | | 2,218,747,875 | | | | — | |
Convertible Bonds | | | 19,950,000 | | | | — | | | | 19,950,000 | | | | — | |
Municipal Bonds | | | 121,458,081 | | | | — | | | | 121,458,081 | | | | — | |
Short Term Investments | | | 595,831,023 | | | | — | | | | 595,831,023 | | | | — | |
| | | | | | | | | | | | | | | | |
Total Investments in Securities | | $ | 4,684,487,008 | | | $ | 103,192,116 | | | $ | 4,568,087,718 | | | $ | 13,207,174 | |
| (a) | In accordance with the guidance prescribed in Accounting Standards Update (“ASU”) No. 2011-04, unadjusted broker quotes were applied to $2,237,813 portfolio securities characterized as Level 3 investments at September 30, 2016. The following table displays a summary of the valuation techniques and unobservable inputs used to value portfolio securities characterized as Level 3 investments, where no unadjusted broker quotes were available at September 30, 2016: |
| | | | | | | | | | | | |
| | | Fair Value At
September 30, 2016 | | | Valuation Technique(s) | | Unobservable Input | | Range
(Weighted Average) | |
U.S. Government Agencies | | $ | 3,540,000 | | | Market comparable securities yield method | | Yields of comparable securities | | | 2.32% (N/A | ) |
Asset Backed Securities | | | 7,429,361 | | | Cost basis | | Cost basis | | $ | 99.99 (N/A | ) |
| | | | | | | | | | | | |
Total | | $ | 10,969,361 | | | | | | | | | |
In accordance with the guidance prescribed in ASU No. 2011-04, it is the policy of the Fund to recognize transfers between levels and those underlying events which caused the movement. The Fund recognized no transfers between Levels 1 and 2 for the year ended September 30, 2016.
A rollforward of fair value measurements using significant unobservable inputs (Level 3) for the year ended September 30, 2016 is as follows:
| | | | | | | | | | | | |
| | | Asset Backed
Securities | | | U.S. Government
Agencies | | | Total(e) | |
Beginning Balance 9/30/2015 | | $ | 21,798,405 | | | $ | 5,300,096 | | | $ | 27,098,501 | |
Accrued Discounts (Premiums) | | | 16,997 | | | | (39,325 | ) | | | (22,328 | ) |
Net Realized Gain (Loss)(a) | | | 71,085 | | | | 207,817 | | | | 278,902 | |
Gross Purchases | | | 7,429,361 | | | | — | | | | 7,429,361 | |
Gross Sales | | | (532,000 | ) | | | (1,970,532 | ) | | | (2,502,532 | ) |
Net Change in Unrealized | | | | | | | | | | | | |
Appreciation (Depreciation)(b)(c) | | | (28,805 | ) | | | 41,944 | | | | 13,139 | |
Transfers into Level 3(d) | | | — | | | | — | | | | — | |
Transfers out of Level 3(d) | | | (19,087,869 | ) | | | — | | | | (19,087,869 | ) |
| | | | | | | | | | | | |
Ending Balance 9/30/2016 | | $ | 9,667,174 | | | $ | 3,540,000 | | | $ | 13,207,174 | |
| (a) | Amount of net realized gain (loss) from investments recognized in income is included in the Fund’s Statement of Operations for the year ended September 30, 2016. |
| (b) | Amount of net change in unrealized appreciation (depreciation) on investments recognized in income is included in the Fund’s Statement of Operations for the year ended September 30, 2016. |
| (c) | The net change in unrealized appreciation (depreciation) attributable to securities owned at September 30, 2016, which were valued using significant unobservable inputs, was $183,411. This is included within net change in unrealized appreciation (depreciation) on investments in the Fund’s the Statement of Operations for the year ended September 30, 2016. |
| (d) | Transfers into or out of Level 3 were out of or into Level 2, and were due to changes in other significant observable inputs available during the year ended September 30, 2016. Transfers into or out of Level 3 are based on the beginning market value of the period in which they occurred. |
| (e) | Level 3 investments represent 0.28% of total net assets at the year ended September 30, 2016. Significant fluctuations of the unobservable inputs applied to portfolio securities characterized as Level 3 investments could be expected to increase or decrease the fair value of these portfolio securities. |
Annual Reports 45
| | |
| NOTES TO FINANCIAL STATEMENTS, CONTINUED | | |
| |
| | September 30, 2016 |
LOW DURATION FUND
The following table displays a summary of the fair value hierarchy measurements of the Low Duration Fund’s investments as of September 30, 2016. In any instance when valuation inputs from more than one level are used to determine the fair value of a specific investment, the investment is placed in the level of the table based upon the lowest level input that is significant in determining the fair value of the investment:
| | | | | | | | | | | | | | | | |
| | | Fair Value Measurements At September 30, 2016 | |
| | | Total | | | Level 1 | | | Level 2 | | | Level 3(a) | |
Assets | | | | | | | | | | | | | | | | |
Investments in Securities | | | | | | | | | | | | | | | | |
U.S. Treasury Securities | | $ | 6,247,166 | | | $ | 6,247,166 | | | $ | — | | | $ | — | |
U.S. Government Agencies | | | 476,868 | | | | — | | | | 476,868 | | | | — | |
Mortgage Backed | | | 699,385 | | | | — | | | | 699,385 | | | | — | |
Asset Backed Securities | | | 7,655,340 | | | | — | | | | 7,585,346 | | | | 69,994 | |
Corporate Bonds | | | 10,572,714 | | | | — | | | | 10,572,714 | | | | — | |
Convertible Bonds | | | 50,000 | | | | — | | | | 50,000 | | | | — | |
Municipal Bonds | | | 269,355 | | | | — | | | | 269,355 | | | | — | |
Short Term Investments | | | 1,363,270 | | | | 1,363,270 | | | | — | | | | — | |
| | | | | | | | | | | | | | | | |
Total Investments in Securities | | $ | 27,334,098 | | | $ | 7,610,436 | | | $ | 19,653,668 | | | $ | 69,994 | |
| (a) | In accordance with the guidance prescribed in Accounting Standards Update (“ASU”) No. 2011-04, a portfolio security characterized as a Level 3 investment was fair valued by the Committee using cost basis of $99.99. |
In accordance with the guidance prescribed in ASU No. 2011-04, it is the policy of the Fund to recognize transfers between levels and those underlying events which caused the movement. The Fund recognized no transfers between Levels 1 and 2 for the year ended September 30, 2016.
A rollforward of fair value measurements using significant unobservable inputs (Level 3) for the year ended September 30, 2016 is as follows:
| | | | | | | | |
| | | Asset Backed Securities | | | Total(a) | |
Beginning Balance 9/30/2015 | | $ | — | | | $ | — | |
Accrued Discounts (Premiums) | | | — | | | | — | |
Net Realized Gain (Loss) | | | — | | | | — | |
Gross Purchases | | | 69,994 | | | | 69,994 | |
Gross Sales | | | — | | | | — | |
Net Change in Unrealized | | | | | | | | |
Appreciation (Depreciation) | | | — | | | | — | |
Transfers into Level 3 | | | — | | | | — | |
Transfers out of Level 3 | | | — | | | | — | |
| | | | | | | | |
Ending Balance 9/30/2016 | | $ | 69,994 | | | $ | 69,994 | |
| (a) | Level 3 investments represent 0.26% of total net assets at the year ended September 30, 2016. Significant fluctuations of the unobservable inputs applied to portfolio securities characterized as Level 3 investments could be expected to increase or decrease the fair value of these portfolio securities. |
NOTE 4 – INVESTMENT ADVISORY FEE AND OTHER TRANSACTIONS WITH AFFILIATES
Pursuant to an investment advisory agreement, the Advisor serves as the investment advisor and performs services for the Funds for which the fees are payable at the end of each month. Under the investment advisory agreement, a Fund pays the Advisor a management fee based on the daily net assets of a Fund at an annual rate as shown in the following table:
| | | | | | | | | | | | | | | | |
Government Fund | | | Income Fund | | | Low Duration Fund | |
Daily net assets | | Fee Rate | | | Daily Net Assets | | Fee Rate | | | Daily Net Assets | | Fee Rate | |
Up to $1 billion | | | 0.375 | % | | Up to $500 million | | | 0.500 | % | | Up to $1 Billion | | | 0.400 | % |
Next $1 billion | | | 0.325 | | | Next $500 million | | | 0.450 | | | Next $500 million | | | 0.300 | |
Over $2 billion | | | 0.275 | | | Next $500 million | | | 0.400 | | | Next $500 million | | | 0.250 | |
| | | | | | Next $500 million | | | 0.350 | | | Over $2 billion | | | 0.225 | |
| | | | | | Over $2 billion | | | 0.275 | | | | | | | |
46 Annual Reports
| | |
| NOTES TO FINANCIAL STATEMENTS, CONTINUED | | |
| |
| | September 30, 2016 |
The Government Fund’s effective management fee for the year ended September 30, 2016 was 0.375% of the Fund’s average dividend assets.
The Income Fund’s effective management fee for the year ended September 30, 2016 was 0.346% of the Fund’s average dividend assets.
The Low Duration Fund’s effective management fee for the year ended September 30, 2016 was 0.400% of the Fund’s average dividend assets, (before applicable management fee waiver of $90,941).
The Funds pay the Advisor the costs of personnel who perform certain accounting services for the Funds. For the year ended September 30, 2016 the Government Fund, Income Fund, and Low Duration Fund paid $10,674, $149,440, and $702 to the Advisor for these accounting services, respectively. The Trust has also entered into administrative service agreements with the Advisor, whereby the Advisor will perform certain administrative services for the shareholders of each class of the Funds’ shares, and for which fees will be payable at an annual rate of up to .125 of 1% per annum of the average daily net assets attributable to Class A, Class B, Class C, Class R3, and Class R4 shares, and up to .05 of 1% per annum of the average daily net assets attributable to Class I and Class R5 shares. Total administrative service fees incurred by each class of shares of the Funds for the year ended September 30, 2016, are set forth in the Statement of Operations.
The Trust has an underwriting agreement with Thornburg Securities Corporation (the “Distributor”), an affiliate of the Advisor, which acts as the distributor of the Funds’ shares. For the year ended September 30, 2016, the Distributor has advised the Funds that they earned net commissions and collected contingent deferred sales charges (CDSC fees) as follows:
| | | | | | | | | | | | |
| | | Government Fund | | | Income Fund | | | Low Duration Fund | |
Commissions | | $ | 251 | | | $ | 4,897 | | | $ | 69 | |
CDSC fees | | $ | 1,656 | | | $ | 40,698 | | | $ | — | |
Pursuant to a service plan under Rule 12b-1 of the Investment Company Act of 1940, the Funds may reimburse to the Advisor an amount not to exceed .25 of 1% per annum of the average daily net assets attributable to the applicable Class A, Class B, Class C, Class R3, and Class R4 shares of the Funds for payments made by the Advisor to securities dealers and other financial institutions to obtain various shareholder and distribution related services. For the year ended September 30, 2016, there were no 12b-1 service plan fees charged for Class I or Class R5 shares. The Advisor may pay out of its own resources additional expenses for distribution of each Fund’s shares and shareholder services.
The Trust has also adopted distribution plans pursuant to Rule 12b-1, applicable to each Fund’s Class C and Class R3 shares, and also applicable to Government Fund’s Class B shares, under which the Funds compensate the Distributor for services in promoting the sale of Class B, C, and R3 shares of the Funds at an annual rate of up to .75 of 1% per annum of the average daily net assets attributable to Class B shares, and an annual rate of up to .25 of 1% per annum of the average daily net assets attributable to Class C and Class R3 shares. Total fees incurred by each class of shares of the Funds under their respective service and distribution plans for the year ended September 30, 2016, are set forth in the Statements of Operations.
The Advisor and Distributor have contractually agreed to waive fees and reimburse expenses incurred by the Funds so that actual expenses of certain share classes do not exceed levels as specified in each Fund’s most recent prospectus. The agreement may be terminated by the Funds at any time, but may not be terminated by the Advisor or Distributor before February 1, 2017, unless the Advisor ceases to be the investment advisor to the Trust or the Distributor ceases to be the distributor of the Funds prior to that date. The Advisor and Distributor retain the right to be repaid by the Funds for fee waivers and expense reimbursements if expenses fall below the contractual limit prior to the end of the fiscal year.
| | | | | | | | | | | | |
| | | Government Fund | | | Income Fund | | | Low Duration Fund | |
Contractual: | | | | | | | | | | | | |
Class A | | $ | — | | | $ | — | | | $ | 69,054 | |
Class B | | $ | 16,814 | | | $ | — | | | $ | — | |
Class C | | $ | 4,376 | | | $ | — | | | $ | — | |
Class I | | $ | — | | | $ | — | | | $ | 37,685 | |
Class R3 | | $ | 70,743 | | | $ | 151,750 | | | $ | — | |
Class R4 | | $ | 24,358 | | | $ | 51,464 | | | $ | — | |
Class R5 | | $ | 25,176 | | | $ | 73,902 | | | $ | — | |
| | | |
| | | Government Fund | | | Income Fund | | | Low Duration Fund | |
Voluntary: | | | | | | | | | | | | |
Class A | | $ | — | | | $ | — | | | $ | 41,799 | |
Class I | | $ | — | | | $ | — | | | $ | 49,142 | |
Annual Reports 47
| | |
| NOTES TO FINANCIAL STATEMENTS, CONTINUED | | |
| |
| | September 30, 2016 |
Certain officers and Trustees of the Trust are also officers or directors of the Advisor and Distributor. The compensation of independent Trustees is borne by the Trust.
The percentage of direct investments in the Funds held by appointed Trustees, Officers, and the Advisor is approximately 0.02%, 0.54%, 4.31% for the Government Fund, Income Fund, and Low Duration Fund, respectively.
The Funds may purchase or sell securities from, or to an affiliated fund, provided the affiliation is due solely to having a common investment advisor, common officers, or common trustees, and provided that all such transactions will comply with Rule 17a-7 under the 1940 Act. For the year ended September 30, 2016, the Government and Low Duration Funds had no affiliated fund transactions. The Income Fund had transactions of $15,135,343 in purchases.
NOTE 5 – SHARES OF BENEFICIAL INTEREST
At September 30, 2016, there were an unlimited number of shares with no par value of beneficial interest authorized. Transactions in shares of beneficial interest were as follows:
GOVERNMENT FUND
| | | | | | | | | | | | | | | | |
| | | Year Ended
September 30, 2016 | | | Year Ended
September 30, 2015 | |
| | | Shares | | | Amount | | | Shares | | | Amount | |
Class A Shares | | | | | | | | | | | | | | | | |
Shares sold | | | 3,244,060 | | | $ | 42,920,650 | | | | 1,924,018 | | | $ | 25,556,433 | |
Shares converted from Class B shares | | | 3,192 | | | | 42,268 | | | | — | | | | — | |
Shares issued to shareholders in reinvestment of dividends | | | 107,867 | | | | 1,428,746 | | | | 117,336 | | | | 1,559,285 | |
Shares repurchased | | | (2,825,799 | ) | | | (37,412,433 | ) | | | (4,145,593 | ) | | | (55,136,516 | ) |
| | | | | | | | | | | | | | | | |
| | | | |
Net increase (decrease) | | | 529,320 | | | | 6,979,231 | | | | (2,104,239 | ) | | | (28,020,798 | ) |
| | | | | | | | | | | | | | | | |
| | | | |
Class B Shares* | | | | | | | | | | | | | | | | |
Shares sold | | | 13,171 | | | $ | 173,000 | | | | 1,585 | | | $ | 21,000 | |
Shares issued to shareholders in reinvestment of dividends | | | 15 | | | | 201 | | | | 118 | | | | 1,567 | |
Shares converted to Class A shares | | | (3,201 | ) | | | (42,268 | ) | | | — | | | | — | |
Shares repurchased | | | (20,937 | ) | | | (276,998 | ) | | | (44,658 | ) | | | (591,839 | ) |
| | | | | | | | | | | | | | | | |
| | | | |
Net increase (decrease) | | | (10,952 | ) | | | (146,065 | ) | | | (42,955 | ) | | | (569,272 | ) |
| | | | | | | | | | | | | | | | |
| | | | |
Class C Shares | | | | | | | | | | | | | | | | |
Shares sold | | | 1,382,885 | | | $ | 18,381,110 | | | | 567,096 | | | $ | 7,580,761 | |
Shares issued to shareholders in reinvestment of dividends | | | 39,396 | | | | 524,936 | | | | 44,200 | | | | 590,931 | |
Shares repurchased | | | (1,300,183 | ) | | | (17,307,556 | ) | | | (925,703 | ) | | | (12,378,229 | ) |
| | | | | | | | | | | | | | | | |
| | | | |
Net increase (decrease) | | | 122,098 | | | | 1,598,490 | | | | (314,407 | ) | | | (4,206,537 | ) |
| | | | | | | | | �� | | | | | | | |
| | | | |
Class I Shares | | | | | | | | | | | | | | | | |
Shares sold | | | 6,846,168 | | | $ | 90,628,309 | | | | 4,981,837 | | | $ | 66,066,766 | |
Shares issued to shareholders in reinvestment of dividends | | | 109,182 | | | | 1,446,413 | | | | 89,785 | | | | 1,193,030 | |
Shares repurchased | | | (4,567,281 | ) | | | (60,353,663 | ) | | | (1,785,584 | ) | | | (23,706,368 | ) |
| | | | | | | | | | | | | | | | |
| | | | |
Net increase (decrease) | | | 2,388,069 | | | | 31,721,059 | | | | 3,286,038 | | | | 43,553,428 | |
| | | | | | | | | | | | | | | | |
| | | | |
Class R3 Shares | | | | | | | | | | | | | | | | |
Shares sold | | | 1,457,239 | | | $ | 19,307,025 | | | | 565,901 | | | $ | 7,509,633 | |
Shares issued to shareholders in reinvestment of dividends | | | 21,503 | | | | 284,976 | | | | 15,356 | | | | 204,132 | |
Shares repurchased | | | (594,414 | ) | | | (7,869,205 | ) | | | (386,887 | ) | | | (5,144,692 | ) |
| | | | | | | | | | | | | | | | |
| | | | |
Net increase (decrease) | | | 884,328 | | | | 11,722,796 | | | | 194,370 | | | | 2,569,073 | |
| | | | | | | | | | | | | | | | |
48 Annual Reports
| | |
| NOTES TO FINANCIAL STATEMENTS, CONTINUED | | |
| |
| | September 30, 2016 |
| |
| GOVERNMENT FUND (continued) | | |
| | | | | | | | | | | | | | | | |
| | | Year Ended
September 30, 2016 | | | Year Ended
September 30, 2015 | |
| | | Shares | | | Amount | | | Shares | | | Amount | |
Class R4 Shares | | | | | | | | | | | | | | | | |
Shares sold | | | 120,688 | | | $ | 1,601,055 | | | | 59,286 | | | $ | 785,142 | |
Shares issued to shareholders in reinvestment of dividends | | | 1,452 | | | | 19,238 | | | | 145 | | | | 1,922 | |
Shares repurchased | | | (17,154 | ) | | | (227,476 | ) | | | (7,333 | ) | | | (97,126 | ) |
| | | | | | | | | | | | | | | | |
| | | | |
Net increase (decrease) | | | 104,986 | | | | 1,392,817 | | | | 52,098 | | | | 689,938 | |
| | | | | | | | | | | | | | | | |
| | | | |
Class R5 Shares | | | | | | | | | | | | | | | | |
Shares sold | | | 64,811 | | | $ | 858,427 | | | | 83,822 | | | $ | 1,113,821 | |
Shares issued to shareholders in reinvestment of dividends | | | 535 | | | | 7,096 | | | | 402 | | | | 5,348 | |
Shares repurchased | | | (185,977 | ) | | | (2,468,065 | ) | | | (60,670 | ) | | | (805,511 | ) |
| | | | | | | | | | | | | | | | |
| | | | |
Net increase (decrease) | | | (120,631 | ) | | | (1,602,542 | ) | | | 23,554 | | | | 313,658 | |
| | | | | | | | | | | | | | | | |
* Class B shares were converted to Class A shares on August 29, 2016. INCOME FUND | |
| | | Year Ended
September 30, 2016 | | | Year Ended
September 30, 2015 | |
| | | Shares | | | Amount | | | Shares | | | Amount | |
Class A Shares | | | | | | | | | | | | | | | | |
Shares sold | | | 32,795,693 | | | $ | 437,429,823 | | | | 25,227,014 | | | $ | 338,693,537 | |
Shares issued to shareholders in reinvestment of dividends | | | 1,328,847 | | | | 17,770,838 | | | | 1,573,173 | | | | 21,117,049 | |
Shares repurchased | | | (25,246,243 | ) | | | (337,848,447 | ) | | | (20,664,967 | ) | | | (277,444,398 | ) |
| | | | | | | | | | | | | | | | |
| | | | |
Net increase (decrease) | | | 8,878,297 | | | | 117,352,214 | | | | 6,135,220 | | | | 82,366,188 | |
| | | | | | | | | | | | | | | | |
| | | | |
Class C Shares | | | | | | | | | | | | | | | | |
Shares sold | | | 12,728,067 | | | $ | 169,641,470 | | | | 10,395,179 | | | $ | 139,390,004 | |
Shares issued to shareholders in reinvestment of dividends | | | 711,677 | | | | 9,500,564 | | | | 932,129 | | | | 12,491,193 | |
Shares repurchased | | | (9,928,440 | ) | | | (132,344,431 | ) | | | (9,440,866 | ) | | | (126,517,493 | ) |
| | | | | | | | | | | | | | | | |
| | | | |
Net increase (decrease) | | | 3,511,304 | | | | 46,797,603 | | | | 1,886,442 | | | | 25,363,704 | |
| | | | | | | | | | | | | | | | |
| | | | |
Class I Shares | | | | | | | | | | | | | | | | |
Shares sold | | | 104,313,980 | | | $ | 1,394,443,302 | | | | 67,108,821 | | | $ | 901,062,644 | |
Shares issued to shareholders in reinvestment of dividends | | | 3,427,302 | | | | 45,859,108 | | | | 3,275,176 | | | | 43,963,186 | |
Shares repurchased | | | (49,935,769 | ) | | | (666,942,117 | ) | | | (38,605,988 | ) | | | (518,197,974 | ) |
| | | | | | | | | | | | | | | | |
| | | | |
Net increase (decrease) | | | 57,805,513 | | | | 773,360,293 | | | | 31,778,009 | | | | 426,827,856 | |
| | | | | | | | | | | | | | | | |
| | | | |
Class R3 Shares | | | | | | | | | | | | | | | | |
Shares sold | | | 5,362,451 | | | $ | 71,387,699 | | | | 9,152,610 | | | $ | 122,597,022 | |
Shares issued to shareholders in reinvestment of dividends | | | 156,543 | | | | 2,091,489 | | | | 227,265 | | | | 3,052,454 | |
Shares repurchased | | | (10,779,842 | ) | | | (143,632,388 | ) | | | (5,298,078 | ) | | | (71,020,631 | ) |
| | | | | | | | | | | | | | | | |
| | | | |
Net increase (decrease) | | | (5,260,848 | ) | | | (70,153,200 | ) | | | 4,081,797 | | | | 54,628,845 | |
| | | | | | | | | | | | | | | | |
Annual Reports 49
| | |
| NOTES TO FINANCIAL STATEMENTS, CONTINUED | | |
| |
| | September 30, 2016 |
| |
| INCOME FUND (continued) | | |
| | | | | | | | | | | | | | | | |
| | | Year Ended | | | Year Ended | |
| | | September 30, 2016 | | | September 30, 2015 | |
| | | Shares | | | Amount | | | Shares | | | Amount | |
Class R4 Shares | | | | | | | | | | | | | | | | |
Shares sold | | | 363,454 | | | $ | 4,853,487 | | | | 342,702 | | | $ | 4,602,724 | |
Shares issued to shareholders in reinvestment of dividends | | | 1,985 | | | | 26,613 | | | | 287 | | | | 3,848 | |
Shares repurchased | | | (190,459 | ) | | | (2,561,975 | ) | | | (52,971 | ) | | | (710,013 | ) |
| | | | | | | | | | | | | | | | |
| | | | |
Net increase (decrease) | | | 174,980 | | | | 2,318,125 | | | | 290,018 | | | | 3,896,559 | |
| | | | | | | | | | | | | | | | |
| | | | |
Class R5 Shares | | | | | | | | | | | | | | | | |
Shares sold | | | 4,605,721 | | | $ | 61,328,527 | | | | 6,867,097 | | | $ | 91,721,414 | |
Shares issued to shareholders in reinvestment of dividends | | | 115,762 | | | | 1,545,596 | | | | 57,917 | | | | 775,893 | |
Shares repurchased | | | (6,632,663 | ) | | | (88,211,221 | ) | | | (943,243 | ) | | | (12,624,225 | ) |
| | | | | | | | | | | | | | | | |
| | | | |
Net increase (decrease) | | | (1,911,180 | ) | | | (25,337,098 | ) | | | 5,981,771 | | | | 79,873,082 | |
| | | | | | | | | | | | | | | | |
LOW DURATION FUND | |
| | | Year Ended | | | Year Ended | |
| | | September 30, 2016 | | | September 30, 2015 | |
| | | Shares | | | Amount | | | Shares | | | Amount | |
Class A Shares | | | | | | | | | | | | | | | | |
Shares sold | | | 418,546 | | | $ | 5,189,601 | | | | 591,759 | | | $ | 7,333,655 | |
Shares issued to shareholders in reinvestment of dividends | | | 7,788 | | | | 96,596 | | | | 4,384 | | | | 54,300 | |
Shares repurchased | | | (407,683 | ) | | | (5,055,468 | ) | | | (332,679 | ) | | | (4,113,115 | ) |
| | | | | | | | | | | | | | | | |
| | | | |
Net increase (decrease) | | | 18,651 | | | | 230,729 | | | | 263,464 | | | | 3,274,840 | |
| | | | | | | | | | | | | | | | |
| | | | |
Class I Shares | | | | | | | | | | | | | | | | |
Shares sold | | | 968,154 | | | $ | 12,006,139 | | | | 377,417 | | | $ | 4,668,821 | |
Shares issued to shareholders in reinvestment of dividends | | | 11,204 | | | | 139,078 | | | | 3,074 | | | | 38,070 | |
Shares repurchased | | | (256,766 | ) | | | (3,188,710 | ) | | | (28,279 | ) | | | (350,298 | ) |
| | | | | | | | | | | | | | | | |
| | | | |
Net increase (decrease) | | | 722,592 | | | | 8,956,507 | | | | 352,212 | | | | 4,356,593 | |
| | | | | | | | | | | | | | | | |
NOTE 6 – INVESTMENT TRANSACTIONS
For the year ended September 30, 2016, the Government Fund had purchase and sale transactions of investments (excluding short-term investments) of $116,767,608 and $26,981,151, respectively.
The Income Fund had purchase and sale transactions of investments (excluding short-term investments and U.S. Government obligations) of $1,411,867,297 and $706,639,601, respectively.
The Low Duration Fund had purchase and sale transactions of investments (excluding short-term investments and U.S. Government obligations) of $13,670,328 and $3,230,055, respectively.
50 Annual Reports
| | |
| NOTES TO FINANCIAL STATEMENTS, CONTINUED | | |
| |
| | September 30, 2016 |
OTHER NOTES
Risks: Each Fund’s investments subject it to risks including, but not limited to, management risk, interest rate risk, prepayment risk, credit risk, market and economic risk, liquidity risk, structured products risk and, in the case of the Income Fund and Low Duration Fund, the risks associated with investments in non-U.S. issuers. Please see each Fund’s prospectus for a discussion of the risks associated with an investment in the Funds.
Subsequent Events: Fund management believes no events have occurred between September 30, 2016 and the date of issuance of the financial statements that require adjustment to or disclosure in the accompanying financial statements.
Annual Reports 51
| | |
| FINANCIAL HIGHLIGHTS | | |
| |
Thornburg Limited Term U.S. Government Fund | | |
| | | | | | | | | | | | | | | | | | | | | | | | | | | | | | | | | | | | | | | | | | | | | | | | | | | | |
| | | PER SHARE PERFORMANCE (for a share outstanding throughout the Year) | | RATIOS TO AVERAGE NET ASSETS | | | SUPPLEMENTAL DATA | |
Unless
Otherwise
Noted,
Periods
are
Fiscal
Years
Ended
Sept. 30, | | Net Asset
Value
Beginning
of Year | | | Net
Investment
Income (Loss)+ | | Net
Realized
&
Unrealized
Gain(Loss)
on
Investments | | | Total from
Investment
Operations | | | Dividends
from Net
Investment
Income | | | Dividends
from Net
Realized
Gains | | Total
Dividends | | | Net
Asset
Value
End
of
Year | | Net
Investment
Income(Loss)
(%) | | | Expenses,
After Expense
Reductions(%) | | | Expenses,
After
Expense
Reductions
and
Net of
Custody
Credits(%) | | | Expenses,
Before
Expense
Reductions
(%) | | | Total
Return
(%)(a) | | | Portfolio
Turnover
Rate (%)(a) | | Net
Assets
at End
of
Year
(Thousands) | |
CLASS A SHARES | | | | | | | | | | | | | | | | | | | | | | | | | | | | | | | | | | | | | | | | | | | | | | |
2016(b),(c) | | $ | 13.26 | | | 0.14 | | | 0.05 | | | | 0.19 | | | | (0.20 | ) | | — | | | (0.20 | ) | | $13.25 | | | 1.08 | | | | 0.91 | | | | 0.91 | | | | 0.91 | | | | 1.41 | | | 9.78 | | $ | 111,874 | |
2015(b) | | $ | 13.27 | | | 0.15 | | | 0.06 | | | | 0.21 | | | | (0.22 | ) | | — | | | (0.22 | ) | | $13.26 | | | 1.15 | | | | 0.92 | | | | 0.92 | | | | 0.92 | | | | 1.62 | | | 14.15 | | $ | 104,933 | |
2014(b) | | $ | 13.36 | | | 0.19 | | | (0.02 | ) | | | 0.17 | | | | (0.26 | ) | | — | | | (0.26 | ) | | $13.27 | | | 1.41 | | | | 0.93 | | | | 0.93 | | | | 0.94 | | | | 1.30 | | | 8.14 | | $ | 132,916 | |
2013(b) | | $ | 13.86 | | | 0.20 | | | (0.39 | ) | | | (0.19 | ) | | | (0.31 | ) | | — | | | (0.31 | ) | | $13.36 | | | 1.45 | | | | 0.89 | | | | 0.89 | | | | 0.89 | | | | (1.38 | ) | | 12.18 | | $ | 159,225 | |
2012(b) | | $ | 13.90 | | | 0.25 | | | 0.06 | | | | 0.31 | | | | (0.35 | ) | | — | | | (0.35 | ) | | $13.86 | | | 1.79 | | | | 0.89 | | | | 0.89 | | | | 0.89 | | | | 2.29 | | | 9.89 | | $ | 214,749 | |
CLASS C SHARES | | | | | | | | | | | | | | | | | | | | | | | | | | | | | | | | | | | | | | | | | | | | | | |
2016 | | $ | 13.34 | | | 0.11 | | | 0.04 | | | | 0.15 | | | | (0.16 | ) | | — | | | (0.16 | ) | | $13.33 | | | 0.81 | | | | 1.19 | | | | 1.19 | | | | 1.20 | | | | 1.13 | | | 9.78 | | $ | 48,369 | |
2015 | | $ | 13.35 | | | 0.12 | | | 0.06 | | | | 0.18 | | | | (0.19 | ) | | — | | | (0.19 | ) | | $13.34 | | | 0.88 | | | | 1.20 | | | | 1.20 | | | | 1.21 | | | | 1.34 | | | 14.15 | | $ | 46,777 | |
2014 | | $ | 13.45 | | | 0.15 | | | (0.02 | ) | | | 0.13 | | | | (0.23 | ) | | — | | | (0.23 | ) | | $13.35 | | | 1.14 | | | | 1.19 | | | | 1.19 | | | | 1.20 | | | | 0.96 | | | 8.14 | | $ | 51,001 | |
2013 | | $ | 13.94 | | | 0.16 | | | (0.37 | ) | | | (0.21 | ) | | | (0.28 | ) | | — | | | (0.28 | ) | | $13.45 | | | 1.17 | | | | 1.17 | | | | 1.17 | | | | 1.17 | | | | (1.56 | ) | | 12.18 | | $ | 73,877 | |
2012 | | $ | 13.98 | | | 0.21 | | | 0.07 | | | | 0.28 | | | | (0.32 | ) | | — | | | (0.32 | ) | | $13.94 | | | 1.51 | | | | 1.17 | | | | 1.17 | | | | 1.17 | | | | 2.01 | | | 9.89 | | $ | 102,790 | |
CLASS I SHARES | | | | | | | | | | | | | | | | | | | | | | | | | | | | | | | | | | | | | | | | | | | | | | |
2016 | | $ | 13.26 | | | 0.19 | | | 0.05 | | | | 0.24 | | | | (0.24 | ) | | — | | | (0.24 | ) | | $13.26 | | | 1.43 | | | | 0.57 | | | | 0.57 | | | | 0.57 | | | | 1.83 | | | 9.78 | | $ | 144,437 | |
2015 | | $ | 13.27 | | | 0.19 | | | 0.06 | | | | 0.25 | | | | (0.26 | ) | | — | | | (0.26 | ) | | $13.26 | | | 1.45 | | | | 0.62 | | | | 0.62 | | | | 0.62 | | | | 1.93 | | | 14.15 | | $ | 112,853 | |
2014 | | $ | 13.36 | | | 0.23 | | | (0.02 | ) | | | 0.21 | | | | (0.30 | ) | | — | | | (0.30 | ) | | $13.27 | | | 1.73 | | | | 0.61 | | | | 0.61 | | | | 0.61 | | | | 1.62 | | | 8.14 | | $ | 69,309 | |
2013 | | $ | 13.86 | | | 0.24 | | | (0.38 | ) | | | (0.14 | ) | | | (0.36 | ) | | — | | | (0.36 | ) | | $13.36 | | | 1.78 | | | | 0.56 | | | | 0.56 | | | | 0.56 | | | | (1.05 | ) | | 12.18 | | $ | 73,645 | |
2012 | | $ | 13.90 | | | 0.29 | | | 0.07 | | | | 0.36 | | | | (0.40 | ) | | — | | | (0.40 | ) | | $13.86 | | | 2.12 | | | | 0.56 | | | | 0.55 | | | | 0.56 | | | | 2.63 | | | 9.89 | | $ | 98,112 | |
CLASS R3 SHARES | | | | | | | | | | | | | | | | | | | | | | | | | | | | | | | | | | | | | | | | | | | | | | |
2016 | | $ | 13.27 | | | 0.14 | | | 0.04 | | | | 0.18 | | | | (0.19 | ) | | — | | | (0.19 | ) | | $13.26 | | | 1.03 | | | | 0.98 | | | | 0.98 | | | | 1.30 | | | | 1.34 | | | 9.78 | | $ | 28,036 | |
2015 | | $ | 13.28 | | | 0.14 | | | 0.06 | | | | 0.20 | | | | (0.21 | ) | | — | | | (0.21 | ) | | $13.27 | | | 1.09 | | | | 0.99 | | | | 0.99 | | | | 1.35 | | | | 1.55 | | | 14.15 | | $ | 16,320 | |
2014 | | $ | 13.37 | | | 0.18 | | | (0.02 | ) | | | 0.16 | | | | (0.25 | ) | | — | | | (0.25 | ) | | $13.28 | | | 1.35 | | | | 0.99 | | | | 0.99 | | | | 1.31 | | | | 1.23 | | | 8.14 | | $ | 13,748 | |
2013 | | $ | 13.87 | | | 0.18 | | | (0.38 | ) | | | (0.20 | ) | | | (0.30 | ) | | — | | | (0.30 | ) | | $13.37 | | | 1.35 | | | | 0.99 | | | | 0.99 | | | | 1.27 | | | | (1.47 | ) | | 12.18 | | $ | 15,350 | |
2012 | | $ | 13.91 | | | 0.23 | | | 0.07 | | | | 0.30 | | | | (0.34 | ) | | — | | | (0.34 | ) | | $13.87 | | | 1.69 | | | | 1.00 | | | | 0.99 | | | | 1.29 | | | | 2.19 | | | 9.89 | | $ | 15,486 | |
CLASS R4 SHARES | | | | | | | | | | | | | | | | | | | | | | | | | | | | | | | | | | | | | | | | | | | | | | |
2016 | | $ | 13.26 | | | 0.14 | | | 0.04 | | | | 0.18 | | | | (0.19 | ) | | — | | | (0.19 | ) | | $13.25 | | | 1.04 | | | | 0.99 | | | | 0.99 | | | | 2.71 | | | | 1.33 | | | 9.78 | | $ | 2,097 | |
2015 | | $ | 13.27 | | | 0.13 | | | 0.08 | | | | 0.21 | | | | (0.22 | ) | | — | | | (0.22 | ) | | $13.26 | | | 1.00 | | | | 0.99 | | | | 0.99 | | | | 17.30 | (d) | | | 1.55 | | | 14.15 | | $ | 706 | |
2014(e) | | $ | 13.36 | | | 0.14 | | | (0.03 | ) | | | 0.11 | | | | (0.20 | ) | | — | | | (0.20 | ) | | $13.27 | | | 1.57 | (f) | | | 0.99 | (f) | | | 0.99 | (f) | | | 64.66 | (d)(f) | | | 0.78 | | | 8.14 | | $ | 15 | |
CLASS R5 SHARES | | | | | | | | | | | | | | | | | | | | | | | | | | | | | | | | | | | | | | | | | | | | | | |
2016 | | $ | 13.27 | | | 0.17 | | | 0.07 | | | | 0.24 | | | | (0.23 | ) | | — | | | (0.23 | ) | | $13.28 | | | 1.30 | | | | 0.67 | | | | 0.67 | | | | 2.05 | | | | 1.80 | | | 9.78 | | $ | 570 | |
2015 | | $ | 13.27 | | | 0.19 | | | 0.07 | | | | 0.26 | | | | (0.26 | ) | | — | | | (0.26 | ) | | $13.27 | | | 1.40 | | | | 0.67 | | | | 0.67 | | | | 2.02 | | | | 1.95 | | | 14.15 | | $ | 2,170 | |
2014 | | $ | 13.36 | | | 0.21 | | | — | (g) | | | 0.21 | | | | (0.30 | ) | | — | | | (0.30 | ) | | $13.27 | | | 1.59 | | | | 0.67 | | | | 0.67 | | | | 2.87 | | | | 1.56 | | | 8.14 | | $ | 1,859 | |
2013 | | $ | 13.85 | | | 0.24 | | | (0.39 | ) | | | (0.15 | ) | | | (0.34 | ) | | — | | | (0.34 | ) | | $13.36 | | | 1.83 | | | | 0.67 | | | | 0.67 | | | | 7.28 | (d) | | | (1.09 | ) | | 12.18 | | $ | 881 | |
2012(h) | | $ | 13.84 | | | 0.10 | | | 0.07 | | | | 0.17 | | | | (0.16 | ) | | — | | | (0.16 | ) | | $13.85 | | | 1.87 | (f) | | | 0.68 | (f) | | | 0.67 | (f) | | | 44.86 | (d)(f) | | | 1.20 | | | 9.89 | | $ | 299 | |
| (a) | Not annualized for periods less than one year. |
| (b) | Sales loads are not reflected in computing total return. |
| (c) | Class B shares converted to Class A shares on August 29, 2016. |
| (d) | Due to the size of net assets and fixed expenses, ratios may appear disproportionate. |
| (e) | Effective date of this class of shares was February 1, 2014. |
| (g) | Net realized and unrealized gain (loss) on investments was less than $0.01 per share. |
| (h) | Effective date of this class of shares was May 1, 2012. |
| + | Based on weighted average shares outstanding. |
See notes to financial statements.
| | | | |
| 52 Annual Reports | | | | Annual Reports 53 |
FINANCIAL HIGHLIGHTS
Thornburg Limited Term Income Fund
| | | | | | | | | | | | | | | | | | | | | | | | | | | | | | | | | | | | | | | | | | | | | | | | | | | | |
| | | PER SHARE PERFORMANCE (for a share outstanding throughout the year) | | RATIOS TO AVERAGE NET ASSETS | | | SUPPLEMENTAL DATA | |
Unless
Otherwise
Noted,
Periods
are Fiscal
Years
Ended
Sept. 30, | | Net Asset
Value
Beginning
of Year | | | Net
Investment
Income
(loss)+ | | Net
Realized
&
Unrealized
Gain (loss)
on
Investments | | | Total from
Investment
Operations | | Dividends
from Net
Investment
Income | | | Dividends
from Net
Realized
Gains | | Total
Dividends | | | Net
Asset
Value
End
of
Year | | Net
Investment
Income
(Loss)
(%) | | | Expenses,
After
Expense
Reductions
(%) | | | Expenses,
After
Expense
Reductions
and
Net of
Custody
Credits
(%) | | | Expenses,
Before
Expense
Reductions
(%) | | | Total
Return
(%)(a) | | | Portfolio
Turnover
Rate
(%)(a) | | | Net
Assets
at End
of
Year
(Thousands) | |
CLASS A SHARES | |
2016(b) | | $ | 13.32 | | | 0.24 | | | 0.20 | | | 0.44 | | | (0.25 | ) | | ��� | | | (0.25 | ) | | $13.51 | | | 1.82 | | | | 0.86 | | | | 0.86 | | | | 0.86 | | | | 3.36 | | | | 20.56 | | | $ | 1,111,441 | |
2015(b) | | $ | 13.49 | | | 0.26 | | | (0.09 | ) | | 0.17 | | | (0.27 | ) | | (0.07) | | | (0.34 | ) | | $13.32 | | | 1.94 | | | | 0.87 | | | | 0.87 | | | | 0.87 | | | | 1.27 | | | | 18.71 | | | $ | 977,470 | |
2014(b) | | $ | 13.42 | | | 0.29 | | | 0.19 | | | 0.48 | | | (0.30 | ) | | (0.11) | | | (0.41 | ) | | $13.49 | | | 2.15 | | | | 0.89 | | | | 0.89 | | | | 0.89 | | | | 3.61 | | | | 29.41 | | | $ | 906,708 | |
2013(b) | | $ | 13.72 | | | 0.32 | | | (0.22 | ) | | 0.10 | | | (0.34 | ) | | (0.06) | | | (0.40 | ) | | $13.42 | | | 2.33 | | | | 0.88 | | | | 0.88 | | | | 0.88 | | | | 0.69 | | | | 36.66 | | | $ | 1,029,692 | |
2012(b) | | $ | 13.32 | | | 0.39 | | | 0.52 | | | 0.91 | | | (0.42 | ) | | (0.09) | | | (0.51 | ) | | $13.72 | | | 2.94 | | | | 0.93 | | | | 0.93 | | | | 0.93 | | | | 7.04 | | | | 23.72 | | | $ | 1,049,044 | |
CLASS C SHARES | |
2016 | | $ | 13.30 | | | 0.21 | | | 0.20 | | | 0.41 | | | (0.22 | ) | | — | | | (0.22 | ) | | $13.49 | | | 1.59 | | | | 1.08 | | | | 1.08 | | | | 1.08 | | | | 3.13 | | | | 20.56 | | | $ | 667,680 | |
2015 | | $ | 13.47 | | | 0.23 | | | (0.09 | ) | | 0.14 | | | (0.24 | ) | | (0.07) | | | (0.31 | ) | | $13.30 | | | 1.71 | | | | 1.10 | | | | 1.10 | | | | 1.10 | | | | 1.04 | | | | 18.71 | | | $ | 611,555 | |
2014 | | $ | 13.39 | | | 0.26 | | | 0.20 | | | 0.46 | | | (0.27 | ) | | (0.11) | | | (0.38 | ) | | $13.47 | | | 1.92 | | | | 1.11 | | | | 1.11 | | | | 1.11 | | | | 3.46 | | | | 29.41 | | | $ | 593,658 | |
2013 | | $ | 13.70 | | | 0.28 | | | (0.23 | ) | | 0.05 | | | (0.30 | ) | | (0.06) | | | (0.36 | ) | | $13.39 | | | 2.09 | | | | 1.12 | | | | 1.12 | | | | 1.12 | | | | 0.38 | | | | 36.66 | | | $ | 632,918 | |
2012 | | $ | 13.30 | | | 0.36 | | | 0.52 | | | 0.88 | | | (0.39 | ) | | (0.09) | | | (0.48 | ) | | $13.70 | | | 2.70 | | | | 1.18 | | | | 1.18 | | | | 1.18 | | | | 6.78 | | | | 23.72 | | | $ | 604,314 | |
CLASS I SHARES | |
2016 | | $ | 13.33 | | | 0.29 | | | 0.20 | | | 0.49 | | | (0.30 | ) | | — | | | (0.30 | ) | | $13.52 | | | 2.17 | | | | 0.50 | | | | 0.50 | | | | 0.50 | | | | 3.73 | | | | 20.56 | | | $ | 2,792,249 | |
2015 | | $ | 13.49 | | | 0.31 | | | (0.08 | ) | | 0.23 | | | (0.32 | ) | | (0.07) | | | (0.39 | ) | | $13.33 | | | 2.29 | | | | 0.52 | | | | 0.52 | | | | 0.52 | | | | 1.71 | | | | 18.71 | | | $ | 1,982,536 | |
2014 | | $ | 13.42 | | | 0.33 | | | 0.20 | | | 0.53 | | | (0.35 | ) | | (0.11) | | | (0.46 | ) | | $13.49 | | | 2.49 | | | | 0.54 | | | | 0.54 | | | | 0.54 | | | | 3.98 | | | | 29.41 | | | $ | 1,578,168 | |
2013 | | $ | 13.73 | | | 0.36 | | | (0.23 | ) | | 0.13 | | | (0.38 | ) | | (0.06) | | | (0.44 | ) | | $13.42 | | | 2.68 | | | | 0.53 | | | | 0.53 | | | | 0.53 | | | | 0.98 | | | | 36.66 | | | $ | 1,260,449 | |
2012 | | $ | 13.32 | | | 0.44 | | | 0.53 | | | 0.97 | | | (0.47 | ) | | (0.09) | | | (0.56 | ) | | $13.73 | | | 3.27 | | | | 0.58 | | | | 0.58 | | | | 0.58 | | | | 7.49 | | | | 23.72 | | | $ | 1,012,430 | |
CLASS R3 SHARES | |
2016 | | $ | 13.33 | | | 0.23 | | | 0.20 | | | 0.43 | | | (0.24 | ) | | — | | | (0.24 | ) | | $13.52 | | | 1.69 | | | | 0.98 | | | | 0.98 | | | | 1.10 | | | | 3.23 | | | | 20.56 | | | $ | 104,309 | |
2015 | | $ | 13.50 | | | 0.24 | | | (0.09 | ) | | 0.15 | | | (0.25 | ) | | (0.07) | | | (0.32 | ) | | $13.33 | | | 1.82 | | | | 0.99 | | | | 0.99 | | | | 1.11 | | | | 1.16 | | | | 18.71 | | | $ | 172,992 | |
2014 | | $ | 13.43 | | | 0.27 | | | 0.19 | | | 0.46 | | | (0.28 | ) | | (0.11) | | | (0.39 | ) | | $13.50 | | | 2.04 | | | | 0.99 | | | | 0.99 | | | | 1.12 | | | | 3.51 | | | | 29.41 | | | $ | 120,013 | |
2013 | | $ | 13.73 | | | 0.30 | | | (0.22 | ) | | 0.08 | | | (0.32 | ) | | (0.06) | | | (0.38 | ) | | $13.43 | | | 2.22 | | | | 0.99 | | | | 0.99 | | | | 1.14 | | | | 0.59 | | | | 36.66 | | | $ | 81,585 | |
2012 | | $ | 13.33 | | | 0.39 | | | 0.52 | | | 0.91 | | | (0.42 | ) | | (0.09) | | | (0.51 | ) | | $13.73 | | | 2.88 | | | | 0.99 | | | | 0.99 | | | | 1.19 | | | | 6.97 | | | | 23.72 | | | $ | 73,373 | |
CLASS R4 SHARES | |
2016 | | $ | 13.32 | | | 0.23 | | | 0.20 | | | 0.43 | | | (0.24 | ) | | — | | | (0.24 | ) | | $13.51 | | | 1.70 | | | | 0.99 | | | | 0.99 | | | | 1.97 | | | | 3.23 | | | | 20.56 | | | $ | 6,328 | |
2015 | | $ | 13.48 | | | 0.24 | | | (0.08 | ) | | 0.16 | | | (0.25 | ) | | (0.07) | | | (0.32 | ) | | $13.32 | | | 1.82 | | | | 0.98 | | | | 0.98 | | | | 1.66 | | | | 1.24 | | | | 18.71 | | | $ | 3,908 | |
2014(c) | | $ | 13.42 | | | 0.18 | | | 0.07 | | | 0.25 | | | (0.19 | ) | | — | | | (0.19 | ) | | $13.48 | | | 1.99 | (d) | | | 0.99 | (d) | | | 0.99 | (d) | | | 61.75 | (d)(e) | | | 1.84 | | | | 29.41 | | | $ | 47 | |
CLASS R5 SHARES | |
2016 | | $ | 13.32 | | | 0.27 | | | 0.20 | | | 0.47 | | | (0.28 | ) | | — | | | (0.28 | ) | | $13.51 | | | 2.05 | | | | 0.62 | | | | 0.62 | | | | 0.72 | | | | 3.60 | | | | 20.56 | | | $ | 71,864 | |
2015 | | $ | 13.49 | | | 0.29 | | | (0.09 | ) | | 0.20 | | | (0.30 | ) | | (0.07) | | | (0.37 | ) | | $13.32 | | | 2.17 | | | | 0.64 | | | | 0.64 | | | | 0.67 | | | | 1.50 | | | | 18.71 | | | $ | 96,326 | |
2014 | | $ | 13.42 | | | 0.32 | | | 0.19 | | | 0.51 | | | (0.33 | ) | | (0.11) | | | (0.44 | ) | | $13.49 | | | 2.38 | | | | 0.64 | | | | 0.64 | | | | 0.72 | | | | 3.86 | | | | 29.41 | | | $ | 16,825 | |
2013 | | $ | 13.72 | | | 0.34 | | | (0.21 | ) | | 0.13 | | | (0.37 | ) | | (0.06) | | | (0.43 | ) | | $13.42 | | | 2.52 | | | | 0.65 | | | | 0.65 | | | | 1.01 | | | | 0.92 | | | | 36.66 | | | $ | 8,164 | |
2012(f) | | $ | 13.47 | | | 0.16 | | | 0.27 | | | 0.43 | | | (0.18 | ) | | — | | | (0.18 | ) | | $13.72 | | | 2.96 | (d) | | | 0.67 | (d) | | | 0.67 | (d) | | | 25.61 | (d)(e) | | | 3.19 | | | | 23.72 | | | $ | 1,322 | |
| (a) | Not annualized for periods less than one year. |
| (b) | Sales loads are not reflected in computing total return. |
| (c) | Effective date of this class of shares was February 1, 2014. |
| (e) | Due to the size of net assets and fixed expenses, ratios may appear disproportionate. |
| (f) | Effective date of this class of shares was May 1, 2012. |
| + | Based on weighted average shares outstanding. |
See notes to financial statements.
| | | | |
| 54 Annual Reports | | | | Annual Reports 55 |
FINANCIAL HIGHLIGHTS
Thornburg Low Duration Income Fund
| | | | | | | | | | | | | | | | | | | | | | | | | | | | | | | | | | | | | | | | | | | | | | | | |
| | | PER SHARE PERFORMANCE (for a share outstanding throughout the year) | | RATIOS TO AVERAGE NET ASSETS | | | SUPPLEMENTAL DATA | |
Unless
Otherwise
Noted,
Periods
are
Fiscal
Years
Ended Sept. 30, | | Net Asset
Value
Beginning
of Year | | | Net
Investment
Income
(Loss)+ | | Net
Realized
&
Unrealized
Gain (Loss)
on
Investments | | | Total from
Investment
Operations | | Dividends
from Net
Investment
Income | | | Dividends
from Net
Realized
Gains | | Total
Dividends | | | Net
Asset Value End
of
Year | | Net
Investment
Income
(Loss)
(%) | | | Expenses,
After
Expense
Reductions
(%) | | | Expenses,
After
Expense
Reductions
and
Net of
Custody
Credits
(%) | | | Expenses,
Before
Expense
Reductions
(%) | | | Total
Return
(%)(a) | | Portfolio
Turnover
Rate
(%)(a) | | Net
Assets
at End
of
Year
(Thousands) | |
CLASS A SHARES | |
2016(b) | | $ | 12.38 | | | 0.11 | | | 0.09 | | | 0.20 | | | (0.12 | ) | | — | | | (0.12 | ) | | $12.46 | | | 0.89 | | | | 0.69 | | | | 0.69 | | | | 1.74 | | | 1.60 | | 42.99 | | $ | 10,235 | |
2015(b) | | $ | 12.38 | | | 0.08 | | | — | (c) | | 0.08 | | | (0.08 | ) | | — | | | (0.08 | ) | | $12.38 | | | 0.67 | | | | 0.70 | | | | 0.70 | | | | 2.10 | | | 0.68 | | 29.22 | | $ | 9,940 | |
2014(b)(d) | | $ | 12.31 | | | 0.08 | | | 0.08 | | | 0.16 | | | (0.09 | ) | | — | | | (0.09 | ) | | $12.38 | | | 0.92 | (e) | | | 0.62 | (e) | | | 0.61 | (e) | | | 3.14 | (e) | | 1.33 | | 23.70 | | $ | 6,678 | |
CLASS I SHARES | |
2016 | | $ | 12.37 | | | 0.14 | | | 0.08 | | | 0.22 | | | (0.14 | ) | | — | | | (0.14 | ) | | $12.45 | | | 1.15 | | | | 0.48 | | | | 0.48 | | | | 1.18 | | | 1.81 | | 42.99 | | $ | 17,106 | |
2015 | | $ | 12.38 | | | 0.11 | | | (0.01 | ) | | 0.10 | | | (0.11 | ) | | — | | | (0.11 | ) | | $12.37 | | | 0.87 | | | | 0.50 | | | | 0.50 | | | | 1.89 | | | 0.80 | | 29.22 | | $ | 8,056 | |
2014(d) | | $ | 12.31 | | | 0.11 | | | 0.07 | | | 0.18 | | | (0.11 | ) | | — | | | (0.11 | ) | | $12.38 | | | 1.19 | (e) | | | 0.41 | (e) | | | 0.41 | (e) | | | 3.19 | (e) | | 1.48 | | 23.70 | | $ | 3,698 | |
| (a) | Not annualized for periods less than one year. |
| (b) | Sales loads are not reflected in computing total return. |
| (c) | Net realized and unrealized gain (loss) on investments was less than $0.01 per share. (d) Fund commenced operations on December 30, 2013. |
| + | Based on weighted average shares outstanding. |
See notes to financial statements.
| | | | |
| 56 Annual Reports | | | | Annual Reports 57 |
REPORT OF INDEPENDENT REGISTERED PUBLIC ACCOUNTING FIRM
To the Trustees and Shareholders of
Thornburg Limited Term Income Funds
In our opinion, the accompanying statements of assets and liabilities, including the schedules of investments in securities, and the related statements of operations and of changes in net assets and the financial highlights present fairly, in all material respects, the financial position of the Thornburg Limited Term Income Funds (comprised of the Thornburg Limited Term U.S. Government Fund, Thornburg Limited Term Income Fund, and Thornburg Low Duration Income Fund, hereafter referred to as the “Funds”) at September 30, 2016, the results of each of their operations for the year then ended, the changes in each of their net assets and the financial highlights for each of the periods presented in conformity with accounting principles generally accepted in the United States of America. These financial statements and financial highlights (hereafter referred to as “financial statements”) are the responsibility of the Funds’ management. Our responsibility is to express an opinion on these financial statements based on our audits. We conducted our audits of these financial statements in accordance with the standards of the Public Company Accounting Oversight Board (United States). Those standards require that we plan and perform the audit to obtain reasonable assurance about whether the financial statements are free of material misstatement. An audit includes examining, on a test basis, evidence supporting the amounts and disclosures in the financial statements, assessing the accounting principles used and significant estimates made by management, and evaluating the overall financial statement presentation. We believe that our audits, which included confirmation of securities at September 30, 2016 by correspondence with the custodian, brokers, transfer agent, and the application of alternative procedures where securities purchased had not been received, provide a reasonable basis for our opinion.
PricewaterhouseCoopers LLP
New York, New York
November 18, 2016
58 Annual Reports
| | |
| EXPENSE EXAMPLES | | |
| |
| | September 30, 2016 (Unaudited) |
As a shareholder of a Fund, you incur two types of costs:
| | (1) | transaction costs, including |
(a) sales charges (loads) on purchase payments, for Class A shares;
(b) a deferred sales charge on redemptions of any part or all of a purchase of $1 million of Class A shares within 12 months of purchase;
(c) a deferred sales charge on redemptions of Class C shares within 12 months of purchase;
| | (2) | ongoing costs, including management fees; distribution and/or service (12b-1) fees; and other Fund expenses. |
This example is intended to help you understand your ongoing costs (in dollars) of investing in a Fund and to compare these costs with the ongoing costs of investing in other mutual funds.
The example is based on a $1,000 investment beginning on April 1, 2016, and held until September 30, 2016.
ACTUAL EXPENSES
For each class of shares, the first line of the accompanying table provides information about actual account values and actual expenses. You may use the information in this line, together with the amount you invested, to estimate the expenses that you paid over the period. Simply divide your account value by $1,000 (for example, an $8,600 account value divided by $1,000 = 8.6), then multiply the result by the number in the first line for your class of shares under the heading entitled “Expenses Paid During Period” to estimate the expenses you paid on your account during this period.
HYPOTHETICAL EXAMPLE FOR COMPARISON PURPOSES
For each class of shares, the second line of the accompanying table provides information about hypothetical account values and hypothetical expenses based on the Fund’s actual expense ratio and an assumed rate of return of 5% per year before expenses, which is not the Fund’s actual return. The hypothetical account values and expenses may not be used to estimate the actual ending account balance or expenses you paid for the period. You may use this information to compare the ongoing costs of investing in the Fund and other funds. To do so, compare this 5% hypothetical example with the 5% hypothetical examples that appear in the shareholder reports of the other funds.
Please note that the expenses shown in the table are meant to highlight your ongoing costs only and do not reflect any transactional costs, such as sales charges (loads), redemption fees, or exchange fees. Therefore, the second line of the table for each class of shares is useful in comparing ongoing costs only, and will not help you determine the relative total costs of owning different funds. In addition, if these transactional costs were included, your costs would have been higher.
| | | | | | | | | | | | |
| | | Beginning
Account Value
4/1/16 | | | Ending
Account Value
9/30/16 | | | Expenses Paid
During period†
4/1/16–9/30/16 | |
LIMITED TERM U.S. GOVERNMENT FUND | | | | | | | | | |
Class A Shares | | | | | | | | | | | | |
Actual | | $ | 1,000.00 | | | $ | 1,005.90 | | | $ | 4.51 | |
Hypothetical* | | $ | 1,000.00 | | | $ | 1,020.50 | | | $ | 4.55 | |
Class C Shares | | | | | | | | | | | | |
Actual | | $ | 1,000.00 | | | $ | 1,004.50 | | | $ | 5.90 | |
Hypothetical* | | $ | 1,000.00 | | | $ | 1,019.11 | | | $ | 5.95 | |
Class I Shares | | | | | | | | | | | | |
Actual | | $ | 1,000.00 | | | $ | 1,008.30 | | | $ | 2.88 | |
Hypothetical* | | $ | 1,000.00 | | | $ | 1,022.14 | | | $ | 2.90 | |
Class R3 Shares | | | | | | | | | | | | |
Actual | | $ | 1,000.00 | | | $ | 1,005.50 | | | $ | 4.86 | |
Hypothetical* | | $ | 1,000.00 | | | $ | 1,020.16 | | | $ | 4.89 | |
Class R4 Shares | | | | | | | | | | | | |
Actual | | $ | 1,000.00 | | | $ | 1,005.50 | | | $ | 4.93 | |
Hypothetical* | | $ | 1,000.00 | | | $ | 1,020.08 | | | $ | 4.97 | |
Class R5 Shares | | | | | | | | | | | | |
Actual | | $ | 1,000.00 | | | $ | 1,008.50 | | | $ | 3.37 | |
Hypothetical* | | $ | 1,000.00 | | | $ | 1,021.64 | | | $ | 3.40 | |
LIMITED TERM INCOME FUND | | | | | | | | | |
Class A Shares | | | | | | | | | | | | |
Actual | | $ | 1,000.00 | | | $ | 1,021.60 | | | $ | 4.36 | |
Hypothetical* | | $ | 1,000.00 | | | $ | 1,020.69 | | | $ | 4.35 | |
Class C Shares | | | | | | | | | | | | |
Actual | | $ | 1,000.00 | | | $ | 1,020.50 | | | $ | 5.43 | |
Hypothetical* | | $ | 1,000.00 | | | $ | 1,019.62 | | | $ | 5.43 | |
Class I Shares | | | | | | | | | | | | |
Actual | | $ | 1,000.00 | | | $ | 1,024.20 | | | $ | 2.54 | |
Hypothetical* | | $ | 1,000.00 | | | $ | 1,022.49 | | | $ | 2.54 | |
Class R3 Shares | | | | | | | | | | | | |
Actual | | $ | 1,000.00 | | | $ | 1,021.00 | | | $ | 4.92 | |
Hypothetical* | | $ | 1,000.00 | | | $ | 1,020.13 | | | $ | 4.92 | |
Class R4 Shares | | | | | | | | | | | | |
Actual | | $ | 1,000.00 | | | $ | 1,021.70 | | | $ | 5.01 | |
Hypothetical* | | $ | 1,000.00 | | | $ | 1,020.05 | | | $ | 5.00 | |
Class R5 Shares | | | | | | | | | | | | |
Actual | | $ | 1,000.00 | | | $ | 1,022.60 | | | $ | 3.38 | |
Hypothetical* | | $ | 1,000.00 | | | $ | 1,021.66 | | | $ | 3.38 | |
LOW DURATION INCOME FUND | | | | | | | | | |
Class A Shares | | | | | | | | | | | | |
Actual | | $ | 1,000.00 | | | $ | 1,010.10 | | | $ | 3.38 | |
Hypothetical* | | $ | 1,000.00 | | | $ | 1,021.64 | | | $ | 3.40 | |
Class I Shares | | | | | | | | | | | | |
Actual | | $ | 1,000.00 | | | $ | 1,010.40 | | | $ | 2.32 | |
Hypothetical* | | $ | 1,000.00 | | | $ | 1,022.69 | | | $ | 2.33 | |
| † | Thornburg Limited Term U.S. Government Fund expenses are equal to the annualized expense ratio for each class (A: 0.90%; C: 1.18%; I: 0.57%; R3: 0.97% R4: 0.98% R5: 0.67%) multiplied by the average account value over the period, multiplied by 183/366 to reflect the one-half year period. |
| † | Thornburg Limited Term Income Fund expenses are equal to the annualized expense ratio for each class (A: 0.86%; C: 1.08%; I: 0.50%; R3: 0.97% R4: 0.99% R5: 0.67%) multiplied by the average account value over the period, multiplied by 183/366 to reflect the one-half year period. |
| † | Thornburg Low Duration Income Fund expenses are equal to the the annualized expense ratio for each class (A: 0.67%; I: 0.46%) multiplied by the average account value over the period, multiplied by 183/366 to reflect the one-half year period. |
| * | Hypothetical assumes a rate of return of 5% per year before expenses. |
Annual Reports 59
| | |
| TRUSTEES AND OFFICERS | | |
| |
| | September 30, 2016 (Unaudited) |
| | | | | | |
Name, Age, Year Elected Position Held with Fund | | Principal Occupation(s) During Past Five Years | | Other
Directorships
Held by Trustee | |
INTERESTED TRUSTEES(1)(2)(4) | | | | |
| | |
Garrett Thornburg, 71 Trustee since 1987, Chairman of Trustees(3) | | Chairman and controlling shareholder of Thornburg Investment Management, Inc. (investment advisor); Chairman and controlling shareholder of Thornburg Securities Corporation (securities dealer); Chairman and CEO of Chamisa Energy, LLC; President of the Thornburg Foundation (nonprofit). | | | None | |
| | |
Brian J. McMahon, 61 Trustee since 2001, Vice Chairman of Trustees, Member of Governance & Nominating Committee & Operations Risk Oversight Committee(5) | | Chief Investment Officer, Managing Director, and Portfolio Manager and, until 2016, CEO and President of Thornburg Investment Management, Inc.; Vice President of Thornburg Securities Corporation. | | | None | |
| |
INDEPENDENT TRUSTEES(1)(2)(4) | | | | |
| | |
David A. Ater, 71 Trustee since 1994, Member of Audit Committee & Chairman of Governance & Nominating Committee | | Principal in Ater & Associates, Santa Fe, NM (developer, planner and broker of residential and commercial real estate); owner, developer and broker for various real estate projects. | | | None | |
| | |
David D. Chase, 75 Trustee since 2000, Chairman of Audit Committee | | Managing Member of CS Group, LLC, Santa Fe, NM (private investment fund – family office). | | | None | |
| | |
Sally Corning, 55 Trustee since 2012, Member of Audit Committee | | Partner in Sun Mountain Capital, Santa Fe, NM (private equity firm with investment programs encompassing venture capital, mezzanine debt, and growth equity). | | | None | |
| | |
Susan H. Dubin, 67 Trustee since 2004, Member of Audit Committee & Governance and Nominating Committee | | President of Dubin Investments, Ltd., Greenwich, CT (private investment fund); Director and officer of various charitable organizations. | | | None | |
| | |
David L. Gardner, 53 Trustee since 2015, Member of Operations Risk Oversight Committee | | Until 2012, head of EMEA (Europe, Middle East and Africa) Sales for iShares of Blackrock, Inc., EMEA Executive Committee Member and EMEA Operating Committee Member at Blackrock, Inc. | | | None | |
| | |
Owen D. Van Essen, 62 Trustee since 2004, Member of Governance & Nominating Committee & Chairman of Operations Risk Oversight Committee | | President of Dirks, Van Essen & Murray, Santa Fe, NM (newspaper mergers and acquisitions). | | | None | |
| | |
James W. Weyhrauch, 57 Trustee since 1996, Member of Audit Committee & Operations Risk Oversight Committee | | Real estate broker, Santa Fe Properties, Santa Fe, NM; Vice Chairman of Nambe LLC, Santa Fe, NM (manufacturing & design company). | | | None | |
60 Annual Reports
| | |
| TRUSTEES AND OFFICERS, CONTINUED | | |
| |
| | September 30, 2016 (Unaudited) |
| | | | | | |
Name, Age, Year Elected Position Held with Fund | | Principal Occupation(s) During Past Five Years | | Other
Directorships
Held by Trustee | |
| |
OFFICERS OF THE FUND (WHO ARE NOT TRUSTEES)(1)(7) | | | | |
| | |
Nimish Bhatt, 53 Treasurer since 2016(6) | | Chief Financial Officer and Treasurer of Thornburg Investment Management, Inc. and Thornburg Securities Corporation since 2016; Senior Vice President (2004-2016), Chief Financial Officer (2011-2016), and Head of Fund Administration (2011-2016) of Calamos Asset Management, Inc., Calamos Investments LLC, Calamos Advisors LLC, and Calamos Wealth Management; Director of Calamos Global Funds plc (2007-2016). | | | Not applicable | |
| | |
Jason Brady, 42 President since 2016(6) | | CEO and President since 2016, Vice President from 2011 to 2016, Portfolio Manager and Managing Director of Thornburg Investment Management, Inc.; Vice President of Thornburg Securities Corporation since 2016. | | | Not applicable | |
| | |
Kathleen Brady, 56 Vice President since 2008 | | Tax Manager Fund Accounting of Thornburg Investment Management, Inc. | | | Not applicable | |
| | |
Connor Browne, 37 Vice President since 2006 | | Portfolio Manager, Vice President since 2013, and Managing Director of Thornburg Investment Management, Inc. | | | Not applicable | |
| | |
Tim Cunningham, 41 Vice President since 2014 | | Managing Director since 2011, Portfolio Manager since 2012, and Associate Portfolio Manager from 2009–2012 of Thornburg Investment Management, Inc. | | | Not applicable | |
| | |
Randy Dry, 42 Vice President since 2014 | | Vice President and Managing Director, Director of Institutional Group from 2014-2016, and since 2016, Chief Administrative Officer of Thornburg Investment Management, Inc. | | | Not applicable | |
| | |
Greg Dunn, 40 Vice President since 2014 | | Managing Director, Portfolio Manager since 2012, and Associate Portfolio Manager from 2009–2012 of Thornburg Investment Management, Inc. | | | Not applicable | |
| | |
Lon Erickson, 41 Vice President since 2008 | | Portfolio Manager and Managing Director of Thornburg Investment Management, Inc. | | | Not applicable | |
| | |
William V. Fries, 77 Vice President since 1995 | | Portfolio Manager, Vice President, and Managing Director of Thornburg Investment Management, Inc. | | | Not applicable | |
| | |
Thomas Garcia, 45 Vice President since 2006 | | Vice President since 2011, Managing Director, Head Equity Trader, and Associate Portfolio Manager of Thornburg Investment Management, Inc. | | | Not applicable | |
| | |
Rolf Kelly, 37 Vice President since 2016 | | Portfolio Manager and Managing Director since 2013 and Associate Portfolio Manager from 2011–2013 of Thornburg Investment Management, Inc. | | | Not applicable | |
| | |
Ben Kirby, 36 Vice President since 2014 | | Portfolio Manager and Managing Director since 2013 and Associate Portfolio Manager from 2011–2013 of Thornburg Investment Management, Inc. | | | Not applicable | |
| | |
Jeff Klingelhofer, 41 Vice President since 2016 | | Portfolio Manager and Managing Director since 2015, Associate Portfolio Manager from 2012–2015, and Fixed Income Analyst from 2010–2012 of Thornburg Investment Management, Inc. | | | Not applicable | |
| | |
Rob MacDonald, 40 Vice President since 2016 | | Managing Director since 2015, Portfolio Manager since 2014, and Associate Portfolio Manager from 2011–2014 of Thornburg Investment Management, Inc. | | | Not applicable | |
| | |
Leigh Moiola, 49 Vice President since 2001 | | Vice President, Managing Director, and Director of Marketing of Thornburg Investment Management, Inc.; Vice President of Thornburg Securities Corporation. | | | Not applicable | |
| | |
Christopher Ryon, 60 Vice President since 2008 | | Portfolio Manager and Managing Director of Thornburg Investment Management, Inc. | | | Not applicable | |
| | |
Nicholos Venditti, 35 Vice President since 2016 | | Portfolio Manager and Managing Director since 2015 and Associate Portfolio Manager from 2011–2015 of Thornburg Investment Management, Inc. | | | Not applicable | |
Annual Reports 61
| | |
| TRUSTEES AND OFFICERS, CONTINUED | | |
| |
| | September 30, 2016 (Unaudited) |
| | | | |
Name, Age, Year Elected Position Held with Fund | | Principal Occupation(s) During Past Five Years | | Other
Directorships
Held by Trustee |
| | |
Vinson Walden, 46 Vice President since 2004 | | Portfolio Manager and Managing Director of Thornburg Investment Management, Inc. | | Not applicable |
| | |
Lei Wang, 45 Vice President since 2006 | | Portfolio Manager and Managing Director of Thornburg Investment Management, Inc. | | Not applicable |
| | |
Sasha Wilcoxon, 42 Vice President since 2003 Secretary since 2007(6) | | Managing Director, Director of Mutual Fund Operations, and Vice President of Thornburg Investment Management, Inc.; Vice President of Thornburg Securities Corporation. | | Not applicable |
| | |
Charles Wilson, 41 Vice President since 2016 | | Portfolio Manager and Managing Director since 2014 and Associate Portfolio Manager from 2012–2014 of Thornburg Investment Management, Inc.; Co-Portfolio Manager of Marsico Capital Management from 2010–2012. | | Not applicable |
| | |
Di Zhou, 38 Vice President since 2016 | | Portfolio Manager and Managing Director since 2016, Associate Portfolio Manager from 2014–2016, and Equity Research Analyst from 2010–2014 of Thornburg Investment Management, Inc. | | Not applicable |
| (1) | Each person’s address is 2300 North Ridgetop Road, Santa Fe, New Mexico 87506. |
| (2) | The Fund is a separate investment “Fund” or “series” of Thornburg Investment Trust (the “Trust”), which comprises the Thornburg mutual fund complex and is organized as a Massachusetts business trust. Thornburg Investment Management, Inc. is the investment advisor to, and manages, all the Funds of the Trust. Each Trustee oversees all the Funds of the Trust. |
| (3) | Mr. Thornburg is considered an “interested” Trustee under the Investment Company Act of 1940 because he is the sole director and controlling shareholder of Thornburg Investment Management, Inc., the investment advisor to the Trust, and is the sole director and controlling shareholder of Thornburg Securities Corporation, the distributor of shares for the Trust. |
| (4) | The Bylaws of the Trust currently require that each Trustee shall retire by the end of the calendar year during which the Trustee reached the age of 75 years. Otherwise each Trustee serves in office until the election and qualification of a successor or until the Trustee sooner dies, resigns, retires or is removed. |
| (5) | Mr. McMahon is considered an “interested” Trustee under the Investment Company Act of 1940 because he is the chief investment officer of Thornburg Investment Management, Inc. |
| (6) | The Trust’s president, secretary, and treasurer each serves a one-year term or until the election and qualification of a successor; each other officer serves at the pleasure of the Trustees. |
| (7) | Assistant vice presidents, assistant secretaries, and assistant treasurers are not shown. |
The Statement of Additional Information for each Fund of the Trust includes additional information about the Trustees and is available, without charge and upon request, by calling 1-800-847-0200.
62 Annual Reports
| | |
| OTHER INFORMATION | | |
| |
| | September 30, 2016 (Unaudited) |
PORTFOLIO PROXY VOTING
Policies and Procedures:
The Trust has delegated to Thornburg Investment Management, Inc. (the “Advisor”) voting decisions respecting proxies for each of the Funds’ voting securities. The Advisor makes voting decisions in accordance with its Proxy Voting Policy. A description of the Policy is available (i) without charge, upon request, by calling the Advisor toll-free at 1-800-847-0200, (ii) on the Thornburg website at www. thornburg.com, and (iii) on the Securities and Exchange Commission’s website at www.sec.gov.
Information regarding how proxies were voted is available on or before August 31 of each year for the twelve months ending the preceding June 30. This information is available (i) without charge, upon request by calling the Advisor toll-free at 1-800-847-0200, (ii) on the Thornburg website at www.thornburg.com, and (iii) on the Securities and Exchange Commission’s website at www.sec.gov.
TAX INFORMATION
For the tax year ended September 30, 2016, dividends paid by the Thornburg Limited Term U.S. Government Fund of $18,603 are being reported as a return of capital and $4,940,293 are taxable ordinary investment income dividends for federal income tax purposes. Dividends paid by the Thornburg Limited Term Income Fund of $86,693,637 are being reported as taxable ordinary investment income dividends. Dividends paid by the Thornburg Low Duration Income Fund of $244,080 are being reported as taxable ordinary investment income dividends for federal income tax purposes.
The information and distributions reported herein may differ from the information and distributions reported to the shareholders for the calendar year ending December 31, 2016. Complete information will be reported in conjunction with your 2016 Form 1099.
AVAILABILITY OF QUARTERLY PORTFOLIO SCHEDULE
The Funds file with the Securities and Exchange Commission schedules of their portfolio holdings on Form N-Q for the first and third quarters of each fiscal year. The Funds’ Forms N-Q are available on the Commission’s website at www.sec.gov, or may be reviewed and copied at the Commission’s Public Reference Room in Washington, D.C. Information on the operation of the Public Reference Room may be obtained by calling 1-800-SEC-0330. The Funds also make this information available on their website at www.thornburg. com/download or upon request by calling 1-800-847-0200.
STATEMENT RESPECTING RENEWAL OF INVESTMENT ADVISORY AGREEMENT
FOR THORNBURG LIMITED TERM U.S. GOVERNMENT FUND
Thornburg Investment Management, Inc. (the “Advisor”) provides investment management services to Thornburg Limited Term U.S. Government Fund pursuant to an investment advisory agreement. The Trustees consider the renewal of this agreement annually, and most recently determined to renew the agreement on September 13, 2016.
In anticipation of their recent consideration of the advisory agreement’s renewal, the independent Trustees met in May 2016 to consider aspects of their annual evaluation of the Advisor’s service to all of the funds of Thornburg Investment Trust, to plan the annual evaluation of the Advisor’s performance and to specify the information the Advisor would present to the Trustees for their review. The independent Trustees met again in independent session in September to consider portions of the information submitted by the Advisor. The Advisor’s president and chief investment officer subsequently reviewed portions of the information with the Trustees and addressed questions from the Trustees at a full meeting session of the Trustees scheduled for that purpose, and the independent Trustees thereafter met in independent session to consider the Advisor’s presentation and various specific issues respecting their consideration of the advisory agreement’s renewal. Following these sessions, the Trustees met to consider renewal of the agreement, and the independent Trustees voted unanimously at that meeting to renew the agreement for an additional term of one year.
The information below summarizes certain factors considered by the Trustees in connection with the determination to renew the advisory agreement. In determining to renew the agreement, the Trustees considered a wide range of information and did not identify any single factor as controlling, and this summary does not describe all of the factors and other matters considered by the Trustees in making their determination.
Nature, Extent and Quality of Services. The Trustees considered presentations by the Advisor at meeting sessions scheduled for consideration of a continuation of the advisory agreement, and also noted their consideration of the reports the Trustees and their committees receive throughout the year on a wide variety of topics, and consideration they had given to a number of topics in previous years. Information identified by the Trustees in their evaluation as having been considered and contributing to their conclusions included Trustees’ assessments of the Advisor’s personnel developed in formal and informal meetings throughout the year, the Advisor’s staffing levels and measures to maintain staffing levels and improve competencies, the Advisor’s commitment to attract and retain high quality portfolio management expertise through competitive compensation levels, the Advisor’s collaborative approach to investment management,
Annual Reports 63
| | |
| OTHER INFORMATION, CONTINUED | | |
| |
| | September 30, 2016 (Unaudited) |
the Fund’s investment performance over different periods of time, portfolio managers’ cognizance of and strategies to address market and economic trends and conditions, the evaluation and selection of individual investments, the structuring and composition of the Fund’s portfolio, management of Fund liquidity requirements, cognizance of and efforts to achieve tax efficiency, responses to share sale and redemption activity, continuing enhancements to the Advisor’s electronic and information systems and the Advisor’s engagement of outside firms to assist in improving or replacing those systems, the Advisor’s evaluation and selection of firms providing portfolio trade execution to the Fund and the Advisor’s measures to obtain favorable trade execution, the Advisor’s performance of accounting and other services, the Advisor’s continued commitment to observance of compliance and regulatory requirements, the Advisor’s responsiveness to the Trustees, the quality and extent of written and oral reports to the Trustees over the course of the year, and other factors.
Fund Investment Performance. The Trustees noted in their evaluation of the Fund’s investment performance the reports they had received in each regular meeting over the course of the year from the Advisor’s portfolio management personnel. The Trustees also noted in their evaluation their consideration of information provided to them at their request in anticipation of their annual evaluation of the Advisor’s services, including the following items of information respecting the investment performance of the Fund: (1) the Fund’s absolute investment performance and achievement of stated objectives; (2) the Advisor’s written explanations and commentary on the Fund’s performance in the context of the Fund’s objectives and reasonable expectations, and business, market and economic conditions, (3) performance data for the most recent ten calendar years, comparing the Fund’s annual investment returns to a fund category selected by an independent mutual fund analyst firm, and to a broad-based securities index, (4) the Fund’s investment performance for the three-month, year-to-date, one-year, three-year, five-year and ten-year periods ending with the second quarter of the current year, comparing the Fund’s annualized returns to two mutual fund categories selected by independent mutual fund analyst firms and to a broad-based securities index, and assigning a percentage rank to the Fund’s performance for each period relative to each of the fund categories, and (5) comparative measures of correlation to equity indices, portfolio volatility, risk and return.
The Trustees noted that quarterly reports during the year and other information presented to them confirmed the Advisor’s continued conformity to the Fund’s stated investment objectives and policies.
The Trustees observed in reviewing comparative performance data for the ten most recent calendar years that the Fund’s investment return for the most recent calendar year was comparable to the return of the broad-based securities index and the average return for the fund category considered, that the Fund’s returns for the preceding nine calendar years exceeded or were comparable to the returns of the index in five of the nine years, and that the Fund’s returns exceeded or were comparable to the average returns of the fund category in all of the nine years. Other quantitative data noted by the Trustees as having been considered in their evaluation showed that the Fund’s annualized investment returns fell in or at the first decile of performance of a mutual fund category for the one-year, three-year, five-year and ten-year periods ended with the second quarter of the current year. Noted data also showed that the Fund’s annualized investment returns fell in the top quartile of performance of the second fund category for the one-year, five-year and ten-year periods ended with the second quarter of the current year, and fell in the top decile of performance for the three-year period. Measures of portfolio volatility, risk and relative return considered by the Trustees demonstrated that the Fund’s performance relative to these measures continued to fulfill expectations in current conditions. The Trustees attached additional significance to the performance of the Fund from the perspective of longer term shareholders.
Comparisons of Fee and Expense Levels. The Trustees recognized in their evaluation the clear disclosures of the Advisor’s fees and Fund expenses in the Fund’s prospectuses. Information noted by the Trustees as having been considered in this context included a variety of comparative data respecting the Fund’s fee and expense levels. This information included comparisons of the Fund’s advisory fee and overall Fund expenses to median and average fees and expenses charged to a category of mutual funds selected by an independent mutual fund analyst firm, comparisons of the advisory fee and other Fund expenses to the fee levels and expenses for two representative share classes of fund peer groups selected from the category by a second independent mutual fund analyst firm, the perspectives and advice from the second mutual fund analyst firm respecting comparisons of fund fee levels and expenses to fund peer groups, and other information. Comparative fee and expense data noted as having been considered by the Trustees showed that the advisory fee for the Fund was comparable to the median fee level for the fund category, the level of total expense for a representative share class of the Fund was slightly higher than the median and average expense levels for the category, and that the level of total expense for a second representative share class was lower than the median and average levels for the category. Data for two peer groups showed that the Fund’s advisory fee was comparable to the median levels for the two peer groups, the total expense level of one representative share class was higher than the median but within the range of levels for the peer group, and that the total expense level of a second representative share class was comparable to the median level of its peer group. The Trustees did not find the differences significant in view of the other factors considered.
The Trustees noted their consideration of information respecting the advisory fees charged by the Advisor to other investment management clients, including sub-advised mutual funds, together with information about fees charged by other advisors to different clients, analysis of the differences between the requirements of institutional clients and mutual funds, analysis of the differences between the requirements of a sub-advised mutual fund and a fund as to which the investment advisor is the primary advisor and sponsor, descriptions of distinguishing characteristics of the sub-advised mutual funds served by the Advisor, and the consequently different investment management services provided to the different categories of clients and the differing contexts in which the fee levels for
64 Annual Reports
| | |
| OTHER INFORMATION, CONTINUED | | |
| |
| | September 30, 2016 (Unaudited) |
these arrangements are established. The Trustees confirmed their previous observations that the differences between the fees charged by the Advisor to different types of clients did not appear exceptional, and that the fee rates charged by an investment advisor to different categories of clients had limited relevance to the evaluation of the fee rate charged by that advisor to mutual funds as to which it is the primary advisor and sponsor.
Costs and Profitability of Advisor. In reviewing the profitability of the Advisor’s services to the Fund the Trustees considered an analysis of the Advisor’s costs and the profitability to the Advisor of its services, together with data respecting the overall profitability of a selection of other investment management firms. The Trustees noted that a portion of the Advisor’s profits are an important element in the compensation of shareholder employees. The Trustees considered in this regard information from the Advisor respecting investment of its profits to maintain staffing levels, pay competitive levels of compensation, and add to its information retrieval and management systems to maintain or improve service levels. The Trustees also considered the contribution of the Advisor’s cost management to its profitability, and the relationship of the Advisor’s financial resources and profitability in previous years to its ability to attract necessary personnel, invest in systems and other assets required for its service to the Fund, and maintain or improve service levels for the Fund notwithstanding fluctuations in revenues and profitability. The information considered did not indicate to the Trustees that the Advisor’s profitability was excessive.
Potential Economies of Scale. In reviewing the extent to which economies of scale would be realized by the Fund as it grows and whether fee levels reflect potential economies of scale, the Trustees considered the breakpoint structure for advisory fees chargeable to the Fund, comparisons of the fee breakpoint structure for the Fund with breakpoint structures (or the absence of such structures) for other funds in a peer group selected by an independent mutual fund analyst firm, the effects of the breakpoint structure and other expense factors realized by certain Funds of the Trust as their asset levels had increased, and the Advisor’s expenditures from its own profits and resources to maintain staffing levels, pay competitive levels of compensation, and add to its information retrieval and management systems to maintain or improve service levels. The information provided demonstrated to the Trustees that the Fund’s advisory fee breakpoint structure is reasonable in relation to the structures observed in the other funds in its peer group, and that shareholders may be expected to benefit from any economies of scale, due to the advisory agreement’s breakpoint fee structure for the Fund and other factors.
Potential Ancillary Benefits. In reviewing potential benefits to the Advisor because of its relationship to the Fund, the Trustees noted disclosures by the Advisor of its receipt of certain research services from broker dealers, and the benefits to both the Fund and the Advisor of the Advisor’s expansion of its staffing, compliance and systems capabilities and other resources to serve a broader variety of investment management clients. No unusual or unfair benefits to the Advisor from its relationship to the Fund were identified by the Trustees.
Summary of Conclusions. The Trustees concluded that the nature, extent and quality of the Advisor’s services performed under the advisory agreement remained sufficient. The Trustees further concluded that the absolute and relative investment performance of the Fund over a range of pertinent holding periods on the whole is satisfactory in the context of its objectives and strategies, and that the Advisor had continued to actively and competently pursue the Fund’s stated investment objectives and adhere to the Fund’s investment policies.
The Trustees further concluded, based upon their consideration of the foregoing factors and other information, that the level of the advisory fee charged to the Fund by the Advisor is reasonable in relation to the services provided by the Advisor in view of the nature, extent and quality of those services, the investment performance of the Fund after fees and expenses, the clear disclosure of fees and expenses in the Fund’s prospectuses, comparisons of fees and expenses charged to the Fund to fees and expenses charged to other mutual funds, and the other factors considered.
STATEMENT RESPECTING RENEWAL OF INVESTMENT ADVISORY AGREEMENT
FOR THORNBURG LIMITED TERM INCOME FUND
Thornburg Investment Management, Inc. (the “Advisor”) provides investment management services to Thornburg Limited Term Income Fund pursuant to an investment advisory agreement. The Trustees consider the renewal of this agreement annually, and most recently determined to renew the agreement on September 13, 2016.
In anticipation of their recent consideration of the advisory agreement’s renewal, the independent Trustees met in May 2016 to consider aspects of their annual evaluation of the Advisor’s service to all of the funds of Thornburg Investment Trust, to plan the annual evaluation of the Advisor’s performance and to specify the information the Advisor would present to the Trustees for their review. The independent Trustees met again in independent session in September to consider portions of the information submitted by the Advisor. The Advisor’s president and chief investment officer subsequently reviewed portions of the information with the Trustees and addressed questions from the Trustees at a full meeting session of the Trustees scheduled for that purpose, and the independent Trustees thereafter met in independent session to consider the Advisor’s presentation and various specific issues respecting their consideration of the advisory agreement’s renewal. Following these sessions, the Trustees met to consider renewal of the agreement, and the independent Trustees voted unanimously at that meeting to renew the agreement for an additional term of one year.
Annual Reports 65
| | |
| OTHER INFORMATION, CONTINUED | | |
| |
| | September 30, 2016 (Unaudited) |
The information below summarizes certain factors considered by the Trustees in connection with the determination to renew the advisory agreement. In determining to renew the agreement, the Trustees considered a wide range of information and did not identify any single factor as controlling, and this summary does not describe all of the factors and other matters considered by the Trustees in making their determination.
Nature, Extent and Quality of Services. The Trustees considered presentations by the Advisor at meeting sessions scheduled for consideration of a continuation of the advisory agreement, and also noted their consideration of the reports the Trustees and their committees receive throughout the year on a wide variety of topics, and consideration they had given to a number of topics in previous years. Information identified by the Trustees in their evaluation as having been considered and contributing to their conclusions included Trustees’ assessments of the Advisor’s personnel developed in formal and informal meetings throughout the year, the Advisor’s staffing levels and measures to maintain staffing levels and improve competencies, the Advisor’s commitment to attract and retain high quality portfolio management expertise through competitive compensation levels, the Advisor’s collaborative approach to investment management, the Fund’s investment performance over different periods of time, portfolio managers’ cognizance of and strategies to address market and economic trends and conditions, the evaluation and selection of individual investments, the structuring and composition of the Fund’s portfolio, management of Fund liquidity requirements, cognizance of and efforts to achieve tax efficiency, responses to share sale and redemption activity, continuing enhancements to the Advisor’s electronic and information systems and the Advisor’s engagement of outside firms to assist in improving or replacing those systems, the Advisor’s evaluation and selection of firms providing portfolio trade execution to the Fund and the Advisor’s measures to obtain favorable trade execution, the Advisor’s performance of accounting and other services, the Advisor’s continued commitment to observance of compliance and regulatory requirements, the Advisor’s responsiveness to the Trustees, the quality and extent of written and oral reports to the Trustees over the course of the year, and other factors.
Investment Performance. The Trustees noted in their evaluation of the Fund’s investment performance the reports they had received in each regular meeting over the course of the year from the Advisor’s portfolio management personnel. The Trustees also noted in their evaluation their consideration of information provided to them at their request in anticipation of their annual evaluation of the Advisor’s services, including the following items of information respecting the investment performance of the Fund: (1) the Fund’s absolute investment performance and achievement of stated objectives; (2) the Advisor’s written and oral explanations and commentary on the Fund’s performance in the context of the Fund’s objectives and reasonable expectations, and business, market and economic conditions, (3) performance data for the most recent ten calendar years, comparing the Fund’s annual investment returns to a fund category selected by an independent mutual fund analyst firm, and to a broad-based securities index, (4) the Fund’s investment performance for the three-month, year-to-date, one-year, three-year, five-year and ten-year periods ending with the second quarter of the current year, comparing the Fund’s annualized returns to two mutual fund categories selected by independent mutual fund analyst firms and to a broad-based securities index, and assigning a percentage rank to the Fund’s performance for each period relative to each of the fund categories, and (5) comparative measures of correlation to equity indices, portfolio volatility, risk and return.
The Trustees noted that quarterly reports during the year and other information presented to them confirmed the Advisor’s continued conformity to the Fund’s stated investment objectives and policies.
The Trustees observed in reviewing comparative performance data for the ten most recent calendar years that the Fund’s investment return for the most recent calendar year was comparable to the return of a broad-based securities index and the average return for the mutual fund category considered, that the Fund’s returns for the preceding nine calendar years exceeded or were comparable to the returns of the index in eight of the nine years, and that the Fund’s returns exceeded or were comparable to the average returns of the fund category in all of the nine years. Other quantitative data noted by the Trustees as having been considered in their evaluation showed that the Fund’s annualized investment returns fell in the top decile of investment performance of a mutual fund category for the one-year, three-year, five-year and ten-year periods ending with the second quarter of the current year. Noted data also showed that the Fund’s annualized investment returns fell in the top quartile of performance of a second mutual fund category for the one-year period ended with the second quarter of the current year, and fell in the top decile of performance of the category for the three-year, five-year and ten-year periods. Measures of portfolio volatility, risk and relative return considered by the Trustees demonstrated that the Fund’s performance relative to these measures continued to fulfill expectations in current conditions. The Trustees noted that they generally attached additional significance to the performance of the Fund from the perspective of longer term shareholders.
Comparisons of Fee and Expense Levels. The Trustees recognized in their evaluation the clear disclosures of the Advisor’s fees and Fund expenses in the Fund’s prospectuses. Information noted by the Trustees as having been considered in this context included a variety of comparative data respecting the Fund’s fee and expense levels. This information included comparisons of the Fund’s advisory fee and overall Fund expenses to median and average fees and expenses charged to a category of mutual funds selected by an independent mutual fund analyst firm, comparisons of the advisory fee and other Fund expenses to the fee levels and expenses for two representative share classes of fund peer groups selected from the category by a second independent mutual fund analyst firm, the perspectives and advice from the second mutual fund analyst firm respecting comparisons of fund fee levels and expenses to fund peer groups, and other information. Comparative fee and expense data noted as having been considered by the Trustees showed that the advisory fee for the Fund was comparable to the median and average fee levels for the fund category, the level of total expense for a representative share class of the Fund was slightly higher than the median and comparable to the average expense levels for the
66 Annual Reports
| | |
| OTHER INFORMATION, CONTINUED | | |
| |
| | September 30, 2016 (Unaudited) |
category, and that the level of total expense for a second representative share class was lower than the median and average levels for the category. Data for the peer groups showed that the Fund’s advisory fee was comparable to the median levels for the two peer groups, and that the total expense levels of the representative share classes were similarly comparable to the median expense levels of their respective peer groups.
The Trustees noted their consideration of information respecting the advisory fees charged by the Advisor to other investment management clients, including sub-advised mutual funds, together with information about fees charged by other advisors to different clients, analysis of the differences between the requirements of institutional clients and mutual funds, analysis of the differences between the requirements of a sub-advised mutual fund and a fund as to which the investment advisor is the primary advisor and sponsor, descriptions of distinguishing characteristics of the sub-advised funds served by the Advisor, and the consequently different investment management services provided to the different categories of clients and the differing contexts in which the fee levels for these arrangements are established. The Trustees confirmed their previous observations that the differences between the fees charged by the Advisor to different types of clients did not appear exceptional, and that the fee rates charged by an investment advisor to different categories of clients had limited relevance to the evaluation of the fee rate charged by that advisor to mutual funds as to which it is the primary advisor and sponsor.
Costs and Profitability of Advisor. In reviewing the profitability of the Advisor’s services to the Fund the Trustees considered an analysis of the Advisor’s costs and the profitability to the Advisor of its services, together with data respecting the overall profitability of a selection of other investment management firms. The Trustees noted that a portion of the Advisor’s profits are an important element in the compensation of shareholder employees. The Trustees considered in this regard information from the Advisor respecting investment of its profits to maintain staffing levels, pay competitive levels of compensation, and add to its information retrieval and management systems to maintain or improve service levels. The Trustees also considered the contribution of the Advisor’s cost management to its profitability, and the relationship of the Advisor’s financial resources and profitability in previous years to its ability to attract necessary personnel, invest in systems and other assets required for its service to the Fund, and maintain or improve service levels for the Fund notwithstanding fluctuations in revenues and profitability. The information considered did not indicate to the Trustees that the Advisor’s profitability was excessive.
Potential Economies of Scale. In reviewing the extent to which economies of scale would be realized by the Fund as it grows and whether fee levels reflect potential economies of scale, the Trustees considered the breakpoint structure for advisory fees chargeable to the Fund, comparisons of the fee breakpoint structure for the Fund with breakpoint structures (or the absence of such structures) for other funds in a peer group selected by an independent mutual fund analyst firm, the effects of the breakpoint structure and other expense factors realized by certain Funds of the Trust as their asset levels had increased, and the Advisor’s expenditures from its own profits and resources to maintain staffing levels, pay competitive levels of compensation, and add to its information retrieval and management systems to maintain or improve service levels. The information provided demonstrated to the Trustees that the Fund’s advisory fee breakpoint structure is reasonable in relation to the structures observed in the other funds in its peer group, and that shareholders may be expected to benefit from any economies of scale, due to the advisory agreement’s breakpoint fee structure for the Fund and other factors.
Potential Ancillary Benefits. In reviewing potential benefits to the Advisor because of its relationship to the Fund, the Trustees noted disclosures by the Advisor of its receipt of certain research services from broker dealers, and the benefits to both the Fund and the Advisor of the Advisor’s expansion of its staffing, compliance and systems capabilities and other resources to serve a broader variety of investment management clients. No unusual or unfair benefits to the Advisor from its relationship to the Fund were identified by the Trustees.
Summary of Conclusions. The Trustees concluded that the nature, extent and quality of the Advisor’s services performed under the advisory agreement remained sufficient. The Trustees further concluded that the absolute and relative investment performance of the Fund over a range of pertinent holding periods on the whole was satisfactory in the context of its objectives and strategies, and that the Advisor had continued to actively and competently pursue the Fund’s stated investment objectives and adhere to the Fund’s investment policies.
The Trustees further concluded, based upon their consideration of the foregoing factors and other information, that the level of the advisory fee charged to the Fund by the Advisor is reasonable in relation to the services provided by the Advisor in view of the nature, extent and quality of those services, the investment performance of the Fund after fees and expenses, the clear disclosure of fees and expenses in the Fund’s prospectuses, comparisons of fees and expenses charged to the Fund to fees and expenses charged to other mutual funds, and the other factors considered.
Annual Reports 67
| | |
| OTHER INFORMATION, CONTINUED | | |
| |
| | September 30, 2016 (Unaudited) |
STATEMENT RESPECTING RENEWAL OF INVESTMENT ADVISORY AGREEMENT FOR THORNBURG LOW DURATION INCOME FUND
Thornburg Investment Management, Inc. (the “Advisor”) provides investment management services to Thornburg Low Duration Income Fund pursuant to an investment advisory agreement. The Trustees consider the renewal of this agreement annually, and most recently determined to renew the agreement on September 13, 2016.
In anticipation of their recent consideration of the advisory agreement’s renewal, the independent Trustees met in May 2016 to consider aspects of their annual evaluation of the Advisor’s service to all of the funds of Thornburg Investment Trust, to plan the annual evaluation of the Advisor’s performance and to specify the information the Advisor would present to the Trustees for their review. The independent Trustees met again in independent session in September to consider portions of the information submitted by the Advisor. The Advisor’s president and chief investment officer subsequently reviewed portions of the information with the Trustees and addressed questions from the Trustees at a full meeting session of the Trustees scheduled for that purpose, and the independent Trustees thereafter met in independent session to consider the Advisor’s presentation and various specific issues respecting their consideration of the advisory agreement’s renewal. Following these sessions, the Trustees met to consider renewal of the agreement, and the independent Trustees voted unanimously at that meeting to renew the agreement for an additional term of one year.
The information below summarizes certain factors considered by the Trustees in connection with the determination to renew the advisory agreement. In determining to renew the agreement, the Trustees considered a wide range of information and did not identify any single factor as controlling, and this summary does not describe all of the factors and other matters considered by the Trustees in making their determination.
Nature, Extent and Quality of Services. The Trustees considered presentations by the Advisor at meeting sessions scheduled for consideration of a continuation of the advisory agreement, and also noted their consideration of the reports the Trustees and their committees receive throughout the year on a wide variety of topics, and consideration they had given to a number of topics in previous years. Information identified by the Trustees in their evaluation as having been considered and contributing to their conclusions included Trustees’ assessments of the Advisor’s personnel developed in formal and informal meetings throughout the year, the Advisor’s staffing levels and measures to maintain staffing levels and improve competencies, the Advisor’s commitment to attract and retain high quality portfolio management expertise through competitive compensation levels, the Advisor’s collaborative approach to investment management, the Fund’s investment performance over different periods of time, portfolio managers’ cognizance of and strategies to address market and economic trends and conditions, the evaluation and selection of individual investments, the structuring and composition of the Fund’s portfolio, management of Fund liquidity requirements, cognizance of and efforts to achieve tax efficiency, responses to share sale and redemption activity, continuing enhancements to the Advisor’s electronic and information systems and the Advisor’s engagement of outside firms to assist in improving or replacing those systems, the Advisor’s evaluation and selection of firms providing portfolio trade execution to the Fund and the Advisor’s measures to obtain favorable trade execution, the Advisor’s performance of accounting and other services, the Advisor’s continued commitment to observance of compliance and regulatory requirements, the Advisor’s responsiveness to the Trustees, the quality and extent of written and oral reports to the Trustees over the course of the year, and other factors.
Investment Performance. The Trustees noted in their evaluation of the Fund’s investment performance the reports they had received in each regular meeting over the course of the year from the Advisor’s portfolio management personnel. The Trustees also noted in their evaluation their consideration of information provided to them at their request in anticipation of their annual evaluation of the Advisor’s services, including the Advisor’s written and oral explanations and commentary on the Fund’s performance in the context of the Fund’s objectives and reasonable expectations, and business, market and economic conditions, and comparative annualized total return data for the Fund, a broad-based securities index, and two mutual fund categories selected by independent mutual fund analyst firms that assign a percentage rank to the Fund’s investment performance for each period relative to each of the fund categories.
The Trustees noted that quarterly reports during the year and other information presented to them confirmed the Advisor’s continued conformity to the Fund’s stated investment objectives and policies.
The Fund commenced investment operations in late 2013, and performance data remain limited. The Trustees observed in reviewing available comparative performance data that the Fund’s annualized investment return fell in the second quartile of performance of a mutual fund category for the one-year period ended with the second quarter of the current year, and also fell in the second quartile of performance of the second mutual fund category for the same one-year period.
Comparisons of Fee and Expense Levels. The Trustees recognized in their evaluation the clear disclosures of the Advisor’s fees and Fund expenses in the Fund’s prospectuses. Information noted by the Trustees as having been considered in this context included a variety of comparative data respecting the Fund’s fee and expense levels. This information included comparisons of the Fund’s advisory fee and overall Fund expenses to median and average fees and expenses charged to a category of mutual funds selected by an independent mutual fund analyst firm, comparisons of the advisory fee and other Fund expenses to the fee level and expenses for a representative share class of a fund peer group selected from the category by a second independent mutual fund analyst firm, the perspectives and advice from the second mutual fund analyst firm respecting comparisons of fund fee levels and expenses to fund
68 Annual Reports
| | |
| OTHER INFORMATION, CONTINUED | | |
| |
| | September 30, 2016 (Unaudited) |
peer groups, and other information. Comparative fee and expense data noted as having been considered by the Trustees showed that the advisory fee is currently reduced by fee waivers by the Advisor, but that the stated advisory fee (before fee waivers) for the Fund is comparable to the median and average fee levels for the fund category, the level of total expense for a representative share class of the Fund after fee waivers and expense reimbursements by the Advisor was comparable to the median and slightly lower than the average levels of total expenses for the category, and that the level of total expense for a second representative share class after waivers and reimbursements was lower than the median and average levels for the category. Peer group data showed that the Fund’s stated advisory fee was comparable to the median levels for the two peer groups, and that the total expense levels of the Fund’s two share classes were comparable to the median levels of their respective peer groups after waivers of fees and reimbursements of expenses.
The Trustees noted their consideration of information respecting the advisory fees charged by the Advisor to other investment management clients, including sub-advised mutual funds, together with information about fees charged by other advisors to different clients, analysis of the differences between the requirements of institutional clients and mutual funds, analysis of the differences between the requirements of a sub-advised mutual fund and a fund as to which the investment advisor is the primary advisor and sponsor, descriptions of distinguishing characteristics of the sub-advised funds served by the Advisor, and the consequently different investment management services provided to the different categories of clients and the differing contexts in which the fee levels for these arrangements are established. The Trustees confirmed their previous observations that the differences between the fees charged by the Advisor to different types of clients did not appear exceptional, and that the fee rates charged by an investment advisor to different categories of clients had limited relevance to the evaluation of the fee rate charged by that advisor to mutual funds as to which it is the primary advisor and sponsor.
Costs and Profitability of Advisor. The Trustees noted the costs incurred by the Advisor in initiating and managing the Fund and the Advisor’s waivers of fees and reimbursements of expenses for the Fund, and further noted that the Fund is not profitable to the Advisor.
Potential Economies of Scale. In reviewing the extent to which economies of scale would be realized by the Fund as it grows and whether fee levels reflect potential economies of scale, the Trustees considered the breakpoint structure for advisory fees chargeable to the Fund, comparisons of the fee breakpoint structure for the Fund with breakpoint structures (or the absence of such structures) for other funds in a peer group selected by an independent mutual fund analyst firm, the effects of the breakpoint structure and other expense factors realized by certain Funds of the Trust as their asset levels had increased, and the Advisor’s expenditures from its own profits and resources to maintain staffing levels, pay competitive levels of compensation, and add to its information retrieval and management systems to maintain or improve service levels. The information provided demonstrated to the Trustees that the Fund’s advisory fee breakpoint structure is reasonable in relation to the structures observed in the other funds in its peer group, and that shareholders may be expected to benefit from any economies of scale, due to the advisory agreement’s breakpoint fee structure for the Fund and other factors.
Potential Ancillary Benefits. In reviewing potential benefits to the Advisor because of its relationship to the Fund, the Trustees noted disclosures by the Advisor of its receipt of certain research services from broker dealers, and the benefits to both the Fund and the Advisor of the Advisor’s expansion of its staffing, compliance and systems capabilities and other resources to serve a broader variety of investment management clients. No unusual or unfair benefits to the Advisor from its relationship to the Fund were identified by the Trustees.
Summary of Conclusions. The Trustees concluded that the nature, extent and quality of the Advisor’s services performed under the advisory agreement remained sufficient. The Trustees further concluded that the absolute and relative investment performance of the Fund over pertinent holding periods on the whole was satisfactory in the context of its objectives and strategies, and that the Advisor had continued to actively and competently pursue the Fund’s stated investment objectives and adhere to the Fund’s investment policies.
The Trustees further concluded, based upon their consideration of the foregoing factors and other information, that the level of the advisory fee charged to the Fund by the Advisor is reasonable in relation to the services provided by the Advisor in view of the nature, extent and quality of those services, current fee waivers and expense reimbursements, investment performance of the Fund after fees and expenses, the clear disclosure of fees and expenses in the Fund’s prospectus, comparisons of fees and expenses charged to the Fund to fees and expenses charged to other mutual funds, and the other factors considered.
Annual Reports 69
TRUSTEES’ STATEMENT TO SHAREHOLDERS
Readopted September 12, 2016
The Trustees believe current and prospective shareholders should know how we discharge our responsibilities in supervising the Funds’ investment advisor and in reviewing the advisor’s contract for renewal. Since 2005, we have issued a statement which sets out clearly the three principal guidelines that we follow in supervising the Trust’s investment advisor on your behalf. In accordance with our customary practice, in September of this year we again reviewed our statement and concluded we should reissue this statement outlining the principal features of our supervision of the advisor’s performance of investment management services for the Funds.
We begin with the premise that each shareholder selected his or her Fund because its investments are managed by the investment advisor identified in the prospectus and in accordance with the objective and policies described in the prospectus. We realize, as each of you do, that if you believe that your Fund’s stated objective and policies no longer serve your personal investment goals, you can sell your shares and leave the Fund.
Therefore, we believe that our primary supervisory task – our principal obligation to you – is to assess the nature and quality of the advisor’s services, and to confirm that the advisor actively and competently pursues the Fund’s objective, in accordance with the policies set out in the prospectus. To do this, we meet regularly with management to review your Fund’s portfolio and to discuss the advisor’s specific actions and judgments in pursuing the Fund’s objective. We do not substitute our own judgment for the advisor’s decisions in selecting investments; the advisor is paid to exercise its informed judgment on investment decisions, and we seek to confirm, in reviewing the advisor’s performance, that the advisor is doing just that.
Second, we are conscious of costs and the effect that costs have on shareholders’ returns. We try to make sure that your Fund’s fees and costs are reasonable in relationship to the services rendered and that they are generally in line with those charged by other expert investment advisors, consistent with our belief that the Fund’s investors searched for and expect that expertise and attention and have decided to pay a reasonable price for it. We do not put the management contract “out to bid” as a matter of course, and we would not do so unless we had concluded that the advisor materially had failed to pursue the Fund’s objectives in accordance with its policies, or for other equally important reasons. We believe that any other approach would be inconsistent with your interests and contrary to your expectations when you bought shares of the Fund in the first place.
Finally, because we believe that most Thornburg Fund shareholders have invested with a long-term perspective, we try not to focus too much on the fashions of the moment and on short-term performance. The market will not favor any specific investment objective or set of policies at all times and under all economic circumstances. A fund will experience periods of both high and low returns relative to other funds and other investments. Even if one of our Funds is not favored by the market at a particular time, we believe that the advisor is nonetheless obliged to remain true to the Fund’s objective and policies, and we watch to see that it does so.
Trustees of Thornburg Investment Trust
70 Annual Reports
THORNBURG FUNDS
Thornburg Investment Management is a privately-owned global investment firm that offers a range of solutions for retail and institutional investors. Founded in 1982 and headquartered in Santa Fe, New Mexico, we manage approximately $53 billion (as of September 30, 2016) across eight equity and 11 bond mutual funds, separate accounts for high-net-worth investors and institutional accounts, and five UCITS funds for non-U.S. investors.
The fund outlined in this report is one of many equity and fixed-income products available from Thornburg Investment Management.
Equity Funds
| | • | | Thornburg Core Growth Fund |
| | • | | Thornburg International Value Fund |
| | • | | Thornburg Better World International Fund |
| | • | | Thornburg International Growth Fund |
| | • | | Thornburg Developing World Fund |
| | • | | Thornburg Investment Income Builder Fund |
| | • | | Thornburg Global Opportunities Fund |
Fixed Income Funds
| | • | | Thornburg Low Duration Income Fund |
| | • | | Thornburg Limited Term U.S. Government Fund |
| | • | | Thornburg Limited Term Income Fund |
| | • | | Thornburg Strategic Income Fund |
| | • | | Thornburg Low Duration Municipal Fund |
| | • | | Thornburg Limited Term Municipal Fund |
| | • | | Thornburg Intermediate Municipal Fund |
| | • | | Thornburg California Limited Term Municipal Fund |
| | • | | Thornburg New Mexico Intermediate Municipal Fund |
| | • | | Thornburg New York Intermediate Municipal Fund |
| | • | | Thornburg Strategic Municipal Income Fund |
Before investing, carefully consider the Fund’s investment goals, risks, charges, and expenses. For a prospectus or summary prospectus containing this and other information, contact your financial advisor or visit thornburg.com. Read it carefully before investing.
For additional information, please visit thornburg.com
Thornburg Investment Management, Inc. 2300 North Ridgetop Road, Santa Fe, NM 87506
Annual Reports 71

| | | | |
| To receive shareholder reports, prospectuses, and proxy statements electronically, go to www.thornburg.com/edelivery. | | 
|
| This Annual Report is submitted for the general information of shareholders of the Fund. It is not authorized for distribution to prospective investors in the Fund unless preceded or accompanied by an effective prospectus. | |
| | | | |
| Investment Advisor: | | Distributor: | | |
| Thornburg Investment Management® | | Thornburg Securities Corporation® | | |
| 800.847.0200 | | 800.847.0200 | | TH076 |
2 Annual Report
Annual Report
Thornburg Strategic Income Fund
September 30, 2016
| | | | |
Share Class | | NASDAQ Symbol | | CUSIP |
Class A | | TSIAX | | 885-215-228 |
Class C | | TSICX | | 885-215-210 |
Class I | | TSIIX | | 885-215-194 |
Class R3 | | TSIRX | | 885-216-887 |
Class R4 | | TSRIX | | 885-216-754 |
Class R5 | | TSRRX | | 885-216-879 |
Class I, R3, R4, and R5 shares may not be available to all investors. Minimum investments for Class I shares may be higher than those for other classes.
Investments carry risks, including possible loss of principal. Portfolios investing in bonds have the same interest rate, inflation, and credit risks that are associated with the underlying bonds. The value of bonds will fluctuate relative to changes in interest rates, decreasing when interest rates rise. This effect is more pronounced for longer-term bonds. Unlike bonds, bond funds have ongoing fees and expenses. Investments in lower rated and unrated bonds may be more sensitive to default, downgrades, and market volatility; these investments may also be less liquid than higher rated bonds. Investments in derivatives are subject to the risks associated with the securities or other assets underlying the pool of securities, including illiquidity and difficulty in valuation. Investments in equity securities are subject to additional risks, such as greater market fluctuations. Additional risks may be associated with investments outside the United States, especially in emerging markets, including currency fluctuations, illiquidity, volatility, and political and economic risks. Please see the Fund’s prospectus for a discussion of the risks associated with an investment in the Fund. Investments in the Fund are not FDIC insured, nor are they bank deposits or guaranteed by a bank or any other entity.
Annual Report 3
| | |
| LETTER TO SHAREHOLDERS | | |
| |
Thornburg Strategic Income Fund | | September 30, 2016 (Unaudited) |
October 17, 2016
Dear Fellow Shareholder:
We are pleased to present the annual report for Thornburg Strategic Income Fund for the year ended September 30, 2016. The net asset value (NAV) of a Class A share of Thornburg Strategic Income Fund increased 34 cents in the period to $11.56. If you were invested for the entire period, you received dividends of 36.5 cents per share. If you reinvested your dividends, you received 37.0 cents per share. Dividends per share varied for other share classes to account for class-specific expenses. Combining income and change in price, Class A shares of Thornburg Strategic Income Fund produced a total return of 6.70% (without sales charge) over the 12-month period. The Bloomberg Barclays U.S. Universal Bond Index produced a return of 6.11%, and a blended index of 80% Bloomberg Barclays U.S. Aggregate Bond Index and 20% MSCI World Index produced a 6.55% total return over the same time period.
Coming out of the third quarter of 2015, risk assets of any kind had declined in value and the October rally was a most welcome relief to the market. The S&P 500 Index increased 8.4%, while the Shanghai Composite Index rose 10.8%. The Bloomberg Barclays U.S. Corporate High-Yield Index gained 2.75%, as credit spreads tightened from 630 basis points to 560 basis points. It did not last long. Renewed concern over the pace of global growth and increased belief in, and the eventual reality of, the U.S. Federal Reserve Board (Fed) interest-rate “lift-off” led to a somewhat stronger U.S. dollar and drove commodity prices markedly lower. Subsequently, the new year started off with a storm. China had been a force behind the initial selloff, but began to stabilize and then recover by late January, as the decline in its foreign reserves slowed and speculation mounted that the government’s upcoming five-year plan would support and stimulate its slowing economy. Meanwhile, energy markets—specifically oil prices—continued to fall and lead markets lower.
Difficult times in financial markets often present opportunities. While the greatest pain was felt in the commodity-related sectors, the credit market overall declined. We found some interesting opportunities in the investment-grade and high-yield segments during the selloff, although it was difficult to acquire bonds outside of the highly stressed oil and gas sectors. While it felt awful at the time, it meant select opportunities could be purchased at what looked like attractive levels—on the assumption that the world was not ending. It was then, and still is, a time for careful credit analysis and rigorous selectivity.
The upside to the decline was that we were able to put some cash to work in the Fund opportunistically. In any case, by the end of the first quarter of 2016, the storm had passed. Risk asset prices had returned roughly to levels seen at the start of the year. Only risk-free U.S. Treasury rates remained lower, with the overall curve somewhat flatter. As market strength continued into the second quarter of 2016, we remained cautious. Nascent signs of wage growth and inflation appeared in the United States, but it does not appear that U.S. Treasury rates grant those signs much credibility. Should rising U.S. inflation prove sustained, even if it moves up in small increments, long rates could move markedly higher and shake up risk markets. A world full of upcoming challenges is widely accepted and nothing new for long-time investors.
The September Federal Open Market Committee meeting ended with no change to the policy rate. This was generally expected by market participants in the run-up to the announcement. However, the Fed signaled an increased likelihood of a December 2016 rate hike, while lowering both the expected pace of tightening going forward and the terminal Fed funds rate. We believe the Fed has subtly, but importantly, moved toward the belief that the U.S. potential growth rate has shifted downward. As a result, monetary policy is no longer searching for “escape velocity” to sustain higher growth, but is now operating under a new reality of subdued growth and inflation amid demographic, productivity, and high global debt level headwinds that the economy will face for years to come.
Despite recent action by the Bank of Japan, most central banks are signaling that the rewards from additional stimulus have declined while the risks have increased. Thus, the market should expect a higher bar for further stimulus in the future. Not to say that global monetary stimulus will cease to exist—quite the opposite, in fact—but this could result in increased market volatility going forward. Conceptually, as historically reliable and largely uneconomic buyers (global central banks) become more discerning, the potential for asset price adjustments could increase. However, introducing volatility to the capital markets could do much to reintroduce a sense of accountability and efficient capital allocation in the process, a situation where active management can provide additional value.
During the course of the year, we have concentrated on purchasing securities on the front end of the maturity spectrum. At the margin, we have subtly shifted portfolio weights towards a higher concentration of floating rate securities, often in the form of asset-backed securities (ABS). Additionally, we continue to place an emphasis on quality, particularly when current valuations do not provide much reward for adding incremental credit risk. In general, ABS investments allow us to access the U.S. consumer, one of the bright spots in the global economy. Consumer balance sheets have been continually improving, average hourly wages have recently grown at about 2.5%, and the economy is at or near historical measures of full employment. Consumer-based credit card and prime auto ABS, both high-quality and relatively liquid short-term securities, can offer attractive relative value in this low-yield
4 Annual Report
| | |
LETTER TO SHAREHOLDERS, CONTINUED | | |
| |
Thornburg Strategic Income Fund | | September 30, 2015 (Unaudited) |
environment. Per our investment philosophy, we only take incremental risk when our shareholders are properly compensated for doing so (and vice versa). Accordingly, we have been moving the portfolio to higher-quality securities.
This shift comes amidst continued deterioration in U.S. corporate balance sheets: net leverage, or debt, rose to the 72nd and 88th percentile (100 being the worst) for the median investment-grade and high-yield issuers vs. the past 30 years, at 1.77x and 3.26x, respectively, in the first half of 2016,1 yet corporate earnings and revenue growth continued to disappoint. Marrying the poor earnings environment with generally higher leverage suggests to us that risks have increased. Moreover, credit spreads narrowed, meaning that investors are accepting less compensation, despite the increased risk environment. As the aforementioned played out during the third quarter, we continued to search for interesting opportunities, ultimately finding them in seemingly unusual places. Generally, the 3-month London Interbank Offered Rate (LIBOR) is not thought of as a catalyst for relative value. However, recent regulatory changes across money market funds have forced banks to turn to alternative sources of liquidity, at increased cost. That higher cost materialized across markets as the 3-month LIBOR rose from 0.65% to 0.87% (as of this writing). At 0.87%, the yield on the 3-month LIBOR is essentially identical to the yield on the 2-year U.S. Treasury, but with less duration. This is the type of relative value proposition we believe has allowed us to produce superior risk-adjusted returns over the long term.
Looking ahead, the November 2016 U.S. general election could surprise markets, and they don’t generally like surprises. Drawing a parallel to the June 2016 “Brexit” referendum in the U.K., markets can head into controversial decision points severely discounting the probability of the non-consensus outcome. Electorates from Colombia to the U.K. to Germany have been behaving in “unpredictable” ways. Italy has an important referendum coming up that has the potential to spiral into a referendum on leaving the euro itself. Additionally, Germany and France both have elections in 2017, with pop-ulist parties gaining traction. Concerns regarding the U.K.’s filing of Article 50 in early 2017 have already begun to manifest themselves in risk markets. Geopolitics are always a risk, the key is in assessing which are adequately “priced-in” with respect to valuations and positioning our portfolios accordingly. Nevertheless, we believe our portfolio is positioned to perform across a broad spectrum of possible outcomes.
On September 30, 1981, the 10-Year U.S. Treasury hit an all-time high in terms of yield at 15.84%. Fast forward 35 years to the end of the third quarter of 2016 and the yield sat at just 1.60%. That same dynamic can be observed across the developed world, with many long-term government bonds currently priced to negative nominal yields. What started in 1981 is slowly coming to a close, though the combination of how and when is open to interpretation. Needless to say, what worked for the past 35 years is not particularly likely to work in the same fashion for the next 35 years. In our opinion, this sea change requires defensive posturing until a significant number of better relative value opportunities emerge, thus the portfolio remains overweight cash when compared to its own longer-term history. While no one can predict when more attractive buying opportunities will manifest themselves, we remain ready to take advantage of such occurrences opportunistically. In the meantime, we will patiently earn income from our current portfolio and attempt to avoid segments of the fixed income landscape that appear overheated.
We thank you for your continued interest.
Sincerely,

Jason H. Brady,CFA
Portfolio Manager
CEO, President, and Managing Director

Lon R. Erickson,CFA
Portfolio Manager
Managing Director

Jeff Klingelhofer,CFA
Portfolio Manager
Managing Director
1. The Credit Trader, “US Credit Quality Continues to Disappoint,” Goldman Sachs
The matters discussed in this report may constitute forward-looking statements made pursuant to the safe harbor provisions of the Securities Litigation Reform Act of 1995. These include any advisor or portfolio manager prediction, assessment, analysis or outlook for individual securities, industries, investment styles, market sectors and/or markets. These statements involve risks and uncertainties. In addition to the general risks described for each fund in its current prospectus, other factors bearing on these reports include the accuracy of the advisor’s or portfolio manager’s forecasts and predictions, the appropriateness of the investment strategies designed by the advisor or portfolio manager and the ability of the advisor or portfolio manager to implement their strategies efficiently and successfully. Any one or more of these factors, as well as other risks affecting the securities markets generally, could cause the actual results of any fund to differ materially as compared to its benchmarks.
The views expressed by the portfolio managers reflect their professional opinions and are subject to change. Under no circumstances does the information contained within represent a recommendation to buy or sell any security.
Annual Report 5
| | |
| PERFORMANCE SUMMARY | | |
| |
Thornburg Strategic Income Fund | | September 30, 2016 (Unaudited) |
Average Annual Total Returns
| | | | | | | | | | | | | | | | |
| | | 1-Yr | | | 3-Yr | | | 5-Yr | | | Since
Incep. | |
Class A Shares (Incep: 12/19/07) | | | | | | | | | | | | | | | | |
Without sales charge | | | 6.70 | % | | | 3.40 | % | | | 5.69 | % | | | 6.48 | % |
With sales charge | | | 1.88 | % | | | 1.84 | % | | | 4.72 | % | | | 5.93 | % |
Class C Shares (Incep: 12/19/07) | | | | | | | | | | | | | | | | |
Without sales charge | | | 6.20 | % | | | 2.85 | % | | | 5.12 | % | | | 5.89 | % |
With sales charge | | | 5.20 | % | | | 2.85 | % | | | 5.12 | % | | | 5.89 | % |
Class I Shares (Incep: 12/19/07) | | | 7.15 | % | | | 3.75 | % | | | 6.04 | % | | | 6.82 | % |
Class R3 Shares (Incep: 5/1/12) | | | 6.69 | % | | | 3.35 | % | | | — | | | | 4.64 | % |
Class R4 Shares (Incep: 2/1/14) | | | 6.79 | % | | | — | | | | — | | | | 2.92 | % |
Class R5 Shares (Incep: 5/1/12) | | | 7.07 | % | | | 3.68 | % | | | — | | | | 4.96 | % |
Bloomberg Barclays U.S. Universal Index (Since 12/19/07) | | | 6.11 | % | | | 4.27 | % | | | 3.62 | % | | | 4.82 | % |
Blended Index (Since 12/19/07) | | | 6.55 | % | | | 4.50 | % | | | 4.87 | % | | | 4.58 | % |
Growth of a Hypothetical $10,000 Investment
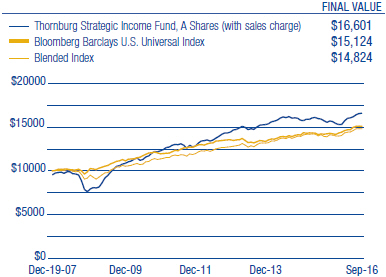
30-Day Yields, A Shares (with sales charge)
| | | | |
SEC Yield | | | 4.90 | % |
Annualized Distribution Yield | | | 2.23 | % |
Performance data shown represents past performance and is no guarantee of future results. Investment return and principal value will fluctuate so shares, when redeemed, may be worth more or less than their original cost. Current performance may be lower or higher than quoted. For performance current to the most recent month end, visit thornburg.com or call 800-847-0200. The performance information does not reflect the deduction of taxes that a shareholder would pay on distributions or the redemption of Fund shares. Returns reflect the reinvestment of dividends and capital gains. Class A shares are sold with a maximum sales charge of 4.50%. Class C shares are subject to a 1% CDSC for the first year only. There is no sales charge for Class I, R3, R4, and R5 shares. As disclosed in the most recent prospectus, the total annual fund operating expenses are as follows: A shares, 1.23%; C shares, 1.97%; I shares, 0.89%; R3 shares, 2.70%; R4 shares, 2.64%; R5 shares, 1.55%. Thornburg Investment Management and/or Thornburg Securities Corporation have contractually agreed to waive fees and reimburse expenses through at least February 1, 2017, for some of the share classes, resulting in net expense ratios of the following: C shares, 1.80%; R3 shares, 1.25%; R4 shares, 1.25%; R5 shares, 0.99%. For more detailed information on fund expenses and waivers/reimbursements please see the Fund’s prospectus.
Glossary
Bloomberg Barclays U.S. Aggregate Bond Index – This index is composed of approximately 8,000 publicly traded bonds including U.S. government, mortgage-backed, corporate and Yankee bonds. The index is weighted by the market value of the bonds included in the index.
Bloomberg Barclays U.S. Corporate High-Yield Index – This index measures the market of USD-denominated, non-investment grade, fixed-rate, taxable corporate bonds. Securities are classified as high yield if the middle rating of Moody’s, Fitch, and S&P is Ba1/BB+/BB+ or below. The index excludes emerging market debt.
Bloomberg Barclays U.S. Universal Bond Index – This index represents the union of the U.S. Aggregate Index, U.S. Corporate High-Yield, Investment Grade 144A Index, Eurodollar Index, U.S. Emerging Markets Index, and the non-ERISA eligible portion of the CMBS Index. The index covers USD denominated, taxable bonds that are rated either investment-grade or below investment-grade.
Blended Index – Thornburg Strategic Income Fund’s Blended Index is composed of 80% Bloomberg Barclays U.S. Aggregate Bond Index and 20% MSCI World Index, rebalanced monthly.
MSCI World Index – This index is an unmanaged market-weighted index that consists of securities traded in 23 of the world’s most developed countries. Securities are listed on exchanges in the U.S., Europe, Canada, Australia, New Zealand, and the Far East. The index is calculated with net dividends reinvested, in U.S. dollars.
S&P 500 Index – An unmanaged broad measure of the U.S. stock market.
Shanghai Composite Index – A capitalization-weighted index that tracks the daily price performance of all A-shares and B-shares listed on the Shanghai Stock Exchange.
Unless otherwise noted, index returns reflect the reinvestment of income dividends and capital gains, if any, but do not reflect fees, brokerage commissions or other expenses of investing. Investors may not make direct investments into any index. The performance of any index is not indicative of the performance of any particular investment.
Annualized Distribution Yield – The distribution yield reflects actual distributions made to shareholders. The Annualized distribution yield is calculated by summing the last 30 days of income at a given month end and annualizing to a 360-day year. The result is divided by the ending maximum offering price.
Asset-backed Security (ABS) – A security whose value and income payments are derived from and collateralized (or “backed”) by a specified pool of underlying assets. The pool of assets is typically a group of small and illiquid assets that are unable to be sold individually. Pooling the assets into financial instruments allows them to be sold to general investors, a process called securitization, and allows the risk of investing in the underlying assets to be diversified because each security will represent a fraction of the total value of the diverse pool of underlying assets.
Credit Spread/Quality Spread – The difference between the yields of securities with different credit qualities.
Duration – A bond’s sensitivity to interest rates. Bonds with longer durations experience greater price volatility than bonds with shorter durations.
SEC Yield – SEC Yield is computed in accordance with SEC standards measuring the net investment income per share over a specified 30-day period expressed as a percentage of the maximum offering price of the Fund’s shares at the end of the period.
Yield Curve – A line that plots the interest rates, at a set point in time, of bonds having equal credit quality, but differing maturity dates.
6 Annual Report
| | |
| FUND SUMMARY | | |
| |
Thornburg Strategic Income Fund | | September 30, 2016 (Unaudited) |
Objectives and Strategies
The Fund’s primary investment goal is to seek a high level of current income. The Fund’s secondary investment goal is some long-term capital appreciation.
The Fund pursues its investment goals by investing in a broad range of income producing investments from throughout the world, primarily including debt obligations and income producing stocks. The Fund expects, under normal conditions, to invest a majority of its assets in debt obligations, but the relative proportions of the Fund’s investments in debt obligations and in income producing stocks can be expected to vary over time.
Portfolio Composition
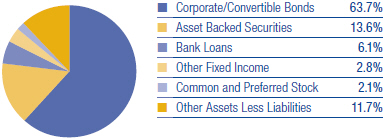
Fixed Income Credit Quality*
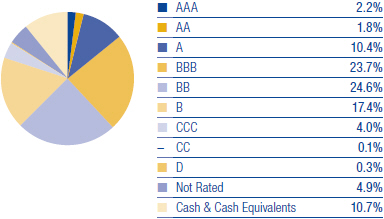
| * | Excludes equity securities. |
A bond credit rating assesses the financial ability of a debt issuer to make timely payments of principal and interest. Ratings of AAA (the highest), AA, A, and BBB are investment-grade quality. Ratings of BB, B, CCC, CC, C and D (the lowest) are considered below investment grade, speculative grade, or junk bonds. Credit quality ratings for Thornburg’s global fixed income portfolios used ratings from Moody’s Investors Service. Where Moody’s ratings are not available, we have used Standard & Poor’s ratings. Where neither rating is available, we have used ratings from other NRSROs. U.S.-backed securities are included in AAA. “NR” = not rated.
Top Ten Industry Groups
| | | | |
Energy | | | 10.6 | % |
Diversified Financials | | | 8.7 | % |
Media | | | 5.6 | % |
Telecommunication Services | | | 4.8 | % |
Capital Goods | | | 4.4 | % |
Materials | | | 3.8 | % |
Commercial & Professional Services | | | 3.1 | % |
Food, Beverage & Tobacco | | | 3.0 | % |
Transportation | | | 3.0 | % |
Software & Services | | | 2.8 | % |
| |
| Country Exposure** | | | | |
| |
United States | | | 67.6 | % |
Canada | | | 4.0 | % |
United Kingdom | | | 2.9 | % |
Mexico | | | 2.7 | % |
Brazil | | | 2.0 | % |
Sweden | | | 1.1 | % |
Cayman Islands | | | 1.0 | % |
Luxembourg | | | 0.8 | % |
France | | | 0.8 | % |
Australia | | | 0.7 | % |
Jamaica | | | 0.7 | % |
Netherlands | | | 0.6 | % |
Morocco | | | 0.5 | % |
Belgium | | | 0.4 | % |
Mauritius | | | 0.4 | % |
South Korea | | | 0.3 | % |
Barbados | | | 0.3 | % |
Romania | | | 0.3 | % |
Ireland | | | 0.3 | % |
Russia | | | 0.3 | % |
Chile | | | 0.2 | % |
Hong Kong | | | 0.2 | % |
Switzerland | | | 0.2 | % |
Panama | | | 0.1 | % |
Other Assets Less Liabilities | | | 11.7 | % |
| ** | The country assignment of each holding is determined by the Fund’s Advisor based on various factors, including the location of the issuer’s head office, the issuer’s jurisdiction of incorporation and the country from which a majority of the issuer’s revenue is derived. |
There is no guarantee that the Fund will meet its investment objectives.
All portfolio information is subject to change. Charts may not add up to 100% due to rounding.
Annual Report 7
| | |
| SCHEDULE OF INVESTMENTS | | |
| |
Thornburg Strategic Income Fund | | September 30, 2016 |
| | | | | | | | |
| | | Shares/ | | | | |
| | | Principal Amount | | | Value | |
COMMON STOCK — 0.30% | | | | | | | | |
ENERGY — 0.30% | | | | | | | | |
Oil, Gas & Consumable Fuels — 0.30% | | | | | | | | |
a ROMGAZ SA-GDR | | | 531,954 | | | $ | 3,085,333 | |
| | | | | | | | |
| | | | | | | 3,085,333 | |
| | | | | | | | |
TOTAL COMMON STOCK (Cost $5,258,023) | | | | | | | 3,085,333 | |
| | | | | | | | |
| | |
PREFERRED STOCK — 1.75% | | | | | | | | |
BANKS — 0.38% | | | | | | | | |
Banks — 0.38% | | | | | | | | |
GMAC Capital Trust I Pfd, 8.125% | | | 140,000 | | | | 3,557,400 | |
b KeyCorp Pfd, 8.625% | | | 17,732 | | | | 463,160 | |
| | | | | | | | |
| | | | | | | 4,020,560 | |
| | | | | | | | |
| | |
MISCELLANEOUS — 1.03% | | | | | | | | |
U.S. Government Agencies — 1.03% | | | | | | | | |
Farm Credit Bank of Texas Pfd, 10.00% | | | 1,000 | | | | 1,187,500 | |
Cobank, ACB Pfd, 6.25% | | | 50,000 | | | | 5,287,500 | |
AgriBank, FCB Pfd, 6.875% | | | 40,000 | | | | 4,312,500 | |
| | | | | | | | |
| | | | | | | 10,787,500 | |
| | | | | | | | |
| | |
REAL ESTATE — 0.07% | | | | | | | | |
Real Estate Investment Trusts — 0.07% | | | | | | | | |
VEREIT, Inc. Pfd, 6.70% | | | 25,857 | | | | 688,830 | |
| | | | | | | | |
| | | | | | | 688,830 | |
| | | | | | | | |
| | |
TELECOMMUNICATION SERVICES — 0.27% | | | | | | | | |
Wireless Telecommunication Services — 0.27% | | | | | | | | |
a Centaur Funding Corp. Pfd, 9.08% | | | 2,380 | | | | 2,812,119 | |
| | | | | | | | |
| | | | | | | 2,812,119 | |
| | | | | | | | |
TOTAL PREFERRED STOCK (Cost $17,336,769) | | | | | | | 18,309,009 | |
| | | | | | | | |
| | |
ASSET BACKED SECURITIES — 13.23% | | | | | | | | |
AUTO RECEIVABLES — 1.71% | | | | | | | | |
a Drive Auto Receivables Trust, 2.59%, 12/16/2019 | | | 9,125,000 | | | | 9,171,913 | |
a,c,d DT Auto Owner Trust, Series 2016-4A Class A, 1.44%, 11/15/2019 | | | 2,100,000 | | | | 2,099,895 | |
a Foursight Capital Automobile Receivables Trust, Series 2016-1 Class A2, 2.87%, 10/15/2021 | | | 4,549,000 | | | | 4,533,946 | |
a,c OSCAR US Funding Trust, Series 2016-2A Class A2A, 2.31%, 11/15/2019 | | | 2,100,000 | | | | 2,099,740 | |
| | | | | | | | |
| | | | | | | 17,905,494 | |
| | | | | | | | |
| | |
COMMERCIAL MTG TRUST — 1.28% | | | | | | | | |
a Capital Automotive REIT, Series 2012-1A Class A, 4.70%, 7/15/2042 | | | 2,808,140 | | | | 2,862,606 | |
a CFCRE Commercial Mortgage Trust, Series 2011-C1 Class C, 6.386%, 4/15/2044 | | | 6,200,000 | | | | 6,800,791 | |
Citigroup Commercial Mortgage Trust, Series 2004-HYB2 Class B1, 2.951%, 3/25/2034 | | | 94,387 | | | | 77,312 | |
a Credit Suisse Mortgage Trust, Series 2016-BDWN Class E, 12.024%, 2/15/2029 | | | 3,000,000 | | | | 3,000,109 | |
a FREMF Mortgage Trust, Series 2013-KF02 Class B Floating Rate Note, 3.496%, 12/25/2045 | | | 662,552 | | | | 672,927 | |
| | | | | | | | |
| | | | | | | 13,413,745 | |
| | | | | | | | |
| | |
OTHER ASSET BACKED — 7.78% | | | | | | | | |
a 321 Henderson Receivables, LLC, Series 2006-3A Class A1, 0.642%, 9/15/2041 | | | 3,475,788 | | | | 3,293,867 | |
a 321 Henderson Receivables, LLC, Series 2014-1A Class A, 3.96%, 3/15/2063 | | | 5,662,692 | | | | 5,832,245 | |
a Aircraft Certificate Owner Trust, Series 2003-1A Class E, 7.001%, 9/20/2022 | | | 2,853,894 | | | | 3,025,127 | |
a American Credit Acceptance, Series 2014-2 Class B, 2.26%, 3/10/2020 | | | 2,421,652 | | | | 2,422,975 | |
a BCC Funding Corp., Series 2016-1 Class A1, 1.10%, 9/20/2017 | | | 2,000,000 | | | | 2,000,019 | |
a,c Concord Funding Co., LLC, Series 2012-2 Class B, 4.145%, 1/15/2017 | | | 4,000,000 | | | | 4,008,000 | |
a Dominos Pizza Master Issuer, LLC, Series 2012-1A Class A2, 5.216%, 1/25/2042 | | | 5,889,928 | | | | 6,048,369 | |
a,e ECAF Ltd., Series 2015-1A Class B1, 5.802%, 6/15/2040 | | | 7,181,937 | | | | 7,038,299 | |
a,f Fairway Outdoor Funding, LLC, Series 2012-1 Class B, 8.835%, 10/15/2042 | | | 3,000,000 | | | | 3,128,631 | |
a,e Global SC Finance SRL, Series 2014-1A Class A1, 3.19%, 7/17/2029 | | | 3,720,833 | | | | 3,587,805 | |
a JPR Royalty, LLC, 14.00%, 9/1/2020 | | | 2,000,000 | | | | 1,000,000 | |
a Motel 6 Trust, Series 2015-MTL6 Class B, 3.298%, 2/5/2030 | | | 3,470,000 | | | | 3,467,260 | |
a,c Northwind Holdings, LLC, Series 2007-1A Class A1 Floating Rate Note, 1.622%, 12/1/2037 | | | 687,500 | | | | 639,375 | |
a OnDeck Asset Securitization Trust II, LLC, Series 2016-1A Class A, 4.21%, 5/17/2020 | | | 4,170,000 | | | | 4,164,845 | |
a Progreso Receivables Funding, LLC, Series 2015-A Class A, 3.625%, 2/8/2020 | | | 10,025,000 | | | | 9,994,036 | |
a SBA Tower Trust, Series 2015-1 Class C, 3.156%, 10/15/2045 | | | 3,750,000 | | | | 3,786,450 | |
a SBA Tower Trust, Series 2016-1 Class C, 2.877%, 7/15/2046 | | | 2,275,000 | | | | 2,313,563 | |
a SolarCity LMC, LLC, Series 2013-1 Class A, 4.80%, 11/20/2038 | | | 3,005,274 | | | | 2,922,650 | |
a SolarCity LMC, LLC, Series 2014-1 Class A, 4.59%, 4/20/2044 | | | 3,116,444 | | | | 3,031,341 | |
a Sonic Capital, LLC, Series 2016-1A Class A2, 4.472%, 5/20/2046 | | | 3,089,667 | | | | 3,137,687 | |
8 Annual Report
| | |
| SCHEDULE OF INVESTMENTS, CONTINUED | | |
| |
Thornburg Strategic Income Fund | | September 30, 2016 |
| | | | | | | | |
| | | Shares/
Principal Amount | | | Value | |
a VB-S1 Issuer, LLC, Series 16-1A Class C, 3.065%, 6/15/2046 | | | 3,100,000 | | | $ | 3,165,070 | |
a Westgate Resorts, Series 2016-1A Class A, 3.50%, 12/20/2028 | | | 3,708,317 | | | | 3,690,607 | |
| | | | | | | | |
| | | | | | | 81,698,221 | |
| | | | | | | | |
| | |
RESIDENTIAL MTG TRUST — 1.39% | | | | | | | | |
Banc of America Funding Corp., Series 2006-I Class SB1, 2.764%, 12/20/2036 | | | 511,138 | | | | 119,810 | |
Bear Stearns ARM Mortgage, Series 2003-6 Class 2B-1, 2.894%, 8/25/2033 | | | 156,258 | | | | 153,512 | |
a Citigroup Mortgage Loan Trust, Inc., Series 2014-A Class A, 4.00%, 1/25/2035 | | | 3,022,750 | | | | 3,146,957 | |
Countrywide, Series 2005-11 Class AF3, 4.778%, 2/25/2036 | | | 278,142 | | | | 280,696 | |
a CS First Boston Mortgage Securities Co., Series 2005-CF1 Class M1, 1.225%, 3/25/2045 | | | 979,606 | | | | 957,836 | |
JPMorgan Mortgage Acquisition Corp., Series 2006-CH1 Class A4, 0.665%, 7/25/2036 | | | 12,196 | | | | 12,194 | |
Merrill Lynch Mortgage Investors Trust, Series 2004-A4 Class M1, 2.855%, 8/25/2034 | | | 272,273 | | | | 243,646 | |
Morgan Stanley Capital, Inc., Series 2005-HE7 Class A2C, 0.845%, 11/25/2035 | | | 650,652 | | | | 647,072 | |
a,c Senior Homeowner Assistance Program, Series 2013-RM1 Class A, 4.00%, 5/26/2053 | | | 2,128,284 | | | | 2,128,284 | |
Structured Asset Securities Corp., Series 2004-20 Class 7A1, 5.25%, 11/25/2034 | | | 527,277 | | | | 545,836 | |
a TAL Advantage V, LLC, Series 2014-1A Class A, 3.51%, 2/22/2039 | | | 6,489,583 | | | | 6,372,877 | |
Wells Fargo Asset Securities Corp., Series 2005-AR1 Class 1B1, 2.77%, 2/25/2035 | | | 154,433 | | | | 24,005 | |
| | | | | | | | |
| | | | | | | 14,632,725 | |
| | | | | | | | |
| | |
STUDENT LOAN — 1.07% | | | | | | | | |
Access Group, Inc., Series 2005-A Class A3, 1.115%, 7/25/2034 | | | 4,028,128 | | | | 3,723,633 | |
a Earnest Student Loan Program, LLC, Series 2016-C Class A2, 2.68%, 7/25/2035 | | | 2,892,985 | | | | 2,873,504 | |
a Social Professional Loan Program, LLC, Series 2014-A Class A2, 3.02%, 10/25/2027 | | | 2,355,591 | | | | 2,400,943 | |
a Social Professional Loan Program, LLC, Series 2014-B Class A1 Floating Rate Note, 1.775%, 8/25/2032 | | | 2,169,955 | | | | 2,190,821 | |
| | | | | | | | |
| | | | | | | 11,188,901 | |
| | | | | | | | |
TOTAL ASSET BACKED SECURITIES (Cost $139,856,881) | | | | | | | 138,839,086 | |
| | | | | | | | |
| | |
CORPORATE BONDS — 61.01% | | | | | | | | |
AUTOMOBILES & COMPONENTS — 0.20% | | | | | | | | |
Auto Components — 0.20% | | | | | | | | |
a,e Nexteer Automotive Group Ltd., 5.875%, 11/15/2021 | | | 2,000,000 | | | | 2,120,000 | |
| | | | | | | | |
| | | | | | | 2,120,000 | |
| | | | | | | | |
| | |
BANKS — 0.99% | | | | | | | | |
Banks — 0.99% | | | | | | | | |
Bank of America Corp., 4.20%, 8/26/2024 | | | 3,200,000 | | | | 3,388,621 | |
e Royal Bank of Scotland Group plc, 9.50%, 3/16/2022 | | | 2,000,000 | | | | 2,060,696 | |
e Royal Bank of Scotland Group plc, 6.125%, 12/15/2022 | | | 2,000,000 | | | | 2,119,228 | |
a,e Sberbank of Russia, 5.50%, 2/26/2024 | | | 2,750,000 | | | | 2,774,062 | |
| | | | | | | | |
| | | | | | | 10,342,607 | |
| | | | | | | | |
| | |
CAPITAL GOODS — 4.34% | | | | | | | | |
Aerospace & Defense — 0.27% | | | | | | | | |
a CBC Ammo, LLC, 7.25%, 11/15/2021 | | | 2,970,000 | | | | 2,895,750 | |
Building Products — 0.29% | | | | | | | | |
a,e Ardagh Packaging Group Ltd., 4.067%, 5/15/2021 | | | 3,000,000 | | | | 3,045,000 | |
Construction & Engineering — 1.30% | | | | | | | | |
URS Corp., 3.85%, 4/1/2017 | | | 7,310,000 | | | | 7,343,465 | |
a Zachry Holdings, Inc., 7.50%, 2/1/2020 | | | 6,310,000 | | | | 6,278,450 | |
Electrical Equipment — 0.44% | | | | | | | | |
a,e Sensata Technologies UK Finance Co., 6.25%, 2/15/2026 | | | 3,550,000 | | | | 3,842,875 | |
a Wesco Distribution, Inc., 5.375%, 6/15/2024 | | | 760,000 | | | | 761,900 | |
Industrial Conglomerates — 0.39% | | | | | | | | |
Otter Tail Corp., 9.00%, 12/15/2016 | | | 4,000,000 | | | | 4,050,432 | |
Machinery — 0.31% | | | | | | | | |
a,e Automation Tooling Systems, 6.50%, 6/15/2023 | | | 3,125,000 | | | | 3,203,125 | |
Trading Companies & Distributors — 1.35% | | | | | | | | |
a Aviation Capital Group Corp., 7.125%, 10/15/2020 | | | 1,881,000 | | | | 2,219,580 | |
a International Lease Finance Corp., 7.125%, 9/1/2018 | | | 8,000,000 | | | | 8,730,000 | |
a Wajax Corp. (CAD), 6.125%, 10/23/2020 | | | 4,210,000 | | | | 3,201,904 | |
| | | | | | | | |
| | | | | | | 45,572,481 | |
| | | | | | | | |
| | |
COMMERCIAL & PROFESSIONAL SERVICES — 2.74% | | | | | | | | |
Commercial Services & Supplies — 1.19% | | | | | | | | |
RR Donnelley & Sons Co., 7.875%, 3/15/2021 | | | 6,968,000 | | | | 7,612,540 | |
RR Donnelley & Sons Co., 8.875%, 4/15/2021 | | | 4,500,000 | | | | 4,905,000 | |
Annual Report 9
| | |
| SCHEDULE OF INVESTMENTS, CONTINUED | | |
| |
Thornburg Strategic Income Fund | | September 30, 2016 |
| | | | | | | | |
| | | Shares/
Principal Amount | | | Value | |
Professional Services — 1.55% | | | | | | | | |
Dun & Bradstreet, Inc., 4.00%, 6/15/2020 | | | 4,185,000 | | | $ | 4,367,165 | |
a Nielsen Finance, LLC, 5.00%, 4/15/2022 | | | 7,420,000 | | | | 7,661,150 | |
Verisk Analytics, Inc., 4.00%, 6/15/2025 | | | 3,920,000 | | | | 4,162,420 | |
| | | | | | | | |
| | | | | | | 28,708,275 | |
| | | | | | | | |
| | |
COMMERCIAL SERVICES & SUPPLIES — 0.40% | | | | | | | | |
Diversified Support Services — 0.40% | | | | | | | | |
Lavare Holding AB (SEK), 4.472%, 4/4/2019 | | | 35,000,000 | | | | 4,192,020 | |
| | | | | | | | |
| | | | | | | 4,192,020 | |
| | | | | | | | |
| | |
CONSUMER DURABLES & APPAREL — 0.37% | | | | | | | | |
Leisure Products — 0.20% | | | | | | | | |
a Vista Outdoor, Inc., 5.875%, 10/1/2023 | | | 1,985,000 | | | | 2,074,325 | |
Textiles, Apparel & Luxury Goods — 0.17% | | | | | | | | |
a Hanesbrands, Inc., 4.625%, 5/15/2024 | | | 1,775,000 | | | | 1,821,594 | |
| | | | | | | | |
| | | | | | | 3,895,919 | |
| | | | | | | | |
| | |
CONSUMER SERVICES — 0.79% | | | | | | | | |
Diversified Consumer Services — 0.60% | | | | | | | | |
a Laureate Education, Inc., 9.25%, 9/1/2019 | | | 2,064,000 | | | | 1,965,960 | |
a Nord Anglia Education Finance, LLC (CHF), 5.75%, 7/15/2022 | | | 3,985,000 | | | | 4,286,490 | |
Hotels, Restaurants & Leisure — 0.19% | | | | | | | | |
Aramark Services, Inc., 5.75%, 3/15/2020 | | | 1,995,000 | | | | 2,049,862 | |
| | | | | | | | |
| | | | | | | 8,302,312 | |
| | | | | | | | |
| | |
DIVERSIFIED FINANCIALS — 7.52% | | | | | | | | |
Capital Markets — 2.94% | | | | | | | | |
Ares Capital Corp., 4.875%, 11/30/2018 | | | 7,000,000 | | | | 7,307,090 | |
a Ares Finance Co., LLC, 4.00%, 10/8/2024 | | | 4,025,000 | | | | 3,899,617 | |
a,e BTG Investments LP, 4.50%, 4/17/2018 | | | 4,750,000 | | | | 4,429,375 | |
e Credit Suisse Group Funding (Guernsey) Ltd., 3.80%, 9/15/2022 | | | 2,450,000 | | | | 2,502,879 | |
FS Investment Corp., 4.00%, 7/15/2019 | | | 6,286,000 | | | | 6,393,604 | |
Goldman Sachs Group, Inc. Floating Rate Note, 1.735%, 10/23/2019 | | | 5,895,000 | | | | 5,926,939 | |
a MSCI, Inc., 4.75%, 8/1/2026 | | | 400,000 | | | | 405,000 | |
Consumer Finance — 1.39% | | | | | | | | |
Ally Financial, Inc., 4.75%, 9/10/2018 | | | 4,000,000 | | | | 4,140,000 | |
First Cash Financial Services, Inc., 6.75%, 4/1/2021 | | | 10,000,000 | | | | 10,450,000 | |
Diversified Financial Services — 3.19% | | | | | | | | |
a Athene Global Funding, 2.875%, 10/23/2018 | | | 4,725,000 | | | | 4,714,402 | |
a,e CFG Holdings Ltd./CFG Finance, LLC, 11.50%, 11/15/2019 | | | 7,000,000 | | | | 7,175,000 | |
a Citicorp, 8.04%, 12/15/2019 | | | 250,000 | | | | 292,156 | |
a,e Credit Suisse Group Ltd., 3.80%, 6/9/2023 | | | 400,000 | | | | 405,312 | |
General Electric Capital Corp. (SEK), 2.625%, 1/16/2018 | | | 24,000,000 | | | | 2,887,251 | |
Morgan Stanley, 2.097%, 4/21/2021 | | | 6,660,000 | | | | 6,788,571 | |
a MSCI, Inc., 5.25%, 11/15/2024 | | | 1,625,000 | | | | 1,720,306 | |
a MSCI, Inc., 5.75%, 8/15/2025 | | | 2,640,000 | | | | 2,818,200 | |
S&P Global, Inc., 4.00%, 6/15/2025 | | | 1,590,000 | | | | 1,722,506 | |
S&P Global, Inc., 3.30%, 8/14/2020 | | | 1,975,000 | | | | 2,073,217 | |
a TMX Finance, LLC/Titlemax Finance, 8.50%, 9/15/2018 | | | 3,780,000 | | | | 2,816,100 | |
| | | | | | | | |
| | | | | | | 78,867,525 | |
| | | | | | | | |
| | |
ENERGY — 9.97% | | | | | | | | |
Energy Equipment & Services — 0.95% | | | | | | | | |
Compressco Partners, L.P., 7.25%, 8/15/2022 | | | 4,800,000 | | | | 4,536,000 | |
Oceaneering International, Inc., 4.65%, 11/15/2024 | | | 4,075,000 | | | | 4,102,237 | |
a,e,g Schahin II Finance Co. (SPV) Ltd., 5.875%, 9/25/2023 | | | 10,684,600 | | | | 1,282,152 | |
Oil, Gas & Consumable Fuels — 9.03% | | | | | | | | |
Calumet Specialty Products Partners, LP, 7.625%, 1/15/2022 | | | 2,050,000 | | | | 1,655,375 | |
Calumet Specialty Products Partners, LP, 6.50%, 4/15/2021 | | | 1,420,000 | | | | 1,160,850 | |
a Citgo Holding, Inc., 10.75%, 2/15/2020 | | | 980,000 | | | | 982,450 | |
a Citgo Petroleum Corp., 6.25%, 8/15/2022 | | | 450,000 | | | | 438,750 | |
Energy Transfer Partners LP, 3.774%, 11/1/2066 | | | 1,200,000 | | | | 816,000 | |
Enterprise Products Operating LP, 7.034%, 1/15/2068 | | | 1,400,000 | | | | 1,479,506 | |
a Florida Gas Transmission Co., LLC, 3.875%, 7/15/2022 | | | 4,765,000 | | | | 4,939,961 | |
a Florida Gas Transmission Co., LLC, 4.35%, 7/15/2025 | | | 2,224,000 | | | | 2,317,339 | |
Gastar Exploration USA, Inc., 8.625%, 5/15/2018 | | | 1,911,000 | | | | 1,605,240 | |
Global Partners LP/GLP Finance Corp., 6.25%, 7/15/2022 | | | 4,975,000 | | | | 4,614,312 | |
10 Annual Report
| | |
| SCHEDULE OF INVESTMENTS, CONTINUED | | |
| |
Thornburg Strategic Income Fund | | September 30, 2016 |
| | | | | | | | |
| | | Shares/
Principal Amount | | | Value | |
Gulf South Pipeline Co., LP, 4.00%, 6/15/2022 | | | 4,860,000 | | | $ | 4,708,932 | |
a Gulfstream Natural Gas System, LLC, 4.60%, 9/15/2025 | | | 5,515,000 | | | | 5,782,555 | |
HollyFrontier Corp., 5.875%, 4/1/2026 | | | 3,500,000 | | | | 3,791,420 | |
a Kinder Morgan (Delaware), Inc., 5.00%, 2/15/2021 | | | 6,101,000 | | | | 6,595,028 | |
a,g Linc Energy, 9.625%, 10/31/2017 | | | 1,324,000 | | | | 264,800 | |
a,g Linc Energy, 12.50%, 10/31/2017 | | | 6,617,950 | | | | 66 | |
NGL Energy Partners LP, 6.875%, 10/15/2021 | | | 6,000,000 | | | | 5,685,000 | |
Northern Tier Energy, LLC, 7.125%, 11/15/2020 | | | 6,450,000 | | | | 6,595,125 | |
a,e Odebrecht Offshore Drilling Finance Ltd., 6.75%, 10/1/2023 | | | 2,583,610 | | | | 477,968 | |
Plains All American Pipeline LP, 8.75%, 5/1/2019 | | | 1,000,000 | | | | 1,152,771 | |
a,e QGOG Atlantic/Alaskan Rigs Ltd., 5.25%, 7/30/2019 | | | 777,060 | | | | 668,272 | |
b,g RAAM Global Energy Co., 12.50%, 10/1/2049 | | | 2,000,000 | | | | 20,000 | |
a Rockies Express Pipeline, LLC, 6.85%, 7/15/2018 | | | 2,000,000 | | | | 2,105,000 | |
a Sabine Pass LNG LP, 7.50%, 11/30/2016 | | | 10,590,000 | | | | 10,669,425 | |
Summit Midstream Holdings, LLC, 5.50%, 8/15/2022 | | | 7,010,000 | | | | 6,677,025 | |
Tesoro Logistics LP, 6.125%, 10/15/2021 | | | 3,510,000 | | | | 3,667,950 | |
a Texas Gas Transmission, LLC, 4.50%, 2/1/2021 | | | 940,000 | | | | 974,064 | |
a Transcontinental Gas Pipe Line Co., LLC, 7.85%, 2/1/2026 | | | 3,600,000 | | | | 4,660,708 | |
a,e Tullow Oil plc, 6.25%, 4/15/2022 | | | 6,400,000 | | | | 5,728,000 | |
Williams Partners LP, 4.50%, 11/15/2023 | | | 4,335,000 | | | | 4,492,829 | |
| | | | | | | | |
| | | | | | | 104,647,110 | |
| | | | | | | | |
| | |
FOOD & STAPLES RETAILING — 1.70% | | | | | | | | |
Food & Staples Retailing — 1.70% | | | | | | | | |
a Bakkavor Finance (2) plc (GBP), 8.75%, 6/15/2020 | | | 6,275,000 | | | | 8,662,004 | |
a C&S Group Enterprises, LLC, 5.375%, 7/15/2022 | | | 3,935,000 | | | | 3,875,975 | |
a Whole Foods Market, Inc., 5.20%, 12/3/2025 | | | 4,830,000 | | | | 5,245,839 | |
| | | | | | | | |
| | | | | | | 17,783,818 | |
| | | | | | | | |
| | |
FOOD, BEVERAGE & TOBACCO — 2.16% | | | | | | | | |
Beverages — 0.56% | | | | | | | | |
Ambev International Finance Co., Ltd. (BRL), 9.50%, 7/24/2017 | | | 2,000,000 | | | | 611,903 | |
a,e Central America Bottling Corp., 6.75%, 2/9/2022 | | | 5,000,000 | | | | 5,225,000 | |
Food Products — 1.10% | | | | | | | | |
a,e Barry Callebaut Services NV, 5.50%, 6/15/2023 | | | 4,000,000 | | | | 4,358,600 | |
a,e BRF S.A., 4.75%, 5/22/2024 | | | 4,650,000 | | | | 4,754,625 | |
a Dean Foods Co., 6.50%, 3/15/2023 | | | 2,300,000 | | | | 2,452,950 | |
Tobacco — 0.50% | | | | | | | | |
Vector Group Ltd., 7.75%, 2/15/2021 | | | 5,000,000 | | | | 5,273,500 | |
| | | | | | | | |
| | | | | | | 22,676,578 | |
| | | | | | | | |
| | |
HEALTH CARE EQUIPMENT & SERVICES — 1.82% | | | | | | | | |
Health Care Providers & Services — 1.82% | | | | | | | | |
a Covenant Surgical Partners, Inc., 8.75%, 8/1/2019 | | | 6,125,000 | | | | 5,880,000 | |
DaVita Healthcare Partners, Inc., 5.00%, 5/1/2025 | | | 3,450,000 | | | | 3,462,937 | |
HCA, Inc., 4.75%, 5/1/2023 | | | 1,735,000 | | | | 1,808,738 | |
HCA, Inc., 4.50%, 2/15/2027 | | | 1,475,000 | | | | 1,484,219 | |
a LifePoint Health, Inc., 5.375%, 5/1/2024 | | | 4,865,000 | | | | 4,865,000 | |
a Quorum Health Corp., 11.625%, 4/15/2023 | | | 1,980,000 | | | | 1,643,400 | |
| | | | | | | | |
| | | | | | | 19,144,294 | |
| | | | | | | | |
| | |
HOUSEHOLD & PERSONAL PRODUCTS — 1.00% | | | | | | | | |
Household Products — 0.87% | | | | | | | | |
Edgewell Personal Care, 4.70%, 5/24/2022 | | | 5,990,000 | | | | 6,192,163 | |
a Energizer Holdings, Inc., 5.50%, 6/15/2025 | | | 2,850,000 | | | | 2,935,500 | |
Personal Products — 0.13% | | | | | | | | |
a Avon International Operations, Inc., 7.875%, 8/15/2022 | | | 1,340,000 | | | | 1,383,550 | |
| | | | | | | | |
| | | | | | | 10,511,213 | |
| | | | | | | | |
| | |
INSURANCE — 2.50% | | | | | | | | |
Insurance — 2.50% | | | | | | | | |
CNA Financial Corp., 4.50%, 3/1/2026 | | | 3,460,000 | | | | 3,746,851 | |
a,e DaVinciRe Holdings Ltd., 4.75%, 5/1/2025 | | | 4,790,000 | | | | 4,924,307 | |
ELM B.V. (AUD), 7.635%, 12/29/2049 | | | 1,000,000 | | | | 782,272 | |
ELM B.V. (AUD), 3.295%, 4/29/2049 | | | 1,000,000 | | | | 755,783 | |
a Forethought Financial Group, Inc., 8.625%, 4/15/2021 | | | 1,160,000 | | | | 1,333,721 | |
Genworth Holdings, Inc., 4.90%, 8/15/2023 | | | 6,000,000 | | | | 4,995,000 | |
Kemper Corp., 4.35%, 2/15/2025 | | | 1,810,000 | | | | 1,859,337 | |
Annual Report 11
| | |
| SCHEDULE OF INVESTMENTS, CONTINUED | | |
| |
Thornburg Strategic Income Fund | | September 30, 2016 |
| | | | | | | | |
| | | Shares/
Principal Amount | | | Value | |
a,e Lancashire Holdings Ltd., 5.70%, 10/1/2022 | | | 4,900,000 | | | $ | 5,290,765 | |
a National Life Insurance of Vermont, 10.50%, 9/15/2039 | | | 1,000,000 | | | | 1,533,480 | |
Reinsurance Group of America, Inc., 3.95%, 9/15/2026 | | | 990,000 | | | | 1,035,752 | |
| | | | | | | | |
| | | | | | | 26,257,268 | |
| | | | | | | | |
| | |
MATERIALS — 3.74% | | | | | | | | |
Chemicals — 1.33% | | | | | | | | |
a,e Consolidated Energy Finance S.A., 6.75%, 10/15/2019 | | | 3,030,000 | | | | 2,992,125 | |
a,e Kissner Milling Co., Ltd., 7.25%, 6/1/2019 | | | 5,595,000 | | | | 5,818,800 | |
a,e Office Cherifien des Phosphates, 5.625%, 4/25/2024 | | | 4,710,000 | | | | 5,115,531 | |
Construction Materials — 0.72% | | | | | | | | |
a,e Cimpor Financial Operations B.V., 5.75%, 7/17/2024 | | | 6,500,000 | | | | 5,557,500 | |
Wesco Distribution, Inc., 5.375%, 12/15/2021 | | | 2,000,000 | | | | 2,045,000 | |
Containers & Packaging — 0.05% | | | | | | | | |
Graphic Packaging International, Inc., 4.125%, 8/15/2024 | | | 500,000 | | | | 503,750 | |
Metals & Mining — 0.99% | | | | | | | | |
a International Wire Group, Inc., 10.75%, 8/1/2021 | | | 3,200,000 | | | | 3,048,000 | |
a,e Newcrest Finance Property Ltd., 4.20%, 10/1/2022 | | | 7,000,000 | | | | 7,292,698 | |
Paper & Forest Products — 0.65% | | | | | | | | |
a Neenah Paper, Inc., 5.25%, 5/15/2021 | | | 6,725,000 | | | | 6,859,500 | |
| | | | | | | | |
| | | | | | | 39,232,904 | |
| | | | | | | | |
| | |
MEDIA — 3.32% | | | | | | | | |
Media — 3.32% | | | | | | | | |
a Cable One, Inc., 5.75%, 6/15/2022 | | | 8,831,000 | | | | 9,228,395 | |
a CSC Holdings, LLC, 5.50%, 4/15/2027 | | | 1,825,000 | | | | 1,866,063 | |
a DHX Media Ltd. (CAD), 5.875%, 12/2/2021 | | | 1,340,000 | | | | 1,029,041 | |
a EMI Music Publishing Ltd., 7.625%, 6/15/2024 | | | 1,520,000 | | | | 1,643,500 | |
a,e SFR Group SA, 7.375%, 5/1/2026 | | | 2,365,000 | | | | 2,417,479 | |
a,e SFR Group SA, 6.00%, 5/15/2022 | | | 5,475,000 | | | | 5,584,500 | |
a Sirius XM Canada Holdings, Inc. (CAD), 5.625%, 4/23/2021 | | | 7,441,000 | | | | 5,643,351 | |
The Washington Post Co., 7.25%, 2/1/2019 | | | 2,100,000 | | | | 2,273,250 | |
a,e Virgin Media, Inc., 5.375%, 4/15/2021 | | | 3,829,500 | | | | 3,992,254 | |
a,e Virgin Media, Inc., 5.50%, 8/15/2026 | | | 1,100,000 | | | | 1,122,000 | |
| | | | | | | | |
| | | | | | | 34,799,833 | |
| | | | | | | | |
| | |
PHARMACEUTICALS, BIOTECHNOLOGY & LIFE SCIENCES — 0.37% | | | | | | | | |
Pharmaceuticals — 0.37% | | | | | | | | |
b,c,g Atlas U.S. Royalty, LLC Participation Rights, 0%, 3/15/2027 | | | 5,450,000 | | | | 0 | |
a,e Concordia International Corp., 9.50%, 10/21/2022 | | | 845,000 | | | | 585,163 | |
a,e Concordia International Corp., 7.00%, 4/15/2023 | | | 5,187,000 | | | | 3,332,647 | |
| | | | | | | | |
| | | | | | | 3,917,810 | |
| | | | | | | | |
| | |
REAL ESTATE — 1.15% | | | | | | | | |
Equity Real Estate Investment Trusts — 1.15% | | | | | | | | |
EPR Properties, 5.25%, 7/15/2023 | | | 5,000,000 | | | | 5,368,685 | |
Retail Opportunity Investments Corp., 5.00%, 12/15/2023 | | | 1,500,000 | | | | 1,601,622 | |
Select Income REIT, 2.85%, 2/1/2018 | | | 5,100,000 | | | | 5,130,279 | |
| | | | | | | | �� |
| | | | | | | 12,100,586 | |
| | | | | | | | |
| | |
RETAILING — 2.13% | | | | | | | | |
Distributors — 0.92% | | | | | | | | |
LKQ Corp., Inc., 4.75%, 5/15/2023 | | | 9,395,000 | | | | 9,653,363 | |
Internet & Direct Marketing Retail — 0.77% | | | | | | | | |
QVC, Inc., 4.45%, 2/15/2025 | | | 8,147,000 | | | | 8,064,112 | |
Multiline Retail — 0.44% | | | | | | | | |
a,e Grupo Famsa S.A.B. de C.V., 7.25%, 6/1/2020 | | | 5,550,000 | | | | 4,662,000 | |
| | | | | | | | |
| | | | | | | 22,379,475 | |
| | | | | | | | |
| | |
SEMICONDUCTORS & SEMICONDUCTOR EQUIPMENT — 0.23% | | | | | | | | |
Semiconductors & Semiconductor Equipment — 0.23% | | | | | | | | |
a,e Sensata Technologies B.V., 5.00%, 10/1/2025 | | | 2,400,000 | | | | 2,454,000 | |
| | | | | | | | |
| | | | | | | 2,454,000 | |
| | | | | | | | |
| | |
SOFTWARE & SERVICES — 2.17% | | | | | | | | |
Information Technology Services — 0.75% | | | | | | | | |
Neustar, Inc., 4.50%, 1/15/2023 | | | 8,770,000 | | | | 7,849,150 | |
Internet Software & Services — 0.54% | | | | | | | | |
12 Annual Report
| | |
| SCHEDULE OF INVESTMENTS, CONTINUED | | |
| |
Thornburg Strategic Income Fund | | September 30, 2016 |
| | | | | | | | |
| | | Shares/
Principal Amount | | | Value | |
Lender Processing Services, Inc./Black Knight Lending Solutions, Inc., 5.75%, 4/15/2023 | | | 5,417,000 | | | $ | 5,701,393 | |
Software — 0.88% | | | | | | | | |
Autodesk, Inc., 3.125%, 6/15/2020 | | | 2,350,000 | | | | 2,420,488 | |
Autodesk, Inc., 4.375%, 6/15/2025 | | | 1,600,000 | | | | 1,695,053 | |
a,e Open Text Corp., 5.875%, 6/1/2026 | | | 1,820,000 | | | | 1,904,175 | |
a Solera Capital, LLC, 10.50%, 3/1/2024 | | | 2,830,000 | | | | 3,155,450 | |
| | | | | | | | |
| | | | | | | 22,725,709 | |
| | | | | | | | |
| | |
TECHNOLOGY HARDWARE & EQUIPMENT — 2.17% | | | | | | | | |
Computers & Peripherals — 0.10% | | | | | | | | |
Lexmark International, Inc., 5.125%, 3/15/2020 | | | 1,038,000 | | | | 1,087,268 | |
Electronic Equipment, Instruments & Components — 1.68% | | | | | | | | |
Anixter, Inc., 5.125%, 10/1/2021 | | | 8,395,000 | | | | 8,751,788 | |
Ingram Micro, Inc., 4.95%, 12/15/2024 | | | 1,951,000 | | | | 1,974,355 | |
Trimble Navigation, Ltd., 4.75%, 12/1/2024 | | | 6,525,000 | | | | 6,862,440 | |
Technology, Hardware, Storage & Peripherals — 0.39% | | | | | | | | |
a Western Digital Corp., 7.375%, 4/1/2023 | | | 3,725,000 | | | | 4,097,500 | |
| | | | | | | | |
| | | | | | | 22,773,351 | |
| | | | | | | | |
| | |
TELECOMMUNICATION SERVICES — 4.55% | | | | | | | | |
Diversified Telecommunication Services — 1.63% | | | | | | | | |
AT&T, Inc., 3.00%, 6/30/2022 | | | 2,395,000 | | | | 2,462,319 | |
a,e Inmarsat Finance plc, 4.875%, 5/15/2022 | | | 400,000 | | | | 380,000 | |
Qwest Corp., 6.75%, 12/1/2021 | | | 3,700,000 | | | | 4,120,875 | |
a,c Unison Ground Lease Funding, 5.78%, 3/15/2043 | | | 1,920,000 | | | | 1,785,600 | |
a,e Videotron Ltd., Co., 5.375%, 6/15/2024 | | | 8,050,000 | | | | 8,372,000 | |
Wireless Telecommunication Services — 2.92% | | | | | | | | |
America Movil SAB de CV (MXN), 6.45%, 12/5/2022 | | | 120,000,000 | | | | 6,027,927 | |
a,e Digicel Ltd., 6.00%, 4/15/2021 | | | 8,450,000 | | | | 7,464,730 | |
a,e Inmarsat Finance plc, 6.50%, 10/1/2024 | | | 600,000 | | | | 601,500 | |
a,e Millicom International Cellular S.A., 6.00%, 3/15/2025 | | | 5,578,000 | | | | 5,648,283 | |
a,e MTN International (Mauritius) Ltd., 4.755%, 11/11/2024 | | | 4,125,000 | | | | 3,990,937 | |
a WCP Issuer, LLC, 7.143%, 8/15/2043 | | | 6,000,000 | | | | 6,450,000 | |
a WCP Issuer, LLC, 6.657%, 8/15/2043 | | | 386,000 | | | | 409,160 | |
| | | | | | | | |
| | | | | | | 47,713,331 | |
| | | | | | | | |
| | |
TRANSPORTATION — 2.93% | | | | | | | | |
Airlines — 2.62% | | | | | | | | |
a American Airlines Group, Inc., 5.60%, 1/15/2022 | | | 11,954,987 | | | | 12,507,905 | |
American Airlines Group, Inc., 4.95%, 7/15/2024 | | | 2,397,342 | | | | 2,607,109 | |
Continental Airlines, 9.798%, 10/1/2022 | | | 4,858,705 | | | | 5,368,869 | |
a,e Guanay Finance Ltd., 6.00%, 12/15/2020 | | | 2,393,953 | | | | 2,444,825 | |
US Airways, 7.076%, 9/20/2022 | | | 1,073,873 | | | | 1,159,783 | |
US Airways, 6.25%, 10/22/2024 | | | 1,354,411 | | | | 1,533,870 | |
US Airways, 5.90%, 4/1/2026 | | | 1,598,889 | | | | 1,838,723 | |
Marine — 0.23% | | | | | | | | |
a,e Stena International SA, 5.75%, 3/1/2024 | | | 2,900,000 | | | | 2,421,500 | |
Transportation Infrastructure — 0.08% | | | | | | | | |
a,e Mexico City Airport Trust, 4.25%, 10/31/2026 | | | 842,000 | | | | 844,105 | |
| | | | | | | | |
| | | | | | | 30,726,689 | |
| | | | | | | | |
| | |
UTILITIES — 1.75% | | | | | | | | |
Electric Utilities — 1.12% | | | | | | | | |
a Duquesne Light Holdings, Inc., 6.40%, 9/15/2020 | | | 2,000,000 | | | | 2,315,976 | |
a Jersey Central Power & Light Co., 4.30%, 1/15/2026 | | | 3,965,000 | | | | 4,222,293 | |
Puget Energy, Inc., 6.50%, 12/15/2020 | | | 2,000,000 | | | | 2,321,240 | |
Puget Energy, Inc., 5.625%, 7/15/2022 | | | 2,500,000 | | | | 2,877,017 | |
Independent Power & Renewable Electricity Producers — 0.41% | | | | | | | | |
Ipalco Enterprises, Inc., 5.00%, 5/1/2018 | | | 2,500,000 | | | | 2,606,250 | |
a Midland Cogeneration Venture, 6.00%, 3/15/2025 | | | 1,569,788 | | | | 1,691,219 | |
Multi-Utilities — 0.22% | | | | | | | | |
CMS Energy Corp., 8.75%, 6/15/2019 | | | 2,000,000 | | | | 2,365,776 | |
| | | | | | | | |
| | | | | | | 18,399,771 | |
| | | | | | | | |
TOTAL CORPORATE BONDS (Cost $653,073,799) | | | | | | | 640,244,879 | |
| | | | | | | | |
Annual Report 13
| | |
| SCHEDULE OF INVESTMENTS, CONTINUED | | |
| |
Thornburg Strategic Income Fund | | September 30, 2016 |
| | | | | | | | |
| | | Shares/
Principal Amount | | | Value | |
CONVERTIBLE BONDS — 2.67% | | | | | | | | |
DIVERSIFIED FINANCIALS — 0.76% | | | | | | | | |
Consumer Finance — 0.76% | | | | | | | | |
EZCORP, Inc., 2.125%, 6/15/2019 | | | 8,159,000 | | | $ | 7,990,721 | |
| | | | | | | | |
| | | | | | | 7,990,721 | |
| | | | | | | | |
| | |
FOOD, BEVERAGE & TOBACCO — 0.25% | | | | | | | | |
Tobacco — 0.25% | | | | | | | | |
Vector Group Ltd., 1.75%, 4/15/2020 | | | 2,260,000 | | | | 2,574,987 | |
| | | | | | | | |
| | | | | | | 2,574,987 | |
| | | | | | | | |
| | |
MEDIA — 0.81% | | | | | | | | |
Media — 0.81% | | | | | | | | |
Comcast Holdings Corp., 2.00%, 10/15/2029 | | | 15,500,000 | | | | 8,447,500 | |
| | | | | | | | |
| | | | | | | 8,447,500 | |
| | | | | | | | |
| | |
REAL ESTATE — 0.85% | | | | | | | | |
Equity Real Estate Investment Trusts — 0.85% | | | | | | | | |
a IAS Operating Partnership LP, 5.00%, 3/15/2018 | | | 5,040,000 | | | | 5,040,000 | |
VEREIT, Inc., 3.00%, 8/1/2018 | | | 3,890,000 | | | | 3,880,275 | |
| | | | | | | | |
| | | | | | | 8,920,275 | |
| | | | | | | | |
TOTAL CONVERTIBLE BONDS (Cost $25,744,949) | | | | | | | 27,933,483 | |
| | | | | | | | |
| | |
MUNICIPAL BONDS — 0.41% | | | | | | | | |
California Health Facilities Financing Authority (Developmental Disabilities), 7.875%, 2/1/2026 | | | 1,940,000 | | | | 2,272,613 | |
Oklahoma Development Finance Authority, 8.00%, 5/1/2020 | | | 805,000 | | | | 822,267 | |
San Bernardino County California Redevelopment Agency (San Sevaine), 8.45%, 9/1/2030 | | | 1,000,000 | | | | 1,183,810 | |
| | | | | | | | |
TOTAL MUNICIPAL BONDS (Cost $3,710,594) | | | | | | | 4,278,690 | |
| | | | | | | | |
| | |
U.S. GOVERNMENT AGENCIES — 1.15% | | | | | | | | |
a CoBank, ACB Floating Rate Note, (Federal Farm Credit Banks), 1.45%, 6/15/2022 | | | 12,700,000 | | | | 12,047,423 | |
| | | | | | | | |
TOTAL U.S. GOVERNMENT AGENCIES (Cost $12,226,504) | | | | | | | 12,047,423 | |
| | | | | | | | |
| | |
OTHER GOVERNMENT — 1.36% | | | | | | | | |
Mexican Bonos de Desarrollo (MXN), 5.00%, 6/15/2017 | | | 130,000,000 | | | | 6,708,670 | |
Mexican Bonos de Desarrollo (MXN), 4.75%, 6/14/2018 | | | 77,700,000 | | | | 3,971,258 | |
a,e Seven and Seven Ltd. Floating Rate Note, (Guaranty: Export-Import Bank of Korea), 2.235%, 9/11/2019 | | | 3,600,000 | | | | 3,588,556 | |
| | | | | | | | |
TOTAL OTHER GOVERNMENT (Cost $19,015,226) | | | | | | | 14,268,484 | |
| | | | | | | | |
| | |
MORTGAGE BACKED — 0.32% | | | | | | | | |
Federal Home Loan Mtg Corp., CMO Series KIR1 Class X, 1.237%, 3/25/2026 | | | 38,002,385 | | | | 3,017,910 | |
Federal National Mtg Assoc., CMO Series 1994-37 Class L, 6.50%, 3/25/2024 | | | 2,672 | | | | 2,954 | |
c Reilly FHA 1997-A Mtg, 6.896%, 7/1/2020 | | | 331,595 | | | | 331,595 | |
| | | | | | | | |
TOTAL MORTGAGE BACKED (Cost $3,245,852) | | | | | | | 3,352,459 | |
| | | | | | | | |
| | |
LOAN PARTICIPATIONS — 6.08% | | | | | | | | |
| | |
COMMERCIAL & PROFESSIONAL SERVICES — 0.36% | | | | | | | | |
Professional Services — 0.36% | | | | | | | | |
Affinion Group, Inc., 6.75%, 4/30/2018 | | | 3,919,598 | | | | 3,800,050 | |
| | | | | | | | |
| | | | | | | 3,800,050 | |
| | | | | | | | |
| | |
CONSUMER SERVICES — 0.27% | | | | | | | | |
Diversified Consumer Services — 0.27% | | | | | | | | |
Laureate Education, Inc., 8.157%, 3/17/2021 | | | 2,898,859 | | | | 2,880,742 | |
| | | | | | | | |
| | | | | | | 2,880,742 | |
| | | | | | | | |
| | |
DIVERSIFIED FINANCIALS — 0.42% | | | | | | | | |
Diversified Financial Services — 0.42% | | | | | | | | |
e Stena International S.A., 4.24%, 3/3/2021 | | | 5,235,750 | | | | 4,432,062 | |
| | | | | | | | |
| | | | | | | 4,432,062 | |
| | | | | | | | |
| | |
ENERGY — 0.34% | | | | | | | | |
Oil, Gas & Consumable Fuels — 0.34% | | | | | | | | |
Citgo Holding, Inc., 9.50%, 5/12/2018 | | | 3,476,387 | | | | 3,514,419 | |
| | | | | | | | |
| | | | | | | 3,514,419 | |
| | | | | | | | |
14 Annual Report
| | |
| SCHEDULE OF INVESTMENTS, CONTINUED | | |
| |
Thornburg Strategic Income Fund | | September 30, 2016 |
| | | | | | | | |
| | | Shares/
Principal Amount | | | Value | |
| | |
FOOD, BEVERAGE & TOBACCO — 0.61% | | | | | | | | |
Tobacco — 0.61% | | | | | | | | |
North Atlantic Trading Co., Inc., 9.00%, 1/13/2020 | | | 6,517,276 | | | $ | 6,443,957 | |
| | | | | | | | |
| | | | | | | 6,443,957 | |
| | | | | | | | |
| | |
HEALTH CARE EQUIPMENT & SERVICES — 0.35% | | | | | | | | |
Health Care Providers & Services — 0.35% | | | | | | | | |
Prospect Medical Holidngs, Inc., 7.00%, 06/30/2022 | | | 3,690,750 | | | | 3,658,456 | |
| | | | | | | | |
| | | | | | | 3,658,456 | |
| | | | | | | | |
| | |
INDUSTRIALS — 0.50% | | | | | | | | |
Construction & Engineering — 0.50% | | | | | | | | |
ABG Intermediate Holdings (2), LLC, 9.50%, 5/27/2022 | | | 5,359,598 | | | | 5,225,608 | |
| | | | | | | | |
| | | | | | | 5,225,608 | |
| | | | | | | | |
| | |
MEDIA — 1.44% | | | | | | | | |
Media — 1.44% | | | | | | | | |
Cumulus Media Holdings, Inc., 4.25%, 12/23/2020 | | | 450,195 | | | | 312,323 | |
e Mood Media Corp., 7.00%, 5/1/2019 | | | 9,685,962 | | | | 9,156,237 | |
New Media Holdings II, LLC, 7.25%, 6/4/2020 | | | 5,708,177 | | | | 5,651,096 | |
| | | | | | | | |
| | | | | | | 15,119,656 | |
| | | | | | | | |
| | |
REAL ESTATE — 0.36% | | | | | | | | |
Real Estate Management & Development — 0.36% | | | | | | | | |
DTZ U.S. Borrower, LLC, 9.25%, 11/4/2022 | | | 3,740,000 | | | | 3,758,700 | |
| | | | | | | | |
| | | | | | | 3,758,700 | |
| | | | | | | | |
| | |
RETAILING — 0.35% | | | | | | | | |
Specialty Retail — 0.35% | | | | | | | | |
Redbox Automated Retail, LLC, 8.50%, 9/24/2021 | | | 3,800,000 | | | | 3,705,000 | |
| | | | | | | | |
| | | | | | | 3,705,000 | |
| | | | | | | | |
| | |
SOFTWARE & SERVICES — 0.64% | | | | | | | | |
Information Technology Services — 0.64% | | | | | | | | |
Neustar, Inc., 3.774%, 1/22/2019 | | | 970,000 | | | | 966,362 | |
c Valores Corporativos Softtek, S.A. de C.V., 7.272%, 8/27/2019 | | | 5,833,333 | | | | 5,757,500 | |
| | | | | | | | |
| | | | | | | 6,723,862 | |
| | | | | | | | |
| | |
TECHNOLOGY HARDWARE & EQUIPMENT — 0.35% | | | | | | | | |
Technology, Hardware, Storage & Peripherals — 0.35% | | | | | | | | |
Harland Clarke Holdings Corp., 7.00%, 12/31/2019 | | | 3,705,000 | | | | 3,629,974 | |
| | | | | | | | |
| | | | | | | 3,629,974 | |
| | | | | | | | |
| | |
TRANSPORTATION — 0.09% | | | | | | | | |
Airlines — 0.09% | | | | | | | | |
a,c,e,g OS Two, LLC, 12.00%, 12/15/2020 | | | 494,100 | | | | 394,292 | |
a,c,e,g ET Two, LLC, 12.00%, 9/30/2019 | | | 338,633 | | | | 270,229 | |
a,c,e,g ET Three, LLC, 12.00%, 9/30/2019 | | | 338,633 | | | | 270,229 | |
| | | | | | | | |
| | | | | | | 934,750 | |
| | | | | | | | |
TOTAL LOAN PARTICIPATIONS (Cost $65,356,008) | | | | | | | 63,827,236 | |
| | | | | | | | |
SHORT TERM INVESTMENTS — 10.94% | | | | | | | | |
h Thornburg Capital Management Fund | | | 11,484,943 | | | | 114,849,428 | |
| | | | | | | | |
TOTAL SHORT TERM INVESTMENTS (Cost $114,849,428) | | | | | | | 114,849,428 | |
| | | | | | | | |
TOTAL INVESTMENTS — 99.20% (Cost $1,059,674,033) | | | | | | $ | 1,041,035,510 | |
OTHER ASSETS LESS LIABILITIES — 0.80% | | | | | | | 8,424,224 | |
| | | | | | | | |
NET ASSETS — 100.00% | | | | | | $ | 1,049,459,734 | |
| | | | | | | | |
Footnote Legend
| a | Securities exempt from registration under Rule 144A of the Securities Act of 1933, as amended. These securities may only be resold in the ordinary course of business in transactions exempt from registration, normally to qualified institutional buyers. As of September 30, 2016, the aggregate value of these securities in the Fund’s portfolio was $509,280,143, representing 48.69% of the Fund’s net assets. |
| c | Security currently fair valued by the Valuation and Pricing Committee using procedures approved by the Trustees’ Audit Committee. |
Annual Report 15
| | |
| SCHEDULE OF INVESTMENTS, CONTINUED | | |
| |
Thornburg Strategic Income Fund | | September 30, 2016 |
| e | Yankee bond denominated in U.S. dollars and is issued in the U.S. by foreign banks and corporations. |
| f | Segregated as collateral for a when-issued security. |
| h | Investment in Affiliates - Shown below are holdings of voting securities of each portfolio company which is considered “affiliated” to the Fund under the Investment Company Act of 1940, including companies for which the Fund’s holding represented 5% or more of the company’s voting securities, and a series of the Thornburg Investment Trust in which the Fund invested for cash management purposes during the period: |
| | | | | | | | | | | | | | | | | | | | | | | | | | | | |
Issuer | | Shares/Principal
September 30,
2015 | | | Gross
Additions | | | Gross
Reductions | | | Shares/Principal
September 30,
2016 | | | Market Value
September 30,
2016 | | | Investment
Income | | | Realized
Gain (Loss) | |
Thornburg Capital Management Fund | | | 10,170,287 | | | | 29,272,370 | | | | 27,957,714 | | | | 11,484,943 | | | $ | 114,849,428 | | | $ | 457,141 | | | $ | — | |
| | | | | | | | | | | | | | | | | | | | | | | | | | | | |
Total non-controlled affiliated issuers - 10.94% of net assets | | | $ | 114,849,428 | | | $ | 457,141 | | | $ | — | |
| | | | | | | | | | | | | | | | | | | | | | | | | | | | |
Portfolio Abbreviations
To simplify the listings of securities, abbreviations are used per the table below:
| | |
| ARM | | Adjustable Rate Mortgage |
| AUD | | Denominated in Australian Dollars |
| BRL | | Denominated in Brazilian Real |
| CAD | | Denominated in Canadian Dollars |
| CHL | | Denominated in Chilean Peso |
| CMO | | Collateralized Mortgage Obligation |
| FCB | | Farm Credit Bank |
| | |
| FHA | | Insured by Federal Housing Administration |
| GBP | | Denominated in Great Britain Pounds Mtg Mortgage |
| MTN | | Medium-Term Note |
| MXN | | Denominated in Mexican Pesos Pfd Preferred Stock |
| REIT | | Real Estate Investment Trust |
| SEK | | Denominated in Swedish Kronor |
| SPV | | Special Purpose Vehicle |
See notes to financial statements.
16 Annual Report
This page intentionally left blank.
Annual Report 17
| | |
| STATEMENT OF ASSETS AND LIABILITIES | | |
| |
Thornburg Strategic Income Fund | | September 30, 2016 |
| | | | |
ASSETS | | | | |
Investments at value (Note 3) | | | | |
Non-affiliated issuers (cost $944,824,605) | | $ | 926,186,082 | |
Non-controlled affiliated issuer (cost $114,849,428) | | | 114,849,428 | |
Cash | | | 980,427 | |
Receivable for investments sold | | | 3,141,254 | |
Receivable for fund shares sold | | | 1,900,248 | |
Unrealized appreciation on forward currency contracts (Note 7) | | | 173,499 | |
Dividends receivable | | | 189,143 | |
Dividend and interest reclaim receivable | | | 53,531 | |
Interest receivable | | | 12,523,659 | |
Prepaid expenses and other assets | | | 69,178 | |
| | | | |
Total Assets | | | 1,060,066,449 | |
| | | | |
| |
LIABILITIES | | | | |
Payable for investments purchased | | | 6,919,738 | |
Payable for fund shares redeemed | | | 2,175,290 | |
Unrealized depreciation on forward currency contracts (Note 7) | | | 47,155 | |
Payable to investment advisor and other affiliates (Note 4) | | | 933,061 | |
Accounts payable and accrued expenses | | | 284,232 | |
Dividends payable | | | 247,239 | |
| | | | |
Total Liabilities | | | 10,606,715 | |
| | | | |
| |
NET ASSETS | | $ | 1,049,459,734 | |
| | | | |
NET ASSETS CONSIST OF | | | | |
Distribution in excess of net investment income | | $ | (4,723,241 | ) |
Net unrealized depreciation on investments | | | (18,550,960 | ) |
Accumulated net realized gain (loss) | | | (32,763,467 | ) |
Net capital paid in on shares of beneficial interest | | | 1,105,497,402 | |
| | | | |
| | $ | 1,049,459,734 | |
| | | | |
18 Annual Report
| | |
| STATEMENT OF ASSETS AND LIABILITIES, CONTINUED | | |
| |
Thornburg Strategic Income Fund | | September 30, 2016 |
| | | | |
NET ASSET VALUE | | | | |
Class A Shares: | | | | |
Net asset value and redemption price per share ($283,398,300 applicable to 24,507,675 shares of beneficial interest outstanding - Note 5) | | $ | 11.56 | |
Maximum sales charge, 4.50% of offering price | | | 0.54 | |
| | | | |
Maximum offering price per share | | $ | 12.10 | |
| | | | |
| |
Class C Shares: | | | | |
Net asset value and offering price per share* ($272,690,655 applicable to 23,616,914 shares of beneficial interest outstanding - Note 5) | | $ | 11.55 | |
| | | | |
| |
Class I Shares: | | | | |
Net asset value, offering and redemption price per share ($480,143,295 applicable to 41,613,852 shares of beneficial interest outstanding - Note 5) | | $ | 11.54 | |
| | | | |
| |
Class R3 Shares: | | | | |
Net asset value, offering and redemption price per share ($2,819,146 applicable to 244,041 shares of beneficial interest outstanding - Note 5) | | $ | 11.55 | |
| | | | |
| |
Class R4 Shares: | | | | |
Net asset value, offering and redemption price per share ($3,217,464 applicable to 278,382 shares of beneficial interest outstanding - Note 5) | | $ | 11.56 | |
| | | | |
| |
Class R5 Shares: | | | | |
Net asset value, offering and redemption price per share ($7,190,874 applicable to 623,350 shares of beneficial interest outstanding - Note 5) | | $ | 11.54 | |
| | | | |
| * | Redemption price per share is equal to net asset value less any applicable contingent deferred sales charge. |
See notes to financial statements.
Annual Report 19
| | |
| STATEMENT OF OPERATIONS | | |
| |
Thornburg Strategic Income Fund | | Year Ended September 30, 2016 |
| | | | |
INVESTMENT INCOME | | | | |
Dividend income | | | | |
Non-affiliated issuers (net of foreign taxes withheld of $43,822) | | $ | 1,755,183 | |
Non-controlled affiliated issuer | | | 457,141 | |
Interest income (net of premium amortized of $2,137,774) | | | 55,511,761 | |
| | | | |
Total Income | | | 57,724,085 | |
| | | | |
| |
EXPENSES | | | | |
Investment advisory fees (Note 4) | | | 7,606,101 | |
Administration fees (Note 4) | | | | |
Class A Shares | | | 379,841 | |
Class C Shares | | | 355,445 | |
Class I Shares | | | 238,635 | |
Class R3 Shares | | | 2,375 | |
Class R4 Shares | | | 3,290 | |
Class R5 Shares | | | 3,471 | |
Distribution and service fees (Note 4) | | | | |
Class A Shares | | | 759,483 | |
Class C Shares | | | 2,842,377 | |
Class R3 Shares | | | 9,476 | |
Class R4 Shares | | | 6,584 | |
Transfer agent fees | | | | |
Class A Shares | | | 309,706 | |
Class C Shares | | | 267,881 | |
Class I Shares | | | 428,122 | |
Class R3 Shares | | | 10,548 | |
Class R4 Shares | | | 13,161 | |
Class R5 Shares | | | 17,319 | |
Registration and filing fees | | | | |
Class A Shares | | | 24,704 | |
Class C Shares | | | 25,861 | |
Class I Shares | | | 38,937 | |
Class R3 Shares | | | 21,856 | |
Class R4 Shares | | | 22,667 | |
Class R5 Shares | | | 21,857 | |
Custodian fees (Note 2) | | | 246,311 | |
Professional fees | | | 147,852 | |
Accounting fees (Note 4) | | | 39,739 | |
Trustee fees | | | 48,033 | |
Other expenses | | | 87,233 | |
| | | | |
Total Expenses | | | 13,978,865 | |
Less: | | | | |
Expenses reimbursed by investment advisor (Note 4) | | | (626,356 | ) |
| | | | |
Net Expenses | | | 13,352,509 | |
| | | | |
Net Investment Income | | $ | 44,371,576 | |
| | | | |
20 Annual Report
| | |
| STATEMENT OF OPERATIONS, CONTINUED | | |
| |
Thornburg Strategic Income Fund | | Year Ended September 30, 2016 |
| | | | |
REALIZED AND UNREALIZED GAIN (LOSS) | | | | |
Net realized gain (loss) on: | | | | |
Non-affiliated issuer Investments | | $ | (38,722,273 | ) |
Forward currency contracts (Note 7) | | | (11,012 | ) |
Foreign currency transactions | | | (80,021 | ) |
| | | | |
| | | (38,813,306 | ) |
| | | | |
Net change in unrealized appreciation (depreciation) on: | | | | |
Non-affiliated issuer Investments | | | 61,818,662 | |
Forward currency contracts (Note 7) | | | 5,612 | |
Foreign currency translations | | | 29,095 | |
| | | | |
| | | 61,853,369 | |
| | | | |
Net Realized and Unrealized Gain | | | 23,040,063 | |
| | | | |
Net Increase in Net Assets Resulting from Operations | | $ | 67,411,639 | |
| | | | |
See notes to financial statements.
Annual Report 21
| | |
| STATEMENT OF CHANGES IN NET ASSETS | | |
| |
Thornburg Strategic Income Fund | | September 30, 2016 |
| | | | | | | | |
| | | Year Ended
September 30, 2016 | | | Year Ended
September 30, 2015 | |
INCREASE (DECREASE) IN NET ASSETS FROM | | | | | | | | |
| | |
OPERATIONS | | | | | | | | |
Net investment income | | $ | 44,371,576 | | | $ | 52,601,931 | |
Net realized gain (loss) on investments, forward currency contracts, and foreign currency transactions | | | (38,813,306 | ) | | | (3,934,186 | ) |
Net unrealized appreciation (depreciation) on investments, forward currency contracts, and foreign currency translations | | | 61,853,369 | | | | (86,863,981 | ) |
| | | | | | | | |
| | |
Net Increase (Decrease) in Net Assets Resulting from Operations | | | 67,411,639 | | | | (38,196,236 | ) |
| | |
DIVIDENDS TO SHAREHOLDERS | | | | | | | | |
From net investment income | | | | | | | | |
Class A Shares | | | (9,880,040 | ) | | | (15,032,369 | ) |
Class C Shares | | | (7,668,653 | ) | | | (11,384,849 | ) |
Class I Shares | | | (17,002,116 | ) | | | (24,576,257 | ) |
Class R3 Shares | | | (59,729 | ) | | | (94,447 | ) |
Class R4 Shares | | | (84,997 | ) | | | (58,755 | ) |
Class R5 Shares | | | (239,592 | ) | | | (206,806 | ) |
From realized gains | | | | | | | | |
Class A Shares | | | (816,703 | ) | | | (4,909,559 | ) |
Class C Shares | | | (732,196 | ) | | | (4,451,217 | ) |
Class I Shares | | | (1,265,868 | ) | | | (7,233,973 | ) |
Class R3 Shares | | | (3,811 | ) | | | (42,240 | ) |
Class R4 Shares | | | (5,676 | ) | | | (514 | ) |
Class R5 Shares | | | (14,864 | ) | | | (39,105 | ) |
| | |
FUND SHARE TRANSACTIONS (NOTE 5) | | | | | | | | |
Class A Shares | | | (63,035,022 | ) | | | (23,177,909 | ) |
Class C Shares | | | (41,609,027 | ) | | | (14,575,088 | ) |
Class I Shares | | | (64,637,440 | ) | | | 26,490,308 | |
Class R3 Shares | | | 1,314,552 | | | | (1,421,430 | ) |
Class R4 Shares | | | 1,018,779 | | | | 2,180,876 | |
Class R5 Shares | | | 514,084 | | | | 4,235,726 | |
| | | | | | | | |
Net Decrease in Net Assets | | | (136,796,680 | ) | | | (112,493,844 | ) |
| | |
NET ASSETS | | | | | | | | |
Beginning of Year | | | 1,186,256,414 | | | | 1,298,750,258 | |
| | | | | | | | |
| | |
End of Year | | $ | 1,049,459,734 | | | $ | 1,186,256,414 | |
| | | | | | | | |
Distribution in excess of net investment income | | $ | (4,723,241 | ) | | $ | (5,244,630 | ) |
See notes to financial statements
22 Annual Report
| | |
| NOTES TO FINANCIAL STATEMENTS | | |
| |
Thornburg Strategic Income Fund | | September 30, 2016 |
NOTE 1 – ORGANIZATION
Thornburg Strategic Income Fund (the “Fund”) is a diversified series of Thornburg Investment Trust (the “Trust”). The Fund commenced operations on December 19, 2007. The Trust was organized as a Massachusetts business trust under a Declaration of Trust dated June 3, 1987 and is registered as a diversified, open-end management investment company under the Investment Company Act of 1940, as amended. The Fund is currently one of twenty separate series of the Trust. Each series is considered to be a separate entity for financial reporting and tax purposes and bears expenses directly attributable to it. The Fund’s primary investment goal is to seek a high level of current income. The Fund’s secondary investment goal is some long-term capital appreciation.
The Fund currently offers six classes of shares of beneficial interest: Class A, Class C, Institutional Class (“Class I”) and Retirement Classes (“Class R3”, “Class R4”, and “Class R5”). Each class of shares of the Fund represents an interest in the same portfolio of investments, except that (i) Class A shares are sold subject to a front-end sales charge collected at the time the shares are purchased and bear a service fee, (ii) Class C shares are sold at net asset value without a sales charge at the time of purchase, but are subject to a contingent deferred sales charge upon redemption within one year of purchase, and bear both a service fee and a distribution fee, (iii) Class I shares are sold at net asset value without a sales charge at the time of purchase and may be subject to a service fee, (iv) Class R3 shares are sold at net asset value without a sales charge at the time of purchase, but bear both a service fee and distribution fee, (v) Class R4 shares are sold at net asset value without a sales charge at the time of purchase, but bear a service fee, (vi) Class R5 shares are sold at net asset value without a sales charge at the time of purchase and may be subject to a service fee, and (vii) the respective classes may have different reinvestment privileges and conversion rights. Additionally, the Fund may allocate among its classes certain expenses, to the extent allocable to specific classes, including transfer agent fees, government registration fees, certain printing and postage costs, and administrative and legal expenses. Currently, class specific expenses of the Fund are limited to service and distribution fees, administration fees, and certain registration and transfer agent expenses.
The following is a summary of significant accounting policies followed by the Fund in the preparation of its financial statements. The Fund prepares its financial statements in conformity with United States generally accepted accounting principles (“GAAP”), including investment company accounting and reporting guidance in the Financial Accounting Standards Board (the “FASB”) Accounting Standard Codification Topic 946.
NOTE 2 – SIGNIFICANT ACCOUNTING POLICIES
Security Valuation: All investments in securities held by the Fund are valued as described in Note 3.
Allocation of Income, Gains, Losses and Expenses: Net investment income (other than class specific expenses) and realized and unrealized gains and losses are allocated daily to each class of shares based upon the relative net asset value of outstanding shares (or the value of the dividend-eligible shares, as appropriate) of each class of shares at the beginning of the day (after adjusting for the current capital shares activity of the respective class). Expenses common to all Funds are allocated among the Funds comprising the Trust based upon their relative net asset values or other appropriate allocation methods. Operating expenses directly attributable to a specific class are charged against the operating income of that class.
Dividends and Distributions to Shareholders: Dividends and distributions to shareholders, which are determined in accordance with federal income tax regulations and may differ from GAAP, are recorded on the ex-dividend date. Ordinary income distributions, if any, are declared and paid monthly. Capital gain distributions, if any, are declared and paid annually and more often if deemed necessary by the Advisor. Dividends are paid and are reinvested in additional shares of the Fund at net asset value per share at the close of business on the ex-dividend date, or at the shareholder’s option, paid in cash.
Investment Income: Dividend income is recorded on the ex-dividend date. Certain income from foreign investments is recognized as soon as information is available to the Fund. Interest income is accrued as earned. Premiums and discounts are amortized and accreted, respectively, to call dates or maturity dates using the effective yield method of the respective investments, which is included in interest income on the Statement of Operations.
Custodian Fees: Custodian fees disclosed in the Statement of Operations may include interest expenses incurred by the Fund on any cash overdrafts of its custodian account during the period. Such cash overdrafts may result from the effects of failed trades in portfolio securities and from cash outflows resulting from unanticipated shareholder redemption activity. The Fund pays interest to its custodian on any such cash overdraft at a rate equal to 2.50% of the overdraft amount in excess of $50,000.
Investment Transactions: Investment transactions are accounted for on a trade date basis. Realized gains and losses from the sale of investments are recorded on an identified cost basis.
When-Issued and Delayed Delivery Transactions: The Fund may engage in when-issued or delayed delivery transactions. To the extent the Fund engages in such transactions, it will do so for the purpose of acquiring portfolio investments consistent with the Fund’s investment objectives and not for the purpose of investment leverage or to speculate on interest rate or market changes. At the time the Fund makes a commitment to purchase an investment on a when-issued or delayed delivery basis, the Fund will record the transaction
Annual Report 23
| | |
| NOTES TO FINANCIAL STATEMENTS, CONTINUED | | |
| |
Thornburg Strategic Income Fund | | September 30, 2016 |
and reflect the value in determining its net asset value. When effecting such transactions, assets of an amount sufficient to make payment for the portfolio investments to be purchased will be segregated on the Fund’s records on the trade date. Investments purchased on a when-issued or delayed delivery basis do not earn interest until the settlement date.
Repurchase Agreements: The Fund may invest excess cash in repurchase agreements whereby the Fund purchases investments, which serve as collateral, with an agreement to resell such collateral to the seller at an agreed upon price at the maturity date of the repurchase agreement. Investments pledged as collateral for repurchase agreements are held in custody until maturity of the repurchase agreement. Provisions in the agreements require that the market value of the collateral is at least equal to the repurchase value in the event of default. In the event of default, the Fund has the right to liquidate the collateral and apply the proceeds in satisfaction of the obligation. Under certain circumstances, in the event of default or bankruptcy by the other party to the agreement, realization and/or retention of the collateral may be subject to legal proceedings.
Unfunded Loan Commitments: The Fund has entered into a loan commitment with Nexstar Broadcasting, Inc., of which at September 30, 2016, no par commitment had been funded. The Fund is committed in the amount of $3,435,000 until January 27, 2017.
Foreign Currency Translation: Portfolio investments and other assets and liabilities denominated in foreign currencies are translated into U.S. dollars based on the exchange rate of such currencies against the U.S. dollar on the date of valuation. Purchases and sales of investments and income items denominated in foreign currencies are translated into U.S. dollars at the exchange rate in effect on the transaction date. When the Fund purchases or sells foreign investments, it will customarily enter into a foreign exchange contract to minimize foreign exchange risk from the trade date to the settlement date of such transactions. The values of such spot contracts are included in receivable for investments sold and payable for investments purchased on the Statement of Assets and Liabilities.
The Fund does not separately report the effect of changes in foreign exchange rates from changes in market prices on investments held. Such changes are included in net unrealized appreciation (depreciation) from investments.
Reported net realized gains and losses from foreign currency transactions arise due to purchases and sales of foreign currencies, currency gains and losses realized between the trade and settlement dates on investment transactions and the difference between the amounts of dividends, interest, and foreign withholding taxes recorded on the Fund’s books, and the U.S. dollar equivalent of the amounts actually received or paid.
Net change in unrealized appreciation (depreciation) on foreign currency translations arise from changes in the fair value of assets and liabilities, other than investments at period end, resulting from changes in exchange rates.
Guarantees and Indemnifications: Under the Trust’s organizational documents (and under separate agreements with the independent Trustees), its officers and Trustees are provided with an indemnification against certain liabilities arising out of the performance of their duties to the Fund. In the normal course of business the Trust may also enter into contracts with service providers that contain general indemnifications. The Trust’s maximum exposure under these arrangements is unknown. However, based on experience, the Trust expects the risk of loss to be remote.
Use of Estimates: The preparation of financial statements in conformity with GAAP requires management to make estimates and assumptions that affect the reported amounts of assets and liabilities and disclosure of contingent assets and liabilities at the date of the financial statements and the reported amounts of increases (decreases) in net assets from operations during the reporting period. Actual results could differ from those estimates.
Federal Income Taxes: It is the policy of the Trust to comply with the provisions of the Internal Revenue Code applicable to regulated investment companies and to distribute to shareholders substantially all investment company taxable income including net realized gains on investments (if any), and tax exempt income of the Fund. Therefore, no provision for federal income or excise tax is required.
The Fund files income tax returns in United States federal and applicable state jurisdictions. The statute of limitations on the Fund’s tax return filings generally remains open for the three years following a return’s filing date. The Fund has analyzed each uncertain tax position believed to be material in the preparation of the Fund’s financial statements for the fiscal year ended September 30, 2016, including open tax years, to assess whether it is more likely than not that the position would be sustained upon examination, based on the technical merits of the position. The Fund has not identified any such position for which an asset or liability must be reflected in the Statement of Assets and Liabilities.
At September 30, 2016, information on the tax components of capital was as follows:
| | | | |
Cost of investments for tax purposes | | $ | 1,059,775,611 | |
| | | | |
Gross unrealized appreciation on a tax basis | | $ | 29,217,342 | |
Gross unrealized depreciation on a tax basis | | | (47,957,443 | ) |
| | | | |
Net unrealized appreciation (depreciation) on investments (tax basis) | | $ | (18,740,101 | ) |
| | | | |
24 Annual Report
| | |
| NOTES TO FINANCIAL STATEMENTS, CONTINUED | | |
| |
Thornburg Strategic Income Fund | | September 30, 2016 |
Temporary book to tax adjustments to cost of investments and net unrealized appreciation (depreciation) for tax purposes result primarily from deferral of outstanding wash sale losses and outstanding contingent payment debt instrument (“CPDI”) tax basis adjustments.
At September 30, 2016, the Fund had deferred tax basis late year specified ordinary losses occurring subsequent to October 31, 2015 through September 30, 2016 of $9,305,389. For tax purposes, such losses will be recognized in the year ending September 30, 2017.
At September 30, 2016, the Fund had deferred tax basis capital losses occurring subsequent to October 31, 2015 through September 30, 2016 of $30,691,256. For tax purposes, such capital losses will be recognized in the year ending September 30, 2017.
At September 30, 2016, the Fund had cumulative tax basis capital losses of $1,894,006, (of which $0 are short-term and $1,894,006 are long-term) generated after September 30, 2011, which may be carried forward to offset future capital gains. To the extent such car-ryforwards are used, capital gain distributions may be reduced to the extent provided by regulations. Such capital loss carryforwards do not expire.
In order to account for permanent book to tax differences, the Fund decreased undistributed net investment income by $8,915,060, decreased accumulated net realized investment (loss) by $8,915,062, and decreased net capital paid in on shares of beneficial interest by $2. Reclassifications have no impact upon the net asset value of the Fund and result primarily from investments in foreign bonds, mortgage-backed security (“MBS”) losses, contingent payment debt instruments (“CPDIs”), real estate investment trusts (“REITs”), foreign currency gains (losses), and redesignation of distributions.
At September 30, 2016, the Fund had $4,879,102 of undistributed tax basis ordinary investment income and no undistributed tax basis capital gains.
The tax character of distributions paid during the years ended September 30, 2016, and September 30, 2015, was as follows:
| | | | | | | | |
| | | 2016 | | | 2015 | |
Distributions from: | | | | | | | | |
Ordinary income | | $ | 37,774,245 | | | $ | 57,525,899 | |
Capital gains | | | — | | | | 10,504,192 | |
| | | | | | | | |
Total | | $ | 37,774,245 | | | $ | 68,030,091 | |
| | | | | | | | |
Foreign Withholding Taxes: The Fund is subject to foreign tax withholding imposed by certain foreign countries in which the Fund may invest. Withholding taxes are incurred on certain foreign dividends and are accrued at the time the dividend is recognized based on applicable foreign tax laws. The Fund files withholding tax reclaims in certain jurisdictions to recover a portion of amounts previously withheld, in view of various considerations, including recent decisions rendered by the courts in those and other jurisdictions. The Fund would expect to record a receivable for such a reclaim based on a variety of factors, including assessment of a jurisdiction’s legal obligation to pay reclaims, the jurisdiction’s administrative practices and payment history, and industry convention. To date the Fund has recorded no such receivable because there is limited precedent for collecting such prior year reclaims and the likelihood of collection remains uncertain.
Deferred Foreign Capital Gain Taxes: The Fund is subject to a tax imposed on net realized gains of securities of certain foreign countries. The Fund records an estimated deferred tax liability for net unrealized gains on these investments as reflected in the accompanying financial statements.
NOTE 3 – SECURITY VALUATION
Valuation of the Fund’s portfolio investment securities is performed in accordance with policies and procedures adopted by and under the oversight of the Trustees.
The Trustees of the Trust have appointed Thornburg Investment Management, Inc., the Trust’s advisor (the “Advisor”) to assist the Trustees in obtaining market values for portfolio investments, evaluate and monitor professional pricing service providers appointed by the Trustees’ Audit Committee (the “Audit Committee”) to assist in determining fair values for portfolio investments, assist in calculating fair values for portfolio investments in certain circumstances, and to perform other functions in connection with the valuation of investments. The Advisor acts through its Valuation and Pricing Committee (the “Committee”) and other employees of the Advisor. The Committee regularly reviews its own valuation calculations, as well as the valuations, valuation techniques and services furnished by pricing service providers, considers circumstances which may require valuation calculations by the Committee, and reviews previous valuation calculations. The Committee reports to the Audit Committee on the Committee’s activities, the performance of pricing service providers, and other matters relating to valuation of portfolio investments.
In those instances when the Committee assists in calculating a fair value for a portfolio investment, the Committee seeks to determine the price that the Fund would reasonably expect to receive upon a sale of the investment in an orderly transaction between market
Annual Report 25
| | |
| NOTES TO FINANCIAL STATEMENTS, CONTINUED | | |
| |
Thornburg Strategic Income Fund | | September 30, 2016 |
participants on the valuation date. The Committee customarily utilizes quotations from securities broker dealers in calculating valuations, but also may utilize prices obtained from pricing service providers or other methods approved by the Audit Committee. Because fair values calculated by the Committee are estimates, the calculation of a value for an investment may differ from the price that would be realized by the Fund upon a sale of the investment, and the difference could be material to the Fund’s financial statements. The Committee’s calculation of a fair value for an investment may also differ from the prices obtained by other persons (including other mutual funds) for the investment.
Valuation of Securities: Securities and other portfolio investments which are listed or traded on a United States securities exchange are valued at the last reported sale price on the valuation date. Investments listed or traded on an exchange for which there has been no sale that day are valued at the mean between the last reported bid and asked prices on that valuation date. Portfolio investments reported by NASDAQ are valued at the official closing price on the valuation date. If an investment is traded on more than one exchange, the investment is considered traded on the exchange that is normally the primary market for that investment. Securities and other portfolio investments which are listed or traded on exchanges outside the United States are valued at the last price or the closing price of the investment on the exchange that is normally the primary market for the investment, as of the close of the exchange preceding the Fund’s valuation date. Foreign investments listed or traded on an exchange for which there has been no sale that day are valued at the mean between the last reported bid and asked prices on that valuation date.
In any case when a market quotation is not readily available for a portfolio investment ordinarily valued by market quotation, the Committee calculates a fair value for the investment using alternative methods approved by the Audit Committee. A market quotation is not readily available when the primary market or exchange for the investment is not open for the entire scheduled day of trading. Market quotations for an investment also may not be readily available if developments after the most recent close of the investment’s primary exchange or market, but prior to the close of business on any Fund business day, or an unusual event or significant period of time occurring since the availability of a market quotation, create a serious question concerning the reliability of the most recent market quotation available for the investment. In particular, on days when market volatility thresholds established by the Audit Committee are exceeded, foreign equity investments held by the Fund may be valued using alternative methods. The Committee customarily obtains valuations in these instances from pricing service providers approved by the Audit Committee. Pricing service providers ordinarily calculate valuations using multi-factor models to adjust market prices based upon various inputs, including exchange data, depository receipt prices, futures, index data and other data.
Debt obligations held by the Fund which are not listed or traded on exchanges or for which no reported market exists are ordinarily valued at the valuation obtained from a pricing service provider approved by the Audit Committee.
In any case when a pricing service provider fails to provide a valuation for a debt obligation held by the Fund, the Committee calculates a fair value for the obligation using alternative methods under procedures approved by the Audit Committee. Additionally, in cases when management believes that a valuation obtained from a pricing service provider merits review for significant reasons, the Committee decides whether or not to use the valuation calculated by the pricing service provider or to use an alternative method approved by the Audit Committee to calculate a fair value for the obligation.
Quotations for foreign investments expressed in foreign currency amounts are converted to U.S. dollar equivalents using a foreign exchange quotation from a third party service provider at the time of valuation. Foreign investments held by the Fund may be traded on days and at times when the Fund is not open for business. Consequently, the value of Fund investments may be significantly affected on days when shareholders cannot purchase or sell Fund shares. Futures contracts and other financial and derivative instruments traded on an exchange are valued at the latest published price for the instrument on its primary exchange. Listed options are valued at the last bid price.
Valuation Hierarchy: The Fund categorizes its investments based upon the inputs used in valuing those investments, according to a three-level hierarchy established in guidance from FASB. Categorization of investments using this hierarchy is intended by the FASB to maximize the use of observable inputs in valuing investments and minimize the use of unobservable inputs by requiring that the most observable inputs be used when available. Observable inputs are those that market participants would use in valuing an investment based on available market information. Unobservable inputs are those that reflect assumptions about the information market participants would use in valuing an investment. An investment’s level within the hierarchy is based on the lowest level input that is deemed significant to the valuation. The methodologies and inputs used to value investments are not necessarily indications of the risk or liquidity associated with those investments.
Various inputs are used in calculating valuations for the Fund’s investments. These inputs are generally summarized according to the three-level hierarchy below:
Level 1: Quoted prices in active markets for identical investments.
Level 2: Other direct or indirect significant observable inputs (including quoted prices for similar investments in active markets and other observable inputs, such as interest rates, prepayment rates, credit risk, etc.).
26 Annual Report
| | |
| NOTES TO FINANCIAL STATEMENTS, CONTINUED | | |
| |
Thornburg Strategic Income Fund | | September 30, 2016 |
Level 3: Significant unobservable inputs (including the Committee’s own assumptions in calculating the fair values of investments).
Valuations for debt obligations held by the Fund are typically calculated by pricing service providers approved by the Audit Committee and are characterized as Level 2 within the valuation hierarchy.
On days when market volatility thresholds established by the Audit Committee are exceeded, foreign securities for which valuations are obtained from pricing service providers are fair valued. On these days, the foreign securities are characterized as Level 2 within the valuation hierarchy and revert to Level 1 after the threshold is no longer exceeded.
In a limited number of cases the Committee calculates a fair value for investments using broker quotations or other methods approved by the Audit Committee. When the Committee uses a single broker quotation to calculate a fair value for an investment without other significant observable inputs, or if a fair value is calculated using other significant inputs that are considered unobservable, the investment is characterized as Level 3 within the hierarchy. Other significant unobservable inputs used to calculate a fair value in these instances might include an income-based valuation approach which considers discounted anticipated future cash flows from the investment, and application of discounts due to the nature or duration of any restrictions on the disposition of the investment.
Valuations based upon the use of inputs from Levels 1, 2 or 3 may not represent the actual price received upon the disposition of an investment, and the Fund may receive a price that is lower than the valuation based upon these inputs when it sells the investment.
The following table displays a summary of the fair value hierarchy measurements of the Fund’s investments as of September 30, 2016. In any instance when valuation inputs from more than one level are used to determine the fair value of a specific investment, the investment is placed in the level of the table based upon the lowest level input that is significant in determining the fair value of the investment:
| | | | | | | | | | | | | | | | |
| | | Fair Value Measurements at September 30, 2016 | |
| | | Total | | | Level 1 | | | Level 2 | | | Level 3(b) | |
Assets | | | | | | | | | | | | | | | | |
Investments in Securities* | | | | | | | | | | | | | | | | |
Common Stock(a) | | $ | 3,085,333 | | | $ | — | | | $ | 3,085,333 | | | $ | — | |
Preferred Stock(a) | | | 18,309,009 | | | | 4,709,390 | | | | 13,599,619 | | | | — | |
Asset Backed Securities | | | 138,839,086 | | | | — | | | | 127,863,792 | | | | 10,975,294 | |
Corporate Bonds | | | 640,244,879 | | | | — | | | | 638,459,279 | | | | 1,785,600 | |
Convertible Bonds | | | 27,933,483 | | | | — | | | | 27,933,483 | | | | — | |
Municipal Bonds | | | 4,278,690 | | | | — | | | | 4,278,690 | | | | — | |
U.S. Government Agencies | | | 12,047,423 | | | | — | | | | 12,047,423 | | | | — | |
Other Government | | | 14,268,484 | | | | — | | | | 14,268,484 | | | | — | |
Mortgage Backed | | | 3,352,459 | | | | — | | | | 3,020,864 | | | | 331,595 | |
Loan Participations | | | 63,827,236 | | | | — | | | | 57,134,986 | | | | 6,692,250 | |
Short Term Investments | | | 114,849,428 | | | | 114,849,428 | | | | — | | | | — | |
| | | | | | | | | | | | | | | | |
Total Investments in Securities | | $ | 1,041,035,510 | | | $ | 119,558,818 | | | $ | 901,691,953 | | | $ | 19,784,739 | |
| | | | |
Other Financial Instruments** | | | | | | | | | | | | | | | | |
Forward Currency Contracts | | $ | 173,499 | | | $ | — | | | $ | 173,499 | | | $ | — | |
| | | | |
Liabilities | | | | | | | | | | | | | | | | |
Other Financial Instruments** | | | | | | | | | | | | | | | | |
Forward Currency Contracts | | $ | (47,155 | ) | | $ | — | | | $ | (47,155 | ) | | $ | — | |
| * | See Schedule of Investments for a summary of the industry exposure as grouped according to the Global Industry Classification Standard (GICS), which is an industry taxonomy developed by MSCI, Inc. and Standard & Poor’s (S&P). |
| ** | Other Financial Instruments include investments not reflected in the Schedule of Investments, which may include futures, forwards and swap contracts, which are valued at the unrealized appreciation (depreciation) on the investment. |
Annual Report 27
| | |
| NOTES TO FINANCIAL STATEMENTS, CONTINUED | | |
| |
Thornburg Strategic Income Fund | | September 30, 2016 |
| (a) | At September 30, 2016, industry classifications for Common Stock and Preferred Stock in Level 2 consist of $3,085,333 in Energy, $10,787,500 in Miscellaneous, and $2,812,119 in Telecommunication Services. |
| (b) | In accordance with the guidance prescribed in Accounting Standards Update (“ASU”) No. 2011-04, unadjusted broker quotes were applied to $970,970 portfolio securities characterized as Level 3 investments at September 30, 2016. The following table displays a summary of the valuation techniques and unobservable inputs used to value portfolio securities characterized as Level 3 investments, where no unadjusted broker quotes were available at September 30, 2016: |
| | | | | | | | | | | | | | |
| | | Fair Value at
September 30, 2016 | | | Valuation
Technique(s) | | | Unobservable Input | | Range
(Weighted Average) | |
Corporate Bonds | | $ | 1,785,600 | | | | Cost basis | | | Cost basis | | | $93.00 (N/A) | |
| | | 0 | | | | Discounted cash flows | | | Third party vendor impairment projection | | | N/A (N/A) | |
Loan Participations | | | 6,692,250 | | | | Discounted cash flows | | | Third party vendor projection of discounted cash flows | | | 8.90% - 20.00% (10.45%) | |
Asset Backed Securities | | | 6,136,284 | | | | Discounted cash flows | | | Third party vendor projection of discounted cash flows | | | 3.30% - 4.10% (3.58%) | |
| | | 4,199,635 | | | | Cost basis | | | Cost basis | | | $99.99 (N/A) | |
| | | | | | | | | | | | | | |
Total | | $ | 18,813,769 | | | | | | | | | | | |
In accordance with the guidance prescribed in ASU No. 2011-04, it is the policy of the Fund to recognize transfers between levels and those underlying events which caused the movement. The Fund recognized no transfers between Levels 1 and 2 for the year ended September 30, 2016, other than when the Fund exceeded market volatility thresholds for foreign equity investments during the period.
A rollforward of fair value measurements using significant unobservable inputs (Level 3) for the year ended September 30, 2016 is as follows:
| | | | | | | | | | | | | | | | | | | | | | | | |
| | | Common
Stock(f) | | | Asset Backed
Securities | | | Corporate
Bonds | | | Mortgage
Backed | | | Other
Securities | | | Total(e) | |
Beginning Balance 9/30/2015 | | $ | — | | | $ | 12,202,675 | | | $ | 1,242,600 | | | $ | 489,490 | | | $ | 17,037,739 | | | $ | 30,972,504 | |
Accrued Discounts (Premiums) | | | | | | | 16,597 | | | | 1,475 | | | | (1,664 | ) | | | 22,560 | | | | 38,968 | |
Net Realized Gain (Loss)(a) | | | (144,406 | ) | | | 32,516 | | | | (5,212,092 | ) | | | (3,159 | ) | | | 85,858 | | | | (5,241,283 | ) |
Gross Purchases | | | | | | | 4,199,635 | | | | 1,785,600 | | | | — | | | | 494,100 | | | | 6,479,335 | |
Gross Sales | | | (9,194 | ) | | | (1,046,795 | ) | | | (36,333 | ) | | | (157,895 | ) | | | (10,897,591 | ) | | | (12,147,808 | ) |
Net Change in Unrealized | | | | | | | | | | | | | | | | | | | | | | | | |
Appreciation (Depreciation)(b)(c) | | | 153,600 | | | | (24,269 | ) | | | 4,004,350 | | | | 4,823 | | | | (50,416 | ) | | | 4,088,088 | |
Transfers into Level 3(d) | | | | | | | — | | | | — | | | | — | | | | — | | | | — | |
Transfers out of Level 3(d) | | | | | | | (4,405,065 | ) | | | — | | | | — | | | | — | | | | (4,405,065 | ) |
| | | | | | | | | | | | | | | | | | | | | | | | |
Ending Balance 9/30/2016 | | $ | — | | | $ | 10,975,294 | | | $ | 1,785,600 | | | $ | 331,595 | | | $ | 6,692,250 | | | $ | 19,784,739 | |
| (a) | Amount of net realized gain (loss) from investments recognized in income is included in the Fund’s Statement of Operations for the year ended September 30, 2016. |
| (b) | Amount of net change in unrealized appreciation (depreciation) on investments recognized in income is included in the Fund’s Statement of Operations for the year ended September 30, 2016. |
| (c) | The net change in unrealized appreciation (depreciation) attributable to securities owned at September 30, 2016, which were valued using significant unobservable inputs, was $(31,995). This is included within net change in unrealized appreciation (depreciation) on investments in the Fund’s the Statement of Operations for the year ended September 30, 2016. |
| (d) | Transfers into or out of Level 3 were out of or into Level 2, and were due to changes in other significant observable inputs available during the year ended September 30, 2016. Transfers into or out of Level 3 are based on the beginning market value of the period in which they occurred. |
| (e) | Level 3 investments represent 1.90% of total net assets at the year ended September 30, 2016. Significant fluctuations of the unobservable inputs applied to portfolio securities characterized as Level 3 investments could be expected to increase or decrease the fair value of these portfolio securities. |
| (f) | Common stock valued at zero was included in the Level 3 rollforward table at September 30, 2015. |
28 Annual Report
| | |
| NOTES TO FINANCIAL STATEMENTS, CONTINUED | | |
| |
Thornburg Strategic Income Fund | | September 30, 2016 |
NOTE 4 – INVESTMENT ADVISORY FEE AND OTHER TRANSACTIONS WITH AFFILIATES
Pursuant to an investment advisory agreement, the Advisor serves as the investment advisor and performs services for the Fund for which the fees are payable at the end of each month. Under the investment advisory agreement, the Fund pays the Advisor a management fee based on the daily net assets of the Fund at an annual rate as shown in the following table:
Management Fee Schedule
| | | | |
Daily Net Assets | | Fee Rate | |
Up to $ 500 million | | | 0.750 | % |
Next $ 500 million | | | 0.675 | |
Next $ 500 million | | | 0.625 | |
Next $ 500 million | | | 0.575 | |
Over $ 2 billion | | | 0.500 | |
The Fund’s effective management fee for the year ended September 30, 2016 was 0.706% of the Fund’s average dividend assets.
The Fund pays to the Advisor the costs of personnel who perform certain accounting services for the Fund. For the year ended September 30, 2016 the Fund paid $39,739 to the Advisor for these accounting services. The Trust has also entered into administrative service agreements with the Advisor, whereby the Advisor will perform certain administrative services for the shareholders of each class of the Fund’s shares, and for which fees will be payable at an annual rate of up to .125 of 1% per annum of the average daily net assets attributable to each class of shares. Total administrative service fees incurred by each class of shares of the Fund for the year ended September 30, 2016, are set forth in the Statement of Operations.
The Trust has an underwriting agreement with Thornburg Securities Corporation (the “Distributor”), an affiliate of the Advisor, which acts as the distributor of the Fund’s shares. For the year ended September 30, 2016, the Distributor has advised the Fund that it earned net commissions aggregating $49,258 from the sale of Class A shares, and collected contingent deferred sales charges aggregating $20,201 from redemptions of Class C shares of the Fund.
Pursuant to a service plan under Rule 12b-1 of the Investment Company Act of 1940, the Fund may pay to the Advisor or securities dealers and other financial institutions at the Advisor’s request an amount not to exceed .25 of 1% per annum of the average daily net assets attributable to Class A, Class C, Class R3, and Class R4 shares of the Fund to obtain various shareholder and distribution related services. For the year ended September 30, 2016, there were no 12b-1 service plan fees charged for Class I and Class R5 shares. The Advisor may pay out of its own resources additional expenses for distribution of the Fund’s shares and shareholder services.
The Trust has also adopted a distribution plan pursuant to Rule 12b-1, applicable only to the Fund’s Class C and Class R3 shares, under which the Fund compensates the Distributor for services in promoting the sale of Class C and Class R3 shares of the Fund at an annual rate of up to .75 of 1% per annum of the average daily net assets attributable to Class C shares and an annual rate of .25 of 1% of the average daily net assets attributable to Class R3 shares. Total fees incurred by each class of shares of the Fund under their respective service and distribution plans for the year ended September 30, 2016, are set forth in the Statement of Operations.
The Advisor and Distributor have contractually agreed to waive fees and reimburse expenses incurred by the Fund so that actual expenses of certain share classes do not exceed levels as specified in the Fund’s most recent prospectus. The agreement may be terminated by the Fund at any time, but may not be terminated by the Advisor or Distributor before February 1, 2017, unless the Advisor ceases to be the investment advisor to the Trust or the Distributor ceases to be the distributor of the Fund prior to that date. The Advisor and Distributor retain the right to be repaid by the Fund for fee waivers and expense reimbursements if expenses fall below the contractual limit prior to the end of the fiscal year.
For the year ended September 30, 2016, the Advisor contractually reimbursed certain class specific expenses, administrative fees, and distribution fees of $532,067 for Class C shares, $34,900 for Class R3 shares, $32,771 for Class R4 shares, and $26,618 for Class R5 shares.
Certain officers and Trustees of the Trust are also officers or directors of the Advisor and Distributor. The compensation of independent Trustees is borne by the Trust.
The Funds may purchase or sell securities from, or to an affiliated fund, provided the affiliation is due solely to having a common investment advisor, common officers, or common trustees, and provided that all such transactions will comply with Rule 17a-7 under the 1940 Act. For the year ended September 30, 2016, the Fund had transactions with affiliated funds of $19,597,343 in sales, resulting in realized gains of $615,036.
Annual Report 29
| | |
| NOTES TO FINANCIAL STATEMENTS, CONTINUED | | |
| |
Thornburg Strategic Income Fund | | September 30, 2016 |
NOTE 5 – SHARES OF BENEFICIAL INTEREST
At September 30, 2016, there were an unlimited number of shares with no par value of beneficial interest authorized. Transactions in shares of beneficial interest were as follows:
| | | | | | | | | | | | | | | | |
| | | Year Ended
September 30, 2016 | | | Year Ended
September 30, 2015 | |
| | | Shares | | | Amount | | | Shares | | | Amount | |
Class A Shares | | | | | | | | | | | | | | | | |
Shares sold | | | 4,582,152 | | | $ | 51,291,779 | | | | 9,448,626 | | | $ | 111,515,219 | |
Shares issued to shareholders in reinvestment of dividends | | | 871,540 | | | | 9,760,425 | | | | 1,545,329 | | | | 18,164,165 | |
Shares repurchased | | | (11,109,168 | ) | | | (124,087,226 | ) | | | (13,052,160 | ) | | | (152,857,293 | ) |
| | | | | | | | | | | | | | | | |
| | | | |
Net increase (decrease) | | | (5,655,476 | ) | | $ | (63,035,022 | ) | | | (2,058,205 | ) | | $ | (23,177,909 | ) |
| | | | | | | | | | | | | | | | |
Class C Shares | | | | | | | | | | | | | | | | |
Shares sold | | | 2,946,495 | | | $ | 32,860,557 | | | | 5,713,342 | | | $ | 67,448,862 | |
Shares issued to shareholders in reinvestment of dividends | | | 654,821 | | | | 7,317,489 | | | | 1,148,477 | | | | 13,483,171 | |
Shares repurchased | | | (7,309,089 | ) | | | (81,787,073 | ) | | | (8,167,118 | ) | | | (95,507,121 | ) |
| | | | | | | | | | | | | | | | |
| | | | |
Net increase (decrease) | | | (3,707,773 | ) | | $ | (41,609,027 | ) | | | (1,305,299 | ) | | $ | (14,575,088 | ) |
| | | | | | | | | | | | | | | | |
Class I Shares | | | | | | | | | | | | | | | | |
Shares sold | | | 13,499,402 | | | $ | 151,142,252 | | | | 20,927,899 | | | $ | 246,352,797 | |
Shares issued to shareholders in reinvestment of dividends | | | 1,377,570 | | | | 15,401,708 | | | | 2,234,492 | | | | 26,178,868 | |
Shares repurchased | | | (20,779,133 | ) | | | (231,181,400 | ) | | | (21,065,602 | ) | | | (246,041,357 | ) |
| | | | | | | | | | | | | | | | |
| | | | |
Net increase (decrease) | | | (5,902,161 | ) | | $ | (64,637,440 | ) | | | 2,096,789 | | | $ | 26,490,308 | |
| | | | | | | | | | | | | | | | |
Class R3 Shares | | | | | | | | | | | | | | | | |
Shares sold | | | 185,212 | | | $ | 2,084,448 | | | | 111,029 | | | $ | 1,316,018 | |
Shares issued to shareholders in reinvestment of dividends | | | 3,115 | | | | 34,849 | | | | 9,969 | | | | 117,693 | |
Shares repurchased | | | (71,853 | ) | | | (804,745 | ) | | | (243,813 | ) | | | (2,855,141 | ) |
| | | | | | | | | | | | | | | | |
| | | | |
Net increase (decrease) | | | 116,474 | | | $ | 1,314,552 | | | | (122,815 | ) | | $ | (1,421,430 | ) |
| | | | | | | | | | | | | | | | |
Class R4 Shares | | | | | | | | | | | | | | | | |
Shares sold | | | 98,418 | | | $ | 1,108,245 | | | | 188,418 | | | $ | 2,202,476 | |
Shares issued to shareholders in reinvestment of dividends | | | 5,291 | | | | 59,279 | | | | 3,607 | | | | 41,823 | |
Shares repurchased | | | (13,157 | ) | | | (148,745 | ) | | | (5,480 | ) | | | (63,423 | ) |
| | | | | | | | | | | | | | | | |
| | | | |
Net increase (decrease) | | | 90,552 | | | $ | 1,018,779 | | | | 186,545 | | | $ | 2,180,876 | |
| | | | | | | | | | | | | | | | |
Class R5 Shares | | | | | | | | | | | | | | | | |
Shares sold | | | 537,061 | | | $ | 5,962,916 | | | | 582,339 | | | $ | 6,800,748 | |
Shares issued to shareholders in reinvestment of dividends | | | 14,404 | | | | 161,108 | | | | 16,493 | | | | 192,828 | |
Shares repurchased | | | (499,950 | ) | | | (5,609,940 | ) | | | (238,073 | ) | | | (2,757,850 | ) |
| | | | | | | | | | | | | | | | |
| | | | |
Net increase (decrease) | | | 51,515 | | | $ | 514,084 | | | | 360,759 | | | $ | 4,235,726 | |
| | | | | | | | | | | | | | | | |
NOTE 6 – INVESTMENT TRANSACTIONS
For the year ended September 30, 2016, the Fund had purchase and sale transactions of investments (excluding short-term investments and U.S. Government obligations) of $285,736,629 and $ 430,535,274, respectively.
30 Annual Report
| | |
| NOTES TO FINANCIAL STATEMENTS, CONTINUED | | |
| |
Thornburg Strategic Income Fund | | September 30, 2016 |
NOTE 7 – DERIVATIVE FINANCIAL INSTRUMENTS WITH OFF-BALANCE SHEET RISK AND FOREIGN INVESTMENT RISK
The Fund may use a variety of derivative financial instruments to hedge or adjust the risks affecting its investment portfolio or to enhance investment returns. Provisions of the FASB Accounting Standards Codification 815-10-50 (“ASC 815”) require certain disclosures. The disclosures are intended to provide users of financial statements with an understanding of the use of derivative instruments by the Fund and how these derivatives affect the financial position, financial performance and cash flows of the Fund. The Fund does not designate any derivative instruments as hedging instruments under ASC 815. During the year ended September 30, 2016, the Fund’s principal exposure to derivative financial instruments of the type addressed by ASC 815 was investment in foreign exchange contracts. A foreign exchange contract is an agreement between two parties to exchange different currencies at a specified rate of exchange at an agreed upon future date. Foreign exchange contracts involve risks to the Fund, including the risk that a contract’s counterparty will not meet its obligations to the Fund, the risk that a change in a contract’s value may not correlate perfectly with the currency the contract was intended to track, and the risk that the Fund’s Advisor is unable to correctly implement its strategy in using a contract. In any such instance, the Fund may not achieve the intended benefit of entering into a contract, and may experience a loss.
The Fund entered into forward currency contracts during the year ended September 30, 2016 in the normal course of pursuing its investment objectives, with the objective of purchasing foreign investments or with the intent of reducing the risk to the value of the Fund’s foreign investments from adverse changes in the relationship between the U.S. dollar and foreign currencies. In each case these contracts have been initiated in conjunction with foreign investment transactions.
These contracts are accounted for by the Fund under ASC 815. Unrealized appreciation and depreciation on outstanding contracts are reported in the Fund’s Statement of Assets and Liabilities, as measured by the difference between the forward exchange rates at the reporting date and the forward exchange rates at each contract’s inception date. Net realized gain (loss) on contracts closed during the period, and changes in net unrealized appreciation (depreciation) on outstanding contracts are recognized in the Fund’s Statement of Operations.
The quarterly average value of open sell currency contracts for the year ended September 30, 2016 was $13,411,790. Open buy currency contracts are entered into for the purpose of closing open sell currency contracts and the values are dependent upon the values of the open sell currency contracts to which they relate.
The following table displays the outstanding forward currency contracts at September 30, 2016:
| | | | | | | | | | | | | | | | | | | | | | | | |
| | | Outstanding Forward Currency Contracts to Buy or Sell at September 30, 2016 | |
Contract Description | | Buy/Sell | | | Contract
Amount | | | Contract
Value Date | | | Value
USD | | | Unrealized
Appreciation | | | Unrealized
Depreciation | |
Canadian Dollar | | | Sell | | | | 14,934,700 | | | | 12/08/2016 | | | | 11,388,972 | | | $ | 173,499 | | | $ | — | |
Canadian Dollar | | | Sell | | | | 554,800 | | | | 12/08/2016 | | | | 423,082 | | | | — | | | | (1,294 | ) |
Canadian Dollar | | | Sell | | | | 1,047,200 | | | | 12/08/2016 | | | | 798,579 | | | | — | | | | (5,943 | ) |
Swiss Franc | | | Sell | | | | 3,974,100 | | | | 09/21/2017 | | | | 4,180,899 | | | | — | | | | (39,918 | ) |
| | | | | | | | | | | | | | | | | | | | | | | | |
Total | | | | | | | | | | | | | | | | | | $ | 173,499 | | | $ | (47,155 | ) |
| | | | | | | | | | | | | | | | | | | | | | | | |
Net unrealized appreciation (depreciation) | | | $ | 126,344 | | | | | |
| | | | | | | | | | | | | | | | | | | | | | | | |
The outstanding forward currency contracts in the foregoing table were entered into with State Street Bank and Trust Company (“SSB”), pursuant to an International Swaps and Derivatives Association (“ISDA”) Master Agreement. In the event of a default or termination under the ISDA Master Agreement with SSB, the non-defaulting party has the right to close out all outstanding forward currency contracts between the parties and to net any payment amounts under those contracts, resulting in a single net amount payable by one party to the other.
Because the ISDA Master Agreement with SSB does not result in an offset of reported amounts of financial assets and liabilities in the Fund’s Statement of Assets and Liabilities unless there has been an event of default or termination event under that agreement, the Fund does not net its outstanding forward currency contracts for purposes of the disclosure in the Fund’s Statement of Assets and Liabilities. Instead the Fund recognizes the unrealized appreciation or depreciation on those forward currency contracts on a gross basis in the Fund’s Statement of Assets and Liabilities.
Annual Report 31
| | |
| NOTES TO FINANCIAL STATEMENTS, CONTINUED | | |
| |
Thornburg Strategic Income Fund | | September 30, 2016 |
The unrealized appreciation (depreciation) of the outstanding forward currency contracts recognized in the Fund’s Statement of Assets and Liabilities at September 30, 2016 is disclosed in the following table:
| | | | | | |
Fair Values of Derivative Financial Instruments at September 30, 2016 | |
Asset Derivatives | | Balance Sheet Location | | Fair Value | |
Foreign exchange contracts | | Assets - Unrealized appreciation on forward currency contracts | | | $173,499 | |
| | |
Liability Derivatives | | Balance Sheet Location | | Fair Value | |
Foreign exchange contracts | | Liabilities - Unrealized depreciation on forward currency contracts | | | $(47,155) | |
Because the Fund does not currently receive or post cash collateral in connection with its currency forward contracts, and because all of the Fund’s outstanding currency forward contracts are with SSB, the net amounts of the Fund’s assets and liabilities which are attributable to those contracts at September 30, 2016 can be determined by offsetting the dollar amounts shown in the preceding table. Based on those amounts, the net amount of the Fund’s assets which is attributable to its outstanding forward currency contracts at September 30, 2016 is $126,344, and the net amount of the Fund’s liabilities which is attributable to those contracts at that date is $0. The Fund’s forward currency contracts are valued each day, and the net amounts of the Fund’s assets and liabilities which are attributable to those contracts are expected to vary over time.
The net realized gain (loss) from forward currency contracts and the net change in unrealized appreciation (depreciation) on outstanding forward currency contracts recognized in the Fund’s Statement of Operations for the year ended September 30, 2016 are disclosed in the following tables:
| | | | |
Net Realized Gain (Loss) on Derivative Financial Instruments Recognized in Income for the Year Ended September 30, 2016 |
| | | Total | | Forward Currency Contracts |
Foreign exchange contracts | | $(11,012) | | $(11,012) |
|
Net Change in Unrealized Appreciation (Depreciation) of Derivative Financial Instruments Recognized in Income for the Year Ended September 30, 2016 |
| | | Total | | Forward Currency Contracts |
Foreign exchange contracts | | $ 5,612 | | $ 5,612 |
OTHER NOTES
Risks: The Fund’s investments subject it to risks including, but not limited to, credit risk, interest rate risk, prepayment risk, management risk, market and economic risk, liquidity risk, risks affecting specific issuers, and the risks associated with investments in derivative instruments, small- and mid-cap companies and non-U.S. issuers, real estate investment trusts, below investment grade debt obligations, and structured finance arrangements. Please see the Fund’s prospectus for a discussion of the risks associated with an investment in the Fund.
Subsequent Events: Fund management believes no events have occurred between September 30, 2016 and the date of issuance of the financial statements that require adjustment to or disclosure in the accompanying financial statements.
32 Annual Report
This page intentionally left blank.
Annual Report 33
FINANCIAL HIGHLIGHTS
Thornburg Strategic Income Fund
| | | | | | | | | | | | | | | | | | | | | | | | | | | | | | | | | | | | | | | | | | | | | | | | | | | | |
| | | PER SHARE PERFORMANCE (for a share outstanding throughout the Year) | | | RATIOS TO AVERAGE NET ASSETS | | | SUPPLEMENTAL DATA | |
Unless Otherwise Noted, Periods are Fiscal Years Ended Sept. 30, | | Net Asset
Value
Beginning
of Year | | | Net
Investment
Income
(Loss)+ | | Net
Realized
&
Unrealized
Gain (Loss)
on
Investments | | | Total from
Investment
Operations | | Dividends
from Net
Investment
Income | | | Dividends
from Net
Realized
Gains | | | Total
Dividends | | | Net
Asset
Value
End
of
Year | | | Net
Investment
Income
(Loss)
(%) | | | Expenses,
After
Expense
Reductions
(%) | | | Expenses,
After
Expense
Reductions
and
Net of
Custody
Credits
(%) | | | Expenses,
Before
Expense
Reductions
(%) | | | Total
Return
(%)(a) | | Portfolio
Turnover
Rate
(%)(a) | | Net
Assets
at End
of Year
(thousands) | |
CLASS A SHARES | | | | | | | | | | | | | | | | | | | | | | | | | | | | | | | | | | | | | | | | | | | | | | |
2016(b) | | $ | 11.22 | | | 0.46 | | | 0.28 | | | 0.74 | | | (0.37 | ) | | | (0.03 | ) | | | (0.40 | ) | | $ | 11.56 | | | | 4.12 | | | | 1.24 | | | | 1.24 | | | | 1.24 | | | 6.70 | | 29.48 | | $ | 283,398 | |
2015(b) | | $ | 12.18 | | | 0.47 | | | (0.82 | ) | | (0.35) | | | (0.46 | ) | | | (0.15 | ) | | | (0.61 | ) | | $ | 11.22 | | | | 4.04 | | | | 1.23 | | | | 1.23 | | | | 1.23 | | | (2.97) | | 38.40 | | $ | 338,387 | |
2014(b) | | $ | 12.19 | | | 0.52 | | | 0.28 | | | 0.80 | | | (0.54 | ) | | | (0.27 | ) | | | (0.81 | ) | | $ | 12.18 | | | | 4.30 | | | | 1.22 | | | | 1.22 | | | | 1.24 | | | 6.79 | | 51.20 | | $ | 392,604 | |
2013(b) | | $ | 12.28 | | | 0.67 | | | 0.03 | | | 0.70 | | | (0.65 | ) | | | (0.14 | ) | | | (0.79 | ) | | $ | 12.19 | | | | 5.44 | | | | 1.25 | | | | 1.25 | | | | 1.27 | | | 5.79 | | 76.47 | | $ | 251,106 | |
2012(b) | | $ | 11.86 | | | 0.71 | | | 0.73 | | | 1.44 | | | (0.74 | ) | | | (0.28 | ) | | | (1.02 | ) | | $ | 12.28 | | | | 5.97 | | | | 1.25 | | | | 1.25 | | | | 1.31 | | | 12.73 | | 34.54 | | $ | 199,770 | |
CLASS C SHARES | | | | | | | | | | | | | | | | | | | | | | | | | | | | | | | | | | | | | | | | | | | | | | |
2016 | | $ | 11.20 | | | 0.40 | | | 0.28 | | | 0.68 | | | (0.30 | ) | | | (0.03 | ) | | | (0.33 | ) | | $ | 11.55 | | | | 3.56 | | | | 1.80 | | | | 1.80 | | | | 1.99 | | | 6.20 | | 29.48 | | $ | 272,691 | |
2015 | | $ | 12.17 | | | 0.41 | | | (0.83 | ) | | (0.42) | | | (0.40 | ) | | | (0.15 | ) | | | (0.55 | ) | | $ | 11.20 | | | | 3.47 | | | | 1.80 | | | | 1.80 | | | | 1.97 | | | (3.61) | | 38.40 | | $ | 306,085 | |
2014 | | $ | 12.17 | | | 0.45 | | | 0.29 | | | 0.74 | | | (0.47 | ) | | | (0.27 | ) | | | (0.74 | ) | | $ | 12.17 | | | | 3.73 | | | | 1.80 | | | | 1.80 | | | | 1.98 | | | 6.27 | | 51.20 | | $ | 348,334 | |
2013 | | $ | 12.26 | | | 0.60 | | | 0.03 | | | 0.63 | | | (0.58 | ) | | | (0.14 | ) | | | (0.72 | ) | | $ | 12.17 | | | | 4.88 | | | | 1.80 | | | | 1.80 | | | | 2.02 | | | 5.21 | | 76.47 | | $ | 237,177 | |
2012 | | $ | 11.84 | | | 0.64 | | | 0.73 | | | 1.37 | | | (0.67 | ) | | | (0.28 | ) | | | (0.95 | ) | | $ | 12.26 | | | | 5.42 | | | | 1.79 | | | | 1.79 | | | | 2.05 | | | 12.15 | | 34.54 | | $ | 188,782 | |
CLASS I SHARES | | | | | | | | | | | | | | | | | | | | | | | | | | | | | | | | | | | | | | | | | | | | | | |
2016 | | $ | 11.19 | | | 0.50 | | | 0.28 | | | 0.78 | | | (0.40 | ) | | | (0.03 | ) | | | (0.43 | ) | | $ | 11.54 | | | | 4.45 | | | | 0.91 | | | | 0.91 | | | | 0.91 | | | 7.15 | | 29.48 | | $ | 480,143 | |
2015 | | $ | 12.16 | | | 0.51 | | | (0.83 | ) | | (0.32) | | | (0.50 | ) | | | (0.15 | ) | | | (0.65 | ) | | $ | 11.19 | | | | 4.38 | | | | 0.89 | | | | 0.89 | | | | 0.89 | | | (2.73) | | 38.40 | | $ | 531,849 | |
2014 | | $ | 12.17 | | | 0.56 | | | 0.28 | | | 0.84 | | | (0.58 | ) | | | (0.27 | ) | | | (0.85 | ) | | $ | 12.16 | | | | 4.60 | | | | 0.90 | | | | 0.90 | | | | 0.90 | | | 7.15 | | 51.20 | | $ | 552,182 | |
2013 | | $ | 12.25 | | | 0.70 | | | 0.04 | | | 0.74 | | | (0.68 | ) | | | (0.14 | ) | | | (0.82 | ) | | $ | 12.17 | | | | 5.75 | | | | 0.94 | | | | 0.94 | | | | 0.94 | | | 6.21 | | 76.47 | | $ | 246,332 | |
2012 | | $ | 11.83 | | | 0.74 | | | 0.73 | | | 1.47 | | | (0.77 | ) | | | (0.28 | ) | | | (1.05 | ) | | $ | 12.25 | | | | 6.27 | | | | 0.96 | | | | 0.96 | | | | 0.97 | | | 13.06 | | 34.54 | | $ | 191,090 | |
CLASS R3 SHARES | | | | | | | | | | | | | | | | | | | | | | | | | | | | | | | | | | | | | | | | | | | | | | |
2016 | | $ | 11.21 | | | 0.46 | | | 0.27 | | | 0.73 | | | (0.36 | ) | | | (0.03 | ) | | | (0.39 | ) | | $ | 11.55 | | | | 4.07 | | | | 1.25 | | | | 1.25 | | | | 3.09 | | | 6.69 | | 29.48 | | $ | 2,819 | |
2015 | | $ | 12.18 | | | 0.47 | | | (0.83 | ) | | (0.36) | | | (0.46 | ) | | | (0.15 | ) | | | (0.61 | ) | | $ | 11.21 | | | | 3.98 | | | | 1.25 | | | | 1.25 | | | | 2.70 | | | (3.07) | | 38.40 | | $ | 1,430 | |
2014 | | $ | 12.19 | | | 0.49 | | | 0.31 | | | 0.80 | | | (0.54 | ) | | | (0.27 | ) | | | (0.81 | ) | | $ | 12.18 | | | | 4.10 | | | | 1.25 | | | | 1.25 | | | | 3.10 | | | 6.76 | | 51.20 | | $ | 3,049 | |
2013 | | $ | 12.28 | | | 0.63 | | | 0.06 | | | 0.69 | | | (0.64 | ) | | | (0.14 | ) | | | (0.78 | ) | | $ | 12.19 | | | | 5.19 | | | | 1.25 | | | | 1.25 | | | | 32.64 | (c) | | 5.78 | | 76.47 | | $ | 171 | |
2012(d) | | $ | 12.03 | | | 0.30 | | | 0.25 | | | 0.55 | | | (0.30 | ) | | | — | | | | (0.30 | ) | | $ | 12.28 | | | | 5.93 | (e) | | | 1.22 | (e) | | | 1.22 | (e) | | | 373.07 | (c)(e) | | 4.63 | | 34.54 | | $ | 11 | |
CLASS R4 SHARES | | | | | | | | | | | | | | | | | | | | | | | | | | | | | | | | | | | | | | | | | | | | | | |
2016 | | $ | 11.21 | | | 0.46 | | | 0.28 | | | 0.74 | | | (0.36 | ) | | | (0.03 | ) | | | (0.39 | ) | | $ | 11.56 | | | | 4.10 | | | | 1.25 | | | | 1.25 | | | | 2.50 | | | 6.79 | | 29.48 | | $ | 3,218 | |
2015 | | $ | 12.18 | | | 0.48 | | | (0.84 | ) | | (0.36) | | | (0.46 | ) | | | (0.15 | ) | | | (0.61 | ) | | $ | 11.21 | | | | 4.15 | | | | 1.25 | | | | 1.25 | | | | 2.64 | | | (3.07) | | 38.40 | | $ | 2,106 | |
2014(f) | | $ | 12.00 | | | 0.35 | | | 0.17 | | | 0.52 | | | (0.34 | ) | | | — | | | | (0.34 | ) | | $ | 12.18 | | | | 4.25 | (e) | | | 1.25 | (e) | | | 1.25 | (e) | | | 60.66 | (c)(e) | | 4.29 | | 51.20 | | $ | 16 | |
CLASS R5 SHARES | | | | | | | | | | | | | | | | | | | | | | | | | | | | | | | | | | | | | | | | | | | | | | |
2016 | | $ | 11.19 | | | 0.49 | | | 0.28 | | | 0.77 | | | (0.39 | ) | | | (0.03 | ) | | | (0.42 | ) | | $ | 11.54 | | | | 4.34 | | | | 0.99 | | | | 0.99 | | | | 1.37 | | | 7.07 | | 29.48 | | $ | 7,191 | |
2015 | | $ | 12.15 | | | 0.50 | | | (0.82 | ) | | (0.32) | | | (0.49 | ) | | | (0.15 | ) | | | (0.64 | ) | | $ | 11.19 | | | | 4.33 | | | | 0.99 | | | | 0.99 | | | | 1.55 | | | (2.75) | | 38.40 | | $ | 6,399 | |
2014 | | $ | 12.16 | | | 0.55 | | | 0.28 | | | 0.83 | | | (0.57 | ) | | | (0.27 | ) | | | (0.84 | ) | | $ | 12.15 | | | | 4.51 | | | | 0.99 | | | | 0.99 | | | | 2.11 | | | 7.05 | | 51.20 | | $ | 2,565 | |
2013 | | $ | 12.25 | | | 0.70 | | | 0.03 | | | 0.73 | | | (0.68 | ) | | | (0.14 | ) | | | (0.82 | ) | | $ | 12.16 | | | | 5.68 | | | | 0.99 | | | | 0.99 | | | | 227.33 | (c) | | 6.07 | | 76.47 | | $ | 11 | |
2012(d) | | $ | 12.00 | | | 0.31 | | | 0.25 | | | 0.56 | | | (0.31 | ) | | | — | | | | (0.31 | ) | | $ | 12.25 | | | | 6.22 | (e) | | | 0.97 | (e) | | | 0.97 | (e) | | | 372.35 | (c)(e) | | 4.75 | | 34.54 | | $ | 11 | |
| (a) | Not annualized for periods less than one year. |
| (b) | Sales loads are not reflected in computing total return. |
| (c) | Due to the size of net assets and fixed expenses, ratios may appear disproportionate. |
| (d) | Effective date of this class of shares was May 1, 2012. |
| (f) | Effective date of this class of shares was February 1, 2014. |
| + | Based on weighted average shares outstanding. |
See notes to financial statements.
| | | | |
| 34 Annual Report | | | | Annual Report 35 |
REPORT OF INDEPENDENT REGISTERED PUBLIC ACCOUNTING FIRM
Thornburg Strategic Income Fund
To the Trustees and Shareholders of
Thornburg Strategic Income Fund
In our opinion, the accompanying statement of assets and liabilities, including the schedule of investments in securities, and the related statements of operations and of changes in net assets and the financial highlights present fairly, in all material respects, the financial position of the Thornburg Strategic Income Fund (the “Fund”) at September 30, 2016, the results of its operations for the year then ended, the changes in its net assets for each of the two years in the period then ended and the financial highlights for each of the periods presented, in conformity with accounting principles generally accepted in the United States of America. These financial statements and financial highlights (hereafter referred to as “financial statements”) are the responsibility of the Fund’s management. Our responsibility is to express an opinion on these financial statements based on our audits. We conducted our audits of these financial statements in accordance with the standards of the Public Company Accounting Oversight Board (United States). Those standards require that we plan and perform the audit to obtain reasonable assurance about whether the financial statements are free of material misstatement. An audit includes examining, on a test basis, evidence supporting the amounts and disclosures in the financial statements, assessing the accounting principles used and significant estimates made by management, and evaluating the overall financial statement presentation. We believe that our audits, which included confirmation of securities at September 30, 2016 by correspondence with the custodian, brokers, transfer agent, and the application of alternative procedures where securities purchased had not been received, provide a reasonable basis for our opinion.
PricewaterhouseCoopers LLP
New York, New York
November 18, 2016
36 Annual Report
| | |
| EXPENSE EXAMPLE | | |
| |
Thornburg Strategic Income Fund | | September 30, 2016 |
As a shareholder of the Fund, you incur two types of costs:
| | (1) | transaction costs, including |
(a) sales charges (loads) on purchase payments, for Class A shares;
(b) a deferred sales charge on redemptions of any part or all of a purchase of $1 million of Class A shares within 12 months of purchase;
(c) a deferred sales charge on redemptions of Class C shares within 12 months of purchase;
| | (2) | ongoing costs, including management fees; distribution and/or service (12b-1) fees; and other Fund expenses. |
This example is intended to help you understand your ongoing costs (in dollars) of investing in the Fund and to compare these costs with the ongoing costs of investing in other mutual funds.
The example is based on a $1,000 investment beginning on April 1, 2016, and held until September 30, 2016.
| | | | | | | | | | | | |
| | | Beginning
Account Value
4/1/16 | | | Ending
Account Value
9/30/16 | | | Expenses Paid
During Period†
4/1/16–9/30/16 | |
CLASS A SHARES | | | | | | | | | | | | |
Actual | | $ | 1,000.00 | | | $ | 1,056.70 | | | $ | 6.38 | |
Hypothetical* | | $ | 1,000.00 | | | $ | 1,018.80 | | | $ | 6.26 | |
CLASS C SHARES | | | | | | | | | | | | |
Actual | | $ | 1,000.00 | | | $ | 1,053.80 | | | $ | 9.24 | |
Hypothetical* | | $ | 1,000.00 | | | $ | 1,016.00 | | | $ | 9.07 | |
CLASS I SHARES | | | | | | | | | | | | |
Actual | | $ | 1,000.00 | | | $ | 1,058.50 | | | $ | 4.62 | |
Hypothetical* | | $ | 1,000.00 | | | $ | 1,020.51 | | | $ | 4.54 | |
CLASS R3 SHARES | | | | | | | | | | | | |
Actual | | $ | 1,000.00 | | | $ | 1,056.70 | | | $ | 6.42 | |
Hypothetical* | | $ | 1,000.00 | | | $ | 1,018.76 | | | $ | 6.30 | |
CLASS R4 SHARES | | | | | | | | | | | | |
Actual | | $ | 1,000.00 | | | $ | 1,056.60 | | | $ | 6.43 | |
Hypothetical* | | $ | 1,000.00 | | | $ | 1,018.75 | | | $ | 6.31 | |
CLASS R5 SHARES | | | | | | | | | | | | |
Actual | | $ | 1,000.00 | | | $ | 1,058.10 | | | $ | 5.09 | |
Hypothetical* | | $ | 1,000.00 | | | $ | 1,020.05 | | | $ | 5.00 | |
| † | Expenses are equal to the annualized expense ratio for each class (A: 1.24%; C: 1.80%; I: 0.90%; R3: 1.25%; R4: 1.25%; R5: 0.99%) multiplied by the average account value over the period, multiplied by 183/366 to reflect the one-half year period. |
| * | Hypothetical assumes a rate of return of 5% per year before expenses. |
ACTUAL EXPENSES
For each class of shares, the first line of the accompanying table provides information about actual account values and actual expenses. You may use the information in this line, together with the amount you invested, to estimate the expenses that you paid over the period. Simply divide your account value by $1,000 (for example, an $8,600 account value divided by $1,000 = 8.6), then multiply the result by the number in the first line for your class of shares under the heading entitled “Expenses Paid During Period” to estimate the expenses you paid on your account during this period.
HYPOTHETICAL EXAMPLE FOR COMPARISON PURPOSES
For each class of shares, the second line of the accompanying table provides information about hypothetical account values and hypothetical expenses based on the Fund’s actual expense ratio and an assumed rate of return of 5% per year before expenses, which is not the Fund’s actual return. The hypothetical account values and expenses may not be used to estimate the actual ending account balance or expenses you paid for the period. You may use this information to compare the ongoing costs of investing in the Fund and other funds. To do so, compare this 5% hypothetical example with the 5% hypothetical examples that appear in the shareholder reports of the other funds.
Please note that the expenses shown in the table are meant to highlight your ongoing costs only and do not reflect any transactional costs, such as sales charges (loads), redemption fees, or exchange fees. Therefore, the second line of the table for each class of shares is useful in comparing ongoing costs only, and will not help you determine the relative total costs of owning different funds. In addition, if these transactional costs were included, your costs would have been higher.
Annual Report 37
| | |
| TRUSTEES AND OFFICERS | | |
| |
Thornburg Strategic Income Fund | | September 30, 2016 (Unaudited) |
| | | | |
Name, Age, Year Elected Position Held with Fund | | Principal Occupation(s) During Past Five Years | | Other
Directorships
Held by Trustee |
INTERESTED TRUSTEES (1)(2)(4) | | |
Garrett Thornburg, 71 Trustee since 1987, Chairman of Trustees(3) | | Chairman and controlling shareholder of Thornburg Investment Management, Inc. (investment advisor); Chairman and controlling shareholder of Thornburg Securities Corporation (securities dealer); Chairman and CEO of Chamisa Energy, LLC; President of the Thornburg Foundation (nonprofit). | | None |
| | |
Brian J. McMahon, 61 Trustee since 2001, Vice Chairman of Trustees, Member of Governance & Nominating Committee & Operations Risk Oversight Committee(5) | | Chief Investment Officer, Managing Director, and Portfolio Manager and, until 2016, CEO and President of Thornburg Investment Management, Inc.; Vice President of Thornburg Securities Corporation. | | None |
| |
INDEPENDENT TRUSTEES (1)(2)(4) | | |
| | |
David A. Ater, 71 Trustee since 1994, Member of Audit Committee & Chairman of Governance & Nominating Committee | | Principal in Ater & Associates, Santa Fe, NM (developer, planner and broker of residential and commercial real estate); owner, developer and broker for various real estate projects. | | None |
| | |
David D. Chase, 75 Trustee since 2000, Chairman of Audit Committee | | Managing Member of CS Group, LLC, Santa Fe, NM (private investment fund – family office). | | None |
| | |
Sally Corning, 55 Trustee since 2012, Member of Audit Committee | | Partner in Sun Mountain Capital, Santa Fe, NM (private equity firm with investment programs encompassing venture capital, mezzanine debt, and growth equity). | | None |
| | |
Susan H. Dubin, 67 Trustee since 2004, Member of Audit Committee & Governance and Nominating Committee | | President of Dubin Investments, Ltd., Greenwich, CT (private investment fund); Director and officer of various charitable organizations. | | None |
| | |
David L. Gardner, 53 Trustee since 2015, Member of Operations Risk Oversight Committee | | Until 2012, head of EMEA (Europe, Middle East and Africa) Sales for iShares of Blackrock, Inc., EMEA Executive Committee Member and EMEA Operating Committee Member at Blackrock, Inc. | | None |
| | |
Owen D. Van Essen, 62 Trustee since 2004, Member of Governance & Nominating Committee & Chairman of Operations Risk Oversight Committee | | President of Dirks, Van Essen & Murray, Santa Fe, NM (newspaper mergers and acquisitions). | | None |
| | |
James W. Weyhrauch, 57 Trustee since 1996, Member of Audit Committee & Operations Risk Oversight Committee | | Real estate broker, Santa Fe Properties, Santa Fe, NM; Vice Chairman of Nambe LLC, Santa Fe, NM (manufacturing & design company). | | None |
38 Annual Report
| | |
| TRUSTEES AND OFFICERS, CONTINUED | | |
| |
Thornburg Strategic Income Fund | | September 30, 2016 (Unaudited) |
| | | | | | |
Name, Age, Year Elected Position Held with Fund | | Principal Occupation(s) During Past Five Years | | Other
Directorships
Held by Trustee | |
| |
OFFICERS OF THE FUND (WHO ARE NOT TRUSTEES) (1)(7) | | | | |
| | |
Nimish Bhatt, 53 Treasurer since 2016(6) | | Chief Financial Officer and Treasurer of Thornburg Investment Management, Inc. and Thornburg Securities Corporation since 2016; Senior Vice President (2004-2016), Chief Financial Officer (2011-2016), and Head of Fund Administration (2011-2016) of Calamos Asset Management, Inc., Calamos Investments LLC, Calamos Advisors LLC, and Calamos Wealth Management; Director of Calamos Global Funds plc (2007-2016). | | | Not applicable | |
| | |
Jason Brady, 42 President since 2016(6) | | CEO and President since 2016, Vice President from 2011 to 2016, Portfolio Manager and Managing Director of Thornburg Investment Management, Inc.; Vice President of Thornburg Securities Corporation since 2016. | | | Not applicable | |
| | |
Kathleen Brady, 56 Vice President since 2008 | | Tax Manager Fund Accounting of Thornburg Investment Management, Inc. | | | Not applicable | |
| | |
Connor Browne, 37 Vice President since 2006 | | Portfolio Manager, Vice President since 2013, and Managing Director of Thornburg Investment Management, Inc. | | | Not applicable | |
| | |
Tim Cunningham, 41 Vice President since 2014 | | Managing Director since 2011, Portfolio Manager since 2012, and Associate Portfolio Manager from 2009–2012 of Thornburg Investment Management, Inc. | | | Not applicable | |
| | |
Randy Dry, 42 Vice President since 2014 | | Vice President and Managing Director, Director of Institutional Group from 2014–2016, and since 2016, Chief Administrative Officer of Thornburg Investment Management, Inc. | | | Not applicable | |
| | |
Greg Dunn, 40 Vice President since 2014 | | Managing Director, Portfolio Manager since 2012, and Associate Portfolio Manager from 2009–2012 of Thornburg Investment Management, Inc. | | | Not applicable | |
| | |
Lon Erickson, 41 Vice President since 2008 | | Portfolio Manager and Managing Director of Thornburg Investment Management, Inc. | | | Not applicable | |
| | |
William V. Fries, 77 Vice President since 1995 | | Portfolio Manager, Vice President, and Managing Director of Thornburg Investment Management, Inc. | | | Not applicable | |
| | |
Thomas Garcia, 45 Vice President since 2006 | | Vice President since 2011, Managing Director, Head Equity Trader, and Associate Portfolio Manager of Thornburg Investment Management, Inc. | | | Not applicable | |
| | |
Rolf Kelly, 37 Vice President since 2016 | | Portfolio Manager and Managing Director since 2013 and Associate Portfolio Manager from 2011–2013 of Thornburg Investment Management, Inc. | | | Not applicable | |
| | |
Ben Kirby, 36 Vice President since 2014 | | Portfolio Manager and Managing Director since 2013 and Associate Portfolio Manager from 2011–2013 of Thornburg Investment Management, Inc. | | | Not applicable | |
| | |
Jeff Klingelhofer, 41 Vice President since 2016 | | Portfolio Manager and Managing Director since 2015, Associate Portfolio Manager from 2012–2015, and Fixed Income Analyst from 2010–2012 of Thornburg Investment Management, Inc. | | | Not applicable | |
| | |
Rob MacDonald, 40 Vice President since 2016 | | Managing Director since 2015, Portfolio Manager since 2014, and Associate Portfolio Manager from 2011–2014 of Thornburg Investment Management, Inc. | | | Not applicable | |
| | |
Leigh Moiola, 49 Vice President since 2001 | | Vice President, Managing Director, and Director of Marketing of Thornburg Investment Management, Inc.; Vice President of Thornburg Securities Corporation. | | | Not applicable | |
| | |
Christopher Ryon, 60 Vice President since 2008 | | Portfolio Manager and Managing Director of Thornburg Investment Management, Inc. | | | Not applicable | |
| | |
Nicholos Venditti, 35 Vice President since 2016 | | Portfolio Manager and Managing Director since 2015 and Associate Portfolio Manager from 2011–2015 of Thornburg Investment Management, Inc. | | | Not applicable | |
Annual Report 39
| | |
| TRUSTEES AND OFFICERS, CONTINUED | | |
| |
Thornburg Strategic Income Fund | | September 30, 2016 (Unaudited) |
| | | | |
Name, Age, Year Elected Position Held with Fund | | Principal Occupation(s) During Past Five Years | | Other
Directorships
Held by Trustee |
| | |
Vinson Walden, 46 Vice President since 2004 | | Portfolio Manager and Managing Director of Thornburg Investment Management, Inc. | | Not applicable |
| | |
Lei Wang, 45 Vice President since 2006 | | Portfolio Manager and Managing Director of Thornburg Investment Management, Inc. | | Not applicable |
| | |
Sasha Wilcoxon, 42 Vice President since 2003 Secretary since 2007(6) | | Managing Director, Director of Mutual Fund Operations, and Vice President of Thornburg Investment Management, Inc.; Vice President of Thornburg Securities Corporation. | | Not applicable |
| | |
Charles Wilson, 41 Vice President since 2016 | | Portfolio Manager and Managing Director since 2014 and Associate Portfolio Manager from 2012–2014 of Thornburg Investment Management, Inc.; Co-Portfolio Manager of Marsico Capital Management from 2010–2012. | | Not applicable |
| | |
Di Zhou, 38 Vice President since 2016 | | Portfolio Manager and Managing Director since 2016, Associate Portfolio Manager from 2014–2016, and Equity Research Analyst from 2010–2014 of Thornburg Investment Management, Inc. | | Not applicable |
| (1) | Each person’s address is 2300 North Ridgetop Road, Santa Fe, New Mexico 87506. |
| (2) | The Fund is a separate investment “Fund” or “series” of Thornburg Investment Trust (the “Trust”), which comprises the Thornburg mutual fund complex and is organized as a Massachusetts business trust. Thornburg Investment Management, Inc. is the investment advisor to, and manages, all the Funds of the Trust. Each Trustee oversees all the Funds of the Trust. |
| (3) | Mr. Thornburg is considered an “interested” Trustee under the Investment Company Act of 1940 because he is the sole director and controlling shareholder of Thornburg Investment Management, Inc., the investment advisor to the Trust, and is the sole director and controlling shareholder of Thornburg Securities Corporation, the distributor of shares for the Trust. |
| (4) | The Bylaws of the Trust currently require that each Trustee shall retire by the end of the calendar year during which the Trustee reached the age of 75 years. Otherwise each Trustee serves in office until the election and qualification of a successor or until the Trustee sooner dies, resigns, retires or is removed. |
| (5) | Mr. McMahon is considered an “interested” Trustee under the Investment Company Act of 1940 because he is the chief investment officer of Thornburg Investment Management, Inc. |
| (6) | The Trust’s president, secretary, and treasurer each serves a one-year term or until the election and qualification of a successor; each other officer serves at the pleasure of the Trustees. |
| (7) | Assistant vice presidents, assistant secretaries, and assistant treasurers are not shown. |
The Statement of Additional Information for each Fund of the Trust includes additional information about the Trustees and is available, without charge and upon request, by calling 1-800-847-0200.
40 Annual Report
| | |
| OTHER INFORMATION | | |
| |
Thornburg Strategic Income Fund | | September 30, 2016 (Unaudited) |
PORTFOLIO PROXY VOTING
Policies and Procedures:
The Trust has delegated to Thornburg Investment Management, Inc. (the “Advisor”) voting decisions respecting proxies for the Fund’s voting securities. The Advisor makes voting decisions in accordance with its Proxy Voting Policy and Procedures. A description of the Policy and Procedures is available (i) without charge, upon request, by calling the Advisor toll-free at 1-800-847-0200, (ii) on the Thornburg website at www.thornburg.com, and (iii) on the Securities and Exchange Commission’s website at www.sec.gov.
Information regarding how proxies were voted is available on or before August 31 of each year for the twelve months ending the preceding June 30. This information is available (i) without charge, upon request by calling the Advisor toll-free at 1-800-847-0200, (ii) on the Thornburg website at www.thornburg.com, and (iii) on the Securities and Exchange Commission’s website at www.sec.gov.
AVAILABILITY OF QUARTERLY PORTFOLIO SCHEDULE
The Fund files with the Securities and Exchange Commission schedules of its portfolio holdings on Form N-Q for the first and third quarters of each fiscal year. The Fund’s Forms N-Q are available on the Commission’s website at www.sec.gov, or may be reviewed and copied at the Commission’s Public Reference Room in Washington, D.C. Information on the operation of the Public Reference Room may be obtained by calling 1-800-SEC-0330. The Fund also makes this information available on its website at www.thornburg. com/download or upon request by calling 1-800-847-0200.
TAX INFORMATION
For the tax year ended September 30, 2016, the Thornburg Strategic Income Fund is reporting 3.70% (or the maximum allowed) of the dividends paid from tax basis net ordinary income as qualifying for the reduced rate under the Jobs and Growth Tax Relief and Reconciliation Act of 2003.
The Fund is reporting 2.74% (or the maximum allowed) of the ordinary income distributions paid by the Fund for the fiscal year ended September 30, 2016 as qualified for the corporate dividends received deduction.
For the tax year ended September 30, 2016, dividends paid by the Thornburg Strategic Income Fund of $37,774,245 are being reported as ordinary investment income for federal income tax purposes.
The information and distributions reported herein may differ from the information and distributions reported to the shareholders for the calendar year ending December 31, 2016. Complete information will be reported in conjunction with your 2016 Form 1099.
STATEMENT RESPECTING RENEWAL OF INVESTMENT ADVISORY AGREEMENT
Thornburg Investment Management, Inc. (the “Advisor”) provides investment management services to Thornburg Strategic Income Fund pursuant to an investment advisory agreement. The Trustees consider the renewal of this agreement annually, and most recently determined to renew the agreement on September 13, 2016.
In anticipation of their recent consideration of the advisory agreement’s renewal, the independent Trustees met in May 2016 to consider aspects of their annual evaluation of the Advisor’s service to all of the funds of Thornburg Investment Trust, to plan the annual evaluation of the Advisor’s performance and to specify the information the Advisor would present to the Trustees for their review. The independent Trustees met again in independent session in September to consider portions of the information submitted by the Advisor. The Advisor’s president and chief investment officer subsequently reviewed portions of the information with the Trustees and addressed questions from the Trustees at a full meeting session of the Trustees scheduled for that purpose, and the independent Trustees thereafter met in independent session to consider the Advisor’s presentation and various specific issues respecting their consideration of the advisory agreement’s renewal. Following these sessions, the Trustees met to consider renewal of the agreement, and the independent Trustees voted unanimously at that meeting to renew the agreement for an additional term of one year.
The information below summarizes certain factors considered by the Trustees in connection with the determination to renew the advisory agreement. In determining to renew the agreement, the Trustees considered a wide range of information and did not identify any single factor as controlling, and this summary does not describe all of the factors and other matters considered by the Trustees in making their determination.
Nature, Extent and Quality of Services. The Trustees considered presentations by the Advisor at meeting sessions scheduled for consideration of a continuation of the advisory agreement, and also noted their consideration of the reports the Trustees and their committees receive throughout the year on a wide variety of topics, and consideration they had given to a number of topics in previous years. Information identified by the Trustees in their evaluation as having been considered and contributing to their conclusions included
Annual Report 41
| | |
| OTHER INFORMATION, CONTINUED | | |
| |
Thornburg Strategic Income Fund | | September 30, 2016 (Unaudited) |
Trustees’ assessments of the Advisor’s personnel developed in formal and informal meetings throughout the year, the Advisor’s staffing levels and measures to maintain staffing levels and improve competencies, the Advisor’s commitment to attract and retain high quality portfolio management expertise through competitive compensation levels, the Advisor’s collaborative approach to investment management, the Fund’s investment performance over different periods of time, portfolio managers’ cognizance of and strategies to address market and economic trends and conditions, the evaluation and selection of individual investments, the structuring and composition of the Fund’s portfolio, management of Fund liquidity requirements, cognizance of and efforts to achieve tax efficiency, responses to share sale and redemption activity, continuing enhancements to the Advisor’s electronic and information systems and the Advisor’s engagement of outside firms to assist in improving or replacing those systems, the Advisor’s evaluation and selection of firms providing portfolio trade execution to the Fund and the Advisor’s measures to obtain favorable trade execution, the Advisor’s performance of accounting and other services, the Advisor’s continued commitment to observance of compliance and regulatory requirements, the Advisor’s responsiveness to the Trustees, the quality and extent of written and oral reports to the Trustees over the course of the year, and other factors.
Investment Performance. The Trustees noted in their evaluation of the Fund’s investment performance the reports they had received in each regular meeting over the course of the year from the Advisor’s portfolio management personnel. The Trustees also noted in their evaluation their consideration of information provided to them at their request in anticipation of their annual evaluation of the Advisor’s services, including the following items of information respecting the investment performance of the Fund: (1) the Fund’s absolute investment performance and achievement of stated objectives; (2) the Advisor’s written and oral explanations and commentary on the Fund’s performance in the context of the Fund’s objectives and reasonable expectations, and business, market and economic conditions, (3) performance data for the eight calendar years since the Fund’s inception, comparing the Fund’s annual investment returns to a fund category selected by an independent mutual fund analyst firm, and to a broad-based securities index and blended performance benchmark, (4) the Fund’s investment performance for the three-month, year-to-date, one-year, three-year and five-year periods ending with the second quarter of the current year, comparing the Fund’s annualized returns to two mutual fund categories selected by independent mutual fund analyst firms and to a broad-based securities index and blended performance benchmark, and assigning a percentage rank to the Fund’s performance for each period relative to each of the fund categories, and (5) comparative measures of correlation to equity indices, portfolio volatility, risk and return.
The Trustees noted that quarterly reports during the year and other information presented to them confirmed the Advisor’s continued conformity to the Fund’s stated investment objectives and policies.
The Trustees observed in reviewing comparative performance data for the eight calendar years since the Fund’s inception that the Fund’s investment return for the most recent calendar year was lower than the returns of the broad based securities index and the Fund’s blended performance benchmark, and was comparable to the average return of the mutual fund category considered. Data considered by the Trustees further showed that the Fund’s returns for the preceding seven calendar years exceeded the returns of the index in four of the seven years, the Fund’s returns exceeded or were comparable to returns of the blended performance benchmark in five of the seven years, and that the Fund’s returns exceeded or were comparable to the average returns of the fund category in six of the seven years. Other quantitative data noted by the Trustees as having been considered in their evaluation showed that the Fund’s annualized investment returns fell in the third quartile of investment performance of a mutual fund category for the one-year period ended with the second quarter of the current year, fell in the second quartile of performance of the category for the three-year period, and fell in the top quartile of performance for the five-year period. Noted data for a second mutual fund category similarly showed that the Fund’s annualized investment returns fell in the third quartile of that category for the one-year period ended with the second quarter of the current year, fell within the second quartile of performance of the category for the three-year period, and fell within the top quartile of performance for the five-year period. The Trustees attached additional significance to the performance of the Fund from the perspective of longer term shareholders.
Comparisons of Fee and Expense Levels. The Trustees recognized in their evaluation the clear disclosures of the Advisor’s fees and Fund expenses in the Fund’s prospectuses. Information noted by the Trustees as having been considered included a variety of comparative data respecting the Fund’s fee and expense levels. This information included comparisons of the Fund’s advisory fee and overall Fund expenses to median and average fees and expenses charged to a category of mutual funds selected by an independent mutual fund analyst firm, comparisons of the advisory fee and other Fund expenses to the fee levels and expenses for two representative share classes of fund peer groups selected from the category by a second independent mutual fund analyst firm, the perspectives and advice from the second mutual fund analyst firm respecting comparisons of fund fee levels and expenses to fund peer groups, and other information. Comparative fee and expense data noted as having been considered by the Trustees showed that the advisory fee for the Fund was somewhat higher than the median and average fee levels for the fund category, the level of total expense for a representative share class of the Fund was somewhat higher than the median and slightly higher than the average expense levels for the category, and that the level of total expense for a second representative share class was lower than the median and average levels for the category. Peer group data showed that the Fund’s advisory fee was comparable to the median level of the two peer groups considered, the total expense level of a representative share class was higher than the median of its peer group but within the range of the peer group, and that the total expense level of a second representative share class was comparable to the median level of its peer group. The Trustees did not find the differences significant in view of the other factors considered.
42 Annual Report
| | |
| OTHER INFORMATION, CONTINUED | | |
| |
Thornburg Strategic Income Fund | | September 30, 2016 (Unaudited) |
The Trustees noted their consideration of information respecting the advisory fees charged by the Advisor to other investment management clients, including sub-advised mutual funds, together with information about fees charged by other advisors to different clients, analysis of the differences between the requirements of institutional clients and mutual funds, analysis of the differences between the requirements of a sub-advised mutual fund and a fund as to which the investment advisor is the primary advisor and sponsor, descriptions of distinguishing characteristics of the sub-advised funds served by the Advisor, and the consequently different investment management services provided to the different categories of clients and the differing contexts in which the fee levels for these arrangements are established. The Trustees confirmed their previous observations that the differences between the fees charged by the Advisor to different types of clients did not appear exceptional, and that the fee rates charged by an investment advisor to different categories of clients had limited relevance to the evaluation of the fee rate charged by that advisor to mutual funds as to which it is the primary advisor and sponsor.
Costs and Profitability of Advisor. In reviewing the profitability of the Advisor’s services to the Fund the Trustees considered an analysis of the Advisor’s costs and the profitability to the Advisor of its services, together with data respecting the overall profitability of a selection of other investment management firms. The Trustees noted that a portion of the Advisor’s profits are an important element in the compensation of shareholder employees. The Trustees considered in this regard information from the Advisor respecting investment of its profits to maintain staffing levels, pay competitive levels of compensation, and add to its information retrieval and management systems to maintain or improve service levels. The Trustees also considered the contribution of the Advisor’s cost management to its profitability, and the relationship of the Advisor’s financial resources and profitability in previous years to its ability to attract necessary personnel, invest in systems and other assets required for its service to the Fund, and maintain or improve service levels for the Fund notwithstanding fluctuations in revenues and profitability. The information considered did not indicate to the Trustees that the Advisor’s profitability was excessive.
Potential Economies of Scale. In reviewing the extent to which economies of scale would be realized by the Fund as it grows and whether fee levels reflect potential economies of scale, the Trustees considered the breakpoint structure for advisory fees chargeable to the Fund, comparisons of the fee breakpoint structure for the Fund with breakpoint structures (or the absence of such structures) for other funds in a peer group selected by an independent mutual fund analyst firm, the effects of the breakpoint structure and other expense factors realized by certain Funds of the Trust as their asset levels had increased, and the Advisor’s expenditures from its own profits and resources to maintain staffing levels, pay competitive levels of compensation, and add to its information retrieval and management systems to maintain or improve service levels. The information provided demonstrated to the Trustees that the Fund’s advisory fee breakpoint structure is reasonable in relation to the structures observed in the other funds in its peer group, and that shareholders may be expected to benefit from any economies of scale, due to the advisory agreement��s breakpoint fee structure for the Fund and other factors.
Potential Ancillary Benefits. In reviewing potential benefits to the Advisor because of its relationship to the Fund, the Trustees noted disclosures by the Advisor of its receipt of certain research services from broker dealers, and the benefits to both the Fund and the Advisor of the Advisor’s expansion of its staffing, compliance and systems capabilities and other resources to serve a broader variety of investment management clients. No unusual or unfair benefits to the Advisor from its relationship to the Fund were identified by the Trustees.
Summary of Conclusions. The Trustees concluded that the nature, extent and quality of the Advisor’s services performed under the advisory agreement remained sufficient. The Trustees further concluded that the absolute and relative investment performance of the Fund over a range of pertinent holding periods on the whole was satisfactory in the context of its objectives and strategies, and that the Advisor had continued to actively and competently pursue the Fund’s stated investment objectives and adhere to the Fund’s investment policies.
The Trustees further concluded, based upon their consideration of the foregoing factors and other information, that the level of the advisory fee charged to the Fund by the Advisor is reasonable in relation to the services provided by the Advisor in view of the nature, extent and quality of those services, the investment performance of the Fund after fees and expenses, the clear disclosure of fees and expenses in the Fund’s prospectuses, comparisons of fees and expenses charged to the Fund to fees and expenses charged to other mutual funds, and the other factors considered.
Annual Report 43
TRUSTEES’ STATEMENT TO SHAREHOLDERS
Readopted September 12, 2016
The Trustees believe current and prospective shareholders should know how we discharge our responsibilities in supervising the Funds’ investment advisor and in reviewing the advisor’s contract for renewal. Since 2005, we have issued a statement which sets out clearly the three principal guidelines that we follow in supervising the Trust’s investment advisor on your behalf. In accordance with our customary practice, in September of this year we again reviewed our statement and concluded we should reissue this statement outlining the principal features of our supervision of the advisor’s performance of investment management services for the Funds.
We begin with the premise that each shareholder selected his or her Fund because its investments are managed by the investment advisor identified in the prospectus and in accordance with the objective and policies described in the prospectus. We realize, as each of you do, that if you believe that your Fund’s stated objective and policies no longer serve your personal investment goals, you can sell your shares and leave the Fund.
Therefore, we believe that our primary supervisory task – our principal obligation to you – is to assess the nature and quality of the advisor’s services, and to confirm that the advisor actively and competently pursues the Fund’s objective, in accordance with the policies set out in the prospectus. To do this, we meet regularly with management to review your Fund’s portfolio and to discuss the advisor’s specific actions and judgments in pursuing the Fund’s objective. We do not substitute our own judgment for the advisor’s decisions in selecting investments; the advisor is paid to exercise its informed judgment on investment decisions, and we seek to confirm, in reviewing the advisor’s performance, that the advisor is doing just that.
Second, we are conscious of costs and the effect that costs have on shareholders’ returns. We try to make sure that your Fund’s fees and costs are reasonable in relationship to the services rendered and that they are generally in line with those charged by other expert investment advisors, consistent with our belief that the Fund’s investors searched for and expect that expertise and attention and have decided to pay a reasonable price for it. We do not put the management contract “out to bid” as a matter of course, and we would not do so unless we had concluded that the advisor materially had failed to pursue the Fund’s objectives in accordance with its policies, or for other equally important reasons. We believe that any other approach would be inconsistent with your interests and contrary to your expectations when you bought shares of the Fund in the first place.
Finally, because we believe that most Thornburg Fund shareholders have invested with a long-term perspective, we try not to focus too much on the fashions of the moment and on short-term performance. The market will not favor any specific investment objective or set of policies at all times and under all economic circumstances. A fund will experience periods of both high and low returns relative to other funds and other investments. Even if one of our Funds is not favored by the market at a particular time, we believe that the advisor is nonetheless obliged to remain true to the Fund’s objective and policies, and we watch to see that it does so.
Trustees of Thornburg Investment Trust
44 Annual Report
THORNBURG FUNDS
Thornburg Investment Management is a privately-owned global investment firm that offers a range of solutions for retail and institutional investors. Founded in 1982 and headquartered in Santa Fe, New Mexico, we manage approximately $53 billion (as of September 30, 2016) across eight equity and 11 bond mutual funds, separate accounts for high-net-worth investors and institutional accounts, and five UCITS funds for non-U.S. investors.
The fund outlined in this report is one of many equity and fixed-income products available from Thornburg Investment Management.
Equity Funds
| | • | | Thornburg Core Growth Fund |
| | • | | Thornburg International Value Fund |
| | • | | Thornburg Better World International Fund |
| | • | | Thornburg International Growth Fund |
| | • | | Thornburg Developing World Fund |
| | • | | Thornburg Investment Income Builder Fund |
| | • | | Thornburg Global Opportunities Fund |
Fixed Income Funds
| | • | | Thornburg Low Duration Income Fund |
| | • | | Thornburg Limited Term U.S. Government Fund |
| | • | | Thornburg Limited Term Income Fund |
| | • | | Thornburg Strategic Income Fund |
| | • | | Thornburg Low Duration Municipal Fund |
| | • | | Thornburg Limited Term Municipal Fund |
| | • | | Thornburg Intermediate Municipal Fund |
| | • | | Thornburg California Limited Term Municipal Fund |
| | • | | Thornburg New Mexico Intermediate Municipal Fund |
| | • | | Thornburg New York Intermediate Municipal Fund |
| | • | | Thornburg Strategic Municipal Income Fund |
Before investing, carefully consider the Fund’s investment goals, risks, charges, and expenses. For a prospectus or summary prospectus containing this and other information, contact your financial advisor or visit thornburg.com. Read it carefully before investing.
For additional information, please visit thornburg.com
Thornburg Investment Management, Inc. 2300 North Ridgetop Road, Santa Fe, NM 87506
Annual Report 45
This page intentionally left blank.
46 Annual Report
This page intentionally left blank.
Annual Report 47

| | |
To receive shareholder reports, prospectuses, and proxy statements electronically, go to www.thornburg.com/edelivery. | |  |
| This Annual Report is submitted for the general information of shareholders of the Fund. It is not authorized for distribution to prospective investors in the Fund unless preceded or accompanied by an effective prospectus. | |
| | | | |
| Investment Advisor: | | Distributor: | | |
| Thornburg Investment Management® | | Thornburg Securities Corporation® | | |
| 800.847.0200 | | 800.847.0200 | | TH1784 |
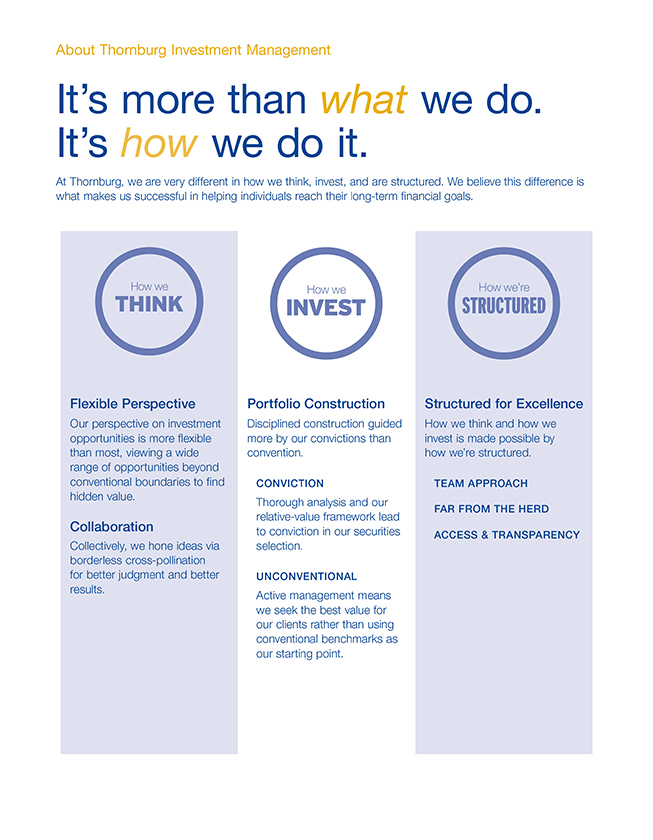
2 Annual Report
Annual Report
Thornburg Value Fund
September 30, 2016
| | | | |
Share Class | | NASDAQ Symbol | | CUSIP |
Class A | | TVAFX | | 885-215-731 |
Class C | | TVCFX | | 885-215-715 |
Class I | | TVIFX | | 885-215-632 |
Class R3 | | TVRFX | | 885-215-533 |
Class R4 | | TVIRX | | 885-215-277 |
Class R5 | | TVRRX | | 885-215-376 |
Class I, R3, R4, and R5 shares may not be available to all investors. Minimum investments for Class I shares may be higher than those for other classes.
Investments carry risks, including possible loss of principal. Additional risks may be associated with investments outside the United States, especially in emerging markets, including currency fluctuations, illiquidity, volatility, and political and economic risks. Investments in small- and mid-capitalization companies may increase the risk of greater price fluctuations. Please see the Fund’s prospectus for a discussion of the risks associated with an investment in the Fund. Investments in the Fund are not FDIC insured, nor are they bank deposits or guaranteed by a bank or any other entity.
Annual Report 3
LETTER TO SHAREHOLDERS
| | |
| |
Thornburg Value Fund | | September 30, 2016 (Unaudited) |
October 18, 2016
Dear Fellow Shareholders:
In this letter, we will update you on our progress in the management of Thornburg Value Fund and examine the drivers of performance for the fiscal year ended September 30, 2016.
Like all of our investment products, we use a bottom-up investment process in this Fund, focused on the fundamentals of businesses. We typically invest in a limited number of stocks and we have the flexibility to actively seek value broadly (employing a three-basket diversification construct in which we categorize companies as basic value, consistent earners, and emerging franchises). We also seek to invest in promising companies trading at a discount to their intrinsic values. We believe this approach is a durable and common-sense investment strategy and, importantly, has worked over the long term for our investors.
If there is one factor driving stock performance over the last few years, it is interest rates. We have written much about them in quarterly letters and white papers, and, in particular, about what low interest rates have done to valuations of what we call “expensive defensives.” We have also heard the term “bond proxies” used to describe large companies that the market today perceives to be stable, with high dividend yields and sky-high valuations. We have worked hard to position our portfolio defensively in this environment, though we have also tried to avoid buying overpriced current market darlings. As highly active managers, Thornburg Investment Management is always on the hunt for promising companies selling at a discount to our calculation of their intrinsic value. Expensive defensives have seemed to be neither promising nor discounted to us for some time now.
This created a headwind to Fund performance during the 12 months ended September 30, 2016. During this period, rates on the U.S. 10-year Treasury dropped from about 2.0% to roughly 1.6%. And while we are happy with the Fund’s performance on an absolute basis, in this environment Thornburg Value Fund lagged its benchmark. For the year ended September 30, 2016, the Fund’s Class A shares returned 10.33% without sales charge, versus 15.43% for the benchmark S&P 500 Index.
We hope, however, when we look back on the current environment years from now, the last quarter of our fiscal year will mark a turn for the better. Already, interest rates have increased from an intra-day low of 1.32% in early July to 1.80% at the time of this writing. So far, this has meant worse performance for the market darling expensive defensives and better relative performance for the Fund.
Our best-performing stocks for the year were ITC Holdings Corp., Thermo Fisher Scientific, Inc., Facebook, Inc., Activision Blizzard, Inc., and International Flavors & Fragrances, Inc. As a group, the Fund’s information technology investments were some of the strongest performers during the year, with both Facebook and Activision securing slots on the list of top contributors. Facebook continues to outperform as its gigantic user base steadily grows. Monthly active users recently topped 1.5 billion worldwide, with over 1 billion of those logging in each day. Facebook continues to monetize its user base better than expectations, aided by additional contributions from Instagram. Revenue generation potential opportunities from subsidiaries Messenger, WhatsApp, and Oculus (VR) are beginning to take shape as well. Activision is a California-based interactive gaming and entertainment company. Investors see Activision to be well positioned to benefit as the installed base of next-generation video game consoles grows. The company has a strong pipeline of high-quality video game content hitting the market over the coming years.
Shares of U.S. independent electricity transmission company ITC Holdings Corp. have climbed over the year as the company continues to generate solid returns on its investments and lower interest rates have pushed investors toward utilities. In a win for the Fund, ITC agreed to be acquired by Fortis during the fiscal year. Thermo Fisher Scientific, Inc., is a provider of analytical instruments, equipment, software, and services for research, analysis, and diagnostics. The company continues to execute on its business strategy and is expected to capture business from research spending associated with the government’s National Institutes of Health budget. Finally, shares of International Flavors & Fragrances have performed well on improving organic growth in both of the company’s primary divisions. The stock has climbed to an increased valuation premium, due to the company’s stability and structural growth opportunities as a result of an oligopolistic market.
Our worst-performing stocks for the year were Dynegy, Inc., Office Depot, Inc., Express Scripts Holding Company, Gilead Sciences, Inc., and Cognizant Tech Solutions Corp. Dynegy is an electric company based in Houston. The combination of increasing balance sheet debt and significantly lower natural gas and electricity prices in the U.S. have caused shares of Dynegy to fall. Deteriorating company fundamentals caused us to sell the stock. Office Depot has continued to underper-form after the Federal Trade Commission successfully blocked the company’s attempted merger with Staples.
Cognizant Tech Solutions is a recent purchase for us. The stock has been the portfolio’s worst performer in recent months. On September 30, 2016, the company released a filing disclosing two things: the resignation of their long-tenured second-in-command, and the beginning of an
4 Annual Report
| | |
| LETTER TO SHAREHOLDERS, | | |
| |
CONTINUED | | September 30, 2016 (Unaudited) |
| |
Thornburg Value Fund | | |
investigation into potential bribery/violation of the Foreign Corrupt Practices Act. The stock finished the last day of the most recent quarter down some 13%, but already has recovered about half these losses since the end of the third quarter.
Two of the Fund’s health care investments were among the year’s worst performers. Express Scripts is the leading pharmacy benefits manager in the United States. A legal dispute between Express and one of its customers weighed on the shares in January. We began to trim significantly on that news, fully exiting the position more recently. Additional work on the name has led us to question our belief that Express Scripts’ position in the health care system leads to lower overall drug spend. Finally, Gilead Sciences, a long-time holding, pulled back dramatically over the last 12 months on a lowered outlook for its Hepatitis C drug business and worse market sentiment surrounding drug companies. After trimming our position significantly in 2015, we have begun to add to our weighting in the stock recently. While the outlook for Gilead’s Hepatitis C drug business remains unpredictable, the current stock valuation seems to discount this. In the meantime, revenue growth in Gilead’s other core business, treatments for HIV, has accelerated on the strength of new product launches. We are very excited about the opportunity in Gilead shares at current valuation levels.
We have worked hard since June of 2012 to bolster the consistent earner characteristics of the portfolio. Specifically, we want to be positioned to protect if we see a significant market pullback in conjunction with lower U.S. interest rates. Given our underexposure to expensive defensives, this is more challenging for the Fund. To offset our lower exposure to these sorts of holdings today, we are carrying higher exposure to consistent earners, and lower exposure to companies in basic value and emerging franchise companies. We have also been carrying higher cash than normal. This potentially will hurt us in a rising market, but should aid portfolio performance during a pullback.
Overall, we are heartened by our performance in the four years, three months since June of 2012. Since then, through fiscal year end, we have outpaced broader market indices during a period when this has been very hard for U.S. large-cap portfolio managers to accomplish. And we have achieved this with what we view as much improved downside capture characteristics compared to the 18 months before June of 2012. We are cautiously optimistic that a period of rising interest rates will create an easier environment for active management more broadly, and for Thornburg Value Fund more specifically.
Thank you for your continued trust and confidence.
Sincerely,
| | |
 | |  |
| Connor Browne,CFA | | Robert MacDonald,CFA |
| Portfolio Manager | | Portfolio Manager |
| Managing Director | | Managing Director |
The matters discussed in this report may constitute forward-looking statements made pursuant to the safe harbor provisions of the Securities Litigation Reform Act of 1995. These include any advisor or portfolio manager prediction, assessment, analysis or outlook for individual securities, industries, investment styles, market sectors and/or markets. These statements involve risks and uncertainties. In addition to the general risks described for each fund in its current prospectus, other factors bearing on these reports include the accuracy of the advisor’s or portfolio manager’s forecasts and predictions, the appropriateness of the investment strategies designed by the advisor or portfolio manager and the ability of the advisor or portfolio manager to implement their strategies efficiently and successfully. Any one or more of these factors, as well as other risks affecting the securities markets generally, could cause the actual results of any fund to differ materially as compared to its benchmarks.
The views expressed by the portfolio managers reflect their professional opinions and are subject to change. Under no circumstances does the information contained within represent a recommendation to buy or sell any security.
Annual Report 5
| | |
| PERFORMANCE SUMMARY | | |
| |
Thornburg Value Fund | | September 30, 2016 (Unaudited) |
Average Annual Total Returns
| | | | | | | | | | | | | | | | | | | | |
| | | 1-Yr | | | 3-Yr | | | 5-Yr | | | 10-Yr | | | Since
Incep. | |
Class A Shares (Incep: 10/2/95) | | | | | | | | | | | | | | | | | | | | |
Without sales charge | | | 10.33 | % | | | 10.14 | % | | | 14.51 | % | | | 5.55 | % | | | 9.54 | % |
With sales charge | | | 5.36 | % | | | 8.47 | % | | | 13.46 | % | | | 5.06 | % | | | 9.30 | % |
Class C Shares (Incep: 10/2/95) | | | | | | | | | | | | | | | | | | | | |
Without sales charge | | | 9.51 | % | | | 9.31 | % | | | 13.65 | % | | | 4.75 | % | | | 8.70 | % |
With sales charge | | | 8.51 | % | | | 9.31 | % | | | 13.65 | % | | | 4.75 | % | | | 8.70 | % |
Class I Shares (Incep: 11/2/98) | | | 10.77 | % | | | 10.57 | % | | | 14.97 | % | | | 5.95 | % | | | 7.21 | % |
Class R3 Shares (Incep: 7/1/03) | | | 10.40 | % | | | 10.18 | % | | | 14.55 | % | | | 5.53 | % | | | 7.33 | % |
Class R4 Shares (Incep: 2/1/07) | | | 10.50 | % | | | 10.29 | % | | | 14.66 | % | | | — | | | | 4.51 | % |
Class R5 Shares (Incep: 2/1/05) | | | 10.78 | % | | | 10.57 | % | | | 14.95 | % | | | 5.92 | % | | | 7.19 | % |
S&P 500 Index (Since 10/2/95) | | | 15.43 | % | | | 11.16 | % | | | 16.37 | % | | | 7.24 | % | | | 8.50 | % |
Growth of a Hypothetical $10,000 Investment
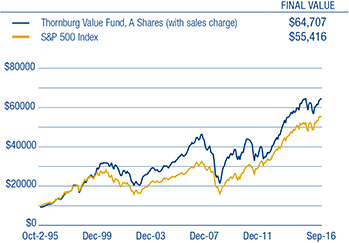
Performance data shown represents past performance and is no guarantee of future results. Investment return and principal value will fluctuate so shares, when redeemed, may be worth more or less than their original cost. Current performance may be lower or higher than quoted. For performance current to the most recent month end, visit thornburg.com or call 800-847-0200. The performance information does not reflect the deduction of taxes that a shareholder would pay on distributions or the redemption of Fund shares. Returns reflect the reinvestment of dividends and capital gains. Class A shares are sold with a maximum sales charge of 4.50%. Class C shares are subject to a 1% CDSC for the first year only. There is no sales charge for Class I, R3, R4, and R5 shares.
As disclosed in the most recent prospectus, the total annual fund operating expenses are as follows: A shares, 1.37%; C shares, 2.12%; I shares, 1.06%; R3 shares, 1.77%; R4 shares, 1.67%; R5 shares, 1.20%. Thornburg Investment Management and/or Thornburg Securities Corporation have contractually agreed to waive fees and reimburse expenses through at least February 1, 2017, for some of the share classes, resulting in net expense ratios of the following: I shares, 0.99%; R3 shares, 1.35%; R4 shares, 1.25%; R5 shares, 0.99%. For more detailed information on fund expenses and waivers/reimbursements please see the Fund’s prospectus.
Glossary
S&P 500 Index – The S&P 500 Index is a broad measure of the U.S. stock market.
Unless otherwise noted, index returns reflect the reinvestment of income dividends and capital gains, if any, but do not reflect fees, brokerage commissions or other expenses of investing. Investors may not make direct investments into any index. The performance of any index is not indicative of the performance of any particular investment.
Upside/Downside Capture Ratio – A ratio that shows whether a given fund has outperformed – gained more or lost less than – a broad market benchmark during periods of market strength and weakness, and if so, by how much.
6 Annual Report
| | |
| FUND SUMMARY | | |
| |
Thornburg Value Fund | | September 30, 2016 (Unaudited) |
Objectives and Strategies
The Fund seeks long-term capital appreciation by investing in equity and debt securities of all types. As a secondary consideration, the Fund also seeks some current income. The Fund expects to invest primarily in domestic equity securities (primarily common stocks) selected on a value basis. However, the Fund may own a variety of securities, including foreign equity securities, partnership interests, and foreign and domestic debt obligations which, in the opinion of the Fund’s investment advisor, offer prospects for meeting the Fund’s investment goals.
Market Capitalization Exposure
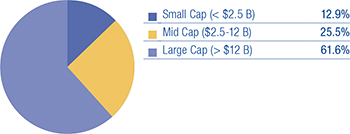
Basket Structure
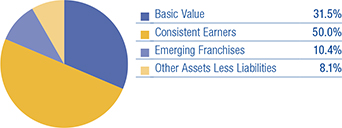
Top Ten Equity Holdings
| | | | |
Thermo Fisher Scientific, Inc. | | | 4.6 | % |
JPMorgan Chase & Co. | | | 4.0 | % |
Wal-Mart Stores, Inc. | | | 4.0 | % |
Facebook, Inc. | | | 3.5 | % |
International Flavors & Fragrances, Inc. | | | 3.4 | % |
ITC Holdings Corp. | | | 3.3 | % |
Medtronic plc | | | 3.2 | % |
Activision Blizzard, Inc. | | | 3.1 | % |
Alphabet, Inc. | | | 2.9 | % |
Enterprise Products Partners L.P. | | | 2.8 | % |
There is no guarantee that the Fund will meet its investment objectives.
All portfolio information is subject to change.
| | | | |
| Sector Exposure | |
| |
Information Technology | | | 19.1 | % |
Health Care | | | 16.8 | % |
Financials | | | 16.4 | % |
Consumer Discretionary | | | 12.6 | % |
Consumer Staples | | | 9.3 | % |
Industrials | | | 4.2 | % |
Energy | | | 3.8 | % |
Materials | | | 3.4 | % |
Utilities | | | 3.3 | % |
Telecommunication Services | | | 2.5 | % |
Real Estate | | | 0.5 | % |
Other Assets Less Liabilities | | | 8.1 | % |
|
| Top Ten Industry Groups | |
| |
Software & Services | | | 11.5 | % |
Pharmaceuticals, Biotechnology & Life Sciences | | | 11.3 | % |
Banks | | | 8.4 | % |
Technology Hardware & Equipment | | | 6.7 | % |
Diversified Financials | | | 6.3 | % |
Health Care Equipment & Services | | | 5.5 | % |
Food, Beverage & Tobacco | | | 5.3 | % |
Consumer Services | | | 4.7 | % |
Retailing | | | 4.1 | % |
Food & Staples Retailing | | | 4.0 | % |
Annual Report 7
| | |
| SCHEDULE OF INVESTMENTS | | |
| |
Thornburg Value Fund | | September 30, 2016 |
| | | | | | | | |
| | | Shares/ | | | | |
| | | Principal Amount | | | Value | |
COMMON STOCK — 91.87% | | | | | | | | |
| | |
BANKS — 8.40% | | | | | | | | |
Banks — 8.40% | | | | | | | | |
Citigroup, Inc. | | | 384,400 | | | $ | 18,155,212 | |
Citizens Financial Group, Inc. | | | 860,185 | | | | 21,255,171 | |
JPMorgan Chase & Co. | | | 539,040 | | | | 35,894,674 | |
| | | | | | | | |
| | | | | | | 75,305,057 | |
| | | | | | | | |
| | |
CAPITAL GOODS — 1.08% | | | | | | | | |
Machinery — 1.08% | | | | | | | | |
Allison Transmission Holdings, Inc. | | | 336,565 | | | | 9,652,684 | |
| | | | | | | | |
| | | | | | | 9,652,684 | |
| | | | | | | | |
| | |
COMMERCIAL & PROFESSIONAL SERVICES — 2.08% | | | | | | | | |
Commercial Services & Supplies — 2.08% | | | | | | | | |
Covanta Holding Corp. | | | 565,245 | | | | 8,699,121 | |
Rentokil Initial plc | | | 3,460,200 | | | | 9,970,013 | |
| | | | | | | | |
| | | | | | | 18,669,134 | |
| | | | | | | | |
CONSUMER DURABLES & APPAREL — 2.04% | | | | | | | | |
Household Durables — 2.04% | | | | | | | | |
a TRI Pointe Homes, Inc. | | | 1,386,720 | | | | 18,276,970 | |
| | | | | | | | |
| | | | | | | 18,276,970 | |
| | | | | | | | |
CONSUMER SERVICES — 4.70% | | | | | | | | |
Diversified Consumer Services — 2.19% | | | | | | | | |
a Grand Canyon Education, Inc. | | | 485,413 | | | | 19,605,831 | |
Hotels, Restaurants & Leisure — 2.51% | | | | | | | | |
Aramark Holdings Corp. | | | 591,376 | | | | 22,490,029 | |
| | | | | | | | |
| | | | | | | 42,095,860 | |
| | | | | | | | |
| | |
DIVERSIFIED FINANCIALS — 6.27% | | | | | | | | |
Capital Markets — 4.17% | | | | | | | | |
Apollo Global Management, LLC | | | 1,036,419 | | | | 18,614,085 | |
Oaktree Capital Group, LLC | | | 441,634 | | | | 18,725,282 | |
Mortgage Real Estate Investment Trusts — 2.10% | | | | | | | | |
PennyMac Mortgage Investment Trust | | | 1,207,530 | | | | 18,813,317 | |
| | | | | | | | |
| | | | | | | 56,152,684 | |
| | | | | | | | |
| | |
ENERGY — 3.77% | | | | | | | | |
Oil, Gas & Consumable Fuels — 3.77% | | | | | | | | |
Devon Energy Corp. | | | 202,392 | | | | 8,927,511 | |
Enterprise Products Partners L.P. | | | 898,614 | | | | 24,828,705 | |
| | | | | | | | |
| | | | | | | 33,756,216 | |
| | | | | | | | |
| | |
FOOD & STAPLES RETAILING — 4.00% | | | | | | | | |
Food & Staples Retailing — 4.00% | | | | | | | | |
Wal-Mart Stores, Inc. | | | 497,651 | | | | 35,890,590 | |
| | | | | | | | |
| | | | | | | 35,890,590 | |
| | | | | | | | |
| | |
FOOD, BEVERAGE & TOBACCO — 5.25% | | | | | | | | |
Beverages — 1.90% | | | | | | | | |
Kweichow Moutai Co., Ltd. | | | 380,902 | | | | 17,023,521 | |
Food Products — 3.35% | | | | | | | | |
Mead Johnson Nutrition Co. | | | 161,839 | | | | 12,786,899 | |
Mondelez International, Inc. | | | 392,885 | | | | 17,247,652 | |
| | | | | | | | |
| | | | | | | 47,058,072 | |
| | | | | | | | |
| | |
HEALTH CARE EQUIPMENT & SERVICES — 5.48% | | | | | | | | |
Health Care Equipment & Supplies — 4.01% | | | | | | | | |
a,b Avinger, Inc. | | | 1,466,902 | | | | 6,997,123 | |
Medtronic plc | | | 334,565 | | | | 28,906,416 | |
Health Care Providers & Services — 1.47% | | | | | | | | |
a Envision Healthcare Holdings, Inc. | | | 592,105 | | | | 13,186,178 | |
| | | | | | | | |
| | | | | | | 49,089,717 | |
| | | | | | | | |
8 Annual Report
| | |
| SCHEDULE OF INVESTMENTS, CONTINUED | | |
| |
Thornburg Value Fund | | September 30, 2016 |
| | | | | | | | |
| | | Shares/ | | | | |
| | | Principal Amount | | | Value | |
| | |
INSURANCE — 1.76% | | | | | | | | |
Insurance — 1.76% | | | | | | | | |
Assured Guaranty Ltd. | | | 568,300 | | | $ | 15,770,325 | |
| | | | | | | | |
| | | | | | | 15,770,325 | |
| | | | | | | | |
| | |
MATERIALS — 3.42% | | | | | | | | |
Chemicals — 3.42% | | | | | | | | |
International Flavors & Fragrances, Inc. | | | 214,596 | | | | 30,680,790 | |
| | | | | | | | |
| | | | | | | 30,680,790 | |
| | | | | | | | |
| | |
MEDIA — 1.80% | | | | | | | | |
Media — 1.80% | | | | | | | | |
Vivendi S.A. | | | 799,969 | | | | 16,130,672 | |
| | | | | | | | |
| | | | | | | 16,130,672 | |
| | | | | | | | |
| |
PHARMACEUTICALS, BIOTECHNOLOGY & LIFE SCIENCES — 11.34% | | | | | |
Biotechnology — 2.56% | | | | | | | | |
Gilead Sciences, Inc. | | | 187,660 | | | | 14,847,659 | |
a Seattle Genetics, Inc. | | | 150,246 | | | | 8,114,787 | |
Life Sciences Tools & Services — 4.65% | | | | | | | | |
Thermo Fisher Scientific, Inc. | | | 261,740 | | | | 41,632,364 | |
Pharmaceuticals — 4.13% | | | | | | | | |
GlaxoSmithKline plc | | | 858,903 | | | | 18,290,971 | |
Phibro Animal Health Corp. | | | 688,612 | | | | 18,716,474 | |
| | | | | | | | |
| | | | | | | 101,602,255 | |
| | | | | | | | |
| | |
REAL ESTATE — 0.48% | | | | | | | | |
Real Estate Management & Development — 0.48% | | | | | | | | |
a CBRE Group, Inc. | | | 153,398 | | | | 4,292,076 | |
| | | | | | | | |
| | | | | | | 4,292,076 | |
| | | | | | | | |
| | |
RETAILING — 4.11% | | | | | | | | |
Internet & Direct Marketing Retail — 1.86% | | | | | | | | |
Expedia, Inc. | | | 62,543 | | | | 7,300,019 | |
a Netflix, Inc. | | | 94,630 | | | | 9,325,786 | |
Specialty Retail — 2.25% | | | | | | | | |
a AutoZone, Inc. | | | 11,178 | | | | 8,588,505 | |
Office Depot, Inc. | | | 1,357,000 | | | | 4,844,490 | |
Staples, Inc. | | | 792,100 | | | | 6,772,455 | |
| | | | | | | | |
| | | | | | | 36,831,255 | |
| | | | | | | | |
| | |
SEMICONDUCTORS & SEMICONDUCTOR EQUIPMENT — 0.87% | | | | | | | | |
Semiconductors & Semiconductor Equipment — 0.87% | | | | | | | | |
a SolarEdge Technologies, Inc. | | | 452,668 | | | | 7,799,470 | |
| | | | | | | | |
| | | | | | | 7,799,470 | |
| | | | | | | | |
| | |
SOFTWARE & SERVICES — 11.54% | | | | | | | | |
Information Technology Services — 1.70% | | | | | | | | |
a Cognizant Tech Solutions Corp. | | | 318,300 | | | | 15,186,093 | |
Internet Software & Services — 6.71% | | | | | | | | |
a Alphabet, Inc. Class C | | | 33,858 | | | | 26,317,485 | |
a Facebook, Inc. | | | 243,800 | | | | 31,272,226 | |
a Marin Software, Inc. | | | 1,006,735 | | | | 2,536,972 | |
Software — 3.13% | | | | | | | | |
Activision Blizzard, Inc. | | | 633,355 | | | | 28,057,626 | |
| | | | | | | | |
| | | | | | | 103,370,402 | |
| | | | | | | | |
| | |
TECHNOLOGY HARDWARE & EQUIPMENT — 6.66% | | | | | | | | |
Communications Equipment — 1.17% | | | | | | | | |
Nokia Oyj | | | 1,819,095 | | | | 10,544,353 | |
Electronic Equipment, Instruments & Components — 1.40% | | | | | | | | |
CDW Corp. | | | 273,801 | | | | 12,520,919 | |
Technology, Hardware, Storage & Peripherals — 4.09% | | | | | | | | |
Apple, Inc. | | | 166,700 | | | | 18,845,435 | |
Annual Report 9
| | |
| SCHEDULE OF INVESTMENTS, CONTINUED | | |
| |
Thornburg Value Fund | | September 30, 2016 |
| | | | | | | | |
| | | Shares/ | | | | |
| | | Principal Amount | | | Value | |
HP, Inc. | | | 1,146,077 | | | $ | 17,798,576 | |
| | | | | | | | |
| | | | | | | 59,709,283 | |
| | | | | | | | |
| | |
TELECOMMUNICATION SERVICES — 2.47% | | | | | | | | |
Diversified Telecommunication Services — 1.11% | | | | | | | | |
a Zayo Group Holdings, Inc. | | | 334,579 | | | | 9,940,342 | |
Wireless Telecommunication Services — 1.36% | | | | | | | | |
China Mobile Ltd. | | | 1,004,500 | | | | 12,154,134 | |
| | | | | | | | |
| | | | | | | 22,094,476 | |
| | | | | | | | |
| | |
TRANSPORTATION — 1.07% | | | | | | | | |
Air Freight & Logistics — 1.07% | | | | | | | | |
United Parcel Service, Inc. | | | 87,480 | | | | 9,566,813 | |
| | | | | | | | |
| | | | | | | 9,566,813 | |
| | | | | | | | |
| | |
UTILITIES — 3.28% | | | | | | | | |
Electric Utilities — 3.28% | | | | | | | | |
ITC Holdings Corp. | | | 631,881 | | | | 29,369,829 | |
| | | | | | | | |
| | | | | | | 29,369,829 | |
| | | | | | | | |
TOTAL COMMON STOCK (Cost $666,870,848) | | | | | | | 823,164,630 | |
| | | | | | | | |
| | |
SHORT TERM INVESTMENTS — 8.19% | | | | | | | | |
b Thornburg Capital Management Fund | | | 7,337,220 | | | | 73,372,204 | |
| | | | | | | | |
| | |
TOTAL SHORT TERM INVESTMENTS (Cost $73,372,204) | | | | | | | 73,372,204 | |
| | | | | | | | |
TOTAL INVESTMENTS — 100.06% (Cost $740,243,052) | | | | | | $ | 896,536,834 | |
LIABILITIES NET OF OTHER ASSETS — (0.06)% | | | | | | | (542,734 | ) |
| | | | | | | | |
NET ASSETS — 100.00% | | | | | | $ | 895,994,100 | |
| | | | | | | | |
Footnote Legend
| b | Investment in Affiliates – Shown below are holdings of voting securities of each portfolio company which is considered “affiliated” to the Fund under the Investment Company Act of 1940, including companies for which the Fund’s holding represented 5% or more of the company’s voting securities, and a series of the Thornburg Investment Trust in which the Fund invested for cash management purposes during the period: |
| | | | | | | | | | | | | | | | | | | | | | | | | | | | |
Issuer | | Shares/Principal
September 30,
2015 | | | Gross
Additions | | | Gross
Reductions | | | Shares/Principal
September 30,
2016 | | | Market Value
September 30,
2016 | | | Investment
Income | | | Realized
Gain (Loss) | |
Avinger, Inc.* | | | — | | | | 1,560,675 | | | | 93,773 | | | | 1,466,902 | | | $ | 6,997,123 | | | $ | — | | | $ | 114,191 | |
Thornburg Capital Management Fund | | | 8,186,055 | | | | 17,654,738 | | | | 18,503,573 | | | | 7,337,220 | | | | 73,372,204 | | | | 349,562 | | | | — | |
| | | | | | | | | | | | | | | | | | | | | | | | | | | | |
Total non-controlled affiliated issuers - 8.97% of net assets | | | $ | 80,369,327 | | | $ | 349,562 | | | $ | 114,191 | |
| | | | | | | | | | | | | | | | | | | | | | | | | | | | |
| * | Issuer not affiliated at September 30, 2015. |
See notes to financial statements.
10 Annual Report
This page intentionally left blank.
Annual Report 11
| | |
| STATEMENT OF ASSETS AND LIABILITIES | | |
| |
Thornburg Value Fund | | September 30, 2016 |
| | | | |
ASSETS | | | | |
Investments at value | | | | |
Non-affiliated issuers (cost $661,736,691) (Note 3) | | $ | 816,167,507 | |
Non-controlled affiliated issuers (cost $78,506,361) (Note 3) | | | 80,369,327 | |
Cash | | | 15,402 | |
Receivable for investments sold | | | 687,647 | |
Receivable for fund shares sold | | | 274,649 | |
Dividends receivable | | | 1,081,604 | |
Prepaid expenses and other assets | | | 86,180 | |
| | | | |
Total Assets | | | 898,682,316 | |
| | | | |
| |
LIABILITIES | | | | |
Payable for investments purchased | | | 29,739 | |
Payable for fund shares redeemed | | | 1,450,941 | |
Unrealized depreciation on forward currency contracts (Note 7) | | | 69,404 | |
Payable to investment advisor and other affiliates (Note 4) | | | 900,306 | |
Accounts payable and accrued expenses | | | 237,826 | |
| | | | |
Total Liabilities | | | 2,688,216 | |
| | | | |
| |
NET ASSETS | | $ | 895,994,100 | |
| | | | |
NET ASSETS CONSIST OF | | | | |
Distribution in excess of net investment income | | $ | (510,337 | ) |
Net unrealized appreciation on investments | | | 156,224,304 | |
Accumulated net realized gain (loss) | | | (395,099,627 | ) |
Net capital paid in on shares of beneficial interest | | | 1,135,379,760 | |
| | | | |
| | $ | 895,994,100 | |
| | | | |
12 Annual Report
| | |
| STATEMENT OF ASSETS AND LIABILITIES, CONTINUED | | |
| |
Thornburg Value Fund | | September 30, 2016 |
| | | | |
| |
NET ASSET VALUE | | | | |
Class A Shares: | | | | |
Net asset value and redemption price per share* ($374,237,362 applicable to 6,919,871 shares of beneficial interest outstanding - Note 5) | | $ | 54.08 | |
Maximum sales charge, 4.50% of offering price | | | 2.55 | |
| | | | |
Maximum offering price per share | | $ | 56.63 | |
| | | | |
| |
Class C Shares: | | | | |
Net asset value and offering price per share** ($166,820,378 applicable to 3,338,355 shares of beneficial interest outstanding - Note 5) | | $ | 49.97 | |
| | | | |
| |
Class I Shares: | | | | |
Net asset value, offering and redemption price per share ($280,570,300 applicable to 5,047,841 shares of beneficial interest outstanding - Note 5) | | $ | 55.58 | |
| | | | |
| |
Class R3 Shares: | | | | |
Net asset value, offering and redemption price per share ($50,088,547 applicable to 931,789 shares of beneficial interest outstanding - Note 5) | | $ | 53.76 | |
| | | | |
| |
Class R4 Shares: | | | | |
Net asset value, offering and redemption price per share ($9,539,205 applicable to 175,656 shares of beneficial interest outstanding - Note 5) | | $ | 54.31 | |
| | | | |
| |
Class R5 Shares: | | | | |
Net asset value, offering and redemption price per share ($14,738,308 applicable to 265,540 shares of beneficial interest outstanding - Note 5) | | $ | 55.50 | |
| | | | |
| * | Class B shares converted to Class A shares on August 29, 2016. |
| ** | Redemption price per share is equal to net asset value less any applicable contingent deferred sales charge. |
See notes to financial statements.
Annual Report 13
| | |
| STATEMENT OF OPERATIONS | | |
| |
Thornburg Value Fund | | Year Ended September 30, 2016 |
| | | | |
INVESTMENT INCOME | | | | |
Dividend income | | | | |
Non-affiliated issuers (net of foreign taxes withheld of $442,807) | | $ | 18,007,528 | |
Non-controlled affiliated issuers | | | 349,562 | |
| | | | |
Total Income | | | 18,357,090 | |
| | | | |
| |
EXPENSES | | | | |
Investment advisory fees (Note 4) | | | 7,772,249 | |
Administration fees (Note 4) | | | | |
Class A Shares | | | 471,187 | |
Class B Shares | | | 960 | |
Class C Shares | | | 212,660 | |
Class I Shares | | | 141,924 | |
Class R3 Shares | | | 67,740 | |
Class R4 Shares | | | 13,107 | |
Class R5 Shares | | | 7,705 | |
Distribution and service fees (Note 4) | | | | |
Class A Shares | | | 942,553 | |
Class B Shares | | | 7,652 | |
Class C Shares | | | 1,701,760 | |
Class R3 Shares | | | 270,923 | |
Class R4 Shares | | | 24,908 | |
Transfer agent fees | | | | |
Class A Shares | | | 442,596 | |
Class B Shares | | | 6,082 | |
Class C Shares | | | 196,206 | |
Class I Shares | | | 337,701 | |
Class R3 Shares | | | 143,642 | |
Class R4 Shares | | | 33,889 | |
Class R5 Shares | | | 63,315 | |
Registration and filing fees | | | | |
Class A Shares | | | 23,164 | |
Class B Shares | | | 14,756 | |
Class C Shares | | | 17,962 | |
Class I Shares | | | 49,354 | |
Class R3 Shares | | | 17,717 | |
Class R4 Shares | | | 18,562 | |
Class R5 Shares | | | 16,568 | |
Custodian fees (Note 2) | | | 74,481 | |
Professional fees | | | 112,455 | |
Accounting fees (Note 4) | | | 33,395 | |
Trustee fees | | | 40,430 | |
Other expenses | | | 56,938 | |
| | | | |
Total Expenses | | | 13,334,541 | |
Less: | | | | |
Expenses reimbursed by investment advisor (Note 4) | | | (628,863 | ) |
| | | | |
Net Expenses | | | 12,705,678 | |
| | | | |
Net Investment Income | | $ | 5,651,412 | |
| | | | |
14 Annual Report
| | |
| STATEMENT OF OPERATIONS, CONTINUED | | |
| |
Thornburg Value Fund | | Year Ended September 30, 2016 |
| | | | |
REALIZED AND UNREALIZED GAIN (LOSS) | | | | |
Net realized gain (loss) on: | | | | |
Investments: | | | | |
Non-affiliated issuers | | $ | (10,183,689 | ) |
Non-controlled affiliated issuers | | | 114,191 | |
Forward currency contracts (Note 7) | | | 442,876 | |
Foreign currency transactions | | | (38,473 | ) |
| | | | |
| | | (9,665,095 | ) |
| | | | |
Net change in unrealized appreciation (depreciation) on: | | | | |
Investments | | | | |
Non-affiliated issuers | | | 91,258,935 | |
Non-controlled affiliated issuers | �� | | 1,862,966 | |
Forward currency contracts (Note 7) | | | (85,129 | ) |
Foreign currency translations | | | 23,539 | |
| | | | |
| | | 93,060,311 | |
| | | | |
Net Realized and Unrealized Gain | | | 83,395,216 | |
| | | | |
Net Increase in Net Assets Resulting from Operations | | $ | 89,046,628 | |
| | | | |
See notes to financial statements.
Annual Report 15
| | |
| STATEMENT OF CHANGES IN NET ASSETS | | |
| |
Thornburg Value Fund | | |
| | | | | | | | |
| | | Year Ended
September 30, 2016 | | | Year Ended
September 30, 2015 | |
INCREASE (DECREASE) IN NET ASSETS FROM | | | | | | | | |
| | |
OPERATIONS | | | | | | | | |
Net investment income | | $ | 5,651,412 | | | $ | 1,341,032 | |
Net realized gain (loss) on investments, forward currency contracts, and foreign currency transactions | | | (9,665,095 | ) | | | 151,512,375 | |
Net unrealized appreciation (depreciation) on investments, forward currency contracts, and foreign currency translations | | | 93,060,311 | | | | (128,134,616 | ) |
| | | | | | | | |
| | |
Net Increase (Decrease) in Net Assets Resulting from Operations | | | 89,046,628 | | | | 24,718,791 | |
| | |
DIVIDENDS TO SHAREHOLDERS | | | | | | | | |
From net investment income | | | | | | | | |
Class A Shares | | | (1,158,420 | ) | | | (149,783 | ) |
Class I Shares | | | (1,940,838 | ) | | | (409,330 | ) |
Class R3 Shares | | | (169,459 | ) | | | (31,715 | ) |
Class R4 Shares | | | (40,361 | ) | | | (8,095 | ) |
Class R5 Shares | | | (101,418 | ) | | | (39,382 | ) |
| | |
FUND SHARE TRANSACTIONS (NOTE 5) | | | | | | | | |
Class A Shares | | | (38,733,979 | ) | | | (27,491,471 | ) |
Class B Shares* | | | (1,613,193 | ) | | | (2,626,614 | ) |
Class C Shares | | | (16,405,080 | ) | | | (10,439,429 | ) |
Class I Shares | | | (35,363,785 | ) | | | (17,760,734 | ) |
Class R3 Shares | | | (14,298,695 | ) | | | (17,826,494 | ) |
Class R4 Shares | | | (1,514,713 | ) | | | (1,538,680 | ) |
Class R5 Shares | | | (6,121,309 | ) | | | (12,826,806 | ) |
| | | | | | | | |
Net Decrease in Net Assets | | | (28,414,622 | ) | | | (66,429,742 | ) |
| | |
NET ASSETS | | | | | | | | |
Beginning of Year | | | 924,408,722 | | | | 990,838,464 | |
| | | | | | | | |
| | |
End of Year | | $ | 895,994,100 | | | $ | 924,408,722 | |
| | | | | | | | |
Undistributed (distribution in excess of) net investment income | | $ | (510,337 | ) | | $ | 56,488 | |
| * | Class B shares converted to Class A shares on August 29, 2016. |
See notes to financial statements.
16 Annual Report
| | |
| NOTES TO FINANCIAL STATEMENTS | | |
| |
Thornburg Value Fund | | September 30, 2016 |
NOTE 1 – ORGANIZATION
Thornburg Value Fund (the “Fund”) is a diversified series of Thornburg Investment Trust (the “Trust”). The Trust is organized as a Massachusetts business trust under a Declaration of Trust dated June 3, 1987 and is registered as a diversified, open-end management investment company under the Investment Company Act of 1940, as amended. The Fund is currently one of twenty separate series of the Trust. Each series is considered to be a separate entity for financial reporting and tax purposes and bears expenses directly attributable to it. The Fund seeks long-term capital appreciation by investing in equity and debt securities of all types. As a secondary objective, the Fund also seeks some current income.
The Fund currently has six classes of shares of beneficial interest: Class A, Class C, Institutional Class (“Class I”), and Retirement Classes (“Class R3,” “Class R4,” and “Class R5”). The Fund converted outstanding Class B shares into Class A shares on August 29, 2016. There was no contingent deferred sales charge for this redemption. Each class of shares of the Fund represents an interest in the same portfolio of investments, except that (i) Class A shares are sold subject to a front-end sales charge collected at the time the shares are purchased and bear a service fee, (ii) Class B shares were sold at net asset value without a sales charge at the time of purchase, but are subject to a contingent deferred sales charge upon redemption , and bear both a service fee and distribution fee, (iii) Class C shares are sold at net asset value without a sales charge at the time of purchase, but are subject to a contingent deferred sales charge upon redemption within one year of purchase, and bear both a service fee and a distribution fee, (iv) Class I shares are sold at net asset value without a sales charge at the time of purchase and may be subject to a service fee, (v) Class R3 shares are sold at net asset value without a sales charge at the time of purchase, but bear both a service fee and distribution fee, (vi) Class R4 shares are sold at net asset value without a sales charge at the time of purchase, but bear a service fee, (vii) Class R5 shares are sold at net asset value without a sales charge at the time of purchase and may be subject to a service fee, and (viii) the respective classes may have different reinvestment privileges and conversion rights. Additionally, the Fund may allocate among its classes certain expenses, to the extent allocable to specific classes, including transfer agent fees, government registration fees, certain printing and postage costs, and administrative and legal expenses. Currently, class specific expenses of the Fund are limited to service and distribution fees, administration fees, and certain registration and transfer agent expenses.
The following is a summary of significant accounting policies followed by the Fund in the preparation of its financial statements. The Fund prepares its financial statements in conformity with United States generally accepted accounting principles (“GAAP”), including investment company accounting and reporting guidance in the Financial Accounting Standards Board (the “FASB”) Accounting Standard Codification Topic 946.
NOTE 2 – SIGNIFICANT ACCOUNTING POLICIES
Security Valuation: All investments in securities held by the Fund are valued as described in Note 3.
Allocation of Income, Gains, Losses and Expenses: Net investment income (other than class specific expenses) and realized and unrealized gains and losses are allocated daily to each class of shares based upon the relative net asset value of outstanding shares (or the value of the dividend-eligible shares, as appropriate) of each class of shares at the beginning of the day (after adjusting for the current capital shares activity of the respective class). Expenses common to all Funds are allocated among the Funds comprising the Trust based upon their relative net asset values or other appropriate allocation methods. Operating expenses directly attributable to a specific class are charged against the operating income of that class.
Dividends and Distributions to Shareholders: Dividends and distributions to shareholders, which are determined in accordance with federal income tax regulations and may differ from GAAP, are recorded on the ex-dividend date. Ordinary income distributions, if any, are declared and paid quarterly. Capital gain distributions, if any, are declared and paid annually and more often if deemed necessary by the Advisor. Dividends are paid and are reinvested in additional shares of the Fund at net asset value per share at the close of business on the ex-dividend date, or at the shareholder’s option, paid in cash.
Investment Income: Dividend income is recorded on the ex-dividend date. Certain income from foreign investments is recognized as soon as information is available to the Fund. Interest income is accrued as earned. Premiums and discounts are amortized and accreted, respectively, to call dates or maturity dates using the effective yield method of the respective investments, which is included in interest income on the Statement of Operations.
Custodian Fees: Custodian fees disclosed in the Statement of Operations may include interest expenses incurred by the Fund on any cash overdrafts of its custodian account during the period. Such cash overdrafts may result from the effects of failed trades in portfolio securities and from cash outflows resulting from unanticipated shareholder redemption activity. The Fund pays interest to its custodian on any such cash overdraft at a rate equal to 2.50% of the overdraft amount in excess of $50,000.
Investment Transactions: Investment transactions are accounted for on a trade date basis. Realized gains and losses from the sale of investments are recorded on an identified cost basis.
When-Issued and Delayed Delivery Transactions: The Fund may engage in when-issued or delayed delivery transactions. To the extent the Fund engages in such transactions, it will do so for the purpose of acquiring portfolio investments consistent with the Fund’s invest-
Annual Report 17
| | |
| NOTES TO FINANCIAL STATEMENTS, CONTINUED | | |
| |
Thornburg Value Fund | | September 30, 2016 |
ment objectives and not for the purpose of investment leverage or to speculate on interest rate or market changes. At the time the Fund makes a commitment to purchase an investment on a when-issued or delayed delivery basis, the Fund will record the transaction and reflect the value in determining its net asset value. When effecting such transactions, assets of an amount sufficient to make payment for the portfolio investments to be purchased will be segregated on the Fund’s records on the trade date. Investments purchased on a when-issued or delayed delivery basis do not earn interest until the settlement date.
Repurchase Agreements: The Fund may invest excess cash in repurchase agreements whereby the Fund purchases investments, which serve as collateral, with an agreement to resell such collateral to the seller at an agreed upon price at the maturity date of the repurchase agreement. Investments pledged as collateral for repurchase agreements are held in custody until maturity of the repurchase agreement. Provisions in the agreements require that the market value of the collateral is at least equal to the repurchase value in the event of default. In the event of default, the Fund has the right to liquidate the collateral and apply the proceeds in satisfaction of the obligation. Under certain circumstances, in the event of default or bankruptcy by the other party to the agreement, realization and/ or retention of the collateral may be subject to legal proceedings.
Foreign Currency Translation: Portfolio investments and other assets and liabilities denominated in foreign currencies are translated into U.S. dollars based on the exchange rate of such currencies against the U.S. dollar on the date of valuation. Purchases and sales of investments and income items denominated in foreign currencies are translated into U.S. dollars at the exchange rate in effect on the transaction date. When the Fund purchases or sells foreign investments, it will customarily enter into a foreign exchange contract to minimize foreign exchange risk from the trade date to the settlement date of such transactions. The values of such spot contracts are included in receivable for investments sold and payable for investments purchased on the Statement of Assets and Liabilities.
The Fund does not separately report the effect of changes in foreign exchange rates from changes in market prices on investments held. Such changes are included in net unrealized appreciation (depreciation) from investments.
Reported net realized gains and losses from foreign currency transactions arise due to purchases and sales of foreign currencies, currency gains and losses realized between the trade and settlement dates on investment transactions and the difference between the amounts of dividends, interest, and foreign withholding taxes recorded on the Fund’s books, and the U.S. dollar equivalent of the amounts actually received or paid.
Net change in unrealized appreciation (depreciation) on foreign currency translations arise from changes in the fair value of assets and liabilities, other than investments at period end, resulting from changes in exchange rates.
Guarantees and Indemnifications: Under the Trust’s organizational documents (and under separate agreements with the independent Trustees), its officers and Trustees are provided with an indemnification against certain liabilities arising out of the performance of their duties to the Fund. In the normal course of business the Trust may also enter into contracts with service providers that contain general indemnifications. The Trust’s maximum exposure under these arrangements is unknown. However, based on experience, the Trust expects the risk of loss to be remote.
Use of Estimates: The preparation of financial statements in conformity with GAAP requires management to make estimates and assumptions that affect the reported amounts of assets and liabilities and disclosure of contingent assets and liabilities at the date of the financial statements and the reported amounts of increases (decreases) in net assets from operations during the reporting period. Actual results could differ from those estimates.
Federal Income Taxes: It is the policy of the Trust to comply with the provisions of the Internal Revenue Code applicable to regulated investment companies and to distribute to shareholders substantially all investment company taxable income including net realized gains on investments (if any), and tax exempt income of the Fund. Therefore, no provision for federal income or excise tax is required.
The Fund files income tax returns in United States federal and applicable state jurisdictions. The statute of limitations on the Fund’s tax return filings generally remains open for the three years following a return’s filing date. The Fund has analyzed each uncertain tax position believed to be material in the preparation of the Fund’s financial statements for the fiscal year ended September 30, 2016, including open tax years, to assess whether it is more likely than not that the position would be sustained upon examination, based on the technical merits of the position. The Fund has not identified any such position for which an asset or liability must be reflected in the Statement of Assets and Liabilities.
At September 30, 2016, information on the tax components of capital was as follows:
| | | | |
Cost of investments for tax purposes | | $ | 739,378,369 | |
| | | | |
Gross unrealized appreciation on a tax basis | | $ | 202,928,640 | |
Gross unrealized depreciation on a tax basis | | | (45,770,175 | ) |
| | | | |
Net unrealized appreciation (depreciation) on investments (tax basis) | | $ | 157,158,465 | |
| | | | |
18 Annual Report
| | |
| NOTES TO FINANCIAL STATEMENTS, CONTINUED | | |
| |
Thornburg Value Fund | | September 30, 2016 |
Temporary book tax adjustments to the cost of investments and net unrealized appreciation (depreciation) for tax purposes result primarily from deferral outstanding wash sale losses and outstanding publicly traded partnership (“PTP”) and real estate investment trust (“REIT”) tax basis adjustments.
At September 30, 2016, the Fund had deferred tax basis late year specified ordinary losses occurring subsequent to October 31, 2015 through September 30, 2016 of $34,093. For tax purposes, such losses will be recognized in the year ending September 30, 2017.
At September 30, 2016, the Fund had deferred tax basis capital losses occurring subsequent to October 31, 2015 through September 30, 2016 of $17,189,381. For tax purposes, such capital losses will be recognized in the year ending September 30, 2017.
At September 30, 2016, the Fund had cumulative tax basis capital losses generated prior to October 1, 2011 which may expire prior to utilization. To the extent such carryforwards are utilized, capital gain distributions may be reduced to the extent provided by regulations.
Capital loss carryforwards generated prior to October 31, 2011 expire as follows:
| | | | |
2017 | | $ | 136,966,580 | |
2018 | | | 242,353,997 | |
| | | | |
| | $ | 379,320,577 | |
| | | | |
During the year ended September 30, 2016, the Fund utilized $7,152,619 of capital loss carryforwards generated prior to October 1, 2011.
In order to account for permanent book to tax differences, the Fund decreased undistributed net investment income by $2,807,741, decreased accumulated net realized (gain) loss by $2,967,917, and decreased net capital paid in on shares of beneficial interest by $160,176. Reclassifications have no impact upon the net asset value of the Fund and result primarily from foreign currency gains (losses), investments in publicly traded partnerships (“PTPs”) and real estate investment trusts (“REITs”).
At September 30, 2016, the Fund had no undistributed tax basis net ordinary investment income and no undistributed tax basis capital gains.
The tax character of distributions paid during the years ended September 30, 2016, and September 30, 2015, was as follows:
| | | | | | | | |
| | | 2016 | | | 2015 | |
Distributions from: | | | | | | | | |
Ordinary income | | $ | 3,410,496 | | | $ | 638,305 | |
Capital gains | | | — | | | | — | |
| | | | | | | | |
Total | | $ | 3,410,496 | | | $ | 638,305 | |
| | | | | | | | |
Foreign Withholding Taxes: The Fund is subject to foreign tax withholding imposed by certain foreign countries in which the Fund may invest. Withholding taxes are incurred on certain foreign dividends and are accrued at the time the dividend is recognized based on applicable foreign tax laws. The Fund files withholding tax reclaims in certain jurisdictions to recover a portion of amounts previously withheld based on applicable laws and regulations, and industry convention.
Deferred Foreign Capital Gain Taxes: The Fund is subject to a tax imposed on net realized gains of securities of certain foreign countries. The Fund records an estimated deferred tax liability for net unrealized gains on these investments as reflected in the accompanying financial statements
NOTE 3 – SECURITY VALUATION
Valuation of the Fund’s portfolio investment securities is performed in accordance with policies and procedures adopted by and under the oversight of the Trustees.
The Trustees of the Trust have appointed Thornburg Investment Management, Inc., the Trust’s investment advisor ( the “Advisor”) to assist the Trustees in obtaining market values for portfolio investments, evaluate and monitor professional pricing service providers appointed by the Trustees’ Audit Committee (the “Audit Committee”) to assist in determining fair values for portfolio investments, assist in calculating fair values for portfolio investments in certain circumstances, and to perform other functions in connection with the valuation of investments. The Advisor acts through its Valuation and Pricing Committee (the “Committee”) and other employees of the Advisor. The Committee regularly reviews its own valuation calculations, as well as the valuations, valuation techniques and services furnished by pricing service providers, considers circumstances which may require valuation calculations by the Committee, and reviews previous valuation calculations. The Committee reports to the Audit Committee on the Committee’s activities, the performance of pricing service providers, and other matters relating to valuation of portfolio investments.
Annual Report 19
| | |
| NOTES TO FINANCIAL STATEMENTS, CONTINUED | | |
| |
Thornburg Value Fund | | September 30, 2016 |
In those instances when the Committee assists in calculating a fair value for a portfolio investment, the Committee seeks to determine the price that the Fund would reasonably expect to receive upon a sale of the investment in an orderly transaction between market participants on the valuation date. The Committee customarily utilizes quotations from securities broker dealers in calculating valuations, but also may utilize prices obtained from pricing service providers or other methods approved by the Audit Committee. Because fair values calculated by the Committee are estimates, the calculation of a value for an investment may differ from the price that would be realized by the Fund upon a sale of the investment, and the difference could be material to the Fund’s financial statements. The Committee’s calculation of a fair value for an investment may also differ from the prices obtained by other persons (including other mutual funds) for the investment.
Valuation of Securities: Securities and other portfolio investments which are listed or traded on a United States securities exchange are valued at the last reported sale price on the valuation date. Investments listed or traded on an exchange for which there has been no sale that day are valued at the mean between the last reported bid and asked prices on that valuation date. Portfolio investments reported by NASDAQ are valued at the official closing price on the valuation date. If an investment is traded on more than one exchange, the investment is considered traded on the exchange that is normally the primary market for that investment. Securities and other portfolio investments which are listed or traded on exchanges outside the United States are valued at the last price or the closing price of the investment on the exchange that is normally the primary market for the investment, as of the close of the exchange preceding the Fund’s valuation date. Foreign investments listed or traded on an exchange for which there has been no sale that day are valued at the mean between the last reported bid and asked prices on that valuation date.
In any case when a market quotation is not readily available for a portfolio investment ordinarily valued by market quotation, the Committee calculates a fair value for the investment using alternative methods approved by the Audit Committee. A market quotation is not readily available when the primary market or exchange for the investment is not open for the entire scheduled day of trading. Market quotations for an investment also may not be readily available if developments after the most recent close of the investment’s primary exchange or market, but prior to the close of business on any Fund business day, or an unusual event or significant period of time occurring since the availability of a market quotation, create a serious question concerning the reliability of the most recent market quotation available for the investment. In particular, on days when market volatility thresholds established by the Audit Committee are exceeded, foreign equity investments held by the Fund may be valued using alternative methods. The Committee customarily obtains valuations in these instances from pricing service providers approved by the Audit Committee. Pricing service providers ordinarily calculate valuations using multi-factor models to adjust market prices based upon various inputs, including exchange data, depository receipt prices, futures, index data and other data.
Debt obligations held by the Fund which are not listed or traded on exchanges or for which no reported market exists are ordinarily valued at the valuation obtained from a pricing service provider approved by the Audit Committee.
In any case when a pricing service provider fails to provide a valuation for a debt obligation held by the Fund, the Committee calculates a fair value for the obligation using alternative methods under procedures approved by the Audit Committee. Additionally, in cases when management believes that a valuation obtained from a pricing service provider merits review for significant reasons, the Committee decides whether or not to use the valuation calculated by the pricing service provider or to use an alternative method approved by the Audit Committee to calculate a fair value for the obligation.
Quotations for foreign investments expressed in foreign currency amounts are converted to U.S. dollar equivalents using a foreign exchange quotation from a third party service provider at the time of valuation. Foreign investments held by the Fund may be traded on days and at times when the Fund is not open for business. Consequently, the value of Fund investments may be significantly affected on days when shareholders cannot purchase or sell Fund shares. Futures contracts and other financial and derivative instruments traded on an exchange are valued at the latest published price for the instrument on its primary exchange. Listed options are valued at the last bid price.
Valuation Hierarchy: The Fund categorizes its investments based upon the inputs used in valuing those investments, according to a three-level hierarchy established in guidance from FASB. Categorization of investments using this hierarchy is intended by the FASB to maximize the use of observable inputs in valuing investments and minimize the use of unobservable inputs by requiring that the most observable inputs be used when available. Observable inputs are those that market participants would use in valuing an investment based on available market information. Unobservable inputs are those that reflect assumptions about the information market participants would use in valuing an investment. An investment’s level within the hierarchy is based on the lowest level input that is deemed significant to the valuation. The methodologies and inputs used to value investments are not necessarily indications of the risk or liquidity associated with those investments.
Various inputs are used in calculating valuations for the Fund’s investments. These inputs are generally summarized according to the three-level hierarchy below:
Level 1: Quoted prices in active markets for identical investments.
20 Annual Report
| | |
| NOTES TO FINANCIAL STATEMENTS, CONTINUED | | |
| |
Thornburg Value Fund | | September 30, 2016 |
Level 2: Other direct or indirect significant observable inputs (including quoted prices for similar investments in active markets and other observable inputs, such as interest rates, prepayment rates, credit risk, etc.).
Level 3: Significant unobservable inputs (including the Committee’s own assumptions in calculating the fair values of investments).
Valuations for debt obligations held by the Fund are typically calculated by pricing service providers approved by the Audit Committee and are characterized as Level 2 within the valuation hierarchy.
On days when market volatility thresholds established by the Audit Committee are exceeded, foreign securities for which valuations are obtained from pricing service providers are fair valued. On these days, the foreign securities are characterized as Level 2 within the valuation hierarchy and revert to Level 1 after the threshold is no longer exceeded.
In a limited number of cases the Committee calculates a fair value for investments using broker quotations or other methods approved by the Audit Committee. When the Committee uses a single broker quotation to calculate a fair value for an investment without other significant observable inputs, or if a fair value is calculated using other significant inputs that are considered unobservable, the investment is characterized as Level 3 within the hierarchy. Other significant unobservable inputs used to calculate a fair value in these instances might include an income-based valuation approach which considers discounted anticipated future cash flows from the investment, and application of discounts due to the nature or duration of any restrictions on the disposition of the investment.
Valuations based upon the use of inputs from Levels 1, 2 or 3 may not represent the actual price received upon the disposition of an investment, and the Fund may receive a price that is lower than the valuation based upon these inputs when it sells the investment.
The following table displays a summary of the fair value hierarchy measurements of the Fund’s investments as of September 30, 2016. In any instance when valuation inputs from more than one level are used to determine the fair value of a specific investment, the investment is placed in the level of the table based upon the lowest level input that is significant in determining the fair value of the investment:
| | | | | | | | | | | | | | | | |
| | | Fair Value Measurements at September 30, 2016 | |
| | | Total | | | Level 1 | | | Level 2 | | | Level 3 | |
Assets | | | | | | | | | | | | | | | | |
Investments in Securities* | | | | | | | | | | | | | | | | |
Common Stock | | $ | 823,164,630 | | | $ | 823,164,630 | | | $ | — | | | $ | — | |
Short Term Investments | | | 73,372,204 | | | | 73,372,204 | | | | — | | | | — | |
| | | | | | | | | | | | | | | | |
Total Investments in Securities | | $ | 896,536,834 | | | $ | 896,536,834 | | | $ | — | | | $ | — | |
Liabilities | | | | | | | | | | | | | | | | |
Other Financial Instruments** | | | | | | | | | | | | | | | | |
Forward Currency Contracts | | $ | (69,404 | ) | | $ | — | | | $ | (69,404 | ) | | $ | — | |
| * | See Schedule of Investments for a summary of the industry exposure as grouped according to the Global Industry Classification Standard (GICS), which is an industry taxonomy developed by MSCI, Inc. and Standard & Poor’s (S&P). |
| ** | Other Financial Instruments include investments not reflected in the Schedule of Investments, which may include futures, forwards and swap contracts, which are valued at the unrealized appreciation (depreciation) on the investment. |
In accordance with the guidance prescribed in Accounting Standards Update (“ASU”) No. 2011-04, it is the policy of the Fund to recognize transfers between levels and those underlying events which caused the movement. The Fund recognized no transfers between Levels 1 and 2 for the year ended September 30, 2016, other than when the Fund exceeded market volatility thresholds for foreign equity investments during the period.
Annual Report 21
| | |
| NOTES TO FINANCIAL STATEMENTS, CONTINUED | | |
| |
Thornburg Value Fund | | September 30, 2016 |
NOTE 4 – INVESTMENT ADVISORY FEE AND OTHER TRANSACTIONS WITH AFFILIATES
Pursuant to an investment advisory agreement, the Advisor serves as the investment advisor and performs services for the Fund for which the fees are payable at the end of each month. Under the investment advisory agreement, the Fund pays the Advisor a management fee based on the daily net assets of the Fund at an annual rate as shown in the following table:
Management Fee Schedule
| | | | |
Daily Net Assets | | Fee Rate | |
Up to $ 500 million | | | 0.875 | % |
Next $ 500 million | | | 0.825 | |
Next $ 500 million | | | 0.775 | |
Next $ 500 million | | | 0.725 | |
Over $ 2 billion | | | 0.675 | |
The Fund’s effective management fee for the year ended September 30, 2016 was 0.852% of the Fund’s average dividend assets.
The Fund pays to the Advisor the costs of personnel who perform certain accounting services for the Fund. For the year ended September 30, 2016 the Fund paid $33,395 to the Advisor for these accounting services. The Trust has also entered into administrative service agreements with the Advisor, whereby the Advisor will perform certain administrative services for the shareholders of each class of the Fund’s shares, and for which fees will be payable at an annual rate of up to .125 of 1% per annum of the average daily net assets attributable to each class of shares. Total administrative service fees incurred by each class of shares of the Fund for the year ended September 30, 2016, are set forth in the Statement of Operations.
The Trust has an underwriting agreement with Thornburg Securities Corporation (the “Distributor”), an affiliate of the Advisor, which acts as the distributor of the Fund’s shares. For the year ended September 30, 2016, the Distributor has advised the Fund that it earned net commissions aggregating $20,993 from the sale of Class A shares, and collected contingent deferred sales charges aggregating $4,657 from redemptions of Class C shares of the Fund.
Pursuant to a service plan under Rule 12b-1 of the Investment Company Act of 1940, the Fund may pay to the Advisor or securities dealers and other financial institutions at the Advisor’s request an amount not to exceed .25 of 1% per annum of the average daily net assets attributable to Class A, Class B, Class C, Class R3, and Class R4 shares of the Fund to obtain various shareholder and distribution related services. For the year ended September 30, 2016, there were no 12b-1 service plan fees charged for Class I and Class R5 shares. The Advisor may pay out of its own resources additional expenses for distribution of the Fund’s shares and shareholder services.
The Trust has also adopted distribution plans pursuant to Rule 12b-1, applicable only to the Fund’s Class B, Class C, and Class R3 shares, under which the Fund compensates the Distributor for services in promoting the sale of Class B, Class C, and Class R3 shares of the Fund at an annual rate of up to .75 of 1% per annum of the average daily net assets attributable to Class B and Class C shares, and an annual rate of up to .25 of 1% per annum of the average daily net assets attributable to Class R3 shares. Total fees incurred by each class of shares of the Fund under their respective service and distribution plans for the year ended September 30, 2016, are set forth in the Statement of Operations.
The Advisor and Distributor have contractually agreed to waive fees and reimburse expenses incurred by the Fund so that actual expenses of certain share classes do not exceed levels as specified in the Fund’s most recent prospectus. The agreement may be terminated by the Fund at any time, but may not be terminated by the Advisor or Distributor before February 1, 2017, unless the Advisor ceases to be the investment advisor to the Trust or the Distributor ceases to be the distributor of the Fund prior to that date. The Advisor and Distributor retain the right to be repaid by the Fund for fee waivers and expense reimbursements if expenses fall below the contractual limit prior to the end of the fiscal year.
For the year ended September 30, 2016, the Advisor contractually reimbursed certain class specific expenses, administrative fees, and distribution fees of $18,025 for Class B shares, $237,336 for Class I shares, $249,317 for Class R3 shares, $52,459 for Class R4 shares, and $71,726 for Class R5 shares.
Certain officers and Trustees of the Trust are also officers or directors of the Advisor and Distributor. The compensation of independent Trustees is borne by the Trust.
The percentage of direct investments in the Fund held by appointed Trustees, Officers and the Advisor is approximately 5.04%. The Fund may sell securities to an affiliated fund, or the Fund may purchase securities held by an affiliated fund, provided the affiliation is due solely to having a common investment advisor, common officers, or common trustees, and provided that all such transactions will comply with Rule 17a-7 under the 1940 Act. For the year ended September 30, 2016, the Fund had transactions with affiliated funds.
22 Annual Report
| | |
| NOTES TO FINANCIAL STATEMENTS, CONTINUED | | |
| |
Thornburg Value Fund | | September 30, 2016 |
NOTE 5 – SHARES OF BENEFICIAL INTEREST
At September 30, 2016, there were an unlimited number of shares with no par value of beneficial interest authorized. Transactions in shares of beneficial interest were as follows:
| | | | | | | | | | | | | | | | |
| | | Year Ended
September 30, 2016 | | | Year Ended
September 30, 2015 | |
| | | Shares | | | Amount | | | Shares | | | Amount | |
Class A Shares | | | | | | | | | | | | | | | | |
Shares sold | | | 536,840 | | | $ | 27,382,909 | | | | 737,926 | | | $ | 38,257,811 | |
Shares converted from Class B shares | | | 6,588 | | | | 352,743 | | | | — | | | | — | |
Shares issued to shareholders in reinvestment of dividends | | | 20,753 | | | | 1,108,861 | | | | 2,867 | | | | 143,603 | |
Shares repurchased | | | (1,318,359 | ) | | | (67,578,492 | ) | | | (1,284,634 | ) | | | (65,892,885 | ) |
| | | | | | | | | | | | | | | | |
| | | | |
Net increase (decrease) | | | (754,178 | ) | | $ | (38,733,979 | ) | | | (543,841 | ) | | $ | (27,491,471 | ) |
| | | | | | | | | | | | | | | | |
| | | | |
Class B Shares* | | | | | | | | | | | | | | | | |
Shares sold | | | 1,210 | | | $ | 56,199 | | | | 6,680 | | | $ | 297,816 | |
Shares issued to shareholders in reinvestment of dividends | | | — | | | | — | | | | — | | | | — | |
Shares converted to Class A shares | | | (7,328 | ) | | | (352,743 | ) | | | | | | | | |
Shares repurchased | | | (28,859 | ) | | | (1,316,649 | ) | | | (61,925 | ) | | | (2,924,430 | ) |
| | | | | | | | | | | | | | | | |
| | | | |
Net increase (decrease) | | | (34,977 | ) | | $ | (1,613,193 | ) | | | (55,245 | ) | | $ | (2,626,614 | ) |
| | | | | | | | | | | | | | | | |
| | | | |
Class C Shares | | | | | | | | | | | | | | | | |
Shares sold | | | 292,210 | | | $ | 13,905,964 | | | | 306,671 | | | $ | 14,470,492 | |
Shares issued to shareholders in reinvestment of dividends | | | — | | | | — | | | | — | | | | — | |
Shares repurchased | | | (642,811 | ) | | | (30,311,044 | ) | | | (521,694 | ) | | | (24,909,921 | ) |
| | | | | | | | | | | | | | | | |
| | | | |
Net increase (decrease) | | | (350,601 | ) | | $ | (16,405,080 | ) | | | (215,023 | ) | | $ | (10,439,429 | ) |
| | | | | | | | | | | | | | | | |
| | | | |
Class I Shares | | | | | | | | | | | | | | | | |
Shares sold | | | 716,301 | | | $ | 37,689,763 | | | | 842,023 | | | $ | 45,593,747 | |
Shares issued to shareholders in reinvestment of dividends | | | 33,666 | | | | 1,848,626 | | | | 7,702 | | | | 397,296 | |
Shares repurchased | | | (1,414,916 | ) | | | (74,902,174 | ) | | | (1,215,376 | ) | | | (63,751,777 | ) |
| | | | | | | | | | | | | | | | |
| | | | |
Net increase (decrease) | | | (664,949 | ) | | $ | (35,363,785 | ) | | | (365,651 | ) | | $ | (17,760,734 | ) |
| | | | | | | | | | | | | | | | |
| | | | |
Class R3 Shares | | | | | | | | | | | | | | | | |
Shares sold | | | 141,034 | | | $ | 7,131,504 | | | | 221,665 | | | $ | 11,268,997 | |
Shares issued to shareholders in reinvestment of dividends | | | 3,090 | | | | 164,106 | | | | 621 | | | | 30,881 | |
Shares repurchased | | | (422,847 | ) | | | (21,594,305 | ) | | | (572,369 | ) | | | (29,126,372 | ) |
| | | | | | | | | | | | | | | | |
| | | | |
Net increase (decrease) | | | (278,723 | ) | | $ | (14,298,695 | ) | | | (350,083 | ) | | $ | (17,826,494 | ) |
| | | | | | | | | | | | | | | | |
| | | | |
Class R4 Shares | | | | | | | | | | | | | | | | |
Shares sold | | | 52,912 | | | $ | 2,743,429 | | | | 53,145 | | | $ | 2,666,567 | |
Shares issued to shareholders in reinvestment of dividends | | | 556 | | | | 29,835 | | | | 126 | | | | 6,316 | |
Shares repurchased | | | (83,787 | ) | | | (4,287,977 | ) | | | (82,169 | ) | | | (4,211,563 | ) |
| | | | | | | | | | | | | | | | |
| | | | |
Net increase (decrease) | | | (30,319 | ) | | $ | (1,514,713 | ) | | | (28,898 | ) | | $ | (1,538,680 | ) |
| | | | | | | | | | | | | | | | |
| | | | |
Class R5 Shares | | | | | | | | | | | | | | | | |
Shares sold | | | 41,585 | | | $ | 2,160,843 | | | | 80,803 | | | $ | 4,258,589 | |
Shares issued to shareholders in reinvestment of dividends | | | 1,838 | | | | 100,759 | | | | 677 | | | | 34,703 | |
Shares repurchased | | | (159,826 | ) | | | (8,382,911 | ) | | | (322,909 | ) | | | (17,120,098 | ) |
| | | | | | | | | | | | | | | | |
| | | | |
Net increase (decrease) | | | (116,403 | ) | | $ | (6,121,309 | ) | | | (241,429 | ) | | $ | (12,826,806 | ) |
| | | | | | | | | | | | | | | | |
| * | Class B shares converted to Class A shares on August 29, 2016. |
Annual Report 23
| | |
| NOTES TO FINANCIAL STATEMENTS, CONTINUED | | |
| |
Thornburg Value Fund | | September 30, 2016 |
NOTE 6 – INVESTMENT TRANSACTIONS
For the year ended September 30, 2016, the Fund had purchase and sale transactions of investments (excluding short-term investments) of $260,042,611 and $353,349,892, respectively.
NOTE 7 – DERIVATIVE FINANCIAL INSTRUMENTS WITH OFF-BALANCE SHEET RISK AND FOREIGN INVESTMENT RISK
The Fund may use a variety of derivative financial instruments to hedge or adjust the risks affecting its investment portfolio or to enhance investment returns. Provisions of the FASB Accounting Standards Codification 815-10-50 (“ASC 815”) require certain disclosures. The disclosures are intended to provide users of financial statements with an understanding of the use of derivative instruments by the Fund and how these derivatives affect the financial position, financial performance and cash flows of the Fund. The Fund does not designate any derivative instruments as hedging instruments under ASC 815. During the year ended September 30, 2016, the Fund’s principal exposure to derivative financial instruments of the type addressed by ASC 815 was investment in foreign exchange contracts. A foreign exchange contract is an agreement between two parties to exchange different currencies at a specified rate of exchange at an agreed upon future date. Foreign exchange contracts involve risks to the Fund, including the risk that a contract’s counterparty will not meet its obligations to the Fund, the risk that a change in a contract’s value may not correlate perfectly with the currency the contract was intended to track, and the risk that the Fund’s Advisor is unable to correctly implement its strategy in using a contract. In any such instance, the Fund may not achieve the intended benefit of entering into a contract, and may experience a loss.
The Fund entered into forward currency contracts during the year ended September 30, 2016 in the normal course of pursuing its investment objectives, with the objective of purchasing foreign investments or with the intent of reducing the risk to the value of the Fund’s foreign investments from adverse changes in the relationship between the U.S. dollar and foreign currencies. In each case these contracts have been initiated in conjunction with foreign investment transactions.
These contracts are accounted for by the Fund under ASC 815. Unrealized appreciation and depreciation on outstanding contracts are reported in the Fund’s Statement of Assets and Liabilities, as measured by the difference between the forward exchange rates at the reporting date and the forward exchange rates at each contract’s inception date. Net realized gain (loss) on contracts closed during the period, and changes in net unrealized appreciation (depreciation) on outstanding contracts are recognized in the Fund’s Statement of Operations.
The quarterly average value of open sell currency contracts for the year ended September 30, 2016 was $20,581,982. Open buy currency contracts are entered into for the purpose of closing open sell currency contracts and the values are dependent upon the values of the open sell currency contracts to which they relate.
The following table displays the outstanding forward currency contracts at September 30, 2016:
| | | | | | | | | | | | | | | | | | | | | | | | |
Outstanding Forward Currency Contracts to Buy or Sell at September 30, 2016 | |
Contract Description | | Buy/Sell | | | Contract
Amount | | | Contract
Value Date | | | Value
USD | | | Unrealized
Appreciation | | | Unrealized
Depreciation | |
Euro | | | Sell | | | | 12,673,300 | | | | 11/30/2016 | | | | 14,272,802 | | | $ | — | | | $ | (69,404 | ) |
| | | | | | | | | | | | | | | | | | | | | | | | |
| | | | | | |
Total | | | | | | | | | | | | | | | | | | $ | — | | | $ | (69,404 | ) |
| | | | | | | | | | | | | | | | | | | | | | | | |
| | | | |
Net unrealized appreciation (depreciation) | | | | | | | | | | | | | | | $ | (69,404 | ) |
| | | | | | | | | | | | | | | | | | | | | | | | |
The outstanding forward currency contracts in the foregoing table were entered into with State Street Bank and Trust Company (“SSB”), pursuant to an International Swaps and Derivatives Association (“ISDA”) Master Agreement. In the event of a default or termination under the ISDA Master Agreement with SSB, the non-defaulting party has the right to close out all outstanding forward currency contracts between the parties and to net any payment amounts under those contracts, resulting in a single net amount payable by one party to the other.
Because the ISDA Master Agreement with SSB does not result in an offset of reported amounts of financial assets and liabilities in the Fund’s Statement of Assets and Liabilities unless there has been an event of default or termination event under that agreement, the Fund does not net its outstanding forward currency contracts for purposes of the disclosure in the Fund’s Statement of Assets and Liabilities. Instead the Fund recognizes the unrealized appreciation or depreciation on those forward currency contracts on a gross basis in the Fund’s Statement of Assets and Liabilities.
The unrealized appreciation (depreciation) of the outstanding forward currency contracts recognized in the Fund’s Statement of Assets and Liabilities at September 30, 2016 is disclosed in the following table:
24 Annual Report
| | |
| NOTES TO FINANCIAL STATEMENTS, CONTINUED | | |
| |
Thornburg Value Fund | | September 30, 2016 |
| | | | | | |
Fair Values of Derivative Financial Instruments at September 30, 2016 | |
Liability Derivatives | | Balance Sheet Location | | Fair Value | |
Foreign exchange contracts | | Liabilities - Unrealized depreciation on forward currency contracts | | $ | (69,404 | ) |
Because the Fund does not currently receive or post cash collateral in connection with its currency forward contracts, and because all of the Fund’s outstanding currency forward contracts are with SSB, the net amounts of the Fund’s assets and liabilities which are attributable to those contracts at September 30, 2016 can be determined by offsetting the dollar amounts shown in the preceding table. Based on those amounts, the net amount of the Fund’s assets which is attributable to its outstanding forward currency contracts at September 30, 2016 is $0, and the net amount of the Fund’s liabilities which is attributable to those contracts at that date is $69,404. The Fund’s forward currency contracts are valued each day, and the net amounts of the Fund’s assets and liabilities which are attributable to those contracts are expected to vary over time.
The net realized gain (loss) from forward currency contracts and the net change in unrealized appreciation (depreciation) on outstanding forward currency contracts recognized in the Fund’s Statement of Operations for the year ended September 30, 2016 are disclosed in the following tables:
| | | | |
Net Realized Gain (Loss) on Derivative Financial Instruments Recognized in Income for the Year Ended September 30, 2016 |
| | | Total | | Forward Currency Contracts |
Foreign exchange contracts | | $ 442,876 | | $ 442,876 |
|
Net Change in Unrealized Appreciation (Depreciation) of Derivative Financial Instruments Recognized in Income for the Year Ended September 30, 2016 |
| | | Total | | Forward Currency Contracts |
Foreign exchange contracts | | $(85,129) | | $(85,129) |
OTHER NOTES
Risks: The Fund’s investments subject it to risks including, but not limited to, management risk, market and economic risk, risks affecting specific issuers, liquidity risk, the risks associated with investments in small- and mid-cap companies and non-U.S. issuers (including developing country issuers), credit risk, and interest rate risk. Please see the Fund’s prospectus for a discussion of the risks associated with an investment in the Fund.
Subsequent Events: Fund management believes no events have occurred between September 30, 2016 and the date of issuance of the financial statements that require adjustment to or disclosure in the accompanying financial statements.
Annual Report 25
FINANCIAL HIGHLIGHTS
Thornburg Value Fund
| | | | | | | | | | | | | | | | | | | | | | | | | | | | | | | | | | | | | | | | | | | | | | | | | | |
| | | PER SHARE PERFORMANCE (for a share outstanding throughout the Year) | | RATIOS TO AVERAGE NET ASSETS | | | SUPPLEMENTAL DATA | |
| | | | | | | | | |
Unless Otherwise Noted, Periods are Fiscal Years Ended Sept. 30, | | Net Asset
Value
Beginning
of Year | | | Net
Investment
Income
(Loss)+ | | | Net
Realized
&
Unrealized
Gain (Loss)
on
Investments | | | Total from Investment
Operations | | Dividends
from Net
Investment
Income | | | Dividends
from Net
Realized
Gains | | Total
Dividends | | | Net Asset Value End of Year | | Net
Investment
Income
(Loss)
(%) | | | Expenses,
After
Expense
Reductions
(%) | | | Expenses,
After
Expense
Reductions
and
Net of
Custody
Credits
(%) | | | Expenses,
Before
Expense
Reductions
(%) | | | Total
Return
(%)(a) | | Portfolio
Turnover
Rate (%)(a) | | Net
Assets
at End
of Year
(thousands) | |
CLASS A SHARES | | | | | | | | | | | | | | | | | | | | | | | | | | | | | | | | | | | | | | | | | | | |
2016(b)(c) | | $ | 49.17 | | | | 0.32 | | | | 4.76 | | | 5.08 | | | (0.17 | ) | | — | | | (0.17 | ) | | $54.08 | | | 0.63 | | | | 1.39 | | | | 1.39 | | | | 1.39 | | | 10.33 | | 31.10 | | $ | 374,237 | |
2015(b) | | $ | 48.09 | | | | 0.07 | | | | 1.03 | | | 1.10 | | | (0.02 | ) | | — | | | (0.02 | ) | | $49.17 | | | 0.14 | | | | 1.37 | | | | 1.37 | | | | 1.37 | | | 2.28 | | 59.70 | | $ | 377,299 | |
2014(b) | | $ | 40.84 | | | | 0.10 | | | | 7.41 | | | 7.51 | | | (0.26 | ) | | — | | | (0.26 | ) | | $48.09 | | | 0.22 | | | | 1.37 | | | | 1.37 | | | | 1.37 | | | 18.40 | | 72.43 | | $ | 395,216 | |
2013(b) | | $ | 31.51 | | | | 0.08 | | | | 9.25 | | | 9.33 | | | — | | | — | | | — | | | $40.84 | | | 0.23 | | | | 1.40 | | | | 1.40 | | | | 1.40 | | | 29.61 | | 61.50 | | $ | 400,275 | |
2012(b) | | $ | 27.71 | | | | (0.10 | ) | | | 3.90 | | | 3.80 | | | — | | | — | | | — | | | $31.51 | | | (0.32 | ) | | | 1.32 | | | | 1.32 | | | | 1.32 | | | 13.71 | | 54.16 | | $ | 470,120 | |
CLASS C SHARES | | | | | | | | | | | | | | | | | | | | | | | | | | | | | | | | | | | | | | | | | | | |
2016 | | $ | 45.63 | | | | (0.06 | ) | | | 4.40 | | | 4.34 | | | — | | | — | | | — | | | $49.97 | | | (0.12 | ) | | | 2.14 | | | | 2.14 | | | | 2.14 | | | 9.51 | | 31.10 | | $ | 166,821 | |
2015 | | $ | 44.95 | | | | (0.29 | ) | | | 0.97 | | | 0.68 | | | — | | | — | | | — | | | $45.63 | | | (0.61 | ) | | | 2.12 | | | | 2.12 | | | | 2.12 | | | 1.51 | | 59.70 | | $ | 168,321 | |
2014 | | $ | 38.26 | | | | (0.24 | ) | | | 6.93 | | | 6.69 | | | — | | | — | | | — | | | $44.95 | | | (0.55 | ) | | | 2.14 | | | | 2.14 | | | | 2.14 | | | 17.49 | | 72.43 | | $ | 175,495 | |
2013 | | $ | 29.75 | | | | (0.18 | ) | | | 8.69 | | | 8.51 | | | — | | | — | | | — | | | $38.26 | | | (0.55 | ) | | | 2.18 | | | | 2.18 | | | | 2.18 | | | 28.60 | | 61.50 | | $ | 166,971 | |
2012 | | $ | 26.36 | | | | (0.32 | ) | | | 3.71 | | | 3.39 | | | — | | | — | | | — | | | $29.75 | | | (1.09 | ) | | | 2.09 | | | | 2.09 | | | | 2.09 | | | 12.86 | | 54.16 | | $ | 185,286 | |
CLASS I SHARES | | | | | | | | | | | | | | | | | | | | | | | | | | | | | | | | | | | | | | | | | | | |
2016 | | $ | 50.53 | | | | 0.54 | | | | 4.90 | | | 5.44 | | | (0.39 | ) | | — | | | (0.39 | ) | | $55.58 | | | 1.02 | | | | 0.99 | | | | 0.99 | | | | 1.07 | | | 10.77 | | 31.10 | | $ | 280,570 | |
2015 | | $ | 49.28 | | | | 0.28 | | | | 1.04 | | | 1.32 | | | (0.07 | ) | | — | | | (0.07 | ) | | $50.53 | | | 0.53 | | | | 0.99 | | | | 0.99 | | | | 1.06 | | | 2.68 | | 59.70 | | $ | 288,642 | |
2014 | | $ | 41.96 | | | | 0.28 | | | | 7.62 | | | 7.90 | | | (0.58 | ) | | — | | | (0.58 | ) | | $49.28 | | | 0.60 | | | | 0.99 | | | | 0.99 | | | | 1.06 | | | 18.86 | | 72.43 | | $ | 299,568 | |
2013 | | $ | 32.24 | | | | 0.20 | | | | 9.52 | | | 9.72 | | | — | | | — | | | — | | | $41.96 | | | 0.59 | | | | 0.98 | | | | 0.98 | | | | 1.01 | | | 30.15 | | 61.50 | | $ | 272,468 | |
2012 | | $ | 28.26 | | | | 0.02 | | | | 3.99 | | | 4.01 | | | (0.03 | ) | | — | | | (0.03 | ) | | $32.24 | | | 0.07 | | | | 0.93 | | | | 0.93 | | | | 0.93 | | | 14.18 | | 54.16 | | $ | 1,104,163 | |
CLASS R3 SHARES | | | | | | | | | | | | | | | | | | | | | | | | | | | | | | | | | | | | | | | | | | | |
2016 | | $ | 48.86 | | | | 0.34 | | | | 4.74 | | | 5.08 | | | (0.18 | ) | | — | | | (0.18 | ) | | $53.76 | | | 0.67 | | | | 1.35 | | | | 1.35 | | | | 1.81 | | | 10.40 | | 31.10 | | $ | 50,089 | |
2015 | | $ | 47.79 | | | | 0.08 | | | | 1.01 | | | 1.09 | | | (0.02 | ) | | — | | | (0.02 | ) | | $48.86 | | | 0.16 | | | | 1.35 | | | | 1.35 | | | | 1.77 | | | 2.28 | | 59.70 | | $ | 59,150 | |
2014 | | $ | 40.56 | | | | 0.11 | | | | 7.37 | | | 7.48 | | | (0.25 | ) | | — | | | (0.25 | ) | | $47.79 | | | 0.23 | | | | 1.35 | | | | 1.35 | | | | 1.77 | | | 18.45 | | 72.43 | | $ | 74,579 | |
2013 | | $ | 31.28 | | | | 0.10 | | | | 9.18 | | | 9.28 | | | — | | | — | | | — | | | $40.56 | | | 0.29 | | | | 1.34 | | | | 1.34 | | | | 1.78 | | | 29.67 | | 61.50 | | $ | 80,671 | |
2012 | | $ | 27.51 | | | | (0.10 | ) | | | 3.87 | | | 3.77 | | | — | | | — | | | — | | | $31.28 | | | (0.34 | ) | | | 1.35 | | | | 1.35 | | | | 1.66 | | | 13.70 | | 54.16 | | $ | 131,013 | |
CLASS R4 SHARES | | | | | | | | | | | | | | | | | | | | | | | | | | | | | | | | | | | | | | | | | | | |
2016 | | $ | 49.36 | | | | 0.40 | | | | 4.78 | | | 5.18 | | | (0.23 | ) | | — | | | (0.23 | ) | | $54.31 | | | 0.78 | | | | 1.25 | | | | 1.25 | | | | 1.75 | | | 10.50 | | 31.10 | | $ | 9,539 | |
2015 | | $ | 48.24 | | | | 0.14 | | | | 1.01 | | | 1.15 | | | (0.03 | ) | | — | | | (0.03 | ) | | $49.36 | | | 0.26 | | | | 1.25 | | | | 1.25 | | | | 1.67 | | | 2.39 | | 59.70 | | $ | 10,167 | |
2014 | | $ | 40.89 | | | | 0.16 | | | | 7.43 | | | 7.59 | | | (0.24 | ) | | — | | | (0.24 | ) | | $48.24 | | | 0.36 | | | | 1.24 | | | | 1.24 | | | | 1.69 | | | 18.56 | | 72.43 | | $ | 11,330 | |
2013 | | $ | 31.50 | | | | 0.13 | | | | 9.26 | | | 9.39 | | | — | | | — | | | — | | | $40.89 | | | 0.39 | | | | 1.25 | | | | 1.25 | | | | 1.67 | | | 29.81 | | 61.50 | | $ | 13,340 | |
2012 | | $ | 27.68 | | | | (0.07 | ) | | | 3.89 | | | 3.82 | | | — | | | — | | | — | | | $31.50 | | | (0.24 | ) | | | 1.25 | | | | 1.25 | | | | 1.50 | | | 13.80 | | 54.16 | | $ | 45,989 | |
CLASS R5 SHARES | | | | | | | | | | | | | | | | | | | | | | | | | | | | | | | | | | | | | | | | | | | |
2016 | | $ | 50.45 | | | | 0.53 | | | | 4.90 | | | 5.43 | | | (0.38 | ) | | — | | | (0.38 | ) | | $55.50 | | | 1.00 | | | | 0.99 | | | | 0.99 | | | | 1.46 | | | 10.78 | | 31.10 | | $ | 14,738 | |
2015 | | $ | 49.21 | | | | 0.27 | | | | 1.04 | | | 1.31 | | | (0.07 | ) | | — | | | (0.07 | ) | | $50.45 | | | 0.51 | | | | 0.99 | | | | 0.99 | | | | 1.20 | | | 2.65 | | 59.70 | | $ | 19,270 | |
2014 | | $ | 41.89 | | | | 0.28 | | | | 7.61 | | | 7.89 | | | (0.57 | ) | | — | | | (0.57 | ) | | $49.21 | | | 0.59 | | | | 0.98 | | | | 0.98 | | | | 1.42 | | | 18.88 | | 72.43 | | $ | 30,676 | |
2013 | | $ | 32.19 | | | | 0.22 | | | | 9.48 | | | 9.70 | | | — | | | — | | | — | | | $41.89 | | | 0.63 | | | | 0.99 | | | | 0.99 | | | | 1.37 | | | 30.13 | | 61.50 | | $ | 47,076 | |
2012 | | $ | 28.22 | | | | — | (e) | | | 3.98 | | | 3.98 | | | (0.01 | ) | | — | | | (0.01 | ) | | $32.19 | | | — | (f) | | | 0.99 | | | | 0.99 | | | | 1.17 | | | 14.10 | | 54.16 | | $ | 129,995 | |
| (a) | Not annualized for periods less than one year. |
| (b) | Sales loads are not reflected in computing total return. |
| (c) | Class B shares converted to Class A shares on August 29, 2016. |
| (d) | Due to the size of net assets and fixed expenses, ratios may appear disproportionate. |
| (e) | Net investment income (loss) was less than $0.01 per share. |
| (f) | Net investment income (Loss) is less than 0.01%. |
| + | Based on weighted average shares outstanding. |
See notes to financial statements.
| | | | |
| 26 Annual Report | | | | Annual Report 27 |
REPORT OF INDEPENDENT REGISTERED PUBLIC ACCOUNTING FIRM
Thornburg Value Fund
To the Trustees and Shareholders of
Thornburg Value Fund
In our opinion, the accompanying statement of assets and liabilities, including the schedule of investments in securities, and the related statements of operations and of changes in net assets and the financial highlights present fairly, in all material respects, the financial position of the Thornburg Value Fund (the “Fund”) at September 30, 2016, the results of its operations for the year then ended, the changes in its net assets for each of the two years in the period then ended and the financial highlights for each of the five years in the period then ended, in conformity with accounting principles generally accepted in the United States of America. These financial statements and financial highlights (hereafter referred to as “financial statements”) are the responsibility of the Fund’s management. Our responsibility is to express an opinion on these financial statements based on our audits. We conducted our audits of these financial statements in accordance with the standards of the Public Company Accounting Oversight Board (United States). Those standards require that we plan and perform the audit to obtain reasonable assurance about whether the financial statements are free of material misstatement. An audit includes examining, on a test basis, evidence supporting the amounts and disclosures in the financial statements, assessing the accounting principles used and significant estimates made by management, and evaluating the overall financial statement presentation. We believe that our audits, which included confirmation of securities at September 30, 2016 by correspondence with the custodian, brokers, transfer agent, and the application of alternative procedures where securities purchased had not been received, provide a reasonable basis for our opinion.
PricewaterhouseCoopers LLP
New York, New York
November 18, 2016
28 Annual Report
| | |
| EXPENSE EXAMPLE | | |
| |
Thornburg Value Fund | | September 30, 2016 |
As a shareholder of the Fund, you incur two types of costs:
| | (1) | transaction costs, including |
(a) sales charges (loads) on purchase payments for Class A shares;
(b) a deferred sales charge on redemptions of any part or all of a purchase of $1 million of Class A shares within 12 months of purchase;
(c) a deferred sales charge on redemptions of Class C shares within 12 months of purchase;
| | (2) | ongoing costs, including management fees; distribution and/or service (12b-1) fees; and other Fund expenses. |
This example is intended to help you understand your ongoing costs (in dollars) of investing in the Fund and to compare these costs with the ongoing costs of investing in other mutual funds.
The example is based on a $1,000 investment beginning on April 1, 2016, and held until September 30, 2016.
| | | | | | | | | | | | |
| | | Beginning
Account Value
4/1/16 | | | Ending
Account Value
9/30/16 | | | Expenses Paid
During Period†
4/1/16–9/30/16 | |
Class A Shares | | | | | | | | | | | | |
Actual | | $ | 1,000.00 | | | $ | 1,073.20 | | | $ | 7.13 | |
Hypothetical* | | $ | 1,000.00 | | | $ | 1,018.12 | | | $ | 6.94 | |
Class C Shares | | | | | | | | | | | | |
Actual | | $ | 1,000.00 | | | $ | 1,069.30 | | | $ | 10.98 | |
Hypothetical* | | $ | 1,000.00 | | | $ | 1,014.39 | | | $ | 10.69 | |
Class I Shares | | | | | | | | | | | | |
Actual | | $ | 1,000.00 | | | $ | 1,075.30 | | | $ | 5.14 | |
Hypothetical* | | $ | 1,000.00 | | | $ | 1,020.05 | | | $ | 5.00 | |
Class R3 Shares | | | | | | | | | | | | |
Actual | | $ | 1,000.00 | | | $ | 1,073.50 | | | $ | 7.00 | |
Hypothetical* | | $ | 1,000.00 | | | $ | 1,018.25 | | | $ | 6.81 | |
Class R4 Shares | | | | | | | | | | | | |
Actual | | $ | 1,000.00 | | | $ | 1,074.10 | | | $ | 6.52 | |
Hypothetical* | | $ | 1,000.00 | | | $ | 1,018.71 | | | $ | 6.35 | |
Class R5 Shares | | | | | | | | | | | | |
Actual | | $ | 1,000.00 | | | $ | 1,075.40 | | | $ | 5.14 | |
Hypothetical* | | $ | 1,000.00 | | | $ | 1,020.05 | | | $ | 5.00 | |
| † | Expenses are equal to the annualized expense ratio for each class (A: 1.38%; C: 2.12%; I: 0.99%; R3: 1.35%; R4: 1.26%; R5: 0.99%) multiplied by the average account value over the period, multiplied by 183/366 to reflect the one-half year period. |
| * | Hypothetical assumes a rate of return of 5% per year before expenses. |
ACTUAL EXPENSES
For each class of shares, the first line of the accompanying table provides information about actual account values and actual expenses. You may use the information in this line, together with the amount you invested, to estimate the expenses that you paid over the period. Simply divide your account value by $1,000 (for example, an $8,600 account value divided by $1,000 = 8.6), then multiply the result by the number in the first line for your class of shares under the heading entitled “Expenses Paid During Period” to estimate the expenses you paid on your account during this period.
HYPOTHETICAL EXAMPLE FOR COMPARISON PURPOSES
For each class of shares, the second line of the accompanying table provides information about hypothetical account values and hypothetical expenses based on the Fund’s actual expense ratio and an assumed rate of return of 5% per year before expenses, which is not the Fund’s actual return. The hypothetical account values and expenses may not be used to estimate the actual ending account balance or expenses you paid for the period. You may use this information to compare the ongoing costs of investing in the Fund and other funds. To do so, compare this 5% hypothetical example with the 5% hypothetical examples that appear in the shareholder reports of the other funds.
Please note that the expenses shown in the table are meant to highlight your ongoing costs only and do not reflect any transactional costs, such as sales charges (loads), redemption fees, or exchange fees. Therefore, the second line of the table for each class of shares is useful in comparing ongoing costs only, and will not help you determine the relative total costs of owning different funds. In addition, if these transactional costs were included, your costs would have been higher.
Annual Report 29
| | |
| TRUSTEES AND OFFICERS | | |
| |
Thornburg Value Fund | | September 30, 2016 (Unaudited) |
| | | | |
Name, Age, Year Elected Position Held with Fund | | Principal Occupation(s) During Past Five Years | | Other Directorships Held by Trustee |
INTERESTED TRUSTEES (1)(2)(4) | | |
| | |
Garrett Thornburg, 71 Trustee since 1987, Chairman of Trustees(3) | | Chairman and controlling shareholder of Thornburg Investment Management, Inc. (investment advisor); Chairman and controlling shareholder of Thornburg Securities Corporation (securities dealer); Chairman and CEO of Chamisa Energy, LLC; President of the Thornburg Foundation (nonprofit). | | None |
| | |
Brian J. McMahon, 61 Trustee since 2001, Vice Chairman of Trustees, Member of Governance & Nominating Committee & Operations Risk Oversight Committee(5) | | Chief Investment Officer, Managing Director, and Portfolio Manager and, until 2016, CEO and President of Thornburg Investment Management, Inc.; Vice President of Thornburg Securities Corporation. | | None |
| |
INDEPENDENT TRUSTEES (1)(2)(4) | | |
| | |
David A. Ater, 71 Trustee since 1994, Member of Audit Committee & Chairman of Governance & Nominating Committee | | Principal in Ater & Associates, Santa Fe, NM (developer, planner and broker of residential and commercial real estate); owner, developer and broker for various real estate projects. | | None |
| | |
David D. Chase, 75 Trustee since 2000, Chairman of Audit Committee | | Managing Member of CS Group, LLC, Santa Fe, NM (private investment fund – family office). | | None |
| | |
Sally Corning, 55 Trustee since 2012, Member of Audit Committee | | Partner in Sun Mountain Capital, Santa Fe, NM (private equity firm with investment programs encompassing venture capital, mezzanine debt, and growth equity). | | None |
| | |
Susan H. Dubin, 67 Trustee since 2004, Member of Audit Committee & Governance and Nominating Committee | | President of Dubin Investments, Ltd., Greenwich, CT (private investment fund); Director and officer of various charitable organizations. | | None |
| | |
David L. Gardner, 53 Trustee since 2015, Member of Operations Risk Oversight Committee | | Until 2012, head of EMEA (Europe, Middle East and Africa) Sales for iShares of Blackrock, Inc., EMEA Executive Committee Member and EMEA Operating Committee Member at Blackrock, Inc. | | None |
| | |
Owen D. Van Essen, 62 Trustee since 2004, Member of Governance & Nominating Committee & Chairman of Operations Risk Oversight Committee | | President of Dirks, Van Essen & Murray, Santa Fe, NM (newspaper mergers and acquisitions). | | None |
| | |
James W. Weyhrauch, 57 Trustee since 1996, Member of Audit Committee & Operations Risk Oversight Committee | | Real estate broker, Santa Fe Properties, Santa Fe, NM; Vice Chairman of Nambe LLC, Santa Fe, NM (manufacturing & design company). | | None |
30 Annual Report
| | |
| TRUSTEES AND OFFICERS, CONTINUED | | |
| |
Thornburg Value Fund | | September 30, 2016 (Unaudited) |
| | | | |
Name, Age, Year Elected Position Held with Fund | | Principal Occupation(s) During Past Five Years | | Other
Directorships
Held by Trustee |
| |
OFFICERS OF THE FUND (WHO ARE NOT TRUSTEES) (1)(7) | | |
| | |
Nimish Bhatt, 53 Treasurer since 2016(6) | | Chief Financial Officer and Treasurer of Thornburg Investment Management, Inc. and Thornburg Securities Corporation since 2016; Senior Vice President (2004-2016), Chief Financial Officer (2011-2016), and Head of Fund Administration (2011-2016) of Calamos Asset Management, Inc., Calamos Investments LLC, Calamos Advisors LLC, and Calamos Wealth Management; Director of Calamos Global Funds plc (2007-2016). | | Not applicable |
| | |
Jason Brady, 42 President since 2016(6) | | CEO and President since 2016, Vice President from 2011 to 2016, Portfolio Manager and Managing Director of Thornburg Investment Management, Inc.; Vice President of Thornburg Securities Corporation since 2016. | | Not applicable |
| | |
Kathleen Brady, 56 Vice President since 2008 | | Tax Manager Fund Accounting of Thornburg Investment Management, Inc. | | Not applicable |
| | |
Connor Browne, 37 Vice President since 2006 | | Portfolio Manager, Vice President since 2013, and Managing Director of Thornburg Investment Management, Inc. | | Not applicable |
| | |
Tim Cunningham, 41 Vice President since 2014 | | Managing Director since 2011, Portfolio Manager since 2012, and Associate Portfolio Manager from 2009–2012 of Thornburg Investment Management, Inc. | | Not applicable |
| | |
Randy Dry, 42 Vice President since 2014 | | Vice President and Managing Director, Director of Institutional Group from 2014-2016, and since 2016, Chief Administrative Officer of Thornburg Investment Management, Inc. | | Not applicable |
| | |
Greg Dunn, 40 Vice President since 2014 | | Managing Director, Portfolio Manager since 2012, and Associate Portfolio Manager from 2009–2012 of Thornburg Investment Management, Inc. | | Not applicable |
| | |
Lon Erickson, 41 Vice President since 2008 | | Portfolio Manager and Managing Director of Thornburg Investment Management, Inc. | | Not applicable |
| | |
William V. Fries, 77 Vice President since 1995 | | Portfolio Manager, Vice President, and Managing Director of Thornburg Investment Management, Inc. | | Not applicable |
| | |
Thomas Garcia, 45 Vice President since 2006 | | Vice President since 2011, Managing Director, Head Equity Trader, and Associate Portfolio Manager of Thornburg Investment Management, Inc. | | Not applicable |
| | |
Rolf Kelly, 37 Vice President since 2016 | | Portfolio Manager and Managing Director since 2013 and Associate Portfolio Manager from 2011–2013 of Thornburg Investment Management, Inc. | | Not applicable |
| | |
Ben Kirby, 36 Vice President since 2014 | | Portfolio Manager and Managing Director since 2013 and Associate Portfolio Manager from 2011–2013 of Thornburg Investment Management, Inc. | | Not applicable |
| | |
Jeff Klingelhofer, 41 Vice President since 2016 | | Portfolio Manager and Managing Director since 2015, Associate Portfolio Manager from 2012–2015, and Fixed Income Analyst from 2010–2012 of Thornburg Investment Management, Inc. | | Not applicable |
| | |
Rob MacDonald, 40 Vice President since 2016 | | Managing Director since 2015, Portfolio Manager since 2014, and Associate Portfolio Manager from 2011–2014 of Thornburg Investment Management, Inc. | | Not applicable |
| | |
Leigh Moiola, 49 Vice President since 2001 | | Vice President, Managing Director, and Director of Marketing of Thornburg Investment Management, Inc.; Vice President of Thornburg Securities Corporation. | | Not applicable |
| | |
Christopher Ryon, 60 Vice President since 2008 | | Portfolio Manager and Managing Director of Thornburg Investment Management, Inc. | | Not applicable |
| | |
Nicholos Venditti, 35 Vice President since 2016 | | Portfolio Manager and Managing Director since 2015 and Associate Portfolio Manager from 2011–2015 of Thornburg Investment Management, Inc. | | Not applicable |
Annual Report 31
| | |
| TRUSTEES AND OFFICERS, CONTINUED | | |
| |
Thornburg Value Fund | | September 30, 2016 (Unaudited) |
| | | | |
Name, Age, Year Elected Position Held with Fund | | Principal Occupation(s) During Past Five Years | | Other
Directorships
Held by Trustee |
| | |
Vinson Walden, 46 Vice President since 2004 | | Portfolio Manager and Managing Director of Thornburg Investment Management, Inc. | | Not applicable |
| | |
Lei Wang, 45 Vice President since 2006 | | Portfolio Manager and Managing Director of Thornburg Investment Management, Inc. | | Not applicable |
| | |
Sasha Wilcoxon, 42 Vice President since 2003 Secretary since 2007(6) | | Managing Director, Director of Mutual Fund Operations, and Vice President of Thornburg Investment Management, Inc.; Vice President of Thornburg Securities Corporation. | | Not applicable |
| | |
Charles Wilson, 41 Vice President since 2016 | | Portfolio Manager and Managing Director since 2014 and Associate Portfolio Manager from 2012–2014 of Thornburg Investment Management, Inc.; Co-Portfolio Manager of Marsico Capital Management from 2010–2012. | | Not applicable |
| | |
Di Zhou, 38 Vice President since 2016 | | Portfolio Manager and Managing Director since 2016, Associate Portfolio Manager from 2014–2016, and Equity Research Analyst from 2010–2014 of Thornburg Investment Management, Inc. | | Not applicable |
| (1) | Each person’s address is 2300 North Ridgetop Road, Santa Fe, New Mexico 87506. |
| (2) | The Fund is a separate investment “Fund” or “series” of Thornburg Investment Trust (the “Trust”), which comprises the Thornburg mutual fund complex and is organized as a Massachusetts business trust. Thornburg Investment Management, Inc. is the investment advisor to, and manages, all the Funds of the Trust. Each Trustee oversees all the Funds of the Trust. |
| (3) | Mr. Thornburg is considered an “interested” Trustee under the Investment Company Act of 1940 because he is the sole director and controlling shareholder of Thornburg Investment Management, Inc., the investment advisor to the Trust, and is the sole director and controlling shareholder of Thornburg Securities Corporation, the distributor of shares for the Trust. |
| (4) | The Bylaws of the Trust currently require that each Trustee shall retire by the end of the calendar year during which the Trustee reached the age of 75 years. Otherwise each Trustee serves in office until the election and qualification of a successor or until the Trustee sooner dies, resigns, retires or is removed. |
| (5) | Mr. McMahon is considered an “interested” Trustee under the Investment Company Act of 1940 because he is the chief investment officer of Thornburg Investment Management, Inc. |
| (6) | The Trust’s president, secretary, and treasurer each serves a one-year term or until the election and qualification of a successor; each other officer serves at the pleasure of the Trustees. |
| (7) | Assistant vice presidents, assistant secretaries, and assistant treasurers are not shown. |
The Statement of Additional Information for each Fund of the Trust includes additional information about the Trustees and is available, without charge and upon request, by calling 1-800-847-0200.
32 Annual Report
| | |
| OTHER INFORMATION | | |
| |
Thornburg Value Fund | | September 30, 2016 (Unaudited) |
PORTFOLIO PROXY VOTING
Policies and Procedures:
The Trust has delegated to Thornburg Investment Management, Inc. (the “Advisor”) voting decisions respecting proxies for the Fund’s voting securities. The Advisor makes voting decisions in accordance with its Proxy Voting Policy and Procedures. A description of the Policy and Procedures is available (i) without charge, upon request, by calling the Advisor toll-free at 1-800-847-0200, (ii) on the Thornburg website at www.thornburg.com, and (iii) on the Securities and Exchange Commission’s website at www.sec.gov.
Information regarding how proxies were voted is available on or before August 31 of each year for the twelve months ending the preceding June 30. This information is available (i) without charge, upon request by calling the Advisor toll-free at 1-800-847-0200, (ii) on the Thornburg website at www.thornburg.com, and (iii) on the Securities and Exchange Commission’s website at www.sec.gov.
AVAILABILITY OF QUARTERLY PORTFOLIO SCHEDULE
The Fund files with the Securities and Exchange Commission schedules of its portfolio holdings on Form N-Q for the first and third quarters of each fiscal year. The Fund’s Forms N-Q are available on the Commission’s website at www.sec.gov, or may be reviewed and copied at the Commission’s Public Reference Room in Washington, D.C. Information on the operation of the Public Reference Room may be obtained by calling 1-800-SEC-0330. The Fund also makes this information available on its website at www.thornburg. com/download or upon request by calling 1-800-847-0200.
TAX INFORMATION
For the tax year ended September 30, 2016, dividends paid by the Thornburg Value Fund of $3,410,496 are being reported as taxable ordinary investment income dividends for federal income tax purposes.
For the tax year ended September 30, 2016, the Fund is reporting 100.00% (or the maximum allowed) of the dividends paid from tax basis net ordinary income as qualifying for the reduced rate under the Jobs and Growth Tax Relief and Reconciliation Act of 2003.
The Fund is reporting 100.00% (or the maximum allowed) of the ordinary income distributions paid by the Fund for the fiscal year ended September 30, 2016 as qualified for the corporate dividends received deduction.
The information and distributions reported herein may differ from the information and distributions reported to the shareholders for the calendar year ending December 31, 2016.
Complete information will be reported in conjunction with your 2016 Form 1099.
STATEMENT RESPECTING RENEWAL OF INVESTMENT ADVISORY AGREEMENT
Thornburg Investment Management, Inc. (the “Advisor”) provides investment management services to Thornburg Value Fund pursuant to an investment advisory agreement. The Trustees consider the renewal of this agreement annually, and most recently determined to renew the agreement on September 13, 2016.
In anticipation of their recent consideration of the advisory agreement’s renewal, the independent Trustees met in May 2016 to consider aspects of their annual evaluation of the Advisor’s service to all of the funds of Thornburg Investment Trust, to plan the annual evaluation of the Advisor’s performance and to specify the information the Advisor would present to the Trustees for their review. The independent Trustees met again in independent session in September to consider portions of the information submitted by the Advisor. The Advisor’s chief investment officer subsequently reviewed portions of the information with the Trustees and addressed questions from the Trustees at a full meeting session of the Trustees scheduled for that purpose, and the independent Trustees thereafter met in independent session to consider the Advisor’s presentation and various specific issues respecting their consideration of the advisory agreement’s renewal. Following these sessions, the Trustees met to consider renewal of the agreement, and the independent Trustees voted unanimously at that meeting to renew the agreement for an additional term of one year.
The information below summarizes certain factors considered by the Trustees in connection with the determination to renew the advisory agreement. In determining to renew the agreement, the Trustees considered a wide range of information and did not identify any single factor as controlling, and this summary does not describe all of the factors and other matters considered by the Trustees in making their determination.
Annual Report 33
| | |
| OTHER INFORMATION, CONTINUED | | |
| |
Thornburg Value Fund | | September 30, 2016 (Unaudited) |
Nature, Extent and Quality of Services. The Trustees considered presentations by the Advisor at meeting sessions scheduled for consideration of a continuation of the advisory agreement, and also noted their consideration of the reports the Trustees and their committees receive throughout the year on a wide variety of topics, and consideration they had given to a number of topics in previous years. Information identified by the Trustees in their evaluation as having been considered and contributing to their conclusions included Trustees’ assessments of the Advisor’s personnel developed in formal and informal meetings throughout the year, the Advisor’s staffing levels and measures to maintain staffing levels and improve competencies, the Advisor’s commitment to attract and retain high quality portfolio management expertise through competitive compensation levels, the Advisor’s collaborative approach to investment management, the Fund’s investment performance over different periods of time, portfolio managers’ cognizance of and strategies to address market and economic trends and conditions, the evaluation and selection of individual investments, the structuring and composition of the Fund’s portfolio, management of Fund liquidity requirements, cognizance of and efforts to achieve tax efficiency, responses to share sale and redemption activity, continuing enhancements to the Advisor’s electronic and information systems and the Advisor’s engagement of outside firms to assist in improving or replacing those systems, the Advisor’s evaluation and selection of firms providing portfolio trade execution to the Fund and the Advisor’s measures to obtain favorable trade execution, the Advisor’s performance of accounting and other services, the Advisor’s continued commitment to observance of compliance and regulatory requirements, the Advisor’s responsiveness to the Trustees, the quality and extent of written and oral reports to the Trustees over the course of the year, and other factors.
Investment Performance. The Trustees noted in their evaluation of the Fund’s investment performance the reports they had received in each regular meeting over the course of the year from the Advisor’s portfolio management personnel. The Trustees also noted in their evaluation their consideration of information provided to them at their request in anticipation of their annual evaluation of the Advisor’s services, including the following items of information respecting the investment performance of the Fund: (1) the Fund’s absolute investment performance and achievement of stated objectives; (2) the Advisor’s written and oral explanations and commentary on the Fund’s performance in the context of the Fund’s objectives and reasonable expectations, and business, market and economic conditions, (3) performance data for the ten most recent calendar years, comparing the Fund’s annual investment returns to a fund category selected by an independent mutual fund analyst firm, and to two broad-based securities indices, (4) the Fund’s investment performance for the three-month, year-to-date, one-year, three-year, five-year and ten-year periods ending with the second quarter of the current year comparing the Fund’s annualized returns to two mutual fund categories selected by independent mutual fund analyst firms and to two broad-based securities indices, and assigning a percentage rank to the Fund’s performance for each period relative to each of the fund categories, (5) comparison of the Fund’s annualized return since inception to the Fund’s benchmark index, and (6) comparative measures of estimated earnings growth, portfolio volatility, risk and return.
The Trustees noted that quarterly reports during the year and other information presented to them confirmed the Advisor’s continued conformity to the Fund’s stated investment objectives and policies.
The Trustees observed in reviewing comparative performance data for the ten most recent calendar years that the Fund’s investment return for the most recent calendar year was higher than the returns of the two securities indices and comparable to the average return of the fund category considered, the returns of the Fund for the preceding nine years exceeded the returns of the first index in four of the nine years and exceeded or were comparable to the returns of the second index in four of the nine years, and that the returns of the Fund exceeded or were comparable to the average returns of the fund category in five of the nine years. Other quantitative data noted by the Trustees as having been considered in their evaluation showed that the Fund’s annualized investment returns varied, falling in the top decile of performance of a mutual fund category for the three-year period ended with the second quarter of the current year, but falling in the third quartile of performance for the ten-year period, and falling in the fourth quartile for the one-year and five-year periods. Noted data also showed that the Fund’s annualized investment returns fell in the top decile of investment performance of a second fund category for the three-year period, fell in the third quartile of performance of the fund category for the one-year and five-year periods, and fell near the midpoint of performance for the ten-year period. Data presented to the Trustees also showed that the Fund’s annualized total return (net of expenses) since the Fund’s inception exceeded the annualized return of the Fund’s benchmark index,. The Trustees attached additional significance to the performance data of the Fund from the perspective of longer term shareholders. The Trustees asked for and received explanations from the Advisor respecting the reasons for the Fund’s underperformance relative to some measures in certain periods, and considered the Advisor’s past success in rectifying underperformance by other funds and the Advisor’s expectations for improvement in this Fund’s performance. The Trustees found these explanations satisfactory, but requested the Advisor to present expanded quarterly reports to them respecting the Advisor’s execution of the Fund’s investment strategies and other matters.
Comparisons of Fee and Expense Levels. The Trustees observed the clear disclosures of the Advisor’s fees and Fund expenses in the Fund’s prospectuses. Information noted by the Trustees as having been considered in this context included a variety of comparative data respecting the Fund’s fee and expense levels. This information included comparisons of the Fund’s advisory fee and overall Fund expenses to median and average fees and expenses charged to a category of mutual funds selected by an independent mutual fund analyst firm, comparisons of the advisory fee and other Fund expenses to the fee levels and expenses for two representative share classes of fund peer groups selected from the category by a second independent mutual fund analyst firm, the perspectives and advice from the second mutual fund analyst firm respecting comparisons of fund fee levels and expenses to fund peer groups, and other information. Comparative fee and expense data noted as having been considered by the Trustees showed that the advisory fee for the
34 Annual Report
| | |
| OTHER INFORMATION, CONTINUED | | |
| |
Thornburg Value Fund | | September 30, 2016 (Unaudited) |
Fund was slightly higher than the median and average fee levels for the fund category, the level of total expense for a representative share class of the Fund was somewhat higher than the median and average expense levels for the category, and that the level of total expense for a second representative share class was lower than the median and average levels for the category. Peer group data showed that the Fund’s advisory fee level was higher than the median of each peer group and that the total expense levels for two representative share classes were above the medians of their peer groups, but that these levels were within the range of group fee and expense levels and generally comparable to a number of other funds in the groups. The Trustees did not find the differences significant in view of the other factors considered.
The Trustees noted their consideration of information respecting the advisory fees charged by the Advisor to other investment management clients, including sub-advised mutual funds, together with information about fees charged by other advisors to different clients, analysis of the differences between the requirements of institutional clients and mutual funds, analysis of the differences between the requirements of a sub-advised mutual fund and a fund as to which the investment advisor is the primary advisor and sponsor, descriptions of distinguishing characteristics of the sub-advised funds served by the Advisor, and the consequently different investment management services provided to the different categories of clients and the differing contexts in which the fee levels for these arrangements are established. The Trustees confirmed their previous observations that the differences between the fees charged by the Advisor to different types of clients did not appear exceptional, and that the fee rates charged by an investment advisor to different categories of clients had limited relevance to the evaluation of the fee rate charged by that advisor to mutual funds as to which it is the primary advisor and sponsor.
Costs and Profitability of Advisor. In reviewing the profitability to the Advisor of its services to the Fund, the Trustees considered an analysis of the Advisor’s costs and the profitability to the Advisor of its services for the Fund together with data respecting the overall profitability of a selection of other investment management firms. The Trustees also considered in this regard the relationship of the Advisor’s efficiency and cost management to its profitability, and the contribution of the Advisor’s cost management, profitability and financial resources to its ability to attract necessary personnel, invest in systems and other assets required for its service to the Fund, and maintain service levels for the Fund notwithstanding fluctuations in revenues and profitability. The information considered did not indicate to the Trustees that the Advisor’s profitability was excessive.
Potential Economies of Scale. In reviewing the extent to which economies of scale would be realized as the Fund’s assets increase and whether fee levels reflect any economies of scale, the Trustees considered the breakpoint structure for advisory fees chargeable to the Fund, comparisons of the fee breakpoint structure for the Fund with breakpoint structures (or the absence of such structures) for other funds in a peer group selected by an independent mutual fund analyst firm, the effects of the breakpoint structure and other expense factors realized by the Fund and other funds of the Trust as their asset levels had increased, and the Advisor’s initiatives to enhance its systems and other measures to increase its capabilities. The information provided demonstrated to the Trustees that the Fund’s advisory fee breakpoint structure is reasonable in relation to the structures observed in the other funds in its peer group, and that shareholders may be expected to benefit from any economies of scale due to the advisory agreement’s breakpoint fee structure and other factors.
Potential Ancillary Benefits. In reviewing potential benefits to the Advisor because of its relationship to the Fund, the Trustees noted disclosures by the Advisor of its receipt of certain research services from broker dealers, and the benefits to both the Fund and the Advisor of the Advisor’s expansion of its staffing, compliance and systems capabilities and other resources to serve a broader variety of investment management clients. No unusual or unfair benefits to the Advisor from its relationship to the Fund were identified by the Trustees.
Summary of Conclusions. The Trustees concluded that the nature, extent and quality of the Advisor’s services performed under the advisory agreement remained sufficient. The Trustees further concluded that the absolute and relative investment performance of the Fund over a range of pertinent holding periods on the whole was satisfactory in the context of its objectives and strategies, and that the Advisor had continued to actively and competently pursue the Fund’s stated investment objectives and adhere to the Fund’s investment policies.
The Trustees further concluded, based upon their consideration of the foregoing factors and other information, that the level of the advisory fee charged to the Fund by the Advisor is reasonable in relation to the services provided by the Advisor in view of the nature, extent and quality of those services, the investment performance of the Fund after fees and expenses, the clear disclosure of fees and expenses in the Fund’s prospectuses, comparisons of fees and expenses charged to the Fund to fees and expenses charged to other mutual funds, and the other factors considered.
Annual Report 35
TRUSTEES’ STATEMENT TO SHAREHOLDERS
Readopted September 12, 2016
The Trustees believe current and prospective shareholders should know how we discharge our responsibilities in supervising the Funds’ investment advisor and in reviewing the advisor’s contract for renewal. Since 2005, we have issued a statement which sets out clearly the three principal guidelines that we follow in supervising the Trust’s investment advisor on your behalf. In accordance with our customary practice, in September of this year we again reviewed our statement and concluded we should reissue this statement outlining the principal features of our supervision of the advisor’s performance of investment management services for the Funds.
We begin with the premise that each shareholder selected his or her Fund because its investments are managed by the investment advisor identified in the prospectus and in accordance with the objective and policies described in the prospectus. We realize, as each of you do, that if you believe that your Fund’s stated objective and policies no longer serve your personal investment goals, you can sell your shares and leave the Fund.
Therefore, we believe that our primary supervisory task – our principal obligation to you—is to assess the nature and quality of the advisor’s services, and to confirm that the advisor actively and competently pursues the Fund’s objective, in accordance with the policies set out in the prospectus. To do this, we meet regularly with management to review your Fund’s portfolio and to discuss the advisor’s specific actions and judgments in pursuing the Fund’s objective. We do not substitute our own judgment for the advisor’s decisions in selecting investments; the advisor is paid to exercise its informed judgment on investment decisions, and we seek to confirm, in reviewing the advisor’s performance, that the advisor is doing just that.
Second, we are conscious of costs and the effect that costs have on shareholders’ returns. We try to make sure that your Fund’s fees and costs are reasonable in relationship to the services rendered and that they are generally in line with those charged by other expert investment advisors, consistent with our belief that the Fund’s investors searched for and expect that expertise and attention and have decided to pay a reasonable price for it. We do not put the management contract “out to bid” as a matter of course, and we would not do so unless we had concluded that the advisor materially had failed to pursue the Fund’s objectives in accordance with its policies, or for other equally important reasons. We believe that any other approach would be inconsistent with your interests and contrary to your expectations when you bought shares of the Fund in the first place.
Finally, because we believe that most Thornburg Fund shareholders have invested with a long-term perspective, we try not to focus too much on the fashions of the moment and on short-term performance. The market will not favor any specific investment objective or set of policies at all times and under all economic circumstances. A fund will experience periods of both high and low returns relative to other funds and other investments. Even if one of our Funds is not favored by the market at a particular time, we believe that the advisor is nonetheless obliged to remain true to the Fund’s objective and policies, and we watch to see that it does so.
Trustees of Thornburg Investment Trust
36 Annual Report
THORNBURG FUNDS
Thornburg Investment Management is a privately-owned global investment firm that offers a range of solutions for retail and institutional investors. Founded in 1982 and headquartered in Santa Fe, New Mexico, we manage approximately $53 billion (as of September 30, 2016) across eight equity and 11 bond mutual funds, separate accounts for high-net-worth investors and institutional accounts, and five UCITS funds for non-U.S. investors.
The fund outlined in this report is one of many equity and fixed-income products available from Thornburg Investment Management.
Equity Funds
| | • | | Thornburg Core Growth Fund |
| | • | | Thornburg International Value Fund |
| | • | | Thornburg Better World International Fund |
| | • | | Thornburg International Growth Fund |
| | • | | Thornburg Developing World Fund |
| | • | | Thornburg Investment Income Builder Fund |
| | • | | Thornburg Global Opportunities Fund |
Fixed Income Funds
| | • | | Thornburg Low Duration Income Fund |
| | • | | Thornburg Limited Term U.S. Government Fund |
| | • | | Thornburg Limited Term Income Fund |
| | • | | Thornburg Strategic Income Fund |
| | • | | Thornburg Low Duration Municipal Fund |
| | • | | Thornburg Limited Term Municipal Fund |
| | • | | Thornburg Intermediate Municipal Fund |
| | • | | Thornburg California Limited Term Municipal Fund |
| | • | | Thornburg New Mexico Intermediate Municipal Fund |
| | • | | Thornburg New York Intermediate Municipal Fund |
| | • | | Thornburg Strategic Municipal Income Fund |
Before investing, carefully consider the Fund’s investment goals, risks, charges, and expenses. For a prospectus or summary prospectus containing this and other information, contact your financial advisor or visit thornburg.com. Read it carefully before investing.
For additional information, please visit thornburg.com
Thornburg Investment Management, Inc. 2300 North Ridgetop Road, Santa Fe, NM 87506
Annual Report 37
This page intentionally left blank.
38 Annual Report
This page intentionally left blank.
Annual Report 39

| | |
To receive shareholder reports, prospectuses, and proxy statements electronically, go to www.thornburg.com/edelivery. | |  |
This Annual Report is submitted for the general information of shareholders of the Fund. It is not authorized for distribution to prospective investors in the Fund unless preceded or accompanied by an effective prospectus.
| | | | |
| Investment Advisor: | | Distributor: | | |
| Thornburg Investment Management® | | Thornburg Securities Corporation® | | |
| 800.847.0200 | | 800.847.0200 | | TH077 |
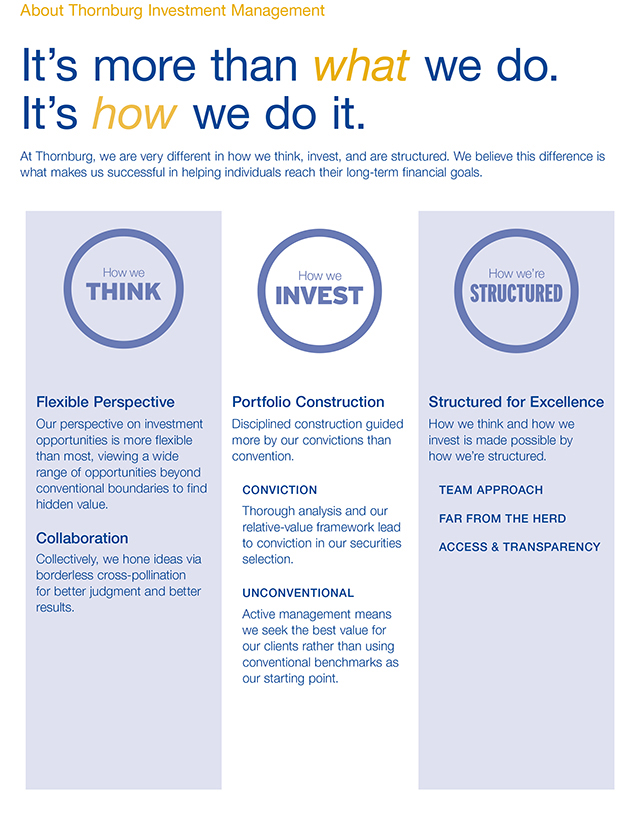
2 Annual Report
Annual Report
Thornburg International Value Fund
September 30, 2016
| | | | |
Share Class | | NASDAQ Symbol | | CUSIP |
Class A | | TGVAX | | 885-215-657 |
Class C | | THGCX | | 885-215-640 |
Class I | | TGVIX | | 885-215-566 |
Class R3 | | TGVRX | | 885-215-525 |
Class R4 | | THVRX | | 885-215-269 |
Class R5 | | TIVRX | | 885-215-368 |
Class R6 | | TGIRX | | 885-216-804 |
Class I, R3, R4, R5, and R6 shares may not be available to all investors. Minimum investments for Class I shares may be higher than those for other classes.
Investments carry risks, including possible loss of principal. Additional risks may be associated with investments outside the United States, especially in emerging markets, including currency fluctuations, illiquidity, volatility, and political and economic risks. Investments in small- and mid-capitalization companies may increase the risk of greater price fluctuations. Please see the Fund’s prospectus for a discussion of the risks associated with an investment in the Fund. Investments in the Fund are not FDIC insured, nor are they bank deposits or guaranteed by a bank or any other entity.
Funds invested in a smaller number of holdings may expose an investor to greater volatility.
Diversification does not assure or guarantee better performance and cannot eliminate the risk of investment losses.
Annual Report 3
LETTER TO SHAREHOLDERS
| | |
| |
Thornburg International Value Fund | | September 30, 2016 (Unaudited) |
October 28, 2016
Dear Fellow Shareholder:
The total return of the Thornburg International Value Fund (the Fund) for the 12 months ended September 30, 2016, was 1.90% (Class A shares without sales charge), a positive if modest return. The MSCI EAFE Index returned 6.52% and the MSCI ACWI ex-U.S. Index returned 9.80% for the same period. Last year at this time, we reported a fiscal year return of 1.25%, materially outperforming the MSCI EAFE Index and the MSCI ACWI ex-U.S. Index by 9.91 and 13.03 percentage points, respectively. While we are not satisfied with this year’s results, we are encouraged by the Fund’s recent performance and confident about the stocks we hold. We construct our focused portfolio on a fundamental basis. As such, it exhibits high active share and differs materially from its benchmarks. We believe it will deliver a better risk-adjusted return over the long term.
In review, while returns were positive point-to-point, month-to-month and day-to-day markets were quite volatile. The fiscal period started with a bang in October 2015, as markets recovered following a selloff largely driven by China “hard-landing” fears after the People’s Bank of China (PBOC) unexpectedly devalued the renminbi. This recovery quickly faded, though, as concerns of a potential U.S. recession sent global equity markets reeling to begin the 2016 calendar year. On February 11, 2016, both oil and equity markets bottomed, and a strong rally in the most cyclically exposed and beaten-up energy and materials markets ensued. This rally gained steam in the lead up to the U.K.’s referendum to leave the European Union, known as “Brexit.” Markets once again sold off sharply as investors reacted to the market uncertainty that the surprise outcome generated. All the while, central banks continued accommodative monetary policies, including unprecedented negative interest rates, first coming out of the Bank of Japan, followed by the European Central Bank. Among major central banks, the lone exception is the U.S. Federal Reserve Bank, which is expected to tighten policy again in the near term after a quarter-point hike off a zero bound last December. We live in an environment with 24-hour-news cycles and headlines impacting stock prices. In theory, stock prices reflect the present value of future cash flows. In the real world, news flow creates noise that can drive share prices away from what we believe may be a stock’s intrinsic value. As in the past, market moving events, such as elections, central bank decisions, and economic developments around the globe will continue to be part of the investment landscape. We attempt to manage the portfolio with this in mind and stick to our investment philosophy and process, which have served us well over the last 18 years. Moreover, volatility isn’t necessarily negative; it creates opportunity.
Performance data shown represents past performance and is no guarantee of future results. Investment return and principal value will fluctuate so shares, when redeemed, may be worth more or less than their original cost. Current performance may be lower or higher than quoted. For performance current to the most recent month end, visit thornburg.com or call 800.847.0200.
The maximum sales charge for Class A shares is 4.50%. The total annual fund operating expense of Class A shares is 1.27%, as disclosed in the most recent prospectus. If the sales charge had been deducted, returns would be lower.
Contributors and Detractors
Top contributors to performance for the period included Nippon Telegraph & Telephone (NTT), Ctrip.com International, Kweichow Moutai, Vinci, and Rakuten. We first purchased Nippon Telegraph & Telephone in July 2014. NTT is Japan’s largest telecommunications carrier, which owns a nationwide fiber network in Japan and has a majority ownership of NTT DoCoMo, Japan’s largest wireless communications carrier. NTT’s stock has performed well for three reasons: 1) margin improvement resulting from a change in its business model from retailing to wholesaling its fiber broadband service; 2) strong contributions from NTT DoCoMo’s operational turnaround; 3) a focus on shareholder return, including dividend and share repurchases. Ctrip.com is the largest online travel service provider in China. It’s a beneficiary of increased travel consumption spending, driven by growth in disposable income and online travel services continuing to gain share from offline bookings. During the period, the company also consolidated the second-largest online travel service provider, Qunar, resulting in easing industry competitive pressures. Kweichow Moutai is the largest white liquor (baijiu) company in China. The company has higher margins and higher returns than its global peers, benefiting from high barriers to entry (brand equity, manufacturing procedure, and location). As demand for its product rebounded, Kweichow Moutai re-rated. French-based toll-road operator and construction-contracting firm, Vinci, benefited from increased toll-road concessions, largely due to lower oil prices flowing through to vehicle travel. The company’s construction contracting business also benefits from the low interest-rate environment and talks of increased fiscal stimulus. Rakuten, the largest e-commerce site in Japan, delivered favorable stock returns thanks to an easing of the domestic competitive environment, continued strong performance in the FinTech (financial technology) segment, and margin improvement from its overseas business.
4 Annual Report
| | |
LETTER TO SHAREHOLDERS, CONTINUED | | |
| |
Thornburg International Value Fund | | September 30, 2016 (Unaudited) |
Top detractors from performance for the period included UBS, Aviva, Lloyds Banking Group, Liberty Global, and Telecom Italia.
Swiss wealth management and investment banking firm UBS Group and the U.K.’s Lloyds Banking Group came under pressure as the low interest rate environment weighed on net interest margins; increased legal and compliance costs; and elevated levels of capital requirements. London-based insurer, Aviva, has delivered Solvency II operational cash generation ahead of plan and is on track to realize synergies from its acquisition of Friends. However, Aviva was negatively impacted by Brexit as the resiliency of its business model came under question amid worries about the broader economic fallout from the U.K. referendum. Liberty Global, the London-based international cable company, was affected by the sentiment-driven market selloff at the beginning of 2016. Liberty Global has higher leverage characteristics relative to peers, adding to the downside, as companies with higher debt levels were punished a bit more. We held on to shares and exited the position later in the period following a recovery in the stock (and broader markets). Italian telecommunications carrier, Telecom Italia, fell on competitive pressure following the announcement of a competing company’s plans to build out its fiber network. Similar to Liberty Global, Telecom Italia also has a higher debt level and sold off along with other highly levered companies in the beginning of the year. We have exited the above stocks and redeployed capital to higher conviction ideas.
Conclusion
While performance for the fiscal year ended September 30, 2016, is disappointing, we are optimistic that our investment philosophy of building a robust portfolio of high-quality companies, diversified by our three categories of value (basic value, consistent earner, and emerging franchise) should serve our shareholders well as we look to add value over a market cycle.
As announced last year, Bill Fries has been transitioning off his primary and joint responsibility for the International Value Fund. Effective December 31, 2016, Bill will begin his new position as Senior Advisor of Thornburg Investment Management. In this role, he will continue as an investment analyst working closely with the 40 portfolio managers, associate portfolio managers and analysts at the firm. In addition, Bill will continue to provide his knowledge, insight, and experience, as he mentors and trains the investment talent at Thornburg.
We thank you for your confidence and your investment in the Thornburg International Value Fund.
Sincerely,

William V. Fries,CFA
Portfolio Manager
Managing Director

Lei Wang,CFA
Portfolio Manager
Managing Director

Di Zhou,CFA
Portfolio Manager
Managing Director
The matters discussed in this report may constitute forward-looking statements made pursuant to the safe harbor provisions of the Securities Litigation Reform Act of 1995. These include any advisor or portfolio manager prediction, assessment, analysis or outlook for individual securities, industries, investment styles, market sectors and/or markets. These statements involve risks and uncertainties. In addition to the general risks described for each fund in its current prospectus, other factors bearing on these reports include the accuracy of the advisor’s or portfolio manager’s forecasts and predictions, the appropriateness of the investment strategies designed by the advisor or portfolio manager and the ability of the advisor or portfolio manager to implement their strategies efficiently and successfully. Any one or more of these factors, as well as other risks affecting the securities markets generally, could cause the actual results of any fund to differ materially as compared to its benchmarks.
The views expressed by the portfolio managers reflect their professional opinions and are subject to change. Under no circumstances does the information contained within represent a recommendation to buy or sell any security.
Annual Report 5
| | |
| PERFORMANCE SUMMARY | | |
| |
Thornburg International Value Fund | | September 30, 2016 (Unaudited) |
Average Annual Total Returns
| | | | | | | | | | | | | | | | | | | | |
| | | 1-Yr | | | 3-Yr | | | 5-Yr | | | 10-Yr | | | Since
Incep. | |
Class A Shares (Incep: 5/28/98) | | | | | | | | | | | | | | | | | | | | |
Without sales charge | | | 1.90 | % | | | 1.00 | % | | | 6.47 | % | | | 3.39 | % | | | 7.24 | % |
With sales charge | | | -2.68 | % | | | -0.54 | % | | | 5.50 | % | | | 2.91 | % | | | 6.97 | % |
Class C Shares (Incep: 5/28/98) | | | | | | | | | | | | | | | | | | | | |
Without sales charge | | | 1.12 | % | | | 0.27 | % | | | 5.69 | % | | | 2.64 | % | | | 6.40 | % |
With sales charge | | | 0.28 | % | | | 0.27 | % | | | 5.69 | % | | | 2.64 | % | | | 6.40 | % |
Class I Shares (Incep: 3/30/01) | | | 2.21 | % | | | 1.36 | % | | | 6.87 | % | | | 3.79 | % | | | 6.90 | % |
Class R3 Shares (Incep: 7/1/03) | | | 1.67 | % | | | 0.82 | % | | | 6.27 | % | | | 3.22 | % | | | 8.03 | % |
Class R4 Shares (Incep: 2/1/07) | | | 1.87 | % | | | 1.01 | % | | | 6.49 | % | | | — | | | | 2.36 | % |
Class R5 Shares (Incep: 2/1/05) | | | 2.19 | % | | | 1.31 | % | | | 6.78 | % | | | 3.71 | % | | | 6.02 | % |
Class R6 Shares (Incep: 5/1/12) | | | 2.40 | % | | | 1.54 | % | | | — | | | | — | | | | 4.53 | % |
MSCI EAFE Index (Since 5/28/98) | | | 6.52 | % | | | 0.48 | % | | | 7.39 | % | | | 1.82 | % | | | 3.67 | % |
MSCI AC World ex-U.S. Index (Gross) (Since 5/28/98) | | | 9.80 | % | | | 0.64 | % | | | 6.52 | % | | | 2.63 | % | | | 4.58 | % |
Growth of a Hypothetical $10,000 Investment
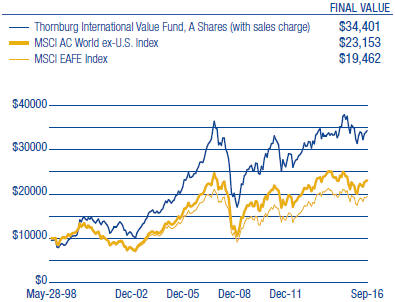
Performance data shown represents past performance and is no guarantee of future results. Investment return and principal value will fluctuate so shares, when redeemed, may be worth more or less than their original cost. Current performance may be lower or higher than quoted. For performance current to the most recent month end, visit thornburg.com or call 800-847-0200. The performance information does not reflect the deduction of taxes that a shareholder would pay on distributions or the redemption of Fund shares. Returns reflect the reinvestment of dividends and capital gains. Class A shares are sold with a maximum sales charge of 4.50%. Class C shares are subject to a 1% CDSC for the first year only. There is no sales charge for Class I, R3, R4, R5 and R6 shares.
As disclosed in the most recent prospectus, the total annual fund operating expenses are as follows: A shares, 1.27%; C shares, 1.99%; I shares, 0.90%; R3 shares, 1.58%; R4 shares, 1.37%; R5 shares, 1.11%; R6 shares, 0.74%. Thornburg Investment Management and/or Thornburg Securities Corporation have contractually agreed to waive fees and reimburse expenses through at least February 1, 2017, for some of the share classes, resulting in net expense ratios of the following: R3 shares, 1.45%; R4 shares, 1.25%; R5 shares, 0.99%. For more detailed information on fund expenses and waivers/reimbursements please see the Fund’s prospectus.
Glossary
MSCI All Country (AC) World ex-US Index – A market capitalization weighted index representative of the market structure of 45 developed and emerging market countries in North and South America, Europe, Africa, and the Pacific Rim, excluding securities of United States issuers. The index is calculated with gross dividends reinvested in U.S. dollars.
MSCI EAFE (Europe, Australasia, Far East) Index – An unmanaged, market capitalization weighted index that is a common benchmark for international portfolio performance. The index is calculated with net dividends reinvested in U.S. dollars.
Unless otherwise noted, index returns reflect the reinvestment of income dividends and capital gains, if any, but do not reflect fees, brokerage commissions or other expenses of investing. Investors may not make direct investments into any index. The performance of any index is not indicative of the performance of any particular investment.
6 Annual Report
| | |
| FUND SUMMARY | | |
| |
Thornburg International Value Fund | | September 30, 2016 (Unaudited) |
Objectives And Strategies
The Fund seeks long-term capital appreciation by investing in equity and debt securities of all types. As a secondary consideration, the Fund also seeks some current income. The Fund invests primarily in foreign securities or depositary receipts of foreign securities. The Fund may invest in developing countries.
Market Capitalization Exposure
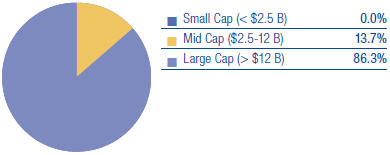
Basket Structure
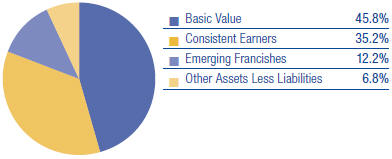
Top Ten Equity Holdings
| | | | |
Novartis AG | | | 3.0 | % |
Total SA | | | 2.9 | % |
Seven & I Holdings Co., Ltd. | | | 2.8 | % |
Nippon Telegraph & Telephone Corp. | | | 2.7 | % |
Rakuten, Inc. | | | 2.6 | % |
Toyota Motor Corp. | | | 2.6 | % |
BNP Paribas SA | | | 2.5 | % |
Hong Kong Exchanges & Clearing Ltd. | | | 2.4 | % |
Koninklijke Philips N.V. | | | 2.4 | % |
Allergan plc | | | 2.4 | % |
There is no guarantee that the Fund will meet its investment objectives.
All portfolio information is subject to change. Charts may not add up to 100% due to rounding.
| | | | |
| Sector Exposure | |
| |
Financials | | | 16.7 | % |
Consumer Discretionary | | | 14.0 | % |
Industrials | | | 13.0 | % |
Health Care | | | 12.7 | % |
Consumer Staples | | | 8.7 | % |
Materials | | | 6.9 | % |
Energy | | | 6.4 | % |
Information Technology | | | 6.0 | % |
Telecommunication Services | | | 5.7 | % |
Utilities | | | 3.2 | % |
Other Assets Less Liabilities | | | 6.8 | % |
|
| Top Ten Industry Groups | |
| |
Pharmaceuticals, Biotechnology & Life Sciences | | | 9.6 | % |
Banks | | | 8.3 | % |
Capital Goods | | | 7.5 | % |
Materials | | | 6.9 | % |
Retailing | | | 6.9 | % |
Energy | | | 6.4 | % |
Telecommunication Services | | | 5.7 | % |
Transportation | | | 5.5 | % |
Diversified Financials | | | 4.4 | % |
Automobiles & Components | | | 4.1 | % |
|
| Country Exposure* | |
| |
| (percent of equity holdings) | | | | |
Japan | | | 22.1 | % |
France | | | 13.8 | % |
China | | | 13.1 | % |
Netherlands | | | 13.0 | % |
Switzerland | | | 7.6 | % |
United Kingdom | | | 7.5 | % |
Germany | | | 6.9 | % |
Italy | | | 3.5 | % |
Spain | | | 3.2 | % |
Hong Kong | | | 2.6 | % |
Ireland | | | 2.6 | % |
Australia | | | 1.2 | % |
Canada | | | 1.2 | % |
Denmark | | | 1.1 | % |
United States | | | 0.6 | % |
| * | The country assignment of each equity holding is determined by the Fund’s Advisor based on various factors, including the location of the issuer’s head office, the issuer’s jurisdiction of incorporation and the country from which a majority of the issuer’s revenue is derived. |
Annual Report 7
SCHEDULE OF INVESTMENTS
| | |
| |
Thornburg International Value Fund | | September 30, 2016 |
| | | | | | | | |
| | | Shares/ | | | | |
| | | Principal Amount | | | Value | |
COMMON STOCK — 93.20% | | | | | | | | |
| | |
AUTOMOBILES & COMPONENTS — 4.07% | | | | | | | | |
Automobiles — 4.07% | | | | | | | | |
Daimler AG | | | 1,548,828 | | | $ | 109,107,560 | |
Toyota Motor Corp. | | | 3,442,691 | | | | 196,196,551 | |
| | | | | | | | |
| | | | | | | 305,304,111 | |
| | | | | | | | |
| | |
BANKS — 8.34% | | | | | | | | |
Banks — 8.34% | | | | | | | | |
BNP Paribas SA | | | 3,655,622 | | | | 187,956,368 | |
ING Groep N.V. | | | 11,177,148 | | | | 137,988,706 | |
Intesa Sanpaolo S.p.A. | | | 75,117,757 | | | | 166,573,001 | |
Mitsubishi UFJ Financial Group, Inc. | | | 26,697,406 | | | | 132,980,226 | |
| | | | | | | | |
| | | | | | | 625,498,301 | |
| | | | | | | | |
| | |
CAPITAL GOODS — 7.45% | | | | | | | | |
Building Products — 1.83% | | | | | | | | |
Compagnie de Saint-Gobain | | | 3,162,366 | | | | 136,662,439 | |
Construction & Engineering — 3.20% | | | | | | | | |
Ferrovial SA | | | 4,663,408 | | | | 99,272,162 | |
Vinci S.A. | | | 1,839,775 | | | | 140,784,292 | |
Industrial Conglomerates — 2.42% | | | | | | | | |
Koninklijke Philips N.V. | | | 6,127,375 | | | | 181,578,365 | |
| | | | | | | | |
| | | | | | | 558,297,258 | |
| | | | | | | | |
| | |
CONSUMER DURABLES & APPAREL — 2.18% | | | | | | | | |
Household Durables — 1.10% | | | | | | | | |
Sony Corp. | | | 2,542,497 | | | | 82,564,396 | |
Textiles, Apparel & Luxury Goods — 1.08% | | | | | | | | |
Compagnie Financiere Richemont SA | | | 1,326,587 | | | | 80,837,829 | |
| | | | | | | | |
| | | | | | | 163,402,225 | |
| | | | | | | | |
| | |
DIVERSIFIED FINANCIALS — 4.42% | | | | | | | | |
Capital Markets — 4.42% | | | | | | | | |
Hong Kong Exchanges & Clearing Ltd. | | | 6,967,190 | | | | 183,063,447 | |
Japan Exchange Group, Inc. | | | 9,626,640 | | | | 148,569,515 | |
| | | | | | | | |
| | | | | | | 331,632,962 | |
| | | | | | | | |
| | |
ENERGY — 6.36% | | | | | | | | |
Oil, Gas & Consumable Fuels — 6.36% | | | | | | | | |
China Petroleum & Chemical Corp. | | | 165,480,852 | | | | 120,541,335 | |
Royal Dutch Shell plc | | | 5,457,831 | | | | 135,925,402 | |
Total SA | | | 4,651,903 | | | | 220,368,290 | |
| | | | | | | | |
| | | | | | | 476,835,027 | |
| | | | | | | | |
| | |
FOOD & STAPLES RETAILING — 3.92% | | | | | | | | |
Food & Staples Retailing — 3.92% | | | | | | | | |
Carrefour SA | | | 3,283,002 | | | | 85,062,757 | |
Seven & I Holdings Co., Ltd. | | | 4,459,465 | | | | 209,197,525 | |
| | | | | | | | |
| | | | | | | 294,260,282 | |
| | | | | | | | |
| | |
FOOD, BEVERAGE & TOBACCO — 3.20% | | | | | | | | |
Beverages — 2.20% | | | | | | | | |
Heineken NV | | | 1,673,616 | | | | 147,227,146 | |
Kweichow Moutai Co., Ltd. | | | 397,575 | | | | 17,768,682 | |
Food Products — 1.00% | | | | | | | | |
Nestle SA | | | 947,058 | | | | 74,624,076 | |
| | | | | | | | |
| | | | | | | 239,619,904 | |
| | | | | | | | |
| | |
HEALTH CARE EQUIPMENT & SERVICES — 3.11% | | | | | | | | |
Health Care Equipment & Supplies — 1.18% | | | | | | | | |
Olympus Corp. | | | 2,554,040 | | | | 88,152,852 | |
Health Care Providers & Services — 1.93% | | | | | | | | |
Fresenius SE & Co. KGaA | | | 1,814,479 | | | | 144,739,247 | |
| | | | | | | | |
| | | | | | | 232,892,099 | |
| | | | | | | | |
| | |
HOUSEHOLD & PERSONAL PRODUCTS — 1.55% | | | | | | | | |
Household Products — 1.55% | | | | | | | | |
Reckitt Benckiser plc | | | 1,231,778 | | | | 115,990,688 | |
| | | | | | | | |
| | | | | | | 115,990,688 | |
| | | | | | | | |
8 Annual Report
| | |
| SCHEDULE OF INVESTMENTS, CONTINUED | | |
| |
Thornburg International Value Fund | | September 30, 2016 |
| | | | | | | | |
| | | Shares/ | | | | |
| | | Principal Amount | | | Value | |
INSURANCE — 3.88% | | | | | | | | |
Insurance — 3.88% | | | | | | | | |
AXA S.A. | | | 3,561,118 | | | $ | 75,767,191 | |
Legal and General Group plc | | | 22,953,628 | | | | 65,066,161 | |
NN Group NV | | | 4,895,381 | | | | 150,403,755 | |
| | | | | | | | |
| | | | | | | 291,237,107 | |
| | | | | | | | |
| | |
MATERIALS — 6.93% | | | | | | | | |
Chemicals — 1.73% | | | | | | | | |
Novozymes AS | | | 1,127,388 | | | | 49,583,367 | |
Potash Corporation of Saskatchewan, Inc. | | | 4,929,034 | | | | 80,441,835 | |
Construction Materials — 4.08% | | | | | | | | |
Anhui Conch Cement Co., Ltd. | | | 60,394,189 | | | | 152,570,028 | |
LafargeHolcim Ltd. | | | 2,832,941 | | | | 153,092,540 | |
Metals & Mining — 1.12% | | | | | | | | |
BHP Billiton plc | | | 5,563,820 | | | | 83,834,175 | |
| | | | | | | | |
| | | | | | | 519,521,945 | |
| | | | | | | | |
| | |
MEDIA — 0.81% | | | | | | | | |
Media — 0.81% | | | | | | | | |
China South Publishing & Media Group Co., Ltd. | | | 22,738,731 | | | | 60,818,435 | |
| | | | | | | | |
| | | | | | | 60,818,435 | |
| | | | | | | | |
| | |
PHARMACEUTICALS, BIOTECHNOLOGY & LIFE SCIENCES — 9.62% | | | | | | | | |
Biotechnology — 2.61% | | | | | | | | |
Gilead Sciences, Inc. | | | 483,606 | | | | 38,262,907 | |
Shire plc | | | 2,432,307 | | | | 157,568,610 | |
Pharmaceuticals — 7.01% | | | | | | | | |
a Allergan plc | | | 775,708 | | | | 178,653,309 | |
GlaxoSmithKline plc | | | 4,329,546 | | | | 92,200,863 | |
Novartis AG | | | 2,866,979 | | | | 225,462,887 | |
Novo Nordisk A/S | | | 694,109 | | | | 28,841,355 | |
| | | | | | | | |
| | | | | | | 720,989,931 | |
| | | | | | | | |
| | |
RETAILING — 6.90% | | | | | | | | |
Internet & Direct Marketing Retail — 6.90% | | | | | | | | |
a Ctrip.com International, Ltd. ADR | | | 3,182,492 | | | | 148,208,652 | |
a JD.com, Inc. ADR | | | 6,540,591 | | | | 170,644,019 | |
Rakuten, Inc. | | | 15,324,135 | | | | 198,115,882 | |
| | | | | | | | |
| | | | | | | 516,968,553 | |
| | | | | | | | |
| | |
SEMICONDUCTORS & SEMICONDUCTOR EQUIPMENT — 3.38% | | | | | | | | |
Semiconductors & Semiconductor Equipment — 3.38% | | | | | | | | |
Infineon Technologies AG | | | 5,437,639 | | | | 97,000,890 | |
a NXP Semiconductors N.V. | | | 1,536,894 | | | | 156,778,557 | |
| | | | | | | | |
| | | | | | | 253,779,447 | |
| | | | | | | | |
| | |
SOFTWARE & SERVICES — 1.52% | | | | | | | | |
Internet Software & Services — 1.18% | | | | | | | | |
a Baidu, Inc. ADR | | | 487,852 | | | | 88,823,214 | |
Software — 0.34% | | | | | | | | |
a LINE Corporation ADR | | | 522,648 | | | | 25,296,163 | |
| | | | | | | | |
| | | | | | | 114,119,377 | |
| | | | | | | | |
| | |
TECHNOLOGY HARDWARE & EQUIPMENT — 1.11% | | | | | | | | |
Electronic Equipment, Instruments & Components — 1.11% | | | | | | | | |
OMRON Corporation | | | 2,333,109 | | | | 82,943,227 | |
| | | | | | | | |
| | | | | | | 82,943,227 | |
| | | | | | | | |
| | |
TELECOMMUNICATION SERVICES — 5.74% | | | | | | | | |
Diversified Telecommunication Services — 5.74% | | | | | | | | |
BT Group plc | | | 18,343,495 | | | | 92,500,178 | |
Deutsche Telekom AG | | | 7,878,112 | | | | 132,040,094 | |
Nippon Telegraph & Telephone Corp. | | | 4,526,742 | | | | 205,969,997 | |
| | | | | | | | |
| | | | | | | 430,510,269 | |
| | | | | | | | |
| | |
TRANSPORTATION — 5.51% | | | | | | | | |
Road & Rail — 2.37% | | | | | | | | |
East Japan Railway Co. | | | 1,981,098 | | | | 177,391,350 | |
Transportation Infrastructure — 3.14% | | | | | | | | |
Atlantia S.p.A. | | | 3,082,051 | | | | 78,211,551 | |
Annual Report 9
| | |
| SCHEDULE OF INVESTMENTS, CONTINUED | | |
| |
Thornburg International Value Fund | | September 30, 2016 |
| | | | | | | | |
| | | Shares/ | | | | |
| | | Principal Amount | | | Value | |
Shanghai International Air Co., Ltd. | | | 38,936,559 | | | $ | 157,439,130 | |
| | | | | | | | |
| | | | | | | 413,042,031 | |
| | | | | | | | |
| | |
UTILITIES — 3.20% | | | | | | | | |
Electric Utilities — 2.65% | | | | | | | | |
Electricite de France SA | | | 6,389,625 | | | | 77,735,371 | |
Iberdrola S.A. | | | 17,811,945 | | | | 121,094,694 | |
Multi-Utilities — 0.55% | | | | | | | | |
Suez Environnement Co. | | | 2,485,393 | | | | 41,027,921 | |
| | | | | | | | |
| | | | | | | 239,857,986 | |
| | | | | | | | |
TOTAL COMMON STOCK (Cost $6,234,569,361) | | | | | | | 6,987,521,165 | |
| | | | | | | | |
SHORT TERM INVESTMENTS — 8.09% | | | | | | | | |
b Thornburg Capital Management Fund | | | 60,637,324 | | | | 606,373,239 | |
| | | | | | | | |
TOTAL SHORT TERM INVESTMENTS (Cost $606,373,239) | | | | | | | 606,373,239 | |
| | | | | | | | |
TOTAL INVESTMENTS — 101.29% (Cost $6,840,942,600) | | | | | | $ | 7,593,894,404 | |
LIABILITIES NET OF OTHER ASSETS — (1.29)% | | | | | | | (96,547,745 | ) |
| | | | | | | | |
NET ASSETS — 100.00% | | | | | | $ | 7,497,346,659 | |
| | | | | | | | |
Footnote Legend
| a | Non-income producing. b Investment in Affiliates - Holdings of voting securities of each portfolio company which is considered “affiliated” to the Fund under the Investment Company Act of 1940 because the Fund’s holding represented 5% or more of the company’s voting securities during the period, are shown below: |
| | | | | | | | | | | | | | | | | | | | | | | | | | | | |
Issuer | | Shares/Principal
September 30,
2015 | | | Gross
Additions | | | Gross
Reductions | | | Shares/Principal
September 30,
2016 | | | Market Value
September 30,
2016 | | | Investment
Income | | | Realized
Gain (Loss) | |
Thornburg Capital Management Fund | | | 59,256,131 | | | | 463,096,886 | | | | 461,715,693 | | | | 60,637,324 | | | $ | 606,373,239 | | | $ | 3,057,340 | | | $ | — | |
| | | | | | | | | | | | | | | | | | | | | | | | | | | | |
Total non-controlled affiliated issuers - 8.09% of net assets | | | $ | 606,373,239 | | | $ | 3,057,340 | | | $ | — | |
| | | | | | | | | | | | | | | | | | | | | | | | | | | | |
Portfolio Abbreviations
To simplify the listings of securities, abbreviations are used per the table below:
| | |
| ADR | | American Depositary Receipt |
See notes to financial statements.
10 Annual Report
This page intentionally left blank.
Annual Report 11
| | |
| STATEMENT OF ASSETS AND LIABILITIES | | |
| |
Thornburg International Value Fund | | September 30, 2016 |
| | | | |
ASSETS | | | | |
Investments at value (Note 3) | | | | |
Non-affiliated issuers (cost $6,234,569,361) | | $ | 6,987,521,165 | |
Non-controlled affiliated issuer (cost $606,373,239) | | | 606,373,239 | |
Cash | | | 122,631 | |
Cash denominated in foreign currency (cost $20,251,866) | | | 20,248,882 | |
Receivable for fund shares sold | | | 6,269,486 | |
Unrealized appreciation on forward currency contracts (Note 7) | | | 5,798,177 | |
Dividends receivable | | | 16,274,251 | |
Dividend and interest reclaim receivable | | | 10,805,218 | |
Prepaid expenses and other assets | | | 400,240 | |
| | | | |
Total Assets | | | 7,653,813,289 | |
| | | | |
| |
LIABILITIES | | | | |
Payable for investments purchased | | | 104,661,836 | |
Payable for fund shares redeemed | | | 38,873,657 | |
Unrealized depreciation on forward currency contracts (Note 7) | | | 5,173,965 | |
Payable to investment advisor and other affiliates (Note 4) | | | 5,692,927 | |
Accounts payable and accrued expenses | | | 2,064,245 | |
| | | | |
Total Liabilities | | | 156,466,630 | |
| | | | |
| |
NET ASSETS | | $ | 7,497,346,659 | |
| | | | |
NET ASSETS CONSIST OF | | | | |
Undistributed net investment income | | $ | 2,740,993 | |
Net unrealized appreciation on investments | | | 753,464,474 | |
Accumulated net realized gain (loss) | | | (39,664,022 | ) |
Net capital paid in on shares of beneficial interest | | | 6,780,805,214 | |
| | | | |
| | $ | 7,497,346,659 | |
| | | | |
12 Annual Report
| | |
| STATEMENT OF ASSETS AND LIABILITIES, CONTINUED | | |
| |
Thornburg International Value Fund | | September 30, 2016 |
| | | | |
| |
NET ASSET VALUE | | | | |
Class A Shares:* | | | | |
Net asset value and redemption price per share ($990,194,350 applicable to 42,264,491 shares of beneficial interest outstanding - Note 5) | | $ | 23.43 | |
Maximum sales charge, 4.50% of offering price | | | 1.10 | |
| | | | |
Maximum offering price per share | | $ | 24.53 | |
| | | | |
| |
Class C Shares: | | | | |
Net asset value and offering price per share** ($535,168,859 applicable to 25,140,776 shares of beneficial interest outstanding - Note 5) | | $ | 21.29 | |
| | | | |
| |
Class I Shares: | | | | |
Net asset value, offering and redemption price per share ($4,375,955,140 applicable to 182,149,865 shares of beneficial interest outstanding - Note 5) | | $ | 24.02 | |
| | | | |
| |
Class R3 Shares: | | | | |
Net asset value, offering and redemption price per share ($325,135,055 applicable to 13,872,018 shares of beneficial interest outstanding - Note 5) | | $ | 23.44 | |
| | | | |
| |
Class R4 Shares: | | | | |
Net asset value, offering and redemption price per share ($267,622,701 applicable to 11,505,107 shares of beneficial interest outstanding - Note 5) | | $ | 23.26 | |
| | | | |
| |
Class R5 Shares: | | | | |
Net asset value, offering and redemption price per share ($529,329,871 applicable to 22,048,644 shares of beneficial interest outstanding - Note 5) | | $ | 24.01 | |
| | | | |
| |
Class R6 Shares: | | | | |
Net asset value, offering and redemption price per share ($473,940,683 applicable to 19,790,305 shares of beneficial interest outstanding - Note 5) | | $ | 23.95 | |
| | | | |
| * | Class B shares converted to Class A shares on August 29, 2016. |
| ** | Redemption price per share is equal to net asset value less any applicable contingent deferred sales charge. |
See notes to financial statements.
Annual Report 13
STATEMENT OF OPERATIONS
| | |
| |
Thornburg International Value Fund | | Year Ended September 30, 2016 |
| | | | |
INVESTMENT INCOME | | | | |
Dividend income | | | | |
Non-affiliated issuers (net of foreign taxes withheld of $25,372,607) | | $ | 239,802,493 | |
Non-controlled affiliated issuer | | | 3,057,340 | |
Other income | | | 66,545 | |
| | | | |
Total Income | | | 242,926,378 | |
| | | | |
| |
EXPENSES | | | | |
Investment advisory fees (Note 4) | | | 60,789,467 | |
Administration fees (Note 4) | | | | |
Class A Shares | | | 1,466,718 | |
Class B Shares | | | 4,592 | |
Class C Shares | | | 766,245 | |
Class I Shares | | | 2,536,318 | |
Class R3 Shares | | | 506,288 | |
Class R4 Shares | | | 370,602 | |
Class R5 Shares | | | 308,590 | |
Distribution and service fees (Note 4) | | | | |
Class A Shares | | | 2,929,714 | |
Class B Shares | | | 36,743 | |
Class C Shares | | | 6,125,211 | |
Class R3 Shares | | | 2,020,662 | |
Class R4 Shares | | | 737,111 | |
Transfer agent fees | | | | |
Class A Shares | | | 1,913,550 | |
Class B Shares | | | 14,721 | |
Class C Shares | | | 956,769 | |
Class I Shares | | | 5,699,125 | |
Class R3 Shares | | | 1,026,107 | |
Class R4 Shares | | | 797,309 | |
Class R5 Shares | | | 963,972 | |
Class R6 Shares | | | 8,634 | |
Registration and filing fees | | | | |
Class A Shares | | | 32,662 | |
Class B Shares | | | 15,039 | |
Class C Shares | | | 28,309 | |
Class I Shares | | | 317,293 | |
Class R3 Shares | | | 21,375 | |
Class R4 Shares | | | 33,024 | |
Class R5 Shares | | | 38,492 | |
Class R6 Shares | | | 27,892 | |
Custodian fees (Note 2) | | | 1,363,158 | |
Professional fees | | | 215,528 | |
Accounting fees (Note 4) | | | 251,325 | |
Trustee fees | | | 389,900 | |
Other expenses | | | 590,169 | |
| | | | |
Total Expenses | | | 93,302,614 | |
Less: | | | | |
Expenses reimbursed by investment advisor (Note 4) | | | (1,109,507 | ) |
| | | | |
Net Expenses | | | 92,193,107 | |
| | | | |
Net Investment Income | | $ | 150,733,271 | |
| | | | |
14 Annual Report
| | |
| STATEMENT OF OPERATIONS, CONTINUED | | |
| |
Thornburg International Value Fund | | Year Ended September 30, 2016 |
| | | | |
REALIZED AND UNREALIZED GAIN (LOSS) | | | | |
Net realized gain (loss) on: | | | | |
Non-affiliated issuer investments (net of realized capital gain taxes paid of $ 2,315,306) | | $ | (7,952,466 | ) |
Forward currency contracts (Note 7) | | | (34,173,303 | ) |
Foreign currency transactions | | | (1,607,396 | ) |
| | | | |
| | | (43,733,165 | ) |
| | | | |
Net change in unrealized appreciation (depreciation) on: | | | | |
Non-affiliated issuer investments | | | 43,088,670 | |
Forward currency contracts (Note 7) | | | 22,853,068 | |
Foreign currency translations | | | 1,995,620 | |
| | | | |
| | | 67,937,358 | |
| | | | |
Net Realized and Unrealized Gain | | | 24,204,193 | |
| | | | |
Net Increase in Net Assets Resulting from Operations | | $ | 174,937,464 | |
| | | | |
See notes to financial statements.
Annual Report 15
| | |
| STATEMENTS OF CHANGES IN NET ASSETS | | |
| |
Thornburg International Value Fund | | |
| | | | | | | | |
| | | Year Ended
September 30, 2016 | | | Year Ended
September 30, 2015 | |
INCREASE (DECREASE) IN NET ASSETS FROM | | | | | | | | |
| | |
OPERATIONS | | | | | | | | |
Net investment income | | $ | 150,733,271 | | | $ | 127,599,192 | |
Net realized gain (loss) on investments, capital gain taxes, forward currency contracts, and foreign currency transactions | | | (43,733,165 | ) | | | 2,158,354,443 | |
Net unrealized appreciation (depreciation) on investments, forward currency contracts, and foreign currency translations | | | 67,937,358 | | | | (2,050,088,223 | ) |
| | | | | | | | |
| | |
Net Increase (Decrease) in Net Assets Resulting from Operations | | | 174,937,464 | | | | 235,865,412 | |
| | |
DIVIDENDS TO SHAREHOLDERS | | | | | | | | |
From net investment income | | | | | | | | |
Class A Shares | | | (17,373,490 | ) | | | (13,268,050 | ) |
Class B Shares | | | (2,771 | ) | | | (5,365 | ) |
Class C Shares | | | (7,105,228 | ) | | | (2,886,929 | ) |
Class I Shares | | | (89,286,035 | ) | | | (82,112,732 | ) |
Class R3 Shares | | | (4,928,035 | ) | | | (3,933,658 | ) |
Class R4 Shares | | | (4,718,359 | ) | | | (3,650,855 | ) |
Class R5 Shares | | | (10,876,039 | ) | | | (10,245,399 | ) |
Class R6 Shares | | | (10,748,034 | ) | | | (7,249,669 | ) |
From realized gains | | | | | | | | |
Class A Shares | | | (206,189,949 | ) | | | (166,562,573 | ) |
Class B Shares | | | (1,033,957 | ) | | | (1,316,453 | ) |
Class C Shares | | | (114,820,498 | ) | | | (75,585,562 | ) |
Class I Shares | | | (855,268,178 | ) | | | (617,568,803 | ) |
Class R3 Shares | | | (72,397,527 | ) | | | (57,375,341 | ) |
Class R4 Shares | | | (50,071,447 | ) | | | (46,567,679 | ) |
Class R5 Shares | | | (102,430,055 | ) | | | (145,792,152 | ) |
Class R6 Shares | | | (63,967,908 | ) | | | (62,251,716 | ) |
| | |
FUND SHARE TRANSACTIONS (NOTE 5) | | | | | | | | |
Class A Shares | | | (164,111,525 | ) | | | (1,089,390,257 | ) |
Class B Shares* | | | (6,445,128 | ) | | | (7,775,348 | ) |
Class C Shares | | | (54,628,381 | ) | | | (96,267,790 | ) |
Class I Shares | | | (696,459,252 | ) | | | (1,275,407,107 | ) |
Class R3 Shares | | | (80,286,274 | ) | | | (229,305,280 | ) |
Class R4 Shares | | | (15,765,354 | ) | | | (351,180,663 | ) |
Class R5 Shares | | | (53,965,690 | ) | | | (1,362,741,831 | ) |
Class R6 Shares | | | 114,956,797 | | | | (399,050,412 | ) |
| | | | | | | | |
Net Decrease in Net Assets | | | (2,392,984,853 | ) | | | (5,871,626,212 | ) |
| | |
NET ASSETS | | | | | | | | |
Beginning of Year | | | 9,890,331,512 | | | | 15,761,957,724 | |
| | | | | | | | |
| | |
End of Year | | $ | 7,497,346,659 | | | $ | 9,890,331,512 | |
| | | | | | | | |
Undistributed net investment income | | $ | 2,740,993 | | | $ | 3,009,051 | |
| * | Class B shares were converted to Class A shares on August 29, 2016. |
See notes to financial statements.
16 Annual Report
| | |
| NOTES TO FINANCIAL STATEMENTS | | |
| |
Thornburg International Value Fund | | September 30, 2016 |
NOTE 1 – ORGANIZATION
Thornburg International Value Fund (the “Fund”) is a diversified series of Thornburg Investment Trust (the “Trust”). The Trust was organized as a Massachusetts business trust under a Declaration of Trust dated June 3, 1987 and is registered as a diversified, open-end management investment company under the Investment Company Act of 1940, as amended. The Fund is currently one of twenty separate series of the Trust. Each series is considered to be a separate entity for financial reporting and tax purposes and bears expenses directly attributable to it. The Fund seeks long-term capital appreciation by investing in equity and debt securities of all types. As a secondary objective, the Fund also seeks some current income.
The Fund currently has seven classes of shares of beneficial interest: Class A, Class C, Institutional Class (“Class I”), and Retirement Classes (“Class R3,” “Class R4,” “Class R5,” and “Class R6”). The Fund converted outstanding Class B shares into Class A shares on August 29, 2016. There was no contingent deferred sales charge for this redemption Each class of shares of the Fund represents an interest in the same portfolio of investments, except that (i) Class A shares are sold subject to a front-end sales charge collected at the time the shares are purchased and bear a service fee, (ii) Class B shares were sold at net asset value without a sales charge at the time of purchase, but are subject to a contingent deferred sales charge upon redemption and bear both a service fee and distribution fee, (iii) Class C shares are sold at net asset value without a sales charge at the time of purchase, but are subject to a contingent deferred sales charge upon redemption within one year of purchase, and bear both a service fee and a distribution fee, (iv) Class I and Class R5 shares are sold at net asset value without a sales charge at the time of purchase and may be subject to a service fee, (v) Class R3 shares are sold at net asset value without a sales charge at the time of purchase, but bear both a service fee and distribution fee, (vi) Class R4 shares are sold at net asset value without a sales charge at the time of purchase, but bear a service fee, (vii) Class R6 shares are sold at net asset value without a sales charge at the time of purchase, and (viii) the respective classes may have different reinvestment privileges and conversion rights. Additionally, the Fund may allocate among its classes certain expenses, to the extent allocable to specific classes, including transfer agent fees, government registration fees, certain printing and postage costs, and administrative and legal expenses. Currently, class specific expenses of the Fund are limited to service and distribution fees, administration fees, and certain registration and transfer agent expenses.
The following is a summary of significant accounting policies followed by the Fund in the preparation of its financial statements. The Fund prepares its financial statements in conformity with United States generally accepted accounting principles (“GAAP”), including investment company accounting and reporting guidance in the Financial Accounting Standards Board (the “FASB”) Accounting Standard Codification Topic 946.
NOTE 2 – SIGNIFICANT ACCOUNTING POLICIES
Security Valuation: All investments in securities held by the Fund are valued as described in Note 3.
Allocation of Income, Gains, Losses and Expenses: Net investment income (other than class specific expenses) and realized and unrealized gains and losses are allocated daily to each class of shares based upon the relative net asset value of outstanding shares (or the value of the dividend-eligible shares, as appropriate) of each class of shares at the beginning of the day (after adjusting for the current capital shares activity of the respective class). Expenses common to all Funds are allocated among the Funds comprising the Trust based upon their relative net asset values or other appropriate allocation methods. Operating expenses directly attributable to a specific class are charged against the operating income of that class.
Dividends and Distributions to Shareholders: Dividends and distributions to shareholders, which are determined in accordance with federal income tax regulations and may differ from GAAP, are recorded on the ex-dividend date. Ordinary income distributions, if any, are declared and paid quarterly. Capital gain distributions, if any, are declared and paid annually and more often if deemed necessary by the Advisor. Dividends are paid and are reinvested in additional shares of the Fund at net asset value per share at the close of business on the ex-dividend date, or at the shareholder’s option, paid in cash.
Investment Income: Dividend income is recorded on the ex-dividend date. Certain income from foreign investments is recognized as soon as information is available to the Fund. Interest income is accrued as earned. Premiums and discounts are amortized and accreted, respectively, to call dates or maturity dates using the effective yield method of the respective investments, which is included in interest income on the Statement of Operations.
Custodian Fees: Custodian fees disclosed in the Statement of Operations may include interest expenses incurred by the Fund on any cash overdrafts of its custodian account during the period. Such cash overdrafts may result from the effects of failed trades in portfolio securities and from cash outflows resulting from unanticipated shareholder redemption activity. The Fund pays interest to its custodian on any such cash overdraft at a rate equal to 2.50% of the overdraft amount in excess of $50,000.
Investment Transactions: Investment transactions are accounted for on a trade date basis. Realized gains and losses from the sale of investments are recorded on an identified cost basis.
Annual Report 17
| | |
| NOTES TO FINANCIAL STATEMENTS, CONTINUED | | |
| |
Thornburg International Value Fund | | September 30, 2016 |
When-Issued and Delayed Delivery Transactions: The Fund may engage in when-issued or delayed delivery transactions. To the extent the Fund engages in such transactions, it will do so for the purpose of acquiring portfolio investments consistent with the Fund’s investment objectives and not for the purpose of investment leverage or to speculate on interest rate or market changes. At the time the Fund makes a commitment to purchase an investment on a when-issued or delayed delivery basis, the Fund will record the transaction and reflect the value in determining its net asset value. When effecting such transactions, assets of an amount sufficient to make payment for the portfolio investments to be purchased will be segregated on the Fund’s records on the trade date. Investments purchased on a when-issued or delayed delivery basis do not earn interest until the settlement date.
Repurchase Agreements: The Fund may invest excess cash in repurchase agreements whereby the Fund purchases investments, which serve as collateral, with an agreement to resell such collateral to the seller at an agreed upon price at the maturity date of the repurchase agreement. Investments pledged as collateral for repurchase agreements are held in custody until maturity of the repurchase agreement. Provisions in the agreements require that the market value of the collateral is at least equal to the repurchase value in the event of default. In the event of default, the Fund has the right to liquidate the collateral and apply the proceeds in satisfaction of the obligation. Under certain circumstances, in the event of default or bankruptcy by the other party to the agreement, realization and/ or retention of the collateral may be subject to legal proceedings.
Foreign Currency Translation: Portfolio investments and other assets and liabilities denominated in foreign currencies are translated into U.S. dollars based on the exchange rate of such currencies against the U.S. dollar on the date of valuation. Purchases and sales of investments and income items denominated in foreign currencies are translated into U.S. dollars at the exchange rate in effect on the transaction date. When the Fund purchases or sells foreign investments, it will customarily enter into a foreign exchange contract to minimize foreign exchange risk from the trade date to the settlement date of such transactions. The values of such spot contracts are included in receivable for investments sold and payable for investments purchased on the Statement of Assets and Liabilities.
The Fund does not separately report the effect of changes in foreign exchange rates from changes in market prices on investments held. Such changes are included in net unrealized appreciation (depreciation) from investments.
Reported net realized gains and losses from foreign currency transactions arise due to purchases and sales of foreign currencies, currency gains and losses realized between the trade and settlement dates on investment transactions and the difference between the amounts of dividends, interest, and foreign withholding taxes recorded on the Fund’s books, and the U.S. dollar equivalent of the amounts actually received or paid.
Net change in unrealized appreciation (depreciation) on foreign currency translations arise from changes in the fair value of assets and liabilities, other than investments at period end, resulting from changes in exchange rates.
Guarantees and Indemnifications: Under the Trust’s organizational documents (and under separate agreements with the independent Trustees), its officers and Trustees are provided with an indemnification against certain liabilities arising out of the performance of their duties to the Fund. In the normal course of business the Trust may also enter into contracts with service providers that contain general indemnifications. The Trust’s maximum exposure under these arrangements is unknown. However, based on experience, the Trust expects the risk of loss to be remote.
Use of Estimates: The preparation of financial statements in conformity with GAAP requires management to make estimates and assumptions that affect the reported amounts of assets and liabilities and disclosure of contingent assets and liabilities at the date of the financial statements and the reported amounts of increases (decreases) in net assets from operations during the reporting period. Actual results could differ from those estimates.
Federal Income Taxes: It is the policy of the Trust to comply with the provisions of the Internal Revenue Code applicable to regulated investment companies and to distribute to shareholders substantially all investment company taxable income including net realized gains on investments (if any), and tax exempt income of the Fund. Therefore, no provision for federal income or excise tax is required.
The Fund files income tax returns in United States federal and applicable state jurisdictions. The statute of limitations on the Fund’s tax return filings generally remains open for the three years following a return’s filing date. The Fund has analyzed each uncertain tax position believed to be material in the preparation of the Fund’s financial statements for the fiscal year ended September 30, 2016, including open tax years, to assess whether it is more likely than not that the position would be sustained upon examination, based on the technical merits of the position. The Fund has not identified any such position for which an asset or liability must be reflected in the Statement of Assets and Liabilities.
At September 30, 2016, information on the tax components of capital was as follows:
| | | | |
Cost of investments for tax purposes | | $ | 6,842,111,651 | |
| | | | |
Gross unrealized appreciation on a tax basis | | $ | 782,735,165 | |
Gross unrealized depreciation on a tax basis | | | (30,952,412 | ) |
| | | | |
Net unrealized appreciation (depreciation) on investments (tax basis) | | $ | 751,782,753 | |
| | | | |
18 Annual Report
| | |
| NOTES TO FINANCIAL STATEMENTS, CONTINUED | | |
| |
Thornburg International Value Fund | | September 30, 2016 |
Temporary book tax adjustments to the cost of investments and net unrealized appreciation (depreciation) for tax purposes result primarily from outstanding wash sale losses.
At September 30, 2016, the Fund had deferred tax basis late year specified ordinary losses occurring subsequent to October 31, 2015 through September 30, 2016 of $1,834,099. For tax purposes, such losses will be recognized in the year ending September 30, 2017.
At September 30, 2016, the Fund had deferred tax basis capital losses occurring subsequent to October 31, 2015 through September 30, 2016 of $37,870,759. For tax purposes, such losses will be recognized in the year ending September 30, 2017.
In order to account for permanent book to tax differences, the Fund decreased undistributed net investment income by $5,963,338, decreased accumulated net realized gain (loss) by $3,922,983, and increased capital paid in on shares of beneficial interest by $2,040,355. Reclassifications have no impact upon the net asset value of the Fund and resulted primarily from foreign currency gains (losses), redesignation of distributions, and foreign capital gain taxes.
At September 30, 2016, the Fund had $4,575,092 of undistributed tax basis ordinary investment income and no undistributed tax basis capital gains.
The tax character of distributions paid during the years ended September 30, 2016, and September 30, 2015, was as follows:
| | | | | | | | |
| | | 2016 | | | 2015 | |
Distributions from: | | | | | | | | |
Ordinary income | | $ | 145,038,271 | | | $ | 123,352,657 | |
Capital gains | | | 1,466,179,239 | | | | 1,173,020,279 | |
| | | | | | | | |
Total | | $ | 1,611,217,510 | | | $ | 1,296,372,936 | |
| | | | | | | | |
Foreign Withholding Taxes: The Fund is subject to foreign tax withholding imposed by certain foreign countries in which the Fund may invest. Withholding taxes are incurred on certain foreign dividends and are accrued at the time the dividend is recognized based on applicable foreign tax laws. The Fund files withholding tax reclaims in certain jurisdictions to recover a portion of amounts previously withheld, in view of various considerations, including recent decisions rendered by the courts in those and other jurisdictions. The Fund would expect to record a receivable for such a reclaim based on a variety of factors, including assessment of a jurisdiction’s legal obligation to pay reclaims, the jurisdiction’s administrative practices and payment history, and industry convention. To date the Fund has recorded no such receivable because there is limited precedent for collecting such prior year reclaims and the likelihood of collection remains uncertain.
Deferred Foreign Capital Gain Taxes: The Fund is subject to a tax imposed on net realized gains of securities of certain foreign countries. The Fund records an estimated deferred tax liability for net unrealized gains on these investments as reflected in the accompanying financial statements.
NOTE 3 – SECURITY VALUATION
Valuation of the Fund’s portfolio investment securities is performed in accordance with policies and procedures adopted by and under the oversight of the Trustees.
The Trustees of the Trust have appointed Thornburg Investment Management, Inc., the Trust’s investment advisor ( the “Advisor”) to assist the Trustees in obtaining market values for portfolio investments, evaluate and monitor professional pricing service providers appointed by the Trustees’ Audit Committee (the “Audit Committee”) to assist in determining fair values for portfolio investments, assist in calculating fair values for portfolio investments in certain circumstances, and to perform other functions in connection with the valuation of investments. The Advisor acts through its Valuation and Pricing Committee (the “Committee”) and other employees of the Advisor. The Committee regularly reviews its own valuation calculations, as well as the valuations, valuation techniques and services furnished by pricing service providers, considers circumstances which may require valuation calculations by the Committee, and reviews previous valuation calculations. The Committee reports to the Audit Committee on the Committee’s activities, the performance of pricing service providers, and other matters relating to valuation of portfolio investments.
In those instances when the Committee assists in calculating a fair value for a portfolio investment, the Committee seeks to determine the price that the Fund would reasonably expect to receive upon a sale of the investment in an orderly transaction between market participants on the valuation date. The Committee customarily utilizes quotations from securities broker dealers in calculating valuations, but also may utilize prices obtained from pricing service providers or other methods approved by the Audit Committee. Because fair values calculated by the Committee are estimates, the calculation of a value for an investment may differ from the price that would be realized by the Fund upon a sale of the investment, and the difference could be material to the Fund’s financial statements. The Committee’s calculation of a fair value for an investment may also differ from the prices obtained by other persons (including other mutual funds) for the investment.
Annual Report 19
| | |
| NOTES TO FINANCIAL STATEMENTS, CONTINUED | | |
| |
Thornburg International Value Fund | | September 30, 2016 |
Valuation of Securities: Securities and other portfolio investments which are listed or traded on a United States securities exchange are valued at the last reported sale price on the valuation date. Investments listed or traded on an exchange for which there has been no sale that day are valued at the mean between the last reported bid and asked prices on that valuation date. Portfolio investments reported by NASDAQ are valued at the official closing price on the valuation date. If an investment is traded on more than one exchange, the investment is considered traded on the exchange that is normally the primary market for that investment. Securities and other portfolio investments which are listed or traded on exchanges outside the United States are valued at the last price or the closing price of the investment on the exchange that is normally the primary market for the investment, as of the close of the exchange preceding the Fund’s valuation date. Foreign investments listed or traded on an exchange for which there has been no sale that day are valued at the mean between the last reported bid and asked prices on that valuation date.
In any case when a market quotation is not readily available for a portfolio investment ordinarily valued by market quotation, the Committee calculates a fair value for the investment using alternative methods approved by the Audit Committee. A market quotation is not readily available when the primary market or exchange for the investment is not open for the entire scheduled day of trading. Market quotations for an investment also may not be readily available if developments after the most recent close of the investment’s primary exchange or market, but prior to the close of business on any Fund business day, or an unusual event or significant period of time occurring since the availability of a market quotation, create a serious question concerning the reliability of the most recent market quotation available for the investment. In particular, on days when market volatility thresholds established by the Audit Committee are exceeded, foreign equity investments held by the Fund may be valued using alternative methods. The Committee customarily obtains valuations in these instances from pricing service providers approved by the Audit Committee. Pricing service providers ordinarily calculate valuations using multi-factor models to adjust market prices based upon various inputs, including exchange data, depository receipt prices, futures, index data and other data.
Debt obligations held by the Fund which are not listed or traded on exchanges or for which no reported market exists are ordinarily valued at the valuation obtained from a pricing service provider approved by the Audit Committee.
In any case when a pricing service provider fails to provide a valuation for a debt obligation held by the Fund, the Committee calculates a fair value for the obligation using alternative methods under procedures approved by the Audit Committee. Additionally, in cases when management believes that a valuation obtained from a pricing service provider merits review for significant reasons, the Committee decides whether or not to use the valuation calculated by the pricing service provider or to use an alternative method approved by the Audit Committee to calculate a fair value for the obligation.
Quotations for foreign investments expressed in foreign currency amounts are converted to U.S. dollar equivalents using a foreign exchange quotation from a third party service provider at the time of valuation. Foreign investments held by the Fund may be traded on days and at times when the Fund is not open for business. Consequently, the value of Fund investments may be significantly affected on days when shareholders cannot purchase or sell Fund shares. Futures contracts and other financial and derivative instruments traded on an exchange are valued at the latest published price for the instrument on its primary exchange. Listed options are valued at the last bid price.
Valuation Hierarchy: The Fund categorizes its investments based upon the inputs used in valuing those investments, according to a three-level hierarchy established in guidance from FASB. Categorization of investments using this hierarchy is intended by the FASB to maximize the use of observable inputs in valuing investments and minimize the use of unobservable inputs by requiring that the most observable inputs be used when available. Observable inputs are those that market participants would use in valuing an investment based on available market information. Unobservable inputs are those that reflect assumptions about the information market participants would use in valuing an investment. An investment’s level within the hierarchy is based on the lowest level input that is deemed significant to the valuation. The methodologies and inputs used to value investments are not necessarily indications of the risk or liquidity associated with those investments.
Various inputs are used in calculating valuations for the Fund’s investments. These inputs are generally summarized according to the three-level hierarchy below:
Level 1: Quoted prices in active markets for identical investments.
Level 2: Other direct or indirect significant observable inputs (including quoted prices for similar investments in active markets and other observable inputs, such as interest rates, prepayment rates, credit risk, etc.).
Level 3: Significant unobservable inputs (including the Committee’s own assumptions in calculating the fair values of investments).
Valuations for debt obligations held by the Fund are typically calculated by pricing service providers approved by the Audit Committee and are characterized as Level 2 within the valuation hierarchy.
20 Annual Report
| | |
| NOTES TO FINANCIAL STATEMENTS, CONTINUED | | |
| |
Thornburg International Value Fund | | September 30, 2016 |
On days when market volatility thresholds established by the Audit Committee are exceeded, foreign securities for which valuations are obtained from pricing service providers are fair valued. On these days, the foreign securities are characterized as Level 2 within the valuation hierarchy and revert to Level 1 after the threshold is no longer exceeded.
In a limited number of cases the Committee calculates a fair value for investments using broker quotations or other methods approved by the Audit Committee. When the Committee uses a single broker quotation to calculate a fair value for an investment without other significant observable inputs, or if a fair value is calculated using other significant inputs that are considered unobservable, the investment is characterized as Level 3 within the hierarchy. Other significant unobservable inputs used to calculate a fair value in these instances might include an income-based valuation approach which considers discounted anticipated future cash flows from the investment, and application of discounts due to the nature or duration of any restrictions on the disposition of the investment.
Valuations based upon the use of inputs from Levels 1, 2 or 3 may not represent the actual price received upon the disposition of an investment, and the Fund may receive a price that is lower than the valuation based upon these inputs when it sells the investment.
The following table displays a summary of the fair value hierarchy measurements of the Fund’s investments as of September 30, 2016. In any instance when valuation inputs from more than one level are used to determine the fair value of a specific investment, the investment is placed in the level of the table based upon the lowest level input that is significant in determining the fair value of the investment:
| | | | | | | | | | | | | | | | |
| | | Fair Value Measurements at September 30, 2016 | |
| | | Total | | | Level 1 | | | Level 2 | | | Level 3 | |
Assets | | | | | | | | | | | | | | | | |
Investments in Securities* | | | | | | | | | | | | | | | | |
Common Stock | | $ | 6,987,521,165 | | | $ | 6,987,521,165 | | | $ | — | | | $ | — | |
Short Term Investments | | | 606,373,239 | | | | 606,373,239 | | | | — | | | | — | |
| | | | | | | | | | | | | | | | |
Total Investments in Securities | | $ | 7,593,894,404 | | | $ | 7,593,894,404 | | | $ | — | | | $ | — | |
Other Financial Instruments** | | | | | | | | | | | | | | | | |
Forward Currency Contracts | | $ | 5,798,177 | | | $ | — | | | $ | 5,798,177 | | | $ | — | |
Liabilities | | | | | | | | | | | | | | | | |
Other Financial Instruments** | | | | | | | | | | | | | | | | |
Forward Currency Contracts | | $ | (5,173,965 | ) | | $ | — | | | $ | (5,173,965 | ) | | $ | — | |
Spot Currency | | $ | (74,347 | ) | | $ | (74,347 | ) | | $ | — | | | $ | — | |
| * | See Schedule of Investments for a summary of the industry exposure as grouped according to the Global Industry Classification Standard (GICS), which is an industry taxonomy developed by MSCI, Inc. and Standard & Poor’s (S&P). |
| ** | Other Financial Instruments include investments not reflected in the Schedule of Investments, which may include futures, forwards and swap contracts, which are valued at the unrealized appreciation (depreciation) on the investment. |
In accordance with the guidance prescribed in Accounting Standards Update No. 2011-04, it is the policy of the Fund to recognize transfers between levels and the underlying events which caused the movement. The Fund recognized no transfers between levels for the year ended September 30, 2016, other than when the Fund exceeded market volatility thresholds for foreign equity investments during the period.
NOTE 4 – INVESTMENT ADVISORY FEE AND OTHER TRANSACTIONS WITH AFFILIATES
Pursuant to an investment advisory agreement, the Advisor serves as the investment advisor and performs services for the Fund for which the fees are payable at the end of each month. Under the investment advisory agreement, the Fund pays the Advisor a management fee based on the daily net assets of the Fund at an annual rate as shown in the following table:
Management Fee Schedule
| | | | |
Daily Net Assets | | Fee Rate | |
Up to $500 million | | | 0.875 | % |
Next $500 million | | | 0.825 | |
Next $500 million | | | 0.775 | |
Next $500 million | | | 0.725 | |
Over $2 billion | | | 0.675 | |
Annual Report 21
| | |
| NOTES TO FINANCIAL STATEMENTS, CONTINUED | | |
| |
Thornburg International Value Fund | | September 30, 2016 |
The Fund’s effective management fee for the year ended September 30, 2016 was 0.704% of the Fund’s average dividend assets.
The Fund pays to the Advisor the costs of personnel who perform certain accounting services for the Fund. For the year ended September 30, 2016 the Fund paid $251,325 to the Advisor for these accounting services. The Trust has also entered into administrative service agreements with the Advisor, whereby the Advisor will perform certain administrative services for the shareholders of each class of the Fund’s shares (except for Class R6 shares, which do not have an administrative services agreement) and for which fees will be payable at an annual rate of up to .125 of 1% per annum of the average daily net assets attributable to each class of shares. Total administrative service fees incurred by each class of shares of the Fund for the year ended September 30, 2016, are set forth in the Statement of Operations.
The Trust has an underwriting agreement with Thornburg Securities Corporation (the “Distributor”), an affiliate of the Advisor, which acts as the distributor of the Fund’s shares. For the year ended September 30, 2016, the Distributor has advised the Fund that it earned net commissions aggregating $28,407 from the sale of Class A shares, and collected contingent deferred sales charges aggregating $32,744 from redemptions of Class C shares of the Fund.
Pursuant to a service plan under Rule 12b-1 of the Investment Company Act of 1940, the Fund may pay to the Advisor or securities dealers and other financial institutions at the Advisor’s request an amount not to exceed .25 of 1% per annum of the average daily net assets attributable to Class A, Class B, Class C, Class R3 and Class R4 shares of the Fund to obtain various shareholder and distribution related services. For the year ended September 30, 2016, there were no 12b-1 service plan fees charged for Class I, Class R5 and Class R6 shares. The Advisor may pay out of its own resources additional expenses for distribution of the Fund’s shares and shareholder services.
The Trust has also adopted distribution plans pursuant to Rule 12b-1, applicable only to the Fund’s Class B, Class C, and Class R3 shares, under which the Fund compensates the Distributor for services in promoting the sale of Class B, Class C, and Class R3 shares of the Fund at an annual rate of up to .75 of 1% per annum of the average daily net assets attributable to Class B and Class C shares, and an annual rate of up to .25 of 1% per annum of the average daily net assets attributable to Class R3 shares. Total fees incurred by each class of shares of the Fund under their respective service and distribution plans for the year ended September 30, 2016, are set forth in the Statement of Operations.
The Advisor and Distributor have contractually agreed to waive fees and reimburse expenses incurred by the Fund so that actual expenses of certain share classes do not exceed levels as specified in the Fund’s most recent prospectus. The agreement may be terminated by the Fund at any time, but may not be terminated by the Advisor or Distributor before February 1, 2017, unless the Advisor ceases to be the investment advisor to the Trust or the Distributor ceases to be the distributor of the Fund prior to that date. The Advisor and Distributor retain the right to be repaid by the Fund for fee waivers and expense reimbursements if expenses fall below the contractual limit prior to the end of the fiscal year.
For the year ended September 30, 2016, the Advisor contractually reimbursed certain class specific expenses, administrative fees, and distribution fees of $11,095 for Class A shares, $684,814 for Class R3 shares, and $413,598 for Class R4 shares.
Certain officers and Trustees of the Trust are also officers or directors of the Advisor and Distributor. The compensation of independent Trustees is borne by the Trust.
The Fund may purchase or sell securities from, or to an affiliated fund, provided the affiliation is due solely to having a common investment advisor, common officers, or common trustees, and provided that all such transactions will comply with Rule 17a-7 under the 1940 Act. For the year ended September 30, 2016, the Fund had no affiliated fund transactions.
NOTE 5 – SHARES OF BENEFICIAL INTEREST
At September 30, 2016, there were an unlimited number of shares with no par value of beneficial interest authorized. Transactions in shares of beneficial interest were as follows:
| | | | | | | | | | | | | | | | |
| | | Year Ended
September 30, 2016 | | | Year Ended
September 30, 2015 | |
| | | Shares | | | Amount | | | Shares | | | Amount | |
Class A Shares | | | | | | | | | | | | | | | | |
Shares sold | | | 6,663,995 | | | $ | 159,603,304 | | | | 8,248,175 | | | $ | 241,288,378 | |
Shares converted from Class B shares | | | 75,049 | | | | 1,748,646 | | | | | | | | | |
Shares issued to shareholders in reinvestment of dividends | | | 8,432,658 | | | | 205,155,554 | | | | 5,853,841 | | | | 162,599,810 | |
Shares repurchased | | | (22,493,529 | ) | | | (530,619,029 | ) | | | (51,693,689 | ) | | | (1,493,278,445 | ) |
| | | | | | | | | | | | | | | | |
| | | | |
Net increase (decrease) | | | (7,321,827 | ) | | $ | (164,111,525 | ) | | | (37,591,673 | ) | | $ | (1,089,390,257 | ) |
| | | | | | | | | | | | | | | | |
22 Annual Report
| | |
| NOTES TO FINANCIAL STATEMENTS, CONTINUED | | |
| |
Thornburg International Value Fund | | September 30, 2016 |
| | | | | | | | | | | | | | | | |
| | | Year Ended
September 30, 2016 | | | Year ended
September 30, 2015 | |
| | | Shares | | | Amount | | | Shares | | | Amount | |
Class B Shares* | | | | | | | | | | | | | | | | |
Shares sold | | | 10,346 | | | $ | 225,076 | | | | 25,095 | | | $ | 674,468 | |
Shares issued to shareholders in reinvestment of dividends | | | 36,621 | | | | 810,856 | | | | 38,401 | | | | 976,975 | |
Shares converted to Class A shares | | | (83,044 | ) | | | (1,748,646 | ) | | | | | | | | |
Shares repurchased | | | (262,313 | ) | | | (5,732,414 | ) | | | (353,486 | ) | | | (9,426,791 | ) |
| | | | | | | | | | | | | | | | |
| | | | |
Net increase (decrease) | | | (298,390 | ) | | $ | (6,445,128 | ) | | | (289,990 | ) | | $ | (7,775,348 | ) |
| | | | | | | | | | | | | | | | |
| | | | |
Class C Shares | | | | | | | | | | | | | | | | |
Shares sold | | | 2,344,411 | | | $ | 51,715,435 | | | | 2,374,020 | | | $ | 63,814,668 | |
Shares issued to shareholders in reinvestment of dividends | | | 4,231,136 | | | | 93,936,821 | | | | 2,324,577 | | | | 59,667,023 | |
Shares repurchased | | | (9,254,631 | ) | | | (200,280,637 | ) | | | (8,267,215 | ) | | | (219,749,481 | ) |
| | | | | | | | | | | | | | | | |
| | | | |
Net increase (decrease) | | | (2,679,084 | ) | | $ | (54,628,381 | ) | | | (3,568,618 | ) | | $ | (96,267,790 | ) |
| | | | | | | | | | | | | | | | |
| | | | |
Class I Shares | | | | | | | | | | | | | | | | |
Shares sold | | | 53,906,880 | | | $ | 1,294,025,547 | | | | 51,033,802 | | | $ | 1,526,947,270 | |
Shares issued to shareholders in reinvestment of dividends | | | 33,325,928 | | | | 830,190,740 | | | | 21,516,580 | | | | 612,023,354 | |
Shares repurchased | | | (115,362,911 | ) | | | (2,820,675,539 | ) | | | (116,894,145 | ) | | | (3,414,377,731 | ) |
| | | | | | | | | | | | | | | | |
| | | | |
Net increase (decrease) | | | (28,130,103 | ) | | $ | (696,459,252 | ) | | | (44,343,763 | ) | | $ | (1,275,407,107 | ) |
| | | | | | | | | | | | | | | | |
| | | | |
Class R3 Shares | | | | | | | | | | | | | | | | |
Shares sold | | | 3,233,955 | | | $ | 76,543,365 | | | | 4,183,276 | | | $ | 121,693,500 | |
Shares issued to shareholders in reinvestment of dividends | | | 2,938,343 | | | | 71,615,592 | | | | 2,069,052 | | | | 57,455,170 | |
Shares repurchased | | | (9,747,898 | ) | | | (228,445,231 | ) | | | (14,059,202 | ) | | | (408,453,950 | ) |
| | | | | | | | | | | | | | | | |
| | | | |
Net increase (decrease) | | | (3,575,600 | ) | | $ | (80,286,274 | ) | | | (7,806,874 | ) | | $ | (229,305,280 | ) |
| | | | | | | | | | | | | | | | |
| | | | |
Class R4 Shares | | | | | | | | | | | | | | | | |
Shares sold | | | 2,976,526 | | | $ | 70,234,604 | | | | 4,065,341 | | | $ | 116,638,346 | |
Shares issued to shareholders in reinvestment of dividends | | | 1,632,286 | | | | 39,409,828 | | | | 1,405,574 | | | | 38,816,115 | |
Shares repurchased | | | (5,312,446 | ) | | | (125,409,786 | ) | | | (17,591,772 | ) | | | (506,635,124 | ) |
| | | | | | | | | | | | | | | | |
| | | | |
Net increase (decrease) | | | (703,634 | ) | | $ | (15,765,354 | ) | | | (12,120,857 | ) | | $ | (351,180,663 | ) |
| | | | | | | | | | | | | | | | |
| | | | |
Class R5 Shares | | | | | | | | | | | | | | | | |
Shares sold | | | 5,121,121 | | | $ | 125,836,118 | | | | 9,113,063 | | | $ | 266,509,147 | |
Shares issued to shareholders in reinvestment of dividends | | | 4,346,336 | | | | 108,199,722 | | | | 5,223,489 | | | | 147,978,195 | |
Shares repurchased | | | (11,882,677 | ) | | | (288,001,530 | ) | | | (61,286,367 | ) | | | (1,777,229,173 | ) |
| | | | | | | | | | | | | | | | |
| | | | |
Net increase (decrease) | | | (2,415,220 | ) | | $ | (53,965,690 | ) | | | (46,949,815 | ) | | $ | (1,362,741,831 | ) |
| | | | | | | | | | | | | | | | |
| | | | |
Class R6 Shares | | | | | | | | | | | | | | | | |
Shares sold | | | 8,733,531 | | | $ | 205,874,135 | | | | 4,410,128 | | | $ | 129,266,866 | |
Shares issued to shareholders in reinvestment of dividends | | | 3,013,284 | | | | 74,472,093 | | | | 2,450,164 | | | | 69,470,703 | |
Shares repurchased | | | (7,004,088 | ) | | | (165,389,431 | ) | | | (20,550,235 | ) | | | (597,787,981 | ) |
| | | | | | | | | | | | | | | | |
| | | | |
Net increase (decrease) | | | 4,742,727 | | | $ | 114,956,797 | | | | (13,689,943 | ) | | $ | (399,050,412 | ) |
| | | | | | | | | | | | | | | | |
| * | Class B shares were converted to Class A shares on August 29, 2016. |
Annual Report 23
| | |
| NOTES TO FINANCIAL STATEMENTS, CONTINUED | | |
| |
Thornburg International Value Fund | | September 30, 2016 |
NOTE 6 – INVESTMENT TRANSACTIONS
For the year ended September 30, 2016, the Fund had purchase and sale transactions of investments (excluding short-term investments) of $8,265,311,773 and $10,221,142,616, respectively.
NOTE 7 – DERIVATIVE FINANCIAL INSTRUMENTS WITH OFF-BALANCE SHEET RISK AND FOREIGN INVESTMENT RISK
The Fund may use a variety of derivative financial instruments to hedge or adjust the risks affecting its investment portfolio or to enhance investment returns. Provisions of the FASB Accounting Standards Codification 815-10-50 (“ASC 815”) require certain disclosures. The disclosures are intended to provide users of financial statements with an understanding of the use of derivative instruments by the Fund and how these derivatives affect the financial position, financial performance and cash flows of the Fund. The Fund does not designate any derivative instruments as hedging instruments under ASC 815. During the year ended September 30, 2016, the Fund’s principal exposure to derivative financial instruments of the type addressed by ASC 815 was investment in foreign exchange contracts. A foreign exchange contract is an agreement between two parties to exchange different currencies at a specified rate of exchange at an agreed upon future date. Foreign exchange contracts involve risks to the Fund, including the risk that a contract’s counterparty will not meet its obligations to the Fund, the risk that a change in a contract’s value may not correlate perfectly with the currency the contract was intended to track, and the risk that the Fund’s Advisor is unable to correctly implement its strategy in using a contract. In any such instance, the Fund may not achieve the intended benefit of entering into a contract, and may experience a loss.
The Fund entered into forward currency contracts during the year ended September 30, 2016 in the normal course of pursuing its investment objectives, with the objective of purchasing foreign investments or with the intent of reducing the risk to the value of the Fund’s foreign investments from adverse changes in the relationship between the U.S. dollar and foreign currencies. In each case these contracts have been initiated in conjunction with foreign investment transactions.
These contracts are accounted for by the Fund under ASC 815. Unrealized appreciation and depreciation on outstanding contracts are reported in the Fund’s Statement of Assets and Liabilities, as measured by the difference between the forward exchange rates at the reporting date and the forward exchange rates at each contract’s inception date. Net realized gain (loss) on contracts closed during the period, and changes in net unrealized appreciation (depreciation) on outstanding contracts are recognized in the Fund’s Statement of Operations.
The quarterly average value of open sell currency contracts for the year ended September 30, 2016 was $1,532,844,246. Open buy currency contracts are entered into for the purpose of closing open sell currency contracts and the values are dependent upon the values of the open sell currency contracts to which they relate.
The following table displays the outstanding forward currency contracts at September 30, 2016:
| | | | | | | | | | | | | | | | | | | | | | | | |
Outstanding Forward Currency Contracts to Buy or Sell at September 30, 2016 | |
Contract Description | | Buy/Sell | | | Contract
Amount | | | Contract
Value Date | | | Value
USD | | | Unrealized
Appreciation | | | Unrealized
Depreciation | |
Euro | | | Sell | | | | 566,822,200 | | | | 12/09/2016 | | | | 638,632,364 | | | $ | 1,182,365 | | | $ | — | |
Great Britain Pound | | | Sell | | | | 69,811,800 | | | | 10/11/2016 | | | | 90,501,881 | | | | 2,618,054 | | | | — | |
Great Britain Pound | | | Sell | | | | 71,997,500 | | | | 10/11/2016 | | | | 93,335,356 | | | | 1,997,758 | | | | — | |
Great Britain Pound | | | Sell | | | | 78,745,900 | | | | 10/11/2016 | | | | 102,083,775 | | | | — | | | | (99,960 | ) |
Great Britain Pound | | | Buy | | | | 220,555,200 | | | | 10/11/2016 | | | | 285,921,012 | | | | — | | | | (5,074,005 | ) |
| | | | | | | | | | | | | | | | | | | | | | | | |
Total | | | | | | | | | | | | | | | | | | $ | 5,798,177 | | | $ | (5,173,965 | ) |
| | | | | | | | | | | | | | | | | | | | | | | | |
Net unrealized appreciation (depreciation) | | | | | | | | | | | $ | 624,212 | | | | | |
| | | | | | | | | | | | | | | | | | | | | | | | |
The outstanding forward currency contracts in the foregoing table were entered into with State Street Bank and Trust Company (“SSB”), pursuant to an International Swaps and Derivatives Association (“ISDA”) Master Agreement. In the event of a default or termination under the ISDA Master Agreement with SSB, the non-defaulting party has the right to close out all outstanding forward currency contracts between the parties and to net any payment amounts under those contracts, resulting in a single net amount payable by one party to the other.
Because the ISDA Master Agreement with SSB does not result in an offset of reported amounts of financial assets and liabilities in the Fund’s Statement of Assets and Liabilities unless there has been an event of default or termination event under that agreement, the Fund does not net its outstanding forward currency contracts for purposes of the disclosure in the Fund’s Statement of Assets and
24 Annual Report
| | |
| NOTES TO FINANCIAL STATEMENTS, CONTINUED | | |
| |
Thornburg International Value Fund | | September 30, 2016 |
Liabilities. Instead the Fund recognizes the unrealized appreciation or depreciation on those forward currency contracts on a gross basis in the Fund’s Statement of Assets and Liabilities.
The unrealized appreciation (depreciation) of the outstanding forward currency contracts recognized in the Fund’s Statement of Assets and Liabilities at September 30, 2016 is disclosed in the following table:
| | | | |
| Fair Values of Derivative Financial Instruments at September 30, 2016 |
Asset Derivatives | | Balance Sheet Location | | Fair Value |
Foreign exchange contracts | | Assets - Unrealized appreciation on forward currency contracts | | $ 5,798,177 |
| | |
Liability Derivatives | | Balance Sheet Location | | Fair Value |
Foreign exchange contracts | | Liabilities - Unrealized depreciation on forward currency contracts | | $ (5,173,965) |
Because the Fund does not currently receive or post cash collateral in connection with its currency forward contracts, and because all of the Fund’s outstanding currency forward contracts are with SSB, the net amounts of the Fund’s assets and liabilities which are attributable to those contracts at September 30, 2016 can be determined by offsetting the dollar amounts shown in the preceding table. Based on those amounts, the net amount of the Fund’s assets which is attributable to its outstanding forward currency contracts at September 30, 2016 is $624,212, and the net amount of the Fund’s liabilities which is attributable to those contracts at that date is $0. The Fund’s forward currency contracts are valued each day, and the net amounts of the Fund’s assets and liabilities which are attributable to those contracts are expected to vary over time.
The net realized gain (loss) from forward currency contracts and the net change in unrealized appreciation (depreciation) on outstanding forward currency contracts recognized in the Fund’s Statement of Operations for the year ended September 30, 2016 are disclosed in the following tables:
| | | | |
Net Realized Gain (Loss) on Derivative Financial Instruments Recognized in Income for the Year Ended September 30, 2016 |
| | | Total | | Forward Currency Contracts |
Foreign exchange contracts | | $ (34,173,303) | | $(34,173,303) |
|
Net Change in Unrealized Appreciation (Depreciation) of Derivative Financial Instruments Recognized in Income for the Year Ended September 30, 2016 |
| | | Total | | Forward Currency Contracts |
Foreign exchange contracts | | $ 22,853,068 | | $22,853,068 |
OTHER NOTES
Risks: The Fund’s investments subject it to risks including, but not limited to, management risk, market and economic risk, risks affecting specific issuers, liquidity risk, the risks associated with investments in small- and mid-cap companies and non-U.S. issuers (including developing country issuers), credit risk, and interest rate risk. Please see the Fund’s prospectus for a discussion of the risks associated with an investment in the Fund.
Subsequent Events: Fund management believes no events have occurred between September 30, 2016 and the date of issuance of the financial statements that require adjustment to or disclosure in the accompanying financial statements.
Annual Report 25
Financial Highlights
Thornburg International Value Fund
| | | | | | | | | | | | | | | | | | | | | | | | | | | | | | | | | | | | | | | | | | | | | | | | | | | | | | | | | | |
| | | PER SHARE PERFORMANCE (for a share outstanding throughout the year) | | | RATIOS TO AVERAGE NET ASSETS | | | SUPPLEMENTAL DATA | |
Unless Otherwise Noted, Periods are Fiscal Years Ended Sept. 30, | | Net Asset
Value
Beginning
of Year | | | Net
Investment
Income
(Loss)+ | | | Net
Realized
&
Unrealized
Gain (Loss)
on
Investments | | | Total from
Investment
Operations | | | Dividends
from Net
Investment
Income | | | Dividends
from Net
Realized
Gains | | Total
Dividends | | | Net
Asset
Value
End
of
Year | | | Net
Investment
Income
(Loss)
(%) | | | Expenses,
After
Expense
Reductions
(%) | | | Expenses,
After
Expense
Reductions
and
Net of
Custody
Credits
(%) | | | Expenses,
Before
Expense
Reductions
(%) | | | Total
Return
(%)(a) | | | Portfolio
Turnover
Rate
(%)(a) | | | Net Assets
at end
of
Year
(Thousands) | |
CLASS A SHARES | | | | | | | | | | | | | | | | | | | | | | | | | | | | | | | | | | | | | | | | | | | | | | | | | | | |
2016(b)(g) | | $ | 27.46 | | | | 0.36 | | | | 0.25 | | | | 0.61 | | | | (0.39 | ) | | (4.25) | | | (4.64 | ) | | $ | 23.43 | | | | 1.51 | | | | 1.28 | | | | 1.28 | | | | 1.28 | | | | 1.90 | | | | 103.90 | | | $ | 990,194 | |
2015(b) | | $ | 29.84 | | | | 0.24 | | | | 0.16 | | | | 0.40 | | | | (0.26 | ) | | (2.52) | | | (2.78 | ) | | $ | 27.46 | | | | 0.82 | | | | 1.27 | | | | 1.27 | | | | 1.27 | | | | 1.25 | | | | 70.88 | | | $ | 1,361,529 | |
2014(b) | | $ | 30.12 | | | | 0.19 | | | | (0.23 | ) | | | (0.04 | ) | | | (0.24 | ) | | — | | | (0.24 | ) | | $ | 29.84 | | | | 0.63 | | | | 1.26 | | | | 1.26 | | | | 1.26 | | | | (0.14 | ) | | | 37.25 | | | $ | 2,601,689 | |
2013(b) | | $ | 26.08 | | | | 0.26 | | | | 4.02 | | | | 4.28 | | | | (0.24 | ) | | — | | | (0.24 | ) | | $ | 30.12 | | | | 0.92 | | | | 1.25 | | | | 1.25 | | | | 1.25 | | | | 16.49 | | | | 34.67 | | | $ | 5,212,813 | |
2012(b) | | $ | 23.14 | | | | 0.28 | | | | 2.95 | | | | 3.23 | | | | (0.29 | ) | | — | | | (0.29 | ) | | $ | 26.08 | | | | 1.09 | | | | 1.29 | | | | 1.29 | | | | 1.29 | | | | 14.02 | | | | 17.86 | | | $ | 5,429,316 | |
CLASS C SHARES | | | | | | | | | | | | | | | | | | | | | | | | | | | | | | | | | | | | | | | | | | | | | | | | | | | |
2016 | | $ | 25.40 | | | | 0.17 | | | | 0.24 | | | | 0.41 | | | | (0.27 | ) | | (4.25) | | | (4.52 | ) | | $ | 21.29 | | | | 0.77 | | | | 2.02 | | | | 2.02 | | | | 2.02 | | | | 1.12 | | | | 103.90 | | | $ | 535,169 | |
2015 | | $ | 27.86 | | | | 0.05 | | | | 0.11 | | | | 0.16 | | | | (0.10 | ) | | (2.52) | | | (2.62 | ) | | $ | 25.40 | | | | 0.19 | | | | 1.99 | | | | 1.99 | | | | 1.99 | | | | 0.52 | | | | 70.88 | | | $ | 706,606 | |
2014 | | $ | 28.17 | | | | – | (c) | | | (0.23 | ) | | | (0.23 | ) | | | (0.08 | ) | | — | | | (0.08 | ) | | $ | 27.86 | | | | – | (d) | | | 1.99 | | | | 1.99 | | | | 1.99 | | | | (0.83 | ) | | | 37.25 | | | $ | 874,358 | |
2013 | | $ | 24.48 | | | | 0.04 | | | | 3.77 | | | | 3.81 | | | | (0.12 | ) | | — | | | (0.12 | ) | | $ | 28.17 | | | | 0.15 | | | | 2.01 | | | | 2.01 | | | | 2.01 | | | | 15.62 | | | | 34.67 | | | $ | 1,181,438 | |
2012 | | $ | 21.77 | | | | 0.08 | | | | 2.77 | | | | 2.85 | | | | (0.14 | ) | | — | | | (0.14 | ) | | $ | 24.48 | | | | 0.35 | | | | 2.03 | | | | 2.03 | | | | 2.03 | | | | 13.14 | | | | 17.86 | | | $ | 1,254,732 | |
CLASS I SHARES | | | | | | | | | | | | | | | | | | | | | | | | | | | | | | | | | | | | | | | | | | | | | | | | | | | |
2016 | | $ | 28.04 | | | | 0.47 | | | | 0.23 | | | | 0.70 | | | | (0.47 | ) | | (4.25) | | | (4.72 | ) | | $ | 24.02 | | | | 1.91 | | | | 0.90 | | | | 0.90 | | | | 0.90 | | | | 2.21 | | | | 103.90 | | | $ | 4,375,955 | |
2015 | | $ | 30.43 | | | | 0.38 | | | | 0.13 | | | | 0.51 | | | | (0.38 | ) | | (2.52) | | | (2.90 | ) | | $ | 28.04 | | | | 1.27 | | | | 0.90 | | | | 0.90 | | | | 0.90 | | | | 1.65 | | | | 70.88 | | | $ | 5,895,731 | |
2014 | | $ | 30.76 | | | | 0.33 | | | | (0.25 | ) | | | 0.08 | | | | (0.41 | ) | | — | | | (0.41 | ) | | $ | 30.43 | | | | 1.05 | | | | 0.88 | | | | 0.88 | | | | 0.88 | | | | 0.23 | | | | 37.25 | | | $ | 7,748,950 | |
2013 | | $ | 26.66 | | | | 0.38 | | | | 4.10 | | | | 4.48 | | | | (0.38 | ) | | — | | | (0.38 | ) | | $ | 30.76 | | | | 1.34 | | | | 0.86 | | | | 0.86 | | | | 0.86 | | | | 16.94 | | | | 34.67 | | | $ | 14,601,876 | |
2012 | | $ | 23.65 | | | | 0.40 | | | | 3.00 | | | | 3.40 | | | | (0.39 | ) | | — | | | (0.39 | ) | | $ | 26.66 | | | | 1.53 | | | | 0.88 | | | | 0.88 | | | | 0.88 | | | | 14.47 | | | | 17.86 | | | $ | 12,505,553 | |
CLASS R3 SHARES | | | | | | | | | | | | | | | | | | | | | | | | | | | | | | | | | | | | | | | | | | | | | | | | | | | |
2016 | | $ | 27.47 | | | | 0.31 | | | | 0.25 | | | | 0.56 | | | | (0.34 | ) | | (4.25) | | | (4.59 | ) | | $ | 23.44 | | | | 1.31 | | | | 1.45 | | | | 1.45 | | | | 1.62 | | | | 1.67 | | | | 103.90 | | | $ | 325,135 | |
2015 | | $ | 29.86 | | | | 0.21 | | | | 0.13 | | | | 0.34 | | | | (0.21 | ) | | (2.52) | | | (2.73 | ) | | $ | 27.47 | | | | 0.71 | | | | 1.45 | | | | 1.45 | | | | 1.58 | | | | 1.09 | | | | 70.88 | | | $ | 479,223 | |
2014 | | $ | 30.14 | | | | 0.15 | | | | (0.24 | ) | | | (0.09 | ) | | | (0.19 | ) | | — | | | (0.19 | ) | | $ | 29.86 | | | | 0.51 | | | | 1.45 | | | | 1.45 | | | | 1.61 | | | | (0.30 | ) | | | 37.25 | | | $ | 754,139 | |
2013 | | $ | 26.11 | | | | 0.20 | | | | 4.02 | | | | 4.22 | | | | (0.19 | ) | | — | | | (0.19 | ) | | $ | 30.14 | | | | 0.71 | | | | 1.45 | | | | 1.45 | | | | 1.57 | | | | 16.23 | | | | 34.67 | | | $ | 1,152,795 | |
2012 | | $ | 23.17 | | | | 0.24 | | | | 2.95 | | | | 3.19 | | | | (0.25 | ) | | — | | | (0.25 | ) | | $ | 26.11 | | | | 0.95 | | | | 1.45 | | | | 1.45 | | | | 1.60 | | | | 13.82 | | | | 17.86 | | | $ | 1,323,765 | |
CLASS R4 SHARES | | | | | | | | | | | | | | | | | | | | | | | | | | | | | | | | | | | | | | | | | | | | | | | | | | | |
2016 | | $ | 27.30 | | | | 0.37 | | | | 0.23 | | | | 0.60 | | | | (0.39 | ) | | (4.25) | | | (4.64 | ) | | $ | 23.26 | | | | 1.55 | | | | 1.25 | | | | 1.25 | | | | 1.39 | | | | 1.87 | | | | 103.90 | | | $ | 267,623 | |
2015 | | $ | 29.69 | | | | 0.25 | | | | 0.15 | | | | 0.40 | | | | (0.27 | ) | | (2.52) | | | (2.79 | ) | | $ | 27.30 | | | | 0.86 | | | | 1.24 | | | | 1.24 | | | | 1.37 | | | | 1.30 | | | | 70.88 | | | $ | 333,247 | |
2014 | | $ | 29.98 | | | | 0.21 | | | | (0.24 | ) | | | (0.03 | ) | | | (0.26 | ) | | — | | | (0.26 | ) | | $ | 29.69 | | | | 0.70 | | | | 1.25 | | | | 1.25 | | | | 1.49 | | | | (0.12 | ) | | | 37.25 | | | $ | 722,349 | |
2013 | | $ | 25.96 | | | | 0.25 | | | | 4.01 | | | | 4.26 | | | | (0.24 | ) | | — | | | (0.24 | ) | | $ | 29.98 | | | | 0.91 | | | | 1.25 | | | | 1.25 | | | | 1.38 | | | | 16.49 | | | | 34.67 | | | $ | 1,342,883 | |
2012 | | $ | 23.04 | | | | 0.29 | | | | 2.93 | | | | 3.22 | | | | (0.30 | ) | | — | | | (0.30 | ) | | $ | 25.96 | | | | 1.16 | | | | 1.25 | | | | 1.25 | | | | 1.45 | | | | 14.05 | | | | 17.86 | | | $ | 1,495,958 | |
CLASS R5 SHARES | | | | | | | | | | | | | | | | | | | | | | | | | | | | | | | | | | | | | | | | | | | | | | | | | | | |
2016 | | $ | 28.03 | | | | 0.46 | | | | 0.23 | | | | 0.69 | | | | (0.46 | ) | | (4.25) | | | (4.71 | ) | | $ | 24.01 | | | | 1.88 | | | | 0.95 | | | | 0.95 | | | | 0.95 | | | | 2.19 | | | | 103.90 | | | $ | 529,330 | |
2015 | | $ | 30.41 | | | | 0.30 | | | | 0.19 | | | | 0.49 | | | | (0.35 | ) | | (2.52) | | | (2.87 | ) | | $ | 28.03 | | | | 1.01 | | | | 0.98 | | | | 0.98 | | | | 1.11 | | | | 1.57 | | | | 70.88 | | | $ | 685,617 | |
2014 | | $ | 30.71 | | | | 0.30 | | | | (0.24 | ) | | | 0.06 | | | | (0.36 | ) | | — | | | (0.36 | ) | | $ | 30.41 | | | | 0.97 | | | | 0.99 | | | | 0.99 | | | | 1.12 | | | | 0.17 | | | | 37.25 | | | $ | 2,171,673 | |
2013 | | $ | 26.61 | | | | 0.34 | | | | 4.10 | | | | 4.44 | | | | (0.34 | ) | | — | | | (0.34 | ) | | $ | 30.71 | | | | 1.20 | | | | 0.96 | | | | 0.96 | | | | 1.00 | | | | 16.80 | | | | 34.67 | | | $ | 4,376,567 | |
2012 | | $ | 23.61 | | | | 0.37 | | | | 3.00 | | | | 3.37 | | | | (0.37 | ) | | — | | | (0.37 | ) | | $ | 26.61 | | | | 1.44 | | | | 0.99 | | | | 0.99 | | | | 1.06 | | | | 14.33 | | | | 17.86 | | | $ | 4,512,144 | |
CLASS R6 SHARES | | | | | | | | | | | | | | | | | | | | | | | | | | | | | | | | | | | | | | | | | | | | | | | | | | | |
2016 | | $ | 27.97 | | | | 0.53 | | | | 0.21 | | | | 0.74 | | | | (0.51 | ) | | (4.25) | | | (4.76 | ) | | $ | 23.95 | | | | 2.19 | | | | 0.74 | | | | 0.74 | | | | 0.74 | | | | 2.40 | | | | 103.90 | | | $ | 473,941 | |
2015 | | $ | 30.36 | | | | 0.39 | | | | 0.17 | | | | 0.56 | | | | (0.43 | ) | | (2.52) | | | (2.95 | ) | | $ | 27.97 | | | | 1.33 | | | | 0.74 | | | | 0.74 | | | | 0.74 | | | | 1.81 | | | | 70.88 | | | $ | 420,849 | |
2014 | | $ | 30.70 | | | | 0.40 | | | | (0.26 | ) | | | 0.14 | | | | (0.48 | ) | | — | | | (0.48 | ) | | $ | 30.36 | | | | 1.28 | | | | 0.73 | | | | 0.73 | | | | 0.73 | | | | 0.42 | | | | 37.25 | | | $ | 872,512 | |
2013 | | $ | 26.62 | | | | 0.46 | | | | 4.05 | | | | 4.51 | | | | (0.43 | ) | | — | | | (0.43 | ) | | $ | 30.70 | | | | 1.59 | | | | 0.74 | | | | 0.74 | | | | 0.74 | | | | 17.07 | | | | 34.67 | | | $ | 1,345,680 | |
2012(e) | | $ | 27.14 | | | | 0.15 | | | | (0.38 | ) | | | (0.23 | ) | | | (0.29 | ) | | — | | | (0.29 | ) | | $ | 26.62 | | | | 1.35 | (f) | | | 0.76 | (f) | | | 0.76 | (f) | | | 0.76 | (f) | | | (0.77 | ) | | | 17.86 | | | $ | 478,078 | |
| (a) | Not annualized for periods less than one year. |
| (b) | Sales loads are not reflected in computing total return. |
| (c) | Net investment income (loss) was less than $0.01 per share. |
| (d) | Net investment income (loss) is less than 0.01%. |
| (e) | Effective date of this class of shares was May 1, 2012. |
| (g) | Class B shares were converted to Class A shares on August 29, 2016. |
| + | Based on weighted average shares outstanding. |
See notes to financial statements.
| | | | |
| 26 Annual Report | | | | Annual Report 27 |
| | |
| REPORT OF INDEPENDENT REGISTERED PUBLIC ACCOUNTING FIRM |
| |
Thornburg International Value Fund | | September 30, 2016 |
To the Trustees and Shareholders of
Thornburg International Value Fund
In our opinion, the accompanying statement of assets and liabilities, including the schedule of investments in securities, and the related statements of operations and of changes in net assets and the financial highlights present fairly, in all material respects, the financial position of the Thornburg International Value Fund (the “Fund”) at September 30, 2016, the results of its operations for the year then ended, the changes in its net assets for each of the two years in the period then ended and the financial highlights for each of the five years in the period then ended, in conformity with accounting principles generally accepted in the United States of America. These financial statements and financial highlights (hereafter referred to as “financial statements”) are the responsibility of the Fund’s management. Our responsibility is to express an opinion on these financial statements based on our audits. We conducted our audits of these financial statements in accordance with the standards of the Public Company Accounting Oversight Board (United States). Those standards require that we plan and perform the audit to obtain reasonable assurance about whether the financial statements are free of material misstatement. An audit includes examining, on a test basis, evidence supporting the amounts and disclosures in the financial statements, assessing the accounting principles used and significant estimates made by management, and evaluating the overall financial statement presentation. We believe that our audits, which included confirmation of securities at September 30, 2016 by correspondence with the custodian, brokers, transfer agent, and the application of alternative procedures where securities purchased had not been received, provide a reasonable basis for our opinion.
PricewaterhouseCoopers LLP
New York, New York
November 18, 2016
28 Annual Report
| | |
| EXPENSE EXAMPLE | | |
| |
Thornburg International Value Fund | | September 30, 2016 (Unaudited) |
As a shareholder of the Fund, you incur two types of costs:
| | (1) | transaction costs, including |
(a) sales charges (loads) on purchase payments for Class A shares;
(b) a deferred sales charge on redemptions of any part or all of a purchase of $1 million of Class A shares within 12 months of purchase;
(c) a deferred sales charge on redemptions of Class C shares within 12 months of purchase;
| | (2) | ongoing costs, including management fees; distribution and/or service (12b-1) fees; and other Fund expenses. |
This example is intended to help you understand your ongoing costs (in dollars) of investing in the Fund and to compare these costs with the ongoing costs of investing in other mutual funds.
The example is based on a $1,000 investment beginning on April 1, 2016, and held until September 30, 2016.
| | | | | | | | | | | | |
| | | Beginning
Account Value
4/1/16 | | | Ending
Account Value
9/30/16 | | | Expenses Paid
During Period†
4/1/16–9/30/16 | |
CLASS A SHARES | | | | | | | | | | | | |
Actual | | $ | 1,000.00 | | | $ | 1,033.20 | | | $ | 6.62 | |
Hypothetical* | | $ | 1,000.00 | | | $ | 1,018.49 | | | $ | 6.57 | |
CLASS C SHARES | | | | | | | | | | | | |
Actual | | $ | 1,000.00 | | | $ | 1,029.30 | | | $ | 10.49 | |
Hypothetical* | | $ | 1,000.00 | | | $ | 1,014.66 | | | $ | 10.42 | |
CLASS I SHARES | | | | | | | | | | | | |
Actual | | $ | 1,000.00 | | | $ | 1,034.90 | | | $ | 7.66 | |
Hypothetical* | | $ | 1,000.00 | | | $ | 1,020.31 | | | $ | 7.60 | |
CLASS R3 SHARES | | | | | | | | | | | | |
Actual | | $ | 1,000.00 | | | $ | 1,032.10 | | | $ | 6.66 | |
Hypothetical* | | $ | 1,000.00 | | | $ | 1,017.46 | | | $ | 6.61 | |
CLASS R4 SHARES | | | | | | | | | | | | |
Actual | | $ | 1,000.00 | | | $ | 1,033.30 | | | $ | 8.89 | |
Hypothetical* | | $ | 1,000.00 | | | $ | 1,018.45 | | | $ | 8.82 | |
CLASS R5 SHARES | | | | | | | | | | | | |
Actual | | $ | 1,000.00 | | | $ | 1,035.30 | | | $ | 4.88 | |
Hypothetical* | | $ | 1,000.00 | | | $ | 1,020.20 | | | $ | 4.85 | |
CLASS R6 SHARES | | | | | | | | | | | | |
Actual | | $ | 1,000.00 | | | $ | 1,035.90 | | | $ | 4.06 | |
Hypothetical* | | $ | 1,000.00 | | | $ | 1,021.01 | | | $ | 4.03 | |
| † | Expenses are equal to the annualized expense ratio for each class (A: 1.30%; C: 2.07%; I: 0.94%; R3: 1.51%; R4: 1.31%; R5: 0.96%; R6: 0.80%) multiplied by the average account value over the period, multiplied by 183/366 to reflect the one-half year period. |
| * | Hypothetical assumes a rate of return of 5% per year before expenses. |
ACTUAL EXPENSES
For each class of shares, the first line of the accompanying table provides information about actual account values and actual expenses. You may use the information in this line, together with the amount you invested, to estimate the expenses that you paid over the period. Simply divide your account value by $1,000 (for example, an $8,600 account value divided by $1,000 = 8.6), then multiply the result by the number in the first line for your class of shares under the heading entitled “Expenses Paid During Period” to estimate the expenses you paid on your account during this period.
HYPOTHETICAL EXAMPLE FOR COMPARISON PURPOSES
For each class of shares, the second line of the accompanying table provides information about hypothetical account values and hypothetical expenses based on the Fund’s actual expense ratio and an assumed rate of return of 5% per year before expenses, which is not the Fund’s actual return. The hypothetical account values and expenses may not be used to estimate the actual ending account balance or expenses you paid for the period. You may use this information to compare the ongoing costs of investing in the Fund and other funds. To do so, compare this 5% hypothetical example with the 5% hypothetical examples that appear in the shareholder reports of the other funds.
Please note that the expenses shown in the table are meant to highlight your ongoing costs only and do not reflect any transactional costs, such as sales charges (loads), redemption fees, or exchange fees. Therefore, the second line of the table for each class of shares is useful in comparing ongoing costs only, and will not help you determine the relative total costs of owning different funds. In addition, if these transactional costs were included, your costs would have been higher.
Annual Report 29
| | |
| TRUSTEES AND OFFICERS | | |
| |
Thornburg International Value Fund | | September 30, 2016 (Unaudited) |
| | | | | | |
Name, Age, Year Elected Position Held with Fund | | Principal Occupation(s) During Past Five Years | | Other
Directorships
Held by Trustee | |
INTERESTED TRUSTEES(1)(2)(4) | | | | |
| | |
Garrett Thornburg, 71 Trustee since 1987, Chairman of Trustees(3) | | Chairman and controlling shareholder of Thornburg Investment Management, Inc. (investment advisor); Chairman and controlling shareholder of Thornburg Securities Corporation (securities dealer); Chairman and CEO of Chamisa Energy, LLC; President of the Thornburg Foundation (nonprofit). | | | None | |
| | |
Brian J. McMahon, 61 Trustee since 2001, Vice Chairman of Trustees, Member of Governance & Nominating Committee & Operations Risk Oversight Committee(5) | | Chief Investment Officer, Managing Director, and Portfolio Manager and, until 2016, CEO and President of Thornburg Investment Management, Inc.; Vice President of Thornburg Securities Corporation. | | | None | |
| |
INDEPENDENT TRUSTEES(1)(2)(4) | | | | |
| | |
David A. Ater, 71 Trustee since 1994, Member of Audit Committee & Chairman of Governance & Nominating Committee | | Principal in Ater & Associates, Santa Fe, NM (developer, planner and broker of residential and commercial real estate); owner, developer and broker for various real estate projects. | | | None | |
| | |
David D. Chase, 75 Trustee since 2000, Chairman of Audit Committee | | Managing Member of CS Group, LLC, Santa Fe, NM (private investment fund – family office). | | | None | |
| | |
Sally Corning, 55 Trustee since 2012, Member of Audit Committee | | Partner in Sun Mountain Capital, Santa Fe, NM (private equity firm with investment programs encompassing venture capital, mezzanine debt, and growth equity). | | | None | |
| | |
Susan H. Dubin, 67 Trustee since 2004, Member of Audit Committee & Governance and Nominating Committee | | President of Dubin Investments, Ltd., Greenwich, CT (private investment fund); Director and officer of various charitable organizations. | | | None | |
| | |
David L. Gardner, 53 Trustee since 2015, Member of Operations Risk Oversight Committee | | Until 2012, head of EMEA (Europe, Middle East and Africa) Sales for iShares of Blackrock, Inc., EMEA Executive Committee Member and EMEA Operating Committee Member at Blackrock, Inc. | | | None | |
| | |
Owen D. Van Essen, 62 Trustee since 2004, Member of Governance & Nominating Committee & Chairman of Operations Risk Oversight Committee | | President of Dirks, Van Essen & Murray, Santa Fe, NM (newspaper mergers and acquisitions). | | | None | |
| | |
James W. Weyhrauch, 57 Trustee since 1996, Member of Audit Committee & Operations Risk Oversight Committee | | Real estate broker, Santa Fe Properties, Santa Fe, NM; Vice Chairman of Nambe LLC, Santa Fe, NM (manufacturing & design company). | | | None | |
30 Annual Report
| | |
| TRUSTEES AND OFFICERS, CONTINUED | | |
| |
Thornburg International Value Fund | | September 30, 2016 (Unaudited) |
| | | | | | |
Name, Age, Year Elected Position Held with Fund | | Principal Occupation(s) During Past Five Years | | Other
Directorships
Held by Trustee | |
OFFICERS OF THE FUND (WHO ARE NOT TRUSTEES)(1)(7) | | | | |
| | |
Nimish Bhatt, 53 Treasurer since 2016(6) | | Chief Financial Officer and Treasurer of Thornburg Investment Management, Inc. and Thornburg Securities Corporation since 2016; Senior Vice President (2004-2016), Chief Financial Officer (2011-2016), and Head of Fund Administration (2011-2016) of Calamos Asset Management, Inc., Calamos Investments LLC, Calamos Advisors LLC, and Calamos Wealth Management; Director of Calamos Global Funds plc (2007-2016). | | | Not applicable | |
| | |
Jason Brady, 42 President since 2016(6) | | CEO and President since 2016, Vice President from 2011 to 2016, Portfolio Manager and Managing Director of Thornburg Investment Management, Inc.; Vice President of Thornburg Securities Corporation since 2016. | | | Not applicable | |
| | |
Kathleen Brady, 56 Vice President since 2008 | | Tax Manager Fund Accounting of Thornburg Investment Management, Inc. | | | Not applicable | |
| | |
Connor Browne, 37 Vice President since 2006 | | Portfolio Manager, Vice President since 2013, and Managing Director of Thornburg Investment Management, Inc. | | | Not applicable | |
| | |
Tim Cunningham, 41 Vice President since 2014 | | Managing Director since 2011, Portfolio Manager since 2012, and Associate Portfolio Manager from 2009–2012 of Thornburg Investment Management, Inc. | | | Not applicable | |
| | |
Randy Dry, 42 Vice President since 2014 | | Vice President and Managing Director, Director of Institutional Group from 2014-2016, and since 2016, Chief Administrative Officer of Thornburg Investment Management, Inc. | | | Not applicable | |
| | |
Greg Dunn, 40 Vice President since 2014 | | Managing Director, Portfolio Manager since 2012, and Associate Portfolio Manager from 2009–2012 of Thornburg Investment Management, Inc. | | | Not applicable | |
| | |
| Lon Erickson, 41 Vice President since 2008 | | Portfolio Manager and Managing Director of Thornburg Investment Management, Inc. | | | Not applicable | |
| | |
William V. Fries, 77 Vice President since 1995 | | Portfolio Manager, Vice President, and Managing Director of Thornburg Investment Management, Inc. | | | Not applicable | |
| | |
Thomas Garcia, 45 Vice President since 2006 | | Vice President since 2011, Managing Director, Head Equity Trader, and Associate Portfolio Manager of Thornburg Investment Management, Inc. | | | Not applicable | |
| | |
Rolf Kelly, 37 Vice President since 2016 | | Portfolio Manager and Managing Director since 2013 and Associate Portfolio Manager from 2011–2013 of Thornburg Investment Management, Inc. | | | Not applicable | |
| | |
Ben Kirby, 36 Vice President since 2014 | | Portfolio Manager and Managing Director since 2013 and Associate Portfolio Manager from 2011–2013 of Thornburg Investment Management, Inc. | | | Not applicable | |
| | |
Jeff Klingelhofer, 41 Vice President since 2016 | | Portfolio Manager and Managing Director since 2015, Associate Portfolio Manager from 2012–2015, and Fixed Income Analyst from 2010–2012 of Thornburg Investment Management, Inc. | | | Not applicable | |
| | |
Rob MacDonald, 40 Vice President since 2016 | | Managing Director since 2015, Portfolio Manager since 2014, and Associate Portfolio Manager from 2011–2014 of Thornburg Investment Management, Inc. | | | Not applicable | |
| | |
Leigh Moiola, 49 Vice President since 2001 | | Vice President, Managing Director, and Director of Marketing of Thornburg Investment Management, Inc.; Vice President of Thornburg Securities Corporation. | | | Not applicable | |
| | |
Christopher Ryon, 60 Vice President since 2008 | | Portfolio Manager and Managing Director of Thornburg Investment Management, Inc. | | | Not applicable | |
| | |
Nicholos Venditti, 35 Vice President since 2016 | | Portfolio Manager and Managing Director since 2015 and Associate Portfolio Manager from 2011–2015 of Thornburg Investment Management, Inc. | | | Not applicable | |
Annual Report 31
| | |
| TRUSTEES AND OFFICERS, CONTINUED | | |
| |
Thornburg International Value Fund | | September 30, 2016 (Unaudited) |
| | | | |
Name, Age, Year Elected Position Held with Fund | | Principal Occupation(s) During Past Five Years | | Other
Directorships
Held by Trustee |
| | |
Vinson Walden, 46 Vice President since 2004 | | Portfolio Manager and Managing Director of Thornburg Investment Management, Inc. | | Not applicable |
| | |
Lei Wang, 45 Vice President since 2006 | | Portfolio Manager and Managing Director of Thornburg Investment Management, Inc. | | Not applicable |
| | |
Sasha Wilcoxon, 42 Vice President since 2003 Secretary since 2007(6) | | Managing Director, Director of Mutual Fund Operations, and Vice President of Thornburg Investment Management, Inc.; Vice President of Thornburg Securities Corporation. | | Not applicable |
| | |
Charles Wilson, 41 Vice President since 2016 | | Portfolio Manager and Managing Director since 2014 and Associate Portfolio Manager from 2012–2014 of Thornburg Investment Management, Inc.; Co-Portfolio Manager of Marsico Capital Management from 2010–2012. | | Not applicable |
| | |
Di Zhou, 38 Vice President since 2016 | | Portfolio Manager and Managing Director since 2016, Associate Portfolio Manager from 2014–2016, and Equity Research Analyst from 2010–2014 of Thornburg Investment Management, Inc. | | Not applicable |
| (1) | Each person’s address is 2300 North Ridgetop Road, Santa Fe, New Mexico 87506. |
| (2) | The Fund is a separate investment “Fund” or “series” of Thornburg Investment Trust (the “Trust”), which comprises the Thornburg mutual fund complex and is organized as a Massachusetts business trust. Thornburg Investment Management, Inc. is the investment advisor to, and manages, all the Funds of the Trust. Each Trustee oversees all the Funds of the Trust. |
| (3) | Mr. Thornburg is considered an “interested” Trustee under the Investment Company Act of 1940 because he is the sole director and controlling shareholder of Thornburg Investment Management, Inc., the investment advisor to the Trust, and is the sole director and controlling shareholder of Thornburg Securities Corporation, the distributor of shares for the Trust. |
| (4) | The Bylaws of the Trust currently require that each Trustee shall retire by the end of the calendar year during which the Trustee reached the age of 75 years. Otherwise each Trustee serves in office until the election and qualification of a successor or until the Trustee sooner dies, resigns, retires or is removed. |
| (5) | Mr. McMahon is considered an “interested” Trustee under the Investment Company Act of 1940 because he is the chief investment officer of Thornburg Investment Management, Inc. |
| (6) | The Trust’s president, secretary, and treasurer each serves a one-year term or until the election and qualification of a successor; each other officer serves at the pleasure of the Trustees. |
| (7) | Assistant vice presidents, assistant secretaries, and assistant treasurers are not shown. |
The Statement of Additional Information for each Fund of the Trust includes additional information about the Trustees and is available, without charge and upon request, by calling 1-800-847-0200.
32 Annual Report
| | |
| OTHER INFORMATION | | |
| |
Thornburg International Value Fund | | September 30, 2016 (Unaudited) |
PORTFOLIO PROXY VOTING
Policies and Procedures:
The Trust has delegated to Thornburg Investment Management, Inc. (the “Advisor”) voting decisions respecting proxies for the Fund’s voting securities. The Advisor makes voting decisions in accordance with its Proxy Voting Policy and Procedures. A description of the Policy and Procedures is available (i) without charge, upon request, by calling the Advisor toll-free at 1-800-847-0200, (ii) on the Thornburg website at www.thornburg.com, and (iii) on the Securities and Exchange Commission’s website at www.sec.gov.
Information regarding how proxies were voted is available on or before August 31 of each year for the twelve months ending the preceding June 30. This information is available (i) without charge, upon request by calling the Advisor toll-free at 1-800-847-0200, (ii) on the Thornburg website at www.thornburg.com, and (iii) on the Securities and Exchange Commission’s website at www.sec.gov.
TAX INFORMATION
For the tax year ended September 30, 2016, dividends paid by the Thornburg International Value Fund of $1,466,179,239 are being reported as long term capital gain dividends and $145,038,271 are taxable ordinary investment income dividends for federal income tax purposes.
For the tax year ended September 30, 2016, the Fund is reporting 100.00% (or the maximum allowed) of the dividends paid from tax basis net ordinary income as qualifying for the reduced rate under the Jobs and Growth Tax Relief and Reconciliation Act of 2003.
The Fund is reporting 6.13% (or the maximum allowed) of the ordinary income distributions paid by the Fund for the fiscal year ended September 30, 2016 as qualified for the corporate dividends received deduction.
For the year ended September 30, 2016, foreign source income and foreign taxes paid is $253,540,367 and $27,687,914, respectively. The information and distributions reported herein may differ from the information and distributions reported to the shareholders for the calendar year ending December 31, 2016. Complete information will be reported in conjunction with your 2016 Form 1099.
AVAILABILITY OF QUARTERLY PORTFOLIO SCHEDULE
The Fund files with the Securities and Exchange Commission schedules of its portfolio holdings on Form N-Q for the first and third quarters of each fiscal year. The Fund’s Forms N-Q are available on the Commission’s website at www.sec.gov, or may be reviewed and copied at the Commission’s Public Reference Room in Washington, D.C. Information on the operation of the Public Reference Room may be obtained by calling 1-800-SEC-0330. The Fund also makes this information available on its website at www.thornburg. com/download or upon request by calling 1-800-847-0200.
STATEMENT RESPECTING RENEWAL OF INVESTMENT ADVISORY AGREEMENT
Thornburg Investment Management, Inc. (the “Advisor”) provides investment management services to Thornburg International Value Fund pursuant to an investment advisory agreement. The Trustees consider the renewal of this agreement annually, and most recently determined to renew the agreement on September 13, 2016.
In anticipation of their recent consideration of the advisory agreement’s renewal, the independent Trustees met in May 2016 to consider aspects of their annual evaluation of the Advisor’s service to all of the funds of Thornburg Investment Trust, to plan the annual evaluation of the Advisor’s performance and to specify the information the Advisor would present to the Trustees for their review. The independent Trustees met again in independent session in September to consider portions of the information submitted by the Advisor. The Advisor’s president and chief investment officer subsequently reviewed portions of the information with the Trustees and addressed questions from the Trustees at a full meeting session of the Trustees scheduled for that purpose, and the independent Trustees thereafter met in independent session to consider the Advisor’s presentation and various specific issues respecting their consideration of the advisory agreement’s renewal. Following these sessions, the Trustees met to consider renewal of the agreement, and the independent Trustees voted unanimously at that meeting to renew the agreement for an additional term of one year.
The information below summarizes certain factors considered by the Trustees in connection with the determination to renew the advisory agreement. In determining to renew the agreement, the Trustees considered a wide range of information and did not identify any single factor as controlling, and this summary does not describe all of the factors and other matters considered by the Trustees in making their determination.
Nature, Extent and Quality of Services. The Trustees considered presentations by the Advisor at meeting sessions scheduled for consideration of a continuation of the advisory agreement, and also noted their consideration of the reports the Trustees and their committees
Annual Report 33
| | |
| OTHER INFORMATION, CONTINUED | | |
| |
Thornburg International Value Fund | | September 30, 2016 (Unaudited) |
receive throughout the year on a wide variety of topics, and consideration they had given to a number of topics in previous years. Information identified by the Trustees in their evaluation as having been considered and contributing to their conclusions included Trustees’ assessments of the Advisor’s personnel developed in formal and informal meetings throughout the year, the Advisor’s staffing levels and measures to maintain staffing levels and improve competencies, the Advisor’s commitment to attract and retain high quality portfolio management expertise through competitive compensation levels, the Advisor’s collaborative approach to investment management, the Fund’s investment performance over different periods of time, portfolio managers’ cognizance of and strategies to address market and economic trends and conditions, the evaluation and selection of individual investments, the structuring and composition of the Fund’s portfolio, management of Fund liquidity requirements, cognizance of and efforts to achieve tax efficiency, responses to share sale and redemption activity, continuing enhancements to the Advisor’s electronic and information systems and the Advisor’s engagement of outside firms to assist in improving or replacing those systems, the Advisor’s evaluation and selection of firms providing portfolio trade execution to the Fund and the Advisor’s measures to obtain favorable trade execution, the Advisor’s performance of accounting and other services, the Advisor’s continued commitment to observance of compliance and regulatory requirements, the Advisor’s responsiveness to the Trustees, the quality and extent of written and oral reports to the Trustees over the course of the year, and other factors.
Investment Performance. The Trustees noted in their evaluation of the Fund’s investment performance the reports they had received in each regular meeting over the course of the year from the Advisor’s portfolio management personnel. The Trustees also noted in their evaluation their consideration of information provided to them at their request in anticipation of their annual evaluation of the Advisor’s services, including the following items of information respecting the investment performance of the Fund: (1) the Fund’s absolute investment performance and achievement of stated objectives; (2) the Advisor’s written and oral explanations and commentary on the Fund’s performance in the context of the Fund’s objectives and reasonable expectations, and business, market and economic conditions, (3) performance data for the ten most recent calendar years, comparing the Fund’s investment performance to a fund category selected by an independent mutual fund analyst firm, and to two broad-based securities indices, (4) performance data for the three-month, year-to-date, one-year, three-year, five-year and ten-year periods ending with the second quarter of the current year comparing the Fund’s annualized returns to two mutual fund categories and to two broad-based securities indices, and assigning a ranking to the Fund’s performance for each period relative to the two fund categories, (5) comparison of the Fund’s annualized return since inception to the Fund’s benchmark index, and (6) comparative measures of estimated earnings growth, portfolio volatility, risk and return.
The Trustees noted that quarterly reports during the year and other information presented to them confirmed the Advisor’s continued conformity to the Fund’s stated investment objectives and policies.
The Trustees observed in reviewing comparative performance data for the ten most recent calendar years that the Fund’s investment return for the most recent calendar year was higher than the returns of the two securities indices and the average return for the mutual fund category, the Fund’s returns for the preceding nine years exceeded or were comparable to the returns of the first index for seven of nine years, the Fund’s returns exceeded or were comparable to the returns of the second index for five of nine years, and that the Fund’s returns exceeded or were comparable to the average returns of the fund category for five of the nine years. Other quantitative data noted by the Trustees as having been considered in their evaluation showed that the Fund’s annualized investment returns fell in the fourth quartile of performance of the first mutual fund category for the one-year and five-year periods ended with the second quarter of the current year, fell in the third quartile of performance for the three-year period, and fell in the second quartile of performance for the ten-year period. The data further showed that the Fund’s annualized investment returns fell in the fourth quartile of performance of the second fund category for the one-year and five-year periods ended with the second quarter of the current year, fell at the midpoint of performance for the three-year period, and fell in the second quartile of performance for the ten-year period. Data presented to the Trustees also showed that the Fund’s annualized total return for the period since inception exceeded the annualized returns of the two indices considered. The Trustees attached additional significance to the performance data of the Fund from the perspective of longer term shareholders.
Comparisons of Fee and Expense Levels. The Trustees recognized in their evaluation the clear disclosures of the Advisor’s fees and Fund expenses in the Fund’s prospectuses. Information noted by the Trustees as having been considered in this context included a variety of comparative data respecting the Fund’s fee and expense levels. This information included comparisons of the Fund’s advisory fee and overall Fund expenses to median and average fees and expenses charged to a category of mutual funds selected by an independent mutual fund analyst firm, comparisons of the advisory fee and other Fund expenses to the fee levels and expenses for two representative share classes of fund peer groups selected from the category by a second independent mutual fund analyst firm, the perspectives and advice from the second mutual fund analyst firm respecting comparisons of fund fee levels and expenses to fund peer groups, and other information. Comparative fee and expense data noted as having been considered by the Trustees showed that the Fund’s advisory fee level was comparable to the median and average fee levels for the fund category, the level of total expense for a representative share class was comparable to the category median and slightly lower than its average, and that the level of total expense for a second representative share class was lower than the median and average levels of total expense for the category. Peer group data showed that the Fund’s advisory fee level was comparable to median levels for the two peer groups, and that the total expense levels for the two representative share classes were comparable to the median levels for their respective peer groups.
The Trustees noted their consideration of information respecting the advisory fees charged by the Advisor to other investment management clients, including sub-advised mutual funds, together with information about fees charged by other advisors to different clients,
34 Annual Report
| | |
| OTHER INFORMATION, CONTINUED | | |
| |
Thornburg International Value Fund | | September 30, 2016 (Unaudited) |
analysis of the differences between the requirements of institutional clients and mutual funds, analysis of the differences between the requirements of a sub-advised mutual fund and a fund as to which the investment advisor is the primary advisor and sponsor, descriptions of distinguishing characteristics of the sub-advised funds served by the Advisor, and the consequently different investment management services provided to the different categories of clients and the differing contexts in which the fee levels for these arrangements are established. The Trustees confirmed their previous observations that the differences between the fees charged by the Advisor to different types of clients did not appear exceptional, and that the fee rates charged by an investment advisor to different categories of clients had limited relevance to the evaluation of the fee rate charged by that advisor to mutual funds as to which it is the primary advisor and sponsor.
Costs and Profitability of Advisor. In reviewing the profitability of the Advisor’s services to the Fund the Trustees considered an analysis of the Advisor’s costs and the profitability to the Advisor of its services, together with data respecting the overall profitability of a selection of other investment management firms. The Trustees noted that a portion of the Advisor’s profits are an important element in the compensation of shareholder employees. The Trustees considered in this regard information from the Advisor respecting investment of its profits to maintain staffing levels, pay competitive levels of compensation, and add to its information retrieval and management systems to maintain or improve service levels. The Trustees also considered the contribution of the Advisor’s cost management to its profitability, and the relationship of the Advisor’s financial resources and profitability in previous years to its ability to attract necessary personnel, invest in systems and other assets required for its service to the Fund, and maintain or improve service levels for the Fund notwithstanding fluctuations in revenues and profitability. The information considered did not indicate to the Trustees that the Advisor’s profitability was excessive.
Potential Economies of Scale. In reviewing the extent to which economies of scale would be realized by the Fund as it grows and whether fee levels reflect potential economies of scale, the Trustees considered the breakpoint structure for advisory fees chargeable to the Fund, comparisons of the fee breakpoint structure for the Fund with breakpoint structures (or the absence of such structures) for other funds in a peer group selected by an independent mutual fund analyst firm, the effects of the breakpoint structure and other expense factors realized by certain Funds of the Trust as their asset levels had increased, and the Advisor’s expenditures from its own profits and resources to maintain staffing levels, pay competitive levels of compensation, and add to its information retrieval and management systems to maintain or improve service levels. The information provided demonstrated to the Trustees that the Fund’s advisory fee breakpoint structure is reasonable in relation to the structures observed in the other funds in its peer group, and that shareholders may be expected to benefit from any economies of scale, due to the advisory agreement’s breakpoint fee structure for the Fund and other factors.
Potential Ancillary Benefits. In reviewing potential benefits to the Advisor because of its relationship to the Fund, the Trustees noted disclosures by the Advisor of its receipt of certain research services from broker dealers, and the benefits to both the Fund and the Advisor of the Advisor’s expansion of its staffing, compliance and systems capabilities and other resources to serve a broader variety of investment management clients. No unusual or unfair benefits to the Advisor from its relationship to the Fund were identified by the Trustees.
Summary of Conclusions. The Trustees concluded that the nature, extent and quality of the Advisor’s services performed under the advisory agreement remained sufficient. The Trustees further concluded that the absolute and relative investment performance of the Fund over a range of pertinent holding periods on the whole was satisfactory in the context of its objectives and strategies, and that the Advisor had continued to actively and competently pursue the Fund’s stated investment objectives and adhere to the Fund’s investment policies.
The Trustees further concluded, based upon their consideration of the foregoing factors and other information, that the level of the advisory fee charged to the Fund by the Advisor is reasonable in relation to the services provided by the Advisor in view of the nature, extent and quality of those services, the investment performance of the Fund after fees and expenses, the clear disclosure of fees and expenses in the Fund’s prospectuses, comparisons of fees and expenses charged to the Fund to fees and expenses charged to other mutual funds, and the other factors considered.
Annual Report 35
TRUSTEES’ STATEMENT TO SHAREHOLDERS
Readopted September 12, 2016
The Trustees believe current and prospective shareholders should know how we discharge our responsibilities in supervising the Funds’ investment advisor and in reviewing the advisor’s contract for renewal. Since 2005, we have issued a statement which sets out clearly the three principal guidelines that we follow in supervising the Trust’s investment advisor on your behalf. In accordance with our customary practice, in September of this year we again reviewed our statement and concluded we should reissue this statement outlining the principal features of our supervision of the advisor’s performance of investment management services for the Funds.
We begin with the premise that each shareholder selected his or her Fund because its investments are managed by the investment advisor identified in the prospectus and in accordance with the objective and policies described in the prospectus. We realize, as each of you do, that if you believe that your Fund’s stated objective and policies no longer serve your personal investment goals, you can sell your shares and leave the Fund.
Therefore, we believe that our primary supervisory task—our principal obligation to you—is to assess the nature and quality of the advisor’s services, and to confirm that the advisor actively and competently pursues the Fund’s objective, in accordance with the policies set out in the prospectus. To do this, we meet regularly with management to review your Fund’s portfolio and to discuss the advisor’s specific actions and judgments in pursuing the Fund’s objective. We do not substitute our own judgment for the advisor’s decisions in selecting investments; the advisor is paid to exercise its informed judgment on investment decisions, and we seek to confirm, in reviewing the advisor’s performance, that the advisor is doing just that.
Second, we are conscious of costs and the effect that costs have on shareholders’ returns. We try to make sure that your Fund’s fees and costs are reasonable in relationship to the services rendered and that they are generally in line with those charged by other expert investment advisors, consistent with our belief that the Fund’s investors searched for and expect that expertise and attention and have decided to pay a reasonable price for it. We do not put the management contract “out to bid” as a matter of course, and we would not do so unless we had concluded that the advisor materially had failed to pursue the Fund’s objectives in accordance with its policies, or for other equally important reasons. We believe that any other approach would be inconsistent with your interests and contrary to your expectations when you bought shares of the Fund in the first place.
Finally, because we believe that most Thornburg Fund shareholders have invested with a long-term perspective, we try not to focus too much on the fashions of the moment and on short-term performance. The market will not favor any specific investment objective or set of policies at all times and under all economic circumstances. A fund will experience periods of both high and low returns relative to other funds and other investments. Even if one of our Funds is not favored by the market at a particular time, we believe that the advisor is nonetheless obliged to remain true to the Fund’s objective and policies, and we watch to see that it does so.
Trustees of Thornburg Investment Trust
36 Annual Report
Thornburg Funds
Thornburg Investment Management is a privately-owned global investment firm that offers a range of solutions for retail and institutional investors. Founded in 1982 and headquartered in Santa Fe, New Mexico, we manage approximately $53 billion (as of September 30, 2016) across eight equity and 11 bond mutual funds, separate accounts for high-net-worth investors and institutional accounts, and five UCITS funds for non-U.S. investors.
The fund outlined in this report is one of many equity and fixed-income products available from Thornburg Investment Management.
Equity Funds
| | • | | Thornburg Core Growth Fund |
| | • | | Thornburg International Value Fund |
| | • | | Thornburg Better World International Fund |
| | • | | Thornburg International Growth Fund |
| | • | | Thornburg Developing World Fund |
| | • | | Thornburg Investment Income Builder Fund |
| | • | | Thornburg Global Opportunities Fund |
Fixed Income Funds
| | • | | Thornburg Low Duration Income Fund |
| | • | | Thornburg Limited Term U.S. Government Fund |
| | • | | Thornburg Limited Term Income Fund |
| | • | | Thornburg Strategic Income Fund |
| | • | | Thornburg Low Duration Municipal Fund |
| | • | | Thornburg Limited Term Municipal Fund |
| | • | | Thornburg Intermediate Municipal Fund |
| | • | | Thornburg California Limited Term Municipal Fund |
| | • | | Thornburg New Mexico Intermediate Municipal Fund |
| | • | | Thornburg New York Intermediate Municipal Fund |
| | • | | Thornburg Strategic Municipal Income Fund |
Before investing, carefully consider the Fund’s investment goals, risks, charges, and expenses. For a prospectus or summary prospectus containing this and other information, contact your financial advisor or visit thornburg.com. Read it carefully before investing.
For additional information, please visit thornburg.com
Thornburg Investment Management, Inc. 2300 North Ridgetop Road, Santa Fe, NM 87506
Annual Report 37
This page intentionally left blank.
38 Annual Report
This page intentionally left blank.
Annual Report 39

| | |
To receive shareholder reports, prospectuses, and proxy statements electronically, go to www.thornburg.com/edelivery. This Annual Report is submitted for the general information of shareholders of the Fund. It is not authorized for distribution to prospective investors in the Fund unless preceded or accompanied by an effective prospectus. | |  |
| | | | |
| Investment Advisor: | | Distributor: | | |
| Thornburg Investment Management® | | Thornburg Securities Corporation® | | |
| 800.847.0200 | | 800.847.0200 | | TH078 |
2 Annual Report
Annual Report
Thornburg Core Growth Fund
September 30, 2016
| | | | |
Share Class | | NASDAQ Symbol | | CUSIP |
Class A | | THCGX | | 885-215-582 |
Class C | | TCGCX | | 885-215-574 |
Class I | | THIGX | | 885-215-475 |
Class R3 | | THCRX | | 885-215-517 |
Class R4 | | TCGRX | | 885-215-251 |
Class R5 | | THGRX | | 885-215-350 |
Class I, R3, R4, and R5 shares may not be available to all investors. Minimum investments for Class I shares may be higher than those for other classes.
Investments carry risks, including possible loss of principal. Additional risks may be associated with investments outside the United States, especially in emerging markets, including currency fluctuations, illiquidity, volatility, and political and economic risks. Investments in small- and mid-capitalization companies may increase the risk of greater price fluctuations. Please see the Fund’s prospectus for a discussion of the risks associated with an investment in the Fund. Investments in the Fund are not FDIC insured, nor are they bank deposits or guaranteed by a bank or any other entity.
Funds invested in a limited number of holdings may expose an investor to greater volatility.
Annual Report 3
LETTER TO SHAREHOLDERS
| | |
| |
Thornburg Core Growth Fund | | September 30, 2016 (Unaudited) |
October 24, 2016
Dear Fellow Shareholder:
For the fiscal year ended September 30, 2016, Thornburg Core Growth Fund returned 8.16% for Class A shares without sales charge, underperforming its benchmark, the Russell 3000 Growth Index, which returned 13.64%. On September 30, 2016, the net asset value per Class A share was $28.22.
We were disappointed to trail the benchmark for the fiscal year, but were encouraged by the strong finish to the period. Over the last seven years, near-zero benchmark interest rate policies around the world and generally anemic economic growth have led to a difficult investing environment. This has driven investors in the direction of stocks that pay attractive dividends and are perceived to be defensive, including the consumer staples, telecommunications, and utilities sectors. At the same time investors have shied away from riskier assets, including smaller capitalization stocks. When you examine the performance of the Russell 3000 Growth Index by market cap deciles, you can see that large-cap stocks outperformed small-and mid-cap stocks by a wide margin. The top three market cap deciles were the top three performers and represented more than 70% of the benchmark. More recently, we also saw a significant rebound in energy and materials stocks as commodity prices broadly bounced off their lows. The result of all of this has been that stocks with low growth characteristics and large market caps have continued to lead the market, creating a headwind to our portfolio based on our longstanding preferences for quality growth stocks, smaller capitalization ranges, long-term secular themes, and idiosyncratic opportunities. While many of the attributes we favor have been underappreciated during prior periods, that was not the case toward the end of the fiscal year. In fact we saw a reversal, benefiting performance, although not enough to overcome the underperformance earlier in the period.
During the year some of our best performing sectors were consumer discretionary and technology. We struggled the most with our financials and industrials exposure.
Contributors and Detractors
The top five individual contributors to performance during the period were Amazon, Acuity Brands, Autodesk, Facebook, and Mobileye.
Amazon – Amazon stock continued to climb during the year as revenue growth rates exceeded expectations, but more importantly as profitability expanded. Amazon Web Services is a fast-growing business that is very profitable, and has reached a scale that makes it a meaningful component of the company’s financial results. The better known e-commerce business continues to grow at a faster rate than its market, having the rare combination of being a market share leader and a market share gainer. Amazon’s stock appreciation has been a function of both of these factors. The cash-flow-to-earnings ratio has remained flat and the price-to-earnings multiple has actually declined.
Acuity Brands – Acuity is the leader in lighting solutions for the commercial construction market in North America. Over the course of the fiscal year, Acuity Brands continued to lead the market in conversions from traditional to LED lighting, which is significantly more energy efficient and cuts total costs over time. This led to over 30% earnings-per-share growth and 20% revenue growth.
Autodesk – Autodesk is a leader in the industrial and architectural design space, providing a software application for two-dimensional and three-dimensional design. The company is in the process of moving from a perpetual license model, in which the customer pays a large up-front license fee with the option to pay for ongoing maintenance on an annual basis, to a subscription model where the software is delivered as a service. These transitions can be messy and opaque. Early in the year investor concerns about its ability to successfully make this transition weighed on the stock. Given our research and perhaps longer-term view, we used the near-term concerns as an opportunity to take a position in the stock. After several quarters of showing strong progress in its transition, the stock recovered nicely.
Facebook – Facebook continues to perform well as its already gigantic user base steadily grows. Monthly active users recently topped 1.5 billion worldwide, with over 1 billion of those logging in every day. Facebook continues to monetize its user base in excess of expectations, aided by additional contributions from Instagram. Potential revenue generation opportunities from its Messenger, WhatsApp, and Oculus (VR) subsidiaries are beginning to take shape as well.
Mobileye – Mobileye is the leading vision-based active safety software provider for passenger vehicles. During the year, Mobileye announced an industry-first mapping solution, a deep partnership with BMW and Intel, and provided a time-line for its autonomous driving solutions. Shares rallied despite heavy short selling and increased competitive pressure. We sold the position when it hit our price target.
The top five individual detractors from performance were Tableau Software, LinkedIn, Stericycle, Perrigo, and the Advisory Board Company.
Tableau Software – Tableau is an analytics company that specializes in visualizing data in easy and efficient ways. Unfortunately, during the first quarter of the year, it reported decelerating revenue growth combined with accelerating investment spending. We sold the stock on its deteriorating fundamental picture.
4 Annual Report
| | |
LETTER TO SHAREHOLDERS, CONTINUED | | |
| |
Thornburg Core Growth Fund | | September 30, 2016 (Unaudited) |
LinkedIn – LinkedIn operates the world’s largest professional social network. It monetizes the network with a product called Talent Solutions, which employers use to identify and recruit talent. First quarter 2016 results and guidance seemed to imply that Talent Solutions was closer to market saturation than we expected. In addition, its newest product, Sales Navigator, did not seem to be generating the kind of demand we hoped would materialize. We sold the stock on these concerns and unfortunately were no longer shareholders when Microsoft stepped in to acquire the struggling business.
Stericycle – Stericycle is primarily a medical waste management company. As management has made acquisitions outside the firm’s core business, it appears the company has become more difficult to manage and overall results have suffered. We sold our position in the company.
Perrigo – Management departures just after a large acquisition combined with pricing pressure for its generic drug portfolio increased uncertainty and caused Perrigo to de-rate. Furthermore, earnings estimates have come down due to lower growth in the core business and problems at the newly acquired European consumer health business. We sold our position during the period.
The Advisory Board Company – Advisory Board provides best practice research and analysis to the health care industry through software tools and membership in research programs. Recently demand for its products has fallen dramatically with revenue growth slowing from the mid-teens to mid-single digits. The fundamental deterioration in its business led us to sell.
Over the life of the Fund we have held true to our philosophy and process, which favor quality growth stocks, smaller capitalization ranges, long-term secular themes, and idiosyncratic opportunities. While we recognize there will be periods when our style is out of favor, over time it has served our investors well. We remain bullish about the prospects of the individual companies we have identified through our bottom-up process.
Thank you for investing alongside us in Thornburg Core Growth Fund.
| | |
| Sincerely, | | |
| |
 | |  |
| Greg Dunn | | Tim Cunningham,CFA |
| Managing Director | | Managing Director |
| Portfolio Manager | | Portfolio Manager |
The matters discussed in this report may constitute forward-looking statements made pursuant to the safe harbor provisions of the Securities Litigation Reform Act of 1995. These include any advisor or portfolio manager prediction, assessment, analysis or outlook for individual securities, industries, investment styles, market sectors and/or markets. These statements involve risks and uncertainties. In addition to the general risks described for each fund in its current prospectus, other factors bearing on these reports include the accuracy of the advisor’s or portfolio manager’s forecasts and predictions, the appropriateness of the investment strategies designed by the advisor or portfolio manager and the ability of the advisor or portfolio manager to implement their strategies efficiently and successfully. Any one or more of these factors, as well as other risks affecting the securities markets generally, could cause the actual results of any fund to differ materially as compared to its benchmarks.
The views expressed by the portfolio managers reflect their professional opinions and are subject to change. Under no circumstances does the information contained within represent a recommendation to buy or sell any security.
Annual Report 5
| | |
| PERFORMANCE SUMMARY | | |
| |
Thornburg Core Growth Fund | | September 30, 2016 (Unaudited) |
Average Annual Total Returns
| | | | | | | | | | | | | | | | | | | | |
| | | 1-Yr | | | 3-Yr | | | 5-Yr | | | 10-Yr | | | Since
Incep. | |
Class A Shares (Incep: 12/27/00) | | | | | | | | | | | | | | | | | | | | |
Without sales charge | | | 8.16 | % | | | 5.04 | % | | | 16.18 | % | | | 5.60 | % | | | 5.72 | % |
With sales charge | | | 3.29 | % | | | 3.44 | % | | | 15.12 | % | | | 5.11 | % | | | 5.42 | % |
Class C Shares (Incep: 12/27/00) | | | | | | | | | | | | | | | | | | | | |
Without sales charge | | | 7.33 | % | | | 4.25 | % | | | 15.30 | % | | | 4.80 | % | | | 4.89 | % |
With sales charge | | | 6.33 | % | | | 4.25 | % | | | 15.30 | % | | | 4.80 | % | | | 4.89 | % |
Class I Shares (Incep: 11/3/03) | | | 8.57 | % | | | 5.45 | % | | | 16.67 | % | | | 6.07 | % | | | 8.33 | % |
Class R3 Shares (Incep: 7/1/03) | | | 8.04 | % | | | 4.92 | % | | | 16.08 | % | | | 5.52 | % | | | 8.59 | % |
Class R4 Shares (Incep: 2/1/07) | | | 8.17 | % | | | 5.05 | % | | | 16.20 | % | | | — | | | | 4.29 | % |
Class R5 Shares (Incep: 10/3/05) | | | 8.58 | % | | | 5.46 | % | | | 16.68 | % | | | 6.06 | % | | | 7.04 | % |
Russell 3000 Growth Index (Since 12/27/00) | | | 13.64 | % | | | 11.40 | % | | | 16.56 | % | | | 8.80 | % | | | 4.53 | % |
Growth of a Hypothetical $10,000 Investment
Performance data shown represents past performance and is no guarantee of future results. Investment return and principal value will fluctuate so shares, when redeemed, may be worth more or less than their original cost. Current performance may be lower or higher than quoted. For performance current to the most recent month end, visit thornburg.com or call 800-847-0200. The performance information does not reflect the deduction of taxes that a shareholder would pay on distributions or the redemption of Fund shares. Returns reflect the reinvestment of dividends and capital gains. Class A shares are sold with a maximum sales charge of 4.50%. Class C shares are subject to a 1% CDSC for the first year only. There is no sales charge for Class I, R3, R4, and R5 shares.
As disclosed in the most recent prospectus, the total annual fund operating expenses are as follows: A shares, 1.39%; C shares, 2.15%; I shares, 1.05%; R3 shares, 1.79%; R4 shares, 1.82%; R5 shares, 1.24%. Thornburg Investment Management and/or Thornburg Securities Corporation have contractually agreed to waive fees and reimburse expenses through at least February 1, 2017, for some of the share classes, resulting in net expense ratios of the following: I shares, 0.99%; R3 shares, 1.50%; R4 shares, 1.40%; R5 shares, 0.99%. For more detailed information on fund expenses and waivers/reimbursements please see the Fund’s prospectus.
Glossary
Russell 3000 Growth Index – An unmanaged index comprised of those Russell 3000 companies with higher price-to-book ratios and higher forecasted growth values. Source: Frank Russell Company.
Unless otherwise noted, index returns reflect the reinvestment of income dividends and capital gains, if any, but do not reflect fees, brokerage commissions or other expenses of investing. Investors may not make direct investments into any index. The performance of any index is not indicative of the performance of any particular investment.
P/E – Price/Earnings ratio (P/E ratio) is a valuation ratio of a company’s current share price compared to its per-share earnings. P/E equals a company’s market value per share divided by earnings per share. Forecasted P/E is not intended to be a forecast of the fund’s future performance.
Cash Flow to Earnings Ratio – The cash flow from operations divided by net earnings. This ratio is used as a measure of a company’s earnings quality.
6 Annual Report
| | |
| FUND SUMMARY | | |
| |
Thornburg Core Growth Fund | | September 30, 2016 (Unaudited) |
OBJECTIVES AND STRATEGIES
The Fund seeks long-term growth of capital by investing in equity securities selected for their growth potential.
The Fund expects to invest primarily in domestic equity securities (primarily common stocks) selected for their growth potential. However, the Fund may own a variety of securities, including foreign equity securities and partnership interests. The Fund may also invest in developing countries.
Market Capitalization Exposure
Basket Structure
Top Ten Equity Holdings
| | | | |
Apple, Inc. | | | 4.5 | % |
SVB Financial Group | | | 3.4 | % |
Visa, Inc. | | | 3.4 | % |
Alphabet, Inc. | | | 3.3 | % |
Facebook, Inc. | | | 3.0 | % |
Amazon.com, Inc. | | | 3.0 | % |
Affiliated Managers Group, Inc. | | | 3.0 | % |
Charles Schwab Corp. | | | 2.9 | % |
SBA Communications Corp. | | | 2.7 | % |
Palo Alto Networks, Inc. | | | 2.6 | % |
There is no guarantee that the Fund will meet its investment objective.
All portfolio information is subject to change. Charts may not add up to 100% due to rounding.
| | | | |
| Sector Exposure | |
| |
Information Technology | | | 34.3 | % |
Consumer Discretionary | | | 20.2 | % |
Health Care | | | 14.4 | % |
Financials | | | 11.9 | % |
Industrials | | | 3.9 | % |
Consumer Staples | | | 3.2 | % |
Telecommunication Services | | | 2.7 | % |
Energy | | | 1.6 | % |
Other Assets Less Liabilities | | | 7.8 | % |
|
| Top Ten Industry Groups | |
| |
Software & Services | | | 27.2 | % |
Retailing | | | 11.6 | % |
Diversified Financials | | | 8.5 | % |
Health Care Equipment & Services | | | 7.7 | % |
Technology Hardware & Equipment | | | 7.1 | % |
Pharmaceuticals, Biotechnology & Life Sciences | | | 6.7 | % |
Consumer Durables & Apparel | | | 3.8 | % |
Banks | | | 3.4 | % |
Consumer Services | | | 3.1 | % |
Telecommunication Services | | | 2.7 | % |
|
Country Exposure* (percent of equity holdings) | |
| |
United States | | | 97.0 | % |
Ireland | | | 2.0 | % |
France | | | 1.0 | % |
| * | The country assignment of each equity holding is determined by the Fund’s Advisor based on various factors, including the location of the issuer’s head office, the issuer’s jurisdiction of incorporation and the country from which a majority of the issuer’s revenue is derived. |
Annual Report 7
SCHEDULE OF INVESTMENTS
| | |
| |
Thornburg Core Growth Fund | | September 30, 2016 |
| | | | | | | | |
| | | Shares/ | | | | |
| | | Principal Amount | | | Value | |
COMMON STOCK — 92.18% | | | | | | | | |
| | |
BANKS — 3.43% | | | | | | | | |
Banks — 3.43% | | | | | | | | |
a SVB Financial Group | | | 203,292 | | | $ | 22,471,898 | |
| | | | | | | | |
| | | | | | | 22,471,898 | |
| | | | | | | | |
| | |
CAPITAL GOODS — 1.94% | | | | | | | | |
Electrical Equipment — 1.94% | | | | | | | | |
Acuity Brands, Inc. | | | 47,961 | | | | 12,690,481 | |
| | | | | | | | |
| | | | | | | 12,690,481 | |
| | | | | | | | |
| | |
COMMERCIAL & PROFESSIONAL SERVICES — 1.94% | | | | | | | | |
Professional Services — 1.94% | | | | | | | | |
a Verisk Analytics, Inc. | | | 156,486 | | | | 12,719,182 | |
| | | | | | | | |
| | | | | | | 12,719,182 | |
| | | | | | | | |
| | |
CONSUMER DURABLES & APPAREL — 3.81% | | | | | | | | |
Household Durables — 2.03% | | | | | | | | |
Newell Brands, Inc. | | | 252,100 | | | | 13,275,586 | |
Textiles, Apparel & Luxury Goods — 1.78% | | | | | | | | |
a Under Armour, Inc. | | | 302,077 | | | | 11,684,338 | |
| | | | | | | | |
| | | | | | | 24,959,924 | |
| | | | | | | | |
| | |
CONSUMER SERVICES — 3.06% | | | | | | | | |
Hotels, Restaurants & Leisure — 3.06% | | | | | | | | |
a Chipotle Mexican Grill, Inc. | | | 25,910 | | | | 10,972,885 | |
a Norwegian Cruise Line Holdings Ltd. | | | 240,000 | | | | 9,048,000 | |
| | | | | | | | |
| | | | | | | 20,020,885 | |
| | | | | | | | |
| | |
DIVERSIFIED FINANCIALS — 8.52% | | | | | | | | |
Capital Markets — 7.47% | | | | | | | | |
a Affiliated Managers Group, Inc. | | | 135,811 | | | | 19,651,852 | |
Charles Schwab Corp. | | | 606,690 | | | | 19,153,203 | |
WisdomTree Investments, Inc. | | | 980,709 | | | | 10,091,496 | |
Consumer Finance — 1.05% | | | | | | | | |
a PRA Group, Inc. | | | 199,622 | | | | 6,894,944 | |
| | | | | | | | |
| | | | | | | 55,791,495 | |
| | | | | | | | |
| | |
ENERGY — 1.62% | | | | | | | | |
Oil, Gas & Consumable Fuels — 1.62% | | | | | | | | |
a Concho Resources, Inc. | | | 77,309 | | | | 10,618,391 | |
| | | | | | | | |
| | | | | | | 10,618,391 | |
| | | | | | | | |
| | |
FOOD & STAPLES RETAILING — 2.28% | | | | | | | | |
Food & Staples Retailing — 2.28% | | | | | | | | |
a Sprouts Farmers Market, Inc. | | | 724,116 | | | | 14,952,995 | |
| | | | | | | | |
| | | | | | | 14,952,995 | |
| | | | | | | | |
| | |
FOOD, BEVERAGE & TOBACCO — 0.91% | | | | | | | | |
Beverages — 0.91% | | | | | | | | |
a Monster Beverage Corp. | | | 40,769 | | | | 5,985,297 | |
| | | | | | | | |
| | | | | | | 5,985,297 | |
| | | | | | | | |
| | |
HEALTH CARE EQUIPMENT & SERVICES — 7.68% | | | | | | | | |
Health Care Equipment & Supplies — 4.79% | | | | | | | | |
Cooper Companies, Inc. | | | 65,036 | | | | 11,658,353 | |
a DexCom, Inc. | | | 150,631 | | | | 13,204,314 | |
a Inogen, Inc. | | | 108,973 | | | | 6,527,483 | |
Health Care Providers & Services — 2.89% | | | | | | | | |
a HealthEquity, Inc. | | | 228,064 | | | | 8,632,222 | |
Patterson Companies, Inc. | | | 224,400 | | | | 10,308,936 | |
| | | | | | | | |
| | | | | | | 50,331,308 | |
| | | | | | | | |
| | |
MEDIA — 1.72% | | | | | | | | |
Media — 1.72% | | | | | | | | |
Comcast Corp. | | | 169,700 | | | | 11,257,898 | |
| | | | | | | | |
| | | | | | | 11,257,898 | |
| | | | | | | | |
| |
PHARMACEUTICALS, BIOTECHNOLOGY & LIFE SCIENCES — 6.69% | | | | | |
Biotechnology — 2.46% | | | | | | | | |
a Alexion Pharmaceuticals, Inc. | | | 131,155 | | | | 16,071,734 | |
Life Sciences Tools & Services — 2.37% | | | | | | | | |
a Illumina, Inc. | | | 85,567 | | | | 15,544,101 | |
Pharmaceuticals — 1.86% | | | | | | | | |
a Allergan plc | | | 52,988 | | | | 12,203,666 | |
| | | | | | | | |
| | | | | | | 43,819,501 | |
| | | | | | | | |
| | |
RETAILING — 11.62% | | | | | | | | |
Distributors — 1.36% | | | | | | | | |
a LKQ Corp. | | | 251,925 | | | | 8,933,261 | |
Internet & Direct Marketing Retail — 8.77% | | | | | | | | |
8 Annual Report
| | |
| SCHEDULE OF INVESTMENTS, CONTINUED | | |
| |
Thornburg Core Growth Fund | | September 30, 2016 |
| | | | | | | | |
| | | Shares/ | | | | |
| | | Principal Amount | | | Value | |
a Amazon.com, Inc. | | | 23,478 | | | $ | 19,658,364 | |
Expedia, Inc. | | | 121,828 | | | | 14,219,764 | |
a Netflix, Inc. | | | 104,907 | | | | 10,338,585 | |
a priceline.com, Inc. | | | 8,986 | | | | 13,222,809 | |
Specialty Retail — 1.49% | | | | | | | | |
Williams Sonoma, Inc. | | | 191,000 | | | | 9,756,280 | |
| | | | | | | | |
| | | | | | | 76,129,063 | |
| | | | | | | | |
SOFTWARE & SERVICES — 27.23% | | | | | | | | |
Information Technology Services — 8.42% | | | | | | | | |
a Cognizant Tech Solutions Corp. | | | 201,400 | | | | 9,608,794 | |
a FleetCor Technologies, Inc. | | | 55,417 | | | | 9,627,595 | |
a PayPal Holdings, Inc. | | | 335,665 | | | | 13,752,195 | |
Visa, Inc. | | | 268,417 | | | | 22,198,086 | |
Internet Software & Services — 9.72% | | | | | | | | |
a Akamai Technologies, Inc. | | | 180,000 | | | | 9,538,200 | |
a Alphabet, Inc. Class C | | | 27,576 | | | | 21,434,549 | |
a CoStar Group, Inc. | | | 31,172 | | | | 6,749,673 | |
a Criteo SA ADR | | | 176,000 | | | | 6,179,360 | |
a Facebook, Inc. | | | 154,486 | | | | 19,815,920 | |
Software — 9.09% | | | | | | | | |
a Autodesk, Inc. | | | 123,657 | | | | 8,944,111 | |
a Paycom Software, Inc. | | | 64,431 | | | | 3,229,926 | |
a Proofpoint, Inc. | | | 132,055 | | | | 9,884,317 | |
a Rapid7, Inc. | | | 447,611 | | | | 7,900,334 | |
a ServiceNow, Inc. | | | 135,918 | | | | 10,757,910 | |
a Splunk, Inc. | | | 148,661 | | | | 8,723,427 | |
a Workday, Inc. | | | 110,018 | | | | 10,087,550 | |
| | | | | | | | |
| | | | | | | 178,431,947 | |
| | | | | | | | |
TECHNOLOGY HARDWARE & EQUIPMENT — 7.06% | | | | | | | | |
Communications Equipment — 2.58% | | | | | | | | |
a Palo Alto Networks, Inc. | | | 106,035 | | | | 16,894,557 | |
Technology, Hardware, Storage & Peripherals — 4.48% | | | | | | | | |
Apple, Inc. | | | 260,026 | | | | 29,395,939 | |
| | | | | | | | |
| | | | | | | 46,290,496 | |
| | | | | | | | |
TELECOMMUNICATION SERVICES — 2.67% | | | | | | | | |
Diversified Telecommunication Services — 2.67% | | | | | | | | |
a SBA Communications Corp. | | | 156,221 | | | | 17,521,747 | |
| | | | | | | | |
| | | | | | | 17,521,747 | |
| | | | | | | | |
TOTAL COMMON STOCK (Cost $458,899,044) | | | | | | | 603,992,508 | |
| | | | | | | | |
SHORT TERM INVESTMENTS — 7.49% | | | | | | | | |
b Thornburg Capital Management Fund | | | 4,908,697 | | | | 49,086,969 | |
| | | | | | | | |
TOTAL SHORT TERM INVESTMENTS (Cost $49,086,969) | | | | | | | 49,086,969 | |
| | | | | | | | |
TOTAL INVESTMENTS — 99.67% (Cost $507,986,013) | | | | | | $ | 653,079,477 | |
OTHER ASSETS LESS LIABILITIES — 0.33% | | | | | | | 2,130,496 | |
| | | | | | | | |
NET ASSETS — 100.00% | | | | | | $ | 655,209,973 | |
| | | | | | | | |
Footnote Legend
| b | Investment in Affiliates – Shown below are holdings of voting securities of each portfolio company which is considered “affiliated” to the Fund under the Investment Company Act of 1940, including companies for which the Fund’s holding represented 5% or more of the company’s voting securities, and a series of the Thornburg Investment Trust in which the Fund invested for cash management purposes during the period: |
| | | | | | | | | | | | | | | | | | | | | | | | | | | | |
Issuer | | Shares/
Principal
September 30,
2015 | | | Gross
Additions | | | Gross
Reductions | | | Shares/
Principal
September 30,
2016 | | | Market
Value
September 30,
2016 | | | Investment
Income | | | Realized
Gain (Loss) | |
Thornburg Capital Management Fund | | | 4,081,390 | | | | 43,169,862 | | | | 42,342,555 | | | | 4,908,697 | | | $ | 49,086,969 | | | $ | 247,890 | | | $ | — | |
| | | | | | | | | | | | | | | | | | | | | | | | | | | | |
Total non-controlled affiliated issuers - 7.49% of net assets | | | | | | | $ | 49,086,969 | | | $ | 247,890 | | | $ | — | |
| | | | | | | | | | | | | | | | | | | | | | | | | | | | |
|
Portfolio Abbreviations |
| To simplify the listings of securities, abbreviations are used per the table below: |
| | |
| |
| ADR | | American Depositary Receipt |
| SBA | | Small Business Administration |
|
| See notes to financial statements. |
Annual Report 9
| | |
| STATEMENT OF ASSETS AND LIABILITIES | | |
| |
Thornburg Core Growth Fund | | September 30, 2016 |
| | | | |
ASSETS | | | | |
Investments at value (Note 3) | | | | |
Non-affiliated issuers (cost $458,899,044) | | $ | 603,992,508 | |
Non-controlled affiliated issuers (cost $49,086,969) | | | 49,086,969 | |
Cash | | | 18,669 | |
Receivable for investments sold | | | 4,781,213 | |
Receivable for fund shares sold | | | 723,953 | |
Dividends receivable | | | 23,166 | |
Prepaid expenses and other assets | | | 59,579 | |
| | | | |
Total Assets | | | 658,686,057 | |
| | | | |
| |
LIABILITIES | | | | |
Payable for investments purchased | | | 1,093,570 | |
Payable for fund shares redeemed | | | 1,475,963 | |
Payable to investment advisor and other affiliates (Note 4) | | | 690,120 | |
Accounts payable and accrued expenses | | | 216,431 | |
| | | | |
Total Liabilities | | | 3,476,084 | |
| | | | |
| |
NET ASSETS | | $ | 655,209,973 | |
| | | | |
NET ASSETS CONSIST OF | | | | |
Accumulated net investment loss | | $ | (5,729,963 | ) |
Net unrealized appreciation on investments | | | 145,093,464 | |
Accumulated net realized gain (loss) | | | (253,298,890 | ) |
Net capital paid in on shares of beneficial interest | | | 769,145,362 | |
| | | | |
| | $ | 655,209,973 | |
| | | | |
10 Annual Report
| | |
| STATEMENT OF ASSETS AND LIABILITIES, CONTINUED | | |
| |
Thornburg Core Growth Fund | | September 30, 2016 |
| | | | |
| |
NET ASSET VALUE | | | | |
Class A Shares: | | | | |
Net asset value and redemption price per share ($199,178,100 applicable to 7,059,221 shares of beneficial interest outstanding - Note 5) | | $ | 28.22 | |
Maximum sales charge, 4.50% of offering price | | | 1.33 | |
| | | | |
Maximum offering price per share | | $ | 29.55 | |
| | | | |
| |
Class C Shares: | | | | |
Net asset value and offering price per share* ($156,115,046 applicable to 6,269,857 shares of beneficial interest outstanding - Note 5) | | $ | 24.90 | |
| | | | |
| |
Class I Shares: | | | | |
Net asset value, offering and redemption price per share ($198,657,728 applicable to 6,618,724 shares of beneficial interest outstanding - Note 5) | | $ | 30.01 | |
| | | | |
| |
Class R3 Shares: | | | | |
Net asset value, offering and redemption price per share ($55,809,443 applicable to 1,985,814 shares of beneficial interest outstanding - Note 5) | | $ | 28.10 | |
| | | | |
| |
Class R4 Shares: | | | | |
Net asset value, offering and redemption price per share ($6,820,480 applicable to 240,783 shares of beneficial interest outstanding - Note 5) | | $ | 28.33 | |
| | | | |
| |
Class R5 Shares: | | | | |
Net asset value, offering and redemption price per share ($38,629,176 applicable to 1,288,370 shares of beneficial interest outstanding - Note 5) | | $ | 29.98 | |
| | | | |
| * | Redemption price per share is equal to net asset value less any applicable contingent deferred sales charge. |
See notes to financial statements.
Annual Report 11
| | |
| STATEMENT OF OPERATIONS | | |
| |
Thornburg Core Growth Fund | | Year Ended September 30, 2016 |
| | | | |
INVESTMENT INCOME | | | | |
Dividend income | | | | |
Non-affiliated issuers | | $ | 2,594,223 | |
Non-controlled affiliated issuer | | | 247,890 | |
| | | | |
Total Income | | | 2,842,113 | |
| | | | |
| |
EXPENSES | | | | |
Investment advisory fees (Note 4) | | | 6,120,765 | |
Administration fees (Note 4) | | | | |
Class A Shares | | | 270,502 | |
Class C Shares | | | 209,230 | |
Class I Shares | | | 107,836 | |
Class R3 Shares | | | 77,903 | |
Class R4 Shares | | | 10,331 | |
Class R5 Shares | | | 20,781 | |
Distribution and service fees (Note 4) | | | | |
Class A Shares | | | 540,833 | |
Class C Shares | | | 1,673,971 | |
Class R3 Shares | | | 311,528 | |
Class R4 Shares | | | 20,366 | |
Transfer agent fees | | | | |
Class A Shares | | | 271,882 | |
Class C Shares | | | 215,547 | |
Class I Shares | | | 214,547 | |
Class R3 Shares | | | 165,979 | |
Class R4 Shares | | | 29,004 | |
Class R5 Shares | | | 129,455 | |
Registration and filing fees | | | | |
Class A Shares | | | 19,601 | |
Class C Shares | | | 17,907 | |
Class I Shares | | | 25,086 | |
Class R3 Shares | | | 18,957 | |
Class R4 Shares | | | 20,152 | |
Class R5 Shares | | | 17,597 | |
Custodian fees (Note 2) | | | 49,859 | |
Professional fees | | | 60,574 | |
Accounting fees (Note 4) | | | 27,086 | |
Trustee fees | | | 31,675 | |
Other expenses | | | 62,854 | |
| | | | |
Total Expenses | | | 10,741,808 | |
Less: | | | | |
Expenses reimbursed by investment advisor (Note 4) | | | (498,027 | ) |
| | | | |
Net Expenses | | | 10,243,781 | |
| | | | |
Net Investment Loss | | $ | (7,401,668) | |
| | | | |
12 Annual Report
| | |
| STATEMENT OF OPERATIONS, CONTINUED | | |
| |
Thornburg Core Growth Fund | | Year Ended September 30, 2016 |
| | | | |
REALIZED AND UNREALIZED GAIN (LOSS) | | | | |
Net realized gain (loss) on non-affiliated issuer investments | | $ | 9,780,002 | |
Net change in unrealized appreciation (depreciation) on non-affiliated issuer investments | | | 43,558,418 | |
| | | | |
Net Realized and Unrealized Gain | | | 53,338,420 | |
| | | | |
Net Increase in Net Assets Resulting from Operations | | $ | 45,936,752 | |
| | | | |
See notes to financial statements.
Annual Report 13
| | |
| STATEMENTS OF CHANGES IN NET ASSETS | | |
| |
Thornburg Core Growth Fund | | |
| | | | | | | | |
| | | Year Ended
September 30, 2016 | | | Year Ended
September 30, 2015 | |
INCREASE (DECREASE) IN NET ASSETS FROM | | | | | | | | |
| | |
OPERATIONS | | | | | | | | |
Net investment income (loss) | | $ | (7,401,668 | ) | | $ | (8,552,558 | ) |
Net realized gain (loss) on investments | | | 9,780,002 | | | | 69,189,563 | |
Net unrealized appreciation (depreciation) on investments | | | 43,558,418 | | | | (66,357,267 | ) |
| | | | | | | | |
| | |
Net Increase (Decrease) in Net Assets Resulting from Operations | | | 45,936,752 | | | | (5,720,262 | ) |
| | |
FUND SHARE TRANSACTIONS (NOTE 5) | | | | | | | | |
Class A Shares | | | (50,041,105 | ) | | | (41,435,655 | ) |
Class C Shares | | | (30,801,495 | ) | | | (21,544,509 | ) |
Class I Shares | | | (58,233,894 | ) | | | (4,425,232 | ) |
Class R3 Shares | | | (18,964,601 | ) | | | (20,360,037 | ) |
Class R4 Shares | | | (3,465,547 | ) | | | (1,594,283 | ) |
Class R5 Shares | | | (9,684,705 | ) | | | (17,252,526 | ) |
| | | | | | | | |
Net Decrease in Net Assets | | | (125,254,595 | ) | | | (112,332,504 | ) |
| | |
NET ASSETS | | | | | | | | |
Beginning of Year | | | 780,464,568 | | | | 892,797,072 | |
| | | | | | | | |
| | |
End of Year | | $ | 655,209,973 | | | $ | 780,464,568 | |
| | | | | | | | |
Accumulated net investment loss | | $ | (5,729,963 | ) | | $ | (5,991,272 | ) |
See notes to financial statements.
14 Annual Report
| | |
| NOTES TO FINANCIAL STATEMENTS | | |
| |
Thornburg Core Growth Fund | | September 30, 2016 |
NOTE 1 – ORGANIZATION
Thornburg Core Growth Fund (the “Fund”) is a diversified series of Thornburg Investment Trust (the “Trust”). The Trust was organized as a Massachusetts business trust under a Declaration of Trust dated June 3, 1987 and is registered as a diversified, open-end management investment company under the Investment Company Act of 1940, as amended. The Fund is currently one of twenty separate series of the Trust. Each series is considered to be a separate entity for financial reporting and tax purposes and bears expenses directly attributable to it. The Fund seeks long-term capital appreciation by investing in equity securities selected for their growth potential.
The Fund currently offers six classes of shares of beneficial interest: Class A, Class C, Institutional Class (“Class I”), and Retirement Classes (“Class R3,” “Class R4,” and “Class R5”). Each class of shares of the Fund represents an interest in the same portfolio of investments, except that (i) Class A shares are sold subject to a front-end sales charge collected at the time the shares are purchased and bear a service fee, (ii) Class C shares are sold at net asset value without a sales charge at the time of purchase, but are subject to a contingent deferred sales charge upon redemption within one year of purchase, and bear both a service fee and a distribution fee, (iii) Class I shares are sold at net asset value without a sales charge at the time of purchase and may be subject to a service fee, (iv) Class R3 shares are sold at net asset value without a sales charge at the time of purchase, but bear both a service fee and distribution fee, (v) Class R4 shares are sold at net asset value without sales charge at the time of purchase, but bear a service fee, (vi) Class R5 shares are sold at net asset value without a sales charge at the time of purchase and may bear a service fee, and (vii) the respective classes may have different reinvestment privileges and conversion rights. Additionally, the Fund may allocate among its classes certain expenses, to the extent allocable to specific classes, including transfer agent fees, government registration fees, certain printing and postage costs, and administrative and legal expenses. Currently, class specific expenses of the Fund are limited to service and distribution fees, administration fees, and certain registration and transfer agent expenses.
The following is a summary of significant accounting policies followed by the Fund in the preparation of its financial statements. The Fund prepares its financial statements in conformity with United States generally accepted accounting principles (“GAAP”), including investment company accounting and reporting guidance in the Financial Accounting Standards Board (the “FASB”) Accounting Standard Codification Topic 946.
NOTE 2 – SIGNIFICANT ACCOUNTING POLICIES
Security Valuation: All investments in securities held by the Fund are valued as described in Note 3.
Allocation of Income, Gains, Losses and Expenses: Net investment income (other than class specific expenses) and realized and unrealized gains and losses are allocated daily to each class of shares based upon the relative net asset value of outstanding shares (or the value of the dividend-eligible shares, as appropriate) of each class of shares at the beginning of the day (after adjusting for the current capital shares activity of the respective class). Expenses common to all Funds are allocated among the Funds comprising the Trust based upon their relative net asset values or other appropriate allocation methods. Operating expenses directly attributable to a specific class are charged against the operating income of that class.
Dividends and Distributions to Shareholders: Dividends and distributions to shareholders, which are determined in accordance with federal income tax regulations and may differ from GAAP, are recorded on the ex-dividend date. Ordinary income distributions, if any, are declared and paid quarterly. Capital gain distributions, if any, are declared and paid annually and more often if deemed necessary by the Advisor. Dividends are paid and are reinvested in additional shares of the Fund at net asset value per share at the close of business on the ex-dividend date, or at the shareholder’s option, paid in cash.
Investment Income: Dividend income is recorded on the ex-dividend date. Certain income from foreign investments is recognized as soon as information is available to the Fund.
Custodian Fees: Custodian fees disclosed in the Statement of Operations may include interest expenses incurred by the Fund on any cash overdrafts of its custodian account during the period. Such cash overdrafts may result from the effects of failed trades in portfolio securities and from cash outflows resulting from unanticipated shareholder redemption activity. The Fund pays interest to its custodian on any such cash overdraft at a rate equal to 2.50% of the overdraft amount in excess of $50,000.
Investment Transactions: Investment transactions are accounted for on a trade date basis. Realized gains and losses from the sale of investments are recorded on an identified cost basis.
When-Issued and Delayed Delivery Transactions: The Fund may engage in when-issued or delayed delivery transactions. To the extent the Fund engages in such transactions, it will do so for the purpose of acquiring portfolio investments consistent with the Fund’s investment objectives and not for the purpose of investment leverage or to speculate on interest rate or market changes. At the time the Fund makes a commitment to purchase an investment on a when-issued or delayed delivery basis, the Fund will record the transaction and reflect the value in determining its net asset value. When effecting such transactions, assets of an amount sufficient to make payment
Annual Report 15
| | |
| NOTES TO FINANCIAL STATEMENTS, CONTINUED | | |
| |
Thornburg Core Growth Fund | | September 30, 2016 |
for the portfolio investments to be purchased will be segregated on the Fund’s records on the trade date. Investments purchased on a when-issued or delayed delivery basis do not earn interest until the settlement date.
Repurchase Agreements: The Fund may invest excess cash in repurchase agreements whereby the Fund purchases investments, which serve as collateral, with an agreement to resell such collateral to the seller at an agreed upon price at the maturity date of the repurchase agreement. Investments pledged as collateral for repurchase agreements are held in custody until maturity of the repurchase agreement. Provisions in the agreements require that the market value of the collateral is at least equal to the repurchase value in the event of default. In the event of default, the Fund has the right to liquidate the collateral and apply the proceeds in satisfaction of the obligation. Under certain circumstances, in the event of default or bankruptcy by the other party to the agreement, realization and/or retention of the collateral may be subject to legal proceedings.
Foreign Currency Translation: Portfolio investments and other assets and liabilities denominated in foreign currencies are translated into U.S. dollars based on the exchange rate of such currencies against the U.S. dollar on the date of valuation. Purchases and sales of investments and income items denominated in foreign currencies are translated into U.S. dollars at the exchange rate in effect on the transaction date. When the Fund purchases or sells foreign investments, it will customarily enter into a foreign exchange contract to minimize foreign exchange risk from the trade date to the settlement date of such transactions. The values of such spot contracts are included in receivable for investments sold and payable for investments purchased on the Statement of Assets and Liabilities.
The Fund does not separately report the effect of changes in foreign exchange rates from changes in market prices on investments held. Such changes are included in net unrealized appreciation (depreciation) from investments.
Reported net realized gains and losses from foreign currency transactions arise due to purchases and sales of foreign currencies, currency gains and losses realized between the trade and settlement dates on investment transactions and the difference between the amounts of dividends, interest, and foreign withholding taxes recorded on the Fund’s books, and the U.S. dollar equivalent of the amounts actually received or paid.
Net change in unrealized appreciation (depreciation) on foreign currency translations arise from changes in the fair value of assets and liabilities, other than investments at period end, resulting from changes in exchange rates.
Guarantees and Indemnifications: Under the Trust’s organizational documents (and under separate agreements with the independent Trustees), its officers and Trustees are provided with an indemnification against certain liabilities arising out of the performance of their duties to the Fund. In the normal course of business the Trust may also enter into contracts with service providers that contain general indemnifications. The Trust’s maximum exposure under these arrangements is unknown. However, based on experience, the Trust expects the risk of loss to be remote.
Use of Estimates: The preparation of financial statements in conformity with GAAP requires management to make estimates and assumptions that affect the reported amounts of assets and liabilities and disclosure of contingent assets and liabilities at the date of the financial statements and the reported amounts of increases (decreases) in net assets from operations during the reporting period. Actual results could differ from those estimates.
Federal Income Taxes: It is the policy of the Trust to comply with the provisions of the Internal Revenue Code applicable to regulated investment companies and to distribute to shareholders substantially all investment company taxable income including net realized gains on investments (if any), and tax exempt income of the Fund. Therefore, no provision for federal income or excise tax is required.
The Fund files income tax returns in United States federal and applicable state jurisdictions. The statute of limitations on the Fund’s tax return filings generally remains open for the three years following a return’s filing date. The Fund has analyzed each uncertain tax position believed to be material in the preparation of the Fund’s financial statements for the fiscal year ended September 30, 2016, including open tax years, to assess whether it is more likely than not that the position would be sustained upon examination, based on the technical merits of the position. The Fund has not identified any such position for which an asset or liability must be reflected in the Statement of Assets and Liabilities.
At September 30, 2016, information on the tax components of capital was as follows:
| | | | |
Cost of investments for tax purposes | | $ | 509,391,121 | |
| | | | |
Gross unrealized appreciation on a tax basis | | $ | 153,394,860 | |
Gross unrealized depreciation on a tax basis | | | (9,706,504 | ) |
| | | | |
Net unrealized appreciation (depreciation) on investments (tax basis) | | $ | 143,688,356 | |
| | | | |
Temporary book to tax adjustments made to the cost of investments and net unrealized appreciation (depreciation) for tax purposes result primarily from deferral of outstanding wash sale losses.
16 Annual Report
| | |
| NOTES TO FINANCIAL STATEMENTS, CONTINUED | | |
| |
Thornburg Core Growth Fund | | September 30, 2016 |
At September 30, 2016, the Fund had deferred tax basis late-year ordinary investment losses occurring subsequent to December 31, 2015 through September 30, 2016 of $5,729,963. For tax purposes, such ordinary losses will be recognized in the year ending September 30, 2017.
At September 30, 2016, the Fund had deferred tax basis capital losses occurring subsequent to October 31, 2015 through September 30, 2016 of $24,900,607. For tax purposes, such capital losses will be recognized in the year ending September 30, 2017.
At September 30, 2016, the Fund had cumulative tax basis capital losses of $226,993,175 generated prior to October 1, 2011 which may be carried forward to offset future capital gains. To the extent such carryforwards are utilized, capital gain distributions may be reduced to the extent provided by regulations. Such capital loss carryforwards expire September 30, 2018.
During the year ended September 30, 2016, the Fund utilized $23,759,393 of capital loss carryforwards generated prior to October 1, 2011.
In order to account for permanent book to tax differences, the Fund decreased net capital paid in on shares of beneficial interest by $7,662,977 and decreased accumulated net investment loss by $7,662,977. Reclassifications have no impact upon the net asset value of the Fund and resulted primarily from a nondeductible net operating loss.
At September 30, 2016, the Fund did not have any undistributed tax basis net ordinary investment income or undistributed tax basis capital gains.
Foreign Withholding Taxes: The Fund is subject to foreign tax withholding imposed by certain foreign countries in which the Fund may invest. Withholding taxes are incurred on certain foreign dividends and are accrued at the time the dividend is recognized based on applicable foreign tax laws. The Fund files withholding tax reclaims in certain jurisdictions to recover a portion of amounts previously withheld, in view of various considerations, including recent decisions rendered by the courts in those and other jurisdictions. The Fund would expect to record a receivable for such a reclaim based on a variety of factors, including assessment of a jurisdiction’s legal obligation to pay reclaims, the jurisdiction’s administrative practices and payment history, and industry convention. To date the Fund has recorded no such receivable because there is limited precedent for collecting such prior year reclaims and the likelihood of collection remains uncertain.
Deferred Foreign Capital Gain Taxes: The Fund is subject to a tax imposed on net realized gains of securities of certain foreign countries. The Fund records an estimated deferred tax liability for net unrealized gains on these investments as reflected in the accompanying financial statements.
NOTE 3 – SECURITY VALUATION
Valuation of the Fund’s portfolio investment securities is performed in accordance with policies and procedures adopted by and under the oversight of the Trustees.
The Trustees of the Trust have appointed the Advisor to assist the Trustees in obtaining market values for portfolio investments, evaluate and monitor professional pricing service providers appointed by the Trustees’ Audit Committee (the “Audit Committee”) to assist in determining fair values for portfolio investments, assist in calculating fair values for portfolio investments in certain circumstances, and to perform other functions in connection with the valuation of investments. The Advisor acts through its Valuation and Pricing Committee (the “Committee”) and other employees of the Advisor. The Committee regularly reviews its own valuation calculations, as well as the valuations, valuation techniques and services furnished by pricing service providers, considers circumstances which may require valuation calculations by the Committee, and reviews previous valuation calculations. The Committee reports to the Audit Committee on the Committee’s activities, the performance of pricing service providers, and other matters relating to valuation of portfolio investments.
In those instances when the Committee assists in calculating a fair value for a portfolio investment, the Committee seeks to determine the price that the Fund would reasonably expect to receive upon a sale of the investment in an orderly transaction between market participants on the valuation date. The Committee customarily utilizes quotations from securities broker dealers in calculating valuations, but also may utilize prices obtained from pricing service providers or other methods approved by the Audit Committee. Because fair values calculated by the Committee are estimates, the calculation of a value for an investment may differ from the price that would be realized by the Fund upon a sale of the investment, and the difference could be material to the Fund’s financial statements. The Committee’s calculation of a fair value for an investment may also differ from the prices obtained by other persons (including other mutual funds) for the investment.
Valuation of Securities: Securities and other portfolio investments which are listed or traded on a United States securities exchange are valued at the last reported sale price on the valuation date. Investments listed or traded on an exchange for which there has been no sale that day are valued at the mean between the last reported bid and asked prices on that valuation date. Portfolio investments reported by NASDAQ are valued at the official closing price on the valuation date. If an investment is traded on more than one exchange, the investment is considered traded on the exchange that is normally the primary market for that investment. Securities and
Annual Report 17
| | |
| NOTES TO FINANCIAL STATEMENTS, CONTINUED | | |
| |
Thornburg Core Growth Fund | | September 30, 2016 |
other portfolio investments which are listed or traded on exchanges outside the United States are valued at the last price or the closing price of the investment on the exchange that is normally the primary market for the investment, as of the close of the exchange preceding the Fund’s valuation date. Foreign investments listed or traded on an exchange for which there has been no sale that day are valued at the mean between the last reported bid and asked prices on that valuation date.
In any case when a market quotation is not readily available for a portfolio investment ordinarily valued by market quotation, the Committee calculates a fair value for the investment using alternative methods approved by the Audit Committee. A market quotation is not readily available when the primary market or exchange for the investment is not open for the entire scheduled day of trading. Market quotations for an investment also may not be readily available if developments after the most recent close of the investment’s primary exchange or market, but prior to the close of business on any Fund business day, or an unusual event or significant period of time occurring since the availability of a market quotation, create a serious question concerning the reliability of the most recent market quotation available for the investment. In particular, on days when market volatility thresholds established by the Audit Committee are exceeded, foreign equity investments held by the Fund may be valued using alternative methods. The Committee customarily obtains valuations in these instances from pricing service providers approved by the Audit Committee. Pricing service providers ordinarily calculate valuations using multi-factor models to adjust market prices based upon various inputs, including exchange data, depository receipt prices, futures, index data and other data.
Debt obligations held by the Fund which are not listed or traded on exchanges or for which no reported market exists are ordinarily valued at the valuation obtained from a pricing service provider approved by the Audit Committee.
In any case when a pricing service provider fails to provide a valuation for a debt obligation held by the Fund, the Committee calculates a fair value for the obligation using alternative methods under procedures approved by the Audit Committee. Additionally, in cases when management believes that a valuation obtained from a pricing service provider merits review for significant reasons, the Committee decides whether or not to use the valuation calculated by the pricing service provider or to use an alternative method approved by the Audit Committee to calculate a fair value for the obligation.
Quotations for foreign investments expressed in foreign currency amounts are converted to U.S. dollar equivalents using a foreign exchange quotation from a third party service provider at the time of valuation. Foreign investments held by the Fund may be traded on days and at times when the Fund is not open for business. Consequently, the value of Fund investments may be significantly affected on days when shareholders cannot purchase or sell Fund shares. Futures contracts and other financial and derivative instruments traded on an exchange are valued at the latest published price for the instrument on its primary exchange. Listed options are valued at the last bid price.
Valuation Hierarchy: The Fund categorizes its investments based upon the inputs used in valuing those investments, according to a three-level hierarchy established in guidance from FASB. Categorization of investments using this hierarchy is intended by the FASB to maximize the use of observable inputs in valuing investments and minimize the use of unobservable inputs by requiring that the most observable inputs be used when available. Observable inputs are those that market participants would use in valuing an investment based on available market information. Unobservable inputs are those that reflect assumptions about the information market participants would use in valuing an investment. An investment’s level within the hierarchy is based on the lowest level input that is deemed significant to the valuation. The methodologies and inputs used to value investments are not necessarily indications of the risk or liquidity associated with those investments.
Various inputs are used in calculating valuations for the Fund’s investments. These inputs are generally summarized according to the three level hierarchy below:
Level 1: Quoted prices in active markets for identical investments.
Level 2: Other direct or indirect significant observable inputs (including quoted prices for similar investments in active markets and other observable inputs, such as interest rates, prepayment rates, credit risk, etc.).
Level 3: Significant unobservable inputs (including the Committee’s own assumptions in calculating the fair values of investments).
Valuations for debt obligations held by the Fund are typically calculated by pricing service providers approved by the Audit Committee and are characterized as Level 2 within the valuation hierarchy.
On days when market volatility thresholds established by the Audit Committee are exceeded, foreign securities for which valuations are obtained from pricing service providers are fair valued. On these days, the foreign securities are characterized as Level 2 within the valuation hierarchy and revert to Level 1 after the threshold is no longer exceeded.
In a limited number of cases the Committee calculates a fair value for investments using broker quotations or other methods approved by the Audit Committee. When the Committee uses a single broker quotation to calculate a fair value for an investment without
18 Annual Report
| | |
| NOTES TO FINANCIAL STATEMENTS, CONTINUED | | |
| |
Thornburg Core Growth Fund | | September 30, 2016 |
other significant observable inputs, or if a fair value is calculated using other significant inputs that are considered unobservable, the investment is characterized as Level 3 within the hierarchy. Other significant unobservable inputs used to calculate a fair value in these instances might include an income-based valuation approach which considers discounted anticipated future cash flows from the investment, and application of discounts due to the nature or duration of any restrictions on the disposition of the investment.
Valuations based upon the use of inputs from Levels 1, 2 or 3 may not represent the actual price received upon the disposition of an investment, and the Fund may receive a price that is lower than the valuation based upon these inputs when it sells the investment.
The following table displays a summary of the fair value hierarchy measurements of the Fund’s investments as of September 30, 2016. In any instance when valuation inputs from more than one level are used to determine the fair value of a specific investment, the investment is placed in the level of the table based upon the lowest level input that is significant in determining the fair value of the investment:
| | | | | | | | | | | | | | | | |
| | | Fair Value Measurements at September 30, 2016 | |
| | | Total | | | Level 1 | | | Level 2 | | | Level 3 | |
Assets | | | | | | | | | | | | | | | | |
Investments in Securities* | | | | | | | | | | | | | | | | |
Common Stock | | $ | 603,992,508 | | | $ | 603,992,508 | | | $ | — | | | $ | — | |
Short Term Investments | | | 49,086,969 | | | | 49,086,969 | | | | — | | | | — | |
| | | | | | | | | | | | | | | | |
Total Investments in Securities | | $ | 653,079,477 | | | $ | 653,079,477 | | | $ | — | | | $ | — | |
| * | See Schedule of Investments for a summary of the industry exposure as grouped according to the Global Industry Classification Standard (GICS), which is an industry taxonomy developed by MSCI, Inc. and Standard & Poor’s (S&P). |
In accordance with the guidance prescribed in Accounting Standards Update No. 2011-04, it is the policy of the Fund to recognize transfers between levels and the underlying events which caused the movement. The Fund recognized no transfers between levels for the year ended September 30, 2016, other than when the Fund exceeded market volatility thresholds for foreign equity investments during the period.
NOTE 4 – INVESTMENT ADVISORY FEE AND OTHER TRANSACTIONS WITH AFFILIATES
Pursuant to an investment advisory agreement, the Advisor serves as the investment advisor and performs services for the Fund for which the fees are payable at the end of each month. Under the investment advisory agreement, the Fund pays the Advisor a management fee based on the daily net assets of the Fund at an annual rate as shown in the following table:
Management Fee Schedule
| | | | |
Daily net assets | | Fee Rate | |
Up to $500 million | | | 0.875 | % |
Next $500 million | | | 0.825 | |
Next $500 million | | | 0.775 | |
Next $500 million | | | 0.725 | |
Over $2 billion | | | 0.675 | |
The Fund’s effective management fee for the year ended September 30, 2016 was 0.86% of the Fund’s average dividend assets.
The Fund pays to the Advisor the costs of personnel who perform certain accounting services for the Fund. For the year ended September 30, 2016 the Fund paid $27,086 to the Advisor for these accounting services. The Trust has also entered into administrative service agreements with the Advisor, whereby the Advisor will perform certain administrative services for the shareholders of each class of the Fund’s shares, and for which fees will be payable at an annual rate of up to .125 of 1% per annum of the average daily net assets attributable to each class of shares. Total administrative service fees incurred by each class of shares of the Fund for the year ended September 30, 2016, are set forth in the Statement of Operations.
The Trust has an underwriting agreement with Thornburg Securities Corporation (the “Distributor”), an affiliate of the Advisor, which acts as the distributor of the Fund��s shares. For the year ended September 30, 2016, the Distributor has advised the Fund that it earned net commissions aggregating $13,596 from the sale of Class A shares, and collected contingent deferred sales charges aggregating $7,371 from redemptions of Class C shares of the Fund.
Annual Report 19
| | |
| NOTES TO FINANCIAL STATEMENTS, CONTINUED | | |
| |
Thornburg Core Growth Fund | | September 30, 2016 |
Pursuant to a service plan under Rule 12b-1 of the Investment Company Act of 1940, the Fund may pay to the Advisor or securities dealers and other financial institutions at the Advisor’s request an amount not to exceed .25 of 1% per annum of the average daily net assets attributable to Class A, Class C, Class R3, and Class R4 shares of the Fund to obtain various shareholder and distribution related services. For the year ended September 30, 2016, there were no 12b-1 service plan fees charged for Class I or Class R5 shares. The Advisor may pay out of its own resources additional expenses for distribution of the Fund’s shares and shareholder services.
The Trust has also adopted distribution plans pursuant to Rule 12b-1, applicable only to the Fund’s Class C and Class R3 shares, under which the Fund compensates the Distributor for services in promoting the sale of Class C and Class R3 shares of the Fund at an annual rate of up to .75 of 1% per annum of the average daily net assets attributable to Class C shares, and an annual rate of up to .25 of 1% per annum of the average daily net assets attributable to Class R3 shares. Total fees incurred by each class of shares of the Fund under their respective service and distribution plans for the year ended September 30, 2016, are set forth in the Statement of Operations.
The Advisor and Distributor have contractually agreed to waive fees and reimburse expenses incurred by the Fund so that actual expenses of certain share classes do not exceed levels as specified in the Fund’s most recent prospectus. The agreement may be terminated by the Fund at any time, but may not be terminated by the Advisor or Distributor before February 1, 2017, unless the Advisor ceases to be the investment advisor to the Trust or the Distributor ceases to be the distributor of the Fund prior to that date. The Advisor and Distributor retain the right to be repaid by the Fund for fee waivers and expense reimbursements if expenses fall below the contractual limit prior to the end of the fiscal year.
For the year ended September 30, 2016, the Advisor contractually reimbursed certain class specific expenses, administrative fees, and distribution fees of $136,764 for Class I shares, $195,868 for Class R3 shares, $38,016 for Class R4 shares, and $127,379 for Class R5 shares.
Certain officers and Trustees of the Trust are also officers or directors of the Advisor and Distributor. The compensation of independent Trustees is borne by the Trust.
The percentage of direct investments in the Fund held by appointed Trustees, Officers and the Advisor is approximately 6.69%.
The Fund may sell securities to an affiliated fund, or the Fund may purchase securities held by an affiliated fund, provided the affiliation is due solely to having a common investment advisor, common officers, or common trustees, and provided that all such transactions will comply with Rule 17a-7 under the 1940 Act. For the year ended September 30, 2016, the Fund had no transactions with affiliated funds.
NOTE 5 – SHARES OF BENEFICIAL INTEREST
At September 30, 2016, there were an unlimited number of shares with no par value of beneficial interest authorized. Transactions in shares of beneficial interest were as follows:
| | | | | | | | | | | | | | | | |
| | | Year Ended
September 30, 2016 | | | Year Ended
September 30, 2015 | |
| | | Shares | | | Amount | | | Shares | | | Amount | |
Class A Shares | | | | | | | | | | | | | | | | |
Shares sold | | | 492,618 | | | $ | 13,190,882 | | | | 996,259 | | | $ | 28,022,370 | |
Shares issued to shareholders in reinvestment of dividends | | | — | | | | — | | | | — | | | | — | |
Shares repurchased | | | (2,413,586 | ) | | | (63,231,987 | ) | | | (2,497,551 | ) | | | (69,458,025 | ) |
| | | | | | | | | | | | | | | | |
| | | | |
Net increase (decrease) | | | (1,920,968 | ) | | $ | (50,041,105 | ) | | | (1,501,292 | ) | | $ | (41,435,655 | ) |
| | | | | | | | | | | | | | | | |
| | | | |
Class C Shares | | | | | | | | | | | | | | | | |
Shares sold | | | 406,148 | | | $ | 9,771,822 | | | | 444,961 | | | $ | 10,904,013 | |
Shares issued to shareholders in reinvestment of dividends | | | — | | | | — | | | | — | | | | — | |
Shares repurchased | | | (1,741,483 | ) | | | (40,573,317 | ) | | | (1,311,327 | ) | | | (32,448,522 | ) |
| | | | | | | | | | | | | | | | |
| | | | |
Net increase (decrease) | | | (1,335,335 | ) | | $ | (30,801,495 | ) | | | (866,366 | ) | | $ | (21,544,509 | ) |
| | | | | | | | | | | | | | | | |
20 Annual Report
| | |
| NOTES TO FINANCIAL STATEMENTS, CONTINUED | | |
| |
Thornburg Core Growth Fund | | September 30, 2016 |
| | | | | | | | | | | | | | | | |
| | | Year Ended
September 30, 2016 | | | Year Ended
September 30, 2015 | |
| | | Shares | | | Amount | | | Shares | | | Amount | |
Class I Shares | | | | | | | | | | | | | | | | |
Shares sold | | | 927,799 | | | $ | 26,349,638 | | | | 1,813,121 | | | $ | 52,780,952 | |
Shares issued to shareholders in reinvestment of dividends | | | — | | | | — | | | | — | | | | — | |
Shares repurchased | | | (3,162,309 | ) | | | (84,583,532 | ) | | | (1,961,775 | ) | | | (57,206,184 | ) |
| | | | | | | | | | | | | | | | |
| | | | |
Net increase (decrease) | | | (2,234,510 | ) | | $ | (58,233,894 | ) | | | (148,654 | ) | | $ | (4,425,232 | ) |
| | | | | | | | | | | | | | | | |
| | | | |
Class R3 Shares | | | | | | | | | | | | | | | | |
Shares sold | | | 286,391 | | | $ | 7,559,165 | | | | 400,614 | | | $ | 11,097,621 | |
Shares issued to shareholders in reinvestment of dividends | | | — | | | | — | | | | — | | | | — | |
Shares repurchased | | | (1,003,594 | ) | | | (26,523,766 | ) | | | (1,138,031 | ) | | | (31,457,658 | ) |
| | | | | | | | | | | | | | | | |
| | | | |
Net increase (decrease) | | | (717,203 | ) | | $ | (18,964,601 | ) | | | (737,417 | ) | | $ | (20,360,037 | ) |
| | | | | | | | | | | | | | | | |
| | | | |
Class R4 Shares | | | | | | | | | | | | | | | | |
Shares sold | | | 203,623 | | | $ | 5,252,801 | | | | 161,503 | | | $ | 4,454,266 | |
Shares issued to shareholders in reinvestment of dividends | | | — | | | | — | | | | — | | | | — | |
Shares repurchased | | | (330,597 | ) | | | (8,718,348 | ) | | | (219,673 | ) | | | (6,048,549 | ) |
| | | | | | | | | | | | | | | | |
| | | | |
Net increase (decrease) | | | (126,974 | ) | | $ | (3,465,547 | ) | | | (58,170 | ) | | $ | (1,594,283 | ) |
| | | | | | | | | | | | | | | | |
| | | | |
Class R5 Shares | | | | | | | | | | | | | | | | |
Shares sold | | | 173,654 | | | $ | 4,899,966 | | | | 330,694 | | | $ | 9,632,579 | |
Shares issued to shareholders in reinvestment of dividends | | | — | | | | — | | | | — | | | | — | |
Shares repurchased | | | (519,703 | ) | | | (14,584,671 | ) | | | (914,591 | ) | | | (26,885,105 | ) |
| | | | | | | | | | | | | | | | |
| | | | |
Net increase (decrease) | | | (346,049 | ) | | $ | (9,684,705 | ) | | | (583,897 | ) | | $ | (17,252,526 | ) |
| | | | | | | | | | | | | | | | |
NOTE 6 – INVESTMENT TRANSACTIONS
For the year ended September 30, 2016, the Fund had purchase and sale transactions of investments (excluding short-term investments) of $575,410,576 and $774,977,158, respectively.
NOTE 7 – DERIVATIVE FINANCIAL INSTRUMENTS WITH OFF-BALANCE SHEET RISK AND FOREIGN INVESTMENT RISK
The Fund may use a variety of derivative financial instruments to hedge or adjust the risks affecting its investment portfolio or to enhance investment returns. Provisions of FASB Accounting Standards Codification ASC 815-10-50 (“ASC 815”) require certain disclosures. The disclosures are intended to provide users of financial statements with an understanding of the use of derivative instruments by the Fund and how these derivatives affect the financial position, financial performance and cash flows of the Fund. The Fund does not designate any derivative instruments as hedging instruments under ASC 815. Additionally, the Fund’s risk of loss may exceed the amounts recognized on the Statement of Assets and Liabilities.
During the year ended September 30, 2016, the Fund did not invest in any derivative financial instruments of the type addressed by ASC 815.
OTHER NOTES
Risks: The Fund’s investments subject it to risks including, but not limited to, management risk, market and economic risk, risks affecting specific issuers, liquidity risk, the risks associated with investments in small- and mid-cap companies and non-U.S. issuers, credit risk, and interest rate risk. Please see the Fund’s prospectus for a discussion of the risks associated with an investment in the Fund.
Subsequent Events: Fund management believes no events have occurred between September 30, 2016 and the date of issuance of the financial statements that require adjustment to or disclosure in the accompanying financial statements.
Annual Report 21
Financial Highlights
Thornburg Core Growth Fund
| | | | | | | | | | | | | | | | | | | | | | | | | | | | | | | | | | | | | | | | | | | | | | | | | | | | | | |
| | | PER SHARE PERFORMANCE (for a share outstanding throughout the Year) | | RATIOS TO AVERAGE NET ASSETS | | | SUPPLEMENTAL DATA | |
Unless Otherwise Noted, Periods are Fiscal Years Ended Sept. 30, | | Net Asset
Value
Beginning
of Year | | | Net Investment Income (Loss)+ | | Net
Realized &
Unrealized
Gain (Loss)
on
Investments | | | Total from Investment Operations | | Dividends
from Net
Investment
Income | | | Dividends
from Net
Realized
Gains | | | Total
Dividends | | | Net Asset Value End of Year | | Net
Investment
Income
(Loss) (%) | | | Expenses,
After
Expense
Reductions
(%) | | | Expenses,
After
Expense
Reductions
and Net of
Custody
Credits (%) | | | Expenses,
Before
Expense
Reductions
(%) | | | Total
Return
(%)(a) | | | Portfolio
Turnover
Rate (%)(a) | | | Net Assets
at End of
Year
(Thousands) | |
CLASS A SHARES | | | | | | | | | | | | | | | | | | | | | | | | | | | | | | | | | | | | | | | | | | | | | |
2016(b) | | $ | 26.09 | | | (0.27) | | | 2.40 | | | 2.13 | | | — | | | | — | | | | — | | | $28.22 | | | (1.00) | | | | 1.40 | | | | 1.40 | | | | 1.40 | | | | 8.16 | | | | 86.24 | | | $ | 199,178 | |
2015(b) | | $ | 26.44 | | | (0.26) | | | (0.09 | ) | | (0.35) | | | — | | | | — | | | | — | | | $26.09 | | | (0.93) | | | | 1.39 | | | | 1.39 | | | | 1.39 | | | | (1.32 | ) | | | 96.02 | | | $ | 234,284 | |
2014(b) | | $ | 24.35 | | | (0.28) | | | 2.37 | | | 2.09 | | | — | | | | — | | | | — | | | $26.44 | | | (1.06) | | | | 1.40 | | | | 1.40 | | | | 1.40 | | | | 8.58 | | | | 100.62 | | | $ | 277,099 | |
2013(b) | | $ | 19.11 | | | (0.21) | | | 5.45 | | | 5.24 | | | — | | | | — | | | | — | | | $24.35 | | | (1.01) | | | | 1.45 | | | | 1.45 | | | | 1.45 | | | | 27.42 | | | | 91.92 | | | $ | 279,483 | |
2012(b) | | $ | 13.33 | | | (0.17) | | | 5.95 | | | 5.78 | | | — | | | | — | | | | — | | | $19.11 | | | (1.02) | | | | 1.48 | | | | 1.49 | | | | 1.48 | | | | 43.36 | | | | 122.93 | | | $ | 225,945 | |
CLASS C SHARES | | | | | | | | | | | | | | | | | | | | | | | | | | | | | | | | | | | | | | | | | | | | | |
2016 | | $ | 23.20 | | | (0.41) | | | 2.11 | | | 1.70 | | | — | | | | — | | | | — | | | $24.90 | | | (1.76) | | | | 2.16 | | | | 2.16 | | | | 2.16 | | | | 7.33 | | | | 86.24 | | | $ | 156,115 | |
2015 | | $ | 23.69 | | | (0.42) | | | (0.07 | ) | | (0.49) | | | — | | | | — | | | | — | | | $23.20 | | | (1.69) | | | | 2.15 | | | | 2.15 | | | | 2.15 | | | | (2.07 | ) | | | 96.02 | | | $ | 176,422 | |
2014 | | $ | 21.98 | | | (0.43) | | | 2.14 | | | 1.71 | | | — | | | | — | | | | — | | | $23.69 | | | (1.81) | | | | 2.14 | | | | 2.14 | | | | 2.14 | | | | 7.78 | | | | 100.62 | | | $ | 200,664 | |
2013 | | $ | 17.38 | | | (0.34) | | | 4.94 | | | 4.60 | | | — | | | | — | | | | — | | | $21.98 | | | (1.76) | | | | 2.20 | | | | 2.20 | | | | 2.20 | | | | 26.47 | | | | 91.92 | | | $ | 182,999 | |
2012 | | $ | 12.22 | | | (0.28) | | | 5.44 | | | 5.16 | | | — | | | | — | | | | — | | | $17.38 | | | (1.79) | | | | 2.25 | | | | 2.25 | | | | 2.25 | | | | 42.23 | | | | 122.93 | | | $ | 156,597 | |
CLASS I SHARES | | | | | | | | | | | | | | | | | | | | | | | | | | | | | | | | | | | | | | | | | | | | | |
2016 | | $ | 27.64 | | | (0.17) | | | 2.54 | | | 2.37 | | | — | | | | — | | | | — | | | $30.01 | | | (0.59) | | | | 0.99 | | | | 0.99 | | | | 1.05 | | | | 8.57 | | | | 86.24 | | | $ | 198,658 | |
2015 | | $ | 27.90 | | | (0.16) | | | (0.10 | ) | | (0.26) | | | — | | | | — | | | | — | | | $27.64 | | | (0.53) | | | | 0.99 | | | | 0.99 | | | | 1.05 | | | | (0.93 | ) | | | 96.02 | | | $ | 244,691 | |
2014 | | $ | 25.59 | | | (0.18) | | | 2.49 | | | 2.31 | | | — | | | | — | | | | — | | | $27.90 | | | (0.65) | | | | 0.99 | | | | 0.99 | | | | 1.03 | | | | 9.03 | | | | 100.62 | | | $ | 251,122 | |
2013 | | $ | 19.99 | | | (0.12) | | | 5.72 | | | 5.60 | | | — | | | | — | | | | — | | | $25.59 | | | (0.55) | | | | 0.99 | | | | 0.99 | | | | 1.02 | | | | 28.01 | | | | 91.92 | | | $ | 191,358 | |
2012 | | $ | 13.88 | | | (0.09) | | | 6.20 | | | 6.11 | | | — | | | | — | | | | — | | | $19.99 | | | (0.52) | | | | 0.99 | | | | 0.99 | | | | 1.08 | | | | 44.02 | | | | 122.93 | | | $ | 116,567 | |
CLASS R3 SHARES | | | | | | | | | | | | | | | | | | | | | | | | | | | | | | | | | | | | | | | | | | | | | |
2016 | | $ | 26.01 | | | (0.29) | | | 2.38 | | | 2.09 | | | — | | | | — | | | | — | | | $28.10 | | | (1.10) | | | | 1.50 | | | | 1.50 | | | | 1.81 | | | | 8.04 | | | | 86.24 | | | $ | 55,809 | |
2015 | | $ | 26.39 | | | (0.29) | | | (0.09 | ) | | (0.38) | | | — | | | | — | | | | — | | | $26.01 | | | (1.05) | | | | 1.50 | | | | 1.50 | | | | 1.79 | | | | (1.44 | ) | | | 96.02 | | | $ | 70,310 | |
2014 | | $ | 24.33 | | | (0.31) | | | 2.37 | | | 2.06 | | | — | | | | — | | | | — | | | $26.39 | | | (1.16) | | | | 1.50 | | | | 1.50 | | | | 1.80 | | | | 8.47 | | | | 100.62 | | | $ | 90,788 | |
2013 | | $ | 19.11 | | | (0.22) | | | 5.44 | | | 5.22 | | | — | | | | — | | | | — | | | $24.33 | | | (1.06) | | | | 1.50 | | | | 1.50 | | | | 1.79 | | | | 27.32 | | | | 91.92 | | | $ | 95,545 | |
2012 | | $ | 13.33 | | | (0.18) | | | 5.96 | | | 5.78 | | | — | | | | — | | | | — | | | $19.11 | | | (1.04) | | | | 1.50 | | | | 1.50 | | | | 1.80 | | | | 43.36 | | | | 122.93 | | | $ | 106,353 | |
CLASS R4 SHARES | | | | | | | | | | | | | | | | | | | | | | | | | | | | | | | | | | | | | | | | | | | | | |
2016 | | $ | 26.19 | | | (0.27) | | | 2.41 | | | 2.14 | | | — | | | | — | | | | — | | | $28.33 | | | (1.00) | | | | 1.40 | | | | 1.40 | | | | 1.86 | | | | 8.17 | | | | 86.24 | | | $ | 6,821 | |
2015 | | $ | 26.54 | | | (0.26) | | | (0.09 | ) | | (0.35) | | | — | | | | — | | | | — | | | $26.19 | | | (0.94) | | | | 1.40 | | | | 1.40 | | | | 1.82 | | | | (1.32 | ) | | | 96.02 | | | $ | 9,632 | |
2014 | | $ | 24.44 | | | (0.28) | | | 2.38 | | | 2.10 | | | — | | | | — | | | | — | | | $26.54 | | | (1.06) | | | | 1.40 | | | | 1.40 | | | | 1.77 | | | | 8.59 | | | | 100.62 | | | $ | 11,306 | |
2013 | | $ | 19.18 | | | (0.20) | | | 5.46 | | | 5.26 | | | — | | | | — | | | | — | | | $24.44 | | | (0.96) | | | | 1.40 | | | | 1.40 | | | | 1.79 | | | | 27.42 | | | | 91.92 | | | $ | 10,277 | |
2012 | | $ | 13.37 | | | (0.16) | | | 5.97 | | | 5.81 | | | — | | | | — | | | | — | | | $19.18 | | | (0.93) | | | | 1.40 | | | | 1.40 | | | | 1.78 | | | | 43.46 | | | | 122.93 | | | $ | 9,344 | |
CLASS R5 SHARES | | | | | | | | | | | | | | | | | | | | | | | | | | | | | | | | | | | | | | | | | | | | | |
2016 | | $ | 27.61 | | | (0.17) | | | 2.54 | | | 2.37 | | | — | | | | — | | | | — | | | $29.98 | | | (0.59) | | | | 0.99 | | | | 0.99 | | | | 1.30 | | | | 8.58 | | | | 86.24 | | | $ | 38,629 | |
2015 | | $ | 27.87 | | | (0.16) | | | (0.10 | ) | | (0.26) | | | — | | | | — | | | | — | | | $27.61 | | | (0.54) | | | | 0.99 | | | | 0.99 | | | | 1.24 | | | | (0.93 | ) | | | 96.02 | | | $ | 45,126 | |
2014 | | $ | 25.56 | | | (0.18) | | | 2.49 | | | 2.31 | | | — | | | | — | | | | — | | | $27.87 | | | (0.65) | | | | 0.99 | | | | 0.99 | | | | 1.28 | | | | 9.04 | | | | 100.62 | | | $ | 61,818 | |
2013 | | $ | 19.97 | | | (0.12) | | | 5.71 | | | 5.59 | | | — | | | | — | | | | — | | | $25.56 | | | (0.55) | | | | 0.99 | | | | 0.99 | | | | 1.12 | | | | 27.99 | | | | 91.92 | | | $ | 62,146 | |
2012 | | $ | 13.86 | | | (0.09) | | | 6.20 | | | 6.11 | | | — | | | | — | | | | — | | | $19.97 | | | (0.52) | | | | 0.98 | | | | 0.99 | | | | 1.32 | | | | 44.08 | | | | 122.93 | | | $ | 61,411 | |
| (a) | Not annualized for periods less than one year. |
| (b) | Sales loads are not reflected in computing total return. |
| + | Based on weighted average shares outstanding. |
See notes to financial statements.
| | | | |
| 22 Annual Report | | | | Annual Report 23 |
| | |
| REPORT OF INDEPENDENT REGISTERED PUBLIC ACCOUNTING FIRM |
| |
Thornburg Core Growth Fund | | September 30, 2016 |
To the Trustees and Shareholders of
Thornburg Core Growth Fund
In our opinion, the accompanying statement of assets and liabilities, including the schedule of investments in securities, and the related statements of operations and of changes in net assets and the financial highlights present fairly, in all material respects, the financial position of the Thornburg Core Growth Fund (the “Fund”) at September 30, 2016, the results of its operations for the year then ended, the changes in its net assets for each of the two years in the period then ended and the financial highlights for each of the five years in the period then ended, in conformity with accounting principles generally accepted in the United States of America. These financial statements and financial highlights (hereafter referred to as “financial statements”) are the responsibility of the Fund’s management. Our responsibility is to express an opinion on these financial statements based on our audits. We conducted our audits of these financial statements in accordance with the standards of the Public Company Accounting Oversight Board (United States). Those standards require that we plan and perform the audit to obtain reasonable assurance about whether the financial statements are free of material misstatement. An audit includes examining, on a test basis, evidence supporting the amounts and disclosures in the financial statements, assessing the accounting principles used and significant estimates made by management, and evaluating the overall financial statement presentation. We believe that our audits, which included confirmation of securities at September 30, 2016 by correspondence with the custodian, brokers, transfer agent, and the application of alternative procedures where securities purchased had not been received, provide a reasonable basis for our opinion.
PricewaterhouseCoopers LLP
New York, New York
November 18, 2016
24 Annual Report
| | |
| EXPENSE EXAMPLE | | |
| |
Thornburg Core Growth Fund | | September 30, 2016 (Unaudited) |
As a shareholder of the Fund, you incur two types of costs:
| | (1) | transaction costs, including |
(a) sales charges (loads) on purchase payments, for Class A shares;
(b) a deferred sales charge on redemptions of any part or all of a purchase of $1 million of Class A shares within 12 months of purchase;
(c) a deferred sales charge on redemptions of Class C shares within 12 months of purchase;
| | (2) | ongoing costs, including management fees; distribution and/or service (12b-1) fees; and other Fund expenses. |
This example is intended to help you understand your ongoing costs (in dollars) of investing in the Fund and to compare these costs with the ongoing costs of investing in other mutual funds.
The example is based on a $1,000 investment beginning on April 1, 2016, and held until September 30, 2016.
| | | | | | | | | | | | |
| | | Beginning
Account Value
4/1/16 | | | Ending
Account Value
9/30/16 | | | Expenses paid
During period†
4/1/16–9/30/16 | |
CLASS A SHARES | | | | | | | | | | | | |
Actual | | $ | 1,000.00 | | | $ | 1,082.10 | | | $ | 7.21 | |
Hypothetical* | | $ | 1,000.00 | | | $ | 1,018.07 | | | $ | 6.99 | |
CLASS C SHARES | | | | | | | | | | | | |
Actual | | $ | 1,000.00 | | | $ | 1,077.90 | | | $ | 11.15 | |
Hypothetical* | | $ | 1,000.00 | | | $ | 1,014.27 | | | $ | 10.81 | |
CLASS I SHARES | | | | | | | | | | | | |
Actual | | $ | 1,000.00 | | | $ | 1,084.20 | | | $ | 5.16 | |
Hypothetical* | | $ | 1,000.00 | | | $ | 1,020.05 | | | $ | 5.00 | |
CLASS R3 SHARES | | | | | | | | | | | | |
Actual | | $ | 1,000.00 | | | $ | 1,081.20 | | | $ | 7.81 | |
Hypothetical* | | $ | 1,000.00 | | | $ | 1,017.50 | | | $ | 7.57 | |
CLASS R4 SHARES | | | | | | | | | | | | |
Actual | | $ | 1,000.00 | | | $ | 1,082.10 | | | $ | 7.29 | |
Hypothetical* | | $ | 1,000.00 | | | $ | 1,018.00 | | | $ | 7.07 | |
CLASS R5 SHARES | | | | | | | | | | | | |
Actual | | $ | 1,000.00 | | | $ | 1,084.30 | | | $ | 5.16 | |
Hypothetical* | | $ | 1,000.00 | | | $ | 1,020.05 | | | $ | 5.00 | |
| † | Expenses are equal to the annualized expense ratio for each class (A: 1.39%; C: 2.15%; I: 0.99%; R3: 1.50%; R4: 1.40%; R5: 0.99%) multiplied by the average account value over the period, multiplied by 183/366 to reflect the one-half year period. |
| * | Hypothetical assumes a rate of return of 5% per year before expenses. |
ACTUAL EXPENSES
For each class of shares, the first line of the accompanying table provides information about actual account values and actual expenses. You may use the information in this line, together with the amount you invested, to estimate the expenses that you paid over the period. Simply divide your account value by $1,000 (for example, an $8,600 account value divided by $1,000 = 8.6), then multiply the result by the number in the first line for your class of shares under the heading entitled “Expenses Paid During Period” to estimate the expenses you paid on your account during this period.
HYPOTHETICAL EXAMPLE FOR COMPARISON PURPOSES
For each class of shares, the second line of the accompanying table provides information about hypothetical account values and hypothetical expenses based on the Fund’s actual expense ratio and an assumed rate of return of 5% per year before expenses, which is not the Fund’s actual return. The hypothetical account values and expenses may not be used to estimate the actual ending account balance or expenses you paid for the period. You may use this information to compare the ongoing costs of investing in the Fund and other funds. To do so, compare this 5% hypothetical example with the 5% hypothetical examples that appear in the shareholder reports of the other funds.
Please note that the expenses shown in the table are meant to highlight your ongoing costs only and do not reflect any transactional costs, such as sales charges (loads), redemption fees, or exchange fees. Therefore, the second line of the table for each class of shares is useful in comparing ongoing costs only, and will not help you determine the relative total costs of owning different funds. In addition, if these transactional costs were included, your costs would have been higher.
Annual Report 25
| | |
| TRUSTEES AND OFFICERS | | |
| |
Thornburg Core Growth Fund | | September 30, 2016 (Unaudited) |
| | | | | | |
Name, Age, Year Elected Position Held with Fund | | Principal Occupation(s) During Past Five Years | | Other
Directorships
Held by Trustee | |
INTERESTED TRUSTEES (1)(2)(4) | | | | |
| | |
Garrett Thornburg, 71 Trustee since 1987, Chairman of Trustees(3) | | Chairman and controlling shareholder of Thornburg Investment Management, Inc. (investment advisor); Chairman and controlling shareholder of Thornburg Securities Corporation (securities dealer); Chairman and CEO of Chamisa Energy, LLC; President of the Thornburg Foundation (nonprofit). | | | None | |
| | |
Brian J. McMahon, 61 Trustee since 2001, Vice Chairman of Trustees, Member of Governance & Nominating Committee & Operations Risk Oversight Committee(5) | | Chief Investment Officer, Managing Director, and Portfolio Manager and, until 2016, CEO and President of Thornburg Investment Management, Inc.; Vice President of Thornburg Securities Corporation. | | | None | |
| |
INDEPENDENT TRUSTEES (1)(2)(4) | | | | |
| | |
David A. Ater, 71 Trustee since 1994, Member of Audit Committee & Chairman of Governance & Nominating Committee | | Principal in Ater & Associates, Santa Fe, NM (developer, planner and broker of residential and commercial real estate); owner, developer and broker for various real estate projects. | | | None | |
| | |
David D. Chase, 75 Trustee since 2000, Chairman of Audit Committee | | Managing Member of CS Group, LLC, Santa Fe, NM (private investment
fund – family office). | | | None | |
| | |
Sally Corning, 55 Trustee since 2012, Member of Audit Committee | | Partner in Sun Mountain Capital, Santa Fe, NM (private equity firm with investment programs encompassing venture capital, mezzanine debt, and growth equity). | | | None | |
| | |
Susan H. Dubin, 67 Trustee since 2004, Member of Audit Committee & Governance and Nominating Committee | | President of Dubin Investments, Ltd., Greenwich, CT (private investment fund); Director and officer of various charitable organizations. | | | None | |
| | |
David L. Gardner, 53 Trustee since 2015, Member of Operations Risk Oversight Committee | | Until 2012, head of EMEA (Europe, Middle East and Africa) Sales for iShares of Blackrock, Inc., EMEA Executive Committee Member and EMEA Operating Committee Member at Blackrock, Inc. | | | None | |
| | |
Owen D. Van Essen, 62 Trustee since 2004, Member of Governance & Nominating Committee & Chairman of Operations Risk Oversight Committee | | President of Dirks, Van Essen & Murray, Santa Fe, NM (newspaper mergers and acquisitions). | | | None | |
| | |
James W. Weyhrauch, 57 Trustee since 1996, Member of Audit Committee & Operations Risk Oversight Committee | | Real estate broker, Santa Fe Properties, Santa Fe, NM; Vice Chairman of Nambe LLC, Santa Fe, NM (manufacturing & design company). | | | None | |
26 Annual Report
| | |
| TRUSTEES AND OFFICERS, CONTINUED | | |
| |
Thornburg Core Growth Fund | | September 30, 2016 (Unaudited) |
| | | | | | |
Name, Age, Year Elected Position Held with Fund | | Principal Occupation(s) During Past Five Years | | Other
Directorships
Held by Trustee | |
OFFICERS OF THE FUND (WHO ARE NOT TRUSTEES)(1)(7) | | | | |
| | |
Nimish Bhatt, 53 Treasurer since 2016(6) | | Chief Financial Officer and Treasurer of Thornburg Investment Management, Inc. and Thornburg Securities Corporation since 2016; Senior Vice President
(2004–2016), Chief Financial Officer (2011–2016), and Head of Fund Administration (2011–2016) of Calamos Asset Management, Inc., Calamos Investments LLC, Calamos Advisors LLC, and Calamos Wealth Management; Director of Calamos Global Funds plc (2007–2016). | | | Not applicable | |
| | |
Jason Brady, 42 President since 2016(6) | | CEO and President since 2016, Vice President from 2011 to 2016, Portfolio Manager and Managing Director of Thornburg Investment Management, Inc.; Vice President of Thornburg Securities Corporation since 2016. | | | Not applicable | |
| | |
Kathleen Brady, 56 Vice President since 2008 | | Tax Manager Fund Accounting of Thornburg Investment Management, Inc. | | | Not applicable | |
| | |
Connor Browne, 37 Vice President since 2006 | | Portfolio Manager, Vice President since 2013, and Managing Director of Thornburg Investment Management, Inc. | | | Not applicable | |
| | |
Tim Cunningham, 41 Vice President since 2014 | | Managing Director since 2011, Portfolio Manager since 2012, and Associate Portfolio Manager from 2009–2012 of Thornburg Investment Management, Inc. | | | Not applicable | |
| | |
Randy Dry, 42 Vice President since 2014 | | Vice President and Managing Director, Director of Institutional Group from
2014–2016, and since 2016, Chief Administrative Officer of Thornburg Investment Management, Inc. | | | Not applicable | |
| | |
Greg Dunn, 40 Vice President since 2014 | | Managing Director, Portfolio Manager since 2012, and Associate Portfolio Manager from 2009–2012 of Thornburg Investment Management, Inc. | | | Not applicable | |
| | |
Lon Erickson, 41 Vice President since 2008 | | Portfolio Manager and Managing Director of Thornburg Investment Management, Inc. | | | Not applicable | |
| | |
William V. Fries, 77 Vice President since 1995 | | Portfolio Manager, Vice President, and Managing Director of Thornburg Investment Management, Inc. | | | Not applicable | |
| | |
Thomas Garcia, 45 Vice President since 2006 | | Vice President since 2011, Managing Director, Head Equity Trader, and Associate Portfolio Manager of Thornburg Investment Management, Inc. | | | Not applicable | |
| | |
Rolf Kelly, 37 Vice President since 2016 | | Portfolio Manager and Managing Director since 2013 and Associate Portfolio Manager from 2011–2013 of Thornburg Investment Management, Inc. | | | Not applicable | |
| | |
Ben Kirby, 36 Vice President since 2014 | | Portfolio Manager and Managing Director since 2013 and Associate Portfolio Manager from 2011–2013 of Thornburg Investment Management, Inc. | | | Not applicable | |
| | |
Jeff Klingelhofer, 41 Vice President since 2016 | | Portfolio Manager and Managing Director since 2015, Associate Portfolio Manager from 2012–2015, and Fixed Income Analyst from 2010–2012 of Thornburg Investment Management, Inc. | | | Not applicable | |
| | |
Rob MacDonald, 40 Vice President since 2016 | | Managing Director since 2015, Portfolio Manager since 2014, and Associate Portfolio Manager from 2011–2014 of Thornburg Investment Management, Inc. | | | Not applicable | |
| | |
Leigh Moiola, 49 Vice President since 2001 | | Vice President, Managing Director, and Director of Marketing of Thornburg Investment Management, Inc.; Vice President of Thornburg Securities Corporation. | | | Not applicable | |
| | |
Christopher Ryon, 60 Vice President since 2008 | | Portfolio Manager and Managing Director of Thornburg Investment Management, Inc. | | | Not applicable | |
| | |
Nicholos Venditti, 35 Vice President since 2016 | | Portfolio Manager and Managing Director since 2015 and Associate Portfolio Manager from 2011–2015 of Thornburg Investment Management, Inc. | | | Not applicable | |
Annual Report 27
| | |
| TRUSTEES AND OFFICERS, CONTINUED | | |
| |
Thornburg Core Growth Fund | | September 30, 2016 (Unaudited) |
| | | | |
Name, Age, Year Elected Position Held with Fund | | Principal Occupation(s) During Past Five Years | | Other
Directorships
Held by Trustee |
Vinson Walden, 46 Vice President since 2004 | | Portfolio Manager and Managing Director of Thornburg Investment Management, Inc. | | Not applicable |
| | |
Lei Wang, 45 Vice President since 2006 | | Portfolio Manager and Managing Director of Thornburg Investment Management, Inc. | | Not applicable |
| | |
Sasha Wilcoxon, 42 Vice President since 2003 Secretary since 2007(6) | | Managing Director, Director of Mutual Fund Operations, and Vice President of Thornburg Investment Management, Inc.; Vice President of Thornburg Securities Corporation. | | Not applicable |
| | |
Charles Wilson, 41 Vice President since 2016 | | Portfolio Manager and Managing Director since 2014 and Associate Portfolio Manager from 2012–2014 of Thornburg Investment Management, Inc.; Co-Portfolio Manager of Marsico Capital Management from 2010–2012. | | Not applicable |
| | |
Di Zhou, 38 Vice President since 2016 | | Portfolio Manager and Managing Director since 2016, Associate Portfolio Manager from 2014–2016, and Equity Research Analyst from 2010–2014 of Thornburg Investment Management, Inc. | | Not applicable |
| (1) | Each person’s address is 2300 North Ridgetop Road, Santa Fe, New Mexico 87506. |
| (2) | The Fund is a separate investment “Fund” or “series” of Thornburg Investment Trust (the “Trust”), which comprises the Thornburg mutual fund complex and is organized as a Massachusetts business trust. Thornburg Investment Management, Inc. is the investment advisor to, and manages, all the Funds of the Trust. Each Trustee oversees all the Funds of the Trust. |
| (3) | Mr. Thornburg is considered an “interested” Trustee under the Investment Company Act of 1940 because he is the sole director and controlling shareholder of Thornburg Investment Management, Inc., the investment advisor to the Trust, and is the sole director and controlling shareholder of Thornburg Securities Corporation, the distributor of shares for the Trust. |
| (4) | The Bylaws of the Trust currently require that each Trustee shall retire by the end of the calendar year during which the Trustee reached the age of 75 years. Otherwise each Trustee serves in office until the election and qualification of a successor or until the Trustee sooner dies, resigns, retires or is removed. |
| (5) | Mr. McMahon is considered an “interested” Trustee under the Investment Company Act of 1940 because he is the chief investment officer of Thornburg Investment Management, Inc. |
| (6) | The Trust’s president, secretary, and treasurer each serves a one-year term or until the election and qualification of a successor; each other officer serves at the pleasure of the Trustees. |
| (7) | Assistant vice presidents, assistant secretaries, and assistant treasurers are not shown. |
The Statement of Additional Information for each Fund of the Trust includes additional information about the Trustees and is available, without charge and upon request, by calling 1-800-847-0200.
28 Annual Report
| | |
| OTHER INFORMATION | | |
| |
Thornburg Core Growth Fund | | September 30, 2016 (Unaudited) |
PORTFOLIO PROXY VOTING
Policies and Procedures:
The Trust has delegated to Thornburg Investment Management, Inc. (the “Advisor”) voting decisions respecting proxies for the Fund’s voting securities. The Advisor makes voting decisions in accordance with its Proxy Voting Policy and Procedures. A description of the Policy and Procedures is available (i) without charge, upon request, by calling the Advisor toll-free at 1-800-847-0200, (ii) on the Thornburg website at www.thornburg.com, and (iii) on the Securities and Exchange Commission’s website at www.sec.gov.
Information regarding how proxies were voted is available on or before August 31 of each year for the twelve months ending the preceding June 30. This information is available (i) without charge, upon request by calling the Advisor toll-free at 1-800-847-0200, (ii) on the Thornburg website at www.thornburg.com, and (iii) on the Securities and Exchange Commission’s website at www.sec.gov.
AVAILABILITY OF QUARTERLY PORTFOLIO SCHEDULE
The Fund files with the Securities and Exchange Commission schedules of its portfolio holdings on Form N-Q for the first and third quarters of each fiscal year. The Fund’s Forms N-Q are available on the Commission’s website at www.sec.gov, or may be reviewed and copied at the Commission’s Public Reference Room in Washington, D.C. Information on the operation of the Public Reference Room may be obtained by calling 1-800-SEC-0330. The Fund also makes this information available on its website at www.thornburg. com/download or upon request by calling 1-800-847-0200.
STATEMENT RESPECTING RENEWAL OF INVESTMENT ADVISORY AGREEMENT
Thornburg Investment Management, Inc. (the “Advisor”) provides investment management services to Thornburg Core Growth Fund pursuant to an investment advisory agreement. The Trustees consider the renewal of this agreement annually, and most recently determined to renew the agreement on September 13, 2016.
In anticipation of their recent consideration of the advisory agreement’s renewal, the independent Trustees met in May 2016 to consider aspects of their annual evaluation of the Advisor’s service to all of the funds of Thornburg Investment Trust, to plan the annual evaluation of the Advisor’s performance and to specify the information the Advisor would present to the Trustees for their review. The independent Trustees met again in independent session in September to consider portions of the information submitted by the Advisor. Representatives of the Advisor subsequently reviewed portions of the information with the Trustees and addressed questions from the Trustees at a full meeting session of the Trustees scheduled for that purpose, and the independent Trustees thereafter met in independent session to consider the Advisor’s presentation and various specific issues respecting their consideration of the advisory agreement’s renewal. Following these sessions, the Trustees met to consider renewal of the agreement, and the independent Trustees voted unanimously at that meeting to renew the agreement for an additional term of one year.
The information below summarizes certain factors considered by the Trustees in connection with the determination to renew the advisory agreement. In determining to renew the agreement, the Trustees considered a wide range of information and did not identify any single factor as controlling, and this summary does not describe all of the factors and other matters considered by the Trustees in making their determination.
Nature, Extent and Quality of Services. The Trustees considered presentations by the Advisor at meeting sessions scheduled for consideration of a continuation of the advisory agreement, and also noted their consideration of the reports the Trustees and their committees receive throughout the year on a wide variety of topics, and consideration they had given to a number of topics in previous years. Information identified by the Trustees in their evaluation as having been considered and contributing to their conclusions included Trustees’ assessments of the Advisor’s personnel developed in formal and informal meetings throughout the year, the Advisor’s staffing levels and measures to maintain staffing levels and improve competencies, the Advisor’s commitment to attract and retain high quality portfolio management expertise through competitive compensation levels, the Advisor’s collaborative approach to investment management, the Fund’s investment performance over different periods of time, portfolio managers’ cognizance of and strategies to address market and economic trends and conditions, the evaluation and selection of individual investments, the structuring and composition of the Fund’s portfolio, management of Fund liquidity requirements, cognizance of and efforts to achieve tax efficiency, responses to share sale and redemption activity, continuing enhancements to the Advisor’s electronic and information systems and the Advisor’s engagement of outside firms to assist in improving or replacing those systems, the Advisor’s evaluation and selection of firms providing portfolio trade execution to the Fund and the Advisor’s measures to obtain favorable trade execution, the Advisor’s performance of accounting and other services, the Advisor’s continued commitment to observance of compliance and regulatory requirements, the Advisor’s responsiveness to the Trustees, the quality and extent of written and oral reports to the Trustees over the course of the year, and other factors.
Annual Report 29
| | |
| OTHER INFORMATION, CONTINUED | | |
| |
Thornburg Core Growth Fund | | September 30, 2016 (Unaudited) |
Investment Performance. The Trustees noted in their evaluation of the Fund’s investment performance the reports they had received in each regular meeting over the course of the year from the Advisor’s portfolio management personnel. The Trustees also noted in their evaluation their consideration of information provided to them at their request in anticipation of their annual evaluation of the Advisor’s services, including the following items of information respecting the investment performance of the Fund: (1) the Fund’s absolute investment performance and achievement of stated objectives; (2) the Advisor’s written and oral explanations and commentary on the Fund’s performance in the context of the Fund’s objectives and reasonable expectations, and business, market and economic conditions, (3) performance data for the ten most recent calendar years, comparing the Fund’s annual investment returns to a fund category selected by an independent mutual fund analyst firm, and to two broad-based securities indices, (4) the Fund’s investment performance for the three-month, year-to-date, one-year, three-year, five-year and ten-year periods ending with the second quarter of the current year, comparing the Fund’s annualized returns to two mutual fund categories selected by independent mutual fund analyst firms and to two broad-based securities indices, and assigning a percentage rank to the Fund’s performance for each period relative to each of the fund categories, (5) comparison of the Fund’s annualized return since inception to the Fund’s benchmark index, and (6) comparative measures of estimated earnings growth, portfolio volatility, risk and return.
The Trustees found that quarterly reports during the year and other information presented to them confirmed the Advisor’s continued conformity to the Fund’s stated investment objectives and policies.
The Trustees observed in reviewing comparative performance data for the ten most recent calendar years that the Fund’s investment return for the most recent calendar year was comparable to the return for the fund category and lower than the returns of the two securities indices considered. The Trustees further observed with respect to the calendar year information that the Fund’s returns for the preceding nine calendar years exceeded or were comparable to the returns for each of the two indices in six of the nine years, and that the Fund’s returns exceeded the average returns of the fund category in five of nine years. Other quantitative data noted by the Trustees as having been considered in their evaluation showed that the Fund’s annualized returns varied, falling in the fourth quartile of performance of the two fund categories for the one-year, three-year and ten-year periods ending with the second quarter of the current year, and falling within the second quartile of investment performance of one of the fund categories for the five-year period and at the midpoint of performance for the second fund category. Data presented to the Trustees also showed that the Fund’s annualized total return (net of expenses) since the Fund’s inception exceeded the annualized return of the Fund’s benchmark index. The Trustees attached additional significance to the performance of the Fund from the perspective of longer term shareholders. The Trustees asked for and received explanations from the Advisor respecting the reasons for the Fund’s underperformance relative to some measures in certain periods, and considered the Advisor’s past success in rectifying underperformance by other funds and the Advisor’s expectations for improvement in this Fund’s performance. The Trustees found these explanations satisfactory, but requested the Advisor to present expanded quarterly reports to them respecting the Advisor’s execution of the Fund’s investment strategies and other matters.
Comparisons of Fee and Expense Levels. The Trustees recognized in their evaluation the clear disclosures of the Advisor’s fees and Fund expenses in the Fund’s prospectuses. Information noted by the Trustees as having been considered in this context included a variety of comparative data respecting the Fund’s fee and expense levels. This information included comparisons of the Fund’s advisory fee and overall Fund expenses to median and average fees and expenses charged to a category of mutual funds selected by an independent mutual fund analyst firm, comparisons of the advisory fee and other Fund expenses to the fee levels and expenses for two representative share classes of fund peer groups selected from the category by a second independent mutual fund analyst firm, the perspectives and advice from the second mutual fund analyst firm respecting comparisons of fund fee levels and expenses to fund peer groups, and other information. Comparative fee and expense data noted as having been considered by the Trustees showed that the Fund’s advisory fee level was slightly higher than the median and average fee levels for the fund category, the level of total expense for one representative share class of the Fund was somewhat higher than the median and average expense levels for the category, and that the level of total expense for a second representative share class was comparable to the median and slightly lower than the average levels for the category. Peer group data showed that the Fund’s advisory fee level was higher than the median of each peer group and that the total expense levels for two representative share classes were above the medians of their peer groups, but that these levels were within the range of group fee and expense levels and generally comparable to a number of other funds in the groups. The Trustees did not find the differences significant in view of the other factors considered.
The Trustees noted their consideration of information respecting the advisory fees charged by the Advisor to other investment management clients, including sub-advised mutual funds, together with information about fees charged by other advisors to different clients, analysis of the differences between the requirements of institutional clients and mutual funds, analysis of the differences between the requirements of a sub-advised mutual fund and a fund as to which the investment advisor is the primary advisor and sponsor, descriptions of distinguishing characteristics of the sub-advised funds served by the Advisor, and the consequently different investment management services provided to the different categories of clients and the differing contexts in which the fee levels for these arrangements are established. The Trustees confirmed their previous observations that the differences between the fees charged by the Advisor to different types of clients did not appear exceptional, and that the fee rates charged by an investment advisor to different categories of clients had limited relevance to the evaluation of the fee rate charged by that advisor to mutual funds as to which it is the primary advisor and sponsor.
30 Annual Report
| | |
| OTHER INFORMATION, CONTINUED | | |
| |
Thornburg Core Growth Fund | | September 30, 2016 (Unaudited) |
Costs and Profitability of Advisor. In reviewing the profitability of the Advisor’s services to the Fund the Trustees considered an analysis of the Advisor’s costs and the profitability to the Advisor of its services, together with data respecting the overall profitability of a selection of other investment management firms. The Trustees noted that a portion of the Advisor’s profits are an important element in the compensation of shareholder employees. The Trustees considered in this regard information from the Advisor respecting investment of its profits to maintain staffing levels, pay competitive levels of compensation, and add to its information retrieval and management systems to maintain or improve service levels. The Trustees also considered the contribution of the Advisor’s cost management to its profitability, and the relationship of the Advisor’s financial resources and profitability in previous years to its ability to attract necessary personnel, invest in systems and other assets required for its service to the Fund, and maintain or improve service levels for the Fund notwithstanding fluctuations in revenues and profitability. The information considered did not indicate to the Trustees that the Advisor’s profitability was excessive.
Potential Economies of Scale. In reviewing the extent to which economies of scale would be realized by the Fund as it grows and whether fee levels reflect potential economies of scale, the Trustees considered the breakpoint structure for advisory fees chargeable to the Fund, comparisons of the fee breakpoint structure for the Fund with breakpoint structures (or the absence of such structures) for other funds in a peer group selected by an independent mutual fund analyst firm, the effects of the breakpoint structure and other expense factors realized by certain Funds of the Trust as their asset levels had increased, and the Advisor’s expenditures from its own profits and resources to maintain staffing levels, pay competitive levels of compensation, and add to its information retrieval and management systems to maintain or improve service levels. The information provided demonstrated to the Trustees that the Fund’s advisory fee breakpoint structure is reasonable in relation to the structures observed in the other funds in its peer group, and that shareholders may be expected to benefit from any economies of scale, due to the advisory agreement’s breakpoint fee structure for the Fund and other factors.
Potential Ancillary Benefits. In reviewing potential benefits to the Advisor because of its relationship to the Fund, the Trustees noted disclosures by the Advisor of its receipt of certain research services from broker dealers, and the benefits to both the Fund and the Advisor of the Advisor’s expansion of its staffing, compliance and systems capabilities and other resources to serve a broader variety of investment management clients. No unusual or unfair benefits to the Advisor from its relationship to the Fund were identified by the Trustees.
Summary of Conclusions. The Trustees concluded that the nature, extent and quality of the Advisor’s services performed under the advisory agreement remained sufficient. The Trustees further concluded that the absolute and relative investment performance of the Fund over a range of pertinent holding periods on the whole was satisfactory in the context of its objectives and strategies, and that the Advisor had continued to actively and competently pursue the Fund’s stated investment objectives and adhere to the Fund’s investment policies.
The Trustees further concluded, based upon their consideration of the foregoing factors and other information, that the level of the advisory fee charged to the Fund by the Advisor is reasonable in relation to the services provided by the Advisor in view of the nature, extent and quality of those services, investment performance of the Fund after fees and expenses, the clear disclosure of fees and expenses in the Fund’s prospectuses, comparisons of fees and expenses charged to the Fund to fees and expenses charged to other mutual funds, and the other factors considered.
Annual Report 31
TRUSTEES’ STATEMENT TO SHAREHOLDERS
Readopted September 12, 2016
The Trustees believe current and prospective shareholders should know how we discharge our responsibilities in supervising the Funds’ investment advisor and in reviewing the advisor’s contract for renewal. Since 2005, we have issued a statement which sets out clearly the three principal guidelines that we follow in supervising the Trust’s investment advisor on your behalf. In accordance with our customary practice, in September of this year we again reviewed our statement and concluded we should reissue this statement outlining the principal features of our supervision of the advisor’s performance of investment management services for the Funds.
We begin with the premise that each shareholder selected his or her Fund because its investments are managed by the investment advisor identified in the prospectus and in accordance with the objective and policies described in the prospectus. We realize, as each of you do, that if you believe that your Fund’s stated objective and policies no longer serve your personal investment goals, you can sell your shares and leave the Fund.
Therefore, we believe that our primary supervisory task – our principal obligation to you – is to assess the nature and quality of the advisor’s services, and to confirm that the advisor actively and competently pursues the Fund’s objective, in accordance with the policies set out in the prospectus. To do this, we meet regularly with management to review your Fund’s portfolio and to discuss the advisor’s specific actions and judgments in pursuing the Fund’s objective. We do not substitute our own judgment for the advisor’s decisions in selecting investments; the advisor is paid to exercise its informed judgment on investment decisions, and we seek to confirm, in reviewing the advisor’s performance, that the advisor is doing just that.
Second, we are conscious of costs and the effect that costs have on shareholders’ returns. We try to make sure that your Fund’s fees and costs are reasonable in relationship to the services rendered and that they are generally in line with those charged by other expert investment advisors, consistent with our belief that the Fund’s investors searched for and expect that expertise and attention and have decided to pay a reasonable price for it. We do not put the management contract “out to bid” as a matter of course, and we would not do so unless we had concluded that the advisor materially had failed to pursue the Fund’s objectives in accordance with its policies, or for other equally important reasons. We believe that any other approach would be inconsistent with your interests and contrary to your expectations when you bought shares of the Fund in the first place.
Finally, because we believe that most Thornburg Fund shareholders have invested with a long-term perspective, we try not to focus too much on the fashions of the moment and on short-term performance. The market will not favor any specific investment objective or set of policies at all times and under all economic circumstances. A fund will experience periods of both high and low returns relative to other funds and other investments. Even if one of our Funds is not favored by the market at a particular time, we believe that the advisor is nonetheless obliged to remain true to the Fund’s objective and policies, and we watch to see that it does so.
Trustees of Thornburg Investment Trust
32 Annual Report
THORNBURG FUNDS
Thornburg Investment Management is a privately-owned global investment firm that offers a range of solutions for retail and institutional investors. Founded in 1982 and headquartered in Santa Fe, New Mexico, we manage approximately $53 billion (as of September 30, 2016) across eight equity and 11 bond mutual funds, separate accounts for high-net-worth investors and institutional accounts, and five UCITS funds for non-U.S. investors.
The fund outlined in this report is one of many equity and fixed-income products available from Thornburg Investment Management.
Equity Funds
| | • | | Thornburg Core Growth Fund |
| | • | | Thornburg International Value Fund |
| | • | | Thornburg Better World International Fund |
| | • | | Thornburg International Growth Fund |
| | • | | Thornburg Developing World Fund |
| | • | | Thornburg Investment Income Builder Fund |
| | • | | Thornburg Global Opportunities Fund |
Fixed Income Funds
| | • | | Thornburg Low Duration Income Fund |
| | • | | Thornburg Limited Term U.S. Government Fund |
| | • | | Thornburg Limited Term Income Fund |
| | • | | Thornburg Strategic Income Fund |
| | • | | Thornburg Low Duration Municipal Fund |
| | • | | Thornburg Limited Term Municipal Fund |
| | • | | Thornburg Intermediate Municipal Fund |
| | • | | Thornburg California Limited Term Municipal Fund |
| | • | | Thornburg New Mexico Intermediate Municipal Fund |
| | • | | Thornburg New York Intermediate Municipal Fund |
| | • | | Thornburg Strategic Municipal Income Fund |
Before investing, carefully consider the Fund’s investment goals, risks, charges, and expenses. For a prospectus or summary prospectus containing this and other information, contact your financial advisor or visit thornburg.com. Read it carefully before investing.
For additional information, please visit thornburg.com
Thornburg Investment Management, Inc. 2300 North Ridgetop Road, Santa Fe, NM 87506
Annual Report 33
This page intentionally left blank.
34 Annual Report
This page intentionally left blank.
Annual Report 35

| | |
| To receive shareholder reports, prospectuses, and proxy statements electronically, go to www.thornburg.com/edelivery. | |  |
This Annual Report is submitted for the general information of shareholders of the Fund. It is not authorized for distribution to prospective investors in the Fund unless preceded or accompanied by an effective prospectus. | |
| | | | |
| Investment Advisor: | | Distributor: | | |
| Thornburg Investment Management® | | Thornburg Securities Corporation® | | |
| 800.847.0200 | | 800.847.0200 | | TH082 |

2 Annual Report
Annual Report
Thornburg International Growth Fund
September 30, 2016
| | | | |
Share Class | | NASDAQ Symbol | | CUSIP |
Class A | | TIGAX | | 885-215-319 |
Class C | | TIGCX | | 885-215-293 |
Class I | | TINGX | | 885-215-244 |
Class R3 | | TIGVX | | 885-215-178 |
Class R4 | | TINVX | | 885-215-160 |
Class R5 | | TINFX | | 885-215-152 |
Class R6 | | THGIX | | 885-216-820 |
Class I, R3, R4, R5, and R6 shares may not be available to all investors. Minimum investments for Class I shares may be higher than those for other classes.
Investments carry risks, including possible loss of principal. Additional risks may be associated with investments outside the United States, especially in emerging markets, including currency fluctuations, illiquidity, volatility, and political and economic risks. Investments in small- and mid-capitalization companies may increase the risk of greater price fluctuations. Please see the Fund’s prospectus for a discussion of the risks associated with an investment in the Fund. Investments in the Fund are not FDIC insured, nor are they bank deposits or guaranteed by a bank or any other entity.
Annual Report 3
LETTER TO SHAREHOLDERS
| | |
| |
Thornburg International Growth Fund | | September 30, 2016 (Unaudited) |
October 17, 2016
Dear Fellow Shareholder,
For the year ended September 30, 2016, Thornburg International Growth Fund returned 8.23% for Class A shares without sales charge, underperforming its benchmark, the MSCI All Country World ex-U.S. Growth Index, which returned 11.51%. On September 30, 2016, the net asset value of the Class A shares was $19.22.
We were disappointed to trail the benchmark for the year, but are encouraged by the Fund’s strong absolute return for the period. Over the last couple of years (including this fiscal year), low interest rate policies around the world, and generally anemic global economic growth, have led to a difficult investing environment. This has driven investors toward stocks that pay attractive dividends and are perceived as defensive, including those in the consumer staples and utilities sectors. At the same time, investors have shied from potentially riskier assets, like smaller capitalization stocks.
When one examines benchmark performance by market cap deciles, it’s clear that large-cap stocks outperformed small- and mid-cap companies by a wide margin over the period. The top three market cap deciles were the top three performers and represented more than a 70% weight in the benchmark. We also saw a significant rebound in the energy and materials sectors during the period as commodity prices broadly bounced off their lows. All of this resulted in stocks with low-growth characteristics and large market caps leading the market, creating a headwind to our portfolio. While many of the attributes we favor have been underappreciated during prior periods, this was not the case towards the end of our fiscal year. In fact, we saw a reversal that actually benefitted performance, although not enough to overcome the underperformance earlier in the fiscal year.
During the year, the Fund’s best-performing sectors were consumer discretionary, industrials, and technology. Conversely, our financials and health care exposure struggled. From a geographic perspective, our U.K. and Canadian exposure was a headwind while our Switzerland- and China-based stocks performed particularly well.
Contributors and Detractors
The top-five individual contributors to performance during the period were ARM Holdings plc, Wirecard AG, Edenred, REA Group Ltd., and Mobileye.
ARM Holdings – Our initial investment thesis for U.K. tech firm ARM centered upon its industry-leading intellectual property assets that allow it to tap into the powerful growth drivers of mobile computing, embedded intelligence, autonomous vehicles, data centers, and the “Internet of Things”—the inter-connection of devices, buildings, autos, etc. As a company that designs a chip once, but licenses it many times—collecting a royalty on every chip sold—ARM is an attractive, highly cash-generative business model with high margins and recurring revenues. We believed ARM would have a place at the table licensing the chips underpinning these technological revolutions and steadily compound value for a long time to come. Although we would have been delighted to watch our thesis play out longer, our interest in ARM was rewarded when it agreed to be acquired by Softbank for £24 billion, a 43% premium to its prior closing price.
Wirecard – Long-time Fund holding Wirecard is a merchant acquirer based in Germany that focuses on online transactions in Europe and electronic transactions in Asia. Shares were hit early in the year when allegations of illegal activity from a newly formed anonymous research organization spurred bets against the stock. Wirecard denied all allegations and asked regulators to investigate the report. We used the pullback as an opportunity to add to our position. The stock has since recovered nicely.
Edenred – France-based Edenred mainly offers employee benefit and expense management solutions. It essentially operates a closed loop payment network allowing companies to effectively manage costs, governments to better track employment and companies to offer more attractive perquisites. A large portion of the business is exposed to Latin America, specifically Brazil. As a result the stock has been volatile, trading in sync with Brazil macroeconomics and the Brazilian real.
REA Group – REA Group is the leading online real estate portal in Australia. These tend to be network-effect businesses, and while home sellers tend to list on the portal with the most traffic, home buyers usually favor searching the site with the most listings. This creates a positive feedback loop resulting in a dominant leader with significant pricing power.
Mobileye – Mobileye is the leading provider of vision-based advanced driver assistance systems for cars. During the year, the Israeli company announced an industry-first mapping solution, a deep partnership with BMW and Intel, and provided a timeline for its autonomous driving solutions. Shares rallied despite heavy short selling and increased competitive pressure, and we sold our position as we achieved our price target.
The top five individual detractors from performance were Foxtons Group plc, Perrigo Company plc, Concordia International Corp., Nomura Holdings, Inc. and Whitbread plc.
Foxtons – Foxtons is a real estate brokerage focused on the London housing market. Real estate transactions in the U.K.
4 Annual Report
LETTER TO SHAREHOLDERS,
CONTINUED
| | |
Thornburg International Growth Fund | | September 30, 2016 (Unaudited) |
have been depressed due to changes in property taxation and increased political fears. Chief among these uncertainties is “Brexit,” Britain’s exit from European Union that was made more likely by an unexpected approval vote in June.
Perrigo – Management departure at Dublin-domiciled Perrigo just after a large acquisition combined with pricing pressure for its generic drug portfolio increased uncertainty and caused the stock to de-rate, in our view. Furthermore, earnings estimates have come down due to lower growth in its core business and problems at the newly acquired European consumer health business.
Concordia – Concordia International, a specialty pharmaceutical company based in Canada, reduced guidance multiple times during the year and reported a large asset impairment due to new competition and a failed sales initiative. These developments significantly diminish the company’s ability to repair its overleveraged capital structure and, thereby, also delay any meaningful return to growth—even in the medium term. Consequently, we sold our position.
Nomura – Nomura is a Japan-based financial services group and bank. The combination of a disappointing earnings report and recently heightened central bank policy actions dilutive to earnings power led us to exit the position.
Whitbread – Whitbread is the leading budget hotel and coffee shop operator in the U.K. The firm’s shares were weak throughout the year as the region’s macro environment deteriorated considerably leading up to Brexit. We sold our position before the actual referendum vote.
Over the life of the Fund, we have held true to our philosophy and process, which tend to focus on quality growth stocks, smaller capitalization ranges, long-term secular themes, and idiosyncratic opportunities. While we recognize there will be periods when our style is out of favor, over time it has served our investors well. We remain bullish about the prospects of the individual companies we have identified through our active, bottom-up investment process.
Thank you for investing alongside us in Thornburg International Growth Fund.
Sincerely,
| | | | |
 | |  | | |
| Greg Dunn | | Tim Cunningham,CFA | | |
| Managing Director | | Managing Director | | |
| Portfolio Manager | | Portfolio Manager | | |
The matters discussed in this report may constitute forward-looking statements made pursuant to the safe harbor provisions of the Securities Litigation Reform Act of 1995. These include any advisor or portfolio manager prediction, assessment, analysis or outlook for individual securities, industries, investment styles, market sectors and/or markets. These statements involve risks and uncertainties. In addition to the general risks described for each fund in its current prospectus, other factors bearing on these reports include the accuracy of the advisor’s or portfolio manager’s forecasts and predictions, the appropriateness of the investment strategies designed by the advisor or portfolio manager and the ability of the advisor or portfolio manager to implement their strategies efficiently and successfully. Any one or more of these factors, as well as other risks affecting the securities markets generally, could cause the actual results of any fund to differ materially as compared to its benchmarks.
The views expressed by the portfolio managers reflect their professional opinions and are subject to change. Under no circumstances does the information contained within represent a recommendation to buy or sell any security.
Annual Report 5
PERFORMANCE SUMMARY
| | |
Thornburg International Growth Fund | | September 30, 2016 (Unaudited) |
Average Annual Total Returns
| | | | | | | | | | | | | | | | |
| | | 1 Yr | | | 3 Yrs | | | 5 Yrs | | | Since
Incep. | |
Class A Shares (Incep: 2/1/07) | | | | | | | | | | | | | | | | |
Without sales charge | | | 8.23 | % | | | 0.44 | % | | | 9.25 | % | | | 6.46 | % |
With sales charge | | | 3.35 | % | | | -1.09 | % | | | 8.25 | % | | | 5.95 | % |
Class C Shares (Incep: 2/1/07) | | | | | | | | | | | | | | | | |
Without sales charge | | | 7.35 | % | | | -0.33 | % | | | 8.41 | % | | | 5.71 | % |
With sales charge | | | 6.35 | % | | | -0.33 | % | | | 8.41 | % | | | 5.71 | % |
Class I Shares (Incep: 2/1/07) | | | 8.63 | % | | | 0.84 | % | | | 9.70 | % | | | 7.01 | % |
Class R3 Shares (Incep: 2/1/08) | | | 8.03 | % | | | 0.31 | % | | | 9.14 | % | | | 5.03 | % |
Class R4 Shares (Incep: 2/1/08) | | | 8.17 | % | | | 0.41 | % | | | 9.28 | % | | | 5.14 | % |
Class R5 Shares (Incep: 2/1/08) | | | 8.56 | % | | | 0.81 | % | | | 9.69 | % | | | 5.56 | % |
Class R6 Shares (Incep: 2/1/13) | | | 8.65 | % | | | 0.91 | % | | | — | | | | 5.89 | % |
MSCI AC World ex-U.S. Growth Index (Since 2/1/07) | | | 11.51 | % | | | 2.23 | % | | | 7.45 | % | | | 2.00 | % |
Growth of A Hypothetical $10,000 Investment
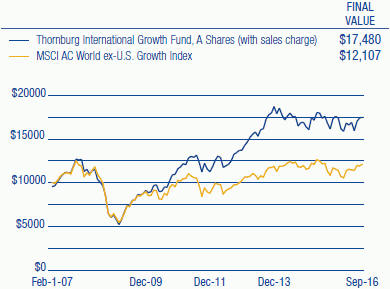
Performance data shown represents past performance and is no guarantee of future results. Investment return and principal value will fluctuate so shares, when redeemed, may be worth more or less than their original cost. Current performance may be lower or higher than quoted. For performance current to the most recent month end, visit thornburg.com or call 800-847-0200. The performance information does not reflect the deduction of taxes that a shareholder would pay on distributions or the redemption of Fund shares. Returns reflect the reinvestment of dividends and capital gains. Class A shares are sold with a maximum sales charge of 4.50%. Class C shares are subject to a 1% CDSC for the first year only. There is no sales charge for Class I, R3, R4, R5, and R6 shares.
As disclosed in the most recent prospectus, the total annual fund operating expenses are as follows: A shares, 1.42%; C shares, 2.20%; I shares, 1.01%; R3 shares, 1.98%; R4 shares, 1.65%; R5 shares, 1.20%; R6 shares, 1.43%. Thornburg Investment Management and/or Thornburg Securities Corporation have contractually agreed to waive fees and reimburse expenses through at least February 1, 2017, for some of the share classes, resulting in net expense ratios of the following: I shares, 0.99%; R3 shares, 1.50%; R4 shares, 1.40%; R5 shares, 0.99%; R6 shares, 0.89%. For more detailed information on fund expenses and waivers/reimbursements please see the Fund’s prospectus.
Glossary
MSCI All Country (AC) World ex-U.S. Growth Index – A market capitalization weighted index that includes growth companies in developed and emerging markets throughout the world, excluding the United States.
Unless otherwise noted, index returns reflect the reinvestment of income dividends and capital gains, if any, but do not reflect fees, brokerage commissions or other expenses of investing. Investors may not make direct investments into any index. The performance of any index is not indicative of the performance of any particular investment.
6 Annual Report
FUND SUMMARY
| | |
Thornburg International Growth Fund | | September 30, 2016 (Unaudited) |
OBJECTIVES AND STRATEGIES
The Fund seeks long-term growth of capital by investing in equity securities selected for their growth potential.
The Fund normally invests at least 75% of its assets in foreign securities or depositary receipts of foreign securities. However, the Fund may own a variety of securities, including domestic equity securities, partnership interests, and debt obligations. The Fund may also invest in developing countries and in smaller companies with market capitalizations of less than $500 million.
Market Capitalization Exposure
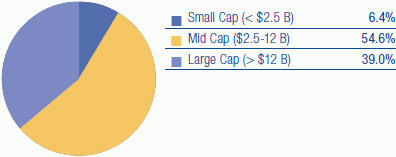
Basket Structure
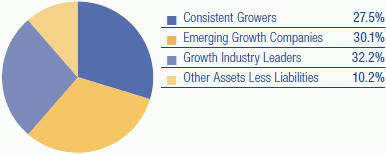
Top Ten Equity Holdings
| | | | |
Wirecard AG | | | 4.6 | % |
MasterCard, Inc. | | | 3.1 | % |
Constellation Software, Inc. | | | 3.1 | % |
Paysafe Group plc | | | 2.9 | % |
Edenred | | | 2.8 | % |
Fomento Economico Mexicano SAB de CV ADR | | | 2.7 | % |
priceline.com, Inc. | | | 2.4 | % |
Japan Exchange Group, Inc. | | | 2.4 | % |
Grifols S.A. | | | 2.2 | % |
Rakuten, Inc. | | | 2.2 | % |
There is no guarantee that the Fund will meet its investment objectives.
All portfolio information is subject to change. Charts may not add up to 100% due to rounding.
Sector Exposure
| | | | |
Information Technology | | | 28.2 | % |
Consumer Discretionary | | | 19.9 | % |
Financials | | | 12.9 | % |
Consumer Staples | | | 10.8 | % |
Health Care | | | 7.7 | % |
Industrials | | | 6.4 | % |
Materials | | | 1.8 | % |
Energy | | | 1.3 | % |
Real Estate | | | 0.7 | % |
Other Assets Less Liabilities | | | 10.2 | % |
|
| Top Ten Industry Groups | |
| |
Software & Services | | | 26.8 | % |
Retailing | | | 13.0 | % |
Diversified Financials | | | 8.6 | % |
Food, Beverage & Tobacco | | | 7.8 | % |
Pharmaceuticals, Biotechnology & Life Sciences | | | 7.7 | % |
Commercial & Professional Services | | | 6.4 | % |
Consumer Services | | | 5.4 | % |
Banks | | | 2.2 | % |
Insurance | | | 2.1 | % |
Household & Personal Products | | | 1.9 | % |
|
Country Exposure* | |
(percent of equity holdings) | |
| |
United Kingdom | | | 17.2 | % |
France | | | 14.0 | % |
Germany | | | 11.7 | % |
United States | | | 9.0 | % |
China | | | 7.6 | % |
Japan | | | 7.2 | % |
Switzerland | | | 4.1 | % |
Mexico | | | 3.7 | % |
Canada | | | 3.4 | % |
India | | | 3.1 | % |
Spain | | | 2.5 | % |
Italy | | | 2.4 | % |
Sweden | | | 2.3 | % |
Ireland | | | 2.1 | % |
South Korea | | | 2.1 | % |
Denmark | | | 2.0 | % |
Taiwan | | | 1.6 | % |
Costa Rica | | | 1.3 | % |
Netherlands | | | 1.2 | % |
Turkey | | | 0.9 | % |
Malta | | | 0.6 | % |
| * | The country assignment of each equity holding is determined by the Fund’s Advisor based on various factors, including the location of the issuer’s head office, the issuer’s jurisdiction of incorporation and the country from which a majority of the issuer’s revenue is derived. |
Annual Report 7
| | |
| SCHEDULE OF INVESTMENTS | | |
| |
Thornburg International Growth Fund | | September 30, 2016 |
| | | | | | | | |
| | | Shares/
Principal Amount | | | Value | |
COMMON STOCK — 89.78% | | | | | | | | |
| | |
BANKS — 2.17% | | | | | | | | |
Banks — 1.09% | | | | | | | | |
ING Groep N.V. | | | 1,264,230 | | | $ | 15,607,690 | |
Thrifts & Mortgage Finance — 1.08% | | | | | | | | |
Housing Development Finance Corp. Ltd. | | | 733,547 | | | | 15,368,900 | |
| | | | | | | | |
| | | | | | | 30,976,590 | |
| | | | | | | | |
| | |
COMMERCIAL & PROFESSIONAL SERVICES — 6.39% | | | | | | | | |
Commercial Services & Supplies — 2.79% | | | | | | | | |
Edenred | | | 1,697,824 | | | | 39,699,399 | |
Professional Services — 3.60% | | | | | | | | |
Bureau Veritas SA | | | 1,364,594 | | | | 29,271,028 | |
SGS S.A. | | | 9,831 | | | | 22,009,701 | |
| | | | | | | | |
| | | | | | | 90,980,128 | |
| | | | | | | | |
| | |
CONSUMER DURABLES & APPAREL — 1.46% | | | | | | | | |
Textiles, Apparel & Luxury Goods — 1.46% | | | | | | | | |
Eclat Textile Co., Ltd. | | | 1,736,603 | | | | 20,720,343 | |
| | | | | | | | |
| | | | | | | 20,720,343 | |
| | | | | | | | |
| | |
CONSUMER SERVICES — 5.39% | | | | | | | | |
Hotels, Restaurants & Leisure — 5.39% | | | | | | | | |
Alsea S.A.B. de C.V. | | | 2,615,900 | | | | 8,851,543 | |
Betsson AB | | | 895,426 | | | | 9,894,902 | |
Evolution Gaming Group AB | | | 255,200 | | | | 8,314,496 | |
Galaxy Entertainment Group Ltd. | | | 3,700,834 | | | | 13,932,282 | |
Merlin Entertainments plc | | | 2,410,126 | | | | 13,732,591 | |
Sands China Ltd. | | | 3,224,000 | | | | 13,986,850 | |
Unibet Group plc | | | 876,724 | | | | 8,145,067 | |
| | | | | | | | |
| | | | | | | 76,857,731 | |
| | | | | | | | |
| | |
DIVERSIFIED FINANCIALS — 8.58% | | | | | | | | |
Capital Markets — 8.58% | | | | | | | | |
Hargreaves Lansdown plc | | | 745,842 | | | | 12,306,379 | |
Japan Exchange Group, Inc. | | | 2,183,313 | | | | 33,695,428 | |
Partners Group Holding AG | | | 32,625 | | | | 16,455,224 | |
Schroders plc | | | 878,985 | | | | 30,715,417 | |
UBS Group AG | | | 1,018,751 | | | | 13,873,470 | |
WisdomTree Investments, Inc. | | | 1,479,487 | | | | 15,223,921 | |
| | | | | | | | |
| | | | | | | 122,269,839 | |
| | | | | | | | |
| | |
ENERGY — 1.28% | | | | | | | | |
Oil, Gas & Consumable Fuels — 1.28% | | | | | | | | |
Total SA | | | 385,728 | | | | 18,272,569 | |
| | | | | | | | |
| | | | | | | 18,272,569 | |
| | | | | | | | |
| | |
FOOD & STAPLES RETAILING — 1.13% | | | | | | | | |
Food & Staples Retailing — 1.13% | | | | | | | | |
PriceSmart, Inc. | | | 192,785 | | | | 16,147,672 | |
| | | | | | | | |
| | | | | | | 16,147,672 | |
| | | | | | | | |
| | |
FOOD, BEVERAGE & TOBACCO — 7.77% | | | | | | | | |
Beverages — 6.08% | | | | | | | | |
Coca Cola Icecek AS | | | 966,049 | | | | 11,756,118 | |
Fomento Economico Mexicano SAB de CV ADR | | | 417,558 | | | | 38,432,038 | |
Pernod Ricard SA | | | 185,648 | | | | 21,970,486 | |
Remy Cointreau SA | | | 169,118 | | | | 14,432,674 | |
Tobacco — 1.69% | | | | | | | | |
ITC Ltd. | | | 6,629,101 | | | | 24,124,830 | |
| | | | | | | | |
| | | | | | | 110,716,146 | |
| | | | | | | | |
| | |
HOUSEHOLD & PERSONAL PRODUCTS — 1.90% | | | | | | | | |
Personal Products — 1.90% | | | | | | | | |
AmorePacific Corp. | | | 76,718 | | | | 27,097,019 | |
| | | | | | | | |
| | | | | | | 27,097,019 | |
| | | | | | | | |
| | |
INSURANCE — 2.15% | | | | | | | | |
Insurance — 2.15% | | | | | | | | |
St. James’s Place plc | | | 2,489,923 | | | | 30,594,920 | |
| | | | | | | | |
| | | | | | | 30,594,920 | |
| | | | | | | | |
8 Annual Report
| | |
| SCHEDULE OF INVESTMENTS, CONTINUED | | |
| |
Thornburg International Growth Fund | | September 30, 2016 |
| | | | | | | | |
| | | Shares/
Principal Amount | | | Value | |
| | |
MATERIALS — 1.82% | | | | | | | | |
Chemicals — 1.82% | | | | | | | | |
Novozymes AS | | | 589,823 | | | $ | 25,940,857 | |
| | | | | | | | |
| | | | | | | 25,940,857 | |
| | | | | | | | |
| | |
PHARMACEUTICALS, BIOTECHNOLOGY & LIFE SCIENCES — 7.72% | | | | | | | | |
Biotechnology — 2.20% | | | | | | | | |
Grifols S.A. | | | 1,456,756 | | | | 31,387,033 | |
Life Sciences Tools & Services — 1.45% | | | | | | | | |
Eurofins Scientific | | | 45,307 | | | | 20,579,632 | |
Pharmaceuticals — 4.07% | | | | | | | | |
a Allergan plc | | | 117,896 | | | | 27,152,628 | |
Bayer AG | | | 306,800 | | | | 30,821,476 | |
| | | | | | | | |
| | | | | | | 109,940,769 | |
| | | | | | | | |
| | |
REAL ESTATE — 0.74% | | | | | | | | |
Real Estate Management & Development — 0.74% | | | | | | | | |
Foxtons Group plc | | | 8,155,443 | | | | 10,597,099 | |
| | | | | | | | |
| | | | | | | 10,597,099 | |
| | | | | | | | |
| | |
RETAILING — 13.04% | | | | | | | | |
Internet & Direct Marketing Retail — 11.31% | | | | | | | | |
a Ctrip.com International, Ltd. ADR | | | 512,218 | | | | 23,853,992 | |
a JD.com, Inc. ADR | | | 550,386 | | | | 14,359,571 | |
a priceline.com, Inc. | | | 23,298 | | | | 34,282,774 | |
Rakuten, Inc. | | | 2,404,600 | | | | 31,087,526 | |
a YOOX S.p.A | | | 984,684 | | | | 30,485,333 | |
a Zalando SE | | | 649,798 | | | | 27,117,649 | |
Multiline Retail — 1.73% | | | | | | | | |
B&M European Value Retail S.A. | | | 7,440,169 | | | | 24,591,105 | |
| | | | | | | | |
| | | | | | | 185,777,950 | |
| | | | | | | | |
| | |
SOFTWARE & SERVICES — 26.77% | | | | | | | | |
Information Technology Services — 13.88% | | | | | | | | |
a Cognizant Tech Solutions Corp. | | | 443,900 | | | | 21,178,469 | |
MasterCard, Inc. | | | 440,847 | | | | 44,864,999 | |
a Paysafe Group plc | | | 7,230,065 | | | | 41,805,121 | |
Wirecard AG | | | 1,254,096 | | | | 65,156,443 | |
Worldpay Group plc | | | 6,456,355 | | | | 24,787,203 | |
Internet Software & Services — 8.30% | | | | | | | | |
a Alibaba Group Holding Ltd. ADR | | | 151,000 | | | | 15,974,290 | |
Auto Trader Group plc | | | 3,156,101 | | | | 16,588,107 | |
a Baidu, Inc. ADR | | | 78,914 | | | | 14,367,872 | |
COOKPAD, Inc. | | | 562,600 | | | | 5,348,320 | |
a Criteo SA ADR | | | 389,000 | | | | 13,657,790 | |
a Just Eat plc | | | 2,072,300 | | | | 14,397,016 | |
NetEnt AB | | | 1,186,466 | | | | 10,856,714 | |
a Rocket Internet SE | | | 1,258,340 | | | | 27,041,316 | |
Software — 4.59% | | | | | | | | |
Constellation Software, Inc. | | | 97,295 | | | | 43,860,063 | |
a LINE Corporation ADR | | | 446,546 | | | | 21,612,826 | |
| | | | | | | | |
| | | | | | | 381,496,549 | |
| | | | | | | | |
| | |
TECHNOLOGY HARDWARE & EQUIPMENT — 1.47% | | | | | | | | |
Electronic Equipment, Instruments & Components — 1.47% | | | | | | | | |
Ingenico S.A. | | | 239,868 | | | | 20,955,560 | |
| | | | | | | | |
| | | | | | | 20,955,560 | |
| | | | | | | | |
TOTAL COMMON STOCK (Cost $1,152,545,407) | | | | | | | 1,279,341,741 | |
| | | | | | | | |
SHORT TERM INVESTMENTS — 9.96% | | | | | | | | |
b Thornburg Capital Management Fund | | | 14,196,332 | | | | 141,963,319 | |
| | | | | | | | |
TOTAL SHORT TERM INVESTMENTS (Cost $141,963,319) | | | | | | | 141,963,319 | |
| | | | | | | | |
TOTAL INVESTMENTS — 99.74% (Cost $1,294,508,726) | | | | | | $ | 1,421,305,060 | |
OTHER ASSETS LESS LIABILITIES — 0.26% | | | | | | | 3,706,537 | |
| | | | | | | | |
NET ASSETS — 100.00% | | | | | | $ | 1,425,011,597 | |
| | | | | | | | |
Annual Report 9
| | |
| SCHEDULE OF INVESTMENTS, CONTINUED | | |
| |
Thornburg International Growth Fund | | September 30, 2016 |
Footnote Legend
| b | Investment in Affiliates – Shown below are holdings of voting securities of each portfolio company which is considered “affiliated” to the Fund under the Investment Company Act of 1940, including companies for which the Fund’s holding represented 5% or more of the company’s voting securities, and a series of the Thornburg Investment Trust in which the Fund invested for cash management purposes during the period: |
| | | | | | | | | | | | | | | | | | | | | | | | | | | | |
Issuer | | Shares/Principal
September 30,
2015 | | | Gross
Additions | | | Gross
Reductions | | | Shares/Principal
September 30,
2016 | | | Market Value
September 30,
2016 | | | Investment
Income | | | Realized
Gain (loss) | |
Thornburg Capital Management Fund | | | 11,457,937 | | | | 85,607,244 | | | | 82,868,849 | | | | 14,196,332 | | | $ | 141,963,319 | | | $ | 579,795 | | | $ | — | |
| | | | | | | | | | | | | | | | | | | | | | | | | | | | |
Total non-controlled affiliated issuers - 9.96% of net assets | | | $ | 141,963,319 | | | $ | 579,795 | | | $ | — | |
| | | | | | | | | | | | | | | | | | | | | | | | | | | | |
Portfolio Abbreviations
To simplify the listings of securities, abbreviations are used per the table below:
| ADR | American Depositary Receipt |
See notes to financial statements.
10 Annual Report
This page intentionally left blank.
Annual Report 11
| | |
| STATEMENT OF ASSETS AND LIABILITIES | | |
| |
Thornburg International Growth Fund | | September 30, 2016 |
| | | | |
ASSETS | | | | |
Investments at value (Note 3) | | | | |
Non-affiliated issuers (cost $1,152,545,407) | | $ | 1,279,341,741 | |
Non-controlled affiliated issuer (cost $141,963,319) | | | 141,963,319 | |
Cash | | | 70,892 | |
Cash denominated in foreign currency (cost $466,951) | | | 465,927 | |
Receivable for investments sold | | | 7,216,516 | |
Receivable for fund shares sold | | | 4,293,479 | |
Dividends receivable | | | 1,336,541 | |
Dividend and interest reclaim receivable | | | 814,178 | |
Prepaid expenses and other assets | | | 102,199 | |
| | | | |
Total Assets | | | 1,435,604,792 | |
| | | | |
| |
LIABILITIES | | | | |
Payable for investments purchased | | | 2,131,152 | |
Payable for fund shares redeemed | | | 4,171,149 | |
Unrealized depreciation on forward currency contracts (Note 7) | | | 760,089 | |
Payable to investment advisor and other affiliates (Note 4) | | | 1,150,119 | |
Deferred taxes payable | | | 1,897,731 | |
Accounts payable and accrued expenses | | | 481,637 | |
Dividends payable | | | 1,318 | |
| | | | |
Total Liabilities | | | 10,593,195 | |
| | | | |
| |
NET ASSETS | | $ | 1,425,011,597 | |
| | | | |
NET ASSETS CONSIST OF | | | | |
Distribution in excess of net investment income | | $ | (365,815 | ) |
Net unrealized appreciation on investments | | | 124,123,382 | |
Accumulated net realized gain (loss) | | | (11,387,186 | ) |
Net capital paid in on shares of beneficial interest | | | 1,312,641,216 | |
| | | | |
| | $ | 1,425,011,597 | |
| | | | |
12 Annual Report
| | |
| STATEMENT OF ASSETS AND LIABILITIES, CONTINUED | | |
| |
Thornburg International Growth Fund | | September 30, 2016 |
| | | | |
NET ASSET VALUE | | | | |
Class A Shares: | | | | |
Net asset value and redemption price per share ($169,248,134 applicable to 8,807,967 shares of beneficial interest outstanding - Note 5) | | $ | 19.22 | |
Maximum sales charge, 4.50% of offering price | | | 0.91 | |
| | | | |
Maximum offering price per share | | $ | 20.13 | |
| | | | |
| |
Class C Shares: | | | | |
Net asset value and offering price per share* ($98,633,011 applicable to 5,402,605 shares of beneficial interest outstanding - Note 5) | | $ | 18.26 | |
| | | | |
| |
Class I Shares: | | | | |
Net asset value, offering and redemption price per share ($1,030,921,022 applicable to 52,368,665 shares of beneficial interest outstanding - Note 5) | | $ | 19.69 | |
| | | | |
| |
Class R3 Shares: | | | | |
Net asset value, offering and redemption price per share ($13,086,014 applicable to 686,190 shares of beneficial interest outstanding - Note 5) | | $ | 19.07 | |
| | | | |
| |
Class R4 Shares: | | | | |
Net asset value, offering and redemption price per share ($40,998,338 applicable to 2,145,739 shares of beneficial interest outstanding - Note 5) | | $ | 19.11 | |
| | | | |
| |
Class R5 Shares: | | | | |
Net asset value, offering and redemption price per share ($66,270,736 applicable to 3,358,253 shares of beneficial interest outstanding - Note 5) | | $ | 19.73 | |
| | | | |
| |
Class R6 Shares: | | | | |
Net asset value, offering and redemption price per share ($5,854,342 applicable to 296,059 shares of beneficial interest outstanding - Note 5) | | $ | 19.77 | |
| | | | |
| * | Redemption price per share is equal to net asset value less any applicable contingent deferred sales charge. |
See notes to financial statements.
Annual Report 13
| | |
| STATEMENT OF OPERATIONS | | |
| |
Thornburg International Growth Fund | | Year Ended September 30, 2016 |
| | | | |
INVESTMENT INCOME | | | | |
Dividend income | | | | |
Non-affiliated issuers (net of foreign taxes withheld of $2,147,332) | | $ | 21,632,368 | |
Non-cotrolled affiliated issuer | | | 579,795 | |
| | | | |
Total Income | | | 22,212,163 | |
| | | | |
| |
EXPENSES | | | | |
Investment advisory fees (Note 4) | | | 12,725,916 | |
Administration fees (Note 4) | | | | |
Class A Shares | | | 264,437 | |
Class C Shares | | | 135,920 | |
Class I Shares | | | 548,740 | |
Class R3 Shares | | | 20,332 | |
Class R4 Shares | | | 50,917 | |
Class R5 Shares | | | 34,798 | |
Distribution and service fees (Note 4) | | | | |
Class A Shares | | | 530,789 | |
Class C Shares | | | 1,087,148 | |
Class R3 Shares | | | 81,219 | |
Class R4 Shares | | | 101,889 | |
Transfer agent fees | | | | |
Class A Shares | | | 282,541 | |
Class C Shares | | | 156,755 | |
Class I Shares | | | 851,256 | |
Class R3 Shares | | | 71,043 | |
Class R4 Shares | | | 163,134 | |
Class R5 Shares | | | 183,763 | |
Class R6 Shares | | | 2,594 | |
Registration and filing fees | | | | |
Class A Shares | | | 31,390 | |
Class C Shares | | | 20,561 | |
Class I Shares | | | 51,760 | |
Class R3 Shares | | | 17,794 | |
Class R4 Shares | | | 17,787 | |
Class R5 Shares | | | 19,094 | |
Class R6 Shares | | | 21,978 | |
Custodian fees (Note 2) | | | 340,446 | |
Professional fees | | | 98,518 | |
Accounting fees (Note 4) | | | 57,107 | |
Trustee fees | | | 68,997 | |
Other expenses | | | 116,431 | |
| | | | |
Total Expenses | | | 18,155,054 | |
Less: | | | | |
Expenses reimbursed by investment advisor (Note 4) | | | (454,786 | ) |
| | | | |
Net Expenses | | | 17,700,268 | |
| | | | |
Net Investment Income | | $ | 4,511,895 | |
| | | | |
14 Annual Report
| | |
| STATEMENT OF OPERATIONS, CONTINUED | | |
| |
Thornburg International Growth Fund | | Year Ended September 30, 2016 |
| | | | |
REALIZED AND UNREALIZED GAIN (LOSS) | | | | |
Net realized gain (loss) on: | | | | |
Non-affiliated issuer investments (net of realized capital gain taxes paid of $26,030) | | $ | 27,269,011 | |
Forward currency contracts (Note 7) | | | (2,240,475 | ) |
Foreign currency transactions | | | (720,581 | ) |
| | | | |
| | | 24,307,955 | |
| | | | |
Net change in unrealized appreciation (depreciation) on: | | | | |
Non-affiliated issuer investments (net of change in deferred taxes payable of $1,896,185) | | | 85,294,716 | |
Forward currency contracts (Note 7) | | | 860,127 | |
Foreign currency translations | | | 56,771 | |
| | | | |
| | | 86,211,614 | |
| | | | |
Net Realized and Unrealized Gain | | | 110,519,569 | |
| | | | |
Net Increase in Net Assets Resulting from Operations | | $ | 115,031,464 | |
| | | | |
See notes to financial statements.
Annual Report 15
| | |
| STATEMENT OF CHANGES IN NET ASSETS | | |
| |
Thornburg International Growth Fund | | September 30, 2016 |
| | | | | | | | |
| | | Year Ended
September 30, 2016 | | | Year Ended
September 30, 2015 | |
INCREASE (DECREASE) IN NET ASSETS FROM | | | | | | | | |
| | |
OPERATIONS | | | | | | | | |
Net investment income | | $ | 4,511,895 | | | $ | 4,470,206 | |
Net realized gain (loss) on investments, capital gain taxes, forward currency contracts, and foreign currency transactions | | | 24,307,955 | | | | 20,219,922 | |
Net unrealized appreciation (depreciation) on investments, deferred taxes payable, forward currency contracts, and foreign currency translations | | | 86,211,614 | | | | (56,836,989 | ) |
| | | | | | | | |
| | |
Net Increase (Decrease) in Net Assets Resulting from
Operations | | | 115,031,464 | | | | (32,146,861 | ) |
| | |
DIVIDENDS TO SHAREHOLDERS | | | | | | | | |
From net investment income | | | | | | | | |
Class A Shares | | | (112,705 | ) | | | — | |
Class I Shares | | | (4,259,877 | ) | | | (3,138,933 | ) |
Class R3 Shares | | | (5,726 | ) | | | — | |
Class R4 Shares | | | (31,291 | ) | | | — | |
Class R5 Shares | | | (283,521 | ) | | | (189,313 | ) |
Class R6 Shares | | | (28,260 | ) | | | (16,090 | ) |
From realized gains | | | | | | | | |
Class A Shares | | | — | | | | (15,965,821 | ) |
Class C Shares | | | — | | | | (7,113,275 | ) |
Class I Shares | | | — | | | | (60,990,387 | ) |
Class R3 Shares | | | — | | | | (1,180,199 | ) |
Class R4 Shares | | | — | | | | (1,967,801 | ) |
Class R5 Shares | | | — | | | | (3,451,556 | ) |
Class R6 Shares | | | — | | | | (216,084 | ) |
| | |
FUND SHARE TRANSACTIONS (NOTE 5) | | | | | | | | |
Class A Shares | | | (65,549,535 | ) | | | (269,211,981 | ) |
Class C Shares | | | (16,163,708 | ) | | | (28,226,569 | ) |
Class I Shares | | | (128,357,590 | ) | | | (2,150,772 | ) |
Class R3 Shares | | | (3,755,415 | ) | | | (5,749,165 | ) |
Class R4 Shares | | | (146,856 | ) | | | 2,288,498 | |
Class R5 Shares | | | (6,042,851 | ) | | | 2,395,126 | |
Class R6 Shares | | | 1,241,489 | | | | 551,299 | |
| | | | | | | | |
Net Decrease in Net Assets | | | (108,464,382 | ) | | | (426,479,884 | ) |
| | |
NET ASSETS | | | | | | | | |
Beginning of Year | | | 1,533,475,979 | | | | 1,959,955,863 | |
| | | | | | | | |
| | |
End of Year | | $ | 1,425,011,597 | | | $ | 1,533,475,979 | |
| | | | | | | | |
Undistributed (distribution in excess of) net investment income | | $ | (365,815 | ) | | $ | 590,281 | |
See notes to financial statements.
16 Annual Report
| | |
| NOTES TO FINANCIAL STATEMENTS | | |
| |
Thornburg International Growth Fund | | September 30, 2016 |
NOTE 1 – ORGANIZATION
Thornburg International Growth Fund (the “Fund”) is a diversified series of Thornburg Investment Trust (the “Trust”). The Fund commenced operations on February 1, 2007. The Trust was organized as a Massachusetts business trust under a Declaration of Trust dated June 3, 1987 and is registered as a diversified, open-end management investment company under the Investment Company Act of 1940, as amended. The Fund is currently one of twenty separate series of the Trust. Each series is considered to be a separate entity for financial reporting and tax purposes and bears expenses directly attributable to it. The Fund seeks long-term capital appreciation by investing in equity securities selected for their growth potential.
The Fund currently offers seven classes of shares of beneficial interest: Class A, Class C, Institutional Class (“Class I”), and Retirement Classes (“Class R3,” “Class R4,” “Class R5,” and “Class R6”). Each class of shares of the Fund represents an interest in the same portfolio of investments, except that (i) Class A shares are sold subject to a front-end sales charge collected at the time the shares are purchased and bear a service fee, (ii) Class C shares are sold at net asset value without a sales charge at the time of purchase, but are subject to a contingent deferred sales charge upon redemption within one year of purchase, and bear both a service fee and a distribution fee, (iii) Class I and Class R5 shares are sold at net asset value without a sales charge at the time of purchase and may be subject to a service fee, (iv) Class R3 shares are sold at net asset value without a sales charge at the time of purchase, but bear both a service fee and distribution fee, (v) Class R4 shares are sold at net asset value without a sales charge at the time of purchase, but bear a service fee, (vi) Class R6 shares are sold at net asset value without a sales charge at the time of purchase, and (vii) the respective classes may have different reinvestment privileges and conversion rights. Additionally, the Fund may allocate among its classes certain expenses, to the extent allocable to specific classes, including transfer agent fees, government registration fees, certain printing and postage costs, and administrative and legal expenses. Currently, class specific expenses of the Fund are limited to service and distribution fees, administration fees, and certain registration and transfer agent expenses.
The following is a summary of significant accounting policies followed by the Fund in the preparation of its financial statements. The Fund prepares its financial statements in conformity with United States generally accepted accounting principles (“GAAP”), including investment company accounting and reporting guidance in the Financial Accounting Standards Board (the “FASB”) Accounting Standard Codification Topic 946.
NOTE 2 – SIGNIFICANT ACCOUNTING POLICIES
Security Valuation: All investments in securities held by the Fund are valued as described in Note 3.
Allocation of Income, Gains, Losses and Expenses: Net investment income (other than class specific expenses) and realized and unrealized gains and losses are allocated daily to each class of shares based upon the relative net asset value of outstanding shares (or the value of the dividend-eligible shares, as appropriate) of each class of shares at the beginning of the day (after adjusting for the current capital shares activity of the respective class). Expenses common to all Funds are allocated among the Funds comprising the Trust based upon their relative net asset values or other appropriate allocation methods. Operating expenses directly attributable to a specific class are charged against the operating income of that class.
Dividends and Distributions to Shareholders: Dividends and distributions to shareholders, which are determined in accordance with federal income tax regulations and may differ from GAAP, are recorded on the ex-dividend date. Ordinary income distributions, if any, are declared and paid quarterly. Capital gain distributions, if any, are declared and paid annually and more often if deemed necessary by the Advisor. Dividends are paid and are reinvested in additional shares of the Fund at net asset value per share at the close of business on the ex-dividend date, or at the shareholder’s option, paid in cash.
Investment Income: Dividend income is recorded on the ex-dividend date. Certain income from foreign investments is recognized as soon as information is available to the Fund. Interest income is accrued as earned. Premiums and discounts are amortized and accreted, respectively, to call dates or maturity dates using the effective yield method of the respective investments, which is included in interest income on the Statement of Operations.
Custodian Fees: Custodian fees disclosed in the Statement of Operations may include interest expenses incurred by the Fund on any cash overdrafts of its custodian account during the period. Such cash overdrafts may result from the effects of failed trades in portfolio securities and from cash outflows resulting from unanticipated shareholder redemption activity. The Fund pays interest to its custodian on any such cash overdraft at a rate equal to 2.50% of the overdraft amount in excess of $50,000.
Investment Transactions: Investment transactions are accounted for on a trade date basis. Realized gains and losses from the sale of investments are recorded on an identified cost basis.
When-Issued and Delayed Delivery Transactions: The Fund may engage in when-issued or delayed delivery transactions. To the extent the Fund engages in such transactions, it will do so for the purpose of acquiring portfolio investments consistent with the Fund’s investment objectives and not for the purpose of investment leverage or to speculate on interest rate or market changes. At the time the Fund
Annual Report 17
| | |
| NOTES TO FINANCIAL STATEMENTS, CONTINUED | | |
| |
Thornburg International Growth Fund | | September 30, 2016 |
makes a commitment to purchase an investment on a when-issued or delayed delivery basis, the Fund will record the transaction and reflect the value in determining its net asset value. When effecting such transactions, assets of an amount sufficient to make payment for the portfolio investments to be purchased will be segregated on the Fund’s records on the trade date. Investments purchased on a when-issued or delayed delivery basis do not earn interest until the settlement date.
Repurchase Agreements: The Fund may invest excess cash in repurchase agreements whereby the Fund purchases investments, which serve as collateral, with an agreement to resell such collateral to the seller at an agreed upon price at the maturity date of the repurchase agreement. Investments pledged as collateral for repurchase agreements are held in custody until maturity of the repurchase agreement. Provisions in the agreements require that the market value of the collateral is at least equal to the repurchase value in the event of default. In the event of default, the Fund has the right to liquidate the collateral and apply the proceeds in satisfaction of the obligation. Under certain circumstances, in the event of default or bankruptcy by the other party to the agreement, realization and/or retention of the collateral may be subject to legal proceedings.
Foreign Currency Translation: Portfolio investments and other assets and liabilities denominated in foreign currencies are translated into U.S. dollars based on the exchange rate of such currencies against the U.S. dollar on the date of valuation. Purchases and sales of investments and income items denominated in foreign currencies are translated into U.S. dollars at the exchange rate in effect on the transaction date. When the Fund purchases or sells foreign investments, it will customarily enter into a foreign exchange contract to minimize foreign exchange risk from the trade date to the settlement date of such transactions. The values of such spot contracts are included in receivable for investments sold and payable for investments purchased on the Statement of Assets and Liabilities.
The Fund does not separately report the effect of changes in foreign exchange rates from changes in market prices on investments held. Such changes are included in net unrealized appreciation (depreciation) from investments.
Reported net realized gains and losses from foreign currency transactions arise due to purchases and sales of foreign currencies, currency gains and losses realized between the trade and settlement dates on investment transactions and the difference between the amounts of dividends, interest, and foreign withholding taxes recorded on the Fund’s books, and the U.S. dollar equivalent of the amounts actually received or paid.
Net change in unrealized appreciation (depreciation) on foreign currency translations arise from changes in the fair value of assets and liabilities, other than investments at period end, resulting from changes in exchange rates.
Guarantees and Indemnifications: Under the Trust’s organizational documents (and under separate agreements with the independent Trustees), its officers and Trustees are provided with an indemnification against certain liabilities arising out of the performance of their duties to the Fund. In the normal course of business the Trust may also enter into contracts with service providers that contain general indemnifications. The Trust’s maximum exposure under these arrangements is unknown. However, based on experience, the Trust expects the risk of loss to be remote.
Use of Estimates: The preparation of financial statements in conformity with GAAP requires management to make estimates and assumptions that affect the reported amounts of assets and liabilities and disclosure of contingent assets and liabilities at the date of the financial statements and the reported amounts of increases (decreases) in net assets from operations during the reporting period. Actual results could differ from those estimates.
Federal Income Taxes: It is the policy of the Trust to comply with the provisions of the Internal Revenue Code applicable to regulated investment companies and to distribute to shareholders substantially all investment company taxable income including net realized gains on investments (if any), and tax exempt income of the Fund. Therefore, no provision for federal income or excise tax is required.
The Fund files income tax returns in United States federal and applicable state jurisdictions. The statute of limitations on the Fund’s tax return filings generally remains open for the three years following a return’s filing date. The Fund has analyzed each uncertain tax position believed to be material in the preparation of the Fund’s financial statements for the fiscal year ended September 30, 2016, including open tax years, to assess whether it is more likely than not that the position would be sustained upon examination, based on the technical merits of the position. The Fund has not identified any such position for which an asset or liability must be reflected in the Statement of Assets and Liabilities.
At September 30, 2016, information on the tax components of capital was as follows:
| | | | |
Cost of investments for tax purposes | | $ | 1,297,731,430 | |
| | | | |
Gross unrealized appreciation on a tax basis | | $ | 180,095,738 | |
Gross unrealized depreciation on a tax basis | | | (56,522,108 | ) |
| | | | |
Net unrealized appreciation (depreciation) on investments (tax basis) | | $ | 123,573, 630 | |
| | | | |
18 Annual Report
| | |
| NOTES TO FINANCIAL STATEMENTS, CONTINUED | | |
| |
Thornburg International Growth Fund | | September 30, 2016 |
Temporary book to tax adjustments to the cost of investments and net unrealized appreciation (depreciation) for tax purposes result primarily from deferral of outstanding wash sale losses.
At September 30, 2016, the Fund had deferred tax basis late year specified ordinary losses occurring subsequent to October 31, 2015 through September 30, 2016 of $356,994. For tax purposes, such losses will be recognized in the year ending September 30, 2017.
At September 30, 2016, the Fund had cumulative tax basis capital losses of $8,924,572, (of which $8,924,572 are short-term and $0 are long-term) generated after September 30, 2011, which may be carried forward to offset future capital gains. To the extent such carryforwards are used, capital gain distributions may be reduced to the extent provided by regulations. Such capital loss carryforwards do not expire.
During the year ended September 30, 2016, the Fund utilized $27,278,820 of capital loss carryforwards generated after October 1, 2011.
In order to account for permanent book to tax differences, the Fund decreased undistributed net investment income by $746,611 and decreased accumulated net realized losses by $746,611. Reclassifications have no impact upon the net asset value of the Fund and result primarily from foreign currency gains (losses) and foreign capital gain taxes.
At September 30, 2016, the Fund had no undistributed tax basis net ordinary investment income and no undistributed tax basis capital gains.
The tax character of distributions paid during the years ended September 30, 2016, and September 30, 2015, was as follows:
| | | | | | | | |
| | | 2016 | | | 2015 | |
Distributions from: | | | | | | | | |
Ordinary income | | $ | 4,721,380 | | | $ | 3,344,992 | |
Capital gains | | | — | | | | 90,884,467 | |
| | | | | | | | |
Total | | $ | 4,721,380 | | | $ | 94,229,459 | |
| | | | | | | | |
Foreign Withholding Taxes: The Fund is subject to foreign tax withholding imposed by certain foreign countries in which the Fund may invest. Withholding taxes are incurred on certain foreign dividends and are accrued at the time the dividend is recognized based on applicable foreign tax laws. The Fund files withholding tax reclaims in certain jurisdictions to recover a portion of amounts previously withheld, in view of various considerations, including recent decisions rendered by the courts in those and other jurisdictions. The Fund would expect to record a receivable for such a reclaim based on a variety of factors, including assessment of a jurisdiction’s legal obligation to pay reclaims, the jurisdiction’s administrative practices and payment history, and industry convention. To date the Fund has recorded no such receivable because there is limited precedent for collecting such prior year reclaims and the likelihood of collection remains uncertain.
Deferred Foreign Capital Gain Taxes: The Fund is subject to a tax imposed on net realized gains of securities of certain foreign countries. The Fund records an estimated deferred tax liability for net unrealized gains on these investments as reflected in the accompanying financial statements.
NOTE 3 – SECURITY VALUATION
Valuation of the Fund’s portfolio investment securities is performed in accordance with policies and procedures adopted by and under the oversight of the Trustees.
The Trustees of the Trust have appointed the Advisor to assist the Trustees in obtaining market values for portfolio investments, evaluate and monitor professional pricing service providers appointed by the Trustees’ Audit Committee (the “Audit Committee”) to assist in determining fair values for portfolio investments, assist in calculating fair values for portfolio investments in certain circumstances, and to perform other functions in connection with the valuation of investments. The Advisor acts through its Valuation and Pricing Committee (the “Committee”) and other employees of the Advisor. The Committee regularly reviews its own valuation calculations, as well as the valuations, valuation techniques and services furnished by pricing service providers, considers circumstances which may require valuation calculations by the Committee, and reviews previous valuation calculations. The Committee reports to the Audit Committee on the Committee’s activities, the performance of pricing service providers, and other matters relating to valuation of portfolio investments.
In those instances when the Committee assists in calculating a fair value for a portfolio investment, the Committee seeks to determine the price that the Fund would reasonably expect to receive upon a sale of the investment in an orderly transaction between market participants on the valuation date. The Committee customarily utilizes quotations from securities broker dealers in calculating valuations, but also may utilize prices obtained from pricing service providers or other methods approved by the Audit Committee. Because fair
Annual Report 19
| | |
| NOTES TO FINANCIAL STATEMENTS, CONTINUED | | |
| |
Thornburg International Growth Fund | | September 30, 2016 |
values calculated by the Committee are estimates, the calculation of a value for an investment may differ from the price that would be realized by the Fund upon a sale of the investment, and the difference could be material to the Fund’s financial statements. The Committee’s calculation of a fair value for an investment may also differ from the prices obtained by other persons (including other mutual funds) for the investment.
Valuation of Securities: Securities and other portfolio investments which are listed or traded on a United States securities exchange are valued at the last reported sale price on the valuation date. Investments listed or traded on an exchange for which there has been no sale that day are valued at the mean between the last reported bid and asked prices on that valuation date. Portfolio investments reported by NASDAQ are valued at the official closing price on the valuation date. If an investment is traded on more than one exchange, the investment is considered traded on the exchange that is normally the primary market for that investment. Securities and other portfolio investments which are listed or traded on exchanges outside the United States are valued at the last price or the closing price of the investment on the exchange that is normally the primary market for the investment, as of the close of the exchange preceding the Fund’s valuation date. Foreign investments listed or traded on an exchange for which there has been no sale that day are valued at the mean between the last reported bid and asked prices on that valuation date.
In any case when a market quotation is not readily available for a portfolio investment ordinarily valued by market quotation, the Committee calculates a fair value for the investment using alternative methods approved by the Audit Committee. A market quotation is not readily available when the primary market or exchange for the investment is not open for the entire scheduled day of trading. Market quotations for an investment also may not be readily available if developments after the most recent close of the investment’s primary exchange or market, but prior to the close of business on any Fund business day, or an unusual event or significant period of time occurring since the availability of a market quotation, create a serious question concerning the reliability of the most recent market quotation available for the investment. In particular, on days when market volatility thresholds established by the Audit Committee are exceeded, foreign equity investments held by the Fund may be valued using alternative methods. The Committee customarily obtains valuations in these instances from pricing service providers approved by the Audit Committee. Pricing service providers ordinarily calculate valuations using multi-factor models to adjust market prices based upon various inputs, including exchange data, depository receipt prices, futures, index data and other data.
Debt obligations held by the Fund which are not listed or traded on exchanges or for which no reported market exists are ordinarily valued at the valuation obtained from a pricing service provider approved by the Audit Committee.
In any case when a pricing service provider fails to provide a valuation for a debt obligation held by the Fund, the Committee calculates a fair value for the obligation using alternative methods under procedures approved by the Audit Committee. Additionally, in cases when management believes that a valuation obtained from a pricing service provider merits review for significant reasons, the Committee decides whether or not to use the valuation calculated by the pricing service provider or to use an alternative method approved by the Audit Committee to calculate a fair value for the obligation.
Quotations for foreign investments expressed in foreign currency amounts are converted to U.S. dollar equivalents using a foreign exchange quotation from a third party service provider at the time of valuation. Foreign investments held by the Fund may be traded on days and at times when the Fund is not open for business. Consequently, the value of Fund investments may be significantly affected on days when shareholders cannot purchase or sell Fund shares. Futures contracts and other financial and derivative instruments traded on an exchange are valued at the latest published price for the instrument on its primary exchange. Listed options are valued at the last bid price.
Valuation Hierarchy: The Fund categorizes its investments based upon the inputs used in valuing those investments, according to a three-level hierarchy established in guidance FASB. Categorization of investments using this hierarchy is intended by the FASB to maximize the use of observable inputs in valuing investments and minimize the use of unobservable inputs by requiring that the most observable inputs be used when available. Observable inputs are those that market participants would use in valuing an investment based on available market information. Unobservable inputs are those that reflect assumptions about the information market participants would use in valuing an investment. An investment’s level within the hierarchy is based on the lowest level input that is deemed significant to the valuation. The methodologies and inputs used to value investments are not necessarily indications of the risk or liquidity associated with those investments.
Various inputs are used in calculating valuations for the Fund’s investments. These inputs are generally summarized according to the three-level hierarchy below:
Level 1: Quoted prices in active markets for identical investments.
Level 2: Other direct or indirect significant observable inputs (including quoted prices for similar investments in active markets and other observable inputs, such as interest rates, prepayment rates, credit risk, etc.).
Level 3: Significant unobservable inputs (including the Committee’s own assumptions in calculating the fair values of investments).
20 Annual Report
| | |
| NOTES TO FINANCIAL STATEMENTS, CONTINUED | | |
| |
Thornburg International Growth Fund | | September 30, 2016 |
Valuations for debt obligations held by the Fund are typically calculated by pricing service providers approved by the Audit Committee and are characterized as Level 2 within the valuation hierarchy.
On days when market volatility thresholds established by the Audit Committee are exceeded, foreign securities for which valuations are obtained from pricing service providers are fair valued. On these days, the foreign securities are characterized as Level 2 within the valuation hierarchy and revert to Level 1 after the threshold is no longer exceeded.
In a limited number of cases the Committee calculates a fair value for investments using broker quotations or other methods approved by the Audit Committee. When the Committee uses a single broker quotation to calculate a fair value for an investment without other significant observable inputs, or if a fair value is calculated using other significant inputs that are considered unobservable, the investment is characterized as Level 3 within the hierarchy. Other significant unobservable inputs used to calculate a fair value in these instances might include an income-based valuation approach which considers discounted anticipated future cash flows from the investment, and application of discounts due to the nature or duration of any restrictions on the disposition of the investment.
Valuations based upon the use of inputs from Levels 1, 2 or 3 may not represent the actual price received upon the disposition of an investment, and the Fund may receive a price that is lower than the valuation based upon these inputs when it sells the investment.
The following table displays a summary of the fair value hierarchy measurements of the Fund’s investments as of September 30, 2016. In any instance when valuation inputs from more than one level are used to determine the fair value of a specific investment, the investment is placed in the level of the table based upon the lowest level input that is significant in determining the fair value of the investment:
| | | | | | | | | | | | | | | | |
| | | Fair Value Measurements at September 30, 2016 | |
| | | Total | | | Level 1 | | | Level 2 | | | Level 3 | |
Assets | | | | | | | | | | | | | | | | |
Investments in Securities* | | | | | | | | | | | | | | | | |
Common Stock | | $ | 1,279,341,741 | | | $ | 1,279,341,741 | | | $ | — | | | $ | — | |
Short Term Investments | | | 141,963,319 | | | | 141,963,319 | | | | — | | | | — | |
| | | | | | | | | | | | | | | | |
Total Investments in Securities | | $ | 1,421,305,060 | | | $ | 1,421,305,060 | | | $ | — | | | $ | — | |
Other Financial Instruments** | | | | | | | | | | | | | | | | |
Spot Currency | | $ | 12,261 | | | $ | 12,261 | | | $ | — | | | $ | — | |
Liabilities | | | | | | | | | | | | | | | | |
Other Financial Instruments** | | | | | | | | | | | | | | | | |
Forward Currency Contracts | | $ | (760,089 | ) | | $ | — | | | $ | (760,089 | ) | | $ | — | |
Spot Currency | | $ | (3,004 | ) | | $ | (3,004 | ) | | $ | — | | | $ | — | |
| * | See Schedule of Investments for a summary of the industry exposure as grouped according to the Global Industry Classification Standard (GICS), which is an industry taxonomy developed by MSCI, Inc. and Standard & Poor’s (S&P). |
| ** | Other Financial Instruments include investments not reflected in the Schedule of Investments, which may include futures, forwards and swap contracts, which are valued at the unrealized appreciation (depreciation) on the investment. |
In accordance with the guidance prescribed in Accounting Standards Update No. 2011-04, it is the policy of the Fund to recognize transfers between levels and the underlying events which caused the movement. The Fund recognized no transfers between levels for the year ended September 30, 2016, other than when the Fund exceeded market volatility thresholds for foreign equity investments during the period.
NOTE 4 – INVESTMENT ADVISORY FEE AND OTHER TRANSACTIONS WITH AFFILIATES
Pursuant to an investment advisory agreement, the Advisor serves as the investment advisor and performs services for the Fund for which the fees are payable at the end of each month. Under the investment advisory agreement, the Fund pays the Advisor a management fee based on the daily net assets of the Fund at an annual rate as shown in the following table:
Management Fee Schedule
| | | | |
Daily Net Assets | | Fee Rate | |
Up to $ 500 million | | | 0.875 | % |
Next $ 500 million | | | 0.825 | |
Next $ 500 million | | | 0.775 | |
Next $ 500 million | | | 0.725 | |
Over $ 2 billion | | | 0.675 | |
Annual Report 21
| | |
| NOTES TO FINANCIAL STATEMENTS, CONTINUED | | |
| |
Thornburg International Growth Fund | | September 30, 2016 |
The Fund’s effective management fee for the year ended September 30, 2016 was 0.821% of the Fund’s average dividend assets.
The Fund pays to the Advisor the costs of personnel who perform certain accounting services for the Fund. For the year ended September 30, 2016 the Fund paid $57,107 to the Advisor for these accounting services. The Trust has also entered into administrative service agreements with the Advisor, whereby the Advisor will perform certain administrative services for the shareholders of each class of the Fund’s shares (except for Class R6 shares, which do not have an administrative services agreement) and for which fees will be payable at an annual rate of up to .125 of 1% per annum of the average daily net assets attributable to each class of shares. Total administrative service fees incurred by each class of shares of the Fund for the year ended September 30, 2016, are set forth in the Statement of Operations.
The Trust has an underwriting agreement with Thornburg Securities Corporation (the “Distributor”), an affiliate of the Advisor, which acts as the distributor of the Fund’s shares. For the year ended September 30, 2016, the Distributor has advised the Fund that it earned net commissions aggregating $9,864 from the sale of Class A shares, and collected contingent deferred sales charges aggregating $12,170 from redemptions of Class C shares of the Fund.
Pursuant to a service plan under Rule 12b-1 of the Investment Company Act of 1940, the Fund may pay to the Advisor or securities dealers and other financial institutions at the Advisor’s request an amount not to exceed .25 of 1% per annum of the average daily net assets attributable to Class A, Class C, Class R3, and Class R4 shares of the Fund to obtain various shareholder and distribution related services. For the year ended September 30, 2016, there were no 12b-1 service plan fees charged for Class I, Class R5 and Class R6 shares. The Advisor may pay out of its own resources additional expenses for distribution of the Fund’s shares and shareholder services.
The Trust has also adopted distribution plans pursuant to Rule 12b-1, applicable only to the Fund’s Class C and Class R3 shares, under which the Fund compensates the Distributor for services in promoting the sale of Class C and Class R3 shares of the Fund at an annual rate of up to .75 of 1% per annum of the average daily net assets attributable to Class C shares, and an annual rate of up to .25 of 1% per annum of the average daily net assets attributable to Class R3 shares. Total fees incurred by each class of shares of the Fund under their respective service and distribution plans for the year ended September 30, 2016, are set forth in the Statement of Operations.
The Advisor and Distributor have contractually agreed to waive fees and reimburse expenses incurred by the Fund so that actual expenses of certain share classes do not exceed levels as specified in the Fund’s most recent prospectus. The agreement may be terminated by the Fund at any time, but may not be terminated by the Advisor or Distributor before February 1, 2017, unless the Advisor ceases to be the investment advisor to the Trust or the Distributor ceases to be the distributor of the Fund prior to that date. The Advisor and Distributor retain the right to be repaid by the Fund for fee waivers and expense reimbursements if expenses fall below the contractual limit prior to the end of the fiscal year.
For the year ended September 30, 2016, the Advisor contractually reimbursed certain class specific expenses, administrative fees, and distribution fees of $78,146 for Class I shares, $87,150 for Class R3 shares, $115,673 for Class R4 shares, $150,544 for Class R5 shares, and $23,273 for Class R6 shares.
Certain officers and Trustees of the Trust are also officers or directors of the Advisor and Distributor. The compensation of independent Trustees is borne by the Trust.
The percentage of direct investments in the Fund held by appointed Trustees, Officers and the Advisor is approximately 2.26%.
The Fund may sell securities to an affiliated fund, or the Fund may purchase securities held by an affiliated fund, provided the affiliation is due solely to having a common investment advisor, common officers, or common trustees, and provided that all such transactions will comply with Rule 17a-7 under the 1940 Act. For the year ended September 30, 2016, the Fund had no transactions with affiliated funds.
NOTE 5 – SHARES OF BENEFICIAL INTEREST
At September 30, 2016, there were an unlimited number of shares with no par value of beneficial interest authorized. Transactions in shares of beneficial interest were as follows:
| | | | | | | | | | | | | | | | |
| | | Year Ended
September 30, 2016 | | | Year Ended
September 30, 2015 | |
| | | Shares | | | Amount | | | Shares | | | Amount | |
Class A Shares | | | | | | | | | | | | | | | | |
Shares sold | | | 2,522,328 | | | $ | 47,142,292 | | | | 3,316,312 | | | $ | 63,027,736 | |
Shares issued to shareholders in reinvestment of dividends | | | 5,384 | | | | 103,750 | | | | 805,337 | | | | 14,850,417 | |
Shares repurchased | | | (6,144,717 | ) | | | (112,795,577 | ) | | | (18,297,115 | ) | | | (347,090,134 | ) |
| | | | | | | | | | | | | | | | |
| | | | |
Net increase (decrease) | | | (3,617,005 | ) | | $ | (65,549,535 | ) | | | (14,175,466 | ) | | $ | (269,211,981 | ) |
| | | | | | | | | | | | | | | | |
22 Annual Report
| | |
| NOTES TO FINANCIAL STATEMENTS, CONTINUED | | |
| |
Thornburg International Growth Fund | | September 30, 2016 |
| | | | | | | | | | | | | | | | |
| | | Year Ended
September 30, 2016 | | | Year Ended
September 30, 2015 | |
| | | Shares | | | Amount | | | Shares | | | Amount | |
Class C Shares | | | | | | | | | | | | | | | | |
Shares sold | | | 870,906 | | | $ | 15,660,814 | | | | 1,000,742 | | | $ | 18,106,596 | |
Shares issued to shareholders in reinvestment of dividends | | | — | | | | — | | | | 348,284 | | | | 6,189,006 | |
Shares repurchased | | | (1,821,172 | ) | | | (31,824,522 | ) | | | (2,929,423 | ) | | | (52,522,171 | ) |
| | | | | | | | | | | | | | | | |
| | | | |
Net increase (decrease) | | | (950,266 | ) | | $ | (16,163,708 | ) | | | (1,580,397 | ) | | $ | (28,226,569 | ) |
| | | | | | | | | | | | | | | | |
| | | | |
Class I Shares | | | | | | | | | | | | | | | | |
Shares sold | | | 18,510,440 | | | $ | 347,208,152 | | | | 28,739,621 | | | $ | 556,653,254 | |
Shares issued to shareholders in reinvestment of dividends | | | 213,288 | | | | 3,990,511 | | | | 3,121,242 | | | | 58,816,576 | |
Shares repurchased | | | (25,673,584 | ) | | | (479,556,253 | ) | | | (32,575,817 | ) | | | (617,620,602 | ) |
| | | | | | | | | | | | | | | | |
| | | | |
Net increase (decrease) | | | (6,949,856 | ) | | $ | (128,357,590 | ) | | | (714,954 | ) | | $ | (2,150,772 | ) |
| | | | | | | | | | | | | | | | |
| | | | |
Class R3 Shares | | | | | | | | | | | | | | | | |
Shares sold | | | 301,326 | | | $ | 5,450,951 | | | | 437,924 | | | $ | 8,250,207 | |
Shares issued to shareholders in reinvestment of dividends | | | 239 | | | | 4,567 | | | | 57,359 | | | | 1,051,381 | |
Shares repurchased | | | (512,912 | ) | | | (9,210,933 | ) | | | (794,860 | ) | | | (15,050,753 | ) |
| | | | | | | | | | | | | | | | |
| | | | |
Net increase (decrease) | | | (211,347 | ) | | $ | (3,755,415 | ) | | | (299,577 | ) | | $ | (5,749,165 | ) |
| | | | | | | | | | | | | | | | |
| | | | |
Class R4 Shares | | | | | | | | | | | | | | | | |
Shares sold | | | 603,840 | | | $ | 10,997,045 | | | | 856,027 | | | $ | 16,247,799 | |
Shares issued to shareholders in reinvestment of dividends | | | 1,168 | | | | 22,375 | | | | 76,525 | | | | 1,403,461 | |
Shares repurchased | | | (610,484 | ) | | | (11,166,276 | ) | | | (811,713 | ) | | | (15,362,762 | ) |
| | | | | | | | | | | | | | | | |
| | | | |
Net increase (decrease) | | | (5,476 | ) | | $ | (146,856 | ) | | | 120,839 | | | $ | 2,288,498 | |
| | | | | | | | | | | | | | | | |
| | | | |
Class R5 Shares | | | | | | | | | | | | | | | | |
Shares sold | | | 1,019,836 | | | $ | 19,060,679 | | | | 1,035,688 | | | $ | 20,181,653 | |
Shares issued to shareholders in reinvestment of dividends | | | 14,800 | | | | 277,832 | | | | 192,484 | | | | 3,636,644 | |
Shares repurchased | | | (1,328,309 | ) | | | (25,381,362 | ) | | | (1,116,192 | ) | | | (21,423,171 | ) |
| | | | | | | | | | | | | | | | |
| | | | |
Net increase (decrease) | | | (293,673 | ) | | $ | (6,042,851 | ) | | | 111,980 | | | $ | 2,395,126 | |
| | | | | | | | | | | | | | | | |
| | | | |
Class R6 Shares | | | | | | | | | | | | | | | | |
Shares sold | | | 136,593 | | | $ | 2,564,302 | | | | 174,955 | | | $ | 3,437,664 | |
Shares issued to shareholders in reinvestment of dividends | | | 1,501 | | | | 28,260 | | | | 12,269 | | | | 232,174 | |
Shares repurchased | | | (71,190 | ) | | | (1,351,073 | ) | | | (159,642 | ) | | | (3,118,539 | ) |
| | | | | | | | | | | | | | | | |
| | | | |
Net increase (decrease) | | | 66,904 | | | $ | 1,241,489 | | | | 27,582 | | | $ | 551,299 | |
| | | | | | | | | | | | | | | | |
NOTE 6 – INVESTMENT TRANSACTIONS
For the year ended September 30, 2016, the Fund had purchase and sale transactions of investments (excluding short-term investments) of $1,487,444,588 and $1,779,348,502, respectively.
Annual Report 23
| | |
| NOTES TO FINANCIAL STATEMENTS, CONTINUED | | |
| |
Thornburg International Growth Fund | | September 30, 2016 |
NOTE 7 – DERIVATIVE FINANCIAL INSTRUMENTS WITH OFF-BALANCE SHEET RISK AND FOREIGN INVESTMENT RISK
The Fund may use a variety of derivative financial instruments to hedge or adjust the risks affecting its investment portfolio or to enhance investment returns. Provisions of the FASB Accounting Standards Codification 815-10-50 (“ASC 815”) require certain disclosures. The disclosures are intended to provide users of financial statements with an understanding of the use of derivative instruments by the Fund and how these derivatives affect the financial position, financial performance and cash flows of the Fund. The Fund does not designate any derivative instruments as hedging instruments under ASC 815. During the year ended September 30, 2016, the Fund’s principal exposure to derivative financial instruments of the type addressed by ASC 815 was investment in foreign exchange contracts. A foreign exchange contract is an agreement between two parties to exchange different currencies at a specified rate of exchange at an agreed upon future date. Foreign exchange contracts involve risks to the Fund, including the risk that a contract’s counterparty will not meet its obligations to the Fund, the risk that a change in a contract’s value may not correlate perfectly with the currency the contract was intended to track, and the risk that the Fund’s Advisor is unable to correctly implement its strategy in using a contract. In any such instance, the Fund may not achieve the intended benefit of entering into a contract, and may experience a loss.
The Fund entered into forward currency contracts during the year ended September 30, 2016 in the normal course of pursuing its investment objectives, with the objective of purchasing foreign investments or with the intent of reducing the risk to the value of the Fund’s foreign investments from adverse changes in the relationship between the U.S. dollar and foreign currencies. In each case these contracts have been initiated in conjunction with foreign investment transactions.
These contracts are accounted for by the Fund under ASC 815. Unrealized appreciation and depreciation on outstanding contracts are reported in the Fund’s Statement of Assets and Liabilities, as measured by the difference between the forward exchange rates at the reporting date and the forward exchange rates at each contract’s inception date. Net realized gain (loss) on contracts closed during the period, and changes in net unrealized appreciation (depreciation) on outstanding contracts are recognized in the Fund’s Statement of Operations.
The quarterly average value of open sell currency contracts for the year ended September 30, 2016 was $134,989,460. Open buy currency contracts are entered into for the purpose of closing open sell currency contracts and the values are dependent upon the values of the open sell currency contracts to which they relate.
The following table displays the outstanding forward currency contracts at September 30, 2016:
| | | | | | | | | | | | | | | | | | | | | | | | |
| Outstanding Forward Currency Contracts to Buy or Sell at September 30, 2016 | |
Contract Description | | Buy/Sell | | | Contract
Amount | | | Contract
Value Date | | | Value
USD | | | Unrealized
Appreciation | | | Unrealized
Depreciation | |
Chinese Yuan Renminbi | | | Sell | | | | 228,039,700 | | | | 10/31/2016 | | | | 34,127,874 | | | $ | — | | | $ | (125,086 | ) |
Japanese Yen | | | Sell | | | | 4,869,405,000 | | | | 12/01/2016 | | | | 48,131,199 | | | | — | | | | (635,003 | ) |
| | | | | | | | | | | | | | | | | | | | | | | | |
| | | | | | |
Total | | | | | | | | | | | | | | | | | | $ | — | | | $ | (760,089 | ) |
| | | | | | | | | | | | | | | | | | | | | | | | |
| | | | | | |
Net unrealized appreciation (depreciation) | | | | | | | | | | | | | | | | | | | | | | $ | (760,089 | ) |
| | | | | | | | | | | | | | | | | | | | | | | | |
The outstanding forward currency contracts in the foregoing table were entered into with State Street Bank and Trust Company (“SSB”), pursuant to an International Swaps and Derivatives Association (“ISDA”) Master Agreement. In the event of a default or termination under the ISDA Master Agreement with SSB, the non-defaulting party has the right to close out all outstanding forward currency contracts between the parties and to net any payment amounts under those contracts, resulting in a single net amount payable by one party to the other. Because the ISDA Master Agreement with SSB does not result in an offset of reported amounts of financial assets and financial liabilities in the Fund’s Statement of Assets and Liabilities unless there has been an event of default or termination event under that agreement, the Fund does not net its outstanding forward currency contracts for purposes of the disclosure in the Fund’s Statement of Assets and Liabilities. Instead the Fund recognizes the unrealized appreciation or depreciation on those forward currency contracts on a gross basis in the Fund’s Statement of Assets and Liabilities.
The unrealized appreciation (depreciation) of the outstanding forward currency contracts recognized in the Fund’s Statement of Assets and Liabilities at September 30, 2016 is disclosed in the following table:
| | | | | | |
Fair Values of Derivative Financial Instruments at September 30, 2016 | |
Liability Derivatives | | Balance Sheet Location | | Fair Value | |
Foreign exchange contracts | | Liabilities - Unrealized depreciation on forward currency contracts | | $ | (760,089 | ) |
24 Annual Report
| | |
| NOTES TO FINANCIAL STATEMENTS, CONTINUED | | |
| |
Thornburg International Growth Fund | | September 30, 2016 |
Because the Fund does not currently receive or post cash collateral in connection with its currency forward contracts, and because all of the Fund’s outstanding currency forward contracts are with SSB, the net amounts of the Fund’s assets and liabilities which are attributable to those contracts at September 30, 2016 can be determined by offsetting the dollar amounts shown in the preceding table. Based on those amounts, the net amount of the Fund’s assets which is attributable to its outstanding forward currency contracts at September 30, 2016 is $0, and the net amount of the Fund’s liabilities which is attributable to those contracts at that date is $760,089. The Fund’s forward currency contracts are valued each day, and the net amounts of the Fund’s assets and liabilities which are attributable to those contracts are expected to vary over time.
The net realized gain (loss) from forward currency contracts and the net change in unrealized appreciation (depreciation) on outstanding forward currency contracts recognized in the Fund’s Statement of Operations for the year ended September 30, 2016 are disclosed in the following tables:
| | | | |
| Net Realized Gain (Loss) on Derivative Financial Instruments |
| Recognized in Income for the Year Ended September 30, 2016 |
| | | Total | | Forward Currency Contracts |
Foreign exchange contracts | | $ (2,240,475) | | $ (2,240,475) |
| | | | |
| Net Change in Unrealized Appreciation (Depreciation) of Derivative Financial Instruments |
| Recognized in Income for the Year Ended September 30, 2016 |
| | | Total | | Forward Currency Contracts |
Foreign exchange contracts | | $ 860,127 | | $ 860,127 |
OTHER NOTES
Risks: The Fund’s investments subject it to risks including, but not limited to, management risk, market and economic risk, risks affecting specific issuers, liquidity risk, the risks associated with investments in small- and mid-cap companies and non-U.S. issuers (including developing country issuers), credit risk, and interest rate risk. Please see the Fund’s prospectus for a discussion of the risks associated with an investment in the Fund.
Subsequent Events: Fund management believes no events have occurred between September 30, 2016 and the date of issuance of the financial statements that require adjustment to or disclosure in the accompanying financial statements.
Annual Report 25
Financial Highlights
Thornburg International Growth Fund
| | | | | | | | | | | | | | | | | | | | | | | | | | | | | | | | | | | | | | | | | | | | | | | | | | | | | | | | | | | | |
| | | Per Share Performance (for A Share Outstanding Throughout the Year) | | | Ratios to Average Net Assets | | | Supplemental Data | |
Unless Otherwise Noted, Periods Are Fiscal Years Ended Sept. 30, | | Net Asset
Value
Beginning
of Year | | |
Net
Investment
Income
(loss)+ | | | Net
Realized
&
Unrealized
Gain (Loss)
on
Investments | | | Total from
Investment
Operations | | | Dividends
from Net
Investment
Income | | | Dividends
from Net
Realized
Gains | | | Total
Dividends | | | Net
Asset
Value
End
of
Year | | | Net Investment
Income (Loss) (%) | | | Expenses,
After
Expense
Reductions
(%) | | | Expenses,
After
Expense
Reductions
And
Net of
Custody
Credits
(%) | | | Expenses,
Before
Expense
Reductions
(%) | | | Total
Return
(%)(a) | | | Portfolio
Turnover
Rate
(%)(a) | | | Net
Assets
at End
of Year
(Thousands) | |
CLASS A SHARES | | | | | | | | | | | | | | | | | | | | | | | | | | | | | | | | | | | | | | | | | | | | | | | | | | | | | |
2016(b) | | $ | 17.78 | | | | — | (c) | | | 1.45 | | | | 1.45 | | | | (0.01 | ) | | | — | | | | (0.01 | ) | | $ | 19.22 | | | | 0.03 | | | | 1.39 | | | | 1.39 | | | | 1.39 | | | | 8.23 | | | | 104.60 | | | $ | 169,248 | |
2015(b) | | $ | 19.10 | | | | (0.01 | ) | | | (0.33 | ) | | | (0.34 | ) | | | — | | | | (0.98 | ) | | | (0.98 | ) | | $ | 17.78 | | | | (0.06 | ) | | | 1.42 | | | | 1.42 | | | | 1.42 | | | | (2.01 | ) | | | 92.01 | | | $ | 220,897 | |
2014(b) | | $ | 20.54 | | | | 0.02 | | | | (0.89 | ) | | | (0.87 | ) | | | — | | | | (0.57 | ) | | | (0.57 | ) | | $ | 19.10 | | | | 0.07 | | | | 1.33 | | | | 1.33 | | | | 1.33 | | | | (4.46 | ) | | | 106.18 | | | $ | 508,044 | |
2013(b) | | $ | 15.78 | | | | (0.01 | ) | | | 4.77 | | | | 4.76 | | | | — | | | | — | | | | — | | | $ | 20.54 | | | | (0.06 | ) | | | 1.41 | | | | 1.41 | | | | 1.42 | | | | 30.16 | | | | 89.17 | | | $ | 580,194 | |
2012(b) | | $ | 13.37 | | | | (0.06 | ) | | | 2.47 | | | | 2.41 | | | | — | (d) | | | — | | | | — | | | $ | 15.78 | | | | (0.41 | ) | | | 1.51 | | | | 1.51 | | | | 1.52 | | | | 18.03 | | | | 95.17 | | | $ | 255,725 | |
CLASS C SHARES | | | | | | | | | | | | | | | | | | | | | | | | | | | | | | | | | | | | | | | | | | | | | | | | | | | | | |
2016 | | $ | 17.01 | | | | (0.13 | ) | | | 1.38 | | | | 1.25 | | | | — | | | | — | | | | — | | | $ | 18.26 | | | | (0.73 | ) | | | 2.15 | | | | 2.15 | | | | 2.15 | | | | 7.35 | | | | 104.60 | | | $ | 98,633 | |
2015 | | $ | 18.45 | | | | (0.14 | ) | | | (0.32 | ) | | | (0.46 | ) | | | — | | | | (0.98 | ) | | | (0.98 | ) | | $ | 17.01 | | | | (0.77 | ) | | | 2.20 | | | | 2.20 | | | | 2.20 | | | | (2.72 | ) | | | 92.01 | | | $ | 108,062 | |
2014 | | $ | 20.01 | | | | (0.13 | ) | | | (0.86 | ) | | | (0.99 | ) | | | — | | | | (0.57 | ) | | | (0.57 | ) | | $ | 18.45 | | | | (0.65 | ) | | | 2.09 | | | | 2.09 | | | | 2.09 | | | | (5.19 | ) | | | 106.18 | | | $ | 146,399 | |
2013 | | $ | 15.49 | | | | (0.14 | ) | | | 4.66 | | | | 4.52 | | | | — | | | | — | | | | — | | | $ | 20.01 | | | | (0.81 | ) | | | 2.15 | | | | 2.15 | | | | 2.17 | | | | 29.18 | | | | 89.17 | | | $ | 116,453 | |
2012 | | $ | 13.23 | | | | (0.17 | ) | | | 2.43 | | | | 2.26 | | | | — | | | | — | | | | — | | | $ | 15.49 | | | | (1.19 | ) | | | 2.27 | | | | 2.27 | | | | 2.28 | | | | 17.08 | | | | 95.17 | | | $ | 55,656 | |
CLASS I SHARES | | | | | | | | | | | | | | | | | | | | | | | | | | | | | | | | | | | | | | | | | | | | | | | | | | | | | |
2016 | | $ | 18.20 | | | | 0.08 | | | | 1.49 | | | | 1.57 | | | | (0.08 | ) | | | — | | | | (0.08 | ) | | $ | 19.69 | | | | 0.45 | | | | 0.99 | | | | 0.99 | | | | 1.00 | | | | 8.63 | | | | 104.60 | | | $ | 1,030,921 | |
2015 | | $ | 19.51 | | | | 0.09 | | | | (0.37 | ) | | | (0.28 | ) | | | (0.05 | ) | | | (0.98 | ) | | | (1.03 | ) | | $ | 18.20 | | | | 0.47 | | | | 0.99 | | | | 0.99 | | | | 1.01 | | | | (1.58 | ) | | | 92.01 | | | $ | 1,079,791 | |
2014 | | $ | 20.96 | | | | 0.10 | | | | (0.91 | ) | | | (0.81 | ) | | | (0.07 | ) | | | (0.57 | ) | | | (0.64 | ) | | $ | 19.51 | | | | 0.47 | | | | 0.98 | | | | 0.98 | | | | 0.98 | | | | (4.09 | ) | | | 106.18 | | | $ | 1,171,032 | |
2013 | | $ | 16.04 | | | | 0.07 | | | | 4.85 | | | | 4.92 | | | | — | | | | — | | | | — | | | $ | 20.96 | | | | 0.38 | | | | 0.99 | | | | 0.99 | | | | 1.04 | | | | 30.67 | | | | 89.17 | | | $ | 737,536 | |
2012 | | $ | 13.55 | | | | 0.02 | | | | 2.50 | | | | 2.52 | | | | (0.03 | ) | | | — | | | | (0.03 | ) | | $ | 16.04 | | | | 0.10 | | | | 0.99 | | | | 0.99 | | | | 1.14 | | | | 18.60 | | | | 95.17 | | | $ | 198,938 | |
CLASS R3 SHARES | | | | | | | | | | | | | | | | | | | | | | | | | | | | | | | | | | | | | | | | | | | | | | | | | | | | | |
2016 | | $ | 17.66 | | | | — | (c) | | | 1.42 | | | | 1.42 | | | | (0.01 | ) | | | — | | | | (0.01 | ) | | $ | 19.07 | | | | (0.02 | ) | | | 1.50 | | | | 1.50 | | | | 2.04 | | | | 8.03 | | | | 104.60 | | | $ | 13,086 | |
2015 | | $ | 18.99 | | | | (0.02 | ) | | | (0.33 | ) | | | (0.35 | ) | | | — | | | | (0.98 | ) | | | (0.98 | ) | | $ | 17.66 | | | | (0.13 | ) | | | 1.50 | | | | 1.50 | | | | 1.98 | | | | (2.03 | ) | | | 92.01 | | | $ | 15,851 | |
2014 | | $ | 20.46 | | | | — | (c) | | | (0.90 | ) | | | (0.90 | ) | | | — | | | | (0.57 | ) | | | (0.57 | ) | | $ | 18.99 | | | | — | (e) | | | 1.50 | | | | 1.50 | | | | 1.86 | | | | (4.63 | ) | | | 106.18 | | | $ | 22,739 | |
2013 | | $ | 15.73 | | | | (0.03 | ) | | | 4.76 | | | | 4.73 | | | | — | | | | — | | | | — | | | $ | 20.46 | | | | (0.15 | ) | | | 1.50 | | | | 1.50 | | | | 2.01 | | | | 30.07 | | | | 89.17 | | | $ | 13,982 | |
2012 | | $ | 13.34 | | | | (0.06 | ) | | | 2.45 | | | | 2.39 | | | | — | (d) | | | — | | | | — | | | $ | 15.73 | | | | (0.40 | ) | | | 1.50 | | | | 1.50 | | | | 2.49 | | | | 17.94 | | | | 95.17 | | | $ | 5,709 | |
CLASS R4 SHARES | | | | | | | | | | | | | | | | | | | | | | | | | | | | | | | | | | | | | | | | | | | | | | | | | | | | | |
2016 | | $ | 17.68 | | | | 0.01 | | | | 1.43 | | | | 1.44 | | | | (0.01 | ) | | | — | | | | (0.01 | ) | | $ | 19.11 | | | | 0.04 | | | | 1.40 | | | | 1.40 | | | | 1.68 | | | | 8.17 | | | | 104.60 | | | $ | 40,999 | |
2015 | | $ | 19.00 | | | | 0.02 | | | | (0.36 | ) | | | (0.34 | ) | | | — | | | | (0.98 | ) | | | (0.98 | ) | | $ | 17.68 | | | | 0.10 | | | | 1.40 | | | | 1.40 | | | | 1.65 | | | | (1.97 | ) | | | 92.01 | | | $ | 38,038 | |
2014 | | $ | 20.45 | | | | 0.01 | | | | (0.89 | ) | | | (0.88 | ) | | | — | | | | (0.57 | ) | | | (0.57 | ) | | $ | 19.00 | | | | 0.04 | | | | 1.39 | | | | 1.39 | | | | 1.63 | | | | (4.53 | ) | | | 106.18 | | | $ | 38,575 | |
2013 | | $ | 15.70 | | | | (0.01 | ) | | | 4.76 | | | | 4.75 | | | | — | | | | — | | | | — | | | $ | 20.45 | | | | (0.04 | ) | | | 1.38 | | | | 1.38 | | | | 1.68 | | | | 30.25 | | | | 89.17 | | | $ | 26,441 | |
2012 | | $ | 13.31 | | | | (0.04 | ) | | | 2.46 | | | | 2.42 | | | | (0.03 | ) | | | — | | | | (0.03 | ) | | $ | 15.70 | | | | (0.29 | ) | | | 1.40 | | | | 1.40 | | | | 2.23 | | | | 18.17 | | | | 95.17 | | | $ | 9,326 | |
CLASS R5 SHARES | | | | | | | | | | | | | | | | | | | | | | | | | | | | | | | | | | | | | | | | | | | | | | | | | | | | | |
2016 | | $ | 18.25 | | | | 0.09 | | | | 1.47 | | | | 1.56 | | | | (0.08 | ) | | | — | | | | (0.08 | ) | | $ | 19.73 | | | | 0.45 | | | | 0.99 | | | | 0.99 | | | | 1.21 | | | | 8.56 | | | | 104.60 | | | $ | 66,271 | |
2015 | | $ | 19.55 | | | | 0.09 | | | | (0.36 | ) | | | (0.27 | ) | | | (0.05 | ) | | | (0.98 | ) | | | (1.03 | ) | | $ | 18.25 | | | | 0.46 | | | | 0.99 | | | | 0.99 | | | | 1.20 | | | | (1.53 | ) | | | 92.01 | | | $ | 66,646 | |
2014 | | $ | 21.01 | | | | 0.10 | | | | (0.93 | ) | | | (0.83 | ) | | | (0.06 | ) | | | (0.57 | ) | | | (0.63 | ) | | $ | 19.55 | | | | 0.46 | | | | 0.99 | | | | 0.99 | | | | 1.18 | | | | (4.15 | ) | | | 106.18 | | | $ | 69,217 | |
2013 | | $ | 16.07 | | | | 0.07 | | | | 4.87 | | | | 4.94 | | | | — | | | | — | | | | — | | | $ | 21.01 | | | | 0.35 | | | | 0.99 | | | | 0.99 | | | | 1.22 | | | | 30.74 | | | | 89.17 | | | $ | 43,209 | |
2012 | | $ | 13.58 | | | | 0.02 | | | | 2.50 | | | | 2.52 | | | | (0.03 | ) | | | — | | | | (0.03 | ) | | $ | 16.07 | | | | 0.13 | | | | 0.99 | | | | 0.99 | | | | 1.29 | | | | 18.56 | | | | 95.17 | | | $ | 19,251 | |
CLASS R6 SHARES | | | | | | | | | | | | | | | | | | | | | | | | | | | | | | | | | | | | | | | | | | | | | | | | | | | | | |
2016 | | $ | 18.29 | | | | 0.11 | | | | 1.47 | | | | 1.58 | | | | (0.10 | ) | | | — | | | | (0.10 | ) | | $ | 19.77 | | | | 0.60 | | | | 0.89 | | | | 0.89 | | | | 1.34 | | | | 8.65 | | | | 104.60 | | | $ | 5,854 | |
2015 | | $ | 19.59 | | | | 0.13 | | | | (0.38 | ) | | | (0.25 | ) | | | (0.07 | ) | | | (0.98 | ) | | | (1.05 | ) | | $ | 18.29 | | | | 0.66 | | | | 0.89 | | | | 0.89 | | | | 1.43 | | | | (1.43 | ) | | | 92.01 | | | $ | 4,191 | |
2014 | | $ | 21.05 | | | | 0.12 | | | | (0.93 | ) | | | (0.81 | ) | | | (0.08 | ) | | | (0.57 | ) | | | (0.65 | ) | | $ | 19.59 | | | | 0.58 | | | | 0.89 | | | | 0.89 | | | | 1.34 | | | | (4.05 | ) | | | 106.18 | | | $ | 3,950 | |
2013(f) | | $ | 17.54 | | | | 0.46 | | | | 3.05 | | | | 3.51 | | | | — | | | | — | | | | — | | | $ | 21.05 | | | | 2.21 | (g) | | | 0.89 | (g) | | | 0.89 | (g) | | | 11.83 | (g)(h) | | | 20.01 | | | | 89.17 | | | $ | 2,553 | |
| (a) | Not annualized for periods less than one year. |
| (b) | Sales loads are not reflected in computing total return. |
| (c) | Net investment income (loss) was less than $0.01 per share. |
| (d) | Dividends from net investment income per share were less than $(0.01). |
| (e) | Net investment income (Loss) is less than 0.01%. |
| (f) | Effective date of this class of shares was February 1, 2013. |
| (h) | Due to the size of net assets and fixed expenses, ratios may appear disproportionate. |
| + | Based on weighted average shares outstanding. |
See notes to financial statements.
| | | | |
| 26 Annual Report | | | | Annual Report 27 |
| | |
| REPORT OF INDEPENDENT REGISTERED PUBLIC ACCOUNTING FIRM | | |
| |
Thornburg International Growth Fund | | |
To the Trustees and Shareholders of
Thornburg International Growth Fund
In our opinion, the accompanying statement of assets and liabilities, including the schedule of investments in securities, and the related statements of operations and of changes in net assets and the financial highlights present fairly, in all material respects, the financial position of the Thornburg International Growth (the “Fund”) at September 30, 2016, the results of its operations for the year then ended, the changes in its net assets for each of the two years in the period then ended and the financial highlights for each of the five years in the period then ended, in conformity with accounting principles generally accepted in the United States of America. These financial statements and financial highlights (hereafter referred to as “financial statements”) are the responsibility of the Fund’s management. Our responsibility is to express an opinion on these financial statements based on our audits. We conducted our audits of these financial statements in accordance with the standards of the Public Company Accounting Oversight Board (United States). Those standards require that we plan and perform the audit to obtain reasonable assurance about whether the financial statements are free of material misstatement. An audit includes examining, on a test basis, evidence supporting the amounts and disclosures in the financial statements, assessing the accounting principles used and significant estimates made by management, and evaluating the overall financial statement presentation. We believe that our audits, which included confirmation of securities at September 30, 2016 by correspondence with the custodian, brokers, transfer agent, and the application of alternative procedures where securities purchased had not been received, provide a reasonable basis for our opinion.
PricewaterhouseCoopers LLP
New York, New York
November 18, 2016
28 Annual Report
| | |
| EXPENSE EXAMPLE | | |
| |
Thornburg International Growth Fund | | September 30, 2016 |
As a shareholder of the Fund, you incur two types of costs:
| | (1) | transaction costs, including |
(a) sales charges (loads) on purchase payments, for Class A shares;
(b) a deferred sales charge on redemptions of any part or all of a purchase of $1 million of Class A shares within 12 months of purchase;
(c) a deferred sales charge on redemptions of Class C shares within 12 months of purchase;
| | (2) | ongoing costs, including management fees; distribution and/or service (12b-1) fees; and other Fund expenses. |
This example is intended to help you understand your ongoing costs (in dollars) of investing in the Fund and to compare these costs with the ongoing costs of investing in other mutual funds.
The example is based on a $1,000 investment beginning on April 1, 2016, and held until September 30, 2016.
| | | | | | | | | | | | |
| | | Beginning
Account Value
4/1/16 | | | Ending
Account Value
9/30/16 | | | Expenses Paid
During Period†
4/1/16–9/30/16 | |
CLASS A SHARES | | | | | | | | | | | | |
Actual | | $ | 1,000.00 | | | $ | 1,038.50 | | | $ | 7.06 | |
Hypothetical* | | $ | 1,000.00 | | | $ | 1,018.07 | | | $ | 6.99 | |
CLASS C SHARES | | | | | | | | | | | | |
Actual | | $ | 1,000.00 | | | $ | 1,034.60 | | | $ | 10.98 | |
Hypothetical* | | $ | 1,000.00 | | | $ | 1,014.21 | | | $ | 10.87 | |
CLASS I SHARES | | | | | | | | | | | | |
Actual | | $ | 1,000.00 | | | $ | 1,040.60 | | | $ | 5.09 | |
Hypothetical* | | $ | 1,000.00 | | | $ | 1,020.01 | | | $ | 5.04 | |
CLASS R3 SHARES | | | | | | | | | | | | |
Actual | | $ | 1,000.00 | | | $ | 1,038.00 | | | $ | 7.66 | |
Hypothetical* | | $ | 1,000.00 | | | $ | 1,017.48 | | | $ | 7.59 | |
CLASS R4 SHARES | | | | | | | | | | | | |
Actual | | $ | 1,000.00 | | | $ | 1,038.20 | | | $ | 7.15 | |
Hypothetical* | | $ | 1,000.00 | | | $ | 1,017.98 | | | $ | 7.08 | |
CLASS R5 SHARES | | | | | | | | | | | | |
Actual | | $ | 1,000.00 | | | $ | 1,040.10 | | | $ | 5.07 | |
Hypothetical* | | $ | 1,000.00 | | | $ | 1,020.03 | | | $ | 5.02 | |
CLASS R6 SHARES | | | | | | | | | | | | |
Actual | | $ | 1,000.00 | | | $ | 1,040.80 | | | $ | 4.56 | |
Hypothetical* | | $ | 1,000.00 | | | $ | 1,020.53 | | | $ | 4.51 | |
| † | Expenses are equal to the annualized expense ratio for each class (A: 1.39%; C: 2.16%; I: 1.00%; R3: 1.50%; R4: 1.40%; R5: 0.99%; R6: 0.89%) multiplied by the average account value over the period, multiplied by 183/366 to reflect the one-half year period. |
| * | Hypothetical assumes a rate of return of 5% per year before expenses. |
ACTUAL EXPENSES
For each class of shares, the first line of the accompanying table provides information about actual account values and actual expenses. You may use the information in this line, together with the amount you invested, to estimate the expenses that you paid over the period. Simply divide your account value by $1,000 (for example, an $8,600 account value divided by $1,000 = 8.6), then multiply the result by the number in the first line for your class of shares under the heading entitled “Expenses Paid During Period” to estimate the expenses you paid on your account during this period.
HYPOTHETICAL EXAMPLE FOR COMPARISON PURPOSES
For each class of shares, the second line of the accompanying table provides information about hypothetical account values and hypothetical expenses based on the Fund’s actual expense ratio and an assumed rate of return of 5% per year before expenses, which is not the Fund’s actual return. The hypothetical account values and expenses may not be used to estimate the actual ending account balance or expenses you paid for the period. You may use this information to compare the ongoing costs of investing in the Fund and other funds. To do so, compare this 5% hypothetical example with the 5% hypothetical examples that appear in the shareholder reports of the other funds.
Please note that the expenses shown in the table are meant to highlight your ongoing costs only and do not reflect any transactional costs, such as sales charges (loads), redemption fees, or exchange fees. Therefore, the second line of the table for each class of shares is useful in comparing ongoing costs only, and will not help you determine the relative total costs of owning different funds. In addition, if these transactional costs were included, your costs would have been higher.
Annual Report 29
| | |
| TRUSTEES AND OFFICERS | | |
| |
Thornburg International Growth Fund | | September 30, 2016 (Unaudited) |
| | | | | | |
Name, Age, Year Elected Position Held with Fund | | Principal Occupation(s) During Past Five Years | | Other
Directorships
Held by Trustee | |
INTERESTED TRUSTEES(1)(2)(4) | | | | |
| | |
Garrett Thornburg, 71 Trustee since 1987, Chairman of Trustees(3) | | Chairman and controlling shareholder of Thornburg Investment Management, Inc. (investment advisor); Chairman and controlling shareholder of Thornburg Securities Corporation (securities dealer); Chairman and CEO of Chamisa Energy, LLC; President of the Thornburg Foundation (nonprofit). | | | None | |
| | |
Brian J. McMahon, 61 Trustee since 2001, Vice Chairman of Trustees, Member of Governance & Nominating Committee & Operations Risk Oversight Committee(5) | | Chief Investment Officer, Managing Director, and Portfolio Manager and, until 2016, CEO and President of Thornburg Investment Management, Inc.; Vice President of Thornburg Securities Corporation. | | | None | |
| |
INDEPENDENT TRUSTEES (1)(2)(4) | | | | |
| | |
David A. Ater, 71 Trustee since 1994, Member of Audit Committee & Chairman of Governance & Nominating Committee | | Principal in Ater & Associates, Santa Fe, NM (developer, planner and broker of residential and commercial real estate); owner, developer and broker for various real estate projects. | | | None | |
| | |
David D. Chase, 75 Trustee since 2000, Chairman of Audit Committee | | Managing Member of CS Group, LLC, Santa Fe, NM (private investment fund – family office). | | | None | |
| | |
Sally Corning, 55 Trustee since 2012, Member of Audit Committee | | Partner in Sun Mountain Capital, Santa Fe, NM (private equity firm with investment programs encompassing venture capital, mezzanine debt, and growth equity). | | | None | |
| | |
Susan H. Dubin, 67 Trustee since 2004, Member of Audit Committee & Governance and Nominating Committee | | President of Dubin Investments, Ltd., Greenwich, CT (private investment fund); Director and officer of various charitable organizations. | | | None | |
| | |
David L. Gardner, 53 Trustee since 2015, Member of Operations Risk Oversight Committee | | Until 2012, head of EMEA (Europe, Middle East and Africa) Sales for iShares of Blackrock, Inc., EMEA Executive Committee Member and EMEA Operating Committee Member at Blackrock, Inc. | | | None | |
| | |
Owen D. Van Essen, 62 Trustee since 2004, Member of Governance & Nominating Committee & Chairman of Operations Risk Oversight Committee | | President of Dirks, Van Essen & Murray, Santa Fe, NM (newspaper mergers and acquisitions). | | | None | |
| | |
James W. Weyhrauch, 57 Trustee since 1996, Member of Audit Committee & Operations Risk Oversight Committee | | Real estate broker, Santa Fe Properties, Santa Fe, NM; Vice Chairman of Nambe LLC, Santa Fe, NM (manufacturing & design company). | | | None | |
30 Annual Report
| | |
| TRUSTEES AND OFFICERS, CONTINUED | | |
| |
Thornburg International Growth Fund | | September 30, 2016 (Unaudited) |
| | | | | | |
Name, Age, Year Elected Position Held with Fund | | Principal Occupation(s) During Past Five Years | | Other
Directorships
Held by Trustee | |
| |
OFFICERS OF THE FUND (WHO ARE NOT TRUSTEES)(1)(7) | | | | |
| | |
Nimish Bhatt, 53 Treasurer since 2016(6) | | Chief Financial Officer and Treasurer of Thornburg Investment Management, Inc. and Thornburg Securities Corporation since 2016; Senior Vice President (2004-2016), Chief Financial Officer (2011-2016), and Head of Fund Administration (2011-2016) of Calamos Asset Management, Inc., Calamos Investments LLC, Calamos Advisors LLC, and Calamos Wealth Management; Director of Calamos Global Funds plc (2007-2016). | | | Not applicable | |
| | |
Jason Brady, 42 President since 2016(6) | | CEO and President since 2016, Vice President from 2011 to 2016, Portfolio Manager and Managing Director of Thornburg Investment Management, Inc.; Vice President of Thornburg Securities Corporation since 2016. | | | Not applicable | |
| | |
Kathleen Brady, 56 Vice President since 2008 | | Tax Manager Fund Accounting of Thornburg Investment Management, Inc. | | | Not applicable | |
| | |
Connor Browne, 37 Vice President since 2006 | | Portfolio Manager, Vice President since 2013, and Managing Director of Thornburg Investment Management, Inc. | | | Not applicable | |
| | |
Tim Cunningham, 41 Vice President since 2014 | | Managing Director since 2011, Portfolio Manager since 2012, and Associate Portfolio Manager from 2009–2012 of Thornburg Investment Management, Inc. | | | Not applicable | |
| | |
Randy Dry, 42 Vice President since 2014 | | Vice President and Managing Director, Director of Institutional Group from 2014-2016, and since 2016, Chief Administrative Officer of Thornburg Investment Management, Inc. | | | Not applicable | |
| | |
Greg Dunn, 40 Vice President since 2014 | | Managing Director, Portfolio Manager since 2012, and Associate Portfolio Manager from 2009–2012 of Thornburg Investment Management, Inc. | | | Not applicable | |
| | |
Lon Erickson, 41 Vice President since 2008 | | Portfolio Manager and Managing Director of Thornburg Investment Management, Inc. | | | Not applicable | |
| | |
William V. Fries, 77 Vice President since 1995 | | Portfolio Manager, Vice President, and Managing Director of Thornburg Investment Management, Inc. | | | Not applicable | |
| | |
Thomas Garcia, 45 Vice President since 2006 | | Vice President since 2011, Managing Director, Head Equity Trader, and Associate Portfolio Manager of Thornburg Investment Management, Inc. | | | Not applicable | |
| | |
Rolf Kelly, 37 Vice President since 2016 | | Portfolio Manager and Managing Director since 2013 and Associate Portfolio Manager from 2011–2013 of Thornburg Investment Management, Inc. | | | Not applicable | |
| | |
Ben Kirby, 36 Vice President since 2014 | | Portfolio Manager and Managing Director since 2013 and Associate Portfolio Manager from 2011–2013 of Thornburg Investment Management, Inc. | | | Not applicable | |
| | |
Jeff Klingelhofer, 41 Vice President since 2016 | | Portfolio Manager and Managing Director since 2015, Associate Portfolio Manager from 2012–2015, and Fixed Income Analyst from 2010–2012 of Thornburg Investment Management, Inc. | | | Not applicable | |
| | |
Rob MacDonald, 40 Vice President since 2016 | | Managing Director since 2015, Portfolio Manager since 2014, and Associate Portfolio Manager from 2011–2014 of Thornburg Investment Management, Inc. | | | Not applicable | |
| | |
Leigh Moiola, 49 Vice President since 2001 | | Vice President, Managing Director, and Director of Marketing of Thornburg Investment Management, Inc.; Vice President of Thornburg Securities Corporation. | | | Not applicable | |
| | |
Christopher Ryon, 60 Vice President since 2008 | | Portfolio Manager and Managing Director of Thornburg Investment Management, Inc. | | | Not applicable | |
| | |
Nicholos Venditti, 35 Vice President since 2016 | | Portfolio Manager and Managing Director since 2015 and Associate Portfolio Manager from 2011–2015 of Thornburg Investment Management, Inc. | | | Not applicable | |
Annual Report 31
| | |
| TRUSTEES AND OFFICERS, CONTINUED | | |
| |
Thornburg International Growth Fund | | September 30, 2016 (Unaudited) |
| | | | |
Name, Age,
Year Elected Position Held with Fund | | Principal Occupation(s) During Past Five Years | | Other
Directorships
Held by Trustee |
| | |
Vinson Walden, 46 Vice President since 2004 | | Portfolio Manager and Managing Director of Thornburg Investment Management, Inc. | | Not applicable |
| | |
Lei Wang, 45 Vice President since 2006 | | Portfolio Manager and Managing Director of Thornburg Investment Management, Inc. | | Not applicable |
| | |
Sasha Wilcoxon, 42 Vice President since 2003 Secretary since 2007(6) | | Managing Director, Director of Mutual Fund Operations, and Vice President of Thornburg Investment Management, Inc.; Vice President of Thornburg Securities Corporation. | | Not applicable |
| | |
Charles Wilson, 41 Vice President since 2016 | | Portfolio Manager and Managing Director since 2014 and Associate Portfolio Manager from 2012–2014 of Thornburg Investment Management, Inc.; Co-Portfolio Manager of Marsico Capital Management from 2010–2012. | | Not applicable |
| | |
Di Zhou, 38 Vice President since 2016 | | Portfolio Manager and Managing Director since 2016, Associate Portfolio Manager from 2014–2016, and Equity Research Analyst from 2010–2014 of Thornburg Investment Management, Inc. | | Not applicable |
| (1) | Each person’s address is 2300 North Ridgetop Road, Santa Fe, New Mexico 87506. |
| (2) | The Fund is a separate investment “Fund” or “series” of Thornburg Investment Trust (the “Trust”), which comprises the Thornburg mutual fund complex and is organized as a Massachusetts business trust. Thornburg Investment Management, Inc. is the investment advisor to, and manages, all the Funds of the Trust. Each Trustee oversees all the Funds of the Trust. |
| (3) | Mr. Thornburg is considered an “interested” Trustee under the Investment Company Act of 1940 because he is the sole director and controlling shareholder of Thornburg Investment Management, Inc., the investment advisor to the Trust, and is the sole director and controlling shareholder of Thornburg Securities Corporation, the distributor of shares for the Trust. |
| (4) | The Bylaws of the Trust currently require that each Trustee shall retire by the end of the calendar year during which the Trustee reached the age of 75 years. Otherwise each Trustee serves in office until the election and qualification of a successor or until the Trustee sooner dies, resigns, retires or is removed. |
| (5) | Mr. McMahon is considered an “interested” Trustee under the Investment Company Act of 1940 because he is the chief investment officer of Thornburg Investment Management, Inc. |
| (6) | The Trust’s president, secretary, and treasurer each serves a one-year term or until the election and qualification of a successor; each other officer serves at the pleasure of the Trustees. |
| (7) | Assistant vice presidents, assistant secretaries, and assistant treasurers are not shown. |
The Statement of Additional Information for each Fund of the Trust includes additional information about the Trustees and is available, without charge and upon request, by calling 1-800-847-0200.
32 Annual Report
| | |
| OTHER INFORMATION | | |
| |
Thornburg International Growth Fund | | September 30, 2016 (Unaudited) |
PORTFOLIO PROXY VOTING
Policies and Procedures:
The Trust has delegated to Thornburg Investment Management, Inc. (the “Advisor”) voting decisions respecting proxies for the Fund’s voting securities. The Advisor makes voting decisions in accordance with its Proxy Voting Policy and Procedures. A description of the Policy and Procedures is available (i) without charge, upon request, by calling the Advisor toll-free at 1-800-847-0200, (ii) on the Thornburg website at www.thornburg.com, and (iii) on the Securities and Exchange Commission’s website at www.sec.gov.
Information regarding how proxies were voted is available on or before August 31 of each year for the twelve months ending the preceding June 30. This information is available (i) without charge, upon request by calling the Advisor toll-free at 1-800-847-0200, (ii) on the Thornburg website at www.thornburg.com, and (iii) on the Securities and Exchange Commission’s website at www.sec.gov.
AVAILABILITY OF QUARTERLY PORTFOLIO SCHEDULE
The Fund files with the Securities and Exchange Commission schedules of its portfolio holdings on Form N-Q for the first and third quarters of each fiscal year. The Fund’s Forms N-Q are available on the Commission’s website at www.sec.gov, or may be reviewed and copied at the Commission’s Public Reference Room in Washington, D.C. Information on the operation of the Public Reference Room may be obtained by calling 1-800-SEC-0330. The Fund also makes this information available on its website at www.thornburg. com/download or upon request by calling 1-800-847-0200.
TAX INFORMATION
For the tax year ended September 30, 2016, dividends paid by the Thornburg International Growth Fund of $4,721,380 are being reported as taxable ordinary investment income dividends for federal income tax purposes.
For the tax year ended September 30, 2016, the Fund is reporting 100.00% (or the maximum allowed) of the dividends paid from tax basis net ordinary income as qualifying for the reduced rate under the Jobs and Growth Tax Relief and Reconciliation Act of 2003.
The Fund is reporting 30.20% (or the maximum allowed) of the ordinary income distributions paid by the Fund for the fiscal year ended September 30, 2016 as qualified for the corporate dividends received deduction.
For the year ended September 30, 2016, foreign source income and foreign taxes paid is $21,850,800 and $2,173,362, respectively. The information and distributions reported herein may differ from the information and distributions reported to the shareholders for the calendar year ending December 31, 2016. Complete information will be reported in conjunction with your 2016 Form 1099.
STATEMENT RESPECTING RENEWAL OF INVESTMENT ADVISORY AGREEMENT
Thornburg Investment Management, Inc. (the “Advisor”) provides investment management services to Thornburg International Growth Fund pursuant to an investment advisory agreement. The Trustees consider the renewal of this agreement annually, and most recently determined to renew the agreement on September 13, 2016.
In anticipation of their recent consideration of the advisory agreement’s renewal, the independent Trustees met in May 2016 to consider aspects of their annual evaluation of the Advisor’s service to all of the funds of Thornburg Investment Trust, to plan the annual evaluation of the Advisor’s performance and to specify the information the Advisor would present to the Trustees for their review. The independent Trustees met again in independent session in September to consider portions of the information submitted by the Advisor. The Advisor’s president and chief investment officer subsequently reviewed portions of the information with the Trustees and addressed questions from the Trustees at a full meeting session of the Trustees scheduled for that purpose, and the independent Trustees thereafter met in independent session to consider the Advisor’s presentation and various specific issues respecting their consideration of the advisory agreement’s renewal. Following these sessions, the Trustees met to consider renewal of the agreement, and the independent Trustees voted unanimously at that meeting to renew the agreement for an additional term of one year.
The information below summarizes certain factors considered by the Trustees in connection with the determination to renew the advisory agreement. In determining to renew the agreement, the Trustees considered a wide range of information and did not identify any single factor as controlling, and this summary does not describe all of the factors and other matters considered by the Trustees in making their determination.
Nature, Extent and Quality of Services. The Trustees considered presentations by the Advisor at meeting sessions scheduled for consideration of a continuation of the advisory agreement, and also noted their consideration of the reports the Trustees and their committees receive throughout the year on a wide variety of topics, and consideration they had given to a number of topics in previous years. Information identified by the Trustees in their evaluation as having been considered and contributing to their conclusions included
Annual Report 33
| | |
| OTHER INFORMATION, CONTINUED | | |
| |
Thornburg International Growth Fund | | September 30, 2016 (Unaudited) |
Trustees’ assessments of the Advisor’s personnel developed in formal and informal meetings throughout the year, the Advisor’s staffing levels and measures to maintain staffing levels and improve competencies, the Advisor’s commitment to attract and retain high quality portfolio management expertise through competitive compensation levels, the Advisor’s collaborative approach to investment management, the Fund’s investment performance over different periods of time, portfolio managers’ cognizance of and strategies to address market and economic trends and conditions, the evaluation and selection of individual investments, the structuring and composition of the Fund’s portfolio, management of Fund liquidity requirements, cognizance of and efforts to achieve tax efficiency, responses to share sale and redemption activity, continuing enhancements to the Advisor’s electronic and information systems and the Advisor’s engagement of outside firms to assist in improving or replacing those systems, the Advisor’s evaluation and selection of firms providing portfolio trade execution to the Fund and the Advisor’s measures to obtain favorable trade execution, the Advisor’s performance of accounting and other services, the Advisor’s continued commitment to observance of compliance and regulatory requirements, the Advisor’s responsiveness to the Trustees, the quality and extent of written and oral reports to the Trustees over the course of the year, and other factors.
Investment Performance. The Trustees noted in their evaluation of the Fund’s investment performance the reports they had received in each regular meeting over the course of the year from the Advisor’s portfolio management personnel. The Trustees also noted in their evaluation their consideration of information provided to them at their request in anticipation of their annual evaluation of the Advisor’s services, including the following items of information respecting the investment performance of the Fund: (1) the Fund’s absolute investment performance and achievement of stated objectives; (2) the Advisor’s written and oral explanations and commentary on the Fund’s performance in the context of the Fund’s objectives and reasonable expectations, and business, market and economic conditions, (3) performance data for the eight calendar years since the Fund’s inception, comparing the Fund’s annual investment returns to a fund category selected by an independent mutual fund analyst firm, and to a broad-based securities index, (4) the Fund’s investment performance for the three-month, year-to-date, one-year, three-year and five-year periods ending with the second quarter of the current year comparing the Fund’s annualized returns to two mutual fund categories selected by independent mutual fund analyst firms and to a broad-based securities index, and assigning a percentage rank to the Fund’s performance for each period relative to each of the fund categories, (5) comparison of the Fund’s annualized return since inception to the Fund’s benchmark index, and (6) comparative measures of estimated earnings growth, portfolio volatility, risk and return.
The Trustees noted that quarterly reports during the year and other information presented to them confirmed the Advisor’s continued conformity to the Fund’s stated investment objectives and policies.
The Trustees observed in reviewing comparative performance data for the eight calendar years since the Fund’s inception that the Fund’s investment return for the most recent calendar year was higher than the return for the securities index and comparable to the average return for the fund category, the Fund’s returns for the preceding seven calendar years exceeded the returns for the index in five of seven years, and that the Fund’s returns exceeded or were comparable to the average returns of the fund category in four of seven years. Other quantitative data noted by the Trustees as having been considered in their evaluation showed that the Fund’s annualized investment returns fell in the third quartile of performance of the first fund category for the one-year period ended with the second quarter of the current year, fell in the fourth quartile for the three-year period, and fell at the midpoint of performance of the category for the five-year period. Noted data also showed that the Fund’s annualized investment returns fell at the midpoint of performance of the second fund category for the one-year period ended with the second quarter, fell in the third quartile of performance for the three-year period, and fell in the top quartile of performance of the category for the five-year period. Data presented to the Trustees showed that the Fund’s annualized total return (net of expenses) over the period since the Fund’s inception exceeded the annualized return for the Fund’s benchmark index. The Trustees attached additional significance to the performance data of the Fund from the perspective of longer term shareholders.
Comparisons of Fee and Expense Levels. The Trustees recognized in their evaluation the clear disclosures of the Advisor’s fees and Fund expenses in the Fund’s prospectus. Information noted by the Trustees as having been considered in this context included a variety of comparative data respecting the Fund’s fee and expense levels. This information included comparisons of the Fund’s advisory fee and overall Fund expenses to median and average fees and expenses charged to a category of mutual funds selected by an independent mutual fund analyst firm, comparisons of the advisory fee and other Fund expenses to the fee levels and expenses for two representative share classes of fund peer groups selected from the category by a second independent mutual fund analyst firm, the perspectives and advice from the second mutual fund analyst firm respecting comparisons of fund fee levels and expenses to fund peer groups, and other information. Comparative data noted as having been considered by the Trustees showed that the Fund’s advisory fee level was comparable to the median and average fee levels for the fund category, the level of total expense for a representative share class of the Fund was comparable to the median and average levels for the category, and that the level of total expense for a second representative share class was lower than the median and average levels for the category. Peer group data showed that the Fund’s advisory fee level was lower than the median for each of the two peer groups, and that the total expense levels for the two representative share classes were comparable to the median expense levels for their respective peer groups.
The Trustees noted their consideration of information respecting the advisory fees charged by the Advisor to other investment management clients, including sub-advised mutual funds, together with information about fees charged by other advisors to different clients, analysis of the differences between the requirements of institutional clients and mutual funds, analysis of the differences between the
34 Annual Report
| | |
| OTHER INFORMATION, CONTINUED | | |
| |
Thornburg International Growth Fund | | September 30, 2016 |
requirements of a sub-advised mutual fund and a fund as to which the investment advisor is the primary advisor and sponsor, descriptions of distinguishing characteristics of the sub-advised funds served by the Advisor, and the consequently different investment management services provided to the different categories of clients and the differing contexts in which the fee levels for these arrangements are established. The Trustees confirmed their previous observations that the differences between the fees charged by the Advisor to different types of clients did not appear exceptional, and that the fee rates charged by an investment advisor to different categories of clients had limited relevance to the evaluation of the fee rate charged by that advisor to mutual funds as to which it is the primary advisor and sponsor.
Costs and Profitability of Advisor. In reviewing the profitability of the Advisor’s services to the Fund the Trustees considered an analysis of the Advisor’s costs and the profitability to the Advisor of its services, together with data respecting the overall profitability of a selection of other investment management firms. The Trustees noted that a portion of the Advisor’s profits are an important element in the compensation of shareholder employees. The Trustees considered in this regard information from the Advisor respecting investment of its profits to maintain staffing levels, pay competitive levels of compensation, and add to its information retrieval and management systems to maintain or improve service levels. The Trustees also considered the contribution of the Advisor’s cost management to its profitability, and the relationship of the Advisor’s financial resources and profitability in previous years to its ability to attract necessary personnel, invest in systems and other assets required for its service to the Fund, and maintain or improve service levels for the Fund notwithstanding fluctuations in revenues and profitability. The information considered did not indicate to the Trustees that the Advisor’s profitability was excessive.
Potential Economies of Scale. In reviewing the extent to which economies of scale would be realized by the Fund as it grows and whether fee levels reflect potential economies of scale, the Trustees considered the breakpoint structure for advisory fees chargeable to the Fund, comparisons of the fee breakpoint structure for the Fund with breakpoint structures (or the absence of such structures) for other funds in a peer group selected by an independent mutual fund analyst firm, the effects of the breakpoint structure and other expense factors realized by certain Funds of the Trust as their asset levels had increased, and the Advisor’s expenditures from its own profits and resources to maintain staffing levels, pay competitive levels of compensation, and add to its information retrieval and management systems to maintain or improve service levels. The information provided demonstrated to the Trustees that the Fund’s advisory fee breakpoint structure is reasonable in relation to the structures observed in the other funds in its peer group, and that shareholders may be expected to benefit from any economies of scale, due to the advisory agreement’s breakpoint fee structure for the Fund and other factors.
Potential Ancillary Benefits. In reviewing potential benefits to the Advisor because of its relationship to the Fund, the Trustees noted disclosures by the Advisor of its receipt of certain research services from broker dealers, and the benefits to both the Fund and the Advisor of the Advisor’s expansion of its staffing, compliance and systems capabilities and other resources to serve a broader variety of investment management clients. No unusual or unfair benefits to the Advisor from its relationship to the Fund were identified by the Trustees.
Summary of Conclusions. The Trustees concluded that the nature, extent and quality of the Advisor’s services performed under the advisory agreement remained sufficient. The Trustees further concluded that the absolute and relative investment performance of the Fund over a range of pertinent holding periods on the whole was satisfactory in the context of its objectives and strategies, and that the Advisor had continued to actively and competently pursue the Fund’s stated investment objectives and adhere to the Fund’s investment policies.
The Trustees further concluded, based upon their consideration of the foregoing factors and other information, that the level of the advisory fee charged to the Fund by the Advisor is reasonable in relation to the services provided by the Advisor in view of the nature, extent and quality of those services, the investment performance of the Fund after fees and expenses, the clear disclosure of fees and expenses in the Fund’s prospectuses, comparisons of fees and expenses charged to the Fund to fees and expenses charged to other mutual funds, and the other factors considered.
Annual Report 35
TRUSTEES’ STATEMENT TO SHAREHOLDERS
Readopted September 12, 2016
The Trustees believe current and prospective shareholders should know how we discharge our responsibilities in supervising the Funds’ investment advisor and in reviewing the advisor’s contract for renewal. Since 2005, we have issued a statement which sets out clearly the three principal guidelines that we follow in supervising the Trust’s investment advisor on your behalf. In accordance with our customary practice, in September of this year we again reviewed our statement and concluded we should reissue this statement outlining the principal features of our supervision of the advisor’s performance of investment management services for the Funds.
We begin with the premise that each shareholder selected his or her Fund because its investments are managed by the investment advisor identified in the prospectus and in accordance with the objective and policies described in the prospectus. We realize, as each of you do, that if you believe that your Fund’s stated objective and policies no longer serve your personal investment goals, you can sell your shares and leave the Fund.
Therefore, we believe that our primary supervisory task—our principal obligation to you—is to assess the nature and quality of the advisor’s services, and to confirm that the advisor actively and competently pursues the Fund’s objective, in accordance with the policies set out in the prospectus. To do this, we meet regularly with management to review your Fund’s portfolio and to discuss the advisor’s specific actions and judgments in pursuing the Fund’s objective. We do not substitute our own judgment for the advisor’s decisions in selecting investments; the advisor is paid to exercise its informed judgment on investment decisions, and we seek to confirm, in reviewing the advisor’s performance, that the advisor is doing just that.
Second, we are conscious of costs and the effect that costs have on shareholders’ returns. We try to make sure that your Fund’s fees and costs are reasonable in relationship to the services rendered and that they are generally in line with those charged by other expert investment advisors, consistent with our belief that the Fund’s investors searched for and expect that expertise and attention and have decided to pay a reasonable price for it. We do not put the management contract “out to bid” as a matter of course, and we would not do so unless we had concluded that the advisor materially had failed to pursue the Fund’s objectives in accordance with its policies, or for other equally important reasons. We believe that any other approach would be inconsistent with your interests and contrary to your expectations when you bought shares of the Fund in the first place.
Finally, because we believe that most Thornburg Fund shareholders have invested with a long-term perspective, we try not to focus too much on the fashions of the moment and on short-term performance. The market will not favor any specific investment objective or set of policies at all times and under all economic circumstances. A fund will experience periods of both high and low returns relative to other funds and other investments. Even if one of our Funds is not favored by the market at a particular time, we believe that the advisor is nonetheless obliged to remain true to the Fund’s objective and policies, and we watch to see that it does so.
Trustees of Thornburg Investment Trust
36 Annual Report
THORNBURG FUNDS
Thornburg Investment Management is a privately-owned global investment firm that offers a range of solutions for retail and institutional investors. Founded in 1982 and headquartered in Santa Fe, New Mexico, we manage approximately $53 billion (as of September 30, 2016) across eight equity and 11 bond mutual funds, separate accounts for high-net-worth investors and institutional accounts, and five UCITS funds for non-U.S. investors.
The fund outlined in this report is one of many equity and fixed-income products available from Thornburg Investment Management.
Equity Funds
| | • | | Thornburg Core Growth Fund |
| | • | | Thornburg International Value Fund |
| | • | | Thornburg Better World International Fund |
| | • | | Thornburg International Growth Fund |
| | • | | Thornburg Developing World Fund |
| | • | | Thornburg Investment Income Builder Fund |
| | • | | Thornburg Global Opportunities Fund |
Fixed Income Funds
| | • | | Thornburg Low Duration Income Fund |
| | • | | Thornburg Limited Term U.S. Government Fund |
| | • | | Thornburg Limited Term Income Fund |
| | • | | Thornburg Strategic Income Fund |
| | • | | Thornburg Low Duration Municipal Fund |
| | • | | Thornburg Limited Term Municipal Fund |
| | • | | Thornburg Intermediate Municipal Fund |
| | • | | Thornburg California Limited Term Municipal Fund |
| | • | | Thornburg New Mexico Intermediate Municipal Fund |
| | • | | Thornburg New York Intermediate Municipal Fund |
| | • | | Thornburg Strategic Municipal Income Fund |
Before investing, carefully consider the Fund’s investment goals, risks, charges, and expenses. For a prospectus or summary prospectus containing this and other information, contact your financial advisor or visit thornburg.com. Read it carefully before investing.
For additional information, please visit thornburg.com
Thornburg Investment Management, Inc. 2300 North Ridgetop Road, Santa Fe, NM 87506
Annual Report 37
This page intentionally left blank.
38 Annual Report
This page intentionally left blank.
Annual Report 39

| | |
To receive shareholder reports, prospectuses, and proxy statements electronically, go to www.thornburg.com/edelivery. This Annual Report is submitted for the general information of shareholders of the Fund. It is not authorized for distribution to prospective investors in the Fund unless preceded or accompanied by an effective prospectus. | |  |
| | | | |
| Investment Advisor: | | Distributor: | | |
| Thornburg Investment Management® | | Thornburg Securities Corporation® | | |
| 800.847.0200 | | 800.847.0200 | | TH1539 |
Annual Report
September 30, 2016
THORNBURG
INVESTMENT
INCOME BUILDER
FUND
Thornburg INVESTMENT MANAGEMENT
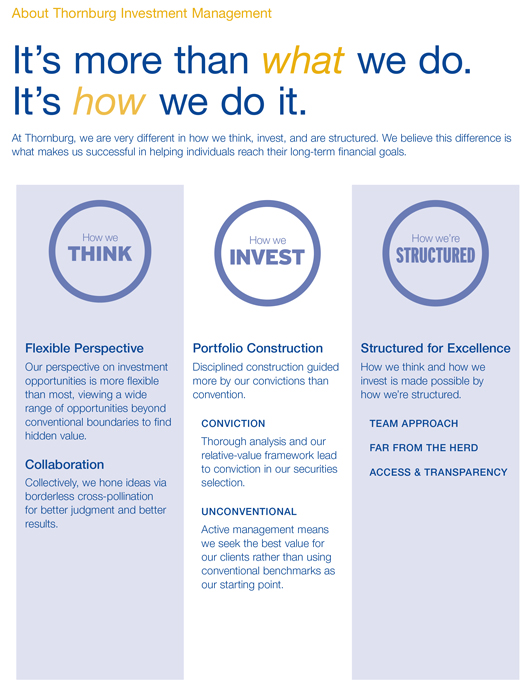
About Thornburg Investment Management
It’s more than what we do.
It’s how we do it.
At Thornburg, we are very different in how we think, invest, and are structured. We believe this difference is what makes us successful in helping individuals reach their long-term financial goals.
How we THINK
How we INVEST
How we’re STRUCTURED
Flexible Perspective
Portfolio Construction
Structured for Excellence
Our perspective on investment
Disciplined construction guided
How we think and how we
opportunities is more flexible
more by our convictions than
invest is made possible by
than most, viewing a wide
convention.
how we’re structured.
range of opportunities beyond
conventional boundaries to find
CONVICTION
TEAM APPROACH
hidden value.
Thorough analysis and our
relative-value framework lead
FAR FROM THE HERD
Collaboration
to conviction in our securities
ACCESS & TRANSPARENCY
Collectively, we hone ideas via
selection.
borderless cross-pollination
for better judgment and better
UNCONVENTIONAL
results.
Active management means
we seek the best value for
our clients rather than using
conventional benchmarks as
our starting point.
2 | Annual Report
2 Annual Report
Annual Report
Thornburg Investment Income Builder Fund
September 30, 2016
| | | | |
Share Class | | NASDAQ Symbol | | CUSIP |
Class A | | TIBAX | | 885-215-558 |
Class C | | TIBCX | | 885-215-541 |
Class I | | TIBIX | | 885-215-467 |
Class R3 | | TIBRX | | 885-215-384 |
Class R4 | | TIBGX | | 885-215-186 |
Class R5 | | TIBMX | | 885-215-236 |
Class I, R3, R4, and R5 shares may not be available to all investors. Minimum investments for Class I shares may be higher than those for other classes.
Investments carry risks, including possible loss of principal. Additional risks may be associated with investments outside the United States, especially in emerging markets, including currency fluctuations, illiquidity, volatility, and political and economic risks. Investments in small- and mid-capitalization companies may increase the risk of greater price fluctuations. Portfolios investing in bonds have the same interest rate, inflation, and credit risks that are associated with the underlying bonds. The value of bonds will fluctuate relative to changes in interest rates, decreasing when interest rates rise. Please see the Fund’s prospectus for a discussion of the risks associated with an investment in the Fund. Investments in the Fund are not FDIC insured, nor are they deposits of or guaranteed by a bank or any other entity.
Annual Report 3
LETTER TO SHAREHOLDERS
| | |
| |
Thornburg Investment Income Builder Fund | | September 30, 2016 (Unaudited) |
October 26, 2016
Dear Fellow Shareholder:
This letter will highlight the basic results of your Thornburg Investment Income Builder Fund’s investment activities for the twelve-month period ended September 30, 2016, the fiscal year end. In addition, we will comment on the overall investment landscape, which continues to evolve.
The Fund paid dividends of 80.3 cents per Class A share in the twelve months ended September 30, 2016, down 2.7% from the 82.5 cents per share in the comparable prior-year period. The dividends per share were higher for Class I and R5 shares, and lower on the Class C, R3, and R4 shares, to account for varying class-specific expenses. The net asset value (NAV) per Class A share increased $0.75 during the 12-month period, from $19.07 to $19.82, giving a total return including dividends of 8.35% (without sales charge).
For the fiscal year ended September 30, 2016, Thornburg Investment Income Builder Fund underperformed the blended index of 75% MSCI World Index/25% Bloomberg Barclays U.S. Aggregate Bond Index’s total return of 9.96%. Investment Income Builder outperformed the blended index by 1.89% in the first nine months of calendar 2016, but underperformed by 3.34% in the December 2015 quarter, the first quarter of this fiscal year. Performance relative to the benchmark for all share classes over various periods is set forth on page 10.
The quarter ended September 30, 2016, was the 55th full calendar quarter since the inception of Thornburg Investment Income Builder in December 2002. In 40 of these quarters, including each of the last four quarters, the Fund delivered a positive total return. The Fund has delivered positive total returns in 11 of its 13 calendar years of existence. As of September 30, 2016, Thornburg Investment Income Builder has delivered tax-efficient average annual total returns in excess of 9.4% since its inception.
Performance data shown represents past performance and is no guarantee of future results. Investment return and principal value will fluctuate so shares, when redeemed, may be worth more or less than their original cost. Current performance may be lower or higher than quoted. For performance current to the most recent month end, visit thornburg.com or call 800.847.0200.
The maximum sales charge for Class A shares is 4.50%. The total annual fund operating expense of Class A shares is 1.33%, as disclosed in the most recent prospectus.
Factors Impacting Your Fund’s Performance
We do not expect to pay a capital gain dividend for 2016. At September 30, 2016, the Fund had realized capital losses of more than $800 million, which may be carried forward to offset future capital gains to the extent permitted by regulations.
Several factors contributed to the year-over-year drop in dividends paid by Thornburg Investment Income Builder in the fiscal year under review. These include the following:
| | • | | Prepayments received on bonds denominated in foreign currencies caused the Fund to recognize currency losses that offset approximately $0.08 of ordinary dividend income. |
| | • | | A portion of the cash distributions that the Fund received from its investments in pass-through entities (business development companies and asset managers) during 2015 were later characterized as capital gains, rather than ordinary income dividends. (Form K-1 disclosing tax information from pass-through entities generally arrives in March or April of the following year. We know the taxable character of the dividends received in the prior calendar year only after we receive these. We must estimate, and distribute, virtually all of the taxable income of the Fund by calendar year end. For 2015, we over-estimated the ordinary income percentage of cash received from these entities, verses capital gains). Why does the tax character of the cash received by the Fund matter? In the interest of tax efficiency, we have accumulated a significant backlog of tax-loss carryforwards sufficient to offset these capital gains. Our accumulated capital loss carryforwards offset the capital gain distribution portion of the cash received for the fiscal year ended September 30th, shielding these cash receipts from the Fund’s income stream that is used to pay dividends. |
| | • | | Several of the Fund’s highest-yielding equity investments, the publicly traded mortgage REITs and business development companies, cut their dividends in 2016 from prior-year levels. We support these dividend cuts to the extent that these firms reduce leverage and financial risk as the interest-rate outlook evolves. |
| | • | | We increased the percentage of the portfolio invested in equities with yields below the average dividend yield of the overall portfolio. We believe these investments will deliver higher dividend payments in the future. |
Many of the common stocks currently held in the Thornburg Investment Income Builder portfolio increased their ordinary dividends in 2016. Collectively, these increases were insufficient to overcome the headwinds described above last year. We are optimistic for the future.
In assessing the overall fiscal year 2016 performance of Thornburg Investment Income Builder, it is instructive to consider the performance of the sector components of the MSCI World Index in U.S. dollars over the 12 months ended September 30, 2016. The MSCI World Index comprises 75%, and the entire equity portion, of the Fund’s global performance benchmark (75% MSCI World Index /25% Bloomberg Barclays U.S. Aggregate Bond Index):
| | 1. | The MSCI World Index showed a return of 11.36% for the 12-months ended September 30, 2016. All eleven index sectors showed positive total returns, with individual sector returns ranging from 24% (materials) to 0.2% (financials). Stocks of firms in the real estate, information technology, consumer staples, energy, industrials, and |
4 Annual Report
| | |
LETTER TO SHAREHOLDERS, CONTINUED | | |
| |
Thornburg Investment Income Builder Fund | | September 30, 2016 (Unaudited) |
| | telecommunications sectors joined materials sector stocks in outperforming the index. Stocks in the consumer discretionary, health care, and utilities sectors joined financials in underperforming the index. |
| | 2. | Income Builder investments in firms in the financials (24% average equity weighting), telecommunications (21% average equity weighting), health care (9% average equity weighting), industrials (9% average equity weighting), consumer discretionary (8% average equity weighting), energy (7% average equity weighting), consumer staples (6% average equity weighting), and information technology (5% average equity weighting) sectors comprised the largest sector weightings in the portfolio during fiscal 2016. The Fund’s performance relative to the MSCI World Index was hurt by comparative underperformance from our holdings in the telecommunications and industrials sectors, and helped by comparative outperformance from our holdings in the financial sector. |
| | 3. | In the Income Builder portfolio, 53 equity investments contributed positive returns of at least 0.05% to the portfolio during fiscal 2016, considering both portfolio weights and individual security returns. Twenty-five of the Fund’s equity investments contributed returns of negative 0.05% or worse for the fiscal year, and eight of these have been sold to fund other investments. |
Investment Income Builder’s bond holdings delivered positive returns during the fiscal year. Yields on corporate and asset-backed bonds were generally lower, which supported bond prices.
Your Fund’s average return from its investments in the financial sector significantly exceeded the performance of the equities in the finance sector of the MSCI World Index in fiscal 2016. Fund investments in CME Group, Invesco Mortgage, MFA Financial, JPMorgan Chase, Ares Capital, and Chimera Investment Corporation were among the strongest performers in the portfolio. Och-Ziff, GAM Holding, UBS Group, KKR & Co., and Blackstone Group were detractors. During the first three quarters of calendar 2016 many investors expected U.S. interest-rate increases to threaten the earnings power and valuations of many of these firms. The interest-rate increases have not arrived. As of the end of the fiscal year, we still hold investments in each of these, other than Och-Ziff and Digital Realty Trust.
Your Fund’s significant holdings in the telecommunications sector delivered positive absolute returns this year, but they were the largest detractor from relative performance vis-à-vis the index. England’s BT Group, the Netherlands’ Royal KPN, Vodafone, Denmark’s TDC, and France’s Orange delivered negative returns. AT&T, China Mobile, and Singapore Telecom delivered positive returns. We sold the Fund’s investment in TDC during the year, and reduced the position in AT&T after strong share price performance increased its valuation relative to other telecommunications firms. Each of these pays interesting dividends.
Your Fund’s investments in the industrials sector delivered positive performance, but lagged the sector return of the MSCI World Index. French toll-road and airport operator Vinci and Sydney Airport led the way, while Italian toll-road and airport operator Atlantia was a detractor as concerns about political instability in Italy weighed on its share price even as operating metrics exceeded expectations.
The performance of Investment Income Builder’s holdings in the health care sector lagged those of the MSCI World Index during the fiscal year. Positive contributions from Merck & Co. and Pfizer were offset by share price declines for Sanofi, Roche Holdings, and Novartis. Political rhetoric has turned against for-profit health care firms, and we have marginally reduced the Fund’s exposure to this sector and remain underweight.
Your Fund’s lower weighting and marginal outperformance in the consumer discretionary sector contributed positively to total return. Las Vegas Sands, and Home Depot were positive contributors. Office products retailer Staples, Target Corporation, and French media firm Vivendi detracted from portfolio performance for the fiscal year.
Among Income Builder’s investments in the energy sector, pipeline operator ONEOK, Royal Dutch Shell, Canadian producers Suncor, and Canadian Oil Sands each saw significant share price gains in fiscal 2016. Negative contributions from U.S. oil refiner HollyFrontier, pipeline operator Kinder Morgan, and Husky Energy detracted from performance. The price of oil rose approximately 1.5% over the course of the fiscal year, though it declined sharply through mid-January before making a steady recovery in subsequent months. Global demand for oil and gas has increased as prices have declined. We expect global oil production growth to slow in the coming years as investments to sustain aging fields and develop new resources are cut.
Among Fund investments in the consumer staples sector, Netherlands-based grocer Royal Ahold, Korea’s KT&G Corporation, and Nestlé each delivered positive contributions in fiscal 2016, while Walgreens Boots Alliance detracted modestly.
Among other portfolio holdings, notable contributors included semiconductor makers Qualcomm and Taiwan Semiconductor Manufacturing, Washington REIT, Lamar Advertising, and Duke Energy. Detractors included Électricité de France and Chinese electricity generator Huaneng Power.
Market Volatility and Performance of Holdings
Because of the significant volatility in financial markets over the last 15 months, we wish to review the share price declines of the most negative contributors to the Fund’s performance during the second half of 2015 through February 11, 2016, along with the subsequent performance of these investments through September 30th. February 11, 2016, was the lowest net asset value day ($17.10/share) for Thornburg Investment Income Builder over the past year. For the most part, the companies listed below appear capable of demonstrating resilience, and the stock price recoveries displayed have contributed significantly to Thornburg Investment
Annual Report 5
| | |
LETTER TO SHAREHOLDERS, CONTINUED | | |
| |
Thornburg Investment Income Builder Fund | | September 30, 2016 (Unaudited) |
Income Builder’s net asset value increase from $17.10/share on February 11th to $19.82 on September 30th. The Fund still held 15 of the 20 below-listed investments as of September 30th. We sold the Fund’s position in Kinder Morgan to make room for attractively priced bonds of energy pipeline firms, and to increase our equity holding in another North American pipeline business, ONEOK, which performed very well. More recently, we sold the Fund’s position in Husky Energy to increase position sizes in Royal Dutch Shell and Suncor, following Husky’s decision to eliminate its dividend. We sold modest positions in Denmark’s telecom operator TDC, office supplies retailer Staples, and French pharmaceuticals firm Sanofi to make room for other opportunities.
Table I | The 20 Most Negative Contributors to Investment Income Builder Performance Between June 30, 2015 and February 11, 2016
| | | | | | | | | | |
| | | | | Stock Price Change | |
Company Name | | Industry Sector | | (6/30/15 to
2/11/16) | | | (2/11/16 to
9/30/16) | |
Williams Companies | | Energy | | | -76.2 | % | | | +131.2 | % |
JP Morgan Chase & Co | | Financial | | | -20.1 | % | | | +25.5 | % |
China Mobile Ltd. | | Telecommunications | | | -17.8 | % | | | +15.0 | % |
TDC A/S | | Telecommunications | | | -39.1 | % | |
| +34.2
(now sold | %
) |
Telenor ASA | | Telecommunications | | | -35.3 | % | | | +23.4 | % |
KKR & Co. | | Financial | | | -49.5 | % | | | +28.1 | % |
Electricite de France | | Utility | | | -44.4 | % | | | +4.8 | % |
Kinder Morgan Inc. | | Energy | | | -57.8 | % | |
| sold during
decline period |
|
DBS Group Holdings | | Financial | | | -32.7 | % | | | +19.4 | % |
Novartis AG | | Health Care | | | -27.6 | % | | | +9.9 | % |
Royal Dutch Shell | | Energy | | | -23.4 | % | | | +18.7 | % |
Staples, Inc. | | Consumer Discretionary | | | -45.3 | % | |
| +4.4
(now sold | %
) |
Blackstone Group | | Financial | | | -39.5 | % | | | +10.9 | % |
Husky Energy | | Energy | | | -55.1 | % | |
| +46.4
(now sold | %
) |
Vodafone Group | | Telecommunications | | | -18.6 | % | | | -0.8 | % |
Sanofi | | Health Care | | | -22.3 | % | |
| -0.4
(now sold | %
) |
ONEOK, Inc. | | Energy | | | -46.1 | % | | | +161.9 | % |
Apollo Investment Corp. | | Financial | | | -35.2 | % | | | +35.5 | % |
Qualcomm | | Technology | | | -30.1 | % | | | +59.3 | % |
Invesco Mortgage Capital | | Financial | | | -27.2 | % | | | +55.2 | % |
The Australian dollar and Japanese yen each appreciated vis-à-vis the U.S. dollar during the fiscal year, while the British pound, the euro, the Swiss franc, and Chinese yuan declined. We hedged a majority of the currency exposure to the Japanese yen, Chinese yuan, the euro, and other European currencies tied to the euro. We are more focused on risk management than on reaping possible currency gains from exposure to assets denominated in these currencies. Currency hedges modestly contributed to our performance relative to the MSCI World Index during the fiscal year.
Your Fund’s Bond Component
Within its bond portfolio, Investment Income Builder owned significantly fewer U.S. government and agency bonds than the Bloomberg Barclays U.S. Aggregate Bond Index. U.S. government bonds delivered a mixed performance in the Fund’s fiscal year, with yields rising on short maturities under three years and dropping between 20 and 55 basis points on maturities longer than five years. Yield spreads of corporate credits over government bond yields decreased from September 30, 2015, to September 30, 2016, driving a strong recovery in prices of these bonds. The FINRA-Bloomberg Active High Yield U.S. Corporate Bonds Index declined 1.64% during the fiscal year. The Fund’s bond portfolio has an effective duration of approximately 4.2 years as of September 30, 2016.
Readers of this commentary who are long-time shareholders of Income Builder will recall that the interest-bearing debt portion of the Fund’s portfolio has varied over time, ranging from less than 9% last year to 45% at June 30, 2009.
Chart I | Interest-Bearing Investments as a Percentage of Total Portfolio as of September 30, 2016
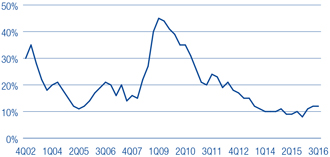
As of September 30th, the Fund portfolio included more than 120 bonds and hybrid securities.
The Economic and Policy Investment Backdrop
Investors continue to debate the future direction of the economies of China, Europe, various emerging markets, and the United States. They weigh potential policy actions (and inaction) by the U.S. Federal Reserve, Congress, the U.S. elections, and the significance of the U.K. electorate’s “Brexit” vote to leave the European Union. For the most part, the political and macroeconomic issues remain open. Production growth of many commodities outpaced demand growth for several years prior to 2015, creating ongoing pressure on prices of oil and other commodities. At today’s commodity prices, flows of new capital necessary to sustain the higher production levels are contracting, while demand for most commodities is firming and inventories are
6 Annual Report
| | |
LETTER TO SHAREHOLDERS, CONTINUED | | |
| |
Thornburg Investment Income Builder Fund | | September 30, 2016 (Unaudited) |
no longer increasing. U.S. domestic oil production has declined by almost one million barrels/day from June 2015 to September 2016, while demand has expanded by a similar amount over the same period, according to the U.S. Energy Information Agency. Overall, global consumer spending is growing.
Forward earnings expectations for the MSCI World Index were reduced throughout 2015 and into 2016; however, company earnings show signs of leveling out or recovering in some markets. Global economic growth expectations appear to be improving, causing investor preferences to shift from more defensive debt and equity assets to more economically sensitive assets during the September quarter. Most major central banks around the world continue to pursue easy monetary conditions, as indicated by the fact that more than $11 trillion of government bonds issued by countries around the world were priced with negative yields as of September 30th. Easy money policies have increased the potential volatility of financial asset prices, as excess liquidity sloshes around from one investment theme to the next. It is debatable whether the unconventional monetary policies are having any positive impact on the real economies of developed countries. We cannot be certain how long unconventional monetary policies will continue, or what consequences will result from any changes in course. We believe that our geographically diverse portfolio of cash generative equities and attractive yielding bonds with limited duration should prove resilient through changing conditions.
While low interest rates are good news for borrowers, they have negative consequences for conservative savers and income-seeking investors. Total reported taxable interest income of all U.S. households fell from $168 billion in 2009 to less than $94 billion in 2014, a five-year drop of $74 billion (negative 44%), according to Statistics of Income published by the U.S. Internal Revenue Service.
Investors must consider other options. Banks have aggressively reduced yields on deposits, and money market funds yield around one half of 1%. A very large pool of investor dollars is looking for better returns elsewhere, but in sensible investments. We are optimistic that the types of income producing investments owned by the Thornburg Investment Income Builder Fund will experience sustainable popularity among investors as their intrinsic value for income production are recognized. A high percentage of investor funds belong to people over the age of 55, for whom income is an increasingly necessary and desirable attribute.
Thank you for being a shareholder of Thornburg Investment Income Builder Fund. Remember that you can review descriptions of many of the stocks in your portfolio at your leisure by going to our internet site, www.thornburg.com/iib. Best wishes for a wonderful holiday season and a happy 2017.
Sincerely,
| | | | |

| | 
| |  |
Brian McMahon Portfolio Manager Chief Investment Officer and Managing Director | | Jason Brady, CFA Portfolio Manager CEO, President, and Managing Director | | Ben Kirby, CFA Portfolio Manager Managing Director |
The matters discussed in this report may constitute forward-looking statements made pursuant to the safe harbor provisions of the Securities Litigation Reform Act of 1995. These include any advisor or portfolio manager prediction, assessment, analysis or outlook for individual securities, industries, investment styles, market sectors and/or markets. These statements involve risks and uncertainties. In addition to the general risks described for each fund in its current prospectus, other factors bearing on these reports include the accuracy of the advisor’s or portfolio manager’s forecasts and predictions, the appropriateness of the investment strategies designed by the advisor or portfolio manager and the ability of the advisor or portfolio manager to implement their strategies efficiently and successfully. Any one or more of these factors, as well as other risks affecting the securities markets generally, could cause the actual results of any fund to differ materially as compared to its benchmarks.
The views expressed by the portfolio managers reflect their professional opinions and are subject to change. Under no circumstances does the information contained within represent a recommendation to buy or sell any security.
Annual Report 7
| | |
| THE DIVIDEND LANDSCAPE | | |
| |
Thornburg Investment Income Builder Fund | | September 30, 2016 (Unaudited) |
To appreciate the investment environment in which Thornburg Investment Income Builder Fund operates, you may wish to review these highlights of the “dividend landscape.”
The S&P 500 Index Payout Ratio – A Historical Perspective
The dividend payout ratio is a fraction that expresses dividend payments as a percentage of per-share earnings. As the economy slowed in the wake of the financial crisis, earnings-per-share on average declined, causing the payout ratio to spike, even as dividends paid by the S&P 500 portfolio declined. Earnings have since materially improved, bringing the payout ratio back in line with the overall trend in recent times.
S&P 500 Index Payout Ratio
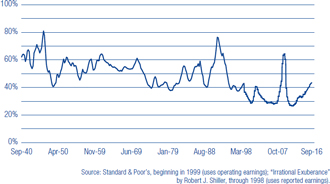
Corporate Willingness to Pay Dividends is Key to the Fund’s Investment Process
The Russell 1000 Index includes approximately 1,000 public companies that are supposed to be generally representative of corporate America. Between 1980 and 1993, at least 75% of these firms paid some dividend. Between 1994 and 2001, the percentage of Russell 1000 companies paying dividends sank to just over 50%, indicating a preference towards reinvesting retained earnings in growth initiatives. Dividends returned to fashion between 2002 and 2008. A reduction in the number of Russell 1000 firms paying dividends followed the 2008 recession. However, from early 2010, the number steadily climbed back to around 70%.
Percentage of Companies Paying Dividends in Russell 1000 Index
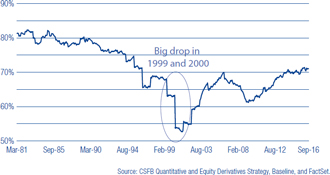
Rising Dividend Payments Despite Decreasing Dividend Yields
Over time, the dollar dividend per unit of the S&P 500 Index has generally increased. Because the price of the index itself has increased even more, the yield on the S&P 500 Index, as a percentage of the current index price, has generally decreased in recent decades. You should note, however, that the dollar yield on an original investment made at a fixed point in time (say, 1970 or 1989) has increased, even without reinvestment of dividends.
S&P 500 Index Average Yield vs. Annual Dividends from a Hypothetical $100,000 Investment (Dividends not Reinvested)
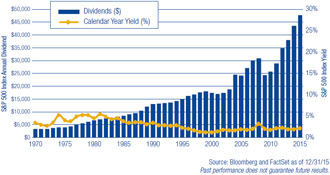
8 Annual Report
| | |
| THE DIVIDEND LANDSCAPE, CONTINUED | | |
| |
Thornburg Investment Income Builder Fund | | September 30, 2016 (Unaudited) |
The Top 100 Dividend Yields
| | | | | | | | |
| | | Russell 1000
Index | | | Russell 2000
Index | |
Real Estate | | | 31 | % | | | 29 | % |
Consumer Discretionary | | | 15 | % | | | 8 | % |
Financials | | | 14 | % | | | 31 | % |
Energy | | | 14 | % | | | 14 | % |
Utilities | | | 12 | % | | | 3 | % |
Industrials | | | 4 | % | | | 5 | % |
Materials | | | 4 | % | | | 2 | % |
Telecommunication Services | | | 4 | % | | | 1 | % |
Consumer Staples | | | 2 | % | | | 2 | % |
Information Technology | | | 0 | % | | | 2 | % |
Health Care | | | 0 | % | | | 3 | % |
Source: FactSet as of September 30, 2016.
A Truly Diversified Dividend-Paying
Portfolio Must Look Beyond the Obvious High-Yield Stocks!
In the (large cap) Russell 1000 Index, 45% of the top 100 dividend payers are in the real estate and financials sectors. In the (small cap) Russell 2000 Index, 60% of the top 100 dividend-yielding stocks are real estate or financials companies. To construct a diversified portfolio of attractive yielding stocks, one must look beyond these sectors. We certainly do.
Dividend yield is a ratio that shows how much a company pays out in dividends each year relative to its share price.
Estimated Average Dividend Yields (MSCI Indices) of Markets Around the Globe
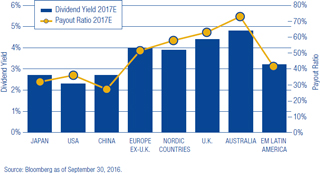
Global Diversification Can Improve the Portfolio Yield
Since firms outside the U.S. tend to pay higher dividends than U.S. firms, particularly outside the financial and utility sectors, we maintain the ability to diversify the Thornburg Investment Income Builder Fund into foreign dividend-paying stocks to try to take advantage of these opportunities.
Diversification does not assure or guarantee better performance and cannot eliminate the risk of investment losses.
Dividends are not guaranteed.
Annual Report 9
| | |
| PERFORMANCE SUMMARY | | |
| |
Thornburg Investment Income Builder Fund | | September 30, 2016 (Unaudited) |
Average Annual Total Returns
| | | | | | | | | | | | | | | | | | | | |
| | | 1-Yr | | | 3-Yr | | | 5-Yr | | | 10-Yr | | | Since
Incep. | |
Class A Shares (Incep: 12/24/02) | | | | | | | | | | | | | | | | | | | | |
Without sales charge | | | 8.35 | % | | | 3.77 | % | | | 7.89 | % | | | 6.07 | % | | | 9.44 | % |
With sales charge | | | 3.46 | % | | | 2.19 | % | | | 6.90 | % | | | 5.58 | % | | | 9.08 | % |
Class C Shares (Incep: 12/24/02) | | | | | | | | | | | | | | | | | | | | |
Without sales charge | | | 7.59 | % | | | 3.03 | % | | | 7.13 | % | | | 5.35 | % | | | 8.78 | % |
With sales charge | | | 6.59 | % | | | 3.03 | % | | | 7.13 | % | | | 5.35 | % | | | 8.78 | % |
Class I Shares (Incep: 11/3/03) | | | 8.71 | % | | | 4.12 | % | | | 8.25 | % | | | 6.42 | % | | | 8.64 | % |
Class R3 Shares (Incep: 2/1/05) | | | 8.01 | % | | | 3.45 | % | | | 7.57 | % | | | 5.78 | % | | | 6.95 | % |
Class R4 Shares (Incep: 2/1/08) | | | 8.12 | % | | | 3.56 | % | | | 7.69 | % | | | — | | | | 4.59 | % |
Class R5 Shares (Incep: 2/1/07) | | | 8.52 | % | | | 3.97 | % | | | 8.10 | % | | | — | | | | 5.49 | % |
Blended Index (Since 12/24/02) | | | 9.96 | % | | | 5.52 | % | | | 9.59 | % | | | 4.83 | % | | | 7.29 | % |
Growth of a Hypothetical $10,000 Investment
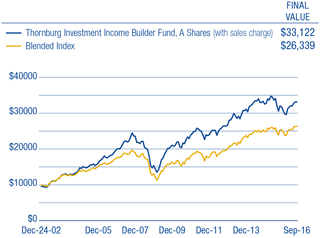
Performance data shown represents past performance and is no guarantee of future results. Investment return and principal value will fluctuate so shares, when redeemed, may be worth more or less than their original cost. Current performance may be lower or higher than quoted. For performance current to the most recent month end, visit thornburg.com or call 800-847-0200. The performance information does not reflect the deduction of taxes that a shareholder would pay on distributions or the redemption of Fund shares. Returns reflect the reinvestment of dividends and capital gains. Class A shares are sold with a maximum sales charge of 4.50%. Class C shares are subject to a 1% CDSC for the first year only. There is no sales charge for Class I, R3, R4, and R5 shares.
As disclosed in the most recent prospectus, the total annual fund operating expenses are as follows: A shares, 1.33%; C shares, 2.08%; I shares, 1.01%; R3 shares, 1.71%; R4 shares, 1.62%; R5 shares, 1.23%. Thornburg Investment Management and/or Thornburg Securities Corporation have contractually agreed to waive fees and reimburse expenses through at least February 1, 2017, for some of the share classes, resulting in net expense ratios of the following: C shares, 2.06%; R3 shares, 1.66%; R4 shares, 1.56%; R5 shares, 1.15%. For more detailed information on fund expenses and waivers/reimbursements please see the Fund’s prospectus.
30-day SEC Yield as of 9/30/16 (A Shares): 3.39%
Glossary
Bloomberg Barclays U.S. Aggregate Bond Index – An index composed of approximately 8,000 publicly traded bonds including U.S. government, mortgage-backed, corporate, and Yankee bonds. The index is weighted by the market value of the bonds included in the index.
Blended Index – The Blended Index is composed of 25% Bloomberg Barclays U.S. Aggregate Bond Index and 75% MSCI World Index.
FlNRA-Bloomberg Active High Yield U.S. Corporate Bond Index – An index comprised of the “active” (most frequently traded) fixed-coupon, high-yield bonds represented by FINRA TRACE, FINRA’s transaction reporting facility that disseminates all over-the-counter secondary market transactions in these public bonds.
MSCI Country Indices – These indices are free float-adjusted market capitalization indices that are designed to measure equity market performance in that specific country in U.S. dollars.
MSCI World Index – An unmanaged market-weighted index that consists of securities traded in 24 of the world’s most developed countries. Securities are listed on exchanges in the U.S., Europe, Canada, Australia, New Zealand, and the Far East. The index is calculated with net dividends reinvested, in U.S. dollars.
S&P 500 Index – An unmanaged broad measure of the U.S. stock market.
Unless otherwise noted, index returns reflect the reinvestment of income dividends and capital gains, if any, but do not reflect fees, brokerage commissions or other expenses of investing. Investors may not make direct investments into any index. The performance of any index is not indicative of the performance of any particular investment.
Basis Point (bp) – A unit equal to 1/100th of 1%. 1% = 100 basis points (bps).
Duration – A bond’s sensitivity to interest rates, incorporating the embedded option features, such as call provisions. Bonds with longer durations experience greater price volatility than bonds with shorter durations.
REITs – Securities that sell like a stock on the major exchanges and invest in real estate directly, either through properties or mortgages. REITs receive special tax considerations and typically offer investors high yields as well as a highly liquid method of investing in real estate.
Yield Spread – The difference between yields on differing debt instruments, calculated by deducting the yield of one instrument from another.
10 Annual Report
| | |
| FUND SUMMARY | | |
| |
Thornburg Investment Income Builder Fund | | September 30, 2016 (Unaudited) |
Objectives and Strategies
The Fund seeks to provide a level of current income which exceeds the average yield on U.S. stocks generally, and which will generally grow, subject to periodic fluctuations, over the years on a per share basis. The Fund’s secondary investment objective is long-term capital appreciation.
The Fund may invest in any domestic or foreign equity or debt security which Thornburg Investment Management believes may assist the Fund in pursuing its investment goals, although the Fund expects that equity securities in its portfolio will normally be weighted in favor of companies that pay dividends or other current income.
Portfolio Composition
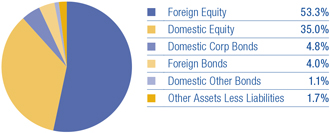
Top Ten Equity Holdings
| | | | |
China Mobile Ltd. | | | 4.7 | % |
Royal Dutch Shell plc ADR | | | 3.4 | % |
JPMorgan Chase & Co. | | | 3.0 | % |
CME Group, Inc. | | | 3.0 | % |
Atlantia S.p.A. | | | 2.9 | % |
BT Group plc | | | 2.4 | % |
The Home Depot, Inc. | | | 2.2 | % |
Telenor ASA | | | 2.1 | % |
Roche Holding AG | | | 2.0 | % |
Orange SA | | | 2.0 | % |
Sector Exposure
(percent of equity holdings)
| | | | |
Financials | | | 26.4 | % |
Telecommunication Services | | | 22.7 | % |
Industrials | | | 9.6 | % |
Energy | | | 8.6 | % |
Health Care | | | 7.4 | % |
Consumer Discretionary | | | 7.3 | % |
Consumer Staples | | | 5.8 | % |
Information Technology | | | 4.7 | % |
Real Estate | | | 3.1 | % |
Utilities | | | 3.0 | % |
Materials | | | 1.3 | % |
Other | | | 0.1 | % |
Country Exposure*
(percent of Fund)
| | | | |
United States | | | 41.0 | % |
Netherlands | | | 9.6 | % |
United Kingdom | | | 7.1 | % |
Switzerland | | | 7.0 | % |
France | | | 6.3 | % |
China | | | 5.4 | % |
Italy | | | 4.6 | % |
Singapore | | | 3.3 | % |
Taiwan | | | 2.4 | % |
Norway | | | 2.4 | % |
Canada | | | 1.4 | % |
Hong Kong | | | 1.2 | % |
South Korea | | | 1.1 | % |
Germany | | | 0.9 | % |
Spain | | | 0.8 | % |
Australia | | | 0.7 | % |
Russia | | | 0.7 | % |
South Africa | | | 0.5 | % |
Thailand | | | 0.4 | % |
Jamaica | | | 0.4 | % |
Brazil | | | 0.3 | % |
Cayman Islands | | | 0.3 | % |
Luxembourg | | | 0.2 | % |
Chile | | | 0.1 | % |
Ireland | | | 0.1 | % |
Japan | | | 0.1 | % |
Panama** | | | 0.0 | % |
Trinidad and Tobago** | | | 0.0 | % |
Other Assets Less Liabilities | | | 1.7 | % |
| * | The country assignment of each holding is determined by the Fund’s Advisor based on various factors, including the location of the issuer’s head office, the issuer’s jurisdiction of incorporation and the country from which a majority of the issuer’s revenue is derived. |
| ** | Country percentage was less than 0.1%. |
There is no guarantee that the Fund will meet its investment objectives.
All portfolio information is subject to change. Charts may not add up to 100% due to rounding.
Annual Report 11
| | |
| FUND SUMMARY, CONTINUED | | |
| |
Thornburg Investment Income Builder Fund | | September 30, 2016 (Unaudited) |
Quarterly Dividend History, Class A
| | | | | | | | | | | | | | | | | | | | |
Year | | Q1 | | | Q2 | | | Q3 | | | Q4 | | | Total | |
2003 | | | 9.2 | ¢ | | | 11.2 | ¢ | | | 12.4 | ¢ | | | 17.5 | ¢ | | | 50.3 | ¢ |
2004 | | | 10.2 | ¢ | | | 12.5 | ¢ | | | 15.0 | ¢ | | | 21.8 | ¢ | | | 59.5 | ¢ |
2005 | | | 11.0 | ¢ | | | 13.6 | ¢ | | | 17.4 | ¢ | | | 29.0 | ¢ | | | 71.0 | ¢ |
2006 | | | 12.5 | ¢ | | | 16.0 | ¢ | | | 19.2 | ¢ | | | 33.0 | ¢ | | | 80.7 | ¢ |
2007 | | | 14.2 | ¢ | | | 18.5 | ¢ | | | 21.5 | ¢ | | | 36.8 | ¢ | | | 91.0 | ¢ |
2008 | | | 17.9 | ¢ | | | 21.8 | ¢ | | | 26.0 | ¢ | | | 36.8 | ¢ | | | 102.4 | ¢ |
2009 | | | 18.0 | ¢ | | | 24.2 | ¢ | | | 28.0 | ¢ | | | 34.5 | ¢ | | | 104.7 | ¢ |
2010 | | | 19.8 | ¢ | | | 25.0 | ¢ | | | 32.0 | ¢ | | | 36.0 | ¢ | | | 112.8 | ¢ |
2011 | | | 21.0 | ¢ | | | 26.0 | ¢ | | | 32.0 | ¢ | | | 37.5 | ¢ | | | 116.5 | ¢ |
2012 | | | 21.5 | ¢ | | | 26.0 | ¢ | | | 28.5 | ¢ | | | 36.0 | ¢ | | | 112.0 | ¢ |
2013 | | | 21.5 | ¢ | | | 25.3 | ¢ | | | 25.0 | ¢ | | | 24.5 | ¢ | | | 96.3 | ¢ |
2014 | | | 22.5 | ¢ | | | 24.0 | ¢ | | | 27.0 | ¢ | | | 26.0 | ¢ | | | 99.5 | ¢ |
2015 | | | 16.5 | ¢ | | | 20.0 | ¢ | | | 20.0 | ¢ | | | 25.3 | ¢ | | | 81.8 | ¢ |
2016 | | | 17.0 | ¢ | | | 18.5 | ¢ | | | 19.5 | ¢ | | | | | | | | |
We do not expect each sequential quarter’s dividend to increase over that of the prior quarter, since dividend payments outside the United States tend to be seasonal. Rather, the Fund aspires to increase the dividend paid on an annual basis.
Evolution of Industry Group Exposure
Top 10 industry groups quarter by quarter (percent of equity holdings)
As of 9/30/16
| | | | |
Telecommunication Services | | | 22.7 | % |
Diversified Financials | | | 15.9 | % |
Energy | | | 8.6 | % |
Banks | | | 7.8 | % |
Pharmaceuticals, Biotechnology & Life Sciences | | | 7.4 | % |
Transportation | | | 4.5 | % |
Capital Goods | | | 4.5 | % |
Retailing | | | 4.4 | % |
Semiconductors & Semiconductor Equipment | | | 4.1 | % |
Real Estate | | | 3.1 | % |
As of 3/31/16
| | | | |
Telecommunication Services | | | 20.9 | % |
Diversified Financials | | | 10.3 | % |
Real Estate | | | 9.9 | % |
Pharmaceuticals, Biotechnology & Life Sciences | | | 9.5 | % |
Banks | | | 7.0 | % |
Energy | | | 6.1 | % |
Retailing | | | 5.6 | % |
Transportation | | | 4.3 | % |
Capital Goods | | | 3.9 | % |
Utilities | | | 3.5 | % |
As of 6/30/16
| | | | |
Telecommunication Services | | | 23.0 | % |
Diversified Financials | | | 9.5 | % |
Pharmaceuticals, Biotechnology & Life Sciences | | | 9.0 | % |
Real Estate | | | 8.7 | % |
Banks | | | 8.2 | % |
Energy | | | 6.9 | % |
Retailing | | | 4.8 | % |
Transportation | | | 4.3 | % |
Semiconductors & Semiconductor Equipment | | | 3.9 | % |
Utilities | | | 3.8 | % |
As of 12/31/15
| | | | |
Telecommunication Services | | | 21.1 | % |
Diversified Financials | | | 11.1 | % |
Real Estate | | | 9.9 | % |
Pharmaceuticals, Biotechnology & Life Sciences | | | 9.3 | % |
Banks | | | 6.8 | % |
Energy | | | 5.9 | % |
Utilities | | | 5.5 | % |
Retailing | | | 5.4 | % |
Transportation | | | 4.2 | % |
Capital Goods | | | 3.5 | % |
12 Annual Report
| | |
| SCHEDULE OF INVESTMENTS | | |
| |
Thornburg Investment Income Builder Fund | | September 30, 2016 |
| | | | | | | | |
| | | Shares/
Principal Amount | | | Value | |
COMMON STOCK — 87.93% | | | | | | | | |
AUTOMOBILES & COMPONENTS — 0.60% | | | | | | | | |
Automobiles — 0.60% | | | | | | | | |
Daimler AG | | | 1,396,100 | | | $ | 98,348,599 | |
| | | | | | | | |
| | | | | | | 98,348,599 | |
| | | | | | | | |
| | |
BANKS — 6.68% | | | | | | | | |
Banks — 6.68% | | | | | | | | |
DBS Group Holdings Ltd. | | | 25,721,200 | | | | 290,275,917 | |
ING Groep N.V. | | | 21,617,500 | | | | 266,881,217 | |
JPMorgan Chase & Co. | | | 7,329,000 | | | | 488,038,110 | |
Liechtensteinische Landesbank AG | | | 1,041,411 | | | | 41,806,515 | |
| | | | | | | | |
| | | | | | | 1,087,001,759 | |
| | | | | | | | |
| | |
CAPITAL GOODS — 3.94% | | | | | | | | |
Aerospace & Defense — 0.65% | | | | | | | | |
BAE Systems plc | | | 15,559,800 | | | | 105,679,405 | |
| | |
Construction & Engineering — 2.10% | | | | | | | | |
Bouygues SA | | | 1,793,900 | | | | 59,437,629 | |
Ferrovial SA | | | 830,000 | | | | 17,668,601 | |
Vinci S.A. | | | 3,454,595 | | | | 264,354,452 | |
| | |
Industrial Conglomerates — 1.19% | | | | | | | | |
Hopewell Holdings Ltd. | | | 37,798,340 | | | | 137,911,018 | |
NWS Holdings Ltd. | | | 34,000,000 | | | | 56,722,191 | |
| | | | | | | | |
| | | | | | | 641,773,296 | |
| | | | | | | | |
| | |
COMMERCIAL & PROFESSIONAL SERVICES — 0.56% | | | | | | | | |
Professional Services — 0.56% | | | | | | | | |
Wolters Kluwer N.V. | | | 2,130,374 | | | | 91,167,213 | |
| | | | | | | | |
| | | | | | | 91,167,213 | |
| | | | | | | | |
| | |
CONSUMER DURABLES & APPAREL — 0.24% | | | | | | | | |
Household Durables — 0.24% | | | | | | | | |
Barratt Developments plc | | | 6,100,000 | | | | 39,081,885 | |
| | | | | | | | |
| | | | | | | 39,081,885 | |
| | | | | | | | |
| | |
CONSUMER SERVICES — 1.06% | | | | | | | | |
Hotels, Restaurants & Leisure — 1.06% | | | | | | | | |
Las Vegas Sands Corp. | | | 3,011,700 | | | | 173,293,218 | |
| | | | | | | | |
| | | | | | | 173,293,218 | |
| | | | | | | | |
| | |
DIVERSIFIED FINANCIALS — 14.02% | | | | | | | | |
Capital Markets — 9.21% | | | | | | | | |
Apollo Global Management, LLC | | | 3,887,163 | | | | 69,813,447 | |
a Apollo Investment Corp. | | | 24,800,000 | | | | 143,840,000 | |
Ares Capital Corp. | | | 15,285,900 | | | | 236,931,450 | |
CME Group, Inc. | | | 4,600,000 | | | | 480,792,000 | |
GAM Holding AG | | | 3,798,882 | | | | 36,287,828 | |
KKR & Co. LP | | | 6,860,110 | | | | 97,825,169 | |
a Solar Capital Ltd. | | | 4,607,900 | | | | 94,554,108 | |
The Blackstone Group LP | | | 5,720,000 | | | | 146,031,600 | |
UBS Group AG | | | 14,116,325 | | | | 192,237,756 | |
| | |
Mortgage Real Estate Investment Trusts — 4.81% | | | | | | | | |
Chimera Investment Corp. | | | 5,707,084 | | | | 91,027,990 | |
a Dynex Capital, Inc. | | | 3,562,668 | | | | 26,434,997 | |
a Invesco Mortgage Capital, Inc. | | | 13,839,800 | | | | 210,780,154 | |
a MFA Financial, Inc. | | | 33,520,151 | | | | 250,730,729 | |
a Two Harbors Investment Corp. | | | 23,875,000 | | | | 203,653,750 | |
| | | | | | | | |
| | | | | | | 2,280,940,978 | |
| | | | | | | | |
Annual Report 13
| | |
| SCHEDULE OF INVESTMENTS, CONTINUED | | |
| |
Thornburg Investment Income Builder Fund | | September 30, 2016 |
| | | | | | | | |
| | | Shares/
Principal Amount | | | Value | |
ENERGY — 7.59% | | | | | | | | |
Oil, Gas & Consumable Fuels — 7.59% | | | | | | | | |
Eni S.p.A. | | | 12,069,800 | | | $ | 173,821,282 | |
HollyFrontier Corp. | | | 1,705,000 | | | | 41,772,500 | |
ONEOK, Inc. | | | 3,644,700 | | | | 187,301,133 | |
Royal Dutch Shell plc A Shares | | | 4,320,880 | | | | 107,193,685 | |
Royal Dutch Shell plc ADR | | | 8,777,800 | | | | 439,504,446 | |
Suncor Energy, Inc. | | | 6,120,976 | | | | 169,919,544 | |
The Williams Companies, Inc. | | | 3,757,000 | | | | 115,452,610 | |
| | | | | | | | |
| | | | | | | 1,234,965,200 | |
| | | | | | | | |
| | |
FOOD & STAPLES RETAILING — 2.55% | | | | | | | | |
Food & Staples Retailing — 2.55% | | | | | | | | |
Koninklijke Ahold Delhaize N.V. | | | 5,174,247 | | | | 117,935,364 | |
Walgreens Boots Alliance, Inc. | | | 3,681,106 | | | | 296,770,766 | |
| | | | | | | | |
| | | | | | | 414,706,130 | |
| | | | | | | | |
| | |
FOOD, BEVERAGE & TOBACCO — 2.17% | | | | | | | | |
Food Products — 1.07% | | | | | | | | |
Nestle SA | | | 2,200,000 | | | | 173,350,489 | |
| | |
Tobacco — 1.10% | | | | | | | | |
KT&G Corp. | | | 1,578,577 | | | | 179,163,867 | |
| | | | | | | | |
| | | | | | | 352,514,356 | |
| | | | | | | | |
| | |
HOUSEHOLD & PERSONAL PRODUCTS — 0.42% | | | | | | | | |
Household Products — 0.42% | | | | | | | | |
Reckitt Benckiser plc | | | 719,900 | | | | 67,789,566 | |
| | | | | | | | |
| | | | | | | 67,789,566 | |
| | | | | | | | |
| | |
INSURANCE — 2.44% | | | | | | | | |
Insurance — 2.44% | | | | | | | | |
Gjensidige Forsikring ASA | | | 2,224,776 | | | | 41,520,099 | |
Legal and General Group plc | | | 34,968,500 | | | | 99,124,463 | |
NN Group NV | | | 8,333,300 | | | | 256,029,022 | |
| | | | | | | | |
| | | | | | | 396,673,584 | |
| | | | | | | | |
| | |
MATERIALS — 1.14% | | | | | | | | |
Chemicals — 0.67% | | | | | | | | |
LyondellBasell Industries NV | | | 1,348,900 | | | | 108,802,274 | |
| | |
Metals & Mining — 0.47% | | | | | | | | |
Mining and Metallurgical Co. Norilsk Nickel PJSC ADR | | | 690,000 | | | | 11,026,200 | |
Mining and Metallurgical Co. Norilsk Nickel PJSC ADR | | | 4,119,000 | | | | 66,109,950 | |
| | | | | | | | |
| | | | | | | 185,938,424 | |
| | | | | | | | |
| | |
MEDIA — 0.70% | | | | | | | | |
Media — 0.70% | | | | | | | | |
Vivendi S.A. | | | 5,619,968 | | | | 113,321,717 | |
| | | | | | | | |
| | | | | | | 113,321,717 | |
| | | | | | | | |
| | |
PHARMACEUTICALS, BIOTECHNOLOGY & LIFE SCIENCES — 6.53% | | | | | | | | |
Pharmaceuticals — 6.53% | | | | | | | | |
Merck & Co., Inc. | | | 5,144,087 | | | | 321,042,470 | |
Novartis AG | | | 2,385,600 | | | | 187,606,629 | |
Pfizer, Inc. | | | 6,740,100 | | | | 228,287,187 | |
Roche Holding AG | | | 1,315,500 | | | | 326,336,078 | |
| | | | | | | | |
| | | | | | | 1,063,272,364 | |
| | | | | | | | |
| | |
REAL ESTATE — 2.75% | | | | | | | | |
Equity Real Estate Investment Trusts — 2.75% | | | | | | | | |
Crown Castle International Corp. | | | 1,750,000 | | | | 164,867,500 | |
Lamar Advertising Co. | | | 1,790,620 | | | | 116,945,392 | |
a Washington REIT | | | 5,300,000 | | | | 164,936,000 | |
| | | | | | | | |
| | | | | | | 446,748,892 | |
| | | | | | | | |
14 Annual Report
| | |
| SCHEDULE OF INVESTMENTS, CONTINUED | | |
| |
Thornburg Investment Income Builder Fund | | September 30, 2016 |
| | | | | | | | |
| | | Shares/
Principal Amount | | | Value | |
RETAILING — 3.84% | | | | | | | | |
Multiline Retail — 1.63% | | | | | | | | |
Target Corp. | | | 3,872,634 | | | $ | 265,972,503 | |
| | |
Specialty Retail — 2.21% | | | | | | | | |
The Home Depot, Inc. | | | 2,794,400 | | | | 359,583,392 | |
| | | | | | | | |
| | | | | | | 625,555,895 | |
| | | | | | | | |
| | |
SEMICONDUCTORS & SEMICONDUCTOR EQUIPMENT — 3.66% | | | | | | | | |
Semiconductors & Semiconductor Equipment — 3.66% | | | | | | | | |
Advanced Semiconductor Engineering, Inc. | | | 60,959,000 | | | | 73,122,407 | |
Qualcomm, Inc. | | | 2,929,200 | | | | 200,650,200 | |
Taiwan Semiconductor Manufacturing Co., Ltd. | | | 55,341,000 | | | | 322,206,776 | |
| | | | | | | | |
| | | | | | | 595,979,383 | |
| | | | | | | | |
| | |
TECHNOLOGY HARDWARE & EQUIPMENT — 0.46% | | | | | | | | |
Technology, Hardware, Storage & Peripherals — 0.46% | | | | | | | | |
Apple, Inc. | | | 659,800 | | | | 74,590,390 | |
| | | | | | | | |
| | | | | | | 74,590,390 | |
| | | | | | | | |
| | |
TELECOMMUNICATION SERVICES — 19.98% | | | | | | | | |
Diversified Telecommunication Services — 12.67% | | | | | | | | |
AT&T, Inc. | | | 6,124,000 | | | | 248,695,640 | |
BT Group plc | | | 76,675,884 | | | | 386,651,122 | |
Jasmine Broadband Internet Infrastructure Fund | | | 205,724,000 | | | | 69,465,247 | |
Koninklijke KPN N.V. | | | 86,168,500 | | | | 286,036,113 | |
Orange SA | | | 20,766,300 | | | | 324,956,396 | |
Singapore Telecommunications Ltd. | | | 82,235,215 | | | | 239,402,950 | |
Swisscom AG | | | 342,000 | | | | 162,533,608 | |
Telenor ASA | | | 20,038,200 | | | | 343,636,607 | |
| | |
Wireless Telecommunication Services — 7.31% | | | | | | | | |
China Mobile Ltd. | | | 62,938,574 | | | | 761,536,945 | |
MegaFon PJSC Reg S GDR | | | 2,522,000 | | | | 24,085,100 | |
MTN Group Ltd. | | | 9,873,310 | | | | 84,512,224 | |
Vodafone Group plc | | | 111,466,424 | | | | 320,378,055 | |
| | | | | | | | |
| | | | | | | 3,251,890,007 | |
| | | | | | | | |
| | |
TRANSPORTATION — 3.96% | | | | | | | | |
Transportation Infrastructure — 3.96% | | | | | | | | |
Atlantia S.p.A. | | | 18,526,902 | | | | 470,147,233 | |
China Merchants Holdings International Co. Ltd. | | | 32,112,830 | | | | 85,494,551 | |
Jiangsu Express Co. Ltd. | | | 18,364,000 | | | | 25,380,599 | |
Sydney Airport | | | 12,023,554 | | | | 64,139,511 | |
| | | | | | | | |
| | | | | | | 645,161,894 | |
| | | | | | | | |
| | |
UTILITIES — 2.64% | | | | | | | | |
Electric Utilities — 1.68% | | | | | | | | |
Electricite de France SA | | | 17,294,003 | | | | 210,396,658 | |
Terna Rete Elettrica Nazionale S.p.A. | | | 12,148,421 | | | | 62,612,074 | |
| | |
Multi-Utilities — 0.96% | | | | | | | | |
Dominion Resources, Inc. | | | 700,000 | | | | 51,989,000 | |
National Grid plc | | | 7,412,000 | | | | 104,909,088 | |
| | | | | | | | |
| | | | | | | 429,906,820 | |
| | | | | | | | |
TOTAL COMMON STOCK (Cost 13,258,229,230) | | | | | | | 14,310,621,570 | |
| | | | | | | | |
| | |
PREFERRED STOCK — 0.40% | | | | | | | | |
| | |
BANKS — 0.21% | | | | | | | | |
Banks — 0.21% | | | | | | | | |
Barclays Bank plc Pfd, 7.10% | | | 200,000 | | | | 5,150,000 | |
b First Tennessee Bank Pfd, 3.75% | | | 12,000 | | | | 8,632,876 | |
GMAC Capital Trust I Pfd, 8.125% | | | 628,126 | | | | 15,960,682 | |
KeyCorp Pfd, 8.625% | | | 143,295 | | | | 3,742,865 | |
| | | | | | | | |
| | | | | | | 33,486,423 | |
| | | | | | | | |
Annual Report 15
| | |
| SCHEDULE OF INVESTMENTS, CONTINUED | | |
| |
Thornburg Investment Income Builder Fund | | September 30, 2016 |
| | | | | | | | |
| | | Shares/
Principal Amount | | | Value | |
DIVERSIFIED FINANCIALS — 0.02% | | | | | | | | |
Capital Markets — 0.02% | | | | | | | | |
Morgan Stanley Pfd, 4.00% | | | 120,000 | | | $ | 2,910,000 | |
| | | | | | | | |
| | | | | | | 2,910,000 | |
| | | | | | | | |
| | |
MISCELLANEOUS — 0.06% | | | | | | | | |
U.S. Government Agencies — 0.06% | | | | | | | | |
Farm Credit Bank of Texas Pfd, 10.00% | | | 9,000 | | | | 10,687,500 | |
| | | | | | | | |
| | | | | | | 10,687,500 | |
| | | | | | | | |
| | |
TELECOMMUNICATION SERVICES — 0.11% | | | | | | | | |
Wireless Telecommunication Services — 0.11% | | | | | | | | |
b Centaur Funding Corp. Pfd, 9.08% | | | 15,000 | | | | 17,723,437 | |
| | | | | | | | |
| | | | | | | 17,723,437 | |
| | | | | | | | |
TOTAL PREFERRED STOCK (Cost 63,787,618) | | | | | | | 64,807,360 | |
| | | | | | | | |
| | |
ASSET BACKED SECURITIES — 0.22% | | | | | | | | |
| | |
COMMERCIAL MTG TRUST — 0.02% | | | | | | | | |
Citigroup Commercial Mortgage Trust, Series 2004-HYB2 Class B1, 2.951%, 3/25/2034 | | $ | 755,094 | | | | 618,495 | |
b Credit Suisse Mortgage Trust, Series 2016-BDWN Class E, 12.024%, 2/15/2029 | | | 2,000,000 | | | | 2,000,072 | |
| | | | | | | | |
| | | | | | | 2,618,567 | |
| | | | | | | | |
| | |
OTHER ASSET BACKED — 0.07% | | | | | | | | |
b Fairway Outdoor Funding, LLC, Series 2012-1 Class B, 8.835%, 10/15/2042 | | | 7,000,000 | | | | 7,300,138 | |
b JPR Royalty, LLC, 14.00%, 9/1/2020 | | | 5,000,000 | | | | 2,500,000 | |
b,c Northwind Holdings, LLC, Series 2007-1A Class A1 Floating Rate Note, 1.622%, 12/1/2037 | | | 2,406,250 | | | | 2,237,813 | |
| | | | | | | | |
| | | | | | | 12,037,951 | |
| | | | | | | | |
| | |
RESIDENTIAL MTG TRUST — 0.13% | | | | | | | | |
Banc of America Funding Corp., Series 2006-I Class SB1, 2.764%, 12/20/2036 | | | 1,738,617 | | | | 407,529 | |
Bear Stearns ARM Mortgage, Series 2003-6 Class 2B-1, 2.894%, 8/25/2033 | | | 156,259 | | | | 153,512 | |
FBR Securitization Trust, Series 2005-2 Class M1, 1.244%, 9/25/2035 | | | 11,361,661 | | | | 11,306,704 | |
Merrill Lynch Mortgage Investors Trust, Series 2004-A4 Class M1, 2.855%, 8/25/2034 | | | 5,009,825 | | | | 4,483,096 | |
Morgan Stanley Capital, Inc., Series 2005-HE7 Class A2C, 0.845%, 11/25/2035 | | | 3,464,602 | | | | 3,445,541 | |
Wells Fargo Asset Securities Corp., Series 2005-AR1 Class 1B1, 2.77%, 2/25/2035 | | | 4,096,323 | | | | 636,726 | |
| | | | | | | | |
| | | | | | | 20,433,108 | |
| | | | | | | | |
TOTAL ASSET BACKED SECURITIES (Cost 39,802,170) | | | | | | | 35,089,626 | |
| | | | | | | | |
| | |
CORPORATE BONDS — 8.51% | | | | | | | | |
| | |
AUTOMOBILES & COMPONENTS — 0.03% | | | | | | | | |
Auto Components — 0.03% | | | | | | | | |
b,d Nexteer Automotive Group Ltd., 5.875%, 11/15/2021 | | | 4,300,000 | | | | 4,558,000 | |
| | | | | | | | |
| | | | | | | 4,558,000 | |
| | | | | | | | |
| | |
BANKS — 0.08% | | | | | | | | |
Banks — 0.08% | | | | | | | | |
b,d Groupe BPCE, 12.50%, 8/29/2049 | | | 10,211,000 | | | | 12,930,802 | |
| | | | | | | | |
| | | | | | | 12,930,802 | |
| | | | | | | | |
| | |
CAPITAL GOODS — 0.26% | | | | | | | | |
Aerospace & Defense — 0.06% | | | | | | | | |
b CBC Ammo, LLC, 7.25%, 11/15/2021 | | | 9,265,000 | | | | 9,033,375 | |
| | |
Construction & Engineering — 0.09% | | | | | | | | |
b Zachry Holdings, Inc., 7.50%, 2/1/2020 | | | 15,420,000 | | | | 15,342,900 | |
| | |
Industrial Conglomerates — 0.11% | | | | | | | | |
Otter Tail Corp., 9.00%, 12/15/2016 | | | 17,000,000 | | | | 17,214,336 | |
| | | | | | | | |
| | | | | | | 41,590,611 | |
| | | | | | | | |
| | |
COMMERCIAL & PROFESSIONAL SERVICES — 0.01% | | | | | | | | |
Commercial Services & Supplies — 0.01% | | | | | | | | |
RR Donnelley, 7.625%, 6/15/2020 | | | 1,697,000 | | | | 1,837,003 | |
| | | | | | | | |
| | | | | | | 1,837,003 | |
| | | | | | | | |
16 Annual Report
| | |
| SCHEDULE OF INVESTMENTS, CONTINUED | | |
| |
Thornburg Investment Income Builder Fund | | September 30, 2016 |
| | | | | | | | |
| | | Shares/
Principal Amount | | | Value | |
CONSUMER SERVICES — 0.23% | | | | | | | | |
Diversified Consumer Services — 0.23% | | | | | | | | |
b Laureate Education, Inc., 10.00%, 9/1/2019 | | $ | 40,000,000 | | | $ | 38,100,000 | |
| | | | | | | | |
| | | | | | | 38,100,000 | |
| | | | | | | | |
| | |
DIVERSIFIED FINANCIALS — 0.46% | | | | | | | | |
Capital Markets — 0.06% | | | | | | | | |
Goldman Sachs Group, Inc., 5.625%, 1/15/2017 | | | 8,000,000 | | | | 8,094,664 | |
b Morgan Stanley (BRL), 10.09%, 5/3/2017 | | | 4,560,000 | | | | 1,379,014 | |
| | |
Consumer Finance — 0.06% | | | | | | | | |
First Cash Financial Services, Inc., 6.75%, 4/1/2021 | | | 10,395,000 | | | | 10,862,775 | |
| | |
Diversified Financial Services — 0.34% | | | | | | | | |
Bank of America Corp. (BRL), 10.75%, 8/20/2018 | | | 5,000,000 | | | | 1,530,818 | |
b,d CFG Holdings Ltd./CFG Finance, LLC, 11.50%, 11/15/2019 | | | 27,634,000 | | | | 28,324,850 | |
JPMorgan Chase & Co., 7.90%, 12/29/2049 | | | 15,000,000 | | | | 15,412,500 | |
National Rural Utilities Cooperative Finance Corp., 10.375%, 11/1/2018 | | | 5,000,000 | | | | 5,912,305 | |
b TMX Finance, LLC/Titlemax Finance, 8.50%, 9/15/2018 | | | 5,385,000 | | | | 4,011,825 | |
| | | | | | | | |
| | | | | | | 75,528,751 | |
| | | | | | | | |
| | |
ENERGY — 2.50% | | | | | | | | |
Energy Equipment & Services — 0.01% | | | | | | | | |
b,d,e Schahin II Finance Co. (SPV) Ltd., 5.875%, 9/25/2023 | | | 11,640,133 | | | | 1,396,816 | |
| | |
Oil, Gas & Consumable Fuels — 2.49% | | | | | | | | |
Calumet Specialty Products Partners, LP, 7.625%, 1/15/2022 | | | 6,550,000 | | | | 5,289,125 | |
Calumet Specialty Products Partners, LP, 6.50%, 4/15/2021 | | | 15,010,000 | | | | 12,270,675 | |
Calumet Specialty Products Partners, LP, 7.75%, 4/15/2023 | | | 5,000,000 | | | | 4,000,000 | |
b Citgo Petroleum Corp., 6.25%, 8/15/2022 | | | 27,000,000 | | | | 26,325,000 | |
b DCP Midstream, LLC, 9.75%, 3/15/2019 | | | 5,000,000 | | | | 5,560,000 | |
Enbridge Energy Partners LP, 9.875%, 3/1/2019 | | | 9,750,000 | | | | 11,353,573 | |
Energy Transfer Partners LP, 3.774%, 11/1/2066 | | | 13,820,000 | | | | 9,397,600 | |
Enterprise Products Operating LP, 7.034%, 1/15/2068 | | | 14,480,000 | | | | 15,302,319 | |
Gastar Exploration USA, Inc., 8.625%, 5/15/2018 | | | 7,782,000 | | | | 6,536,880 | |
b,d Gaz Capital SA, 8.146%, 4/11/2018 | | | 2,000,000 | | | | 2,161,016 | |
HollyFrontier Corp., 5.875%, 4/1/2026 | | | 25,000,000 | | | | 27,081,575 | |
Kinder Morgan Energy Partners LP, 9.00%, 2/1/2019 | | | 8,000,000 | | | | 9,168,920 | |
Kinder Morgan Energy Partners LP, 5.00%, 3/1/2043 | | | 10,000,000 | | | | 9,405,950 | |
Kinder Morgan Energy Partners LP, 5.80%, 3/15/2035 | | | 10,000,000 | | | | 10,376,260 | |
Kinder Morgan, Inc., 5.30%, 12/1/2034 | | | 23,630,000 | | | | 23,558,519 | |
Kinder Morgan, Inc., 5.55%, 6/1/2045 | | | 5,000,000 | | | | 5,129,455 | |
b,e Linc Energy, 12.50%, 10/31/2017 | | | 22,791,000 | | | | 228 | |
b,e Linc Energy, 9.625%, 10/31/2017 | | | 19,433,000 | | | | 3,886,600 | |
NuStar Logistics LP, 8.15%, 4/15/2018 | | | 18,000,000 | | | | 19,440,000 | |
b,d Odebrecht Offshore Drilling Finance Ltd., 6.75%, 10/1/2023 | | | 19,809,103 | | | | 3,664,684 | |
ONEOK Partners LP, 8.625%, 3/1/2019 | | | 8,000,000 | | | | 9,073,984 | |
b,d Petro Co., Trinidad Tobago Ltd., 9.75%, 8/14/2019 | | | 4,000,000 | | | | 4,430,000 | |
e,f RAAM Global Energy Co., 12.50%, 10/1/2049 | | | 15,000,000 | | | | 150,000 | |
Summit Midstream Holdings, LLC, 5.50%, 8/15/2022 | | | 8,172,000 | | | | 7,783,830 | |
Teppco Partners LP, 7.00%, 6/1/2067 | | | 7,000,000 | | | | 5,822,320 | |
The Williams Companies, Inc., 3.70%, 1/15/2023 | | | 29,129,000 | | | | 28,255,130 | |
The Williams Companies, Inc., 4.55%, 6/24/2024 | | | 69,318,000 | | | | 70,673,167 | |
The Williams Companies, Inc., 5.75%, 6/24/2044 | | | 14,198,000 | | | | 14,623,940 | |
b Transcontinental Gas Pipe Line Co., LLC, 7.85%, 2/1/2026 | | | 32,700,000 | | | | 42,334,761 | |
b,d Tullow Oil plc, 6.25%, 4/15/2022 | | | 13,500,000 | | | | 12,082,500 | |
| | | | | | | | |
| | | | | | | 406,534,827 | |
| | | | | | | | |
| | |
FOOD & STAPLES RETAILING — 0.17% | | | | | | | | |
Food & Staples Retailing — 0.17% | | | | | | | | |
b Bakkavor Finance (2) plc (GBP), 8.75%, 6/15/2020 | | | 14,132,000 | | | | 19,507,800 | |
b C&S Group Enterprises, LLC, 5.375%, 7/15/2022 | | | 7,860,000 | | | | 7,742,100 | |
| | | | | | | | |
| | | | | | | 27,249,900 | |
| | | | | | | | |
| | |
FOOD, BEVERAGE & TOBACCO — 0.20% | | | | | | | | |
Beverages — 0.04% | | | | | | | | |
Ambev International Finance Co., Ltd. (BRL), 9.50%, 7/24/2017 | | | 21,669,000 | | | | 6,629,662 | |
Annual Report 17
| | |
| SCHEDULE OF INVESTMENTS, CONTINUED | | |
| |
Thornburg Investment Income Builder Fund | | September 30, 2016 |
| | | | | | | | |
| | | Shares/
Principal Amount | | | Value | |
Food Products — 0.04% | | | | | | | | |
b,d BRF S.A., 4.75%, 5/22/2024 | | $ | 6,000,000 | | | $ | 6,135,000 | |
| | |
Tobacco — 0.12% | | | | | | | | |
Vector Group Ltd., 7.75%, 2/15/2021 | | | 18,400,000 | | | | 19,406,480 | |
| | | | | | | | |
| | | | | | | 32,171,142 | |
| | | | | | | | |
| | |
HEALTH CARE EQUIPMENT & SERVICES — 0.03% | | | | | | | | |
Health Care Providers & Services — 0.03% | | | | | | | | |
b Quorum Health Corp., 11.625%, 4/15/2023 | | | 5,930,000 | | | | 4,921,900 | |
| | | | | | | | |
| | | | | | | 4,921,900 | |
| | | | | | | | |
| | |
HOUSEHOLD & PERSONAL PRODUCTS — 0.05% | | | | | | | | |
Household Products — 0.05% | | | | | | | | |
b Energizer Holdings, Inc., 5.50%, 6/15/2025 | | | 7,500,000 | | | | 7,725,000 | |
| | | | | | | | |
| | | | | | | 7,725,000 | |
| | | | | | | | |
| | |
INSURANCE — 0.96% | | | | | | | | |
Insurance — 0.96% | | | | | | | | |
b,d Dai Ichi Mutual Life Insurance Co., Ltd., 7.25%, 12/29/2049 | | | 9,000,000 | | | | 10,597,500 | |
ELM B.V. (AUD), 7.635%, 12/29/2049 | | | 10,500,000 | | | | 8,213,853 | |
ELM B.V. (AUD), 3.295%, 4/29/2049 | | | 8,000,000 | | | | 6,046,264 | |
Genworth Holdings, Inc., 4.90%, 8/15/2023 | | | 24,020,000 | | | | 19,996,650 | |
Hartford Financial Services Group, 8.125%, 6/15/2068 | | | 9,650,000 | | | | 10,542,625 | |
b MetLife Capital Trust X, 9.25%, 4/8/2068 | | | 12,000,000 | | | | 17,264,400 | |
MetLife, Inc., 6.817%, 8/15/2018 | | | 4,000,000 | | | | 4,392,712 | |
b National Life Insurance of Vermont, 10.50%, 9/15/2039 | | | 2,000,000 | | | | 3,066,960 | |
b,d QBE Capital Funding III Ltd., 7.25%, 5/24/2041 | | | 40,000,000 | | | | 45,550,000 | |
b,d Sirius International Group, 7.506%, 5/29/2049 | | | 28,590,000 | | | | 28,772,976 | |
b ZFS Finance USA Trust V, 6.50%, 5/9/2067 | | | 1,260,000 | | | | 1,271,907 | |
| | | | | | | | |
| | | | | | | 155,715,847 | |
| | | | | | | | |
| | |
MATERIALS — 0.33% | | | | | | | | |
Chemicals — 0.07% | | | | | | | | |
b,d Consolidated Energy Finance S.A., 6.75%, 10/15/2019 | | | 11,000,000 | | | | 10,862,500 | |
| | |
Construction Materials — 0.18% | | | | | | | | |
b,d Cimpor Financial Operations B.V., 5.75%, 7/17/2024 | | | 17,985,000 | | | | 15,377,175 | |
CRH America, Inc., 8.125%, 7/15/2018 | | | 12,000,000 | | | | 13,274,556 | |
| | |
Metals & Mining — 0.09% | | | | | | | | |
b International Wire Group, Inc., 10.75%, 8/1/2021 | | | 15,780,000 | | | | 15,030,450 | |
| | | | | | | | |
| | | | | | | 54,544,681 | |
| | | | | | | | |
| | |
MEDIA — 0.46% | | | | | | | | |
Media — 0.46% | | | | | | | | |
Comcast Cable Communications, LLC, 8.875%, 5/1/2017 | | | 5,000,000 | | | | 5,215,480 | |
b EMI Music Publishing Ltd., 7.625%, 6/15/2024 | | | 5,000,000 | | | | 5,406,250 | |
b,d Mood Media Corp., 9.25%, 10/15/2020 | | | 18,445,000 | | | | 14,387,100 | |
b,d SFR Group SA, 7.375%, 5/1/2026 | | | 33,480,000 | | | | 34,222,921 | |
Time Warner Cable, Inc., 8.75%, 2/14/2019 | | | 14,000,000 | | | | 16,145,626 | |
| | | | | | | | |
| | | | | | | 75,377,377 | |
| | | | | | | | |
| | |
PHARMACEUTICALS, BIOTECHNOLOGY & LIFE SCIENCES — 0.05% | | | | | | | | |
Pharmaceuticals — 0.05% | | | | | | | | |
b,d Concordia International Corp., 7.00%, 4/15/2023 | | | 11,400,000 | | | | 7,324,500 | |
b,d Concordia International Corp., 9.50%, 10/21/2022 | | | 2,000,000 | | | | 1,385,000 | |
| | | | | | | | |
| | | | | | | 8,709,500 | |
| | | | | | | | |
| | |
SOFTWARE & SERVICES — 0.32% | | | | | | | | |
Information Technology Services — 0.06% | | | | | | | | |
Neustar, Inc., 4.50%, 1/22/2019 | | | 11,185,000 | | | | 10,010,575 | |
| | |
Internet Software & Services — 0.05% | | | | | | | | |
b,c Yahoo!, Inc., 6.65%, 8/10/2026 | | | 6,882,889 | | | | 7,605,592 | |
| | |
Software — 0.21% | | | | | | | | |
18 Annual Report
| | |
| SCHEDULE OF INVESTMENTS, CONTINUED | | |
| |
Thornburg Investment Income Builder Fund | | September 30, 2016 |
| | | | | | | | |
| | | Shares/
Principal Amount | | | Value | |
b Solera Capital, LLC, 10.50%, 3/1/2024 | | $ | 31,000,000 | | | $ | 34,565,000 | |
| | | | | | | | |
| | | | | | | 52,181,167 | |
| | | | | | | | |
| | |
TELECOMMUNICATION SERVICES — 1.64% | | | | | | | | |
Diversified Telecommunication Services — 1.03% | | | | | | | | |
d Deutsche Telekom International Finance BV, 8.75%, 6/15/2030 | | | 26,150,000 | | | | 40,647,456 | |
Qwest Corp., 6.75%, 12/1/2021 | | | 9,000,000 | | | | 10,023,750 | |
d Telefonica Emisiones SAU, 6.221%, 7/3/2017 | | | 2,770,000 | | | | 2,867,138 | |
d Telefonica Emisiones SAU, 7.045%, 6/20/2036 | | | 85,390,000 | | | | 112,014,431 | |
b,d,e Telemar Norte Leste SA, 0%, 10/23/2020 | | | 9,065,000 | | | | 2,311,575 | |
| | |
Wireless Telecommunication Services — 0.61% | | | | | | | | |
b,d Digicel Ltd., 6.00%, 4/15/2021 | | | 69,037,000 | | | | 60,987,286 | |
b,d Millicom International Cellular S.A., 6.00%, 3/15/2025 | | | 28,423,000 | | | | 28,781,130 | |
b,d VimpelCom Holdings B.V., 7.504%, 3/1/2022 | | | 8,735,000 | | | | 9,783,200 | |
| | | | | | | | |
| | | | | | | 267,415,966 | |
| | | | | | | | |
| | |
TRANSPORTATION — 0.13% | | | | | | | | |
Airlines — 0.13% | | | | | | | | |
American Airlines Group, Inc., 4.95%, 7/15/2024 | | | 4,255,282 | | | | 4,627,619 | |
b,d Guanay Finance Ltd., 6.00%, 12/15/2020 | | | 13,419,196 | | | | 13,704,354 | |
US Airways, 6.25%, 10/22/2024 | | | 2,031,616 | | | | 2,300,805 | |
| | | | | | | | |
| | | | | | | 20,632,778 | |
| | | | | | | | |
| | |
UTILITIES — 0.60% | | | | | | | | |
Electric Utilities — 0.36% | | | | | | | | |
Arizona Public Service Co., 8.75%, 3/1/2019 | | | 6,500,000 | | | | 7,594,372 | |
b,d Enel Finance International S.A., 6.25%, 9/15/2017 | | | 40,000,000 | | | | 41,763,200 | |
Entergy Gulf States Louisiana, LLC, 6.00%, 5/1/2018 | | | 8,000,000 | | | | 8,529,872 | |
b Great River Energy, 5.829%, 7/1/2017 | | | 249,461 | | | | 255,880 | |
| | |
Multi-Utilities — 0.24% | | | | | | | | |
Ameren Illinois Co., 9.75%, 11/15/2018 | | | 5,000,000 | | | | 5,835,545 | |
b Enable Oklahoma Intrastate Transmission, LLC, 6.25%, 3/15/2020 | | | 2,500,000 | | | | 2,681,613 | |
NiSource Finance Corp., 6.40%, 3/15/2018 | | | 20,000,000 | | | | 21,350,820 | |
Sempra Energy, 9.80%, 2/15/2019 | | | 7,750,000 | | | | 9,174,822 | |
| | | | | | | | |
| | | | | | | 97,186,124 | |
| | | | | | | | |
TOTAL CORPORATE BONDS (Cost 1,287,845,247) | | | | | | | 1,384,911,376 | |
| | | | | | | | |
| | |
MUNICIPAL BONDS — 0.02% | | | | | | | | |
San Bernardino County California Redevelopment Agency (San Sevaine), 8.45%, 9/1/2030 | | | 2,555,000 | | | | 3,024,635 | |
| | | | | | | | |
TOTAL MUNICIPAL BONDS (Cost 2,507,551) | | | | | | | 3,024,635 | |
| | | | | | | | |
| | |
OTHER GOVERNMENT— 0.04% | | | | | | | | |
Federative Republic of Brazil (BRL), 12.50%, 1/5/2022 | | | 20,000,000 | | | | 6,795,505 | |
| | | | | | | | |
TOTAL OTHER GOVERNMENT (Cost 12,816,857) | | | | | | | 6,795,505 | |
| | | | | | | | |
| | |
LOAN PARTICIPATIONS — 1.19% | | | | | | | | |
| | |
CONSUMER SERVICES — 0.14% | | | | | | | | |
Diversified Consumer Services — 0.14% | | | | | | | | |
Laureate Education, Inc., 8.157%, 3/17/2021 | | | 23,171,729 | | | | 23,026,905 | |
| | |
FOOD, BEVERAGE & TOBACCO — 0.05% | | | | | | | | |
Tobacco — 0.05% | | | | | | | | |
North Atlantic Trading Co., Inc., 9.00%, 1/13/2020 | | | 8,689,702 | | | | 8,591,943 | |
| | |
INDUSTRIALS — 0.09% | | | | | | | | |
Construction & Engineering — 0.09% | | | | | | | | |
ABG Intermediate Holdings (2), LLC, 9.50%, 5/27/2022 | | | 15,710,047 | | | | 15,317,296 | |
| | |
MEDIA — 0.05% | | | | | | | | |
Media — 0.05% | | | | | | | | |
d Mood Media Corp., 7.00%, 5/1/2019 | | | 8,383,752 | | | | 7,925,244 | |
Annual Report 19
| | |
| SCHEDULE OF INVESTMENTS, CONTINUED | | |
| |
Thornburg Investment Income Builder Fund | | September 30, 2016 |
| | | | | | | | |
| | | Shares/
Principal Amount | | | Value | |
PHARMACEUTICALS, BIOTECHNOLOGY & LIFE SCIENCES — 0.21% | | | | | | | | |
Pharmaceuticals — 0.21% | | | | | | | | |
d Concordia Healthcare Corp., 9.50%, 10/21/2017 | | $ | 33,610,960 | | | $ | 33,905,056 | |
| | |
RETAILING — 0.21% | | | | | | | | |
Specialty Retail — 0.21% | | | | | | | | |
Redbox Automated Retail, LLC, 8.50%, 9/24/2021 | | | 35,000,000 | | | | 34,125,000 | |
| | |
SOFTWARE & SERVICES — 0.17% | | | | | | | | |
Information Technology Services — 0.17% | | | | | | | | |
Neustar, Inc., 3.774%, 1/22/2019 | | | 28,378,350 | | | | 28,271,931 | |
| | |
TECHNOLOGY HARDWARE & EQUIPMENT — 0.12% | | | | | | | | |
Technology, Hardware, Storage & Peripherals — 0.12% | | | | | | | | |
Harland Clarke Holdings Corp., 7.00%, 12/31/2019 | | | 19,500,000 | | | | 19,105,125 | |
| | |
TRANSPORTATION — 0.11% | | | | | | | | |
Airlines — 0.11% | | | | | | | | |
b,c,d,e ET Three, LLC, 12.00%, 9/30/2019 | | | 2,201,115 | | | | 1,756,490 | |
b,c,d,e ET Two, LLC, 12.00%, 9/30/2019 | | | 2,201,115 | | | | 1,756,490 | |
b,c,d,e OS Two, LLC, 12.00%, 12/15/2020 | | | 3,211,200 | | | | 2,562,537 | |
b,c,g WU Finance I, LLC, 8.50%, 08/17/2025 | | | 12,210,435 | | | | 12,062,244 | |
| | |
UTILITIES — 0.04% | | | | | | | | |
Electric Utilities — 0.04% | | | | | | | | |
e,f Texas Competitive Electric Holdings Co., LLC, 4.933%, 10/10/2016 | | | 20,669,860 | | | | 5,887,190 | |
| | | | | | | | |
TOTAL LOAN PARTICIPATIONS (Cost 211,093,176) | | | | | | | 194,293,451 | |
| | | | | | | | |
| | |
SHORT TERM INVESTMENTS — 1.44% | | | | | | | | |
a Thornburg Capital Management Fund | | | 23,399,287 | | | | 233,992,871 | |
| | | | | | | | |
TOTAL SHORT TERM INVESTMENTS (Cost 233,992,871) | | | | | | | 233,992,871 | |
| | | | | | | | |
TOTAL INVESTMENTS — 99.75% (Cost 15,110,074,720) | | | | | | $ | 16,233,536,394 | |
OTHER ASSETS LESS LIABILITIES — (0.25)% | | | | | | | 40,953,474 | |
| | | | | | | | |
NET ASSETS — 100.00% | | | | | | $ | 16,274,489,868 | |
| | | | | | | | |
Footnote Legend
| a | Investment in Affiliates - Shown below are holdings of voting securities of each portfolio company which is considered “affiliated” to the Fund under the Investment Company Act of 1940, including companies for which the Fund’s holding represented 5% or more of the company’s voting securities, and a series of the Thornburg Investment Trust in which the Fund invested for cash management purposes during the period: |
| | | | | | | | | | | | | | | | | | | | | | | | | | | | |
Issuer | | Shares/Principal
September 30,
2015 | | | Gross
Additions | | | Gross
Reductions | | | Shares/Principal
September 30,
2016 | | | Market Value
September 30,
2016 | | | Investment
Income | | | Realized
Gain (Loss) | |
Apollo Investment Corp. | | | 24,800,000 | | | | — | | | | — | | | | 24,800,000 | | | $ | 143,840,000 | | | $ | 12,090,000 | | | $ | — | |
Dynex Capital, Inc. | | | 4,418,542 | | | | — | | | | 855,874 | | | | 3,562,668 | | | | 26,434,997 | | | | 3,461,227 | | | | (2,553,346 | ) |
Invesco Mortgage Capital, Inc. | | | 15,851,700 | | | | — | | | | 2,011,900 | | | | 13,839,800 | | | | 210,780,154 | | | | 24,457,960 | | | | (11,541,386 | ) |
Jasmine Broadband Internet | | | | | | | | | | | | | | | | | | | | | | | | | | | | |
Infrastructure Fund* | | | 359,941,200 | | | | | | | | 154,217,200 | | | | | | | | | | | | 8,346,757 | | | | (7,138,236 | ) |
MFA Financial, Inc. | | | 33,531,700 | | | | 1,910,200 | | | | 1,921,749 | | | | 33,520,151 | | | | 250,730,729 | | | | 27,863,170 | | | | (2,814,719 | ) |
Solar Capital Ltd. | | | 4,607,900 | | | | — | | | | — | | | | 4,607,900 | | | | 94,554,108 | | | | 7,372,640 | | | | — | |
TDC A/S* | | | 45,566,900 | | | | | | | | 45,566,900 | | | | | | | | | | | | | | | | (114,514,295 | ) |
Thornburg Capital Management Fund | | | 55,637,891 | | | | 312,099,738 | | | | 344,338,342 | | | | 23,399,287 | | | | 233,992,871 | | | | 1,447,463 | | | | — | |
Two Harbors Investment Corp. | | | 20,272,500 | | | | 4,190,200 | | | | 587,700 | | | | 23,875,000 | | | | 203,653,750 | | | | 22,596,198 | | | | (1,836,406 | ) |
Washington REIT | | | 5,721,000 | | | | — | | | | 421,000 | | | | 5,300,000 | | | | 164,936,000 | | | | 5,181,228 | | | | 480,720 | |
| | | | | | | | | | | | | | | | | | | | | | | | | | | | |
Total non-controlled affiliated issuers - 8.17% of net assets | | | | | | | | | | | | | | | | | | $ | 1,328,922,609 | | | $ | 112,816,643 | | | $ | (139,917,668 | ) |
| | | | | | | | | | | | | | | | | | | | | | | | | | | | |
| * | Issuers not affiliated at September 30, 2016. |
| b | Securities exempt from registration under Rule 144A of the Securities Act of 1933, as amended. These securities may only be resold in the ordinary course of business in transactions exempt from registration, normally to qualified institutional buyers. As of September 30, 2016, the aggregate value of these securities in the Fund’s portfolio was 733,070,823, representing 4.52% of the Fund’s net assets. |
| c | Security currently fair valued by the Valuation and Pricing Committee using procedures approved by the Trustees’ Audit Committee. |
20 Annual Report
| | |
| SCHEDULE OF INVESTMENTS, CONTINUED | | |
| |
Thornburg Investment Income Builder Fund | | September 30, 2016 |
| d | Yankee bond denominated in U.S. dollars and is issued in the U.S. by foreign banks and corporations. |
| g | Loan participation with unfunded commitment outstanding of $2,608,695. |
Portfolio Abbreviations
To simplify the listings of securities, abbreviations are used per the table below:
| | |
| ADR | | American Depositary Receipt |
| ARM | | Adjustable Rate Mortgage |
| AUD | | Denominated in Australian Dollars |
| BRL | | Denominated in Brazilian Real |
| CHL | | Denominated in Chilean Peso |
| GBP | | Denominated in Great Britain Pounds |
| GDR | | Global Depository Receipt |
| MFA | | Mortgage Finance Authority |
| MTN | | Medium-Term Note |
| Pfd | | Preferred Stock |
| REIT | | Real Estate Investment Trust |
| SPV | | Special Purpose Vehicle |
See notes to financial statements.
Annual Report 21
| | |
| STATEMENT OF ASSETS AND LIABILITIES | | |
| |
Thornburg Investment Income Builder Fund | | September 30, 2016 |
| | | | |
ASSETS | | | | |
Investments at value (Note 3) | | | | |
Non-affiliated issuers (cost $13,743,457,944) | | $ | 14,904,613,785 | |
Non-controlled affiliated issuers (cost $1,366,616,776) | | | 1,328,922,609 | |
Cash | | | 3,596,318 | |
Cash denominated in foreign currency (cost $10,878,191) | | | 10,874,123 | |
Receivable for investments sold | | | 39,630,199 | |
Receivable for fund shares sold | | | 16,326,765 | |
Unrealized appreciation on forward currency contracts (Note 7) | | | 30,724,332 | |
Dividends receivable | | | 33,045,490 | |
Dividend and interest reclaim receivable | | | 24,455,935 | |
Interest receivable | | | 30,839,363 | |
Prepaid expenses and other assets | | | 300,119 | |
| | | | |
Total Assets | | | 16,423,329,038 | |
| | | | |
| |
LIABILITIES | | | | |
Payable for investments purchased | | | 82,111,367 | |
Payable for fund shares redeemed | | | 33,834,881 | |
Unrealized depreciation on forward currency contracts (Note 7) | | | 6,803,264 | |
Payable to investment advisor and other affiliates (Note 4) | | | 15,660,158 | |
Deferred taxes payable | | | 1,513,986 | |
Accounts payable and accrued expenses | | | 2,126,153 | |
Dividends payable | | | 6,789,361 | |
| | | | |
Total Liabilities | | | 148,839,170 | |
| | | | |
| |
NET ASSETS | | $ | 16,274,489,868 | |
| | | | |
NET ASSETS CONSIST OF | | | | |
Undistributed net investment income | | $ | 28,786,241 | |
Net unrealized appreciation on investments | | | 1,145,759,674 | |
Accumulated net realized gain (loss) | | | (1,059,472,370 | ) |
Net capital paid in on shares of beneficial interest | | | 16,159,416,323 | |
| | | | |
| | $ | 16,274,489,868 | |
| | | | |
22 Annual Report
| | |
| STATEMENT OF ASSETS AND LIABILITIES, CONTINUED |
| |
Thornburg Investment Income Builder Fund | | September 30, 2016 |
| | | | |
NET ASSET VALUE | | | | |
Class A Shares: | | | | |
Net asset value and redemption price per share ($3,778,862,777 applicable to 190,618,151 shares of beneficial interest outstanding - Note 5) | | $ | 19.82 | |
Maximum sales charge, 4.50% of offering price | | | 0.93 | |
| | | | |
Maximum offering price per share | | $ | 20.75 | |
| | | | |
| |
Class C Shares: | | | | |
Net asset value and offering price per share* ($5,356,152,380 applicable to 270,355,291 shares of beneficial interest outstanding - Note 5) | | $ | 19.81 | |
| | | | |
| |
Class I Shares: | | | | |
Net asset value, offering and redemption price per share ($6,928,783,377 applicable to 347,019,597 shares of beneficial interest outstanding - Note 5) | | $ | 19.97 | |
| | | | |
| |
Class R3 Shares: | | | | |
Net asset value, offering and redemption price per share ($78,188,316 applicable to 3,945,310 shares of beneficial interest outstanding - Note 5) | | $ | 19.82 | |
| | | | |
| |
Class R4 Shares: | | | | |
Net asset value, offering and redemption price per share ($45,967,691 applicable to 2,315,507 shares of beneficial interest outstanding - Note 5) | | $ | 19.85 | |
| | | | |
| |
Class R5 Shares: | | | | |
Net asset value, offering and redemption price per share ($86,535,327 applicable to 4,336,711 shares of beneficial interest outstanding - Note 5) | | $ | 19.95 | |
| | | | |
| * | Redemption price per share is equal to net asset value less any applicable contingent deferred sales charge. |
See notes to financial statements.
Annual Report 23
| | |
| STATEMENT OF OPERATIONS | | |
| |
Thornburg Investment Income Builder Fund | | Year Ended September 30, 2016 |
| | | | |
INVESTMENT INCOME | | | | |
Dividend income | | | | |
Non-affiliated issuers (net of foreign taxes withheld of $60,154,158) | | $ | 768,096,608 | |
Non-controlled affiliated issuers | | | 112,816,643 | |
Interest income (net of premium amortized of $1,360,559) | | | 134,108,461 | |
| | | | |
Total Income | | | 1,015,021,712 | |
| | | | |
| |
EXPENSES | | | | |
Investment advisory fees (Note 4) | | | 116,583,200 | |
Administration fees (Note 4) | | | | |
Class A Shares | | | 4,951,144 | |
Class C Shares | | | 7,020,340 | |
Class I Shares | | | 3,557,567 | |
Class R3 Shares | | | 99,610 | |
Class R4 Shares | | | 55,271 | |
Class R5 Shares | | | 42,493 | |
Distribution and service fees (Note 4) | | | | |
Class A Shares | | | 9,898,347 | |
Class C Shares | | | 56,144,487 | |
Class R3 Shares | | | 397,529 | |
Class R4 Shares | | | 108,941 | |
Transfer agent fees | | | | |
Class A Shares | | | 3,215,025 | |
Class C Shares | | | 4,586,455 | |
Class I Shares | | | 5,982,678 | |
Class R3 Shares | | | 192,553 | |
Class R4 Shares | | | 153,682 | |
Class R5 Shares | | | 229,955 | |
Registration and filing fees | | | | |
Class A Shares | | | 61,007 | |
Class C Shares | | | 62,714 | |
Class I Shares | | | 121,390 | |
Class R3 Shares | | | 3,660 | |
Class R4 Shares | | | 18,278 | |
Class R5 Shares | | | 23,566 | |
Custodian fees (Note 2) | | | 2,804,133 | |
Professional fees | | | 384,790 | |
Accounting fees (Note 4) | | | 637,990 | |
Trustee fees | | | 751,300 | |
Other expenses | | | 1,052,929 | |
| | | | |
Total Expenses | | | 219,141,034 | |
Less: | | | | |
Expenses reimbursed by investment advisor (Note 4) | | | (1,898,571 | ) |
| | | | |
Net Expenses | | | 217,242,463 | |
| | | | |
Net Investment Income | | $ | 797,779,249 | |
| | | | |
24 Annual Report
| | |
| STATEMENT OF OPERATIONS, CONTINUED | | |
| |
Thornburg Investment Income Builder Fund | | Year Ended September 30, 2016 |
| | | | |
REALIZED AND UNREALIZED GAIN (LOSS) | | | | |
Net realized gain (loss) from: | | | | |
Investments | | | | |
Non-affiliated issuers (net of realized capital gain taxes paid of $23,531) | | $ | (904,891,131 | ) |
Non-controlled affiliated issuers | | | (139,917,668 | ) |
Foreign currency contracts (Note 7) | | | 134,158,769 | |
Foreign currency transactions | | | (8,326,328 | ) |
| | | | |
| | | (918,976,358 | ) |
| | | | |
Net change in unrealized appreciation (depreciation) on: | | | | |
Investments | | | | |
Non-affiliated issuers (net of deferred capital gain taxes of $770,203) | | | 1,099,567,303 | |
Non-controlled affiliated issuers | | | 272,208,164 | |
Foreign currency contracts (Note 7) | | | 43,254,249 | |
Foreign currency translations | | | 1,754,298 | |
| | | | |
| | | 1,416,784,014 | |
| | | | |
Net Realized and Unrealized Gain | | | 497,807,656 | |
| | | | |
Net Increase in Net Assets Resulting from Operations | | $ | 1,295,586,905 | |
| | | | |
See notes to financial statements.
Annual Report 25
| | |
| STATEMENTS OF CHANGES IN NET ASSETS | | |
| |
Thornburg Investment Income Builder Fund | | |
| | | | | | | | |
| | | Year Ended
September 30, 2016 | | | Year Ended
September 30, 2015 | |
INCREASE (DECREASE) IN NET ASSETS FROM | | | | | | | | |
| | |
OPERATIONS | | | | | | | | |
Net investment income | | $ | 797,779,249 | | | $ | 747,432,600 | |
Net realized gain (loss) from investments, forward currency contracts, and foreign currency transactions | | | (918,976,358 | ) | | | 284,086,721 | |
Net unrealized appreciation (depreciation) on investments, forward currency contracts and foreign currency translations | | | 1,416,784,014 | | | | (2,463,361,330 | ) |
| | | | | | | | |
| | |
Net Increase (Decrease) in Net Assets Resulting from Operations | | | 1,295,586,905 | | | | (1,431,842,009 | ) |
| | |
DIVIDENDS TO SHAREHOLDERS | | | | | | | | |
From net investment income | | | | | | | | |
Class A Shares | | | (165,152,557 | ) | | | (180,681,373 | ) |
Class C Shares | | | (194,621,516 | ) | | | (202,366,869 | ) |
Class I Shares | | | (318,850,073 | ) | | | (329,515,668 | ) |
Class R3 Shares | | | (3,068,837 | ) | | | (3,040,478 | ) |
Class R4 Shares | | | (1,745,250 | ) | | | (1,592,222 | ) |
Class R5 Shares | | | (3,692,411 | ) | | | (3,132,039 | ) |
| | |
FUND SHARE TRANSACTIONS (NOTE 5) | | | | | | | | |
Class A Shares | | | (621,247,635 | ) | | | 185,220,853 | |
Class C Shares | | | (754,505,642 | ) | | | 354,009,401 | |
Class I Shares | | | (797,345,150 | ) | | | 916,835,216 | |
Class R3 Shares | | | (4,651,940 | ) | | | 5,970,486 | |
Class R4 Shares | | | 1,865,239 | | | | 7,486,131 | |
Class R5 Shares | | | 4,254,268 | | | | 23,425,938 | |
| | | | | | | | |
Net Decrease in Net Assets | | | (1,563,174,599 | ) | | | (659,222,633 | ) |
| | |
NET ASSETS | | | | | | | | |
Beginning of Year | | | 17,837,664,467 | | | | 18,496,887,100 | |
| | | | | | | | |
| | |
End of Year | | $ | 16,274,489,868 | | | $ | 17,837,664,467 | |
| | | | | | | | |
Undistributed net investment income | | $ | 28,786,241 | | | $ | 104,418,225 | |
See notes to financial statements.
26 Annual Report
| | |
| NOTES TO FINANCIAL STATEMENTS | | |
| |
Thornburg Investment Income Builder Fund | | September 30, 2016 |
NOTE 1 – ORGANIZATION
Thornburg Investment Income Builder Fund (the “Fund”) is a diversified series of Thornburg Investment Trust (the “Trust”). The Trust is organized as a Massachusetts business trust under a Declaration of Trust dated June 3, 1987 and is registered as a diversified, open-end management investment company under the Investment Company Act of 1940, as amended. The Fund is currently one of twenty separate series of the Trust. Each series is considered to be a separate entity for financial reporting and tax purposes and bears expenses directly attributable to it. The Fund’s primary investment goal is to provide a level of current income which exceeds the average yield on U.S. stocks generally, and which will generally grow, subject to periodic fluctuations, over the years on a per share basis. The Fund’s secondary investment goal is long-term capital appreciation.
The Fund currently offers six classes of shares of beneficial interest: Class A, Class C, Institutional Class (“Class I”), and Retirement Classes (“Class R3,” “Class R4,” and “Class R5”). Each class of shares of the Fund represents an interest in the same portfolio of investments, except that (i) Class A shares are sold subject to a front-end sales charge collected at the time the shares are purchased and bear a service fee, (ii) Class C shares are sold at net asset value without a sales charge at the time of purchase, but are subject to a contingent deferred sales charge upon redemption within one year of purchase, and bear both a service fee and a distribution fee, (iii) Class I shares are sold at net asset value without a sales charge at the time of purchase and may be subject to a service fee, (iv) Class R3 shares are sold at net asset value without a sales charge at the time of purchase, but bear both a service fee and distribution fee, (v) Class R4 shares are sold at net asset value without sales charge at the time of purchase, but bear a service fee, (vi) Class R5 shares are sold at net asset value without a sales charge at the time of purchase and may be subject to a service fee, and (vii) the respective classes may have different reinvestment privileges and conversion rights. Additionally, the Fund may allocate among its classes certain expenses, to the extent allocable to specific classes, including transfer agent fees, government registration fees, certain printing and postage costs, and administrative and legal expenses. Currently, class specific expenses of the Fund are limited to service and distribution fees, administration fees, and certain registration and transfer agent expenses.
The following is a summary of significant accounting policies followed by the Fund in the preparation of its financial statements. The Fund prepares its financial statements in conformity with United States generally accepted accounting principles (“GAAP”), including investment company accounting and reporting guidance in the Financial Accounting Standards Board (the “FASB”) Accounting Standard Codification Topic 946.
NOTE 2 – SIGNIFICANT ACCOUNTING POLICIES
Security Valuation: All investments in securities held by the Fund are valued as described in Note 3.
Allocation of Income, Gains, Losses and Expenses: Net investment income (other than class specific expenses) and realized and unrealized gains and losses are allocated daily to each class of shares based upon the relative net asset value of outstanding shares (or the value of the dividend-eligible shares, as appropriate) of each class of shares at the beginning of the day (after adjusting for the current capital shares activity of the respective class). Expenses common to all Funds are allocated among the Funds comprising the Trust based upon their relative net asset values or other appropriate allocation methods. Operating expenses directly attributable to a specific class are charged against the operating income of that class.
Dividends and Distributions to Shareholders: Dividends and distributions to shareholders, which are determined in accordance with federal income tax regulations and may differ from GAAP, are recorded on the ex-dividend date. Ordinary income distributions, if any, are declared daily and paid quarterly. Capital gain distributions, if any, are declared and paid annually and more often if deemed necessary by the Advisor. Dividends are paid and are reinvested in additional shares of the Fund at net asset value per share at the close of business on the ex-dividend date, or at the shareholder’s option, paid in cash.
Investment Income: Dividend income is recorded on the ex-dividend date. Certain income from foreign investments is recognized as soon as information is available to the Fund. Interest income is accrued as earned. Premiums and discounts are amortized and accreted, respectively, to call dates or maturity dates using the effective yield method of the respective investments, which is included in interest income on the Statement of Operations.
Custodian Fees: Custodian fees disclosed in the Statement of Operations may include interest expenses incurred by the Fund on any cash overdrafts of its custodian account during the period. Such cash overdrafts may result from the effects of failed trades in portfolio securities and from cash outflows resulting from unanticipated shareholder redemption activity. The Fund pays interest to its custodian on any such cash overdraft at a rate equal to 2.50% of the overdraft amount in excess of $50,000.
Investment Transactions: Investment transactions are accounted for on a trade date basis. Realized gains and losses from the sale of investments are recorded on an identified cost basis.
When-Issued and Delayed Delivery Transactions: The Fund may engage in when-issued or delayed delivery transactions. To the extent the Fund engages in such transactions, it will do so for the purpose of acquiring portfolio investments consistent with the Fund’s investment objectives and not for the purpose of investment leverage or to speculate on interest rate or market changes. At the time the Fund
Annual Report 27
| | |
| NOTES TO FINANCIAL STATEMENTS, CONTINUED | | |
| |
Thornburg Investment Income Builder Fund | | September 30, 2016 |
makes a commitment to purchase an investment on a when-issued or delayed delivery basis, the Fund will record the transaction and reflect the value in determining its net asset value. When effecting such transactions, assets of an amount sufficient to make payment for the portfolio investments to be purchased will be segregated on the Fund’s records on the trade date. Investments purchased on a when-issued or delayed delivery basis do not earn interest until the settlement date.
Repurchase Agreements: The Fund may invest excess cash in repurchase agreements whereby the Fund purchases investments, which serve as collateral, with an agreement to resell such collateral to the seller at an agreed upon price at the maturity date of the repurchase agreement. Investments pledged as collateral for repurchase agreements are held in custody until maturity of the repurchase agreement. Provisions in the agreements require that the market value of the collateral is at least equal to the repurchase value in the event of default. In the event of default, the Fund has the right to liquidate the collateral and apply the proceeds in satisfaction of the obligation. Under certain circumstances, in the event of default or bankruptcy by the other party to the agreement, realization and/or retention of the collateral may be subject to legal proceedings.
Unfunded Loan Commitments: The Fund has entered into a loan commitment with Nexstar Broadcasting, Inc., of which at September 30, 2016, no par commitment had been funded. The Fund is committed in the amount of $55,480,000 until January 27, 2017. The Fund has entered into a loan commitment with WU Finance I, LLC, of which at September 30, 2016, $12,210,435 had been funded. The Fund is committed for an additional amount of $2,608,696 until August 17, 2025.
Foreign Currency Translation: Portfolio investments and other assets and liabilities denominated in foreign currencies are translated into U.S. dollars based on the exchange rate of such currencies against the U.S. dollar on the date of valuation. Purchases and sales of investments and income items denominated in foreign currencies are translated into U.S. dollars at the exchange rate in effect on the transaction date. When the Fund purchases or sells foreign investments, it will customarily enter into a foreign exchange contract to minimize foreign exchange risk from the trade date to the settlement date of such transactions. The values of such spot contracts are included in receivable for investments sold and payable for investments purchased on the Statement of Assets and Liabilities.
The Fund does not separately report the effect of changes in foreign exchange rates from changes in market prices on investments held. Such changes are included in net unrealized appreciation (depreciation) from investments.
Reported net realized gains and losses from foreign currency transactions arise due to purchases and sales of foreign currencies, currency gains and losses realized between the trade and settlement dates on investment transactions and the difference between the amounts of dividends, interest, and foreign withholding taxes recorded on the Fund’s books, and the U.S. dollar equivalent of the amounts actually received or paid.
Net change in unrealized appreciation (depreciation) on foreign currency translations arise from changes in the fair value of assets and liabilities, other than investments at period end, resulting from changes in exchange rates.
Guarantees and Indemnifications: Under the Trust’s organizational documents (and under separate agreements with the independent Trustees), its officers and Trustees are provided with an indemnification against certain liabilities arising out of the performance of their duties to the Fund. In the normal course of business the Trust may also enter into contracts with service providers that contain general indemnifications. The Trust’s maximum exposure under these arrangements is unknown. However, based on experience, the Trust expects the risk of loss to be remote.
Use of Estimates: The preparation of financial statements in conformity with GAAP requires management to make estimates and assumptions that affect the reported amounts of assets and liabilities and disclosure of contingent assets and liabilities at the date of the financial statements and the reported amounts of increases (decreases) in net assets from operations during the reporting period. Actual results could differ from those estimates.
Federal Income Taxes: It is the policy of the Trust to comply with the provisions of the Internal Revenue Code applicable to regulated investment companies and to distribute to shareholders substantially all investment company taxable income including net realized gains on investments (if any), and tax exempt income of the Fund. Therefore, no provision for federal income or excise tax is required.
The Fund files income tax returns in United States federal and applicable state jurisdictions. The statute of limitations on the Fund’s tax return filings generally remains open for the three years following a return’s filing date. The Fund has analyzed each uncertain tax position believed to be material in the preparation of the Fund’s financial statements for the fiscal year ended September 30, 2016, including open tax years, to assess whether it is more likely than not that the position would be sustained upon examination, based on the technical merits of the position. The Fund has not identified any such position for which an asset or liability must be reflected in the Statement of Assets and Liabilities.
28 Annual Report
| | |
| NOTES TO FINANCIAL STATEMENTS, CONTINUED | | |
| |
Thornburg Investment Income Builder Fund | | September 30, 2016 |
At September 30, 2016, information on the tax components of capital was as follows:
| | | | |
Cost of investments for tax purposes | | $ | 15,262,580,775 | |
| | | | |
Gross unrealized appreciation on a tax basis | | $ | 2,058,546,166 | |
Gross unrealized depreciation on a tax basis | | | (1,087,590,547 | ) |
| | | | |
Net unrealized appreciation (depreciation) on investments (tax basis) | | $ | 970,955,619 | |
| | | | |
Temporary book to tax adjustments to the cost of investments and net unrealized appreciation (depreciation) for tax purposes result primarily from deferral of outstanding wash sale losses, and outstanding publicly traded partnership (“PTP”), passive foreign investment company (“PFIC”), and real estate investment trust (“REIT”) tax basis adjustments.
At September 30, 2016, the Fund had deferred tax basis late year specified ordinary losses occurring subsequent to October 31, 2015 through September 30, 2016 of $68,712,311. For tax purposes, such losses will be recognized in the year ending September 30, 2017.
At September 30, 2016, the Fund had deferred tax basis capital losses occurring subsequent to October 31, 2015 through September 30, 2016 of $662,713,179. For tax purposes, such capital losses will be recognized in the year ending September 30, 2017.
At September 30, 2016, the Fund had cumulative tax basis capital losses of $226,181,345, (of which $219,602,120 are short-term and $6,579,225 are long-term) generated after September 30, 2011, which may be carried forward to offset future capital gains. To the extent such carryforwards are used, capital gain distributions may be reduced to the extent provided by regulations. Such capital loss carryforwards do not expire.
In order to account for permanent book to tax differences, the Fund decreased undistributed net investment income by $186,280,589, decreased accumulated net realized gain (loss) by $186,215,202, and increased net capital paid in on shares of beneficial interest by $65,387. Reclassifications have no impact upon the net asset value of the Fund and result primarily from foreign investment transactions, investments in foreign bonds, publicly traded partnership (“PTPs”), and real estate investment trusts (“REITs”).
At September 30, 2016, the Fund had $110,055,660 of undistributed tax basis net ordinary investment income and no undistributed tax basis capital gains.
The tax character of distributions paid during the years ended September 30, 2016, and September 30, 2015, was as follows:
| | | | | | | | |
| | | 2016 | | | 2015 | |
Distributions from: | | | | | | | | |
Ordinary income | | $ | 687,130,644 | | | $ | 720,328,649 | |
Capital gains | | | — | | | | — | |
| | | | | | | | |
Total | | $ | 687,130,644 | | | $ | 720,328,649 | |
| | | | | | | | |
Foreign Withholding Taxes: The Fund is subject to foreign tax withholding imposed by certain foreign countries in which the Fund may invest. Withholding taxes are incurred on certain foreign dividends and are accrued at the time the dividend is recognized based on applicable foreign tax laws. The Fund files withholding tax reclaims in certain jurisdictions to recover a portion of amounts previously withheld, in view of various considerations, including recent decisions rendered by the courts in those and other jurisdictions. The Fund would expect to record a receivable for such a reclaim based on a variety of factors, including assessment of a jurisdiction’s legal obligation to pay reclaims, the jurisdiction’s administrative practices and payment history, and industry convention. To date the Fund has recorded no such receivable because there is limited precedent for collecting such prior year reclaims and the likelihood of collection remains uncertain.
Deferred Foreign Capital Gain Taxes: The Fund is subject to a tax imposed on net realized gains of securities of certain foreign countries. The Fund records an estimated deferred tax liability for net unrealized gains on these investments as reflected in the accompanying financial statements.
NOTE 3 – SECURITY VALUATION
Valuation of the Fund’s portfolio investment securities is performed in accordance with policies and procedures adopted by and under the oversight of the Trustees.
The Trustees of the Trust have appointed Thornburg Investment Management, Inc., the Trust’s investment advisor ( the “Advisor”) to assist the Trustees in obtaining market values for portfolio investments, evaluate and monitor professional pricing service providers appointed by the Trustees’ Audit Committee (the “Audit Committee”) to assist in determining fair values for portfolio investments, assist in calculating fair values for portfolio investments in certain circumstances, and to perform other functions in connection with the
Annual Report 29
| | |
| NOTES TO FINANCIAL STATEMENTS, CONTINUED | | |
| |
Thornburg Investment Income Builder Fund | | September 30, 2016 |
valuation of investments. The Advisor acts through its Valuation and Pricing Committee (the “Committee”) and other employees of the Advisor. The Committee regularly reviews its own valuation calculations, as well as the valuations, valuation techniques and services furnished by pricing service providers, considers circumstances which may require valuation calculations by the Committee, and reviews previous valuation calculations. The Committee reports to the Audit Committee on the Committee’s activities, the performance of pricing service providers, and other matters relating to valuation of portfolio investments.
In those instances when the Committee assists in calculating a fair value for a portfolio investment, the Committee seeks to determine the price that the Fund would reasonably expect to receive upon a sale of the investment in an orderly transaction between market participants on the valuation date. The Committee customarily utilizes quotations from securities broker dealers in calculating valuations, but also may utilize prices obtained from pricing service providers or other methods approved by the Audit Committee. Because fair values calculated by the Committee are estimates, the calculation of a value for an investment may differ from the price that would be realized by the Fund upon a sale of the investment, and the difference could be material to the Fund’s financial statements. The Committee’s calculation of a fair value for an investment may also differ from the prices obtained by other persons (including other mutual funds) for the investment.
Valuation of Securities: Securities and other portfolio investments which are listed or traded on a United States securities exchange are valued at the last reported sale price on the valuation date. Investments listed or traded on an exchange for which there has been no sale that day are valued at the mean between the last reported bid and asked prices on that valuation date. Portfolio investments reported by NASDAQ are valued at the official closing price on the valuation date. If an investment is traded on more than one exchange, the investment is considered traded on the exchange that is normally the primary market for that investment. Securities and other portfolio investments which are listed or traded on exchanges outside the United States are valued at the last price or the closing price of the investment on the exchange that is normally the primary market for the investment, as of the close of the exchange preceding the Fund’s valuation date. Foreign investments listed or traded on an exchange for which there has been no sale that day are valued at the mean between the last reported bid and asked prices on that valuation date.
In any case when a market quotation is not readily available for a portfolio investment ordinarily valued by market quotation, the Committee calculates a fair value for the investment using alternative methods approved by the Audit Committee. A market quotation is not readily available when the primary market or exchange for the investment is not open for the entire scheduled day of trading. Market quotations for an investment also may not be readily available if developments after the most recent close of the investment’s primary exchange or market, but prior to the close of business on any Fund business day, or an unusual event or significant period of time occurring since the availability of a market quotation, create a serious question concerning the reliability of the most recent market quotation available for the investment. In particular, on days when market volatility thresholds established by the Audit Committee are exceeded, foreign equity investments held by the Fund may be valued using alternative methods. The Committee customarily obtains valuations in these instances from pricing service providers approved by the Audit Committee. Pricing service providers ordinarily calculate valuations using multi-factor models to adjust market prices based upon various inputs, including exchange data, depository receipt prices, futures, index data and other data.
Debt obligations held by the Fund which are not listed or traded on exchanges or for which no reported market exists are ordinarily valued at the valuation obtained from a pricing service provider approved by the Audit Committee.
In any case when a pricing service provider fails to provide a valuation for a debt obligation held by the Fund, the Committee calculates a fair value for the obligation using alternative methods under procedures approved by the Audit Committee. Additionally, in cases when management believes that a valuation obtained from a pricing service provider merits review for significant reasons, the Committee decides whether or not to use the valuation calculated by the pricing service provider or to use an alternative method approved by the Audit Committee to calculate a fair value for the obligation.
Quotations for foreign investments expressed in foreign currency amounts are converted to U.S. dollar equivalents using a foreign exchange quotation from a third party service provider at the time of valuation. Foreign investments held by the Fund may be traded on days and at times when the Fund is not open for business. Consequently, the value of Fund investments may be significantly affected on days when shareholders cannot purchase or sell Fund shares. Futures contracts and other financial and derivative instruments traded on an exchange are valued at the latest published price for the instrument on its primary exchange. Listed options are valued at the last bid price.
Valuation Hierarchy: The Fund categorizes its investments based upon the inputs used in valuing those investments, according to a three-level hierarchy established in guidance from FASB. Categorization of investments using this hierarchy is intended by the FASB to maximize the use of observable inputs in valuing investments and minimize the use of unobservable inputs by requiring that the most observable inputs be used when available. Observable inputs are those that market participants would use in valuing an investment based on available market information. Unobservable inputs are those that reflect assumptions about the information market participants would use in valuing an investment. An investment’s level within the hierarchy is based on the lowest level input that is deemed significant to the valuation. The methodologies and inputs used to value investments are not necessarily indications of the risk or liquidity associated with those investments.
30 Annual Report
| | |
| NOTES TO FINANCIAL STATEMENTS, CONTINUED | | |
| |
Thornburg Investment Income Builder Fund | | September 30, 2016 |
Various inputs are used in calculating valuations for the Fund’s investments. These inputs are generally summarized according to the three-level hierarchy below:
Level 1: Quoted prices in active markets for identical investments.
Level 2: Other direct or indirect significant observable inputs (including quoted prices for similar investments in active markets and other observable inputs, such as interest rates, prepayment rates, credit risk, etc.).
Level 3: Significant unobservable inputs (including the Committee’s own assumptions in calculating the fair values of investments).
Valuations for debt obligations held by the Fund are typically calculated by pricing service providers approved by the Audit Committee and are characterized as Level 2 within the valuation hierarchy.
On days when market volatility thresholds established by the Audit Committee are exceeded, foreign securities for which valuations are obtained from pricing service providers are fair valued. On these days, the foreign securities are characterized as Level 2 within the valuation hierarchy and revert to Level 1 after the threshold is no longer exceeded.
In a limited number of cases the Committee calculates a fair value for investments using broker quotations or other methods approved by the Audit Committee. When the Committee uses a single broker quotation to calculate a fair value for an investment without other significant observable inputs, or if a fair value is calculated using other significant inputs that are considered unobservable, the investment is characterized as Level 3 within the hierarchy. Other significant unobservable inputs used to calculate a fair value in these instances might include an income-based valuation approach which considers discounted anticipated future cash flows from the investment, and application of discounts due to the nature or duration of any restrictions on the disposition of the investment.
Valuations based upon the use of inputs from Levels 1, 2 or 3 may not represent the actual price received upon the disposition of an investment, and the Fund may receive a price that is lower than the valuation based upon these inputs when it sells the investment.
The following table displays a summary of the fair value hierarchy measurements of the Fund’s investments as of September 30, 2016. In any instance when valuation inputs from more than one level are used to determine the fair value of a specific investment, the investment is placed in the level of the table based upon the lowest level input that is significant in determining the fair value of the investment:
| | | | | | | | | | | | | | | | |
| | | Fair Value Measurements At September 30, 2016 | |
| | | Total | | | Level 1 | | | Level 2 | | | Level 3(b) | |
Assets | | | | | | | | | | | | | | | | |
Investments in Securities* | | | | | | | | | | | | | | | | |
Common Stock(a) | | $ | 14,310,621,570 | | | $ | 14,241,156,323 | | | $ | 69,465,247 | | | $ | — | |
Preferred Stock(a) | | | 64,807,360 | | | | 27,763,547 | | | | 37,043,813 | | | | — | |
Asset Backed Securities | | | 35,089,626 | | | | — | | | | 32,851,813 | | | | 2,237,813 | |
Corporate Bonds | | | 1,384,911,376 | | | | — | | | | 1,377,305,784 | | | | 7,605,592 | |
Municipal Bonds | | | 3,024,635 | | | | — | | | | 3,024,635 | | | | — | |
Other Government | | | 6,795,505 | | | | — | | | | 6,795,505 | | | | — | |
Loan Participations | | | 194,293,451 | | | | — | | | | 176,155,690 | | | | 18,137,761 | |
Short Term Investments | | | 233,992,871 | | | | 233,992,871 | | | | — | | | | — | |
| | | | | | | | | | | | | | | | |
Total Investments in Securities | | $ | 16,233,536,394 | | | $ | 14,502,912,741 | | | $ | 1,702,642,487 | | | $ | 27,981,166 | |
| | | | |
Other Financial Instruments** | | | | | | | | | | | | | | | | |
Forward Currency Contracts | | $ | 30,724,332 | | | $ | — | | | $ | 30,724,332 | | | $ | — | |
Spot Currency | | $ | 8,782 | | | $ | 8,782 | | | $ | — | | | $ | — | |
| | | | |
Liabilities | | | | | | | | | | | | | | | | |
Other Financial Instruments** | | | | | | | | | | | | | | | | |
Forward Currency Contracts | | $ | (6,803,264 | ) | | $ | — | | | $ | (6,803,264 | ) | | $ | — | |
Spot Currency | | $ | (40,310 | ) | | $ | (40,310 | ) | | $ | — | | | $ | — | |
| * | See Schedule of Investments for a summary of the industry exposure as grouped according to the Global Industry Classification Standard (GICS), which is an industry taxonomy developed by MSCI, Inc. and Standard & Poor’s (S&P). |
| ** | Other Financial Instruments include investments not reflected in the Schedule of Investments, which may include futures, forwards and swap contracts, which are valued at the unrealized appreciation (depreciation) on the investment. |
| (a) | At September 30, 2016, industry classifications for Common Stock and Preferred Stock in Level 2 consist of $87,188,684 In Telecommunication Services, $10,687,500 in Miscellaneous and $8,632,876 in Banks. |
Annual Report 31
| | |
| NOTES TO FINANCIAL STATEMENTS, CONTINUED | | |
| |
Thornburg Investment Income Builder Fund | | September 30, 2016 |
| (b) | In accordance with the guidance prescribed in Accounting Standards update (“ASU”) No. 2011-04, an unadjusted broker quote was applied to $9,843,405 portfolio securities characterized as Level 3 investments at September 30, 2016. The following table displays a summary of the valuation techniques and unobservable inputs used to value portfolio securities characterized as Level 3 investments, where unadjusted broker quotes were not available at September 30, 2016: |
| | | | | | | | | | | | | | | | |
| | | Fair Value At
September 30, 2016 | | | Valuation Technique(s) | | | Unobservable Input | | | Range
(Weighted Average) | |
Loan Participations | | $ | 12,062,244 | | | | Cost basis | | | | Cost basis | | | | $99.00 (N/A) | |
| | | 6,075,517 | | | | Discounted cash flows | | |
| Third party vendor projection of
discounted cash flows |
| | | 20.00% (N/A) | |
| | | | | | | | | | | | | | | | |
Total | | $ | 18,137,761 | | | | | | | | | | | | | |
In accordance with the guidance prescribed in ASU No. 2011-04, it is the policy of the Fund to recognize transfers between levels and those underlying events which caused the movement. The Fund recognized no transfers between Levels 1 and 2 for the year ended September 30, 2016, other than when the Fund exceeded market volatility thresholds for foreign equity investments during the period.
A rollforward of fair value measurements using significant unobservable inputs (Level 3) for the year ended September 30, 2016 is as follows:
| | | | | | | | | | | | | | | | | | | | |
| | | Common
Stock(a) | | | Asset Backed
Securities | | | Corporate
Bonds | | | Loan
Participations | | | Total(f) | |
Beginning Balance 9/30/2015 | | $ | — | | | $ | 2,710,536 | | | $ | 9,121,792 | | | $ | 47,514,542 | | | $ | 59,346,870 | |
Accrued Discounts (Premiums) | | | — | | | | 16,995 | | | | 54,895 | | | | 73,951 | | | | 145,841 | |
Net Realized Gain (Loss)(b) | | | (1,154,896 | ) | | | 71,085 | | | | 34,556 | | | | 345,200 | | | | (704,055 | ) |
Gross Purchases | | | — | | | | — | | | | — | | | | 15,452,505 | | | | 15,452,505 | |
Gross Sales | | | (73,529 | ) | | | (532,000 | ) | | | (333,497 | ) | | | (43,513,301 | ) | | | (44,452,327 | ) |
Net Change in Unrealized Appreciation (Depreciation)(c)(d) | | | 1,228,425 | | | | (28,803 | ) | | | (124,468 | ) | | | (1,735,136 | ) | | | (659,982 | ) |
Transfers into Level 3(e) | | | — | | | | — | | | | — | | | | — | | | | — | |
Transfers out of Level 3(e) | | | — | | | | — | | | | (1,147,686 | ) | | | — | | | | (1,147,686 | ) |
| | | | | | | | | | | | | | | | | | | | |
Ending Balance 9/30/2016 | | $ | — | | | $ | 2,237,813 | | | $ | 7,605,592 | | | $ | 18,137,761 | | | $ | 27,981,166 | |
| (a) | Common stock valued at zero was included as a security in the Level 3 rollforward table at September 30, 2016. |
| (b) | Amount of net realized gain (loss) from investments recognized in income is included in the Fund’s Statement of Operations for the year ended September 30, 2016. |
| (c) | Amount of net change in unrealized appreciation (depreciation) on investments recognized in income is included in the Fund’s Statement of Operations for the year ended September 30, 2016. |
| (d) | The net change in unrealized appreciation (depreciation) attributable to securities owned at September 30, 2016, which were valued using significant unobservable inputs, is negative $1,691,876. This is included within the net change in unrealized appreciation (depreciation) on investments on the Fund’s Statement of Operations. |
| (e) | Transfers into or out of Level 3 were out of or into Level 2, and were due to changes in other significant observable inputs available during the year ended September 30, 2016. Transfers into or out of Level 3 are based on the beginning market value of the period in which they occurred. |
| (f) | Level 3 investments represent 0.17% of total net assets at the year ended September 30, 2016. Significant fluctuations of the unobservable inputs applied to portfolio securities characterized as Level 3 investments could be expected to increase or decrease the fair value of these portfolio securities. |
NOTE 4 – INVESTMENT ADVISORY FEE AND OTHER TRANSACTIONS WITH AFFILIATES
Pursuant to an investment advisory agreement, the Advisor serves as the investment advisor and performs services for the Fund for which the fees are payable at the end of each month. Under the investment advisory agreement, the Fund pays the Advisor a management fee based on the daily net assets of the Fund at an annual rate as shown in the following table:
Management Fee Schedule
| | | | |
Daily net assets | | Fee Rate | |
Up to $500 million | | | 0.875 | % |
Next $500 million | | | 0.825 | |
Next $500 million | | | 0.775 | |
Next $500 million | | | 0.725 | |
Over $2 billion | | | 0.675 | |
The Fund’s effective management fee for the year ended September 30, 2016 was 0.690% of the Fund’s average dividend assets.
32 Annual Report
| | |
| NOTES TO FINANCIAL STATEMENTS, CONTINUED | | |
| |
Thornburg Investment Income Builder Fund | | September 30, 2016 |
The Fund pays to the Advisor the costs of personnel who perform certain accounting services for the Fund. For the year ended September 30, 2016 the Fund paid $637,990 to the Advisor for these accounting services. The Trust has also entered into administrative service agreements with the Advisor, whereby the Advisor will perform certain administrative services for the shareholders of each class of the Fund’s shares, and for which fees will be payable at an annual rate of up to .125 of 1% per annum of the average daily net assets attributable to each class of shares. Total administrative service fees incurred by each class of shares of the Fund for the year ended September 30, 2016, are set forth in the Statement of Operations.
The Trust has an underwriting agreement with Thornburg Securities Corporation (the “Distributor”), an affiliate of the Advisor, which acts as the distributor of the Fund’s shares. For the year ended September 30, 2016, the Distributor has advised the Fund that it earned net commissions aggregating $491,695 from the sale of Class A shares, and collected contingent deferred sales charges aggregating $440,074 from redemptions of Class C shares of the Fund.
Pursuant to a service plan under Rule 12b-1 of the Investment Company Act of 1940, the Fund may pay to the Advisor or securities dealers and other financial institutions at the Advisor’s request an amount not to exceed .25 of 1% per annum of the average daily net assets attributable to Class A, Class C, Class R3, and Class R4 shares of the Fund to obtain various shareholder and distribution related services. For the year ended September 30, 2016, there were no 12b-1 service plan fees charged for Class I and Class R5 shares. The Advisor may pay out of its own resources additional expenses for distribution of the Fund’s shares and shareholder services.
The Trust has also adopted distribution plans pursuant to Rule 12b-1, applicable only to the Fund’s Class C, and Class R3 shares, under which the Fund compensates the Distributor for services in promoting the sale of Class C and Class R3 shares of the Fund at an annual rate of up to .75 of 1% per annum of the average daily net assets attributable to Class C shares, and an annual rate of up to .25 of 1% per annum of the average daily net assets attributable to Class R3 shares. Total fees incurred by each class of shares of the Fund under their respective service and distribution plans for the year ended September 30, 2016, are set forth in the Statement of Operations.
The Advisor and Distributor have contractually agreed to waive fees and reimburse expenses incurred by the Fund so that actual expenses of certain share classes do not exceed levels as specified in the Fund’s most recent prospectus. The agreement may be terminated by the Fund at any time, but may not be terminated by the Advisor or Distributor before February 1, 2017, unless the Advisor ceases to be the investment advisor to the Trust or the Distributor ceases to be the distributor of the Fund prior to that date. The Advisor and Distributor retain the right to be repaid by the Fund for fee waivers and expense reimbursements if expenses fall below the contractual limit prior to the end of the fiscal year.
For the year ended September 30, 2016, the Advisor contractually reimbursed certain class specific expenses, administrative fees, and distribution fees of $1,718,359 for Class C shares, $74,227 for Class R3 shares, $36,803 for Class R4 shares, and $69,182 for Class R5 shares.
Certain officers and Trustees of the Trust are also officers or directors of the Advisor and Distributor. The compensation of independent Trustees is borne by the Trust.
The Fund may sell securities to an affiliated fund, or the Fund may purchase securities held by an affiliated fund, provided the affiliation is due solely to having a common investment advisor, common officers, or common trustees, and provided that all such transactions will comply with Rule 17a-7 under the 1940 Act. For the year ended September 30, 2016, the Fund had transactions with affiliated funds of $4,462,000 in purchases.
NOTE 5 – SHARES OF BENEFICIAL INTEREST
At September 30, 2016, there were an unlimited number of shares with no par value of beneficial interest authorized. Transactions in shares of beneficial interest were as follows:
| | | | | | | | | | | | | | | | |
| | | Year Ended
September 30, 2016 | | | Year Ended
September 30, 2015 | |
| | | Shares | | | Amount | | | Shares | | | Amount | |
Class A Shares | | | | | | | | | | | | | | | | |
Shares sold | | | 19,832,477 | | | $ | 379,977,526 | | | | 39,942,804 | | | $ | 845,842,088 | |
Shares issued to shareholders in reinvestment of dividends | | | 8,070,888 | | | | 153,998,830 | | | | 8,027,583 | | | | 166,841,094 | |
Shares repurchased | | | (60,535,763 | ) | | | (1,155,223,991 | ) | | | (39,349,193 | ) | | | (827,462,329 | ) |
| | | | | | | | | | | | | | | | |
| | | | |
Net increase (decrease) | | | (32,632,398 | ) | | $ | (621,247,635 | ) | | | 8,621,194 | | | $ | 185,220,853 | |
| | | | | | | | | | | | | | | | |
Annual Report 33
| | |
| NOTES TO FINANCIAL STATEMENTS, CONTINUED | | |
| |
Thornburg Investment Income Builder Fund | | September 30, 2016 |
| | | | | | | | | | | | | | | | |
| | | Year Ended
September 30, 2016 | | | Year Ended
September 30, 2015 | |
| | | Shares | | | Amount | | | Shares | | | Amount | |
Class C Shares | | | | | | | | | | | | | | | | |
Shares sold | | | 18,917,018 | | | $ | 362,084,120 | | | | 44,700,687 | | | $ | 948,313,812 | |
Shares issued to shareholders in reinvestment of dividends | | | 8,898,237 | | | | 169,695,424 | | | | 8,343,112 | | | | 173,215,686 | |
Shares repurchased | | | (67,268,251 | ) | | | (1,286,285,186 | ) | | | (36,466,647 | ) | | | (767,520,097 | ) |
| | | | | | | | | | | | | | | | |
| | | | |
Net increase (decrease) | | | (39,452,996 | ) | | $ | (754,505,642 | ) | | | 16,577,152 | | | $ | 354,009,401 | |
| | | | | | | | | | | | | | | | |
| | | | |
Class I Shares | | | | | | | | | | | | | | | | |
Shares sold | | | 72,402,003 | | | $ | 1,398,940,681 | | | | 98,224,899 | | | $ | 2,092,406,561 | |
Shares issued to shareholders in reinvestment of dividends | | | 14,573,749 | | | | 280,115,894 | | | | 13,752,647 | | | | 287,659,480 | |
Shares repurchased | | | (128,987,422 | ) | | | (2,476,401,725 | ) | | | (69,222,046 | ) | | | (1,463,230,825 | ) |
| | | | | | | | | | | | | | | | |
| | | | |
Net increase (decrease) | | | (42,011,670 | ) | | $ | (797,345,150 | ) | | | 42,755,500 | | | $ | 916,835,216 | |
| | | | | | | | | | | | | | | | |
| | | | |
Class R3 Shares | | | | | | | | | | | | | | | | |
Shares sold | | | 861,058 | | | $ | 16,544,230 | | | | 1,511,834 | | | $ | 32,132,928 | |
Shares issued to shareholders in reinvestment of dividends | | | 142,700 | | | | 2,722,374 | | | | 133,120 | | | | 2,764,150 | |
Shares repurchased | | | (1,245,253 | ) | | | (23,918,544 | ) | | | (1,373,103 | ) | | | (28,926,592 | ) |
| | | | | | | | | | | | | | | | |
| | | | |
Net increase (decrease) | | | (241,495 | ) | | $ | (4,651,940 | ) | | | 271,851 | | | $ | 5,970,486 | |
| | | | | | | | | | | | | | | | |
| | | | |
Class R4 Shares | | | | | | | | | | | | | | | | |
Shares sold | | | 727,487 | | | $ | 14,065,623 | | | | 981,655 | | | $ | 20,835,501 | |
Shares issued to shareholders in reinvestment of dividends | | | 61,508 | | | | 1,175,805 | | | | 49,770 | | | | 1,034,418 | |
Shares repurchased | | | (692,777 | ) | | | (13,376,189 | ) | | | (674,843 | ) | | | (14,383,788 | ) |
| | | | | | | | | | | | | | | | |
| | | | |
Net increase (decrease) | | | 96,218 | | | $ | 1,865,239 | | | | 356,582 | | | $ | 7,486,131 | |
| | | | | | | | | | | | | | | | |
| | | | |
Class R5 Shares | | | | | | | | | | | | | | | | |
Shares sold | | | 1,447,762 | | | $ | 27,879,490 | | | | 1,847,706 | | | $ | 39,326,203 | |
Shares issued to shareholders in reinvestment of dividends | | | 170,327 | | | | 3,272,878 | | | | 132,999 | | | | 2,777,304 | |
Shares repurchased | | | (1,393,727 | ) | | | (26,898,100 | ) | | | (877,762 | ) | | | (18,677,569 | ) |
| | | | | | | | | | | | | | | | |
| | | | |
Net increase (decrease) | | | 224,362 | | | $ | 4,254,268 | | | | 1,102,943 | | | $ | 23,425,938 | |
| | | | | | | | | | | | | | | | |
NOTE 6 – INVESTMENT TRANSACTIONS
For the year ended September 30, 2016, the Fund had purchase and sale transactions of investments (excluding short-term investments) of $7,106,521,465 and $8,708,314,829, respectively.
NOTE 7 – DERIVATIVE FINANCIAL INSTRUMENTS WITH OFF-BALANCE SHEET RISK AND FOREIGN INVESTMENT RISK
The Fund may use a variety of derivative financial instruments to hedge or adjust the risks affecting its investment portfolio or to enhance investment returns. Provisions of the FASB Accounting Standards Codification 815-10-50 (“ASC 815”) require certain disclosures. The disclosures are intended to provide users of financial statements with an understanding of the use of derivative instruments by the Fund and how these derivatives affect the financial position, financial performance and cash flows of the Fund. The Fund does not designate any derivative instruments as hedging instruments under ASC 815. During the year ended September 30, 2016, the Fund’s principal exposure to derivative financial instruments of the type addressed by ASC 815 was investment in foreign exchange contracts. A foreign exchange contract is an agreement between two parties to exchange different currencies at a specified rate of exchange at an agreed upon future date. Foreign exchange contracts involve risks to the Fund, including the risk that a contract’s counterparty will not meet its obligations to the Fund, the risk that a change in a contract’s value may not correlate perfectly with the
34 Annual Report
| | |
| NOTES TO FINANCIAL STATEMENTS, CONTINUED | | |
| |
Thornburg Investment Income Builder Fund | | September 30, 2016 |
currency the contract was intended to track, and the risk that the Fund’s Advisor is unable to correctly implement its strategy in using a contract. In any such instance, the Fund may not achieve the intended benefit of entering into a contract, and may experience a loss.
The Fund entered into forward currency contracts during the year ended September 30, 2016 in the normal course of pursuing its investment objectives, with the objective of purchasing foreign investments or with the intent of reducing the risk to the value of the Fund’s foreign investments from adverse changes in the relationship between the U.S. dollar and foreign currencies. In each case these contracts have been initiated in conjunction with foreign investment transactions.
These contracts are accounted for by the Fund under ASC 815. Unrealized appreciation and depreciation on outstanding contracts are reported in the Fund’s Statement of Assets and Liabilities, as measured by the difference between the forward exchange rates at the reporting date and the forward exchange rates at each contract’s inception date. Net realized gain (loss) on contracts closed during the period, and changes in net unrealized appreciation (depreciation) on outstanding contracts are recognized in the Fund’s Statement of Operations.
The quarterly average value of open sell currency contracts for the year ended September 30, 2016 was $4,749,144,288. Open buy currency contracts are entered into for the purpose of closing open sell currency contracts and the values are dependent upon the values of the open sell currency contracts to which they relate.
The following table displays the outstanding forward currency contracts at September 30, 2016:
| | | | | | | | | | | | | | | | | | | | | | | | | | | | |
| Outstanding Forward Currency Contracts to Buy or Sell at September 30, 2016 | |
Contract Description | | Counter
Buy/Sell | | | Contract
Party* | | | Contract
Amount | | | Value
Date | | | Unrealized
USD | | | Appreciation | | | Unrealized
Depreciation | |
Euro | | | Sell | | | | SSB | | | | 2,288,235,700 | | | | 11/22/2016 | | | | 2,576,160,416 | | | $ | 21,124,398 | | | $ | — | |
Great Britain Pound | | | Sell | | | | SSB | | | | 693,377,500 | | | | 10/07/2016 | | | | 898,786,200 | | | | 8,186,239 | | | | — | |
South Korean Won | | | Sell | | | | SSB | | | | 169,962.426,200 | | | | 11/28/2016 | | | | 154,265,874 | | | | — | | | | (2,986,455 | ) |
Swiss Franc | | | Buy | | | | SSB | | | | 297,023,000 | | | | 10/05/2016 | | | | 305,753,575 | | | | — | | | | (487,275 | ) |
Swiss Franc | | | Sell | | | | SSB | | | | 297,023,000 | | | | 10/05/2016 | | | | 305,753,575 | | | | 885,631 | | | | — | |
Swiss Franc | | | Sell | | | | SSB | | | | 292,930,700 | | | | 01/04/2017 | | | | 303,281,705 | | | | 446,534 | | | | — | |
Thai Baht | | | Sell | | | | BBH | | | | 1,684,879,600 | | | | 11/30/2016 | | | | 48,586,281 | | | | 81,530 | | | | — | |
Chinese Yuan Renminbi | | | Sell | | | | SSB | | | | 6,069,949,500 | | | | 10/31/2016 | | | | 908,414,078 | | | | — | | | | (3,329,534 | ) |
| | | | | | | | | | | | | | | | | | | | | | | | | | | | |
Total | | | | | | | | | | | | | | | | | | | | | | $ | 30,724,332 | | | $ | (6,803,264 | ) |
| | | | | | | | | | | | | | | | | | | | | | | | | | | | |
Net unrealized appreciation (depreciation) | | | | | | | | | | | | | | | | | | | $ | 23,921,068 | | | | | |
| | | | | | | | | | | | | | | | | | | | | | | | | | | | |
| * | Counterparties include State Street Bank and Trust Company (“SSB”) and Brown Brothers Harriman (“BBH”). |
The outstanding forward currency contracts in the foregoing table which were entered into with State Street Bank and Trust Company (“SSB”), were entered into pursuant to an International Swaps and Derivatives Association (“ISDA”) Master Agreement. Outstanding forward currency contracts which were entered into with Brown Brothers Harriman & Co. (“BBH”) were entered into pursuant to a written agreement with BBH. In the event of a default or termination under the ISDA Master Agreement with SSB or the agreement with BBH, the non-defaulting party has the right to close out all outstanding forward currency contracts between the parties and to net any payment amounts under those contracts, resulting in a single net amount payable by one party to the other.
Because the ISDA Master Agreement with SSB and the agreement with BBH does not result in an offset of reported amounts of financial assets and liabilities in the Fund’s Statement of Assets and Liabilities unless there has been an event of default or termination event under such agreements, the Fund does not net its outstanding forward currency contracts for the purpose of disclosure in the Fund’s Statement of Assets and Liabilities. Instead the Fund recognizes the unrealized appreciation (depreciation) on those forward currency contracts on a gross basis in the Fund’s Statement of Assets and Liabilities.
The unrealized appreciation (depreciation) of the outstanding forward currency contracts recognized in the Fund’s Statement of Assets and Liabilities at September 30, 2016 is disclosed in the following table:
| | | | | | |
| Fair Values of Derivative Financial Instruments at September 30, 2016 | |
Asset Derivatives | | Balance Sheet Location | | Fair Value | |
Foreign exchange contracts | | Assets - Unrealized appreciation on forward currency contracts | | $ | 30,724,332 | |
Annual Report 35
| | |
| NOTES TO FINANCIAL STATEMENTS, CONTINUED | | |
| |
Thornburg Investment Income Builder Fund | | September 30, 2016 |
| | | | | | |
| Fair Values of Derivative Financial Instruments at September 30, 2016 | |
Liability Derivatives | | Balance Sheet Location | | Fair Value | |
Foreign exchange contracts | | Liabilities - Unrealized depreciation on forward currency contracts | | $ | (6,803,264 | ) |
Because the Fund does not currently receive or post cash collateral in connection with its currency forward contracts, the net amounts of the Fund’s assets and liabilities which are attributable to those contracts at September 30, 2016 can be determined by offsetting the dollar amounts shown in the preceding table. Based on those amounts, the net amount of the Fund’s assets which is attributable to its outstanding forward currency contracts at September 30, 2016 is $23,839,538 attributable to the Fund’s contracts with SSB, and the net amount of the Fund’s assets which is attributable to those contracts at that date is $81,530 attributable to the Fund’s contracts with BBH. The Fund’s forward currency contracts are valued each day, and the net amounts of the Fund’s assets and liabilities which are attributable to those contracts are expected to vary over time.
The net realized gain (loss) from forward currency contracts and the net change in unrealized appreciation (depreciation) on outstanding forward currency contracts recognized in the Fund’s Statement of Operations for the year ended September 30, 2016 are disclosed in the following tables:
| | | | | | | | |
Net Realized Gain (Loss) on Derivative Financial Instruments Recognized in Income for the Year Ended September 30, 2016 | |
| | | Total | | | Forward Currency Contracts | |
Foreign exchange contracts | | $ | 134,158,769 | | | $ | 134,158,769 | |
|
Net Change in Unrealized Appreciation (Depreciation) of Derivative Financial Instruments Recognized in Income for the Year Ended September 30, 2016 | |
| | | Total | | | Forward Currency Contracts | |
Foreign exchange contracts | | $ | 43,254,249 | | | $ | 43,254,249 | |
OTHER NOTES
Risks: The Fund’s investments subject it to risks including, but not limited to, management risk, market and economic risk, risks affecting specific issuers, the risks associated with investments in small- and mid-cap companies, credit risk, high-yield risk, interest rate risk, prepayment risk, foreign investment and developing country risks, liquidity risk and real estate investment trust risk. Please see the Fund’s prospectus for a discussion of the risks associated with an investment in the Fund.
Subsequent Events: Fund management believes no events have occurred between September 30, 2016 and the date of issuance of the financial statements that require adjustment to or disclosure in the accompanying financial statements.
36 Annual Report
This page intentionally left blank.
Annual Report 37
FINANCIAL HIGHLIGHTS
Thornburg Investment Income Builder Fund
| | | | | | | | | | | | | | | | | | | | | | | | | | | | | | | | | | | | | | | | | | | | | | | | | | | | | | | | |
| | | PER SHARE PERFORMANCE (for a share outstanding throughout the Year) | | | RATIOS TO AVERAGE NET ASSETS | | | SUPPLEMENTAL DATA | |
Unless
Otherwise
Noted,
Periods
are
Fiscal
Years
Ended
Sept. 30, | | Net Asset
Value
Beginning
of Year | | | Net
Investment
Income
(Loss)+ | | Net
Realized
&
Unrealized
Gain(Loss)
on
Investments | | | Total from
Investment
Operations | | | Dividends
from Net
Investment
Income | | | Dividends
from Net
Realized
Gains | | Total
Dividends | | | Net
Asset
Value
End
of
Year | | | Net
Investment
Income
(Loss)
(%) | | | Expenses,
After
Expense
Reductions
(%) | | | Expenses,
After
Expense
Reductions
and
Net of
Custody
Credits
(%) | | | Expenses,
Before
Expense
Reductions
(%) | | | Total
Return
(%)(a) | | | Portfolio
Turnover
Rate
(%)(a) | | | Net
Assets
at End
of
Year
(Thousands) | |
CLASS A SHARES | | | | | | | | | | | | | | | | | | | | | | | | | | | | | | | | | | | | | | | | | | | | | | | | | | |
2016(b) | | $ | 19.07 | | | 0.93 | | | 0.62 | | | | 1.55 | | | | (0.80 | ) | | — | | | (0.80 | ) | | $ | 19.82 | | | | 4.82 | | | | 1.18 | | | | 1.18 | | | | 1.18 | | | | 8.35 | | | | 42.81 | | | $ | 3,778,863 | |
2015(b) | | $ | 21.38 | | | 0.85 | | | (2.34 | ) | | | (1.49 | ) | | | (0.82 | ) | | — | | | (0.82 | ) | | $ | 19.07 | | | | 4.02 | | | | 1.17 | | | | 1.17 | | | | 1.17 | | | | (7.27 | ) | | | 51.27 | | | $ | 4,257,943 | |
2014(b) | | $ | 20.13 | | | 1.10 | | | 1.13 | | | | 2.23 | | | | (0.98 | ) | | — | | | (0.98 | ) | | $ | 21.38 | | | | 5.21 | | | | 1.18 | | | | 1.18 | | | | 1.18 | | | | 11.19 | | | | 38.81 | | | $ | 4,588,033 | |
2013(b) | | $ | 18.90 | | | 1.03 | | | 1.27 | | | | 2.30 | | | | (1.07 | ) | | — | | | (1.07 | ) | | $ | 20.13 | | | | 5.26 | | | | 1.18 | | | | 1.18 | | | | 1.18 | | | | 12.51 | | | | 46.14 | | | $ | 4,281,060 | |
2012(b) | | $ | 17.29 | | | 1.15 | | | 1.60 | | | | 2.75 | | | | (1.14 | ) | | — | | | (1.14 | ) | | $ | 18.90 | | | | 6.32 | | | | 1.20 | | | | 1.20 | | | | 1.20 | | | | 16.26 | | | | 40.96 | | | $ | 3,420,877 | |
CLASS C SHARES | | | | | | | | | | | | | | | | | | | | | | | | | | | | | | | | | | | | | | | | | | | | | | | | | | |
2016 | | $ | 19.06 | | | 0.79 | | | 0.62 | | | | 1.41 | | | | (0.66 | ) | | — | | | (0.66 | ) | | $ | 19.81 | | | | 4.11 | | | | 1.90 | | | | 1.90 | | | | 1.93 | | | | 7.59 | | | | 42.81 | | | $ | 5,356,153 | |
2015 | | $ | 21.37 | | | 0.70 | | | (2.34 | ) | | | (1.64 | ) | | | (0.67 | ) | | — | | | (0.67 | ) | | $ | 19.06 | | | | 3.30 | | | | 1.90 | | | | 1.90 | | | | 1.92 | | | | (7.93 | ) | | | 51.27 | | | $ | 5,906,206 | |
2014 | | $ | 20.13 | | | 0.94 | | | 1.13 | | | | 2.07 | | | | (0.83 | ) | | — | | | (0.83 | ) | | $ | 21.37 | | | | 4.44 | | | | 1.90 | | | | 1.90 | | | | 1.93 | | | | 10.36 | | | | 38.81 | | | $ | 6,266,270 | |
2013 | | $ | 18.89 | | | 0.89 | | | 1.28 | | | | 2.17 | | | | (0.93 | ) | | — | | | (0.93 | ) | | $ | 20.13 | | | | 4.55 | | | | 1.90 | | | | 1.90 | | | | 1.94 | | | | 11.78 | | | | 46.14 | | | $ | 5,160,706 | |
2012 | | $ | 17.29 | | | 1.02 | | | 1.59 | | | | 2.61 | | | | (1.01 | ) | | — | | | (1.01 | ) | | $ | 18.89 | | | | 5.63 | | | | 1.90 | | | | 1.90 | | | | 1.97 | | | | 15.43 | | | | 40.96 | | | $ | 4,051,242 | |
CLASS I SHARES | | | | | | | | | | | | | | | | | | | | | | | | | | | | | | | | | | | | | | | | | | | | | | | | | | |
2016 | | $ | 19.21 | | | 1.00 | | | 0.62 | | | | 1.62 | | | | (0.86 | ) | | — | | | (0.86 | ) | | $ | 19.97 | | | | 5.15 | | | | 0.86 | | | | 0.86 | | | | 0.86 | | | | 8.71 | | | | 42.81 | | | $ | 6,928,783 | |
2015 | | $ | 21.53 | | | 0.93 | | | (2.35 | ) | | | (1.42 | ) | | | (0.90 | ) | | — | | | (0.90 | ) | | $ | 19.21 | | | | 4.35 | | | | 0.85 | | | | 0.85 | | | | 0.85 | | | | (6.94 | ) | | | 51.27 | | | $ | 7,472,344 | |
2014 | | $ | 20.27 | | | 1.16 | | | 1.15 | | | | 2.31 | | | | (1.05 | ) | | — | | | (1.05 | ) | | $ | 21.53 | | | | 5.45 | | | | 0.86 | | | | 0.86 | | | | 0.86 | | | | 11.54 | | | | 38.81 | | | $ | 7,454,275 | |
2013 | | $ | 19.03 | | | 1.10 | | | 1.28 | | | | 2.38 | | | | (1.14 | ) | | — | | | (1.14 | ) | | $ | 20.27 | | | | 5.58 | | | | 0.85 | | | | 0.85 | | | | 0.85 | | | | 12.94 | | | | 46.14 | | | $ | 5,567,617 | |
2012 | | $ | 17.40 | | | 1.22 | | | 1.61 | | | | 2.83 | | | | (1.20 | ) | | — | | | (1.20 | ) | | $ | 19.03 | | | | 6.67 | | | | 0.89 | | | | 0.89 | | | | 0.89 | | | | 16.61 | | | | 40.96 | | | $ | 3,981,955 | |
CLASS R3 SHARES | | | | | | | | | | | | | | | | | | | | | | | | | | | | | | | | | | | | | | | | | | | | | | | | | | |
2016 | | $ | 19.07 | | | 0.87 | | | 0.62 | | | | 1.49 | | | | (0.74 | ) | | — | | | (0.74 | ) | | $ | 19.82 | | | | 4.53 | | | | 1.50 | | | | 1.50 | | | | 1.59 | | | | 8.01 | | | | 42.81 | | | $ | 78,188 | |
2015 | | $ | 21.37 | | | 0.78 | | | (2.32 | ) | | | (1.54 | ) | | | (0.76 | ) | | — | | | (0.76 | ) | | $ | 19.07 | | | | 3.70 | | | | 1.50 | | | | 1.50 | | | | 1.55 | | | | (7.52 | ) | | | 51.27 | | | $ | 79,834 | |
2014 | | $ | 20.13 | | | 1.03 | | | 1.12 | | | | 2.15 | | | | (0.91 | ) | | — | | | (0.91 | ) | | $ | 21.37 | | | | 4.84 | | | | 1.49 | | | | 1.49 | | | | 1.55 | | | | 10.80 | | | | 38.81 | | | $ | 83,670 | |
2013 | | $ | 18.89 | | | 0.97 | | | 1.28 | | | | 2.25 | | | | (1.01 | ) | | — | | | (1.01 | ) | | $ | 20.13 | | | | 4.96 | | | | 1.49 | | | | 1.49 | | | | 1.70 | | | | 12.23 | | | | 46.14 | | | $ | 61,334 | |
2012 | | $ | 17.28 | | | 1.10 | | | 1.60 | | | | 2.70 | | | | (1.09 | ) | | — | | | (1.09 | ) | | $ | 18.89 | | | | 6.05 | | | | 1.50 | | | | 1.50 | | | | 1.59 | | | | 15.94 | | | | 40.96 | | | $ | 47,023 | |
CLASS R4 SHARES | | | | | | | | | | | | | | | | | | | | | | | | | | | | | | | | | | | | | | | | | | | | | | | | | | |
2016 | | $ | 19.10 | | | 0.89 | | | 0.62 | | | | 1.51 | | | | (0.76 | ) | | — | | | (0.76 | ) | | $ | 19.85 | | | | 4.63 | | | | 1.40 | | | | 1.40 | | | | 1.48 | | | | 8.12 | | | | 42.81 | | | $ | 45,968 | |
2015 | | $ | 21.42 | | | 0.81 | | | (2.35 | ) | | | (1.54 | ) | | | (0.78 | ) | | — | | | (0.78 | ) | | $ | 19.10 | | | | 3.81 | | | | 1.40 | | | | 1.40 | | | | 1.46 | | | | (7.48 | ) | | | 51.27 | | | $ | 42,392 | |
2014 | | $ | 20.17 | | | 1.04 | | | 1.16 | | | | 2.20 | | | | (0.95 | ) | | — | | | (0.95 | ) | | $ | 21.42 | | | | 4.88 | | | | 1.35 | | | | 1.35 | | | | 1.40 | | | | 11.00 | | | | 38.81 | | | $ | 39,890 | |
2013 | | $ | 18.93 | | | 0.99 | | | 1.29 | | | | 2.28 | | | | (1.04 | ) | | — | | | (1.04 | ) | | $ | 20.17 | | | | 5.05 | | | | 1.37 | | | | 1.37 | | | | 1.41 | | | | 12.35 | | | | 46.14 | | | $ | 24,906 | |
2012 | | $ | 17.31 | | | 1.12 | | | 1.61 | | | | 2.73 | | | | (1.11 | ) | | — | | | (1.11 | ) | | $ | 18.93 | | | | 6.14 | | | | 1.39 | | | | 1.39 | | | | 1.53 | | | | 16.10 | | | | 40.96 | | | $ | 19,471 | |
CLASS R5 SHARES | | | | | | | | | | | | | | | | | | | | | | | | | | | | | | | | | | | | | | | | | | | | | | | | | | |
2016 | | $ | 19.20 | | | 0.98 | | | 0.62 | | | | 1.60 | | | | (0.85 | ) | | — | | | (0.85 | ) | | $ | 19.95 | | | | 5.08 | | | | 0.99 | | | | 0.99 | | | | 1.07 | | | | 8.52 | | | | 42.81 | | | $ | 86,535 | |
2015 | | $ | 21.52 | | | 0.90 | | | (2.35 | ) | | | (1.45 | ) | | | (0.87 | ) | | — | | | (0.87 | ) | | $ | 19.20 | | | | 4.23 | | | | 0.98 | | | | 0.98 | | | | 1.07 | | | | (7.06 | ) | | | 51.27 | | | $ | 78,945 | |
2014 | | $ | 20.26 | | | 1.10 | | | 1.19 | | | | 2.29 | | | | (1.03 | ) | | — | | | (1.03 | ) | | $ | 21.52 | | | | 5.15 | | | | 0.99 | | | | 0.99 | | | | 1.10 | | | | 11.40 | | | | 38.81 | | | $ | 64,748 | |
2013 | | $ | 19.01 | | | 1.07 | | | 1.30 | | | | 2.37 | | | | (1.12 | ) | | — | | | (1.12 | ) | | $ | 20.26 | | | | 5.37 | | | | 0.99 | | | | 0.98 | | | | 1.05 | | | | 12.80 | | | | 46.14 | | | $ | 39,985 | |
2012 | | $ | 17.40 | | | 1.21 | | | 1.58 | | | | 2.79 | | | | (1.18 | ) | | — | | | (1.18 | ) | | $ | 19.01 | | | | 6.61 | | | | 0.99 | | | | 0.99 | | | | 1.29 | | | | 16.44 | | | | 40.96 | | | $ | 14,914 | |
| (a) | Not annualized for periods less than one year. |
| (b) | Sales loads are not reflected in computing total return. |
| + | Based on weighted average shares outstanding. |
See notes to financial statements.
| | | | |
| 38 Annual Report | | | | Annual Report 39 |
REPORT OF INDEPENDENT REGISTERED PUBLIC ACCOUNTING FIRM
Thornburg Investment Income Builder Fund
To the Trustees and Shareholders of
Thornburg Investment Income Builder Fund
In our opinion, the accompanying statement of assets and liabilities, including the schedule of investments in securities, and the related statements of operations and of changes in net assets and the financial highlights present fairly, in all material respects, the financial position of the Thornburg Investment Income Builder (the “Fund”) at September 30, 2016, the results of its operations for the year then ended, the changes in its net assets for each of the two years in the period then ended and the financial highlights for each of the five years in the period then ended, in conformity with accounting principles generally accepted in the United States of America. These financial statements and financial highlights (hereafter referred to as “financial statements”) are the responsibility of the Fund’s management. Our responsibility is to express an opinion on these financial statements based on our audits. We conducted our audits of these financial statements in accordance with the standards of the Public Company Accounting Oversight Board (United States). Those standards require that we plan and perform the audit to obtain reasonable assurance about whether the financial statements are free of material misstatement. An audit includes examining, on a test basis, evidence supporting the amounts and disclosures in the financial statements, assessing the accounting principles used and significant estimates made by management, and evaluating the overall financial statement presentation. We believe that our audits, which included confirmation of securities at September 30, 2016 by correspondence with the custodian, brokers, transfer agent, and the application of alternative procedures where securities purchased had not been received, provide a reasonable basis for our opinion.
PricewaterhouseCoopers LLP
New York, New York
November 18, 2016
40 Annual Report
| | |
| EXPENSE EXAMPLE | | |
| |
Thornburg Investment Income Builder Fund | | September 30, 2016 (Unaudited) |
As a shareholder of the Fund, you incur two types of costs:
| | (1) | transaction costs, including |
(a) sales charges (loads) on purchase payments, for Class A shares;
(b) a deferred sales charge on redemptions of any part or all of a purchase of $1 million of Class A shares within 12 months of purchase;
(c) a deferred sales charge on redemptions of Class C shares within 12 months of purchase;
| | (2) | ongoing costs, including management fees; distribution and/or service (12b-1) fees; and other Fund expenses. |
This example is intended to help you understand your ongoing costs (in dollars) of investing in the Fund and to compare these costs with the ongoing costs of investing in other mutual funds.
The example is based on a $1,000 investment beginning on April 1, 2016, and held until September 30, 2016.
| | | | | | | | | | | | |
| | | Beginning
Account Value
4/1/16 | | | Ending
Account Value
9/30/16 | | | Expenses paid
During period†
4/1/16–9/30/16 | |
CLASS A SHARES | | | | | | | | | | | | |
Actual | | $ | 1,000.00 | | | $ | 1,060.00 | | | $ | 6.04 | |
Hypothetical* | | $ | 1,000.00 | | | $ | 1,019.14 | | | $ | 5.92 | |
CLASS C SHARES | | | | | | | | | | | | |
Actual | | $ | 1,000.00 | | | $ | 1,056.20 | | | $ | 9.77 | |
Hypothetical* | | $ | 1,000.00 | | | $ | 1,015.50 | | | $ | 9.58 | |
CLASS I SHARES | | | | | | | | | | | | |
Actual | | $ | 1,000.00 | | | $ | 1,062.50 | | | $ | 4.39 | |
Hypothetical* | | $ | 1,000.00 | | | $ | 1,020.74 | | | $ | 4.30 | |
CLASS R3 SHARES | | | | | | | | | | | | |
Actual | | $ | 1,000.00 | | | $ | 1,058.90 | | | $ | 7.72 | |
Hypothetical* | | $ | 1,000.00 | | | $ | 1,017.50 | | | $ | 7.57 | |
CLASS R4 SHARES | | | | | | | | | | | | |
Actual | | $ | 1,000.00 | | | $ | 1,058.80 | | | $ | 7.21 | |
Hypothetical* | | $ | 1,000.00 | | | $ | 1,017.99 | | | $ | 7.07 | |
CLASS R5 SHARES | | | | | | | | | | | | |
Actual | | $ | 1,000.00 | | | $ | 1,061.30 | | | $ | 5.10 | |
Hypothetical* | | $ | 1,000.00 | | | $ | 1,020.05 | | | $ | 5.00 | |
| † | Expenses are equal to the annualized expense ratio for each class (A: 1.17%; C: 1.90%; I: 0.85%; R3: 1.50%; R4: 1.40%; R5: 0.99%) multiplied by the average account value over the period, multiplied by 183/366 to reflect the one-half year period. |
| * | Hypothetical assumes a rate of return of 5% per year before expenses. |
ACTUAL EXPENSES
For each class of shares, the first line of the accompanying table provides information about actual account values and actual expenses. You may use the information in this line, together with the amount you invested, to estimate the expenses that you paid over the period. Simply divide your account value by $1,000 (for example, an $8,600 account value divided by $1,000 = 8.6), then multiply the result by the number in the first line for your class of shares under the heading entitled “Expenses Paid During Period” to estimate the expenses you paid on your account during this period.
HYPOTHETICAL EXAMPLE FOR COMPARISON PURPOSES
For each class of shares, the second line of the accompanying table provides information about hypothetical account values and hypothetical expenses based on the Fund’s actual expense ratio and an assumed rate of return of 5% per year before expenses, which is not the Fund’s actual return. The hypothetical account values and expenses may not be used to estimate the actual ending account balance or expenses you paid for the period. You may use this information to compare the ongoing costs of investing in the Fund and other funds. To do so, compare this 5% hypothetical example with the 5% hypothetical examples that appear in the shareholder reports of the other funds.
Please note that the expenses shown in the table are meant to highlight your ongoing costs only and do not reflect any transactional costs, such as sales charges (loads), redemption fees, or exchange fees. Therefore, the second line of the table for each class of shares is useful in comparing ongoing costs only, and will not help you determine the relative total costs of owning different funds. In addition, if these transactional costs were included, your costs would have been higher.
Annual Report 41
| | |
| TRUSTEES AND OFFICERS | | |
| |
Thornburg Investment Income Builder Fund | | September 30, 2016 (Unaudited) |
| | | | |
Name, Age, Year Elected Position Held with Fund | | Principal Occupation(s) During Past Five Years | | Other
Directorships
Held by Trustee |
INTERESTED TRUSTEES (1)(2)(4) | | |
| | |
Garrett Thornburg, 71 Trustee since 1987, Chairman of Trustees(3) | | Chairman and controlling shareholder of Thornburg Investment Management, Inc. (investment advisor); Chairman and controlling shareholder of Thornburg Securities Corporation (securities dealer); Chairman and CEO of Chamisa Energy, LLC; President of the Thornburg Foundation (nonprofit). | | None |
| | |
Brian J. McMahon, 61 Trustee since 2001, Vice Chairman of Trustees, Member of Governance & Nominating Committee & Operations Risk Oversight Committee(5) | | Chief Investment Officer, Managing Director, and Portfolio Manager and, until 2016, CEO and President of Thornburg Investment Management, Inc.; Vice President of Thornburg Securities Corporation. | | None |
| |
INDEPENDENT TRUSTEES (1)(2)(4) | | |
| | |
David A. Ater, 71 Trustee since 1994, Member of Audit Committee & Chairman of Governance & Nominating Committee | | Principal in Ater & Associates, Santa Fe, NM (developer, planner and broker of residential and commercial real estate); owner, developer and broker for various real estate projects. | | None |
| | |
David D. Chase, 75 Trustee since 2000, Chairman of Audit Committee | | Managing Member of CS Group, LLC, Santa Fe, NM (private investment fund – family office). | | None |
| | |
Sally Corning, 55 Trustee since 2012, Member of Audit Committee | | Partner in Sun Mountain Capital, Santa Fe, NM (private equity firm with investment programs encompassing venture capital, mezzanine debt, and growth equity). | | None |
| | |
Susan H. Dubin, 67 Trustee since 2004, Member of Audit Committee & Governance and Nominating Committee | | President of Dubin Investments, Ltd., Greenwich, CT (private investment fund); Director and officer of various charitable organizations. | | None |
| | |
David L. Gardner, 53 Trustee since 2015, Member of Operations Risk Oversight Committee | | Until 2012, head of EMEA (Europe, Middle East and Africa) Sales for iShares of Blackrock, Inc., EMEA Executive Committee Member and EMEA Operating Committee Member at Blackrock, Inc. | | None |
| | |
Owen D. Van Essen, 62 Trustee since 2004, Member of Governance & Nominating Committee & Chairman of Operations Risk Oversight Committee | | President of Dirks, Van Essen & Murray, Santa Fe, NM (newspaper mergers and acquisitions). | | None |
| | |
James W. Weyhrauch, 57 Trustee since 1996, Member of Audit Committee & Operations Risk Oversight Committee | | Real estate broker, Santa Fe Properties, Santa Fe, NM; Vice Chairman of Nambe LLC, Santa Fe, NM (manufacturing & design company). | | None |
42 Annual Report
| | |
| TRUSTEES AND OFFICERS, CONTINUED | | |
| |
Thornburg Investment Income Builder Fund | | September 30, 2016 (Unaudited) |
| | | | |
Name, Age, Year Elected Position Held with Fund | | Principal Occupation(s) During Past Five Years | | Other
Directorships
Held by Trustee |
OFFICERS OF THE FUND (WHO ARE NOT TRUSTEES)(1)(7) | | |
| | |
Nimish Bhatt, 53 Treasurer since 2016(6) | | Chief Financial Officer and Treasurer of Thornburg Investment Management, Inc. and Thornburg Securities Corporation since 2016; Senior Vice President (2004–2016), Chief Financial Officer (2011–2016), and Head of Fund Administration (2011–2016) of Calamos Asset Management, Inc., Calamos Investments LLC, Calamos Advisors LLC, and Calamos Wealth Management; Director of Calamos Global Funds plc (2007–2016). | | Not applicable |
| | |
Jason Brady, 42 President since 2016(6) | | CEO and President since 2016, Vice President from 2011 to 2016, Portfolio Manager and Managing Director of Thornburg Investment Management, Inc.; Vice President of Thornburg Securities Corporation since 2016. | | Not applicable |
| | |
Kathleen Brady, 56 Vice President since 2008 | | Tax Manager Fund Accounting of Thornburg Investment Management, Inc. | | Not applicable |
| | |
Connor Browne, 37 Vice President since 2006 | | Portfolio Manager, Vice President since 2013, and Managing Director of Thornburg Investment Management, Inc. | | Not applicable |
| | |
Tim Cunningham, 41 Vice President since 2014 | | Managing Director since 2011, Portfolio Manager since 2012, and Associate Portfolio Manager from 2009–2012 of Thornburg Investment Management, Inc. | | Not applicable |
| | |
Randy Dry, 42 Vice President since 2014 | | Vice President and Managing Director, Director of Institutional Group from 2014–2016, and since 2016, Chief Administrative Officer of Thornburg Investment Management, Inc. | | Not applicable |
| | |
Greg Dunn, 40 Vice President since 2014 | | Managing Director, Portfolio Manager since 2012, and Associate Portfolio Manager from 2009–2012 of Thornburg Investment Management, Inc. | | Not applicable |
| | |
Lon Erickson, 41 Vice President since 2008 | | Portfolio Manager and Managing Director of Thornburg Investment Management, Inc. | | Not applicable |
| | |
William V. Fries, 77 Vice President since 1995 | | Portfolio Manager, Vice President, and Managing Director of Thornburg Investment Management, Inc. | | Not applicable |
| | |
Thomas Garcia, 45 Vice President since 2006 | | Vice President since 2011, Managing Director, Head Equity Trader, and Associate Portfolio Manager of Thornburg Investment Management, Inc. | | Not applicable |
| | |
Rolf Kelly, 37 Vice President since 2016 | | Portfolio Manager and Managing Director since 2013 and Associate Portfolio Manager from 2011–2013 of Thornburg Investment Management, Inc. | | Not applicable |
| | |
Ben Kirby, 36 Vice President since 2014 | | Portfolio Manager and Managing Director since 2013 and Associate Portfolio Manager from 2011–2013 of Thornburg Investment Management, Inc. | | Not applicable |
| | |
Jeff Klingelhofer, 41 Vice President since 2016 | | Portfolio Manager and Managing Director since 2015, Associate Portfolio Manager from 2012–2015, and Fixed Income Analyst from 2010–2012 of Thornburg Investment Management, Inc. | | Not applicable |
| | |
Rob MacDonald, 40 Vice President since 2016 | | Managing Director since 2015, Portfolio Manager since 2014, and Associate Portfolio Manager from 2011–2014 of Thornburg Investment Management, Inc. | | Not applicable |
| | |
Leigh Moiola, 49 Vice President since 2001 | | Vice President, Managing Director, and Director of Marketing of Thornburg Investment Management, Inc.; Vice President of Thornburg Securities Corporation. | | Not applicable |
| | |
Christopher Ryon, 60 Vice President since 2008 | | Portfolio Manager and Managing Director of Thornburg Investment Management, Inc. | | Not applicable |
| | |
Nicholos Venditti, 35 Vice President since 2016 | | Portfolio Manager and Managing Director since 2015 and Associate Portfolio Manager from 2011–2015 of Thornburg Investment Management, Inc. | | Not applicable |
Annual Report 43
| | |
| TRUSTEES AND OFFICERS, CONTINUED | | |
| |
Thornburg Investment Income Builder Fund | | September 30, 2016 (Unaudited) |
| | | | |
Name, Age, Year Elected Position Held with Fund | | Principal Occupation(s) During Past Five Years | | Other
Directorships
Held by Trustee |
| | |
Vinson Walden, 46 Vice President since 2004 | | Portfolio Manager and Managing Director of Thornburg Investment Management, Inc. | | Not applicable |
| | |
Lei Wang, 45 Vice President since 2006 | | Portfolio Manager and Managing Director of Thornburg Investment Management, Inc. | | Not applicable |
| | |
Sasha Wilcoxon, 42 Vice President since 2003 Secretary since 2007(6) | | Managing Director, Director of Mutual Fund Operations, and Vice President of Thornburg Investment Management, Inc.; Vice President of Thornburg Securities Corporation. | | Not applicable |
| | |
Charles Wilson, 41 Vice President since 2016 | | Portfolio Manager and Managing Director since 2014 and Associate Portfolio Manager from 2012–2014 of Thornburg Investment Management, Inc.; Co-Portfolio Manager of Marsico Capital Management from 2010–2012. | | Not applicable |
| | |
Di Zhou, 38 Vice President since 2016 | | Portfolio Manager and Managing Director since 2016, Associate Portfolio Manager from 2014–2016, and Equity Research Analyst from 2010–2014 of Thornburg Investment Management, Inc. | | Not applicable |
| (1) | Each person’s address is 2300 North Ridgetop Road, Santa Fe, New Mexico 87506. |
| (2) | The Fund is a separate investment “Fund” or “series” of Thornburg Investment Trust (the “Trust”), which comprises the Thornburg mutual fund complex and is organized as a Massachusetts business trust. Thornburg Investment Management, Inc. is the investment advisor to, and manages, all the Funds of the Trust. Each Trustee oversees all the Funds of the Trust. |
| (3) | Mr. Thornburg is considered an “interested” Trustee under the Investment Company Act of 1940 because he is the sole director and controlling shareholder of Thornburg Investment Management, Inc., the investment advisor to the Trust, and is the sole director and controlling shareholder of Thornburg Securities Corporation, the distributor of shares for the Trust. |
| (4) | The Bylaws of the Trust currently require that each Trustee shall retire by the end of the calendar year during which the Trustee reached the age of 75 years. Otherwise each Trustee serves in office until the election and qualification of a successor or until the Trustee sooner dies, resigns, retires or is removed. |
| (5) | Mr. McMahon is considered an “interested” Trustee under the Investment Company Act of 1940 because he is the chief investment officer of Thornburg Investment Management, Inc. |
| (6) | The Trust’s president, secretary, and treasurer each serves a one-year term or until the election and qualification of a successor; each other officer serves at the pleasure of the Trustees. |
| (7) | Assistant vice presidents, assistant secretaries, and assistant treasurers are not shown. |
The Statement of Additional Information for each Fund of the Trust includes additional information about the Trustees and is available, without charge and upon request, by calling 1-800-847-0200.
44 Annual Report
| | |
| OTHER INFORMATION | | |
| |
Thornburg Investment Income Builder Fund | | September 30, 2016 (Unaudited) |
PORTFOLIO PROXY VOTING
Policies and Procedures:
The Trust has delegated to Thornburg Investment Management, Inc. (the “Advisor”) voting decisions respecting proxies for the Fund’s voting securities. The Advisor makes voting decisions in accordance with its Proxy Voting Policy and Procedures. A description of the Policy and Procedures is available (i) without charge, upon request, by calling the Advisor toll-free at 1-800-847-0200, (ii) on the Thornburg website at www.thornburg.com, and (iii) on the Securities and Exchange Commission’s website at www.sec.gov.
Information regarding how proxies were voted is available on or before August 31 of each year for the twelve months ending the preceding June 30. This information is available (i) without charge, upon request by calling the Advisor toll-free at 1-800-847-0200, (ii) on the Thornburg website at www.thornburg.com, and (iii) on the Securities and Exchange Commission’s website at www.sec.gov.
TAX INFORMATION
For the tax year ended September 30, 2016, dividends paid by the Thornburg Investment Income Builder Fund of $687,130,644 are being reported as ordinary investment income for federal income tax purposes.
For the tax year ended September 30, 2016, the Fund is reporting 79.15% (or the maximum allowed) of the dividends paid from tax basis net ordinary income as qualifying for the reduced rate under the Jobs and Growth Tax Relief and Reconciliation Act of 2003.
The Fund is reporting 21.21% (or the maximum allowed) of the ordinary income distributions paid by the Fund for the fiscal year ended September 30, 2016 as qualified for the corporate dividends received deduction.
For the year ended September 30, 2016, foreign source income and foreign taxes paid are $588,321,163 and $58,318,994, respectively. The information and distributions reported herein may differ from the information and distributions reported to the shareholders for the calendar year ending December 31, 2016. Complete information will be reported in conjunction with your 2016 Form 1099.
AVAILABILITY OF QUARTERLY PORTFOLIO SCHEDULE
The Fund files with the Securities and Exchange Commission schedules of its portfolio holdings on Form N-Q for the first and third quarters of each fiscal year. The Fund’s Forms N-Q are available on the Commission’s website at www.sec.gov, or may be reviewed and copied at the Commission’s Public Reference Room in Washington, D.C. Information on the operation of the Public Reference Room may be obtained by calling 1-800-SEC-0330. The Fund also makes this information available on its website at www.thornburg. com/download or upon request by calling 1-800-847-0200.
STATEMENT RESPECTING RENEWAL OF INVESTMENT ADVISORY AGREEMENT
Thornburg Investment Management, Inc. (the “Advisor”) provides investment management services to Thornburg Investment Income Builder Fund pursuant to an investment advisory agreement. The Trustees consider the renewal of this agreement annually, and most recently determined to renew the agreement on September 13, 2016.
In anticipation of their recent consideration of the advisory agreement’s renewal, the independent Trustees met in May 2016 to consider aspects of their annual evaluation of the Advisor’s service to all of the funds of Thornburg Investment Trust, to plan the annual evaluation of the Advisor’s performance and to specify the information the Advisor would present to the Trustees for their review. The independent Trustees met again in independent session in September to consider portions of the information submitted by the Advisor. The Advisor’s president and chief investment officer subsequently reviewed portions of the information with the Trustees and addressed questions from the Trustees at a full meeting session of the Trustees scheduled for that purpose, and the independent Trustees thereafter met in independent session to consider the Advisor’s presentation and various specific issues respecting their consideration of the advisory agreement’s renewal. Following these sessions, the Trustees met to consider renewal of the agreement, and the independent Trustees voted unanimously at that meeting to renew the agreement for an additional term of one year.
The information below summarizes certain factors considered by the Trustees in connection with the determination to renew the advisory agreement. In determining to renew the agreement, the Trustees considered a wide range of information and did not identify any single factor as controlling, and this summary does not describe all of the factors and other matters considered by the Trustees in making their determination.
Nature, Extent and Quality of Services. The Trustees considered presentations by the Advisor at meeting sessions scheduled for consideration of a continuation of the advisory agreement, and also noted their consideration of the reports the Trustees and their committees receive throughout the year on a wide variety of topics, and consideration they had given to a number of topics in previous
Annual Report 45
| | |
| OTHER INFORMATION, CONTINUED | | |
| |
Thornburg Investment Income Builder Fund | | September 30, 2016 (Unaudited) |
years. Information identified by the Trustees in their evaluation as having been considered and contributing to their conclusions included Trustees’ assessments of the Advisor’s personnel developed in formal and informal meetings throughout the year, the Advisor’s staffing levels and measures to maintain staffing levels and improve competencies, the Advisor’s commitment to attract and retain high quality portfolio management expertise through competitive compensation levels, the Advisor’s collaborative approach to investment management, the Fund’s investment performance over different periods of time, portfolio managers’ cognizance of and strategies to address market and economic trends and conditions, the evaluation and selection of individual investments, the structuring and composition of the Fund’s portfolio, management of Fund liquidity requirements, cognizance of and efforts to achieve tax efficiency, responses to share sale and redemption activity, continuing enhancements to the Advisor’s electronic and information systems and the Advisor’s engagement of outside firms to assist in improving or replacing those systems, the Advisor’s evaluation and selection of firms providing portfolio trade execution to the Fund and the Advisor’s measures to obtain favorable trade execution, the Advisor’s performance of accounting and other services, the Advisor’s continued commitment to observance of compliance and regulatory requirements, the Advisor’s responsiveness to the Trustees, the quality and extent of written and oral reports to the Trustees over the course of the year, and other factors.
Investment Performance. The Trustees noted in their evaluation of the Fund’s investment performance the reports they had received in each regular meeting over the course of the year from the Advisor’s portfolio management personnel. The Trustees also noted in their evaluation their consideration of information provided to them at their request in anticipation of their annual evaluation of the Advisor’s services, including the following items of information respecting the investment performance of the Fund: (1) the Fund’s absolute investment performance and achievement of stated objectives; (2) the Advisor’s written and oral explanations and commentary on the Fund’s performance in the context of the Fund’s objectives and reasonable expectations, and business, market and economic conditions, (3) performance data for the ten most recent calendar years, comparing the Fund’s annual investment returns to a fund category selected by an independent mutual fund analyst firm, a blended performance benchmark and a broad-based securities index, (4) the Fund’s investment performance for the three-month, year-to-date, one-year, three-year, five-year and ten-year periods ending with the second quarter of the current year comparing the Fund’s annualized returns to two mutual fund categories selected by independent mutual fund analyst firms, a broad-based securities index and a blended performance benchmark, and assigning a percentage rank to the Fund’s performance for each period relative to each of the fund categories, (5) comparison of the Fund’s annualized investment return since inception to the Fund’s blended benchmark, (6) comparative measures of estimated earnings growth, portfolio volatility, risk and return, and (7) dividend distributions by the Fund.
The Trustees noted that quarterly reports during the year and other information presented to them confirmed the Advisor’s continued conformity to the Fund’s stated investment objectives and policies.
The Trustees observed in reviewing comparative performance data for the ten most recent calendar years since the Fund’s inception that the Fund’s investment return for the most recent calendar year was lower than the returns for the securities index and the blended benchmark, and comparable to the average return for the fund category. The Trustees further observed that these data showed the Fund’s returns in the preceding nine years exceeded or were comparable to the returns of the blended benchmark in six of nine years, exceeded the returns of the index in four of nine years, and exceeded or were comparable to the average returns of the category in eight of nine years. Other quantitative data noted by the Trustees as having been considered in their evaluation showed that the Fund’s annualized investment returns fell in the third quartile of performance of the first fund category for the one-year period ended with the second quarter of the current year, fell in the second quartile of performance for the three-year period, fell in the top quartile of performance for the five-year period, and fell in the top decile of performance for the ten-year period. Noted data also showed that the Fund’s annualized investment returns fell in the fourth quartile of performance of the second fund category for the one-year, three-year and five-year periods, and fell near the midpoint of performance for the ten-year period. Data presented to the Trustees showed that the Fund’s annualized total return (net of expenses) over the period since the Fund’s inception exceeded the annualized return for the Fund’s blended performance benchmark. Dividends paid with respect to shares of the Fund were noted as consistent with expectations and prevailing conditions. The Trustees attached additional significance to the performance of the Fund from the perspective of longer term shareholders.
Comparisons of Fee and Expense Levels. The Trustees recognized in their evaluation the clear disclosures of the Advisor’s fees and Fund expenses in the Fund’s prospectus. Information noted by the Trustees as having been considered in this context included a variety of comparative data respecting the Fund’s fee and expense levels. This information included comparisons of the Fund’s advisory fee and overall Fund expenses to median and average fees and expenses charged to a category of mutual funds selected by an independent mutual fund analyst firm, comparisons of the advisory fee and other Fund expenses to the fee levels and expenses for two representative share classes of fund peer groups selected from the category by a second independent mutual fund analyst firm, the perspectives and advice from the second mutual fund analyst firm respecting comparisons of fund fee levels and expenses to fund peer groups, and other information. Comparative data noted as having been considered by the Trustees showed that the Fund’s advisory fee level was comparable to the median and slightly higher than the average levels for the fund category, the level of total expense for a representative share class of the Fund was comparable to the median and average expense levels for the category, and that the level of total expense for a second representative share class was lower than the median and average levels for the category. Peer group data showed the Fund’s advisory fee level was comparable to the median levels for the two peer groups, and that the total expense levels for the two representative share classes of the Fund were comparable to the median levels for the respective peer groups.
46 Annual Report
| | |
| OTHER INFORMATION, CONTINUED | | |
| |
Thornburg Investment Income Builder Fund | | September 30, 2016 (Unaudited) |
The Trustees noted their consideration of information respecting the advisory fees charged by the Advisor to other investment management clients, including sub-advised mutual funds, together with information about fees charged by other advisors to different clients, analysis of the differences between the requirements of institutional clients and mutual funds, analysis of the differences between the requirements of a sub-advised mutual fund and a fund as to which the investment advisor is the primary advisor and sponsor, descriptions of distinguishing characteristics of the sub-advised funds served by the Advisor, and the consequently different investment management services provided to the different categories of clients and the differing contexts in which the fee levels for these arrangements are established. The Trustees confirmed their previous observations that the differences between the fees charged by the Advisor to different types of clients did not appear exceptional, and that the fee rates charged by an investment advisor to different categories of clients had limited relevance to the evaluation of the fee rate charged by that advisor to mutual funds as to which it is the primary advisor and sponsor.
Costs and Profitability of Advisor. In reviewing the profitability of the Advisor’s services to the Fund the Trustees considered an analysis of the Advisor’s costs and the profitability to the Advisor of its services, together with data respecting the overall profitability of a selection of other investment management firms. The Trustees noted that a portion of the Advisor’s profits are an important element in the compensation of shareholder employees. The Trustees considered in this regard information from the Advisor respecting investment of its profits to maintain staffing levels, pay competitive levels of compensation, and add to its information retrieval and management systems to maintain or improve service levels. The Trustees also considered the contribution of the Advisor’s cost management to its profitability, and the relationship of the Advisor’s financial resources and profitability in previous years to its ability to attract necessary personnel, invest in systems and other assets required for its service to the Fund, and maintain or improve service levels for the Fund notwithstanding fluctuations in revenues and profitability. The information considered did not indicate to the Trustees that the Advisor’s profitability was excessive.
Potential Economies of Scale. In reviewing the extent to which economies of scale would be realized by the Fund as it grows and whether fee levels reflect potential economies of scale, the Trustees considered the breakpoint structure for advisory fees chargeable to the Fund, comparisons of the fee breakpoint structure for the Fund with breakpoint structures (or the absence of such structures) for other funds in a peer group selected by an independent mutual fund analyst firm, the effects of the breakpoint structure and other expense factors realized by certain Funds of the Trust as their asset levels had increased, and the Advisor’s expenditures from its own profits and resources to maintain staffing levels, pay competitive levels of compensation, and add to its information retrieval and management systems to maintain or improve service levels. The information provided demonstrated to the Trustees that the Fund’s advisory fee breakpoint structure is reasonable in relation to the structures observed in the other funds in its peer group, and that shareholders may be expected to benefit from any economies of scale, due to the advisory agreement’s breakpoint fee structure for the Fund and other factors.
Potential Ancillary Benefits. In reviewing potential benefits to the Advisor because of its relationship to the Fund, the Trustees noted disclosures by the Advisor of its receipt of certain research services from broker dealers, and the benefits to both the Fund and the Advisor of the Advisor’s expansion of its staffing, compliance and systems capabilities and other resources to serve a broader variety of investment management clients. No unusual or unfair benefits to the Advisor from its relationship to the Fund were identified by the Trustees.
Summary of Conclusions. The Trustees concluded that the nature, extent and quality of the Advisor’s services performed under the advisory agreement remained sufficient. The Trustees further concluded that the absolute and relative investment performance of the Fund over a range of pertinent holding periods on the whole was satisfactory in the context of its objectives and strategies, and that the Advisor had continued to actively and competently pursue the Fund’s stated investment objectives and adhere to the Fund’s investment policies.
The Trustees further concluded, based upon their consideration of the foregoing factors and other information, that the level of the advisory fee charged to the Fund by the Advisor is reasonable in relation to the services provided by the Advisor in view of the nature, extent and quality of those services, the investment performance of the Fund after fees and expenses, the clear disclosure of fees and expenses in the Fund’s prospectuses, comparisons of fees and expenses charged to the Fund to fees and expenses charged to other mutual funds, and the other factors considered.
Annual Report 47
TRUSTEES’ STATEMENT TO SHAREHOLDERS
Readopted September 12, 2016
The Trustees believe current and prospective shareholders should know how we discharge our responsibilities in supervising the Funds’ investment advisor and in reviewing the advisor’s contract for renewal. Since 2005, we have issued a statement which sets out clearly the three principal guidelines that we follow in supervising the Trust’s investment advisor on your behalf. In accordance with our customary practice, in September of this year we again reviewed our statement and concluded we should reissue this statement outlining the principal features of our supervision of the advisor’s performance of investment management services for the Funds.
We begin with the premise that each shareholder selected his or her Fund because its investments are managed by the investment advisor identified in the prospectus and in accordance with the objective and policies described in the prospectus. We realize, as each of you do, that if you believe that your Fund’s stated objective and policies no longer serve your personal investment goals, you can sell your shares and leave the Fund.
Therefore, we believe that our primary supervisory task – our principal obligation to you – is to assess the nature and quality of the advisor’s services, and to confirm that the advisor actively and competently pursues the Fund’s objective, in accordance with the policies set out in the prospectus. To do this, we meet regularly with management to review your Fund’s portfolio and to discuss the advisor’s specific actions and judgments in pursuing the Fund’s objective. We do not substitute our own judgment for the advisor’s decisions in selecting investments; the advisor is paid to exercise its informed judgment on investment decisions, and we seek to confirm, in reviewing the advisor’s performance, that the advisor is doing just that.
Second, we are conscious of costs and the effect that costs have on shareholders’ returns. We try to make sure that your Fund’s fees and costs are reasonable in relationship to the services rendered and that they are generally in line with those charged by other expert investment advisors, consistent with our belief that the Fund’s investors searched for and expect that expertise and attention and have decided to pay a reasonable price for it. We do not put the management contract “out to bid” as a matter of course, and we would not do so unless we had concluded that the advisor materially had failed to pursue the Fund’s objectives in accordance with its policies, or for other equally important reasons. We believe that any other approach would be inconsistent with your interests and contrary to your expectations when you bought shares of the Fund in the first place.
Finally, because we believe that most Thornburg Fund shareholders have invested with a long-term perspective, we try not to focus too much on the fashions of the moment and on short-term performance. The market will not favor any specific investment objective or set of policies at all times and under all economic circumstances. A fund will experience periods of both high and low returns relative to other funds and other investments. Even if one of our Funds is not favored by the market at a particular time, we believe that the advisor is nonetheless obliged to remain true to the Fund’s objective and policies, and we watch to see that it does so.
Trustees of Thornburg Investment Trust
48 Annual Report
THORNBURG FUNDS
Thornburg Investment Management is a privately-owned global investment firm that offers a range of solutions for retail and institutional investors. Founded in 1982 and headquartered in Santa Fe, New Mexico, we manage approximately $53 billion (as of September 30, 2016) across eight equity and 11 bond mutual funds, separate accounts for high-net-worth investors and institutional accounts, and five UCITS funds for non-U.S. investors.
The fund outlined in this report is one of many equity and fixed-income products available from Thornburg Investment Management.
Equity Funds
| | • | | Thornburg Core Growth Fund |
| | • | | Thornburg International Value Fund |
| | • | | Thornburg Better World International Fund |
| | • | | Thornburg International Growth Fund |
| | • | | Thornburg Developing World Fund |
| | • | | Thornburg Investment Income Builder Fund |
| | • | | Thornburg Global Opportunities Fund |
Fixed Income Funds
| | • | | Thornburg Low Duration Income Fund |
| | • | | Thornburg Limited Term U.S. Government Fund |
| | • | | Thornburg Limited Term Income Fund |
| | • | | Thornburg Strategic Income Fund |
| | • | | Thornburg Low Duration Municipal Fund |
| | • | | Thornburg Limited Term Municipal Fund |
| | • | | Thornburg Intermediate Municipal Fund |
| | • | | Thornburg California Limited Term Municipal Fund |
| | • | | Thornburg New Mexico Intermediate Municipal Fund |
| | • | | Thornburg New York Intermediate Municipal Fund |
| | • | | Thornburg Strategic Municipal Income Fund |
Before investing, carefully consider the Fund’s investment goals, risks, charges, and expenses. For a prospectus or summary prospectus containing this and other information, contact your financial advisor or visit thornburg.com. Read it carefully before investing.
For additional information, please visit thornburg.com
Thornburg Investment Management, Inc. 2300 North Ridgetop Road, Santa Fe, NM 87506
Annual Report 49
This page intentionally left blank.
50 Annual Report
This page intentionally left blank.
Annual Report 51

| | |
| To receive shareholder reports, prospectuses, and proxy statements electronically, go to www.thornburg.com/edelivery. | |  |
This Annual Report is submitted for the general information of shareholders of the Fund. It is not authorized for distribution to prospective investors in the Fund unless preceded or accompanied by an effective prospectus. | |
| | | | |
| Investment Advisor: | | Distributor: | | |
| Thornburg Investment Management® | | Thornburg Securities Corporation® | | |
| 800.847.0200 | | 800.847.0200 | | TH857 |
2 Annual Report
Annual Report
Thornburg Global Opportunities Fund
September 30, 2016
| | | | |
Share Class | | NASDAQ Symbol | | CUSIP |
Class A | | THOAX | | 885-215-343 |
Class C | | THOCX | | 885-215-335 |
Class I | | THOIX | | 885-215-327 |
Class R3 | | THORX | | 885-215-145 |
Class R4 | | THOVX | | 885-215-137 |
Class R5 | | THOFX | | 885-215-129 |
Class I, R3, R4, and R5 shares may not be available to all investors. Minimum investments for Class I shares may be higher than those for other classes.
Investments carry risks, including possible loss of principal. Additional risks may be associated with investments outside the United States, especially in emerging markets, including currency fluctuations, illiquidity, volatility, and political and economic risks. Investments in small- and mid-capitalization companies may increase the risk of greater price fluctuations. Please see the Fund’s prospectus for a discussion of the risks associated with an investment in the Fund. Investments in the Fund are not FDIC insured, nor are they bank deposits or guaranteed by a bank or any other entity.
Funds invested in a smaller number of holdings may expose an investor to greater volatility.
Annual Report 3
LETTER TO SHAREHOLDERS
| | |
| |
Thornburg Global Opportunities Fund | | September 30, 2016 (Unaudited) |
October 17, 2016
Dear Fellow Shareholder:
This letter will highlight the results of Thornburg Global Opportunities Fund’s investment activities for the 12-month period ended September 30, 2016. In addition, we will comment on the overall investment landscape. Recall that Thornburg Global Opportunities Fund seeks capital appreciation from a portfolio of typically 30–40 equity investments from around the world. We believe that the structure of the Fund—built on our core investment principles of flexibility, focus, and value—gives us a durable framework for value-added investing.
The Fund’s total return for the fiscal year ended September 30, 2016, was 2.57% (Class A shares without sales charge), lagging the 11.96% return of the benchmark MSCI All Country World Index. The net asset value (NAV) per share increased from $24.41 to $24.90. The Class A shares paid 13.7 cents per share in dividend income. The dividends per share were higher for Class I, Class R4, and Class R5 shares, and lower on the Class R3 shares, to account for varying class-specific expenses. Class C shares paid no dividend for the period.
Following our previous two years of strong results, our performance this fiscal year was not satisfying. We have been working to improve the portfolio and have seen signs of progress over the past months, including outperformance in the September quarter. Comparisons of the Fund to the MSCI All Country World Index over various time periods are shown on page 8 of this report, and on our website, www.thornburg.com. July 2016 marked the 10th anniversary of the Fund’s inception. From its inception on July 28, 2006, through September 30, 2016, the A Shares of Thornburg Global Opportunities Fund have outperformed the ACWI Index by an average margin of over 450 basis points per year, resulting in a total cumulative return since inception of 145% (A shares without sales charge) versus 59% for the index. As of September 30, 2016, the Fund’s Class A and I shares are rated four stars and five stars overall, respectively, by Morningstar, and rank in the top 1% of World Stock Funds for the time period starting from July 31, 2006, to September 30, 2016 (based on total returns without sales charge, among 607 funds). Over this same time period, the Fund exhibited share-price volatility, as measured by weekly beta, nominally lower than that of the index.1
Table I displays the Fund’s ranking over various periods, by performance percentile relative to the Morningstar World Stock category (lower numbers represent higher ranking).
We do not expect to pay any capital gain distribution to shareholders of Thornburg Global Opportunities Fund for 2016. As of September 30, 2016, the Fund had tax basis net realized capital losses of more than $83.9 million, which may be carried forward to offset future capital gains, to the extent permitted by regulations.
Performance data shown represents past performance and is no guarantee of future results. Investment return and principal value will fluctuate so shares, when redeemed, may be worth more or less than their original cost. Current performance may be lower or higher than quoted. For performance current to the most recent month end, visit thornburg.com or call 800.847.0200.
The maximum sales charge for Class A shares is 4.50%. The total annual fund operating expense of Class A shares is 1.32%, as disclosed in the most recent prospectus. If the sales charge had been deducted, returns would be lower.
Table I Morningstar World Stock Ratings and Rankings
as of September 30, 2016
| | | | | | | | | | | | | | | | | | | | |
| | | | | | Ratings | |
| | | | | | Overall | | | 3-Yr | | | 5-Yr | | | 10-Yr | |
A Shares | | | | | | | 4 stars | | | | 4 stars | | | | 4 stars | | | | 4 stars | |
I Shares | | | | | | | 5 stars | | | | 5 stars | | | | 5 stars | | | | 5 stars | |
# of Funds | | | | | | | 953 | | | | 953 | | | | 735 | | | | 425 | |
| |
| | | Rankings | |
| | | 1-Yr | | | 3-Yr | | | 5-Yr | | | 10-Yr | | | Since Incep. | |
A Shares | | | 98 | % | | | 6 | % | | | 5 | % | | | 1 | % | | | 1 | % |
I Shares | | | 98 | % | | | 4 | % | | | 3 | % | | | 1 | % | | | 1 | % |
# of Funds | | | 1141 | | | | 953 | | | | 735 | | | | 425 | | | | 607 | |
Percentile rankings are based on total returns, before sales charge. Source: Morningstar.
The Fund’s Overall Morningstar Rating, based on risk-adjusted returns, uses a weighted average of the Fund’s three-, five-, and ten-year ratings. To determine a fund’s Morningstar Rating™, funds with at least a three-year history are ranked in their categories by their Morningstar Risk-Adjusted Return scores. The top 10% receive 5 stars; the next 22.5%, 4 stars; the middle 35%, 3 stars; the next 22.5%, 2 stars; and the bottom 10% receive 1 star. The Risk-Adjusted Return accounts for variation in a fund’s performance (including the effects of all sales charges), placing more emphasis on downward variations and rewarding consistent performance. Other share classes may have different performance characteristics.
In assessing the performance of the Fund over the fiscal year ended September 30, 2016, it is constructive to consider the results in U.S. dollars of the 11 sector components of our benchmark, the MSCI All Country World Index. For the index, sector returns ranged from 2% (financials) to 24% (materials) with all of the sectors showing positive returns. The behavior of interest rates was an important factor influencing equities over the year. Defensive sectors, such as telecommunications and utilities, outperformed in the first three quarters of our fiscal year, but this trend reversed sharply in the September quarter in favor of cyclical industries such as
| 1. | Beta, since inception of the fund versus the MSCI All Country World Index, is 0.98. |
Source: Bloomberg.
4 Annual Report
| | |
LETTER TO SHAREHOLDERS, CONTINUED | | |
| |
Thornburg Global Opportunities Fund | | September 30, 2016 (Unaudited) |
banks and technology. The Fund posted positive returns from its investments in seven of the 11 sectors, negative returns from its holdings in three sectors, and had no exposure to the utilities sector.
| 1. | 15 portfolio investments contributed at least 1⁄4 of 1% to portfolio returns during the fiscal year, while 9 contributed overall portfolio losses of more than 1⁄4 of 1%, taking into account absolute performance and portfolio weightings over the course of the period. |
| 2. | The Fund’s investments in the following sectors comprised the largest weightings in the portfolio: consumer discretionary (20% weight as of 9/30/16), information technology (15%), and financials (13%). |
| 3. | The Fund’s positions in the consumer discretionary sector delivered mixed results during the fiscal year. Multinational communications network operator Altice and Asian casino operator Galaxy Entertainment each made positive contributions to the portfolio, but that favorable outcome was partially offset by the negative impact from U.K. homebuilder Barratt Developments and Korean casino operator Paradise Co. |
| 4. | Your Fund’s holdings in the financial sector made positive contributions to portfolio returns, and outperformed the index. U.S. commercial real estate lessor VEREIT delivered a 42.5% return, and Dutch insurer NN Group also contributed positively. Citigroup and UBS each detracted from portfolio returns for the fiscal year. |
| 5. | Holdings in the information technology sectors bolstered the Fund’s absolute performance during the fiscal year. Our long-time technology holdings Alphabet (formerly known as Google) and InterXion in the Netherlands were good contributors by combining greater than 4% portfolio weightings with strong double-digit percentage total returns. |
| 6. | The poor results of our investments in the health care sector accounted for virtually all of the Fund’s fiscal year underperformance vis-à-vis the index. Two drug makers, Concordia International and Valeant, each declined by more than 70% during the period. Both of these have been eliminated from the portfolio. We should have responded more swiftly to the eroding fundamental outlook for these acquisitive companies in light of their use of debt-to-fund acquisitions and the evolving political landscape facing the health care industry. We have reduced the Fund’s health care exposure to approximately 5%, from over 15% a year ago. (Chart I) |
Chart I Health Care Weights
12-month Comparison
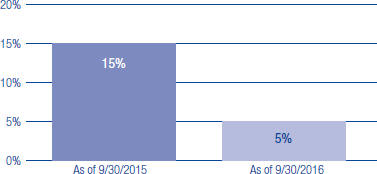
| 7. | Spanish airport operator Aena again made a strong contribution to fiscal year portfolio performance within the industrials sector. Supported by less spectacular positive performances from Spanish construction and infrastructure operator Ferrovial and low-cost airline Ryanair Holdings, these more than offset a negative contribution from the Fund’s investment in American Airlines. |
| 8. | Your Fund’s holdings in consumer staples businesses delivered positive returns for the fiscal year, led by a 30%+ return from Kraft Heinz Company, powered by profit margin improvements, and a more modest contribution from global food & snacks firm Mondelez International. |
| 9. | The Fund saw strong gains from its sole investment in the energy sector, Helmerich & Payne, a contract drilling company based in Oklahoma. The company’s solid balance sheet and outstanding assets allowed it to persevere through the oil price slump and then participate in the recent recovery by posting a 49% return for the period. |
Other Fund contributors included (i) Australian mining services firm Mineral Resources, which returned more than 200%. In addition to providing mining services, Mineral Resources also mines iron ore and lithium. The company’s strong total return was driven by an improving outlook for both of these minerals. (ii) Telecom services firm T-Mobile U.S., which made a strong contribution as it rolled up material customer gains in the U.S. mobile telecom services market, and (iii) U.S. fertilizer producer CF Industries, which detracted from portfolio performance in a difficult environment for the agricultural sector.
Global Opportunities Fund 15 Detractors Update
Because of the volatility of stock prices over the last 12 months, we review in table II the share price declines of the biggest detractors to the Fund’s performance during the last quarter of 2015 through February 11 of this year, along with their subsequent performance through September 30, 2016. February 11 was the lowest net asset value day ($21.70/share) for Thornburg Global Opportunities Fund over the fiscal year ended September 30, 2016. For the most part, the companies listed in table II demonstrated resilience, and the stock price
Annual Report 5
| | |
LETTER TO SHAREHOLDERS, CONTINUED | | |
| |
Thornburg Global Opportunities Fund | | September 30, 2016 (Unaudited) |
recoveries of many of these firms contributed to Thornburg Global Opportunities Fund’s rebound from $21.70/share on February 11 to $24.90 on September 30, 2016. The Fund still holds 12 of the 15 investments shown. In addition, our longtime holding Level 3 Communications benefitted from a takeover offer from CenturyLink on October 27 at a premium of more than 40% to its September 30 closing price, though it is uncertain whether this premium will be realized.
Table II The 15 Most Negative Contributors to Performance Between
September 30, 2015 and February 11, 2016
| | | | | | | | | | |
| | | | | Stock Price Change | |
Company Name | | Industry
Sector | | (9/30/15 to
2/11/16) | | | (2/11/16 to
9/30/16) | |
Valeant Pharmaceuticals | | Health Care | | | -52.7 | % | | | (sold | ) |
Concordia Healthcare | | Health Care | | | -42.6 | % | | | (sold | ) |
Citigroup | | Financial | | | -29.3 | % | | | +35.7 | % |
Baidu, Inc. | | Information Technology | | | -16.5 | % | | | +28.9 | % |
SFR Group (formerly Numericable) | | Telecommunications | | | -14.2 | % | | | -11.9 | % |
T-Mobile U.S. | | Telecommunications | | | -14.6 | % | | | +37.3 | % |
Barratt Developments plc | | Consumer Discretionary | | | -17.2 | % | | | -18.8 | % |
Paradise Co. Ltd. | | Consumer Discretionary | | | -35.4 | % | | | (sold | ) |
ING Group | | Financial | | | -25.1 | % | | | +22.8 | % |
Express Scripts | | Health Care | | | -18.2 | % | | | +6.2 | % |
Altice NV | | Consumer Discretionary | | | -17.4 | % | | | +39.9 | % |
Mondelez International, Inc. | | Consumer Staples | | | -9.7 | % | | | +18.0 | % |
EchoStar Corporation | | Information Technology | | | -22.4 | % | | | +31.3 | % |
Capital One Financial | | Financial | | | -16.1 | % | | | +20.8 | % |
Delphi Automotive | | Industrial | | | -22.7 | % | | | +23.3 | % |
Source: FactSet.
At September 30, 2016, domestic stocks comprised approximately 44% of your portfolio, foreign stocks 52%, and cash the remaining 4%. The average price/earnings multiple of the 31 stocks in the portfolio as of September 30, 2016, was 17.1x on a forward basis, using estimates from market data providers FactSet and the Institutional Brokers’ Estimate System (IBES). By comparison, the forward price/earnings multiple of the MSCI All Country World Index at September 30, 2016 was approximately 16.5x.
Top equity holdings and other portfolio data about Global Opportunities Fund are summarized on page 9 of this report.
We pursue investment ideas based on fundamental analysis of individual businesses, not macroeconomic forecasts. That noted, political and macroeconomic events on the horizon present both uncertainties and potential opportunities. These include elections in certain large economies, rate decisions by the Federal Reserve and other central banks, and an Italian constitutional referendum in December that could have consequences for the future direction of Europe. Companies around the world have moved to take advantage of generally benign capital-markets conditions, filing numerous debt and equity offerings during the month of September 2016.
Earnings expectations for the MSCI All Country World Index portfolio this year and next were reduced throughout 2015 and into 2016; however, these show signs of leveling out or recovering in some markets. Global economic growth expectations appear to be improving, leading to a rotation of investor preferences from more defensive debt and equity assets to more economically sensitive ones during the September quarter, and continuing through October. Most major central banks around the world are still pursuing easy monetary conditions as evidenced by more than $11 trillion of government bonds that are priced with negative yields.
Patience and a long-term investment orientation have served Thornburg Global Opportunities Fund well over the past 10 years. We encourage a similar mindset for our investors in the years ahead. We continue to follow our core investment principles of flexibility, focus, and value, as we have through a wide variety of macroeconomic settings over the Fund’s life.
Thank you for your support of Thornburg Global Opportunities Fund. Remember that you can review our periodic portfolio commentary, as well as descriptions of many of the stocks in your portfolio, at www.thornburg.com/global.
Best wishes for a great holiday season and New Year.
| | |
| Sincerely, | | |
| |
 | |  |
| Brian McMahon | | W. Vinson Walden, cfa |
| Portfolio Manager | | Portfolio Manager |
| Chief Investment Officer | | Managing Director |
The matters discussed in this report may constitute forward-looking statements made pursuant to the safe harbor provisions of the Securities Litigation Reform Act of 1995. These include any advisor or portfolio manager prediction, assessment, analysis or outlook for individual securities, industries, investment styles, market sectors and/or markets. These statements involve risks and uncertainties. In addition to the general risks described for each fund in its current prospectus, other factors bearing on these reports include the accuracy of the advisor’s or portfolio manager’s forecasts and predictions, the appropriateness of the investment strategies designed by the advisor or portfolio manager and the ability of the advisor or portfolio manager to implement their strategies efficiently and successfully. Any one or more of these factors, as well as other risks affecting the securities markets generally, could cause the actual results of any fund to differ materially as compared to its benchmarks.
The views expressed by the portfolio managers reflect their professional opinions and are subject to change. Under no circumstances does the information contained within represent a recommendation to buy or sell any security.
6 Annual Report
This page intentionally left blank.
Annual Report 7
| | |
| PERFORMANCE SUMMARY | | |
| |
Thornburg Global Opportunities Fund | | September 30, 2016 (Unaudited) |
Average Annual Total Returns
| | | | | | | | | | | | | | | | | | | | |
| | | 1-Yr | | | 3-Yr | | | 5-Yr | | | 10-Yr | | | Since
Incep. | |
Class A Shares (Incep: 7/28/06) | | | | | | | | | | | | | | | | | | | | |
Without sales charge | | | 2.57 | % | | | 8.42 | % | | | 14.35 | % | | | 8.55 | % | | | 9.19 | % |
With sales charge | | | -2.05 | % | | | 6.77 | % | | | 13.30 | % | | | 8.05 | % | | | 8.70 | % |
Class C Shares (Incep: 7/28/06) | | | | | | | | | | | | | | | | | | | | |
Without sales charge | | | 1.81 | % | | | 7.61 | % | | | 13.47 | % | | | 7.71 | % | | | 8.35 | % |
With sales charge | | | 0.81 | % | | | 7.61 | % | | | 13.47 | % | | | 7.71 | % | | | 8.35 | % |
Class I Shares (Incep: 7/28/06) | | | 2.91 | % | | | 8.82 | % | | | 14.82 | % | | | 9.05 | % | | | 9.69 | % |
Class R3 Shares (Incep: 2/1/08) | | | 2.38 | % | | | 8.27 | % | | | 14.23 | % | | | — | | | | 5.26 | % |
Class R4 Shares (Incep: 2/1/08) | | | 2.45 | % | | | 8.35 | % | | | 14.34 | % | | | — | | | | 5.35 | % |
Class R5 Shares (Incep: 2/1/08) | | | 2.91 | % | | | 8.82 | % | | | 14.82 | % | | | — | | | | 5.81 | % |
MSCI AC World Index (Since 7/28/06) | | | 11.96 | % | | | 5.17 | % | | | 10.63 | % | | | 4.34 | % | | | 4.64 | % |
Growth of a Hypothetical $10,000 Investment
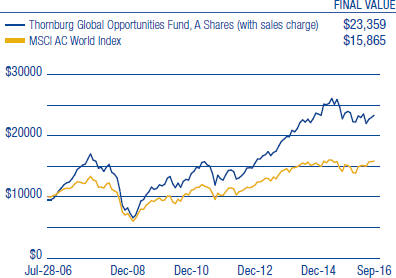
Performance data shown represents past performance and is no guarantee of future results. Investment return and principal value will fluctuate so shares, when redeemed, may be worth more or less than their original cost. Current performance may be lower or higher than quoted. For performance current to the most recent month end, visit thornburg.com or call 800-847-0200. The performance information does not reflect the deduction of taxes that a shareholder would pay on distributions or the redemption of Fund shares. Returns reflect the reinvestment of dividends and capital gains. Class A shares are sold with a maximum sales charge of 4.50%. Class C shares are subject to a 1% CDSC for the first year only. There is no sales charge for Class I, R3, R4, and R5 shares.
As disclosed in the most recent prospectus, the total annual fund operating expenses are as follows: A shares, 1.32%; C shares, 2.10%; I shares, 0.97%; R3 shares, 2.15%; R4 shares, 1.76%; R5 shares, 1.02%. Thornburg Investment Management and/or Thornburg Securities Corporation have contractually agreed to waive fees and reimburse expenses through at least February 1, 2017, for some of the share classes, resulting in net expense ratios of the following: R3 shares, 1.50%; R4 shares, 1.40%; R5 shares, 0.99%. For more detailed information on fund expenses and waivers/reimbursements please see the Fund’s prospectus.
Glossary
MSCI All Country (AC) World Index – A market capitalization weighted index that is representative of the market structure of 46 developed and emerging market countries in North and South America, Europe, Africa, and the Pacific Rim. The index is calculated with net dividends reinvested in U.S. dollars.
Unless otherwise noted, index returns reflect the reinvestment of income dividends and capital gains, if any, but do not reflect fees, brokerage commissions or other expenses of investing. Investors may not make direct investments into any index. The performance of any index is not indicative of the performance of any particular investment.
Basis Point (bp) – A unit equal to 1/100th of 1%. 1% = 100 basis points (bps).
P/E – Price/Earnings ratio (P/E ratio) is a valuation ratio of a company’s current share price compared to its per-share earnings. P/E equals a company’s market value per share divided by earnings per share. Forecasted P/E is not intended to be a forecast of the fund’s future performance.
8 Annual Report
| | |
| FUND SUMMARY | | |
| |
Thornburg Global Opportunities Fund | | September 30, 2016 (Unaudited) |
OBJECTIVES AND STRATEGIES
The Fund seeks long-term capital appreciation by investing in equity and debt securities of all types from issuers around the world.
The Fund pursues its investment goals by investing primarily in a broad range of equity securities, including common stocks, preferred stocks, real estate investment trusts, other equity trusts, and partnership interests. The Fund may invest in any stock or other equity security which the investment advisor believes may assist the Fund in pursuing its goals, including smaller companies with market capitalizations of less than $500 million. The Fund may also invest in debt obligations of any kind.
Market Capitalization Exposure
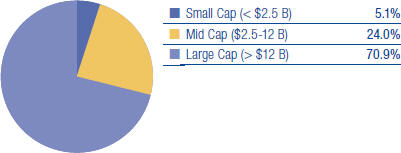
Asset Structure
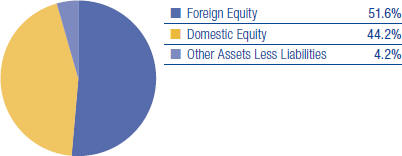
Top Ten Equity Holdings
| | | | |
VEREIT, Inc. | | | 5.6 | % |
Level 3 Communications, Inc. | | | 5.5 | % |
Aena S.A. | | | 5.5 | % |
Altice N.V. | | | 5.5 | % |
Mondelez International, Inc. | | | 5.1 | % |
Alphabet, Inc. Class A | | | 5.0 | % |
Baidu, Inc. ADR | | | 4.9 | % |
Barratt Developments plc | | | 4.7 | % |
Citigroup, Inc. | | | 4.0 | % |
T-Mobile US, Inc. | | | 3.8 | % |
There is no guarantee that the Fund will meet its investment objective.
All portfolio information is subject to change. Charts may not add up to 100% due to rounding.
| | | | |
| Sector Exposure | |
| |
Consumer Discretionary | | | 19.7 | % |
Information Technology | | | 15.3 | % |
Financials | | | 13.3 | % |
Telecommunication Services | | | 12.4 | % |
Industrials | | | 11.7 | % |
Real Estate | | | 6.6 | % |
Consumer Staples | | | 6.3 | % |
Health Care | | | 5.5 | % |
Materials | | | 4.7 | % |
Energy | | | 0.3 | % |
Other Assets Less Liabilities | | | 4.2 | % |
|
| Top Ten Industry Groups | |
| |
Software & Services | | | 12.7 | % |
Telecommunication Services | | | 12.4 | % |
Transportation | | | 8.8 | % |
Real Estate | | | 6.6 | % |
Banks | | | 6.4 | % |
Consumer Services | | | 6.3 | % |
Food, Beverage & Tobacco | | | 6.3 | % |
Media | | | 5.5 | % |
Consumer Durables & Apparel | | | 4.7 | % |
Pharmaceuticals, Biotechnology & Life Sciences | | | 3.7 | % |
|
Country Exposure* (percent of equity holdings) | |
| |
United States | | | 46.1 | % |
Netherlands | | | 14.6 | % |
Spain | | | 8.8 | % |
China | | | 8.5 | % |
United Kingdom | | | 8.3 | % |
Ireland | | | 7.3 | % |
France | | | 3.2 | % |
Australia | | | 1.5 | % |
Brazil | | | 1.1 | % |
Switzerland | | | 0.7 | % |
| * | The country assignment of each equity holding is determined by the Fund’s Advisor based on various factors, including the location of the issuer’s head office, the issuer’s jurisdiction of incorporation and the country from which a majority of the issuer’s revenue is derived. |
Annual Report 9
| | |
| SCHEDULE OF INVESTMENTS | | |
| |
Thornburg Global Opportunities Fund | | September 30, 2016 |
| | | | | | | | |
| | | Shares/ | | | | |
| | | Principal Amount | | | Value | |
COMMON STOCK — 95.79% | | | | | | | | |
| | |
AUTOMOBILES & COMPONENTS — 3.30% | | | | | | | | |
Auto Components — 3.30% | | | | | | | | |
Delphi Automotive plc | | | 874,608 | | | $ | 62,377,043 | |
| | | | | | | | |
| | | | | | | 62,377,043 | |
| | | | | | | | |
| | |
BANKS — 6.39% | | | | | | | | |
Banks — 6.39% | | | | | | | | |
Citigroup, Inc. | | | 1,588,115 | | | | 75,006,671 | |
ING Groep N.V. | | | 3,712,919 | | | | 45,838,249 | |
| | | | | | | | |
| | | | | | | 120,844,920 | |
| | | | | | | | |
| | |
CAPITAL GOODS — 2.91% | | | | | | | | |
Construction & Engineering — 2.91% | | | | | | | | |
Ferrovial SA | | | 2,588,917 | | | | 55,111,495 | |
| | | | | | | | |
| | | | | | | 55,111,495 | |
| | | | | | | | |
| | |
CONSUMER DURABLES & APPAREL — 4.65% | | | | | | | | |
Household Durables — 4.65% | | | | | | | | |
Barratt Developments plc | | | 13,737,153 | | | | 88,012,105 | |
| | | | | | | | |
| | | | | | | 88,012,105 | |
| | | | | | | | |
| | |
CONSUMER SERVICES — 6.31% | | | | | | | | |
Hotels, Restaurants & Leisure — 6.31% | | | | | | | | |
Galaxy Entertainment Group Ltd. | | | 16,490,463 | | | | 62,080,543 | |
Wynn Resorts, Ltd. | | | 588,720 | | | | 57,353,102 | |
| | | | | | | | |
| | | | | | | 119,433,645 | |
| | | | | | | | |
| | |
DIVERSIFIED FINANCIALS — 3.61% | | | | | | | | |
Capital Markets — 0.63% | | | | | | | | |
UBS Group AG | | | 875,012 | | | | 11,916,015 | |
Consumer Finance — 2.98% | | | | | | | | |
Capital One Financial Corp. | | | 784,932 | | | | 56,381,666 | |
| | | | | | | | |
| | | | | | | 68,297,681 | |
| | | | | | | | |
| | |
ENERGY — 0.31% | | | | | | | | |
Energy Equipment & Services — 0.31% | | | | | | | | |
Helmerich & Payne, Inc. | | | 88,323 | | | | 5,944,138 | |
| | | | | | | | |
| | | | | | | 5,944,138 | |
| | | | | | | | |
| | |
FOOD, BEVERAGE & TOBACCO — 6.30% | | | | | | | | |
Food Products — 6.30% | | | | | | | | |
BRF SA | | | 1,152,534 | | | | 19,604,932 | |
Mondelez International, Inc. | | | 2,181,426 | | | | 95,764,602 | |
The Kraft Heinz Co. | | | 43,432 | | | | 3,887,598 | |
| | | | | | | | |
| | | | | | | 119,257,132 | |
| | | | | | | | |
| | |
HEALTH CARE EQUIPMENT & SERVICES — 1.78% | | | | | | | | |
Health Care Providers & Services — 1.78% | | | | | | | | |
a Express Scripts Holding Company | | | 477,814 | | | | 33,700,221 | |
| | | | | | | | |
| | | | | | | 33,700,221 | |
| | | | | | | | |
| | |
INSURANCE — 3.29% | | | | | | | | |
Insurance — 3.29% | | | | | | | | |
NN Group NV | | | 2,023,563 | | | | 62,171,151 | |
| | | | | | | | |
| | | | | | | 62,171,151 | |
| | | | | | | | |
| | |
MATERIALS — 4.72% | | | | | | | | |
Chemicals — 3.27% | | | | | | | | |
CF Industries Holdings, Inc. | | | 2,543,824 | | | | 61,942,114 | |
Metals & Mining — 1.45% | | | | | | | | |
Mineral Resources Ltd. | | | 3,249,219 | | | | 27,528,758 | |
| | | | | | | | |
| | | | | | | 89,470,872 | |
| | | | | | | | |
| | |
MEDIA — 5.47% | | | | | | | | |
Media — 5.47% | | | | | | | | |
a Altice N.V. | | | 5,764,903 | | | | 103,421,723 | |
| | | | | | | | |
| | | | | | | 103,421,723 | |
| | | | | | | | |
| | |
PHARMACEUTICALS, BIOTECHNOLOGY & LIFE SCIENCES — 3.69% | | | | | | | | |
Pharmaceuticals — 3.69% | | | | | | | | |
a Allergan plc | | | 303,023 | | | | 69,789,227 | |
| | | | | | | | |
| | | | | | | 69,789,227 | |
| | | | | | | | |
10 Annual Report
| | |
| SCHEDULE OF INVESTMENTS, CONTINUED | | |
| |
Thornburg Global Opportunities Fund | | September 30, 2016 |
| | | | | | | | |
| | | Shares/ | | | | |
| | | Principal Amount | | | Value | |
REAL ESTATE — 6.65% | | | | | | | | |
Equity Real Estate Investment Trusts — 6.65% | | | | | | | | |
VEREIT, Inc. | | | 10,299,514 | | | $ | 106,805,960 | |
Ryman Hospitality Properties, Inc. | | | 393,622 | | | | 18,956,836 | |
| | | | | | | | |
| | | | | | | 125,762,796 | |
| | | | | | | | |
| | |
SOFTWARE & SERVICES — 12.71% | | | | | | | | |
Information Technology Services — 2.79% | | | | | | | | |
a InterXion Holding NV | | | 1,459,466 | | | | 52,861,858 | |
Internet Software & Services — 9.92% | | | | | | | | |
a Alphabet, Inc. Class A | | | 118,090 | | | | 94,951,446 | |
a Baidu, Inc. ADR | | | 508,720 | | | | 92,622,650 | |
| | | | | | | | |
| | | | | | | 240,435,954 | |
| | | | | | | | |
| | |
TECHNOLOGY HARDWARE & EQUIPMENT — 2.55% | | | | | | | | |
Communications Equipment — 2.42% | | | | | | | | |
a EchoStar Corp. | | | 1,042,709 | | | | 45,701,935 | |
Technology, Hardware, Storage & Peripherals — 0.13% | | | | | | | | |
Apple, Inc. | | | 22,094 | | | | 2,497,727 | |
| | | | | | | | |
| | | | | | | 48,199,662 | |
| | | | | | | | |
| | |
TELECOMMUNICATION SERVICES — 12.39% | | | | | | | | |
Diversified Telecommunication Services — 8.55% | | | | | | | | |
a Level 3 Communications, Inc. | | | 2,252,087 | | | | 104,451,795 | |
a SFR Group SA | | | 1,942,121 | | | | 57,181,844 | |
Wireless Telecommunication Services — 3.84% | | | | | | | | |
a T-Mobile US, Inc. | | | 1,555,772 | | | | 72,685,668 | |
| | | | | | | | |
| | | | | | | 234,319,307 | |
| | | | | | | | |
| | |
TRANSPORTATION — 8.76% | | | | | | | | |
Airlines — 3.28% | | | | | | | | |
Ryanair Holdings plc ADR | | | 826,432 | | | | 62,007,193 | |
Transportation Infrastructure — 5.48% | | | | | | | | |
Aena S.A. | | | 702,724 | | | | 103,648,820 | |
| | | | | | | | |
| | | | | | | 165,656,013 | |
| | | | | | | | |
TOTAL COMMON STOCK (Cost $1,634,970,232) | | | | | | | 1,812,205,085 | |
| | | | | | | | |
SHORT TERM INVESTMENTS — 4.29% | | | | | | | | |
b Thornburg Capital Management Fund | | | 8,109,038 | | | | 81,090,376 | |
| | | | | | | | |
TOTAL SHORT TERM INVESTMENTS (Cost $81,090,376) | | | | | | | 81,090,376 | |
| | | | | | | | |
TOTAL INVESTMENTS — 100.08% (Cost $1,716,060,608) | | | | | | $ | 1,893,295,461 | |
LIABILITIES NET OF OTHER ASSETS — (0.08)% | | | | | | | (1,515,522 | ) |
| | | | | | | | |
NET ASSETS — 100.00% | | | | | | $ | 1,891,779,939 | |
| | | | | | | | |
Footnote Legend
| b | Investment in Affiliates – Shown below are holdings of voting securities of each portfolio company which is considered “affiliated” to the Fund under the Investment Company Act of 1940, including companies for which the Fund’s holding represented 5% or more of the company’s voting securities, and a series of the Thornburg Investment Trust in which the Fund invested for cash management purposes during the period: |
| | | | | | | | | | | | | | | | | | | | | | | | | | | | |
Issuer | | Shares/
Principal
September 30,
2015 | | | Gross
Additions | | | Gross
Reductions | | | Shares/
Principal
September 30,
2016 | | | Market
Value
September 30,
2016 | | | Investment
Income | | | Realized
Gain (Loss) | |
Concordia Healthcare Corp.* | | | 1,840,424 | | | | | | | | 1,840,424 | | | | | | | $ | | | | $ | 742,769 | | | $ | (91,349,495 | ) |
InterXion Holding NV* | | | 3,881,212 | | | | | | | | 2,421,746 | | | | | | | | | | | | — | | | | 13,318,033 | |
Thornburg Capital Management Fund | | | 18,271,004 | | | | 91,032,250 | | | | 101,194,216 | | | | 8,109,038 | | | | 81,090,376 | | | | 591,379 | | | | — | |
| | | | | | | | | | | | | | | | | | | | | | | | | | | | |
Total non-controlled affiliated issuers - 4.29% of net assets | | | $ | 81,090,376 | | | $ | 1,334,148 | | | $ | (78,031,462 | ) |
| | | | | | | | | | | | | | | | | | | | | | | | | | | | |
| * | Issuers not affiliated at September 30, 2016. |
Portfolio Abbreviations
To simplify the listings of securities, abbreviations are used per the table below:
ADR American Depositary Receipt
See notes to financial statements.
Annual Report 11
| | |
| STATEMENT OF ASSETS AND LIABILITIES | | |
| |
Thornburg Global Opportunities Fund | | September 30, 2016 |
| | | | |
ASSETS | | | | |
Investments at value (Note 3) | | | | |
Non-affiliated issuers (cost $1,634,970,232) | | $ | 1,812,205,085 | |
Non-controlled issuers (cost $81,090,376) | | | 81,090,376 | |
Cash | | | 214,050 | |
Receivable for investments sold | | | 441,484 | |
Receivable for fund shares sold | | | 2,577,801 | |
Unrealized appreciation on forward currency contracts (Note 7) | | | 1,218,342 | |
Dividends receivable | | | 2,622,738 | |
Prepaid expenses and other assets | | | 115,143 | |
| | | | |
Total Assets | | | 1,900,485,019 | |
| | | | |
| |
LIABILITIES | | | | |
Payable for investments purchased | | | 29,004 | |
Payable for fund shares redeemed | | | 4,271,870 | |
Unrealized depreciation on forward currency contracts (Note 7) | | | 2,331,466 | |
Payable to investment advisor and other affiliates (Note 4) | | | 1,695,027 | |
Accounts payable and accrued expenses | | | 377,524 | |
Dividends payable | | | 189 | |
| | | | |
Total Liabilities | | | 8,705,080 | |
| | | | |
| |
NET ASSETS | | $ | 1,891,779,939 | |
| | | | |
NET ASSETS CONSIST OF | | | | |
Undistributed net investment income | | $ | 1,186,466 | |
Net unrealized appreciation on investments | | | 176,122,717 | |
Accumulated net realized gain (loss) | | | (221,281,796 | ) |
Net capital paid in on shares of beneficial interest | | | 1,935,752,552 | |
| | | | |
| | $ | 1,891,779,939 | |
| | | | |
12 Annual Report
| | |
| STATEMENT OF ASSETS AND LIABILITIES, CONTINUED | | |
| |
Thornburg Global Opportunities Fund | | September 30, 2016 |
| | | | |
| |
NET ASSET VALUE | | | | |
Class A Shares: | | | | |
Net asset value and redemption price per share ($443,072,050 applicable to 17,794,144 shares of beneficial interest outstanding - Note 5) | | $ | 24.90 | |
Maximum sales charge, 4.50% of offering price | | | 1.17 | |
| | | | |
Maximum offering price per share | | $ | 26.07 | |
| | | | |
| |
Class C Shares: | | | | |
Net asset value and offering price per share* ($359,426,176 applicable to 14,897,945 shares of beneficial interest outstanding - Note 5) | | $ | 24.13 | |
| | | | |
| |
Class I Shares: | | | | |
Net asset value, offering and redemption price per share ($996,969,438 applicable to 39,937,161 shares of beneficial interest outstanding - Note 5) | | $ | 24.96 | |
| | | | |
| |
Class R3 Shares: | | | | |
Net asset value, offering and redemption price per share ($10,645,332 applicable to 431,663 shares of beneficial interest outstanding - Note 5) | | $ | 24.66 | |
| | | | |
| |
Class R4 Shares: | | | | |
Net asset value, offering and redemption price per share ($21,415,431 applicable to 867,906 shares of beneficial interest outstanding - Note 5) | | $ | 24.67 | |
| | | | |
| |
Class R5 Shares: | | | | |
Net asset value, offering and redemption price per share ($60,251,512 applicable to 2,411,159 shares of beneficial interest outstanding - Note 5) | | $ | 24.99 | |
| | | | |
| * | Redemption price per share is equal to net asset value less any applicable contingent deferred sales charge. |
See notes to financial statements.
Annual Report 13
STATEMENT OF OPERATIONS
| | |
| |
Thornburg Global Opportunities Fund | | Year Ended September 30, 2016 |
| | | | |
INVESTMENT INCOME | | | | |
Dividend income | | | | |
Non-affiliated issuers (net of foreign taxes withheld of $1,647,358) | | $ | 51,780,619 | |
Non-controlled affiliated issuer | | | 1,334,148 | |
| | | | |
Total Income | | | 53,114,767 | |
| | | | |
| |
EXPENSES | | | | |
Investment advisory fees (Note 4) | | | 17,583,202 | |
Administration fees (Note 4) | | | | |
Class A Shares | | | 673,218 | |
Class C Shares | | | 492,866 | |
Class I Shares | | | 581,526 | |
Class R3 Shares | | | 11,660 | |
Class R4 Shares | | | 23,080 | |
Class R5 Shares | | | 55,852 | |
Distribution and service fees (Note 4) | | | | |
Class A Shares | | | 1,345,187 | |
Class C Shares | | | 3,942,738 | |
Class R3 Shares | | | 46,667 | |
Class R4 Shares | | | 45,967 | |
Transfer agent fees | | | | |
Class A Shares | | | 761,105 | |
Class C Shares | | | 509,574 | |
Class I Shares | | | 1,267,237 | |
Class R3 Shares | | | 34,576 | |
Class R4 Shares | | | 66,620 | |
Class R5 Shares | | | 200,584 | |
Registration and filing fees | | | | |
Class A Shares | | | 47,773 | |
Class C Shares | | | 42,447 | |
Class I Shares | | | 84,767 | |
Class R3 Shares | | | 17,562 | |
Class R4 Shares | | | 17,973 | |
Class R5 Shares | | | 18,906 | |
Custodian fees (Note 2) | | | 205,080 | |
Professional fees | | | 108,064 | |
Accounting fees (Note 4) | | | 109,865 | |
Trustee fees | | | 98,343 | |
Other expenses | | | 271,138 | |
| | | | |
Total Expenses | | | 28,663,577 | |
Less: | | | | |
Expenses reimbursed by investment advisor (Note 4) | | | (152,691 | ) |
| | | | |
Net Expenses | | | 28,510,886 | |
| | | | |
Net Investment Income | | $ | 24,603,881 | |
| | | | |
14 Annual Report
| | |
| STATEMENT OF OPERATIONS, CONTINUED | | |
| |
Thornburg Global Opportunities Fund | | Year Ended September 30, 2016 |
| | | | |
REALIZED AND UNREALIZED GAIN (LOSS) | | | | |
Net realized gain (loss) on: | | | | |
Investments | | | | |
Non-affiliated issuers | | $ | (78,707,796 | ) |
Non-controlled affiliated issuers | | | (78,031,462 | ) |
Forward currency contracts (Note 7) | | | 4,785,014 | |
Foreign currency transactions | | | (273,425 | ) |
| | | | |
| | | (152,227,669 | ) |
| | | | |
Net change in unrealized appreciation (depreciation) on: | | | | |
Investments | | | | |
Non-affiliated issuers | | | 150,028,925 | |
Non-controlled affiliated issuers | | | 3,727,667 | |
Forward currency contracts (Note 7) | | | 2,718,041 | |
Foreign currency translations | | | 43,343 | |
| | | | |
| | | 156,517,976 | |
| | | | |
Net Realized and Unrealized Gain | | | 4,290,307 | |
| | | | |
Net Increase in Net Assets Resulting from Operations | | $ | 28,894,188 | |
| | | | |
See notes to financial statements.
Annual Report 15
| | |
| STATEMENTS OF CHANGES IN NET ASSETS | | |
| |
Thornburg Global Opportunities Fund | | |
| | | | | | | | |
| | | Year Ended
September 30, 2016 | | | Year Ended
September 30, 2015 | |
INCREASE (DECREASE) IN NET ASSETS FROM | | | | | | | | |
| | |
OPERATIONS | | | | | | | | |
Net investment income (loss) | | $ | 24,603,881 | | | $ | (5,711,823 | ) |
Net realized gain (loss) on investments, forward currency contracts, and foreign currency transactions | | | (152,227,669 | ) | | | 44,175,598 | |
Net unrealized appreciation (depreciation) on investments, forward currency contracts, and foreign currency translations | | | 156,517,976 | | | | (142,134,583 | ) |
| | | | | | | | |
| | |
Net Increase (Decrease) in Net Assets Resulting from Operations | | | 28,894,188 | | | | (103,670,808 | ) |
| | |
DIVIDENDS TO SHAREHOLDERS | | | | | | | | |
From net investment income | | | | | | | | |
Class A Shares | | | (3,010,113 | ) | | | — | |
Class I Shares | | | (13,341,341 | ) | | | (344,505 | ) |
Class R3 Shares | | | (36,643 | ) | | | — | |
Class R4 Shares | | | (110,179 | ) | | | — | |
Class R5 Shares | | | (1,174,656 | ) | | | (48,802 | ) |
| | |
FUND SHARE TRANSACTIONS (NOTE 5) | | | | | | | | |
Class A Shares | | | (110,083,884 | ) | | | 370,955,478 | |
Class C Shares | | | (7,662,535 | ) | | | 239,292,442 | |
Class I Shares | | | (293,034,015 | ) | | | 887,933,296 | |
Class R3 Shares | | | 1,433,669 | | | | 7,293,561 | |
Class R4 Shares | | | 8,050,573 | | | | 9,285,030 | |
Class R5 Shares | | | (48,461,226 | ) | | | 34,520,070 | |
| | | | | | | | |
Net Increase (Decrease) in Net Assets | | | (438,536,162 | ) | | | 1,445,215,762 | |
| | |
NET ASSETS | | | | | | | | |
Beginning of Year | | | 2,330,316,101 | | | | 885,100,339 | |
| | | | | | | | |
| | |
End of Year | | $ | 1,891,779,939 | | | $ | 2,330,316,101 | |
| | | | | | | | |
Undistributed (distribution in excess of) net investment income | | $ | 1,186,466 | | | $ | (4,461,055 | ) |
See notes to financial statements.
16 Annual Report
| | |
| NOTES TO FINANCIAL STATEMENTS | | |
| |
Thornburg Global Opportunities Fund | | September 30, 2016 |
NOTE 1 – ORGANIZATION
Thornburg Global Opportunities Fund (the “Fund”) is a diversified series of Thornburg Investment Trust (the “Trust”). The Trust was organized as a Massachusetts business trust under a Declaration of Trust dated June 3, 1987 and is registered as a diversified, open-end management investment company under the Investment Company Act of 1940, as amended. The Fund is currently one of twenty separate series of the Trust. Each series is considered to be a separate entity for financial reporting and tax purposes and bears expenses directly attributable to it. The Fund seeks long-term capital appreciation by investing in equity and debt securities of all types from issuers around the world.
The Fund currently offers six classes of shares of beneficial interest: Class A, Class C, Institutional Class (“Class I”), and Retirement Classes (“Class R3,” “Class R4,” and “Class R5”). Each class of shares of the Fund represents an interest in the same portfolio of investments, except that (i) Class A shares are sold subject to a front-end sales charge collected at the time the shares are purchased and bear a service fee, (ii) Class C shares are sold at net asset value without a sales charge at the time of purchase, but are subject to a contingent deferred sales charge upon redemption within one year of purchase, and bear both a service fee and a distribution fee, (iii) Class I and Class R5 shares are sold at net asset value without a sales charge at the time of purchase and may be subject to a service fee, (iv) Class R3 shares are sold at net asset value without a sales charge at the time of purchase, but bear both a service fee and distribution fee, (v) Class R4 shares are sold at net asset value without a sales charge at the time of purchase, but bear a service fee, and (vi) the respective classes may have different reinvestment privileges and conversion rights. Additionally, the Fund may allocate among its classes certain expenses, to the extent allocable to specific classes, including transfer agent fees, government registration fees, certain printing and postage costs, and administrative and legal expenses. Currently, class specific expenses of the Fund are limited to service and distribution fees, administration fees, and certain registration and transfer agent expenses.
The following is a summary of significant accounting policies followed by the Fund in the preparation of its financial statements. The Fund prepares its financial statements in conformity with United States generally accepted accounting principles (“GAAP”), including investment company accounting and reporting guidance in the Financial Accounting Standards Board (the “FASB”) Accounting Standard Codification Topic 946.
NOTE 2 – SIGNIFICANT ACCOUNTING POLICIES
Security Valuation: All investments in securities held by the Fund are valued as described in Note 3.
Allocation of Income, Gains, Losses and Expenses: Net investment income (other than class specific expenses) and realized and unrealized gains and losses are allocated daily to each class of shares based upon the relative net asset value of outstanding shares (or the value of the dividend-eligible shares, as appropriate) of each class of shares at the beginning of the day (after adjusting for the current capital shares activity of the respective class). Expenses common to all Funds are allocated among the Funds comprising the Trust based upon their relative net asset values or other appropriate allocation methods. Operating expenses directly attributable to a specific class are charged against the operating income of that class.
Dividends and Distributions to Shareholders: Dividends and distributions to shareholders, which are determined in accordance with federal income tax regulations and may differ from GAAP, are recorded on the ex-dividend date. Ordinary income distributions, if any, are declared and paid quarterly. Capital gain distributions, if any, are declared and paid annually and more often if deemed necessary by the Advisor. Dividends are paid and are reinvested in additional shares of the Fund at net asset value per share at the close of business on the ex-dividend date, or at the shareholder’s option, paid in cash.
Investment Income: Dividend income is recorded on the ex-dividend date. Certain income from foreign investments is recognized as soon as information is available to the Fund. Interest income is accrued as earned. Premiums and discounts are amortized and accreted, respectively, to call dates or maturity dates using the effective yield method of the respective investments, which is included in interest income on the Statement of Operations.
Custodian Fees: Custodian fees disclosed in the Statement of Operations may include interest expenses incurred by the Fund on any cash overdrafts of its custodian account during the period. Such cash overdrafts may result from the effects of failed trades in portfolio securities and from cash outflows resulting from unanticipated shareholder redemption activity. The Fund pays interest to its custodian on any such cash overdraft at a rate equal to 2.50% of the overdraft amount in excess of $50,000.
Investment Transactions: Investment transactions are accounted for on a trade date basis. Realized gains and losses from the sale of investments are recorded on an identified cost basis.
When-Issued and Delayed Delivery Transactions: The Fund may engage in when-issued or delayed delivery transactions. To the extent the Fund engages in such transactions, it will do so for the purpose of acquiring portfolio investments consistent with the Fund’s investment objectives and not for the purpose of investment leverage or to speculate on interest rate or market changes. At the time the Fund makes a commitment to purchase an investment on a when-issued or delayed delivery basis, the Fund will record the transaction and
Annual Report 17
| | |
| NOTES TO FINANCIAL STATEMENTS, CONTINUED | | |
| |
Thornburg Global Opportunities Fund | | September 30, 2016 |
reflect the value in determining its net asset value. When effecting such transactions, assets of an amount sufficient to make payment for the portfolio investments to be purchased will be segregated on the Fund’s records on the trade date. Investments purchased on a when-issued or delayed delivery basis do not earn interest until the settlement date.
Repurchase Agreements: The Fund may invest excess cash in repurchase agreements whereby the Fund purchases investments, which serve as collateral, with an agreement to resell such collateral to the seller at an agreed upon price at the maturity date of the repurchase agreement. Investments pledged as collateral for repurchase agreements are held in custody until maturity of the repurchase agreement. Provisions in the agreements require that the market value of the collateral is at least equal to the repurchase value in the event of default. In the event of default, the Fund has the right to liquidate the collateral and apply the proceeds in satisfaction of the obligation. Under certain circumstances, in the event of default or bankruptcy by the other party to the agreement, realization and/or retention of the collateral may be subject to legal proceedings.
Foreign Currency Translation: Portfolio investments and other assets and liabilities denominated in foreign currencies are translated into U.S. dollars based on the exchange rate of such currencies against the U.S. dollar on the date of valuation. Purchases and sales of investments and income items denominated in foreign currencies are translated into U.S. dollars at the exchange rate in effect on the transaction date. When the Fund purchases or sells foreign investments, it will customarily enter into a foreign exchange contract to minimize foreign exchange risk from the trade date to the settlement date of such transactions. The values of such spot contracts are included in receivable for investments sold and payable for investments purchased on the Statement of Assets and Liabilities.
The Fund does not separately report the effect of changes in foreign exchange rates from changes in market prices on investments held. Such changes are included in net unrealized appreciation (depreciation) from investments.
Reported net realized gains and losses from foreign currency transactions arise due to purchases and sales of foreign currencies, currency gains and losses realized between the trade and settlement dates on investment transactions and the difference between the amounts of dividends, interest, and foreign withholding taxes recorded on the Fund’s books, and the U.S. dollar equivalent of the amounts actually received or paid.
Net change in unrealized appreciation (depreciation) on foreign currency translations arise from changes in the fair value of assets and liabilities, other than investments at period end, resulting from changes in exchange rates.
Guarantees and Indemnifications: Under the Trust’s organizational documents (and under separate agreements with the independent Trustees), its officers and Trustees are provided with an indemnification against certain liabilities arising out of the performance of their duties to the Fund. In the normal course of business the Trust may also enter into contracts with service providers that contain general indemnifications. The Trust’s maximum exposure under these arrangements is unknown. However, based on experience, the Trust expects the risk of loss to be remote.
Use of Estimates: The preparation of financial statements in conformity with GAAP requires management to make estimates and assumptions that affect the reported amounts of assets and liabilities and disclosure of contingent assets and liabilities at the date of the financial statements and the reported amounts of increases (decreases) in net assets from operations during the reporting period. Actual results could differ from those estimates.
Federal Income Taxes: It is the policy of the Trust to comply with the provisions of the Internal Revenue Code applicable to regulated investment companies and to distribute to shareholders substantially all investment company taxable income including net realized gains on investments (if any), and tax exempt income of the Fund. Therefore, no provision for federal income or excise tax is required.
The Fund files income tax returns in United States federal and applicable state jurisdictions. The statute of limitations on the Fund’s tax return filings generally remains open for the three years following a return’s filing date. The Fund has analyzed each uncertain tax position believed to be material in the preparation of the Fund’s financial statements for the fiscal year ended September 30, 2016, including open tax years, to assess whether it is more likely than not that the position would be sustained upon examination, based on the technical merits of the position. The Fund has not identified any such position for which an asset or liability must be reflected in the Statement of Assets and Liabilities.
At September 30, 2016, information on the tax components of capital was as follows:
| | | | |
Cost of investments for tax purposes | | $ | 1,721,376,342 | |
| | | | |
Gross unrealized appreciation on a tax basis | | $ | 221,077,753 | |
Gross unrealized depreciation on a tax basis | | | (49,158,634 | ) |
| | | | |
Net unrealized appreciation (depreciation) on investments (tax basis) | | $ | 171,919,119 | |
| | | | |
Temporary book to tax adjustments to the cost of investments and net unrealized appreciation (depreciation) for tax purposes result primarily from outstanding wash sale losses and outstanding real estate investment trust (“REIT”) tax basis adjustments.
18 Annual Report
| | |
| NOTES TO FINANCIAL STATEMENTS, CONTINUED | | |
| |
Thornburg Global Opportunities Fund | | September 30, 2016 |
At September 30, 2016, the Fund had deferred tax basis late year specified ordinary losses occurring subsequent to October 31, 2015 through September 30, 2016 of $301,466. For tax purposes, such losses will be recognized in the year ending September 30, 2017.
At September 30, 2016, the Fund had deferred tax basis capital losses occurring subsequent to October 31, 2015 through September 30, 2016 of $133,084,576. For tax purposes, such capital losses will be recognized in the year ending September 30, 2017.
At September 30, 2016, the Fund had cumulative tax basis capital losses of $18,965,104, (of which $18,965,104 are short-term and $0 are long-term) generated after September 30, 2011, which may be carried forward to offset future capital gains. To the extent such carryforwards are used, capital gain distributions may be reduced to the extent provided by regulations. Such capital loss carryforwards do not expire, but are required to be utilized to offset future gains prior to the utilization of losses generated prior to October 1, 2011.
At September 30, 2016, the Fund had tax basis capital losses of $65,016,060 generated prior to October 1, 2011, which may be carried forward to offset future capital gains. To the extent such carryforwards are used, capital gain distributions may be reduced to the extent provided by regulations. Such capital loss carryforwards expire September 30, 2018.
In order to account for permanent book to tax differences, the Fund decreased undistributed net investment income by $1,283,428, decreased accumulated net realized gain (loss) by $1,316,397, and decreased net capital paid in on shares of beneficial interest by $32,969. Reclassifications have no impact upon the net asset value of the Fund and result primarily from foreign currency gains (losses) and investments in real estate investments trusts (“REITs”).
At September 30, 2016, the Fund had $1,474,485 of undistributed tax basis ordinary investment income and no undistributed tax basis capital gains.
The tax character of distributions paid during the years ended September 30, 2016, and September 30, 2015, was as follows:
| | | | | | | | |
| | | 2016 | | | 2015 | |
Distributions from: | | | | | | | | |
Ordinary income | | $ | 17,672,932 | | | $ | 393,307 | |
Capital gains | | | — | | | | — | |
| | | | | | | | |
Total | | $ | 17,672,932 | | | $ | 393,307 | |
| | | | | | | | |
Foreign Withholding Taxes: The Fund is subject to foreign tax withholding imposed by certain foreign countries in which the Fund may invest. Withholding taxes are incurred on certain foreign dividends and are accrued at the time the dividend is recognized based on applicable foreign tax laws. The Fund files withholding tax reclaims in certain jurisdictions to recover a portion of amounts previously withheld, in view of various considerations, including recent decisions rendered by the courts in those and other jurisdictions. The Fund would expect to record a receivable for such a reclaim based on a variety of factors, including assessment of a jurisdiction’s legal obligation to pay reclaims, the jurisdiction’s administrative practices and payment history, and industry convention. To date the Fund has recorded no such receivable because there is limited precedent for collecting such prior year reclaims and the likelihood of collection remains uncertain.
Deferred Foreign Capital Gain Taxes: The Fund is subject to a tax imposed on net realized gains of securities of certain foreign countries. The Fund records an estimated deferred tax liability for net unrealized gains on these investments as reflected in the accompanying financial statements.
NOTE 3 – SECURITY VALUATION
Valuation of the Fund’s portfolio investment securities is performed in accordance with policies and procedures adopted by and under the oversight of the Trustees.
The Trustees of the Trust have appointed Thornburg Investment Management, Inc., the Trust’s investment advisor (the “Advisor”) to assist the Trustees in obtaining market values for portfolio investments, evaluate and monitor professional pricing service providers appointed by the Trustees’ Audit Committee (the “Audit Committee”) to assist in determining fair values for portfolio investments, assist in calculating fair values for portfolio investments in certain circumstances, and to perform other functions in connection with the valuation of investments. The Advisor acts through its Valuation and Pricing Committee (the “Committee”) and other employees of the Advisor. The Committee regularly reviews its own valuation calculations, as well as the valuations, valuation techniques and services furnished by pricing service providers, considers circumstances which may require valuation calculations by the Committee, and reviews previous valuation calculations. The Committee reports to the Audit Committee on the Committee’s activities, the performance of pricing service providers, and other matters relating to valuation of portfolio investments.
In those instances when the Committee assists in calculating a fair value for a portfolio investment, the Committee seeks to determine the price that the Fund would reasonably expect to receive upon a sale of the investment in an orderly transaction between market
Annual Report 19
| | |
| NOTES TO FINANCIAL STATEMENTS, CONTINUED | | |
| |
Thornburg Global Opportunities Fund | | September 30, 2016 |
participants on the valuation date. The Committee customarily utilizes quotations from securities broker dealers in calculating valuations, but also may utilize prices obtained from pricing service providers or other methods approved by the Audit Committee. Because fair values calculated by the Committee are estimates, the calculation of a value for an investment may differ from the price that would be realized by the Fund upon a sale of the investment, and the difference could be material to the Fund’s financial statements. The Committee’s calculation of a fair value for an investment may also differ from the prices obtained by other persons (including other mutual funds) for the investment.
Valuation of Securities: Securities and other portfolio investments which are listed or traded on a United States securities exchange are valued at the last reported sale price on the valuation date. Investments listed or traded on an exchange for which there has been no sale that day are valued at the mean between the last reported bid and asked prices on that valuation date. Portfolio investments reported by NASDAQ are valued at the official closing price on the valuation date. If an investment is traded on more than one exchange, the investment is considered traded on the exchange that is normally the primary market for that investment. Securities and other portfolio investments which are listed or traded on exchanges outside the United States are valued at the last price or the closing price of the investment on the exchange that is normally the primary market for the investment, as of the close of the exchange preceding the Fund’s valuation date. Foreign investments listed or traded on an exchange for which there has been no sale that day are valued at the mean between the last reported bid and asked prices on that valuation date.
In any case when a market quotation is not readily available for a portfolio investment ordinarily valued by market quotation, the Committee calculates a fair value for the investment using alternative methods approved by the Audit Committee. A market quotation is not readily available when the primary market or exchange for the investment is not open for the entire scheduled day of trading. Market quotations for an investment also may not be readily available if developments after the most recent close of the investment’s primary exchange or market, but prior to the close of business on any Fund business day, or an unusual event or significant period of time occurring since the availability of a market quotation, create a serious question concerning the reliability of the most recent market quotation available for the investment. In particular, on days when market volatility thresholds established by the Audit Committee are exceeded, foreign equity investments held by the Fund may be valued using alternative methods. The Committee customarily obtains valuations in these instances from pricing service providers approved by the Audit Committee. Pricing service providers ordinarily calculate valuations using multi-factor models to adjust market prices based upon various inputs, including exchange data, depository receipt prices, futures, index data and other data.
Debt obligations held by the Fund which are not listed or traded on exchanges or for which no reported market exists are ordinarily valued at the valuation obtained from a pricing service provider approved by the Audit Committee.
In any case when a pricing service provider fails to provide a valuation for a debt obligation held by the Fund, the Committee calculates a fair value for the obligation using alternative methods under procedures approved by the Audit Committee. Additionally, in cases when management believes that a valuation obtained from a pricing service provider merits review for significant reasons, the Committee decides whether or not to use the valuation calculated by the pricing service provider or to use an alternative method approved by the Audit Committee to calculate a fair value for the obligation.
Quotations for foreign investments expressed in foreign currency amounts are converted to U.S. dollar equivalents using a foreign exchange quotation from a third party service provider at the time of valuation. Foreign investments held by the Fund may be traded on days and at times when the Fund is not open for business. Consequently, the value of Fund investments may be significantly affected on days when shareholders cannot purchase or sell Fund shares. Futures contracts and other financial and derivative instruments traded on an exchange are valued at the latest published price for the instrument on its primary exchange. Listed options are valued at the last bid price.
Valuation Hierarchy: The Fund categorizes its investments based upon the inputs used in valuing those investments, according to a three-level hierarchy established in guidance from FASB. Categorization of investments using this hierarchy is intended by the FASB to maximize the use of observable inputs in valuing investments and minimize the use of unobservable inputs by requiring that the most observable inputs be used when available. Observable inputs are those that market participants would use in valuing an investment based on available market information. Unobservable inputs are those that reflect assumptions about the information market participants would use in valuing an investment. An investment’s level within the hierarchy is based on the lowest level input that is deemed significant to the valuation. The methodologies and inputs used to value investments are not necessarily indications of the risk or liquidity associated with those investments.
Various inputs are used in calculating valuations for the Fund’s investments. These inputs are generally summarized according to the three-level hierarchy below:
Level 1: Quoted prices in active markets for identical investments.
Level 2: Other direct or indirect significant observable inputs (including quoted prices for similar investments in active markets and other observable inputs, such as interest rates, prepayment rates, credit risk, etc.).
20 Annual Report
| | |
| NOTES TO FINANCIAL STATEMENTS, CONTINUED | | |
| |
Thornburg Global Opportunities Fund | | September 30, 2016 |
Level 3: Significant unobservable inputs (including the Committee’s own assumptions in calculating the fair values of investments).
Valuations for debt obligations held by the Fund are typically calculated by pricing service providers approved by the Audit Committee and are characterized as Level 2 within the valuation hierarchy.
On days when market volatility thresholds established by the Audit Committee are exceeded, foreign securities for which valuations are obtained from pricing service providers are fair valued. On these days, the foreign securities are characterized as Level 2 within the valuation hierarchy and revert to Level 1 after the threshold is no longer exceeded.
In a limited number of cases the Committee calculates a fair value for investments using broker quotations or other methods approved by the Audit Committee. When the Committee uses a single broker quotation to calculate a fair value for an investment without other significant observable inputs, or if a fair value is calculated using other significant inputs that are considered unobservable, the investment is characterized as Level 3 within the hierarchy. Other significant unobservable inputs used to calculate a fair value in these instances might include an income-based valuation approach which considers discounted anticipated future cash flows from the investment, and application of discounts due to the nature or duration of any restrictions on the disposition of the investment.
Valuations based upon the use of inputs from Levels 1, 2 or 3 may not represent the actual price received upon the disposition of an investment, and the Fund may receive a price that is lower than the valuation based upon these inputs when it sells the investment.
The following table displays a summary of the fair value hierarchy measurements of the Fund’s investments as of September 30, 2016. In any instance when valuation inputs from more than one level are used to determine the fair value of a specific investment, the investment is placed in the level of the table based upon the lowest level input that is significant in determining the fair value of the investment:
| | | | | | | | | | | | | | | | |
| | | Fair Value Measurements at September 30, 2016 | |
| | | Total | | | Level 1 | | | Level 2 | | | Level 3 | |
Assets | | | | | | | | | | | | | | | | |
Investments in Securities* | | | | | | | | | | | | | | | | |
Common Stock | | $ | 1,812,205,085 | | | $ | 1,812,205,085 | | | $ | — | | | $ | — | |
Short Term Investments | | | 81,090,376 | | | | 81,090,376 | | | | — | | | | — | |
| | | | | | | | | | | | | | | | |
Total Investments in Securities | | $ | 1,893,295,461 | | | $ | 1,893,295,461 | | | $ | — | | | $ | — | |
Other Financial Instruments** | | | | | | | | | | | | | | | | |
Forward Currency Contracts | | $ | 1,218,342 | | | $ | — | | | $ | 1,218,342 | | | $ | — | |
Spot Currency | | $ | 413 | | | $ | 413 | | | $ | — | | | $ | — | |
Liabilities | | | | | | | | | | | | | | | | |
Other Financial Instruments** | | | | | | | | | | | | | | | | |
Forward Currency Contracts | | $ | (2,331,466 | ) | | $ | — | | | $ | (2,331,466 | ) | | $ | — | |
| * | See Schedule of Investments for a summary of the industry exposure as grouped according to the Global Industry Classification Standard (GICS), which is an industry taxonomy developed by MSCI, Inc. and Standard & Poor’s (S&P). |
| ** | Other Financial Instruments include investments not reflected in the Schedule of Investments, which may include futures, forwards and swap contracts, which are valued at the unrealized appreciation (depreciation) on the investment. |
In accordance with the guidance prescribed in Accounting Standards Update No. 2011-04, it is the policy of the Fund to recognize transfers between levels and the underlying events which caused the movement. The Fund recognized no transfers between levels for the year ended September 30, 2016, other than when the Fund exceeded market volatility thresholds for foreign equity investments during the period.
Annual Report 21
| | |
| NOTES TO FINANCIAL STATEMENTS, CONTINUED | | |
| |
Thornburg Global Opportunities Fund | | September 30, 2016 |
NOTE 4 – INVESTMENT ADVISORY FEE AND OTHER TRANSACTIONS WITH AFFILIATES
Pursuant to an investment advisory agreement, the Advisor serves as the investment advisor and performs services for the Fund for which the fees are payable at the end of each month. Under the investment advisory agreement, the Fund pays the Advisor a management fee based on the daily net assets of the Fund at an annual rate as shown in the following table:
Management Fee Schedule
| | | | |
Daily net assets | | Fee Rate | |
Up to $500 million | | | 0.875 | % |
Next $500 million | | | 0.825 | |
Next $500 million | | | 0.775 | |
Next $500 million | | | 0.725 | |
Over $2 billion | | | 0.675 | |
The Fund’s effective management fee for the year ended September 30, 2016 was 0.787% of the Fund’s average dividend assets.
The Fund pays to the Advisor the costs of personnel who perform certain accounting services for the Fund. For the year ended September 30, 2016 the Fund paid $109,865 to the Advisor for these accounting services. The Trust has also entered into administrative service agreements with the Advisor, whereby the Advisor will perform certain administrative services for the shareholders of each class of the Fund’s shares, and for which fees will be payable at an annual rate of up to .125 of 1% per annum of the average daily net assets attributable to each class of shares. Total administrative service fees incurred by each class of shares of the Fund for the year ended September 30, 2016, are set forth in the Statement of Operations.
The Trust has an underwriting agreement with Thornburg Securities Corporation (the “Distributor”), an affiliate of the Advisor, which acts as the distributor of the Fund’s shares. For the year ended September 30, 2016, the Distributor has advised the Fund that it earned net commissions aggregating $85,492 from the sale of Class A shares, and collected contingent deferred sales charges aggregating $116,992 from redemptions of Class C shares of the Fund.
Pursuant to a service plan under Rule 12b-1 of the Investment Company Act of 1940, the Fund may reimburse to the Advisor an amount not to exceed .25 of 1% per annum of the average daily net assets attributable to Class A, Class C, Class R3, and Class R4 shares of the Fund for payments made by the Advisor to securities dealers and other financial institutions to obtain various shareholder and distribution related services. For the year ended September 30, 2016, there were no 12b-1 service plan fees charged for Class I and R5 shares. The Advisor may pay out of its own resources additional expenses for distribution of the Fund’s shares and shareholder services.
The Trust has also adopted distribution plans pursuant to Rule 12b-1, applicable only to the Fund’s Class C and Class R3 shares, under which the Fund compensates the Distributor for services in promoting the sale of Class C and Class R3 shares of the Fund at an annual rate of up to .75 of 1% per annum of the average daily net assets attributable to Class C shares, and an annual rate of up to .25 of 1% per annum of the average daily net assets attributable to Class R3 shares. Total fees incurred by each class of shares of the Fund under their respective service and distribution plans for the year ended September 30, 2016, are set forth in the Statement of Operations.
The Advisor and Distributor have contractually agreed to waive fees and reimburse expenses incurred by the Fund so that actual expenses of certain share classes do not exceed levels as specified in the Fund’s most recent prospectus. The agreement may be terminated by the Fund at any time, but may not be terminated by the Advisor or Distributor before February 1, 2017, unless the Advisor ceases to be the investment advisor to the Trust or the Distributor ceases to be the distributor of the Fund prior to that date. The Advisor and Distributor retain the right to be repaid by the Fund for fee waivers and expense reimbursements if expenses fall below the contractual limit prior to the end of the fiscal year.
For the year ended September 30, 2016, the Advisor contractually reimbursed certain class specific expenses, administrative fees, and distribution fees of $47,415 for Class R3 shares, $47,363 for Class R4 shares, and $87,632 for Class R5 shares. The Fund contractually recaptured certain class specific expenses, administrative fees, and distribution fees of $29,719 for Class I shares.
Certain officers and Trustees of the Trust are also officers or directors of the Advisor and Distributor. The compensation of independent Trustees is borne by the Trust.
The percentage of direct investments in the Fund held by appointed Trustees, Officers and the Advisor is approximately 2.20%.
The Fund may sell securities to an affiliated fund, or the Fund may purchase securities held by an affiliated fund, provided the affiliation is due solely to having a common investment advisor, common officers, or common trustees, and provided that all such transactions will comply with Rule 17a-7 under the 1940 Act. For the year ended September 30, 2016, the Fund had no transactions with affiliated funds.
22 Annual Report
| | |
| NOTES TO FINANCIAL STATEMENTS, CONTINUED | | |
| |
Thornburg Global Opportunities Fund | | September 30, 2016 |
NOTE 5 – SHARES OF BENEFICIAL INTEREST
At September 30, 2016, there were an unlimited number of shares with no par value of beneficial interest authorized. Transactions in shares of beneficial interest were as follows:
| | | | | | | | | | | | | | | | |
| | | Year Ended
September 30, 2016 | | | Year Ended
September 30, 2015 | |
| | | Shares | | | Amount | | | Shares | | | Amount | |
Class A Shares | | | | | | | | | | | | | | | | |
Shares sold | | | 8,325,065 | | | $ | 206,319,481 | | | | 17,590,204 | | | $ | 468,824,712 | |
Shares issued to shareholders in reinvestment of dividends | | | 110,072 | | | | 2,763,766 | | | | — | | | | — | |
Shares repurchased | | | (13,183,729 | ) | | | (319,167,131 | ) | | | (3,775,955 | ) | | | (97,869,234 | ) |
| | | | | | | | | | | | | | | | |
| | | | |
Net increase (decrease) | | | (4,748,592 | ) | | $ | (110,083,884 | ) | | | 13,814,249 | | | $ | 370,955,478 | |
| | | | | | | | | | | | | | | | |
| | | | |
Class C Shares | | | | | | | | | | | | | | | | |
Shares sold | | | 4,803,724 | | | $ | 115,763,249 | | | | 10,179,065 | | | $ | 265,057,532 | |
Shares issued to shareholders in reinvestment of dividends | | | — | | | | — | | | | (34 | ) | | | (914 | ) |
Shares repurchased | | | (5,248,474 | ) | | | (123,425,784 | ) | | | (1,014,489 | ) | | | (25,764,176 | ) |
| | | | | | | | | | | | | | | | |
| | | | |
Net increase (decrease) | | | (444,750 | ) | | $ | (7,662,535 | ) | | | 9,164,542 | | | $ | 239,292,442 | |
| | | | | | | | | | | | | | | | |
| | | | |
Class I Shares | | | | | | | | | | | | | | | | |
Shares sold | | | 18,934,040 | | | $ | 468,189,151 | | | | 40,710,414 | | | $ | 1,082,618,625 | |
Shares issued to shareholders in reinvestment of dividends | | | 471,633 | | | | 11,765,280 | | | | 11,868 | | | | 299,435 | |
Shares repurchased | | | (31,876,944 | ) | | | (772,988,446 | ) | | | (7,379,162 | ) | | | (194,984,764 | ) |
| | | | | | | | | | | | | | | | |
| | | | |
Net increase (decrease) | | | (12,471,271 | ) | | $ | (293,034,015 | ) | | | 33,343,120 | | | $ | 887,933,296 | |
| | | | | | | | | | | | | | | | |
| | | | |
Class R3 Shares | | | | | | | | | | | | | | | | |
Shares sold | | | 305,984 | | | $ | 7,356,605 | | | | 301,768 | | | $ | 7,931,259 | |
Shares issued to shareholders in reinvestment of dividends | | | 773 | | | | 19,074 | | | | — | | | | — | |
Shares repurchased | | | (244,734 | ) | | | (5,942,010 | ) | | | (24,749 | ) | | | (637,698 | ) |
| | | | | | | | | | | | | | | | |
| | | | |
Net increase (decrease) | | | 62,023 | | | $ | 1,433,669 | | | | 277,019 | | | $ | 7,293,561 | |
| | | | | | | | | | | | | | | | |
| | | | |
Class R4 Shares | | | | | | | | | | | | | | | | |
Shares sold | | | 659,749 | | | $ | 16,156,222 | | | | 455,895 | | | $ | 11,931,206 | |
Shares issued to shareholders in reinvestment of dividends | | | 3,301 | | | | 81,175 | | | | — | | | | — | |
Shares repurchased | | | (339,232 | ) | | | (8,186,824 | ) | | | (101,106 | ) | | | (2,646,176 | ) |
| | | | | | | | | | | | | | | | |
| | | | |
Net increase (decrease) | | | 323,818 | | | $ | 8,050,573 | | | | 354,789 | | | $ | 9,285,030 | |
| | | | | | | | | | | | | | | | |
| | | | |
Class R5 Shares | | | | | | | | | | | | | | | | |
Shares sold | | | 1,385,031 | | | $ | 34,352,393 | | | | 2,061,965 | | | $ | 54,277,368 | |
Shares issued to shareholders in reinvestment of dividends | | | 46,737 | | | | 1,162,738 | | | | 1,933 | | | | 48,802 | |
Shares repurchased | | | (3,446,732 | ) | | | (83,976,357 | ) | | | (755,208 | ) | | | (19,806,100 | ) |
| | | | | | | | | | | | | | | | |
| | | | |
Net increase (decrease) | | | (2,014,964 | ) | | $ | (48,461,226 | ) | | | 1,308,690 | | | $ | 34,520,070 | |
| | | | | | | | | | | | | | | | |
Annual Report 23
| | |
| NOTES TO FINANCIAL STATEMENTS, CONTINUED | | |
| |
Thornburg Global Opportunities Fund | | September 30, 2016 |
NOTE 6 – INVESTMENT TRANSACTIONS
For the year ended September 30, 2016, the Fund had purchase and sale transactions of investments (excluding short-term investments) of $778,069,999 and $1,108,540,401, respectively.
NOTE 7 – DERIVATIVE FINANCIAL INSTRUMENTS WITH OFF-BALANCE SHEET RISK AND FOREIGN INVESTMENT RISK
The Fund may use a variety of derivative financial instruments to hedge or adjust the risks affecting its investment portfolio or to enhance investment returns. Provisions of the FASB Accounting Standards Codification 815-10-50 (“ASC 815”) require certain disclosures. The disclosures are intended to provide users of financial statements with an understanding of the use of derivative instruments by the Fund and how these derivatives affect the financial position, financial performance and cash flows of the Fund. The Fund does not designate any derivative instruments as hedging instruments under ASC 815. During the year ended September 30, 2016, the Fund’s principal exposure to derivative financial instruments of the type addressed by ASC 815 was investment in foreign exchange contracts. A foreign exchange contract is an agreement between two parties to exchange different currencies at a specified rate of exchange at an agreed upon future date. Foreign exchange contracts involve risks to the Fund, including the risk that a contract’s counterparty will not meet its obligations to the Fund, the risk that a change in a contract’s value may not correlate perfectly with the currency the contract was intended to track, and the risk that the Fund’s Advisor is unable to correctly implement its strategy in using a contract. In any such instance, the Fund may not achieve the intended benefit of entering into a contract, and may experience a loss.
The Fund entered into forward currency contracts during the year ended September 30, 2016 in the normal course of pursuing its investment objectives, with the objective of purchasing foreign investments or with the intent of reducing the risk to the value of the Fund’s foreign investments from adverse changes in the relationship between the U.S. dollar and foreign currencies. In each case these contracts have been initiated in conjunction with foreign investment transactions.
These contracts are accounted for by the Fund under ASC 815. Unrealized appreciation and depreciation on outstanding contracts are reported in the Fund’s Statement of Assets and Liabilities, as measured by the difference between the forward exchange rates at the reporting date and the forward exchange rates at each contract’s inception date. Net realized gain (loss) on contracts closed during the period, and changes in net unrealized appreciation (depreciation) on outstanding contracts are recognized in the Fund’s Statement of Operations.
The quarterly average value of open sell currency contracts for the year ended September 30, 2016 was $597,425,165. Open buy currency contracts are entered into for the purpose of closing open sell currency contracts and the values are dependent upon the values of the open sell currency contracts to which they relate.
The following table displays the outstanding forward currency contracts at September 30, 2016:
| | | | | | | | | | | | | | | | | | | | | | |
Outstanding Forward Currency Contracts to Buy or Sell at September 30, 2016 | |
Contract Description | | Buy/Sell | | Contract
Amount | | | Contract
Value Date | | | Value USD | | | Unrealized
Appreciation | | | Unrealized
Depreciation | |
Australian Dollar | | Sell | | | 30,126,800 | | | | 11/15/2016 | | | | 23,036,580 | | | $ | 152,921 | | | $ | — | |
Australian Dollar | | Sell | | | 3,796,700 | | | | 11/15/2016 | | | | 2,903,162 | | | | — | | | | (14,975 | ) |
Euro | | Sell | | | 386,847,300 | | | | 11/15/2016 | | | | 435,394,352 | | | | — | | | | (2,295,589 | ) |
Great Britain Pound | | Sell | | | 40,006,000 | | | | 10/07/2016 | | | | 51,857,525 | | | | 472,324 | | | | — | |
Great Britain Pound | | Sell | | | 7,934,500 | | | | 10/07/2016 | | | | 10,285,045 | | | | 230,682 | | | | — | |
Great Britain Pound | | Sell | | | 9,293,200 | | | | 10/07/2016 | | | | 12,046,252 | | | | 181,323 | | | | — | |
Great Britain Pound | | Sell | | | 11,955,500 | | | | 10/07/2016 | | | | 15,497,241 | | | | 119,033 | | | | — | |
Great Britain Pound | | Buy | | | 5,738,700 | | | | 10/07/2016 | | | | 7,438,754 | | | | 31,699 | | | | — | |
Swiss Franc | | Sell | | | 7,267,800 | | | | 10/05/2016 | | | | 7,481,427 | | | | 21,670 | | | | — | |
Swiss Franc | | Sell | | | 5,700,700 | | | | 01/04/2017 | | | | 5,902,140 | | | | 8,690 | | | | — | |
Swiss Franc | | Buy | | | 5,827,600 | | | | 10/05/2016 | | | | 5,998,894 | | | | — | | | | (9,560 | ) |
Swiss Franc | | Buy | | | 1,440,200 | | | | 10/05/2016 | | | | 1,482,533 | | | | — | | | | (11,342 | ) |
| | | | | | | | | | | | | | | | | | | | | | |
Total | | | | | | | | | | | | | | | | $ | 1,218,342 | | | $ | (2,331,466 | ) |
| | | | | | | | | | | | | | | | | | | | | | |
| | | | |
Net unrealized appreciation (depreciation) | | | | | | | | | | | | | | | $ | (1,113,124 | ) |
| | | | | | | | | | | | | | | | | | | | | | |
24 Annual Report
| | |
| NOTES TO FINANCIAL STATEMENTS, CONTINUED | | |
| |
Thornburg Global Opportunities Fund | | September 30, 2016 |
The outstanding forward currency contracts in the foregoing table were entered into with State Street Bank and Trust Company (“SSB”), pursuant to an International Swaps and Derivatives Association (“ISDA”) Master Agreement. In the event of a default or termination under the ISDA Master Agreement with SSB, the non-defaulting party has the right to close out all outstanding forward currency contracts between the parties and to net any payment amounts under those contracts, resulting in a single net amount payable by one party to the other.
Because the ISDA Master Agreement with SSB does not result in an offset of reported amounts of financial assets and liabilities in the Fund’s Statement of Assets and Liabilities unless there has been an event of default or termination event under that agreement, the Fund does not net its outstanding forward currency contracts for purposes of the disclosure in the Fund’s Statement of Assets and Liabilities. Instead the Fund recognizes the unrealized appreciation or depreciation on those forward currency contracts on a gross basis in the Fund’s Statement of Assets and Liabilities.
The unrealized appreciation (depreciation) of the outstanding forward currency contracts recognized in the Fund’s Statement of Assets and Liabilities at September 30, 2016 is disclosed in the following table:
| | | | | | |
Fair Values of Derivative Financial Instruments at September 30, 2016 | |
| Asset Derivatives | | Balance Sheet Location | | Fair Value | |
Foreign exchange contracts | | Assets - Unrealized appreciation on forward currency contracts | | | $1,218,342 | |
| | |
| Liability Derivatives | | Balance Sheet Location | | Fair Value | |
Foreign exchange contracts | | Liabilities - Unrealized depreciation on forward currency contracts | | | $(2,331,466) | |
Because the Fund does not currently receive or post cash collateral in connection with its currency forward contracts, and because all of the Fund’s outstanding currency forward contracts are with SSB, the net amounts of the Fund’s assets and liabilities which are attributable to those contracts at September 30, 2016 can be determined by offsetting the dollar amounts shown in the preceding table. Based on those amounts, the net amount of the Fund’s assets which is attributable to its outstanding forward currency contracts at September 30, 2016 is $0, and the net amount of the Fund’s liabilities which is attributable to those contracts at that date is $1,113,124. The Fund’s forward currency contracts are valued each day, and the net amounts of the Fund’s assets and liabilities which are attributable to those contracts are expected to vary over time.
The net realized gain (loss) from forward currency contracts and the net change in unrealized appreciation (depreciation) on outstanding forward currency contracts recognized in the Fund’s Statement of Operations for the year ended September 30, 2016 are disclosed in the following tables:
| | | | |
Net Realized Gain (Loss) on Derivative Financial Instruments Recognized in Income for the Year Ended September 30, 2016 |
| | | Total | | Forward Currency Contracts |
Foreign exchange contracts | | $4,785,014 | | $4,785,014 |
|
Net Change in Unrealized Appreciation (Depreciation) of Derivative Financial Instruments Recognized in Income for the Year Ended September 30, 2016 |
| | | Total | | Forward Currency Contracts |
Foreign exchange contracts | | $2,718,041 | | $2,718,041 |
OTHER NOTES
Risks: The Fund’s investments subject it to risks including, but not limited to, management risk, market and economic risk, risks affecting specific issuers, liquidity risk, the risks associated with investments in small- and mid-cap companies and non-U.S. issuers (including developing country issuers), credit risk, real estate investment trusts, and interest rate risk. Please see the Fund’s prospectus for a discussion of the risks associated with an investment in the Fund.
Subsequent Events: Fund management believes no events have occurred between September 30, 2016 and the date of issuance of the financial statements that require adjustment to or disclosure in the accompanying financial statements.
Annual Report 25
FINANCIAL HIGHLIGHTS
Thornburg Global Opportunities Fund
| | | | | | | | | | | | | | | | | | | | | | | | | | | | | | | | | | | | | | | | | | | | | | | | | | |
| | | PER SHARE PERFORMANCE (for a share outstanding throughout the Year) | | RATIOS TO AVERAGE NET ASSETS | | | SUPPLEMENTAL DATA | |
Unless Otherwise Noted, Periods are Fiscal Years Ended Sept. 30, | | Net Asset
Value
Beginning
of Year | | | Net
Investment
Income
(Loss)+ | | | Net
Realized &
Unrealized
Gain (Loss)
on
Investments | | | Total from
Investment
Operations | | Dividends
from Net
Investment
Income | | | Dividends
from Net
Realized
Gains | | Total
Dividends | | | Net Asset Value End of Year | | Net
Investment
Income
(Loss) (%) | | | Expenses,
After
Expense
Reductions
(%) | | | Expenses,
After
Expense
Reductions
and Net of
Custody
Credits (%) | | | Expenses,
Before
Expense
Reductions
(%) | | | Total
Return (%)(a) | | Portfolio Turnover Rate (%)(a) | | Net Assets
at End of
Year
(Thousands) | |
CLASS A SHARES | | | | | | | | | | | | | | | | | | | | | | | | | | | | | | | | | | | | | | | | | | | |
2016(b) | | $ | 24.41 | | | | 0.25 | | | | 0.38 | | | 0.63 | | | (0.14 | ) | | — | | | (0.14 | ) | | $24.90 | | | 1.02 | | | | 1.35 | | | | 1.35 | | | | 1.35 | | | 2.57 | | 37.11 | | $ | 443,072 | |
2015(b) | | $ | 23.74 | | | | (0.11 | ) | | | 0.78 | | | 0.67 | | | — | | | — | | | — | | | $24.41 | | | (0.42 | ) | | | 1.32 | | | | 1.32 | | | | 1.32 | | | 2.82 | | 45.41 | | $ | 550,327 | |
2014(b) | | $ | 19.72 | | | | (0.03 | ) | | | 4.13 | | | 4.10 | | | (0.08 | ) | | — | | | (0.08 | ) | | $23.74 | | | (0.15 | ) | | | 1.41 | | | | 1.41 | | | | 1.41 | | | 20.85 | | 60.29 | | $ | 207,227 | |
2013(b) | | $ | 15.97 | | | | 0.11 | | | | 3.79 | | | 3.90 | | | (0.15 | ) | | — | | | (0.15 | ) | | $19.72 | | | 0.60 | | | | 1.46 | | | | 1.46 | | | | 1.46 | | | 24.50 | | 66.12 | | $ | 96,855 | |
2012(b) | | $ | 13.15 | | | | 0.14 | | | | 2.89 | | | 3.03 | | | (0.21 | ) | | — | | | (0.21 | ) | | $15.97 | | | 0.94 | | | | 1.49 | | | | 1.49 | | | | 1.49 | | | 23.22 | | 66.07 | | $ | 77,103 | |
CLASS C SHARES | | | | | | | | | | | | | | | | | | | | | | | | | | | | | | | | | | | | | | | | | | | |
2016 | | $ | 23.70 | | | | 0.07 | | | | 0.36 | | | 0.43 | | | — | | | — | | | — | | | $24.13 | | | 0.29 | | | | 2.09 | | | | 2.09 | | | | 2.09 | | | 1.81 | | 37.11 | | $ | 359,426 | |
2015 | | $ | 23.23 | | | | (0.31 | ) | | | 0.78 | | | 0.47 | | | — | | | — | | | — | | | $23.70 | | | (1.20 | ) | | | 2.10 | | | | 2.10 | | | | 2.10 | | | 2.02 | | 45.41 | | $ | 363,615 | |
2014 | | $ | 19.38 | | | | (0.20 | ) | | | 4.07 | | | 3.87 | | | (0.02 | ) | | — | | | (0.02 | ) | | $23.23 | | | (0.92 | ) | | | 2.17 | | | | 2.17 | | | | 2.17 | | | 19.96 | | 60.29 | | $ | 143,506 | |
2013 | | $ | 15.69 | | | | (0.03 | ) | | | 3.72 | | | 3.69 | | | — | | | — | | | — | | | $19.38 | | | (0.18 | ) | | | 2.22 | | | | 2.22 | | | | 2.22 | | | 23.52 | | 66.12 | | $ | 87,808 | |
2012 | | $ | 12.98 | | | | 0.02 | | | | 2.84 | | | 2.86 | | | (0.15 | ) | | — | | | (0.15 | ) | | $15.69 | | | 0.17 | | | | 2.27 | | | | 2.27 | | | | 2.27 | | | 22.21 | | 66.07 | | $ | 76,738 | |
CLASS I SHARES | | | | | | | | | | | | | | | | | | | | | | | | | | | | | | | | | | | | | | | | | | | |
2016 | | $ | 24.53 | | | | 0.34 | | | | 0.37 | | | 0.71 | | | (0.28 | ) | | — | | | (0.28 | ) | | $24.96 | | | 1.39 | | | | 0.99 | | | | 0.99 | | | | 0.99 | | | 2.91 | | 37.11 | | $ | 996,970 | |
2015 | | $ | 23.79 | | | | (0.02 | ) | | | 0.77 | | | 0.75 | | | (0.01 | ) | | — | | | (0.01 | ) | | $24.53 | | | (0.08 | ) | | | 0.97 | | | | 0.97 | | | | 0.98 | | | 3.17 | | 45.41 | | $ | 1,285,609 | |
2014 | | $ | 19.74 | | | | 0.06 | | | | 4.15 | | | 4.21 | | | (0.16 | ) | | — | | | (0.16 | ) | | $23.79 | | | 0.26 | | | | 0.99 | | | | 0.99 | | | | 1.08 | | | 21.39 | | 60.29 | | $ | 453,511 | |
2013 | | $ | 16.06 | | | | 0.19 | | | | 3.80 | | | 3.99 | | | (0.31 | ) | | — | | | (0.31 | ) | | $19.74 | | | 1.07 | | | | 0.99 | | | | 0.99 | | | | 1.11 | | | 25.08 | | 66.12 | | $ | 249,283 | |
2012 | | $ | 13.20 | | | | 0.21 | | | | 2.90 | | | 3.11 | | | (0.25 | ) | | — | | | (0.25 | ) | | $16.06 | | | 1.44 | | | | 0.99 | | | | 0.99 | | | | 1.21 | | | 23.82 | | 66.07 | | $ | 169,384 | |
CLASS R3 SHARES | | | | | | | | | | | | | | | | | | | | | | | | | | | | | | | | | | | | | | | | | | | |
2016 | | $ | 24.18 | | | | 0.20 | | | | 0.38 | | | 0.58 | | | (0.10 | ) | | — | | | (0.10 | ) | | $24.66 | | | 0.84 | | | | 1.50 | | | | 1.50 | | | | 2.01 | | | 2.38 | | 37.11 | | $ | 10,645 | |
2015 | | $ | 23.55 | | | | (0.15 | ) | | | 0.78 | | | 0.63 | | | — | | | — | | | — | | | $24.18 | | | (0.58 | ) | | | 1.50 | | | | 1.50 | | | | 2.15 | | | 2.68 | | 45.41 | | $ | 8,936 | |
2014 | | $ | 19.55 | | | | (0.06 | ) | | | 4.11 | | | 4.05 | | | (0.05 | ) | | — | | | (0.05 | ) | | $23.55 | | | (0.26 | ) | | | 1.50 | | | | 1.50 | | | | 2.59 | | | 20.75 | | 60.29 | | $ | 2,182 | |
2013 | | $ | 15.91 | | | | 0.11 | | | | 3.74 | | | 3.85 | | | (0.21 | ) | | — | | | (0.21 | ) | | $19.55 | | | 0.60 | | | | 1.49 | | | | 1.49 | | | | 3.41 | | | 24.37 | | 66.12 | | $ | 1,653 | |
2012 | | $ | 13.11 | | | | 0.11 | | | | 2.90 | | | 3.01 | | | (0.21 | ) | | — | | | (0.21 | ) | | $15.91 | | | 0.75 | | | | 1.50 | | | | 1.50 | | | | 9.01 | (c) | | 23.22 | | 66.07 | | $ | 894 | |
Class R4 Shares | | | | | | | | | | | | | | | | | | | | | | | | | | | | | | | | | | | | | | | | | | | |
2016 | | $ | 24.22 | | | | 0.24 | | | | 0.35 | | | 0.59 | | | (0.14 | ) | | — | | | (0.14 | ) | | $24.67 | | | 0.98 | | | | 1.40 | | | | 1.40 | | | | 1.66 | | | 2.45 | | 37.11 | | $ | 21,415 | |
2015 | | $ | 23.57 | | | | (0.13 | ) | | | 0.78 | | | 0.65 | | | — | | | — | | | — | | | $24.22 | | | (0.51 | ) | | | 1.40 | | | | 1.40 | | | | 1.76 | | | 2.76 | | 45.41 | | $ | 13,175 | |
2014 | | $ | 19.59 | | | | (0.03 | ) | | | 4.10 | | | 4.07 | | | (0.09 | ) | | — | | | (0.09 | ) | | $23.57 | | | (0.14 | ) | | | 1.40 | | | | 1.40 | | | | 2.23 | | | 20.82 | | 60.29 | | $ | 4,462 | |
2013 | | $ | 15.90 | | | | 0.12 | | | | 3.76 | | | 3.88 | | | (0.19 | ) | | — | | | (0.19 | ) | | $19.59 | | | 0.68 | | | | 1.40 | | | | 1.40 | | | | 2.76 | | | 24.57 | | 66.12 | | $ | 2,161 | |
2012 | | $ | 13.09 | | | | 0.15 | | | | 2.88 | | | 3.03 | | | (0.22 | ) | | — | | | (0.22 | ) | | $15.90 | | | 1.05 | | | | 1.40 | | | | 1.40 | | | | 3.72 | | | 23.36 | | 66.07 | | $ | 1,329 | |
CLASS R5 SHARES | | | | | | | | | | | | | | | | | | | | | | | | | | | | | | | | | | | | | | | | | | | |
2016 | | $ | 24.55 | | | | 0.34 | | | | 0.37 | | | 0.71 | | | (0.27 | ) | | — | | | (0.27 | ) | | $24.99 | | | 1.38 | | | | 0.99 | | | | 0.99 | | | | 1.07 | | | 2.91 | | 37.11 | | $ | 60,252 | |
2015 | | $ | 23.81 | | | | (0.03 | ) | | | 0.78 | | | 0.75 | | | (0.01 | ) | | — | | | (0.01 | ) | | $24.55 | | | (0.11 | ) | | | 0.98 | | | | 0.98 | | | | 1.02 | | | 3.17 | | 45.41 | | $ | 108,654 | |
2014 | | $ | 19.76 | | | | 0.06 | | | | 4.15 | | | 4.21 | | | (0.16 | ) | | — | | | (0.16 | ) | | $23.81 | | | 0.26 | | | | 0.99 | | | | 0.99 | | | | 1.10 | | | 21.36 | | 60.29 | | $ | 74,212 | |
2013 | | $ | 16.07 | | | | 0.18 | | | | 3.82 | | | 4.00 | | | (0.31 | ) | | — | | | (0.31 | ) | | $19.76 | | | 1.03 | | | | 0.99 | | | | 0.99 | | | | 1.15 | | | 25.13 | | 66.12 | | $ | 49,023 | |
2012 | | $ | 13.21 | | | | 0.21 | | | | 2.90 | | | 3.11 | | | (0.25 | ) | | — | | | (0.25 | ) | | $16.07 | | | 1.44 | | | | 0.99 | | | | 0.99 | | | | 1.15 | | | 23.80 | | 66.07 | | $ | 50,327 | |
| (a) | Not annualized for periods less than one year. |
| (b) | Sales loads are not reflected in computing total return. |
| (c) | Due to the size of net assets and fixed expenses, ratios may appear disproportionate. |
| + | Based on weighted average shares outstanding. |
See notes to financial statements.
| | | | |
| 26 Annual Report | | | | Annual Report 27 |
| | |
| REPORT OF INDEPENDENT REGISTERED PUBLIC ACCOUNTING FIRM |
| |
Thornburg Global Opportunities Fund | | September 30, 2016 |
To the Trustees and Shareholders of
Thornburg Global Opportunities Fund
In our opinion, the accompanying statement of assets and liabilities, including the schedule of investments in securities, and the related statements of operations and of changes in net assets and the financial highlights present fairly, in all material respects, the financial position of the Thornburg Global Opportunities (the “Fund”) at September 30, 2016, the results of its operations for the year then ended, the changes in its net assets for each of the two years in the period then ended and the financial highlights for each of the five years in the period then ended, in conformity with accounting principles generally accepted in the United States of America. These financial statements and financial highlights (hereafter referred to as “financial statements”) are the responsibility of the Fund’s management. Our responsibility is to express an opinion on these financial statements based on our audits. We conducted our audits of these financial statements in accordance with the standards of the Public Company Accounting Oversight Board (United States). Those standards require that we plan and perform the audit to obtain reasonable assurance about whether the financial statements are free of material misstatement. An audit includes examining, on a test basis, evidence supporting the amounts and disclosures in the financial statements, assessing the accounting principles used and significant estimates made by management, and evaluating the overall financial statement presentation. We believe that our audits, which included confirmation of securities at September 30, 2016 by correspondence with the custodian, brokers, transfer agent, and the application of alternative procedures where securities purchased had not been received, provide a reasonable basis for our opinion.
PricewaterhouseCoopers LLP
New York, New York
November 18, 2016
28 Annual Report
| | |
| EXPENSE EXAMPLE | | |
| |
Thornburg Global Opportunities Fund | | September 30, 2016 (Unaudited) |
As a shareholder of the Fund, you incur two types of costs:
| | (1) | transaction costs, including |
(a) sales charges (loads) on purchase payments, for Class A shares;
(b) a deferred sales charge on redemptions of any part or all of a purchase of $1 million of Class A shares within 12 months of purchase;
(c) a deferred sales charge on redemptions of Class C shares within 12 months of purchase;
| | (2) | ongoing costs, including management fees; distribution and/or service (12b-1) fees; and other Fund expenses. |
This example is intended to help you understand your ongoing costs (in dollars) of investing in the Fund and to compare these costs with the ongoing costs of investing in other mutual funds.
The example is based on a $1,000 investment beginning on April 1, 2016, and held until September 30, 2016.
| | | | | | | | | | | | |
| | | Beginning
Account Value
4/1/16 | | | Ending
Account Value
9/30/16 | | | Expenses paid
During period†
4/1/16–9/30/16 | |
CLASS A SHARES | | | | | | | | | | | | |
Actual | | $ | 1,000.00 | | | $ | 1,004.70 | | | $ | 6.97 | |
Hypothetical* | | $ | 1,000.00 | | | $ | 1,018.05 | | | $ | 7.01 | |
CLASS C SHARES | | | | | | | | | | | | |
Actual | | $ | 1,000.00 | | | $ | 1,001.20 | | | $ | 10.62 | |
Hypothetical* | | $ | 1,000.00 | | | $ | 1,014.38 | | | $ | 10.69 | |
CLASS I SHARES | | | | | | | | | | | | |
Actual | | $ | 1,000.00 | | | $ | 1,006.30 | | | $ | 5.14 | |
Hypothetical* | | $ | 1,000.00 | | | $ | 1,019.87 | | | $ | 5.18 | |
CLASS R3 SHARES | | | | | | | | | | | | |
Actual | | $ | 1,000.00 | | | $ | 1,004.00 | | | $ | 7.51 | |
Hypothetical* | | $ | 1,000.00 | | | $ | 1,017.50 | | | $ | 7.56 | |
CLASS R4 SHARES | | | | | | | | | | | | |
Actual | | $ | 1,000.00 | | | $ | 1,004.40 | | | $ | 7.01 | |
Hypothetical* | | $ | 1,000.00 | | | $ | 1,018.00 | | | $ | 7.06 | |
CLASS R5 SHARES | | | | | | | | | | | | |
Actual | | $ | 1,000.00 | | | $ | 1,006.60 | | | $ | 4.97 | |
Hypothetical* | | $ | 1,000.00 | | | $ | 1,020.04 | | | $ | 5.01 | |
| † | Expenses are equal to the annualized expense ratio for each class (A: 1.39%; C: 2.12%; I: 1.03%; R3: 1.50%; R4: 1.40%; R5: 0.99%) multiplied by the average account value over the period, multiplied by 183/366 to reflect the one-half year period. |
| * | Hypothetical assumes a rate of return of 5% per year before expenses. |
ACTUAL EXPENSES
For each class of shares, the first line of the accompanying table provides information about actual account values and actual expenses. You may use the information in this line, together with the amount you invested, to estimate the expenses that you paid over the period. Simply divide your account value by $1,000 (for example, an $8,600 account value divided by $1,000 = 8.6), then multiply the result by the number in the first line for your class of shares under the heading entitled “Expenses Paid During Period” to estimate the expenses you paid on your account during this period.
HYPOTHETICAL EXAMPLE FOR COMPARISON PURPOSES
For each class of shares, the second line of the accompanying table provides information about hypothetical account values and hypothetical expenses based on the Fund’s actual expense ratio and an assumed rate of return of 5% per year before expenses, which is not the Fund’s actual return. The hypothetical account values and expenses may not be used to estimate the actual ending account balance or expenses you paid for the period. You may use this information to compare the ongoing costs of investing in the Fund and other funds. To do so, compare this 5% hypothetical example with the 5% hypothetical examples that appear in the shareholder reports of the other funds.
Please note that the expenses shown in the table are meant to highlight your ongoing costs only and do not reflect any transactional costs, such as sales charges (loads), redemption fees, or exchange fees. Therefore, the second line of the table for each class of shares is useful in comparing ongoing costs only, and will not help you determine the relative total costs of owning different funds. In addition, if these transactional costs were included, your costs would have been higher.
Annual Report 29
| | |
| TRUSTEES AND OFFICERS | | |
| |
Thornburg Global Opportunities Fund | | September 30, 2016 (Unaudited) |
| | | | | | |
Name, Age, Year Elected Position Held with Fund | | Principal Occupation(s) During Past Five Years | | Other
Directorships
Held by Trustee | |
INTERESTED TRUSTEES (1)(2)(4) | | | | |
| | |
Garrett Thornburg, 71 Trustee since 1987, Chairman of Trustees(3) | | Chairman and controlling shareholder of Thornburg Investment Management, Inc. (investment advisor); Chairman and controlling shareholder of Thornburg Securities Corporation (securities dealer); Chairman and CEO of Chamisa Energy, LLC; President of the Thornburg Foundation (nonprofit). | | | None | |
| | |
Brian J. McMahon, 61 Trustee since 2001, Vice Chairman of Trustees, Member of Governance & Nominating Committee & Operations Risk Oversight Committee(5) | | Chief Investment Officer, Managing Director, and Portfolio Manager and, until 2016, CEO and President of Thornburg Investment Management, Inc.; Vice President of Thornburg Securities Corporation. | | | None | |
| |
INDEPENDENT TRUSTEES (1)(2)(4) | | | | |
| | |
David A. Ater, 71 Trustee since 1994, Member of Audit Committee & Chairman of Governance & Nominating Committee | | Principal in Ater & Associates, Santa Fe, NM (developer, planner and broker of residential and commercial real estate); owner, developer and broker for various real estate projects. | | | None | |
| | |
David D. Chase, 75 Trustee since 2000, Chairman of Audit Committee | | Managing Member of CS Group, LLC, Santa Fe, NM (private investment fund – family office). | | | None | |
| | |
Sally Corning, 55 Trustee since 2012, Member of Audit Committee | | Partner in Sun Mountain Capital, Santa Fe, NM (private equity firm with investment programs encompassing venture capital, mezzanine debt, and growth equity). | | | None | |
| | |
Susan H. Dubin, 67 Trustee since 2004, Member of Audit Committee & Governance and Nominating Committee | | President of Dubin Investments, Ltd., Greenwich, CT (private investment fund); Director and officer of various charitable organizations. | | | None | |
| | |
David L. Gardner, 53 Trustee since 2015, Member of Operations Risk Oversight Committee | | Until 2012, head of EMEA (Europe, Middle East and Africa) Sales for iShares of Blackrock, Inc., EMEA Executive Committee Member and EMEA Operating Committee Member at Blackrock, Inc. | | | None | |
| | |
Owen D. Van Essen, 62 Trustee since 2004, Member of Governance & Nominating Committee & Chairman of Operations Risk Oversight Committee | | President of Dirks, Van Essen & Murray, Santa Fe, NM (newspaper mergers and acquisitions). | | | None | |
| | |
James W. Weyhrauch, 57 Trustee since 1996, Member of Audit Committee & Operations Risk Oversight Committee | | Real estate broker, Santa Fe Properties, Santa Fe, NM; Vice Chairman of Nambe LLC, Santa Fe, NM (manufacturing & design company). | | | None | |
30 Annual Report
| | |
| TRUSTEES AND OFFICERS, CONTINUED | | |
| |
Thornburg Global Opportunities Fund | | September 30, 2016 (Unaudited) |
| | | | | | |
Name, Age, Year Elected Position Held with Fund | | Principal Occupation(s) During Past Five Years | | Other
Directorships
Held by Trustee | |
OFFICERS OF THE FUND (WHO ARE NOT TRUSTEES)(1)(7) | | | | |
| | |
Nimish Bhatt, 53 Treasurer since 2016(6) | | Chief Financial Officer and Treasurer of Thornburg Investment Management, Inc. and Thornburg Securities Corporation since 2016; Senior Vice President
(2004–2016), Chief Financial Officer (2011–2016), and Head of Fund Administration (2011–2016) of Calamos Asset Management, Inc., Calamos Investments LLC, Calamos Advisors LLC, and Calamos Wealth Management; Director of Calamos Global Funds plc (2007–2016). | | | Not applicable | |
| | |
Jason Brady, 42 President since 2016(6) | | CEO and President since 2016, Vice President from 2011 to 2016, Portfolio Manager and Managing Director of Thornburg Investment Management, Inc.; Vice President of Thornburg Securities Corporation since 2016. | | | Not applicable | |
| | |
Kathleen Brady, 56 Vice President since 2008 | | Tax Manager Fund Accounting of Thornburg Investment Management, Inc. | | | Not applicable | |
| | |
Connor Browne, 37 Vice President since 2006 | | Portfolio Manager, Vice President since 2013, and Managing Director of Thornburg Investment Management, Inc. | | | Not applicable | |
| | |
Tim Cunningham, 41 Vice President since 2014 | | Managing Director since 2011, Portfolio Manager since 2012, and Associate Portfolio Manager from 2009–2012 of Thornburg Investment Management, Inc. | | | Not applicable | |
| | |
Randy Dry, 42 Vice President since 2014 | | Vice President and Managing Director, Director of Institutional Group from
2014–2016, and since 2016, Chief Administrative Officer of Thornburg Investment Management, Inc. | | | Not applicable | |
| | |
Greg Dunn, 40 Vice President since 2014 | | Managing Director, Portfolio Manager since 2012, and Associate Portfolio Manager from 2009–2012 of Thornburg Investment Management, Inc. | | | Not applicable | |
| | |
Lon Erickson, 41 Vice President since 2008 | | Portfolio Manager and Managing Director of Thornburg Investment Management, Inc. | | | Not applicable | |
| | |
William V. Fries, 77 Vice President since 1995 | | Portfolio Manager, Vice President, and Managing Director of Thornburg Investment Management, Inc. | | | Not applicable | |
| | |
Thomas Garcia, 45 Vice President since 2006 | | Vice President since 2011, Managing Director, Head Equity Trader, and Associate Portfolio Manager of Thornburg Investment Management, Inc. | | | Not applicable | |
| | |
Rolf Kelly, 37 Vice President since 2016 | | Portfolio Manager and Managing Director since 2013 and Associate Portfolio Manager from 2011–2013 of Thornburg Investment Management, Inc. | | | Not applicable | |
| | |
Ben Kirby, 36 Vice President since 2014 | | Portfolio Manager and Managing Director since 2013 and Associate Portfolio Manager from 2011–2013 of Thornburg Investment Management, Inc. | | | Not applicable | |
| | |
Jeff Klingelhofer, 41 Vice President since 2016 | | Portfolio Manager and Managing Director since 2015, Associate Portfolio Manager from 2012–2015, and Fixed Income Analyst from 2010–2012 of Thornburg Investment Management, Inc. | | | Not applicable | |
| | |
Rob MacDonald, 40 Vice President since 2016 | | Managing Director since 2015, Portfolio Manager since 2014, and Associate Portfolio Manager from 2011–2014 of Thornburg Investment Management, Inc. | | | Not applicable | |
| | |
Leigh Moiola, 49 Vice President since 2001 | | Vice President, Managing Director, and Director of Marketing of Thornburg Investment Management, Inc.; Vice President of Thornburg Securities Corporation. | | | Not applicable | |
| | |
Christopher Ryon, 60 Vice President since 2008 | | Portfolio Manager and Managing Director of Thornburg Investment Management, Inc. | | | Not applicable | |
| | |
Nicholos Venditti, 35 Vice President since 2016 | | Portfolio Manager and Managing Director since 2015 and Associate Portfolio Manager from 2011–2015 of Thornburg Investment Management, Inc. | | | Not applicable | |
Annual Report 31
| | |
| TRUSTEES AND OFFICERS, CONTINUED | | |
| |
Thornburg Global Opportunities Fund | | September 30, 2016 (Unaudited) |
| | | | |
Name, Age, Year Elected Position Held with Fund | | Principal Occupation(s) During Past Five Years | | Other
Directorships
Held by Trustee |
| | |
Vinson Walden, 46 Vice President since 2004 | | Portfolio Manager and Managing Director of Thornburg Investment Management, Inc. | | Not applicable |
| | |
Lei Wang, 45 Vice President since 2006 | | Portfolio Manager and Managing Director of Thornburg Investment Management, Inc. | | Not applicable |
| | |
Sasha Wilcoxon, 42 Vice President since 2003 Secretary since 2007(6) | | Managing Director, Director of Mutual Fund Operations, and Vice President of Thornburg Investment Management, Inc.; Vice President of Thornburg Securities Corporation. | | Not applicable |
| | |
Charles Wilson, 41 Vice President since 2016 | | Portfolio Manager and Managing Director since 2014 and Associate Portfolio Manager from 2012–2014 of Thornburg Investment Management, Inc.; Co-Portfolio Manager of Marsico Capital Management from 2010–2012. | | Not applicable |
| | |
Di Zhou, 38 Vice President since 2016 | | Portfolio Manager and Managing Director since 2016, Associate Portfolio Manager from 2014–2016, and Equity Research Analyst from 2010–2014 of Thornburg Investment Management, Inc. | | Not applicable |
| (1) | Each person’s address is 2300 North Ridgetop Road, Santa Fe, New Mexico 87506. |
| (2) | The Fund is a separate investment “Fund” or “series” of Thornburg Investment Trust (the “Trust”), which comprises the Thornburg mutual fund complex and is organized as a Massachusetts business trust. Thornburg Investment Management, Inc. is the investment advisor to, and manages, all the Funds of the Trust. Each Trustee oversees all the Funds of the Trust. |
| (3) | Mr. Thornburg is considered an “interested” Trustee under the Investment Company Act of 1940 because he is the sole director and controlling shareholder of Thornburg Investment Management, Inc., the investment advisor to the Trust, and is the sole director and controlling shareholder of Thornburg Securities Corporation, the distributor of shares for the Trust. |
| (4) | The Bylaws of the Trust currently require that each Trustee shall retire by the end of the calendar year during which the Trustee reached the age of 75 years. Otherwise each Trustee serves in office until the election and qualification of a successor or until the Trustee sooner dies, resigns, retires or is removed. |
| (5) | Mr. McMahon is considered an “interested” Trustee under the Investment Company Act of 1940 because he is the chief investment officer of Thornburg Investment Management, Inc. |
| (6) | The Trust’s president, secretary, and treasurer each serves a one-year term or until the election and qualification of a successor; each other officer serves at the pleasure of the Trustees. |
| (7) | Assistant vice presidents, assistant secretaries, and assistant treasurers are not shown. |
The Statement of Additional Information for each Fund of the Trust includes additional information about the Trustees and is available, without charge and upon request, by calling 1-800-847-0200.
32 Annual Report
| | |
| OTHER INFORMATION | | |
| |
Thornburg Global Opportunities Fund | | September 30, 2016 (Unaudited) |
PORTFOLIO PROXY VOTING
Policies and Procedures:
The Trust has delegated to Thornburg Investment Management, Inc. (the “Advisor”) voting decisions respecting proxies for the Fund’s voting securities. The Advisor makes voting decisions in accordance with its Proxy Voting Policy and Procedures. A description of the Policy and Procedures is available (i) without charge, upon request, by calling the Advisor toll-free at 1-800-847-0200, (ii) on the Thornburg website at www.thornburg.com, and (iii) on the Securities and Exchange Commission’s website at www.sec.gov.
Information regarding how proxies were voted is available on or before August 31 of each year for the twelve months ending the preceding June 30. This information is available (i) without charge, upon request by calling the Advisor toll-free at 1-800-847-0200, (ii) on the Thornburg website at www.thornburg.com, and (iii) on the Securities and Exchange Commission’s website at www.sec.gov.
AVAILABILITY OF QUARTERLY PORTFOLIO SCHEDULE
The Fund files with the Securities and Exchange Commission schedules of its portfolio holdings on Form N-Q for the first and third quarters of each fiscal year. The Fund’s Forms N-Q are available on the Commission’s website at www.sec.gov, or may be reviewed and copied at the Commission’s Public Reference Room in Washington, D.C. Information on the operation of the Public Reference Room may be obtained by calling 1-800-SEC-0330. The Fund also makes this information available on its website at www.thornburg.com/download or upon request by calling 1-800-847-0200.
TAX INFORMATION
For the tax year ended September 30, 2016, dividends paid by the Thornburg Global Opportunities Fund of $17,672,932 are being reported as taxable ordinary investment income dividends for federal income tax purposes.
For the tax year ended September 30, 2016, the Fund is reporting 100.00% (or the maximum allowed) of the dividends paid from tax basis net ordinary income as qualifying for the reduced rate under the Jobs and Growth Tax Relief and Reconciliation Act of 2003.
The Fund is reporting 50.61% (or the maximum allowed) of the ordinary income distributions paid by the Fund for the fiscal year ended September 30, 2016 as qualified for the corporate dividends received deduction.
For the year ended September 30, 2016, foreign source income and foreign taxes paid is $33,116,675 and $1,647,358, respectively. The information and distributions reported herein may differ from the information and distributions reported to the shareholders for the calendar year ending December 31, 2016. Complete information will be reported in conjunction with your 2016 Form 1099.
STATEMENT RESPECTING RENEWAL OF INVESTMENT ADVISORY AGREEMENT
Thornburg Investment Management, Inc. (the “Advisor”) provides investment management services to Thornburg Global Opportunities Fund pursuant to an investment advisory agreement. The Trustees consider the renewal of this agreement annually, and most recently determined to renew the agreement on September 13, 2016.
In anticipation of their recent consideration of the advisory agreement’s renewal, the independent Trustees met in May 2016 to consider aspects of their annual evaluation of the Advisor’s service to all of the funds of Thornburg Investment Trust, to plan the annual evaluation of the Advisor’s performance and to specify the information the Advisor would present to the Trustees for their review. The independent Trustees met again in independent session in September to consider portions of the information submitted by the Advisor. Representatives of the Advisor subsequently reviewed portions of the information with the Trustees and addressed questions from the Trustees at a full meeting session of the Trustees scheduled for that purpose, and the independent Trustees thereafter met in independent session to consider the Advisor’s presentation and various specific issues respecting their consideration of the advisory agreement’s renewal. Following these sessions, the Trustees met to consider renewal of the agreement, and the independent Trustees voted unanimously at that meeting to renew the agreement for an additional term of one year.
The information below summarizes certain factors considered by the Trustees in connection with the determination to renew the advisory agreement. In determining to renew the agreement, the Trustees considered a wide range of information and did not identify any single factor as controlling, and this summary does not describe all of the factors and other matters considered by the Trustees in making their determination.
Nature, Extent and Quality of Services. The Trustees considered presentations by the Advisor at meeting sessions scheduled for consideration of a continuation of the advisory agreement, and also noted their consideration of the reports the Trustees and their committees receive throughout the year on a wide variety of topics, and consideration they had given to a number of topics in previous
Annual Report 33
| | |
| OTHER INFORMATION, CONTINUED | | |
| |
Thornburg Global Opportunities Fund | | September 30, 2016 (Unaudited) |
years. Information identified by the Trustees in their evaluation as having been considered and contributing to their conclusions included Trustees’ assessments of the Advisor’s personnel developed in formal and informal meetings throughout the year, the Advisor’s staffing levels and measures to maintain staffing levels and improve competencies, the Advisor’s commitment to attract and retain high quality portfolio management expertise through competitive compensation levels, the Advisor’s collaborative approach to investment management, the Fund’s investment performance over different periods of time, portfolio managers’ cognizance of and strategies to address market and economic trends and conditions, the evaluation and selection of individual investments, the structuring and composition of the Fund’s portfolio, management of Fund liquidity requirements, cognizance of and efforts to achieve tax efficiency, responses to share sale and redemption activity, continuing enhancements to the Advisor’s electronic and information systems and the Advisor’s engagement of outside firms to assist in improving or replacing those systems, the Advisor’s evaluation and selection of firms providing portfolio trade execution to the Fund and the Advisor’s measures to obtain favorable trade execution, the Advisor’s performance of accounting and other services, the Advisor’s continued commitment to observance of compliance and regulatory requirements, the Advisor’s responsiveness to the Trustees, the quality and extent of written and oral reports to the Trustees over the course of the year, and other factors.
Investment Performance. The Trustees noted in their evaluation of the Fund’s investment performance the reports they had received in each regular meeting over the course of the year from the Advisor’s portfolio management personnel. The Trustees also noted in their evaluation their consideration of information provided to them at their request in anticipation of their annual evaluation of the Advisor’s services, including the following items of information respecting the investment performance of the Fund: (1) the Fund’s absolute investment performance and achievement of stated objectives; (2) the Advisor’s written and oral explanations and commentary on the Fund’s performance in the context of the Fund’s objectives and reasonable expectations, and business, market and economic conditions, (3) performance data for the nine calendar years since the Fund’s inception, comparing the Fund’s annual investment returns to a fund category selected by an independent mutual fund analyst firm, and to a broad-based securities index, (4) the Fund’s investment performance for the three-month, year-to-date, one-year, three-year and five-year periods ending with the second quarter of the current year comparing the Fund’s annualized returns to two mutual fund categories selected by independent mutual fund analyst firms and to a broad-based securities index, and assigning a percentage rank to the Fund’s performance for each period relative to each of the fund categories, (5) comparison of the Fund’s annualized return since inception to the Fund’s benchmark index, and (6) comparative measures of estimated earnings growth, portfolio volatility, risk and return.
The Trustees found that quarterly reports during the year and other information presented to them confirmed the Advisor’s continued conformity to the Fund’s stated investment objectives and policies.
The Trustees observed in reviewing comparative performance data for the nine calendar years since the Fund’s inception showed that the Fund’s investment return for the most recent calendar year was higher than the returns for the fund category considered and the securities index, the Fund’s returns for the preceding eight calendar years exceeded or were comparable to the returns for the index in seven of the eight years, and that the Fund’s returns exceeded or were comparable to the average returns of the fund category in seven of eight years. Other quantitative data noted by the Trustees as having been considered in their evaluation showed that the Fund’s annualized investment return for the one-year period ended with the second quarter of the current year fell in the lowest quartile of the two fund categories considered, but that the Fund’s annualized investment returns for the three-year and five-year periods fell in the top decile of performance for both fund categories. Data presented to the Trustees showed that the Fund’s annualized total return (net of expenses) over the period since the Fund’s inception exceeded the annualized return for the Fund’s benchmark index. The Trustees attached additional significance to the performance data of the Fund from the perspective of longer term shareholders.
Comparisons of Fee and Expense Levels. The Trustees recognized in their evaluation the clear disclosures of the Advisor’s fees and Fund expenses in the Fund’s prospectuses. Information noted by the Trustees as having been considered in this context included a variety of comparative data respecting the Fund’s fee and expense levels. This information included comparisons of the Fund’s advisory fee and overall Fund expenses to median and average fees and expenses charged to a category of mutual funds selected by an independent mutual fund analyst firm, comparisons of the advisory fee and other Fund expenses to the fee levels and expenses for two representative share classes of fund peer groups selected from the category by a second independent mutual fund analyst firm, the perspectives and advice from the second mutual fund analyst firm respecting comparisons of fund fee levels and expenses to fund peer groups, and other information. Comparative fee and expense data noted as having been considered by the Trustees showed that the Fund’s advisory fee level was comparable to the median and slightly higher than the average levels for the fund category, the level of total expense for a representative share class of the Fund was comparable to the median and average expense levels for the category, and that the level of total expense for a second representative share class was lower than the median and average expense levels for the category. Peer group data showed the Fund’s advisory fee level was comparable to the medians of each of two peer groups, and that the total expense levels of two representative share classes of the Fund were comparable to the medians of their respective peer groups. The Trustees did not find the differences significant in view of the other factors considered.
The Trustees noted their consideration of information respecting the advisory fees charged by the Advisor to other investment management clients, including sub-advised mutual funds, together with information about fees charged by other advisors to different clients, analysis of the differences between the requirements of institutional clients and mutual funds, analysis of the differences between the requirements of a sub-advised mutual fund and a fund as to which the investment advisor is the primary advisor and sponsor, descriptions
34 Annual Report
| | |
| OTHER INFORMATION, CONTINUED | | |
| |
Thornburg Global Opportunities Fund | | September 30, 2016 (Unaudited) |
of distinguishing characteristics of the sub-advised funds served by the Advisor, and the consequently different investment management services provided to the different categories of clients and the differing contexts in which the fee levels for these arrangements are established. The Trustees confirmed their previous observations that the differences between the fees charged by the Advisor to different types of clients did not appear exceptional, and that the fee rates charged by an investment advisor to different categories of clients had limited relevance to the evaluation of the fee rate charged by that advisor to mutual funds as to which it is the primary advisor and sponsor.
Costs and Profitability of Advisor. In reviewing the profitability of the Advisor’s services to the Fund the Trustees considered an analysis of the Advisor’s costs and the profitability to the Advisor of its services, together with data respecting the overall profitability of a selection of other investment management firms. The Trustees noted that a portion of the Advisor’s profits are an important element in the compensation of shareholder employees. The Trustees considered in this regard information from the Advisor respecting investment of its profits to maintain staffing levels, pay competitive levels of compensation, and add to its information retrieval and management systems to maintain or improve service levels. The Trustees also considered the contribution of the Advisor’s cost management to its profitability, and the relationship of the Advisor’s financial resources and profitability in previous years to its ability to attract necessary personnel, invest in systems and other assets required for its service to the Fund, and maintain or improve service levels for the Fund notwithstanding fluctuations in revenues and profitability. The information considered did not indicate to the Trustees that the Advisor’s profitability was excessive.
Potential Economies of Scale. In reviewing the extent to which economies of scale would be realized by the Fund as it grows and whether fee levels reflect potential economies of scale, the Trustees considered the breakpoint structure for advisory fees chargeable to the Fund, comparisons of the fee breakpoint structure for the Fund with breakpoint structures (or the absence of such structures) for other funds in a peer group selected by an independent mutual fund analyst firm, the effects of the breakpoint structure and other expense factors realized by certain Funds of the Trust as their asset levels had increased, and the Advisor’s expenditures from its own profits and resources to maintain staffing levels, pay competitive levels of compensation, and add to its information retrieval and management systems to maintain or improve service levels. The information provided demonstrated to the Trustees that the Fund’s advisory fee breakpoint structure is reasonable in relation to the structures observed in the other funds in its peer group, and that shareholders may be expected to benefit from any economies of scale, due to the advisory agreement’s breakpoint fee structure for the Fund and other factors.
Potential Ancillary Benefits. In reviewing potential benefits to the Advisor because of its relationship to the Fund, the Trustees noted disclosures by the Advisor of its receipt of certain research services from broker dealers, and the benefits to both the Fund and the Advisor of the Advisor’s expansion of its staffing, compliance and systems capabilities and other resources to serve a broader variety of investment management clients. No unusual or unfair benefits to the Advisor from its relationship to the Fund were identified by the Trustees.
Summary of Conclusions. The Trustees concluded that the nature, extent and quality of the Advisor’s services performed under the advisory agreement remained sufficient. The Trustees further concluded that the absolute and relative investment performance of the Fund over a range of pertinent holding periods on the whole was satisfactory in the context of its objectives and strategies, and that the Advisor had continued to actively and competently pursue the Fund’s stated investment objectives and adhere to the Fund’s investment policies.
The Trustees further concluded, based upon their consideration of the foregoing factors and other information, that the level of the advisory fee charged to the Fund by the Advisor is reasonable in relation to the services provided by the Advisor in view of the nature, extent and quality of those services, the investment performance of the Fund after fees and expenses, the clear disclosure of fees and expenses in the Fund’s prospectuses, comparisons of fees and expenses charged to the Fund to fees and expenses charged to other mutual funds, and the other factors considered.
Annual Report 35
TRUSTEES’ STATEMENT TO SHAREHOLDERS
Readopted September 12, 2016
The Trustees believe current and prospective shareholders should know how we discharge our responsibilities in supervising the Funds’ investment advisor and in reviewing the advisor’s contract for renewal. Since 2005, we have issued a statement which sets out clearly the three principal guidelines that we follow in supervising the Trust’s investment advisor on your behalf. In accordance with our customary practice, in September of this year we again reviewed our statement and concluded we should reissue this statement outlining the principal features of our supervision of the advisor’s performance of investment management services for the Funds.
We begin with the premise that each shareholder selected his or her Fund because its investments are managed by the investment advisor identified in the prospectus and in accordance with the objective and policies described in the prospectus. We realize, as each of you do, that if you believe that your Fund’s stated objective and policies no longer serve your personal investment goals, you can sell your shares and leave the Fund.
Therefore, we believe that our primary supervisory task – our principal obligation to you – is to assess the nature and quality of the advisor’s services, and to confirm that the advisor actively and competently pursues the Fund’s objective, in accordance with the policies set out in the prospectus. To do this, we meet regularly with management to review your Fund’s portfolio and to discuss the advisor’s specific actions and judgments in pursuing the Fund’s objective. We do not substitute our own judgment for the advisor’s decisions in selecting investments; the advisor is paid to exercise its informed judgment on investment decisions, and we seek to confirm, in reviewing the advisor’s performance, that the advisor is doing just that.
Second, we are conscious of costs and the effect that costs have on shareholders’ returns. We try to make sure that your Fund’s fees and costs are reasonable in relationship to the services rendered and that they are generally in line with those charged by other expert investment advisors, consistent with our belief that the Fund’s investors searched for and expect that expertise and attention and have decided to pay a reasonable price for it. We do not put the management contract “out to bid” as a matter of course, and we would not do so unless we had concluded that the advisor materially had failed to pursue the Fund’s objectives in accordance with its policies, or for other equally important reasons. We believe that any other approach would be inconsistent with your interests and contrary to your expectations when you bought shares of the Fund in the first place.
Finally, because we believe that most Thornburg Fund shareholders have invested with a long-term perspective, we try not to focus too much on the fashions of the moment and on short-term performance. The market will not favor any specific investment objective or set of policies at all times and under all economic circumstances. A fund will experience periods of both high and low returns relative to other funds and other investments. Even if one of our Funds is not favored by the market at a particular time, we believe that the advisor is nonetheless obliged to remain true to the Fund’s objective and policies, and we watch to see that it does so.
Trustees of Thornburg Investment Trust
36 Annual Report
THORNBURG FUNDS
Thornburg Investment Management is a privately-owned global investment firm that offers a range of solutions for retail and institutional investors. Founded in 1982 and headquartered in Santa Fe, New Mexico, we manage approximately $53 billion (as of September 30, 2016) across eight equity and 11 bond mutual funds, separate accounts for high-net-worth investors and institutional accounts, and five UCITS funds for non-U.S. investors.
The fund outlined in this report is one of many equity and fixed-income products available from Thornburg Investment Management.
Equity Funds
| | • | | Thornburg Core Growth Fund |
| | • | | Thornburg International Value Fund |
| | • | | Thornburg Better World International Fund |
| | • | | Thornburg International Growth Fund |
| | • | | Thornburg Developing World Fund |
| | • | | Thornburg Investment Income Builder Fund |
| | • | | Thornburg Global Opportunities Fund |
Fixed Income Funds
| | • | | Thornburg Low Duration Income Fund |
| | • | | Thornburg Limited Term U.S. Government Fund |
| | • | | Thornburg Limited Term Income Fund |
| | • | | Thornburg Strategic Income Fund |
| | • | | Thornburg Low Duration Municipal Fund |
| | • | | Thornburg Limited Term Municipal Fund |
| | • | | Thornburg Intermediate Municipal Fund |
| | • | | Thornburg California Limited Term Municipal Fund |
| | • | | Thornburg New Mexico Intermediate Municipal Fund |
| | • | | Thornburg New York Intermediate Municipal Fund |
| | • | | Thornburg Strategic Municipal Income Fund |
Before investing, carefully consider the Fund’s investment goals, risks, charges, and expenses. For a prospectus or summary prospectus containing this and other information, contact your financial advisor or visit thornburg.com. Read it carefully before investing.
For additional information, please visit thornburg.com
Thornburg Investment Management, Inc. 2300 North Ridgetop Road, Santa Fe, NM 87506
Annual Report 37
This page intentionally left blank.
38 Annual Report
This page intentionally left blank.
Annual Report 39

| | |
| To receive shareholder reports, prospectuses, and proxy statements electronically, go to www.thornburg.com/edelivery. | |  |
This Annual Report is submitted for the general information of shareholders of the Fund. It is not authorized for distribution to prospective investors in the Fund unless preceded or accompanied by an effective prospectus. | |
| | | | |
| Investment Advisor: | | Distributor: | | |
| Thornburg Investment Management® | | Thornburg Securities Corporation® | | |
| 800.847.0200 | | 800.847.0200 | | TH1245 |
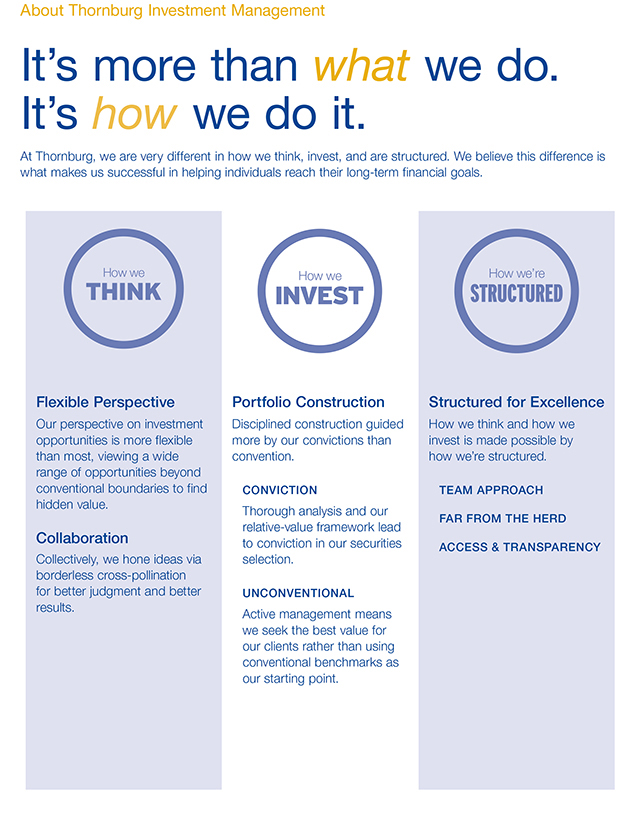
2 Annual Report
Annual Report
Thornburg Developing World Fund
September 30, 2016
| | | | | | |
Share Class | | NASDAQ Symbol | | CUSIP | |
Class A | | THDAX | | | 885-216-408 | |
Class C | | THDCX | | | 885-216-507 | |
Class I | | THDIX | | | 885-216-606 | |
Class R5 | | THDRX | | | 885-216-846 | |
Class R6 | | TDWRX | | | 885-216-838 | |
Class I, R5, and R6 shares may not be available to all investors. Minimum investments for Class I shares may be higher than those for other classes.
Investments carry risks, including possible loss of principal. Additional risks may be associated with investments outside the United States, especially in emerging markets, including currency fluctuations, illiquidity, volatility, and political and economic risks. Investments in small- and mid-capitalization companies may increase the risk of greater price fluctuations. Please see the Fund’s prospectus for a discussion of the risks associated with an investment in the Fund. Investments in the Fund are not FDIC insured, nor are they bank deposits or guaranteed by a bank or any other entity.
Funds invested in a smaller number of holdings may expose an investor to greater volatility.
Annual Report 3
LETTER TO SHAREHOLDERS
| | |
| |
Thornburg Developing World Fund | | September 30, 2016 (Unaudited) |
October 10, 2016
Dear Fellow Shareholders:
For investors in emerging markets, 2016 is shaping up to be much better than the last few calendar years, despite a first half largely spent in negative territory. We argued last year that emerging market equity valuations and currencies were approaching multi-decade lows, but we were uncertain about the timing of a positive catalyst required to reverse the trend. A soft patch in the U.S. economy along with rising external macroeconomic risks were enough to slow the dollar bulls as global monetary policy re-converged. The result was a decline in the premium investors demand to hold emerging market assets, as it became safe once again to buy non-dollar-denominated equities. The most favored markets were those deemed to be the most oversold, such as those tied to the Russian ruble, the South African rand, and the Brazilian real. The market also flocked to commodities, prices of which had been in part pressured by dollar strength, not to mention oversupply and sluggish economic growth.
The shift to a more dovish tone from U.S. Federal Reserve Chairwoman Janet Yellen in late January gave emerging markets the path needed to get out from under the dollar’s shadow. With dollar headwinds abating, emerging market equities have shifted into high gear with the expectation that higher dollar-based earnings revisions would be sure to follow. Fast forward almost nine months to early October, and the MSCI Emerging Markets Index is up 34% off the bottom, but index-level earnings per share revisions are flat. Simply put, we have seen emerging market equities re-rate by almost 35% without earnings-per-share revisions supporting the newfound price level. To which we ask – will we have jam tomorrow?
Fund Performance
For the year ended September 30, 2016, the MSCI Emerging Markets Index returned 16.78%, while Thornburg Developing World Fund A shares (without sales charge) delivered 13.20%. We are disappointed our return fell short of the index, though it was in line with our expectations given our more conservative stance. We generally avoid financially-levered companies, which typically perform well during periods of strong market performance, such as we have experienced since late January. During such periods, we think it’s worth reiterating that our process is designed to capture more of the upside and less of the downside during the inevitable sharp pullbacks we see from time to time in emerging markets. We think this is the right strategy for the long term, notwithstanding some underperformance in prolonged rallies such as the current one.
Top contributors to performance included Chinese online platform company Tencent Holdings, which performed well thanks to strong execution and consistent quarterly results that beat expectations. Chinese spirit maker Kweichow Moutai has benefitted from price rises amid resilient demand; pan-Asian insurer AIA Group enjoyed strong premium growth in China and Hong Kong; Credicorp, Peru’s leading bank, rose amid the recent surge in precious metals prices and optimism about the election of a market-friendly businessman and former finance minister as president; and U.S.-based Facebook saw strong gains amid a surge in domestic and international users and revenues per user amid higher ad click-rates.
The main detractors comprised China’s Zhuzhou CRRC Times Electric, which makes electronic equipment for the locomotive and inter-city rail industries. It sagged amid concerns that new high-speed rail multiple unit tenders have peaked, leaving near-term growth reliant mainly on maintenance orders. Chinese online retailer Vipshop Holdings saw strong total sales and increasing active users in recent earnings, but user growth was weaker than expected, leading to concerns about the long-term market opportunity. Saudi Arabia’s Al Tayyar Travel Group saw its share price fall with oil prices as investors became concerned that fiscal adjustments might impact their government business. Vehicle-parts maker Delphi Automotive shares dropped as European volume growth forecasts were revised lower following the “Brexit” referendum. Copper miner Grupo Mexico fell in sympathy with copper prices.
Market Outlook
Our inboxes have been consistently bombarded with notes from equity strategists that remain bullish on emerging market equities in both relative and absolute terms, despite the extended rally. Considering that many of these strategists were predicting new lows in emerging market equities less than a year ago, we take this newfound bullishness with a grain of salt. As we argued last year, emerging market valuations were too low and a rebound was in order. But from here, we firmly believe that we need to see additional earnings upgrades to support the current market multiple. Through the end of September, earnings revisions have been driven largely by positive revisions in the energy and materials sectors with negative revisions in four of the 11 index sectors, since the January market low. Those sectors (consumer discretionary, financials, telecom services, and industrials) make up nearly half of the index weight. What’s the disconnect? Clearly many emerging markets are in a much stronger position this year than they were last year. But many stocks are approaching all-time highs in terms of price and valuation despite the fact that in general
4 Annual Report
| | |
LETTER TO SHAREHOLDERS, CONTINUED | | |
| |
Thornburg Developing World Fund | | September 30, 2016 (Unaudited) |
growth and returns are much lower than last decade, driven by a variety of factors such as slower overall economic growth, higher debt levels, weaker global trade growth, and slower demographic tailwinds (in some cases even headwinds). We believe that without additional earnings upgrades to support the new price levels, stocks remain vulnerable to external shocks such as euro zone uncertainty and the impact of a change in monetary policy from global central banks.
Considering the tightrope global markets are walking currently, we think our focus on companies with long-term growth opportunities in consolidated markets with strong management and the ability to self fund that growth is more important than ever. We remain confident that the companies we hold can grow through a variety of macroeconomic scenarios and even take share during periods of market stress. We also believe that focusing on these types of companies can help us maintain a defensive posture relative to the market while still growing earnings and free cash flow faster. Our process has demonstrated success over time, although to a lesser extent in the most recent 12 months. We know in the long term that fundamentals still matter, which is why in a world that is distorted by monetary policy and fast money passive flows, we still expect to have our jam today in the form of consistent earnings. Earnings hope works well early in normal economic recoveries but as we approach eight years of extraordinary monetary policy with consistent downgrades of economic forecasts we have to wonder what normal looks like today. We remain as excited as ever about the medium and long-term prospects within emerging markets but wonder if the market has moved too far with too little in the form of additional earnings upgrades in a period of such high levels of uncertainty.
As always, we thank you for your trust as we invest alongside you in Thornburg Developing World Fund.
| | |
| Sincerely, | | |
| |
 | |  |
| Ben Kirby,CFA | | Charlie Wilson, PhD |
| Portfolio Manager | | Portfolio Manager |
| Managing Director | | Managing Director |
The matters discussed in this report may constitute forward-looking statements made pursuant to the safe harbor provisions of the Securities Litigation Reform Act of 1995. These include any advisor or portfolio manager prediction, assessment, analysis or outlook for individual securities, industries, investment styles, market sectors and/or markets. These statements involve risks and uncertainties. In addition to the general risks described for each fund in its current prospectus, other factors bearing on these reports include the accuracy of the advisor’s or portfolio manager’s forecasts and predictions, the appropriateness of the investment strategies designed by the advisor or portfolio manager and the ability of the advisor or portfolio manager to implement their strategies efficiently and successfully. Any one or more of these factors, as well as other risks affecting the securities markets generally, could cause the actual results of any fund to differ materially as compared to its benchmarks.
The views expressed by the portfolio managers reflect their professional opinions and are subject to change. Under no circumstances does the information contained within represent a recommendation to buy or sell any security.
Annual Report 5
| | |
| PERFORMANCE SUMMARY | | |
| |
Thornburg Developing World Fund | | September 30, 2016 (Unaudited) |
Average Annual Total Returns
| | | | | | | | | | | | | | | | |
| | | 1-Yr | | | 3-Yr | | | 5-Yr | | | Since
Incep. | |
Class A Shares (Incep: 12/16/09) | | | | | | | | | | | | | | | | |
Without sales charge | | | 13.20 | % | | | -1.39 | % | | | 6.41 | % | | | 5.41 | % |
With sales charge | | | 8.10 | % | | | -2.90 | % | | | 5.43 | % | | | 4.70 | % |
Class C Shares (Incep: 12/16/09) | | | | | | | | | | | | | | | | |
Without sales charge | | | 12.29 | % | | | -2.12 | % | | | 5.62 | % | | | 4.67 | % |
With sales charge | | | 11.29 | % | | | -2.12 | % | | | 5.62 | % | | | 4.67 | % |
Class I Shares (Incep: 12/16/09) | | | 13.68 | % | | | -0.95 | % | | | 6.92 | % | | | 5.95 | % |
Class R5 Shares (Incep: 2/1/13) | | | 13.65 | % | | | -0.96 | % | | | — | | | | 0.06 | % |
Class R6 Shares (Incep: 2/1/13) | | | 13.81 | % | | | -0.87 | % | | | — | | | | 0.16 | % |
MSCI Emerging Markets Index (Since 12/16/09) | | | 16.78 | % | | | -0.56 | % | | | 3.03 | % | | | 1.37 | % |
Growth of a Hypothetical $10,000 Investment
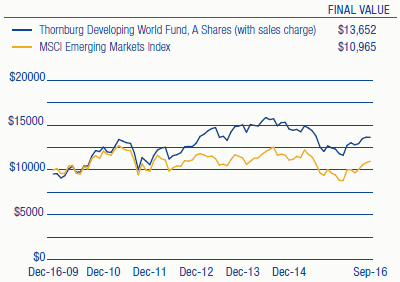
Performance data shown represents past performance and is no guarantee of future results. Investment return and principal value will fluctuate so shares, when redeemed, may be worth more or less than their original cost. Current performance may be lower or higher than quoted. For performance current to the most recent month end, visit thornburg.com or call 800.847.0200. The performance information does not reflect the deduction of taxes that a shareholder would pay on distributions or the redemption of Fund shares. Returns reflect the reinvestment of dividends and capital gains as well as applicable sales charges. Class A shares are sold with a maximum sales charge of 4.50%. Class C shares are subject to a 1% CDSC for the first year only. There is no sales charge for Class I, R5, and R6 shares.
As disclosed in the most recent prospectus, the total annual fund operating expenses are as follows: A shares, 1.53%; C shares, 2.27%; I shares, 1.14%; R5 shares, 1.67%; R6 shares, 1.10%. Thornburg Investment Management and/or Thornburg Securities Corporation have contractually agreed to waive fees and reimburse expenses through at least February 1, 2017, for some of the share classes, resulting in net expense ratios of the following: I shares, 1.09%; R5 shares, 1.09%; R6 shares, 0.99%. For more detailed information on fund expenses and waivers/reimbursements please see the Fund’s prospectus.
Glossary
MSCI Emerging Markets (EM) Index – Free float-adjusted market capitalization index that is designed to measure equity market performance of emerging markets. The MSCI Emerging Markets Index consists of the following 23 emerging market country indexes: Brazil, Chile, China, Colombia, Czech Republic, Egypt, Greece, Hungary, India, Indonesia, Korea, Malaysia, Mexico, Peru, Philippines, Poland, Qatar, Russia, South Africa, Taiwan, Thailand, Turkey and United Arab Emirates.
Unless otherwise noted, index returns reflect the reinvestment of income dividends and capital gains, if any, but do not reflect fees, brokerage commissions or other expenses of investing. Investors may not make direct investments into any index. The performance of any index is not indicative of the performance of any particular investment.
Earnings per Share (EPS) – The total earnings divided by the number of shares outstanding.
Multiple – A valuation multiple reflects an investment’s market value relative to some key metric. Price to earnings ratio (P/E) is a commonly used multiple. It’s calculated by dividing a stock’s price by the company’s earnings per share.
6 Annual Report
| | |
| FUND SUMMARY | | |
| |
Thornburg Developing World Fund | | September 30, 2016 (Unaudited) |
Objectives and Strategies
The Fund seeks long-term capital appreciation. Under normal market conditions the Fund invests at least 80% of its assets in equity securities and debt obligations of developing country issuers. A developing country issuer is a company or sovereign entity that is domiciled or otherwise tied economically to one or more developing countries. The Fund expects that investments in the Fund’s portfolio normally will be weighted in favor of equity securities.
Market Capitalization Exposure
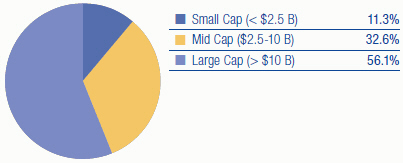
Basket Structure

| | | | |
| Top Ten Equity Holdings | |
| |
AIA Group Ltd. | | | 3.6 | % |
Tencent Holdings Ltd. | | | 3.5 | % |
Coway Co., Ltd. | | | 3.1 | % |
ITC Ltd. | | | 3.1 | % |
HDFC Bank Ltd. ADR | | | 3.0 | % |
Shanghai International Air Co., Ltd. | | | 2.9 | % |
Facebook, Inc. | | | 2.9 | % |
Magnit PJSC GDR | | | 2.7 | % |
NovaTek OAO-GDR | | | 2.6 | % |
AmorePacific Corp. | | | 2.6 | % |
There is no guarantee that the Fund will meet its investment objective.
All portfolio information is subject to change. Charts may not add up to 100% due to rounding.
| | | | |
| Sector Exposure | |
| |
Financials | | | 24.2 | % |
Consumer Staples | | | 17.7 | % |
Consumer Discretionary | | | 16.2 | % |
Information Technology | | | 15.0 | % |
Industrials | | | 6.0 | % |
Real Estate | | | 4.8 | % |
Health Care | | | 3.5 | % |
Energy | | | 2.6 | % |
Utilities | | | 1.8 | % |
Telecommunication Services | | | 0.8 | % |
Miscellaneous | | | 2.2 | % |
Other Assets Less Liabilities | | | 5.3 | % |
|
| Top Ten Industry Groups | |
| |
Software & Services | | | 15.0 | % |
Banks | | | 10.2 | % |
Food, Beverage & Tobacco | | | 8.5 | % |
Insurance | | | 8.5 | % |
Diversified Financials | | | 5.5 | % |
Consumer Durables & Apparel | | | 5.4 | % |
Real Estate | | | 4.8 | % |
Household & Personal Products | | | 4.7 | % |
Food & Staples Retailing | | | 4.5 | % |
Media | | | 4.4 | % |
Annual Report 7
| | |
FUND SUMMARY, CONTINUED | | |
| |
Thornburg Developing World Fund | | September 30, 2016 (Unaudited) |
Country Exposure*
(percent of equity holdings)
| | | | |
China | | | 21.0 | % |
South Korea | | | 10.3 | % |
India | | | 9.9 | % |
Hong Kong | | | 7.4 | % |
Brazil | | | 6.4 | % |
United States | | | 6.4 | % |
Mexico | | | 6.1 | % |
Russia | | | 5.7 | % |
Indonesia | | | 4.5 | % |
South Africa | | | 4.2 | % |
Taiwan | | | 3.1 | % |
United Arab Emirates | | | 2.6 | % |
United Kingdom | | | 2.3 | % |
Philippines | | | 2.0 | % |
Turkey | | | 1.9 | % |
Switzerland | | | 1.8 | % |
Thailand | | | 1.8 | % |
Saudi Arabia | | | 1.5 | % |
Czech Republic | | | 1.1 | % |
| * | The country assignment of each equity holding is determined by the Fund’s Advisor based on various factors, including the location of the issuer’s head office, the issuer’s jurisdiction of incorporation and the country from which a majority of the issuer’s revenue is derived. The Advisor may deem certain issuers to be developing country issuers, as defined in the Fund’s prospectus, even if those issuers have country exposure in a developed country. |
8 Annual Report
| | |
| SCHEDULE OF INVESTMENTS | | |
| |
Thornburg Developing World Fund | | September 30, 2016 |
| | | | | | | | |
| | | Shares/
Principal Amount | | | Value | |
COMMON STOCK — 92.52% | | | | | | | | |
| | |
BANKS — 10.24% | | | | | | | | |
Banks — 10.24% | | | | | | | | |
Grupo Financiero Banorte S.A.B. de C.V. | | | 3,612,758 | | | $ | 18,965,827 | |
HDFC Bank Ltd. ADR | | | 505,432 | | | | 36,335,506 | |
Itau Unibanco Holding SA ADR | | | 1,106,129 | | | | 12,101,051 | |
a Moneta Money Bank, A.S. | | | 3,924,343 | | | | 12,497,336 | |
PT Bank Central Asia | | | 23,969,858 | | | | 28,835,091 | |
Siam Commercial Bank plc | | | 3,541,760 | | | | 15,127,864 | |
| | | | | | | | |
| | | | | | | 123,862,675 | |
| | | | | | | | |
| | |
CAPITAL GOODS — 1.80% | | | | | | | | |
Industrial Conglomerates — 1.80% | | | | | | | | |
CJ Corp. | | | 129,147 | | | | 21,810,816 | |
| | | | | | | | |
| | | | | | | 21,810,816 | |
| | | | | | | | |
| | |
COMMERCIAL & PROFESSIONAL SERVICES — 1.27% | | | | | | | | |
Commercial Services & Supplies — 1.27% | | | | | | | | |
Valid Solucoes e Servicos SA | | | 1,642,098 | | | | 15,395,221 | |
| | | | | | | | |
| | | | | | | 15,395,221 | |
| | | | | | | | |
| | |
CONSUMER DURABLES & APPAREL — 5.36% | | | | | | | | |
Household Durables — 3.06% | | | | | | | | |
Coway Co., Ltd. | | | 427,184 | | | | 37,003,090 | |
Textiles, Apparel & Luxury Goods — 2.30% | | | | | | | | |
Eclat Textile Co., Ltd. | | | 1,306,494 | | | | 15,588,482 | |
NIKE, Inc. | | | 231,600 | | | | 12,193,740 | |
| | | | | | | | |
| | | | | | | 64,785,312 | |
| | | | | | | | |
| | |
CONSUMER SERVICES — 2.63% | | | | | | | | |
Hotels, Restaurants & Leisure — 2.63% | | | | | | | | |
a Al Tayyar Travel Group Holding Co. | | | 2,300,987 | | | | 17,001,187 | |
Galaxy Entertainment Group Ltd. | | | 3,924,763 | | | | 14,775,293 | |
| | | | | | | | |
| | | | | | | 31,776,480 | |
| | | | | | | | |
| | |
DIVERSIFIED FINANCIALS — 5.54% | | | | | | | | |
Capital Markets — 3.66% | | | | | | | | |
Hong Kong Exchanges & Clearing Ltd. | | | 925,233 | | | | 24,310,567 | |
Julius Baer Group Ltd. | | | 492,634 | | | | 20,045,108 | |
Diversified Financial Services — 1.88% | | | | | | | | |
GT Capital Holdings, Inc. | | | 764,693 | | | | 22,706,628 | |
| | | | | | | | |
| | | | | | | 67,062,303 | |
| | | | | | | | |
| | |
ENERGY — 2.58% | | | | | | | | |
Oil, Gas & Consumable Fuels — 2.58% | | | | | | | | |
NovaTek OAO-GDR Reg S | | | 284,196 | | | | 31,261,560 | |
| | | | | | | | |
| | | | | | | 31,261,560 | |
| | | | | | | | |
| | |
FOOD & STAPLES RETAILING — 4.47% | | | | | | | | |
Food & Staples Retailing — 4.47% | | | | | | | | |
BIM Birlesik Magazalar A.S. | | | 1,287,947 | | | | 21,480,089 | |
Magnit PJSC GDR | | | 780,704 | | | | 32,547,550 | |
| | | | | | | | |
| | | | | | | 54,027,639 | |
| | | | | | | | |
| | |
FOOD, BEVERAGE & TOBACCO — 8.50% | | | | | | | | |
Beverages — 1.19% | | | | | | | | |
Kweichow Moutai Co., Ltd. | | | 322,391 | | | | 14,408,509 | |
Food Products — 4.26% | | | | | | | | |
China Mengniu Dairy Co., Ltd. | | | 16,527,617 | | | | 30,684,040 | |
Grupo Lala, S.A.B. de C.V. | | | 10,905,519 | | | | 20,810,181 | |
Tobacco — 3.05% | | | | | | | | |
ITC Ltd. | | | 10,143,740 | | | | 36,915,413 | |
| | | | | | | | |
| | | | | | | 102,818,143 | |
| | | | | | | | |
| | |
HEALTH CARE EQUIPMENT & SERVICES — 1.98% | | | | | | | | |
Health Care Providers & Services — 1.98% | | | | | | | | |
Life Healthcare Group Holdings Ltd. | | | 8,696,932 | | | | 24,000,934 | |
| | | | | | | | |
| | | | | | | 24,000,934 | |
| | | | | | | | |
Annual Report 9
| | |
| SCHEDULE OF INVESTMENTS, CONTINUED | | |
| |
Thornburg Developing World Fund | | September 30, 2016 |
| | | | | | | | |
| | | Shares/
Principal Amount | | | Value | |
HOUSEHOLD & PERSONAL PRODUCTS — 4.68% | | | | | | | | |
Personal Products — 4.68% | | | | | | | | |
AmorePacific Corp. | | | 88,259 | | | $ | 31,173,333 | |
Grape King Bio Ltd. | | | 2,338,063 | | | | 19,393,418 | |
Hypermarcas SA | | | 710,600 | | | | 6,089,640 | |
| | | | | | | | |
| | | | | | | 56,656,391 | |
| | | | | | | | |
| | |
INSURANCE — 8.46% | | | | | | | | |
Insurance — 8.46% | | | | | | | | |
AIA Group Ltd. | | | 6,545,193 | | | | 43,500,168 | |
BB Seguridade Participacoes S.A. | | | 1,477,384 | | | | 13,573,862 | |
Dongbu Insurance Co., Ltd. | | | 366,535 | | | | 22,697,314 | |
Sanlam Ltd. | | | 4,847,188 | | | | 22,536,024 | |
| | | | | | | | |
| | | | | | | 102,307,368 | |
| | | | | | | | |
| | |
MEDIA — 4.40% | | | | | | | | |
Media — 4.40% | | | | | | | | |
a IMAX China Holding, Inc. | | | 3,157,535 | | | | 15,469,332 | |
a Liberty Global plc LiLAC | | | 898,957 | | | | 25,215,744 | |
PVR Ltd. | | | 41,690 | | | | 746,387 | |
Zee Entertainment Enterprises Ltd. | | | 1,440,364 | | | | 11,802,202 | |
| | | | | | | | |
| | | | | | | 53,233,665 | |
| | | | | | | | |
| | |
PHARMACEUTICALS, BIOTECHNOLOGY & LIFE SCIENCES — 1.49% | | | | | | | | |
Pharmaceuticals — 1.49% | | | | | | | | |
a,b China Animal Healthcare Ltd. | | | 35,787,582 | | | | 2,306,971 | |
Sun Pharmaceutical Industries Ltd. | | | 1,403,078 | | | | 15,657,660 | |
| | | | | | | | |
| | | | | | | 17,964,631 | |
| | | | | | | | |
| | |
REAL ESTATE — 4.78% | | | | | | | | |
Equity Real Estate Investment Trusts — 2.36% | | | | | | | | |
Fibra Uno Administracion S.A. de C.V. | | | 15,575,134 | | | | 28,475,793 | |
Real Estate Management & Development — 2.42% | | | | | | | | |
Emaar Properties PJSC | | | 15,161,883 | | | | 29,308,295 | |
| | | | | | | | |
| | | | | | | 57,784,088 | |
| | | | | | | | |
| | |
RETAILING — 3.82% | | | | | | | | |
Internet & Direct Marketing Retail — 1.65% | | | | | | | | |
GS Home Shopping, Inc. | | | 14,032 | | | | 2,098,398 | |
a JD.com, Inc. ADR | | | 684,554 | | | | 17,860,014 | |
Multiline Retail — 1.74% | | | | | | | | |
Matahari Department Store Tbk | | | 14,834,586 | | | | 20,999,845 | |
Specialty Retail — 0.43% | | | | | | | | |
Beauty Community PCL | | | 19,013,945 | | | | 5,213,058 | |
| | | | | | | | |
| | | | | | | 46,171,315 | |
| | | | | | | | |
| | |
SOFTWARE & SERVICES — 14.98% | | | | | | | | |
Information Technology Services — 2.87% | | | | | | | | |
Cielo SA | | | 1,023,033 | | | | 10,226,712 | |
a Cognizant Tech Solutions Corp. | | | 513,346 | | | | 24,491,738 | |
Internet Software & Services — 10.94% | | | | | | | | |
a Alibaba Group Holding Ltd. ADR | | | 291,716 | | | | 30,860,636 | |
a Baidu, Inc. ADR | | | 133,306 | | | | 24,271,023 | |
a Facebook, Inc. | | | 275,250 | | | | 35,306,318 | |
Tencent Holdings Ltd. | | | 1,523,292 | | | | 41,831,416 | |
Software — 1.17% | | | | | | | | |
Linx S.A. | | | 2,369,706 | | | | 14,135,970 | |
| | | | | | | | |
| | | | | | | 181,123,813 | |
| | | | | | | | |
| | |
TELECOMMUNICATION SERVICES — 0.79% | | | | | | | | |
Diversified Telecommunication Services — 0.79% | | | | | | | | |
Bharti Infratel Ltd. | | | 1,730,082 | | | | 9,554,688 | |
| | | | | | | | |
| | | | | | | 9,554,688 | |
| | | | | | | | |
| | |
TRANSPORTATION — 2.93% | | | | | | | | |
Transportation Infrastructure — 2.93% | | | | | | | | |
Shanghai International Air Co., Ltd. | | | 8,760,548 | | | | 35,423,085 | |
| | | | | | | | |
| | | | | | | 35,423,085 | |
| | | | | | | | |
10 Annual Report
| | |
| SCHEDULE OF INVESTMENTS, CONTINUED | | |
| |
Thornburg Developing World Fund | | September 30, 2016 |
| | | | | | | | |
| | | Shares/
Principal Amount | | | Value | |
UTILITIES — 1.82% | | | | | | | | |
Water Utilities — 1.82% | | | | | | | | |
CT Environmental Group Ltd. | | | 75,744,109 | | | $ | 21,972,081 | |
| | | | | | | | |
| | | | | | | 21,972,081 | |
| | | | | | | | |
TOTAL COMMON STOCK (Cost $1,036,595,260) | | | | | | | 1,118,992,208 | |
| | | | | | | | |
| | |
OTHER GOVERNMENT — 2.20% | | | | | | | | |
| | |
MISCELLANEOUS — 2.20% | | | | | | | | |
Miscellaneous — 2.20% | | | | | | | | |
Nota do Tesouro Nacional, 10.00% due 1/1/2021 (BRL) | | $ | 67,317,000 | | | | 20,251,526 | |
Nota do Tesouro Nacional, 10.00% due 1/1/2018 (BRL) | | | 20,400,000 | | | | 6,286,040 | |
| | | | | | | | |
TOTAL OTHER GOVERNMENT (Cost $23,065,445) | | | | | | | 26,537,566 | |
| | | | | | | | |
| | |
SHORT TERM INVESTMENTS — 7.15% | | | | | | | | |
c Thornburg Capital Management Fund | | | 8,651,050 | | | | 86,510,496 | |
| | | | | | | | |
TOTAL SHORT TERM INVESTMENTS (Cost $86,510,496) | | | | | | | 86,510,496 | |
| | | | | | | | |
TOTAL INVESTMENTS — 101.87% (Cost $1,146,171,201) | | | | | | $ | 1,232,040,270 | |
LIABILITIES NET OF OTHER ASSETS — (1.87)% | | | | | | | (22,584,294 | ) |
| | | | | | | | |
NET ASSETS — 100.00% | | | | | | $ | 1,209,455,976 | |
| | | | | | | | |
Footnote Legend
| b | Security currently fair valued by the Valuation and Pricing Committee using procedures approved by the Trustees’ Audit Committee. |
| c | Investment in Affiliates – Shown below are holdings of voting securities of each portfolio company which is considered “affiliated” to the Fund under the Investment Company Act of 1940, including companies for which the Fund’s holding represented 5% or more of the company’s voting securities, and a series of the Thornburg Investment Trust in which the Fund invested for cash management purposes during the period: |
| | | | | | | | | | | | | | | | | | | | | | | | | | | | |
Issuer | | Shares/
Principal
September 30,
2015 | | | Gross
Additions | | | Gross
Reductions | | | Shares/
Principal
September 30,
2016 | | | Market
Value
September 30,
2016 | | | Investment
Income | | | Realized
Gain (Loss) | |
Thornburg Capital Management Fund | | | 9,917,505 | | | | 52,110,018 | | | | 53,376,473 | | | | 8,651,050 | | | $ | 86,510,496 | | | $ | 283,085 | | | $ | — | |
| | | | | | | | | | | | | | | | | | | | | | | | | | | | |
Total non-controlled affiliated issuers - 7.15% of net assets | | | | | | | $ | 86,510,496 | | | $ | 283,085 | | | $ | — | |
| | | | | | | | | | | | | | | | | | | | | | | | | | | | |
Portfolio Abbreviations
To simplify the listings of securities, abbreviations are used per the table below:
| | |
| ADR | | American Depositary Receipt |
| BRL | | Denominated in Brazilian Real |
| GDR | | Global Depository Receipt |
See notes to financial statements.
Annual Report 11
| | |
| STATEMENT OF ASSETS AND LIABILITIES | | |
| |
Thornburg Developing World Fund | | September 30, 2016 |
| | | | |
| |
ASSETS | | | | |
Investments at value (Note 3) | | | | |
Non-affiliated issuers (cost $1,059,660,705) | | $ | 1,145,529,774 | |
Non-controlled affiliated issuer (cost $86,510,496) | | | 86,510,496 | |
Cash denominated in foreign currency (cost $2,166,547) | | | 2,166,547 | |
Receivable for investments sold | | | 3,948,348 | |
Receivable for fund shares sold | | | 3,404,831 | |
Dividends receivable | | | 730,358 | |
Dividend reclaim receivable | | | 319,742 | |
Interest receivable | | | 94,766 | |
Prepaid expenses and other assets | | | 96,229 | |
| | | | |
Total Assets | | | 1,242,801,091 | |
| | | | |
| |
LIABILITIES | | | | |
Payable for investments purchased | | | 27,488,396 | |
Payable for fund shares redeemed | | | 2,442,111 | |
Unrealized depreciation on forward currency contracts (Note 7) | | | 1,073,912 | |
Payable to investment advisor and other affiliates (Note 4) | | | 1,178,499 | |
Deferred taxes payable | | | 667,623 | |
Accounts payable and accrued expenses | | | 494,513 | |
Dividends payable | | | 61 | |
| | | | |
Total Liabilities | | | 33,345,115 | |
| | | | |
| |
NET ASSETS | | $ | 1,209,455,976 | |
| | | | |
NET ASSETS CONSIST OF | | | | |
Distribution in excess of net investment income | | $ | (1,751,077 | ) |
Net unrealized appreciation on investments | | | 84,190,849 | |
Accumulated net realized gain (loss) | | | (259,478,282 | ) |
Net capital paid in on shares of beneficial interest | | | 1,386,494,486 | |
| | | | |
| | $ | 1,209,455,976 | |
| | | | |
12 Annual Report
| | |
| STATEMENT OF ASSETS AND LIABILITIES, CONTINUED | | |
| |
Thornburg Developing World Fund | | September 30, 2016 |
| | | | |
NET ASSET VALUE | | | | |
Class A Shares: | | | | |
Net asset value and redemption price per share ($166,655,055 applicable to 9,814,982 shares of beneficial interest outstanding - Note 5) | | $ | 16.98 | |
Maximum sales charge, 4.50% of offering price | | | 0.80 | |
| | | | |
Maximum offering price per share | | $ | 17.78 | |
| | | | |
| |
Class C Shares: | | | | |
Net asset value and offering price per share* ($134,129,022 applicable to 8,250,812 shares of beneficial interest outstanding - Note 5) | | $ | 16.26 | |
| | | | |
| |
Class I Shares: | | | | |
Net asset value, offering and redemption price per share ($853,865,710 applicable to 49,484,056 shares of beneficial interest outstanding - Note 5) | | $ | 17.26 | |
| | | | |
| |
Class R5 Shares: | | | | |
Net asset value, offering and redemption price per share ($6,208,094 applicable to 360,947 shares of beneficial interest outstanding - Note 5) | | $ | 17.20 | |
| | | | |
| |
Class R6 Shares: | | | | |
Net asset value, offering and redemption price per share ($48,598,095 applicable to 2,817,256 shares of beneficial interest outstanding - Note 5) | | $ | 17.25 | |
| | | | |
| * | Redemption price per share is equal to net asset value less any applicable contingent deferred sales charge. |
See notes to financial statements.
Annual Report 13
| | |
| STATEMENT OF OPERATIONS | | |
| |
Thornburg Developing World Fund | | Year Ended September 30, 2016 |
| | | | |
INVESTMENT INCOME | | | | |
Dividend income | | | | |
Non-affiliated issuers (net of foreign taxes withheld of $1,881,960) | | $ | 18,983,724 | |
Non-controlled affiliated issuer | | | 283,085 | |
Interest income | | | 1,764,332 | |
| | | | |
Total Income | | | 21,031,141 | |
| | | | |
| |
EXPENSES | | | | |
Investment advisory fees (Note 4) | | | 11,127,985 | |
Administration fees (Note 4) | | | | |
Class A Shares | | | 217,219 | |
Class C Shares | | | 173,264 | |
Class I Shares | | | 420,536 | |
Class R5 Shares | | | 2,864 | |
Distribution and service fees (Note 4) | | | | |
Class A Shares | | | 433,827 | |
Class C Shares | | | 1,385,261 | |
Transfer agent fees | | | | |
Class A Shares | | | 263,880 | |
Class C Shares | | | 250,827 | |
Class I Shares | | | 734,687 | |
Class R5 Shares | | | 16,104 | |
Class R6 Shares | | | 7,202 | |
Registration and filing fees | | | | |
Class A Shares | | | 33,003 | |
Class C Shares | | | 21,498 | |
Class I Shares | | | 78,677 | |
Class R5 Shares | | | 22,868 | |
Class R6 Shares | | | 22,958 | |
Custodian fees (Note 2) | | | 627,367 | |
Professional fees | | | 88,446 | |
Accounting fees (Note 4) | | | 42,101 | |
Trustee fees | | | 44,585 | |
Other expenses | | | 147,603 | |
| | | | |
Total Expenses | | | 16,162,762 | |
Less: | | | | |
Fees waived by investment advisor (Note 4) | | | (350,716 | ) |
Expenses reimbursed by investment advisor (Note 4) | | | (629,692 | ) |
| | | | |
Net Expenses | | | 15,182,354 | |
| | | | |
Net Investment Income | | $ | 5,848,787 | |
| | | | |
14 Annual Report
| | |
| STATEMENT OF OPERATIONS, CONTINUED | | |
| |
Thornburg Developing World Fund | | Year Ended September 30, 2016 |
| | | | |
REALIZED AND UNREALIZED GAIN (LOSS) | | | | |
Net realized gain (loss) from: | | | | |
Non-affiliated issuer investments (net of realized capital gain taxes paid of $164,468) | | $ | (6,522,151 | ) |
Forward currency contracts (Note 7) | | | (170,806 | ) |
Foreign currency transactions | | | (2,350,964 | ) |
| | | | |
| | | (9,043,921 | ) |
| | | | |
Net change in unrealized appreciation (depreciation) on: | | | | |
Non-affiliated issuer investments (net of change in deferred taxes payable of $667,623) | | | 151,120,883 | |
Forward currency contracts (Note 7) | | | 3,312,962 | |
Foreign currency translations | | | 106,634 | |
| | | | |
| | | 154,540,479 | |
| | | | |
Net Realized and Unrealized Gain | | | 145,496,558 | |
| | | | |
Net Increase in Net Assets Resulting from Operations | | $ | 151,345,345 | |
| | | | |
See notes to financial statements.
Annual Report 15
| | |
| STATEMENTS OF CHANGES IN NET ASSETS | | |
| |
Thornburg Developing World Fund | | |
| | | | | | | | |
| | | Year Ended
September 30, 2016 | | | Year Ended
September 30, 2015 | |
INCREASE (DECREASE) IN NET ASSETS FROM | | | | | | | | |
| | |
OPERATIONS | | | | | | | | |
Net investment income | | $ | 5,848,787 | | | $ | 9,495,705 | |
Net realized gain (loss) from investments, capital gain taxes, forward currency contracts, and foreign currency transactions | | | (9,043,921 | ) | | | (178,080,350 | ) |
Net unrealized appreciation (depreciation) on investments, deferred taxes payable, forward currency contracts, and foreign currency translations | | | 154,540,479 | | | | (235,638,599 | ) |
| | | | | | | | |
| | |
Net Increase (Decrease) in Net Assets Resulting from Operations | | | 151,345,345 | | | | (404,223,244 | ) |
| | |
DIVIDENDS TO SHAREHOLDERS | | | | | | | | |
From net investment income | | | | | | | | |
Class A Shares | | | (343,296 | ) | | | (305,746 | ) |
Class I Shares | | | (4,899,868 | ) | | | (7,517,677 | ) |
Class R5 Shares | | | (35,207 | ) | | | (39,389 | ) |
Class R6 Shares | | | (276,797 | ) | | | (178,462 | ) |
| | |
FUND SHARE TRANSACTIONS (NOTE 5) | | | | | | | | |
Class A Shares | | | (61,310,070 | ) | | | (194,862,909 | ) |
Class C Shares | | | (36,759,558 | ) | | | (35,907,758 | ) |
Class I Shares | | | (267,526,805 | ) | | | (1,052,861,620 | ) |
Class R5 Shares | | | 200,879 | | | | (677,452 | ) |
Class R6 Shares | | | 23,520,145 | | | | 3,921,323 | |
| | | | | | | | |
Net Decrease in Net Assets | | | (196,085,232 | ) | | | (1,692,652,934 | ) |
| | |
NET ASSETS | | | | | | | | |
Beginning of Year | | | 1,405,541,208 | | | | 3,098,194,142 | |
| | | | | | | | |
| | |
End of Year | | $ | 1,209,455,976 | | | $ | 1,405,541,208 | |
| | | | | | | | |
Undistributed (distribution in excess of) net investment income | | $ | (1,751,077 | ) | | $ | 585,376 | |
See notes to financial statements.
16 Annual Report
| | |
| NOTES TO FINANCIAL STATEMENTS | | |
| |
Thornburg Developing World Fund | | September 30, 2016 |
NOTE 1 – ORGANIZATION
Thornburg Developing World Fund (the “Fund”) is a diversified series of Thornburg Investment Trust (the “Trust”). The Fund commenced operations on December 16, 2009. The Trust was organized as a Massachusetts business trust under a Declaration of Trust dated June 3, 1987 and is registered as a diversified, open-end management investment company under the Investment Company Act of 1940, as amended. The Fund is currently one of twenty separate series of the Trust. Each series is considered to be a separate entity for financial reporting and tax purposes and bears expenses directly attributable to it. The Fund seeks long-term capital appreciation.
The Fund currently offers five classes of shares of beneficial interest: Class A, Class C, Institutional Class (“Class I”) and Retirement Classes (“Class R5” and “Class R6”). Each class of shares of the Fund represents an interest in the same portfolio of investments, except that (i) Class A shares are sold subject to a front-end sales charge collected at the time the shares are purchased and bear a service fee, (ii) Class C shares are sold at net asset value without a sales charge at the time of purchase, but are subject to a contingent deferred sales charge upon redemption within one year of purchase, and bear both a service fee and a distribution fee, (iii) Class I and Class R5 shares are sold at net asset value without a sales charge at the time of purchase and may be subject to a service fee, (iv) Class R6 shares are sold at net asset value without a sales charge at the time of purchase, and (v) the respective classes may have different reinvestment privileges and conversion rights. Additionally, the Fund may allocate among its classes certain expenses, to the extent allocable to specific classes, including transfer agent fees, government registration fees, certain printing and postage costs, and administrative and legal expenses. Currently, class specific expenses of the Fund are limited to service and distribution fees, administration fees, and certain registration and transfer agent expenses.
The following is a summary of significant accounting policies followed by the Fund in the preparation of its financial statements. The Fund prepares its financial statements in conformity with United States generally accepted accounting principles (“GAAP”), including investment company accounting and reporting guidance in the Financial Accounting Standards Board (the “FASB”) Accounting Standard Codification Topic 946.
NOTE 2 – SIGNIFICANT ACCOUNTING POLICIES
Security Valuation: All investments in securities held by the Fund are valued as described in Note 3.
Allocation of Income, Gains, Losses and Expenses: Net investment income (other than class specific expenses) and realized and unrealized gains and losses are allocated daily to each class of shares based upon the relative net asset value of outstanding shares (or the value of the dividend-eligible shares, as appropriate) of each class of shares at the beginning of the day (after adjusting for the current capital shares activity of the respective class). Expenses common to all Funds are allocated among the Funds comprising the Trust based upon their relative net asset values or other appropriate allocation methods. Operating expenses directly attributable to a specific class are charged against the operating income of that class.
Dividends and Distributions to Shareholders: Dividends and distributions to shareholders, which are determined in accordance with federal income tax regulations and may differ from GAAP, are recorded on the ex-dividend date. Ordinary income distributions, if any, are declared and paid quarterly. Capital gain distributions, if any, are declared and paid annually and more often if deemed necessary by the Advisor. Dividends are paid and are reinvested in additional shares of the Fund at net asset value per share at the close of business on the ex-dividend date, or at the shareholder’s option, paid in cash.
Investment Income: Dividend income is recorded on the ex-dividend date. Certain income from foreign investments is recognized as soon as information is available to the Fund. Interest income is accrued as earned. Premiums and discounts are amortized and accreted, respectively, to call dates or maturity dates using the effective yield method of the respective investments, which is included in interest income on the Statement of Operations.
Custodian Fees: Custodian fees disclosed in the Statement of Operations may include interest expenses incurred by the Fund on any cash overdrafts of its custodian account during the period. Such cash overdrafts may result from the effects of failed trades in portfolio securities and from cash outflows resulting from unanticipated shareholder redemption activity. The Fund pays interest to its custodian on any such cash overdraft at a rate equal to 2.50% of the overdraft amount in excess of $50,000.
Investment Transactions: Investment transactions are accounted for on a trade date basis. Realized gains and losses from the sale of investments are recorded on an identified cost basis.
When-Issued and Delayed Delivery Transactions: The Fund may engage in when-issued or delayed delivery transactions. To the extent the Fund engages in such transactions, it will do so for the purpose of acquiring portfolio investments consistent with the Fund’s investment objectives and not for the purpose of investment leverage or to speculate on interest rate or market changes. At the time the Fund makes a commitment to purchase an investment on a when-issued or delayed delivery basis, the Fund will record the transaction and reflect the value in determining its net asset value. When effecting such transactions, assets of an amount sufficient to make payment for the portfolio investments to be purchased will be segregated on the Fund’s records on the trade date. Investments purchased on a when-issued or delayed delivery basis do not earn interest until the settlement date.
Annual Report 17
| | |
| NOTES TO FINANCIAL STATEMENTS, CONTINUED | | |
| |
Thornburg Developing World Fund | | September 30, 2016 |
Repurchase Agreements: The Fund may invest excess cash in repurchase agreements whereby the Fund purchases investments, which serve as collateral, with an agreement to resell such collateral to the seller at an agreed upon price at the maturity date of the repurchase agreement. Investments pledged as collateral for repurchase agreements are held in custody until maturity of the repurchase agreement. Provisions in the agreements require that the market value of the collateral is at least equal to the repurchase value in the event of default. In the event of default, the Fund has the right to liquidate the collateral and apply the proceeds in satisfaction of the obligation. Under certain circumstances, in the event of default or bankruptcy by the other party to the agreement, realization and/or retention of the collateral may be subject to legal proceedings.
Foreign Currency Translation: Portfolio investments and other assets and liabilities denominated in foreign currencies are translated into U.S. dollars based on the exchange rate of such currencies against the U.S. dollar on the date of valuation. Purchases and sales of investments and income items denominated in foreign currencies are translated into U.S. dollars at the exchange rate in effect on the transaction date. When the Fund purchases or sells foreign investments, it will customarily enter into a foreign exchange contract to minimize foreign exchange risk from the trade date to the settlement date of such transactions. The values of such spot contracts are included in receivable for investments sold and payable for investments purchased on the Statement of Assets and Liabilities.
The Fund does not separately report the effect of changes in foreign exchange rates from changes in market prices on investments held. Such changes are included in net unrealized appreciation (depreciation) from investments.
Reported net realized gains and losses from foreign currency transactions arise due to purchases and sales of foreign currencies, currency gains and losses realized between the trade and settlement dates on investment transactions and the difference between the amounts of dividends, interest, and foreign withholding taxes recorded on the Fund’s books, and the U.S. dollar equivalent of the amounts actually received or paid.
Net change in unrealized appreciation (depreciation) on foreign currency translations arise from changes in the fair value of assets and liabilities, other than investments at period end, resulting from changes in exchange rates.
Guarantees and Indemnifications: Under the Trust’s organizational documents (and under separate agreements with the independent Trustees), its officers and Trustees are provided with an indemnification against certain liabilities arising out of the performance of their duties to the Fund. In the normal course of business the Trust may also enter into contracts with service providers that contain general indemnifications. The Trust’s maximum exposure under these arrangements is unknown. However, based on experience, the Trust expects the risk of loss to be remote.
Use of Estimates: The preparation of financial statements in conformity with GAAP requires management to make estimates and assumptions that affect the reported amounts of assets and liabilities and disclosure of contingent assets and liabilities at the date of the financial statements and the reported amounts of increases (decreases) in net assets from operations during the reporting period. Actual results could differ from those estimates.
Federal Income Taxes: It is the policy of the Trust to comply with the provisions of the Internal Revenue Code applicable to regulated investment companies and to distribute to shareholders substantially all investment company taxable income including net realized gains on investments (if any), and tax exempt income of the Fund. Therefore, no provision for federal income or excise tax is required.
The Fund files income tax returns in United States federal and applicable state jurisdictions. The statute of limitations on the Fund’s tax return filings generally remains open for the three years following a return’s filing date. The Fund has analyzed each uncertain tax position believed to be material in the preparation of the Fund’s financial statements for the fiscal year ended September 30, 2016, including open tax years, to assess whether it is more likely than not that the position would be sustained upon examination, based on the technical merits of the position. The Fund has not identified any such position for which an asset or liability must be reflected in the Statement of Assets and Liabilities.
At September 30, 2016, information on the tax components of capital was as follows:
| | | | |
Cost of investments for tax purposes | | $ | 1,151,168,613 | |
| | | | |
Gross unrealized appreciation on a tax basis | | $ | 141,164,375 | |
Gross unrealized depreciation on a tax basis | | | (60,292,718 | ) |
| | | | |
Net unrealized appreciation (depreciation) on investments (tax basis) | | $ | 80,871,657 | |
| | | | |
Temporary book to tax adjustments made to the cost of investments and net unrealized appreciation (depreciation) for tax purposes result primarily from deferral of outstanding wash sale losses and outstanding passive foreign investment company (“PFIC”) tax basis adjustments.
At September 30, 2016, the Fund had deferred tax basis late year specified ordinary losses occurring subsequent to October 31, 2015 through September 30, 2016 of $2,393,848. For tax purposes, such losses will be recognized in the year ending September 30, 2017.
18 Annual Report
| | |
| NOTES TO FINANCIAL STATEMENTS, CONTINUED | | |
| |
Thornburg Developing World Fund | | September 30, 2016 |
At September 30, 2016, the Fund had deferred tax basis capital losses occurring subsequent to October 31, 2015 through September 30, 2016 of $55,539,592. For tax purposes, such capital losses will be recognized in the year ending September 30, 2017.
At September 30, 2016, the Fund had cumulative tax basis capital losses of $200,029,811, (of which $200,029,811 are short-term and $0 are long-term) generated after September 30, 2011, which may be carried forward to offset future capital gains. To the extent such carryforwards are used, capital gain distributions may be reduced to the extent provided by regulations. Such capital loss carryforwards do not expire.
During the year ended September 30, 2016, the Fund utilized $16,139,003 of capital loss carryforwards generated after October 1, 2011.
In order to account for permanent book to tax differences, the Fund decreased undistributed net investment income by $2,630,072 and decreased accumulated net realized gain (loss) by $2,630,072. Reclassifications have no impact upon the net asset value of the Fund and result primarily from foreign currency gains (losses), investments in foreign bonds, and foreign capital gain taxes.
At September 30, 2016, the Fund had $668,406 of undistributed tax basis net ordinary investment income and no undistributed tax basis capital gains.
The tax character of distributions paid during the years ended September 30, 2016, and September 30, 2015, was as follows:
| | | | | | | | |
| | | 2016 | | | 2015 | |
Distributions from: | | | | | | | | |
Ordinary income | | $ | 5,555,168 | | | $ | 8,041,274 | |
Capital gains | | | — | | | | — | |
| | | | | | | | |
Total | | $ | 5,555,168 | | | $ | 8,041,274 | |
| | | | | | | | |
Foreign Withholding Taxes: The Fund is subject to foreign tax withholding imposed by certain foreign countries in which the Fund may invest. Withholding taxes are incurred on certain foreign dividends and are accrued at the time the dividend is recognized based on applicable foreign tax laws. The Fund files withholding tax reclaims in certain jurisdictions to recover a portion of amounts previously withheld, in view of various considerations, including recent decisions rendered by the courts in those and other jurisdictions. The Fund would expect to record a receivable for such a reclaim based on a variety of factors, including assessment of a jurisdiction’s legal obligation to pay reclaims, the jurisdiction’s administrative practices and payment history, and industry convention. To date the Fund has recorded no such receivable because there is limited precedent for collecting such prior year reclaims and the likelihood of collection remains uncertain.
Deferred Foreign Capital Gain Taxes: The Fund is subject to a tax imposed on net realized gains of securities of certain foreign countries. The Fund records an estimated deferred tax liability for net unrealized gains on these investments as reflected in the accompanying financial statements.
NOTE 3 – SECURITY VALUATION
Valuation of the Fund’s portfolio investment securities is performed in accordance with policies and procedures adopted by and under the oversight of the Trustees.
The Trustees of the Trust have appointed Thornburg Investment Management, Inc., the Trust’s investment advisor (the “Advisor”) to assist the Trustees in obtaining market values for portfolio investments, evaluate and monitor professional pricing service providers appointed by the Trustees’ Audit Committee (the “Audit Committee”) to assist in determining fair values for portfolio investments, assist in calculating fair values for portfolio investments in certain circumstances, and to perform other functions in connection with the valuation of investments. The Advisor acts through its Valuation and Pricing Committee (the “Committee”) and other employees of the Advisor. The Committee regularly reviews its own valuation calculations, as well as the valuations, valuation techniques and services furnished by pricing service providers, considers circumstances which may require valuation calculations by the Committee, and reviews previous valuation calculations. The Committee reports to the Audit Committee on the Committee’s activities, the performance of pricing service providers, and other matters relating to valuation of portfolio investments.
In those instances when the Committee assists in calculating a fair value for a portfolio investment, the Committee seeks to determine the price that the Fund would reasonably expect to receive upon a sale of the investment in an orderly transaction between market participants on the valuation date. The Committee customarily utilizes quotations from securities broker dealers in calculating valuations, but also may utilize prices obtained from pricing service providers or other methods approved by the Audit Committee. Because fair values calculated by the Committee are estimates, the calculation of a value for an investment may differ from the price that would be realized by the Fund upon a sale of the investment, and the difference could be material to the Fund’s financial statements. The Committee’s calculation of a fair value for an investment may also differ from the prices obtained by other persons (including other mutual funds) for the investment.
Annual Report 19
| | |
| NOTES TO FINANCIAL STATEMENTS, CONTINUED | | |
| |
Thornburg Developing World Fund | | September 30, 2016 |
Valuation of Securities: Securities and other portfolio investments which are listed or traded on a United States securities exchange are valued at the last reported sale price on the valuation date. Investments listed or traded on an exchange for which there has been no sale that day are valued at the mean between the last reported bid and asked prices on that valuation date. Portfolio investments reported by NASDAQ are valued at the official closing price on the valuation date. If an investment is traded on more than one exchange, the investment is considered traded on the exchange that is normally the primary market for that investment. Securities and other portfolio investments which are listed or traded on exchanges outside the United States are valued at the last price or the closing price of the investment on the exchange that is normally the primary market for the investment, as of the close of the exchange preceding the Fund’s valuation date. Foreign investments listed or traded on an exchange for which there has been no sale that day are valued at the mean between the last reported bid and asked prices on that valuation date.
In any case when a market quotation is not readily available for a portfolio investment ordinarily valued by market quotation, the Committee calculates a fair value for the investment using alternative methods approved by the Audit Committee. A market quotation is not readily available when the primary market or exchange for the investment is not open for the entire scheduled day of trading. Market quotations for an investment also may not be readily available if developments after the most recent close of the investment’s primary exchange or market, but prior to the close of business on any Fund business day, or an unusual event or significant period of time occurring since the availability of a market quotation, create a serious question concerning the reliability of the most recent market quotation available for the investment. In particular, on days when market volatility thresholds established by the Audit Committee are exceeded, foreign equity investments held by the Fund may be valued using alternative methods. The Committee customarily obtains valuations in these instances from pricing service providers approved by the Audit Committee. Pricing service providers ordinarily calculate valuations using multi-factor models to adjust market prices based upon various inputs, including exchange data, depository receipt prices, futures, index data and other data.
Debt obligations held by the Fund which are not listed or traded on exchanges or for which no reported market exists are ordinarily valued at the valuation obtained from a pricing service provider approved by the Audit Committee.
In any case when a pricing service provider fails to provide a valuation for a debt obligation held by the Fund, the Committee calculates a fair value for the obligation using alternative methods under procedures approved by the Audit Committee. Additionally, in cases when management believes that a valuation obtained from a pricing service provider merits review for significant reasons, the Committee decides whether or not to use the valuation calculated by the pricing service provider or to use an alternative method approved by the Audit Committee to calculate a fair value for the obligation.
Quotations for foreign investments expressed in foreign currency amounts are converted to U.S. dollar equivalents using a foreign exchange quotation from a third party service provider at the time of valuation. Foreign investments held by the Fund may be traded on days and at times when the Fund is not open for business. Consequently, the value of Fund investments may be significantly affected on days when shareholders cannot purchase or sell Fund shares. Futures contracts and other financial and derivative instruments traded on an exchange are valued at the latest published price for the instrument on its primary exchange. Listed options are valued at the last bid price.
Valuation Hierarchy: The Fund categorizes its investments based upon the inputs used in valuing those investments, according to a three-level hierarchy established in guidance from FASB. Categorization of investments using this hierarchy is intended by the FASB to maximize the use of observable inputs in valuing investments and minimize the use of unobservable inputs by requiring that the most observable inputs be used when available. Observable inputs are those that market participants would use in valuing an investment based on available market information. Unobservable inputs are those that reflect assumptions about the information market participants would use in valuing an investment. An investment’s level within the hierarchy is based on the lowest level input that is deemed significant to the valuation. The methodologies and inputs used to value investments are not necessarily indications of the risk or liquidity associated with those investments.
Various inputs are used in calculating valuations for the Fund’s investments. These inputs are generally summarized according to the three level hierarchy below:
Level 1: Quoted prices in active markets for identical investments.
Level 2: Other direct or indirect significant observable inputs (including quoted prices for similar investments in active markets and other observable inputs, such as interest rates, prepayment rates, credit risk, etc.).
Level 3: Significant unobservable inputs (including the Committee’s own assumptions in calculating the fair values of investments).
Valuations for debt obligations held by the Fund are typically calculated by pricing service providers approved by the Audit Committee and are characterized as Level 2 within the valuation hierarchy.
On days when market volatility thresholds established by the Audit Committee are exceeded, foreign securities for which valuations are obtained from pricing service providers are fair valued. On these days, the foreign securities are characterized as Level 2 within the valuation hierarchy and revert to Level 1 after the threshold is no longer exceeded.
20 Annual Report
| | |
| NOTES TO FINANCIAL STATEMENTS, CONTINUED | | |
| |
Thornburg Developing World Fund | | September 30, 2016 |
In a limited number of cases the Committee calculates a fair value for investments using broker quotations or other methods approved by the Audit Committee. When the Committee uses a single broker quotation to calculate a fair value for an investment without other significant observable inputs, or if a fair value is calculated using other significant inputs that are considered unobservable, the investment is characterized as Level 3 within the hierarchy. Other significant unobservable inputs used to calculate a fair value in these instances might include an income-based valuation approach which considers discounted anticipated future cash flows from the investment, and application of discounts due to the nature or duration of any restrictions on the disposition of the investment.
Valuations based upon the use of inputs from Levels 1, 2 or 3 may not represent the actual price received upon the disposition of an investment, and the Fund may receive a price that is lower than the valuation based upon these inputs when it sells the investment.
The following table displays a summary of the fair value hierarchy measurements of the Fund’s investments as of September 30, 2016. In any instance when valuation inputs from more than one level are used to determine the fair value of a specific investment, the investment is placed in the level of the table based upon the lowest level input that is significant in determining the fair value of the investment:
| | | | | | | | | | | | | | | | |
| | | Fair Value Measurements at September 30, 2016 | |
| | | Total | | | Level 1 | | | Level 2 | | | Level 3(a) | |
Assets | | | | | | | | | | | | | | | | |
Investments in Securities* | | | | | | | | | | | | | | | | |
Common Stock(b) | | $ | 1,118,992,208 | | | $ | 1,096,344,315 | | | $ | 20,340,922 | | | $ | 2,306,971 | |
Other Government | | | 26,537,566 | | | | — | | | | 26,537,566 | | | | — | |
Short Term Investments | | | 86,510,496 | | | | 86,510,496 | | | | — | | | | — | |
| | | | | | | | | | | | | | | | |
Total Investments in Securities | | $ | 1,232,040,270 | | | $ | 1,182,854,811 | | | $ | 46,878,488 | | | $ | 2,306,971 | |
Other Financial Instruments** | | | | | | | | | | | | | | | | |
Spot Currency | | $ | 12,053 | | | $ | 12,053 | | | $ | — | | | $ | — | |
Liabilities | | | | | | | | | | | | | | | | |
Other Financial Instruments** | | | | | | | | | | | | | | | | |
Forward Currency Contracts | | $ | (1,073,912 | ) | | $ | — | | | $ | (1,073,912 | ) | | $ | — | |
Spot Currency | | $ | (1,038 | ) | | $ | (1,038 | ) | | $ | — | | | $ | — | |
| * | See Schedule of Investments for a summary of the industry exposure as grouped according to the Global Industry Classification Standard (GICS), which is an industry taxonomy developed by MSCI, Inc. and Standard & Poor’s (S&P). |
| ** | Other Financial Instruments include investments not reflected in the Schedule of Investments, which may include futures, forwards and swap contracts, which are valued at the unrealized appreciation (depreciation) on the investment. |
| (a) | In accordance with the guidance prescribed in Accounting Standards Update (“ASU”) No. 2011-04, a fair value determination was applied to a portfolio security characterized as a Level 3 investment at September 30, 2016. The valuation technique and unobservable input applied to value this portfolio security was a discount to the valuation determined by the Valuation and Pricing Committee due to a halt in trading of the security and lack of information and liquidity. |
| (b) | At September 30, 2016, industry classifications for Common Stock in Levels 2 and 3 consist of $2,306,971 in Pharmaceuticals, Biotechnology and Life Sciences, $15,127,864 in Banks, $5,213,058 in Retailing. |
In accordance with the guidance prescribed in ASU No. 2011-04, it is the policy of the Fund to recognize transfers between levels and the underlying events which caused the movement. The Fund recognized no transfers between levels for the year ended September 30, 2016, other than when the Fund exceeded market volatility thresholds for foreign equity investments during the period.
A rollforward of fair value measurements using significant unobservable inputs (Level 3) for the year ended September 30, 2016 is as follows:
| | | | | | | | |
| | | Common Stock | | | Total(c) | |
Beginning Balance 9/30/2015 | | $ | 2,355,625 | | | $ | 2,355,625 | |
Accrued Discounts (Premiums) | | | — | | | | — | |
Net Realized Gain (Loss)(a) | | | (428,351 | ) | | | (428,351 | ) |
Gross Purchases | | | — | | | | — | |
Gross Sales | | | (92,896 | ) | | | (92,896 | ) |
Net Change in Unrealized Appreciation (Depreciation)(b) | | | 472,594 | | | | 472,594 | |
Transfers into Level 3 | | | — | | | | — | |
Transfers out of Level 3 | | | — | | | | — | |
| | | | | | | | |
Ending Balance 9/30/2016 | | $ | 2,306,972 | | | $ | 2,306,972 | |
| (a) | Amount of net realized gain (loss) from investments recognized in income is included in the Fund’s Statement of Operations for the year ended September 30, 2016. |
| (b) | Amount of net change in unrealized appreciation (depreciation) on investments recognized in income is included in the Fund’s Statement of Operations for the year ended September |
Annual Report 21
| | |
| NOTES TO FINANCIAL STATEMENTS, CONTINUED | | |
| |
Thornburg Developing World Fund | | September 30, 2016 |
| | 30, 2016. The net change in unrealized appreciation (depreciation) attributable to securities owned at September 30, 2016 which were valued using significant unobservable inputs is $472,594. |
| (c) | Level 3 investments represent 0.19% of total net assets at the year ended September 30, 2016. Significant fluctuations of the unobservable inputs applied to portfolio investments characterized as Level 3 could be expected to increase or decrease the fair value of these portfolio investments. |
NOTE 4 – INVESTMENT ADVISORY FEE AND OTHER TRANSACTIONS WITH AFFILIATES
Pursuant to an investment advisory agreement, the Advisor serves as the investment advisor and performs services for the Fund for which the fees are payable at the end of each month. Under the investment advisory agreement, the Fund pays the Advisor a management fee based on the daily net assets of the Fund at an annual rate as shown in the following table:
Management Fee Schedule
| | | | |
Daily Net Assets | | Fee Rate | |
Up to $500 million | | | 0.975 | % |
Next $500 million | | | 0.925 | |
Next $500 million | | | 0.875 | |
Next $500 million | | | 0.825 | |
Over $2 billion | | | 0.775 | |
The Fund’s effective management fee for the year ended September 30, 2016 was 0.938% of the Fund’s average dividend assets (before applicable fees waived by the Advisor of $350,716).
The Fund pays to the Advisor the costs of personnel who perform certain accounting services for the Fund. For the year ended September 30, 2016 the Fund paid $42,101 to the Advisor for these accounting services. The Trust has also entered into administrative service agreements with the Advisor, whereby the Advisor will perform certain administrative services for the shareholders of each class of the Fund’s shares (except for Class R6 shares, which do not have an administrative services agreement) and for which fees will be payable at an annual rate of up to .125 of 1% per annum of the average daily net assets attributable to each class of shares. Total administrative service fees incurred by each class of shares of the Fund for the year ended September 30, 2016, are set forth in the Statement of Operations.
The Trust has an underwriting agreement with Thornburg Securities Corporation (the “Distributor”), an affiliate of the Advisor, which acts as the distributor of the Fund’s shares. For the year ended September 30, 2016, the Distributor has advised the Fund that it earned net commissions aggregating $6,370 from the sale of Class A shares, and collected contingent deferred sales charges aggregating $14,161 from redemptions of Class C shares of the Fund.
Pursuant to a service plan under Rule 12b-1 of the Investment Company Act of 1940, the Fund may pay to the Advisor or securities dealers and other financial institutions at the Advisor’s request an amount not to exceed .25 of 1% per annum of the average daily net assets attributable to Class A and Class C shares of the Fund to obtain various shareholder and distribution related services. For the year ended September 30, 2016, there were no 12b-1 service plan fees charged for Class I, Class R5, and Class R6 shares. The Advisor may pay out of its own resources additional expenses for distribution of the Fund’s shares and shareholder services.
The Trust has also adopted a distribution plan pursuant to Rule 12b-1, applicable only to the Fund’s Class C shares under which the Fund compensates the Distributor for services in promoting the sale of Class C shares of the Fund at an annual rate of up to .75 of 1% per annum of the average daily net assets attributable to Class C shares. Total fees incurred by each class of shares of the Fund under their respective service and distribution plans for the year ended September 30, 2016, are set forth in the Statement of Operations.
The Advisor and Distributor have contractually agreed to waive fees and reimburse expenses incurred by the Fund so that actual expenses of certain share classes do not exceed levels as specified in the Fund’s most recent prospectus. The agreement may be terminated by the Fund at any time, but may not be terminated by the Advisor or Distributor before February 1, 2017, unless the Advisor ceases to be the investment advisor to the Trust or the Distributor ceases to be the distributor of the Fund prior to that date. The Advisor and Distributor retain the right to be repaid by the Fund for fee waivers and expense reimbursements if expenses fall below the contractual limit prior to the end of the fiscal year.
For the year ended September 30, 2016, the Advisor voluntarily waived Fund level investment advisory fees of $350,716. For the year ended September 30, 2016, the Advisor contractually reimbursed certain class specific expenses, administrative fees, and distribution fees of $28,383 for Class A shares, $23,635 for Class C shares, $511,235 for Class I shares, $36,257 for Class R5 shares, and $30,182 for Class R6 shares.
22 Annual Report
| | |
| NOTES TO FINANCIAL STATEMENTS, CONTINUED | | |
| |
Thornburg Developing World Fund | | September 30, 2016 |
Certain officers and Trustees of the Trust are also officers or directors of the Advisor and Distributor. The compensation of independent Trustees is borne by the Trust.
The percentage of direct investments in the Fund held by appointed Trustees, Officers and the Advisor is approximately 2.55%.
The Fund may sell securities to an affiliated fund, or the Fund may purchase securities held by an affiliated fund, provided the affiliation is due solely to having a common investment advisor, common officers, or common trustees, and provided that all such transactions will comply with Rule 17a-7 under the 1940 Act. For the year ended September 30, 2016, the Fund had no transactions with affiliated funds.
NOTE 5 – SHARES OF BENEFICIAL INTEREST
At September 30, 2016, there were an unlimited number of shares with no par value of beneficial interest authorized. Transactions in shares of beneficial interest were as follows:
| | | | | | | | | | | | | | | | |
| | | Year Ended
September 30, 2016 | | | Year Ended
September 30, 2015 | |
| | | Shares | | | Amount | | | Shares | | | Amount | |
Class A Shares | | | | | | | | | | | | | | | | |
Shares sold | | | 3,308,344 | | | $ | 52,192,505 | | | | 6,122,531 | | | $ | 109,999,302 | |
Shares issued to shareholders in reinvestment of dividends | | | 18,515 | | | | 317,350 | | | | 19,021 | | | | 288,166 | |
Shares repurchased | | | (7,300,644 | ) | | | (113,819,925 | ) | | | (17,017,940 | ) | | | (305,150,377 | ) |
| | | | | | | | | | | | | | | | |
| | | | |
Net increase (decrease) | | | (3,973,785 | ) | | $ | (61,310,070 | ) | | | (10,876,388 | ) | | $ | (194,862,909 | ) |
| | | | | | | | | | | | | | | | |
| | | | |
Class C Shares | | | | | | | | | | | | | | | | |
Shares sold | | | 1,054,538 | | | $ | 15,948,557 | | | | 2,635,964 | | | $ | 46,044,059 | |
Shares issued to shareholders in reinvestment of dividends | | | — | | | | — | | | | — | | | | — | |
Shares repurchased | | | (3,507,682 | ) | | | (52,708,115 | ) | | | (4,826,475 | ) | | | (81,951,817 | ) |
| | | | | | | | | | | | | | | | |
| | | | |
Net increase (decrease) | | | (2,453,144 | ) | | $ | (36,759,558 | ) | | | (2,190,511 | ) | | $ | (35,907,758 | ) |
| | | | | | | | | | | | | | | | |
| | | | |
Class I Shares | | | | | | | | | | | | | | | | |
Shares sold | | | 23,659,769 | | | $ | 375,895,310 | | | | 58,044,611 | | | $ | 1,065,967,200 | |
Shares issued to shareholders in reinvestment of dividends | | | 262,131 | | | | 4,510,533 | | | | 437,693 | | | | 6,877,427 | |
Shares repurchased | | | (41,050,094 | ) | | | (647,932,648 | ) | | | (117,474,718 | ) | | | (2,125,706,247 | ) |
| | | | | | | | | | | | | | | | |
| | | | |
Net increase (decrease) | | | (17,128,194 | ) | | $ | (267,526,805 | ) | | | (58,992,414 | ) | | $ | (1,052,861,620 | ) |
| | | | | | | | | | | | | | | | |
| | | | |
Class R5 Shares | | | | | | | | | | | | | | | | |
Shares sold | | | 154,398 | | | $ | 2,473,042 | | | | 251,105 | | | $ | 4,536,726 | |
Shares issued to shareholders in reinvestment of dividends | | | 2,053 | | | | 35,206 | | | | 2,544 | | | | 39,389 | |
Shares repurchased | | | (147,926 | ) | | | (2,307,369 | ) | | | (295,282 | ) | | | (5,253,567 | ) |
| | | | | | | | | | | | | | | | |
| | | | |
Net increase (decrease) | | | 8,525 | | | $ | 200,879 | | | | (41,633 | ) | | $ | (677,452 | ) |
| | | | | | | | | | | | | | | | |
| | | | |
Class R6 Shares | | | | | | | | | | | | | | | | |
Shares sold | | | 2,141,556 | | | $ | 34,838,084 | | | | 1,107,694 | | | $ | 20,345,235 | |
Shares issued to shareholders in reinvestment of dividends | | | 15,902 | | | | 275,102 | | | | 9,657 | | | | 150,167 | |
Shares repurchased | | | (720,421 | ) | | | (11,593,041 | ) | | | (938,665 | ) | | | (16,574,079 | ) |
| | | | | | | | | | | | | | | | |
| | | | |
Net increase (decrease) | | | 1,437,037 | | | $ | 23,520,145 | | | | 178,686 | | | $ | 3,921,323 | |
| | | | | | | | | | | | | | | | |
NOTE 6 – INVESTMENT TRANSACTIONS
For the year ended September 30, 2016, the Fund had purchase and sale transactions of investments (excluding short-term investments) of $1,065,855,528 and $1,362,096,271, respectively.
Annual Report 23
| | |
| NOTES TO FINANCIAL STATEMENTS, CONTINUED | | |
| |
Thornburg Developing World Fund | | September 30, 2016 |
NOTE 7 – DERIVATIVE FINANCIAL INSTRUMENTS WITH OFF-BALANCE SHEET RISK AND FOREIGN INVESTMENT RISK
The Fund may use a variety of derivative financial instruments to hedge or adjust the risks affecting its investment portfolio or to enhance investment returns. Provisions of the FASB Accounting Standards Codification 815-10-50 (“ASC 815”) require certain disclosures. The disclosures are intended to provide users of financial statements with an understanding of the use of derivative instruments by the Fund and how these derivatives affect the financial position, financial performance and cash flows of the Fund. The Fund does not designate any derivative instruments as hedging instruments under ASC 815. During the year ended September 30, 2016, the Fund’s principal exposure to derivative financial instruments of the type addressed by ASC 815 was investment in foreign exchange contracts. A foreign exchange contract is an agreement between two parties to exchange different currencies at a specified rate of exchange at an agreed upon future date. Foreign exchange contracts involve risks to the Fund, including the risk that a contract’s counterparty will not meet its obligations to the Fund, the risk that a change in a contract’s value may not correlate perfectly with the currency the contract was intended to track, and the risk that the Fund’s Advisor is unable to correctly implement its strategy in using a contract. In any such instance, the Fund may not achieve the intended benefit of entering into a contract, and may experience a loss.
The Fund entered into forward currency contracts during the year ended September 30, 2016 in the normal course of pursuing its investment objectives, with the objective of purchasing foreign investments or with the intent of reducing the risk to the value of the Fund’s foreign investments from adverse changes in the relationship between the U.S. dollar and foreign currencies. In each case these contracts have been initiated in conjunction with foreign investment transactions.
These contracts are accounted for by the Fund under ASC 815. Unrealized appreciation and depreciation on outstanding contracts are reported in the Fund’s Statement of Assets and Liabilities, as measured by the difference between the forward exchange rates at the reporting date and the forward exchange rates at each contract’s inception date. Net realized gain (loss) on contracts closed during the period, and changes in net unrealized appreciation (depreciation) on outstanding contracts are recognized in the Fund’s Statement of Operations.
The quarterly average value of open sell currency contracts for the year ended September 30, 2016 was $213,210,362. Open buy currency contracts are entered into for the purpose of closing open sell currency contracts and the values are dependent upon the values of the open sell currency contracts to which they relate.
The following table displays the outstanding forward currency contracts at September 30, 2016:
| | | | | | | | | | | | | | | | | | | | | | |
Outstanding Forward Currency Contracts to Buy or Sell at September 30, 2016 | |
Contract Description | | Buy/Sell | | Contract
Amount | | | Contract
Value Date | | | Value
USD | | | Unrealized
Appreciation | | | Unrealized
Depreciation | |
Chinese Yuan Renminbi | | Sell | | | 666,949,200 | | | | 02/16/2017 | | | | 99,222,226 | | | $ | — | | | $ | (1,073,912 | ) |
| | | | | | | | | | | | | | | | | | | | | | |
| | | | | | |
Total | | | | | | | | | | | | | | | | $ | — | | | $ | (1,073,912 | ) |
| | | | | | | | | | | | | | | | | | | | | | |
| | | | | |
Net unrealized appreciation (depreciation) | | | | | | | | | | | | | | | | | | $ | (1,073,912 | ) |
| | | | | | | | | | | | | | | | | | | | | | |
The outstanding forward currency contracts in the foregoing table were entered into with State Street Bank and Trust Company (“SSB”), pursuant to an International Swaps and Derivatives Association (“ISDA”) Master Agreement. In the event of a default or termination under the ISDA Master Agreement with SSB, the non-defaulting party has the right to close out all outstanding forward currency contracts between the parties and to net any payment amounts under those contracts, resulting in a single net amount payable by one party to the other.
Because the ISDA Master Agreement with SSB does not result in an offset of reported amounts of financial assets and liabilities in the Fund’s Statement of Assets and Liabilities unless there has been an event of default or termination event under that agreement, the Fund does not net its outstanding forward currency contracts for purposes of the disclosure in the Fund’s Statement of Assets and Liabilities. Instead the Fund recognizes the unrealized appreciation or depreciation on those forward currency contracts on a gross basis in the Fund’s Statement of Assets and Liabilities.
24 Annual Report
| | |
| NOTES TO FINANCIAL STATEMENTS, CONTINUED | | |
| |
Thornburg Developing World Fund | | September 30, 2016 |
The unrealized appreciation (depreciation) of the outstanding forward currency contracts recognized in the Fund’s Statement of Assets and Liabilities at September 30, 2016 is disclosed in the following table:
| | | | | | |
Fair Values of Derivative Financial Instruments at September 30, 2016 | |
Liability Derivatives | | Balance Sheet Location | | Fair Value | |
Foreign exchange contracts | | Liabilities - Unrealized depreciation on forward currency contracts | | $ | (1,073,912 | ) |
Because the Fund does not currently receive or post cash collateral in connection with its currency forward contracts, and because all of the Fund’s outstanding currency forward contracts are with SSB, the net amounts of the Fund’s assets and liabilities which are attributable to those contracts at September 30, 2016 can be determined by offsetting the dollar amounts shown in the preceding table. Based on those amounts, the net amount of the Fund’s assets which is attributable to its outstanding forward currency contracts at September 30, 2016 is $0, and the net amount of the Fund’s liabilities which is attributable to those contracts at that date is $1,073,912. The Fund’s forward currency contracts are valued each day, and the net amounts of the Fund’s assets and liabilities which are attributable to those contracts are expected to vary over time.
The net realized gain (loss) from forward currency contracts and the net change in unrealized appreciation (depreciation) on outstanding forward currency contracts recognized in the Fund’s Statement of Operations for the year ended September 30, 2016 are disclosed in the following tables:
| | | | |
Net Realized Gain (Loss) on Derivative Financial Instruments Recognized in Income for the Year Ended September 30, 2016 |
| | | Total | | Forward Currency Contracts |
Foreign exchange contracts | | $(170,806) | | $(170,806) |
|
Net Change in Unrealized Appreciation (Depreciation) of Derivative Financial Instruments Recognized in Income for the Year Ended September 30, 2016 |
| | | Total | | Forward Currency Contracts |
Foreign exchange contracts | | $3,312,962 | | $3,312,962 |
OTHER NOTES
Risks: The Fund’s investments subject it to risks including, but not limited to, management risk, market and economic risk, risks affecting specific issuers, liquidity risk, the risks associated with investments in small- and mid-cap companies and non-U.S. issuers (including developing country issuers), credit risk, and interest rate risk. Please see the Fund’s prospectus for a discussion of the risks associated with an investment in the Fund.
Subsequent Events: Fund management believes no events have occurred between September 30, 2016 and the date of issuance of the financial statements that require adjustment to or disclosure in the accompanying financial statements.
Annual Report 25
FINANCIAL HIGHLIGHTS
Thornburg Developing World Fund
| | | | | | | | | | | | | | | | | | | | | | | | | | | | | | | | | | | | | | | | | | | | | | | | |
| | | PER SHARE PERFORMANCE (for A Share Outstanding Throughout The Year) | | RATIOS TO AVERAGE NET ASSETS | | | SUPPLEMENTAL DATA | |
Unless Otherwise Noted, Periods are Fiscal Years Ended Sept. 30, | | Net Asset
Value
Beginning
of Year | | | Net
Investment
Income
(loss)+ | | Net
Realized
&
Unrealized
Gain (loss)
on
Investments | | | Total from
Investment
Operations | | Dividends
from Net
Investment
Income | | | Dividends
from Net
Realized
Gains | | Total
Dividends | | | Net Asset Value End of Year | | Net
Investment
Income
(Loss)
(%) | | | Expenses,
After
Expense
Reductions
(%) | | | Expenses,
After
Expense
Reductions
and
Net of
Custody
Credits
(%) | | | Expenses,
Before
Expense
Reductions
(%) | | | Total
Return
(%)(a) | | Portfolio
Turnover
Rate
(%)(a) | | Net
Assets
at End
of Year
(thousands) | |
CLASS A SHARES | | | | | | | | | | | | | | | | | | | | | | | | | | | | | | | | | | | | | | | | | | |
2016(b) | | $ | 15.03 | | | 0.04 | | | 1.94 | | | 1.98 | | | (0.03 | ) | | — | | | (0.03 | ) | | $16.98 | | | 0.25 | | | | 1.52 | | | | 1.52 | | | | 1.57 | | | 13.20 | | 94.68 | | $ | 166,655 | |
2015(b) | | $ | 18.61 | | | 0.02 | | | (3.58 | ) | | (3.56) | | | (0.02 | ) | | — | | | (0.02 | ) | | $15.03 | | | 0.14 | | | | 1.53 | | | | 1.53 | | | | 1.53 | | | (19.12) | | 96.74 | | $ | 207,282 | |
2014(b) | | $ | 17.77 | | | 0.03 | | | 0.81 | | | 0.84 | | | — | | | — | | | — | | | $18.61 | | | 0.15 | | | | 1.45 | | | | 1.45 | | | | 1.45 | | | 4.73 | | 61.46 | | $ | 459,121 | |
2013(b) | | $ | 15.71 | | | 0.01 | | | 2.06 | | | 2.07 | | | (0.01 | ) | | — | | | (0.01 | ) | | $17.77 | | | 0.05 | | | | 1.48 | | | | 1.48 | | | | 1.59 | | | 13.19 | | 61.67 | | $ | 347,073 | |
2012(b) | | $ | 12.50 | | | (0.01) | | | 3.22 | | | 3.21 | | | — | | | — | | | — | | | $15.71 | | | (0.05 | ) | | | 1.69 | | | | 1.69 | | | | 1.85 | | | 25.68 | | 129.49 | | $ | 39,390 | |
CLASS C SHARES | | | | | | | | | | | | | | | | | | | | | | | | | | | | | | | | | | | | | | | | | | |
2016 | | $ | 14.48 | | | (0.08) | | | 1.86 | | | 1.78 | | | — | | | — | | | — | | | $16.26 | | | (0.51 | ) | | | 2.29 | | | | 2.29 | | | | 2.34 | | | 12.29 | | 94.68 | | $ | 134,129 | |
2015 | | $ | 18.03 | | | (0.09) | | | (3.46 | ) | | (3.55) | | | — | | | — | | | — | | | $14.48 | | | (0.55 | ) | | | 2.27 | | | | 2.27 | | | | 2.27 | | | (19.69) | | 96.74 | | $ | 154,943 | |
2014 | | $ | 17.34 | | | (0.11) | | | 0.80 | | | 0.69 | | | — | | | — | | | — | | | $18.03 | | | (0.62 | ) | | | 2.23 | | | | 2.23 | | | | 2.23 | | | 3.98 | | 61.46 | | $ | 232,493 | |
2013 | | $ | 15.44 | | | (0.12) | | | 2.02 | | | 1.90 | | | — | | | — | | | — | | | $17.34 | | | (0.71 | ) | | | 2.26 | | | | 2.26 | | | | 2.40 | | | 12.31 | | 61.67 | | $ | 106,168 | |
2012 | | $ | 12.37 | | | (0.11) | | | 3.18 | | | 3.07 | | | — | | | — | | | — | | | $15.44 | | | (0.76 | ) | | | 2.38 | | | | 2.38 | | | | 2.86 | | | 24.82 | | 129.49 | | $ | 10,006 | |
CLASS I SHARES | | | | | | | | | | | | | | | | | | | | | | | | | | | | | | | | | | | | | | | | | | |
2016 | | $ | 15.27 | | | 0.11 | | | 1.97 | | | 2.08 | | | (0.09 | ) | | — | | | (0.09 | ) | | $17.26 | | | 0.70 | | | | 1.07 | | | | 1.07 | | | | 1.16 | | | 13.68 | | 94.68 | | $ | 853,866 | |
2015 | | $ | 18.92 | | | 0.10 | | | (3.65 | ) | | (3.55) | | | (0.10 | ) | | — | | | (0.10 | ) | | $15.27 | | | 0.52 | | | | 1.09 | | | | 1.09 | | | | 1.14 | | | (18.75) | | 96.74 | | $ | 1,016,898 | |
2014 | | $ | 18.05 | | | 0.10 | | | 0.84 | | | 0.94 | | | (0.07 | ) | | — | | | (0.07 | ) | | $18.92 | | | 0.54 | | | | 1.09 | | | | 1.09 | | | | 1.09 | | | 5.20 | | 61.46 | | $ | 2,376,420 | |
2013 | | $ | 15.96 | | | 0.09 | | | 2.09 | | | 2.18 | | | (0.09 | ) | | — | | | (0.09 | ) | | $18.05 | | | 0.52 | | | | 1.04 | | | | 1.04 | | | | 1.22 | | | 13.74 | | 61.67 | | $ | 828,147 | |
2012 | | $ | 12.62 | | | 0.08 | | | 3.26 | | | 3.34 | | | — | | | — | | | — | | | $15.96 | | | 0.57 | | | | 1.09 | | | | 1.09 | | | | 1.45 | | | 26.47 | | 129.49 | | $ | 53,103 | |
CLASS R5 SHARES | | | | | | | | | | | | | | | | | | | | | | | | | | | | | | | | | | | | | | | | | | |
2016 | | $ | 15.22 | | | 0.12 | | | 1.96 | | | 2.08 | | | (0.10 | ) | | — | | | (0.10 | ) | | $17.20 | | | 0.74 | | | | 1.08 | | | | 1.08 | | | | 1.75 | | | 13.65 | | 94.68 | | $ | 6,208 | |
2015 | | $ | 18.86 | | | 0.12 | | | (3.65 | ) | | (3.53) | | | (0.11 | ) | | — | | | (0.11 | ) | | $15.22 | | | 0.66 | | | | 1.09 | | | | 1.09 | | | | 1.67 | | | (18.72) | | 96.74 | | $ | 5,363 | |
2014 | | $ | 18.04 | | | 0.13 | | | 0.80 | | | 0.93 | | | (0.11 | ) | | — | | | (0.11 | ) | | $18.86 | | | 0.67 | | | | 1.09 | | | | 1.09 | | | | 1.90 | | | 5.17 | | 61.46 | | $ | 7,433 | |
2013(c) | | $ | 17.49 | | | 0.08 | | | 0.47 | | | 0.55 | | | — | | | — | | | — | | | $18.04 | | | 0.47 | (d) | | | 1.07 | (d) | | | 1.07 | (d) | | | 17.45 | (d)(e) | | 3.14 | | 61.67 | | $ | 697 | |
CLASS R6 SHARES | | | | | | | | | | | | | | | | | | | | | | | | | | | | | | | | | | | | | | | | | | |
2016 | | $ | 15.25 | | | 0.13 | | | 1.98 | | | 2.11 | | | (0.17 | ) | | — | | | (0.17 | ) | | $17.25 | | | 0.80 | | | | 0.97 | | | | 0.97 | | | | 1.12 | | | 13.81 | | 94.68 | | $ | 48,598 | |
2015 | | $ | 18.91 | | | 0.15 | | | (3.68 | ) | | (3.53) | | | (0.13 | ) | | — | | | (0.13 | ) | | $15.25 | | | 0.84 | | | | 0.99 | | | | 0.99 | | | | 1.10 | | | (18.68) | | 96.74 | | $ | 21,055 | |
2014 | | $ | 18.08 | | | 0.11 | | | 0.84 | | | 0.95 | | | (0.12 | ) | | — | | | (0.12 | ) | | $18.91 | | | 0.57 | | | | 0.99 | | | | 0.99 | | | | 1.10 | | | 5.26 | | 61.46 | | $ | 22,727 | |
2013(c) | | $ | 17.51 | | | 0.04 | | | 0.53 | | | 0.57 | | | — | | | — | | | — | | | $18.08 | |
| 0.20
| (d)
| |
| 0.98
| (d)
| |
| 0.98
| (d)
| |
| 1.99
| (d)
| | 3.26 | | 61.67 | | $ | 14,422 | |
| (a) | Not annualized for periods less than one year. |
| (b) | Sales loads are not reflected in computing total return. |
| (c) | Effective date of this class of shares was February 1, 2013. |
| (e) | Due to the size of net assets and fixed expenses, ratios may appear disproportionate. |
| + | Based on weighted average shares outstanding. |
See notes to financial statements.
| | | | |
| 26 Annual Report | | | | Annual Report 27 |
REPORT OF INDEPENDENT REGISTERED PUBLIC ACCOUNTING FIRM
Thornburg Developing World Fund
To the Trustees and Shareholders of
Thornburg Developing World Fund
In our opinion, the accompanying statement of assets and liabilities, including the schedule of investments in securities, and the related statements of operations and of changes in net assets and the financial highlights present fairly, in all material respects, the financial position of the Thornburg Developing World Fund (the “Fund”) at September 30, 2016, the results of its operations for the year then ended, the changes in its net assets for each of the two years in the period then ended and the financial highlights for each of the periods presented, in conformity with accounting principles generally accepted in the United States of America. These financial statements and financial highlights (hereafter referred to as “financial statements”) are the responsibility of the Fund’s management. Our responsibility is to express an opinion on these financial statements based on our audits. We conducted our audits of these financial statements in accordance with the standards of the Public Company Accounting Oversight Board (United States). Those standards require that we plan and perform the audit to obtain reasonable assurance about whether the financial statements are free of material misstatement. An audit includes examining, on a test basis, evidence supporting the amounts and disclosures in the financial statements, assessing the accounting principles used and significant estimates made by management, and evaluating the overall financial statement presentation. We believe that our audits, which included confirmation of securities at September 30, 2016 by correspondence with the custodian, brokers, transfer agent, and the application of alternative procedures where securities purchased had not been received, provide a reasonable basis for our opinion.
PricewaterhouseCoopers LLP
New York, New York
November 18, 2016
28 Annual Report
| | |
| EXPENSE EXAMPLE | | |
| |
Thornburg Developing World Fund | | September 30, 2016 |
As a shareholder of the Fund, you incur two types of costs:
| | (1) | transaction costs, including |
(a) sales charges (loads) on purchase payments, for Class A shares;
(b) a deferred sales charge on redemptions of any part or all of a purchase of $1 million of Class A shares within 12 months of purchase;
(c) a deferred sales charge on redemptions of Class C shares within 12 months of purchase;
| | (2) | ongoing costs, including management fees; distribution and/or service (12b-1) fees; and other Fund expenses. |
This example is intended to help you understand your ongoing costs (in dollars) of investing in the Fund and to compare these costs with the ongoing costs of investing in other mutual funds.
The example is based on a $1,000 investment beginning on April 1, 2016, and held until September 30, 2016.
| | | | | | | | | | | | |
| | | Beginning
Account Value
4/1/16 | | | Ending
Account Value
9/30/16 | | | Expenses Paid
During Period†
4/1/16–9/30/16 | |
CLASS A SHARES | | | | | | | | | | | | |
Actual | | $ | 1,000.00 | | | $ | 1,072.10 | | | $ | 7.47 | |
Hypothetical* | | $ | 1,000.00 | | | $ | 1,017.79 | | | $ | 7.27 | |
CLASS C SHARES | | | | | | | | | | | | |
Actual | | $ | 1,000.00 | | | $ | 1,067.60 | | | $ | 11.66 | |
Hypothetical* | | $ | 1,000.00 | | | $ | 1,013.72 | | | $ | 11.35 | |
CLASS I SHARES | | | | | | | | | | | | |
Actual | | $ | 1,000.00 | | | $ | 1,074.10 | | | $ | 5.49 | |
Hypothetical* | | $ | 1,000.00 | | | $ | 1,019.71 | | | $ | 5.35 | |
CLASS R5 SHARES | | | | | | | | | | | | |
Actual | | $ | 1,000.00 | | | $ | 1,073.60 | | | $ | 5.59 | |
Hypothetical* | | $ | 1,000.00 | | | $ | 1,019.61 | | | $ | 5.45 | |
CLASS R6 SHARES | | | | | | | | | | | | |
Actual | | $ | 1,000.00 | | | $ | 1,074.50 | | | $ | 5.00 | |
Hypothetical* | | $ | 1,000.00 | | | $ | 1,020.18 | | | $ | 4.87 | |
| † | Expenses are equal to the annualized expense ratio for each class (A: 1.44%; C: 2.26%; I: 1.06%; R5: 1.08%; R6: 0.96%) multiplied by the average account value over the period, multiplied by 183/366 to reflect the one-half year period. |
| * | Hypothetical assumes a rate of return of 5% per year before expenses. |
ACTUAL EXPENSES
For each class of shares, the first line of the accompanying table provides information about actual account values and actual expenses. You may use the information in this line, together with the amount you invested, to estimate the expenses that you paid over the period. Simply divide your account value by $1,000 (for example, an $8,600 account value divided by $1,000 = 8.6), then multiply the result by the number in the first line for your class of shares under the heading entitled “Expenses Paid During Period” to estimate the expenses you paid on your account during this period.
HYPOTHETICAL EXAMPLE FOR COMPARISON PURPOSES
For each class of shares, the second line of the accompanying table provides information about hypothetical account values and hypothetical expenses based on the Fund’s actual expense ratio and an assumed rate of return of 5% per year before expenses, which is not the Fund’s actual return. The hypothetical account values and expenses may not be used to estimate the actual ending account balance or expenses you paid for the period. You may use this information to compare the ongoing costs of investing in the Fund and other funds. To do so, compare this 5% hypothetical example with the 5% hypothetical examples that appear in the shareholder reports of the other funds.
Please note that the expenses shown in the table are meant to highlight your ongoing costs only and do not reflect any transactional costs, such as sales charges (loads), redemption fees, or exchange fees. Therefore, the second line of the table for each class of shares is useful in comparing ongoing costs only, and will not help you determine the relative total costs of owning different funds. In addition, if these transactional costs were included, your costs would have been higher.
Annual Report 29
| | |
| TRUSTEES AND OFFICERS | | |
| |
Thornburg Developing World Fund | | September 30, 2016 (Unaudited) |
| | | | | | |
Name, Age, Year Elected Position Held with Fund | | Principal Occupation(s) During Past Five Years | | Other
Directorships
Held by Trustee | |
INTERESTED TRUSTEES(1)(2)(4) | | | | |
| | |
Garrett Thornburg, 71 Trustee since 1987, Chairman of Trustees(3) | | Chairman and controlling shareholder of Thornburg Investment Management, Inc. (investment advisor); Chairman and controlling shareholder of Thornburg Securities Corporation (securities dealer); Chairman and CEO of Chamisa Energy, LLC; President of the Thornburg Foundation (nonprofit). | | | None | |
| | |
Brian J. McMahon, 61 Trustee since 2001, Vice Chairman of Trustees, Member of Governance & Nominating Committee & Operations Risk Oversight Committee(5) | | Chief Investment Officer, Managing Director, and Portfolio Manager and, until 2016, CEO and President of Thornburg Investment Management, Inc.; Vice President of Thornburg Securities Corporation. | | | None | |
| |
INDEPENDENT TRUSTEES(1)(2)(4) | | | | |
| | |
David A. Ater, 71 Trustee since 1994, Member of Audit Committee & Chairman of Governance & Nominating Committee | | Principal in Ater & Associates, Santa Fe, NM (developer, planner and broker of residential and commercial real estate); owner, developer and broker for various real estate projects. | | | None | |
| | |
David D. Chase, 75 Trustee since 2000, Chairman of Audit Committee | | Managing Member of CS Group, LLC, Santa Fe, NM (private investment fund – family office). | | | None | |
| | |
Sally Corning, 55 Trustee since 2012, Member of Audit Committee | | Partner in Sun Mountain Capital, Santa Fe, NM (private equity firm with investment programs encompassing venture capital, mezzanine debt, and growth equity). | | | None | |
| | |
Susan H. Dubin, 67 Trustee since 2004, Member of Audit Committee & Governance and Nominating Committee | | President of Dubin Investments, Ltd., Greenwich, CT (private investment fund); Director and officer of various charitable organizations. | | | None | |
| | |
David L. Gardner, 53 Trustee since 2015, Member of Operations Risk Oversight Committee | | Until 2012, head of EMEA (Europe, Middle East and Africa) Sales for iShares of Blackrock, Inc., EMEA Executive Committee Member and EMEA Operating Committee Member at Blackrock, Inc. | | | None | |
| | |
Owen D. Van Essen, 62 Trustee since 2004, Member of Governance & Nominating Committee & Chairman of Operations Risk Oversight Committee | | President of Dirks, Van Essen & Murray, Santa Fe, NM (newspaper mergers and acquisitions). | | | None | |
| | |
James W. Weyhrauch, 57 Trustee since 1996, Member of Audit Committee & Operations Risk Oversight Committee | | Real estate broker, Santa Fe Properties, Santa Fe, NM; Vice Chairman of Nambe LLC, Santa Fe, NM (manufacturing & design company). | | | None | |
30 Annual Report
| | |
| TRUSTEES AND OFFICERS, CONTINUED | | |
| |
Thornburg Developing World Fund | | September 30, 2016 (Unaudited) |
| | | | | | |
Name, Age, Year Elected Position Held with Fund | | Principal Occupation(s) During Past Five Years | | Other
Directorships
Held by Trustee | |
OFFICERS OF THE FUND (WHO ARE NOT TRUSTEES)(1)(7) | | | | |
| | |
Nimish Bhatt, 53 Treasurer since 2016(6) | | Chief Financial Officer and Treasurer of Thornburg Investment Management, Inc. and Thornburg Securities Corporation since 2016; Senior Vice President (2004-2016), Chief Financial Officer (2011-2016), and Head of Fund Administration (2011-2016) of Calamos Asset Management, Inc., Calamos Investments LLC, Calamos Advisors LLC, and Calamos Wealth Management; Director of Calamos Global Funds plc (2007-2016). | | | Not applicable | |
| | |
Jason Brady, 42 President since 2016(6) | | CEO and President since 2016, Vice President from 2011 to 2016, Portfolio Manager and Managing Director of Thornburg Investment Management, Inc.; Vice President of Thornburg Securities Corporation since 2016. | | | Not applicable | |
| | |
Kathleen Brady, 56 Vice President since 2008 | | Tax Manager Fund Accounting of Thornburg Investment Management, Inc. | | | Not applicable | |
| | |
Connor Browne, 37 Vice President since 2006 | | Portfolio Manager, Vice President since 2013, and Managing Director of Thornburg Investment Management, Inc. | | | Not applicable | |
| | |
Tim Cunningham, 41 Vice President since 2014 | | Managing Director since 2011, Portfolio Manager since 2012, and Associate Portfolio Manager from 2009–2012 of Thornburg Investment Management, Inc. | |
| Not applicable
|
|
| | |
Randy Dry, 42 Vice President since 2014 | | Vice President and Managing Director, Director of Institutional Group from 2014-2016, and since 2016, Chief Administrative Officer of Thornburg Investment Management, Inc. | | | Not applicable | |
| | |
Greg Dunn, 40 Vice President since 2014 | | Managing Director, Portfolio Manager since 2012, and Associate Portfolio Manager from 2009–2012 of Thornburg Investment Management, Inc. | | | Not applicable | |
| | |
Lon Erickson, 41 Vice President since 2008 | | Portfolio Manager and Managing Director of Thornburg Investment Management, Inc. | | | Not applicable | |
| | |
William V. Fries, 77 Vice President since 1995 | | Portfolio Manager, Vice President, and Managing Director of Thornburg Investment Management, Inc. | | | Not applicable | |
| | |
Thomas Garcia, 45 Vice President since 2006 | | Vice President since 2011, Managing Director, Head Equity Trader, and Associate Portfolio Manager of Thornburg Investment Management, Inc. | | | Not applicable | |
| | |
Rolf Kelly, 37 Vice President since 2016 | | Portfolio Manager and Managing Director since 2013 and Associate Portfolio Manager from 2011–2013 of Thornburg Investment Management, Inc. | | | Not applicable | |
| | |
Ben Kirby, 36 Vice President since 2014 | | Portfolio Manager and Managing Director since 2013 and Associate Portfolio Manager from 2011–2013 of Thornburg Investment Management, Inc. | | | Not applicable | |
| | |
Jeff Klingelhofer, 41 Vice President since 2016 | | Portfolio Manager and Managing Director since 2015, Associate Portfolio Manager from 2012–2015, and Fixed Income Analyst from 2010–2012 of Thornburg Investment Management, Inc. | | | Not applicable | |
| | |
Rob MacDonald, 40 Vice President since 2016 | | Managing Director since 2015, Portfolio Manager since 2014, and Associate Portfolio Manager from 2011–2014 of Thornburg Investment Management, Inc. | | | Not applicable | |
| | |
Leigh Moiola, 49 Vice President since 2001 | | Vice President, Managing Director, and Director of Marketing of Thornburg Investment Management, Inc.; Vice President of Thornburg Securities Corporation. | | | Not applicable | |
| | |
Christopher Ryon, 60 Vice President since 2008 | | Portfolio Manager and Managing Director of Thornburg Investment Management, Inc. | | | Not applicable | |
| | |
Nicholos Venditti, 35 Vice President since 2016 | | Portfolio Manager and Managing Director since 2015 and Associate Portfolio Manager from 2011–2015 of Thornburg Investment Management, Inc. | | | Not applicable | |
Annual Report 31
| | |
| TRUSTEES AND OFFICERS, CONTINUED | | |
| |
Thornburg Developing World Fund | | September 30, 2016 (Unaudited) |
| | | | |
Name, Age, Year Elected Position Held with Fund | | Principal Occupation(s) During Past Five Years | | Other
Directorships
Held by Trustee |
| | |
Vinson Walden, 46 Vice President since 2004 | | Portfolio Manager and Managing Director of Thornburg Investment Management, Inc. | | Not applicable |
| | |
Lei Wang, 45 Vice President since 2006 | | Portfolio Manager and Managing Director of Thornburg Investment Management, Inc. | | Not applicable |
| | |
Sasha Wilcoxon, 42 Vice President since 2003 Secretary since 2007(6) | | Managing Director, Director of Mutual Fund Operations, and Vice President of Thornburg Investment Management, Inc.; Vice President of Thornburg Securities Corporation. | | Not applicable |
| | |
Charles Wilson, 41 Vice President since 2016 | | Portfolio Manager and Managing Director since 2014 and Associate Portfolio Manager from 2012–2014 of Thornburg Investment Management, Inc.; Co-Portfolio Manager of Marsico Capital Management from 2010–2012. | | Not applicable |
| | |
Di Zhou, 38 Vice President since 2016 | | Portfolio Manager and Managing Director since 2016, Associate Portfolio Manager from 2014–2016, and Equity Research Analyst from 2010–2014 of Thornburg Investment Management, Inc. | | Not applicable |
| (1) | Each person’s address is 2300 North Ridgetop Road, Santa Fe, New Mexico 87506. |
| (2) | The Fund is a separate investment “Fund” or “series” of Thornburg Investment Trust (the “Trust”), which comprises the Thornburg mutual fund complex and is organized as a Massachusetts business trust. Thornburg Investment Management, Inc. is the investment advisor to, and manages, all the Funds of the Trust. Each Trustee oversees all the Funds of the Trust. |
| (3) | Mr. Thornburg is considered an “interested” Trustee under the Investment Company Act of 1940 because he is the sole director and controlling shareholder of Thornburg Investment Management, Inc., the investment advisor to the Trust, and is the sole director and controlling shareholder of Thornburg Securities Corporation, the distributor of shares for the Trust. |
| (4) | The Bylaws of the Trust currently require that each Trustee shall retire by the end of the calendar year during which the Trustee reached the age of 75 years. Otherwise each Trustee serves in office until the election and qualification of a successor or until the Trustee sooner dies, resigns, retires or is removed. |
| (5) | Mr. McMahon is considered an “interested” Trustee under the Investment Company Act of 1940 because he is the chief investment officer of Thornburg Investment Management, Inc. |
| (6) | The Trust’s president, secretary, and treasurer each serves a one-year term or until the election and qualification of a successor; each other officer serves at the pleasure of the Trustees. |
| (7) | Assistant vice presidents, assistant secretaries, and assistant treasurers are not shown. |
The Statement of Additional Information for each Fund of the Trust includes additional information about the Trustees and is available, without charge and upon request, by calling 1-800-847-0200.
32 Annual Report
| | |
| OTHER INFORMATION | | |
| |
Thornburg Developing World Fund | | September 30, 2016 (Unaudited) |
PORTFOLIO PROXY VOTING
Policies and Procedures:
The Trust has delegated to Thornburg Investment Management, Inc. (the “Advisor”) voting decisions respecting proxies for the Fund’s voting securities. The Advisor makes voting decisions in accordance with its Proxy Voting Policy and Procedures. A description of the Policy and Procedures is available (i) without charge, upon request, by calling the Advisor toll-free at 1-800-847-0200, (ii) on the Thornburg website at www.thornburg.com, and (iii) on the Securities and Exchange Commission’s website at www.sec.gov.
Information regarding how proxies were voted is available on or before August 31 of each year for the twelve months ending the preceding June 30. This information is available (i) without charge, upon request by calling the Advisor toll-free at 1-800-847-0200, (ii) on the Thornburg website at www.thornburg.com, and (iii) on the Securities and Exchange Commission’s website at www.sec.gov.
AVAILABILITY OF QUARTERLY PORTFOLIO SCHEDULE
The Fund files with the Securities and Exchange Commission schedules of its portfolio holdings on Form N-Q for the first and third quarters of each fiscal year. The Fund’s Forms N-Q are available on the Commission’s website at www.sec.gov, or may be reviewed and copied at the Commission’s Public Reference Room in Washington, D.C. Information on the operation of the Public Reference Room may be obtained by calling 1-800-SEC-0330. The Fund also makes this information available on its website at www.thornburg. com/download or upon request by calling 1-800-847-0200.
TAX INFORMATION
For the tax year ended September 30, 2016, dividends paid by the Thornburg Developing World Fund of $5,555,168 are being reported as taxable ordinary investment income dividends for federal income tax purposes.
For the tax year ended September 30, 2016, the Fund is reporting 100.00% (or the maximum allowed) of the dividends paid from tax basis net ordinary income as qualifying for the reduced rate under the Jobs and Growth Tax Relief and Reconciliation Act of 2003.
The Fund is reporting 5.47% (or the maximum allowed) of the ordinary income distributions paid by the Fund for the fiscal year ended September 30, 2016 as qualified for the corporate dividends received deduction.
For the year ended September 30, 2016, foreign source income and foreign taxes paid is $20,405,061 and $1,930,817, respectively. The information and distributions reported herein may differ from the information and distributions reported to the shareholders for the calendar year ending December 31, 2016. Complete information will be reported in conjunction with your 2016 Form 1099.
STATEMENT RESPECTING RENEWAL OF INVESTMENT ADVISORY AGREEMENT
Thornburg Investment Management, Inc. (the “Advisor”) provides investment management services to Thornburg Developing World Fund pursuant to an investment advisory agreement. The Trustees consider the renewal of this agreement annually, and most recently determined to renew the agreement on September 13, 2016.
In anticipation of their recent consideration of the advisory agreement’s renewal, the independent Trustees met in May 2016 to consider aspects of their annual evaluation of the Advisor’s service to all of the funds of Thornburg Investment Trust, to plan the annual evaluation of the Advisor’s performance and to specify the information the Advisor would present to the Trustees for their review. The independent Trustees met again in independent session in September to consider portions of the information submitted by the Advisor. Representatives of the Advisor subsequently reviewed portions of the information with the Trustees and addressed questions from the Trustees at a full meeting session of the Trustees scheduled for that purpose, and the independent Trustees thereafter met in independent session to consider the Advisor’s presentation and various specific issues respecting their consideration of the advisory agreement’s renewal. Following these sessions, the Trustees met to consider renewal of the agreement, and the independent Trustees voted unanimously at that meeting to renew the agreement for an additional term of one year.
The information below summarizes certain factors considered by the Trustees in connection with the determination to renew the advisory agreement. In determining to renew the agreement, the Trustees did not identify any single factor as controlling and considered a wide range of information, and this summary does not describe all of the factors and other matters considered by the Trustees in making their determination.
Nature, Extent and Quality of Services. The Trustees considered presentations by the Advisor at meeting sessions scheduled for consideration of a continuation of the advisory agreement, and also noted their consideration of the reports the Trustees and their committees receive throughout the year on a wide variety of topics, and consideration they had given to a number of topics in previous years.
Annual Report 33
| | |
| OTHER INFORMATION, CONTINUED | | |
| |
Thornburg Developing World Fund | | September 30, 2016 (Unaudited) |
Information identified by the Trustees in their evaluation as having been considered and contributing to their conclusions included Trustees’ assessments of the Advisor’s personnel developed in formal and informal meetings throughout the year, the Advisor’s staffing levels and measures to maintain staffing levels and improve competencies, the Advisor’s commitment to attract and retain high quality portfolio management expertise through competitive compensation levels, the Advisor’s collaborative approach to investment management, the Fund’s investment performance over different periods of time, portfolio managers’ cognizance of and strategies to address market and economic trends and conditions, the evaluation and selection of individual investments, the structuring and composition of the Fund’s portfolio, management of Fund liquidity requirements, cognizance of and efforts to achieve tax efficiency, responses to share sale and redemption activity, continuing enhancements to the Advisor’s electronic and information systems and the Advisor’s engagement of outside firms to assist in improving or replacing those systems, the Advisor’s evaluation and selection of firms providing portfolio trade execution to the Fund and the Advisor’s measures to obtain favorable trade execution, the Advisor’s performance of accounting and other services, the Advisor’s continued commitment to observance of compliance and regulatory requirements, the Advisor’s responsiveness to the Trustees, the quality and extent of written and oral reports to the Trustees over the course of the year, and other factors.
Investment Performance. The Trustees noted in their evaluation of the Fund’s investment performance the reports they had received in each regular meeting over the course of the year from the Advisor’s portfolio management personnel. The Trustees also noted in their evaluation their consideration of information provided to them at their request in anticipation of their annual evaluation of the Advisor’s services, including the following items of information respecting the investment performance of the Fund: (1) the Fund’s absolute investment performance and achievement of stated objectives; (2) the Advisor’s written and oral explanations and commentary on the Fund’s performance in the context of the Fund’s objectives and reasonable expectations, and business, market and economic conditions, (3) performance data for the six calendar years since the Fund’s inception, comparing the Fund’s annual investment returns to a fund category selected by an independent mutual fund analyst firm, and to a broad-based securities index, (4) the Fund’s investment performance for the year-to-date, one-year, three-year and five-year periods ending with the second quarter of the current year comparing the Fund’s annualized returns to two mutual fund categories selected by independent mutual fund analyst firms and to a broad-based securities index, and assigning a percentage rank to the Fund’s performance for each period relative to each of the fund categories, (5) comparison of the Fund’s annualized return since inception to the Fund’s benchmark index, and (6) comparative measures of estimated earnings growth, portfolio volatility, risk and return.
The Trustees noted that quarterly reports during the year and other information presented to them confirmed the Advisor’s continued conformity to the Fund’s stated investment objectives and policies.
The Trustees observed in reviewing comparative performance data for the six calendar years since the Fund’s inception that the Fund’s investment return for the most recent calendar year was lower than the return for the fund category and comparable to the return of the securities index, that the Fund’s return for the preceding year was comparable to the returns of the fund category and the index, and that the Fund’s returns for the preceding four calendar years exceeded the returns for the index and the category in all years. Other quantitative data noted by the Trustees as having been considered in their evaluation showed the Fund’s annualized investment returns fell above the midpoint of performance for the two fund categories considered for the one-year and three-year periods ended with the second quarter of the current year, and fell in the top decile of performance for the five-year period. Data presented to the Trustees showed that the Fund’s annualized total return (net of expenses) over the period since the Fund’s inception exceeded the annualized return for the Fund’s benchmark index. The Trustees attached additional significance to the performance from the perspective of longer term shareholders.
Comparisons of Fee and Expense Levels. The Trustees recognized in their evaluation the clear disclosures of the Advisor’s fees and Fund expenses in the Fund’s prospectus. Information noted by the Trustees as having been considered in evaluating the Fund’s fees and expenses included a variety of comparative data respecting the Fund’s fee and expense levels. This information included comparisons of the Fund’s advisory fee and overall Fund expenses to median and average fees and expenses charged to a category of mutual funds selected by an independent mutual fund analyst firm, comparisons of the advisory fee and other Fund expenses to the fee levels and expenses for two representative share classes of fund peer groups selected from the category by a second independent mutual fund analyst firm, the perspectives and advice from the second mutual fund analyst firm respecting comparisons of fund fee levels and expenses to fund peer groups, and other information. Comparative fee and expense data noted as having been considered by the Trustees showed that the Fund’s advisory fee level was comparable to the median and average levels for the fund category, the level of total expense for one representative share class of the Fund was comparable to the median and average levels for the category, and that the level of total expense for a second representative share class was lower than the median and average total expense level for the category. Peer group data showed the Fund’s advisory fee level was lower than the median levels of the two peer groups, and that the total expense levels for two representative share classes were comparable to the median levels of their respective peer groups.
The Trustees noted their consideration of information respecting the advisory fees charged by the Advisor to other investment management clients, including sub-advised mutual funds, together with information about fees charged by other advisors to different clients, analysis of the differences between the requirements of institutional clients and mutual funds, analysis of the differences between the requirements of a sub-advised mutual fund and a fund as to which the investment advisor is the primary advisor and sponsor,
34 Annual Report
| | |
| OTHER INFORMATION, CONTINUED | | |
| |
Thornburg Developing World Fund | | September 30, 2016 (Unaudited) |
descriptions of distinguishing characteristics of the sub-advised funds served by the Advisor, and the consequently different investment management services provided to the different categories of clients and the differing contexts in which the fee levels for these arrangements are established. The Trustees confirmed their previous observations that the differences between the fees charged by the Advisor to different types of clients did not appear exceptional, and that the fee rates charged by an investment advisor to different categories of clients had limited relevance to the evaluation of the fee rate charged by that advisor to mutual funds as to which it is the primary advisor and sponsor.
Costs and Profitability of Advisor. In reviewing the profitability of the Advisor’s services to the Fund the Trustees considered an analysis of the Advisor’s costs and the profitability to the Advisor of its services, together with data respecting the overall profitability of a selection of other investment management firms. The Trustees noted that a portion of the Advisor’s profits are an important element in the compensation of shareholder employees. The Trustees considered in this regard information from the Advisor respecting investment of its profits to maintain staffing levels, pay competitive levels of compensation, and add to its information retrieval and management systems to maintain or improve service levels. The Trustees also considered the contribution of the Advisor’s cost management to its profitability, and the relationship of the Advisor’s financial resources and profitability in previous years to its ability to attract necessary personnel, invest in systems and other assets required for its service to the Fund, and maintain or improve service levels for the Fund notwithstanding fluctuations in revenues and profitability. The information considered did not indicate to the Trustees that the Advisor’s profitability was excessive.
Potential Economies of Scale. In reviewing the extent to which economies of scale would be realized by the Fund as it grows and whether fee levels reflect potential economies of scale, the Trustees considered the breakpoint structure for advisory fees chargeable to the Fund, comparisons of the fee breakpoint structure for the Fund with breakpoint structures (or the absence of such structures) for other funds in a peer group selected by an independent mutual fund analyst firm, the effects of the breakpoint structure and other expense factors realized by certain Funds of the Trust as their asset levels had increased, and the Advisor’s expenditures from its own profits and resources to maintain staffing levels, pay competitive levels of compensation, and add to its information retrieval and management systems to maintain or improve service levels. The information provided demonstrated to the Trustees that the Fund’s advisory fee breakpoint structure is reasonable in relation to the structures observed in the other funds in its peer group, and that shareholders may be expected to benefit from any economies of scale, due to the advisory agreement’s breakpoint fee structure for the Fund and other factors.
Potential Ancillary Benefits. In reviewing potential benefits to the Advisor because of its relationship to the Fund, the Trustees noted disclosures by the Advisor of its receipt of certain research services from broker dealers, and the benefits to both the Fund and the Advisor of the Advisor’s expansion of its staffing, compliance and systems capabilities and other resources to serve a broader variety of investment management clients. No unusual or unfair benefits to the Advisor from its relationship to the Fund were identified by the Trustees.
Summary of Conclusions. The Trustees concluded that the nature, extent and quality of the Advisor’s services performed under the advisory agreement remained sufficient. The Trustees further concluded that the absolute and relative investment performance of the Fund over a range of pertinent holding periods on the whole is satisfactory in the context of its objectives and strategies, and that the Advisor had continued to actively and competently pursue the Fund’s stated investment objectives and adhere to the Fund’s investment policies.
The Trustees further concluded, based upon their consideration of the foregoing factors and other information, that the level of the advisory fee charged to the Fund by the Advisor is reasonable in relation to the services provided by the Advisor in view of the nature, extent and quality of those services, the investment performance of the Fund after fees and expenses, the clear disclosure of fees and expenses in the Fund’s prospectus, comparisons of fees and expenses charged to the Fund to fees and expenses charged to other mutual funds, and the other factors considered.
Annual Report 35
TRUSTEES’ STATEMENT TO SHAREHOLDERS
Readopted September 12, 2016
The Trustees believe current and prospective shareholders should know how we discharge our responsibilities in supervising the Funds’ investment advisor and in reviewing the advisor’s contract for renewal. Since 2005, we have issued a statement which sets out clearly the three principal guidelines that we follow in supervising the Trust’s investment advisor on your behalf. In accordance with our customary practice, in September of this year we again reviewed our statement and concluded we should reissue this statement outlining the principal features of our supervision of the advisor’s performance of investment management services for the Funds.
We begin with the premise that each shareholder selected his or her Fund because its investments are managed by the investment advisor identified in the prospectus and in accordance with the objective and policies described in the prospectus. We realize, as each of you do, that if you believe that your Fund’s stated objective and policies no longer serve your personal investment goals, you can sell your shares and leave the Fund.
Therefore, we believe that our primary supervisory task – our principal obligation to you – is to assess the nature and quality of the advisor’s services, and to confirm that the advisor actively and competently pursues the Fund’s objective, in accordance with the policies set out in the prospectus. To do this, we meet regularly with management to review your Fund’s portfolio and to discuss the advisor’s specific actions and judgments in pursuing the Fund’s objective. We do not substitute our own judgment for the advisor’s decisions in selecting investments; the advisor is paid to exercise its informed judgment on investment decisions, and we seek to confirm, in reviewing the advisor’s performance, that the advisor is doing just that.
Second, we are conscious of costs and the effect that costs have on shareholders’ returns. We try to make sure that your Fund’s fees and costs are reasonable in relationship to the services rendered and that they are generally in line with those charged by other expert investment advisors, consistent with our belief that the Fund’s investors searched for and expect that expertise and attention and have decided to pay a reasonable price for it. We do not put the management contract “out to bid” as a matter of course, and we would not do so unless we had concluded that the advisor materially had failed to pursue the Fund’s objectives in accordance with its policies, or for other equally important reasons. We believe that any other approach would be inconsistent with your interests and contrary to your expectations when you bought shares of the Fund in the first place.
Finally, because we believe that most Thornburg Fund shareholders have invested with a long-term perspective, we try not to focus too much on the fashions of the moment and on short-term performance. The market will not favor any specific investment objective or set of policies at all times and under all economic circumstances. A fund will experience periods of both high and low returns relative to other funds and other investments. Even if one of our Funds is not favored by the market at a particular time, we believe that the advisor is nonetheless obliged to remain true to the Fund’s objective and policies, and we watch to see that it does so.
Trustees of Thornburg Investment Trust
36 Annual Report
THORNBURG FUNDS
Thornburg Investment Management is a privately-owned global investment firm that offers a range of solutions for retail and institutional investors. Founded in 1982 and headquartered in Santa Fe, New Mexico, we manage approximately $53 billion (as of September 30, 2016) across eight equity and 11 bond mutual funds, separate accounts for high-net-worth investors and institutional accounts, and five UCITS funds for non-U.S. investors.
The fund outlined in this report is one of many equity and fixed-income products available from Thornburg Investment Management.
Equity Funds
| | • | | Thornburg Core Growth Fund |
| | • | | Thornburg International Value Fund |
| | • | | Thornburg Better World International Fund |
| | • | | Thornburg International Growth Fund |
| | • | | Thornburg Developing World Fund |
| | • | | Thornburg Investment Income Builder Fund |
| | • | | Thornburg Global Opportunities Fund |
Fixed Income Funds
| | • | | Thornburg Low Duration Income Fund |
| | • | | Thornburg Limited Term U.S. Government Fund |
| | • | | Thornburg Limited Term Income Fund |
| | • | | Thornburg Strategic Income Fund |
| | • | | Thornburg Low Duration Municipal Fund |
| | • | | Thornburg Limited Term Municipal Fund |
| | • | | Thornburg Intermediate Municipal Fund |
| | • | | Thornburg California Limited Term Municipal Fund |
| | • | | Thornburg New Mexico Intermediate Municipal Fund |
| | • | | Thornburg New York Intermediate Municipal Fund |
| | • | | Thornburg Strategic Municipal Income Fund |
Before investing, carefully consider the Fund’s investment goals, risks, charges, and expenses. For a prospectus or summary prospectus containing this and other information, contact your financial advisor or visit thornburg.com. Read it carefully before investing.
For additional information, please visit thornburg.com
Thornburg Investment Management, Inc. 2300 North Ridgetop Road, Santa Fe, NM 87506
Annual Report 37
This page intentionally left blank.
38 Annual Report
This page intentionally left blank.
Annual Report 39

| | | | |
| To receive shareholder reports, prospectuses, and proxy statements electronically, go to www.thornburg.com/edelivery. | |  |
This Annual Report is submitted for the general information of shareholders of the Fund. It is not authorized for distribution to prospective investors in the Fund unless preceded or accompanied by an effective prospectus.
| | | | |
| Investment Advisor: | | Distributor: | | |
| Thornburg Investment Management® | | Thornburg Securities Corporation® | | |
| 800.847.0200 | | 800.847.0200 | | TH2149 |
Annual Report
September 30, 2016
THORNBURG
BETTER WORLD
INTERNATIONAL
FUND
INVESTMENT MANAGEMENT
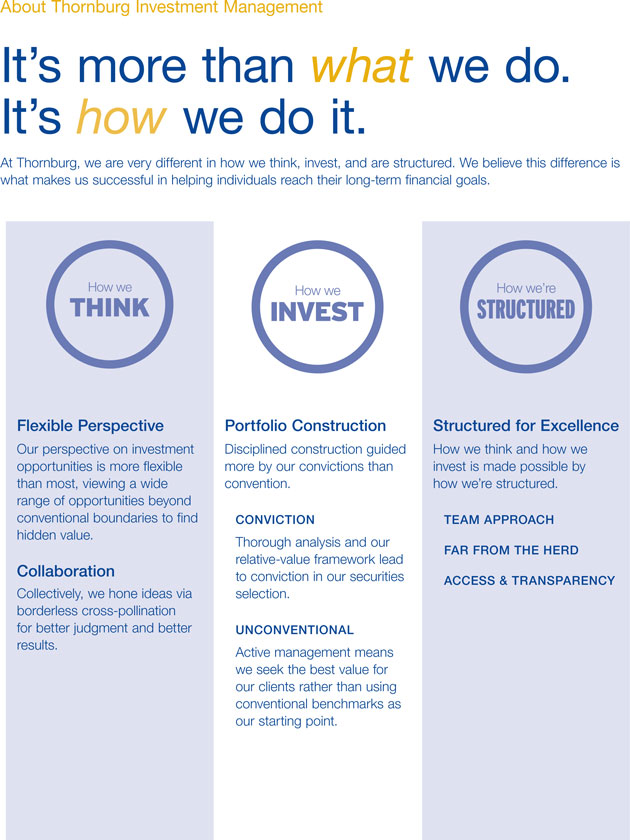
About Thornburg Investment Management
It’s more than what we do.
It’s how we do it.
At Thornburg, we are very different in how we think, invest, and are structured We believe this difference is
what makes us successful in helping individuals reach their long-term financial goals.
How we How we How we’re
Flexible Perspective Our perspective on investment opportunities is more flexible than most, viewing a wide range of opportunities beyond conventional boundaries to find hidden value
Collaboration Collectively, we hone ideas via borderless cross-pollination for better judgment and better results.
Portfolio Construction Disciplined construction guided more by our convictions than convention
CONVICTION Thorough analysis and our relative-value framework lead to conviction in our securities selection
UNCONVENTIONAL Active management means we seek the best value for our clients rather than using conventional benchmarks as our starting point.
Structured for Excellence How we think and how we invest is made possible by how we’re structured TEAM APPROACH FAR FROM THE HERD ACCESS & TRANSPARENCY
2 Annual Report
Annual Report
Thornburg Better World International Fund
September 30, 2016
| | | | |
Share Class | | NASDAQ Symbol | | CUSIP |
Class A | | TBWAX | | 885-216-721 |
Class C | | TBWCX | | 885-216-713 |
Class I | | TBWIX | | 885-216-697 |
Class I shares may not be available to all investors. Minimum investments for Class I shares may be higher than those for other classes.
Investments carry risks, including possible loss of principal. Additional risks may be associated with investments outside the United States, especially in emerging markets, including currency fluctuations, illiquidity, volatility, and political and economic risks. Investments in small- and mid-capitalization companies may increase the risk of greater price fluctuations. Investments in the Fund are not FDIC insured, nor are they bank deposits or guaranteed by a bank or any other entity.
Funds invested in a smaller number of holdings may expose an investor to greater volatility.
Annual Report 3
| | |
| LETTER TO SHAREHOLDERS | | |
| |
Thornburg Better World International Fund | | September 30, 2016 (Unaudited) |
October 24, 2016
Dear Fellow Shareholder:
As this is our first annual letter, we thought it fitting to re-introduce how we think and how we invest. Thornburg Better World International Fund seeks attractively priced stocks of quality companies that have sustainable business models, compelling growth prospects, and, critically, exhibit high “ESG” standards of environmental sensitivity, social responsibility, and corporate governance. In our research and experience-subadvising on socially responsible funds for years prior to launching our own ESG fund-we have found that companies with durable business models that incorporate these values lower their regulatory and legal risks, enhance their marketplace reputations, reduce operating costs, and allocate capital more effectively, all to the benefit of their clients, employees, and shareholders.
Launching an equity mutual fund at the end of September 2015, on the heels of the biggest quarterly rout in global stocks in four years, might not seem like auspicious timing for Thornburg Better World International Fund. However, we eagerly welcomed the opportunity to deploy the Fund’s seed money at better share prices. As active managers, we welcome the introduction of volatility to the capital markets, as this can do much to reintroduce a sense of accountability and efficient capital allocation, a situation where active management can provide additional value. Quality companies as identified by ESG analysis tend to shine in periods of volatility. One rather tumultuous year later, we’re pleased that Better World International Fund has acquitted itself well.
In the July-through-September period, the Better World International Fund gained 12.82% (A shares without sales charge), outperforming the MSCI AC World ex-U.S. Index’s 6.91% return. That brought the first full-year return on September 30, 2016, to 16.60% (A shares without sales charge), versus 9.26% for the benchmark. This landed the Fund’s class A and I shares in the top 1% of Morningstar rankings among 856 foreign large blend funds for the one-year period (based on total returns without sales charge). Our third quarter was particularly strong, given our participation in a few ESG-screened technology IPOs. While these performed remarkably well for our investors, they quickly moved from undervalued to overvalued; an uncomfortable reminder of the dot-com era. We don’t generally expect to consistently outperform in rising markets, as our ultimate goal is to truncate downward moves for our investors; as the best way to destroy long-term value is to have a year of severe losses. We’ll seek market outperformance from a higher base. We’ve designed the portfolio to be conservative and think it should fare well during periods of volatility. Our research and experience have shown that high-quality companies as measured through ROIC (return on invested capital) & ESG factors reflective of intangible company culture, are likely to have a positive effect on long-term performance and volatility.
The portfolio’s structure is also a key component of our drive for competitive, risk-adjusted returns. Although the Fund is quite focused currently with roughly 50 names as of September 30, 2016, it’s diversified across market capitalization, geography, and sector. As part of our unconventional approach, we spend an extensive amount of time focusing on companies that are off the beaten path (e.g. Chile, Norway, New Zealand); this allows us to work around heightened correlation of stocks in primary markets. In addition, we diversify by style baskets, of which there are three. “Basic value” companies are well-established cyclical businesses, the shares of which are trading at meaningful discounts to our assessment of their intrinsic value. Stock prices routinely overshoot their fundamentals (both positively and negatively). Ultimately, those mispricings are revealed and valuations normalize; mean reversion tends to be a source of long-term excess returns for our “basic value” basket. “Emerging franchises” are in the early stages of what we believe to be their development as future leaders in their particular markets. And, with typically the largest presence in the portfolio, the “consistent earners” exhibit steady cash flow, earnings, and, often, dividend growth. Over time, we believe such compounders can generate a market-beating total return.
We credit the portfolio’s conservative bias and structure for its resilience amid the bouts of volatility over the last year, particularly the January global markets selloff and the U.K.’s June referendum to exit the E.U. In the year to September 30, the Better World International’s down-capture ratio, which reflects the Fund’s losses as a percentage of those of the market, was 45%. Meanwhile, the Fund’s up-capture ratio, which shows its percentage of the index’s gains in rising markets, stood at 92% in the period. To be sure, we don’t necessarily expect the up-capture ratio to remain at such elevated levels over time, given the Fund’s defensive characteristics and typically higher allocation to its consistent earners basket. Moreover, if international equity market conditions have been stable and favorable in recent months, there’s no guarantee they’ll stay so for long. That being said, our integration of ESG and financial metrics gives us insight into the long-term sustainability of the companies in which we invest. This, we believe, should smooth the ride for our investors over time.
Unprecedented central bank monetary stimulus in the form of asset purchases, near- or sub-zero interest rates, or both, has driven extraordinary asset price inflation. Due to record-low yields among sovereign bonds in Europe and Japan, where more than $11 trillion in government bonds are priced with negative yields, investors worldwide have been pushed outside of what would be considered their normal risk profile,
4 Annual Report
| | |
LETTER TO SHAREHOLDERS, CONTINUED | | |
| |
Thornburg Better World International Fund | | September 30, 2016 (Unaudited) |
pumping up asset valuations to levels that their expected earnings will be hard-pressed to justify. These factors, coupled with a regulatory environment that has resulted in withdrawal from the markets by many traditional market makers (i.e. lower liquidity), makes for a precarious situation for investors going forward. Still, there are attractively priced stocks to be found across the globe for those with a keen eye towards value, and ability to assess opportunities beyond conventional boundaries. Consequently, as fundamental, benchmark-agnostic investors, the Fund’s active share—the percentage of stock holdings in the portfolio that differ from the benchmark index—at the end of August stood at 94%.
Although we’re bottom-up investors, we’re well aware that plenty of political and macroeconomic risks could tip markets over, from the U.S. elections in November, to the Italian constitutional referendum and the U.S. Federal Reserve rate policy meeting in December, to the U.K.’s unfolding exit from the E.U. Forward-earnings multiples running at decade-plus highs, amid waning earnings expectations and anemic global growth suggest that any of these risks, not to mention those potential unexpected “black swan” events, could easily throw markets into a tailspin.
A diversified portfolio populated with carefully selected, attractively valued, quality stocks that exhibit high ESG standards may provide protection in turbulent markets and decent upside participation in rising markets. Both environments were present over Better World International Fund’s first year, and stock selection drove the returns. Given current market valuation levels and risks, we’re confident that our portfolio holdings can weather potential bouts of market volatility, while our currently elevated cash position should enable us to capitalize on them. For long-term, value investors, volatility can be helpful, allowing us to upgrade the portfolio with less-pricey ESG stocks offering greater upside potential. We are ready for it and look to capitalize on it.
Thank you for investing alongside us in Thornburg Better World International Fund.
| | |
| Sincerely, | | |
| |
 | | |
| |
| Rolf Kelly,CFA | | |
| Portfolio Manager | | |
| Managing Director | | |
The matters discussed in this report may constitute forward-looking statements made pursuant to the safe harbor provisions of the Securities Litigation Reform Act of 1995. These include any advisor or portfolio manager prediction, assessment, analysis or outlook for individual securities, industries, investment styles, market sectors and/or markets. These statements involve risks and uncertainties. In addition to the general risks described for each fund in its current prospectus, other factors bearing on these reports include the accuracy of the advisor’s or portfolio manager’s forecasts and predictions, the appropriateness of the investment strategies designed by the advisor or portfolio manager and the ability of the advisor or portfolio manager to implement their strategies efficiently and successfully. Any one or more of these factors, as well as other risks affecting the securities markets generally, could cause the actual results of any fund to differ materially as compared to its benchmarks.
The views expressed by the portfolio managers reflect their professional opinions and are subject to change. Under no circumstances does the information contained within represent a recommendation to buy or sell any security.
Annual Report 5
| | |
| PERFORMANCE SUMMARY | | |
| |
Thornburg Better World International Fund | | September 30, 2016 (Unaudited) |
Average Annual Total Returns
| | | | | | | | |
| | | 1-Yr | | | Since
Incep. | |
Class A Shares (Incep: 9/30/15) | | | | | | | | |
Without sales charge | | | 16.60 | % | | | 16.60 | % |
With sales charge | | | 11.38 | % | | | 11.38 | % |
Class C Shares (Incep: 9/30/15) | | | | | | | | |
Without sales charge | | | 15.94 | % | | | 15.94 | % |
With sales charge | | | 14.94 | % | | | 14.94 | % |
Class I Shares (Incep: 9/30/15) | | | 17.44 | % | | | 17.44 | % |
MSCI AC World ex-U.S. Index (Since 9/30/15) | | | 9.26 | % | | | 9.26 | % |
Growth of a Hypothetical $10,000 Investment
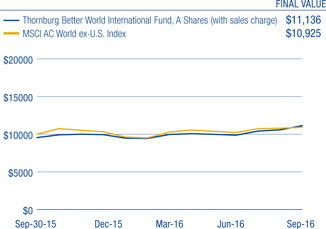
Performance data shown represents past performance and is no guarantee of future results. Investment return and principal value will fluctuate so shares, when redeemed, may be worth more or less than their original cost. Current performance may be lower or higher than quoted. For performance current to the most recent month end, visit thornburg.com or call 800-847-0200. The performance information does not reflect the deduction of taxes that a shareholder would pay on distributions or the redemption of Fund shares. Returns reflect the reinvestment of dividends and capital gains. Class A shares are sold with a maximum sales charge of 4.50%. Class C shares are subject to a 1% CDSC for the first year only. There is no sales charge for Class I shares.
As disclosed in the most recent prospectus, the total annual fund operating expenses are as follows: A shares, 2.38%; C shares, 3.13%; I shares, 1.68%. Thornburg Investment Management and/or Thornburg Securities Corporation have contractually agreed to waive fees and reimburse expenses through at least February 1, 2017, for some of the share classes, resulting in net expense ratios of the following: A shares, 1.83%; C shares, 2.38%; I shares, 1.09%. For more detailed information on fund expenses and waivers/reimbursements please see the Fund’s prospectus.
The Fund may invest in shares of companies through initial public offerings (IPOs). IPOs have the potential to produce substantial gains and there is no assurance that the Fund will have continued access to profitable IPOs. As Fund assets grow, the impact of IPO investments on performance may decline.
Glossary
MSCI All Country (AC) World ex-US Index – A market capitalization weighted index representative of the market structure of 45 developed and emerging market countries in North and South America, Europe, Africa, and the Pacific Rim, excluding securities of United States’ issuers.
Unless otherwise noted, index returns reflect the reinvestment of income dividends and capital gains, if any, but do not reflect fees, brokerage commissions or other expenses of investing. Investors may not make direct investments into any index. The performance of any index is not indicative of the performance of any particular investment.
Active Share – A measure of the percentage of stock holdings in a manager’s portfolio that differ from the benchmark index.
Multiple – A valuation multiple reflects an investment’s market value relative to some key metric. Price to earnings ratio (P/E) is a commonly used multiple. It’s calculated by dividing a stock’s price by the company’s earnings per share.
P/E – Price/Earnings ratio (P/E ratio) is a valuation ratio of a company’s current share price compared to its per-share earnings. P/E equals a company’s market value per share divided by earnings per share. Forecasted P/E is not intended to be a forecast of the fund’s future performance.
Sovereign Debt – Government debt that has been issued in a foreign currency.
Upside/Downside Capture Ratio – A ratio that shows whether a given fund has outperformed—gained more or lost less than—a broad market benchmark during periods of market strength and weakness, and if so, by how much.
6 Annual Report
| | |
| FUND SUMMARY | | |
| |
Thornburg Better World International Fund | | September 30, 2016 (Unaudited) |
Objectives and Strategies
The Fund seeks long-term capital appreciation.
The Fund invests primarily in a broad range of foreign companies that demonstrate one or more positive environmental, social, and governance (ESG) characteristics that the investment manager identifies as significant. The Fund targets companies of any size or country of origin, and which are high-quality and attractively valued.
Market Capitalization Exposure
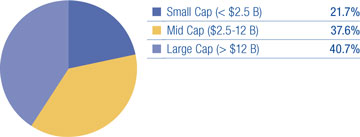
Basket Structure
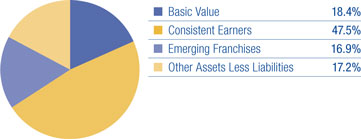
Top Ten Equity Holdings
| | | | |
ING Groep N.V. | | | 2.8 | % |
Europris ASA | | | 2.8 | % |
Nippon Telegraph & Telephone Corp. | | | 2.7 | % |
Telenet Group Holding NV | | | 2.7 | % |
Cairn Homes plc | | | 2.6 | % |
Thermo Fisher Scientific, Inc. | | | 2.4 | % |
Aguas Andinas S.A. | | | 2.4 | % |
Empiric Student Property plc | | | 2.2 | % |
AIA Group Ltd. | | | 2.2 | % |
Novartis AG | | | 2.1 | % |
There is no guarantee that the Fund will meet its investment objective.
All portfolio information is subject to change. Charts may not add up to 100% due to rounding.
| * | The country assignment of each equity holding is determined by the Fund’s Advisor based on various factors, including the location of the issuer’s head office, the issuer’s jurisdiction of incorporation and the country from which a majority of the issuer’s revenue is derived. |
| | | | |
| Sector Exposure | |
| |
Consumer Discretionary | | | 22.5 | % |
Consumer Staples | | | 13.5 | % |
Health Care | | | 12.5 | % |
Financials | | | 9.1 | % |
Industrials | | | 7.1 | % |
Real Estate | | | 5.1 | % |
Telecommunication Services | | | 4.1 | % |
Utilities | | | 4.0 | % |
Information Technology | | | 3.0 | % |
Materials | | | 1.8 | % |
Other Assets Less Liabilities | | | 17.2 | % |
|
| Top Ten Industry Groups | |
| |
Media | | | 10.6 | % |
Pharmaceuticals, Biotechnology & Life Sciences | | | 9.2 | % |
Consumer Durables & Apparel | | | 7.1 | % |
Food, Beverage & Tobacco | | | 6.2 | % |
Household & Personal Products | | | 5.7 | % |
Real Estate | | | 5.1 | % |
Telecommunication Services | | | 4.1 | % |
Diversified Financials | | | 4.1 | % |
Utilities | | | 4.0 | % |
Retailing | | | 3.4 | % |
|
| Country Exposure* (Percent of Equity Holdings) | |
| |
Japan | | | 16.9 | % |
United Kingdom | | | 9.2 | % |
United States | | | 8.4 | % |
Norway | | | 6.4 | % |
Germany | | | 6.1 | % |
Netherlands | | | 5.1 | % |
South Korea | | | 4.9 | % |
China | | | 4.1 | % |
Mexico | | | 4.1 | % |
Switzerland | | | 3.9 | % |
Belgium | | | 3.3 | % |
Ireland | | | 3.2 | % |
India | | | 3.1 | % |
Spain | | | 2.9 | % |
Chile | | | 2.9 | % |
Canada | | | 2.6 | % |
Hong Kong | | | 2.6 | % |
Sweden | | | 2.2 | % |
Italy | | | 1.9 | % |
South Africa | | | 1.6 | % |
Brazil | | | 1.5 | % |
Philippines | | | 1.2 | % |
Taiwan | | | 1.2 | % |
New Zealand | | | 0.7 | % |
Annual Report 7
SCHEDULE OF INVESTMENTS
| | |
| |
Thornburg Better World International Fund | | September 30, 2016 |
| | | | | | | | |
| | | Shares/
Principal Amount | | | Value | |
COMMON STOCK — 82.78% | | | | | | | | |
BANKS — 2.84% | | | | | | | | |
Banks — 2.84% | | | | | | | | |
ING Groep N.V. | | | 69,665 | | | $ | 860,057 | |
| | | | | | | | |
| | | | | | | 860,057 | |
| | | | | | | | |
| | |
CAPITAL GOODS — 3.33% | | | | | | | | |
Electrical Equipment — 1.51% | | | | | | | | |
a Senvion S.A. | | | 24,899 | | | | 455,636 | |
Trading Companies & Distributors — 1.82% | | | | | | | | |
Brenntag AG | | | 10,082 | | | | 550,481 | |
| | | | | | | | |
| | | | | | | 1,006,117 | |
| | | | | | | | |
| | |
COMMERCIAL & PROFESSIONAL SERVICES — 1.36% | | | | | | | | |
Professional Services — 1.36% | | | | | | | | |
RELX plc | | | 21,692 | | | | 411,338 | |
| | | | | | | | |
| | | | | | | 411,338 | |
| | | | | | | | |
| | |
CONSUMER DURABLES & APPAREL — 7.13% | | | | | | | | |
Household Durables — 5.96% | | | | | | | | |
a Cairn Homes plc | | | 661,131 | | | | 798,382 | |
Coway Co., Ltd. | | | 5,326 | | | | 461,344 | |
Sony Corp. | | | 16,756 | | | | 544,130 | |
Leisure Products — 1.17% | | | | | | | | |
Shimano, Inc. | | | 2,403 | | | | 353,560 | |
| | | | | | | | |
| | | | | | | 2,157,416 | |
| | | | | | | | |
| | |
CONSUMER SERVICES — 1.38% | | | | | | | | |
Hotels, Restaurants & Leisure — 1.38% | | | | | | | | |
Compass Group plc | | | 21,545 | | | | 417,487 | |
| | | | | | | | |
| | | | | | | 417,487 | |
| | | | | | | | |
| | |
DIVERSIFIED FINANCIALS — 4.09% | | | | | | | | |
Capital Markets — 1.52% | | | | | | | | |
Japan Exchange Group, Inc. | | | 29,747 | | | | 459,090 | |
Diversified Financial Services — 2.57% | | | | | | | | |
Cerved Information Solutions S.p.A. | | | 55,685 | | | | 471,029 | |
GT Capital Holdings, Inc. | | | 10,383 | | | | 308,311 | |
| | | | | | | | |
| | | | | | | 1,238,430 | |
| | | | | | | | |
| | |
FOOD & STAPLES RETAILING — 1.56% | | | | | | | | |
Food & Staples Retailing — 1.56% | | | | | | | | |
Tsuruha Holdings, Inc. | | | 4,115 | | | | 472,349 | |
| | | | | | | | |
| | | | | | | 472,349 | |
| | | | | | | | |
| | |
FOOD, BEVERAGE & TOBACCO — 6.15% | | | | | | | | |
Food Products — 6.15% | | | | | | | | |
BRF SA | | | 22,172 | | | | 377,152 | |
Marine Harvest ASA | | | 16,194 | | | | 289,866 | |
Orkla ASA | | | 45,292 | | | | 467,956 | |
Premium Brands Holdings Corp. | | | 6,323 | | | | 297,848 | |
Wessanen NV | | | 33,310 | | | | 427,696 | |
| | | | | | | | |
| | | | | | | 1,860,518 | |
| | | | | | | | |
| | |
HEALTH CARE EQUIPMENT & SERVICES — 3.26% | | | | | | | | |
Health Care Equipment & Supplies — 1.95% | | | | | | | | |
Olympus Corp. | | | 17,147 | | | | 591,830 | |
Health Care Providers & Services — 1.31% | | | | | | | | |
Life Healthcare Group Holdings Ltd. | | | 143,393 | | | | 395,722 | |
| | | | | | | | |
| | | | | | | 987,552 | |
| | | | | | | | |
| | |
HOUSEHOLD & PERSONAL PRODUCTS — 5.74% | | | | | | | | |
Household Products — 3.43% | | | | | | | | |
Lion Corp. | | | 30,000 | | | | 482,817 | |
Svenska Cellulosa AB SCA-B | | | 18,689 | | | | 555,084 | |
Personal Products — 2.31% | | | | | | | | |
AmorePacific Corp. | | | 612 | | | | 216,160 | |
Unilever NV | | | 10,484 | | | | 483,748 | |
| | | | | | | | |
| | | | | | | 1,737,809 | |
| | | | | | | | |
| | |
INSURANCE — 2.18% | | | | | | | | |
Insurance — 2.18% | | | | | | | | |
AIA Group Ltd. | | | 99,226 | | | | 659,468 | |
| | | | | | | | |
| | | | | | | 659,468 | |
| | | | | | | | |
8 Annual Report
| | |
| SCHEDULE OF INVESTMENTS, CONTINUED | | |
| |
Thornburg Better World International Fund | | September 30, 2016 |
| | | | | | | | |
| | | Shares/
Principal Amount | | | Value | |
MATERIALS — 1.83% | | | | | | | | |
Metals & Mining — 1.83% | | | | | | | | |
Korea Zinc Co., Ltd. | | | 1,270 | | | $ | 554,656 | |
| | | | | | | | |
| | | | | | | 554,656 | |
| | | | | | | | |
MEDIA — 10.59% | | | | | | | | |
Media — 10.59% | | | | | | | | |
China South Publishing & Media Group Co., Ltd. | | | 210,714 | | | | 563,589 | |
DHX Media Ltd. | | | 69,208 | | | | 362,406 | |
a Dish TV India Ltd. | | | 254,074 | | | | 354,513 | |
Megacable Holdings S.A.B. de C.V. | | | 152,921 | | | | 587,322 | |
ProSiebenSat.1 Media SE | | | 12,271 | | | | 525,470 | |
a Telenet Group Holding NV | | | 15,582 | | | | 812,712 | |
| | | | | | | | |
| | | | | | | 3,206,012 | |
| | | | | | | | |
PHARMACEUTICALS, BIOTECHNOLOGY & LIFE SCIENCES — 9.25% | | | | | | | | |
Biotechnology — 1.90% | | | | | | | | |
Gilead Sciences, Inc. | | | 7,265 | | | | 574,807 | |
Life Sciences Tools & Services — 2.38% | | | | | | | | |
Thermo Fisher Scientific, Inc. | | | 4,519 | | | | 718,792 | |
Pharmaceuticals — 4.97% | | | | | | | | |
Astellas Pharma, Inc. | | | 33,534 | | | | 520,347 | |
Novartis AG | | | 8,273 | | | | 650,599 | |
Roche Holding AG | | | 1,348 | | | | 334,398 | |
| | | | | | | | |
| | | | | | | 2,798,943 | |
| | | | | | | | |
| | |
REAL ESTATE — 5.12% | | | | | | | | |
Equity Real Estate Investment Trusts — 5.12% | | | | | | | | |
a Empiric Student Property plc | | | 444,299 | | | | 668,018 | |
Fibra Uno Administracion S.A. de C.V. | | | 243,586 | | | | 445,345 | |
Merlin Properties Socimi S.A. | | | 36,740 | | | | 434,799 | |
| | | | | | | | |
| | | | | | | 1,548,162 | |
| | | | | | | | |
| | |
RETAILING — 3.35% | | | | | | | | |
Internet & Direct Marketing Retail — 0.55% | | | | | | | | |
Trade Me Ltd. | | | 40,428 | | | | 165,537 | |
Multiline Retail — 2.80% | | | | | | | | |
Europris ASA | | | 167,876 | | | | 848,347 | |
| | | | | | | | |
| | | | | | | 1,013,884 | |
| | | | | | | | |
| | |
SEMICONDUCTORS & SEMICONDUCTOR EQUIPMENT — 0.99% | | | | | | | | |
Semiconductors & Semiconductor Equipment — 0.99% | | | | | | | | |
Taiwan Semiconductor Manufacturing Co., Ltd. ADR | | | 9,738 | | | | 297,885 | |
| | | | | | | | |
| | | | | | | 297,885 | |
| | | | | | | | |
| | |
SOFTWARE & SERVICES — 2.02% | | | | | | | | |
Information Technology Services — 2.02% | | | | | | | | |
MasterCard, Inc. | | | 1,765 | | | | 179,624 | |
a PayPal Holdings, Inc. | | | 10,567 | | | | 432,930 | |
| | | | | | | | |
| | | | | | | 612,554 | |
| | | | | | | | |
| | |
TELECOMMUNICATION SERVICES — 4.11% | | | | | | | | |
Diversified Telecommunication Services — 4.11% | | | | | | | | |
Bharti Infratel Ltd. | | | 77,434 | | | | 427,643 | |
Nippon Telegraph & Telephone Corp. | | | 17,930 | | | | 815,828 | |
| | | | | | | | |
| | | | | | | 1,243,471 | |
| | | | | | | | |
| | |
TRANSPORTATION — 2.46% | | | | | | | | |
Transportation Infrastructure — 2.46% | | | | | | | | |
Aena S.A. | | | 1,987 | | | | 293,074 | |
Shanghai International Air Co., Ltd. | | | 111,663 | | | | 451,507 | |
| | | | | | | | |
| | | | | | | 744,581 | |
| | | | | | | | |
| | |
UTILITIES — 4.04% | | | | | | | | |
Electric Utilities — 0.65% | | | | | | | | |
Nextera Energy, Inc. | | | 1,612 | | | | 197,180 | |
Multi-Utilities — 1.03% | | | | | | | | |
National Grid plc | | | 21,879 | | | | 309,674 | |
Water Utilities — 2.36% | | | | | | | | |
Aguas Andinas S.A. | | | 1,111,536 | | | | 714,950 | |
| | | | | | | | |
| | | | | | | 1,221,804 | |
| | | | | | | | |
TOTAL COMMON STOCK (Cost $23,062,653) | | | | | | | 25,050,493 | |
| | | | | | | | |
Annual Report 9
| | |
| SCHEDULE OF INVESTMENTS, CONTINUED | | |
| |
Thornburg Better World International Fund | | September 30, 2016 |
| | | | | | | | |
| | | Shares/
Principal Amount | | | Value | |
SHORT TERM INVESTMENTS — 16.30% | | | | | | | | |
b Thornburg Capital Management Fund | | | 493,408 | | | $ | 4,934,082 | |
| | | | | | | | |
TOTAL SHORT TERM INVESTMENTS (Cost $4,934,082) | | | | | | | 4,934,082 | |
| | | | | | | | |
TOTAL INVESTMENTS — 99.08% (Cost $27,996,735) | | | | | | $ | 29,984,575 | |
OTHER ASSETS LESS LIABILITIES — 0.92% | | | | | | | 284,216 | |
| | | | | | | | |
NET ASSETS — 100.00% | | | | | | $ | 30,268,791 | |
| | | | | | | | |
Footnote Legend
| b | Investment in Affiliates – Shown below are holdings of voting securities of each portfolio company which is considered “affiliated” to the Fund under the Investment Company Act of 1940, including companies for which the Fund’s holding represented 5% or more of the company’s voting securities, and a series of the Thornburg Investment Trust in which the Fund invested for cash management purposes during the period: |
| | | | | | | | | | | | | | | | | | | | | | | | | | | | |
Issuer | | Shares/Principal
September 30, 2015 | | | Gross
Additions | | | Gross
Reductions | | | Shares/
Principal
September 30,
2016 | | | Market
Value
September 30,
2016 | | | Investment
Income | | | Realized
Gain (Loss) | |
Thornburg Capital Management Fund | | | — | | | | 2,935,791 | | | | 2,442,383 | | | | 493,408 | | | $ | 4,934,082 | | | $ | 10,861 | | | $ | — | |
| | | | | | | | | | | | | | | | | | | | | | | | | | | | |
Total non-controlled affiliated issuers - 16.30% of net assets | | | | | | | | | | | | | | | | | | $ | 4,934,082 | | | $ | 10,861 | | | $ | — | |
| | | | | | | | | | | | | | | | | | | | | | | | | | | | |
Portfolio Abbreviations
To simplify the listings of securities, abbreviations are used per the table below:
| ADR | American Depositary Receipt |
| CHL | Denominated in Chilean Peso |
See notes to financial statements.
10 Annual Report
This page intentionally left blank.
Annual Report 11
| | |
| STATEMENT OF ASSETS AND LIABILITIES | | |
| |
Thornburg Better World International Fund | | September 30, 2016 |
| | | | |
ASSETS | | | | |
Investments at value (Note 3) | | | | |
Non-affiliated issuers (cost $23,062,653) | | $ | 25,050,493 | |
Non-controlled affiliated issuer (cost $4,934,082) | | | 4,934,082 | |
Cash | | | 10,961 | |
Cash denominated in foreign currency (cost $4) | | | 4 | |
Receivable for investments sold | | | 533,230 | |
Receivable for fund shares sold | | | 128,465 | |
Dividends receivable | | | 27,787 | |
Dividend and interest reclaim receivable | | | 7,604 | |
Prepaid expenses and other assets | | | 51,367 | |
| | | | |
Total Assets | | | 30,743,993 | |
| | | | |
| |
LIABILITIES | | | | |
Payable for investments purchased | | | 392,908 | |
Payable to investment advisor and other affiliates (Note 4) | | | 14,564 | |
Deferred taxes payable | | | 2,479 | |
Accounts payable and accrued expenses | | | 65,251 | |
| | | | |
Total Liabilities | | | 475,202 | |
| | | | |
| |
NET ASSETS | | $ | 30,268,791 | |
| | | | |
NET ASSETS CONSIST OF | | | | |
Distribution in excess of net investment income | | $ | (14,634 | ) |
Net unrealized appreciation on investments | | | 1,985,163 | |
Accumulated net realized gain (loss) | | | 1,600,813 | |
Net capital paid in on shares of beneficial interest | | | 26,697,449 | |
| | | | |
| | $ | 30,268,791 | |
| | | | |
12 Annual Report
| | |
| STATEMENT OF ASSETS AND LIABILITIES, CONTINUED | | |
| |
Thornburg Better World International Fund | | September 30, 2016 |
| | | | |
| |
NET ASSET VALUE | | | | |
Class A Shares: | | | | |
Net asset value and redemption price per share ($1,666,488 applicable to 120,194 shares of beneficial interest outstanding - Note 5) | | $ | 13.86 | |
Maximum sales charge, 4.50% of offering price | | | 0.65 | |
| | | | |
Maximum offering price per share | | $ | 14.51 | |
| | | | |
| |
Class C Shares: | | | | |
Net asset value and offering price per share* ($821,561 applicable to 59,582 shares of beneficial interest outstanding - Note 5) | | $ | 13.79 | |
| | | | |
| |
Class I Shares: | | | | |
Net asset value, offering and redemption price per share ($27,780,742 applicable to 1,989,376 shares of beneficial interest outstanding - Note 5) | | $ | 13.96 | |
| | | | |
| * | Redemption price per share is equal to net asset value less any applicable contingent deferred sales charge. |
See notes to financial statements.
Annual Report 13
STATEMENT OF OPERATIONS
| | |
| |
Thornburg Better World International Fund | | Year Ended September 30, 2016 |
| | | | |
INVESTMENT INCOME | | | | |
Dividend income | | | | |
Non-affiliated issuers (net of foreign taxes withheld of $37,015) | | $ | 341,247 | |
Non-controlled affiliated issuer | | | 10,861 | |
| | | | |
Total | | | 352,108 | |
| | | | |
| |
EXPENSES | | | | |
Investment advisory fees (Note 4) | | | 184,750 | |
Administration fees (Note 4) | | | | |
Class A Shares | | | 790 | |
Class C Shares | | | 362 | |
Class I Shares | | | 9,014 | |
Distribution and service fees (Note 4) | | | | |
Class A Shares | | | 1,594 | |
Class C Shares | | | 2,786 | |
Transfer agent fees | | | | |
Class A Shares | | | 3,787 | |
Class C Shares | | | 1,952 | |
Class I Shares | | | 4,022 | |
Registration and filing fees | | | | |
Class A Shares | | | 27,281 | |
Class C Shares | | | 27,281 | |
Class I Shares | | | 27,367 | |
Custodian fees (Note 2) | | | 65,760 | |
Professional fees | | | 85,876 | |
Accounting fees (Note 4) | | | 473 | |
Trustee fees | | | 1,311 | |
Other expenses | | | 50,055 | |
| | | | |
Total Expenses | | | 494,461 | |
Less: | | | | |
Fees waived by investment advisor (Note 4) | | | (206,822 | ) |
Expenses reimbursed by investment advisor (Note 4) | | | (72,715 | ) |
| | | | |
Net Expenses | | | 214,924 | |
| | | | |
Net Investment Income | | | 137,184 | |
| | | | |
REALIZED AND UNREALIZED GAIN (LOSS) | | | | |
Net realized gain (loss) on: | | | | |
Non-affiliated issuer investments | | | 1,642,804 | |
Forward currency contracts (Note 7) | | | (31,184 | ) |
Foreign currency transactions | | | (29,159 | ) |
| | | | |
| | | 1,582,461 | |
| | | | |
Net change in unrealized appreciation (depreciation) on: | | | | |
Non-affiliated issuer investments (net of deferred taxes payable of $2,479) | | | 1,985,361 | |
Foreign currency translations | | | (198 | ) |
| | | | |
| | | 1,985,163 | |
| | | | |
Net Realized and Unrealized Gain | | | 3,567,624 | |
| | | | |
Net Increase in Net Assets Resulting from Operations | | $ | 3,704,808 | |
| | | | |
See notes to financial statements.
14 Annual Report
| | |
| STATEMENT OF CHANGES IN NET ASSETS | | |
| |
Thornburg Better World International Fund | | September 30, 2016 |
| | | | |
| | | Year Ended
September 30, 2016* | |
INCREASE (DECREASE) IN NET ASSETS FROM | | | | |
| |
OPERATIONS | | | | |
Net investment income | | $ | 137,184 | |
Net realized gain (loss) on investments, forward currency contract, and foreign currency transactions | | | 1,582,461 | |
Net unrealized appreciation (depreciation) on investments, foreign currency translations, and deferred taxes | | | 1,985,163 | |
| | | | |
| |
Net Increase (Decrease) in Net Assets Resulting from Operations | | | 3,704,808 | |
| |
DIVIDENDS TO SHAREHOLDERS | | | | |
From net investment income | | | | |
Class A Shares | | | (7,285 | ) |
Class C Shares | | | (3,171 | ) |
Class I Shares | | | (123,062 | ) |
| |
FUND SHARE TRANSACTIONS (NOTE 5) | | | | |
Class A Shares | | | 1,518,080 | |
Class C Shares | | | 753,057 | |
Class I Shares | | | 24,426,364 | |
| | | | |
Net Increase in Net Assets | | | 30,268,791 | |
| |
NET ASSETS | | | | |
Beginning of Year | | | — | |
| | | | |
| |
End of Year | | $ | 30,268,791 | |
| | | | |
Distribution in excess of net investment income | | $ | (14,634 | ) |
| * | The Fund commenced operations on October 1, 2015. |
See notes to financial statements.
Annual Report 15
| | |
| NOTES TO FINANCIAL STATEMENTS | | |
| |
Thornburg Better World International Fund | | September 30, 2016 |
NOTE 1 – ORGANIZATION
Thornburg Better World International Fund (the “Fund”) is a diversified series of Thornburg Investment Trust (the “Trust”). The Fund commenced operations on October 1, 2015. The Trust was organized as a Massachusetts business trust under a Declaration of Trust dated June 3, 1987 and is registered as a diversified, open-end management investment company under the Investment Company Act of 1940, as amended.
The Fund is currently one of twenty separate series of the Trust. Each series is considered to be a separate entity for financial reporting and tax purposes and bears expenses directly attributable to it. The Fund seeks long-term capital appreciation. The Fund currently offers three classes of shares of beneficial interest: Class A, Class C, and Institutional Class (“Class I”). Each class of shares of the Fund represents an interest in the same portfolio of investments, except that (i) Class A shares are sold subject to a front-end sales charge collected at the time the shares are purchased and bear a service fee, (ii) Class C shares are sold at net asset value without a sales charge at the time of purchase, but are subject to a contingent deferred sales charge upon redemption within one year of purchase, and bear both a service fee and a distribution fee, (iii) Class I shares are sold at net asset value without a sales charge at the time of purchase and may be subject to a service fee, and (iv) the respective classes may have different reinvestment privileges and conversion rights. Additionally, the Fund may allocate among its classes certain expenses, to the extent allocable to specific classes, including transfer agent fees, government registration fees, certain printing and postage costs, and administrative and legal expenses. Currently, class specific expenses of the Fund are limited to service and distribution fees, administration fees, and certain registration and transfer agent expenses.
The following is a summary of significant accounting policies followed by the Fund in the preparation of its financial statements. The Fund prepares its financial statements in conformity with United States generally accepted accounting principles (“GAAP”), including investment company accounting and reporting guidance in the Financial Accounting Standards Board (the “FASB”) Accounting Standard Codification Topic 946.
NOTE 2 – SIGNIFICANT ACCOUNTING POLICIES
Security Valuation: All investments in securities held by the Fund are valued as described in Note 3.
Allocation of Income, Gains, Losses and Expenses: Net investment income (other than class specific expenses) and realized and unrealized gains and losses are allocated daily to each class of shares based upon the relative net asset value of outstanding shares (or the value of the dividend-eligible shares, as appropriate) of each class of shares at the beginning of the day (after adjusting for the current capital shares activity of the respective class). Expenses common to all Funds are allocated among the Funds comprising the Trust based upon their relative net asset values or other appropriate allocation methods. Operating expenses directly attributable to a specific class are charged against the operating income of that class.
Dividends and Distributions to Shareholders: Dividends and distributions to shareholders, which are determined in accordance with federal income tax regulations and may differ from GAAP, are recorded on the ex-dividend date. Ordinary income distributions, if any, are declared and paid quarterly. Capital gain distributions, if any, are declared and paid annually and more often if deemed necessary by the Advisor. Dividends are paid and are reinvested in additional shares of the Fund at net asset value per share at the close of business on the ex-dividend date, or at the shareholder’s option, paid in cash.
Investment Income: Dividend income is recorded on the ex-dividend date. Certain income from foreign investments is recognized as soon as information is available to the Fund. Interest income is accrued as earned. Premiums and discounts are amortized and accreted, respectively, to call dates or maturity dates using the effective yield method of the respective investments, which is included in interest income on the Statement of Operations.
Custodian Fees: Custodian fees disclosed in the Statement of Operations may include interest expenses incurred by the Fund on any cash overdrafts of its custodian account during the period. Such cash overdrafts may result from the effects of failed trades in portfolio securities and from cash outflows resulting from unanticipated shareholder redemption activity. The Fund pays interest to its custodian on any such cash overdraft at a rate equal to 2.50% of the overdraft amount in excess of $50,000.
Investment Transactions: Investment transactions are accounted for on a trade date basis. Realized gains and losses from the sale of investments are recorded on an identified cost basis.
When-Issued and Delayed Delivery Transactions: The Fund may engage in when-issued or delayed delivery transactions. To the extent the Fund engages in such transactions, it will do so for the purpose of acquiring portfolio investments consistent with the Fund’s investment objectives and not for the purpose of investment leverage or to speculate on interest rate or market changes. At the time the Fund makes a commitment to purchase an investment on a when-issued or delayed delivery basis, the Fund will record the transaction and reflect the value in determining its net asset value. When effecting such transactions, assets of an amount sufficient to make payment for the portfolio investments to be purchased will be segregated on the Fund’s records on the trade date. Investments purchased on a when-issued or delayed delivery basis do not earn interest until the settlement date.
Repurchase Agreements: The Fund may invest excess cash in repurchase agreements whereby the Fund purchases investments, which serve as collateral, with an agreement to resell such collateral to the seller at an agreed upon price at the maturity date of the
16 Annual Report
| | |
| NOTES TO FINANCIAL STATEMENTS, CONTINUED | | |
| |
Thornburg Better World International Fund | | September 30, 2016 |
repurchase agreement. Investments pledged as collateral for repurchase agreements are held in custody until maturity of the repurchase agreement. Provisions in the agreements require that the market value of the collateral is at least equal to the repurchase value in the event of default. In the event of default, the Fund has the right to liquidate the collateral and apply the proceeds in satisfaction of the obligation. Under certain circumstances, in the event of default or bankruptcy by the other party to the agreement, realization and/or retention of the collateral may be subject to legal proceedings.
Foreign Currency Translation: Portfolio investments and other assets and liabilities denominated in foreign currencies are translated into U.S. dollars based on the exchange rate of such currencies against the U.S. dollar on the date of valuation. Purchases and sales of investments and income items denominated in foreign currencies are translated into U.S. dollars at the exchange rate in effect on the transaction date. When the Fund purchases or sells foreign investments, it will customarily enter into a foreign exchange contract to minimize foreign exchange risk from the trade date to the settlement date of such transactions. The values of such spot contracts are included in receivable for investments sold and payable for investments purchased on the Statement of Assets and Liabilities.
The Fund does not separately report the effect of changes in foreign exchange rates from changes in market prices on investments held. Such changes are included in net unrealized appreciation (depreciation) from investments.
Reported net realized gains and losses from foreign currency transactions arise due to purchases and sales of foreign currencies, currency gains and losses realized between the trade and settlement dates on investment transactions and the difference between the amounts of dividends, interest, and foreign withholding taxes recorded on the Fund’s books, and the U.S. dollar equivalent of the amounts actually received or paid.
Net change in unrealized appreciation (depreciation) on foreign currency translations arise from changes in the fair value of assets and liabilities, other than investments at period end, resulting from changes in exchange rates.
Guarantees and Indemnifications: Under the Trust’s organizational documents (and under separate agreements with the independent Trustees), its officers and Trustees are provided with an indemnification against certain liabilities arising out of the performance of their duties to the Fund. In the normal course of business the Trust may also enter into contracts with service providers that contain general indemnifications. The Trust’s maximum exposure under these arrangements is unknown. However, based on experience, the Trust expects the risk of loss to be remote.
Use of Estimates: The preparation of financial statements in conformity with GAAP requires management to make estimates and assumptions that affect the reported amounts of assets and liabilities and disclosure of contingent assets and liabilities at the date of the financial statements and the reported amounts of increases (decreases) in net assets from operations during the reporting period. Actual results could differ from those estimates.
Federal Income Taxes: It is the policy of the Trust to comply with the provisions of the Internal Revenue Code applicable to regulated investment companies and to distribute to shareholders substantially all investment company taxable income including net realized gains on investments (if any), and tax exempt income of the Fund. Therefore, no provision for federal income or excise tax is required.
The Fund files income tax returns in United States federal and applicable state jurisdictions. The statute of limitations on the Fund’s tax return filings generally remains open for the three years following a return’s filing date. The Fund has analyzed each uncertain tax position believed to be material in the preparation of the Fund’s financial statements for the fiscal year ended September 30, 2016, including open tax years, to assess whether it is more likely than not that the position would be sustained upon examination, based on the technical merits of the position. The Fund has not identified any such position for which an asset or liability must be reflected in the Statement of Assets and Liabilities.
At September 30, 2016, information on the tax components of capital was as follows:
| | | | |
Cost of investments for tax purposes | | $ | 28,083,194 | |
| | | | |
Gross unrealized appreciation on a tax basis | | $ | 2,136,128 | |
Gross unrealized depreciation on a tax basis | | | (234,747 | ) |
| | | | |
Net unrealized appreciation (depreciation) on investments (tax basis) | | $ | 1,901,381 | |
| | | | |
Temporary book to tax adjustments made to the cost of investments and net unrealized appreciation (depreciation) for tax purposes result primarily from deferral of outstanding wash sale losses and outstanding passive foreign investment company (“PFIC”) tax basis adjustments.
At September 30, 2016, the Fund had deferred tax basis capital losses occurring subsequent to October 31, 2015 through September 30, 2016 of $17,380. For tax purposes, such capital losses will be recognized in the year ending September 30, 2017.
In order to account for permanent book to tax differences, the Fund increased distribution in excess of net investment income by $18,300, increased accumulated net realized gain (loss) by $18,352, and decreased net capital paid in on shares of beneficial interest
Annual Report 17
| | |
| NOTES TO FINANCIAL STATEMENTS, CONTINUED | | |
| |
Thornburg Better World International Fund | | September 30, 2016 |
by $52. Reclassifications have no impact upon the net asset value of the Fund and result primarily from currency losses, non-deductible expenses, and the disposition of a passive foreign investment company investment.
At September 30, 2016, the Fund had $1,689,984 of undistributed tax basis net ordinary investment income. The Fund had no undistributed tax basis capital gains.
The tax character of distributions paid during the year ended September 30, 2016, was as follows:
| | | | |
| | | 2016 | |
Distributions from: | | | | |
Ordinary income | | $ | 133,518 | |
Capital gains | | | — | |
| | | | |
Total | | $ | 133,518 | |
| | | | |
Foreign Withholding Taxes: The Fund is subject to foreign tax withholding imposed by certain foreign countries in which the Fund may invest. Withholding taxes are incurred on certain foreign dividends and are accrued at the time the dividend is recognized based on applicable foreign tax laws. The Fund files withholding tax reclaims in certain jurisdictions to recover a portion of amounts previously withheld, in view of various considerations, including recent decisions rendered by the courts in those and other jurisdictions. The Fund would expect to record a receivable for such a reclaim based on a variety of factors, including assessment of a jurisdiction’s legal obligation to pay reclaims, the jurisdiction’s administrative practices and payment history, and industry convention. To date the Fund has recorded no such receivable because there is limited precedent for collecting such prior year reclaims and the likelihood of collection remains uncertain.
Deferred Foreign Capital Gain Taxes: The Fund is subject to a tax imposed on net realized gains of securities of certain foreign countries. The Fund records an estimated deferred tax liability for net unrealized gains on these investments as reflected in the accompanying financial statements.
NOTE 3 – SECURITY VALUATION
Valuation of the Fund’s portfolio investment securities is performed in accordance with policies and procedures adopted by and under the oversight of the Trustees.
The Trustees of the Trust have appointed Thornburg Investment Management, Inc., the Trust’s investment advisor (the “Advisor”), to assist the Trustees in obtaining market values for portfolio investments, evaluate and monitor professional pricing service providers appointed by the Trustees’ Audit Committee (the “Audit Committee”) to assist in determining fair values for portfolio investments, assist in calculating fair values for portfolio investments in certain circumstances, and to perform other functions in connection with the valuation of investments. The Advisor acts through its Valuation and Pricing Committee (the “Committee”) and other employees of the Advisor. The Committee regularly reviews its own valuation calculations, as well as the valuations, valuation techniques and services furnished by pricing service providers, considers circumstances which may require valuation calculations by the Committee, and reviews previous valuation calculations. The Committee reports to the Audit Committee on the Committee’s activities, the performance of pricing service providers, and other matters relating to valuation of portfolio investments.
In those instances when the Committee assists in calculating a fair value for a portfolio investment, the Committee seeks to determine the price that the Fund would reasonably expect to receive upon a sale of the investment in an orderly transaction between market participants on the valuation date. The Committee customarily utilizes quotations from securities broker dealers in calculating valuations, but also may utilize prices obtained from pricing service providers or other methods approved by the Audit Committee. Because fair values calculated by the Committee are estimates, the calculation of a value for an investment may differ from the price that would be realized by the Fund upon a sale of the investment, and the difference could be material to the Fund’s financial statements. The Committee’s calculation of a fair value for an investment may also differ from the prices obtained by other persons (including other mutual funds) for the investment.
Valuation of Securities: Securities and other portfolio investments which are listed or traded on a United States securities exchange are valued at the last reported sale price on the valuation date. Investments listed or traded on an exchange for which there has been no sale that day are valued at the mean between the last reported bid and asked prices on that valuation date. Portfolio investments reported by NASDAQ are valued at the official closing price on the valuation date. If an investment is traded on more than one exchange, the investment is considered traded on the exchange that is normally the primary market for that investment. Securities and other portfolio investments which are listed or traded on exchanges outside the United States are valued at the last price or the closing price of the investment on the exchange that is normally the primary market for the investment, as of the close of the exchange preceding the Fund’s valuation date. Foreign investments listed or traded on an exchange for which there has been no sale that day are valued at the mean between the last reported bid and asked prices on that valuation date.
18 Annual Report
| | |
| NOTES TO FINANCIAL STATEMENTS, CONTINUED | | |
| |
Thornburg Better World International Fund | | September 30, 2016 |
In any case when a market quotation is not readily available for a portfolio investment ordinarily valued by market quotation, the Committee calculates a fair value for the investment using alternative methods approved by the Audit Committee. A market quotation is not readily available when the primary market or exchange for the investment is not open for the entire scheduled day of trading. Market quotations for an investment also may not be readily available if developments after the most recent close of the investment’s primary exchange or market, but prior to the close of business on any Fund business day, or an unusual event or significant period of time occurring since the availability of a market quotation, create a serious question concerning the reliability of the most recent market quotation available for the investment. In particular, on days when market volatility thresholds established by the Audit Committee are exceeded, foreign equity investments held by the Fund may be valued using alternative methods. The Committee customarily obtains valuations in these instances from pricing service providers approved by the Audit Committee. Pricing service providers ordinarily calculate valuations using multi-factor models to adjust market prices based upon various inputs, including exchange data, depository receipt prices, futures, index data and other data.
Debt obligations held by the Fund which are not listed or traded on exchanges or for which no reported market exists are ordinarily valued at the valuation obtained from a pricing service provider approved by the Audit Committee.
In any case when a pricing service provider fails to provide a valuation for a debt obligation held by the Fund, the Committee calculates a fair value for the obligation using alternative methods under procedures approved by the Audit Committee. Additionally, in cases when management believes that a valuation obtained from a pricing service provider merits review for significant reasons, the Committee decides whether or not to use the valuation calculated by the pricing service provider or to use an alternative method approved by the Audit Committee to calculate a fair value for the obligation.
Quotations for foreign investments expressed in foreign currency amounts are converted to U.S. dollar equivalents using a foreign exchange quotation from a third party service provider at the time of valuation. Foreign investments held by the Fund may be traded on days and at times when the Fund is not open for business. Consequently, the value of Fund investments may be significantly affected on days when shareholders cannot purchase or sell Fund shares. Futures contracts and other financial and derivative instruments traded on an exchange are valued at the latest published price for the instrument on its primary exchange. Listed options are valued at the last bid price.
Valuation Hierarchy: The Fund categorizes its investments based upon the inputs used in valuing those investments, according to a three-level hierarchy established in guidance from the FASB. Categorization of investments using this hierarchy is intended by the FASB to maximize the use of observable inputs in valuing investments and minimize the use of unobservable inputs by requiring that the most observable inputs be used when available. Observable inputs are those that market participants would use in valuing an investment based on available market information. Unobservable inputs are those that reflect assumptions about the information market participants would use in valuing an investment. An investment’s level within the hierarchy is based on the lowest level input that is deemed significant to the valuation. The methodologies and inputs used to value investments are not necessarily indications of the risk or liquidity associated with those investments.
Various inputs are used in calculating valuations for the Fund’s investments. These inputs are generally summarized according to the three-level hierarchy below:
Level 1: Quoted prices in active markets for identical investments.
Level 2: Other direct or indirect significant observable inputs (including quoted prices for similar investments in active markets and other observable inputs, such as interest rates, prepayment rates, credit risk, etc.).
Level 3: Significant unobservable inputs (including the Committee’s own assumptions in calculating the fair values of investments).
Valuations for debt obligations held by the Fund are typically calculated by pricing service providers approved by the Audit Committee and are characterized as Level 2 within the valuation hierarchy.
On days when market volatility thresholds established by the Audit Committee are exceeded, foreign securities for which valuations are obtained from pricing service providers are fair valued. On these days, the foreign securities are characterized as Level 2 within the valuation hierarchy and revert to Level 1 after the threshold is no longer exceeded.
In a limited number of cases the Committee calculates a fair value for investments using broker quotations or other methods approved by the Audit Committee. When the Committee uses a single broker quotation to calculate a fair value for an investment without other significant observable inputs, or if a fair value is calculated using other significant inputs that are considered unobservable, the investment is characterized as Level 3 within the hierarchy. Other significant unobservable inputs used to calculate a fair value in these instances might include an income-based valuation approach which considers discounted anticipated future cash flows from the investment, and application of discounts due to the nature or duration of any restrictions on the disposition of the investment.
Valuations based upon the use of inputs from Levels 1, 2 or 3 may not represent the actual price received upon the disposition of an investment, and the Fund may receive a price that is lower than the valuation based upon these inputs when it sells the investment.
Annual Report 19
| | |
| NOTES TO FINANCIAL STATEMENTS, CONTINUED | | |
| |
Thornburg Better World International Fund | | September 30, 2016 |
The following table displays a summary of the fair value hierarchy measurements of the Fund’s investments as of September 30, 2016. In any instance when valuation inputs from more than one level are used to determine the fair value of a specific investment, the investment is placed in the level of the table based upon the lowest level input that is significant in determining the fair value of the investment:
| | | | | | | | | | | | | | | | |
| | | Fair Value Measurements at September 30, 2016 | |
| | | Total | | | Level 1 | | | Level 2 | | | Level 3 | |
Assets | | | | | | | | | | | | | | | | |
Investments in Securities* | | | | | | | | | | | | | | | | |
Common Stock | | $ | 25,050,493 | | | $ | 25,050,493 | | | $ | — | | | $ | — | |
Short Term Investments | | | 4,934,082 | | | | 4,934,082 | | | | — | | | | — | |
| | | | | | | | | | | | | | | | |
Total Investments in Securities | | $ | 29,984,575 | | | $ | 29,984,575 | | | $ | — | | | $ | — | |
Other Financial Instruments** | | | | | | | | | | | | | | | | |
Spot Currency | | $ | 10 | | | $ | 10 | | | $ | — | | | $ | — | |
Liabilities | | | | | | | | | | | | | | | | |
Other Financial Instruments** | | | | | | | | | | | | | | | | |
Spot Currency | | $ | (342 | ) | | $ | (342 | ) | | $ | — | | | $ | — | |
| * | See Schedule of Investments for a summary of the industry exposure as grouped according to the Global Industry Classification Standard (GICS), which is an industry taxonomy developed by MSCI, Inc. and Standard & Poor’s (S&P). |
| ** | Other Financial Instruments include investments not reflected in the Schedule of Investments, which may include futures, forwards and swap contracts, which are valued at the unrealized appreciation (depreciation) on the investment. |
In accordance with the guidance prescribed in Accounting Standards Update No. 2011-04, it is the policy of the Fund to recognize transfers between levels and the underlying events which caused the movement. The Fund recognized no transfers between levels for the year ended September 30, 2016, other than when the Fund exceeded market volatility thresholds for foreign equity investments during the period.
NOTE 4 – INVESTMENT ADVISORY FEE AND OTHER TRANSACTIONS WITH AFFILIATES
Pursuant to an investment advisory agreement, the Advisor serves as the investment advisor and performs services for the Fund for which the fees are payable at the end of each month. Under the investment advisory agreement, the Fund pays the Advisor a management fee based on the daily net assets of the Fund at an annual rate as shown in the following table:
Management Fee Schedule
| | | | |
Daily Net Assets | | Fee Rate | |
Up to $500 million | | | 0.975 | % |
Next $500 million | | | 0.925 | |
Next $500 million | | | 0.875 | |
Next $500 million | | | 0.825 | |
Over $2 billion | | | 0.775 | |
The Fund’s effective management fee for the year ended September 30, 2016 was 0.975% of the Fund’s average dividend assets (before applicable fees waived by the Advisor of $206,822).
The Fund pays to the Advisor the costs of personnel who perform certain accounting services for the Fund. For the year ended September 30, 2016 the Fund paid $473 to the Advisor for these accounting services. The Trust has also entered into administrative service agreements with the Advisor, whereby the Advisor will perform certain administrative services for the shareholders of each class of the Fund’s shares, and for which fees will be payable at an annual rate of up to .125 of 1% per annum of the average daily net assets attributable to each class of shares.
The Trust has an underwriting agreement with Thornburg Securities Corporation (the “Distributor”), an affiliate of the Advisor, which acts as the distributor of the Fund’s shares. For the year ended September 30, 2016, the Distributor has advised the Fund that it earned net commissions aggregating $2,150 from the sale of Class A shares of the Fund, and collected contingent deferred sales charges aggregating $25 from redemptions of Class C shares of the Fund.
20 Annual Report
| | |
| NOTES TO FINANCIAL STATEMENTS, CONTINUED | | |
| |
Thornburg Better World International Fund | | September 30, 2016 |
Pursuant to a service plan under Rule 12b-1 of the Investment Company Act of 1940, the Fund may pay to the Advisor or securities dealers and other financial institutions at the Advisor’s request an amount not to exceed .25 of 1% per annum of the average daily net assets attributable to Class A and Class C shares of the Fund to obtain various shareholder and distribution related services. For the year ended September 30, 2016, there were no 12b-1 service plan fees charged for Class I shares. The Advisor may pay out of its own resources additional expenses for distribution of the Fund’s shares and shareholder services.
The Trust has also adopted distribution plans pursuant to Rule 12b-1, applicable only to the Fund’s Class C shares, under which the Fund compensates the Distributor for services in promoting the sale of Class C shares of the Fund at an annual rate of up to .75 of 1% per annum of the average daily net assets attributable to Class C shares. Total fees incurred by each class of shares of the Fund under their respective service and distribution plans for the year ended September 30, 2016, are set forth in the Statement of Operations.
The Advisor and Distributor have contractually agreed to waive fees and reimburse expenses incurred by the Fund so that actual expenses of certain share classes do not exceed levels as specified in the Fund’s most recent prospectus. The agreement may be terminated by the Fund at any time, but may not be terminated by the Advisor or Distributor before February 1, 2017, unless the Advisor ceases to be the investment advisor to the Trust or the Distributor ceases to be the distributor of the Fund prior to that date. The Advisor and Distributor retain the right to be repaid by the Fund for fee waivers and expense reimbursements if expenses fall below the contractual limit prior to the end of the fiscal year.
For the year ended September 30, 2016, the Advisor voluntarily waived Fund level investment advisory fees and other Fund level fees of $206,822. For the year ended September 30, 2016, the Advisor contractually reimbursed certain class specific expenses, administrative fees, and distribution fees of $27,470 for Class A shares, $27,955 for Class C shares, and $17,290 for Class I shares.
Certain officers and Trustees of the Trust are also officers or directors of the Advisor and Distributor. The compensation of independent Trustees is borne by the Trust.
The percentage of direct investments in the Fund held by appointed Trustees, Officers and the Advisor is approximately 59.46%.
The Fund may sell securities to an affiliated fund, or the Fund may purchase securities held by an affiliated fund, provided the affiliation is due solely to having a common investment advisor, common officers, or common trustees, and provided that all such transactions will comply with Rule 17a-7 under the 1940 Act. For the year ended September 30, 2016, the Fund had no transactions with affiliated funds.
NOTE 5 – SHARES OF BENEFICIAL INTEREST
At September 30, 2016, there were an unlimited number of shares with no par value of beneficial interest authorized. Transactions in shares of beneficial interest were as follows:
| | | | | | | | |
| | | Year Ended
September 30, 2016* | |
| | | Shares | | | | Amount | |
Class A Shares | | | | | | | | |
Shares sold | | | 132,207 | | | $ | 1,665,516 | |
Shares issued to shareholders in reinvestment of dividends | | | 515 | | | | 7,141 | |
Shares repurchased | | | (12,528 | ) | | | (154,577 | ) |
| | | | | | | | |
| | |
Net increase (decrease) | | | 120,194 | | | $ | 1,518,080 | |
| | | | | | | | |
| | |
Class C Shares | | | | | | | | |
Shares sold | | | 59,567 | | | $ | 752,758 | |
Shares issued to shareholders in reinvestment of dividends | | | 230 | | | | 3,171 | |
Shares repurchased | | | (215 | ) | | | (2,872 | ) |
| | | | | | | | |
| | |
Net increase (decrease) | | | 59,582 | | | $ | 753,057 | |
| | | | | | | | |
| | |
Class I Shares | | | | | | | | |
Shares sold | | | 1,992,451 | | | $ | 24,462,178 | |
Shares issued to shareholders in reinvestment of dividends | | | 6,180 | | | | 86,279 | |
Shares repurchased | | | (9,255 | ) | | | (122,093 | ) |
| | | | | | | | |
| | |
Net increase (decrease) | | | 1,989,376 | | | $ | 24,426,364 | |
| | | | | | | | |
| * | The Fund commenced operations on October 1, 2015. |
Annual Report 21
| | |
| NOTES TO FINANCIAL STATEMENTS, CONTINUED | | |
| |
Thornburg Better World International Fund | | September 30, 2016 |
NOTE 6 – INVESTMENT TRANSACTIONS
For the year ended September 30, 2016, the Fund had purchase and sale transactions of investments (excluding short-term investments) of $50,304,043 and $28,884,194, respectively.
NOTE 7 – DERIVATIVE FINANCIAL INSTRUMENTS WITH OFF-BALANCE SHEET RISK AND FOREIGN INVESTMENT RISK
The Fund may use a variety of derivative financial instruments to hedge or adjust the risks affecting its investment portfolio or to enhance investment returns. Provisions of the FASB Accounting Standards Codification 815-10-50 (“ASC 815”) require certain disclosures. The disclosures are intended to provide users of financial statements with an understanding of the use of derivative instruments by the Fund and how these derivatives affect the financial position, financial performance and cash flows of the Fund. The Fund does not designate any derivative instruments as hedging instruments under ASC 815. During the year ended September 30, 2016, the Fund’s principal exposure to derivative financial instruments of the type addressed by ASC 815 was investment in foreign exchange contracts. A foreign exchange contract is an agreement between two parties to exchange different currencies at a specified rate of exchange at an agreed upon future date. Foreign exchange contracts involve risks to the Fund, including the risk that a contract’s counterparty will not meet its obligations to the Fund, the risk that a change in a contract’s value may not correlate perfectly with the currency the contract was intended to track, and the risk that the Fund’s Advisor is unable to correctly implement its strategy in using a contract. In any such instance, the Fund may not achieve the intended benefit of entering into a contract, and may experience a loss.
The Fund entered into forward currency contracts during the year ended September 30, 2016 in the normal course of pursuing its investment objectives, with the objective of purchasing foreign investments or with the intent of reducing the risk to the value of the Fund’s foreign investments from adverse changes in the relationship between the U.S. dollar and foreign currencies. In each case these contracts have been initiated in conjunction with foreign investment transactions.
These contracts are accounted for by the Fund under ASC 815. Unrealized appreciation and depreciation on outstanding contracts are reported in the Fund’s Statement of Assets and Liabilities, as measured by the difference between the forward exchange rates at the reporting date and the forward exchange rates at each contract’s inception date. Net realized gain (loss) on contracts closed during the period, and changes in net unrealized appreciation (depreciation) on outstanding contracts are recognized in the Fund’s Statement of Operations.
The quarterly average value of open sell currency contracts for the year ended September 30, 2016 was $196,978. Open buy currency contracts are entered into for the purpose of closing open sell currency contracts and the values are dependent upon the values of the open sell currency contracts to which they relate.
As of September 30, 2016, there were no open derivative financial instruments of the type addressed by ASC 815 held by the Fund, and there is no unrealized appreciation (depreciation) of outstanding forward currency contracts recognized in the Fund’s Statement of Assets and Liabilities or in the Statement of Operations.
The net realized gain (loss) from forward currency contracts and on outstanding forward currency contracts recognized in the Fund’s Statement of Operations for the year ended September 30, 2016 are disclosed in the following table:
| | | | |
Net Realized Gain (Loss) on Derivative Financial Instruments Recognized in Income for the Year Ended September 30, 2016 |
| | | Total | | Forward Currency Contracts |
Foreign exchange contracts | | $(31,184) | | $(31,184) |
OTHER NOTES
Risks: The Fund’s investments subject it to risks including, but not limited to, management risk, market and economic risk, risks affecting specific issuers, liquidity risk, the risks associated with investments in small- and mid-cap companies and non-U.S. issuers (including developing country issuers), credit risk, social investing risk, real estate investment trusts, and interest rate risk. Please see the Fund’s prospectus for a discussion of the risks associated with an investment in the Fund.
Subsequent Events: Fund management believes no events have occurred between September 30, 2016 and the date of issuance of the financial statements that require adjustment to or disclosure in the accompanying financial statements.
22 Annual Report
This page intentionally left blank.
Annual Report 23
FINANCIAL HIGHLIGHTS
Thornburg Better World International Fund
| | | | | | | | | | | | | | | | | | | | | | | | | | | | | | | | | | | | | | | | | | | | | | | | | | | | | | | | |
| | | PER SHARE PERFORMANCE (for a share outstanding throughout the Year) | | | RATIOS TO AVERAGE NET ASSETS | | | SUPPLEMENTAL DATA | |
Unless Otherwise Noted, Periods
are
Fiscal Years
Ended Sept. 30, | | Net Asset
Value
Beginning
of Year | | | Net
Investment
Income
(Loss)+ | | Net
Realized
&
Unrealized
Gain (Loss)
on
Investments | | | Total from
Investment
Operations | | | Dividends
from Net
Investment
Income | | | Dividends
from Net
Realized
Gains | | Total
Dividends | | | Net
Asset
Value
End
of
Year | | | Net
Investment
Income
(Loss)
(%) | | | Expenses,
After
Expense
Reductions
(%) | | | Expenses,
After
Expense
Reductions
and
Net of
Custody
Credits
(%) | | | Expenses,
Before
Expense
Reductions
(%) | | | Total
Return
(%)(a) | | | Portfolio
Turnover
Rate
(%)(a) | | | Net
Assets
at End
of
Year
(Thousands) | |
CLASS A SHARES | | | | | | | | | | | | | | | | | | | | | | | | | | | | | | | | | | | | | | | | | | | | | | | | | | |
2016(b)(c) | | $ | 11.94 | | | 0.03 | | | 2.04 | | | | 2.07 | | | | (0.15 | ) | | — | | | (0.15 | ) | | $ | 13.86 | | | | 0.21 | | | | 1.83 | | | | 1.83 | | | | 7.27 | | | | 16.60 | | | | 180.60 | | | $ | 1,666 | |
CLASS C SHARES | | | | | | | | | | | | | | | | | | | | | | | | | | | | | | | | | | | | | | | | | | | | | | | | | | |
2016(b) | | $ | 11.94 | | | (0.05) | | | 2.04 | | | | 1.99 | | | | (0.14 | ) | | — | | | (0.14 | ) | | $ | 13.79 | | | | (0.40 | ) | | | 2.38 | | | | 2.38 | | | | 13.13 | | | | 15.94 | | | | 180.60 | | | $ | 822 | |
CLASS I SHARES | | | | | | | | | | | | | | | | | | | | | | | | | | | | | | | | | | | | | | | | | | | | | | | | | | |
2016(b) | | $ | 11.94 | | | 0.10 | | | 2.01 | | | | 2.11 | | | | (0.09 | ) | | — | | | (0.09 | ) | | $ | 13.96 | | | | 0.76 | | | | 1.09 | | | | 1.09 | | | | 2.28 | | | | 17.44 | | | | 180.60 | | | $ | 27,781 | |
| (a) | Not annualized for periods less than one year. |
| (b) | Fund commenced operations on October 1, 2015. |
| (c) | Sales loads are not reflected in computing total return. |
| + | Based on weighted average shares outstanding. |
See notes to financial statements.
| | | | |
| 24 Annual Report | | | | Annual Report 25 |
REPORT OF INDEPENDENT REGISTERED PUBLIC ACCOUNTING FIRM
Thornburg Better World International Fund
To the Trustees and Shareholders of
Thornburg Better World International Fund
In our opinion, the accompanying statement of assets and liabilities, including the schedule of investments in securities, and the related statement of operations and of changes in net assets and the financial highlights present fairly, in all material respects, the financial position of the Thornburg Better World International Fund (the “Fund”) at September 30, 2016, and the results of its operations, the changes in its net assets and the financial highlights for the period October 1, 2015 (commencement of operations) through September 30, 2016 , in conformity with accounting principles generally accepted in the United States of America. These financial statements and financial highlights (hereafter referred to as “financial statements”) are the responsibility of the Fund’s management. Our responsibility is to express an opinion on these financial statements based on our audit. We conducted our audit of these financial statements in accordance with the standards of the Public Company Accounting Oversight Board (United States). Those standards require that we plan and perform the audit to obtain reasonable assurance about whether the financial statements are free of material misstatement. An audit includes examining, on a test basis, evidence supporting the amounts and disclosures in the financial statements, assessing the accounting principles used and significant estimates made by management, and evaluating the overall financial statement presentation. We believe that our audits, which included confirmation of securities at September 30, 2016 by correspondence with the custodian, brokers, transfer agent, and the application of alternative procedures where securities purchased had not been received, provide a reasonable basis for our opinion.
PricewaterhouseCoopers LLP
New York, New York
November 18, 2016
26 Annual Report
| | |
| EXPENSE EXAMPLE | | |
| |
Thornburg Better World International Fund | | September 30, 2016 |
As a shareholder of the Fund, you incur two types of costs:
| | (1) | transaction costs, including |
(a) sales charges (loads) on purchase payments, for Class A shares;
(b) a deferred sales charge on redemptions of any part or all of a purchase of $1 million of Class A shares within 12 months of purchase;
(c) a deferred sales charge on redemptions of Class C shares within 12 months of purchase;
| | (2) | ongoing costs, including management fees; distribution and/or service (12b-1) fees; and other Fund expenses. |
This example is intended to help you understand your ongoing costs (in dollars) of investing in the Fund and to compare these costs with the ongoing costs of investing in other mutual funds.
The example is based on a $1,000 investment beginning on April 1, 2016, and held until September 30, 2016.
| | | | | | | | | | | | |
| | | Beginning
Account Value
4/1/16 | | | Ending
Account Value
9/30/16 | | | Expenses paid
During period†
4/1/16–9/30/16 | |
Class A Shares | | | | | | | | | | | | |
Actual | | $ | 1,000.00 | | | $ | 1,117.40 | | | $ | 9.91 | |
Hypothetical* | | $ | 1,000.00 | | | $ | 1,015.64 | | | $ | 9.44 | |
Class C Shares | | | | | | | | | | | | |
Actual | | $ | 1,000.00 | | | $ | 1,114.60 | | | $ | 12.56 | |
Hypothetical* | | $ | 1,000.00 | | | $ | 1,013.12 | | | $ | 11.95 | |
Class I Shares | | | | | | | | | | | | |
Actual | | $ | 1,000.00 | | | $ | 1,120.90 | | | $ | 6.33 | |
Hypothetical* | | $ | 1,000.00 | | | $ | 1,019.03 | | | $ | 6.02 | |
| † | Expenses are equal to the annualized expense ratio for each class (A: 1.87%; C: 2.38%; I: 1.19%) multiplied by the average account value over the period, multiplied by 183/366 to reflect the one-half year period. |
| * | Hypothetical assumes a rate of return of 5% per year before expenses. |
ACTUAL EXPENSES
For each class of shares, the first line of the accompanying table provides information about actual account values and actual expenses. You may use the information in this line, together with the amount you invested, to estimate the expenses that you paid over the period. Simply divide your account value by $1,000 (for example, an $8,600 account value divided by $1,000 = 8.6), then multiply the result by the number in the first line for your class of shares under the heading entitled “Expenses Paid During Period” to estimate the expenses you paid on your account during this period.
HYPOTHETICAL EXAMPLE FOR COMPARISON PURPOSES
For each class of shares, the second line of the accompanying table provides information about hypothetical account values and hypothetical expenses based on the Fund’s actual expense ratio and an assumed rate of return of 5% per year before expenses, which is not the Fund’s actual return. The hypothetical account values and expenses may not be used to estimate the actual ending account balance or expenses you paid for the period. You may use this information to compare the ongoing costs of investing in the Fund and other funds. To do so, compare this 5% hypothetical example with the 5% hypothetical examples that appear in the shareholder reports of the other funds.
Please note that the expenses shown in the table are meant to highlight your ongoing costs only and do not reflect any transactional costs, such as sales charges (loads), redemption fees, or exchange fees. Therefore, the second line of the table for each class of shares is useful in comparing ongoing costs only, and will not help you determine the relative total costs of owning different funds. In addition, if these transactional costs were included, your costs would have been higher.
Annual Report 27
| | |
| TRUSTEES AND OFFICERS | | |
| |
Thornburg Better World International Fund | | September 30, 2016 (Unaudited) |
| | | | | | |
Name, Age, Year Elected Position Held with Fund | | Principal Occupation(s) During Past Five Years | | Other
Directorships
Held by Trustee | |
INTERESTED TRUSTEES(1)(2)(4) | | | | |
| | |
Garrett Thornburg, 71 Trustee since 1987, Chairman of Trustees(3) | | Chairman and controlling shareholder of Thornburg Investment Management, Inc. (investment advisor); Chairman and controlling shareholder of Thornburg Securities Corporation (securities dealer); Chairman and CEO of Chamisa Energy, LLC; President of the Thornburg Foundation (nonprofit). | | | None | |
| | |
Brian J. McMahon, 61 Trustee since 2001, Vice Chairman of Trustees, Member of Governance & Nominating Committee & Operations Risk Oversight Committee(5) | | Chief Investment Officer, Managing Director, and Portfolio Manager and, until 2016, CEO and President of Thornburg Investment Management, Inc.; Vice President of Thornburg Securities Corporation. | | | None | |
| |
INDEPENDENT TRUSTEES(1)(2)(4) | | | | |
| | |
David A. Ater, 71 Trustee since 1994, Member of Audit Committee & Chairman of Governance & Nominating Committee | | Principal in Ater & Associates, Santa Fe, NM (developer, planner and broker of residential and commercial real estate); owner, developer and broker for various real estate projects. | | | None | |
| | |
David D. Chase, 75 Trustee since 2000, Chairman of Audit Committee | | Managing Member of CS Group, LLC, Santa Fe, NM (private investment fund – family office). | | | None | |
| | |
Sally Corning, 55 Trustee since 2012, Member of Audit Committee | | Partner in Sun Mountain Capital, Santa Fe, NM (private equity firm with investment programs encompassing venture capital, mezzanine debt, and growth equity). | | | None | |
| | |
Susan H. Dubin, 67 Trustee since 2004, Member of Audit Committee & Governance and Nominating Committee | | President of Dubin Investments, Ltd., Greenwich, CT (private investment fund); Director and officer of various charitable organizations. | | | None | |
| | |
David L. Gardner, 53 Trustee since 2015, Member of Operations Risk Oversight Committee | | Until 2012, head of EMEA (Europe, Middle East and Africa) Sales for iShares of Blackrock, Inc., EMEA Executive Committee Member and EMEA Operating Committee Member at Blackrock, Inc. | | | None | |
| | |
Owen D. Van Essen, 62 Trustee since 2004, Member of Governance & Nominating Committee & Chairman of Operations Risk Oversight Committee | | President of Dirks, Van Essen & Murray, Santa Fe, NM (newspaper mergers and acquisitions). | | | None | |
| | |
James W. Weyhrauch, 57 Trustee since 1996, Member of Audit Committee & Operations Risk Oversight Committee | | Real estate broker, Santa Fe Properties, Santa Fe, NM; Vice Chairman of Nambe LLC, Santa Fe, NM (manufacturing & design company). | | | None | |
28 Annual Report
| | |
| TRUSTEES AND OFFICERS, CONTINUED | | |
| |
Thornburg Better World International Fund | | September 30, 2016 (Unaudited) |
| | | | | | |
Name, Age, Year Elected Position Held with Fund | | Principal Occupation(s) During Past Five Years | | Other
Directorships
Held by Trustee | |
OFFICERS OF THE FUND (WHO ARE NOT TRUSTEES)(1)(7) | | | | |
| | |
Nimish Bhatt, 53 Treasurer since 2016(6) | | Chief Financial Officer and Treasurer of Thornburg Investment Management, Inc. and Thornburg Securities Corporation since 2016; Senior Vice President (2004-2016), Chief Financial Officer (2011-2016), and Head of Fund Administration (2011-2016) of Calamos Asset Management, Inc., Calamos Investments LLC, Calamos Advisors LLC, and Calamos Wealth Management; Director of Calamos Global Funds plc (2007-2016). | | | Not applicable | |
| | |
Jason Brady, 42 President since 2016(6) | | CEO and President since 2016, Vice President from 2011 to 2016, Portfolio Manager and Managing Director of Thornburg Investment Management, Inc.; Vice President of Thornburg Securities Corporation since 2016. | | | Not applicable | |
| | |
Kathleen Brady, 56 Vice President since 2008 | | Tax Manager Fund Accounting of Thornburg Investment Management, Inc. | | | Not applicable | |
| | |
Connor Browne, 37 Vice President since 2006 | | Portfolio Manager, Vice President since 2013, and Managing Director of Thornburg Investment Management, Inc. | | | Not applicable | |
| | |
Tim Cunningham, 41 Vice President since 2014 | | Managing Director since 2011, Portfolio Manager since 2012, and Associate Portfolio Manager from 2009–2012 of Thornburg Investment Management, Inc. | | | Not applicable | |
| | |
Randy Dry, 42 Vice President since 2014 | | Vice President and Managing Director, Director of Institutional Group from 2014-2016, and since 2016, Chief Administrative Officer of Thornburg Investment Management, Inc. | | | Not applicable | |
| | |
Greg Dunn, 40 Vice President since 2014 | | Managing Director, Portfolio Manager since 2012, and Associate Portfolio Manager from 2009–2012 of Thornburg Investment Management, Inc. | | | Not applicable | |
| | |
Lon Erickson, 41 Vice President since 2008 | | Portfolio Manager and Managing Director of Thornburg Investment Management, Inc. | | | Not applicable | |
| | |
William V. Fries, 77 Vice President since 1995 | | Portfolio Manager, Vice President, and Managing Director of Thornburg Investment Management, Inc. | | | Not applicable | |
| | |
Thomas Garcia, 45 Vice President since 2006 | | Vice President since 2011, Managing Director, Head Equity Trader, and Associate Portfolio Manager of Thornburg Investment Management, Inc. | | | Not applicable | |
| | |
Rolf Kelly, 37 Vice President since 2016 | | Portfolio Manager and Managing Director since 2013 and Associate Portfolio Manager from 2011–2013 of Thornburg Investment Management, Inc. | | | Not applicable | |
| | |
Ben Kirby, 36 Vice President since 2014 | | Portfolio Manager and Managing Director since 2013 and Associate Portfolio Manager from 2011–2013 of Thornburg Investment Management, Inc. | | | Not applicable | |
| | |
Jeff Klingelhofer, 41 Vice President since 2016 | | Portfolio Manager and Managing Director since 2015, Associate Portfolio Manager from 2012–2015, and Fixed Income Analyst from 2010–2012 of Thornburg Investment Management, Inc. | | | Not applicable | |
| | |
Rob MacDonald, 40 Vice President since 2016 | | Managing Director since 2015, Portfolio Manager since 2014, and Associate Portfolio Manager from 2011–2014 of Thornburg Investment Management, Inc. | | | Not applicable | |
| | |
Leigh Moiola, 49 Vice President since 2001 | | Vice President, Managing Director, and Director of Marketing of Thornburg Investment Management, Inc.; Vice President of Thornburg Securities Corporation. | | | Not applicable | |
| | |
Christopher Ryon, 60 Vice President since 2008 | | Portfolio Manager and Managing Director of Thornburg Investment Management, Inc. | | | Not applicable | |
| | |
Nicholos Venditti, 35 Vice President since 2016 | | Portfolio Manager and Managing Director since 2015 and Associate Portfolio Manager from 2011–2015 of Thornburg Investment Management, Inc. | | | Not applicable | |
Annual Report 29
| | |
| TRUSTEES AND OFFICERS, CONTINUED | | |
| |
Thornburg Better World International Fund | | September 30, 2016 (Unaudited) |
| | | | |
Name, Age, Year Elected Position Held with Fund | | Principal Occupation(s) During Past Five Years | | Other
Directorships
Held by Trustee |
| | |
Vinson Walden, 46 Vice President since 2004 | | Portfolio Manager and Managing Director of Thornburg Investment Management, Inc. | | Not applicable |
| | |
Lei Wang, 45 Vice President since 2006 | | Portfolio Manager and Managing Director of Thornburg Investment Management, Inc. | | Not applicable |
| | |
Sasha Wilcoxon, 42 Vice President since 2003 Secretary since 2007(6) | | Managing Director, Director of Mutual Fund Operations, and Vice President of Thornburg Investment Management, Inc.; Vice President of Thornburg Securities Corporation. | | Not applicable |
| | |
Charles Wilson, 41 Vice President since 2016 | | Portfolio Manager and Managing Director since 2014 and Associate Portfolio Manager from 2012–2014 of Thornburg Investment Management, Inc.; Co-Portfolio Manager of Marsico Capital Management from 2010–2012. | | Not applicable |
| | |
Di Zhou, 38 Vice President since 2016 | | Portfolio Manager and Managing Director since 2016, Associate Portfolio Manager from 2014–2016, and Equity Research Analyst from 2010–2014 of Thornburg Investment Management, Inc. | | Not applicable |
| (1) | Each person’s address is 2300 North Ridgetop Road, Santa Fe, New Mexico 87506. |
| (2) | The Fund is a separate investment “Fund” or “series” of Thornburg Investment Trust (the “Trust”), which comprises the Thornburg mutual fund complex and is organized as a Massachusetts business trust. Thornburg Investment Management, Inc. is the investment advisor to, and manages, all the Funds of the Trust. Each Trustee oversees all the Funds of the Trust. |
| (3) | Mr. Thornburg is considered an “interested” Trustee under the Investment Company Act of 1940 because he is the sole director and controlling shareholder of Thornburg Investment Management, Inc., the investment advisor to the Trust, and is the sole director and controlling shareholder of Thornburg Securities Corporation, the distributor of shares for the Trust. |
| (4) | The Bylaws of the Trust currently require that each Trustee shall retire by the end of the calendar year during which the Trustee reached the age of 75 years. Otherwise each Trustee serves in office until the election and qualification of a successor or until the Trustee sooner dies, resigns, retires or is removed. |
| (5) | Mr. McMahon is considered an “interested” Trustee under the Investment Company Act of 1940 because he is the chief investment officer of Thornburg Investment Management, Inc. |
| (6) | The Trust’s president, secretary, and treasurer each serves a one-year term or until the election and qualification of a successor; each other officer serves at the pleasure of the Trustees. |
| (7) | Assistant vice presidents, assistant secretaries, and assistant treasurers are not shown. |
The Statement of Additional Information for each Fund of the Trust includes additional information about the Trustees and is available, without charge and upon request, by calling 1-800-847-0200.
30 Annual Report
| | |
| OTHER INFORMATION | | |
| |
Thornburg Better World International Fund | | September 30, 2016 (Unaudited) |
PORTFOLIO PROXY VOTING
Policies and Procedures:
The Trust has delegated to Thornburg Investment Management, Inc. (the “Advisor”) voting decisions respecting proxies for the Fund’s voting securities. The Advisor makes voting decisions in accordance with its Proxy Voting Policy. A description of the Policy is available (i) without charge, upon request, by calling the Advisor toll-free at 1-800-847-0200, (ii) on the Thornburg website at www.thornburg. com, and (iii) on the Securities and Exchange Commission’s website at www.sec.gov.
No proxy voting information is currently available because the Fund commenced operations on October 1, 2015. The Fund expects to begin making annual proxy voting information available in accordance with applicable regulations commencing on or before August 31, 2016. This information is available (i) without charge, upon request by calling the Advisor toll-free at 1-800-847-0200, (ii) on the Thornburg website at www.thornburg.com, and (iii) on the Securities and Exchange Commission’s website at www.sec.gov.
AVAILABILITY OF QUARTERLY PORTFOLIO SCHEDULE
The Fund files with the Securities and Exchange Commission schedules of its portfolio holdings on Form N-Q for the first and third quarters of each fiscal year. The Fund’s Forms N-Q are available on the Commission’s website at www.sec.gov, or may be reviewed and copied at the Commission’s Public Reference Room in Washington, D.C. Information on the operation of the Public Reference Room may be obtained by calling 1-800-SEC-0330. The Fund also makes this information available on its website at www.thornburg.com/download or upon request by calling 1-800-847-0200.
TAX INFORMATION
For the tax year ended September 30, 2016, dividends paid by the Thornburg Better World International Fund of $133,518 are being reported as ordinary investment income for federal income tax purposes.
For the tax year ended September 30, 2016, the Fund is reporting 17.31% (or the maximum allowed) of the dividends paid from tax basis net ordinary income as qualifying for the reduced rate under the Jobs and Growth Tax Relief and Reconciliation Act of 2003.
The Fund is reporting 00.89% (or the maximum allowed) of the ordinary income distributions paid by the Fund for the fiscal year ended September 30, 2016 as qualified for the corporate dividends received deduction.
For the year ended September 30, 2016, foreign source income and foreign taxes paid are $361,738 and $37,015, respectively.
The information and distributions reported herein may differ from the information and distributions reported to the shareholders for the calendar year ending December 31, 2016. Complete information will be reported in conjunction with your 2016 Form 1099.
STATEMENT RESPECTING RENEWAL OF INVESTMENT ADVISORY AGREEMENT
Thornburg Investment Management, Inc. (the “Advisor”) provides investment management services to Thornburg Better World International Fund pursuant to an investment advisory agreement. The Trustees consider the renewal of this agreement annually, and most recently determined to renew the agreement on September 13, 2016.
In anticipation of their recent consideration of the advisory agreement’s renewal, the independent Trustees met in May 2016 to consider aspects of their annual evaluation of the Advisor’s service to all of the funds of Thornburg Investment Trust, to plan the annual evaluation of the Advisor’s performance and to specify the information the Advisor would present to the Trustees for their review. The independent Trustees met again in independent session in September to consider portions of the information submitted by the Advisor. Representatives of the Advisor subsequently reviewed portions of the information with the Trustees and addressed questions from the Trustees at a full meeting session of the Trustees scheduled for that purpose, and the independent Trustees thereafter met in independent session to consider the Advisor’s presentation and various specific issues respecting their consideration of the advisory agreement’s renewal. Following these sessions, the Trustees met to consider renewal of the agreement, and the independent Trustees voted unanimously at that meeting to renew the agreement for an additional term of one year.
The information below summarizes certain factors considered by the Trustees in connection with the determination to renew the advisory agreement. In determining to renew the agreement, the Trustees considered a wide range of information and did not identify any single factor as controlling, and this summary does not describe all of the factors and other matters considered by the Trustees in making their determination.
Annual Report 31
| | |
| OTHER INFORMATION, CONTINUED | | |
| |
Thornburg Better World International Fund | | September 30, 2016 (Unaudited) |
Nature, Extent and Quality of Services. The Trustees considered presentations by the Advisor at meeting sessions scheduled for consideration of a continuation of the advisory agreement, and also noted their consideration of the reports the Trustees and their committees receive throughout the year on a wide variety of topics, and consideration they had given to a number of topics in previous years. Information identified by the Trustees in their evaluation as having been considered and contributing to their conclusions included Trustees’ assessments of the Advisor’s personnel developed in formal and informal meetings throughout the year, the Advisor’s staffing levels and measures to maintain staffing levels and improve competencies, the Advisor’s commitment to attract and retain high quality portfolio management expertise through competitive compensation levels, the Advisor’s collaborative approach to investment management, the Fund’s investment performance over different periods of time, portfolio managers’ cognizance of and strategies to address market and economic trends and conditions, the evaluation and selection of individual investments, the structuring and composition of the Fund’s portfolio, management of Fund liquidity requirements, cognizance of and efforts to achieve tax efficiency, responses to share sale and redemption activity, continuing enhancements to the Advisor’s electronic and information systems and the Advisor’s engagement of outside firms to assist in improving or replacing those systems, the Advisor’s evaluation and selection of firms providing portfolio trade execution to the Fund and the Advisor’s measures to obtain favorable trade execution, the Advisor’s performance of accounting and other services, the Advisor’s continued commitment to observance of compliance and regulatory requirements, the Advisor’s responsiveness to the Trustees, the quality and extent of written and oral reports to the Trustees over the course of the year, and other factors.
Investment Performance. The Trustees noted in their evaluation of the Fund’s investment performance the reports they had received in each regular meeting over the course of the year from the Advisor’s portfolio management personnel. The Trustees also noted in their evaluation their consideration of information provided to them at their request in anticipation of their annual evaluation of the Advisor’s services, including the following items of information respecting the investment performance of the Fund: (1) the Fund’s absolute investment performance and achievement of stated objectives; (2) the Advisor’s written and oral explanations and commentary on the Fund’s performance in the context of the Fund’s objectives and reasonable expectations, and business, market and economic conditions, (3) the Fund’s investment performance for the three-month and year-to-date periods ending with the second quarter of the current year comparing the Fund’s annualized returns to two mutual fund categories selected by independent mutual fund analyst firms and to a broad-based securities index, and assigning a percentage rank to the Fund’s performance for each period relative to each of the fund categories, (5) comparison of the Fund’s annualized return since inception to the Fund’s benchmark index, and (6) comparative measures of estimated earnings growth, portfolio volatility, risk and return.
The Trustees found that quarterly reports during the year and other information presented to them confirmed the Advisor’s continued conformity to the Fund’s stated investment objectives and policies.
The Trustees noted that the information available for the Fund is limited because it commenced investment operations in 2015, but observed that the available comparative performance data showed the Fund’s annualized investment returns fell at the midpoint of performance for the first of the two fund categories considered for the three-month period ended with the second quarter of the current year, and fell in the top quartile of the category’s performance for the year-to-date period. Noted data also showed that the Fund’s annualized investment returns fell just below the midpoint of performance of the second fund category for the three-month period ended with the second quarter of the current year, and fell in the second quartile of performance for the year-to-date period.
Comparisons of Fee and Expense Levels. The Trustees recognized in their evaluation the clear disclosures of the Advisor’s fees and Fund expenses in the Fund’s prospectuses. Information noted by the Trustees as having been considered in this context included a variety of comparative data respecting the Fund’s fee and expense levels. This information included comparisons of the Fund’s advisory fee and overall Fund expenses to median and average fees and expenses charged to a category of mutual funds selected by an independent mutual fund analyst firm, comparisons of the advisory fee and other Fund expenses to the fee levels and expenses for two representative share classes of fund peer groups selected from the category by a second independent mutual fund analyst firm, the perspectives and advice from the second mutual fund analyst firm respecting comparisons of fund fee levels and expenses to fund peer groups, and other information. The Trustees noted that, because the Fund commenced investment operations in 2015, the Advisor has agreed to waive fees and reimburse certain expenses for the current period. Comparative fee and expense data considered by the Trustees showed that the Fund’s advisory fee level before fee waivers was higher than the median and average levels for the category, but that the level of the fee charged to the Fund after waivers is lower. Total Fund expenses for a representative share class were observed to be higher than the median and average expense level for the category, and total fund expenses for a second share class were lower than the median and average levels for the category. Peer group data showed the Fund’s advisory fee level after fee waivers was comparable to or lower than the median levels for the peer groups considered, the current total expense level for one representative share class fell at or near the top of the expense levels of the peer groups, and the expense level for a second share class was comparable to the medians of its peer groups. The Trustees did not find the differences significant in view of the other factors considered.
The Trustees noted their consideration of information respecting the advisory fees charged by the Advisor to other investment management clients, including sub-advised mutual funds, together with information about fees charged by other advisors to different clients, analysis of the differences between the requirements of institutional clients and mutual funds, analysis of the differences between the requirements of a sub-advised mutual fund and a fund as to which the investment advisor is the primary advisor and sponsor, descriptions of distinguishing characteristics of the sub-advised funds served by the Advisor, and the consequently different investment
32 Annual Report
| | |
| OTHER INFORMATION, CONTINUED | | |
| |
Thornburg Better World International Fund | | September 30, 2016 (Unaudited) |
management services provided to the different categories of clients and the differing contexts in which the fee levels for these arrangements are established. The Trustees confirmed their previous observations that the differences between the fees charged by the Advisor to different types of clients did not appear exceptional, and that the fee rates charged by an investment advisor to different categories of clients had limited relevance to the evaluation of the fee rate charged by that advisor to mutual funds as to which it is the primary advisor and sponsor.
Costs and Profitability of Advisor. The Trustees noted the costs incurred by the Advisor in initiating and managing the Fund and the Advisor’s waivers of fees and reimbursements of expenses for the Fund, and further noted that the Fund produces no profits for the Advisor.
Potential Economies of Scale. In reviewing the extent to which economies of scale would be realized by the Fund as it grows and whether fee levels reflect potential economies of scale, the Trustees considered the breakpoint structure for advisory fees chargeable to the Fund, comparisons of the fee breakpoint structure for the Fund with breakpoint structures (or the absence of such structures) for other funds in a peer group selected by an independent mutual fund analyst firm, the effects of the breakpoint structure and other expense factors realized by certain Funds of the Trust as their asset levels had increased, and the Advisor’s expenditures from its own profits and resources to maintain staffing levels, pay competitive levels of compensation, and add to its information retrieval and management systems to maintain or improve service levels. The information provided demonstrated to the Trustees that the Fund’s advisory fee breakpoint structure is reasonable in relation to the structures observed in the other funds in its peer group, and that shareholders may be expected to benefit from any economies of scale, due to the advisory agreement’s breakpoint fee structure for the Fund and other factors.
Potential Ancillary Benefits. In reviewing potential benefits to the Advisor because of its relationship to the Fund, the Trustees noted disclosures by the Advisor of its receipt of certain research services from broker dealers, and the benefits to both the Fund and the Advisor of the Advisor’s expansion of its staffing, compliance and systems capabilities and other resources to serve a broader variety of investment management clients. No unusual or unfair benefits to the Advisor from its relationship to the Fund were identified by the Trustees.
Summary of Conclusions. The Trustees concluded that the nature, extent and quality of the Advisor’s services performed under the advisory agreement remained sufficient. The Trustees further concluded that the absolute and relative investment performance of the Fund over pertinent holding periods on the whole was satisfactory in the context of its objectives and strategies, and that the Advisor had continued to actively and competently pursue the Fund’s stated investment objectives and adhere to the Fund’s investment policies.
The Trustees further concluded, based upon their consideration of the foregoing factors and other information, that the level of the advisory fee charged to the Fund by the Advisor is reasonable in relation to the services provided by the Advisor in view of the nature, extent and quality of those services, current fee waivers and expenses, the investment performance of the Fund after fees and expenses, the clear disclosure of fees and expenses in the Fund’s prospectuses, comparisons of fees and expenses charged to the Fund to fees and expenses charged to other mutual funds, and the other factors considered.
Annual Report 33
TRUSTEES’ STATEMENT TO SHAREHOLDERS
Readopted September 12, 2016
The Trustees believe current and prospective shareholders should know how we discharge our responsibilities in supervising the Funds’ investment advisor and in reviewing the advisor’s contract for renewal. Since 2005, we have issued a statement which sets out clearly the three principal guidelines that we follow in supervising the Trust’s investment advisor on your behalf. In accordance with our customary practice, in September of this year we again reviewed our statement and concluded we should reissue this statement outlining the principal features of our supervision of the advisor’s performance of investment management services for the Funds.
We begin with the premise that each shareholder selected his or her Fund because its investments are managed by the investment advisor identified in the prospectus and in accordance with the objective and policies described in the prospectus. We realize, as each of you do, that if you believe that your Fund’s stated objective and policies no longer serve your personal investment goals, you can sell your shares and leave the Fund.
Therefore, we believe that our primary supervisory task – our principal obligation to you – is to assess the nature and quality of the advisor’s services, and to confirm that the advisor actively and competently pursues the Fund’s objective, in accordance with the policies set out in the prospectus. To do this, we meet regularly with management to review your Fund’s portfolio and to discuss the advisor’s specific actions and judgments in pursuing the Fund’s objective. We do not substitute our own judgment for the advisor’s decisions in selecting investments; the advisor is paid to exercise its informed judgment on investment decisions, and we seek to confirm, in reviewing the advisor’s performance, that the advisor is doing just that.
Second, we are conscious of costs and the effect that costs have on shareholders’ returns. We try to make sure that your Fund’s fees and costs are reasonable in relationship to the services rendered and that they are generally in line with those charged by other expert investment advisors, consistent with our belief that the Fund’s investors searched for and expect that expertise and attention and have decided to pay a reasonable price for it. We do not put the management contract “out to bid” as a matter of course, and we would not do so unless we had concluded that the advisor materially had failed to pursue the Fund’s objectives in accordance with its policies, or for other equally important reasons. We believe that any other approach would be inconsistent with your interests and contrary to your expectations when you bought shares of the Fund in the first place.
Finally, because we believe that most Thornburg Fund shareholders have invested with a long-term perspective, we try not to focus too much on the fashions of the moment and on short-term performance. The market will not favor any specific investment objective or set of policies at all times and under all economic circumstances. A fund will experience periods of both high and low returns relative to other funds and other investments. Even if one of our Funds is not favored by the market at a particular time, we believe that the advisor is nonetheless obliged to remain true to the Fund’s objective and policies, and we watch to see that it does so.
Trustees of Thornburg Investment Trust
34 Annual Report
THORNBURG FUNDS
Thornburg Investment Management is a privately-owned global investment firm that offers a range of solutions for retail and institutional investors. Founded in 1982 and headquartered in Santa Fe, New Mexico, we manage approximately $53 billion (as of September 30, 2016) across eight equity and 11 bond mutual funds, separate accounts for high-net-worth investors and institutional accounts, and five UCITS funds for non-U.S. investors.
The fund outlined in this report is one of many equity and fixed-income products available from Thornburg Investment Management.
Equity Funds
| | • | | Thornburg Core Growth Fund |
| | • | | Thornburg International Value Fund |
| | • | | Thornburg Better World International Fund |
| | • | | Thornburg International Growth Fund |
| | • | | Thornburg Developing World Fund |
| | • | | Thornburg Investment Income Builder Fund |
| | • | | Thornburg Global Opportunities Fund |
Fixed Income Funds
| | • | | Thornburg Low Duration Income Fund |
| | • | | Thornburg Limited Term U.S. Government Fund |
| | • | | Thornburg Limited Term Income Fund |
| | • | | Thornburg Strategic Income Fund |
| | • | | Thornburg Low Duration Municipal Fund |
| | • | | Thornburg Limited Term Municipal Fund |
| | • | | Thornburg Intermediate Municipal Fund |
| | • | | Thornburg California Limited Term Municipal Fund |
| | • | | Thornburg New Mexico Intermediate Municipal Fund |
| | • | | Thornburg New York Intermediate Municipal Fund |
| | • | | Thornburg Strategic Municipal Income Fund |
Before investing, carefully consider the Fund’s investment goals, risks, charges, and expenses. For a prospectus or summary prospectus containing this and other information, contact your financial advisor or visit thornburg.com. Read it carefully before investing.
For additional information, please visit thornburg.com
Thornburg Investment Management, Inc. 2300 North Ridgetop Road, Santa Fe, NM 87506
Annual Report 35

| | |
| To receive shareholder reports, prospectuses, and proxy statements electronically, go to www.thornburg.com/edelivery. | |  |
This Annual Report is submitted for the general information of shareholders of the Fund. It is not authorized for distribution to prospective investors in the Fund unless preceded or accompanied by an effective prospectus. | |
| | | | |
| Investment Advisor: | | Distributor: | | |
| Thornburg Investment Management® | | Thornburg Securities Corporation® | | |
| 800.847.0200 | | 800.847.0200 | | TH3644 |
This page intentionally left blank.
2 Annual Report
Annual Report
Thornburg Capital Management Fund
September 30, 2016
| | | | |
Share Class | | NASDAQ Symbol | | CUSIP |
Class I | | N/A | | 885-216-739 |
Annual Report 3
| | |
| LETTER TO SHAREHOLDERS | | |
| |
Thornburg Capital Management Fund | | September 30, 2016 (Unaudited) |
October 18, 2016
Thornburg Capital Management Fund (TCMF) was started on July 31, 2015, with the goal of providing better risk exposures for cash management across the Thornburg family of funds with higher returns and lower costs. As of September 30, 2016, we have invested approximately $1.4 billion of Thornburg Investment Trust cash in high-quality, short-term instruments. With the custodian of the Thornburg Investment Trust funds charging 20 basis points (0.20%) for large cash balances, the annualized distribution yield from the portfolio of 48 basis points (0.48%) represents a significant pick-up in return.
High return, however, is not what TCMF is designed to provide. Instead, by combining the cash balances of all eligible Thornburg Investment Trust portfolios into a single pool, we seek to reduce costs of investing and significantly diversify and reduce high-risk exposure in any given portfolio. As an example, while we wish to invest cash balances in some sort of short-term, high-quality investments (due both to the custodian’s charge and the singular exposure to the custodian if cash is left uninvested), doing so on a fund-by-fund basis incurs significant transaction costs. While the costs themselves are low (ticketing costs are $6 and an additional $6 for every maturity), these costs can add up quickly in a portfolio of overnight securities. Duplicate trades in different portfolios incur separate charges, and with 10 different eligible portfolios, the multiplier effect on costs is high. Combining all of the cash into a single portfolio eliminates the majority of those costs.
Risk diversification is also an important factor in the design of the TCMF. Because we expect to have a large pool of assets, we can buy a number of different names and still expect to have a vast cost advantage versus splitting investments amongst portfolios. As of September 30, 2016, our largest exposure away from supranationals or U.S. government entities was Sysco Corp, at 1.94% of the portfolio. Keep in mind that at the investing fund level, this is 1.94% of the cash position. As an example, if cash in the investing fund sat at 10%, the investing fund Sysco Corp position would be 0.194%. All of the Fund’s investments are rated A1+, A1, or A2 by Standard & Poor’s. Also, 35.7% of the portfolio was invested in instruments with maturities of less than three days, with a total of 39.1% available within three days to portfolio managers of investing funds if the 3.4% of uninvested cash is included. At the end of the period, the weighted average maturity was 8.89 days.
The above figures should give investors a picture of a very high quality, short-term, liquid portfolio that avoids undue fees and provides a notable return over the custodian’s negative 20 basis points (-0.20%) penalty rate. Again, the Fund’s goal is not to provide high returns, but rather to reduce and diversify risk.
We believe that this structure is a significant improvement over a fragmented, costly, less diversified outcome of investing the cash of each fund separately and should be a benefit to all of the participating portfolios of Thornburg Investment Trust.
Sincerely,
| | | | |
| | |
 | | 
| | 
|
| Jason Brady, CFA | | Lon R. Erickson, CFA | | Jeff Klingelhofer, CFA |
| Portfolio Manager | | Portfolio Manager | | Portfolio Manager |
| CEO, President, and Managing Director | | Managing Director | | Managing Director |
The matters discussed in this report may constitute forward-looking statements made pursuant to the safe harbor provisions of the Securities Litigation Reform Act of 1995. These include any advisor or portfolio manager prediction, assessment, analysis or outlook for individual securities, industries, investment styles, market sectors and/or markets. These statements involve risks and uncertainties. In addition to the general risks described for each fund in its current prospectus, other factors bearing on these reports include the accuracy of the advisor’s or portfolio manager’s forecasts and predictions, the appropriateness of the investment strategies designed by the advisor or portfolio manager and the ability of the advisor or portfolio manager to implement their strategies efficiently and successfully. Any one or more of these factors, as well as other risks affecting the securities markets generally, could cause the actual results of any fund to differ materially as compared to its benchmarks.
The views expressed by the portfolio managers reflect their professional opinions and are subject to change. Under no circumstances does the information contained within represent a recommendation to buy or sell any security.
4 Annual Report
| | |
| PERFORMANCE SUMMARY | | |
| |
Thornburg Capital Management Fund | | September 30, 2016 (Unaudited) |
Average Annual Total Returns
| | | | | | | | |
| | | 1-Yr | | | Since
Incep. | |
I Shares (Incep: 7/31/15) | | | 0.45 | % | | | 0.42 | % |
Citigroup 30-day T-bill Index (Since: 7/31/15) | | | 0.16 | % | | | 0.14 | % |
30-Day Yields
| | | | |
SEC Yield | | | 0.48 | % |
| |
Annualized Distribution Yield | | | 0.48 | % |
Performance data shown represents past performance and is no guarantee of future results. Investment return and principal value will fluctuate so shares, when redeemed, may be worth more or less than their original cost. Current performance may be lower or higher than quoted. For performance current to the most recent month end, call 800-847-0200. There is no sales charge for class I shares.
Growth of a Hypothetical $10,000 Investment
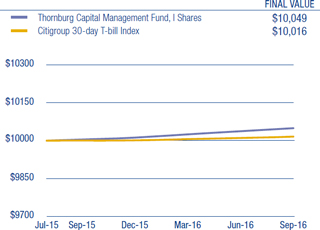
Fund Summary
Portfolio Composition
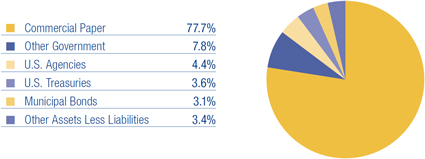
Glossary
Citigroup 30-day T-bill Index – Measures monthly return equivalents of yield averages that are not marked to market. The One-Month Treasury Bill Index consists of the last one-month Treasury bill issue.
The performance of any index is not indicative of the performance of any particular investment. Unless otherwise noted, index returns reflect the reinvestment of income dividends and capital gains, if any, but do not reflect fees, brokerage commissions or other expenses of investing. Investors may not make direct investments into any index.
Annualized Distribution Yield – The distribution yield reflects actual distributions made to shareholders. The annualized distribution yield is calculated by summing the last 30 days of income at a given month end and annualizing to a 360-day year. The result is divided by the ending maximum offering price.
Basis Point (bp) – A unit equal to 1/100th of 1%. 1% = 100 basis points (bps).
SEC Yield – SEC Yield is computed in accordance with SEC standards measuring the net investment income per share over a specified 30-day period expressed as a percentage of the maximum offering price of the Fund’s shares at the end of the period.
Short-Term Credit Ratings – A bond credit rating assesses the financial ability of a debt issuer to make timely payments of principal and interest. Short-term obligation ratings of A-1 (the highest), A-2 and A-3 are investment-grade quality. Ratings of B, C and D (the lowest) are considered below investment grade, speculative grade, or junk bonds.
Annual Report 5
| | |
| SCHEDULE OF INVESTMENTS | | |
| |
Thornburg Capital Management Fund | | September 30, 2016 |
| | | | | | | | |
| | | Shares/
Principal Amount | | | Value | |
SHORT TERM INVESTMENTS — 96.60% | | | | | | | | |
a AGL Capital Corp., 0.63%, 10/3/2016 | | $ | 24,000,000 | | | $ | 23,999,160 | |
Agrium, Inc., 0.63%, 10/5/2016 | | | 5,000,000 | | | | 4,999,650 | |
Ameren Corp., 0.60%, 10/3/2016 | | | 14,000,000 | | | | 13,999,533 | |
Ameren Corp., 0.70%, 10/7/2016 | | | 7,900,000 | | | | 7,899,078 | |
a Anthem, Inc., 0.55%, 10/11/2016 | | | 10,000,000 | | | | 9,998,472 | |
a Atmos Energy Corp., 0.65%, 10/20/2016 | | | 9,000,000 | | | | 8,996,912 | |
a Autozone, Inc., 0.68%, 10/6/2016 | | | 18,100,000 | | | | 18,098,291 | |
a Autozone, Inc., 0.70%, 10/19/2016 | | | 3,500,000 | | | | 3,498,775 | |
a B.A.T. International Finance plc, 0.78%, 10/14/2016 | | | 23,000,000 | | | | 22,993,522 | |
Bank of New York Tri-Party Repurchase Agreement 0.48% dated 9/30/2016 due 10/3/2016, repurchase price $55,002,200 collateralized by 24 corporate debt securities, having an average coupon of 3.31%, a minimum credit rating of BBB-, maturity dates from 10/6/2016 to 3/15/2055, and having an aggregate market value of $58,944,020 at 9/30/2016 | | | 55,000,000 | | | | 55,000,000 | |
a Brown-Forman Corp., 0.55%, 10/26/2016 | | | 22,500,000 | | | | 22,491,406 | |
a Canadian National Railway Co., 0.49%, 10/18/2016 | | | 13,350,000 | | | | 13,346,911 | |
a Canadian National Railway Co., 0.48%, 10/21/2016 | | | 10,000,000 | | | | 9,997,333 | |
a Centerpoint Energy, Inc., 0.58%, 10/3/2016 | | | 21,000,000 | | | | 20,999,323 | |
a Church & Dwight Co., Inc., 0.60%, 10/7/2016 | | | 16,000,000 | | | | 15,998,400 | |
a Church & Dwight Co., Inc., 0.60%, 10/27/2016 | | | 4,600,000 | | | | 4,598,007 | |
City of New York GO, 0.86%, 8/1/2038 | | | 15,150,000 | | | | 15,150,000 | |
Commonwealth of Massachusetts GO, 0.84%, 3/1/2026 | | | 12,000,000 | | | | 12,000,000 | |
a Consolidated Edison, Inc., 0.59%, 10/3/2016 | | | 5,000,000 | | | | 4,999,836 | |
a Consolidated Edison, Inc., 0.54%, 10/3/2016 | | | 16,000,000 | | | | 15,999,520 | |
a Cummins, Inc., 0.40%, 10/5/2016 | | | 21,000,000 | | | | 20,999,067 | |
a Edison International, 0.60%, 10/3/2016 | | | 22,000,000 | | | | 21,999,267 | |
a Eni Finance USA, Inc., 0.65%, 10/3/2016 | | | 21,000,000 | | | | 20,999,242 | |
a Equifax, Inc., 0.70%, 10/28/2016 | | | 7,100,000 | | | | 7,096,273 | |
a Experian Finance plc, 0.60%, 10/3/2016 | | | 16,000,000 | | | | 15,999,467 | |
a Experian Finance plc, 0.70%, 10/4/2016 | | | 6,800,000 | | | | 6,799,603 | |
Farmer Mac Discount Note, 0.27%, 10/11/2016 | | | 7,700,000 | | | | 7,699,422 | |
Federal Home Loan Discount Note, 0.22%, 10/13/2016 | | | 25,000,000 | | | | 24,998,167 | |
Federal Home Loan Discount Note, 0.265%, 10/14/2016 | | | 4,100,000 | | | | 4,099,608 | |
Federal Home Loan Discount Note, 0.22%, 10/24/2016 | | | 24,000,000 | | | | 23,996,627 | |
a General Mills, Inc., 0.55%, 10/3/2016 | | | 10,400,000 | | | | 10,399,682 | |
a General Mills, Inc., 0.57%, 10/5/2016 | | | 12,000,000 | | | | 11,999,240 | |
a Hasbro, Inc., 0.60%, 10/3/2016 | | | 22,000,000 | | | | 21,999,267 | |
a Illinois Tool Works, Inc., 0.41%, 10/21/2016 | | | 12,000,000 | | | | 11,997,267 | |
b Inter-American Development Bank Discount Note, 0.30%, 10/5/2016 | | | 5,000,000 | | | | 4,999,833 | |
b Inter-American Development Bank Discount Note, 0.35%, 10/14/2016 | | | 25,000,000 | | | | 24,996,840 | |
b Inter-American Development Bank Discount Note, 0.24%, 10/28/2016 | | | 4,300,000 | | | | 4,299,226 | |
a Intercontinental Exchange, Inc., 0.46%, 10/6/2016 | | | 13,000,000 | | | | 12,999,169 | |
b International Bank for Reconstruction & Development Discount Note, 0.10%, 10/3/2016 | | | 40,000,000 | | | | 39,999,778 | |
b International Bank for Reconstruction & Development Discount Note, 0.20%, 10/25/2016 | | | 15,000,000 | | | | 14,998,000 | |
b International Finance Corp. Discount Note, 0.23%, 10/24/2016 | | | 20,000,000 | | | | 19,997,061 | |
a Kansas City Power & Light Co., 0.60%, 10/3/2016 | | | 20,600,000 | | | | 20,599,327 | |
a Kroger Co., 0.58%, 10/3/2016 | | | 21,000,000 | | | | 20,999,323 | |
a L’Oreal USA, Inc., 0.40%, 10/12/2016 | | | 24,000,000 | | | | 23,997,067 | |
a Leggett & Platt, 0.52%, 10/3/2016 | | | 19,000,000 | | | | 18,999,451 | |
a Louisville Gas & Electric Co., 0.65%, 10/5/2016 | | | 14,000,000 | | | | 13,998,989 | |
a Louisville Gas & Electric Co., 0.67%, 10/6/2016 | | | 5,000,000 | | | | 4,999,535 | |
a Louisville Gas & Electric Co., 0.71%, 10/11/2016 | | | 5,000,000 | | | | 4,999,014 | |
a Marriott International, Inc., 0.76%, 10/24/2016 | | | 12,000,000 | | | | 11,994,173 | |
a Marriott International, Inc., 0.80%, 10/26/2016 | | | 11,000,000 | | | | 10,993,889 | |
a Mondelez International, Inc., 0.65%, 10/12/2016 | | | 21,000,000 | | | | 20,995,829 | |
a National Grid plc, 0.71%, 10/11/2016 | | | 25,000,000 | | | | 24,995,069 | |
a NBC Universal Enterprise, Inc., 0.67%, 10/12/2016 | | | 10,000,000 | | | | 9,997,953 | |
a NBC Universal Enterprise, Inc., 0.67%, 10/17/2016 | | | 5,000,000 | | | | 4,998,511 | |
a NBC Universal Enterprise, Inc., 0.69%, 10/19/2016 | | | 8,000,000 | | | | 7,997,240 | |
New York City Municipal Water Finance Authority, 0.87%, 6/15/2032 | | | 16,290,000 | | | | 16,290,000 | |
a Nextera Energy Capital Holdings, Inc., 0.55%, 10/3/2016 | | | 10,500,000 | | | | 10,499,679 | |
a Nike, Inc., 0.35%, 10/11/2016 | | | 23,000,000 | | | | 22,997,764 | |
Northern Illinois Gas Co., 0.48%, 10/11/2016 | | | 23,000,000 | | | | 22,996,933 | |
a Novartis Finance Corp., 0.34%, 10/17/2016 | | | 15,000,000 | | | | 14,997,733 | |
a Oglethorpe Power Corp., 0.50%, 10/12/2016 | | | 11,039,000 | | | | 11,037,313 | |
a Oglethorpe Power Corp., 0.51%, 10/24/2016 | | | 11,000,000 | | | | 10,996,416 | |
a Pacific Gas & Electric Co., 0.62%, 10/4/2016 | | | 22,000,000 | | | | 21,998,863 | |
6 Annual Report
| | |
| SCHEDULE OF INVESTMENTS, CONTINUED | | |
| |
Thornburg Capital Management Fund | | September 30, 2016 |
| | | | | | | | |
| | | Shares/
Principal Amount | | | Value | |
Peoples Gas Light & Coke Co., 0.60%, 10/3/2016 | | $ | 7,000,000 | | | $ | 6,999,767 | |
Peoples Gas Light & Coke Co., 0.65%, 10/7/2016 | | | 17,300,000 | | | | 17,298,126 | |
a PepsiCo, Inc., 0.37%, 10/4/2016 | | | 5,000,000 | | | | 4,999,846 | |
a PepsiCo, Inc., 0.37%, 10/5/2016 | | | 18,000,000 | | | | 17,999,260 | |
a Pfizer, Inc., 0.40%, 10/12/2016 | | | 12,100,000 | | | | 12,098,521 | |
a PotashCorp of Saskatchewan, Inc., 0.77%, 10/6/2016 | | | 13,000,000 | | | | 12,998,610 | |
a PPL Corp., 0.63%, 10/3/2016 | | | 15,000,000 | | | | 14,999,475 | |
a PPL Corp., 0.70%, 10/11/2016 | | | 8,000,000 | | | | 7,998,444 | |
a Precision Castparts Corp., 0.30%, 10/3/2016 | | | 10,000,000 | | | | 9,999,833 | |
a Ralph Lauren Corp., 0.39%, 10/5/2016 | | | 22,000,000 | | | | 21,999,047 | |
a Roche Holding, Inc., 0.43%, 10/5/2016 | | | 13,300,000 | | | | 13,299,365 | |
a Rockwell Automation, Inc., 0.52%, 10/11/2016 | | | 12,000,000 | | | | 11,998,267 | |
a Rockwell Automation, Inc., 0.53%, 10/24/2016 | | | 11,000,000 | | | | 10,996,275 | |
Ryder System, Inc., 0.69%, 10/5/2016 | | | 16,000,000 | | | | 15,998,773 | |
a Southern California Edison Co., 0.50%, 10/3/2016 | | | 20,000,000 | | | | 19,999,444 | |
a Spectra Energy Partners, LP, 0.76%, 10/4/2016 | | | 10,000,000 | | | | 9,999,367 | |
a Spectra Energy Partners, LP, 0.85%, 10/11/2016 | | | 13,000,000 | | | | 12,996,931 | |
a Sysco Corp., 0.58%, 10/3/2016 | | | 6,000,000 | | | | 5,999,807 | |
a Sysco Corp., 0.60%, 10/3/2016 | | | 21,000,000 | | | | 20,999,300 | |
a The Hershey Co., 0.42%, 10/24/2016 | | | 10,000,000 | | | | 9,997,317 | |
a The J.M. Smucker Co., 0.55%, 10/3/2016 | | | 10,000,000 | | | | 9,999,694 | |
a Tyco Electronics Group S.A., 0.60%, 10/3/2016 | | | 6,000,000 | | | | 5,999,800 | |
a Tyco Electronics Group S.A., 0.65%, 10/3/2016 | | | 21,000,000 | | | | 20,999,242 | |
United States Treasury Bill, 0.082%, 10/6/2016 | | | 50,000,000 | | | | 49,999,361 | |
a Volvo Group, 0.80%, 10/6/2016 | | | 5,670,000 | | | | 5,669,370 | |
Wisconsin Public Service Corp., 0.63%, 10/4/2016 | | | 12,000,000 | | | | 11,999,370 | |
Wisconsin Public Service Corp., 0.66%, 10/7/2016 | | | 11,000,000 | | | | 10,998,790 | |
| | | | | | | | |
TOTAL SHORT TERM INVESTMENTS (Cost $1,346,157,708) | | | | | | | 1,346,157,708 | |
| | | | | | | | |
TOTAL INVESTMENTS — 96.60% (Cost $1,346,157,708) | | | | | | $ | 1,346,157,708 | |
OTHER ASSETS LESS LIABILITIES — 3.40% | | | | | | | 47,378,546 | |
| | | | | | | | |
NET ASSETS — 100.00% | | | | | | $ | 1,393,536,254 | |
| | | | | | | | |
Footnotes
| a | Securities exempt from registration under Rule 144A of the Securities Act of 1933, as amended. These securities may only be resold in the ordinary course of business in transactions exempt from registration, normally to qualified institutional buyers. As of September 30, 2016, the aggregate value of these securities in the Fund’s portfolio was $914,443,765, representing 65.62% of the Fund’s net assets. |
| b | Yankee bond denominated in U.S. dollars and is issued in the U.S. by foreign banks and corporations. |
Portfolio Abbreviations
To simplify the listings of securities, abbreviations are used per the table below:
See notes to financial statements.
Annual Report 7
| | |
| STATEMENT OF ASSETS AND LIABILITIES | | |
| |
Thornburg Capital Management Fund | | September 30, 2016 |
| | | | |
ASSETS | | | | |
Investments at value (cost $1,346,157,708) (Note 3) | | $ | 1,346,157,708 | |
Cash | | | 47,397,723 | |
Interest receivable | | | 19,769 | |
| | | | |
Total Assets | | | 1,393,575,200 | |
| | | | |
| |
LIABILITIES | | | | |
Accounts payable and accrued expenses | | | 38,864 | |
Dividends payable | | | 82 | |
| | | | |
Total Liabilities | | | 38,946 | |
| | | | |
| |
NET ASSETS | | $ | 1,393,536,254 | |
| | | | |
NET ASSETS CONSIST OF | | | | |
Undistributed net investment income | | $ | 23,695 | |
Net capital paid in on shares of beneficial interest | | | 1,393,512,559 | |
| | | | |
| | $ | 1,393,536,254 | |
| | | | |
NET ASSET VALUE | | | | |
Class I Shares: | | | | |
Net asset value and redemption price per share ($1,393,536,254 applicable to 139,353,625 shares of beneficial interest outstanding - Note 5) | | $ | 10.00 | |
| | | | |
See notes to financial statements.
8 Annual Report
| | |
| STATEMENT OF OPERATIONS | | |
| |
Thornburg Capital Management Fund | | Year Ended September 30, 2016 |
| | | | |
INVESTMENT INCOME | | | | |
Interest income (net of premium amortized of $84,439) | | $ | 7,449,030 | |
| | | | |
| |
EXPENSES | | | | |
Transfer agent fees | | | 9,376 | |
Custodian fees (Note 2) | | | 162,929 | |
Professional fees | | | 62,097 | |
Accounting fees (Note 4) | | | 77,885 | |
Trustee fees | | | 63,687 | |
Other expenses | | | 36,939 | |
| | | | |
Total Expenses | | | 412,913 | |
| | | | |
Net Investment Income | | $ | 7,036,117 | |
| | | | |
See notes to financial statements.
Annual Report 9
| | |
| STATEMENTS OF CHANGES IN NET ASSETS | | |
| |
Thornburg Capital Management Fund | | |
| | | | | | | | |
| | | Year Ended
September 30, 2016 | | | Period Ended
September 30, 2015* | |
INCREASE (DECREASE) IN NET ASSETS FROM | | | | | | | | |
| | |
OPERATIONS | | | | | | | | |
Net investment income | | $ | 7,036,117 | | | $ | 963,650 | |
| | | | | | | | |
| | |
Net Increase (Decrease) in Net Assets Resulting from Operations | | | 7,036,117 | | | | 963,650 | |
| | |
DIVIDENDS TO SHAREHOLDERS | | | | | | | | |
From net investment income | | | (7,036,117 | ) | | | (963,650 | ) |
| | |
FUND SHARE TRANSACTIONS (NOTE 5) | | | | | | | | |
Class I Shares | | | (379,323,866 | ) | | | 1,772,860,120 | |
| | | | | | | | |
Net Increase (Decrease) in Net Assets | | | (379,323,866 | ) | | | 1,772,860,120 | |
| | |
NET ASSETS | | | | | | | | |
Beginning of Year | | | 1,772,860,120 | | | | — | |
| | | | | | | | |
| | |
End of Year | | $ | 1,393,536,254 | | | $ | 1,772,860,120 | |
| | | | | | | | |
Undistributed net investment income | | $ | 23,695 | | | $ | — | |
| * | For the period from commencement of operations on July 31, 2015 through September 30, 2015. |
See notes to financial statements.
10 Annual Report
| | |
| NOTES TO FINANCIAL STATEMENTS | | |
| |
Thornburg Capital Management Fund | | September 30, 2016 |
NOTE 1 – ORGANIZATION
Thornburg Capital Management Fund (the “Fund”) is a non-diversified series of Thornburg Investment Trust (the “Trust”). The Trust is organized as a Massachusetts business trust under a Declaration of Trust dated June 3, 1987 and is registered as a diversified, open-end management investment company under the Investment Company Act of 1940, as amended. The Fund is currently one of twenty separate series of the Trust. Each series is considered to be a separate entity for financial reporting and tax purposes and bears expenses directly attributable to it. The Fund’s investment objective is to seek current income consistent with liquidity management and safety of capital.
The Fund currently offers one class of shares of beneficial interest: Institutional Class (“Class I”). This class of shares of the Fund represents all interest in the portfolio of investments. Class I shares are sold at net asset value without a sales charge at the time of purchase and may be subject to a service fee. All expenses are allocated to the class including transfer agent fees, government registration fees, printing and postage costs, and legal expenses.
Shares of the Fund are issued solely in private placement transactions that do not involve any “public offering” within the meaning of Section (4)2 of the 1933 Act. Investments in the Fund may only be made by investment companies, or other persons that are “accredited investors” within the meaning of Regulation D under the 1933 Act. Currently, the Fund’s shares are only sold to certain other series of the Trust. Thornburg Investment Management, Inc., acting as the agent for the other series of the Trust will affect all purchases and sells of shares of the Fund on behalf of any series of the Trust.
The following is a summary of significant accounting policies followed by the Fund in the preparation of its financial statements. The Fund prepares its financial statements in conformity with United States generally accepted accounting principles (“GAAP”), including investment company accounting and reporting guidance in the Financial Accounting Standards Board (the “FASB”) Accounting Standard Codification Topic 946.
NOTE 2 – SIGNIFICANT ACCOUNTING POLICIES
Security Valuation: All investments in securities held by the Fund are valued as described in Note 3.
Allocation of Income, Gains, Losses and Expenses: Net investment income (other than class specific expenses) and realized and unrealized gains and losses are allocated daily to each class of shares based upon the relative net asset value of outstanding shares (or the value of the dividend-eligible shares, as appropriate) of each class of shares at the beginning of the day (after adjusting for the current capital shares activity of the respective class). Expenses common to all Funds are allocated among the Funds comprising the Trust based upon their relative net asset values or other appropriate allocation methods. Operating expenses directly attributable to a specific class are charged against the operating income of that class.
Dividends and Distributions to Shareholders: Dividends and distributions to shareholders, which are determined in accordance with federal income tax regulations and may differ from GAAP, are recorded on the ex-dividend date. Ordinary income distributions, if any, are declared and paid monthly. Capital gain distributions, if any, are declared and paid annually and more often if deemed necessary by the Advisor. Dividends are paid and are reinvested in additional shares of the Fund at net asset value per share at the close of business on the ex-dividend date, or at the shareholder’s option, paid in cash.
Investment Income: Interest income is accrued as earned. Premiums and discounts are amortized and accreted, respectively, to call dates or maturity dates using the effective yield method of the respective investments, which is included in interest income on the Statement of Operations.
Custodian Fees: Custodian fees disclosed in the Statement of Operations may include interest expenses incurred by the Fund on any cash overdrafts of its custodian account during the period. Such cash overdrafts may result from the effects of failed trades in portfolio securities and from cash outflows resulting from unanticipated shareholder redemption activity. The Fund pays interest to its custodian on any such cash overdraft at a rate equal to 2.50% of the overdraft amount in excess of $50,000.
Investment Transactions: Investment transactions are accounted for on a trade date basis. Realized gains and losses from the sale of investments are recorded on an identified cost basis.
When-Issued and Delayed Delivery Transactions: The Fund may engage in when-issued or delayed delivery transactions. To the extent the Fund engages in such transactions, it will do so for the purpose of acquiring portfolio investments consistent with the Fund’s investment objectives and not for the purpose of investment leverage or to speculate on interest rate or market changes. At the time the Fund makes a commitment to purchase an investment on a when-issued or delayed delivery basis, the Fund will record the transaction and reflect the value in determining its net asset value. When effecting such transactions, assets of an amount sufficient to make payment for the portfolio investments to be purchased will be segregated on the Fund’s records on the trade date. Investments purchased on a when-issued or delayed delivery basis do not earn interest until the settlement date.
Annual Report 11
| | |
| NOTES TO FINANCIAL STATEMENTS, CONTINUED | | |
| |
Thornburg Capital Management Fund | | September 30, 2016 |
Repurchase Agreements: The Fund may invest excess cash in repurchase agreements whereby the Fund purchases investments, which serve as collateral, with an agreement to resell such collateral to the seller at an agreed upon price at the maturity date of the repurchase agreement. Investments pledged as collateral for repurchase agreements are held in custody until maturity of the repurchase agreement. Provisions in the agreements require that the market value of the collateral is at least equal to the repurchase value in the event of default. In the event of default, the Fund has the right to liquidate the collateral and apply the proceeds in satisfaction of the obligation. Under certain circumstances, in the event of default or bankruptcy by the other party to the agreement, realization and/ or retention of the collateral may be subject to legal proceedings.
Guarantees and Indemnifications: Under the Trust’s organizational documents (and under separate agreements with the independent Trustees), its officers and Trustees are provided with an indemnification against certain liabilities arising out of the performance of their duties to the Fund. In the normal course of business the Trust may also enter into contracts with service providers that contain general indemnifications. The Trust’s maximum exposure under these arrangements is unknown. However, based on experience, the Trust expects the risk of loss to be remote.
Use of Estimates: The preparation of financial statements in conformity with GAAP requires management to make estimates and assumptions that affect the reported amounts of assets and liabilities and disclosure of contingent assets and liabilities at the date of the financial statements and the reported amounts of increases (decreases) in net assets from operations during the reporting period. Actual results could differ from those estimates.
Federal Income Taxes: It is the policy of the Trust to comply with the provisions of the Internal Revenue Code applicable to regulated investment companies and to distribute to shareholders substantially all investment company taxable income including net realized gains on investments (if any), and tax exempt income of the Fund. Therefore, no provision for federal income or excise tax is required.
The Fund files income tax returns in United States federal and applicable state jurisdictions. The statute of limitations on the Fund’s tax return filings generally remains open for the three years following a return’s filing date. The Fund has analyzed each uncertain tax position believed to be material in the preparation of the Fund’s financial statements for the fiscal year ended September 30, 2016, including open tax years, to assess whether it is more likely than not that the position would be sustained upon examination, based on the technical merits of the position. The Fund has not identified any such position for which an asset or liability must be reflected in the Statement of Assets and Liabilities.
At September 30, 2016, information on the tax components of capital was as follows:
| | | | |
Cost of investments for tax purposes | | $ | 1,346,157,708 | |
| | | | |
Net unrealized appreciation (depreciation) on investments (tax basis) | | $ | 0 | |
| | | | |
There is no unrealized gain (loss) in the Fund at September 30, 2016 due to all securities with less than 60 days to maturity being valued by the amortized cost method.
In order to account for permanent book to tax differences, the Fund increased undistributed net investment income by $23,695 and decreased net capital paid in on shares of beneficial interest by $23,695. Reclassifications have no impact upon the net asset value of the Fund and result primarily from nondeductible expenses.
At September 30, 2016, the Fund had undistributed tax basis net ordinary income of $23,695 and no undistributed tax basis capital gains.
The tax character of distributions paid during the year ended September 30, 2016, and September 30, 2015, was as follows:
| | | | | | | | |
| | | 2016 | | | 2015 | |
Distributions from: | | | | | | | | |
Ordinary income | | $ | 7,036,117 | | | $ | 963,650 | |
Capital gains | | | — | | | | — | |
| | | | | | | | |
Total | | $ | 7,036,117 | | | $ | 963,650 | |
| | | | | | | | |
NOTE 3 – SECURITY VALUATION
Valuation of the Fund’s portfolio investment securities is performed in accordance with policies and procedures adopted by and under the oversight of the Trustees.
The Trustees of the Trust have appointed Thornburg Investment Management, Inc., the Trust’s investment advisor (the “Advisor”) to assist the Trustees in obtaining market values for portfolio investments, evaluate and monitor professional pricing service providers appointed by the Trustees’ Audit Committee (the “Audit Committee”), assist in determining fair values for portfolio investments, assist in calculating fair values for portfolio investments in certain circumstances, and to perform other functions in connection with the valuation
12 Annual Report
| | |
| NOTES TO FINANCIAL STATEMENTS, CONTINUED | | |
| |
Thornburg Capital Management Fund | | September 30, 2016 |
of investments. The Advisor acts through its Valuation and Pricing Committee (the “Committee”) and other employees of the Advisor. The Committee regularly reviews its own valuation calculations, as well as the valuations, valuation techniques and services furnished by pricing service providers, considers circumstances which may require valuation calculations by the Committee, and reviews previous valuation calculations. The Committee reports to the Audit Committee on the Committee’s activities, the performance of pricing service providers, and other matters relating to valuation of portfolio investments.
In those instances when the Committee assists in calculating a fair value for a portfolio investment, the Committee seeks to determine the price that the Fund would reasonably expect to receive upon a sale of the investment in an orderly transaction between market participants on the valuation date. The Committee customarily utilizes quotations from securities broker dealers in calculating valuations, but also may utilize prices obtained from pricing service providers or other methods approved by the Audit Committee. Because fair values calculated by the Committee are estimates, the calculation of a value for an investment may differ from the price that would be realized by the Fund upon a sale of the investment, and the difference could be material to the Fund’s financial statements. The Committee’s calculation of a fair value for an investment may also differ from the prices obtained by other persons (including other mutual funds) for the investment.
Valuation of Securities: Debt obligations held by the Funds which are not listed or traded on exchanges or for which no reported market exists are ordinarily valued at the valuation obtained from a pricing service provider approved by the Audit Committee. The Committee is authorized by the Audit Committee to calculate values of commercial paper having a remaining maturity of 60 days or less using amortized cost, subject to regular confirmation of those calculated values using procedures approved by the Audit Committee.
In any case when a pricing service provider fails to provide a valuation for a debt obligation held by the Funds, the Committee calculates a fair value for the obligation using alternative methods under procedures approved by the Audit Committee. Additionally, in cases when management believes that a valuation obtained from a pricing service provider merits review for significant reasons, the Committee decides whether or not to use the valuation calculated by the pricing service provider or to use an alternative method approved by the Audit Committee to calculate a fair value for the obligation.
Valuation Hierarchy: The Fund categorizes its investments based upon the inputs used in valuing those investments, according to a three level hierarchy established in guidance from the FASB. Categorization of investments using this hierarchy is intended by the FASB to maximize the use of observable inputs in valuing investments and minimize the use of unobservable inputs by requiring that the most observable inputs be used when available. Observable inputs are those that market participants would use in valuing an investment based on available market information. Unobservable inputs are those that reflect assumptions about the information market participants would use in valuing an investment. An investment’s level within the hierarchy is based on the lowest level input that is deemed significant to the valuation. The methodologies and inputs used to value investments are not necessarily indications of the risk or liquidity associated with those investments.
Various inputs are used in calculating valuations for the Fund’s investments. These inputs are generally summarized according to the three-level hierarchy below:
Level 1: Quoted prices in active markets for identical investments.
Level 2: Other direct or indirect significant observable inputs (including quoted prices for similar investments in active markets and other observable inputs, such as interest rates, prepayment rates, credit risk, etc.).
Level 3: Significant unobservable inputs (including the Committee’s own assumptions in calculating the fair values of investments).
Valuations for debt obligations held by the Fund are typically calculated by pricing service providers approved by the Audit Committee and are characterized as Level 2 within the valuation hierarchy.
On days when market volatility thresholds established by the Audit Committee are exceeded, foreign securities for which valuations are obtained from pricing service providers are fair valued. On these days, the foreign securities are characterized as Level 2 within the valuation hierarchy and revert to Level 1 after the threshold is no longer exceeded.
In a limited number of cases the Committee calculates a fair value for investments using broker quotations or other methods approved by the Audit Committee. When the Committee uses a single broker quotation to calculate a fair value for an investment without other significant observable inputs, or if a fair value is calculated using other significant inputs that are considered unobservable, the investment is characterized as Level 3 within the hierarchy. Other significant unobservable inputs used to calculate a fair value in these instances might include an income-based valuation approach which considers discounted anticipated future cash flows from the investment, and application of discounts due to the nature or duration of any restrictions on the disposition of the investment.
Valuations based upon the use of inputs from Levels 1, 2 or 3 may not represent the actual price received upon the disposition of an investment, and the Fund may receive a price that is lower than the valuation based upon these inputs when it sells the investment.
Annual Report 13
| | |
| NOTES TO FINANCIAL STATEMENTS, CONTINUED | | |
| |
Thornburg Capital Management Fund | | September 30, 2016 |
The following table displays a summary of the fair value hierarchy measurements of the Fund’s investments as of September 30, 2016. In any instance when valuation inputs from more than one level are used to determine the fair value of a specific investment, the investment is placed in the level of the table based upon the lowest level input that is significant in determining the fair value of the investment:
| | | | | | | | | | | | | | | | |
| | | Fair Value Measurements at September 30, 2016 | |
| | | Total | | | Level 1 | | | Level 2 | | | Level 3 | |
Assets | | | | | | | | | | | | | | | | |
Investments in Securities | | | | | | | | | | | | | | | | |
Short Term Investments | | $ | 1,346,157,708 | | | $ | — | | | $ | 1,346,157,708 | | | $ | — | |
| | | | | | | | | | | | | | | | |
Total Investments in Securities | | $ | 1,346,157,708 | | | $ | — | | | $ | 1,346,157,708 | | | $ | — | |
In accordance with the guidance prescribed in Accounting Standards Update No. 2011-04, it is the policy of the Fund to recognize transfers between levels and the underlying events which caused the movement. The Fund recognized no transfers between levels for the year ended September 30, 2016.
NOTE 4 – INVESTMENT ADVISORY FEE AND OTHER TRANSACTIONS WITH AFFILIATES
Pursuant to an investment advisory agreement, the Advisor serves as the investment advisor and performs services for the Fund. The Fund does not pay an advisory fee to the Advisor under this agreement.
The Fund pays to the Advisor the costs of personnel who perform certain accounting services for the Fund. For the year ended September 30, 2015 the Fund paid $77,885 to the Advisor for these accounting services. The Advisor provides certain administrative services to the Fund. No fees are charged for those services.
The Fund may sell securities to an affiliated fund, or the Fund may purchase securities held by an affiliated fund, provided the affiliation is due solely to having a common investment advisor, common officers, or common trustees, and provided that all such transactions will comply with Rule 17a-7 under the 1940 Act. For the year ended September 30, 2016, the Fund had no transactions with affiliated funds.
NOTE 5 – SHARES OF BENEFICIAL INTEREST
At September 30, 2016, there were an unlimited number of shares with no par value of beneficial interest authorized. Transactions in shares of beneficial interest were as follows:
| | | | | | | | | | | | | | | | |
| | | Year Ended | | | Period Ended | |
| | | September 30, 2016 | | | September 30, 2015* | |
| | | Shares | | | Amount | | | Shares | | | Amount | |
Class I Shares | | | | | | | | | | | | | | | | |
Shares sold | | | 1,098,287,670 | | | $ | 10,982,876,709 | | | | 431,721,191 | | | $ | 4,317,211,909 | |
Shares issued to shareholders in reinvestment of dividends | | | 703,612 | | | | 7,036,117 | | | | 96,365 | | | | 963,650 | |
Shares repurchased | | | (1,136,923,669 | ) | | | (11,369,236,692 | ) | | | (254,531,544 | ) | | | (2,545,315,439 | ) |
| | | | | | | | | | | | | | | | |
| | | | |
Net increase (decrease) | | | (37,932,387 | ) | | $ | (379,323,866 | ) | | | 177,286,012 | | | $ | 1,772,860,120 | |
| | | | | | | | | | | | | | | | |
| * | For the period from commencement of operations on July 31, 2015 through September 30, 2015. |
NOTE 6 – INVESTMENT TRANSACTIONS
For the year ended September 30, 2016, the Fund had no purchase and sale transactions of investments other than short-term investments.
OTHER NOTES
Risks: The Fund’s investments subject it to risks including, but not limited to, credit risk, interest rate risk, management risk, market and economic risk, foreign investment risk, diversification risk, and liquidity risk. Please see the Fund’s prospectus for a discussion of the risks associated with an investment in the Fund.
Subsequent Events: Fund management believes no events have occurred between September 30, 2016 and the date of issuance of the financial statements that require adjustment to or disclosure in the accompanying financial statements.
14 Annual Report
This page intentionally left blank.
Annual Report 15
FINANCIAL HIGHLIGHTS
Thornburg Capital Management Fund
| | | | | | | | | | | | | | | | | | | | | | | | | | | | | | | | | | | | | | | | | | | | | | | | | | | | | | | | | | | | |
| | | PER SHARE PERFORMANCE (for a share outstanding throughout the Year) | | | RATIOS TO AVERAGE NET ASSETS | | | SUPPLEMENTAL DATA | |
Unless Otherwise Noted, Periods are Fiscal Years Ended Sept. 30, | | Net Asset
Value
Beginning
of Year | | | Net
Invest-
ment
Income
(Loss)+ | | | Net
Realized
&
Unrealized
Gain (Loss)
on
Investments | | | Total from
Investment
Operations | | | Divi-
dends
from Net
Invest-
ment
Income | | | Divi-
dends
from Net
Realized
Gains | | | Total
Dividends | | | Net
Asset
Value
End
of
Year | | | Net
Invest-
ment
Income
(Loss)
(%) | | | Expenses,
After
Expense
Reductions
(%) | | | Expenses,
After
Expense
Reductions
and
Net of
Custody
Credits
(%) | | | Expenses,
Before
Expense
Reductions
(%) | | | Total
Return
(%)(a) | | | Portfolio
Turnover
Rate
(%)(a) | | | Net
Assets
at End
of Year
(Thousands) | |
CLASS I SHARES | | | | | | | | | | | | | | | | | | | | | | | | | | | | | | | | | | | | | | | | | | | | | | | | | | | | | | | | | |
2016 | | $ | 10.00 | | | | 0.05 | | | | — | | | | 0.05 | | | | (0.05 | ) | | | — | | | | (0.05 | ) | | $ | 10.00 | | | | 0.45 | | | | 0.03 | | | | 0.03 | | | | 0.03 | | | | 0.45 | | | | — | (b) | | $ | 1,393,536 | |
2015(c) | | $ | 10.00 | | | | — | (d) | | | — | (e) | | | — | (f) | | | — | (g) | | | — | | | | — | | | $ | 10.00 | | | | 0.26 | (h) | | | 0.03 | (h) | | | 0.03 | (h) | | | 0.03 | (h) | | | 0.04 | | | | — | (b) | | $ | 1,772,860 | |
| (a) | Not annualized for periods less than one year. |
| (b) | Portfolio turnover rate equals zero due to no long term investment transactions in the period. |
| (c) | Fund commenced operations on July 31, 2015. |
| (d) | Net investment income (loss) was less than $0.01 per share. |
| (e) | Net realized and unrealized gain (loss) on investments was less than $0.01 per share. |
| (f) | Total from investment operations was less than $0.01 per share. |
| (g) | Dividends from net investment income per share were less than $(0.01) . |
| + | Based on weighted average shares outstanding. |
See notes to financial statements.
| | | | |
| 16 Annual Report | | | | Annual Report 17 |
REPORT OF INDEPENDENT REGISTERED PUBLIC ACCOUNTING FIRM
Thornburg Capital Management Fund
To the Trustees and Shareholders of
Thornburg Capital Management Fund
In our opinion, the accompanying statement of assets and liabilities, including the schedule of investments in securities, and the related statement of operations and of changes in net assets and the financial highlights present fairly, in all material respects, the financial position of the Thornburg Capital Management Fund (the “Fund”) at September 30, 2016, the results of its operations for the year then ended, and the changes in its net assets and the financial highlights for the year then ended and for the period July 31, 2015 (commencement of operations) through September 30, 2016, in conformity with accounting principles generally accepted in the United States of America. These financial statements and financial highlights (hereafter referred to as “financial statements”) are the responsibility of the Fund’s management. Our responsibility is to express an opinion on these financial statements based on our audit. We conducted our audit of these financial statements in accordance with the standards of the Public Company Accounting Oversight Board (United States). Those standards require that we plan and perform the audit to obtain reasonable assurance about whether the financial statements are free of material misstatement. An audit includes examining, on a test basis, evidence supporting the amounts and disclosures in the financial statements, assessing the accounting principles used and significant estimates made by management, and evaluating the overall financial statement presentation. We believe that our audits, which included confirmation of securities at September 30, 2016 by correspondence with the custodian, brokers, transfer agent, and the application of alternative procedures where securities purchased had not been received, provide a reasonable basis for our opinion.
PricewaterhouseCoopers LLP
New York, New York
November 18, 2016
18 Annual Report
| | |
| EXPENSE EXAMPLE | | |
| |
Thornburg Capital Management Fund | | September 30, 2016 (Unaudited) |
As a shareholder of the Fund, you incur ongoing costs of investing in the Fund. Because the Fund does not pay any management fee or distribution and/or service (12b-1) fee, the Fund’s ongoing costs are comprised of other Fund expenses. Shareholders of the Fund do not incur any transaction costs.
This example is intended to help you understand your ongoing costs (in dollars) of investing in the Fund and to compare these costs with the ongoing costs of investing in other mutual funds.
The example is based on a $1,000 investment beginning on April 1, 2016, and held until September 30, 2016.
| | | | | | | | | | | | |
| | | Beginning
Account Value
4/1/16 | | | Ending
Account Value
9/30/16 | | | Expenses Paid
During Period†
4/1/16–9/30/16 | |
Actual | | $ | 1,000.00 | | | $ | 1,002.40 | | | $ | 0.13 | |
Hypothetical* | | $ | 1,000.00 | | | $ | 1,024.87 | | | $ | 0.13 | |
| † | Expenses are equal to the annualized expense ratio of the Fund (I:0.03%) multiplied by the average account value over the period, multiplied by 183/366 to reflect the one-half year period. |
| * | Hypothetical assumes a rate of return of 5% per year before expenses. |
ACTUAL EXPENSES
The first line of the accompanying table provides information about actual account values and actual expenses. You may use the information in this line, together with the amount you invested, to estimate the expenses that you paid over the period. Simply divide your account value by $1,000 (for example, an $8,600 account value divided by $1,000 = 8.6), then multiply the result by the number in the first line for your class of shares under the heading entitled “Expenses Paid During Period” to estimate the expenses you paid on your account during this period.
HYPOTHETICAL EXAMPLE FOR COMPARISON PURPOSES
The second line of the accompanying table provides information about hypothetical account values and hypothetical expenses based on the Fund’s actual expense ratio and an assumed rate of return of 5% per year before expenses, which is not the Fund’s actual return. The hypothetical account values and expenses may not be used to estimate the actual ending account balance or expenses you paid for the period. You may use this information to compare the ongoing costs of investing in the Fund and other funds. To do so, compare this 5% hypothetical example with the 5% hypothetical examples that appear in the shareholder reports of the other funds.
Please note that the expenses shown in the table are meant to highlight your ongoing costs and therefore, the second line of the table is useful in comparing ongoing costs only, and will not help you determine the relative total costs of owning different funds which may impose transactional costs. Shareholders of the Fund do not incur transactional costs such as sales charges (loads), redemption fees, or exchange fees.
Annual Report 19
| | |
| TRUSTEES AND OFFICERS | | |
| |
Thornburg Capital Management Fund | | September 30, 2016 (Unaudited) |
| | | | | | |
Name, Age, Year Elected Position Held with Fund | | Principal Occupation(s) During Past Five Years | | Other
Directorships
Held by Trustee | |
INTERESTED TRUSTEES(1)(2)(4) | | | | |
| | |
Garrett Thornburg, 71 Trustee since 1987, Chairman of Trustees(3) | | Chairman and controlling shareholder of Thornburg Investment Management, Inc. (investment advisor); Chairman and controlling shareholder of Thornburg Securities Corporation (securities dealer); Chairman and CEO of Chamisa Energy, LLC; President of the Thornburg Foundation (nonprofit). | | | None | |
| | |
Brian J. McMahon, 61 Trustee since 2001, Vice Chairman of Trustees, Member of Governance & Nominating Committee & Operations Risk Oversight Committee(5) | | Chief Investment Officer, Managing Director, and Portfolio Manager and, until 2016, CEO and President of Thornburg Investment Management, Inc.; Vice President of Thornburg Securities Corporation. | | | None | |
| |
INDEPENDENT TRUSTEES(1)(2)(4) | | | | |
| | |
David A. Ater, 71 Trustee since 1994, Member of Audit Committee & Chairman of Governance & Nominating Committee | | Principal in Ater & Associates, Santa Fe, NM (developer, planner and broker of residential and commercial real estate); owner, developer and broker for various real estate projects. | | | None | |
| | |
David D. Chase, 75 Trustee since 2000, Chairman of Audit Committee | | Managing Member of CS Group, LLC, Santa Fe, NM (private investment fund – family office). | | | None | |
| | |
Sally Corning, 55 Trustee since 2012, Member of Audit Committee | | Partner in Sun Mountain Capital, Santa Fe, NM (private equity firm with investment programs encompassing venture capital, mezzanine debt, and growth equity). | | | None | |
| | |
Susan H. Dubin, 67 Trustee since 2004, Member of Audit Committee & Governance and Nominating Committee | | President of Dubin Investments, Ltd., Greenwich, CT (private investment fund); Director and officer of various charitable organizations. | | | None | |
| | |
David L. Gardner, 53 Trustee since 2015, Member of Operations Risk Oversight Committee | | Until 2012, head of EMEA (Europe, Middle East and Africa) Sales for iShares of Blackrock, Inc., EMEA Executive Committee Member and EMEA Operating Committee Member at Blackrock, Inc. | | | None | |
| | |
Owen D. Van Essen, 62 Trustee since 2004, Member of Governance & Nominating Committee & Chairman of Operations Risk Oversight Committee | | President of Dirks, Van Essen & Murray, Santa Fe, NM (newspaper mergers and acquisitions). | | | None | |
| | |
James W. Weyhrauch, 57 Trustee since 1996, Member of Audit Committee & Operations Risk Oversight Committee | | Real estate broker, Santa Fe Properties, Santa Fe, NM; Vice Chairman of Nambe LLC, Santa Fe, NM (manufacturing & design company). | | | None | |
20 Annual Report
| | |
| TRUSTEES AND OFFICERS, CONTINUED | | |
| |
Thornburg Capital Management Fund | | September 30, 2016 (Unaudited) |
| | | | | | |
Name, Age, Year Elected Position Held with Fund | | Principal Occupation(s) During Past Five Years | | Other
Directorships
Held by Trustee | |
OFFICERS OF THE FUND (WHO ARE NOT TRUSTEES)(1)(7) | | | | |
| | |
Nimish Bhatt, 53 Treasurer since 2016(6) | | Chief Financial Officer and Treasurer of Thornburg Investment Management, Inc. and Thornburg Securities Corporation since 2016; Senior Vice President (2004-2016), Chief Financial Officer (2011-2016), and Head of Fund Administration (2011-2016) of Calamos Asset Management, Inc., Calamos Investments LLC, Calamos Advisors LLC, and Calamos Wealth Management; Director of Calamos Global Funds plc (2007-2016). | | | Not applicable | |
| | |
Jason Brady, 42 President since 2016(6) | | CEO and President since 2016, Vice President from 2011 to 2016, Portfolio Manager and Managing Director of Thornburg Investment Management, Inc.; Vice President of Thornburg Securities Corporation since 2016. | | | Not applicable | |
| | |
Kathleen Brady, 56 Vice President since 2008 | | Tax Manager Fund Accounting of Thornburg Investment Management, Inc. | | | Not applicable | |
| | |
Connor Browne, 37 Vice President since 2006 | | Portfolio Manager, Vice President since 2013, and Managing Director of Thornburg Investment Management, Inc. | | | Not applicable | |
| | |
Tim Cunningham, 41 Vice President since 2014 | | Managing Director since 2011, Portfolio Manager since 2012, and Associate Portfolio Manager from 2009–2012 of Thornburg Investment Management, Inc. | | | Not applicable | |
| | |
Randy Dry, 42 Vice President since 2014 | | Vice President and Managing Director, Director of Institutional Group from 2014-2016, and since 2016, Chief Administrative Officer of Thornburg Investment Management, Inc. | | | Not applicable | |
| | |
Greg Dunn, 40 Vice President since 2014 | | Managing Director, Portfolio Manager since 2012, and Associate Portfolio Manager from 2009–2012 of Thornburg Investment Management, Inc. | | | Not applicable | |
| | |
Lon Erickson, 41 Vice President since 2008 | | Portfolio Manager and Managing Director of Thornburg Investment Management, Inc. | | | Not applicable | |
| | |
William V. Fries, 77 Vice President since 1995 | | Portfolio Manager, Vice President, and Managing Director of Thornburg Investment Management, Inc. | | | Not applicable | |
| | |
Thomas Garcia, 45 Vice President since 2006 | | Vice President since 2011, Managing Director, Head Equity Trader, and Associate Portfolio Manager of Thornburg Investment Management, Inc. | | | Not applicable | |
| | |
Rolf Kelly, 37 Vice President since 2016 | | Portfolio Manager and Managing Director since 2013 and Associate Portfolio Manager from 2011–2013 of Thornburg Investment Management, Inc. | | | Not applicable | |
| | |
Ben Kirby, 36 Vice President since 2014 | | Portfolio Manager and Managing Director since 2013 and Associate Portfolio Manager from 2011–2013 of Thornburg Investment Management, Inc. | | | Not applicable | |
| | |
Jeff Klingelhofer, 41 Vice President since 2016 | | Portfolio Manager and Managing Director since 2015, Associate Portfolio Manager from 2012–2015, and Fixed Income Analyst from 2010–2012 of Thornburg Investment Management, Inc. | | | Not applicable | |
| | |
Rob MacDonald, 40 Vice President since 2016 | | Managing Director since 2015, Portfolio Manager since 2014, and Associate Portfolio Manager from 2011–2014 of Thornburg Investment Management, Inc. | | | Not applicable | |
| | |
Leigh Moiola, 49 Vice President since 2001 | | Vice President, Managing Director, and Director of Marketing of Thornburg Investment Management, Inc.; Vice President of Thornburg Securities Corporation. | | | Not applicable | |
| | |
Christopher Ryon, 60 Vice President since 2008 | | Portfolio Manager and Managing Director of Thornburg Investment Management, Inc. | | | Not applicable | |
| | |
Nicholos Venditti, 35 Vice President since 2016 | | Portfolio Manager and Managing Director since 2015 and Associate Portfolio Manager from 2011–2015 of Thornburg Investment Management, Inc. | | | Not applicable | |
Annual Report 21
| | |
| TRUSTEES AND OFFICERS, CONTINUED | | |
| |
Thornburg Capital Management Fund | | September 30, 2016 (Unaudited) |
| | | | |
Name, Age, Year Elected Position Held with Fund | | Principal Occupation(s) During Past Five Years | | Other
Directorships
Held by Trustee |
| | |
Vinson Walden, 46 Vice President since 2004 | | Portfolio Manager and Managing Director of Thornburg Investment Management, Inc. | | Not applicable |
| | |
Lei Wang, 45 Vice President since 2006 | | Portfolio Manager and Managing Director of Thornburg Investment Management, Inc. | | Not applicable |
| | |
Sasha Wilcoxon, 42 Vice President since 2003 Secretary since 2007(6) | | Managing Director, Director of Mutual Fund Operations, and Vice President of Thornburg Investment Management, Inc.; Vice President of Thornburg Securities Corporation. | | Not applicable |
| | |
Charles Wilson, 41 Vice President since 2016 | | Portfolio Manager and Managing Director since 2014 and Associate Portfolio Manager from 2012–2014 of Thornburg Investment Management, Inc.; Co-Portfolio Manager of Marsico Capital Management from 2010–2012. | | Not applicable |
| | |
Di Zhou, 38 Vice President since 2016 | | Portfolio Manager and Managing Director since 2016, Associate Portfolio Manager from 2014–2016, and Equity Research Analyst from 2010–2014 of Thornburg Investment Management, Inc. | | Not applicable |
| (1) | Each person’s address is 2300 North Ridgetop Road, Santa Fe, New Mexico 87506. |
| (2) | The Fund is a separate investment “Fund” or “series” of Thornburg Investment Trust (the “Trust”), which comprises the Thornburg mutual fund complex and is organized as a Massachusetts business trust. Thornburg Investment Management, Inc. is the investment advisor to, and manages, all the Funds of the Trust. Each Trustee oversees all the Funds of the Trust. |
| (3) | Mr. Thornburg is considered an “interested” Trustee under the Investment Company Act of 1940 because he is the sole director and controlling shareholder of Thornburg Investment Management, Inc., the investment advisor to the Trust, and is the sole director and controlling shareholder of Thornburg Securities Corporation, the distributor of shares for the Trust. |
| (4) | The Bylaws of the Trust currently require that each Trustee shall retire by the end of the calendar year during which the Trustee reached the age of 75 years. Otherwise each Trustee serves in office until the election and qualification of a successor or until the Trustee sooner dies, resigns, retires or is removed. |
| (5) | Mr. McMahon is considered an “interested” Trustee under the Investment Company Act of 1940 because he is the chief investment officer of Thornburg Investment Management, Inc. |
| (6) | The Trust’s president, secretary, and treasurer each serves a one-year term or until the election and qualification of a successor; each other officer serves at the pleasure of the Trustees. |
| (7) | Assistant vice presidents, assistant secretaries, and assistant treasurers are not shown. |
The Statement of Additional Information for each Fund of the Trust includes additional information about the Trustees and is available, without charge and upon request, by calling 1-800-847-0200.
22 Annual Report
| | |
| OTHER INFORMATION | | |
| |
Thornburg Capital Management Fund | | September 30, 2016 (Unaudited) |
PORTFOLIO PROXY VOTING
Policies and Procedures:
The Trust has delegated to Thornburg Investment Management, Inc.(the “Advisor”) voting decisions respecting proxies for the Fund’s voting securities. The Advisor makes voting decisions in accordance with its Proxy Voting Policy. A description of the Policy is available (i) without charge, upon request, by calling the Advisor toll-free at 1-800-847-0200, (ii) on the Thornburg website at www.thornburg.com, and (iii) on the Securities and Exchange Commission’s website at www.sec.gov.
Information regarding how proxies were voted is available on or before August 31 of each year for the twelve months ending the preceding June 30. This information is available (i) without charge, upon request by calling the Advisor toll-free at 1-800-847-0200, (ii) on the Thornburg website at www.thornburg.com, and (iii) on the Securities and Exchange Commission’s website at www.sec.gov.
AVAILABILITY OF QUARTERLY PORTFOLIO SCHEDULE
The Fund files with the Securities and Exchange Commission schedules of its portfolio holdings on Form N-Q for the first and third quarters of each fiscal year. The Fund’s Forms N-Q are available on the Commission’s website at www.sec.gov, or may be reviewed and copied at the Commission’s Public Reference Room in Washington, D.C. Information on the operation of the Public Reference Room may be obtained by calling 1-800-SEC-0330. The Fund also makes this information available on its website at www.thornburg.com/download or upon request by calling 1-800-847-0200.
STATEMENT RESPECTING RENEWAL OF INVESTMENT ADVISORY AGREEMENT
Thornburg Investment Management, Inc. (the “Advisor”) provides investment management services to Thornburg Capital Management Fund pursuant to an investment advisory agreement. The Trustees considered this agreement for renewal for the first time since its initial approval, and determined to renew the agreement on September 13, 2016.
The information below summarizes certain factors considered by the Trustees in connection with the determination to renew the advisory agreement. In determining to renew the agreement, the Trustees did not identify any single factor as controlling, and this summary does not describe all of the factors and other matters considered by the Trustees in making their determination.
Nature, Extent and Quality of Services. Information noted by the Trustees in their evaluation as having been considered included information previously received from the Advisor respecting the Advisor’s proposed selection of investments and execution of the Fund’s investment strategies, and other factors. Portfolio holdings and related information confirmed that the Advisor had managed the Fund in the short period since commencement of investment operations in accordance with the Fund’s prospectus.
Investment Performance. Dividend distribution information appeared consistent with expectations respecting the Fund’s investment performance in view of current market conditions.
Comparisons of Fee and Expense Levels. The Trustees did not consider fee levels because the Advisor does not charge fees to the Fund. Expense information was consistent with expectations.
Costs and Profitability of Advisor. The Trustees did not consider the profitability of the Advisor in reviewing the advisory agreement, because the Advisor does not charge fees under that agreement.
Potential Economies of Scale. The Trustees did not consider any economies of scale potentially available to the Fund in reviewing the advisory agreement, because the Advisor does not receive a fee under that agreement.
Potential Ancillary Benefits. The Trustees did not identify any collateral benefits to the Advisor because of its relationship to the Fund.
Summary of Conclusions. The Trustees concluded that the nature, extent and quality of the Advisor’s services performed under the advisory agreement remained sufficient. The Trustees further concluded that the investment performance of the Fund over the limited period of time considered was satisfactory in the context of the Fund’s objectives and strategies, and that the Advisor has actively and competently pursued the Fund’s stated investment objectives and adhered to the Fund’s investment policies.
The Trustees further concluded that the level of the Fund’s expenses was reasonable.
Annual Report 23
TRUSTEES’ STATEMENT TO SHAREHOLDERS
Readopted September 12, 2016
The Trustees believe current and prospective shareholders should know how we discharge our responsibilities in supervising the Funds’ investment advisor and in reviewing the advisor’s contract for renewal. Since 2005, we have issued a statement which sets out clearly the three principal guidelines that we follow in supervising the Trust’s investment advisor on your behalf. In accordance with our customary practice, in September of this year we again reviewed our statement and concluded we should reissue this statement outlining the principal features of our supervision of the advisor’s performance of investment management services for the Funds.
We begin with the premise that each shareholder selected his or her Fund because its investments are managed by the investment advisor identified in the prospectus and in accordance with the objective and policies described in the prospectus. We realize, as each of you do, that if you believe that your Fund’s stated objective and policies no longer serve your personal investment goals, you can sell your shares and leave the Fund.
Therefore, we believe that our primary supervisory task – our principal obligation to you – is to assess the nature and quality of the advisor’s services, and to confirm that the advisor actively and competently pursues the Fund’s objective, in accordance with the policies set out in the prospectus. To do this, we meet regularly with management to review your Fund’s portfolio and to discuss the advisor’s specific actions and judgments in pursuing the Fund’s objective. We do not substitute our own judgment for the advisor’s decisions in selecting investments; the advisor is paid to exercise its informed judgment on investment decisions, and we seek to confirm, in reviewing the advisor’s performance, that the advisor is doing just that.
Second, we are conscious of costs and the effect that costs have on shareholders’ returns. We try to make sure that your Fund’s fees and costs are reasonable in relationship to the services rendered and that they are generally in line with those charged by other expert investment advisors, consistent with our belief that the Fund’s investors searched for and expect that expertise and attention and have decided to pay a reasonable price for it. We do not put the management contract “out to bid” as a matter of course, and we would not do so unless we had concluded that the advisor materially had failed to pursue the Fund’s objectives in accordance with its policies, or for other equally important reasons. We believe that any other approach would be inconsistent with your interests and contrary to your expectations when you bought shares of the Fund in the first place.
Finally, because we believe that most Thornburg Fund shareholders have invested with a long-term perspective, we try not to focus too much on the fashions of the moment and on short-term performance. The market will not favor any specific investment objective or set of policies at all times and under all economic circumstances. A fund will experience periods of both high and low returns relative to other funds and other investments. Even if one of our Funds is not favored by the market at a particular time, we believe that the advisor is nonetheless obliged to remain true to the Fund’s objective and policies, and we watch to see that it does so.
Trustees of Thornburg Investment Trust
24 Annual Report

| | | | |
To receive shareholder reports, prospectuses, and proxy statements electronically, go to www.thornburg.com/edelivery. | |  |
This Annual Report is submitted for the general information of shareholders of the Fund. It is not authorized for distribution to prospective investors in the Fund unless preceded or accompanied by an effective prospectus. | |
| | |
| Investment Advisor: | | Distributor: | | |
| Thornburg Investment Management® | | Thornburg Securities Corporation® | | |
| 800.847.0200 | | 800.847.0200 | | TH3477 |
Item 2. Code of Ethics
Thornburg Investment Trust (the “Trust”) has adopted a code of ethics described in Item 2 of Form N-CSR. A copy of the code of ethics is filed as an exhibit to this Form N-CSR.
Item 3. Audit Committee Financial Expert
The Trustees of Thornburg Investment Trust have determined that three members of the Trust’s audit committee, David A. Ater, David D. Chase and Sally Corning, are each audit committee financial experts as defined in Item 3 of Form N-CSR. Mr. Ater, Mr. Chase and Ms. Corning are each independent for purposes of Item 3 of Form N-CSR. The Trustees’ determinations in this regard were based upon their current understandings of the definition of “audit committee financial expert” and current interpretations of the definition. The Trustees call attention to the lack of clarity in the definition, and that shareholders and prospective investors may wish to evaluate independently this definition and the qualifications of the Trust’s audit committee. The definition of “audit committee financial expert,” together with comments on the definition, is set forth in the Securities and Exchange Commission’s website (www.sec.gov).
Item 4. Principal Accountant Fees and Services
Audit Fees
The aggregate fees billed to Thornburg Investment Trust in each of the last two fiscal years for the audit of the Trust’s financial statements and for services that are normally provided by PricewaterhouseCoopers LLP, registered independent public accounting firm (“PWC”), in connection with statutory and regulatory filings or requirements for those fiscal years are set out below.
| | | | | | | | |
| | | Year Ended
September 30, 2015 | | | Year Ended
September 30, 2016 | |
Thornburg Investment Trust | | $ | 730,000 | | | $ | 680,460 | |
Audit-Related Fees
The fees billed to Thornburg Investment Trust by PWC in each of the last two fiscal years for assurance and related services that are reasonably related to the audit or review of the Trust’s financial statements (and that are not reflected in “Audit Fees,” above) are set out below.
| | | | | | | | |
| | | Year Ended
September 30, 2015 | | | Year Ended
September 30, 2016 | |
Thornburg Investment Trust | | $ | 5,000 | | | $ | 45,000 | |
Tax Fees
The fees billed to Thornburg Investment Trust by PWC in each of the last two fiscal years for professional services rendered by PWC for tax compliance, tax advice or tax planning, including amounts paid in connection with filing foreign tax reclaims, are set out below.
| | | | | | | | |
| | | Year Ended
September 30, 2015 | | | Year Ended
September 30, 2016 | |
Thornburg Investment Trust | | $ | 444,068 | | | $ | 374,392 | |
All Other Fees
The fees billed to Thornburg Investment Trust by PWC in each of the last two fiscal years for all other services rendered by PWC to the Trust are set out below.
| | | | | | | | |
| | | Year Ended
September 30, 2015 | | | Year Ended
September 30, 2016 | |
Thornburg Investment Trust | | $ | 8,245 | | | $ | 5,400 | |
The figure shown under All Other Fees for the year ended September 30, 2015 includes amounts from out of pocket expenses during the 2014 annual audit. The figure shown under All Other Fees for the year ended September 30, 2016 includes amounts from out of pocket expenses during the 2015 annual audit.
PWC performs no services for the investment advisor, the Funds’ principal underwriter or any other person controlling, controlled by, or under common control with the investment advisor which provides ongoing services to the Funds.
Audit Committee Pre-Approval Policies and Procedures
As of September 30, 2016, the Trust’s Audit Committee has not adopted pre-approval policies and procedures.
Item 5. Audit Committee of Listed Registrants
Not applicable.
Item 6. Schedule of Investments
Filed as part of the reports to shareholders filed under item 1 of this Form.
Item 7. Disclosure of Proxy Voting Policies and Procedures for Closed-End Management Investment Companies
Not applicable.
Item 8. Portfolio Managers of Closed-End Management Investment Companies
Not applicable.
Item 9. Purchases of Equity Securities by Closed-End Management Investment Companies and Affiliated Purchasers.
Not applicable.
Item 10. Submission of Matters to a Vote of Security Holders
The authority to consider candidates recommended by the shareholders in accordance with the Trust’s Procedures for Shareholder Communications is committed to the Governance and Nominating Committee.
Item 11. Controls and Procedures
(a) The principal executive officer and the principal financial officer have concluded that Thornburg Investment Trust’s disclosure controls and procedures provide reasonable assurance that material information relating to Thornburg Investment Trust is made known to them by the appropriate persons, based on their evaluation of these controls and procedures as of a date within 90 days prior to the filing date of this report.
(b) There was no change in Thornburg Investment Trust’s internal control over financial reporting that occurred during the registrant’s second fiscal quarter of the period covered by this report (that is, the registrant’s fourth fiscal quarter) that has materially affected, or is reasonably likely to materially affect, the registrant’s internal control over financial reporting.
Item 12. Exhibits
| | |
| |
(a) (1) | | Code of Business Conduct and Ethics. |
| |
(a) (2) | | Certifications pursuant to Rule 30a-2(a) under the Investment Company Act of 1940 (17 CFR 70.30a-2(a)) attached hereto as Exhibit 99.CERT. |
| |
(a) (3) | | Not Applicable |
| |
(b) | | Certification pursuant to Section 906 of the Sarbanes-Oxley Act of 2002 and Rule 30a-2(b) under the Investment Company Act of 1940 (17 CFR 70.30a-2(b)) attached hereto as Exhibit 99.906CERT. |
SIGNATURES
Pursuant to the requirements of the Securities Exchange Act of 1934 and the Investment Company Act of 1940, the registrant has duly caused this report to be signed on its behalf by the undersigned, thereunto duly authorized.
Thornburg Investment Trust, in respect of the following Thornburg Funds: Low Duration Municipal Fund, Limited Term Municipal Fund, California Limited Term Municipal Fund, Intermediate Municipal Fund, New Mexico Intermediate Municipal Fund, New York Intermediate Municipal Fund, Low Duration Income Fund, Limited Term U.S. Government Fund, Limited Term Income Fund, Value Fund, International Value Fund, Core Growth Fund, Investment Income Builder Fund, Global Opportunities Fund, International Growth Fund, Strategic Income Fund, Strategic Municipal Income Fund, Developing World Fund, Better World International Fund, and Capital Management Fund.
| | |
| By: | | /s/ Jason H. Brady |
| | Jason H. Brady |
| | President and principal executive officer |
| |
| Date: | | November 28, 2016 |
Pursuant to the requirements of the Securities Exchange Act of 1934 and the Investment Company Act of 1940, this report has been signed below by the following persons on behalf of the registrant and in the capacities and on the dates indicated.
| | |
| By: | | /s/ Jason H. Brady |
| | Jason H. Brady |
| | President and principal executive officer |
| |
| Date: | | November 28, 2016 |
| |
| By: | | /s/ Nimish Bhatt |
| | Nimish Bhatt |
| | Treasurer and principal financial officer |
| |
| Date: | | November 28, 2016 |