UNITED STATES
SECURITIES AND EXCHANGE COMMISSION
Washington, D.C. 20549
FORM N-CSR
CERTIFIED SHAREHOLDER REPORT OF REGISTERED
MANAGEMENT INVESTMENT COMPANIES
Investment Company Act file number 811-05201
Thornburg Investment Trust
(Exact name of registrant as specified in charter)
c/o Thornburg Investment Management, Inc.
2300 North Ridgetop Road, Santa Fe, New Mexico 87506
(Address of principal executive offices) (Zip code)
Garrett Thornburg, 2300 North Ridgetop Road, Santa Fe, New Mexico 87506
(Name and address of agent for service)
Registrant’s telephone number, including area code: 505-984-0200
Date of fiscal year end: September 30, 2019
Date of reporting period: September 30, 2019
Item 1.Reports to Stockholders
The following annual reports are attached hereto, in order:
Thornburg Low Duration Municipal Fund
Thornburg Limited Term Municipal Fund
Thornburg Intermediate Municipal Fund
Thornburg Strategic Municipal Income Fund
Thornburg California Limited Term Municipal Fund
Thornburg New Mexico Intermediate Municipal Fund
Thornburg New York Intermediate Municipal Fund
Thornburg Limited Term U.S. Government Fund
Thornburg Limited Term Income Fund
Thornburg Low Duration Income Fund
Thornburg Strategic Income Fund
Thornburg Value Fund
Thornburg International Value Fund
Thornburg Core Growth Fund
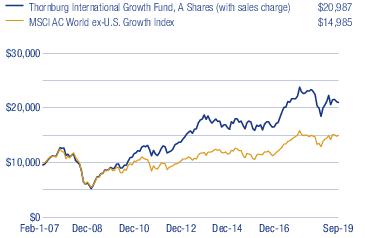
Thornburg International Growth Fund
Thornburg Investment Income Builder Fund
Thornburg Global Opportunities Fund
Thornburg Developing World Fund
Thornburg Better World International Fund
Thornburg Capital Management Fund
Thornburg Long/Short Equity Fund
Thornburg Summit Fund
Annual Report
September 30, 2019
Beginning on January 1, 2021, as permitted by regulations adopted by the Securities and Exchange Commission, paper copies of the Fund’s shareholder reports will no longer be sent by mail, unless you specifically request paper copies of the reports from the Fund or from your financial intermediary, such as a broker-dealer or bank. Instead, the reports will be made available on a website, and you will be notified by mail each time a report is posted and provided with a website link to access the report.
If you already elected to receive shareholder reports electronically, you will not be affected by this change and you need not take any action. You may elect to receive shareholder reports and other communications from the Fund or your financial intermediary electronically by going to thornburg.com/edelivery.
You may elect to receive all future reports in paper free of charge. You can inform the Fund or your financial intermediary that you wish to continue receiving paper copies of your shareholder reports by calling 800.847.0200 or your financial intermediary directly. Your election to receive reports in paper will apply to all funds held with the fund complex/your financial intermediary.
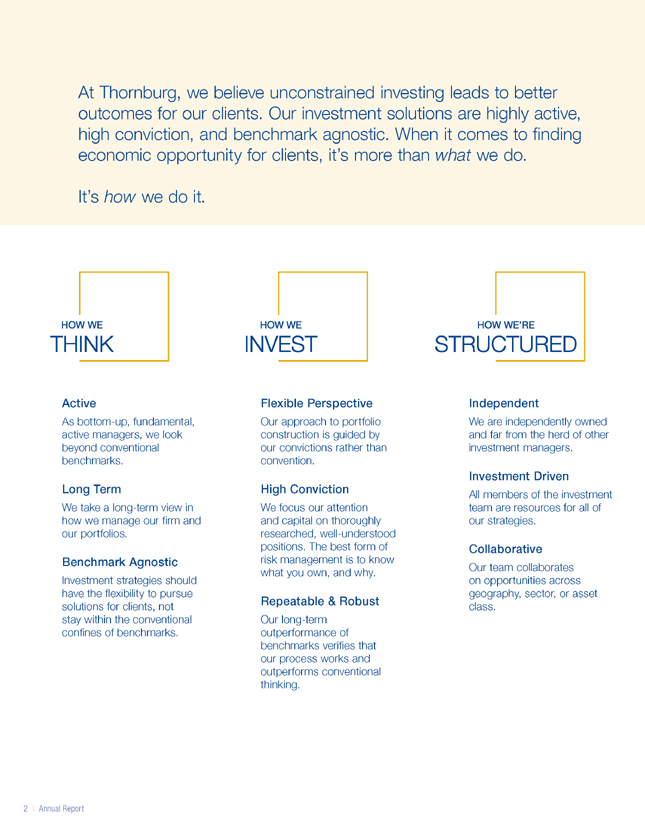
At Thornburg, we believe unconstrained investing leads to better outcomes for our clients. Our investment solutions are highly active, high conviction, and benchmark agnostic. When it comes to finding economic opportunity for clients, it’s more than what we do.
It’s how we do it. Active Asbottom-up, fundamental, active managers, we look beyond conventional benchmarks. Long Term We take a long-term view in how we manage our firm and our portfolios. Benchmark Agnostic Investment strategies should have the flexibility to pursue solutions for clients, not stay within the conventional confines of benchmarks. Flexible Perspective Our approach to portfolio construction is guided by our convictions rather than convention. High Conviction We focus our attention and capital on thoroughly researched, well-understood positions. The best form of risk management is to know what you own, and why. Repeatable & Robust Our long-term outperformance of benchmarks verifies that our process works and outperforms conventional thinking. Independent We are independently owned and far from the herd of other investment managers. Investment Driven All members of the investment team are resources for all of our strategies. Collaborative Our team collaborates on opportunities across geography, sector, or asset class.
Thornburg Low Duration Municipal Fund
Annual Report | September 30, 2019
Table of Contents
| SHARE CLASS | NASDAQ SYMBOL | CUSIP |
| Class A | TLMAX | 885-216-788 |
| Class I | TLMIX | 885-216-770 |
Minimum investments for Class I shares may be higher than those for Class A. Class I shares may not be available to all investors.
Investments carry risks, including possible loss of principal. Portfolios investing in bonds have the same interest rate, inflation, and credit risks that are associated with the underlying bonds. The value of bonds will fluctuate relative to changes in interest rates, decreasing when interest rates rise. Unlike bonds, bond funds have ongoing fees and expenses. Please see the Fund’s prospectus for a discussion of the risks associated with an investment in the Fund. Investments in the Funds are not FDIC insured, nor are they bank deposits or guaranteed by a bank or any other entity.
The laddering strategy does not assure or guarantee better performance and cannot eliminate the risk of investment losses.
Letter to Shareholders
Thornburg Low Duration Municipal Fund | September 30, 2019 (Unaudited)
October 18, 2019
Dear Fellow Shareholder:
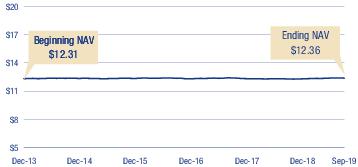
We are pleased to present the annual report for the Thornburg Low Duration Municipal Fund. The net asset value (NAV) of the Class I shares increased 9 cents to $12.36 per share during the fiscal year ended September 30, 2019. The Class I shares of your Fund underperformed the index with a 2.22% total return for the fiscal year ended September 30, 2019, compared to the 3.12% total return for the ICE BofA Merrill Lynch 1-3 Year Municipal Securities Index.
The drivers of the Fund’s total return relative to its benchmark include its interest rate sensitivity, as measured by the Fund’s duration, differing maturity allocations and other risk factors. The impact of the Fund’s 0.81 years shorter duration detracted 0.036%. The Fund’s sector allocations contributed 0.055%, while other risk factors detracted 0.354%. The Fund’s expenses and residuals accounted for the remainder of the performance differential.
Since the last annual letter published in November 2018, the municipal market and its investors have experienced one of the great rallies in the market’s history, driven by the largest amount of inflows into municipal bond mutual funds on record. Mutual funds have experienced positive inflows every week of 2019, with the aggregate amounting to more than $70 billion. During that time, the 10-year Thomson Reuters Municipal Market Data (MMD) AAA Curve has fallen from a high of 2.80% in early November 2018 to an all-time low of 1.22% in late August 2019, only to settle around 1.45% at the time of this writing. The decrease in yields and the insatiable demand from retail mutual fund investors has led to appreciating bond prices that have accounted for a large portion of the returns the market inked over the last 12 months.
While the increase in the price of the investments has been great to watch, municipal investors find themselves in a tough situation. Does one sell the bonds at high prices? Is it best to pay a capital gain and look for reinvestment opportunities? Or does one hold the bonds? Collect a coupon and reinvest the proceeds knowing that the premium could evaporate if yields spike?
In many cases the answer is contingent on investor goals and risk tolerance. So instead of providing an answer, we would like to present an analysis of market risks that will allow investors to draw their own conclusions.
Municipal Bond Supply and Demand
Municipal investors tend to be overly sensitive to supply trends. The common refrain is that a big supply year is bearish for bond prices and vice versa. While that is generally true, it negates the other half of the equation. Demand, not supply, can be a large driver of total return, and that is exactly what the market has experienced throughout 2019. $70 billion has poured into the municipal market through the end of September 2019, the largest amount of annual inflows on record.
That $70 billion represents roughly 10% of all assets in municipal bond mutual funds. So technical demand, not fundamentals, has been the key driver of asset appreciation. That should be troubling. As investors, we like fundamentals to move asset prices. If you were to invest in Apple, and Apple sells more iPhones, and the firm’s stock appreciates, we would consider that being for the right reasons. When price is driven by factors other than fundamental value, the potential for a reversal tends to be high. Therefore, we would recommend caution when investing in a market where fundamental improvement isn’t the reason for price appreciation.
Municipal Bond Credit Risk
Credit spreads, much like triple-A bond insurers, have all but disappeared from the muni market. That is somewhat of an overstatement, but for some time now credit spreads, especially across the plain vanilla investment grade space, have become virtually commoditized. At the same time, while much has been said surrounding the covenant-lite status of recent corporate debt issuance, little has been said about the phenomenon in the municipal bond market. Credit security packages are getting weaker. Net revenue covenants, liquidity covenants, additional bonds tests and other protections granted to municipal investors are weakening. It is undeniable that municipal investors are taking on more and more credit risk for less and less yield.
State and Local Tax Deduction (SALT)
At least part of the increase in demand for municipal paper has been driven by the changes to the SALT deduction cap. The cap of $10,000 in state and local taxes that are deductible from federal taxes was part of the tax changes that were passed by the Trump administration at the end of 2017. It is estimated that over 10 million taxpayers were unable to write-off some $320 billion in state and local taxes, effectively increasing their tax liability despite a reduction in marginal personal income tax rates. The impact has been the most severe in states with high local and state taxes.
Faced with an ever-increasing tax bill, investors in these high-tax states have flocked to the municipal bond market. In no place is that truer than California. For many investors in the state, investments in the California municipal bond market no longer make economic sense. After adjusting yields for state and local taxes, many California investors would be better off investing in U.S. Treasuries due to the higher after-tax yield. Yet, money continues to flow into the California municipal bond market as investors make these non-economic decisions. Non-economic decision-making is not isolated to the California market, though. It’s evident in many high-tax states.
The Federal Reserve and Monetary Policy
As recently as December 2018, the Federal Reserve seemed bound and determined to push interest rates higher. It took only a few angry tweets and some stock market volatility in the fourth quarter of 2018 for the Fed to put its interest rate hikes
Letter to Shareholders, Continued
Thornburg Low Duration Municipal Fund | September 30, 2019 (Unaudited)
on pause, and only seven months for a complete reversal of course. Since the 25 basis point (bps) rate cut in July, the Fed cut again in September and the market is pricing in one more cut before year end.
While monetary policy has been the elixir of choice for a decade running, it has also created a host of problems for fixed income investors. By keeping yields low for the last decade, fixed income investors have been driven out the risk spectrum in search of their income goals. Many have taken on additional duration risk by buying longer-dated bonds, making them more susceptible to interest rate movements.
Other fixed income investors have taken on more credit risk, making them more susceptible to a slowing economy. Others have been forced out of the fixed income market and into the equity markets, which completely changes the risk profile of their investments. This is all being done at a time of all-time low yields and all-time low credit spreads. This situation is hardly sustainable.
The highlighted risks have led us to maintain our present course. The Fund remains higher in credit quality and cash with durations at lower levels. While the latter has impacted total returns as price appreciation has driven total return, the distribution yield, or tax-free monthly income, has held up nicely. Cash has been allowed to build given the flatness of the
yield curve and the trade-off in investing in the variable rate demand note (VRDN) market. When opportunities arise, we have ample dry powder to take advantage of dislocations. Until those conditions are met, we are content to manage the Fund in a more conservative fashion commensurate with the risk profile of a municipal bond investor.
Thank you for your continued trust and support.
Sincerely,

| 
|
Christopher Ryon,cfa
Portfolio Manager
Managing Director | Nicholos Venditti,cfa
Portfolio Manager
Managing Director |

| |
David Ashley,cfa
Portfolio Manager
Managing Director | |
The matters discussed in this report may constitute forward-looking statements made pursuant to the safe harbor provisions of the Securities Litigation Reform Act of 1995. These include any advisor or portfolio manager prediction, assessment, analysis or outlook for individual securities, industries, investment styles, market sectors and/or markets. These statements involve risks and uncertainties. In addition to the general risks described for each fund in its current prospectus, other factors bearing on these reports include the accuracy of the advisor’s or portfolio manager’s forecasts and predictions, the appropriateness of the investment strategies designed by the advisor or portfolio manager and the ability of the advisor or portfolio manager to implement their strategies efficiently and successfully. Any one or more of these factors, as well as other risks affecting the securities markets generally, could cause the actual results of any fund to differ materially as compared to its benchmarks.
The views expressed are subject to change and do not necessarily reflect the views of Thornburg Investment Management, Inc. This information should not be relied upon as a recommendation or investment advice and is not intended to predict the performance of any investment or market.
Performance results of individual share classes will vary based on the fees and expenses associated with each share class, and may be higher or lower than other share classes within the same Fund. Please see Performance Summary for performance results of each share class.
Performance Summary
Thornburg Low Duration Municipal Fund | September 30, 2019 (Unaudited)
AVERAGE ANNUAL TOTAL RETURNS
| | 1-YR | 3-YR | 5-YR | SINCE
INCEP. |
| Class A Shares(Incep: 12/30/13) | | | | |
| Without sales charge | 2.02% | 1.00% | 0.68% | 0.66% |
| With sales charge | 0.46% | 0.49% | 0.37% | 0.39% |
| Class I Shares(Incep: 12/30/13) | 2.22% | 1.20% | 0.87% | 0.85% |
30-DAY YIELDS, A SHARES(with sales charge)
| Annualized Distribution Yield | 1.21% |
| SEC Yield | 0.85% |
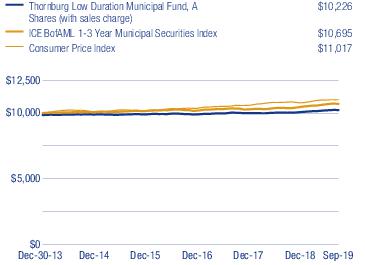
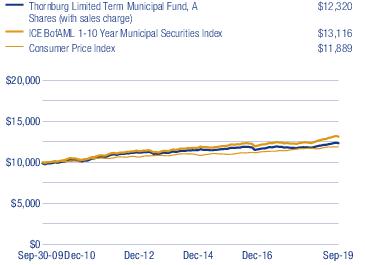
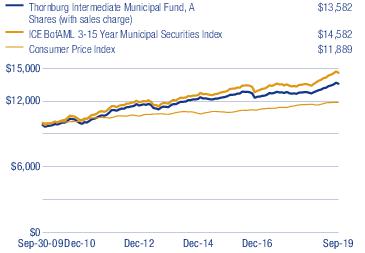
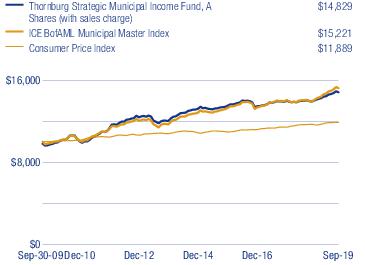
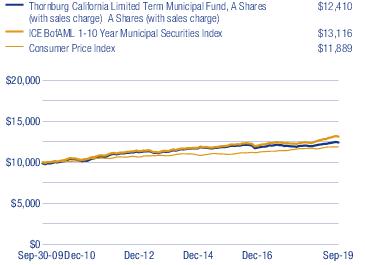
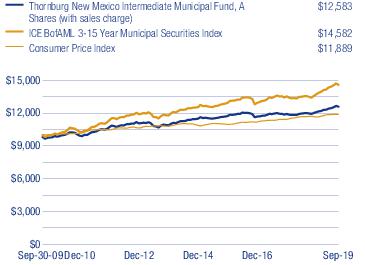
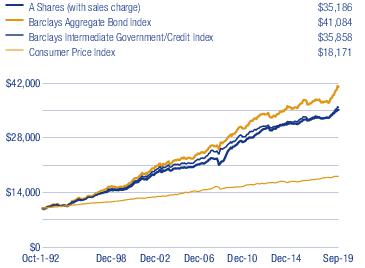
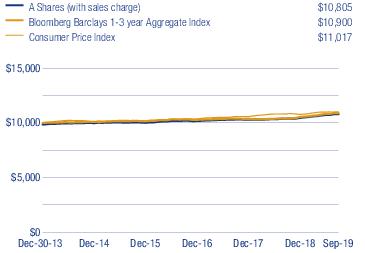
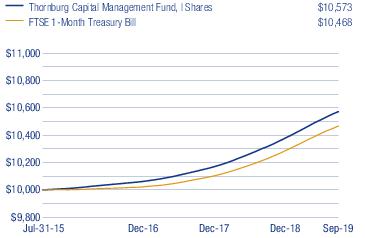
GROWTH OF A HYPOTHETICAL $10,000 INVESTMENT
Performance data shown represents past performance and is no guarantee of future results. Investment return and principal value will fluctuate so shares, when redeemed, may be worth more or less than their original cost. Current performance may be lower or higher than quoted. For performance current to the most recent month end, visit thornburg.com or call 800-847-0200. The performance information does not reflect the deduction of taxes that a shareholder would pay on distributions or the redemption of Fund shares. Returns reflect the reinvestment of dividends and capital gains. Class A shares are sold with a maximum sales charge of 1.50%. There is no sales charge for Class I shares. As disclosed in the most recent prospectus, the total annual fund operating expenses before fee waivers and expense reimbursements are as follows: A shares, 1.06%; I shares, 0.64%. Thornburg Investment Management has contractually agreed to waive fees and reimburse expenses until at least February 1, 2020, for some of the share classes, resulting in net expense ratios of the following: A shares, 0.70%; I shares, 0.50%. For more detailed information on fund expenses and waivers/reimbursements please see the Fund’s prospectus. Without the fee waivers and expense reimbursements, the Annualized Distribution yield would have been 0.86%, and the SEC yield would have been 0.50%.
The ICE index data referenced herein is the property of ICE Data Indices, LLC, its affiliates (“ICE Data”) and/or its Third Party Suppliers and has been licensed for use by Thornburg Investment Management, Inc. ICE Data and its Third Party Suppliers accept no liability in connection with its use. See www.thornburg.com/indices for a full copy of the Disclaimer.
TheICE BofAML 1-3 Year Municipal Securities Index is a subset of the ICE BofAML Municipal Securities Index including all securities with a remaining term to final maturity greater than or equal to 1 year and less than 3 years.
The performance of any index is not indicative of the performance of any particular investment. Unless otherwise noted, index returns reflect the reinvestment of income dividends and capital gains, if any, but do not reflect fees, brokerage commissions or other expenses of investing. Investors may not make direct investments into any index.
Bond Credit Ratings (Credit Quality) – A bond credit rating assesses the financial ability of a debt issuer to make timely payments of principal and interest. Ratings of AAA (the highest), AA, A, and BBB are investment-grade quality. Ratings of BB, B, CCC, CC, C and D (the lowest) are considered below investment grade, speculative grade, or junk bonds.
Duration – A bond’s sensitivity to interest rates. Bonds with longer durations experience greater price volatility than bonds with shorter durations. Effective duration incorporates a bond’s embedded option features, such as call provisions.
Yield Curve – A line that plots the interest rates, at a set point in time, of bonds having equal credit quality, but differing maturity dates.
Thomson Reuters Municipal Market Data (MMD) AAA Curve - Thomson Reuters Municipal Market Data (MMD) AAA Curve is a proprietary yield curve that provides the offer-side of “AAA” rated state general obligation bonds, as determined by the MMD analyst team. The MMD AAA curve represents the MMD analyst team’s opinion of AAA valuation, based on institutional block size ($2 million+) market activity in both the primary and secondary municipal bond market. In the interest of transparency, MMD publishes extensive yield curve assumptions relating to various structural criteria which are used in filtering market information for the purpose of benchmark yield curve creation.
Fund Summary
Thornburg Low Duration Municipal Fund | September 30, 2019 (Unaudited)
OBJECTIVES AND STRATEGIES
The Fund seeks current income exempt from federal income tax, consistent with preservation of capital (may be subject to Alternative Minimum Tax).
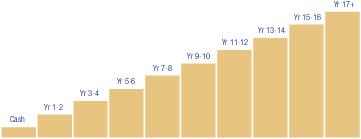
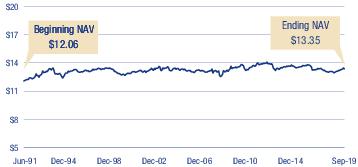
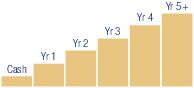
This Fund invests principally in a laddered portfolio of municipal bonds with a dollar-weighted average duration of normally no more than three years. Laddering involves building a portfolio of bonds with staggered maturities so that a portion of the portfolio matures each year. Cash from maturing bonds, if not needed for other purposes, is typically invested in bonds with longer maturities at the far end of the ladder. We regard the strategy as a good compromise for managing different types of risk.
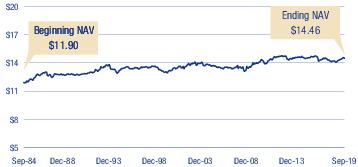
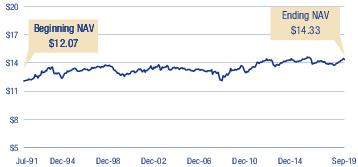
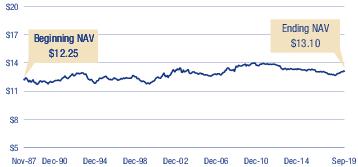
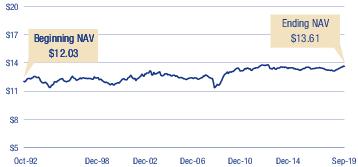
LONG-TERM STABILITY OF PRINCIPAL
Net Asset Value History of A Shares
| KEY PORTFOLIO ATTRIBUTES | |
| Number of Bonds | 159 |
| Effective Duration | 0.9 Yrs |
| Average Maturity | 1.5 Yrs |
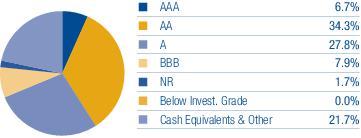
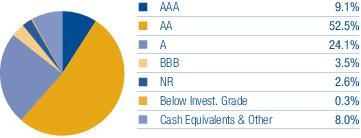
SECURITY CREDIT RATINGS
A bond credit rating assesses the financial ability of a debt issuer to make timely payments of principal and interest. Ratings of AAA (the highest), AA, A, and BBB are investment-grade quality. Ratings of BB, B, CCC, CC, C and D (the lowest) are considered below investment grade, speculative grade, or junk bonds.
Unrated pre-refunded and escrowed-to-maturity bonds are included in the not rated category.
PORTFOLIO LADDER
Percent of portfolio maturing in each year. Cash includes cash equivalents and other.
There is no guarantee that the Fund will meet its investment objectives.
All data is subject to change. Charts may not add up to 100% due to rounding.
Schedule of Investments
Thornburg Low Duration Municipal Fund | September 30, 2019
| | | PRINCIPAL
AMOUNT | VALUE |
| | Municipal Bonds — 95.3% | | |
| | Alabama — 0.8% | | |
| a | City of Mobile Industrial Development Board (Alabama Power Company Barry Plant), 1.85% due 6/1/2034 (put 3/24/2020) | $1,000,000 | $ 1,001,090 |
| | Southeast Alabama Gas Supply District, Series A, 4.00% due 6/1/2020 | 1,000,000 | 1,015,840 |
| | Alaska — 2.3% | | |
| | Alaska Industrial Development & Export Authority, Series A, 5.25% due 4/1/2024 (pre-refunded 4/1/2020) (put 10/1/2019) | 3,780,000 | 3,851,480 |
| | City of Valdez (BP Pipelines (Alaska), Inc. Project), Series B, 5.00% due 1/1/2021 | 1,725,000 | 1,799,503 |
| | Arizona — 1.6% | | |
| b | Arizona (Banner Health Obligated Group; LOC Bank of America, N.A.) HFA, Series C, 1.77% due 1/1/2046 (put 10/1/2019) | 800,000 | 800,000 |
| c | Maricopa County (Banner Health Obligated Group) IDA, Series B, 1.96% (MUNIPSA + 0.38%) due 1/1/2035 (put 10/18/2022) | 2,000,000 | 2,003,660 |
| d | Mesa Utility System Revenue, 4.00% due 7/1/2020 | 915,000 | 933,639 |
| | California — 2.5% | | |
| c | California Infrastructure and Economic Development Bank (California Academy of Sciences), Series D, 1.806% (LIBOR 1 Month + 0.38%) due 8/1/2047 (put 8/1/2021) | 2,000,000 | 2,000,060 |
| c | California Infrastructure and Economic Development Bank (Los Angeles County Museum of Art), Series A, 2.088% (LIBOR 1 Month + 0.65%) due 12/1/2050 (put 2/1/2021) | 1,000,000 | 1,002,730 |
| a,e | California Municipal Finance Authority, Series A, 2.00% due 2/1/2039 (put 2/3/2020) | 2,000,000 | 2,003,320 |
| | California Statewide Communities Development Authority (Irvine East Campus Apartments), 5.00% due 5/15/2020 | 565,000 | 577,633 |
| | State of California GO, 2.00% due 12/1/2019 | 500,000 | 500,715 |
| | Colorado — 5.4% | | |
| | City & County of Denver (SPA JPMorgan Chase Bank, N.A.), | | |
| b | Series A1, 1.75% due 12/1/2029 (put 10/1/2019) | 4,370,000 | 4,370,000 |
| b | Series A3, 1.75% due 12/1/2031 (put 10/1/2019) | 3,070,000 | 3,070,000 |
| | City of Aurora (Sports Park and E-911 Projects) COP, 5.00% due 12/1/2019 | 365,000 | 367,227 |
| | Colorado (Catholic Health Initiatives) HFA ETM, Series A, 5.00% due 2/1/2020 | 2,885,000 | 2,919,245 |
| | Interlocken Metropolitan District (Insured: AGM) GO, Series A-1, 5.00% due 12/1/2020 - 12/1/2023 | 2,000,000 | 2,212,191 |
| | Connecticut — 1.5% | | |
| | State of Connecticut GO, | | |
| | Series C, 5.00% due 6/15/2022 | 1,715,000 | 1,877,685 |
| | Series F, 5.00% due 9/15/2023 | 1,000,000 | 1,134,970 |
| | State of Connecticut Special Tax Revenue, Series B, 5.00% due 10/1/2021 | 525,000 | 561,346 |
| | Florida — 5.5% | | |
| | City of Jacksonville, Series C, 5.00% due 10/1/2019 - 10/1/2020 | 1,500,000 | 1,536,440 |
| | City of Orlando (Insured: AGM), Series A, 4.00% due 11/1/2021 | 900,000 | 947,664 |
| | City of Orlando (Senior Tourist Development; Insured: AGM), Series A, 4.00% due 11/1/2020 | 850,000 | 872,865 |
| a,f | Escambia County (International Paper Co.) 2.00% due 11/1/2033 (put 10/1/2024) | 775,000 | 776,038 |
| b | Manatee County (Florida Power & Light Co.), 1.78% due 9/1/2024 (put 10/1/2019) | 4,300,000 | 4,300,000 |
| b | Miami-Dade County (Florida Power & Light Co.) IDA, 1.78% due 6/1/2021 (put 10/1/2019) | 4,800,000 | 4,800,000 |
| | Georgia — 3.4% | | |
| | City of Atlanta (Atlantic Station Project), 5.00% due 12/1/2019 - 12/1/2021 | 1,000,000 | 1,048,332 |
| | Main Street Natural Gas, Inc, Series A, 5.00% due 5/15/2022 | 1,000,000 | 1,082,050 |
| a | Monroe County Development Authority (Gulf Power Co.), 2.00% due 9/1/2037 (put 6/25/2020) | 3,000,000 | 3,008,220 |
| c | Private Colleges & Universities Authority (Emory University), Series B, 2.00% (MUNIPSA + 0.42%) due 10/1/2039 (put 8/16/2022) | 3,000,000 | 3,005,910 |
| | Guam — 0.5% | | |
| | Guam Power Authority (Electric Power System; Insured: AGM), Series A, 5.00% due 10/1/2019 - 10/1/2020 | 1,200,000 | 1,210,143 |
| | Hawaii — 0.4% | | |
| c | City and County of Honolulu (Rail Transit Project) GO, 1.90% (MUNIPSA + 0.32%) due 9/1/2028 (put 9/1/2020) | 1,000,000 | 1,000,080 |
| | Illinois — 7.8% | | |
| | Chicago Park District (Capital Improvement Plan) GO, Series D, 5.00% due 1/1/2020 | 500,000 | 504,175 |
| | Chicago Park District GO, Series B, 5.00% due 1/1/2022 | 400,000 | 427,248 |
| | City of Chicago (Water System), | | |
| | 5.00% due 11/1/2020 | 600,000 | 621,762 |
| | Series 2017-2, 5.00% due 11/1/2019 - 11/1/2022 | 2,200,000 | 2,263,664 |
| | Series A, 5.00% due 11/1/2019 | 3,250,000 | 3,258,807 |
| | City of Chicago ETM, 5.00% due 1/1/2020 | 600,000 | 605,400 |
| | Cook County Community College District No. 508 (City Colleges of Chicago) GO, 5.00% due 12/1/2023 | 500,000 | 547,035 |
| | Cook County School District No. 170 Chicago Heights (Insured: AGM) GO, Series D, 5.00% due 12/1/2022 | 1,500,000 | 1,628,955 |
| | County of Cook (Capital Improvement Plan) GO, Series A, 5.00% due 11/15/2019 | 615,000 | 617,552 |
| | County of Cook GO, Series C, 4.25% due 11/15/2019 | 200,000 | 200,652 |
| | Du Page County High School District No. 88 (Addison Trail and Willowbrook High Schools GO, 3.00% due 1/15/2020 | 1,245,000 | 1,250,752 |
Schedule of Investments, Continued
Thornburg Low Duration Municipal Fund | September 30, 2019
| | | PRINCIPAL
AMOUNT | VALUE |
| a | Illinois Finance Authority (Peoples Gas Light & Coke Co.), Series B, 1.875% due 2/1/2033 (put 8/1/2020) | $3,600,000 | $ 3,604,248 |
| | State of Illinois (Build Illinois Program), 5.00% due 6/15/2020 | 535,000 | 546,283 |
| | State of Illinois (State Facilities Improvements) GO, | | |
| | 5.00% due 7/1/2021 - 3/1/2022 | 1,575,000 | 1,660,116 |
| | Series A, 5.00% due 10/1/2022 | 1,000,000 | 1,078,350 |
| | Indiana — 3.9% | | |
| b | Indiana Finance Authority (Franciscan Alliance, Inc. Obligated Group; LOC Barclays Bank Plc), 1.77% due 11/1/2037 (put 10/1/2019) | 4,700,000 | 4,700,000 |
| c | Indiana Finance Authority (Indiana University Health, Inc. Obligated Group), Series L, 2.13% (MUNIPSA + 0.55%) due 12/1/2046 (put 7/2/2021) | 4,800,000 | 4,801,296 |
| | Kentucky — 1.6% | | |
| | Commonwealth of Kentucky State Property and Buildings Commission (Project No. 112), Series B, 5.00% due 11/1/2019 - 11/1/2021 | 2,600,000 | 2,718,522 |
| a | Louisville/Jefferson County Metropolitan Government (Louisville Gas & Electric Co.), 1.85% due 10/1/2033 (put 4/1/2021) | 1,200,000 | 1,207,260 |
| | Louisiana — 2.8% | | |
| | Louisiana Energy & Power Authority (Rodemacher Unit No. 2 Power), 5.00% due 1/1/2021 | 600,000 | 624,090 |
| a | Parish of St. Charles (Valero Energy Corp. Refinery), 4.00% due 12/1/2040 (put 6/1/2022) | 1,925,000 | 2,028,988 |
| | Shreveport Water & Sewer Revenue (Insured: BAM), Series C, 5.00% due 12/1/2023 | 860,000 | 977,519 |
| | State of Louisiana GO, Series C, 5.00% due 8/1/2021 | 2,960,000 | 3,154,650 |
| | Maryland — 0.3% | | |
| | Washington County (Diakon Lutheran Social Ministries Obligated Group), Series B, 5.00% due 1/1/2020 - 1/1/2023 | 770,000 | 820,455 |
| | Massachusetts — 1.3% | | |
| a | Commonwealth of Massachusetts GO, Series D-1, 1.05% due 8/1/2043 (put 7/1/2020) | 2,000,000 | 1,993,920 |
| | Massachusetts Development Finance Agency (Beth Israel Lahey Health Obligated Group) 3.00% due 7/1/2020 | 1,000,000 | 1,011,840 |
| | Michigan — 3.4% | | |
| | Detroit Downtown Development Authority (Catalyst Development Project; Insured: AGM), Series A, 5.00% due 7/1/2021 - 7/1/2022 | 500,000 | 537,971 |
| | Detroit Sewage Disposal System Revenue (Great Lakes Water Authority Sewage Disposal System Revenue; Insured: AGM), Series A, 5.25% due 7/1/2020 | 2,800,000 | 2,879,800 |
| | Livonia Public Schools School District (Insured: BAM) GO, 5.00% due 5/1/2021 - 5/1/2022 | 985,000 | 1,054,882 |
| | Michigan Strategic Fund (Detroit Edison Company; Insured: AMBAC), 7.00% due 5/1/2021 | 2,000,000 | 2,166,880 |
| | Northern Michigan University, Series A, 5.00% due 12/1/2019 - 12/1/2021 | 1,535,000 | 1,592,720 |
| | Minnesota — 1.9% | | |
| b | City of Minneapolis/St. Paul Housing & Redevelopment Authority (Allina Health Obligated Group; LOC JPMorgan Chase Bank, N.A.), Series B-2, 1.77% due 11/15/2035 (put 10/1/2019) | 2,400,000 | 2,400,000 |
| c | Minnesota Housing Finance Agency (Residential Single Family Development; Collateralized: GNMA, FNMA, FHLMC), 2.13% (MUNIPSA + 0.55%) due 7/1/2041 (put 12/12/2023) | 2,150,000 | 2,148,796 |
| | Mississippi — 0.5% | | |
| | Mississippi Development Bank (Jackson Public School District), 4.00% due 10/1/2019 | 750,000 | 750,000 |
| | Mississippi Development Bank (Jackson Public School District; Insured: BAM), 5.00% due 10/1/2022 | 375,000 | 413,550 |
| | Montana — 0.3% | | |
| | Montana Facility Finance Authority (Sisters of Charity of Leavenworth Health System, Inc.) Series B, 5.00% due 1/1/2021 | 800,000 | 807,304 |
| | Nebraska — 0.9% | | |
| a | Central Plains Energy Project, 5.00% due 3/1/2050 (put 1/1/2024) | 2,000,000 | 2,236,520 |
| | Nevada — 1.0% | | |
| | Clark County Department of Aviation, Series A, 5.00% due 7/1/2021 | 2,000,000 | 2,127,380 |
| | Clark County School District (School Facilities Improvements) GO, Series C, 5.00% due 6/15/2021 | 250,000 | 265,088 |
| | New Hampshire — 2.0% | | |
| b | New Hampshire Health and Education Facilities Authority Act (University System of New Hampshire; SPA Wells Fargo Bank, N.A.), Series B-1, 1.77% due 7/1/2033 (put 10/1/2019) | 4,700,000 | 4,700,000 |
| | New Jersey — 3.0% | | |
| | City of Trenton (Various Capital Improvements; Insured: AGM) (State Aid Withholding) GO, 5.00% due 7/15/2020 | 500,000 | 513,735 |
| | Hudson County Improvement Authority GO, Series B-1, 3.00% due 5/22/2020 | 1,350,000 | 1,363,999 |
| | New Jersey (School Facilities Construction; Insured: AMBAC) EDA, Series K, 5.50% due 12/15/2019 | 200,000 | 201,542 |
| | New Jersey Transportation Trust Fund Authority (State Transportation System Improvements), 5.00% due 6/15/2020 | 500,000 | 511,965 |
| | New Jersey Transportation Trust Fund Authority (State Transportation System Improvements; Insured: Natl-Re), Series B, 5.50% due 12/15/2020 | 2,000,000 | 2,091,020 |
| | Passaic Valley Sewer Commissioners (Sewer System) GO, Series G, 5.75% due 12/1/2021 | 500,000 | 543,855 |
| | Tobacco Settlement Financing Corp., Series A, 5.00% due 6/1/2021 | 1,790,000 | 1,891,511 |
| | New Mexico — 2.7% | | |
| a | City of Farmington (Southern California Edison Co.-Four Corners Project), 2.125% due 6/1/2040 (put 6/1/2022) | 2,500,000 | 2,521,700 |
| b | New Mexico Hospital Equipment Loan Council (Presbyterian Healthcare Services Obligated Group; SPA Wells Fargo Bank, N.A.), Series D, 1.77% due 8/1/2034 (put 10/1/2019) | 2,175,000 | 2,175,000 |
| | New Mexico Municipal Energy Acquisition Authority, Series A, 4.00% due 11/1/2021 - 11/1/2022 | 1,750,000 | 1,860,597 |
Schedule of Investments, Continued
Thornburg Low Duration Municipal Fund | September 30, 2019
| | | PRINCIPAL
AMOUNT | VALUE |
| | New York — 10.0% | | |
| b | City of New York (SPA Barclays Bank plc) GO, Series B-4, 1.77% due 10/1/2046 (put 10/1/2019) | $ 500,000 | $ 500,000 |
| b | City of New York, (SPA JPMorgan Chase Bank, N.A.) GO, Series 1, 1.75% due 3/1/2040 (put 10/1/2019) | 2,000,000 | 2,000,000 |
| | Metropolitan Transportation Authority (Transit and Commuter System), Series C-1, 5.00% due 9/1/2020 | 2,350,000 | 2,425,012 |
| | Metropolitan Transportation Authority, | | |
| | Series A, 4.00% due 2/3/2020 | 1,000,000 | 1,008,700 |
| | Series D-1, 5.00% due 9/1/2022 | 3,000,000 | 3,285,600 |
| | New York City Housing Development Corp., 2.00% due 11/1/2020 | 2,500,000 | 2,500,550 |
| b | New York City Transitional Finance Authority Future Tax Secured Revenue, (SPA JPMorgan Chase Bank, N.A.), Series 1, 1.75% due 11/1/2022 (put 10/1/2019) | 4,600,000 | 4,600,000 |
| b | New York City Water & Sewer System, (SPA JPMorgan Chase Bank, N.A.), 1.75% due 6/15/2050 (put 10/1/2019) | 1,505,000 | 1,505,000 |
| | New York State Dormitory Authority (NYSARC, Inc. Developmental Disability Programs; Insured: State Intercept), Series A, 5.00% due 7/1/2020 | 1,175,000 | 1,207,559 |
| b | New York State Housing Finance Agency (160 Madison Ave, LLC; LOC Lands Bank Hessen-Thrgn) 1.76% due 11/1/2046 (put 10/1/2019) | 400,000 | 400,000 |
| | Tobacco Settlement Asset Securitization Corp., Series A, 5.00% due 6/1/2021 | 1,000,000 | 1,057,880 |
| | Town of Oyster Bay GO, Series B, 3.00% due 2/1/2020 - 3/13/2020 | 3,150,000 | 3,165,511 |
| | Westchester County Local Development Corp. (Miriam Osborn Memorial Home Assoc.), 5.00% due 7/1/2023 | 425,000 | 479,498 |
| | North Carolina — 0.4% | | |
| | North Carolina Turnpike Authority, | | |
| | 4.00% due 1/1/2020 | 400,000 | 402,308 |
| | 5.00% due 1/1/2021 - 1/1/2022 | 415,000 | 439,100 |
| | North Dakota — 1.6% | | |
| | County of McKenzie, 5.00% due 8/1/2022 | 2,000,000 | 2,190,320 |
| | Ward County (Insured: AGM), 3.00% due 4/1/2021 | 1,680,000 | 1,691,357 |
| | Ohio — 2.5% | | |
| | City of Cleveland (Parking Facility; Insured: AGM), 5.25% due 9/15/2021 | 500,000 | 536,145 |
| a | County of Franklin (Trinity Health Corp. Obligated Group), 1.35% due 12/1/2046 (put 11/1/2019) | 2,000,000 | 1,999,700 |
| | County of Scioto (Southern Ohio Medical Center), 5.00% due 2/15/2022 - 2/15/2023 | 3,130,000 | 3,437,383 |
| | Pennsylvania — 1.6% | | |
| | City of Philadelphia (Pennsylvania Gas Works), 5.00% due 10/1/2020 | 500,000 | 518,270 |
| | Coatesville Area School District (Insured: AGM) (State Aid Withholding) GO, 5.00% due 8/1/2021 | 1,000,000 | 1,061,070 |
| | East Penn School District (State Aid Withholding) GO, 2.00% due 9/15/2020 | 555,000 | 555,283 |
| | Luzerne County Industrial Development Authority (Insured: AGM) GO, 5.00% due 12/15/2019 - 12/15/2020 | 1,000,000 | 1,020,655 |
| | Philadelphia Authority for Industrial Development, 5.00% due 5/1/2020 - 5/1/2022 | 745,000 | 788,121 |
| | Rhode Island — 0.7% | | |
| | State of Rhode Island and Providence Plantations (Training School) COP, Series B, 5.00% due 10/1/2019 | 1,575,000 | 1,575,000 |
| | South Carolina — 1.0% | | |
| c | City of Charleston Waterworks & Sewer System Revenue (Capital Improvement), Series B, 1.807% (LIBOR 1 Month + 0.37%) due 1/1/2035 (put 1/1/2022) | 2,500,000 | 2,502,250 |
| | Tennessee — 0.6% | | |
| | Tennessee Energy Acquisition Corp. (The Gas Project), Series C, 5.00% due 2/1/2023 | 1,310,000 | 1,439,323 |
| | Texas — 17.6% | | |
| | City of Brownsville (Water, Wastewater & Electric Utilities Systems), 5.00% due 9/1/2020 | 1,000,000 | 1,032,750 |
| | City of Dallas (Trinity River Corridor Infrastructure) GO, 5.00% due 2/15/2021 | 1,000,000 | 1,050,750 |
| c | City of Houston (Combined Utility System), Series C, 1.792% (LIBOR 1 Month + 0.36%) due 5/15/2034 (put 8/1/2021) | 3,200,000 | 3,200,160 |
| | City of Olmos Park Higher Education Facilities Corp. (University of the Incarnate Word), 5.00% due 12/1/2022 | 1,000,000 | 1,098,520 |
| | City of San Antonio (Electric and Gas Systems), | | |
| a | Series A, 2.25% due 2/1/2033 (put 12/1/2019) | 1,000,000 | 1,001,290 |
| a | Series C, 3.00% due 12/1/2045 (put 12/1/2019) | 265,000 | 265,665 |
| | City of Texas City Industrial Development Corp. (ARCO Pipe Line Co. Project), 7.375% due 10/1/2020 | 1,000,000 | 1,057,520 |
| | County of La Salle (Insured: AGM) GO, 5.00% due 3/1/2020 - 3/1/2021 | 1,900,000 | 1,962,387 |
| a | Cypress-Fairbanks Independent School District (Insured: PSF-GTD), Series B, 1.25% due 2/15/2036 (put 8/15/2022) | 4,425,000 | 4,396,459 |
| a | Dallas Independent School District (School District Buildings Renovations; Insured: PSF-GTD) GO, Series B-4, 5.00% due 2/15/2036 (put 2/15/2020) | 325,000 | 329,144 |
| c,e | Harris County Cultural Education Facilities Finance Corp. (Memorial Hermann Health System), Series B-REM, 1.955% (MUNIPSA + 0.38%) due 6/1/2032 (put 4/1/2021) | 4,825,000 | 4,823,166 |
| | Harris County Cultural Education Facilities Finance Corp. (Texas Medical Center Central Heating & Cooling Service Corp.), 5.00% due 11/15/2020 | 1,145,000 | 1,189,953 |
| | Harris County Cultural Education Facilities Finance Corp. (Texas Medical Center; LOC JPMorgan Chase Bank, N.A.), | | |
| b | Series A, 1.77% due 9/1/2031 (put 10/1/2019) | 1,350,000 | 1,350,000 |
| b | Series B-1, 1.77% due 9/1/2031 (put 10/1/2019) | 2,315,000 | 2,315,000 |
| | Houston Airport System Revenue, Series B, 5.00% due 7/1/2022 - 7/1/2023 | 780,000 | 862,035 |
| a | Houston Independent School District (Insured: PSF-GTD) GO, Series B-REM, 2.40% due 6/1/2036 (put 6/1/2021) | 3,275,000 | 3,323,241 |
| | North Texas Tollway Authority, Series A, 5.00% due 1/1/2022 | 1,000,000 | 1,081,700 |
| | Red River Authority (Insured: Natl-Re), 4.45% due 6/1/2020 | 2,650,000 | 2,697,488 |
Schedule of Investments, Continued
Thornburg Low Duration Municipal Fund | September 30, 2019
| | | PRINCIPAL
AMOUNT | VALUE |
| | Sam Rayburn Municipal Power Agency, 5.00% due 10/1/2021 | $ 510,000 | $ 544,078 |
| | State of Texas (Trans), 4.00% due 8/27/2020 | 4,000,000 | 4,095,760 |
| b | Tarrant County Cultural Education Facilities Finance Corp. (Baylor Scott & White Health Obligated Group; LOC TD Bank, N.A.), 1.77% due 11/15/2050 (put 10/1/2019) | 4,800,000 | 4,800,000 |
| | Utah — 1.0% | | |
| b | City of Murray (IHC Health Services, Inc. Obligated Group; SPA JPMorgan Chase Bank, N.A.), Series A, 1.75% due 5/15/2037 (put 10/1/2019) | 2,400,000 | 2,400,000 |
| | West Virginia — 1.0% | | |
| | Mason County (Appalachian Power Co.), Series L, 2.75% due 10/1/2022 | 1,000,000 | 1,032,910 |
| a | West Virginia Economic Development Authority, (Appalachian Power Co.), Series A, 2.625% due 12/1/2042 (put 6/1/2022) | 1,425,000 | 1,465,413 |
| | Total Investments — 95.3%(Cost $228,436,868) | | $229,866,414 |
| | Other Assets Less Liabilities — 4.7% | | 11,375,359 |
| | Net Assets — 100.0% | | $241,241,773 |
| Footnote Legend |
| a | Variable Rate Demand Obligations are instruments whose interest rates change on a mandatory date (demand date) or whose interest rates will vary with changes in a designated base rate. The rate disclosed is the rate at September 30, 2019. |
| b | Variable Rate Demand Notes are instruments whose interest rates change on a specific date (such as coupon date or interest payment date) or whose interest rates vary with changes in a designated base rate (such as the prime interest rate). This instrument is payable on demand and is secured by letters of credit or other credit support agreements from major banks. |
| c | Floating Rate Security. Stated interest/floor rate was in effect at September 30, 2019. |
| d | Segregated as collateral for a when-issued security. |
| e | Securities exempt from registration under Rule 144A of the Securities Act of 1933, as amended. These securities are restricted and may only be resold in the ordinary course of business in transactions exempt from registration, normally to qualified institutional buyers. As of September 30, 2019, the aggregate value of these securities in the Fund’s portfolio was $6,826,486, representing 2.83% of the Fund’s net assets. |
| f | When-issued security. |
Portfolio Abbreviations
To simplify the listings of securities, abbreviations are used per the table below:
| AGM | Insured by Assured Guaranty Municipal Corp. |
| AMBAC | Insured by American Municipal Bond Assurance Corp. |
| BAM | Insured by Build America Mutual Insurance Co. |
| COP | Certificates of Participation |
| EDA | Economic Development Authority |
| ETM | Escrowed to Maturity |
| FHLMC | Insured by Federal Home Loan Mortgage Corp. |
| FNMA | Collateralized by Federal National Mortgage Association |
| GNMA | Collateralized by Government National Mortgage Association |
| GO | General Obligation |
| HFA | Health Facilities Authority |
| IDA | Industrial Development Authority |
| LIBOR | London Interbank Offered Rates |
| LOC | Letter of Credit |
| MUNIPSA | Securities Industry and Financial Markets Association (SIFMA) Municipal Swap Index |
| Natl-Re | Insured by National Public Finance Guarantee Corp. |
| SPA | Stand-by Purchase Agreement |
See notes to financial statements.
Statement of Assets and Liabilities
Thornburg Low Duration Municipal Fund | September 30, 2019
| ASSETS | |
| Investments at value (cost $228,436,868) (Note 3) | $ 229,866,414 |
| Cash | 39,495 |
| Receivable for investments sold | 10,154,838 |
| Interest receivable | 2,011,023 |
| Prepaid expenses and other assets | 134,925 |
| Total Assets | 242,206,695 |
| Liabilities | |
| Payable for investments purchased | 775,000 |
| Payable for fund shares redeemed | 38,214 |
| Payable to investment advisor and other affiliates (Note 4) | 56,857 |
| Accounts payable and accrued expenses | 84,990 |
| Dividends payable | 9,861 |
| Total Liabilities | 964,922 |
| Net Assets | $ 241,241,773 |
| NET ASSETS CONSIST OF | |
| Distributable earnings | $ 1,208,081 |
| Net capital paid in on shares of beneficial interest | 240,033,692 |
| | $ 241,241,773 |
| NET ASSET VALUE | |
| Class A Shares: | |
Net asset value and redemption price per share
($16,898,465 applicable to 1,366,876 shares of beneficial interest outstanding - Note 5) | $ 12.36 |
| Maximum sales charge, 1.50% of offering price | 0.19 |
| Maximum offering price per share | $ 12.55 |
| Class I Shares: | |
Net asset value, offering and redemption price per share
($224,343,308 applicable to 18,152,714 shares of beneficial interest outstanding - Note 5) | $ 12.36 |
See notes to financial statements.
Statement of Operations
Thornburg Low Duration Municipal Fund | Year Ended September 30, 2019
| INVESTMENT INCOME | |
| Interest income (net of premium amortized of $2,908,970) | $ 4,364,265 |
| EXPENSES | |
| Investment advisory fees (Note 4) | 885,421 |
| Administration fees (Note 4) | |
| Class A Shares | 18,237 |
| Class I Shares | 176,209 |
| Distribution and service fees (Note 4) | |
| Class A Shares | 41,555 |
| Transfer agent fees | |
| Class A Shares | 34,276 |
| Class I Shares | 171,306 |
| Registration and filing fees | |
| Class A Shares | 18,097 |
| Class I Shares | 32,696 |
| Custodian fees | 36,987 |
| Professional fees | 45,196 |
| Trustee and officer fees (Note 4) | 9,317 |
| Other expenses | 26,367 |
| Total Expenses | 1,495,664 |
| Less: | |
| Expenses reimbursed by investment advisor (Note 4) | (347,334) |
| Net Expenses | 1,148,330 |
| Net Investment Income | $ 3,215,935 |
| REALIZED AND UNREALIZED GAIN (LOSS) | |
| Net realized gain (loss) on investments | (169,603) |
| Net change in unrealized appreciation (depreciation) on investments | 1,829,461 |
| Net Realized and Unrealized Gain | 1,659,858 |
| Net Increase in Net Assets Resulting from Operations | $ 4,875,793 |
See notes to financial statements.
Statements of Changes in Net Assets
Thornburg Low Duration Municipal Fund
| | Year Ended
September 30, 2019 | Year Ended
September 30, 2018 |
| INCREASE (DECREASE) IN NET ASSETS FROM | | |
| OPERATIONS | | |
| Net investment income | $ 3,215,935 | $ 1,224,067 |
| Net realized gain (loss) on investments | (169,603) | (10,655) |
| Net change in unrealized appreciation (depreciation) on investments | 1,829,461 | (744,589) |
| Net Increase in Net Assets Resulting from Operations | 4,875,793 | 468,823 |
| DIVIDENDS TO SHAREHOLDERS | | |
| From distributable earnings | | |
| Class A Shares | (262,793) | (166,761) |
| Class I Shares | (2,953,142) | (1,057,306) |
| FUND SHARE TRANSACTIONS (NOTE 5) | | |
| Class A Shares | (2,770,805) | 3,245,973 |
| Class I Shares | 60,596,807 | 109,088,169 |
| Net Increase in Net Assets | 59,485,860 | 111,578,898 |
| NET ASSETS | | |
| Beginning of Year | 181,755,913 | 70,177,015 |
| End of Year | $ 241,241,773 | $ 181,755,913 |
See notes to financial statements.
Notes to Financial Statements
Thornburg Low Duration Municipal Fund | September 30, 2019
NOTE 1 – ORGANIZATION
Thornburg Low Duration Municipal Fund (the “Fund”) is a diversified series of Thornburg Investment Trust (the “Trust”). The Trust was organized as a Massachusetts business trust under a Declaration of Trust dated June 3, 1987 and is registered as a diversified, open-end management investment company under the Investment Company Act of 1940, as amended (the "1940 Act"). The Fund is currently one of twenty-two separate series of the Trust. Each series is considered to be a separate entity for financial reporting and tax purposes and bears expenses directly attributable to it. The Fund’s investment objective is to seek current income exempt from federal income tax, consistent with preservation of capital.
The Fund currently offers two classes of shares of beneficial interest: Class A and Institutional Class (“Class I”) shares. Each class of shares of the Fund represents an interest in the same portfolio of investments, except that (i) Class A shares are sold subject to a front-end sales charge collected at the time the shares are purchased and bear a service fee, (ii) Class I shares are sold at net asset value without a sales charge at the time of purchase and may be subject to a service fee, and (iii) the respective classes may have different reinvestment privileges and conversion rights. Additionally, the Fund may allocate among its classes certain expenses, to the extent allocable to specific classes, including administration fees, transfer agent fees, government registration fees, certain printing and postage costs, and administrative and legal expenses. Currently, class specific expenses of the Fund are limited to service and distribution fees and certain registration and transfer agent expenses.
The following is a summary of significant accounting policies followed by the Fund in the preparation of its financial statements. The Fund prepares its financial statements in conformity with United States generally accepted accounting principles (“GAAP”), including investment company accounting and reporting guidance in the Financial Accounting Standards Board (the “FASB”) Accounting Standard Codification Topic 946.
NOTE 2 – SIGNIFICANT ACCOUNTING POLICIES
Security Valuation: All investments in securities held by the Fund are valued as described in Note 3.
Allocation of Income, Gains, Losses and Expenses: Net investment income (other than class specific expenses) and realized and unrealized gains and losses are allocated daily to each class of shares based upon the relative net asset value of outstanding shares (or the value of the dividend-eligible shares, as appropriate) of each class of shares at the beginning of the day (after adjusting for the current capital shares activity of the respective class). Expenses common to all Funds are allocated among the Funds comprising the Trust based upon their relative net asset values or other appropriate allocation methods. Operating expenses directly attributable to a specific class are charged against the operating income of that class.
Dividends and Distributions to Shareholders: Dividends and distributions to shareholders, which are determined in accordance with federal income tax regulations and may differ from GAAP, are recorded on the ex-dividend date. Ordinary income dividends, if any, are declared daily and paid monthly. Capital gain distributions, if any, are declared and paid annually and more often if deemed necessary by Thornburg Investment Management, Inc., the Trust’s investment advisor (the “Advisor”). Dividends and distributions are paid and are reinvested in additional shares of the Fund at net asset value per share at the close of business on the ex-dividend date, or at the shareholder’s option, paid in cash.
Investment Income: Interest income is accrued as earned. Premiums and discounts are amortized and accreted, respectively, to first call dates or maturity dates using the effective yield method of the respective investments. These amounts are included in Investment Income in the Statement of Operations.
Investment Transactions: Investment transactions are accounted for on a trade date basis. Realized gains and losses from the sale of investments are recorded on an identified cost basis.
When-Issued and Delayed Delivery Transactions: The Fund may engage in when-issued or delayed delivery transactions. To the extent the Fund engages in such transactions, it will do so for the purpose of acquiring portfolio investments consistent with the Fund’s investment objectives and not for the purpose of investment leverage or to speculate on interest rate or market changes. At the time the Fund makes a commitment to purchase an investment on a when-issued or delayed delivery basis, the Fund will record the transaction and reflect the value in determining its net asset value. When effecting such transactions, assets of an amount sufficient to make payment for the portfolio investments to be purchased will be segregated on the Fund’s records on the trade date. Investments purchased on a when-issued or delayed delivery basis do not earn interest until the settlement date. The values of these securities held at September 30, 2019 are detailed in the Schedule of Investments.
Guarantees and Indemnifications: Under the Trust’s organizational documents (and under separate agreements with the independent Trustees), its officers and Trustees are provided with an indemnification against certain liabilities arising out of the performance of their duties to the Fund. In the normal course of business the Trust may also enter into contracts with service providers that contain general
Notes to Financial Statements, Continued
Thornburg Low Duration Municipal Fund | September 30, 2019
indemnifications. The Trust’s maximum exposure under these arrangements is unknown. However, based on experience, the Trust expects the risk of loss to be remote.
Use of Estimates: The preparation of financial statements in conformity with GAAP requires management to make estimates and assumptions that affect the reported amounts of assets and liabilities and disclosure of contingent assets and liabilities at the date of the financial statements and the reported amounts of increases (decreases) in net assets from operations during the reporting period. Actual results could differ from those estimates.
Federal Income Taxes: It is the policy of the Trust to comply with the provisions of the Internal Revenue Code applicable to regulated investment companies and to distribute to shareholders substantially all investment company taxable income including net realized gains on investments (if any), and tax exempt income of the Fund. Therefore, no provision for federal income or excise tax is required.
The Fund files income tax returns in United States federal and applicable state jurisdictions. The statute of limitations on the Fund’s tax return filings generally remains open for the three years following a return’s filing date. The Fund has analyzed each uncertain tax position believed to be material in the preparation of the Fund’s financial statements for the fiscal year ended September 30, 2019, including open tax years, to assess whether it is more likely than not that the position would be sustained upon examination, based on the technical merits of the position. The Fund has not identified any such position for which an asset or liability must be reflected in the Statement of Assets and Liabilities.
At September 30, 2019, information on the tax components of capital was as follows:
| Cost of investments for tax purposes | $ 228,436,869 |
| Gross unrealized appreciation on a tax basis | 1,497,420 |
| Gross unrealized depreciation on a tax basis | (67,875) |
| Net unrealized appreciation (depreciation) on investments (tax basis) | $ 1,429,545 |
At September 30, 2019, the Fund had deferred tax basis capital losses occurring subsequent to October 31, 2018 through September 30, 2019 of $169,603. For tax purposes, such losses will be recognized in the year ending September 30, 2020.
At September 30, 2019, the Fund had cumulative tax basis capital losses of $51,861 (of which $9,613 are short-term and $42,248 are long-term), which may be carried forward to offset future capital gains. To the extent such carryforwards are used, capital gain distributions may be reduced to the extent provided by regulations. Such capital loss carryforwards do not expire.
At September 30, 2019, the Fund had $9,861 of undistributed net tax-exempt income, no undistributed tax basis net ordinary income and no undistributed tax basis capital gains.
Distributions from tax exempt income paid by the Fund for the year ended September 30, 2019 and September 30, 2018 are excludable by shareholders from gross income for Federal income tax purposes.
The tax character of distributions paid during the year ended September 30, 2019, and September 30, 2018, was as follows:
| | 2019 | 2018 |
| Distributions from: | | |
| Tax exempt income | $ 3,204,635 | $ 1,219,984 |
| Ordinary income | 11,300 | 4,083 |
| Total | $ 3,215,935 | $ 1,224,067 |
NOTE 3 – SECURITY VALUATION
Valuation of the Fund’s portfolio investment securities is performed in accordance with policies and procedures adopted by and under the oversight of the Trustees.
The Trustees of the Trust have appointed the Advisor to assist the Trustees with obtaining fair market values for portfolio investments, evaluating and monitoring professional pricing service providers appointed by the Trustees’ Audit Committee (the “Audit Committee”) to assist in determining fair values for portfolio investments, assisting in calculating fair values for portfolio investments in certain circumstances, and performing other functions in connection with the valuation of investments. The Advisor acts through its Valuation and Pricing Committee (the “Committee”) and other employees of the Advisor. The Committee regularly reviews its own valuation calculations, reviews the valuations, valuation techniques and services furnished by pricing service providers, considers circumstances which may
Notes to Financial Statements, Continued
Thornburg Low Duration Municipal Fund | September 30, 2019
require valuation calculations by the Committee, and reviews previous valuation calculations. The Committee reports to the Audit Committee on the Committee’s activities, the performance of pricing service providers, and other matters relating to valuation of portfolio investments.
In those instances when the Committee assists in calculating a fair value for a portfolio investment, the Committee seeks to determine the price that the Fund would reasonably expect to receive upon a sale of the investment in an orderly transaction between market participants on the valuation date. The Committee customarily utilizes quotations from securities broker dealers in calculating valuations, but also may utilize prices obtained from pricing service providers or other methods approved by the Audit Committee. Because fair values calculated by the Committee are estimates, the calculation of a value for an investment may differ from the price that would be realized by the Fund upon a sale of the investment, and the difference could be material to the Fund’s financial statements. The Committee’s calculation of a fair value for an investment may also differ from the prices obtained by other persons (including other mutual funds) for the investment.
Valuation of Securities: Debt obligations held by the Fund which are not listed or traded on exchanges or for which no reported market exists are ordinarily valued at the valuation obtained from a pricing service provider approved by the Audit Committee.
In any case when a pricing service provider fails to provide a valuation for a debt obligation held by the Fund, the Committee calculates a fair value for the obligation using alternative methods under procedures approved by the Audit Committee. Additionally, in cases when management believes that a valuation obtained from a pricing service provider is stale, does not reflect material factors affecting the valuation of the investment, is significantly different than the value the Fund is likely to obtain if it sought a bid for the investment, or is otherwise unreliable, the Committee calculates a fair value for the obligation using an alternative method approved by the Audit Committee.
Valuation Hierarchy: The Fund categorizes its investments based upon the inputs used in valuing those investments, according to a three-level hierarchy established in guidance from the FASB. Categorization of investments using this hierarchy is intended by the FASB to maximize the use of observable inputs in valuing investments and minimize the use of unobservable inputs by requiring that the most observable inputs be used when available. Observable inputs are those that market participants would use in valuing an investment based on available market information. Unobservable inputs are those that reflect assumptions about the information market participants would use in valuing an investment. An investment’s level within the hierarchy is based on the lowest level input that is deemed significant to the valuation. The methodologies and inputs used to value investments are not necessarily indications of the risk or liquidity associated with those investments.
Various inputs are used in calculating valuations for the Fund’s investments. These inputs are generally summarized according to the three-level hierarchy below:
Level 1: Quoted prices in active markets for identical investments.
Level 2: Other direct or indirect significant observable inputs (including quoted prices for similar investments in active markets and other observable inputs, such as interest rates, prepayment rates, credit ratings, etc.).
Level 3: Significant unobservable inputs (including the Committee’s own assumptions in calculating the fair values of investments).
Valuations for debt obligations held by the Fund are typically calculated by pricing service providers approved by the Audit Committee and are generally characterized as Level 2 within the valuation hierarchy.
In a limited number of cases the Committee calculates a fair value for investments using broker quotations or other methods approved by the Audit Committee. When the Committee uses a single broker quotation to calculate a fair value for an investment without other significant observable inputs, or if a fair value is calculated using other significant inputs that are considered unobservable, the investment is characterized as Level 3 within the hierarchy. Other significant unobservable inputs used to calculate a fair value in these instances might include an income-based valuation approach which considers discounted anticipated future cash flows from the investment and application of discounts due to the nature or duration of any restrictions on the disposition of the investment.
Valuations based upon the use of inputs from Levels 1, 2 or 3 may not represent the actual price received upon the disposition of an investment, and a Fund may receive a price that is lower than the valuation based upon these inputs when it sells the investment.
Notes to Financial Statements, Continued
Thornburg Low Duration Municipal Fund | September 30, 2019
The following table displays a summary of the fair value hierarchy measurements of the Fund’s investments as of September 30, 2019:
| | Fair Value Measurements at September 30, 2019 |
| | TOTAL | LEVEL 1 | LEVEL 2 | LEVEL 3 |
| Assets | | | | |
| Investments in Securities | | | | |
| Municipal Bonds | $ 229,866,414 | $ — | $ 229,866,414 | $ — |
| Total Investments in Securities | $229,866,414 | $— | $229,866,414 | $— |
| Total Assets | $229,866,414 | $— | $229,866,414 | $— |
NOTE 4 – INVESTMENT ADVISORY FEE AND OTHER TRANSACTIONS WITH AFFILIATES
Pursuant to an investment advisory agreement, the Advisor serves as the investment advisor and performs services for the Fund for which the fees are payable at the end of each month. Under the investment advisory agreement, the Fund pays the Advisor a management fee based on the average daily net assets of the Fund at an annual rate as shown in the following table:
| Management Fee Schedule |
| DAILY NET ASSETS | FEE RATE |
| Up to $1 billion | 0.400% |
| Next $500 million | 0.300 |
| Next $500 million | 0.250 |
| Over $2 billion | 0.225 |
The Fund’s effective management fee for the year ended September 30, 2019 was 0.40% of the Fund’s average daily net assets. Total management fees incurred by the Fund for the year ended September 30, 2019 are set forth in the Statement of Operations.
The Trust has entered into an administrative services agreement with the Advisor, whereby the Advisor will perform certain administrative services related to each class of the Fund’s shares. The fees are computed as an annual percentage of the aggregate average daily net assets of all shares classes of all Funds in the Trust as follows:
| Administration Fee Schedule |
| Daily Net Assets | Fee Rate |
| Up to $20 billion | 0.100% |
| $20 billion to $40 billion | 0.075 |
| $40 billion to $60 billion | 0.040 |
| Over $60 billion | 0.030 |
The aggregate fee amount is allocated on a daily basis to each Fund based on net assets and subsequently allocated to each class of shares of the Fund. Total administrative service fees incurred by each class of shares of the Fund for the year ended September 30, 2019, are set forth in the Statement of Operations.
The Trust has an underwriting agreement with Thornburg Securities Corporation (the “Distributor”), an affiliate of the Advisor, which acts as the distributor of the Fund’s shares. For the year ended September 30, 2019, the Distributor has advised the Fund that it earned no net commissions from the sale of Class A shares.
Pursuant to a service plan under Rule 12b-1 of the 1940 Act, the Fund may pay to the Distributor or securities dealers and other financial institutions at the Distributor’s direction an amount not to exceed .20 of 1% per annum of the average daily net assets attributable to Class A shares of the Fund to obtain various shareholder and distribution related services. For the year ended September 30, 2019, there were no 12b-1 service plan fees charged for Class I shares. The Advisor and Distributor each may pay out of its own resources additional expenses for distribution of the Fund’s shares and shareholder services.
Total fees incurred for the year ended September 30, 2019 are set forth in the Statement of Operations.
The Advisor has contractually agreed to waive fees and reimburse expenses incurred by the Fund so that actual expenses of certain share classes do not exceed levels as specified in each Fund’s most recent prospectus (Class A shares, 0.70%; Class I shares, 0.50%). The agreement may be terminated by the Fund at any time, but may not be terminated by the Advisor before February 1, 2020, unless the
Notes to Financial Statements, Continued
Thornburg Low Duration Municipal Fund | September 30, 2019
Advisor ceases to be the investment advisor to the Fund prior to that date. The Advisor may recoup amounts waived or reimbursed during the fiscal year ended September 30, 2019 if, during that year, expenses fall below the contractual limit that was in place at the time those fees and expenses were waived or reimbursed. The Advisor will not recoup fees or expenses as described in the preceding sentence if that recoupment would cause the Fund’s total annual operating expenses (after the recoupment is taken into account) to exceed the lesser of: (a) the expense cap that was in place at the time the waiver or reimbursement occurred; or (b) the expense cap that is in place at the time of the recoupment.
For the year ended September 30, 2019, the Advisor contractually reimbursed certain class specific expenses and distribution fees of $60,879 for Class A shares and $286,455 for Class I shares.
Certain officers and Trustees of the Trust are also officers or directors of the Advisor and Distributor. The compensation of the independent Trustees is borne by the Trust. The Trust also pays a portion of the Chief Compliance Officer’s compensation. These amounts are reflected as Trustee and officer fees in the Statement of Operations.
The percentage of direct investments in the Fund held by the Trustees, officers of the Trust, and the Advisor is approximately 31.34%.
The Fund may purchase or sell securities from or to an affiliated fund, provided the affiliation is due solely to having a common investment advisor, common officers, or common trustees, and provided that all such transactions will comply with Rule 17a-7 under the 1940 Act. For the year ended September 30, 2019, the Fund had transactions with affiliated funds of $34,636,088 in purchases and $11,275,000 in sales generating no realized gains or losses.
NOTE 5 – SHARES OF BENEFICIAL INTEREST
At September 30, 2019, there were an unlimited number of shares with no par value of beneficial interest authorized. Transactions in shares of beneficial interest were as follows:
| | YEAR ENDED
September 30, 2019 | YEAR ENDED
September 30, 2018 |
| | SHARES | AMOUNT | SHARES | AMOUNT |
| Class A Shares | | | | |
| Shares sold | 985,212 | $ 12,093,230 | 1,063,545 | $ 13,097,781 |
Shares issued to shareholders in
reinvestment of dividends | 21,204 | 261,359 | 12,892 | 158,574 |
| Shares repurchased | (1,228,414) | (15,125,394) | (813,563) | (10,010,382) |
| Net increase (decrease) | (221,998) | $ (2,770,805) | 262,874 | $ 3,245,973 |
| Class I Shares | | | | |
| Shares sold | 8,234,527 | $ 101,374,617 | 10,776,875 | $ 132,406,952 |
Shares issued to shareholders in
reinvestment of dividends | 230,292 | 2,839,589 | 82,245 | 1,011,086 |
| Shares repurchased | (3,539,014) | (43,617,399) | (1,977,745) | (24,329,869) |
| Net increase | 4,925,805 | $ 60,596,807 | 8,881,375 | $ 109,088,169 |
NOTE 6 – INVESTMENT TRANSACTIONS
For the year ended September 30, 2019, the Fund had purchase and sale transactions of investments (excluding short-term investments) of $113,845,977 and $48,413,836, respectively.
NOTE 7 – RECENT ACCOUNTING PRONOUNCEMENTS
In August 2018, the FASB issued ASU 2018-13, Fair Value Measurement (Topic 820): Changes to the Disclosure Requirements for Fair Value Measurement, which adds, removes, and modifies certain aspects of the fair value disclosure. ASU 2018-13 is effective for annual periods beginning after December 15, 2019, and early adoption is permitted. The Funds have elected to early adopt, and had applied ASU 2018-13 for the fiscal year ended September 30, 2019. The adoption of this accounting guidance did not have a material impact on the Funds’ financial statements.
In March 2017, the FASB issued Accounting Standards Update (ASU) 2017-08, Premium Amortization of Purchased Callable Debt Securities. The amendments in the ASU shorten the premium amortization period on a purchased callable debt security from the security’s
Notes to Financial Statements, Continued
Thornburg Low Duration Municipal Fund | September 30, 2019
contractual life to the earliest call date. It is anticipated that this change will enhance disclosures by reducing losses recognized when a security is called on an earlier date. This ASU is effective for fiscal years beginning after December 15, 2018. Management has evaluated the implications of these changes and the amendments will have no material effect on the Funds’ net assets or results of operations.
OTHER NOTES
Risks: The Fund’s investments subject it to risks including, but not limited to, management risk, interest rate risk, credit risk, market and economic risk, and liquidity risk. Please see the Fund’s prospectus for a discussion of the risks associated with an investment in the Fund.
Subsequent Events: Fund management believes no events have occurred between September 30, 2019 and the date of issuance of the financial statements that require adjustment to or disclosure in the accompanying financial statements.
This page intentionally left blank.
Financial Highlights
Thornburg Low Duration Municipal Fund
| | PER SHARE PERFORMANCE (FOR A SHARE OUTSTANDING THROUGHOUT THE YEAR) |
UNLESS OTHERWISE
NOTED, PERIODS ARE
FISCAL YEARS ENDED
SEPTEMBER 30, | Net Asset
Value,
Beginning of
YEAR | Net
Investment
Income
(Loss)+ | Net Realized &
Unrealized Gain
(Loss) on
Investments | Total from
Investment
Operations | Dividends
from Net
Investment
Income | Dividends
from Net
Realized
Gains | Total
Dividends | Net Asset
Value,
End of YEAR |
| CLASS A SHARES(b) |
| 2019 | $ 12.27 | 0.16 | 0.09 | 0.25 | (0.16) | — | (0.16) | $ 12.36 |
| 2018 | $ 12.38 | 0.11 | (0.11) | —(c) | (0.11) | — | (0.11) | $ 12.27 |
| 2017 | $ 12.34 | 0.08 | 0.04 | 0.12 | (0.08) | — | (0.08) | $ 12.38 |
| 2016 | $ 12.35 | 0.03 | (0.01) | 0.02 | (0.03) | — | (0.03) | $ 12.34 |
| 2015 | $ 12.34 | 0.02 | 0.01 | 0.03 | (0.02) | — | (0.02) | $ 12.35 |
| CLASS I SHARES |
| 2019 | $ 12.27 | 0.18 | 0.09 | 0.27 | (0.18) | — | (0.18) | $ 12.36 |
| 2018 | $ 12.37 | 0.14 | (0.10) | 0.04 | (0.14) | — | (0.14) | $ 12.27 |
| 2017 | $ 12.34 | 0.10 | 0.03 | 0.13 | (0.10) | — | (0.10) | $ 12.37 |
| 2016 | $ 12.35 | 0.05 | (0.01) | 0.04 | (0.05) | — | (0.05) | $ 12.34 |
| 2015 | $ 12.34 | 0.04 | 0.01 | 0.05 | (0.04) | — | (0.04) | $ 12.35 |
| (a) | Not annualized for periods less than one year. |
| (b) | Sales loads are not reflected in computing total return. |
| (c) | Total from investment operations was less than $0.01 per share. |
| + | Based on weighted average shares outstanding. |
See notes to financial statements.
Financial Highlights, Continued
Thornburg Low Duration Municipal Fund
| RATIOS TO AVERAGE NET ASSETS | | SUPPLEMENTAL DATA |
Net Investment
Income (Loss) (%) | Expenses, After
Expense
Reductions (%) | Expenses,
Before Expense
Reductions (%) | | Total
Return (%)(a) | Portfolio
Turnover
Rate (%)(a) | Net Assets
at End of YEAR
(Thousands) |
| |
| 1.26 | 0.70 | 0.99 | | 2.02 | 33.60 | $ 16,899 |
| 0.92 | 0.70 | 1.06 | | 0.02 | 35.36 | $ 19,497 |
| 0.72 | 0.67 | 1.16 | | 0.98 | 42.94 | $ 16,412 |
| 0.24 | 0.70 | 2.19 | | 0.15 | 21.17 | $ 4,241 |
| 0.15 | 0.67 | 2.85 | | 0.22 | 15.75 | $ 3,273 |
| |
| 1.47 | 0.50 | 0.64 | | 2.22 | 33.60 | $ 224,343 |
| 1.12 | 0.50 | 0.64 | | 0.30 | 35.36 | $ 162,259 |
| 0.85 | 0.49 | 0.67 | | 1.09 | 42.94 | $ 53,765 |
| 0.43 | 0.50 | 0.72 | | 0.36 | 21.17 | $ 38,572 |
| 0.32 | 0.50 | 0.82 | | 0.40 | 15.75 | $ 41,755 |
Report of Independent Registered Public Accounting Firm
Thornburg Low Duration Municipal Fund
To the Board of Trustees of Thornburg Investment Trust and Shareholders of
Thornburg Low Duration Municipal Fund
Opinion on the Financial Statements
We have audited the accompanying statement of assets and liabilities, including the schedule of investments, of Thornburg Low Duration Municipal Fund (one of the funds constituting Thornburg Investment Trust, referred to hereafter as the "Fund") as of September 30, 2019, the related statement of operations for the year ended September 30, 2019, the statements of changes in net assets for each of the two years in the period ended September 30, 2019, including the related notes, and the financial highlights for each of the five years in the period ended September 30, 2019 (collectively referred to as the “financial statements”). In our opinion, the financial statements present fairly, in all material respects, the financial position of the Fund as of September 30, 2019, the results of its operations for the year then ended, the changes in its net assets for each of the two years in the period ended September 30, 2019 and the financial highlights for each of the five years in the period ended September 30, 2019 in conformity with accounting principles generally accepted in the United States of America.
Basis for Opinion
These financial statements are the responsibility of the Fund’s management. Our responsibility is to express an opinion on the Fund’s financial statements based on our audits. We are a public accounting firm registered with the Public Company Accounting Oversight Board (United States) (PCAOB) and are required to be independent with respect to the Fund in accordance with the U.S. federal securities laws and the applicable rules and regulations of the Securities and Exchange Commission and the PCAOB.
We conducted our audits of these financial statements in accordance with the standards of the PCAOB. Those standards require that we plan and perform the audit to obtain reasonable assurance about whether the financial statements are free of material misstatement, whether due to error or fraud.
Our audits included performing procedures to assess the risks of material misstatement of the financial statements, whether due to error or fraud, and performing procedures that respond to those risks. Such procedures included examining, on a test basis, evidence regarding the amounts and disclosures in the financial statements. Our audits also included evaluating the accounting principles used and significant estimates made by management, as well as evaluating the overall presentation of the financial statements. Our procedures included confirmation of securities owned as of September 30, 2019 by correspondence with the custodian and brokers; when replies were not received from brokers, we performed other auditing procedures. We believe that our audits provide a reasonable basis for our opinion.
/s/PricewaterhouseCoopers LLP
New York, New York
November 22, 2019
We have served as the auditor of one or more investment companies in Thornburg Investment Trust since 1999.
Expense Example
Thornburg Low Duration Municipal Fund | September 30, 2019 (Unaudited)
As a shareholder of the Fund, you incur two types of costs:
| (1) | transaction costs, including |
| (a) | sales charges (loads) on purchase payments, for Class A shares; |
| (b) | a deferred sales charge on redemptions of any part or all of a purchase of $1 million of Class A shares within 12 months of purchase; |
| (2) | ongoing costs, including management fees; distribution and/or service (12b-1) fees; and other Fund expenses. |
This example is intended to help you understand your ongoing costs (in dollars) of investing in the Fund and to compare these costs with the ongoing costs of investing in other mutual funds.
The example is based on a $1,000 investment beginning on April 1, 2019, and held until September 30, 2019.
| | BEGINNING
ACCOUNT VALUE
4/1/19 | ENDING
ACCOUNT VALUE
9/30/19 | EXPENSES PAID
DURING PERIOD†
4/1/19—9/30/19 |
| CLASS A SHARES |
| Actual | $1,000.00 | $1,008.03 | $3.52 |
| Hypothetical* | $1,000.00 | $1,021.56 | $3.55 |
| CLASS I SHARES |
| Actual | $1,000.00 | $1,009.87 | $2.52 |
| Hypothetical* | $1,000.00 | $1,022.56 | $2.54 |
| † | Expenses are equal to the annualized expense ratio for each class (A: 0.70%; I: 0.50%) multiplied by the average account value over the period, multiplied by 183/365 to reflect the one-half year period. |
| * | Hypothetical assumes a rate of return of 5% per year before expenses. |
ACTUAL EXPENSES
For each class of shares, the first line of the accompanying table provides information about actual account values and actual expenses. You may use the information in this line, together with the amount you invested, to estimate the expenses that you paid over the period. Simply divide your account value by $1,000 (for example, an $8,600 account value divided by $1,000 = 8.6), then multiply the result by the number in the first line for your class of shares under the heading entitled “Expenses Paid During Period” to estimate the expenses you paid on your account during this period.
HYPOTHETICAL EXAMPLE FOR COMPARISON PURPOSES
For each class of shares, the second line of the accompanying table provides information about hypothetical account values and hypothetical expenses based on the Fund’s actual expense ratio and an assumed rate of return of 5% per year before expenses, which is not the Fund’s actual return. The hypothetical account values and expenses may not be used to estimate the actual ending account balance or expenses you paid for the period. You may use this information to compare the ongoing costs of investing in the Fund and other funds. To do so, compare this 5% hypothetical example with the 5% hypothetical examples that appear in the shareholder reports of the other funds.
Please note that the expenses shown in the table are meant to highlight your ongoing costs only and do not reflect any transactional costs, such as sales charges (loads), redemption fees, or exchange fees. Therefore, the second line of the table for each class of shares is useful in comparing ongoing costs only, and will not help you determine the relative total costs of owning different funds. In addition, if these transactional costs were included, your costs would have been higher.
Trustees and Officers
Thornburg Low Duration Municipal Fund | September 30, 2019 (Unaudited)
NAME, AGE, YEAR ELECTED
POSITION HELD WITH FUND | PRINCIPAL OCCUPATION(S) DURING PAST FIVE YEARS | OTHER DIRECTORSHIPS
HELD BY TRUSTEE |
| INTERESTED TRUSTEES(1)(2) |
Garrett Thornburg, 73
Trustee since 1984,
Chairman of Trustees(3) | Chairman and controlling shareholder of Thornburg Investment Management, Inc. (investment advisor); Chairman and controlling shareholder of Thornburg Securities Corporation (securities dealer); President of the Thornburg Foundation (nonprofit). | None |
Brian J. McMahon, 64
Trustee since 2001,
Vice Chairman of Trustees,
Member of Governance and
Nominating Committee &
Operations Risk Oversight
Committee(4) | Vice Chairman, Chief Investment Strategist, Managing Director, and Portfolio Manager and, until 2016, CEO and President of Thornburg Investment Management, Inc.; Vice President of Thornburg Securities Corporation. | None |
| INDEPENDENT TRUSTEES(1)(2)(5) |
David A. Ater, 74
Trustee since 1994,
Lead Independent Trustee,
Chairman of Governance and
Nominating Committee &
Member of Audit Committee | Principal in Ater & Associates, Santa Fe, NM (developer, planner and broker of residential and commercial real estate); owner, developer and broker for various real estate projects. | None |
Sally Corning, 58
Trustee since 2012,
Chairman of Audit Committee | Partner in Sun Mountain Capital, Santa Fe, NM (private equity firm with investment programs encompassing venture capital, mezzanine debt, and growth equity). | None |
Susan H. Dubin, 70
Trustee since 2004,
Member of Audit
Committee & Governance
and Nominating Committee | President of Dubin Investments, Ltd., Greenwich, CT (private investment fund); Director and officer of various charitable organizations. | None |
David L. Gardner, 56
Trustee since 2015,
Member of Operations Risk
Oversight Committee | Until 2012, head of EMEA (Europe, Middle East and Africa) Sales for iShares of Blackrock, Inc., EMEA Executive Committee Member and EMEA Operating Committee Member at Blackrock, Inc. | None |
Patrick J. Talamantes, 55
Trustee since 2019,
Member of Audit Committee | President of Talamantes Strategies, LLC, a management consulting firm, since 2018; until 2017, President and Chief Executive Officer of The McClatchy Company, Sacramento, CA (news and media company). | None |
Owen D. Van Essen, 65
Trustee since 2004,
Chairman of Operations Risk
Oversight Committee &
Member of Governance and
Nominating Committee | President of Dirks, Van Essen, Murray & April, Santa Fe, NM (newspaper mergers and acquisitions). | None |
James W. Weyhrauch, 60
Trustee since 1996,
Member of Audit
Committee & Operations Risk
Oversight Committee | Real estate broker, Santa Fe Properties, Santa Fe, NM; General Partner, Investments of Genext LLC (a family investment partnership); until 2019, Vice Chairman of Nambe LLC, Santa Fe, NM (manufacturing & design company). | None |
Trustees and Officers, Continued
Thornburg Low Duration Municipal Fund | September 30, 2019 (Unaudited)
NAME, AGE, YEAR ELECTED
POSITION HELD WITH FUND | PRINCIPAL OCCUPATION(S) DURING PAST FIVE YEARS | OTHER DIRECTORSHIPS
HELD BY TRUSTEE |
| OFFICERS OF THE FUND (WHO ARE NOT TRUSTEES)(1)(6) |
David Ashley, 49
Vice President since 2019 | Portfolio Manager and Managing Director since 2019 and Associate Portfolio Manager from 2011-2019 of Thornburg Investment Management, Inc. | Not applicable |
Nimish Bhatt, 56
Chief Financial Officer
since 2019; Treasurer
2016-2019; Secretary
(2018-2019)(7) | Chief Financial Officer and Treasurer of Thornburg Investment Management, Inc. and Thornburg Securities Corporation since 2016 and Secretary of Thornburg Securities Corporation since 2018; Senior Vice President (2004-2016), Chief Financial Officer (2011-2016), and Head of Fund Administration (2011-2016) of Calamos Asset Management, Inc., Calamos Investments LLC, Calamos Advisors LLC, and Calamos Wealth Management; Director of Calamos Global Funds plc (2007-2016). | Not applicable |
Jason Brady, 45
President since 2016(7) | Director since 2017, CEO and President since 2016, and Portfolio Manager and Managing Director of Thornburg Investment Management, Inc.; Vice President of Thornburg Securities Corporation since 2016. | Not applicable |
Connor Browne, 40
Vice President since 2006 | Portfolio Manager and Managing Director of Thornburg Investment Management, Inc. | Not applicable |
Randy Dry, 45
Vice President since 2014 | Managing Director, Director of Institutional Group from 2014-2016, and since 2016, Chief Administrative Officer of Thornburg Investment Management, Inc. | Not applicable |
Greg Dunn, 43
Vice President since 2014 | Portfolio Manager and Managing Director of Thornburg Investment Management, Inc. | Not applicable |
Lon Erickson, 44
Vice President since 2008 | Portfolio Manager and Managing Director of Thornburg Investment Management, Inc. | Not applicable |
Thomas Garcia, 48
Vice President since 2006 | Managing Director, Head Equity Trader, and Associate Portfolio Manager of Thornburg Investment Management, Inc. | Not applicable |
Christian Hoffmann, 37
Vice President since 2018 | Portfolio Manager and Managing Director since 2018, and Associate Portfolio Manager from 2014-2018, of Thornburg Investment Management, Inc. | Not applicable |
Curtis Holloway, 52
Treasurer since 2019(7) | Director of Fund Administration since 2019 of Thornburg Investment Management, Inc.; Senior Vice President, Head of Fund Administration (2017-2019) and Vice President, Fund Administration (2010-2017) of Calamos Investments, and Chief Financial Officer (2017-2019) and Treasurer (2010-2019) of Calamos Funds. | Not applicable |
Ben Kirby, 39
Vice President since 2014 | Head of Investments since 2019, Portfolio Manager and Managing Director since 2013. | Not applicable |
Jeff Klingelhofer, 38
Vice President since 2016 | Head of Investments since 2019, Portfolio Manager and Managing Director since 2015, and Associate Portfolio Manager from 2012–2015, of Thornburg Investment Management, Inc. | Not applicable |
Ponn Lithiluxa, 48
Vice President since 2017 | Manager, Tax & Fund Administration of Thornburg Investment Management, Inc.; Senior Vice President, Citi Fund Services, Inc. (2014–2017); Vice President, Citi Fund Services, Inc. (2007–2014). | Not applicable |
Rob MacDonald, 43
Vice President since 2016 | Managing Director since 2015, Portfolio Manager since 2014, and Associate Portfolio Manager from 2011–2014 of Thornburg Investment Management, Inc. | Not applicable |
Michael Mastroianni, 42
Secretary and Vice President since 2019(7) | Director of Fund Operations since 2019 of Thornburg Investment Management, Inc.; Executive Director, Global Head of Client Services - Global Liquidity (2018-2019), Executive Director, North American Head of Transfer Agency Relationship Management (2011-2019), Executive Director, North American Head of Transfer Agency Service Delivery (2011-2018) of J.P. Morgan Asset Management. | Not applicable |
Leigh Moiola, 52
Vice President since 2001 | Managing Director and Director of Marketing of Thornburg Investment Management, Inc.; Vice President of Thornburg Securities Corporation. | Not applicable |
Christopher Ryon, 63
Vice President since 2008 | Portfolio Manager and Managing Director of Thornburg Investment Management, Inc. | Not applicable |
Trustees and Officers, Continued
Thornburg Low Duration Municipal Fund | September 30, 2019 (Unaudited)
NAME, AGE, YEAR ELECTED
POSITION HELD WITH FUND | PRINCIPAL OCCUPATION(S) DURING PAST FIVE YEARS | OTHER DIRECTORSHIPS
HELD BY TRUSTEE |
Sean Koung Sun, 38
Vice President since 2017 | Portfolio Manager and Managing Director since 2017, Associate Portfolio Manager from 2015-2016, and Equity Research Analyst from 2012-2014 of Thornburg Investment Management, Inc. | Not applicable |
Stephen Velie, 52
Chief Compliance Officer since 2009 | Chief Compliance Officer of Thornburg Investment Trust and Thornburg Investment Management, Inc. | Not applicable |
Nicholos Venditti, 38
Vice President since 2016 | Portfolio Manager and Managing Director since 2015 and Associate Portfolio Manager from 2011–2015 of Thornburg Investment Management, Inc. | Not applicable |
Vinson Walden, 49
Vice President since 2004 | Portfolio Manager and Managing Director of Thornburg Investment Management, Inc. | Not applicable |
Lei Wang, 48
Vice President since 2006 | Portfolio Manager and Managing Director of Thornburg Investment Management, Inc. | Not applicable |
Charles Wilson, 44
Vice President since 2016 | Portfolio Manager and Managing Director since 2014 and Associate Portfolio Manager from 2012–2014 of Thornburg Investment Management, Inc. | Not applicable |
Di Zhou, 41
Vice President since 2016 | Portfolio Manager and Managing Director since 2016, Associate Portfolio Manager from 2014–2016, and Equity Research Analyst from 2010–2014 of Thornburg Investment Management, Inc. | Not applicable |
| (1) | Each person’s address is 2300 North Ridgetop Road, Santa Fe, New Mexico 87506. |
| (2) | The Fund is a separate investment “Fund” or “series” of Thornburg Investment Trust (the “Trust”), which comprises the Thornburg mutual fund complex and is organized as a Massachusetts business trust. Thornburg Investment Management, Inc. is the investment advisor to, and manages, all the Funds of the Trust. Each Trustee oversees all the Funds of the Trust. |
| (3) | Mr. Thornburg is considered an “interested” Trustee under the Investment Company Act of 1940 because he is a director and controlling shareholder of Thornburg Investment Management, Inc., the investment advisor to the Trust, and is the sole director and controlling shareholder of Thornburg Securities Corporation, the distributor of shares for the Trust. |
| (4) | Mr. McMahon is considered an “interested” Trustee under the Investment Company Act of 1940 because he is a director and the chief investment strategist of Thornburg Investment Management, Inc. |
| (5) | The Bylaws of the Trust currently require that each Independent Trustee shall retire by the end of the calendar year during which the Trustee reached the age of 75 years. Otherwise each Trustee serves in office until the election and qualification of a successor or until the Trustee sooner dies, resigns, retires or is removed. |
| (6) | Assistant vice presidents and assistant secretaries are not shown. |
| (7) | The Trust’s president, chief financial officer, secretary, and treasurer each serves a one-year term or until the election and qualification of a successor; each other officer serves at the pleasure of the Trustees. |
The Statement of Additional Information for each Fund of the Trust includes additional information about the Trustees and is available, without charge and upon request, by calling 1-800-847-0200.
Other Information
Thornburg Low Duration Municipal Fund | September 30, 2019 (Unaudited)
PORTFOLIO PROXY VOTING
Policies and Procedures:
The Trust has delegated to the Advisor voting decisions respecting proxies for the Fund’s voting securities. The Advisor makes voting decisions in accordance with its Proxy Voting Policy and Procedures. A description of the Policy and Procedures is available (i) without charge, upon request, by calling the Advisor toll-free at 1-800-847-0200, (ii) on the Thornburg website at www.thornburg.com, and (iii) on the U.S. Securities and Exchange Commission’s website at www.sec.gov.
Information regarding how proxies were voted is available on or before August 31 of each year for the twelve months ending the preceding June 30. This information is available (i) without charge, upon request by calling the Advisor toll-free at 1-800-847-0200, (ii) on the Thornburg website at www.thornburg.com, and (iii) on the U.S. Securities and Exchange Commission’s website at www.sec.gov.
TAX INFORMATION
For the tax year ended September 30, 2019, dividends paid by the Fund of $3,204,635 (or the maximum allowed) are tax exempt dividends and $11,300 are taxable ordinary investment income dividends for federal income tax purposes. The information and the distributions reported herein may differ from information and distributions reported to the shareholders for the calendar year ending December 31, 2019. Complete information will be reported in conjunction with your 2019 Form 1099.
AVAILABILITY OF QUARTERLY PORTFOLIO SCHEDULE
The Fund files with the Securities and Exchange Commission schedules of its portfolio holdings on Form N-Q for the first and third quarters of each fiscal year. The Fund’s Forms N-Q are available on the Commission’s website at www.sec.gov, or may be reviewed and copied at the Commission’s Public Reference Room in Washington, D.C. Information on the operation of the Public Reference Room may be obtained by calling 1-800-SEC-0330. The Fund also makes this information available on its website at www.thornburg.com/download or upon request by calling 1-800-847-0200.
STATEMENT RESPECTING RENEWAL OF INVESTMENT ADVISORY AGREEMENT
Thornburg Investment Management, Inc. (the “Advisor”) provides investment management services to Thornburg Low Duration Municipal Fund (the “Fund”) pursuant to an investment advisory agreement. The Trustees consider the renewal of this agreement annually, and most recently determined to renew the agreement on September 17, 2019.
Planning for their recent consideration of the advisory agreement’s renewal, the independent Trustees met in May 2019 to consider aspects of their annual evaluation of the Advisor’s service to all of the funds of Thornburg Investment Trust, to plan the annual evaluation of the Advisor’s performance and to discuss preliminarily the information the Advisor would present to the Trustees for their review. The independent Trustees met in a second independent session in July 2019 to further define certain portions of the information to be submitted by the Advisor. The independent Trustees met again in an independent session in September 2019 with a mutual fund analyst firm engaged by the independent Trustees to provide explanations of comparative cost and expense information, comparative investment performance information, and other data obtained and analyzed by the analyst firm. In that session the independent Trustees discussed their evaluations of the Advisor’s services to the Fund and the Fund’s fee and expense levels, investment performance, and other information presented for the Fund, conferred independently with legal counsel respecting the factors typically considered in evaluating renewal of an advisory agreement, and conferred with representatives of management to receive explanations of certain aspects of the information they had requested. Representatives of the Advisor subsequently reviewed portions of the information with the Trustees and addressed questions from the Trustees at a full meeting session of the Trustees scheduled in September for that purpose, and the independent Trustees thereafter met again in an independent session to consider the Advisor’s presentations and various specific issues respecting their consideration of the advisory agreement’s renewal. Following these sessions, the Trustees met to consider renewal of the advisory agreement, and the independent Trustees voted unanimously at that meeting to renew the agreement for an additional term of one year.
The information below summarizes certain factors considered by the Trustees in connection with the determination to renew the advisory agreement with the Advisor. In determining to renew the advisory agreement, the Trustees considered a wide range of information and did not identify any single factor as controlling, and this summary does not describe all of the factors and other matters considered by the Trustees in making their determination.
Nature, Extent and Quality of Services. The Trustees considered in their evaluation of the advisory agreement the written and oral reports provided to the Trustees and their standing committees throughout the year on a wide variety of topics by personnel from the Advisor’s
Other Information, Continued
Thornburg Low Duration Municipal Fund | September 30, 2019 (Unaudited)
portfolio management, administration, operations and compliance staffs. The Trustees also considered in this evaluation presentations and explanations made by representatives of the Advisor in meeting sessions scheduled for consideration of the renewal of the advisory agreement. The Trustees further noted in their evaluation the consideration they had given to a number of topics in previous years, reports from their standing committees, and advice received from counsel.
Information noted by the Trustees as having been considered in relation to the nature, extent and quality of services provided by the Advisor under the advisory agreement and contributing (together with other information considered) to their conclusions respecting the nature, extent and quality of the services rendered to the Fund by the Advisor included: (1) reports from portfolio managers and other personnel throughout the year demonstrating that the Fund was managed in conformity with stated strategies and objectives and conformed to investment restrictions and limitations; (2) reports demonstrating that management of the Fund remained faithful and competent, and demonstrating sufficient skill by portfolio managers in executing the Fund’s strategies in varying environments, managers’ cognizance of and strategies to pursue the Fund’s objectives and address pertinent market and economic trends and conditions, the evaluation and selection of individual investments, management to achieve tax efficiencies, and the structuring and composition of the Fund’s portfolio and management of Fund liquidity requirements; (3) the Fund’s achievement of its investment objectives over different periods of time; (4) presentations by and interactions with members of the Advisor’s fund administration, operations and compliance staffs; (5) reports from standing committees of the Trustees on their respective proceedings throughout the year, including in particular reports from and interactions with the Advisor’s personnel; (6) the sufficiency of the resources the Advisor devotes to the services it provides to the Fund, including the expertise of its personnel and staffing levels and its enhancements to the electronic systems it utilizes in providing these services, and also including the Advisor’s own financial management and sufficiency of its resources; and (7) the measures employed to achieve efficient trade execution for the Fund, including the evaluation and selection of firms to execute transactions for the Fund. As in past years, the Trustees noted particularly their assessments of the Advisor’s personnel developed in meetings throughout the year, measures to expand and improve the depth and experience of the Advisor’s staff, and the Advisor’s collaborative approach to investment management, continued commitment to observance of compliance and regulatory requirements in managing investments by the Fund, responsiveness to the Trustees, and other factors.
Based upon these and other considerations, the Trustees concluded that the Advisor’s management of the Fund’s investments continued to conform to the Fund’s stated objectives and policies, and that the nature, extent and quality of the services provided to the Fund by the Advisor remained sufficient.
Investment Performance. The Trustees noted in their evaluation of the Fund’s investment performance the written and oral reports they had received in each regular meeting over the course of the year from the Advisor’s portfolio management personnel. The Trustees also noted their consideration of information provided to them at their request in anticipation of their annual evaluation of the Advisor’s services, including the following items of information respecting the investment performance of the Fund: (1) the Fund’s absolute investment performance and achievement of stated objectives; (2) the Advisor’s explanations and commentary on the Fund’s performance in the context of the Fund’s objectives and reasonable expectations, and business, market and economic conditions; (3) performance data for the most recent five calendar years, comparing the Fund’s annual investment returns to a broad-based securities index and to the applicable Morningstar category of funds; (4) the Fund’s investment performance for the three-month, year-to-date, one-year, three-year, five-year, and since inception periods ending with the second quarter of the current year, comparing the Fund’s annualized returns to two mutual fund categories created by independent mutual fund analyst firms and to a broad-based securities index, and assigning a percentage rank to the Fund’s performance for each period relative to each of the fund categories; (5) analyses of specified performance and risk metrics for the Fund relative to its benchmark and to a selected peer group of funds, prepared by an independent financial analyst firm engaged by the independent Trustees; (6) the Fund’s cash flows; (7) comparative performance data for fund peer groups selected by an independent mutual fund analyst firm engaged by the independent Trustees, and the analysis and observations of the analyst firm respecting those data; and (8) comparative measures of correlation to equity indices, and risk and return statistics. Measures of risk and relative return demonstrated that the Fund’s performance relative to these measures continued to fulfill expectations in current conditions. The Trustees generally attach additional significance to the investment performance of the Fund from the perspective of longer-term shareholders, and noted in that regard that the Fund’s relative investment performance may be affected to some extent in periods when the Advisor pursues defensive measures in line with the Fund’s stated objectives. Based upon their consideration of this and other information, the Trustees concluded that the Fund’s absolute and relative investment performance over a range of pertinent holding periods on the whole was satisfactory in view of its objectives and strategies.
Comparisons of Fee and Expense Levels. Information noted by the Trustees as having been considered in this context included a variety of comparative data respecting the Fund’s fee and expense levels. This information included comparisons of the Fund’s advisory fee and overall Fund expenses to median and average fees and expenses charged to funds in the applicable Morningstar category, comparisons of the advisory fee and total expenses for the Fund’s two share classes to the fee levels and expenses of fund peer groups selected from the category by an independent mutual fund analyst firm engaged by the independent Trustees, the perspectives and advice from that mutual fund analyst firm respecting comparisons of fund fee levels and expenses to fund peer groups, and other information. The Trustees considered that the Advisor has agreed to certain fee waivers and expense reimbursements for the current period. Comparative fee and expense data noted as having been considered by the Trustees showed that, after fee waivers and expense reimbursements, the level of total expense for one share class of the Fund was higher than the median charged to funds in the applicable Morningstar category and
Other Information, Continued
Thornburg Low Duration Municipal Fund | September 30, 2019 (Unaudited)
comparable to the average levels of total expenses for that category, and that the level of total expense for a second share class was lower than the median and average levels for that category. Peer group data showed that the Fund’s stated advisory fee was comparable to the median level for the two peer groups, and that the total expense levels of the Fund’s two share classes were comparable to the median levels of their respective peer groups after waivers of fees and reimbursement of expenses. The Trustees did not find the differences significant in view of their findings and conclusions respecting the other factors considered.
The Trustees noted their consideration of information respecting the advisory fees charged by the Advisor to other investment management clients, including sub-advised mutual funds and other institutional clients, together with information about fees charged by other advisors to different clients, analysis of the differences between the requirements of institutional clients and mutual funds, analysis of the differences between the requirements of a sub-advised mutual fund and a fund as to which the investment advisor is the primary advisor and sponsor, and the consequently different investment management services provided to the different categories of clients and the differing contexts in which these arrangements are entered into. The Trustees confirmed their previous observations that the differences between the fees charged by the Advisor or by other investment advisors to different types of clients did not appear exceptional and had limited relevance to the evaluation of the fee rate charged to mutual funds as to which the Advisor or such other advisors are the primary advisor and sponsor.
Costs and Profitability of Advisor. In reviewing the profitability of the Advisor’s services to the Fund, the Trustees considered an analysis of the Advisor’s costs and the estimated profitability to the Advisor of its services, together with data respecting the overall profitability of a selection of other investment management firms. The Trustees considered in this regard information from the Advisor respecting investment of its profits to maintain staffing levels, and noted that a portion of the Advisor’s profits is an important element in the compensation of shareholder employees. The Trustees considered information from the Advisor respecting the use of profits to enhance staff competencies through training and other measures, hire personnel to expand and develop the scope of senior management expertise, pay competitive levels of compensation, and add to the Advisor’s electronic and information technology systems to maintain or improve service levels. The Trustees also considered the contribution of the Advisor’s cost management to its profitability, and the relationship of the Advisor’s financial resources and profitability in previous years to its ability to attract necessary personnel, invest in systems and other assets required for its service to the Fund, and maintain or improve service levels for the Fund notwithstanding fluctuations in revenues and profitability. The information considered did not indicate to the Trustees that the Advisor’s profitability was excessive.
Potential Economies of Scale. In reviewing the extent to which economies of scale would be realized by the Fund as it grows and whether fee levels reflect potential economies of scale, the Trustees considered the breakpoint structure for advisory fees chargeable to the Fund, comparisons of the fee breakpoint structure for the Fund with breakpoint structures (or the absence of such structures) for other funds in a peer group selected by an independent mutual fund analyst firm, the effects of the breakpoint structure and other expense factors realized by certain funds of the Trust as their asset levels had increased, the Advisor’s undertakings to waive or reimburse certain fees and expenses of the Fund, and the Advisor’s expenditures from its own profits and resources to maintain staffing levels and expand staff competencies, pay competitive levels of compensation, and add to its electronic and information technology systems so as to maintain or improve service levels. The information provided demonstrated to the Trustees that the Fund’s advisory fee breakpoint structure is reasonable in relation to the structures observed in the other funds in its peer group, and that shareholders may be expected to benefit from any economies of scale, due to the advisory agreement’s breakpoint fee structure for the Fund and other factors.
Potential Ancillary Benefits. In reviewing potential benefits to the Advisor because of its relationship to the Fund, the Trustees considered explanations from the Advisor respecting its receipt of certain research services from broker dealers, and the benefits to both the Fund and the Advisor of the Advisor’s expansion of its staffing, compliance and systems capabilities and other resources to serve a broader variety of investment management clients. No unusual or unfair benefits to the Advisor from its relationship to the Fund were identified by the Trustees.
Summary of Conclusions. The Trustees concluded that the general nature, extent and quality of the Advisor’s services performed under the advisory agreement remained sufficient, the Advisor had continued to actively and competently pursue the Fund’s stated investment objectives and adhere to the Fund’s investment policies, and that the absolute and relative investment performance of the Fund over pertinent holding periods on the whole was satisfactory in the context of the Fund’s objectives and strategies. The Trustees further concluded that the level of the advisory fee charged to the Fund by the Advisor is fair and reasonable in relation to the services provided by the Advisor, in view of the nature, extent and quality of those services, the investment performance of the Fund after fees and expenses, the clear disclosure of fees and expenses in the Fund’s prospectus, comparisons of fees and expenses charged to the Fund to fees and expenses charged to other mutual funds, and the other factors considered. The Trustees accordingly determined to renew the Fund’s investment advisory agreement with the Advisor for an additional term of one year.
Trustees’ Statement to Shareholders (Unaudited)
Readopted September 17, 2019
The Trustees believe current and prospective shareholders should know how we discharge our responsibilities in supervising the Funds’ investment advisor and in reviewing the advisor’s contract for renewal. Since 2005, we have issued a statement which sets out clearly the three principal guidelines that we follow in supervising the Trust’s investment advisor on your behalf. In accordance with our customary practice, in September of this year we again reviewed our statement and concluded we should reissue this statement outlining the principal features of our supervision of the advisor’s performance of investment management services for the Funds.
We begin with the premise that each shareholder selected his or her Fund because its investments are managed by the investment advisor identified in the prospectus and in accordance with the objective and policies described in the prospectus. We realize, as each of you do, that if you believe that your Fund’s stated objective and policies no longer serve your personal investment goals, you can sell your shares and leave the Fund.
Therefore, we believe that our primary supervisory task—our principal obligation to you—is to assess the nature and quality of the advisor’s services, and to confirm that the advisor actively and competently pursues the Fund’s objective, in accordance with the policies set out in the prospectus. To do this, we meet regularly with management to review your Fund’s portfolio and to discuss the advisor’s specific actions and judgments in pursuing the Fund’s objective. We do not substitute our own judgment for the advisor’s decisions in selecting investments; the advisor is paid to exercise its informed judgment on investment decisions, and we seek to confirm, in reviewing the advisor’s performance, that the advisor is doing just that.
Second, we are conscious of costs and the effect that costs have on shareholders’ returns. We try to make sure that your Fund’s fees and costs are reasonable in relationship to the services rendered and that they are generally in line with those charged by other expert investment advisors, consistent with our belief that the Fund’s investors searched for and expect that expertise and attention and have decided to pay a reasonable price for it. We do not put the management contract “out to bid” as a matter of course, and we would not do so unless we had concluded that the advisor materially had failed to pursue the Fund’s objectives in accordance with its policies, or for other equally important reasons. We believe that any other approach would be inconsistent with your interests and contrary to your expectations when you bought shares of the Fund in the first place.
Finally, because we believe that most Thornburg Fund shareholders have invested with a long-term perspective, we try not to focus too much on the fashions of the moment and on short-term performance. The market will not favor any specific investment objective or set of policies at all times and under all economic circumstances. A fund will experience periods of both high and low returns relative to other funds and other investments. Even if one of our Funds is not favored by the market at a particular time, we believe that the advisor is nonetheless obliged to remain true to the Fund’s objective and policies, and we watch to see that it does so.
Trustees of Thornburg Investment Trust
Thornburg Investment Management is a privately-owned global investment firm that offers a range of solutions for retail and institutional investors. Founded in 1982 and headquartered in Santa Fe, New Mexico, we manage approximately $41.9 billion (as of September 30, 2019) across U.S. mutual funds, separate accounts for high-net-worth investors, institutional accounts, and UCITS funds for non-U.S. investors.
The fund outlined in this report is one of many equity and fixed-income products available from Thornburg Investment Management.
EQUITY FUNDS
| ■ | Thornburg Global Opportunities Fund |
| ■ | Thornburg International Value Fund |
| ■ | Thornburg Better World International Fund |
| ■ | Thornburg International Growth Fund |
| ■ | Thornburg Developing World Fund |
| ■ | Thornburg Value Fund |
| ■ | Thornburg Core Growth Fund |
MULTI_ASSET FUNDS
| ■ | Thornburg Investment Income Builder Fund |
| ■ | Thornburg Summit Fund |
FIXED INCOME FUNDS
| ■ | Thornburg Low Duration Income Fund |
| ■ | Thornburg Limited Term U.S. Government Fund |
| ■ | Thornburg Limited Term Income Fund |
| ■ | Thornburg Strategic Income Fund |
| ■ | Thornburg Low Duration Municipal Fund |
| ■ | Thornburg Limited Term Municipal Fund |
| ■ | Thornburg Intermediate Municipal Fund |
| ■ | Thornburg California Limited Term Municipal Fund |
| ■ | Thornburg New Mexico Intermediate Municipal Fund |
| ■ | Thornburg New York Intermediate Municipal Fund |
| ■ | Thornburg Strategic Municipal Income Fund |
ALTERNATIVE FUNDS
| ■ | Thornburg Long/Short Equity Fund |
Before investing, carefully consider the Fund’s investment goals, risks, charges, and expenses. For a prospectus or summary prospectus containing this and other information, contact your financial advisor or visit thornburg.com. Read it carefully before investing.
For additional information, please visit thornburg.com
Thornburg Investment Management, Inc. 2300 North Ridgetop Road, Santa Fe, NM 87506
This page intentionally left blank.
This page intentionally left blank.
To receive shareholder reports, prospectuses, and proxy statements electronically, go to www.thornburg.com/edelivery.
This Annual Report is submitted for the general information of shareholders of the Fund. It is not authorized for distribution to prospective investors in the Fund unless preceded or accompanied by an effective prospectus.
Investment Advisor:
Thornburg Investment Management®
800.847.0200
Distributor:
Thornburg Securities Corporation®
Annual Report
September 30, 2019
Beginning on January 1, 2021, as permitted by regulations adopted by the Securities and Exchange Commission, paper copies of the Fund’s shareholder reports will no longer be sent by mail, unless you specifically request paper copies of the reports from the Fund or from your financial intermediary, such as a broker-dealer or bank. Instead, the reports will be made available on a website, and you will be notified by mail each time a report is posted and provided with a website link to access the report.
If you already elected to receive shareholder reports electronically, you will not be affected by this change and you need not take any action. You may elect to receive shareholder reports and other communications from the Fund or your financial intermediary electronically by going to thornburg.com/edelivery.
You may elect to receive all future reports in paper free of charge. You can inform the Fund or your financial intermediary that you wish to continue receiving paper copies of your shareholder reports by calling 800.847.0200 or your financial intermediary directly. Your election to receive reports in paper will apply to all funds held with the fund complex/your financial intermediary.
At Thornburg, we believe unconstrained investing leads to better outcomes for our clients. Our investment solutions are highly active, high conviction, and benchmark agnostic. When it comes to finding economic opportunity for clients, it’s more than what we do.
It’s how we do it. Active Asbottom-up, fundamental, active managers, we look beyond conventional benchmarks. Long Term We take a long-term view in how we manage our firm and our portfolios. Benchmark Agnostic Investment strategies should have the flexibility to pursue solutions for clients, not stay within the conventional confines of benchmarks. Flexible Perspective Our approach to portfolio construction is guided by our convictions rather than convention. High Conviction We focus our attention and capital on thoroughly researched, well-understood positions. The best form of risk management is to know what you own, and why. Repeatable & Robust Our long-term outperformance of benchmarks verifies that our process works and outperforms conventional thinking. Independent We are independently owned and far from the herd of other investment managers. Investment Driven All members of the investment team are resources for all of our strategies. Collaborative Our team collaborates on opportunities across geography, sector, or asset class.
Thornburg Limited Term Municipal Fund
Annual Report | September 30, 2019
Table of Contents
| SHARE CLASS | NASDAQ SYMBOL | CUSIP |
| Class A | LTMFX | 885-215-459 |
| Class C | LTMCX | 885-215-442 |
| Class I | LTMIX | 885-215-434 |
Minimum investments for Class I shares may be higher than those for Class A. Class I shares may not be available to all investors.
Investments carry risks, including possible loss of principal. Portfolios investing in bonds have the same interest rate, inflation, and credit risks that are associated with the underlying bonds. The value of bonds will fluctuate relative to changes in interest rates, decreasing when interest rates rise. Unlike bonds, bond funds have ongoing fees and expenses. Please see the Fund’s prospectus for a discussion of the risks associated with an investment in the Fund. Investments in the Funds are not FDIC insured, nor are they bank deposits or guaranteed by a bank or any other entity.
The laddering strategy does not assure or guarantee better performance and cannot eliminate the risk of investment losses.
Letter to Shareholders
Thornburg Limited Term Municipal Fund | September 30, 2019 (Unaudited)
October 18, 2019
Dear Fellow Shareholder:
We are pleased to present the annual report for the Thornburg Limited Term Municipal Fund. The net asset value (NAV) of the Class I shares increased 36 cents to $14.46 per share during the fiscal year ended September 30, 2019. The Class I shares of your Fund underperformed the index with a 4.67% total return for the fiscal year ended September 30, 2019, compared to the 6.05% total return for the ICE BofA Merrill Lynch 1-10 Year Municipal Securities Index.
The drivers of the Fund’s total return relative to its benchmark include its interest rate sensitivity, as measured by the Fund’s duration, differing maturity allocations and other risk factors. The impact of the Fund’s 0.82 years shorter duration detracted 0.784%. The Fund’s maturity allocations detracted 0.022%, while other risk factors detracted 0.092%. The Fund’s expenses and residuals accounted for the remainder of the performance differential.
Since the last annual letter published in November 2018, the municipal market and its investors have experienced one of the great rallies in the market’s history, driven by the largest amount of inflows into municipal bond mutual funds on record. Mutual funds have experienced positive inflows every week of 2019, with the aggregate amounting to more than $70 billion. During that time, the 10-year Thomson Reuters Municipal Market Data (MMD) AAA Curve has fallen from a high of 2.80% in early November 2018 to an all-time low of 1.22% in late August 2019, only to settle around 1.45% at the time of this writing. The decrease in yields and the insatiable demand from retail mutual fund investors has led to appreciating bond prices that have accounted for a large portion of the returns the market inked over the last 12 months.
While the increase in the price of the investments has been great to watch, municipal investors find themselves in a tough situation. Does one sell the bonds at high prices? Is it best to pay a capital gain and look for reinvestment opportunities? Or does one hold the bonds? Collect a coupon and reinvest the proceeds knowing that the premium could evaporate if yields spike?
In many cases the answer is contingent on investor goals and risk tolerance. So instead of providing an answer, we would like to present an analysis of market risks that will allow investors to draw their own conclusions.
Municipal Bond Supply and Demand
Municipal investors tend to be overly sensitive to supply trends. The common refrain is that a big supply year is bearish for bond prices and vice versa. While that is generally true, it negates the other half of the equation. Demand, not supply, can be a large driver of total return, and that is exactly what the market has experienced throughout 2019. $70 billion has poured into the municipal market through the end of September 2019, the largest amount of annual inflows on record.
That $70 billion represents roughly 10% of all assets in municipal bond mutual funds. So technical demand, not fundamentals, has been the key driver of asset appreciation. That should be troubling. As investors, we like fundamentals to move asset prices. If you were to invest in Apple, and Apple sells more iPhones, and the firm’s stock appreciates, we would consider that being for the right reasons. When price is driven by factors other than fundamental value, the potential for a reversal tends to be high. Therefore, we would recommend caution when investing in a market where fundamental improvement isn’t the reason for price appreciation.
Municipal Bond Credit Risk
Credit spreads, much like triple-A bond insurers, have all but disappeared from the muni market. That is somewhat of an overstatement, but for some time now credit spreads, especially across the plain vanilla investment grade space, have become virtually commoditized. At the same time, while much has been said surrounding the covenant-lite status of recent corporate debt issuance, little has been said about the phenomenon in the municipal bond market. Credit security packages are getting weaker. Net revenue covenants, liquidity covenants, additional bonds tests and other protections granted to municipal investors are weakening. It is undeniable that municipal investors are taking on more and more credit risk for less and less yield.
State and Local Tax Deduction (SALT)
At least part of the increase in demand for municipal paper has been driven by the changes to the SALT deduction cap. The cap of $10,000 in state and local taxes that are deductible from federal taxes was part of the tax changes that were passed by the Trump administration at the end of 2017. It is estimated that over 10 million taxpayers were unable to write-off some $320 billion in state and local taxes, effectively increasing their tax liability despite a reduction in marginal personal income tax rates. The impact has been the most severe in states with high local and state taxes.
Faced with an ever-increasing tax bill, investors in these high-tax states have flocked to the municipal bond market. In no place is that truer than California. For many investors in the state, investments in the California municipal bond market no longer make economic sense. After adjusting yields for state and local taxes, many California investors would be better off investing in U.S. Treasuries due to the higher after-tax yield. Yet, money continues to flow into the California municipal bond market as investors make these non-economic decisions. Non-economic decision-making is not isolated to the California market, though. It’s evident in many high-tax states.
The Federal Reserve and Monetary Policy
As recently as December 2018, the Federal Reserve seemed bound and determined to push interest rates higher. It took only a few angry tweets and some stock market volatility in the fourth quarter of 2018 for the Fed to put its interest rate hikes
Letter to Shareholders, Continued
Thornburg Limited Term Municipal Fund | September 30, 2019 (Unaudited)
on pause, and only seven months for a complete reversal of course. Since the 25 basis point (bps) rate cut in July, the Fed cut again in September and the market is pricing in one more cut before year end.
While monetary policy has been the elixir of choice for a decade running, it has also created a host of problems for fixed income investors. By keeping yields low for the last decade, fixed income investors have been driven out the risk spectrum in search of their income goals. Many have taken on additional duration risk by buying longer-dated bonds, making them more susceptible to interest rate movements.
Other fixed income investors have taken on more credit risk, making them more susceptible to a slowing economy. Others have been forced out of the fixed income market and into the equity markets, which completely changes the risk profile of their investments. This is all being done at a time of all-time low yields and all-time low credit spreads. This situation is hardly sustainable.
The highlighted risks have led us to maintain our present course. The Fund remains higher in credit quality and cash with durations at lower levels. While the latter has impacted total returns as price appreciation has driven total return, the distribution yield, or tax-free monthly income, has held up nicely. Cash has been allowed to build given the flatness of the
yield curve and the trade-off in investing in the variable rate demand note (VRDN) market. When opportunities arise, we have ample dry powder to take advantage of dislocations. Until those conditions are met, we are content to manage the Fund in a more conservative fashion commensurate with the risk profile of a municipal bond investor.
Thank you for your continued trust and support.
Sincerely,

| 
|
Christopher Ryon,cfa
Portfolio Manager
Managing Director | Nicholos Venditti,cfa
Portfolio Manager
Managing Director |

| |
David Ashley,cfa
Portfolio Manager
Managing Director | |
The matters discussed in this report may constitute forward-looking statements made pursuant to the safe harbor provisions of the Securities Litigation Reform Act of 1995. These include any advisor or portfolio manager prediction, assessment, analysis or outlook for individual securities, industries, investment styles, market sectors and/or markets. These statements involve risks and uncertainties. In addition to the general risks described for each fund in its current prospectus, other factors bearing on these reports include the accuracy of the advisor’s or portfolio manager’s forecasts and predictions, the appropriateness of the investment strategies designed by the advisor or portfolio manager and the ability of the advisor or portfolio manager to implement their strategies efficiently and successfully. Any one or more of these factors, as well as other risks affecting the securities markets generally, could cause the actual results of any fund to differ materially as compared to its benchmarks.
The views expressed are subject to change and do not necessarily reflect the views of Thornburg Investment Management, Inc. This information should not be relied upon as a recommendation or investment advice and is not intended to predict the performance of any investment or market.
Performance results of individual share classes will vary based on the fees and expenses associated with each share class, and may be higher or lower than other share classes within the same Fund. Please see Performance Summary for performance results of each share class.
Performance Summary
Thornburg Limited Term Municipal Fund | September 30, 2019 (Unaudited)
AVERAGE ANNUAL TOTAL RETURNS
| | 1-YR | 3-YR | 5-YR | 10-YR | SINCE
INCEP. |
| Class A Shares(Incep: 9/28/84) | | | | | |
| Without sales charge | 4.41% | 1.32% | 1.48% | 2.26% | 4.67% |
| With sales charge | 2.88% | 0.81% | 1.18% | 2.11% | 4.62% |
| Class C Shares(Incep: 9/1/94) | | | | | |
| Without sales charge | 4.16% | 1.05% | 1.24% | 2.00% | 3.15% |
| With sales charge | 3.66% | 1.05% | 1.24% | 2.00% | 3.15% |
| Class I Shares(Incep: 7/5/96) | 4.67% | 1.57% | 1.78% | 2.58% | 3.72% |
30-DAY YIELDS, A SHARES(with sales charge)
| Annualized Distribution Yield | 1.77% |
| SEC Yield | 0.84% |
GROWTH OF A HYPOTHETICAL $10,000 INVESTMENT
Performance data shown represents past performance and is no guarantee of future results. Investment return and principal value will fluctuate so shares, when redeemed, may be worth more or less than their original cost. Current performance may be lower or higher than quoted. For performance current to the most recent month end, visit thornburg.com or call 800-847-0200. The performance information does not reflect the deduction of taxes that a shareholder would pay on distributions or the redemption of Fund shares. Returns reflect the reinvestment of dividends and capital gains. Class A shares are sold with a maximum sales charge of 1.50%, Class C shares include a 0.50% CDSC for the first year only. There is no sales charge for Class I shares. As disclosed in the most recent prospectus, the total annual fund operating expenses are as follows: A shares, 0.71%; C shares, 0.95%; I shares, 0.43%. For more detailed information on fund expenses and waivers/reimbursements please see the Fund’s prospectus.
The ICE index data referenced herein is the property of ICE Data Indices, LLC, its affiliates (“ICE Data”) and/or its Third Party Suppliers and has been licensed for use by Thornburg Investment Management, Inc. ICE Data and its Third Party Suppliers accept no liability in connection with its use. See www.thornburg.com/indices for a full copy of the Disclaimer.
TheICE BofAML 1-10 Year Municipal Securities Index is a subset of the ICE BofAML Municipal Securities Index including all securities with a remaining term to final maturity less than 10 years.
The performance of any index is not indicative of the performance of any particular investment. Unless otherwise noted, index returns reflect the reinvestment of income dividends and capital gains, if any, but do not reflect fees, brokerage commissions or other expenses of investing. Investors may not make direct investments into any index.
Bond Credit Ratings (Credit Quality) – A bond credit rating assesses the financial ability of a debt issuer to make timely payments of principal and interest. Ratings of AAA (the highest), AA, A, and BBB are investment-grade quality. Ratings of BB, B, CCC, CC, C and D (the lowest) are considered below investment grade, speculative grade, or junk bonds.
Duration – A bond’s sensitivity to interest rates. Bonds with longer durations experience greater price volatility than bonds with shorter durations. Effective duration incorporates a bond’s embedded option features, such as call provisions.
Yield Curve – A line that plots the interest rates, at a set point in time, of bonds having equal credit quality, but differing maturity dates.
Thomson Reuters Municipal Market Data (MMD) AAA Curve - Thomson Reuters Municipal Market Data (MMD) AAA Curve is a proprietary yield curve that provides the offer-side of “AAA” rated state general obligation bonds, as determined by the MMD analyst team. The MMD AAA curve represents the MMD analyst team’s opinion of AAA valuation, based on institutional block size ($2 million+) market activity in both the primary and secondary municipal bond market. In the interest of transparency, MMD publishes extensive yield curve assumptions relating to various structural criteria which are used in filtering market information for the purpose of benchmark yield curve creation.
Fund Summary
Thornburg Limited Term Municipal Fund | September 30, 2019 (Unaudited)
OBJECTIVES AND STRATEGIES
The Fund’s primary investment objective is to obtain as high a level of current income exempt from federal individual income tax as is consistent, in the view of the Fund’s investment advisor, with preservation of capital (may be subject to Alternative Minimum Tax).
The secondary goal of the Fund is to reduce expected changes in its share price compared to longer intermediate and long-term bond portfolios.
This Fund is a laddered portfolio of municipal bonds with a dollar-weighted average maturity of normally less than five years. Laddering involves building a portfolio of bonds with staggered maturities so that a portion of the portfolio matures each year. Cash from maturing bonds, if not needed for other purposes, is typically invested in bonds with longer maturities at the far end of the ladder. We regard the strategy as a good compromise for managing different types of risk.
LONG-TERM STABILITY OF PRINCIPAL
Net Asset Value History of A Shares
| KEY PORTFOLIO ATTRIBUTES | |
| Number of Bonds | 1,644 |
| Effective Duration | 2.8 Yrs |
| Average Maturity | 3.4 Yrs |
SECURITY CREDIT RATINGS
A bond credit rating assesses the financial ability of a debt issuer to make timely payments of principal and interest. Ratings of AAA (the highest), AA, A, and BBB are investment-grade quality. Ratings of BB, B, CCC, CC, C and D (the lowest) are considered below investment grade, speculative grade, or junk bonds.
Unrated pre-refunded and escrowed-to-maturity bonds are included in the not rated category.
PORTFOLIO LADDER
| 8% | 16% | 14% | 15% | 10% | 12% | 10% | 6% | 5% | 3% | 3% |
Percent of portfolio maturing in each year. Cash includes cash equivalents and other.
There is no guarantee that the Fund will meet its investment objectives.
All data is subject to change. Charts may not add up to 100% due to rounding.
Schedule of Investments
Thornburg Limited Term Municipal Fund | September 30, 2019
| | | PRINCIPAL
AMOUNT | VALUE |
| | Municipal Bonds — 99.2% | | |
| | Alabama — 0.7% | | |
| | Alabama Public School & College Authority (Education System Capital Improvements), | | |
| | Series A, 5.00% due 6/1/2020 - 6/1/2022 | $ 16,025,000 | $ 17,026,347 |
| | Series B, 5.00% due 6/1/2023 | 735,000 | 831,454 |
| | Alabama State Board of Education (Calhoun Community College), 4.00% due 5/1/2020 - 5/1/2022 | 3,230,000 | 3,361,101 |
| | East Alabama Health Care Authority GO, Series A, 5.00% due 9/1/2021 - 9/1/2022 | 2,045,000 | 2,181,580 |
| | Lower Alabama Gas District, Series A, 5.00% due 9/1/2029 | 3,625,000 | 4,499,060 |
| | UAB Medicine Finance Authority (University Hospital), Series B, 5.00% due 9/1/2025 - 9/1/2027 | 8,915,000 | 10,868,581 |
| | Water Works Board of the City of Birmingham, 5.00% due 1/1/2029 | 2,230,000 | 2,810,536 |
| | Alaska — 0.4% | | |
| | Alaska Energy Authority (Bradley Lake Hydroelectric Project; Insured: AGM), 6.00% due 7/1/2020 | 1,790,000 | 1,850,950 |
| | City of Valdez (BP Pipelines (Alaska), Inc. Project), | | |
| | Series B, 5.00% due 1/1/2021 | 6,485,000 | 6,765,087 |
| | Series C, 5.00% due 1/1/2021 | 12,000,000 | 12,518,280 |
| | Arizona — 2.1% | | |
| a | Arizona (Banner Health Obligated Group; LOC Bank of America, N.A.) HFA, Series C, 1.77% due 1/1/2046 (put 10/1/2019) | 17,985,000 | 17,985,000 |
| | Arizona (Scottsdale Lincoln Hospitals) HFA, 5.00% due 12/1/2022 - 12/1/2024 | 3,100,000 | 3,529,822 |
| | Arizona Board of Regents (Arizona State University) COP, | | |
| | Series A, 5.00% due 9/1/2020 - 9/1/2023 | 17,150,000 | 18,773,063 |
| | Series C, 5.00% due 6/1/2022 | 6,080,000 | 6,662,038 |
| | Arizona Board of Regents (Northern Arizona University Projects) COP, 5.00% due 9/1/2020 - 9/1/2023 | 6,825,000 | 7,429,035 |
| | Arizona Board of Regents (University of Arizona) COP, 5.00% due 6/1/2022 - 6/1/2028 | 1,690,000 | 1,991,396 |
| | Arizona Board of Regents (University of Arizona), 5.00% due 8/1/2020 - 8/1/2024 | 1,925,000 | 2,148,602 |
| | Arizona Transportation Board, Series A, 5.00% due 7/1/2021 - 7/1/2022 | 12,465,000 | 13,266,683 |
| | City of Phoenix Civic Improvement Corp., Series A, 5.00% due 7/1/2022 - 7/1/2025 | 8,580,000 | 10,025,709 |
| | City of Tucson (Street and Highway Projects), Series A, 5.00% due 7/1/2022 | 2,135,000 | 2,348,073 |
| b | Maricopa County (Banner Health Obligated Group) IDA, Series B, 1.96% (MUNIPSA + 0.38%) due 1/1/2035 (put 10/18/2022) | 8,000,000 | 8,014,640 |
| | Pima County (Ina & Roger Road Wastewater Reclamation Facilities), | | |
| | Series A, | | |
| | 3.00% due 7/1/2021 - 7/1/2022 | 2,525,000 | 2,622,705 |
| | 5.00% due 7/1/2020 - 7/1/2022 | 1,400,000 | 1,489,953 |
| | Pima County (Sewer System & Fleet Services Facilities Expansion) COP, Series A, 5.00% due 12/1/2019 - 12/1/2022 | 4,760,000 | 5,042,812 |
| | Pinal County (Detention and Training Facilities), Series A, 5.00% due 8/1/2021 - 8/1/2025 | 5,075,000 | 5,762,941 |
| | Pinal County (Hunt Highway (Phases III-V), Ironwood Drive, Public Safety Radio & Court Buildings), 5.00% due 8/1/2025 | 3,000,000 | 3,505,350 |
| | Salt River Project Agricultural Improvement and Power District (Salt River Electric System), 5.00% due 1/1/2026 - 1/1/2028 | 7,000,000 | 8,768,580 |
| | State of Arizona Department of Administration (State Lottery; Insured: AGM), Series A, 5.00% due 7/1/2020 | 8,705,000 | 8,941,602 |
| | Arkansas — 0.0% | | |
| | Board of Trustees of the University of Arkansas (Fayetteville Campus Athletic Facilities), 3.00% due 11/1/2023 | 615,000 | 654,046 |
| | City of Fort Smith (Water and Sewer System Construction; Insured: AGM), 4.00% due 10/1/2019 | 1,670,000 | 1,670,000 |
| | California — 5.2% | | |
| | Alameda County Joint Powers Authority (Alameda County Medical Center Highland Hospital), Series A, 5.00% due 12/1/2021 - 12/1/2023 | 6,200,000 | 7,030,208 |
| | Anaheim Public Financing Authority (Public Improvements; Insured: AGM), Series C, Zero Coupon due 9/1/2022 | 3,250,000 | 3,105,180 |
| | Brentwood Infrastructure Financing Authority (Redevelopment Agency of the City of Brentwood; Insured: AGM), 5.25% due 11/1/2019 | 725,000 | 727,393 |
| | Cabrillo (Educational Facilities; Insured: AMBAC) USD GO, Series A, Zero Coupon due 8/1/2021 | 1,000,000 | 973,700 |
| | California (Community Developmental Disabilities Program; Insured: California Mtg Insurance) HFFA, 5.75% due 2/1/2020 - 2/1/2021 | 3,670,000 | 3,800,946 |
| | California (Dignity Health) HFFA, | | |
| | Series A, | | |
| | 5.00% due 3/1/2020 - 3/1/2021 | 7,850,000 | 8,082,485 |
| | 5.25% due 3/1/2022 | 7,020,000 | 7,405,047 |
| c,d | California (Providence St. Joseph Health Obligated Group) HFFA, 5.00% due 10/1/2039 (put 10/1/2027) | 4,670,000 | 5,908,531 |
| c | California (St. Joseph Health System) HFFA, Series D, 5.00% due 7/1/2043 (put 10/15/2020) | 5,000,000 | 5,184,500 |
| | California Educational Facilities Authority (Chapman University), 5.00% due 4/1/2021 | 4,870,000 | 5,146,762 |
| b | California Infrastructure and Economic Development Bank (Los Angeles County Museum of Art), Series A, 2.088% (LIBOR 1 Month + 0.65%) due 12/1/2050 (put 2/1/2021) | 5,000,000 | 5,013,650 |
| | California State Public Works Board (California School for the Deaf Riverside Campus), Series H, 5.00% due 4/1/2020 - 4/1/2021 | 2,475,000 | 2,553,562 |
| | California State Public Works Board (California State University), Series A, 5.00% due 10/1/2020 | 1,000,000 | 1,036,850 |
| | California State Public Works Board (Coalinga State Hospital), Series H, 5.00% due 6/1/2020 - 6/1/2022 | 22,240,000 | 23,809,430 |
| | California State Public Works Board (Laboratory Facility and San Diego Courthouse), Series I, 5.00% due 11/1/2021 - 11/1/2022 | 10,825,000 | 12,010,346 |
| | California State Public Works Board (Various Capital Projects), | | |
| | Series A, 5.00% due 10/1/2021 | 1,000,000 | 1,073,540 |
Schedule of Investments, Continued
Thornburg Limited Term Municipal Fund | September 30, 2019
| | | PRINCIPAL
AMOUNT | VALUE |
| | Series G, 5.00% due 11/1/2020 - 11/1/2021 | $ 3,250,000 | $ 3,443,885 |
| | Castaic Lake Water Agency (Water System Improvement; Insured: AMBAC) COP, Zero Coupon due 8/1/2023 | 10,125,000 | 9,561,341 |
| | County of Los Angeles Redevelopment Refunding Authority (Bunker Hill Project), | | |
| | 5.00% due 12/1/2020 - 12/1/2024 | 26,635,000 | 30,015,893 |
| | Series C, 5.00% due 6/1/2020 - 6/1/2024 | 8,960,000 | 10,106,443 |
| | Escondido Union High School District (Insured: Natl-Re) GO, Zero Coupon due 11/1/2020 | 2,655,000 | 2,615,892 |
| e | Los Angeles (Educational Facilities and Information Technology Infrastructure) USD COP, Series B-2, 5.50% due 12/1/2019 | 7,040,000 | 7,088,224 |
| | Los Angeles (Educational Facilities and Information Technology Infrastructure) USD GO, | | |
| | Series A, 5.00% due 7/1/2023 | 8,950,000 | 10,171,317 |
| | Series B, 5.00% due 7/1/2023 | 11,950,000 | 13,580,697 |
| | Series D, 5.00% due 7/1/2022 - 7/1/2024 | 22,900,000 | 25,959,960 |
| | Needles (Insured: Natl-Re) USD GO, Series B, Zero Coupon due 8/1/2023 | 1,005,000 | 942,941 |
| | North City West School Facilities Financing Authority (Carmel Valley Educational Facilities; Insured: AGM), Series A, 5.00% due 9/1/2023 | 4,545,000 | 5,024,225 |
| c | Northern California Energy Authority (Commodity Supply Revenue), Series A, 4.00% due 7/1/2049 (put 7/1/2024) | 35,000,000 | 38,054,450 |
| | Palomar Community College District GO, Series B, Zero Coupon due 8/1/2021 | 2,560,000 | 2,498,560 |
| | Rocklin (Insured: Natl-Re) USD GO, Zero Coupon due 8/1/2022 | 3,910,000 | 3,750,159 |
| | Sacramento City (Educational Facilities Improvements) USD GO, 5.00% due 7/1/2021 | 3,265,000 | 3,445,554 |
| | Sacramento City Financing Authority (Merged Downtown & Oak Park; Insured: Natl-Re), Zero Coupon due 12/1/2019 - 12/1/2021 | 4,520,000 | 4,456,014 |
| | San Diego (Educational System Capital Projects; Insured: Natl-Re) USD GO, Series D-1, 5.50% due 7/1/2020 | 10,000,000 | 10,327,100 |
| | San Diego Convention Center Expansion Financing Authority, Series A, 5.00% due 4/15/2020 - 4/15/2022 | 15,000,000 | 16,038,650 |
| | Santa Fe Springs Community Development Commission (Consolidated Redevelopment Project; Insured: Natl-Re), Zero Coupon due 9/1/2024 | 7,000,000 | 6,399,960 |
| | State of California (Various Purposes) GO, 5.00% due 9/1/2020 - 9/1/2021 | 15,000,000 | 15,703,650 |
| | West Contra Costa (Educational Facilities; Insured: AGC) USD GO, Series C-1, Zero Coupon due 8/1/2022 | 4,000,000 | 3,831,080 |
| | West Covina Redevelopment Agency (Fashion Plaza), 6.00% due 9/1/2022 | 4,070,000 | 4,406,508 |
| | Colorado — 1.3% | | |
| | City & County of Denver (Buell Theatre Property) COP, 5.00% due 12/1/2020 - 12/1/2023 | 8,610,000 | 9,302,247 |
| | City & County of Denver (SPA JPMorgan Chase Bank, N.A.), | | |
| a | Series A1, 1.75% due 12/1/2029 (put 10/1/2019) | 5,520,000 | 5,520,000 |
| a | Series A3, 1.75% due 12/1/2031 (put 10/1/2019) | 6,620,000 | 6,620,000 |
| | City & County of Denver School District No. 1 (Eastbridge Elementary and Conservatory Green K-8 Schools) COP, | | |
| | Series C, | | |
| | 4.00% due 12/15/2019 - 12/15/2020 | 1,000,000 | 1,021,838 |
| | 5.00% due 12/15/2021 - 12/15/2023 | 3,210,000 | 3,582,030 |
| c | Colorado (Adventist Health System/Sunbelt Obligated Group) HFA, 5.00% due 11/15/2049 (put 11/19/2026) | 16,100,000 | 19,808,796 |
| | Colorado (Northern Colorado Medical Center) HFA, 5.00% due 5/15/2025 - 5/15/2026 | 1,305,000 | 1,563,304 |
| | Colorado Educational & Cultural Facilities Authority (National Conference of State Legislatures), 5.00% due 6/1/2020 - 6/1/2021 | 1,925,000 | 2,000,439 |
| | El Paso County (Judicial Complex; Insured: AGM) COP, 5.00% due 12/1/2022 - 12/1/2028 | 2,500,000 | 3,036,518 |
| | El Paso County (Pikes Peak Regional Development Center) COP, | | |
| | 4.00% due 12/1/2021 | 1,000,000 | 1,056,570 |
| | 5.00% due 12/1/2023 | 1,330,000 | 1,523,887 |
| | El Paso County Falcon School District No. 49 COP, 5.00% due 12/15/2020 - 12/15/2024 | 1,950,000 | 2,216,703 |
| | Interlocken Metropolitan District (Insured: AGM) GO, Series A-1, 5.00% due 12/1/2024 - 12/1/2026 | 2,375,000 | 2,826,811 |
| | Park Creek Metropolitan District (Insured: AGC) ETM, 5.50% due 12/1/2019 | 1,000,000 | 1,006,860 |
| | Regional Transportation District (FasTracks Transportation System) COP, Series A, 5.00% due 6/1/2020 | 3,655,000 | 3,744,548 |
| | Regional Transportation District (North Metro Rail Line) COP, Series A, 5.00% due 6/1/2023 - 6/1/2024 | 8,000,000 | 9,017,680 |
| | Regional Transportation District COP, | | |
| | Series A, | | |
| | 5.50% due 6/1/2021 | 205,000 | 210,724 |
| | 5.50% due 6/1/2021 (pre-refunded 6/1/2020) | 2,165,000 | 2,225,902 |
| | State of Colorado COP, Series A, 5.00% due 9/1/2024 - 9/1/2028 | 4,610,000 | 5,627,616 |
| | Connecticut — 1.1% | | |
| | City of Hartford (Various Public Improvements; Insured: AGM) GO, | | |
| | Series A, 5.00% due 7/1/2024 - 7/1/2025 | 1,820,000 | 2,140,066 |
| | Series B, 5.00% due 10/1/2022 | 1,765,000 | 1,950,290 |
| | State of Connecticut (Educational Facilities) GO, | | |
| | Series B, 5.00% due 6/15/2024 - 6/15/2025 | 30,400,000 | 35,450,198 |
| | Series E, 5.00% due 9/1/2023 | 5,550,000 | 6,291,979 |
| | State of Connecticut (Various Capital Projects) GO, | | |
| | Series B, 5.00% due 5/15/2027 | 5,000,000 | 6,020,150 |
| | Series E, 5.00% due 8/15/2024 | 1,845,000 | 2,088,208 |
| | State of Connecticut GO, | | |
| | Series C, 5.00% due 6/15/2028 | 1,855,000 | 2,327,116 |
| | Series E, 5.00% due 9/15/2028 | 2,560,000 | 3,227,008 |
Schedule of Investments, Continued
Thornburg Limited Term Municipal Fund | September 30, 2019
| | | PRINCIPAL
AMOUNT | VALUE |
| | State of Connecticut Special Tax Revenue, Series B, 5.00% due 10/1/2021 | $ 2,200,000 | $ 2,352,306 |
| | State of Connecticut, Series C, 5.00% due 6/15/2023 - 6/15/2027 | 4,825,000 | 5,817,877 |
| | Delaware — 0.0% | | |
| | Delaware Transportation Authority (Transportation System), 5.00% due 7/1/2020 - 7/1/2022 | 1,940,000 | 2,100,522 |
| | District of Columbia — 0.2% | | |
| | District of Columbia (Insured: Syncora) GO, Series B, 5.25% due 6/1/2020 | 3,005,000 | 3,084,182 |
| | District of Columbia (National Public Radio), Series A, 5.00% due 4/1/2020 | 1,890,000 | 1,923,888 |
| | District of Columbia, Series A, 5.00% due 12/1/2027 | 925,000 | 947,598 |
| | Washington Metropolitan Area Transit Authority, 5.00% due 7/1/2020 - 7/1/2028 | 6,705,000 | 7,816,952 |
| | Florida — 6.5% | | |
| | Alachua County School Board (Educational Facilities) COP, 5.00% due 7/1/2022 - 7/1/2023 | 3,850,000 | 4,292,278 |
| | Broward County (Airport, Marina & Port Improvements), | | |
| | Series Q-1, | | |
| | 4.00% due 10/1/2020 | 1,660,000 | 1,703,924 |
| | 5.00% due 10/1/2019 - 10/1/2020 | 3,000,000 | 3,072,680 |
| | Broward County School Board (Educational Facilities) COP, | | |
| | Series A, 5.00% due 7/1/2021 - 7/1/2025 | 22,580,000 | 25,717,997 |
| | Series B, 5.00% due 7/1/2023 - 7/1/2025 | 9,000,000 | 10,580,930 |
| | Series C, 5.00% due 7/1/2025 - 7/1/2026 | 12,830,000 | 15,578,341 |
| | Broward County School Board COP, | | |
| | Series A 5.00% due 7/1/2028 | 8,590,000 | 10,920,725 |
| | Series B 5.00% due 7/1/2029 | 8,920,000 | 11,543,015 |
| | Central Florida Expressway Authority, 5.00% due 7/1/2022 - 7/1/2026 | 4,100,000 | 4,717,521 |
| | City of Cape Coral (Water and Sewer System Improvements), 5.00% due 10/1/2022 - 10/1/2026 | 5,435,000 | 6,581,730 |
| | City of Jacksonville, Series C, 5.00% due 10/1/2023 | 1,105,000 | 1,261,766 |
| | City of Lakeland (Energy System; Insured: AGM), 5.00% due 10/1/2019 - 10/1/2020 | 6,695,000 | 6,757,274 |
| | City of Lakeland (Lakeland Regional Health Systems), 5.00% due 11/15/2019 - 11/15/2026 | 7,580,000 | 8,015,400 |
| | City of Miami (Stormwater Management Utility System), 5.00% due 9/1/2026 - 9/1/2028 | 2,675,000 | 3,335,267 |
| | City of North Miami Beach (North Miami Beach Water Project), 5.00% due 8/1/2020 - 8/1/2021 | 1,780,000 | 1,870,816 |
| | City of Orlando (Senior Tourist Development; Insured: AGM), 5.00% due 11/1/2023 - 11/1/2027 | 3,545,000 | 4,222,537 |
| | Florida Higher Educational Facilities Financing Authority (Nova Southeastern University), 5.00% due 4/1/2020 | 1,190,000 | 1,210,670 |
| | Florida Higher Educational Facilities Financing Authority (University of Tampa), Series A, 5.00% due 4/1/2022 | 620,000 | 671,255 |
| | Florida State Board of Governors (University System Capital Improvements), Series A, 4.00% due 7/1/2020 - 7/1/2022 | 12,655,000 | 13,248,769 |
| | Fort Myers Utility System Revenue, | | |
| | 5.00% due 10/1/2023 | 990,000 | 1,060,003 |
| | 5.00% due 10/1/2023 (pre-refunded 10/1/2021) | 2,370,000 | 2,540,877 |
| | Highlands County HFA, ETM, 5.00% due 11/15/2019 | 3,000,000 | 3,013,229 |
| | Hillsborough County (Court Facilities), Series B, 5.00% due 11/1/2019 - 11/1/2021 | 13,945,000 | 14,510,384 |
| | Hillsborough County (Jail and Storm Water Projects), Series A, 5.00% due 11/1/2021 - 11/1/2022 | 5,305,000 | 5,810,804 |
| | Hillsborough County School Board (Master Lease Program) COP, 5.00% due 7/1/2027 - 7/1/2028 | 10,035,000 | 12,632,437 |
| | Jacksonville Electric Authority (Electric System) ETM, Series A, 5.00% due 10/1/2023 | 1,395,000 | 1,595,420 |
| | Jacksonville Electric Authority (Electric System), Series A, 5.00% due 10/1/2024 (pre-refunded 10/1/2023) | 1,200,000 | 1,372,404 |
| | Lee County School Board (School Facilities Improvements) COP, 5.00% due 8/1/2023 - 8/1/2024 | 3,000,000 | 3,464,680 |
| | Manatee County (County Capital Projects), 5.00% due 10/1/2021 | 2,775,000 | 2,975,633 |
| a | Manatee County (Florida Power & Light Co.), 1.78% due 9/1/2024 (put 10/1/2019) | 8,200,000 | 8,200,000 |
| | Manatee County (Public Utilities Improvements), 5.00% due 10/1/2024 - 10/1/2025 | 970,000 | 1,147,560 |
| | Manatee County School District (School Facilities Improvements; Insured: AGM), 5.00% due 10/1/2025 - 10/1/2027 | 2,900,000 | 3,567,338 |
| | Marion County School Board (Insured: BAM) COP, Series B, 5.00% due 6/1/2020 - 6/1/2024 | 8,330,000 | 9,007,265 |
| | Miami Beach GO, | | |
| | 4.00% due 9/1/2021 | 1,015,000 | 1,068,013 |
| | 5.00% due 9/1/2020 - 9/1/2022 | 4,720,000 | 4,916,441 |
| a | Miami-Dade County (Florida Power & Light Co.) IDA, 1.78% due 6/1/2021 (put 10/1/2019) | 23,700,000 | 23,700,000 |
| | Miami-Dade County (Miami International Airport), Series B, 5.00% due 10/1/2025 | 2,500,000 | 2,936,500 |
| | Miami-Dade County (Professional Sports Franchise Facilities; Insured: AGC), Series C, Zero Coupon due 10/1/2019 | 2,170,000 | 2,170,000 |
| | Miami-Dade County (Transit System), 5.00% due 7/1/2023 - 7/1/2025 | 10,215,000 | 12,011,488 |
| | Miami-Dade County Expressway Authority (Toll System), Series B, 5.00% due 7/1/2024 - 7/1/2025 | 4,000,000 | 4,609,260 |
| | Miami-Dade County School Board (Educational Facilities Improvements) COP, | | |
| | Series A, | | |
| | 5.00% due 5/1/2022 - 5/1/2024 | 15,535,000 | 17,636,647 |
| c | 5.00% due 5/1/2031 (put 5/1/2024) | 2,550,000 | 2,920,643 |
| | Series C, 5.00% due 5/1/2025 | 15,000,000 | 17,862,450 |
| | Orange County (Orlando Health, Inc.) HFA, ETM, 5.25% due 10/1/2019 | 6,050,000 | 6,050,000 |
| | Orange County (Orlando Health, Inc.; Insured: Natl-Re) HFA ETM, 6.25% due 10/1/2021 | 820,000 | 859,557 |
Schedule of Investments, Continued
Thornburg Limited Term Municipal Fund | September 30, 2019
| | | PRINCIPAL
AMOUNT | VALUE |
| | Orange County School Board (Educational Facilities) COP, Series D, 5.00% due 8/1/2020 - 8/1/2025 | $ 9,795,000 | $ 10,861,198 |
| d | Palm Beach County (Baptist Health South Florida Obligated Group) HFA, 5.00% due 8/15/2024 - 8/15/2027 | 1,145,000 | 1,376,314 |
| | Palm Beach County (Boca Raton Regional Hospital) HFA, ETM, 5.00% due 12/1/2020 | 600,000 | 624,978 |
| | Palm Beach County School Board (Educational Facilities) COP, | | |
| | Series B, 5.00% due 8/1/2022 - 8/1/2024 | 10,095,000 | 11,599,368 |
| | Series C, | | |
| | 4.00% due 8/1/2021 | 3,835,000 | 4,021,649 |
| | 5.00% due 8/1/2020 - 8/1/2022 | 2,750,000 | 2,953,122 |
| | Palm Beach County School District COP, Series C, 5.00% due 8/1/2021 - 8/1/2026 | 10,130,000 | 11,673,878 |
| | Polk County (Water and Wastewater Utility Systems), 5.00% due 10/1/2023 | 1,420,000 | 1,573,928 |
| | Polk County (Water and Wastewater Utility Systems; Insured: AGM), | | |
| | 3.00% due 10/1/2021 | 3,125,000 | 3,227,531 |
| | 4.00% due 10/1/2020 | 3,100,000 | 3,184,227 |
| | Reedy Creek Improvement District (Buena Vista Drive Corridor Improvements) GO, Series A, 5.00% due 6/1/2023 | 1,940,000 | 2,197,554 |
| | Reedy Creek Improvement District (Walt Disney World Resort Complex Utility Systems) GO, Series A, 5.00% due 6/1/2021 - 6/1/2025 | 4,210,000 | 4,887,295 |
| | Reedy Creek Improvement District (Walt Disney World Resort Complex Utility Systems), Series 1, 5.00% due 10/1/2021 - 10/1/2023 | 2,575,000 | 2,831,839 |
| | South Florida Water Management District (Everglades Restoration Plan) COP, 5.00% due 10/1/2019 - 10/1/2022 | 7,030,000 | 7,440,347 |
| | South Lake County Hospital District, 5.00% due 10/1/2025 (pre-refunded 4/1/2020) | 4,140,000 | 4,215,058 |
| | Sunshine State Governmental Financing Commission (Miami-Dade County Program), Series B-1, 5.00% due 9/1/2021 - 9/1/2024 | 7,275,000 | 8,092,181 |
| | Sunshine State Governmental Financing Commission (Miami-Dade County Program; Insured: AGM), Series A, 5.00% due 9/1/2021 | 5,000,000 | 5,352,450 |
| | Tampa Bay Regional Water Supply Authority, 5.00% due 10/1/2019 | 3,000,000 | 3,000,000 |
| | Volusia County Educational Facilities Authority (Embry-Riddle Aeronautical University, Inc.), Series B, 5.00% due 10/15/2023 - 10/15/2025 | 1,750,000 | 2,024,055 |
| | Volusia County Educational Facilities Authority (Embry-Riddle Aeronautical University, Inc.; Insured: AGM) ETM, 5.00% due 10/15/2019 | 2,350,000 | 2,353,126 |
| | Volusia County School Board (University High School, River Springs Middle School) COP, 5.00% due 8/1/2024 | 1,000,000 | 1,162,420 |
| | Georgia — 1.6% | | |
| | Athens-Clarke County Unified Government Development Authority (UGAREF Bolton Commons, LLC), 4.00% due 6/15/2020 | 395,000 | 402,572 |
| | Athens-Clarke County Unified Government Development Authority (UGAREF Central Precinct, LLC), 5.00% due 6/15/2022 - 6/15/2023 | 1,270,000 | 1,408,445 |
| | City of Atlanta (Airport Passenger Facility), | | |
| | 5.00% due 1/1/2024 - 1/1/2025 | 3,850,000 | 4,424,928 |
| | Series B, 5.00% due 1/1/2023 - 1/1/2025 | 2,645,000 | 3,006,588 |
| | City of Atlanta (Atlantic Station Project), 5.00% due 12/1/2020 - 12/1/2024 | 4,290,000 | 4,767,034 |
| | City of Atlanta (BeltLine Project), Series A, 5.00% due 1/1/2020 - 1/1/2021 | 585,000 | 590,037 |
| | City of Atlanta (Hartsfield-Jackson Atlanta International Airport), | | |
| | Series B, 5.00% due 1/1/2020 - 1/1/2021 | 13,000,000 | 13,119,690 |
| | Series C, | | |
| | 5.25% due 1/1/2020 | 5,000,000 | 5,048,950 |
| | 5.50% due 1/1/2021 | 3,525,000 | 3,710,203 |
| | City of Atlanta (Water & Wastewater System), | | |
| | 5.00% due 11/1/2021 - 11/1/2025 | 6,630,000 | 7,472,332 |
| | Series A, 6.00% due 11/1/2019 | 5,650,000 | 5,671,470 |
| | Fulton County Development Authority (Georgia Tech Athletic Association) ETM, 5.00% due 10/1/2022 | 4,550,000 | 5,033,301 |
| | Fulton County Facilities Corp. (Public Purpose Project) COP, 5.00% due 11/1/2019 | 6,600,000 | 6,619,470 |
| | Main Street Natural Gas, Inc., Series A, 5.00% due 5/15/2023 - 5/15/2029 | 14,265,000 | 16,969,208 |
| c | Monroe County Development Authority (Gulf Power Co.), 2.00% due 9/1/2037 (put 6/25/2020) | 1,300,000 | 1,303,562 |
| b | Private Colleges & Universities Authority (Emory University), Series B, 2.00% (MUNIPSA + 0.42%) due 10/1/2039 (put 8/16/2022) | 16,400,000 | 16,432,308 |
| d | Savannah Economic Development Authority (International Paper Co.), 1.90% due 8/1/2024 | 4,000,000 | 4,010,760 |
| | Guam — 0.5% | | |
| | Government of Guam (Layon Solid Waste Disposal Facility ETM, Series A, 5.50% due 12/1/2019 | 2,000,000 | 2,014,000 |
| | Government of Guam (Various Capital Projects), Series D, 5.00% due 11/15/2019 - 11/15/2024 | 12,170,000 | 13,205,667 |
| | Guam Government Waterworks Authority (Water & Wastewater System Improvements), 5.25% due 7/1/2020 - 7/1/2023 | 1,995,000 | 2,169,820 |
| | Guam Government, Series A, 5.00% due 1/1/2025 | 305,000 | 323,712 |
| | Guam Power Authority (Electric Power System), Series A, 5.00% due 10/1/2023 - 10/1/2026 | 4,330,000 | 4,916,632 |
| | Guam Power Authority (Electric Power System; Insured: AGM), Series A, 5.00% due 10/1/2019 - 10/1/2022 | 8,840,000 | 9,518,945 |
| | Hawaii — 1.2% | | |
| | City and County of Honolulu (Capital Improvements) GO ETM, Series A, 5.00% due 11/1/2022 | 1,750,000 | 1,947,697 |
| | City and County of Honolulu (Capital Improvements) GO, | | |
| | Series A, 5.00% due 11/1/2020 | 8,265,000 | 8,596,509 |
| | Series B, 5.00% due 11/1/2019 - 11/1/2022 | 13,085,000 | 14,070,099 |
| b | City and County of Honolulu (Rail Transit Project) GO, 1.90% (MUNIPSA + 0.32%) due 9/1/2025 - 9/1/2028 (put 9/1/2020) | 17,075,000 | 17,076,366 |
| | County of Hawaii (Capital Improvements) GO, | | |
| | Series A, 5.00% due 9/1/2023 | 800,000 | 913,184 |
| | Series B, 5.00% due 9/1/2023 | 1,500,000 | 1,712,220 |
| | Series C, 5.00% due 9/1/2021 - 9/1/2026 | 5,250,000 | 5,966,693 |
Schedule of Investments, Continued
Thornburg Limited Term Municipal Fund | September 30, 2019
| | | PRINCIPAL
AMOUNT | VALUE |
| | Series D, 5.00% due 9/1/2023 - 9/1/2026 | $ 3,085,000 | $ 3,691,998 |
| | Series E, 5.00% due 9/1/2021 - 9/1/2026 | 4,665,000 | 5,178,953 |
| | State of Hawaii (Hawaiian Home Lands Settlement) GO ETM, | | |
| | Series DZ, 5.00% due 12/1/2019 | 1,545,000 | 1,554,224 |
| | Series DZ-2017, 5.00% due 12/1/2019 | 60,000 | 60,368 |
| | State of Hawaii (Hawaiian Home Lands Settlement) GO, | | |
| | Series DZ, 5.00% due 12/1/2022 (pre-refunded 12/1/2021) | 4,000,000 | 4,313,256 |
| | Series DZ-2017, 5.00% due 12/1/2019 | 1,395,000 | 1,403,509 |
| | Series EA, 5.00% due 12/1/2020 - 12/1/2021 | 5,500,000 | 5,847,470 |
| | State of Hawaii Airports System Revenue, Series A, 5.25% due 7/1/2027 | 2,400,000 | 2,468,400 |
| | Idaho — 0.3% | | |
| | Idaho (Trinity Health Credit Group) HFA, Series D, 5.00% due 12/1/2022 - 12/1/2024 | 4,200,000 | 4,806,124 |
| c | Regents of the University of Idaho, 5.25% due 4/1/2041 (put 4/1/2021) | 12,295,000 | 12,927,209 |
| | Illinois — 6.8% | | |
| | Board of Education of the City of Chicago (Educational Facilities; Insured: BHAC) GO, Series B-1, Zero Coupon due 12/1/2020 | 12,000,000 | 11,737,920 |
| | Board of Trustees of Southern Illinois University (Housing & Auxiliary Facilities; Insured: Natl-Re), Series A, 5.25% due 4/1/2020 | 1,000,000 | 1,014,950 |
| | Chicago Midway International Airport, Series B, 5.00% due 1/1/2022 - 1/1/2024 | 3,700,000 | 4,119,914 |
| | Chicago O’Hare International Airport (2015 Airport Projects), Series B, 5.00% due 1/1/2020 - 1/1/2021 | 5,350,000 | 5,505,825 |
| | Chicago O’Hare International Airport (2016 Airport Projects), Series C, 5.00% due 1/1/2027 | 1,750,000 | 2,103,815 |
| | Chicago O’Hare International Airport (Capital Development Programs), Series B, 5.00% due 1/1/2022 (pre-refunded 1/1/2021) | 5,835,000 | 6,106,327 |
| | Chicago Park District (Capital Improvement Plan) GO, | | |
| | 4.00% due 1/1/2020 | 815,000 | 819,809 |
| | Series A, 5.00% due 1/1/2024 - 1/1/2025 | 1,915,000 | 2,170,593 |
| | Series B, | | |
| | 4.00% due 1/1/2020 | 2,730,000 | 2,746,107 |
| | 5.00% due 1/1/2021 - 1/1/2024 | 7,270,000 | 7,811,940 |
| | Series C, 5.00% due 1/1/2022 - 1/1/2023 | 5,155,000 | 5,602,448 |
| | Series D, 5.00% due 1/1/2020 - 1/1/2024 | 3,965,000 | 4,356,949 |
| | Chicago Park District GO, Series D, 5.00% due 1/1/2021 - 1/1/2024 | 2,850,000 | 3,055,936 |
| | Chicago Park District, Series B 5.00% due 1/1/2020 | 3,185,000 | 3,211,595 |
| | Chicago School Reform Board of Trustees of the Board of Education (School District Capital Improvement Program; Insured: Natl-Re) GO, Series A, 5.25% due 12/1/2021 | 1,500,000 | 1,590,285 |
| | City of Chicago (Chicago Midway Airport), Series B, 5.00% due 1/1/2023 - 1/1/2024 | 22,275,000 | 24,776,597 |
| | City of Chicago (Project Fund), Series A, 5.00% due 1/1/2024 - 1/1/2027 (pre-refunded 1/1/2020) | 17,850,000 | 18,010,650 |
| | City of Chicago (Riverwalk Expansion Project; Insured: AGM), | | |
| e | 5.00% due 1/1/2021 | 1,410,000 | 1,452,258 |
| | 5.00% due 1/1/2023 | 1,000,000 | 1,068,430 |
| | City of Chicago (Wastewater Transmission System), Series C-REMK-10/, 5.00% due 1/1/2020 - 1/1/2025 | 17,750,000 | 19,775,482 |
| | City of Chicago (Wastewater Transmission System; Insured: BHAC), Series A, 5.50% due 1/1/2020 | 1,400,000 | 1,404,970 |
| | City of Chicago (Water System), | | |
| | Series 2017-2, 5.00% due 11/1/2020 - 11/1/2024 | 4,150,000 | 4,512,309 |
| | Series A, 5.00% due 11/1/2019 - 11/1/2027 | 7,250,000 | 8,441,585 |
| | City of Chicago (Water System; Insured: AGM), Series 2017-2, 5.00% due 11/1/2028 | 2,000,000 | 2,441,120 |
| | City of Mount Vernon (Various Municipal Capital Improvements; Insured: AGM) GO, 4.00% due 12/15/2019 - 12/15/2021 | 3,425,000 | 3,501,526 |
| | City of Waukegan (Lakehurst Redevelopment Project; Insured: AGM) GO, Series A, 5.00% due 12/30/2019 - 12/30/2022 | 6,035,000 | 6,363,366 |
| | Community College District No. 503 (Black Hawk College; Insured: AGM) GO, 5.00% due 12/1/2021 - 12/1/2024 | 10,935,000 | 12,323,374 |
| | Community College District No. 516 (Waubonsee Community College) GO, | | |
| | Series A, | | |
| | 4.50% due 12/15/2020 | 1,325,000 | 1,374,277 |
| | 5.00% due 12/15/2021 | 6,175,000 | 6,658,441 |
| | Community High School District No. 127 (Lake County-Grayslake Educational Facilities.; Insured: Syncora) GO, 7.375% due 2/1/2020 | 1,000,000 | 1,019,700 |
| | Community Unit School District No. 302 (Kane & DeKalb County Educational Facilities; Insured: Natl-Re) GO, Zero Coupon due 2/1/2021 | 3,165,000 | 3,090,749 |
| | Community Unit School District No. 428 (DeKalb County Educational Facilities) GO, Zero Coupon due 1/1/2021 | 6,140,000 | 5,916,443 |
| | Community Unit School District No. 5 (Insured: BAM) GO, 5.00% due 4/15/2024 - 4/15/2026 | 1,650,000 | 1,943,828 |
| | Cook County Community College District No. 508 (City Colleges of Chicago) GO, | | |
| | 5.00% due 12/1/2020 - 12/1/2024 | 8,020,000 | 8,622,088 |
| | 5.25% due 12/1/2025 - 12/1/2026 | 3,365,000 | 3,691,311 |
| | Cook County School District No.170 (Insured: AGM) GO, Series D, 5.00% due 12/1/2024 | 1,190,000 | 1,351,471 |
| | County of Cook (Capital Improvement Plan) GO, | | |
| | Series A, 5.00% due 11/15/2021 | 5,000,000 | 5,350,250 |
| | Series C, | | |
| | 4.00% due 11/15/2020 - 11/15/2022 | 3,925,000 | 4,117,686 |
| | 5.00% due 11/15/2020 - 11/15/2022 | 9,195,000 | 9,582,897 |
Schedule of Investments, Continued
Thornburg Limited Term Municipal Fund | September 30, 2019
| | | PRINCIPAL
AMOUNT | VALUE |
| | Series D, 5.00% due 11/15/2019 | $ 3,690,000 | $ 3,705,313 |
| | County of Cook Sales Tax Revenue, 5.00% due 11/15/2028 | 2,250,000 | 2,768,850 |
| | Du Page County High School District No. 88 (Addison Trail and Willowbrook High Schools GO, 3.00% due 1/15/2020 | 2,630,000 | 2,642,151 |
| | Forest Preserve District of Cook County GO, Series A, 5.00% due 11/15/2021 | 1,500,000 | 1,590,390 |
| | Forest Preserve District of DuPage County GO, 5.00% due 11/1/2020 - 11/1/2024 | 9,455,000 | 10,782,311 |
| a | Illinois Development Finance Authority (NorthShore University HealthSystem; SPA JP Morgan Chase Bank N.A.), Series C, 1.75% due 5/1/2031 (put 10/1/2019) | 7,085,000 | 7,085,000 |
| | Illinois Finance Authority (Advocate Health Care), | | |
| | 5.00% due 8/1/2023 - 8/1/2024 | 1,365,000 | 1,571,048 |
| c | Series A-1, 5.00% due 11/1/2030 (put 1/15/2020) | 1,575,000 | 1,591,096 |
| | Illinois Finance Authority (Northwestern Memorial Healthcare Obligated Group; SPA JP Morgan Chase Bank N.A.), | | |
| a | Series A-1, 1.77% due 8/15/2042 (put 10/1/2019) | 34,880,000 | 34,880,000 |
| a | Series A-3, 1.77% due 8/15/2042 (put 10/1/2019) | 12,245,000 | 12,245,000 |
| | Illinois Finance Authority (Rush University Medical Center), Series A, 5.00% due 11/15/2020 - 11/15/2025 | 3,020,000 | 3,479,001 |
| | Illinois Finance Authority (Trinity Health), Series L, 4.00% due 12/1/2021 | 1,000,000 | 1,055,250 |
| | Illinois State Toll Highway Authority, | | |
| | Series A-1, 5.00% due 1/1/2025 | 6,500,000 | 6,557,525 |
| | Series D, 5.00% due 1/1/2023 - 1/1/2024 | 10,500,000 | 11,878,120 |
| | Kane McHenry Cook & DeKalb Counties Unit School District No. 300 (Insured: AMBAC) GO ETM, Zero Coupon due 12/1/2021 | 765,000 | 741,453 |
| | Kane McHenry Cook & DeKalb Counties Unit School District No. 300 (Insured: AMBAC) GO, Zero Coupon due 12/1/2021 | 1,235,000 | 1,185,020 |
| | Kane McHenry Cook & DeKalb Counties Unit School District No. 300 GO, 5.00% due 1/1/2024 | 7,150,000 | 8,123,544 |
| | Knox & Warren Counties Community Unit School District No 205 Galesburg GO, | | |
| | Series B | | |
| d | 4.00% due 12/1/2020 - 12/1/2024 | 4,850,000 | 5,236,615 |
| d | 5.00% due 12/1/2025 - 12/1/2029 | 7,400,000 | 9,005,513 |
| | McHenry County Conservation District GO, 5.00% due 2/1/2021 - 2/1/2025 | 4,325,000 | 4,791,287 |
| | Metropolitan Pier & Exposition Authority (McCormick Place Expansion) (State Aid Withholding), Series B, 5.00% due 12/15/2020 | 4,000,000 | 4,145,680 |
| | Metropolitan Water Reclamation District of Greater Chicago (Green Bond), GO, Series E, 5.00% due 12/1/2025 | 1,000,000 | 1,200,220 |
| | Peoria Metropolitan Airport Authority GO, Series D, 5.00% due 12/1/2027 | 1,000,000 | 1,210,600 |
| | State of Illinois (State Facilities Improvements) GO, 5.00% due 7/1/2021 | 1,735,000 | 1,819,286 |
| | State of Illinois GO, Series A, 5.00% due 12/1/2021 | 4,500,000 | 4,767,840 |
| | State of Illinois, Series B, 5.00% due 6/15/2026 - 6/15/2029 | 20,000,000 | 23,325,900 |
| | Town of Cicero Cook County (Cicero and Laramie Development Areas; Insured: AGM) GO, Series A, 5.00% due 1/1/2020 - 1/1/2021 | 2,700,000 | 2,759,731 |
| | University of Illinois Board of Trustees (Insured: AGM) COP, Series B, 5.00% due 10/1/2019 | 955,000 | 955,000 |
| | Village of Tinley Park GO, 4.00% due 12/1/2022 | 625,000 | 671,431 |
| | Will & Kendall Counties Plainfield Community Consolidated School District 202 (Capital Improvements; Insured: BAM) GO, Series A, 5.00% due 1/1/2023 - 1/1/2025 | 21,125,000 | 24,035,475 |
| | Indiana — 1.9% | | |
| | Avon Community School Building Corp (Educational Facilities; Insured: State Intercept), 5.00% due 7/15/2021 - 7/15/2027 | 6,730,000 | 7,696,627 |
| | Board of Trustees for the Vincennes University, Series J, 5.00% due 6/1/2020 | 1,000,000 | 1,024,500 |
| | City of Carmel Redevelopment Authority (Road and Intersection Improvements), 5.00% due 8/1/2021 - 8/1/2022 | 4,915,000 | 5,278,306 |
| | City of Carmel Redevelopment District (CFP Energy Center, LLC Installment Purchase Agreement) COP, Series C, 5.75% due 7/15/2022 (pre-refunded 1/15/2021) | 1,610,000 | 1,676,525 |
| | Duneland School Building Corp. (State Aid Withholding), Zero Coupon due 2/1/2020 - 8/1/2021 | 12,480,000 | 12,257,231 |
| | Hamilton Southeastern Consolidated School Building Corp. (Educational Facilities; Insured: State Intercept), Series D, 5.00% due 7/15/2021 - 1/15/2024 | 3,210,000 | 3,530,079 |
| | Indiana Bond Bank (Columbus Learning Center), 5.00% due 8/1/2021 | 1,300,000 | 1,375,465 |
| | Indiana Finance Authority (Community Health Network), Series A, 5.00% due 5/1/2020 - 5/1/2022 | 4,340,000 | 4,593,563 |
| | Indiana Finance Authority (CWA Authority, Inc. Wastewater System Project), Series A, 5.00% due 10/1/2021 - 10/1/2024 | 2,000,000 | 2,261,435 |
| a | Indiana Finance Authority (Franciscan Alliance, Inc. Obligated Group; LOC Barclays Bank Plc), 1.77% due 11/1/2037 (put 10/1/2019) | 11,935,000 | 11,935,000 |
| | Indiana Finance Authority (Indiana University Health System), | | |
| | Series N, | | |
| | 5.00% due 3/1/2020 - 3/1/2021 | 14,880,000 | 15,455,022 |
| | 5.00% due 3/1/2022 (pre-refunded 3/1/2021) | 3,240,000 | 3,405,953 |
| | Indiana Finance Authority (Indiana University Health, Inc. Obligated Group), | | |
| b | Series L, 2.13% (MUNIPSA + 0.55%) due 12/1/2046 (put 7/2/2021) | 5,200,000 | 5,201,404 |
| b | Series M, 1.86% (MUNIPSA + 0.28%) due 12/1/2046 (put 7/2/2021) | 6,000,000 | 6,001,560 |
| | Indiana Finance Authority (Marian University Health Sciences) ETM, 5.00% due 9/15/2020 - 9/15/2021 | 4,565,000 | 4,802,884 |
| a | Indiana Finance Authority (Marion County Capital Improvement Board; SPA U.S. Bank, N.A.), Series A-3-RMKT, 1.77% due 2/1/2037 (put 10/1/2019) | 8,400,000 | 8,400,000 |
| | Indiana Finance Authority (Parkview Health System), 5.00% due 5/1/2022 | 1,135,000 | 1,237,641 |
| | Indiana Municipal Power Agency (Power Supply System), Series A, 5.00% due 1/1/2026 - 1/1/2028 | 4,235,000 | 5,240,649 |
| | Knox Middle School Building Corp. (Insured: Natl-Re) (State Aid Withholding), Zero Coupon due 1/15/2020 | 1,295,000 | 1,287,191 |
Schedule of Investments, Continued
Thornburg Limited Term Municipal Fund | September 30, 2019
| | | PRINCIPAL
AMOUNT | VALUE |
| | Lake Central Multi-District School Building Corp. (Educational Facilities) (State Aid Withholding), | | |
| | Series B, | | |
| | 4.00% due 1/15/2020 - 1/15/2022 | $ 4,050,000 | $ 4,184,732 |
| | 5.00% due 7/15/2020 - 7/15/2022 | 3,420,000 | 3,627,199 |
| | Perry Township Multischool Building Corp. (Educational Facilities) (State Aid Withholding), 5.00% due 7/10/2020 - 7/10/2021 | 3,090,000 | 3,208,605 |
| | Iowa — 0.3% | | |
| | Des Moines Independent Community School District (School Infrastructure; Insured: AGM), 4.00% due 6/1/2020 - 6/1/2022 | 10,255,000 | 10,441,567 |
| | Iowa Finance Authority (Genesis Health System), 5.00% due 7/1/2022 - 7/1/2024 | 6,085,000 | 6,771,417 |
| | Kansas — 1.0% | | |
| | Kansas (National Bio and Agro-Defense Facility) DFA, Series G, 5.00% due 4/1/2020 - 4/1/2025 | 39,450,000 | 43,074,919 |
| | Kansas (New Jobs Training; Insured: BAM) DFA, Series K, 5.00% due 12/1/2020 | 1,500,000 | 1,508,925 |
| | Seward County No. 480 USD GO, Series B, 5.00% due 9/1/2024 - 9/1/2027 | 6,120,000 | 7,293,912 |
| | Unified Government of Wyandotte County/Kansas City (Utility Systems Improvement), Series A, 5.00% due 9/1/2022 - 9/1/2024 | 3,600,000 | 4,032,928 |
| | Wyandotte County No. 500 (General Improvement) USD GO, Series A, 5.00% due 9/1/2025 - 9/1/2026 | 5,675,000 | 6,924,880 |
| | Kentucky — 2.1% | | |
| | Kentucky Economic (Norton Healthcare, Inc.; Insured: Natl-Re) DFA, Series B, Zero Coupon due 10/1/2019 - 10/1/2023 | 21,680,000 | 20,993,129 |
| c | Kentucky Public Energy Authority (Gas Supply System), Series C-1, 4.00% due 12/1/2049 (put 6/1/2025) | 77,500,000 | 85,719,650 |
| | Lexington-Fayette Urban County Government Public Facilities Corp. (Eastern State Hospital), Series A, 5.00% due 6/1/2022 | 6,165,000 | 6,513,446 |
| c | Louisville/Jefferson County Metropolitan Government (Louisville Gas & Electric Co.), 1.85% due 10/1/2033 (put 4/1/2021) | 6,500,000 | 6,539,325 |
| | Louisville/Jefferson County Metropolitan Government (Norton Healthcare, Inc.), 5.00% due 10/1/2026 | 3,000,000 | 3,666,990 |
| | Turnpike Authority of Kentucky (Revitalization Projects), Series B, 5.00% due 7/1/2025 - 7/1/2026 | 5,615,000 | 6,712,259 |
| | Louisiana — 2.6% | | |
| | City of Bossier (Public Improvements; Insured: AGM), Series ST-2010, 4.50% due 12/1/2021 | 2,240,000 | 2,384,077 |
| | City of Lafayette (Utilities System Improvements), 5.00% due 11/1/2019 | 1,000,000 | 1,002,910 |
| | City of New Orleans (Public Improvements) GO, | | |
| | 4.00% due 12/1/2019 | 750,000 | 753,165 |
| | 5.00% due 12/1/2020 - 12/1/2021 | 2,515,000 | 2,658,565 |
| | City of New Orleans (Public Improvements; Insured: AGM) GO, 5.00% due 12/1/2019 - 12/1/2021 | 12,030,000 | 12,605,907 |
| | City of Shreveport (Water and Sewer System; Insured: BAM), | | |
| | Series A, | | |
| | 5.00% due 12/1/2020 - 12/1/2024 | 26,905,000 | 29,276,890 |
| e | 5.00% due 12/1/2023 | 4,245,000 | 4,821,386 |
| | East Baton Rouge Sewerage Commission (Wastewater System Improvements), Series B, 5.00% due 2/1/2023 - 2/1/2025 | 2,150,000 | 2,482,400 |
| | Ernest N. Morial - New Orleans Exhibition Hall Authority (Convention Center), 5.00% due 7/15/2020 - 7/15/2023 | 3,780,000 | 4,047,810 |
| | Jefferson Sales Tax District (Insured: AGM), | | |
| | Series A, 5.00% due 12/1/2023 - 12/1/2027 | 4,700,000 | 5,674,475 |
| | Series B, 5.00% due 12/1/2027 - 12/1/2028 | 4,690,000 | 5,912,231 |
| | Louisiana Energy & Power Authority (LEPA Unit No. 1 Power; Insured: AGM), Series A, 5.00% due 6/1/2022 - 6/1/2023 | 1,750,000 | 1,942,443 |
| | Louisiana Energy & Power Authority (Rodemacher Unit No. 2 Power), 5.00% due 1/1/2020 - 1/1/2023 | 4,240,000 | 4,490,912 |
| | Louisiana Local Govt Environmental Facilities & Community Development Authority (Bossier Parish Community College - Campus Facilities, Inc. Project), | | |
| | 4.00% due 12/1/2019 | 1,310,000 | 1,315,568 |
| | 5.00% due 12/1/2020 | 1,200,000 | 1,249,104 |
| | Louisiana Local Govt Environmental Facilities & Community Development Authority (LCTCS Act 391 Project; Insured: BAM), 5.00% due 10/1/2022 - 10/1/2027 | 15,565,000 | 18,446,597 |
| | Louisiana Local Govt Environmental Facilities & Community Development Authority (Town of Vinton Public Power Authority; Insured: AGM) ETM, 4.50% due 10/1/2019 | 1,000,000 | 1,000,000 |
| | Louisiana Public Facilities Authority (Hurricane Recovery Program), 5.00% due 6/1/2022 - 6/1/2023 | 7,945,000 | 8,834,332 |
| | Louisiana State Office Facilities Corp. (State Capitol), Series A, 5.00% due 5/1/2021 | 4,595,000 | 4,689,427 |
| | New Orleans Regional Transit Authority (Streetcar Rail Lines; Insured: AGM), 5.00% due 12/1/2019 - 12/1/2022 | 3,110,000 | 3,202,384 |
| | Parish of LaFourche (Roads, Highways & Bridges), 5.00% due 1/1/2022 - 1/1/2023 | 930,000 | 1,021,253 |
| | Parish of Orleans School District (Insured: AGM) GO, 5.00% due 9/1/2020 | 3,840,000 | 3,969,331 |
| c | Parish of St. Charles (Valero Energy Corp. Refinery), 4.00% due 12/1/2040 (put 6/1/2022) | 16,395,000 | 17,280,658 |
| | Parish of Terrebonne Hospital Service District No. 1 (Terrebonne General Medical Center), | | |
| | 5.00% due 4/1/2021 | 1,485,000 | 1,510,200 |
| | 5.00% due 4/1/2021 (pre-refunded 4/1/2020) | 835,000 | 850,139 |
| | Shreveport Water & Sewer Revenue (Insured: BAM), Series C, 5.00% due 12/1/2024 - 12/1/2026 | 2,420,000 | 2,865,839 |
| | State of Louisiana GO, Series C, 5.00% due 8/1/2021 | 11,175,000 | 11,909,868 |
| | Maine — 0.1% | | |
| | Maine Governmental Facilities Authority (Augusta & Machias Courthouses), | | |
| | Series A, | | |
Schedule of Investments, Continued
Thornburg Limited Term Municipal Fund | September 30, 2019
| | | PRINCIPAL
AMOUNT | VALUE |
| | 5.00% due 10/1/2020 - 10/1/2022 | $ 3,735,000 | $ 4,005,180 |
| e | 5.00% due 10/1/2023 | 1,445,000 | 1,652,416 |
| | Maryland — 0.6% | | |
| | Maryland Economic Development Corp. (Public Health Laboratory), | | |
| | 4.00% due 6/1/2022 | 8,245,000 | 8,617,179 |
| | 5.00% due 6/1/2021 | 8,725,000 | 9,263,507 |
| | Prince County George’s GO, 5.00% due 9/15/2026 | 6,110,000 | 7,596,868 |
| | State of Maryland GO, Series B, 5.00% due 8/1/2024 | 6,955,000 | 8,162,597 |
| | Massachusetts — 1.2% | | |
| | Berkshire Wind Power Cooperative Corp., Series 1, 5.00% due 7/1/2020 (pre-refunded 1/1/2020) | 2,965,000 | 2,991,685 |
| | Commonwealth of Massachusetts GO, | | |
| c | Series D-1, 1.05% due 8/1/2043 (put 7/1/2020) | 6,150,000 | 6,131,304 |
| | Series G, 5.00% due 9/1/2029 | 5,000,000 | 6,584,900 |
| | Massachusetts (Insured: BHAC-CR FGIC), 5.50% due 1/1/2029 | 8,300,000 | 11,177,361 |
| | Massachusetts Development Finance Agency (Beth Israel Lahey Health Obligated Group), 5.00% due 7/1/2027 - 7/1/2028 | 2,000,000 | 2,501,260 |
| | Massachusetts Development Finance Agency (CareGroup Healthcare System), | | |
| | Series H-1, 5.00% due 7/1/2020 | 5,000,000 | 5,131,350 |
| | Series I, 5.00% due 7/1/2023 - 7/1/2026 | 11,020,000 | 12,957,095 |
| | Massachusetts Development Finance Agency (CareGroup Obligated Group), Series I, 5.00% due 7/1/2027 | 450,000 | 547,772 |
| | Massachusetts Development Finance Agency (Mount Auburn Hospital Health Records System), Series H-1, 5.00% due 7/1/2022 - 7/1/2025 | 15,415,000 | 17,665,224 |
| | Massachusetts Development Finance Agency (Simmons College), Series J, 5.25% due 10/1/2023 | 595,000 | 676,717 |
| | Massachusetts Educational Financing Authority, Series I, 5.75% due 1/1/2020 | 7,500,000 | 7,580,775 |
| | Michigan — 2.4% | | |
| | Board of Governors of Wayne State University (Educational Facilities and Equipment), Series A, 5.00% due 11/15/2022 - 11/15/2025 | 1,870,000 | 2,156,859 |
| | Byron Center Michigan Public Schools (Insured: AGM/Q-SBLF) GO, 4.00% due 5/1/2020 | 1,000,000 | 1,015,730 |
| | County of Genesee (Water Supply System; Insured: BAM) GO, 5.00% due 11/1/2022 | 600,000 | 661,614 |
| | County of Livingston (Howell Public Schools; Insured: Q-SBLF) GO, 4.00% due 5/1/2020 - 5/1/2021 | 2,000,000 | 2,056,440 |
| | Kalamazoo Hospital Finance Authority (Bronson Methodist Hospital; Insured: AGM) ETM, 5.00% due 5/15/2020 | 1,735,000 | 1,774,124 |
| | Kalamazoo Hospital Finance Authority (Bronson Methodist Hospital; Insured: AGM), | | |
| | 5.00% due 5/15/2021 | 1,050,000 | 1,073,677 |
| | 5.00% due 5/15/2021 (pre-refunded 5/15/2020) | 1,300,000 | 1,328,912 |
| | Livonia Public Schools School District (School Building & Site) GO, | | |
| | Series I, | | |
| | 4.00% due 5/1/2020 | 800,000 | 812,024 |
| | 5.00% due 5/1/2021 | 900,000 | 950,895 |
| | Michigan Finance Authority ((McLaren Health Care Corp. Obligated Group), 5.00% due 2/15/2029 | 1,000,000 | 1,281,490 |
| | Michigan Finance Authority (Beaumont Health Credit Group), 5.00% due 8/1/2023 - 8/1/2025 | 18,800,000 | 21,784,588 |
| | Michigan Finance Authority (Henry Ford Health System), 5.00% due 11/15/2027 | 1,000,000 | 1,219,160 |
| | Michigan Finance Authority (LOC JPMorgan Chase Bank, N.A.) (State Aid Withholding), Series A-2, 2.00% due 8/20/2020 | 3,800,000 | 3,822,002 |
| | Michigan Finance Authority (McLaren Health Care Corp. Obligated Group), 5.00% due 2/15/2028 | 1,000,000 | 1,258,740 |
| | Michigan Finance Authority (Trinity Health Credit Group), 5.00% due 12/1/2022 - 12/1/2028 | 10,500,000 | 12,484,435 |
| | Michigan Finance Authority (Ypsilanti Community Schools), 5.00% due 8/1/2020 - 8/1/2022 | 3,890,000 | 4,130,271 |
| | Michigan Municipal Bond Authority (Clean Water Fund), 5.00% due 10/1/2020 | 35,000 | 35,106 |
| | Michigan State Building Authority (Facilities Program), Series I, 5.00% due 4/15/2023 - 4/15/2026 | 1,750,000 | 2,047,282 |
| c | Michigan State Hospital Finance Authority (Ascension Health), Series F-2-REMK, 1.90% due 11/15/2047 (put 4/1/2021) | 5,170,000 | 5,209,706 |
| | Michigan Strategic Fund (Detroit Edison Company; Insured: AMBAC), 7.00% due 5/1/2021 | 4,115,000 | 4,458,356 |
| | Plymouth-Canton Community Schools (Insured: Q-SBLF) GO, Series A, 5.00% due 5/1/2020 | 1,000,000 | 1,021,500 |
| | Royal Oak Hospital Finance Authority (William Beaumont Hospital), 5.00% due 9/1/2020 - 9/1/2024 | 6,940,000 | 7,624,767 |
| | School District of the City of Dearborn (Insured: Q-SBLF) (State Aid Withholding) GO, | | |
| | 4.00% due 5/1/2020 - 5/1/2023 | 1,510,000 | 1,606,095 |
| e | 4.00% due 5/1/2021 | 570,000 | 593,535 |
| | School District of the City of Detroit (Wayne County School Building & Site; Insured: Q-SBLF) GO, Series A, 5.00% due 5/1/2020 - 5/1/2022 | 9,200,000 | 9,727,854 |
| | Sparta Area Schools, Counties of Kent and Ottawa (School Building & Site; Insured: Q-SBLF) GO, 5.00% due 5/1/2020 | 1,335,000 | 1,362,915 |
| | St. Johns Public Schools (Insured: Natl-Re/FGIC/Q-SBLF) GO, 5.00% due 5/1/2021 | 665,000 | 690,576 |
| | State Building Authority of the State of Michigan (Higher Education Facilities Program), Series I-A, 5.00% due 10/15/2020 - 10/15/2023 | 12,715,000 | 14,279,817 |
| | Warren Consolidated School District (Insured: Q-SBLF) GO, 5.00% due 5/1/2020 - 5/1/2021 | 2,000,000 | 2,075,260 |
| | Wayne County Airport Authority (Detroit Metropolitan Airport), | | |
| | Series C, | | |
| | 5.00% due 12/1/2019 | 12,645,000 | 12,721,123 |
| | 5.50% due 12/1/2020 | 4,395,000 | 4,607,454 |
| | Series D, 5.50% due 12/1/2019 - 12/1/2020 | 5,715,000 | 5,883,337 |
| | Wayne State University, Series A, 5.00% due 11/15/2023 - 11/15/2026 | 12,640,000 | 15,061,001 |
Schedule of Investments, Continued
Thornburg Limited Term Municipal Fund | September 30, 2019
| | | PRINCIPAL
AMOUNT | VALUE |
| | Minnesota — 0.5% | | |
| a | City of Minneapolis/St. Paul Housing & Redevelopment Authority (Allina Health Obligated Group; LOC JPMorgan Chase Bank, N.A.), Series B-2, 1.77% due 11/15/2035 (put 10/1/2019) | $ 2,000,000 | $ 2,000,000 |
| | City of St. Cloud (CentraCare Health System), Series A, 5.00% due 5/1/2020 | 3,310,000 | 3,379,212 |
| | Le Sueur-Henderson No. 2397 (Minnesota School District Credit Enhancement Program) (State Aid Withholding) ISD, 3.00% due 4/1/2021 | 1,125,000 | 1,154,453 |
| | Minnesota Higher Education Facilities Authority, 5.00% due 10/1/2029 | 300,000 | 385,755 |
| | Minnesota Housing Finance Agency (Collateralized: GNMA, FNMA, FHLMC), | | |
| | Series F, | | |
| | 1.75% due 7/1/2027 | 920,000 | 902,860 |
| | 1.80% due 1/1/2028 | 1,020,000 | 999,967 |
| | 1.85% due 7/1/2028 | 1,205,000 | 1,180,551 |
| | 1.90% due 1/1/2029 | 365,000 | 357,817 |
| | 1.95% due 7/1/2029 | 885,000 | 867,096 |
| b | Minnesota Housing Finance Agency (Residential Single Family Development; Collateralized: GNMA, FNMA, FHLMC), 2.13% (MUNIPSA + 0.55%) due 7/1/2041 (put 12/12/2023) | 6,375,000 | 6,371,430 |
| | Northern Municipal Power Agency (Electric System), Series A1, 5.00% due 1/1/2020 | 3,500,000 | 3,531,430 |
| | Port Authority of the City of St. Paul (Minnesota Andersen Office Building), Series 3, 5.00% due 12/1/2021 - 12/1/2022 | 2,215,000 | 2,434,174 |
| | Port Authority of the City of St. Paul (Minnesota Freeman Office Building), Series 2, 5.00% due 12/1/2019 - 12/1/2020 | 4,675,000 | 4,802,707 |
| | St. Paul Housing and Redevelopment Authority (HealthPartners), 5.00% due 7/1/2023 - 7/1/2025 | 1,850,000 | 2,122,445 |
| | Mississippi — 0.3% | | |
| | Mississippi Development Bank (MDOT-Harrison County Highway), Series A-GA, 5.00% due 1/1/2020 - 1/1/2023 | 6,500,000 | 6,877,930 |
| | Mississippi Development Bank (MDOT-Madison County Highway), 5.00% due 1/1/2020 - 1/1/2023 | 5,250,000 | 5,572,098 |
| | Mississippi Development Bank, 5.00% due 10/1/2024 - 10/1/2028 | 2,400,000 | 2,919,500 |
| | Missouri — 0.7% | | |
| | Cass County COP, | | |
| e | 5.00% due 5/1/2020 | 2,255,000 | 2,302,152 |
| | 5.00% due 5/1/2021 | 1,750,000 | 1,786,173 |
| | Jackson County (Parking Facility Projects), 4.00% due 12/1/2019 - 12/1/2021 | 1,500,000 | 1,556,955 |
| | Kansas City Municipal Assistance Corp. (H. Roe Bartle Convention Center & Infrastructure Project; Insured: AMBAC), Series B-1, Zero Coupon due 4/15/2021 - 4/15/2022 | 15,095,000 | 14,562,242 |
| | Missouri Development Finance Board (City of Independence Electric System), | | |
| | Series B, 5.00% due 6/1/2020 | 1,000,000 | 1,023,890 |
| | Series F, 4.00% due 6/1/2020 - 6/1/2022 | 6,885,000 | 7,174,230 |
| | Platte County (Community & Resource Centers), 5.00% due 4/1/2021 | 2,440,000 | 2,362,213 |
| | Southeast Missouri State University (City of Cape Girardeau Campus System Facilities), Series A, 5.00% due 4/1/2020 | 2,825,000 | 2,875,652 |
| | Special Administrative Board of the Transitional School District of the City of St. Louis (State Aid Withholding) GO, 4.00% due 4/1/2020 - 4/1/2022 | 6,955,000 | 7,277,549 |
| | Nebraska — 1.0% | | |
| c | Central Plains Energy Project, 5.00% due 3/1/2050 (put 1/1/2024) | 49,000,000 | 54,794,740 |
| | Douglas County Hospital Authority No. 3 (Nebraska Methodist Health System), 5.00% due 11/1/2022 - 11/1/2025 | 6,980,000 | 8,014,193 |
| | Nevada — 3.2% | | |
| | Carson City (Carson Tahoe Regional Healthcare), 5.00% due 9/1/2020 - 9/1/2027 | 5,155,000 | 5,693,701 |
| | Clark County Department of Aviation, Series A, 5.00% due 7/1/2021 | 1,855,000 | 1,973,145 |
| | Clark County School District (Acquisition of Transportation & Technology Equipment) GO, | | |
| | Series C, 5.00% due 6/15/2022 | 2,560,000 | 2,804,992 |
| | Series D, 5.00% due 6/15/2021 - 6/15/2022 | 47,150,000 | 50,955,255 |
| | Series E, 5.00% due 6/15/2021 | 21,405,000 | 22,696,792 |
| | Las Vegas Convention and Visitors Authority, Series C, 5.00% due 7/1/2023 - 7/1/2026 | 3,050,000 | 3,620,562 |
| | Las Vegas Valley Water District GO, | | |
| | Series A, 5.00% due 6/1/2023 - 6/1/2026 | 55,955,000 | 65,572,448 |
| | Series B, 5.00% due 12/1/2025 | 20,000,000 | 24,005,800 |
| | Series C, 5.00% due 6/1/2020 - 6/1/2021 | 9,255,000 | 9,667,501 |
| | Series D, 5.00% due 6/1/2020 | 5,080,000 | 5,205,120 |
| | Washoe County (Reno-Sparks Convention & Visitors Authority) GO, 5.00% due 7/1/2021 - 7/1/2022 | 4,200,000 | 4,469,803 |
| | New Hampshire — 0.4% | | |
| | New Hampshire Health and Education Facilities Authority Act (University System of New Hampshire; SPA State Street Bank and Trust Co.), | | |
| a | Series A-1, 1.77% due 7/1/2035 (put 10/1/2019) | 6,930,000 | 6,930,000 |
| a | Series A-2-RMKT 1.75% due 7/1/2035 (put 10/1/2019) | 2,000,000 | 2,000,000 |
| | New Hampshire Health and Education Facilities Authority Act (University System of New Hampshire; SPA Wells Fargo Bank, N.A.), | | |
| a | Series B, 1.75% due 7/1/2033 (put 10/1/2019) | 9,615,000 | 9,615,000 |
| a | Series B-1, 1.77% due 7/1/2033 (put 10/1/2019) | 1,965,000 | 1,965,000 |
| | New Hampshire Municipal Bond Bank (Educational Facilities; Insured: State Intercept), Series C, 5.25% due 8/15/2020 - 8/15/2022 | 3,770,000 | 4,114,101 |
| | New Hampshire Turnpike System, Series B, 5.00% due 2/1/2020 - 2/1/2021 | 2,260,000 | 2,332,797 |
Schedule of Investments, Continued
Thornburg Limited Term Municipal Fund | September 30, 2019
| | | PRINCIPAL
AMOUNT | VALUE |
| | New Jersey — 2.3% | | |
| | City of Jersey City (Qualified General Improvement; Insured: BAM) (State Aid Withholding) GO, | | |
| | Series A, | | |
| | 4.00% due 8/1/2020 - 8/1/2021 | $ 5,455,000 | $ 5,645,848 |
| | 5.00% due 8/1/2022 - 8/1/2023 | 4,985,000 | 5,553,157 |
| | Essex County Improvement Authority (County Correctional Facilities & Gibraltar Facilities; Insured: Natl-Re), 5.50% due 10/1/2024 | 5,000,000 | 6,022,850 |
| | Hudson County Improvement Authority (Hudson County Lease; Insured: AGM), | | |
| | 4.75% due 10/1/2019 | 4,390,000 | 4,390,000 |
| | 5.375% due 10/1/2020 | 2,020,000 | 2,098,214 |
| | New Jersey (New Jersey Transit Corporation) (State Aid Withholding) EDA, Series B, 5.00% due 11/1/2024 | 8,000,000 | 9,185,520 |
| | New Jersey (School Facilities Construction) EDA ETM, 5.00% due 9/1/2020 | 365,000 | 376,954 |
| | New Jersey (School Facilities Construction) EDA, | | |
| | 5.00% due 9/1/2020 | 135,000 | 139,070 |
| | Series G, 5.75% due 9/1/2023 (pre-refunded 3/1/2021) | 4,955,000 | 5,260,674 |
| | Series GG, 5.75% due 9/1/2023 | 550,000 | 581,697 |
| | Series UU, 5.00% due 6/15/2028 | 7,930,000 | 8,915,223 |
| | New Jersey (School Facilities Construction; Insured: AMBAC) EDA, Series K, 5.50% due 12/15/2019 | 5,525,000 | 5,567,598 |
| | New Jersey Health Care Facilities Financing Authority (Virtua Health Issue), 5.00% due 7/1/2023 - 7/1/2024 | 1,535,000 | 1,751,624 |
| | New Jersey Higher Educational Assistance Authority, Series 1A, 5.25% due 12/1/2019 | 5,650,000 | 5,686,216 |
| | New Jersey Transit Corp. (Urban Public Transportation Capital Improvement), Series A, 5.00% due 9/15/2021 | 3,395,000 | 3,620,088 |
| | New Jersey Transportation Trust Fund Authority (State Transportation System Improvements), | | |
| b | 2.78% (MUNIPSA + 1.20%) due 6/15/2034 (put 12/15/2021) | 6,250,000 | 6,288,062 |
| | 5.00% due 6/15/2020 - 6/15/2028 | 43,525,000 | 50,993,313 |
| | Series A, 5.25% due 12/15/2022 | 2,000,000 | 2,221,460 |
| | Series B, 5.00% due 6/15/2020 - 6/15/2021 | 3,570,000 | 3,737,577 |
| | New Jersey Transportation Trust Fund Authority (State Transportation System Improvements; Insured: AMBAC), Series B, 5.25% due 12/15/2023 | 3,545,000 | 4,038,606 |
| | Passaic Valley Sewer Commissioners (Sewer System) GO, Series G, 5.75% due 12/1/2019 - 12/1/2021 | 10,750,000 | 11,359,305 |
| | New Mexico — 1.7% | | |
| | Carlsbad Municipal School District (Educational Facilities) (State Aid Withholding) GO, 5.00% due 8/1/2023 | 1,650,000 | 1,876,000 |
| e | City of Albuquerque (City Infrastructure Improvements) GO, Series A, 5.00% due 7/1/2023 | 1,360,000 | 1,545,042 |
| | City of Farmington (Arizona Public Service Co.-Four Corners Project), Series A, 4.70% due 5/1/2024 | 2,375,000 | 2,450,715 |
| | City of Farmington (Southern California Edison Co.-Four Corners Project), | | |
| c | 1.875% due 4/1/2029 (put 4/1/2020) | 3,000,000 | 3,001,560 |
| c | 2.125% due 6/1/2040 (put 6/1/2022) | 2,000,000 | 2,017,360 |
| | City of Santa Fe (El Castillo Retirement Residences), 4.50% due 5/15/2022 | 1,615,000 | 1,705,198 |
| | New Mexico Educational Assistance Foundation (Student Loans), Series A-1, 5.00% due 12/1/2021 | 3,000,000 | 3,126,030 |
| | New Mexico Hospital Equipment Loan Council (Presbyterian Healthcare Services Obligated Group; SPA Wells Fargo Bank, N.A.), | | |
| a | Series C, 1.77% due 8/1/2034 (put 10/1/2019) | 8,245,000 | 8,245,000 |
| a | Series D, 1.77% due 8/1/2034 (put 10/1/2019) | 19,825,000 | 19,825,000 |
| | New Mexico Hospital Equipment Loan Council (Presbyterian Healthcare Services), 5.00% due 8/1/2024 - 8/1/2025 | 1,780,000 | 2,099,157 |
| | New Mexico Municipal Energy Acquisition Authority, | | |
| | Series A, | | |
| | 4.00% due 5/1/2020 - 11/1/2024 | 5,790,000 | 6,163,758 |
| c | 5.00% due 11/1/2039 (put 5/1/2025) | 30,600,000 | 35,674,704 |
| | New Mexico State University ETM, Series B, 5.00% due 4/1/2020 - 4/1/2022 | 3,175,000 | 3,320,353 |
| | New Mexico State University, Series B, 5.00% due 4/1/2020 - 4/1/2022 | 3,015,000 | 3,142,280 |
| | Rio Rancho Public School District No. 94 (State Aid Withholding) GO, Series A, 5.00% due 8/1/2026 | 1,085,000 | 1,324,188 |
| | Santa Fe County (County Buildings & Facilities) GRT, Series A, 5.00% due 6/1/2025 | 1,250,000 | 1,498,662 |
| | State of New Mexico (Educational Facilities), Series A, 5.00% due 7/1/2020 | 4,000,000 | 4,110,240 |
| | New York — 13.8% | | |
| | City of Long Beach School District (Insured: AGM) (State Aid Withholding) GO, 3.50% due 5/1/2022 | 1,600,000 | 1,621,680 |
| | City of New York (City Budget Financial Management) GO, | | |
| | Series D, 5.00% due 8/1/2021 - 8/1/2022 | 6,000,000 | 6,513,630 |
| | Series G, 5.00% due 8/1/2021 - 8/1/2023 | 25,145,000 | 27,765,907 |
| | Series J, 5.00% due 8/1/2021 - 8/1/2024 | 80,480,000 | 91,833,586 |
| | Series K, 5.00% due 8/1/2021 - 8/1/2022 | 20,850,000 | 22,732,092 |
| a | City of New York (SPA Barclays Bank plc) GO, Series F-5, 1.77% due 6/1/2044 (put 10/1/2019) | 500,000 | 500,000 |
| | Metropolitan Transportation Authority (Green Bond), Series A2, 5.00% due 11/15/2025 - 11/15/2027 | 44,520,000 | 54,605,824 |
| | Metropolitan Transportation Authority, | | |
| | Series A, | | |
| | 4.00% due 2/3/2020 | 18,000,000 | 18,156,600 |
| | 5.00% due 11/15/2020 | 2,000,000 | 2,085,840 |
| | Series C, 5.00% due 9/1/2021 | 14,500,000 | 15,450,910 |
Schedule of Investments, Continued
Thornburg Limited Term Municipal Fund | September 30, 2019
| | | PRINCIPAL
AMOUNT | VALUE |
| c | Series C-2B, 5.00% due 11/15/2034 (put 2/15/2020) | $ 550,000 | $ 556,826 |
| | Series D, 5.00% due 11/15/2020 - 11/15/2021 | 37,280,000 | 39,616,177 |
| | Series D-1, 5.00% due 9/1/2022 | 75,000,000 | 82,140,000 |
| | Monroe County Industrial Development Corp. (St. John Fisher College), Series A, 5.00% due 6/1/2022 | 2,000,000 | 2,188,700 |
| | Nassau County (New York Institute of Technology) IDA ETM, Series A, 5.25% due 3/1/2020 | 1,715,000 | 1,743,212 |
| | New York City Health and Hospital Corp. (Healthcare Facilities Improvements) GO, Series A, 5.00% due 2/15/2020 - 2/15/2021 | 12,615,000 | 12,789,270 |
| | New York City Housing Development Corp., 2.00% due 11/1/2020 | 6,900,000 | 6,901,518 |
| a | New York City Transitional Finance Authority Future Tax Secured Revenue (SPA Barclays Bank plc), Series B3, 1.77% due 11/1/2042 (put 10/1/2019) | 3,620,000 | 3,620,000 |
| | New York City Transitional Finance Authority Future Tax Secured Revenue (SPA JP Morgan Chase Bank, N.A), | | |
| a | Series A-4, 1.75% due 8/1/2039 (put 10/1/2019) | 3,705,000 | 3,705,000 |
| a | Series B-4, 1.75% due 8/1/2042 (put 10/1/2019) | 41,890,000 | 41,890,000 |
| a | Series C-4, 1.75% due 11/1/2036 (put 10/1/2019) | 7,215,000 | 7,215,000 |
| a | Series E-3, 1.75% due 2/1/2045 (put 10/1/2019) | 10,500,000 | 10,500,000 |
| a | Series E-4, 1.75% due 2/1/2045 (put 10/1/2019) | 2,600,000 | 2,600,000 |
| | New York City Transitional Finance Authority Future Tax Secured Revenue (SPA Landesbank Hessen-Thuringen), | | |
| a | Series 1-SUB 1D, 1.75% due 11/1/2022 (put 10/1/2019) | 9,700,000 | 9,700,000 |
| a | Series C-2, 1.75% due 8/1/2031 (put 10/1/2019) | 27,060,000 | 27,060,000 |
| | New York City Trust for Cultural Resources (Lincoln Center for the Performing Arts, Inc.), 5.00% due 12/1/2026 | 2,500,000 | 3,114,600 |
| a | New York City Water & Sewer System (SPA JP Morgan Chase Bank, N.A.), 1.75% due 6/15/2043 - 6/15/2050 (put 10/1/2019) | 6,695,000 | 6,695,000 |
| a | New York City Water & Sewer System (SPA Landesbank Hessen-Thuringen), 1.75% due 6/15/2044 (put 10/1/2019) | 71,250,000 | 71,250,000 |
| | New York City Water & Sewer System (SPA Mizuho Bank, Ltd.), | | |
| a | Series A-1, 1.77% due 6/15/2044 (put 10/1/2019) | 3,555,000 | 3,555,000 |
| a | Series AA-6, 1.77% due 6/15/2048 (put 10/1/2019) | 5,425,000 | 5,425,000 |
| | New York City Water & Sewer System (SPA State Street Bank and Trust Co.), | | |
| a | Series B-3, 1.76% due 6/15/2045 (put 10/1/2019) | 10,300,000 | 10,300,000 |
| a | Series B-4, 1.76% due 6/15/2045 (put 10/1/2019) | 8,665,000 | 8,665,000 |
| a | New York City Water & Sewer System, (SPA JPMorgan Chase Bank, N.A.), 1.75% due 6/15/2050 (put 10/1/2019) | 13,400,000 | 13,400,000 |
| | New York State Dormitory Authority (Metropolitan Transportation Authority Service Contract), Series A, 5.00% due 12/15/2019 | 60,000,000 | 60,450,600 |
| | New York State Dormitory Authority (NYSARC, Inc. Developmental Disability Programs; Insured: State Intercept), Series A, 5.00% due 7/1/2020 | 1,000,000 | 1,027,710 |
| | New York State Dormitory Authority (School Districts Financing Program) (State Aid Withholding), | | |
| | Series G, 5.00% due 4/1/2020 - 10/1/2022 | 1,750,000 | 1,826,728 |
| | Series H, 5.00% due 10/1/2019 - 10/1/2021 | 3,335,000 | 3,429,100 |
| | Series J, 5.00% due 10/1/2019 - 10/1/2020 | 5,420,000 | 5,521,676 |
| | New York State Dormitory Authority (School Districts Financing Program; Insured: AGC) (State Aid Withholding), | | |
| | 5.25% due 10/1/2023 | 140,000 | 151,495 |
| | 5.25% due 10/1/2023 (pre-refunded 10/1/2021) | 1,860,000 | 2,010,920 |
| | New York State Dormitory Authority (School Districts Financing Program; Insured: AGM) (State Aid Withholding), | | |
| | Series A, | | |
| | 5.00% due 10/1/2020 - 10/1/2024 | 6,850,000 | 7,725,495 |
| e | 5.00% due 10/1/2022 | 1,800,000 | 2,004,678 |
| | Series F, 5.00% due 10/1/2019 - 10/1/2021 | 5,450,000 | 5,619,894 |
| | New York State Thruway Authority (Governor Thomas E. Dewey Thruway), | | |
| | Series I, 5.00% due 1/1/2020 - 1/1/2022 | 7,500,000 | 7,882,865 |
| | Series K, 5.00% due 1/1/2024 - 1/1/2025 | 3,000,000 | 3,516,040 |
| | New York State Thruway Authority (Highway, Bridge, Multi-Modal and MTA Projects), Series A, 5.00% due 3/15/2024 | 18,300,000 | 19,293,141 |
| | Suffolk County Economic Development Corp. (Catholic Health Services), 5.00% due 7/1/2020 - 7/1/2022 | 15,000,000 | 15,710,900 |
| | Town of Oyster Bay GO, Series B, 3.00% due 2/1/2020 - 3/13/2020 | 81,635,000 | 82,057,393 |
| | Triborough Bridge and Tunnel Authority (MTA Bridges and Tunnels), | | |
| | 5.00% due 11/15/2026 | 4,000,000 | 5,012,040 |
| | Series A, 5.00% due 11/15/2021 | 5,140,000 | 5,551,097 |
| | West Seneca Central School District (Insured: BAM) (State Aid Withholding) GO, 5.00% due 11/15/2022 | 1,000,000 | 1,116,900 |
| | Westchester County Local Development Corp. (Miriam Osborn Memorial Home Association Obligated Group), | | |
| | 5.00% due 7/1/2024 - 7/1/2028 | 1,125,000 | 1,329,809 |
| e | 5.00% due 7/1/2027 | 270,000 | 320,833 |
| | North Carolina — 2.5% | | |
| a | Charlotte-Mecklenburg Hospital Authority (Carolinas Healthcare System Obligated Group; SPA JP Morgan Chase Bank, N.A), Series C, 1.77% due 1/15/2037 (put 10/1/2019) | 31,360,000 | 31,360,000 |
| | Charlotte-Mecklenburg Hospital Authority (Carolinas HealthCare System), | | |
| | Series A, | | |
| | 3.00% due 1/15/2021 | 1,595,000 | 1,627,809 |
| | 4.00% due 1/15/2022 | 845,000 | 895,261 |
| | 5.00% due 1/15/2023 - 1/15/2024 | 4,255,000 | 4,738,723 |
Schedule of Investments, Continued
Thornburg Limited Term Municipal Fund | September 30, 2019
| | | PRINCIPAL
AMOUNT | VALUE |
| | City of Charlotte (Equipment Acquisition & Public Facilities) COP, Series C, 5.00% due 12/1/2020 - 12/1/2025 | $ 8,940,000 | $ 10,155,778 |
| | County of Buncombe (Primary, Middle School & Community College Facilities), Series A, 5.00% due 6/1/2022 - 6/1/2024 | 2,350,000 | 2,645,071 |
| | County of Dare (Educational Facility Capital Projects), | | |
| | Series A, | | |
| | 4.00% due 6/1/2020 - 6/1/2022 | 1,255,000 | 1,301,232 |
| | 5.00% due 6/1/2021 - 6/1/2024 | 1,925,000 | 2,089,890 |
| | County of Randolph, | | |
| | Series B, 5.00% due 10/1/2021 - 10/1/2023 | 3,560,000 | 3,923,922 |
| | Series C, 5.00% due 10/1/2020 - 10/1/2023 | 1,400,000 | 1,511,720 |
| | North Carolina Eastern Municipal Power Agency ETM, | | |
| | Series A, 5.00% due 1/1/2022 | 4,715,000 | 5,102,243 |
| | Series B, 5.00% due 1/1/2021 | 5,000,000 | 5,229,300 |
| | North Carolina Municipal Power Agency (Catawba Electric) ETM, | | |
| | Series A, | | |
| | 4.00% due 1/1/2020 | 945,000 | 951,303 |
| e | 5.00% due 1/1/2020 | 280,000 | 282,556 |
| | North Carolina Municipal Power Agency (Catawba Electric), | | |
| | Series A, | | |
| | 4.00% due 1/1/2020 | 605,000 | 608,933 |
| | 5.00% due 1/1/2020 | 720,000 | 726,444 |
| | Series B, 4.00% due 1/1/2022 | 1,000,000 | 1,058,030 |
| | North Carolina Turnpike Authority 5.00% due 1/1/2024 | 475,000 | 538,218 |
| | North Carolina Turnpike Authority, 5.00% due 1/1/2023 - 1/1/2029 | 12,655,000 | 15,285,804 |
| | State of North Carolina (State Capital Projects and Correctional Facilities), Series B, 5.00% due 11/1/2019 | 23,635,000 | 23,705,432 |
| b | University of North Carolina at Chapel Hill, Series A, 1.75% (LIBOR 1 Month + 0.35%) due 12/1/2041 (put 12/1/2021) | 40,500,000 | 40,510,125 |
| | Winston-Salem State University (Student Housing and Student Services Facilities), 5.00% due 4/1/2022 | 945,000 | 1,020,231 |
| | North Dakota — 0.2% | | |
| | County of Mckenzie, 5.00% due 8/1/2020 - 8/1/2023 | 8,285,000 | 8,921,177 |
| | County of McKenzie, 5.00% due 8/1/2022 | 1,425,000 | 1,560,603 |
| | County of Ward (Insured: AGM), 4.00% due 4/1/2020 | 2,445,000 | 2,475,783 |
| | Ohio — 3.7% | | |
| | Akron, Bath & Copley Joint Township Hospital District (Children’s Hospital Medical Center), 5.00% due 11/15/2021 | 1,000,000 | 1,072,770 |
| | American Municipal Power, Inc. (AMP Fremont Energy Center), 5.00% due 2/15/2020 - 2/15/2022 | 5,915,000 | 6,241,188 |
| | Cincinnati City School District Board of Education (Educational Facilities; Insured: Natl-Re) GO, 5.25% due 12/1/2023 | 2,690,000 | 3,118,732 |
| | City of Akron (Community Learning Centers), 5.00% due 12/1/2021 | 4,120,000 | 4,446,180 |
| | City of Akron (Various Municipal Capital Projects) GO, Series A, 5.00% due 12/1/2019 | 1,685,000 | 1,695,194 |
| | City of Cleveland (City Capital Projects; Insured: AMBAC) GO, 5.50% due 10/1/2019 | 1,260,000 | 1,260,000 |
| | City of Cleveland (Cleveland Stadium) COP, 4.75% due 11/15/2020 | 2,000,000 | 2,070,720 |
| | City of Cleveland (Municipal Street System Improvements) GO, | | |
| | Series A, | | |
| | 3.00% due 12/1/2020 - 12/1/2021 | 2,980,000 | 3,077,693 |
| | 4.00% due 12/1/2022 - 12/1/2023 | 6,725,000 | 7,369,217 |
| | 5.00% due 12/1/2025 - 12/1/2026 | 7,165,000 | 8,673,186 |
| | City of Cleveland (Parking Facility; Insured: AGM), 5.25% due 9/15/2021 | 2,035,000 | 2,182,110 |
| | City of Cleveland (Parks & Recreation Facilities), | | |
| | 4.00% due 10/1/2019 | 520,000 | 520,000 |
| | 5.00% due 10/1/2020 - 10/1/2023 | 3,375,000 | 3,699,021 |
| | City of Cleveland (Police & Fire Pension Payment), 5.00% due 5/15/2020 - 5/15/2021 | 2,355,000 | 2,436,159 |
| | City of Cleveland (Public Facilities Improvements), | | |
| e | 5.00% due 10/1/2025 | 535,000 | 643,214 |
| | 5.00% due 10/1/2026 - 10/1/2028 | 2,320,000 | 2,907,951 |
| | City of Cleveland (Public Facilities), | | |
| | 4.00% due 10/1/2019 | 600,000 | 600,000 |
| | 5.00% due 10/1/2020 - 10/1/2023 | 2,570,000 | 2,843,555 |
| | City of Toledo (Water System Improvements), 5.00% due 11/15/2019 - 11/15/2023 | 11,265,000 | 12,085,141 |
| | Cleveland Package Facilities (Insured: AGM) ETM, 5.25% due 9/15/2021 | 965,000 | 1,036,700 |
| | Cleveland State University (Campus Capital Projects), 5.00% due 6/1/2020 - 6/1/2022 | 3,700,000 | 3,928,634 |
| | Cleveland-Cuyahoga County Port Authority (Cleveland Museum of Art), 5.00% due 10/1/2019 | 2,000,000 | 2,000,000 |
| | County of Cuyahoga (Convention Hotel Project) COP, 5.00% due 12/1/2019 - 12/1/2024 | 29,470,000 | 32,978,774 |
| c | County of Franklin (Trinity Health Corp. Obligated Group), 1.35% due 12/1/2046 (put 11/1/2019) | 15,000,000 | 14,997,750 |
| | County of Hamilton, Series A, 5.00% due 12/1/2019 - 12/1/2020 | 4,200,000 | 4,269,738 |
| | County of Scioto (Southern Ohio Medical Center), | | |
| e | 5.00% due 2/15/2024 | 1,640,000 | 1,864,221 |
Schedule of Investments, Continued
Thornburg Limited Term Municipal Fund | September 30, 2019
| | | PRINCIPAL
AMOUNT | VALUE |
| | 5.00% due 2/15/2025 | $ 1,695,000 | $ 1,975,421 |
| | Franklin County Convention Facilities Authority (Greater Columbus Convention Center), 5.00% due 12/1/2021 - 12/1/2024 | 2,500,000 | 2,803,920 |
| | Ohio Turnpike & Infrastructure Commission, 5.00% due 2/15/2027 - 2/15/2028 | 14,555,000 | 18,318,627 |
| | RiverSouth Authority (RiverSouth Area Redevelopment), 5.00% due 12/1/2019 | 2,500,000 | 2,515,250 |
| | State of Ohio (Cultural and Sports Capital Facilities), Series A, 5.00% due 10/1/2020 | 3,845,000 | 3,987,073 |
| | State of Ohio (Major New Street Infrastructure Project), | | |
| | Series 1, | | |
| | 4.00% due 12/15/2019 | 1,000,000 | 1,005,510 |
| | 5.00% due 12/15/2020 - 12/15/2021 | 3,500,000 | 3,747,040 |
| | Series 2016-1, 5.00% due 12/15/2020 - 12/15/2026 | 2,000,000 | 2,274,370 |
| | State of Ohio GO, Series V, 5.00% due 5/1/2021 - 5/1/2028 | 46,260,000 | 53,380,274 |
| | Youngstown City School District (Educational Facilities) (State Aid Withholding) GO, 4.00% due 12/1/2019 - 12/1/2023 | 8,515,000 | 8,738,518 |
| | Oklahoma — 0.6% | | |
| | Canadian County Educational Facilities Authority (Mustang Public Schools), | | |
| | 4.50% due 9/1/2020 | 2,690,000 | 2,768,413 |
| e | 4.50% due 9/1/2021 | 2,290,000 | 2,425,362 |
| | 5.00% due 9/1/2027 | 1,000,000 | 1,215,220 |
| | Cleveland County Educational Facilities Authority (Moore Public Schools), 5.00% due 6/1/2023 | 5,355,000 | 6,026,999 |
| | Oklahoma (INTEGRIS Health) DFA, Series A, 5.00% due 8/15/2022 - 8/15/2025 | 4,725,000 | 5,417,739 |
| | Oklahoma Capitol Improvement Authority (State Highway Capital Improvement), 5.00% due 7/1/2023 | 325,000 | 368,456 |
| | Oklahoma County Finance Authority (Midwest City Public Service), 5.00% due 10/1/2022 - 10/1/2026 | 3,200,000 | 3,690,590 |
| | Oklahoma County Finance Authority (Western Heights Public Schools), 5.00% due 9/1/2020 | 2,000,000 | 2,065,500 |
| | Tulsa County Industrial Authority (Broken Arrow Public Schools), 4.50% due 9/1/2020 - 9/1/2021 | 10,360,000 | 10,936,471 |
| | Tulsa County Industrial Authority, 5.00% due 9/1/2020 - 9/1/2022 | 4,215,000 | 4,506,666 |
| | Oregon — 0.3% | | |
| | Hillsboro School District No. 1J (School Capital Improvements) (State Aid Withholding) GO, 5.00% due 6/15/2025 - 6/15/2027 | 9,130,000 | 11,262,720 |
| | Polk County Dallas School District No. 2 (Capital Improvements) GO, Zero Coupon due 6/15/2021 | 1,475,000 | 1,438,332 |
| | Tri-County Metropolitan Transportation District of Oregon, Series A, 5.00% due 10/1/2028 | 2,845,000 | 3,581,684 |
| | Pennsylvania — 5.3% | | |
| | Allegheny County Higher Education Building Authority (Duquesne University of the Holy Spirit), Series A, 5.00% due 3/1/2020 - 3/1/2025 | 2,195,000 | 2,508,452 |
| | Allegheny County Hospital Development Authority, 5.00% due 7/15/2028 - 7/15/2029 | 7,425,000 | 9,481,240 |
| | Allegheny County Sanitary Authority (2015 Capital Project), 5.00% due 12/1/2023 - 12/1/2024 | 19,150,000 | 22,131,718 |
| | Allegheny County Sanitary Authority (2015 Capital Project; Insured: BAM), 5.00% due 12/1/2025 | 1,000,000 | 1,216,610 |
| | Altoona Area School District (Insured: AGM) (State Aid Withholding) GO, 3.00% due 12/1/2022 | 1,335,000 | 1,396,944 |
| | City of Philadelphia (Insured: AGM) GO, 5.00% due 8/1/2025 - 8/1/2027 | 28,685,000 | 35,265,125 |
| | City of Philadelphia (Pennsylvania Gas Works), 5.00% due 10/1/2020 - 8/1/2025 | 12,200,000 | 13,918,473 |
| | City of Philadelphia (Water and Wastewater System), 5.00% due 10/1/2024 - 10/1/2026 | 5,455,000 | 6,547,838 |
| | City of Philadelphia GO, Series A, 5.00% due 8/1/2025 - 8/1/2026 | 25,130,000 | 30,403,676 |
| | City of Pittsburgh (Insured: BAM) GO, 5.00% due 9/1/2022 | 1,100,000 | 1,217,315 |
| | Commonwealth Financing Authority (Tobacco Master Settlement), 5.00% due 6/1/2023 | 930,000 | 1,039,991 |
| | Commonwealth of Pennsylvania (Capital Facilities Projects) GO, 5.00% due 3/15/2022 | 12,485,000 | 13,587,301 |
| | Commonwealth of Pennsylvania (Capital Facilities) GO, Series D, 5.00% due 8/15/2023 - 8/15/2025 | 49,450,000 | 57,623,874 |
| | Economy Borough Municipal Authority (Beaver County Sewer System; Insured: BAM), 4.00% due 12/15/2020 - 12/15/2022 | 1,785,000 | 1,897,020 |
| | Lancaster County Solid Waste Management Authority (Harrisburg Resource Recovery Facility), | | |
| | Series A, | | |
| | 5.00% due 12/15/2023 | 2,680,000 | 3,040,112 |
| | 5.25% due 12/15/2024 | 4,770,000 | 5,448,628 |
| | Luzerne County (Insured: AGM) GO, Series A, 5.00% due 11/15/2021 - 11/15/2024 | 11,840,000 | 13,232,269 |
| | Luzerne County Industrial Development Authority (Insured: AGM) GO, 5.00% due 12/15/2020 - 12/15/2027 | 6,545,000 | 7,296,730 |
| | Monroeville Finance Authority (University of Pittsburgh Medical Center), | | |
| | 5.00% due 2/15/2021 | 2,400,000 | 2,519,424 |
| e | 5.00% due 2/15/2022 | 1,250,000 | 1,355,450 |
| | Montgomery County Higher Education & Health Authority (Abington Memorial Hospital), 5.00% due 6/1/2022 | 3,000,000 | 3,272,340 |
| | Montgomery County Higher Education & Health Authority (Thomas Jefferson University Obligated Group), 5.00% due 9/1/2026 - 9/1/2029 | 4,140,000 | 5,134,638 |
| | Northampton Borough Municipal Authority (Water System; Insured: AGM), | | |
| | 3.00% due 5/15/2023 | 1,255,000 | 1,299,942 |
| | 4.00% due 5/15/2021 - 5/15/2022 | 1,685,000 | 1,780,327 |
| | Pennsylvania Economic Development Financing Authority, Series A, 5.00% due 11/15/2026 | 2,310,000 | 2,844,950 |
| | Pennsylvania Higher Educational Facilities Authority (Saint Joseph’s University), Series A, 5.00% due 11/1/2023 | 1,075,000 | 1,114,248 |
| | Pennsylvania Higher Educational Facilities Authority (Shippensburg University Student Services, Inc. Student Housing) ETM, 4.00% due 10/1/2022 | 2,075,000 | 2,177,069 |
| | Pennsylvania Higher Educational Facilities Authority (University of Pennsylvania Health System), 5.00% due 8/15/2027 | 1,000,000 | 1,260,840 |
| | Pennsylvania Higher Educational Facilities Authority (University of Pittsburgh Medical Center), Series E, 5.00% due 5/15/2020 | 5,100,000 | 5,214,699 |
| c | Pennsylvania State University, Series B-REMK 06/01/18, 1.58% due 6/1/2031 (put 6/1/2020) | 12,500,000 | 12,506,500 |
Schedule of Investments, Continued
Thornburg Limited Term Municipal Fund | September 30, 2019
| | | PRINCIPAL
AMOUNT | VALUE |
| | Pennsylvania Turnpike Commission, Series A-1, 5.00% due 12/1/2022 - 12/1/2027 | $ 5,050,000 | $ 6,131,153 |
| | Philadelphia Authority for Industrial Development (Mast Charter School) ETM, 5.00% due 8/1/2020 | 115,000 | 118,375 |
| | Philadelphia Authority for Industrial Development, 5.00% due 5/1/2024 - 5/1/2028 | 2,975,000 | 3,607,642 |
| | Philadelphia Municipal Authority (Juvenile Justice Services Center), 5.00% due 4/1/2021 - 4/1/2027 | 7,850,000 | 8,989,713 |
| | Philadelphia School District (State Aid Withholding) GO, Series E, 5.25% due 9/1/2021 | 2,265,000 | 2,343,663 |
| | Pittsburgh Water and Sewer Authority ETM, Series B, 5.00% due 9/1/2023 | 2,520,000 | 2,865,341 |
| | Pittsburgh Water and Sewer Authority, | | |
| | Series A, 5.00% due 9/1/2024 | 7,365,000 | 8,310,666 |
| | Series B, 5.00% due 9/1/2024 (pre-refunded 9/1/2023) | 2,395,000 | 2,723,211 |
| | Plum Borough School District (Insured: BAM) (State Aid Withholding) GO, | | |
| | Series A, 5.00% due 9/15/2022 - 9/15/2024 | 4,790,000 | 5,353,891 |
| | Series B, 5.00% due 9/15/2023 | 470,000 | 530,348 |
| | Series C, 4.00% due 9/15/2020 - 9/15/2021 | 3,065,000 | 3,170,813 |
| | School District of Philadelphia (State Aid Withholding) GO, Series A, 5.00% due 9/1/2023 - 9/1/2028 | 2,400,000 | 2,843,906 |
| | Southeastern Pennsylvania Transportation Authority, 5.00% due 6/1/2022 - 6/1/2028 | 7,705,000 | 9,316,781 |
| | Rhode Island — 1.5% | | |
| | Rhode Island Clean Water Finance Agency (Public Drinking Water Supply or Treatment Facilities), | | |
| | Series B, | | |
| | 5.00% due 10/1/2019 - 10/1/2023 | 7,210,000 | 7,857,934 |
| e | 5.00% due 10/1/2021 | 2,000,000 | 2,147,900 |
| | Rhode Island Convention Center Authority (Convention Center and Parking Projects), 5.00% due 5/15/2020 | 5,890,000 | 6,020,228 |
| | Rhode Island Health and Educational Building Corp. (University of Rhode Island Auxiliary Enterprise), Series C, 5.00% due 9/15/2020 - 9/15/2023 | 2,150,000 | 2,361,383 |
| | Rhode Island Health and Educational Building Corp. (University of Rhode Island), Series B, 5.00% due 9/15/2020 - 9/15/2025 | 1,320,000 | 1,475,953 |
| | State of Rhode Island and Providence Plantations (Consolidated Capital Development Loan) GO, | | |
| | 5.00% due 8/1/2020 - 8/1/2022 | 34,725,000 | 37,126,398 |
| | Series A, 5.00% due 10/1/2019 | 5,000,000 | 5,000,000 |
| | Series B, 4.00% due 10/15/2020 - 10/15/2022 | 3,200,000 | 3,369,894 |
| | State of Rhode Island and Providence Plantations (Energy Conservation) COP, Series C, 5.00% due 4/1/2022 | 2,020,000 | 2,196,326 |
| | State of Rhode Island and Providence Plantations (Information Technology) COP, 5.00% due 11/1/2024 | 3,010,000 | 3,516,402 |
| | State of Rhode Island and Providence Plantations (Kent County Courthouse) COP, Series A, 5.00% due 10/1/2019 - 10/1/2023 | 7,575,000 | 8,187,250 |
| | State of Rhode Island and Providence Plantations (Training School) COP, Series B, 5.00% due 10/1/2020 - 10/1/2023 | 10,270,000 | 11,177,006 |
| | South Carolina — 0.7% | | |
| | Beaufort-Jasper Water & Sewer Authority (Waterworks & Sewer System), Series B, 5.00% due 3/1/2021 - 3/1/2025 | 4,750,000 | 5,346,932 |
| | Berkeley County School District (School Facility Equipment Acquisition), 5.00% due 12/1/2020 - 12/1/2024 | 3,550,000 | 4,000,169 |
| | Charleston County (South Aviation Ave. Construction), 5.00% due 12/1/2022 - 12/1/2023 | 4,270,000 | 4,842,997 |
| | City of Charleston Public Facilities Corp. (City of Charleston Project), Series A, 5.00% due 9/1/2020 - 9/1/2025 | 2,860,000 | 3,201,418 |
| b | City of Charleston Waterworks & Sewer System Revenue (Capital Improvement), Series B, 1.807% (LIBOR 1 Month + 0.37%) due 1/1/2035 (put 1/1/2022) | 17,800,000 | 17,816,020 |
| | Greenwood County (Self Regional Healthcare), Series B, 5.00% due 10/1/2022 | 1,000,000 | 1,087,290 |
| | SCAGO Educational Facilities Corp. (School District of Pickens County), 5.00% due 12/1/2021 - 12/1/2025 | 5,320,000 | 6,024,443 |
| | South Dakota — 0.1% | | |
| | South Dakota Building Authority, Series B, 5.00% due 6/1/2022 - 6/1/2024 | 1,500,000 | 1,679,785 |
| | South Dakota Health & Educational Facilities Authority (Avera Health), Series A, 5.00% due 7/1/2021 | 1,670,000 | 1,775,177 |
| | South Dakota Health & Educational Facilities Authority (Regional Health) ETM, 5.00% due 9/1/2020 | 1,000,000 | 1,033,680 |
| | South Dakota Health & Educational Facilities Authority (Sanford Health), 5.00% due 11/1/2021 - 11/1/2025 | 2,825,000 | 3,233,128 |
| | Tennessee — 0.4% | | |
| | Clarksville Natural Gas Acquisition Corp., 5.00% due 12/15/2019 | 6,000,000 | 6,040,800 |
| | State of Tennessee GO, | | |
| | Series A, 5.00% due 8/1/2020 | 2,000,000 | 2,061,740 |
| | Series B, 5.00% due 8/1/2020 | 2,000,000 | 2,061,740 |
| | Tennessee Energy Acquisition Corp. (The Gas Project), | | |
| | Series A, | | |
| c | 4.00% due 5/1/2048 (put 5/1/2023) | 13,750,000 | 14,703,012 |
| | 5.25% due 9/1/2023 | 1,025,000 | 1,152,592 |
| | Tennessee Energy Acquisition Corp., Series A, 5.25% due 9/1/2020 | 1,190,000 | 1,227,247 |
| | Texas — 13.3% | | |
| | Austin Convention Enterprises, Inc. (Convention Center Hotel First Tier), 5.00% due 1/1/2021 - 1/1/2027 | 3,680,000 | 4,167,106 |
| | Bexar County Hospital District (University Health System) GO, 5.00% due 2/15/2022 - 2/15/2027 | 7,355,000 | 8,596,403 |
| | Cities of Dallas and Fort Worth (DFW International Airport Terminal Renewal & Improvement Program), Series D, 5.25% due 11/1/2023 | 3,000,000 | 3,252,270 |
| | City of Austin (Water and Wastewater System), | | |
| | 5.00% due 11/15/2022 | 1,940,000 | 2,092,174 |
| | 5.00% due 11/15/2022 (pre-refunded 11/15/2021) | 700,000 | 752,739 |
Schedule of Investments, Continued
Thornburg Limited Term Municipal Fund | September 30, 2019
| | | PRINCIPAL
AMOUNT | VALUE |
| | City of Beaumont (Waterworks & Sewer System Improvements; Insured: AGM), Series A, 5.00% due 9/1/2023 - 9/1/2024 | $ 7,500,000 | $ 8,499,675 |
| | City of Beaumont GO, 5.00% due 3/1/2022 - 3/1/2026 | 3,930,000 | 4,559,913 |
| | City of Brownsville (Water, Wastewater & Electric Utilities Systems), | | |
| | 5.00% due 9/1/2022 | 1,300,000 | 1,427,660 |
| | Series A, 5.00% due 9/1/2020 - 9/1/2023 | 5,400,000 | 5,897,246 |
| | City of Bryan (Electric System Improvements), 5.00% due 7/1/2026 | 535,000 | 652,791 |
| | City of Dallas (Public Improvements) GO, 5.00% due 2/15/2022 - 2/15/2025 | 5,500,000 | 6,259,540 |
| | City of Dallas (Trinity River Corridor Infrastructure) GO, | | |
| | 5.00% due 2/15/2021 - 2/15/2026 | 22,605,000 | 25,813,309 |
| | Series A, 5.00% due 2/15/2024 | 10,235,000 | 11,470,262 |
| | City of Dallas GO, 5.00% due 2/15/2022 - 2/15/2023 | 18,955,000 | 20,565,044 |
| | City of Houston (Combined Utility System), | | |
| | Series C, | | |
| b | 1.792% (LIBOR 1 Month + 0.36%) due 5/15/2034 (put 8/1/2021) | 23,525,000 | 23,526,176 |
| | 5.00% due 5/15/2022 - 5/15/2024 | 14,695,000 | 16,735,344 |
| | Series D, 5.00% due 11/15/2022 - 11/15/2024 | 17,535,000 | 20,012,282 |
| | City of Houston (Convention & Entertainment Facilities), 5.00% due 9/1/2020 - 9/1/2024 | 3,965,000 | 4,351,707 |
| | City of Houston (Convention & Entertainment Facilities; Insured: AGM/AMBAC), Series B, Zero Coupon due 9/1/2020 | 3,650,000 | 3,601,455 |
| | City of Houston (Convention & Entertainment), 5.00% due 9/1/2025 - 9/1/2029 | 6,415,000 | 7,966,126 |
| | City of Houston (Public Improvements) GO, Series A, 5.00% due 3/1/2020 - 3/1/2028 | 62,905,000 | 72,434,292 |
| | City of Laredo (Acquire & Purchase Personal Property) GO, | | |
| e | 5.00% due 2/15/2020 | 735,000 | 744,974 |
| | 5.00% due 2/15/2021 - 2/15/2026 | 5,280,000 | 6,020,977 |
| | City of Laredo (City Infrastructure Improvements) GO, | | |
| | Series A, | | |
| | 4.00% due 2/15/2020 | 110,000 | 111,089 |
| | 5.00% due 2/15/2021 - 2/15/2027 | 2,875,000 | 3,389,114 |
| | City of Laredo (Sports Venues; Insured: AGM), 5.00% due 3/15/2021 - 3/15/2024 | 4,400,000 | 4,809,524 |
| | City of Lubbock (Waterworks System) GO, 5.00% due 2/15/2020 - 2/15/2025 | 41,750,000 | 46,885,068 |
| | City of McAllen (International Toll Bridge System; Insured: AGM), Series A, 5.00% due 3/1/2024 - 3/1/2027 | 3,015,000 | 3,550,420 |
| | City of Olmos Park Higher Education Facilities Corp. (University of the Incarnate Word), 5.00% due 12/1/2020 - 12/1/2021 | 4,620,000 | 4,839,048 |
| | City of San Antonio (CPS Energy), 5.25% due 2/1/2024 | 7,000,000 | 8,148,910 |
| | City of San Antonio (Electric and Gas Systems), | | |
| c | Series A, 2.25% due 2/1/2033 (put 12/1/2019) | 4,655,000 | 4,661,005 |
| c | Series C, 3.00% due 12/1/2045 (put 12/1/2019) | 5,200,000 | 5,213,052 |
| | City of San Antonio (San Antonio Water System), Series A, 5.00% due 5/15/2023 - 5/15/2026 | 3,700,000 | 4,353,368 |
| | City of San Antonio Public Facilities Corp. (Convention Center Refinancing & Expansion), 5.00% due 9/15/2022 | 1,450,000 | 1,599,118 |
| | City of Texas City Industrial Development Corp. (ARCO Pipe Line Co. Project), 7.375% due 10/1/2020 | 4,000,000 | 4,230,080 |
| | Clifton Higher Education Finance Corp. (IDEA Public Schools), 5.00% due 8/15/2023 | 1,100,000 | 1,179,574 |
| | Corpus Christi Business and Job Development Corp. (Seawall Project), 5.00% due 3/1/2021 | 625,000 | 657,013 |
| | Cypress-Fairbanks Independent School District (Guaranty: PSF) ISD GO, | | |
| c | Series A-2- REMK, 1.25% due 2/15/2036 (put 8/15/2022) | 5,500,000 | 5,464,525 |
| c | Series B-3- REMK, 1.25% due 2/15/2040 (put 8/15/2022) | 7,000,000 | 6,954,850 |
| | Dallas County Utility & Reclamation District GO, 5.00% due 2/15/2020 - 2/15/2027 | 16,485,000 | 18,889,805 |
| | Dallas Independent School District (Guaranty: PSF) ISD GO, | | |
| | 5.00% due 2/15/2036 (pre-refunded 2/15/2022) | 760,000 | 824,836 |
| c | 5.00% due 2/15/2036 (put 2/15/2022) | 3,155,000 | 3,408,851 |
| c | Dallas Independent School District (Guaranty: PSF) ISD, 5.00% due 2/15/2036 (pre-refunded 2/15/2022) | 60,000 | 65,192 |
| | Grayson County (State Highway Toll System) GO, | | |
| | 4.00% due 1/1/2020 | 2,000,000 | 2,013,500 |
| | 5.00% due 1/1/2022 | 3,000,000 | 3,239,550 |
| | Gulf Coast Waste Disposal Authority (Bayport Area Wastewater Treatment System; Insured: AGM), 5.00% due 10/1/2019 - 10/1/2025 | 6,485,000 | 7,039,414 |
| | Harris County (Flood Control), 5.00% due 10/1/2025 - 10/1/2027 | 14,305,000 | 17,903,308 |
| | Harris County (Tax Road) GO, Series A, 5.00% due 10/1/2025 - 10/1/2028 | 8,985,000 | 11,269,509 |
| | Harris County (Texas Permanent Improvement) GO, | | |
| | Series A, 5.00% due 10/1/2025 - 10/1/2027 | 11,565,000 | 14,484,120 |
| | Series B, 5.00% due 10/1/2019 - 10/1/2020 | 1,200,000 | 1,218,270 |
| b,f | Harris County Cultural Education Facilities Finance Corp. (Memorial Hermann Health System), Series B-REM, 1.955% (MUNIPSA + 0.38%) due 6/1/2032 (put 4/1/2021) | 21,375,000 | 21,366,877 |
| | Harris County Cultural Education Facilities Finance Corp. (Memorial Hermann Health), Series A, 5.00% due 12/1/2022 - 12/1/2025 | 6,445,000 | 7,513,012 |
| | Harris County Cultural Education Facilities Finance Corp. (TECO Project), 5.00% due 11/15/2020 - 11/15/2027 | 5,825,000 | 6,887,370 |
| | Harris County Cultural Education Facilities Finance Corp. (Texas Medical Center Central Heating & Cooling Services Corp.), Series A, 5.00% due 11/15/2019 | 1,000,000 | 1,004,290 |
Schedule of Investments, Continued
Thornburg Limited Term Municipal Fund | September 30, 2019
| | | PRINCIPAL
AMOUNT | VALUE |
| a | Harris County Cultural Education Facilities Finance Corp. (Texas Medical Center; LOC JP Morgan Chase Bank, N.A.), Series B-2, 1.77% due 9/1/2031 (put 10/1/2019) | $ 330,000 | $ 330,000 |
| a | Harris County Cultural Education Facilities Finance Corp. (Texas Medical Center; LOC JPMorgan Chase Bank, N.A.), Series B-1, 1.77% due 9/1/2031 (put 10/1/2019) | 5,325,000 | 5,325,000 |
| | Harris County-Houston Sports Authority (Insured: AGM), Series A, 5.00% due 11/15/2022 - 11/15/2024 | 23,315,000 | 26,646,722 |
| | Hays County GO, 5.00% due 2/15/2022 - 2/15/2025 | 4,050,000 | 4,580,927 |
| | Houston Airport System Revenue, | | |
| | Series B, 5.00% due 7/1/2020 - 7/1/2028 | 10,380,000 | 12,548,639 |
| | Series D, 5.00% due 7/1/2027 | 3,355,000 | 4,202,171 |
| | Houston Higher Education Finance Corp. (Cosmos Foundation, Inc.) ETM, Series A, 5.875% due 5/15/2021 | 615,000 | 642,903 |
| | Houston Higher Education Finance Corp. (KIPP, Inc.; Guaranty: PSF), | | |
| e | 5.00% due 8/15/2021 | 300,000 | 319,911 |
| | 5.00% due 8/15/2022 | 1,185,000 | 1,301,035 |
| | Houston Independent School District (Guaranty: PSF) ISD, | | |
| c | 2.40% due 6/1/2030 (put 6/1/2021) | 4,000,000 | 4,058,920 |
| c | Series A-1B, 2.20% due 6/1/2039 (put 6/1/2020) | 7,715,000 | 7,749,486 |
| c | Houston Independent School District (Insured: PSF-GTD) GO, Series B-REM, 2.40% due 6/1/2036 (put 6/1/2021) | 1,725,000 | 1,750,409 |
| | Katy (Educational Facilities Improvements; Guaranty: PSF) ISD GO, Series A, 5.00% due 2/15/2023 - 2/15/2026 | 9,670,000 | 11,412,736 |
| | Keller (Guaranty: PSF) ISD GO, Series A, 5.00% due 8/15/2023 | 1,715,000 | 1,950,109 |
| | La Salle County (Insured: AGM) GO, 5.00% due 3/1/2022 - 3/1/2028 | 18,885,000 | 22,590,820 |
| | Laredo Community College District (School Facilities Improvements) GO, 5.00% due 8/1/2020 - 8/1/2024 | 3,340,000 | 3,636,180 |
| | Lower Colorado River Authority, | | |
| | Series A, | | |
| | 5.00% due 5/15/2025 | 8,020,000 | 8,755,675 |
| | 5.00% due 5/15/2025 (pre-refunded 5/15/2022) | 55,000 | 60,104 |
| | Metropolitan Transit Authority of Harris County, | | |
| | 5.00% due 11/1/2022 - 11/1/2028 | 18,750,000 | 22,825,401 |
| | Series D, 5.00% due 11/1/2019 - 11/1/2027 | 12,880,000 | 14,366,216 |
| | New Caney (Guaranty: PSF) ISD GO, 5.00% due 2/15/2024 | 865,000 | 955,868 |
| | North Harris County Regional Water Authority (Regional Water Production Design, Acquisition and Construction), 5.00% due 12/15/2020 - 12/15/2026 | 6,490,000 | 7,523,866 |
| | North Texas Tollway Authority (North Texas Tollway System), Series A 5.00% due 1/1/2026 - 1/1/2029 | 7,550,000 | 9,462,332 |
| c | Pflugerville Independent School District (Guaranty: PSF) ISD GO, Series A, 2.25% due 8/15/2037 (put 8/15/2022) | 2,750,000 | 2,810,802 |
| | Round Rock (Educational Facilities Improvements) ISD GO, 5.00% due 8/1/2026 - 8/1/2027 | 2,100,000 | 2,618,452 |
| | Round Rock (Educational Facilities Improvements; Guaranty: PSF) ISD GO, 5.00% due 8/1/2020 - 8/1/2026 | 3,245,000 | 3,678,772 |
| | Sam Rayburn Municipal Power Agency, 5.00% due 10/1/2019 - 10/1/2021 | 5,390,000 | 5,516,841 |
| | San Antonio Public Facilities Corp. (Convention Center Refinancing & Expansion), 5.00% due 9/15/2020 | 915,000 | 946,952 |
| | San Antonio Water System Series A 5.00% due 5/15/2020 - 5/15/2023 | 1,080,000 | 1,149,610 |
| | San Juan Higher Education Finance Authority (IDEA Public Schools), Series A, 5.125% due 8/15/2020 | 300,000 | 307,062 |
| | State of Texas (Trans), 4.00% due 8/27/2020 | 106,500,000 | 109,049,610 |
| a | Tarrant County Cultural Education Facilities Finance Corp. (Baylor Scott & White Health Obligated Group; LOC TD Bank, N.A.), 1.77% due 11/15/2050 (put 10/1/2019) | 2,725,000 | 2,725,000 |
| | Tarrant Regional Water District, | | |
| | Series A, | | |
| | 2.00% due 3/1/2020 | 800,000 | 802,464 |
| | 5.00% due 3/1/2021 - 3/1/2027 | 8,850,000 | 10,352,580 |
| | Texas Transportation Commission (Central Texas Turnpike System), Series C, 5.00% due 8/15/2022 - 8/15/2024 | 2,130,000 | 2,415,592 |
| | Texas Transportation Commission (Highway Improvements) GO, 5.00% due 4/1/2022 - 4/1/2024 | 10,380,000 | 11,743,725 |
| | Texas Transportation Commission State Highway Fund, Series A, 5.00% due 4/1/2024 | 1,650,000 | 1,914,445 |
| | Walnut Creek Special Utility District (Water System Improvements; Insured: BAM), | | |
| e | 4.00% due 1/10/2020 | 520,000 | 523,734 |
| | 4.00% due 1/10/2021 | 445,000 | 458,675 |
| | 5.00% due 1/10/2022 - 1/10/2024 | 1,275,000 | 1,415,628 |
| | U. S. Virgin Islands — 0.0% | | |
| | Virgin Islands Public Finance Authority (Diageo Project), 6.75% due 10/1/2019 | 1,750,000 | 1,750,000 |
| | Utah — 1.8% | | |
| a | City of Murray (IHC Health Services, Inc. Obligated Group; SPA Barclays Bank plc), Series C, 1.75% due 5/15/2037 (put 10/1/2019) | 13,165,000 | 13,165,000 |
| a | City of Murray (IHC Health Services, Inc. Obligated Group; SPA JPMorgan Chase Bank, N.A.), Series A, 1.75% due 5/15/2037 (put 10/1/2019) | 9,120,000 | 9,120,000 |
| c | County of Utah, (IHC Health Services, Inc. Obligated Group), Series B, 5.00% due 5/15/2056 (put 8/1/2022) | 7,500,000 | 8,168,025 |
| | County of Weber (IHC Health Services, Inc. Obligated Group; SPA The Bank of NY Mellon), | | |
| a | Series A, 1.75% due 2/15/2031 (put 10/1/2019) | 16,690,000 | 16,690,000 |
| a | Series C, 1.75% due 2/15/2035 (put 10/1/2019) | 19,715,000 | 19,715,000 |
| | Utah State Board of Regents (Insured; Natl-Re), Series A, 5.50% due 4/1/2029 | 30,365,000 | 39,108,905 |
Schedule of Investments, Continued
Thornburg Limited Term Municipal Fund | September 30, 2019
| | | PRINCIPAL
AMOUNT | VALUE |
| | Utah Transit Authority (Integrated Mass Transit System), Series A-SUB, 5.00% due 6/15/2022 - 6/15/2025 | $ 3,545,000 | $ 4,091,888 |
| | Vermont — 0.2% | | |
| | Vermont (Vermont Public Service Corp.) EDA, 5.00% due 12/15/2020 | 14,250,000 | 14,768,130 |
| | Virginia — 0.2% | | |
| | Fairfax County (Inova Health System) IDA, | | |
| | 4.00% due 5/15/2022 | 5,500,000 | 5,879,775 |
| | 5.00% due 5/15/2022 | 5,000,000 | 5,473,550 |
| | Washington — 2.6% | | |
| | Clark County School District No 37 Vancouver (State Aid Withholding) GO, 5.00% due 12/1/2026 - 12/1/2029 | 5,150,000 | 6,688,051 |
| | Energy Northwest (Nine Canyon Wind Project Phase I-III), 5.00% due 7/1/2020 - 7/1/2025 | 6,850,000 | 7,413,544 |
| | Marysville School District No. 25 (Snohomish County Educational Facilities) (State Aid Withholding) GO, 5.00% due 12/1/2019 - 12/1/2023 | 9,085,000 | 9,826,725 |
| | Skagit County Public Hospital District No. 1 (Skagit Regional Health) GO, 5.00% due 12/1/2019 - 12/1/2022 | 10,035,000 | 10,731,047 |
| | Skagit County Public Hospital District No. 1 (Skagit Regional Health), Series A, 5.00% due 12/1/2019 - 12/1/2023 | 3,245,000 | 3,469,705 |
| | Skagit County Public Hospital District No. 2 (Island Hospital) GO, | | |
| | 4.00% due 12/1/2019 - 12/1/2021 | 3,000,000 | 3,087,850 |
| | 5.00% due 12/1/2022 | 1,700,000 | 1,883,549 |
| | State of Washington (Capital Projects) GO, Series R-G-Ref, 5.00% due 7/1/2025 | 10,475,000 | 12,433,511 |
| | State of Washington (Public Highway, Bridge, Ferry Capital and Operating Costs; Insured: Natl-Re) GO, Series F, Zero Coupon due 12/1/2019 | 3,030,000 | 3,023,213 |
| | State of Washington (State and Local Agency Real and Personal Property Projects) (Insured: State Intercept) COP, 5.00% due 7/1/2020 - 7/1/2022 | 9,415,000 | 10,002,062 |
| | State of Washington (State and Local Agency Real and Personal Property Projects) COP, Series A, 5.00% due 7/1/2024 - 7/1/2027 | 17,775,000 | 21,579,604 |
| | State of Washington (Various Purposes) GO, Series C, 5.00% due 2/1/2025 - 2/1/2029 | 50,385,000 | 62,822,984 |
| | Tacoma School District No.10 (Pierce County Capital Projects) (State Aid Withholding) GO, 5.00% due 12/1/2019 - 12/1/2020 | 4,500,000 | 4,617,835 |
| | Washington Health Care Facilities Authority (Overlake Hospital Medical Center) ETM, 4.75% due 7/1/2020 | 1,000,000 | 1,025,700 |
| | West Virginia — 0.5% | | |
| | Mason County (Appalachian Power Co.), Series L, 2.75% due 10/1/2022 | 15,000,000 | 15,493,650 |
| | West Virginia Economic Development Authority, (Appalachian Power Co.), | | |
| c | 2.625% due 12/1/2042 (put 6/1/2022) | 6,000,000 | 6,170,160 |
| c | Series A, 2.625% due 12/1/2042 (put 6/1/2022) | 2,500,000 | 2,570,900 |
| | West Virginia Higher Education Policy Commission (Higher Education Facilities), Series A, 5.00% due 4/1/2020 - 4/1/2022 | 3,500,000 | 3,702,850 |
| | Wisconsin — 1.3% | | |
| | Wisconsin Health & Educational Facilities Authority (Advocate Aurora Health Obligated Group), | | |
| c | 5.00% due 8/15/2054 (put 1/25/2023) | 10,485,000 | 11,679,661 |
| c | 5.00% due 8/15/2054 (put 1/26/2022) | 9,520,000 | 10,300,925 |
| c | 5.00% due 8/15/2054 (put 1/29/2025) | 16,065,000 | 18,818,220 |
| | Wisconsin Health & Educational Facilities Authority (Agnesian Healthcare, Inc.) ETM, | | |
| e | 5.00% due 7/1/2020 | 730,000 | 749,841 |
| | 5.00% due 7/1/2020 | 1,380,000 | 1,417,508 |
| | Wisconsin Health & Educational Facilities Authority (Ascension Health Alliance System), | | |
| | 5.00% due 11/15/2025 - 11/15/2026 | 3,235,000 | 3,944,057 |
| c | 5.00% due 11/15/2043 (put 6/1/2021) | 10,000,000 | 10,593,300 |
| d | Wisconsin Health & Educational Facilities Authority (Marquette University), 5.00% due 10/1/2023 - 10/1/2026 | 1,575,000 | 1,870,358 |
| | Wisconsin Health & Educational Facilities Authority (ProHealth Care, Inc.), 5.00% due 8/15/2020 - 8/15/2022 | 5,250,000 | 5,559,885 |
| | Wisconsin Health & Educational Facilities Authority (UnityPoint Health), Series A, 5.00% due 12/1/2022 | 1,000,000 | 1,109,940 |
| | Wisconsin Housing & Economic Development Authority (Collateralized: FNMA), | | |
| | Series C, | | |
| | 1.65% due 9/1/2026 | 1,615,000 | 1,585,462 |
| | 1.70% due 3/1/2027 | 1,605,000 | 1,576,848 |
| | 1.75% due 9/1/2027 | 1,645,000 | 1,615,193 |
| | 1.80% due 3/1/2028 | 1,660,000 | 1,627,431 |
| | 1.85% due 9/1/2028 | 1,680,000 | 1,648,702 |
| | 1.95% due 3/1/2029 | 1,695,000 | 1,662,812 |
| | WPPI Energy (Power Supply System), Series A, 5.00% due 7/1/2021 | 4,100,000 | 4,358,956 |
| | WPPI Energy, Series A, 5.00% due 7/1/2022 - 7/1/2028 | 1,835,000 | 2,157,456 |
| | Total Investments — 99.2%(Cost $5,912,944,183) | | $6,084,463,696 |
| | Other Assets Less Liabilities — 0.8% | | 50,229,694 |
| | Net Assets — 100.0% | | $6,134,693,390 |
Schedule of Investments, Continued
Thornburg Limited Term Municipal Fund | September 30, 2019
| Footnote Legend |
| a | Variable Rate Demand Notes are instruments whose interest rates change on a specific date (such as coupon date or interest payment date) or whose interest rates vary with changes in a designated base rate (such as the prime interest rate). This instrument is payable on demand and is secured by letters of credit or other credit support agreements from major banks. |
| b | Floating Rate Security. Stated interest/floor rate was in effect at September 30, 2019. |
| c | Variable Rate Demand Obligations are instruments whose interest rates change on a mandatory date (demand date) or whose interest rates will vary with changes in a designated base rate. The rate disclosed is the rate at September 30, 2019. |
| d | When-issued security. |
| e | Segregated as collateral for a when-issued security. |
| f | Securities exempt from registration under Rule 144A of the Securities Act of 1933, as amended. These securities are restricted and may only be resold in the ordinary course of business in transactions exempt from registration, normally to qualified institutional buyers. As of September 30, 2019, the aggregate value of these securities in the Fund’s portfolio was $21,366,877, representing 0.35% of the Fund’s net assets. |
Portfolio Abbreviations
To simplify the listings of securities, abbreviations are used per the table below:
| AGC | Insured by Associated General Contractors |
| AGM | Insured by Assured Guaranty Municipal Corp. |
| AMBAC | Insured by American Municipal Bond Assurance Corp. |
| BAM | Insured by Build America Mutual Insurance Co. |
| BHAC | Insured by Berkshire Hathaway Assurance Corp. |
| BHAC-CR | Berkshire Hathaway Assurance Corp. Custodial Receipts |
| COP | Certificates of Participation |
| DFA | Development Finance Authority |
| EDA | Economic Development Authority |
| ETM | Escrowed to Maturity |
| FGIC | Insured by Financial Guaranty Insurance Co. |
| FHLMC | Insured by Federal Home Loan Mortgage Corp. |
| FNMA | Collateralized by Federal National Mortgage Association |
| GNMA | Collateralized by Government National Mortgage Association |
| GO | General Obligation |
| GRT | Gross Receipts Tax |
| HFA | Health Facilities Authority |
| HFFA | Health Facilities Financing Authority |
| IDA | Industrial Development Authority |
| ISD | Independent School District |
| LIBOR | London Interbank Offered Rates |
| LOC | Letter of Credit |
| Mtg | Mortgage |
| MUNIPSA | Securities Industry and Financial Markets Association (SIFMA) Municipal Swap Index |
| Natl-Re | Insured by National Public Finance Guarantee Corp. |
| PSF | Guaranteed by Permanent School Fund |
| Q-SBLF | Insured by Qualified School Bond Loan Fund |
| SPA | Stand-by Purchase Agreement |
| Syncora | Insured by Syncora Guarantee Inc. |
| USD | Unified School District |
See notes to financial statements.
Statement of Assets and Liabilities
Thornburg Limited Term Municipal Fund | September 30, 2019
| ASSETS | |
| Investments at value (cost $5,912,944,183) (Note 3) | $ 6,084,463,696 |
| Cash | 49,993 |
| Receivable for investments sold | 15,668,731 |
| Receivable for fund shares sold | 10,254,306 |
| Interest receivable | 64,461,104 |
| Prepaid expenses and other assets | 214,278 |
| Total Assets | 6,175,112,108 |
| Liabilities | |
| Payable for investments purchased | 27,297,564 |
| Payable for fund shares redeemed | 8,837,354 |
| Payable to investment advisor and other affiliates (Note 4) | 2,156,782 |
| Accounts payable and accrued expenses | 1,125,655 |
| Dividends payable | 1,001,363 |
| Total Liabilities | 40,418,718 |
| Net Assets | $ 6,134,693,390 |
| NET ASSETS CONSIST OF | |
| Distributable earnings | $ 137,399,646 |
| Net capital paid in on shares of beneficial interest | 5,997,293,744 |
| | $ 6,134,693,390 |
| NET ASSET VALUE | |
| Class A Shares: | |
Net asset value and redemption price per share
($915,684,656 applicable to 63,345,546 shares of beneficial interest outstanding - Note 5) | $ 14.46 |
| Maximum sales charge, 1.50% of offering price | 0.22 |
| Maximum offering price per share | $ 14.68 |
| Class C Shares: | |
Net asset value and offering price per share*
($325,144,050 applicable to 22,452,642 shares of beneficial interest outstanding - Note 5) | $ 14.48 |
| Class I Shares: | |
Net asset value, offering and redemption price per share
($4,893,864,684 applicable to 338,511,183 shares of beneficial interest outstanding - Note 5) | $ 14.46 |
| * | Redemption price per share is equal to net asset value less any applicable contingent deferred sales charge. |
See notes to financial statements.
Statement of Operations
Thornburg Limited Term Municipal Fund | Year Ended September 30, 2019
| INVESTMENT INCOME | |
| Interest income (net of premium amortized of $100,876,382) | $ 154,433,852 |
| EXPENSES | |
| Investment advisory fees (Note 4) | 16,679,954 |
| Administration fees (Note 4) | |
| Class A Shares | 867,255 |
| Class C Shares | 346,861 |
| Class I Shares | 4,222,779 |
| Distribution and service fees (Note 4) | |
| Class A Shares | 2,469,231 |
| Class C Shares | 1,974,882 |
| Transfer agent fees | |
| Class A Shares | 631,253 |
| Class C Shares | 227,863 |
| Class I Shares | 3,464,049 |
| Registration and filing fees | |
| Class A Shares | 31,722 |
| Class C Shares | 20,954 |
| Class I Shares | 101,385 |
| Custodian fees | 304,333 |
| Professional fees | 153,826 |
| Trustee and officer fees (Note 4) | 392,251 |
| Other expenses | 389,229 |
| Total Expenses | 32,277,827 |
| Net Investment Income | $ 122,156,025 |
| REALIZED AND UNREALIZED GAIN (LOSS) | |
| Net realized gain (loss) on investments | (11,356,119) |
| Net change in unrealized appreciation (depreciation) on investments | 165,364,756 |
| Net Realized and Unrealized Gain | 154,008,637 |
| Net Increase in Net Assets Resulting from Operations | $ 276,164,662 |
See notes to financial statements.
Statements of Changes in Net Assets
Thornburg Limited Term Municipal Fund
| | Year Ended
September 30, 2019 | Year Ended
September 30, 2018 |
| INCREASE (DECREASE) IN NET ASSETS FROM | | |
| OPERATIONS | | |
| Net investment income | $ 122,156,025 | $ 128,531,531 |
| Net realized gain (loss) on investments | (11,356,119) | 2,140,529 |
| Net change in unrealized appreciation (depreciation) on investments | 165,364,756 | (166,568,493) |
| Net Increase (Decrease) in Net Assets Resulting from Operations | 276,164,662 | (35,896,433) |
| DIVIDENDS TO SHAREHOLDERS | | |
| From distributable earnings | | |
| Class A Shares | (17,773,721) | (19,574,441) |
| Class C Shares | (6,148,179) | (7,623,811) |
| Class I Shares | (98,235,022) | (101,333,279) |
| FUND SHARE TRANSACTIONS (NOTE 5) | | |
| Class A Shares | (146,463,605) | (248,125,740) |
| Class C Shares | (135,672,142) | (142,631,526) |
| Class I Shares | (315,109,295) | (52,452,302) |
| Net Decrease in Net Assets | (443,237,302) | (607,637,532) |
| NET ASSETS | | |
| Beginning of Year | 6,577,930,692 | 7,185,568,224 |
| End of Year | $ 6,134,693,390 | $ 6,577,930,692 |
See notes to financial statements.
Notes to Financial Statements
Thornburg Limited Term Municipal Fund | September 30, 2019
NOTE 1 – ORGANIZATION
Thornburg Limited Term Municipal Fund (the “Fund”) is a diversified series of Thornburg Investment Trust (the “Trust”). The Trust was organized as a Massachusetts business trust under a Declaration of Trust dated June 3, 1987 and is registered as a diversified, open-end management investment company under the Investment Company Act of 1940, as amended (the "1940 Act"). The Fund is currently one of twenty-two separate series of the Trust. Each series is considered to be a separate entity for financial reporting and tax purposes and bears expenses directly attributable to it. The Fund’s primary investment objective is to obtain as high a level of current income exempt from federal individual income taxes as is consistent, in the view of Thornburg Investment Management, Inc., the Trust’s investment advisor (the “Advisor”), with the preservation of capital. The Fund’s secondary objective is to reduce expected changes in its share price compared to longer intermediate and long-term bond portfolios.
The Fund currently offers three classes of shares of beneficial interest: Class A, Class C, and Institutional Class (“Class I”). Each class of shares of the Fund represents an interest in the same portfolio of investments, except that (i) Class A shares are sold subject to a front-end sales charge collected at the time the shares are purchased and bear a service fee, (ii) Class C shares are sold at net asset value without a sales charge at the time of purchase, but are subject to a contingent deferred sales charge upon redemption within one year of purchase, and bear both a service fee and a distribution fee, (iii) Class I shares are sold at net asset value without a sales charge at the time of purchase and may be subject to a service fee, and (iv) the respective classes may have different reinvestment privileges and conversion rights. Additionally, the Fund may allocate among its classes certain expenses, to the extent allocable to specific classes, including administration fees, transfer agent fees, government registration fees, certain printing and postage costs, and administrative and legal expenses. Currently, class specific expenses of the Fund are limited to service and distribution fees and certain registration and transfer agent expenses.
The following is a summary of significant accounting policies followed by the Fund in the preparation of its financial statements. The Fund prepares its financial statements in conformity with United States generally accepted accounting principles (“GAAP”), including investment company accounting and reporting guidance in the Financial Accounting Standards Board (the “FASB”) Accounting Standard Codification Topic 946.
NOTE 2 – SIGNIFICANT ACCOUNTING POLICIES
Security Valuation: All investments in securities held by the Fund are valued as described in Note 3.
Allocation of Income, Gains, Losses and Expenses: Net investment income (other than class specific expenses) and realized and unrealized gains and losses are allocated daily to each class of shares based upon the relative net asset value of outstanding shares (or the value of the dividend-eligible shares, as appropriate) of each class of shares at the beginning of the day (after adjusting for the current capital shares activity of the respective class). Expenses common to all Funds are allocated among the Funds comprising the Trust based upon their relative net asset values or other appropriate allocation methods. Operating expenses directly attributable to a specific class are charged against the operating income of that class.
Dividends and Distributions to Shareholders: Dividends and distributions to shareholders, which are determined in accordance with federal income tax regulations and may differ from GAAP, are recorded on the ex-dividend date. Ordinary income dividends, if any, are declared daily and paid monthly. Capital gain distributions, if any, are declared and paid annually and more often if deemed necessary by the Advisor. Dividends and distributions are paid and are reinvested in additional shares of the Fund at net asset value per share at the close of business on the ex-dividend date, or at the shareholder’s option, paid in cash.
Investment Income: Interest income is accrued as earned. Premiums and discounts are amortized and accreted, respectively, to first call dates or maturity dates using the effective yield method of the respective investments. These amounts are included in Investment Income in the Statement of Operations.
Investment Transactions: Investment transactions are accounted for on a trade date basis. Realized gains and losses from the sale of investments are recorded on an identified cost basis.
When-Issued and Delayed Delivery Transactions: The Fund may engage in when-issued or delayed delivery transactions. To the extent the Fund engages in such transactions, it will do so for the purpose of acquiring portfolio investments consistent with the Fund’s investment objectives and not for the purpose of investment leverage or to speculate on interest rate or market changes. At the time the Fund makes a commitment to purchase an investment on a when-issued or delayed delivery basis, the Fund will record the transaction and reflect the value in determining its net asset value. When effecting such transactions, assets of an amount sufficient to make payment for the portfolio investments to be purchased will be segregated on the Fund’s records on the trade date. Investments purchased on a when-issued or delayed delivery basis do not earn interest until the settlement date. The values of these securities held at September 30, 2019 are detailed in the Schedule of Investments.
Notes to Financial Statements, Continued
Thornburg Limited Term Municipal Fund | September 30, 2019
Guarantees and Indemnifications: Under the Trust’s organizational documents (and under separate agreements with the independent Trustees), its officers and Trustees are provided with an indemnification against certain liabilities arising out of the performance of their duties to the Fund. In the normal course of business the Trust may also enter into contracts with service providers that contain general indemnifications. The Trust’s maximum exposure under these arrangements is unknown. However, based on experience, the Trust expects the risk of loss to be remote.
Use of Estimates: The preparation of financial statements in conformity with GAAP requires management to make estimates and assumptions that affect the reported amounts of assets and liabilities and disclosure of contingent assets and liabilities at the date of the financial statements and the reported amounts of increases (decreases) in net assets from operations during the reporting period. Actual results could differ from those estimates.
Federal Income Taxes: It is the policy of the Trust to comply with the provisions of the Internal Revenue Code applicable to regulated investment companies and to distribute to shareholders substantially all investment company taxable income including net realized gains on investments (if any), and tax exempt income of the Fund. Therefore, no provision for federal income or excise tax is required.
The Fund files income tax returns in United States federal and applicable state jurisdictions. The statute of limitations on the Fund’s tax return filings generally remains open for the three years following a return’s filing date. The Fund has analyzed each uncertain tax position believed to be material in the preparation of the Fund’s financial statements for the fiscal year ended September 30, 2019, including open tax years, to assess whether it is more likely than not that the position would be sustained upon examination, based on the technical merits of the position. The Fund has not identified any such position for which an asset or liability must be reflected in the Statement of Assets and Liabilities.
At September 30, 2019, information on the tax components of capital was as follows:
| Cost of investments for tax purposes | $ 5,912,944,183 |
| Gross unrealized appreciation on a tax basis | 173,064,267 |
| Gross unrealized depreciation on a tax basis | (1,544,754) |
| Net unrealized appreciation (depreciation) on investments (tax basis) | $ 171,519,513 |
At September 30, 2019, the Fund had deferred tax basis capital losses occurring subsequent to October 31, 2018 through September 30, 2019 of $11,325,459. For tax purposes, such losses will be recognized in the year ending September 30, 2020.
At September 30, 2019, the Fund had cumulative tax basis capital losses of $21,890,240 (of which $17,014,543 are short-term and $4,875,697 are long-term), which may be carried forward to offset future capital gains. To the extent such carryforwards are used, capital gain distributions may be reduced to the extent provided by regulations. Such capital loss carryforwards do not expire.
At September 30, 2019, the Fund had $97,195 of undistributed net tax-exempt income, no undistributed tax basis net ordinary income and no undistributed tax basis capital gains.
Distributions from tax exempt income paid by the Fund for the year ended September 30, 2019 and September 30, 2018 are excludable by shareholders from gross income for Federal income tax purposes.
The tax character of distributions paid during the year ended September 30, 2019, and September 30, 2018, was as follows:
| | 2019 | 2018 |
| Distributions from: | | |
| Tax exempt income | $ 122,138,207 | $ 128,508,169 |
| Ordinary income | 18,715 | 23,362 |
| Total | $ 122,156,922 | $ 128,531,531 |
NOTE 3 – SECURITY VALUATION
Valuation of the Fund’s portfolio investment securities is performed in accordance with policies and procedures adopted by and under the oversight of the Trustees.
The Trustees of the Trust have appointed the Advisor to assist the Trustees with obtaining fair market values for portfolio investments, evaluating and monitoring professional pricing service providers appointed by the Trustees’ Audit Committee (the “Audit Committee”) to assist in determining fair values for portfolio investments, assisting in calculating fair values for portfolio investments in certain
Notes to Financial Statements, Continued
Thornburg Limited Term Municipal Fund | September 30, 2019
circumstances, and performing other functions in connection with the valuation of investments. The Advisor acts through its Valuation and Pricing Committee (the “Committee”) and other employees of the Advisor. The Committee regularly reviews its own valuation calculations, reviews the valuations, valuation techniques and services furnished by pricing service providers, considers circumstances which may require valuation calculations by the Committee, and reviews previous valuation calculations. The Committee reports to the Audit Committee on the Committee’s activities, the performance of pricing service providers, and other matters relating to valuation of portfolio investments.
In those instances when the Committee assists in calculating a fair value for a portfolio investment, the Committee seeks to determine the price that the Fund would reasonably expect to receive upon a sale of the investment in an orderly transaction between market participants on the valuation date. The Committee customarily utilizes quotations from securities broker dealers in calculating valuations, but also may utilize prices obtained from pricing service providers or other methods approved by the Audit Committee. Because fair values calculated by the Committee are estimates, the calculation of a value for an investment may differ from the price that would be realized by the Fund upon a sale of the investment, and the difference could be material to the Fund’s financial statements. The Committee’s calculation of a fair value for an investment may also differ from the prices obtained by other persons (including other mutual funds) for the investment.
Valuation of Securities: Debt obligations held by the Fund which are not listed or traded on exchanges or for which no reported market exists are ordinarily valued at the valuation obtained from a pricing service provider approved by the Audit Committee.
In any case when a pricing service provider fails to provide a valuation for a debt obligation held by the Fund, the Committee calculates a fair value for the obligation using alternative methods under procedures approved by the Audit Committee. Additionally, in cases when management believes that a valuation obtained from a pricing service provider is stale, does not reflect material factors affecting the valuation of the investment, is significantly different than the value the Fund is likely to obtain if it sought a bid for the investment, or is otherwise unreliable, the Committee calculates a fair value for the obligation using an alternative method approved by the Audit Committee.
Valuation Hierarchy: The Fund categorizes its investments based upon the inputs used in valuing those investments, according to a three-level hierarchy established in guidance from the FASB. Categorization of investments using this hierarchy is intended by the FASB to maximize the use of observable inputs in valuing investments and minimize the use of unobservable inputs by requiring that the most observable inputs be used when available. Observable inputs are those that market participants would use in valuing an investment based on available market information. Unobservable inputs are those that reflect assumptions about the information market participants would use in valuing an investment. An investment’s level within the hierarchy is based on the lowest level input that is deemed significant to the valuation. The methodologies and inputs used to value investments are not necessarily indications of the risk or liquidity associated with those investments.
Various inputs are used in calculating valuations for the Fund’s investments. These inputs are generally summarized according to the three-level hierarchy below:
Level 1: Quoted prices in active markets for identical investments.
Level 2: Other direct or indirect significant observable inputs (including quoted prices for similar investments in active markets and other observable inputs, such as interest rates, prepayment rates, credit ratings, etc.).
Level 3: Significant unobservable inputs (including the Committee’s own assumptions in calculating the fair values of investments).
Valuations for debt obligations held by the Fund are typically calculated by pricing service providers approved by the Audit Committee and are generally characterized as Level 2 within the valuation hierarchy.
In a limited number of cases the Committee calculates a fair value for investments using broker quotations or other methods approved by the Audit Committee. When the Committee uses a single broker quotation to calculate a fair value for an investment without other significant observable inputs, or if a fair value is calculated using other significant inputs that are considered unobservable, the investment is characterized as Level 3 within the hierarchy. Other significant unobservable inputs used to calculate a fair value in these instances might include an income-based valuation approach which considers discounted anticipated future cash flows from the investment and application of discounts due to the nature or duration of any restrictions on the disposition of the investment.
Valuations based upon the use of inputs from Levels 1, 2 or 3 may not represent the actual price received upon the disposition of an investment, and a Fund may receive a price that is lower than the valuation based upon these inputs when it sells the investment.
Notes to Financial Statements, Continued
Thornburg Limited Term Municipal Fund | September 30, 2019
The following table displays a summary of the fair value hierarchy measurements of the Fund’s investments as of September 30, 2019:
| | Fair Value Measurements at September 30, 2019 |
| | TOTAL | LEVEL 1 | LEVEL 2 | LEVEL 3 |
| Assets | | | | |
| Investments in Securities | | | | |
| Municipal Bonds | $ 6,084,463,696 | $ — | $ 6,084,463,696 | $ — |
| Total Investments in Securities | $6,084,463,696 | $— | $6,084,463,696 | $— |
| Total Assets | $6,084,463,696 | $— | $6,084,463,696 | $— |
NOTE 4 – INVESTMENT ADVISORY FEE AND OTHER TRANSACTIONS WITH AFFILIATES
Pursuant to an investment advisory agreement, the Advisor serves as the investment advisor and performs services for the Fund for which the fees are payable at the end of each month. Under the investment advisory agreement, the Fund pays the Advisor a management fee based on the average daily net assets of the Fund at an annual rate as shown in the following table:
| Management Fee Schedule |
| DAILY NET ASSETS | FEE RATE |
| Up to $500 million | 0.500% |
| Next $500 million | 0.400 |
| Next $500 million | 0.300 |
| Next $500 million | 0.250 |
| Over $2 billion | 0.225 |
The Fund’s effective management fee for the year ended September 30, 2019 was 0.269% of the Fund’s average daily net assets. Total management fees incurred by the Fund for the year ended September 30, 2019 are set forth in the Statement of Operations.
The Trust has entered into an administrative services agreement with the Advisor, whereby the Advisor will perform certain administrative services related to each class of the Fund’s shares. The fees are computed as an annual percentage of the aggregate average daily net assets of all shares classes of all Funds in the Trust as follows:
| Administration Fee Schedule |
| Daily Net Assets | Fee Rate |
| Up to $20 billion | 0.100% |
| $20 billion to $40 billion | 0.075 |
| $40 billion to $60 billion | 0.040 |
| Over $60 billion | 0.030 |
The aggregate fee amount is allocated on a daily basis to each Fund based on net assets and subsequently allocated to each class of shares of the Fund. Total administrative service fees incurred by each class of shares of the Fund for the year ended September 30, 2019, are set forth in the Statement of Operations.
The Trust has an underwriting agreement with Thornburg Securities Corporation (the “Distributor”), an affiliate of the Advisor, which acts as the distributor of the Fund’s shares. For the year ended September 30, 2019, the Distributor has advised the Fund that it earned net commissions aggregating $4,757 from the sale of Class A shares, and collected contingent deferred sales charges aggregating $16,032 from redemptions of Class C shares of the Fund.
Pursuant to a service plan under Rule 12b-1 of the 1940 Act, the Fund may pay to the Distributor or securities dealers and other financial institutions at the Distributor’s direction an amount not to exceed .25 of 1% per annum of the average daily net assets attributable to Class A and Class C shares of the Fund to obtain various shareholder and distribution related services. For the year ended September 30, 2019, there were no 12b-1 service plan fees charged for Class I shares. The Advisor and Distributor each may pay out of its own resources additional expenses for distribution of the Fund’s shares and shareholder services.
The Trust has also adopted a distribution plan pursuant to Rule 12b-1, applicable only to the Fund’s Class C shares, under which the Fund compensates the Distributor for services in promoting the sale of Class C shares of the Fund at an annual rate of up to .25 of 1% per annum of the average daily net assets attributable to Class C shares.
Notes to Financial Statements, Continued
Thornburg Limited Term Municipal Fund | September 30, 2019
Total fees incurred by each class of shares of the Fund under their respective service and distribution plans for the year ended September 30, 2019, are set forth in the Statement of Operations.
Certain officers and Trustees of the Trust are also officers or directors of the Advisor and Distributor. The compensation of the independent Trustees is borne by the Trust. The Trust also pays a portion of the Chief Compliance Officer’s compensation. These amounts are reflected as Trustee and officer fees in the Statement of Operations.
The percentage of direct investments in the Fund held by the Trustees, officers of the Trust, and the Advisor is approximately 1.64%.
The Fund may purchase or sell securities from or to an affiliated fund, provided the affiliation is due solely to having a common investment advisor, common officers, or common trustees, and provided that all such transactions will comply with Rule 17a-7 under the 1940 Act. For the year ended September 30, 2019, the Fund had transactions with affiliated funds of $69,584,662 in purchases and $52,002,706 in sales generating realized losses of $121,182.
NOTE 5 – SHARES OF BENEFICIAL INTEREST
At September 30, 2019, there were an unlimited number of shares with no par value of beneficial interest authorized. Transactions in shares of beneficial interest were as follows:
| | YEAR ENDED
September 30, 2019 | YEAR ENDED
September 30, 2018 |
| | SHARES | AMOUNT | SHARES | AMOUNT |
| Class A Shares | | | | |
| Shares sold | 13,658,346 | $ 195,633,417 | 10,903,871 | $ 155,220,953 |
Shares issued to shareholders in
reinvestment of dividends | 1,149,701 | 16,469,051 | 1,276,035 | 18,129,763 |
| Shares repurchased | (25,081,271) | (358,566,073) | (29,617,720) | (421,476,456) |
| Net decrease | (10,273,224) | $ (146,463,605) | (17,437,814) | $ (248,125,740) |
| Class C Shares | | | | |
| Shares sold | 1,605,055 | $ 22,970,017 | 1,992,579 | $ 28,459,923 |
Shares issued to shareholders in
reinvestment of dividends | 376,902 | 5,404,463 | 472,032 | 6,719,090 |
| Shares repurchased | (11,422,496) | (164,046,622) | (12,478,365) | (177,810,539) |
| Net decrease | (9,440,539) | $ (135,672,142) | (10,013,754) | $ (142,631,526) |
| Class I Shares | | | | |
| Shares sold | 104,092,829 | $ 1,488,791,962 | 100,614,374 | $ 1,432,688,087 |
Shares issued to shareholders in
reinvestment of dividends | 6,098,914 | 87,365,336 | 6,390,337 | 90,797,213 |
| Shares repurchased | (132,701,949) | (1,891,266,593) | (110,796,332) | (1,575,937,602) |
| Net decrease | (22,510,206) | $ (315,109,295) | (3,791,621) | $ (52,452,302) |
NOTE 6 – INVESTMENT TRANSACTIONS
For the year ended September 30, 2019, the Fund had purchase and sale transactions of investments (excluding short-term investments) of $1,181,266,814 and $1,483,617,633, respectively.
NOTE 7 – RECENT ACCOUNTING PRONOUNCEMENTS
In August 2018, the FASB issued ASU 2018-13, Fair Value Measurement (Topic 820): Changes to the Disclosure Requirements for Fair Value Measurement, which adds, removes, and modifies certain aspects of the fair value disclosure. ASU 2018-13 is effective for annual periods beginning after December 15, 2019, and early adoption is permitted. The Funds have elected to early adopt, and had applied ASU 2018-13 for the fiscal year ended September 30, 2019. The adoption of this accounting guidance did not have a material impact on the Funds’ financial statements.
In March 2017, the FASB issued Accounting Standards Update (ASU) 2017-08, Premium Amortization of Purchased Callable Debt Securities. The amendments in the ASU shorten the premium amortization period on a purchased callable debt security from the security’s
Notes to Financial Statements, Continued
Thornburg Limited Term Municipal Fund | September 30, 2019
contractual life to the earliest call date. It is anticipated that this change will enhance disclosures by reducing losses recognized when a security is called on an earlier date. This ASU is effective for fiscal years beginning after December 15, 2018. Management has evaluated the implications of these changes and the amendments will have no material effect on the Funds’ net assets or results of operations.
OTHER NOTES
Risks: The Fund’s investments subject it to risks including, but not limited to, management risk, interest rate risk, credit risk, market and economic risk, and liquidity risk. Please see the Fund’s prospectus for a discussion of the risks associated with an investment in the Fund.
Subsequent Events: Fund management believes no events have occurred between September 30, 2019 and the date of issuance of the financial statements that require adjustment to or disclosure in the accompanying financial statements.
This page intentionally left blank.
Financial Highlights
Thornburg Limited Term Municipal Fund
| | PER SHARE PERFORMANCE (FOR A SHARE OUTSTANDING THROUGHOUT THE YEAR) |
UNLESS OTHERWISE
NOTED, PERIODS ARE
FISCAL YEARS ENDED
SEPTEMBER 30, | Net Asset
Value,
Beginning of
YEAR | Net
Investment
Income
(Loss)+ | Net Realized &
Unrealized Gain
(Loss) on
Investments | Total from
Investment
Operations | Dividends
from Net
Investment
Income | Dividends
from Net
Realized
Gains | Total
Dividends | Net Asset
Value,
End of YEAR |
| CLASS A SHARES(b) |
| 2019 | $ 14.10 | 0.26 | 0.36 | 0.62 | (0.26) | — | (0.26) | $ 14.46 |
| 2018 | $ 14.43 | 0.24 | (0.33) | (0.09) | (0.24) | — | (0.24) | $ 14.10 |
| 2017 | $ 14.63 | 0.23 | (0.20) | 0.03 | (0.23) | — | (0.23) | $ 14.43 |
| 2016 | $ 14.52 | 0.22 | 0.11 | 0.33 | (0.22) | — | (0.22) | $ 14.63 |
| 2015 | $ 14.58 | 0.23 | (0.06) | 0.17 | (0.23) | — | (0.23) | $ 14.52 |
| CLASS C SHARES |
| 2019 | $ 14.12 | 0.22 | 0.36 | 0.58 | (0.22) | — | (0.22) | $ 14.48 |
| 2018 | $ 14.46 | 0.20 | (0.34) | (0.14) | (0.20) | — | (0.20) | $ 14.12 |
| 2017 | $ 14.66 | 0.20 | (0.20) | — | (0.20) | — | (0.20) | $ 14.46 |
| 2016 | $ 14.55 | 0.19 | 0.11 | 0.30 | (0.19) | — | (0.19) | $ 14.66 |
| 2015 | $ 14.60 | 0.19 | (0.05) | 0.14 | (0.19) | — | (0.19) | $ 14.55 |
| CLASS I SHARES |
| 2019 | $ 14.10 | 0.29 | 0.36 | 0.65 | (0.29) | — | (0.29) | $ 14.46 |
| 2018 | $ 14.43 | 0.28 | (0.33) | (0.05) | (0.28) | — | (0.28) | $ 14.10 |
| 2017 | $ 14.64 | 0.28 | (0.21) | 0.07 | (0.28) | — | (0.28) | $ 14.43 |
| 2016 | $ 14.53 | 0.27 | 0.11 | 0.38 | (0.27) | — | (0.27) | $ 14.64 |
| 2015 | $ 14.58 | 0.27 | (0.05) | 0.22 | (0.27) | — | (0.27) | $ 14.53 |
| (a) | Not annualized for periods less than one year. |
| (b) | Sales loads are not reflected in computing total return. |
| + | Based on weighted average shares outstanding. |
See notes to financial statements.
Financial Highlights, Continued
Thornburg Limited Term Municipal Fund
| RATIOS TO AVERAGE NET ASSETS | | SUPPLEMENTAL DATA |
Net Investment
Income (Loss) (%) | Expenses, After
Expense
Reductions (%) | Expenses,
Before Expense
Reductions (%) | | Total
Return (%)(a) | Portfolio
Turnover
Rate (%)(a) | Net Assets
at End of YEAR
(Thousands) |
| |
| 1.80 | 0.69 | 0.69 | | 4.41 | 21.22 | $ 915,684 |
| 1.67 | 0.71 | 0.71 | | (0.64) | 16.29 | $ 1,037,769 |
| 1.62 | 0.73 | 0.73 | | 0.24 | 17.56 | $ 1,314,094 |
| 1.54 | 0.72 | 0.72 | | 2.32 | 14.53 | $ 1,697,329 |
| 1.56 | 0.73 | 0.73 | | 1.15 | 18.56 | $ 1,700,127 |
| |
| 1.56 | 0.94 | 0.94 | | 4.16 | 21.22 | $ 325,144 |
| 1.43 | 0.95 | 0.95 | | (0.94) | 16.29 | $ 450,402 |
| 1.38 | 0.97 | 0.97 | | 0.01 | 17.56 | $ 605,898 |
| 1.30 | 0.96 | 0.96 | | 2.07 | 14.53 | $ 741,637 |
| 1.32 | 0.96 | 0.96 | | 0.98 | 18.56 | $ 730,395 |
| |
| 2.04 | 0.45 | 0.45 | | 4.67 | 21.22 | $ 4,893,865 |
| 1.95 | 0.43 | 0.43 | | (0.36) | 16.29 | $ 5,089,760 |
| 1.93 | 0.42 | 0.42 | | 0.49 | 17.56 | $ 5,265,576 |
| 1.85 | 0.41 | 0.41 | | 2.64 | 14.53 | $ 5,506,166 |
| 1.88 | 0.41 | 0.41 | | 1.54 | 18.56 | $ 4,832,467 |
Report of Independent Registered Public Accounting Firm
Thornburg Limited Term Municipal Fund
To the Board of Trustees of Thornburg Investment Trust and Shareholders of
Thornburg Limited Term Municipal Fund
Opinion on the Financial Statements
We have audited the accompanying statement of assets and liabilities, including the schedule of investments, of Thornburg Limited Term Municipal Fund (one of the funds constituting Thornburg Investment Trust, referred to hereafter as the "Fund") as of September 30, 2019, the related statement of operations for the year ended September 30, 2019, the statements of changes in net assets for each of the two years in the period ended September 30, 2019, including the related notes, and the financial highlights for each of the five years in the period ended September 30, 2019 (collectively referred to as the “financial statements”). In our opinion, the financial statements present fairly, in all material respects, the financial position of the Fund as of September 30, 2019, the results of its operations for the year then ended, the changes in its net assets for each of the two years in the period ended September 30, 2019 and the financial highlights for each of the five years in the period ended September 30, 2019 in conformity with accounting principles generally accepted in the United States of America.
Basis for Opinion
These financial statements are the responsibility of the Fund’s management. Our responsibility is to express an opinion on the Fund’s financial statements based on our audits. We are a public accounting firm registered with the Public Company Accounting Oversight Board (United States) (PCAOB) and are required to be independent with respect to the Fund in accordance with the U.S. federal securities laws and the applicable rules and regulations of the Securities and Exchange Commission and the PCAOB.
We conducted our audits of these financial statements in accordance with the standards of the PCAOB. Those standards require that we plan and perform the audit to obtain reasonable assurance about whether the financial statements are free of material misstatement, whether due to error or fraud.
Our audits included performing procedures to assess the risks of material misstatement of the financial statements, whether due to error or fraud, and performing procedures that respond to those risks. Such procedures included examining, on a test basis, evidence regarding the amounts and disclosures in the financial statements. Our audits also included evaluating the accounting principles used and significant estimates made by management, as well as evaluating the overall presentation of the financial statements. Our procedures included confirmation of securities owned as of September 30, 2019 by correspondence with the custodian and brokers; when replies were not received from brokers, we performed other auditing procedures. We believe that our audits provide a reasonable basis for our opinion.
/s/PricewaterhouseCoopers LLP
New York, New York
November 22, 2019
We have served as the auditor of one or more investment companies in Thornburg Investment Trust since 1999.
Expense Example
Thornburg Limited Term Municipal Fund | September 30, 2019 (Unaudited)
As a shareholder of the Fund, you incur two types of costs:
| (1) | transaction costs, including |
| (a) | sales charges (loads) on purchase payments, for Class A shares; |
| (b) | a deferred sales charge on redemptions of any part or all of a purchase of $1 million of Class A shares within 12 months of purchase; |
| (c) | a deferred sales charge on redemptions of Class C shares within 12 months of purchase; |
| (2) | ongoing costs, including management fees; distribution and/or service (12b-1) fees; and other Fund expenses. |
This example is intended to help you understand your ongoing costs (in dollars) of investing in the Fund and to compare these costs with the ongoing costs of investing in other mutual funds.
The example is based on a $1,000 investment beginning on April 1, 2019, and held until September 30, 2019.
| | BEGINNING
ACCOUNT VALUE
4/1/19 | ENDING
ACCOUNT VALUE
9/30/19 | EXPENSES PAID
DURING PERIOD†
4/1/19—9/30/19 |
| CLASS A SHARES |
| Actual | $1,000.00 | $1,017.45 | $3.44 |
| Hypothetical* | $1,000.00 | $1,021.66 | $3.45 |
| CLASS C SHARES |
| Actual | $1,000.00 | $1,015.49 | $4.70 |
| Hypothetical* | $1,000.00 | $1,020.41 | $4.71 |
| CLASS I SHARES |
| Actual | $1,000.00 | $1,018.65 | $2.23 |
| Hypothetical* | $1,000.00 | $1,022.86 | $2.23 |
| † | Expenses are equal to the annualized expense ratio for each class (A: 0.68%; C: 0.93%; I: 0.44%) multiplied by the average account value over the period, multiplied by 183/365 to reflect the one-half year period. |
| * | Hypothetical assumes a rate of return of 5% per year before expenses. |
ACTUAL EXPENSES
For each class of shares, the first line of the accompanying table provides information about actual account values and actual expenses. You may use the information in this line, together with the amount you invested, to estimate the expenses that you paid over the period. Simply divide your account value by $1,000 (for example, an $8,600 account value divided by $1,000 = 8.6), then multiply the result by the number in the first line for your class of shares under the heading entitled “Expenses Paid During Period” to estimate the expenses you paid on your account during this period.
HYPOTHETICAL EXAMPLE FOR COMPARISON PURPOSES
For each class of shares, the second line of the accompanying table provides information about hypothetical account values and hypothetical expenses based on the Fund’s actual expense ratio and an assumed rate of return of 5% per year before expenses, which is not the Fund’s actual return. The hypothetical account values and expenses may not be used to estimate the actual ending account balance or expenses you paid for the period. You may use this information to compare the ongoing costs of investing in the Fund and other funds. To do so, compare this 5% hypothetical example with the 5% hypothetical examples that appear in the shareholder reports of the other funds.
Please note that the expenses shown in the table are meant to highlight your ongoing costs only and do not reflect any transactional costs, such as sales charges (loads), redemption fees, or exchange fees. Therefore, the second line of the table for each class of shares is useful in comparing ongoing costs only, and will not help you determine the relative total costs of owning different funds. In addition, if these transactional costs were included, your costs would have been higher.
Trustees and Officers
Thornburg Limited Term Municipal Fund | September 30, 2019 (Unaudited)
NAME, AGE, YEAR ELECTED
POSITION HELD WITH FUND | PRINCIPAL OCCUPATION(S) DURING PAST FIVE YEARS | OTHER DIRECTORSHIPS
HELD BY TRUSTEE |
| INTERESTED TRUSTEES(1)(2) |
Garrett Thornburg, 73
Trustee since 1984,
Chairman of Trustees(3) | Chairman and controlling shareholder of Thornburg Investment Management, Inc. (investment advisor); Chairman and controlling shareholder of Thornburg Securities Corporation (securities dealer); President of the Thornburg Foundation (nonprofit). | None |
Brian J. McMahon, 64
Trustee since 2001,
Vice Chairman of Trustees,
Member of Governance and
Nominating Committee &
Operations Risk Oversight
Committee(4) | Vice Chairman, Chief Investment Strategist, Managing Director, and Portfolio Manager and, until 2016, CEO and President of Thornburg Investment Management, Inc.; Vice President of Thornburg Securities Corporation. | None |
| INDEPENDENT TRUSTEES(1)(2)(5) |
David A. Ater, 74
Trustee since 1994,
Lead Independent Trustee,
Chairman of Governance and
Nominating Committee &
Member of Audit Committee | Principal in Ater & Associates, Santa Fe, NM (developer, planner and broker of residential and commercial real estate); owner, developer and broker for various real estate projects. | None |
Sally Corning, 58
Trustee since 2012,
Chairman of Audit Committee | Partner in Sun Mountain Capital, Santa Fe, NM (private equity firm with investment programs encompassing venture capital, mezzanine debt, and growth equity). | None |
Susan H. Dubin, 70
Trustee since 2004,
Member of Audit
Committee & Governance
and Nominating Committee | President of Dubin Investments, Ltd., Greenwich, CT (private investment fund); Director and officer of various charitable organizations. | None |
David L. Gardner, 56
Trustee since 2015,
Member of Operations Risk
Oversight Committee | Until 2012, head of EMEA (Europe, Middle East and Africa) Sales for iShares of Blackrock, Inc., EMEA Executive Committee Member and EMEA Operating Committee Member at Blackrock, Inc. | None |
Patrick J. Talamantes, 55
Trustee since 2019,
Member of Audit Committee | President of Talamantes Strategies, LLC, a management consulting firm, since 2018; until 2017, President and Chief Executive Officer of The McClatchy Company, Sacramento, CA (news and media company). | None |
Owen D. Van Essen, 65
Trustee since 2004,
Chairman of Operations Risk
Oversight Committee &
Member of Governance and
Nominating Committee | President of Dirks, Van Essen, Murray & April, Santa Fe, NM (newspaper mergers and acquisitions). | None |
James W. Weyhrauch, 60
Trustee since 1996,
Member of Audit
Committee & Operations Risk
Oversight Committee | Real estate broker, Santa Fe Properties, Santa Fe, NM; General Partner, Investments of Genext LLC (a family investment partnership); until 2019, Vice Chairman of Nambe LLC, Santa Fe, NM (manufacturing & design company). | None |
Trustees and Officers, Continued
Thornburg Limited Term Municipal Fund | September 30, 2019 (Unaudited)
NAME, AGE, YEAR ELECTED
POSITION HELD WITH FUND | PRINCIPAL OCCUPATION(S) DURING PAST FIVE YEARS | OTHER DIRECTORSHIPS
HELD BY TRUSTEE |
| OFFICERS OF THE FUND (WHO ARE NOT TRUSTEES)(1)(6) |
David Ashley, 49
Vice President since 2019 | Portfolio Manager and Managing Director since 2019 and Associate Portfolio Manager from 2011-2019 of Thornburg Investment Management, Inc. | Not applicable |
Nimish Bhatt, 56
Chief Financial Officer
since 2019; Treasurer
2016-2019; Secretary
(2018-2019)(7) | Chief Financial Officer and Treasurer of Thornburg Investment Management, Inc. and Thornburg Securities Corporation since 2016 and Secretary of Thornburg Securities Corporation since 2018; Senior Vice President (2004-2016), Chief Financial Officer (2011-2016), and Head of Fund Administration (2011-2016) of Calamos Asset Management, Inc., Calamos Investments LLC, Calamos Advisors LLC, and Calamos Wealth Management; Director of Calamos Global Funds plc (2007-2016). | Not applicable |
Jason Brady, 45
President since 2016(7) | Director since 2017, CEO and President since 2016, and Portfolio Manager and Managing Director of Thornburg Investment Management, Inc.; Vice President of Thornburg Securities Corporation since 2016. | Not applicable |
Connor Browne, 40
Vice President since 2006 | Portfolio Manager and Managing Director of Thornburg Investment Management, Inc. | Not applicable |
Randy Dry, 45
Vice President since 2014 | Managing Director, Director of Institutional Group from 2014-2016, and since 2016, Chief Administrative Officer of Thornburg Investment Management, Inc. | Not applicable |
Greg Dunn, 43
Vice President since 2014 | Portfolio Manager and Managing Director of Thornburg Investment Management, Inc. | Not applicable |
Lon Erickson, 44
Vice President since 2008 | Portfolio Manager and Managing Director of Thornburg Investment Management, Inc. | Not applicable |
Thomas Garcia, 48
Vice President since 2006 | Managing Director, Head Equity Trader, and Associate Portfolio Manager of Thornburg Investment Management, Inc. | Not applicable |
Christian Hoffmann, 37
Vice President since 2018 | Portfolio Manager and Managing Director since 2018, and Associate Portfolio Manager from 2014-2018, of Thornburg Investment Management, Inc. | Not applicable |
Curtis Holloway, 52
Treasurer since 2019(7) | Director of Fund Administration since 2019 of Thornburg Investment Management, Inc.; Senior Vice President, Head of Fund Administration (2017-2019) and Vice President, Fund Administration (2010-2017) of Calamos Investments, and Chief Financial Officer (2017-2019) and Treasurer (2010-2019) of Calamos Funds. | Not applicable |
Ben Kirby, 39
Vice President since 2014 | Head of Investments since 2019, Portfolio Manager and Managing Director since 2013. | Not applicable |
Jeff Klingelhofer, 38
Vice President since 2016 | Head of Investments since 2019, Portfolio Manager and Managing Director since 2015, and Associate Portfolio Manager from 2012–2015, of Thornburg Investment Management, Inc. | Not applicable |
Ponn Lithiluxa, 48
Vice President since 2017 | Manager, Tax & Fund Administration of Thornburg Investment Management, Inc.; Senior Vice President, Citi Fund Services, Inc. (2014–2017); Vice President, Citi Fund Services, Inc. (2007–2014). | Not applicable |
Rob MacDonald, 43
Vice President since 2016 | Managing Director since 2015, Portfolio Manager since 2014, and Associate Portfolio Manager from 2011–2014 of Thornburg Investment Management, Inc. | Not applicable |
Michael Mastroianni, 42
Secretary and Vice President since 2019(7) | Director of Fund Operations since 2019 of Thornburg Investment Management, Inc.; Executive Director, Global Head of Client Services - Global Liquidity (2018-2019), Executive Director, North American Head of Transfer Agency Relationship Management (2011-2019), Executive Director, North American Head of Transfer Agency Service Delivery (2011-2018) of J.P. Morgan Asset Management. | Not applicable |
Leigh Moiola, 52
Vice President since 2001 | Managing Director and Director of Marketing of Thornburg Investment Management, Inc.; Vice President of Thornburg Securities Corporation. | Not applicable |
Christopher Ryon, 63
Vice President since 2008 | Portfolio Manager and Managing Director of Thornburg Investment Management, Inc. | Not applicable |
Trustees and Officers, Continued
Thornburg Limited Term Municipal Fund | September 30, 2019 (Unaudited)
NAME, AGE, YEAR ELECTED
POSITION HELD WITH FUND | PRINCIPAL OCCUPATION(S) DURING PAST FIVE YEARS | OTHER DIRECTORSHIPS
HELD BY TRUSTEE |
Sean Koung Sun, 38
Vice President since 2017 | Portfolio Manager and Managing Director since 2017, Associate Portfolio Manager from 2015-2016, and Equity Research Analyst from 2012-2014 of Thornburg Investment Management, Inc. | Not applicable |
Stephen Velie, 52
Chief Compliance Officer since 2009 | Chief Compliance Officer of Thornburg Investment Trust and Thornburg Investment Management, Inc. | Not applicable |
Nicholos Venditti, 38
Vice President since 2016 | Portfolio Manager and Managing Director since 2015 and Associate Portfolio Manager from 2011–2015 of Thornburg Investment Management, Inc. | Not applicable |
Vinson Walden, 49
Vice President since 2004 | Portfolio Manager and Managing Director of Thornburg Investment Management, Inc. | Not applicable |
Lei Wang, 48
Vice President since 2006 | Portfolio Manager and Managing Director of Thornburg Investment Management, Inc. | Not applicable |
Charles Wilson, 44
Vice President since 2016 | Portfolio Manager and Managing Director since 2014 and Associate Portfolio Manager from 2012–2014 of Thornburg Investment Management, Inc. | Not applicable |
Di Zhou, 41
Vice President since 2016 | Portfolio Manager and Managing Director since 2016, Associate Portfolio Manager from 2014–2016, and Equity Research Analyst from 2010–2014 of Thornburg Investment Management, Inc. | Not applicable |
| (1) | Each person’s address is 2300 North Ridgetop Road, Santa Fe, New Mexico 87506. |
| (2) | The Fund is a separate investment “Fund” or “series” of Thornburg Investment Trust (the “Trust”), which comprises the Thornburg mutual fund complex and is organized as a Massachusetts business trust. Thornburg Investment Management, Inc. is the investment advisor to, and manages, all the Funds of the Trust. Each Trustee oversees all the Funds of the Trust. |
| (3) | Mr. Thornburg is considered an “interested” Trustee under the Investment Company Act of 1940 because he is a director and controlling shareholder of Thornburg Investment Management, Inc., the investment advisor to the Trust, and is the sole director and controlling shareholder of Thornburg Securities Corporation, the distributor of shares for the Trust. |
| (4) | Mr. McMahon is considered an “interested” Trustee under the Investment Company Act of 1940 because he is a director and the chief investment strategist of Thornburg Investment Management, Inc. |
| (5) | The Bylaws of the Trust currently require that each Independent Trustee shall retire by the end of the calendar year during which the Trustee reached the age of 75 years. Otherwise each Trustee serves in office until the election and qualification of a successor or until the Trustee sooner dies, resigns, retires or is removed. |
| (6) | Assistant vice presidents and assistant secretaries are not shown. |
| (7) | The Trust’s president, chief financial officer, secretary, and treasurer each serves a one-year term or until the election and qualification of a successor; each other officer serves at the pleasure of the Trustees. |
The Statement of Additional Information for each Fund of the Trust includes additional information about the Trustees and is available, without charge and upon request, by calling 1-800-847-0200.
Other Information
Thornburg Limited Term Municipal Fund | September 30, 2019 (Unaudited)
PORTFOLIO PROXY VOTING
Policies and Procedures:
The Trust has delegated to the Advisor voting decisions respecting proxies for the Fund’s voting securities. The Advisor makes voting decisions in accordance with its Proxy Voting Policy and Procedures. A description of the Policy and Procedures is available (i) without charge, upon request, by calling the Advisor toll-free at 1-800-847-0200, (ii) on the Thornburg website at www.thornburg.com, and (iii) on the U.S. Securities and Exchange Commission’s website at www.sec.gov.
Information regarding how proxies were voted is available on or before August 31 of each year for the twelve months ending the preceding June 30. This information is available (i) without charge, upon request by calling the Advisor toll-free at 1-800-847-0200, (ii) on the Thornburg website at www.thornburg.com, and (iii) on the U.S. Securities and Exchange Commission’s website at www.sec.gov.
TAX INFORMATION
For the tax year ended September 30, 2019, dividends paid by the Fund of $122,138,207 (or the maximum allowed) are tax exempt dividends and $18,715 are taxable ordinary investment income dividends for federal income tax purposes. The information and the distributions reported herein may differ from the information and distributions reported to the shareholders for the calendar year ending December 31, 2019. Complete information will be reported in conjunction with your 2019 Form 1099.
AVAILABILITY OF QUARTERLY PORTFOLIO SCHEDULE
The Fund files with the Securities and Exchange Commission schedules of its portfolio holdings on Form N-Q for the first and third quarters of each fiscal year. The Fund’s Forms N-Q are available on the Commission’s website at www.sec.gov, or may be reviewed and copied at the Commission’s Public Reference Room in Washington, D.C. Information on the operation of the Public Reference Room may be obtained by calling 1-800-SEC-0330. The Fund also makes this information available on its website at www.thornburg.com/download or upon request by calling 1-800-847-0200.
STATEMENT RESPECTING RENEWAL OF INVESTMENT ADVISORY AGREEMENT
Thornburg Investment Management, Inc. (the “Advisor”) provides investment management services to Thornburg Limited Term Municipal Fund (the “Fund”) pursuant to an investment advisory agreement. The Trustees consider the renewal of this agreement annually, and most recently determined to renew the agreement on September 17, 2019.
Planning for their recent consideration of the advisory agreement’s renewal, the independent Trustees met in May 2019 to consider aspects of their annual evaluation of the Advisor’s service to all of the funds of Thornburg Investment Trust, to plan the annual evaluation of the Advisor’s performance and to discuss preliminarily the information the Advisor would present to the Trustees for their review. The independent Trustees met in a second independent session in July 2019 to further define certain portions of the information to be submitted by the Advisor. The independent Trustees met again in an independent session in September 2019 with a mutual fund analyst firm engaged by the independent Trustees to provide explanations of comparative cost and expense information, comparative investment performance information, and other data obtained and analyzed by the analyst firm. In that session the independent Trustees discussed their evaluations of the Advisor’s services to the Fund and the Fund’s fee and expense levels, investment performance, and other information presented for the Fund, conferred independently with legal counsel respecting the factors typically considered in evaluating renewal of an advisory agreement, and conferred with representatives of management to receive explanations of certain aspects of the information they had requested. Representatives of the Advisor subsequently reviewed portions of the information with the Trustees and addressed questions from the Trustees at a full meeting session of the Trustees scheduled in September for that purpose, and the independent Trustees thereafter met again in an independent session to consider the Advisor’s presentations and various specific issues respecting their consideration of the advisory agreement’s renewal. Following these sessions, the Trustees met to consider renewal of the advisory agreement, and the independent Trustees voted unanimously at that meeting to renew the agreement for an additional term of one year.
The information below summarizes certain factors considered by the Trustees in connection with the determination to renew the advisory agreement with the Advisor. In determining to renew the advisory agreement, the Trustees considered a wide range of information and did not identify any single factor as controlling, and this summary does not describe all of the factors and other matters considered by the Trustees in making their determination.
Nature, Extent and Quality of Services. The Trustees considered in their evaluation of the advisory agreement the written and oral reports provided to the Trustees and their standing committees throughout the year on a wide variety of topics by personnel from the Advisor’s
Other Information, Continued
Thornburg Limited Term Municipal Fund | September 30, 2019 (Unaudited)
portfolio management, administration, operations and compliance staffs. The Trustees also considered in this evaluation presentations and explanations made by representatives of the Advisor in meeting sessions scheduled for consideration of the renewal of the advisory agreement. The Trustees further noted in their evaluation the consideration they had given to a number of topics in previous years, reports from their standing committees, and advice received from counsel.
Information noted by the Trustees as having been considered in relation to the nature, extent and quality of services provided by the Advisor under the advisory agreement and contributing (together with other information considered) to their conclusions respecting the nature, extent and quality of the services rendered to the Fund by the Advisor included: (1) reports from portfolio managers and other personnel throughout the year demonstrating that the Fund was managed in conformity with stated strategies and objectives and conformed to investment restrictions and limitations; (2) reports demonstrating that management of the Fund remained faithful and competent, and demonstrating sufficient skill by portfolio managers in executing the Fund’s strategies in varying environments, managers’ cognizance of and strategies to pursue the Fund’s objectives and address pertinent market and economic trends and conditions, the evaluation and selection of individual investments, management to achieve tax efficiencies, and the structuring and composition of the Fund’s portfolio and management of Fund liquidity requirements; (3) the Fund’s achievement of its investment objectives over different periods of time; (4) presentations by and interactions with members of the Advisor’s fund administration, operations and compliance staffs; (5) reports from standing committees of the Trustees on their respective proceedings throughout the year, including in particular reports from and interactions with the Advisor’s personnel; (6) the sufficiency of the resources the Advisor devotes to the services it provides to the Fund, including the expertise of its personnel and staffing levels and its enhancements to the electronic systems it utilizes in providing these services, and also including the Advisor’s own financial management and sufficiency of its resources; and (7) the measures employed to achieve efficient trade execution for the Fund, including the evaluation and selection of firms to execute transactions for the Fund. As in past years, the Trustees noted particularly their assessments of the Advisor’s personnel developed in meetings throughout the year, measures to expand and improve the depth and experience of the Advisor’s staff, and the Advisor’s collaborative approach to investment management, continued commitment to observance of compliance and regulatory requirements in managing investments by the Fund, responsiveness to the Trustees, and other factors.
Based upon these and other considerations, the Trustees concluded that the Advisor’s management of the Fund’s investments continued to conform to the Fund’s stated objectives and policies, and that the nature, extent and quality of the services provided to the Fund by the Advisor remained sufficient.
Investment Performance. The Trustees noted in their evaluation of the Fund’s investment performance the written and oral reports they had received in each regular meeting over the course of the year from the Advisor’s portfolio management personnel. The Trustees also noted their consideration of information provided to them at their request in anticipation of their annual evaluation of the Advisor’s services, including the following items of information respecting the investment performance of the Fund: (1) the Fund’s absolute investment performance and achievement of stated objectives; (2) the Advisor’s explanations and commentary on the Fund’s performance in the context of the Fund’s objectives and reasonable expectations, and business, market and economic conditions; (3) performance data for the most recent ten calendar years, comparing the Fund’s annual investment returns to a broad-based securities index and to the applicable Morningstar category of funds; (4) the Fund’s investment performance for the three-month, year-to-date, one-year, three-year, five-year, ten-year, fifteen-year, and since inception periods ending with the second quarter of the current year, comparing the Fund’s annualized returns to two mutual fund categories created by independent mutual fund analyst firms and to a broad-based securities index, and assigning a percentage rank to the Fund’s performance for each period relative to each of the fund categories; (5) analyses of specified performance and risk metrics for the Fund relative to its benchmark and to a selected peer group of funds, prepared by an independent financial analyst firm engaged by the independent Trustees; (6) the Fund’s cash flows; (7) comparative performance data for fund peer groups selected by an independent mutual fund analyst firm engaged by the independent Trustees, and the analysis and observations of the analyst firm respecting those data; and (8) comparative measures of correlation to equity indices, and risk and return statistics. Measures of risk and relative return demonstrated that the Fund’s performance relative to these measures continued to fulfill expectations in current conditions.
The Trustees considered explanations from the Advisor respecting performance of the Fund in some recent periods that had compared less favorably to some comparative measures, together with the reports they had received from the Advisor throughout the year, the effects of market and economic conditions, the investment decisions by the Advisor in view of the Fund’s strategies, and the fact that the Fund’s investment performance compared more favorably to certain other comparative measures. The Trustees generally attach additional significance to the investment performance of the Fund from the perspective of longer-term shareholders, and noted in that regard that the Fund’s relative investment performance may be affected to some extent in periods when the Advisor pursues defensive measures in line with the Fund’s stated objectives.
Based upon their consideration of this and other information, the Trustees concluded that the Fund’s absolute and relative investment performance over a range of pertinent holding periods on the whole was satisfactory in view of its objectives and strategies.
Comparisons of Fee and Expense Levels. Information noted by the Trustees as having been considered in this context included a variety of comparative data respecting the Fund’s fee and expense levels. This information included comparisons of the Fund’s advisory fee and
Other Information, Continued
Thornburg Limited Term Municipal Fund | September 30, 2019 (Unaudited)
overall Fund expenses to median and average fees and expenses charged to funds in the applicable Morningstar category, comparisons of the advisory fee and total expenses for two Fund share classes to the fee levels and expenses of fund peer groups selected from the category by an independent mutual fund analyst firm engaged by the independent Trustees, the perspectives and advice from that mutual fund analyst firm respecting comparisons of fund fee levels and expenses to fund peer groups, and other information. Comparative fee and expense data noted as having been considered by the Trustees showed that the level of total expense for one share class of the Fund was higher than the median and comparable to the average levels charged to funds in the applicable Morningstar category, and that the level of total expense for a second share class was lower than the median and average levels for that category. Peer group data showed that the Fund’s stated advisory fee was lower than the median level for the two peer groups. The Trustees did not find the differences significant in view of their findings and conclusions respecting the other factors considered.
The Trustees noted their consideration of information respecting the advisory fees charged by the Advisor to other investment management clients, including sub-advised mutual funds and other institutional clients, together with information about fees charged by other advisors to different clients, analysis of the differences between the requirements of institutional clients and mutual funds, analysis of the differences between the requirements of a sub-advised mutual fund and a fund as to which the investment advisor is the primary advisor and sponsor, and the consequently different investment management services provided to the different categories of clients and the differing contexts in which these arrangements are entered into. The Trustees confirmed their previous observations that the differences between the fees charged by the Advisor or by other investment advisors to different types of clients did not appear exceptional and had limited relevance to the evaluation of the fee rate charged to mutual funds as to which the Advisor or such other advisors are the primary advisor and sponsor.
Costs and Profitability of Advisor. In reviewing the profitability of the Advisor’s services to the Fund, the Trustees considered an analysis of the Advisor’s costs and the estimated profitability to the Advisor of its services, together with data respecting the overall profitability of a selection of other investment management firms. The Trustees considered in this regard information from the Advisor respecting investment of its profits to maintain staffing levels, and noted that a portion of the Advisor’s profits is an important element in the compensation of shareholder employees. The Trustees considered information from the Advisor respecting the use of profits to enhance staff competencies through training and other measures, hire personnel to expand and develop the scope of senior management expertise, pay competitive levels of compensation, and add to the Advisor’s electronic and information technology systems to maintain or improve service levels. The Trustees also considered the contribution of the Advisor’s cost management to its profitability, and the relationship of the Advisor’s financial resources and profitability in previous years to its ability to attract necessary personnel, invest in systems and other assets required for its service to the Fund, and maintain or improve service levels for the Fund notwithstanding fluctuations in revenues and profitability. The information considered did not indicate to the Trustees that the Advisor’s profitability was excessive.
Potential Economies of Scale. In reviewing the extent to which economies of scale would be realized by the Fund as it grows and whether fee levels reflect potential economies of scale, the Trustees considered the breakpoint structure for advisory fees chargeable to the Fund, comparisons of the fee breakpoint structure for the Fund with breakpoint structures (or the absence of such structures) for other funds in a peer group selected by an independent mutual fund analyst firm, the effects of the breakpoint structure and other expense factors realized by certain funds of the Trust as their asset levels had increased, and the Advisor’s expenditures from its own profits and resources to maintain staffing levels and expand staff competencies, pay competitive levels of compensation, and add to its electronic and information technology systems so as to maintain or improve service levels. The information provided demonstrated to the Trustees that the Fund’s advisory fee breakpoint structure is reasonable in relation to the structures observed in the other funds in its peer group, and that shareholders may be expected to benefit from any economies of scale, due to the advisory agreement’s breakpoint fee structure for the Fund and other factors.
Potential Ancillary Benefits. In reviewing potential benefits to the Advisor because of its relationship to the Fund, the Trustees considered explanations from the Advisor respecting its receipt of certain research services from broker dealers, and the benefits to both the Fund and the Advisor of the Advisor’s expansion of its staffing, compliance and systems capabilities and other resources to serve a broader variety of investment management clients. No unusual or unfair benefits to the Advisor from its relationship to the Fund were identified by the Trustees.
Summary of Conclusions. The Trustees concluded that the general nature, extent and quality of the Advisor’s services performed under the advisory agreement remained sufficient, the Advisor had continued to actively and competently pursue the Fund’s stated investment objectives and adhere to the Fund’s investment policies, and that the absolute and relative investment performance of the Fund over pertinent holding periods on the whole was satisfactory in the context of the Fund’s objectives and strategies. The Trustees further concluded that the level of the advisory fee charged to the Fund by the Advisor is fair and reasonable in relation to the services provided by the Advisor, in view of the nature, extent and quality of those services, the investment performance of the Fund after fees and expenses, the clear disclosure of fees and expenses in the Fund’s prospectus, comparisons of fees and expenses charged to the Fund to fees and expenses charged to other mutual funds, and the other factors considered. The Trustees accordingly determined to renew the Fund’s investment advisory agreement with the Advisor for an additional term of one year.
Trustees’ Statement to Shareholders (Unaudited)
Readopted September 17, 2019
The Trustees believe current and prospective shareholders should know how we discharge our responsibilities in supervising the Funds’ investment advisor and in reviewing the advisor’s contract for renewal. Since 2005, we have issued a statement which sets out clearly the three principal guidelines that we follow in supervising the Trust’s investment advisor on your behalf. In accordance with our customary practice, in September of this year we again reviewed our statement and concluded we should reissue this statement outlining the principal features of our supervision of the advisor’s performance of investment management services for the Funds.
We begin with the premise that each shareholder selected his or her Fund because its investments are managed by the investment advisor identified in the prospectus and in accordance with the objective and policies described in the prospectus. We realize, as each of you do, that if you believe that your Fund’s stated objective and policies no longer serve your personal investment goals, you can sell your shares and leave the Fund.
Therefore, we believe that our primary supervisory task—our principal obligation to you—is to assess the nature and quality of the advisor’s services, and to confirm that the advisor actively and competently pursues the Fund’s objective, in accordance with the policies set out in the prospectus. To do this, we meet regularly with management to review your Fund’s portfolio and to discuss the advisor’s specific actions and judgments in pursuing the Fund’s objective. We do not substitute our own judgment for the advisor’s decisions in selecting investments; the advisor is paid to exercise its informed judgment on investment decisions, and we seek to confirm, in reviewing the advisor’s performance, that the advisor is doing just that.
Second, we are conscious of costs and the effect that costs have on shareholders’ returns. We try to make sure that your Fund’s fees and costs are reasonable in relationship to the services rendered and that they are generally in line with those charged by other expert investment advisors, consistent with our belief that the Fund’s investors searched for and expect that expertise and attention and have decided to pay a reasonable price for it. We do not put the management contract “out to bid” as a matter of course, and we would not do so unless we had concluded that the advisor materially had failed to pursue the Fund’s objectives in accordance with its policies, or for other equally important reasons. We believe that any other approach would be inconsistent with your interests and contrary to your expectations when you bought shares of the Fund in the first place.
Finally, because we believe that most Thornburg Fund shareholders have invested with a long-term perspective, we try not to focus too much on the fashions of the moment and on short-term performance. The market will not favor any specific investment objective or set of policies at all times and under all economic circumstances. A fund will experience periods of both high and low returns relative to other funds and other investments. Even if one of our Funds is not favored by the market at a particular time, we believe that the advisor is nonetheless obliged to remain true to the Fund’s objective and policies, and we watch to see that it does so.
Trustees of Thornburg Investment Trust
Thornburg Investment Management is a privately-owned global investment firm that offers a range of solutions for retail and institutional investors. Founded in 1982 and headquartered in Santa Fe, New Mexico, we manage approximately $41.9 billion (as of September 30, 2019) across U.S. mutual funds, separate accounts for high-net-worth investors, institutional accounts, and UCITS funds for non-U.S. investors.
The fund outlined in this report is one of many equity and fixed-income products available from Thornburg Investment Management.
EQUITY FUNDS
| ■ | Thornburg Global Opportunities Fund |
| ■ | Thornburg International Value Fund |
| ■ | Thornburg Better World International Fund |
| ■ | Thornburg International Growth Fund |
| ■ | Thornburg Developing World Fund |
| ■ | Thornburg Value Fund |
| ■ | Thornburg Core Growth Fund |
MULTI_ASSET FUNDS
| ■ | Thornburg Investment Income Builder Fund |
| ■ | Thornburg Summit Fund |
FIXED INCOME FUNDS
| ■ | Thornburg Low Duration Income Fund |
| ■ | Thornburg Limited Term U.S. Government Fund |
| ■ | Thornburg Limited Term Income Fund |
| ■ | Thornburg Strategic Income Fund |
| ■ | Thornburg Low Duration Municipal Fund |
| ■ | Thornburg Limited Term Municipal Fund |
| ■ | Thornburg Intermediate Municipal Fund |
| ■ | Thornburg California Limited Term Municipal Fund |
| ■ | Thornburg New Mexico Intermediate Municipal Fund |
| ■ | Thornburg New York Intermediate Municipal Fund |
| ■ | Thornburg Strategic Municipal Income Fund |
ALTERNATIVE FUNDS
| ■ | Thornburg Long/Short Equity Fund |
Before investing, carefully consider the Fund’s investment goals, risks, charges, and expenses. For a prospectus or summary prospectus containing this and other information, contact your financial advisor or visit thornburg.com. Read it carefully before investing.
For additional information, please visit thornburg.com
Thornburg Investment Management, Inc. 2300 North Ridgetop Road, Santa Fe, NM 87506
To receive shareholder reports, prospectuses, and proxy statements electronically, go to www.thornburg.com/edelivery.
This Annual Report is submitted for the general information of shareholders of the Fund. It is not authorized for distribution to prospective investors in the Fund unless preceded or accompanied by an effective prospectus.
Investment Advisor:
Thornburg Investment Management®
800.847.0200
Distributor:
Thornburg Securities Corporation®
Annual Report
September 30, 2019
Beginning on January 1, 2021, as permitted by regulations adopted by the Securities and Exchange Commission, paper copies of the Fund’s shareholder reports will no longer be sent by mail, unless you specifically request paper copies of the reports from the Fund or from your financial intermediary, such as a broker-dealer or bank. Instead, the reports will be made available on a website, and you will be notified by mail each time a report is posted and provided with a website link to access the report.
If you already elected to receive shareholder reports electronically, you will not be affected by this change and you need not take any action. You may elect to receive shareholder reports and other communications from the Fund or your financial intermediary electronically by going to thornburg.com/edelivery.
You may elect to receive all future reports in paper free of charge. You can inform the Fund or your financial intermediary that you wish to continue receiving paper copies of your shareholder reports by calling 800.847.0200 or your financial intermediary directly. Your election to receive reports in paper will apply to all funds held with the fund complex/your financial intermediary.
At Thornburg, we believe unconstrained investing leads to better outcomes for our clients. Our investment solutions are highly active, high conviction, and benchmark agnostic. When it comes to finding economic opportunity for clients, it’s more than what we do.
It’s how we do it. Active Asbottom-up, fundamental, active managers, we look beyond conventional benchmarks. Long Term We take a long-term view in how we manage our firm and our portfolios. Benchmark Agnostic Investment strategies should have the flexibility to pursue solutions for clients, not stay within the conventional confines of benchmarks. Flexible Perspective Our approach to portfolio construction is guided by our convictions rather than convention. High Conviction We focus our attention and capital on thoroughly researched, well-understood positions. The best form of risk management is to know what you own, and why. Repeatable & Robust Our long-term outperformance of benchmarks verifies that our process works and outperforms conventional thinking. Independent We are independently owned and far from the herd of other investment managers. Investment Driven All members of the investment team are resources for all of our strategies. Collaborative Our team collaborates on opportunities across geography, sector, or asset class.
Thornburg Intermediate Municipal Fund
Annual Report | September 30, 2019
Table of Contents
| SHARE CLASS | NASDAQ SYMBOL | CUSIP |
| Class A | THIMX | 885-215-202 |
| Class C | THMCX | 885-215-780 |
| Class I | THMIX | 885-215-673 |
Minimum investments for Class I shares may be higher than those for other classes. Class I shares may not be available to all investors.
Investments carry risks, including possible loss of principal. Portfolios investing in bonds have the same interest rate, inflation, and credit risks that are associated with the underlying bonds. The value of bonds will fluctuate relative to changes in interest rates, decreasing when interest rates rise. Unlike bonds, bond funds have ongoing fees and expenses. Please see the Fund’s prospectus for a discussion of the risks associated with an investment in the Fund. Investments in the Funds are not FDIC insured, nor are they bank deposits or guaranteed by a bank or any other entity.
The laddering strategy does not assure or guarantee better performance and cannot eliminate the risk of investment losses.
Letter to Shareholders
Thornburg Intermediate Municipal Fund | September 30, 2019 (Unaudited)
October 18, 2019
Dear Fellow Shareholder:
We are pleased to present the annual report for the Thornburg Intermediate Municipal Fund. The net asset value (NAV) of the Class I shares increased 53 cents to $14.31 per share during the fiscal year ended September 30, 2019. The Class I shares of your Fund underperformed the index with a 6.66% total return for the fiscal year ended September 30, 2019, compared to the 8.14% total return for the ICE BofA Merrill Lynch 3-15 Year Municipal Securities Index.
The drivers of the Fund’s total return relative to its benchmark include its interest rate sensitivity, as measured by the Fund’s duration, differing credit quality allocations and other risk factors. The impact of the Fund’s 0.65 years shorter duration detracted 0.625%. The Fund’s sector allocations detracted 0.057%, while other risk factors detracted 0.088%. The Fund’s expenses and residuals accounted for the remainder of the performance differential.
Since the last annual letter published in November 2018, the municipal market and its investors have experienced one of the great rallies in the market’s history, driven by the largest amount of inflows into municipal bond mutual funds on record. Mutual funds have experienced positive inflows every week of 2019, with the aggregate amounting to more than $70 billion. During that time, the 10-year Thomson Reuters Municipal Market Data (MMD) AAA Curve has fallen from a high of 2.80% in early November 2018 to an all-time low of 1.22% in late August 2019, only to settle around 1.45% at the time of this writing. The decrease in yields and the insatiable demand from retail mutual fund investors has led to appreciating bond prices that have accounted for a large portion of the returns the market inked over the last 12 months.
While the increase in the price of the investments has been great to watch, municipal investors find themselves in a tough situation. Does one sell the bonds at high prices? Is it best to pay a capital gain and look for reinvestment opportunities? Or does one hold the bonds? Collect a coupon and reinvest the proceeds knowing that the premium could evaporate if yields spike?
In many cases the answer is contingent on investor goals and risk tolerance. So instead of providing an answer, we would like to present an analysis of market risks that will allow investors to draw their own conclusions.
Municipal Bond Supply and Demand
Municipal investors tend to be overly sensitive to supply trends. The common refrain is that a big supply year is bearish for bond prices and vice versa. While that is generally true, it negates the other half of the equation. Demand, not supply, can be a large driver of total return, and that is exactly what the market has experienced throughout 2019. $70 billion has poured into the municipal market through the end of September 2019, the largest amount of annual inflows on record.
That $70 billion represents roughly 10% of all assets in municipal bond mutual funds. So technical demand, not fundamentals, has been the key driver of asset appreciation. That should be troubling. As investors, we like fundamentals to move asset prices. If you were to invest in Apple, and Apple sells more iPhones, and the firm’s stock appreciates, we would consider that being for the right reasons. When price is driven by factors other than fundamental value, the potential for a reversal tends to be high. Therefore, we would recommend caution when investing in a market where fundamental improvement isn’t the reason for price appreciation.
Municipal Bond Credit Risk
Credit spreads, much like triple-A bond insurers, have all but disappeared from the muni market. That is somewhat of an overstatement, but for some time now credit spreads, especially across the plain vanilla investment grade space, have become virtually commoditized. At the same time, while much has been said surrounding the covenant-lite status of recent corporate debt issuance, little has been said about the phenomenon in the municipal bond market. Credit security packages are getting weaker. Net revenue covenants, liquidity covenants, additional bonds tests and other protections granted to municipal investors are weakening. It is undeniable that municipal investors are taking on more and more credit risk for less and less yield.
State and Local Tax Deduction (SALT)
At least part of the increase in demand for municipal paper has been driven by the changes to the SALT deduction cap. The cap of $10,000 in state and local taxes that are deductible from federal taxes was part of the tax changes that were passed by the Trump administration at the end of 2017. It is estimated that over 10 million taxpayers were unable to write-off some $320 billion in state and local taxes, effectively increasing their tax liability despite a reduction in marginal personal income tax rates. The impact has been the most severe in states with high local and state taxes.
Faced with an ever-increasing tax bill, investors in these high-tax states have flocked to the municipal bond market. In no place is that truer than California. For many investors in the state, investments in the California municipal bond market no longer make economic sense. After adjusting yields for state and local taxes, many California investors would be better off investing in U.S. Treasuries due to the higher after-tax yield. Yet, money continues to flow into the California municipal bond market as investors make these non-economic decisions. Non-economic decision-making is not isolated to the California market, though. It’s evident in many high-tax states.
The Federal Reserve and Monetary Policy
As recently as December 2018, the Federal Reserve seemed bound and determined to push interest rates higher. It took only a few angry tweets and some stock market volatility in the fourth quarter of 2018 for the Fed to put its interest rate hikes
Letter to Shareholders, Continued
Thornburg Intermediate Municipal Fund | September 30, 2019 (Unaudited)
on pause, and only seven months for a complete reversal of course. Since the 25 basis point (bps) rate cut in July, the Fed cut again in September and the market is pricing in one more cut before year end.
While monetary policy has been the elixir of choice for a decade running, it has also created a host of problems for fixed income investors. By keeping yields low for the last decade, fixed income investors have been driven out the risk spectrum in search of their income goals. Many have taken on additional duration risk by buying longer-dated bonds, making them more susceptible to interest rate movements.
Other fixed income investors have taken on more credit risk, making them more susceptible to a slowing economy. Others have been forced out of the fixed income market and into the equity markets, which completely changes the risk profile of their investments. This is all being done at a time of all-time low yields and all-time low credit spreads. This situation is hardly sustainable.
The highlighted risks have led us to maintain our present course. The Fund remains higher in credit quality and cash with durations at lower levels. While the latter has impacted total returns as price appreciation has driven total return, the distribution yield, or tax-free monthly income, has held up nicely. Cash has been allowed to build given the flatness of the
yield curve and the trade-off in investing in the variable rate demand note (VRDN) market. When opportunities arise, we have ample dry powder to take advantage of dislocations. Until those conditions are met, we are content to manage the Fund in a more conservative fashion commensurate with the risk profile of a municipal bond investor.
Thank you for your continued trust and support.
Sincerely,

| 
|
Christopher Ryon,cfa
Portfolio Manager
Managing Director | Nicholos Venditti,cfa
Portfolio Manager
Managing Director |

| |
David Ashley,cfa
Portfolio Manager
Managing Director | |
The matters discussed in this report may constitute forward-looking statements made pursuant to the safe harbor provisions of the Securities Litigation Reform Act of 1995. These include any advisor or portfolio manager prediction, assessment, analysis or outlook for individual securities, industries, investment styles, market sectors and/or markets. These statements involve risks and uncertainties. In addition to the general risks described for each fund in its current prospectus, other factors bearing on these reports include the accuracy of the advisor’s or portfolio manager’s forecasts and predictions, the appropriateness of the investment strategies designed by the advisor or portfolio manager and the ability of the advisor or portfolio manager to implement their strategies efficiently and successfully. Any one or more of these factors, as well as other risks affecting the securities markets generally, could cause the actual results of any fund to differ materially as compared to its benchmarks.
The views expressed are subject to change and do not necessarily reflect the views of Thornburg Investment Management, Inc. This information should not be relied upon as a recommendation or investment advice and is not intended to predict the performance of any investment or market.
Performance results of individual share classes will vary based on the fees and expenses associated with each share class, and may be higher or lower than other share classes within the same Fund. Please see Performance Summary for performance results of each share class.
Performance Summary
Thornburg Intermediate Municipal Fund | September 30, 2019 (Unaudited)
AVERAGE ANNUAL TOTAL RETURNS
| | 1-YR | 3-YR | 5-YR | 10-YR | SINCE
INCEP. |
| Class A Shares(Incep: 7/22/91) | | | | | |
| Without sales charge | 6.39% | 1.99% | 2.36% | 3.32% | 4.61% |
| With sales charge | 4.28% | 1.29% | 1.95% | 3.11% | 4.54% |
| Class C Shares(Incep: 9/1/94) | | | | | |
| Without sales charge | 6.02% | 1.64% | 2.02% | 2.99% | 3.81% |
| With sales charge | 5.42% | 1.64% | 2.02% | 2.99% | 3.81% |
| Class I Shares(Incep: 7/5/96) | 6.66% | 2.24% | 2.63% | 3.62% | 4.35% |
30-DAY YIELDS, A SHARES(with sales charge)
| Annualized Distribution Yield | 2.42% |
| SEC Yield | 0.92% |
GROWTH OF A HYPOTHETICAL $10,000 INVESTMENT
Performance data shown represents past performance and is no guarantee of future results. Investment return and principal value will fluctuate so shares, when redeemed, may be worth more or less than their original cost. Current performance may be lower or higher than quoted. For performance current to the most recent month end, visit thornburg.com or call 800-847-0200. The performance information does not reflect the deduction of taxes that a shareholder would pay on distributions or the redemption of Fund shares. Returns reflect the reinvestment of dividends and capital gains. Class A shares are sold with a maximum sales charge of 2.00%. Class C shares include a 0.60% CDSC for the first year only. There is no sales charge for Class I shares. As disclosed in the most recent prospectus, the total annual fund operating expenses before fee waivers and expense reimbursements are as follows: A shares, 0.89%; C shares, 1.26%; I shares, 0.63%. Thornburg Investment Management has contractually agreed to waive fees and reimburse expenses until at least February 1, 2020, for some of the share classes, resulting in net expense ratios of the following: C shares, 1.24%. For more detailed information on fund expenses and waivers/reimbursements please see the Fund’s prospectus.
The ICE index data referenced herein is the property of ICE Data Indices, LLC, its affiliates (“ICE Data”) and/or its Third Party Suppliers and has been licensed for use by Thornburg Investment Management, Inc. ICE Data and its Third Party Suppliers accept no liability in connection with its use. See www.thornburg.com/indices for a full copy of the Disclaimer.
TheICE BofAML 3-15 Year Municipal Securities Index is a subset of the ICE BofAML Municipal Securities Index including all securities with a remaining term to final maturity greater than or equal to 3 years and less than 15 years.
The performance of any index is not indicative of the performance of any particular investment. Unless otherwise noted, index returns reflect the reinvestment of income dividends and capital gains, if any, but do not reflect fees, brokerage commissions or other expenses of investing. Investors may not make direct investments into any index.
Bond Credit Ratings (Credit Quality) – A bond credit rating assesses the financial ability of a debt issuer to make timely payments of principal and interest. Ratings of AAA (the highest), AA, A, and BBB are investment-grade quality. Ratings of BB, B, CCC, CC, C and D (the lowest) are considered below investment grade, speculative grade, or junk bonds.
Duration – A bond’s sensitivity to interest rates. Bonds with longer durations experience greater price volatility than bonds with shorter durations. Effective duration incorporates a bond’s embedded option features, such as call provisions.
Yield Curve – A line that plots the interest rates, at a set point in time, of bonds having equal credit quality, but differing maturity dates.
Thomson Reuters Municipal Market Data (MMD) AAA Curve - Thomson Reuters Municipal Market Data (MMD) AAA Curve is a proprietary yield curve that provides the offer-side of “AAA” rated state general obligation bonds, as determined by the MMD analyst team. The MMD AAA curve represents the MMD analyst team’s opinion of AAA valuation, based on institutional block size ($2 million+) market activity in both the primary and secondary municipal bond market. In the interest of transparency, MMD publishes extensive yield curve assumptions relating to various structural criteria which are used in filtering market information for the purpose of benchmark yield curve creation.
Fund Summary
Thornburg Intermediate Municipal Fund | September 30, 2019 (Unaudited)
OBJECTIVES AND STRATEGIES
The Fund’s primary investment goal is to obtain as high a level of current income exempt from federal individual income tax as is consistent, in the view of the Fund’s investment advisor, with preservation of capital (may be subject to Alternative Minimum Tax).
The secondary goal of the Fund is to reduce expected changes in its share price compared to long-term bond portfolios.
This Fund invests principally in a laddered portfolio of municipal bonds with a dollar-weighted average maturity of normally three to 10 years. Laddering involves building a portfolio of bonds with staggered maturities so that a portion of the portfolio matures each year. Cash from maturing bonds, if not needed for other purposes, is typically invested in bonds with longer maturities at the far end of the ladder. We regard the strategy as a good compromise for managing different types of risk.
LONG-TERM STABILITY OF PRINCIPAL
Net Asset Value History of A Shares
| KEY PORTFOLIO ATTRIBUTES | |
| Number of Bonds | 479 |
| Effective Duration | 4.2 Yrs |
| Average Maturity | 8.3 Yrs |
SECURITY CREDIT RATINGS
A bond credit rating assesses the financial ability of a debt issuer to make timely payments of principal and interest. Ratings of AAA (the highest), AA, A, and BBB are investment-grade quality. Ratings of BB, B, CCC, CC, C and D (the lowest) are considered below investment grade, speculative grade, or junk bonds.
Unrated pre-refunded and escrowed-to-maturity bonds are included in the not rated category.
PORTFOLIO LADDER
| 4% | 11% | 9% | 12% | 13% | 9% | 14% | 10% | 7% | 10% |
Percent of portfolio maturing in each year. Cash includes cash equivalents and other.
There is no guarantee that the Fund will meet its investment objectives.
All data is subject to change. Charts may not add up to 100% due to rounding.
Schedule of Investments
Thornburg Intermediate Municipal Fund | September 30, 2019
| | | PRINCIPAL
AMOUNT | VALUE |
| | Municipal Bonds — 97.5% | | |
| | Alabama — 1.6% | | |
| | Alabama Public School & College Authority (Educational Facilities), Series B, 5.00% due 6/1/2021 - 6/1/2026 | $ 5,155,000 | $ 5,762,773 |
| | East Alabama Health Care Authority (Health Care Facilities Capital Improvements) GO, Series A, 5.00% due 9/1/2027 | 1,250,000 | 1,330,637 |
| | Lower Alabama Gas District, Series A, 5.00% due 9/1/2034 | 3,000,000 | 3,908,310 |
| | UAB Medicine Finance Authority (University Hospital), Series B, 5.00% due 9/1/2032 | 6,000,000 | 7,184,160 |
| | Alaska — 0.2% | | |
| | Alaska Housing Finance Corp. (State Capital Project) GO, Series A, 5.00% due 12/1/2021 (pre-refunded 12/1/2020) | 500,000 | 521,410 |
| | City of Valdez (BP Pipelines (Alaska), Inc. Project), Series C, 5.00% due 1/1/2021 | 2,000,000 | 2,086,380 |
| | Arizona — 2.0% | | |
| | Arizona Board of Regents (University of Arizona SPEED), 5.00% due 8/1/2024 - 8/1/2029 | 2,635,000 | 2,898,450 |
| | Arizona Health Facilities Authority (Scottsdale Lincoln Hospitals) HFA, 5.00% due 12/1/2031 | 2,500,000 | 2,889,700 |
| | City of Flagstaff (Urban Trail, Street and Utilities Improvements) GO, 4.00% due 7/1/2022 - 7/1/2023 | 620,000 | 671,050 |
| | County of Pima (Providence Day School Project) IDA, 5.00% due 12/1/2030 | 2,000,000 | 2,062,600 |
| a | County of Yavapai, (Waste Management, Inc.) AMT, IDA, 2.80% due 6/1/2027 (put 6/1/2021) | 2,000,000 | 2,039,000 |
| | Salt River Project Agricultural Improvement and Power District (Salt River Electric System), 5.00% due 1/1/2033 - 1/1/2037 | 7,000,000 | 8,762,920 |
| | Salt Verde Financial Corp. (Gas Supply Acquisition), 5.25% due 12/1/2022 - 12/1/2028 | 2,770,000 | 3,180,224 |
| | Arkansas — 0.4% | | |
| | Board of Trustees of the University of Arkansas (Fayetteville Campus), 5.00% due 11/1/2031 - 11/1/2034 | 3,655,000 | 4,220,778 |
| | California — 5.9% | | |
| | Alameda County Joint Powers Authority (Alameda County Medical Center Highland Hospital), Series A, 5.25% due 12/1/2027 - 12/1/2029 | 3,650,000 | 4,234,739 |
| | Brentwood Infrastructure Financing Authority (Insured: AGM), 5.00% due 11/1/2026 | 2,000,000 | 2,146,700 |
| | California (Adventist Health System/West) HFFA, Series A, 5.00% due 3/1/2026 | 3,020,000 | 3,383,759 |
| | California (Children’s Hospital Los Angeles) HFFA, Series A, 5.00% due 11/15/2022 - 8/15/2033 | 1,950,000 | 2,256,769 |
| | California (Dignity Health) HFFA, Series A, 5.25% due 3/1/2027 | 5,250,000 | 5,530,350 |
| | California Educational Facilities Authority (Pitzer College), 5.50% due 4/1/2029 (pre-refunded 4/1/2020) | 3,000,000 | 3,065,280 |
| | California Infrastructure and Economic Development Bank (King City Joint Union High School District), 5.75% due 8/15/2029 | 1,500,000 | 1,524,720 |
| b | California Infrastructure and Economic Development Bank (Los Angeles County Museum of Art), Series A, 2.088% (LIBOR 1 Month + 0.65%) due 12/1/2050 (put 2/1/2021) | 3,000,000 | 3,008,190 |
| | Corona-Norco (Insured: AGM) USD COP, Series A, 5.00% due 4/15/2021 | 1,000,000 | 1,019,160 |
| | Delano Financing Authority (City of Delano Police Station and Woollomes Avenue Bridge), Series A, 5.00% due 12/1/2025 | 2,555,000 | 2,656,945 |
| | Franklin-McKinley School District (Insured: Natl-Re) GO, 5.25% due 8/1/2027 | 1,000,000 | 1,307,500 |
| | Fresno (Educational Facilities and Improvements; Insured: Natl-Re) USD GO, Series A, 6.00% due 8/1/2026 | 1,410,000 | 1,672,232 |
| | Jurupa Public Financing Authority (Eastvale Community Services; Insured: AGM), Series A, 5.50% due 9/1/2025 - 9/1/2027 | 2,530,000 | 2,944,386 |
| | M-S-R Energy Authority, Series B, 6.125% due 11/1/2029 | 2,480,000 | 3,177,450 |
| | North City West School Facilities Financing Authority (Carmel Valley Schools; Insured: AGM), Series A, 5.00% due 9/1/2024 | 1,080,000 | 1,193,551 |
| a | Northern California Energy Authority (Commodity Supply Revenue), Series A, 4.00% due 7/1/2049 (put 7/1/2024) | 8,000,000 | 8,698,160 |
| | Oakland (County of Alameda Educational Facilities) USD GO, Series A, 5.00% due 8/1/2032 - 8/1/2034 | 3,000,000 | 3,546,090 |
| | Redwood City Redevelopment Agency (Redevelopment Area A-2; Insured: AMBAC), Zero Coupon due 7/15/2023 | 2,065,000 | 1,936,784 |
| | San Jose Redevelopment Agency (Merged Area Redevelopment Project), | | |
| | 5.25% due 8/1/2027 (pre-refunded 8/1/2020) | 2,400,000 | 2,482,080 |
| | 5.375% due 8/1/2028 (pre-refunded 8/1/2020) | 1,175,000 | 1,216,395 |
| | Saratoga Union School District (Insured: Natl-Re) USD GO, Series B, Zero Coupon due 9/1/2023 | 900,000 | 848,475 |
| | State of California (Kindergarten-University Facilities) GO, 5.25% due 9/1/2026 | 5,000,000 | 5,383,000 |
| | Turlock Irrigation District, | | |
| | Series A, | | |
| | 5.00% due 1/1/2021 | 1,005,000 | 1,014,527 |
| | 5.00% due 1/1/2021 (pre-refunded 1/1/2020) | 745,000 | 752,234 |
| | William S. Hart Union High School District (Educational Facilities; Insured: AGM) GO, Series B, Zero Coupon due 9/1/2021 | 800,000 | 778,784 |
| | Colorado — 1.2% | | |
| | Housing Authority of the City and County of Denver (Three Towers Rehabilitation; Insured: AGM) AMT, 5.20% due 11/1/2027 | 1,335,000 | 1,339,032 |
| | Park Creek Metropolitan District (Insured: AGC), 5.25% due 12/1/2020 (pre-refunded 12/1/2019) | 1,120,000 | 1,127,235 |
| | Regional Transportation District (North Metro Rail Line) COP, Series A, 5.00% due 6/1/2028 | 1,550,000 | 1,738,031 |
| | Regional Transportation District (Public Mass Transportation System) COP, | | |
| | Series A, | | |
| | 5.50% due 6/1/2022 | 260,000 | 266,908 |
| | 5.50% due 6/1/2022 (pre-refunded 6/1/2020) | 2,740,000 | 2,817,076 |
| | State of Colorado COP, Series A, 5.00% due 9/1/2029 - 9/1/2032 | 5,205,000 | 6,527,735 |
| | Connecticut — 2.0% | | |
| | City of Hartford (Various Public Improvements; Insured: AGM) GO, Series A, 5.00% due 7/1/2031 | 1,700,000 | 1,990,530 |
| | State of Connecticut GO, | | |
| | Series A, 5.00% due 4/15/2033 - 4/15/2035 | 12,415,000 | 15,194,480 |
| | Series C, 5.00% due 6/15/2028 - 6/15/2029 | 1,890,000 | 2,366,521 |
| | Series E, 5.00% due 9/15/2033 | 2,650,000 | 3,274,976 |
Schedule of Investments, Continued
Thornburg Intermediate Municipal Fund | September 30, 2019
| | | PRINCIPAL
AMOUNT | VALUE |
| | District of Columbia — 1.6% | | |
| | Metropolitan Airports Authority (Dulles Toll Road; Insured: AGC), Zero Coupon due 10/1/2023 - 10/1/2024 | $ 9,890,000 | $ 8,993,844 |
| | Metropolitan Washington Airports Authority Dulles Toll Road Revenue, Series A-Dulles Metrorail and capital improvement project, 5.00% due 10/1/2038 - 10/1/2039 | 3,000,000 | 3,698,250 |
| | Washington Convention & Sports Authority, Series A, 5.00% due 10/1/2028 | 1,105,000 | 1,390,455 |
| | Washington Metropolitan Area Transit Authority, 5.00% due 7/1/2032 - 7/1/2037 | 3,325,000 | 4,080,912 |
| | Florida — 6.5% | | |
| | Broward County (Airport System Improvements) AMT, 5.00% due 10/1/2034 - 10/1/2035 | 3,500,000 | 4,246,110 |
| | Central Florida Expressway Authority, 5.00% due 7/1/2037 | 1,095,000 | 1,327,666 |
| | City of Jacksonville (Better Jacksonville Plan), Series A, 5.00% due 10/1/2026 | 2,075,000 | 2,279,346 |
| | City of Lakeland (Electric Power System Smart Grid Project; Insured: AGM), 5.25% due 10/1/2027 - 10/1/2036 | 6,450,000 | 8,637,322 |
| | City of Orlando (Senior Tourist Development; Insured: AGM), 5.00% due 11/1/2032 - 11/1/2037 | 3,430,000 | 4,170,839 |
| | Escambia County (Florida Health Care Facility Loan Program; Insured: AMBAC) HFA ETM, 5.95% due 7/1/2020 | 260,000 | 268,895 |
| | Florida State Department of Children & Families (South Florida Evaluation Treatment Center) COP, 5.00% due 10/1/2019 | 2,255,000 | 2,255,000 |
| | Lake County School Board (School District Facility Projects) COP, Series B, 5.00% due 6/1/2026 | 1,210,000 | 1,315,899 |
| | Manatee County (Public Utilities System Improvements), 5.00% due 10/1/2026 - 10/1/2033 | 6,080,000 | 7,189,702 |
| | Miami-Dade County (Miami International Airport), Series B, 5.00% due 10/1/2028 - 10/1/2031 | 5,335,000 | 6,195,277 |
| | Miami-Dade County (Nicklaus Children’s Hospital), HFA 5.00% due 8/1/2035 - 8/1/2037 | 2,905,000 | 3,488,925 |
| | Miami-Dade County (Seaport Properties) GO, Series C, 5.00% due 10/1/2023 | 1,040,000 | 1,115,889 |
| | Miami-Dade County Educational Facilities Authority (University of Miami; Insured: AMBAC), Series B, 5.25% due 4/1/2024 | 1,000,000 | 1,156,930 |
| | Miami-Dade County School Board (Insured: AMBAC) COP, Series D, 5.00% due 10/1/2021 | 3,035,000 | 3,256,312 |
| | Miami-Dade County School Board COP, Series A, 5.00% due 5/1/2030 | 3,250,000 | 3,824,080 |
| | Orange County (Tourist Development), Series A, 5.00% due 10/1/2031 | 2,000,000 | 2,434,340 |
| | Palm Beach County (Boca Raton Regional Hospital) HFA, 5.00% due 12/1/2025 (pre-refunded 12/1/2024) | 500,000 | 587,995 |
| | Palm Beach County School District COP, Series C, 5.00% due 8/1/2028 | 595,000 | 766,199 |
| | Sarasota County Public Hospital Board (Sarasota Memorial Hospital; Insured: Natl-Re), Series A, 5.034% due 10/1/2021 | 2,000,000 | 2,064,380 |
| | School Board of Broward County (Educational Facilities and Equipment) COP, Series A, 5.00% due 7/1/2027 | 2,000,000 | 2,193,300 |
| | School Board of Broward County (Educational Facilities) COP, | | |
| | Series A, 5.00% due 7/1/2030 | 1,250,000 | 1,476,275 |
| | Series B, 5.00% due 7/1/2032 | 2,000,000 | 2,349,240 |
| | School District of Broward County COP, | | |
| | Series A, | | |
| | 5.00% due 7/1/2026 | 545,000 | 599,075 |
| | 5.00% due 7/1/2026 (pre-refunded 7/1/2022) | 2,455,000 | 2,697,210 |
| c | School District of Manatee County (School Facilities Improvement; Insured: AGM), 5.00% due 10/1/2032 | 2,250,000 | 2,742,300 |
| | Sunshine State Governmental Finance Commission (Miami-Dade County Program), Series B-1, 5.00% due 9/1/2028 | 3,500,000 | 3,948,000 |
| | Georgia — 2.0% | | |
| | Athens-Clarke County Unified Government Development Authority (UGAREF Bolton Commons, LLC), 5.00% due 6/15/2024 - 6/15/2028 | 2,320,000 | 2,617,464 |
| | City of Atlanta (Water & Wastewater System; Insured: AGM), | | |
| | Series B, | | |
| | 5.50% due 11/1/2024 | 1,740,000 | 1,745,899 |
| | 5.50% due 11/1/2024 (pre-refunded 11/1/2019) | 3,260,000 | 3,271,051 |
| | City of Atlanta (Water & Wastewater System; Insured: Natl-Re), Series A, 5.50% due 11/1/2022 | 530,000 | 576,995 |
| | Clarke County Hospital Authority (Athens Regional Medical Center), 5.00% due 1/1/2023 - 1/1/2026 (pre-refunded 1/1/2022) | 5,620,000 | 6,082,864 |
| | Main Street Natural Gas, Inc. Series A, 5.00% due 5/15/2037 | 1,975,000 | 2,626,315 |
| | Main Street Natural Gas, Inc., Series A, 5.00% due 5/15/2035 - 5/15/2036 | 3,750,000 | 4,944,992 |
| | Guam — 0.7% | | |
| | Guam Power Authority (Electric Power System; Insured: AGM), Series A, 5.00% due 10/1/2023 - 10/1/2025 | 6,500,000 | 7,157,740 |
| | Guam Waterworks Authority (Water and Wastewater System), 5.25% due 7/1/2024 | 1,000,000 | 1,115,570 |
| | Hawaii — 1.1% | | |
| | County of Hawaii GO, Series A, 5.00% due 9/1/2033 | 1,250,000 | 1,500,837 |
| | State of Hawaii GO, | | |
| | Series DZ, 5.00% due 12/1/2027 (pre-refunded 12/1/2021) | 3,635,000 | 3,917,767 |
| | Series DZ-2016, 5.00% due 12/1/2027 (pre-refunded 12/1/2021) | 6,365,000 | 6,874,327 |
| | Illinois — 9.6% | | |
| | Chicago O’Hare International Airport (2015 Airport Projects), Series B, 5.00% due 1/1/2020 | 1,000,000 | 1,008,900 |
| | Chicago O’Hare International Airport (2016 Airport Projects), Series C, 5.00% due 1/1/2029 - 1/1/2030 | 1,765,000 | 2,110,037 |
| | Chicago O’Hare International Airport (2017 Airport Projects), Series B, 5.00% due 1/1/2034 - 1/1/2037 | 8,160,000 | 9,777,991 |
| | Chicago O’Hare International Airport, Series D, 5.25% due 1/1/2033 | 1,500,000 | 1,663,785 |
| | Chicago Park District (Capital Improvement Plan) GO, | | |
| | Series A, 5.00% due 1/1/2027 - 1/1/2029 | 3,940,000 | 4,410,030 |
| | Series B, | | |
| c | 5.00% due 1/1/2025 | 1,000,000 | 1,127,650 |
| | 5.00% due 1/1/2030 | 3,500,000 | 3,888,185 |
| | Series D, 5.00% due 1/1/2028 | 3,450,000 | 3,862,516 |
Schedule of Investments, Continued
Thornburg Intermediate Municipal Fund | September 30, 2019
| | | PRINCIPAL
AMOUNT | VALUE |
| | City of Chicago (Midway Airport), | | |
| | Series B, | | |
| | 5.00% due 1/1/2032 - 1/1/2033 | $ 9,805,000 | $ 11,058,252 |
| | 5.25% due 1/1/2034 | 4,700,000 | 5,211,642 |
| | City of Chicago (Wastewater Transmission System), Series C, 5.00% due 1/1/2028 - 1/1/2029 | 7,865,000 | 8,980,385 |
| | City of Chicago (Wastewater Transmission System; Insured: AGM), Series B-AGM-CR, 5.00% due 1/1/2034 | 1,375,000 | 1,636,773 |
| | City of Chicago (Water System; Insured: AGM), Series 2017-2, 5.00% due 11/1/2037 | 4,250,000 | 5,023,585 |
| | City of Chicago (Water System; Insured: BHAC-CR AMBAC), 5.75% due 11/1/2030 | 1,270,000 | 1,623,314 |
| | City of Mount Vernon (Various Municipal Capital Improvements; Insured: AGM) GO, 4.00% due 12/15/2025 | 1,900,000 | 1,955,708 |
| | Cook County GO, Series A, 5.25% due 11/15/2024 | 3,000,000 | 3,123,810 |
| | Cook County School District No. 104 (Argo Summit Elementary School Facilities; Insured: AGM) GO ETM, Series D, Zero Coupon due 12/1/2022 | 2,000,000 | 1,905,240 |
| | Illinois (Midwest Care Center I, Inc.; Collateralized: GNMA) HFA, 5.70% due 2/20/2021 | 190,000 | 190,359 |
| d | Illinois Finance Authority (Northwestern Memorial Healthcare Obligated Group; SPA JP Morgan Chase Bank N.A.), Series A-3, 1.77% due 8/15/2042 (put 10/1/2019) | 1,265,000 | 1,265,000 |
| | Illinois Finance Authority (Rush University Medical Center), Series A, 5.00% due 11/15/2033 | 1,000,000 | 1,153,890 |
| | Illinois Finance Authority (Silver Cross Hospital and Medical Centers), 5.00% due 8/15/2024 | 1,000,000 | 1,138,930 |
| | Illinois Toll Highway Authority (Move Illinois Program), Series A, 5.00% due 1/1/2037 | 5,550,000 | 6,437,667 |
| e | Knox & Warren Counties Community Unit School District No 205 Galesburg GO, Series B, 5.00% due 12/1/2030 - 12/1/2031 | 2,655,000 | 3,226,125 |
| | Metropolitan Pier & Exposition Authority (McCormick Place Expansion Project), Series B, 5.00% due 12/15/2022 | 1,000,000 | 1,084,360 |
| | Monroe and St. Clair Counties (Community Unit School District No. 5; Insured: BAM) GO, 5.00% due 4/15/2027 - 4/15/2031 | 6,285,000 | 7,454,659 |
| | State of Illinois, Series B, 5.00% due 6/15/2030 - 6/15/2032 | 12,165,000 | 14,153,128 |
| | Tazewell County School District (Insured: Natl-Re) GO, 9.00% due 12/1/2024 | 1,205,000 | 1,605,289 |
| | Village of Tinley Park GO, | | |
| | 4.00% due 12/1/2021 | 585,000 | 615,268 |
| | 5.00% due 12/1/2024 | 870,000 | 987,380 |
| | Indiana — 2.9% | | |
| | Board of Trustees for the Vincennes University, Series J, 5.375% due 6/1/2022 | 895,000 | 918,288 |
| | City of Carmel Redevelopment Authority (Performing Arts Center), Zero Coupon due 2/1/2021 | 2,000,000 | 1,956,940 |
| | City of Carmel Redevelopment District (Performing Arts Center) COP, Series C, 6.50% due 7/15/2035 (pre-refunded 1/15/2021) | 2,730,000 | 2,906,767 |
| a | City of Whiting Environmental Facilities (BP Products North America Inc. Project) AMT, Series A, 5.00% due 3/1/2046 (put 3/1/2023) | 1,000,000 | 1,106,530 |
| | Indiana (Ascension Health Credit Group) HFFA, 5.00% due 11/15/2034 - 11/15/2036 | 8,325,000 | 9,843,049 |
| | Indiana Bond Bank (Hendricks Regional Health Financing Program; Insured: AMBAC), 5.25% due 4/1/2023 | 2,000,000 | 2,243,200 |
| | Indiana Bond Bank (Natural Gas Utility Improvements), Series A, 5.25% due 10/15/2020 | 5,340,000 | 5,535,017 |
| | Indiana Finance Authority (Marian University), 5.25% due 9/15/2022 - 9/15/2023 (pre-refunded 9/15/2021) | 5,085,000 | 5,462,815 |
| d | Indiana Finance Authority (Marion County Capital Improvement Board; SPA U.S. Bank, N.A.), Series A-3-RMKT, 1.77% due 2/1/2037 (put 10/1/2019) | 1,100,000 | 1,100,000 |
| d | Indiana Finance Authority (Marion County Capital Improvement Board; SPA Wells Fargo Bank, N.A.), Series A-2-RMKT, 1.75% due 2/1/2037 (put 10/1/2019) | 1,025,000 | 1,025,000 |
| | Indiana Finance Authority (Sisters of St. Francis Health Services, Inc.), 5.00% due 11/1/2021 | 605,000 | 615,588 |
| | Iowa — 0.4% | | |
| | Iowa Finance Authority (UnityPoint Health), Series C, 5.00% due 2/15/2030 - 2/15/2032 | 4,100,000 | 4,629,208 |
| | Kansas — 0.1% | | |
| | Kansas (Wichita State University) DFA, Series A, 5.00% due 6/1/2020 | 575,000 | 588,622 |
| | Unified Government of Wyandotte County/Kansas City (School Improvement Project; Insured: AGM) USD GO, Series A, 5.00% due 9/1/2030 - 9/1/2031 | 640,000 | 785,193 |
| | Kentucky — 2.0% | | |
| a | Kentucky Public Energy Authority (Gas Supply System), Series C-1, 4.00% due 12/1/2049 (put 6/1/2025) | 17,500,000 | 19,356,050 |
| | Louisville/Jefferson County Metropolitan Government (Norton Suburban Hospital and Kosair Children’s Hospital), 5.25% due 10/1/2026 | 2,320,000 | 2,646,354 |
| | Louisiana — 2.2% | | |
| | East Baton Rouge Sewerage Commission, Series B, 5.00% due 2/1/2030 - 2/1/2032 | 6,825,000 | 8,003,923 |
| | Jefferson Sales Tax District (Insured: AGM), Series B, 5.00% due 12/1/2034 - 12/1/2035 | 1,500,000 | 1,833,650 |
| | Louisiana Energy and Power Authority (LEPA Unit No. 1; Insured: AGM), Series A, 5.25% due 6/1/2029 - 6/1/2031 | 6,100,000 | 6,867,581 |
| | New Orleans Regional Transit Authority (Insured: AGM), 5.00% due 12/1/2023 - 12/1/2024 | 2,000,000 | 2,080,520 |
| | Parish of Lafourche (Roads, Highways and Bridges), 5.00% due 1/1/2024 - 1/1/2025 | 3,685,000 | 4,302,026 |
| | Terrebonne Parish Hospital Service District No. 1 (General Medical Center), | | |
| | 5.00% due 4/1/2028 | 960,000 | 972,931 |
| | 5.00% due 4/1/2028 (pre-refunded 4/1/2020) | 540,000 | 549,790 |
| | Massachusetts — 1.8% | | |
| | Massachusetts (Insured: BHAC-CR FGIC), 5.50% due 1/1/2029 | 8,370,000 | 11,271,628 |
| | Massachusetts Bay Transportation Authority (Transportation Capital Program), Series A, 5.25% due 7/1/2030 | 1,000,000 | 1,358,840 |
| | Massachusetts Development Finance Agency (CareGroup Healthcare System), | | |
| | Series H-1, 5.00% due 7/1/2021 | 2,330,000 | 2,470,476 |
| | Series I, 5.00% due 7/1/2036 | 1,750,000 | 2,071,965 |
| | Massachusetts Development Finance Agency (Simmons College), Series J, 5.50% due 10/1/2025 - 10/1/2028 | 1,790,000 | 2,057,113 |
| | Massachusetts Educational Financing Authority (Higher Education Student Loans), Series A, 5.50% due 1/1/2022 | 1,130,000 | 1,142,588 |
| | Michigan — 2.5% | | |
Schedule of Investments, Continued
Thornburg Intermediate Municipal Fund | September 30, 2019
| | | PRINCIPAL
AMOUNT | VALUE |
| | Board of Governors of Wayne State University (Educational Facilities and Equipment), Series A, 5.00% due 11/15/2031 | $ 1,010,000 | $ 1,171,065 |
| | City of Troy (Downtown Development Authority-Community Center Facilities) GO, 5.00% due 11/1/2025 | 300,000 | 322,785 |
| | County of Genesee (Water Supply System; Insured: BAM) GO, | | |
| | 5.00% due 11/1/2024 - 11/1/2030 | 3,360,000 | 3,740,483 |
| | 5.125% due 11/1/2032 | 750,000 | 836,857 |
| | 5.25% due 11/1/2026 - 11/1/2028 | 2,920,000 | 3,273,668 |
| | Detroit City School District (School Building & Site Improvement; Insured: AGM/Q-SBLF) GO, Series A, 5.25% due 5/1/2026 | 3,150,000 | 3,850,654 |
| | Detroit City School District (School Building & Site; Insured: AGM Q-SBLF) GO, Series A, 5.25% due 5/1/2027 | 1,100,000 | 1,376,364 |
| | Kalamazoo Hospital Finance Authority (Bronson Healthcare), | | |
| | 5.25% due 5/15/2026 | 175,000 | 184,977 |
| | 5.25% due 5/15/2026 (pre-refunded 5/15/2021) | 1,110,000 | 1,178,542 |
| | Kalamazoo Hospital Finance Authority (Bronson Healthcare; Insured: AGM), | | |
| | 5.00% due 5/15/2022 | 1,105,000 | 1,129,918 |
| | 5.00% due 5/15/2022 (pre-refunded 5/15/2020) | 1,365,000 | 1,395,358 |
| | Michigan Finance Authority (Government Loan Program), Series F, 5.00% due 4/1/2026 | 1,580,000 | 1,682,447 |
| | Michigan Finance Authority (McLaren Health System), Series A, 5.00% due 2/15/2039 | 3,200,000 | 3,956,256 |
| | Michigan Public School Academy (Will Carleton Charter School), 8.00% due 8/1/2035 | 845,000 | 851,168 |
| | Michigan State Hospital Finance Authority (Henry Ford Health System), 5.625% due 11/15/2029 (pre-refunded 11/15/2019) | 2,500,000 | 2,512,725 |
| | Minnesota — 0.9% | | |
| d | City of Minneapolis/St. Paul Housing & Redevelopment Authority (Allina Health Obligated Group; LOC JPMorgan Chase Bank, N.A.), Series B-2, 1.77% due 11/15/2035 (put 10/1/2019) | 1,600,000 | 1,600,000 |
| | Minnesota Agriculture & Economic Development Board (Essentia Health; Insured: AGC), Series C-1, 5.50% due 2/15/2025 | 2,500,000 | 2,537,475 |
| | Minnesota Higher Education Facilities Authority, (University of St. Thomas) 5.00% due 10/1/2034 - 10/1/2035 | 600,000 | 757,241 |
| | Minnesota Housing Finance Agency (Collateralized: GNMA, FNMA, FHLMC), | | |
| | Series F, | | |
| | 2.45% due 7/1/2034 | 2,765,000 | 2,717,774 |
| | 2.55% due 7/1/2039 | 2,235,000 | 2,194,122 |
| | Mississippi — 1.3% | | |
| | Mississippi Development Bank (Capital City Convention Center) GO, 5.00% due 3/1/2025 | 2,850,000 | 3,277,472 |
| | Mississippi Development Bank (Department of Corrections), Series D, 5.25% due 8/1/2027 (pre-refunded 8/1/2020) | 3,415,000 | 3,528,037 |
| | Mississippi Development Bank (Jackson Public School District; Insured BAM) GO, 5.25% due 10/1/2037 - 10/1/2038 | 5,250,000 | 6,537,282 |
| | Mississippi Development Bank, (Vicksburg Warren School District; Insured: BAM) 5.50% due 3/1/2038 | 700,000 | 896,903 |
| | Missouri — 0.2% | | |
| | Missouri Health and Educational Facilities Authority (Webster University) ETM, 5.00% due 4/1/2021 | 2,520,000 | 2,656,660 |
| | Nebraska — 0.8% | | |
| a | Central Plains Energy Project, 5.00% due 3/1/2050 (put 1/1/2024) | 8,350,000 | 9,337,471 |
| | Nevada — 1.2% | | |
| | Carson City (Carson Tahoe Regional Healthcare), 5.00% due 9/1/2027 - 9/1/2032 | 3,180,000 | 3,546,496 |
| | Washoe County (Reno Sparks Convention & Visitors Authority) GO, 5.00% due 7/1/2026 - 7/1/2032 (pre-refunded 7/1/2021) | 7,095,000 | 7,549,350 |
| | Washoe County NV GO, 5.00% due 7/1/2032 (pre-refunded 7/1/2021) | 1,905,000 | 2,026,904 |
| | New Hampshire — 0.8% | | |
| d | New Hampshire Health and Education Facilities Authority Act (University System of New Hampshire; SPA State Street Bank and Trust Co.), Series A-2-RMKT 1.75% due 7/1/2035 (put 10/1/2019) | 2,800,000 | 2,800,000 |
| | New Hampshire Municipal Bond Bank, Series C, 5.00% due 8/15/2026 | 1,860,000 | 2,118,001 |
| | State of New Hampshire (Turnpike System), Series B, 5.00% due 2/1/2022 - 2/1/2024 | 4,005,000 | 4,338,549 |
| | New Jersey — 3.6% | | |
| | Cape May County Industrial Pollution Control Financing Authority (Atlantic City Electric Company; Insured: Natl-Re), Series A, 6.80% due 3/1/2021 | 675,000 | 723,566 |
| | Essex County Improvement Authority (County Correctional Facilities & Gibraltar Facilities; Insured: Natl-Re), 5.50% due 10/1/2024 | 2,500,000 | 3,011,425 |
| | New Jersey (School Facilities Construction) EDA, 5.00% due 3/1/2026 | 2,000,000 | 2,189,840 |
| | New Jersey (School Facilities Construction; Insured: AMBAC) EDA, Series N-1, 5.50% due 9/1/2026 | 3,000,000 | 3,639,450 |
| | New Jersey (School Facilities Construction; Insured: Natl-Re) EDA, Series N-1, 5.50% due 9/1/2027 | 1,700,000 | 2,100,027 |
| | New Jersey State Health Care Facilities Financing Authority (Virtua Health), 5.00% due 7/1/2027 - 7/1/2028 | 3,000,000 | 3,428,800 |
| | New Jersey Transportation Trust Fund Authority (State Transportation System Improvements), | | |
| b | 2.78% (MUNIPSA + 1.20%) due 6/15/2034 (put 12/15/2021) | 2,000,000 | 2,012,180 |
| | 5.00% due 6/15/2023 - 6/15/2031 | 13,250,000 | 15,595,398 |
| | New Jersey Transportation Trust Fund Authority (State Transportation System Improvements; Insured: Natl-Re), Series B, 5.50% due 12/15/2020 | 3,185,000 | 3,329,949 |
| | New Jersey Transportation Trust Fund Authority, Series A, 5.00% due 12/15/2034 | 500,000 | 587,860 |
| | Passaic Valley Sewage Commissioners GO, Series G, 5.75% due 12/1/2022 | 3,000,000 | 3,381,270 |
| | New Mexico — 0.9% | | |
| | City of Farmington (Arizona Public Service Co.-Four Corners Project), Series B, 4.70% due 9/1/2024 | 3,000,000 | 3,095,850 |
| | City of Las Cruces (NMFA Loan), 5.00% due 6/1/2030 | 2,040,000 | 2,087,491 |
| | New Mexico Hospital Equipment Loan Council (Haverland Carter Lifestyle Group), 5.00% due 7/1/2032 | 2,130,000 | 2,259,440 |
| | Regents of New Mexico State University (Campus Buildings Acquisition & Improvements), Series A, 5.00% due 4/1/2034 | 1,810,000 | 2,190,607 |
| | New York — 7.5% | | |
| | City of New York (City Budget Financial Management) GO, | | |
Schedule of Investments, Continued
Thornburg Intermediate Municipal Fund | September 30, 2019
| | | PRINCIPAL
AMOUNT | VALUE |
| | Series G, 5.00% due 8/1/2027 | $ 4,530,000 | $ 5,209,500 |
| | Series J, 5.00% due 8/1/2030 - 8/1/2031 | 9,000,000 | 10,466,920 |
| | City of New York (SPA Barclays Bank plc) GO, | | |
| d | Series B-4, 1.77% due 10/1/2046 (put 10/1/2019) | 1,400,000 | 1,400,000 |
| d | Series B-5, 1.77% due 10/1/2046 (put 10/1/2019) | 1,950,000 | 1,950,000 |
| d | City of New York (SPA Landesbank Hessen-Thuringen) GO, Series A-3, 1.78% due 8/1/2035 (put 10/1/2019) | 3,400,000 | 3,400,000 |
| | County of Nassau (Insured: BAM) GO, Series B, 5.00% due 4/1/2026 | 1,300,000 | 1,473,953 |
| | Erie County Industrial Development Agency (City of Buffalo School District) (State Aid Withholding), Series A, 5.00% due 5/1/2027 | 5,000,000 | 5,623,100 |
| | Metropolitan Transportation Authority (Green Bond), | | |
| | Series A2, 5.00% due 11/15/2025 | 7,500,000 | 9,015,975 |
| | Series C-1, 5.00% due 11/15/2030 | 8,500,000 | 10,635,625 |
| | Metropolitan Transportation Authority (Transit and Commuter System), Series A2-Green Bond, 5.00% due 11/15/2024 | 5,435,000 | 6,373,516 |
| d | New York City Transitional Finance Authority Future Tax Secured Revenue (SPA JP Morgan Chase Bank, N.A), Series E-3, 1.75% due 2/1/2045 (put 10/1/2019) | 5,335,000 | 5,335,000 |
| d | New York City Transitional Finance Authority Future Tax Secured Revenue, (SPA State Street Bank and Trust Co.), Series A-6, 1.76% due 8/1/2039 (put 10/1/2019) | 6,000,000 | 6,000,000 |
| d | New York City Water & Sewer System (SPA Mizuho Bank, Ltd.), Series AA-6, 1.77% due 6/15/2048 (put 10/1/2019) | 500,000 | 500,000 |
| | New York State Dormitory Authority (Metropolitan Transportation Authority & State Urban Development Corp.), Series A, 5.00% due 12/15/2027 | 2,500,000 | 2,781,450 |
| | New York State Dormitory Authority (State University Educational Facilities), Series A, 5.25% due 5/15/2021 | 500,000 | 521,790 |
| | Town of Oyster Bay GO, Series B, 3.00% due 2/1/2020 - 3/13/2020 | 12,750,000 | 12,813,952 |
| | North Carolina — 2.4% | | |
| d | Charlotte-Mecklenburg Hospital Authority (Carolinas Healthcare System Obligated Group; SPA JP Morgan Chase Bank, N.A), Series C, 1.77% due 1/15/2037 (put 10/1/2019) | 1,700,000 | 1,700,000 |
| | Charlotte-Mecklenburg Hospital Authority (Carolinas HealthCare System), Series A, 5.00% due 1/15/2028 | 2,190,000 | 2,424,856 |
| | North Carolina Medical Care Commission (Vidant Health), 5.00% due 6/1/2030 | 3,000,000 | 3,532,950 |
| | State of North Carolina, 5.00% due 3/1/2033 - 3/1/2034 | 15,400,000 | 19,522,192 |
| | Ohio — 5.3% | | |
| | Akron, Bath and Copley Joint Township Hospital District (Children’s Hospital Medical Center of Akron), 5.00% due 11/15/2024 | 1,000,000 | 1,083,920 |
| | American Municipal Power, Inc. (AMP Fremont Energy Center), Series B, 5.25% due 2/15/2028 (pre-refunded 2/15/2022) | 4,000,000 | 4,364,480 |
| | Cincinnati City School District (School Improvement Project) COP, 5.00% due 12/15/2031 | 3,075,000 | 3,570,721 |
| | City of Cleveland (Bridges and Roadways), 5.00% due 10/1/2028 - 10/1/2029 (pre-refunded 10/1/2023) | 2,520,000 | 2,887,340 |
| | City of Cleveland (Public Facilities Improvements), | | |
| | 5.00% due 10/1/2029 | 1,500,000 | 1,888,170 |
| | Series A-1, 5.00% due 11/15/2027 - 11/15/2030 (pre-refunded 11/15/2023) | 5,185,000 | 5,958,309 |
| | City of Cleveland (Various Municipal Capital Improvements) GO, 5.00% due 12/1/2024 - 12/1/2026 | 2,230,000 | 2,477,390 |
| | City of Cleveland Income Tax Revenue, 5.00% due 10/1/2033 - 10/1/2035 | 1,450,000 | 1,789,290 |
| | Cleveland-Cuyahoga County Port Authority (Cleveland Museum of Art), 5.00% due 10/1/2021 | 2,040,000 | 2,114,950 |
| | Cleveland-Cuyahoga County Port Authority (County Administration Offices), 5.00% due 7/1/2025 | 1,780,000 | 2,099,029 |
| | County of Allen (Catholic Health Partners-Mercy Health West Facility), Series A, 5.00% due 5/1/2025 - 5/1/2026 | 8,325,000 | 9,054,600 |
| | County of Cuyahoga (Convention Center Hotel) COP, 5.00% due 12/1/2026 | 2,910,000 | 3,325,635 |
| | County of Cuyahoga (Musical Arts Association) 5.00% due 1/1/2030 - 1/1/2039 | 3,170,000 | 3,961,887 |
| | County of Hamilton (Cincinnati Children’s Hospital Medical Center), 5.00% due 5/15/2028 - 5/15/2031 | 8,085,000 | 9,282,136 |
| | Deerfield Township (Public Street Improvements-Wilkens Blvd.), 5.00% due 12/1/2025 | 925,000 | 927,682 |
| | Greene County Vocational School District (School Facilities Construction and Improvement) GO, 5.00% due 12/1/2030 - 12/1/2033 | 2,580,000 | 3,283,102 |
| | Lucas County Health Care Facility (Sunset Retirement Community), | | |
| | 5.00% due 8/15/2021 | 505,000 | 527,205 |
| | 5.125% due 8/15/2025 | 1,250,000 | 1,322,887 |
| | Oklahoma — 0.2% | | |
| | Oklahoma (INTEGRIS Health) DFA, Series A, 5.00% due 8/15/2026 - 8/15/2027 | 2,230,000 | 2,655,670 |
| | Pennsylvania — 7.9% | | |
| | Allegheny County (Propel Charter School-McKeesport) IDA, | | |
| | Series C, | | |
| | 5.90% due 8/15/2026 | 685,000 | 706,550 |
| | 6.375% due 8/15/2035 | 1,130,000 | 1,164,476 |
| | Allegheny County Hospital Development Authority (University of Pittsburgh Medical Center), Series A, 5.00% due 7/15/2034 | 1,150,000 | 1,444,561 |
| | Bucks County (Waste Management, Inc.) AMT, IDA, 2.75% due 12/1/2022 | 7,000,000 | 7,211,680 |
| | City of Philadelphia (Pennsylvania Gas Works), 5.00% due 8/1/2032 - 8/1/2034 | 2,300,000 | 2,683,595 |
| | City of Philadelphia (Philadelphia Gas Works), 5.00% due 8/1/2036 - 8/1/2037 | 5,485,000 | 6,577,312 |
| | City of Philadelphia (Water and Wastewater System), 5.00% due 10/1/2029 - 10/1/2030 | 3,510,000 | 4,267,159 |
| | City of Pittsburgh (Capital Projects) GO, 5.00% due 9/1/2024 - 9/1/2036 | 1,715,000 | 2,061,425 |
| | County of Luzerne (Insured: AGM) GO, Series A, 5.00% due 11/15/2029 | 3,000,000 | 3,534,390 |
| | Dallastown Area School District (State Aid Withholding) GO, Series A, 4.00% due 5/1/2021 | 460,000 | 479,881 |
| | Lancaster County Solid Waste Management Authority (Acquisition of Susquehanna Resource Management Facility), Series A, 5.25% due 12/15/2030 | 3,000,000 | 3,387,210 |
| | Monroeville Financing Authority (University of Pittsburgh Medical Center), 5.00% due 2/15/2026 | 3,490,000 | 4,221,644 |
| | Pennsylvania Higher Educational Facilities Authority (Insured: AMBAC), Series 14, Zero Coupon due 7/1/2020 | 2,032,839 | 1,929,998 |
Schedule of Investments, Continued
Thornburg Intermediate Municipal Fund | September 30, 2019
| | | PRINCIPAL
AMOUNT | VALUE |
| | Pennsylvania State Public School Building Authority (Philadelphia School District; Insured: AGM) (State Aid Withholding) GO, Series B, 5.00% due 6/1/2027 | $ 5,000,000 | $ 6,125,700 |
| | Pennsylvania Turnpike Commission (Highway Improvements), | | |
| | 5.35% due 12/1/2030 (pre-refunded 12/1/2020) | 1,540,000 | 1,612,149 |
| | Series A-1, 5.00% due 12/1/2035 - 12/1/2036 | 1,750,000 | 2,133,895 |
| | Series C-2, 5.35% due 12/1/2030 (pre-refunded 12/1/2020) | 2,460,000 | 2,575,251 |
| | Philadelphia Authority for Industrial Development (Thomas Jefferson University), Series A, 5.00% due 9/1/2032 - 9/1/2034 | 5,685,000 | 6,793,656 |
| | Philadelphia Municipal Authority (Juvenile Justice Services Center), 5.00% due 4/1/2032 - 4/1/2036 | 11,125,000 | 13,346,237 |
| | Pittsburgh Water & Sewer Authority (Water and Sewer System; Insured: AGM), | | |
| | Series A, 5.00% due 9/1/2030 - 9/1/2031 | 8,740,000 | 9,885,679 |
| | Series B, 5.00% due 9/1/2031 (pre-refunded 9/1/2023) | 3,665,000 | 4,167,252 |
| | Plum Borough School District (Insured: BAM) (State Aid Withholding) GO, | | |
| | Series A, 4.00% due 9/15/2020 - 9/15/2021 | 830,000 | 858,484 |
| | Series B, | | |
| | 4.00% due 9/15/2020 | 385,000 | 393,589 |
| | 5.00% due 9/15/2021 | 430,000 | 457,907 |
| | Rhode Island — 0.4% | | |
| | State of Rhode Island and Providence Plantations (Consolidated Capital Development Loan) GO, Series B, 4.00% due 10/15/2023 | 800,000 | 861,776 |
| | State of Rhode Island and Providence Plantations (Training School Project) COP, Series B, 5.00% due 10/1/2024 | 3,595,000 | 4,070,511 |
| | South Carolina — 0.2% | | |
| | City of Myrtle Beach (Municipal Sports Complex), Series B, 5.00% due 6/1/2028 - 6/1/2030 | 2,000,000 | 2,294,250 |
| | South Dakota — 0.5% | | |
| | South Dakota Health and Educational Facilities Authority (Avera Health), Series A, 5.00% due 7/1/2023 | 1,575,000 | 1,670,996 |
| | South Dakota Health and Educational Facilities Authority (Sanford Health), 5.00% due 11/1/2024 - 11/1/2029 | 3,500,000 | 3,838,802 |
| | Tennessee — 1.8% | | |
| | County of Shelby Health, Educational and Housing Facility Board (Methodist Le Bonheur Healthcare), 5.00% due 5/1/2027 - 5/1/2035 | 3,560,000 | 4,339,234 |
| | Metropolitan Government of Nashville and Davidson County (Green Projects), Series B, 5.00% due 7/1/2033 - 7/1/2036 | 3,000,000 | 3,687,190 |
| | Tennessee Energy Acquisition Corp. (The Gas Project), | | |
| | Series A, | | |
| a | 4.00% due 5/1/2048 (put 5/1/2023) | 1,850,000 | 1,978,224 |
| | 5.25% due 9/1/2023 | 7,000,000 | 7,871,360 |
| | Series C, 5.00% due 2/1/2023 | 2,500,000 | 2,746,800 |
| | Texas — 8.1% | | |
| | City of Dallas (Public Improvements) GO, 5.00% due 2/15/2025 - 2/15/2034 | 9,720,000 | 11,433,086 |
| | City of Dallas (Trinity River Corridor Infrastructure) GO, 5.00% due 2/15/2028 | 1,000,000 | 1,145,930 |
| | City of Galveston (Galveston Island Convention Center; Insured: AGM), | | |
| | Series A, 5.00% due 9/1/2021 | 545,000 | 581,918 |
| | Series B, 5.00% due 9/1/2024 | 1,115,000 | 1,224,159 |
| | City of Houston (Convention & Entertainment Facilities), 5.00% due 9/1/2032 | 3,560,000 | 4,068,866 |
| | City of Houston (Public Improvements) GO, Series A, 5.00% due 3/1/2027 | 1,175,000 | 1,426,756 |
| | City of McAllen (International Toll Bridge; Insured: AGM), Series A, 5.00% due 3/1/2028 - 3/1/2032 | 6,120,000 | 7,249,472 |
| | City of San Antonio (Airport System Capital Improvements) AMT, 5.00% due 7/1/2024 - 7/1/2025 | 3,225,000 | 3,517,438 |
| | City of San Antonio (Water System), Series A, 5.00% due 5/15/2033 - 5/15/2034 | 3,075,000 | 3,693,517 |
| | City of Texas City Industrial Development Corp. (ARCO Pipe Line Co. Project), 7.375% due 10/1/2020 | 2,705,000 | 2,860,592 |
| | Dallas Area Rapid Transit, Series A, 5.00% due 12/1/2035 - 12/1/2036 | 7,200,000 | 8,570,304 |
| | Dallas County Utility & Reclamation District GO, 5.00% due 2/15/2027 | 1,905,000 | 2,353,037 |
| | Harris County Cultural Education Facilities Finance Corp. (Memorial Hermann Health System), Series A, 5.00% due 12/1/2028 | 3,000,000 | 3,475,920 |
| | Harris County Cultural Education Facilities Finance Corp. (TECO Project), 5.00% due 11/15/2028 - 11/15/2033 | 2,225,000 | 2,745,814 |
| | Houston Airport System Revenue, Series D, 5.00% due 7/1/2035 | 1,750,000 | 2,172,660 |
| | Houston Higher Education Finance Corp. (Cosmos Foundation, Inc.), 6.50% due 5/15/2031 (pre-refunded 5/15/2021) | 775,000 | 836,752 |
| | Lower Colorado River Authority, | | |
| | Series A, | | |
| | 5.00% due 5/15/2026 | 9,415,000 | 10,271,012 |
| | 5.00% due 5/15/2026 (pre-refunded 5/15/2022) | 55,000 | 60,104 |
| | Metropolitan Transit Authority of Harris County, 5.00% due 11/1/2029 - 11/1/2030 | 4,040,000 | 5,203,201 |
| | North Texas Tollway Authority (NTTA System), Series A, 5.00% due 1/1/2037 | 1,750,000 | 2,104,287 |
| | Round Rock (Educational Facilities Improvements; Guaranty: PSF) ISD GO, 5.00% due 8/1/2028 - 8/1/2029 | 5,820,000 | 7,028,225 |
| | San Antonio Water System, Series A, 5.00% due 5/15/2037 | 500,000 | 619,285 |
| | San Juan Higher Education Finance Authority (IDEA Public Schools), Series A, 5.75% due 8/15/2024 (pre-refunded 8/15/2020) | 1,590,000 | 1,649,816 |
| | Stephen F Austin State University (Financing System), Series A, 5.00% due 10/15/2030 - 10/15/2033 | 1,265,000 | 1,585,029 |
| | Texas Public Finance Authority Charter School Finance Corp. (Cosmos Foundation, Inc.), Series A, 6.00% due 2/15/2030 (pre-refunded 2/15/2020) | 1,750,000 | 1,778,928 |
| | Texas Transportation Commission (Central Texas Turnpike System), Series C, 5.00% due 8/15/2024 - 8/15/2025 | 2,250,000 | 2,597,955 |
| | U. S. Virgin Islands — 0.5% | | |
| | Virgin Islands Public Finance Authority, Series A, 6.625% due 10/1/2029 | 5,000,000 | 5,025,050 |
Schedule of Investments, Continued
Thornburg Intermediate Municipal Fund | September 30, 2019
| | | PRINCIPAL
AMOUNT | VALUE |
| | Utah — 1.0% | | |
| d | City of Murray UT (IHC Health Services, Inc. Obligated Group; SPA JP Morgan Chase Bank, N.A), Series B, 1.75% due 5/15/2037 (put 10/1/2019) | $ 8,130,000 | $ 8,130,000 |
| a | County of Utah, (IHC Health Services, Inc. Obligated Group), Series B, 5.00% due 5/15/2056 (put 8/1/2022) | 2,500,000 | 2,722,675 |
| | Washington — 3.0% | | |
| | King County Public Hospital District No. 2 (EvergreenHealth Medical Center) GO, 5.00% due 12/1/2028 - 12/1/2030 | 4,545,000 | 5,311,200 |
| | Skagit County Public Hospital District No. 1 (Skagit Regional Health) GO, 5.00% due 12/1/2025 - 12/1/2028 (pre-refunded 12/1/2022) | 7,860,000 | 8,735,132 |
| | Skagit County Public Hospital District No. 2 (Island Hospital) GO, 5.00% due 12/1/2027 - 12/1/2028 | 4,640,000 | 5,068,908 |
| | State of Washington (Acquisition and Improvements of Real and Personal Property) COP, Series A, 5.00% due 7/1/2030 | 4,415,000 | 5,500,207 |
| | State of Washington GO, Series C, 5.00% due 2/1/2036 - 2/1/2037 | 7,425,000 | 9,378,001 |
| | West Virginia — 0.3% | | |
| a | West Virginia Economic Development Authority, (Appalachian Power Co.) AMT, Series A, 1.70% due 1/1/2041 (put 9/1/2020) | 1,500,000 | 1,499,175 |
| a | West Virginia Economic Development Authority, (Appalachian Power Co.), Series A, 2.625% due 12/1/2042 (put 6/1/2022) | 2,000,000 | 2,056,720 |
| | Wisconsin — 2.0% | | |
| | Wisconsin Health & Educational Facilities Authority (Agnesian Healthcare), | | |
| | 5.00% due 7/1/2021 (pre-refunded 7/1/2020) | 2,170,000 | 2,228,981 |
| | 5.50% due 7/1/2025 (pre-refunded 7/1/2020) | 5,000,000 | 5,154,400 |
| | Wisconsin Health & Educational Facilities Authority (ProHealth Care, Inc.), 5.00% due 8/15/2023 - 8/15/2026 | 10,925,000 | 11,599,223 |
| | WPPI Energy, Series A, 5.00% due 7/1/2029 - 7/1/2036 | 2,980,000 | 3,712,860 |
| | Total Investments — 97.5%(Cost $1,023,457,462) | | $1,093,029,231 |
| | Other Assets Less Liabilities — 2.5% | | 28,075,947 |
| | Net Assets — 100.0% | | $1,121,105,178 |
| Footnote Legend |
| a | Variable Rate Demand Obligations are instruments whose interest rates change on a mandatory date (demand date) or whose interest rates will vary with changes in a designated base rate. The rate disclosed is the rate at September 30, 2019. |
| b | Floating Rate Security. Stated interest/floor rate was in effect at September 30, 2019. |
| c | Segregated as collateral for a when-issued security. |
| d | Variable Rate Demand Notes are instruments whose interest rates change on a specific date (such as coupon date or interest payment date) or whose interest rates vary with changes in a designated base rate (such as the prime interest rate). This instrument is payable on demand and is secured by letters of credit or other credit support agreements from major banks. |
| e | When-issued security. |
Portfolio Abbreviations
To simplify the listings of securities, abbreviations are used per the table below:
| AGC | Insured by Associated General Contractors |
| AGM | Insured by Assured Guaranty Municipal Corp. |
| AMBAC | Insured by American Municipal Bond Assurance Corp. |
| AMT | Alternative Minimum Tax |
| BAM | Insured by Build America Mutual Insurance Co. |
| BHAC-CR | Berkshire Hathaway Assurance Corp. Custodial Receipts |
| COP | Certificates of Participation |
| DFA | Development Finance Authority |
| EDA | Economic Development Authority |
| ETM | Escrowed to Maturity |
| FGIC | Insured by Financial Guaranty Insurance Co. |
| FHLMC | Insured by Federal Home Loan Mortgage Corp. |
| FNMA | Collateralized by Federal National Mortgage Association |
| GNMA | Collateralized by Government National Mortgage Association |
| GO | General Obligation |
| HFA | Health Facilities Authority |
| HFFA | Health Facilities Financing Authority |
| IDA | Industrial Development Authority |
| ISD | Independent School District |
| LIBOR | London Interbank Offered Rates |
| LOC | Letter of Credit |
| MUNIPSA | Securities Industry and Financial Markets Association (SIFMA) Municipal Swap Index |
| Natl-Re | Insured by National Public Finance Guarantee Corp. |
| PSF | Guaranteed by Permanent School Fund |
| Q-SBLF | Insured by Qualified School Bond Loan Fund |
| SPA | Stand-by Purchase Agreement |
| USD | Unified School District |
See notes to financial statements.
Statement of Assets and Liabilities
Thornburg Intermediate Municipal Fund | September 30, 2019
| ASSETS | |
| Investments at value (cost $1,023,457,462) (Note 3) | $ 1,093,029,231 |
| Cash | 20,660 |
| Receivable for investments sold | 19,941,356 |
| Receivable for fund shares sold | 2,184,027 |
| Interest receivable | 13,242,323 |
| Prepaid expenses and other assets | 75,491 |
| Total Assets | 1,128,493,088 |
| Liabilities | |
| Payable for investments purchased | 3,194,342 |
| Payable for fund shares redeemed | 2,850,584 |
| Payable to investment advisor and other affiliates (Note 4) | 618,124 |
| Accounts payable and accrued expenses | 286,507 |
| Dividends payable | 438,353 |
| Total Liabilities | 7,387,910 |
| Net Assets | $ 1,121,105,178 |
| NET ASSETS CONSIST OF | |
| Distributable earnings | $ 60,055,534 |
| Net capital paid in on shares of beneficial interest | 1,061,049,644 |
| | $ 1,121,105,178 |
| NET ASSET VALUE | |
| Class A Shares: | |
Net asset value and redemption price per share
($313,967,210 applicable to 21,910,419 shares of beneficial interest outstanding - Note 5) | $ 14.33 |
| Maximum sales charge, 2.00% of offering price | 0.29 |
| Maximum offering price per share | $ 14.62 |
| Class C Shares: | |
Net asset value and offering price per share*
($76,994,149 applicable to 5,366,501 shares of beneficial interest outstanding - Note 5) | $ 14.35 |
| Class I Shares: | |
Net asset value, offering and redemption price per share
($730,143,819 applicable to 51,017,447 shares of beneficial interest outstanding - Note 5) | $ 14.31 |
| * | Redemption price per share is equal to net asset value less any applicable contingent deferred sales charge. |
See notes to financial statements.
Statement of Operations
Thornburg Intermediate Municipal Fund | Year Ended September 30, 2019
| INVESTMENT INCOME | |
| Interest income (net of premium amortized of $12,044,744) | $ 40,489,976 |
| EXPENSES | |
| Investment advisory fees (Note 4) | 5,626,187 |
| Administration fees (Note 4) | |
| Class A Shares | 271,592 |
| Class C Shares | 80,808 |
| Class I Shares | 718,101 |
| Distribution and service fees (Note 4) | |
| Class A Shares | 772,342 |
| Class C Shares | 551,792 |
| Transfer agent fees | |
| Class A Shares | 174,796 |
| Class C Shares | 58,695 |
| Class I Shares | 530,225 |
| Registration and filing fees | |
| Class A Shares | 18,538 |
| Class C Shares | 15,690 |
| Class I Shares | 38,475 |
| Custodian fees | 87,156 |
| Professional fees | 66,480 |
| Trustee and officer fees (Note 4) | 79,670 |
| Other expenses | 97,404 |
| Total Expenses | 9,187,951 |
| Less: | |
| Expenses reimbursed by investment advisor (Note 4) | (16,210) |
| Net Expenses | 9,171,741 |
| Net Investment Income | $ 31,318,235 |
| REALIZED AND UNREALIZED GAIN (LOSS) | |
| Net realized gain (loss) on investments | (1,568,098) |
| Net change in unrealized appreciation (depreciation) on investments | 46,711,129 |
| Net Realized and Unrealized Gain | 45,143,031 |
| Net Increase in Net Assets Resulting from Operations | $ 76,461,266 |
See notes to financial statements.
Statements of Changes in Net Assets
Thornburg Intermediate Municipal Fund
| | Year Ended
September 30, 2019 | Year Ended
September 30, 2018 |
| INCREASE (DECREASE) IN NET ASSETS FROM | | |
| OPERATIONS | | |
| Net investment income | $ 31,318,235 | $ 34,344,102 |
| Net realized gain (loss) on investments | (1,568,098) | (508,141) |
| Net change in unrealized appreciation (depreciation) on investments | 46,711,129 | (34,817,777) |
| Net Increase (Decrease) in Net Assets Resulting from Operations | 76,461,266 | (981,816) |
| DIVIDENDS TO SHAREHOLDERS | | |
| From distributable earnings | | |
| Class A Shares | (7,524,534) | (8,110,815) |
| Class C Shares | (1,916,359) | (2,463,091) |
| Class I Shares | (21,877,342) | (23,770,196) |
| FUND SHARE TRANSACTIONS (NOTE 5) | | |
| Class A Shares | (21,630,968) | (54,640,103) |
| Class C Shares | (30,593,410) | (32,956,483) |
| Class I Shares | (205,746,732) | (22,998,283) |
| Net Decrease in Net Assets | (212,828,079) | (145,920,787) |
| NET ASSETS | | |
| Beginning of Year | 1,333,933,257 | 1,479,854,044 |
| End of Year | $ 1,121,105,178 | $ 1,333,933,257 |
See notes to financial statements.
Notes to Financial Statements
Thornburg Intermediate Municipal Fund | September 30, 2019
NOTE 1 – ORGANIZATION
Thornburg Intermediate Municipal Fund (the “Fund”) is a diversified series of Thornburg Investment Trust (the “Trust”). The Trust was organized as a Massachusetts business trust under a Declaration of Trust dated June 3, 1987 and is registered as a diversified, open-end management investment company under the Investment Company Act of 1940, as amended (the "1940 Act"). The Fund is currently one of twenty-two separate series of the Trust. Each series is considered to be a separate entity for financial reporting and tax purposes and bears expenses directly attributable to it. The Fund’s primary investment objective is to obtain as high a level of current income exempt from federal individual income taxes as is consistent, in the view of Thornburg Investment Management, Inc., the Trust’s investment advisor (the “Advisor”), with the preservation of capital. The Fund’s secondary objective is to reduce expected changes in its share price compared to long-term bond portfolios.
The Fund currently offers three classes of shares of beneficial interest: Class A, Class C, and Institutional Class (“Class I”). Each class of shares of the Fund represents an interest in the same portfolio of investments, except that (i) Class A shares are sold subject to a front-end sales charge collected at the time the shares are purchased and bear a service fee, (ii) Class C shares are sold at net asset value without a sales charge at the time of purchase, but are subject to a contingent deferred sales charge upon redemption within one year of purchase, and bear both a service fee and a distribution fee, (iii) Class I shares are sold at net asset value without a sales charge at the time of purchase and may be subject to a service fee, and (iv) the respective classes may have different reinvestment privileges and conversion rights. Additionally, the Fund may allocate among its classes certain expenses, to the extent allocable to specific classes, including administration fees, transfer agent fees, government registration fees, certain printing and postage costs, and administrative and legal expenses. Currently, class specific expenses of the Fund are limited to service and distribution fees and certain registration and transfer agent expenses.
The following is a summary of significant accounting policies followed by the Fund in the preparation of its financial statements. The Fund prepares its financial statements in conformity with United States generally accepted accounting principles (“GAAP”), including investment company accounting and reporting guidance in the Financial Accounting Standards Board (the “FASB”) Accounting Standard Codification Topic 946.
NOTE 2 – SIGNIFICANT ACCOUNTING POLICIES
Security Valuation: All investments in securities held by the Fund are valued as described in Note 3.
Allocation of Income, Gains, Losses and Expenses: Net investment income (other than class specific expenses) and realized and unrealized gains and losses are allocated daily to each class of shares based upon the relative net asset value of outstanding shares (or the value of the dividend-eligible shares, as appropriate) of each class of shares at the beginning of the day (after adjusting for the current capital shares activity of the respective class). Expenses common to all Funds are allocated among the Funds comprising the Trust based upon their relative net asset values or other appropriate allocation methods. Operating expenses directly attributable to a specific class are charged against the operating income of that class.
Dividends and Distributions to Shareholders: Dividends and distributions to shareholders, which are determined in accordance with federal income tax regulations and may differ from GAAP, are recorded on the ex-dividend date. Ordinary income dividends, if any, are declared daily and paid monthly. Capital gain distributions, if any, are declared and paid annually and more often if deemed necessary by the Advisor. Dividends and distributions are paid and are reinvested in additional shares of the Fund at net asset value per share at the close of business on the ex-dividend date, or at the shareholder’s option, paid in cash.
Investment Income: Interest income is accrued as earned. Premiums and discounts are amortized and accreted, respectively, to first call dates or maturity dates using the effective yield method of the respective investments. These amounts are included in Investment Income in the Statement of Operations.
Investment Transactions: Investment transactions are accounted for on a trade date basis. Realized gains and losses from the sale of investments are recorded on an identified cost basis.
When-Issued and Delayed Delivery Transactions: The Fund may engage in when-issued or delayed delivery transactions. To the extent the Fund engages in such transactions, it will do so for the purpose of acquiring portfolio investments consistent with the Fund’s investment objectives and not for the purpose of investment leverage or to speculate on interest rate or market changes. At the time the Fund makes a commitment to purchase an investment on a when-issued or delayed delivery basis, the Fund will record the transaction and reflect the value in determining its net asset value. When effecting such transactions, assets of an amount sufficient to make payment for the portfolio investments to be purchased will be segregated on the Fund’s records on the trade date. Investments purchased on a when-issued or delayed delivery basis do not earn interest until the settlement date. The values of these securities held at September 30, 2019 are detailed in the Schedule of Investments.
Notes to Financial Statements, Continued
Thornburg Intermediate Municipal Fund | September 30, 2019
Guarantees and Indemnifications: Under the Trust’s organizational documents (and under separate agreements with the independent Trustees), its officers and Trustees are provided with an indemnification against certain liabilities arising out of the performance of their duties to the Fund. In the normal course of business the Trust may also enter into contracts with service providers that contain general indemnifications. The Trust’s maximum exposure under these arrangements is unknown. However, based on experience, the Trust expects the risk of loss to be remote.
Use of Estimates: The preparation of financial statements in conformity with GAAP requires management to make estimates and assumptions that affect the reported amounts of assets and liabilities and disclosure of contingent assets and liabilities at the date of the financial statements and the reported amounts of increases (decreases) in net assets from operations during the reporting period. Actual results could differ from those estimates.
Federal Income Taxes: It is the policy of the Trust to comply with the provisions of the Internal Revenue Code applicable to regulated investment companies and to distribute to shareholders substantially all investment company taxable income including net realized gains on investments (if any), and tax exempt income of the Fund. Therefore, no provision for federal income or excise tax is required.
The Fund files income tax returns in United States federal and applicable state jurisdictions. The statute of limitations on the Fund’s tax return filings generally remains open for the three years following a return’s filing date. The Fund has analyzed each uncertain tax position believed to be material in the preparation of the Fund’s financial statements for the fiscal year ended September 30, 2019, including open tax years, to assess whether it is more likely than not that the position would be sustained upon examination, based on the technical merits of the position. The Fund has not identified any such position for which an asset or liability must be reflected in the Statement of Assets and Liabilities.
At September 30, 2019, information on the tax components of capital was as follows:
| Cost of investments for tax purposes | $ 1,023,457,460 |
| Gross unrealized appreciation on a tax basis | 69,663,659 |
| Gross unrealized depreciation on a tax basis | (91,888) |
| Net unrealized appreciation (depreciation) on investments (tax basis) | $ 69,571,771 |
At September 30, 2019, the Fund had deferred tax basis capital losses occurring subsequent to October 31, 2018 through September 30, 2019 of $178,409. For tax purposes, such losses will be recognized in the year ending September 30, 2020.
At September 30, 2019, the Fund had cumulative tax basis capital losses of $9,334,251 (of which $4,347,434 are short-term and $4,986,817 are long-term), which may be carried forward to offset future capital gains. To the extent such carryforwards are used, capital gain distributions may be reduced to the extent provided by regulations. Such capital loss carryforwards do not expire.
At September 30, 2019, the Fund had $434,776 of undistributed net tax-exempt income, no undistributed tax basis net ordinary income and no undistributed tax basis capital gains.
Distributions from tax exempt income paid by the Fund for the year ended September 30, 2019 and September 30, 2018 are excludable by shareholders from gross income for Federal income tax purposes.
The tax character of distributions paid during the year ended September 30, 2019, and September 30, 2018, was as follows:
| | 2019 | 2018 |
| Distributions from: | | |
| Tax exempt income | $ 31,234,545 | $ 34,219,968 |
| Ordinary income | 83,690 | 124,134 |
| Total | $ 31,318,235 | $ 34,344,102 |
NOTE 3 – SECURITY VALUATION
Valuation of the Fund’s portfolio investment securities is performed in accordance with policies and procedures adopted by and under the oversight of the Trustees.
The Trustees of the Trust have appointed the Advisor to assist the Trustees with obtaining fair market values for portfolio investments, evaluating and monitoring professional pricing service providers appointed by the Trustees’ Audit Committee (the “Audit Committee”) to assist in determining fair values for portfolio investments, assisting in calculating fair values for portfolio investments in certain
Notes to Financial Statements, Continued
Thornburg Intermediate Municipal Fund | September 30, 2019
circumstances, and performing other functions in connection with the valuation of investments. The Advisor acts through its Valuation and Pricing Committee (the “Committee”) and other employees of the Advisor. The Committee regularly reviews its own valuation calculations, reviews the valuations, valuation techniques and services furnished by pricing service providers, considers circumstances which may require valuation calculations by the Committee, and reviews previous valuation calculations. The Committee reports to the Audit Committee on the Committee’s activities, the performance of pricing service providers, and other matters relating to valuation of portfolio investments.
In those instances when the Committee assists in calculating a fair value for a portfolio investment, the Committee seeks to determine the price that the Fund would reasonably expect to receive upon a sale of the investment in an orderly transaction between market participants on the valuation date. The Committee customarily utilizes quotations from securities broker dealers in calculating valuations, but also may utilize prices obtained from pricing service providers or other methods approved by the Audit Committee. Because fair values calculated by the Committee are estimates, the calculation of a value for an investment may differ from the price that would be realized by the Fund upon a sale of the investment, and the difference could be material to the Fund’s financial statements. The Committee’s calculation of a fair value for an investment may also differ from the prices obtained by other persons (including other mutual funds) for the investment.
Valuation of Securities: Debt obligations held by the Fund which are not listed or traded on exchanges or for which no reported market exists are ordinarily valued at the valuation obtained from a pricing service provider approved by the Audit Committee.
In any case when a pricing service provider fails to provide a valuation for a debt obligation held by the Fund, the Committee calculates a fair value for the obligation using alternative methods under procedures approved by the Audit Committee. Additionally, in cases when management believes that a valuation obtained from a pricing service provider is stale, does not reflect material factors affecting the valuation of the investment, is significantly different than the value the Fund is likely to obtain if it sought a bid for the investment, or is otherwise unreliable, the Committee calculates a fair value for the obligation using an alternative method approved by the Audit Committee.
Valuation Hierarchy: The Fund categorizes its investments based upon the inputs used in valuing those investments, according to a three-level hierarchy established in guidance from the FASB. Categorization of investments using this hierarchy is intended by the FASB to maximize the use of observable inputs in valuing investments and minimize the use of unobservable inputs by requiring that the most observable inputs be used when available. Observable inputs are those that market participants would use in valuing an investment based on available market information. Unobservable inputs are those that reflect assumptions about the information market participants would use in valuing an investment. An investment’s level within the hierarchy is based on the lowest level input that is deemed significant to the valuation. The methodologies and inputs used to value investments are not necessarily indications of the risk or liquidity associated with those investments.
Various inputs are used in calculating valuations for the Fund’s investments. These inputs are generally summarized according to the three-level hierarchy below:
Level 1: Quoted prices in active markets for identical investments.
Level 2: Other direct or indirect significant observable inputs (including quoted prices for similar investments in active markets and other observable inputs, such as interest rates, prepayment rates, credit ratings, etc.).
Level 3: Significant unobservable inputs (including the Committee’s own assumptions in calculating the fair values of investments).
Valuations for debt obligations held by the Fund are typically calculated by pricing service providers approved by the Audit Committee and are generally characterized as Level 2 within the valuation hierarchy.
In a limited number of cases the Committee calculates a fair value for investments using broker quotations or other methods approved by the Audit Committee. When the Committee uses a single broker quotation to calculate a fair value for an investment without other significant observable inputs, or if a fair value is calculated using other significant inputs that are considered unobservable, the investment is characterized as Level 3 within the hierarchy. Other significant unobservable inputs used to calculate a fair value in these instances might include an income-based valuation approach which considers discounted anticipated future cash flows from the investment and application of discounts due to the nature or duration of any restrictions on the disposition of the investment.
Valuations based upon the use of inputs from Levels 1, 2 or 3 may not represent the actual price received upon the disposition of an investment, and a Fund may receive a price that is lower than the valuation based upon these inputs when it sells the investment.
Notes to Financial Statements, Continued
Thornburg Intermediate Municipal Fund | September 30, 2019
The following table displays a summary of the fair value hierarchy measurements of the Fund’s investments as of September 30, 2019:
| | Fair Value Measurements at September 30, 2019 |
| | TOTAL | LEVEL 1 | LEVEL 2 | LEVEL 3 |
| Assets | | | | |
| Investments in Securities | | | | |
| Municipal Bonds | $ 1,093,029,231 | $ — | $ 1,093,029,231 | $ — |
| Total Investments in Securities | $1,093,029,231 | $— | $1,093,029,231 | $— |
| Total Assets | $1,093,029,231 | $— | $1,093,029,231 | $— |
NOTE 4 – INVESTMENT ADVISORY FEE AND OTHER TRANSACTIONS WITH AFFILIATES
Pursuant to an investment advisory agreement, the Advisor serves as the investment advisor and performs services for the Fund for which the fees are payable at the end of each month. Under the investment advisory agreement, the Fund pays the Advisor a management fee based on the average daily net assets of the Fund at an annual rate as shown in the following table:
| Management Fee Schedule |
| DAILY NET ASSETS | FEE RATE |
| Up to $500 million | 0.500% |
| Next $500 million | 0.450 |
| Next $500 million | 0.400 |
| Next $500 million | 0.350 |
| Over $2 billion | 0.275 |
The Fund’s effective management fee for the year ended September 30, 2019 was 0.462% of the Fund’s average daily net assets. Total management fees incurred by the Fund for the year ended September 30, 2019 are set forth in the Statement of Operations.
The Trust has entered into an administrative services agreement with the Advisor, whereby the Advisor will perform certain administrative services related to each class of the Fund’s shares. The fees are computed as an annual percentage of the aggregate average daily net assets of all shares classes of all Funds in the Trust as follows:
| Administration Fee Schedule |
| Daily Net Assets | Fee Rate |
| Up to $20 billion | 0.100% |
| $20 billion to $40 billion | 0.075 |
| $40 billion to $60 billion | 0.040 |
| Over $60 billion | 0.030 |
The aggregate fee amount is allocated on a daily basis to each Fund based on net assets and subsequently allocated to each class of shares of the Fund. Total administrative service fees incurred by each class of shares of the Fund for the year ended September 30, 2019, are set forth in the Statement of Operations.
The Trust has an underwriting agreement with Thornburg Securities Corporation (the “Distributor”), an affiliate of the Advisor, which acts as the distributor of the Fund’s shares. For the year ended September 30, 2019, the Distributor has advised the Fund that it earned net commissions aggregating $1,233 from the sale of Class A shares, and collected contingent deferred sales charges aggregating $3,662 from redemptions of Class C shares of the Fund.
Pursuant to a service plan under Rule 12b-1 of the 1940 Act, the Fund may pay to the Distributor or securities dealers and other financial institutions at the Distributor’s direction an amount not to exceed .25 of 1% per annum of the average daily net assets attributable to Class A and Class C shares of the Fund to obtain various shareholder and distribution related services. For the year ended September 30, 2019, there were no 12b-1 service plan fees charged for Class I shares. The Advisor and Distributor each may pay out of its own resources additional expenses for distribution of the Fund’s shares and shareholder services.
The Trust has also adopted a distribution plan pursuant to Rule 12b-1, applicable only to the Fund’s Class C shares, under which the Fund compensates the Distributor for services in promoting the sale of Class C shares of the Fund at an annual rate of up to .35 of 1% per annum of the average daily net assets attributable to Class C shares.
Notes to Financial Statements, Continued
Thornburg Intermediate Municipal Fund | September 30, 2019
Total fees incurred by each class of shares of the Fund under their respective service and distribution plans for the year ended September 30, 2019, are set forth in the Statement of Operations.
The Advisor has contractually agreed to waive fees and reimburse expenses incurred by the Fund so that actual expenses of certain share classes do not exceed levels as specified in each Fund’s most recent prospectus (Class C shares, 1.24%). The agreement may be terminated by the Fund at any time, but may not be terminated by the Advisor before February 1, 2020, unless the Advisor ceases to be the investment advisor to the Fund prior to that date. The Advisor may recoup amounts waived or reimbursed during the fiscal year ended September 30, 2019 if, during that year, expenses fall below the contractual limit that was in place at the time those fees and expenses were waived or reimbursed. The Advisor will not recoup fees or expenses as described in the preceding sentence if that recoupment would cause the Fund’s total annual operating expenses (after the recoupment is taken into account) to exceed the lesser of: (a) the expense cap that was in place at the time the waiver or reimbursement occurred; or (b) the expense cap that is in place at the time of the recoupment.
For the year ended September 30, 2019, the Advisor contractually reimbursed certain class specific expenses and distribution fees of $16,210 for Class C shares.
Certain officers and Trustees of the Trust are also officers or directors of the Advisor and Distributor. The compensation of the independent Trustees is borne by the Trust. The Trust also pays a portion of the Chief Compliance Officer’s compensation. These amounts are reflected as Trustee and officer fees in the Statement of Operations.
The percentage of direct investments in the Fund held by the Trustees, officers of the Trust, and the Advisor is approximately 0.10%.
The Fund may purchase or sell securities from or to an affiliated fund, provided the affiliation is due solely to having a common investment advisor, common officers, or common trustees, and provided that all such transactions will comply with Rule 17a-7 under the 1940 Act. For the year ended September 30, 2019, the Fund had transactions with affiliated funds of $24,716,879 in purchases and $59,591,891 in sales generating realized losses of $6,444.
NOTE 5 – SHARES OF BENEFICIAL INTEREST
At September 30, 2019, there were an unlimited number of shares with no par value of beneficial interest authorized. Transactions in shares of beneficial interest were as follows:
| | YEAR ENDED
September 30, 2019 | YEAR ENDED
September 30, 2018 |
| | SHARES | AMOUNT | SHARES | AMOUNT |
| Class A Shares | | | | |
| Shares sold | 3,767,982 | $ 53,079,171 | 3,440,093 | $ 48,061,162 |
Shares issued to shareholders in
reinvestment of dividends | 496,765 | 6,996,037 | 540,781 | 7,537,537 |
| Shares repurchased | (5,845,339) | (81,706,176) | (7,900,250) | (110,238,802) |
| Net decrease | (1,580,592) | $ (21,630,968) | (3,919,376) | $ (54,640,103) |
| Class C Shares | | | | |
| Shares sold | 595,781 | $ 8,375,099 | 610,549 | $ 8,566,397 |
Shares issued to shareholders in
reinvestment of dividends | 113,502 | 1,598,215 | 152,703 | 2,131,447 |
| Shares repurchased | (2,875,902) | (40,566,724) | (3,125,429) | (43,654,327) |
| Net decrease | (2,166,619) | $ (30,593,410) | (2,362,177) | $ (32,956,483) |
| Class I Shares | | | | |
| Shares sold | 20,388,015 | $ 284,155,586 | 20,029,348 | $ 278,934,355 |
Shares issued to shareholders in
reinvestment of dividends | 1,175,839 | 16,516,753 | 1,368,222 | 19,052,210 |
| Shares repurchased | (36,252,366) | (506,419,071) | (23,058,970) | (320,984,848) |
| Net decrease | (14,688,512) | $ (205,746,732) | (1,661,400) | $ (22,998,283) |
Notes to Financial Statements, Continued
Thornburg Intermediate Municipal Fund | September 30, 2019
NOTE 6 – INVESTMENT TRANSACTIONS
For the year ended September 30, 2019, the Fund had purchase and sale transactions of investments (excluding short-term investments) of $179,423,479 and $378,026,182, respectively.
NOTE 7 – RECENT ACCOUNTING PRONOUNCEMENTS
In August 2018, the FASB issued ASU 2018-13, Fair Value Measurement (Topic 820): Changes to the Disclosure Requirements for Fair Value Measurement, which adds, removes, and modifies certain aspects of the fair value disclosure. ASU 2018-13 is effective for annual periods beginning after December 15, 2019, and early adoption is permitted. The Funds have elected to early adopt, and had applied ASU 2018-13 for the fiscal year ended September 30, 2019. The adoption of this accounting guidance did not have a material impact on the Funds’ financial statements.
In March 2017, the FASB issued Accounting Standards Update (ASU) 2017-08, Premium Amortization of Purchased Callable Debt Securities. The amendments in the ASU shorten the premium amortization period on a purchased callable debt security from the security’s contractual life to the earliest call date. It is anticipated that this change will enhance disclosures by reducing losses recognized when a security is called on an earlier date. This ASU is effective for fiscal years beginning after December 15, 2018. Management has evaluated the implications of these changes and the amendments will have no material effect on the Funds’ net assets or results of operations.
OTHER NOTES
Risks: The Fund’s investments subject it to risks including, but not limited to, management risk, interest rate risk, credit risk, market and economic risk, and liquidity risk. Please see the Fund’s prospectus for a discussion of the risks associated with an investment in the Fund.
Subsequent Events: Fund management believes no events have occurred between September 30, 2019 and the date of issuance of the financial statements that require adjustment to or disclosure in the accompanying financial statements.
Financial Highlights
Thornburg Intermediate Municipal Fund
| | PER SHARE PERFORMANCE (FOR A SHARE OUTSTANDING THROUGHOUT THE YEAR) |
UNLESS OTHERWISE
NOTED, PERIODS ARE
FISCAL YEARS ENDED
SEPTEMBER 30, | Net Asset
Value,
Beginning of
YEAR | Net
Investment
Income
(Loss)+ | Net Realized &
Unrealized Gain
(Loss) on
Investments | Total from
Investment
Operations | Dividends
from Net
Investment
Income | Dividends
from Net
Realized
Gains | Total
Dividends | Net Asset
Value,
End of YEAR |
| CLASS A SHARES(b) |
| 2019 | $ 13.80 | 0.34 | 0.53 | 0.87 | (0.34) | — | (0.34) | $ 14.33 |
| 2018 | $ 14.15 | 0.32 | (0.35) | (0.03) | (0.32) | — | (0.32) | $ 13.80 |
| 2017 | $ 14.47 | 0.30 | (0.32) | (0.02) | (0.30) | — | (0.30) | $ 14.15 |
| 2016 | $ 14.17 | 0.29 | 0.30 | 0.59 | (0.29) | — | (0.29) | $ 14.47 |
| 2015 | $ 14.23 | 0.30 | (0.06) | 0.24 | (0.30) | — | (0.30) | $ 14.17 |
| CLASS C SHARES |
| 2019 | $ 13.82 | 0.29 | 0.53 | 0.82 | (0.29) | — | (0.29) | $ 14.35 |
| 2018 | $ 14.17 | 0.27 | (0.35) | (0.08) | (0.27) | — | (0.27) | $ 13.82 |
| 2017 | $ 14.49 | 0.26 | (0.32) | (0.06) | (0.26) | — | (0.26) | $ 14.17 |
| 2016 | $ 14.19 | 0.24 | 0.30 | 0.54 | (0.24) | — | (0.24) | $ 14.49 |
| 2015 | $ 14.25 | 0.25 | (0.06) | 0.19 | (0.25) | — | (0.25) | $ 14.19 |
| CLASS I SHARES |
| 2019 | $ 13.78 | 0.38 | 0.53 | 0.91 | (0.38) | — | (0.38) | $ 14.31 |
| 2018 | $ 14.13 | 0.36 | (0.35) | 0.01 | (0.36) | — | (0.36) | $ 13.78 |
| 2017 | $ 14.46 | 0.35 | (0.33) | 0.02 | (0.35) | — | (0.35) | $ 14.13 |
| 2016 | $ 14.15 | 0.33 | 0.31 | 0.64 | (0.33) | — | (0.33) | $ 14.46 |
| 2015 | $ 14.22 | 0.34 | (0.07) | 0.27 | (0.34) | — | (0.34) | $ 14.15 |
| (a) | Not annualized for periods less than one year. |
| (b) | Sales loads are not reflected in computing total return. |
| + | Based on weighted average shares outstanding. |
See notes to financial statements.
Financial Highlights, Continued
Thornburg Intermediate Municipal Fund
| RATIOS TO AVERAGE NET ASSETS | | SUPPLEMENTAL DATA |
Net Investment
Income (Loss) (%) | Expenses, After
Expense
Reductions (%) | Expenses,
Before Expense
Reductions (%) | | Total
Return (%)(a) | Portfolio
Turnover
Rate (%)(a) | Net Assets
at End of YEAR
(Thousands) |
| |
| 2.44 | 0.89 | 0.89 | | 6.39 | 15.88 | $ 313,967 |
| 2.29 | 0.89 | 0.89 | | (0.21) | 20.68 | $ 324,199 |
| 2.15 | 0.92 | 0.92 | | (0.08) | 24.04 | $ 387,790 |
| 2.00 | 0.92 | 0.92 | | 4.17 | 10.80 | $ 467,335 |
| 2.09 | 0.92 | 0.92 | | 1.68 | 13.49 | $ 423,113 |
| |
| 2.08 | 1.24 | 1.26 | | 6.02 | 15.88 | $ 76,994 |
| 1.94 | 1.24 | 1.26 | | (0.55) | 20.68 | $ 104,093 |
| 1.83 | 1.24 | 1.27 | | (0.40) | 24.04 | $ 140,176 |
| 1.68 | 1.24 | 1.27 | | 3.84 | 10.80 | $ 170,149 |
| 1.77 | 1.24 | 1.28 | | 1.35 | 13.49 | $ 160,042 |
| |
| 2.67 | 0.65 | 0.65 | | 6.66 | 15.88 | $ 730,144 |
| 2.55 | 0.63 | 0.63 | | 0.05 | 20.68 | $ 905,641 |
| 2.45 | 0.62 | 0.62 | | 0.15 | 24.04 | $ 951,888 |
| 2.30 | 0.61 | 0.61 | | 4.57 | 10.80 | $ 958,674 |
| 2.39 | 0.62 | 0.62 | | 1.91 | 13.49 | $ 751,486 |
Report of Independent Registered Public Accounting Firm
Thornburg Intermediate Municipal Fund
To the Board of Trustees of Thornburg Investment Trust and Shareholders of
Thornburg Intermediate Municipal Fund
Opinion on the Financial Statements
We have audited the accompanying statement of assets and liabilities, including the schedule of investments, of Thornburg Intermediate Municipal Fund (one of the funds constituting Thornburg Investment Trust, referred to hereafter as the "Fund") as of September 30, 2019, the related statement of operations for the year ended September 30, 2019, the statements of changes in net assets for each of the two years in the period ended September 30, 2019, including the related notes, and the financial highlights for each of the five years in the period ended September 30, 2019 (collectively referred to as the “financial statements”). In our opinion, the financial statements present fairly, in all material respects, the financial position of the Fund as of September 30, 2019, the results of its operations for the year then ended, the changes in its net assets for each of the two years in the period ended September 30, 2019 and the financial highlights for each of the five years in the period ended September 30, 2019 in conformity with accounting principles generally accepted in the United States of America.
Basis for Opinion
These financial statements are the responsibility of the Fund’s management. Our responsibility is to express an opinion on the Fund’s financial statements based on our audits. We are a public accounting firm registered with the Public Company Accounting Oversight Board (United States) (PCAOB) and are required to be independent with respect to the Fund in accordance with the U.S. federal securities laws and the applicable rules and regulations of the Securities and Exchange Commission and the PCAOB.
We conducted our audits of these financial statements in accordance with the standards of the PCAOB. Those standards require that we plan and perform the audit to obtain reasonable assurance about whether the financial statements are free of material misstatement, whether due to error or fraud.
Our audits included performing procedures to assess the risks of material misstatement of the financial statements, whether due to error or fraud, and performing procedures that respond to those risks. Such procedures included examining, on a test basis, evidence regarding the amounts and disclosures in the financial statements. Our audits also included evaluating the accounting principles used and significant estimates made by management, as well as evaluating the overall presentation of the financial statements. Our procedures included confirmation of securities owned as of September 30, 2019 by correspondence with the custodian and brokers; when replies were not received from brokers, we performed other auditing procedures. We believe that our audits provide a reasonable basis for our opinion.
/s/PricewaterhouseCoopers LLP
New York, New York
November 22, 2019
We have served as the auditor of one or more investment companies in Thornburg Investment Trust since 1999.
Expense Example
Thornburg Intermediate Municipal Fund | September 30, 2019 (Unaudited)
As a shareholder of the Fund, you incur two types of costs:
| (1) | transaction costs, including |
| (a) | sales charges (loads) on purchase payments, for Class A shares; |
| (b) | a deferred sales charge on redemptions of any part or all of a purchase of $1 million of Class A shares within 12 months of purchase; |
| (c) | a deferred sales charge on redemptions of Class C shares within 12 months of purchase; |
| (2) | ongoing costs, including management fees; distribution and/or service (12b-1) fees; and other Fund expenses. |
This example is intended to help you understand your ongoing costs (in dollars) of investing in the Fund and to compare these costs with the ongoing costs of investing in other mutual funds.
The example is based on a $1,000 investment beginning on April 1, 2019, and held until September 30, 2019.
| | BEGINNING
ACCOUNT VALUE
4/1/19 | ENDING
ACCOUNT VALUE
9/30/19 | EXPENSES PAID
DURING PERIOD†
4/1/19—9/30/19 |
| CLASS A SHARES |
| Actual | $1,000.00 | $1,030.34 | $4.48 |
| Hypothetical* | $1,000.00 | $1,020.66 | $4.46 |
| CLASS C SHARES |
| Actual | $1,000.00 | $1,028.47 | $6.31 |
| Hypothetical* | $1,000.00 | $1,018.85 | $6.28 |
| CLASS I SHARES |
| Actual | $1,000.00 | $1,030.89 | $3.26 |
| Hypothetical* | $1,000.00 | $1,021.86 | $3.24 |
| † | Expenses are equal to the annualized expense ratio for each class (A: 0.88%; C: 1.24%; I: 0.64%) multiplied by the average account value over the period, multiplied by 183/365 to reflect the one-half year period. |
| * | Hypothetical assumes a rate of return of 5% per year before expenses. |
ACTUAL EXPENSES
For each class of shares, the first line of the accompanying table provides information about actual account values and actual expenses. You may use the information in this line, together with the amount you invested, to estimate the expenses that you paid over the period. Simply divide your account value by $1,000 (for example, an $8,600 account value divided by $1,000 = 8.6), then multiply the result by the number in the first line for your class of shares under the heading entitled “Expenses Paid During Period” to estimate the expenses you paid on your account during this period.
HYPOTHETICAL EXAMPLE FOR COMPARISON PURPOSES
For each class of shares, the second line of the accompanying table provides information about hypothetical account values and hypothetical expenses based on the Fund’s actual expense ratio and an assumed rate of return of 5% per year before expenses, which is not the Fund’s actual return. The hypothetical account values and expenses may not be used to estimate the actual ending account balance or expenses you paid for the period. You may use this information to compare the ongoing costs of investing in the Fund and other funds. To do so, compare this 5% hypothetical example with the 5% hypothetical examples that appear in the shareholder reports of the other funds.
Please note that the expenses shown in the table are meant to highlight your ongoing costs only and do not reflect any transactional costs, such as sales charges (loads), redemption fees, or exchange fees. Therefore, the second line of the table for each class of shares is useful in comparing ongoing costs only, and will not help you determine the relative total costs of owning different funds. In addition, if these transactional costs were included, your costs would have been higher.
Trustees and Officers
Thornburg Intermediate Municipal Fund | September 30, 2019 (Unaudited)
NAME, AGE, YEAR ELECTED
POSITION HELD WITH FUND | PRINCIPAL OCCUPATION(S) DURING PAST FIVE YEARS | OTHER DIRECTORSHIPS
HELD BY TRUSTEE |
| INTERESTED TRUSTEES(1)(2) |
Garrett Thornburg, 73
Trustee since 1984,
Chairman of Trustees(3) | Chairman and controlling shareholder of Thornburg Investment Management, Inc. (investment advisor); Chairman and controlling shareholder of Thornburg Securities Corporation (securities dealer); President of the Thornburg Foundation (nonprofit). | None |
Brian J. McMahon, 64
Trustee since 2001,
Vice Chairman of Trustees,
Member of Governance and
Nominating Committee &
Operations Risk Oversight
Committee(4) | Vice Chairman, Chief Investment Strategist, Managing Director, and Portfolio Manager and, until 2016, CEO and President of Thornburg Investment Management, Inc.; Vice President of Thornburg Securities Corporation. | None |
| INDEPENDENT TRUSTEES(1)(2)(5) |
David A. Ater, 74
Trustee since 1994,
Lead Independent Trustee,
Chairman of Governance and
Nominating Committee &
Member of Audit Committee | Principal in Ater & Associates, Santa Fe, NM (developer, planner and broker of residential and commercial real estate); owner, developer and broker for various real estate projects. | None |
Sally Corning, 58
Trustee since 2012,
Chairman of Audit Committee | Partner in Sun Mountain Capital, Santa Fe, NM (private equity firm with investment programs encompassing venture capital, mezzanine debt, and growth equity). | None |
Susan H. Dubin, 70
Trustee since 2004,
Member of Audit
Committee & Governance
and Nominating Committee | President of Dubin Investments, Ltd., Greenwich, CT (private investment fund); Director and officer of various charitable organizations. | None |
David L. Gardner, 56
Trustee since 2015,
Member of Operations Risk
Oversight Committee | Until 2012, head of EMEA (Europe, Middle East and Africa) Sales for iShares of Blackrock, Inc., EMEA Executive Committee Member and EMEA Operating Committee Member at Blackrock, Inc. | None |
Patrick J. Talamantes, 55
Trustee since 2019,
Member of Audit Committee | President of Talamantes Strategies, LLC, a management consulting firm, since 2018; until 2017, President and Chief Executive Officer of The McClatchy Company, Sacramento, CA (news and media company). | None |
Owen D. Van Essen, 65
Trustee since 2004,
Chairman of Operations Risk
Oversight Committee &
Member of Governance and
Nominating Committee | President of Dirks, Van Essen, Murray & April, Santa Fe, NM (newspaper mergers and acquisitions). | None |
James W. Weyhrauch, 60
Trustee since 1996,
Member of Audit
Committee & Operations Risk
Oversight Committee | Real estate broker, Santa Fe Properties, Santa Fe, NM; General Partner, Investments of Genext LLC (a family investment partnership); until 2019, Vice Chairman of Nambe LLC, Santa Fe, NM (manufacturing & design company). | None |
Trustees and Officers, Continued
Thornburg Intermediate Municipal Fund | September 30, 2019 (Unaudited)
NAME, AGE, YEAR ELECTED
POSITION HELD WITH FUND | PRINCIPAL OCCUPATION(S) DURING PAST FIVE YEARS | OTHER DIRECTORSHIPS
HELD BY TRUSTEE |
| OFFICERS OF THE FUND (WHO ARE NOT TRUSTEES)(1)(6) |
David Ashley, 49
Vice President since 2019 | Portfolio Manager and Managing Director since 2019 and Associate Portfolio Manager from 2011-2019 of Thornburg Investment Management, Inc. | Not applicable |
Nimish Bhatt, 56
Chief Financial Officer
since 2019; Treasurer
2016-2019; Secretary
(2018-2019)(7) | Chief Financial Officer and Treasurer of Thornburg Investment Management, Inc. and Thornburg Securities Corporation since 2016 and Secretary of Thornburg Securities Corporation since 2018; Senior Vice President (2004-2016), Chief Financial Officer (2011-2016), and Head of Fund Administration (2011-2016) of Calamos Asset Management, Inc., Calamos Investments LLC, Calamos Advisors LLC, and Calamos Wealth Management; Director of Calamos Global Funds plc (2007-2016). | Not applicable |
Jason Brady, 45
President since 2016(7) | Director since 2017, CEO and President since 2016, and Portfolio Manager and Managing Director of Thornburg Investment Management, Inc.; Vice President of Thornburg Securities Corporation since 2016. | Not applicable |
Connor Browne, 40
Vice President since 2006 | Portfolio Manager and Managing Director of Thornburg Investment Management, Inc. | Not applicable |
Randy Dry, 45
Vice President since 2014 | Managing Director, Director of Institutional Group from 2014-2016, and since 2016, Chief Administrative Officer of Thornburg Investment Management, Inc. | Not applicable |
Greg Dunn, 43
Vice President since 2014 | Portfolio Manager and Managing Director of Thornburg Investment Management, Inc. | Not applicable |
Lon Erickson, 44
Vice President since 2008 | Portfolio Manager and Managing Director of Thornburg Investment Management, Inc. | Not applicable |
Thomas Garcia, 48
Vice President since 2006 | Managing Director, Head Equity Trader, and Associate Portfolio Manager of Thornburg Investment Management, Inc. | Not applicable |
Christian Hoffmann, 37
Vice President since 2018 | Portfolio Manager and Managing Director since 2018, and Associate Portfolio Manager from 2014-2018, of Thornburg Investment Management, Inc. | Not applicable |
Curtis Holloway, 52
Treasurer since 2019(7) | Director of Fund Administration since 2019 of Thornburg Investment Management, Inc.; Senior Vice President, Head of Fund Administration (2017-2019) and Vice President, Fund Administration (2010-2017) of Calamos Investments, and Chief Financial Officer (2017-2019) and Treasurer (2010-2019) of Calamos Funds. | Not applicable |
Ben Kirby, 39
Vice President since 2014 | Head of Investments since 2019, Portfolio Manager and Managing Director since 2013. | Not applicable |
Jeff Klingelhofer, 38
Vice President since 2016 | Head of Investments since 2019, Portfolio Manager and Managing Director since 2015, and Associate Portfolio Manager from 2012–2015, of Thornburg Investment Management, Inc. | Not applicable |
Ponn Lithiluxa, 48
Vice President since 2017 | Manager, Tax & Fund Administration of Thornburg Investment Management, Inc.; Senior Vice President, Citi Fund Services, Inc. (2014–2017); Vice President, Citi Fund Services, Inc. (2007–2014). | Not applicable |
Rob MacDonald, 43
Vice President since 2016 | Managing Director since 2015, Portfolio Manager since 2014, and Associate Portfolio Manager from 2011–2014 of Thornburg Investment Management, Inc. | Not applicable |
Michael Mastroianni, 42
Secretary and Vice President since 2019(7) | Director of Fund Operations since 2019 of Thornburg Investment Management, Inc.; Executive Director, Global Head of Client Services - Global Liquidity (2018-2019), Executive Director, North American Head of Transfer Agency Relationship Management (2011-2019), Executive Director, North American Head of Transfer Agency Service Delivery (2011-2018) of J.P. Morgan Asset Management. | Not applicable |
Leigh Moiola, 52
Vice President since 2001 | Managing Director and Director of Marketing of Thornburg Investment Management, Inc.; Vice President of Thornburg Securities Corporation. | Not applicable |
Christopher Ryon, 63
Vice President since 2008 | Portfolio Manager and Managing Director of Thornburg Investment Management, Inc. | Not applicable |
Trustees and Officers, Continued
Thornburg Intermediate Municipal Fund | September 30, 2019 (Unaudited)
NAME, AGE, YEAR ELECTED
POSITION HELD WITH FUND | PRINCIPAL OCCUPATION(S) DURING PAST FIVE YEARS | OTHER DIRECTORSHIPS
HELD BY TRUSTEE |
Sean Koung Sun, 38
Vice President since 2017 | Portfolio Manager and Managing Director since 2017, Associate Portfolio Manager from 2015-2016, and Equity Research Analyst from 2012-2014 of Thornburg Investment Management, Inc. | Not applicable |
Stephen Velie, 52
Chief Compliance Officer since 2009 | Chief Compliance Officer of Thornburg Investment Trust and Thornburg Investment Management, Inc. | Not applicable |
Nicholos Venditti, 38
Vice President since 2016 | Portfolio Manager and Managing Director since 2015 and Associate Portfolio Manager from 2011–2015 of Thornburg Investment Management, Inc. | Not applicable |
Vinson Walden, 49
Vice President since 2004 | Portfolio Manager and Managing Director of Thornburg Investment Management, Inc. | Not applicable |
Lei Wang, 48
Vice President since 2006 | Portfolio Manager and Managing Director of Thornburg Investment Management, Inc. | Not applicable |
Charles Wilson, 44
Vice President since 2016 | Portfolio Manager and Managing Director since 2014 and Associate Portfolio Manager from 2012–2014 of Thornburg Investment Management, Inc. | Not applicable |
Di Zhou, 41
Vice President since 2016 | Portfolio Manager and Managing Director since 2016, Associate Portfolio Manager from 2014–2016, and Equity Research Analyst from 2010–2014 of Thornburg Investment Management, Inc. | Not applicable |
| (1) | Each person’s address is 2300 North Ridgetop Road, Santa Fe, New Mexico 87506. |
| (2) | The Fund is a separate investment “Fund” or “series” of Thornburg Investment Trust (the “Trust”), which comprises the Thornburg mutual fund complex and is organized as a Massachusetts business trust. Thornburg Investment Management, Inc. is the investment advisor to, and manages, all the Funds of the Trust. Each Trustee oversees all the Funds of the Trust. |
| (3) | Mr. Thornburg is considered an “interested” Trustee under the Investment Company Act of 1940 because he is a director and controlling shareholder of Thornburg Investment Management, Inc., the investment advisor to the Trust, and is the sole director and controlling shareholder of Thornburg Securities Corporation, the distributor of shares for the Trust. |
| (4) | Mr. McMahon is considered an “interested” Trustee under the Investment Company Act of 1940 because he is a director and the chief investment strategist of Thornburg Investment Management, Inc. |
| (5) | The Bylaws of the Trust currently require that each Independent Trustee shall retire by the end of the calendar year during which the Trustee reached the age of 75 years. Otherwise each Trustee serves in office until the election and qualification of a successor or until the Trustee sooner dies, resigns, retires or is removed. |
| (6) | Assistant vice presidents and assistant secretaries are not shown. |
| (7) | The Trust’s president, chief financial officer, secretary, and treasurer each serves a one-year term or until the election and qualification of a successor; each other officer serves at the pleasure of the Trustees. |
The Statement of Additional Information for each Fund of the Trust includes additional information about the Trustees and is available, without charge and upon request, by calling 1-800-847-0200.
Other Information
Thornburg Intermediate Municipal Fund | September 30, 2019 (Unaudited)
PORTFOLIO PROXY VOTING
Policies and Procedures:
The Trust has delegated to the Advisor voting decisions respecting proxies for the Fund’s voting securities. The Advisor makes voting decisions in accordance with its Proxy Voting Policy and Procedures. A description of the Policy and Procedures is available (i) without charge, upon request, by calling the Advisor toll-free at 1-800-847-0200, (ii) on the Thornburg website at www.thornburg.com, and (iii) on the U.S. Securities and Exchange Commission’s website at www.sec.gov.
Information regarding how proxies were voted is available on or before August 31 of each year for the twelve months ending the preceding June 30. This information is available (i) without charge, upon request by calling the Advisor toll-free at 1-800-847-0200, (ii) on the Thornburg website at www.thornburg.com, and (iii) on the U.S. Securities and Exchange Commission’s website at www.sec.gov.
TAX INFORMATION
For the tax year ended September 30, 2019, dividends paid by the Fund of $31,234,545 (or the maximum allowed) are tax exempt dividends and $83,690 are taxable ordinary investment income dividends for federal income tax purposes. The information and the distributions reported herein may differ from the information and distributions reported to the shareholders for the calendar year ending December 31, 2019. Complete information will be reported in conjunction with your 2019 Form 1099.
AVAILABILITY OF QUARTERLY PORTFOLIO SCHEDULE
The Fund files with the Securities and Exchange Commission schedules of its portfolio holdings on Form N-Q for the first and third quarters of each fiscal year. The Fund’s Forms N-Q are available on the Commission’s website at www.sec.gov, or may be reviewed and copied at the Commission’s Public Reference Room in Washington, D.C. Information on the operation of the Public Reference Room may be obtained by calling 1-800-SEC-0330. The Fund also makes this information available on its website at www.thornburg.com/download or upon request by calling 1-800-847-0200.
STATEMENT RESPECTING RENEWAL OF INVESTMENT ADVISORY AGREEMENT
Thornburg Investment Management, Inc. (the “Advisor”) provides investment management services to Thornburg Intermediate Municipal Fund (the “Fund”) pursuant to an investment advisory agreement. The Trustees consider the renewal of this agreement annually, and most recently determined to renew the agreement on September 17, 2019.
Planning for their recent consideration of the advisory agreement’s renewal, the independent Trustees met in May 2019 to consider aspects of their annual evaluation of the Advisor’s service to all of the funds of Thornburg Investment Trust, to plan the annual evaluation of the Advisor’s performance and to discuss preliminarily the information the Advisor would present to the Trustees for their review. The independent Trustees met in a second independent session in July 2019 to further define certain portions of the information to be submitted by the Advisor. The independent Trustees met again in an independent session in September 2019 with a mutual fund analyst firm engaged by the independent Trustees to provide explanations of comparative cost and expense information, comparative investment performance information, and other data obtained and analyzed by the analyst firm. In that session the independent Trustees discussed their evaluations of the Advisor’s services to the Fund and the Fund’s fee and expense levels, investment performance, and other information presented for the Fund, conferred independently with legal counsel respecting the factors typically considered in evaluating renewal of an advisory agreement, and conferred with representatives of management to receive explanations of certain aspects of the information they had requested. Representatives of the Advisor subsequently reviewed portions of the information with the Trustees and addressed questions from the Trustees at a full meeting session of the Trustees scheduled in September for that purpose, and the independent Trustees thereafter met again in an independent session to consider the Advisor’s presentations and various specific issues respecting their consideration of the advisory agreement’s renewal. Following these sessions, the Trustees met to consider renewal of the advisory agreement, and the independent Trustees voted unanimously at that meeting to renew the agreement for an additional term of one year.
The information below summarizes certain factors considered by the Trustees in connection with the determination to renew the advisory agreement with the Advisor. In determining to renew the advisory agreement, the Trustees considered a wide range of information and did not identify any single factor as controlling, and this summary does not describe all of the factors and other matters considered by the Trustees in making their determination.
Nature, Extent and Quality of Services. The Trustees considered in their evaluation of the advisory agreement the written and oral reports provided to the Trustees and their standing committees throughout the year on a wide variety of topics by personnel from the Advisor’s
Other Information, Continued
Thornburg Intermediate Municipal Fund | September 30, 2019 (Unaudited)
portfolio management, administration, operations and compliance staffs. The Trustees also considered in this evaluation presentations and explanations made by representatives of the Advisor in meeting sessions scheduled for consideration of the renewal of the advisory agreement. The Trustees further noted in their evaluation the consideration they had given to a number of topics in previous years, reports from their standing committees, and advice received from counsel.
Information noted by the Trustees as having been considered in relation to the nature, extent and quality of services provided by the Advisor under the advisory agreement and contributing (together with other information considered) to their conclusions respecting the nature, extent and quality of the services rendered to the Fund by the Advisor included: (1) reports from portfolio managers and other personnel throughout the year demonstrating that the Fund was managed in conformity with stated strategies and objectives and conformed to investment restrictions and limitations; (2) reports demonstrating that management of the Fund remained faithful and competent, and demonstrating sufficient skill by portfolio managers in executing the Fund’s strategies in varying environments, managers’ cognizance of and strategies to pursue the Fund’s objectives and address pertinent market and economic trends and conditions, the evaluation and selection of individual investments, management to achieve tax efficiencies, and the structuring and composition of the Fund’s portfolio and management of Fund liquidity requirements; (3) the Fund’s achievement of its investment objectives over different periods of time; (4) presentations by and interactions with members of the Advisor’s fund administration, operations and compliance staffs; (5) reports from standing committees of the Trustees on their respective proceedings throughout the year, including in particular reports from and interactions with the Advisor’s personnel; (6) the sufficiency of the resources the Advisor devotes to the services it provides to the Fund, including the expertise of its personnel and staffing levels and its enhancements to the electronic systems it utilizes in providing these services, and also including the Advisor’s own financial management and sufficiency of its resources; and (7) the measures employed to achieve efficient trade execution for the Fund, including the evaluation and selection of firms to execute transactions for the Fund. As in past years, the Trustees noted particularly their assessments of the Advisor’s personnel developed in meetings throughout the year, measures to expand and improve the depth and experience of the Advisor’s staff, and the Advisor’s collaborative approach to investment management, continued commitment to observance of compliance and regulatory requirements in managing investments by the Fund, responsiveness to the Trustees, and other factors.
Based upon these and other considerations, the Trustees concluded that the Advisor’s management of the Fund’s investments continued to conform to the Fund’s stated objectives and policies, and that the nature, extent and quality of the services provided to the Fund by the Advisor remained sufficient.
Investment Performance. The Trustees noted in their evaluation of the Fund’s investment performance the written and oral reports they had received in each regular meeting over the course of the year from the Advisor’s portfolio management personnel. The Trustees also noted their consideration of information provided to them at their request in anticipation of their annual evaluation of the Advisor’s services, including the following items of information respecting the investment performance of the Fund: (1) the Fund’s absolute investment performance and achievement of stated objectives; (2) the Advisor’s explanations and commentary on the Fund’s performance in the context of the Fund’s objectives and reasonable expectations, and business, market and economic conditions; (3) performance data for the most recent ten calendar years, comparing the Fund’s annual investment returns to a broad-based securities index and to the applicable Morningstar category of funds; (4) the Fund’s investment performance for the three-month, year-to-date, one-year, three-year, five-year, ten-year, fifteen-year, and since inception periods ending with the second quarter of the current year, comparing the Fund’s annualized returns to two mutual fund categories created by independent mutual fund analyst firms and to a broad-based securities index, and assigning a percentage rank to the Fund’s performance for each period relative to each of the fund categories; (5) analyses of specified performance and risk metrics for the Fund relative to its benchmark and to a selected peer group of funds, prepared by an independent financial analyst firm engaged by the independent Trustees; (6) the Fund’s cash flows; (7) comparative performance data for fund peer groups selected by an independent mutual fund analyst firm engaged by the independent Trustees, and the analysis and observations of the analyst firm respecting those data; and (8) comparative measures of correlation to equity indices, and risk and return statistics. Measures of risk and relative return demonstrated that the Fund’s performance relative to these measures continued to fulfill expectations in current conditions. The Trustees generally attach additional significance to the investment performance of the Fund from the perspective of longer-term shareholders, and noted in that regard that the Fund’s relative investment performance may be affected to some extent in periods when the Advisor pursues defensive measures in line with the Fund’s stated objectives. Based upon their consideration of this and other information, the Trustees concluded that the Fund’s absolute and relative investment performance over a range of pertinent holding periods on the whole was satisfactory in view of its objectives and strategies.
Comparisons of Fee and Expense Levels. Information noted by the Trustees as having been considered in this context included a variety of comparative data respecting the Fund’s fee and expense levels. This information included comparisons of the Fund’s advisory fee and overall Fund expenses to median and average fees and expenses charged to funds in the applicable Morningstar category, comparisons of the advisory fee and total expenses for two Fund share classes to the fee levels and expenses of fund peer groups selected from the category by an independent mutual fund analyst firm engaged by the independent Trustees, the perspectives and advice from that mutual fund analyst firm respecting comparisons of fund fee levels and expenses to fund peer groups, and other information. Comparative fee and expense data noted as having been considered by the Trustees showed that the level of total expense for one share class of the Fund was higher than the median and average levels charged to funds in the applicable Morningstar category, and that the level of total expense for a second share class was lower than the median and average levels for that category. Peer group data showed that the Fund’s stated
Other Information, Continued
Thornburg Intermediate Municipal Fund | September 30, 2019 (Unaudited)
advisory fee was comparable to the median level for the two peer groups, and that the total expense levels of two representative share classes were higher than the medians of their respective peer groups but comparable to other funds in the peer groups. The Trustees did not find the differences significant in view of their findings and conclusions respecting the other factors considered.
The Trustees noted their consideration of information respecting the advisory fees charged by the Advisor to other investment management clients, including sub-advised mutual funds and other institutional clients, together with information about fees charged by other advisors to different clients, analysis of the differences between the requirements of institutional clients and mutual funds, analysis of the differences between the requirements of a sub-advised mutual fund and a fund as to which the investment advisor is the primary advisor and sponsor, and the consequently different investment management services provided to the different categories of clients and the differing contexts in which these arrangements are entered into. The Trustees confirmed their previous observations that the differences between the fees charged by the Advisor or by other investment advisors to different types of clients did not appear exceptional and had limited relevance to the evaluation of the fee rate charged to mutual funds as to which the Advisor or such other advisors are the primary advisor and sponsor.
Costs and Profitability of Advisor. In reviewing the profitability of the Advisor’s services to the Fund, the Trustees considered an analysis of the Advisor’s costs and the estimated profitability to the Advisor of its services, together with data respecting the overall profitability of a selection of other investment management firms. The Trustees considered in this regard information from the Advisor respecting investment of its profits to maintain staffing levels, and noted that a portion of the Advisor’s profits is an important element in the compensation of shareholder employees. The Trustees considered information from the Advisor respecting the use of profits to enhance staff competencies through training and other measures, hire personnel to expand and develop the scope of senior management expertise, pay competitive levels of compensation, and add to the Advisor’s electronic and information technology systems to maintain or improve service levels. The Trustees also considered the contribution of the Advisor’s cost management to its profitability, and the relationship of the Advisor’s financial resources and profitability in previous years to its ability to attract necessary personnel, invest in systems and other assets required for its service to the Fund, and maintain or improve service levels for the Fund notwithstanding fluctuations in revenues and profitability. The information considered did not indicate to the Trustees that the Advisor’s profitability was excessive.
Potential Economies of Scale. In reviewing the extent to which economies of scale would be realized by the Fund as it grows and whether fee levels reflect potential economies of scale, the Trustees considered the breakpoint structure for advisory fees chargeable to the Fund, comparisons of the fee breakpoint structure for the Fund with breakpoint structures (or the absence of such structures) for other funds in a peer group selected by an independent mutual fund analyst firm, the effects of the breakpoint structure and other expense factors realized by certain funds of the Trust as their asset levels had increased, the Advisor’s undertakings to waive or reimburse certain fees and expenses of the Fund, and the Advisor’s expenditures from its own profits and resources to maintain staffing levels and expand staff competencies, pay competitive levels of compensation, and add to its electronic and information technology systems so as to maintain or improve service levels. The information provided demonstrated to the Trustees that the Fund’s advisory fee breakpoint structure is reasonable in relation to the structures observed in the other funds in its peer group, and that shareholders may be expected to benefit from any economies of scale, due to the advisory agreement’s breakpoint fee structure for the Fund and other factors.
Potential Ancillary Benefits. In reviewing potential benefits to the Advisor because of its relationship to the Fund, the Trustees considered explanations from the Advisor respecting its receipt of certain research services from broker dealers, and the benefits to both the Fund and the Advisor of the Advisor’s expansion of its staffing, compliance and systems capabilities and other resources to serve a broader variety of investment management clients. No unusual or unfair benefits to the Advisor from its relationship to the Fund were identified by the Trustees.
Summary of Conclusions. The Trustees concluded that the general nature, extent and quality of the Advisor’s services performed under the advisory agreement remained sufficient, the Advisor had continued to actively and competently pursue the Fund’s stated investment objectives and adhere to the Fund’s investment policies, and that the absolute and relative investment performance of the Fund over pertinent holding periods on the whole was satisfactory in the context of the Fund’s objectives and strategies. The Trustees further concluded that the level of the advisory fee charged to the Fund by the Advisor is fair and reasonable in relation to the services provided by the Advisor, in view of the nature, extent and quality of those services, the investment performance of the Fund after fees and expenses, the clear disclosure of fees and expenses in the Fund’s prospectus, comparisons of fees and expenses charged to the Fund to fees and expenses charged to other mutual funds, and the other factors considered. The Trustees accordingly determined to renew the Fund’s investment advisory agreement with the Advisor for an additional term of one year.
Trustees’ Statement to Shareholders (Unaudited)
Readopted September 17, 2019
The Trustees believe current and prospective shareholders should know how we discharge our responsibilities in supervising the Funds’ investment advisor and in reviewing the advisor’s contract for renewal. Since 2005, we have issued a statement which sets out clearly the three principal guidelines that we follow in supervising the Trust’s investment advisor on your behalf. In accordance with our customary practice, in September of this year we again reviewed our statement and concluded we should reissue this statement outlining the principal features of our supervision of the advisor’s performance of investment management services for the Funds.
We begin with the premise that each shareholder selected his or her Fund because its investments are managed by the investment advisor identified in the prospectus and in accordance with the objective and policies described in the prospectus. We realize, as each of you do, that if you believe that your Fund’s stated objective and policies no longer serve your personal investment goals, you can sell your shares and leave the Fund.
Therefore, we believe that our primary supervisory task—our principal obligation to you—is to assess the nature and quality of the advisor’s services, and to confirm that the advisor actively and competently pursues the Fund’s objective, in accordance with the policies set out in the prospectus. To do this, we meet regularly with management to review your Fund’s portfolio and to discuss the advisor’s specific actions and judgments in pursuing the Fund’s objective. We do not substitute our own judgment for the advisor’s decisions in selecting investments; the advisor is paid to exercise its informed judgment on investment decisions, and we seek to confirm, in reviewing the advisor’s performance, that the advisor is doing just that.
Second, we are conscious of costs and the effect that costs have on shareholders’ returns. We try to make sure that your Fund’s fees and costs are reasonable in relationship to the services rendered and that they are generally in line with those charged by other expert investment advisors, consistent with our belief that the Fund’s investors searched for and expect that expertise and attention and have decided to pay a reasonable price for it. We do not put the management contract “out to bid” as a matter of course, and we would not do so unless we had concluded that the advisor materially had failed to pursue the Fund’s objectives in accordance with its policies, or for other equally important reasons. We believe that any other approach would be inconsistent with your interests and contrary to your expectations when you bought shares of the Fund in the first place.
Finally, because we believe that most Thornburg Fund shareholders have invested with a long-term perspective, we try not to focus too much on the fashions of the moment and on short-term performance. The market will not favor any specific investment objective or set of policies at all times and under all economic circumstances. A fund will experience periods of both high and low returns relative to other funds and other investments. Even if one of our Funds is not favored by the market at a particular time, we believe that the advisor is nonetheless obliged to remain true to the Fund’s objective and policies, and we watch to see that it does so.
Trustees of Thornburg Investment Trust
Thornburg Investment Management is a privately-owned global investment firm that offers a range of solutions for retail and institutional investors. Founded in 1982 and headquartered in Santa Fe, New Mexico, we manage approximately $41.9 billion (as of September 30, 2019) across U.S. mutual funds, separate accounts for high-net-worth investors, institutional accounts, and UCITS funds for non-U.S. investors.
The fund outlined in this report is one of many equity and fixed-income products available from Thornburg Investment Management.
EQUITY FUNDS
| ■ | Thornburg Global Opportunities Fund |
| ■ | Thornburg International Value Fund |
| ■ | Thornburg Better World International Fund |
| ■ | Thornburg International Growth Fund |
| ■ | Thornburg Developing World Fund |
| ■ | Thornburg Value Fund |
| ■ | Thornburg Core Growth Fund |
MULTI_ASSET FUNDS
| ■ | Thornburg Investment Income Builder Fund |
| ■ | Thornburg Summit Fund |
FIXED INCOME FUNDS
| ■ | Thornburg Low Duration Income Fund |
| ■ | Thornburg Limited Term U.S. Government Fund |
| ■ | Thornburg Limited Term Income Fund |
| ■ | Thornburg Strategic Income Fund |
| ■ | Thornburg Low Duration Municipal Fund |
| ■ | Thornburg Limited Term Municipal Fund |
| ■ | Thornburg Intermediate Municipal Fund |
| ■ | Thornburg California Limited Term Municipal Fund |
| ■ | Thornburg New Mexico Intermediate Municipal Fund |
| ■ | Thornburg New York Intermediate Municipal Fund |
| ■ | Thornburg Strategic Municipal Income Fund |
ALTERNATIVE FUNDS
| ■ | Thornburg Long/Short Equity Fund |
Before investing, carefully consider the Fund’s investment goals, risks, charges, and expenses. For a prospectus or summary prospectus containing this and other information, contact your financial advisor or visit thornburg.com. Read it carefully before investing.
For additional information, please visit thornburg.com
Thornburg Investment Management, Inc. 2300 North Ridgetop Road, Santa Fe, NM 87506
To receive shareholder reports, prospectuses, and proxy statements electronically, go to www.thornburg.com/edelivery.
This Annual Report is submitted for the general information of shareholders of the Fund. It is not authorized for distribution to prospective investors in the Fund unless preceded or accompanied by an effective prospectus.
Investment Advisor:
Thornburg Investment Management®
800.847.0200
Distributor:
Thornburg Securities Corporation®
Annual Report
September 30, 2019
Beginning on January 1, 2021, as permitted by regulations adopted by the Securities and Exchange Commission, paper copies of the Fund’s shareholder reports will no longer be sent by mail, unless you specifically request paper copies of the reports from the Fund or from your financial intermediary, such as a broker-dealer or bank. Instead, the reports will be made available on a website, and you will be notified by mail each time a report is posted and provided with a website link to access the report.
If you already elected to receive shareholder reports electronically, you will not be affected by this change and you need not take any action. You may elect to receive shareholder reports and other communications from the Fund or your financial intermediary electronically by going to thornburg.com/edelivery.
You may elect to receive all future reports in paper free of charge. You can inform the Fund or your financial intermediary that you wish to continue receiving paper copies of your shareholder reports by calling 800.847.0200 or your financial intermediary directly. Your election to receive reports in paper will apply to all funds held with the fund complex/your financial intermediary.
At Thornburg, we believe unconstrained investing leads to better outcomes for our clients. Our investment solutions are highly active, high conviction, and benchmark agnostic. When it comes to finding economic opportunity for clients, it’s more than what we do.
It’s how we do it. Active Asbottom-up, fundamental, active managers, we look beyond conventional benchmarks. Long Term We take a long-term view in how we manage our firm and our portfolios. Benchmark Agnostic Investment strategies should have the flexibility to pursue solutions for clients, not stay within the conventional confines of benchmarks. Flexible Perspective Our approach to portfolio construction is guided by our convictions rather than convention. High Conviction We focus our attention and capital on thoroughly researched, well-understood positions. The best form of risk management is to know what you own, and why. Repeatable & Robust Our long-term outperformance of benchmarks verifies that our process works and outperforms conventional thinking. Independent We are independently owned and far from the herd of other investment managers. Investment Driven All members of the investment team are resources for all of our strategies. Collaborative Our team collaborates on opportunities across geography, sector, or asset class.
Thornburg Strategic Municipal Income Fund
Annual Report | September 30, 2019
Table of Contents
| SHARE CLASS | NASDAQ SYMBOL | CUSIP |
| Class A | TSSAX | 885-216-101 |
| Class C | TSSCX | 885-216-200 |
| Class I | TSSIX | 885-216-309 |
Minimum investments for Class I shares may be higher than those for Class A. Class I shares may not be available to all investors.
Investments carry risks, including possible loss of principal. Portfolios investing in bonds have the same interest rate, inflation, and credit risks that are associated with the underlying bonds. The value of bonds will fluctuate relative to changes in interest rates, decreasing when interest rates rise. This effect is more pronounced for longer-term bonds. Unlike bonds, bond funds have ongoing fees and expenses. Investments in lower rated and unrated bonds may be more sensitive to default, downgrades, and market volatility; these investments may also be less liquid than higher rated bonds. Investments in derivatives are subject to the risks associated with the securities or other assets underlying the pool of securities, including illiquidity and difficulty in valuation. Please see the Fund’s prospectus for a discussion of the risks associated with an investment in the Fund. Investments in the Fund are not FDIC insured, nor are they bank deposits or guaranteed by a bank or any other entity.
Letter to Shareholders
Thornburg Strategic Municipal Income Fund | September 30, 2019 (Unaudited)
October 18, 2019
Dear Fellow Shareholder:
We are pleased to present the annual report for the Thornburg Strategic Municipal Income Fund. The net asset value (NAV) of the Class I shares increased 49 cents to $15.33 per share during the fiscal year ended September 30, 2019. The Class I shares of your Fund underperformed the index with a 6.24% total return for the fiscal year ended September 30, 2019, compared to the 8.73% total return for the ICE BofA Merrill Lynch Municipal Master Index.
The drivers of the Fund’s total return relative to its benchmark include its interest rate sensitivity, as measured by the Fund’s duration, differing credit quality allocations and other risk factors. The impact of the Fund’s 2.17 years shorter duration detracted 2.056%. The Fund’s credit quality allocations contributed 0.17%, while other risk factors contributed 0.246%. The Fund’s expenses and residuals accounted for the remainder of the performance differential.
Since the last annual letter published in November 2018, the municipal market and its investors have experienced one of the great rallies in the market’s history, driven by the largest amount of inflows into municipal bond mutual funds on record. Mutual funds have experienced positive inflows every week of 2019, with the aggregate amounting to more than $70 billion. During that time, the 10-year Thomson Reuters Municipal Market Data (MMD) AAA Curve has fallen from a high of 2.80% in early November 2018 to an all-time low of 1.22% in late August 2019, only to settle around 1.45% at the time of this writing. The decrease in yields and the insatiable demand from retail mutual fund investors has led to appreciating bond prices that have accounted for a large portion of the returns the market inked over the last 12 months.
While the increase in the price of the investments has been great to watch, municipal investors find themselves in a tough situation. Does one sell the bonds at high prices? Is it best to pay a capital gain and look for reinvestment opportunities? Or does one hold the bonds? Collect a coupon and reinvest the proceeds knowing that the premium could evaporate if yields spike?
In many cases the answer is contingent on investor goals and risk tolerance. So instead of providing an answer, we would like to present an analysis of market risks that will allow investors to draw their own conclusions.
Municipal Bond Supply and Demand
Municipal investors tend to be overly sensitive to supply trends. The common refrain is that a big supply year is bearish for bond prices and vice versa. While that is generally true, it negates the other half of the equation. Demand, not supply, can be a large driver of total return, and that is exactly what the market has experienced throughout 2019. $70 billion has poured into the municipal market through the end of September 2019, the largest amount of annual inflows on record.
That $70 billion represents roughly 10% of all assets in municipal bond mutual funds. So technical demand, not fundamentals, has been the key driver of asset appreciation. That should be troubling. As investors, we like fundamentals to move asset prices. If you were to invest in Apple, and Apple sells more iPhones, and the firm’s stock appreciates, we would consider that being for the right reasons. When price is driven by factors other than fundamental value, the potential for a reversal tends to be high. Therefore, we would recommend caution when investing in a market where fundamental improvement isn’t the reason for price appreciation.
Municipal Bond Credit Risk
Credit spreads, much like triple-A bond insurers, have all but disappeared from the muni market. That is somewhat of an overstatement, but for some time now credit spreads, especially across the plain vanilla investment grade space, have become virtually commoditized. At the same time, while much has been said surrounding the covenant-lite status of recent corporate debt issuance, little has been said about the phenomenon in the municipal bond market. Credit security packages are getting weaker. Net revenue covenants, liquidity covenants, additional bonds tests and other protections granted to municipal investors are weakening. It is undeniable that municipal investors are taking on more and more credit risk for less and less yield.
State and Local Tax Deduction (SALT)
At least part of the increase in demand for municipal paper has been driven by the changes to the SALT deduction cap. The cap of $10,000 in state and local taxes that are deductible from federal taxes was part of the tax changes that were passed by the Trump administration at the end of 2017. It is estimated that over 10 million taxpayers were unable to write-off some $320 billion in state and local taxes, effectively increasing their tax liability despite a reduction in marginal personal income tax rates. The impact has been the most severe in states with high local and state taxes.
Faced with an ever-increasing tax bill, investors in these high-tax states have flocked to the municipal bond market. In no place is that truer than California. For many investors in the state, investments in the California municipal bond market no longer make economic sense. After adjusting yields for state and local taxes, many California investors would be better off investing in U.S. Treasuries due to the higher after-tax yield. Yet, money continues to flow into the California municipal bond market as investors make these non-economic decisions. Non-economic decision-making is not isolated to the California market, though. It’s evident in many high-tax states.
The Federal Reserve and Monetary Policy
As recently as December 2018, the Federal Reserve seemed bound and determined to push interest rates higher. It took only a few angry tweets and some stock market volatility in the fourth quarter of 2018 for the Fed to put its interest rate hikes
Letter to Shareholders, Continued
Thornburg Strategic Municipal Income Fund | September 30, 2019 (Unaudited)
on pause, and only seven months for a complete reversal of course. Since the 25 basis point (bps) rate cut in July, the Fed cut again in September and the market is pricing in one more cut before year end.
While monetary policy has been the elixir of choice for a decade running, it has also created a host of problems for fixed income investors. By keeping yields low for the last decade, fixed income investors have been driven out the risk spectrum in search of their income goals. Many have taken on additional duration risk by buying longer-dated bonds, making them more susceptible to interest rate movements.
Other fixed income investors have taken on more credit risk, making them more susceptible to a slowing economy. Others have been forced out of the fixed income market and into the equity markets, which completely changes the risk profile of their investments. This is all being done at a time of all-time low yields and all-time low credit spreads. This situation is hardly sustainable.
The highlighted risks have led us to maintain our present course. The Fund remains higher in credit quality and cash with durations at lower levels. While the latter has impacted total returns as price appreciation has driven total return, the distribution yield, or tax-free monthly income, has held up nicely. Cash has been allowed to build given the flatness of the
yield curve and the trade-off in investing in the variable rate demand note (VRDN) market. When opportunities arise, we have ample dry powder to take advantage of dislocations. Until those conditions are met, we are content to manage the Fund in a more conservative fashion commensurate with the risk profile of a municipal bond investor.
Thank you for your continued trust and support.
Sincerely,

| 
|
Christopher Ryon,cfa
Portfolio Manager
Managing Director | Nicholos Venditti,cfa
Portfolio Manager
Managing Director |

| |
David Ashley,cfa
Portfolio Manager
Managing Director | |
The matters discussed in this report may constitute forward-looking statements made pursuant to the safe harbor provisions of the Securities Litigation Reform Act of 1995. These include any advisor or portfolio manager prediction, assessment, analysis or outlook for individual securities, industries, investment styles, market sectors and/or markets. These statements involve risks and uncertainties. In addition to the general risks described for each fund in its current prospectus, other factors bearing on these reports include the accuracy of the advisor’s or portfolio manager’s forecasts and predictions, the appropriateness of the investment strategies designed by the advisor or portfolio manager and the ability of the advisor or portfolio manager to implement their strategies efficiently and successfully. Any one or more of these factors, as well as other risks affecting the securities markets generally, could cause the actual results of any fund to differ materially as compared to its benchmarks.
The views expressed are subject to change and do not necessarily reflect the views of Thornburg Investment Management, Inc. This information should not be relied upon as a recommendation or investment advice and is not intended to predict the performance of any investment or market.
Performance results of individual share classes will vary based on the fees and expenses associated with each share class, and may be higher or lower than other share classes within the same Fund. Please see Performance Summary for performance results of each share class.
Performance Summary
Thornburg Strategic Municipal Income Fund | September 30, 2019 (Unaudited)
AVERAGE ANNUAL TOTAL RETURNS
| | 1-YR | 3-YR | 5-YR | 10-YR | SINCE
INCEP. |
| Class A Shares(Incep: 4/1/09) | | | | | |
| Without sales charge | 6.08% | 2.03% | 2.58% | 4.23% | 5.73% |
| With sales charge | 3.98% | 1.34% | 2.16% | 4.02% | 5.53% |
| Class C Shares(Incep: 4/1/09) | | | | | |
| Without sales charge | 5.58% | 1.59% | 2.18% | 3.87% | 5.38% |
| With sales charge | 4.98% | 1.59% | 2.18% | 3.87% | 5.38% |
| Class I Shares(Incep: 4/1/09) | 6.24% | 2.27% | 2.85% | 4.51% | 6.03% |
30-DAY YIELDS, A SHARES(with sales charge)
| Annualized Distribution Yield | 2.40% |
| SEC Yield | 0.99% |
GROWTH OF A HYPOTHETICAL $10,000 INVESTMENT
Performance data shown represents past performance and is no guarantee of future results. Investment return and principal value will fluctuate so shares, when redeemed, may be worth more or less than their original cost. Current performance may be lower or higher than quoted. For performance current to the most recent month end, visit thornburg.com or call 800-847-0200. The performance information does not reflect the deduction of taxes that a shareholder would pay on distributions or the redemption of Fund shares. Returns reflect the reinvestment of dividends and capital gains. Class A shares are sold with a maximum sales charge of 2.00%. Class C shares include a 0.60% CDSC for the first year only. There is no sales charge for Class I shares. As disclosed in the most recent prospectus, the total annual fund operating expenses before fee waivers and expense reimbursements are as follows: A shares, 1.28%; C shares, 1.64% and I shares, 0.96%. Thornburg Investment Management has contractually agreed to waive fees and reimburse expenses until at least February 1, 2020, for some of the share classes, resulting in net expense ratios of the following: A shares, 1.00%; C shares, 1.47% and I shares, 0.78%. For more detailed information on fund expenses and waivers/reimbursements please see the Fund’s prospectus. Without the fee waivers and expense reimbursements, the Annualized Distribution yield would have been 2.34%, and the SEC yield would have been 0.93%.
The ICE index data referenced herein is the property of ICE Data Indices, LLC, its affiliates (“ICE Data”) and/or its Third Party Suppliers and has been licensed for use by Thornburg Investment Management, Inc. ICE Data and its Third Party Suppliers accept no liability in connection with its use. See www.thornburg.com/indices for a full copy of the Disclaimer.
TheICE BofAML Municipal Master Index tracks the performance of the investment-grade U.S. tax-exempt bond market. Qualifying bonds must have at least one year remaining term to maturity, a fixed coupon schedule, and an investment grade rating (based on average of Moody’s, S&P, and Fitch).
The performance of any index is not indicative of the performance of any particular investment. Unless otherwise noted, index returns reflect the reinvestment of income dividends and capital gains, if any, but do not reflect fees, brokerage commissions or other expenses of investing. Investors may not make direct investments into any index.
Bond Credit Ratings (Credit Quality) – A bond credit rating assesses the financial ability of a debt issuer to make timely payments of principal and interest. Ratings of AAA (the highest), AA, A, and BBB are investment-grade quality. Ratings of BB, B, CCC, CC, C and D (the lowest) are considered below investment grade, speculative grade, or junk bonds.
Duration – A bond’s sensitivity to interest rates. Bonds with longer durations experience greater price volatility than bonds with shorter durations. Effective duration incorporates a bond’s embedded option features, such as call provisions.
Yield Curve – A line that plots the interest rates, at a set point in time, of bonds having equal credit quality, but differing maturity dates.
Thomson Reuters Municipal Market Data (MMD) AAA Curve - Thomson Reuters Municipal Market Data (MMD) AAA Curve is a proprietary yield curve that provides the offer-side of “AAA” rated state general obligation bonds, as determined by the MMD analyst team. The MMD AAA curve represents the MMD analyst team’s opinion of AAA valuation, based on institutional block size ($2 million+) market activity in both the primary and secondary municipal bond market. In the interest of transparency, MMD publishes extensive yield curve assumptions relating to various structural criteria which are used in filtering market information for the purpose of benchmark yield curve creation.
Fund Summary
Thornburg Strategic Municipal Income Fund | September 30, 2019 (Unaudited)
OBJECTIVES AND STRATEGIES
The Fund seeks a high level of current income exempt from federal individual income tax (may be subject to Alternative Minimum Tax).
The Fund invests principally in a portfolio of municipal bonds issued by states and state agencies, local governments and their agencies, and by U.S. territories and possessions.
Not more than 50% of the portfolio may be invested in bonds rated below investment grade (or of equivalent quality as determined in accordance with the prospectus) at the time of purchase. Also, the portfolio is typically diversified among sectors, issuers, credit qualities, geographic regions, and segments of the yield curve. The flexible nature of the Fund allows the team to adapt the portfolio’s duration and credit quality to our perception of future market conditions.
| KEY PORTFOLIO ATTRIBUTES | |
| Number of Bonds | 224 |
| Effective Duration | 3.9 Yrs |
| Average Maturity | 8.7 Yrs |
SECURITY CREDIT RATINGS
A bond credit rating assesses the financial ability of a debt issuer to make timely payments of principal and interest. Ratings of AAA (the highest), AA, A, and BBB are investment-grade quality. Ratings of BB, B, CCC, CC, C and D (the lowest) are considered below investment grade, speculative grade, or junk bonds.
Unrated pre-refunded and escrowed-to-maturity bonds are included in the not rated category.
There is no guarantee that the Fund will meet its investment objectives.
All data is subject to change. Charts may not add up to 100% due to rounding.
Schedule of Investments
Thornburg Strategic Municipal Income Fund | September 30, 2019
| | | PRINCIPAL
AMOUNT | VALUE |
| | Municipal Bonds — 98.5% | | |
| | Alabama — 2.1% | | |
| | Lower Alabama Gas District, Series A, 5.00% due 9/1/2034 | $2,000,000 | $ 2,605,540 |
| a,b | Selma Industrial Development Board (International Paper Co.), Series A, 2.00% due 11/1/2033 (put 10/1/2024) | 3,650,000 | 3,654,891 |
| | Arizona — 1.9% | | |
| c | Arizona (Banner Health Obligated Group; LOC Bank of America, N.A.) HFA, Series C, 1.77% due 1/1/2046 (put 10/1/2019) | 550,000 | 550,000 |
| | Arizona Health Facilities Authority (Scottsdale Lincoln Hospitals) HFA, 5.00% due 12/1/2031 | 2,500,000 | 2,889,700 |
| a | County of Yavapai, (Waste Management, Inc.) AMT, IDA, 2.80% due 6/1/2027 (put 6/1/2021) | 1,500,000 | 1,529,250 |
| | Pima County (Providence Day School) IDA, 5.125% due 12/1/2040 | 710,000 | 727,239 |
| | Arkansas — 0.4% | | |
| | University of Arkansas Board of Trustees (Fayetteville Campus), 5.00% due 11/1/2036 | 1,000,000 | 1,148,000 |
| | California — 8.9% | | |
| | ABAG Finance Authority for Nonprofit Corporations (Episcopal Senior Communities), 5.00% due 7/1/2047 | 1,635,000 | 1,742,289 |
| | Benicia (Benicia High School; Insured: AGM) USD GO, Series C, Zero Coupon due 8/1/2026 | 830,000 | 731,305 |
| | California (Children’s Hospital Los Angeles) HFFA, | | |
| | 5.00% due 11/15/2034 | 420,000 | 458,909 |
| | Series A, 5.00% due 8/15/2036 | 500,000 | 600,695 |
| | California (Community Program Developmental Disabilities; Insured: California Mtg Insurance) HFFA, 6.25% due 2/1/2026 | 1,500,000 | 1,600,230 |
| d | California Infrastructure and Economic Development Bank (Los Angeles County Museum of Art), Series A, 2.088% (LIBOR 1 Month + 0.65%) due 12/1/2050 (put 2/1/2021) | 1,000,000 | 1,002,730 |
| | California Municipal Finance Authority (Harbor Regional Center), 8.50% due 11/1/2039 (pre-refunded 11/1/2019) | 1,000,000 | 1,005,780 |
| e | California Pollution Control Financing Authority (Poseidon Resources (Channelside) L.P. Desalination Project) AMT, 5.00% due 11/21/2045 | 1,000,000 | 1,068,450 |
| | Calipatria (Educational Facilities; Insured: ACA) USD GO, Series B, Zero Coupon due 8/1/2025 | 1,945,000 | 1,559,423 |
| | City of Moorpark Mobile Home Park (Villa Del Arroyo), Series A, 6.15% due 5/15/2031 | 1,000,000 | 1,065,880 |
| | City of Palm Springs Financing Authority (Downtown Revitalization Project), 5.25% due 6/1/2027 | 1,620,000 | 1,782,518 |
| | Corona-Norco (Insured: AGM) USD COP, Series A, 5.00% due 4/15/2031 | 1,750,000 | 1,783,057 |
| | County of El Dorado (El Dorado Hills Development-Community Facilities), 5.00% due 9/1/2026 | 630,000 | 693,699 |
| | Daly County Housing Development Finance Agency (Franciscan Country Club Mobile Home Park Acquisition), Series A, 5.25% due 12/15/2023 | 650,000 | 652,190 |
| | M-S-R Energy Authority, Series A, 6.50% due 11/1/2039 | 1,245,000 | 1,956,580 |
| a | Northern California Energy Authority (Commodity Supply Revenue), Series A, 4.00% due 7/1/2049 (put 7/1/2024) | 2,000,000 | 2,174,540 |
| | Oakland (County of Alameda Educational Facilities) USD GO, Series A, 5.00% due 8/1/2035 | 1,000,000 | 1,177,430 |
| | Redwood City Redevelopment Agency (Redevelopment Project Area 2; Insured: AMBAC), Zero Coupon due 7/15/2021 | 1,285,000 | 1,249,997 |
| | Riverside County Asset Leasing Corp. (Riverside County Hospital; Insured: Natl-Re), Zero Coupon due 6/1/2021 | 535,000 | 523,027 |
| | San Francisco City & County Redevelopment Financing Authority (Mission Bay North Redevelopment), Series C, 6.75% due 8/1/2041 (pre-refunded 2/1/2021) | 500,000 | 537,340 |
| | San Francisco City & County Redevelopment Financing Authority (Redevelopment Project; Insured: Natl-Re), Zero Coupon due 8/1/2023 | 1,025,000 | 966,472 |
| | San Jose Redevelopment Agency (Merged Area Redevelopment), 5.50% due 8/1/2035 (pre-refunded 8/1/2020) | 1,000,000 | 1,036,260 |
| | Union Elementary School District (Santa Clara County District Schools; Insured: Natl-Re) GO, Series D, Zero Coupon due 9/1/2027 | 905,000 | 787,278 |
| | Colorado — 1.1% | | |
| | Denver Convention Center Hotel Authority, 5.00% due 12/1/2028 | 1,000,000 | 1,170,800 |
| | Eagle River Fire District COP, | | |
| | 6.625% due 12/1/2024 (pre-refunded 12/1/2019) | 225,000 | 226,910 |
| | 6.875% due 12/1/2030 (pre-refunded 12/1/2019) | 400,000 | 403,560 |
| | Public Authority for Colorado Energy (Natural Gas Purchase), 6.50% due 11/15/2038 | 260,000 | 396,594 |
| | Regional Transportation District (FasTracks Transportation System) COP, | | |
| | Series A, | | |
| | 5.00% due 6/1/2044 | 565,000 | 623,551 |
| | 5.375% due 6/1/2031 | 500,000 | 512,170 |
| | Connecticut — 2.2% | | |
| | State of Connecticut GO, | | |
| | Series A, 5.00% due 4/15/2035 | 2,000,000 | 2,438,660 |
| | Series E, 5.00% due 9/15/2033 | 1,350,000 | 1,668,384 |
| | University of Connecticut (Insured: AGM-CR), Series A, 5.00% due 4/15/2028 | 1,975,000 | 2,482,101 |
| | Delaware — 0.4% | | |
| | Delaware (Nanticoke Memorial Hospital) HFA, 5.00% due 7/1/2021 | 1,000,000 | 1,048,000 |
| | District of Columbia — 0.4% | | |
| | Metropolitan Washington Airports Authority (Dulles Toll Road; Insured: AGC), Series B, Zero Coupon due 10/1/2027 | 1,500,000 | 1,243,140 |
| | Florida — 5.6% | | |
| | Broward County (Airport System Improvements) AMT, 5.00% due 10/1/2037 | 1,000,000 | 1,203,850 |
| e | Charlotte County Industrial Development Authority (Town & Country Utilities Projects),AMT 5.00% due 10/1/2029 | 500,000 | 552,510 |
| | Florida Higher Educational Facilities Financing Authority (Nova Southeastern University), 5.00% due 4/1/2027 - 4/1/2028 | 2,250,000 | 2,550,875 |
Schedule of Investments, Continued
Thornburg Strategic Municipal Income Fund | September 30, 2019
| | | PRINCIPAL
AMOUNT | VALUE |
| c | Miami-Dade County (Florida Power & Light Co.) IDA, 1.78% due 6/1/2021 (put 10/1/2019) | $5,500,000 | $ 5,500,000 |
| | Miami-Dade County Expressway Authority (Toll System Five-Year Work Program), Series A, 5.00% due 7/1/2022 - 7/1/2024 | 1,250,000 | 1,402,869 |
| | Miami-Dade County School Board (District School Facilities and Infrastructure) COP, Series A, 5.00% due 8/1/2027 | 1,100,000 | 1,205,490 |
| | Orange County (Tourist Development), Series A, 5.00% due 10/1/2031 | 1,000,000 | 1,217,170 |
| | Sarasota County Public Hospital Board (Sarasota Memorial Hospital; Insured: Natl-Re), Series A, 5.034% due 10/1/2021 | 1,015,000 | 1,047,673 |
| | Tampa Sports Authority (Tampa Bay Arena; Insured: Natl-Re), 5.75% due 10/1/2020 | 220,000 | 224,774 |
| | Volusia County Educational Facilities Authority (Embry-Riddle Aeronautical University, Inc.), Series B, 5.00% due 10/15/2030 | 1,500,000 | 1,737,255 |
| | Georgia — 1.8% | | |
| | City of Atlanta (Water and Wastewater Capital Improvement Program), Series A, 6.25% due 11/1/2034 (pre-refunded 11/1/2019) | 500,000 | 501,990 |
| | Development Authority of Fulton County (Georgia Tech Athletic Assoc.) ETM, 5.00% due 10/1/2019 | 1,000,000 | 1,000,000 |
| | Main Street Natural Gas, Inc. Series A, 5.00% due 5/15/2037 | 2,640,000 | 3,510,619 |
| | Main Street Natural Gas, Inc. (Georgia Gas), Series A, 5.50% due 9/15/2023 | 350,000 | 398,727 |
| | Guam — 1.1% | | |
| | Government of Guam (Economic Development) GO, Series A, 7.00% due 11/15/2039 (pre-refunded 11/15/2019) | 520,000 | 523,541 |
| | Government of Guam (Layon Solid Waste Disposal Facility), Series A, 5.75% due 12/1/2034 (pre-refunded 12/1/2019) | 500,000 | 503,700 |
| | Guam Power Authority (Electric Power System; Insured: AGM), Series A, 5.00% due 10/1/2027 | 1,000,000 | 1,100,580 |
| | Guam Waterworks Authority (Water and Wastewater System), | | |
| | 5.00% due 7/1/2028 | 500,000 | 549,605 |
| | 5.25% due 7/1/2024 | 500,000 | 557,785 |
| | Hawaii — 0.3% | | |
| d | City and County of Honolulu (Rail Transit Project) GO, 1.90% (MUNIPSA + 0.32%) due 9/1/2028 (put 9/1/2020) | 1,000,000 | 1,000,080 |
| | Illinois — 11.1% | | |
| | Chicago O’Hare International Airport, Series D, 5.25% due 1/1/2033 | 1,500,000 | 1,663,785 |
| | Chicago Park District (Various Capital Projects) GO, Series A, 5.00% due 1/1/2035 | 2,000,000 | 2,191,120 |
| | Chicago Park District GO, Series A, 5.00% due 1/1/2027 | 825,000 | 961,950 |
| | City of Chicago (Chicago O’Hare International Airport), Series C, 5.00% due 1/1/2031 | 500,000 | 594,705 |
| | City of Chicago (Riverwalk Expansion Project; Insured: AGM), 5.00% due 1/1/2031 | 500,000 | 554,265 |
| | City of Chicago (Wastewater Transmission System), Series C, 5.00% due 1/1/2030 | 1,500,000 | 1,707,000 |
| | City of Chicago (Water System Improvements), 5.00% due 11/1/2029 | 200,000 | 217,714 |
| | City of Chicago (Water System; Insured: AGM), Series 2017-2, 5.00% due 11/1/2037 | 1,500,000 | 1,773,030 |
| | City of Chicago GO, Series A, 5.00% due 1/1/2039 | 1,000,000 | 1,139,970 |
| | City of Chicago, 5.00% due 1/1/2022 | 1,195,000 | 1,254,762 |
| | Cook County GO, Series A, 5.25% due 11/15/2033 | 1,000,000 | 1,036,680 |
| | Illinois Finance Authority (Advocate Health Care Network), 5.00% due 8/1/2029 | 2,195,000 | 2,531,076 |
| | Illinois Finance Authority (OSF Healthcare System), 6.00% due 5/15/2039 (pre-refunded 5/15/2020) | 990,000 | 1,018,037 |
| | Illinois Finance Authority (Silver Cross Hospital & Medical Centers), 5.00% due 8/15/2035 | 2,355,000 | 2,682,251 |
| | Illinois Finance Authority (Southern Illinois Healthcare), 5.00% due 3/1/2032 - 3/1/2034 | 700,000 | 827,980 |
| | Illinois State University (Insured: AGM), Series A, 5.00% due 4/1/2021 - 4/1/2036 | 1,915,000 | 2,223,621 |
| | Illinois Toll Highway Authority (Move Illinois Program), Series A, 5.00% due 1/1/2037 | 1,000,000 | 1,159,940 |
| | Kane, Cook, & DuPage Counties School District No. 46 GO, | | |
| | Series A, 5.00% due 1/1/2031 | 2,255,000 | 2,537,687 |
| | Series D, 5.00% due 1/1/2028 | 1,000,000 | 1,128,510 |
| | Metropolitan Water Reclamation District of Greater Chicago (Various Capital Improvement Projects) GO, Series C, 5.25% due 12/1/2032 | 40,000 | 53,043 |
| | State of Illinois, Series B, 5.00% due 6/15/2032 - 6/15/2035 | 4,500,000 | 5,157,245 |
| | Will County School District No. 114 (Educational Facilities; Insured: Natl-Re) GO, Series C, Zero Coupon due 12/1/2023 | 570,000 | 515,787 |
| | Indiana — 1.2% | | |
| | City of Carmel Redevelopment District (Performing Arts Center) COP, Series C, 6.50% due 7/15/2035 (pre-refunded 1/15/2021) | 1,000,000 | 1,064,750 |
| | Indiana Finance Authority (Marian University), 6.375% due 9/15/2041 (pre-refunded 9/15/2021) | 1,000,000 | 1,095,700 |
| c | Indiana Finance Authority (Marion County Capital Improvement Board; SPA Wells Fargo Bank, N.A.), Series A-2-RMKT, 1.75% due 2/1/2037 (put 10/1/2019) | 1,225,000 | 1,225,000 |
| | Kansas — 0.8% | | |
| | Unified Government of Wyandotte County/Kansas City (Utility System Improvement), Series A, 5.00% due 9/1/2031 - 9/1/2032 | 2,000,000 | 2,294,240 |
| | Kentucky — 3.6% | | |
| | County of Owen (Kentucky-American Water Co. Project), Series A, 6.25% due 6/1/2039 | 540,000 | 542,009 |
| | Kentucky Economic (Norton Healthcare, Inc.; Insured: Natl-Re) DFA, Series B, Zero Coupon due 10/1/2021 - 10/1/2022 | 3,365,000 | 3,164,123 |
| | Kentucky Higher Education Student Loan Corp. AMT, Series A-1, 5.00% due 6/1/2028 - 6/1/2029 | 1,250,000 | 1,519,723 |
| a | Kentucky Public Energy Authority (Gas Supply System), Series C-1, 4.00% due 12/1/2049 (put 6/1/2025) | 5,000,000 | 5,530,300 |
| | Louisiana — 2.0% | | |
| | City of New Orleans (Water System Facilities Improvement), 5.00% due 12/1/2034 | 400,000 | 455,280 |
| | Louisiana Energy and Power Authority (LEPA Unit No. 1; Insured: AGM), Series A, 5.25% due 6/1/2038 | 2,000,000 | 2,247,600 |
| | New Orleans Aviation Board (Louis Armstrong New Orleans International Airport CFC Revenue; Insured: AGM), 5.00% due 1/1/2029 | 700,000 | 866,383 |
| a | Parish of St. Charles (Valero Energy Corp. Refinery), 4.00% due 12/1/2040 (put 6/1/2022) | 2,250,000 | 2,371,545 |
Schedule of Investments, Continued
Thornburg Strategic Municipal Income Fund | September 30, 2019
| | | PRINCIPAL
AMOUNT | VALUE |
| | Massachusetts — 0.3% | | |
| | Massachusetts Development Finance Agency (Jordan Hospital and Milton Hospital), Series H-1, 5.00% due 7/1/2032 - 7/1/2033 | $ 555,000 | $ 649,545 |
| | Massachusetts Educational Financing Authority (MEFA Loan Program), Series I, 6.00% due 1/1/2028 | 90,000 | 90,807 |
| | Michigan — 5.6% | | |
| | Board of Governors of Wayne State University (Educational Facilities and Equipment), Series A, 5.00% due 11/15/2033 | 1,250,000 | 1,447,850 |
| | City of Detroit GO, 5.00% due 4/1/2023 - 4/1/2024 | 900,000 | 972,021 |
| | City of Troy (Downtown Development Authority-Community Center Facilities) GO, 5.25% due 11/1/2032 | 1,025,000 | 1,107,656 |
| | County of Genesee (Water Supply System; Insured: BAM) GO, 5.375% due 11/1/2038 | 1,000,000 | 1,127,890 |
| | Detroit City School District (School Building & Site; Insured: AGM Q-SBLF) GO, Series A, 5.25% due 5/1/2027 | 1,000,000 | 1,251,240 |
| | Detroit City School District (School Building & Site; Insured: Q-SBLF) GO, Series A, 5.00% due 5/1/2025 | 1,000,000 | 1,089,600 |
| | Detroit Downtown Development Authority (Catalyst Development Project; Insured: AGM), Series A, 5.00% due 7/1/2024 | 850,000 | 975,273 |
| | Kalamazoo Hospital Finance Authority (Bronson Methodist Hospital), | | |
| | 5.00% due 5/15/2036 | 450,000 | 460,148 |
| | 5.00% due 5/15/2036 (pre-refunded 5/15/2020) | 550,000 | 562,232 |
| | 5.25% due 5/15/2041 | 140,000 | 147,221 |
| | 5.25% due 5/15/2041 (pre-refunded 5/15/2021) | 860,000 | 913,105 |
| | Livonia Public School District (School Building & Site; Insured: AGM) GO, Series I, 5.00% due 5/1/2036 | 225,000 | 252,362 |
| | Michigan Finance Authority (State Dept. of Human Services Office Buildings), Series F, 5.00% due 4/1/2031 | 1,000,000 | 1,066,840 |
| | Michigan Public School Academy (Will Carleton Charter School), 8.00% due 8/1/2035 | 920,000 | 926,716 |
| | Michigan State Hospital Finance Authority (Henry Ford Health System), 5.75% due 11/15/2039 (pre-refunded 11/15/2019) | 1,000,000 | 1,005,240 |
| | Michigan Strategic Fund (Detroit Edison Company; Insured: Natl-IBC, AMBAC), 7.00% due 5/1/2021 | 250,000 | 270,245 |
| | Wayne County Airport Authority (Detroit Metropolitan Wayne County Airport), | | |
| | Series B, | | |
| | 5.00% due 12/1/2031 - 12/1/2033 | 1,475,000 | 1,706,223 |
| f | 5.00% due 12/1/2034 | 1,140,000 | 1,312,721 |
| | Minnesota — 2.0% | | |
| c | City of Minneapolis/St. Paul Housing & Redevelopment Authority (Allina Health Obligated Group; LOC JPMorgan Chase Bank, N.A.), Series B-2, 1.77% due 11/15/2035 (put 10/1/2019) | 1,000,000 | 1,000,000 |
| f | Minnesota Housing Finance Agency (Collateralized: GNMA, FNMA, FHLMC), Series F, 2.55% due 7/1/2039 | 5,000,000 | 4,908,550 |
| | Missouri — 0.7% | | |
| | Platte County, 5.00% due 4/1/2020 | 350,000 | 346,052 |
| | Tax Increment Financing Commission of Kansas City (Union Hill Redevelopment Project), 6.00% due 5/1/2030 | 1,805,000 | 1,842,851 |
| | Nebraska — 1.3% | | |
| a | Central Plains Energy Project, 5.00% due 3/1/2050 (put 1/1/2024) | 1,650,000 | 1,845,129 |
| | Douglas County Health Facilities (Nebraska Methodist Health System), 5.00% due 11/1/2029 - 11/1/2030 | 1,750,000 | 2,054,805 |
| | Nevada — 0.4% | | |
| | Carson City (Carson Tahoe Regional Healthcare), 5.00% due 9/1/2037 | 1,000,000 | 1,176,800 |
| | New Jersey — 3.0% | | |
| | New Jersey (School Facilities Construction) EDA, 5.00% due 3/1/2026 | 1,000,000 | 1,094,920 |
| | New Jersey (School Facilities Construction; Insured: Natl-Re) EDA, Series N-1, 5.50% due 9/1/2027 | 1,000,000 | 1,235,310 |
| | New Jersey Transit Corp. (Federal Transit Administration Section 5307 Urbanized Area Formula Funds), Series A, 5.00% due 9/15/2020 | 1,000,000 | 1,033,170 |
| | New Jersey Transportation Trust Fund Authority (State Transportation System Improvements), | | |
| d | 2.78% (MUNIPSA + 1.20%) due 6/15/2034 (put 12/15/2021) | 1,000,000 | 1,006,090 |
| | 5.00% due 6/15/2027 | 3,000,000 | 3,570,390 |
| | New Jersey Transportation Trust Fund Authority, Series A, 5.00% due 12/15/2034 | 700,000 | 823,004 |
| | New Mexico — 2.0% | | |
| | City of Farmington (Arizona Public Service Co.-Four Corners Project), Series B, 4.70% due 9/1/2024 | 1,000,000 | 1,031,950 |
| | New Mexico Hospital Equipment Loan Council (Haverland Carter Lifestyle Group), 5.00% due 7/1/2032 | 2,525,000 | 2,678,444 |
| a | New Mexico Municipal Energy Acquisition Authority, Series A, 5.00% due 11/1/2039 (put 5/1/2025) | 2,000,000 | 2,331,680 |
| | New York — 10.2% | | |
| | City of New York (City Budget Financial Management) GO, | | |
| | Series G, 5.00% due 8/1/2023 | 3,000,000 | 3,418,140 |
| | Series J, 5.00% due 8/1/2031 | 2,000,000 | 2,324,360 |
| c | City of New York (SPA Landesbank Hessen-Thuringen) GO, Series A-3, 1.78% due 8/1/2035 (put 10/1/2019) | 2,075,000 | 2,075,000 |
| | Metropolitan Transportation Authority (Transit and Commuter System), Series C-1, 5.00% due 9/1/2020 | 5,000,000 | 5,159,600 |
| | Metropolitan Transportation Authority, | | |
| | Series A, 4.00% due 2/3/2020 | 1,000,000 | 1,008,700 |
| | Series D-1, 5.00% due 9/1/2022 | 2,000,000 | 2,190,400 |
| c | New York City Transitional Finance Authority Future Tax Secured Revenue (SPA Barclays Bank plc), Series B3, 1.77% due 11/1/2042 (put 10/1/2019) | 2,800,000 | 2,800,000 |
| c | New York City Transitional Finance Authority Future Tax Secured Revenue (SPA Landesbank Hessen-Thuringen), Series 1-SUB 1D, 1.75% due 11/1/2022 (put 10/1/2019) | 900,000 | 900,000 |
| c | New York City Water & Sewer System (SPA Mizuho Bank, Ltd.), Series AA-6, 1.77% due 6/15/2048 (put 10/1/2019) | 4,100,000 | 4,100,000 |
Schedule of Investments, Continued
Thornburg Strategic Municipal Income Fund | September 30, 2019
| | | PRINCIPAL
AMOUNT | VALUE |
| | Town of Oyster Bay GO, Series B, 3.00% due 2/1/2020 - 3/13/2020 | $6,000,000 | $ 6,030,360 |
| | North Carolina — 3.3% | | |
| c | Charlotte-Mecklenburg Hospital Authority (Carolinas Healthcare System Obligated Group; SPA JP Morgan Chase Bank, N.A), Series C, 1.77% due 1/15/2037 (put 10/1/2019) | 5,600,000 | 5,600,000 |
| | North Carolina Medical Care Commission (Vidant Health), 5.00% due 6/1/2029 | 1,500,000 | 1,773,555 |
| | North Carolina Turnpike Authority, 5.00% due 1/1/2029 - 1/1/2030 | 1,000,000 | 1,245,150 |
| d | University of North Carolina at Chapel Hill, Series A, 1.75% (LIBOR 1 Month + 0.35%) due 12/1/2041 (put 12/1/2021) | 1,000,000 | 1,000,250 |
| | Ohio — 1.1% | | |
| | Akron, Bath and Copley Joint Hospital District (Summa Health), 5.25% due 11/15/2030 | 1,420,000 | 1,721,125 |
| | City of Akron (Community Learning Centers), 5.00% due 12/1/2031 | 625,000 | 679,681 |
| | Cleveland-Cuyahoga County Port Authority (Flats East Development Project; LOC Fifth Third Bank), 7.00% due 5/15/2040 | 905,000 | 956,522 |
| | Pennsylvania — 6.8% | | |
| | Allegheny County (Propel Charter School) IDA, Series A, 6.75% due 8/15/2035 | 875,000 | 904,496 |
| | Bucks County (Waste Management, Inc.) AMT, IDA, 2.75% due 12/1/2022 | 5,000,000 | 5,151,200 |
| | Coatesville Area School District (Insured: AGM) (State Aid Withholding) GO, 5.00% due 8/1/2024 - 8/1/2025 | 1,475,000 | 1,708,017 |
| | Commonwealth Financing Authority, 5.00% due 6/1/2029 | 1,000,000 | 1,245,000 |
| | County of Luzerne (Insured: AGM) GO, Series A, 5.00% due 11/15/2029 | 1,000,000 | 1,178,130 |
| | Montgomery County Higher Education & Health Authority (Thomas Jefferson University Obligated Group), 5.00% due 9/1/2033 | 700,000 | 876,141 |
| | Pennsylvania Turnpike Commission (Highway Improvements), | | |
| | 5.35% due 12/1/2030 (pre-refunded 12/1/2020) | 770,000 | 806,074 |
| | Series C-2, 5.35% due 12/1/2030 (pre-refunded 12/1/2020) | 1,230,000 | 1,287,626 |
| | Pennsylvania Turnpike Commission, Series A-1, 5.00% due 12/1/2037 | 750,000 | 910,440 |
| | Philadelphia (Mast Charter School) IDA, 6.00% due 8/1/2035 (pre-refunded 8/1/2020) | 1,000,000 | 1,037,490 |
| | Philadelphia Authority for Industrial Development (Thomas Jefferson University), 5.00% due 9/1/2035 | 1,500,000 | 1,782,990 |
| | Philadelphia Municipal Authority (Juvenile Justice Services Center), 5.00% due 4/1/2038 | 1,360,000 | 1,613,477 |
| | Pittsburgh Water & Sewer Authority (Insured: AGM), Series B, 5.00% due 9/1/2033 | 1,000,000 | 1,348,920 |
| | School District of Philadelphia (State Aid Witholding) GO, Series A, 5.00% due 9/1/2038 | 100,000 | 120,092 |
| | Rhode Island — 0.2% | | |
| | Pawtucket Housing Authority, | | |
| | 5.50% due 9/1/2022 - 9/1/2024 | 475,000 | 505,319 |
| | 5.50% due 9/1/2022 - 9/1/2024 (pre-refunded 9/1/2020) | 190,000 | 202,620 |
| | South Dakota — 0.4% | | |
| | South Dakota Health & Educational Facilities Authority (Avera Health), Series A, 5.00% due 7/1/2027 | 400,000 | 423,096 |
| | South Dakota Health & Educational Facilities Authority (Sanford Health), 5.50% due 11/1/2040 | 750,000 | 752,183 |
| | Tennessee — 0.9% | | |
| | Shelby County Health, Educational and Housing Facility (Methodist Le Bonheur Healthcare), 5.00% due 5/1/2036 | 1,000,000 | 1,204,670 |
| | Tennessee Energy Acquisition Corp. Series A, 5.25% due 9/1/2024 | 500,000 | 575,885 |
| a | Tennessee Energy Acquisition Corp. (The Gas Project), Series A, 4.00% due 5/1/2048 (put 5/1/2023) | 750,000 | 801,982 |
| | Texas — 10.2% | | |
| | Austin Convention Enterprises, Inc. (Convention Center Hotel First Tier), 5.00% due 1/1/2032 - 1/1/2034 | 1,600,000 | 1,870,027 |
| | City of Dallas (Public Improvements) GO, 5.00% due 2/15/2031 | 1,930,000 | 2,255,533 |
| | City of Houston (Combined Utility System), Series D, 5.00% due 11/15/2028 | 2,500,000 | 2,941,875 |
| | City of Houston (Convention & Entertainment Facilities Department), 5.00% due 9/1/2025 - 9/1/2034 | 2,875,000 | 3,306,097 |
| | City of Houston (Public Improvements) GO, Series A, 5.00% due 3/1/2032 | 3,000,000 | 3,586,260 |
| | City of Texas City Industrial Development Corp. (ARCO Pipe Line Co. Project), 7.375% due 10/1/2020 | 1,165,000 | 1,232,011 |
| | Harris County-Houston Sports Authority, Series A, 5.00% due 11/15/2030 | 2,000,000 | 2,306,860 |
| | Lower Colorado River Authority, | | |
| | Series A, | | |
| | 5.00% due 5/15/2026 | 2,980,000 | 3,250,942 |
| | 5.00% due 5/15/2026 (pre-refunded 5/15/2022) | 20,000 | 21,856 |
| | North Texas Tollway Authority (NTTA System), Series A, 5.00% due 1/1/2034 | 750,000 | 1,020,060 |
| | Red River Authority (Insured: Natl-Re), 4.45% due 6/1/2020 | 2,500,000 | 2,544,800 |
| | San Antonio Energy Acquisition Public Facilities Corp. (Natural Gas Supply Agreement), 5.50% due 8/1/2021 | 40,000 | 42,674 |
| | San Juan Higher Education Finance Authority (IDEA Public Schools), Series A, 6.70% due 8/15/2040 (pre-refunded 8/15/2020) | 1,000,000 | 1,045,620 |
| | State of Texas (Trans), 4.00% due 8/27/2020 | 2,500,000 | 2,559,850 |
| | Texas Public Finance Authority Charter School Finance Corp. (Cosmos Foundation, Inc.), Series A, 6.20% due 2/15/2040 (pre-refunded 2/15/2020) | 1,000,000 | 1,017,260 |
| | Texas Transportation Commission (Central Texas Turnpike System), Series C, 5.00% due 8/15/2034 | 1,000,000 | 1,133,290 |
| | U. S. Virgin Islands — 0.6% | | |
| | Virgin Islands Public Finance Authority (Diageo Project), 6.75% due 10/1/2037 | 1,650,000 | 1,654,224 |
| | Utah — 0.7% | | |
| | Herriman City (Towne Center Access and Utility Improvements), 4.75% due 11/1/2022 (pre-refunded 5/1/2020) | 1,000,000 | 1,020,290 |
Schedule of Investments, Continued
Thornburg Strategic Municipal Income Fund | September 30, 2019
| | | PRINCIPAL
AMOUNT | VALUE |
| | Utah Transit Authority (Integrated Mass Transit System), Series A, 5.00% due 6/15/2033 | $1,000,000 | $ 1,180,410 |
| | Washington — 1.5% | | |
| | Washington Health Care Facilities Authority (Catholic Health Initiatives), Series A, 5.75% due 1/1/2045 | 2,000,000 | 2,264,920 |
| | Washington Health Care Facilities Authority (Overlake Hospital Medical Center), Series A, 5.70% due 7/1/2038 (pre-refunded 7/1/2020) | 1,000,000 | 1,032,740 |
| b,e | Washington State Housing Finance Commission (Presbyterian Retirement Communities Northwest Obligated Group), 5.00% due 1/1/2044 | 1,000,000 | 1,094,040 |
| | West Virginia — 0.9% | | |
| a | West Virginia Economic Development Authority, (Appalachian Power Co.) AMT, Series A, 1.70% due 1/1/2041 (put 9/1/2020) | 1,000,000 | 999,450 |
| a | West Virginia Economic Development Authority, (Appalachian Power Co.), 2.625% due 12/1/2042 (put 6/1/2022) | 1,500,000 | 1,542,540 |
| | Wisconsin — 1.5% | | |
| e,g | Public Finance Authority (Alabama Proton Therapy Center), 6.25% due 10/1/2031 | 1,000,000 | 1,110,520 |
| a | Wisconsin Health & Educational Facilities Authority (Advocate Aurora Health Obligated Group), 5.00% due 8/15/2054 (put 1/29/2025) | 1,250,000 | 1,464,225 |
| | Wisconsin Housing & Economic Development Authority (Collateralized: FNMA), Series C, 2.75% due 9/1/2039 | 2,000,000 | 1,983,360 |
| | Total Investments — 98.5%(Cost $273,848,620) | | $291,284,978 |
| | Other Assets Less Liabilities — 1.5% | | 4,459,324 |
| | Net Assets — 100.0% | | $295,744,302 |
| Footnote Legend |
| a | Variable Rate Demand Obligations are instruments whose interest rates change on a mandatory date (demand date) or whose interest rates will vary with changes in a designated base rate. The rate disclosed is the rate at September 30, 2019. |
| b | When-issued security. |
| c | Variable Rate Demand Notes are instruments whose interest rates change on a specific date (such as coupon date or interest payment date) or whose interest rates vary with changes in a designated base rate (such as the prime interest rate). This instrument is payable on demand and is secured by letters of credit or other credit support agreements from major banks. |
| d | Floating Rate Security. Stated interest/floor rate was in effect at September 30, 2019. |
| e | Securities exempt from registration under Rule 144A of the Securities Act of 1933, as amended. These securities are restricted and may only be resold in the ordinary course of business in transactions exempt from registration, normally to qualified institutional buyers. As of September 30, 2019, the aggregate value of these securities in the Fund’s portfolio was $3,825,520, representing 1.29% of the Fund’s net assets. |
| f | Segregated as collateral for a when-issued security. |
| g | Illiquid security. |
Portfolio Abbreviations
To simplify the listings of securities, abbreviations are used per the table below:
| ABAG | Association of Bay Area Governments |
| ACA | Insured by American Capital Access |
| AGC | Insured by Associated General Contractors |
| AGM | Insured by Assured Guaranty Municipal Corp. |
| AMBAC | Insured by American Municipal Bond Assurance Corp. |
| AMT | Alternative Minimum Tax |
| BAM | Insured by Build America Mutual Insurance Co. |
| COP | Certificates of Participation |
| DFA | Development Finance Authority |
| EDA | Economic Development Authority |
| ETM | Escrowed to Maturity |
| FHLMC | Insured by Federal Home Loan Mortgage Corp. |
| FNMA | Collateralized by Federal National Mortgage Association |
| GNMA | Collateralized by Government National Mortgage Association |
| GO | General Obligation |
| HFA | Health Facilities Authority |
| HFFA | Health Facilities Financing Authority |
| IDA | Industrial Development Authority |
| LIBOR | London Interbank Offered Rates |
| LOC | Letter of Credit |
| Mtg | Mortgage |
| MUNIPSA | Securities Industry and Financial Markets Association (SIFMA) Municipal Swap Index |
| Natl-IBC | Insured by National Public Finance Gurantee Corp. and IBC Bank |
| Natl-Re | Insured by National Public Finance Guarantee Corp. |
| Q-SBLF | Insured by Qualified School Bond Loan Fund |
| SPA | Stand-by Purchase Agreement |
| USD | Unified School District |
See notes to financial statements.
Statement of Assets and Liabilities
Thornburg Strategic Municipal Income Fund | September 30, 2019
| ASSETS | |
| Investments at value (cost $273,848,620) (Note 3) | $ 291,284,978 |
| Cash | 403,015 |
| Receivable for investments sold | 4,505,353 |
| Receivable for fund shares sold | 1,632,244 |
| Interest receivable | 3,255,625 |
| Prepaid expenses and other assets | 39,291 |
| Total Assets | 301,120,506 |
| Liabilities | |
| Payable for investments purchased | 4,741,540 |
| Payable for fund shares redeemed | 337,236 |
| Payable to investment advisor and other affiliates (Note 4) | 176,785 |
| Accounts payable and accrued expenses | 98,350 |
| Dividends payable | 22,293 |
| Total Liabilities | 5,376,204 |
| Net Assets | $ 295,744,302 |
| NET ASSETS CONSIST OF | |
| Distributable earnings | $ 16,556,566 |
| Net capital paid in on shares of beneficial interest | 279,187,736 |
| | $ 295,744,302 |
| NET ASSET VALUE | |
| Class A Shares: | |
Net asset value and redemption price per share
($56,123,834 applicable to 3,663,251 shares of beneficial interest outstanding - Note 5) | $ 15.32 |
| Maximum sales charge, 2.00% of offering price | 0.31 |
| Maximum offering price per share | $ 15.63 |
| Class C Shares: | |
Net asset value and offering price per share*
($20,085,388 applicable to 1,309,660 shares of beneficial interest outstanding - Note 5) | $ 15.34 |
| Class I Shares: | |
Net asset value, offering and redemption price per share
($219,535,080 applicable to 14,316,625 shares of beneficial interest outstanding - Note 5) | $ 15.33 |
| * | Redemption price per share is equal to net asset value less any applicable contingent deferred sales charge. |
See notes to financial statements.
Statement of Operations
Thornburg Strategic Municipal Income Fund | Year Ended September 30, 2019
| INVESTMENT INCOME | |
| Interest income (net of premium amortized of $2,119,889) | $ 9,846,919 |
| EXPENSES | |
| Investment advisory fees (Note 4) | 2,057,474 |
| Administration fees (Note 4) | |
| Class A Shares | 47,249 |
| Class C Shares | 19,653 |
| Class I Shares | 174,032 |
| Distribution and service fees (Note 4) | |
| Class A Shares | 134,479 |
| Class C Shares | 134,281 |
| Transfer agent fees | |
| Class A Shares | 49,494 |
| Class C Shares | 20,127 |
| Class I Shares | 154,290 |
| Registration and filing fees | |
| Class A Shares | 15,259 |
| Class C Shares | 14,587 |
| Class I Shares | 18,032 |
| Custodian fees | 41,957 |
| Professional fees | 49,124 |
| Trustee and officer fees (Note 4) | 15,280 |
| Other expenses | 38,819 |
| Total Expenses | 2,984,137 |
| Less: | |
| Expenses reimbursed by investment advisor (Note 4) | (160,104) |
| Investment advisory fees waived by investment advisor (Note 4) | (411,495) |
| Net Expenses | 2,412,538 |
| Net Investment Income | $ 7,434,381 |
| REALIZED AND UNREALIZED GAIN (LOSS) | |
| Net realized gain (loss) on investments | (38,431) |
| Net change in unrealized appreciation (depreciation) on investments | 9,029,130 |
| Net Realized and Unrealized Gain | 8,990,699 |
| Net Increase in Net Assets Resulting from Operations | $ 16,425,080 |
See notes to financial statements.
Statements of Changes in Net Assets
Thornburg Strategic Municipal Income Fund
| | Year Ended
September 30, 2019 | Year Ended
September 30, 2018 |
| INCREASE (DECREASE) IN NET ASSETS FROM | | |
| OPERATIONS | | |
| Net investment income | $ 7,434,381 | $ 6,904,272 |
| Net realized gain (loss) on investments | (38,431) | 565,924 |
| Net change in unrealized appreciation (depreciation) on investments | 9,029,130 | (6,324,250) |
| Net Increase in Net Assets Resulting from Operations | 16,425,080 | 1,145,946 |
| DIVIDENDS TO SHAREHOLDERS | | |
| From distributable earnings | | |
| Class A Shares | (1,394,124) | (1,457,674) |
| Class C Shares | (475,727) | (591,918) |
| Class I Shares | (5,564,530) | (4,854,680) |
| FUND SHARE TRANSACTIONS (NOTE 5) | | |
| Class A Shares | 643,486 | (6,585,158) |
| Class C Shares | (5,595,820) | (7,341,022) |
| Class I Shares | 27,507,142 | 14,540,613 |
| Net Increase (Decrease) in Net Assets | 31,545,507 | (5,143,893) |
| NET ASSETS | | |
| Beginning of Year | 264,198,795 | 269,342,688 |
| End of Year | $ 295,744,302 | $ 264,198,795 |
See notes to financial statements.
Notes to Financial Statements
Thornburg Strategic Municipal Income Fund | September 30, 2019
NOTE 1 – ORGANIZATION
Thornburg Strategic Municipal Income Fund (the “Fund”) is a diversified series of Thornburg Investment Trust (the “Trust”). The Trust was organized as a Massachusetts business trust under a Declaration of Trust dated June 3, 1987 and is registered as a diversified, open-end management investment company under the Investment Company Act of 1940, as amended (the "1940 Act"). The Fund is currently one of twenty-two separate series of the Trust. Each series is considered to be a separate entity for financial reporting and tax purposes and bears expenses directly attributable to it. The Fund’s primary investment objective is to seek a high level of current income exempt from federal individual income tax.
The Fund currently offers three classes of shares of beneficial interest: Class A, Class C, and Institutional Class (“Class I”). Each class of shares of the Fund represents an interest in the same portfolio of investments, except that (i) Class A shares are sold subject to a front-end sales charge collected at the time the shares are purchased and bear a service fee, (ii) Class C shares are sold at net asset value without a sales charge at the time of purchase, but are subject to a contingent deferred sales charge upon redemption within one year of purchase, and bear both a service fee and a distribution fee, (iii) Class I shares are sold at net asset value without a sales charge at the time of purchase and may be subject to a service fee, and (iv) the respective classes may have different reinvestment privileges and conversion rights. Additionally, the Fund may allocate among its classes certain expenses, to the extent allocable to specific classes, including administration fees, transfer agent fees, government registration fees, certain printing and postage costs, and administrative and legal expenses. Currently, class specific expenses of the Fund are limited to service and distribution fees and certain registration and transfer agent expenses.
The following is a summary of significant accounting policies followed by the Fund in the preparation of its financial statements. The Fund prepares its financial statements in conformity with United States generally accepted accounting principles (“GAAP”), including investment company accounting and reporting guidance in the Financial Accounting Standards Board (the “FASB”) Accounting Standard Codification Topic 946.
NOTE 2 – SIGNIFICANT ACCOUNTING POLICIES
Security Valuation: All investments in securities held by the Fund are valued as described in Note 3.
Allocation of Income, Gains, Losses and Expenses: Net investment income (other than class specific expenses) and realized and unrealized gains and losses are allocated daily to each class of shares based upon the relative net asset value of outstanding shares (or the value of the dividend-eligible shares, as appropriate) of each class of shares at the beginning of the day (after adjusting for the current capital shares activity of the respective class). Expenses common to all Funds are allocated among the Funds comprising the Trust based upon their relative net asset values or other appropriate allocation methods. Operating expenses directly attributable to a specific class are charged against the operating income of that class.
Dividends and Distributions to Shareholders: Dividends and distributions to shareholders, which are determined in accordance with federal income tax regulations and may differ from GAAP, are recorded on the ex-dividend date. Ordinary income dividends, if any, are declared daily and paid monthly. Capital gain distributions, if any, are declared and paid annually and more often if deemed necessary by Thornburg Investment Management, Inc., the Trust’s investment advisor (the “Advisor”). Dividends and distributions are paid and are reinvested in additional shares of the Fund at net asset value per share at the close of business on the ex-dividend date, or at the shareholder’s option, paid in cash.
Investment Income: Interest income is accrued as earned. Premiums and discounts are amortized and accreted, respectively, to first call dates or maturity dates using the effective yield method of the respective investments. These amounts are included in Investment Income in the Statement of Operations.
Investment Transactions: Investment transactions are accounted for on a trade date basis. Realized gains and losses from the sale of investments are recorded on an identified cost basis.
When-Issued and Delayed Delivery Transactions: The Fund may engage in when-issued or delayed delivery transactions. To the extent the Fund engages in such transactions, it will do so for the purpose of acquiring portfolio investments consistent with the Fund’s investment objectives and not for the purpose of investment leverage or to speculate on interest rate or market changes. At the time the Fund makes a commitment to purchase an investment on a when-issued or delayed delivery basis, the Fund will record the transaction and reflect the value in determining its net asset value. When effecting such transactions, assets of an amount sufficient to make payment for the portfolio investments to be purchased will be segregated on the Fund’s records on the trade date. Investments purchased on a when-issued or delayed delivery basis do not earn interest until the settlement date. The values of these securities held at September 30, 2019 are detailed in the Schedule of Investments.
Notes to Financial Statements, Continued
Thornburg Strategic Municipal Income Fund | September 30, 2019
Guarantees and Indemnifications: Under the Trust’s organizational documents (and under separate agreements with the independent Trustees), its officers and Trustees are provided with an indemnification against certain liabilities arising out of the performance of their duties to the Fund. In the normal course of business the Trust may also enter into contracts with service providers that contain general indemnifications. The Trust’s maximum exposure under these arrangements is unknown. However, based on experience, the Trust expects the risk of loss to be remote.
Use of Estimates: The preparation of financial statements in conformity with GAAP requires management to make estimates and assumptions that affect the reported amounts of assets and liabilities and disclosure of contingent assets and liabilities at the date of the financial statements and the reported amounts of increases (decreases) in net assets from operations during the reporting period. Actual results could differ from those estimates.
Federal Income Taxes: It is the policy of the Trust to comply with the provisions of the Internal Revenue Code applicable to regulated investment companies and to distribute to shareholders substantially all investment company taxable income including net realized gains on investments (if any), and tax exempt income of the Fund. Therefore, no provision for federal income or excise tax is required.
The Fund files income tax returns in United States federal and applicable state jurisdictions. The statute of limitations on the Fund’s tax return filings generally remains open for the three years following a return’s filing date. The Fund has analyzed each uncertain tax position believed to be material in the preparation of the Fund’s financial statements for the fiscal year ended September 30, 2019, including open tax years, to assess whether it is more likely than not that the position would be sustained upon examination, based on the technical merits of the position. The Fund has not identified any such position for which an asset or liability must be reflected in the Statement of Assets and Liabilities.
At September 30, 2019, information on the tax components of capital was as follows:
| Cost of investments for tax purposes | $ 273,848,621 |
| Gross unrealized appreciation on a tax basis | 17,568,588 |
| Gross unrealized depreciation on a tax basis | (132,231) |
| Net unrealized appreciation (depreciation) on investments (tax basis) | $ 17,436,357 |
At September 30, 2019, the Fund had deferred tax basis capital losses occurring subsequent to October 31, 2018 through September 30, 2019 of $246,733. For tax purposes, such losses will be recognized in the year ending September 30, 2020.
At September 30, 2019, the Fund had cumulative tax basis capital losses of $636,169 (of which $636,169 are short-term and $0 are long-term), which may be carried forward to offset future capital gains. To the extent such carryforwards are used, capital gain distributions may be reduced to the extent provided by regulations. Such capital loss carryforwards do not expire.
At September 30, 2019, the Fund had $25,404 of undistributed net tax-exempt income, no undistributed tax basis net ordinary income and no undistributed tax basis capital gains.
Distributions from tax exempt income paid by the Fund for the year ended September 30, 2019 and September 30, 2018 are excludable by shareholders from gross income for Federal income tax purposes.
The tax character of distributions paid during the year ended September 30, 2019, and September 30, 2018, was as follows:
| | 2019 | 2018 |
| Distributions from: | | |
| Tax exempt income | $ 7,354,552 | $ 6,823,980 |
| Ordinary income | 79,829 | 80,292 |
| Total | $ 7,434,381 | $ 6,904,272 |
NOTE 3 – SECURITY VALUATION
Valuation of the Fund’s portfolio investment securities is performed in accordance with policies and procedures adopted by and under the oversight of the Trustees.
The Trustees of the Trust have appointed the Advisor to assist the Trustees with obtaining fair market values for portfolio investments, evaluating and monitoring professional pricing service providers appointed by the Trustees’ Audit Committee (the “Audit Committee”) to assist in determining fair values for portfolio investments, assisting in calculating fair values for portfolio investments in certain
Notes to Financial Statements, Continued
Thornburg Strategic Municipal Income Fund | September 30, 2019
circumstances, and performing other functions in connection with the valuation of investments. The Advisor acts through its Valuation and Pricing Committee (the “Committee”) and other employees of the Advisor. The Committee regularly reviews its own valuation calculations, reviews the valuations, valuation techniques and services furnished by pricing service providers, considers circumstances which may require valuation calculations by the Committee, and reviews previous valuation calculations. The Committee reports to the Audit Committee on the Committee’s activities, the performance of pricing service providers, and other matters relating to valuation of portfolio investments.
In those instances when the Committee assists in calculating a fair value for a portfolio investment, the Committee seeks to determine the price that the Fund would reasonably expect to receive upon a sale of the investment in an orderly transaction between market participants on the valuation date. The Committee customarily utilizes quotations from securities broker dealers in calculating valuations, but also may utilize prices obtained from pricing service providers or other methods approved by the Audit Committee. Because fair values calculated by the Committee are estimates, the calculation of a value for an investment may differ from the price that would be realized by the Fund upon a sale of the investment, and the difference could be material to the Fund’s financial statements. The Committee’s calculation of a fair value for an investment may also differ from the prices obtained by other persons (including other mutual funds) for the investment.
Valuation of Securities: Debt obligations held by the Fund which are not listed or traded on exchanges or for which no reported market exists are ordinarily valued at the valuation obtained from a pricing service provider approved by the Audit Committee.
In any case when a pricing service provider fails to provide a valuation for a debt obligation held by the Fund, the Committee calculates a fair value for the obligation using alternative methods under procedures approved by the Audit Committee. Additionally, in cases when management believes that a valuation obtained from a pricing service provider is stale, does not reflect material factors affecting the valuation of the investment, is significantly different than the value the Fund is likely to obtain if it sought a bid for the investment, or is otherwise unreliable, the Committee calculates a fair value for the obligation using an alternative method approved by the Audit Committee.
Valuation Hierarchy: The Fund categorizes its investments based upon the inputs used in valuing those investments, according to a three-level hierarchy established in guidance from the FASB. Categorization of investments using this hierarchy is intended by the FASB to maximize the use of observable inputs in valuing investments and minimize the use of unobservable inputs by requiring that the most observable inputs be used when available. Observable inputs are those that market participants would use in valuing an investment based on available market information. Unobservable inputs are those that reflect assumptions about the information market participants would use in valuing an investment. An investment’s level within the hierarchy is based on the lowest level input that is deemed significant to the valuation. The methodologies and inputs used to value investments are not necessarily indications of the risk or liquidity associated with those investments.
Various inputs are used in calculating valuations for the Fund’s investments. These inputs are generally summarized according to the three-level hierarchy below:
Level 1: Quoted prices in active markets for identical investments.
Level 2: Other direct or indirect significant observable inputs (including quoted prices for similar investments in active markets and other observable inputs, such as interest rates, prepayment rates, credit ratings, etc.).
Level 3: Significant unobservable inputs (including the Committee’s own assumptions in calculating the fair values of investments).
Valuations for debt obligations held by the Fund are typically calculated by pricing service providers approved by the Audit Committee and are generally characterized as Level 2 within the valuation hierarchy.
In a limited number of cases the Committee calculates a fair value for investments using broker quotations or other methods approved by the Audit Committee. When the Committee uses a single broker quotation to calculate a fair value for an investment without other significant observable inputs, or if a fair value is calculated using other significant inputs that are considered unobservable, the investment is characterized as Level 3 within the hierarchy. Other significant unobservable inputs used to calculate a fair value in these instances might include an income-based valuation approach which considers discounted anticipated future cash flows from the investment and application of discounts due to the nature or duration of any restrictions on the disposition of the investment.
Valuations based upon the use of inputs from Levels 1, 2 or 3 may not represent the actual price received upon the disposition of an investment, and a Fund may receive a price that is lower than the valuation based upon these inputs when it sells the investment.
Notes to Financial Statements, Continued
Thornburg Strategic Municipal Income Fund | September 30, 2019
The following table displays a summary of the fair value hierarchy measurements of the Fund’s investments as of September 30, 2019:
| | Fair Value Measurements at September 30, 2019 |
| | TOTAL | LEVEL 1 | LEVEL 2 | LEVEL 3 |
| Assets | | | | |
| Investments in Securities | | | | |
| Municipal Bonds | $ 291,284,978 | $ — | $ 291,284,978 | $ — |
| Total Investments in Securities | $291,284,978 | $— | $291,284,978 | $— |
| Total Assets | $291,284,978 | $— | $291,284,978 | $— |
NOTE 4 – INVESTMENT ADVISORY FEE AND OTHER TRANSACTIONS WITH AFFILIATES
Pursuant to an investment advisory agreement, the Advisor serves as the investment advisor and performs services for the Fund for which the fees are payable at the end of each month. Under the investment advisory agreement, the Fund pays the Advisor a management fee based on the average daily net assets of the Fund at an annual rate as shown in the following table:
| Management Fee Schedule |
| DAILY NET ASSETS | FEE RATE |
| Up to $500 million | 0.750% |
| Next $500 million | 0.675 |
| Next $500 million | 0.625 |
| Next $500 million | 0.575 |
| Over $2 billion | 0.500 |
The Fund’s effective management fee for the year ended September 30, 2019 was 0.75% of the Fund’s average daily net assets (before applicable management fee waiver of $411,495). Total management fees incurred by the Fund for the year ended September 30, 2019 are set forth in the Statement of Operations.
The Trust has entered into an administrative services agreement with the Advisor, whereby the Advisor will perform certain administrative services related to each class of the Fund’s shares. The fees are computed as an annual percentage of the aggregate average daily net assets of all shares classes of all Funds in the Trust as follows:
| Administration Fee Schedule |
| Daily Net Assets | Fee Rate |
| Up to $20 billion | 0.100% |
| $20 billion to $40 billion | 0.075 |
| $40 billion to $60 billion | 0.040 |
| Over $60 billion | 0.030 |
The aggregate fee amount is allocated on a daily basis to each Fund based on net assets and subsequently allocated to each class of shares of the Fund. Total administrative service fees incurred by each class of shares of the Fund for the year ended September 30, 2019, are set forth in the Statement of Operations.
The Trust has an underwriting agreement with Thornburg Securities Corporation (the “Distributor”), an affiliate of the Advisor, which acts as the distributor of the Fund’s shares. For the year ended September 30, 2019, the Distributor has advised the Fund that it earned net commissions aggregating $552 from the sale of Class A shares, and collected contingent deferred sales charges aggregating $633 from redemptions of Class C shares of the Fund.
Pursuant to a service plan under Rule 12b-1 of the 1940 Act, the Fund may pay to the Distributor or securities dealers and other financial institutions at the Distributor’s direction an amount not to exceed .25 of 1% per annum of the average daily net assets attributable to Class A and Class C shares of the Fund to obtain various shareholder and distribution related services. For the year ended September 30, 2019, there were no 12b-1 service plan fees charged for Class I shares. The Advisor and Distributor each may pay out of its own resources additional expenses for distribution of the Fund’s shares and shareholder services.
Notes to Financial Statements, Continued
Thornburg Strategic Municipal Income Fund | September 30, 2019
The Trust has also adopted a distribution plan pursuant to Rule 12b-1, applicable only to the Fund’s Class C shares, under which the Fund compensates the Distributor for services in promoting the sale of Class C shares of the Fund at an annual rate of up to .35 of 1% per annum of the average daily net assets attributable to Class C shares.
Total fees incurred by each class of shares of the Fund under their respective service and distribution plans for the year ended September 30, 2019, are set forth in the Statement of Operations.
The Advisor has contractually agreed to waive fees and reimburse expenses incurred by the Fund so that actual expenses of certain share classes do not exceed levels as specified in each Fund’s most recent prospectus (Class A shares, 1.00%; Class C shares, 1.47%; Class I shares, 0.78%). The agreement may be terminated by the Fund at any time, but may not be terminated by the Advisor before February 1, 2020, unless the Advisor ceases to be the investment advisor to the Fund prior to that date. The Advisor may recoup amounts waived or reimbursed during the fiscal year ended September 30, 2019 if, during that year, expenses fall below the contractual limit that was in place at the time those fees and expenses were waived or reimbursed. The Advisor will not recoup fees or expenses as described in the preceding sentence if that recoupment would cause the Fund’s total annual operating expenses (after the recoupment is taken into account) to exceed the lesser of: (a) the expense cap that was in place at the time the waiver or reimbursement occurred; or (b) the expense cap that is in place at the time of the recoupment.
For the year ended September 30, 2019, the Advisor contractually waived Fund level investment advisory fees of $411,495. The Advisor contractually reimbursed certain class specific expenses and distribution fees of $59,858 for Class A shares, $5,821 for Class C shares, and $94,425 for Class I shares.
Certain officers and Trustees of the Trust are also officers or directors of the Advisor and Distributor. The compensation of the independent Trustees is borne by the Trust. The Trust also pays a portion of the Chief Compliance Officer’s compensation. These amounts are reflected as Trustee and officer fees in the Statement of Operations.
The percentage of direct investments in the Fund held by the Trustees, officers of the Trust, and the Advisor is approximately 8.44%.
The Fund may purchase or sell securities from or to an affiliated fund, provided the affiliation is due solely to having a common investment advisor, common officers, or common trustees, and provided that all such transactions will comply with Rule 17a-7 under the 1940 Act. For the year ended September 30, 2019, the Fund had transactions with affiliated funds of $6,245,000 in purchases and $16,724,676 in sales generating realized losses of $8,358.
NOTE 5 – SHARES OF BENEFICIAL INTEREST
At September 30, 2019, there were an unlimited number of shares with no par value of beneficial interest authorized. Transactions in shares of beneficial interest were as follows:
| | YEAR ENDED
September 30, 2019 | YEAR ENDED
September 30, 2018 |
| | SHARES | AMOUNT | SHARES | AMOUNT |
| Class A Shares | | | | |
| Shares sold | 1,105,890 | $ 16,584,191 | 807,030 | $ 12,094,444 |
Shares issued to shareholders in
reinvestment of dividends | 91,356 | 1,376,932 | 96,102 | 1,437,053 |
| Shares repurchased | (1,156,578) | (17,317,637) | (1,343,468) | (20,116,655) |
| Net increase (decrease) | 40,668 | $ 643,486 | (440,336) | $ (6,585,158) |
| Class C Shares | | | | |
| Shares sold | 168,343 | $ 2,526,426 | 197,098 | $ 2,958,861 |
Shares issued to shareholders in
reinvestment of dividends | 29,512 | 444,738 | 36,988 | 553,863 |
| Shares repurchased | (569,863) | (8,566,984) | (724,556) | (10,853,746) |
| Net decrease | (372,008) | $ (5,595,820) | (490,470) | $ (7,341,022) |
Notes to Financial Statements, Continued
Thornburg Strategic Municipal Income Fund | September 30, 2019
| | YEAR ENDED
September 30, 2019 | YEAR ENDED
September 30, 2018 |
| | SHARES | AMOUNT | SHARES | AMOUNT |
| Class I Shares | | | | |
| Shares sold | 5,083,758 | $ 76,479,655 | 3,992,645 | $ 59,838,166 |
Shares issued to shareholders in
reinvestment of dividends | 358,400 | 5,409,565 | 308,845 | 4,621,743 |
| Shares repurchased | (3,633,064) | (54,382,078) | (3,332,449) | (49,919,296) |
| Net increase | 1,809,094 | $ 27,507,142 | 969,041 | $ 14,540,613 |
NOTE 6 – INVESTMENT TRANSACTIONS
For the year ended September 30, 2019, the Fund had purchase and sale transactions of investments (excluding short-term investments) of $75,190,570 and $50,273,809, respectively.
NOTE 7 – RECENT ACCOUNTING PRONOUNCEMENTS
In August 2018, the FASB issued ASU 2018-13, Fair Value Measurement (Topic 820): Changes to the Disclosure Requirements for Fair Value Measurement, which adds, removes, and modifies certain aspects of the fair value disclosure. ASU 2018-13 is effective for annual periods beginning after December 15, 2019, and early adoption is permitted. The Funds have elected to early adopt, and had applied ASU 2018-13 for the fiscal year ended September 30, 2019. The adoption of this accounting guidance did not have a material impact on the Funds’ financial statements.
In March 2017, the FASB issued Accounting Standards Update (ASU) 2017-08, Premium Amortization of Purchased Callable Debt Securities. The amendments in the ASU shorten the premium amortization period on a purchased callable debt security from the security’s contractual life to the earliest call date. It is anticipated that this change will enhance disclosures by reducing losses recognized when a security is called on an earlier date. This ASU is effective for fiscal years beginning after December 15, 2018. Management has evaluated the implications of these changes and the amendments will have no material effect on the Funds’ net assets or results of operations.
OTHER NOTES
Risks: The Fund’s investments subject it to risks including, but not limited to, management risk, interest rate risk, credit risk, high yield risk, market and economic risk, liquidity risk, and derivatives risk. Please see the Fund’s prospectus for a discussion of the risks associated with an investment in the Fund.
Subsequent Events: Fund management believes no events have occurred between September 30, 2019 and the date of issuance of the financial statements that require adjustment to or disclosure in the accompanying financial statements.
Financial Highlights
Thornburg Strategic Municipal Income Fund
| | PER SHARE PERFORMANCE (FOR A SHARE OUTSTANDING THROUGHOUT THE YEAR) |
UNLESS OTHERWISE
NOTED, PERIODS ARE
FISCAL YEARS ENDED
SEPTEMBER 30, | Net Asset
Value,
Beginning of
YEAR | Net
Investment
Income
(Loss)+ | Net Realized &
Unrealized Gain
(Loss) on
Investments | Total from
Investment
Operations | Dividends
from Net
Investment
Income | Dividends
from Net
Realized
Gains | Total
Dividends | Net Asset
Value,
End of YEAR |
| CLASS A SHARES(b) |
| 2019 | $ 14.82 | 0.39 | 0.50 | 0.89 | (0.39) | — | (0.39) | $ 15.32 |
| 2018 | $ 15.14 | 0.37 | (0.32) | 0.05 | (0.37) | — | (0.37) | $ 14.82 |
| 2017 | $ 15.53 | 0.35 | (0.39) | (0.04) | (0.35) | — | (0.35) | $ 15.14 |
| 2016 | $ 15.16 | 0.33 | 0.37 | 0.70 | (0.33) | — | (0.33) | $ 15.53 |
| 2015 | $ 15.19 | 0.35 | (0.02) | 0.33 | (0.35) | (0.01) | (0.36) | $ 15.16 |
| CLASS C SHARES |
| 2019 | $ 14.84 | 0.32 | 0.50 | 0.82 | (0.32) | — | (0.32) | $ 15.34 |
| 2018 | $ 15.16 | 0.30 | (0.32) | (0.02) | (0.30) | — | (0.30) | $ 14.84 |
| 2017 | $ 15.54 | 0.28 | (0.38) | (0.10) | (0.28) | — | (0.28) | $ 15.16 |
| 2016 | $ 15.17 | 0.28 | 0.37 | 0.65 | (0.28) | — | (0.28) | $ 15.54 |
| 2015 | $ 15.20 | 0.30 | (0.02) | 0.28 | (0.30) | (0.01) | (0.31) | $ 15.17 |
| CLASS I SHARES |
| 2019 | $ 14.84 | 0.42 | 0.49 | 0.91 | (0.42) | — | (0.42) | $ 15.33 |
| 2018 | $ 15.16 | 0.41 | (0.32) | 0.09 | (0.41) | — | (0.41) | $ 14.84 |
| 2017 | $ 15.54 | 0.39 | (0.38) | 0.01 | (0.39) | — | (0.39) | $ 15.16 |
| 2016 | $ 15.17 | 0.38 | 0.37 | 0.75 | (0.38) | — | (0.38) | $ 15.54 |
| 2015 | $ 15.20 | 0.39 | (0.01) | 0.38 | (0.40) | (0.01) | (0.41) | $ 15.17 |
| (a) | Not annualized for periods less than one year. |
| (b) | Sales loads are not reflected in computing total return. |
| + | Based on weighted average shares outstanding. |
See notes to financial statements.
Financial Highlights, Continued
Thornburg Strategic Municipal Income Fund
| RATIOS TO AVERAGE NET ASSETS | | SUPPLEMENTAL DATA |
Net Investment
Income (Loss) (%) | Expenses, After
Expense
Reductions (%) | Expenses,
Before Expense
Reductions (%) | | Total
Return (%)(a) | Portfolio
Turnover
Rate (%)(a) | Net Assets
at End of YEAR
(Thousands) |
| |
| 2.59 | 1.00 | 1.26 | | 6.08 | 20.04 | $ 56,124 |
| 2.49 | 1.00 | 1.28 | | 0.36 | 21.06 | $ 53,693 |
| 2.30 | 1.09 | 1.30 | | (0.23) | 27.35 | $ 61,525 |
| 2.11 | 1.25 | 1.29 | | 4.63 | 11.24 | $ 79,058 |
| 2.28 | 1.25 | 1.31 | | 2.18 | 12.13 | $ 66,722 |
| |
| 2.13 | 1.47 | 1.65 | | 5.58 | 20.04 | $ 20,085 |
| 2.01 | 1.48 | 1.64 | | (0.12) | 21.06 | $ 24,951 |
| 1.88 | 1.52 | 1.66 | | (0.59) | 27.35 | $ 32,926 |
| 1.80 | 1.55 | 1.66 | | 4.32 | 11.24 | $ 38,773 |
| 1.98 | 1.55 | 1.70 | | 1.87 | 12.13 | $ 29,073 |
| |
| 2.81 | 0.78 | 0.98 | | 6.24 | 20.04 | $ 219,535 |
| 2.72 | 0.78 | 0.96 | | 0.59 | 21.06 | $ 185,555 |
| 2.56 | 0.83 | 0.94 | | 0.09 | 27.35 | $ 174,892 |
| 2.42 | 0.93 | 0.93 | | 4.96 | 11.24 | $ 190,658 |
| 2.60 | 0.93 | 0.93 | | 2.50 | 12.13 | $ 151,992 |
Report of Independent Registered Public Accounting Firm
Thornburg Strategic Municipal Income Fund
To the Board of Trustees of Thornburg Investment Trust and Shareholders of
Thornburg Strategic Municipal Income Fund
Opinion on the Financial Statements
We have audited the accompanying statement of assets and liabilities, including the schedule of investments, of Thornburg Strategic Municipal Income Fund (one of the funds constituting Thornburg Investment Trust, referred to hereafter as the "Fund") as of September 30, 2019, the related statement of operations for the year ended September 30, 2019, the statements of changes in net assets for each of the two years in the period ended September 30, 2019, including the related notes, and the financial highlights for each of the five years in the period ended September 30, 2019 (collectively referred to as the “financial statements”). In our opinion, the financial statements present fairly, in all material respects, the financial position of the Fund as of September 30, 2019, the results of its operations for the year then ended, the changes in its net assets for each of the two years in the period ended September 30, 2019 and the financial highlights for each of the five years in the period ended September 30, 2019 in conformity with accounting principles generally accepted in the United States of America.
Basis for Opinion
These financial statements are the responsibility of the Fund’s management. Our responsibility is to express an opinion on the Fund’s financial statements based on our audits. We are a public accounting firm registered with the Public Company Accounting Oversight Board (United States) (PCAOB) and are required to be independent with respect to the Fund in accordance with the U.S. federal securities laws and the applicable rules and regulations of the Securities and Exchange Commission and the PCAOB.
We conducted our audits of these financial statements in accordance with the standards of the PCAOB. Those standards require that we plan and perform the audit to obtain reasonable assurance about whether the financial statements are free of material misstatement, whether due to error or fraud.
Our audits included performing procedures to assess the risks of material misstatement of the financial statements, whether due to error or fraud, and performing procedures that respond to those risks. Such procedures included examining, on a test basis, evidence regarding the amounts and disclosures in the financial statements. Our audits also included evaluating the accounting principles used and significant estimates made by management, as well as evaluating the overall presentation of the financial statements. Our procedures included confirmation of securities owned as of September 30, 2019 by correspondence with the custodian and brokers. We believe that our audits provide a reasonable basis for our opinion.
/s/PricewaterhouseCoopers LLP
New York, New York
November 22, 2019
We have served as the auditor of one or more investment companies in Thornburg Investment Trust since 1999.
Expense Example
Thornburg Strategic Municipal Income Fund | September 30, 2019 (Unaudited)
As a shareholder of the Fund, you incur two types of costs:
| (1) | transaction costs, including |
| (a) | sales charges (loads) on purchase payments, for Class A shares; |
| (b) | a deferred sales charge on redemptions of any part or all of a purchase of $1 million of Class A shares within 12 months of purchase; |
| (c) | a deferred sales charge on redemptions of Class C shares within 12 months of purchase; |
| (2) | ongoing costs, including management fees; distribution and/or service (12b-1) fees; and other Fund expenses. |
This example is intended to help you understand your ongoing costs (in dollars) of investing in the Fund and to compare these costs with the ongoing costs of investing in other mutual funds.
The example is based on a $1,000 investment beginning on April 1, 2019, and held until September 30, 2019.
| | BEGINNING
ACCOUNT VALUE
4/1/19 | ENDING
ACCOUNT VALUE
9/30/19 | EXPENSES PAID
DURING PERIOD†
4/1/19—9/30/19 |
| CLASS A SHARES |
| Actual | $1,000.00 | $1,029.57 | $5.09 |
| Hypothetical* | $1,000.00 | $1,020.05 | $5.06 |
| CLASS C SHARES |
| Actual | $1,000.00 | $1,027.81 | $7.47 |
| Hypothetical* | $1,000.00 | $1,017.70 | $7.44 |
| CLASS I SHARES |
| Actual | $1,000.00 | $1,030.70 | $3.97 |
| Hypothetical* | $1,000.00 | $1,021.16 | $3.95 |
| † | Expenses are equal to the annualized expense ratio for each class (A: 1.00%; C: 1.47%; I: 0.78%) multiplied by the average account value over the period, multiplied by 183/365 to reflect the one-half year period. |
| * | Hypothetical assumes a rate of return of 5% per year before expenses. |
ACTUAL EXPENSES
For each class of shares, the first line of the accompanying table provides information about actual account values and actual expenses. You may use the information in this line, together with the amount you invested, to estimate the expenses that you paid over the period. Simply divide your account value by $1,000 (for example, an $8,600 account value divided by $1,000 = 8.6), then multiply the result by the number in the first line for your class of shares under the heading entitled “Expenses Paid During Period” to estimate the expenses you paid on your account during this period.
HYPOTHETICAL EXAMPLE FOR COMPARISON PURPOSES
For each class of shares, the second line of the accompanying table provides information about hypothetical account values and hypothetical expenses based on the Fund’s actual expense ratio and an assumed rate of return of 5% per year before expenses, which is not the Fund’s actual return. The hypothetical account values and expenses may not be used to estimate the actual ending account balance or expenses you paid for the period. You may use this information to compare the ongoing costs of investing in the Fund and other funds. To do so, compare this 5% hypothetical example with the 5% hypothetical examples that appear in the shareholder reports of the other funds.
Please note that the expenses shown in the table are meant to highlight your ongoing costs only and do not reflect any transactional costs, such as sales charges (loads), redemption fees, or exchange fees. Therefore, the second line of the table for each class of shares is useful in comparing ongoing costs only, and will not help you determine the relative total costs of owning different funds. In addition, if these transactional costs were included, your costs would have been higher.
Trustees and Officers
Thornburg Strategic Municipal Income Fund | September 30, 2019 (Unaudited)
NAME, AGE, YEAR ELECTED
POSITION HELD WITH FUND | PRINCIPAL OCCUPATION(S) DURING PAST FIVE YEARS | OTHER DIRECTORSHIPS
HELD BY TRUSTEE |
| INTERESTED TRUSTEES(1)(2) |
Garrett Thornburg, 73
Trustee since 1984,
Chairman of Trustees(3) | Chairman and controlling shareholder of Thornburg Investment Management, Inc. (investment advisor); Chairman and controlling shareholder of Thornburg Securities Corporation (securities dealer); President of the Thornburg Foundation (nonprofit). | None |
Brian J. McMahon, 64
Trustee since 2001,
Vice Chairman of Trustees,
Member of Governance and
Nominating Committee &
Operations Risk Oversight
Committee(4) | Vice Chairman, Chief Investment Strategist, Managing Director, and Portfolio Manager and, until 2016, CEO and President of Thornburg Investment Management, Inc.; Vice President of Thornburg Securities Corporation. | None |
| INDEPENDENT TRUSTEES(1)(2)(5) |
David A. Ater, 74
Trustee since 1994,
Lead Independent Trustee,
Chairman of Governance and
Nominating Committee &
Member of Audit Committee | Principal in Ater & Associates, Santa Fe, NM (developer, planner and broker of residential and commercial real estate); owner, developer and broker for various real estate projects. | None |
Sally Corning, 58
Trustee since 2012,
Chairman of Audit Committee | Partner in Sun Mountain Capital, Santa Fe, NM (private equity firm with investment programs encompassing venture capital, mezzanine debt, and growth equity). | None |
Susan H. Dubin, 70
Trustee since 2004,
Member of Audit
Committee & Governance
and Nominating Committee | President of Dubin Investments, Ltd., Greenwich, CT (private investment fund); Director and officer of various charitable organizations. | None |
David L. Gardner, 56
Trustee since 2015,
Member of Operations Risk
Oversight Committee | Until 2012, head of EMEA (Europe, Middle East and Africa) Sales for iShares of Blackrock, Inc., EMEA Executive Committee Member and EMEA Operating Committee Member at Blackrock, Inc. | None |
Patrick J. Talamantes, 55
Trustee since 2019,
Member of Audit Committee | President of Talamantes Strategies, LLC, a management consulting firm, since 2018; until 2017, President and Chief Executive Officer of The McClatchy Company, Sacramento, CA (news and media company). | None |
Owen D. Van Essen, 65
Trustee since 2004,
Chairman of Operations Risk
Oversight Committee &
Member of Governance and
Nominating Committee | President of Dirks, Van Essen, Murray & April, Santa Fe, NM (newspaper mergers and acquisitions). | None |
James W. Weyhrauch, 60
Trustee since 1996,
Member of Audit
Committee & Operations Risk
Oversight Committee | Real estate broker, Santa Fe Properties, Santa Fe, NM; General Partner, Investments of Genext LLC (a family investment partnership); until 2019, Vice Chairman of Nambe LLC, Santa Fe, NM (manufacturing & design company). | None |
Trustees and Officers, Continued
Thornburg Strategic Municipal Income Fund | September 30, 2019 (Unaudited)
NAME, AGE, YEAR ELECTED
POSITION HELD WITH FUND | PRINCIPAL OCCUPATION(S) DURING PAST FIVE YEARS | OTHER DIRECTORSHIPS
HELD BY TRUSTEE |
| OFFICERS OF THE FUND (WHO ARE NOT TRUSTEES)(1)(6) |
David Ashley, 49
Vice President since 2019 | Portfolio Manager and Managing Director since 2019 and Associate Portfolio Manager from 2011-2019 of Thornburg Investment Management, Inc. | Not applicable |
Nimish Bhatt, 56
Chief Financial Officer
since 2019; Treasurer
2016-2019; Secretary
(2018-2019)(7) | Chief Financial Officer and Treasurer of Thornburg Investment Management, Inc. and Thornburg Securities Corporation since 2016 and Secretary of Thornburg Securities Corporation since 2018; Senior Vice President (2004-2016), Chief Financial Officer (2011-2016), and Head of Fund Administration (2011-2016) of Calamos Asset Management, Inc., Calamos Investments LLC, Calamos Advisors LLC, and Calamos Wealth Management; Director of Calamos Global Funds plc (2007-2016). | Not applicable |
Jason Brady, 45
President since 2016(7) | Director since 2017, CEO and President since 2016, and Portfolio Manager and Managing Director of Thornburg Investment Management, Inc.; Vice President of Thornburg Securities Corporation since 2016. | Not applicable |
Connor Browne, 40
Vice President since 2006 | Portfolio Manager and Managing Director of Thornburg Investment Management, Inc. | Not applicable |
Randy Dry, 45
Vice President since 2014 | Managing Director, Director of Institutional Group from 2014-2016, and since 2016, Chief Administrative Officer of Thornburg Investment Management, Inc. | Not applicable |
Greg Dunn, 43
Vice President since 2014 | Portfolio Manager and Managing Director of Thornburg Investment Management, Inc. | Not applicable |
Lon Erickson, 44
Vice President since 2008 | Portfolio Manager and Managing Director of Thornburg Investment Management, Inc. | Not applicable |
Thomas Garcia, 48
Vice President since 2006 | Managing Director, Head Equity Trader, and Associate Portfolio Manager of Thornburg Investment Management, Inc. | Not applicable |
Christian Hoffmann, 37
Vice President since 2018 | Portfolio Manager and Managing Director since 2018, and Associate Portfolio Manager from 2014-2018, of Thornburg Investment Management, Inc. | Not applicable |
Curtis Holloway, 52
Treasurer since 2019(7) | Director of Fund Administration since 2019 of Thornburg Investment Management, Inc.; Senior Vice President, Head of Fund Administration (2017-2019) and Vice President, Fund Administration (2010-2017) of Calamos Investments, and Chief Financial Officer (2017-2019) and Treasurer (2010-2019) of Calamos Funds. | Not applicable |
Ben Kirby, 39
Vice President since 2014 | Head of Investments since 2019, Portfolio Manager and Managing Director since 2013. | Not applicable |
Jeff Klingelhofer, 38
Vice President since 2016 | Head of Investments since 2019, Portfolio Manager and Managing Director since 2015, and Associate Portfolio Manager from 2012–2015, of Thornburg Investment Management, Inc. | Not applicable |
Ponn Lithiluxa, 48
Vice President since 2017 | Manager, Tax & Fund Administration of Thornburg Investment Management, Inc.; Senior Vice President, Citi Fund Services, Inc. (2014–2017); Vice President, Citi Fund Services, Inc. (2007–2014). | Not applicable |
Rob MacDonald, 43
Vice President since 2016 | Managing Director since 2015, Portfolio Manager since 2014, and Associate Portfolio Manager from 2011–2014 of Thornburg Investment Management, Inc. | Not applicable |
Michael Mastroianni, 42
Secretary and Vice President since 2019(7) | Director of Fund Operations since 2019 of Thornburg Investment Management, Inc.; Executive Director, Global Head of Client Services - Global Liquidity (2018-2019), Executive Director, North American Head of Transfer Agency Relationship Management (2011-2019), Executive Director, North American Head of Transfer Agency Service Delivery (2011-2018) of J.P. Morgan Asset Management. | Not applicable |
Leigh Moiola, 52
Vice President since 2001 | Managing Director and Director of Marketing of Thornburg Investment Management, Inc.; Vice President of Thornburg Securities Corporation. | Not applicable |
Christopher Ryon, 63
Vice President since 2008 | Portfolio Manager and Managing Director of Thornburg Investment Management, Inc. | Not applicable |
Trustees and Officers, Continued
Thornburg Strategic Municipal Income Fund | September 30, 2019 (Unaudited)
NAME, AGE, YEAR ELECTED
POSITION HELD WITH FUND | PRINCIPAL OCCUPATION(S) DURING PAST FIVE YEARS | OTHER DIRECTORSHIPS
HELD BY TRUSTEE |
Sean Koung Sun, 38
Vice President since 2017 | Portfolio Manager and Managing Director since 2017, Associate Portfolio Manager from 2015-2016, and Equity Research Analyst from 2012-2014 of Thornburg Investment Management, Inc. | Not applicable |
Stephen Velie, 52
Chief Compliance Officer since 2009 | Chief Compliance Officer of Thornburg Investment Trust and Thornburg Investment Management, Inc. | Not applicable |
Nicholos Venditti, 38
Vice President since 2016 | Portfolio Manager and Managing Director since 2015 and Associate Portfolio Manager from 2011–2015 of Thornburg Investment Management, Inc. | Not applicable |
Vinson Walden, 49
Vice President since 2004 | Portfolio Manager and Managing Director of Thornburg Investment Management, Inc. | Not applicable |
Lei Wang, 48
Vice President since 2006 | Portfolio Manager and Managing Director of Thornburg Investment Management, Inc. | Not applicable |
Charles Wilson, 44
Vice President since 2016 | Portfolio Manager and Managing Director since 2014 and Associate Portfolio Manager from 2012–2014 of Thornburg Investment Management, Inc. | Not applicable |
Di Zhou, 41
Vice President since 2016 | Portfolio Manager and Managing Director since 2016, Associate Portfolio Manager from 2014–2016, and Equity Research Analyst from 2010–2014 of Thornburg Investment Management, Inc. | Not applicable |
| (1) | Each person’s address is 2300 North Ridgetop Road, Santa Fe, New Mexico 87506. |
| (2) | The Fund is a separate investment “Fund” or “series” of Thornburg Investment Trust (the “Trust”), which comprises the Thornburg mutual fund complex and is organized as a Massachusetts business trust. Thornburg Investment Management, Inc. is the investment advisor to, and manages, all the Funds of the Trust. Each Trustee oversees all the Funds of the Trust. |
| (3) | Mr. Thornburg is considered an “interested” Trustee under the Investment Company Act of 1940 because he is a director and controlling shareholder of Thornburg Investment Management, Inc., the investment advisor to the Trust, and is the sole director and controlling shareholder of Thornburg Securities Corporation, the distributor of shares for the Trust. |
| (4) | Mr. McMahon is considered an “interested” Trustee under the Investment Company Act of 1940 because he is a director and the chief investment strategist of Thornburg Investment Management, Inc. |
| (5) | The Bylaws of the Trust currently require that each Independent Trustee shall retire by the end of the calendar year during which the Trustee reached the age of 75 years. Otherwise each Trustee serves in office until the election and qualification of a successor or until the Trustee sooner dies, resigns, retires or is removed. |
| (6) | Assistant vice presidents and assistant secretaries are not shown. |
| (7) | The Trust’s president, chief financial officer, secretary, and treasurer each serves a one-year term or until the election and qualification of a successor; each other officer serves at the pleasure of the Trustees. |
The Statement of Additional Information for each Fund of the Trust includes additional information about the Trustees and is available, without charge and upon request, by calling 1-800-847-0200.
Other Information
Thornburg Strategic Municipal Income Fund | September 30, 2019 (Unaudited)
PORTFOLIO PROXY VOTING
Policies and Procedures:
The Trust has delegated to the Advisor voting decisions respecting proxies for the Fund’s voting securities. The Advisor makes voting decisions in accordance with its Proxy Voting Policy and Procedures. A description of the Policy and Procedures is available (i) without charge, upon request, by calling the Advisor toll-free at 1-800-847-0200, (ii) on the Thornburg website at www.thornburg.com, and (iii) on the U.S. Securities and Exchange Commission’s website at www.sec.gov.
Information regarding how proxies were voted is available on or before August 31 of each year for the twelve months ending the preceding June 30. This information is available (i) without charge, upon request by calling the Advisor toll-free at 1-800-847-0200, (ii) on the Thornburg website at www.thornburg.com, and (iii) on the U.S. Securities and Exchange Commission’s website at www.sec.gov.
TAX INFORMATION
For the tax year ended September 30, 2019, dividends paid by the Fund of $7,354,552 (or the maximum allowed) are tax exempt dividends and $79,829 are taxable ordinary investment income dividends for federal income tax purposes. The information and the distributions reported herein may differ from the information and distributions reported to the shareholders for the calendar year ending December 31, 2019. Complete information will be reported in conjunction with your 2019 Form 1099.
AVAILABILITY OF QUARTERLY PORTFOLIO SCHEDULE
The Fund files with the Securities and Exchange Commission schedules of its portfolio holdings on Form N-Q for the first and third quarters of each fiscal year. The Fund’s Forms N-Q are available on the Commission’s website at www.sec.gov, or may be reviewed and copied at the Commission’s Public Reference Room in Washington, D.C. Information on the operation of the Public Reference Room may be obtained by calling 1-800-SEC-0330. The Fund also makes this information available on its website at www.thornburg.com/download or upon request by calling 1-800-847-0200.
STATEMENT RESPECTING RENEWAL OF INVESTMENT ADVISORY AGREEMENT
Thornburg Investment Management, Inc. (the “Advisor”) provides investment management services to Thornburg Strategic Municipal Income Fund (the “Fund”) pursuant to an investment advisory agreement. The Trustees consider the renewal of this agreement annually, and most recently determined to renew the agreement on September 17, 2019.
Planning for their recent consideration of the advisory agreement’s renewal, the independent Trustees met in May 2019 to consider aspects of their annual evaluation of the Advisor’s service to all of the funds of Thornburg Investment Trust, to plan the annual evaluation of the Advisor’s performance and to discuss preliminarily the information the Advisor would present to the Trustees for their review. The independent Trustees met in a second independent session in July 2019 to further define certain portions of the information to be submitted by the Advisor. The independent Trustees met again in an independent session in September 2019 with a mutual fund analyst firm engaged by the independent Trustees to provide explanations of comparative cost and expense information, comparative investment performance information, and other data obtained and analyzed by the analyst firm. In that session the independent Trustees discussed their evaluations of the Advisor’s services to the Fund and the Fund’s fee and expense levels, investment performance, and other information presented for the Fund, conferred independently with legal counsel respecting the factors typically considered in evaluating renewal of an advisory agreement, and conferred with representatives of management to receive explanations of certain aspects of the information they had requested. Representatives of the Advisor subsequently reviewed portions of the information with the Trustees and addressed questions from the Trustees at a full meeting session of the Trustees scheduled in September for that purpose, and the independent Trustees thereafter met again in an independent session to consider the Advisor’s presentations and various specific issues respecting their consideration of the advisory agreement’s renewal. Following these sessions, the Trustees met to consider renewal of the advisory agreement, and the independent Trustees voted unanimously at that meeting to renew the agreement for an additional term of one year.
The information below summarizes certain factors considered by the Trustees in connection with the determination to renew the advisory agreement with the Advisor. In determining to renew the advisory agreement, the Trustees considered a wide range of information and did not identify any single factor as controlling, and this summary does not describe all of the factors and other matters considered by the Trustees in making their determination.
Nature, Extent and Quality of Services. The Trustees considered in their evaluation of the advisory agreement the written and oral reports provided to the Trustees and their standing committees throughout the year on a wide variety of topics by personnel from the Advisor’s
Other Information, Continued
Thornburg Strategic Municipal Income Fund | September 30, 2019 (Unaudited)
portfolio management, administration, operations and compliance staffs. The Trustees also considered in this evaluation presentations and explanations made by representatives of the Advisor in meeting sessions scheduled for consideration of the renewal of the advisory agreement. The Trustees further noted in their evaluation the consideration they had given to a number of topics in previous years, reports from their standing committees, and advice received from counsel.
Information noted by the Trustees as having been considered in relation to the nature, extent and quality of services provided by the Advisor under the advisory agreement and contributing (together with other information considered) to their conclusions respecting the nature, extent and quality of the services rendered to the Fund by the Advisor included: (1) reports from portfolio managers and other personnel throughout the year demonstrating that the Fund was managed in conformity with stated strategies and objectives and conformed to investment restrictions and limitations; (2) reports demonstrating that management of the Fund remained faithful and competent, and demonstrating sufficient skill by portfolio managers in executing the Fund’s strategies in varying environments, managers’ cognizance of and strategies to pursue the Fund’s objectives and address pertinent market and economic trends and conditions, the evaluation and selection of individual investments, management to achieve tax efficiencies, and the structuring and composition of the Fund’s portfolio and management of Fund liquidity requirements; (3) the Fund’s achievement of its investment objectives over different periods of time; (4) presentations by and interactions with members of the Advisor’s fund administration, operations and compliance staffs; (5) reports from standing committees of the Trustees on their respective proceedings throughout the year, including in particular reports from and interactions with the Advisor’s personnel; (6) the sufficiency of the resources the Advisor devotes to the services it provides to the Fund, including the expertise of its personnel and staffing levels and its enhancements to the electronic systems it utilizes in providing these services, and also including the Advisor’s own financial management and sufficiency of its resources; and (7) the measures employed to achieve efficient trade execution for the Fund, including the evaluation and selection of firms to execute transactions for the Fund. As in past years, the Trustees noted particularly their assessments of the Advisor’s personnel developed in meetings throughout the year, measures to expand and improve the depth and experience of the Advisor’s staff, and the Advisor’s collaborative approach to investment management, continued commitment to observance of compliance and regulatory requirements in managing investments by the Fund, responsiveness to the Trustees, and other factors.
Based upon these and other considerations, the Trustees concluded that the Advisor’s management of the Fund’s investments continued to conform to the Fund’s stated objectives and policies, and that the nature, extent and quality of the services provided to the Fund by the Advisor remained sufficient.
Investment Performance. The Trustees noted in their evaluation of the Fund’s investment performance the written and oral reports they had received in each regular meeting over the course of the year from the Advisor’s portfolio management personnel. The Trustees also noted their consideration of information provided to them at their request in anticipation of their annual evaluation of the Advisor’s services, including the following items of information respecting the investment performance of the Fund: (1) the Fund’s absolute investment performance and achievement of stated objectives; (2) the Advisor’s explanations and commentary on the Fund’s performance in the context of the Fund’s objectives and reasonable expectations, and business, market and economic conditions; (3) performance data for the most recent nine calendar years since the inception of the Fund’s investment operations, comparing the Fund’s annual investment returns to a broad-based securities index and to the applicable Morningstar category of funds; (4) the Fund’s investment performance for the three-month, year-to-date, one-year, three-year, five-year, and since inception periods ending with the second quarter of the current year, comparing the Fund’s annualized returns to two mutual fund categories created by independent mutual fund analyst firms and to a broad-based securities index, and assigning a percentage rank to the Fund’s performance for each period relative to each of the fund categories; (5) analyses of specified performance and risk metrics for the Fund relative to its benchmark and to a selected peer group of funds, prepared by an independent financial analyst firm engaged by the independent Trustees; (6) the Fund’s cash flows; (7) comparative performance data for fund peer groups selected by an independent mutual fund analyst firm engaged by the independent Trustees, and the analysis and observations of the analyst firm respecting those data; and (8) comparative measures of correlation to equity indices, and risk and return statistics. Measures of risk and relative return demonstrated that the Fund’s performance relative to these measures continued to fulfill expectations in current conditions. The Trustees generally attach additional significance to the investment performance of the Fund from the perspective of longer-term shareholders, and noted in that regard that the Fund’s relative investment performance may be affected to some extent in periods when the Advisor pursues defensive measures in line with the Fund’s stated objectives. Based upon their consideration of this and other information, the Trustees concluded that the Fund’s absolute and relative investment performance over a range of pertinent holding periods on the whole was satisfactory in view of its objectives and strategies.
Comparisons of Fee and Expense Levels. Information noted by the Trustees as having been considered in this context included a variety of comparative data respecting the Fund’s fee and expense levels. This information included comparisons of the Fund’s advisory fee and overall Fund expenses to median and average fees and expenses charged to funds in the applicable Morningstar category, comparisons of the advisory fee and total expenses for two Fund share classes to the fee levels and expenses of fund peer groups selected from the category by an independent mutual fund analyst firm engaged by the independent Trustees, the perspectives and advice from that mutual fund analyst firm respecting comparisons of fund fee levels and expenses to fund peer groups, and other information. The Trustees considered that the Advisor has agreed to certain fee waivers and expense reimbursements for the current period. Comparative fee and expense data noted as having been considered by the Trustees showed that, after fee waivers and expense reimbursements, the level of total expense for one share class of the Fund was higher than the median and average levels charged to funds in the applicable
Other Information, Continued
Thornburg Strategic Municipal Income Fund | September 30, 2019 (Unaudited)
Morningstar category, and that the level of total expense for a second share class was higher than the median and lower than the average levels for that category. Peer group data showed that the Fund’s stated advisory fee was higher than the medians of the two peer groups considered but comparable to other funds in the peer groups, and that the total expense levels of two representative share classes were higher than the medians of their respective peer groups but comparable to other funds in the peer groups after waivers of fees and reimbursement of expenses. The Trustees did not find the differences significant in view of their findings and conclusions respecting the other factors considered.
The Trustees noted their consideration of information respecting the advisory fees charged by the Advisor to other investment management clients, including sub-advised mutual funds and other institutional clients, together with information about fees charged by other advisors to different clients, analysis of the differences between the requirements of institutional clients and mutual funds, analysis of the differences between the requirements of a sub-advised mutual fund and a fund as to which the investment advisor is the primary advisor and sponsor, and the consequently different investment management services provided to the different categories of clients and the differing contexts in which these arrangements are entered into. The Trustees confirmed their previous observations that the differences between the fees charged by the Advisor or by other investment advisors to different types of clients did not appear exceptional and had limited relevance to the evaluation of the fee rate charged to mutual funds as to which the Advisor or such other advisors are the primary advisor and sponsor.
Costs and Profitability of Advisor. In reviewing the profitability of the Advisor’s services to the Fund, the Trustees considered an analysis of the Advisor’s costs and the estimated profitability to the Advisor of its services, together with data respecting the overall profitability of a selection of other investment management firms. The Trustees considered in this regard information from the Advisor respecting investment of its profits to maintain staffing levels, and noted that a portion of the Advisor’s profits is an important element in the compensation of shareholder employees. The Trustees considered information from the Advisor respecting the use of profits to enhance staff competencies through training and other measures, hire personnel to expand and develop the scope of senior management expertise, pay competitive levels of compensation, and add to the Advisor’s electronic and information technology systems to maintain or improve service levels. The Trustees also considered the contribution of the Advisor’s cost management to its profitability, and the relationship of the Advisor’s financial resources and profitability in previous years to its ability to attract necessary personnel, invest in systems and other assets required for its service to the Fund, and maintain or improve service levels for the Fund notwithstanding fluctuations in revenues and profitability. The information considered did not indicate to the Trustees that the Advisor’s profitability was excessive.
Potential Economies of Scale. In reviewing the extent to which economies of scale would be realized by the Fund as it grows and whether fee levels reflect potential economies of scale, the Trustees considered the breakpoint structure for advisory fees chargeable to the Fund, comparisons of the fee breakpoint structure for the Fund with breakpoint structures (or the absence of such structures) for other funds in a peer group selected by an independent mutual fund analyst firm, the effects of the breakpoint structure and other expense factors realized by certain funds of the Trust as their asset levels had increased, the Advisor’s undertakings to waive or reimburse certain fees and expenses of the Fund, and the Advisor’s expenditures from its own profits and resources to maintain staffing levels and expand staff competencies, pay competitive levels of compensation, and add to its electronic and information technology systems so as to maintain or improve service levels. The information provided demonstrated to the Trustees that the Fund’s advisory fee breakpoint structure is reasonable in relation to the structures observed in the other funds in its peer group, and that shareholders may be expected to benefit from any economies of scale, due to the advisory agreement’s breakpoint fee structure for the Fund and other factors.
Potential Ancillary Benefits. In reviewing potential benefits to the Advisor because of its relationship to the Fund, the Trustees considered explanations from the Advisor respecting its receipt of certain research services from broker dealers, and the benefits to both the Fund and the Advisor of the Advisor’s expansion of its staffing, compliance and systems capabilities and other resources to serve a broader variety of investment management clients. No unusual or unfair benefits to the Advisor from its relationship to the Fund were identified by the Trustees.
Summary of Conclusions. The Trustees concluded that the general nature, extent and quality of the Advisor’s services performed under the advisory agreement remained sufficient, the Advisor had continued to actively and competently pursue the Fund’s stated investment objectives and adhere to the Fund’s investment policies, and that the absolute and relative investment performance of the Fund over pertinent holding periods on the whole was satisfactory in the context of the Fund’s objectives and strategies. The Trustees further concluded that the level of the advisory fee charged to the Fund by the Advisor is fair and reasonable in relation to the services provided by the Advisor, in view of the nature, extent and quality of those services, the investment performance of the Fund after fees and expenses, the clear disclosure of fees and expenses in the Fund’s prospectus, comparisons of fees and expenses charged to the Fund to fees and expenses charged to other mutual funds, and the other factors considered. The Trustees accordingly determined to renew the Fund’s investment advisory agreement with the Advisor for an additional term of one year.
Trustees’ Statement to Shareholders (Unaudited)
Readopted September 17, 2019
The Trustees believe current and prospective shareholders should know how we discharge our responsibilities in supervising the Funds’ investment advisor and in reviewing the advisor’s contract for renewal. Since 2005, we have issued a statement which sets out clearly the three principal guidelines that we follow in supervising the Trust’s investment advisor on your behalf. In accordance with our customary practice, in September of this year we again reviewed our statement and concluded we should reissue this statement outlining the principal features of our supervision of the advisor’s performance of investment management services for the Funds.
We begin with the premise that each shareholder selected his or her Fund because its investments are managed by the investment advisor identified in the prospectus and in accordance with the objective and policies described in the prospectus. We realize, as each of you do, that if you believe that your Fund’s stated objective and policies no longer serve your personal investment goals, you can sell your shares and leave the Fund.
Therefore, we believe that our primary supervisory task—our principal obligation to you—is to assess the nature and quality of the advisor’s services, and to confirm that the advisor actively and competently pursues the Fund’s objective, in accordance with the policies set out in the prospectus. To do this, we meet regularly with management to review your Fund’s portfolio and to discuss the advisor’s specific actions and judgments in pursuing the Fund’s objective. We do not substitute our own judgment for the advisor’s decisions in selecting investments; the advisor is paid to exercise its informed judgment on investment decisions, and we seek to confirm, in reviewing the advisor’s performance, that the advisor is doing just that.
Second, we are conscious of costs and the effect that costs have on shareholders’ returns. We try to make sure that your Fund’s fees and costs are reasonable in relationship to the services rendered and that they are generally in line with those charged by other expert investment advisors, consistent with our belief that the Fund’s investors searched for and expect that expertise and attention and have decided to pay a reasonable price for it. We do not put the management contract “out to bid” as a matter of course, and we would not do so unless we had concluded that the advisor materially had failed to pursue the Fund’s objectives in accordance with its policies, or for other equally important reasons. We believe that any other approach would be inconsistent with your interests and contrary to your expectations when you bought shares of the Fund in the first place.
Finally, because we believe that most Thornburg Fund shareholders have invested with a long-term perspective, we try not to focus too much on the fashions of the moment and on short-term performance. The market will not favor any specific investment objective or set of policies at all times and under all economic circumstances. A fund will experience periods of both high and low returns relative to other funds and other investments. Even if one of our Funds is not favored by the market at a particular time, we believe that the advisor is nonetheless obliged to remain true to the Fund’s objective and policies, and we watch to see that it does so.
Trustees of Thornburg Investment Trust
Thornburg Investment Management is a privately-owned global investment firm that offers a range of solutions for retail and institutional investors. Founded in 1982 and headquartered in Santa Fe, New Mexico, we manage approximately $41.9 billion (as of September 30, 2019) across U.S. mutual funds, separate accounts for high-net-worth investors, institutional accounts, and UCITS funds for non-U.S. investors.
The fund outlined in this report is one of many equity and fixed-income products available from Thornburg Investment Management.
EQUITY FUNDS
| ■ | Thornburg Global Opportunities Fund |
| ■ | Thornburg International Value Fund |
| ■ | Thornburg Better World International Fund |
| ■ | Thornburg International Growth Fund |
| ■ | Thornburg Developing World Fund |
| ■ | Thornburg Value Fund |
| ■ | Thornburg Core Growth Fund |
MULTI_ASSET FUNDS
| ■ | Thornburg Investment Income Builder Fund |
| ■ | Thornburg Summit Fund |
FIXED INCOME FUNDS
| ■ | Thornburg Low Duration Income Fund |
| ■ | Thornburg Limited Term U.S. Government Fund |
| ■ | Thornburg Limited Term Income Fund |
| ■ | Thornburg Strategic Income Fund |
| ■ | Thornburg Low Duration Municipal Fund |
| ■ | Thornburg Limited Term Municipal Fund |
| ■ | Thornburg Intermediate Municipal Fund |
| ■ | Thornburg California Limited Term Municipal Fund |
| ■ | Thornburg New Mexico Intermediate Municipal Fund |
| ■ | Thornburg New York Intermediate Municipal Fund |
| ■ | Thornburg Strategic Municipal Income Fund |
ALTERNATIVE FUNDS
| ■ | Thornburg Long/Short Equity Fund |
Before investing, carefully consider the Fund’s investment goals, risks, charges, and expenses. For a prospectus or summary prospectus containing this and other information, contact your financial advisor or visit thornburg.com. Read it carefully before investing.
For additional information, please visit thornburg.com
Thornburg Investment Management, Inc. 2300 North Ridgetop Road, Santa Fe, NM 87506
This page intentionally left blank.
This page intentionally left blank.
To receive shareholder reports, prospectuses, and proxy statements electronically, go to www.thornburg.com/edelivery.
This Annual Report is submitted for the general information of shareholders of the Fund. It is not authorized for distribution to prospective investors in the Fund unless preceded or accompanied by an effective prospectus.
Investment Advisor:
Thornburg Investment Management®
800.847.0200
Distributor:
Thornburg Securities Corporation®
Annual Report
September 30, 2019
Beginning on January 1, 2021, as permitted by regulations adopted by the Securities and Exchange Commission, paper copies of the Fund’s shareholder reports will no longer be sent by mail, unless you specifically request paper copies of the reports from the Fund or from your financial intermediary, such as a broker-dealer or bank. Instead, the reports will be made available on a website, and you will be notified by mail each time a report is posted and provided with a website link to access the report.
If you already elected to receive shareholder reports electronically, you will not be affected by this change and you need not take any action. You may elect to receive shareholder reports and other communications from the Fund or your financial intermediary electronically by going to thornburg.com/edelivery.
You may elect to receive all future reports in paper free of charge. You can inform the Fund or your financial intermediary that you wish to continue receiving paper copies of your shareholder reports by calling 800.847.0200 or your financial intermediary directly. Your election to receive reports in paper will apply to all funds held with the fund complex/your financial intermediary.
At Thornburg, we believe unconstrained investing leads to better outcomes for our clients. Our investment solutions are highly active, high conviction, and benchmark agnostic. When it comes to finding economic opportunity for clients, it’s more than what we do.
It’s how we do it. Active Asbottom-up, fundamental, active managers, we look beyond conventional benchmarks. Long Term We take a long-term view in how we manage our firm and our portfolios. Benchmark Agnostic Investment strategies should have the flexibility to pursue solutions for clients, not stay within the conventional confines of benchmarks. Flexible Perspective Our approach to portfolio construction is guided by our convictions rather than convention. High Conviction We focus our attention and capital on thoroughly researched, well-understood positions. The best form of risk management is to know what you own, and why. Repeatable & Robust Our long-term outperformance of benchmarks verifies that our process works and outperforms conventional thinking. Independent We are independently owned and far from the herd of other investment managers. Investment Driven All members of the investment team are resources for all of our strategies. Collaborative Our team collaborates on opportunities across geography, sector, or asset class.
Thornburg California Limited Term Municipal Fund
Annual Report | September 30, 2019
Table of Contents
| SHARE CLASS | NASDAQ SYMBOL | CUSIP |
| Class A | LTCAX | 885-215-426 |
| Class C | LTCCX | 885-215-418 |
| Class I | LTCIX | 885-215-392 |
Minimum investments for Class I shares may be higher than those for Class A. Class I shares may not be available to all investors.
Investments carry risks, including possible loss of principal. Portfolios investing in bonds have the same interest rate, inflation, and credit risks that are associated with the underlying bonds. The value of bonds will fluctuate relative to changes in interest rates, decreasing when interest rates rise. Unlike bonds, bond funds have ongoing fees and expenses. Please see the Fund’s prospectus for a discussion of the risks associated with an investment in the Fund. Investments in the Funds are not FDIC insured, nor are they bank deposits or guaranteed by a bank or any other entity.
The laddering strategy does not assure or guarantee better performance and cannot eliminate the risk of investment losses.
Letter to Shareholders
Thornburg California Limited Term Municipal Fund | September 30, 2019 (Unaudited)
October 18, 2019
Dear Fellow Shareholder:
We are pleased to present the annual report for the Thornburg California Limited Term Municipal Fund. The net asset value (NAV) of the Class I shares increased 27 cents to $13.73 per share during the fiscal year ended September 30, 2019. The Class I shares of your Fund underperformed the index with a 3.90% total return for the fiscal year ended September 30, 2019, compared to the 6.05% total return for the ICE BofA Merrill Lynch 1-10 Year Municipal Securities Index.
The drivers of the Fund’s total return relative to its benchmark include its interest rate sensitivity, as measured by the Fund’s duration, differing maturity allocations and other risk factors. The impact of the Fund’s 0.88 years shorter duration detracted 0.626%. The Fund’s sector allocations contributed 0.015%, while other risk factors detracted 0.852%. The Fund’s expenses and residuals accounted for the remainder of the performance differential.
Since the last annual letter published in November 2018, the municipal market and its investors have experienced one of the great rallies in the market’s history, driven by the largest amount of inflows into municipal bond mutual funds on record. Mutual funds have experienced positive inflows every week of 2019, with the aggregate amounting to more than $70 billion. During that time, the 10-year Thomson Reuters Municipal Market Data (MMD) AAA Curve has fallen from a high of 2.80% in early November 2018 to an all-time low of 1.22% in late August 2019, only to settle around 1.45% at the time of this writing. The decrease in yields and the insatiable demand from retail mutual fund investors has led to appreciating bond prices that have accounted for a large portion of the returns the market inked over the last 12 months.
While the increase in the price of the investments has been great to watch, municipal investors find themselves in a tough situation. Does one sell the bonds at high prices? Is it best to pay a capital gain and look for reinvestment opportunities? Or does one hold the bonds? Collect a coupon and reinvest the proceeds knowing that the premium could evaporate if yields spike?
In many cases the answer is contingent on investor goals and risk tolerance. So instead of providing an answer, we would like to present an analysis of market risks that will allow investors to draw their own conclusions.
Municipal Bond Supply and Demand
Municipal investors tend to be overly sensitive to supply trends. The common refrain is that a big supply year is bearish for bond prices and vice versa. While that is generally true, it negates the other half of the equation. Demand, not supply, can be a large driver of total return, and that is exactly what the market has experienced throughout 2019. $70 billion has poured into the municipal market through the end of September 2019, the largest amount of annual inflows on record.
That $70 billion represents roughly 10% of all assets in municipal bond mutual funds. So technical demand, not fundamentals, has been the key driver of asset appreciation. That should be troubling. As investors, we like fundamentals to move asset prices. If you were to invest in Apple, and Apple sells more iPhones, and the firm’s stock appreciates, we would consider that being for the right reasons. When price is driven by factors other than fundamental value, the potential for a reversal tends to be high. Therefore, we would recommend caution when investing in a market where fundamental improvement isn’t the reason for price appreciation.
Municipal Bond Credit Risk
Credit spreads, much like triple-A bond insurers, have all but disappeared from the muni market. That is somewhat of an overstatement, but for some time now credit spreads, especially across the plain vanilla investment grade space, have become virtually commoditized. At the same time, while much has been said surrounding the covenant-lite status of recent corporate debt issuance, little has been said about the phenomenon in the municipal bond market. Credit security packages are getting weaker. Net revenue covenants, liquidity covenants, additional bonds tests and other protections granted to municipal investors are weakening. It is undeniable that municipal investors are taking on more and more credit risk for less and less yield.
State and Local Tax Deduction (SALT)
At least part of the increase in demand for municipal paper has been driven by the changes to the SALT deduction cap. The cap of $10,000 in state and local taxes that are deductible from federal taxes was part of the tax changes that were passed by the Trump administration at the end of 2017. It is estimated that over 10 million taxpayers were unable to write-off some $320 billion in state and local taxes, effectively increasing their tax liability despite a reduction in marginal personal income tax rates. The impact has been the most severe in states with high local and state taxes.
Faced with an ever-increasing tax bill, investors in these high-tax states have flocked to the municipal bond market. In no place is that truer than California. For many investors in the state, investments in the California municipal bond market no longer make economic sense. After adjusting yields for state and local taxes, many California investors would be better off investing in U.S. Treasuries due to the higher after-tax yield. Yet, money continues to flow into the California municipal bond market as investors make these non-economic decisions. Non-economic decision-making is not isolated to the California market, though. It’s evident in many high-tax states.
The Federal Reserve and Monetary Policy
As recently as December 2018, the Federal Reserve seemed bound and determined to push interest rates higher. It took only a few angry tweets and some stock market volatility in the fourth quarter of 2018 for the Fed to put its interest rate hikes
Letter to Shareholders, Continued
Thornburg California Limited Term Municipal Fund | September 30, 2019 (Unaudited)
on pause, and only seven months for a complete reversal of course. Since the 25 basis point (bps) rate cut in July, the Fed cut again in September and the market is pricing in one more cut before year end.
While monetary policy has been the elixir of choice for a decade running, it has also created a host of problems for fixed income investors. By keeping yields low for the last decade, fixed income investors have been driven out the risk spectrum in search of their income goals. Many have taken on additional duration risk by buying longer-dated bonds, making them more susceptible to interest rate movements.
Other fixed income investors have taken on more credit risk, making them more susceptible to a slowing economy. Others have been forced out of the fixed income market and into the equity markets, which completely changes the risk profile of their investments. This is all being done at a time of all-time low yields and all-time low credit spreads. This situation is hardly sustainable.
The highlighted risks have led us to maintain our present course. The Fund remains higher in credit quality and cash with durations at lower levels. While the latter has impacted total returns as price appreciation has driven total return, the distribution yield, or tax-free monthly income, has held up nicely. Cash has been allowed to build given the flatness of the
yield curve and the trade-off in investing in the variable rate demand note (VRDN) market. When opportunities arise, we have ample dry powder to take advantage of dislocations. Until those conditions are met, we are content to manage the Fund in a more conservative fashion commensurate with the risk profile of a municipal bond investor.
Thank you for your continued trust and support.
Sincerely,

| 
|
Christopher Ryon,cfa
Portfolio Manager
Managing Director | Nicholos Venditti,cfa
Portfolio Manager
Managing Director |

| |
David Ashley,cfa
Portfolio Manager
Managing Director | |
The matters discussed in this report may constitute forward-looking statements made pursuant to the safe harbor provisions of the Securities Litigation Reform Act of 1995. These include any advisor or portfolio manager prediction, assessment, analysis or outlook for individual securities, industries, investment styles, market sectors and/or markets. These statements involve risks and uncertainties. In addition to the general risks described for each fund in its current prospectus, other factors bearing on these reports include the accuracy of the advisor’s or portfolio manager’s forecasts and predictions, the appropriateness of the investment strategies designed by the advisor or portfolio manager and the ability of the advisor or portfolio manager to implement their strategies efficiently and successfully. Any one or more of these factors, as well as other risks affecting the securities markets generally, could cause the actual results of any fund to differ materially as compared to its benchmarks.
The views expressed are subject to change and do not necessarily reflect the views of Thornburg Investment Management, Inc. This information should not be relied upon as a recommendation or investment advice and is not intended to predict the performance of any investment or market.
Performance results of individual share classes will vary based on the fees and expenses associated with each share class, and may be higher or lower than other share classes within the same Fund. Please see Performance Summary for performance results of each share class.
Performance Summary
Thornburg California Limited Term Municipal Fund | September 30, 2019 (Unaudited)
AVERAGE ANNUAL TOTAL RETURNS
| | 1-YR | 3-YR | 5-YR | 10-YR | SINCE
INCEP. |
| Class A Shares(Incep: 2/19/87) | | | | | |
| Without sales charge | 3.63% | 0.85% | 1.25% | 2.34% | 4.06% |
| With sales charge | 2.11% | 0.35% | 0.95% | 2.18% | 4.01% |
| Class C Shares(Incep: 9/1/94) | | | | | |
| Without sales charge | 3.34% | 0.58% | 0.99% | 2.07% | 3.04% |
| With sales charge | 2.83% | 0.58% | 0.99% | 2.07% | 3.04% |
| Class I Shares(Incep: 4/1/97) | 3.90% | 1.12% | 1.54% | 2.65% | 3.52% |
30-DAY YIELDS, A SHARES(with sales charge)
| Annualized Distribution Yield | 1.48% |
| SEC Yield | 0.43% |
GROWTH OF A HYPOTHETICAL $10,000 INVESTMENT
Performance data shown represents past performance and is no guarantee of future results. Investment return and principal value will fluctuate so shares, when redeemed, may be worth more or less than their original cost. Current performance may be lower or higher than quoted. For performance current to the most recent month end, visit thornburg.com or call 800-847-0200. The performance information does not reflect the deduction of taxes that a shareholder would pay on distributions or the redemption of Fund shares. Returns reflect the reinvestment of dividends and capital gains. Class A shares are sold with a maximum sales charge of 1.50%, Class C shares include a 0.50% CDSC for the first year only. There is no sales charge for Class I shares. As disclosed in the most recent prospectus, the total annual fund operating expenses are as follows: A shares, 0.92%; C shares, 1.19%; I shares, 0.67%. For more detailed information on fund expenses and waivers/reimbursements please see the Fund’s prospectus.
The ICE index data referenced herein is the property of ICE Data Indices, LLC, its affiliates (“ICE Data”) and/or its Third Party Suppliers and has been licensed for use by Thornburg Investment Management, Inc. ICE Data and its Third Party Suppliers accept no liability in connection with its use. See www.thornburg.com/indices for a full copy of the Disclaimer.
TheICE BofAML 1-10 Year Municipal Securities Index is a subset of the ICE BofAML Municipal Securities Index including all securities with a remaining term to final maturity less than 10 years.
The performance of any index is not indicative of the performance of any particular investment. Unless otherwise noted, index returns reflect the reinvestment of income dividends and capital gains, if any, but do not reflect fees, brokerage commissions or other expenses of investing. Investors may not make direct investments into any index.
Bond Credit Ratings (Credit Quality) – A bond credit rating assesses the financial ability of a debt issuer to make timely payments of principal and interest. Ratings of AAA (the highest), AA, A, and BBB are investment-grade quality. Ratings of BB, B, CCC, CC, C and D (the lowest) are considered below investment grade, speculative grade, or junk bonds.
Duration – A bond’s sensitivity to interest rates. Bonds with longer durations experience greater price volatility than bonds with shorter durations. Effective duration incorporates a bond’s embedded option features, such as call provisions.
Yield Curve – A line that plots the interest rates, at a set point in time, of bonds having equal credit quality, but differing maturity dates.
Thomson Reuters Municipal Market Data (MMD) AAA Curve - Thomson Reuters Municipal Market Data (MMD) AAA Curve is a proprietary yield curve that provides the offer-side of “AAA” rated state general obligation bonds, as determined by the MMD analyst team. The MMD AAA curve represents the MMD analyst team’s opinion of AAA valuation, based on institutional block size ($2 million+) market activity in both the primary and secondary municipal bond market. In the interest of transparency, MMD publishes extensive yield curve assumptions relating to various structural criteria which are used in filtering market information for the purpose of benchmark yield curve creation.
Fund Summary
Thornburg California Limited Term Municipal Fund | September 30, 2019 (Unaudited)
OBJECTIVES AND STRATEGIES
The Fund’s primary investment objective is to obtain as high a level of current income exempt from federal and California state individual income taxes as is consistent, in the view of the Fund’s investment advisor, with preservation of capital.
The secondary goal of the Fund is to reduce expected changes in its share price compared to longer intermediate and long-term bond portfolios.
As described in the Fund’s prospectus, the Fund offers California investors double tax-free yields (may be subject to Alternative Minimum Tax) in a laddered municipal bond portfolio with a dollar-weighted average maturity of normally less than five years. Laddering involves building a portfolio of bonds with staggered maturities so that a portion of the portfolio matures each year. Cash from maturing bonds, if not needed for other purposes, is typically invested in bonds with longer maturities at the far end of the ladder. We regard this strategy as a good compromise for managing different types of risk.
LONG-TERM STABILITY OF PRINCIPAL
Net Asset Value History of A Shares
| KEY PORTFOLIO ATTRIBUTES | |
| Number of Bonds | 321 |
| Effective Duration | 3.0 Yrs |
| Average Maturity | 3.6 Yrs |
SECURITY CREDIT RATINGS
A bond credit rating assesses the financial ability of a debt issuer to make timely payments of principal and interest. Ratings of AAA (the highest), AA, A, and BBB are investment-grade quality. Ratings of BB, B, CCC, CC, C and D (the lowest) are considered below investment grade, speculative grade, or junk bonds.
Unrated pre-refunded and escrowed-to-maturity bonds are included in the not rated category.
PORTFOLIO LADDER
| 7% | 16% | 14% | 10% | 10% | 12% | 11% | 8% | 4% | 5% | 3% |
Percent of portfolio maturing in each year. Cash includes cash equivalents and other.
There is no guarantee that the Fund will meet its investment objectives.
All data is subject to change. Charts may not add up to 100% due to rounding.
Schedule of Investments
Thornburg California Limited Term Municipal Fund | September 30, 2019
| Issuer-Description | PRINCIPAL
AMOUNT | VALUE |
| | MUNICIPAL BONDS — 97.4% | | |
| | Alameda County Joint Powers Authority (Alameda County Medical Center Highland Hospital), Series A, 5.00% due 12/1/2019 - 12/1/2024 | $ 3,975,000 | $ 4,405,759 |
| | Alameda County Joint Powers Authority (Juvenile Justice), 5.00% due 12/1/2021 | 500,000 | 541,710 |
| | Alameda County Joint Powers Authority (Public Facilities Capital Projects), 5.00% due 12/1/2021 | 1,000,000 | 1,083,420 |
| | Anaheim Public Financing Authority (Public Improvements; Insured: AGM), Series C, Zero Coupon due 9/1/2022 | 3,000,000 | 2,866,320 |
| a | Bay Area Toll Authority (San Francisco Bay Area Toll Bridge), Series A, 2.95% due 4/1/2047 (put 4/1/2026) | 4,775,000 | 5,186,509 |
| | Bonita (Educational Facilities) USD GO, 5.00% due 8/1/2024 | 1,000,000 | 1,106,010 |
| | Brentwood Infrastructure Financing Authority (Residential Single Family Development; Insured: AGM), Series A, 5.00% due 9/2/2020 - 9/2/2023 | 6,225,000 | 6,851,128 |
| | California (Children’s Hospital Los Angeles Obligated Group) HFFA, Series A 5.00% due 8/15/2030 | 1,990,000 | 2,430,805 |
| | California (Children’s Hospital Los Angeles) HFFA, Series A, 5.00% due 11/15/2020 - 11/15/2023 | 3,025,000 | 3,257,562 |
| | California (Children’s Hospital of Orange County Obligated Group) HFFA, | | |
| | 3.00% due 11/1/2019 | 1,820,000 | 1,822,803 |
| | 4.00% due 11/1/2020 | 750,000 | 773,378 |
| | 5.00% due 11/1/2021 - 11/1/2028 | 4,295,000 | 5,187,412 |
| | California (Dignity Health) HFFA, Series A, 5.25% due 3/1/2022 | 1,000,000 | 1,054,850 |
| | California (Kaiser Permanente) HFFA, Series A-1, 5.00% due 11/1/2027 | 3,000,000 | 3,860,730 |
| a,b | California (Providence St. Joseph Health Obligated Group) HFFA, 5.00% due 10/1/2039 (put 10/1/2027) | 3,000,000 | 3,795,630 |
| | California (St. Joseph Health System) HFFA, | | |
| | Series A, 5.00% due 7/1/2024 | 1,000,000 | 1,141,980 |
| a | Series D, 5.00% due 7/1/2043 (put 10/15/2020) | 5,575,000 | 5,780,717 |
| | California Educational Facilities Authority (Chapman University), 5.00% due 4/1/2022 | 2,000,000 | 2,111,560 |
| | California Educational Facilities Authority (Loyola Marymount University; Insured: Natl-Re), Series A, Zero Coupon due 10/1/2019 | 2,025,000 | 2,025,000 |
| | California Educational Facilities Authority (Pitzer College) ETM, 5.00% due 4/1/2020 | 1,445,000 | 1,472,874 |
| | California Infrastructure and Economic Development Bank (California Academy of Sciences), | | |
| c | Series C, 1.793% (LIBOR 1 Month + 0.38%) due 8/1/2047 (put 8/1/2021) | 4,985,000 | 4,985,150 |
| c | Series D, 1.806% (LIBOR 1 Month + 0.38%) due 8/1/2047 (put 8/1/2021) | 6,000,000 | 6,000,180 |
| c | California Infrastructure and Economic Development Bank (J Paul Getty Trust), Series B, 1.662% (LIBOR 1 Month + 0.20%) due 10/1/2047 (put 4/1/2021) | 1,000,000 | 999,700 |
| | California Infrastructure and Economic Development Bank (King City High School), 5.25% due 8/15/2020 | 515,000 | 522,967 |
| c | California Infrastructure and Economic Development Bank (Los Angeles County Museum of Art), Series A, 2.088% (LIBOR 1 Month + 0.65%) due 12/1/2050 (put 2/1/2021) | 6,250,000 | 6,267,062 |
| | California Infrastructure and Economic Development Bank (The Scripps Research Institute), 5.00% due 7/1/2020 - 7/1/2027 | 1,050,000 | 1,234,259 |
| | California Municipal Finance Authority (Biola University Residential Hall and Parking Structure), 5.00% due 10/1/2021 - 10/1/2023 | 435,000 | 478,571 |
| | California Municipal Finance Authority (Biola University), | | |
| | 4.00% due 10/1/2019 | 405,000 | 405,000 |
| | 5.00% due 10/1/2020 - 10/1/2027 | 2,855,000 | 3,236,458 |
| | California Municipal Finance Authority (Biola University, Inc.), 5.00% due 10/1/2030 | 1,000,000 | 1,215,120 |
| | California Municipal Finance Authority (CHF-DAVIS I, LLC-WEST VILLAGE; Insured BAM-TCRS), 5.00% due 5/15/2028 | 2,905,000 | 3,651,672 |
| a,d | California Municipal Finance Authority, Series A, 2.00% due 2/1/2039 (put 2/3/2020) | 4,000,000 | 4,006,640 |
| a | California Pollution Control Financing Authority AMT, 2.50% due 7/1/2031 (put 5/1/2024) | 1,125,000 | 1,168,976 |
| | California State Housing Finance Agency (Multi-Family Housing; Insured: FHA), Series A, 3.05% due 12/1/2019 | 735,000 | 735,639 |
| | California State Public Works Board (California School for the Deaf Riverside Campus), Series H, 5.00% due 4/1/2022 | 565,000 | 616,505 |
| | California State Public Works Board (Correctional and Rehabilitation Facilities), | | |
| | Series A, 5.00% due 9/1/2022 - 9/1/2024 | 13,780,000 | 15,565,144 |
| | Series G, 5.00% due 11/1/2022 | 1,500,000 | 1,667,925 |
| | California State Public Works Board (Judicial Council Projects), | | |
| | Series A, 5.00% due 3/1/2023 - 3/1/2024 | 2,400,000 | 2,696,424 |
| | Series D, 5.00% due 12/1/2021 - 12/1/2022 | 4,300,000 | 4,642,323 |
| | California State Public Works Board (Laboratory Facility and San Diego Courthouse), | | |
| | Series I, | | |
| | 5.00% due 11/1/2023 | 3,000,000 | 3,440,520 |
| e | 5.00% due 11/1/2024 | 4,000,000 | 4,585,640 |
| | California State Public Works Board (University of California; Insured: Natl-Re) ETM, Series A, 5.00% due 6/1/2020 | 1,185,000 | 1,215,869 |
| | California State Public Works Board (Various State Participating Agency Capital Projects), Series A1, 5.125% due 3/1/2021 (pre-refunded 3/1/2020) | 1,635,000 | 1,662,419 |
| | California State Public Works Board (Yuba City Courthouse), Series D, 5.00% due 6/1/2022 | 1,950,000 | 2,139,364 |
| | California Statewide Communities Development Authority (CHF-Irvine, LLC), Series A, 5.00% due 5/15/2027 | 500,000 | 617,650 |
| | California Statewide Communities Development Authority (Cottage Health System), | | |
| | 4.00% due 11/1/2021 | 150,000 | 158,133 |
| | 5.00% due 11/1/2020 - 11/1/2025 | 710,000 | 806,907 |
| | California Statewide Communities Development Authority (Irvine East Campus Apartments), 5.00% due 5/15/2021 - 5/15/2027 | 2,760,000 | 3,135,692 |
| | California Statewide Communities Development Authority (Methodist Hospital of Southern California Obligated Group), 5.00% due 1/1/2020 - 1/1/2024 | 1,460,000 | 1,571,460 |
| a | California Statewide Communities Development Authority (Southern California Edison Company), 2.625% due 11/1/2033 (put 12/1/2023) | 4,895,000 | 5,108,030 |
| | Calipatria (Educational Facilities; Insured: ACA) USD GO, Series B, Zero Coupon due 8/1/2025 | 4,015,000 | 3,219,066 |
Schedule of Investments, Continued
Thornburg California Limited Term Municipal Fund | September 30, 2019
| Issuer-Description | PRINCIPAL
AMOUNT | VALUE |
| | Carson Redevelopment Successor Agency (Project Area 1) ETM, Series A, 6.00% due 10/1/2019 | $ 540,000 | $ 540,000 |
| | Carson Redevelopment Successor Agency (Redevelopment Project Area No 1; Insured: AGM), Series A, 5.00% due 10/1/2026 | 500,000 | 582,755 |
| | CDC Successor Agency of the City of Santee (Redevelopment and Low and Moderate Income Housing; Insured: BAM), Series A, 5.00% due 8/1/2025 | 550,000 | 663,812 |
| | Central Valley Financing Authority (Carson Ice) ETM, 5.25% due 7/1/2020 | 500,000 | 515,390 |
| | City and County of San Francisco (525 Golden Gate Avenue-Public Utilities Commission Office Project) COP, Series C, 5.00% due 11/1/2022 | 700,000 | 702,184 |
| | City of Antioch Public Financing Authority (Municipal Facilities Project), 5.00% due 5/1/2022 - 5/1/2024 | 1,400,000 | 1,606,134 |
| | City of Burbank (Burbank Water and Power System), Series A, 5.00% due 6/1/2020 | 625,000 | 641,238 |
| | City of Chula Vista (Capital Facilities Project) COP ETM, 5.25% due 3/1/2020 | 1,300,000 | 1,322,204 |
| | City of Chula Vista (Police Facility Project) COP, 5.00% due 10/1/2024 | 1,700,000 | 2,023,068 |
| | City of Chula Vista Financing Authority (Infrastructure, Facilities and Equipment), 5.00% due 5/1/2026 - 5/1/2027 | 3,500,000 | 4,365,680 |
| | City of Clovis (Water System Facilities; Insured: BAM), 5.00% due 3/1/2021 - 3/1/2023 | 2,270,000 | 2,496,059 |
| | City of Manteca (Water Supply System), 5.00% due 7/1/2021 - 7/1/2023 | 1,650,000 | 1,780,329 |
| | City of San Jose Financing Authority (Civic Center Project), | | |
| | Series A, | | |
| | 4.00% due 6/1/2021 | 1,000,000 | 1,048,690 |
| | 5.00% due 6/1/2020 - 6/1/2024 | 3,095,000 | 3,433,118 |
| | City of Torrance (Torrance Memorial Medical Center), Series A, 5.00% due 9/1/2020 | 1,155,000 | 1,193,150 |
| | Compton (Insured BAM) USD GO, Series B, 5.00% due 6/1/2028 - 6/1/2029 | 1,625,000 | 2,041,673 |
| c | Contra Costa Transportation Authority, Series A, 1.712% (LIBOR 1 Month + 0.25%) due 3/1/2034 (put 9/1/2021) | 7,500,000 | 7,503,375 |
| | County of Los Angeles Redevelopment Refunding Authority (Bunker Hill Project), Series C, 5.00% due 6/1/2020 - 6/1/2024 | 6,000,000 | 6,521,550 |
| | County of Monterey (Natividad Medical Center; Insured: AGM) COP, 5.25% due 8/1/2021 | 3,700,000 | 3,749,321 |
| | Delano Financing Authority (Police Station and Capital Improvements), Series A, 5.00% due 12/1/2019 | 1,195,000 | 1,202,469 |
| | Desert Sands (Educational Facilities; Insured: BAM) USD COP, 5.00% due 3/1/2020 - 3/1/2021 | 1,780,000 | 1,851,767 |
| | Downey Public Financing Authority (Public Capital Improvements), 5.00% due 12/1/2025 - 12/1/2027 | 1,445,000 | 1,806,457 |
| | Elk Grove Finance Authority (Poppy Ridge CFD No. 2003-1 and East Franklin CFD No. 2002-1), | | |
| | 4.00% due 9/1/2020 | 575,000 | 589,530 |
| | 5.00% due 9/1/2021 - 9/1/2025 | 1,200,000 | 1,385,364 |
| | Emeryville Redevelopment Agency (Emeryville and Shellmound Park Projects; Insured: AGM), Series A, 5.00% due 9/1/2022 - 9/1/2024 | 9,095,000 | 10,453,709 |
| | Fresno County (Educational Facilities; Insured: Natl-Re) USD GO, | | |
| | Series B, 5.00% due 2/1/2020 | 2,510,000 | 2,541,224 |
| | Series C, 5.90% due 8/1/2020 | 720,000 | 747,806 |
| | Guam Power Authority (Electric Power System), Series A, 5.00% due 10/1/2027 | 1,230,000 | 1,468,116 |
| | Guam Power Authority (Electric Power System; Insured: AGM), Series A, 5.00% due 10/1/2021 | 1,275,000 | 1,360,463 |
| | Guam Waterworks Authority (Water and Wastewater System), 5.00% due 7/1/2021 - 7/1/2027 | 2,735,000 | 3,102,639 |
| | Hacienda La Puente (Educational Facilities; Insured: AGM) USD COP, 5.00% due 6/1/2020 - 6/1/2025 | 3,495,000 | 3,976,819 |
| | Jurupa Public Financing Authority (Community Services District-Eastvale Area; Insured: AGM), Series A, 4.50% due 9/1/2020 | 945,000 | 973,511 |
| | La Quinta Redevelopment Agency (Redevelopment Project Areas No. 1 and 2), Series A, 5.00% due 9/1/2021 - 9/1/2023 | 4,500,000 | 5,026,190 |
| | Lodi Public Financing Authority (City Police Building and Jail), 5.00% due 10/1/2020 - 10/1/2023 | 4,145,000 | 4,445,369 |
| | Los Angeles (Educational Facilities and Information Technology Infrastructure) USD GO, | | |
| | Series B, 5.00% due 7/1/2023 | 3,000,000 | 3,409,380 |
| | Series D, 5.00% due 7/1/2022 - 7/1/2024 | 5,750,000 | 6,541,422 |
| | Los Angeles (Insured BAM-TCRS) USD GO, Series B-1, 5.00% due 7/1/2029 | 2,500,000 | 3,178,275 |
| | Los Angeles Community College District (Facilities Projects) GO, Series J, 5.00% due 8/1/2026 | 1,000,000 | 1,249,810 |
| | Los Angeles County Schools Regionalized Business Services Corp. (Insured: AMBAC) COP, Series A, Zero Coupon due 8/1/2021 | 2,135,000 | 2,064,545 |
| | Los Angeles County Schools USD, Series A-2, 3.00% due 6/1/2020 | 7,000,000 | 7,089,950 |
| | Los Angeles County, 5.00% due 6/25/2020 - 6/30/2020 | 15,000,000 | 15,419,500 |
| | Los Angeles Department of Airports AMT, | | |
| | Series A, 5.00% due 5/15/2029 | 4,000,000 | 4,796,760 |
| | Series B, 5.00% due 5/15/2025 - 5/15/2026 | 10,220,000 | 12,301,771 |
| | Los Angeles Department of Water & Power System Revenue, | | |
| f | Series A-7-REMK, 1.52% due 7/1/2035 (put 10/1/2019) | 1,185,000 | 1,185,000 |
| f | Series B-6-REMK, 1.52% due 7/1/2034 (put 10/1/2019) | 3,500,000 | 3,500,000 |
| | Los Angeles Department of Water and Power (Power System Capital Improvements), Series A, 5.00% due 7/1/2025 - 7/1/2026 | 800,000 | 979,315 |
| | Los Angeles Department of Water, Series A, 5.00% due 7/1/2027 | 1,565,000 | 2,010,242 |
| | Lynwood (Insured: AGM) USD GO, 5.00% due 8/1/2023 | 1,000,000 | 1,139,780 |
| | Manteca Community Facilities District No. 1989-2 (Educational Facilities; Insured: AGM) USD, Series F, 5.00% due 9/1/2020 - 9/1/2023 | 2,675,000 | 2,850,852 |
| | Mark West Union School District (Educational Facilities; Insured: Natl-Re) GO, 4.125% due 8/1/2020 | 670,000 | 671,662 |
| | Milpitas Redevelopment Agency (Redevelopment Project Area No. 1), 5.00% due 9/1/2025 | 2,300,000 | 2,810,186 |
| | Modesto Irrigation District (San Joaquin Valley Electric System), Series A, 5.00% due 7/1/2022 | 1,000,000 | 1,106,680 |
| | Moreno Valley Public Financing Authority (Public Improvements), 5.00% due 11/1/2024 | 1,455,000 | 1,719,315 |
| | Murrieta Valley Public Financing Authority (Educational Facilities; Insured: BAM) USD GO, 5.00% due 9/1/2023 | 1,080,000 | 1,239,937 |
| | North City West School Facilities Financing Authority (Carmel Valley; Insured: AGM), Series A, 5.00% due 9/1/2021 - 9/1/2022 | 4,415,000 | 4,818,103 |
| a | Northern California Energy Authority (Commodity Supply Revenue), Series A, 4.00% due 7/1/2049 (put 7/1/2024) | 5,000,000 | 5,436,350 |
Schedule of Investments, Continued
Thornburg California Limited Term Municipal Fund | September 30, 2019
| Issuer-Description | PRINCIPAL
AMOUNT | VALUE |
| | Oakland (County of Alameda Educational Facilities) USD GO, Series A, 5.00% due 8/1/2022 - 8/1/2025 | $ 2,745,000 | $ 3,179,848 |
| | Palomar Pomerado Health (Insured: Natl-Re) GO, Series A, Zero Coupon due 8/1/2021 | 2,850,000 | 2,764,984 |
| | Pasadena (2019 Crossover) USD GO, Series B, 5.00% due 8/1/2025 | 1,000,000 | 1,220,750 |
| | Pasadena (Educational Facilities Improvements) USD GO, 5.00% due 8/1/2024 - 8/1/2025 | 615,000 | 741,819 |
| | Pittsburg Successor Agency Redevelopment Agency (Insured: AGM), Series A, 5.00% due 9/1/2021 | 1,000,000 | 1,068,720 |
| | Pomona (Educational Facilities Improvements; Insured: Natl-Re) USD GO, Series A, 6.10% due 2/1/2020 | 465,000 | 472,435 |
| | Pomona Public Financing Authority (Facilities Improvements), Series BC, 3.00% due 6/1/2020 | �� 250,000 | 253,030 |
| | Pomona Public Financing Authority (Facilities Improvements; Insured: AGM), Series BC, 4.00% due 6/1/2024 - 6/1/2026 | 725,000 | 823,498 |
| | Rancho Santa Fe Community Services District Financing Authority, Series A, 5.00% due 9/1/2025 | 1,745,000 | 2,110,961 |
| | Redevelopment Agency of the City and County of San Francisco (Yerba Buena Center Redevelopment Project Area; Insured: AGM), 5.00% due 6/1/2020 | 1,730,000 | 1,773,544 |
| | Redevelopment Agency of the City of Rialto (Merged Project Area; Insured: BAM), Series A, 5.00% due 9/1/2023 - 9/1/2024 | 1,050,000 | 1,221,441 |
| | Regents of the University of California Medical Center Pooled Revenue, | | |
| f | Series B-1-REMK, 1.51% due 5/15/2032 (put 10/1/2019) | 2,325,000 | 2,325,000 |
| f | Series B-2-REMK, 1.45% due 5/15/2032 (put 10/1/2019) | 3,600,000 | 3,600,000 |
| f | Series K-REMK, 1.51% due 5/15/2047 (put 10/1/2019) | 1,100,000 | 1,100,000 |
| | Ridgecrest Redevelopment Agency (Redevelopment Project) ETM, 5.50% due 6/30/2020 | 1,040,000 | 1,073,415 |
| | Riverside County Infrastructure Financing Authority (Capital Improvement Projects), | | |
| | Series A, | | |
| | 4.00% due 11/1/2019 | 1,700,000 | 1,703,995 |
| | 5.00% due 11/1/2020 - 11/1/2021 | 1,205,000 | 1,275,423 |
| | Riverside County Public Financing Authority (Capital Facilities Project), | | |
| | 4.00% due 11/1/2020 | 465,000 | 479,801 |
| | 5.00% due 11/1/2019 - 11/1/2025 | 4,000,000 | 4,296,430 |
| | Riverside County Public Financing Authority, 4.00% due 5/1/2021 | 295,000 | 307,561 |
| | Riverside Financing Authority (Educational Facilities; Insured: BAM) USD, 5.00% due 9/1/2022 - 9/1/2025 | 1,245,000 | 1,449,219 |
| | Sacramento City (Educational Facilities Improvements) USD GO, 5.00% due 7/1/2021 | 3,600,000 | 3,799,080 |
| | Sacramento City (Educational Facilities Improvements; Insured: AGM) USD GO, 5.00% due 7/1/2020 - 7/1/2022 | 1,600,000 | 1,700,137 |
| | Sacramento City Schools Joint Power Financing Authority (Sacramento City USD Educational Facility Sublease; Insured: BAM), Series A, 5.00% due 3/1/2021 - 3/1/2025 | 5,360,000 | 6,017,855 |
| | Salinas Valley Solid Waste Authority AMT (Insured: AGM), Series A, 5.00% due 8/1/2023 | 1,530,000 | 1,732,817 |
| | San Diego (Educational System Capital Projects) GO, Series R-3, 5.00% due 7/1/2023 - 7/1/2024 | 8,000,000 | 9,204,620 |
| | San Diego (Educational System Capital Projects; Insured: Natl-Re) USD GO, Series D-1, 5.50% due 7/1/2020 | 1,390,000 | 1,435,467 |
| | San Francisco City and County Airports Commission (San Francisco International Airport) AMT, Series H 5.00% due 5/1/2028 | 5,000,000 | 6,262,250 |
| | San Francisco City and County Airports Commission (San Francisco International Airport), Series A, 5.00% due 5/1/2026 | 5,000,000 | 6,153,600 |
| | San Jose, Series A1, 3.50% due 10/1/2021 | 95,000 | 96,528 |
| | San Mateo County Joint Powers Financing Authority (Maple Street Correctional Center), 5.00% due 6/15/2021 - 6/15/2023 | 1,995,000 | 2,209,532 |
| | Santa Ana (Insured: Natl-Re) USD GO, Series B, Zero Coupon due 8/1/2020 | 2,035,000 | 2,010,885 |
| | Santa Clara County Financing Authority (Multiple Facilities Projects), Series P, 5.00% due 5/15/2025 | 6,755,000 | 8,190,708 |
| | Santa Margarita Water District (Talega Community Facilities), Series A, 5.00% due 9/1/2026 - 9/1/2027 | 1,050,000 | 1,327,139 |
| | Semitropic Water Storage Improvement District (Irrigation Water System; Insured: AGM), Series A, 5.00% due 12/1/2022 - 12/1/2027 | 3,535,000 | 4,229,277 |
| | South Bay/San Diego County USD GO, Zero Coupon due 8/1/2022 | 2,250,000 | 2,150,752 |
| a | Southern California Public Power Authority (Magnolia Power Project A), Series 1, 2.00% due 7/1/2036 (put 7/1/2020) | 5,000,000 | 5,013,100 |
| | Southwestern Community College District GO, Series B, 4.00% due 8/1/2024 - 8/1/2026 | 1,125,000 | 1,307,449 |
| f | State of California (Kindergarten-B1-RMKT-; LOC Citibank N.A.) GO, 1.50% due 5/1/2034 (put 10/1/2019) | 2,100,000 | 2,100,000 |
| f | State of California (LOC Barclays Bank plc) GO, Series A-1-REMK, 1.48% due 5/1/2033 (put 10/1/2019) | 2,800,000 | 2,800,000 |
| f | State of California (LOC MUFG Union Bank N.A.) GO, Series B, 1.50% due 5/1/2040 (put 10/1/2019) | 7,305,000 | 7,305,000 |
| | State of California (Various Capital Projects) GO, 5.00% due 9/1/2020 | 2,000,000 | 2,068,660 |
| | Stockton Public Financing Authority (Stockton Water Revenue; Green Bond; Insured BAM), Series A, 5.00% due 10/1/2019 - 10/1/2027 | 4,465,000 | 5,133,815 |
| | Successor Agency to the City of Colton Redevelopment Agency (Multiple Redevelopment Project Areas; Insured: BAM), 5.00% due 8/1/2021 - 8/1/2025 | 2,815,000 | 3,201,057 |
| | Successor Agency to the City of Riverside Redevelopment Agency (Multiple Redevelopment Project Areas), Series A, 5.00% due 9/1/2023 - 9/1/2024 | 2,985,000 | 3,480,639 |
| | Successor Agency to the City of San Diego Redevelopment Agency (Multiple Redevelopment Project Areas), Series A, 5.00% due 9/1/2025 - 9/1/2026 | 1,770,000 | 2,160,435 |
| | Successor Agency to the Commerce Community Development Commission (Multiple Redevelopment Project Areas; Insured: AGM), Series A, 5.00% due 8/1/2027 | 1,760,000 | 2,159,150 |
| | Successor Agency to the Community Development Agency of the City of Menlo Park (Las Pulgas Community Development Project), 5.00% due 10/1/2019 - 10/1/2020 | 725,000 | 737,337 |
| | Successor Agency to the Community Development Agency of the City of Menlo Park (Las Pulgas Community Development Project; Insured: AGM), 5.00% due 10/1/2022 - 10/1/2025 | 1,400,000 | 1,614,248 |
| | Successor Agency to the Community Redevelopment Agency of the City of Palmdale (Merged Redevelopment Project Areas), Series A, 5.00% due 9/1/2024 - 9/1/2026 | 1,600,000 | 1,929,239 |
| | Successor Agency to the Poway Redevelopment Agency (Paguay Redevelopment Project), Series A, 5.00% due 6/15/2025 | 4,665,000 | 5,667,555 |
Schedule of Investments, Continued
Thornburg California Limited Term Municipal Fund | September 30, 2019
| Issuer-Description | PRINCIPAL
AMOUNT | VALUE |
| | Successor Agency to the Rancho Cucamonga Redevelopment Project (Rancho Redevelopment Project Area; Insured: AGM), 5.00% due 9/1/2023 - 9/1/2024 | $ 3,000,000 | $ 3,510,540 |
| | Successor Agency to the Redevelopment Agency of the City and County of San Francisco (San Francisco Redevelopment Projects), Series C, 5.00% due 8/1/2020 - 8/1/2021 | 2,685,000 | 2,811,519 |
| | Successor Agency to the Redevelopment Agency of the City of San Mateo (Multiple Redevelopment Project Areas), Series A, 5.00% due 8/1/2025 | 425,000 | 517,744 |
| | Successor Agency to the Redevelopment Agency of the City of Stockton (Redevelopment of Midtown, North and South Stockton and Waterfront Areas; Insured: AGM), Series A, 5.00% due 9/1/2026 - 9/1/2027 | 2,000,000 | 2,471,950 |
| | Successor Agency to the Richmond County Redevelopment Agency (Joint Powers Financing Authority & Harbour Redevelopment Project; Insured: BAM), Series A, 5.00% due 9/1/2022 - 9/1/2024 | 1,250,000 | 1,426,847 |
| | Successor Agency to the Rosemead Community Development Commission (Rosemead Merged Project Area; Insured: BAM), 5.00% due 10/1/2020 - 10/1/2026 | 4,835,000 | 5,510,232 |
| | Temecula Valley Financing Authority (Educational Facilities; Insured: BAM) USD, 5.00% due 9/1/2020 - 9/1/2025 | 2,090,000 | 2,322,721 |
| | Temecula Valley Financing Authority (Insured BAM) USD, 5.00% due 9/1/2027 | 2,220,000 | 2,641,933 |
| | Trustees of the California State University (Educational Facilities Improvements), Series A, 5.00% due 11/1/2026 | 1,000,000 | 1,244,070 |
| | Tulare Public Financing Authority (Insured BAM), | | |
| | 4.00% due 4/1/2020 - 4/1/2022 | 725,000 | 757,210 |
| | 5.00% due 4/1/2023 - 4/1/2028 | 1,410,000 | 1,691,573 |
| | Upper Lake Union High School District (Insured: Natl-Re) GO, Series A, Zero Coupon due 8/1/2020 | 330,000 | 325,888 |
| | Ventura County Public Financing Authority (Office Building Purchase and Improvements), Series B, 5.00% due 11/1/2023 - 11/1/2024 | 1,560,000 | 1,801,349 |
| | Vista Redevelopment Agency (Vista Redevelopment Project; Insured: AGM), Series B1, 5.00% due 9/1/2020 - 9/1/2023 | 1,275,000 | 1,396,855 |
| | West Sacramento Financing Authority (Insured XLCA), Series A, 5.00% due 9/1/2020 | 1,040,000 | 1,070,878 |
| | Total Investments — 97.4%(Cost $462,600,193) | | $479,634,134 |
| | Other Assets Less Liabilities — 2.6% | | 13,045,441 |
| | Net Assets — 100.0% | | $492,679,575 |
| Footnote Legend |
| a | Variable Rate Demand Obligations are instruments whose interest rates change on a mandatory date (demand date) or whose interest rates will vary with changes in a designated base rate. The rate disclosed is the rate at September 30, 2019. |
| b | When-issued security. |
| c | Floating Rate Security. Stated interest/floor rate was in effect at September 30, 2019. |
| d | Securities exempt from registration under Rule 144A of the Securities Act of 1933, as amended. These securities are restricted and may only be resold in the ordinary course of business in transactions exempt from registration, normally to qualified institutional buyers. As of September 30, 2019, the aggregate value of these securities in the Fund’s portfolio was $4,006,640, representing 0.81% of the Fund’s net assets. |
| e | Segregated as collateral for a when-issued security. |
| f | Variable Rate Demand Notes are instruments whose interest rates change on a specific date (such as coupon date or interest payment date) or whose interest rates vary with changes in a designated base rate (such as the prime interest rate). This instrument is payable on demand and is secured by letters of credit or other credit support agreements from major banks. |
Portfolio Abbreviations
To simplify the listings of securities, abbreviations are used per the table below:
| ACA | Insured by American Capital Access |
| AGM | Insured by Assured Guaranty Municipal Corp. |
| AMBAC | Insured by American Municipal Bond Assurance Corp. |
| AMT | Alternative Minimum Tax |
| BAM | Insured by Build America Mutual Insurance Co. |
| COP | Certificates of Participation |
| ETM | Escrowed to Maturity |
| FHA | Insured by Federal Housing Administration |
| GO | General Obligation |
| HFFA | Health Facilities Financing Authority |
| LIBOR | London Interbank Offered Rates |
| LOC | Letter of Credit |
| Natl-Re | Insured by National Public Finance Guarantee Corp. |
| USD | Unified School District |
See notes to financial statements.
Statement of Assets and Liabilities
Thornburg California Limited Term Municipal Fund | September 30, 2019
| ASSETS | |
| Investments at value (cost $462,600,193) (Note 3) | $ 479,634,134 |
| Cash | 81,578 |
| Receivable for investments sold | 15,031,221 |
| Receivable for fund shares sold | 776,921 |
| Interest receivable | 4,563,268 |
| Prepaid expenses and other assets | 19,582 |
| Total Assets | 500,106,704 |
| Liabilities | |
| Payable for investments purchased | 3,796,500 |
| Payable for fund shares redeemed | 3,061,229 |
| Payable to investment advisor and other affiliates (Note 4) | 287,658 |
| Accounts payable and accrued expenses | 149,289 |
| Dividends payable | 132,453 |
| Total Liabilities | 7,427,129 |
| Net Assets | $ 492,679,575 |
| NET ASSETS CONSIST OF | |
| Distributable earnings | $ 12,453,339 |
| Net capital paid in on shares of beneficial interest | 480,226,236 |
| | $ 492,679,575 |
| NET ASSET VALUE | |
| Class A Shares: | |
Net asset value and redemption price per share
($113,635,267 applicable to 8,285,437 shares of beneficial interest outstanding - Note 5) | $ 13.72 |
| Maximum sales charge, 1.50% of offering price | 0.21 |
| Maximum offering price per share | $ 13.93 |
| Class C Shares: | |
Net asset value and offering price per share*
($28,082,706 applicable to 2,045,679 shares of beneficial interest outstanding - Note 5) | $ 13.73 |
| Class I Shares: | |
Net asset value, offering and redemption price per share
($350,961,602 applicable to 25,563,037 shares of beneficial interest outstanding - Note 5) | $ 13.73 |
| * | Redemption price per share is equal to net asset value less any applicable contingent deferred sales charge. |
See notes to financial statements.
Statement of Operations
Thornburg California Limited Term Municipal Fund | Year Ended September 30, 2019
| INVESTMENT INCOME | |
| Interest income (net of premium amortized of $7,272,540) | $ 12,617,193 |
| EXPENSES | |
| Investment advisory fees (Note 4) | 2,509,978 |
| Administration fees (Note 4) | |
| Class A Shares | 103,965 |
| Class C Shares | 30,392 |
| Class I Shares | 307,438 |
| Distribution and service fees (Note 4) | |
| Class A Shares | 295,710 |
| Class C Shares | 172,956 |
| Transfer agent fees | |
| Class A Shares | 55,812 |
| Class C Shares | 23,014 |
| Class I Shares | 189,928 |
| Registration and filing fees | |
| Class A Shares | 7,303 |
| Class C Shares | 5,775 |
| Class I Shares | 9,633 |
| Custodian fees | 58,885 |
| Professional fees | 54,139 |
| Trustee and officer fees (Note 4) | 31,370 |
| Other expenses | 46,900 |
| Total Expenses | 3,903,198 |
| Less: | |
| Expenses reimbursed by investment advisor (Note 4) | (40,418) |
| Net Expenses | 3,862,780 |
| Net Investment Income | $ 8,754,413 |
| REALIZED AND UNREALIZED GAIN (LOSS) | |
| Net realized gain (loss) on investments | (967,268) |
| Net change in unrealized appreciation (depreciation) on investments | 10,697,992 |
| Net Realized and Unrealized Gain | 9,730,724 |
| Net Increase in Net Assets Resulting from Operations | $ 18,485,137 |
See notes to financial statements.
Statements of Changes in Net Assets
Thornburg California Limited Term Municipal Fund
| | Year Ended
September 30, 2019 | Year Ended
September 30, 2018 |
| INCREASE (DECREASE) IN NET ASSETS FROM | | |
| OPERATIONS | | |
| Net investment income | $ 8,754,413 | $ 9,698,816 |
| Net realized gain (loss) on investments | (967,268) | (1,747,276) |
| Net change in unrealized appreciation (depreciation) on investments | 10,697,992 | (12,993,888) |
| Net Increase (Decrease) in Net Assets Resulting from Operations | 18,485,137 | (5,042,348) |
| DIVIDENDS TO SHAREHOLDERS | | |
| From distributable earnings | | |
| Class A Shares | (1,870,732) | (2,112,942) |
| Class C Shares | (451,533) | (604,775) |
| Class I Shares | (6,432,174) | (6,981,099) |
| FUND SHARE TRANSACTIONS (NOTE 5) | | |
| Class A Shares | (15,984,630) | (27,285,984) |
| Class C Shares | (13,246,225) | (14,914,594) |
| Class I Shares | (24,597,797) | (56,019,128) |
| Net Decrease in Net Assets | (44,097,954) | (112,960,870) |
| NET ASSETS | | |
| Beginning of Year | 536,777,529 | 649,738,399 |
| End of Year | $ 492,679,575 | $ 536,777,529 |
See notes to financial statements.
Notes to Financial Statements
Thornburg California Limited Term Municipal Fund | September 30, 2019
NOTE 1 – ORGANIZATION
Thornburg California Limited Term Municipal Fund (the “Fund”) is a diversified series of Thornburg Investment Trust (the “Trust”). The Trust was organized as a Massachusetts business trust under a Declaration of Trust dated June 3, 1987 and is registered as a diversified, open-end management investment company under the Investment Company Act of 1940, as amended (the "1940 Act"). The Fund is currently one of twenty-two separate series of the Trust. Each series is considered to be a separate entity for financial reporting and tax purposes and bears expenses directly attributable to it. The Fund’s primary investment objective is to obtain as high a level of current income exempt from federal and California state individual income tax as is consistent, in the view of Thornburg Investment Management, Inc., the Trust’s investment advisor (the “Advisor”), with the preservation of capital. The Fund’s secondary objective is to reduce expected changes in its share price compared to longer intermediate and long-term bond portfolios.
The Fund currently offers three classes of shares of beneficial interest: Class A, Class C, and Institutional Class (“Class I”). Each class of shares of the Fund represents an interest in the same portfolio of investments, except that (i) Class A shares are sold subject to a front-end sales charge collected at the time the shares are purchased and bear a service fee, (ii) Class C shares are sold at net asset value without a sales charge at the time of purchase, but are subject to a contingent deferred sales charge upon redemption within one year of purchase, and bear both a service fee and a distribution fee, (iii) Class I shares are sold at net asset value without a sales charge at the time of purchase and may be subject to a service fee, and (iv) the respective classes may have different reinvestment privileges and conversion rights. Additionally, the Fund may allocate among its classes certain expenses, to the extent allocable to specific classes, including administration fees, transfer agent fees, government registration fees, certain printing and postage costs, and administrative and legal expenses. Currently, class specific expenses of the Fund are limited to service and distribution fees and certain registration and transfer agent expenses.
The following is a summary of significant accounting policies followed by the Fund in the preparation of its financial statements. The Fund prepares its financial statements in conformity with United States generally accepted accounting principles (“GAAP”), including investment company accounting and reporting guidance in the Financial Accounting Standards Board (the “FASB”) Accounting Standard Codification Topic 946.
NOTE 2 – SIGNIFICANT ACCOUNTING POLICIES
Security Valuation: All investments in securities held by the Fund are valued as described in Note 3.
Allocation of Income, Gains, Losses and Expenses: Net investment income (other than class specific expenses) and realized and unrealized gains and losses are allocated daily to each class of shares based upon the relative net asset value of outstanding shares (or the value of the dividend-eligible shares, as appropriate) of each class of shares at the beginning of the day (after adjusting for the current capital shares activity of the respective class). Expenses common to all Funds are allocated among the Funds comprising the Trust based upon their relative net asset values or other appropriate allocation methods. Operating expenses directly attributable to a specific class are charged against the operating income of that class.
Dividends and Distributions to Shareholders: Dividends and distributions to shareholders, which are determined in accordance with federal income tax regulations and may differ from GAAP, are recorded on the ex-dividend date. Ordinary income dividends, if any, are declared daily and paid monthly. Capital gain distributions, if any, are declared and paid annually and more often if deemed necessary by the Advisor. Dividends and distributions are paid and are reinvested in additional shares of the Fund at net asset value per share at the close of business on the ex-dividend date, or at the shareholder’s option, paid in cash.
Investment Income: Interest income is accrued as earned. Premiums and discounts are amortized and accreted, respectively, to first call dates or maturity dates using the effective yield method of the respective investments. These amounts are included in Investment Income in the Statement of Operations.
Investment Transactions: Investment transactions are accounted for on a trade date basis. Realized gains and losses from the sale of investments are recorded on an identified cost basis.
When-Issued and Delayed Delivery Transactions: The Fund may engage in when-issued or delayed delivery transactions. To the extent the Fund engages in such transactions, it will do so for the purpose of acquiring portfolio investments consistent with the Fund’s investment objectives and not for the purpose of investment leverage or to speculate on interest rate or market changes. At the time the Fund makes a commitment to purchase an investment on a when-issued or delayed delivery basis, the Fund will record the transaction and reflect the value in determining its net asset value. When effecting such transactions, assets of an amount sufficient to make payment for the portfolio investments to be purchased will be segregated on the Fund’s records on the trade date. Investments purchased on a when-issued or delayed delivery basis do not earn interest until the settlement date. The values of these securities held at September 30, 2019 are detailed in the Schedule of Investments.
Notes to Financial Statements, Continued
Thornburg California Limited Term Municipal Fund | September 30, 2019
Guarantees and Indemnifications: Under the Trust’s organizational documents (and under separate agreements with the independent Trustees), its officers and Trustees are provided with an indemnification against certain liabilities arising out of the performance of their duties to the Fund. In the normal course of business the Trust may also enter into contracts with service providers that contain general indemnifications. The Trust’s maximum exposure under these arrangements is unknown. However, based on experience, the Trust expects the risk of loss to be remote.
Use of Estimates: The preparation of financial statements in conformity with GAAP requires management to make estimates and assumptions that affect the reported amounts of assets and liabilities and disclosure of contingent assets and liabilities at the date of the financial statements and the reported amounts of increases (decreases) in net assets from operations during the reporting period. Actual results could differ from those estimates.
Federal Income Taxes: It is the policy of the Trust to comply with the provisions of the Internal Revenue Code applicable to regulated investment companies and to distribute to shareholders substantially all investment company taxable income including net realized gains on investments (if any), and tax exempt income of the Fund. Therefore, no provision for federal income or excise tax is required.
The Fund files income tax returns in United States federal and applicable state jurisdictions. The statute of limitations on the Fund’s tax return filings generally remains open for the three years following a return’s filing date. The Fund has analyzed each uncertain tax position believed to be material in the preparation of the Fund’s financial statements for the fiscal year ended September 30, 2019, including open tax years, to assess whether it is more likely than not that the position would be sustained upon examination, based on the technical merits of the position. The Fund has not identified any such position for which an asset or liability must be reflected in the Statement of Assets and Liabilities.
At September 30, 2019, information on the tax components of capital was as follows:
| Cost of investments for tax purposes | $ 462,600,193 |
| Gross unrealized appreciation on a tax basis | 17,071,902 |
| Gross unrealized depreciation on a tax basis | (37,961) |
| Net unrealized appreciation (depreciation) on investments (tax basis) | $ 17,033,941 |
At September 30, 2019, the Fund had deferred tax basis capital losses occurring subsequent to October 31, 2018 through September 30, 2019 of $967,307. For tax purposes, such losses will be recognized in the year ending September 30, 2020.
At September 30, 2019, the Fund had cumulative tax basis capital losses of $3,615,671 (of which $2,809,058 are short-term and $806,613 are long-term), which may be carried forward to offset future capital gains. To the extent such carryforwards are used, capital gain distributions may be reduced to the extent provided by regulations. Such capital loss carryforwards do not expire.
At September 30, 2019, the Fund had $134,831 of undistributed net tax-exempt income, no undistributed tax basis net ordinary income and no undistributed tax basis capital gains.
Distributions from tax exempt income paid by the Fund for the year ended September 30, 2019 and September 30, 2018 are excludable by shareholders from gross income for Federal income tax purposes.
The tax character of distributions paid during the year ended September 30, 2019, and September 30, 2018, was as follows:
| | 2019 | 2018 |
| Distributions from: | | |
| Tax exempt income | $ 8,752,440 | $ 9,695,219 |
| Ordinary income | 1,999 | 3,597 |
| Total | $ 8,754,439 | $ 9,698,816 |
NOTE 3 – SECURITY VALUATION
Valuation of the Fund’s portfolio investment securities is performed in accordance with policies and procedures adopted by and under the oversight of the Trustees.
The Trustees of the Trust have appointed the Advisor to assist the Trustees with obtaining fair market values for portfolio investments, evaluating and monitoring professional pricing service providers appointed by the Trustees’ Audit Committee (the “Audit Committee”) to assist in determining fair values for portfolio investments, assisting in calculating fair values for portfolio investments in certain
Notes to Financial Statements, Continued
Thornburg California Limited Term Municipal Fund | September 30, 2019
circumstances, and performing other functions in connection with the valuation of investments. The Advisor acts through its Valuation and Pricing Committee (the “Committee”) and other employees of the Advisor. The Committee regularly reviews its own valuation calculations, reviews the valuations, valuation techniques and services furnished by pricing service providers, considers circumstances which may require valuation calculations by the Committee, and reviews previous valuation calculations. The Committee reports to the Audit Committee on the Committee’s activities, the performance of pricing service providers, and other matters relating to valuation of portfolio investments.
In those instances when the Committee assists in calculating a fair value for a portfolio investment, the Committee seeks to determine the price that the Fund would reasonably expect to receive upon a sale of the investment in an orderly transaction between market participants on the valuation date. The Committee customarily utilizes quotations from securities broker dealers in calculating valuations, but also may utilize prices obtained from pricing service providers or other methods approved by the Audit Committee. Because fair values calculated by the Committee are estimates, the calculation of a value for an investment may differ from the price that would be realized by the Fund upon a sale of the investment, and the difference could be material to the Fund’s financial statements. The Committee’s calculation of a fair value for an investment may also differ from the prices obtained by other persons (including other mutual funds) for the investment.
Valuation of Securities: Debt obligations held by the Fund which are not listed or traded on exchanges or for which no reported market exists are ordinarily valued at the valuation obtained from a pricing service provider approved by the Audit Committee.
In any case when a pricing service provider fails to provide a valuation for a debt obligation held by the Fund, the Committee calculates a fair value for the obligation using alternative methods under procedures approved by the Audit Committee. Additionally, in cases when management believes that a valuation obtained from a pricing service provider is stale, does not reflect material factors affecting the valuation of the investment, is significantly different than the value the Fund is likely to obtain if it sought a bid for the investment, or is otherwise unreliable, the Committee calculates a fair value for the obligation using an alternative method approved by the Audit Committee.
Valuation Hierarchy: The Fund categorizes its investments based upon the inputs used in valuing those investments, according to a three-level hierarchy established in guidance from the FASB. Categorization of investments using this hierarchy is intended by the FASB to maximize the use of observable inputs in valuing investments and minimize the use of unobservable inputs by requiring that the most observable inputs be used when available. Observable inputs are those that market participants would use in valuing an investment based on available market information. Unobservable inputs are those that reflect assumptions about the information market participants would use in valuing an investment. An investment’s level within the hierarchy is based on the lowest level input that is deemed significant to the valuation. The methodologies and inputs used to value investments are not necessarily indications of the risk or liquidity associated with those investments.
Various inputs are used in calculating valuations for the Fund’s investments. These inputs are generally summarized according to the three-level hierarchy below:
Level 1: Quoted prices in active markets for identical investments.
Level 2: Other direct or indirect significant observable inputs (including quoted prices for similar investments in active markets and other observable inputs, such as interest rates, prepayment rates, credit ratings, etc.).
Level 3: Significant unobservable inputs (including the Committee’s own assumptions in calculating the fair values of investments).
Valuations for debt obligations held by the Fund are typically calculated by pricing service providers approved by the Audit Committee and are generally characterized as Level 2 within the valuation hierarchy.
In a limited number of cases the Committee calculates a fair value for investments using broker quotations or other methods approved by the Audit Committee. When the Committee uses a single broker quotation to calculate a fair value for an investment without other significant observable inputs, or if a fair value is calculated using other significant inputs that are considered unobservable, the investment is characterized as Level 3 within the hierarchy. Other significant unobservable inputs used to calculate a fair value in these instances might include an income-based valuation approach which considers discounted anticipated future cash flows from the investment and application of discounts due to the nature or duration of any restrictions on the disposition of the investment.
Valuations based upon the use of inputs from Levels 1, 2 or 3 may not represent the actual price received upon the disposition of an investment, and a Fund may receive a price that is lower than the valuation based upon these inputs when it sells the investment.
Notes to Financial Statements, Continued
Thornburg California Limited Term Municipal Fund | September 30, 2019
The following table displays a summary of the fair value hierarchy measurements of the Fund’s investments as of September 30, 2019:
| | Fair Value Measurements at September 30, 2019 |
| | TOTAL | LEVEL 1 | LEVEL 2 | LEVEL 3 |
| Assets | | | | |
| Investments in Securities | | | | |
| Municipal Bonds | $ 479,634,134 | $ — | $ 479,634,134 | $ — |
| Total Investments in Securities | $479,634,134 | $— | $479,634,134 | $— |
| Total Assets | $479,634,134 | $— | $479,634,134 | $— |
NOTE 4 – INVESTMENT ADVISORY FEE AND OTHER TRANSACTIONS WITH AFFILIATES
Pursuant to an investment advisory agreement, the Advisor serves as the investment advisor and performs services for the Fund for which the fees are payable at the end of each month. Under the investment advisory agreement, the Fund pays the Advisor a management fee based on the average daily net assets of the Fund at an annual rate as shown in the following table:
| Management Fee Schedule |
| DAILY NET ASSETS | FEE RATE |
| Up to $500 million | 0.500% |
| Next $500 million | 0.400 |
| Next $500 million | 0.300 |
| Next $500 million | 0.250 |
| Over $2 billion | 0.225 |
The Fund’s effective management fee for the year ended September 30, 2019 was 0.499% of the Fund’s average daily net assets. Total management fees incurred by the Fund for the year ended September 30, 2019 are set forth in the Statement of Operations.
The Trust has entered into an administrative services agreement with the Advisor, whereby the Advisor will perform certain administrative services related to each class of the Fund’s shares. The fees are computed as an annual percentage of the aggregate average daily net assets of all shares classes of all Funds in the Trust as follows:
| Administration Fee Schedule |
| Daily Net Assets | Fee Rate |
| Up to $20 billion | 0.100% |
| $20 billion to $40 billion | 0.075 |
| $40 billion to $60 billion | 0.040 |
| Over $60 billion | 0.030 |
The aggregate fee amount is allocated on a daily basis to each Fund based on net assets and subsequently allocated to each class of shares of the Fund. Total administrative service fees incurred by each class of shares of the Fund for the year ended September 30, 2019, are set forth in the Statement of Operations.
The Trust has an underwriting agreement with Thornburg Securities Corporation (the “Distributor”), an affiliate of the Advisor, which acts as the distributor of the Fund’s shares. For the year ended September 30, 2019, the Distributor has advised the Fund that it earned net commissions aggregating $867 from the sale of Class A shares, and collected contingent deferred sales charges aggregating $715 from redemptions of Class C shares of the Fund.
Pursuant to a service plan under Rule 12b-1 of the 1940 Act, the Fund may pay to the Distributor or securities dealers and other financial institutions at the Distributor’s direction an amount not to exceed .25 of 1% per annum of the average daily net assets attributable to Class A and Class C shares of the Fund to obtain various shareholder and distribution related services. For the year ended September 30, 2019, there were no 12b-1 service plan fees charged for Class I shares. The Advisor and Distributor each may pay out of its own resources additional expenses for distribution of the Fund’s shares and shareholder services.
The Trust has also adopted a distribution plan pursuant to Rule 12b-1, applicable only to the Fund’s Class C shares, under which the Fund compensates the Distributor for services in promoting the sale of Class C shares of the Fund at an annual rate of up to .25 of 1% per annum of the average daily net assets attributable to Class C shares.
Notes to Financial Statements, Continued
Thornburg California Limited Term Municipal Fund | September 30, 2019
Total fees incurred by each class of shares of the Fund under their respective service and distribution plans for the year ended September 30, 2019, are set forth in the Statement of Operations.
For the year ended September 30, 2019, the Advisor voluntarily reimbursed certain class specific expenses and distribution fees of $40,418 for Class I shares.
Certain officers and Trustees of the Trust are also officers or directors of the Advisor and Distributor. The compensation of the independent Trustees is borne by the Trust. The Trust also pays a portion of the Chief Compliance Officer’s compensation. These amounts are reflected as Trustee and officer fees in the Statement of Operations.
The Fund may purchase or sell securities from or to an affiliated fund, provided the affiliation is due solely to having a common investment advisor, common officers, or common trustees, and provided that all such transactions will comply with Rule 17a-7 under the 1940 Act. For the year ended September 30, 2019, the Fund had transactions with affiliated funds of $11,385,000 in purchases and $2,000,000 in sales generating no realized gains or losses.
NOTE 5 – SHARES OF BENEFICIAL INTEREST
At September 30, 2019, there were an unlimited number of shares with no par value of beneficial interest authorized. Transactions in shares of beneficial interest were as follows:
| | YEAR ENDED
September 30, 2019 | YEAR ENDED
September 30, 2018 |
| | SHARES | AMOUNT | SHARES | AMOUNT |
| Class A Shares | | | | |
| Shares sold | 1,166,943 | $ 15,894,863 | 2,057,216 | $ 27,886,865 |
Shares issued to shareholders in
reinvestment of dividends | 124,346 | 1,692,823 | 137,683 | 1,865,179 |
| Shares repurchased | (2,474,418) | (33,572,316) | (4,205,146) | (57,038,028) |
| Net decrease | (1,183,129) | $ (15,984,630) | (2,010,247) | $ (27,285,984) |
| Class C Shares | | | | |
| Shares sold | 152,314 | $ 2,075,247 | 155,781 | $ 2,117,566 |
Shares issued to shareholders in
reinvestment of dividends | 25,843 | 351,865 | 36,042 | 488,741 |
| Shares repurchased | (1,149,285) | (15,673,337) | (1,289,977) | (17,520,901) |
| Net decrease | (971,128) | $ (13,246,225) | (1,098,154) | $ (14,914,594) |
| Class I Shares | | | | |
| Shares sold | 8,778,679 | $ 119,359,166 | 10,542,473 | $ 143,344,996 |
Shares issued to shareholders in
reinvestment of dividends | 361,463 | 4,927,943 | 391,001 | 5,304,088 |
| Shares repurchased | (10,973,012) | (148,884,906) | (15,071,222) | (204,668,212) |
| Net decrease | (1,832,870) | $ (24,597,797) | (4,137,748) | $ (56,019,128) |
NOTE 6 – INVESTMENT TRANSACTIONS
For the year ended September 30, 2019, the Fund had purchase and sale transactions of investments (excluding short-term investments) of $81,622,973 and $108,029,772, respectively.
NOTE 7 – RECENT ACCOUNTING PRONOUNCEMENTS
In August 2018, the FASB issued ASU 2018-13, Fair Value Measurement (Topic 820): Changes to the Disclosure Requirements for Fair Value Measurement, which adds, removes, and modifies certain aspects of the fair value disclosure. ASU 2018-13 is effective for annual periods beginning after December 15, 2019, and early adoption is permitted. The Funds have elected to early adopt, and had applied ASU 2018-13 for the fiscal year ended September 30, 2019. The adoption of this accounting guidance did not have a material impact on the Funds’ financial statements.
Notes to Financial Statements, Continued
Thornburg California Limited Term Municipal Fund | September 30, 2019
In March 2017, the FASB issued Accounting Standards Update (ASU) 2017-08, Premium Amortization of Purchased Callable Debt Securities. The amendments in the ASU shorten the premium amortization period on a purchased callable debt security from the security’s contractual life to the earliest call date. It is anticipated that this change will enhance disclosures by reducing losses recognized when a security is called on an earlier date. This ASU is effective for fiscal years beginning after December 15, 2018. Management has evaluated the implications of these changes and the amendments will have no material effect on the Funds’ net assets or results of operations.
OTHER NOTES
Risks: The Fund’s investments subject it to risks including, but not limited to, management risk, interest rate risk, credit risk, market and economic risk, liquidity risk, and single state risk. Please see the Fund’s prospectus for a discussion of the risks associated with an investment in the Fund.
Subsequent Events: Fund management believes no events have occurred between September 30, 2019 and the date of issuance of the financial statements that require adjustment to or disclosure in the accompanying financial statements.
This page intentionally left blank.
Financial Highlights
Thornburg California Limited Term Municipal Fund
| | PER SHARE PERFORMANCE (FOR A SHARE OUTSTANDING THROUGHOUT THE YEAR) |
UNLESS OTHERWISE
NOTED, PERIODS ARE
FISCAL YEARS ENDED
SEPTEMBER 30, | Net Asset
Value,
Beginning of
YEAR | Net
Investment
Income
(Loss)+ | Net Realized &
Unrealized Gain
(Loss) on
Investments | Total from
Investment
Operations | Dividends
from Net
Investment
Income | Dividends
from Net
Realized
Gains | Total
Dividends | Net Asset
Value,
End of YEAR |
| CLASS A SHARES(b) |
| 2019 | $ 13.45 | 0.22 | 0.27 | 0.49 | (0.22) | — | (0.22) | $ 13.72 |
| 2018 | $ 13.78 | 0.20 | (0.33) | (0.13) | (0.20) | — | (0.20) | $ 13.45 |
| 2017 | $ 13.98 | 0.18 | (0.20) | (0.02) | (0.18) | — | (0.18) | $ 13.78 |
| 2016 | $ 13.84 | 0.18 | 0.14 | 0.32 | (0.18) | — | (0.18) | $ 13.98 |
| 2015 | $ 13.84 | 0.19 | —(c) | 0.19 | (0.19) | — | (0.19) | $ 13.84 |
| CLASS C SHARES |
| 2019 | $ 13.46 | 0.18 | 0.27 | 0.45 | (0.18) | — | (0.18) | $ 13.73 |
| 2018 | $ 13.79 | 0.17 | (0.33) | (0.16) | (0.17) | — | (0.17) | $ 13.46 |
| 2017 | $ 13.99 | 0.15 | (0.20) | (0.05) | (0.15) | — | (0.15) | $ 13.79 |
| 2016 | $ 13.85 | 0.14 | 0.14 | 0.28 | (0.14) | — | (0.14) | $ 13.99 |
| 2015 | $ 13.85 | 0.16 | —(c) | 0.16 | (0.16) | — | (0.16) | $ 13.85 |
| CLASS I SHARES |
| 2019 | $ 13.46 | 0.25 | 0.27 | 0.52 | (0.25) | — | (0.25) | $ 13.73 |
| 2018 | $ 13.79 | 0.24 | (0.33) | (0.09) | (0.24) | — | (0.24) | $ 13.46 |
| 2017 | $ 13.99 | 0.22 | (0.20) | 0.02 | (0.22) | — | (0.22) | $ 13.79 |
| 2016 | $ 13.85 | 0.22 | 0.14 | 0.36 | (0.22) | — | (0.22) | $ 13.99 |
| 2015 | $ 13.85 | 0.24 | —(c) | 0.24 | (0.24) | — | (0.24) | $ 13.85 |
| (a) | Not annualized for periods less than one year. |
| (b) | Sales loads are not reflected in computing total return. |
| (c) | Net realized and unrealized gain (loss) on investments was less than $0.01 per share. |
| + | Based on weighted average shares outstanding. |
See notes to financial statements.
Financial Highlights, Continued
Thornburg California Limited Term Municipal Fund
| RATIOS TO AVERAGE NET ASSETS | | SUPPLEMENTAL DATA |
Net Investment
Income (Loss) (%) | Expenses, After
Expense
Reductions (%) | Expenses,
Before Expense
Reductions (%) | | Total
Return (%)(a) | Portfolio
Turnover
Rate (%)(a) | Net Assets
at End of YEAR
(Thousands) |
| |
| 1.58 | 0.93 | 0.93 | | 3.63 | 17.86 | $ 113,635 |
| 1.50 | 0.92 | 0.92 | | (0.92) | 25.20 | $ 127,346 |
| 1.33 | 0.93 | 0.93 | | (0.11) | 18.25 | $ 158,142 |
| 1.28 | 0.93 | 0.93 | | 2.32 | 16.47 | $ 193,321 |
| 1.39 | 0.94 | 0.94 | | 1.40 | 14.43 | $ 171,344 |
| |
| 1.31 | 1.21 | 1.21 | | 3.34 | 17.86 | $ 28,083 |
| 1.23 | 1.19 | 1.19 | | (1.18) | 25.20 | $ 40,608 |
| 1.08 | 1.19 | 1.19 | | (0.36) | 18.25 | $ 56,737 |
| 1.04 | 1.18 | 1.18 | | 2.06 | 16.47 | $ 68,229 |
| 1.15 | 1.18 | 1.18 | | 1.15 | 14.43 | $ 64,216 |
| |
| 1.84 | 0.67 | 0.68 | | 3.90 | 17.86 | $ 350,962 |
| 1.76 | 0.66 | 0.67 | | (0.65) | 25.20 | $ 368,824 |
| 1.62 | 0.64 | 0.64 | | 0.19 | 18.25 | $ 434,859 |
| 1.60 | 0.62 | 0.62 | | 2.64 | 16.47 | $ 476,364 |
| 1.70 | 0.63 | 0.63 | | 1.72 | 14.43 | $ 407,557 |
Report of Independent Registered Public Accounting Firm
Thornburg California Limited Term Municipal Fund
To the Board of Trustees of Thornburg Investment Trust and Shareholders of
Thornburg California Limited Term Municipal Fund
Opinion on the Financial Statements
We have audited the accompanying statement of assets and liabilities, including the schedule of investments, of Thornburg California Limited Term Municipal Fund (one of the funds constituting Thornburg Investment Trust, referred to hereafter as the "Fund") as of September 30, 2019, the related statement of operations for the year ended September 30, 2019, the statements of changes in net assets for each of the two years in the period ended September 30, 2019, including the related notes, and the financial highlights for each of the five years in the period ended September 30, 2019 (collectively referred to as the “financial statements”). In our opinion, the financial statements present fairly, in all material respects, the financial position of the Fund as of September 30, 2019, the results of its operations for the year then ended, the changes in its net assets for each of the two years in the period ended September 30, 2019 and the financial highlights for each of the five years in the period ended September 30, 2019 in conformity with accounting principles generally accepted in the United States of America.
Basis for Opinion
These financial statements are the responsibility of the Fund’s management. Our responsibility is to express an opinion on the Fund’s financial statements based on our audits. We are a public accounting firm registered with the Public Company Accounting Oversight Board (United States) (PCAOB) and are required to be independent with respect to the Fund in accordance with the U.S. federal securities laws and the applicable rules and regulations of the Securities and Exchange Commission and the PCAOB.
We conducted our audits of these financial statements in accordance with the standards of the PCAOB. Those standards require that we plan and perform the audit to obtain reasonable assurance about whether the financial statements are free of material misstatement, whether due to error or fraud.
Our audits included performing procedures to assess the risks of material misstatement of the financial statements, whether due to error or fraud, and performing procedures that respond to those risks. Such procedures included examining, on a test basis, evidence regarding the amounts and disclosures in the financial statements. Our audits also included evaluating the accounting principles used and significant estimates made by management, as well as evaluating the overall presentation of the financial statements. Our procedures included confirmation of securities owned as of September 30, 2019 by correspondence with the custodian and brokers. We believe that our audits provide a reasonable basis for our opinion.
/s/PricewaterhouseCoopers LLP
New York, New York
November 22, 2019
We have served as the auditor of one or more investment companies in Thornburg Investment Trust since 1999.
Expense Example
Thornburg California Limited Term Municipal Fund | September 30, 2019 (Unaudited)
As a shareholder of the Fund, you incur two types of costs:
| (1) | transaction costs, including |
| (a) | sales charges (loads) on purchase payments, for Class A shares; |
| (b) | a deferred sales charge on redemptions of any part or all of a purchase of $1 million of Class A shares within 12 months of purchase; |
| (c) | a deferred sales charge on redemptions of Class C shares within 12 months of purchase; |
| (2) | ongoing costs, including management fees; distribution and/or service (12b-1) fees; and other Fund expenses. |
This example is intended to help you understand your ongoing costs (in dollars) of investing in the Fund and to compare these costs with the ongoing costs of investing in other mutual funds.
The example is based on a $1,000 investment beginning on April 1, 2019, and held until September 30, 2019.
| | BEGINNING
ACCOUNT VALUE
4/1/19 | ENDING
ACCOUNT VALUE
9/30/19 | EXPENSES PAID
DURING PERIOD†
4/1/19—9/30/19 |
| CLASS A SHARES |
| Actual | $1,000.00 | $1,014.44 | $4.65 |
| Hypothetical* | $1,000.00 | $1,020.46 | $4.66 |
| CLASS C SHARES |
| Actual | $1,000.00 | $1,013.00 | $6.06 |
| Hypothetical* | $1,000.00 | $1,019.05 | $6.07 |
| CLASS I SHARES |
| Actual | $1,000.00 | $1,015.70 | $3.39 |
| Hypothetical* | $1,000.00 | $1,021.71 | $3.40 |
| † | Expenses are equal to the annualized expense ratio for each class (A: 0.92%; C: 1.20%; I: 0.67%) multiplied by the average account value over the period, multiplied by 183/365 to reflect the one-half year period. |
| * | Hypothetical assumes a rate of return of 5% per year before expenses. |
ACTUAL EXPENSES
For each class of shares, the first line of the accompanying table provides information about actual account values and actual expenses. You may use the information in this line, together with the amount you invested, to estimate the expenses that you paid over the period. Simply divide your account value by $1,000 (for example, an $8,600 account value divided by $1,000 = 8.6), then multiply the result by the number in the first line for your class of shares under the heading entitled “Expenses Paid During Period” to estimate the expenses you paid on your account during this period.
HYPOTHETICAL EXAMPLE FOR COMPARISON PURPOSES
For each class of shares, the second line of the accompanying table provides information about hypothetical account values and hypothetical expenses based on the Fund’s actual expense ratio and an assumed rate of return of 5% per year before expenses, which is not the Fund’s actual return. The hypothetical account values and expenses may not be used to estimate the actual ending account balance or expenses you paid for the period. You may use this information to compare the ongoing costs of investing in the Fund and other funds. To do so, compare this 5% hypothetical example with the 5% hypothetical examples that appear in the shareholder reports of the other funds.
Please note that the expenses shown in the table are meant to highlight your ongoing costs only and do not reflect any transactional costs, such as sales charges (loads), redemption fees, or exchange fees. Therefore, the second line of the table for each class of shares is useful in comparing ongoing costs only, and will not help you determine the relative total costs of owning different funds. In addition, if these transactional costs were included, your costs would have been higher.
Trustees and Officers
Thornburg California Limited Term Municipal Fund | September 30, 2019 (Unaudited)
NAME, AGE, YEAR ELECTED
POSITION HELD WITH FUND | PRINCIPAL OCCUPATION(S) DURING PAST FIVE YEARS | OTHER DIRECTORSHIPS
HELD BY TRUSTEE |
| INTERESTED TRUSTEES(1)(2) |
Garrett Thornburg, 73
Trustee since 1984,
Chairman of Trustees(3) | Chairman and controlling shareholder of Thornburg Investment Management, Inc. (investment advisor); Chairman and controlling shareholder of Thornburg Securities Corporation (securities dealer); President of the Thornburg Foundation (nonprofit). | None |
Brian J. McMahon, 64
Trustee since 2001,
Vice Chairman of Trustees,
Member of Governance and
Nominating Committee &
Operations Risk Oversight
Committee(4) | Vice Chairman, Chief Investment Strategist, Managing Director, and Portfolio Manager and, until 2016, CEO and President of Thornburg Investment Management, Inc.; Vice President of Thornburg Securities Corporation. | None |
| INDEPENDENT TRUSTEES(1)(2)(5) |
David A. Ater, 74
Trustee since 1994,
Lead Independent Trustee,
Chairman of Governance and
Nominating Committee &
Member of Audit Committee | Principal in Ater & Associates, Santa Fe, NM (developer, planner and broker of residential and commercial real estate); owner, developer and broker for various real estate projects. | None |
Sally Corning, 58
Trustee since 2012,
Chairman of Audit Committee | Partner in Sun Mountain Capital, Santa Fe, NM (private equity firm with investment programs encompassing venture capital, mezzanine debt, and growth equity). | None |
Susan H. Dubin, 70
Trustee since 2004,
Member of Audit
Committee & Governance
and Nominating Committee | President of Dubin Investments, Ltd., Greenwich, CT (private investment fund); Director and officer of various charitable organizations. | None |
David L. Gardner, 56
Trustee since 2015,
Member of Operations Risk
Oversight Committee | Until 2012, head of EMEA (Europe, Middle East and Africa) Sales for iShares of Blackrock, Inc., EMEA Executive Committee Member and EMEA Operating Committee Member at Blackrock, Inc. | None |
Patrick J. Talamantes, 55
Trustee since 2019,
Member of Audit Committee | President of Talamantes Strategies, LLC, a management consulting firm, since 2018; until 2017, President and Chief Executive Officer of The McClatchy Company, Sacramento, CA (news and media company). | None |
Owen D. Van Essen, 65
Trustee since 2004,
Chairman of Operations Risk
Oversight Committee &
Member of Governance and
Nominating Committee | President of Dirks, Van Essen, Murray & April, Santa Fe, NM (newspaper mergers and acquisitions). | None |
James W. Weyhrauch, 60
Trustee since 1996,
Member of Audit
Committee & Operations Risk
Oversight Committee | Real estate broker, Santa Fe Properties, Santa Fe, NM; General Partner, Investments of Genext LLC (a family investment partnership); until 2019, Vice Chairman of Nambe LLC, Santa Fe, NM (manufacturing & design company). | None |
Trustees and Officers, Continued
Thornburg California Limited Term Municipal Fund | September 30, 2019 (Unaudited)
NAME, AGE, YEAR ELECTED
POSITION HELD WITH FUND | PRINCIPAL OCCUPATION(S) DURING PAST FIVE YEARS | OTHER DIRECTORSHIPS
HELD BY TRUSTEE |
| OFFICERS OF THE FUND (WHO ARE NOT TRUSTEES)(1)(6) |
David Ashley, 49
Vice President since 2019 | Portfolio Manager and Managing Director since 2019 and Associate Portfolio Manager from 2011-2019 of Thornburg Investment Management, Inc. | Not applicable |
Nimish Bhatt, 56
Chief Financial Officer
since 2019; Treasurer
2016-2019; Secretary
(2018-2019)(7) | Chief Financial Officer and Treasurer of Thornburg Investment Management, Inc. and Thornburg Securities Corporation since 2016 and Secretary of Thornburg Securities Corporation since 2018; Senior Vice President (2004-2016), Chief Financial Officer (2011-2016), and Head of Fund Administration (2011-2016) of Calamos Asset Management, Inc., Calamos Investments LLC, Calamos Advisors LLC, and Calamos Wealth Management; Director of Calamos Global Funds plc (2007-2016). | Not applicable |
Jason Brady, 45
President since 2016(7) | Director since 2017, CEO and President since 2016, and Portfolio Manager and Managing Director of Thornburg Investment Management, Inc.; Vice President of Thornburg Securities Corporation since 2016. | Not applicable |
Connor Browne, 40
Vice President since 2006 | Portfolio Manager and Managing Director of Thornburg Investment Management, Inc. | Not applicable |
Randy Dry, 45
Vice President since 2014 | Managing Director, Director of Institutional Group from 2014-2016, and since 2016, Chief Administrative Officer of Thornburg Investment Management, Inc. | Not applicable |
Greg Dunn, 43
Vice President since 2014 | Portfolio Manager and Managing Director of Thornburg Investment Management, Inc. | Not applicable |
Lon Erickson, 44
Vice President since 2008 | Portfolio Manager and Managing Director of Thornburg Investment Management, Inc. | Not applicable |
Thomas Garcia, 48
Vice President since 2006 | Managing Director, Head Equity Trader, and Associate Portfolio Manager of Thornburg Investment Management, Inc. | Not applicable |
Christian Hoffmann, 37
Vice President since 2018 | Portfolio Manager and Managing Director since 2018, and Associate Portfolio Manager from 2014-2018, of Thornburg Investment Management, Inc. | Not applicable |
Curtis Holloway, 52
Treasurer since 2019(7) | Director of Fund Administration since 2019 of Thornburg Investment Management, Inc.; Senior Vice President, Head of Fund Administration (2017-2019) and Vice President, Fund Administration (2010-2017) of Calamos Investments, and Chief Financial Officer (2017-2019) and Treasurer (2010-2019) of Calamos Funds. | Not applicable |
Ben Kirby, 39
Vice President since 2014 | Head of Investments since 2019, Portfolio Manager and Managing Director since 2013. | Not applicable |
Jeff Klingelhofer, 38
Vice President since 2016 | Head of Investments since 2019, Portfolio Manager and Managing Director since 2015, and Associate Portfolio Manager from 2012–2015, of Thornburg Investment Management, Inc. | Not applicable |
Ponn Lithiluxa, 48
Vice President since 2017 | Manager, Tax & Fund Administration of Thornburg Investment Management, Inc.; Senior Vice President, Citi Fund Services, Inc. (2014–2017); Vice President, Citi Fund Services, Inc. (2007–2014). | Not applicable |
Rob MacDonald, 43
Vice President since 2016 | Managing Director since 2015, Portfolio Manager since 2014, and Associate Portfolio Manager from 2011–2014 of Thornburg Investment Management, Inc. | Not applicable |
Michael Mastroianni, 42
Secretary and Vice President since 2019(7) | Director of Fund Operations since 2019 of Thornburg Investment Management, Inc.; Executive Director, Global Head of Client Services - Global Liquidity (2018-2019), Executive Director, North American Head of Transfer Agency Relationship Management (2011-2019), Executive Director, North American Head of Transfer Agency Service Delivery (2011-2018) of J.P. Morgan Asset Management. | Not applicable |
Leigh Moiola, 52
Vice President since 2001 | Managing Director and Director of Marketing of Thornburg Investment Management, Inc.; Vice President of Thornburg Securities Corporation. | Not applicable |
Christopher Ryon, 63
Vice President since 2008 | Portfolio Manager and Managing Director of Thornburg Investment Management, Inc. | Not applicable |
Trustees and Officers, Continued
Thornburg California Limited Term Municipal Fund | September 30, 2019 (Unaudited)
NAME, AGE, YEAR ELECTED
POSITION HELD WITH FUND | PRINCIPAL OCCUPATION(S) DURING PAST FIVE YEARS | OTHER DIRECTORSHIPS
HELD BY TRUSTEE |
Sean Koung Sun, 38
Vice President since 2017 | Portfolio Manager and Managing Director since 2017, Associate Portfolio Manager from 2015-2016, and Equity Research Analyst from 2012-2014 of Thornburg Investment Management, Inc. | Not applicable |
Stephen Velie, 52
Chief Compliance Officer since 2009 | Chief Compliance Officer of Thornburg Investment Trust and Thornburg Investment Management, Inc. | Not applicable |
Nicholos Venditti, 38
Vice President since 2016 | Portfolio Manager and Managing Director since 2015 and Associate Portfolio Manager from 2011–2015 of Thornburg Investment Management, Inc. | Not applicable |
Vinson Walden, 49
Vice President since 2004 | Portfolio Manager and Managing Director of Thornburg Investment Management, Inc. | Not applicable |
Lei Wang, 48
Vice President since 2006 | Portfolio Manager and Managing Director of Thornburg Investment Management, Inc. | Not applicable |
Charles Wilson, 44
Vice President since 2016 | Portfolio Manager and Managing Director since 2014 and Associate Portfolio Manager from 2012–2014 of Thornburg Investment Management, Inc. | Not applicable |
Di Zhou, 41
Vice President since 2016 | Portfolio Manager and Managing Director since 2016, Associate Portfolio Manager from 2014–2016, and Equity Research Analyst from 2010–2014 of Thornburg Investment Management, Inc. | Not applicable |
| (1) | Each person’s address is 2300 North Ridgetop Road, Santa Fe, New Mexico 87506. |
| (2) | The Fund is a separate investment “Fund” or “series” of Thornburg Investment Trust (the “Trust”), which comprises the Thornburg mutual fund complex and is organized as a Massachusetts business trust. Thornburg Investment Management, Inc. is the investment advisor to, and manages, all the Funds of the Trust. Each Trustee oversees all the Funds of the Trust. |
| (3) | Mr. Thornburg is considered an “interested” Trustee under the Investment Company Act of 1940 because he is a director and controlling shareholder of Thornburg Investment Management, Inc., the investment advisor to the Trust, and is the sole director and controlling shareholder of Thornburg Securities Corporation, the distributor of shares for the Trust. |
| (4) | Mr. McMahon is considered an “interested” Trustee under the Investment Company Act of 1940 because he is a director and the chief investment strategist of Thornburg Investment Management, Inc. |
| (5) | The Bylaws of the Trust currently require that each Independent Trustee shall retire by the end of the calendar year during which the Trustee reached the age of 75 years. Otherwise each Trustee serves in office until the election and qualification of a successor or until the Trustee sooner dies, resigns, retires or is removed. |
| (6) | Assistant vice presidents and assistant secretaries are not shown. |
| (7) | The Trust’s president, chief financial officer, secretary, and treasurer each serves a one-year term or until the election and qualification of a successor; each other officer serves at the pleasure of the Trustees. |
The Statement of Additional Information for each Fund of the Trust includes additional information about the Trustees and is available, without charge and upon request, by calling 1-800-847-0200.
Other Information
Thornburg California Limited Term Municipal Fund | September 30, 2019 (Unaudited)
PORTFOLIO PROXY VOTING
Policies and Procedures:
The Trust has delegated to the Advisor voting decisions respecting proxies for the Fund’s voting securities. The Advisor makes voting decisions in accordance with its Proxy Voting Policy and Procedures. A description of the Policy and Procedures is available (i) without charge, upon request, by calling the Advisor toll-free at 1-800-847-0200, (ii) on the Thornburg website at www.thornburg.com, and (iii) on the U.S. Securities and Exchange Commission’s website at www.sec.gov.
Information regarding how proxies were voted is available on or before August 31 of each year for the twelve months ending the preceding June 30. This information is available (i) without charge, upon request by calling the Advisor toll-free at 1-800-847-0200, (ii) on the Thornburg website at www.thornburg.com, and (iii) on the U.S. Securities and Exchange Commission’s website at www.sec.gov.
TAX INFORMATION
For the tax year ended September 30, 2019, dividends paid by the Fund of $8,752,440 (or the maximum allowed) are tax exempt dividends and $1,999 are taxable ordinary investment income dividends for federal income tax purposes. The information and the distributions reported herein may differ from the information and distributions reported to the shareholders for the calendar year ending December 31, 2019. Complete information will be reported in conjunction with your 2019 Form 1099.
AVAILABILITY OF QUARTERLY PORTFOLIO SCHEDULE
The Fund files with the Securities and Exchange Commission schedules of its portfolio holdings on Form N-Q for the first and third quarters of each fiscal year. The Fund’s Forms N-Q are available on the Commission’s website at www.sec.gov, or may be reviewed and copied at the Commission’s Public Reference Room in Washington, D.C. Information on the operation of the Public Reference Room may be obtained by calling 1-800-SEC-0330. The Fund also makes this information available on its website at www.thornburg.com/download or upon request by calling 1-800-847-0200.
STATEMENT RESPECTING RENEWAL OF INVESTMENT ADVISORY AGREEMENT
Thornburg Investment Management, Inc. (the “Advisor”) provides investment management services to Thornburg California Limited Term Municipal Fund (the “Fund”) pursuant to an investment advisory agreement. The Trustees consider the renewal of this agreement annually, and most recently determined to renew the agreement on September 17, 2019.
Planning for their recent consideration of the advisory agreement’s renewal, the independent Trustees met in May 2019 to consider aspects of their annual evaluation of the Advisor’s service to all of the funds of Thornburg Investment Trust, to plan the annual evaluation of the Advisor’s performance and to discuss preliminarily the information the Advisor would present to the Trustees for their review. The independent Trustees met in a second independent session in July 2019 to further define certain portions of the information to be submitted by the Advisor. The independent Trustees met again in an independent session in September 2019 with a mutual fund analyst firm engaged by the independent Trustees to provide explanations of comparative cost and expense information, comparative investment performance information, and other data obtained and analyzed by the analyst firm. In that session the independent Trustees discussed their evaluations of the Advisor’s services to the Fund and the Fund’s fee and expense levels, investment performance, and other information presented for the Fund, conferred independently with legal counsel respecting the factors typically considered in evaluating renewal of an advisory agreement, and conferred with representatives of management to receive explanations of certain aspects of the information they had requested. Representatives of the Advisor subsequently reviewed portions of the information with the Trustees and addressed questions from the Trustees at a full meeting session of the Trustees scheduled in September for that purpose, and the independent Trustees thereafter met again in an independent session to consider the Advisor’s presentations and various specific issues respecting their consideration of the advisory agreement’s renewal. Following these sessions, the Trustees met to consider renewal of the advisory agreement, and the independent Trustees voted unanimously at that meeting to renew the agreement for an additional term of one year.
The information below summarizes certain factors considered by the Trustees in connection with the determination to renew the advisory agreement with the Advisor. In determining to renew the advisory agreement, the Trustees considered a wide range of information and did not identify any single factor as controlling, and this summary does not describe all of the factors and other matters considered by the Trustees in making their determination.
Nature, Extent and Quality of Services. The Trustees considered in their evaluation of the advisory agreement the written and oral reports provided to the Trustees and their standing committees throughout the year on a wide variety of topics by personnel from the Advisor’s
Other Information, Continued
Thornburg California Limited Term Municipal Fund | September 30, 2019 (Unaudited)
portfolio management, administration, operations and compliance staffs. The Trustees also considered in this evaluation presentations and explanations made by representatives of the Advisor in meeting sessions scheduled for consideration of the renewal of the advisory agreement. The Trustees further noted in their evaluation the consideration they had given to a number of topics in previous years, reports from their standing committees, and advice received from counsel.
Information noted by the Trustees as having been considered in relation to the nature, extent and quality of services provided by the Advisor under the advisory agreement and contributing (together with other information considered) to their conclusions respecting the nature, extent and quality of the services rendered to the Fund by the Advisor included: (1) reports from portfolio managers and other personnel throughout the year demonstrating that the Fund was managed in conformity with stated strategies and objectives and conformed to investment restrictions and limitations; (2) reports demonstrating that management of the Fund remained faithful and competent, and demonstrating sufficient skill by portfolio managers in executing the Fund’s strategies in varying environments, managers’ cognizance of and strategies to pursue the Fund’s objectives and address pertinent market and economic trends and conditions, the evaluation and selection of individual investments, management to achieve tax efficiencies, and the structuring and composition of the Fund’s portfolio and management of Fund liquidity requirements; (3) the Fund’s achievement of its investment objectives over different periods of time; (4) presentations by and interactions with members of the Advisor’s fund administration, operations and compliance staffs; (5) reports from standing committees of the Trustees on their respective proceedings throughout the year, including in particular reports from and interactions with the Advisor’s personnel; (6) the sufficiency of the resources the Advisor devotes to the services it provides to the Fund, including the expertise of its personnel and staffing levels and its enhancements to the electronic systems it utilizes in providing these services, and also including the Advisor’s own financial management and sufficiency of its resources; and (7) the measures employed to achieve efficient trade execution for the Fund, including the evaluation and selection of firms to execute transactions for the Fund. As in past years, the Trustees noted particularly their assessments of the Advisor’s personnel developed in meetings throughout the year, measures to expand and improve the depth and experience of the Advisor’s staff, and the Advisor’s collaborative approach to investment management, continued commitment to observance of compliance and regulatory requirements in managing investments by the Fund, responsiveness to the Trustees, and other factors.
Based upon these and other considerations, the Trustees concluded that the Advisor’s management of the Fund’s investments continued to conform to the Fund’s stated objectives and policies, and that the nature, extent and quality of the services provided to the Fund by the Advisor remained sufficient.
Investment Performance. The Trustees noted in their evaluation of the Fund’s investment performance the written and oral reports they had received in each regular meeting over the course of the year from the Advisor’s portfolio management personnel. The Trustees also noted their consideration of information provided to them at their request in anticipation of their annual evaluation of the Advisor’s services, including the following items of information respecting the investment performance of the Fund: (1) the Fund’s absolute investment performance and achievement of stated objectives; (2) the Advisor’s explanations and commentary on the Fund’s performance in the context of the Fund’s objectives and reasonable expectations, and business, market and economic conditions; (3) performance data for the most recent ten calendar years, comparing the Fund’s annual investment returns to a broad-based securities index and to the applicable Morningstar category of funds; (4) the Fund’s investment performance for the three-month, year-to-date, one-year, three-year, five-year, ten-year, fifteen-year, and since inception periods ending with the second quarter of the current year, comparing the Fund’s annualized returns to two mutual fund categories created by independent mutual fund analyst firms and to a broad-based securities index, and assigning a percentage rank to the Fund’s performance for each period relative to each of the fund categories; (5) analyses of specified performance and risk metrics for the Fund relative to its benchmark and to a selected peer group of funds, prepared by an independent financial analyst firm engaged by the independent Trustees; (6) the Fund’s cash flows; (7) comparative performance data for fund peer groups selected by an independent mutual fund analyst firm engaged by the independent Trustees, and the analysis and observations of the analyst firm respecting those data; and (8) comparative measures of correlation to equity indices, and risk and return statistics. Measures of risk and relative return demonstrated that the Fund’s performance relative to these measures continued to fulfill expectations in current conditions. The Trustees generally attach additional significance to the investment performance of the Fund from the perspective of longer-term shareholders, and noted in that regard that the Fund’s relative investment performance may be affected to some extent in periods when the Advisor pursues defensive measures in line with the Fund’s stated objectives. Based upon their consideration of this and other information, the Trustees concluded that the Fund’s absolute and relative investment performance over a range of pertinent holding periods on the whole was satisfactory in view of its objectives and strategies.
Comparisons of Fee and Expense Levels. Information noted by the Trustees as having been considered in this context included a variety of comparative data respecting the Fund’s fee and expense levels. This information included comparisons of the Fund’s advisory fee and overall Fund expenses to median and average fees and expenses charged to funds in the applicable Morningstar category, comparisons of the advisory fee and total expenses for two Fund share classes to the fee levels and expenses of fund peer groups selected from the category by an independent mutual fund analyst firm engaged by the independent Trustees, the perspectives and advice from that mutual fund analyst firm respecting comparisons of fund fee levels and expenses to fund peer groups, and other information. Comparative fee and expense data noted as having been considered by the Trustees showed that the level of total expense for one share class of the Fund was higher than the median and average levels charged to funds in the applicable Morningstar category, and that the level of total expense for a second share class was comparable to the median level and lower than the average level for that category. Peer group data showed that
Other Information, Continued
Thornburg California Limited Term Municipal Fund | September 30, 2019 (Unaudited)
the Fund’s stated advisory fee was higher than the medians of the two peer groups considered but comparable to other funds in the peer groups, and that the total expense levels of two representative share classes were higher than the medians of their respective peer groups but comparable to other funds in the peer groups. The Trustees did not find the differences significant in view of their findings and conclusions respecting the other factors considered.
The Trustees noted their consideration of information respecting the advisory fees charged by the Advisor to other investment management clients, including sub-advised mutual funds and other institutional clients, together with information about fees charged by other advisors to different clients, analysis of the differences between the requirements of institutional clients and mutual funds, analysis of the differences between the requirements of a sub-advised mutual fund and a fund as to which the investment advisor is the primary advisor and sponsor, and the consequently different investment management services provided to the different categories of clients and the differing contexts in which these arrangements are entered into. The Trustees confirmed their previous observations that the differences between the fees charged by the Advisor or by other investment advisors to different types of clients did not appear exceptional and had limited relevance to the evaluation of the fee rate charged to mutual funds as to which the Advisor or such other advisors are the primary advisor and sponsor.
Costs and Profitability of Advisor. In reviewing the profitability of the Advisor’s services to the Fund, the Trustees considered an analysis of the Advisor’s costs and the estimated profitability to the Advisor of its services, together with data respecting the overall profitability of a selection of other investment management firms. The Trustees considered in this regard information from the Advisor respecting investment of its profits to maintain staffing levels, and noted that a portion of the Advisor’s profits is an important element in the compensation of shareholder employees. The Trustees considered information from the Advisor respecting the use of profits to enhance staff competencies through training and other measures, hire personnel to expand and develop the scope of senior management expertise, pay competitive levels of compensation, and add to the Advisor’s electronic and information technology systems to maintain or improve service levels. The Trustees also considered the contribution of the Advisor’s cost management to its profitability, and the relationship of the Advisor’s financial resources and profitability in previous years to its ability to attract necessary personnel, invest in systems and other assets required for its service to the Fund, and maintain or improve service levels for the Fund notwithstanding fluctuations in revenues and profitability. The information considered did not indicate to the Trustees that the Advisor’s profitability was excessive.
Potential Economies of Scale. In reviewing the extent to which economies of scale would be realized by the Fund as it grows and whether fee levels reflect potential economies of scale, the Trustees considered the breakpoint structure for advisory fees chargeable to the Fund, comparisons of the fee breakpoint structure for the Fund with breakpoint structures (or the absence of such structures) for other funds in a peer group selected by an independent mutual fund analyst firm, the effects of the breakpoint structure and other expense factors realized by certain funds of the Trust as their asset levels had increased, and the Advisor’s expenditures from its own profits and resources to maintain staffing levels and expand staff competencies, pay competitive levels of compensation, and add to its electronic and information technology systems so as to maintain or improve service levels. The information provided demonstrated to the Trustees that the Fund’s advisory fee breakpoint structure is reasonable in relation to the structures observed in the other funds in its peer group, and that shareholders may be expected to benefit from any economies of scale, due to the advisory agreement’s breakpoint fee structure for the Fund and other factors.
Potential Ancillary Benefits. In reviewing potential benefits to the Advisor because of its relationship to the Fund, the Trustees considered explanations from the Advisor respecting its receipt of certain research services from broker dealers, and the benefits to both the Fund and the Advisor of the Advisor’s expansion of its staffing, compliance and systems capabilities and other resources to serve a broader variety of investment management clients. No unusual or unfair benefits to the Advisor from its relationship to the Fund were identified by the Trustees.
Summary of Conclusions. The Trustees concluded that the general nature, extent and quality of the Advisor’s services performed under the advisory agreement remained sufficient, the Advisor had continued to actively and competently pursue the Fund’s stated investment objectives and adhere to the Fund’s investment policies, and that the absolute and relative investment performance of the Fund over pertinent holding periods on the whole was satisfactory in the context of the Fund’s objectives and strategies. The Trustees further concluded that the level of the advisory fee charged to the Fund by the Advisor is fair and reasonable in relation to the services provided by the Advisor, in view of the nature, extent and quality of those services, the investment performance of the Fund after fees and expenses, the clear disclosure of fees and expenses in the Fund’s prospectus, comparisons of fees and expenses charged to the Fund to fees and expenses charged to other mutual funds, and the other factors considered. The Trustees accordingly determined to renew the Fund’s investment advisory agreement with the Advisor for an additional term of one year.
Trustees’ Statement to Shareholders (Unaudited)
Readopted September 17, 2019
The Trustees believe current and prospective shareholders should know how we discharge our responsibilities in supervising the Funds’ investment advisor and in reviewing the advisor’s contract for renewal. Since 2005, we have issued a statement which sets out clearly the three principal guidelines that we follow in supervising the Trust’s investment advisor on your behalf. In accordance with our customary practice, in September of this year we again reviewed our statement and concluded we should reissue this statement outlining the principal features of our supervision of the advisor’s performance of investment management services for the Funds.
We begin with the premise that each shareholder selected his or her Fund because its investments are managed by the investment advisor identified in the prospectus and in accordance with the objective and policies described in the prospectus. We realize, as each of you do, that if you believe that your Fund’s stated objective and policies no longer serve your personal investment goals, you can sell your shares and leave the Fund.
Therefore, we believe that our primary supervisory task—our principal obligation to you—is to assess the nature and quality of the advisor’s services, and to confirm that the advisor actively and competently pursues the Fund’s objective, in accordance with the policies set out in the prospectus. To do this, we meet regularly with management to review your Fund’s portfolio and to discuss the advisor’s specific actions and judgments in pursuing the Fund’s objective. We do not substitute our own judgment for the advisor’s decisions in selecting investments; the advisor is paid to exercise its informed judgment on investment decisions, and we seek to confirm, in reviewing the advisor’s performance, that the advisor is doing just that.
Second, we are conscious of costs and the effect that costs have on shareholders’ returns. We try to make sure that your Fund’s fees and costs are reasonable in relationship to the services rendered and that they are generally in line with those charged by other expert investment advisors, consistent with our belief that the Fund’s investors searched for and expect that expertise and attention and have decided to pay a reasonable price for it. We do not put the management contract “out to bid” as a matter of course, and we would not do so unless we had concluded that the advisor materially had failed to pursue the Fund’s objectives in accordance with its policies, or for other equally important reasons. We believe that any other approach would be inconsistent with your interests and contrary to your expectations when you bought shares of the Fund in the first place.
Finally, because we believe that most Thornburg Fund shareholders have invested with a long-term perspective, we try not to focus too much on the fashions of the moment and on short-term performance. The market will not favor any specific investment objective or set of policies at all times and under all economic circumstances. A fund will experience periods of both high and low returns relative to other funds and other investments. Even if one of our Funds is not favored by the market at a particular time, we believe that the advisor is nonetheless obliged to remain true to the Fund’s objective and policies, and we watch to see that it does so.
Trustees of Thornburg Investment Trust
Thornburg Investment Management is a privately-owned global investment firm that offers a range of solutions for retail and institutional investors. Founded in 1982 and headquartered in Santa Fe, New Mexico, we manage approximately $41.9 billion (as of September 30, 2019) across U.S. mutual funds, separate accounts for high-net-worth investors, institutional accounts, and UCITS funds for non-U.S. investors.
The fund outlined in this report is one of many equity and fixed-income products available from Thornburg Investment Management.
EQUITY FUNDS
| ■ | Thornburg Global Opportunities Fund |
| ■ | Thornburg International Value Fund |
| ■ | Thornburg Better World International Fund |
| ■ | Thornburg International Growth Fund |
| ■ | Thornburg Developing World Fund |
| ■ | Thornburg Value Fund |
| ■ | Thornburg Core Growth Fund |
MULTI_ASSET FUNDS
| ■ | Thornburg Investment Income Builder Fund |
| ■ | Thornburg Summit Fund |
FIXED INCOME FUNDS
| ■ | Thornburg Low Duration Income Fund |
| ■ | Thornburg Limited Term U.S. Government Fund |
| ■ | Thornburg Limited Term Income Fund |
| ■ | Thornburg Strategic Income Fund |
| ■ | Thornburg Low Duration Municipal Fund |
| ■ | Thornburg Limited Term Municipal Fund |
| ■ | Thornburg Intermediate Municipal Fund |
| ■ | Thornburg California Limited Term Municipal Fund |
| ■ | Thornburg New Mexico Intermediate Municipal Fund |
| ■ | Thornburg New York Intermediate Municipal Fund |
| ■ | Thornburg Strategic Municipal Income Fund |
ALTERNATIVE FUNDS
| ■ | Thornburg Long/Short Equity Fund |
Before investing, carefully consider the Fund’s investment goals, risks, charges, and expenses. For a prospectus or summary prospectus containing this and other information, contact your financial advisor or visit thornburg.com. Read it carefully before investing.
For additional information, please visit thornburg.com
Thornburg Investment Management, Inc. 2300 North Ridgetop Road, Santa Fe, NM 87506
This page intentionally left blank.
This page intentionally left blank.
To receive shareholder reports, prospectuses, and proxy statements electronically, go to www.thornburg.com/edelivery.
This Annual Report is submitted for the general information of shareholders of the Fund. It is not authorized for distribution to prospective investors in the Fund unless preceded or accompanied by an effective prospectus.
Investment Advisor:
Thornburg Investment Management®
800.847.0200
Distributor:
Thornburg Securities Corporation®
Annual Report
September 30, 2019
Beginning on January 1, 2021, as permitted by regulations adopted by the Securities and Exchange Commission, paper copies of the Fund’s shareholder reports will no longer be sent by mail, unless you specifically request paper copies of the reports from the Fund or from your financial intermediary, such as a broker-dealer or bank. Instead, the reports will be made available on a website, and you will be notified by mail each time a report is posted and provided with a website link to access the report.
If you already elected to receive shareholder reports electronically, you will not be affected by this change and you need not take any action. You may elect to receive shareholder reports and other communications from the Fund or your financial intermediary electronically by going to thornburg.com/edelivery.
You may elect to receive all future reports in paper free of charge. You can inform the Fund or your financial intermediary that you wish to continue receiving paper copies of your shareholder reports by calling 800.847.0200 or your financial intermediary directly. Your election to receive reports in paper will apply to all funds held with the fund complex/your financial intermediary.
At Thornburg, we believe unconstrained investing leads to better outcomes for our clients. Our investment solutions are highly active, high conviction, and benchmark agnostic. When it comes to finding economic opportunity for clients, it’s more than what we do.
It’s how we do it. Active Asbottom-up, fundamental, active managers, we look beyond conventional benchmarks. Long Term We take a long-term view in how we manage our firm and our portfolios. Benchmark Agnostic Investment strategies should have the flexibility to pursue solutions for clients, not stay within the conventional confines of benchmarks. Flexible Perspective Our approach to portfolio construction is guided by our convictions rather than convention. High Conviction We focus our attention and capital on thoroughly researched, well-understood positions. The best form of risk management is to know what you own, and why. Repeatable & Robust Our long-term outperformance of benchmarks verifies that our process works and outperforms conventional thinking. Independent We are independently owned and far from the herd of other investment managers. Investment Driven All members of the investment team are resources for all of our strategies. Collaborative Our team collaborates on opportunities across geography, sector, or asset class.
Thornburg New Mexico Intermediate Municipal Fund
Annual Report | September 30, 2019
Table of Contents
| SHARE CLASS | NASDAQ SYMBOL | CUSIP |
| Class A | THNMX | 885-215-301 |
| Class D | THNDX | 885-215-624 |
| Class I | THNIX | 885-215-285 |
Minimum investments for Class I shares may be higher than those for other classes. Class I shares may not be available to all investors.
Investments carry risks, including possible loss of principal. Portfolios investing in bonds have the same interest rate, inflation, and credit risks that are associated with the underlying bonds. The value of bonds will fluctuate relative to changes in interest rates, decreasing when interest rates rise. Unlike bonds, bond funds have ongoing fees and expenses. Please see the Fund’s prospectus for a discussion of the risks associated with an investment in the Fund. Investments in the Funds are not FDIC insured, nor are they bank deposits or guaranteed by a bank or any other entity.
The laddering strategy does not assure or guarantee better performance and cannot eliminate the risk of investment losses.
Letter to Shareholders
Thornburg New Mexico Intermediate Municipal Fund | September 30, 2019 (Unaudited)
October 18, 2019
Dear Fellow Shareholder:
We are pleased to present the annual report for the Thornburg New Mexico Intermediate Municipal Fund. The net asset value (NAV) of the Class I shares increased 34 cents to $13.34 per share during the fiscal year ended September 30, 2019. The Class I shares of your Fund underperformed the index with a 5.39% total return for the fiscal year ended September 30, 2019, compared to the 8.14% total return for the ICE BofA Merrill Lynch 3-15 Year Municipal Securities Index.
The drivers of the Fund’s total return relative to its benchmark include its interest rate sensitivity, as measured by the Fund’s duration, differing credit quality allocations and other risk factors. The impact of the Fund’s 1.49 years shorter duration detracted 2.085%. The Fund’s sector allocations detracted 0.092%, while other risk factors detracted 0.573%. The Fund’s expenses and residuals accounted for the remainder of the performance differential.
Since the last annual letter published in November 2018, the municipal market and its investors have experienced one of the great rallies in the market’s history, driven by the largest amount of inflows into municipal bond mutual funds on record. Mutual funds have experienced positive inflows every week of 2019, with the aggregate amounting to more than $70 billion. During that time, the 10-year Thomson Reuters Municipal Market Data (MMD) AAA Curve has fallen from a high of 2.80% in early November 2018 to an all-time low of 1.22% in late August 2019, only to settle around 1.45% at the time of this writing. The decrease in yields and the insatiable demand from retail mutual fund investors has led to appreciating bond prices that have accounted for a large portion of the returns the market inked over the last 12 months.
While the increase in the price of the investments has been great to watch, municipal investors find themselves in a tough situation. Does one sell the bonds at high prices? Is it best to pay a capital gain and look for reinvestment opportunities? Or does one hold the bonds? Collect a coupon and reinvest the proceeds knowing that the premium could evaporate if yields spike?
In many cases the answer is contingent on investor goals and risk tolerance. So instead of providing an answer, we would like to present an analysis of market risks that will allow investors to draw their own conclusions.
Municipal Bond Supply and Demand
Municipal investors tend to be overly sensitive to supply trends. The common refrain is that a big supply year is bearish for bond prices and vice versa. While that is generally true, it negates the other half of the equation. Demand, not supply, can be a large driver of total return, and that is exactly what the market has experienced throughout 2019. $70 billion has poured into the municipal market through the end of September 2019, the largest amount of annual inflows on record.
That $70 billion represents roughly 10% of all assets in municipal bond mutual funds. So technical demand, not fundamentals, has been the key driver of asset appreciation. That should be troubling. As investors, we like fundamentals to move asset prices. If you were to invest in Apple, and Apple sells more iPhones, and the firm’s stock appreciates, we would consider that being for the right reasons. When price is driven by factors other than fundamental value, the potential for a reversal tends to be high. Therefore, we would recommend caution when investing in a market where fundamental improvement isn’t the reason for price appreciation.
Municipal Bond Credit Risk
Credit spreads, much like triple-A bond insurers, have all but disappeared from the muni market. That is somewhat of an overstatement, but for some time now credit spreads, especially across the plain vanilla investment grade space, have become virtually commoditized. At the same time, while much has been said surrounding the covenant-lite status of recent corporate debt issuance, little has been said about the phenomenon in the municipal bond market. Credit security packages are getting weaker. Net revenue covenants, liquidity covenants, additional bonds tests and other protections granted to municipal investors are weakening. It is undeniable that municipal investors are taking on more and more credit risk for less and less yield.
State and Local Tax Deduction (SALT)
At least part of the increase in demand for municipal paper has been driven by the changes to the SALT deduction cap. The cap of $10,000 in state and local taxes that are deductible from federal taxes was part of the tax changes that were passed by the Trump administration at the end of 2017. It is estimated that over 10 million taxpayers were unable to write-off some $320 billion in state and local taxes, effectively increasing their tax liability despite a reduction in marginal personal income tax rates. The impact has been the most severe in states with high local and state taxes.
Faced with an ever-increasing tax bill, investors in these high-tax states have flocked to the municipal bond market. In no place is that truer than California. For many investors in the state, investments in the California municipal bond market no longer make economic sense. After adjusting yields for state and local taxes, many California investors would be better off investing in U.S. Treasuries due to the higher after-tax yield. Yet, money continues to flow into the California municipal bond market as investors make these non-economic decisions. Non-economic decision-making is not isolated to the California market, though. It’s evident in many high-tax states.
The Federal Reserve and Monetary Policy
As recently as December 2018, the Federal Reserve seemed bound and determined to push interest rates higher. It took only a few angry tweets and some stock market volatility in the fourth quarter of 2018 for the Fed to put its interest rate hikes
Letter to Shareholders, Continued
Thornburg New Mexico Intermediate Municipal Fund | September 30, 2019 (Unaudited)
on pause, and only seven months for a complete reversal of course. Since the 25 basis point (bps) rate cut in July, the Fed cut again in September and the market is pricing in one more cut before year end.
While monetary policy has been the elixir of choice for a decade running, it has also created a host of problems for fixed income investors. By keeping yields low for the last decade, fixed income investors have been driven out the risk spectrum in search of their income goals. Many have taken on additional duration risk by buying longer-dated bonds, making them more susceptible to interest rate movements.
Other fixed income investors have taken on more credit risk, making them more susceptible to a slowing economy. Others have been forced out of the fixed income market and into the equity markets, which completely changes the risk profile of their investments. This is all being done at a time of all-time low yields and all-time low credit spreads. This situation is hardly sustainable.
The highlighted risks have led us to maintain our present course. The Fund remains higher in credit quality and cash with durations at lower levels. While the latter has impacted total returns as price appreciation has driven total return, the distribution yield, or tax-free monthly income, has held up nicely. Cash has been allowed to build given the flatness of the
yield curve and the trade-off in investing in the variable rate demand note (VRDN) market. When opportunities arise, we have ample dry powder to take advantage of dislocations. Until those conditions are met, we are content to manage the Fund in a more conservative fashion commensurate with the risk profile of a municipal bond investor.
Thank you for your continued trust and support.
Sincerely,

| 
|
Christopher Ryon,cfa
Portfolio Manager
Managing Director | Nicholos Venditti,cfa
Portfolio Manager
Managing Director |

| |
David Ashley,cfa
Portfolio Manager
Managing Director | |
The matters discussed in this report may constitute forward-looking statements made pursuant to the safe harbor provisions of the Securities Litigation Reform Act of 1995. These include any advisor or portfolio manager prediction, assessment, analysis or outlook for individual securities, industries, investment styles, market sectors and/or markets. These statements involve risks and uncertainties. In addition to the general risks described for each fund in its current prospectus, other factors bearing on these reports include the accuracy of the advisor’s or portfolio manager’s forecasts and predictions, the appropriateness of the investment strategies designed by the advisor or portfolio manager and the ability of the advisor or portfolio manager to implement their strategies efficiently and successfully. Any one or more of these factors, as well as other risks affecting the securities markets generally, could cause the actual results of any fund to differ materially as compared to its benchmarks.
The views expressed are subject to change and do not necessarily reflect the views of Thornburg Investment Management, Inc. This information should not be relied upon as a recommendation or investment advice and is not intended to predict the performance of any investment or market.
Performance results of individual share classes will vary based on the fees and expenses associated with each share class, and may be higher or lower than other share classes within the same Fund. Please see Performance Summary for performance results of each share class.
Performance Summary
Thornburg New Mexico Intermediate Municipal Fund | September 30, 2019 (Unaudited)
AVERAGE ANNUAL TOTAL RETURNS
| | 1-YR | 3-YR | 5-YR | 10-YR | SINCE
INCEP. |
| Class A Shares(Incep: 6/18/91) | | | | | |
| Without sales charge | 5.15% | 1.64% | 2.03% | 2.53% | 4.18% |
| With sales charge | 3.01% | 0.95% | 1.62% | 2.32% | 4.11% |
| Class D Shares(Incep: 6/1/99) | | | | | |
| Without sales charge | 4.87% | 1.38% | 1.78% | 2.29% | 3.11% |
| Class I Shares(Incep: 2/1/07) | 5.39% | 1.93% | 2.36% | 2.87% | 3.43% |
30-DAY YIELDS, A SHARES(with sales charge)
| Annualized Distribution Yield | 2.16% |
| SEC Yield | 0.96% |
GROWTH OF A HYPOTHETICAL $10,000 INVESTMENT
Performance data shown represents past performance and is no guarantee of future results. Investment return and principal value will fluctuate so shares, when redeemed, may be worth more or less than their original cost. Current performance may be lower or higher than quoted. For performance current to the most recent month end, visit thornburg.com or call 800-847-0200. The performance information does not reflect the deduction of taxes that a shareholder would pay on distributions or the redemption of Fund shares. Returns reflect the reinvestment of dividends and capital gains. Class A shares are sold with a maximum sales charge of 2.00%. There is no sales charge for Class D and Class I shares. As disclosed in the most recent prospectus, the total annual fund operating expenses before any fee waivers or expense reimbursements are as follows: A shares, 0.97%; D shares, 1.23%; I shares, 0.68%. Thornburg Investment Management has contractually agreed to waive fees and reimburse expense until at least February 1, 2020 for some of the share classes, resulting in net expense ratios of the following: I shares, 0.67%. For more detailed information on fund expenses and waivers/reimbursements please see the Fund’s prospectus.
The ICE index data referenced herein is the property of ICE Data Indices, LLC, its affiliates (“ICE Data”) and/or its Third Party Suppliers and has been licensed for use by Thornburg Investment Management, Inc. ICE Data and its Third Party Suppliers accept no liability in connection with its use. See www.thornburg.com/indices for a full copy of the Disclaimer.
TheICE BofAML 3-15 Year Municipal Securities Index is a subset of the ICE BofAML Municipal Securities Index including all securities with a remaining term to final maturity greater than or equal to 3 years and less than 15 years.
The performance of any index is not indicative of the performance of any particular investment. Unless otherwise noted, index returns reflect the reinvestment of income dividends and capital gains, if any, but do not reflect fees, brokerage commissions or other expenses of investing. Investors may not make direct investments into any index.
Bond Credit Ratings (Credit Quality) – A bond credit rating assesses the financial ability of a debt issuer to make timely payments of principal and interest. Ratings of AAA (the highest), AA, A, and BBB are investment-grade quality. Ratings of BB, B, CCC, CC, C and D (the lowest) are considered below investment grade, speculative grade, or junk bonds.
Duration – A bond’s sensitivity to interest rates. Bonds with longer durations experience greater price volatility than bonds with shorter durations. Effective duration incorporates a bond’s embedded option features, such as call provisions.
Yield Curve – A line that plots the interest rates, at a set point in time, of bonds having equal credit quality, but differing maturity dates.
Thomson Reuters Municipal Market Data (MMD) AAA Curve - Thomson Reuters Municipal Market Data (MMD) AAA Curve is a proprietary yield curve that provides the offer-side of “AAA” rated state general obligation bonds, as determined by the MMD analyst team. The MMD AAA curve represents the MMD analyst team’s opinion of AAA valuation, based on institutional block size ($2 million+) market activity in both the primary and secondary municipal bond market. In the interest of transparency, MMD publishes extensive yield curve assumptions relating to various structural criteria which are used in filtering market information for the purpose of benchmark yield curve creation.
Fund Summary
Thornburg New Mexico Intermediate Municipal Fund | September 30, 2019 (Unaudited)
OBJECTIVES AND STRATEGIES
The Fund’s primary investment objective is to obtain as high a level of current income exempt from federal and New Mexico state individual income taxes as is consistent, in the view of the investment advisor, with preservation of capital.
The secondary goal of the Fund is to reduce expected changes in its share price compared to long-term bond portfolios.
This Fund offers New Mexico investors double tax-free yields (may be subject to Alternative Minimum Tax) in a laddered municipal bond portfolio with a dollar-weighted average maturity of normally three to 10 years. Laddering involves building a portfolio of bonds with staggered maturities so that a portion of the portfolio matures each year. Cash from maturing bonds, if not needed for other purposes, is typically invested in bonds with longer maturities at the far end of the ladder. We regard the strategy as a good compromise for managing different types of risk.
LONG-TERM STABILITY OF PRINCIPAL
Net Asset Value History of A Shares
| KEY PORTFOLIO ATTRIBUTES | |
| Number of Bonds | 118 |
| Effective Duration | 3.5 Yrs |
| Average Maturity | 8.4 Yrs |
SECURITY CREDIT RATINGS
A bond credit rating assesses the financial ability of a debt issuer to make timely payments of principal and interest. Ratings of AAA (the highest), AA, A, and BBB are investment-grade quality. Ratings of BB, B, CCC, CC, C and D (the lowest) are considered below investment grade, speculative grade, or junk bonds.
Unrated pre-refunded and escrowed-to-maturity bonds are included in the not rated category.
PORTFOLIO LADDER
Percent of portfolio maturing in each year. Cash includes cash equivalents and other.
There is no guarantee that the Fund will meet its investment objectives.
All data is subject to change. Charts may not add up to 100% due to rounding.
Schedule of Investments
Thornburg New Mexico Intermediate Municipal Fund | September 30, 2019
| Issuer-Description | PRINCIPAL
AMOUNT | VALUE |
| | MUNICIPAL BONDS — 96.8% | | |
| | Albuquerque Bernalillo County Water Utility Authority (2005 NMFA Loan and Joint Water and Sewer System Improvements), Series A, 5.00% due 7/1/2026 | $ 2,000,000 | $ 2,337,520 |
| | Albuquerque Bernalillo County Water Utility Authority (2007 NMFA Loan and Joint Water and Sewer System Improvements), 5.00% due 7/1/2031 - 7/1/2032 | 1,500,000 | 1,777,470 |
| | Albuquerque Municipal School District No. 12 (Bernalillo and Sandoval Counties School Facilities) (State Aid Withholding) GO, | | |
| | 5.00% due 8/1/2031 - 8/1/2034 | 2,260,000 | 2,805,850 |
| | Series A, 4.00% due 8/1/2029 | 1,300,000 | 1,415,167 |
| | Bernalillo County (Government Services), | | |
| | 5.25% due 4/1/2027 | 300,000 | 357,591 |
| | Series B, 5.70% due 4/1/2027 | 3,000,000 | 3,646,950 |
| | Bernalillo County (Government Services; Insured: AMBAC), 5.25% due 10/1/2022 - 10/1/2025 | 8,295,000 | 9,727,209 |
| | Bernalillo County (Government Services; Insured: Natl-IBC), | | |
| | 5.70% due 4/1/2027 | 815,000 | 990,755 |
| | Series B, 5.00% due 4/1/2021 | 1,290,000 | 1,336,995 |
| | Central New Mexico Community College (Campus Buildings Acquisition & Improvements) GO, | | |
| | 4.00% due 8/15/2023 | 1,920,000 | 2,016,134 |
| | Series A, 5.00% due 8/15/2021 - 8/15/2022 | 2,535,000 | 2,749,567 |
| | City of Albuquerque (City Infrastructure Improvements) GO, Series A, 5.00% due 7/1/2026 | 870,000 | 1,070,318 |
| | City of Albuquerque (City Infrastructure Improvements), Series A, 5.00% due 7/1/2033 - 7/1/2034 | 2,300,000 | 2,724,750 |
| | City of Albuquerque (I-25/Paseo del Norte Interchange), 5.00% due 7/1/2025 - 7/1/2027 | 1,095,000 | 1,238,599 |
| | City of Albuquerque (Lodgers’ Tax Obligation Reserve Fund), | | |
| | Series A, 5.00% due 7/1/2021 | 1,340,000 | 1,344,087 |
| | Series B, 5.00% due 7/1/2021 | 3,000,000 | 3,009,150 |
| | City of Albuquerque GO, Series A, 4.00% due 7/1/2024 | 2,500,000 | 2,549,800 |
| | City of Farmington (Arizona Public Service Co.-Four Corners Project), | | |
| | Series A, 4.70% due 5/1/2024 | 965,000 | 995,764 |
| | Series B, 4.70% due 9/1/2024 | 4,000,000 | 4,127,800 |
| | City of Farmington (San Juan Regional Medical Center), Series A, 5.00% due 6/1/2022 | 1,780,000 | 1,785,785 |
| | City of Las Cruces (Joint Utility System), Series A, 4.00% due 6/1/2021 - 6/1/2025 | 2,215,000 | 2,440,217 |
| | City of Las Cruces (NMFA Loan), 5.00% due 6/1/2021 - 6/1/2037 | 10,135,000 | 10,366,380 |
| | City of Roswell (Joint Water and Sewer Improvement; Insured: BAM), 5.00% due 6/1/2026 - 6/1/2036 | 2,050,000 | 2,452,468 |
| | City of Roswell, 4.00% due 8/1/2029 | 260,000 | 301,483 |
| | City of Santa Fe (El Castillo Retirement Residences), | | |
| | 4.50% due 5/15/2027 | 3,275,000 | 3,381,896 |
| | 5.00% due 5/15/2034 | 1,465,000 | 1,522,838 |
| | City of Santa Fe (Public Facilities) GRT, 5.00% due 6/1/2028 - 6/1/2029 | 1,880,000 | 2,182,198 |
| | City of Santa Fe, Series A, 5.00% due 6/1/2034 - 6/1/2038 | 1,870,000 | 2,320,447 |
| | County of Sandoval GO, 5.00% due 8/1/2025 - 8/1/2029 | 2,015,000 | 2,499,612 |
| | County of Santa Fe GO, 5.00% due 7/1/2024 | 825,000 | 965,885 |
| | Government of Guam (Layon Solid Waste Disposal Facility), Series A, 5.375% due 12/1/2024 (pre-refunded 12/1/2019) | 2,000,000 | 2,013,580 |
| | Guam Power Authority (Electric Power System; Insured: AGM), Series A, 5.00% due 10/1/2026 | 2,000,000 | 2,202,820 |
| | Guam Waterworks Authority (Water and Wastewater System), 5.00% due 7/1/2035 - 7/1/2037 | 2,200,000 | 2,560,780 |
| | New Mexico Educational Assistance Foundation (Student Loans), Series A-1, 5.00% due 12/1/2019 - 12/1/2022 | 4,000,000 | 4,133,290 |
| | New Mexico Finance Authority (State Highway Infrastructure), Series A, 5.00% due 6/15/2026 - 6/15/2027 | 2,415,000 | 2,812,394 |
| | New Mexico Finance Authority (The Public Project Revolving Fund Program), Series A, 5.00% due 6/15/2031 | 1,000,000 | 1,183,470 |
| | New Mexico Finance Authority, | | |
| | 5.00% due 6/15/2029 - 6/1/2038 | 1,450,000 | 1,823,613 |
| | Series B, 5.00% due 6/1/2032 - 6/1/2033 | 4,125,000 | 5,287,807 |
| | Series D, 5.00% due 6/1/2033 | 695,000 | 874,011 |
| | New Mexico Hospital Equipment Loan Council (Haverland Carter Lifestyle Group), 5.00% due 7/1/2032 | 2,000,000 | 2,121,540 |
| | New Mexico Hospital Equipment Loan Council (Haverland Carter Lifestyle Obligated Group), Series A, 5.00% due 7/1/2030 - 7/1/2039 | 3,605,000 | 4,160,268 |
| | New Mexico Hospital Equipment Loan Council (Presbyterian Healthcare Services Obligated Group; SPA Wells Fargo Bank, N.A.), | | |
| a | Series C, 1.77% due 8/1/2034 (put 10/1/2019) | 3,000,000 | 3,000,000 |
| a | Series D, 1.77% due 8/1/2034 (put 10/1/2019) | 1,505,000 | 1,505,000 |
| | New Mexico Hospital Equipment Loan Council (Presbyterian Healthcare Services), 5.00% due 8/1/2031 | 1,750,000 | 2,128,039 |
| | New Mexico Housing Authority (El Paseo Apartments; Insured: AMBAC) AMT, Series A, 5.30% due 12/1/2022 | 20,000 | 20,021 |
| | New Mexico Institute of Mining and Technology (Campus Buildings Acquisition & Improvements), 5.00% due 7/1/2020 - 7/1/2028 | 3,805,000 | 4,009,517 |
| | New Mexico Mortgage Finance Authority (Collateralized: GNMA, FNMA, FHLMC), Series C, 2.85% due 7/1/2031 | 640,000 | 663,046 |
| | New Mexico Mortgage Finance Authority (NIBP SFM Loan Program; Collateralized: GNMA, FNMA, FHLMC), 4.625% due 3/1/2028 | 610,000 | 626,513 |
| a | New Mexico Mortgage Finance Authority (Villas de San Ignacio L.P.; LOC Freddie Mac), Series A, 1.58% due 11/1/2043 (put 10/7/2019) | 2,525,000 | 2,525,000 |
| | New Mexico Municipal Energy Acquisition Authority, | | |
| | Series A, | | |
Schedule of Investments, Continued
Thornburg New Mexico Intermediate Municipal Fund | September 30, 2019
| Issuer-Description | PRINCIPAL
AMOUNT | VALUE |
| | 4.00% due 5/1/2024 | $ 250,000 | $ 276,178 |
| b | 5.00% due 11/1/2039 (put 5/1/2025) | 1,000,000 | 1,165,840 |
| | Regents of New Mexico State University (Campus Buildings Acquisition & Improvements), Series A, 5.00% due 4/1/2032 - 4/1/2036 | 4,125,000 | 4,975,807 |
| | Regents of the University of New Mexico (Campus Buildings Acquisition & Improvements), | | |
| | Series A, | | |
| | 4.50% due 6/1/2034 - 6/1/2036 | 4,500,000 | 5,159,835 |
| | 6.00% due 6/1/2021 | 100,000 | 105,316 |
| | Rio Rancho Public School District No. 94 (Insured: BAM) (State Aid Withholding) GO, 5.00% due 8/1/2020 | 550,000 | 566,143 |
| | San Juan County (County Capital Improvements), Series B, 5.00% due 6/15/2028 - 6/15/2030 | 2,645,000 | 3,052,878 |
| | Santa Fe County (County Buildings & Facilities) GRT, Series A, 5.00% due 6/1/2026 - 6/1/2027 | 940,000 | 1,125,179 |
| | Santa Fe County (County Correctional System; Insured: AGM), 6.00% due 2/1/2027 | 1,390,000 | 1,610,565 |
| | Santa Fe Gasoline Tax, 5.00% due 6/1/2024 - 6/1/2028 | 1,540,000 | 1,871,921 |
| | State of New Mexico (Educational Facilities), Series A, 5.00% due 7/1/2025 | 2,040,000 | 2,448,918 |
| | State of New Mexico GO, 5.00% due 3/1/2029 | 2,000,000 | 2,619,760 |
| | Town of Silver City (Public Facility Capital Projects), | | |
| | Series A, | | |
| | 4.00% due 6/1/2029 | 1,000,000 | 1,030,140 |
| | 4.25% due 6/1/2032 | 1,050,000 | 1,081,899 |
| a | University of New Mexico (SPA U.S. Bank N.A.), 1.54% due 6/1/2026 (put 10/7/2019) | 3,155,000 | 3,155,000 |
| | Village of Los Ranchos de Albuquerque (Albuquerque Academy), 4.50% due 9/1/2040 | 3,000,000 | 3,059,010 |
| | Virgin Islands Public Finance Authority, Series A, 6.625% due 10/1/2029 | 2,500,000 | 2,512,525 |
| | Zuni Public School District (Teacher Housing Projects), 5.00% due 8/1/2028 | 1,600,000 | 1,739,248 |
| | Total Investments — 96.8%(Cost $151,099,579) | | $157,647,556 |
| | Other Assets Less Liabilities — 3.2% | | 5,184,411 |
| | Net Assets — 100.0% | | $162,831,967 |
| Footnote Legend |
| a | Variable Rate Demand Notes are instruments whose interest rates change on a specific date (such as coupon date or interest payment date) or whose interest rates vary with changes in a designated base rate (such as the prime interest rate). This instrument is payable on demand and is secured by letters of credit or other credit support agreements from major banks. |
| b | Variable Rate Demand Obligations are instruments whose interest rates change on a mandatory date (demand date) or whose interest rates will vary with changes in a designated base rate. The rate disclosed is the rate at September 30, 2019. |
Portfolio Abbreviations
To simplify the listings of securities, abbreviations are used per the table below:
| AGM | Insured by Assured Guaranty Municipal Corp. |
| AMBAC | Insured by American Municipal Bond Assurance Corp. |
| AMT | Alternative Minimum Tax |
| BAM | Insured by Build America Mutual Insurance Co. |
| FHLMC | Insured by Federal Home Loan Mortgage Corp. |
| FNMA | Collateralized by Federal National Mortgage Association |
| GNMA | Collateralized by Government National Mortgage Association |
| GO | General Obligation |
| GRT | Gross Receipts Tax |
| LOC | Letter of Credit |
| Natl-IBC | Insured by National Public Finance Gurantee Corp. and IBC Bank |
| SPA | Stand-by Purchase Agreement |
See notes to financial statements.
Statement of Assets and Liabilities
Thornburg New Mexico Intermediate Municipal Fund | September 30, 2019
| ASSETS | |
| Investments at value (cost $151,099,579) (Note 3) | $ 157,647,556 |
| Cash | 1,388,599 |
| Receivable for investments sold | 2,004,839 |
| Receivable for fund shares sold | 106,175 |
| Interest receivable | 2,065,569 |
| Prepaid expenses and other assets | 13,610 |
| Total Assets | 163,226,348 |
| Liabilities | |
| Payable for fund shares redeemed | 191,918 |
| Payable to investment advisor and other affiliates (Note 4) | 105,363 |
| Accounts payable and accrued expenses | 74,069 |
| Dividends payable | 23,031 |
| Total Liabilities | 394,381 |
| Net Assets | $ 162,831,967 |
| NET ASSETS CONSIST OF | |
| Distributable earnings | $ 5,646,829 |
| Net capital paid in on shares of beneficial interest | 157,185,138 |
| | $ 162,831,967 |
| NET ASSET VALUE | |
| Class A Shares: | |
Net asset value and redemption price per share
($84,782,482 applicable to 6,350,849 shares of beneficial interest outstanding - Note 5) | $ 13.35 |
| Maximum sales charge, 2.00% of offering price | 0.27 |
| Maximum offering price per share | $ 13.62 |
| Class D Shares: | |
Net asset value, offering and redemption price per share
($15,887,529 applicable to 1,189,526 shares of beneficial interest outstanding - Note 5) | $ 13.36 |
| Class I Shares: | |
Net asset value, offering and redemption price per share
($62,161,956 applicable to 4,658,306 shares of beneficial interest outstanding - Note 5) | $ 13.34 |
See notes to financial statements.
Statement of Operations
Thornburg New Mexico Intermediate Municipal Fund | Year Ended September 30, 2019
| INVESTMENT INCOME | |
| Interest income (net of premium amortized of $1,655,429) | $ 5,434,698 |
| EXPENSES | |
| Investment advisory fees (Note 4) | 813,647 |
| Administration fees (Note 4) | |
| Class A Shares | 78,186 |
| Class D Shares | 14,898 |
| Class I Shares | 49,827 |
| Distribution and service fees (Note 4) | |
| Class A Shares | 222,582 |
| Class D Shares | 84,806 |
| Transfer agent fees | |
| Class A Shares | 48,006 |
| Class D Shares | 11,311 |
| Class I Shares | 14,237 |
| Registration and filing fees | |
| Class A Shares | 5,192 |
| Class D Shares | 4,429 |
| Class I Shares | 5,344 |
| Custodian fees | 34,409 |
| Professional fees | 45,164 |
| Trustee and officer fees (Note 4) | 9,709 |
| Other expenses | 28,591 |
| Total Expenses | 1,470,338 |
| Less: | |
| Expenses reimbursed by investment advisor (Note 4) | (16,340) |
| Net Expenses | 1,453,998 |
| Net Investment Income | $ 3,980,700 |
| REALIZED AND UNREALIZED GAIN (LOSS) | |
| Net realized gain (loss) on investments | 506,448 |
| Net change in unrealized appreciation (depreciation) on investments | 3,783,935 |
| Net Realized and Unrealized Gain | 4,290,383 |
| Net Increase in Net Assets Resulting from Operations | $ 8,271,083 |
See notes to financial statements.
Statements of Changes in Net Assets
Thornburg New Mexico Intermediate Municipal Fund
| | Year Ended
September 30, 2019 | Year Ended
September 30, 2018 |
| INCREASE (DECREASE) IN NET ASSETS FROM | | |
| OPERATIONS | | |
| Net investment income | $ 3,980,700 | $ 4,667,064 |
| Net realized gain (loss) on investments | 506,448 | (129,992) |
| Net change in unrealized appreciation (depreciation) on investments | 3,783,935 | (4,117,035) |
| Net Increase in Net Assets Resulting from Operations | 8,271,083 | 420,037 |
| DIVIDENDS TO SHAREHOLDERS | | |
| From distributable earnings | | |
| Class A Shares | (2,111,980) | (2,599,663) |
| Class D Shares | (356,830) | (471,656) |
| Class I Shares | (1,511,890) | (1,595,745) |
| FUND SHARE TRANSACTIONS (NOTE 5) | | |
| Class A Shares | (12,251,499) | (19,812,373) |
| Class D Shares | (2,990,005) | (3,739,263) |
| Class I Shares | 6,986,154 | (7,228,636) |
| Net Decrease in Net Assets | (3,964,967) | (35,027,299) |
| NET ASSETS | | |
| Beginning of Year | 166,796,934 | 201,824,233 |
| End of Year | $ 162,831,967 | $ 166,796,934 |
See notes to financial statements.
Notes to Financial Statements
Thornburg New Mexico Intermediate Municipal Fund | September 30, 2019
NOTE 1 – ORGANIZATION
Thornburg New Mexico Intermediate Municipal Fund (the “Fund”) is a non-diversified series of Thornburg Investment Trust (the “Trust”). The Trust was organized as a Massachusetts business trust under a Declaration of Trust dated June 3, 1987 and is registered as a diversified, open-end management investment company under the Investment Company Act of 1940, as amended (the "1940 Act"). The Fund is currently one of twenty-two separate series of the Trust. Each series is considered to be a separate entity for financial reporting and tax purposes and bears expenses directly attributable to it. The Fund’s primary investment objective is to obtain as high a level of current income exempt from federal and New Mexico state individual income tax as is consistent, in the view of Thornburg Investment Management, Inc., the Trust’s investment advisor (the “Advisor”), with the preservation of capital. The Fund’s secondary objective is to reduce expected changes in its share price compared to long-term bond portfolios.
The Fund currently offers three classes of shares of beneficial interest: Class A, Class D, and Institutional Class (“Class I”). Each class of shares of the Fund represents an interest in the same portfolio of investments, except that (i) Class A shares are sold subject to a front-end sales charge collected at the time the shares are purchased and bear a service fee, (ii) Class D shares are sold at net asset value without a sales charge at the time of purchase or redemption, and bear both a service fee and a distribution fee, (iii) Class I shares are sold at net asset value without a sales charge at the time of purchase and may be subject to a service fee, and (iv) the respective classes may have different reinvestment privileges and conversion rights. Additionally, the Fund may allocate among its classes certain expenses, to the extent allocable to specific classes, including administration fees, transfer agent fees, government registration fees, certain printing and postage costs, and administrative and legal expenses. Currently, class specific expenses of the Fund are limited to service and distribution fees and certain registration and transfer agent expenses.
The following is a summary of significant accounting policies followed by the Fund in the preparation of its financial statements. The Fund prepares its financial statements in conformity with United States generally accepted accounting principles (“GAAP”), including investment company accounting and reporting guidance in the Financial Accounting Standards Board (the “FASB”) Accounting Standard Codification Topic 946.
NOTE 2 – SIGNIFICANT ACCOUNTING POLICIES
Security Valuation: All investments in securities held by the Fund are valued as described in Note 3.
Allocation of Income, Gains, Losses and Expenses: Net investment income (other than class specific expenses) and realized and unrealized gains and losses are allocated daily to each class of shares based upon the relative net asset value of outstanding shares (or the value of the dividend-eligible shares, as appropriate) of each class of shares at the beginning of the day (after adjusting for the current capital shares activity of the respective class). Expenses common to all Funds are allocated among the Funds comprising the Trust based upon their relative net asset values or other appropriate allocation methods. Operating expenses directly attributable to a specific class are charged against the operating income of that class.
Dividends and Distributions to Shareholders: Dividends and distributions to shareholders, which are determined in accordance with federal income tax regulations and may differ from GAAP, are recorded on the ex-dividend date. Ordinary income dividends, if any, are declared daily and paid monthly. Capital gain distributions, if any, are declared and paid annually and more often if deemed necessary by the Advisor. Dividends and distributions are paid and are reinvested in additional shares of the Fund at net asset value per share at the close of business on the ex-dividend date, or at the shareholder’s option, paid in cash.
Investment Income: Interest income is accrued as earned. Premiums and discounts are amortized and accreted, respectively, to first call dates or maturity dates using the effective yield method of the respective investments. These amounts are included in Investment Income in the Statement of Operations.
Investment Transactions: Investment transactions are accounted for on a trade date basis. Realized gains and losses from the sale of investments are recorded on an identified cost basis.
When-Issued and Delayed Delivery Transactions: The Fund may engage in when-issued or delayed delivery transactions. To the extent the Fund engages in such transactions, it will do so for the purpose of acquiring portfolio investments consistent with the Fund’s investment objectives and not for the purpose of investment leverage or to speculate on interest rate or market changes. At the time the Fund makes a commitment to purchase an investment on a when-issued or delayed delivery basis, the Fund will record the transaction and reflect the value in determining its net asset value. When effecting such transactions, assets of an amount sufficient to make payment for the portfolio investments to be purchased will be segregated on the Fund’s records on the trade date. Investments purchased on a when-issued or delayed delivery basis do not earn interest until the settlement date. The values of these securities held at September 30, 2019 are detailed in the Schedule of Investments.
Notes to Financial Statements, Continued
Thornburg New Mexico Intermediate Municipal Fund | September 30, 2019
Guarantees and Indemnifications: Under the Trust’s organizational documents (and under separate agreements with the independent Trustees), its officers and Trustees are provided with an indemnification against certain liabilities arising out of the performance of their duties to the Fund. In the normal course of business the Trust may also enter into contracts with service providers that contain general indemnifications. The Trust’s maximum exposure under these arrangements is unknown. However, based on experience, the Trust expects the risk of loss to be remote.
Use of Estimates: The preparation of financial statements in conformity with GAAP requires management to make estimates and assumptions that affect the reported amounts of assets and liabilities and disclosure of contingent assets and liabilities at the date of the financial statements and the reported amounts of increases (decreases) in net assets from operations during the reporting period. Actual results could differ from those estimates.
Federal Income Taxes: It is the policy of the Trust to comply with the provisions of the Internal Revenue Code applicable to regulated investment companies and to distribute to shareholders substantially all investment company taxable income including net realized gains on investments (if any), and tax exempt income of the Fund. Therefore, no provision for federal income or excise tax is required.
The Fund files income tax returns in United States federal and applicable state jurisdictions. The statute of limitations on the Fund’s tax return filings generally remains open for the three years following a return’s filing date. The Fund has analyzed each uncertain tax position believed to be material in the preparation of the Fund’s financial statements for the fiscal year ended September 30, 2019, including open tax years, to assess whether it is more likely than not that the position would be sustained upon examination, based on the technical merits of the position. The Fund has not identified any such position for which an asset or liability must be reflected in the Statement of Assets and Liabilities.
At September 30, 2019, information on the tax components of capital was as follows:
| Cost of investments for tax purposes | $ 151,099,579 |
| Gross unrealized appreciation on a tax basis | 6,547,977 |
| Gross unrealized depreciation on a tax basis | - |
| Net unrealized appreciation (depreciation) on investments (tax basis) | $ 6,547,977 |
At September 30, 2019, the Fund had deferred tax basis capital losses occurring subsequent to October 31, 2018 through September 30, 2019 of $1,637. For tax purposes, such losses will be recognized in the year ending September 30, 2020.
At September 30, 2019, the Fund had cumulative tax basis capital losses of $876,480 (of which $109,867 are short-term and $766,613 are long-term), which may be carried forward to offset future capital gains. To the extent such carryforwards are used, capital gain distributions may be reduced to the extent provided by regulations. Such capital loss carryforwards do not expire.
In order to account for permanent book to tax differences, the Fund increased distribution in excess of distributable earnings by $2,865, and decreased net capital paid in on shares of beneficial interest by $2,865. Reclassifications have no impact upon the net asset value of the Fund and resulted primarily from distributions in excess of current earnings.
At September 30, 2019, the Fund had no undistributed net tax-exempt income, no undistributed tax basis net ordinary income and no undistributed tax basis capital gains.
Distributions from tax exempt income paid by the Fund for the year ended September 30, 2019 and September 30, 2018 are excludable by shareholders from gross income for Federal income tax purposes.
The tax character of distributions paid during the year ended September 30, 2019, and September 30, 2018, was as follows:
| | 2019 | 2018 |
| Distributions from: | | |
| Tax exempt income | $ 3,976,891 | $ 4,662,723 |
| Ordinary income | 3,809 | 4,341 |
| Total | $ 3,980,700 | $ 4,667,064 |
NOTE 3 – SECURITY VALUATION
Valuation of the Fund’s portfolio investment securities is performed in accordance with policies and procedures adopted by and under the oversight of the Trustees.
Notes to Financial Statements, Continued
Thornburg New Mexico Intermediate Municipal Fund | September 30, 2019
The Trustees of the Trust have appointed the Advisor to assist the Trustees with obtaining fair market values for portfolio investments, evaluating and monitoring professional pricing service providers appointed by the Trustees’ Audit Committee (the “Audit Committee”) to assist in determining fair values for portfolio investments, assisting in calculating fair values for portfolio investments in certain circumstances, and performing other functions in connection with the valuation of investments. The Advisor acts through its Valuation and Pricing Committee (the “Committee”) and other employees of the Advisor. The Committee regularly reviews its own valuation calculations, reviews the valuations, valuation techniques and services furnished by pricing service providers, considers circumstances which may require valuation calculations by the Committee, and reviews previous valuation calculations. The Committee reports to the Audit Committee on the Committee’s activities, the performance of pricing service providers, and other matters relating to valuation of portfolio investments.
In those instances when the Committee assists in calculating a fair value for a portfolio investment, the Committee seeks to determine the price that the Fund would reasonably expect to receive upon a sale of the investment in an orderly transaction between market participants on the valuation date. The Committee customarily utilizes quotations from securities broker dealers in calculating valuations, but also may utilize prices obtained from pricing service providers or other methods approved by the Audit Committee. Because fair values calculated by the Committee are estimates, the calculation of a value for an investment may differ from the price that would be realized by the Fund upon a sale of the investment, and the difference could be material to the Fund’s financial statements. The Committee’s calculation of a fair value for an investment may also differ from the prices obtained by other persons (including other mutual funds) for the investment.
Valuation of Securities: Debt obligations held by the Fund which are not listed or traded on exchanges or for which no reported market exists are ordinarily valued at the valuation obtained from a pricing service provider approved by the Audit Committee.
In any case when a pricing service provider fails to provide a valuation for a debt obligation held by the Fund, the Committee calculates a fair value for the obligation using alternative methods under procedures approved by the Audit Committee. Additionally, in cases when management believes that a valuation obtained from a pricing service provider is stale, does not reflect material factors affecting the valuation of the investment, is significantly different than the value the Fund is likely to obtain if it sought a bid for the investment, or is otherwise unreliable, the Committee calculates a fair value for the obligation using an alternative method approved by the Audit Committee.
Valuation Hierarchy: The Fund categorizes its investments based upon the inputs used in valuing those investments, according to a three-level hierarchy established in guidance from the FASB. Categorization of investments using this hierarchy is intended by the FASB to maximize the use of observable inputs in valuing investments and minimize the use of unobservable inputs by requiring that the most observable inputs be used when available. Observable inputs are those that market participants would use in valuing an investment based on available market information. Unobservable inputs are those that reflect assumptions about the information market participants would use in valuing an investment. An investment’s level within the hierarchy is based on the lowest level input that is deemed significant to the valuation. The methodologies and inputs used to value investments are not necessarily indications of the risk or liquidity associated with those investments.
Various inputs are used in calculating valuations for the Fund’s investments. These inputs are generally summarized according to the three-level hierarchy below:
Level 1: Quoted prices in active markets for identical investments.
Level 2: Other direct or indirect significant observable inputs (including quoted prices for similar investments in active markets and other observable inputs, such as interest rates, prepayment rates, credit ratings, etc.).
Level 3: Significant unobservable inputs (including the Committee’s own assumptions in calculating the fair values of investments).
Valuations for debt obligations held by the Fund are typically calculated by pricing service providers approved by the Audit Committee and are generally characterized as Level 2 within the valuation hierarchy.
In a limited number of cases the Committee calculates a fair value for investments using broker quotations or other methods approved by the Audit Committee. When the Committee uses a single broker quotation to calculate a fair value for an investment without other significant observable inputs, or if a fair value is calculated using other significant inputs that are considered unobservable, the investment is characterized as Level 3 within the hierarchy. Other significant unobservable inputs used to calculate a fair value in these instances might include an income-based valuation approach which considers discounted anticipated future cash flows from the investment and application of discounts due to the nature or duration of any restrictions on the disposition of the investment.
Valuations based upon the use of inputs from Levels 1, 2 or 3 may not represent the actual price received upon the disposition of an investment, and a Fund may receive a price that is lower than the valuation based upon these inputs when it sells the investment.
Notes to Financial Statements, Continued
Thornburg New Mexico Intermediate Municipal Fund | September 30, 2019
The following table displays a summary of the fair value hierarchy measurements of the Fund’s investments as of September 30, 2019:
| | Fair Value Measurements at September 30, 2019 |
| | TOTAL | LEVEL 1 | LEVEL 2 | LEVEL 3 |
| Assets | | | | |
| Investments in Securities | | | | |
| Municipal Bonds | $ 157,647,556 | $ — | $ 157,647,556 | $ — |
| Total Investments in Securities | $157,647,556 | $— | $157,647,556 | $— |
| Total Assets | $157,647,556 | $— | $157,647,556 | $— |
NOTE 4 – INVESTMENT ADVISORY FEE AND OTHER TRANSACTIONS WITH AFFILIATES
Pursuant to an investment advisory agreement, the Advisor serves as the investment advisor and performs services for the Fund for which the fees are payable at the end of each month. Under the investment advisory agreement, the Fund pays the Advisor a management fee based on the average daily net assets of the Fund at an annual rate as shown in the following table:
| Management Fee Schedule |
| DAILY NET ASSETS | FEE RATE |
| Up to $500 million | 0.500% |
| Next $500 million | 0.450 |
| Next $500 million | 0.400 |
| Next $500 million | 0.350 |
| Over $2 billion | 0.275 |
The Fund’s effective management fee for the year ended September 30, 2019 was 0.50% of the Fund’s average daily net assets. Total management fees incurred by the Fund for the year ended September 30, 2019 are set forth in the Statement of Operations.
The Trust has entered into an administrative services agreement with the Advisor, whereby the Advisor will perform certain administrative services related to each class of the Fund’s shares. The fees are computed as an annual percentage of the aggregate average daily net assets of all shares classes of all Funds in the Trust as follows:
| Administration Fee Schedule |
| Daily Net Assets | Fee Rate |
| Up to $20 billion | 0.100% |
| $20 billion to $40 billion | 0.075 |
| $40 billion to $60 billion | 0.040 |
| Over $60 billion | 0.030 |
The aggregate fee amount is allocated on a daily basis to each Fund based on net assets and subsequently allocated to each class of shares of the Fund. Total administrative service fees incurred by each class of shares of the Fund for the year ended September 30, 2019, are set forth in the Statement of Operations.
The Trust has an underwriting agreement with Thornburg Securities Corporation (the “Distributor”), an affiliate of the Advisor, which acts as the distributor of the Fund’s shares. For the year ended September 30, 2019, the Distributor has advised the Fund that it earned net commissions aggregating $173 from the sale of Class A shares.
Pursuant to a service plan under Rule 12b-1 of the 1940 Act, the Fund may pay to the Distributor or securities dealers and other financial institutions at the Distributor’s direction an amount not to exceed .25 of 1% per annum of the average daily net assets attributable to Class A and Class D shares of the Fund to obtain various shareholder and distribution related services. For the year ended September 30, 2019, there were no 12b-1 service plan fees charged for Class I shares. The Advisor and Distributor each may pay out of its own resources additional expenses for distribution of the Fund’s shares and shareholder services.
The Trust has also adopted a distribution plan pursuant to Rule 12b-1, applicable only to the Fund’s Class D shares, under which the Fund compensates the Distributor for services in promoting the sale of Class D shares of the Fund at an annual rate of up to .25 of 1% per annum of the average daily net assets attributable to Class D shares.
Notes to Financial Statements, Continued
Thornburg New Mexico Intermediate Municipal Fund | September 30, 2019
Total fees incurred by each class of shares of the Fund under their respective service and distribution plans for the year ended September 30, 2019, are set forth in the Statement of Operations.
The Advisor has contractually agreed to waive fees and reimburse expenses incurred by the Fund so that actual expenses of certain share classes do not exceed levels as specified in each Fund’s most recent prospectus (Class I shares, 0.67%). The agreement may be terminated by the Fund at any time, but may not be terminated by the Advisor before February 1, 2020, unless the Advisor ceases to be the investment advisor to the Fund prior to that date. The Advisor may recoup amounts waived or reimbursed during the fiscal year ended September 30, 2019 if, during that year, expenses fall below the contractual limit that was in place at the time those fees and expenses were waived or reimbursed. The Advisor will not recoup fees or expenses as described in the preceding sentence if that recoupment would cause the Fund’s total annual operating expenses (after the recoupment is taken into account) to exceed the lesser of: (a) the expense cap that was in place at the time the waiver or reimbursement occurred; or (b) the expense cap that is in place at the time of the recoupment.
For the year ended September 30, 2019, the Advisor voluntarily reimbursed certain class specific expenses and distribution fees of $2,215 for Class D shares and contractually reimbursed $14,125 for Class I shares.
Certain officers and Trustees of the Trust are also officers or directors of the Advisor and Distributor. The compensation of the independent Trustees is borne by the Trust. The Trust also pays a portion of the Chief Compliance Officer’s compensation. These amounts are reflected as Trustee and officer fees in the Statement of Operations.
The percentage of direct investments in the Fund held by the Trustees, officers of the Trust, and the Advisor is approximately 13.62%.
The Fund may purchase or sell securities from or to an affiliated fund, provided the affiliation is due solely to having a common investment advisor, common officers, or common trustees, and provided that all such transactions will comply with Rule 17a-7 under the 1940 Act. For the year ended September 30, 2019, the Fund had transactions with affiliated funds of $3,300,000 in purchases and $5,534,987 in sales generating realized losses of $1,637.
NOTE 5 – SHARES OF BENEFICIAL INTEREST
At September 30, 2019, there were an unlimited number of shares with no par value of beneficial interest authorized. Transactions in shares of beneficial interest were as follows:
| | YEAR ENDED
September 30, 2019 | YEAR ENDED
September 30, 2018 |
| | SHARES | AMOUNT | SHARES | AMOUNT |
| Class A Shares | | | | |
| Shares sold | 234,408 | $ 3,072,960 | 142,988 | $ 1,880,897 |
Shares issued to shareholders in
reinvestment of dividends | 141,896 | 1,869,564 | 175,091 | 2,291,097 |
| Shares repurchased | (1,308,484) | (17,194,023) | (1,826,448) | (23,984,367) |
| Net decrease | (932,180) | $ (12,251,499) | (1,508,369) | $ (19,812,373) |
| Class D Shares | | | | |
| Shares sold | 49,324 | $ 646,870 | 148,304 | $ 1,955,850 |
Shares issued to shareholders in
reinvestment of dividends | 25,795 | 339,947 | 34,493 | 451,653 |
| Shares repurchased | (302,963) | (3,976,822) | (468,941) | (6,146,766) |
| Net decrease | (227,844) | $ (2,990,005) | (286,144) | $ (3,739,263) |
| Class I Shares | | | | |
| Shares sold | 1,057,272 | $ 13,882,892 | 667,719 | $ 8,786,130 |
Shares issued to shareholders in
reinvestment of dividends | 103,598 | 1,365,495 | 109,625 | 1,434,193 |
| Shares repurchased | (632,748) | (8,262,233) | (1,329,549) | (17,448,959) |
| Net increase (decrease) | 528,122 | $ 6,986,154 | (552,205) | $ (7,228,636) |
Notes to Financial Statements, Continued
Thornburg New Mexico Intermediate Municipal Fund | September 30, 2019
NOTE 6 – INVESTMENT TRANSACTIONS
For the year ended September 30, 2019, the Fund had purchase and sale transactions of investments (excluding short-term investments) of $26,321,149 and $32,691,444, respectively.
NOTE 7 – RECENT ACCOUNTING PRONOUNCEMENTS
In August 2018, the FASB issued ASU 2018-13, Fair Value Measurement (Topic 820): Changes to the Disclosure Requirements for Fair Value Measurement, which adds, removes, and modifies certain aspects of the fair value disclosure. ASU 2018-13 is effective for annual periods beginning after December 15, 2019, and early adoption is permitted. The Funds have elected to early adopt, and had applied ASU 2018-13 for the fiscal year ended September 30, 2019. The adoption of this accounting guidance did not have a material impact on the Funds’ financial statements.
In March 2017, the FASB issued Accounting Standards Update (ASU) 2017-08, Premium Amortization of Purchased Callable Debt Securities. The amendments in the ASU shorten the premium amortization period on a purchased callable debt security from the security’s contractual life to the earliest call date. It is anticipated that this change will enhance disclosures by reducing losses recognized when a security is called on an earlier date. This ASU is effective for fiscal years beginning after December 15, 2018. Management has evaluated the implications of these changes and the amendments will have no material effect on the Funds’ net assets or results of operations.
OTHER NOTES
Risks: The Fund’s investments subject it to risks including, but not limited to, management risk, interest rate risk, credit risk, market and economic risk, liquidity risk, single state risk, and non-diversification risk. Please see the Fund’s prospectus for a discussion of the risks associated with an investment in the Fund.
Subsequent Events: Fund management believes no events have occurred between September 30, 2019 and the date of issuance of the financial statements that require adjustment to or disclosure in the accompanying financial statements.
This page intentionally left blank.
Financial Highlights
Thornburg New Mexico Intermediate Municipal Fund
| | PER SHARE PERFORMANCE (FOR A SHARE OUTSTANDING THROUGHOUT THE YEAR) |
UNLESS OTHERWISE
NOTED, PERIODS ARE
FISCAL YEARS ENDED
SEPTEMBER 30, | Net Asset
Value,
Beginning of
YEAR | Net
Investment
Income
(Loss)+ | Net Realized &
Unrealized Gain
(Loss) on
Investments | Total from
Investment
Operations | Dividends
from Net
Investment
Income | Dividends
from Net
Realized
Gains | Total
Dividends | Net Asset
Value,
End of YEAR |
| CLASS A SHARES(b) |
| 2019 | $ 13.00 | 0.31 | 0.35 | 0.66 | (0.31) | — | (0.31) | $ 13.35 |
| 2018 | $ 13.30 | 0.33 | (0.30) | 0.03 | (0.33) | — | (0.33) | $ 13.00 |
| 2017 | $ 13.67 | 0.31 | (0.37) | (0.06) | (0.31) | — | (0.31) | $ 13.30 |
| 2016 | $ 13.55 | 0.30 | 0.12 | 0.42 | (0.30) | — | (0.30) | $ 13.67 |
| 2015 | $ 13.60 | 0.34 | (0.05) | 0.29 | (0.34) | — | (0.34) | $ 13.55 |
| CLASS D SHARES |
| 2019 | $ 13.01 | 0.28 | 0.35 | 0.63 | (0.28) | — | (0.28) | $ 13.36 |
| 2018 | $ 13.31 | 0.30 | (0.30) | — | (0.30) | — | (0.30) | $ 13.01 |
| 2017 | $ 13.68 | 0.28 | (0.37) | (0.09) | (0.28) | — | (0.28) | $ 13.31 |
| 2016 | $ 13.55 | 0.28 | 0.12 | 0.40 | (0.27) | — | (0.27) | $ 13.68 |
| 2015 | $ 13.61 | 0.31 | (0.06) | 0.25 | (0.31) | — | (0.31) | $ 13.55 |
| CLASS I SHARES |
| 2019 | $ 13.00 | 0.35 | 0.34 | 0.69 | (0.35) | — | (0.35) | $ 13.34 |
| 2018 | $ 13.29 | 0.37 | (0.29) | 0.08 | (0.37) | — | (0.37) | $ 13.00 |
| 2017 | $ 13.67 | 0.36 | (0.38) | (0.02) | (0.36) | — | (0.36) | $ 13.29 |
| 2016 | $ 13.54 | 0.35 | 0.12 | 0.47 | (0.34) | — | (0.34) | $ 13.67 |
| 2015 | $ 13.59 | 0.38 | (0.05) | 0.33 | (0.38) | — | (0.38) | $ 13.54 |
| (a) | Not annualized for periods less than one year. |
| (b) | Sales loads are not reflected in computing total return. |
| + | Based on weighted average shares outstanding. |
See notes to financial statements.
Financial Highlights, Continued
Thornburg New Mexico Intermediate Municipal Fund
| RATIOS TO AVERAGE NET ASSETS | | SUPPLEMENTAL DATA |
Net Investment
Income (Loss) (%) | Expenses, After
Expense
Reductions (%) | Expenses,
Before Expense
Reductions (%) | | Total
Return (%)(a) | Portfolio
Turnover
Rate (%)(a) | Net Assets
at End of YEAR
(Thousands) |
| |
| 2.37 | 0.97 | 0.97 | | 5.15 | 17.26 | $ 84,782 |
| 2.51 | 0.97 | 0.97 | | 0.24 | 7.77 | $ 94,686 |
| 2.36 | 0.98 | 0.98 | | (0.38) | 8.61 | $ 116,915 |
| 2.18 | 0.97 | 0.97 | | 3.11 | 6.80 | $ 136,743 |
| 2.50 | 0.98 | 0.98 | | 2.15 | 19.01 | $ 139,939 |
| |
| 2.10 | 1.24 | 1.25 | | 4.87 | 17.26 | $ 15,888 |
| 2.26 | 1.23 | 1.23 | | (0.02) | 7.77 | $ 18,436 |
| 2.13 | 1.21 | 1.21 | | (0.61) | 8.61 | $ 22,666 |
| 1.94 | 1.21 | 1.21 | | 2.94 | 6.80 | $ 28,489 |
| 2.27 | 1.20 | 1.20 | | 1.84 | 19.01 | $ 28,953 |
| |
| 2.66 | 0.67 | 0.69 | | 5.39 | 17.26 | $ 62,162 |
| 2.82 | 0.67 | 0.68 | | 0.62 | 7.77 | $ 53,675 |
| 2.68 | 0.66 | 0.66 | | (0.13) | 8.61 | $ 62,243 |
| 2.52 | 0.63 | 0.63 | | 3.53 | 6.80 | $ 65,843 |
| 2.80 | 0.65 | 0.65 | | 2.48 | 19.01 | $ 57,958 |
Report of Independent Registered Public Accounting Firm
Thornburg New Mexico Intermediate Municipal Fund
To the Board of Trustees of Thornburg Investment Trust and Shareholders of
Thornburg New Mexico Intermediate Municipal Fund
Opinion on the Financial Statements
We have audited the accompanying statement of assets and liabilities, including the schedule of investments, of Thornburg New Mexico Intermediate Municipal Fund (one of the funds constituting Thornburg Investment Trust, referred to hereafter as the "Fund") as of September 30, 2019, the related statement of operations for the year ended September 30, 2019, the statements of changes in net assets for each of the two years in the period ended September 30, 2019, including the related notes, and the financial highlights for each of the five years in the period ended September 30, 2019 (collectively referred to as the “financial statements”). In our opinion, the financial statements present fairly, in all material respects, the financial position of the Fund as of September 30, 2019, the results of its operations for the year then ended, the changes in its net assets for each of the two years in the period ended September 30, 2019 and the financial highlights for each of the five years in the period ended September 30, 2019 in conformity with accounting principles generally accepted in the United States of America.
Basis for Opinion
These financial statements are the responsibility of the Fund’s management. Our responsibility is to express an opinion on the Fund’s financial statements based on our audits. We are a public accounting firm registered with the Public Company Accounting Oversight Board (United States) (PCAOB) and are required to be independent with respect to the Fund in accordance with the U.S. federal securities laws and the applicable rules and regulations of the Securities and Exchange Commission and the PCAOB.
We conducted our audits of these financial statements in accordance with the standards of the PCAOB. Those standards require that we plan and perform the audit to obtain reasonable assurance about whether the financial statements are free of material misstatement, whether due to error or fraud.
Our audits included performing procedures to assess the risks of material misstatement of the financial statements, whether due to error or fraud, and performing procedures that respond to those risks. Such procedures included examining, on a test basis, evidence regarding the amounts and disclosures in the financial statements. Our audits also included evaluating the accounting principles used and significant estimates made by management, as well as evaluating the overall presentation of the financial statements. Our procedures included confirmation of securities owned as of September 30, 2019 by correspondence with the custodian. We believe that our audits provide a reasonable basis for our opinion.
/s/PricewaterhouseCoopers LLP
New York, New York
November 22, 2019
We have served as the auditor of one or more investment companies in Thornburg Investment Trust since 1999.
Expense Example
Thornburg New Mexico Intermediate Municipal Fund | September 30, 2019 (Unaudited)
As a shareholder of the Fund, you incur two types of costs:
| (1) | transaction costs, including |
| (a) | sales charges (loads) on purchase payments, for Class A shares; |
| (b) | a deferred sales charge on redemptions of any part or all of a purchase of $1 million of Class A shares within 12 months of purchase; |
| (2) | ongoing costs, including management fees; distribution and/or service (12b-1) fees; and other Fund expenses. |
This example is intended to help you understand your ongoing costs (in dollars) of investing in the Fund and to compare these costs with the ongoing costs of investing in other mutual funds.
The example is based on a $1,000 investment beginning on April 1, 2019, and held until September 30, 2019.
| | BEGINNING
ACCOUNT VALUE
4/1/19 | ENDING
ACCOUNT VALUE
9/30/19 | EXPENSES PAID
DURING PERIOD†
4/1/19—9/30/19 |
| CLASS A SHARES |
| Actual | $1,000.00 | $1,023.86 | $4.87 |
| Hypothetical* | $1,000.00 | $1,020.26 | $4.86 |
| CLASS D SHARES |
| Actual | $1,000.00 | $1,023.20 | $6.29 |
| Hypothetical* | $1,000.00 | $1,018.85 | $6.28 |
| CLASS I SHARES |
| Actual | $1,000.00 | $1,025.36 | $3.40 |
| Hypothetical* | $1,000.00 | $1,021.71 | $3.40 |
| † | Expenses are equal to the annualized expense ratio for each class (A: 0.96%; D: 1.24%; I: 0.67%) multiplied by the average account value over the period, multiplied by 183/365 to reflect the one-half year period. |
| * | Hypothetical assumes a rate of return of 5% per year before expenses. |
ACTUAL EXPENSES
For each class of shares, the first line of the accompanying table provides information about actual account values and actual expenses. You may use the information in this line, together with the amount you invested, to estimate the expenses that you paid over the period. Simply divide your account value by $1,000 (for example, an $8,600 account value divided by $1,000 = 8.6), then multiply the result by the number in the first line for your class of shares under the heading entitled “Expenses Paid During Period” to estimate the expenses you paid on your account during this period.
HYPOTHETICAL EXAMPLE FOR COMPARISON PURPOSES
For each class of shares, the second line of the accompanying table provides information about hypothetical account values and hypothetical expenses based on the Fund’s actual expense ratio and an assumed rate of return of 5% per year before expenses, which is not the Fund’s actual return. The hypothetical account values and expenses may not be used to estimate the actual ending account balance or expenses you paid for the period. You may use this information to compare the ongoing costs of investing in the Fund and other funds. To do so, compare this 5% hypothetical example with the 5% hypothetical examples that appear in the shareholder reports of the other funds.
Please note that the expenses shown in the table are meant to highlight your ongoing costs only and do not reflect any transactional costs, such as sales charges (loads), redemption fees, or exchange fees. Therefore, the second line of the table for each class of shares is useful in comparing ongoing costs only, and will not help you determine the relative total costs of owning different funds. In addition, if these transactional costs were included, your costs would have been higher.
Trustees and Officers
Thornburg New Mexico Intermediate Municipal Fund | September 30, 2019 (Unaudited)
NAME, AGE, YEAR ELECTED
POSITION HELD WITH FUND | PRINCIPAL OCCUPATION(S) DURING PAST FIVE YEARS | OTHER DIRECTORSHIPS
HELD BY TRUSTEE |
| INTERESTED TRUSTEES(1)(2) |
Garrett Thornburg, 73
Trustee since 1984,
Chairman of Trustees(3) | Chairman and controlling shareholder of Thornburg Investment Management, Inc. (investment advisor); Chairman and controlling shareholder of Thornburg Securities Corporation (securities dealer); President of the Thornburg Foundation (nonprofit). | None |
Brian J. McMahon, 64
Trustee since 2001,
Vice Chairman of Trustees,
Member of Governance and
Nominating Committee &
Operations Risk Oversight
Committee(4) | Vice Chairman, Chief Investment Strategist, Managing Director, and Portfolio Manager and, until 2016, CEO and President of Thornburg Investment Management, Inc.; Vice President of Thornburg Securities Corporation. | None |
| INDEPENDENT TRUSTEES(1)(2)(5) |
David A. Ater, 74
Trustee since 1994,
Lead Independent Trustee,
Chairman of Governance and
Nominating Committee &
Member of Audit Committee | Principal in Ater & Associates, Santa Fe, NM (developer, planner and broker of residential and commercial real estate); owner, developer and broker for various real estate projects. | None |
Sally Corning, 58
Trustee since 2012,
Chairman of Audit Committee | Partner in Sun Mountain Capital, Santa Fe, NM (private equity firm with investment programs encompassing venture capital, mezzanine debt, and growth equity). | None |
Susan H. Dubin, 70
Trustee since 2004,
Member of Audit
Committee & Governance
and Nominating Committee | President of Dubin Investments, Ltd., Greenwich, CT (private investment fund); Director and officer of various charitable organizations. | None |
David L. Gardner, 56
Trustee since 2015,
Member of Operations Risk
Oversight Committee | Until 2012, head of EMEA (Europe, Middle East and Africa) Sales for iShares of Blackrock, Inc., EMEA Executive Committee Member and EMEA Operating Committee Member at Blackrock, Inc. | None |
Patrick J. Talamantes, 55
Trustee since 2019,
Member of of Audit Committee | President of Talamantes Strategies, LLC, a management consulting firm, since 2018; until 2017, President and Chief Executive Officer of The McClatchy Company, Sacramento, CA (news and media company). | None |
Owen D. Van Essen, 65
Trustee since 2004,
Chairman of Operations Risk
Oversight Committee &
Member of Governance and
Nominating Committee | President of Dirks, Van Essen, Murray & April, Santa Fe, NM (newspaper mergers and acquisitions). | None |
James W. Weyhrauch, 60
Trustee since 1996,
Member of Audit
Committee & Operations Risk
Oversight Committee | Real estate broker, Santa Fe Properties, Santa Fe, NM; General Partner, Investments of Genext LLC (a family investment partnership); until 2019, Vice Chairman of Nambe LLC, Santa Fe, NM (manufacturing & design company). | None |
Trustees and Officers, Continued
Thornburg New Mexico Intermediate Municipal Fund | September 30, 2019 (Unaudited)
NAME, AGE, YEAR ELECTED
POSITION HELD WITH FUND | PRINCIPAL OCCUPATION(S) DURING PAST FIVE YEARS | OTHER DIRECTORSHIPS
HELD BY TRUSTEE |
| OFFICERS OF THE FUND (WHO ARE NOT TRUSTEES)(1)(6) |
David Ashley, 49
Vice President since 2019 | Portfolio Manager and Managing Director since 2019 and Associate Portfolio Manager from 2011-2019 of Thornburg Investment Management, Inc. | Not applicable |
Nimish Bhatt, 56
Chief Financial Officer
since 2019; Treasurer
2016-2019; Secretary
(2018-2019)(7) | Chief Financial Officer and Treasurer of Thornburg Investment Management, Inc. and Thornburg Securities Corporation since 2016 and Secretary of Thornburg Securities Corporation since 2018; Senior Vice President (2004-2016), Chief Financial Officer (2011-2016), and Head of Fund Administration (2011-2016) of Calamos Asset Management, Inc., Calamos Investments LLC, Calamos Advisors LLC, and Calamos Wealth Management; Director of Calamos Global Funds plc (2007-2016). | Not applicable |
Jason Brady, 45
President since 2016(7) | Director since 2017, CEO and President since 2016, and Portfolio Manager and Managing Director of Thornburg Investment Management, Inc.; Vice President of Thornburg Securities Corporation since 2016. | Not applicable |
Connor Browne, 40
Vice President since 2006 | Portfolio Manager and Managing Director of Thornburg Investment Management, Inc. | Not applicable |
Randy Dry, 45
Vice President since 2014 | Managing Director, Director of Institutional Group from 2014-2016, and since 2016, Chief Administrative Officer of Thornburg Investment Management, Inc. | Not applicable |
Greg Dunn, 43
Vice President since 2014 | Portfolio Manager and Managing Director of Thornburg Investment Management, Inc. | Not applicable |
Lon Erickson, 44
Vice President since 2008 | Portfolio Manager and Managing Director of Thornburg Investment Management, Inc. | Not applicable |
Thomas Garcia, 48
Vice President since 2006 | Managing Director, Head Equity Trader, and Associate Portfolio Manager of Thornburg Investment Management, Inc. | Not applicable |
Christian Hoffmann, 37
Vice President since 2018 | Portfolio Manager and Managing Director since 2018, and Associate Portfolio Manager from 2014-2018, of Thornburg Investment Management, Inc. | Not applicable |
Curtis Holloway, 52
Treasurer since 2019(7) | Director of Fund Administration since 2019 of Thornburg Investment Management, Inc.; Senior Vice President, Head of Fund Administration (2017-2019) and Vice President, Fund Administration (2010-2017) of Calamos Investments, and Chief Financial Officer (2017-2019) and Treasurer (2010-2019) of Calamos Funds. | Not applicable |
Ben Kirby, 39
Vice President since 2014 | Head of Investments since 2019, Portfolio Manager and Managing Director since 2013. | Not applicable |
Jeff Klingelhofer, 38
Vice President since 2016 | Head of Investments since 2019, Portfolio Manager and Managing Director since 2015, and Associate Portfolio Manager from 2012–2015, of Thornburg Investment Management, Inc. | Not applicable |
Ponn Lithiluxa, 48
Vice President since 2017 | Manager, Tax & Fund Administration of Thornburg Investment Management, Inc.; Senior Vice President, Citi Fund Services, Inc. (2014–2017); Vice President, Citi Fund Services, Inc. (2007–2014). | Not applicable |
Rob MacDonald, 43
Vice President since 2016 | Managing Director since 2015, Portfolio Manager since 2014, and Associate Portfolio Manager from 2011–2014 of Thornburg Investment Management, Inc. | Not applicable |
Michael Mastroianni, 42
Secretary and Vice President since 2019(7) | Director of Fund Operations since 2019 of Thornburg Investment Management, Inc.; Executive Director, Global Head of Client Services - Global Liquidity (2018-2019), Executive Director, North American Head of Transfer Agency Relationship Management (2011-2019), Executive Director, North American Head of Transfer Agency Service Delivery (2011-2018) of J.P. Morgan Asset Management. | Not applicable |
Leigh Moiola, 52
Vice President since 2001 | Managing Director and Director of Marketing of Thornburg Investment Management, Inc.; Vice President of Thornburg Securities Corporation. | Not applicable |
Christopher Ryon, 63
Vice President since 2008 | Portfolio Manager and Managing Director of Thornburg Investment Management, Inc. | Not applicable |
Trustees and Officers, Continued
Thornburg New Mexico Intermediate Municipal Fund | September 30, 2019 (Unaudited)
NAME, AGE, YEAR ELECTED
POSITION HELD WITH FUND | PRINCIPAL OCCUPATION(S) DURING PAST FIVE YEARS | OTHER DIRECTORSHIPS
HELD BY TRUSTEE |
Sean Koung Sun, 38
Vice President since 2017 | Portfolio Manager and Managing Director since 2017, Associate Portfolio Manager from 2015-2016, and Equity Research Analyst from 2012-2014 of Thornburg Investment Management, Inc. | Not applicable |
Stephen Velie, 52
Chief Compliance Officer since 2009 | Chief Compliance Officer of Thornburg Investment Trust and Thornburg Investment Management, Inc. | Not applicable |
Nicholos Venditti, 38
Vice President since 2016 | Portfolio Manager and Managing Director since 2015 and Associate Portfolio Manager from 2011–2015 of Thornburg Investment Management, Inc. | Not applicable |
Vinson Walden, 49
Vice President since 2004 | Portfolio Manager and Managing Director of Thornburg Investment Management, Inc. | Not applicable |
Lei Wang, 48
Vice President since 2006 | Portfolio Manager and Managing Director of Thornburg Investment Management, Inc. | Not applicable |
Charles Wilson, 44
Vice President since 2016 | Portfolio Manager and Managing Director since 2014 and Associate Portfolio Manager from 2012–2014 of Thornburg Investment Management, Inc. | Not applicable |
Di Zhou, 41
Vice President since 2016 | Portfolio Manager and Managing Director since 2016, Associate Portfolio Manager from 2014–2016, and Equity Research Analyst from 2010–2014 of Thornburg Investment Management, Inc. | Not applicable |
| (1) | Each person’s address is 2300 North Ridgetop Road, Santa Fe, New Mexico 87506. |
| (2) | The Fund is a separate investment “Fund” or “series” of Thornburg Investment Trust (the “Trust”), which comprises the Thornburg mutual fund complex and is organized as a Massachusetts business trust. Thornburg Investment Management, Inc. is the investment advisor to, and manages, all the Funds of the Trust. Each Trustee oversees all the Funds of the Trust. |
| (3) | Mr. Thornburg is considered an “interested” Trustee under the Investment Company Act of 1940 because he is a director and controlling shareholder of Thornburg Investment Management, Inc., the investment advisor to the Trust, and is the sole director and controlling shareholder of Thornburg Securities Corporation, the distributor of shares for the Trust. |
| (4) | Mr. McMahon is considered an “interested” Trustee under the Investment Company Act of 1940 because he is a director and the chief investment strategist of Thornburg Investment Management, Inc. |
| (5) | The Bylaws of the Trust currently require that each Independent Trustee shall retire by the end of the calendar year during which the Trustee reached the age of 75 years. Otherwise each Trustee serves in office until the election and qualification of a successor or until the Trustee sooner dies, resigns, retires or is removed. |
| (6) | Assistant vice presidents and assistant secretaries are not shown. |
| (7) | The Trust’s president, chief financial officer, secretary, and treasurer each serves a one-year term or until the election and qualification of a successor; each other officer serves at the pleasure of the Trustees. |
The Statement of Additional Information for each Fund of the Trust includes additional information about the Trustees and is available, without charge and upon request, by calling 1-800-847-0200.
Other Information
Thornburg New Mexico Intermediate Municipal Fund | September 30, 2019 (Unaudited)
PORTFOLIO PROXY VOTING
Policies and Procedures:
The Trust has delegated to the Advisor voting decisions respecting proxies for the Fund’s voting securities. The Advisor makes voting decisions in accordance with its Proxy Voting Policy and Procedures. A description of the Policy and Procedures is available (i) without charge, upon request, by calling the Advisor toll-free at 1-800-847-0200, (ii) on the Thornburg website at www.thornburg.com, and (iii) on the U.S. Securities and Exchange Commission’s website at www.sec.gov.
Information regarding how proxies were voted is available on or before August 31 of each year for the twelve months ending the preceding June 30. This information is available (i) without charge, upon request by calling the Advisor toll-free at 1-800-847-0200, (ii) on the Thornburg website at www.thornburg.com, and (iii) on the U.S. Securities and Exchange Commission’s website at www.sec.gov.
TAX INFORMATION
For the tax year ended September 30, 2019, dividends paid by the Fund of $3,976,891 (or the maximum allowed) are tax exempt dividends and $3,809 are taxable ordinary investment income dividends for federal income tax purposes. The information and the distributions reported herein may differ from the information and distributions reported to the shareholders for the calendar year ending December 31, 2019. Complete information will be reported in conjunction with your 2019 Form 1099.
AVAILABILITY OF QUARTERLY PORTFOLIO SCHEDULE
The Fund files with the Securities and Exchange Commission schedules of its portfolio holdings on Form N-Q for the first and third quarters of each fiscal year. The Fund’s Forms N-Q are available on the Commission’s website at www.sec.gov, or may be reviewed and copied at the Commission’s Public Reference Room in Washington, D.C. Information on the operation of the Public Reference Room may be obtained by calling 1-800-SEC-0330. The Fund also makes this information available on its website at www.thornburg.com/download or upon request by calling 1-800-847-0200.
STATEMENT RESPECTING RENEWAL OF INVESTMENT ADVISORY AGREEMENT
Thornburg Investment Management, Inc. (the “Advisor”) provides investment management services to Thornburg New Mexico Intermediate Municipal Fund (the “Fund”) pursuant to an investment advisory agreement. The Trustees consider the renewal of this agreement annually, and most recently determined to renew the agreement on September 17, 2019.
Planning for their recent consideration of the advisory agreement’s renewal, the independent Trustees met in May 2019 to consider aspects of their annual evaluation of the Advisor’s service to all of the funds of Thornburg Investment Trust, to plan the annual evaluation of the Advisor’s performance and to discuss preliminarily the information the Advisor would present to the Trustees for their review. The independent Trustees met in a second independent session in July 2019 to further define certain portions of the information to be submitted by the Advisor. The independent Trustees met again in an independent session in September 2019 with a mutual fund analyst firm engaged by the independent Trustees to provide explanations of comparative cost and expense information, comparative investment performance information, and other data obtained and analyzed by the analyst firm. In that session the independent Trustees discussed their evaluations of the Advisor’s services to the Fund and the Fund’s fee and expense levels, investment performance, and other information presented for the Fund, conferred independently with legal counsel respecting the factors typically considered in evaluating renewal of an advisory agreement, and conferred with representatives of management to receive explanations of certain aspects of the information they had requested. Representatives of the Advisor subsequently reviewed portions of the information with the Trustees and addressed questions from the Trustees at a full meeting session of the Trustees scheduled in September for that purpose, and the independent Trustees thereafter met again in an independent session to consider the Advisor’s presentations and various specific issues respecting their consideration of the advisory agreement’s renewal. Following these sessions, the Trustees met to consider renewal of the advisory agreement, and the independent Trustees voted unanimously at that meeting to renew the agreement for an additional term of one year.
The information below summarizes certain factors considered by the Trustees in connection with the determination to renew the advisory agreement with the Advisor. In determining to renew the advisory agreement, the Trustees considered a wide range of information and did not identify any single factor as controlling, and this summary does not describe all of the factors and other matters considered by the Trustees in making their determination.
Nature, Extent and Quality of Services. The Trustees considered in their evaluation of the advisory agreement the written and oral reports provided to the Trustees and their standing committees throughout the year on a wide variety of topics by personnel from the Advisor’s
Other Information, Continued
Thornburg New Mexico Intermediate Municipal Fund | September 30, 2019 (Unaudited)
portfolio management, administration, operations and compliance staffs. The Trustees also considered in this evaluation presentations and explanations made by representatives of the Advisor in meeting sessions scheduled for consideration of the renewal of the advisory agreement. The Trustees further noted in their evaluation the consideration they had given to a number of topics in previous years, reports from their standing committees, and advice received from counsel.
Information noted by the Trustees as having been considered in relation to the nature, extent and quality of services provided by the Advisor under the advisory agreement and contributing (together with other information considered) to their conclusions respecting the nature, extent and quality of the services rendered to the Fund by the Advisor included: (1) reports from portfolio managers and other personnel throughout the year demonstrating that the Fund was managed in conformity with stated strategies and objectives and conformed to investment restrictions and limitations; (2) reports demonstrating that management of the Fund remained faithful and competent, and demonstrating sufficient skill by portfolio managers in executing the Fund’s strategies in varying environments, managers’ cognizance of and strategies to pursue the Fund’s objectives and address pertinent market and economic trends and conditions, the evaluation and selection of individual investments, management to achieve tax efficiencies, and the structuring and composition of the Fund’s portfolio and management of Fund liquidity requirements; (3) the Fund’s achievement of its investment objectives over different periods of time; (4) presentations by and interactions with members of the Advisor’s fund administration, operations and compliance staffs; (5) reports from standing committees of the Trustees on their respective proceedings throughout the year, including in particular reports from and interactions with the Advisor’s personnel; (6) the sufficiency of the resources the Advisor devotes to the services it provides to the Fund, including the expertise of its personnel and staffing levels and its enhancements to the electronic systems it utilizes in providing these services, and also including the Advisor’s own financial management and sufficiency of its resources; and (7) the measures employed to achieve efficient trade execution for the Fund, including the evaluation and selection of firms to execute transactions for the Fund. As in past years, the Trustees noted particularly their assessments of the Advisor’s personnel developed in meetings throughout the year, measures to expand and improve the depth and experience of the Advisor’s staff, and the Advisor’s collaborative approach to investment management, continued commitment to observance of compliance and regulatory requirements in managing investments by the Fund, responsiveness to the Trustees, and other factors.
Based upon these and other considerations, the Trustees concluded that the Advisor’s management of the Fund’s investments continued to conform to the Fund’s stated objectives and policies, and that the nature, extent and quality of the services provided to the Fund by the Advisor remained sufficient.
Investment Performance. The Trustees noted in their evaluation of the Fund’s investment performance the written and oral reports they had received in each regular meeting over the course of the year from the Advisor’s portfolio management personnel. The Trustees also noted their consideration of information provided to them at their request in anticipation of their annual evaluation of the Advisor’s services, including the following items of information respecting the investment performance of the Fund: (1) the Fund’s absolute investment performance and achievement of stated objectives; (2) the Advisor’s explanations and commentary on the Fund’s performance in the context of the Fund’s objectives and reasonable expectations, and business, market and economic conditions; (3) performance data for the most recent ten calendar years, comparing the Fund’s annual investment returns to a broad-based securities index and to the applicable Morningstar category of funds; (4) the Fund’s investment performance for the three-month, year-to-date, one-year, three-year, five-year, ten-year, fifteen-year, and since inception periods ending with the second quarter of the current year, comparing the Fund’s annualized returns to two mutual fund categories created by independent mutual fund analyst firms and to a broad-based securities index, and assigning a percentage rank to the Fund’s performance for each period relative to each of the fund categories; (5) analyses of specified performance and risk metrics for the Fund relative to its benchmark and to a selected peer group of funds, prepared by an independent financial analyst firm engaged by the independent Trustees; (6) the Fund’s cash flows; (7) comparative performance data for fund peer groups selected by an independent mutual fund analyst firm engaged by the independent Trustees, and the analysis and observations of the analyst firm respecting those data; and (8) comparative measures of correlation to equity indices, and risk and return statistics. Measures of risk and relative return demonstrated that the Fund’s performance relative to these measures continued to fulfill expectations in current conditions. The Trustees generally attach additional significance to the investment performance of the Fund from the perspective of longer-term shareholders, and noted in that regard that the Fund’s relative investment performance may be affected to some extent in periods when the Advisor pursues defensive measures in line with the Fund’s stated objectives. Based upon their consideration of this and other information, the Trustees concluded that the Fund’s absolute and relative investment performance over a range of pertinent holding periods on the whole was satisfactory in view of its objectives and strategies.
Comparisons of Fee and Expense Levels. Information noted by the Trustees as having been considered in this context included a variety of comparative data respecting the Fund’s fee and expense levels. This information included comparisons of the Fund’s advisory fee and overall Fund expenses to median and average fees and expenses charged to funds in the applicable Morningstar category, comparisons of the advisory fee and total expenses for two Fund share classes to the fee levels and expenses of fund peer groups selected from the category by an independent mutual fund analyst firm engaged by the independent Trustees, the perspectives and advice from that mutual fund analyst firm respecting comparisons of fund fee levels and expenses to fund peer groups, and other information. The Trustees considered that the Advisor has agreed to certain fee waivers and expense reimbursements for the current period. Comparative fee and expense data noted as having been considered by the Trustees showed that the level of total expense for one share class of the Fund was higher than the median and average levels charged to funds in the applicable Morningstar category, and that, after fee waivers and
Other Information, Continued
Thornburg New Mexico Intermediate Municipal Fund | September 30, 2019 (Unaudited)
expense reimbursements, the level of total expense for a second share class was lower than the median and average levels for that category. Peer group data showed that the Fund’s stated advisory fee was higher than the medians of the two peer groups considered but comparable to other funds in the peer groups, and that the total expense levels of two representative share classes were higher than the medians of their respective peer groups but comparable to other funds in the peer groups after waivers of fees and reimbursement of expenses. The Trustees did not find the differences significant in view of their findings and conclusions respecting the other factors considered.
The Trustees noted their consideration of information respecting the advisory fees charged by the Advisor to other investment management clients, including sub-advised mutual funds and other institutional clients, together with information about fees charged by other advisors to different clients, analysis of the differences between the requirements of institutional clients and mutual funds, analysis of the differences between the requirements of a sub-advised mutual fund and a fund as to which the investment advisor is the primary advisor and sponsor, and the consequently different investment management services provided to the different categories of clients and the differing contexts in which these arrangements are entered into. The Trustees confirmed their previous observations that the differences between the fees charged by the Advisor or by other investment advisors to different types of clients did not appear exceptional and had limited relevance to the evaluation of the fee rate charged to mutual funds as to which the Advisor or such other advisors are the primary advisor and sponsor.
Costs and Profitability of Advisor. In reviewing the profitability of the Advisor’s services to the Fund, the Trustees considered an analysis of the Advisor’s costs and the estimated profitability to the Advisor of its services, together with data respecting the overall profitability of a selection of other investment management firms. The Trustees considered in this regard information from the Advisor respecting investment of its profits to maintain staffing levels, and noted that a portion of the Advisor’s profits is an important element in the compensation of shareholder employees. The Trustees considered information from the Advisor respecting the use of profits to enhance staff competencies through training and other measures, hire personnel to expand and develop the scope of senior management expertise, pay competitive levels of compensation, and add to the Advisor’s electronic and information technology systems to maintain or improve service levels. The Trustees also considered the contribution of the Advisor’s cost management to its profitability, and the relationship of the Advisor’s financial resources and profitability in previous years to its ability to attract necessary personnel, invest in systems and other assets required for its service to the Fund, and maintain or improve service levels for the Fund notwithstanding fluctuations in revenues and profitability. The information considered did not indicate to the Trustees that the Advisor’s profitability was excessive.
Potential Economies of Scale. In reviewing the extent to which economies of scale would be realized by the Fund as it grows and whether fee levels reflect potential economies of scale, the Trustees considered the breakpoint structure for advisory fees chargeable to the Fund, comparisons of the fee breakpoint structure for the Fund with breakpoint structures (or the absence of such structures) for other funds in a peer group selected by an independent mutual fund analyst firm, the effects of the breakpoint structure and other expense factors realized by certain funds of the Trust as their asset levels had increased, the Advisor’s undertakings to waive or reimburse certain fees and expenses of the Fund, and the Advisor’s expenditures from its own profits and resources to maintain staffing levels and expand staff competencies, pay competitive levels of compensation, and add to its electronic and information technology systems so as to maintain or improve service levels. The information provided demonstrated to the Trustees that the Fund’s advisory fee breakpoint structure is reasonable in relation to the structures observed in the other funds in its peer group, and that shareholders may be expected to benefit from any economies of scale, due to the advisory agreement’s breakpoint fee structure for the Fund and other factors.
Potential Ancillary Benefits. In reviewing potential benefits to the Advisor because of its relationship to the Fund, the Trustees considered explanations from the Advisor respecting its receipt of certain research services from broker dealers, and the benefits to both the Fund and the Advisor of the Advisor’s expansion of its staffing, compliance and systems capabilities and other resources to serve a broader variety of investment management clients. No unusual or unfair benefits to the Advisor from its relationship to the Fund were identified by the Trustees.
Summary of Conclusions. The Trustees concluded that the general nature, extent and quality of the Advisor’s services performed under the advisory agreement remained sufficient, the Advisor had continued to actively and competently pursue the Fund’s stated investment objectives and adhere to the Fund’s investment policies, and that the absolute and relative investment performance of the Fund over pertinent holding periods on the whole was satisfactory in the context of the Fund’s objectives and strategies. The Trustees further concluded that the level of the advisory fee charged to the Fund by the Advisor is fair and reasonable in relation to the services provided by the Advisor, in view of the nature, extent and quality of those services, the investment performance of the Fund after fees and expenses, the clear disclosure of fees and expenses in the Fund’s prospectus, comparisons of fees and expenses charged to the Fund to fees and expenses charged to other mutual funds, and the other factors considered. The Trustees accordingly determined to renew the Fund’s investment advisory agreement with the Advisor for an additional term of one year.
Trustees’ Statement to Shareholders (Unaudited)
Readopted September 17, 2019
The Trustees believe current and prospective shareholders should know how we discharge our responsibilities in supervising the Funds’ investment advisor and in reviewing the advisor’s contract for renewal. Since 2005, we have issued a statement which sets out clearly the three principal guidelines that we follow in supervising the Trust’s investment advisor on your behalf. In accordance with our customary practice, in September of this year we again reviewed our statement and concluded we should reissue this statement outlining the principal features of our supervision of the advisor’s performance of investment management services for the Funds.
We begin with the premise that each shareholder selected his or her Fund because its investments are managed by the investment advisor identified in the prospectus and in accordance with the objective and policies described in the prospectus. We realize, as each of you do, that if you believe that your Fund’s stated objective and policies no longer serve your personal investment goals, you can sell your shares and leave the Fund.
Therefore, we believe that our primary supervisory task—our principal obligation to you—is to assess the nature and quality of the advisor’s services, and to confirm that the advisor actively and competently pursues the Fund’s objective, in accordance with the policies set out in the prospectus. To do this, we meet regularly with management to review your Fund’s portfolio and to discuss the advisor’s specific actions and judgments in pursuing the Fund’s objective. We do not substitute our own judgment for the advisor’s decisions in selecting investments; the advisor is paid to exercise its informed judgment on investment decisions, and we seek to confirm, in reviewing the advisor’s performance, that the advisor is doing just that.
Second, we are conscious of costs and the effect that costs have on shareholders’ returns. We try to make sure that your Fund’s fees and costs are reasonable in relationship to the services rendered and that they are generally in line with those charged by other expert investment advisors, consistent with our belief that the Fund’s investors searched for and expect that expertise and attention and have decided to pay a reasonable price for it. We do not put the management contract “out to bid” as a matter of course, and we would not do so unless we had concluded that the advisor materially had failed to pursue the Fund’s objectives in accordance with its policies, or for other equally important reasons. We believe that any other approach would be inconsistent with your interests and contrary to your expectations when you bought shares of the Fund in the first place.
Finally, because we believe that most Thornburg Fund shareholders have invested with a long-term perspective, we try not to focus too much on the fashions of the moment and on short-term performance. The market will not favor any specific investment objective or set of policies at all times and under all economic circumstances. A fund will experience periods of both high and low returns relative to other funds and other investments. Even if one of our Funds is not favored by the market at a particular time, we believe that the advisor is nonetheless obliged to remain true to the Fund’s objective and policies, and we watch to see that it does so.
Trustees of Thornburg Investment Trust
Thornburg Investment Management is a privately-owned global investment firm that offers a range of solutions for retail and institutional investors. Founded in 1982 and headquartered in Santa Fe, New Mexico, we manage approximately $41.9 billion (as of September 30, 2019) across U.S. mutual funds, separate accounts for high-net-worth investors, institutional accounts, and UCITS funds for non-U.S. investors.
The fund outlined in this report is one of many equity and fixed-income products available from Thornburg Investment Management.
EQUITY FUNDS
| ■ | Thornburg Global Opportunities Fund |
| ■ | Thornburg International Value Fund |
| ■ | Thornburg Better World International Fund |
| ■ | Thornburg International Growth Fund |
| ■ | Thornburg Developing World Fund |
| ■ | Thornburg Value Fund |
| ■ | Thornburg Core Growth Fund |
MULTI_ASSET FUNDS
| ■ | Thornburg Investment Income Builder Fund |
| ■ | Thornburg Summit Fund |
FIXED INCOME FUNDS
| ■ | Thornburg Low Duration Income Fund |
| ■ | Thornburg Limited Term U.S. Government Fund |
| ■ | Thornburg Limited Term Income Fund |
| ■ | Thornburg Strategic Income Fund |
| ■ | Thornburg Low Duration Municipal Fund |
| ■ | Thornburg Limited Term Municipal Fund |
| ■ | Thornburg Intermediate Municipal Fund |
| ■ | Thornburg California Limited Term Municipal Fund |
| ■ | Thornburg New Mexico Intermediate Municipal Fund |
| ■ | Thornburg New York Intermediate Municipal Fund |
| ■ | Thornburg Strategic Municipal Income Fund |
ALTERNATIVE FUNDS
| ■ | Thornburg Long/Short Equity Fund |
Before investing, carefully consider the Fund’s investment goals, risks, charges, and expenses. For a prospectus or summary prospectus containing this and other information, contact your financial advisor or visit thornburg.com. Read it carefully before investing.
For additional information, please visit thornburg.com
Thornburg Investment Management, Inc. 2300 North Ridgetop Road, Santa Fe, NM 87506
To receive shareholder reports, prospectuses, and proxy statements electronically, go to www.thornburg.com/edelivery.
This Annual Report is submitted for the general information of shareholders of the Fund. It is not authorized for distribution to prospective investors in the Fund unless preceded or accompanied by an effective prospectus.
Investment Advisor:
Thornburg Investment Management®
800.847.0200
Distributor:
Thornburg Securities Corporation®
Annual Report
September 30, 2019
Beginning on January 1, 2021, as permitted by regulations adopted by the Securities and Exchange Commission, paper copies of the Fund’s shareholder reports will no longer be sent by mail, unless you specifically request paper copies of the reports from the Fund or from your financial intermediary, such as a broker-dealer or bank. Instead, the reports will be made available on a website, and you will be notified by mail each time a report is posted and provided with a website link to access the report.
If you already elected to receive shareholder reports electronically, you will not be affected by this change and you need not take any action. You may elect to receive shareholder reports and other communications from the Fund or your financial intermediary electronically by going to thornburg.com/edelivery.
You may elect to receive all future reports in paper free of charge. You can inform the Fund or your financial intermediary that you wish to continue receiving paper copies of your shareholder reports by calling 800.847.0200 or your financial intermediary directly. Your election to receive reports in paper will apply to all funds held with the fund complex/your financial intermediary.
At Thornburg, we believe unconstrained investing leads to better outcomes for our clients. Our investment solutions are highly active, high conviction, and benchmark agnostic. When it comes to finding economic opportunity for clients, it’s more than what we do.
It’s how we do it. Active Asbottom-up, fundamental, active managers, we look beyond conventional benchmarks. Long Term We take a long-term view in how we manage our firm and our portfolios. Benchmark Agnostic Investment strategies should have the flexibility to pursue solutions for clients, not stay within the conventional confines of benchmarks. Flexible Perspective Our approach to portfolio construction is guided by our convictions rather than convention. High Conviction We focus our attention and capital on thoroughly researched, well-understood positions. The best form of risk management is to know what you own, and why. Repeatable & Robust Our long-term outperformance of benchmarks verifies that our process works and outperforms conventional thinking. Independent We are independently owned and far from the herd of other investment managers. Investment Driven All members of the investment team are resources for all of our strategies. Collaborative Our team collaborates on opportunities across geography, sector, or asset class.
Thornburg New York Intermediate Municipal Fund
Annual Report | September 30, 2019
Table of Contents
| SHARE CLASS | NASDAQ SYMBOL | CUSIP |
| Class A | THNYX | 885-215-665 |
| Class I | TNYIX | 885-216-705 |
Minimum investments for Class I shares may be higher than those for Class A. Class I shares may not be available to all investors.
Investments carry risks, including possible loss of principal. Portfolios investing in bonds have the same interest rate, inflation, and credit risks that are associated with the underlying bonds. The value of bonds will fluctuate relative to changes in interest rates, decreasing when interest rates rise. Unlike bonds, bond funds have ongoing fees and expenses. Please see the Fund’s prospectus for a discussion of the risks associated with an investment in the Fund. Investments in the Funds are not FDIC insured, nor are they bank deposits or guaranteed by a bank or any other entity.
The laddering strategy does not assure or guarantee better performance and cannot eliminate the risk of investment losses.
Letter to Shareholders
Thornburg New York Intermediate Municipal Fund | September 30, 2019 (Unaudited)
October 18, 2019
Dear Fellow Shareholder:
We are pleased to present the annual report for the Thornburg New York Intermediate Municipal Fund. The net asset value (NAV) of the Class I shares increased 34 cents to $12.95 per share during the fiscal year ended September 30, 2019. The Class I shares of your Fund underperformed the index with a 5.50% total return for the fiscal year ended September 30, 2019, compared to the 8.14% total return for the ICE BofA Merrill Lynch 3-15 Year Municipal Securities Index.
The drivers of the Fund’s total return relative to its benchmark include its interest rate sensitivity, as measured by the Fund’s duration, differing credit quality allocations and other risk factors. The impact of the Fund’s 1.34 years shorter duration detracted 1.254%. The Fund’s credit quality allocations detracted 0.132%, while other risk factors detracted 0.458%. The Fund’s expenses and residuals accounted for the remainder of the performance differential.
Since the last annual letter published in November 2018, the municipal market and its investors have experienced one of the great rallies in the market’s history, driven by the largest amount of inflows into municipal bond mutual funds on record. Mutual funds have experienced positive inflows every week of 2019, with the aggregate amounting to more than $70 billion. During that time, the 10-year Thomson Reuters Municipal Market Data (MMD) AAA Curve has fallen from a high of 2.80% in early November 2018 to an all-time low of 1.22% in late August 2019, only to settle around 1.45% at the time of this writing. The decrease in yields and the insatiable demand from retail mutual fund investors has led to appreciating bond prices that have accounted for a large portion of the returns the market inked over the last 12 months.
While the increase in the price of the investments has been great to watch, municipal investors find themselves in a tough situation. Does one sell the bonds at high prices? Is it best to pay a capital gain and look for reinvestment opportunities? Or does one hold the bonds? Collect a coupon and reinvest the proceeds knowing that the premium could evaporate if yields spike?
In many cases the answer is contingent on investor goals and risk tolerance. So instead of providing an answer, we would like to present an analysis of market risks that will allow investors to draw their own conclusions.
Municipal Bond Supply and Demand
Municipal investors tend to be overly sensitive to supply trends. The common refrain is that a big supply year is bearish for bond prices and vice versa. While that is generally true, it negates the other half of the equation. Demand, not supply, can be a large driver of total return, and that is exactly what the market has experienced throughout 2019. $70 billion has poured into the municipal market through the end of September 2019, the largest amount of annual inflows on record.
That $70 billion represents roughly 10% of all assets in municipal bond mutual funds. So technical demand, not fundamentals, has been the key driver of asset appreciation. That should be troubling. As investors, we like fundamentals to move asset prices. If you were to invest in Apple, and Apple sells more iPhones, and the firm’s stock appreciates, we would consider that being for the right reasons. When price is driven by factors other than fundamental value, the potential for a reversal tends to be high. Therefore, we would recommend caution when investing in a market where fundamental improvement isn’t the reason for price appreciation.
Municipal Bond Credit Risk
Credit spreads, much like triple-A bond insurers, have all but disappeared from the muni market. That is somewhat of an overstatement, but for some time now credit spreads, especially across the plain vanilla investment grade space, have become virtually commoditized. At the same time, while much has been said surrounding the covenant-lite status of recent corporate debt issuance, little has been said about the phenomenon in the municipal bond market. Credit security packages are getting weaker. Net revenue covenants, liquidity covenants, additional bonds tests and other protections granted to municipal investors are weakening. It is undeniable that municipal investors are taking on more and more credit risk for less and less yield.
State and Local Tax Deduction (SALT)
At least part of the increase in demand for municipal paper has been driven by the changes to the SALT deduction cap. The cap of $10,000 in state and local taxes that are deductible from federal taxes was part of the tax changes that were passed by the Trump administration at the end of 2017. It is estimated that over 10 million taxpayers were unable to write-off some $320 billion in state and local taxes, effectively increasing their tax liability despite a reduction in marginal personal income tax rates. The impact has been the most severe in states with high local and state taxes.
Faced with an ever-increasing tax bill, investors in these high-tax states have flocked to the municipal bond market. In no place is that truer than California. For many investors in the state, investments in the California municipal bond market no longer make economic sense. After adjusting yields for state and local taxes, many California investors would be better off investing in U.S. Treasuries due to the higher after-tax yield. Yet, money continues to flow into the California municipal bond market as investors make these non-economic decisions. Non-economic decision-making is not isolated to the California market, though. It’s evident in many high-tax states.
The Federal Reserve and Monetary Policy
As recently as December 2018, the Federal Reserve seemed bound and determined to push interest rates higher. It took only a few angry tweets and some stock market volatility in the fourth quarter of 2018 for the Fed to put its interest rate hikes
Letter to Shareholders, Continued
Thornburg New York Intermediate Municipal Fund | September 30, 2019 (Unaudited)
on pause, and only seven months for a complete reversal of course. Since the 25 basis point (bps) rate cut in July, the Fed cut again in September and the market is pricing in one more cut before year end.
While monetary policy has been the elixir of choice for a decade running, it has also created a host of problems for fixed income investors. By keeping yields low for the last decade, fixed income investors have been driven out the risk spectrum in search of their income goals. Many have taken on additional duration risk by buying longer-dated bonds, making them more susceptible to interest rate movements.
Other fixed income investors have taken on more credit risk, making them more susceptible to a slowing economy. Others have been forced out of the fixed income market and into the equity markets, which completely changes the risk profile of their investments. This is all being done at a time of all-time low yields and all-time low credit spreads. This situation is hardly sustainable.
The highlighted risks have led us to maintain our present course. The Fund remains higher in credit quality and cash with durations at lower levels. While the latter has impacted total returns as price appreciation has driven total return, the distribution yield, or tax-free monthly income, has held up nicely. Cash has been allowed to build given the flatness of the
yield curve and the trade-off in investing in the variable rate demand note (VRDN) market. When opportunities arise, we have ample dry powder to take advantage of dislocations. Until those conditions are met, we are content to manage the Fund in a more conservative fashion commensurate with the risk profile of a municipal bond investor.
Thank you for your continued trust and support.
Sincerely,

| 
|
Christopher Ryon,cfa
Portfolio Manager
Managing Director | Nicholos Venditti,cfa
Portfolio Manager
Managing Director |

| |
David Ashley,cfa
Portfolio Manager
Managing Director | |
The matters discussed in this report may constitute forward-looking statements made pursuant to the safe harbor provisions of the Securities Litigation Reform Act of 1995. These include any advisor or portfolio manager prediction, assessment, analysis or outlook for individual securities, industries, investment styles, market sectors and/or markets. These statements involve risks and uncertainties. In addition to the general risks described for each fund in its current prospectus, other factors bearing on these reports include the accuracy of the advisor’s or portfolio manager’s forecasts and predictions, the appropriateness of the investment strategies designed by the advisor or portfolio manager and the ability of the advisor or portfolio manager to implement their strategies efficiently and successfully. Any one or more of these factors, as well as other risks affecting the securities markets generally, could cause the actual results of any fund to differ materially as compared to its benchmarks.
The views expressed are subject to change and do not necessarily reflect the views of Thornburg Investment Management, Inc. This information should not be relied upon as a recommendation or investment advice and is not intended to predict the performance of any investment or market.
Performance results of individual share classes will vary based on the fees and expenses associated with each share class, and may be higher or lower than other share classes within the same Fund. Please see Performance Summary for performance results of each share class.
Performance Summary
Thornburg New York Intermediate Municipal Fund | September 30, 2019 (Unaudited)
AVERAGE ANNUAL TOTAL RETURNS
| | 1-YR | 3-YR | 5-YR | 10-YR | SINCE
INCEP. |
| Class A Shares(Incep: 9/5/97) | | | | | |
| Without sales charge | 5.16% | 1.29% | 1.92% | 2.75% | 3.67% |
| With sales charge | 3.04% | 0.61% | 1.51% | 2.54% | 3.57% |
| Class I Shares(Incep: 2/1/10) | 5.50% | 1.61% | 2.25% | - | 3.31% |
30-DAY YIELDS, A SHARES(with sales charge)
| Annualized Distribution Yield | 2.18% |
| SEC Yield | 0.62% |
GROWTH OF A HYPOTHETICAL $10,000 INVESTMENT
Performance data shown represents past performance and is no guarantee of future results. Investment return and principal value will fluctuate so shares, when redeemed, may be worth more or less than their original cost. Current performance may be lower or higher than quoted. For performance current to the most recent month end, visit thornburg.com or call 800-847-0200. The performance information does not reflect the deduction of taxes that a shareholder would pay on distributions or the redemption of Fund shares. Returns reflect the reinvestment of dividends and capital gains. Class A shares are sold with a maximum sales charge of 2.00%. There is no sales charge for Class I shares. As disclosed in the most recent prospectus, the total annual fund operating expenses before fee waivers and expense reimbursements are as follows: A shares, 1.08%; I shares, 0.82%. Thornburg Investment Management has contractually agreed to waive fees and reimburse expenses until at least February 1, 2020, for all share classes, resulting in net expense ratios of the following: A shares, 0.99%; I shares, 0.67%. For more detailed information on fund expenses and waivers/reimbursements please see the Fund’s prospectus. Without the fee waivers and expense reimbursements, the Annualized Distribution yield would have been 2.15%, and the SEC yield would have been 0.49%.
The ICE index data referenced herein is the property of ICE Data Indices, LLC, its affiliates (“ICE Data”) and/or its Third Party Suppliers and has been licensed for use by Thornburg Investment Management, Inc. ICE Data and its Third Party Suppliers accept no liability in connection with its use. See www.thornburg.com/indices for a full copy of the Disclaimer.
TheICE BofAML 3-15 Year Municipal Securities Index is a subset of the ICE BofAML Municipal Securities Index including all securities with a remaining term to final maturity greater than or equal to 3 years and less than 15 years.
The performance of any index is not indicative of the performance of any particular investment. Unless otherwise noted, index returns reflect the reinvestment of income dividends and capital gains, if any, but do not reflect fees, brokerage commissions or other expenses of investing. Investors may not make direct investments into any index.
Bond Credit Ratings (Credit Quality) – A bond credit rating assesses the financial ability of a debt issuer to make timely payments of principal and interest. Ratings of AAA (the highest), AA, A, and BBB are investment-grade quality. Ratings of BB, B, CCC, CC, C and D (the lowest) are considered below investment grade, speculative grade, or junk bonds.
Duration – A bond’s sensitivity to interest rates. Bonds with longer durations experience greater price volatility than bonds with shorter durations. Effective duration incorporates a bond’s embedded option features, such as call provisions.
Yield Curve – A line that plots the interest rates, at a set point in time, of bonds having equal credit quality, but differing maturity dates.
Thomson Reuters Municipal Market Data (MMD) AAA Curve - Thomson Reuters Municipal Market Data (MMD) AAA Curve is a proprietary yield curve that provides the offer-side of “AAA” rated state general obligation bonds, as determined by the MMD analyst team. The MMD AAA curve represents the MMD analyst team’s opinion of AAA valuation, based on institutional block size ($2 million+) market activity in both the primary and secondary municipal bond market. In the interest of transparency, MMD publishes extensive yield curve assumptions relating to various structural criteria which are used in filtering market information for the purpose of benchmark yield curve creation.
Fund Summary
Thornburg New York Intermediate Municipal Fund | September 30, 2019 (Unaudited)
OBJECTIVES AND STRATEGIES
The Fund’s primary investment objective is to obtain as high a level of current income exempt from federal, New York State and New York City individual income taxes as is consistent, in the view of the Fund’s investment advisor, with preservation of capital.
The secondary goal of the Fund is to reduce expected changes in its share price compared to long-term bond portfolios.
The Fund offers New York investors double (or for New York City residents triple) tax-free yields in a laddered municipal bond portfolio with a dollar-weighted average maturity of normally three to 10 years (may be subject to Alternative Minimum Tax). Laddering involves building a portfolio of bonds with staggered maturities so that a portion of the portfolio matures each year. Cash from maturing bonds, if not needed for other purposes, is typically invested in bonds with longer maturities at the far end of the ladder. We regard the strategy as a good compromise for managing different types of risk.
LONG-TERM STABILITY OF PRINCIPAL
Net Asset Value History of A Shares
| KEY PORTFOLIO ATTRIBUTES | |
| Number of Bonds | 58 |
| Effective Duration | 4.0 Yrs |
| Average Maturity | 8.8 Yrs |
SECURITY CREDIT RATINGS
A bond credit rating assesses the financial ability of a debt issuer to make timely payments of principal and interest. Ratings of AAA (the highest), AA, A, and BBB are investment-grade quality. Ratings of BB, B, CCC, CC, C and D (the lowest) are considered below investment grade, speculative grade, or junk bonds.
Unrated pre-refunded and escrowed-to-maturity bonds are included in the not rated category.
PORTFOLIO LADDER
| 6% | 13% | 6% | 10% | 6% | 15% | 12% | 10% | 6% | 17% |
Percent of portfolio maturing in each year. Cash includes cash equivalents and other.
There is no guarantee that the Fund will meet its investment objectives.
All data is subject to change. Charts may not add up to 100% due to rounding.
Schedule of Investments
Thornburg New York Intermediate Municipal Fund | September 30, 2019
| Issuer-Description | PRINCIPAL
AMOUNT | VALUE |
| | MUNICIPAL BONDS — 98.9% | | |
| | City of New York (City Budget Financial Management) GO, Series G, 5.00% due 8/1/2030 | $1,000,000 | $ 1,147,240 |
| | City of New York GO, | | |
| | Series A, 5.00% due 8/1/2039 | 1,000,000 | 1,258,150 |
| | Series F1, 5.00% due 4/1/2037 | 940,000 | 1,161,887 |
| | County of Nassau (Insured: BAM) GO, Series B, 5.00% due 4/1/2026 | 1,000,000 | 1,133,810 |
| | Dutchess County Local Development Corp. (Health Quest Systems, Inc.; Insured: AGM), Series A, 5.00% due 7/1/2021 - 7/1/2022 (pre-refunded 7/1/2020) | 1,045,000 | 1,073,236 |
| | Erie County Fiscal Stability Authority, Series D, 5.00% due 9/1/2034 | 850,000 | 1,061,361 |
| | Government of Guam (Layon Solid Waste Disposal Facility), Series A, 5.375% due 12/1/2024 (pre-refunded 12/1/2019) | 1,000,000 | 1,006,790 |
| | Guam Waterworks Authority (Water and Wastewater System), 5.00% due 7/1/2028 - 7/1/2036 | 1,500,000 | 1,714,355 |
| | Hempstead Town Local Development Corp. (Hofstra University), 5.00% due 7/1/2028 | 500,000 | 529,405 |
| | Hudson Yards Infrastructure Corp. (Hudson Yards Subway Station), Series A, 5.00% due 2/15/2035 | 1,000,000 | 1,221,070 |
| | Long Island Power Authority (Electric System Capital Improvements; Insured: AGC), Series C, 5.25% due 9/1/2029 | 645,000 | 846,085 |
| | Metropolitan Transportation Authority (Green Bond), Series C-1, 5.00% due 11/15/2028 | 1,000,000 | 1,265,450 |
| | Monroe County Industrial Development Corp. (Monroe Community College Association, Inc.; Insured: AGM), 5.00% due 1/15/2028 - 1/15/2029 | 550,000 | 625,392 |
| | Nassau County (New York Institute of Technology) IDA, Series A, 4.75% due 3/1/2026 (pre-refunded 3/1/2020) | 1,000,000 | 1,014,390 |
| | Nassau County Sewer & Storm Water Finance Authority (Sewerage and Storm Water Resource Facilities), Series A, 5.00% due 10/1/2021 - 10/1/2031 | 1,675,000 | 1,929,374 |
| | New York City Health and Hospitals Corp. (Healthcare Facilities Improvements) GO, Series A, 5.00% due 2/15/2025 | 1,000,000 | 1,013,460 |
| | New York City Transitional Finance Authority Future Tax Secured Revenue, | | |
| | 5.00% due 8/1/2038 | 1,000,000 | 1,236,090 |
| | Series A2, 5.00% due 5/1/2039 | 1,000,000 | 1,251,990 |
| a | New York City Water & Sewer System (LOC Citibank N.A.), Series F, 1.76% due 6/15/2035 (put 10/1/2019) | 500,000 | 500,000 |
| a | New York City Water & Sewer System (SPA Mizuho Bank, Ltd.), Series AA-6, 1.77% due 6/15/2048 (put 10/1/2019) | 1,500,000 | 1,500,000 |
| a | New York City Water & Sewer System (SPA State Street Bank and Trust Co.), Series B-3, 1.76% due 6/15/2045 (put 10/1/2019) | 500,000 | 500,000 |
| | New York State Dormitory Authority (Catholic Health System Obligated Group), Series A, 5.00% due 7/1/2036 | 400,000 | 496,396 |
| | New York State Dormitory Authority (Columbia University Teachers College), Series A, 5.00% due 7/1/2027 | 750,000 | 822,060 |
| | New York State Dormitory Authority (Green Bond-Cornell University), Series D, 5.00% due 7/1/2036 | 1,000,000 | 1,426,090 |
| | New York State Dormitory Authority (Health Quest Systems; Insured: AGC), Series A, 5.25% due 7/1/2027 | 420,000 | 420,092 |
| | New York State Dormitory Authority (Metropolitan Transportation Authority & State Urban Development Corp.), Series A, 5.00% due 12/15/2027 | 2,500,000 | 2,781,450 |
| | New York State Dormitory Authority (Northwell Health Obligated Group), Series A, 5.00% due 5/1/2033 | 100,000 | 124,494 |
| | New York State Dormitory Authority (School District Financing Program) (State Aid Withholding), Series C, 5.00% due 10/1/2023 | 575,000 | 660,928 |
| | New York State Dormitory Authority (School District Financing Program; Insured: AGM) (State Aid Withholding), | | |
| | Series A, 5.00% due 10/1/2028 | 200,000 | 233,134 |
| | Series H, | | |
| | 5.00% due 10/1/2024 | 480,000 | 514,925 |
| | 5.00% due 10/1/2024 (pre-refunded 10/1/2021) | 520,000 | 560,170 |
| | New York State Dormitory Authority (St. John’s University; Insured: Natl-Re), Series C, 5.25% due 7/1/2022 | 1,000,000 | 1,103,670 |
| | New York State Dormitory Authority, Series A, 5.00% due 2/15/2032 | 1,000,000 | 1,225,150 |
| a | New York State Housing Finance Agency (LOC Landesbank Hessen-Thuringen), Series A, 1.76% due 11/1/2046 (put 10/1/2019) | 600,000 | 600,000 |
| | Onondaga Civic Development Corp. (Le Moyne College), 5.00% due 7/1/2021 | 685,000 | 705,790 |
| | Onondaga Civic Development Corp. (State University of New York Upstate Medical University), 5.50% due 12/1/2031 | 1,000,000 | 1,089,470 |
| | Sales Tax Asset Receivable Corp. (New York Local Government Assistance Corp.), Series A, 5.00% due 10/15/2029 - 10/15/2031 | 2,250,000 | 2,640,940 |
| | Syracuse Industrial Development Agency (Syracuse City School District) (State Aid Withholding), 5.25% due 5/1/2026 | 2,150,000 | 2,283,923 |
| | Tompkins County Development Corp. (Ithaca College Project), 5.00% due 7/1/2034 - 7/1/2037 | 820,000 | 999,034 |
| | Town of Amherst Development Corp. (University at Buffalo Foundation Facility-Student Housing; Insured: AGM) ETM, Series A, 5.00% due 10/1/2020 | 1,000,000 | 1,038,060 |
| | Town of Oyster Bay GO, Series B, 3.00% due 2/1/2020 - 3/13/2020 | 1,000,000 | 1,004,760 |
| | Triborough Bridge & Tunnel Authority (MTA Bridges and Tunnels) GO, | | |
| | Series A, | | |
| | 5.00% due 11/15/2028 (pre-refunded 5/15/2024) | 1,000,000 | 1,173,700 |
| | 5.00% due 11/15/2029 | 1,000,000 | 1,162,800 |
| | Utility Debt Securitization Authority (Long Island Power Authority-Electric Service), Series TE, 5.00% due 12/15/2029 - 12/15/2030 | 2,000,000 | 2,297,690 |
| | West Seneca Central School District (Facilities Improvements; Insured: BAM) (State Aid Withholding) GO, 5.00% due 11/15/2023 | 1,300,000 | 1,496,027 |
| | Westchester County Local Development Corp. (Miriam Osborn Memorial Home Association Obligated Group), 5.00% due 7/1/2029 - 7/1/2034 | 450,000 | 531,774 |
| | Total Investments — 98.9%(Cost $47,663,262) | | $50,382,062 |
| | Other Assets Less Liabilities — 1.1% | | 584,415 |
| | Net Assets — 100.0% | | $50,966,477 |
Schedule of Investments, Continued
Thornburg New York Intermediate Municipal Fund | September 30, 2019
| Footnote Legend |
| a | Variable Rate Demand Notes are instruments whose interest rates change on a specific date (such as coupon date or interest payment date) or whose interest rates vary with changes in a designated base rate (such as the prime interest rate). This instrument is payable on demand and is secured by letters of credit or other credit support agreements from major banks. |
Portfolio Abbreviations
To simplify the listings of securities, abbreviations are used per the table below:
| AGC | Insured by Associated General Contractors |
| AGM | Insured by Assured Guaranty Municipal Corp. |
| BAM | Insured by Build America Mutual Insurance Co. |
| ETM | Escrowed to Maturity |
| GO | General Obligation |
| IDA | Industrial Development Authority |
| LOC | Letter of Credit |
| Natl-Re | Insured by National Public Finance Guarantee Corp. |
| SPA | Stand-by Purchase Agreement |
See notes to financial statements.
Statement of Assets and Liabilities
Thornburg New York Intermediate Municipal Fund | September 30, 2019
| ASSETS | |
| Investments at value (cost $47,663,262) (Note 3) | $ 50,382,062 |
| Cash | 65,662 |
| Receivable for fund shares sold | 23,559 |
| Interest receivable | 617,646 |
| Prepaid expenses and other assets | 12,848 |
| Total Assets | 51,101,777 |
| Liabilities | |
| Payable for fund shares redeemed | 26,394 |
| Payable to investment advisor and other affiliates (Note 4) | 24,301 |
| Accounts payable and accrued expenses | 66,812 |
| Dividends payable | 17,793 |
| Total Liabilities | 135,300 |
| Net Assets | $ 50,966,477 |
| NET ASSETS CONSIST OF | |
| Distributable earnings | $ 2,159,135 |
| Net capital paid in on shares of beneficial interest | 48,807,342 |
| | $ 50,966,477 |
| NET ASSET VALUE | |
| Class A Shares: | |
Net asset value and redemption price per share
($26,416,448 applicable to 2,039,403 shares of beneficial interest outstanding - Note 5) | $ 12.95 |
| Maximum sales charge, 2.00% of offering price | 0.26 |
| Maximum offering price per share | $ 13.21 |
| Class I Shares: | |
Net asset value, offering and redemption price per share
($24,550,029 applicable to 1,895,226 shares of beneficial interest outstanding - Note 5) | $ 12.95 |
See notes to financial statements.
Statement of Operations
Thornburg New York Intermediate Municipal Fund | Year Ended September 30, 2019
| INVESTMENT INCOME | |
| Interest income (net of premium amortized of $483,362) | $ 1,788,846 |
| EXPENSES | |
| Investment advisory fees (Note 4) | 265,589 |
| Administration fees (Note 4) | |
| Class A Shares | 26,501 |
| Class I Shares | 20,144 |
| Distribution and service fees (Note 4) | |
| Class A Shares | 75,434 |
| Transfer agent fees | |
| Class A Shares | 22,802 |
| Class I Shares | 21,637 |
| Registration and filing fees | |
| Class A Shares | 7,436 |
| Class I Shares | 5,308 |
| Custodian fees | 24,254 |
| Professional fees | 42,469 |
| Trustee and officer fees (Note 4) | 3,145 |
| Other expenses | 24,707 |
| Total Expenses | 539,426 |
| Less: | |
| Expenses reimbursed by investment advisor (Note 4) | (82,529) |
| Investment advisory fees waived by investment advisor (Note 4) | (4,452) |
| Net Expenses | 452,445 |
| Net Investment Income | $ 1,336,401 |
| REALIZED AND UNREALIZED GAIN (LOSS) | |
| Net realized gain (loss) on investments | 83,145 |
| Net change in unrealized appreciation (depreciation) on investments | 1,328,381 |
| Net Realized and Unrealized Gain | 1,411,526 |
| Net Increase in Net Assets Resulting from Operations | $ 2,747,927 |
See notes to financial statements.
Statements of Changes in Net Assets
Thornburg New York Intermediate Municipal Fund
| | Year Ended
September 30, 2019 | Year Ended
September 30, 2018 |
| INCREASE (DECREASE) IN NET ASSETS FROM | | |
| OPERATIONS | | |
| Net investment income | $ 1,336,401 | $ 1,570,023 |
| Net realized gain (loss) on investments | 83,145 | (9,562) |
| Net change in unrealized appreciation (depreciation) on investments | 1,328,381 | (1,951,804) |
| Net Increase (Decrease) in Net Assets Resulting from Operations | 2,747,927 | (391,343) |
| DIVIDENDS TO SHAREHOLDERS | | |
| From distributable earnings | | |
| Class A Shares | (719,633) | (861,533) |
| Class I Shares | (616,768) | (708,490) |
| FUND SHARE TRANSACTIONS (NOTE 5) | | |
| Class A Shares | (8,173,078) | (1,663,676) |
| Class I Shares | (59,783) | (2,380,889) |
| Net Decrease in Net Assets | (6,821,335) | (6,005,931) |
| NET ASSETS | | |
| Beginning of Year | 57,787,812 | 63,793,743 |
| End of Year | $ 50,966,477 | $ 57,787,812 |
See notes to financial statements.
Notes to Financial Statements
Thornburg New York Intermediate Municipal Fund | September 30, 2019
NOTE 1 – ORGANIZATION
Thornburg New York Intermediate Municipal Fund (the “Fund”) is a non-diversified series of Thornburg Investment Trust (the “Trust”). The Trust was organized as a Massachusetts business trust under a Declaration of Trust dated June 3, 1987 and is registered as a diversified, open-end management investment company under the Investment Company Act of 1940, as amended (the "1940 Act"). The Fund is currently one of twenty-two separate series of the Trust. Each series is considered to be a separate entity for financial reporting and tax purposes and bears expenses directly attributable to it. The Fund’s primary investment objective is to obtain as high a level of current income exempt from federal, New York State, and New York City individual income taxes as is consistent, in the view of Thornburg Investment Management, Inc., the Trust’s investment advisor (the “Advisor”), with the preservation of capital. The Fund’s secondary objective is to reduce expected changes in its share price compared to long-term bond portfolios.
The Fund currently offers two classes of shares of beneficial interest: Class A and Institutional Class (“Class I”) shares. Each class of shares of the Fund represents an interest in the same portfolio of investments, except that (i) Class A shares are sold subject to a front-end sales charge collected at the time the shares are purchased and bear a service fee, (ii) Class I shares are sold at net asset value without a sales charge at the time of purchase and may be subject to a service fee, and (iii) the respective classes may have different reinvestment privileges and conversion rights. Additionally, the Fund may allocate among its classes certain expenses, to the extent allocable to specific classes, including administration fees, transfer agent fees, government registration fees, certain printing and postage costs, and administrative and legal expenses. Currently, class specific expenses of the Fund are limited to service and distribution fees and certain registration and transfer agent expenses.
The following is a summary of significant accounting policies followed by the Fund in the preparation of its financial statements. The Fund prepares its financial statements in conformity with United States generally accepted accounting principles (“GAAP”), including investment company accounting and reporting guidance in the Financial Accounting Standards Board (the “FASB”) Accounting Standard Codification Topic 946.
NOTE 2 – SIGNIFICANT ACCOUNTING POLICIES
Security Valuation: All investments in securities held by the Fund are valued as described in Note 3.
Allocation of Income, Gains, Losses and Expenses: Net investment income (other than class specific expenses) and realized and unrealized gains and losses are allocated daily to each class of shares based upon the relative net asset value of outstanding shares (or the value of the dividend-eligible shares, as appropriate) of each class of shares at the beginning of the day (after adjusting for the current capital shares activity of the respective class). Expenses common to all Funds are allocated among the Funds comprising the Trust based upon their relative net asset values or other appropriate allocation methods. Operating expenses directly attributable to a specific class are charged against the operating income of that class.
Dividends and Distributions to Shareholders: Dividends and distributions to shareholders, which are determined in accordance with federal income tax regulations and may differ from GAAP, are recorded on the ex-dividend date. Ordinary income dividends, if any, are declared daily and paid monthly. Capital gain distributions, if any, are declared and paid annually and more often if deemed necessary by the Advisor. Dividends and distributions are paid and are reinvested in additional shares of the Fund at net asset value per share at the close of business on the ex-dividend date, or at the shareholder’s option, paid in cash.
Investment Income: Interest income is accrued as earned. Premiums and discounts are amortized and accreted, respectively, to first call dates or maturity dates using the effective yield method of the respective investments. These amounts are included in Investment Income in the Statement of Operations.
Investment Transactions: Investment transactions are accounted for on a trade date basis. Realized gains and losses from the sale of investments are recorded on an identified cost basis.
When-Issued and Delayed Delivery Transactions: The Fund may engage in when-issued or delayed delivery transactions. To the extent the Fund engages in such transactions, it will do so for the purpose of acquiring portfolio investments consistent with the Fund’s investment objectives and not for the purpose of investment leverage or to speculate on interest rate or market changes. At the time the Fund makes a commitment to purchase an investment on a when-issued or delayed delivery basis, the Fund will record the transaction and reflect the value in determining its net asset value. When effecting such transactions, assets of an amount sufficient to make payment for the portfolio investments to be purchased will be segregated on the Fund’s records on the trade date. Investments purchased on a when-issued or delayed delivery basis do not earn interest until the settlement date. The values of these securities held at September 30, 2019 are detailed in the Schedule of Investments.
Guarantees and Indemnifications: Under the Trust’s organizational documents (and under separate agreements with the independent Trustees), its officers and Trustees are provided with an indemnification against certain liabilities arising out of the performance of their
Notes to Financial Statements, Continued
Thornburg New York Intermediate Municipal Fund | September 30, 2019
duties to the Fund. In the normal course of business the Trust may also enter into contracts with service providers that contain general indemnifications. The Trust’s maximum exposure under these arrangements is unknown. However, based on experience, the Trust expects the risk of loss to be remote.
Use of Estimates: The preparation of financial statements in conformity with GAAP requires management to make estimates and assumptions that affect the reported amounts of assets and liabilities and disclosure of contingent assets and liabilities at the date of the financial statements and the reported amounts of increases (decreases) in net assets from operations during the reporting period. Actual results could differ from those estimates.
Federal Income Taxes: It is the policy of the Trust to comply with the provisions of the Internal Revenue Code applicable to regulated investment companies and to distribute to shareholders substantially all investment company taxable income including net realized gains on investments (if any), and tax exempt income of the Fund. Therefore, no provision for federal income or excise tax is required.
The Fund files income tax returns in United States federal and applicable state jurisdictions. The statute of limitations on the Fund’s tax return filings generally remains open for the three years following a return’s filing date. The Fund has analyzed each uncertain tax position believed to be material in the preparation of the Fund’s financial statements for the fiscal year ended September 30, 2019, including open tax years, to assess whether it is more likely than not that the position would be sustained upon examination, based on the technical merits of the position. The Fund has not identified any such position for which an asset or liability must be reflected in the Statement of Assets and Liabilities.
At September 30, 2019, information on the tax components of capital was as follows:
| Cost of investments for tax purposes | $ 47,663,262 |
| Gross unrealized appreciation on a tax basis | 2,732,562 |
| Gross unrealized depreciation on a tax basis | (13,762) |
| Net unrealized appreciation (depreciation) on investments (tax basis) | $ 2,718,800 |
At September 30, 2019, the Fund had deferred tax basis capital losses occurring subsequent to October 31, 2018 through September 30, 2019 of $64,050. For tax purposes, such losses will be recognized in the year ending September 30, 2020.
At September 30, 2019, the Fund had cumulative tax basis capital losses of $479,025 (of which $412,560 are short-term and $66,465 are long-term), which may be carried forward to offset future capital gains. To the extent such carryforwards are used, capital gain distributions may be reduced to the extent provided by regulations. Such capital loss carryforwards do not expire.
At September 30, 2019, the Fund had $1,203 of undistributed net tax-exempt income, no undistributed tax basis net ordinary income and no undistributed tax basis capital gains.
Distributions from tax exempt income paid by the Fund for the year ended September 30, 2019 and September 30, 2018 are excludable by shareholders from gross income for Federal income tax purposes.
The tax character of distributions paid during the year ended September 30, 2019, and September 30, 2018, was as follows:
| | 2019 | 2018 |
| Distributions from: | | |
| Tax exempt income | $ 1,335,918 | $ 1,567,752 |
| Ordinary income | 483 | 2,014 |
| Capital gains | - | 257 |
| Total | $ 1,336,401 | $ 1,570,023 |
NOTE 3 – SECURITY VALUATION
Valuation of the Fund’s portfolio investment securities is performed in accordance with policies and procedures adopted by and under the oversight of the Trustees.
The Trustees of the Trust have appointed the Advisor to assist the Trustees with obtaining fair market values for portfolio investments, evaluating and monitoring professional pricing service providers appointed by the Trustees’ Audit Committee (the “Audit Committee”) to assist in determining fair values for portfolio investments, assisting in calculating fair values for portfolio investments in certain circumstances, and performing other functions in connection with the valuation of investments. The Advisor acts through its Valuation and
Notes to Financial Statements, Continued
Thornburg New York Intermediate Municipal Fund | September 30, 2019
Pricing Committee (the “Committee”) and other employees of the Advisor. The Committee regularly reviews its own valuation calculations, reviews the valuations, valuation techniques and services furnished by pricing service providers, considers circumstances which may require valuation calculations by the Committee, and reviews previous valuation calculations. The Committee reports to the Audit Committee on the Committee’s activities, the performance of pricing service providers, and other matters relating to valuation of portfolio investments.
In those instances when the Committee assists in calculating a fair value for a portfolio investment, the Committee seeks to determine the price that the Fund would reasonably expect to receive upon a sale of the investment in an orderly transaction between market participants on the valuation date. The Committee customarily utilizes quotations from securities broker dealers in calculating valuations, but also may utilize prices obtained from pricing service providers or other methods approved by the Audit Committee. Because fair values calculated by the Committee are estimates, the calculation of a value for an investment may differ from the price that would be realized by the Fund upon a sale of the investment, and the difference could be material to the Fund’s financial statements. The Committee’s calculation of a fair value for an investment may also differ from the prices obtained by other persons (including other mutual funds) for the investment.
Valuation of Securities: Debt obligations held by the Fund which are not listed or traded on exchanges or for which no reported market exists are ordinarily valued at the valuation obtained from a pricing service provider approved by the Audit Committee.
In any case when a pricing service provider fails to provide a valuation for a debt obligation held by the Fund, the Committee calculates a fair value for the obligation using alternative methods under procedures approved by the Audit Committee. Additionally, in cases when management believes that a valuation obtained from a pricing service provider is stale, does not reflect material factors affecting the valuation of the investment, is significantly different than the value the Fund is likely to obtain if it sought a bid for the investment, or is otherwise unreliable, the Committee calculates a fair value for the obligation using an alternative method approved by the Audit Committee.
Valuation Hierarchy: The Fund categorizes its investments based upon the inputs used in valuing those investments, according to a three-level hierarchy established in guidance from the FASB. Categorization of investments using this hierarchy is intended by the FASB to maximize the use of observable inputs in valuing investments and minimize the use of unobservable inputs by requiring that the most observable inputs be used when available. Observable inputs are those that market participants would use in valuing an investment based on available market information. Unobservable inputs are those that reflect assumptions about the information market participants would use in valuing an investment. An investment’s level within the hierarchy is based on the lowest level input that is deemed significant to the valuation. The methodologies and inputs used to value investments are not necessarily indications of the risk or liquidity associated with those investments.
Various inputs are used in calculating valuations for the Fund’s investments. These inputs are generally summarized according to the three-level hierarchy below:
Level 1: Quoted prices in active markets for identical investments.
Level 2: Other direct or indirect significant observable inputs (including quoted prices for similar investments in active markets and other observable inputs, such as interest rates, prepayment rates, credit ratings, etc.).
Level 3: Significant unobservable inputs (including the Committee’s own assumptions in calculating the fair values of investments).
Valuations for debt obligations held by the Fund are typically calculated by pricing service providers approved by the Audit Committee and are generally characterized as Level 2 within the valuation hierarchy.
In a limited number of cases the Committee calculates a fair value for investments using broker quotations or other methods approved by the Audit Committee. When the Committee uses a single broker quotation to calculate a fair value for an investment without other significant observable inputs, or if a fair value is calculated using other significant inputs that are considered unobservable, the investment is characterized as Level 3 within the hierarchy. Other significant unobservable inputs used to calculate a fair value in these instances might include an income-based valuation approach which considers discounted anticipated future cash flows from the investment and application of discounts due to the nature or duration of any restrictions on the disposition of the investment.
Valuations based upon the use of inputs from Levels 1, 2 or 3 may not represent the actual price received upon the disposition of an investment, and a Fund may receive a price that is lower than the valuation based upon these inputs when it sells the investment.
Notes to Financial Statements, Continued
Thornburg New York Intermediate Municipal Fund | September 30, 2019
The following table displays a summary of the fair value hierarchy measurements of the Fund’s investments as of September 30, 2019:
| | Fair Value Measurements at September 30, 2019 |
| | TOTAL | LEVEL 1 | LEVEL 2 | LEVEL 3 |
| Assets | | | | |
| Investments in Securities | | | | |
| Municipal Bonds | $ 50,382,062 | $ — | $ 50,382,062 | $ — |
| Total Investments in Securities | $50,382,062 | $— | $50,382,062 | $— |
| Total Assets | $50,382,062 | $— | $50,382,062 | $— |
NOTE 4 – INVESTMENT ADVISORY FEE AND OTHER TRANSACTIONS WITH AFFILIATES
Pursuant to an investment advisory agreement, the Advisor serves as the investment advisor and performs services for the Fund for which the fees are payable at the end of each month. Under the investment advisory agreement, the Fund pays the Advisor a management fee based on the average daily net assets of the Fund at an annual rate as shown in the following table:
| Management Fee Schedule |
| DAILY NET ASSETS | FEE RATE |
| Up to $500 million | 0.500% |
| Next $500 million | 0.450 |
| Next $500 million | 0.400 |
| Next $500 million | 0.350 |
| Over $2 billion | 0.275 |
The Fund’s effective management fee for the year ended September 30, 2019 was 0.50% of the Fund’s average daily net assets (before applicable management fee waiver of $4,452). Total management fees incurred by the Fund for the year ended September 30, 2019 are set forth in the Statement of Operations.
The Trust has entered into an administrative services agreement with the Advisor, whereby the Advisor will perform certain administrative services related to each class of the Fund’s shares. The fees are computed as an annual percentage of the aggregate average daily net assets of all shares classes of all Funds in the Trust as follows:
| Administration Fee Schedule |
| Daily Net Assets | Fee Rate |
| Up to $20 billion | 0.100% |
| $20 billion to $40 billion | 0.075 |
| $40 billion to $60 billion | 0.040 |
| Over $60 billion | 0.030 |
The aggregate fee amount is allocated on a daily basis to each Fund based on net assets and subsequently allocated to each class of shares of the Fund. Total administrative service fees incurred by each class of shares of the Fund for the year ended September 30, 2019, are set forth in the Statement of Operations.
The Trust has an underwriting agreement with Thornburg Securities Corporation (the “Distributor”), an affiliate of the Advisor, which acts as the distributor of the Fund’s shares. For the year ended September 30, 2019, the Distributor has advised the Fund that it earned net commissions aggregating $23 from the sale of Class A shares.
Pursuant to a service plan under Rule 12b-1 of the 1940 Act, the Fund may pay to the Distributor or securities dealers and other financial institutions at the Distributor’s direction an amount not to exceed .25 of 1% per annum of the average daily net assets attributable to Class A shares of the Fund to obtain various shareholder and distribution related services. For the year ended September 30, 2019, there were no 12b-1 service plan fees charged for Class I shares. The Advisor and Distributor each may pay out of its own resources additional expenses for distribution of the Fund’s shares and shareholder services.
Total fees incurred for the year ended September 30, 2019 are set forth in the Statement of Operations.
Notes to Financial Statements, Continued
Thornburg New York Intermediate Municipal Fund | September 30, 2019
The Advisor has contractually agreed to waive fees and reimburse expenses incurred by the Fund so that actual expenses of certain share classes do not exceed levels as specified in each Fund’s most recent prospectus (Class A shares, 0.99%; Class I shares, 0.67%). The agreement may be terminated by the Fund at any time, but may not be terminated by the Advisor before February 1, 2020, unless the Advisor ceases to be the investment advisor to the Fund prior to that date. The Advisor may recoup amounts waived or reimbursed during the fiscal year ended September 30, 2019 if, during that year, expenses fall below the contractual limit that was in place at the time those fees and expenses were waived or reimbursed. The Advisor will not recoup fees or expenses as described in the preceding sentence if that recoupment would cause the Fund’s total annual operating expenses (after the recoupment is taken into account) to exceed the lesser of: (a) the expense cap that was in place at the time the waiver or reimbursement occurred; or (b) the expense cap that is in place at the time of the recoupment.
For the year ended September 30, 2019, the Advisor voluntarily waived Fund level investment advisory fees of $4,452. The Advisor contractually reimbursed certain class specific expenses and distribution fees of $35,440 for Class A shares and $47,089 for Class I shares.
Certain officers and Trustees of the Trust are also officers or directors of the Advisor and Distributor. The compensation of the independent Trustees is borne by the Trust. The Trust also pays a portion of the Chief Compliance Officer’s compensation. These amounts are reflected as Trustee and officer fees in the Statement of Operations.
The Fund may purchase or sell securities from or to an affiliated fund, provided the affiliation is due solely to having a common investment advisor, common officers, or common trustees, and provided that all such transactions will comply with Rule 17a-7 under the 1940 Act. For the year ended September 30, 2019, the Fund had transactions with affiliated funds of $3,153,104 in purchases and $5,891,474 in sales generating realized gains of $27,982.
NOTE 5 – SHARES OF BENEFICIAL INTEREST
At September 30, 2019, there were an unlimited number of shares with no par value of beneficial interest authorized. Transactions in shares of beneficial interest were as follows:
| | YEAR ENDED
September 30, 2019 | YEAR ENDED
September 30, 2018 |
| | SHARES | AMOUNT | SHARES | AMOUNT |
| Class A Shares | | | | |
| Shares sold | 109,181 | $ 1,394,851 | 509,755 | $ 6,596,193 |
Shares issued to shareholders in
reinvestment of dividends | 46,317 | 591,531 | 56,051 | 715,470 |
| Shares repurchased | (794,796) | (10,159,460) | (700,474) | (8,975,339) |
| Net decrease | (639,298) | $ (8,173,078) | (134,668) | $ (1,663,676) |
| Class I Shares | | | | |
| Shares sold | 742,617 | $ 9,506,280 | 591,763 | $ 7,620,816 |
Shares issued to shareholders in
reinvestment of dividends | 43,073 | 550,736 | 51,601 | 658,900 |
| Shares repurchased | (794,596) | (10,116,799) | (832,821) | (10,660,605) |
| Net decrease | (8,906) | $ (59,783) | (189,457) | $ (2,380,889) |
NOTE 6 – INVESTMENT TRANSACTIONS
For the year ended September 30, 2019, the Fund had purchase and sale transactions of investments (excluding short-term investments) of $8,802,510 and $16,743,830, respectively.
NOTE 7 – RECENT ACCOUNTING PRONOUNCEMENTS
In August 2018, the FASB issued ASU 2018-13, Fair Value Measurement (Topic 820): Changes to the Disclosure Requirements for Fair Value Measurement, which adds, removes, and modifies certain aspects of the fair value disclosure. ASU 2018-13 is effective for annual periods beginning after December 15, 2019, and early adoption is permitted. The Funds have elected to early adopt, and had applied ASU 2018-13 for the fiscal year ended September 30, 2019. The adoption of this accounting guidance did not have a material impact on the Funds’ financial statements.
Notes to Financial Statements, Continued
Thornburg New York Intermediate Municipal Fund | September 30, 2019
In March 2017, the FASB issued Accounting Standards Update (ASU) 2017-08, Premium Amortization of Purchased Callable Debt Securities. The amendments in the ASU shorten the premium amortization period on a purchased callable debt security from the security’s contractual life to the earliest call date. It is anticipated that this change will enhance disclosures by reducing losses recognized when a security is called on an earlier date. This ASU is effective for fiscal years beginning after December 15, 2018. Management has evaluated the implications of these changes and the amendments will have no material effect on the Funds’ net assets or results of operations.
OTHER NOTES
Risks: The Fund’s investments subject it to risks including, but not limited to, management risk, interest rate risk, credit risk, market and economic risk, liquidity risk, single state risk, and non-diversification risk. Please see the Fund’s prospectus for a discussion of the risks associated with an investment in the Fund.
Subsequent Events: Fund management believes no events have occurred between September 30, 2019 and the date of issuance of the financial statements that require adjustment to or disclosure in the accompanying financial statements.
This page intentionally left blank.
Financial Highlights
Thornburg New York Intermediate Municipal Fund
| | PER SHARE PERFORMANCE (FOR A SHARE OUTSTANDING THROUGHOUT THE YEAR) |
UNLESS OTHERWISE
NOTED, PERIODS ARE
FISCAL YEARS ENDED
SEPTEMBER 30, | Net Asset
Value,
Beginning of
YEAR | Net
Investment
Income
(Loss)+ | Net Realized &
Unrealized Gain
(Loss) on
Investments | Total from
Investment
Operations | Dividends
from Net
Investment
Income | Dividends
from Net
Realized
Gains | Total
Dividends | Net Asset
Value,
End of YEAR |
| CLASS A SHARES(b) |
| 2019 | $ 12.61 | 0.30 | 0.34 | 0.64 | (0.30) | — | (0.30) | $ 12.95 |
| 2018 | $ 13.00 | 0.30 | (0.39) | (0.09) | (0.30) | — | (0.30) | $ 12.61 |
| 2017 | $ 13.40 | 0.33 | (0.40) | (0.07) | (0.33) | — | (0.33) | $ 13.00 |
| 2016 | $ 13.18 | 0.29 | 0.22 | 0.51 | (0.29) | — | (0.29) | $ 13.40 |
| 2015 | $ 13.22 | 0.29 | (0.04) | 0.25 | (0.29) | — | (0.29) | $ 13.18 |
| CLASS I SHARES |
| 2019 | $ 12.61 | 0.34 | 0.34 | 0.68 | (0.34) | — | (0.34) | $ 12.95 |
| 2018 | $ 13.00 | 0.34 | (0.39) | (0.05) | (0.34) | — | (0.34) | $ 12.61 |
| 2017 | $ 13.40 | 0.37 | (0.40) | (0.03) | (0.37) | — | (0.37) | $ 13.00 |
| 2016 | $ 13.18 | 0.33 | 0.22 | 0.55 | (0.33) | — | (0.33) | $ 13.40 |
| 2015 | $ 13.22 | 0.33 | (0.04) | 0.29 | (0.33) | — | (0.33) | $ 13.18 |
| (a) | Not annualized for periods less than one year. |
| (b) | Sales loads are not reflected in computing total return. |
| + | Based on weighted average shares outstanding. |
See notes to financial statements.
Financial Highlights, Continued
Thornburg New York Intermediate Municipal Fund
| RATIOS TO AVERAGE NET ASSETS | | SUPPLEMENTAL DATA |
Net Investment
Income (Loss) (%) | Expenses, After
Expense
Reductions (%) | Expenses,
Before Expense
Reductions (%) | | Total
Return (%)(a) | Portfolio
Turnover
Rate (%)(a) | Net Assets
at End of YEAR
(Thousands) |
| |
| 2.38 | 0.99 | 1.12 | | 5.16 | 17.75 | $ 26,416 |
| 2.36 | 0.99 | 1.08 | | (0.68) | 15.88 | $ 33,778 |
| 2.50 | 0.99 | 1.09 | | (0.52) | 11.11 | $ 36,576 |
| 2.18 | 0.96 | 1.03 | | 3.91 | 7.02 | $ 45,009 |
| 2.16 | 0.98 | 1.05 | | 1.87 | 7.72 | $ 49,845 |
| |
| 2.69 | 0.67 | 0.88 | | 5.50 | 17.75 | $ 24,550 |
| 2.68 | 0.67 | 0.82 | | (0.36) | 15.88 | $ 24,010 |
| 2.81 | 0.67 | 0.77 | | (0.20) | 11.11 | $ 27,217 |
| 2.51 | 0.63 | 0.72 | | 4.25 | 7.02 | $ 31,498 |
| 2.47 | 0.67 | 0.76 | | 2.19 | 7.72 | $ 30,242 |
Report of Independent Registered Public Accounting Firm
Thornburg New York Intermediate Municipal Fund
To the Board of Trustees of Thornburg Investment Trust and Shareholders of
Thornburg New York Intermediate Municipal Fund
Opinion on the Financial Statements
We have audited the accompanying statement of assets and liabilities, including the schedule of investments, of Thornburg New York Intermediate Municipal Fund (one of the funds constituting Thornburg Investment Trust, referred to hereafter as the "Fund") as of September 30, 2019, the related statement of operations for the year ended September 30, 2019, the statements of changes in net assets for each of the two years in the period ended September 30, 2019, including the related notes, and the financial highlights for each of the five years in the period ended September 30, 2019 (collectively referred to as the “financial statements”). In our opinion, the financial statements present fairly, in all material respects, the financial position of the Fund as of September 30, 2019, the results of its operations for the year then ended, the changes in its net assets for each of the two years in the period ended September 30, 2019 and the financial highlights for each of the five years in the period ended September 30, 2019 in conformity with accounting principles generally accepted in the United States of America.
Basis for Opinion
These financial statements are the responsibility of the Fund’s management. Our responsibility is to express an opinion on the Fund’s financial statements based on our audits. We are a public accounting firm registered with the Public Company Accounting Oversight Board (United States) (PCAOB) and are required to be independent with respect to the Fund in accordance with the U.S. federal securities laws and the applicable rules and regulations of the Securities and Exchange Commission and the PCAOB.
We conducted our audits of these financial statements in accordance with the standards of the PCAOB. Those standards require that we plan and perform the audit to obtain reasonable assurance about whether the financial statements are free of material misstatement, whether due to error or fraud.
Our audits included performing procedures to assess the risks of material misstatement of the financial statements, whether due to error or fraud, and performing procedures that respond to those risks. Such procedures included examining, on a test basis, evidence regarding the amounts and disclosures in the financial statements. Our audits also included evaluating the accounting principles used and significant estimates made by management, as well as evaluating the overall presentation of the financial statements. Our procedures included confirmation of securities owned as of September 30, 2019 by correspondence with the custodian. We believe that our audits provide a reasonable basis for our opinion.
/s/PricewaterhouseCoopers LLP
New York, New York
November 22, 2019
We have served as the auditor of one or more investment companies in Thornburg Investment Trust since 1999.
Expense Example
Thornburg New York Intermediate Municipal Fund | September 30, 2019 (Unaudited)
As a shareholder of the Fund, you incur two types of costs:
| (1) | transaction costs, including |
| (a) | sales charges (loads) on purchase payments, for Class A shares; |
| (b) | a deferred sales charge on redemptions of any part or all of a purchase of $1 million of Class A shares within 12 months of purchase; |
| (2) | ongoing costs, including management fees; distribution and/or service (12b-1) fees; and other Fund expenses. |
This example is intended to help you understand your ongoing costs (in dollars) of investing in the Fund and to compare these costs with the ongoing costs of investing in other mutual funds.
The example is based on a $1,000 investment beginning on April 1, 2019, and held until September 30, 2019.
| | BEGINNING
ACCOUNT VALUE
4/1/19 | ENDING
ACCOUNT VALUE
9/30/19 | EXPENSES PAID
DURING PERIOD†
4/1/19—9/30/19 |
| CLASS A SHARES |
| Actual | $1,000.00 | $1,023.22 | $5.02 |
| Hypothetical* | $1,000.00 | $1,020.10 | $5.01 |
| CLASS I SHARES |
| Actual | $1,000.00 | $1,024.86 | $3.40 |
| Hypothetical* | $1,000.00 | $1,021.71 | $3.40 |
| † | Expenses are equal to the annualized expense ratio for each class (A: 0.99%; I: 0.67%) multiplied by the average account value over the period, multiplied by 183/365 to reflect the one-half year period. |
| * | Hypothetical assumes a rate of return of 5% per year before expenses. |
ACTUAL EXPENSES
For each class of shares, the first line of the accompanying table provides information about actual account values and actual expenses. You may use the information in this line, together with the amount you invested, to estimate the expenses that you paid over the period. Simply divide your account value by $1,000 (for example, an $8,600 account value divided by $1,000 = 8.6), then multiply the result by the number in the first line for your class of shares under the heading entitled “Expenses Paid During Period” to estimate the expenses you paid on your account during this period.
HYPOTHETICAL EXAMPLE FOR COMPARISON PURPOSES
For each class of shares, the second line of the accompanying table provides information about hypothetical account values and hypothetical expenses based on the Fund’s actual expense ratio and an assumed rate of return of 5% per year before expenses, which is not the Fund’s actual return. The hypothetical account values and expenses may not be used to estimate the actual ending account balance or expenses you paid for the period. You may use this information to compare the ongoing costs of investing in the Fund and other funds. To do so, compare this 5% hypothetical example with the 5% hypothetical examples that appear in the shareholder reports of the other funds.
Please note that the expenses shown in the table are meant to highlight your ongoing costs only and do not reflect any transactional costs, such as sales charges (loads), redemption fees, or exchange fees. Therefore, the second line of the table for each class of shares is useful in comparing ongoing costs only, and will not help you determine the relative total costs of owning different funds. In addition, if these transactional costs were included, your costs would have been higher.
Trustees and Officers
Thornburg New York Intermediate Municipal Fund | September 30, 2019 (Unaudited)
NAME, AGE, YEAR ELECTED
POSITION HELD WITH FUND | PRINCIPAL OCCUPATION(S) DURING PAST FIVE YEARS | OTHER DIRECTORSHIPS
HELD BY TRUSTEE |
| INTERESTED TRUSTEES(1)(2) |
Garrett Thornburg, 73
Trustee since 1984,
Chairman of Trustees(3) | Chairman and controlling shareholder of Thornburg Investment Management, Inc. (investment advisor); Chairman and controlling shareholder of Thornburg Securities Corporation (securities dealer); President of the Thornburg Foundation (nonprofit). | None |
Brian J. McMahon, 64
Trustee since 2001,
Vice Chairman of Trustees,
Member of Governance and
Nominating Committee &
Operations Risk Oversight
Committee(4) | Vice Chairman, Chief Investment Strategist, Managing Director, and Portfolio Manager and, until 2016, CEO and President of Thornburg Investment Management, Inc.; Vice President of Thornburg Securities Corporation. | None |
| INDEPENDENT TRUSTEES(1)(2)(5) |
David A. Ater, 74
Trustee since 1994,
Lead Independent Trustee,
Chairman of Governance and
Nominating Committee &
Member of Audit Committee | Principal in Ater & Associates, Santa Fe, NM (developer, planner and broker of residential and commercial real estate); owner, developer and broker for various real estate projects. | None |
Sally Corning, 58
Trustee since 2012,
Chairman of Audit Committee | Partner in Sun Mountain Capital, Santa Fe, NM (private equity firm with investment programs encompassing venture capital, mezzanine debt, and growth equity). | None |
Susan H. Dubin, 70
Trustee since 2004,
Member of Audit
Committee & Governance
and Nominating Committee | President of Dubin Investments, Ltd., Greenwich, CT (private investment fund); Director and officer of various charitable organizations. | None |
David L. Gardner, 56
Trustee since 2015,
Member of Operations Risk
Oversight Committee | Until 2012, head of EMEA (Europe, Middle East and Africa) Sales for iShares of Blackrock, Inc., EMEA Executive Committee Member and EMEA Operating Committee Member at Blackrock, Inc. | None |
Patrick J. Talamantes, 55
Trustee since 2019,
Member of Audit Committee | President of Talamantes Strategies, LLC, a management consulting firm, since 2018; until 2017, President and Chief Executive Officer of The McClatchy Company, Sacramento, CA (news and media company). | None |
Owen D. Van Essen, 65
Trustee since 2004,
Chairman of Operations Risk
Oversight Committee &
Member of Governance and
Nominating Committee | President of Dirks, Van Essen, Murray & April, Santa Fe, NM (newspaper mergers and acquisitions). | None |
James W. Weyhrauch, 60
Trustee since 1996,
Member of Audit
Committee & Operations Risk
Oversight Committee | Real estate broker, Santa Fe Properties, Santa Fe, NM; General Partner, Investments of Genext LLC (a family investment partnership); until 2019, Vice Chairman of Nambe LLC, Santa Fe, NM (manufacturing & design company). | None |
Trustees and Officers, Continued
Thornburg New York Intermediate Municipal Fund | September 30, 2019 (Unaudited)
NAME, AGE, YEAR ELECTED
POSITION HELD WITH FUND | PRINCIPAL OCCUPATION(S) DURING PAST FIVE YEARS | OTHER DIRECTORSHIPS
HELD BY TRUSTEE |
| OFFICERS OF THE FUND (WHO ARE NOT TRUSTEES)(1)(6) |
David Ashley, 49
Vice President since 2019 | Portfolio Manager and Managing Director since 2019 and Associate Portfolio Manager from 2011-2019 of Thornburg Investment Management, Inc. | Not applicable |
Nimish Bhatt, 56
Chief Financial Officer
since 2019; Treasurer
2016-2019; Secretary
(2018-2019)(7) | Chief Financial Officer and Treasurer of Thornburg Investment Management, Inc. and Thornburg Securities Corporation since 2016 and Secretary of Thornburg Securities Corporation since 2018; Senior Vice President (2004-2016), Chief Financial Officer (2011-2016), and Head of Fund Administration (2011-2016) of Calamos Asset Management, Inc., Calamos Investments LLC, Calamos Advisors LLC, and Calamos Wealth Management; Director of Calamos Global Funds plc (2007-2016). | Not applicable |
Jason Brady, 45
President since 2016(7) | Director since 2017, CEO and President since 2016, and Portfolio Manager and Managing Director of Thornburg Investment Management, Inc.; Vice President of Thornburg Securities Corporation since 2016. | Not applicable |
Connor Browne, 40
Vice President since 2006 | Portfolio Manager and Managing Director of Thornburg Investment Management, Inc. | Not applicable |
Randy Dry, 45
Vice President since 2014 | Managing Director, Director of Institutional Group from 2014-2016, and since 2016, Chief Administrative Officer of Thornburg Investment Management, Inc. | Not applicable |
Greg Dunn, 43
Vice President since 2014 | Portfolio Manager and Managing Director of Thornburg Investment Management, Inc. | Not applicable |
Lon Erickson, 44
Vice President since 2008 | Portfolio Manager and Managing Director of Thornburg Investment Management, Inc. | Not applicable |
Thomas Garcia, 48
Vice President since 2006 | Managing Director, Head Equity Trader, and Associate Portfolio Manager of Thornburg Investment Management, Inc. | Not applicable |
Christian Hoffmann, 37
Vice President since 2018 | Portfolio Manager and Managing Director since 2018, and Associate Portfolio Manager from 2014-2018, of Thornburg Investment Management, Inc. | Not applicable |
Curtis Holloway, 52
Treasurer since 2019(7) | Director of Fund Administration since 2019 of Thornburg Investment Management, Inc.; Senior Vice President, Head of Fund Administration (2017-2019) and Vice President, Fund Administration (2010-2017) of Calamos Investments, and Chief Financial Officer (2017-2019) and Treasurer (2010-2019) of Calamos Funds. | Not applicable |
Ben Kirby, 39
Vice President since 2014 | Head of Investments since 2019, Portfolio Manager and Managing Director since 2013. | Not applicable |
Jeff Klingelhofer, 38
Vice President since 2016 | Head of Investments since 2019, Portfolio Manager and Managing Director since 2015, and Associate Portfolio Manager from 2012–2015, of Thornburg Investment Management, Inc. | Not applicable |
Ponn Lithiluxa, 48
Vice President since 2017 | Manager, Tax & Fund Administration of Thornburg Investment Management, Inc.; Senior Vice President, Citi Fund Services, Inc. (2014–2017); Vice President, Citi Fund Services, Inc. (2007–2014). | Not applicable |
Rob MacDonald, 43
Vice President since 2016 | Managing Director since 2015, Portfolio Manager since 2014, and Associate Portfolio Manager from 2011–2014 of Thornburg Investment Management, Inc. | Not applicable |
Michael Mastroianni, 42
Secretary and Vice President since 2019(7) | Director of Fund Operations since 2019 of Thornburg Investment Management, Inc.; Executive Director, Global Head of Client Services - Global Liquidity (2018-2019), Executive Director, North American Head of Transfer Agency Relationship Management (2011-2019), Executive Director, North American Head of Transfer Agency Service Delivery (2011-2018) of J.P. Morgan Asset Management. | Not applicable |
Leigh Moiola, 52
Vice President since 2001 | Managing Director and Director of Marketing of Thornburg Investment Management, Inc.; Vice President of Thornburg Securities Corporation. | Not applicable |
Christopher Ryon, 63
Vice President since 2008 | Portfolio Manager and Managing Director of Thornburg Investment Management, Inc. | Not applicable |
Trustees and Officers, Continued
Thornburg New York Intermediate Municipal Fund | September 30, 2019 (Unaudited)
NAME, AGE, YEAR ELECTED
POSITION HELD WITH FUND | PRINCIPAL OCCUPATION(S) DURING PAST FIVE YEARS | OTHER DIRECTORSHIPS
HELD BY TRUSTEE |
Sean Koung Sun, 38
Vice President since 2017 | Portfolio Manager and Managing Director since 2017, Associate Portfolio Manager from 2015-2016, and Equity Research Analyst from 2012-2014 of Thornburg Investment Management, Inc. | Not applicable |
Stephen Velie, 52
Chief Compliance Officer since 2009 | Chief Compliance Officer of Thornburg Investment Trust and Thornburg Investment Management, Inc. | Not applicable |
Nicholos Venditti, 38
Vice President since 2016 | Portfolio Manager and Managing Director since 2015 and Associate Portfolio Manager from 2011–2015 of Thornburg Investment Management, Inc. | Not applicable |
Vinson Walden, 49
Vice President since 2004 | Portfolio Manager and Managing Director of Thornburg Investment Management, Inc. | Not applicable |
Lei Wang, 48
Vice President since 2006 | Portfolio Manager and Managing Director of Thornburg Investment Management, Inc. | Not applicable |
Charles Wilson, 44
Vice President since 2016 | Portfolio Manager and Managing Director since 2014 and Associate Portfolio Manager from 2012–2014 of Thornburg Investment Management, Inc. | Not applicable |
Di Zhou, 41
Vice President since 2016 | Portfolio Manager and Managing Director since 2016, Associate Portfolio Manager from 2014–2016, and Equity Research Analyst from 2010–2014 of Thornburg Investment Management, Inc. | Not applicable |
| (1) | Each person’s address is 2300 North Ridgetop Road, Santa Fe, New Mexico 87506. |
| (2) | The Fund is a separate investment “Fund” or “series” of Thornburg Investment Trust (the “Trust”), which comprises the Thornburg mutual fund complex and is organized as a Massachusetts business trust. Thornburg Investment Management, Inc. is the investment advisor to, and manages, all the Funds of the Trust. Each Trustee oversees all the Funds of the Trust. |
| (3) | Mr. Thornburg is considered an “interested” Trustee under the Investment Company Act of 1940 because he is a director and controlling shareholder of Thornburg Investment Management, Inc., the investment advisor to the Trust, and is the sole director and controlling shareholder of Thornburg Securities Corporation, the distributor of shares for the Trust. |
| (4) | Mr. McMahon is considered an “interested” Trustee under the Investment Company Act of 1940 because he is a director and the chief investment strategist of Thornburg Investment Management, Inc. |
| (5) | The Bylaws of the Trust currently require that each Independent Trustee shall retire by the end of the calendar year during which the Trustee reached the age of 75 years. Otherwise each Trustee serves in office until the election and qualification of a successor or until the Trustee sooner dies, resigns, retires or is removed. |
| (6) | Assistant vice presidents and assistant secretaries are not shown. |
| (7) | The Trust’s president, chief financial officer, secretary, and treasurer each serves a one-year term or until the election and qualification of a successor; each other officer serves at the pleasure of the Trustees. |
The Statement of Additional Information for each Fund of the Trust includes additional information about the Trustees and is available, without charge and upon request, by calling 1-800-847-0200.
Other Information
Thornburg New York Intermediate Municipal Fund | September 30, 2019 (Unaudited)
PORTFOLIO PROXY VOTING
Policies and Procedures:
The Trust has delegated to the Advisor voting decisions respecting proxies for the Fund’s voting securities. The Advisor makes voting decisions in accordance with its Proxy Voting Policy and Procedures. A description of the Policy and Procedures is available (i) without charge, upon request, by calling the Advisor toll-free at 1-800-847-0200, (ii) on the Thornburg website at www.thornburg.com, and (iii) on the U.S. Securities and Exchange Commission’s website at www.sec.gov.
Information regarding how proxies were voted is available on or before August 31 of each year for the twelve months ending the preceding June 30. This information is available (i) without charge, upon request by calling the Advisor toll-free at 1-800-847-0200, (ii) on the Thornburg website at www.thornburg.com, and (iii) on the U.S. Securities and Exchange Commission’s website at www.sec.gov.
TAX INFORMATION
For the tax year ended September 30, 2019, dividends paid by the Fund of $1,335,918 (or the maximum allowed) are tax exempt dividends for federal income tax purposes and $483 are taxable ordinary investment income dividends. The information and the distributions reported herein may differ from the information and distributions reported to the shareholders for the calendar year ending December 31, 2019. Complete information will be reported in conjunction with your 2019 Form 1099.
AVAILABILITY OF QUARTERLY PORTFOLIO SCHEDULE
The Fund files with the Securities and Exchange Commission schedules of its portfolio holdings on Form N-Q for the first and third quarters of each fiscal year. The Fund’s Forms N-Q are available on the Commission’s website at www.sec.gov, or may be reviewed and copied at the Commission’s Public Reference Room in Washington, D.C. Information on the operation of the Public Reference Room may be obtained by calling 1-800-SEC-0330. The Fund also makes this information available on its website at www.thornburg.com/download or upon request by calling 1-800-847-0200.
STATEMENT RESPECTING RENEWAL OF INVESTMENT ADVISORY AGREEMENT
Thornburg Investment Management, Inc. (the “Advisor”) provides investment management services to Thornburg New York Intermediate Municipal Fund (the “Fund”) pursuant to an investment advisory agreement. The Trustees consider the renewal of this agreement annually, and most recently determined to renew the agreement on September 17, 2019.
Planning for their recent consideration of the advisory agreement’s renewal, the independent Trustees met in May 2019 to consider aspects of their annual evaluation of the Advisor’s service to all of the funds of Thornburg Investment Trust, to plan the annual evaluation of the Advisor’s performance and to discuss preliminarily the information the Advisor would present to the Trustees for their review. The independent Trustees met in a second independent session in July 2019 to further define certain portions of the information to be submitted by the Advisor. The independent Trustees met again in an independent session in September 2019 with a mutual fund analyst firm engaged by the independent Trustees to provide explanations of comparative cost and expense information, comparative investment performance information, and other data obtained and analyzed by the analyst firm. In that session the independent Trustees discussed their evaluations of the Advisor’s services to the Fund and the Fund’s fee and expense levels, investment performance, and other information presented for the Fund, conferred independently with legal counsel respecting the factors typically considered in evaluating renewal of an advisory agreement, and conferred with representatives of management to receive explanations of certain aspects of the information they had requested. Representatives of the Advisor subsequently reviewed portions of the information with the Trustees and addressed questions from the Trustees at a full meeting session of the Trustees scheduled in September for that purpose, and the independent Trustees thereafter met again in an independent session to consider the Advisor’s presentations and various specific issues respecting their consideration of the advisory agreement’s renewal. Following these sessions, the Trustees met to consider renewal of the advisory agreement, and the independent Trustees voted unanimously at that meeting to renew the agreement for an additional term of one year.
The information below summarizes certain factors considered by the Trustees in connection with the determination to renew the advisory agreement with the Advisor. In determining to renew the advisory agreement, the Trustees considered a wide range of information and did not identify any single factor as controlling, and this summary does not describe all of the factors and other matters considered by the Trustees in making their determination.
Nature, Extent and Quality of Services. The Trustees considered in their evaluation of the advisory agreement the written and oral reports provided to the Trustees and their standing committees throughout the year on a wide variety of topics by personnel from the Advisor’s
Other Information, Continued
Thornburg New York Intermediate Municipal Fund | September 30, 2019 (Unaudited)
portfolio management, administration, operations and compliance staffs. The Trustees also considered in this evaluation presentations and explanations made by representatives of the Advisor in meeting sessions scheduled for consideration of the renewal of the advisory agreement. The Trustees further noted in their evaluation the consideration they had given to a number of topics in previous years, reports from their standing committees, and advice received from counsel.
Information noted by the Trustees as having been considered in relation to the nature, extent and quality of services provided by the Advisor under the advisory agreement and contributing (together with other information considered) to their conclusions respecting the nature, extent and quality of the services rendered to the Fund by the Advisor included: (1) reports from portfolio managers and other personnel throughout the year demonstrating that the Fund was managed in conformity with stated strategies and objectives and conformed to investment restrictions and limitations; (2) reports demonstrating that management of the Fund remained faithful and competent, and demonstrating sufficient skill by portfolio managers in executing the Fund’s strategies in varying environments, managers’ cognizance of and strategies to pursue the Fund’s objectives and address pertinent market and economic trends and conditions, the evaluation and selection of individual investments, management to achieve tax efficiencies, and the structuring and composition of the Fund’s portfolio and management of Fund liquidity requirements; (3) the Fund’s achievement of its investment objectives over different periods of time; (4) presentations by and interactions with members of the Advisor’s fund administration, operations and compliance staffs; (5) reports from standing committees of the Trustees on their respective proceedings throughout the year, including in particular reports from and interactions with the Advisor’s personnel; (6) the sufficiency of the resources the Advisor devotes to the services it provides to the Fund, including the expertise of its personnel and staffing levels and its enhancements to the electronic systems it utilizes in providing these services, and also including the Advisor’s own financial management and sufficiency of its resources; and (7) the measures employed to achieve efficient trade execution for the Fund, including the evaluation and selection of firms to execute transactions for the Fund. As in past years, the Trustees noted particularly their assessments of the Advisor’s personnel developed in meetings throughout the year, measures to expand and improve the depth and experience of the Advisor’s staff, and the Advisor’s collaborative approach to investment management, continued commitment to observance of compliance and regulatory requirements in managing investments by the Fund, responsiveness to the Trustees, and other factors.
Based upon these and other considerations, the Trustees concluded that the Advisor’s management of the Fund’s investments continued to conform to the Fund’s stated objectives and policies, and that the nature, extent and quality of the services provided to the Fund by the Advisor remained sufficient.
Investment Performance. The Trustees noted in their evaluation of the Fund’s investment performance the written and oral reports they had received in each regular meeting over the course of the year from the Advisor’s portfolio management personnel. The Trustees also noted their consideration of information provided to them at their request in anticipation of their annual evaluation of the Advisor’s services, including the following items of information respecting the investment performance of the Fund: (1) the Fund’s absolute investment performance and achievement of stated objectives; (2) the Advisor’s explanations and commentary on the Fund’s performance in the context of the Fund’s objectives and reasonable expectations, and business, market and economic conditions; (3) performance data for the most recent ten calendar years, comparing the Fund’s annual investment returns to a broad-based securities index and to the applicable Morningstar category of funds; (4) the Fund’s investment performance for the three-month, year-to-date, one-year, three-year, five-year, ten-year, fifteen-year, and since inception periods ending with the second quarter of the current year, comparing the Fund’s annualized returns to two mutual fund categories created by independent mutual fund analyst firms and to a broad-based securities index, and assigning a percentage rank to the Fund’s performance for each period relative to each of the fund categories; (5) analyses of specified performance and risk metrics for the Fund relative to its benchmark and to a selected peer group of funds, prepared by an independent financial analyst firm engaged by the independent Trustees; (6) the Fund’s cash flows; (7) comparative performance data for fund peer groups selected by an independent mutual fund analyst firm engaged by the independent Trustees, and the analysis and observations of the analyst firm respecting those data; and (8) comparative measures of correlation to equity indices, and risk and return statistics. Measures of risk and relative return demonstrated that the Fund’s performance relative to these measures continued to fulfill expectations in current conditions. The Trustees generally attach additional significance to the investment performance of the Fund from the perspective of longer-term shareholders, and noted in that regard that the Fund’s relative investment performance may be affected to some extent in periods when the Advisor pursues defensive measures in line with the Fund’s stated objectives. Based upon their consideration of this and other information, the Trustees concluded that the Fund’s absolute and relative investment performance over a range of pertinent holding periods on the whole was satisfactory in view of its objectives and strategies.
Comparisons of Fee and Expense Levels. Information noted by the Trustees as having been considered in this context included a variety of comparative data respecting the Fund’s fee and expense levels. This information included comparisons of the Fund’s advisory fee and overall Fund expenses to median and average fees and expenses charged to funds in the applicable Morningstar category, comparisons of the advisory fee and total expenses for two Fund share classes to the fee levels and expenses of fund peer groups selected from the category by an independent mutual fund analyst firm engaged by the independent Trustees, the perspectives and advice from that mutual fund analyst firm respecting comparisons of fund fee levels and expenses to fund peer groups, and other information. The Trustees considered that the Advisor has agreed to certain fee waivers and expense reimbursements for the current period. Comparative fee and expense data noted as having been considered by the Trustees showed that, after fee waivers and expense reimbursements, the level of total expense for one share class of the Fund was higher than the median and average levels charged to funds in the applicable
Other Information, Continued
Thornburg New York Intermediate Municipal Fund | September 30, 2019 (Unaudited)
Morningstar category, and that the level of total expense for a second share class was lower than the median and average levels for that category. Peer group data showed that the Fund’s stated advisory fee was higher than the medians of the two peer groups considered but comparable to other funds in the peer groups, that the total expense level of one representative share class was higher than the median of the respective peer group but comparable to other funds in the peer group after waivers of fees and reimbursement of expenses, and that the total expense level of another representative share class was equal to the median of the respective peer group after waivers of fees and reimbursement of expenses. The Trustees did not find the differences significant in view of their findings and conclusions respecting the other factors considered.
The Trustees noted their consideration of information respecting the advisory fees charged by the Advisor to other investment management clients, including sub-advised mutual funds and other institutional clients, together with information about fees charged by other advisors to different clients, analysis of the differences between the requirements of institutional clients and mutual funds, analysis of the differences between the requirements of a sub-advised mutual fund and a fund as to which the investment advisor is the primary advisor and sponsor, and the consequently different investment management services provided to the different categories of clients and the differing contexts in which these arrangements are entered into. The Trustees confirmed their previous observations that the differences between the fees charged by the Advisor or by other investment advisors to different types of clients did not appear exceptional and had limited relevance to the evaluation of the fee rate charged to mutual funds as to which the Advisor or such other advisors are the primary advisor and sponsor.
Costs and Profitability of Advisor. In reviewing the profitability of the Advisor’s services to the Fund, the Trustees considered an analysis of the Advisor’s costs and the estimated profitability to the Advisor of its services, together with data respecting the overall profitability of a selection of other investment management firms. The Trustees considered in this regard information from the Advisor respecting investment of its profits to maintain staffing levels, and noted that a portion of the Advisor’s profits is an important element in the compensation of shareholder employees. The Trustees considered information from the Advisor respecting the use of profits to enhance staff competencies through training and other measures, hire personnel to expand and develop the scope of senior management expertise, pay competitive levels of compensation, and add to the Advisor’s electronic and information technology systems to maintain or improve service levels. The Trustees also considered the contribution of the Advisor’s cost management to its profitability, and the relationship of the Advisor’s financial resources and profitability in previous years to its ability to attract necessary personnel, invest in systems and other assets required for its service to the Fund, and maintain or improve service levels for the Fund notwithstanding fluctuations in revenues and profitability. The information considered did not indicate to the Trustees that the Advisor’s profitability was excessive.
Potential Economies of Scale. In reviewing the extent to which economies of scale would be realized by the Fund as it grows and whether fee levels reflect potential economies of scale, the Trustees considered the breakpoint structure for advisory fees chargeable to the Fund, comparisons of the fee breakpoint structure for the Fund with breakpoint structures (or the absence of such structures) for other funds in a peer group selected by an independent mutual fund analyst firm, the effects of the breakpoint structure and other expense factors realized by certain funds of the Trust as their asset levels had increased, the Advisor’s undertakings to waive or reimburse certain fees and expenses of the Fund, and the Advisor’s expenditures from its own profits and resources to maintain staffing levels and expand staff competencies, pay competitive levels of compensation, and add to its electronic and information technology systems so as to maintain or improve service levels. The information provided demonstrated to the Trustees that the Fund’s advisory fee breakpoint structure is reasonable in relation to the structures observed in the other funds in its peer group, and that shareholders may be expected to benefit from any economies of scale, due to the advisory agreement’s breakpoint fee structure for the Fund and other factors.
Potential Ancillary Benefits. In reviewing potential benefits to the Advisor because of its relationship to the Fund, the Trustees considered explanations from the Advisor respecting its receipt of certain research services from broker dealers, and the benefits to both the Fund and the Advisor of the Advisor’s expansion of its staffing, compliance and systems capabilities and other resources to serve a broader variety of investment management clients. No unusual or unfair benefits to the Advisor from its relationship to the Fund were identified by the Trustees.
Summary of Conclusions. The Trustees concluded that the general nature, extent and quality of the Advisor’s services performed under the advisory agreement remained sufficient, the Advisor had continued to actively and competently pursue the Fund’s stated investment objectives and adhere to the Fund’s investment policies, and that the absolute and relative investment performance of the Fund over pertinent holding periods on the whole was satisfactory in the context of the Fund’s objectives and strategies. The Trustees further concluded that the level of the advisory fee charged to the Fund by the Advisor is fair and reasonable in relation to the services provided by the Advisor, in view of the nature, extent and quality of those services, the investment performance of the Fund after fees and expenses, the clear disclosure of fees and expenses in the Fund’s prospectus, comparisons of fees and expenses charged to the Fund to fees and expenses charged to other mutual funds, and the other factors considered. The Trustees accordingly determined to renew the Fund’s investment advisory agreement with the Advisor for an additional term of one year.
Trustees’ Statement to Shareholders (Unaudited)
Readopted September 17, 2019
The Trustees believe current and prospective shareholders should know how we discharge our responsibilities in supervising the Funds’ investment advisor and in reviewing the advisor’s contract for renewal. Since 2005, we have issued a statement which sets out clearly the three principal guidelines that we follow in supervising the Trust’s investment advisor on your behalf. In accordance with our customary practice, in September of this year we again reviewed our statement and concluded we should reissue this statement outlining the principal features of our supervision of the advisor’s performance of investment management services for the Funds.
We begin with the premise that each shareholder selected his or her Fund because its investments are managed by the investment advisor identified in the prospectus and in accordance with the objective and policies described in the prospectus. We realize, as each of you do, that if you believe that your Fund’s stated objective and policies no longer serve your personal investment goals, you can sell your shares and leave the Fund.
Therefore, we believe that our primary supervisory task—our principal obligation to you—is to assess the nature and quality of the advisor’s services, and to confirm that the advisor actively and competently pursues the Fund’s objective, in accordance with the policies set out in the prospectus. To do this, we meet regularly with management to review your Fund’s portfolio and to discuss the advisor’s specific actions and judgments in pursuing the Fund’s objective. We do not substitute our own judgment for the advisor’s decisions in selecting investments; the advisor is paid to exercise its informed judgment on investment decisions, and we seek to confirm, in reviewing the advisor’s performance, that the advisor is doing just that.
Second, we are conscious of costs and the effect that costs have on shareholders’ returns. We try to make sure that your Fund’s fees and costs are reasonable in relationship to the services rendered and that they are generally in line with those charged by other expert investment advisors, consistent with our belief that the Fund’s investors searched for and expect that expertise and attention and have decided to pay a reasonable price for it. We do not put the management contract “out to bid” as a matter of course, and we would not do so unless we had concluded that the advisor materially had failed to pursue the Fund’s objectives in accordance with its policies, or for other equally important reasons. We believe that any other approach would be inconsistent with your interests and contrary to your expectations when you bought shares of the Fund in the first place.
Finally, because we believe that most Thornburg Fund shareholders have invested with a long-term perspective, we try not to focus too much on the fashions of the moment and on short-term performance. The market will not favor any specific investment objective or set of policies at all times and under all economic circumstances. A fund will experience periods of both high and low returns relative to other funds and other investments. Even if one of our Funds is not favored by the market at a particular time, we believe that the advisor is nonetheless obliged to remain true to the Fund’s objective and policies, and we watch to see that it does so.
Trustees of Thornburg Investment Trust
Thornburg Investment Management is a privately-owned global investment firm that offers a range of solutions for retail and institutional investors. Founded in 1982 and headquartered in Santa Fe, New Mexico, we manage approximately $41.9 billion (as of September 30, 2019) across U.S. mutual funds, separate accounts for high-net-worth investors, institutional accounts, and UCITS funds for non-U.S. investors.
The fund outlined in this report is one of many equity and fixed-income products available from Thornburg Investment Management.
EQUITY FUNDS
| ■ | Thornburg Global Opportunities Fund |
| ■ | Thornburg International Value Fund |
| ■ | Thornburg Better World International Fund |
| ■ | Thornburg International Growth Fund |
| ■ | Thornburg Developing World Fund |
| ■ | Thornburg Value Fund |
| ■ | Thornburg Core Growth Fund |
MULTI_ASSET FUNDS
| ■ | Thornburg Investment Income Builder Fund |
| ■ | Thornburg Summit Fund |
FIXED INCOME FUNDS
| ■ | Thornburg Low Duration Income Fund |
| ■ | Thornburg Limited Term U.S. Government Fund |
| ■ | Thornburg Limited Term Income Fund |
| ■ | Thornburg Strategic Income Fund |
| ■ | Thornburg Low Duration Municipal Fund |
| ■ | Thornburg Limited Term Municipal Fund |
| ■ | Thornburg Intermediate Municipal Fund |
| ■ | Thornburg California Limited Term Municipal Fund |
| ■ | Thornburg New Mexico Intermediate Municipal Fund |
| ■ | Thornburg New York Intermediate Municipal Fund |
| ■ | Thornburg Strategic Municipal Income Fund |
ALTERNATIVE FUNDS
| ■ | Thornburg Long/Short Equity Fund |
Before investing, carefully consider the Fund’s investment goals, risks, charges, and expenses. For a prospectus or summary prospectus containing this and other information, contact your financial advisor or visit thornburg.com. Read it carefully before investing.
For additional information, please visit thornburg.com
Thornburg Investment Management, Inc. 2300 North Ridgetop Road, Santa Fe, NM 87506
To receive shareholder reports, prospectuses, and proxy statements electronically, go to www.thornburg.com/edelivery.
This Annual Report is submitted for the general information of shareholders of the Fund. It is not authorized for distribution to prospective investors in the Fund unless preceded or accompanied by an effective prospectus.
Investment Advisor:
Thornburg Investment Management®
800.847.0200
Distributor:
Thornburg Securities Corporation®
Annual Reports
September 30, 2019
Beginning on January 1, 2021, as permitted by regulations adopted by the Securities and Exchange Commission, paper copies of the Fund’s shareholder reports will no longer be sent by mail, unless you specifically request paper copies of the reports from the Fund or from your financial intermediary, such as a broker-dealer or bank. Instead, the reports will be made available on a website, and you will be notified by mail each time a report is posted and provided with a website link to access the report.
If you already elected to receive shareholder reports electronically, you will not be affected by this change and you need not take any action. You may elect to receive shareholder reports and other communications from the Fund or your financial intermediary electronically by going to thornburg.com/edelivery.
You may elect to receive all future reports in paper free of charge. You can inform the Fund or your financial intermediary that you wish to continue receiving paper copies of your shareholder reports by calling 800.847.0200 or your financial intermediary directly. Your election to receive reports in paper will apply to all funds held with the fund complex/your financial intermediary.
At Thornburg, we believe unconstrained investing leads to better outcomes for our clients. Our investment solutions are highly active, high conviction, and benchmark agnostic. When it comes to finding economic opportunity for clients, it’s more than what we do.
It’s how we do it. Active Asbottom-up, fundamental, active managers, we look beyond conventional benchmarks. Long Term We take a long-term view in how we manage our firm and our portfolios. Benchmark Agnostic Investment strategies should have the flexibility to pursue solutions for clients, not stay within the conventional confines of benchmarks. Flexible Perspective Our approach to portfolio construction is guided by our convictions rather than convention. High Conviction We focus our attention and capital on thoroughly researched, well-understood positions. The best form of risk management is to know what you own, and why. Repeatable & Robust Our long-term outperformance of benchmarks verifies that our process works and outperforms conventional thinking. Independent We are independently owned and far from the herd of other investment managers. Investment Driven All members of the investment team are resources for all of our strategies. Collaborative Our team collaborates on opportunities across geography, sector, or asset class.
Thornburg Limited Term U.S. Government Fund
Thornburg Limited Term Income Fund
Thornburg Low Duration Income Fund
Annual Reports | September 30, 2019
Table of Contents
| LIMITED TERM U.S. GOVERNMENT FUND | NASDAQ SYMBOLS | CUSIPS |
| Class A | LTUSX | 885-215-103 |
| Class C | LTUCX | 885-215-830 |
| Class I | LTUIX | 885-215-699 |
| Class R3 | LTURX | 885-215-491 |
| Class R4 | LTUGX | 885-216-747 |
| Class R5 | LTGRX | 885-216-861 |
| LIMITED TERM INCOME FUND | | |
| Class A | THIFX | 885-215-509 |
| Class C | THICX | 885-215-764 |
| Class I | THIIX | 885-215-681 |
| Class R3 | THIRX | 885-215-483 |
| Class R4 | THRIX | 885-216-762 |
| Class R5 | THRRX | 885-216-853 |
| Class R6 | THRLX | 885-216-671 |
| LOW DURATION INCOME FUND | | |
| Class A | TLDAX | 885-216-812 |
| Class I | TLDIX | 885-216-796 |
Class I, R3, R4, R5, and R6 shares may not be available to all investors. Minimum investments for Class I shares may be higher than those for other classes.
Investments carry risks, including possible loss of principal. Portfolios investing in bonds have the same interest rate, inflation, and credit risks that are associated with the underlying bonds. The value of bonds will fluctuate relative to changes in interest rates, decreasing when interest rates rise. Unlike bonds, bond funds have ongoing fees and expenses. Investments in mortgage backed securities (MBS) may bear additional risk. Please see the Fund’s prospectus for a discussion of the risks associated with an investment in the Fund. Investments in the Funds are not FDIC insured, nor are they bank deposits or guaranteed by a bank or any other entity.
The laddering strategy does not assure or guarantee better performance and cannot eliminate the risk of investment losses.
Letter to Shareholders
September 30, 2019 (Unaudited)
October 21, 2019
Dear Fellow Shareholder:
We are pleased to present the annual report for the Thornburg Limited Term U.S. Government Fund, the Thornburg Limited Term Income Fund and the Thornburg Low Duration Income Fund for the year ended September 30, 2019. Combining income and change in price, the Class I shares of the Thornburg Limited Term U.S. Government Fund produced a total return of 5.35% over the period. The Bloomberg Barclays Intermediate Government Bond Index produced a total return of 7.52% over the same period. The Class I shares of the Thornburg Limited Term Income Fund produced a total return of 6.44% over the year ended September 30, 2019. The Bloomberg Barclays Intermediate Government/Credit Bond Index produced a 8.17% total return over the same time period. The Class I shares of the Thornburg Low Duration Income Fund produced a total return of 4.21% over the year ended September 30, 2019. The Bloomberg Barclays 1-3 Year Aggregate Bond Index produced a 4.67% total return over the same period.
The earlier portion of the reporting period represented a major shift in market sentiment across asset classes. The U.S. Treasury 10-year yield peaked in early November 2018, but investor fears surrounding trade tensions, weakening global economic data, Brexit, and especially a hawkish U.S. Federal Reserve (Fed), caused investors to shun risk assets, catching many off-guard as a result. Rising market volatility in the fourth quarter of 2018 suggested that investors feared a tilt away from global monetary policy accommodation and the less predictable, and potentially uneven, economic results that were likely to follow.
The Fed had taken the lead on draining the punchbowl with a series of rate hikes and a simultaneous shrinkage of its balance sheet. Meanwhile, the Fed continued to grapple with inflation running at or close to its 2% target, while factoring in the specter of rising wages potentially fueling higher inflation down the road. Unemployment remained less than 4% and wage growth had risen above 3%, creating a conundrum for policy makers. During the fourth quarter of 2018, the Fed battled signals from the financial markets as well as negative rhetoric from U.S. President Donald Trump. Ultimately, the Fed stayed the course and hiked rates in December, but the median forecast for 2019 fell from three hikes to two in a dovish signal for market participants. The market took the signal as gospel, with risk assets recovering to varying degrees. This would mark the beginning of a global reinflation for risk assets, and a renewed deflation in global yields.
By early January, Fed Chairman Jerome Powell retreated from further planned interest rate hikes in the months ahead, creating downside pressure on rates and truly reinvigorating risk assets across the globe. Additionally, the Federal Open Markets Committee, the Fed’s monetary policy panel, decided to end balance sheet normalization toward the end of 2019, accelerating the downward move in rates and further buoying
markets. It set the stage for what would become a series of rate cuts later on in the year. The retreat allowed other central banks around the globe to abandon rate hike plans. On a global basis, general underlying economic fundamentals did not materially deteriorate. This fact, combined with more accommodative central banks, resulted in one of the strongest quarters for risk assets on record. While we had taken advantage of widening spreads and increased rates across portfolios during the latter parts of 2018, we did not view risk as wholesale attractive given continued concerns surrounding economic growth. However, within appropriate portfolios, we maintained a healthy allocation to credit, participating in the broad lift experienced by markets. That said, we find the recent Fed actions concerning.
It seems policy decisions are no longer driven by economic fundamentals, but instead by market movements. In many instances, asset prices are widely disconnected from their fundamentals. What has gone from a tacit inference that the Fed would prop up swooning financial markets—the Greenspan, Bernanke and Yellen “puts”—has become somewhat more explicit under Chairman Powell, who has spoken more openly about “financial conditions” and stability as part of the Fed’s decision-making process. A financial asset’s price should reflect more its individual fundamentals and less the tidal effects of Fed policy. To be sure, some economic data had been weakening in the U.S. and abroad. Global purchasing manager indices continued to trend downward and have recently moved into contractionary territory, including in the U.S. Yet strong U.S. labor force growth and a supportive capex cycle, at least through the first quarter of 2019, continued to drive productivity gains. And while wage growth has leveled off lately, consumer sentiment and balance sheets remain relatively healthy.
The economic backdrop is important for fixed income investors, so it’s vitally important to look at both corporate and consumer health as leading indicators for the economy and for portfolio positioning. Corporate fundamentals have slipped a bit as growth in revenue and earnings before interest, taxes, depreciation and amortization are roughly flat. One important area of concern in the corporate market is leverage and interest coverage. While we are at or near all-time highs in terms of leverage, it is in a very different market than we experienced a decade ago. Since 2009, U.S. non-financial corporations have added $4.3 trillion in new debt, a 66% increase. What we find disconcerting is not the sheer amount of leverage in the system but how stretched the fundamentals become when one factors in a slowing growth environment. This will surely cause future problems for those who have thrown caution to the wind and indiscriminately bought credit at current levels. However, the market continues to provide select opportunities within corporates that have less cyclical underlying cash flows.
Along with the decline in corporate fundamentals, consumer fundamentals have deteriorated, albeit much more modestly. The consumer is seeing increasing debt-to-income ratios as credit card rates are at a decade high. As expected, there has also
Letter to Shareholders, Continued
September 30, 2019 (Unaudited)
been an uptick in delinquencies and losses. Despite these metrics, we continue to believe the consumer is on solid footing, bolstered by the tight labor market. Credit quality underlying ABS (asset-backed securities) and MBS (mortgage-backed securities) remains solid. We believe credit underwriting and structure within these spaces are still favorable and especially so for our portfolios as we stay focused on the top of the capital stack. In our view, our place in the capital structure reduces our credit risk and the underlying borrowers’ incentives and ability to refinance controls prepayment activity, targeting attractive, sensible exposures with limited convexity risk.
Overall, we remain defensive across portfolios, maintaining lower credit duration with a focus on defensive businesses. Currently, we prefer consumer ABS and MBS over corporates, consistent with our preference for superior balance sheets. Duration in the Thornburg Limited Term Income Fund remains skewed toward the lower end of our range as the relative value of increasing duration is currently muted. We did take advantage of recent rate volatility, removing some duration as the 10-year Treasury hit the 1.45% area and increasing it as the sovereign yield rose to 1.89%.
Looking forward, investors have to contend with Brexit, the Hong Kong protests, talk around a potential U.S. presidential
impeachment and bouts of geopolitical turmoil, particularly in the Middle East. Not a backdrop most would find appealing, yet risk asset prices remain near all-time highs. Yet uncertainty often breeds opportunity for astute investors with a long-term, balanced focus.
Thank you for your continued trust and investing alongside us. We enjoy working hard to add value.

| 
|
Jason Brady,cfa
Portfolio Manager
CEO, President, and
Managing Director | Lon R. Erickson,cfa
Portfolio Manager
Managing Director |

| |
Jeff Klingelhofer,cfa
Portfolio Manager
Managing Director | |
The matters discussed in this report may constitute forward-looking statements made pursuant to the safe harbor provisions of the Securities Litigation Reform Act of 1995. These include any advisor or portfolio manager prediction, assessment, analysis or outlook for individual securities, industries, investment styles, market sectors and/or markets. These statements involve risks and uncertainties. In addition to the general risks described for each fund in its current prospectus, other factors bearing on these reports include the accuracy of the advisor’s or portfolio manager’s forecasts and predictions, the appropriateness of the investment strategies designed by the advisor or portfolio manager and the ability of the advisor or portfolio manager to implement their strategies efficiently and successfully. Any one or more of these factors, as well as other risks affecting the securities markets generally, could cause the actual results of any fund to differ materially as compared to its benchmarks.
The views expressed are subject to change and do not necessarily reflect the views of Thornburg Investment Management, Inc. This information should not be relied upon as a recommendation or investment advice and is not intended to predict the performance of any investment or market.
Performance results of individual share classes will vary based on the fees and expenses associated with each share class, and may be higher or lower than other share classes within the same Fund. Please see Performance Summary for performance results of each share class.
Performance Summary
September 30, 2019 (Unaudited)
AVERAGE ANNUAL TOTAL RETURNS
| LIMITED TERM U.S. GOVERNMENT FUND | 1-YR | 3-YR | 5-YR | 10-YR | SINCE
INCEP. |
| Class A Shares(Incep: 11/16/87) | | | | | |
| Without sales charge | 5.06% | 1.25% | 1.36% | 1.62% | 4.64% |
| With sales charge | 3.51% | 0.74% | 1.05% | 1.47% | 4.59% |
| Class C Shares(Incep: 9/1/94) | | | | | |
| Without sales charge | 4.60% | 0.90% | 1.03% | 1.32% | 3.54% |
| With sales charge | 4.10% | 0.90% | 1.03% | 1.32% | 3.54% |
| Class I Shares(Incep: 7/5/96) | 5.35% | 1.53% | 1.67% | 1.95% | 4.03% |
| Class R3 Shares(Incep: 7/1/03) | 4.88% | 1.15% | 1.27% | 1.54% | 2.34% |
| Class R4 Shares(Incep: 2/1/14) | 4.88% | 1.15% | 1.26% | - | 1.26% |
| Class R5 Shares(Incep: 5/1/12) | 5.29% | 1.48% | 1.64% | - | 1.33% |
GROWTH OF A HYPOTHETICAL $10,000 INVESTMENT
| THORNBURG LIMITED TERM U.S. GOVERNMENT FUND | FINAL VALUE |
AVERAGE ANNUAL TOTAL RETURNS
| LIMITED TERM INCOME FUND | 1-YR | 3-YR | 5-YR | 10-YR | SINCE
INCEP. |
| Class A Shares(Incep: 10/1/92) | | | | | |
| Without sales charge | 6.03% | 2.44% | 2.39% | 3.51% | 4.83% |
| With sales charge | 4.45% | 1.92% | 2.08% | 3.35% | 4.77% |
| Class C Shares(Incep: 9/1/94) | | | | | |
| Without sales charge | 5.82% | 2.23% | 2.17% | 3.28% | 4.51% |
| With sales charge | 5.32% | 2.23% | 2.17% | 3.28% | 4.51% |
| Class I Shares(Incep: 7/5/96) | 6.44% | 2.79% | 2.76% | 3.87% | 5.03% |
| Class R3 Shares(Incep: 7/1/03) | 5.84% | 2.29% | 2.25% | 3.41% | 3.60% |
| Class R4 Shares(Incep: 2/1/14) | 5.84% | 2.29% | 2.27% | - | 2.33% |
| Class R5 Shares(Incep: 5/1/12) | 6.31% | 2.67% | 2.62% | - | 2.84% |
| Class R6 Shares(Incep: 4/10/17) | 6.43% | - | - | - | 3.58% |
GROWTH OF A HYPOTHETICAL $10,000 INVESTMENT
| THORNBURG LIMITED TERM INCOME FUND | FINAL VALUE |
Performance data shown represents past performance and is no guarantee of future results. Investment return and principal value will fluctuate so shares, when redeemed, may be worth more or less than their original cost. Current performance may be lower or higher than quoted. For performance current to the most recent month end, visit thornburg.com or call 800-847-0200. The performance information does not reflect the deduction of taxes that a shareholder would pay on distributions or the redemption of Fund shares. Returns reflect the reinvestment of dividends and capital gains. Class A shares are sold with a maximum sales charge of 1.50%. Class C shares include a 0.50% CDSC for the first year only. There is no sales charge for Class I, Class R3, Class R4, Class R5, and Class R6 shares. As disclosed in the most recent prospectus, the total annual fund operating expenses before waivers and expense reimbursements are as follows: Limited Term U.S. Government Fund A shares, 0.91%; C shares, 1.23%; I shares, 0.60%; R3 shares, 1.45%; R4 shares, 1.75%; R5 shares, 1.94%; Limited Term Income Fund A shares, 0.84%; C shares, 1.05%; I shares, 0.51%; R3 shares, 1.09%; R4 shares, 1.45%; R5 shares, 0.69%; R6 shares, 0.57%; and Low Duration Income Fund A shares, 1.82%; I shares, 1.09%. Thornburg Investment Management has contractually agreed to waive fees and reimburse expenses until at least February 1, 2020, for some of the share classes, resulting in net expense ratios of the following: For Limited Term U.S. Government Fund R3 shares, 0.99%; R4 shares, 0.99%; R5 shares, 0.67%. Limited Term Income Fund I shares, 0.49%; R3 shares, 0.99%; R4 shares, 0.99%; R5 shares, 0.49%; R6 shares 0.42%. Low Duration Income Fund A shares, 0.70%; I shares, 0.50%. For more detailed information on fund expenses and waivers/reimbursements please see the Fund’s prospectus. Without the fee waivers and expense reimbursements, the Annualized Distribution yield for Low Duration Income Fund A shares would have been 1.22%, and the SEC yield would have been 0.69%.
Performance Summary, Continued
September 30, 2019 (Unaudited)
AVERAGE ANNUAL TOTAL RETURNS
| LOW DURATION INCOME FUND | 1-YR | 3-YR | 5-YR | 10-YR | SINCE
INCEP. |
| Class A Shares(Incep: 12/30/13) | | | | | |
| Without sales charge | 4.00% | 1.92% | 1.60% | - | 1.63% |
| With sales charge | 2.42% | 1.40% | 1.30% | - | 1.36% |
| Class I Shares(Incep: 12/30/13) | 4.21% | 2.11% | 1.78% | - | 1.81% |
GROWTH OF A HYPOTHETICAL $10,000 INVESTMENT
| THORNBURG LOW DURATION INCOME FUND | FINAL VALUE |
30-DAY YIELDS, A SHARES(with sales charge)
| THORNBURG LIMITED TERM U.S. GOVERNMENT FUND | |
| Annualized Distribution Yield | 1.85% |
| SEC Yield | 1.65% |
| THORNBURG LIMITED TERM INCOME FUND | |
| Annualized Distribution Yield | 2.38% |
| SEC Yield | 2.03% |
| THORNBURG LOW DURATION INCOME FUND | |
| Annualized Distribution Yield | 2.23% |
| SEC Yield | 1.71% |
TheBloomberg Barclays Intermediate Government/Credit Bond Index is an unmanaged, market-weighted index generally representative of intermediate government and investment-grade corporate debt securities having maturities from one up to ten years.
TheBloomberg Barclays Intermediate Government Bond Index is an unmanaged, market-weighted index generally representative of all public obligations of the U.S. Government, its agencies and instrumentalities having maturities from one up to ten years.
TheBloomberg Barclays U.S. 1-3 Yr Aggregate Bond Index measures the investment grade, U.S. dollar-denominated, fixed-rate taxable bond market with maturities between 1 and 3 years, including Treasuries, government-related and corporate securities, MBS (agency fixed-rate and hybrid ARM passthroughs), ABS, and CMBS.
The performance of any index is not indicative of the performance of any particular investment. Unless otherwise noted, index returns reflect the reinvestment of income
dividends and capital gains, if any, but do not reflect fees, brokerage commissions or other expenses of investing. Investors may not make direct investments into any index.
Credit risk is the probable risk of loss resulting from a borrower’s failure to repay a loan or meet contractual obligations.
Interest rate risk is the risk that an investment’s value will change due to a change in the absolute level of interest rates, in the spread between two rates, in the shape of the yield curve, or in any other interest rate relationship.
Credit Spread/Quality Spread – The difference between the yields of securities with different credit qualities.
Duration – A bond’s sensitivity to interest rates. Bonds with longer durations experience greater price volatility than bonds with shorter durations. Effective duration incorporates a bond’s embedded option features, such as call provisions.
Fund Summary
Thornburg Limited Term U.S. Government Fund | September 30, 2019 (Unaudited)
OBJECTIVES AND STRATEGIES
The Fund’s primary objective is to provide as high a level of current income as is consistent, in the view of the Fund’s investment advisor, with the safety of capital. As a secondary goal, the Fund seeks to reduce changes in its share price compared to longer term portfolios.
This Fund is a laddered portfolio primarily composed of short/intermediate debt obligations at least 80% of which are issued by the U.S. Government, its agencies, or its instrumentalities, with a dollar-weighted average maturity of normally less than five years.
LONG-TERM STABILITY OF PRINCIPAL
Net Asset Value History of A Shares
| KEY PORTFOLIO ATTRIBUTES | |
| Number of Bonds | 144 |
| Effective Duration | 2.5 Yrs |
| Average Maturity | 3.3 Yrs |
TYPES OF HOLDINGS
PORTFOLIO LADDER
| 11% | 6% | 7% | 24% | 20% | 12% | 9% | 5% | 3% | 2% | 2% |
Percent of portfolio maturing in each year. Cash includes cash equivalents and other.
There is no guarantee that the Fund will meet its investment objectives.
All data is subject to change. Charts may not add up to 100% due to rounding.
Schedule of Investments
Thornburg Limited Term U.S. Government Fund | September 30, 2019
| | | PRINCIPAL
AMOUNT | VALUE |
| | U.S. Treasury Securities — 10.1% | | |
| | United States Treasury Notes Inflationary Index, 0.125% due 7/15/2022 - 1/15/2023 | $ 8,356,925 | $ 8,308,095 |
| | United States Treasury Notes, | | |
| | 1.375% due 10/31/2020 | 1,480,000 | 1,473,077 |
| | 1.625% due 12/31/2019 - 8/15/2029 | 14,500,000 | 14,473,482 |
| | Total U.S. Treasury Securities(Cost $24,158,564) | | 24,254,654 |
| | U.S. Government Agencies — 17.1% | | |
| a | Durrah MSN 35603 (Guaranty: Export-Import Bank of the United States), 1.684% due 1/22/2025 | 696,980 | 694,362 |
| | HNA Group LLC (Guaranty: Export-Import Bank of the United States), Series 2015, 2.291% due 6/30/2027 | 2,066,652 | 2,094,020 |
| a | MSN 41079 and 41084 Ltd. (Guaranty: Export-Import Bank of the United States), 1.717% due 7/13/2024 | 696,644 | 694,003 |
| | Petroleos Mexicanos (Guaranty: Export-Import Bank of the United States), | | |
| a | 1.70% due 12/20/2022 | 1,828,750 | 1,819,992 |
| a | 2.46% due 12/15/2025 | 1,625,000 | 1,649,787 |
| a,b | 2.653% (LIBOR 3 Month + 0.35%) due 4/15/2025 | 2,012,500 | 2,018,686 |
| | Reliance Industries Ltd. (Guaranty: Export-Import Bank of the United States), | | |
| a | 1.87% due 1/15/2026 | 1,737,895 | 1,736,486 |
| a | 2.06% due 1/15/2026 | 2,275,000 | 2,285,391 |
| a,c | 2.512% due 1/15/2026 | 3,428,750 | 3,480,251 |
| | Small Business Administration Participation Certificates, | | |
| | Series 2001-20D Class 1, 6.35% due 4/1/2021 | 136,161 | 138,641 |
| | Series 2001-20F Class 1, 6.44% due 6/1/2021 | 124,123 | 127,160 |
| | Series 2002-20A Class 1, 6.14% due 1/1/2022 | 82,222 | 84,467 |
| | Series 2002-20K Class 1, 5.08% due 11/1/2022 | 95,314 | 98,088 |
| | Series 2005-20H Class 1, 5.11% due 8/1/2025 | 104,615 | 109,657 |
| | Series 2007-20D Class 1, 5.32% due 4/1/2027 | 304,736 | 324,185 |
| | Series 2007-20F Class 1, 5.71% due 6/1/2027 | 165,397 | 178,088 |
| | Series 2007-20I Class 1, 5.56% due 9/1/2027 | 517,683 | 539,511 |
| | Series 2007-20K Class 1, 5.51% due 11/1/2027 | 339,843 | 363,782 |
| | Series 2008-20G Class 1, 5.87% due 7/1/2028 | 952,870 | 1,034,752 |
| | Series 2011-20G Class 1, 3.74% due 7/1/2031 | 1,339,315 | 1,407,870 |
| | Series 2011-20K Class 1, 2.87% due 11/1/2031 | 1,657,933 | 1,704,749 |
| | Series 2014-20H Class 1, 2.88% due 8/1/2034 | 1,037,183 | 1,071,244 |
| | Series 2015-20B Class 1, 2.46% due 2/1/2035 | 871,585 | 881,171 |
| | Series 2015-20G Class 1, 2.88% due 7/1/2035 | 1,826,179 | 1,873,943 |
| | Series 2015-20I Class 1, 2.82% due 9/1/2035 | 1,840,019 | 1,885,254 |
| | Series 2017-20I Class 1, 2.59% due 9/1/2037 | 3,447,774 | 3,511,236 |
| | Series 2017-20K Class 1, 2.79% due 11/1/2037 | 1,460,639 | 1,506,063 |
| | Ulani MSN 35940 LLC (Guaranty: Export-Import Bank of the United States), 2.227% due 5/16/2025 | 2,395,833 | 2,415,634 |
| | Union 13 Leasing LLC (Guaranty: Export-Import Bank of the United States), 1.87% due 6/28/2024 | 1,274,139 | 1,271,808 |
| a,b | Washington Aircraft 2 Co. Ltd. (Guaranty: Export-Import Bank of the United States), 2.543% (LIBOR 3 Month + 0.43%) due 6/26/2024 | 3,968,384 | 3,971,432 |
| | Total U.S. Government Agencies(Cost $40,472,930) | | 40,971,713 |
| | Mortgage Backed — 59.9% | | |
| | Federal Home Loan Mtg Corp., Series K716 Class A1, 2.413% due 1/25/2021 | 537,385 | 537,739 |
| | Federal Home Loan Mtg Corp., CMO REMIC, | | |
| | Series 1351 Class TE, 7.00% due 8/15/2022 | 49,476 | 52,153 |
| | Series 3291 Class BY, 4.50% due 3/15/2022 | 91,425 | 92,575 |
| | Series 3640 Class EL, 4.00% due 3/15/2020 | 26,433 | 26,491 |
| | Series 3704 Class DC, 4.00% due 11/15/2036 | 278,931 | 284,466 |
| | Series 3867 Class VA, 4.50% due 3/15/2024 | 1,184,766 | 1,228,574 |
| | Series 3922 Class PQ, 2.00% due 4/15/2041 | 564,916 | 556,850 |
| | Series 4050 Class MV, 3.50% due 8/15/2023 | 1,376,823 | 1,395,537 |
| | Series 4072 Class VA, 3.50% due 10/15/2023 | 1,225,448 | 1,242,625 |
| | Series 4097 Class TE, 1.75% due 5/15/2039 | 983,227 | 973,521 |
| b | Series 4105 Class FG, 2.428% (LIBOR 1 Month + 0.40%) due 9/15/2042 | 1,375,711 | 1,372,210 |
| | Series 4120 Class TC, 1.50% due 10/15/2027 | 1,396,724 | 1,356,016 |
| | Series 4120 Class UE, 2.00% due 10/15/2027 | 1,384,766 | 1,377,278 |
| | Federal Home Loan Mtg Corp., CMO, | | |
| | Series K018 Class A1, 1.781% due 10/25/2020 | 90,734 | 90,539 |
| | Series K035 Class A1, 2.615% due 3/25/2023 | 1,643,485 | 1,657,842 |
| | Series K037 Class A1, 2.592% due 4/25/2023 | 1,009,482 | 1,019,941 |
Schedule of Investments, Continued
Thornburg Limited Term U.S. Government Fund | September 30, 2019
| | | PRINCIPAL
AMOUNT | VALUE |
| | Series K038 Class A1, 2.604% due 10/25/2023 | $ 3,278,589 | $ 3,319,428 |
| | Series K042 Class A1, 2.267% due 6/25/2024 | 2,694,474 | 2,710,334 |
| d | Series KP02 Class A2, 2.355% due 4/25/2021 | 282,870 | 281,622 |
| | Series KS03 Class A2, 2.79% due 6/25/2022 | 2,500,000 | 2,545,197 |
| b | Federal Home Loan Mtg Corp., Multi-Family Structured Pass Through, Series KF15 Class A, 2.759% (LIBOR 1 Month + 0.67%) due 2/25/2023 | 553,803 | 553,661 |
| | Federal Home Loan Mtg Corp., REMIC, | | |
| | Pool D98887, 3.50% due 1/1/2032 | 828,281 | 862,185 |
| | Pool G13804, 5.00% due 3/1/2025 | 209,728 | 219,521 |
| | Pool G15227, 3.50% due 12/1/2029 | 2,010,589 | 2,096,384 |
| e | Pool G16800, 3.00% due 5/1/2034 | 2,859,651 | 2,956,393 |
| | Pool G18435, 2.50% due 5/1/2027 | 1,433,688 | 1,450,659 |
| | Pool J11371, 4.50% due 12/1/2024 | 206,864 | 214,985 |
| | Pool J13583, 3.50% due 11/1/2025 | 394,920 | 408,810 |
| | Pool J14888, 3.50% due 4/1/2026 | 433,630 | 449,152 |
| | Pool T61943, 3.50% due 8/1/2045 | 631,408 | 646,810 |
| | Pool T65457, 3.00% due 1/1/2048 | 2,949,258 | 2,989,600 |
| | Pool ZT1958, 3.00% due 11/1/2030 | 2,750,196 | 2,825,808 |
| | Federal Home Loan Mtg Corp., Seasoned Credit Risk Transfer CMO, | | |
| | Series 2018-3 Class MA, 3.50% due 8/25/2057 | 551,542 | 579,869 |
| | Series 2019-3 Class MA, 3.50% due 10/25/2058 | 1,956,012 | 2,040,874 |
| d | Federal Home Loan Mtg Corp., Seasoned Credit Risk Transfer Whole Loan Securities CMO, Series 2018-2 Class HA, 3.00% due 11/25/2057 | 1,505,213 | 1,543,947 |
| | Federal Home Loan Mtg Corp., Seasoned Credit Risk Transfer Whole Loan Securities Trust CMO, Series 2018-4 Class HA, 3.00% due 3/25/2058 | 1,841,730 | 1,886,729 |
| | Federal Home Loan Mtg Corp., Seasoned Credit Risk Transfer, Whole Loan Securities Trust CMO, | | |
| f | Series 2017-3 Class HA, 3.00% due 7/25/2056 | 2,011,982 | 2,082,946 |
| f | Series 2017-4 Class HT, 3.00% due 6/25/2057 | 1,125,126 | 1,201,270 |
| f | Series 2018-1 Class HA, 2.75% due 5/25/2057 | 2,506,222 | 2,569,176 |
| | Series 2018-3 Class HA, 3.00% due 8/25/2057 | 1,755,099 | 1,801,682 |
| | Series 2019-1 Class MA, 3.50% due 7/25/2058 | 2,797,581 | 2,928,838 |
| | Series 2019-2 Class MA, 3.50% due 8/25/2058 | 3,824,449 | 4,006,495 |
| | Federal Home Loan Mtg Corp., Whole Loan Securities Trust CMO, | | |
| | Series 2015-SC02 Class 2A, 3.50% due 9/25/2045 | 1,295,963 | 1,362,332 |
| | Series 2016-SC01 Class 2A, 3.50% due 7/25/2046 | 1,455,040 | 1,512,446 |
| | Series 2016-SC02 Class 2A, 3.50% due 10/25/2046 | 1,179,963 | 1,230,807 |
| | Series 2017-SC01 Class 1A, 3.00% due 12/25/2046 | 2,217,289 | 2,239,441 |
| | Series 2017-SC02 Class 1A, 3.00% due 5/25/2047 | 549,768 | 555,394 |
| | Series 2017-SC02 Class 2A1, 3.50% due 5/25/2047 | 554,683 | 560,718 |
| | Federal National Mtg Assoc., | | |
| | 1.875% due 12/28/2020 | 2,000,000 | 2,001,763 |
| | Pool 252648, 6.50% due 5/1/2022 | 8,475 | 8,826 |
| | Pool 342947, 7.25% due 4/1/2024 | 5,083 | 5,260 |
| b | Pool 895572, 4.695% (LIBOR 12 Month + 1.82%) due 6/1/2036 | 146,797 | 154,553 |
| | Pool AA2870, 4.00% due 3/1/2024 | 214,017 | 223,217 |
| | Pool AB7997, 2.50% due 2/1/2023 | 299,478 | 302,022 |
| | Pool AB8442, 2.00% due 2/1/2028 | 3,026,382 | 3,028,241 |
| | Pool AB8447, 2.50% due 2/1/2028 | 1,284,834 | 1,300,566 |
| | Pool AD8191, 4.00% due 9/1/2025 | 389,690 | 406,441 |
| | Pool AE0704, 4.00% due 1/1/2026 | 1,496,673 | 1,561,008 |
| | Pool AH3487, 3.50% due 2/1/2026 | 1,785,637 | 1,848,601 |
| | Pool AJ1752, 3.50% due 9/1/2026 | 1,226,741 | 1,269,998 |
| | Pool AK6518, 3.00% due 3/1/2027 | 898,917 | 923,428 |
| | Pool AK6768, 3.00% due 3/1/2027 | 1,280,886 | 1,311,010 |
| | Pool AL9821, 2.50% due 1/1/2032 | 4,387,602 | 4,453,665 |
| | Pool AS4916, 3.00% due 5/1/2030 | 2,670,648 | 2,742,635 |
| | Pool AS9749, 4.00% due 6/1/2047 | 2,027,883 | 2,123,940 |
| | Pool AU2669, 2.50% due 10/1/2028 | 1,269,618 | 1,289,527 |
| | Pool BF0130, 3.50% due 8/1/2056 | 618,974 | 651,120 |
| | Pool BF0144, 3.50% due 10/1/2056 | 841,667 | 889,850 |
| | Pool BM4864, 3.50% due 5/1/2033 | 2,124,272 | 2,215,773 |
| | Pool BM5490, 3.50% due 11/1/2031 | 2,646,078 | 2,750,959 |
| | Pool CA0200, 3.00% due 8/1/2032 | 2,227,335 | 2,302,686 |
| | Pool MA0380, 4.00% due 4/1/2020 | 13,690 | 13,721 |
| | Pool MA1582, 3.50% due 9/1/2043 | 3,384,785 | 3,545,765 |
| | Pool MA1585, 2.00% due 9/1/2023 | 873,586 | 872,112 |
Schedule of Investments, Continued
Thornburg Limited Term U.S. Government Fund | September 30, 2019
| | | PRINCIPAL
AMOUNT | VALUE |
| | Pool MA2322, 2.50% due 7/1/2025 | $ 851,099 | $ 860,191 |
| | Pool MA2353, 3.00% due 8/1/2035 | 1,937,726 | 1,995,240 |
| | Pool MA2480, 4.00% due 12/1/2035 | 1,839,545 | 1,949,675 |
| | Pool MA2499, 2.50% due 1/1/2026 | 1,494,303 | 1,510,731 |
| | Pool MA3465, 4.00% due 9/1/2038 | 2,109,509 | 2,224,594 |
| | Pool MA3557, 4.00% due 1/1/2029 | 2,484,481 | 2,596,712 |
| | Pool MA3681, 3.00% due 6/1/2034 | 2,240,685 | 2,290,579 |
| | Federal National Mtg Assoc., CMO REMIC, | | |
| | Series 1993-32 Class H, 6.00% due 3/25/2023 | 6,415 | 6,727 |
| d | Series 2009-17 Class AH, 0.62% due 3/25/2039 | 336,138 | 291,296 |
| | Series 2009-52 Class AJ, 4.00% due 7/25/2024 | 7,344 | 7,428 |
| | Series 2011-45 Class VA, 4.00% due 3/25/2024 | 30,446 | 30,436 |
| | Series 2012-36 Class CV, 4.00% due 6/25/2023 | 1,497,770 | 1,520,440 |
| b | Series 2013-81 Class FW, 2.318% (LIBOR 1 Month + 0.30%) due 1/25/2043 | 2,197,609 | 2,179,418 |
| b | Series 2013-92 Class FA, 2.568% (LIBOR 1 Month + 0.55%) due 9/25/2043 | 1,594,380 | 1,603,688 |
| | Federal National Mtg Assoc., CMO, | | |
| | Series 2011-70 Class CA, 3.00% due 8/25/2026 | 3,009,008 | 3,001,484 |
| | Series 2012-20 Class VT, 3.50% due 3/25/2025 | 2,349,355 | 2,369,449 |
| b | Series 2015-SB5 Class A10, 3.15% (LIBOR 1 Month + 3.15%) due 9/25/2035 | 1,080,871 | 1,114,742 |
| b | Series 2018-SB47 Class A5H, 2.92% (LIBOR 1 Month + 2.92%) due 1/25/2038 | 1,462,542 | 1,494,460 |
| | Federal National Mtg Assoc., Grantor Trust, Series 2017-T1 Class A, 2.898% due 6/25/2027 | 998,295 | 1,037,730 |
| | Government National Mtg Assoc., | | |
| d | Pool 751388, 5.303% due 1/20/2061 | 758,625 | 760,940 |
| d | Pool 751392, 5.00% due 2/20/2061 | 4,300,687 | 4,464,082 |
| b | Pool 894205, 3.75% (H15T1Y + 1.50%) due 8/20/2039 | 331,080 | 340,587 |
| b | Pool MA0100, 3.875% (H15T1Y + 1.50%) due 5/20/2042 | 512,866 | 529,362 |
| | Pool MA0907, 2.00% due 4/20/2028 | 1,714,342 | 1,705,217 |
| | Government National Mtg Assoc., CMO, | | |
| | Series 2010-160 Class VY, 4.50% due 1/20/2022 | 249,873 | 255,575 |
| | Series 2017-186 Class VA, 3.00% due 2/20/2031 | 2,691,080 | 2,740,664 |
| | Mortgage-Linked Amortizing Notes CMO, Series 2012-1 Class A10, 2.06% due 1/15/2022 | 394,480 | 395,069 |
| | Total Mortgage Backed(Cost $141,620,947) | | 143,371,073 |
| | Corporate Bonds — 1.7% | | |
| | Telecommunication Services — 1.7% | | |
| | Wireless Telecommunication Services — 1.7% | | |
| | Sprint Communications, Inc., 9.25% due 4/15/2022 | 3,500,000 | 4,055,625 |
| | | | 4,055,625 |
| | Total Corporate Bonds(Cost $4,020,244) | | 4,055,625 |
| | Short-Term Investments — 12.1% | | |
| | Bank of New York Tri-Party Repurchase Agreement 1.94% dated 9/30/2019 due 10/1/2019, repurchase price $9,000,485 collateralized by 4 U.S. Government debt securities, having an average coupon of 4.75%, a minimum credit rating of BBB-, maturity dates from 10/25/2021 to 8/20/2049, and having an aggregate market value of $9,143,909 at 9/30/2019 | 9,000,000 | 9,000,000 |
| | Federal Home Loan Bank Discount Notes, 1.50% due 10/1/2019 | 5,024,000 | 5,024,000 |
| | United States Treasury Bill, | | |
| | 1.657% due 10/3/2019 | 3,000,000 | 2,999,724 |
| | 1.795% due 10/15/2019 | 3,000,000 | 2,997,906 |
| | 1.962% due 10/10/2019 | 3,000,000 | 2,998,525 |
| | 1.98% due 10/8/2019 | 3,000,000 | 2,998,845 |
| | 1.986% due 10/1/2019 | 3,000,000 | 3,000,000 |
| | Total Short-Term Investments(Cost $29,019,000) | | 29,019,000 |
| | Total Investments — 100.9%(Cost $239,291,685) | | $241,672,065 |
| | Liabilities Net of Other Assets — (0.9)% | | (2,270,166) |
| | Net Assets — 100.0% | | $239,401,899 |
| Footnote Legend |
| a | Yankee bond denominated in U.S. dollars and is issued in the U.S. by foreign banks and corporations. |
Schedule of Investments, Continued
Thornburg Limited Term U.S. Government Fund | September 30, 2019
| b | Floating Rate Security. Stated interest/floor rate was in effect at September 30, 2019. |
| c | Segregated as collateral for a when-issued security. |
| d | Variable rate coupon, rate shown as of September 30, 2019. |
| e | When-issued security. |
| f | Coupon rate adjusts periodically based upon a predetermined schedule. Stated interest rate in effect at September 30, 2019. |
Portfolio Abbreviations
To simplify the listings of securities, abbreviations are used per the table below:
| CMO | Collateralized Mortgage Obligation |
| H15T1Y | US Treasury Yield Curve Rate T-Note Constant Maturity 1 Year |
| LIBOR | London Interbank Offered Rates |
| Mtg | Mortgage |
| REMIC | Real Estate Mortgage Investment Conduit |
See notes to financial statements.
Fund Summary
Thornburg Limited Term Income Fund | September 30, 2019 (Unaudited)
OBJECTIVES AND STRATEGIES
The Fund’s primary objective is to provide as high a level of current income as is consistent, in the view of the Fund’s investment advisor, with the preservation of capital. As a secondary goal, the Fund seeks to reduce changes in its share price compared to longer term portfolios.
This Fund is a laddered portfolio primarily composed of short/intermediate debt obligations which are investment grade or judged by the advisor to be of equivalent quality, with a dollar-weighted average maturity of normally less than five years.
LONG-TERM STABILITY OF PRINCIPAL
Net Asset Value History of A Shares
| KEY PORTFOLIO ATTRIBUTES | |
| Number of Bonds | 602 |
| Effective Duration | 2.5 Yrs |
| Average Maturity | 3.3 Yrs |
SECURITY CREDIT RATINGS
A bond credit rating assesses the financial ability of a debt issuer to make timely payments of principal and interest. Ratings of AAA (the highest), AA, A, and BBB are investment-grade quality. Ratings of BB, B, CCC, CC, C and D (the lowest) are considered below investment grade, speculative grade, or junk bonds.
PORTFOLIO LADDER
| 8% | 17% | 13% | 15% | 14% | 11% | 7% | 3% | 4% | 2% | 6% |
Percent of portfolio maturing in each year. Cash includes cash equivalents and other.
There is no guarantee that the Fund will meet its investment objectives.
All data is subject to change. Charts may not add up to 100% due to rounding.
Schedule of Investments
Thornburg Limited Term Income Fund | September 30, 2019
| | | PRINCIPAL
AMOUNT | VALUE |
| | U.S. Treasury Securities — 9.3% | | |
| | United States Treasury Notes Inflationary Index, | | |
| | 0.125% due 4/15/2020 | $ 18,140,117 | $ 17,982,808 |
| | 0.25% due 1/15/2025 | 5,957,490 | 5,971,802 |
| | 0.375% due 7/15/2027 | 65,948,544 | 66,936,486 |
| | 0.875% due 1/15/2029 | 83,109,643 | 88,174,138 |
| | United States Treasury Notes, | | |
| | 1.375% due 5/31/2020 - 8/31/2020 | 36,075,000 | 35,947,529 |
| | 1.50% due 5/15/2020 | 30,000,000 | 29,931,444 |
| | 1.625% due 12/31/2019 - 8/15/2029 | 207,430,000 | 206,975,629 |
| | 2.25% due 11/15/2025 - 8/15/2027 | 35,637,000 | 37,115,071 |
| | 2.50% due 5/31/2020 | 7,000,000 | 7,028,096 |
| | 2.625% due 2/15/2029 | 31,970,000 | 34,606,902 |
| | Total U.S. Treasury Securities(Cost $517,427,566) | | 530,669,905 |
| | U.S. Government Agencies — 1.0% | | |
| a | Durrah MSN 35603 (Guaranty: Export-Import Bank of the United States), 1.684% due 1/22/2025 | 7,210,140 | 7,183,055 |
| | Export Leasing (2009), LLC (Guaranty: Export-Import Bank of the United States), 1.859% due 8/28/2021 | 1,794,044 | 1,794,855 |
| a | MSN 41079 and 41084 Ltd. (Guaranty: Export-Import Bank of the United States), 1.717% due 7/13/2024 | 5,324,667 | 5,304,485 |
| | Petroleos Mexicanos (Guaranty: Export-Import Bank of the United States), | | |
| a | 1.70% due 12/20/2022 | 3,640,000 | 3,622,567 |
| a | 2.46% due 12/15/2025 | 4,875,000 | 4,949,360 |
| a,b | 2.653% (LIBOR 3 Month + 0.35%) due 4/15/2025 | 5,957,000 | 5,975,311 |
| | Reliance Industries Ltd. (Guaranty: Export-Import Bank of the United States), | | |
| a | 1.87% due 1/15/2026 | 4,666,316 | 4,662,534 |
| a | 2.06% due 1/15/2026 | 975,000 | 979,453 |
| a | 2.512% due 1/15/2026 | 4,225,000 | 4,288,461 |
| | Small Business Administration Participation Certificates, | | |
| | Series 2011-20G Class 1, 3.74% due 7/1/2031 | 5,357,260 | 5,631,481 |
| | Series 2011-20K Class 1, 2.87% due 11/1/2031 | 6,453,504 | 6,635,736 |
| c,d,e,f | U.S. Department of Transportation, 6.001% due 12/7/2031 | 3,000,000 | 3,232,814 |
| a,b | Washington Aircraft 2 Co. Ltd. (Guaranty: Export-Import Bank of the United States), 2.543% (LIBOR 3 Month + 0.43%) due 6/26/2024 | 4,947,181 | 4,950,981 |
| | Total U.S. Government Agencies(Cost $59,146,214) | | 59,211,093 |
| | Other Government — 0.9% | | |
| a,c,d | Bermuda Government International Bond, 4.138% due 1/3/2023 | 4,000,000 | 4,198,750 |
| | Carpintero Finance Ltd. (Guaranty: Export Credits Guarantee Department), | | |
| a,c | 2.004% due 9/18/2024 | 5,132,834 | 5,143,876 |
| a,c | 2.581% due 11/11/2024 | 7,425,108 | 7,553,633 |
| a,c | Khadrawy Ltd. (Guaranty: Export Credits Guarantee Department), 2.471% due 3/31/2025 | 3,513,883 | 3,377,895 |
| a,b,c | Korea Expressway Corp., 2.978% (LIBOR 3 Month + 0.70%) due 4/20/2020 | 15,000,000 | 15,027,300 |
| a | North American Development Bank, 4.375% due 2/11/2020 | 15,500,000 | 15,591,508 |
| | Total Other Government(Cost $50,689,875) | | 50,892,962 |
| | Mortgage Backed — 20.6% | | |
| | Angel Oak Mortgage Trust, LLC, Whole Loan Securities Trust CMO, | | |
| c,g | Series 2017-1 Class A2, 3.085% due 1/25/2047 | 1,112,133 | 1,110,291 |
| c,g | Series 2017-3 Class A1, 2.708% due 11/25/2047 | 3,186,161 | 3,146,935 |
| c,g | Series 2018-1 Class A1, 3.258% due 4/27/2048 | 5,312,568 | 5,379,284 |
| c,g | Series 2018-2 Class A1, 3.674% due 7/27/2048 | 5,634,913 | 5,745,008 |
| | Arroyo Mortgage Trust, Whole Loan Securities Trust CMO, | | |
| c,g | Series 2018-1 Class A1, 3.763% due 4/25/2048 | 11,565,346 | 11,767,743 |
| c,g | Series 2019-1 Class A1, 3.805% due 1/25/2049 | 18,402,901 | 18,743,556 |
| c,g | Series 2019-2 Class A1, 3.347% due 4/25/2049 | 9,340,616 | 9,496,916 |
| c,g | Series 2019-3 Class A1, 2.962% due 10/25/2048 | 21,686,292 | 21,576,954 |
| c | Barclays Commercial Mortgage Securities, LLC, Series 2015-STP Class A, 3.323% due 9/10/2028 | 3,237,712 | 3,263,651 |
| b,c | Bayview Commercial Asset Trust CMO, Series 2004-3 Class A2, 2.648% (LIBOR 1 Month + 0.63%) due 1/25/2035 | 1,488,223 | 1,469,691 |
| c | Bravo Residential Funding Trust, Whole Loan Securities Trust CMO, Series 2019-1 Class A1C, 3.50% due 3/25/2058 | 8,065,935 | 8,127,077 |
| c,g | CIM Trust, Whole Loan Securities Trust CMO, Series 18-INV1 Class A4, 4.00% due 8/25/2048 | 7,188,278 | 7,344,655 |
| g | Citigroup Mortgage Loan Trust, Inc., Whole Loan Securities Trust CMO, Series 2004-HYB2 Class B1, 4.917% due 3/25/2034 | 96,285 | 84,795 |
| c,g | Citigroup Mortgage Loan Trust, Whole Loan Securities Trust CMO, Series 2014-A Class A, 4.00% due 1/25/2035 | 1,531,831 | 1,567,334 |
Schedule of Investments, Continued
Thornburg Limited Term Income Fund | September 30, 2019
| | | PRINCIPAL
AMOUNT | VALUE |
| | COMM Mortgage Trust, Series 2016-DC2 Class A1, 1.82% due 2/10/2049 | $ 8,807,491 | $ 8,783,742 |
| c,g | Credit Suisse Mortgage Trust, Whole Loan Securities Trust CMO, Series 2017-HL2 Class A3, 3.50% due 10/25/2047 | 12,778,763 | 12,986,198 |
| b,c | DBUBS Mortgage Trust, Series 2011-LC2A Class A1FL, 3.389% (LIBOR 1 Month + 1.35%) due 7/12/2044 | 1,465,762 | 1,471,320 |
| c | FDIC Trust, Whole Loan Securities Trust CMO, Series 2013-R1 Class A, 1.15% due 3/25/2033 | 631,620 | 628,106 |
| | Federal Home Loan Mtg Corp. CMO REMIC, Series 3195 Class PD, 6.50% due 7/15/2036 | 545,182 | 614,057 |
| g,h | Federal Home Loan Mtg Corp. Multifamily Structured Pass Through Certificates IO, Series K008 Class X1, 1.643% due 6/25/2020 | 28,751,105 | 200,628 |
| | Federal Home Loan Mtg Corp. Multifamily Structured Pass Through Certificates, | | |
| g | Series K031 Class A2, 3.30% due 4/25/2023 | 9,203,000 | 9,595,282 |
| | Series K039 Class A1, 2.683% due 12/25/2023 | 4,005,510 | 4,067,638 |
| g | Series K719 Class A2, 2.731% due 6/25/2022 | 6,355,000 | 6,457,856 |
| | Series K722 Class A2, 2.406% due 3/25/2023 | 4,800,000 | 4,864,182 |
| | Series K725 Class A1, 2.666% due 5/25/2023 | 6,949,860 | 7,043,178 |
| | Federal Home Loan Mtg Corp., | | |
| | Pool G15643, 3.00% due 10/1/2030 | 13,353,343 | 13,787,239 |
| | Pool J17504, 3.00% due 12/1/2026 | 990,517 | 1,018,059 |
| | Pool ZS7299, 3.00% due 10/1/2030 | 17,198,959 | 17,748,552 |
| | Series K716 Class A1, 2.413% due 1/25/2021 | 1,652,458 | 1,653,546 |
| | Federal Home Loan Mtg Corp., CMO REMIC, | | |
| | Series 2682 Class JG, 4.50% due 10/15/2023 | 261,581 | 268,126 |
| | Series 3291 Class BY, 4.50% due 3/15/2022 | 121,900 | 123,433 |
| | Series 3504 Class PC, 4.00% due 1/15/2039 | 17,516 | 17,758 |
| | Series 3838 Class GV, 4.00% due 3/15/2024 | 4,949,380 | 5,084,410 |
| | Series 3919 Class VB, 4.00% due 8/15/2024 | 2,642,250 | 2,714,898 |
| | Series 3922 Class PQ, 2.00% due 4/15/2041 | 847,374 | 835,275 |
| | Series 4050 Class MV, 3.50% due 8/15/2023 | 1,573,062 | 1,594,444 |
| | Series 4072 Class VA, 3.50% due 10/15/2023 | 1,233,137 | 1,250,421 |
| | Series 4079 Class WV, 3.50% due 3/15/2027 | 2,175,652 | 2,222,463 |
| | Series 4097 Class TE, 1.75% due 5/15/2039 | 2,949,681 | 2,920,564 |
| | Series 4120 Class TC, 1.50% due 10/15/2027 | 1,813,657 | 1,760,799 |
| | Federal Home Loan Mtg Corp., CMO, Series K038 Class A1, 2.604% due 10/25/2023 | 7,691,023 | 7,786,825 |
| | Federal Home Loan Mtg Corp., Multi-Family Structured Pass Through, | | |
| | Series K030 Class A1, 2.779% due 9/25/2022 | 2,397,003 | 2,421,418 |
| | Series K717 Class A2, 2.991% due 9/25/2021 | 4,700,000 | 4,759,919 |
| | Federal Home Loan Mtg Corp., REMIC, | | |
| | Pool D98887, 3.50% due 1/1/2032 | 2,772,667 | 2,886,160 |
| i | Pool G16800, 3.00% due 5/1/2034 | 20,247,476 | 20,932,448 |
| | Pool T65457, 3.00% due 1/1/2048 | 26,480,125 | 26,842,341 |
| | Pool ZT1958, 3.00% due 11/1/2030 | 745,962 | ��� 766,471 |
| | Federal Home Loan Mtg Corp., Seasoned Credit Risk Transfer CMO, | | |
| f | Series 2017-1 Class HA, 3.00% due 1/25/2056 | 9,687,255 | 9,923,885 |
| | Series 2019-3 Class MA, 3.50% due 10/25/2058 | 27,611,059 | 28,808,984 |
| g | Federal Home Loan Mtg Corp., Seasoned Credit Risk Transfer Whole Loan Securities CMO, Series 2018-2 Class HA, 3.00% due 11/25/2057 | 24,083,411 | 24,703,152 |
| | Federal Home Loan Mtg Corp., Seasoned Credit Risk Transfer Whole Loan Securities Trust CMO, Series 2018-4 Class HA, 3.00% due 3/25/2058 | 20,829,970 | 21,338,903 |
| | Federal Home Loan Mtg Corp., Seasoned Credit Risk Transfer, Whole Loan Securities Trust CMO, | | |
| f | Series 2017-3 Class HA, 3.00% due 7/25/2056 | 16,790,391 | 17,382,603 |
| f | Series 2017-4 Class HT, 3.00% due 6/25/2057 | 14,433,760 | 15,410,578 |
| f | Series 2018-1 Class HA, 2.75% due 5/25/2057 | 9,962,231 | 10,212,473 |
| | Series 2018-3 Class HA, 3.00% due 8/25/2057 | 25,273,425 | 25,944,225 |
| | Series 2019-1 Class MA, 3.50% due 7/25/2058 | 19,377,909 | 20,287,082 |
| | Series 2019-2 Class MA, 3.50% due 8/25/2058 | 47,530,250 | 49,792,718 |
| | Federal Home Loan Mtg Corp., Whole Loan Securities Trust CMO, | | |
| | Series 2016-SC01 Class 2A, 3.50% due 7/25/2046 | 5,577,653 | 5,797,708 |
| | Series 2017-SC01 Class 1A, 3.00% due 12/25/2046 | 46,623,543 | 47,089,331 |
| | Series 2017-SC02 Class 2A1, 3.50% due 5/25/2047 | 4,240,124 | 4,286,258 |
| | Federal National Mtg Assoc. CMO REMIC, | | |
| | Series 2005-48 Class AR, 5.50% due 2/25/2035 | 7,282 | 7,289 |
| | Series 2007-42 Class PA, 5.50% due 4/25/2037 | 122,678 | 126,555 |
| | Series 2012-129 Class LA, 3.50% due 12/25/2042 | 5,987,023 | 6,148,729 |
| | Federal National Mtg Assoc., | | |
| | Pool 469616, 3.50% due 11/1/2021 | 3,539,103 | 3,626,894 |
| | Pool 897936, 5.50% due 8/1/2021 | 96,284 | 98,252 |
| | Pool AB7997, 2.50% due 2/1/2023 | 1,630,423 | 1,644,273 |
Schedule of Investments, Continued
Thornburg Limited Term Income Fund | September 30, 2019
| | | PRINCIPAL
AMOUNT | VALUE |
| | Pool AB8442, 2.00% due 2/1/2028 | $ 18,204,264 | $ 18,215,447 |
| | Pool AE0160, 4.416% due 6/1/2020 | 4,407,410 | 4,421,549 |
| | Pool AE0704, 4.00% due 1/1/2026 | 3,892,813 | 4,060,147 |
| | Pool AK6518, 3.00% due 3/1/2027 | 1,253,874 | 1,288,064 |
| | Pool AL9445, 3.00% due 7/1/2031 | 50,733,602 | 52,354,794 |
| | Pool AL9612, 3.50% due 11/1/2043 | 6,676,510 | 7,012,821 |
| | Pool AS3111, 3.00% due 8/1/2029 | 7,479,995 | 7,707,331 |
| | Pool AS4916, 3.00% due 5/1/2030 | 831,435 | 853,847 |
| | Pool AS9733, 4.00% due 6/1/2047 | 26,833,405 | 28,867,524 |
| | Pool AS9749, 4.00% due 6/1/2047 | 17,216,043 | 18,031,532 |
| | Pool AV5059, 3.00% due 2/1/2029 | 4,760,532 | 4,900,753 |
| | Pool BM4324, 3.50% due 7/1/2033 | 5,994,089 | 6,299,106 |
| | Pool BM5462, 3.00% due 11/1/2032 | 16,496,891 | 16,993,117 |
| | Pool BM5490, 3.50% due 11/1/2031 | 8,732,058 | 9,078,164 |
| | Pool CA0200, 3.00% due 8/1/2032 | 16,577,659 | 17,138,481 |
| | Pool CA3430, 3.50% due 4/1/2034 | 23,474,168 | 24,698,024 |
| | Pool CA3904, 3.00% due 7/1/2034 | 14,000,510 | 14,482,897 |
| | Pool FM1126, 3.00% due 3/1/2033 | 9,684,723 | 9,966,960 |
| | Pool MA1278, 2.50% due 12/1/2022 | 2,146,258 | 2,164,488 |
| | Pool MA1585, 2.00% due 9/1/2023 | 3,308,707 | 3,303,126 |
| | Pool MA2815, 3.00% due 11/1/2026 | 2,431,290 | 2,488,468 |
| | Pool MA3465, 4.00% due 9/1/2038 | 18,918,075 | 19,950,160 |
| | Pool MA3681, 3.00% due 6/1/2034 | 16,700,007 | 17,071,874 |
| | Federal National Mtg Assoc., CMO REMIC, | | |
| g | Series 2009-17 Class AH, 0.62% due 3/25/2039 | 560,229 | 485,494 |
| | Series 2009-52 Class AJ, 4.00% due 7/25/2024 | 12,240 | 12,380 |
| | Series 2012-36 Class CV, 4.00% due 6/25/2023 | 1,366,341 | 1,387,022 |
| b | Series 2013-81 Class FW, 2.318% (LIBOR 1 Month + 0.30%) due 1/25/2043 | 7,984,944 | 7,918,846 |
| | Federal National Mtg Assoc., Grantor Trust, Series 2017-T1 Class A, 2.898% due 6/25/2027 | 17,969,318 | 18,679,143 |
| c,g | Flagstar Mortgage Trust, Whole Loan Securities Trust CMO, Series 2017-1 Class 2A2, 3.00% due 3/25/2047 | 8,818,179 | 8,861,751 |
| c,g | FWD Securitization Trust, Whole Loan Securities Trust CMO, Series 2019-INV1 Class A1, 2.81% due 6/25/2049 | 7,174,740 | 7,206,259 |
| c,g | Galton Funding Mortgage Trust, Whole Loan Securities Trust CMO, Series 2018-1 Class A43, 3.50% due 11/25/2057 | 2,879,033 | 2,905,908 |
| c,f | GCAT 2019-NQM1 LLC, Whole Loan Securities Trust CMO, Series 2019-NQM1 Class A1, 2.985% due 2/25/2059 | 19,137,624 | 19,349,853 |
| c,f | GCAT Trust Whole Loan Securities Trust, Whole Loan Securities Trust CMO, Series 2019-NQM2 Class A1, 2.855% due 9/25/2059 | 19,900,000 | 19,898,171 |
| | Government National Mtg Assoc., | | |
| g | Pool 731491, 5.17% due 12/20/2060 | 644,049 | 655,136 |
| g | Pool 751388, 5.303% due 1/20/2061 | 1,192,125 | 1,195,763 |
| | Pool 783299, 4.50% due 2/15/2022 | 8,088 | 8,103 |
| b | Pool MA0100, 3.875% (H15T1Y + 1.50%) due 5/20/2042 | 518,047 | 534,709 |
| | Series 2009-68 Class DP, 4.50% due 11/16/2038 | 163,688 | 168,627 |
| | Homeward Opportunities Fund I Trust, Whole Loan Securities Trust CMO, | | |
| c,g | Series 2018-1 Class A1, 3.766% due 6/25/2048 | 8,641,685 | 8,893,524 |
| c,g | Series 2019-1 Class A1, 3.454% due 1/25/2059 | 15,345,304 | 15,561,860 |
| | JPMorgan Mortgage Trust, Whole Loan Securities Trust CMO, | | |
| c,g | Series 2017-2 Class A6, 3.00% due 5/25/2047 | 15,255,308 | 15,350,412 |
| c,g | Series 2017-6 Class A5, 3.50% due 12/25/2048 | 17,567,274 | 17,860,176 |
| c,g | Mello Mortgage Capital Acceptance, Whole Loan Securities Trust CMO, Series 2018-MTG1 Class A3, 3.50% due 3/25/2048 | 10,858,920 | 11,037,893 |
| g | Merrill Lynch Mortgage Investors Trust, Whole Loan Securities Trust CMO, Series 2004-A4 Class M1, 4.38% due 8/25/2034 | 303,605 | 269,219 |
| c,g | Metlife Securitization Trust, Whole Loan Securities Trust CMO, Series 2019-1A Class A1A, 3.75% due 4/25/2058 | 4,848,072 | 5,039,594 |
| | Mortgage-Linked Amortizing Notes CMO, Series 2012-1 Class A10, 2.06% due 1/15/2022 | 333,791 | 334,289 |
| c,g | New Residential Mortgage Loan Trust Whole Loan Securities Trust CMO, Series 2017-2A Class A3, 4.00% due 3/25/2057 | 7,540,823 | 7,920,591 |
| | New Residential Mortgage Loan Trust, Whole Loan Securities Trust CMO, | | |
| c,g | Series 2017-3A Class A1, 4.00% due 4/25/2057 | 9,515,174 | 9,932,991 |
| c,g | Series 2017-4A Class A1, 4.00% due 5/25/2057 | 11,881,023 | 12,477,021 |
| b,c | Series 2017-5A Class A1, 3.518% (LIBOR 1 Month + 1.50%) due 6/25/2057 | 988,445 | 1,004,058 |
| c,g | Series 2018-2A Class A1, 4.50% due 2/25/2058 | 11,040,560 | 11,621,500 |
| c,g | Series 2018-NQM1 Class A1, 3.986% due 11/25/2048 | 16,925,884 | 17,516,369 |
| c,g | Series 2018-RPL1 Class A1, 3.50% due 12/25/2057 | 6,795,615 | 7,083,093 |
| | RAMP Trust, Whole Loan Securities Trust CMO, Series 2003-SL1 Class A31, 7.125% due 4/25/2031 | 905,074 | 924,918 |
| | Sequoia Mortgage Trust, Whole Loan Securities Trust CMO, | | |
| c,g | Series 2017-4 Class A4, 3.50% due 7/25/2047 | 3,243,983 | 3,300,373 |
| c,g | Series 2017-5 Class A4, 3.50% due 8/25/2047 | 8,063,938 | 8,214,193 |
| c,g | Shellpoint Asset Funding Trust, Whole Loan Securities Trust CMO, Series 2013-1 Class A1, 3.75% due 7/25/2043 | 4,684,248 | 4,802,893 |
Schedule of Investments, Continued
Thornburg Limited Term Income Fund | September 30, 2019
| | | PRINCIPAL
AMOUNT | VALUE |
| g | Structured Asset Securities Corp. Mortgage Pass-Through Ctfs, Whole Loan Securities Trust CMO, Series 2003-9A Class 2A2, 4.171% due 3/25/2033 | $ 835,459 | $ 846,506 |
| | Verus Securitization Trust, Whole Loan Securities Trust CMO, | | |
| c,g | Series 2017-2A Class A1, 2.485% due 7/25/2047 | 6,340,538 | 6,300,038 |
| c,g | Series 2018-2 Class A1, 3.677% due 6/1/2058 | 8,673,433 | 8,882,925 |
| c,g | Series 2018-3 Class A1, 4.108% due 10/25/2058 | 9,306,746 | 9,576,224 |
| c,f | Series 2019-3 Class A1, 2.784% due 7/25/2059 | 25,644,160 | 25,700,444 |
| c,g | Wells Fargo Commercial Mortgage Trust, Series 2013-120B Class A, 2.80% due 3/18/2028 | 15,000,000 | 14,992,723 |
| | Total Mortgage Backed(Cost $1,155,239,801) | | 1,173,621,204 |
| | Asset Backed Securities — 15.5% | | |
| | Advance Receivables — 0.7% | | |
| c,j | New Residential Advance Receivables Trust, Series 2019-T2 Class AT2, 2.52% due 8/15/2053 | 31,650,000 | 31,571,505 |
| c | SPS Servicer Advance Receivables Trust Advance Receivables Backed Notes, Series 2018-T1 Class A, 3.62% due 10/17/2050 | 7,605,593 | 7,710,383 |
| | | | 39,281,888 |
| | Asset-Backed - Finance & Insurance — 3.7% | | |
| c | Aqua Finance Trust, Series 2019-A Class A, 3.14% due 7/16/2040 | 16,800,000 | 16,821,738 |
| c | Conn’s Receivables Funding LLC, Series 2019-A Class A, 3.40% due 10/16/2023 | 5,695,939 | 5,718,885 |
| c | ExteNet, LLC, Series 2019-1A Class A2, 3.204% due 7/26/2049 | 9,855,000 | 9,976,126 |
| c | Freed ABS Trust, Series 2019-1 Class-A, 3.42% due 6/18/2026 | 4,100,151 | 4,120,393 |
| c | Hilton Grand Vacations Trust, Series 2019-AA Class A, 2.34% due 7/25/2033 | 12,852,201 | 12,826,413 |
| c | Lendingpoint Asset Securitization Trust, Series 2019-1 Class A, 3.154% due 8/15/2025 | 16,161,137 | 16,182,339 |
| c | Meltel Land Funding, LLC, Series 2019-1A Class A, 3.768% due 4/15/2049 | 9,400,000 | 9,635,246 |
| c | NRZ Advance Receivables Trust, Series 2019-T1 Class AT1, 2.59% due 7/15/2052 | 27,675,000 | 27,802,120 |
| c | SCF Equipment Leasing, Series 2019-1A Class A1, 3.04% due 3/20/2023 | 8,053,824 | 8,084,742 |
| c | Sierra Timeshare Receivables Funding, LLC, Series 2019-1A Class A, 3.20% due 1/20/2036 | 3,630,729 | 3,730,585 |
| c | Small Business Lending Trust, Series 2019-A Class A, 2.85% due 7/15/2026 | 8,400,000 | 8,395,987 |
| | Sofi Consumer Loan Program Trust, | | |
| c | Series 2018-1 Class A2, 3.14% due 2/25/2027 | 450,000 | 452,461 |
| c | Series 2019-3 Class A, 2.90% due 5/25/2028 | 20,639,269 | 20,770,551 |
| c | SpringCastle Funding, Series 2019-AA Class A, 3.20% due 5/27/2036 | 28,656,200 | 28,939,888 |
| | Upstart Securitization Trust, | | |
| c | Series 2019-1 Class B, 4.19% due 4/20/2026 | 14,850,000 | 15,004,923 |
| c | Series 2019-2 Class A, 2.897% due 9/20/2029 | 19,974,977 | 20,029,047 |
| | | | 208,491,444 |
| | Auto Receivables — 1.8% | | |
| | American Credit Acceptance Receivables Trust, | | |
| c | Series 2016-4 Class C, 2.91% due 2/13/2023 | 453,878 | 453,902 |
| c | Series 2018-3 Class B, 3.49% due 6/13/2022 | 3,815,000 | 3,828,264 |
| c | Avis Budget Rental Car Funding AESOP, LLC, Series 2015-2A Class A, 2.63% due 12/20/2021 | 6,000,000 | 6,018,190 |
| c | CarNow Auto Receivables Trust, Series 2019-1A Class A, 2.72% due 11/15/2022 | 10,893,885 | 10,908,764 |
| c | CIG Auto Receivables Trust, Series 2017-1A Class A, 2.71% due 5/15/2023 | 1,041,738 | 1,042,163 |
| c | CPS Auto Receivables Trust, Series 2019-A Class B, 3.58% due 12/16/2024 | 11,800,000 | 11,954,496 |
| c | Enterprise Fleet Financing, LLC, Series 2017-1 Class A2, 2.13% due 7/20/2022 | 1,104,309 | 1,103,836 |
| | Foursight Capital Automobile Receivables Trust, | | |
| c | Series 2016-1 Class A2, 2.87% due 10/15/2021 | 1,838,554 | 1,839,540 |
| c | Series 2019-1 Class A2, 2.58% due 3/15/2023 | 8,900,000 | 8,912,738 |
| | GLS Auto Receivables Trust, | | |
| c | Series 2018-2A Class A, 3.25% due 4/18/2022 | 2,551,220 | 2,557,398 |
| c | Series 2018-3A Class A, 3.35% due 8/15/2022 | 4,207,289 | 4,226,611 |
| c | Series 2019-1A Class A, 3.37% due 1/17/2023 | 9,660,329 | 9,712,917 |
| b,c | Hertz Fleet Lease Funding LP, Series 2016-1 Class A1, 3.149% (LIBOR 1 Month + 1.10%) due 4/10/2030 | 1,176,707 | 1,176,857 |
| a,b,c | OSCAR US Funding Trust VII, LLC, Series 2017-2A Class A2B, 2.699% (LIBOR 1 Month + 0.65%) due 11/10/2020 | 99,891 | 99,897 |
| c | OSCAR US Funding Trust, Series 2016-2A Class A3, 2.73% due 12/15/2020 | 604,579 | 604,656 |
| a,c | Oscar US Funding XI, LLC, Series 2019-2A Class A3, 2.59% due 9/11/2023 | 14,400,000 | 14,472,997 |
| c | Skopos Auto Receivables Trust, Series 2019-1A Class A, 2.90% due 12/15/2022 | 10,250,000 | 10,255,649 |
| c | Tesla Auto Lease Trust, Series 2018-B Class A, 3.71% due 8/20/2021 | 5,390,611 | 5,473,707 |
| c | U.S. Auto Funding, LLC, Series 2019-1A Class A, 3.61% due 4/15/2022 | 7,883,419 | 7,921,357 |
| c | Veros Automobile Receivables Trust, Series 2017-1 Class A, 2.84% due 4/17/2023 | 296,032 | 296,000 |
| | | | 102,859,939 |
Schedule of Investments, Continued
Thornburg Limited Term Income Fund | September 30, 2019
| | | PRINCIPAL
AMOUNT | VALUE |
| | Other Asset Backed — 7.1% | | |
| | Appalachian Consumer Rate Relief Funding, LLC, Series 2013-1 Class A1, 2.008% due 2/1/2024 | $ 6,047,771 | $ 6,055,657 |
| c | Avant Loans Funding Trust, Series 2019-A Class A, 3.48% due 7/15/2022 | 8,432,312 | 8,469,666 |
| | AXIS Equipment Finance Receivables VI, LLC, | | |
| c | Series 2018-2A Class A2, 3.89% due 7/20/2022 | 5,242,753 | 5,289,827 |
| c | Series 2019-1A Class A2, 2.63% due 6/20/2024 | 8,400,000 | 8,429,048 |
| c,g | Bayview Opportunity Master Fund IVa Trust, Series 2017-RT1 Class A1, 3.00% due 3/28/2057 | 3,030,562 | 3,067,078 |
| c | BCC Funding XIV, LLC, Series 2018-1A Class A2, 2.96% due 6/20/2023 | 2,250,981 | 2,262,538 |
| c | BRE Grand Islander Timeshare Issuer, LLC, Series 2017-1A Class A, 2.94% due 5/25/2029 | 3,152,441 | 3,184,960 |
| | Consumer Loan Underlying Bond Credit Trust, | | |
| c | Series 2018-P2 Class A, 3.47% due 10/15/2025 | 3,978,843 | 3,999,537 |
| c | Series 2018-P3 Class A, 3.82% due 1/15/2026 | 4,289,201 | 4,331,408 |
| c | Credit Suisse ABS Trust, Series 2018-LD1 Class A, 3.42% due 7/25/2024 | 710,502 | 710,818 |
| c | Dell Equipment Finance Trust, Series 2018-1 Class A2A, 2.97% due 10/22/2020 | 3,419,916 | 3,426,365 |
| | Diamond Resorts Owner Trust, | | |
| c | Series 2018-1 Class A, 3.70% due 1/21/2031 | 8,406,360 | 8,565,772 |
| c | Series 2019-1A Class A, 2.89% due 2/20/2032 | 22,946,320 | 23,002,405 |
| a,c | ECAF I Ltd., Series 2015-1A Class A2, 4.947% due 6/15/2040 | 4,556,666 | 4,557,384 |
| | Entergy New Orleans Storm Recovery Funding I, LLC, Series 2015-1 Class A, 2.67% due 6/1/2027 | 9,153,050 | 9,264,256 |
| | Foundation Finance Trust, | | |
| c | Series 2017-1A Class A, 3.30% due 7/15/2033 | 3,607,621 | 3,627,839 |
| c | Series 2019-1A Class A, 3.86% due 11/15/2034 | 12,717,235 | 13,016,468 |
| a,c | Global SC Finance IV Ltd., Series 2017-1A Class A, 3.85% due 4/15/2037 | 6,550,638 | 6,740,291 |
| | HERO Funding Trust, | | |
| c | Series 2015-1A Class A, 3.84% due 9/21/2040 | 6,749,378 | 6,912,186 |
| c | Series 2017-2A Class A1, 3.28% due 9/20/2048 | 1,306,006 | 1,317,414 |
| | Louisiana Local Government Environmental Facilities & Community Development Authority, Series 2014-ELL Class A1, 1.66% due 2/1/2022 | 239,804 | 239,476 |
| | Nationstar HECM Loan Trust, | | |
| c,e,g | Series 2018-1A Class A, 2.76% due 2/25/2028 | 2,511,040 | 2,495,974 |
| c,g | Series 2018-2A Class A, 3.188% due 7/25/2028 | 1,924,842 | 1,930,017 |
| c,g | Series 2019-1A Class A, 2.651% due 6/25/2029 | 10,441,971 | 10,458,064 |
| b,c | Navient Private Education Loan Trust, Series 2015-AA Class A2B, 3.228% (LIBOR 1 Month + 1.20%) due 12/15/2028 | 3,717,929 | 3,750,703 |
| b | Navient Student Loan Trust, Series 2014-1 Class A3, 2.528% (LIBOR 1 Month + 0.51%) due 6/25/2031 | 8,450,616 | 8,385,692 |
| b,c | Nelnet Student Loan Trust, Series 2013-1A Class A, 2.618% (LIBOR 1 Month + 0.60%) due 6/25/2041 | 5,680,948 | 5,624,945 |
| b,c,d,e | Northwind Holdings, LLC, Series 2007-1A Class A1, 3.30% (LIBOR 3 Month + 0.78%) due 12/1/2037 | 831,250 | 819,613 |
| | Ocwen Master Advance Receivables Trust, | | |
| c | Series 2019-T1 Class AT1, 2.514% due 8/15/2050 | 10,500,000 | 10,525,977 |
| c | Series 2019-T2 Class AT2, 2.419% due 8/15/2051 | 7,900,000 | 7,919,011 |
| c | Oportun Funding VI, LLC, Series 2017-A Class A, 3.23% due 6/8/2023 | 5,500,000 | 5,506,189 |
| c | Oportun Funding VII, LLC, Series 2017-B Class A, 3.22% due 10/10/2023 | 7,500,000 | 7,557,716 |
| b,c | Pennsylvania Higher Education Assistance Agency, Series 2012-1A Class A1, 2.568% (LIBOR 1 Month + 0.55%) due 5/25/2057 | 1,499,224 | 1,495,430 |
| | PFS Financing Corp., | | |
| c | Series 2016-BA Class A, 1.87% due 10/15/2021 | 5,610,000 | 5,608,867 |
| b,c | Series 2017-BA Class A1, 2.628% (LIBOR 1 Month + 0.60%) due 7/15/2022 | 16,900,000 | 16,922,333 |
| c | Series 2017-D Class A, 2.40% due 10/17/2022 | 10,000,000 | 10,011,097 |
| c | Series 2018-B Class A, 2.89% due 2/15/2023 | 7,400,000 | 7,469,393 |
| c | Purchasing Power Funding, LLC, Series 2018-A Class A, 3.34% due 8/15/2022 | 9,400,000 | 9,428,758 |
| c,e | Scala Funding Co., LLC, Series 2016-1 Class A, 3.91% due 2/15/2021 | 2,000,000 | 1,966,000 |
| c | SCF Equipment Leasing, LLC, Series 2018-1A Class A2, 3.63% due 10/20/2024 | 5,886,060 | 5,905,308 |
| | Sierra Timeshare Receivables Funding, LLC, | | |
| c | Series 2015-1A Class A, 2.40% due 3/22/2032 | 1,168,781 | 1,167,854 |
| c | Series 2015-2A Class A, 2.43% due 6/20/2032 | 843,249 | 842,336 |
| c | Series 2015-3A Class A, 2.58% due 9/20/2032 | 2,307,153 | 2,307,198 |
| b | SLM Student Loan Trust, Series 2013-6 Class A3, 2.668% (LIBOR 1 Month + 0.65%) due 6/25/2055 | 39,387,081 | 39,234,873 |
| | Small Business Administration, | | |
| | Series 2001-20J Class 1, 5.76% due 10/1/2021 | 59,086 | 60,282 |
| | Series 2008-20D Class 1, 5.37% due 4/1/2028 | 935,960 | 997,391 |
| | Series 2009-20E Class 1, 4.43% due 5/1/2029 | 547,780 | 575,598 |
| | Series 2009-20K Class 1, 4.09% due 11/1/2029 | 3,923,213 | 4,121,191 |
| | Series 2011-20E Class 1, 3.79% due 5/1/2031 | 4,914,856 | 5,170,249 |
| | Series 2011-20F Class 1, 3.67% due 6/1/2031 | 806,991 | 853,048 |
| | Series 2011-20I Class 1, 2.85% due 9/1/2031 | 7,770,179 | 7,953,879 |
| | Series 2012-20D Class 1, 2.67% due 4/1/2032 | 6,196,579 | 6,364,769 |
Schedule of Investments, Continued
Thornburg Limited Term Income Fund | September 30, 2019
| | | PRINCIPAL
AMOUNT | VALUE |
| | Series 2012-20J Class 1, 2.18% due 10/1/2032 | $ 4,897,490 | $ 4,941,939 |
| | Series 2012-20K Class 1, 2.09% due 11/1/2032 | 3,087,565 | 3,107,813 |
| b,c | SMB Private Education Loan Trust, Series 2015-A Class A3, 3.528% (LIBOR 1 Month + 1.50%) due 2/17/2032 | 10,000,000 | 10,135,781 |
| c | Social Professional Loan Program, LLC, Series 2014-B Class A2, 2.55% due 8/27/2029 | 208,449 | 207,947 |
| c | Sofi Consumer Loan Program, LLC, Series 2017-3 Class A, 2.77% due 5/25/2026 | 1,247,521 | 1,251,103 |
| c | SoFi Professional Loan Program, LLC, Series 2017-E Class A2B, 2.72% due 11/26/2040 | 6,000,000 | 6,065,731 |
| c | Sonic Capital, LLC, Series 2016-1A Class A2, 4.472% due 5/20/2046 | 8,743,251 | 8,858,885 |
| c | Tax Ease Funding, LLC, Series 2016-1A Class A, 3.131% due 6/15/2028 | 3,914,609 | 3,909,169 |
| | Towd Point Mortgage Trust, | | |
| c,g | Series 2016-5 Class A1, 2.50% due 10/25/2056 | 7,934,601 | 7,935,395 |
| c,g | Series 2017-1 Class A1, 2.75% due 10/25/2056 | 4,428,096 | 4,450,679 |
| c,g | Series 2018-2 Class A1, 3.25% due 3/25/2058 | 9,766,259 | 9,924,473 |
| c,g | Series 2018-3 Class A1, 3.75% due 5/25/2058 | 6,563,610 | 6,801,213 |
| c,g | Series 2018-6 Class A1A, 3.75% due 3/25/2058 | 12,675,494 | 13,050,689 |
| b,c | Volvo Financial Equipment Master Owner Trust, Series 2017-A Class A, 2.528% (LIBOR 1 Month + 0.50%) due 11/15/2022 | 3,350,000 | 3,358,502 |
| c | Westgate Resorts, LLC, Series 2016-1A Class A, 3.50% due 12/20/2028 | 3,427,210 | 3,444,899 |
| | | | 407,344,366 |
| | Residential MTG Trust — 0.3% | | |
| c,g | Finance of America Structured Securities Trust, Series 2018-HB1 Class A, 3.375% due 9/25/2028 | 7,226,242 | 7,241,167 |
| | New Residential Mortgage Loan Trust, | | |
| c,g | Series 2017-6A Class A1, 4.00% due 8/27/2057 | 4,354,781 | 4,550,095 |
| c,g | Series 2018-1A Class A1A, 4.00% due 12/25/2057 | 5,136,859 | 5,355,645 |
| | | | 17,146,907 |
| | Student Loan — 1.9% | | |
| c | Commonbond Student Loan Trust, Series 18-CGS, Class A1, 3.87% due 2/25/2046 | 8,979,863 | 9,401,096 |
| | Navient Private Education Refinance Loan Trust, | | |
| c | Series 2018-CA Class A1, 3.01% due 6/16/2042 | 2,472,933 | 2,494,711 |
| b,c | Series 2019-D Class A2B, 3.078% (LIBOR 1 Month + 1.05%) due 12/15/2059 | 14,400,000 | 14,399,929 |
| b,c | Navient Student Loan Trust, Series 2016-6A Class A2, 2.768% (LIBOR 1 Month + 0.75%) due 3/25/2066 | 11,160,184 | 11,207,506 |
| | Nelnet Student Loan Trust, | | |
| b,c | Series 2015-2A Class A2, 2.618% (LIBOR 1 Month + 0.60%) due 9/25/2047 | 40,548,862 | 40,505,754 |
| b,c | Series 2016-A Class A1A, 3.768% (LIBOR 1 Month + 1.75%) due 12/26/2040 | 6,154,959 | 6,124,735 |
| | SLM Student Loan Trust, | | |
| b,c | Series 2011-A Class A3, 4.528% (LIBOR 1 Month + 2.50%) due 1/15/2043 | 6,072,111 | 6,112,760 |
| b,c | Series 2013-B Class A2B, 3.128% (LIBOR 1 Month + 1.10%) due 6/17/2030 | 18,364 | 18,367 |
| b,c | SMB Private Education Loan Trust, Series 2019-B Class A1, 2.378% (LIBOR 1 Month + 0.35%) due 7/15/2026 | 15,363,124 | 15,363,110 |
| b,c | SoFi Professional Loan Program, LLC, Series 2014-B Class A1, 3.268% (LIBOR 1 Month + 1.25%) due 8/25/2032 | 710,599 | 711,526 |
| | | | 106,339,494 |
| | Total Asset Backed Securities(Cost $875,930,610) | | 881,464,038 |
| | Corporate Bonds — 42.8% | | |
| | Automobiles & Components — 3.5% | | |
| | Automobiles — 2.8% | | |
| a,b,c | BMW Finance N.V., 2.965% (LIBOR 3 Month + 0.79%) due 8/12/2022 | 25,800,000 | 25,889,326 |
| c | BMW US Capital, LLC, 3.25% due 8/14/2020 | 3,892,200 | 3,926,996 |
| | Daimler Finance North America, LLC, | | |
| b,c | 3.058% (LIBOR 3 Month + 0.90%) due 2/15/2022 | 19,050,000 | 19,148,507 |
| c | 3.40% due 2/22/2022 | 12,000,000 | 12,276,152 |
| c | 3.75% due 11/5/2021 | 3,345,000 | 3,439,223 |
| | Harley-Davidson Financial Services, Inc., | | |
| c | 2.40% due 6/15/2020 | 9,827,000 | 9,820,992 |
| c | Series CO, 4.05% due 2/4/2022 | 7,976,000 | 8,226,297 |
| c | Hyundai Capital America, 3.95% due 2/1/2022 | 22,900,000 | 23,532,913 |
| a,c | Hyundai Capital Services, Inc., 3.75% due 3/5/2023 | 7,000,000 | 7,230,232 |
| | Nissan Motor Acceptance Corp., | | |
| b,c | 2.794% (LIBOR 3 Month + 0.69%) due 9/28/2022 | 2,453,000 | 2,448,740 |
| b,c | 2.953% (LIBOR 3 Month + 0.65%) due 7/13/2022 | 1,560,000 | 1,555,894 |
| a | Toyota Motor Corp., 2.157% due 7/2/2022 | 6,740,000 | 6,788,849 |
| b | Toyota Motor Credit Corp. MTN, 2.576% (LIBOR 3 Month + 0.40%) due 2/13/2020 | 20,090,000 | 20,088,825 |
| b | Toyota Motor Credit Corp., 2.843% (LIBOR 3 Month + 0.54%) due 1/8/2021 | 4,830,000 | 4,851,222 |
Schedule of Investments, Continued
Thornburg Limited Term Income Fund | September 30, 2019
| | | PRINCIPAL
AMOUNT | VALUE |
| | Volkswagen Group of America Finance, LLC, | | |
| c | 2.50% due 9/24/2021 | $ 5,375,000 | $ 5,388,324 |
| c | 4.00% due 11/12/2021 | 4,500,000 | 4,650,617 |
| | Construction & Engineering — 0.6% | | |
| | SBA Tower Trust, | | |
| c | 2.877% due 7/15/2046 | 9,500,000 | 9,532,090 |
| c,j | 3.156% due 10/10/2045 | 23,975,000 | 24,000,713 |
| | Trading Companies & Distributors — 0.1% | | |
| | Altitude Investments 12, LLC (Guaranty: Export-Import Bank of the United States), 2.454% due 12/9/2025 | 3,887,759 | 3,944,550 |
| a,c | Mitsubishi UFJ Lease & Finance Co. Ltd., 3.406% due 2/28/2022 | 2,800,000 | 2,854,994 |
| | | | 199,595,456 |
| | Banks — 2.3% | | |
| | Banks — 2.3% | | |
| a,b,c | ABN AMRO Bank N.V., 2.702% (LIBOR 3 Month + 0.57%) due 8/27/2021 | 6,800,000 | 6,818,836 |
| a,b | Barclays Bank plc, 2.801% (LIBOR 3 Month + 0.46%) due 1/11/2021 | 7,000,000 | 6,986,357 |
| b | Capital One NA/Mclean VA, 3.007% (LIBOR 3 Month + 0.82%) due 8/8/2022 | 28,150,000 | 28,231,360 |
| b | Citizens Bank N.A./Providence RI, 3.054% (LIBOR 3 Month + 0.95%) due 3/29/2023 | 20,500,000 | 20,622,420 |
| | First Tennessee Bank N.A., 2.95% due 12/1/2019 | 7,000,000 | 7,002,229 |
| | Goldman Sachs Bank USA, | | |
| b | 2.575% (SOFR + 0.60%) due 5/24/2021 | 2,825,000 | 2,829,621 |
| | 3.20% due 6/5/2020 | 5,000,000 | 5,038,155 |
| | Santander Holdings USA, Inc., | | |
| | 3.40% due 1/18/2023 | 7,980,000 | 8,165,887 |
| | 4.45% due 12/3/2021 | 4,940,000 | 5,159,663 |
| c | Sovereign Bank Lease Pass-Through Trust, 12.18% due 6/30/2020 | 1,586,698 | 1,682,947 |
| a,b | Sumitomo Mitsui Banking Corp. (Guaranty: Sumitomo Mitsui Banking Corp/New York), 2.61% (LIBOR 3 Month + 0.31%) due 10/18/2019 | 15,000,000 | 15,003,435 |
| a | Sumitomo Mitsui Banking Corp., 2.65% due 7/23/2020 | 10,600,000 | 10,644,759 |
| a | Svenska Handelsbanken AB, 3.90% due 11/20/2023 | 8,250,000 | 8,815,868 |
| | Zions Bancorp N.A., 3.35% due 3/4/2022 | 6,750,000 | 6,900,902 |
| | | | 133,902,439 |
| | Capital Goods — 0.5% | | |
| | Industrial Conglomerates — 0.2% | | |
| b | General Electric Co. MTN, 3.119% (LIBOR 3 Month + 1.00%) due 3/15/2023 | 2,625,000 | 2,585,092 |
| | Ingersoll-Rand Co. (Guaranty: Ingersoll-Rand plc), 6.391% due 11/15/2027 | 3,000,000 | 3,663,469 |
| a | Pentair Finance Sarl, 4.50% due 7/1/2029 | 7,930,000 | 8,226,207 |
| | Machinery — 0.3% | | |
| | Nvent Finance Sarl, | | |
| a | 3.95% due 4/15/2023 | 7,980,000 | 8,131,539 |
| a | 4.55% due 4/15/2028 | 7,023,000 | 7,334,601 |
| | | | 29,940,908 |
| | Commercial & Professional Services — 0.3% | | |
| | Commercial Services & Supplies — 0.1% | | |
| | Republic Services, Inc., 2.50% due 8/15/2024 | 6,800,000 | 6,872,227 |
| | Leisure Products — 0.2% | | |
| | Mattel, Inc., 2.35% due 8/15/2021 | 9,915,000 | 9,642,338 |
| | | | 16,514,565 |
| | Consumer Durables & Apparel — 0.9% | | |
| | Household Durables — 0.9% | | |
| a,c | Panasonic Corp., 2.536% due 7/19/2022 | 21,100,000 | 21,227,819 |
| | Tupperware Brands Corp. (Guaranty: Dart Industries, Inc.), 4.75% due 6/1/2021 | 28,411,000 | 29,046,338 |
| | | | 50,274,157 |
| | Consumer Services — 0.3% | | |
| | Transportation Infrastructure — 0.3% | | |
| a,c | Adani Ports & Special Economic Zone Ltd., 3.375% due 7/24/2024 | 13,465,000 | 13,537,772 |
| | Mexico City Airport Trust, | | |
| a,c | 3.875% due 4/30/2028 | 2,439,000 | 2,393,269 |
| a,c | 4.25% due 10/31/2026 | 1,864,000 | 1,875,650 |
Schedule of Investments, Continued
Thornburg Limited Term Income Fund | September 30, 2019
| | | PRINCIPAL
AMOUNT | VALUE |
| | | | 17,806,691 |
| | Diversified Financials — 7.7% | | |
| | Capital Markets — 1.6% | | |
| | Ares Capital Corp., 4.20% due 6/10/2024 | $ 19,930,000 | $ 20,428,355 |
| c | Ares Finance Co., LLC, 4.00% due 10/8/2024 | 5,000,000 | 4,922,910 |
| | DY8 Leasing, LLC (Guaranty: Export-Import Bank of the United States), 2.627% due 4/29/2026 | 2,882,813 | 2,944,371 |
| a | Genpact Luxembourg Sarl, 3.70% due 4/1/2022 | 12,000,000 | 12,181,839 |
| c | GTP Acquisition Partners I, LLC (Guaranty: American Tower Holding Sub II, LLC), 2.35% due 6/15/2045 | 10,000,000 | 9,995,676 |
| | Legg Mason, Inc., 4.75% due 3/15/2026 | 5,000,000 | 5,473,719 |
| | Sandalwood 2013, LLC (Guaranty: Export-Import Bank of the United States), 2.821% due 2/12/2026 | 4,068,454 | 4,179,831 |
| | Solar Capital Ltd., 4.50% due 1/20/2023 | 12,000,000 | 11,927,850 |
| a,c | SumitG Guaranteed Secured Obligation Issuer DAC, 2.251% due 11/2/2020 | 15,000,000 | 14,999,412 |
| | TPG Specialty Lending, Inc., 4.50% due 1/22/2023 | 7,480,000 | 7,681,519 |
| | Consumer Finance — 0.3% | | |
| b | Citibank N.A., 2.531% (LIBOR 3 Month + 0.35%) due 2/12/2021 | 5,750,000 | 5,756,249 |
| | Wells Fargo Bank N.A., 3.625% due 10/22/2021 | 10,000,000 | 10,289,621 |
| | Diversified Financial Services — 4.0% | | |
| | Barclays plc, | | |
| a,b | 3.548% (LIBOR 3 Month + 1.38%) due 5/16/2024 | 17,500,000 | 17,411,742 |
| a,k | 4.61% (LIBOR 3 Month + 1.40%) due 2/15/2023 | 3,000,000 | 3,115,343 |
| a,c | BNP Paribas S.A., 3.375% due 1/9/2025 | 3,000,000 | 3,097,928 |
| | Citigroup, Inc., | | |
| | 2.65% due 10/26/2020 | 4,890,000 | 4,919,941 |
| k | 3.352% (LIBOR 3 Month + 0.90%) due 4/24/2025 | 8,905,000 | 9,226,560 |
| | Credit Suisse Group Funding Guernsey Ltd. (Guaranty: Credit Suisse Group AG), | | |
| a | 3.125% due 12/10/2020 | 10,000,000 | 10,093,770 |
| a | 3.80% due 9/15/2022 | 7,000,000 | 7,279,156 |
| | Deutsche Bank AG, | | |
| a,b | 3.093% (LIBOR 3 Month + 0.82%) due 1/22/2021 | 8,650,000 | 8,566,796 |
| a,b | 3.362% (LIBOR 3 Month + 1.23%) due 2/27/2023 | 17,100,000 | 16,471,184 |
| a | 5.00% due 2/14/2022 | 6,350,000 | 6,580,359 |
| | Goldman Sachs Group, Inc., | | |
| b | 3.279% (LIBOR 3 Month + 1.02%) due 10/23/2019 | 4,517,000 | 4,519,808 |
| b | 3.319% (LIBOR 3 Month + 1.20%) due 9/15/2020 | 7,930,000 | 7,991,131 |
| b | 3.377% (LIBOR 3 Month + 1.11%) due 4/26/2022 | 10,931,000 | 11,024,843 |
| a,k | HSBC Holdings plc, 4.292% (LIBOR 3 Month + 1.35%) due 9/12/2026 | 5,000,000 | 5,361,565 |
| | JPMorgan Chase & Co., | | |
| b | 2.652% (LIBOR 3 Month + 0.55%) due 3/9/2021 | 6,440,000 | 6,447,184 |
| b | 3.618% (LIBOR 3 Month + 1.48%) due 3/1/2021 | 7,000,000 | 7,106,124 |
| a | Mitsubishi UFJ Financial Group, Inc., 2.623% due 7/18/2022 | 25,800,000 | 26,033,159 |
| a,k | Mizuho Financial Group, Inc., 3.922% (LIBOR 3 Month + 1.00%) due 9/11/2024 | 10,850,000 | 11,418,856 |
| | Morgan Stanley, | | |
| b | 2.738% (SOFR+ 0.83%) due 6/10/2022 | 4,675,000 | 4,688,456 |
| | 2.80% due 6/16/2020 | 1,350,000 | 1,356,820 |
| | Private Export Funding Corp. (Guaranty: Export-Import Bank of the United States), Series KK, 3.55% due 1/15/2024 | 10,000,000 | 10,741,919 |
| | Royal Bank of Scotland Group plc, | | |
| a,b | 3.628% (LIBOR 3 Month + 1.47%) due 5/15/2023 | 1,952,000 | 1,953,768 |
| a,k | 4.269% (LIBOR 3 Month + 1.76%) due 3/22/2025 | 10,000,000 | 10,460,114 |
| | Societe Generale S.A., | | |
| a,c | 3.875% due 3/28/2024 | 8,000,000 | 8,392,817 |
| a,c | 4.25% due 9/14/2023 | 12,000,000 | 12,732,240 |
| a,b,c | UBS AG, 2.682% (LIBOR 3 Month + 0.58%) due 6/8/2020 | 5,000,000 | 5,013,405 |
| a,b,c | UBS Group Funding Switzerland AG, 4.083% (LIBOR 3 Month + 1.78%) due 4/14/2021 | 5,800,000 | 5,921,143 |
| | Insurance — 1.4% | | |
| | AIG Global Funding, | | |
| c | 2.30% due 7/1/2022 | 5,795,000 | 5,810,569 |
| b,c | 2.565% (LIBOR 3 Month + 0.48%) due 7/2/2020 | 3,000,000 | 3,008,361 |
| b,c | 2.566% (LIBOR 3 Month + 0.46%) due 6/25/2021 | 9,910,000 | 9,939,054 |
| | ALEX Alpha, LLC (Guaranty: Export-Import Bank of the United States), 1.617% due 8/15/2024 | 2,173,913 | 2,156,792 |
| a | Gate Capital Cayman One Ltd. (Guaranty: Export-Import Bank of the United States), 1.839% due 3/27/2021 | 2,540,736 | 2,540,888 |
| c,e,i | Global Atlantic Fin Co., 4.40% due 10/15/2029 | 27,285,000 | 27,238,616 |
| | Helios Leasing I, LLC (Guaranty: Export-Import Bank of the United States), 1.562% due 9/28/2024 | 2,644,754 | 2,617,572 |
Schedule of Investments, Continued
Thornburg Limited Term Income Fund | September 30, 2019
| | | PRINCIPAL
AMOUNT | VALUE |
| c | Protective Life Global Funding, 2.615% due 8/22/2022 | $ 7,500,000 | $ 7,584,777 |
| | Santa Rosa Leasing, LLC (Guaranty: Export-Import Bank of the United States), | | |
| | 1.472% due 11/3/2024 | 7,381,405 | 7,295,888 |
| | 1.693% due 8/15/2024 | 2,604,877 | 2,588,564 |
| | Union 13 Leasing, LLC (Guaranty: Export-Import Bank of the United States), 1.682% due 12/19/2024 | 6,925,169 | 6,876,207 |
| | Mortgage Real Estate Investment Trusts — 0.4% | | |
| | Senior Housing Properties Trust, 4.75% due 2/15/2028 | 20,960,000 | 21,066,795 |
| | | | 437,431,566 |
| | Energy — 2.8% | | |
| | Energy Equipment & Services — 0.2% | | |
| c | Hanwha Energy USA Holdings Corp., 2.375% due 7/30/2022 | 5,100,000 | 5,106,842 |
| | Oceaneering International, Inc., 4.65% due 11/15/2024 | 10,000,000 | 9,400,000 |
| a,c,l,m | Schahin II Finance Co. SPV Ltd., 5.875% due 9/25/2023 | 4,082,733 | 284,648 |
| | Oil, Gas & Consumable Fuels — 2.6% | | |
| b | BP Capital Markets America, Inc., 2.814% (LIBOR 3 Month + 0.65%) due 9/19/2022 | 6,771,000 | 6,790,060 |
| | Buckeye Partners L.P., 4.15% due 7/1/2023 | 7,000,000 | 6,992,035 |
| c | Colorado Interstate Gas Co., LLC / Colorado Interstate Issuing Corp., 4.15% due 8/15/2026 | 4,253,000 | 4,468,627 |
| c | Enable Oklahoma Intrastate Transmission, LLC (Guaranty: Enable Midstream Partners L.P.), 6.25% due 3/15/2020 | 3,640,000 | 3,693,574 |
| | Energen Corp., 4.625% due 9/1/2021 | 10,000,000 | 10,287,500 |
| | EQT Midstream Partners L.P., Series 5Y, 4.75% due 7/15/2023 | 11,440,000 | 11,475,293 |
| c | Florida Gas Transmission Co., LLC, 3.875% due 7/15/2022 | 10,435,000 | 10,768,549 |
| | Gulf South Pipeline Co. L.P., 4.00% due 6/15/2022 | 13,850,000 | 14,187,411 |
| | Midwest Connector Capital Co., LLC, | | |
| c | 3.625% due 4/1/2022 | 5,520,000 | 5,662,476 |
| c | 3.90% due 4/1/2024 | 5,555,000 | 5,851,082 |
| | NuStar Logistics L.P., 4.75% due 2/1/2022 | 5,000,000 | 5,087,500 |
| | Occidental Petroleum Corp., | | |
| b | 3.437% (LIBOR 3 Month + 1.25%) due 8/13/2021 | 3,950,000 | 3,973,678 |
| b | 3.637% (LIBOR 3 Month + 1.45%) due 8/15/2022 | 11,200,000 | 11,273,920 |
| a | Petroleos Mexicanos (Guaranty: Export-Import Bank of the United States), 6.50% due 1/23/2029 | 14,980,000 | 15,233,162 |
| a,c | Sinopec Group Overseas Development 2018 Ltd., 3.75% due 9/12/2023 | 11,800,000 | 12,347,086 |
| c | Texas Gas Transmission, LLC, 4.50% due 2/1/2021 | 17,624,000 | 17,963,374 |
| | | | 160,846,817 |
| | Food & Staples Retailing — 0.3% | | |
| | Food & Staples Retailing — 0.3% | | |
| a,c | Alimentation Couche-Tard, Inc., 2.70% due 7/26/2022 | 15,850,000 | 15,956,081 |
| | | | 15,956,081 |
| | Food, Beverage & Tobacco — 1.8% | | |
| | Beverages — 0.3% | | |
| a,c | Becle SAB de CV, 3.75% due 5/13/2025 | 13,750,000 | 14,149,007 |
| | Food Products — 0.9% | | |
| | Conagra Brands, Inc., | | |
| b | 2.811% (LIBOR 3 Month + 0.50%) due 10/9/2020 | 14,850,000 | 14,848,487 |
| | 3.80% due 10/22/2021 | 6,892,000 | 7,112,931 |
| | General Mills, Inc., | | |
| b | 2.862% (LIBOR 3 Month + 0.54%) due 4/16/2021 | 3,380,000 | 3,387,674 |
| b | 3.313% (LIBOR 3 Month + 1.01%) due 10/17/2023 | 6,475,000 | 6,521,728 |
| | JM Smucker Co., 2.50% due 3/15/2020 | 10,494,000 | 10,504,039 |
| b | Kraft Heinz Foods Co. (Guaranty: Kraft Heinz Co.), 2.751% (LIBOR 3 Month + 0.57%) due 2/10/2021 | 6,693,000 | 6,678,533 |
| | Mead Johnson Nutrition Co. (Guaranty: Reckitt Benckiser Group plc), 3.00% due 11/15/2020 | 1,900,000 | 1,916,495 |
| b | Tyson Foods, Inc., 2.682% (LIBOR 3 Month + 0.55%) due 6/2/2020 | 2,850,000 | 2,851,873 |
| | Tobacco — 0.6% | | |
| | Altria Group, Inc. (Guaranty: Philip Morris USA, Inc.), 2.625% due 1/14/2020 | 5,790,000 | 5,792,210 |
| | Altria Group, Inc., 4.40% due 2/14/2026 | 3,683,000 | 3,938,411 |
| | BAT Capital Corp., | | |
| b | 2.765% (LIBOR 3 Month + 0.59%) due 8/14/2020 | 7,370,000 | 7,384,127 |
| b | 3.038% (LIBOR 3 Month + 0.88%) due 8/15/2022 | 5,000,000 | 5,028,899 |
| a,c | BAT International Finance plc, 3.95% due 6/15/2025 | 3,000,000 | 3,123,057 |
| a,c | Imperial Brands Finance plc, 3.50% due 7/26/2026 | 3,000,000 | 2,999,918 |
| | Reynolds American, Inc., 6.875% due 5/1/2020 | 5,000,000 | 5,130,807 |
Schedule of Investments, Continued
Thornburg Limited Term Income Fund | September 30, 2019
| | | PRINCIPAL
AMOUNT | VALUE |
| | | | 101,368,196 |
| | Healthcare Equipment & Services — 0.4% | | |
| | Health Care Equipment & Supplies — 0.1% | | |
| c | Alcon Finance Corp., 2.75% due 9/23/2026 | $ 4,790,000 | $ 4,829,362 |
| | Health Care Providers & Services — 0.3% | | |
| | Catholic Health Initiatives, 2.95% due 11/1/2022 | 7,000,000 | 7,125,005 |
| b | CVS Health Corp., 2.732% (LIBOR 3 Month + 0.63%) due 3/9/2020 | 778,000 | 779,536 |
| | Express Scripts Holding Co., 2.60% due 11/30/2020 | 9,750,000 | 9,792,368 |
| | | | 22,526,271 |
| | Household & Personal Products — 0.1% | | |
| | Household Products — 0.1% | | |
| a,c | Kimberly-Clark de Mexico SAB de CV, 3.80% due 4/8/2024 | 3,000,000 | 2,998,108 |
| | | | 2,998,108 |
| | Insurance — 4.2% | | |
| | Insurance — 4.2% | | |
| c | AIG Global Funding, 1.95% due 10/18/2019 | 3,000,000 | 2,999,858 |
| a,c | DaVinciRe Holdings Ltd., 4.75% due 5/1/2025 | 10,260,000 | 10,681,741 |
| | Enstar Group Ltd., | | |
| a | 4.50% due 3/10/2022 | 1,950,000 | 2,022,459 |
| a | 4.95% due 6/1/2029 | 19,899,000 | 21,008,460 |
| a | Fairfax Financial Holdings Ltd., 4.85% due 4/17/2028 | 2,034,000 | 2,200,340 |
| c | Guardian Life Global Funding, 3.40% due 4/25/2023 | 6,918,000 | 7,218,965 |
| | Horace Mann Educators Corp., 4.50% due 12/1/2025 | 4,800,000 | 5,070,377 |
| | Infinity Property & Casualty Corp., 5.00% due 9/19/2022 | 4,690,000 | 4,993,376 |
| | Jackson National Life Global Funding, | | |
| c | 2.20% due 1/30/2020 | 8,000,000 | 8,003,007 |
| b,c | 2.618% (LIBOR 3 Month + 0.48%) due 6/11/2021 | 6,150,000 | 6,164,875 |
| c | 3.25% due 1/30/2024 | 10,000,000 | 10,398,850 |
| a,c | Lancashire Holdings Ltd., 5.70% due 10/1/2022 | 11,000,000 | 11,563,816 |
| c | MassMutual Global Funding II, 2.95% due 1/11/2025 | 25,000,000 | 25,838,945 |
| | Mercury General Corp., 4.40% due 3/15/2027 | 11,000,000 | 11,561,088 |
| b,c | Metropolitan Life Global Funding, 2.39% (SOFR + 0.57%) due 9/7/2020 | 7,760,000 | 7,780,847 |
| a | Montpelier Re Holdings Ltd., 4.70% due 10/15/2022 | 5,000,000 | 5,272,733 |
| c | Pricoa Global Funding, 3.45% due 9/1/2023 | 9,850,000 | 10,325,057 |
| c | Protective Life Corp., 3.40% due 1/15/2030 | 19,740,000 | 20,068,563 |
| | Protective Life Global Funding, | | |
| b,c | 2.624% (LIBOR 3 Month + 0.52%) due 6/28/2021 | 17,000,000 | 17,072,823 |
| c | 3.104% due 4/15/2024 | 7,350,000 | 7,577,991 |
| | Reliance Standard Life Global Funding II, | | |
| c | 2.50% due 1/15/2020 | 15,000,000 | 15,011,081 |
| c | 2.625% due 7/22/2022 | 4,125,000 | 4,159,460 |
| c | 3.05% due 1/20/2021 | 4,662,000 | 4,708,792 |
| c | 3.85% due 9/19/2023 | 9,950,000 | 10,455,294 |
| c | Sammons Financial Group, Inc., 4.45% due 5/12/2027 | 7,950,000 | 8,252,247 |
| | | | 240,411,045 |
| | Materials — 1.2% | | |
| | Chemicals — 0.9% | | |
| b,c | Chevron Phillips Chemical Co., LLC / Chevron Phillips Chemical Co., L.P. 3.003% (LIBOR 3 Month + 0.75%) due 5/1/2020 | 29,900,000 | 29,969,612 |
| | DuPont de Nemours, Inc., 4.205% due 11/15/2023 | 7,900,000 | 8,465,761 |
| c | Incitec Pivot Finance, LLC (Guaranty: Incitec Pivot Ltd.), 6.00% due 12/10/2019 | 4,538,000 | 4,566,740 |
| a,c | OCP S.A., 5.625% due 4/25/2024 | 8,555,000 | 9,327,979 |
| | Metals & Mining — 0.3% | | |
| | AngloGold Ashanti Holdings plc (Guaranty: AngloGold Ashanti Ltd.), | | |
| a | 5.125% due 8/1/2022 | 6,500,000 | 6,849,700 |
| a | 5.375% due 4/15/2020 | 8,100,000 | 8,225,406 |
| | | | 67,405,198 |
| | Media & Entertainment — 0.2% | | |
Schedule of Investments, Continued
Thornburg Limited Term Income Fund | September 30, 2019
| | | PRINCIPAL
AMOUNT | VALUE |
| | Interactive Media & Services — 0.2% | | |
| a | Baidu, Inc., 3.875% due 9/29/2023 | $ 6,000,000 | $ 6,242,750 |
| a,c | Tencent Holdings Ltd., 2.985% due 1/19/2023 | 6,450,000 | 6,550,616 |
| | | | 12,793,366 |
| | Pharmaceuticals, Biotechnology & Life Sciences — 1.3% | | |
| | Biotechnology — 0.2% | | |
| | Celgene Corp., | | |
| | 2.75% due 2/15/2023 | 2,265,000 | 2,305,386 |
| | 3.25% due 2/20/2023 | 9,936,000 | 10,285,909 |
| | Pharmaceuticals — 1.1% | | |
| | AbbVie, Inc., 3.75% due 11/14/2023 | 6,820,000 | 7,172,297 |
| | Allergan Funding SCS, | | |
| a,b | 3.387% (LIBOR 3 Month + 1.26%) due 3/12/2020 | 5,000,000 | 5,019,858 |
| a | 3.45% due 3/15/2022 | 5,000,000 | 5,123,905 |
| a,b | AstraZeneca plc, 2.789% (LIBOR 3 Month + 0.67%) due 8/17/2023 | 10,524,000 | 10,471,918 |
| | Bayer US Finance II, LLC, | | |
| b,c | 2.736% (LIBOR 3 Month + 0.63%) due 6/25/2021 | 9,500,000 | 9,489,085 |
| c | 4.25% due 12/15/2025 | 2,500,000 | 2,670,889 |
| a | Shire Acquisitions Investments Ireland DAC, 2.40% due 9/23/2021 | 9,776,000 | 9,821,291 |
| | Takeda Pharmaceutical Co. Ltd., | | |
| a,c | 4.00% due 11/26/2021 | 5,500,000 | 5,692,979 |
| a,c | 4.40% due 11/26/2023 | 3,750,000 | 4,038,642 |
| | Zoetis, Inc., 3.45% due 11/13/2020 | 2,000,000 | 2,025,846 |
| | | | 74,118,005 |
| | Real Estate — 1.4% | | |
| | Equity Real Estate Investment Trusts — 1.4% | | |
| | American Tower Corp., 3.375% due 5/15/2024 | 26,600,000 | 27,647,504 |
| | Crown Castle International Corp., 3.20% due 9/1/2024 | 17,870,000 | 18,355,862 |
| c | SBA Tower Trust, 2.836% due 1/15/2025 | 12,525,000 | 12,541,085 |
| | Washington Real Estate Investment Trust, 4.95% due 10/1/2020 | 19,100,000 | 19,330,684 |
| | | | 77,875,135 |
| | Retailing — 0.4% | | |
| | Multiline Retail — 0.4% | | |
| b | Dollar Tree, Inc., 3.003% (LIBOR 3 Month + 0.70%) due 4/17/2020 | 6,185,000 | 6,186,112 |
| | Family Dollar Stores, Inc., 5.00% due 2/1/2021 | 18,475,000 | 19,050,609 |
| | | | 25,236,721 |
| | Semiconductors & Semiconductor Equipment — 0.6% | | |
| | Semiconductors & Semiconductor Equipment — 0.6% | | |
| | Broadcom Corp. / Broadcom Cayman Finance Ltd., | | |
| | 2.375% due 1/15/2020 | 8,875,000 | 8,874,438 |
| | 3.625% due 1/15/2024 | 18,000,000 | 18,406,981 |
| | Micron Technology, Inc., 4.185% due 2/15/2027 | 8,257,000 | 8,495,523 |
| | | | 35,776,942 |
| | Software & Services — 1.4% | | |
| | Information Technology Services — 0.6% | | |
| | Global Payments, Inc., 2.65% due 2/15/2025 | 11,850,000 | 11,904,860 |
| | Leidos Holdings, Inc. (Guaranty: Leidos, Inc.), 4.45% due 12/1/2020 | 2,000,000 | 2,030,000 |
| | S&P Global, Inc. (Guaranty: Standard & Poor’s Financial Services, LLC), 3.30% due 8/14/2020 | 2,450,000 | 2,473,455 |
| | Total System Services, Inc., | | |
| | 3.80% due 4/1/2021 | 3,000,000 | 3,063,038 |
| | 4.00% due 6/1/2023 | 14,735,000 | 15,467,382 |
| | Interactive Media & Services — 0.1% | | |
| a | Baidu, Inc., 4.375% due 5/14/2024 | 6,376,000 | 6,794,130 |
| | Software — 0.7% | | |
| | Autodesk, Inc., 3.125% due 6/15/2020 | 1,945,000 | 1,955,416 |
| | Broadridge Financial Solutions, Inc., 3.95% due 9/1/2020 | 8,000,000 | 8,122,393 |
| | CA, Inc., 3.60% due 8/1/2020 - 8/15/2022 | 16,905,000 | 17,090,153 |
| | CDK Global, Inc., 3.80% due 10/15/2019 | 5,000,000 | 5,000,000 |
Schedule of Investments, Continued
Thornburg Limited Term Income Fund | September 30, 2019
| | | PRINCIPAL
AMOUNT | VALUE |
| | VMware, Inc., 2.30% due 8/21/2020 | $ 7,925,000 | $ 7,929,127 |
| | | | 81,829,954 |
| | Technology Hardware & Equipment — 2.2% | | |
| | Communications Equipment — 1.1% | | |
| | Juniper Networks, Inc., 3.75% due 8/15/2029 | 10,890,000 | 10,933,335 |
| | Motorola Solutions, Inc., 4.60% due 2/23/2028 - 5/23/2029 | 25,172,000 | 27,268,499 |
| a | Telefonaktiebolaget LM Ericsson, 4.125% due 5/15/2022 | 21,215,000 | 21,848,268 |
| | Electronic Equipment, Instruments & Components — 0.8% | | |
| a | Allegion plc, 3.50% due 10/1/2029 | 5,395,000 | 5,447,844 |
| | Ingram Micro, Inc., 5.45% due 12/15/2024 | 5,596,000 | 5,797,213 |
| | PerkinElmer, Inc., 3.30% due 9/15/2029 | 11,690,000 | 11,686,103 |
| | Tech Data Corp., 4.95% due 2/15/2027 | 6,000,000 | 6,439,491 |
| | Trimble, Inc., 4.75% due 12/1/2024 | 17,000,000 | 18,246,458 |
| | Office Electronics — 0.1% | | |
| | Lexmark International, Inc., 7.125% due 3/15/2020 | 5,375,000 | 5,280,938 |
| | Technology Hardware, Storage & Peripherals — 0.2% | | |
| | Hewlett Packard Enterprise Co., 3.50% due 10/5/2021 | 9,701,000 | 9,945,123 |
| | | | 122,893,272 |
| | Telecommunication Services — 1.6% | | |
| | Diversified Telecommunication Services — 0.5% | | |
| | AT&T, Inc., | | |
| b | 3.034% (LIBOR 3 Month + 0.93%) due 6/30/2020 | 4,950,000 | 4,975,143 |
| b | 3.312% (LIBOR 3 Month + 1.18%) due 6/12/2024 | 15,975,000 | 16,267,342 |
| | 7.85% due 1/15/2022 | 3,000,000 | 3,343,527 |
| | Qwest Corp., 6.75% due 12/1/2021 | 3,000,000 | 3,242,280 |
| | Media — 0.1% | | |
| b,c | NBCUniversal Enterprise, Inc., 2.499% (LIBOR 3 Month + 0.40%) due 4/1/2021 | 7,800,000 | 7,815,405 |
| | Wireless Telecommunication Services — 1.0% | | |
| | Sprint Communications, Inc., 9.25% due 4/15/2022 | 44,854,000 | 51,974,573 |
| a | Vodafone Group plc, 4.125% due 5/30/2025 | 4,968,000 | 5,364,176 |
| | | | 92,982,446 |
| | Transportation — 0.5% | | |
| | Air Freight & Logistics — 0.1% | | |
| | TTX Co., | | |
| c | 4.15% due 1/15/2024 | 6,000,000 | 6,313,639 |
| c | 5.453% due 1/2/2022 | 1,646,055 | 1,682,713 |
| | Airlines — 0.2% | | |
| | American Airlines Pass Through Trust, Series 2013-2 Class A, 4.95% due 7/15/2024 | 3,715,630 | 3,894,723 |
| | Northwest Airlines Pass Through Trust, Series 2007-1 Class A, 7.027% due 5/1/2021 | 3,252,873 | 3,264,258 |
| | US Airways Pass Through Trust, Series 2010-1 Class A, 6.25% due 10/22/2024 | 3,632,738 | 3,950,239 |
| | Diversified Consumer Services — 0.0% | | |
| | University of Chicago, Series 12-B, 3.065% due 10/1/2024 | 863,000 | 877,624 |
| | Road & Rail — 0.2% | | |
| c | Penske Truck Leasing Co. L.P. / PTL Finance Corp., 4.125% due 8/1/2023 | 9,000,000 | 9,524,180 |
| | | | 29,507,376 |
| | Utilities — 6.9% | | |
| | Electric Utilities — 6.0% | | |
| c | Alliant Energy Finance, LLC, 3.75% due 6/15/2023 | 11,865,000 | 12,402,661 |
| | Appalachian Power Co., 3.40% due 6/1/2025 | 7,000,000 | 7,289,100 |
| | Avangrid, Inc., | | |
| | 3.15% due 12/1/2024 | 8,870,000 | 9,143,215 |
| | 3.80% due 6/1/2029 | 7,940,000 | 8,529,905 |
| | CenterPoint Energy, Inc., 3.60% due 11/1/2021 | 8,901,000 | 9,137,553 |
| b | Consolidated Edison Co. of New York, Inc., Series C, 2.506% (LIBOR 3 Month + 0.40%) due 6/25/2021 | 19,496,000 | 19,561,745 |
| | Duke Energy Florida Project Finance, LLC, Series 2018, 1.196% due 3/1/2022 | 1,543,768 | 1,537,315 |
| | Edison International, 2.40% due 9/15/2022 | 4,900,000 | 4,851,824 |
| a,c | Electricite de France S.A., 4.60% due 1/27/2020 | 5,955,000 | 6,001,944 |
| a,c | Enel Finance International N.V., 4.625% due 9/14/2025 | 25,000,000 | 27,305,632 |
Schedule of Investments, Continued
Thornburg Limited Term Income Fund | September 30, 2019
| | | PRINCIPAL
AMOUNT | VALUE |
| | Entergy Louisiana, LLC, 4.80% due 5/1/2021 | $ 4,300,000 | $ 4,426,413 |
| | Entergy Mississippi, Inc., 3.25% due 12/1/2027 | 4,727,000 | 4,903,475 |
| | Entergy Texas, Inc., 3.45% due 12/1/2027 | 12,000,000 | 12,478,698 |
| | Evergy, Inc., 2.45% due 9/15/2024 | 4,895,000 | 4,891,221 |
| | Eversource Energy, 3.80% due 12/1/2023 | 12,395,000 | 13,106,508 |
| | Exelon Corp., 2.85% due 6/15/2020 | 2,950,000 | 2,962,338 |
| | Georgia Power Co., Series A, 2.20% due 9/15/2024 | 19,650,000 | 19,439,607 |
| c | Jersey Central Power & Light Co., 4.30% due 1/15/2026 | 18,892,000 | 20,680,969 |
| c | Metropolitan Edison Co. 4.30% due 1/15/2029 | 3,970,000 | 4,478,399 |
| c | Midland Cogeneration Venture L.P., 6.00% due 3/15/2025 | 4,527,648 | 4,584,481 |
| b | Mississippi Power Co., 2.75% (LIBOR 3 Month + 0.65%) due 3/27/2020 | 7,971,000 | 7,974,048 |
| c | Monongahela Power Co., 4.10% due 4/15/2024 | 11,500,000 | 12,328,370 |
| | NextEra Energy Capital Holdings, Inc., | | |
| | 2.403% due 9/1/2021 | 24,550,000 | 24,701,470 |
| | 3.342% due 9/1/2020 | 9,742,000 | 9,851,729 |
| | Northern States Power Co., 3.30% due 6/15/2024 | 10,000,000 | 10,388,009 |
| | PNM Resources, Inc., 3.25% due 3/9/2021 | 7,784,000 | 7,857,504 |
| | Public Service Co. of New Mexico, 5.35% due 10/1/2021 | 3,000,000 | 3,142,719 |
| | San Diego Gas & Electric Co., 3.60% due 9/1/2023 | 4,212,000 | 4,417,045 |
| | SCANA Corp. MTN, 4.125% due 2/1/2022 | 3,937,000 | 4,063,657 |
| | Southern Co., 3.25% due 7/1/2026 | 8,075,000 | 8,327,491 |
| | Southern Power Co., | | |
| b,c | 2.706% (LIBOR 3 Month + 0.55%) due 12/20/2020 | 1,875,000 | 1,875,158 |
| | Series 15B, 2.375% due 6/1/2020 | 9,793,000 | 9,801,428 |
| a,c | State Grid Overseas Investment (2016) Ltd. (Guaranty: State Grid Corp. of China), 2.25% due 5/4/2020 | 10,000,000 | 9,995,900 |
| | Toledo Edison Co., 7.25% due 5/1/2020 | 167,000 | 171,201 |
| a,c | Transelec S.A., 4.25% due 1/14/2025 | 6,000,000 | 6,360,060 |
| | UIL Holdings Corp., 4.625% due 10/1/2020 | 13,335,000 | 13,601,858 |
| | WEC Energy Group, Inc., | | |
| | 3.10% due 3/8/2022 | 4,791,000 | 4,898,168 |
| | 3.375% due 6/15/2021 | 4,660,000 | 4,761,079 |
| | Gas Utilities — 0.9% | | |
| | Dominion Energy Gas Holdings, LLC, 2.80% due 11/15/2020 | 5,225,000 | 5,261,135 |
| | Dominion Gas Holdings, LLC, 2.50% due 12/15/2019 | 3,900,000 | 3,899,708 |
| c | SEMCO Energy, Inc., 5.15% due 4/21/2020 | 3,000,000 | 3,044,960 |
| | Southern Co. Gas Capital Corp., 3.50% due 9/15/2021 | 9,925,000 | 10,136,961 |
| | WGL Holdings, Inc., | | |
| b | 2.517% (LIBOR 3 Month + 0.40%) due 11/29/2019 | 13,883,000 | 13,878,517 |
| b | 2.682% (LIBOR 3 Month + 0.55%) due 3/12/2020 | 12,318,000 | 12,298,862 |
| | | | 390,750,040 |
| | Total Corporate Bonds(Cost $2,390,388,805) | | 2,440,740,755 |
| | Loan Participations — 0.3% | | |
| | Utilities — 0.3% | | |
| | Electric Utilities — 0.3% | | |
| n | Pacific Gas & Electric Co., 4.32% (LIBOR 1 Month + 2.25%) due 12/31/2020 | 14,250,000 | 14,321,250 |
| | | | 14,321,250 |
| | Total Loan Participations(Cost $14,200,218) | | 14,321,250 |
| | Municipal Bonds — 1.5% | | |
| d | Brentwood Infrastructure Financing Authority ETM, Series B, 6.16% due 10/1/2019 | 730,000 | 730,000 |
| | California School Finance Authority (LOC City National Bank), 5.041% due 7/1/2020 | 4,000,000 | 4,074,720 |
| | Colorado Educational & Cultural Facilities Authority, | | |
| | Series B Class B, | | |
| | 2.244% due 3/1/2021 | 450,000 | 452,012 |
| | 2.474% due 3/1/2022 | 600,000 | 607,194 |
| | Series B, 2.691% due 3/1/2023 | 580,000 | 593,572 |
| d | Connecticut Housing Finance Authority, Series D, 5.071% due 11/15/2019 | 285,000 | 286,094 |
| | Denver City & County School District No. 1 COP, Series B, 2.018% due 12/15/2019 | 3,000,000 | 3,000,750 |
| | Fort Collins Electric Utility Enterprise Revenue ETM, Series B-Qualified Energy, 4.92% due 12/1/2020 | 2,250,000 | 2,293,875 |
Schedule of Investments, Continued
Thornburg Limited Term Income Fund | September 30, 2019
| | | PRINCIPAL
AMOUNT | VALUE |
| | Los Angeles County Public Works Financing Authority, 5.591% due 8/1/2020 | $ 3,350,000 | $ 3,443,867 |
| | Municipal Improvement Corp. of Los Angeles (Build America-BDS-Recovery Zone), Series B, 6.165% due 11/1/2020 | 11,885,000 | 12,180,936 |
| | New York City Transitional Finance Authority Future Tax Secured Revenue (Build America Bonds), 4.075% due 11/1/2020 | 2,500,000 | 2,553,875 |
| | New York State Urban Development Corp., Series D-1, 2.55% due 3/15/2022 | 29,675,000 | 30,149,206 |
| d | Oklahoma Development Finance Authority, 8.00% due 5/1/2020 | 410,000 | 414,912 |
| | Orleans Parish Parishwide School District (Insured AGM) GO, Series B, 4.40% due 2/1/2021 | 10,000,000 | 10,306,500 |
| d | Redlands Redevelopment Agency Successor Agency (Insured AMBAC) ETM, Series A, 5.818% due 8/1/2022 | 810,000 | 868,118 |
| | Rutgers The State University of New Jersey, Series K, 3.028% due 5/1/2021 | 1,500,000 | 1,520,100 |
| | San Bernardino County Redevelopment Agency Successor Agency, Series A, 7.135% due 9/1/2020 | 290,000 | 301,443 |
| | State of Connecticut GO, | | |
| | Series A, | | |
| | 3.471% due 9/15/2022 | 4,695,000 | 4,870,969 |
| | 4.00% due 9/15/2021 | 3,980,000 | 4,119,300 |
| | Tampa-Hillsborough County Expressway Authority, Series C, 2.84% due 7/1/2020 | 1,750,000 | 1,754,900 |
| | Wallenpaupack Area School District (State Aid Withholding) GO, Series B, 4.00% due 9/1/2020 | 2,750,000 | 2,798,978 |
| | Total Municipal Bonds(Cost $85,608,685) | | 87,321,321 |
| | Short-Term Investments — 8.4% | | |
| c | Automatic Data Processing, Inc., 1.96% due 10/2/2019 | 27,000,000 | 26,998,530 |
| | Bank of New York Tri-Party Repurchase Agreement 2.02% dated 9/30/2019 due 10/1/2019, repurchase price $120,006,733 collateralized by 47 corporate debt securities and 2 U.S. Government debt securities, having an average coupon of 3.68%, a minimum credit rating of BBB-, maturity dates from 10/1/2019 to 8/1/2059, and having an aggregate market value of $128,109,793 at 9/30/2019 | 120,000,000 | 120,000,000 |
| c | Berkshire Hathway Energy Co., 2.15% due 10/2/2019 | 7,000,000 | 6,999,582 |
| c | Chevron Corp., 1.98% due 10/9/2019 | 8,179,000 | 8,175,401 |
| c | Cintas Executive, 2.10% due 10/1/2019 | 27,000,000 | 27,000,000 |
| c | Consolidated Ed Co., 2.15% due 10/7/2019 | 5,000,000 | 4,998,208 |
| a,c | Electricite de France S.A., 2.22% due 10/7/2019 | 27,000,000 | 26,990,010 |
| | Experian Finance plc, | | |
| a,c | 2.10% due 10/1/2019 | 5,000,000 | 5,000,000 |
| a,c | 2.24% due 10/3/2019 | 625,000 | 624,922 |
| | Federal Home Loan Bank Discount Notes, | | |
| | 1.72% due 10/3/2019 | 2,650,000 | 2,649,747 |
| | 1.80% due 10/4/2019 | 14,800,000 | 14,797,780 |
| c | Intercontinental Exchange, Inc., 2.04% due 10/4/2019 | 2,775,000 | 2,774,528 |
| | Louisville Gas & Electric Co., | | |
| c | 2.10% due 10/1/2019 | 8,000,000 | 8,000,000 |
| c | 2.18% due 10/8/2019 | 5,000,000 | 4,997,881 |
| c | Nike, Inc., 1.95% due 10/10/2019 | 27,000,000 | 26,986,837 |
| | Northern Il Gas Corp., 1.94% due 10/2/2019 | 27,000,000 | 26,998,545 |
| c | Novartis Finance Corp., 1.95% due 10/8/2019 | 10,000,000 | 9,996,208 |
| c | ONE Gas, Inc., 2.02% due 10/1/2019 | 27,000,000 | 27,000,000 |
| c | Roche Holding, Inc., 1.86% due 10/4/2019 | 27,000,000 | 26,995,815 |
| | Southern Co. Gas Capital Corp., | | |
| c | 1.96% due 10/1/2019 | 7,000,000 | 7,000,000 |
| c | 2.00% due 10/3/2019 | 20,000,000 | 19,997,778 |
| a,c | Total Fina Elf Holdings USA, Inc., 1.80% due 10/1/2019 | 11,017,000 | 11,017,000 |
| c | Unilever Capital Corp., 1.89% due 10/1/2019 | 16,000,000 | 16,000,000 |
| | United Parcel Service, Inc., | | |
| c | 1.65% due 10/3/2019 | 2,000,000 | 1,999,817 |
| c | 1.75% due 10/1/2019 | 25,000,000 | 25,000,000 |
| | Wisconsin Public Service Corp., 2.00% due 10/1/2019 | 18,500,000 | 18,500,000 |
| | Total Short-Term Investments(Cost $477,498,590) | | 477,498,589 |
| | Total Investments — 100.3%(Cost $5,626,130,364) | | $5,715,741,117 |
| | Liabilities Net of Other Assets — (0.3)% | | (19,095,398) |
| | Net Assets — 100.0% | | $5,696,645,719 |
| Footnote Legend |
| a | Yankee bond denominated in U.S. dollars and is issued in the U.S. by foreign banks and corporations. |
| b | Floating Rate Security. Stated interest/floor rate was in effect at September 30, 2019. |
Schedule of Investments, Continued
Thornburg Limited Term Income Fund | September 30, 2019
| c | Securities exempt from registration under Rule 144A of the Securities Act of 1933, as amended. These securities are restricted and may only be resold in the ordinary course of business in transactions exempt from registration, normally to qualified institutional buyers. As of September 30, 2019, the aggregate value of these securities in the Fund’s portfolio was $2,360,181,578, representing 41.43% of the Fund’s net assets. |
| d | Illiquid security. |
| e | Security currently fair valued by the Valuation and Pricing Committee using procedures approved by the Trustees’ Audit Committee. |
| f | Coupon rate adjusts periodically based upon a predetermined schedule. Stated interest rate in effect at September 30, 2019. |
| g | Variable rate coupon, rate shown as of September 30, 2019. |
| h | Interest Only. |
| i | When-issued security. |
| j | Segregated as collateral for a when-issued security. |
| k | Fixed to floating security that initially pays a fixed rate and converts to a floating rate coupon at a specified date in the future. The rate presented is a fixed rate. |
| l | Bond in default. |
| m | Non-income producing. |
| n | The stated coupon rate represents the greater of the LIBOR or the LIBOR floor rate plus a spread at September 30, 2019. |
Portfolio Abbreviations
To simplify the listings of securities, abbreviations are used per the table below:
| AGM | Insured by Assured Guaranty Municipal Corp. |
| AMBAC | Insured by American Municipal Bond Assurance Corp. |
| CMO | Collateralized Mortgage Obligation |
| COP | Certificates of Participation |
| ETM | Escrowed to Maturity |
| FDIC | Federal Deposit Insurance Corporation |
| GO | General Obligation |
| H15T1Y | US Treasury Yield Curve Rate T-Note Constant Maturity 1 Year |
| IO | Interest Only Security |
| LIBOR | London Interbank Offered Rates |
| LOC | Letter of Credit |
| Mtg | Mortgage |
| MTN | Medium-Term Note |
| REMIC | Real Estate Mortgage Investment Conduit |
| SBA | Small Business Administration |
| SOFR | Secured Overnight Financing Rate |
| SPV | Special Purpose Vehicle |
| VA | Veterans Affairs |
See notes to financial statements.
Fund Summary
Thornburg Low Duration Income Fund | September 30, 2019 (Unaudited)
OBJECTIVES AND STRATEGIES
The Fund’s objective is to seek current income, consistent with preservation of capital.
The Fund invests in debt obligations issued by the U.S. Government, its agencies, or its instrumentalities, and in debt obligations rated at the time of purchase in one of the four highest credit ratings categories or, if no credit rating is available, judged to be of comparable quality by the Fund’s advisor. The Fund aims to reduce changes in its share value compared to longer duration fixed income portfolios by maintaining a laddered portfolio of investments with a dollar-weighted average duration of normally no more than three years.
LONG-TERM STABILITY OF PRINCIPAL
Net Asset Value History of A Shares
| KEY PORTFOLIO ATTRIBUTES | |
| Number of Bonds | 260 |
| Effective Duration | 1.2 Yrs |
| Average Maturity | 1.6 Yrs |
SECURITY CREDIT RATINGS
A bond credit rating assesses the financial ability of a debt issuer to make timely payments of principal and interest. Ratings of AAA (the highest), AA, A, and BBB are investment-grade quality. Ratings of BB, B, CCC, CC, C and D (the lowest) are considered below investment grade, speculative grade, or junk bonds.
PORTFOLIO LADDER
Percent of portfolio maturing in each year. Cash includes cash equivalents and other.
There is no guarantee that the Fund will meet its investment objectives.
All data is subject to change. Charts may not add up to 100% due to rounding.
Schedule of Investments
Thornburg Low Duration Income Fund | September 30, 2019
| | | PRINCIPAL
AMOUNT | VALUE |
| | U.S. Treasury Securities — 10.6% | | |
| | United States Treasury Notes Inflationary Index, 0.125% due 4/15/2022 | $ 316,482 | $ 313,156 |
| | United States Treasury Notes, | | |
| | 1.25% due 10/31/2019 | 1,300,000 | 1,299,264 |
| | 1.375% due 3/31/2020 - 8/31/2020 | 797,000 | 794,684 |
| | 1.625% due 12/31/2019 | 500,000 | 499,565 |
| | 2.375% due 4/30/2020 | 588,000 | 589,648 |
| | Total U.S. Treasury Securities(Cost $3,492,094) | | 3,496,317 |
| | U.S. Government Agencies — 3.5% | | |
| a | Durrah MSN 35603 (Guaranty: Export-Import Bank of the United States), 1.684% due 1/22/2025 | 384,541 | 383,096 |
| | Export Leasing (2009), LLC (Guaranty: Export-Import Bank of the United States), 1.859% due 8/28/2021 | 26,001 | 26,012 |
| a | MSN 41079 and 41084 Ltd. (Guaranty: Export-Import Bank of the United States), 1.717% due 7/13/2024 | 399,350 | 397,836 |
| | Petroleos Mexicanos (Guaranty: Export-Import Bank of the United States), | | |
| a | 1.70% due 12/20/2022 | 35,000 | 34,832 |
| a,b | 2.653% (LIBOR 3 Month + 0.35%) due 4/15/2025 | 57,500 | 57,677 |
| a | Reliance Industries Ltd. (Guaranty: Export-Import Bank of the United States), 1.87% due 1/15/2026 | 153,947 | 153,823 |
| a,b | Washington Aircraft 2 Co. Ltd. (Guaranty: Export-Import Bank of the United States), 2.543% (LIBOR 3 Month + 0.43%) due 6/26/2024 | 106,391 | 106,473 |
| | Total U.S. Government Agencies(Cost $1,139,814) | | 1,159,749 |
| | Mortgage Backed — 13.6% | | |
| c,d | Angel Oak Mortgage Trust LLC, Whole Loan Securities Trust CMO, Series 2017-1 Class A3, 3.644% due 1/25/2047 | 28,524 | 28,551 |
| | Angel Oak Mortgage Trust, LLC, Whole Loan Securities Trust CMO, | | |
| c,d | Series 2017-1 Class A2, 3.085% due 1/25/2047 | 14,856 | 14,832 |
| c,d | Series 2017-3 Class A1, 2.708% due 11/25/2047 | 16,092 | 15,894 |
| c,d | Series 2018-1 Class A1, 3.258% due 4/27/2048 | 36,471 | 36,929 |
| c,d | Series 2018-2 Class A1, 3.674% due 7/27/2048 | 63,671 | 64,915 |
| | Arroyo Mortgage Trust, Whole Loan Securities Trust CMO, | | |
| c,d | Series 2018-1 Class A1, 3.763% due 4/25/2048 | 72,738 | 74,011 |
| c,d | Series 2019-3 Class A1, 2.962% due 10/25/2048 | 95,534 | 95,053 |
| c | Barclays Commercial Mortgage Securities, LLC, Series 2015-STP Class A, 3.323% due 9/10/2028 | 54,876 | 55,316 |
| c | Bravo Residential Funding Trust, Whole Loan Securities Trust CMO, Series 2019-1 Class A1C, 3.50% due 3/25/2058 | 91,141 | 91,831 |
| | COMM Mortgage Trust, Series 2016-DC2 Class A1, 1.82% due 2/10/2049 | 46,515 | 46,390 |
| c,d | Credit Suisse Mortgage Trust, Whole Loan Securities Trust CMO, Series 2017-HL2 Class A3, 3.50% due 10/25/2047 | 125,436 | 127,472 |
| b,c | DBUBS Mortgage Trust, Series 2011-LC2A Class A1FL, 3.389% (LIBOR 1 Month + 1.35%) due 7/12/2044 | 14,919 | 14,975 |
| | Federal Home Loan Mtg Corp., | | |
| | Pool G15523, 2.50% due 8/1/2025 | 73,534 | 74,359 |
| | Series K716 Class A1, 2.413% due 1/25/2021 | 26,869 | 26,887 |
| | Federal Home Loan Mtg Corp., Multi-Family Structured Pass Through, | | |
| | Series K030 Class A1, 2.779% due 9/25/2022 | 60,481 | 61,097 |
| | Series K036 Class A1, 2.777% due 4/25/2023 | 130,377 | 132,299 |
| | Series K717 Class A2, 2.991% due 9/25/2021 | 100,000 | 101,275 |
| d | Federal Home Loan Mtg Corp., Seasoned Credit Risk Transfer Whole Loan Securities CMO, Series 2018-2 Class HA, 3.00% due 11/25/2057 | 172,024 | 176,451 |
| | Federal Home Loan Mtg Corp., Seasoned Credit Risk Transfer Whole Loan Securities Trust CMO, Series 2018-4 Class HA, 3.00% due 3/25/2058 | 276,260 | 283,009 |
| | Federal Home Loan Mtg Corp., Seasoned Credit Risk Transfer, Whole Loan Securities Trust CMO, | | |
| e | Series 2017-3 Class HA, 3.00% due 7/25/2056 | 60,359 | 62,488 |
| e | Series 2018-1 Class HA, 2.75% due 5/25/2057 | 41,770 | 42,820 |
| | Series 2018-3 Class HA, 3.00% due 8/25/2057 | 87,755 | 90,084 |
| | Series 2019-1 Class MA, 3.50% due 7/25/2058 | 46,626 | 48,814 |
| | Series 2019-2 Class MA, 3.50% due 8/25/2058 | 143,417 | 150,243 |
| | Federal Home Loan Mtg Corp., Whole Loan Securities Trust CMO, Series 2017-SC02 Class 2A1, 3.50% due 5/25/2047 | 26,667 | 26,958 |
| | Federal National Mtg Assoc., | | |
| | Pool AL9445, 3.00% due 7/1/2031 | 93,651 | 96,643 |
| | Pool AS3705, 2.50% due 11/1/2024 | 41,049 | 41,487 |
| | Pool AS8538, 2.50% due 12/1/2026 | 174,816 | 176,793 |
| | Pool FM1126, 3.00% due 3/1/2033 | 61,465 | 63,257 |
| | Pool MA3557, 4.00% due 1/1/2029 | 166,147 | 173,652 |
| c,d | Flagstar Mortgage Trust, Whole Loan Securities Trust CMO, Series 2017-1 Class 2A2, 3.00% due 3/25/2047 | 68,358 | 68,696 |
| c,d | FWD Securitization Trust, Whole Loan Securities Trust CMO, Series 2019-INV1 Class A1, 2.81% due 6/25/2049 | 95,663 | 96,083 |
| c,e | GCAT 2019-NQM1 LLC, Whole Loan Securities Trust CMO, Series 2019-NQM1 Class A1, 2.985% due 2/25/2059 | 93,812 | 94,852 |
| c,e | GCAT Trust Whole Loan Securities Trust, Whole Loan Securities Trust CMO, Series 2019-NQM2 Class A1, 2.855% due 9/25/2059 | 100,000 | 99,991 |
Schedule of Investments, Continued
Thornburg Low Duration Income Fund | September 30, 2019
| | | PRINCIPAL
AMOUNT | VALUE |
| | Homeward Opportunities Fund I Trust, Whole Loan Securities Trust CMO, | | |
| c,d | Series 2018-1 Class A1, 3.766% due 6/25/2048 | $ 69,106 | $ 71,120 |
| c,d | Series 2019-1 Class A1, 3.454% due 1/25/2059 | 84,199 | 85,387 |
| | JPMorgan Mortgage Trust, Whole Loan Securities Trust CMO, | | |
| c,d | Series 2017-2 Class A6, 3.00% due 5/25/2047 | 34,829 | 35,047 |
| c,d | Series 2017-6 Class A5, 3.50% due 12/25/2048 | 77,119 | 78,405 |
| c,d | Series 2018-6 Class 1A4, 3.50% due 12/25/2048 | 131,912 | 132,993 |
| c,d | Metlife Securitization Trust, Whole Loan Securities Trust CMO, Series 2019-1A Class A1A, 3.75% due 4/25/2058 | 277,033 | 287,977 |
| c,d | New Residential Mortgage Loan Trust Whole Loan Securities Trust CMO, Series 2017-2A Class A3, 4.00% due 3/25/2057 | 239,168 | 251,213 |
| | New Residential Mortgage Loan Trust, Whole Loan Securities Trust CMO, | | |
| b,c | Series 2017-5A Class A1, 3.518% (LIBOR 1 Month + 1.50%) due 6/25/2057 | 52,023 | 52,845 |
| c,d | Series 2018-NQM1 Class A1, 3.986% due 11/25/2048 | 77,642 | 80,350 |
| c,d | Series 2018-RPL1 Class A1, 3.50% due 12/25/2057 | 84,945 | 88,539 |
| | Verus Securitization Trust, Whole Loan Securities Trust CMO, | | |
| c,d | Series 2018-2 Class A1, 3.677% due 6/1/2058 | 61,623 | 63,111 |
| c,d | Series 2018-3 Class A1, 4.108% due 10/25/2058 | 216,436 | 222,703 |
| c,e | Series 2019-3 Class A1, 2.784% due 7/25/2059 | 145,982 | 146,302 |
| c,d | WinWater Mortgage Loan Trust Whole Loan Securities Trust CMO, Series 2014-3 Class A7, 3.00% due 11/20/2044 | 218 | 217 |
| | Total Mortgage Backed(Cost $4,367,608) | | 4,450,616 |
| | Asset Backed Securities — 23.2% | | |
| | Advance Receivables — 0.5% | | |
| c | SPS Servicer Advance Receivables Trust Advance Receivables Backed Notes, Series 2018-T1 Class A, 3.62% due 10/17/2050 | 160,000 | 162,204 |
| | | | 162,204 |
| | Asset-Backed - Finance & Insurance — 6.7% | | |
| c | Aqua Finance Trust, Series 2019-A Class A, 3.14% due 7/16/2040 | 100,000 | 100,129 |
| c | Ascentium Equipment Receivables Trust, Series 2018-2A Class A2, 3.27% due 10/12/2021 | 80,946 | 81,573 |
| c | CCG Receivables Trust, Series 2017-1 Class A2, 1.84% due 11/14/2023 | 28,827 | 28,786 |
| c | Conn’s Receivables Funding LLC, Series 2019-A Class A, 3.40% due 10/16/2023 | 57,535 | 57,767 |
| c | Freed ABS Trust, Series 2019-1 Class-A, 3.42% due 6/18/2026 | 70,692 | 71,041 |
| c | Hilton Grand Vacations Trust, Series 2019-AA Class A, 2.34% due 7/25/2033 | 148,295 | 147,997 |
| c | Lendingpoint Asset Securitization Trust, Series 2019-1 Class A, 3.154% due 8/15/2025 | 99,148 | 99,278 |
| c | NRZ Advance Receivables Trust, Series 2019-T1 Class AT1, 2.59% due 7/15/2052 | 150,000 | 150,689 |
| c | PFS Financing Corp., Series 2018-F Class A, 3.52% due 10/15/2023 | 100,000 | 101,522 |
| c | Prosper Marketplace Issuance Trust, Series 2019-2A Class A, 3.20% due 9/15/2025 | 74,110 | 74,285 |
| c | Regional Management Issuance Trust, Series 2018-1 Class A, 3.83% due 7/15/2027 | 100,000 | 100,586 |
| c | SCF Equipment Leasing, Series 2019-1A Class A1, 3.04% due 3/20/2023 | 272,515 | 273,561 |
| c | Small Business Lending Trust, Series 2019-A Class A, 2.85% due 7/15/2026 | 100,000 | 99,952 |
| c | SpringCastle Funding, Series 2019-AA Class A, 3.20% due 5/27/2036 | 99,626 | 100,613 |
| c | Upgrade Receivables Trust, Series 2018-1A Class A, 3.76% due 11/15/2024 | 76,445 | 76,685 |
| | Upstart Securitization Trust, | | |
| c | Series 2018-2 Class B, 4.445% due 12/22/2025 | 150,000 | 150,936 |
| c | Series 2019-1 Class B, 4.19% due 4/20/2026 | 300,000 | 303,130 |
| c | Series 2019-2 Class A, 2.897% due 9/20/2029 | 192,067 | 192,587 |
| | | | 2,211,117 |
| | Auto Receivables — 3.3% | | |
| c | American Credit Acceptance Receivables Trust, Series 2018-3 Class B, 3.49% due 6/13/2022 | 125,000 | 125,435 |
| | CarNow Auto Receivables Trust, | | |
| c | Series 2017-1A Class B, 4.35% due 9/15/2022 | 100,000 | 100,858 |
| c | Series 2019-1A Class A, 2.72% due 11/15/2022 | 91,010 | 91,134 |
| c | CIG Auto Receivables Trust, Series 2017-1A Class A, 2.71% due 5/15/2023 | 15,948 | 15,955 |
| c | CPS Auto Receivables Trust, Series 2019-A Class B, 3.58% due 12/16/2024 | 100,000 | 101,309 |
| | Foursight Capital Automobile Receivables Trust, | | |
| c | Series 2016-1 Class A2, 2.87% due 10/15/2021 | 8,434 | 8,438 |
| c | Series 2019-1 Class A2, 2.58% due 3/15/2023 | 100,000 | 100,143 |
| | GLS Auto Receivables Trust, | | |
| c | Series 2018-2A Class A, 3.25% due 4/18/2022 | 14,285 | 14,319 |
| c | Series 2018-3A Class A, 3.35% due 8/15/2022 | 45,981 | 46,193 |
| c | Series 2019-1A Class A, 3.37% due 1/17/2023 | 33,519 | 33,702 |
| b,c | Hertz Fleet Lease Funding LP, Series 2016-1 Class A1, 3.149% (LIBOR 1 Month + 1.10%) due 4/10/2030 | 11,886 | 11,887 |
Schedule of Investments, Continued
Thornburg Low Duration Income Fund | September 30, 2019
| | | PRINCIPAL
AMOUNT | VALUE |
| | OSCAR US Funding Trust, | | |
| c | Series 2016-2A Class A3, 2.73% due 12/15/2020 | $ 5,696 | $ 5,697 |
| a,c | Series 2018-1A Class A3, 3.23% due 5/10/2022 | 180,000 | 181,870 |
| a,c | Oscar US Funding XI, LLC, Series 2019-2A Class A3, 2.59% due 9/11/2023 | 100,000 | 100,507 |
| c | Skopos Auto Receivables Trust, Series 2018-1A Class A, 3.19% due 9/15/2021 | 13,732 | 13,738 |
| c | U.S. Auto Funding, LLC, Series 2019-1A Class A, 3.61% due 4/15/2022 | 73,905 | 74,260 |
| c | Veros Automobile Receivables Trust, Series 2018-1 Class A, 3.63% due 5/15/2023 | 53,926 | 54,091 |
| | | | 1,079,536 |
| | Credit Card — 0.3% | | |
| c | Genesis Sales Finance Master Trust, Series 2019-AA Class A, 4.68% due 8/20/2023 | 100,000 | 101,944 |
| | | | 101,944 |
| | Other Asset Backed — 9.6% | | |
| c | Avant Loans Funding Trust, Series 2019-A Class A, 3.48% due 7/15/2022 | 90,670 | 91,072 |
| | AXIS Equipment Finance Receivables VI, LLC, | | |
| c | Series 2018-2A Class A2, 3.89% due 7/20/2022 | 149,793 | 151,138 |
| c | Series 2019-1A Class A2, 2.63% due 6/20/2024 | 100,000 | 100,346 |
| c,d | Bayview Opportunity Master Fund Series 2017-RT3 Class A, 3.50% due 1/28/2058 | 65,312 | 66,514 |
| c,d | Bayview Opportunity Master Fund IVa Trust, Series 2017-RT1 Class A1, 3.00% due 3/28/2057 | 107,447 | 108,742 |
| c | BCC Funding XIV, LLC, Series 2018-1A Class A2, 2.96% due 6/20/2023 | 56,275 | 56,563 |
| c | BRE Grand Islander Timeshare Issuer, LLC, Series 2017-1A Class A, 2.94% due 5/25/2029 | 49,257 | 49,765 |
| | Consumer Loan Underlying Bond Credit Trust, | | |
| c | Series 2018-P2 Class A, 3.47% due 10/15/2025 | 46,536 | 46,778 |
| c | Series 2018-P3 Class A, 3.82% due 1/15/2026 | 57,151 | 57,714 |
| c | Series 2019-A Class A, 3.52% due 4/15/2026 | 78,091 | 78,557 |
| c | Dell Equipment Finance Trust, Series 2018-1 Class A2A, 2.97% due 10/22/2020 | 46,215 | 46,302 |
| c | Diamond Resorts Owner Trust, Series 2019-1A Class A, 2.89% due 2/20/2032 | 196,964 | 197,445 |
| | Foundation Finance Trust, | | |
| c | Series 2017-1A Class A, 3.30% due 7/15/2033 | 45,095 | 45,348 |
| c | Series 2019-1A Class A, 3.86% due 11/15/2034 | 125,499 | 128,452 |
| | Louisiana Local Government Environmental Facilities & Community Development Authority, Series 2014-ELL Class A1, 1.66% due 2/1/2022 | 2,872 | 2,868 |
| | MVW Owner Trust, Series 2013-1X Class A, 2.15% due 4/22/2030 | 11,341 | 11,318 |
| | Nationstar HECM Loan Trust, | | |
| c,d | Series 2018-2A Class A, 3.188% due 7/25/2028 | 24,365 | 24,431 |
| c,d | Series 2019-1A Class A, 2.651% due 6/25/2029 | 97,589 | 97,739 |
| c | Ocwen Master Advance Receivables Trust, Series 2019-T1 Class AT1, 2.514% due 8/15/2050 | 150,000 | 150,371 |
| b,c | Pennsylvania Higher Education Assistance Agency, Series 2012-1A Class A1, 2.568% (LIBOR 1 Month + 0.55%) due 5/25/2057 | 27,259 | 27,190 |
| | PFS Financing Corp., | | |
| c | Series 2016-BA Class A, 1.87% due 10/15/2021 | 260,000 | 259,947 |
| c | Series 2018-B Class A, 2.89% due 2/15/2023 | 100,000 | 100,938 |
| | PSNH Funding, LLC 3, Series 2018-1 Class A1, 3.094% due 2/1/2026 | 77,816 | 79,702 |
| c | Purchasing Power Funding, LLC, Series 2018-A Class A, 3.34% due 8/15/2022 | 100,000 | 100,306 |
| | SCF Equipment Leasing, LLC, | | |
| c | Series 2017-2A Class A, 3.41% due 12/20/2023 | 75,662 | 76,552 |
| c | Series 2018-1A Class A2, 3.63% due 10/20/2024 | 59,455 | 59,649 |
| | Sierra Timeshare Receivables Funding, LLC, | | |
| c | Series 2015-1A Class A, 2.40% due 3/22/2032 | 33,245 | 33,219 |
| c | Series 2015-2A Class A, 2.43% due 6/20/2032 | 36,139 | 36,100 |
| c | Series 2015-3A Class A, 2.58% due 9/20/2032 | 14,510 | 14,511 |
| b | SLM Student Loan Trust, Series 2013-6 Class A3, 2.668% (LIBOR 1 Month + 0.65%) due 6/25/2055 | 232,425 | 231,527 |
| | Small Business Administration Participation Certificates, Series 2005-20K Class 1, 5.36% due 11/1/2025 | 16,917 | 17,675 |
| | Small Business Administration, Series 2009-20E Class 1, 4.43% due 5/1/2029 | 54,778 | 57,560 |
| c | Social Professional Loan Program, LLC, Series 2014-B Class A2, 2.55% due 8/27/2029 | 8,685 | 8,664 |
| c | Tax Ease Funding, LLC, Series 2016-1A Class A, 3.131% due 6/15/2028 | 45,696 | 45,632 |
| | Towd Point Mortgage Trust, | | |
| c,d | Series 2016-5 Class A1, 2.50% due 10/25/2056 | 53,252 | 53,258 |
| c,d | Series 2018-2 Class A1, 3.25% due 3/25/2058 | 79,400 | 80,687 |
| c,d | Series 2018-6 Class A1A, 3.75% due 3/25/2058 | 258,684 | 266,340 |
| b,c | Volvo Financial Equipment Master Owner Trust, Series 2017-A Class A, 2.528% (LIBOR 1 Month + 0.50%) due 11/15/2022 | 100,000 | 100,254 |
| | | | 3,161,174 |
| | Residential MTG Trust — 0.2% | | |
| c,d | Finance of America Structured Securities Trust, Series 2018-HB1 Class A, 3.375% due 9/25/2028 | 41,770 | 41,856 |
Schedule of Investments, Continued
Thornburg Low Duration Income Fund | September 30, 2019
| | | PRINCIPAL
AMOUNT | VALUE |
| | | | 41,856 |
| | Student Loan — 2.6% | | |
| | Navient Student Loan Trust, | | |
| b,c | Series 2016-6A Class A2, 2.768% (LIBOR 1 Month + 0.75%) due 3/25/2066 | $ 80,289 | $ 80,630 |
| c | Series 2018-EA Class A1, 3.43% due 12/15/2059 | 129,515 | 130,958 |
| b,c | Series 2019-D Class A1, 2.428% (LIBOR 1 Month + 0.40%) due 12/15/2059 | 204,335 | 204,339 |
| | Nelnet Student Loan Trust, | | |
| b,c | Series 2012-2A Class A, 2.818% (LIBOR 1 Month + 0.80%) due 12/26/2033 | 148,285 | 148,209 |
| b,c | Series 2016-A Class A1A, 3.768% (LIBOR 1 Month + 1.75%) due 12/26/2040 | 51,486 | 51,233 |
| | SLM Student Loan Trust, | | |
| b,c | Series 2011-A Class A3, 4.528% (LIBOR 1 Month + 2.50%) due 1/15/2043 | 44,484 | 44,782 |
| b | Series 2013-4 Class A, 2.568% (LIBOR 1 Month + 0.55%) due 6/25/2043 | 37,308 | 37,026 |
| b,c | Series 2013-B Class A2B, 3.128% (LIBOR 1 Month + 1.10%) due 6/17/2030 | 3,673 | 3,673 |
| b,c | SMB Private Education Loan Trust, Series 2019-B Class A1, 2.378% (LIBOR 1 Month + 0.35%) due 7/15/2026 | 90,250 | 90,251 |
| c | Sofi Professional Loan Program, LLC, Series 2016-B Class A2B, 2.74% due 10/25/2032 | 65,186 | 65,734 |
| | | | 856,835 |
| | Total Asset Backed Securities(Cost $7,563,683) | | 7,614,666 |
| | Corporate Bonds — 34.4% | | |
| | Automobiles & Components — 3.0% | | |
| | Automobiles — 1.8% | | |
| b,c | Daimler Finance North America, LLC, 3.058% (LIBOR 3 Month + 0.90%) due 2/15/2022 | 150,000 | 150,775 |
| c | Harley-Davidson Financial Services, Inc., 2.40% due 6/15/2020 | 144,000 | 143,912 |
| c | Hyundai Capital America, 3.95% due 2/1/2022 | 70,000 | 71,935 |
| b,c | Nissan Motor Acceptance Corp., 2.794% (LIBOR 3 Month + 0.69%) due 9/28/2022 | 33,000 | 32,943 |
| a | Toyota Motor Corp., 2.157% due 7/2/2022 | 30,000 | 30,217 |
| b | Toyota Motor Credit Corp. MTN, 2.576% (LIBOR 3 Month + 0.40%) due 2/13/2020 | 100,000 | 99,994 |
| b | Toyota Motor Credit Corp., 2.843% (LIBOR 3 Month + 0.54%) due 1/8/2021 | 50,000 | 50,220 |
| | Construction & Engineering — 0.6% | | |
| c | SBA Tower Trust, 3.156% due 10/10/2045 | 200,000 | 200,215 |
| | Trading Companies & Distributors — 0.6% | | |
| a,c | Mitsubishi UFJ Lease & Finance Co. Ltd., 3.406% due 2/28/2022 | 200,000 | 203,928 |
| | | | 984,139 |
| | Banks — 3.6% | | |
| | Banks — 3.6% | | |
| a,b,c | ABN AMRO Bank N.V., 2.702% (LIBOR 3 Month + 0.57%) due 8/27/2021 | 200,000 | 200,554 |
| b | Goldman Sachs Bank USA, 2.575% (SOFR + 0.60%) due 5/24/2021 | 50,000 | 50,082 |
| a | Lloyds Bank plc, 3.30% due 5/7/2021 | 200,000 | 203,407 |
| a,c | Mizuho Bank Ltd., 2.70% due 10/20/2020 | 200,000 | 201,196 |
| | Santander Holdings USA, Inc., 4.45% due 12/3/2021 | 40,000 | 41,779 |
| f | SunTrust Bank, 3.525% (LIBOR 3 Month + 0.50%) due 10/26/2021 | 225,000 | 228,162 |
| | Zions Bancorp N.A., 3.35% due 3/4/2022 | 250,000 | 255,589 |
| | | | 1,180,769 |
| | Capital Goods — 0.3% | | |
| | Machinery — 0.3% | | |
| b | Wabtec Corp., 3.419% (LIBOR 3 Month + 1.30%) due 9/15/2021 | 100,000 | 100,003 |
| | | | 100,003 |
| | Commercial & Professional Services — 0.7% | | |
| | Leisure Products — 0.4% | | |
| | Mattel, Inc., 2.35% due 8/15/2021 | 125,000 | 121,562 |
| | Professional Services — 0.3% | | |
| | Verisk Analytics, Inc., 5.80% due 5/1/2021 | 100,000 | 105,370 |
| | | | 226,932 |
| | Consumer Durables & Apparel — 1.0% | | |
| | Household Durables — 1.0% | | |
| a,c | Panasonic Corp., 2.536% due 7/19/2022 | 200,000 | 201,211 |
| | Tupperware Brands Corp. (Guaranty: Dart Industries, Inc.), 4.75% due 6/1/2021 | 140,000 | 143,131 |
Schedule of Investments, Continued
Thornburg Low Duration Income Fund | September 30, 2019
| | | PRINCIPAL
AMOUNT | VALUE |
| | | | 344,342 |
| | Diversified Financials — 3.4% | | |
| | Capital Markets — 0.3% | | |
| c | GTP Acquisition Partners I, LLC (Guaranty: American Tower Holding Sub II, LLC), 2.35% due 6/15/2045 | $ 100,000 | $ 99,957 |
| | Diversified Financial Services — 2.7% | | |
| | Citigroup, Inc., 2.65% due 10/26/2020 | 100,000 | 100,612 |
| a,b | Deutsche Bank AG, 3.362% (LIBOR 3 Month + 1.23%) due 2/27/2023 | 100,000 | 96,323 |
| b | Goldman Sachs Group, Inc., 3.319% (LIBOR 3 Month + 1.20%) due 9/15/2020 | 100,000 | 100,771 |
| | JPMorgan Chase & Co., | | |
| b | 2.652% (LIBOR 3 Month + 0.55%) due 3/9/2021 | 42,000 | 42,047 |
| b | 3.461% (LIBOR 3 Month + 1.21%) due 10/29/2020 | 125,000 | 126,198 |
| | Morgan Stanley, | | |
| b | 2.738% (SOFR+ 0.83%) due 6/10/2022 | 35,000 | 35,101 |
| b | 3.396% (LIBOR 3 Month + 1.14%) due 1/27/2020 | 75,000 | 75,258 |
| b | State Street Corp., 3.024% (LIBOR 3 Month + 0.90%) due 8/18/2020 | 100,000 | 100,708 |
| a,b,c | UBS Group Funding Switzerland AG, 4.083% (LIBOR 3 Month + 1.78%) due 4/14/2021 | 200,000 | 204,177 |
| | Insurance — 0.4% | | |
| | AIG Global Funding, | | |
| c | 2.30% due 7/1/2022 | 75,000 | 75,201 |
| b,c | 2.566% (LIBOR 3 Month + 0.46%) due 6/25/2021 | 50,000 | 50,147 |
| | | | 1,106,500 |
| | Energy — 1.8% | | |
| | Oil, Gas & Consumable Fuels — 1.8% | | |
| | EQT Midstream Partners L.P., Series 5Y, 4.75% due 7/15/2023 | 60,000 | 60,185 |
| c | Midwest Connector Capital Co., LLC, 3.625% due 4/1/2022 | 99,000 | 101,555 |
| | Occidental Petroleum Corp., | | |
| b | 3.437% (LIBOR 3 Month + 1.25%) due 8/13/2021 | 20,000 | 20,120 |
| b | 3.637% (LIBOR 3 Month + 1.45%) due 8/15/2022 | 70,000 | 70,462 |
| a,c | Sinopec Group Overseas Development 2018 Ltd., 3.75% due 9/12/2023 | 200,000 | 209,273 |
| c | Texas Gas Transmission, LLC, 4.50% due 2/1/2021 | 129,000 | 131,484 |
| | | | 593,079 |
| | Food & Staples Retailing — 0.3% | | |
| | Food & Staples Retailing — 0.3% | | |
| a,c | Alimentation Couche-Tard, Inc., 2.70% due 7/26/2022 | 100,000 | 100,669 |
| | | | 100,669 |
| | Food, Beverage & Tobacco — 3.2% | | |
| | Beverages — 0.5% | | |
| | Molson Coors Brewing Co., 2.10% due 7/15/2021 | 150,000 | 149,993 |
| | Food Products — 1.4% | | |
| | Conagra Brands, Inc., | | |
| b | 2.811% (LIBOR 3 Month + 0.50%) due 10/9/2020 | 100,000 | 99,990 |
| | 3.80% due 10/22/2021 | 92,000 | 94,949 |
| b | General Mills, Inc., 2.862% (LIBOR 3 Month + 0.54%) due 4/16/2021 | 20,000 | 20,045 |
| | JM Smucker Co., 2.50% due 3/15/2020 | 50,000 | 50,048 |
| | Mead Johnson Nutrition Co. (Guaranty: Reckitt Benckiser Group plc), 3.00% due 11/15/2020 | 100,000 | 100,868 |
| b | Tyson Foods, Inc., 2.682% (LIBOR 3 Month + 0.55%) due 6/2/2020 | 100,000 | 100,066 |
| | Tobacco — 1.3% | | |
| | Altria Group, Inc. (Guaranty: Philip Morris USA, Inc.), | | |
| | 2.625% due 1/14/2020 | 200,000 | 200,076 |
| | 3.49% due 2/14/2022 | 120,000 | 123,109 |
| b | BAT Capital Corp., 2.765% (LIBOR 3 Month + 0.59%) due 8/14/2020 | 100,000 | 100,192 |
| | | | 1,039,336 |
| | Healthcare Equipment & Services — 0.7% | | |
| | Health Care Providers & Services — 0.7% | | |
| | Anthem, Inc., 2.50% due 11/21/2020 | 75,000 | 75,370 |
| | Cigna Corp., 3.40% due 9/17/2021 | 75,000 | 76,685 |
| b | CVS Health Corp., 2.732% (LIBOR 3 Month + 0.63%) due 3/9/2020 | 4,000 | 4,008 |
| | Express Scripts Holding Co., 2.60% due 11/30/2020 | 62,000 | 62,270 |
Schedule of Investments, Continued
Thornburg Low Duration Income Fund | September 30, 2019
| | | PRINCIPAL
AMOUNT | VALUE |
| | | | 218,333 |
| | Household & Personal Products — 0.1% | | |
| | Household Products — 0.1% | | |
| | Church & Dwight Co., Inc., 2.45% due 8/1/2022 | $ 50,000 | $ 50,149 |
| | | | 50,149 |
| | Insurance — 3.3% | | |
| | Insurance — 3.3% | | |
| a | Enstar Group Ltd., 4.50% due 3/10/2022 | 50,000 | 51,858 |
| c | Guardian Life Global Funding, 3.40% due 4/25/2023 | 57,000 | 59,480 |
| | Infinity Property & Casualty Corp., 5.00% due 9/19/2022 | 100,000 | 106,469 |
| | Jackson National Life Global Funding, | | |
| c | 2.10% due 10/25/2021 | 100,000 | 99,710 |
| b,c | 2.618% (LIBOR 3 Month + 0.48%) due 6/11/2021 | 100,000 | 100,242 |
| c | MassMutual Global Funding II, 2.00% due 4/15/2021 | 200,000 | 199,770 |
| b,c | Metropolitan Life Global Funding, 2.39% (SOFR + 0.57%) due 9/7/2020 | 150,000 | 150,403 |
| | Reliance Standard Life Global Funding II, | | |
| c | 2.625% due 7/22/2022 | 75,000 | 75,626 |
| c | 3.05% due 1/20/2021 | 25,000 | 25,251 |
| c | 3.85% due 9/19/2023 | 50,000 | 52,539 |
| a | Willis Towers Watson plc, 5.75% due 3/15/2021 | 170,000 | 178,208 |
| | | | 1,099,556 |
| | Materials — 0.3% | | |
| | Chemicals — 0.3% | | |
| b,c | Chevron Phillips Chemical Co., LLC / Chevron Phillips Chemical Co., L.P. 3.003% (LIBOR 3 Month + 0.75%) due 5/1/2020 | 100,000 | 100,233 |
| | | | 100,233 |
| | Media & Entertainment — 0.5% | | |
| | Media — 0.5% | | |
| c | Cox Communications, Inc., 3.25% due 12/15/2022 | 160,000 | 164,334 |
| | | | 164,334 |
| | Pharmaceuticals, Biotechnology & Life Sciences — 0.8% | | |
| | Biotechnology — 0.5% | | |
| | Celgene Corp., | | |
| | 2.75% due 2/15/2023 | 100,000 | 101,783 |
| | 3.25% due 2/20/2023 | 44,000 | 45,550 |
| | Pharmaceuticals — 0.3% | | |
| a,b | AstraZeneca plc, 2.789% (LIBOR 3 Month + 0.67%) due 8/17/2023 | 65,000 | 64,678 |
| a | Shire Acquisitions Investments Ireland DAC, 2.40% due 9/23/2021 | 44,000 | 44,204 |
| | | | 256,215 |
| | Real Estate — 0.7% | | |
| | Equity Real Estate Investment Trusts — 0.7% | | |
| | Crown Castle International Corp., 3.20% due 9/1/2024 | 115,000 | 118,127 |
| c | SBA Tower Trust, 2.836% due 1/15/2025 | 100,000 | 100,128 |
| | | | 218,255 |
| | Retailing — 0.5% | | |
| | Multiline Retail — 0.5% | | |
| b | Dollar Tree, Inc., 3.003% (LIBOR 3 Month + 0.70%) due 4/17/2020 | 175,000 | 175,032 |
| | | | 175,032 |
| | Semiconductors & Semiconductor Equipment — 0.4% | | |
| | Semiconductors & Semiconductor Equipment — 0.4% | | |
| | Broadcom Corp. / Broadcom Cayman Finance Ltd., 2.375% due 1/15/2020 | 125,000 | 124,992 |
| | | | 124,992 |
| | Software & Services — 0.4% | | |
| | Software — 0.4% | | |
| | Autodesk, Inc., 3.125% due 6/15/2020 | 100,000 | 100,536 |
| | VMware, Inc., 2.30% due 8/21/2020 | 50,000 | 50,026 |
Schedule of Investments, Continued
Thornburg Low Duration Income Fund | September 30, 2019
| | | PRINCIPAL
AMOUNT | VALUE |
| | | | 150,562 |
| | Technology Hardware & Equipment — 0.4% | | |
| | Technology Hardware, Storage & Peripherals — 0.4% | | |
| | Hewlett Packard Enterprise Co., 3.50% due 10/5/2021 | $ 132,000 | $ 135,322 |
| | | | 135,322 |
| | Telecommunication Services — 2.7% | | |
| | Diversified Telecommunication Services — 0.5% | | |
| | AT&T, Inc., | | |
| | 2.45% due 6/30/2020 | 100,000 | 100,238 |
| b | 3.034% (LIBOR 3 Month + 0.93%) due 6/30/2020 | 50,000 | 50,254 |
| | Media — 0.3% | | |
| b,c | NBCUniversal Enterprise, Inc., 2.499% (LIBOR 3 Month + 0.40%) due 4/1/2021 | 100,000 | 100,197 |
| | Wireless Telecommunication Services — 1.9% | | |
| | Sprint Communications, Inc., 9.25% due 4/15/2022 | 400,000 | 463,500 |
| a | Vodafone Group plc, 2.50% due 9/26/2022 | 160,000 | 161,586 |
| | | | 875,775 |
| | Transportation — 0.4% | | |
| | Road & Rail — 0.4% | | |
| | Penske Truck Leasing Co. L.P. / PTL Finance Corp., | | |
| c | 3.20% due 7/15/2020 | 100,000 | 100,593 |
| c | 3.65% due 7/29/2021 | 35,000 | 35,811 |
| | | | 136,404 |
| | Utilities — 5.9% | | |
| | Electric Utilities — 5.3% | | |
| c | Alliant Energy Finance, LLC, 3.75% due 6/15/2023 | 100,000 | 104,532 |
| | CenterPoint Energy, Inc., 3.60% due 11/1/2021 | 150,000 | 153,986 |
| b | Consolidated Edison Co. of New York, Inc., Series C, 2.506% (LIBOR 3 Month + 0.40%) due 6/25/2021 | 100,000 | 100,337 |
| | Duke Energy Florida Project Finance, LLC, Series 2018, 1.196% due 3/1/2022 | 17,346 | 17,273 |
| a,c | Electricite de France S.A., 4.60% due 1/27/2020 | 25,000 | 25,197 |
| a,c | Enel Finance International N.V., 4.25% due 9/14/2023 | 200,000 | 212,403 |
| | Evergy, Inc., 2.45% due 9/15/2024 | 30,000 | 29,977 |
| | Exelon Corp., 2.85% due 6/15/2020 | 50,000 | 50,209 |
| b | Mississippi Power Co., 2.75% (LIBOR 3 Month + 0.65%) due 3/27/2020 | 200,000 | 200,076 |
| | NextEra Energy Capital Holdings, Inc., 2.403% due 9/1/2021 | 150,000 | 150,926 |
| | PNM Resources, Inc., 3.25% due 3/9/2021 | 100,000 | 100,944 |
| | Public Service Enterprise Group, 2.65% due 11/15/2022 | 50,000 | 50,699 |
| | SCANA Corp. MTN, 4.125% due 2/1/2022 | 22,000 | 22,708 |
| b,c | Southern Power Co., 2.706% (LIBOR 3 Month + 0.55%) due 12/20/2020 | 115,000 | 115,010 |
| | Tampa Electric Co., 2.60% due 9/15/2022 | 185,000 | 186,607 |
| | Virginia Electric & Power Co., 2.95% due 1/15/2022 | 100,000 | 101,595 |
| | WEC Energy Group, Inc., 3.375% due 6/15/2021 | 100,000 | 102,169 |
| | Gas Utilities — 0.6% | | |
| | Dominion Gas Holdings, LLC, 2.50% due 12/15/2019 | 100,000 | 99,992 |
| | WGL Holdings, Inc., | | |
| b | 2.517% (LIBOR 3 Month + 0.40%) due 11/29/2019 | 50,000 | 49,984 |
| b | 2.682% (LIBOR 3 Month + 0.55%) due 3/12/2020 | 58,000 | 57,910 |
| | | | 1,932,534 |
| | Total Corporate Bonds(Cost $11,151,302) | | 11,313,465 |
| | Municipal Bonds — 1.1% | | |
| | Colorado Educational & Cultural Facilities Authority, | | |
| | Series B Class B, | | |
| | 2.244% due 3/1/2021 | 50,000 | 50,223 |
| | 2.474% due 3/1/2022 | 50,000 | 50,599 |
| | Los Angeles County Public Works Financing Authority, 5.591% due 8/1/2020 | 100,000 | 102,802 |
| | New York State Urban Development Corp., Series D-1, 2.55% due 3/15/2022 | 120,000 | 121,918 |
| | State of Connecticut GO, | | |
| | Series A, | | |
Schedule of Investments, Continued
Thornburg Low Duration Income Fund | September 30, 2019
| | | PRINCIPAL
AMOUNT | VALUE |
| | 3.471% due 9/15/2022 | $ 20,000 | $ 20,750 |
| | 4.00% due 9/15/2021 | 20,000 | 20,700 |
| | Total Municipal Bonds(Cost $363,181) | | 366,992 |
| | Short-Term Investments — 13.4% | | |
| g | Thornburg Capital Management Fund | 440,070 | 4,400,701 |
| | Total Short-Term Investments(Cost $4,400,701) | | 4,400,701 |
| | Total Investments — 99.8%(Cost $32,478,383) | | $32,802,506 |
| | Other Assets Less Liabilities — 0.2% | | 67,445 |
| | Net Assets — 100.0% | | $32,869,951 |
| Footnote Legend |
| a | Yankee bond denominated in U.S. dollars and is issued in the U.S. by foreign banks and corporations. |
| b | Floating Rate Security. Stated interest/floor rate was in effect at September 30, 2019. |
| c | Securities exempt from registration under Rule 144A of the Securities Act of 1933, as amended. These securities are restricted and may only be resold in the ordinary course of business in transactions exempt from registration, normally to qualified institutional buyers. As of September 30, 2019, the aggregate value of these securities in the Fund’s portfolio was $13,953,191, representing 42.45% of the Fund’s net assets. |
| d | Variable rate coupon, rate shown as of September 30, 2019. |
| e | Coupon rate adjusts periodically based upon a predetermined schedule. Stated interest rate in effect at September 30, 2019. |
| f | Fixed to floating security that initially pays a fixed rate and converts to a floating rate coupon at a specified date in the future. The rate presented is a fixed rate. |
| g | Investment in Affiliates. |
Portfolio Abbreviations
To simplify the listings of securities, abbreviations are used per the table below:
| CMO | Collateralized Mortgage Obligation |
| GO | General Obligation |
| LIBOR | London Interbank Offered Rates |
| Mtg | Mortgage |
| MTN | Medium-Term Note |
| SBA | Small Business Administration |
| SOFR | Secured Overnight Financing Rate |
See notes to financial statements.
Statements of Assets and Liabilities
September 30, 2019
| | THORNBURG
LIMITED TERM U.S.
GOVERNMENT FUND | THORNBURG
LIMITED TERM
INCOME FUND | THORNBURG
LOW DURATION
INCOME FUND |
| ASSETS | | | |
| Investments at value (Note 3) | | | |
| Non-affiliated issuers (cost $239,291,685, $5,626,130,364 and $28,077,682, respectively) | $ 241,672,065 | $ 5,715,741,117 | $ 28,401,805 |
| Non-controlled affiliated issuer (cost $0, $0 and $4,400,701, respectively) | - | - | 4,400,701 |
| Cash | 1,193 | 199,727 | 14 |
| Receivable for investments sold | - | 159,000 | - |
| Receivable for fund shares sold | 394,962 | 13,916,268 | 3,000 |
| Receivable from investment advisor | - | - | 3,757 |
| Dividends receivable | - | - | 5,317 |
| Dividend and interest reclaim receivable | - | 7,713 | 48 |
| Interest receivable | 781,111 | 27,209,371 | 123,566 |
| Prepaid expenses and other assets | 51,939 | 219,405 | 19,682 |
| Total Assets | 242,901,270 | 5,757,452,601 | 32,957,890 |
| Liabilities | | | |
| Payable for investments purchased | 2,959,977 | 48,196,440 | - |
| Payable for fund shares redeemed | 210,040 | 7,668,612 | 18,620 |
| Payable to investment advisor and other affiliates (Note 4) | ��� 111,000 | 2,080,058 | - |
| Accounts payable and accrued expenses | 131,013 | 1,161,200 | 67,626 |
| Dividends payable | 87,341 | 1,724,322 | 1,693 |
| Total Liabilities | 3,499,371 | 60,830,632 | 87,939 |
| Commitments and contingencies (Note 2) | | | |
| Unrealized appreciation on unfunded commmitments | - | 23,750 | - |
| Net Assets | $ 239,401,899 | $ 5,696,645,719 | $ 32,869,951 |
| NET ASSETS CONSIST OF | | | |
| Distributable earnings (accumulated loss) | $ (10,168,240) | $ 122,721,184 | $ 424,315 |
| Net capital paid in on shares of beneficial interest | 249,570,139 | 5,573,924,535 | 32,445,636 |
| | $ 239,401,899 | $ 5,696,645,719 | $ 32,869,951 |
Statements of Assets and Liabilities, Continued
September 30, 2019
| | THORNBURG
LIMITED TERM U.S.
GOVERNMENT FUND | THORNBURG
LIMITED TERM
INCOME FUND | THORNBURG
LOW DURATION
INCOME FUND |
| NET ASSET VALUE | | | |
| Class A Shares: | | | |
Net asset value and redemption price per share
($66,140,193, $645,382,566 and $8,011,933 applicable to 5,050,165, 47,402,642 and 641,493 shares of beneficial interest outstanding - Note 5) | $ 13.10 | $ 13.61 | $ 12.49 |
| Maximum sales charge, 1.50% of offering price | 0.20 | 0.21 | 0.19 |
| Maximum offering price per share | $ 13.30 | $ 13.82 | $ 12.68 |
| Class C Shares: | | | |
Net asset value and offering price per share*
($15,618,021 and $356,205,471 applicable to 1,185,461 and 26,204,290 shares of beneficial interest outstanding - Note 5) | $ 13.17 | $ 13.59 | $ - |
| Class I Shares: | | | |
Net asset value, offering and redemption price per share
($145,272,850, $4,455,457,145 and $24,858,018 applicable to 11,092,876, 327,183,139 and 1,991,414 shares of beneficial interest outstanding - Note 5) | $ 13.10 | $ 13.62 | $ 12.48 |
| Class R3 Shares: | | | |
Net asset value, offering and redemption price per share
($9,181,131 and $64,334,852 applicable to 700,604 and 4,721,824 shares of beneficial interest outstanding - Note 5) | $ 13.10 | $ 13.63 | $ - |
| Class R4 Shares: | | | |
Net asset value, offering and redemption price per share
($2,292,366 and $8,072,873 applicable to 175,087 and 593,207 shares of beneficial interest outstanding - Note 5) | $ 13.09 | $ 13.61 | $ - |
| Class R5 Shares: | | | |
Net asset value, offering and redemption price per share
($897,338 and $106,753,168 applicable to 68,467 and 7,841,623 shares of beneficial interest outstanding - Note 5) | $ 13.11 | $ 13.61 | $ - |
| Class R6 Shares: | | | |
Net asset value, offering and redemption price per share
($60,439,644 applicable to 4,429,917 shares of beneficial interest outstanding - Note 5) | $ - | $ 13.64 | $ - |
| * | Redemption price per share is equal to net asset value less any applicable contingent deferred sales charge. |
See notes to financial statements.
Statements of Operations
Year Ended September 30, 2019
| | THORNBURG
LIMITED TERM U.S.
GOVERNMENT FUND | THORNBURG
LIMITED TERM
INCOME FUND | THORNBURG
LOW DURATION
INCOME FUND |
| INVESTMENT INCOME | | | |
| Dividend income non-controlled affiliated issuer | $ - | $ - | $ 86,209 |
| Interest income (net of premium amortized of $429,311, $6,197,291, and $37,289, respectively) | 5,559,884 | 171,346,485 | 920,544 |
| Total Income | 5,559,884 | 171,346,485 | 1,006,753 |
| EXPENSES | | | |
| Investment advisory fees (Note 4) | 877,126 | 17,491,382 | 135,440 |
| Administration fees (Note 4) | | | |
| Class A Shares | 60,084 | 552,686 | 7,553 |
| Class C Shares | 15,986 | 344,946 | - |
| Class I Shares | 118,273 | 3,512,491 | 22,185 |
| Class R3 Shares | 7,985 | 70,569 | - |
| Class R4 Shares | 2,009 | 8,037 | - |
| Class R5 Shares | 1,087 | 101,534 | - |
| Class R6 Shares | - | 37,899 | - |
| Distribution and service fees (Note 4) | | | |
| Class A Shares | 170,964 | 1,573,481 | 17,158 |
| Class C Shares | 90,999 | 1,963,738 | - |
| Class R3 Shares | 45,459 | 401,579 | - |
| Class R4 Shares | 5,724 | 22,860 | - |
| Transfer agent fees | | | |
| Class A Shares | 66,327 | 719,649 | 33,397 |
| Class C Shares | 25,629 | 296,521 | - |
| Class I Shares | 100,464 | 3,455,714 | 15,131 |
| Class R3 Shares | 23,355 | 82,564 | - |
| Class R4 Shares | 10,422 | 36,565 | - |
| Class R5 Shares | 5,823 | 335,519 | - |
| Class R6 Shares | - | 7,848 | - |
| Registration and filing fees | | | |
| Class A Shares | 13,662 | 28,379 | 19,844 |
| Class C Shares | 12,512 | 17,797 | - |
| Class I Shares | 14,934 | 94,944 | 16,302 |
| Class R3 Shares | 12,648 | 14,276 | - |
| Class R4 Shares | 12,407 | 12,942 | - |
| Class R5 Shares | �� 12,803 | 13,741 | - |
| Class R6 Shares | - | 12,909 | - |
| Custodian fees | 55,072 | 266,410 | 52,635 |
| Professional fees | 48,439 | 138,579 | 43,618 |
| Trustee and officer fees (Note 4) | 13,459 | 311,973 | 1,959 |
| Other expenses | 41,926 | 435,752 | 14,829 |
| Total Expenses | 1,865,578 | 32,363,284 | 380,051 |
| Less: | | | |
| Expenses reimbursed by investment advisor (Note 4) | (74,713) | (1,422,449) | (114,926) |
| Investment advisory fees waived by investment advisor (Note 4) | - | - | (78,667) |
| Net Expenses | 1,790,865 | 30,940,835 | 186,458 |
| Net Investment Income | $ 3,769,019 | $ 140,405,650 | $ 820,295 |
| REALIZED AND UNREALIZED GAIN (LOSS) | | | |
| Net realized gain (loss) on investments | (533,177) | 40,927,563 | 122,581 |
| Net change in unrealized appreciation (depreciation) on investments | 8,550,764 | 140,547,442 | 476,950 |
| Net Realized and Unrealized Gain | 8,017,587 | 181,475,005 | 599,531 |
| Net Increase in Net Assets Resulting from Operations | $ 11,786,606 | $ 321,880,655 | $ 1,419,826 |
See notes to financial statements.
Statements of Changes in Net Assets
Thornburg Limited Term U.S. Government Fund
| | Year Ended
September 30, 2019 | Year Ended
September 30, 2018 |
| INCREASE (DECREASE) IN NET ASSETS FROM | | |
| OPERATIONS | | |
| Net investment income | $ 3,769,019 | $ 4,024,275 |
| Net realized gain (loss) on investments | (533,177) | (7,773) |
| Net change in unrealized appreciation (depreciation) on investments | 8,550,764 | (5,807,249) |
| Net Increase (Decrease) in Net Assets Resulting from Operations | 11,786,606 | (1,790,747) |
| DIVIDENDS TO SHAREHOLDERS | | |
| From distributable earnings | | |
| Class A Shares | (1,199,716) | (1,281,346) |
| Class C Shares | (255,887) | (399,126) |
| Class I Shares | (2,750,402) | (2,841,403) |
| Class R3 Shares | (151,499) | (163,648) |
| Class R4 Shares | (38,072) | (48,362) |
| Class R5 Shares | (25,660) | (30,541) |
| FUND SHARE TRANSACTIONS (NOTE 5) | | |
| Class A Shares | (5,683,527) | (13,133,162) |
| Class C Shares | (4,644,010) | (14,392,126) |
| Class I Shares | 9,185,352 | (12,028,799) |
| Class R3 Shares | (143,550) | (1,579,987) |
| Class R4 Shares | (289,505) | (782,019) |
| Class R5 Shares | 187,963 | (3,430,735) |
| Net Increase (Decrease) in Net Assets | 5,978,093 | (51,902,001) |
| NET ASSETS | | |
| Beginning of Year | 233,423,806 | 285,325,807 |
| End of Year | $ 239,401,899 | $ 233,423,806 |
See notes to financial statements.
Statements of Changes in Net Assets
Thornburg Limited Term Income Fund
| | Year Ended
September 30, 2019 | Year Ended
September 30, 2018 |
| INCREASE (DECREASE) IN NET ASSETS FROM | | |
| OPERATIONS | | |
| Net investment income | $ 140,405,650 | $ 117,668,835 |
| Net realized gain (loss) on investments | 40,927,563 | 1,476,259 |
| Net change in unrealized appreciation (depreciation) on investments | 140,547,442 | (104,119,301) |
| Net Increase in Net Assets Resulting from Operations | 321,880,655 | 15,025,793 |
| DIVIDENDS TO SHAREHOLDERS | | |
| From distributable earnings | | |
| Class A Shares | (15,727,847) | (17,119,570) |
| Class C Shares | (9,006,464) | (10,088,457) |
| Class I Shares | (112,128,865) | (88,345,810) |
| Class R3 Shares | (1,869,318) | (1,923,947) |
| Class R4 Shares | (212,808) | (172,865) |
| Class R5 Shares | (3,178,918) | (2,536,903) |
| Class R6 Shares | (1,237,001) | (342,075) |
| FUND SHARE TRANSACTIONS (NOTE 5) | | |
| Class A Shares | (55,963,967) | (193,537,163) |
| Class C Shares | (96,148,218) | (117,451,478) |
| Class I Shares | 633,212,444 | 526,525,749 |
| Class R3 Shares | (26,586,996) | (6,441,054) |
| Class R4 Shares | (214,678) | 37,813 |
| Class R5 Shares | (10,373,438) | 14,319,765 |
| Class R6 Shares | 29,403,168 | 29,035,669 |
| Net Increase in Net Assets | 651,847,749 | 146,985,467 |
| NET ASSETS | | |
| Beginning of Year | 5,044,797,970 | 4,897,812,503 |
| End of Year | $ 5,696,645,719 | $ 5,044,797,970 |
See notes to financial statements.
Statements of Changes in Net Assets
Thornburg Low Duration Income Fund
| | Year Ended
September 30, 2019 | Year Ended
September 30, 2018 |
| INCREASE (DECREASE) IN NET ASSETS FROM | | |
| OPERATIONS | | |
| Net investment income | $ 820,295 | $ 444,861 |
| Net realized gain (loss) on investments | 122,581 | (2,466) |
| Net change in unrealized appreciation (depreciation) on investments | 476,950 | (229,583) |
| Net Increase in Net Assets Resulting from Operations | 1,419,826 | 212,812 |
| DIVIDENDS TO SHAREHOLDERS | | |
| From distributable earnings | | |
| Class A Shares | (198,275) | (128,246) |
| Class I Shares | (631,318) | (329,263) |
| FUND SHARE TRANSACTIONS (NOTE 5) | | |
| Class A Shares | 721,326 | 683,438 |
| Class I Shares | 1,670,436 | 10,063,257 |
| Net Increase in Net Assets | 2,981,995 | 10,501,998 |
| NET ASSETS | | |
| Beginning of Year | 29,887,956 | 19,385,958 |
| End of Year | $ 32,869,951 | $ 29,887,956 |
See notes to financial statements.
Notes to Financial Statements
September 30, 2019
NOTE 1 – ORGANIZATION
Thornburg Limited Term U.S. Government Fund (the “Government Fund”), Thornburg Limited Term Income Fund (the “Income Fund”) and Thornburg Low Duration Income Fund (the “Low Duration Fund”), collectively the (“Funds”), are diversified series of Thornburg Investment Trust (the “Trust”). The Trust is organized as a Massachusetts business trust under a Declaration of Trust dated June 3, 1987 and is registered as a diversified, open-end management investment company under the Investment Company Act of 1940, as amended (the "1940 Act"). The Funds are currently three of twenty-two separate series of the Trust. Each series is considered to be a separate entity for financial reporting and tax purposes and bears expenses directly attributable to it. The Government and Income Funds’ primary objectives are to provide as high a level of current income as is consistent, in the view of the Trust’s investment advisor, Thornburg Investment Management, Inc. (the “Advisor”), with safety of capital. The Low Duration Fund’s primary objective is to seek current income, consistent with preservation of capital. As a secondary objective, the Government Fund and the Income Fund seek to reduce changes in their share prices compared to longer term portfolios.
The Government Fund currently has six classes of shares of beneficial interest: Class A, Class C, Institutional Class (“Class I”), and Retirement Classes (“Class R3,” “Class R4,” and “Class R5”).
The Income Fund currently offers seven classes of shares of beneficial interest outstanding, Class A, Class C, Institutional Class (“Class I”), and Retirement Classes (“Class R3,” “Class R4,” “Class R5,” and “Class R6”).
The Low Duration Fund currently offers two classes of shares of beneficial interest outstanding, Class A and Institutional Class (“Class I”).
Each class of shares of the Funds represents an interest in the same portfolio of investments, except that (i) Class A shares are sold subject to a front-end sales charge collected at the time the shares are purchased and bear a service fee, (ii) Class C shares are sold at net asset value without a sales charge at the time of purchase, but are subject to a contingent deferred sales charge upon redemption within one year of purchase, and bear both a service fee and a distribution fee, (iii) Class I and Class R5 shares are sold at net asset value without a sales charge at the time of purchase and may be subject to a service fee, (iv) Class R3 shares are sold at net asset value without a sales charge, but bear both a service fee and a distribution fee, (v) Class R4 shares are sold at net asset value without a sales charge at the time of purchase but bear a service fee, (vi) Class R6 shares are sold at net asset value without a sales charge at the time of purchase, and (vii) the respective classes may have different reinvestment privileges and conversion rights. Additionally, each Fund may allocate among its classes certain expenses, to the extent allocable to specific classes, including administration fees, transfer agent fees, government registration fees, certain printing and postage costs, and administrative and legal expenses. Currently, class specific expenses of the Funds are limited to distribution and service fees and certain registration and transfer agent expenses.
The following is a summary of significant accounting policies followed by each of the Funds in the preparation of its financial statements. Each Fund prepares its financial statements in conformity with United States generally accepted accounting principles (“GAAP”), including investment company accounting and reporting guidance in the Financial Accounting Standards Board (the “FASB”) Accounting Standard Codification Topic 946.
NOTE 2 – SIGNIFICANT ACCOUNTING POLICIES
Security Valuation: All investments in securities held by the Funds are valued as described in Note 3.
Allocation of Income, Gains, Losses and Expenses: Net investment income (other than class specific expenses) and realized and unrealized gains and losses are allocated daily to each class of shares based upon the relative net asset value of outstanding shares (or the value of the dividend-eligible shares, as appropriate) of each class of shares at the beginning of the day (after adjusting for the current capital shares activity of the respective class). Expenses common to all Funds are allocated among the Funds comprising the Trust based upon their relative net asset values or other appropriate allocation methods. Operating expenses directly attributable to a specific class are charged against the operating income of that class.
Dividends and Distributions to Shareholders: Dividends and distributions to shareholders, which are determined in accordance with federal income tax regulations and may differ from GAAP, are recorded on the ex-dividend date. Ordinary income dividends, if any, are declared daily and paid monthly. Capital gain distributions, if any, are declared and paid annually and more often if deemed necessary by the Advisor. Dividends and distributions are paid and are reinvested in additional shares of the Funds at net asset value per share at the close of business on the ex-dividend date, or at the shareholder’s option, paid in cash.
Investment Income: Dividend income is recorded on the ex-dividend date. Interest income is accrued as earned. Premiums and discounts are amortized and accreted, respectively, to first call dates or maturity dates using the effective yield method of the respective investments. These amounts are included in Investment Income in the Statement of Operations.
Notes to Financial Statements, Continued
September 30, 2019
Investment Transactions: Investment transactions are accounted for on a trade date basis. Realized gains and losses from the sale of investments are recorded on an identified cost basis.
Repurchase Agreements: The Funds may invest excess cash in repurchase agreements whereby the Funds purchase investments, which serve as collateral, with an agreement to resell such collateral to the seller at an agreed upon price at the maturity date of the repurchase agreement. Investments pledged as collateral for repurchase agreements are held in custody until maturity of the repurchase agreement. Provisions in the agreements require that the market value of the collateral is at least equal to the repurchase value in the event of default. In the event of default, the Funds have the right to liquidate the collateral and apply the proceeds in satisfaction of the obligation. Under certain circumstances, in the event of default or bankruptcy by the other party to the agreement, realization and/or retention of the collateral may be subject to legal proceedings.
Unfunded Loan Commitments: The Income Fund has entered into a loan commitment with Pacific Gas & Electric Co., of which at September 30, 2019, $0 of the $4,750,000 par commitment had been funded. The maturity date for $4,750,000 of the par commitment is December 31, 2019.
When-Issued and Delayed Delivery Transactions: The Funds may engage in when-issued or delayed delivery transactions. To the extent the Funds engage in such transactions, they will do so for the purpose of acquiring portfolio investments consistent with the Funds’ investment objectives and not for the purpose of investment leverage or to speculate on interest rate or market changes. At the time the Funds make a commitment to purchase an investment on a when-issued or delayed delivery basis, the Funds will record the transaction and reflect the value in determining its net asset value. When effecting such transactions, assets of an amount sufficient to make payment for the portfolio investments to be purchased will be segregated on the Funds’ records on the trade date. Investments purchased on a when-issued or delayed delivery basis do not earn interest until the settlement date. The values of these securities held at September 30, 2019 are detailed in the Schedule of Investments.
Guarantees and Indemnifications: Under the Trust’s organizational documents (and under separate agreements with the independent Trustees), its officers and Trustees are provided with an indemnification against certain liabilities arising out of the performance of their duties to the Funds. In the normal course of business the Trust may also enter into contracts with service providers that contain general indemnifications. The Trust’s maximum exposure under these arrangements is unknown. However, based on experience, the Trust expects the risk of loss to be remote.
Use of Estimates: The preparation of financial statements in conformity with GAAP requires management to make estimates and assumptions that affect the reported amounts of assets and liabilities and disclosure of contingent assets and liabilities at the date of the financial statements and the reported amounts of increases (decreases) in net assets from operations during the reporting period. Actual results could differ from those estimates.
Federal Income Taxes: It is the policy of the Trust to comply with the provisions of the Internal Revenue Code applicable to regulated investment companies and to distribute to shareholders substantially all investment company taxable income including net realized gains on investments (if any), and tax exempt income of the Funds. Therefore, no provision for federal income or excise tax is required.
The Funds file income tax returns in United States federal and applicable state jurisdictions. The statute of limitations on the Funds’ tax return filings generally remains open for the three years following a return’s filing date. The Funds have analyzed each uncertain tax position believed to be material in the preparation of the Funds’ financial statements for the fiscal year ended September 30, 2019, including open tax years, to assess whether it is more likely than not that the position would be sustained upon examination, based on the technical merits of the position. The Funds have not identified any such position for which an asset or liability must be reflected in the Statement of Assets and Liabilities.
At September 30, 2019, information on the tax components of capital was as follows:
| | GOVERNMENT FUND | INCOME FUND | LOW DURATION FUND |
| Cost of investments for tax purposes | $ 239,292,823 | $ 5,626,138,034 | $ 32,478,383 |
| Gross unrealized appreciation on a tax basis | 2,999,502 | 103,120,270 | 342,047 |
| Gross unrealized depreciation on a tax basis | (620,260) | (13,517,187) | (17,924) |
| Net unrealized appreciation (depreciation) on investments (tax basis) | $ 2,379,242 | $ 89,603,083 | $ 324,123 |
Temporary book to tax adjustments to the cost of investments and net unrealized appreciation (depreciation) for tax purposes result primarily from deferral of outstanding wash sale losses and dividends payable.
At September 30, 2019, the Funds had deferred tax basis capital losses occurring subsequent to October 31, 2018 through September 30, 2019 as follows. For tax purposes, such losses will be recognized in the year ending September 30, 2020.
Notes to Financial Statements, Continued
September 30, 2019
| | GOVERNMENT FUND | INCOME FUND | LOW DURATION FUND |
| Deferred tax basis capital losses | $ 1,001,586 | $ - | $ - |
At September 30, 2019, the Government Fund had cumulative tax basis capital losses of $11,502,486 (of which $2,368,435 are short-term and $9,134,051 are long-term), which may be carried forward to offset future capital gains. To the extent such carryforwards are used, capital gain distributions may be reduced to the extent provided by regulations. Such capital loss carryforwards do not expire, but are required to be utilized to offset future gains prior to the utilization of losses generated prior to October 1, 2011 which may expire prior to utilization.
At September 30, 2019, the Government Fund had $106,151 of capital loss carryforwards generated prior to October 1, 2011 which expired.
During the year ended September 30, 2019, the Income Fund utilized $1,244,225 of capital loss carryforwards generated after September 30, 2011.
During the year ended September 30, 2019, the Low Duration Fund utilized $4,763 of capital loss carryforwards generated after September 30, 2011.
In order to account for permanent book to tax differences, the Government Fund increased distributable earnings by $106,151, and decreased net capital paid in on shares of beneficial interest by $106,151. The Income Fund decreased distributable earnings by $1,842,084 and increased net capital paid in on shares of beneficial interest by $1,842,084. Reclassifications have no impact upon the net asset value of the Funds and result primarily from mortgage-backed securities (“MBS”) losses, expiration of capital loss carryforwards and equalization of undistributed capital gains to shareholders.
At September 30, 2019, the Funds had undistributed tax basis ordinary investment income and undistributed tax basis capital gains as follows:
| | GOVERNMENT FUND | INCOME FUND | LOW DURATION FUND |
| Undistributed tax basis ordinary investment income | $ 43,931 | $ 25,991,722 | $ 95,429 |
| Undistributed tax basis capital gains | $ — | $ 8,826,951 | $ 6,456 |
The tax character of distributions paid for the Funds during the year ended September 30, 2019, and September 30, 2018, was as follows:
| | GOVERNMENT FUND | INCOME FUND | LOW DURATION FUND |
| | 2019 | 2018 | 2019 | 2018 | 2019 | 2018 |
| Distributions from: | | | | | | |
| Ordinary income | $ 4,421,236 | $ 4,764,426 | $ 143,361,221 | $ 120,529,627 | $ 829,593 | $ 457,509 |
| Total | $ 4,421,236 | $ 4,764,426 | $ 143,361,221 | $ 120,529,627 | $ 829,593 | $ 457,509 |
NOTE 3 – SECURITY VALUATION
Valuation of the Funds’ portfolio investment securities is performed in accordance with policies and procedures adopted by and under the oversight of the Trustees.
The Trustees of the Trust have appointed the Advisor to assist the Trustees with obtaining fair market values for portfolio investments, evaluating and monitoring professional pricing service providers appointed by the Trustees’ Audit Committee (the “Audit Committee”) to assist in determining fair values for portfolio investments, assisting in calculating fair values for portfolio investments in certain circumstances, and performing other functions in connection with the valuation of investments. The Advisor acts through its Valuation and Pricing Committee (the “Committee”) and other employees of the Advisor. The Committee regularly reviews its own valuation calculations, reviews the valuations, valuation techniques and services furnished by pricing service providers, considers circumstances which may require valuation calculations by the Committee, and reviews previous valuation calculations. The Committee reports to the Audit Committee on the Committee’s activities, the performance of pricing service providers, and other matters relating to valuation of portfolio investments.
In those instances when the Committee assists in calculating a fair value for a portfolio investment, the Committee seeks to determine the price that the Funds would reasonably expect to receive upon a sale of the investment in an orderly transaction between market participants on the valuation date. The Committee customarily utilizes quotations from securities broker dealers in calculating valuations, but also may utilize prices obtained from pricing service providers or other methods approved by the Audit Committee. Because fair values
Notes to Financial Statements, Continued
September 30, 2019
calculated by the Committee are estimates, the calculation of a value for an investment may differ from the price that would be realized by the Funds upon a sale of the investment, and the difference could be material to the Funds’ financial statements. The Committee’s calculation of a fair value for an investment may also differ from the prices obtained by other persons (including other mutual funds) for the investment.
Valuation of Securities: Debt obligations held by the Funds which are not listed or traded on exchanges or for which no reported market exists are ordinarily valued at the valuation obtained from a pricing service provider approved by the Audit Committee.
In any case when a pricing service provider fails to provide a valuation for a debt obligation held by the Funds, the Committee calculates a fair value for the obligation using alternative methods under procedures approved by the Audit Committee. Additionally, in cases when management believes that a valuation obtained from a pricing service provider is stale, does not reflect material factors affecting the valuation of the investment, is significantly different than the value the Funds are likely to obtain if it sought a bid for the investment, or is otherwise unreliable, the Committee calculates a fair value for the obligation using an alternative method approved by the Audit Committee.
Valuation Hierarchy: The Funds categorize their investments based upon the inputs used in valuing those investments, according to a three-level hierarchy established in guidance from the FASB. Categorization of investments using this hierarchy is intended by the FASB to maximize the use of observable inputs in valuing investments and minimize the use of unobservable inputs by requiring that the most observable inputs be used when available. Observable inputs are those that market participants would use in valuing an investment based on available market information. Unobservable inputs are those that reflect assumptions about the information market participants would use in valuing an investment. An investment’s level within the hierarchy is based on the lowest level input that is deemed significant to the valuation. The methodologies and inputs used to value investments are not necessarily indications of the risk or liquidity associated with those investments.
Various inputs are used in calculating valuations for the Fund’s investments. These inputs are generally summarized according to the three-level hierarchy below:
Level 1: Quoted prices in active markets for identical investments.
Level 2: Other direct or indirect significant observable inputs (including quoted prices for similar investments in active markets and other observable inputs, such as interest rates, prepayment rates, credit ratings, etc.).
Level 3: Significant unobservable inputs (including the Committee’s own assumptions in calculating the fair values of investments).
Valuations for debt obligations held by the Funds are typically calculated by pricing service providers approved by the Audit Committee and are generally characterized as Level 2 within the valuation hierarchy.
In a limited number of cases the Committee calculates a fair value for investments using broker quotations or other methods approved by the Audit Committee. When the Committee uses a single broker quotation to calculate a fair value for an investment without other significant observable inputs, or if a fair value is calculated using other significant inputs that are considered unobservable, the investment is characterized as Level 3 within the hierarchy. Other significant unobservable inputs used to calculate a fair value in these instances might include an income-based valuation approach which considers discounted anticipated future cash flows from the investment and application of discounts due to the nature or duration of any restrictions on the disposition of the investment.
Valuations based upon the use of inputs from Levels 1, 2 or 3 may not represent the actual price received upon the disposition of an investment, and the Funds may receive a price that is lower than the valuation based upon these inputs when it sells the investment.
Notes to Financial Statements, Continued
September 30, 2019
GOVERNMENT FUND
The following table displays a summary of the fair value hierarchy measurements of the Government Fund’s investments as of September 30, 2019:
| | Fair Value Measurements at September 30, 2019 |
| | TOTAL | LEVEL 1 | LEVEL 2 | LEVEL 3 |
| Assets | | | | |
| Investments in Securities | | | | |
| U.S. Treasury Securities | $ 24,254,654 | $ 24,254,654 | $ — | $ — |
| U.S. Government Agencies | 40,971,713 | — | 40,971,713 | — |
| Mortgage Backed | 143,371,073 | — | 143,371,073 | — |
| Corporate Bonds | 4,055,625 | — | 4,055,625 | — |
| Short-Term Investments | 29,019,000 | — | 29,019,000 | — |
| Total Investments in Securities | $241,672,065 | $24,254,654 | $217,417,411 | $— |
| Total Assets | $241,672,065 | $24,254,654 | $217,417,411 | $— |
INCOME FUND
The following table displays a summary of the fair value hierarchy measurements of the Income Fund’s investments as of September 30, 2019:
| | Fair Value Measurements at September 30, 2019 |
| | TOTAL | LEVEL 1 | LEVEL 2 | LEVEL 3 |
| Assets | | | | |
| Investments in Securities | | | | |
| U.S. Treasury Securities | $ 530,669,905 | $ 530,669,905 | $ — | $ — |
| U.S. Government Agencies | 59,211,093 | — | 55,978,279 | 3,232,814 |
| Other Government | 50,892,962 | — | 50,892,962 | — |
| Mortgage Backed | 1,173,621,204 | — | 1,173,621,204 | — |
| Asset Backed Securities | 881,464,038 | — | 876,182,451 | 5,281,587 |
| Corporate Bonds | ��� 2,440,740,755 | — | 2,413,502,139 | 27,238,616 |
| Loan Participations | 14,321,250 | — | 14,321,250 | — |
| Municipal Bonds | 87,321,321 | — | 87,321,321 | — |
| Short-Term Investments | 477,498,589 | — | 477,498,589 | — |
| Total Investments in Securities | $5,715,741,117 | $530,669,905 | $5,149,318,195 | $35,753,017(a)(b) |
| Total Assets | $5,715,741,117 | $530,669,905 | $5,149,318,195 | $35,753,017 |
| (a) | Level 3 investments at the beginning and/or end of the period in relation to net assets were not significant and accordingly, a reconciliation of Level 3 assets for the period ended September 30, 2019 is not presented. |
| (b) | During the fiscal year ended September 30, 2019, there were no significant transfers into or out of Level 3 of the fair value hierarchy. |
Notes to Financial Statements, Continued
September 30, 2019
LOW DURATION FUND
The following table displays a summary of the fair value hierarchy measurements of the Low Duration Fund’s investments as of September 30, 2019:
| | Fair Value Measurements at September 30, 2019 |
| | TOTAL | LEVEL 1 | LEVEL 2 | LEVEL 3 |
| Assets | | | | |
| Investments in Securities | | | | |
| U.S. Treasury Securities | $ 3,496,317 | $ 3,496,317 | $ — | $ — |
| U.S. Government Agencies | 1,159,749 | — | 1,159,749 | — |
| Mortgage Backed | 4,450,616 | — | 4,450,616 | — |
| Asset Backed Securities | 7,614,666 | — | 7,614,666 | — |
| Corporate Bonds | 11,313,465 | — | 11,313,465 | — |
| Municipal Bonds | 366,992 | — | 366,992 | — |
| Short-Term Investments | 4,400,701 | 4,400,701 | — | — |
| Total Investments in Securities | $32,802,506 | $7,897,018 | $24,905,488 | $— |
| Total Assets | $32,802,506 | $7,897,018 | $24,905,488 | $— |
NOTE 4 – INVESTMENT ADVISORY FEE AND OTHER TRANSACTIONS WITH AFFILIATES
Pursuant to an investment advisory agreement, the Advisor serves as the investment advisor and performs services for the Funds for which the fees are payable at the end of each month. Under the investment advisory agreement, a Fund pays the Advisor a management fee based on the average daily net assets of a Fund at an annual rate as shown in the following table:
| Management Fee Schedule |
| GOVERNMENT FUND | INCOME FUND | LOW DURATION FUND |
| DAILY NET ASSETS | FEE RATE | DAILY NET ASSETS | FEE RATE | DAILY NET ASSETS | FEE RATE |
| Up to $1 billion | 0.375% | Up to $500 million | 0.500% | Up to $1 Billion | 0.400% |
| Next $1 billion | 0.325 | Next $500 million | 0.450 | Next $500 million | 0.300 |
| Over $2 billion | 0.275 | Next $500 million | 0.400 | Next $500 million | 0.250 |
| | | Next $500 million | 0.350 | Over $2 billion | 0.225 |
| | | Over $2 billion | 0.275 | | |
The Government Fund’s effective management fee for the year ended September 30, 2019 was 0.375% of the Fund’s average daily net assets.
The Income Fund’s effective management fee for the year ended September 30, 2019 was 0.332% of the Fund’s average daily net assets.
The Low Duration Fund’s effective management fee for the year ended September 30, 2019 was 0.40% of the Fund’s average daily net assets (before applicable management fee waiver of $78,667).
Total management fees incurred by each fund for the year ended September 30, 2019 are set forth in the Statement of Operations.
The Trust has entered into an administrative services agreement with the Advisor, whereby the Advisor will perform certain administrative services related to each class of the Funds’ shares. The fees are computed as an annual percentage of the aggregate average daily net assets of all shares classes of all Funds in the Trust as follows:
| Administration Fee Schedule |
| Daily Net Assets | Fee Rate |
| Up to $20 billion | 0.100% |
| $20 billion to $40 billion | 0.075 |
| $40 billion to $60 billion | 0.040 |
| Over $60 billion | 0.030 |
Notes to Financial Statements, Continued
September 30, 2019
The aggregate fee amount is allocated on a daily basis to each Fund based on net assets and subsequently allocated to each class of shares of the Funds. Total administrative service fees incurred by each class of shares of the Funds for the year ended September 30, 2019, are set forth in the Statement of Operations.
The Trust has an underwriting agreement with Thornburg Securities Corporation (the “Distributor”), an affiliate of the Advisor, which acts as the distributor of the Funds’ shares. For the year ended September 30, 2019, the Distributor has advised the Funds that they earned net commissions from the sale of Class A shares and collected contingent deferred sales charges from redemptions of Class C shares as follows:
| | GOVERNMENT FUND | INCOME FUND | LOW DURATION FUND |
| Commissions | $ 638 | $ 2,936 | $ 88 |
| CDSC fees | $ 2,187 | $ 13,498 | $ — |
Pursuant to a service plan under Rule 12b-1 of the 1940 Act, the Funds may reimburse to the Distributor an amount not to exceed .25 of 1% per annum of the average daily net assets attributable to the applicable Class A, Class C, Class I, Class R3, Class R4, and Class R5 shares of the Government Fund and Income Fund and .20 of 1% per annum of the average daily net assets attributable to the applicable Class A and Class I of the Low Duration Fund for payments made by the Distributor to securities dealers and other financial institutions to obtain various shareholder and distribution related services. For the year ended September 30, 2019, there were no 12b-1 service plan fees charged for Class I or Class R5 shares. Class R6 shares are not subject to a service plan. The Advisor and Distributor each may pay out of its own resources additional expenses for distribution of each Fund’s shares and shareholder services.
The Trust has also adopted a distribution plan pursuant to Rule 12b-1, applicable to each Fund’s Class C and Class R3 shares, under which the Funds compensate the Distributor for services in promoting the sale of Class C and R3 shares of the Funds at an annual rate of up to .25 of 1% per annum of the average daily net assets attributable to Class C and Class R3 shares.
Total fees incurred by each class of shares of the Funds under their respective service and distribution plans for the year ended September 30, 2019, are set forth in the Statements of Operations.
The Advisor has contractually agreed to waive fees and reimburse expenses incurred by the Funds so that actual expenses of certain share classes do not exceed levels as specified in each Fund’s most recent prospectus (Government Fund: Class R3 shares, 0.99%; Class R4 shares, 0.99%; Class R5 shares, 0.67%; Income Fund: Class I shares, 0.49%; Class R3 shares, 0.99%; Class R4 shares, 0.99%; Class R5 shares, 0.49%; Class R6 shares, 0.42%; Low Duration Fund: Class A shares, 0.70%, Class I shares, 0.50%). The agreement may be terminated by the Funds at any time, but may not be terminated by the Advisor before February 1, 2020, unless the Advisor ceases to be the investment advisor to the Funds prior to that date. The Advisor may recoup amounts waived or reimbursed during the fiscal year ended September 30, 2019 if, during that year, expenses fall below the contractual limit that was in place at the time these fees and expenses were waived or reimbursed. The Advisor will not recoup fees or expenses as described in the preceding sentence if that recoupment would cause the Fund’s total annual operating expenses (after the recoupment is taken into account) to exceed the lesser of: (a) the expense cap that was in place at the time the waiver or reimbursement occurred; or (b) the expense cap that is in place at the time of the recoupment.
For the year ended September 30, 2019, the Advisor contractually reimbursed certain class specific expenses and distribution fees and voluntarily waived Fund level investment advisory fees as follows:
| | GOVERNMENT FUND | INCOME FUND | LOW DURATION FUND |
| Contractual: | | | |
| Class A | $ — | $ — | $ 61,308 |
| Class C | $ — | $ — | $ — |
| Class I | $ — | $ 1,105,976 | $ 53,618 |
| Class R3 | $ 39,712 | $ 58,303 | $ — |
| Class R4 | $ 18,027 | $ 22,264 | $ — |
| Class R5 | $ 16,917 | $ 209,312 | $ — |
| Class R6 | $ — | $ 26,594 | $ — |
| | GOVERNMENT FUND | INCOME FUND | LOW DURATION FUND |
| Voluntary: | | | |
| Class A | $ — | $ — | $ 19,971 |
| Class C | $57 | $— | $— |
| Class I | $ — | $ — | $ 58,696 |
Certain officers and Trustees of the Trust are also officers or directors of the Advisor and Distributor. The compensation of the independent Trustees is borne by the Trust. The Trust also pays a portion of the Chief Compliance Officer’s compensation. These amounts are reflected as Trustee and officer fees in the Statement of Operations.
Notes to Financial Statements, Continued
September 30, 2019
The percentage of direct investments in the Funds held by the Trustees, officers of the Trust, and the Advisor is approximately 8.21%, 0.12% and 28.87% for the Government Fund, Income Fund and Low Duration Fund, respectively.
The Funds may purchase or sell securities from or to an affiliated fund, provided the affiliation is due solely to having a common investment advisor, common officers, or common trustees, and provided that all such transactions will comply with Rule 17a-7 under the 1940 Act. For the year ended September 30, 2019, the Government Fund had no such transactions with affiliated funds. The Income Fund had transactions of $2,666,846 in purchases. The Low Duration Fund had transactions of $2,666,846 in sales generating realized gains of $30,049.
Shown below are holdings of voting securities of each portfolio company which is considered "affiliated" to the Funds under the 1940 Act, including companies for which the Funds’ holding represented 5% or more of the company’s voting securities, and a series of the Thornburg Investment Trust in which the Low Duration Fund invested for cash management purposes during the period:
| Fund | Market Value
9/30/18 | Purchases
at Cost | Sales
Proceeds | Realized
Gain
(Loss) | Change in
Unrealized
Appr./(Depr.) | Market Value
9/30/19 | Dividend
Income |
| Thornburg Capital Management Fund | $3,393,011 | $35,725,734 | $(34,718,044) | $- | $- | $4,400,701 | $86,209 |
NOTE 5 – SHARES OF BENEFICIAL INTEREST
At September 30, 2019, there were an unlimited number of shares with no par value of beneficial interest authorized. Transactions in shares of beneficial interest were as follows:
| GOVERNMENT FUND |
| | YEAR ENDED
September 30, 2019 | YEAR ENDED
September 30, 2018 |
| | SHARES | AMOUNT | SHARES | AMOUNT |
| Class A Shares | | | | |
| Shares sold | 1,721,046 | $ 22,033,056 | 1,099,905 | $ 14,065,102 |
Shares issued to shareholders in
reinvestment of dividends | 88,399 | 1,142,632 | 93,726 | 1,200,485 |
| Shares repurchased | (2,246,645) | (28,859,215) | (2,215,498) | (28,398,749) |
| Net decrease | (437,200) | $ (5,683,527) | (1,021,867) | $ (13,133,162) |
| Class C Shares | | | | |
| Shares sold | 318,393 | $ 4,102,384 | 166,565 | $ 2,149,930 |
Shares issued to shareholders in
reinvestment of dividends | 17,901 | 232,658 | 28,965 | 373,400 |
| Shares repurchased | (692,937) | (8,979,052) | (1,314,476) | (16,915,456) |
| Net decrease | (356,643) | $ (4,644,010) | (1,118,946) | $ (14,392,126) |
| Class I Shares | | | | |
| Shares sold | 3,482,631 | $ 44,982,797 | 4,630,618 | $ 59,387,148 |
Shares issued to shareholders in
reinvestment of dividends | 151,069 | 1,954,051 | 148,236 | 1,898,568 |
| Shares repurchased | (2,934,949) | (37,751,496) | (5,720,914) | (73,314,515) |
| Net increase (decrease) | 698,751 | $ 9,185,352 | (942,060) | $ (12,028,799) |
| Class R3 Shares | | | | |
| Shares sold | 225,399 | $ 2,909,281 | 158,351 | $ 2,034,020 |
Shares issued to shareholders in
reinvestment of dividends | 9,883 | 127,893 | 10,523 | 134,890 |
| Shares repurchased | (246,350) | (3,180,724) | (292,383) | (3,748,897) |
| Net decrease | (11,068) | $ (143,550) | (123,509) | $ (1,579,987) |
Notes to Financial Statements, Continued
September 30, 2019
| GOVERNMENT FUND (Continued) |
| | YEAR ENDED
September 30, 2019 | YEAR ENDED
September 30, 2018 |
| | SHARES | AMOUNT | SHARES | AMOUNT |
| Class R4 Shares | | | | |
| Shares sold | 63,299 | $ 813,546 | 52,835 | $ 677,337 |
Shares issued to shareholders in
reinvestment of dividends | 2,778 | 35,914 | 3,429 | 43,918 |
| Shares repurchased | (88,727) | (1,138,965) | (117,232) | (1,503,274) |
| Net decrease | (22,650) | $ (289,505) | (60,968) | $ (782,019) |
| Class R5 Shares | | | | |
| Shares sold | 184,589 | $ 2,382,395 | 42,582 | $ 548,472 |
Shares issued to shareholders in
reinvestment of dividends | 1,872 | 24,305 | 2,303 | 29,698 |
| Shares repurchased | (170,048) | (2,218,737) | (310,027) | (4,008,905) |
| Net increase (decrease) | 16,413 | $ 187,963 | (265,142) | $ (3,430,735) |
| INCOME FUND |
| | YEAR ENDED
September 30, 2019 | YEAR ENDED
September 30, 2018 |
| | SHARES | AMOUNT | SHARES | AMOUNT |
| Class A Shares | | | | |
| Shares sold | 13,748,857 | $ 184,402,206 | 12,078,839 | $ 160,306,743 |
Shares issued to shareholders in
reinvestment of dividends | 1,084,259 | 14,505,433 | 1,178,150 | 15,633,345 |
| Shares repurchased | (19,129,192) | (254,871,606) | (27,847,379) | (369,477,251) |
| Net decrease | (4,296,076) | $ (55,963,967) | (14,590,390) | $ (193,537,163) |
| Class C Shares | | | | |
| Shares sold | 3,281,161 | $ 43,830,555 | 3,244,802 | $ 43,127,640 |
Shares issued to shareholders in
reinvestment of dividends | 615,065 | 8,208,672 | 698,398 | 9,250,695 |
| Shares repurchased | (11,120,955) | (148,187,445) | (12,824,015) | (169,829,813) |
| Net decrease | (7,224,729) | $ (96,148,218) | (8,880,815) | $ (117,451,478) |
| Class I Shares | | | | |
| Shares sold | 131,962,699 | $ 1,761,668,144 | 117,645,362 | $ 1,562,648,935 |
Shares issued to shareholders in
reinvestment of dividends | 7,121,081 | 95,348,794 | 5,803,751 | 76,986,129 |
| Shares repurchased | (91,879,373) | (1,223,804,494) | (83,909,122) | (1,113,109,315) |
| Net increase | 47,204,407 | $ 633,212,444 | 39,539,991 | $ 526,525,749 |
| Class R3 Shares | | | | |
| Shares sold | 3,355,494 | $ 44,478,093 | 3,135,687 | $ 41,637,292 |
Shares issued to shareholders in
reinvestment of dividends | 132,659 | 1,772,552 | 130,756 | 1,735,498 |
| Shares repurchased | (5,469,939) | (72,837,641) | (3,753,356) | (49,813,844) |
| Net decrease | (1,981,786) | $ (26,586,996) | (486,913) | $ (6,441,054) |
| Class R4 Shares | | | | |
| Shares sold | 364,786 | $ 4,838,911 | 200,886 | $ 2,665,572 |
Shares issued to shareholders in
reinvestment of dividends | 8,707 | 116,439 | 6,258 | 82,958 |
| Shares repurchased | (385,528) | (5,170,028) | (204,900) | (2,710,717) |
| Net increase (decrease) | (12,035) | $ (214,678) | 2,244 | $ 37,813 |
Notes to Financial Statements, Continued
September 30, 2019
| INCOME FUND (Continued) |
| | YEAR ENDED
September 30, 2019 | YEAR ENDED
September 30, 2018 |
| | SHARES | AMOUNT | SHARES | AMOUNT |
| Class R5 Shares | | | | |
| Shares sold | 6,573,404 | $ 87,102,928 | 3,375,058 | $ 44,760,496 |
Shares issued to shareholders in
reinvestment of dividends | 229,191 | 3,061,860 | 187,976 | 2,492,025 |
| Shares repurchased | (7,572,567) | (100,538,226) | (2,480,942) | (32,932,756) |
| Net increase (decrease) | (769,972) | $ (10,373,438) | 1,082,092 | $ 14,319,765 |
| Class R6 Shares | | | | |
| Shares sold | 4,265,546 | $ 57,037,358 | 2,493,017 | $ 33,131,663 |
Shares issued to shareholders in
reinvestment of dividends | 91,789 | 1,232,605 | 25,652 | 339,948 |
| Shares repurchased | (2,169,399) | (28,866,795) | (333,838) | (4,435,942) |
| Net increase | 2,187,936 | $ 29,403,168 | 2,184,831 | $ 29,035,669 |
| LOW DURATION FUND |
| | YEAR ENDED
September 30, 2019 | YEAR ENDED
September 30, 2018 |
| | SHARES | AMOUNT | SHARES | AMOUNT |
| Class A Shares | | | | |
| Shares sold | 469,668 | $ 5,773,137 | 262,967 | $ 3,246,041 |
Shares issued to shareholders in
reinvestment of dividends | 15,917 | 197,238 | 10,348 | 127,521 |
| Shares repurchased | (425,106) | (5,249,049) | (218,266) | (2,690,124) |
| Net increase | 60,479 | $ 721,326 | 55,049 | $ 683,438 |
| Class I Shares | | | | |
| Shares sold | 2,398,897 | $ 29,598,268 | 1,058,651 | $ 13,051,377 |
Shares issued to shareholders in
reinvestment of dividends | 46,385 | 574,411 | 23,119 | 284,692 |
| Shares repurchased | (2,305,834) | (28,502,243) | (265,402) | (3,272,812) |
| Net increase | 139,448 | $ 1,670,436 | 816,368 | $ 10,063,257 |
NOTE 6 – INVESTMENT TRANSACTIONS
For the year ended September 30, 2019, the Government Fund had purchase and sale transactions of investments (excluding short-term investments) of $79,287,935 and $61,385,218, respectively.
The Income Fund had purchase and sale transactions of investments (excluding short-term investments and U.S. Government obligations) of $2,854,250,102 and $2,066,820,270, respectively.
The Low Duration Fund had purchase and sale transactions of investments (excluding short-term investments and U.S. Government obligations) of $30,050,007 and $23,408,621, respectively.
NOTE 7 – RECENT ACCOUNTING PRONOUNCEMENTS
In August 2018, the FASB issued ASU 2018-13, Fair Value Measurement (Topic 820): Changes to the Disclosure Requirements for Fair Value Measurement, which adds, removes, and modifies certain aspects of the fair value disclosure. ASU 2018-13 is effective for annual periods beginning after December 15, 2019, and early adoption is permitted. The Funds have elected to early adopt, and had applied ASU 2018-13 for the fiscal year ended September 30, 2019. The adoption of this accounting guidance did not have a material impact on the Funds’ financial statements.
Notes to Financial Statements, Continued
September 30, 2019
In March 2017, the FASB issued Accounting Standards Update (ASU) 2017-08, Premium Amortization of Purchased Callable Debt Securities. The amendments in the ASU shorten the premium amortization period on a purchased callable debt security from the security’s contractual life to the earliest call date. It is anticipated that this change will enhance disclosures by reducing losses recognized when a security is called on an earlier date. This ASU is effective for fiscal years beginning after December 15, 2018. Management has evaluated the implications of these changes and the amendments will have no material effect on the Funds’ net assets or results of operations.
OTHER NOTES
Risks: Each Fund’s investments subject it to risks including, but not limited to, management risk, interest rate risk, prepayment risk, credit risk, market and economic risk, liquidity risk, structured products risk and, in the case of Income Fund and Low Duration Fund, risks affecting specific issuers and foreign investment risk. Please see each Fund’s prospectus for a discussion of the risks associated with an investment in the Funds.
Subsequent Events: Fund management believes no events have occurred between September 30, 2019 and the date of issuance of the financial statements that require adjustment to or disclosure in the accompanying financial statements.
This page intentionally left blank.
Financial Highlights
Thornburg Limited Term U.S. Government Fund
| | PER SHARE PERFORMANCE (FOR A SHARE OUTSTANDING THROUGHOUT THE YEAR) |
UNLESS OTHERWISE
NOTED, PERIODS ARE
FISCAL YEARS ENDED
SEPTEMBER 30, | Net Asset
Value,
Beginning of
PERIOD | Net
Investment
Income
(Loss)+ | Net Realized &
Unrealized Gain
(Loss) on
Investments | Total from
Investment
Operations | Dividends
from Net
Investment
Income | Dividends
from Net
Realized
Gains | Total
Dividends | Net Asset
Value,
End of PERIOD |
| CLASS A SHARES(b) |
| 2019 | $ 12.69 | 0.19 | 0.45 | 0.64 | (0.23) | — | (0.23) | $ 13.10 |
| 2018 | $ 13.01 | 0.18 | (0.28) | (0.10) | (0.22) | — | (0.22) | $ 12.69 |
| 2017 | $ 13.25 | 0.14 | (0.20) | (0.06) | (0.18) | — | (0.18) | $ 13.01 |
| 2016(c) | $ 13.26 | 0.14 | 0.05 | 0.19 | (0.20) | — | (0.20) | $ 13.25 |
| 2015 | $ 13.27 | 0.15 | 0.06 | 0.21 | (0.22) | — | (0.22) | $ 13.26 |
| CLASS C SHARES |
| 2019 | $ 12.77 | 0.15 | 0.43 | 0.58 | (0.18) | — | (0.18) | $ 13.17 |
| 2018 | $ 13.09 | 0.14 | (0.28) | (0.14) | (0.18) | — | (0.18) | $ 12.77 |
| 2017 | $ 13.33 | 0.10 | (0.20) | (0.10) | (0.14) | — | (0.14) | $ 13.09 |
| 2016 | $ 13.34 | 0.11 | 0.04 | 0.15 | (0.16) | — | (0.16) | $ 13.33 |
| 2015 | $ 13.35 | 0.12 | 0.06 | 0.18 | (0.19) | — | (0.19) | $ 13.34 |
| CLASS I SHARES |
| 2019 | $ 12.69 | 0.23 | 0.44 | 0.67 | (0.26) | — | (0.26) | $ 13.10 |
| 2018 | $ 13.01 | 0.22 | (0.28) | (0.06) | (0.26) | — | (0.26) | $ 12.69 |
| 2017 | $ 13.26 | 0.18 | (0.20) | (0.02) | (0.23) | — | (0.23) | $ 13.01 |
| 2016 | $ 13.26 | 0.19 | 0.05 | 0.24 | (0.24) | — | (0.24) | $ 13.26 |
| 2015 | $ 13.27 | 0.19 | 0.06 | 0.25 | (0.26) | — | (0.26) | $ 13.26 |
| CLASS R3 SHARES |
| 2019 | $ 12.70 | 0.18 | 0.44 | 0.62 | (0.22) | — | (0.22) | $ 13.10 |
| 2018 | $ 13.02 | 0.17 | (0.28) | (0.11) | (0.21) | — | (0.21) | $ 12.70 |
| 2017 | $ 13.26 | 0.13 | (0.19) | (0.06) | (0.18) | — | (0.18) | $ 13.02 |
| 2016 | $ 13.27 | 0.14 | 0.04 | 0.18 | (0.19) | — | (0.19) | $ 13.26 |
| 2015 | $ 13.28 | 0.14 | 0.06 | 0.20 | (0.21) | — | (0.21) | $ 13.27 |
| CLASS R4 SHARES |
| 2019 | $ 12.69 | 0.18 | 0.43 | 0.61 | (0.21) | — | (0.21) | $ 13.09 |
| 2018 | $ 13.01 | 0.17 | (0.28) | (0.11) | (0.21) | — | (0.21) | $ 12.69 |
| 2017 | $ 13.25 | 0.12 | (0.19) | (0.07) | (0.17) | — | (0.17) | $ 13.01 |
| 2016 | $ 13.26 | 0.14 | 0.04 | 0.18 | (0.19) | — | (0.19) | $ 13.25 |
| 2015 | $ 13.27 | 0.13 | 0.08 | 0.21 | (0.22) | — | (0.22) | $ 13.26 |
| CLASS R5 SHARES |
| 2019 | $ 12.70 | 0.23 | 0.44 | 0.67 | (0.26) | — | (0.26) | $ 13.11 |
| 2018 | $ 13.02 | 0.21 | (0.28) | (0.07) | (0.25) | — | (0.25) | $ 12.70 |
| 2017 | $ 13.28 | 0.18 | (0.21) | (0.03) | (0.23) | — | (0.23) | $ 13.02 |
| 2016 | $ 13.27 | 0.17 | 0.07 | 0.24 | (0.23) | — | (0.23) | $ 13.28 |
| 2015 | $ 13.27 | 0.19 | 0.07 | 0.26 | (0.26) | — | (0.26) | $ 13.27 |
| (a) | Not annualized for periods less than one year. |
| (b) | Sales loads are not reflected in computing total return. |
| (c) | Class B shares converted to Class A shares on August 29, 2016. |
| (d) | Due to the size of net assets and fixed expenses, ratios may appear disproportionate. |
| + | Based on weighted average shares outstanding. |
See notes to financial statements.
Financial Highlights, Continued
Thornburg Limited Term U.S. Government Fund
| RATIOS TO AVERAGE NET ASSETS | | SUPPLEMENTAL DATA |
Net Investment
Income (Loss) (%) | Expenses, After
Expense
Reductions (%) | Expenses,
Before Expense
Reductions (%) | | Total
Return (%)(a) | Portfolio
Turnover
Rate (%)(a) | Net Assets
at End of PERIOD
(Thousands) |
| |
| 1.48 | 0.90 | 0.90 | | 5.06 | 29.37 | $ 66,140 |
| 1.42 | 0.91 | 0.91 | | (0.77) | 5.93 | $ 69,634 |
| 1.03 | 0.93 | 0.93 | | (0.43) | 11.05 | $ 84,674 |
| 1.08 | 0.91 | 0.91 | | 1.41 | 9.78 | $ 111,874 |
| 1.15 | 0.92 | 0.92 | | 1.62 | 14.15 | $ 104,933 |
| |
| 1.13 | 1.24 | 1.24 | | 4.60 | 29.37 | $ 15,618 |
| 1.10 | 1.23 | 1.23 | | (1.08) | 5.93 | $ 19,686 |
| 0.73 | 1.23 | 1.24 | | (0.72) | 11.05 | $ 34,821 |
| 0.81 | 1.19 | 1.20 | | 1.13 | 9.78 | $ 48,369 |
| 0.88 | 1.20 | 1.21 | | 1.34 | 14.15 | $ 46,777 |
| |
| 1.76 | 0.62 | 0.62 | | 5.35 | 29.37 | $ 145,273 |
| 1.73 | 0.60 | 0.60 | | (0.47) | 5.93 | $ 131,898 |
| 1.36 | 0.60 | 0.60 | | (0.18) | 11.05 | $ 147,464 |
| 1.43 | 0.57 | 0.57 | | 1.83 | 9.78 | $ 144,437 |
| 1.45 | 0.62 | 0.62 | | 1.93 | 14.15 | $ 112,853 |
| |
| 1.39 | 0.99 | 1.43 | | 4.88 | 29.37 | $ 9,181 |
| 1.34 | 0.99 | 1.45 | | (0.85) | 5.93 | $ 9,036 |
| 1.00 | 0.97 | 1.40 | | (0.47) | 11.05 | $ 10,871 |
| 1.03 | 0.98 | 1.30 | | 1.34 | 9.78 | $ 28,036 |
| 1.09 | 0.99 | 1.35 | | 1.55 | 14.15 | $ 16,320 |
| |
| 1.38 | 0.99 | 1.78 | | 4.88 | 29.37 | $ 2,293 |
| 1.35 | 0.99 | 1.75 | | (0.85) | 5.93 | $ 2,509 |
| 0.96 | 0.99 | 1.95 | | (0.49) | 11.05 | $ 3,365 |
| 1.04 | 0.99 | 2.71 | | 1.33 | 9.78 | $ 2,097 |
| 1.00 | 0.99 | 17.30(d) | | 1.55 | 14.15 | $ 706 |
| |
| 1.80 | 0.67 | 2.04 | | 5.29 | 29.37 | $ 897 |
| 1.60 | 0.65 | 1.94 | | (0.52) | 5.93 | $ 661 |
| 1.40 | 0.58 | 1.21 | | (0.23) | 11.05 | $ 4,131 |
| 1.30 | 0.67 | 2.05 | | 1.80 | 9.78 | $ 570 |
| 1.40 | 0.67 | 2.02 | | 1.95 | 14.15 | $ 2,170 |
Financial Highlights
Thornburg Limited Term Income Fund
| | PER SHARE PERFORMANCE (FOR A SHARE OUTSTANDING THROUGHOUT THE YEAR) |
UNLESS OTHERWISE
NOTED, PERIODS ARE
FISCAL YEARS ENDED
SEPTEMBER 30, | Net Asset
Value,
Beginning of
PERIOD | Net
Investment
Income
(Loss)+ | Net Realized &
Unrealized Gain
(Loss) on
Investments | Total from
Investment
Operations | Dividends
from Net
Investment
Income | Dividends
from Net
Realized
Gains | Total
Dividends | Net Asset
Value,
End of PERIOD |
| CLASS A SHARES(b) |
| 2019 | $ 13.16 | 0.33 | 0.45 | 0.78 | (0.33) | — | (0.33) | $ 13.61 |
| 2018 | $ 13.44 | 0.28 | (0.27) | 0.01 | (0.29) | — | (0.29) | $ 13.16 |
| 2017 | $ 13.51 | 0.24 | (0.07) | 0.17 | (0.24) | — | (0.24) | $ 13.44 |
| 2016 | $ 13.32 | 0.24 | 0.20 | 0.44 | (0.25) | — | (0.25) | $ 13.51 |
| 2015 | $ 13.49 | 0.26 | (0.09) | 0.17 | (0.27) | (0.07) | (0.34) | $ 13.32 |
| CLASS C SHARES |
| 2019 | $ 13.14 | 0.30 | 0.46 | 0.76 | (0.31) | — | (0.31) | $ 13.59 |
| 2018 | $ 13.42 | 0.25 | (0.27) | (0.02) | (0.26) | — | (0.26) | $ 13.14 |
| 2017 | $ 13.49 | 0.21 | (0.06) | 0.15 | (0.22) | — | (0.22) | $ 13.42 |
| 2016 | $ 13.30 | 0.21 | 0.20 | 0.41 | (0.22) | — | (0.22) | $ 13.49 |
| 2015 | $ 13.47 | 0.23 | (0.09) | 0.14 | (0.24) | (0.07) | (0.31) | $ 13.30 |
| CLASS I SHARES |
| 2019 | $ 13.16 | 0.37 | 0.47 | 0.84 | (0.38) | — | (0.38) | $ 13.62 |
| 2018 | $ 13.44 | 0.33 | (0.28) | 0.05 | (0.33) | — | (0.33) | $ 13.16 |
| 2017 | $ 13.52 | 0.29 | (0.08) | 0.21 | (0.29) | — | (0.29) | $ 13.44 |
| 2016 | $ 13.33 | 0.29 | 0.20 | 0.49 | (0.30) | — | (0.30) | $ 13.52 |
| 2015 | $ 13.49 | 0.31 | (0.08) | 0.23 | (0.32) | (0.07) | (0.39) | $ 13.33 |
| CLASS R3 SHARES |
| 2019 | $ 13.17 | 0.30 | 0.47 | 0.77 | (0.31) | — | (0.31) | $ 13.63 |
| 2018 | $ 13.45 | 0.26 | (0.27) | (0.01) | (0.27) | — | (0.27) | $ 13.17 |
| 2017 | $ 13.52 | 0.22 | (0.06) | 0.16 | (0.23) | — | (0.23) | $ 13.45 |
| 2016 | $ 13.33 | 0.23 | 0.20 | 0.43 | (0.24) | — | (0.24) | $ 13.52 |
| 2015 | $ 13.50 | 0.24 | (0.09) | 0.15 | (0.25) | (0.07) | (0.32) | $ 13.33 |
| CLASS R4 SHARES |
| 2019 | $ 13.16 | 0.30 | 0.46 | 0.76 | (0.31) | — | (0.31) | $ 13.61 |
| 2018 | $ 13.43 | 0.26 | (0.26) | —(c) | (0.27) | — | (0.27) | $ 13.16 |
| 2017 | $ 13.51 | 0.22 | (0.07) | 0.15 | (0.23) | — | (0.23) | $ 13.43 |
| 2016 | $ 13.32 | 0.23 | 0.20 | 0.43 | (0.24) | — | (0.24) | $ 13.51 |
| 2015 | $ 13.48 | 0.24 | (0.08) | 0.16 | (0.25) | (0.07) | (0.32) | $ 13.32 |
| CLASS R5 SHARES |
| 2019 | $ 13.16 | 0.36 | 0.46 | 0.82 | (0.37) | — | (0.37) | $ 13.61 |
| 2018 | $ 13.44 | 0.31 | (0.28) | 0.03 | (0.31) | — | (0.31) | $ 13.16 |
| 2017 | $ 13.51 | 0.27 | (0.07) | 0.20 | (0.27) | — | (0.27) | $ 13.44 |
| 2016 | $ 13.32 | 0.27 | 0.20 | 0.47 | (0.28) | — | (0.28) | $ 13.51 |
| 2015 | $ 13.49 | 0.29 | (0.09) | 0.20 | (0.30) | (0.07) | (0.37) | $ 13.32 |
| CLASS R6 SHARES |
| 2019 | $ 13.19 | 0.38 | 0.46 | 0.84 | (0.39) | — | (0.39) | $ 13.64 |
| 2018 | $ 13.46 | 0.35 | (0.28) | 0.07 | (0.34) | — | (0.34) | $ 13.19 |
| 2017(d) | $ 13.40 | 0.15 | 0.11 | 0.26 | (0.20) | — | (0.20) | $ 13.46 |
| (a) | Not annualized for periods less than one year. |
| (b) | Sales loads are not reflected in computing total return. |
| (c) | Total from investment operations was less than $0.01 per share. |
| (d) | Effective date of this class of shares was April 10, 2017. |
| (e) | Annualized. |
| (f) | Due to the size of net assets and fixed expenses, ratios may appear disproportionate. |
| + | Based on weighted average shares outstanding. |
See notes to financial statements.
Financial Highlights, Continued
Thornburg Limited Term Income Fund
| RATIOS TO AVERAGE NET ASSETS | | SUPPLEMENTAL DATA |
Net Investment
Income (Loss) (%) | Expenses, After
Expense
Reductions (%) | Expenses,
Before Expense
Reductions (%) | | Total
Return (%)(a) | Portfolio
Turnover
Rate (%)(a) | Net Assets
at End of PERIOD
(Thousands) |
| |
| 2.44 | 0.81 | 0.81 | | 6.03 | 43.22 | $ 645,383 |
| 2.12 | 0.84 | 0.84 | | 0.09 | 33.62 | $ 680,473 |
| 1.76 | 0.87 | 0.87 | | 1.31 | 26.90 | $ 890,990 |
| 1.82 | 0.86 | 0.86 | | 3.36 | 20.56 | $ 1,111,441 |
| 1.94 | 0.87 | 0.87 | | 1.27 | 18.71 | $ 977,470 |
| |
| 2.24 | 1.02 | 1.02 | | 5.82 | 43.22 | $ 356,205 |
| 1.91 | 1.05 | 1.05 | | (0.13) | 33.62 | $ 439,305 |
| 1.56 | 1.08 | 1.08 | | 1.10 | 26.90 | $ 567,771 |
| 1.59 | 1.08 | 1.08 | | 3.13 | 20.56 | $ 667,680 |
| 1.71 | 1.10 | 1.10 | | 1.04 | 18.71 | $ 611,555 |
| |
| 2.75 | 0.50 | 0.53 | | 6.44 | 43.22 | $ 4,455,457 |
| 2.46 | 0.51 | 0.51 | | 0.41 | 33.62 | $ 3,685,859 |
| 2.14 | 0.50 | 0.50 | | 1.61 | 26.90 | $ 3,232,277 |
| 2.17 | 0.50 | 0.50 | | 3.73 | 20.56 | $ 2,792,249 |
| 2.29 | 0.52 | 0.52 | | 1.71 | 18.71 | $ 1,982,536 |
| |
| 2.27 | 0.99 | 1.06 | | 5.84 | 43.22 | $ 64,335 |
| 1.98 | 0.99 | 1.09 | | (0.06) | 33.62 | $ 88,298 |
| 1.65 | 0.99 | 1.12 | | 1.19 | 26.90 | $ 96,715 |
| 1.69 | 0.98 | 1.10 | | 3.23 | 20.56 | $ 104,309 |
| 1.82 | 0.99 | 1.11 | | 1.16 | 18.71 | $ 172,992 |
| |
| 2.27 | 0.99 | 1.23 | | 5.84 | 43.22 | $ 8,073 |
| 1.98 | 0.99 | 1.45 | | 0.01 | 33.62 | $ 7,962 |
| 1.65 | 0.99 | 1.56 | | 1.11 | 26.90 | $ 8,101 |
| 1.70 | 0.99 | 1.97 | | 3.23 | 20.56 | $ 6,328 |
| 1.82 | 0.98 | 1.66 | | 1.24 | 18.71 | $ 3,908 |
| |
| 2.70 | 0.56 | 0.74 | | 6.31 | 43.22 | $ 106,753 |
| 2.31 | 0.67 | 0.69 | | 0.26 | 33.62 | $ 113,333 |
| 1.99 | 0.65 | 0.67 | | 1.53 | 26.90 | $ 101,189 |
| 2.05 | 0.62 | 0.72 | | 3.60 | 20.56 | $ 71,864 |
| 2.17 | 0.64 | 0.67 | | 1.50 | 18.71 | $ 96,326 |
| |
| 2.82 | 0.43 | 0.49 | | 6.43 | 43.22 | $ 60,440 |
| 2.62 | 0.45 | 0.57 | | 0.56 | 33.62 | $ 29,568 |
| 2.28(e) | 0.45(e) | 24.38(e)(f) | | 1.92 | 26.90 | $ 770 |
Financial Highlights
Thornburg Low Duration Income Fund
| | PER SHARE PERFORMANCE (FOR A SHARE OUTSTANDING THROUGHOUT THE YEAR) |
UNLESS OTHERWISE
NOTED, PERIODS ARE
FISCAL YEARS ENDED
SEPTEMBER 30, | Net Asset
Value,
Beginning of
PERIOD | Net
Investment
Income
(Loss)+ | Net Realized &
Unrealized Gain
(Loss) on
Investments | Total from
Investment
Operations | Dividends
from Net
Investment
Income | Dividends
from Net
Realized
Gains | Total
Dividends | Net Asset
Value,
End of PERIOD |
| CLASS A SHARES(b) |
| 2019 | $ 12.29 | 0.28 | 0.21 | 0.49 | (0.29) | — | (0.29) | $ 12.49 |
| 2018 | $ 12.42 | 0.22 | (0.13) | 0.09 | (0.22) | — | (0.22) | $ 12.29 |
| 2017 | $ 12.46 | 0.16 | (0.03) | 0.13 | (0.17) | — | (0.17) | $ 12.42 |
| 2016 | $ 12.38 | 0.11 | 0.09 | 0.20 | (0.12) | — | (0.12) | $ 12.46 |
| 2015 | $ 12.38 | 0.08 | —(c) | 0.08 | (0.08) | — | (0.08) | $ 12.38 |
| CLASS I SHARES |
| 2019 | $ 12.28 | 0.31 | 0.20 | 0.51 | (0.31) | — | (0.31) | $ 12.48 |
| 2018 | $ 12.41 | 0.24 | (0.12) | 0.12 | (0.25) | — | (0.25) | $ 12.28 |
| 2017 | $ 12.45 | 0.18 | (0.03) | 0.15 | (0.19) | — | (0.19) | $ 12.41 |
| 2016 | $ 12.37 | 0.14 | 0.08 | 0.22 | (0.14) | — | (0.14) | $ 12.45 |
| 2015 | $ 12.38 | 0.11 | (0.01) | 0.10 | (0.11) | — | (0.11) | $ 12.37 |
| (a) | Not annualized for periods less than one year. |
| (b) | Sales loads are not reflected in computing total return. |
| (c) | Net realized and unrealized gain (loss) on investments was less than $0.01 per share. |
| + | Based on weighted average shares outstanding. |
See notes to financial statements.
Financial Highlights, Continued
Thornburg Low Duration Income Fund
| RATIOS TO AVERAGE NET ASSETS | | SUPPLEMENTAL DATA |
Net Investment
Income (Loss) (%) | Expenses, After
Expense
Reductions (%) | Expenses,
Before Expense
Reductions (%) | | Total
Return (%)(a) | Portfolio
Turnover
Rate (%)(a) | Net Assets
at End of PERIOD
(Thousands) |
| |
| 2.28 | 0.70 | 1.65 | | 4.00 | 79.59 | $ 8,012 |
| 1.75 | 0.70 | 1.82 | | 0.75 | 20.93 | $ 7,140 |
| 1.30 | 0.65 | 1.77 | | 1.03 | 34.79 | $ 6,532 |
| 0.89 | 0.69 | 1.74 | | 1.60 | 42.99 | $ 10,235 |
| 0.67 | 0.70 | 2.10 | | 0.68 | 29.22 | $ 9,940 |
| |
| 2.47 | 0.50 | 0.94 | | 4.21 | 79.59 | $ 24,858 |
| 1.96 | 0.50 | 1.09 | | 0.95 | 20.93 | $ 22,748 |
| 1.46 | 0.50 | 1.03 | | 1.19 | 34.79 | $ 12,854 |
| 1.15 | 0.48 | 1.18 | | 1.81 | 42.99 | $ 17,106 |
| 0.87 | 0.50 | 1.89 | | 0.80 | 29.22 | $ 8,056 |
Report of Independent Registered Public Accounting Firm
To the Board of Trustees of Thornburg Investment Trust and Shareholders of
Thornburg Limited Term U.S. Government Fund,
Thornburg Limited Term Income Fund, and
Thornburg Low Duration Income Fund
Opinions on the Financial Statements
We have audited the accompanying statements of assets and liabilities, including the schedules of investments, of Thornburg Limited Term U.S. Government Fund, Thornburg Limited Term Income Fund, and Thornburg Low Duration Income Fund (three of the funds constituting Thornburg Investment Trust, hereafter collectively referred to as the "Funds") as of September 30, 2019, the related statements of operations for the year ended September 30, 2019, the statements of changes in net assets for each of the two years in the period ended September 30, 2019, including the related notes, and the financial highlights for each of the periods indicated therein (collectively referred to as the “financial statements”). In our opinion, the financial statements present fairly, in all material respects, the financial position of the Funds as of September 30, 2019, the results of each of their operations for the year then ended, the changes in each of their net assets for each of the two years in the period ended September 30, 2019 and each of the financial highlights for each of the periods indicated therein in conformity with accounting principles generally accepted in the United States of America.
Basis for Opinions
These financial statements are the responsibility of the Funds’ management. Our responsibility is to express an opinion on the Funds’ financial statements based on our audits. We are a public accounting firm registered with the Public Company Accounting Oversight Board (United States) (PCAOB) and are required to be independent with respect to the Funds in accordance with the U.S. federal securities laws and the applicable rules and regulations of the Securities and Exchange Commission and the PCAOB.
We conducted our audits of these financial statements in accordance with the standards of the PCAOB. Those standards require that we plan and perform the audit to obtain reasonable assurance about whether the financial statements are free of material misstatement, whether due to error or fraud.
Our audits included performing procedures to assess the risks of material misstatement of the financial statements, whether due to error or fraud, and performing procedures that respond to those risks. Such procedures included examining, on a test basis, evidence regarding the amounts and disclosures in the financial statements. Our audits also included evaluating the accounting principles used and significant estimates made by management, as well as evaluating the overall presentation of the financial statements. Our procedures included confirmation of securities owned as of September 30, 2019 by correspondence with the custodian, transfer agent, agent banks and brokers; when replies were not received from brokers, we performed other auditing procedures. We believe that our audits provide a reasonable basis for our opinions.
/s/PricewaterhouseCoopers LLP
New York, New York
November 22, 2019
We have served as the auditor of one or more investment companies in Thornburg Investment Trust since 1999.
Expense Example
September 30, 2019 (Unaudited)
As a shareholder of the Fund, you incur two types of costs:
| (1) | transaction costs, including |
| (a) | sales charges (loads) on purchase payments, for Class A shares; |
| (b) | a deferred sales charge on redemptions of any part or all of a purchase of $1 million of Class A shares within 12 months of purchase; |
| (c) | a deferred sales charge on redemptions of Class C shares within 12 months of purchase; |
| (2) | ongoing costs, including management fees; distribution and/or service (12b-1) fees; and other Fund expenses. |
This example is intended to help you understand your ongoing costs (in dollars) of investing in the Fund and to compare these costs with the ongoing costs of investing in other mutual funds.
The example is based on a $1,000 investment beginning on April 1, 2019, and held until September 30, 2019.
ACTUAL EXPENSES
For each class of shares, the first line of the accompanying table provides information about actual account values and actual expenses. You may use the information in this line, together with the amount you invested, to estimate the expenses that you paid over the period. Simply divide your account value by $1,000 (for example, an $8,600 account value divided by $1,000 = 8.6), then multiply the result by the number in the first line for your class of shares under the heading entitled “Expenses Paid During Period” to estimate the expenses you paid on your account during this period.
HYPOTHETICAL EXAMPLE FOR COMPARISON PURPOSES
For each class of shares, the second line of the accompanying table provides information about hypothetical account values and hypothetical expenses based on the Fund’s actual expense ratio and an assumed rate of return of 5% per year before expenses, which is not the Fund’s actual return. The hypothetical account values and expenses may not be used to estimate the actual ending account balance or expenses you paid for the period. You may use this information to compare the ongoing costs of investing in the Fund and other funds. To do so, compare this 5% hypothetical example with the 5% hypothetical examples that appear in the shareholder reports of the other funds.
Please note that the expenses shown in the table are meant to highlight your ongoing costs only and do not reflect any transactional costs, such as sales charges (loads), redemption fees, or exchange fees. Therefore, the second line of the table for each class of shares is useful in comparing ongoing costs only, and will not help you determine the relative total costs of owning different funds. In addition, if these transactional costs were included, your costs would have been higher.
| | BEGINNING
ACCOUNT VALUE
4/1/19 | ENDING
ACCOUNT VALUE
9/30/19 | EXPENSES PAID
DURING PERIOD†
4/1/19—9/30/19 |
| LIMITED TERM U.S. GOVERNMENT FUND |
| CLASS A SHARES |
| Actual | $1,000.00 | $1,022.90 | $4.61 |
| Hypothetical* | $1,000.00 | $1,020.51 | $4.61 |
| CLASS C SHARES |
| Actual | $1,000.00 | $1,020.34 | $6.28 |
| Hypothetical* | $1,000.00 | $1,018.85 | $6.28 |
| CLASS I SHARES |
| Actual | $1,000.00 | $1,024.41 | $3.10 |
| Hypothetical* | $1,000.00 | $1,022.01 | $3.09 |
| CLASS R3 SHARES |
| Actual | $1,000.00 | $1,021.69 | $5.02 |
| Hypothetical* | $1,000.00 | $1,020.10 | $5.01 |
| CLASS R4 SHARES |
| Actual | $1,000.00 | $1,021.70 | $5.02 |
| Hypothetical* | $1,000.00 | $1,020.10 | $5.01 |
| CLASS R5 SHARES |
| Actual | $1,000.00 | $1,024.09 | $3.40 |
| Hypothetical* | $1,000.00 | $1,021.71 | $3.40 |
| LIMITED TERM INCOME FUND |
| CLASS A SHARES |
| Actual | $1,000.00 | $1,029.07 | $4.02 |
| Hypothetical* | $1,000.00 | $1,021.11 | $4.00 |
| CLASS C SHARES |
| Actual | $1,000.00 | $1,027.99 | $5.13 |
| Hypothetical* | $1,000.00 | $1,020.00 | $5.11 |
| CLASS I SHARES |
| Actual | $1,000.00 | $1,031.38 | $2.50 |
| Hypothetical* | $1,000.00 | $1,022.61 | $2.48 |
| CLASS R3 SHARES |
| Actual | $1,000.00 | $1,028.03 | $5.03 |
| Hypothetical* | $1,000.00 | $1,020.10 | $5.01 |
| CLASS R4 SHARES |
| Actual | $1,000.00 | $1,028.82 | $5.04 |
| Hypothetical* | $1,000.00 | $1,020.10 | $5.01 |
| CLASS R5 SHARES |
| Actual | $1,000.00 | $1,030.62 | $2.49 |
| Hypothetical* | $1,000.00 | $1,022.61 | $2.48 |
| CLASS R6 SHARES |
| Actual | $1,000.00 | $1,030.95 | $2.14 |
| Hypothetical* | $1,000.00 | $1,022.96 | $2.13 |
| LOW DURATION INCOME FUND |
| CLASS A SHARES |
| Actual | $1,000.00 | $1,019.23 | $3.54 |
| Hypothetical* | $1,000.00 | $1,021.56 | $3.55 |
| CLASS I SHARES |
| Actual | $1,000.00 | $1,020.26 | $2.53 |
| Hypothetical* | $1,000.00 | $1,022.56 | $2.54 |
| † | Thornburg Limited Term U.S. Government Fund Expenses are equal to the annualized expense ratio for each class (A: 0.91%; C: 1.24%; I: 0.61%; R3: 0.99%; R4: 0.99%; R5: 0.67%) multiplied by the average account value over the period, multiplied by 183/365 to reflect the one-half year period. |
| † | Thornburg Limited Term Income Fund Expenses are equal to the annualized expense ratio for each class (A: 0.79%; C: 1.01%; I: 0.49%; R3: 0.99%; R4: 0.99%; R5: 0.49%; R6: 0.42%) multiplied by the average account value over the period, multiplied by 183/365 to reflect the one-half year period. |
| † | Thornburg Low Duration Income Fund Expenses are equal to the annualized expense ratio for each class (A: 0.70%; I: 0.50%) multiplied by the average account value over the period, multiplied by 183/365 to reflect the one-half year period. |
| * | Hypothetical assumes a rate of return of 5% per year before expenses. |
Trustees and Officers
September 30, 2019 (Unaudited)
NAME, AGE, YEAR ELECTED
POSITION HELD WITH FUND | PRINCIPAL OCCUPATION(S) DURING PAST FIVE YEARS | OTHER DIRECTORSHIPS
HELD BY TRUSTEE |
| INTERESTED TRUSTEES(1)(2) |
Garrett Thornburg, 73
Trustee since 1984,
Chairman of Trustees(3) | Chairman and controlling shareholder of Thornburg Investment Management, Inc. (investment advisor); Chairman and controlling shareholder of Thornburg Securities Corporation (securities dealer); President of the Thornburg Foundation (nonprofit). | None |
Brian J. McMahon, 64
Trustee since 2001,
Vice Chairman of Trustees,
Member of Governance and
Nominating Committee &
Operations Risk Oversight
Committee(4) | Vice Chairman, Chief Investment Strategist, Managing Director, and Portfolio Manager and, until 2016, CEO and President of Thornburg Investment Management, Inc.; Vice President of Thornburg Securities Corporation. | None |
| INDEPENDENT TRUSTEES(1)(2)(5) |
David A. Ater, 74
Trustee since 1994,
Lead Independent Trustee,
Chairman of Governance and
Nominating Committee &
Member of Audit Committee | Principal in Ater & Associates, Santa Fe, NM (developer, planner and broker of residential and commercial real estate); owner, developer and broker for various real estate projects. | None |
Sally Corning, 58
Trustee since 2012,
Chairman of Audit Committee | Partner in Sun Mountain Capital, Santa Fe, NM (private equity firm with investment programs encompassing venture capital, mezzanine debt, and growth equity). | None |
Susan H. Dubin, 70
Trustee since 2004,
Member of Audit
Committee & Governance
and Nominating Committee | President of Dubin Investments, Ltd., Greenwich, CT (private investment fund); Director and officer of various charitable organizations. | None |
David L. Gardner, 56
Trustee since 2015,
Member of Operations Risk
Oversight Committee | Until 2012, head of EMEA (Europe, Middle East and Africa) Sales for iShares of Blackrock, Inc., EMEA Executive Committee Member and EMEA Operating Committee Member at Blackrock, Inc. | None |
Patrick J. Talamantes, 55
Trustee since 2019,
Member of Audit Committee | President of Talamantes Strategies, LLC, a management consulting firm, since 2018; until 2017, President and Chief Executive Officer of The McClatchy Company, Sacramento, CA (news and media company). | None |
Owen D. Van Essen, 65
Trustee since 2004,
Chairman of Operations Risk
Oversight Committee &
Member of Governance and
Nominating Committee | President of Dirks, Van Essen, Murray & April, Santa Fe, NM (newspaper mergers and acquisitions). | None |
James W. Weyhrauch, 60
Trustee since 1996,
Member of Audit
Committee & Operations Risk
Oversight Committee | Real estate broker, Santa Fe Properties, Santa Fe, NM; General Partner, Investments of Genext LLC (a family investment partnership); until 2019, Vice Chairman of Nambe LLC, Santa Fe, NM (manufacturing & design company). | None |
Trustees and Officers, Continued
September 30, 2019 (Unaudited)
NAME, AGE, YEAR ELECTED
POSITION HELD WITH FUND | PRINCIPAL OCCUPATION(S) DURING PAST FIVE YEARS | OTHER DIRECTORSHIPS
HELD BY TRUSTEE |
| OFFICERS OF THE FUND (WHO ARE NOT TRUSTEES)(1)(6) |
David Ashley, 49
Vice President since 2019 | Portfolio Manager and Managing Director since 2019 and Associate Portfolio Manager from 2011-2019 of Thornburg Investment Management, Inc. | Not applicable |
Nimish Bhatt, 56
Chief Financial Officer
since 2019; Treasurer
2016-2019; Secretary
(2018-2019)(7) | Chief Financial Officer and Treasurer of Thornburg Investment Management, Inc. and Thornburg Securities Corporation since 2016 and Secretary of Thornburg Securities Corporation since 2018; Senior Vice President (2004-2016), Chief Financial Officer (2011-2016), and Head of Fund Administration (2011-2016) of Calamos Asset Management, Inc., Calamos Investments LLC, Calamos Advisors LLC, and Calamos Wealth Management; Director of Calamos Global Funds plc (2007-2016). | Not applicable |
Jason Brady, 45
President since 2016(7) | Director since 2017, CEO and President since 2016, and Portfolio Manager and Managing Director of Thornburg Investment Management, Inc.; Vice President of Thornburg Securities Corporation since 2016. | Not applicable |
Connor Browne, 40
Vice President since 2006 | Portfolio Manager and Managing Director of Thornburg Investment Management, Inc. | Not applicable |
Randy Dry, 45
Vice President since 2014 | Managing Director, Director of Institutional Group from 2014-2016, and since 2016, Chief Administrative Officer of Thornburg Investment Management, Inc. | Not applicable |
Greg Dunn, 43
Vice President since 2014 | Portfolio Manager and Managing Director of Thornburg Investment Management, Inc. | Not applicable |
Lon Erickson, 44
Vice President since 2008 | Portfolio Manager and Managing Director of Thornburg Investment Management, Inc. | Not applicable |
Thomas Garcia, 48
Vice President since 2006 | Managing Director, Head Equity Trader, and Associate Portfolio Manager of Thornburg Investment Management, Inc. | Not applicable |
Christian Hoffmann, 37
Vice President since 2018 | Portfolio Manager and Managing Director since 2018, and Associate Portfolio Manager from 2014-2018, of Thornburg Investment Management, Inc. | Not applicable |
Curtis Holloway, 52
Treasurer since 2019(7) | Director of Fund Administration since 2019 of Thornburg Investment Management, Inc.; Senior Vice President, Head of Fund Administration (2017-2019) and Vice President, Fund Administration (2010-2017) of Calamos Investments, and Chief Financial Officer (2017-2019) and Treasurer (2010-2019) of Calamos Funds. | Not applicable |
Ben Kirby, 39
Vice President since 2014 | Head of Investments since 2019, Portfolio Manager and Managing Director since 2013. | Not applicable |
Jeff Klingelhofer, 38
Vice President since 2016 | Head of Investments since 2019, Portfolio Manager and Managing Director since 2015, and Associate Portfolio Manager from 2012–2015, of Thornburg Investment Management, Inc. | Not applicable |
Ponn Lithiluxa, 48
Vice President since 2017 | Manager, Tax & Fund Administration of Thornburg Investment Management, Inc.; Senior Vice President, Citi Fund Services, Inc. (2014–2017); Vice President, Citi Fund Services, Inc. (2007–2014). | Not applicable |
Rob MacDonald, 43
Vice President since 2016 | Managing Director since 2015, Portfolio Manager since 2014, and Associate Portfolio Manager from 2011–2014 of Thornburg Investment Management, Inc. | Not applicable |
Michael Mastroianni, 42
Secretary and Vice President since 2019(7) | Director of Fund Operations since 2019 of Thornburg Investment Management, Inc.; Executive Director, Global Head of Client Services - Global Liquidity (2018-2019), Executive Director, North American Head of Transfer Agency Relationship Management (2011-2019), Executive Director, North American Head of Transfer Agency Service Delivery (2011-2018) of J.P. Morgan Asset Management. | Not applicable |
Leigh Moiola, 52
Vice President since 2001 | Managing Director and Director of Marketing of Thornburg Investment Management, Inc.; Vice President of Thornburg Securities Corporation. | Not applicable |
Christopher Ryon, 63
Vice President since 2008 | Portfolio Manager and Managing Director of Thornburg Investment Management, Inc. | Not applicable |
Trustees and Officers, Continued
September 30, 2019 (Unaudited)
NAME, AGE, YEAR ELECTED
POSITION HELD WITH FUND | PRINCIPAL OCCUPATION(S) DURING PAST FIVE YEARS | OTHER DIRECTORSHIPS
HELD BY TRUSTEE |
Sean Koung Sun, 38
Vice President since 2017 | Portfolio Manager and Managing Director since 2017, Associate Portfolio Manager from 2015-2016, and Equity Research Analyst from 2012-2014 of Thornburg Investment Management, Inc. | Not applicable |
Stephen Velie, 52
Chief Compliance Officer since 2009 | Chief Compliance Officer of Thornburg Investment Trust and Thornburg Investment Management, Inc. | Not applicable |
Nicholos Venditti, 38
Vice President since 2016 | Portfolio Manager and Managing Director since 2015 and Associate Portfolio Manager from 2011–2015 of Thornburg Investment Management, Inc. | Not applicable |
Vinson Walden, 49
Vice President since 2004 | Portfolio Manager and Managing Director of Thornburg Investment Management, Inc. | Not applicable |
Lei Wang, 48
Vice President since 2006 | Portfolio Manager and Managing Director of Thornburg Investment Management, Inc. | Not applicable |
Charles Wilson, 44
Vice President since 2016 | Portfolio Manager and Managing Director since 2014 and Associate Portfolio Manager from 2012–2014 of Thornburg Investment Management, Inc. | Not applicable |
Di Zhou, 41
Vice President since 2016 | Portfolio Manager and Managing Director since 2016, Associate Portfolio Manager from 2014–2016, and Equity Research Analyst from 2010–2014 of Thornburg Investment Management, Inc. | Not applicable |
| (1) | Each person’s address is 2300 North Ridgetop Road, Santa Fe, New Mexico 87506. |
| (2) | The Fund is a separate investment “Fund” or “series” of Thornburg Investment Trust (the “Trust”), which comprises the Thornburg mutual fund complex and is organized as a Massachusetts business trust. Thornburg Investment Management, Inc. is the investment advisor to, and manages, all the Funds of the Trust. Each Trustee oversees all the Funds of the Trust. |
| (3) | Mr. Thornburg is considered an “interested” Trustee under the Investment Company Act of 1940 because he is a director and controlling shareholder of Thornburg Investment Management, Inc., the investment advisor to the Trust, and is the sole director and controlling shareholder of Thornburg Securities Corporation, the distributor of shares for the Trust. |
| (4) | Mr. McMahon is considered an “interested” Trustee under the Investment Company Act of 1940 because he is a director and the chief investment strategist of Thornburg Investment Management, Inc. |
| (5) | The Bylaws of the Trust currently require that each Independent Trustee shall retire by the end of the calendar year during which the Trustee reached the age of 75 years. Otherwise each Trustee serves in office until the election and qualification of a successor or until the Trustee sooner dies, resigns, retires or is removed. |
| (6) | Assistant vice presidents and assistant secretaries are not shown. |
| (7) | The Trust’s president, chief financial officer, secretary, and treasurer each serves a one-year term or until the election and qualification of a successor; each other officer serves at the pleasure of the Trustees. |
The Statement of Additional Information for each Fund of the Trust includes additional information about the Trustees and is available, without charge and upon request, by calling 1-800-847-0200.
Other Information
September 30, 2019 (Unaudited)
PORTFOLIO PROXY VOTING
Policies and Procedures:
The Trust has delegated to the Advisor voting decisions respecting proxies for the Fund’s voting securities. The Advisor makes voting decisions in accordance with its Proxy Voting Policy and Procedures. A description of the Policy and Procedures is available (i) without charge, upon request, by calling the Advisor toll-free at 1-800-847-0200, (ii) on the Thornburg website at www.thornburg.com, and (iii) on the U.S. Securities and Exchange Commission’s website at www.sec.gov.
Information regarding how proxies were voted is available on or before August 31 of each year for the twelve months ending the preceding June 30. This information is available (i) without charge, upon request by calling the Advisor toll-free at 1-800-847-0200, (ii) on the Thornburg website at www.thornburg.com, and (iii) on the U.S. Securities and Exchange Commission’s website at www.sec.gov.
TAX INFORMATION
For the tax year ended September 30, 2019, dividends paid by the Thornburg Limited Term U.S. Government Fund of $4,421,236 are taxable ordinary investment income dividends for federal income tax purposes. Dividends paid by the Thornburg Limited Term Income Fund of $143,361,221 are being reported as taxable ordinary investment income dividends. Dividends paid by the Thornburg Low Duration Income Fund of $829,593 are being reported as taxable ordinary investment income dividends for federal income tax purposes.
The information and distributions reported herein may differ from the information and distributions reported to the shareholders for the calendar year ending December 31, 2019. Complete information will be reported in conjunction with your 2019 Form 1099.
AVAILABILITY OF QUARTERLY PORTFOLIO SCHEDULE
The Fund files with the Securities and Exchange Commission schedules of its portfolio holdings on Form N-Q for the first and third quarters of each fiscal year. The Fund’s Forms N-Q are available on the Commission’s website at www.sec.gov, or may be reviewed and copied at the Commission’s Public Reference Room in Washington, D.C. Information on the operation of the Public Reference Room may be obtained by calling 1-800-SEC-0330. The Fund also makes this information available on its website at www.thornburg.com/download or upon request by calling 1-800-847-0200.
STATEMENT RESPECTING RENEWAL OF INVESTMENT ADVISORY AGREEMENT
Thornburg Limited Term U.S. Government Fund
Thornburg Investment Management, Inc. (the “Advisor”) provides investment management services to Thornburg Limited Term U.S. Government Fund (the “Fund”) pursuant to an investment advisory agreement. The Trustees consider the renewal of this agreement annually, and most recently determined to renew the agreement on September 17, 2019.
Planning for their recent consideration of the advisory agreement’s renewal, the independent Trustees met in May 2019 to consider aspects of their annual evaluation of the Advisor’s service to all of the funds of Thornburg Investment Trust, to plan the annual evaluation of the Advisor’s performance and to discuss preliminarily the information the Advisor would present to the Trustees for their review. The independent Trustees met in a second independent session in July 2019 to further define certain portions of the information to be submitted by the Advisor. The independent Trustees met again in an independent session in September 2019 with a mutual fund analyst firm engaged by the independent Trustees to provide explanations of comparative cost and expense information, comparative investment performance information, and other data obtained and analyzed by the analyst firm. In that session the independent Trustees discussed their evaluations of the Advisor’s services to the Fund and the Fund’s fee and expense levels, investment performance, and other information presented for the Fund, conferred independently with legal counsel respecting the factors typically considered in evaluating renewal of an advisory agreement, and conferred with representatives of management to receive explanations of certain aspects of the information they had requested. Representatives of the Advisor subsequently reviewed portions of the information with the Trustees and addressed questions from the Trustees at a full meeting session of the Trustees scheduled in September for that purpose, and the independent Trustees thereafter met again in an independent session to consider the Advisor’s presentations and various specific issues respecting their consideration of the advisory agreement’s renewal. Following these sessions, the Trustees met to consider renewal of the advisory agreement, and the independent Trustees voted unanimously at that meeting to renew the agreement for an additional term of one year.
The information below summarizes certain factors considered by the Trustees in connection with the determination to renew the advisory agreement with the Advisor. In determining to renew the advisory agreement, the Trustees considered a wide range of information and did
Other Information, Continued
September 30, 2019 (Unaudited)
not identify any single factor as controlling, and this summary does not describe all of the factors and other matters considered by the Trustees in making their determination.
Nature, Extent and Quality of Services.The Trustees considered in their evaluation of the advisory agreement the written and oral reports provided to the Trustees and their standing committees throughout the year on a wide variety of topics by personnel from the Advisor’s portfolio management, administration, operations and compliance staffs. The Trustees also considered in this evaluation presentations and explanations made by representatives of the Advisor in meeting sessions scheduled for consideration of the renewal of the advisory agreement. The Trustees further noted in their evaluation the consideration they had given to a number of topics in previous years, reports from their standing committees, and advice received from counsel.
Information noted by the Trustees as having been considered in relation to the nature, extent and quality of services provided by the Advisor under the advisory agreement and contributing (together with other information considered) to their conclusions respecting the nature, extent and quality of the services rendered to the Fund by the Advisor included: (1) reports from portfolio managers and other personnel throughout the year demonstrating that the Fund was managed in conformity with stated strategies and objectives and conformed to investment restrictions and limitations; (2) reports demonstrating that management of the Fund remained faithful and competent, and demonstrating sufficient skill by portfolio managers in executing the Fund’s strategies in varying environments, managers’ cognizance of and strategies to pursue the Fund’s objectives and address pertinent market and economic trends and conditions, the evaluation and selection of individual investments, management to achieve tax efficiencies, and the structuring and composition of the Fund’s portfolio and management of Fund liquidity requirements; (3) the Fund’s achievement of its investment objectives over different periods of time; (4) presentations by and interactions with members of the Advisor’s fund administration, operations and compliance staffs; (5) reports from standing committees of the Trustees on their respective proceedings throughout the year, including in particular reports from and interactions with the Advisor’s personnel; (6) the sufficiency of the resources the Advisor devotes to the services it provides to the Fund, including the expertise of its personnel and staffing levels and its enhancements to the electronic systems it utilizes in providing these services, and also including the Advisor’s own financial management and sufficiency of its resources; and (7) the measures employed to achieve efficient trade execution for the Fund, including the evaluation and selection of firms to execute transactions for the Fund. As in past years, the Trustees noted particularly their assessments of the Advisor’s personnel developed in meetings throughout the year, measures to expand and improve the depth and experience of the Advisor’s staff, and the Advisor’s collaborative approach to investment management, continued commitment to observance of compliance and regulatory requirements in managing investments by the Fund, responsiveness to the Trustees, and other factors.
Based upon these and other considerations, the Trustees concluded that the Advisor’s management of the Fund’s investments continued to conform to the Fund’s stated objectives and policies, and that the nature, extent and quality of the services provided to the Fund by the Advisor remained sufficient.
Investment Performance. The Trustees noted in their evaluation of the Fund’s investment performance the written and oral reports they had received in each regular meeting over the course of the year from the Advisor’s portfolio management personnel. The Trustees also noted their consideration of information provided to them at their request in anticipation of their annual evaluation of the Advisor’s services, including the following items of information respecting the investment performance of the Fund: (1) the Fund’s absolute investment performance and achievement of stated objectives; (2) the Advisor’s explanations and commentary on the Fund’s performance in the context of the Fund’s objectives and reasonable expectations, and business, market and economic conditions; (3) performance data for the most recent ten calendar years, comparing the Fund’s annual investment returns to a broad-based securities index and to the applicable Morningstar category of funds; (4) the Fund’s investment performance for the three-month, year-to-date, one-year, three-year, five-year, ten-year, fifteen-year, and since inception periods ending with the second quarter of the current year, comparing the Fund’s annualized returns to two mutual fund categories created by independent mutual fund analyst firms and to a broad-based securities index, and assigning a percentage rank to the Fund’s performance for each period relative to each of the fund categories; (5) analyses of specified performance and risk metrics for the Fund relative to its benchmark and to a selected peer group of funds, prepared by an independent financial analyst firm engaged by the independent Trustees; (6) the Fund’s cash flows; (7) comparative performance data for fund peer groups selected by an independent mutual fund analyst firm engaged by the independent Trustees, and the analysis and observations of the analyst firm respecting those data; and (8) comparative measures of correlation to equity indices, and risk and return statistics. Measures of risk and relative return demonstrated that the Fund’s performance relative to these measures continued to fulfill expectations in current conditions. The Trustees generally attach additional significance to the investment performance of the Fund from the perspective of longer-term shareholders, and noted in that regard that the Fund’s relative investment performance may be affected to some extent in periods when the Advisor pursues defensive measures in line with the Fund’s stated objectives. Based upon their consideration of this and other information, the Trustees concluded that the Fund’s absolute and relative investment performance over a range of pertinent holding periods on the whole was satisfactory in view of its objectives and strategies.
Comparisons of Fee and Expense Levels. Information noted by the Trustees as having been considered in this context included a variety of comparative data respecting the Fund’s fee and expense levels. This information included comparisons of the Fund’s advisory fee and overall Fund expenses to median and average fees and expenses charged to funds in the applicable Morningstar category, comparisons of the advisory fee and total expenses for two Fund share classes to the fee levels and expenses of fund peer groups selected from the
Other Information, Continued
September 30, 2019 (Unaudited)
category by an independent mutual fund analyst firm engaged by the independent Trustees, the perspectives and advice from that mutual fund analyst firm respecting comparisons of fund fee levels and expenses to fund peer groups, and other information. Comparative fee and expense data noted as having been considered by the Trustees showed that the level of total expense for one share class of the Fund was higher than the median and average levels charged to funds in the applicable Morningstar category, and that the level of total expense for a second share class was lower than the median and average levels for that category. Peer group data showed that the Fund’s stated advisory fee was lower than the median level for the two peer groups, and that the total expense levels of two representative share classes were higher than the medians of their respective peer groups but comparable to other funds in the peer groups. The Trustees did not find the differences significant in view of their findings and conclusions respecting the other factors considered.
The Trustees noted their consideration of information respecting the advisory fees charged by the Advisor to other investment management clients, including sub-advised mutual funds and other institutional clients, together with information about fees charged by other advisors to different clients, analysis of the differences between the requirements of institutional clients and mutual funds, analysis of the differences between the requirements of a sub-advised mutual fund and a fund as to which the investment advisor is the primary advisor and sponsor, and the consequently different investment management services provided to the different categories of clients and the differing contexts in which these arrangements are entered into. The Trustees confirmed their previous observations that the differences between the fees charged by the Advisor or by other investment advisors to different types of clients did not appear exceptional and had limited relevance to the evaluation of the fee rate charged to mutual funds as to which the Advisor or such other advisors are the primary advisor and sponsor.
Costs and Profitability of Advisor. In reviewing the profitability of the Advisor’s services to the Fund, the Trustees considered an analysis of the Advisor’s costs and the estimated profitability to the Advisor of its services, together with data respecting the overall profitability of a selection of other investment management firms. The Trustees considered in this regard information from the Advisor respecting investment of its profits to maintain staffing levels, and noted that a portion of the Advisor’s profits is an important element in the compensation of shareholder employees. The Trustees considered information from the Advisor respecting the use of profits to enhance staff competencies through training and other measures, hire personnel to expand and develop the scope of senior management expertise, pay competitive levels of compensation, and add to the Advisor’s electronic and information technology systems to maintain or improve service levels. The Trustees also considered the contribution of the Advisor’s cost management to its profitability, and the relationship of the Advisor’s financial resources and profitability in previous years to its ability to attract necessary personnel, invest in systems and other assets required for its service to the Fund, and maintain or improve service levels for the Fund notwithstanding fluctuations in revenues and profitability. The information considered did not indicate to the Trustees that the Advisor’s profitability was excessive.
Potential Economies of Scale. In reviewing the extent to which economies of scale would be realized by the Fund as it grows and whether fee levels reflect potential economies of scale, the Trustees considered the breakpoint structure for advisory fees chargeable to the Fund, comparisons of the fee breakpoint structure for the Fund with breakpoint structures (or the absence of such structures) for other funds in a peer group selected by an independent mutual fund analyst firm, the effects of the breakpoint structure and other expense factors realized by certain funds of the Trust as their asset levels had increased, the Advisor’s undertakings to waive or reimburse certain fees and expenses of the Fund, and the Advisor’s expenditures from its own profits and resources to maintain staffing levels and expand staff competencies, pay competitive levels of compensation, and add to its electronic and information technology systems so as to maintain or improve service levels. The information provided demonstrated to the Trustees that the Fund’s advisory fee breakpoint structure is reasonable in relation to the structures observed in the other funds in its peer group, and that shareholders may be expected to benefit from any economies of scale, due to the advisory agreement’s breakpoint fee structure for the Fund and other factors.
Potential Ancillary Benefits. In reviewing potential benefits to the Advisor because of its relationship to the Fund, the Trustees considered explanations from the Advisor respecting its receipt of certain research services from broker dealers, and the benefits to both the Fund and the Advisor of the Advisor’s expansion of its staffing, compliance and systems capabilities and other resources to serve a broader variety of investment management clients. No unusual or unfair benefits to the Advisor from its relationship to the Fund were identified by the Trustees.
Summary of Conclusions. The Trustees concluded that the general nature, extent and quality of the Advisor’s services performed under the advisory agreement remained sufficient, the Advisor had continued to actively and competently pursue the Fund’s stated investment objectives and adhere to the Fund’s investment policies, and that the absolute and relative investment performance of the Fund over pertinent holding periods on the whole was satisfactory in the context of the Fund’s objectives and strategies. The Trustees further concluded that the level of the advisory fee charged to the Fund by the Advisor is fair and reasonable in relation to the services provided by the Advisor, in view of the nature, extent and quality of those services, the investment performance of the Fund after fees and expenses, the clear disclosure of fees and expenses in the Fund’s prospectuses, comparisons of fees and expenses charged to the Fund to fees and expenses charged to other mutual funds, and the other factors considered. The Trustees accordingly determined to renew the Fund’s investment advisory agreement with the Advisor for an additional term of one year.
Other Information, Continued
September 30, 2019 (Unaudited)
Thornburg Limited Term Income Fund
Thornburg Investment Management, Inc. (the “Advisor”) provides investment management services to Thornburg Limited Term Income Fund (the “Fund”) pursuant to an investment advisory agreement. The Trustees consider the renewal of this agreement annually, and most recently determined to renew the agreement on September 17, 2019.
Planning for their recent consideration of the advisory agreement’s renewal, the independent Trustees met in May 2019 to consider aspects of their annual evaluation of the Advisor’s service to all of the funds of Thornburg Investment Trust, to plan the annual evaluation of the Advisor’s performance and to discuss preliminarily the information the Advisor would present to the Trustees for their review. The independent Trustees met in a second independent session in July 2019 to further define certain portions of the information to be submitted by the Advisor. The independent Trustees met again in an independent session in September 2019 with a mutual fund analyst firm engaged by the independent Trustees to provide explanations of comparative cost and expense information, comparative investment performance information, and other data obtained and analyzed by the analyst firm. In that session the independent Trustees discussed their evaluations of the Advisor’s services to the Fund and the Fund’s fee and expense levels, investment performance, and other information presented for the Fund, conferred independently with legal counsel respecting the factors typically considered in evaluating renewal of an advisory agreement, and conferred with representatives of management to receive explanations of certain aspects of the information they had requested. Representatives of the Advisor subsequently reviewed portions of the information with the Trustees and addressed questions from the Trustees at a full meeting session of the Trustees scheduled in September for that purpose, and the independent Trustees thereafter met again in an independent session to consider the Advisor’s presentations and various specific issues respecting their consideration of the advisory agreement’s renewal. Following these sessions, the Trustees met to consider renewal of the advisory agreement, and the independent Trustees voted unanimously at that meeting to renew the agreement for an additional term of one year.
The information below summarizes certain factors considered by the Trustees in connection with the determination to renew the advisory agreement with the Advisor. In determining to renew the advisory agreement, the Trustees considered a wide range of information and did not identify any single factor as controlling, and this summary does not describe all of the factors and other matters considered by the Trustees in making their determination.
Nature, Extent and Quality of Services. The Trustees considered in their evaluation of the advisory agreement the written and oral reports provided to the Trustees and their standing committees throughout the year on a wide variety of topics by personnel from the Advisor’s portfolio management, administration, operations and compliance staffs. The Trustees also considered in this evaluation presentations and explanations made by representatives of the Advisor in meeting sessions scheduled for consideration of the renewal of the advisory agreement. The Trustees further noted in their evaluation the consideration they had given to a number of topics in previous years, reports from their standing committees, and advice received from counsel.
Information noted by the Trustees as having been considered in relation to the nature, extent and quality of services provided by the Advisor under the advisory agreement and contributing (together with other information considered) to their conclusions respecting the nature, extent and quality of the services rendered to the Fund by the Advisor included: (1) reports from portfolio managers and other personnel throughout the year demonstrating that the Fund was managed in conformity with stated strategies and objectives and conformed to investment restrictions and limitations; (2) reports demonstrating that management of the Fund remained faithful and competent, and demonstrating sufficient skill by portfolio managers in executing the Fund’s strategies in varying environments, managers’ cognizance of and strategies to pursue the Fund’s objectives and address pertinent market and economic trends and conditions, the evaluation and selection of individual investments, management to achieve tax efficiencies, and the structuring and composition of the Fund’s portfolio and management of Fund liquidity requirements; (3) the Fund’s achievement of its investment objectives over different periods of time; (4) presentations by and interactions with members of the Advisor’s fund administration, operations and compliance staffs; (5) reports from standing committees of the Trustees on their respective proceedings throughout the year, including in particular reports from and interactions with the Advisor’s personnel; (6) the sufficiency of the resources the Advisor devotes to the services it provides to the Fund, including the expertise of its personnel and staffing levels and its enhancements to the electronic systems it utilizes in providing these services, and also including the Advisor’s own financial management and sufficiency of its resources; and (7) the measures employed to achieve efficient trade execution for the Fund, including the evaluation and selection of firms to execute transactions for the Fund. As in past years, the Trustees noted particularly their assessments of the Advisor’s personnel developed in meetings throughout the year, measures to expand and improve the depth and experience of the Advisor’s staff, and the Advisor’s collaborative approach to investment management, continued commitment to observance of compliance and regulatory requirements in managing investments by the Fund, responsiveness to the Trustees, and other factors.
Based upon these and other considerations, the Trustees concluded that the Advisor’s management of the Fund’s investments continued to conform to the Fund’s stated objectives and policies, and that the nature, extent and quality of the services provided to the Fund by the Advisor remained sufficient.
Investment Performance. The Trustees noted in their evaluation of the Fund’s investment performance the written and oral reports they had received in each regular meeting over the course of the year from the Advisor’s portfolio management personnel. The Trustees also noted
Other Information, Continued
September 30, 2019 (Unaudited)
their consideration of information provided to them at their request in anticipation of their annual evaluation of the Advisor’s services, including the following items of information respecting the investment performance of the Fund: (1) the Fund’s absolute investment performance and achievement of stated objectives; (2) the Advisor’s explanations and commentary on the Fund’s performance in the context of the Fund’s objectives and reasonable expectations, and business, market and economic conditions; (3) performance data for the most recent ten calendar years, comparing the Fund’s annual investment returns to a broad-based securities index and to the applicable Morningstar category of funds; (4) the Fund’s investment performance for the three-month, year-to-date, one-year, three-year, five-year, ten-year, fifteen-year, and since inception periods ending with the second quarter of the current year, comparing the Fund’s annualized returns to two mutual fund categories created by independent mutual fund analyst firms and to a broad-based securities index, and assigning a percentage rank to the Fund’s performance for each period relative to each of the fund categories; (5) analyses of specified performance and risk metrics for the Fund relative to its benchmark and to a selected peer group of funds, prepared by an independent financial analyst firm engaged by the independent Trustees; (6) the Fund’s cash flows; (7) comparative performance data for fund peer groups selected by an independent mutual fund analyst firm engaged by the independent Trustees, and the analysis and observations of the analyst firm respecting those data; and (8) comparative measures of correlation to equity indices, and risk and return statistics. Measures of risk and relative return demonstrated that the Fund’s performance relative to these measures continued to fulfill expectations in current conditions. The Trustees generally attach additional significance to the investment performance of the Fund from the perspective of longer-term shareholders, and noted in that regard that the Fund’s relative investment performance may be affected to some extent in periods when the Advisor pursues defensive measures in line with the Fund’s stated objectives. Based upon their consideration of this and other information, the Trustees concluded that the Fund’s absolute and relative investment performance over a range of pertinent holding periods on the whole was satisfactory in view of its objectives and strategies.
Comparisons of Fee and Expense Levels. Information noted by the Trustees as having been considered in this context included a variety of comparative data respecting the Fund’s fee and expense levels. This information included comparisons of the Fund’s advisory fee and overall Fund expenses to median and average fees and expenses charged to funds in the applicable Morningstar category, comparisons of the advisory fee and total expenses for two Fund share classes to the fee levels and expenses of fund peer groups selected from the category by an independent mutual fund analyst firm engaged by the independent Trustees, the perspectives and advice from that mutual fund analyst firm respecting comparisons of fund fee levels and expenses to fund peer groups, and other information. The Trustees considered that the Advisor has agreed to certain fee waivers and expense reimbursements for the current period. Comparative fee and expense data noted as having been considered by the Trustees showed that, after fee waivers and expense reimbursements, the level of total expense for two representative share classes of the Fund were higher than the median and average levels charged to funds in the applicable Morningstar category. Peer group data showed that the Fund’s stated advisory fee was lower than the median level for the two peer groups, that the total expense level of a representative share class was higher than the median of the respective peer group but comparable to other funds in the peer groups after waivers of fees and reimbursement of expenses, and that the total expense level of a second representative share class was equal to the median of the respective peer group after waivers of fees and reimbursement of expenses. The Trustees did not find the differences significant in view of their findings and conclusions respecting the other factors considered.
The Trustees noted their consideration of information respecting the advisory fees charged by the Advisor to other investment management clients, including sub-advised mutual funds and other institutional clients, together with information about fees charged by other advisors to different clients, analysis of the differences between the requirements of institutional clients and mutual funds, analysis of the differences between the requirements of a sub-advised mutual fund and a fund as to which the investment advisor is the primary advisor and sponsor, and the consequently different investment management services provided to the different categories of clients and the differing contexts in which these arrangements are entered into. The Trustees confirmed their previous observations that the differences between the fees charged by the Advisor or by other investment advisors to different types of clients did not appear exceptional and had limited relevance to the evaluation of the fee rate charged to mutual funds as to which the Advisor or such other advisors are the primary advisor and sponsor.
Costs and Profitability of Advisor. In reviewing the profitability of the Advisor’s services to the Fund, the Trustees considered an analysis of the Advisor’s costs and the estimated profitability to the Advisor of its services, together with data respecting the overall profitability of a selection of other investment management firms. The Trustees considered in this regard information from the Advisor respecting investment of its profits to maintain staffing levels, and noted that a portion of the Advisor’s profits is an important element in the compensation of shareholder employees. The Trustees considered information from the Advisor respecting the use of profits to enhance staff competencies through training and other measures, hire personnel to expand and develop the scope of senior management expertise, pay competitive levels of compensation, and add to the Advisor’s electronic and information technology systems to maintain or improve service levels. The Trustees also considered the contribution of the Advisor’s cost management to its profitability, and the relationship of the Advisor’s financial resources and profitability in previous years to its ability to attract necessary personnel, invest in systems and other assets required for its service to the Fund, and maintain or improve service levels for the Fund notwithstanding fluctuations in revenues and profitability. The information considered did not indicate to the Trustees that the Advisor’s profitability was excessive.
Potential Economies of Scale. In reviewing the extent to which economies of scale would be realized by the Fund as it grows and whether fee levels reflect potential economies of scale, the Trustees considered the breakpoint structure for advisory fees chargeable to the Fund, comparisons of the fee breakpoint structure for the Fund with breakpoint structures (or the absence of such structures) for other funds in a
Other Information, Continued
September 30, 2019 (Unaudited)
peer group selected by an independent mutual fund analyst firm, the effects of the breakpoint structure and other expense factors realized by certain funds of the Trust as their asset levels had increased, the Advisor’s undertakings to waive or reimburse certain fees and expenses of the Fund, and the Advisor’s expenditures from its own profits and resources to maintain staffing levels and expand staff competencies, pay competitive levels of compensation, and add to its electronic and information technology systems so as to maintain or improve service levels. The information provided demonstrated to the Trustees that the Fund’s advisory fee breakpoint structure is reasonable in relation to the structures observed in the other funds in its peer group, and that shareholders may be expected to benefit from any economies of scale, due to the advisory agreement’s breakpoint fee structure for the Fund and other factors.
Potential Ancillary Benefits. In reviewing potential benefits to the Advisor because of its relationship to the Fund, the Trustees considered explanations from the Advisor respecting its receipt of certain research services from broker dealers, and the benefits to both the Fund and the Advisor of the Advisor’s expansion of its staffing, compliance and systems capabilities and other resources to serve a broader variety of investment management clients. No unusual or unfair benefits to the Advisor from its relationship to the Fund were identified by the Trustees.
Summary of Conclusions. The Trustees concluded that the general nature, extent and quality of the Advisor’s services performed under the advisory agreement remained sufficient, the Advisor had continued to actively and competently pursue the Fund’s stated investment objectives and adhere to the Fund’s investment policies, and that the absolute and relative investment performance of the Fund over pertinent holding periods on the whole was satisfactory in the context of the Fund’s objectives and strategies. The Trustees further concluded that the level of the advisory fee charged to the Fund by the Advisor is fair and reasonable in relation to the services provided by the Advisor, in view of the nature, extent and quality of those services, the investment performance of the Fund after fees and expenses, the clear disclosure of fees and expenses in the Fund’s prospectuses, comparisons of fees and expenses charged to the Fund to fees and expenses charged to other mutual funds, and the other factors considered. The Trustees accordingly determined to renew the Fund’s investment advisory agreement with the Advisor for an additional term of one year.
Thornburg Low Duration Income Fund
Thornburg Investment Management, Inc. (the “Advisor”) provides investment management services to Thornburg Low Duration Income Fund (the “Fund”) pursuant to an investment advisory agreement. The Trustees consider the renewal of this agreement annually, and most recently determined to renew the agreement on September 17, 2019.
Planning for their recent consideration of the advisory agreement’s renewal, the independent Trustees met in May 2019 to consider aspects of their annual evaluation of the Advisor’s service to all of the funds of Thornburg Investment Trust, to plan the annual evaluation of the Advisor’s performance and to discuss preliminarily the information the Advisor would present to the Trustees for their review. The independent Trustees met in a second independent session in July 2019 to further define certain portions of the information to be submitted by the Advisor. The independent Trustees met again in an independent session in September 2019 with a mutual fund analyst firm engaged by the independent Trustees to provide explanations of comparative cost and expense information, comparative investment performance information, and other data obtained and analyzed by the analyst firm. In that session the independent Trustees discussed their evaluations of the Advisor’s services to the Fund and the Fund’s fee and expense levels, investment performance, and other information presented for the Fund, conferred independently with legal counsel respecting the factors typically considered in evaluating renewal of an advisory agreement, and conferred with representatives of management to receive explanations of certain aspects of the information they had requested. Representatives of the Advisor subsequently reviewed portions of the information with the Trustees and addressed questions from the Trustees at a full meeting session of the Trustees scheduled in September for that purpose, and the independent Trustees thereafter met again in an independent session to consider the Advisor’s presentations and various specific issues respecting their consideration of the advisory agreement’s renewal. Following these sessions, the Trustees met to consider renewal of the advisory agreement, and the independent Trustees voted unanimously at that meeting to renew the agreement for an additional term of one year.
The information below summarizes certain factors considered by the Trustees in connection with the determination to renew the advisory agreement with the Advisor. In determining to renew the advisory agreement, the Trustees considered a wide range of information and did not identify any single factor as controlling, and this summary does not describe all of the factors and other matters considered by the Trustees in making their determination.
Nature, Extent and Quality of Services. The Trustees considered in their evaluation of the advisory agreement the written and oral reports provided to the Trustees and their standing committees throughout the year on a wide variety of topics by personnel from the Advisor’s portfolio management, administration, operations and compliance staffs. The Trustees also considered in this evaluation presentations and explanations made by representatives of the Advisor in meeting sessions scheduled for consideration of the renewal of the advisory agreement. The Trustees further noted in their evaluation the consideration they had given to a number of topics in previous years, reports from their standing committees, and advice received from counsel.
Information noted by the Trustees as having been considered in relation to the nature, extent and quality of services provided by the Advisor under the advisory agreement and contributing (together with other information considered) to their conclusions respecting the
Other Information, Continued
September 30, 2019 (Unaudited)
nature, extent and quality of the services rendered to the Fund by the Advisor included: (1) reports from portfolio managers and other personnel throughout the year demonstrating that the Fund was managed in conformity with stated strategies and objectives and conformed to investment restrictions and limitations; (2) reports demonstrating that management of the Fund remained faithful and competent, and demonstrating sufficient skill by portfolio managers in executing the Fund’s strategies in varying environments, managers’ cognizance of and strategies to pursue the Fund’s objectives and address pertinent market and economic trends and conditions, the evaluation and selection of individual investments, management to achieve tax efficiencies, and the structuring and composition of the Fund’s portfolio and management of Fund liquidity requirements; (3) the Fund’s achievement of its investment objectives over different periods of time; (4) presentations by and interactions with members of the Advisor’s fund administration, operations and compliance staffs; (5) reports from standing committees of the Trustees on their respective proceedings throughout the year, including in particular reports from and interactions with the Advisor’s personnel; (6) the sufficiency of the resources the Advisor devotes to the services it provides to the Fund, including the expertise of its personnel and staffing levels and its enhancements to the electronic systems it utilizes in providing these services, and also including the Advisor’s own financial management and sufficiency of its resources; and (7) the measures employed to achieve efficient trade execution for the Fund, including the evaluation and selection of firms to execute transactions for the Fund. As in past years, the Trustees noted particularly their assessments of the Advisor’s personnel developed in meetings throughout the year, measures to expand and improve the depth and experience of the Advisor’s staff, and the Advisor’s collaborative approach to investment management, continued commitment to observance of compliance and regulatory requirements in managing investments by the Fund, responsiveness to the Trustees, and other factors.
Based upon these and other considerations, the Trustees concluded that the Advisor’s management of the Fund’s investments continued to conform to the Fund’s stated objectives and policies, and that the nature, extent and quality of the services provided to the Fund by the Advisor remained sufficient.
Investment Performance. The Trustees noted in their evaluation of the Fund’s investment performance the written and oral reports they had received in each regular meeting over the course of the year from the Advisor’s portfolio management personnel. The Trustees also noted their consideration of information provided to them at their request in anticipation of their annual evaluation of the Advisor’s services, including the following items of information respecting the investment performance of the Fund: (1) the Fund’s absolute investment performance and achievement of stated objectives; (2) the Advisor’s explanations and commentary on the Fund’s performance in the context of the Fund’s objectives and reasonable expectations, and business, market and economic conditions; (3) performance data for the most recent five calendar years, comparing the Fund’s annual investment returns to a broad-based securities index and to the applicable Morningstar category of funds; (4) the Fund’s investment performance for the three-month, year-to-date, one-year, three-year, five-year, and since inception periods ending with the second quarter of the current year, comparing the Fund’s annualized returns to two mutual fund categories created by independent mutual fund analyst firms and to a broad-based securities index, and assigning a percentage rank to the Fund’s performance for each period relative to each of the fund categories; (5) analyses of specified performance and risk metrics for the Fund relative to its benchmark and to a selected peer group of funds, prepared by an independent financial analyst firm engaged by the independent Trustees; (6) the Fund’s cash flows; (7) comparative performance data for fund peer groups selected by an independent mutual fund analyst firm engaged by the independent Trustees, and the analysis and observations of the analyst firm respecting those data; and (8) comparative measures of correlation to equity indices, and risk and return statistics. Measures of risk and relative return demonstrated that the Fund’s performance relative to these measures continued to fulfill expectations in current conditions. The Trustees generally attach additional significance to the investment performance of the Fund from the perspective of longer-term shareholders, and noted in that regard that the Fund’s relative investment performance may be affected to some extent in periods when the Advisor pursues defensive measures in line with the Fund’s stated objectives. Based upon their consideration of this and other information, the Trustees concluded that the Fund’s absolute and relative investment performance over a range of pertinent holding periods on the whole was satisfactory in view of its objectives and strategies.
Comparisons of Fee and Expense Levels. Information noted by the Trustees as having been considered in this context included a variety of comparative data respecting the Fund’s fee and expense levels. This information included comparisons of the Fund’s advisory fee and overall Fund expenses to median and average fees and expenses charged to funds in the applicable Morningstar category, comparisons of the advisory fee and total expenses for two Fund share classes to the fee levels and expenses of fund peer groups selected from the category by an independent mutual fund analyst firm engaged by the independent Trustees, the perspectives and advice from that mutual fund analyst firm respecting comparisons of fund fee levels and expenses to fund peer groups, and other information. The Trustees considered that the Advisor has agreed to certain fee waivers and expense reimbursements for the current period. Comparative fee and expense data noted as having been considered by the Trustees showed that, after fee waivers and expense reimbursements, the level of total expense for one share class of the Fund was comparable to the median level and lower than the average level charged to funds in the applicable Morningstar category, and that, after fee waivers and expense reimbursements, the level of total expense for a second share class was lower than the median and average levels for that category. Peer group data showed that the Fund’s stated advisory fee was higher than the median level for the two peer groups but comparable to other funds in the peer group, that the total expense level of one representative share class was lower than the median of the respective peer group after waivers of fees and reimbursement of expenses, and that the total expense level of a second representative share class was higher than the median of the respective peer group but comparable to other funds in the peer groups after waivers of fees and reimbursement of expenses. The Trustees did not find the differences significant in view of their findings and conclusions respecting the other factors considered.
Other Information, Continued
September 30, 2019 (Unaudited)
The Trustees noted their consideration of information respecting the advisory fees charged by the Advisor to other investment management clients, including sub-advised mutual funds and other institutional clients, together with information about fees charged by other advisors to different clients, analysis of the differences between the requirements of institutional clients and mutual funds, analysis of the differences between the requirements of a sub-advised mutual fund and a fund as to which the investment advisor is the primary advisor and sponsor, and the consequently different investment management services provided to the different categories of clients and the differing contexts in which these arrangements are entered into. The Trustees confirmed their previous observations that the differences between the fees charged by the Advisor or by other investment advisors to different types of clients did not appear exceptional and had limited relevance to the evaluation of the fee rate charged to mutual funds as to which the Advisor or such other advisors are the primary advisor and sponsor.
Costs and Profitability of Advisor. The Trustees noted the costs incurred by the Advisor in initiating and managing the Fund and the Advisor’s waivers of fees and reimbursements of expenses for the Fund, and further noted that the Fund is not currently profitable to the Advisor.
Potential Economies of Scale. In reviewing the extent to which economies of scale would be realized by the Fund as it grows and whether fee levels reflect potential economies of scale, the Trustees considered the breakpoint structure for advisory fees chargeable to the Fund, comparisons of the fee breakpoint structure for the Fund with breakpoint structures (or the absence of such structures) for other funds in a peer group selected by an independent mutual fund analyst firm, the effects of the breakpoint structure and other expense factors realized by certain funds of the Trust as their asset levels had increased, the Advisor’s undertakings to waive or reimburse certain fees and expenses of the Fund, and the Advisor’s expenditures from its own profits and resources to maintain staffing levels and expand staff competencies, pay competitive levels of compensation, and add to its electronic and information technology systems so as to maintain or improve service levels. The information provided demonstrated to the Trustees that the Fund’s advisory fee breakpoint structure is reasonable in relation to the structures observed in the other funds in its peer group, and that shareholders may be expected to benefit from any economies of scale, due to the advisory agreement’s breakpoint fee structure for the Fund and other factors.
Potential Ancillary Benefits. In reviewing potential benefits to the Advisor because of its relationship to the Fund, the Trustees considered explanations from the Advisor respecting its receipt of certain research services from broker dealers, and the benefits to both the Fund and the Advisor of the Advisor’s expansion of its staffing, compliance and systems capabilities and other resources to serve a broader variety of investment management clients. No unusual or unfair benefits to the Advisor from its relationship to the Fund were identified by the Trustees.
Summary of Conclusions. The Trustees concluded that the general nature, extent and quality of the Advisor’s services performed under the advisory agreement remained sufficient, the Advisor had continued to actively and competently pursue the Fund’s stated investment objectives and adhere to the Fund’s investment policies, and that the absolute and relative investment performance of the Fund over pertinent holding periods on the whole was satisfactory in the context of the Fund’s objectives and strategies. The Trustees further concluded that the level of the advisory fee charged to the Fund by the Advisor is fair and reasonable in relation to the services provided by the Advisor, in view of the nature, extent and quality of those services, the investment performance of the Fund after fees and expenses, the clear disclosure of fees and expenses in the Fund’s prospectus, comparisons of fees and expenses charged to the Fund to fees and expenses charged to other mutual funds, and the other factors considered. The Trustees accordingly determined to renew the Fund’s investment advisory agreement with the Advisor for an additional term of one year.
Trustees’ Statement to Shareholders (Unaudited)
Readopted September 17, 2019
The Trustees believe current and prospective shareholders should know how we discharge our responsibilities in supervising the Funds’ investment advisor and in reviewing the advisor’s contract for renewal. Since 2005, we have issued a statement which sets out clearly the three principal guidelines that we follow in supervising the Trust’s investment advisor on your behalf. In accordance with our customary practice, in September of this year we again reviewed our statement and concluded we should reissue this statement outlining the principal features of our supervision of the advisor’s performance of investment management services for the Funds.
We begin with the premise that each shareholder selected his or her Fund because its investments are managed by the investment advisor identified in the prospectus and in accordance with the objective and policies described in the prospectus. We realize, as each of you do, that if you believe that your Fund’s stated objective and policies no longer serve your personal investment goals, you can sell your shares and leave the Fund.
Therefore, we believe that our primary supervisory task—our principal obligation to you—is to assess the nature and quality of the advisor’s services, and to confirm that the advisor actively and competently pursues the Fund’s objective, in accordance with the policies set out in the prospectus. To do this, we meet regularly with management to review your Fund’s portfolio and to discuss the advisor’s specific actions and judgments in pursuing the Fund’s objective. We do not substitute our own judgment for the advisor’s decisions in selecting investments; the advisor is paid to exercise its informed judgment on investment decisions, and we seek to confirm, in reviewing the advisor’s performance, that the advisor is doing just that.
Second, we are conscious of costs and the effect that costs have on shareholders’ returns. We try to make sure that your Fund’s fees and costs are reasonable in relationship to the services rendered and that they are generally in line with those charged by other expert investment advisors, consistent with our belief that the Fund’s investors searched for and expect that expertise and attention and have decided to pay a reasonable price for it. We do not put the management contract “out to bid” as a matter of course, and we would not do so unless we had concluded that the advisor materially had failed to pursue the Fund’s objectives in accordance with its policies, or for other equally important reasons. We believe that any other approach would be inconsistent with your interests and contrary to your expectations when you bought shares of the Fund in the first place.
Finally, because we believe that most Thornburg Fund shareholders have invested with a long-term perspective, we try not to focus too much on the fashions of the moment and on short-term performance. The market will not favor any specific investment objective or set of policies at all times and under all economic circumstances. A fund will experience periods of both high and low returns relative to other funds and other investments. Even if one of our Funds is not favored by the market at a particular time, we believe that the advisor is nonetheless obliged to remain true to the Fund’s objective and policies, and we watch to see that it does so.
Trustees of Thornburg Investment Trust
Thornburg Investment Management is a privately-owned global investment firm that offers a range of solutions for retail and institutional investors. Founded in 1982 and headquartered in Santa Fe, New Mexico, we manage approximately $41.9 billion (as of September 30, 2019) across U.S. mutual funds, separate accounts for high-net-worth investors, institutional accounts, and UCITS funds for non-U.S. investors.
The fund outlined in this report is one of many equity and fixed-income products available from Thornburg Investment Management.
EQUITY FUNDS
| ■ | Thornburg Global Opportunities Fund |
| ■ | Thornburg International Value Fund |
| ■ | Thornburg Better World International Fund |
| ■ | Thornburg International Growth Fund |
| ■ | Thornburg Developing World Fund |
| ■ | Thornburg Value Fund |
| ■ | Thornburg Core Growth Fund |
MULTI_ASSET FUNDS
| ■ | Thornburg Investment Income Builder Fund |
| ■ | Thornburg Summit Fund |
FIXED INCOME FUNDS
| ■ | Thornburg Low Duration Income Fund |
| ■ | Thornburg Limited Term U.S. Government Fund |
| ■ | Thornburg Limited Term Income Fund |
| ■ | Thornburg Strategic Income Fund |
| ■ | Thornburg Low Duration Municipal Fund |
| ■ | Thornburg Limited Term Municipal Fund |
| ■ | Thornburg Intermediate Municipal Fund |
| ■ | Thornburg California Limited Term Municipal Fund |
| ■ | Thornburg New Mexico Intermediate Municipal Fund |
| ■ | Thornburg New York Intermediate Municipal Fund |
| ■ | Thornburg Strategic Municipal Income Fund |
ALTERNATIVE FUNDS
| ■ | Thornburg Long/Short Equity Fund |
Before investing, carefully consider the Fund’s investment goals, risks, charges, and expenses. For a prospectus or summary prospectus containing this and other information, contact your financial advisor or visit thornburg.com. Read it carefully before investing.
For additional information, please visit thornburg.com
Thornburg Investment Management, Inc. 2300 North Ridgetop Road, Santa Fe, NM 87506
This page intentionally left blank.
This page intentionally left blank.
This page intentionally left blank.
To receive shareholder reports, prospectuses, and proxy statements electronically, go to www.thornburg.com/edelivery.
This Annual Report is submitted for the general information of shareholders of the Fund. It is not authorized for distribution to prospective investors in the Fund unless preceded or accompanied by an effective prospectus.
Investment Advisor:
Thornburg Investment Management®
800.847.0200
Distributor:
Thornburg Securities Corporation®
Annual Report
September 30, 2019
Beginning on January 1, 2021, as permitted by regulations adopted by the Securities and Exchange Commission, paper copies of the Fund’s shareholder reports will no longer be sent by mail, unless you specifically request paper copies of the reports from the Fund or from your financial intermediary, such as a broker-dealer or bank. Instead, the reports will be made available on a website, and you will be notified by mail each time a report is posted and provided with a website link to access the report.
If you already elected to receive shareholder reports electronically, you will not be affected by this change and you need not take any action. You may elect to receive shareholder reports and other communications from the Fund or your financial intermediary electronically by going to thornburg.com/edelivery.
You may elect to receive all future reports in paper free of charge. You can inform the Fund or your financial intermediary that you wish to continue receiving paper copies of your shareholder reports by calling 800.847.0200 or your financial intermediary directly. Your election to receive reports in paper will apply to all funds held with the fund complex/your financial intermediary.
At Thornburg, we believe unconstrained investing leads to better outcomes for our clients. Our investment solutions are highly active, high conviction, and benchmark agnostic. When it comes to finding economic opportunity for clients, it’s more than what we do.
It’s how we do it. Active Asbottom-up, fundamental, active managers, we look beyond conventional benchmarks. Long Term We take a long-term view in how we manage our firm and our portfolios. Benchmark Agnostic Investment strategies should have the flexibility to pursue solutions for clients, not stay within the conventional confines of benchmarks. Flexible Perspective Our approach to portfolio construction is guided by our convictions rather than convention. High Conviction We focus our attention and capital on thoroughly researched, well-understood positions. The best form of risk management is to know what you own, and why. Repeatable & Robust Our long-term outperformance of benchmarks verifies that our process works and outperforms conventional thinking. Independent We are independently owned and far from the herd of other investment managers. Investment Driven All members of the investment team are resources for all of our strategies. Collaborative Our team collaborates on opportunities across geography, sector, or asset class.
Thornburg Strategic Income Fund
Annual Report | September 30, 2019
Table of Contents
| SHARE CLASS | NASDAQ SYMBOL | CUSIP |
| Class A | TSIAX | 885-215-228 |
| Class C | TSICX | 885-215-210 |
| Class I | TSIIX | 885-215-194 |
| Class R3 | TSIRX | 885-216-887 |
| Class R4 | TSRIX | 885-216-754 |
| Class R5 | TSRRX | 885-216-879 |
| Class R6 | TSRSX | 885-216-648 |
Class I, R3, R4, R5, and R6 shares may not be available to all investors. Minimum investments for Class I shares may be higher than those for other classes.
Investments carry risks, including possible loss of principal. Portfolios investing in bonds have the same interest rate, inflation, and credit risks that are associated with the underlying bonds. The value of bonds will fluctuate relative to changes in interest rates, decreasing when interest rates rise. This effect is more pronounced for longer-term bonds. Unlike bonds, bond funds have ongoing fees and expenses. Investments in lower rated and unrated bonds may be more sensitive to default, downgrades, and market volatility; these investments may also be less liquid than higher rated bonds. Investments in derivatives are subject to the risks associated with the securities or other assets underlying the pool of securities, including illiquidity and difficulty in valuation. Investments in equity securities are subject to additional risks, such as greater market fluctuations. Additional risks may be associated with investments outside the United States, especially in emerging markets, including currency fluctuations, illiquidity, volatility, and political and economic risks. Please see the Fund’s prospectus for a discussion of the risks associated with an investment in the Fund. Investments in the Funds are not FDIC insured, nor are they bank deposits or guaranteed by a bank or any other entity.
Letter to Shareholders
Thornburg Strategic Income Fund | September 30, 2019 (Unaudited)
October 20, 2019
Dear Fellow Shareholder:
We are pleased to present the annual report for the Thornburg Strategic Income Fund for the period ended September 30, 2019. Combining income and change in price, the Thornburg Strategic Income Fund produced a total return of 6.35% (Class I shares) over the period. The longer duration Bloomberg Barclays U.S. Universal Bond Index produced a return of 10.07%, and a blended index of 80% Bloomberg Barclays U.S. Aggregate Bond Index and 20% MSCI World Index produced an 8.82% total return over the same time.
Over the last decade, on a three-year rolling basis, our strategy has managed to outperform both the Morningstar Multisector Bond category and Non-Traditional Bond Category 100% of the time. Overall, we are proud of our record through several different market episodes. Today, we continue to be more defensive due to the current state of global rate and credit markets, but we still have been able to generate significant value for shareholders. Because we are uniquely structured with a distinct investment process, we believe we are well positioned to provide a differentiated set of outcomes in a quite uncertain environment.
The earlier portion of the reporting period represented a major shift in market sentiment across asset classes. The U.S. Treasury 10-year yield peaked in early November 2018, but investor fears surrounding trade tensions, weakening global economic data, Brexit and especially a hawkish U.S. Federal Reserve (Fed), caused investors to shun risk assets. Rising market volatility at the time suggested that investors feared a tilt away from global monetary policy accommodation and the less predictable, and potentially uneven, economic results that were likely to follow.
The Fed had taken the lead on draining the punchbowl with a series of rate hikes and a simultaneous shrinkage of its balance sheet. But it grappled with inflation running at or close to its 2% target, while factoring in the specter of rising wages, potentially fueling higher inflation down the road. Unemployment remained less than 4% and wage growth had risen above 3%, creating a conundrum for policy makers. During the fourth quarter of 2018, the Fed battled signals from the financial markets as well as negative rhetoric from U.S. President Donald Trump. Ultimately, the Fed stayed the course and hiked rates in December, but the median forecast for 2019 fell from three hikes to two in a dovish signal for market participants. The market took the signal as gospel, with risk assets recovering to varying degrees. This would mark the beginning of a global reinflation for risk assets, and a renewed deflation in global yields.
By early January, Fed Chairman Jerome Powell retreated from further planned interest rate hikes in the months ahead, creating downside pressure on rates, and truly reinvigorating risk assets across the globe. Additionally, the Federal Open Markets Committee, the Fed’s monetary policy panel, decided to end balance sheet normalization toward the end of 2019, accelerating the downward move in rates and further buoying markets. It set the stage for what would become a series of rate cuts later on in the year. The retreat allowed other central banks around the globe to abandon rate hike plans. On a global basis,
general underlying economic fundamentals did not materially deteriorate. This fact, combined with more accommoda
tive central banks, resulted in one of the strongest quarters for risk assets on record. While we had taken advantage of widening spreads and increased rates across portfolios during the latter parts of 2018, we did not view risk as wholesale attractive given continued concerns surrounding economic growth. However, within appropriate portfolios, we maintained a healthy allocation to credit, participating in the broad lift experienced by markets. That said, we find the recent Fed actions concerning.
It seems policy decisions are no longer driven by economic fundamentals, but instead by market movements. In many instances, asset prices are widely disconnected from their fundamentals. What has gone from a tacit inference that the Fed would prop up swooning financial markets—the Greenspan, Bernanke and Yellen “puts”—has become somewhat more explicit under Chairman Powell, who has spoken openly about “financial conditions” and stability as part of the Fed’s decision-making process. A financial asset’s price should reflect more its individual fundamentals and less the tidal effects of Fed policy. To be sure, some economic data had been weakening in the U.S. and abroad. Global purchasing manager indices continued to trend downward and have recently moved into contractionary territory, including in the U.S. Yet strong U.S. labor force growth and a supportive capex cycle, at least through the first quarter of 2019, continued to drive productivity gains. And while wage growth has leveled off lately, consumer sentiment and balance sheets remain relatively healthy.
The economic backdrop is important for fixed income investors, so it’s crucial to look at both corporate and consumer health as leading indicators for the economy and for portfolio positioning. Corporate fundamentals have slipped a bit as growth in revenue and earnings before interest, taxes, depreciation and amortization are roughly flat. One important area of concern in the corporate market is leverage and interest coverage. While we are at or near all-time highs in terms of leverage, it is in a very different market than we experienced a decade ago. Since 2009, U.S. non-financial corporations have added $4.3 trillion in new debt, a 66% increase. What we find disconcerting is not the sheer amount of leverage in the system but how stretched the fundamentals become when one factors in a slowing growth environment. This will surely cause future problems for those who have thrown caution to the wind and indiscriminately bought credit at current levels. However, the market continues to provide select opportunities within corporates of both investment grade and high yield that have less cyclical underlying cash flows.
Along with the decline in corporate fundamentals, consumer fundamentals have deteriorated, albeit much more modestly. The consumer is seeing increasing debt-to-income ratios as credit card rates are at a decade high. As expected, there has also been an uptick in delinquencies and losses. Despite these metrics, we continue to believe the consumer is on solid footing, bolstered by the tight labor market. Credit quality underlying ABS (asset-backed securities) and MBS (mortgage-backed securities) remains solid. We believe credit underwriting and structure within these spaces are still favorable and especially so for our portfolios as we stay focused on the top of the capital
Letter to Shareholders, Continued
Thornburg Strategic Income Fund | September 30, 2019 (Unaudited)
stack. In our view, our place in the capital structure reduces our credit risk and the underlying borrowers’ incentives and ability to refinance controls prepayment activity, targeting attractive, sensible exposures with limited convexity risk.
While stronger economic growth continues to give us confidence to hold a decent amount of credit currently, we have continued to lower risk exposures in the portfolio over time as risk compensation has declined. Throughout the period we expressed a defensive posture in multiple ways. Given our guiding philosophy of managing a diversified portfolio to be robust across many macro environments, we continued to build balanced risk exposures to avoid overdependence upon any singular outcome. Within our high-yield holdings for example, we’ve continued to upgrade quality and reduce potential volatility. All high-yield bonds are not created equal. We’ve focused on shorter maturities, less cyclical cash flows as mentioned above, and companies focused on the stronger segments of the economy that will generally lower volatility at the portfolio level in times of stress.
Overall, we remain defensive, maintaining lower credit duration. Currently, we prefer consumer ABS and MBS over corporates, consistent with our preference for superior balance sheets. Looking forward, investors have to contend with Brexit, the Hong Kong protests, talk around a potential U.S. presidential impeachment and bouts of geopolitical turmoil, particularly in the Middle East. Not a backdrop most would find appealing, particularly when risk asset prices remain near all-time highs. Yet uncertainty often breeds opportunity for astute investors with a long-term, balanced focus.
The matters discussed in this report may constitute forward-looking statements made pursuant to the safe harbor provisions of the Securities Litigation Reform Act of 1995. These include any advisor or portfolio manager prediction, assessment, analysis or outlook for individual securities, industries, investment styles, market sectors and/or markets. These statements involve risks and uncertainties. In addition to the general risks described for each fund in its current prospectus, other factors bearing on these reports include the accuracy of the advisor’s or portfolio manager’s forecasts and predictions, the appropriateness of the investment strategies designed by the advisor or portfolio manager and the ability of the advisor or portfolio manager to implement their strategies efficiently and successfully. Any one or more of these factors, as well as other risks affecting the securities markets generally, could cause the actual results of any fund to differ materially as compared to its benchmarks.
The views expressed are subject to change and do not necessarily reflect the views of Thornburg Investment Management, Inc. This information should not be relied upon as a recommendation or investment advice and is not intended to predict the performance of any investment or market.
Performance results of individual share classes will vary based on the fees and expenses associated with each share class, and may be higher or lower than other share classes within the same Fund. Please see Performance Summary for performance results of each share class.
Performance Summary
Thornburg Strategic Income Fund | September 30, 2019 (Unaudited)
AVERAGE ANNUAL TOTAL RETURNS
| | 1-YR | 3-YR | 5-YR | 10-YR | SINCE
INCEP. |
| Class A Shares(Incep: 12/19/07) | | | | | |
| Without sales charge | 5.92% | 4.22% | 3.22% | 5.96% | 5.90% |
| With sales charge | 1.14% | 2.65% | 2.28% | 5.47% | 5.49% |
| Class C Shares(Incep: 12/19/07) | | | | | |
| Without sales charge | 5.15% | 3.48% | 2.55% | 5.33% | 5.27% |
| With sales charge | 4.15% | 3.48% | 2.55% | 5.33% | 5.27% |
| Class I Shares(Incep: 12/19/07) | 6.35% | 4.62% | 3.60% | 6.32% | 6.25% |
| Class R3 Shares(Incep: 5/1/12) | 5.71% | 4.10% | 3.13% | - | 4.42% |
| Class R4 Shares(Incep: 2/1/14) | 5.71% | 4.03% | 3.10% | - | 3.51% |
| Class R5 Shares(Incep: 5/1/12) | 6.35% | 4.61% | 3.58% | - | 4.82% |
| Class R6 Shares(Incep: 4/10/17) | 6.40% | - | - | - | 4.87% |
| Bloomberg Barclays U.S. Universal Bond Index(Since 12/19/07) | 10.07% | 3.23% | 3.62% | 4.14% | 4.42% |
30-DAY YIELDS, A SHARES(with sales charge)
| Annualized Distribution Yield | 3.15% |
| SEC Yield | 2.38% |
GROWTH OF A HYPOTHETICAL $10,000 INVESTMENT
Performance data shown represents past performance and is no guarantee of future results. Investment return and principal value will fluctuate so shares, when redeemed, may be worth more or less than their original cost. Current performance may be lower or higher than quoted. For performance current to the most recent month end, visit thornburg.com or call 800-847-0200. The performance information does not reflect the deduction of taxes that a shareholder would pay on distributions or the redemption of Fund shares. Returns reflect the reinvestment of dividends and capital gains. Class A shares are sold with a maximum sales charge of 4.50%. Class C shares are subject to a 1% CDSC for the first year only. There is no sales charge for Class I, R3, R4, R5 and R6 shares. As disclosed in the most recent prospectus, the total annual fund operating expenses before fee waivers and expense reimbursements are as follows: A shares, 1.21%; C shares, 1.96%; I shares, 0.91%; R3 shares, 2.46%; R4 shares, 2.14%; R5 shares, 1.20% and R6 shares, 1.13%. Thornburg Investment Management has contractually agreed to waive fees and reimburse expenses until at least February 1, 2020, resulting in net expense ratios of the following: A shares, 1.05%; C shares, 1.80%; I shares, 0.60%; R3 shares, 1.25%; R4 shares, 1.25%; R5 shares, 0.60% and R6 shares, 0.53%. For more detailed information on fund expenses and waivers/reimbursements please see the Fund’s prospectus.
The Bloomberg Barclays U.S. Aggregate Bond Index is composed of approximately 8,000 publicly traded bonds including U.S. government, mortgage-backed, corporate and Yankee bonds. The index is weighted by the market value of the bonds included in the index.
TheBloomberg Barclays U.S. Universal Bond Indexrepresents the union of the U.S. Aggregate Index, U.S. Corporate High-Yield, investment Grade 144A Index, Eurodollar Index, U.S. Emerging Markets Index, and the non-ERISA eligible portion of the CMBS Index. The index covers USD denominated, taxable bonds that are rated either investment-grade or below investment-grade.
TheMSCI World Index is an unmanaged market-weighted index that consists of securities traded in 23 of the world’s most developed countries. Securities are listed on exchanges in the U.S., Europe, Canada, Australia, New Zealand, and the Far East. The index is calculated with net dividends reinvested in U.S. dollars.
The performance of any index is not indicative of the performance of any particular investment. Unless otherwise noted, index returns reflect the reinvestment of income dividends and capital gains, if any, but do not reflect fees, brokerage commissions or other expenses of investing. Investors may not make direct investments into any index.
High yield bonds may offer higher yields in return for risk exposure.
Morningstar Multisector Bond category portfolios seek income by diversifying their assets among several fixed income sectors, usually U.S. government obligations, U.S. corporate
bonds, foreign bonds, and high-yield U.S. debt securities. These portfolios typically hold 35% to 65% of bond assets in securities that are not rated or are rated by a major agency such as Standard & Poor’s or Moody’s at the level of BB (considered speculative for taxable bonds) and below.
Morningstar Non-Traditional Bond category. The Non-traditional Bond category contains funds that pursue strategies divergent in one or more ways from conventional practice in the broader bond-fund universe. Many funds in this group describe themselves as "absolute return" portfolios, which seek to avoid losses and produce returns uncorrelated with the overall bond market; they employ a variety of methods to achieve those aims. Another large subset are self-described "unconstrained" portfolios that have more flexibility to invest tactically across a wide swath of individual sectors, including high-yield and foreign debt, and typically with very large allocations. Funds in the latter group typically have broad freedom to manage interest-rate sensitivity, but attempt to tactically manage those exposures in order to minimize volatility. The category is also home to a subset of portfolios that attempt to minimize volatility by maintaining short or ultra-short duration portfolios, but explicitly court significant credit and foreign bond market risk in order to generate high returns. Funds within this category often will use credit default swaps and other fixed income derivatives to a significant level within their portfolios.
Fund Summary
Thornburg Strategic Income Fund | September 30, 2019 (Unaudited)
OBJECTIVES AND STRATEGIES
The Fund’s primary investment goal is to seek a high level of current income. The Fund’s secondary investment goal is some long-term capital appreciation.
The Fund pursues its investment goals by investing in a broad range of income-producing investments from throughout the world, primarily including debt obligations and income-producing stocks. The Fund expects, under normal conditions, to invest a majority of its assets in debt obligations, but the relative proportions of the Fund’s investments in debt obligations and in income-producing stocks can be expected to vary over time.
| PORTFOLIO COMPOSITION |
| Corporate/Convertible Bonds | 55.3% |
| Asset Backed Securities | 17.1% |
| Bank Loans | 3.2% |
| Common & Preferred Stock | 1.1% |
| U.S. Treasury Securities | 0.3% |
| Other Fixed Income | 9.3% |
| Other Assets Less Liabilities | 13.7% |
FIXED INCOME CREDIT QUALITY*
| * | Excludes equity securities. |
A bond credit rating assesses the financial ability of a debt issuer to make timely payments of principal and interest. Ratings of AAA (the highest), AA, A, and BBB are investment-grade quality. Ratings of BB, B, CCC, CC, C and D (the lowest) are considered below investment grade, speculative grade, or junk bonds.
Credit quality ratings for Thornburg’s global fixed income portfolios used ratings from Moody’s Investors Service. Where Moody’s ratings are not available, we have used Standard & Poor’s ratings. Where neither rating is available, we have used ratings from other nationally recognized statistical rating organizations (NRSROs). “NR” = not rated.
| TOP TEN INDUSTRY GROUPS |
| Diversified Financials | 8.2% |
| Energy | 5.8% |
| Materials | 4.1% |
| Utilities | 3.7% |
| Telecommunication Services | 3.7% |
| Media & Entertainment | 3.6% |
| Technology Hardware & Equipment | 3.2% |
| Insurance | 3.2% |
| Automobiles & Components | 3.0% |
| Software & Services | 2.6% |
COUNTRY EXPOSURE *
(percent of Fund) |
| United States | 68.4% |
| Canada | 2.6% |
| United Kingdom | 1.7% |
| Germany | 1.7% |
| Japan | 1.6% |
| South Korea | 1.3% |
| France | 1.0% |
| Bermuda | 0.9% |
| China | 0.8% |
| Belgium | 0.6% |
| Switzerland | 0.5% |
| Cayman Islands | 0.5% |
| Sweden | 0.5% |
| Luxembourg | 0.5% |
| Mexico | 0.4% |
| Italy | 0.4% |
| Ireland | 0.3% |
| India | 0.3% |
| Morocco | 0.3% |
| South Africa | 0.3% |
| Jamaica | 0.3% |
| Australia | 0.3% |
| Netherlands | 0.2% |
| Guatemala | 0.2% |
| Turkey | 0.2% |
| Brazil | 0.2% |
| Barbados | 0.1% |
| Chile | 0.1% |
| New Zealand | 0.1% |
| Saint Lucia | 0.0%** |
| Other Assets Less Liabilities | 13.7% |
| * | Holdings are classified by country of risk as determined by MSCI and Bloomberg. |
| ** | Country percentage was less than 0.1%. |
There is no guarantee that the Fund will meet its investment objectives.
All data is subject to change. Charts may not add up to 100% due to rounding.
Schedule of Investments
Thornburg Strategic Income Fund | September 30, 2019
| | | SHARES/
PRINCIPAL AMOUNT | VALUE |
| | Common Stock — 0.0% | | |
| | Energy — 0.0% | | |
| | Oil, Gas & Consumable Fuels — 0.0% | | |
| a,b,c | Malamute Energy, Inc., | 847 | $ 8,893 |
| | | | 8,893 |
| | Total Common Stock(Cost $0) | | 8,893 |
| | Preferred Stock — 1.1% | | |
| | Banks — 0.6% | | |
| | Banks — 0.6% | | |
| d,e | AgriBank FCB, 6.875% (LIBOR 3 Month + 4.23%) | 40,000 | 4,280,000 |
| d,e | CoBank ACB, Series F, 6.25% (LIBOR 3 Month + 4.56%) | 50,000 | 5,350,000 |
| | | | 9,630,000 |
| | Energy — 0.2% | | |
| | Oil, Gas & Consumable Fuels — 0.2% | | |
| e | Crestwood Equity Partners L.P., 9.25% | 320,654 | 2,961,240 |
| | | | 2,961,240 |
| | Miscellaneous — 0.1% | | |
| | U.S. Government Agencies — 0.1% | | |
| e | Farm Credit Bank of Texas, Series 1, 10.00% | 1,000 | 1,111,250 |
| | | | 1,111,250 |
| | Telecommunication Services — 0.2% | | |
| | Diversified Telecommunication Services — 0.2% | | |
| a,f,g | Centaur Funding Corp., 9.08%, 4/21/2020 | 2,380 | 2,466,870 |
| | | | 2,466,870 |
| | Total Preferred Stock(Cost $16,017,997) | | 16,169,360 |
| | Asset Backed Securities — 17.1% | | |
| | Asset-Backed - Finance & Insurance — 6.2% | | |
| f | Aqua Finance Trust, Series 2019-A 4.01%, 7/16/2040 | $ 3,100,000 | 3,114,247 |
| f | Conn’s Receivables Funding LLC, Series 2019-A Class A, 3.40%, 10/16/2023 | 2,876,737 | 2,888,326 |
| f | ExteNet, LLC, Series 2019-1A Class A2, 3.204%, 7/26/2049 | 5,000,000 | 5,061,454 |
| f | Freed ABS Trust, Series 2019-1 Class-A, 3.42%, 6/18/2026 | 2,827,690 | 2,841,650 |
| f | Hilton Grand Vacations Trust, Series 2019-AA Class A, 2.34%, 7/25/2033 | 3,806,229 | 3,798,592 |
| f | Lendingpoint Asset Securitization Trust, Series 2019-1 Class A, 3.154%, 8/15/2025 | 5,948,885 | 5,956,689 |
| f | Meltel Land Funding, LLC, Series 2019-1A Class A, 3.768%, 4/15/2049 | 5,500,000 | 5,637,644 |
| f | New Residential Advance Receivables Trust, Series 2019-T2 3.06%, 8/15/2053 | 4,875,000 | 4,862,393 |
| f | NRZ Advance Receivables Trust, Series 2019-T1 Class AT1, 2.59%, 7/15/2052 | 7,000,000 | 7,032,153 |
| f | Ocwen Master Advance Receivables Trust Series 2019-T2 3.042%, 8/15/2051 | 3,100,000 | 3,107,525 |
| f | Ocwen Master Advance Receivables Trust, Series 2019-T1 3.107%, 8/15/2050 | 2,050,000 | 2,055,057 |
| f | Oportun Funding X, LLC Series 2018-C Class A, 4.10%, 10/8/2024 | 2,690,000 | 2,755,043 |
| f | Prosper Marketplace Issuance Trust, Series 2019-2A Class A, 3.20%, 9/15/2025 | 3,631,397 | 3,639,979 |
| f | SCF Equipment Leasing LLC, Series 2019-1A Class D, 4.56%, 5/20/2027 | 3,000,000 | 3,077,796 |
| f | Small Business Lending Trust, Series 2019-A Class A, 2.85%, 7/15/2026 | 2,500,000 | 2,498,806 |
| f | Sofi Consumer Loan Program Trust, Series 2019-3 Class A, 2.90%, 5/25/2028 | 7,581,772 | 7,629,998 |
| f | SpringCastle Funding, Series 2019-AA Class A, 3.20%, 5/27/2036 | 7,471,987 | 7,545,957 |
| f | Upgrade Receivables Trust, Series 2019-2A Class A, 2.77%, 10/15/2025 | 5,000,000 | 5,004,882 |
| | Upstart Securitization Trust, | | |
| f | Series 2017-1 Class C, 6.35%, 6/20/2024 | 4,000,000 | 4,073,625 |
| f | Series 2018-2 Class B, 4.445%, 12/22/2025 | 450,000 | 452,807 |
| f | Series 2019-1 Class B, 4.19%, 4/20/2026 | 5,000,000 | 5,052,162 |
| f | Series 2019-2 Class A, 2.897%, 9/20/2029 | 5,762,012 | 5,777,610 |
| | | | 93,864,395 |
| | Auto Receivables — 3.0% | | |
| f | ACC Trust, Series 2018-1 Class A, 3.70%, 12/21/2020 | 358,920 | 359,162 |
Schedule of Investments, Continued
Thornburg Strategic Income Fund | September 30, 2019
| | | SHARES/
PRINCIPAL AMOUNT | VALUE |
| f | American Credit Acceptance Receivables Trust, Series 2016-4 Class C, 2.91%, 2/13/2023 | $ 764,426 | $ 764,467 |
| f | Avis Budget Rental Car Funding AESOP, LLC, Series 2015-1A Class A, 2.50%, 7/20/2021 | 2,900,000 | 2,902,237 |
| | CarNow Auto Receivables Trust, | | |
| f | Series 2017-1A Class B, 4.35%, 9/15/2022 | 5,800,000 | 5,849,757 |
| f | Series 2019-1A Class A, 2.72%, 11/15/2022 | 2,730,297 | 2,734,026 |
| f | CIG Auto Receivables Trust, Series 2017-1A Class A, 2.71%, 5/15/2023 | 357,810 | 357,956 |
| f | CPS Auto Receivables Trust, Series 2019-A Class B, 3.58%, 12/16/2024 | 3,000,000 | 3,039,279 |
| | Foursight Capital Automobile Receivables Trust, | | |
| f | Series 2016-1 Class A2, 2.87%, 10/15/2021 | 383,650 | 383,856 |
| f | Series 2018-1 Class E, 5.56%, 1/16/2024 | 1,000,000 | 1,042,586 |
| f | Series 2018-2 Class E, 5.50%, 10/15/2024 | 1,370,000 | 1,437,515 |
| f | Series 2019-1 Class A2, 2.58%, 3/15/2023 | 5,500,000 | 5,507,872 |
| f | GLS Auto Receivables Trust, Series 2018-2A Class A, 3.25%, 4/18/2022 | 857,073 | 859,148 |
| f | Hertz Vehicle Financing II L.P., Series 2015-1A Class A, 2.73%, 3/25/2021 | 4,000,000 | 4,005,661 |
| d,f,g | OSCAR US Funding Trust VII, LLC, Series 2017-2A Class A2B, 2.699% (LIBOR 1 Month + 0.65%), 11/10/2020 | 38,502 | 38,504 |
| f | Sierra Auto Receivables Securitization Trust, Series 2016-1A Class B, 6.84%, 1/18/2022 | 595,542 | 596,605 |
| | Skopos Auto Receivables Trust, | | |
| f | Series 2018-1A Class A, 3.19%, 9/15/2021 | 197,532 | 197,615 |
| f | Series 2019-1A Class A, 2.90%, 12/15/2022 | 2,750,000 | 2,751,516 |
| f | Tesla Auto Lease Trust, Series 2018-B Class A, 3.71%, 8/20/2021 | 2,374,719 | 2,411,324 |
| f | U.S. Auto Funding, LLC, Series 2019-1A Class A, 3.61%, 4/15/2022 | 3,695,237 | 3,713,020 |
| f | United Auto Credit Securitization Trust, Series 2019-1A Class B, 3.03%, 4/10/2024 | 6,000,000 | 6,037,224 |
| f | Veros Automobile Receivables Trust, Series 2017-1 Class A, 2.84%, 4/17/2023 | 74,194 | 74,186 |
| | | | 45,063,516 |
| | Credit Card — 0.2% | | |
| f | Genesis Sales Finance Master Trust, Series 2019-AA Class A, 4.68%, 8/20/2023 | 3,250,000 | 3,313,192 |
| | | | 3,313,192 |
| | Other Asset Backed — 6.1% | | |
| d,f | 321 Henderson Receivables II, LLC, Series 2006-3A Class A1, 2.228% (LIBOR 1 Month + 0.20%), 9/15/2041 | 1,820,591 | 1,781,422 |
| f | Avant Loans Funding Trust, Series 2019-A Class A, 3.48%, 7/15/2022 | 1,813,401 | 1,821,434 |
| | AXIS Equipment Finance Receivables VI, LLC, | | |
| f | Series 2018-2A Class A2, 3.89%, 7/20/2022 | 2,995,859 | 3,022,758 |
| f | Series 2019-1A Class A2, 2.63%, 6/20/2024 | 2,000,000 | 2,006,916 |
| f | BCC Funding XIV, LLC, Series 2018-1A Class A2, 2.96%, 6/20/2023 | 1,069,216 | 1,074,706 |
| f | CFG Investments Ltd. Series 2019-1 Class A, 5.56%, 8/15/2029 | 5,000,000 | 5,007,272 |
| f | CLUB Credit Trust, Series 2017-P2 Class A, 2.61%, 1/15/2024 | 189,358 | 189,377 |
| f | Consumer Loan Underlying Bond Credit Trust, Series 2019-A Class A, 3.52%, 4/15/2026 | 1,998,506 | 2,010,433 |
| f | Credit Suisse ABS Trust, Series 2018-LD1 Class A, 3.42%, 7/25/2024 | 304,501 | 304,636 |
| | Diamond Resorts Owner Trust, | | |
| f | Series 2018-1 Class A, 3.70%, 1/21/2031 | 2,303,112 | 2,346,787 |
| f | Series 2019-1A Class A, 2.89%, 2/20/2032 | 6,401,334 | 6,416,980 |
| f,g | ECAF I Ltd., Series 2015-1A Class B1, 5.802%, 6/15/2040 | 5,260,362 | 5,242,358 |
| | Foundation Finance Trust, | | |
| f | Series 2017-1A Class A, 3.30%, 7/15/2033 | 1,758,716 | 1,768,572 |
| f | Series 2019-1A Class A, 3.86%, 11/15/2034 | 4,852,629 | 4,966,810 |
| f,g | Global SC Finance II SRL, Series 2014-1A Class A1, 3.19%, 7/17/2029 | 2,295,833 | 2,290,956 |
| f | HERO Funding Trust, Series 2017-2A Class A1, 3.28%, 9/20/2048 | 2,612,012 | 2,634,828 |
| | Marlette Funding Trust, | | |
| f | Series 2018-1A Class A, 2.61%, 3/15/2028 | 261,981 | 262,021 |
| f | Series 2019-3A Class A, 2.69%, 9/17/2029 | 5,066,720 | 5,075,510 |
| | Nationstar HECM Loan Trust, | | |
| b,f,h | Series 2018-1A Class A, 2.76%, 2/25/2028 | 606,113 | 602,476 |
| f,h | Series 2018-2A Class A, 3.188%, 7/25/2028 | 487,302 | 488,612 |
| a,b,d,f | Northwind Holdings, LLC, Series 2007-1A Class A1, 3.30% (LIBOR 3 Month + 0.78%), 12/1/2037 | 237,500 | 234,175 |
| f | Oportun Funding VI, LLC, Series 2017-A Class A, 3.23%, 6/8/2023 | 4,000,000 | 4,004,501 |
| f | PFS Financing Corp., Series 2018-B Class A, 2.89%, 2/15/2023 | 3,000,000 | 3,028,132 |
| f | Purchasing Power Funding, LLC, Series 2018-A Class A, 3.34%, 8/15/2022 | 3,000,000 | 3,009,178 |
| b,f | Scala Funding Co., LLC, Series 2016-1 Class B, 5.21%, 2/15/2021 | 4,000,000 | 3,948,000 |
| | SCF Equipment Leasing, LLC, | | |
| f | Series 2017-2A Class A, 3.41%, 12/20/2023 | 553,339 | 559,851 |
| f | Series 2018-1A Class A2, 3.63%, 10/20/2024 | 1,783,654 | 1,789,487 |
| f | Sierra Timeshare Receivables Funding, LLC, Series 2015-2A Class A, 2.43%, 6/20/2032 | 1,566,034 | 1,564,338 |
Schedule of Investments, Continued
Thornburg Strategic Income Fund | September 30, 2019
| | | SHARES/
PRINCIPAL AMOUNT | VALUE |
| d | SLM Student Loan Trust, Series 2013-6 Class A3, 2.668% (LIBOR 1 Month + 0.65%), 6/25/2055 | $ 2,860,614 | $ 2,849,560 |
| f | Sofi Consumer Loan Program, LLC, Series 2017-3 Class A, 2.77%, 5/25/2026 | 388,118 | 389,232 |
| f | SolarCity LMC Series I, LLC, Series 2013-1 Class A, 4.80%, 11/20/2038 | 2,190,625 | 2,316,811 |
| f | Solarcity LMC Series II, LLC, Series 2014-1 Class A, 4.59%, 4/20/2044 | 2,530,369 | 2,583,423 |
| f | Sonic Capital, LLC, Series 2016-1A Class A2, 4.472%, 5/20/2046 | 2,883,412 | 2,921,547 |
| f,g | Textainer Marine Containers V Ltd., Series 2017-1A Class A, 3.72%, 5/20/2042 | 3,631,406 | 3,703,035 |
| | Towd Point Mortgage Trust, | | |
| f,h | Series 2018-2 Class A1, 3.25%, 3/25/2058 | 3,176,019 | 3,227,471 |
| f,h | Series 2018-3 Class A1, 3.75%, 5/25/2058 | 2,461,354 | 2,550,455 |
| f,h | Series 2018-6 Class A1A, 3.75%, 3/25/2058 | 2,586,836 | 2,663,406 |
| f | Westgate Resorts, LLC, Series 2016-1A Class A, 3.50%, 12/20/2028 | 819,487 | 823,716 |
| | | | 91,481,182 |
| | Residential MTG Trust — 0.3% | | |
| f,h | Finance of America Structured Securities Trust, Series 2018-HB1 Class A, 3.375%, 9/25/2028 | 2,088,509 | 2,092,823 |
| | New Residential Mortgage Loan Trust, | | |
| f,h | Series 2017-6A Class A1, 4.00%, 8/27/2057 | 1,004,949 | 1,050,022 |
| f,h | Series 2018-1A Class A1A, 4.00%, 12/25/2057 | 1,834,593 | 1,912,730 |
| | | | 5,055,575 |
| | Student Loan — 1.3% | | |
| f | Commonbond Student Loan Trust, Series 18-CGS, Class A1, 3.87%, 2/25/2046 | 2,449,053 | 2,563,935 |
| f | Earnest Student Loan Program, LLC, Series 2016-C Class A2, 2.68%, 7/25/2035 | 1,122,897 | 1,127,162 |
| d,f | Navient Private Education Refinance Loan Trust, Series 2019-D Class A2B, 3.078% (LIBOR 1 Month + 1.05%), 12/15/2059 | 6,000,000 | 5,999,971 |
| | Nelnet Student Loan Trust, | | |
| d,f | Series 2015-2A Class A2, 2.618% (LIBOR 1 Month + 0.60%), 9/25/2047 | 3,680,286 | 3,676,373 |
| d,f | Series 2016-A Class A1A, 3.768% (LIBOR 1 Month + 1.75%), 12/26/2040 | 1,544,575 | 1,536,990 |
| | SLM Student Loan Trust, | | |
| d | Series 2008-2 Class A3, 3.026% (LIBOR 3 Month + 0.75%), 4/25/2023 | 950,442 | 937,695 |
| d | Series 2008-5 Class A4, 3.976% (LIBOR 3 Month + 1.70%), 7/25/2023 | 1,407,200 | 1,413,574 |
| d | Series 2012-1 Class A3, 2.968% (LIBOR 1 Month + 0.95%), 9/25/2028 | 2,485,798 | 2,456,830 |
| d,f | SoFi Professional Loan Program, LLC, Series 2014-B Class A1, 3.268% (LIBOR 1 Month + 1.25%), 8/25/2032 | 473,109 | 473,727 |
| | | | 20,186,257 |
| | Total Asset Backed Securities(Cost $257,053,084) | | 258,964,117 |
| | Corporate Bonds — 54.1% | | |
| | Automobiles & Components — 3.0% | | |
| | Auto Components — 0.2% | | |
| f,g | Nexteer Automotive Group Ltd., 5.875%, 11/15/2021 | 2,000,000 | 2,034,635 |
| | Automobiles — 1.9% | | |
| d,f,g | BMW Finance N.V., 2.965% (LIBOR 3 Month + 0.79%), 8/12/2022 | 4,000,000 | 4,013,849 |
| | Daimler Finance North America, LLC, | | |
| d,f | 3.058% (LIBOR 3 Month + 0.90%), 2/15/2022 | 5,500,000 | 5,528,441 |
| f | 3.75%, 11/5/2021 | 1,505,000 | 1,547,393 |
| f | Hyundai Capital America, 3.95%, 2/1/2022 | 2,000,000 | 2,055,276 |
| f,g | Hyundai Capital Services, Inc., 3.75%, 3/5/2023 | 3,000,000 | 3,098,671 |
| | Nissan Motor Acceptance Corp., | | |
| d,f | 2.794% (LIBOR 3 Month + 0.69%), 9/28/2022 | 460,000 | 459,201 |
| d,f | 2.953% (LIBOR 3 Month + 0.65%), 7/13/2022 | 440,000 | 438,842 |
| g | Toyota Motor Corp., 2.157%, 7/2/2022 | 8,000,000 | 8,057,981 |
| | Volkswagen Group of America Finance, LLC, | | |
| f | 2.50%, 9/24/2021 | 1,425,000 | 1,428,532 |
| f | 4.00%, 11/12/2021 | 2,500,000 | 2,583,676 |
| | Construction & Engineering — 0.9% | | |
| | SBA Tower Trust, | | |
| f | 2.877%, 7/15/2046 | 2,275,000 | 2,282,685 |
| f,i | 3.156%, 10/10/2045 | 11,750,000 | 11,762,602 |
| | | | 45,291,784 |
| | Banks — 1.0% | | |
| | Banks — 1.0% | | |
| d | Capital One NA/Mclean VA, 3.007% (LIBOR 3 Month + 0.82%), 8/8/2022 | 3,000,000 | 3,008,671 |
Schedule of Investments, Continued
Thornburg Strategic Income Fund | September 30, 2019
| | | SHARES/
PRINCIPAL AMOUNT | VALUE |
| d | Citizens Bank N.A./Providence RI, 3.054% (LIBOR 3 Month + 0.95%), 3/29/2023 | $ 4,000,000 | $ 4,023,887 |
| d | Goldman Sachs Bank USA, 2.575% (SOFR + 0.60%), 5/24/2021 | 1,885,000 | 1,888,083 |
| | Santander Holdings USA, Inc., 3.40%, 1/18/2023 | 2,000,000 | 2,046,588 |
| g | Sumitomo Mitsui Banking Corp., 2.65%, 7/23/2020 | 2,000,000 | 2,008,445 |
| g | Svenska Handelsbanken AB, 3.90%, 11/20/2023 | 1,500,000 | 1,602,885 |
| | | | 14,578,559 |
| | Capital Goods — 2.0% | | |
| | Aerospace & Defense — 0.4% | | |
| f | BWX Technologies, Inc., 5.375%, 7/15/2026 | 5,375,000 | 5,650,469 |
| | Industrial Conglomerates — 0.1% | | |
| g | Pentair Finance Sarl, 4.50%, 7/1/2029 | 1,950,000 | 2,022,838 |
| | Machinery — 0.8% | | |
| f,g | ATS Automation Tooling Systems, Inc., 6.50%, 6/15/2023 | 4,005,000 | 4,135,162 |
| | Mueller Industries, Inc., 6.00%, 3/1/2027 | 2,216,000 | 2,238,160 |
| | Nvent Finance Sarl, | | |
| g | 3.95%, 4/15/2023 | 2,000,000 | 2,037,980 |
| g | 4.55%, 4/15/2028 | 3,000,000 | 3,133,106 |
| | Trading Companies & Distributors — 0.7% | | |
| f | IAA, Inc. 5.50%, 6/15/2027 | 930,000 | 981,150 |
| | LKQ Corp., 4.75%, 5/15/2023 | 8,045,000 | 8,145,562 |
| f | Performance Food Group, Inc. 5.50%, 10/15/2027 | 1,428,000 | 1,502,970 |
| | | | 29,847,397 |
| | Commercial & Professional Services — 1.1% | | |
| | Commercial Services & Supplies — 0.9% | | |
| f,g | Cimpress N.V., 7.00%, 6/15/2026 | 3,190,000 | 3,293,037 |
| f | Nielsen Finance, LLC / Nielsen Finance Co., 5.00%, 4/15/2022 | 4,420,000 | 4,432,376 |
| f | ServiceMaster Co., LLC, 5.125%, 11/15/2024 | 6,470,000 | 6,712,625 |
| | Leisure Products — 0.2% | | |
| | Mattel, Inc., 2.35%, 8/15/2021 | 3,000,000 | 2,917,500 |
| | | | 17,355,538 |
| | Consumer Durables & Apparel — 1.3% | | |
| | Household Durables — 0.7% | | |
| f,g | Panasonic Corp., 2.536%, 7/19/2022 | 3,500,000 | 3,521,202 |
| | Tupperware Brands Corp. (Guaranty: Dart Industries, Inc.), 4.75%, 6/1/2021 | 7,187,000 | 7,347,719 |
| | Leisure Products — 0.4% | | |
| | Vista Outdoor, Inc., 5.875%, 10/1/2023 | 5,490,000 | 5,105,700 |
| | Textiles, Apparel & Luxury Goods — 0.2% | | |
| | Under Armour, Inc., 3.25%, 6/15/2026 | 3,200,000 | 3,086,061 |
| | | | 19,060,682 |
| | Consumer Services — 1.0% | | |
| | Hotels, Restaurants & Leisure — 0.6% | | |
| | Aramark Services, Inc., 4.75%, 6/1/2026 | 5,000,000 | 5,137,500 |
| f | Nathan’s Famous, Inc., 6.625%, 11/1/2025 | 3,780,000 | 3,761,100 |
| | Transportation Infrastructure — 0.4% | | |
| f,g | Adani Ports & Special Economic Zone Ltd., 3.375%, 7/24/2024 | 5,135,000 | 5,162,752 |
| | Mexico City Airport Trust, | | |
| f,g | 3.875%, 4/30/2028 | 488,000 | 478,850 |
| f,g | 4.25%, 10/31/2026 | 419,000 | 421,619 |
| | | | 14,961,821 |
| | Diversified Financials — 7.8% | | |
| | Capital Markets — 1.5% | | |
| | Ares Capital Corp., 4.20%, 6/10/2024 | 4,350,000 | 4,458,773 |
| f | Ares Finance Co., LLC, 4.00%, 10/8/2024 | 4,160,000 | 4,095,861 |
| f | Compass Group Diversified Holdings, LLC, 8.00%, 5/1/2026 | 3,000,000 | 3,172,500 |
| g | Genpact Luxembourg Sarl, 3.70%, 4/1/2022 | 6,000,000 | 6,090,920 |
| a,b,f | JPR Royalty Sub, LLC, 14.00%, 9/1/2020 | 2,000,000 | 200,000 |
| | Solar Capital Ltd., 4.50%, 1/20/2023 | 3,000,000 | 2,981,962 |
Schedule of Investments, Continued
Thornburg Strategic Income Fund | September 30, 2019
| | | SHARES/
PRINCIPAL AMOUNT | VALUE |
| | TPG Specialty Lending, Inc., 4.50%, 1/22/2023 | $ 2,500,000 | $ 2,567,353 |
| | Consumer Finance — 1.0% | | |
| d | Citibank N.A., 2.531% (LIBOR 3 Month + 0.35%), 2/12/2021 | 3,000,000 | 3,003,260 |
| f | FirstCash, Inc., 5.375%, 6/1/2024 | 7,500,000 | 7,725,000 |
| d | Wells Fargo Bank N.A., 2.788% (LIBOR 3 Month + 0.51%), 10/22/2021 | 5,000,000 | 5,015,860 |
| | Diversified Financial Services — 4.1% | | |
| f | Antares Holdings L.P., 6.00%, 8/15/2023 | 4,435,000 | 4,594,641 |
| | Bank of America Corp. MTN, 4.20%, 8/26/2024 | 3,200,000 | 3,432,302 |
| | Barclays plc, | | |
| d,g | 3.548% (LIBOR 3 Month + 1.38%), 5/16/2024 | 2,500,000 | 2,487,392 |
| g,j | 4.61% (LIBOR 3 Month + 1.40%), 2/15/2023 | 2,000,000 | 2,076,895 |
| f,g | BNP Paribas S.A., 3.375%, 1/9/2025 | 5,000,000 | 5,163,214 |
| j | Citigroup, Inc., 3.352% (LIBOR 3 Month + 0.90%), 4/24/2025 | 2,000,000 | 2,072,220 |
| g | Credit Suisse Group Funding Guernsey Ltd. (Guaranty: Credit Suisse Group AG), 3.80%, 9/15/2022 - 6/9/2023 | 2,850,000 | 2,965,456 |
| | Deutsche Bank AG, | | |
| d,g | 3.093% (LIBOR 3 Month + 0.82%), 1/22/2021 | 1,350,000 | 1,337,014 |
| d,g | 3.362% (LIBOR 3 Month + 1.23%), 2/27/2023 | 2,800,000 | 2,697,036 |
| g | 5.00%, 2/14/2022 | 3,500,000 | 3,626,970 |
| d | Goldman Sachs Group, Inc., 3.377% (LIBOR 3 Month + 1.11%), 4/26/2022 | 4,000,000 | 4,034,340 |
| | HSBC Holdings plc, | | |
| g,j | 3.803% (LIBOR 3 Month + 1.21%), 3/11/2025 | 1,000,000 | 1,042,031 |
| g,j | 4.292% (LIBOR 3 Month + 1.35%), 9/12/2026 | 2,000,000 | 2,144,626 |
| g | Mitsubishi UFJ Financial Group, Inc., 2.623%, 7/18/2022 | 4,000,000 | 4,036,149 |
| g,j | Mizuho Financial Group, Inc., 3.922% (LIBOR 3 Month + 1.00%), 9/11/2024 | 3,150,000 | 3,315,152 |
| d | Morgan Stanley MTN, 3.678% (LIBOR 3 Month + 1.40%), 4/21/2021 | 3,000,000 | 3,044,860 |
| d | Morgan Stanley, 3.208% (LIBOR 3 Month + 0.93%), 7/22/2022 | 3,000,000 | 3,022,827 |
| | Royal Bank of Scotland Group plc, | | |
| d,g | 3.628% (LIBOR 3 Month + 1.47%), 5/15/2023 | 1,398,000 | 1,399,266 |
| g | 6.125%, 12/15/2022 | 2,000,000 | 2,164,123 |
| | Societe Generale S.A., | | |
| f,g | 3.875%, 3/28/2024 | 2,000,000 | 2,098,204 |
| f,g | 4.25%, 9/14/2023 | 3,000,000 | 3,183,060 |
| d,f,g | UBS Group Funding Switzerland AG (Guaranty: UBS Group AG), 3.108% (LIBOR 3 Month + 0.95%), 8/15/2023 | 2,000,000 | 2,009,558 |
| | Insurance — 0.9% | | |
| | AIG Global Funding, | | |
| f | 2.30%, 7/1/2022 | 4,000,000 | 4,010,746 |
| d,f | 2.565% (LIBOR 3 Month + 0.48%), 7/2/2020 | 2,000,000 | 2,005,574 |
| a,f | Citicorp Lease Pass-Through Trust 1999-1, 8.04%, 12/15/2019 | 185,942 | 188,081 |
| b,f,k | Global Atlantic Fin Co., 4.40%, 10/15/2029 | 7,275,000 | 7,262,633 |
| | Mortgage Real Estate Investment Trusts — 0.3% | | |
| | Senior Housing Properties Trust, 4.75%, 2/15/2028 | 4,000,000 | 4,020,381 |
| | | | 118,746,240 |
| | Energy — 5.3% | | |
| | Energy Equipment & Services — 0.6% | | |
| | Enviva Partners L.P. / Enviva Partners Finance Corp., 8.50%, 11/1/2021 | 4,145,000 | 4,238,262 |
| f | Hanwha Energy USA Holdings Corp., 2.375%, 7/30/2022 | 2,500,000 | 2,503,354 |
| | Odebrecht Offshore Drilling Finance Ltd., | | |
| f,g | 6.72%, 12/1/2022 | 500,348 | 489,096 |
| f,g,l | 7.72%, 12/1/2026 PIK | 2,132,608 | 557,933 |
| e,f,g | Odebrecht Oil & Gas Finance Ltd. (Guaranty: Odebrecht Oleo e Gas S.A.) Zero Coupon , 12/31/2099 | 304,899 | 2,668 |
| c,f,g,m | Schahin II Finance Co. SPV Ltd., 5.875%, 9/25/2023 | 10,684,600 | 744,930 |
| | Oil, Gas & Consumable Fuels — 4.7% | | |
| | Boardwalk Pipelines L.P., 4.80%, 5/3/2029 | 3,920,000 | 4,163,139 |
| f | Citgo Holding, Inc., 9.25%, 8/1/2024 | 3,695,000 | 3,925,937 |
| f | Colorado Interstate Gas Co., LLC / Colorado Interstate Issuing Corp., 4.15%, 8/15/2026 | 725,000 | 761,757 |
| d | Energy Transfer Operating L.P., 5.271% (LIBOR 3 Month + 3.02%), 11/1/2066 | 1,200,000 | 900,120 |
| | EQT Midstream Partners L.P., Series 5Y, 4.75%, 7/15/2023 | 3,475,000 | 3,485,721 |
| f | Florida Gas Transmission Co., LLC, 3.875%, 7/15/2022 | 4,765,000 | 4,917,310 |
| | Gulf South Pipeline Co. L.P., 4.00%, 6/15/2022 | 4,860,000 | 4,978,399 |
| f | Gulfstream Natural Gas System, LLC, 4.60%, 9/15/2025 | 5,000,000 | 5,411,908 |
| f,g | Harvest Operations Corp. (Guaranty: Korea National Oil Corp.), 3.00%, 9/21/2022 | 4,000,000 | 4,073,960 |
Schedule of Investments, Continued
Thornburg Strategic Income Fund | September 30, 2019
| | | SHARES/
PRINCIPAL AMOUNT | VALUE |
| a,b,c,f,m | Linc USA GP / Linc Energy Finance USA, Inc., 9.625%, 10/31/2017 | $ 1,062,182 | $ 44,081 |
| | Midwest Connector Capital Co., LLC, | | |
| f | 3.625%, 4/1/2022 | 1,310,000 | 1,343,812 |
| f | 3.90%, 4/1/2024 | 3,315,000 | 3,491,690 |
| | Murphy Oil USA, Inc. 4.75%, 9/15/2029 | 1,945,000 | 1,988,763 |
| | Northern Border Pipeline Co., Series A, 7.50%, 9/15/2021 | 2,150,000 | 2,335,548 |
| | Occidental Petroleum Corp., | | |
| d | 3.437% (LIBOR 3 Month + 1.25%), 8/13/2021 | 900,000 | 905,395 |
| d,i | 3.637% (LIBOR 3 Month + 1.45%), 8/15/2022 | 3,500,000 | 3,523,100 |
| f | Par Petroleum, LLC / Par Petroleum Finance Corp., 7.75%, 12/15/2025 | 1,500,000 | 1,488,750 |
| f,g | Parkland Fuel Corp. 5.875%, 7/15/2027 | 1,945,000 | 2,040,908 |
| f,g | Petroleos Mexicanos 6.49%, 1/23/2027 | 2,925,000 | 3,051,067 |
| | Plains All American Pipeline L.P. / PAA Finance Corp. 3.55%, 12/15/2029 | 4,890,000 | 4,780,137 |
| c,m | RAAM Global Energy Co., 12.50%, 10/1/2015 | 2,000,000 | 2,500 |
| b,f,g,l | Schahin II Finance Co. SPV Ltd., 8.00%, 5/25/2020 PIK | 624,191 | 586,740 |
| f,g | Sinopec Group Overseas Development Ltd., 4.125%, 9/12/2025 | 6,000,000 | 6,472,523 |
| | Summit Midstream Holdings, LLC / Summit Midstream Finance Corp., 5.50%, 8/15/2022 | 1,210,000 | 1,104,125 |
| e,j | Summit Midstream Partners L.P., Series A, 9.50% (LIBOR 3 Month + 7.43%), 12/15/2022 | 3,550,000 | 2,556,000 |
| | Tennessee Gas Pipeline Co., LLC, 7.00%, 3/15/2027 | 2,251,000 | 2,780,288 |
| | | | 79,649,921 |
| | Food & Staples Retailing — 1.0% | | |
| | Food & Staples Retailing — 1.0% | | |
| f,g | Alimentation Couche-Tard, Inc., 2.70%, 7/26/2022 | 4,000,000 | 4,026,771 |
| f | C&S Group Enterprises, LLC, 5.375%, 7/15/2022 | 3,935,000 | 3,979,269 |
| | Ingles Markets, Inc., 5.75%, 6/15/2023 | 4,500,000 | 4,595,625 |
| f | KeHE Distributors, LLC / KeHE Finance Corp. 8.625%, 10/15/2026 | 2,097,000 | 2,138,940 |
| | | | 14,740,605 |
| | Food, Beverage & Tobacco — 1.8% | | |
| | Beverages — 0.4% | | |
| f,g | Central American Bottling Corp., 5.75%, 1/31/2027 | 2,980,000 | 3,158,830 |
| f,g | Coca-Cola Icecek A/S, 4.215%, 9/19/2024 | 3,000,000 | 2,982,912 |
| | Food Products — 0.7% | | |
| f,g | Barry Callebaut Services N.V., 5.50%, 6/15/2023 | 4,000,000 | 4,384,800 |
| d | General Mills, Inc., 3.313% (LIBOR 3 Month + 1.01%), 10/17/2023 | 3,500,000 | 3,525,258 |
| f | Lamb Weston Holdings, Inc., 4.625%, 11/1/2024 | 2,500,000 | 2,631,000 |
| | Tobacco — 0.7% | | |
| | Altria Group, Inc., 4.40%, 2/14/2026 | 1,000,000 | 1,069,349 |
| d | BAT Capital Corp., 2.765% (LIBOR 3 Month + 0.59%), 8/14/2020 | 2,500,000 | 2,504,792 |
| f,g | Imperial Brands Finance plc, 3.50%, 7/26/2026 | 2,000,000 | 1,999,945 |
| | Vector Group Ltd., | | |
| f | 6.125%, 2/1/2025 | 2,194,000 | 2,100,755 |
| f | 10.50%, 11/1/2026 | 3,000,000 | 3,060,000 |
| | | | 27,417,641 |
| | Healthcare Equipment & Services — 1.7% | | |
| | Health Care Equipment & Supplies — 0.3% | | |
| f | Hologic, Inc. 4.625%, 2/1/2028 | 4,880,000 | 5,056,900 |
| | Health Care Providers & Services — 1.4% | | |
| | Anthem, Inc., 2.50%, 11/21/2020 | 2,000,000 | 2,009,871 |
| f | Centene Corp., 5.375%, 6/1/2026 | 2,000,000 | 2,092,500 |
| d | CVS Health Corp., 2.732% (LIBOR 3 Month + 0.63%), 3/9/2020 | 200,000 | 200,395 |
| | DaVita, Inc., 5.00%, 5/1/2025 | 7,415,000 | 7,385,859 |
| f | Tenet Healthcare Corp., 6.25%, 2/1/2027 | 4,350,000 | 4,530,742 |
| | WellCare Health Plans, Inc., | | |
| | 5.25%, 4/1/2025 | 3,000,000 | 3,123,750 |
| f | 5.375%, 8/15/2026 | 1,000,000 | 1,067,300 |
| | | | 25,467,317 |
| | Household & Personal Products — 1.2% | | |
| | Household Products — 0.8% | | |
| | Central Garden & Pet Co., 5.125%, 2/1/2028 | 4,475,000 | 4,564,500 |
Schedule of Investments, Continued
Thornburg Strategic Income Fund | September 30, 2019
| | | SHARES/
PRINCIPAL AMOUNT | VALUE |
| f | Energizer Gamma Acquisition B.V., 4.625%, 7/15/2026 | $ 2,000,000 | $ 2,300,885 |
| f | Prestige Brands, Inc., 6.375%, 3/1/2024 | 3,880,000 | 4,035,200 |
| f | Spectrum Brands, Inc. 5.00%, 10/1/2029 | 930,000 | 946,275 |
| | Personal Products — 0.4% | | |
| | First Quality Finance Co., Inc., | | |
| f | 4.625%, 5/15/2021 | 3,030,000 | 3,030,000 |
| f | 5.00%, 7/1/2025 | 3,000,000 | 3,101,340 |
| | | | 17,978,200 |
| | Insurance — 3.2% | | |
| | Insurance — 3.2% | | |
| f,g | DaVinciRe Holdings Ltd., 4.75%, 5/1/2025 | 4,790,000 | 4,986,895 |
| | Enstar Group Ltd., | | |
| g | 4.50%, 3/10/2022 | 2,000,000 | 2,074,317 |
| g | 4.95%, 6/1/2029 | 5,835,000 | 6,160,328 |
| g | Fairfax Financial Holdings Ltd., 4.85%, 4/17/2028 | 3,000,000 | 3,245,339 |
| f,g | Lancashire Holdings Ltd., 5.70%, 10/1/2022 | 4,900,000 | 5,151,154 |
| | Mercury General Corp., 4.40%, 3/15/2027 | 4,000,000 | 4,204,032 |
| d,f | Metropolitan Life Global Funding, 2.39% (SOFR + 0.57%), 9/7/2020 | 1,940,000 | 1,945,212 |
| f | Protective Life Corp., 3.40%, 1/15/2030 | 4,902,000 | 4,983,591 |
| | Protective Life Global Funding, | | |
| d,f | 2.624% (LIBOR 3 Month + 0.52%), 6/28/2021 | 3,000,000 | 3,012,851 |
| f | 3.104%, 4/15/2024 | 2,500,000 | 2,577,548 |
| | Reliance Standard Life Global Funding II, | | |
| f | 2.625%, 7/22/2022 | 2,425,000 | 2,445,259 |
| f | 3.85%, 9/19/2023 | 5,000,000 | 5,253,916 |
| f | Sammons Financial Group, Inc., 4.45%, 5/12/2027 | 2,000,000 | 2,076,037 |
| | | | 48,116,479 |
| | Materials — 3.9% | | |
| | Chemicals — 2.5% | | |
| | CF Industries, Inc. 7.125%, 5/1/2020 | 5,540,000 | 5,692,350 |
| d,f | Chevron Phillips Chemical Co., LLC / Chevron Phillips Chemical Co., L.P. 3.003% (LIBOR 3 Month + 0.75%), 5/1/2020 | 4,000,000 | 4,009,313 |
| | Consolidated Energy Finance S.A., | | |
| d,f,g | 5.869% (LIBOR 3 Month + 3.75%), 6/15/2022 | 2,500,000 | 2,494,178 |
| f,g | 6.875%, 6/15/2025 | 500,000 | 501,250 |
| | DuPont de Nemours, Inc., 4.205%, 11/15/2023 | 1,738,000 | 1,862,467 |
| f,g | Kissner Holdings L.P. / Kissner Milling Co. Ltd. / BSC Holding, Inc. / Kissner USA, 8.375%, 12/1/2022 | 4,170,000 | 4,347,225 |
| f,g | NOVA Chemicals Corp., 4.875%, 6/1/2024 | 4,425,000 | 4,550,449 |
| f,g | Nufarm Australia Ltd. / Nufarm Americas, Inc. 5.75%, 4/30/2026 | 3,885,000 | 3,836,438 |
| f,g | OCP S.A., 5.625%, 4/25/2024 | 4,710,000 | 5,135,567 |
| | Valvoline, Inc., | | |
| | 4.375%, 8/15/2025 | 2,920,000 | 2,971,100 |
| | 5.50%, 7/15/2024 | 1,945,000 | 2,022,800 |
| | Containers & Packaging — 0.9% | | |
| | Ball Corp., | | |
| | 4.375%, 12/15/2020 | 2,000,000 | 2,041,020 |
| | 4.875%, 3/15/2026 | 1,500,000 | 1,629,375 |
| f | Graphic Packaging International, LLC 4.75%, 7/15/2027 | 2,910,000 | 3,055,500 |
| f | Matthews International Corp. 5.25%, 12/1/2025 | 3,363,000 | 3,186,442 |
| f | Sealed Air Corp. 5.50%, 9/15/2025 | 4,000,000 | 4,310,000 |
| | Paper & Forest Products — 0.5% | | |
| f | Neenah, Inc., 5.25%, 5/15/2021 | 7,575,000 | 7,575,000 |
| | | | 59,220,474 |
| | Media & Entertainment — 2.7% | | |
| | Hotels, Restaurants & Leisure — 0.3% | | |
| | Speedway Motorsports, Inc. 5.125%, 2/1/2023 | 4,862,000 | 4,934,930 |
| | Interactive Media & Services — 0.1% | | |
| g | Baidu, Inc., 3.875%, 9/29/2023 | 2,000,000 | 2,080,917 |
| | Media — 2.3% | | |
Schedule of Investments, Continued
Thornburg Strategic Income Fund | September 30, 2019
| | | SHARES/
PRINCIPAL AMOUNT | VALUE |
| | CCO Holdings, LLC / CCO Holdings Capital Corp., | | |
| f,k | 4.75%, 3/1/2030 | $ 2,930,000 | $ 2,974,565 |
| f | 5.375%, 6/1/2029 | 4,500,000 | 4,792,500 |
| f | CSC Holdings LLC, 6.50%, 2/1/2029 | 1,000,000 | 1,111,475 |
| | CSC Holdings, LLC, | | |
| f | 5.375%, 2/1/2028 | 2,000,000 | 2,107,500 |
| f | 5.50%, 4/15/2027 | 1,825,000 | 1,929,737 |
| | DISH DBS Corp., 5.125%, 5/1/2020 | 1,000,000 | 1,011,250 |
| | Lamar Media Corp. 5.75%, 2/1/2026 | 1,940,000 | 2,051,065 |
| b,f,l | Mood Media Borrower, LLC / Mood Media Co-Issuer, Inc., 2.085%, 12/31/2023 PIK | 3,089,019 | 2,579,331 |
| f | Salem Media Group, Inc., 6.75%, 6/1/2024 | 3,351,000 | 2,898,615 |
| f | Sirius XM Radio, Inc., 3.875%, 8/1/2022 | 5,000,000 | 5,076,562 |
| f,g | Telenet Finance Luxembourg Notes Sarl, 5.50%, 3/1/2028 | 4,000,000 | 4,190,000 |
| | Warner Media, LLC 3.80%, 2/15/2027 | 3,190,000 | 3,310,833 |
| | | | 41,049,280 |
| | Pharmaceuticals, Biotechnology & Life Sciences — 0.4% | | |
| | Pharmaceuticals — 0.4% | | |
| a,b,c,m | Atlas U.S. Royalty, LLC Participation Rights,, 3/15/2027 | 5,450,000 | 0 |
| | Bayer US Finance II, LLC, | | |
| d,f | 2.736% (LIBOR 3 Month + 0.63%), 6/25/2021 | 500,000 | 499,425 |
| f | 4.25%, 12/15/2025 | 2,500,000 | 2,670,889 |
| | Takeda Pharmaceutical Co. Ltd., | | |
| f,g | 4.00%, 11/26/2021 | 1,500,000 | 1,552,631 |
| f,g | 4.40%, 11/26/2023 | 1,250,000 | 1,346,214 |
| | | | 6,069,159 |
| | Real Estate — 1.3% | | |
| | Equity Real Estate Investment Trusts — 1.3% | | |
| | American Tower Corp., 3.375%, 5/15/2024 | 3,000,000 | 3,118,140 |
| | CoreCivic, Inc. | | |
| | 4.625%, 5/1/2023 | 1,735,000 | 1,681,024 |
| | 4.75%, 10/15/2027 | 4,917,000 | 4,320,814 |
| | Crown Castle International Corp., 3.20%, 9/1/2024 | 2,000,000 | 2,054,377 |
| | GEO Group, Inc., 6.00%, 4/15/2026 | 4,625,000 | 3,732,375 |
| | Retail Opportunity Investments Partnership L.P. (Guaranty: Retail Opportunity Investments Corp.), 5.00%, 12/15/2023 | 1,500,000 | 1,582,719 |
| | Service Properties Trust, 4.95%, 2/15/2027 | 2,850,000 | 2,887,530 |
| | | | 19,376,979 |
| | Retailing — 0.7% | | |
| | Internet & Direct Marketing Retail — 0.1% | | |
| | Booking Holdings, Inc., 2.75%, 3/15/2023 | 2,000,000 | 2,047,406 |
| | Multiline Retail — 0.3% | | |
| d | Dollar Tree, Inc., 3.003% (LIBOR 3 Month + 0.70%), 4/17/2020 | 4,596,000 | 4,596,826 |
| | Specialty Retail — 0.3% | | |
| f | Michaels Stores, Inc. 8.00%, 7/15/2027 | 4,365,000 | 4,370,456 |
| | | | 11,014,688 |
| | Semiconductors & Semiconductor Equipment — 1.0% | | |
| | Semiconductors & Semiconductor Equipment — 1.0% | | |
| | Broadcom Corp. / Broadcom Cayman Finance Ltd., | | |
| | 2.375%, 1/15/2020 | 1,000,000 | 999,937 |
| | 3.625%, 1/15/2024 | 2,000,000 | 2,045,220 |
| f | Broadcom, Inc. 3.625%, 10/15/2024 | 2,965,000 | 3,014,645 |
| | Micron Technology, Inc., 4.185%, 2/15/2027 | 8,379,000 | 8,621,047 |
| | | | 14,680,849 |
| | Software & Services — 2.3% | | |
| | Information Technology Services — 0.2% | | |
| f | Harland Clarke Holdings Corp., 8.375%, 8/15/2022 | 1,955,000 | 1,603,100 |
| | S&P Global, Inc. (Guaranty: Standard & Poor’s Financial Services, LLC), 3.30%, 8/14/2020 | 1,975,000 | 1,993,908 |
| | Interactive Media & Services — 0.1% | | |
| g | Baidu, Inc., 4.375%, 5/14/2024 | 1,424,000 | 1,517,384 |
Schedule of Investments, Continued
Thornburg Strategic Income Fund | September 30, 2019
| | | SHARES/
PRINCIPAL AMOUNT | VALUE |
| | Software — 2.0% | | |
| | Autodesk, Inc., 3.125%, 6/15/2020 | $ 2,350,000 | $ 2,362,586 |
| | CDK Global, Inc., | | |
| | 3.80%, 10/15/2019 | 4,315,000 | 4,315,000 |
| f | 5.25%, 5/15/2029 | 460,000 | 476,100 |
| | 5.875%, 6/15/2026 | 2,000,000 | 2,127,500 |
| | Citrix Systems, Inc., 4.50%, 12/1/2027 | 3,000,000 | 3,243,200 |
| f | Fair Isaac Corp. 5.25%, 5/15/2026 | 2,460,000 | 2,626,050 |
| f | j2 Cloud Services, LLC / j2 Global Co-Obligor, Inc., 6.00%, 7/15/2025 | 4,165,000 | 4,397,615 |
| f | MSCI, Inc., 5.75%, 8/15/2025 | 4,635,000 | 4,860,956 |
| f,g | Open Text Corp., 5.875%, 6/1/2026 | 3,320,000 | 3,544,764 |
| | VMware, Inc., 2.30%, 8/21/2020 | 2,000,000 | 2,001,042 |
| | | | 35,069,205 |
| | Technology Hardware & Equipment — 3.2% | | |
| | Communications Equipment — 1.5% | | |
| | Anixter, Inc. (Guaranty: Anixter International, Inc.), 5.125%, 10/1/2021 | 6,395,000 | 6,650,800 |
| | Juniper Networks, Inc., 3.75%, 8/15/2029 | 3,940,000 | 3,955,679 |
| | Motorola Solutions, Inc., 4.60%, 2/23/2028 - 5/23/2029 | 6,409,000 | 6,948,332 |
| g | Telefonaktiebolaget LM Ericsson, 4.125%, 5/15/2022 | 5,456,000 | 5,618,861 |
| | Electronic Equipment, Instruments & Components — 1.4% | | |
| g | Allegion plc, 3.50%, 10/1/2029 | 1,420,000 | 1,433,909 |
| | Ingram Micro, Inc., 5.45%, 12/15/2024 | 1,951,000 | 2,021,151 |
| | PerkinElmer, Inc., 3.30%, 9/15/2029 | 3,040,000 | 3,038,987 |
| f,g | Sensata Technologies B.V. 4.875%, 10/15/2023 | 2,938,000 | 3,095,917 |
| | Tech Data Corp., 4.95%, 2/15/2027 | 4,000,000 | 4,292,994 |
| | Trimble, Inc., 4.75%, 12/1/2024 | 6,525,000 | 7,003,420 |
| | Office Electronics — 0.3% | | |
| | CDW, LLC / CDW Finance Corp. 4.25%, 4/1/2028 | 930,000 | 948,693 |
| | CDW, LLC / CDW Finance Corp., 5.00%, 9/1/2025 | 2,000,000 | 2,077,500 |
| | Lexmark International, Inc., 7.125%, 3/15/2020 | 1,797,000 | 1,765,553 |
| | | | 48,851,796 |
| | Telecommunication Services — 2.9% | | |
| | Diversified Telecommunication Services — 1.4% | | |
| d | AT&T, Inc., 3.312% (LIBOR 3 Month + 1.18%), 6/12/2024 | 3,750,000 | 3,818,625 |
| f,g | Digicel Ltd., 6.00%, 4/15/2021 | 5,750,000 | 4,053,808 |
| f | GTT Communications, Inc. 7.875%, 12/31/2024 | 3,860,000 | 2,161,600 |
| | Qwest Corp., 6.75%, 12/1/2021 | 3,700,000 | 3,998,812 |
| f,g | Videotron Ltd., 5.375%, 6/15/2024 | 6,000,000 | 6,558,900 |
| | Wireless Telecommunication Services — 1.5% | | |
| | America Movil SAB de C.V., 6.45%, 12/5/2022 | 45,000,000 | 2,194,816 |
| f,g | Digicel International Finance Ltd., 8.75%, 5/25/2024 | 500,000 | 475,000 |
| f,g | MTN Mauritius Investment Ltd., 4.755%, 11/11/2024 | 4,125,000 | 4,175,325 |
| f,g | SK Telecom Co. Ltd., 3.75%, 4/16/2023 | 3,000,000 | 3,129,827 |
| | Sprint Communications, Inc., 9.25%, 4/15/2022 | 11,516,000 | 13,344,165 |
| | | | 43,910,878 |
| | Transportation — 0.9% | | |
| | Airlines — 0.9% | | |
| | American Airlines Pass Through Trust, | | |
| | Series 2013-2 Class A, 4.95%, 7/15/2024 | 1,489,827 | 1,561,637 |
| f | Series 2013-2 Class B, 5.60%, 1/15/2022 | 6,196,504 | 6,301,224 |
| | Continental Airlines Pass Through Trust, Series 2005-ERJ1, 9.798%, 10/1/2022 | 1,209,877 | 1,251,376 |
| f,g | Guanay Finance Ltd., 6.00%, 12/15/2020 | 1,740,904 | 1,758,313 |
| | US Airways Pass Through Trust, | | |
| | Series 2010-1 Class A, 6.25%, 10/22/2024 | 967,054 | 1,051,574 |
| | Series 2012-1 Class A, 5.90%, 4/1/2026 | 1,239,174 | 1,379,449 |
| | US Airways Pass Through Trust, (MBIA Insurance Corp), Series 2001-1G, 7.076%, 9/20/2022 | 351,219 | 368,112 |
| | | | 13,671,685 |
| | Utilities — 3.4% | | |
| | Electric Utilities — 3.0% | | |
Schedule of Investments, Continued
Thornburg Strategic Income Fund | September 30, 2019
| | | SHARES/
PRINCIPAL AMOUNT | VALUE |
| | Avangrid, Inc., | | |
| | 3.15%, 12/1/2024 | $ 3,000,000 | $ 3,092,406 |
| | 3.80%, 6/1/2029 | 2,000,000 | 2,148,591 |
| | CenterPoint Energy, Inc., 3.60%, 11/1/2021 | 3,000,000 | 3,079,728 |
| f | Duquesne Light Holdings, Inc., 6.40%, 9/15/2020 | 2,000,000 | 2,070,166 |
| f,g | Electricite de France S.A., 4.60%, 1/27/2020 | 4,000,000 | 4,031,533 |
| f,g | Enel Finance International N.V., 4.625%, 9/14/2025 | 5,500,000 | 6,007,239 |
| | Entergy Texas, Inc., 3.45%, 12/1/2027 | 3,000,000 | 3,119,675 |
| | Evergy, Inc., 2.45%, 9/15/2024 | 1,970,000 | 1,968,479 |
| f | Jersey Central Power & Light Co., 4.30%, 1/15/2026 | 4,065,000 | 4,449,933 |
| f | Metropolitan Edison Co. 4.30%, 1/15/2029 | 1,940,000 | 2,188,437 |
| f | Midland Cogeneration Venture L.P., 6.00%, 3/15/2025 | 1,131,912 | 1,146,120 |
| | PNM Resources, Inc., 3.25%, 3/9/2021 | 2,835,000 | 2,861,771 |
| | Puget Energy, Inc., | | |
| | 5.625%, 7/15/2022 | 2,500,000 | 2,673,951 |
| | 6.50%, 12/15/2020 | 2,000,000 | 2,094,009 |
| | SCANA Corp. MTN, 4.125%, 2/1/2022 | 528,000 | 544,986 |
| | Southern Co., 3.25%, 7/1/2026 | 3,500,000 | 3,609,439 |
| | Electronic Equipment, Instruments & Components — 0.2% | | |
| f | Sensata Technologies, Inc.,Co. 4.375%, 2/15/2030 | 3,900,000 | 3,895,125 |
| | Gas Utilities — 0.2% | | |
| f,g | Rockpoint Gas Storage Canada Ltd., 7.00%, 3/31/2023 | 2,562,000 | 2,574,810 |
| | | | 51,556,398 |
| | Total Corporate Bonds(Cost $813,561,695) | | 817,683,575 |
| | Convertible Bonds — 1.2% | | |
| | Diversified Financials — 0.4% | | |
| | Consumer Finance — 0.4% | | |
| | EZCORP, Inc. 2.375%, 5/1/2025 | 7,263,000 | 5,756,291 |
| | | | 5,756,291 |
| | Food, Beverage & Tobacco — 0.1% | | |
| | Tobacco — 0.1% | | |
| h | Vector Group Ltd., 1.75%, 4/15/2020 | 2,260,000 | 2,348,987 |
| | | | 2,348,987 |
| | Media & Entertainment — 0.7% | | |
| | Media — 0.7% | | |
| a | Comcast Holdings Corp. (Guaranty: Comcast Corp.), 2.00%, 10/15/2029 | 18,000,000 | 10,350,000 |
| | | | 10,350,000 |
| | Total Convertible Bonds(Cost $18,455,512) | | 18,455,278 |
| | Municipal Bonds — 0.5% | | |
| | California Health Facilities Financing Authority, 7.875%, 2/1/2026 | 1,940,000 | 2,077,449 |
| | City of Chicago IL GO, Series B, 7.045%, 1/1/2029 | 3,000,000 | 3,341,430 |
| a | Oklahoma Development Finance Authority, 8.00%, 5/1/2020 | 140,000 | 141,677 |
| | San Bernardino County Redevelopment Agency Successor Agency, Class A, 8.45%, 9/1/2030 | 1,000,000 | 1,044,040 |
| | Total Municipal Bonds(Cost $6,051,870) | | 6,604,596 |
| | U.S. Treasury Securities — 0.3% | | |
| | United States Treasury Notes, 2.50%, 5/31/2020 | 4,865,000 | 4,884,527 |
| | Total U.S. Treasury Securities(Cost $4,867,355) | | 4,884,527 |
| | Mortgage Backed — 8.8% | | |
| | Angel Oak Mortgage Trust, LLC, Whole Loan Securities Trust CMO, | | |
| f,h | Series 2017-3 Class A1, 2.708%, 11/25/2047 | 643,669 | 635,745 |
| f,h | Series 2018-1 Class A1, 3.258%, 4/27/2048 | 1,215,691 | 1,230,957 |
| f,h | Series 2018-2 Class A1, 3.674%, 7/27/2048 | 1,910,140 | 1,947,460 |
Schedule of Investments, Continued
Thornburg Strategic Income Fund | September 30, 2019
| | | SHARES/
PRINCIPAL AMOUNT | VALUE |
| | Arroyo Mortgage Trust, Whole Loan Securities Trust CMO, | | |
| f,h | Series 2018-1 Class A1, 3.763%, 4/25/2048 | $ 2,909,521 | $ 2,960,439 |
| f,h | Series 2019-1 Class A1, 3.805%, 1/25/2049 | 3,505,315 | 3,570,201 |
| f,h | Series 2019-3 Class A1, 2.962%, 10/25/2048 | 6,687,403 | 6,653,686 |
| h | Bear Stearns ARM Trust, Whole Loan Securities Trust CMO, Series 2003-6 Class 2B1, 4.774%, 8/25/2033 | 57,725 | 55,617 |
| f | Bravo Residential Funding Trust, Whole Loan Securities Trust CMO, Series 2019-1 Class A1C, 3.50%, 3/25/2058 | 4,329,174 | 4,361,990 |
| f,h | CFCRE Commercial Mortgage Trust, Series 2011-C1 Class C, 6.272%, 4/15/2044 | 6,200,000 | 6,477,088 |
| f,h | CIM Trust, Whole Loan Securities Trust CMO, Series 18-INV1 Class A4, 4.00%, 8/25/2048 | 1,615,343 | 1,650,484 |
| h | Citigroup Mortgage Loan Trust, Inc., Whole Loan Securities Trust CMO, Series 2004-HYB2 Class B1, 4.917%, 3/25/2034 | 43,371 | 38,196 |
| f,h | Citigroup Mortgage Loan Trust, Whole Loan Securities Trust CMO, Series 2014-A Class A, 4.00%, 1/25/2035 | 1,179,510 | 1,206,847 |
| f,h | Credit Suisse Mortgage Trust, Whole Loan Securities Trust CMO, Series 2017-HL2 Class A3, 3.50%, 10/25/2047 | 2,775,265 | 2,820,316 |
| h,n | Federal Home Loan Mtg Corp. Multifamily Structured Pass Through Certificates IO, Series KIR1 Class X, 1.213%, 3/25/2026 | 36,029,680 | 2,123,697 |
| | Federal Home Loan Mtg Corp., Pool ZS7299, 3.00%, 10/1/2030 | 1,443,747 | 1,489,882 |
| | Federal Home Loan Mtg Corp., Seasoned Credit Risk Transfer, Whole Loan Securities Trust CMO, | | |
| o | Series 2017-4 Class HT, 3.00%, 6/25/2057 | 1,607,323 | 1,716,100 |
| | Series 2018-3 Class HA, 3.00%, 8/25/2057 | 3,510,198 | 3,603,365 |
| | Series 2019-1 Class MA, 3.50%, 7/25/2058 | 4,662,635 | 4,881,396 |
| | Series 2019-2 Class MA, 3.50%, 8/25/2058 | 10,517,234 | 11,017,861 |
| | Federal Home Loan Mtg Corp., Whole Loan Securities Trust CMO, Series 2017-SC02 Class 2A1, 3.50%, 5/25/2047 | 533,349 | 539,152 |
| | Federal National Mtg Assoc. CMO REMIC, Series 1994-37 Class L, 6.50%, 3/25/2024 | 987 | 1,045 |
| | Federal National Mtg Assoc., | | |
| | Pool AL9445, 3.00%, 7/1/2031 | 4,058,189 | 4,187,868 |
| | Pool AS9733, 4.00%, 6/1/2047 | 2,443,102 | 2,628,303 |
| | Pool FM1126, 3.00%, 3/1/2033 | 3,309,676 | 3,406,129 |
| f,h | Flagstar Mortgage Trust, Whole Loan Securities Trust CMO, Series 2017-1 Class 2A2, 3.00%, 3/25/2047 | 1,367,160 | 1,373,915 |
| d,f | FREMF Mortgage Trust, Series 2016-KF24 Class B, 7.089% (LIBOR 1 Month + 5.00%), 10/25/2026 | 584,152 | 626,115 |
| f,h | FWD Securitization Trust, Whole Loan Securities Trust CMO, Series 2019-INV1 Class A1, 2.81%, 6/25/2049 | 3,826,528 | 3,843,338 |
| f,h | Galton Funding Mortgage Trust, Whole Loan Securities Trust CMO, Series 2018-1 Class A43, 3.50%, 11/25/2057 | 1,308,651 | 1,320,867 |
| f,o | GCAT 2019-NQM1 LLC, Whole Loan Securities Trust CMO, Series 2019-NQM1 Class A1, 2.985%, 2/25/2059 | 6,097,772 | 6,165,394 |
| f,o | GCAT Trust Whole Loan Securities Trust, Whole Loan Securities Trust CMO, Series 2019-NQM2 Class A1, 2.855%, 9/25/2059 | 5,000,000 | 4,999,541 |
| | Homeward Opportunities Fund I Trust, Whole Loan Securities Trust CMO, | | |
| f,h | Series 2018-1 Class A1, 3.766%, 6/25/2048 | 1,382,117 | 1,422,395 |
| f,h | Series 2019-1 Class A1, 3.454%, 1/25/2059 | 5,472,948 | 5,550,183 |
| | JPMorgan Mortgage Trust, Whole Loan Securities Trust CMO, | | |
| f,h | Series 2017-2 Class A6, 3.00%, 5/25/2047 | 2,089,768 | 2,102,796 |
| f,h | Series 2017-6 Class A5, 3.50%, 12/25/2048 | 2,313,563 | 2,352,138 |
| f,h | Mello Mortgage Capital Acceptance, Whole Loan Securities Trust CMO, Series 2018-MTG1 Class A3, 3.50%, 3/25/2048 | 2,326,911 | 2,365,263 |
| h | Merrill Lynch Mortgage Investors Trust, Whole Loan Securities Trust CMO, Series 2004-A4 Class M1, 4.38%, 8/25/2034 | 121,442 | 107,687 |
| f,h | Metlife Securitization Trust, Whole Loan Securities Trust CMO, Series 2019-1A Class A1A, 3.75%, 4/25/2058 | 1,846,885 | 1,919,845 |
| | New Residential Mortgage Loan Trust, Whole Loan Securities Trust CMO, | | |
| f,h | Series 2017-3A Class A1, 4.00%, 4/25/2057 | 2,393,754 | 2,498,866 |
| f,h | Series 2017-4A Class A1, 4.00%, 5/25/2057 | 2,263,052 | 2,376,575 |
| d,f | Series 2017-5A Class A1, 3.518% (LIBOR 1 Month + 1.50%), 6/25/2057 | 1,560,702 | 1,585,355 |
| f,h | Series 2018-NQM1 Class A1, 3.986%, 11/25/2048 | 3,105,667 | 3,214,013 |
| f,h | Series 2018-RPL1 Class A1, 3.50%, 12/25/2057 | 2,463,410 | 2,567,621 |
| a,b,f | Reilly 1997 A Mtg 1, 6.896%, 7/1/2020 | 46,280 | 46,280 |
| | Sequoia Mortgage Trust, Whole Loan Securities Trust CMO, | | |
| f,h | Series 2017-4 Class A4, 3.50%, 7/25/2047 | 1,324,075 | 1,347,091 |
| f,h | Series 2017-5 Class A4, 3.50%, 8/25/2047 | 2,932,341 | 2,986,979 |
| | Verus Securitization Trust, Whole Loan Securities Trust CMO, | | |
| f,h | Series 2017-2A Class A1, 2.485%, 7/25/2047 | 1,334,850 | 1,326,324 |
| f,h | Series 2018-2 Class A1, 3.677%, 6/1/2058 | 2,464,919 | 2,524,455 |
| f,h | Series 2018-3 Class A1, 4.108%, 10/25/2058 | 2,164,360 | 2,227,029 |
| f,o | Series 2019-3 Class A1, 2.784%, 7/25/2059 | 6,325,884 | 6,339,768 |
| | Total Mortgage Backed(Cost $130,919,887) | | 132,393,657 |
| | Loan Participations — 3.2% | | |
| | Commercial & Professional Services — 0.8% | | |
| | Professional Services — 0.8% | | |
| p | Harland Clarke Holdings Corp., 6.854% (LIBOR 3 Month + 4.75%), 11/3/2023 | 3,451,975 | 2,683,910 |
| p | Par Pacific Holdings, Inc., 9.10% (LIBOR 3 Month + 6.75%), 12/17/2025 | 1,755,000 | 1,750,612 |
| p | R.R. Donnelley & Sons Company, 7.044% (LIBOR 3 Month + 5.00%), 1/15/2024 | 2,977,500 | 2,984,944 |
Schedule of Investments, Continued
Thornburg Strategic Income Fund | September 30, 2019
| | | SHARES/
PRINCIPAL AMOUNT | VALUE |
| | RGIS Services, LLC, | | |
| p | 9.756% (LIBOR 3 Month + 7.50%), 3/31/2023 | $ 928,958 | $ 797,353 |
| p | 9.544% (LIBOR 1 Month + 7.50%), 3/31/2023 | 2,136,603 | 1,833,911 |
| p | 9.624% (LIBOR 3 Month + 7.50%), 3/31/2023 | 1,058,548 | 908,583 |
| g,p | Titan Acquisition Co.,Ltd. 6.354% (LIBOR 3 Month + 4.25%), 5/1/2026 | 1,426,425 | 1,430,348 |
| | | | 12,389,661 |
| | Consumer Services — 0.4% | | |
| | Hotels, Restaurants & Leisure — 0.4% | | |
| p | Hanjin International Corp., 4.554% (LIBOR 1 Month + 2.50%), 10/18/2020 | 6,475,000 | 6,475,000 |
| | | | 6,475,000 |
| | Energy — 0.3% | | |
| | Oil, Gas & Consumable Fuels — 0.3% | | |
| p | Citgo Holding, Inc., 9.044% (LIBOR 1 Month + 7.00%), 7/24/2023 | 2,000,000 | 2,035,000 |
| b,l,p | Malamute Energy, Inc., 2.104% (LIBOR 3 Month + 1.50% PIK), 11/22/2022 | 21,359 | 21,360 |
| k,p,q | McDermott Technology Americas, Inc., 7.104% (LIBOR 3 Month + 5.00%), 5/9/2025 | 4,209,950 | 2,647,006 |
| | | | 4,703,366 |
| | Materials — 0.2% | | |
| | Chemicals — 0.1% | | |
| p | US Salt LLC, 6.794% (LIBOR 1 Month + 4.75%), 1/16/2026 | 1,455,685 | 1,461,144 |
| | Containers & Packaging — 0.1% | | |
| p | Crown Americas, LLC 4.057% (LIBOR 1 Month + 2.00%), 4/3/2025 | 804,946 | 807,392 |
| p | Crown European Holdings S.A. 2.375% (EURIBOR 1 Month + 2.375%), 4/3/2025 | 987,562 | 1,084,973 |
| | | | 3,353,509 |
| | Media & Entertainment — 0.2% | | |
| | Media — 0.2% | | |
| p | ABG Intermediate Holdings 2, LLC, 9.794% (LIBOR 1 Month + 7.75%), 9/29/2025 | 2,942,313 | 2,932,015 |
| | | | 2,932,015 |
| | Retailing — 0.1% | | |
| | Specialty Retail — 0.1% | | |
| p | Office Depot, Inc., 7.307% (LIBOR 1 Month + 5.25%), 11/8/2022 | 850,216 | 855,530 |
| | | | 855,530 |
| | Software & Services — 0.3% | | |
| | Information Technology Services — 0.1% | | |
| p | Cypress Intermediate Holdings III, Inc., 8.794% (LIBOR 1 Month + 6.75%), 4/27/2025 | 1,000,000 | 1,006,500 |
| | Internet Software & Services — 0.2% | | |
| p | Dun & Bradstreet Corporation (The), 7.054% (LIBOR 1 Month + 5.00%), 2/6/2026 | 3,000,000 | 3,017,670 |
| | | | 4,024,170 |
| | Telecommunication Services — 0.6% | | |
| | Diversified Telecommunication Services — 0.6% | | |
| p | Colorado Buyer, Inc., 9.30% (LIBOR 1 Month + 7.25%), 5/1/2025 | 3,000,000 | 2,442,510 |
| g,p | Intelsat Jackson Holdings S.A., 6.554% (LIBOR 1 Month + 4.50%), 1/2/2024 | 6,845,000 | 6,919,131 |
| | | | 9,361,641 |
| | Utilities — 0.3% | | |
| | Electric Utilities — 0.3% | | |
| p | Pacific Gas & Electric Co., 4.32% (LIBOR 1 Month + 2.25%), 12/31/2020 | 4,500,000 | 4,522,500 |
| | | | 4,522,500 |
| | Total Loan Participations(Cost $51,170,383) | | 48,617,392 |
| | Short-Term Investments — 13.4% | | |
| r | Thornburg Capital Management Fund | 20,254,277 | 202,542,770 |
| | Total Short-Term Investments(Cost $202,542,770) | | 202,542,770 |
| | Total Investments — 99.7%(Cost $1,500,640,553) | | $1,506,324,165 |
Schedule of Investments, Continued
Thornburg Strategic Income Fund | September 30, 2019
| | | SHARES/
PRINCIPAL AMOUNT | VALUE |
| | Other Assets Less Liabilities — 0.3% | | 4,894,984 |
| | Net Assets — 100.0% | | $1,511,219,149 |
| Outstanding Forward Currency Contracts To Buy Or Sell At September 30, 2019 |
Contract
Description | Contract
Party* | Buy/Sell | Contract
Amount | Contract
Value Date | Value
USD | Unrealized
Appreciation | Unrealized
Depreciation |
| Euro | SSB | Sell | 2,977,100 | 1/22/2020 | 3,273,105 | $ 117,455 | $ — |
| |
| Net unrealized appreciation (depreciation) | | | | | | $117,455 | |
| * | Counterparty includes State Street Bank and Trust Company ("SSB"). |
| Footnote Legend |
| a | Illiquid security. |
| b | Security currently fair valued by the Valuation and Pricing Committee using procedures approved by the Trustees’ Audit Committee. |
| c | Non-income producing. |
| d | Floating Rate Security. Stated interest/floor rate was in effect at September 30, 2019. |
| e | Securities are perpetual and, thus, do not have a predetermined maturity date. The date shown, if applicable, reflects the next call date. |
| f | Securities exempt from registration under Rule 144A of the Securities Act of 1933, as amended. These securities are restricted and may only be resold in the ordinary course of business in transactions exempt from registration, normally to qualified institutional buyers. As of September 30, 2019, the aggregate value of these securities in the Fund’s portfolio was $764,029,894, representing 50.56% of the Fund’s net assets. |
| g | Yankee bond denominated in U.S. dollars and is issued in the U.S. by foreign banks and corporations. |
| h | Variable rate coupon, rate shown as of September 30, 2019. |
| i | Segregated as collateral for a when-issued security. |
| j | Fixed to floating security that initially pays a fixed rate and converts to a floating rate coupon at a specified date in the future. The rate presented is a fixed rate. |
| k | When-issued security. |
| l | Pay-In-Kind Payments (PIK). The issuer may pay cash interest and/or interest in additional debt securities. Rates shown are the rates in effect at September 30, 2019. |
| m | Bond in default. |
| n | Interest Only. |
| o | Coupon rate adjusts periodically based upon a predetermined schedule. Stated interest rate in effect at September 30, 2019. |
| p | The stated coupon rate represents the greater of the LIBOR or the LIBOR floor rate plus a spread at September 30, 2019. |
| q | This position or a portion of this position represents an unsettled loan purchase. The coupon rate will be effective at the time of settlement and will be based upon the London-Interbank Offered Rate ("LIBOR") plus a premium which was determined at the time of purchase. |
| r | Investment in Affiliates. |
Portfolio Abbreviations
To simplify the listings of securities, abbreviations are used per the table below:
| ARM | Adjustable Rate Mortgage |
| CMO | Collateralized Mortgage Obligation |
| EURIBOR | Euro Interbank Offered Rates |
| FCB | Farm Credit Bank |
| GO | General Obligation |
| IO | Interest Only Security |
| LIBOR | London Interbank Offered Rates |
| Mtg | Mortgage |
| MTN | Medium-Term Note |
| REMIC | Real Estate Mortgage Investment Conduit |
| SOFR | Secured Overnight Financing Rate |
| SPV | Special Purpose Vehicle |
| VA | Veterans Affairs |
See notes to financial statements.
This page intentionally left blank.
Statement of Assets and Liabilities
Thornburg Strategic Income Fund | September 30, 2019
| ASSETS | |
| Investments at value (Note 3) | |
| Non-affiliated issuers (cost $1,298,097,783) | $ 1,303,781,395 |
| Non-controlled affiliated issuer (cost $202,542,770) | 202,542,770 |
| Cash | 322,288 |
| Receivable for investments sold | 1,363,469 |
| Receivable for fund shares sold | 6,083,079 |
| Unrealized appreciation on forward currency contracts (Note 7) | 117,455 |
| Dividends receivable | 475,179 |
| Dividend and interest reclaim receivable | 533 |
| Interest receivable | 11,472,473 |
| Prepaid expenses and other assets | 119,073 |
| Total Assets | 1,526,277,714 |
| Liabilities | |
| Payable for investments purchased | 11,554,633 |
| Payable for fund shares redeemed | 1,845,011 |
| Payable to investment advisor and other affiliates (Note 4) | 689,557 |
| Accounts payable and accrued expenses | 353,739 |
| Dividends payable | 623,125 |
| Total Liabilities | 15,066,065 |
| Commitments and contingencies (Note 2) | |
| Unrealized appreciation on unfunded commmitments | 7,500 |
| Net Assets | $ 1,511,219,149 |
| NET ASSETS CONSIST OF | |
| Accumulated loss | $ (17,661,544) |
| Net capital paid in on shares of beneficial interest | 1,528,880,693 |
| | $ 1,511,219,149 |
Statement of Assets and Liabilities, Continued
Thornburg Strategic Income Fund | September 30, 2019
| NET ASSET VALUE | |
| Class A Shares: | |
Net asset value and redemption price per share
($215,440,945 applicable to 18,071,764 shares of beneficial interest outstanding - Note 5) | $ 11.92 |
| Maximum sales charge, 4.50% of offering price | 0.56 |
| Maximum offering price per share | $ 12.48 |
| Class C Shares: | |
Net asset value and offering price per share*
($118,981,838 applicable to 9,998,130 shares of beneficial interest outstanding - Note 5) | $ 11.90 |
| Class I Shares: | |
Net asset value, offering and redemption price per share
($1,141,046,454 applicable to 95,981,538 shares of beneficial interest outstanding - Note 5) | $ 11.89 |
| Class R3 Shares: | |
Net asset value, offering and redemption price per share
($1,661,002 applicable to 139,495 shares of beneficial interest outstanding - Note 5) | $ 11.91 |
| Class R4 Shares: | |
Net asset value, offering and redemption price per share
($1,279,028 applicable to 107,483 shares of beneficial interest outstanding - Note 5) | $ 11.90 |
| Class R5 Shares: | |
Net asset value, offering and redemption price per share
($11,179,679 applicable to 939,938 shares of beneficial interest outstanding - Note 5) | $ 11.89 |
| Class R6 Shares: | |
Net asset value, offering and redemption price per share
($21,630,203 applicable to 1,813,824 shares of beneficial interest outstanding - Note 5) | $ 11.93 |
| * | Redemption price per share is equal to net asset value less any applicable contingent deferred sales charge. |
See notes to financial statements.
Statement of Operations
Thornburg Strategic Income Fund | Year Ended September 30, 2019
| INVESTMENT INCOME | |
| Dividend income | |
| Non-affiliated issuers | $ 1,110,292 |
| Non-controlled affiliated issuer | 4,128,560 |
| Interest income (net of premium amortized of $1,553,241) | 53,186,068 |
| Total Income | 58,424,920 |
| EXPENSES | |
| Investment advisory fees (Note 4) | 8,953,890 |
| Administration fees (Note 4) | |
| Class A Shares | 174,929 |
| Class C Shares | 118,569 |
| Class I Shares | 821,647 |
| Class R3 Shares | 1,605 |
| Class R4 Shares | 1,305 |
| Class R5 Shares | 7,208 |
| Class R6 Shares | 10,084 |
| Distribution and service fees (Note 4) | |
| Class A Shares | 497,610 |
| Class C Shares | 1,350,293 |
| Class R3 Shares | 9,131 |
| Class R4 Shares | 3,731 |
| Transfer agent fees | |
| Class A Shares | 160,894 |
| Class C Shares | 122,052 |
| Class I Shares | 842,311 |
| Class R3 Shares | 10,246 |
| Class R4 Shares | 9,075 |
| Class R5 Shares | 16,284 |
| Class R6 Shares | 5,251 |
| Registration and filing fees | |
| Class A Shares | 15,726 |
| Class C Shares | 13,954 |
| Class I Shares | 67,452 |
| Class R3 Shares | 12,928 |
| Class R4 Shares | 12,531 |
| Class R5 Shares | 13,101 |
| Class R6 Shares | 12,578 |
| Custodian fees | 160,349 |
| Professional fees | 103,849 |
| Trustee and officer fees (Note 4) | 68,819 |
| Other expenses | 129,639 |
| Total Expenses | 13,727,041 |
| Less: | |
| Expenses reimbursed by investment advisor (Note 4) | (1,222,295) |
| Investment advisory fees waived by investment advisor (Note 4) | (2,174,863) |
| Net Expenses | 10,329,883 |
| Net Investment Income | $ 48,095,037 |
Statement of Operations, Continued
Thornburg Strategic Income Fund | Year Ended September 30, 2019
| REALIZED AND UNREALIZED GAIN (LOSS) | |
| Net realized gain (loss) on: | |
| Non-affiliated issuer investments | $ 5,010,070 |
| Forward currency contracts (Note 7) | 209,286 |
| Foreign currency transactions | (9,711) |
| | 5,209,645 |
| Net change in unrealized appreciation (depreciation) on: | |
| Non-affiliated issuer investments | 25,772,417 |
| Forward currency contracts (Note 7) | 98,757 |
| Foreign currency translations | (5,024) |
| | 25,866,150 |
| Net Realized and Unrealized Gain | 31,075,795 |
| Net Increase in Net Assets Resulting from Operations | $ 79,170,832 |
See notes to financial statements.
Statements of Changes in Net Assets
Thornburg Strategic Income Fund
| | Year Ended
September 30, 2019 | Year Ended
September 30, 2018 |
| INCREASE (DECREASE) IN NET ASSETS FROM | | |
| OPERATIONS | | |
| Net investment income | $ 48,095,037 | $ 38,820,653 |
| Net realized gain (loss) on investments, forward currency contracts and foreign currency transactions | 5,209,645 | 4,472,928 |
| Net change in unrealized appreciation (depreciation) on investments, forward currency contracts and foreign currency translations | 25,866,150 | (27,376,113) |
| Net Increase in Net Assets Resulting from Operations | 79,170,832 | 15,917,468 |
| DIVIDENDS TO SHAREHOLDERS | | |
| From distributable earnings | | |
| Class A Shares | (6,894,360) | (6,046,721) |
| Class C Shares | (3,682,212) | (3,851,817) |
| Class I Shares | (36,220,081) | (22,085,177) |
| Class R3 Shares | (59,577) | (63,112) |
| Class R4 Shares | (47,973) | (68,696) |
| Class R5 Shares | (316,965) | (233,736) |
| Class R6 Shares | (448,157) | (174,873) |
| FUND SHARE TRANSACTIONS (NOTE 5) | | |
| Class A Shares | 12,482,392 | (31,322,121) |
| Class C Shares | (34,400,304) | (51,986,964) |
| Class I Shares | 355,456,316 | 151,633,298 |
| Class R3 Shares | (347,860) | (661,921) |
| Class R4 Shares | (926,459) | (548,403) |
| Class R5 Shares | 3,578,573 | 1,226,187 |
| Class R6 Shares | 11,717,095 | 9,728,794 |
| Net Increase in Net Assets | 379,061,260 | 61,462,206 |
| NET ASSETS | | |
| Beginning of Year | 1,132,157,889 | 1,070,695,683 |
| End of Year | $ 1,511,219,149 | $ 1,132,157,889 |
See notes to financial statements.
Notes to Financial Statements
Thornburg Strategic Income Fund | September 30, 2019
NOTE 1 – ORGANIZATION
Thornburg Strategic Income Fund (the “Fund”) is a diversified series of Thornburg Investment Trust (the “Trust”). The Trust was organized as a Massachusetts business trust under a Declaration of Trust dated June 3, 1987 and is registered as a diversified, open-end management investment company under the Investment Company Act of 1940, as amended (the "1940 Act"). The Fund is currently one of twenty-two separate series of the Trust. Each series is considered to be a separate entity for financial reporting and tax purposes and bears expenses directly attributable to it. The Fund’s primary investment goal is to seek a high level of current income. The Fund’s secondary investment goal is some long-term capital appreciation.
The Fund currently offers seven classes of shares of beneficial interest: Class A, Class C, Institutional Class (“Class I”), and Retirement Classes (“Class R3”, “Class R4”, “Class R5”, and “Class R6”). Each class of shares of the Fund represents an interest in the same portfolio of investments, except that (i) Class A shares are sold subject to a front-end sales charge collected at the time the shares are purchased and bear a service fee, (ii) Class C shares are sold at net asset value without a sales charge at the time of purchase, but are subject to a contingent deferred sales charge upon redemption within one year of purchase, and bear both a service fee and a distribution fee, (iii) Class I and Class R5 shares are sold at net asset value without a sales charge at the time of purchase and may be subject to a service fee, (iv) Class R3 shares are sold at net asset value without a sales charge at the time of purchase, but bear both a service fee and distribution fee, (v) Class R4 shares are sold at net asset value without a sales charge at the time of purchase, but bear a service fee, (vi) Class R6 shares are sold at net asset value without a sales charge at the time of purchase, and (vii) the respective classes may have different reinvestment privileges and conversion rights. Additionally, the Fund may allocate among its classes certain expenses, to the extent allocable to specific classes, including administration fees, transfer agent fees, government registration fees, certain printing and postage costs, and administrative and legal expenses. Currently, class specific expenses of the Fund are limited to service and distribution fees and certain registration and transfer agent expenses.
The following is a summary of significant accounting policies followed by the Fund in the preparation of its financial statements. The Fund prepares its financial statements in conformity with United States generally accepted accounting principles (“GAAP”), including investment company accounting and reporting guidance in the Financial Accounting Standards Board (the “FASB”) Accounting Standard Codification Topic 946.
NOTE 2 – SIGNIFICANT ACCOUNTING POLICIES
Security Valuation: All investments in securities held by the Fund are valued as described in Note 3.
Allocation of Income, Gains, Losses and Expenses: Net investment income (other than class specific expenses) and realized and unrealized gains and losses are allocated daily to each class of shares based upon the relative net asset value of outstanding shares (or the value of the dividend-eligible shares, as appropriate) of each class of shares at the beginning of the day (after adjusting for the current capital shares activity of the respective class). Expenses common to all Funds are allocated among the Funds comprising the Trust based upon their relative net asset values or other appropriate allocation methods. Operating expenses directly attributable to a specific class are charged against the operating income of that class.
Dividends and Distributions to Shareholders: Dividends and distributions to shareholders, which are determined in accordance with federal income tax regulations and may differ from GAAP, are recorded on the ex-dividend date. Ordinary income dividends, if any, are declared and paid monthly. Capital gain distributions, if any, are declared and paid annually and more often if deemed necessary by Thornburg Investment Management, Inc., the Trust’s investment advisor (the “Advisor”). Dividends and distributions are paid and are reinvested in additional shares of the Fund at net asset value per share at the close of business on the ex-dividend date, or at the shareholder’s option, paid in cash.
Investment Income: Dividend income is recorded on the ex-dividend date. Certain income from foreign investments is recognized as soon as information is available to the Fund. Interest income is accrued as earned. Premiums and discounts are amortized and accreted, respectively, to first call dates or maturity dates using the effective yield method of the respective investments. These amounts are included in Investment Income in the Statement of Operations.
Investment Transactions: Investment transactions are accounted for on a trade date basis. Realized gains and losses from the sale of investments are recorded on an identified cost basis.
Unfunded Loan Commitments: The Fund has entered into a loan commitment with Malamute Energy, Inc., of which at September 30, 2019, $21,360 of the $43,064 par commitment had been funded. The maturity date is December 31, 2019. The Fund has also entered into a loan commitment with Pacific Gas & Electric Co., of which at September 30, 2019, $0 of the $1,500,000 par commitment had been funded. The maturity date is December 31, 2019.
Notes to Financial Statements, Continued
Thornburg Strategic Income Fund | September 30, 2019
When-Issued and Delayed Delivery Transactions: The Fund may engage in when-issued or delayed delivery transactions. To the extent the Fund engages in such transactions, it will do so for the purpose of acquiring portfolio investments consistent with the Fund’s investment objectives and not for the purpose of investment leverage or to speculate on interest rate or market changes. At the time the Fund makes a commitment to purchase an investment on a when-issued or delayed delivery basis, the Fund will record the transaction and reflect the value in determining its net asset value. When effecting such transactions, assets of an amount sufficient to make payment for the portfolio investments to be purchased will be segregated on the Fund’s records on the trade date. Investments purchased on a when-issued or delayed delivery basis do not earn interest until the settlement date. The values of these securities held at September 30, 2019 are detailed in the Schedule of Investments.
Foreign Currency Translation: Portfolio investments and other assets and liabilities denominated in foreign currencies are translated into U.S. dollars based on the exchange rate of such currencies against the U.S. dollar on the date of valuation. Purchases and sales of investments and income items denominated in foreign currencies are translated into U.S. dollars at the exchange rate in effect on the transaction date. When the Fund purchases or sells foreign investments, it will customarily enter into a foreign exchange contract to minimize foreign exchange risk from the trade date to the settlement date of such transactions. The values of such spot contracts are included in receivable for investments sold and payable for investments purchased on the Statement of Assets and Liabilities.
The Fund does not separately report the effect of changes in foreign exchange rates from changes in market prices on investments held. Such changes are included in net unrealized appreciation (depreciation) from investments in the Statement of Operations.
Reported net realized gains and losses from foreign currency transactions arise due to purchases and sales of foreign currencies, currency gains and losses realized between the trade and settlement dates on investment transactions and the difference between the amounts of dividends, interest, and foreign withholding taxes recorded on the Fund’s books, and the U.S. dollar equivalent of the amounts actually received or paid. These amounts are included in foreign currency transactions in the Statement of Operations.
Net change in unrealized appreciation (depreciation) on foreign currency translations arise from changes in the fair value of assets and liabilities, other than investments at period end, resulting from changes in exchange rates.
Guarantees and Indemnifications: Under the Trust’s organizational documents (and under separate agreements with the independent Trustees), its officers and Trustees are provided with an indemnification against certain liabilities arising out of the performance of their duties to the Fund. In the normal course of business the Trust may also enter into contracts with service providers that contain general indemnifications. The Trust’s maximum exposure under these arrangements is unknown. However, based on experience, the Trust expects the risk of loss to be remote.
Use of Estimates: The preparation of financial statements in conformity with GAAP requires management to make estimates and assumptions that affect the reported amounts of assets and liabilities and disclosure of contingent assets and liabilities at the date of the financial statements and the reported amounts of increases (decreases) in net assets from operations during the reporting period. Actual results could differ from those estimates.
Federal Income Taxes: It is the policy of the Trust to comply with the provisions of the Internal Revenue Code applicable to regulated investment companies and to distribute to shareholders substantially all investment company taxable income including net realized gains on investments (if any), and tax exempt income of the Fund. Therefore, no provision for federal income or excise tax is required.
The Fund files income tax returns in United States federal and applicable state jurisdictions. The statute of limitations on the Fund’s tax return filings generally remains open for the three years following a return’s filing date. The Fund has analyzed each uncertain tax position believed to be material in the preparation of the Fund’s financial statements for the fiscal year ended September 30, 2019, including open tax years, to assess whether it is more likely than not that the position would be sustained upon examination, based on the technical merits of the position. The Fund has not identified any such position for which an asset or liability must be reflected in the Statement of Assets and Liabilities.
At September 30, 2019, information on the tax components of capital was as follows:
| Cost of investments for tax purposes | $ 1,500,555,355 |
| Gross unrealized appreciation on a tax basis | 33,797,893 |
| Gross unrealized depreciation on a tax basis | (27,911,628) |
| Net unrealized appreciation (depreciation) on investments (tax basis) | $ 5,886,265 |
Temporary book to tax adjustments to cost of investments and net unrealized appreciation (depreciation) for tax purposes result primarily from outstanding contingent payment debt instrument (“CPDI”) tax basis adjustments, dividend payable, marked-to-market of foreign currency contracts, and outstanding tax basis adjustments for publicly traded partnerships ("PTP").
Notes to Financial Statements, Continued
Thornburg Strategic Income Fund | September 30, 2019
At September 30, 2019, the Fund had deferred tax basis late-year ordinary losses occurring subsequent to October 31, 2018 through September 30, 2019 of $1,413,244. For tax purposes, such ordinary losses will be recognized in the year ending September 30, 2020.
At September 30, 2019, the Fund had cumulative tax basis capital losses of $21,517,681 (of which $0 are short-term and $21,517,681 are long-term), which may be carried forward to offset future capital gains. To the extent such carryforwards are used, capital gain distributions may be reduced to the extent provided by regulations. Such capital loss carryforwards do not expire.
During the year ended September 30, 2019, the Fund utilized $6,926,985 of capital loss carryforwards generated after September 30, 2011.
Foreign Withholding Taxes: The Fund is subject to foreign tax withholding imposed by certain foreign countries in which the Fund may invest. Withholding taxes are incurred on certain foreign dividends and are accrued at the time the dividend is recognized based on applicable foreign tax laws. The Fund may file withholding tax reclaims in certain jurisdictions to recover a portion of amounts previously withheld, in view of various considerations, including recent decisions rendered by the courts in those and other jurisdictions. The Fund would expect to record a receivable for such a reclaim based on a variety of factors, including assessment of a jurisdiction’s legal obligation to pay reclaims, the jurisdiction’s administrative practices and payment history, and industry convention. To date the Fund has recorded no such receivable because there is limited precedent for collecting such prior year reclaims and the likelihood of collection remains uncertain.
Deferred Foreign Capital Gain Taxes: The Fund is subject to a tax imposed on net realized gains of securities of certain foreign countries. The Fund records an estimated deferred tax liability for net unrealized gains on these investments as reflected in the accompanying financial statements. Such changes are included in net unrealized appreciation (depreciation) from investments in the Statement of Operations.
The tax character of distributions paid during the year ended September 30, 2019, and September 30, 2018, was as follows:
| | 2019 | 2018 |
| Distributions from: | | |
| Ordinary income | $ 47,669,325 | $ 32,524,132 |
| Total | $ 47,669,325 | $ 32,524,132 |
NOTE 3 – SECURITY VALUATION
Valuation of the Fund’s portfolio investment securities is performed in accordance with policies and procedures adopted by and under the oversight of the Trustees.
The Trustees of the Trust have appointed the Advisor to assist the Trustees with obtaining fair market values for portfolio investments, evaluating and monitoring professional pricing service providers appointed by the Trustees’ Audit Committee (the “Audit Committee”) to assist in determining fair values for portfolio investments, assisting in calculating fair values for portfolio investments in certain circumstances, and performing other functions in connection with the valuation of investments. The Advisor acts through its Valuation and Pricing Committee (the “Committee”) and other employees of the Advisor. The Committee regularly reviews its own valuation calculations, reviews the valuations, valuation techniques and services furnished by pricing service providers, considers circumstances which may require valuation calculations by the Committee, and reviews previous valuation calculations. The Committee reports to the Audit Committee on the Committee’s activities, the performance of pricing service providers, and other matters relating to valuation of portfolio investments.
In those instances when the Committee assists in calculating a fair value for a portfolio investment, the Committee seeks to determine the price that the Fund would reasonably expect to receive upon a sale of the investment in an orderly transaction between market participants on the valuation date. The Committee customarily utilizes quotations from securities broker dealers in calculating valuations, but also may utilize prices obtained from pricing service providers or other methods approved by the Audit Committee. Because fair values calculated by the Committee are estimates, the calculation of a value for an investment may differ from the price that would be realized by the Fund upon a sale of the investment, and the difference could be material to the Fund’s financial statements. The Committee’s calculation of a fair value for an investment may also differ from the prices obtained by other persons (including other mutual funds) for the investment.
Valuation of Securities: Securities and other portfolio investments which are listed or traded on a United States securities exchange are valued at the last reported sale price on the valuation date. Investments listed or traded on an exchange for which there has been no sale that day are valued at the mean between the last reported bid and asked prices on that valuation date. Portfolio investments reported by NASDAQ are valued at the official closing price on the valuation date. If an investment is traded on more than one exchange, the investment is considered traded on the exchange that is normally the primary market for that investment. Securities and other portfolio investments which are listed or traded on exchanges outside the United States are valued at the last price or the closing price of the
Notes to Financial Statements, Continued
Thornburg Strategic Income Fund | September 30, 2019
investment on the exchange that is normally the primary market for the investment, as of the close of the exchange preceding the Fund’s valuation date. Foreign investments listed or traded on an exchange for which there has been no sale that day are valued at the mean between the last reported bid and asked prices on that valuation date.
In any case when a market quotation is not readily available for a portfolio investment ordinarily valued by market quotation, the Committee calculates a fair value for the investment using alternative methods approved by the Audit Committee. A market quotation is not readily available when the primary market or exchange for the investment is not open for the entire scheduled day of trading. Market quotations for an investment also may not be readily available if developments after the most recent close of the investment’s primary exchange or market, but prior to the close of business on any Fund business day, or an unusual event or significant period of time occurring since the availability of a market quotation, create a serious question concerning the reliability of the most recent market quotation available for the investment. In particular, on days when market volatility thresholds established by the Audit Committee are exceeded, foreign equity investments held by the Fund may be valued using alternative methods. The Committee customarily obtains valuations in these instances from pricing service providers approved by the Audit Committee. Pricing service providers ordinarily calculate valuations using multi-factor models to adjust market prices based upon various inputs, including exchange data, depository receipt prices, futures, index data and other data.
Debt obligations held by the Fund which are not listed or traded on exchanges or for which no reported market exists are ordinarily valued at the valuation obtained from a pricing service provider approved by the Audit Committee.
In any case when a pricing service provider fails to provide a valuation for a debt obligation held by the Fund, the Committee calculates a fair value for the obligation using alternative methods under procedures approved by the Audit Committee. Additionally, in cases when management believes that a valuation obtained from a pricing service provider is stale, does not reflect material factors affecting the valuation of the investment, is significantly different than the value the Fund is likely to obtain if it sought a bid for the investment, or is otherwise unreliable, the Committee calculates a fair value for the obligation using an alternative method approved by the Audit Committee.
Quotations for foreign investments expressed in foreign currency amounts are converted to U.S. dollar equivalents using a foreign exchange quotation from a third party service provider at the time of valuation. Foreign investments held by the Fund may be traded on days and at times when the Fund is not open for business. Consequently, the value of Fund investments may be significantly affected on days when shareholders cannot purchase or sell Fund shares.
Valuation Hierarchy: The Fund categorizes its investments based upon the inputs used in valuing those investments, according to a three-level hierarchy established in guidance from the FASB. Categorization of investments using this hierarchy is intended by the FASB to maximize the use of observable inputs in valuing investments and minimize the use of unobservable inputs by requiring that the most observable inputs be used when available. Observable inputs are those that market participants would use in valuing an investment based on available market information. Unobservable inputs are those that reflect assumptions about the information market participants would use in valuing an investment. An investment’s level within the hierarchy is based on the lowest level input that is deemed significant to the valuation. The methodologies and inputs used to value investments are not necessarily indications of the risk or liquidity associated with those investments.
Various inputs are used in calculating valuations for the Fund’s investments. These inputs are generally summarized according to the three-level hierarchy below:
Level 1: Quoted prices in active markets for identical investments.
Level 2: Other direct or indirect significant observable inputs (including quoted prices for similar investments in active markets and other observable inputs, such as interest rates, prepayment rates, credit ratings, etc.).
Level 3: Significant unobservable inputs (including the Committee’s own assumptions in calculating the fair values of investments).
Valuations for debt obligations held by the Fund are typically calculated by pricing service providers approved by the Audit Committee and are generally characterized as Level 2 within the valuation hierarchy.
On days when market volatility thresholds established by the Audit Committee are exceeded, foreign securities for which valuations are obtained from pricing service providers are fair valued. On these days, the foreign securities are characterized as Level 2 within the valuation hierarchy and revert to Level 1 after the threshold is no longer exceeded.
In a limited number of cases the Committee calculates a fair value for investments using broker quotations or other methods approved by the Audit Committee. When the Committee uses a single broker quotation to calculate a fair value for an investment without other significant observable inputs, or if a fair value is calculated using other significant inputs that are considered unobservable, the investment is characterized as Level 3 within the hierarchy. Other significant unobservable inputs used to calculate a fair value in these instances might
Notes to Financial Statements, Continued
Thornburg Strategic Income Fund | September 30, 2019
include an income-based valuation approach which considers discounted anticipated future cash flows from the investment and application of discounts due to the nature or duration of any restrictions on the disposition of the investment.
Valuations based upon the use of inputs from Levels 1, 2 or 3 may not represent the actual price received upon the disposition of an investment, and a Fund may receive a price that is lower than the valuation based upon these inputs when it sells the investment.
The following table displays a summary of the fair value hierarchy measurements of the Fund’s investments as of September 30, 2019:
| | Fair Value Measurements at September 30, 2019 |
| | TOTAL | LEVEL 1 | LEVEL 2 | LEVEL 3 |
| Assets | | | | |
| Investments in Securities* | | | | |
| Common Stock(a) | $ 8,893 | $ — | $ — | $ 8,893 |
| Preferred Stock(a) | 16,169,360 | 12,591,240 | 3,578,120 | — |
| Asset Backed Securities | 258,964,117 | — | 254,179,466 | 4,784,651 |
| Corporate Bonds | 817,683,575 | — | 807,010,790 | 10,672,785 |
| Convertible Bonds | 18,455,278 | — | 18,455,278 | — |
| Municipal Bonds | 6,604,596 | — | 6,604,596 | — |
| U.S. Treasury Securities | 4,884,527 | 4,884,527 | — | — |
| Mortgage Backed | 132,393,657 | — | 132,347,377 | 46,280 |
| Loan Participations | 48,617,392 | — | 48,596,032 | 21,360 |
| Short-Term Investments | 202,542,770 | 202,542,770 | — | — |
| Total Investments in Securities | $1,506,324,165 | $220,018,537 | $1,270,771,659 | $15,533,969(b) |
| Other Financial Instruments | | | | |
| Forward Currency Contracts | $ 117,455 | $ — | $ 117,455 | $ — |
| Total Assets | $1,506,441,620 | $220,018,537 | $1,270,889,114 | $15,533,969 |
| * | See Schedule of Investments for a summary of the industry exposure as grouped according to the Global Industry Classification Standard (GICS), which is an industry taxonomy developed by MSCI, Inc. and Standard & Poor’s (S&P). |
| (a) | At September 30, 2019, industry classifications for Common Stock and Preferred Stock in level 2 and Level 3 consist of $8,893 in Energy, $1,111,250 in Miscellaneous, and $2,466,870 Telecommunication Services. |
| (b) | In accordance with the guidance prescribed in Accounting Standards Update ("ASU") No. 2011-04, the following table displays a summary of the valuation techniques and unobservable inputs used to value portfolio securities characterized as Level 3 investments for the period ended at September 30, 2019. |
| | FAIR VALUE AT
September 30, 2019 | VALUATION
TECHNIQUE(S) | UNOBSERVABLE
INPUT | RANGE
(WEIGHTED AVERAGE) |
| Common Stock | $ 8,893 | Discount to valuation | Discount for lack of
marketability | $10.50/(N/A)(a) |
| Asset-Backed Securities | 4,784,651 | Discounted cash flows | Yield (Discount
Rate of Cash Flows) | 4.50%-6.40%/(6.11%) |
| Corporate Bonds | 200,000 | Discount to valuation | Expected Recovery | $10.00/(N/A) |
| | 44,081 | Discount to valuation | Discount for lack of
marketability | $4.15/(N/A)(a) |
| | 586,740 | Discounted cash flows | Yield (Discount
Rate of Cash Flows) | 19.50%/(N/A) |
| | 2,579,331 | Discounted cash flows | Yield (Discount
Rate of Cash Flows) | 17.40%/(N/A) |
| | 7,262,633 | Recent trade | Trade price | $99.83/(N/A) |
| Loan Participations | 21,360 | Discount to valuation | Discount for lack of
marketability | $100.00/(N/A)(a) |
| Mortgage Backed | 46,280 | Unadjusted Broker Quote | Unadjusted Broker Quote | $100.00/(N/A) |
| Total | $15,533,969 | | | |
(a) Represents price used after factoring in market impact including discounts, as applicable.
Notes to Financial Statements, Continued
Thornburg Strategic Income Fund | September 30, 2019
A rollforward of fair value measurements using significant unobservable inputs (Level 3) for the year ended September 30, 2019 is as follows:
| | COMMON
STOCK | MORTGAGE
BACKED | ASSET BACKED
SECURITIES | CORPORATE
BONDS | LOAN
PARTICIPATIONS | TOTAL(e) |
| Beginning Balance 9/30/2018 | $ 8,893 | $ 104,670 | $ 4,543,975 | $ 44,081 | $ 248,379 | $ 4,949,998 |
| Accrued Discounts (Premiums) | – | (379) | 1,978 | 27,760 | – | 29,359 |
| Net Realized Gain (Loss)(a) | – | (366) | 17,324 | – | (438,169) | (421,211) |
| Gross Purchases | – | – | – | 10,845,549 | 6,660 | 10,852,209 |
| Gross Sales | – | (58,390) | (1,729,430) | – | – | (1,787,820) |
| Net Change in Unrealized Appreciation (Depreciation)(b)(c) | – | 745 | 43,983 | (1,244,605) | 204,490 | (995,387) |
| Transfers into Level 3(d) | – | – | 3,894,800 | 1,000,000 | – | 4,894,800 |
| Transfers out of Level 3(d) | – | – | (1,987,979) | – | – | (1,987,979) |
| Ending Balance 9/30/2019 | $8,893 | $46,280 | $4,784,651 | $10,672,785 | $21,360 | $15,533,969 |
| (a) | Amount of net realized gain (loss) from investments is included in the Fund’s Statement of Operations for the year ended September 30, 2019. |
| (b) | Amount of net change in unrealized appreciation (depreciation) on investments is included in the Fund’s Statement of Operations for the year ended September 30, 2019. |
| (c) | The net change in unrealized appreciation (depreciation) attributable to securities owned at September 30, 2019, which were valued using significant unobservable inputs, was $(1,199,875). This is included within net change in unrealized appreciation (depreciation) on investments in the Fund’s Statement of Operations for the year ended September 30, 2019. |
| (d) | Transfers into or out of Level 3 were out of or into Level 2, and were due to changes in other significant observable inputs available during the period ended September 30, 2019. Transfers into or out of Level 3 are based on the beginning market value of the period in which they occurred. |
| (e) | Level 3 investments represent 1.03% of total net assets at the period ended September 30, 2019. Significant fluctuations of the unobservable inputs applied to portfolio securities characterized as Level 3 investments could be expected to increase or decrease the fair value of these portfolio securities. |
NOTE 4 – INVESTMENT ADVISORY FEE AND OTHER TRANSACTIONS WITH AFFILIATES
Pursuant to an investment advisory agreement, the Advisor serves as the investment advisor and performs services for the Fund for which the fees are payable at the end of each month. Under the investment advisory agreement, the Fund pays the Advisor a management fee based on the average daily net assets of the Fund at an annual rate as shown in the following table:
| Management Fee Schedule |
| DAILY NET ASSETS | FEE RATE |
| Up to $500 million | 0.750% |
| Next $500 million | 0.675 |
| Next $500 million | 0.625 |
| Next $500 million | 0.575 |
| Over $2 billion | 0.500 |
The Fund’s effective management fee for the year ended September 30, 2019 was 0.693% of the Fund’s average daily net assets (before applicable management fee waiver of $2,174,863). Total management fees incurred by the Fund for the year ended September 30, 2019 are set forth in the Statement of Operations.
The Trust has entered into an administrative services agreement with the Advisor, whereby the Advisor will perform certain administrative services related to each class of the Fund’s shares. The fees are computed as an annual percentage of the aggregate average daily net assets of all shares classes of all Funds in the Trust as follows:
| Administration Fee Schedule |
| Daily Net Assets | Fee Rate |
| Up to $20 billion | 0.100% |
| $20 billion to $40 billion | 0.075 |
| $40 billion to $60 billion | 0.040 |
| Over $60 billion | 0.030 |
The aggregate fee amount is allocated on a daily basis to each Fund based on net assets and subsequently allocated to each class of shares of the Fund. Total administrative service fees incurred by each class of shares of the Fund for the year ended September 30, 2019, are set forth in the Statement of Operations.
Notes to Financial Statements, Continued
Thornburg Strategic Income Fund | September 30, 2019
The Trust has an underwriting agreement with Thornburg Securities Corporation (the “Distributor”), an affiliate of the Advisor, which acts as the distributor of the Fund’s shares. For the year ended September 30, 2019, the Distributor has advised the Fund that it earned net commissions aggregating $30,923 from the sale of Class A shares, and collected contingent deferred sales charges aggregating $8,033 from redemptions of Class C shares of the Fund.
Pursuant to a service plan under Rule 12b-1 of the 1940 Act, the Fund may pay to the Distributor or securities dealers and other financial institutions at the Distributor’s direction an amount not to exceed .25 of 1% per annum of the average daily net assets attributable to Class A, Class C, Class I, Class R3, Class R4, and Class R5 shares of the Fund to obtain various shareholder and distribution related services. For the year ended September 30, 2019, there were no 12b-1 service plan fees charged for Class I or Class R5 shares. Class R6 shares are not subject to a service plan. The Advisor and Distributor each may pay out of its own resources additional expenses for distribution of the Fund’s shares and shareholder services.
The Trust has also adopted a distribution plan pursuant to Rule 12b-1, applicable only to the Fund’s Class C and Class R3 shares, under which the Fund compensates the Distributor for services in promoting the sale of Class C and Class R3 shares of the Fund at an annual rate of up to .75 of 1% per annum of the average daily net assets attributable to Class C shares, and an annual rate of up to .25 of 1% per annum of the average daily net assets attributable to Class R3 shares.
Total fees incurred by each class of shares of the Fund under their respective service and distribution plans for the year ended September 30, 2019, are set forth in the Statement of Operations.
The Advisor has contractually agreed to waive fees and reimburse expenses incurred by the Fund so that actual expenses of certain share classes do not exceed levels as specified in each Fund’s most recent prospectus (Class A shares, 1.05%; Class C shares, 1.80%; Class l shares, 0.60%; Class R3 shares, 1.25%; Class R4 shares, 1.25%; Class R5 shares, 0.60%; Class R6 shares, 0.53%). The agreement may be terminated by the Fund at any time, but may not be terminated by the Advisor before February 1, 2020, unless the Advisor ceases to be the investment advisor to the Fund prior to that date. The Advisor may recoup amounts waived or reimbursed during the fiscal year ended September 30, 2019 if, during that year, expenses fall below the contractual limit that was in place at the time those fees and expenses were waived or reimbursed. The Advisor will not recoup fees or expenses as described in the preceding sentence if that recoupment would cause the Fund’s total annual operating expenses (after the recoupment is taken into account) to exceed the lesser of: (a) the expense cap that was in place at the time the waiver or reimbursement occurred; or (b) the expense cap that is in place at the time of the recoupment.
For the year ended September 30, 2019, the Advisor voluntarily waived Fund level investment advisory fees of $2,174,863. The Advisor contractually reimbursed certain class specific expenses and distribution fees of $1,117,658 for Class I shares, $21,343 for Class R3 shares, $16,356 for Class R4 shares, $34,628 for Class R5 shares, and $32,310 for Class R6 shares.
Certain officers and Trustees of the Trust are also officers or directors of the Advisor and Distributor. The compensation of the independent Trustees is borne by the Trust. The Trust also pays a portion of the Chief Compliance Officer’s compensation. These amounts are reflected as Trustee and officer fees in the Statement of Operations.
The percentage of direct investments in the Fund held by the Trustees, officers of the Trust, and the Advisor is approximately 1.04%.
The Fund may purchase or sell securities from or to an affiliated fund, provided the affiliation is due solely to having a common investment advisor, common officers, or common trustees, and provided that all such transactions will comply with Rule 17a-7 under the 1940 Act. For the year ended September 30, 2019, the Fund had no such transactions with affiliated funds.
Shown below are holdings of voting securities of each portfolio company which is considered "affiliated" to the Fund under the 1940 Act, including companies for which the Fund’s holding represented 5% or more of the company’s voting securities, and a series of the Thornburg Investment Trust in which the Fund invested for cash management purposes during the period:
| Fund | Market Value
9/30/18 | Purchases
at Cost | Sales
Proceeds | Realized
Gain
(Loss) | Change in
Unrealized
Appr./(Depr.) | Market Value
9/30/19 | Dividend
Income |
| Thornburg Capital Management Fund | $139,164,733 | $509,697,899 | $(446,319,862) | $- | $- | $202,542,770 | $4,128,560 |
NOTE 5 – SHARES OF BENEFICIAL INTEREST
At September 30, 2019, there were an unlimited number of shares with no par value of beneficial interest authorized. Transactions in shares of beneficial interest were as follows:
Notes to Financial Statements, Continued
Thornburg Strategic Income Fund | September 30, 2019
| | YEAR ENDED
September 30, 2019 | YEAR ENDED
September 30, 2018 |
| | SHARES | AMOUNT | SHARES | AMOUNT |
| Class A Shares | | | | |
| Shares sold | 4,602,506 | $ 54,164,265 | 3,743,553 | $ 43,800,920 |
Shares issued to shareholders in
reinvestment of dividends | 545,564 | 6,404,897 | 476,454 | 5,580,759 |
| Shares repurchased | (4,105,748) | (48,086,770) | (6,889,844) | (80,703,800) |
| Net increase (decrease) | 1,042,322 | $ 12,482,392 | (2,669,837) | $ (31,322,121) |
| Class C Shares | | | | |
| Shares sold | 1,497,612 | $ 17,532,219 | 1,374,316 | $ 16,093,680 |
Shares issued to shareholders in
reinvestment of dividends | 284,168 | 3,326,973 | 298,369 | 3,489,800 |
| Shares repurchased | (4,716,285) | (55,259,496) | (6,126,306) | (71,570,444) |
| Net decrease | (2,934,505) | $ (34,400,304) | (4,453,621) | $ (51,986,964) |
| Class I Shares | | | | |
| Shares sold | 50,512,264 | $ 590,315,060 | 28,836,011 | $ 336,883,252 |
Shares issued to shareholders in
reinvestment of dividends | 2,632,522 | 30,881,194 | 1,562,832 | 18,254,037 |
| Shares repurchased | (22,772,557) | (265,739,938) | (17,411,738) | (203,503,991) |
| Net increase | 30,372,229 | $ 355,456,316 | 12,987,105 | $ 151,633,298 |
| Class R3 Shares | | | | |
| Shares sold | 25,351 | $ 297,418 | 77,122 | $ 906,267 |
Shares issued to shareholders in
reinvestment of dividends | 2,366 | 27,737 | 2,313 | 27,086 |
| Shares repurchased | (57,329) | (673,015) | (135,984) | (1,595,274) |
| Net decrease | (29,612) | $ (347,860) | (56,549) | $ (661,921) |
| Class R4 Shares | | | | |
| Shares sold | 55,791 | $ 650,716 | 40,422 | $ 475,669 |
Shares issued to shareholders in
reinvestment of dividends | 3,645 | 42,591 | 4,590 | 53,698 |
| Shares repurchased | (139,493) | (1,619,766) | (92,068) | (1,077,770) |
| Net decrease | (80,057) | $ (926,459) | (47,056) | $ (548,403) |
| Class R5 Shares | | | | |
| Shares sold | 629,213 | $ 7,426,138 | 413,985 | $ 4,848,911 |
Shares issued to shareholders in
reinvestment of dividends | 24,925 | 292,321 | 18,076 | 211,166 |
| Shares repurchased | (351,588) | (4,139,886) | (327,434) | (3,833,890) |
| Net increase | 302,550 | $ 3,578,573 | 104,627 | $ 1,226,187 |
| Class R6 Shares | | | | |
| Shares sold | 1,076,161 | $ 12,806,841 | 859,057 | $ 10,062,046 |
Shares issued to shareholders in
reinvestment of dividends | 19,711 | 231,827 | 7,722 | 90,009 |
| Shares repurchased | (112,525) | (1,321,573) | (36,324) | (423,261) |
| Net increase | 983,347 | $ 11,717,095 | 830,455 | $ 9,728,794 |
NOTE 6 – INVESTMENT TRANSACTIONS
For the year ended September 30, 2019, the Fund had purchase and sale transactions of investments (excluding short-term investments and U.S. Government obligations) of $745,238,702 and $355,010,405, respectively.
Notes to Financial Statements, Continued
Thornburg Strategic Income Fund | September 30, 2019
NOTE 7 – DERIVATIVE FINANCIAL INSTRUMENTS WITH OFF-BALANCE
SHEET RISK AND FOREIGN INVESTMENT RISK
The Fund may use a variety of derivative financial instruments to hedge or adjust the risks affecting its investment portfolio or to enhance investment returns. Provisions of the FASB Accounting Standards Codification 815-10-50 (“ASC 815”) require certain disclosures. The disclosures are intended to provide users of financial statements with an understanding of the use of derivative instruments by the Fund and how these derivatives affect the financial position, financial performance and cash flows of the Fund. The Fund does not designate any derivative instruments as hedging instruments under ASC 815. During the year ended September 30, 2019, the Fund’s principal exposure to derivative financial instruments of the type addressed by ASC 815 was investment in foreign currency contracts. A foreign currency contract is an agreement between two parties to exchange different currencies at a specified rate of exchange at an agreed upon future date. Foreign currency contracts involve risks to the Fund, including the risk that a contract’s counterparty will not meet its obligations to the Fund, the risk that a change in a contract’s value may not correlate perfectly with the currency the contract was intended to track, and the risk that the Fund’s Advisor is unable to correctly implement its strategy in using a contract. In any such instance, the Fund may not achieve the intended benefit of entering into a contract, and may experience a loss.
The Fund entered into forward currency contracts during the year ended September 30, 2019 in the normal course of pursuing its investment objectives, with the objective of purchasing foreign investments or with the intent of reducing the risk to the value of the Fund’s foreign investments from adverse changes in the relationship between the U.S. dollar and foreign currencies. In each case these contracts have been initiated in conjunction with foreign investment transactions. The monthly average value of open forward currency sell contracts for the year ended September 30, 2019 was $3,299,998.
These contracts are accounted for by the Fund under ASC 815. Unrealized appreciation and depreciation on outstanding contracts are reported in the Fund’s Statement of Assets and Liabilities, as measured by the difference between the forward exchange rates at the reporting date and the forward exchange rates at each contract’s inception date. Net realized gain (loss) on contracts closed during the period, and changes in net unrealized appreciation (depreciation) on outstanding contracts are recognized in the Fund’s Statement of Operations.
The outstanding forward currency contracts in the table located in the Schedule of Investments, which were entered into with State Street Bank and Trust Company (“SSB”), were entered into pursuant to an International Swaps and Derivatives Association (“ISDA”) Master Agreement. In the event of a default or termination under the ISDA Master Agreement with SSB, the non-defaulting party has the right to close out all outstanding forward currency contracts between the parties and to net any payment amounts under those contracts, resulting in a single net amount payable by one party to the other.
Because the ISDA Master Agreement with SSB does not result in an offset of reported amounts of financial assets and liabilities in the Fund’s Statement of Assets and Liabilities unless there has been an event of default or termination event under that agreement, the Fund does not net its outstanding forward currency contracts for purposes of the disclosure in the Fund’s Statement of Assets and Liabilities. Instead the Fund recognizes the unrealized appreciation (depreciation) on those forward currency contracts on a gross basis in the Fund’s Statement of Assets and Liabilities.
The unrealized appreciation (depreciation) of the outstanding forward currency contracts recognized in the Fund’s Statement of Assets and Liabilities at September 30, 2019 is disclosed in the following table:
| FAIR VALUES OF DERIVATIVE FINANCIAL INSTRUMENTS AT SEPTEMBER 30, 2019 |
| ASSET DERIVATIVES | BALANCE SHEET LOCATION | FAIR VALUE |
| Foreign currency contracts | Assets - Unrealized appreciation on forward currency contracts | $ 117,455 |
Because the Fund does not receive or post cash collateral in connection with its currency forward contracts during the period, the net amounts of the Fund’s assets and liabilities which are attributable to those contracts at September 30, 2019 can be determined by offsetting the dollar amounts shown in the preceding table. Based on those amounts, the net amount of the Fund’s assets which is attributable to its outstanding forward currency contracts at September 30, 2019 is $117,455, and the net amount of the Fund’s liabilities which is attributable to those contracts at that date is $0. The Fund’s forward currency contracts are valued each day, and the net amounts of the Fund’s assets and liabilities which are attributable to those contracts are expected to vary over time.
Notes to Financial Statements, Continued
Thornburg Strategic Income Fund | September 30, 2019
The net realized gain (loss) from forward currency contracts and the net change in unrealized appreciation (depreciation) on outstanding forward currency contracts recognized in the Fund’s Statement of Operations for the year ended September 30, 2019 are disclosed in the following tables:
NET REALIZED GAIN (LOSS) ON DERIVATIVE FINANCIAL INSTRUMENTS
RECOGNIZED IN INCOME FOR THE YEAR ENDED September 30, 2019 |
| | TOTAL | FORWARD CURRENCY CONTRACTS |
| Foreign currency contracts | $ 209,286 | $ 209,286 |
NET CHANGE IN UNREALIZED APPRECIATION (DEPRECIATION) OF DERIVATIVE FINANCIAL INSTRUMENTS
RECOGNIZED IN INCOME FOR THE YEAR ENDED September 30, 2019 |
| | TOTAL | FORWARD CURRENCY CONTRACTS |
| Foreign currency contracts | $ 98,757 | $ 98,757 |
NOTE 8 – RECENT ACCOUNTING PRONOUNCEMENTS
In August 2018, the FASB issued ASU 2018-13, Fair Value Measurement (Topic 820): Changes to the Disclosure Requirements for Fair Value Measurement, which adds, removes, and modifies certain aspects of the fair value disclosure. ASU 2018-13 is effective for annual periods beginning after December 15, 2019, and early adoption is permitted. The Funds have elected to early adopt, and had applied ASU 2018-13 for the fiscal year ended September 30, 2019. The adoption of this accounting guidance did not have a material impact on the Funds’ financial statements.
In March 2017, the FASB issued Accounting Standards Update (ASU) 2017-08, Premium Amortization of Purchased Callable Debt Securities. The amendments in the ASU shorten the premium amortization period on a purchased callable debt security from the security’s contractual life to the earliest call date. It is anticipated that this change will enhance disclosures by reducing losses recognized when a security is called on an earlier date. This ASU is effective for fiscal years beginning after December 15, 2018. Management has evaluated the implications of these changes and the amendments will have no material effect on the Funds’ net assets or results of operations.
OTHER NOTES
Risks: The Fund’s investments subject it to risks including, but not limited to, management risk, interest rate risk, prepayment risk, credit risk, high yield risk, market and economic risk, risk affecting specific issuers, liquidity risk, small and mid-cap company risk, foreign investment risk, developing country risk, structured products risk, derivatives risk, and real estate risk. Please see the Fund’s prospectus for a discussion of the risks associated with an investment in the Fund.
Subsequent Events: Fund management believes no events have occurred between September 30, 2019 and the date of issuance of the financial statements that require adjustment to or disclosure in the accompanying financial statements.
This page intentionally left blank.
Financial Highlights
Thornburg Strategic Income Fund
| | PER SHARE PERFORMANCE (FOR A SHARE OUTSTANDING THROUGHOUT THE YEAR) |
UNLESS OTHERWISE
NOTED, PERIODS ARE
FISCAL YEARS ENDED
SEPTEMBER 30, | Net Asset
Value,
Beginning of
PERIOD | Net
Investment
Income
(Loss)+ | Net Realized &
Unrealized Gain
(Loss) on
Investments | Total from
Investment
Operations | Dividends
from Net
Investment
Income | Dividends
from Net
Realized
Gains | Total
Dividends | Net Asset
Value,
End of PERIOD |
| CLASS A SHARES(b) |
| 2019 | $ 11.65 | 0.42 | 0.26 | 0.68 | (0.41) | — | (0.41) | $ 11.92 |
| 2018 | $ 11.82 | 0.40 | (0.24) | 0.16 | (0.33) | — | (0.33) | $ 11.65 |
| 2017 | $ 11.56 | 0.42 | 0.20 | 0.62 | (0.36) | — | (0.36) | $ 11.82 |
| 2016 | $ 11.22 | 0.46 | 0.28 | 0.74 | (0.37) | (0.03) | (0.40) | $ 11.56 |
| 2015 | $ 12.18 | 0.47 | (0.82) | (0.35) | (0.46) | (0.15) | (0.61) | $ 11.22 |
| CLASS C SHARES |
| 2019 | $ 11.63 | 0.33 | 0.26 | 0.59 | (0.32) | — | (0.32) | $ 11.90 |
| 2018 | $ 11.81 | 0.32 | (0.25) | 0.07 | (0.25) | — | (0.25) | $ 11.63 |
| 2017 | $ 11.55 | 0.35 | 0.19 | 0.54 | (0.28) | — | (0.28) | $ 11.81 |
| 2016 | $ 11.20 | 0.40 | 0.28 | 0.68 | (0.30) | (0.03) | (0.33) | $ 11.55 |
| 2015 | $ 12.17 | 0.41 | (0.83) | (0.42) | (0.40) | (0.15) | (0.55) | $ 11.20 |
| CLASS I SHARES |
| 2019 | $ 11.62 | 0.45 | 0.27 | 0.72 | (0.45) | — | (0.45) | $ 11.89 |
| 2018 | $ 11.80 | 0.45 | (0.25) | 0.20 | (0.38) | — | (0.38) | $ 11.62 |
| 2017 | $ 11.54 | 0.47 | 0.19 | 0.66 | (0.40) | — | (0.40) | $ 11.80 |
| 2016 | $ 11.19 | 0.50 | 0.28 | 0.78 | (0.40) | (0.03) | (0.43) | $ 11.54 |
| 2015 | $ 12.16 | 0.51 | (0.83) | (0.32) | (0.50) | (0.15) | (0.65) | $ 11.19 |
| CLASS R3 SHARES |
| 2019 | $ 11.64 | 0.39 | 0.26 | 0.65 | (0.38) | — | (0.38) | $ 11.91 |
| 2018 | $ 11.82 | 0.38 | (0.25) | 0.13 | (0.31) | — | (0.31) | $ 11.64 |
| 2017 | $ 11.55 | 0.42 | 0.20 | 0.62 | (0.35) | — | (0.35) | $ 11.82 |
| 2016 | $ 11.21 | 0.46 | 0.27 | 0.73 | (0.36) | (0.03) | (0.39) | $ 11.55 |
| 2015 | $ 12.18 | 0.47 | (0.83) | (0.36) | (0.46) | (0.15) | (0.61) | $ 11.21 |
| CLASS R4 SHARES |
| 2019 | $ 11.63 | 0.39 | 0.26 | 0.65 | (0.38) | — | (0.38) | $ 11.90 |
| 2018 | $ 11.82 | 0.38 | (0.25) | 0.13 | (0.32) | — | (0.32) | $ 11.63 |
| 2017 | $ 11.56 | 0.41 | 0.20 | 0.61 | (0.35) | — | (0.35) | $ 11.82 |
| 2016 | $ 11.21 | 0.46 | 0.28 | 0.74 | (0.36) | (0.03) | (0.39) | $ 11.56 |
| 2015 | $ 12.18 | 0.48 | (0.84) | (0.36) | (0.46) | (0.15) | (0.61) | $ 11.21 |
| CLASS R5 SHARES |
| 2019 | $ 11.62 | 0.46 | 0.26 | 0.72 | (0.45) | — | (0.45) | $ 11.89 |
| 2018 | $ 11.80 | 0.45 | (0.25) | 0.20 | (0.38) | — | (0.38) | $ 11.62 |
| 2017 | $ 11.54 | 0.47 | 0.19 | 0.66 | (0.40) | — | (0.40) | $ 11.80 |
| 2016 | $ 11.19 | 0.49 | 0.28 | 0.77 | (0.39) | (0.03) | (0.42) | $ 11.54 |
| 2015 | $ 12.15 | 0.50 | (0.82) | (0.32) | (0.49) | (0.15) | (0.64) | $ 11.19 |
| CLASS R6 SHARES |
| 2019 | $ 11.65 | 0.47 | 0.27 | 0.74 | (0.46) | — | (0.46) | $ 11.93 |
| 2018 | $ 11.85 | 0.45 | (0.26) | 0.19 | (0.39) | — | (0.39) | $ 11.65 |
| 2017(c) | $ 11.63 | 0.33 | 0.13 | 0.46 | (0.24) | — | (0.24) | $ 11.85 |
| (a) | Not annualized for periods less than one year. |
| (b) | Sales loads are not reflected in computing total return. |
| (c) | Effective date of this class of shares was April 10, 2017. |
| (d) | Annualized. |
| (e) | Due to the size of net assets and fixed expenses, ratios may appear disproportionate. |
| (f) | Net Assets at End of Period was less than $1,000. |
| + | Based on weighted average shares outstanding. |
See notes to financial statements.
Financial Highlights, Continued
Thornburg Strategic Income Fund
| RATIOS TO AVERAGE NET ASSETS | | SUPPLEMENTAL DATA |
Net Investment
Income (Loss) (%) | Expenses, After
Expense
Reductions (%) | Expenses,
Before Expense
Reductions (%) | | Total
Return (%)(a) | Portfolio
Turnover
Rate (%)(a) | Net Assets
at End of PERIOD
(Thousands) |
| |
| 3.55 | 0.99 | 1.16 | | 5.92 | 31.55 | $ 215,441 |
| 3.41 | 1.09 | 1.21 | | 1.39 | 29.90 | $ 198,320 |
| 3.61 | 1.17 | 1.25 | | 5.41 | 44.74 | $ 232,938 |
| 4.12 | 1.24 | 1.24 | | 6.70 | 29.48 | $ 283,398 |
| 4.04 | 1.23 | 1.23 | | (2.97) | 38.40 | $ 338,387 |
| |
| 2.80 | 1.75 | 1.92 | | 5.15 | 31.55 | $ 118,982 |
| 2.70 | 1.80 | 1.96 | | 0.59 | 29.90 | $ 150,364 |
| 2.98 | 1.80 | 1.99 | | 4.76 | 44.74 | $ 205,253 |
| 3.56 | 1.80 | 1.99 | | 6.20 | 29.48 | $ 272,691 |
| 3.47 | 1.80 | 1.97 | | (3.61) | 38.40 | $ 306,085 |
| |
| 3.89 | 0.63 | 0.91 | | 6.35 | 31.55 | $ 1,141,046 |
| 3.81 | 0.69 | 0.91 | | 1.71 | 29.90 | $ 762,239 |
| 4.02 | 0.75 | 0.92 | | 5.85 | 44.74 | $ 620,780 |
| 4.45 | 0.91 | 0.91 | | 7.15 | 29.48 | $ 480,143 |
| 4.38 | 0.89 | 0.89 | | (2.73) | 38.40 | $ 531,849 |
| |
| 3.30 | 1.25 | 2.59 | | 5.71 | 31.55 | $ 1,661 |
| 3.24 | 1.25 | 2.46 | | 1.16 | 29.90 | $ 1,968 |
| 3.65 | 1.12 | 2.58 | | 5.49 | 44.74 | $ 2,667 |
| 4.07 | 1.25 | 3.09 | | 6.69 | 29.48 | $ 2,819 |
| 3.98 | 1.25 | 2.70 | | (3.07) | 38.40 | $ 1,430 |
| |
| 3.28 | 1.25 | 2.51 | | 5.71 | 31.55 | $ 1,279 |
| 3.25 | 1.25 | 2.14 | | 1.08 | 29.90 | $ 2,182 |
| 3.52 | 1.25 | 2.30 | | 5.35 | 44.74 | $ 2,772 |
| 4.10 | 1.25 | 2.50 | | 6.79 | 29.48 | $ 3,218 |
| 4.15 | 1.25 | 2.64 | | (3.07) | 38.40 | $ 2,106 |
| |
| 3.94 | 0.59 | 1.18 | | 6.35 | 31.55 | $ 11,180 |
| 3.82 | 0.69 | 1.20 | | 1.71 | 29.90 | $ 7,406 |
| 4.03 | 0.74 | 1.36 | | 5.84 | 44.74 | $ 6,286 |
| 4.34 | 0.99 | 1.37 | | 7.07 | 29.48 | $ 7,191 |
| 4.33 | 0.99 | 1.55 | | (2.75) | 38.40 | $ 6,399 |
| |
| 3.98 | 0.53 | 0.98 | | 6.40 | 31.55 | $ 21,630 |
| 3.91 | 0.65 | 1.13 | | 1.66 | 29.90 | $ 9,679 |
| 5.83(d) | 0.00(d) | 200.66(d)(e) | | 3.99 | 44.74 | $ —(f) |
Report of Independent Registered Public Accounting Firm
Thornburg Strategic Income Fund
To the Board of Trustees of Thornburg Investment Trust and Shareholders of
Thornburg Strategic Income Fund
Opinion on the Financial Statements
We have audited the accompanying statement of assets and liabilities, including the schedule of investments, of Thornburg Strategic Income Fund (one of the funds constituting Thornburg Investment Trust, referred to hereafter as the "Fund") as of September 30, 2019, the related statement of operations for the year ended September 30, 2019, the statements of changes in net assets for each of the two years in the period ended September 30, 2019, including the related notes, and the financial highlights for each of the periods indicated therein (collectively referred to as the “financial statements”). In our opinion, the financial statements present fairly, in all material respects, the financial position of the Fund as of September 30, 2019, the results of its operations for the year then ended, the changes in its net assets for each of the two years in the period ended September 30, 2019 and the financial highlights for each of the periods indicated therein in conformity with accounting principles generally accepted in the United States of America.
Basis for Opinion
These financial statements are the responsibility of the Fund’s management. Our responsibility is to express an opinion on the Fund’s financial statements based on our audits. We are a public accounting firm registered with the Public Company Accounting Oversight Board (United States) (PCAOB) and are required to be independent with respect to the Fund in accordance with the U.S. federal securities laws and the applicable rules and regulations of the Securities and Exchange Commission and the PCAOB.
We conducted our audits of these financial statements in accordance with the standards of the PCAOB. Those standards require that we plan and perform the audit to obtain reasonable assurance about whether the financial statements are free of material misstatement, whether due to error or fraud.
Our audits included performing procedures to assess the risks of material misstatement of the financial statements, whether due to error or fraud, and performing procedures that respond to those risks. Such procedures included examining, on a test basis, evidence regarding the amounts and disclosures in the financial statements. Our audits also included evaluating the accounting principles used and significant estimates made by management, as well as evaluating the overall presentation of the financial statements. Our procedures included confirmation of securities owned as of September 30, 2019 by correspondence with the custodian, transfer agent, agent banks and brokers; when replies were not received from brokers, we performed other auditing procedures. We believe that our audits provide a reasonable basis for our opinion.
/s/PricewaterhouseCoopers LLP
New York, New York
November 22, 2019
We have served as the auditor of one or more investment companies in Thornburg Investment Trust since 1999.
Expense Example
Thornburg Strategic Income Fund | September 30, 2019 (Unaudited)
As a shareholder of the Fund, you incur two types of costs:
| (1) | transaction costs, including |
| (a) | sales charges (loads) on purchase payments, for Class A shares; |
| (b) | a deferred sales charge on redemptions of any part or all of a purchase of $1 million of Class A shares within 12 months of purchase; |
| (c) | a deferred sales charge on redemptions of Class C shares within 12 months of purchase; |
| (2) | ongoing costs, including management fees; distribution and/or service (12b-1) fees; and other Fund expenses. |
This example is intended to help you understand your ongoing costs (in dollars) of investing in the Fund and to compare these costs with the ongoing costs of investing in other mutual funds.
The example is based on a $1,000 investment beginning on April 1, 2019, and held until September 30, 2019.
ACTUAL EXPENSES
For each class of shares, the first line of the accompanying table provides information about actual account values and actual expenses. You may use the information in this line, together with the amount you invested, to estimate the expenses that you paid over the period. Simply divide your account value by $1,000 (for example, an $8,600 account value divided by $1,000 = 8.6), then multiply the result by the number in the first line for your class of shares under the heading entitled “Expenses Paid During Period” to estimate the expenses you paid on your account during this period.
| | BEGINNING
ACCOUNT VALUE
4/1/19 | ENDING
ACCOUNT VALUE
9/30/19 | EXPENSES PAID
DURING PERIOD†
4/1/19—9/30/19 |
| CLASS A SHARES |
| Actual | $1,000.00 | $1,032.25 | $4.69 |
| Hypothetical* | $1,000.00 | $1,020.46 | $4.66 |
| CLASS C SHARES |
| Actual | $1,000.00 | $1,028.44 | $8.64 |
| Hypothetical* | $1,000.00 | $1,016.55 | $8.59 |
| CLASS I SHARES |
| Actual | $1,000.00 | $1,034.39 | $3.06 |
| Hypothetical* | $1,000.00 | $1,022.06 | $3.04 |
| CLASS R3 SHARES |
| Actual | $1,000.00 | $1,030.24 | $6.36 |
| Hypothetical* | $1,000.00 | $1,018.80 | $6.33 |
| CLASS R4 SHARES |
| Actual | $1,000.00 | $1,030.26 | $6.36 |
| Hypothetical* | $1,000.00 | $1,018.80 | $6.33 |
| CLASS R5 SHARES |
| Actual | $1,000.00 | $1,033.51 | $2.70 |
| Hypothetical* | $1,000.00 | $1,022.41 | $2.69 |
| CLASS R6 SHARES |
| Actual | $1,000.00 | $1,033.77 | $2.35 |
| Hypothetical* | $1,000.00 | $1,022.76 | $2.33 |
| † | Expenses are equal to the annualized expense ratio for each class (A: 0.92%; C: 1.70%; I: 0.60%; R3: 1.25%; R4: 1.25%; R5: 0.53%; R6: 0.46%) multiplied by the average account value over the period, multiplied by 183/365 to reflect the one-half year period. |
| * | Hypothetical assumes a rate of return of 5% per year before expenses. |
HYPOTHETICAL EXAMPLE FOR COMPARISON PURPOSES
For each class of shares, the second line of the accompanying table provides information about hypothetical account values and hypothetical expenses based on the Fund’s actual expense ratio and an assumed rate of return of 5% per year before expenses, which is not the Fund’s actual return. The hypothetical account values and expenses may not be used to estimate the actual ending account balance or expenses you paid for the period. You may use this information to compare the ongoing costs of investing in the Fund and other funds. To do so, compare this 5% hypothetical example with the 5% hypothetical examples that appear in the shareholder reports of the other funds.
Please note that the expenses shown in the table are meant to highlight your ongoing costs only and do not reflect any transactional costs, such as sales charges (loads), redemption fees, or exchange fees. Therefore, the second line of the table for each class of shares is useful in comparing ongoing costs only, and will not help you determine the relative total costs of owning different funds. In addition, if these transactional costs were included, your costs would have been higher.
Trustees and Officers
Thornburg Strategic Income Fund | September 30, 2019 (Unaudited)
NAME, AGE, YEAR ELECTED
POSITION HELD WITH FUND | PRINCIPAL OCCUPATION(S) DURING PAST FIVE YEARS | OTHER DIRECTORSHIPS
HELD BY TRUSTEE |
| INTERESTED TRUSTEES(1)(2) |
Garrett Thornburg, 73
Trustee since 1984,
Chairman of Trustees(3) | Chairman and controlling shareholder of Thornburg Investment Management, Inc. (investment advisor); Chairman and controlling shareholder of Thornburg Securities Corporation (securities dealer); President of the Thornburg Foundation (nonprofit). | None |
Brian J. McMahon, 64
Trustee since 2001,
Vice Chairman of Trustees,
Member of Governance and
Nominating Committee &
Operations Risk Oversight
Committee(4) | Vice Chairman, Chief Investment Strategist, Managing Director, and Portfolio Manager and, until 2016, CEO and President of Thornburg Investment Management, Inc.; Vice President of Thornburg Securities Corporation. | None |
| INDEPENDENT TRUSTEES(1)(2)(5) |
David A. Ater, 74
Trustee since 1994,
Lead Independent Trustee,
Chairman of Governance and
Nominating Committee &
Member of Audit Committee | Principal in Ater & Associates, Santa Fe, NM (developer, planner and broker of residential and commercial real estate); owner, developer and broker for various real estate projects. | None |
Sally Corning, 58
Trustee since 2012,
Chairman of Audit Committee | Partner in Sun Mountain Capital, Santa Fe, NM (private equity firm with investment programs encompassing venture capital, mezzanine debt, and growth equity). | None |
Susan H. Dubin, 70
Trustee since 2004,
Member of Audit
Committee & Governance
and Nominating Committee | President of Dubin Investments, Ltd., Greenwich, CT (private investment fund); Director and officer of various charitable organizations. | None |
David L. Gardner, 56
Trustee since 2015,
Member of Operations Risk
Oversight Committee | Until 2012, head of EMEA (Europe, Middle East and Africa) Sales for iShares of Blackrock, Inc., EMEA Executive Committee Member and EMEA Operating Committee Member at Blackrock, Inc. | None |
Patrick J. Talamantes, 55
Trustee since 2019,
Member of Audit Committee | President of Talamantes Strategies, LLC, a management consulting firm, since 2018; until 2017, President and Chief Executive Officer of The McClatchy Company, Sacramento, CA (news and media company). | None |
Owen D. Van Essen, 65
Trustee since 2004,
Chairman of Operations Risk
Oversight Committee &
Member of Governance and
Nominating Committee | President of Dirks, Van Essen, Murray & April, Santa Fe, NM (newspaper mergers and acquisitions). | None |
James W. Weyhrauch, 60
Trustee since 1996,
Member of Audit
Committee & Operations Risk
Oversight Committee | Real estate broker, Santa Fe Properties, Santa Fe, NM; General Partner, Investments of Genext LLC (a family investment partnership); until 2019, Vice Chairman of Nambe LLC, Santa Fe, NM (manufacturing & design company). | None |
Trustees and Officers, Continued
Thornburg Strategic Income Fund | September 30, 2019 (Unaudited)
NAME, AGE, YEAR ELECTED
POSITION HELD WITH FUND | PRINCIPAL OCCUPATION(S) DURING PAST FIVE YEARS | OTHER DIRECTORSHIPS
HELD BY TRUSTEE |
| OFFICERS OF THE FUND (WHO ARE NOT TRUSTEES)(1)(6) |
David Ashley, 49
Vice President since 2019 | Portfolio Manager and Managing Director since 2019 and Associate Portfolio Manager from 2011-2019 of Thornburg Investment Management, Inc. | Not applicable |
Nimish Bhatt, 56
Chief Financial Officer
since 2019; Treasurer
2016-2019; Secretary
(2018-2019)(7) | Chief Financial Officer and Treasurer of Thornburg Investment Management, Inc. and Thornburg Securities Corporation since 2016 and Secretary of Thornburg Securities Corporation since 2018; Senior Vice President (2004-2016), Chief Financial Officer (2011-2016), and Head of Fund Administration (2011-2016) of Calamos Asset Management, Inc., Calamos Investments LLC, Calamos Advisors LLC, and Calamos Wealth Management; Director of Calamos Global Funds plc (2007-2016). | Not applicable |
Jason Brady, 45
President since 2016(7) | Director since 2017, CEO and President since 2016, and Portfolio Manager and Managing Director of Thornburg Investment Management, Inc.; Vice President of Thornburg Securities Corporation since 2016. | Not applicable |
Connor Browne, 40
Vice President since 2006 | Portfolio Manager and Managing Director of Thornburg Investment Management, Inc. | Not applicable |
Randy Dry, 45
Vice President since 2014 | Managing Director, Director of Institutional Group from 2014-2016, and since 2016, Chief Administrative Officer of Thornburg Investment Management, Inc. | Not applicable |
Greg Dunn, 43
Vice President since 2014 | Portfolio Manager and Managing Director of Thornburg Investment Management, Inc. | Not applicable |
Lon Erickson, 44
Vice President since 2008 | Portfolio Manager and Managing Director of Thornburg Investment Management, Inc. | Not applicable |
Thomas Garcia, 48
Vice President since 2006 | Managing Director, Head Equity Trader, and Associate Portfolio Manager of Thornburg Investment Management, Inc. | Not applicable |
Christian Hoffmann, 37
Vice President since 2018 | Portfolio Manager and Managing Director since 2018, and Associate Portfolio Manager from 2014-2018, of Thornburg Investment Management, Inc. | Not applicable |
Curtis Holloway, 52
Treasurer since 2019(7) | Director of Fund Administration since 2019 of Thornburg Investment Management, Inc.; Senior Vice President, Head of Fund Administration (2017-2019) and Vice President, Fund Administration (2010-2017) of Calamos Investments, and Chief Financial Officer (2017-2019) and Treasurer (2010-2019) of Calamos Funds. | Not applicable |
Ben Kirby, 39
Vice President since 2014 | Head of Investments since 2019, Portfolio Manager and Managing Director since 2013. | Not applicable |
Jeff Klingelhofer, 38
Vice President since 2016 | Head of Investments since 2019, Portfolio Manager and Managing Director since 2015, and Associate Portfolio Manager from 2012–2015, of Thornburg Investment Management, Inc. | Not applicable |
Ponn Lithiluxa, 48
Vice President since 2017 | Manager, Tax & Fund Administration of Thornburg Investment Management, Inc.; Senior Vice President, Citi Fund Services, Inc. (2014–2017); Vice President, Citi Fund Services, Inc. (2007–2014). | Not applicable |
Rob MacDonald, 43
Vice President since 2016 | Managing Director since 2015, Portfolio Manager since 2014, and Associate Portfolio Manager from 2011–2014 of Thornburg Investment Management, Inc. | Not applicable |
Michael Mastroianni, 42
Secretary and Vice President since 2019(7) | Director of Fund Operations since 2019 of Thornburg Investment Management, Inc.; Executive Director, Global Head of Client Services - Global Liquidity (2018-2019), Executive Director, North American Head of Transfer Agency Relationship Management (2011-2019), Executive Director, North American Head of Transfer Agency Service Delivery (2011-2018) of J.P. Morgan Asset Management. | Not applicable |
Leigh Moiola, 52
Vice President since 2001 | Managing Director and Director of Marketing of Thornburg Investment Management, Inc.; Vice President of Thornburg Securities Corporation. | Not applicable |
Christopher Ryon, 63
Vice President since 2008 | Portfolio Manager and Managing Director of Thornburg Investment Management, Inc. | Not applicable |
Trustees and Officers, Continued
Thornburg Strategic Income Fund | September 30, 2019 (Unaudited)
NAME, AGE, YEAR ELECTED
POSITION HELD WITH FUND | PRINCIPAL OCCUPATION(S) DURING PAST FIVE YEARS | OTHER DIRECTORSHIPS
HELD BY TRUSTEE |
Sean Koung Sun, 38
Vice President since 2017 | Portfolio Manager and Managing Director since 2017, Associate Portfolio Manager from 2015-2016, and Equity Research Analyst from 2012-2014 of Thornburg Investment Management, Inc. | Not applicable |
Stephen Velie, 52
Chief Compliance Officer since 2009 | Chief Compliance Officer of Thornburg Investment Trust and Thornburg Investment Management, Inc. | Not applicable |
Nicholos Venditti, 38
Vice President since 2016 | Portfolio Manager and Managing Director since 2015 and Associate Portfolio Manager from 2011–2015 of Thornburg Investment Management, Inc. | Not applicable |
Vinson Walden, 49
Vice President since 2004 | Portfolio Manager and Managing Director of Thornburg Investment Management, Inc. | Not applicable |
Lei Wang, 48
Vice President since 2006 | Portfolio Manager and Managing Director of Thornburg Investment Management, Inc. | Not applicable |
Charles Wilson, 44
Vice President since 2016 | Portfolio Manager and Managing Director since 2014 and Associate Portfolio Manager from 2012–2014 of Thornburg Investment Management, Inc. | Not applicable |
Di Zhou, 41
Vice President since 2016 | Portfolio Manager and Managing Director since 2016, Associate Portfolio Manager from 2014–2016, and Equity Research Analyst from 2010–2014 of Thornburg Investment Management, Inc. | Not applicable |
| (1) | Each person’s address is 2300 North Ridgetop Road, Santa Fe, New Mexico 87506. |
| (2) | The Fund is a separate investment “Fund” or “series” of Thornburg Investment Trust (the “Trust”), which comprises the Thornburg mutual fund complex and is organized as a Massachusetts business trust. Thornburg Investment Management, Inc. is the investment advisor to, and manages, all the Funds of the Trust. Each Trustee oversees all the Funds of the Trust. |
| (3) | Mr. Thornburg is considered an “interested” Trustee under the Investment Company Act of 1940 because he is a director and controlling shareholder of Thornburg Investment Management, Inc., the investment advisor to the Trust, and is the sole director and controlling shareholder of Thornburg Securities Corporation, the distributor of shares for the Trust. |
| (4) | Mr. McMahon is considered an “interested” Trustee under the Investment Company Act of 1940 because he is a director and the chief investment strategist of Thornburg Investment Management, Inc. |
| (5) | The Bylaws of the Trust currently require that each Independent Trustee shall retire by the end of the calendar year during which the Trustee reached the age of 75 years. Otherwise each Trustee serves in office until the election and qualification of a successor or until the Trustee sooner dies, resigns, retires or is removed. |
| (6) | Assistant vice presidents and assistant secretaries are not shown. |
| (7) | The Trust’s president, chief financial officer, secretary, and treasurer each serves a one-year term or until the election and qualification of a successor; each other officer serves at the pleasure of the Trustees. |
The Statement of Additional Information for each Fund of the Trust includes additional information about the Trustees and is available, without charge and upon request, by calling 1-800-847-0200.
Other Information
Thornburg Strategic Income Fund | September 30, 2019 (Unaudited)
PORTFOLIO PROXY VOTING
Policies and Procedures:
The Trust has delegated to the Advisor voting decisions respecting proxies for the Fund’s voting securities. The Advisor makes voting decisions in accordance with its Proxy Voting Policy and Procedures. A description of the Policy and Procedures is available (i) without charge, upon request, by calling the Advisor toll-free at 1-800-847-0200, (ii) on the Thornburg website at www.thornburg.com, and (iii) on the U.S. Securities and Exchange Commission’s website at www.sec.gov.
Information regarding how proxies were voted is available on or before August 31 of each year for the twelve months ending the preceding June 30. This information is available (i) without charge, upon request by calling the Advisor toll-free at 1-800-847-0200, (ii) on the Thornburg website at www.thornburg.com, and (iii) on the U.S. Securities and Exchange Commission’s website at www.sec.gov.
TAX INFORMATION
For the tax year ended September 30, 2019, dividends paid by the Thornburg Strategic Income Fund of $47,669,325 are being reported as ordinary investment income for federal income tax purposes.
For the tax year ended September 30, 2019, the Thornburg Strategic Income Fund is reporting 1.50% (or the maximum allowed) of the dividends paid from tax basis net ordinary income as qualifying for the reduced rate under the Jobs and Growth Tax Relief and Reconciliation Act of 2003.
The Fund is reporting 1.49% (or the maximum allowed) of the ordinary income distributions paid by the Fund for the fiscal year ended September 30, 2019 as qualified for the corporate dividends received deduction.
The information and distributions reported herein may differ from the information and distributions reported to the shareholders for the calendar year ending December 31, 2019. Complete information will be reported in conjunction with your 2019 Form 1099.
AVAILABILITY OF QUARTERLY PORTFOLIO SCHEDULE
The Fund files with the Securities and Exchange Commission schedules of its portfolio holdings on Form N-Q for the first and third quarters of each fiscal year. The Fund’s Forms N-Q are available on the Commission’s website at www.sec.gov, or may be reviewed and copied at the Commission’s Public Reference Room in Washington, D.C. Information on the operation of the Public Reference Room may be obtained by calling 1-800-SEC-0330. The Fund also makes this information available on its website at www.thornburg.com/download or upon request by calling 1-800-847-0200.
STATEMENT RESPECTING RENEWAL OF INVESTMENT ADVISORY AGREEMENT
Thornburg Investment Management, Inc. (the “Advisor”) provides investment management services to Thornburg Strategic Income Fund (the “Fund”) pursuant to an investment advisory agreement. The Trustees consider the renewal of this agreement annually, and most recently determined to renew the agreement on September 17, 2019.
Planning for their recent consideration of the advisory agreement’s renewal, the independent Trustees met in May 2019 to consider aspects of their annual evaluation of the Advisor’s service to all of the funds of Thornburg Investment Trust, to plan the annual evaluation of the Advisor’s performance and to discuss preliminarily the information the Advisor would present to the Trustees for their review. The independent Trustees met in a second independent session in July 2019 to further define certain portions of the information to be submitted by the Advisor. The independent Trustees met again in an independent session in September 2019 with a mutual fund analyst firm engaged by the independent Trustees to provide explanations of comparative cost and expense information, comparative investment performance information, and other data obtained and analyzed by the analyst firm. In that session the independent Trustees discussed their evaluations of the Advisor’s services to the Fund and the Fund’s fee and expense levels, investment performance, and other information presented for the Fund, conferred independently with legal counsel respecting the factors typically considered in evaluating renewal of an advisory agreement, and conferred with representatives of management to receive explanations of certain aspects of the information they had requested. Representatives of the Advisor subsequently reviewed portions of the information with the Trustees and addressed questions from the Trustees at a full meeting session of the Trustees scheduled in September for that purpose, and the independent Trustees thereafter met again in an independent session to consider the Advisor’s presentations and various specific issues respecting their consideration of the advisory agreement’s renewal. Following these sessions, the Trustees met to consider renewal of the advisory agreement, and the independent Trustees voted unanimously at that meeting to renew the agreement for an additional term of one year.
Other Information, Continued
Thornburg Strategic Income Fund | September 30, 2019 (Unaudited)
The information below summarizes certain factors considered by the Trustees in connection with the determination to renew the advisory agreement with the Advisor. In determining to renew the advisory agreement, the Trustees considered a wide range of information and did not identify any single factor as controlling, and this summary does not describe all of the factors and other matters considered by the Trustees in making their determination.
Nature, Extent and Quality of Services. The Trustees considered in their evaluation of the advisory agreement the written and oral reports provided to the Trustees and their standing committees throughout the year on a wide variety of topics by personnel from the Advisor’s portfolio management, administration, operations and compliance staffs. The Trustees also considered in this evaluation presentations and explanations made by representatives of the Advisor in meeting sessions scheduled for consideration of the renewal of the advisory agreement. The Trustees further noted in their evaluation the consideration they had given to a number of topics in previous years, reports from their standing committees, and advice received from counsel.
Information noted by the Trustees as having been considered in relation to the nature, extent and quality of services provided by the Advisor under the advisory agreement and contributing (together with other information considered) to their conclusions respecting the nature, extent and quality of the services rendered to the Fund by the Advisor included: (1) reports from portfolio managers and other personnel throughout the year demonstrating that the Fund was managed in conformity with stated strategies and objectives and conformed to investment restrictions and limitations; (2) reports demonstrating that management of the Fund remained faithful and competent, and demonstrating sufficient skill by portfolio managers in executing the Fund’s strategies in varying environments, managers’ cognizance of and strategies to pursue the Fund’s objectives and address pertinent market and economic trends and conditions, the evaluation and selection of individual investments, management to achieve tax efficiencies, and the structuring and composition of the Fund’s portfolio and management of Fund liquidity requirements; (3) the Fund’s achievement of its investment objectives over different periods of time; (4) presentations by and interactions with members of the Advisor’s fund administration, operations and compliance staffs; (5) reports from standing committees of the Trustees on their respective proceedings throughout the year, including in particular reports from and interactions with the Advisor’s personnel; (6) the sufficiency of the resources the Advisor devotes to the services it provides to the Fund, including the expertise of its personnel and staffing levels and its enhancements to the electronic systems it utilizes in providing these services, and also including the Advisor’s own financial management and sufficiency of its resources; and (7) the measures employed to achieve efficient trade execution for the Fund, including the evaluation and selection of firms to execute transactions for the Fund. As in past years, the Trustees noted particularly their assessments of the Advisor’s personnel developed in meetings throughout the year, measures to expand and improve the depth and experience of the Advisor’s staff, and the Advisor’s collaborative approach to investment management, continued commitment to observance of compliance and regulatory requirements in managing investments by the Fund, responsiveness to the Trustees, and other factors.
Based upon these and other considerations, the Trustees concluded that the Advisor’s management of the Fund’s investments continued to conform to the Fund’s stated objectives and policies, and that the nature, extent and quality of the services provided to the Fund by the Advisor remained sufficient.
Investment Performance. The Trustees noted in their evaluation of the Fund’s investment performance the written and oral reports they had received in each regular meeting over the course of the year from the Advisor’s portfolio management personnel. The Trustees also noted their consideration of information provided to them at their request in anticipation of their annual evaluation of the Advisor’s services, including the following items of information respecting the investment performance of the Fund: (1) the Fund’s absolute investment performance and achievement of stated objectives; (2) the Advisor’s explanations and commentary on the Fund’s performance in the context of the Fund’s objectives and reasonable expectations, and business, market and economic conditions; (3) performance data for the most recent ten calendar years, comparing the Fund’s annual investment returns to a broad-based securities index, to a blended performance benchmark, and to the applicable Morningstar category of funds; (4) the Fund’s investment performance for the three-month, year-to-date, one-year, three-year, five-year, ten-year, and since inception periods ending with the second quarter of the current year, comparing the Fund’s annualized returns to two mutual fund categories created by independent mutual fund analyst firms, to a broad-based securities index, and to a blended performance benchmark, and assigning a percentage rank to the Fund’s performance for each period relative to each of the fund categories; (5) analyses of specified performance and risk metrics for the Fund relative to one of its benchmarks and to a selected peer group of funds, prepared by an independent financial analyst firm engaged by the independent Trustees; (6) the Fund’s cash flows; (7) comparative performance data for fund peer groups selected by an independent mutual fund analyst firm engaged by the independent Trustees, and the analysis and observations of the analyst firm respecting those data; and (8) comparative measures of correlation to equity indices, and risk and return statistics. Measures of risk and relative return demonstrated that the Fund’s performance relative to these measures continued to fulfill expectations in current conditions. The Trustees generally attach additional significance to the investment performance of the Fund from the perspective of longer-term shareholders, and noted in that regard that the Fund’s relative investment performance may be affected to some extent in periods when the Advisor pursues defensive measures in line with the Fund’s stated objectives. Based upon their consideration of this and other information, the Trustees concluded that the Fund’s absolute and relative investment performance over a range of pertinent holding periods on the whole was satisfactory in view of its objectives and strategies.
Other Information, Continued
Thornburg Strategic Income Fund | September 30, 2019 (Unaudited)
Comparisons of Fee and Expense Levels. Information noted by the Trustees as having been considered in this context included a variety of comparative data respecting the Fund’s fee and expense levels. This information included comparisons of the Fund’s advisory fee and overall Fund expenses to median and average fees and expenses charged to funds in the applicable Morningstar category, comparisons of the advisory fee and total expenses for two Fund share classes to the fee levels and expenses of fund peer groups selected from the category by an independent mutual fund analyst firm engaged by the independent Trustees, the perspectives and advice from that mutual fund analyst firm respecting comparisons of fund fee levels and expenses to fund peer groups, and other information. The Trustees considered that the Advisor has agreed to certain fee waivers and expense reimbursements for the current period. Comparative fee and expense data noted as having been considered by the Trustees showed that, after fee waivers and expense reimbursements, the level of total expense for one share class of the Fund was higher than the median level and comparable to the average level charged to funds in the applicable Morningstar category, and that, after fee waivers and expense reimbursements, the level of total expense for a second share class was lower than the median and average levels for that category. Peer group data showed that the Fund’s stated advisory fee was higher than the median level for the two peer groups but comparable to other funds in the peer group, and that the total expense levels of two representative share classes were higher than the medians of the respective peer group but comparable to other funds in the peer groups after waivers of fees and reimbursement of expenses. The Trustees did not find the differences significant in view of their findings and conclusions respecting the other factors considered.
The Trustees noted their consideration of information respecting the advisory fees charged by the Advisor to other investment management clients, including sub-advised mutual funds and other institutional clients, together with information about fees charged by other advisors to different clients, analysis of the differences between the requirements of institutional clients and mutual funds, analysis of the differences between the requirements of a sub-advised mutual fund and a fund as to which the investment advisor is the primary advisor and sponsor, and the consequently different investment management services provided to the different categories of clients and the differing contexts in which these arrangements are entered into. The Trustees confirmed their previous observations that the differences between the fees charged by the Advisor or by other investment advisors to different types of clients did not appear exceptional and had limited relevance to the evaluation of the fee rate charged to mutual funds as to which the Advisor or such other advisors are the primary advisor and sponsor.
Costs and Profitability of Advisor. In reviewing the profitability of the Advisor’s services to the Fund, the Trustees considered an analysis of the Advisor’s costs and the estimated profitability to the Advisor of its services, together with data respecting the overall profitability of a selection of other investment management firms. The Trustees considered in this regard information from the Advisor respecting investment of its profits to maintain staffing levels, and noted that a portion of the Advisor’s profits is an important element in the compensation of shareholder employees. The Trustees considered information from the Advisor respecting the use of profits to enhance staff competencies through training and other measures, hire personnel to expand and develop the scope of senior management expertise, pay competitive levels of compensation, and add to the Advisor’s electronic and information technology systems to maintain or improve service levels. The Trustees also considered the contribution of the Advisor’s cost management to its profitability, and the relationship of the Advisor’s financial resources and profitability in previous years to its ability to attract necessary personnel, invest in systems and other assets required for its service to the Fund, and maintain or improve service levels for the Fund notwithstanding fluctuations in revenues and profitability. The information considered did not indicate to the Trustees that the Advisor’s profitability was excessive.
Potential Economies of Scale. In reviewing the extent to which economies of scale would be realized by the Fund as it grows and whether fee levels reflect potential economies of scale, the Trustees considered the breakpoint structure for advisory fees chargeable to the Fund, comparisons of the fee breakpoint structure for the Fund with breakpoint structures (or the absence of such structures) for other funds in a peer group selected by an independent mutual fund analyst firm, the effects of the breakpoint structure and other expense factors realized by certain funds of the Trust as their asset levels had increased, the Advisor’s undertakings to waive or reimburse certain fees and expenses of the Fund, and the Advisor’s expenditures from its own profits and resources to maintain staffing levels and expand staff competencies, pay competitive levels of compensation, and add to its electronic and information technology systems so as to maintain or improve service levels. The information provided demonstrated to the Trustees that the Fund’s advisory fee breakpoint structure is reasonable in relation to the structures observed in the other funds in its peer group, and that shareholders may be expected to benefit from any economies of scale, due to the advisory agreement’s breakpoint fee structure for the Fund and other factors.
Potential Ancillary Benefits. In reviewing potential benefits to the Advisor because of its relationship to the Fund, the Trustees considered explanations from the Advisor respecting its receipt of certain research services from broker dealers, and the benefits to both the Fund and the Advisor of the Advisor’s expansion of its staffing, compliance and systems capabilities and other resources to serve a broader variety of investment management clients. No unusual or unfair benefits to the Advisor from its relationship to the Fund were identified by the Trustees.
Summary of Conclusions. The Trustees concluded that the general nature, extent and quality of the Advisor’s services performed under the advisory agreement remained sufficient, the Advisor had continued to actively and competently pursue the Fund’s stated investment objectives and adhere to the Fund’s investment policies, and that the absolute and relative investment performance of the Fund over pertinent holding periods on the whole was satisfactory in the context of the Fund’s objectives and strategies. The Trustees further concluded that the level of the advisory fee charged to the Fund by the Advisor is fair and reasonable in relation to the services provided by the Advisor, in view of the nature, extent and quality of those services, the investment performance of the Fund after fees and expenses,
Other Information, Continued
Thornburg Strategic Income Fund | September 30, 2019 (Unaudited)
the clear disclosure of fees and expenses in the Fund’s prospectuses, comparisons of fees and expenses charged to the Fund to fees and expenses charged to other mutual funds, and the other factors considered. The Trustees accordingly determined to renew the Fund’s investment advisory agreement with the Advisor for an additional term of one year.
Trustees’ Statement to Shareholders (Unaudited)
Readopted September 17, 2019
The Trustees believe current and prospective shareholders should know how we discharge our responsibilities in supervising the Funds’ investment advisor and in reviewing the advisor’s contract for renewal. Since 2005, we have issued a statement which sets out clearly the three principal guidelines that we follow in supervising the Trust’s investment advisor on your behalf. In accordance with our customary practice, in September of this year we again reviewed our statement and concluded we should reissue this statement outlining the principal features of our supervision of the advisor’s performance of investment management services for the Funds.
We begin with the premise that each shareholder selected his or her Fund because its investments are managed by the investment advisor identified in the prospectus and in accordance with the objective and policies described in the prospectus. We realize, as each of you do, that if you believe that your Fund’s stated objective and policies no longer serve your personal investment goals, you can sell your shares and leave the Fund.
Therefore, we believe that our primary supervisory task—our principal obligation to you—is to assess the nature and quality of the advisor’s services, and to confirm that the advisor actively and competently pursues the Fund’s objective, in accordance with the policies set out in the prospectus. To do this, we meet regularly with management to review your Fund’s portfolio and to discuss the advisor’s specific actions and judgments in pursuing the Fund’s objective. We do not substitute our own judgment for the advisor’s decisions in selecting investments; the advisor is paid to exercise its informed judgment on investment decisions, and we seek to confirm, in reviewing the advisor’s performance, that the advisor is doing just that.
Second, we are conscious of costs and the effect that costs have on shareholders’ returns. We try to make sure that your Fund’s fees and costs are reasonable in relationship to the services rendered and that they are generally in line with those charged by other expert investment advisors, consistent with our belief that the Fund’s investors searched for and expect that expertise and attention and have decided to pay a reasonable price for it. We do not put the management contract “out to bid” as a matter of course, and we would not do so unless we had concluded that the advisor materially had failed to pursue the Fund’s objectives in accordance with its policies, or for other equally important reasons. We believe that any other approach would be inconsistent with your interests and contrary to your expectations when you bought shares of the Fund in the first place.
Finally, because we believe that most Thornburg Fund shareholders have invested with a long-term perspective, we try not to focus too much on the fashions of the moment and on short-term performance. The market will not favor any specific investment objective or set of policies at all times and under all economic circumstances. A fund will experience periods of both high and low returns relative to other funds and other investments. Even if one of our Funds is not favored by the market at a particular time, we believe that the advisor is nonetheless obliged to remain true to the Fund’s objective and policies, and we watch to see that it does so.
Trustees of Thornburg Investment Trust
Thornburg Investment Management is a privately-owned global investment firm that offers a range of solutions for retail and institutional investors. Founded in 1982 and headquartered in Santa Fe, New Mexico, we manage approximately $41.9 billion (as of September 30, 2019) across U.S. mutual funds, separate accounts for high-net-worth investors, institutional accounts, and UCITS funds for non-U.S. investors.
The fund outlined in this report is one of many equity and fixed-income products available from Thornburg Investment Management.
EQUITY FUNDS
| ■ | Thornburg Global Opportunities Fund |
| ■ | Thornburg International Value Fund |
| ■ | Thornburg Better World International Fund |
| ■ | Thornburg International Growth Fund |
| ■ | Thornburg Developing World Fund |
| ■ | Thornburg Value Fund |
| ■ | Thornburg Core Growth Fund |
MULTI_ASSET FUNDS
| ■ | Thornburg Investment Income Builder Fund |
| ■ | Thornburg Summit Fund |
FIXED INCOME FUNDS
| ■ | Thornburg Low Duration Income Fund |
| ■ | Thornburg Limited Term U.S. Government Fund |
| ■ | Thornburg Limited Term Income Fund |
| ■ | Thornburg Strategic Income Fund |
| ■ | Thornburg Low Duration Municipal Fund |
| ■ | Thornburg Limited Term Municipal Fund |
| ■ | Thornburg Intermediate Municipal Fund |
| ■ | Thornburg California Limited Term Municipal Fund |
| ■ | Thornburg New Mexico Intermediate Municipal Fund |
| ■ | Thornburg New York Intermediate Municipal Fund |
| ■ | Thornburg Strategic Municipal Income Fund |
ALTERNATIVE FUNDS
| ■ | Thornburg Long/Short Equity Fund |
Before investing, carefully consider the Fund’s investment goals, risks, charges, and expenses. For a prospectus or summary prospectus containing this and other information, contact your financial advisor or visit thornburg.com. Read it carefully before investing.
For additional information, please visit thornburg.com
Thornburg Investment Management, Inc. 2300 North Ridgetop Road, Santa Fe, NM 87506
This page intentionally left blank.
To receive shareholder reports, prospectuses, and proxy statements electronically, go to www.thornburg.com/edelivery.
This Annual Report is submitted for the general information of shareholders of the Fund. It is not authorized for distribution to prospective investors in the Fund unless preceded or accompanied by an effective prospectus.
Investment Advisor:
Thornburg Investment Management®
800.847.0200
Distributor:
Thornburg Securities Corporation®
Annual Report
September 30, 2019
Beginning on January 1, 2021, as permitted by regulations adopted by the Securities and Exchange Commission, paper copies of the Fund’s shareholder reports will no longer be sent by mail, unless you specifically request paper copies of the reports from the Fund or from your financial intermediary, such as a broker-dealer or bank. Instead, the reports will be made available on a website, and you will be notified by mail each time a report is posted and provided with a website link to access the report.
If you already elected to receive shareholder reports electronically, you will not be affected by this change and you need not take any action. You may elect to receive shareholder reports and other communications from the Fund or your financial intermediary electronically by going to thornburg.com/edelivery.
You may elect to receive all future reports in paper free of charge. You can inform the Fund or your financial intermediary that you wish to continue receiving paper copies of your shareholder reports by calling 800.847.0200 or your financial intermediary directly. Your election to receive reports in paper will apply to all funds held with the fund complex/your financial intermediary.
At Thornburg, we believe unconstrained investing leads to better outcomes for our clients. Our investment solutions are highly active, high conviction, and benchmark agnostic. When it comes to finding economic opportunity for clients, it’s more than what we do.
It’s how we do it. Active Asbottom-up, fundamental, active managers, we look beyond conventional benchmarks. Long Term We take a long-term view in how we manage our firm and our portfolios. Benchmark Agnostic Investment strategies should have the flexibility to pursue solutions for clients, not stay within the conventional confines of benchmarks. Flexible Perspective Our approach to portfolio construction is guided by our convictions rather than convention. High Conviction We focus our attention and capital on thoroughly researched, well-understood positions. The best form of risk management is to know what you own, and why. Repeatable & Robust Our long-term outperformance of benchmarks verifies that our process works and outperforms conventional thinking. Independent We are independently owned and far from the herd of other investment managers. Investment Driven All members of the investment team are resources for all of our strategies. Collaborative Our team collaborates on opportunities across geography, sector, or asset class.
Thornburg Value Fund
Annual Report | September 30, 2019
Table of Contents
| SHARE CLASS | NASDAQ SYMBOL | CUSIP |
| Class A | TVAFX | 885-215-731 |
| Class C | TVCFX | 885-215-715 |
| Class I | TVIFX | 885-215-632 |
| Class R3 | TVRFX | 885-215-533 |
| Class R4 | TVIRX | 885-215-277 |
| Class R5 | TVRRX | 885-215-376 |
Class I, R3, R4, and R5 shares may not be available to all investors. Minimum investments for Class I shares may be higher than those for other classes.
Investments carry risks, including possible loss of principal. Additional risks may be associated with investments outside the United States, especially in emerging markets, including currency fluctuations, illiquidity, volatility, and political and economic risks. Investments in small- and mid-capitalization companies may increase the risk of greater price fluctuations. Please see the Fund’s prospectus for a discussion of the risks associated with an investment in the Fund. Investments in the Fund are not FDIC insured, nor are they deposits of or guaranteed by a bank or any other entity.
Letter to Shareholders
Thornburg Value Fund | September 30, 2019 (Unaudited)
October 14, 2019
Dear Fellow Shareholder:
For the fiscal year ended September 30, 2019, Thornburg Value Fund trailed its benchmark with the Fund returning negative 0.07% (Class I shares) vs. the S&P 500 Index return of 4.25%. Relative underperformance was driven by sector allocation and stock selection.
Our stock selection was best within financials, with a diverse group of businesses within the sector adding to performance. Additionally, our positions in the materials sector proved successful. Lastly, consumer staples was a positive contributor to the portfolio as we benefited from investments in food-related investments.
Our underweight to information technology (IT) was the most meaningful detractor from an allocation perspective. Additionally, stock selection also hurt us in IT. Communications services was also challenging from a stock selection standpoint, with disappointing results coming from a video gaming business, in particular.
Additionally, energy was a challenging sector for the portfolio from both an allocation and selection standpoint. A few individual positions had an outsized effect on performance, but, in some cases, we feel the market has yet to appreciate the promise contained in what continue to be good businesses.
Top 5 Contributors:
U.S. Foods Holding Corp: U.S. Foods continues to gain share within its key Independent Restaurant channel, where margins are much higher. As they’ve proven out this operational momentum over time, the stock has closed some of the valuation gap with its closest peers.
Starbucks Corp: Starbucks continues to post impressive results, with same-store sales up 6% globally in the most recent quarter. U.S. sales were up a very strong +7%, a return to previous highs, with improvements in both store traffic and sales per order. Investors continue to gain confidence that the company is past the operational issues that caused the slowdown last year. The growth story in China also continues to look good, with sales back up to +6% compared to flat growth earlier in the year.
Thermo Fisher Scientific, Inc: Thermo Fisher Scientific’s fundamentals remain strong as demand from biopharma research continues. The company has been executing on its plan—organic revenue growth, margin improvement and smart capital allocation.
Oaktree Capital Group LLC: Oaktree outperformed the market during the annual period as Brookfield Asset Management acquired the company at a premium. When the deal closed, we received a mix of cash and Brookfield stock.
Comcast Corp: Comcast owns an irreplaceable position in the delivery of internet service via cable and fiber across their
markets, which, in our opinion, is the key driver for their overall business. They continue to invest in their footprint to get their network closer to homes, thus expanding their moat/competitive advantage.
Bottom 5 Detractors:
Alkermes plc: Alkermes shares have slumped despite a few positive catalysts (Vivitrol IP challenge resolution and good Phase III data on pipeline candidates). Investors seem broadly skeptical of the market opportunity for approved drugs, Vivitrol and Aristada, as well as for pipeline products Vumerity, ALKS 3831 and ALKS 4230. We remain bullish on the prospects for each and expect better revenue and earnings results than consensus over the next few years.
Devon Energy Corp: The U.S. exploration and production (E&P) sector moved further out of favor during the quarter on heightened political risk and lower commodity prices. As a result, Devon declined with its peers despite continued progress in reshaping its portfolio and strong operational results reported throughout the year.
McDermott International, Inc: Accelerating cost overruns on the company’s large liquified natural gas (LNG) projects overshadowed positive momentum on new business generation and created potential future liquidity issues that impacted shares of this contractor.
Gilead Sciences, Inc: While fundamentals at Gilead continue to develop well, shares have traded weaker on concerns about potential government action that could impact drug pricing. While we view this as a risk, we believe it’s harder to accomplish meaningful reform than generally appreciated, and the shares seem to have already discounted much of this risk.
Activision Blizzard, Inc: Activision is a leading publisher and developer of video games. Shares were pressured in the early part of the fiscal year as the industry faced a rapidly changing landscape. While Activision was late to respond to these dynamics, they have since restructured the company to focus resources on their strongest franchises. We believe this strategy will bear fruit over the long term and remain holders.
Looking forward, we are focused on navigating an uncertain landscape through our time-tested, fundamental, bottom-up investment process and three-basket portfolio construction framework. Our goal is to deliver compelling investment returns over the course of a cycle, while managing the volatility and investor experience along the way. In particular, we are heartened by the fact that valuations across our portfolio as a whole are substantially lower than that of the index, yet our stocks’ estimated earnings growth rates are nearly identical to the index. While short-term underperformance is disappointing to us, we remain committed to our process and believe that we remain on track towards delivering our long-term goals.
We value your partnership, and thank you for investing alongside us in Thornburg Value Fund.
Letter to Shareholders, Continued
Thornburg Value Fund | September 30, 2019 (Unaudited)

| 
|
Connor Browne,cfa
Portfolio Manager
Managing Director | Robert MacDonald,cfa
Portfolio Manager
Managing Director |
The matters discussed in this report may constitute forward-looking statements made pursuant to the safe harbor provisions of the Securities Litigation Reform Act of 1995. These include any advisor or portfolio manager prediction, assessment, analysis or outlook for individual securities, industries, investment styles, market sectors and/or markets. These statements involve risks and uncertainties. In addition to the general risks described for each fund in its current prospectus, other factors bearing on these reports include the accuracy of the advisor’s or portfolio manager’s forecasts and predictions, the appropriateness of the investment strategies designed by the advisor or portfolio manager and the ability of the advisor or portfolio manager to implement their strategies efficiently and successfully. Any one or more of these factors, as well as other risks affecting the securities markets generally, could cause the actual results of any fund to differ materially as compared to its benchmarks.
The views expressed are subject to change and do not necessarily reflect the views of Thornburg Investment Management, Inc. This information should not be relied upon as a recommendation or investment advice and is not intended to predict the performance of any investment or market.
Performance results of individual share classes will vary based on the fees and expenses associated with each share class, and may be higher or lower than other share classes within the same Fund. Please see Performance Summary for performance results of each share class.
Performance Summary
Thornburg Value Fund | September 30, 2019 (Unaudited)
AVERAGE ANNUAL TOTAL RETURNS
| | 1-YR | 3-YR | 5-YR | 10-YR | SINCE
INCEP. |
| Class A Shares(Incep: 10/2/95) | | | | | |
| Without sales charge | -0.42% | 10.30% | 8.65% | 9.52% | 9.63% |
| With sales charge | -4.89% | 8.62% | 7.66% | 9.02% | 9.43% |
| Class C Shares(Incep: 10/2/95) | | | | | |
| Without sales charge | -1.26% | 9.42% | 7.81% | 8.68% | 8.79% |
| With sales charge | -2.24% | 9.42% | 7.81% | 8.68% | 8.79% |
| Class I Shares(Incep: 11/2/98) | -0.07% | 10.70% | 9.06% | 9.94% | 7.71% |
| Class R3 Shares(Incep: 7/1/03) | -0.43% | 10.30% | 8.67% | 9.52% | 7.87% |
| Class R4 Shares(Incep: 2/1/07) | -0.33% | 10.41% | 8.78% | 9.63% | 5.88% |
| Class R5 Shares(Incep: 2/1/05) | -0.07% | 10.70% | 9.06% | 9.92% | 7.90% |
S&P 500 Index
(Since 10/2/95) | 4.25% | 13.39% | 10.84% | 13.24% | 9.10% |
GROWTH OF A HYPOTHETICAL $10,000 INVESTMENT
Performance data shown represents past performance and is no guarantee of future results. Investment return and principal value will fluctuate so shares, when redeemed, may be worth more or less than their original cost. Current performance may be lower or higher than quoted. For performance current to the most recent month end, visit thornburg.com or call 800-847-0200. The performance information does not reflect the deduction of taxes that a shareholder would pay on distributions or the redemption of Fund shares. Returns reflect the reinvestment of dividends and capital gains. Class A shares are sold with a maximum sales charge of 4.50%. Class C shares are subject to a 1% CDSC for the first year only. There is no sales charge for Class I, R3, R4 and R5 shares. As disclosed in the most recent prospectus, the total annual fund operating expenses before any fee waivers or expense reimbursements are as follows: A shares, 1.33%; C shares, 2.11%; I shares, 1.06%; R3 shares, 1.78%; R4 shares, 1.77%; R5 shares, 1.38%. Thornburg Investment Management has contractually agreed to waive fees and reimburse expenses until at least February 1, 2020, for some of the share classes, resulting in net expense ratios of the following: I shares, 0.99%; R3 shares, 1.35%; R4 shares, 1.25%; R5 shares, 0.99%. For more detailed information on fund expenses and waivers/reimbursements please see the Fund’s prospectus.
TheS&P 500 Index is an unmanaged broad measure of the U.S. stock market.
The performance of any index is not indicative of the performance of any particular investment. Unless otherwise noted, index returns reflect the reinvestment of income dividends and capital gains, if any, but do not reflect fees, brokerage commissions or other expenses of investing. Investors may not make direct investments into any index.
Free-Cash-Flow Yield – An overall return evaluation ratio of a stock, which standardizes the free cash flow per share a company is expected to earn against its market price per share. The ratio is calculated by taking the free cash flow per share divided by the share price.
Fund Summary
Thornburg Value Fund | September 30, 2019 (Unaudited)
OBJECTIVES AND STRATEGIES
The Fund seeks long-term capital appreciation by investing in equity and debt securities of all types. As a secondary goal, the Fund also seeks some current income.
The Fund expects to invest primarily in domestic equity securities (primarily common stocks) selected on a value basis. However, the Fund may own a variety of securities, including foreign equity securities, partnership interests, and foreign and domestic debt obligations which, in the opinion of the Fund’s investment advisor, offer prospects for meeting the Fund’s investment goals.
MARKET CAPITALIZATION EXPOSURE
BASKET STRUCTURE
| TOP TEN EQUITY HOLDINGS |
| US Foods Holding Corp. | 5.2% |
| Thermo Fisher Scientific, Inc. | 5.1% |
| JPMorgan Chase & Co. | 4.9% |
| Alphabet, Inc. Class C | 4.7% |
| Crown Holdings, Inc. | 4.5% |
| Gilead Sciences, Inc. | 3.9% |
| Comcast Corp. Class A | 3.7% |
| Medtronic plc | 3.5% |
| Enterprise Products Partners L.P. | 3.5% |
| Assured Guaranty Ltd. | 3.4% |
| SECTOR EXPOSURE |
| Financials | 20.5% |
| Communication Services | 17.0% |
| Health Care | 13.5% |
| Consumer Discretionary | 10.3% |
| Information Technology | 8.6% |
| Consumer Staples | 8.1% |
| Materials | 6.9% |
| Energy | 6.7% |
| Industrials | 2.7% |
| Utilities | 1.5% |
| Other Assets Less Liabilities | 4.2% |
| TOP TEN INDUSTRY GROUPS |
| Media & Entertainment | 14.6% |
| Pharmaceuticals, Biotechnology & Life Sciences | 10.0% |
| Diversified Financials | 9.4% |
| Banks | 7.7% |
| Technology Hardware & Equipment | 7.6% |
| Materials | 6.9% |
| Energy | 6.7% |
| Food & Staples Retailing | 5.2% |
| Retailing | 4.7% |
| Consumer Services | 3.6% |
There is no guarantee that the Fund will meet its investment objectives.
All data is subject to change. Charts may not add up to 100% due to rounding.
Schedule of Investments
Thornburg Value Fund | September 30, 2019
| | | SHARES | VALUE |
| | Common Stock — 95.8% | | |
| | Banks — 7.7% | | |
| | Banks — 7.7% | | |
| | Citigroup, Inc. | 347,156 | $ 23,981,536 |
| | JPMorgan Chase & Co. | 367,211 | 43,217,063 |
| | | | 67,198,599 |
| | Capital Goods — 1.2% | | |
| | Machinery — 1.2% | | |
| | ITT, Inc. | 163,890 | 10,028,429 |
| | | | 10,028,429 |
| | Consumer Durables & Apparel — 2.0% | | |
| | Household Durables — 1.0% | | |
| a | Mohawk Industries, Inc. | 68,996 | 8,560,334 |
| | Textiles, Apparel & Luxury Goods — 1.0% | | |
| a | Capri Holdings Ltd. | 262,100 | 8,691,236 |
| | | | 17,251,570 |
| | Consumer Services — 3.6% | | |
| | Hotels, Restaurants & Leisure — 3.6% | | |
| | Domino’s Pizza Group plc | 1,964,284 | 6,156,305 |
| | Starbucks Corp. | 156,038 | 13,796,880 |
| | Wyndham Hotels & Resorts, Inc. | 221,900 | 11,481,106 |
| | | | 31,434,291 |
| | Diversified Financials — 9.4% | | |
| | Capital Markets — 3.2% | | |
| | Apollo Global Management, Inc. Class A | 255,343 | 9,657,072 |
| | Brookfield Asset Management, Inc. Class A | 342,614 | 18,117,453 |
| | Consumer Finance — 3.9% | | |
| | Capital One Financial Corp. | 278,206 | 25,311,182 |
| | Navient Corp. | 734,797 | 9,405,402 |
| | Mortgage Real Estate Investment Trusts — 2.3% | | |
| | PennyMac Mortgage Investment Trust | 897,645 | 19,954,648 |
| | | | 82,445,757 |
| | Energy — 6.7% | | |
| | Oil, Gas & Consumable Fuels — 6.7% | | |
| | Devon Energy Corp. | 637,700 | 15,343,062 |
| | Enterprise Products Partners L.P. | 1,072,386 | 30,648,792 |
| | Teekay LNG Partners L.P. | 914,908 | 12,488,494 |
| | | | 58,480,348 |
| | Food & Staples Retailing — 5.2% | | |
| | Food & Staples Retailing — 5.2% | | |
| a | US Foods Holding Corp. | 1,110,723 | 45,650,715 |
| | | | 45,650,715 |
| | Food, Beverage & Tobacco — 2.9% | | |
| | Food Products — 2.9% | | |
| a | Nomad Foods Ltd. | 1,241,970 | 25,460,385 |
| | | | 25,460,385 |
| | Healthcare Equipment & Services — 3.5% | | |
| | Health Care Equipment & Supplies — 3.5% | | |
| | Medtronic plc | 284,725 | 30,926,829 |
| | | | 30,926,829 |
| | Insurance — 3.4% | | |
| | Insurance — 3.4% | | |
| | Assured Guaranty Ltd. | 671,424 | 29,851,511 |
| | | | 29,851,511 |
Schedule of Investments, Continued
Thornburg Value Fund | September 30, 2019
| | | SHARES | VALUE |
| | Materials — 6.9% | | |
| | Chemicals — 2.4% | | |
| | Huntsman Corp. | 908,504 | $ 21,131,803 |
| | Containers & Packaging — 4.5% | | |
| a | Crown Holdings, Inc. | 590,499 | 39,008,364 |
| | | | 60,140,167 |
| | Media & Entertainment — 14.6% | | |
| | Entertainment — 4.2% | | |
| | Activision Blizzard, Inc. | 402,774 | 21,314,800 |
| a | Netflix, Inc. | 57,584 | 15,410,630 |
| | Interactive Media & Services — 6.8% | | |
| a | Alphabet, Inc. Class C | 33,858 | 41,272,902 |
| a | Facebook, Inc. Class A | 101,836 | 18,134,955 |
| | Media — 3.6% | | |
| | Comcast Corp. Class A | 711,400 | 32,069,912 |
| | | | 128,203,199 |
| | Pharmaceuticals, Biotechnology & Life Sciences — 10.0% | | |
| | Biotechnology — 4.8% | | |
| a | Alkermes plc | 443,246 | 8,647,729 |
| | Gilead Sciences, Inc. | 533,439 | 33,809,364 |
| | Life Sciences Tools & Services — 5.2% | | |
| | Thermo Fisher Scientific, Inc. | 154,865 | 45,107,529 |
| | | | 87,564,622 |
| | Retailing — 4.7% | | |
| | Internet & Direct Marketing Retail — 3.1% | | |
| a | Alibaba Group Holding Ltd. Sponsored ADR | 115,172 | 19,260,214 |
| | Expedia Group, Inc. | 59,922 | 8,054,116 |
| | Specialty Retail — 1.6% | | |
| a | CarMax, Inc. | 160,566 | 14,129,808 |
| | | | 41,444,138 |
| | Software & Services — 1.0% | | |
| | Information Technology Services — 1.0% | | |
| | Cognizant Technology Solutions Corp. Class A | 142,479 | 8,586,497 |
| | | | 8,586,497 |
| | Technology Hardware & Equipment — 7.6% | | |
| | Communications Equipment — 0.1% | | |
| a | Casa Systems, Inc. | 165,314 | 1,298,542 |
| | Electronic Equipment, Instruments & Components — 1.3% | | |
| a | Flex Ltd. | 1,090,901 | 11,416,279 |
| | Technology Hardware, Storage & Peripherals — 6.2% | | |
| | Apple, Inc. | 92,267 | 20,665,040 |
| | HP, Inc. | 739,777 | 13,996,581 |
| a | Pure Storage, Inc. Class A | 1,151,129 | 19,500,125 |
| | | | 66,876,567 |
| | Telecommunication Services — 2.4% | | |
| | Wireless Telecommunication Services — 2.4% | | |
| | China Mobile Ltd. | 2,519,332 | 20,845,233 |
| | | | 20,845,233 |
| | Transportation — 1.5% | | |
| | Air Freight & Logistics — 1.5% | | |
| | United Parcel Service, Inc. Class B | 108,581 | 13,010,175 |
| | | | 13,010,175 |
| | Utilities — 1.5% | | |
| | Electric Utilities — 1.5% | | |
| | Fortis, Inc. | 302,670 | 12,812,021 |
Schedule of Investments, Continued
Thornburg Value Fund | September 30, 2019
| | | SHARES | VALUE |
| | | | 12,812,021 |
| | Total Common Stock(Cost $751,577,574) | | 838,211,053 |
| | Short-Term Investments — 3.0% | | |
| b | Thornburg Capital Management Fund | 2,663,977 | $ 26,639,766 |
| | Total Short-Term Investments(Cost $26,639,766) | | 26,639,766 |
| | Total Investments — 98.8%(Cost $778,217,340) | | $864,850,819 |
| | Other Assets Less Liabilities — 1.2% | | 10,524,919 |
| | Net Assets — 100.0% | | $875,375,738 |
| Outstanding Forward Currency Contracts To Buy Or Sell At September 30, 2019 |
Contract
Description | Contract
Party* | Buy/Sell | Contract
Amount | Contract
Value Date | Value
USD | Unrealized
Appreciation | Unrealized
Depreciation |
| Great Britain Pound | SSB | Sell | 4,487,900 | 11/8/2019 | 5,526,307 | $ — | $ (52,703) |
| Great Britain Pound | SSB | Buy | 354,600 | 11/8/2019 | 436,647 | 5,867 | — |
| Euro | SSB | Sell | 15,836,000 | 11/29/2019 | 17,333,762 | 328,920 | — |
| |
| Total | | | | | | $334,787 | $(52,703) |
| |
| Net unrealized appreciation (depreciation) | | | | | | $282,084 | |
| * | Counterparty includes State Street Bank and Trust Company ("SSB"). |
| Footnote Legend |
| a | Non-income producing. |
| b | Investment in Affiliates. |
Portfolio Abbreviations
To simplify the listings of securities, abbreviations are used per the table below:
| ADR | American Depositary Receipt |
See notes to financial statements.
This page intentionally left blank.
Statement of Assets and Liabilities
Thornburg Value Fund | September 30, 2019
| ASSETS | |
| Investments at value (Note 3) | |
| Non-affiliated issuers (cost $751,577,574) | $ 838,211,053 |
| Non-controlled affiliated issuer (cost $26,639,766) | 26,639,766 |
| Cash | 11,611,039 |
| Receivable for investments sold | 125,700 |
| Receivable for fund shares sold | 192,070 |
| Unrealized appreciation on forward currency contracts (Note 7) | 334,787 |
| Dividends receivable | 462,579 |
| Prepaid expenses and other assets | 46,154 |
| Total Assets | 877,623,148 |
| Liabilities | |
| Payable for fund shares redeemed | 979,580 |
| Unrealized depreciation on forward currency contracts (Note 7) | 52,703 |
| Payable to investment advisor and other affiliates (Note 4) | 799,849 |
| Accounts payable and accrued expenses | 415,278 |
| Total Liabilities | 2,247,410 |
| Net Assets | $ 875,375,738 |
| NET ASSETS CONSIST OF | |
| Distributable earnings | $ 78,534,515 |
| Net capital paid in on shares of beneficial interest | 796,841,223 |
| | $ 875,375,738 |
| NET ASSET VALUE | |
| Class A Shares: | |
Net asset value and redemption price per share
($425,217,776 applicable to 5,921,524 shares of beneficial interest outstanding - Note 5) | $ 71.81 |
| Maximum sales charge, 4.50% of offering price | 3.38 |
| Maximum offering price per share | $ 75.19 |
| Class C Shares: | |
Net asset value and offering price per share*
($35,933,820 applicable to 551,217 shares of beneficial interest outstanding - Note 5) | $ 65.19 |
| Class I Shares: | |
Net asset value, offering and redemption price per share
($360,070,113 applicable to 4,863,337 shares of beneficial interest outstanding - Note 5) | $ 74.04 |
| Class R3 Shares: | |
Net asset value, offering and redemption price per share
($29,600,773 applicable to 414,336 shares of beneficial interest outstanding - Note 5) | $ 71.44 |
| Class R4 Shares: | |
Net asset value, offering and redemption price per share
($6,434,509 applicable to 89,064 shares of beneficial interest outstanding - Note 5) | $ 72.25 |
| Class R5 Shares: | |
Net asset value, offering and redemption price per share
($18,118,747 applicable to 245,070 shares of beneficial interest outstanding - Note 5) | $ 73.93 |
| * | Redemption price per share is equal to net asset value less any applicable contingent deferred sales charge. |
See notes to financial statements.
Statement of Operations
Thornburg Value Fund | Year Ended September 30, 2019
| INVESTMENT INCOME | |
| Dividend income | |
| Non-affiliated issuers (net of foreign taxes withheld of $155,116) | $ 13,966,149 |
| Non-controlled affiliated issuer | 1,195,296 |
| Total Income | 15,161,445 |
| EXPENSES | |
| Investment advisory fees (Note 4) | 7,656,543 |
| Administration fees (Note 4) | |
| Class A Shares | 373,441 |
| Class C Shares | 37,498 |
| Class I Shares | 326,834 |
| Class R3 Shares | 28,762 |
| Class R4 Shares | 5,997 |
| Class R5 Shares | 15,783 |
| Distribution and service fees (Note 4) | |
| Class A Shares | 1,062,989 |
| Class C Shares | 427,307 |
| Class R3 Shares | 163,872 |
| Class R4 Shares | 17,074 |
| Transfer agent fees | |
| Class A Shares | 448,248 |
| Class C Shares | 79,241 |
| Class I Shares | 332,613 |
| Class R3 Shares | 91,872 |
| Class R4 Shares | 22,804 |
| Class R5 Shares | 68,197 |
| Registration and filing fees | |
| Class A Shares | 15,497 |
| Class C Shares | 13,237 |
| Class I Shares | 15,606 |
| Class R3 Shares | 13,039 |
| Class R4 Shares | 12,759 |
| Class R5 Shares | 12,734 |
| Custodian fees | 60,393 |
| Professional fees | 84,746 |
| Trustee and officer fees (Note 4) | 54,693 |
| Other expenses | 112,636 |
| Total Expenses | 11,554,415 |
| Less: | |
| Expenses reimbursed by investment advisor (Note 4) | (551,569) |
| Net Expenses | 11,002,846 |
| Net Investment Income | $ 4,158,599 |
Statement of Operations, Continued
Thornburg Value Fund | Year Ended September 30, 2019
| REALIZED AND UNREALIZED GAIN (LOSS) | |
| Net realized gain (loss) on: | |
| Non-affiliated issuer investments | $ (13,789,407) |
| Forward currency contracts (Note 7) | 2,465,218 |
| Foreign currency transactions | 4,791 |
| | (11,319,398) |
| Net change in unrealized appreciation (depreciation) on: | |
| Non-affiliated issuer investments | (3,831,066) |
| Forward currency contracts (Note 7) | 237,111 |
| Foreign currency translations | (1,663) |
| | (3,595,618) |
| Net Realized and Unrealized Loss | (14,915,016) |
| Net Decrease in Net Assets Resulting from Operations | $ (10,756,417) |
See notes to financial statements.
Statements of Changes in Net Assets
Thornburg Value Fund
| | Year Ended
September 30, 2019 | Year Ended
September 30, 2018 |
| INCREASE (DECREASE) IN NET ASSETS FROM | | |
| OPERATIONS | | |
| Net investment income | $ 4,158,599 | $ 5,975,880 |
| Net realized gain (loss) on investments, forward currency contracts and foreign currency transactions | (11,319,398) | 241,438,605 |
| Net change in unrealized appreciation (depreciation) on investments, forward currency contracts and foreign currency translations | (3,595,618) | (137,958,472) |
| Net Increase (Decrease) in Net Assets Resulting from Operations | (10,756,417) | 109,456,013 |
| DIVIDENDS TO SHAREHOLDERS | | |
| From distributable earnings | | |
| Class A Shares | (1,836,449) | (2,045,321) |
| Class C Shares | - | (643,910) |
| Class I Shares | (2,694,843) | (2,283,277) |
| Class R3 Shares | (114,235) | (248,385) |
| Class R4 Shares | (29,384) | (51,776) |
| Class R5 Shares | (128,320) | (113,541) |
| FUND SHARE TRANSACTIONS (NOTE 5) | | |
| Class A Shares | (42,236,468) | 48,921,442 |
| Class C Shares | (14,837,174) | (122,477,269) |
| Class I Shares | (55,270,314) | 12,485,587 |
| Class R3 Shares | (8,888,072) | (11,000,791) |
| Class R4 Shares | (1,294,640) | (3,261,498) |
| Class R5 Shares | (767,164) | 34,360 |
| Net Increase (Decrease) in Net Assets | (138,853,480) | 28,771,634 |
| NET ASSETS | | |
| Beginning of Year | 1,014,229,218 | 985,457,584 |
| End of Year | $ 875,375,738 | $ 1,014,229,218 |
See notes to financial statements.
Notes to Financial Statements
Thornburg Value Fund | September 30, 2019
NOTE 1 – ORGANIZATION
Thornburg Value Fund (the “Fund”) is a diversified series of Thornburg Investment Trust (the “Trust”). The Trust was organized as a Massachusetts business trust under a Declaration of Trust dated June 3, 1987 and is registered as a diversified, open-end management investment company under the Investment Company Act of 1940, as amended (the "1940 Act"). The Fund is currently one of twenty-two separate series of the Trust. Each series is considered to be a separate entity for financial reporting and tax purposes and bears expenses directly attributable to it. The Fund seeks long-term capital appreciation by investing in equity and debt securities of all types. As a secondary objective, the Fund also seeks some current income.
The Fund currently offers six classes of shares of beneficial interest: Class A, Class C, Institutional Class (“Class I”), and Retirement Classes (“Class R3”, “Class R4”, and “Class R5”). Each class of shares of the Fund represents an interest in the same portfolio of investments, except that (i) Class A shares are sold subject to a front-end sales charge collected at the time the shares are purchased and bear a service fee, (ii) Class C shares are sold at net asset value without a sales charge at the time of purchase, but are subject to a contingent deferred sales charge upon redemption within one year of purchase, and bear both a service fee and a distribution fee, (iii) Class I shares are sold at net asset value without a sales charge at the time of purchase and may be subject to a service fee, (iv) Class R3 shares are sold at net asset value without a sales charge at the time of purchase, but bear both a service fee and distribution fee, (v) Class R4 shares are sold at net asset value without a sales charge at the time of purchase, but bear a service fee, (vi) Class R5 shares are sold at net asset value without a sales charge at the time of purchase and may be subject to a service fee, and (vii) the respective classes may have different reinvestment privileges and conversion rights. Additionally, the Fund may allocate among its classes certain expenses, to the extent allocable to specific classes, including administration fees, transfer agent fees, government registration fees, certain printing and postage costs, and administrative and legal expenses. Currently, class specific expenses of the Fund are limited to service and distribution fees and certain registration and transfer agent expenses.
The following is a summary of significant accounting policies followed by the Fund in the preparation of its financial statements. The Fund prepares its financial statements in conformity with United States generally accepted accounting principles (“GAAP”), including investment company accounting and reporting guidance in the Financial Accounting Standards Board (the “FASB”) Accounting Standard Codification Topic 946.
NOTE 2 – SIGNIFICANT ACCOUNTING POLICIES
Security Valuation: All investments in securities held by the Fund are valued as described in Note 3.
Allocation of Income, Gains, Losses and Expenses: Net investment income (other than class specific expenses) and realized and unrealized gains and losses are allocated daily to each class of shares based upon the relative net asset value of outstanding shares (or the value of the dividend-eligible shares, as appropriate) of each class of shares at the beginning of the day (after adjusting for the current capital shares activity of the respective class). Expenses common to all Funds are allocated among the Funds comprising the Trust based upon their relative net asset values or other appropriate allocation methods. Operating expenses directly attributable to a specific class are charged against the operating income of that class.
Dividends and Distributions to Shareholders: Dividends and distributions to shareholders, which are determined in accordance with federal income tax regulations and may differ from GAAP, are recorded on the ex-dividend date. Ordinary income dividends, if any, are declared and paid annually. Capital gain distributions, if any, are declared and paid annually and more often if deemed necessary by Thornburg Investment Management, Inc., the Trust’s investment advisor (the “Advisor”). Dividends and distributions are paid and are reinvested in additional shares of the Fund at net asset value per share at the close of business on the ex-dividend date, or at the shareholder’s option, paid in cash.
Investment Income: Dividend income is recorded on the ex-dividend date. Certain income from foreign investments is recognized as soon as information is available to the Fund. Interest income is accrued as earned. Premiums and discounts are amortized and accreted, respectively, to first call dates or maturity dates using the effective yield method of the respective investments. These amounts are included in Investment Income in the Statement of Operations.
Investment Transactions: Investment transactions are accounted for on a trade date basis. Realized gains and losses from the sale of investments are recorded on an identified cost basis.
When-Issued and Delayed Delivery Transactions: The Fund may engage in when-issued or delayed delivery transactions. To the extent the Fund engages in such transactions, it will do so for the purpose of acquiring portfolio investments consistent with the Fund’s investment objectives and not for the purpose of investment leverage or to speculate on interest rate or market changes. At the time the Fund makes a commitment to purchase an investment on a when-issued or delayed delivery basis, the Fund will record the transaction and reflect the value in determining its net asset value. When effecting such transactions, assets of an amount sufficient to make payment for the portfolio investments to be purchased will be segregated on the Fund’s records on the trade date. Investments purchased on a when-issued or
Notes to Financial Statements, Continued
Thornburg Value Fund | September 30, 2019
delayed delivery basis do not earn interest until the settlement date. The values of these securities held at September 30, 2019 are detailed in the Schedule of Investments.
Foreign Currency Translation: Portfolio investments and other assets and liabilities denominated in foreign currencies are translated into U.S. dollars based on the exchange rate of such currencies against the U.S. dollar on the date of valuation. Purchases and sales of investments and income items denominated in foreign currencies are translated into U.S. dollars at the exchange rate in effect on the transaction date. When the Fund purchases or sells foreign investments, it will customarily enter into a foreign exchange contract to minimize foreign exchange risk from the trade date to the settlement date of such transactions. The values of such spot contracts are included in receivable for investments sold and payable for investments purchased on the Statement of Assets and Liabilities.
The Fund does not separately report the effect of changes in foreign exchange rates from changes in market prices on investments held. Such changes are included in net unrealized appreciation (depreciation) from investments in the Statement of Operations.
Reported net realized gains and losses from foreign currency transactions arise due to purchases and sales of foreign currencies, currency gains and losses realized between the trade and settlement dates on investment transactions and the difference between the amounts of dividends, interest, and foreign withholding taxes recorded on the Fund’s books, and the U.S. dollar equivalent of the amounts actually received or paid. These amounts are included in foreign currency transactions in the Statement of Operations.
Net change in unrealized appreciation (depreciation) on foreign currency translations arise from changes in the fair value of assets and liabilities, other than investments at period end, resulting from changes in exchange rates.
Guarantees and Indemnifications: Under the Trust’s organizational documents (and under separate agreements with the independent Trustees), its officers and Trustees are provided with an indemnification against certain liabilities arising out of the performance of their duties to the Fund. In the normal course of business the Trust may also enter into contracts with service providers that contain general indemnifications. The Trust’s maximum exposure under these arrangements is unknown. However, based on experience, the Trust expects the risk of loss to be remote.
Use of Estimates: The preparation of financial statements in conformity with GAAP requires management to make estimates and assumptions that affect the reported amounts of assets and liabilities and disclosure of contingent assets and liabilities at the date of the financial statements and the reported amounts of increases (decreases) in net assets from operations during the reporting period. Actual results could differ from those estimates.
Federal Income Taxes: It is the policy of the Trust to comply with the provisions of the Internal Revenue Code applicable to regulated investment companies and to distribute to shareholders substantially all investment company taxable income including net realized gains on investments (if any), and tax exempt income of the Fund. Therefore, no provision for federal income or excise tax is required.
The Fund files income tax returns in United States federal and applicable state jurisdictions. The statute of limitations on the Fund’s tax return filings generally remains open for the three years following a return’s filing date. The Fund has analyzed each uncertain tax position believed to be material in the preparation of the Fund’s financial statements for the fiscal year ended September 30, 2019, including open tax years, to assess whether it is more likely than not that the position would be sustained upon examination, based on the technical merits of the position. The Fund has not identified any such position for which an asset or liability must be reflected in the Statement of Assets and Liabilities.
At September 30, 2019, information on the tax components of capital was as follows:
| Cost of investments for tax purposes | $ 771,249,467 |
| Gross unrealized appreciation on a tax basis | 151,903,815 |
| Gross unrealized depreciation on a tax basis | (58,020,379) |
| Net unrealized appreciation (depreciation) on investments (tax basis) | $ 93,883,436 |
Temporary book to tax adjustments to the cost of investments and net unrealized appreciation (depreciation) for tax purposes result primarily from outstanding publicly traded partnership (“PTP”), real estate investment trust (“REIT”) tax basis adjustments, non-taxable dividend distributions and marked-to-market adjustments of outstanding forward currency contracts.
At September 30, 2019, the Fund had deferred tax basis capital losses occurring subsequent to October 31, 2018 through September 30, 2019 of $11,133,633. For tax purposes, such losses will be recognized in the year ending September 30, 2020.
At September 30, 2019, the Fund had cumulative tax basis capital losses of $4,653,285 (of which $761,266 are short-term and $3,892,019 are long-term), which may be carried forward to offset future capital gains. To the extent such carryforwards are used, capital gain distributions may be reduced to the extent provided by regulations. Such capital loss carryforwards do not expire.
Notes to Financial Statements, Continued
Thornburg Value Fund | September 30, 2019
In order to account for permanent book to tax differences, the Fund increased distributable earnings by $537,176, and decreased net capital paid in on shares of beneficial interest by $537,176. Reclassifications have no impact upon the net asset value of the Fund and resulted primarily from expired capital losses carried forward.
At September 30, 2019, the Fund had $438,236 of undistributed tax basis ordinary investment income and no undistributed tax basis capital gains.
Foreign Withholding Taxes: The Fund is subject to foreign tax withholding imposed by certain foreign countries in which the Fund may invest. Withholding taxes are incurred on certain foreign dividends and are accrued at the time the dividend is recognized based on applicable foreign tax laws. The Fund may file withholding tax reclaims in certain jurisdictions to recover a portion of amounts previously withheld, in view of various considerations, including recent decisions rendered by the courts in those and other jurisdictions. The Fund would expect to record a receivable for such a reclaim based on a variety of factors, including assessment of a jurisdiction’s legal obligation to pay reclaims, the jurisdiction’s administrative practices and payment history, and industry convention. To date the Fund has recorded no such receivable because there is limited precedent for collecting such prior year reclaims and the likelihood of collection remains uncertain.
Deferred Foreign Capital Gain Taxes: The Fund is subject to a tax imposed on net realized gains of securities of certain foreign countries. The Fund records an estimated deferred tax liability for net unrealized gains on these investments as reflected in the accompanying financial statements. Such changes are included in net unrealized appreciation (depreciation) from investments in the Statement of Operations.
The tax character of distributions paid during the year ended September 30, 2019, and September 30, 2018, was as follows:
| | 2019 | 2018 |
| Distributions from: | | |
| Ordinary income | $ 4,803,231 | $ 5,386,210 |
| Total | $ 4,803,231 | $ 5,386,210 |
NOTE 3 – SECURITY VALUATION
Valuation of the Fund’s portfolio investment securities is performed in accordance with policies and procedures adopted by and under the oversight of the Trustees.
The Trustees of the Trust have appointed the Advisor to assist the Trustees with obtaining fair market values for portfolio investments, evaluating and monitoring professional pricing service providers appointed by the Trustees’ Audit Committee (the “Audit Committee”) to assist in determining fair values for portfolio investments, assisting in calculating fair values for portfolio investments in certain circumstances, and performing other functions in connection with the valuation of investments. The Advisor acts through its Valuation and Pricing Committee (the “Committee”) and other employees of the Advisor. The Committee regularly reviews its own valuation calculations, reviews the valuations, valuation techniques and services furnished by pricing service providers, considers circumstances which may require valuation calculations by the Committee, and reviews previous valuation calculations. The Committee reports to the Audit Committee on the Committee’s activities, the performance of pricing service providers, and other matters relating to valuation of portfolio investments.
In those instances when the Committee assists in calculating a fair value for a portfolio investment, the Committee seeks to determine the price that the Fund would reasonably expect to receive upon a sale of the investment in an orderly transaction between market participants on the valuation date. The Committee customarily utilizes quotations from securities broker dealers in calculating valuations, but also may utilize prices obtained from pricing service providers or other methods approved by the Audit Committee. Because fair values calculated by the Committee are estimates, the calculation of a value for an investment may differ from the price that would be realized by the Fund upon a sale of the investment, and the difference could be material to the Fund’s financial statements. The Committee’s calculation of a fair value for an investment may also differ from the prices obtained by other persons (including other mutual funds) for the investment.
Valuation of Securities: Securities and other portfolio investments which are listed or traded on a United States securities exchange are valued at the last reported sale price on the valuation date. Investments listed or traded on an exchange for which there has been no sale that day are valued at the mean between the last reported bid and asked prices on that valuation date. Portfolio investments reported by NASDAQ are valued at the official closing price on the valuation date. If an investment is traded on more than one exchange, the investment is considered traded on the exchange that is normally the primary market for that investment. Securities and other portfolio investments which are listed or traded on exchanges outside the United States are valued at the last price or the closing price of the investment on the exchange that is normally the primary market for the investment, as of the close of the exchange preceding the Fund’s valuation date. Foreign investments listed or traded on an exchange for which there has been no sale that day are valued at the mean between the last reported bid and asked prices on that valuation date.
Notes to Financial Statements, Continued
Thornburg Value Fund | September 30, 2019
In any case when a market quotation is not readily available for a portfolio investment ordinarily valued by market quotation, the Committee calculates a fair value for the investment using alternative methods approved by the Audit Committee. A market quotation is not readily available when the primary market or exchange for the investment is not open for the entire scheduled day of trading. Market quotations for an investment also may not be readily available if developments after the most recent close of the investment’s primary exchange or market, but prior to the close of business on any Fund business day, or an unusual event or significant period of time occurring since the availability of a market quotation, create a serious question concerning the reliability of the most recent market quotation available for the investment. In particular, on days when market volatility thresholds established by the Audit Committee are exceeded, foreign equity investments held by the Fund may be valued using alternative methods. The Committee customarily obtains valuations in these instances from pricing service providers approved by the Audit Committee. Pricing service providers ordinarily calculate valuations using multi-factor models to adjust market prices based upon various inputs, including exchange data, depository receipt prices, futures, index data and other data.
Debt obligations held by the Fund which are not listed or traded on exchanges or for which no reported market exists are ordinarily valued at the valuation obtained from a pricing service provider approved by the Audit Committee.
In any case when a pricing service provider fails to provide a valuation for a debt obligation held by the Fund, the Committee calculates a fair value for the obligation using alternative methods under procedures approved by the Audit Committee. Additionally, in cases when management believes that a valuation obtained from a pricing service provider is stale, does not reflect material factors affecting the valuation of the investment, is significantly different than the value the Fund is likely to obtain if it sought a bid for the investment, or is otherwise unreliable, the Committee calculates a fair value for the obligation using an alternative method approved by the Audit Committee.
Quotations for foreign investments expressed in foreign currency amounts are converted to U.S. dollar equivalents using a foreign exchange quotation from a third party service provider at the time of valuation. Foreign investments held by the Fund may be traded on days and at times when the Fund is not open for business. Consequently, the value of Fund investments may be significantly affected on days when shareholders cannot purchase or sell Fund shares.
Valuation Hierarchy: The Fund categorizes its investments based upon the inputs used in valuing those investments, according to a three-level hierarchy established in guidance from the FASB. Categorization of investments using this hierarchy is intended by the FASB to maximize the use of observable inputs in valuing investments and minimize the use of unobservable inputs by requiring that the most observable inputs be used when available. Observable inputs are those that market participants would use in valuing an investment based on available market information. Unobservable inputs are those that reflect assumptions about the information market participants would use in valuing an investment. An investment’s level within the hierarchy is based on the lowest level input that is deemed significant to the valuation. The methodologies and inputs used to value investments are not necessarily indications of the risk or liquidity associated with those investments.
Various inputs are used in calculating valuations for the Fund’s investments. These inputs are generally summarized according to the three-level hierarchy below:
Level 1: Quoted prices in active markets for identical investments.
Level 2: Other direct or indirect significant observable inputs (including quoted prices for similar investments in active markets and other observable inputs, such as interest rates, prepayment rates, credit ratings, etc.).
Level 3: Significant unobservable inputs (including the Committee’s own assumptions in calculating the fair values of investments).
Valuations for debt obligations held by the Fund are typically calculated by pricing service providers approved by the Audit Committee and are generally characterized as Level 2 within the valuation hierarchy.
On days when market volatility thresholds established by the Audit Committee are exceeded, foreign securities for which valuations are obtained from pricing service providers are fair valued. On these days, the foreign securities are characterized as Level 2 within the valuation hierarchy and revert to Level 1 after the threshold is no longer exceeded.
In a limited number of cases the Committee calculates a fair value for investments using broker quotations or other methods approved by the Audit Committee. When the Committee uses a single broker quotation to calculate a fair value for an investment without other significant observable inputs, or if a fair value is calculated using other significant inputs that are considered unobservable, the investment is characterized as Level 3 within the hierarchy. Other significant unobservable inputs used to calculate a fair value in these instances might include an income-based valuation approach which considers discounted anticipated future cash flows from the investment and application of discounts due to the nature or duration of any restrictions on the disposition of the investment.
Valuations based upon the use of inputs from Levels 1, 2 or 3 may not represent the actual price received upon the disposition of an investment, and a Fund may receive a price that is lower than the valuation based upon these inputs when it sells the investment.
Notes to Financial Statements, Continued
Thornburg Value Fund | September 30, 2019
The following table displays a summary of the fair value hierarchy measurements of the Fund’s investments as of September 30, 2019:
| | Fair Value Measurements at September 30, 2019 |
| | TOTAL | LEVEL 1 | LEVEL 2 | LEVEL 3 |
| Assets | | | | |
| Investments in Securities* | | | | |
| Common Stock(a) | $ 838,211,053 | $ 820,093,600 | $ 18,117,453 | $ — |
| Short-Term Investments | 26,639,766 | 26,639,766 | — | — |
| Total Investments in Securities | $864,850,819 | $846,733,366 | $18,117,453 | $— |
| Other Financial Instruments | | | | |
| Forward Currency Contracts | $ 334,787 | $ — | $ 334,787 | $ — |
| Total Assets | $865,185,606 | $846,733,366 | $18,452,240 | $— |
| Liabilities | | | | |
| Other Financial Instruments | | | | |
| Forward Currency Contracts | $ (52,703) | $ — | $ (52,703) | $ — |
| Total Liabilities | $(52,703) | $— | $(52,703) | $— |
| * | See Schedule of Investments for a summary of the industry exposure as grouped according to the Global Industry Classification Standard (GICS), which is an industry taxonomy developed by MSCI, Inc. and Standard & Poor’s (S&P). |
| (a) | At September 30, 2019, industry classifications for Common Stock in Level 2 consist of $18,117,453 in Diversified Financials. |
NOTE 4 – INVESTMENT ADVISORY FEE AND OTHER TRANSACTIONS WITH AFFILIATES
Pursuant to an investment advisory agreement, the Advisor serves as the investment advisor and performs services for the Fund for which the fees are payable at the end of each month. Under the investment advisory agreement, the Fund pays the Advisor a management fee based on the average daily net assets of the Fund at an annual rate as shown in the following table:
| Management Fee Schedule |
| DAILY NET ASSETS | FEE RATE |
| Up to $500 million | 0.875% |
| Next $500 million | 0.825 |
| Next $500 million | 0.775 |
| Next $500 million | 0.725 |
| Over $2 billion | 0.675 |
The Fund’s effective management fee for the year ended September 30, 2019 was 0.853% of the Fund’s average daily net assets. Total management fees incurred by the Fund for the year ended September 30, 2019 are set forth in the Statement of Operations.
The Trust has entered into an administrative services agreement with the Advisor, whereby the Advisor will perform certain administrative services related to each class of the Fund’s shares. The fees are computed as an annual percentage of the aggregate average daily net assets of all shares classes of all Funds in the Trust as follows:
| Administration Fee Schedule |
| Daily Net Assets | Fee Rate |
| Up to $20 billion | 0.100% |
| $20 billion to $40 billion | 0.075 |
| $40 billion to $60 billion | 0.040 |
| Over $60 billion | 0.030 |
The aggregate fee amount is allocated on a daily basis to each Fund based on net assets and subsequently allocated to each class of shares of the Fund. Total administrative service fees incurred by each class of shares of the Fund for the year ended September 30, 2019, are set forth in the Statement of Operations.
The Trust has an underwriting agreement with Thornburg Securities Corporation (the “Distributor”), an affiliate of the Advisor, which acts as the distributor of the Fund’s shares. For the year ended September 30, 2019, the Distributor has advised the Fund that it earned net
Notes to Financial Statements, Continued
Thornburg Value Fund | September 30, 2019
commissions aggregating $9,405 from the sale of Class A shares, and collected contingent deferred sales charges aggregating $488 from redemptions of Class C shares of the Fund.
Pursuant to a service plan under Rule 12b-1 of the 1940 Act, the Fund may pay to the Distributor or securities dealers and other financial institutions at the Distributor’s direction an amount not to exceed .25 of 1% per annum of the average daily net assets attributable to Class A, Class C, Class I, Class R3, Class R4, and Class R5 shares of the Fund to obtain various shareholder and distribution related services. For the year ended September 30, 2019, there were no 12b-1 service plan fees charged for Class I or Class R5 shares. The Advisor and Distributor each may pay out of its own resources additional expenses for distribution of the Fund’s shares and shareholder services.
The Trust has also adopted a distribution plan pursuant to Rule 12b-1, applicable only to the Fund’s Class C and Class R3 shares, under which the Fund compensates the Distributor for services in promoting the sale of Class C and Class R3 shares of the Fund at an annual rate of up to .75 of 1% per annum of the average daily net assets attributable to Class C shares, and an annual rate of up to .25 of 1% per annum of the average daily net assets attributable to Class R3 shares.
Total fees incurred by each class of shares of the Fund under their respective service and distribution plans for the year ended September 30, 2019, are set forth in the Statement of Operations.
The Advisor has contractually agreed to waive fees and reimburse expenses incurred by the Fund so that actual expenses of certain share classes do not exceed levels as specified in each Fund’s most recent prospectus (Class I shares, 0.99%; Class R3 shares, 1.35%; Class R4 shares, 1.25%; Class R5 shares, 0.99%). The agreement may be terminated by the Fund at any time, but may not be terminated by the Advisor before February 1, 2020, unless the Advisor ceases to be the investment advisor to the Fund prior to that date. The Advisor may recoup amounts waived or reimbursed during the fiscal year ended September 30, 2019 if, during that year, expenses fall below the contractual limit that was in place at the time those fees and expenses were waived or reimbursed. The Advisor will not recoup fees or expenses as described in the preceding sentence if that recoupment would cause the Fund’s total annual operating expenses (after the recoupment is taken into account) to exceed the lesser of: (a) the expense cap that was in place at the time the waiver or reimbursement occurred; or (b) the expense cap that is in place at the time of the recoupment.
For the year ended September 30, 2019, the Advisor contractually reimbursed certain class specific expenses and distribution fees of $293,409 for Class I shares, $145,841 for Class R3 shares, $33,886 for Class R4 shares, and $78,433 for Class R5 shares.
Certain officers and Trustees of the Trust are also officers or directors of the Advisor and Distributor. The compensation of the independent Trustees is borne by the Trust. The Trust also pays a portion of the Chief Compliance Officer’s compensation. These amounts are reflected as Trustee and officer fees in the Statement of Operations.
The percentage of direct investments in the Fund held by the Trustees, officers of the Trust, and the Advisor is approximately 6.16%.
The Fund may purchase or sell securities from or to an affiliated fund, provided the affiliation is due solely to having a common investment advisor, common officers, or common trustees, and provided that all such transactions will comply with Rule 17a-7 under the 1940 Act. For the year ended September 30, 2019, the Fund had no such transactions with affiliated funds.
Shown below are holdings of voting securities of each portfolio company which is considered "affiliated" to the Fund under the 1940 Act, including companies for which the Fund’s holding represented 5% or more of the company’s voting securities, and a series of the Thornburg Investment Trust in which the Fund invested for cash management purposes during the period:
| Fund | Market Value
9/30/18 | Purchases
at Cost | Sales
Proceeds | Realized
Gain
(Loss) | Change in
Unrealized
Appr./(Depr.) | Market Value
9/30/19 | Dividend
Income |
| Thornburg Capital Management Fund | $112,260,426 | $159,281,369 | $(244,902,029) | $- | $- | $26,639,766 | $1,195,296 |
NOTE 5 – SHARES OF BENEFICIAL INTEREST
At September 30, 2019, there were an unlimited number of shares with no par value of beneficial interest authorized. Transactions in shares of beneficial interest were as follows:
Notes to Financial Statements, Continued
Thornburg Value Fund | September 30, 2019
| | YEAR ENDED
September 30, 2019 | YEAR ENDED
September 30, 2018 |
| | SHARES | AMOUNT | SHARES | AMOUNT |
| Class A Shares | | | | |
| Shares sold | 291,297 | $ 19,819,489 | 1,753,542 | $ 124,113,117 |
Shares issued to shareholders in
reinvestment of dividends | 29,837 | 1,759,754 | 28,581 | 1,940,082 |
| Shares repurchased | (937,331) | (63,815,711) | (1,114,963) | (77,131,757) |
| Net increase (decrease) | (616,197) | $ (42,236,468) | 667,160 | $ 48,921,442 |
| Class C Shares | | | | |
| Shares sold | 81,722 | $ 4,843,957 | 95,949 | $ 6,089,425 |
Shares issued to shareholders in
reinvestment of dividends | - | - | 10,013 | 623,226 |
| Shares repurchased | (318,422) | (19,681,131) | (2,001,456) | (129,189,920) |
| Net decrease | (236,700) | $ (14,837,174) | (1,895,494) | $ (122,477,269) |
| Class I Shares | | | | |
| Shares sold | 436,870 | $ 30,503,549 | 1,261,932 | $ 90,593,694 |
Shares issued to shareholders in
reinvestment of dividends | 41,897 | 2,541,041 | 30,761 | 2,147,141 |
| Shares repurchased | (1,268,473) | (88,314,904) | (1,135,822) | (80,255,248) |
| Net increase (decrease) | (789,706) | $ (55,270,314) | 156,871 | $ 12,485,587 |
| Class R3 Shares | | | | |
| Shares sold | 46,946 | $ 3,167,611 | 86,863 | $ 5,923,634 |
Shares issued to shareholders in
reinvestment of dividends | 1,862 | 109,276 | 3,543 | 239,041 |
| Shares repurchased | (178,925) | (12,164,959) | (249,858) | (17,163,466) |
| Net decrease | (130,117) | $ (8,888,072) | (159,452) | $ (11,000,791) |
| Class R4 Shares | | | | |
| Shares sold | 7,385 | $ 507,408 | 17,806 | $ 1,229,724 |
Shares issued to shareholders in
reinvestment of dividends | 401 | 23,796 | 541 | 36,893 |
| Shares repurchased | (26,747) | (1,825,844) | (65,297) | (4,528,115) |
| Net decrease | (18,961) | $ (1,294,640) | (46,950) | $ (3,261,498) |
| Class R5 Shares | | | | |
| Shares sold | 33,412 | $ 2,353,451 | 53,918 | $ 3,798,893 |
Shares issued to shareholders in
reinvestment of dividends | 2,117 | 128,201 | 1,616 | 112,647 |
| Shares repurchased | (46,303) | (3,248,816) | (54,291) | (3,877,180) |
| Net increase (decrease) | (10,774) | $ (767,164) | 1,243 | $ 34,360 |
NOTE 6 – INVESTMENT TRANSACTIONS
For the year ended September 30, 2019, the Fund had purchase and sale transactions of investments (excluding short-term investments) of $211,991,648 and $278,614,099, respectively.
NOTE 7 – DERIVATIVE FINANCIAL INSTRUMENTS WITH OFF-BALANCE
SHEET RISK AND FOREIGN INVESTMENT RISK
The Fund may use a variety of derivative financial instruments to hedge or adjust the risks affecting its investment portfolio or to enhance investment returns. Provisions of the FASB Accounting Standards Codification 815-10-50 (“ASC 815”) require certain disclosures. The disclosures are intended to provide users of financial statements with an understanding of the use of derivative instruments by the Fund and how these derivatives affect the financial position, financial performance and cash flows of the Fund. The Fund does not designate any derivative instruments as hedging instruments under ASC 815. During the year ended September 30, 2019, the Fund’s principal exposure
Notes to Financial Statements, Continued
Thornburg Value Fund | September 30, 2019
to derivative financial instruments of the type addressed by ASC 815 was investment in foreign currency contracts. A foreign currency contract is an agreement between two parties to exchange different currencies at a specified rate of exchange at an agreed upon future date. Foreign currency contracts involve risks to the Fund, including the risk that a contract’s counterparty will not meet its obligations to the Fund, the risk that a change in a contract’s value may not correlate perfectly with the currency the contract was intended to track, and the risk that the Fund’s Advisor is unable to correctly implement its strategy in using a contract. In any such instance, the Fund may not achieve the intended benefit of entering into a contract, and may experience a loss.
The Fund entered into forward currency contracts during the year ended September 30, 2019 in the normal course of pursuing its investment objectives, with the objective of purchasing foreign investments or with the intent of reducing the risk to the value of the Fund’s foreign investments from adverse changes in the relationship between the U.S. dollar and foreign currencies. In each case these contracts have been initiated in conjunction with foreign investment transactions. The monthly average value of open forward currency sell contracts for the year ended September 30, 2019 was $34,717,723.
These contracts are accounted for by the Fund under ASC 815. Unrealized appreciation and depreciation on outstanding contracts are reported in the Fund’s Statement of Assets and Liabilities, as measured by the difference between the forward exchange rates at the reporting date and the forward exchange rates at each contract’s inception date. Net realized gain (loss) on contracts closed during the period, and changes in net unrealized appreciation (depreciation) on outstanding contracts are recognized in the Fund’s Statement of Operations.
The outstanding forward currency contracts in the table located in the Schedule of Investments, which were entered into with State Street Bank and Trust Company (“SSB”), were entered into pursuant to an International Swaps and Derivatives Association (“ISDA”) Master Agreement. In the event of a default or termination under the ISDA Master Agreement with SSB, the non-defaulting party has the right to close out all outstanding forward currency contracts between the parties and to net any payment amounts under those contracts, resulting in a single net amount payable by one party to the other.
Because the ISDA Master Agreement with SSB does not result in an offset of reported amounts of financial assets and liabilities in the Fund’s Statement of Assets and Liabilities unless there has been an event of default or termination event under that agreement, the Fund does not net its outstanding forward currency contracts for purposes of the disclosure in the Fund’s Statement of Assets and Liabilities. Instead the Fund recognizes the unrealized appreciation (depreciation) on those forward currency contracts on a gross basis in the Fund’s Statement of Assets and Liabilities.
The unrealized appreciation (depreciation) of the outstanding forward currency contracts recognized in the Fund’s Statement of Assets and Liabilities at September 30, 2019 is disclosed in the following tables:
| FAIR VALUES OF DERIVATIVE FINANCIAL INSTRUMENTS AT SEPTEMBER 30, 2019 |
| ASSET DERIVATIVES | BALANCE SHEET LOCATION | FAIR VALUE |
| Foreign currency contracts | Assets - Unrealized appreciation on forward currency contracts | $ 334,787 |
| FAIR VALUES OF DERIVATIVE FINANCIAL INSTRUMENTS AT SEPTEMBER 30, 2019 |
| LIABILITY DERIVATIVES | BALANCE SHEET LOCATION | FAIR VALUE |
| Foreign currency contracts | Liabilities - Unrealized depreciation on forward currency contracts | $ (52,703) |
Because the Fund does not receive or post cash collateral in connection with its currency forward contracts during the period, the net amounts of the Fund’s assets and liabilities which are attributable to those contracts at September 30, 2019 can be determined by offsetting the dollar amounts shown in the preceding table. Based on those amounts, the net amount of the Fund’s assets which is attributable to its outstanding forward currency contracts at September 30, 2019 is $282,084, and the net amount of the Fund’s liabilities which is attributable to those contracts at that date is $0. The Fund’s forward currency contracts are valued each day, and the net amounts of the Fund’s assets and liabilities which are attributable to those contracts are expected to vary over time.
Notes to Financial Statements, Continued
Thornburg Value Fund | September 30, 2019
The net realized gain (loss) from forward currency contracts and the net change in unrealized appreciation (depreciation) on outstanding forward currency contracts recognized in the Fund’s Statement of Operations for the year ended September 30, 2019 are disclosed in the following tables:
NET REALIZED GAIN (LOSS) ON DERIVATIVE FINANCIAL INSTRUMENTS
RECOGNIZED IN INCOME FOR THE YEAR ENDED September 30, 2019 |
| | TOTAL | FORWARD CURRENCY CONTRACTS |
| Foreign currency contracts | $ 2,465,218 | $ 2,465,218 |
NET CHANGE IN UNREALIZED APPRECIATION (DEPRECIATION) OF DERIVATIVE FINANCIAL INSTRUMENTS
RECOGNIZED IN INCOME FOR THE YEAR ENDED September 30, 2019 |
| | TOTAL | FORWARD CURRENCY CONTRACTS |
| Foreign currency contracts | $ 237,111 | $ 237,111 |
NOTE 8 – RECENT ACCOUNTING PRONOUNCEMENTS
In August 2018, the FASB issued ASU 2018-13, Fair Value Measurement (Topic 820): Changes to the Disclosure Requirements for Fair Value Measurement, which adds, removes, and modifies certain aspects of the fair value disclosure. ASU 2018-13 is effective for annual periods beginning after December 15, 2019, and early adoption is permitted. The Funds have elected to early adopt, and had applied ASU 2018-13 for the fiscal year ended September 30, 2019. The adoption of this accounting guidance did not have a material impact on the Funds’ financial statements.
In March 2017, the FASB issued Accounting Standards Update (ASU) 2017-08, Premium Amortization of Purchased Callable Debt Securities. The amendments in the ASU shorten the premium amortization period on a purchased callable debt security from the security’s contractual life to the earliest call date. It is anticipated that this change will enhance disclosures by reducing losses recognized when a security is called on an earlier date. This ASU is effective for fiscal years beginning after December 15, 2018. Management has evaluated the implications of these changes and the amendments will have no material effect on the Funds’ net assets or results of operations.
OTHER NOTES
Risks: The Fund’s investments subject it to risks including, but not limited to, management risk, market and economic risk, risks affecting specific issuers, small and mid-cap company risk, foreign investment risk, credit risk, interest rate risk, and liquidity risk. Please see the Fund’s prospectus for a discussion of the risks associated with an investment in the Fund.
Subsequent Events: Fund management believes no events have occurred between September 30, 2019 and the date of issuance of the financial statements that require adjustment to or disclosure in the accompanying financial statements.
This page intentionally left blank.
Financial Highlights
Thornburg Value Fund
| | PER SHARE PERFORMANCE (FOR A SHARE OUTSTANDING THROUGHOUT THE YEAR) |
UNLESS OTHERWISE
NOTED, PERIODS ARE
FISCAL YEARS ENDED
SEPTEMBER 30, | Net Asset
Value,
Beginning of
YEAR | Net
Investment
Income
(Loss)+ | Net Realized &
Unrealized Gain
(Loss) on
Investments | Total from
Investment
Operations | Dividends
from Net
Investment
Income | Dividends
from Net
Realized
Gains | Total
Dividends | Net Asset
Value,
End of YEAR |
| CLASS A SHARES(b) |
| 2019 | $ 72.46 | 0.24 | (0.60) | (0.36) | (0.29) | — | (0.29) | $ 71.81 |
| 2018 | $ 65.26 | 0.39 | 7.17 | 7.56 | (0.36) | — | (0.36) | $ 72.46 |
| 2017 | $ 54.08 | 0.16 | 11.04 | 11.20 | (0.02) | — | (0.02) | $ 65.26 |
| 2016(c) | $ 49.17 | 0.32 | 4.76 | 5.08 | (0.17) | — | (0.17) | $ 54.08 |
| 2015 | $ 48.09 | 0.07 | 1.03 | 1.10 | (0.02) | — | (0.02) | $ 49.17 |
| CLASS C SHARES |
| 2019 | $ 66.03 | (0.31) | (0.53) | (0.84) | — | — | — | $ 65.19 |
| 2018 | $ 59.87 | (0.11) | 6.52 | 6.41 | (0.25) | — | (0.25) | $ 66.03 |
| 2017 | $ 49.97 | (0.27) | 10.17 | 9.90 | — | — | — | $ 59.87 |
| 2016 | $ 45.63 | (0.06) | 4.40 | 4.34 | — | — | — | $ 49.97 |
| 2015 | $ 44.95 | (0.29) | 0.97 | 0.68 | — | — | — | $ 45.63 |
| CLASS I SHARES |
| 2019 | $ 74.70 | 0.49 | (0.65) | (0.16) | (0.50) | — | (0.50) | $ 74.04 |
| 2018 | $ 67.10 | 0.64 | 7.38 | 8.02 | (0.42) | — | (0.42) | $ 74.70 |
| 2017 | $ 55.58 | 0.42 | 11.35 | 11.77 | (0.25) | — | (0.25) | $ 67.10 |
| 2016 | $ 50.53 | 0.54 | 4.90 | 5.44 | (0.39) | — | (0.39) | $ 55.58 |
| 2015 | $ 49.28 | 0.28 | 1.04 | 1.32 | (0.07) | — | (0.07) | $ 50.53 |
| CLASS R3 SHARES |
| 2019 | $ 72.02 | 0.23 | (0.59) | (0.36) | (0.22) | — | (0.22) | $ 71.44 |
| 2018 | $ 64.88 | 0.39 | 7.11 | 7.50 | (0.36) | — | (0.36) | $ 72.02 |
| 2017 | $ 53.76 | 0.18 | 10.97 | 11.15 | (0.03) | — | (0.03) | $ 64.88 |
| 2016 | $ 48.86 | 0.34 | 4.74 | 5.08 | (0.18) | — | (0.18) | $ 53.76 |
| 2015 | $ 47.79 | 0.08 | 1.01 | 1.09 | (0.02) | — | (0.02) | $ 48.86 |
| CLASS R4 SHARES |
| 2019 | $ 72.83 | 0.30 | (0.60) | (0.30) | (0.28) | — | (0.28) | $ 72.25 |
| 2018 | $ 65.55 | 0.47 | 7.19 | 7.66 | (0.38) | — | (0.38) | $ 72.83 |
| 2017 | $ 54.31 | 0.25 | 11.08 | 11.33 | (0.09) | — | (0.09) | $ 65.55 |
| 2016 | $ 49.36 | 0.40 | 4.78 | 5.18 | (0.23) | — | (0.23) | $ 54.31 |
| 2015 | $ 48.24 | 0.14 | 1.01 | 1.15 | (0.03) | — | (0.03) | $ 49.36 |
| CLASS R5 SHARES |
| 2019 | $ 74.60 | 0.49 | (0.66) | (0.17) | (0.50) | — | (0.50) | $ 73.93 |
| 2018 | $ 67.01 | 0.63 | 7.38 | 8.01 | (0.42) | — | (0.42) | $ 74.60 |
| 2017 | $ 55.50 | 0.41 | 11.35 | 11.76 | (0.25) | — | (0.25) | $ 67.01 |
| 2016 | $ 50.45 | 0.53 | 4.90 | 5.43 | (0.38) | — | (0.38) | $ 55.50 |
| 2015 | $ 49.21 | 0.27 | 1.04 | 1.31 | (0.07) | — | (0.07) | $ 50.45 |
| (a) | Not annualized for periods less than one year. |
| (b) | Sales loads are not reflected in computing total return. |
| (c) | Class B shares converted to Class A shares on August 29, 2016. |
| + | Based on weighted average shares outstanding. |
See notes to financial statements.
Financial Highlights, Continued
Thornburg Value Fund
| RATIOS TO AVERAGE NET ASSETS | | SUPPLEMENTAL DATA |
Net Investment
Income (Loss) (%) | Expenses, After
Expense
Reductions (%) | Expenses,
Before Expense
Reductions (%) | | Total
Return (%)(a) | Portfolio
Turnover
Rate (%)(a) | Net Assets
at End of YEAR
(Thousands) |
| |
| 0.35 | 1.33 | 1.33 | | (0.42) | 24.94 | $ 425,218 |
| 0.56 | 1.33 | 1.33 | | 11.62 | 57.33 | $ 473,740 |
| 0.27 | 1.39 | 1.39 | | 20.72 | 43.53 | $ 383,118 |
| 0.63 | 1.39 | 1.39 | | 10.33 | 31.10 | $ 374,237 |
| 0.14 | 1.37 | 1.37 | | 2.28 | 59.70 | $ 377,299 |
| |
| (0.50) | 2.19 | 2.19 | | (1.26) | 24.94 | $ 35,934 |
| (0.17) | 2.11 | 2.11 | | 10.73 | 57.33 | $ 52,023 |
| (0.49) | 2.14 | 2.14 | | 19.81 | 43.53 | $ 160,663 |
| (0.12) | 2.14 | 2.14 | | 9.51 | 31.10 | $ 168,821 |
| (0.61) | 2.12 | 2.12 | | 1.51 | 59.70 | $ 168,321 |
| |
| 0.70 | 0.99 | 1.07 | | (0.07) | 24.94 | $ 360,070 |
| 0.90 | 0.99 | 1.06 | | 12.00 | 57.33 | $ 422,302 |
| 0.68 | 0.99 | 1.06 | | 21.20 | 43.53 | $ 368,790 |
| 1.02 | 0.99 | 1.07 | | 10.77 | 31.10 | $ 280,570 |
| 0.53 | 0.99 | 1.06 | | 2.68 | 59.70 | $ 288,642 |
| |
| 0.34 | 1.35 | 1.79 | | (0.43) | 24.94 | $ 29,601 |
| 0.57 | 1.35 | 1.78 | | 11.60 | 57.33 | $ 39,211 |
| 0.30 | 1.35 | 1.82 | | 20.75 | 43.53 | $ 45,668 |
| 0.67 | 1.35 | 1.81 | | 10.40 | 31.10 | $ 50,089 |
| 0.16 | 1.35 | 1.77 | | 2.28 | 59.70 | $ 59,150 |
| |
| 0.44 | 1.25 | 1.75 | | (0.33) | 24.94 | $ 6,434 |
| 0.68 | 1.25 | 1.77 | | 11.72 | 57.33 | $ 7,868 |
| 0.42 | 1.24 | 1.78 | | 20.87 | 43.53 | $ 10,159 |
| 0.78 | 1.25 | 1.75 | | 10.50 | 31.10 | $ 9,539 |
| 0.26 | 1.25 | 1.67 | | 2.39 | 59.70 | $ 10,167 |
| |
| 0.70 | 0.99 | 1.43 | | (0.07) | 24.94 | $ 18,119 |
| 0.89 | 0.99 | 1.38 | | 12.00 | 57.33 | $ 19,085 |
| 0.68 | 0.99 | 1.42 | | 21.21 | 43.53 | $ 17,060 |
| 1.00 | 0.99 | 1.46 | | 10.78 | 31.10 | $ 14,738 |
| 0.51 | 0.99 | 1.20 | | 2.65 | 59.70 | $ 19,270 |
Report of Independent Registered Public Accounting Firm
Thornburg Value Fund
To the Board of Trustees of Thornburg Investment Trust and Shareholders of
Thornburg Value Fund
Opinion on the Financial Statements
We have audited the accompanying statement of assets and liabilities, including the schedule of investments, of Thornburg Value Fund (one of the funds constituting Thornburg Investment Trust, referred to hereafter as the "Fund") as of September 30, 2019, the related statement of operations for the year ended September 30, 2019, the statements of changes in net assets for each of the two years in the period ended September 30, 2019, including the related notes, and the financial highlights for each of the five years in the period ended September 30, 2019 (collectively referred to as the “financial statements”). In our opinion, the financial statements present fairly, in all material respects, the financial position of the Fund as of September 30, 2019, the results of its operations for the year then ended, the changes in its net assets for each of the two years in the period ended September 30, 2019 and the financial highlights for each of the five years in the period ended September 30, 2019 in conformity with accounting principles generally accepted in the United States of America.
Basis for Opinion
These financial statements are the responsibility of the Fund’s management. Our responsibility is to express an opinion on the Fund’s financial statements based on our audits. We are a public accounting firm registered with the Public Company Accounting Oversight Board (United States) (PCAOB) and are required to be independent with respect to the Fund in accordance with the U.S. federal securities laws and the applicable rules and regulations of the Securities and Exchange Commission and the PCAOB.
We conducted our audits of these financial statements in accordance with the standards of the PCAOB. Those standards require that we plan and perform the audit to obtain reasonable assurance about whether the financial statements are free of material misstatement, whether due to error or fraud.
Our audits included performing procedures to assess the risks of material misstatement of the financial statements, whether due to error or fraud, and performing procedures that respond to those risks. Such procedures included examining, on a test basis, evidence regarding the amounts and disclosures in the financial statements. Our audits also included evaluating the accounting principles used and significant estimates made by management, as well as evaluating the overall presentation of the financial statements. Our procedures included confirmation of securities owned as of September 30, 2019 by correspondence with the custodian, transfer agent and broker. We believe that our audits provide a reasonable basis for our opinion.
/s/PricewaterhouseCoopers LLP
New York, New York
November 22, 2019
We have served as the auditor of one or more investment companies in Thornburg Investment Trust since 1999.
Expense Example
Thornburg Value Fund | September 30, 2019 (Unaudited)
As a shareholder of the Fund, you incur two types of costs:
| (1) | transaction costs, including |
| (a) | sales charges (loads) on purchase payments, for Class A shares; |
| (b) | a deferred sales charge on redemptions of any part or all of a purchase of $1 million of Class A shares within 12 months of purchase; |
| (c) | a deferred sales charge on redemptions of Class C shares within 12 months of purchase; |
| (2) | ongoing costs, including management fees; distribution and/or service (12b-1) fees; and other Fund expenses. |
This example is intended to help you understand your ongoing costs (in dollars) of investing in the Fund and to compare these costs with the ongoing costs of investing in other mutual funds.
The example is based on a $1,000 investment beginning on April 1, 2019, and held until September 30, 2019.
ACTUAL EXPENSES
For each class of shares, the first line of the accompanying table provides information about actual account values and actual expenses. You may use the information in this line, together with the amount you invested, to estimate the expenses that you paid over the period. Simply divide your account value by $1,000 (for example, an $8,600 account value divided by $1,000 = 8.6), then multiply the result by the number in the first line for your class of shares under the heading entitled “Expenses Paid During Period” to estimate the expenses you paid on your account during this period.
| | BEGINNING
ACCOUNT VALUE
4/1/19 | ENDING
ACCOUNT VALUE
9/30/19 | EXPENSES PAID
DURING PERIOD†
4/1/19—9/30/19 |
| CLASS A SHARES |
| Actual | $1,000.00 | $1,038.16 | $6.85 |
| Hypothetical* | $1,000.00 | $1,018.35 | $6.78 |
| CLASS C SHARES |
| Actual | $1,000.00 | $1,034.26 | $10.76 |
| Hypothetical* | $1,000.00 | $1,014.49 | $10.66 |
| CLASS I SHARES |
| Actual | $1,000.00 | $1,039.88 | $5.06 |
| Hypothetical* | $1,000.00 | $1,020.10 | $5.01 |
| CLASS R3 SHARES |
| Actual | $1,000.00 | $1,038.21 | $6.90 |
| Hypothetical* | $1,000.00 | $1,018.30 | $6.83 |
| CLASS R4 SHARES |
| Actual | $1,000.00 | $1,038.67 | $6.39 |
| Hypothetical* | $1,000.00 | $1,018.80 | $6.33 |
| CLASS R5 SHARES |
| Actual | $1,000.00 | $1,039.94 | $5.06 |
| Hypothetical* | $1,000.00 | $1,020.10 | $5.01 |
| † | Expenses are equal to the annualized expense ratio for each class (A: 1.34%; C: 2.11%; I: 0.99%; R3: 1.35%; R4: 1.25%; R5: 0.99%) multiplied by the average account value over the period, multiplied by 183/365 to reflect the one-half year period. |
| * | Hypothetical assumes a rate of return of 5% per year before expenses. |
HYPOTHETICAL EXAMPLE FOR COMPARISON PURPOSES
For each class of shares, the second line of the accompanying table provides information about hypothetical account values and hypothetical expenses based on the Fund’s actual expense ratio and an assumed rate of return of 5% per year before expenses, which is not the Fund’s actual return. The hypothetical account values and expenses may not be used to estimate the actual ending account balance or expenses you paid for the period. You may use this information to compare the ongoing costs of investing in the Fund and other funds. To do so, compare this 5% hypothetical example with the 5% hypothetical examples that appear in the shareholder reports of the other funds.
Please note that the expenses shown in the table are meant to highlight your ongoing costs only and do not reflect any transactional costs, such as sales charges (loads), redemption fees, or exchange fees. Therefore, the second line of the table for each class of shares is useful in comparing ongoing costs only, and will not help you determine the relative total costs of owning different funds. In addition, if these transactional costs were included, your costs would have been higher.
Trustees and Officers
Thornburg Value Fund | September 30, 2019 (Unaudited)
NAME, AGE, YEAR ELECTED
POSITION HELD WITH FUND | PRINCIPAL OCCUPATION(S) DURING PAST FIVE YEARS | OTHER DIRECTORSHIPS
HELD BY TRUSTEE |
| INTERESTED TRUSTEES(1)(2) |
Garrett Thornburg, 73
Trustee since 1984,
Chairman of Trustees(3) | Chairman and controlling shareholder of Thornburg Investment Management, Inc. (investment advisor); Chairman and controlling shareholder of Thornburg Securities Corporation (securities dealer); President of the Thornburg Foundation (nonprofit). | None |
Brian J. McMahon, 64
Trustee since 2001,
Vice Chairman of Trustees,
Member of Governance and
Nominating Committee &
Operations Risk Oversight
Committee(4) | Vice Chairman, Chief Investment Strategist, Managing Director, and Portfolio Manager and, until 2016, CEO and President of Thornburg Investment Management, Inc.; Vice President of Thornburg Securities Corporation. | None |
| INDEPENDENT TRUSTEES(1)(2)(5) |
David A. Ater, 74
Trustee since 1994,
Lead Independent Trustee,
Chairman of Governance and
Nominating Committee &
Member of Audit Committee | Principal in Ater & Associates, Santa Fe, NM (developer, planner and broker of residential and commercial real estate); owner, developer and broker for various real estate projects. | None |
Sally Corning, 58
Trustee since 2012,
Chairman of Audit Committee | Partner in Sun Mountain Capital, Santa Fe, NM (private equity firm with investment programs encompassing venture capital, mezzanine debt, and growth equity). | None |
Susan H. Dubin, 70
Trustee since 2004,
Member of Audit
Committee & Governance
and Nominating Committee | President of Dubin Investments, Ltd., Greenwich, CT (private investment fund); Director and officer of various charitable organizations. | None |
David L. Gardner, 56
Trustee since 2015,
Member of Operations Risk
Oversight Committee | Until 2012, head of EMEA (Europe, Middle East and Africa) Sales for iShares of Blackrock, Inc., EMEA Executive Committee Member and EMEA Operating Committee Member at Blackrock, Inc. | None |
Patrick J. Talamantes, 55
Trustee since 2019,
Member of Audit Committee | President of Talamantes Strategies, LLC, a management consulting firm, since 2018; until 2017, President and Chief Executive Officer of The McClatchy Company, Sacramento, CA (news and media company). | None |
Owen D. Van Essen, 65
Trustee since 2004,
Chairman of Operations Risk
Oversight Committee &
Member of Governance and
Nominating Committee | President of Dirks, Van Essen, Murray & April, Santa Fe, NM (newspaper mergers and acquisitions). | None |
James W. Weyhrauch, 60
Trustee since 1996,
Member of Audit
Committee & Operations Risk
Oversight Committee | Real estate broker, Santa Fe Properties, Santa Fe, NM; General Partner, Investments of Genext LLC (a family investment partnership); until 2019, Vice Chairman of Nambe LLC, Santa Fe, NM (manufacturing & design company). | None |
Trustees and Officers, Continued
Thornburg Value Fund | September 30, 2019 (Unaudited)
NAME, AGE, YEAR ELECTED
POSITION HELD WITH FUND | PRINCIPAL OCCUPATION(S) DURING PAST FIVE YEARS | OTHER DIRECTORSHIPS
HELD BY TRUSTEE |
| OFFICERS OF THE FUND (WHO ARE NOT TRUSTEES)(1)(6) |
David Ashley, 49
Vice President since 2019 | Portfolio Manager and Managing Director since 2019 and Associate Portfolio Manager from 2011-2019 of Thornburg Investment Management, Inc. | Not applicable |
Nimish Bhatt, 56
Chief Financial Officer
since 2019; Treasurer
2016-2019; Secretary
(2018-2019)(7) | Chief Financial Officer and Treasurer of Thornburg Investment Management, Inc. and Thornburg Securities Corporation since 2016 and Secretary of Thornburg Securities Corporation since 2018; Senior Vice President (2004-2016), Chief Financial Officer (2011-2016), and Head of Fund Administration (2011-2016) of Calamos Asset Management, Inc., Calamos Investments LLC, Calamos Advisors LLC, and Calamos Wealth Management; Director of Calamos Global Funds plc (2007-2016). | Not applicable |
Jason Brady, 45
President since 2016(7) | Director since 2017, CEO and President since 2016, and Portfolio Manager and Managing Director of Thornburg Investment Management, Inc.; Vice President of Thornburg Securities Corporation since 2016. | Not applicable |
Connor Browne, 40
Vice President since 2006 | Portfolio Manager and Managing Director of Thornburg Investment Management, Inc. | Not applicable |
Randy Dry, 45
Vice President since 2014 | Managing Director, Director of Institutional Group from 2014-2016, and since 2016, Chief Administrative Officer of Thornburg Investment Management, Inc. | Not applicable |
Greg Dunn, 43
Vice President since 2014 | Portfolio Manager and Managing Director of Thornburg Investment Management, Inc. | Not applicable |
Lon Erickson, 44
Vice President since 2008 | Portfolio Manager and Managing Director of Thornburg Investment Management, Inc. | Not applicable |
Thomas Garcia, 48
Vice President since 2006 | Managing Director, Head Equity Trader, and Associate Portfolio Manager of Thornburg Investment Management, Inc. | Not applicable |
Christian Hoffmann, 37
Vice President since 2018 | Portfolio Manager and Managing Director since 2018, and Associate Portfolio Manager from 2014-2018, of Thornburg Investment Management, Inc. | Not applicable |
Curtis Holloway, 52
Treasurer since 2019(7) | Director of Fund Administration since 2019 of Thornburg Investment Management, Inc.; Senior Vice President, Head of Fund Administration (2017-2019) and Vice President, Fund Administration (2010-2017) of Calamos Investments, and Chief Financial Officer (2017-2019) and Treasurer (2010-2019) of Calamos Funds. | Not applicable |
Ben Kirby, 39
Vice President since 2014 | Head of Investments since 2019, Portfolio Manager and Managing Director since 2013. | Not applicable |
Jeff Klingelhofer, 38
Vice President since 2016 | Head of Investments since 2019, Portfolio Manager and Managing Director since 2015, and Associate Portfolio Manager from 2012–2015, of Thornburg Investment Management, Inc. | Not applicable |
Ponn Lithiluxa, 48
Vice President since 2017 | Manager, Tax & Fund Administration of Thornburg Investment Management, Inc.; Senior Vice President, Citi Fund Services, Inc. (2014–2017); Vice President, Citi Fund Services, Inc. (2007–2014). | Not applicable |
Rob MacDonald, 43
Vice President since 2016 | Managing Director since 2015, Portfolio Manager since 2014, and Associate Portfolio Manager from 2011–2014 of Thornburg Investment Management, Inc. | Not applicable |
Michael Mastroianni, 42
Secretary and Vice President since 2019(7) | Director of Fund Operations since 2019 of Thornburg Investment Management, Inc.; Executive Director, Global Head of Client Services - Global Liquidity (2018-2019), Executive Director, North American Head of Transfer Agency Relationship Management (2011-2019), Executive Director, North American Head of Transfer Agency Service Delivery (2011-2018) of J.P. Morgan Asset Management. | Not applicable |
Leigh Moiola, 52
Vice President since 2001 | Managing Director and Director of Marketing of Thornburg Investment Management, Inc.; Vice President of Thornburg Securities Corporation. | Not applicable |
Christopher Ryon, 63
Vice President since 2008 | Portfolio Manager and Managing Director of Thornburg Investment Management, Inc. | Not applicable |
Trustees and Officers, Continued
Thornburg Value Fund | September 30, 2019 (Unaudited)
NAME, AGE, YEAR ELECTED
POSITION HELD WITH FUND | PRINCIPAL OCCUPATION(S) DURING PAST FIVE YEARS | OTHER DIRECTORSHIPS
HELD BY TRUSTEE |
Sean Koung Sun, 38
Vice President since 2017 | Portfolio Manager and Managing Director since 2017, Associate Portfolio Manager from 2015-2016, and Equity Research Analyst from 2012-2014 of Thornburg Investment Management, Inc. | Not applicable |
Stephen Velie, 52
Chief Compliance Officer since 2009 | Chief Compliance Officer of Thornburg Investment Trust and Thornburg Investment Management, Inc. | Not applicable |
Nicholos Venditti, 38
Vice President since 2016 | Portfolio Manager and Managing Director since 2015 and Associate Portfolio Manager from 2011–2015 of Thornburg Investment Management, Inc. | Not applicable |
Vinson Walden, 49
Vice President since 2004 | Portfolio Manager and Managing Director of Thornburg Investment Management, Inc. | Not applicable |
Lei Wang, 48
Vice President since 2006 | Portfolio Manager and Managing Director of Thornburg Investment Management, Inc. | Not applicable |
Charles Wilson, 44
Vice President since 2016 | Portfolio Manager and Managing Director since 2014 and Associate Portfolio Manager from 2012–2014 of Thornburg Investment Management, Inc. | Not applicable |
Di Zhou, 41
Vice President since 2016 | Portfolio Manager and Managing Director since 2016, Associate Portfolio Manager from 2014–2016, and Equity Research Analyst from 2010–2014 of Thornburg Investment Management, Inc. | Not applicable |
| (1) | Each person’s address is 2300 North Ridgetop Road, Santa Fe, New Mexico 87506. |
| (2) | The Fund is a separate investment “Fund” or “series” of Thornburg Investment Trust (the “Trust”), which comprises the Thornburg mutual fund complex and is organized as a Massachusetts business trust. Thornburg Investment Management, Inc. is the investment advisor to, and manages, all the Funds of the Trust. Each Trustee oversees all the Funds of the Trust. |
| (3) | Mr. Thornburg is considered an “interested” Trustee under the Investment Company Act of 1940 because he is a director and controlling shareholder of Thornburg Investment Management, Inc., the investment advisor to the Trust, and is the sole director and controlling shareholder of Thornburg Securities Corporation, the distributor of shares for the Trust. |
| (4) | Mr. McMahon is considered an “interested” Trustee under the Investment Company Act of 1940 because he is a director and the chief investment strategist of Thornburg Investment Management, Inc. |
| (5) | The Bylaws of the Trust currently require that each Independent Trustee shall retire by the end of the calendar year during which the Trustee reached the age of 75 years. Otherwise each Trustee serves in office until the election and qualification of a successor or until the Trustee sooner dies, resigns, retires or is removed. |
| (6) | Assistant vice presidents and assistant secretaries are not shown. |
| (7) | The Trust’s president, chief financial officer, secretary, and treasurer each serves a one-year term or until the election and qualification of a successor; each other officer serves at the pleasure of the Trustees. |
The Statement of Additional Information for each Fund of the Trust includes additional information about the Trustees and is available, without charge and upon request, by calling 1-800-847-0200.
Other Information
Thornburg Value Fund | September 30, 2019 (Unaudited)
PORTFOLIO PROXY VOTING
Policies and Procedures:
The Trust has delegated to the Advisor voting decisions respecting proxies for the Fund’s voting securities. The Advisor makes voting decisions in accordance with its Proxy Voting Policy and Procedures. A description of the Policy and Procedures is available (i) without charge, upon request, by calling the Advisor toll-free at 1-800-847-0200, (ii) on the Thornburg website at www.thornburg.com, and (iii) on the U.S. Securities and Exchange Commission’s website at www.sec.gov.
Information regarding how proxies were voted is available on or before August 31 of each year for the twelve months ending the preceding June 30. This information is available (i) without charge, upon request by calling the Advisor toll-free at 1-800-847-0200, (ii) on the Thornburg website at www.thornburg.com, and (iii) on the U.S. Securities and Exchange Commission’s website at www.sec.gov.
TAX INFORMATION
For the tax year ended September 30, 2019, dividends paid by the Thornburg Value Fund of $4,803,231 are being reported as taxable ordinary investment income dividends for federal income tax purposes.
For the tax year ended September 30, 2019, the Fund is reporting 100.00% (or the maximum allowed) of the dividends paid from tax basis net ordinary income as qualifying for the reduced rate under the Jobs and Growth Tax Relief and Reconciliation Act of 2003.
The Fund is reporting 100.00% (or the maximum allowed) of the ordinary income distributions paid by the Fund for the fiscal year ended September 30, 2019 as qualified for the corporate dividends received deduction.
The information and distributions reported herein may differ from the information and distributions reported to the shareholders for the calendar year ending December 31, 2019. Complete information will be reported in conjunction with your 2019 Form 1099.
AVAILABILITY OF QUARTERLY PORTFOLIO SCHEDULE
The Fund files with the Securities and Exchange Commission schedules of its portfolio holdings on Form N-Q for the first and third quarters of each fiscal year. The Fund’s Forms N-Q are available on the Commission’s website at www.sec.gov, or may be reviewed and copied at the Commission’s Public Reference Room in Washington, D.C. Information on the operation of the Public Reference Room may be obtained by calling 1-800-SEC-0330. The Fund also makes this information available on its website at www.thornburg.com/download or upon request by calling 1-800-847-0200.
STATEMENT RESPECTING RENEWAL OF INVESTMENT ADVISORY AGREEMENT
Thornburg Investment Management, Inc. (the “Advisor”) provides investment management services to Thornburg Value Fund (the “Fund”) pursuant to an investment advisory agreement. The Trustees consider the renewal of this agreement annually, and most recently determined to renew the agreement on September 17, 2019.
Planning for their recent consideration of the advisory agreement’s renewal, the independent Trustees met in May 2019 to consider aspects of their annual evaluation of the Advisor’s service to all of the funds of Thornburg Investment Trust, to plan the annual evaluation of the Advisor’s performance and to discuss preliminarily the information the Advisor would present to the Trustees for their review. The independent Trustees met in a second independent session in July 2019 to further define certain portions of the information to be submitted by the Advisor. The independent Trustees met again in an independent session in September 2019 with a mutual fund analyst firm engaged by the independent Trustees to provide explanations of comparative cost and expense information, comparative investment performance information, and other data obtained and analyzed by the analyst firm. In that session the independent Trustees discussed their evaluations of the Advisor’s services to the Fund and the Fund’s fee and expense levels, investment performance, and other information presented for the Fund, conferred independently with legal counsel respecting the factors typically considered in evaluating renewal of an advisory agreement, and conferred with representatives of management to receive explanations of certain aspects of the information they had requested. Representatives of the Advisor subsequently reviewed portions of the information with the Trustees and addressed questions from the Trustees at a full meeting session of the Trustees scheduled in September for that purpose, and the independent Trustees thereafter met again in an independent session to consider the Advisor’s presentations and various specific issues respecting their consideration of the advisory agreement’s renewal. Following these sessions, the Trustees met to consider renewal of the advisory agreement, and the independent Trustees voted unanimously at that meeting to renew the agreement for an additional term of one year.
Other Information, Continued
Thornburg Value Fund | September 30, 2019 (Unaudited)
The information below summarizes certain factors considered by the Trustees in connection with the determination to renew the advisory agreement with the Advisor. In determining to renew the advisory agreement, the Trustees considered a wide range of information and did not identify any single factor as controlling, and this summary does not describe all of the factors and other matters considered by the Trustees in making their determination.
Nature, Extent and Quality of Services. The Trustees considered in their evaluation of the advisory agreement the written and oral reports provided to the Trustees and their standing committees throughout the year on a wide variety of topics by personnel from the Advisor’s portfolio management, administration, operations and compliance staffs. The Trustees also considered in this evaluation presentations and explanations made by representatives of the Advisor in meeting sessions scheduled for consideration of the renewal of the advisory agreement. The Trustees further noted in their evaluation the consideration they had given to a number of topics in previous years, reports from their standing committees, and advice received from counsel.
Information noted by the Trustees as having been considered in relation to the nature, extent and quality of services provided by the Advisor under the advisory agreement and contributing (together with other information considered) to their conclusions respecting the nature, extent and quality of the services rendered to the Fund by the Advisor included: (1) reports from portfolio managers and other personnel throughout the year demonstrating that the Fund was managed in conformity with stated strategies and objectives and conformed to investment restrictions and limitations; (2) reports demonstrating that management of the Fund remained faithful and competent, and demonstrating sufficient skill by portfolio managers in executing the Fund’s strategies in varying environments, managers’ cognizance of and strategies to pursue the Fund’s objectives and address pertinent market and economic trends and conditions, the evaluation and selection of individual investments, management to achieve tax efficiencies, and the structuring and composition of the Fund’s portfolio and management of Fund liquidity requirements; (3) the Fund’s achievement of its investment objectives over different periods of time; (4) presentations by and interactions with members of the Advisor’s fund administration, operations and compliance staffs; (5) reports from standing committees of the Trustees on their respective proceedings throughout the year, including in particular reports from and interactions with the Advisor’s personnel; (6) the sufficiency of the resources the Advisor devotes to the services it provides to the Fund, including the expertise of its personnel and staffing levels and its enhancements to the electronic systems it utilizes in providing these services, and also including the Advisor’s own financial management and sufficiency of its resources; and (7) the measures employed to achieve efficient trade execution for the Fund, including the evaluation and selection of firms to execute transactions for the Fund. As in past years, the Trustees noted particularly their assessments of the Advisor’s personnel developed in meetings throughout the year, measures to expand and improve the depth and experience of the Advisor’s staff, and the Advisor’s collaborative approach to investment management, continued commitment to observance of compliance and regulatory requirements in managing investments by the Fund, responsiveness to the Trustees, and other factors.
Based upon these and other considerations, the Trustees concluded that the Advisor’s management of the Fund’s investments continued to conform to the Fund’s stated objectives and policies, and that the nature, extent and quality of the services provided to the Fund by the Advisor remained sufficient.
Investment Performance. The Trustees noted in their evaluation of the Fund’s investment performance the written and oral reports they had received in each regular meeting over the course of the year from the Advisor’s portfolio management personnel. The Trustees also noted their consideration of information provided to them at their request in anticipation of their annual evaluation of the Advisor’s services, including the following items of information respecting the investment performance of the Fund: (1) the Fund’s absolute investment performance and achievement of stated objectives; (2) the Advisor’s explanations and commentary on the Fund’s performance in the context of the Fund’s objectives and reasonable expectations, and business, market and economic conditions; (3) performance data for the most recent ten calendar years, comparing the Fund’s annual investment returns to two broad-based securities indices and to the applicable Morningstar category of funds; (4) the Fund’s investment performance for the three-month, year-to-date, one-year, three-year, five-year, ten-year, and since inception periods ending with the second quarter of the current year, comparing the Fund’s annualized returns to two mutual fund categories selected by independent mutual fund analyst firms and to two broad-based securities indices, and assigning a percentage rank to the Fund’s performance for each period relative to each of the fund categories; (5) analyses of specified performance and risk metrics for the Fund relative to its benchmark and to a selected peer group of funds, prepared by an independent financial analyst firm engaged by the independent Trustees; (6) the Fund’s cash flows; (7) comparative performance data for fund peer groups selected by an independent mutual fund analyst firm engaged by the independent Trustees, and the analysis and observations of the analyst firm respecting those data; (8) comparison of the Fund’s annualized return to the Fund’s benchmark index over various periods since the Fund’s inception; and (9) comparative measures of estimated earnings growth, and risk and return statistics. The Trustees generally attach additional significance to investment performance from the perspective of longer-term shareholders.
The Trustees considered explanations from the Advisor respecting performance of the Fund in some recent periods that had compared less favorably to some comparative measures, together with the reports they had received from the Advisor throughout the year, explanations of the comparisons by reference to the investment strategies of the Fund, the effects of market and economic conditions, the investment decisions by the Advisor in view of the Fund’s strategies, and where pertinent the Advisor’s measures and expectations for improvement in the Fund’s relative investment performance. The Trustees noted their understanding that strategies pursued for a fund may produce intermittent lower relative performance, other funds managed by the Advisor have in the past returned to favor as conditions
Other Information, Continued
Thornburg Value Fund | September 30, 2019 (Unaudited)
changed or the strategies of those funds gained traction, and that the Advisor has successfully remediated lower relative performance of other funds in cases where execution of investment strategies had contributed to lower performance. Based upon their consideration of this and other information, the Trustees concluded that the Fund’s absolute and relative investment performance over a range of pertinent holding periods on the whole was satisfactory in view of its objectives and strategies.
Comparisons of Fee and Expense Levels. Information noted by the Trustees as having been considered in this context included a variety of comparative data respecting the Fund’s fee and expense levels. This information included comparisons of the Fund’s advisory fee and overall Fund expenses to median and average fees and expenses charged to funds in the applicable Morningstar category, comparisons of the advisory fee and total expenses for two Fund share classes to the fee levels and expenses of fund peer groups selected from the category by an independent mutual fund analyst firm engaged by the independent Trustees, the perspectives and advice from that mutual fund analyst firm respecting comparisons of fund fee levels and expenses to fund peer groups, and other information. The Trustees considered that the Advisor has agreed to certain fee waivers and expense reimbursements for the current period. Comparative fee and expense data noted as having been considered by the Trustees showed that, after fee waivers and expense reimbursements, the level of total expense for one share class of the Fund was higher than the median and average levels charged to funds in the applicable Morningstar category, and that the level of total expense for a second share class was higher than the median and lower than the average levels for that category. Peer group data showed that the Fund’s stated advisory fee was higher than the median level for the two peer groups but comparable to other funds in the peer group, and that the total expense levels of two representative share classes were higher than the medians of their respective peer groups but comparable to other funds in the peer groups after waivers of fees and reimbursement of expenses. The Trustees did not find the differences significant in view of their findings and conclusions respecting the other factors considered.
The Trustees noted their consideration of information respecting the advisory fees charged by the Advisor to other investment management clients, including sub-advised mutual funds and other institutional clients, together with information about fees charged by other advisors to different clients, analysis of the differences between the requirements of institutional clients and mutual funds, analysis of the differences between the requirements of a sub-advised mutual fund and a fund as to which the investment advisor is the primary advisor and sponsor, and the consequently different investment management services provided to the different categories of clients and the differing contexts in which these arrangements are entered into. The Trustees confirmed their previous observations that the differences between the fees charged by the Advisor or by other investment advisors to different types of clients did not appear exceptional and had limited relevance to the evaluation of the fee rate charged to mutual funds as to which the Advisor or such other advisors are the primary advisor and sponsor.
Costs and Profitability of Advisor. In reviewing the profitability of the Advisor’s services to the Fund, the Trustees considered an analysis of the Advisor’s costs and the estimated profitability to the Advisor of its services, together with data respecting the overall profitability of a selection of other investment management firms. The Trustees considered in this regard information from the Advisor respecting investment of its profits to maintain staffing levels, and noted that a portion of the Advisor’s profits is an important element in the compensation of shareholder employees. The Trustees considered information from the Advisor respecting the use of profits to enhance staff competencies through training and other measures, hire personnel to expand and develop the scope of senior management expertise, pay competitive levels of compensation, and add to the Advisor’s electronic and information technology systems to maintain or improve service levels. The Trustees also considered the contribution of the Advisor’s cost management to its profitability, and the relationship of the Advisor’s financial resources and profitability in previous years to its ability to attract necessary personnel, invest in systems and other assets required for its service to the Fund, and maintain or improve service levels for the Fund notwithstanding fluctuations in revenues and profitability. The information considered did not indicate to the Trustees that the Advisor’s profitability was excessive.
Potential Economies of Scale. In reviewing the extent to which economies of scale would be realized by the Fund as it grows and whether fee levels reflect potential economies of scale, the Trustees considered the breakpoint structure for advisory fees chargeable to the Fund, comparisons of the fee breakpoint structure for the Fund with breakpoint structures (or the absence of such structures) for other funds in a peer group selected by an independent mutual fund analyst firm, the effects of the breakpoint structure and other expense factors realized by certain funds of the Trust as their asset levels had increased, the Advisor’s undertakings to waive or reimburse certain fees and expenses of the Fund, and the Advisor’s expenditures from its own profits and resources to maintain staffing levels and expand staff competencies, pay competitive levels of compensation, and add to its electronic and information technology systems so as to maintain or improve service levels. The information provided demonstrated to the Trustees that the Fund’s advisory fee breakpoint structure is reasonable in relation to the structures observed in the other funds in its peer group, and that shareholders may be expected to benefit from any economies of scale, due to the advisory agreement’s breakpoint fee structure for the Fund and other factors.
Potential Ancillary Benefits. In reviewing potential benefits to the Advisor because of its relationship to the Fund, the Trustees considered explanations from the Advisor respecting its receipt of certain research services from broker dealers, and the benefits to both the Fund and the Advisor of the Advisor’s expansion of its staffing, compliance and systems capabilities and other resources to serve a broader variety of investment management clients. No unusual or unfair benefits to the Advisor from its relationship to the Fund were identified by the Trustees.
Other Information, Continued
Thornburg Value Fund | September 30, 2019 (Unaudited)
Summary of Conclusions. The Trustees concluded that the general nature, extent and quality of the Advisor’s services performed under the advisory agreement remained sufficient, the Advisor had continued to actively and competently pursue the Fund’s stated investment objectives and adhere to the Fund’s investment policies, and that the absolute and relative investment performance of the Fund over pertinent holding periods on the whole was satisfactory in the context of the Fund’s objectives and strategies. The Trustees further concluded that the level of the advisory fee charged to the Fund by the Advisor is fair and reasonable in relation to the services provided by the Advisor, in view of the nature, extent and quality of those services, the investment performance of the Fund after fees and expenses, the clear disclosure of fees and expenses in the Fund’s prospectuses, comparisons of fees and expenses charged to the Fund to fees and expenses charged to other mutual funds, and the other factors considered. The Trustees accordingly determined to renew the Fund’s investment advisory agreement with the Advisor for an additional term of one year.
Trustees’ Statement to Shareholders (Unaudited)
Readopted September 17, 2019
The Trustees believe current and prospective shareholders should know how we discharge our responsibilities in supervising the Funds’ investment advisor and in reviewing the advisor’s contract for renewal. Since 2005, we have issued a statement which sets out clearly the three principal guidelines that we follow in supervising the Trust’s investment advisor on your behalf. In accordance with our customary practice, in September of this year we again reviewed our statement and concluded we should reissue this statement outlining the principal features of our supervision of the advisor’s performance of investment management services for the Funds.
We begin with the premise that each shareholder selected his or her Fund because its investments are managed by the investment advisor identified in the prospectus and in accordance with the objective and policies described in the prospectus. We realize, as each of you do, that if you believe that your Fund’s stated objective and policies no longer serve your personal investment goals, you can sell your shares and leave the Fund.
Therefore, we believe that our primary supervisory task—our principal obligation to you—is to assess the nature and quality of the advisor’s services, and to confirm that the advisor actively and competently pursues the Fund’s objective, in accordance with the policies set out in the prospectus. To do this, we meet regularly with management to review your Fund’s portfolio and to discuss the advisor’s specific actions and judgments in pursuing the Fund’s objective. We do not substitute our own judgment for the advisor’s decisions in selecting investments; the advisor is paid to exercise its informed judgment on investment decisions, and we seek to confirm, in reviewing the advisor’s performance, that the advisor is doing just that.
Second, we are conscious of costs and the effect that costs have on shareholders’ returns. We try to make sure that your Fund’s fees and costs are reasonable in relationship to the services rendered and that they are generally in line with those charged by other expert investment advisors, consistent with our belief that the Fund’s investors searched for and expect that expertise and attention and have decided to pay a reasonable price for it. We do not put the management contract “out to bid” as a matter of course, and we would not do so unless we had concluded that the advisor materially had failed to pursue the Fund’s objectives in accordance with its policies, or for other equally important reasons. We believe that any other approach would be inconsistent with your interests and contrary to your expectations when you bought shares of the Fund in the first place.
Finally, because we believe that most Thornburg Fund shareholders have invested with a long-term perspective, we try not to focus too much on the fashions of the moment and on short-term performance. The market will not favor any specific investment objective or set of policies at all times and under all economic circumstances. A fund will experience periods of both high and low returns relative to other funds and other investments. Even if one of our Funds is not favored by the market at a particular time, we believe that the advisor is nonetheless obliged to remain true to the Fund’s objective and policies, and we watch to see that it does so.
Trustees of Thornburg Investment Trust
Thornburg Investment Management is a privately-owned global investment firm that offers a range of solutions for retail and institutional investors. Founded in 1982 and headquartered in Santa Fe, New Mexico, we manage approximately $41.9 billion (as of September 30, 2019) across U.S. mutual funds, separate accounts for high-net-worth investors, institutional accounts, and UCITS funds for non-U.S. investors.
The fund outlined in this report is one of many equity and fixed-income products available from Thornburg Investment Management.
EQUITY FUNDS
| ■ | Thornburg Global Opportunities Fund |
| ■ | Thornburg International Value Fund |
| ■ | Thornburg Better World International Fund |
| ■ | Thornburg International Growth Fund |
| ■ | Thornburg Developing World Fund |
| ■ | Thornburg Value Fund |
| ■ | Thornburg Core Growth Fund |
MULTI_ASSET FUNDS
| ■ | Thornburg Investment Income Builder Fund |
| ■ | Thornburg Summit Fund |
FIXED INCOME FUNDS
| ■ | Thornburg Low Duration Income Fund |
| ■ | Thornburg Limited Term U.S. Government Fund |
| ■ | Thornburg Limited Term Income Fund |
| ■ | Thornburg Strategic Income Fund |
| ■ | Thornburg Low Duration Municipal Fund |
| ■ | Thornburg Limited Term Municipal Fund |
| ■ | Thornburg Intermediate Municipal Fund |
| ■ | Thornburg California Limited Term Municipal Fund |
| ■ | Thornburg New Mexico Intermediate Municipal Fund |
| ■ | Thornburg New York Intermediate Municipal Fund |
| ■ | Thornburg Strategic Municipal Income Fund |
ALTERNATIVE FUNDS
| ■ | Thornburg Long/Short Equity Fund |
Before investing, carefully consider the Fund’s investment goals, risks, charges, and expenses. For a prospectus or summary prospectus containing this and other information, contact your financial advisor or visit thornburg.com. Read it carefully before investing.
For additional information, please visit thornburg.com
Thornburg Investment Management, Inc. 2300 North Ridgetop Road, Santa Fe, NM 87506
This page intentionally left blank.
To receive shareholder reports, prospectuses, and proxy statements electronically, go to www.thornburg.com/edelivery.
This Annual Report is submitted for the general information of shareholders of the Fund. It is not authorized for distribution to prospective investors in the Fund unless preceded or accompanied by an effective prospectus.
Investment Advisor:
Thornburg Investment Management®
800.847.0200
Distributor:
Thornburg Securities Corporation®
Annual Report
September 30, 2019
Beginning on January 1, 2021, as permitted by regulations adopted by the Securities and Exchange Commission, paper copies of the Fund’s shareholder reports will no longer be sent by mail, unless you specifically request paper copies of the reports from the Fund or from your financial intermediary, such as a broker-dealer or bank. Instead, the reports will be made available on a website, and you will be notified by mail each time a report is posted and provided with a website link to access the report.
If you already elected to receive shareholder reports electronically, you will not be affected by this change and you need not take any action. You may elect to receive shareholder reports and other communications from the Fund or your financial intermediary electronically by going to thornburg.com/edelivery.
You may elect to receive all future reports in paper free of charge. You can inform the Fund or your financial intermediary that you wish to continue receiving paper copies of your shareholder reports by calling 800.847.0200 or your financial intermediary directly. Your election to receive reports in paper will apply to all funds held with the fund complex/your financial intermediary.
At Thornburg, we believe unconstrained investing leads to better outcomes for our clients. Our investment solutions are highly active, high conviction, and benchmark agnostic. When it comes to finding economic opportunity for clients, it’s more than what we do.
It’s how we do it. Active Asbottom-up, fundamental, active managers, we look beyond conventional benchmarks. Long Term We take a long-term view in how we manage our firm and our portfolios. Benchmark Agnostic Investment strategies should have the flexibility to pursue solutions for clients, not stay within the conventional confines of benchmarks. Flexible Perspective Our approach to portfolio construction is guided by our convictions rather than convention. High Conviction We focus our attention and capital on thoroughly researched, well-understood positions. The best form of risk management is to know what you own, and why. Repeatable & Robust Our long-term outperformance of benchmarks verifies that our process works and outperforms conventional thinking. Independent We are independently owned and far from the herd of other investment managers. Investment Driven All members of the investment team are resources for all of our strategies. Collaborative Our team collaborates on opportunities across geography, sector, or asset class.
Thornburg International Value Fund
Annual Report | September 30, 2019
Table of Contents
| SHARE CLASS | NASDAQ SYMBOL | CUSIP |
| Class A | TGVAX | 885-215-657 |
| Class C | THGCX | 885-215-640 |
| Class I | TGVIX | 885-215-566 |
| Class R3 | TGVRX | 885-215-525 |
| Class R4 | THVRX | 885-215-269 |
| Class R5 | TIVRX | 885-215-368 |
| Class R6 | TGIRX | 885-216-804 |
Class I, R3, R4, R5, and R6 shares may not be available to all investors. Minimum investments for Class I shares may be higher than those for other classes.
Investments carry risks, including possible loss of principal. Additional risks may be associated with investments outside the United States, especially in emerging markets, including currency fluctuations, illiquidity, volatility, and political and economic risks. Investments in small- and mid-capitalization companies may increase the risk of greater price fluctuations. Please see the Fund’s prospectus for a discussion of the risks associated with an investment in the Fund. Investments in the Fund are not FDIC insured, nor are they deposits of or guaranteed by a bank or any other entity.
Funds invested in a smaller number of holdings may expose an investor to greater volatility.
Letter to Shareholders
Thornburg International Value Fund | September 30, 2019 (Unaudited)
October 18, 2019
Dear Fellow Shareholder:
Returns in international equity markets were modestly negative in the fiscal year ended September 30, 2019. Developed markets, represented by the MSCI EAFE Index, lost 1.34% while the MSCI ACWI ex U.S. Index, which includes emerging markets, lost 1.23%. The Thornburg International Value Fund (Class I shares) outperformed both of its benchmark indices, returning 2.76%.
Most global markets were down sharply in the 4th quarter of 2018, driven by concerns about a synchronized global slowdown, the potential for tighter-than-expected monetary policy in the U.S., the U.S.-China trade war, slowing growth in China, Brexit and other issues. For the 4th quarter 2018, the MSCI ACWI ex U.S. Index lost 11.5% and the MSCI EAFE Index was down 12.5%. U.S. markets were down sharply as well, with the S&P 500 Index down 13.5%. The Thornburg International Value Fund (Class I shares) returned negative 13.6%.
In our view, the global macro headwinds experienced during 2018, particularly in the 4th quarter, created valuation dislocations, which drove many markets and individual stocks below their intrinsic value and created attractive entry points. While the Fund underperformed its benchmarks during the quarter, we re-examined the investment thesis for all of our holdings, reducing or selling a number where our thesis had changed and keeping those which we believed were undervalued. We also used the market decline as an opportunity to upgrade our portfolio, acquiring a number of quality companies which were trading at attractive valuations.
That effort was repaid in the 1st quarter of 2019, as global equity markets rebounded strongly. The MSCI ACWI ex U.S. Index returned 10.3% and the MSCI EAFE Index 10.0%. The International Value Fund (Class I shares) outperformed both, returning 15.7%. Many of the stocks we had acquired at attractive valuations in the 4th quarter contributed to the outperformance, as did many of the companies that we believed to be undervalued and continued to hold.
While both the Fund and its benchmarks generated more modest returns in the 2nd and 3rd quarters of 2019, for the first nine months of 2019 the International Value Fund (Class I shares) returned 19.0% versus 11.6% for the MSCI ACWI ex U.S. Index and 12.8% for the MSCI EAFE Index. For the fiscal
year ended September 30, 2019, roughly 75% to 80% of the Fund’s outperformance versus its benchmark indices was driven by bottom-up stock selection, which is central to the Fund’s investment process.
As we look forward, many of the issues that concerned markets in the 4th quarter of 2018 remain. While we may see some progress in the U.S.-China trade dispute in the form of a narrower initial agreement, a more meaningful agreement that addresses the larger issues which remain will be more difficult, will take time and will likely continue to generate periodic market volatility. While both the U.S. Federal Reserve and the European Central Bank have eased monetary policy in 2019 and China has taken a number of macro measures to stimulate its economy, many indicators of economic activity continue to show weakness. Both the U.S. Institute of Supply Management (ISM) Purchasing Managers Index (PMI) and the Eurozone PMI are below 50, indicating contraction, with the U.S. indicator at a 10-year low. Reflecting the slower economic growth, global bond yields have fallen through much of 2019. As we approach the October 31 Brexit deadline, concerns over the potential impact to growth in Europe and the U.K. remain.
We see global growth bottoming at low, but not necessarily negative, levels. Recent stimulus measures and other policy tools which global policy makers still have at their disposal may help, although the path for global markets from here may remain bumpy, given the risks and unresolved issues which remain. We expect to see a wider dispersion of investing outcomes, with gains less broad-based in a slower global environment. Those conditions should favor bottom-up stock selection and our investment process. While the international outlook from a top-down perspective may remain uncertain, on a bottom-up basis we remain optimistic that there will continue to be attractive opportunities.
Thank you for investing alongside us in Thornburg International Value Fund

| 
|
Lei Wang,cfa
Portfolio Manager
Managing Director | Di Zhou,cfa,frm®
Portfolio Manager
Managing Director |
The matters discussed in this report may constitute forward-looking statements made pursuant to the safe harbor provisions of the Securities Litigation Reform Act of 1995. These include any advisor or portfolio manager prediction, assessment, analysis or outlook for individual securities, industries, investment styles, market sectors and/or markets. These statements involve risks and uncertainties. In addition to the general risks described for each fund in its current prospectus, other factors bearing on these reports include the accuracy of the advisor’s or portfolio manager’s forecasts and predictions, the appropriateness of the investment strategies designed by the advisor or portfolio manager and the ability of the advisor or portfolio manager to implement their strategies efficiently and successfully. Any one or more of these factors, as well as other risks affecting the securities markets generally, could cause the actual results of any fund to differ materially as compared to its benchmarks.
The views expressed are subject to change and do not necessarily reflect the views of Thornburg Investment Management, Inc. This information should not be relied upon as a recommendation or investment advice and is not intended to predict the performance of any investment or market.
Performance results of individual share classes will vary based on the fees and expenses associated with each share class, and may be higher or lower than other share classes within the same Fund. Please see Performance Summary for performance results of each share class.
Performance Summary
Thornburg International Value Fund | September 30, 2019 (Unaudited)
AVERAGE ANNUAL TOTAL RETURNS
| | 1-YR | 3-YR | 5-YR | 10-YR | SINCE
INCEP. |
| Class A Shares(Incep: 5/28/98) | | | | | |
| Without sales charge | 2.47% | 5.28% | 3.78% | 4.62% | 6.96% |
| With sales charge | -2.14% | 3.68% | 2.83% | 4.14% | 6.73% |
| Class C Shares(Incep: 5/28/98) | | | | | |
| Without sales charge | 1.60% | 4.46% | 2.99% | 3.84% | 6.12% |
| With sales charge | 0.60% | 4.46% | 2.99% | 3.84% | 6.12% |
| Class I Shares(Incep: 3/30/01) | 2.76% | 5.64% | 4.14% | 5.01% | 6.70% |
| Class R3 Shares(Incep: 7/1/03) | 2.25% | 5.10% | 3.60% | 4.44% | 7.49% |
| Class R4 Shares(Incep: 2/1/07) | 2.45% | 5.31% | 3.80% | 4.64% | 3.05% |
| Class R5 Shares(Incep: 2/1/05) | 2.74% | 5.58% | 4.08% | 4.93% | 5.93% |
| Class R6 Shares(Incep: 5/1/12) | 2.95% | 5.79% | 4.30% | - | 5.04% |
| MSCI EAFE Index(Since 5/28/98) | -1.34% | 6.48% | 3.27% | 4.90% | 4.06% |
| MSCI AC World ex U.S. Index(Net) (Since 5/28/98) | -1.23% | 6.33% | 2.90% | 4.45% | 4.50% |
GROWTH OF A HYPOTHETICAL $10,000 INVESTMENT
Performance data shown represents past performance and is no guarantee of future results. Investment return and principal value will fluctuate so shares, when redeemed, may be worth more or less than their original cost. Current performance may be lower or higher than quoted. For performance current to the most recent month end, visit thornburg.com or call 800-847-0200. The performance information does not reflect the deduction of taxes that a shareholder would pay on distributions or the redemption of Fund shares. Returns reflect the reinvestment of dividends and capital gains. Class A shares are sold with a maximum sales charge of 4.50%. Class C shares are subject to a 1% CDSC for the first year only. There is no sales charge for Class I, R3, R4, R5 and R6 shares. As disclosed in the most recent prospectus, the total annual fund operating expenses before any fee waivers or expense reimbursements are as follows: A shares, 1.27%; C shares, 2.02%; I shares, 0.91%; R3 shares, 1.64%; R4 shares, 1.47%; R5 shares, 1.17%; R6 shares, 0.83%. Thornburg Investment Management has contractually agreed to waive fees and reimburse expenses until at least February 1, 2020, for some of the share classes, resulting in net expense ratios of the following: R3 shares, 1.45%; R4 shares, 1.25% and R5 shares, 0.99%. For more detailed information on fund expenses and waivers/reimbursements please see the Fund’s prospectus.
TheMSCI All Country (AC) World ex U.S. Index is a market capitalization weighted index representative of the market structure of 45 developed and emerging market countries in North and South America, Europe, Africa, and the Pacific Rim, excluding securities of United States issuers. Beginning in January 2001, the index is calculated with net dividends reinvested in U.S. dollars. Prior data is calculated with gross dividends.
TheMSCI EAFE (Europe, Australasia, Far East) Index is an unmanaged index. It is a generally accepted benchmark for major overseas markets. Index weightings represent the relative capitalizations of the major overseas developed markets on a U.S. dollar adjusted basis. The index is calculated with net dividends reinvested in U.S. dollars
TheS&P 500 Index is an unmanaged broad measure of the U.S. stock market.
The performance of any index is not indicative of the performance of any particular investment. Unless otherwise noted, index returns reflect the reinvestment of income dividends and capital gains, if any, but do not reflect fees, brokerage commissions or other expenses of investing. Investors may not make direct investments into any index.
The Eurozone Manufacturing Purchasing Managers Index (PMI) measures the activity level of purchasing managers in the eurozone manufacturing sector. A reading above 50 indicates expansion in the sector; below 50 indicates contraction.
The U.S. Institute of Supply Management (ISM) Purchasing Managers Index (PMI) Report on Business is based on data compiled from monthly replies to questions asked of purchasing and supply executives in over 400 industrial companies. For each of the indicators measured (New Orders, Backlog of Orders, New Export Orders, Imports, Production, Supplier Deliveries, Inventories, Customers Inventories, Employment, and Prices), this report shows the percentage reporting each response, the net difference between the number of responses in the positive economic direction and the negative economic direction and the diffusion index.
Any securities, sectors, or countries mentioned are for illustration purposes only. Holdings are subject to change. Under no circumstances does the information contained within represent a recommendation to buy or sell any security.
Fund Summary
Thornburg International Value Fund | September 30, 2019 (Unaudited)
OBJECTIVES AND STRATEGIES
The Fund seeks long-term capital appreciation by investing in equity and debt securities of all types. As a secondary goal, the Fund also seeks some current income.
The Fund invests primarily in foreign securities or depositary receipts of foreign securities. The Fund may invest in developing countries.
MARKET CAPITALIZATION EXPOSURE
BASKET STRUCTURE
| TOP TEN EQUITY HOLDINGS |
| Keyence Corp. | 3.1% |
| Safran S.A. | 3.1% |
| Ferrovial S.A. | 3.0% |
| ING Groep N.V. | 3.0% |
| Danone S.A. | 3.0% |
| Vinci S.A. | 3.0% |
| Nintendo Co. Ltd. | 2.9% |
| Kose Corp. | 2.9% |
| Vodafone Group plc | 2.9% |
| Iberdrola S.A. | 2.8% |
| SECTOR EXPOSURE |
| Industrials | 17.7% |
| Financials | 12.6% |
| Information Technology | 12.4% |
| Communication Services | 11.7% |
| Consumer Staples | 11.2% |
| Consumer Discretionary | 8.4% |
| Utilities | 5.0% |
| Health Care | 4.3% |
| Energy | 3.2% |
| Materials | 3.2% |
| Other Assets Less Liabilities | 10.3% |
| TOP TEN INDUSTRY GROUPS |
| Capital Goods | 13.3% |
| Food, Beverage & Tobacco | 8.3% |
| Media & Entertainment | 8.1% |
| Software & Services | 5.2% |
| Utilities | 5.0% |
| Technology Hardware & Equipment | 5.0% |
| Banks | 4.9% |
| Insurance | 4.6% |
| Consumer Durables & Apparel | 4.0% |
| Telecommunication Services | 3.6% |
COUNTRY EXPOSURE*
(percent of equity holdings) |
| Japan | 15.1% |
| France | 14.2% |
| China | 14.0% |
| Germany | 10.8% |
| Spain | 8.8% |
| United Kingdom | 7.4% |
| Netherlands | 6.8% |
| Switzerland | 6.0% |
| Canada | 5.8% |
| Australia | 2.3% |
| Sweden | 2.2% |
| Hong Kong | 2.1% |
| Italy | 1.8% |
| India | 1.2% |
| South Korea | 1.1% |
| Denmark | 0.4% |
| * | Holdings are classified by country of risk as determined by MSCI and Bloomberg. |
There is no guarantee that the Fund will meet its investment objectives.
All data is subject to change. Charts may not add up to 100% due to rounding.
Schedule of Investments
Thornburg International Value Fund | September 30, 2019
| | | SHARES | VALUE |
| | Common Stock — 89.7% | | |
| | Banks — 4.9% | | |
| | Banks — 4.9% | | |
| | Barclays plc | 16,796,331 | $ 31,060,488 |
| | ING Groep N.V. | 8,943,176 | 93,616,120 |
| | Intesa Sanpaolo SpA | 11,593,635 | 27,490,676 |
| | | | 152,167,284 |
| | Capital Goods — 13.3% | | |
| | Aerospace & Defense — 5.3% | | |
| | BAE Systems plc | 10,138,292 | 71,053,532 |
| | Safran S.A. | 603,692 | 95,047,276 |
| | Construction & Engineering — 6.0% | | |
| | Ferrovial S.A. | 3,244,977 | 93,762,258 |
| | Vinci S.A. | 853,182 | 91,895,288 |
| | Electrical Equipment — 0.4% | | |
| | Vestas Wind Systems A/S | 154,791 | 12,017,293 |
| | Machinery — 1.6% | | |
| | Knorr-Bremse AG | 516,345 | 48,535,044 |
| | | | 412,310,691 |
| | Commercial & Professional Services — 1.9% | | |
| | Professional Services — 1.9% | | |
| | Recruit Holdings Co. Ltd. | 1,917,670 | 58,279,432 |
| | | | 58,279,432 |
| | Consumer Durables & Apparel — 4.0% | | |
| | Textiles, Apparel & Luxury Goods — 4.0% | | |
| | adidas AG | 254,699 | 79,299,085 |
| | Kering S.A. | 86,295 | 43,976,474 |
| | | | 123,275,559 |
| | Consumer Services — 1.9% | | |
| | Diversified Consumer Services — 0.7% | | |
| a | TAL Education Group ADR | 618,978 | 21,193,807 |
| | Hotels, Restaurants & Leisure — 1.2% | | |
| | Huazhu Group Ltd. ADR | 1,115,728 | 36,841,338 |
| | | | 58,035,145 |
| | Diversified Financials — 3.1% | | |
| | Capital Markets — 3.1% | | |
| | Hong Kong Exchanges & Clearing Ltd. | 1,049,522 | 30,798,584 |
| | UBS Group AG | 5,832,398 | 66,210,179 |
| | | | 97,008,763 |
| | Energy — 3.2% | | |
| | Oil, Gas & Consumable Fuels — 3.2% | | |
| | Reliance Industries Ltd. | 1,810,811 | 34,070,499 |
| | Royal Dutch Shell plc Sponsored ADR Class A | 1,129,256 | 66,456,716 |
| | | | 100,527,215 |
| | Food, Beverage & Tobacco — 8.3% | | |
| | Beverages — 3.3% | | |
| | Kweichow Moutai Co. Ltd. Class A | 246,138 | 39,652,961 |
| | Treasury Wine Estates Ltd. | 5,072,937 | 63,583,297 |
| | Food Products — 5.0% | | |
| | Associated British Foods plc | 544,747 | 15,425,342 |
| | Danone S.A. | 1,050,904 | 92,573,908 |
| | Foshan Haitian Flavouring & Food Co. Ltd. Class A | 328,883 | 5,063,814 |
| | Inner Mongolia Yili Industrial Group Co. Ltd. Class A | 9,936,746 | 39,700,213 |
| | | | 255,999,535 |
| | Healthcare Equipment & Services — 2.5% | | |
Schedule of Investments, Continued
Thornburg International Value Fund | September 30, 2019
| | | SHARES | VALUE |
| | Health Care Equipment & Supplies — 1.2% | | |
| a | Alcon, Inc. | 657,846 | $ 38,361,442 |
| | Health Care Providers & Services — 1.3% | | |
| | Fresenius Medical Care AG & Co. KGaA | 573,580 | 38,573,218 |
| | | | 76,934,660 |
| | Household & Personal Products — 2.9% | | |
| | Personal Products — 2.9% | | |
| | Kose Corp. | 531,795 | 89,759,618 |
| | | | 89,759,618 |
| | Insurance — 4.6% | | |
| | Insurance — 4.6% | | |
| | AIA Group Ltd. | 2,906,209 | 27,457,644 |
| | NN Group N.V. | 840,860 | 29,822,768 |
| | Ping An Insurance Group Co. of China Ltd. Class H | 7,297,573 | 83,844,297 |
| | | | 141,124,709 |
| | Materials — 3.2% | | |
| | Chemicals — 2.4% | | |
| | Nutrien Ltd. | 1,448,771 | 72,264,698 |
| | Shin-Etsu Chemical Co. Ltd. | 29,947 | 3,201,732 |
| | Metals & Mining — 0.8% | | |
| | Franco-Nevada Corp. | 251,056 | 22,886,265 |
| | | | 98,352,695 |
| | Media & Entertainment — 8.1% | | |
| | Entertainment — 3.4% | | |
| | Nintendo Co. Ltd. | 243,433 | 90,101,167 |
| a | Ubisoft Entertainment S.A. | 210,602 | 15,228,063 |
| | Interactive Media & Services — 4.7% | | |
| | Tencent Holdings Ltd. | 2,036,371 | 85,791,712 |
| | Yahoo Japan Corp. | 21,429,739 | 60,251,012 |
| | | | 251,371,954 |
| | Pharmaceuticals, Biotechnology & Life Sciences — 1.8% | | |
| | Life Sciences Tools & Services — 1.8% | | |
| | Lonza Group AG | 170,196 | 57,536,326 |
| | | | 57,536,326 |
| | Retailing — 2.5% | | |
| | Internet & Direct Marketing Retail — 2.5% | | |
| a | Alibaba Group Holding Ltd. Sponsored ADR | 429,630 | 71,847,025 |
| a | Ctrip.com International Ltd. ADR | 160,000 | 4,686,400 |
| | | | 76,533,425 |
| | Semiconductors & Semiconductor Equipment — 2.2% | | |
| | Semiconductors & Semiconductor Equipment — 2.2% | | |
| | Infineon Technologies AG | 2,086,950 | 37,559,382 |
| | SK Hynix, Inc. | 458,189 | 31,486,967 |
| | | | 69,046,349 |
| | Software & Services — 5.2% | | |
| | Information Technology Services — 3.0% | | |
| | Amadeus IT Group S.A. | 883,848 | 63,311,390 |
| | Wirecard AG | 186,586 | 29,844,470 |
| | Software — 2.2% | | |
| | SAP SE | 569,217 | 66,930,721 |
| | | | 160,086,581 |
| | Technology Hardware & Equipment — 5.0% | | |
| | Communications Equipment — 1.9% | | |
| | Telefonaktiebolaget LM Ericsson | 7,436,070 | 59,418,762 |
| | Electronic Equipment, Instruments & Components — 3.1% | | |
Schedule of Investments, Continued
Thornburg International Value Fund | September 30, 2019
| | | SHARES | VALUE |
| | Keyence Corp. | 155,248 | $ 96,056,335 |
| | | | 155,475,097 |
| | Telecommunication Services — 3.6% | | |
| | Wireless Telecommunication Services — 3.6% | | |
| | SoftBank Group Corp. | 551,354 | 21,620,726 |
| | Vodafone Group plc | 44,546,454 | 88,730,755 |
| | | | 110,351,481 |
| | Transportation — 2.5% | | |
| | Marine — 0.2% | | |
| | Kuehne + Nagel International AG | 31,416 | 4,627,175 |
| | Road & Rail — 2.1% | | |
| | Canadian Pacific Railway Ltd. | 297,669 | 66,219,446 |
| | Transportation Infrastructure — 0.2% | | |
| | Atlantia SpA | 234,052 | 5,660,781 |
| | | | 76,507,402 |
| | Utilities — 5.0% | | |
| | Electric Utilities — 5.0% | | |
| | Electricite de France S.A. | 4,835,566 | 54,128,310 |
| | Enel SpA | 2,066,970 | 15,434,581 |
| | Iberdrola S.A. | 8,333,118 | 86,612,482 |
| | | | 156,175,373 |
| | Total Common Stock(Cost $2,456,455,310) | | 2,776,859,294 |
| | Short-Term Investments — 10.6% | | |
| b | Thornburg Capital Management Fund | 32,678,811 | 326,788,112 |
| | Total Short-Term Investments(Cost $326,788,112) | | 326,788,112 |
| | Total Investments — 100.3%(Cost $2,783,243,422) | | $3,103,647,406 |
| | Liabilities Net of Other Assets — (0.3)% | | (9,052,596) |
| | Net Assets — 100.0% | | $3,094,594,810 |
| Footnote Legend |
| a | Non-income producing. |
| b | Investment in Affiliates. |
Portfolio Abbreviations
To simplify the listings of securities, abbreviations are used per the table below:
| ADR | American Depositary Receipt |
See notes to financial statements.
Statement of Assets and Liabilities
Thornburg International Value Fund | September 30, 2019
| ASSETS | |
| Investments at value (Note 3) | |
| Non-affiliated issuers (cost $2,456,455,310) | $ 2,776,859,294 |
| Non-controlled affiliated issuer (cost $326,788,112) | 326,788,112 |
| Cash denominated in foreign currency (cost $21) | 21 |
| Receivable for investments sold | 14,258,503 |
| Receivable for fund shares sold | 988,781 |
| Dividends receivable | 4,407,100 |
| Dividend and interest reclaim receivable | 1,937,410 |
| Prepaid expenses and other assets | 102,435 |
| Total Assets | 3,125,341,656 |
| Liabilities | |
| Payable for investments purchased | 17,627,016 |
| Payable for fund shares redeemed | 6,752,758 |
| Payable to investment advisor and other affiliates (Note 4) | 2,547,016 |
| Deferred taxes payable (Note 2) | 858,720 |
| Accounts payable and accrued expenses | 2,961,336 |
| Total Liabilities | 30,746,846 |
| Net Assets | $ 3,094,594,810 |
| NET ASSETS CONSIST OF | |
| Distributable earnings | $ 515,505,324 |
| Net capital paid in on shares of beneficial interest | 2,579,089,486 |
| | $ 3,094,594,810 |
Statement of Assets and Liabilities, Continued
Thornburg International Value Fund | September 30, 2019
| NET ASSET VALUE | |
| Class A Shares: | |
Net asset value and redemption price per share
($655,806,721 applicable to 28,624,362 shares of beneficial interest outstanding - Note 5) | $ 22.91 |
| Maximum sales charge, 4.50% of offering price | 1.08 |
| Maximum offering price per share | $ 23.99 |
| Class C Shares: | |
Net asset value and offering price per share*
($81,401,240 applicable to 4,003,304 shares of beneficial interest outstanding - Note 5) | $ 20.33 |
| Class I Shares: | |
Net asset value, offering and redemption price per share
($1,694,780,279 applicable to 71,529,787 shares of beneficial interest outstanding - Note 5) | $ 23.69 |
| Class R3 Shares: | |
Net asset value, offering and redemption price per share
($164,437,140 applicable to 7,184,102 shares of beneficial interest outstanding - Note 5) | $ 22.89 |
| Class R4 Shares: | |
Net asset value, offering and redemption price per share
($125,363,112 applicable to 5,513,123 shares of beneficial interest outstanding - Note 5) | $ 22.74 |
| Class R5 Shares: | |
Net asset value, offering and redemption price per share
($153,365,817 applicable to 6,478,793 shares of beneficial interest outstanding - Note 5) | $ 23.67 |
| Class R6 Shares: | |
Net asset value, offering and redemption price per share
($219,440,501 applicable to 9,293,696 shares of beneficial interest outstanding - Note 5) | $ 23.61 |
| * | Redemption price per share is equal to net asset value less any applicable contingent deferred sales charge. |
See notes to financial statements.
Statement of Operations
Thornburg International Value Fund | Year Ended September 30, 2019
| INVESTMENT INCOME | |
| Dividend income | |
| Non-affiliated issuers (net of foreign taxes withheld of $5,510,003) | $ 60,978,229 |
| Non-controlled affiliated issuer | 5,843,558 |
| Non-cash dividend | 8,109,292 |
| Total Income | 74,931,079 |
| EXPENSES | |
| Investment advisory fees (Note 4) | 26,556,904 |
| Administration fees (Note 4) | |
| Class A Shares | 594,217 |
| Class C Shares | 101,566 |
| Class I Shares | 1,642,750 |
| Class R3 Shares | 160,334 |
| Class R4 Shares | 124,650 |
| Class R5 Shares | 160,906 |
| Class R6 Shares | 344,660 |
| Distribution and service fees (Note 4) | |
| Class A Shares | 1,690,265 |
| Class C Shares | 1,157,701 |
| Class R3 Shares | 912,368 |
| Class R4 Shares | 354,825 |
| Transfer agent fees | |
| Class A Shares | 901,316 |
| Class C Shares | 236,613 |
| Class I Shares | 1,755,894 |
| Class R3 Shares | 480,036 |
| Class R4 Shares | 433,537 |
| Class R5 Shares | 445,317 |
| Class R6 Shares | 15,769 |
| Registration and filing fees | |
| Class A Shares | 17,910 |
| Class C Shares | 15,384 |
| Class I Shares | 33,314 |
| Class R3 Shares | 14,170 |
| Class R4 Shares | 15,531 |
| Class R5 Shares | 12,952 |
| Class R6 Shares | 14,897 |
| Custodian fees | 578,623 |
| Professional fees | 211,144 |
| Trustee and officer fees (Note 4) | 221,213 |
| Other expenses | 454,253 |
| Total Expenses | 39,659,019 |
| Less: | |
| Expenses reimbursed by investment advisor (Note 4) | (1,226,422) |
| Net Expenses | 38,432,597 |
| Net Investment Income | $ 36,498,482 |
Statement of Operations, Continued
Thornburg International Value Fund | Year Ended September 30, 2019
| REALIZED AND UNREALIZED GAIN (LOSS) | |
| Net realized gain (loss) on: | |
| Non-affiliated issuer investments (net of realized capital gain taxes paid of $385,317) | $ 230,392,595 |
| Forward currency contracts (Note 7) | 25,303,245 |
| Foreign currency transactions | (1,437,600) |
| | 254,258,240 |
| Net change in unrealized appreciation (depreciation) on: | |
| Non-affiliated issuer investments (net of change in deferred taxes payable of $575,006) | (265,017,783) |
| Forward currency contracts (Note 7) | (9,869,658) |
| Foreign currency translations | (146,198) |
| | (275,033,639) |
| Net Realized and Unrealized Loss | (20,775,399) |
| Net Increase in Net Assets Resulting from Operations | $ 15,723,083 |
See notes to financial statements.
Statements of Changes in Net Assets
Thornburg International Value Fund
| | Year Ended
September 30, 2019 | Year Ended
September 30, 2018 |
| INCREASE (DECREASE) IN NET ASSETS FROM | | |
| OPERATIONS | | |
| Net investment income | $ 36,498,482 | $ 54,098,205 |
| Net realized gain (loss) on investments, forward currency contracts, foreign currency transactions and capital gain taxes | 254,258,240 | (3,667,466) |
| Net change in unrealized appreciation (depreciation) on investments, forward currency contracts, foreign currency translations and deferred taxes | (275,033,639) | (234,416,570) |
| Net Increase (Decrease) in Net Assets Resulting from Operations | 15,723,083 | (183,985,831) |
| DIVIDENDS TO SHAREHOLDERS | | |
| From distributable earnings | | |
| Class A Shares | (8,986,188) | (119,664,083) |
| Class C Shares | - | (62,573,001) |
| Class I Shares | (30,860,690) | (450,919,825) |
| Class R3 Shares | (1,984,958) | (40,754,715) |
| Class R4 Shares | (1,906,286) | (30,158,902) |
| Class R5 Shares | (3,078,981) | (40,624,260) |
| Class R6 Shares | (7,281,194) | (76,239,643) |
| FUND SHARE TRANSACTIONS (NOTE 5) | | |
| Class A Shares | (126,975,885) | 91,509,368 |
| Class C Shares | (76,657,213) | (167,868,829) |
| Class I Shares | (731,547,651) | (358,945,418) |
| Class R3 Shares | (48,954,078) | (23,143,248) |
| Class R4 Shares | (40,117,767) | (7,395,851) |
| Class R5 Shares | (75,022,223) | (20,256,219) |
| Class R6 Shares | (236,639,711) | 18,030,208 |
| Net Decrease in Net Assets | (1,374,289,742) | (1,472,990,249) |
| NET ASSETS | | |
| Beginning of Year | 4,468,884,552 | 5,941,874,801 |
| End of Year | $ 3,094,594,810 | $ 4,468,884,552 |
See notes to financial statements.
Notes to Financial Statements
Thornburg International Value Fund | September 30, 2019
NOTE 1 – ORGANIZATION
Thornburg International Value Fund (the “Fund”) is a diversified series of Thornburg Investment Trust (the “Trust”). The Trust was organized as a Massachusetts business trust under a Declaration of Trust dated June 3, 1987 and is registered as a diversified, open-end management investment company under the Investment Company Act of 1940, as amended (the "1940 Act"). The Fund is currently one of twenty-two separate series of the Trust. Each series is considered to be a separate entity for financial reporting and tax purposes and bears expenses directly attributable to it. The Fund seeks long-term capital appreciation by investing in equity and debt securities of all types. As a secondary objective, the Fund also seeks some current income.
The Fund currently offers seven classes of shares of beneficial interest: Class A, Class C, Institutional Class (“Class I”), and Retirement Classes (“Class R3”, “Class R4”, “Class R5”, and “Class R6”). Each class of shares of the Fund represents an interest in the same portfolio of investments, except that (i) Class A shares are sold subject to a front-end sales charge collected at the time the shares are purchased and bear a service fee, (ii) Class C shares are sold at net asset value without a sales charge at the time of purchase, but are subject to a contingent deferred sales charge upon redemption within one year of purchase, and bear both a service fee and a distribution fee, (iii) Class I and Class R5 shares are sold at net asset value without a sales charge at the time of purchase and may be subject to a service fee, (iv) Class R3 shares are sold at net asset value without a sales charge at the time of purchase, but bear both a service fee and distribution fee, (v) Class R4 shares are sold at net asset value without a sales charge at the time of purchase, but bear a service fee, (vi) Class R6 shares are sold at net asset value without a sales charge at the time of purchase, and (vii) the respective classes may have different reinvestment privileges and conversion rights. Additionally, the Fund may allocate among its classes certain expenses, to the extent allocable to specific classes, including administration fees, transfer agent fees, government registration fees, certain printing and postage costs, and administrative and legal expenses. Currently, class specific expenses of the Fund are limited to service and distribution fees and certain registration and transfer agent expenses.
The following is a summary of significant accounting policies followed by the Fund in the preparation of its financial statements. The Fund prepares its financial statements in conformity with United States generally accepted accounting principles (“GAAP”), including investment company accounting and reporting guidance in the Financial Accounting Standards Board (the “FASB”) Accounting Standard Codification Topic 946.
NOTE 2 – SIGNIFICANT ACCOUNTING POLICIES
Security Valuation: All investments in securities held by the Fund are valued as described in Note 3.
Allocation of Income, Gains, Losses and Expenses: Net investment income (other than class specific expenses) and realized and unrealized gains and losses are allocated daily to each class of shares based upon the relative net asset value of outstanding shares (or the value of the dividend-eligible shares, as appropriate) of each class of shares at the beginning of the day (after adjusting for the current capital shares activity of the respective class). Expenses common to all Funds are allocated among the Funds comprising the Trust based upon their relative net asset values or other appropriate allocation methods. Operating expenses directly attributable to a specific class are charged against the operating income of that class.
Dividends and Distributions to Shareholders: Dividends and distributions to shareholders, which are determined in accordance with federal income tax regulations and may differ from GAAP, are recorded on the ex-dividend date. Ordinary income dividends, if any, are declared and paid annually. Capital gain distributions, if any, are declared and paid annually and more often if deemed necessary by Thornburg Investment Management, Inc., the Trust’s investment advisor (the “Advisor”). Dividends and distributions are paid and are reinvested in additional shares of the Fund at net asset value per share at the close of business on the ex-dividend date, or at the shareholder’s option, paid in cash.
Investment Income: Dividend income is recorded on the ex-dividend date. Certain income from foreign investments is recognized as soon as information is available to the Fund. Interest income is accrued as earned. Premiums and discounts are amortized and accreted, respectively, to first call dates or maturity dates using the effective yield method of the respective investments. These amounts are included in Investment Income in the Statement of Operations.
Investment Transactions: Investment transactions are accounted for on a trade date basis. Realized gains and losses from the sale of investments are recorded on an identified cost basis.
When-Issued and Delayed Delivery Transactions: The Fund may engage in when-issued or delayed delivery transactions. To the extent the Fund engages in such transactions, it will do so for the purpose of acquiring portfolio investments consistent with the Fund’s investment objectives and not for the purpose of investment leverage or to speculate on interest rate or market changes. At the time the Fund makes a commitment to purchase an investment on a when-issued or delayed delivery basis, the Fund will record the transaction and reflect the value in determining its net asset value. When effecting such transactions, assets of an amount sufficient to make payment for the portfolio investments to be purchased will be segregated on the Fund’s records on the trade date. Investments purchased on a when-issued or
Notes to Financial Statements, Continued
Thornburg International Value Fund | September 30, 2019
delayed delivery basis do not earn interest until the settlement date. The values of these securities held at September 30, 2019 are detailed in the Schedule of Investments.
Foreign Currency Translation: Portfolio investments and other assets and liabilities denominated in foreign currencies are translated into U.S. dollars based on the exchange rate of such currencies against the U.S. dollar on the date of valuation. Purchases and sales of investments and income items denominated in foreign currencies are translated into U.S. dollars at the exchange rate in effect on the transaction date. When the Fund purchases or sells foreign investments, it will customarily enter into a foreign exchange contract to minimize foreign exchange risk from the trade date to the settlement date of such transactions. The values of such spot contracts are included in receivable for investments sold and payable for investments purchased on the Statement of Assets and Liabilities.
The Fund does not separately report the effect of changes in foreign exchange rates from changes in market prices on investments held. Such changes are included in net unrealized appreciation (depreciation) from investments in the Statement of Operations.
Reported net realized gains and losses from foreign currency transactions arise due to purchases and sales of foreign currencies, currency gains and losses realized between the trade and settlement dates on investment transactions and the difference between the amounts of dividends, interest, and foreign withholding taxes recorded on the Fund’s books, and the U.S. dollar equivalent of the amounts actually received or paid. These amounts are included in foreign currency transactions in the Statement of Operations.
Net change in unrealized appreciation (depreciation) on foreign currency translations arise from changes in the fair value of assets and liabilities, other than investments at period end, resulting from changes in exchange rates.
Guarantees and Indemnifications: Under the Trust’s organizational documents (and under separate agreements with the independent Trustees), its officers and Trustees are provided with an indemnification against certain liabilities arising out of the performance of their duties to the Fund. In the normal course of business the Trust may also enter into contracts with service providers that contain general indemnifications. The Trust’s maximum exposure under these arrangements is unknown. However, based on experience, the Trust expects the risk of loss to be remote.
Use of Estimates: The preparation of financial statements in conformity with GAAP requires management to make estimates and assumptions that affect the reported amounts of assets and liabilities and disclosure of contingent assets and liabilities at the date of the financial statements and the reported amounts of increases (decreases) in net assets from operations during the reporting period. Actual results could differ from those estimates.
Federal Income Taxes: It is the policy of the Trust to comply with the provisions of the Internal Revenue Code applicable to regulated investment companies and to distribute to shareholders substantially all investment company taxable income including net realized gains on investments (if any), and tax exempt income of the Fund. Therefore, no provision for federal income or excise tax is required.
The Fund files income tax returns in United States federal and applicable state jurisdictions. The statute of limitations on the Fund’s tax return filings generally remains open for the three years following a return’s filing date. The Fund has analyzed each uncertain tax position believed to be material in the preparation of the Fund’s financial statements for the fiscal year ended September 30, 2019, including open tax years, to assess whether it is more likely than not that the position would be sustained upon examination, based on the technical merits of the position. The Fund has not identified any such position for which an asset or liability must be reflected in the Statement of Assets and Liabilities.
At September 30, 2019, information on the tax components of capital was as follows:
| Cost of investments for tax purposes | $ 2,787,195,993 |
| Gross unrealized appreciation on a tax basis | 375,976,291 |
| Gross unrealized depreciation on a tax basis | (59,524,878) |
| Net unrealized appreciation (depreciation) on investments (tax basis) | $ 316,451,413 |
Temporary book to tax adjustments to the cost of investments and net unrealized appreciation (depreciation) for tax purposes result primarily from deferral of wash sale losses.
In order to account for permanent book to tax differences, the Fund decreased distributable earnings by $24,545,973 and increased net capital paid in on shares of beneficial interest by $24,545,973. Reclassifications have no impact upon the net asset value of the Fund and resulted primarily from equalization of undistributed capital gains to shareholders.
At September 30, 2019, the Fund had $32,979,395 of undistributed tax basis ordinary investment income and $166,936,882 of undistributed tax basis capital gains.
Notes to Financial Statements, Continued
Thornburg International Value Fund | September 30, 2019
Foreign Withholding Taxes: The Fund is subject to foreign tax withholding imposed by certain foreign countries in which the Fund may invest. Withholding taxes are incurred on certain foreign dividends and are accrued at the time the dividend is recognized based on applicable foreign tax laws. The Fund files withholding tax reclaims in certain jurisdictions to recover a portion of amounts previously withheld, in view of various considerations, including recent decisions rendered by the courts in those and other jurisdictions. To date the Fund has recovered certain amounts previously withheld in Finland, which amounts are reflected in the financial statements included in this report. The Fund would expect to record a receivable for other such reclaims based on a variety of factors, including assessments of a jurisdiction’s legal obligation to pay reclaims, the jurisdiction’s administrative practices and payment history, and industry convention. To date the Fund has recorded no such receivable because there is limited precedent for collecting such prior year reclaims in countries other than Finland, and the likelihood of collection in those other countries remains uncertain.
Deferred Foreign Capital Gain Taxes: The Fund is subject to a tax imposed on net realized gains of securities of certain foreign countries. The Fund records an estimated deferred tax liability for net unrealized gains on these investments as reflected in the accompanying financial statements. Such changes are included in net unrealized appreciation (depreciation) from investments in the Statement of Operations.
The tax character of distributions paid during the year ended September 30, 2019, and September 30, 2018, was as follows:
| | 2019 | 2018 |
| Distributions from: | | |
| Ordinary income | $ 54,098,297 | $ 132,342,388 |
| Capital gains | - | 688,592,041 |
| Total | $ 54,098,297 | $ 820,934,429 |
NOTE 3 – SECURITY VALUATION
Valuation of the Fund’s portfolio investment securities is performed in accordance with policies and procedures adopted by and under the oversight of the Trustees.
The Trustees of the Trust have appointed the Advisor to assist the Trustees with obtaining fair market values for portfolio investments, evaluating and monitoring professional pricing service providers appointed by the Trustees’ Audit Committee (the “Audit Committee”) to assist in determining fair values for portfolio investments, assisting in calculating fair values for portfolio investments in certain circumstances, and performing other functions in connection with the valuation of investments. The Advisor acts through its Valuation and Pricing Committee (the “Committee”) and other employees of the Advisor. The Committee regularly reviews its own valuation calculations, reviews the valuations, valuation techniques and services furnished by pricing service providers, considers circumstances which may require valuation calculations by the Committee, and reviews previous valuation calculations. The Committee reports to the Audit Committee on the Committee’s activities, the performance of pricing service providers, and other matters relating to valuation of portfolio investments.
In those instances when the Committee assists in calculating a fair value for a portfolio investment, the Committee seeks to determine the price that the Fund would reasonably expect to receive upon a sale of the investment in an orderly transaction between market participants on the valuation date. The Committee customarily utilizes quotations from securities broker dealers in calculating valuations, but also may utilize prices obtained from pricing service providers or other methods approved by the Audit Committee. Because fair values calculated by the Committee are estimates, the calculation of a value for an investment may differ from the price that would be realized by the Fund upon a sale of the investment, and the difference could be material to the Fund’s financial statements. The Committee’s calculation of a fair value for an investment may also differ from the prices obtained by other persons (including other mutual funds) for the investment.
Valuation of Securities: Securities and other portfolio investments which are listed or traded on a United States securities exchange are valued at the last reported sale price on the valuation date. Investments listed or traded on an exchange for which there has been no sale that day are valued at the mean between the last reported bid and asked prices on that valuation date. Portfolio investments reported by NASDAQ are valued at the official closing price on the valuation date. If an investment is traded on more than one exchange, the investment is considered traded on the exchange that is normally the primary market for that investment. Securities and other portfolio investments which are listed or traded on exchanges outside the United States are valued at the last price or the closing price of the investment on the exchange that is normally the primary market for the investment, as of the close of the exchange preceding the Fund’s valuation date. Foreign investments listed or traded on an exchange for which there has been no sale that day are valued at the mean between the last reported bid and asked prices on that valuation date.
In any case when a market quotation is not readily available for a portfolio investment ordinarily valued by market quotation, the Committee calculates a fair value for the investment using alternative methods approved by the Audit Committee. A market quotation is not readily available when the primary market or exchange for the investment is not open for the entire scheduled day of trading. Market quotations for
Notes to Financial Statements, Continued
Thornburg International Value Fund | September 30, 2019
an investment also may not be readily available if developments after the most recent close of the investment’s primary exchange or market, but prior to the close of business on any Fund business day, or an unusual event or significant period of time occurring since the availability of a market quotation, create a serious question concerning the reliability of the most recent market quotation available for the investment. In particular, on days when market volatility thresholds established by the Audit Committee are exceeded, foreign equity investments held by the Fund may be valued using alternative methods. The Committee customarily obtains valuations in these instances from pricing service providers approved by the Audit Committee. Pricing service providers ordinarily calculate valuations using multi-factor models to adjust market prices based upon various inputs, including exchange data, depository receipt prices, futures, index data and other data.
Debt obligations held by the Fund which are not listed or traded on exchanges or for which no reported market exists are ordinarily valued at the valuation obtained from a pricing service provider approved by the Audit Committee.
In any case when a pricing service provider fails to provide a valuation for a debt obligation held by the Fund, the Committee calculates a fair value for the obligation using alternative methods under procedures approved by the Audit Committee. Additionally, in cases when management believes that a valuation obtained from a pricing service provider is stale, does not reflect material factors affecting the valuation of the investment, is significantly different than the value the Fund is likely to obtain if it sought a bid for the investment, or is otherwise unreliable, the Committee calculates a fair value for the obligation using an alternative method approved by the Audit Committee.
Quotations for foreign investments expressed in foreign currency amounts are converted to U.S. dollar equivalents using a foreign exchange quotation from a third party service provider at the time of valuation. Foreign investments held by the Fund may be traded on days and at times when the Fund is not open for business. Consequently, the value of Fund investments may be significantly affected on days when shareholders cannot purchase or sell Fund shares.
Valuation Hierarchy: The Fund categorizes its investments based upon the inputs used in valuing those investments, according to a three-level hierarchy established in guidance from the FASB. Categorization of investments using this hierarchy is intended by the FASB to maximize the use of observable inputs in valuing investments and minimize the use of unobservable inputs by requiring that the most observable inputs be used when available. Observable inputs are those that market participants would use in valuing an investment based on available market information. Unobservable inputs are those that reflect assumptions about the information market participants would use in valuing an investment. An investment’s level within the hierarchy is based on the lowest level input that is deemed significant to the valuation. The methodologies and inputs used to value investments are not necessarily indications of the risk or liquidity associated with those investments.
Various inputs are used in calculating valuations for the Fund’s investments. These inputs are generally summarized according to the three-level hierarchy below:
Level 1: Quoted prices in active markets for identical investments.
Level 2: Other direct or indirect significant observable inputs (including quoted prices for similar investments in active markets and other observable inputs, such as interest rates, prepayment rates, credit ratings, etc.).
Level 3: Significant unobservable inputs (including the Committee’s own assumptions in calculating the fair values of investments).
Valuations for debt obligations held by the Fund are typically calculated by pricing service providers approved by the Audit Committee and are generally characterized as Level 2 within the valuation hierarchy.
On days when market volatility thresholds established by the Audit Committee are exceeded, foreign securities for which valuations are obtained from pricing service providers are fair valued. On these days, the foreign securities are characterized as Level 2 within the valuation hierarchy and revert to Level 1 after the threshold is no longer exceeded.
In a limited number of cases the Committee calculates a fair value for investments using broker quotations or other methods approved by the Audit Committee. When the Committee uses a single broker quotation to calculate a fair value for an investment without other significant observable inputs, or if a fair value is calculated using other significant inputs that are considered unobservable, the investment is characterized as Level 3 within the hierarchy. Other significant unobservable inputs used to calculate a fair value in these instances might include an income-based valuation approach which considers discounted anticipated future cash flows from the investment and application of discounts due to the nature or duration of any restrictions on the disposition of the investment.
Valuations based upon the use of inputs from Levels 1, 2 or 3 may not represent the actual price received upon the disposition of an investment, and a Fund may receive a price that is lower than the valuation based upon these inputs when it sells the investment.
Notes to Financial Statements, Continued
Thornburg International Value Fund | September 30, 2019
The following table displays a summary of the fair value hierarchy measurements of the Fund’s investments as of September 30, 2019:
| | Fair Value Measurements at September 30, 2019 |
| | TOTAL | LEVEL 1 | LEVEL 2 | LEVEL 3 |
| Assets | | | | |
| Investments in Securities* | | | | |
| Common Stock | $ 2,776,859,294 | $ 2,776,859,294 | $ — | $ — |
| Short-Term Investments | 326,788,112 | 326,788,112 | — | — |
| Total Investments in Securities | $3,103,647,406 | $3,103,647,406 | $— | $— |
| Total Assets | $3,103,647,406 | $3,103,647,406 | $— | $— |
| * | See Schedule of Investments for a summary of the industry exposure as grouped according to the Global Industry Classification Standard (GICS), which is an industry taxonomy developed by MSCI, Inc. and Standard & Poor’s (S&P). |
A rollforward of fair value measurements using significant unobservable inputs (Level 3) for the year ended September 30, 2019 is as follows:
| | COMMON
STOCK | TOTAL |
| Beginning Balance 9/30/2018 | $ 69,188,477 | $ 69,188,477 |
| Accrued Discounts (Premiums) | – | – |
| Net Realized Gain (Loss)(a) | (4,781,938) | (4,781,938) |
| Gross Purchases | – | – |
| Gross Sales | (78,676,800) | (78,676,800) |
| Net Change in Unrealized Appreciation (Depreciation)(b)(c) | 14,270,261 | 14,270,261 |
| Transfers into Level 3 | – | – |
| Transfers out of Level 3 | – | – |
| Ending Balance 9/30/2019 | $– | $– |
| (a) | Amount of net realized gain (loss) from investments is included in the Fund’s Statement of Operations for the year ended September 30, 2019. |
| (b) | Amount of net change in unrealized appreciation (depreciation) on investments is included in the Fund’s Statement of Operations for the year ended September 30, 2019. |
| (c) | The net change in unrealized appreciation (depreciation) attributable to securities owned at September 30, 2019, which were valued using significant unobservable inputs, was $0. |
NOTE 4 – INVESTMENT ADVISORY FEE AND OTHER TRANSACTIONS WITH AFFILIATES
Pursuant to an investment advisory agreement, the Advisor serves as the investment advisor and performs services for the Fund for which the fees are payable at the end of each month. Under the investment advisory agreement, the Fund pays the Advisor a management fee based on the average daily net assets of the Fund at an annual rate as shown in the following table:
| Management Fee Schedule |
| DAILY NET ASSETS | FEE RATE |
| Up to $500 million | 0.875% |
| Next $500 million | 0.825 |
| Next $500 million | 0.775 |
| Next $500 million | 0.725 |
| Over $2 billion | 0.675 |
The Fund’s effective management fee for the year ended September 30, 2019 was 0.745% of the Fund’s average daily net assets. Total management fees incurred by the Fund for the year ended September 30, 2019 are set forth in the Statement of Operations.
Notes to Financial Statements, Continued
Thornburg International Value Fund | September 30, 2019
The Trust has entered into an administrative services agreement with the Advisor, whereby the Advisor will perform certain administrative services related to each class of the Fund’s shares. The fees are computed as an annual percentage of the aggregate average daily net assets of all shares classes of all Funds in the Trust as follows:
| Administration Fee Schedule |
| Daily Net Assets | Fee Rate |
| Up to $20 billion | 0.100% |
| $20 billion to $40 billion | 0.075 |
| $40 billion to $60 billion | 0.040 |
| Over $60 billion | 0.030 |
The aggregate fee amount is allocated on a daily basis to each Fund based on net assets and subsequently allocated to each class of shares of the Fund. Total administrative service fees incurred by each class of shares of the Fund for the year ended September 30, 2019, are set forth in the Statement of Operations.
The Trust has an underwriting agreement with Thornburg Securities Corporation (the “Distributor”), an affiliate of the Advisor, which acts as the distributor of the Fund’s shares. For the year ended September 30, 2019, the Distributor has advised the Fund that it earned net commissions aggregating $7,611 from the sale of Class A shares, and collected contingent deferred sales charges aggregating $6,687 from redemptions of Class C shares of the Fund.
Pursuant to a service plan under Rule 12b-1 of the 1940 Act, the Fund may pay to the Distributor or securities dealers and other financial institutions at the Distributor’s direction an amount not to exceed .25 of 1% per annum of the average daily net assets attributable to Class A, Class C, Class I, Class R3, Class R4, and Class R5 shares of the Fund to obtain various shareholder and distribution related services. For the year ended September 30, 2019, there were no 12b-1 service plan fees charged for Class I or Class R5 shares. Class R6 shares are not subject to a service plan. The Advisor and Distributor each may pay out of its own resources additional expenses for distribution of the Fund’s shares and shareholder services.
The Trust has also adopted a distribution plan pursuant to Rule 12b-1, applicable only to the Fund’s Class C and Class R3 shares, under which the Fund compensates the Distributor for services in promoting the sale of Class C and Class R3 shares of the Fund at an annual rate of up to .75 of 1% per annum of the average daily net assets attributable to Class C shares, and an annual rate of up to .25 of 1% per annum of the average daily net assets attributable to Class R3 shares.
Total fees incurred by each class of shares of the Fund under their respective service and distribution plans for the year ended September 30, 2019, are set forth in the Statement of Operations.
The Advisor has contractually agreed to waive fees and reimburse expenses incurred by the Fund so that actual expenses of certain share classes do not exceed levels as specified in each Fund’s most recent prospectus (Class R3 shares, 1.45%; Class R4 shares, 1.25%; Class R5 shares, 0.99%). The agreement may be terminated by the Fund at any time, but may not be terminated by the Advisor before February 1, 2020, unless the Advisor ceases to be the investment advisor to the Fund prior to that date. The Advisor may recoup amounts waived or reimbursed during the fiscal year ended September 30, 2019 if, during that year, expenses fall below the contractual limit that was in place at the time those fees and expenses were waived or reimbursed. The Advisor will not recoup fees or expenses as described in the preceding sentence if that recoupment would cause the Fund’s total annual operating expenses (after the recoupment is taken into account) to exceed the lesser of: (a) the expense cap that was in place at the time the waiver or reimbursement occurred; or (b) the expense cap that is in place at the time of the recoupment.
For the year ended September 30, 2019, the Advisor contractually reimbursed certain class specific expenses and distribution fees of $357,203 for Class R3 shares, $270,959 for Class R4 shares, $245,976 for Class R5 shares, and voluntarily reimbursed $352,284 for Class R6 shares.
Certain officers and Trustees of the Trust are also officers or directors of the Advisor and Distributor. The compensation of the independent Trustees is borne by the Trust. The Trust also pays a portion of the Chief Compliance Officer’s compensation. These amounts are reflected as Trustee and officer fees in the Statement of Operations.
The percentage of direct investments in the Fund held by the Trustees, officers of the Trust, and the Advisor is approximately 1.29%.
The Fund may purchase or sell securities from or to an affiliated fund, provided the affiliation is due solely to having a common investment advisor, common officers, or common trustees, and provided that all such transactions will comply with Rule 17a-7 under the 1940 Act. For the year ended September 30, 2019, the Fund had no such transactions with affiliated funds.
Notes to Financial Statements, Continued
Thornburg International Value Fund | September 30, 2019
Shown below are holdings of voting securities of each portfolio company which is considered "affiliated" to the Fund under the 1940 Act, including companies for which the Fund’s holding represented 5% or more of the company’s voting securities, and a series of the Thornburg Investment Trust in which the Fund invested for cash management purposes during the period:
| Fund | Market Value
9/30/18 | Purchases
at Cost | Sales
Proceeds | Realized
Gain
(Loss) | Change in
Unrealized
Appr./(Depr.) | Market Value
9/30/19 | Dividend
Income |
| Thornburg Capital Management Fund | $214,290,589 | $1,942,479,183 | $(1,829,981,660) | $- | $- | $326,788,112 | $5,843,558 |
NOTE 5 – SHARES OF BENEFICIAL INTEREST
At September 30, 2019, there were an unlimited number of shares with no par value of beneficial interest authorized. Transactions in shares of beneficial interest were as follows:
| | YEAR ENDED
September 30, 2019 | YEAR ENDED
September 30, 2018 |
| | SHARES | AMOUNT | SHARES | AMOUNT |
| Class A Shares | | | | |
| Shares sold | 4,193,267 | $ 91,176,594 | 9,801,105 | $ 232,103,746 |
Shares issued to shareholders in
reinvestment of dividends | 432,321 | 8,153,571 | 4,440,886 | 106,847,709 |
| Shares repurchased | (10,476,530) | (226,306,050) | (10,172,663) | (247,442,087) |
| Net increase (decrease) | (5,850,942) | $ (126,975,885) | 4,069,328 | $ 91,509,368 |
| Class C Shares | | | | |
| Shares sold | 259,750 | $ 4,848,426 | 765,525 | $ 16,811,768 |
Shares issued to shareholders in
reinvestment of dividends | - | - | 2,608,037 | 55,707,675 |
| Shares repurchased | (4,241,881) | (81,505,639) | (11,423,876) | (240,388,272) |
| Net decrease | (3,982,131) | $ (76,657,213) | (8,050,314) | $ (167,868,829) |
| Class I Shares | | | | |
| Shares sold | 11,926,611 | $ 261,023,247 | 21,186,332 | $ 538,039,749 |
Shares issued to shareholders in
reinvestment of dividends | 1,426,129 | 27,752,471 | 15,260,323 | 378,932,754 |
| Shares repurchased | (46,729,970) | (1,020,323,369) | (50,362,898) | (1,275,917,921) |
| Net decrease | (33,377,230) | $ (731,547,651) | (13,916,243) | $ (358,945,418) |
| Class R3 Shares | | | | |
| Shares sold | 959,317 | $ 20,864,279 | 1,528,944 | $ 37,523,777 |
Shares issued to shareholders in
reinvestment of dividends | 94,905 | 1,790,857 | 1,519,952 | 36,554,848 |
| Shares repurchased | (3,275,976) | (71,609,214) | (3,976,568) | (97,221,873) |
| Net decrease | (2,221,754) | $ (48,954,078) | (927,672) | $ (23,143,248) |
| Class R4 Shares | | | | |
| Shares sold | 1,477,039 | $ 31,561,225 | 2,063,382 | $ 50,114,257 |
Shares issued to shareholders in
reinvestment of dividends | 66,011 | 1,235,734 | 847,935 | 20,240,210 |
| Shares repurchased | (3,343,042) | (72,914,726) | (3,215,582) | (77,750,318) |
| Net decrease | (1,799,992) | $ (40,117,767) | (304,265) | $ (7,395,851) |
| Class R5 Shares | | | | |
| Shares sold | 1,157,927 | $ 25,895,089 | 1,805,671 | $ 45,657,236 |
Shares issued to shareholders in
reinvestment of dividends | 154,892 | 3,012,644 | 1,570,374 | 38,946,199 |
| Shares repurchased | (4,623,294) | (103,929,956) | (4,132,147) | (104,859,654) |
| Net decrease | (3,310,475) | $ (75,022,223) | (756,102) | $ (20,256,219) |
Notes to Financial Statements, Continued
Thornburg International Value Fund | September 30, 2019
| | YEAR ENDED
September 30, 2019 | YEAR ENDED
September 30, 2018 |
| | SHARES | AMOUNT | SHARES | AMOUNT |
| Class R6 Shares | | | | |
| Shares sold | 3,823,624 | $ 86,514,020 | 4,840,622 | $ 121,564,541 |
Shares issued to shareholders in
reinvestment of dividends | 358,774 | 6,949,445 | 3,027,489 | 74,876,752 |
| Shares repurchased | (14,415,098) | (330,103,176) | (7,309,496) | (178,411,085) |
| Net increase (decrease) | (10,232,700) | $ (236,639,711) | 558,615 | $ 18,030,208 |
NOTE 6 – INVESTMENT TRANSACTIONS
For the year ended September 30, 2019, the Fund had purchase and sale transactions of investments (excluding short-term investments) of $2,371,009,743 and $3,747,059,751, respectively.
NOTE 7 – DERIVATIVE FINANCIAL INSTRUMENTS WITH OFF-BALANCE
SHEET RISK AND FOREIGN INVESTMENT RISK
The Fund may use a variety of derivative financial instruments to hedge or adjust the risks affecting its investment portfolio or to enhance investment returns. Provisions of the FASB Accounting Standards Codification 815-10-50 (“ASC 815”) require certain disclosures. The disclosures are intended to provide users of financial statements with an understanding of the use of derivative instruments by the Fund and how these derivatives affect the financial position, financial performance and cash flows of the Fund. The Fund does not designate any derivative instruments as hedging instruments under ASC 815. During the year ended September 30, 2019, the Fund’s principal exposure to derivative financial instruments of the type addressed by ASC 815 was investment in foreign currency contracts. A foreign currency contract is an agreement between two parties to exchange different currencies at a specified rate of exchange at an agreed upon future date. Foreign currency contracts involve risks to the Fund, including the risk that a contract’s counterparty will not meet its obligations to the Fund, the risk that a change in a contract’s value may not correlate perfectly with the currency the contract was intended to track, and the risk that the Fund’s Advisor is unable to correctly implement its strategy in using a contract. In any such instance, the Fund may not achieve the intended benefit of entering into a contract, and may experience a loss.
The Fund entered into forward currency contracts during the year ended September 30, 2019 in the normal course of pursuing its investment objectives, with the objective of purchasing foreign investments or with the intent of reducing the risk to the value of the Fund’s foreign investments from adverse changes in the relationship between the U.S. dollar and foreign currencies. In each case these contracts have been initiated in conjunction with foreign investment transactions. The monthly average value of open forward currency sell contracts for the year ended September 30, 2019 was $230,445,272.
As of September 30, 2019, the Fund did not have any outstanding forward foreign currency contracts.
The net realized gain (loss) from forward currency contracts and the net change in unrealized appreciation (depreciation) on outstanding forward currency contracts recognized in the Fund’s Statement of Operations for the year ended September 30, 2019 are disclosed in the following tables:
NET REALIZED GAIN (LOSS) ON DERIVATIVE FINANCIAL INSTRUMENTS
RECOGNIZED IN INCOME FOR THE YEAR ENDED September 30, 2019 |
| | TOTAL | FORWARD CURRENCY CONTRACTS |
| Foreign currency contracts | $ 25,303,245 | $ 25,303,245 |
NET CHANGE IN UNREALIZED APPRECIATION (DEPRECIATION) OF DERIVATIVE FINANCIAL INSTRUMENTS
RECOGNIZED IN INCOME FOR THE YEAR ENDED September 30, 2019 |
| | TOTAL | FORWARD CURRENCY CONTRACTS |
| Foreign currency contracts | $ (9,869,658) | $ (9,869,658) |
NOTE 8 – RECENT ACCOUNTING PRONOUNCEMENTS
In August 2018, the FASB issued ASU 2018-13, Fair Value Measurement (Topic 820): Changes to the Disclosure Requirements for Fair Value Measurement, which adds, removes, and modifies certain aspects of the fair value disclosure. ASU 2018-13 is effective for annual
Notes to Financial Statements, Continued
Thornburg International Value Fund | September 30, 2019
periods beginning after December 15, 2019, and early adoption is permitted. The Funds have elected to early adopt, and had applied ASU 2018-13 for the fiscal year ended September 30, 2019. The adoption of this accounting guidance did not have a material impact on the Funds’ financial statements.
In March 2017, the FASB issued Accounting Standards Update (ASU) 2017-08, Premium Amortization of Purchased Callable Debt Securities. The amendments in the ASU shorten the premium amortization period on a purchased callable debt security from the security’s contractual life to the earliest call date. It is anticipated that this change will enhance disclosures by reducing losses recognized when a security is called on an earlier date. This ASU is effective for fiscal years beginning after December 15, 2018. Management has evaluated the implications of these changes and the amendments will have no material effect on the Funds’ net assets or results of operations.
OTHER NOTES
Risks: The Fund’s investments subject it to risks including, but not limited to, management risk, market and economic risk, risks affecting specific issuers, foreign investment risk, developing country risk, risks affecting specific countries or regions, risks affecting investments in China, small and mid-cap company risk, credit risk, interest rate risk, and liquidity risk. Please see the Fund’s prospectus for a discussion of the risks associated with an investment in the Fund.
Subsequent Events: Fund management believes no events have occurred between September 30, 2019 and the date of issuance of the financial statements that require adjustment to or disclosure in the accompanying financial statements.
Financial Highlights
Thornburg International Value Fund
| | PER SHARE PERFORMANCE (FOR A SHARE OUTSTANDING THROUGHOUT THE YEAR) |
UNLESS OTHERWISE
NOTED, PERIODS ARE
FISCAL YEARS ENDED
SEPTEMBER 30, | Net Asset
Value,
Beginning of
YEAR | Net
Investment
Income
(Loss)+ | Net Realized &
Unrealized Gain
(Loss) on
Investments | Total from
Investment
Operations | Dividends
from Net
Investment
Income | Dividends
from Net
Realized
Gains | Total
Dividends | Net Asset
Value,
End of YEAR |
| CLASS A SHARES(b) |
| 2019 | $ 22.69 | 0.19 | 0.31 | 0.50 | (0.28) | — | (0.28) | $ 22.91 |
| 2018 | $ 27.63 | 0.19 | (1.10) | (0.91) | — | (4.03) | (4.03) | $ 22.69 |
| 2017 | $ 23.43 | 0.16 | 4.24 | 4.40 | (0.20) | — | (0.20) | $ 27.63 |
| 2016(c) | $ 27.46 | 0.36 | 0.25 | 0.61 | (0.39) | (4.25) | (4.64) | $ 23.43 |
| 2015 | $ 29.84 | 0.24 | 0.16 | 0.40 | (0.26) | (2.52) | (2.78) | $ 27.46 |
| CLASS C SHARES |
| 2019 | $ 20.01 | —(d) | 0.32 | 0.32 | — | — | — | $ 20.33 |
| 2018 | $ 25.00 | 0.02 | (0.98) | (0.96) | — | (4.03) | (4.03) | $ 20.01 |
| 2017 | $ 21.29 | (0.02) | 3.84 | 3.82 | (0.11) | — | (0.11) | $ 25.00 |
| 2016 | $ 25.40 | 0.17 | 0.24 | 0.41 | (0.27) | (4.25) | (4.52) | $ 21.29 |
| 2015 | $ 27.86 | 0.05 | 0.11 | 0.16 | (0.10) | (2.52) | (2.62) | $ 25.40 |
| CLASS I SHARES |
| 2019 | $ 23.47 | 0.25 | 0.32 | 0.57 | (0.35) | — | (0.35) | $ 23.69 |
| 2018 | $ 28.37 | 0.29 | (1.15) | (0.86) | (0.01) | (4.03) | (4.04) | $ 23.47 |
| 2017 | $ 24.02 | 0.25 | 4.37 | 4.62 | (0.27) | — | (0.27) | $ 28.37 |
| 2016 | $ 28.04 | 0.47 | 0.23 | 0.70 | (0.47) | (4.25) | (4.72) | $ 24.02 |
| 2015 | $ 30.43 | 0.38 | 0.13 | 0.51 | (0.38) | (2.52) | (2.90) | $ 28.04 |
| CLASS R3 SHARES |
| 2019 | $ 22.65 | 0.15 | 0.31 | 0.46 | (0.22) | — | (0.22) | $ 22.89 |
| 2018 | $ 27.63 | 0.14 | (1.09) | (0.95) | — | (4.03) | (4.03) | $ 22.65 |
| 2017 | $ 23.44 | 0.14 | 4.22 | 4.36 | (0.17) | — | (0.17) | $ 27.63 |
| 2016 | $ 27.47 | 0.31 | 0.25 | 0.56 | (0.34) | (4.25) | (4.59) | $ 23.44 |
| 2015 | $ 29.86 | 0.21 | 0.13 | 0.34 | (0.21) | (2.52) | (2.73) | $ 27.47 |
| CLASS R4 SHARES |
| 2019 | $ 22.52 | 0.19 | 0.30 | 0.49 | (0.27) | — | (0.27) | $ 22.74 |
| 2018 | $ 27.45 | 0.20 | (1.10) | (0.90) | — | (4.03) | (4.03) | $ 22.52 |
| 2017 | $ 23.26 | 0.18 | 4.21 | 4.39 | (0.20) | — | (0.20) | $ 27.45 |
| 2016 | $ 27.30 | 0.37 | 0.23 | 0.60 | (0.39) | (4.25) | (4.64) | $ 23.26 |
| 2015 | $ 29.69 | 0.25 | 0.15 | 0.40 | (0.27) | (2.52) | (2.79) | $ 27.30 |
| CLASS R5 SHARES |
| 2019 | $ 23.44 | 0.25 | 0.32 | 0.57 | (0.34) | — | (0.34) | $ 23.67 |
| 2018 | $ 28.35 | 0.27 | (1.15) | (0.88) | —(e) | (4.03) | (4.03) | $ 23.44 |
| 2017 | $ 24.01 | 0.24 | 4.35 | 4.59 | (0.25) | — | (0.25) | $ 28.35 |
| 2016 | $ 28.03 | 0.46 | 0.23 | 0.69 | (0.46) | (4.25) | (4.71) | $ 24.01 |
| 2015 | $ 30.41 | 0.30 | 0.19 | 0.49 | (0.35) | (2.52) | (2.87) | $ 28.03 |
| CLASS R6 SHARES |
| 2019 | $ 23.40 | 0.31 | 0.29 | 0.60 | (0.39) | — | (0.39) | $ 23.61 |
| 2018 | $ 28.27 | 0.33 | (1.15) | (0.82) | (0.02) | (4.03) | (4.05) | $ 23.40 |
| 2017 | $ 23.95 | 0.31 | 4.33 | 4.64 | (0.32) | — | (0.32) | $ 28.27 |
| 2016 | $ 27.97 | 0.53 | 0.21 | 0.74 | (0.51) | (4.25) | (4.76) | $ 23.95 |
| 2015 | $ 30.36 | 0.39 | 0.17 | 0.56 | (0.43) | (2.52) | (2.95) | $ 27.97 |
| (a) | Not annualized for periods less than one year. |
| (b) | Sales loads are not reflected in computing total return. |
| (c) | Class B shares converted to Class A shares on August 29, 2016. |
| (d) | Net investment income (loss) was less than $0.01 per share. |
| (e) | Dividends from net investment income per share were less than $(0.01). |
| + | Based on weighted average shares outstanding. |
See notes to financial statements.
Financial Highlights, Continued
Thornburg International Value Fund
| RATIOS TO AVERAGE NET ASSETS | | SUPPLEMENTAL DATA |
Net Investment
Income (Loss) (%) | Expenses, After
Expense
Reductions (%) | Expenses,
Before Expense
Reductions (%) | | Total
Return (%)(a) | Portfolio
Turnover
Rate (%)(a) | Net Assets
at End of YEAR
(Thousands) |
| |
| 0.86 | 1.26 | 1.26 | | 2.47 | 71.09 | $ 655,807 |
| 0.77 | 1.27 | 1.27 | | (4.13) | 44.41 | $ 782,371 |
| 0.65 | 1.31 | 1.31 | | 18.78 | 86.88 | $ 840,244 |
| 1.51 | 1.28 | 1.28 | | 1.90 | 103.90 | $ 990,194 |
| 0.82 | 1.27 | 1.27 | | 1.25 | 70.88 | $ 1,361,529 |
| |
| (0.02) | 2.09 | 2.09 | | 1.60 | 71.09 | $ 81,401 |
| 0.07 | 2.02 | 2.02 | | (4.86) | 44.41 | $ 159,789 |
| (0.08) | 2.04 | 2.04 | | 17.94 | 86.88 | $ 400,859 |
| 0.77 | 2.02 | 2.02 | | 1.12 | 103.90 | $ 535,169 |
| 0.19 | 1.99 | 1.99 | | 0.52 | 70.88 | $ 706,606 |
| |
| 1.11 | 0.97 | 0.97 | | 2.76 | 71.09 | $ 1,694,780 |
| 1.15 | 0.91 | 0.91 | | (3.81) | 44.41 | $ 2,462,564 |
| 0.99 | 0.92 | 0.92 | | 19.29 | 86.88 | $ 3,370,930 |
| 1.91 | 0.90 | 0.90 | | 2.21 | 103.90 | $ 4,375,955 |
| 1.27 | 0.90 | 0.90 | | 1.65 | 70.88 | $ 5,895,731 |
| |
| 0.67 | 1.45 | 1.65 | | 2.25 | 71.09 | $ 164,437 |
| 0.59 | 1.45 | 1.64 | | (4.29) | 44.41 | $ 213,007 |
| 0.55 | 1.45 | 1.64 | | 18.63 | 86.88 | $ 285,510 |
| 1.31 | 1.45 | 1.62 | | 1.67 | 103.90 | $ 325,135 |
| 0.71 | 1.45 | 1.58 | | 1.09 | 70.88 | $ 479,223 |
| |
| 0.88 | 1.25 | 1.44 | | 2.45 | 71.09 | $ 125,363 |
| 0.81 | 1.25 | 1.47 | | (4.11) | 44.41 | $ 164,663 |
| 0.74 | 1.25 | 1.46 | | 18.90 | 86.88 | $ 209,066 |
| 1.55 | 1.25 | 1.39 | | 1.87 | 103.90 | $ 267,623 |
| 0.86 | 1.24 | 1.37 | | 1.30 | 70.88 | $ 333,247 |
| |
| 1.10 | 0.99 | 1.12 | | 2.74 | 71.09 | $ 153,366 |
| 1.06 | 0.99 | 1.17 | | (3.87) | 44.41 | $ 229,485 |
| 0.96 | 0.99 | 1.15 | | 19.17 | 86.88 | $ 298,970 |
| 1.88 | 0.95 | 0.95 | | 2.19 | 103.90 | $ 529,330 |
| 1.01 | 0.98 | 1.11 | | 1.57 | 70.88 | $ 685,617 |
| |
| 1.37 | 0.79 | 0.88 | | 2.95 | 71.09 | $ 219,441 |
| 1.33 | 0.79 | 0.83 | | (3.68) | 44.41 | $ 457,006 |
| 1.23 | 0.78 | 0.79 | | 19.40 | 86.88 | $ 536,296 |
| 2.19 | 0.74 | 0.74 | | 2.40 | 103.90 | $ 473,941 |
| 1.33 | 0.74 | 0.74 | | 1.81 | 70.88 | $ 420,849 |
Report of Independent Registered Public Accounting Firm
Thornburg International Value Fund
To the Board of Trustees of Thornburg Investment Trust and Shareholders of
Thornburg International Value Fund
Opinion on the Financial Statements
We have audited the accompanying statement of assets and liabilities, including the schedule of investments, of Thornburg International Value Fund (one of the funds constituting Thornburg Investment Trust, referred to hereafter as the "Fund") as of September 30, 2019, the related statement of operations for the year ended September 30, 2019, the statements of changes in net assets for each of the two years in the period ended September 30, 2019, including the related notes, and the financial highlights for each of the five years in the period ended September 30, 2019 (collectively referred to as the “financial statements”). In our opinion, the financial statements present fairly, in all material respects, the financial position of the Fund as of September 30, 2019, the results of its operations for the year then ended, the changes in its net assets for each of the two years in the period ended September 30, 2019 and the financial highlights for each of the five years in the period ended September 30, 2019 in conformity with accounting principles generally accepted in the United States of America.
Basis for Opinion
These financial statements are the responsibility of the Fund’s management. Our responsibility is to express an opinion on the Fund’s financial statements based on our audits. We are a public accounting firm registered with the Public Company Accounting Oversight Board (United States) (PCAOB) and are required to be independent with respect to the Fund in accordance with the U.S. federal securities laws and the applicable rules and regulations of the Securities and Exchange Commission and the PCAOB.
We conducted our audits of these financial statements in accordance with the standards of the PCAOB. Those standards require that we plan and perform the audit to obtain reasonable assurance about whether the financial statements are free of material misstatement, whether due to error or fraud.
Our audits included performing procedures to assess the risks of material misstatement of the financial statements, whether due to error or fraud, and performing procedures that respond to those risks. Such procedures included examining, on a test basis, evidence regarding the amounts and disclosures in the financial statements. Our audits also included evaluating the accounting principles used and significant estimates made by management, as well as evaluating the overall presentation of the financial statements. Our procedures included confirmation of securities owned as of September 30, 2019 by correspondence with the custodian, transfer agent and brokers; when replies were not received from brokers, we performed other auditing procedures. We believe that our audits provide a reasonable basis for our opinion.
/s/PricewaterhouseCoopers LLP
New York, New York
November 22, 2019
We have served as the auditor of one or more investment companies in Thornburg Investment Trust since 1999.
Expense Example
Thornburg International Value Fund | September 30, 2019 (Unaudited)
As a shareholder of the Fund, you incur two types of costs:
| (1) | transaction costs, including |
| (a) | sales charges (loads) on purchase payments, for Class A shares; |
| (b) | a deferred sales charge on redemptions of any part or all of a purchase of $1 million of Class A shares within 12 months of purchase; |
| (c) | a deferred sales charge on redemptions of Class C shares within 12 months of purchase; |
| (2) | ongoing costs, including management fees; distribution and/or service (12b-1) fees; and other Fund expenses. |
This example is intended to help you understand your ongoing costs (in dollars) of investing in the Fund and to compare these costs with the ongoing costs of investing in other mutual funds.
The example is based on a $1,000 investment beginning on April 1, 2019, and held until September 30, 2019.
ACTUAL EXPENSES
For each class of shares, the first line of the accompanying table provides information about actual account values and actual expenses. You may use the information in this line, together with the amount you invested, to estimate the expenses that you paid over the period. Simply divide your account value by $1,000 (for example, an $8,600 account value divided by $1,000 = 8.6), then multiply the result by the number in the first line for your class of shares under the heading entitled “Expenses Paid During Period” to estimate the expenses you paid on your account during this period.
| | BEGINNING
ACCOUNT VALUE
4/1/19 | ENDING
ACCOUNT VALUE
9/30/19 | EXPENSES PAID
DURING PERIOD†
4/1/19—9/30/19 |
| CLASS A SHARES |
| Actual | $1,000.00 | $1,027.35 | $6.25 |
| Hypothetical* | $1,000.00 | $1,018.90 | $6.23 |
| CLASS C SHARES |
| Actual | $1,000.00 | $1,022.63 | $10.45 |
| Hypothetical* | $1,000.00 | $1,014.74 | $10.40 |
| CLASS I SHARES |
| Actual | $1,000.00 | $1,028.65 | $4.83 |
| Hypothetical* | $1,000.00 | $1,020.31 | $4.81 |
| CLASS R3 SHARES |
| Actual | $1,000.00 | $1,025.99 | $7.36 |
| Hypothetical* | $1,000.00 | $1,017.80 | $7.33 |
| CLASS R4 SHARES |
| Actual | $1,000.00 | $1,027.09 | $6.35 |
| Hypothetical* | $1,000.00 | $1,018.80 | $6.33 |
| CLASS R5 SHARES |
| Actual | $1,000.00 | $1,028.23 | $5.03 |
| Hypothetical* | $1,000.00 | $1,020.10 | $5.01 |
| CLASS R6 SHARES |
| Actual | $1,000.00 | $1,029.20 | $4.02 |
| Hypothetical* | $1,000.00 | $1,021.11 | $4.00 |
| † | Expenses are equal to the annualized expense ratio for each class (A: 1.23%; C: 2.06%; I: 0.95%; R3: 1.45%; R4: 1.25%; R5: 0.99%; R6: 0.79%) multiplied by the average account value over the period, multiplied by 183/365 to reflect the one-half year period. |
| * | Hypothetical assumes a rate of return of 5% per year before expenses. |
HYPOTHETICAL EXAMPLE FOR COMPARISON PURPOSES
For each class of shares, the second line of the accompanying table provides information about hypothetical account values and hypothetical expenses based on the Fund’s actual expense ratio and an assumed rate of return of 5% per year before expenses, which is not the Fund’s actual return. The hypothetical account values and expenses may not be used to estimate the actual ending account balance or expenses you paid for the period. You may use this information to compare the ongoing costs of investing in the Fund and other funds. To do so, compare this 5% hypothetical example with the 5% hypothetical examples that appear in the shareholder reports of the other funds.
Please note that the expenses shown in the table are meant to highlight your ongoing costs only and do not reflect any transactional costs, such as sales charges (loads), redemption fees, or exchange fees. Therefore, the second line of the table for each class of shares is useful in comparing ongoing costs only, and will not help you determine the relative total costs of owning different funds. In addition, if these transactional costs were included, your costs would have been higher.
Trustees and Officers
Thornburg International Value Fund | September 30, 2019 (Unaudited)
NAME, AGE, YEAR ELECTED
POSITION HELD WITH FUND | PRINCIPAL OCCUPATION(S) DURING PAST FIVE YEARS | OTHER DIRECTORSHIPS
HELD BY TRUSTEE |
| INTERESTED TRUSTEES(1)(2) |
Garrett Thornburg, 73
Trustee since 1984,
Chairman of Trustees(3) | Chairman and controlling shareholder of Thornburg Investment Management, Inc. (investment advisor); Chairman and controlling shareholder of Thornburg Securities Corporation (securities dealer); President of the Thornburg Foundation (nonprofit). | None |
Brian J. McMahon, 64
Trustee since 2001,
Vice Chairman of Trustees,
Member of Governance and
Nominating Committee &
Operations Risk Oversight
Committee(4) | Vice Chairman, Chief Investment Strategist, Managing Director, and Portfolio Manager and, until 2016, CEO and President of Thornburg Investment Management, Inc.; Vice President of Thornburg Securities Corporation. | None |
| INDEPENDENT TRUSTEES(1)(2)(5) |
David A. Ater, 74
Trustee since 1994,
Lead Independent Trustee,
Chairman of Governance and
Nominating Committee &
Member of Audit Committee | Principal in Ater & Associates, Santa Fe, NM (developer, planner and broker of residential and commercial real estate); owner, developer and broker for various real estate projects. | None |
Sally Corning, 58
Trustee since 2012,
Chairman of Audit Committee | Partner in Sun Mountain Capital, Santa Fe, NM (private equity firm with investment programs encompassing venture capital, mezzanine debt, and growth equity). | None |
Susan H. Dubin, 70
Trustee since 2004,
Member of Audit
Committee & Governance
and Nominating Committee | President of Dubin Investments, Ltd., Greenwich, CT (private investment fund); Director and officer of various charitable organizations. | None |
David L. Gardner, 56
Trustee since 2015,
Member of Operations Risk
Oversight Committee | Until 2012, head of EMEA (Europe, Middle East and Africa) Sales for iShares of Blackrock, Inc., EMEA Executive Committee Member and EMEA Operating Committee Member at Blackrock, Inc. | None |
Patrick J. Talamantes, 55
Trustee since 2019,
Member of Audit Committee | President of Talamantes Strategies, LLC, a management consulting firm, since 2018; until 2017, President and Chief Executive Officer of The McClatchy Company, Sacramento, CA (news and media company). | None |
Owen D. Van Essen, 65
Trustee since 2004,
Chairman of Operations Risk
Oversight Committee &
Member of Governance and
Nominating Committee | President of Dirks, Van Essen, Murray & April, Santa Fe, NM (newspaper mergers and acquisitions). | None |
James W. Weyhrauch, 60
Trustee since 1996,
Member of Audit
Committee & Operations Risk
Oversight Committee | Real estate broker, Santa Fe Properties, Santa Fe, NM; General Partner, Investments of Genext LLC (a family investment partnership); until 2019, Vice Chairman of Nambe LLC, Santa Fe, NM (manufacturing & design company). | None |
Trustees and Officers, Continued
Thornburg International Value Fund | September 30, 2019 (Unaudited)
NAME, AGE, YEAR ELECTED
POSITION HELD WITH FUND | PRINCIPAL OCCUPATION(S) DURING PAST FIVE YEARS | OTHER DIRECTORSHIPS
HELD BY TRUSTEE |
| OFFICERS OF THE FUND (WHO ARE NOT TRUSTEES)(1)(6) |
David Ashley, 49
Vice President since 2019 | Portfolio Manager and Managing Director since 2019 and Associate Portfolio Manager from 2011-2019 of Thornburg Investment Management, Inc. | Not applicable |
Nimish Bhatt, 56
Chief Financial Officer
since 2019; Treasurer
2016-2019; Secretary
(2018-2019)(7) | Chief Financial Officer and Treasurer of Thornburg Investment Management, Inc. and Thornburg Securities Corporation since 2016 and Secretary of Thornburg Securities Corporation since 2018; Senior Vice President (2004-2016), Chief Financial Officer (2011-2016), and Head of Fund Administration (2011-2016) of Calamos Asset Management, Inc., Calamos Investments LLC, Calamos Advisors LLC, and Calamos Wealth Management; Director of Calamos Global Funds plc (2007-2016). | Not applicable |
Jason Brady, 45
President since 2016(7) | Director since 2017, CEO and President since 2016, and Portfolio Manager and Managing Director of Thornburg Investment Management, Inc.; Vice President of Thornburg Securities Corporation since 2016. | Not applicable |
Connor Browne, 40
Vice President since 2006 | Portfolio Manager and Managing Director of Thornburg Investment Management, Inc. | Not applicable |
Randy Dry, 45
Vice President since 2014 | Managing Director, Director of Institutional Group from 2014-2016, and since 2016, Chief Administrative Officer of Thornburg Investment Management, Inc. | Not applicable |
Greg Dunn, 43
Vice President since 2014 | Portfolio Manager and Managing Director of Thornburg Investment Management, Inc. | Not applicable |
Lon Erickson, 44
Vice President since 2008 | Portfolio Manager and Managing Director of Thornburg Investment Management, Inc. | Not applicable |
Thomas Garcia, 48
Vice President since 2006 | Managing Director, Head Equity Trader, and Associate Portfolio Manager of Thornburg Investment Management, Inc. | Not applicable |
Christian Hoffmann, 37
Vice President since 2018 | Portfolio Manager and Managing Director since 2018, and Associate Portfolio Manager from 2014-2018, of Thornburg Investment Management, Inc. | Not applicable |
Curtis Holloway, 52
Treasurer since 2019(7) | Director of Fund Administration since 2019 of Thornburg Investment Management, Inc.; Senior Vice President, Head of Fund Administration (2017-2019) and Vice President, Fund Administration (2010-2017) of Calamos Investments, and Chief Financial Officer (2017-2019) and Treasurer (2010-2019) of Calamos Funds. | Not applicable |
Ben Kirby, 39
Vice President since 2014 | Head of Investments since 2019, Portfolio Manager and Managing Director since 2013. | Not applicable |
Jeff Klingelhofer, 38
Vice President since 2016 | Head of Investments since 2019, Portfolio Manager and Managing Director since 2015, and Associate Portfolio Manager from 2012–2015, of Thornburg Investment Management, Inc. | Not applicable |
Ponn Lithiluxa, 48
Vice President since 2017 | Manager, Tax & Fund Administration of Thornburg Investment Management, Inc.; Senior Vice President, Citi Fund Services, Inc. (2014–2017); Vice President, Citi Fund Services, Inc. (2007–2014). | Not applicable |
Rob MacDonald, 43
Vice President since 2016 | Managing Director since 2015, Portfolio Manager since 2014, and Associate Portfolio Manager from 2011–2014 of Thornburg Investment Management, Inc. | Not applicable |
Michael Mastroianni, 42
Secretary and Vice President since 2019(7) | Director of Fund Operations since 2019 of Thornburg Investment Management, Inc.; Executive Director, Global Head of Client Services - Global Liquidity (2018-2019), Executive Director, North American Head of Transfer Agency Relationship Management (2011-2019), Executive Director, North American Head of Transfer Agency Service Delivery (2011-2018) of J.P. Morgan Asset Management. | Not applicable |
Leigh Moiola, 52
Vice President since 2001 | Managing Director and Director of Marketing of Thornburg Investment Management, Inc.; Vice President of Thornburg Securities Corporation. | Not applicable |
Christopher Ryon, 63
Vice President since 2008 | Portfolio Manager and Managing Director of Thornburg Investment Management, Inc. | Not applicable |
Trustees and Officers, Continued
Thornburg International Value Fund | September 30, 2019 (Unaudited)
NAME, AGE, YEAR ELECTED
POSITION HELD WITH FUND | PRINCIPAL OCCUPATION(S) DURING PAST FIVE YEARS | OTHER DIRECTORSHIPS
HELD BY TRUSTEE |
Sean Koung Sun, 38
Vice President since 2017 | Portfolio Manager and Managing Director since 2017, Associate Portfolio Manager from 2015-2016, and Equity Research Analyst from 2012-2014 of Thornburg Investment Management, Inc. | Not applicable |
Stephen Velie, 52
Chief Compliance Officer since 2009 | Chief Compliance Officer of Thornburg Investment Trust and Thornburg Investment Management, Inc. | Not applicable |
Nicholos Venditti, 38
Vice President since 2016 | Portfolio Manager and Managing Director since 2015 and Associate Portfolio Manager from 2011–2015 of Thornburg Investment Management, Inc. | Not applicable |
Vinson Walden, 49
Vice President since 2004 | Portfolio Manager and Managing Director of Thornburg Investment Management, Inc. | Not applicable |
Lei Wang, 48
Vice President since 2006 | Portfolio Manager and Managing Director of Thornburg Investment Management, Inc. | Not applicable |
Charles Wilson, 44
Vice President since 2016 | Portfolio Manager and Managing Director since 2014 and Associate Portfolio Manager from 2012–2014 of Thornburg Investment Management, Inc. | Not applicable |
Di Zhou, 41
Vice President since 2016 | Portfolio Manager and Managing Director since 2016, Associate Portfolio Manager from 2014–2016, and Equity Research Analyst from 2010–2014 of Thornburg Investment Management, Inc. | Not applicable |
| (1) | Each person’s address is 2300 North Ridgetop Road, Santa Fe, New Mexico 87506. |
| (2) | The Fund is a separate investment “Fund” or “series” of Thornburg Investment Trust (the “Trust”), which comprises the Thornburg mutual fund complex and is organized as a Massachusetts business trust. Thornburg Investment Management, Inc. is the investment advisor to, and manages, all the Funds of the Trust. Each Trustee oversees all the Funds of the Trust. |
| (3) | Mr. Thornburg is considered an “interested” Trustee under the Investment Company Act of 1940 because he is a director and controlling shareholder of Thornburg Investment Management, Inc., the investment advisor to the Trust, and is the sole director and controlling shareholder of Thornburg Securities Corporation, the distributor of shares for the Trust. |
| (4) | Mr. McMahon is considered an “interested” Trustee under the Investment Company Act of 1940 because he is a director and the chief investment strategist of Thornburg Investment Management, Inc. |
| (5) | The Bylaws of the Trust currently require that each Independent Trustee shall retire by the end of the calendar year during which the Trustee reached the age of 75 years. Otherwise each Trustee serves in office until the election and qualification of a successor or until the Trustee sooner dies, resigns, retires or is removed. |
| (6) | Assistant vice presidents and assistant secretaries are not shown. |
| (7) | The Trust’s president, chief financial officer, secretary, and treasurer each serves a one-year term or until the election and qualification of a successor; each other officer serves at the pleasure of the Trustees. |
The Statement of Additional Information for each Fund of the Trust includes additional information about the Trustees and is available, without charge and upon request, by calling 1-800-847-0200.
Other Information
Thornburg International Value Fund | September 30, 2019 (Unaudited)
PORTFOLIO PROXY VOTING
Policies and Procedures:
The Trust has delegated to the Advisor voting decisions respecting proxies for the Fund’s voting securities. The Advisor makes voting decisions in accordance with its Proxy Voting Policy and Procedures. A description of the Policy and Procedures is available (i) without charge, upon request, by calling the Advisor toll-free at 1-800-847-0200, (ii) on the Thornburg website at www.thornburg.com, and (iii) on the U.S. Securities and Exchange Commission’s website at www.sec.gov.
Information regarding how proxies were voted is available on or before August 31 of each year for the twelve months ending the preceding June 30. This information is available (i) without charge, upon request by calling the Advisor toll-free at 1-800-847-0200, (ii) on the Thornburg website at www.thornburg.com, and (iii) on the U.S. Securities and Exchange Commission’s website at www.sec.gov.
TAX INFORMATION
For tax year ended September 30, 2019, dividends paid by Thornburg International Value Fund of $54,098,297 are being reported as taxable ordinary investment income dividends for federal income tax purposes.
For the tax year ended September 30, 2019, the Fund is reporting 86.96% (or the maximum allowed) of the dividends paid from tax basis net ordinary income as qualifying for the reduced rate under the Jobs and Growth Tax Relief and Reconciliation Act of 2003.
The Fund is reporting 2.59% (or the maximum allowed) of the ordinary income distributions paid by the Fund for the fiscal year ended September 30, 2019 as qualified for the corporate dividends received deduction.
For the year ended September 30, 2019, foreign source income and foreign taxes paid is $74,568,670 and $5,509,902 respectively.
The information and distributions reported herein may differ from the information and distributions reported to the shareholders for the calendar year ending December 31, 2019. Complete information will be reported in conjunction with your 2019 Form 1099.
AVAILABILITY OF QUARTERLY PORTFOLIO SCHEDULE
The Fund files with the Securities and Exchange Commission schedules of its portfolio holdings on Form N-Q for the first and third quarters of each fiscal year. The Fund’s Forms N-Q are available on the Commission’s website at www.sec.gov, or may be reviewed and copied at the Commission’s Public Reference Room in Washington, D.C. Information on the operation of the Public Reference Room may be obtained by calling 1-800-SEC-0330. The Fund also makes this information available on its website at www.thornburg.com/download or upon request by calling 1-800-847-0200.
STATEMENT RESPECTING RENEWAL OF INVESTMENT ADVISORY AGREEMENT
Thornburg Investment Management, Inc. (the “Advisor”) provides investment management services to Thornburg International Value Fund (the “Fund”) pursuant to an investment advisory agreement. The Trustees consider the renewal of this agreement annually, and most recently determined to renew the agreement on September 17, 2019.
Planning for their recent consideration of the advisory agreement’s renewal, the independent Trustees met in May 2019 to consider aspects of their annual evaluation of the Advisor’s service to all of the funds of Thornburg Investment Trust, to plan the annual evaluation of the Advisor’s performance and to discuss preliminarily the information the Advisor would present to the Trustees for their review. The independent Trustees met in a second independent session in July 2019 to further define certain portions of the information to be submitted by the Advisor. The independent Trustees met again in an independent session in September 2019 with a mutual fund analyst firm engaged by the independent Trustees to provide explanations of comparative cost and expense information, comparative investment performance information, and other data obtained and analyzed by the analyst firm. In that session the independent Trustees discussed their evaluations of the Advisor’s services to the Fund and the Fund’s fee and expense levels, investment performance, and other information presented for the Fund, conferred independently with legal counsel respecting the factors typically considered in evaluating renewal of an advisory agreement, and conferred with representatives of management to receive explanations of certain aspects of the information they had requested. Representatives of the Advisor subsequently reviewed portions of the information with the Trustees and addressed questions from the Trustees at a full meeting session of the Trustees scheduled in September for that purpose, and the independent Trustees thereafter met again in an independent session to consider the Advisor’s presentations and various specific issues respecting their consideration of the advisory agreement’s renewal. Following these sessions, the Trustees met to consider renewal of the advisory agreement, and the independent Trustees voted unanimously at that meeting to renew the agreement for an additional term of one year.
Other Information, Continued
Thornburg International Value Fund | September 30, 2019 (Unaudited)
The information below summarizes certain factors considered by the Trustees in connection with the determination to renew the advisory agreement with the Advisor. In determining to renew the advisory agreement, the Trustees considered a wide range of information and did not identify any single factor as controlling, and this summary does not describe all of the factors and other matters considered by the Trustees in making their determination.
Nature, Extent and Quality of Services. The Trustees considered in their evaluation of the advisory agreement the written and oral reports provided to the Trustees and their standing committees throughout the year on a wide variety of topics by personnel from the Advisor’s portfolio management, administration, operations and compliance staffs. The Trustees also considered in this evaluation presentations and explanations made by representatives of the Advisor in meeting sessions scheduled for consideration of the renewal of the advisory agreement. The Trustees further noted in their evaluation the consideration they had given to a number of topics in previous years, reports from their standing committees, and advice received from counsel.
Information noted by the Trustees as having been considered in relation to the nature, extent and quality of services provided by the Advisor under the advisory agreement and contributing (together with other information considered) to their conclusions respecting the nature, extent and quality of the services rendered to the Fund by the Advisor included: (1) reports from portfolio managers and other personnel throughout the year demonstrating that the Fund was managed in conformity with stated strategies and objectives and conformed to investment restrictions and limitations; (2) reports demonstrating that management of the Fund remained faithful and competent, and demonstrating sufficient skill by portfolio managers in executing the Fund’s strategies in varying environments, managers’ cognizance of and strategies to pursue the Fund’s objectives and address pertinent market and economic trends and conditions, the evaluation and selection of individual investments, management to achieve tax efficiencies, and the structuring and composition of the Fund’s portfolio and management of Fund liquidity requirements; (3) the Fund’s achievement of its investment objectives over different periods of time; (4) presentations by and interactions with members of the Advisor’s fund administration, operations and compliance staffs; (5) reports from standing committees of the Trustees on their respective proceedings throughout the year, including in particular reports from and interactions with the Advisor’s personnel; (6) the sufficiency of the resources the Advisor devotes to the services it provides to the Fund, including the expertise of its personnel and staffing levels and its enhancements to the electronic systems it utilizes in providing these services, and also including the Advisor’s own financial management and sufficiency of its resources; and (7) the measures employed to achieve efficient trade execution for the Fund, including the evaluation and selection of firms to execute transactions for the Fund. As in past years, the Trustees noted particularly their assessments of the Advisor’s personnel developed in meetings throughout the year, measures to expand and improve the depth and experience of the Advisor’s staff, and the Advisor’s collaborative approach to investment management, continued commitment to observance of compliance and regulatory requirements in managing investments by the Fund, responsiveness to the Trustees, and other factors.
Based upon these and other considerations, the Trustees concluded that the Advisor’s management of the Fund’s investments continued to conform to the Fund’s stated objectives and policies, and that the nature, extent and quality of the services provided to the Fund by the Advisor remained sufficient.
Investment Performance. The Trustees noted in their evaluation of the Fund’s investment performance the written and oral reports they had received in each regular meeting over the course of the year from the Advisor’s portfolio management personnel. The Trustees also noted their consideration of information provided to them at their request in anticipation of their annual evaluation of the Advisor’s services, including the following items of information respecting the investment performance of the Fund: (1) the Fund’s absolute investment performance and achievement of stated objectives; (2) the Advisor’s explanations and commentary on the Fund’s performance in the context of the Fund’s objectives and reasonable expectations, and business, market and economic conditions; (3) performance data for the most recent ten calendar years, comparing the Fund’s annual investment returns to two broad-based securities indices and to the applicable Morningstar category of funds; (4) the Fund’s investment performance for the three-month, year-to-date, one-year, three-year, five-year, ten-year, and since inception periods ending with the second quarter of the current year, comparing the Fund’s annualized returns to two mutual fund categories selected by independent mutual fund analyst firms and to two broad-based securities indices, and assigning a percentage rank to the Fund’s performance for each period relative to each of the fund categories; (5) analyses of specified performance and risk metrics for the Fund relative to one of its benchmarks and to a selected peer group of funds, prepared by an independent financial analyst firm engaged by the independent Trustees; (6) the Fund’s cash flows; (7) comparative performance data for fund peer groups selected by an independent mutual fund analyst firm engaged by the independent Trustees, and the analysis and observations of the analyst firm respecting those data; (8) comparison of the Fund’s annualized return to the Fund’s benchmark indices over various periods since the Fund’s inception; and (9) comparative measures of estimated earnings growth, and risk and return statistics. The Trustees generally attach additional significance to investment performance from the perspective of longer-term shareholders. The Trustees also noted the improvement in the Fund’s investment performance and favorable results relative to comparatives. Based upon their consideration of this and other information, the Trustees concluded that the Fund’s absolute and relative investment performance over a range of pertinent holding periods on the whole was satisfactory in view of its objectives and strategies.
Comparisons of Fee and Expense Levels. Information noted by the Trustees as having been considered in this context included a variety of comparative data respecting the Fund’s fee and expense levels. This information included comparisons of the Fund’s advisory fee and overall Fund expenses to median and average fees and expenses charged to funds in the applicable Morningstar category, comparisons of
Other Information, Continued
Thornburg International Value Fund | September 30, 2019 (Unaudited)
the advisory fee and total expenses for two Fund share classes to the fee levels and expenses of fund peer groups selected from the category by an independent mutual fund analyst firm engaged by the independent Trustees, the perspectives and advice from that mutual fund analyst firm respecting comparisons of fund fee levels and expenses to fund peer groups, and other information. Comparative fee and expense data noted as having been considered by the Trustees showed that the level of total expense for one share class of the Fund was higher than the median and average levels charged to funds in the applicable Morningstar category, and that the level of total expense for a second share class was lower than the median and average levels for that category. Peer group data showed that the Fund’s stated advisory fee was lower than the median level for the two peer groups, and that the total expense levels of two representative share classes were higher than the medians of their respective peer groups but comparable to other funds in the peer groups. The Trustees did not find the differences significant in view of their findings and conclusions respecting the other factors considered.
The Trustees noted their consideration of information respecting the advisory fees charged by the Advisor to other investment management clients, including sub-advised mutual funds and other institutional clients, together with information about fees charged by other advisors to different clients, analysis of the differences between the requirements of institutional clients and mutual funds, analysis of the differences between the requirements of a sub-advised mutual fund and a fund as to which the investment advisor is the primary advisor and sponsor, and the consequently different investment management services provided to the different categories of clients and the differing contexts in which these arrangements are entered into. The Trustees confirmed their previous observations that the differences between the fees charged by the Advisor or by other investment advisors to different types of clients did not appear exceptional and had limited relevance to the evaluation of the fee rate charged to mutual funds as to which the Advisor or such other advisors are the primary advisor and sponsor.
Costs and Profitability of Advisor. In reviewing the profitability of the Advisor’s services to the Fund, the Trustees considered an analysis of the Advisor’s costs and the estimated profitability to the Advisor of its services, together with data respecting the overall profitability of a selection of other investment management firms. The Trustees considered in this regard information from the Advisor respecting investment of its profits to maintain staffing levels, and noted that a portion of the Advisor’s profits is an important element in the compensation of shareholder employees. The Trustees considered information from the Advisor respecting the use of profits to enhance staff competencies through training and other measures, hire personnel to expand and develop the scope of senior management expertise, pay competitive levels of compensation, and add to the Advisor’s electronic and information technology systems to maintain or improve service levels. The Trustees also considered the contribution of the Advisor’s cost management to its profitability, and the relationship of the Advisor’s financial resources and profitability in previous years to its ability to attract necessary personnel, invest in systems and other assets required for its service to the Fund, and maintain or improve service levels for the Fund notwithstanding fluctuations in revenues and profitability. The information considered did not indicate to the Trustees that the Advisor’s profitability was excessive.
Potential Economies of Scale. In reviewing the extent to which economies of scale would be realized by the Fund as it grows and whether fee levels reflect potential economies of scale, the Trustees considered the breakpoint structure for advisory fees chargeable to the Fund, comparisons of the fee breakpoint structure for the Fund with breakpoint structures (or the absence of such structures) for other funds in a peer group selected by an independent mutual fund analyst firm, the effects of the breakpoint structure and other expense factors realized by certain funds of the Trust as their asset levels had increased, the Advisor’s undertakings to waive or reimburse certain fees and expenses of the Fund, and the Advisor’s expenditures from its own profits and resources to maintain staffing levels and expand staff competencies, pay competitive levels of compensation, and add to its electronic and information technology systems so as to maintain or improve service levels. The information provided demonstrated to the Trustees that the Fund’s advisory fee breakpoint structure is reasonable in relation to the structures observed in the other funds in its peer group, and that shareholders may be expected to benefit from any economies of scale, due to the advisory agreement’s breakpoint fee structure for the Fund and other factors.
Potential Ancillary Benefits. In reviewing potential benefits to the Advisor because of its relationship to the Fund, the Trustees considered explanations from the Advisor respecting its receipt of certain research services from broker dealers, and the benefits to both the Fund and the Advisor of the Advisor’s expansion of its staffing, compliance and systems capabilities and other resources to serve a broader variety of investment management clients. No unusual or unfair benefits to the Advisor from its relationship to the Fund were identified by the Trustees.
Summary of Conclusions. The Trustees concluded that the general nature, extent and quality of the Advisor’s services performed under the advisory agreement remained sufficient, the Advisor had continued to actively and competently pursue the Fund’s stated investment objectives and adhere to the Fund’s investment policies, and that the absolute and relative investment performance of the Fund over pertinent holding periods on the whole was satisfactory in the context of the Fund’s objectives and strategies. The Trustees further concluded that the level of the advisory fee charged to the Fund by the Advisor is fair and reasonable in relation to the services provided by the Advisor, in view of the nature, extent and quality of those services, the investment performance of the Fund after fees and expenses, the clear disclosure of fees and expenses in the Fund’s prospectuses, comparisons of fees and expenses charged to the Fund to fees and expenses charged to other mutual funds, and the other factors considered. The Trustees accordingly determined to renew the Fund’s investment advisory agreement with the Advisor for an additional term of one year.
Trustees’ Statement to Shareholders (Unaudited)
Readopted September 17, 2019
The Trustees believe current and prospective shareholders should know how we discharge our responsibilities in supervising the Funds’ investment advisor and in reviewing the advisor’s contract for renewal. Since 2005, we have issued a statement which sets out clearly the three principal guidelines that we follow in supervising the Trust’s investment advisor on your behalf. In accordance with our customary practice, in September of this year we again reviewed our statement and concluded we should reissue this statement outlining the principal features of our supervision of the advisor’s performance of investment management services for the Funds.
We begin with the premise that each shareholder selected his or her Fund because its investments are managed by the investment advisor identified in the prospectus and in accordance with the objective and policies described in the prospectus. We realize, as each of you do, that if you believe that your Fund’s stated objective and policies no longer serve your personal investment goals, you can sell your shares and leave the Fund.
Therefore, we believe that our primary supervisory task—our principal obligation to you—is to assess the nature and quality of the advisor’s services, and to confirm that the advisor actively and competently pursues the Fund’s objective, in accordance with the policies set out in the prospectus. To do this, we meet regularly with management to review your Fund’s portfolio and to discuss the advisor’s specific actions and judgments in pursuing the Fund’s objective. We do not substitute our own judgment for the advisor’s decisions in selecting investments; the advisor is paid to exercise its informed judgment on investment decisions, and we seek to confirm, in reviewing the advisor’s performance, that the advisor is doing just that.
Second, we are conscious of costs and the effect that costs have on shareholders’ returns. We try to make sure that your Fund’s fees and costs are reasonable in relationship to the services rendered and that they are generally in line with those charged by other expert investment advisors, consistent with our belief that the Fund’s investors searched for and expect that expertise and attention and have decided to pay a reasonable price for it. We do not put the management contract “out to bid” as a matter of course, and we would not do so unless we had concluded that the advisor materially had failed to pursue the Fund’s objectives in accordance with its policies, or for other equally important reasons. We believe that any other approach would be inconsistent with your interests and contrary to your expectations when you bought shares of the Fund in the first place.
Finally, because we believe that most Thornburg Fund shareholders have invested with a long-term perspective, we try not to focus too much on the fashions of the moment and on short-term performance. The market will not favor any specific investment objective or set of policies at all times and under all economic circumstances. A fund will experience periods of both high and low returns relative to other funds and other investments. Even if one of our Funds is not favored by the market at a particular time, we believe that the advisor is nonetheless obliged to remain true to the Fund’s objective and policies, and we watch to see that it does so.
Trustees of Thornburg Investment Trust
Thornburg Investment Management is a privately-owned global investment firm that offers a range of solutions for retail and institutional investors. Founded in 1982 and headquartered in Santa Fe, New Mexico, we manage approximately $41.9 billion (as of September 30, 2019) across U.S. mutual funds, separate accounts for high-net-worth investors, institutional accounts, and UCITS funds for non-U.S. investors.
The fund outlined in this report is one of many equity and fixed-income products available from Thornburg Investment Management.
EQUITY FUNDS
| ■ | Thornburg Global Opportunities Fund |
| ■ | Thornburg International Value Fund |
| ■ | Thornburg Better World International Fund |
| ■ | Thornburg International Growth Fund |
| ■ | Thornburg Developing World Fund |
| ■ | Thornburg Value Fund |
| ■ | Thornburg Core Growth Fund |
MULTI_ASSET FUNDS
| ■ | Thornburg Investment Income Builder Fund |
| ■ | Thornburg Summit Fund |
FIXED INCOME FUNDS
| ■ | Thornburg Low Duration Income Fund |
| ■ | Thornburg Limited Term U.S. Government Fund |
| ■ | Thornburg Limited Term Income Fund |
| ■ | Thornburg Strategic Income Fund |
| ■ | Thornburg Low Duration Municipal Fund |
| ■ | Thornburg Limited Term Municipal Fund |
| ■ | Thornburg Intermediate Municipal Fund |
| ■ | Thornburg California Limited Term Municipal Fund |
| ■ | Thornburg New Mexico Intermediate Municipal Fund |
| ■ | Thornburg New York Intermediate Municipal Fund |
| ■ | Thornburg Strategic Municipal Income Fund |
ALTERNATIVE FUNDS
| ■ | Thornburg Long/Short Equity Fund |
Before investing, carefully consider the Fund’s investment goals, risks, charges, and expenses. For a prospectus or summary prospectus containing this and other information, contact your financial advisor or visit thornburg.com. Read it carefully before investing.
For additional information, please visit thornburg.com
Thornburg Investment Management, Inc. 2300 North Ridgetop Road, Santa Fe, NM 87506
To receive shareholder reports, prospectuses, and proxy statements electronically, go to www.thornburg.com/edelivery.
This Annual Report is submitted for the general information of shareholders of the Fund. It is not authorized for distribution to prospective investors in the Fund unless preceded or accompanied by an effective prospectus.
Investment Advisor:
Thornburg Investment Management®
800.847.0200
Distributor:
Thornburg Securities Corporation®
Annual Report
September 30, 2019
Beginning on January 1, 2021, as permitted by regulations adopted by the Securities and Exchange Commission, paper copies of the Fund’s shareholder reports will no longer be sent by mail, unless you specifically request paper copies of the reports from the Fund or from your financial intermediary, such as a broker-dealer or bank. Instead, the reports will be made available on a website, and you will be notified by mail each time a report is posted and provided with a website link to access the report.
If you already elected to receive shareholder reports electronically, you will not be affected by this change and you need not take any action. You may elect to receive shareholder reports and other communications from the Fund or your financial intermediary electronically by going to thornburg.com/edelivery.
You may elect to receive all future reports in paper free of charge. You can inform the Fund or your financial intermediary that you wish to continue receiving paper copies of your shareholder reports by calling 800.847.0200 or your financial intermediary directly. Your election to receive reports in paper will apply to all funds held with the fund complex/your financial intermediary.
At Thornburg, we believe unconstrained investing leads to better outcomes for our clients. Our investment solutions are highly active, high conviction, and benchmark agnostic. When it comes to finding economic opportunity for clients, it’s more than what we do.
It’s how we do it. Active Asbottom-up, fundamental, active managers, we look beyond conventional benchmarks. Long Term We take a long-term view in how we manage our firm and our portfolios. Benchmark Agnostic Investment strategies should have the flexibility to pursue solutions for clients, not stay within the conventional confines of benchmarks. Flexible Perspective Our approach to portfolio construction is guided by our convictions rather than convention. High Conviction We focus our attention and capital on thoroughly researched, well-understood positions. The best form of risk management is to know what you own, and why. Repeatable & Robust Our long-term outperformance of benchmarks verifies that our process works and outperforms conventional thinking. Independent We are independently owned and far from the herd of other investment managers. Investment Driven All members of the investment team are resources for all of our strategies. Collaborative Our team collaborates on opportunities across geography, sector, or asset class.
Thornburg Core Growth Fund
Annual Report | September 30, 2019
Table of Contents
| SHARE CLASS | NASDAQ SYMBOL | CUSIP |
| Class A | THCGX | 885-215-582 |
| Class C | TCGCX | 885-215-574 |
| Class I | THIGX | 885-215-475 |
| Class R3 | THCRX | 885-215-517 |
| Class R4 | TCGRX | 885-215-251 |
| Class R5 | THGRX | 885-215-350 |
Class I, R3, R4, and R5 shares may not be available to all investors. Minimum investments for Class I shares may be higher than those for other classes.
Investments carry risks, including possible loss of principal. Additional risks may be associated with investments outside the United States, especially in emerging markets, including currency fluctuations, illiquidity, volatility, and political and economic risks. Investments in small- and mid-capitalization companies may increase the risk of greater price fluctuations. Please see the Fund’s prospectus for a discussion of the risks associated with an investment in the Fund. Investments in the Fund are not FDIC insured, nor are they deposits of or guaranteed by a bank or any other entity.
Funds invested in a smaller number of holdings may expose an investor to greater volatility.
Letter to Shareholders
Thornburg Core Growth Fund | September 30, 2019 (Unaudited)
October 9, 2019
Dear Fellow Shareholder,
For the 12 months ended September 30, 2019, the Thornburg Core Growth Fund returned negative 2.26% (Class I shares). The Fund’s benchmark, the Russell 3000 Growth Index, returned 2.70%. On September 30, 2019, the NAV per share of the Class I shares was $42.35.
Volatility has returned to U.S. equity markets. Although the period returns appear benign, there were significant contractions and recoveries during the year. The first quarter of the period was strongly negative, with the Russell 3000 Growth Index down over 20% from October 1, 2018 to December 24, 2018. Markets recovered but have since struggled to sustain positive momentum with significant downdrafts in May and the end of July. The primary drivers of volatility have been the escalating trade war between the United States and China and weakening economic indicators in the U.S. and globally. Risk appetite of investors seems subdued, as small and midcap stocks have underperformed by a wide margin.
Performance Discussion
Sector performance, driven by stock selection, was positive in information technology and industrials during the period. This was offset by weak stock selection within energy, financials and communication services.
Leading top performers for the period were FleetCor Technologies, Comcast, Fidelity National Information Services, ServiceNow and Proofpoint.
FleetCor Technologies is a global provider of fleet payment cards and commercial payment solutions. FleetCor saw accelerating fundamentals in the core fleet card business and continued to extend their growth runway through newer business segments.
Comcast is a media company that provides cable, broadband and phone services, owns and produces media content and operates theme parks. Equity performance was driven by strong fundamental results as demand for broadband remains very strong, even as demand for traditional cable wanes.
Fidelity National Information Services (FIS) is a global provider of payment solutions and the acquirer of Worldpay. As a shareholder of Worldpay, we realized a 39% takeover premium from when the deal was announced in mid-March. We received shares of FIS in the transaction and have a favorable view of the transaction synergies and competitive positioning of the newly formed company.
ServiceNow’s shares have re-rated as investors have come to better appreciate the strong secular growth prospects of cloud based “SaaS” software companies such as ServiceNow. Furthermore, the company has executed well over the past year, growing revenues rapidly at scale as they increasingly become a
critical partner for businesses as they digitize their various workflows.
Proofpoint is a software company that provides a suite of on-demand protection solutions that include threat protection, compliance and secure communication. One of their areas of expertise is email security, where they have a best in class solution. Email has been an area experiencing growing pressure from viruses, hacker attacks and spam. This has led to growing demand for Proofpoint products which has driven strong fundamental results.
Bottom performers for the period included Affiliated Managers Group, SVB Financial Group, Inogen, Concho Resources and Activision.
Affiliated Managers Group’s shares have de-rated as investors have become frustrated with a variety of factors, including persistently weak organic flows, less than stellar capital allocation decisions, inconsistent communication and the overall late-cycle dynamics that financial markets are faced with. With overall assets under management (AUM) likely to head lower rather than higher, we have exited the position for higher conviction ideas.
SVB Financial Group sold off primarily due to volatile equity markets. The combination of a slower rising rate environment coupled with potential initial public offering delays to start 2019 caused pressure in the shares. We exited the position (a long-term positive contributor) in December as fundamentals felt to be peaking.
Inogen shares stumbled as the company missed revenue targets due to a sudden slowdown in sales to a large national account as well as lower than expected sales in their direct-to-consumer business. Given the multiple missteps by management, and limited near term visibility on growth, we have exited the position.
Concho Resources is an oil and gas exploration and production company operating primarily in the Permian Basin. During the last quarter of the period Concho, and many of its peers, suffered steep stock declines as the oil price declined but, more importantly, as the value of their assets came into question.
Activision is a leading publisher and developer of video games. Shares were pressured in the early part of the fiscal year as the industry faced a rapidly changing landscape. While Activision was late to respond to these dynamics, they have since restructured the company to focus resources on their strongest franchises. We believe this strategy will bear fruit over the long term and remain holders.
We expect to see a wider dispersion of investing outcomes, with gains less broad-based in a slowing environment. We remain focused on bottom-up stock selection and our process, which focuses on high quality growth companies with secular growth opportunities that can sustainably compound value over the long term through idiosyncratic factors such as expanding market
Letter to Shareholders, Continued
Thornburg Core Growth Fund | September 30, 2019 (Unaudited)
share, deepening economic moats, superior technology and best in class execution. The businesses we own in the portfolio today are well positioned for long-term growth, and we remain excited about their prospects.
We thank you for investing alongside us in the Thornburg Core Growth Fund.

| 
|
Greg Dunn
Managing Director
Portfolio Manager | Ted Chang,cfa
Portfolio Manager
Managing Director |
The matters discussed in this report may constitute forward-looking statements made pursuant to the safe harbor provisions of the Securities Litigation Reform Act of 1995. These include any advisor or portfolio manager prediction, assessment, analysis or outlook for individual securities, industries, investment styles, market sectors and/or markets. These statements involve risks and uncertainties. In addition to the general risks described for each fund in its current prospectus, other factors bearing on these reports include the accuracy of the advisor’s or portfolio manager’s forecasts and predictions, the appropriateness of the investment strategies designed by the advisor or portfolio manager and the ability of the advisor or portfolio manager to implement their strategies efficiently and successfully. Any one or more of these factors, as well as other risks affecting the securities markets generally, could cause the actual results of any fund to differ materially as compared to its benchmarks.
The views expressed are subject to change and do not necessarily reflect the views of Thornburg Investment Management, Inc. This information should not be relied upon as a recommendation or investment advice and is not intended to predict the performance of any investment or market.
Performance results of individual share classes will vary based on the fees and expenses associated with each share class, and may be higher or lower than other share classes within the same Fund. Please see Performance Summary for performance results of each share class.
Performance Summary
Thornburg Core Growth Fund | September 30, 2019 (Unaudited)
AVERAGE ANNUAL TOTAL RETURNS
| | 1-YR | 3-YR | 5-YR | 10-YR | SINCE
INCEP. |
| Class A Shares(Incep: 12/27/00) | | | | | |
| Without sales charge | -2.62% | 11.74% | 8.29% | 11.21% | 6.66% |
| With sales charge | -7.01% | 10.04% | 7.29% | 10.70% | 6.40% |
| Class C Shares(Incep: 12/27/00) | | | | | |
| Without sales charge | -3.42% | 10.84% | 7.44% | 10.35% | 5.82% |
| With sales charge | -4.38% | 10.84% | 7.44% | 10.35% | 5.82% |
| Class I Shares(Incep: 11/3/03) | -2.26% | 12.17% | 8.71% | 11.67% | 9.04% |
| Class R3 Shares(Incep: 7/1/03) | -2.76% | 11.59% | 8.15% | 11.11% | 9.14% |
| Class R4 Shares(Incep: 2/1/07) | -2.64% | 11.71% | 8.27% | 11.22% | 6.00% |
| Class R5 Shares(Incep: 10/3/05) | -2.26% | 12.17% | 8.71% | 11.68% | 8.12% |
| Russell 3000 Growth Index(Since 12/27/00) | 2.70% | 16.36% | 13.07% | 14.74% | 6.34% |
GROWTH OF A HYPOTHETICAL $10,000 INVESTMENT
Performance data shown represents past performance and is no guarantee of future results. Investment return and principal value will fluctuate so shares, when redeemed, may be worth more or less than their original cost. Current performance may be lower or higher than quoted. For performance current to the most recent month end, visit thornburg.com or call 800-847-0200. The performance information does not reflect the deduction of taxes that a shareholder would pay on distributions or the redemption of Fund shares. Returns reflect the reinvestment of dividends and capital gains. Class A shares are sold with a maximum sales charge of 4.50%. Class C shares are subject to a 1% CDSC for the first year only. There is no sales charge for Class I, R3, R4 and R5 shares. As disclosed in the most recent prospectus, the total annual fund operating expenses before any fee waivers or expense reimbursements are as follows: A shares, 1.34%; C shares, 2.14%; I shares, 1.05%; R3 shares, 1.80%; R4 shares, 1.97%; R5 shares, 1.33%. Thornburg Investment Management has contractually agreed to waive fees and reimburse expenses until at least February 1, 2020, for some of the share classes, resulting in net expense ratios of the following: I shares, 0.99%, R3 shares, 1.50%; R4 shares, 1.40%; R5 shares, 0.99%. For more detailed information on fund expenses and waivers/reimbursements please see the Fund’s prospectus.
TheRussell 3000 Growth Index is an unmanaged index comprised of those Russell 3000 companies with higher price-to-book ratios and higher forecasted growth values. The stocks in this index are also members of either the Russell 1000 Growth or the Russell 2000 Growth indices. Source: Frank Russell Company.
The performance of any index is not indicative of the performance of any particular investment. Unless otherwise noted, index returns reflect the reinvestment of income dividends and capital gains, if any, but do not reflect fees, brokerage commissions or other expenses of investing. Investors may not make direct investments into any index.
Fund Summary
Thornburg Core Growth Fund | September 30, 2019 (Unaudited)
OBJECTIVES AND STRATEGIES
The Fund seeks long-term growth of capital by investing in equity securities selected for their growth potential.
The Fund expects to invest primarily in domestic equity securities (primarily common stocks) selected for their growth potential. However, the Fund may own a variety of securities, including foreign equity securities and partnership interests. The Fund may also invest in developing countries.
MARKET CAPITALIZATION EXPOSURE
BASKET STRUCTURE
| TOP TEN EQUITY HOLDINGS |
| Amazon.com, Inc. | 4.8% |
| Alphabet, Inc. Class C | 4.0% |
| Visa, Inc. Class A | 3.6% |
| Activision Blizzard, Inc. | 3.6% |
| Microsoft Corp. | 3.6% |
| Booking Holdings, Inc. | 3.5% |
| Comcast Corp. Class A | 3.3% |
| Expedia Group, Inc. | 3.2% |
| Facebook, Inc. Class A | 3.0% |
| Brink’s Co. | 2.8% |
| SECTOR EXPOSURE |
| Information Technology | 31.0% |
| Communication Services | 17.8% |
| Consumer Discretionary | 16.4% |
| Health Care | 7.4% |
| Financials | 6.6% |
| Industrials | 5.0% |
| Consumer Staples | 4.3% |
| Energy | 1.4% |
| Materials | 1.0% |
| Other Assets Less Liabilities | 9.1% |
| TOP TEN INDUSTRY GROUPS |
| Software & Services | 26.3% |
| Media & Entertainment | 17.8% |
| Retailing | 14.1% |
| Commercial & Professional Services | 5.0% |
| Healthcare Equipment & Services | 4.4% |
| Diversified Financials | 4.3% |
| Food, Beverage & Tobacco | 4.3% |
| Semiconductors & Semiconductor Equipment | 3.0% |
| Pharmaceuticals, Biotechnology & Life Sciences | 3.0% |
| Consumer Services | 2.3% |
COUNTRY EXPOSURE*
(percent of equity holdings) |
| United States | 89.9% |
| China | 2.8% |
| Ireland | 2.4% |
| Mexico | 2.3% |
| France | 1.6% |
| Argentina | 1.0% |
| * | Holdings are classified by country of risk as determined by MSCI and Bloomberg. |
There is no guarantee that the Fund will meet its investment objectives.
All data is subject to change. Charts may not add up to 100% due to rounding.
Schedule of Investments
Thornburg Core Growth Fund | September 30, 2019
| | | SHARES | VALUE |
| | Common Stock — 90.9% | | |
| | Banks — 2.3% | | |
| | Banks — 2.3% | | |
| | JPMorgan Chase & Co. | 117,334 | $ 13,809,038 |
| | | | 13,809,038 |
| | Commercial & Professional Services — 5.0% | | |
| | Commercial Services & Supplies — 5.0% | | |
| | Brink’s Co. | 201,796 | 16,738,978 |
| a | IAA, Inc. | 325,951 | 13,601,935 |
| | | | 30,340,913 |
| | Consumer Services — 2.3% | | |
| | Hotels, Restaurants & Leisure — 2.3% | | |
| | Las Vegas Sands Corp. | 242,700 | 14,018,352 |
| | | | 14,018,352 |
| | Diversified Financials — 4.3% | | |
| | Capital Markets — 4.3% | | |
| | Charles Schwab Corp. | 254,500 | 10,645,735 |
| | CME Group, Inc. | 73,371 | 15,506,227 |
| | | | 26,151,962 |
| | Energy — 1.4% | | |
| | Oil, Gas & Consumable Fuels — 1.4% | | |
| | Pioneer Natural Resources Co. | 65,924 | 8,291,262 |
| | | | 8,291,262 |
| | Food, Beverage & Tobacco — 4.3% | | |
| | Beverages — 2.1% | | |
| | Fomento Economico Mexicano SAB de CV Sponsored ADR | 141,500 | 12,958,570 |
| | Food Products — 2.2% | | |
| | Kerry Group plc Class A | 112,182 | 13,119,872 |
| | | | 26,078,442 |
| | Healthcare Equipment & Services — 4.4% | | |
| | Health Care Equipment & Supplies — 1.9% | | |
| a | DexCom, Inc. | 76,257 | 11,380,595 |
| | Health Care Providers & Services — 2.5% | | |
| a | DaVita, Inc. | 271,807 | 15,512,025 |
| | | | 26,892,620 |
| | Materials — 1.0% | | |
| | Chemicals — 1.0% | | |
| | CF Industries Holdings, Inc. | 119,843 | 5,896,276 |
| | | | 5,896,276 |
| | Media & Entertainment — 17.8% | | |
| | Entertainment — 7.0% | | |
| | Activision Blizzard, Inc. | 408,985 | 21,643,486 |
| a | Netflix, Inc. | 43,366 | 11,605,609 |
| a | Ubisoft Entertainment S.A. | 123,300 | 8,915,491 |
| | Interactive Media & Services — 7.5% | | |
| a | Alphabet, Inc. Class C | 19,785 | 24,117,915 |
| a | Facebook, Inc. Class A | 103,338 | 18,402,431 |
| a | Pinterest, Inc. Class A | 109,521 | 2,896,830 |
| | Media — 3.3% | | |
| | Comcast Corp. Class A | 441,363 | 19,896,644 |
| | | | 107,478,406 |
| | Pharmaceuticals, Biotechnology & Life Sciences — 3.0% | | |
| | Biotechnology — 3.0% | | |
| a | Alexion Pharmaceuticals, Inc. | 94,925 | 9,296,955 |
| | Gilead Sciences, Inc. | 136,300 | 8,638,694 |
Schedule of Investments, Continued
Thornburg Core Growth Fund | September 30, 2019
| | | SHARES | VALUE |
| | | | 17,935,649 |
| | Retailing — 14.1% | | |
| | Internet & Direct Marketing Retail — 14.1% | | |
| a | Alibaba Group Holding Ltd. Sponsored ADR | 92,839 | $ 15,525,466 |
| a | Amazon.com, Inc. | 16,785 | 29,137,250 |
| a | Booking Holdings, Inc. | 10,974 | 21,537,682 |
| | Expedia Group, Inc. | 142,320 | 19,129,231 |
| | | | 85,329,629 |
| | Semiconductors & Semiconductor Equipment — 3.0% | | |
| | Semiconductors & Semiconductor Equipment — 3.0% | | |
| a | Micron Technology, Inc. | 224,095 | 9,602,471 |
| | Texas Instruments, Inc. | 66,800 | 8,633,232 |
| | | | 18,235,703 |
| | Software & Services — 26.3% | | |
| | Information Technology Services — 13.4% | | |
| | Accenture plc Class A | 33,000 | 6,347,550 |
| | Fidelity National Information Services, Inc. | 98,095 | 13,023,092 |
| a | FleetCor Technologies, Inc. | 47,953 | 13,751,962 |
| a | PayPal Holdings, Inc. | 114,400 | 11,850,696 |
| a | Square, Inc. Class A | 225,000 | 13,938,750 |
| | Visa, Inc. Class A | 128,728 | 22,142,503 |
| | Software — 12.9% | | |
| a | Globant S.A. | 57,715 | 5,285,540 |
| | Microsoft Corp. | 155,036 | 21,554,655 |
| a | Proofpoint, Inc. | 52,586 | 6,786,223 |
| a | salesforce.com, Inc. | 100,910 | 14,979,081 |
| a | ServiceNow, Inc. | 33,806 | 8,581,653 |
| a | Splunk, Inc. | 89,619 | 10,562,495 |
| a | Workday, Inc. Class A | 45,228 | 7,686,951 |
| a | Zoom Video Communications, Inc. Class A | 38,256 | 2,915,107 |
| | | | 159,406,258 |
| | Technology Hardware & Equipment — 1.7% | | |
| | Technology Hardware, Storage & Peripherals — 1.7% | | |
| | Apple, Inc. | 46,722 | 10,464,326 |
| | | | 10,464,326 |
| | Total Common Stock(Cost $474,436,676) | | 550,328,836 |
| | Short-Term Investments — 9.0% | | |
| b | Thornburg Capital Management Fund | 5,479,196 | 54,791,964 |
| | Total Short-Term Investments(Cost $54,791,964) | | 54,791,964 |
| | Total Investments — 99.9%(Cost $529,228,640) | | $605,120,800 |
| | Other Assets Less Liabilities — 0.1% | | 490,777 |
| | Net Assets — 100.0% | | $605,611,577 |
| Footnote Legend |
| a | Non-income producing. |
| b | Investment in Affiliates. |
Portfolio Abbreviations
To simplify the listings of securities, abbreviations are used per the table below:
| ADR | American Depositary Receipt |
See notes to financial statements.
Statement of Assets and Liabilities
Thornburg Core Growth Fund | September 30, 2019
| ASSETS | |
| Investments at value (Note 3) | |
| Non-affiliated issuers (cost $474,436,676) | $ 550,328,836 |
| Non-controlled affiliated issuer (cost $54,791,964) | 54,791,964 |
| Receivable for investments sold | 1,583,535 |
| Receivable for fund shares sold | 65,827 |
| Dividends receivable | 117,634 |
| Dividend and interest reclaim receivable | 1,089 |
| Prepaid expenses and other assets | 41,625 |
| Total Assets | 606,930,510 |
| Liabilities | |
| Payable for fund shares redeemed | 447,633 |
| Payable to investment advisor and other affiliates (Note 4) | 580,009 |
| Accounts payable and accrued expenses | 291,291 |
| Total Liabilities | 1,318,933 |
| Net Assets | $ 605,611,577 |
| NET ASSETS CONSIST OF | |
| Distributable earnings | $ 126,521,783 |
| Net capital paid in on shares of beneficial interest | 479,089,794 |
| | $ 605,611,577 |
| NET ASSET VALUE | |
| Class A Shares: | |
Net asset value and redemption price per share
($259,799,488 applicable to 6,598,787 shares of beneficial interest outstanding - Note 5) | $ 39.37 |
| Maximum sales charge, 4.50% of offering price | 1.86 |
| Maximum offering price per share | $ 41.23 |
| Class C Shares: | |
Net asset value and offering price per share*
($36,840,967 applicable to 1,086,290 shares of beneficial interest outstanding - Note 5) | $ 33.91 |
| Class I Shares: | |
Net asset value, offering and redemption price per share
($254,720,547 applicable to 6,014,176 shares of beneficial interest outstanding - Note 5) | $ 42.35 |
| Class R3 Shares: | |
Net asset value, offering and redemption price per share
($30,083,872 applicable to 770,304 shares of beneficial interest outstanding - Note 5) | $ 39.05 |
| Class R4 Shares: | |
Net asset value, offering and redemption price per share
($4,183,005 applicable to 105,934 shares of beneficial interest outstanding - Note 5) | $ 39.49 |
| Class R5 Shares: | |
Net asset value, offering and redemption price per share
($19,983,698 applicable to 472,338 shares of beneficial interest outstanding - Note 5) | $ 42.31 |
| * | Redemption price per share is equal to net asset value less any applicable contingent deferred sales charge. |
See notes to financial statements.
Statement of Operations
Thornburg Core Growth Fund | Year Ended September 30, 2019
| INVESTMENT INCOME | |
| Dividend income | |
| Non-affiliated issuers (net of foreign taxes withheld of $1,853) | $ 4,861,090 |
| Non-controlled affiliated issuer | 917,456 |
| Total Income | 5,778,546 |
| EXPENSES | |
| Investment advisory fees (Note 4) | 5,509,605 |
| Administration fees (Note 4) | |
| Class A Shares | 233,669 |
| Class C Shares | 39,657 |
| Class I Shares | 232,343 |
| Class R3 Shares | 29,597 |
| Class R4 Shares | 3,652 |
| Class R5 Shares | 20,892 |
| Distribution and service fees (Note 4) | |
| Class A Shares | 665,106 |
| Class C Shares | 451,826 |
| Class R3 Shares | 168,629 |
| Class R4 Shares | 10,393 |
| Transfer agent fees | |
| Class A Shares | 270,614 |
| Class C Shares | 71,719 |
| Class I Shares | 160,235 |
| Class R3 Shares | 93,515 |
| Class R4 Shares | 15,342 |
| Class R5 Shares | 83,858 |
| Registration and filing fees | |
| Class A Shares | 14,427 |
| Class C Shares | 12,717 |
| Class I Shares | 13,817 |
| Class R3 Shares | 13,052 |
| Class R4 Shares | 12,569 |
| Class R5 Shares | 12,825 |
| Custodian fees | 52,711 |
| Professional fees | 65,281 |
| Trustee and officer fees (Note 4) | 37,264 |
| Other expenses | 81,579 |
| Total Expenses | 8,376,894 |
| Less: | |
| Expenses reimbursed by investment advisor (Note 4) | (391,985) |
| Net Expenses | 7,984,909 |
| Net Investment Loss | $ (2,206,363) |
Statement of Operations, Continued
Thornburg Core Growth Fund | Year Ended September 30, 2019
| REALIZED AND UNREALIZED GAIN (LOSS) | |
| Net realized gain (loss) on: | |
| Non-affiliated issuer investments | $ 54,108,925 |
| Foreign currency transactions | (11,552) |
| | 54,097,373 |
| Net change in unrealized appreciation (depreciation) on: | |
| Non-affiliated issuer investments | (71,350,351) |
| Foreign currency translations | 560 |
| | (71,349,791) |
| Net Realized and Unrealized Loss | (17,252,418) |
| Net Decrease in Net Assets Resulting from Operations | $ (19,458,781) |
See notes to financial statements.
Statements of Changes in Net Assets
Thornburg Core Growth Fund
| | Year Ended
September 30, 2019 | Year Ended
September 30, 2018 |
| INCREASE (DECREASE) IN NET ASSETS FROM | | |
| OPERATIONS | | |
| Net investment loss | $ (2,206,363) | $ (3,700,426) |
| Net realized gain (loss) on investments and foreign currency transactions | 54,097,373 | 165,765,366 |
| Net change in unrealized appreciation (depreciation) on investments and foreign currency translations | (71,349,791) | (16,297,238) |
| Net Increase (Decrease) in Net Assets Resulting from Operations | (19,458,781) | 145,767,702 |
| FUND SHARE TRANSACTIONS (NOTE 5) | | |
| Class A Shares | (28,138,946) | 63,051,371 |
| Class C Shares | (15,122,046) | (101,970,153) |
| Class I Shares | (24,897,376) | (4,992,603) |
| Class R3 Shares | (9,425,792) | (15,683,490) |
| Class R4 Shares | (293,149) | (7,673,126) |
| Class R5 Shares | (10,416,662) | (1,875,573) |
| Net Increase (Decrease) in Net Assets | (107,752,752) | 76,624,128 |
| NET ASSETS | | |
| Beginning of Year | 713,364,329 | 636,740,201 |
| End of Year | $ 605,611,577 | $ 713,364,329 |
See notes to financial statements.
Notes to Financial Statements
Thornburg Core Growth Fund | September 30, 2019
NOTE 1 – ORGANIZATION
Thornburg Core Growth Fund (the “Fund”) is a diversified series of Thornburg Investment Trust (the “Trust”). The Trust was organized as a Massachusetts business trust under a Declaration of Trust dated June 3, 1987 and is registered as a diversified, open-end management investment company under the Investment Company Act of 1940, as amended (the "1940 Act"). The Fund is currently one of twenty-two separate series of the Trust. Each series is considered to be a separate entity for financial reporting and tax purposes and bears expenses directly attributable to it. The Fund seeks long-term capital appreciation by investing in equity securities selected for their growth potential.
The Fund currently offers six classes of shares of beneficial interest: Class A, Class C, Institutional Class (“Class I”), and Retirement Classes (“Class R3”, “Class R4”, and “Class R5”). Each class of shares of the Fund represents an interest in the same portfolio of investments, except that (i) Class A shares are sold subject to a front-end sales charge collected at the time the shares are purchased and bear a service fee, (ii) Class C shares are sold at net asset value without a sales charge at the time of purchase, but are subject to a contingent deferred sales charge upon redemption within one year of purchase, and bear both a service fee and a distribution fee, (iii) Class I shares are sold at net asset value without a sales charge at the time of purchase and may be subject to a service fee, (iv) Class R3 shares are sold at net asset value without a sales charge at the time of purchase, but bear both a service fee and distribution fee, (v) Class R4 shares are sold at net asset value without a sales charge at the time of purchase, but bear a service fee, (vi) Class R5 shares are sold at net asset value without a sales charge at the time of purchase and may be subject to a service fee, and (vii) the respective classes may have different reinvestment privileges and conversion rights. Additionally, the Fund may allocate among its classes certain expenses, to the extent allocable to specific classes, including administration fees, transfer agent fees, government registration fees, certain printing and postage costs, and administrative and legal expenses. Currently, class specific expenses of the Fund are limited to service and distribution fees and certain registration and transfer agent expenses.
The following is a summary of significant accounting policies followed by the Fund in the preparation of its financial statements. The Fund prepares its financial statements in conformity with United States generally accepted accounting principles (“GAAP”), including investment company accounting and reporting guidance in the Financial Accounting Standards Board (the “FASB”) Accounting Standard Codification Topic 946.
NOTE 2 – SIGNIFICANT ACCOUNTING POLICIES
Security Valuation: All investments in securities held by the Fund are valued as described in Note 3.
Allocation of Income, Gains, Losses and Expenses: Net investment income (other than class specific expenses) and realized and unrealized gains and losses are allocated daily to each class of shares based upon the relative net asset value of outstanding shares (or the value of the dividend-eligible shares, as appropriate) of each class of shares at the beginning of the day (after adjusting for the current capital shares activity of the respective class). Expenses common to all Funds are allocated among the Funds comprising the Trust based upon their relative net asset values or other appropriate allocation methods. Operating expenses directly attributable to a specific class are charged against the operating income of that class.
Dividends and Distributions to Shareholders: Dividends and distributions to shareholders, which are determined in accordance with federal income tax regulations and may differ from GAAP, are recorded on the ex-dividend date. Ordinary income dividends, if any, are declared and paid annually. Capital gain distributions, if any, are declared and paid annually and more often if deemed necessary by Thornburg Investment Management, Inc., the Trust’s investment advisor (the “Advisor”). Dividends and distributions are paid and are reinvested in additional shares of the Fund at net asset value per share at the close of business on the ex-dividend date, or at the shareholder’s option, paid in cash.
Investment Income: Dividend income is recorded on the ex-dividend date. Certain income from foreign investments is recognized as soon as information is available to the Fund. Interest income is accrued as earned. Premiums and discounts are amortized and accreted, respectively, to first call dates or maturity dates using the effective yield method of the respective investments. These amounts are included in Investment Income in the Statement of Operations.
Investment Transactions: Investment transactions are accounted for on a trade date basis. Realized gains and losses from the sale of investments are recorded on an identified cost basis.
When-Issued and Delayed Delivery Transactions: The Fund may engage in when-issued or delayed delivery transactions. To the extent the Fund engages in such transactions, it will do so for the purpose of acquiring portfolio investments consistent with the Fund’s investment objectives and not for the purpose of investment leverage or to speculate on interest rate or market changes. At the time the Fund makes a commitment to purchase an investment on a when-issued or delayed delivery basis, the Fund will record the transaction and reflect the value in determining its net asset value. When effecting such transactions, assets of an amount sufficient to make payment for the portfolio investments to be purchased will be segregated on the Fund’s records on the trade date. Investments purchased on a when-issued or
Notes to Financial Statements, Continued
Thornburg Core Growth Fund | September 30, 2019
delayed delivery basis do not earn interest until the settlement date. The values of these securities held at September 30, 2019 are detailed in the Schedule of Investments.
Foreign Currency Translation: Portfolio investments and other assets and liabilities denominated in foreign currencies are translated into U.S. dollars based on the exchange rate of such currencies against the U.S. dollar on the date of valuation. Purchases and sales of investments and income items denominated in foreign currencies are translated into U.S. dollars at the exchange rate in effect on the transaction date. When the Fund purchases or sells foreign investments, it will customarily enter into a foreign exchange contract to minimize foreign exchange risk from the trade date to the settlement date of such transactions. The values of such spot contracts are included in receivable for investments sold and payable for investments purchased on the Statement of Assets and Liabilities.
The Fund does not separately report the effect of changes in foreign exchange rates from changes in market prices on investments held. Such changes are included in net unrealized appreciation (depreciation) from investments in the Statement of Operations.
Reported net realized gains and losses from foreign currency transactions arise due to purchases and sales of foreign currencies, currency gains and losses realized between the trade and settlement dates on investment transactions and the difference between the amounts of dividends, interest, and foreign withholding taxes recorded on the Fund’s books, and the U.S. dollar equivalent of the amounts actually received or paid. These amounts are included in foreign currency transactions in the Statement of Operations.
Net change in unrealized appreciation (depreciation) on foreign currency translations arise from changes in the fair value of assets and liabilities, other than investments at period end, resulting from changes in exchange rates.
Guarantees and Indemnifications: Under the Trust’s organizational documents (and under separate agreements with the independent Trustees), its officers and Trustees are provided with an indemnification against certain liabilities arising out of the performance of their duties to the Fund. In the normal course of business the Trust may also enter into contracts with service providers that contain general indemnifications. The Trust’s maximum exposure under these arrangements is unknown. However, based on experience, the Trust expects the risk of loss to be remote.
Use of Estimates: The preparation of financial statements in conformity with GAAP requires management to make estimates and assumptions that affect the reported amounts of assets and liabilities and disclosure of contingent assets and liabilities at the date of the financial statements and the reported amounts of increases (decreases) in net assets from operations during the reporting period. Actual results could differ from those estimates.
Federal Income Taxes: It is the policy of the Trust to comply with the provisions of the Internal Revenue Code applicable to regulated investment companies and to distribute to shareholders substantially all investment company taxable income including net realized gains on investments (if any), and tax exempt income of the Fund. Therefore, no provision for federal income or excise tax is required.
The Fund files income tax returns in United States federal and applicable state jurisdictions. The statute of limitations on the Fund’s tax return filings generally remains open for the three years following a return’s filing date. The Fund has analyzed each uncertain tax position believed to be material in the preparation of the Fund’s financial statements for the fiscal year ended September 30, 2019, including open tax years, to assess whether it is more likely than not that the position would be sustained upon examination, based on the technical merits of the position. The Fund has not identified any such position for which an asset or liability must be reflected in the Statement of Assets and Liabilities.
At September 30, 2019, information on the tax components of capital was as follows:
| Cost of investments for tax purposes | $ 530,783,218 |
| Gross unrealized appreciation on a tax basis | 89,910,098 |
| Gross unrealized depreciation on a tax basis | (15,572,516) |
| Net unrealized appreciation (depreciation) on investments (tax basis) | $ 74,337,582 |
Temporary book tax adjustments made to the cost of investments and net unrealized appreciation (depreciation) for tax purposes result primarily from deferral of outstanding wash sale losses.
At September 30, 2019, the Fund had deferred tax basis late-year ordinary investment losses occurring subsequent to October 31, 2018 through September 30, 2019 of $1,720,335. For tax purposes, such ordinary losses will be recognized in the year ending September 30, 2020.
In order to account for permanent book to tax differences, the Fund increased distributable earnings by $3,117,562 and decreased the net capital paid in on shares of beneficial interest by $3,117,562. Reclassifications have no impact upon the net asset value of the Fund and result primarily from non-deductible operating losses.
Notes to Financial Statements, Continued
Thornburg Core Growth Fund | September 30, 2019
At September 30, 2019, the Fund did not have any undistributed tax basis net ordinary investment income and had undistributed tax basis capital gains of $53,904,752.
Foreign Withholding Taxes: The Fund is subject to foreign tax withholding imposed by certain foreign countries in which the Fund may invest. Withholding taxes are incurred on certain foreign dividends and are accrued at the time the dividend is recognized based on applicable foreign tax laws. The Fund may file withholding tax reclaims in certain jurisdictions to recover a portion of amounts previously withheld, in view of various considerations, including recent decisions rendered by the courts in those and other jurisdictions. The Fund would expect to record a receivable for such a reclaim based on a variety of factors, including assessment of a jurisdiction’s legal obligation to pay reclaims, the jurisdiction’s administrative practices and payment history, and industry convention. To date the Fund has recorded no such receivable because there is limited precedent for collecting such prior year reclaims and the likelihood of collection remains uncertain.
Deferred Foreign Capital Gain Taxes: The Fund is subject to a tax imposed on net realized gains of securities of certain foreign countries. The Fund records an estimated deferred tax liability for net unrealized gains on these investments as reflected in the accompanying financial statements. Such changes are included in net unrealized appreciation (depreciation) from investments in the Statement of Operations.
NOTE 3 – SECURITY VALUATION
Valuation of the Fund’s portfolio investment securities is performed in accordance with policies and procedures adopted by and under the oversight of the Trustees.
The Trustees of the Trust have appointed the Advisor to assist the Trustees with obtaining fair market values for portfolio investments, evaluating and monitoring professional pricing service providers appointed by the Trustees’ Audit Committee (the “Audit Committee”) to assist in determining fair values for portfolio investments, assisting in calculating fair values for portfolio investments in certain circumstances, and performing other functions in connection with the valuation of investments. The Advisor acts through its Valuation and Pricing Committee (the “Committee”) and other employees of the Advisor. The Committee regularly reviews its own valuation calculations, reviews the valuations, valuation techniques and services furnished by pricing service providers, considers circumstances which may require valuation calculations by the Committee, and reviews previous valuation calculations. The Committee reports to the Audit Committee on the Committee’s activities, the performance of pricing service providers, and other matters relating to valuation of portfolio investments.
In those instances when the Committee assists in calculating a fair value for a portfolio investment, the Committee seeks to determine the price that the Fund would reasonably expect to receive upon a sale of the investment in an orderly transaction between market participants on the valuation date. The Committee customarily utilizes quotations from securities broker dealers in calculating valuations, but also may utilize prices obtained from pricing service providers or other methods approved by the Audit Committee. Because fair values calculated by the Committee are estimates, the calculation of a value for an investment may differ from the price that would be realized by the Fund upon a sale of the investment, and the difference could be material to the Fund’s financial statements. The Committee’s calculation of a fair value for an investment may also differ from the prices obtained by other persons (including other mutual funds) for the investment.
Valuation of Securities: Securities and other portfolio investments which are listed or traded on a United States securities exchange are valued at the last reported sale price on the valuation date. Investments listed or traded on an exchange for which there has been no sale that day are valued at the mean between the last reported bid and asked prices on that valuation date. Portfolio investments reported by NASDAQ are valued at the official closing price on the valuation date. If an investment is traded on more than one exchange, the investment is considered traded on the exchange that is normally the primary market for that investment. Securities and other portfolio investments which are listed or traded on exchanges outside the United States are valued at the last price or the closing price of the investment on the exchange that is normally the primary market for the investment, as of the close of the exchange preceding the Fund’s valuation date. Foreign investments listed or traded on an exchange for which there has been no sale that day are valued at the mean between the last reported bid and asked prices on that valuation date.
In any case when a market quotation is not readily available for a portfolio investment ordinarily valued by market quotation, the Committee calculates a fair value for the investment using alternative methods approved by the Audit Committee. A market quotation is not readily available when the primary market or exchange for the investment is not open for the entire scheduled day of trading. Market quotations for an investment also may not be readily available if developments after the most recent close of the investment’s primary exchange or market, but prior to the close of business on any Fund business day, or an unusual event or significant period of time occurring since the availability of a market quotation, create a serious question concerning the reliability of the most recent market quotation available for the investment. In particular, on days when market volatility thresholds established by the Audit Committee are exceeded, foreign equity investments held by the Fund may be valued using alternative methods. The Committee customarily obtains valuations in these instances from pricing service providers approved by the Audit Committee. Pricing service providers ordinarily calculate valuations using multi-factor models to adjust market prices based upon various inputs, including exchange data, depository receipt prices, futures, index data and other data.
Notes to Financial Statements, Continued
Thornburg Core Growth Fund | September 30, 2019
Debt obligations held by the Fund which are not listed or traded on exchanges or for which no reported market exists are ordinarily valued at the valuation obtained from a pricing service provider approved by the Audit Committee.
In any case when a pricing service provider fails to provide a valuation for a debt obligation held by the Fund, the Committee calculates a fair value for the obligation using alternative methods under procedures approved by the Audit Committee. Additionally, in cases when management believes that a valuation obtained from a pricing service provider is stale, does not reflect material factors affecting the valuation of the investment, is significantly different than the value the Fund is likely to obtain if it sought a bid for the investment, or is otherwise unreliable, the Committee calculates a fair value for the obligation using an alternative method approved by the Audit Committee.
Quotations for foreign investments expressed in foreign currency amounts are converted to U.S. dollar equivalents using a foreign exchange quotation from a third party service provider at the time of valuation. Foreign investments held by the Fund may be traded on days and at times when the Fund is not open for business. Consequently, the value of Fund investments may be significantly affected on days when shareholders cannot purchase or sell Fund shares.
Valuation Hierarchy: The Fund categorizes its investments based upon the inputs used in valuing those investments, according to a three-level hierarchy established in guidance from the FASB. Categorization of investments using this hierarchy is intended by the FASB to maximize the use of observable inputs in valuing investments and minimize the use of unobservable inputs by requiring that the most observable inputs be used when available. Observable inputs are those that market participants would use in valuing an investment based on available market information. Unobservable inputs are those that reflect assumptions about the information market participants would use in valuing an investment. An investment’s level within the hierarchy is based on the lowest level input that is deemed significant to the valuation. The methodologies and inputs used to value investments are not necessarily indications of the risk or liquidity associated with those investments.
Various inputs are used in calculating valuations for the Fund’s investments. These inputs are generally summarized according to the three-level hierarchy below:
Level 1: Quoted prices in active markets for identical investments.
Level 2: Other direct or indirect significant observable inputs (including quoted prices for similar investments in active markets and other observable inputs, such as interest rates, prepayment rates, credit ratings, etc.).
Level 3: Significant unobservable inputs (including the Committee’s own assumptions in calculating the fair values of investments).
Valuations for debt obligations held by the Fund are typically calculated by pricing service providers approved by the Audit Committee and are generally characterized as Level 2 within the valuation hierarchy.
On days when market volatility thresholds established by the Audit Committee are exceeded, foreign securities for which valuations are obtained from pricing service providers are fair valued. On these days, the foreign securities are characterized as Level 2 within the valuation hierarchy and revert to Level 1 after the threshold is no longer exceeded.
In a limited number of cases the Committee calculates a fair value for investments using broker quotations or other methods approved by the Audit Committee. When the Committee uses a single broker quotation to calculate a fair value for an investment without other significant observable inputs, or if a fair value is calculated using other significant inputs that are considered unobservable, the investment is characterized as Level 3 within the hierarchy. Other significant unobservable inputs used to calculate a fair value in these instances might include an income-based valuation approach which considers discounted anticipated future cash flows from the investment and application of discounts due to the nature or duration of any restrictions on the disposition of the investment.
Valuations based upon the use of inputs from Levels 1, 2 or 3 may not represent the actual price received upon the disposition of an investment, and a Fund may receive a price that is lower than the valuation based upon these inputs when it sells the investment.
The following table displays a summary of the fair value hierarchy measurements of the Fund’s investments as of September 30, 2019:
| | Fair Value Measurements at September 30, 2019 |
| | TOTAL | LEVEL 1 | LEVEL 2 | LEVEL 3 |
| Assets | | | | |
| Investments in Securities | | | | |
| Common Stock | $ 550,328,836 | $ 550,328,836 | $ — | $ — |
| Short-Term Investments | 54,791,964 | 54,791,964 | — | — |
| Total Investments in Securities | $605,120,800 | $605,120,800 | $— | $— |
| Total Assets | $605,120,800 | $605,120,800 | $— | $— |
Notes to Financial Statements, Continued
Thornburg Core Growth Fund | September 30, 2019
NOTE 4 – INVESTMENT ADVISORY FEE AND OTHER TRANSACTIONS WITH AFFILIATES
Pursuant to an investment advisory agreement, the Advisor serves as the investment advisor and performs services for the Fund for which the fees are payable at the end of each month. Under the investment advisory agreement, the Fund pays the Advisor a management fee based on the average daily net assets of the Fund at an annual rate as shown in the following table:
| Management Fee Schedule |
| DAILY NET ASSETS | FEE RATE |
| Up to $500 million | 0.875% |
| Next $500 million | 0.825 |
| Next $500 million | 0.775 |
| Next $500 million | 0.725 |
| Over $2 billion | 0.675 |
The Fund’s effective management fee for the year ended September 30, 2019 was 0.864% of the Fund’s average daily net assets. Total management fees incurred by the Fund for the year ended September 30, 2019 are set forth in the Statement of Operations.
The Trust has entered into an administrative services agreement with the Advisor, whereby the Advisor will perform certain administrative services related to each class of the Fund’s shares. The fees are computed as an annual percentage of the aggregate average daily net assets of all shares classes of all Funds in the Trust as follows:
| Administration Fee Schedule |
| Daily Net Assets | Fee Rate |
| Up to $20 billion | 0.100% |
| $20 billion to $40 billion | 0.075 |
| $40 billion to $60 billion | 0.040 |
| Over $60 billion | 0.030 |
The aggregate fee amount is allocated on a daily basis to each Fund based on net assets and subsequently allocated to each class of shares of the Fund. Total administrative service fees incurred by each class of shares of the Fund for the year ended September 30, 2019, are set forth in the Statement of Operations.
The Trust has an underwriting agreement with Thornburg Securities Corporation (the “Distributor”), an affiliate of the Advisor, which acts as the distributor of the Fund’s shares. For the year ended September 30, 2019, the Distributor has advised the Fund that it earned net commissions aggregating $10,933 from the sale of Class A shares, and collected contingent deferred sales charges aggregating $2,276 from redemptions of Class C shares of the Fund.
Pursuant to a service plan under Rule 12b-1 of the 1940 Act, the Fund may pay to the Distributor or securities dealers and other financial institutions at the Distributor’s direction an amount not to exceed .25 of 1% per annum of the average daily net assets attributable to Class A, Class C, Class I, Class R3, Class R4, and Class R5 shares of the Fund to obtain various shareholder and distribution related services. For the year ended September 30, 2019, there were no 12b-1 service plan fees charged for Class I or Class R5 shares. The Advisor and Distributor each may pay out of its own resources additional expenses for distribution of the Fund’s shares and shareholder services.
The Trust has also adopted a distribution plan pursuant to Rule 12b-1, applicable only to the Fund’s Class C and Class R3 shares, under which the Fund compensates the Distributor for services in promoting the sale of Class C and Class R3 shares of the Fund at an annual rate of up to .75 of 1% per annum of the average daily net assets attributable to Class C shares, and an annual rate of up to .25 of 1% per annum of the average daily net assets attributable to Class R3 shares.
Total fees incurred by each class of shares of the Fund under their respective service and distribution plans for the year ended September 30, 2019, are set forth in the Statement of Operations.
The Advisor has contractually agreed to waive fees and reimburse expenses incurred by the Fund so that actual expenses of certain share classes do not exceed levels as specified in each Fund’s most recent prospectus (Class I shares, 0.99%; Class R3 shares, 1.50%; Class R4 shares, 1.40%; Class R5 shares, 0.99%). The agreement may be terminated by the Fund at any time, but may not be terminated by the Advisor before February 1, 2020, unless the Advisor ceases to be the investment advisor to the Fund prior to that date. The Advisor may recoup amounts waived or reimbursed during the fiscal year ended September 30, 2019 if, during that year, expenses fall below the
Notes to Financial Statements, Continued
Thornburg Core Growth Fund | September 30, 2019
contractual limit that was in place at the time those fees and expenses were waived or reimbursed. The Advisor will not recoup fees or expenses as described in the preceding sentence if that recoupment would cause the Fund’s total annual operating expenses (after the recoupment is taken into account) to exceed the lesser of: (a) the expense cap that was in place at the time the waiver or reimbursement occurred; or (b) the expense cap that is in place at the time of the recoupment.
For the year ended September 30, 2019, the Advisor contractually reimbursed certain class specific expenses and distribution fees of $171,707 for Class I Shares, $102,738 for Class R3 shares, $21,237 for Class R4 shares, and $96,303 for Class R5 shares.
Certain officers and Trustees of the Trust are also officers or directors of the Advisor and Distributor. The compensation of the independent Trustees is borne by the Trust. The Trust also pays a portion of the Chief Compliance Officer’s compensation. These amounts are reflected as Trustee and officer fees in the Statement of Operations.
The percentage of direct investments in the Fund held by the Trustees, officers of the Trust, and the Advisor is approximately 7.66%.
The Fund may purchase or sell securities from or to an affiliated fund, provided the affiliation is due solely to having a common investment advisor, common officers, or common trustees, and provided that all such transactions will comply with Rule 17a-7 under the 1940 Act. For the year ended September 30, 2019, the Fund had no such transactions with affiliated funds.
Shown below are holdings of voting securities of each portfolio company which is considered "affiliated" to the Fund under the 1940 Act, including companies for which the Fund’s holding represented 5% or more of the company’s voting securities, and a series of the Thornburg Investment Trust in which the Fund invested for cash management purposes during the period:
| Fund | Market Value
9/30/18 | Purchases
at Cost | Sales
Proceeds | Realized
Gain
(Loss) | Change in
Unrealized
Appr./(Depr.) | Market Value
9/30/19 | Dividend
Income |
| Thornburg Capital Management Fund | $43,785,824 | $277,132,269 | $(266,126,129) | $- | $- | $54,791,964 | $917,456 |
NOTE 5 – SHARES OF BENEFICIAL INTEREST
At September 30, 2019, there were an unlimited number of shares with no par value of beneficial interest authorized. Transactions in shares of beneficial interest were as follows:
| | YEAR ENDED
September 30, 2019 | YEAR ENDED
September 30, 2018 |
| | SHARES | AMOUNT | SHARES | AMOUNT |
| Class A Shares | | | | |
| Shares sold | 541,287 | $ 20,620,298 | 2,648,691 | $ 102,848,390 |
Shares issued to shareholders in
reinvestment of dividends | - | - | - | - |
| Shares repurchased | (1,275,196) | (48,759,244) | (1,078,735) | (39,797,019) |
| Net increase (decrease) | (733,909) | $ (28,138,946) | 1,569,956 | $ 63,051,371 |
| Class C Shares | | | | |
| Shares sold | 152,226 | $ 4,818,016 | 142,699 | $ 4,669,918 |
Shares issued to shareholders in
reinvestment of dividends | - | - | - | - |
| Shares repurchased | (601,080) | (19,940,062) | (3,186,362) | (106,640,071) |
| Net decrease | (448,854) | $ (15,122,046) | (3,043,663) | $ (101,970,153) |
| Class I Shares | | | | |
| Shares sold | 596,624 | $ 24,270,464 | 1,000,610 | $ 39,866,402 |
Shares issued to shareholders in
reinvestment of dividends | - | - | - | - |
| Shares repurchased | (1,186,019) | (49,167,840) | (1,172,618) | (44,859,005) |
| Net decrease | (589,395) | $ (24,897,376) | (172,008) | $ (4,992,603) |
Notes to Financial Statements, Continued
Thornburg Core Growth Fund | September 30, 2019
| | YEAR ENDED
September 30, 2019 | YEAR ENDED
September 30, 2018 |
| | SHARES | AMOUNT | SHARES | AMOUNT |
| Class R3 Shares | | | | |
| Shares sold | 111,678 | $ 4,160,104 | 152,644 | $ 5,576,446 |
Shares issued to shareholders in
reinvestment of dividends | - | �� - | - | - |
| Shares repurchased | (361,286) | (13,585,896) | (589,803) | (21,259,936) |
| Net decrease | (249,608) | $ (9,425,792) | (437,159) | $ (15,683,490) |
| Class R4 Shares | | | | |
| Shares sold | 302,187 | $ 11,693,291 | 180,163 | $ 8,379,103 |
Shares issued to shareholders in
reinvestment of dividends | - | - | - | - |
| Shares repurchased | (306,810) | (11,986,440) | (233,164) | (16,052,229) |
| Net decrease | (4,623) | $ (293,149) | (53,001) | $ (7,673,126) |
| Class R5 Shares | | | | |
| Shares sold | 83,722 | $ 3,402,828 | 211,055 | $ 6,542,444 |
Shares issued to shareholders in
reinvestment of dividends | - | - | - | - |
| Shares repurchased | (337,535) | (13,819,490) | (414,498) | (8,418,017) |
| Net decrease | (253,813) | $ (10,416,662) | (203,443) | $ (1,875,573) |
NOTE 6 – INVESTMENT TRANSACTIONS
For the year ended September 30, 2019, the Fund had purchase and sale transactions of investments (excluding short-term investments) of $244,867,614 and $343,885,437, respectively.
NOTE 7 – DERIVATIVE FINANCIAL INSTRUMENTS WITH OFF-BALANCE
SHEET RISK AND FOREIGN INVESTMENT RISK
The Fund may use a variety of derivative financial instruments to hedge or adjust the risks affecting its investment portfolio or to enhance investment returns. Provisions of FASB Accounting Standards Codification ASC 815-10-50 (“ASC 815”) require certain disclosures. The disclosures are intended to provide users of financial statements with an understanding of the use of derivative instruments by the Fund and how these derivatives affect the financial position, financial performance and cash flows of the Fund. The Fund does not designate any derivative instruments as hedging instruments under ASC 815. Additionally, the Fund’s risk of loss may exceed the amounts recognized on the Statement of Assets and Liabilities.
During the year ended September 30, 2019, the Fund did not invest in any derivative financial instruments of the type addressed by ASC 815.
NOTE 8 – RECENT ACCOUNTING PRONOUNCEMENTS
In August 2018, the FASB issued ASU 2018-13, Fair Value Measurement (Topic 820): Changes to the Disclosure Requirements for Fair Value Measurement, which adds, removes, and modifies certain aspects of the fair value disclosure. ASU 2018-13 is effective for annual periods beginning after December 15, 2019, and early adoption is permitted. The Funds have elected to early adopt, and had applied ASU 2018-13 for the fiscal year ended September 30, 2019. The adoption of this accounting guidance did not have a material impact on the Funds’ financial statements.
In March 2017, the FASB issued Accounting Standards Update (ASU) 2017-08, Premium Amortization of Purchased Callable Debt Securities. The amendments in the ASU shorten the premium amortization period on a purchased callable debt security from the security’s contractual life to the earliest call date. It is anticipated that this change will enhance disclosures by reducing losses recognized when a security is called on an earlier date. This ASU is effective for fiscal years beginning after December 15, 2018. Management has evaluated the implications of these changes and the amendments will have no material effect on the Funds’ net assets or results of operations.
Notes to Financial Statements, Continued
Thornburg Core Growth Fund | September 30, 2019
OTHER NOTES
Risks: The Fund’s investments subject it to risks including, but not limited to, management risk, market and economic risk, risks affecting specific issuers, small and mid-cap company risk, foreign investment risk, credit risk, interest rate risk, and liquidity risk. Please see the Fund’s prospectus for a discussion of the risks associated with an investment in the Fund.
Subsequent Events: Fund management believes no events have occurred between September 30, 2019 and the date of issuance of the financial statements that require adjustment to or disclosure in the accompanying financial statements.
Financial Highlights
Thornburg Core Growth Fund
| | PER SHARE PERFORMANCE (FOR A SHARE OUTSTANDING THROUGHOUT THE YEAR) |
UNLESS OTHERWISE
NOTED, PERIODS ARE
FISCAL YEARS ENDED
SEPTEMBER 30, | Net Asset
Value,
Beginning of
YEAR | Net
Investment
Income
(Loss)+ | Net Realized &
Unrealized Gain
(Loss) on
Investments | Total from
Investment
Operations | Dividends
from Net
Investment
Income | Dividends
from Net
Realized
Gains | Total
Dividends | Net Asset
Value,
End of YEAR |
| CLASS A SHARES(b) |
| 2019 | $ 40.43 | (0.17) | (0.89) | (1.06) | — | — | — | $ 39.37 |
| 2018 | $ 32.46 | (0.21) | 8.18 | 7.97 | — | — | — | $ 40.43 |
| 2017 | $ 28.22 | (0.24) | 4.48 | 4.24 | — | — | — | $ 32.46 |
| 2016 | $ 26.09 | (0.27) | 2.40 | 2.13 | — | — | — | $ 28.22 |
| 2015 | $ 26.44 | (0.26) | (0.09) | (0.35) | — | — | — | $ 26.09 |
| CLASS C SHARES |
| 2019 | $ 35.11 | (0.42) | (0.78) | (1.20) | — | — | — | $ 33.91 |
| 2018 | $ 28.43 | (0.42) | 7.10 | 6.68 | — | — | — | $ 35.11 |
| 2017 | $ 24.90 | (0.41) | 3.94 | 3.53 | — | — | — | $ 28.43 |
| 2016 | $ 23.20 | (0.41) | 2.11 | 1.70 | — | — | — | $ 24.90 |
| 2015 | $ 23.69 | (0.42) | (0.07) | (0.49) | — | — | — | $ 23.20 |
| CLASS I SHARES |
| 2019 | $ 43.33 | (0.03) | (0.95) | (0.98) | — | — | — | $ 42.35 |
| 2018 | $ 34.67 | (0.08) | 8.74 | 8.66 | — | — | — | $ 43.33 |
| 2017 | $ 30.01 | (0.12) | 4.78 | 4.66 | — | — | — | $ 34.67 |
| 2016 | $ 27.64 | (0.17) | 2.54 | 2.37 | — | — | — | $ 30.01 |
| 2015 | $ 27.90 | (0.16) | (0.10) | (0.26) | — | — | — | $ 27.64 |
| CLASS R3 SHARES |
| 2019 | $ 40.16 | (0.23) | (0.88) | (1.11) | — | — | — | $ 39.05 |
| 2018 | $ 32.30 | (0.26) | 8.12 | 7.86 | — | — | — | $ 40.16 |
| 2017 | $ 28.10 | (0.27) | 4.47 | 4.20 | — | — | — | $ 32.30 |
| 2016 | $ 26.01 | (0.29) | 2.38 | 2.09 | — | — | — | $ 28.10 |
| 2015 | $ 26.39 | (0.29) | (0.09) | (0.38) | — | — | — | $ 26.01 |
| CLASS R4 SHARES |
| 2019 | $ 40.56 | (0.19) | (0.88) | (1.07) | — | — | — | $ 39.49 |
| 2018 | $ 32.59 | (0.23) | 8.20 | 7.97 | — | — | — | $ 40.56 |
| 2017 | $ 28.33 | (0.24) | 4.50 | 4.26 | — | — | — | $ 32.59 |
| 2016 | $ 26.19 | (0.27) | 2.41 | 2.14 | — | — | — | $ 28.33 |
| 2015 | $ 26.54 | (0.26) | (0.09) | (0.35) | — | — | — | $ 26.19 |
| CLASS R5 SHARES |
| 2019 | $ 43.29 | (0.04) | (0.94) | (0.98) | — | — | — | $ 42.31 |
| 2018 | $ 34.64 | (0.08) | 8.73 | 8.65 | — | — | — | $ 43.29 |
| 2017 | $ 29.98 | (0.12) | 4.78 | 4.66 | — | — | — | $ 34.64 |
| 2016 | $ 27.61 | (0.17) | 2.54 | 2.37 | — | — | — | $ 29.98 |
| 2015 | $ 27.87 | (0.16) | (0.10) | (0.26) | — | — | — | $ 27.61 |
| (a) | Not annualized for periods less than one year. |
| (b) | Sales loads are not reflected in computing total return. |
| + | Based on weighted average shares outstanding. |
See notes to financial statements.
Financial Highlights, Continued
Thornburg Core Growth Fund
| RATIOS TO AVERAGE NET ASSETS | | SUPPLEMENTAL DATA |
Net Investment
Income (Loss) (%) | Expenses, After
Expense
Reductions (%) | Expenses,
Before Expense
Reductions (%) | | Total
Return (%)(a) | Portfolio
Turnover
Rate (%)(a) | Net Assets
at End of YEAR
(Thousands) |
| |
| (0.44) | 1.35 | 1.35 | | (2.62) | 40.69 | $ 259,799 |
| (0.57) | 1.34 | 1.34 | | 24.55 | 54.98 | $ 296,429 |
| (0.79) | 1.40 | 1.40 | | 15.02 | 72.03 | $ 187,062 |
| (1.00) | 1.40 | 1.40 | | 8.16 | 86.24 | $ 199,178 |
| (0.93) | 1.39 | 1.39 | | (1.32) | 96.02 | $ 234,284 |
| |
| (1.27) | 2.18 | 2.18 | | (3.42) | 40.69 | $ 36,841 |
| (1.33) | 2.14 | 2.14 | | 23.50 | 54.98 | $ 53,903 |
| (1.56) | 2.16 | 2.16 | | 14.18 | 72.03 | $ 130,165 |
| (1.76) | 2.16 | 2.16 | | 7.33 | 86.24 | $ 156,115 |
| (1.69) | 2.15 | 2.15 | | (2.07) | 96.02 | $ 176,422 |
| |
| (0.08) | 0.99 | 1.05 | | (2.26) | 40.69 | $ 254,721 |
| (0.20) | 0.99 | 1.05 | | 24.98 | 54.98 | $ 286,152 |
| (0.37) | 0.99 | 1.05 | | 15.53 | 72.03 | $ 234,922 |
| (0.59) | 0.99 | 1.05 | | 8.57 | 86.24 | $ 198,658 |
| (0.53) | 0.99 | 1.05 | | (0.93) | 96.02 | $ 244,691 |
| |
| (0.60) | 1.50 | 1.80 | | (2.76) | 40.69 | $ 30,084 |
| (0.72) | 1.50 | 1.80 | | 24.33 | 54.98 | $ 40,963 |
| (0.90) | 1.50 | 1.84 | | 14.95 | 72.03 | $ 47,064 |
| (1.10) | 1.50 | 1.81 | | 8.04 | 86.24 | $ 55,809 |
| (1.05) | 1.50 | 1.79 | | (1.44) | 96.02 | $ 70,310 |
| |
| (0.50) | 1.40 | 1.91 | | (2.64) | 40.69 | $ 4,183 |
| (0.62) | 1.40 | 1.97 | | 24.46 | 54.98 | $ 4,484 |
| (0.80) | 1.40 | 2.00 | | 15.04 | 72.03 | $ 5,330 |
| (1.00) | 1.40 | 1.86 | | 8.17 | 86.24 | $ 6,821 |
| (0.94) | 1.40 | 1.82 | | (1.32) | 96.02 | $ 9,632 |
| |
| (0.09) | 0.99 | 1.39 | | (2.26) | 40.69 | $ 19,984 |
| (0.21) | 0.99 | 1.33 | | 24.97 | 54.98 | $ 31,433 |
| (0.38) | 0.99 | 1.34 | | 15.54 | 72.03 | $ 32,197 |
| (0.59) | 0.99 | 1.30 | | 8.58 | 86.24 | $ 38,629 |
| (0.54) | 0.99 | 1.24 | | (0.93) | 96.02 | $ 45,126 |
Report of Independent Registered Public Accounting Firm
Thornburg Core Growth Fund
To the Board of Trustees of Thornburg Investment Trust and Shareholders of
Thornburg Core Growth Fund
Opinion on the Financial Statements
We have audited the accompanying statement of assets and liabilities, including the schedule of investments, of Thornburg Core Growth Fund (one of the funds constituting Thornburg Investment Trust, referred to hereafter as the "Fund") as of September 30, 2019, the related statement of operations for the year ended September 30, 2019, the statements of changes in net assets for each of the two years in the period ended September 30, 2019, including the related notes, and the financial highlights for each of the five years in the period ended September 30, 2019 (collectively referred to as the “financial statements”). In our opinion, the financial statements present fairly, in all material respects, the financial position of the Fund as of September 30, 2019, the results of its operations for the year then ended, the changes in its net assets for each of the two years in the period ended September 30, 2019 and the financial highlights for each of the five years in the period ended September 30, 2019 in conformity with accounting principles generally accepted in the United States of America.
Basis for Opinion
These financial statements are the responsibility of the Fund’s management. Our responsibility is to express an opinion on the Fund’s financial statements based on our audits. We are a public accounting firm registered with the Public Company Accounting Oversight Board (United States) (PCAOB) and are required to be independent with respect to the Fund in accordance with the U.S. federal securities laws and the applicable rules and regulations of the Securities and Exchange Commission and the PCAOB.
We conducted our audits of these financial statements in accordance with the standards of the PCAOB. Those standards require that we plan and perform the audit to obtain reasonable assurance about whether the financial statements are free of material misstatement, whether due to error or fraud.
Our audits included performing procedures to assess the risks of material misstatement of the financial statements, whether due to error or fraud, and performing procedures that respond to those risks. Such procedures included examining, on a test basis, evidence regarding the amounts and disclosures in the financial statements. Our audits also included evaluating the accounting principles used and significant estimates made by management, as well as evaluating the overall presentation of the financial statements. Our procedures included confirmation of securities owned as of September 30, 2019 by correspondence with the custodian and transfer agent. We believe that our audits provide a reasonable basis for our opinion.
/s/PricewaterhouseCoopers LLP
New York, New York
November 22, 2019
We have served as the auditor of one or more investment companies in Thornburg Investment Trust since 1999.
Expense Example
Thornburg Core Growth Fund | September 30, 2019 (Unaudited)
As a shareholder of the Fund, you incur two types of costs:
| (1) | transaction costs, including |
| (a) | sales charges (loads) on purchase payments, for Class A shares; |
| (b) | a deferred sales charge on redemptions of any part or all of a purchase of $1 million of Class A shares within 12 months of purchase; |
| (c) | a deferred sales charge on redemptions of Class C shares within 12 months of purchase; |
| (2) | ongoing costs, including management fees; distribution and/or service (12b-1) fees; and other Fund expenses. |
This example is intended to help you understand your ongoing costs (in dollars) of investing in the Fund and to compare these costs with the ongoing costs of investing in other mutual funds.
The example is based on a $1,000 investment beginning on April 1, 2019, and held until September 30, 2019.
ACTUAL EXPENSES
For each class of shares, the first line of the accompanying table provides information about actual account values and actual expenses. You may use the information in this line, together with the amount you invested, to estimate the expenses that you paid over the period. Simply divide your account value by $1,000 (for example, an $8,600 account value divided by $1,000 = 8.6), then multiply the result by the number in the first line for your class of shares under the heading entitled “Expenses Paid During Period” to estimate the expenses you paid on your account during this period.
| | BEGINNING
ACCOUNT VALUE
4/1/19 | ENDING
ACCOUNT VALUE
9/30/19 | EXPENSES PAID
DURING PERIOD†
4/1/19—9/30/19 |
| CLASS A SHARES |
| Actual | $1,000.00 | $1,007.41 | $6.84 |
| Hypothetical* | $1,000.00 | $1,018.25 | $6.88 |
| CLASS C SHARES |
| Actual | $1,000.00 | $1,003.55 | $10.70 |
| Hypothetical* | $1,000.00 | $1,014.39 | $10.76 |
| CLASS I SHARES |
| Actual | $1,000.00 | $1,009.29 | $4.99 |
| Hypothetical* | $1,000.00 | $1,020.10 | $5.01 |
| CLASS R3 SHARES |
| Actual | $1,000.00 | $1,006.70 | $7.55 |
| Hypothetical* | $1,000.00 | $1,017.55 | $7.59 |
| CLASS R4 SHARES |
| Actual | $1,000.00 | $1,007.39 | $7.05 |
| Hypothetical* | $1,000.00 | $1,018.05 | $7.08 |
| CLASS R5 SHARES |
| Actual | $1,000.00 | $1,009.30 | $4.99 |
| Hypothetical* | $1,000.00 | $1,020.10 | $5.01 |
| † | Expenses are equal to the annualized expense ratio for each class (A: 1.36%; C: 2.13%; I: 0.99%; R3: 1.50%; R4: 1.40%; R5: 0.99%) multiplied by the average account value over the period, multiplied by 183/365 to reflect the one-half year period. |
| * | Hypothetical assumes a rate of return of 5% per year before expenses. |
HYPOTHETICAL EXAMPLE FOR COMPARISON PURPOSES
For each class of shares, the second line of the accompanying table provides information about hypothetical account values and hypothetical expenses based on the Fund’s actual expense ratio and an assumed rate of return of 5% per year before expenses, which is not the Fund’s actual return. The hypothetical account values and expenses may not be used to estimate the actual ending account balance or expenses you paid for the period. You may use this information to compare the ongoing costs of investing in the Fund and other funds. To do so, compare this 5% hypothetical example with the 5% hypothetical examples that appear in the shareholder reports of the other funds.
Please note that the expenses shown in the table are meant to highlight your ongoing costs only and do not reflect any transactional costs, such as sales charges (loads), redemption fees, or exchange fees. Therefore, the second line of the table for each class of shares is useful in comparing ongoing costs only, and will not help you determine the relative total costs of owning different funds. In addition, if these transactional costs were included, your costs would have been higher.
Trustees and Officers
Thornburg Core Growth Fund | September 30, 2019 (Unaudited)
NAME, AGE, YEAR ELECTED
POSITION HELD WITH FUND | PRINCIPAL OCCUPATION(S) DURING PAST FIVE YEARS | OTHER DIRECTORSHIPS
HELD BY TRUSTEE |
| INTERESTED TRUSTEES(1)(2) |
Garrett Thornburg, 73
Trustee since 1984,
Chairman of Trustees(3) | Chairman and controlling shareholder of Thornburg Investment Management, Inc. (investment advisor); Chairman and controlling shareholder of Thornburg Securities Corporation (securities dealer); President of the Thornburg Foundation (nonprofit). | None |
Brian J. McMahon, 64
Trustee since 2001,
Vice Chairman of Trustees,
Member of Governance and
Nominating Committee &
Operations Risk Oversight
Committee(4) | Vice Chairman, Chief Investment Strategist, Managing Director, and Portfolio Manager and, until 2016, CEO and President of Thornburg Investment Management, Inc.; Vice President of Thornburg Securities Corporation. | None |
| INDEPENDENT TRUSTEES(1)(2)(5) |
David A. Ater, 74
Trustee since 1994,
Lead Independent Trustee,
Chairman of Governance and
Nominating Committee &
Member of Audit Committee | Principal in Ater & Associates, Santa Fe, NM (developer, planner and broker of residential and commercial real estate); owner, developer and broker for various real estate projects. | None |
Sally Corning, 58
Trustee since 2012,
Chairman of Audit Committee | Partner in Sun Mountain Capital, Santa Fe, NM (private equity firm with investment programs encompassing venture capital, mezzanine debt, and growth equity). | None |
Susan H. Dubin, 70
Trustee since 2004,
Member of Audit
Committee & Governance
and Nominating Committee | President of Dubin Investments, Ltd., Greenwich, CT (private investment fund); Director and officer of various charitable organizations. | None |
David L. Gardner, 56
Trustee since 2015,
Member of Operations Risk
Oversight Committee | Until 2012, head of EMEA (Europe, Middle East and Africa) Sales for iShares of Blackrock, Inc., EMEA Executive Committee Member and EMEA Operating Committee Member at Blackrock, Inc. | None |
Patrick J. Talamantes, 55
Trustee since 2019,
Member of Audit Committee | President of Talamantes Strategies, LLC, a management consulting firm, since 2018; until 2017, President and Chief Executive Officer of The McClatchy Company, Sacramento, CA (news and media company). | None |
Owen D. Van Essen, 65
Trustee since 2004,
Chairman of Operations Risk
Oversight Committee &
Member of Governance and
Nominating Committee | President of Dirks, Van Essen, Murray & April, Santa Fe, NM (newspaper mergers and acquisitions). | None |
James W. Weyhrauch, 60
Trustee since 1996,
Member of Audit
Committee & Operations Risk
Oversight Committee | Real estate broker, Santa Fe Properties, Santa Fe, NM; General Partner, Investments of Genext LLC (a family investment partnership); until 2019, Vice Chairman of Nambe LLC, Santa Fe, NM (manufacturing & design company). | None |
Trustees and Officers, Continued
Thornburg Core Growth Fund | September 30, 2019 (Unaudited)
NAME, AGE, YEAR ELECTED
POSITION HELD WITH FUND | PRINCIPAL OCCUPATION(S) DURING PAST FIVE YEARS | OTHER DIRECTORSHIPS
HELD BY TRUSTEE |
| OFFICERS OF THE FUND (WHO ARE NOT TRUSTEES)(1)(6) |
David Ashley, 49
Vice President since 2019 | Portfolio Manager and Managing Director since 2019 and Associate Portfolio Manager from 2011-2019 of Thornburg Investment Management, Inc. | Not applicable |
Nimish Bhatt, 56
Chief Financial Officer
since 2019; Treasurer
2016-2019; Secretary
(2018-2019)(7) | Chief Financial Officer and Treasurer of Thornburg Investment Management, Inc. and Thornburg Securities Corporation since 2016 and Secretary of Thornburg Securities Corporation since 2018; Senior Vice President (2004-2016), Chief Financial Officer (2011-2016), and Head of Fund Administration (2011-2016) of Calamos Asset Management, Inc., Calamos Investments LLC, Calamos Advisors LLC, and Calamos Wealth Management; Director of Calamos Global Funds plc (2007-2016). | Not applicable |
Jason Brady, 45
President since 2016(7) | Director since 2017, CEO and President since 2016, and Portfolio Manager and Managing Director of Thornburg Investment Management, Inc.; Vice President of Thornburg Securities Corporation since 2016. | Not applicable |
Connor Browne, 40
Vice President since 2006 | Portfolio Manager and Managing Director of Thornburg Investment Management, Inc. | Not applicable |
Randy Dry, 45
Vice President since 2014 | Managing Director, Director of Institutional Group from 2014-2016, and since 2016, Chief Administrative Officer of Thornburg Investment Management, Inc. | Not applicable |
Greg Dunn, 43
Vice President since 2014 | Portfolio Manager and Managing Director of Thornburg Investment Management, Inc. | Not applicable |
Lon Erickson, 44
Vice President since 2008 | Portfolio Manager and Managing Director of Thornburg Investment Management, Inc. | Not applicable |
Thomas Garcia, 48
Vice President since 2006 | Managing Director, Head Equity Trader, and Associate Portfolio Manager of Thornburg Investment Management, Inc. | Not applicable |
Christian Hoffmann, 37
Vice President since 2018 | Portfolio Manager and Managing Director since 2018, and Associate Portfolio Manager from 2014-2018, of Thornburg Investment Management, Inc. | Not applicable |
Curtis Holloway, 52
Treasurer since 2019(7) | Director of Fund Administration since 2019 of Thornburg Investment Management, Inc.; Senior Vice President, Head of Fund Administration (2017-2019) and Vice President, Fund Administration (2010-2017) of Calamos Investments, and Chief Financial Officer (2017-2019) and Treasurer (2010-2019) of Calamos Funds. | Not applicable |
Ben Kirby, 39
Vice President since 2014 | Head of Investments since 2019, Portfolio Manager and Managing Director since 2013. | Not applicable |
Jeff Klingelhofer, 38
Vice President since 2016 | Head of Investments since 2019, Portfolio Manager and Managing Director since 2015, and Associate Portfolio Manager from 2012–2015, of Thornburg Investment Management, Inc. | Not applicable |
Ponn Lithiluxa, 48
Vice President since 2017 | Manager, Tax & Fund Administration of Thornburg Investment Management, Inc.; Senior Vice President, Citi Fund Services, Inc. (2014–2017); Vice President, Citi Fund Services, Inc. (2007–2014). | Not applicable |
Rob MacDonald, 43
Vice President since 2016 | Managing Director since 2015, Portfolio Manager since 2014, and Associate Portfolio Manager from 2011–2014 of Thornburg Investment Management, Inc. | Not applicable |
Michael Mastroianni, 42
Secretary and Vice President since 2019(7) | Director of Fund Operations since 2019 of Thornburg Investment Management, Inc.; Executive Director, Global Head of Client Services - Global Liquidity (2018-2019), Executive Director, North American Head of Transfer Agency Relationship Management (2011-2019), Executive Director, North American Head of Transfer Agency Service Delivery (2011-2018) of J.P. Morgan Asset Management. | Not applicable |
Leigh Moiola, 52
Vice President since 2001 | Managing Director and Director of Marketing of Thornburg Investment Management, Inc.; Vice President of Thornburg Securities Corporation. | Not applicable |
Christopher Ryon, 63
Vice President since 2008 | Portfolio Manager and Managing Director of Thornburg Investment Management, Inc. | Not applicable |
Trustees and Officers, Continued
Thornburg Core Growth Fund | September 30, 2019 (Unaudited)
NAME, AGE, YEAR ELECTED
POSITION HELD WITH FUND | PRINCIPAL OCCUPATION(S) DURING PAST FIVE YEARS | OTHER DIRECTORSHIPS
HELD BY TRUSTEE |
Sean Koung Sun, 38
Vice President since 2017 | Portfolio Manager and Managing Director since 2017, Associate Portfolio Manager from 2015-2016, and Equity Research Analyst from 2012-2014 of Thornburg Investment Management, Inc. | Not applicable |
Stephen Velie, 52
Chief Compliance Officer since 2009 | Chief Compliance Officer of Thornburg Investment Trust and Thornburg Investment Management, Inc. | Not applicable |
Nicholos Venditti, 38
Vice President since 2016 | Portfolio Manager and Managing Director since 2015 and Associate Portfolio Manager from 2011–2015 of Thornburg Investment Management, Inc. | Not applicable |
Vinson Walden, 49
Vice President since 2004 | Portfolio Manager and Managing Director of Thornburg Investment Management, Inc. | Not applicable |
Lei Wang, 48
Vice President since 2006 | Portfolio Manager and Managing Director of Thornburg Investment Management, Inc. | Not applicable |
Charles Wilson, 44
Vice President since 2016 | Portfolio Manager and Managing Director since 2014 and Associate Portfolio Manager from 2012–2014 of Thornburg Investment Management, Inc. | Not applicable |
Di Zhou, 41
Vice President since 2016 | Portfolio Manager and Managing Director since 2016, Associate Portfolio Manager from 2014–2016, and Equity Research Analyst from 2010–2014 of Thornburg Investment Management, Inc. | Not applicable |
| (1) | Each person’s address is 2300 North Ridgetop Road, Santa Fe, New Mexico 87506. |
| (2) | The Fund is a separate investment “Fund” or “series” of Thornburg Investment Trust (the “Trust”), which comprises the Thornburg mutual fund complex and is organized as a Massachusetts business trust. Thornburg Investment Management, Inc. is the investment advisor to, and manages, all the Funds of the Trust. Each Trustee oversees all the Funds of the Trust. |
| (3) | Mr. Thornburg is considered an “interested” Trustee under the Investment Company Act of 1940 because he is a director and controlling shareholder of Thornburg Investment Management, Inc., the investment advisor to the Trust, and is the sole director and controlling shareholder of Thornburg Securities Corporation, the distributor of shares for the Trust. |
| (4) | Mr. McMahon is considered an “interested” Trustee under the Investment Company Act of 1940 because he is a director and the chief investment strategist of Thornburg Investment Management, Inc. |
| (5) | The Bylaws of the Trust currently require that each Independent Trustee shall retire by the end of the calendar year during which the Trustee reached the age of 75 years. Otherwise each Trustee serves in office until the election and qualification of a successor or until the Trustee sooner dies, resigns, retires or is removed. |
| (6) | Assistant vice presidents and assistant secretaries are not shown. |
| (7) | The Trust’s president, chief financial officer, secretary, and treasurer each serves a one-year term or until the election and qualification of a successor; each other officer serves at the pleasure of the Trustees. |
The Statement of Additional Information for each Fund of the Trust includes additional information about the Trustees and is available, without charge and upon request, by calling 1-800-847-0200.
Other Information
Thornburg Core Growth Fund | September 30, 2019 (Unaudited)
PORTFOLIO PROXY VOTING
Policies and Procedures:
The Trust has delegated to the Advisor voting decisions respecting proxies for the Fund’s voting securities. The Advisor makes voting decisions in accordance with its Proxy Voting Policy and Procedures. A description of the Policy and Procedures is available (i) without charge, upon request, by calling the Advisor toll-free at 1-800-847-0200, (ii) on the Thornburg website at www.thornburg.com, and (iii) on the U.S. Securities and Exchange Commission’s website at www.sec.gov.
Information regarding how proxies were voted is available on or before August 31 of each year for the twelve months ending the preceding June 30. This information is available (i) without charge, upon request by calling the Advisor toll-free at 1-800-847-0200, (ii) on the Thornburg website at www.thornburg.com, and (iii) on the U.S. Securities and Exchange Commission’s website at www.sec.gov.
AVAILABILITY OF QUARTERLY PORTFOLIO SCHEDULE
The Fund files with the Securities and Exchange Commission schedules of its portfolio holdings on Form N-Q for the first and third quarters of each fiscal year. The Fund’s Forms N-Q are available on the Commission’s website at www.sec.gov, or may be reviewed and copied at the Commission’s Public Reference Room in Washington, D.C. Information on the operation of the Public Reference Room may be obtained by calling 1-800-SEC-0330. The Fund also makes this information available on its website at www.thornburg.com/download or upon request by calling 1-800-847-0200.
STATEMENT RESPECTING RENEWAL OF INVESTMENT ADVISORY AGREEMENT
Thornburg Investment Management, Inc. (the “Advisor”) provides investment management services to Thornburg Core Growth Fund (the “Fund”) pursuant to an investment advisory agreement. The Trustees consider the renewal of this agreement annually, and most recently determined to renew the agreement on September 17, 2019.
Planning for their recent consideration of the advisory agreement’s renewal, the independent Trustees met in May 2019 to consider aspects of their annual evaluation of the Advisor’s service to all of the funds of Thornburg Investment Trust, to plan the annual evaluation of the Advisor’s performance and to discuss preliminarily the information the Advisor would present to the Trustees for their review. The independent Trustees met in a second independent session in July 2019 to further define certain portions of the information to be submitted by the Advisor. The independent Trustees met again in an independent session in September 2019 with a mutual fund analyst firm engaged by the independent Trustees to provide explanations of comparative cost and expense information, comparative investment performance information, and other data obtained and analyzed by the analyst firm. In that session the independent Trustees discussed their evaluations of the Advisor’s services to the Fund and the Fund’s fee and expense levels, investment performance, and other information presented for the Fund, conferred independently with legal counsel respecting the factors typically considered in evaluating renewal of an advisory agreement, and conferred with representatives of management to receive explanations of certain aspects of the information they had requested. Representatives of the Advisor subsequently reviewed portions of the information with the Trustees and addressed questions from the Trustees at a full meeting session of the Trustees scheduled in September for that purpose, and the independent Trustees thereafter met again in an independent session to consider the Advisor’s presentations and various specific issues respecting their consideration of the advisory agreement’s renewal. Following these sessions, the Trustees met to consider renewal of the advisory agreement, and the independent Trustees voted unanimously at that meeting to renew the agreement for an additional term of one year.
The information below summarizes certain factors considered by the Trustees in connection with the determination to renew the advisory agreement with the Advisor. In determining to renew the advisory agreement, the Trustees considered a wide range of information and did not identify any single factor as controlling, and this summary does not describe all of the factors and other matters considered by the Trustees in making their determination.
Nature, Extent and Quality of Services. The Trustees considered in their evaluation of the advisory agreement the written and oral reports provided to the Trustees and their standing committees throughout the year on a wide variety of topics by personnel from the Advisor’s portfolio management, administration, operations and compliance staffs. The Trustees also considered in this evaluation presentations and explanations made by representatives of the Advisor in meeting sessions scheduled for consideration of the renewal of the advisory agreement. The Trustees further noted in their evaluation the consideration they had given to a number of topics in previous years, reports from their standing committees, and advice received from counsel.
Information noted by the Trustees as having been considered in relation to the nature, extent and quality of services provided by the Advisor under the advisory agreement and contributing (together with other information considered) to their conclusions respecting the nature, extent and quality of the services rendered to the Fund by the Advisor included: (1) reports from portfolio managers and other
Other Information, Continued
Thornburg Core Growth Fund | September 30, 2019 (Unaudited)
personnel throughout the year demonstrating that the Fund was managed in conformity with stated strategies and objectives and conformed to investment restrictions and limitations; (2) reports demonstrating that management of the Fund remained faithful and competent, and demonstrating sufficient skill by portfolio managers in executing the Fund’s strategies in varying environments, managers’ cognizance of and strategies to pursue the Fund’s objectives and address pertinent market and economic trends and conditions, the evaluation and selection of individual investments, management to achieve tax efficiencies, and the structuring and composition of the Fund’s portfolio and management of Fund liquidity requirements; (3) the Fund’s achievement of its investment objectives over different periods of time; (4) presentations by and interactions with members of the Advisor’s fund administration, operations and compliance staffs; (5) reports from standing committees of the Trustees on their respective proceedings throughout the year, including in particular reports from and interactions with the Advisor’s personnel; (6) the sufficiency of the resources the Advisor devotes to the services it provides to the Fund, including the expertise of its personnel and staffing levels and its enhancements to the electronic systems it utilizes in providing these services, and also including the Advisor’s own financial management and sufficiency of its resources; and (7) the measures employed to achieve efficient trade execution for the Fund, including the evaluation and selection of firms to execute transactions for the Fund. As in past years, the Trustees noted particularly their assessments of the Advisor’s personnel developed in meetings throughout the year, measures to expand and improve the depth and experience of the Advisor’s staff, and the Advisor’s collaborative approach to investment management, continued commitment to observance of compliance and regulatory requirements in managing investments by the Fund, responsiveness to the Trustees, and other factors.
Based upon these and other considerations, the Trustees concluded that the Advisor’s management of the Fund’s investments continued to conform to the Fund’s stated objectives and policies, and that the nature, extent and quality of the services provided to the Fund by the Advisor remained sufficient.
Investment Performance. The Trustees noted in their evaluation of the Fund’s investment performance the written and oral reports they had received in each regular meeting over the course of the year from the Advisor’s portfolio management personnel. The Trustees also noted their consideration of information provided to them at their request in anticipation of their annual evaluation of the Advisor’s services, including the following items of information respecting the investment performance of the Fund: (1) the Fund’s absolute investment performance and achievement of stated objectives; (2) the Advisor’s explanations and commentary on the Fund’s performance in the context of the Fund’s objectives and reasonable expectations, and business, market and economic conditions; (3) performance data for the most recent ten calendar years, comparing the Fund’s annual investment returns to two broad-based securities indices and to the applicable Morningstar category of funds; (4) the Fund’s investment performance for the three-month, year-to-date, one-year, three-year, five-year, ten-year, and since inception periods ending with the second quarter of the current year, comparing the Fund’s annualized returns to two mutual fund categories selected by independent mutual fund analyst firms and to two broad-based securities indices, and assigning a percentage rank to the Fund’s performance for each period relative to each of the fund categories; (5) analyses of specified performance and risk metrics for the Fund relative to its benchmark and to a selected peer group of funds, prepared by an independent financial analyst firm engaged by the independent Trustees; (6) the Fund’s cash flows; (7) comparative performance data for fund peer groups selected by an independent mutual fund analyst firm engaged by the independent Trustees, and the analysis and observations of the analyst firm respecting those data; (8) comparison of the Fund’s annualized return to the Fund’s benchmark index over various periods since the Fund’s inception; and (9) comparative measures of estimated earnings growth, and risk and return statistics. The Trustees generally attach additional significance to investment performance from the perspective of longer-term shareholders.
The Trustees considered explanations from the Advisor respecting performance of the Fund in some recent periods that had compared less favorably to some comparative measures, together with the reports they had received from the Advisor throughout the year, explanations of the comparisons by reference to the investment strategies of the Fund, the effects of market and economic conditions, the investment decisions by the Advisor in view of the Fund’s strategies, and where pertinent the Advisor’s measures and expectations for improvement in the Fund’s relative investment performance. The Trustees noted their understanding that strategies pursued for a fund may produce intermittent lower relative performance, other funds managed by the Advisor have in the past returned to favor as conditions changed or the strategies of those funds gained traction, and that the Advisor has successfully remediated lower relative performance of other funds in cases where execution of investment strategies had contributed to lower performance. Based upon their consideration of this and other information, the Trustees concluded that the Fund’s absolute and relative investment performance over a range of pertinent holding periods on the whole was satisfactory in view of its objectives and strategies.
Comparisons of Fee and Expense Levels. Information noted by the Trustees as having been considered in this context included a variety of comparative data respecting the Fund’s fee and expense levels. This information included comparisons of the Fund’s advisory fee and overall Fund expenses to median and average fees and expenses charged to funds in the applicable Morningstar category, comparisons of the advisory fee and total expenses for two Fund share classes to the fee levels and expenses of fund peer groups selected from the category by an independent mutual fund analyst firm engaged by the independent Trustees, the perspectives and advice from that mutual fund analyst firm respecting comparisons of fund fee levels and expenses to fund peer groups, and other information. The Trustees considered that the Advisor has agreed to certain fee waivers and expense reimbursements for the current period. Comparative fee and expense data noted as having been considered by the Trustees showed that, after fee waivers and expense reimbursements, the level of total expense for one share class of the Fund was higher than the median and average levels charged to funds in the applicable Morningstar category, and that the level of total expense for a second share class was lower than the median and average levels for that
Other Information, Continued
Thornburg Core Growth Fund | September 30, 2019 (Unaudited)
category. Peer group data showed that the Fund’s stated advisory fee was higher than the median level for the two peer groups but comparable to other funds in the peer group, and that the total expense levels of two representative share classes were higher than the medians of their respective peer groups but comparable to other funds in the peer groups after waivers of fees and reimbursement of expenses. The Trustees did not find the differences significant in view of their findings and conclusions respecting the other factors considered.
The Trustees noted their consideration of information respecting the advisory fees charged by the Advisor to other investment management clients, including sub-advised mutual funds and other institutional clients, together with information about fees charged by other advisors to different clients, analysis of the differences between the requirements of institutional clients and mutual funds, analysis of the differences between the requirements of a sub-advised mutual fund and a fund as to which the investment advisor is the primary advisor and sponsor, and the consequently different investment management services provided to the different categories of clients and the differing contexts in which these arrangements are entered into. The Trustees confirmed their previous observations that the differences between the fees charged by the Advisor or by other investment advisors to different types of clients did not appear exceptional and had limited relevance to the evaluation of the fee rate charged to mutual funds as to which the Advisor or such other advisors are the primary advisor and sponsor.
Costs and Profitability of Advisor. In reviewing the profitability of the Advisor’s services to the Fund, the Trustees considered an analysis of the Advisor’s costs and the estimated profitability to the Advisor of its services, together with data respecting the overall profitability of a selection of other investment management firms. The Trustees considered in this regard information from the Advisor respecting investment of its profits to maintain staffing levels, and noted that a portion of the Advisor’s profits is an important element in the compensation of shareholder employees. The Trustees considered information from the Advisor respecting the use of profits to enhance staff competencies through training and other measures, hire personnel to expand and develop the scope of senior management expertise, pay competitive levels of compensation, and add to the Advisor’s electronic and information technology systems to maintain or improve service levels. The Trustees also considered the contribution of the Advisor’s cost management to its profitability, and the relationship of the Advisor’s financial resources and profitability in previous years to its ability to attract necessary personnel, invest in systems and other assets required for its service to the Fund, and maintain or improve service levels for the Fund notwithstanding fluctuations in revenues and profitability. The information considered did not indicate to the Trustees that the Advisor’s profitability was excessive.
Potential Economies of Scale. In reviewing the extent to which economies of scale would be realized by the Fund as it grows and whether fee levels reflect potential economies of scale, the Trustees considered the breakpoint structure for advisory fees chargeable to the Fund, comparisons of the fee breakpoint structure for the Fund with breakpoint structures (or the absence of such structures) for other funds in a peer group selected by an independent mutual fund analyst firm, the effects of the breakpoint structure and other expense factors realized by certain funds of the Trust as their asset levels had increased, the Advisor’s undertakings to waive or reimburse certain fees and expenses of the Fund, and the Advisor’s expenditures from its own profits and resources to maintain staffing levels and expand staff competencies, pay competitive levels of compensation, and add to its electronic and information technology systems so as to maintain or improve service levels. The information provided demonstrated to the Trustees that the Fund’s advisory fee breakpoint structure is reasonable in relation to the structures observed in the other funds in its peer group, and that shareholders may be expected to benefit from any economies of scale, due to the advisory agreement’s breakpoint fee structure for the Fund and other factors.
Potential Ancillary Benefits. In reviewing potential benefits to the Advisor because of its relationship to the Fund, the Trustees considered explanations from the Advisor respecting its receipt of certain research services from broker dealers, and the benefits to both the Fund and the Advisor of the Advisor’s expansion of its staffing, compliance and systems capabilities and other resources to serve a broader variety of investment management clients. No unusual or unfair benefits to the Advisor from its relationship to the Fund were identified by the Trustees.
Summary of Conclusions. The Trustees concluded that the general nature, extent and quality of the Advisor’s services performed under the advisory agreement remained sufficient, the Advisor had continued to actively and competently pursue the Fund’s stated investment objectives and adhere to the Fund’s investment policies, and that the absolute and relative investment performance of the Fund over pertinent holding periods on the whole was satisfactory in the context of the Fund’s objectives and strategies. The Trustees further concluded that the level of the advisory fee charged to the Fund by the Advisor is fair and reasonable in relation to the services provided by the Advisor, in view of the nature, extent and quality of those services, the investment performance of the Fund after fees and expenses, the clear disclosure of fees and expenses in the Fund’s prospectuses, comparisons of fees and expenses charged to the Fund to fees and expenses charged to other mutual funds, and the other factors considered. The Trustees accordingly determined to renew the Fund’s investment advisory agreement with the Advisor for an additional term of one year.
Trustees’ Statement to Shareholders (Unaudited)
Readopted September 17, 2019
The Trustees believe current and prospective shareholders should know how we discharge our responsibilities in supervising the Funds’ investment advisor and in reviewing the advisor’s contract for renewal. Since 2005, we have issued a statement which sets out clearly the three principal guidelines that we follow in supervising the Trust’s investment advisor on your behalf. In accordance with our customary practice, in September of this year we again reviewed our statement and concluded we should reissue this statement outlining the principal features of our supervision of the advisor’s performance of investment management services for the Funds.
We begin with the premise that each shareholder selected his or her Fund because its investments are managed by the investment advisor identified in the prospectus and in accordance with the objective and policies described in the prospectus. We realize, as each of you do, that if you believe that your Fund’s stated objective and policies no longer serve your personal investment goals, you can sell your shares and leave the Fund.
Therefore, we believe that our primary supervisory task—our principal obligation to you—is to assess the nature and quality of the advisor’s services, and to confirm that the advisor actively and competently pursues the Fund’s objective, in accordance with the policies set out in the prospectus. To do this, we meet regularly with management to review your Fund’s portfolio and to discuss the advisor’s specific actions and judgments in pursuing the Fund’s objective. We do not substitute our own judgment for the advisor’s decisions in selecting investments; the advisor is paid to exercise its informed judgment on investment decisions, and we seek to confirm, in reviewing the advisor’s performance, that the advisor is doing just that.
Second, we are conscious of costs and the effect that costs have on shareholders’ returns. We try to make sure that your Fund’s fees and costs are reasonable in relationship to the services rendered and that they are generally in line with those charged by other expert investment advisors, consistent with our belief that the Fund’s investors searched for and expect that expertise and attention and have decided to pay a reasonable price for it. We do not put the management contract “out to bid” as a matter of course, and we would not do so unless we had concluded that the advisor materially had failed to pursue the Fund’s objectives in accordance with its policies, or for other equally important reasons. We believe that any other approach would be inconsistent with your interests and contrary to your expectations when you bought shares of the Fund in the first place.
Finally, because we believe that most Thornburg Fund shareholders have invested with a long-term perspective, we try not to focus too much on the fashions of the moment and on short-term performance. The market will not favor any specific investment objective or set of policies at all times and under all economic circumstances. A fund will experience periods of both high and low returns relative to other funds and other investments. Even if one of our Funds is not favored by the market at a particular time, we believe that the advisor is nonetheless obliged to remain true to the Fund’s objective and policies, and we watch to see that it does so.
Trustees of Thornburg Investment Trust
Thornburg Investment Management is a privately-owned global investment firm that offers a range of solutions for retail and institutional investors. Founded in 1982 and headquartered in Santa Fe, New Mexico, we manage approximately $41.9 billion (as of September 30, 2019) across U.S. mutual funds, separate accounts for high-net-worth investors, institutional accounts, and UCITS funds for non-U.S. investors.
The fund outlined in this report is one of many equity and fixed-income products available from Thornburg Investment Management.
EQUITY FUNDS
| ■ | Thornburg Global Opportunities Fund |
| ■ | Thornburg International Value Fund |
| ■ | Thornburg Better World International Fund |
| ■ | Thornburg International Growth Fund |
| ■ | Thornburg Developing World Fund |
| ■ | Thornburg Value Fund |
| ■ | Thornburg Core Growth Fund |
MULTI_ASSET FUNDS
| ■ | Thornburg Investment Income Builder Fund |
| ■ | Thornburg Summit Fund |
FIXED INCOME FUNDS
| ■ | Thornburg Low Duration Income Fund |
| ■ | Thornburg Limited Term U.S. Government Fund |
| ■ | Thornburg Limited Term Income Fund |
| ■ | Thornburg Strategic Income Fund |
| ■ | Thornburg Low Duration Municipal Fund |
| ■ | Thornburg Limited Term Municipal Fund |
| ■ | Thornburg Intermediate Municipal Fund |
| ■ | Thornburg California Limited Term Municipal Fund |
| ■ | Thornburg New Mexico Intermediate Municipal Fund |
| ■ | Thornburg New York Intermediate Municipal Fund |
| ■ | Thornburg Strategic Municipal Income Fund |
ALTERNATIVE FUNDS
| ■ | Thornburg Long/Short Equity Fund |
Before investing, carefully consider the Fund’s investment goals, risks, charges, and expenses. For a prospectus or summary prospectus containing this and other information, contact your financial advisor or visit thornburg.com. Read it carefully before investing.
For additional information, please visit thornburg.com
Thornburg Investment Management, Inc. 2300 North Ridgetop Road, Santa Fe, NM 87506
This page intentionally left blank.
This page intentionally left blank.
To receive shareholder reports, prospectuses, and proxy statements electronically, go to www.thornburg.com/edelivery.
This Annual Report is submitted for the general information of shareholders of the Fund. It is not authorized for distribution to prospective investors in the Fund unless preceded or accompanied by an effective prospectus.
Investment Advisor:
Thornburg Investment Management®
800.847.0200
Distributor:
Thornburg Securities Corporation®
Annual Report
September 30, 2019
Beginning on January 1, 2021, as permitted by regulations adopted by the Securities and Exchange Commission, paper copies of the Fund’s shareholder reports will no longer be sent by mail, unless you specifically request paper copies of the reports from the Fund or from your financial intermediary, such as a broker-dealer or bank. Instead, the reports will be made available on a website, and you will be notified by mail each time a report is posted and provided with a website link to access the report.
If you already elected to receive shareholder reports electronically, you will not be affected by this change and you need not take any action. You may elect to receive shareholder reports and other communications from the Fund or your financial intermediary electronically by going to thornburg.com/edelivery.
You may elect to receive all future reports in paper free of charge. You can inform the Fund or your financial intermediary that you wish to continue receiving paper copies of your shareholder reports by calling 800.847.0200 or your financial intermediary directly. Your election to receive reports in paper will apply to all funds held with the fund complex/your financial intermediary.
At Thornburg, we believe unconstrained investing leads to better outcomes for our clients. Our investment solutions are highly active, high conviction, and benchmark agnostic. When it comes to finding economic opportunity for clients, it’s more than what we do.
It’s how we do it. Active Asbottom-up, fundamental, active managers, we look beyond conventional benchmarks. Long Term We take a long-term view in how we manage our firm and our portfolios. Benchmark Agnostic Investment strategies should have the flexibility to pursue solutions for clients, not stay within the conventional confines of benchmarks. Flexible Perspective Our approach to portfolio construction is guided by our convictions rather than convention. High Conviction We focus our attention and capital on thoroughly researched, well-understood positions. The best form of risk management is to know what you own, and why. Repeatable & Robust Our long-term outperformance of benchmarks verifies that our process works and outperforms conventional thinking. Independent We are independently owned and far from the herd of other investment managers. Investment Driven All members of the investment team are resources for all of our strategies. Collaborative Our team collaborates on opportunities across geography, sector, or asset class.
Thornburg International Growth Fund
Annual Report | September 30, 2019
Table of Contents
| SHARE CLASS | NASDAQ SYMBOL | CUSIP |
| Class A | TIGAX | 885-215-319 |
| Class C | TIGCX | 885-215-293 |
| Class I | TINGX | 885-215-244 |
| Class R3 | TIGVX | 885-215-178 |
| Class R4 | TINVX | 885-215-160 |
| Class R5 | TINFX | 885-215-152 |
| Class R6 | THGIX | 885-216-820 |
Class I, R3, R4, R5, and R6 shares may not be available to all investors. Minimum investments for Class I shares may be higher than those for other classes.
Investments carry risks, including possible loss of principal. Additional risks may be associated with investments outside the United States, especially in emerging markets, including currency fluctuations, illiquidity, volatility, and political and economic risks. Investments in small- and mid-capitalization companies may increase the risk of greater price fluctuations. Please see the Fund’s prospectus for a discussion of the risks associated with an investment in the Fund. Investments in the Fund are not FDIC insured, nor are they deposits of or guaranteed by a bank or any other entity.
Letter to Shareholders
Thornburg International Growth Fund | September 30, 2019 (Unaudited)
October 10, 2019
Dear Fellow Shareholder:
For the fiscal year ended September 30, 2019, the Thornburg International Growth Fund returned negative 6.02% (Class I shares), underperforming its benchmark, the MSCI All Country World ex-U.S. Growth Index, which returned 2.03%. On September 30, 2019, the net asset value of the Class I shares was $22.13.
We were disappointed to trail the benchmark for the year but remain encouraged by the Fund’s strong long-term performance. Although the recent environment for international equities has been difficult for certain segments of the market, such as stocks with smaller capitalization ranges, we also made some individual stock selection errors. We remain committed to working as hard as possible, learning from our mistakes, and returning performance towards levels more in line with our long-term track record. As we have said in the past, investing is a marathon and not a sprint, with business value compounded over longer time horizons as opposed to shorter ones.
Although the absolute return of international equity indices over the past fiscal year has been relatively muted, digging beneath the surface we saw several periods of acute volatility as markets were pressured by various events such as rising trade tensions, weak economic data points, tightening monetary policy, political developments and general concerns around slowing global growth and late cycle fears. Over this period, we have seen investors clamor for safe-haven assets, such as treasuries and other foreign sovereign debt. We have seen yields fall across many forms of government debt and remarkably the world now has about $15.8 trillion dollars of negatively yielding bonds.
The flight to safety has impacted equities as well, driving investors towards stocks that are perceived as defensive and low volatility, such as consumer staples and utilities, which have been the two best performing sectors in our benchmark over the past year. Investors have also shied away from riskier segments, such as smaller capitalization stocks. From a market capitalization standpoint, our significant exposure towards smaller and medium-sized capitalization ranges vis-à-vis the benchmark proved to be a significant headwind. With large capitalization stocks posting generally positive returns while small and medium capitalization stocks were generally negative, our relative positioning from a market capitalization standpoint resulted in a nearly 400 basis point drag on relative performance during the fiscal year. Low growth large and mega cap stocks, many of which dominate top spots in our benchmark, have led the markets and now many of these stocks are at valuation levels that represent multi-year highs. As a fund with a high active share, we seek to own a portfolio of stocks that look different than our benchmark and the stock attributes we prefer, although not in favor at the moment, we believe will, over time, deliver favorable returns.
During the fiscal year, the top performing sectors for the Fund were materials and information technology. We had no exposure to materials during the year, and this proved to be a tailwind to performance as that sector underperformed. Within information technology, we saw positive underlying stock selection drive much of the outperformance in this sector. The key sectors that drove underperformance were consumer discretionary and consumer staples, where we simply had unsatisfactory stock selection results. On a geographic basis, our best performing countries were the United States and Korea. The companies we own in the United States are domiciled there, but economically are more exposed to international markets and the growth opportunities therein. In Korea, being underweight helped us, as well as a favorably-timed initial purchase of our singular holding in the country, SK Hynix. Our primary detractors on a country level were the United Kingdom, where two of our e-commerce holdings underperformed, and Germany.
Contributors and Detractors
Leading contributors to performance on a stock basis for this period included Worldpay, TAL Education, AstraZeneca, Mastercard and Edenred.
Worldpay is a global provider of payment solutions. During the early part of the year, Worldpay reported accelerating fundamentals and subsequently received a takeover offer from Fidelity National Information Services. The deal was completed during the latter part of the fiscal year at a healthy premium and the combined scale of the two companies is expected to generate a robust degree of synergies.
TAL Education Group provides after school tutoring services as well as an online education platform in China. Rising urbanization, favorable demographics and intense competition for admission into top schools in China have been tailwinds for the business. TAL has grown rapidly over the past year as it benefits from positive brand recognition due to its strong reputation for quality outcomes, increasing penetration of online services and a regulatory environment that should favor larger players like TAL over time.
AstraZeneca is a U.K.-domiciled global pharmaceutical provider. Our initial investment thesis centered upon the expansion of Astra’s oncology franchise as a driver of accelerating growth, expanding margins and ultimately business value creation. We are delighted that the proof points we have seen so far, such as sales trends, regulatory approvals and clinical data read outs have been favorable and we remain hopeful that our thesis will continue to play out over an even longer time horizon.
Mastercard is a leading global payments and technology company that helps to enable global commerce. During the fiscal year, Mastercard has consistently delivered strong financial results and over the long run we believe Mastercard will continue to benefit from the secular trend of payments transactions shifting from cash towards digital forms.
Letter to Shareholders, Continued
Thornburg International Growth Fund | September 30, 2019 (Unaudited)
Edenred is a France-based global provider of payments and benefits solutions. During the year, organic revenue growth has accelerated, and shares have re-rated higher as quality growth stocks in Europe continue to attract a scarcity premium in terms of valuation. Furthermore, Edenred has made several strategic acquisitions that have been positively viewed as extensions of its growth runway.
Primary detractors to performance for the fiscal year were ASOS, Baidu, Fresenius Medical Care, Wirecard and Zozo, Inc.
ASOS is a UK-based online fashion retailer. The company issued two profit warnings over the past year. The first related to poor performance from heightened competition over the most recent holiday season and the second due to operational missteps and disruption in their warehouses leading to elevated fulfilment costs and lower margins. Although the stock is trading at historically low levels relative to peers and its own history, the structural growth opportunity remains attractive and the management team asserts the current issues are temporary. The recent track record of execution has been very poor and competition from other digitally native retailers is increasing. Our holding is under review.
Baidu is an internet company that operates a search engine and other online services in China. Shares have fallen as revenues have slowed and earnings have collapsed over the past year due to weak advertising sales from a slowing economy as well as increasing competition. Baidu has seen the economic moat around its search engine business deteriorate as advertising dollars move to competitors, such as short video platforms. Given the fundamental concerns, we have exited position.
Fresenius Medical Care is a German provider of kidney dialysis services and equipment. Shares have suffered from a combination of weak operating performance as well as heightened regulatory concerns as it relates to a recently signed executive order called Advancing American Kidney Health. We believe the regulatory proposals will have a limited fundamental impact on the business and recent operational issues are either transitory or correctable.
Wirecard is a German digital payments platform provider and a long-held position within the Fund that has been a strong contributor over time. During the fiscal year, shares fell sharply due to an allegation of fraudulent accounting practices in a small segment of their business managed out of their Singapore offices. The company has denied any wrongdoing and nothing
material was found by the law firm that was hired to investigate. Shares partially recovered as SoftBank announced a €900m strategic investment in the company, representing about a 5.6% stake, via a convertible bond issue. Despite also reporting financial results since the allegations that tracked better than consensus expectations, the stock remains modestly down over the fiscal year.
Zozo is a Japanese fashion e-commerce platform. The company reported results that saw operating losses widen dramatically due to costs associated with ramping their private brand business. Outside of the private brand, the core business saw merchandise value growth disappoint and some brands have recently decided to leave the platform. Given the execution issues and decelerating growth trends, we completely sold out of the position.
We have always managed the Fund with a long-term perspective and have consistently stayed true to our philosophy and process. We strive to deliver our shareholders superior risk-adjusted returns through a full market cycle through a fundamentally-driven process that seeks to invest in the highest quality international growth stocks, secular themes, idiosyncratic opportunities and a mix of capitalization ranges that tend to skew smaller than the index. Although we recognize there are times when our style is temporarily out of favor, or we undergo stretches where stock selection mistakes are made, over the long run our approach has been effective at achieving favorable results for our investors. We remain optimistic about the potential for long-term business value creation from the portfolio of individual companies we have identified through our active, bottom-up investment process and look forward to once again delivering the type of outperformance we have demonstrated over the past decade.
We thank you for investing alongside us in the Thornburg International Growth Fund.

| 
|
Greg Dunn
Managing Director
Portfolio Manager | Sean Koung Sun,cfa
Managing Director
Portfolio Manager |
The matters discussed in this report may constitute forward-looking statements made pursuant to the safe harbor provisions of the Securities Litigation Reform Act of 1995. These include any advisor or portfolio manager prediction, assessment, analysis or outlook for individual securities, industries, investment styles, market sectors and/or markets. These statements involve risks and uncertainties. In addition to the general risks described for each fund in its current prospectus, other factors bearing on these reports include the accuracy of the advisor’s or portfolio manager’s forecasts and predictions, the appropriateness of the investment strategies designed by the advisor or portfolio manager and the ability of the advisor or portfolio manager to implement their strategies efficiently and successfully. Any one or more of these factors, as well as other risks affecting the securities markets generally, could cause the actual results of any fund to differ materially as compared to its benchmarks.
The views expressed are subject to change and do not necessarily reflect the views of Thornburg Investment Management, Inc. This information should not be relied upon as a recommendation or investment advice and is not intended to predict the performance of any investment or market.
Performance results of individual share classes will vary based on the fees and expenses associated with each share class, and may be higher or lower than other share classes within the same Fund. Please see Performance Summary for performance results of each share class.
Performance Summary
Thornburg International Growth Fund | September 30, 2019 (Unaudited)
AVERAGE ANNUAL TOTAL RETURNS
| | 1-YR | 3-YR | 5-YR | 10-YR | SINCE
INCEP. |
| Class A Shares(Incep: 2/1/07) | | | | | |
| Without sales charge | -6.36% | 6.28% | 4.95% | 9.28% | 6.41% |
| With sales charge | -10.57% | 4.65% | 3.99% | 8.78% | 6.03% |
| Class C Shares(Incep: 2/1/07) | | | | | |
| Without sales charge | -7.04% | 5.48% | 4.16% | 8.45% | 5.66% |
| With sales charge | -7.94% | 5.48% | 4.16% | 8.45% | 5.66% |
| Class I Shares(Incep: 2/1/07) | -6.02% | 6.67% | 5.35% | 9.76% | 6.93% |
| Class R3 Shares(Incep: 2/1/08) | -6.50% | 6.14% | 4.83% | 9.20% | 5.32% |
| Class R4 Shares(Incep: 2/1/08) | -6.39% | 6.25% | 4.93% | 9.33% | 5.42% |
| Class R5 Shares(Incep: 2/1/08) | -6.05% | 6.68% | 5.35% | 9.76% | 5.85% |
| Class R6 Shares(Incep: 2/1/13) | -5.91% | 6.80% | 5.46% | - | 6.30% |
| MSCI AC World ex-U.S. Growth Index(Since 2/1/07) | 2.03% | 7.37% | 4.86% | 5.82% | 3.25% |
GROWTH OF A HYPOTHETICAL $10,000 INVESTMENT
Performance data shown represents past performance and is no guarantee of future results. Investment return and principal value will fluctuate so shares, when redeemed, may be worth more or less than their original cost. Current performance may be lower or higher than quoted. For performance current to the most recent month end, visit thornburg.com or call 800-847-0200. The performance information does not reflect the deduction of taxes that a shareholder would pay on distributions or the redemption of Fund shares. Returns reflect the reinvestment of dividends and capital gains. Class A shares are sold with a maximum sales charge of 4.50%. Class C shares are subject to a 1% CDSC for the first year only. There is no sales charge for Class I, R3, R4, R5 and R6 shares. As disclosed in the most recent prospectus, the total annual fund operating expenses before any fee waivers or expense reimbursements are as follows: A shares, 1.32%; C shares, 2.08%; I shares, 0.99%; R3 shares, 1.98%; R4 shares, 1.88%; R5 shares, 1.25% and R6 shares, 0.99%. Thornburg Investment Management has contractually agreed to waive fees and reimburse expenses until at least February 1, 2020, for some of the share classes, resulting in net expense ratios of the following: R3 shares, 1.50%; R4 shares, 1.40%; R5 shares, 0.99% and R6 shares, 0.89%. For more detailed information on fund expenses and waivers/reimbursements please see the Fund’s prospectus.

Lipper fund classification awards are given for the three-year, five-year, and 10-year periods. Fund family awards are issued for the three-year period only. Thornburg did not win the awards for any time periods or years other than those listed above. Only fund families with at least five bond funds were eligible for the Best Fixed Income Funds Manager Award. Lipper’s Large Company universe was comprised of fund families with more than $40 billion in total net assets for the 2012 award and more than $28 billion for the 2008 award.
From Thomson Reuters Lipper Awards, © 2018 Thomson Reuters. All rights reserved. Used by permission and protected by the Copyright Laws of the United States. The printing, copying, redistribution, or retransmission of this Content without express written permission is prohibited.
TheMSCI All Country (AC) World ex-U.S. Growth Index is a market capitalization weighted index that includes growth companies in developed and emerging markets throughout the world, excluding the United States.
The performance of any index is not indicative of the performance of any particular investment. Unless otherwise noted, index returns reflect the reinvestment of income
dividends and capital gains, if any, but do not reflect fees, brokerage commissions or other expenses of investing. Investors may not make direct investments into any index.
Fund Summary
Thornburg International Growth Fund | September 30, 2019 (Unaudited)
OBJECTIVES AND STRATEGIES
The Fund seeks long-term growth of capital by investing in equity securities selected for their growth potential.
The Fund normally invests at least 75% of its assets in foreign securities or depositary receipts of foreign securities. However, the Fund may own a variety of securities, including domestic equity securities, partnership interests, and debt obligations. The Fund may also invest in developing countries.
MARKET CAPITALIZATION EXPOSURE
BASKET STRUCTURE
| TOP TEN EQUITY HOLDINGS |
| Alibaba Group Holding Ltd. Sponsored ADR | 4.1% |
| AstraZeneca plc | 3.7% |
| Tencent Holdings Ltd. | 3.6% |
| Danone S.A. | 2.7% |
| Fomento Economico Mexicano SAB de C.V. | 2.6% |
| TAL Education Group | 2.6% |
| Lonza Group AG | 2.5% |
| Royal Dutch Shell plc Class A | 2.4% |
| Wirecard AG | 2.4% |
| Galaxy Entertainment Group Ltd. | 2.3% |
| SECTOR EXPOSURE |
| Consumer Discretionary | 21.5% |
| Information Technology | 17.2% |
| Communication Services | 15.1% |
| Health Care | 12.0% |
| Consumer Staples | 11.5% |
| Industrials | 5.4% |
| Financials | 5.2% |
| Energy | 2.4% |
| Other Assets Less Liabilities | 9.7% |
| TOP TEN INDUSTRY GROUPS |
| Media & Entertainment | 15.1% |
| Software & Services | 13.9% |
| Retailing | 12.2% |
| Food, Beverage & Tobacco | 9.5% |
| Pharmaceuticals, Biotechnology & Life Sciences | 7.8% |
| Consumer Services | 7.1% |
| Healthcare Equipment & Services | 4.2% |
| Diversified Financials | 4.1% |
| Commercial & Professional Services | 3.7% |
| Semiconductors & Semiconductor Equipment | 3.3% |
COUNTRY EXPOSURE*
(percent of equity holdings) |
| China | 13.4% |
| United States | 12.8% |
| United Kingdom | 11.2% |
| Germany | 9.7% |
| France | 9.4% |
| Japan | 7.7% |
| Macao | 4.5% |
| Ireland | 4.4% |
| Netherlands | 4.0% |
| Australia | 3.9% |
| India | 3.3% |
| Mexico | 2.9% |
| Switzerland | 2.8% |
| Taiwan | 2.5% |
| Russian Federation | 2.2% |
| South Korea | 1.9% |
| Sweden | 1.8% |
| United Arab Emirates | 1.6% |
| * | Holdings are classified by country of risk as determined by MSCI and Bloomberg. |
There is no guarantee that the Fund will meet its investment objectives.
All data is subject to change. Charts may not add up to 100% due to rounding.
Schedule of Investments
Thornburg International Growth Fund | September 30, 2019
| | | SHARES | VALUE |
| | Common Stock — 90.3% | | |
| | Banks — 1.1% | | |
| | Thrifts & Mortgage Finance — 1.1% | | |
| | Housing Development Finance Corp. Ltd. | 550,469 | $ 15,356,613 |
| | | | 15,356,613 |
| | Commercial & Professional Services — 3.7% | | |
| | Commercial Services & Supplies — 1.7% | | |
| | Edenred | 525,765 | 25,231,732 |
| | Professional Services — 2.0% | | |
| | Nihon M&A Center, Inc. | 1,013,700 | 28,500,791 |
| | | | 53,732,523 |
| | Consumer Durables & Apparel — 2.2% | | |
| | Textiles, Apparel & Luxury Goods — 2.2% | | |
| | adidas AG | 100,144 | 31,179,265 |
| | | | 31,179,265 |
| | Consumer Services — 7.1% | | |
| | Diversified Consumer Services — 2.5% | | |
| a | TAL Education Group ADR | 1,084,601 | 37,136,738 |
| | Hotels, Restaurants & Leisure — 4.6% | | |
| | Evolution Gaming Group AB | 391,285 | 7,695,286 |
| | Galaxy Entertainment Group Ltd. | 5,447,658 | 33,884,089 |
| | Sands China Ltd. | 5,422,200 | 24,559,259 |
| | | | 103,275,372 |
| | Diversified Financials — 4.1% | | |
| | Capital Markets — 4.1% | | |
| | Japan Exchange Group, Inc. | 2,041,513 | 32,078,896 |
| | St James’s Place plc | 2,206,812 | 26,574,889 |
| | | | 58,653,785 |
| | Energy — 2.4% | | |
| | Oil, Gas & Consumable Fuels — 2.4% | | |
| | Royal Dutch Shell plc Class A | 1,172,499 | 34,377,276 |
| | | | 34,377,276 |
| | Food, Beverage & Tobacco — 9.5% | | |
| | Beverages — 2.6% | | |
| | Fomento Economico Mexicano SAB de CV Sponsored ADR | 410,019 | 37,549,540 |
| | Food Products — 5.0% | | |
| | Danone S.A. | 450,342 | 39,670,530 |
| | Kerry Group plc Class A | 283,970 | 33,210,766 |
| | Tobacco — 1.9% | | |
| | ITC Ltd. | 7,561,419 | 27,650,274 |
| | | �� | 138,081,110 |
| | Healthcare Equipment & Services — 4.2% | | |
| | Health Care Equipment & Supplies — 2.0% | | |
| | Siemens Healthineers AG | 741,400 | 29,167,979 |
| | Health Care Providers & Services — 2.2% | | |
| | Fresenius Medical Care AG & Co. KGaA | 478,836 | 32,201,690 |
| | | | 61,369,669 |
| | Household & Personal Products — 2.0% | | |
| | Personal Products — 2.0% | | |
| | Kose Corp. | 171,600 | 28,963,699 |
| | | | 28,963,699 |
| | Media & Entertainment — 15.1% | | |
| | Entertainment — 7.6% | | |
| | Activision Blizzard, Inc. | 564,253 | 29,860,269 |
Schedule of Investments, Continued
Thornburg International Growth Fund | September 30, 2019
| | | SHARES | VALUE |
| a | DouYu International Holdings Ltd. ADR | 966,400 | $ 7,914,816 |
| a | HUYA, Inc. ADR | 802,271 | 18,965,686 |
| a | Netflix, Inc. | 55,020 | 14,724,452 |
| a | Sea Ltd. ADR | 318,300 | 9,851,385 |
| a | Ubisoft Entertainment S.A. | 387,195 | 27,997,027 |
| | Interactive Media & Services — 7.5% | | |
| | carsales.com Ltd. | 2,733,510 | 28,209,788 |
| | Tencent Holdings Ltd. | 1,249,600 | 52,645,281 |
| a | Yandex N.V. Class A | 808,998 | 28,323,020 |
| | | | 218,491,724 |
| | Pharmaceuticals, Biotechnology & Life Sciences — 7.8% | | |
| | Biotechnology — 1.6% | | |
| | CSL Ltd. | 146,593 | 23,121,981 |
| | Life Sciences Tools & Services — 2.5% | | |
| | Lonza Group AG | 106,900 | 36,138,530 |
| | Pharmaceuticals — 3.7% | | |
| | AstraZeneca plc | 599,265 | 53,500,935 |
| | | | 112,761,446 |
| | Retailing — 12.2% | | |
| | Internet & Direct Marketing Retail — 10.1% | | |
| a | Alibaba Group Holding Ltd. Sponsored ADR | 350,161 | 58,557,424 |
| a | ASOS plc | 664,635 | 20,233,913 |
| a | Booking Holdings, Inc. | 16,102 | 31,601,946 |
| a | Boozt AB | 2,367,563 | 16,330,426 |
| a | Just Eat plc | 1,136,691 | 9,338,882 |
| a | Mercari, Inc. | 412,665 | 10,247,450 |
| | Multiline Retail — 2.1% | | |
| | B&M European Value Retail S.A. | 6,311,803 | 29,443,999 |
| | | | 175,754,040 |
| | Semiconductors & Semiconductor Equipment — 3.3% | | |
| | Semiconductors & Semiconductor Equipment — 3.3% | | |
| | SK Hynix, Inc. | 363,900 | 25,007,382 |
| | Taiwan Semiconductor Manufacturing Co., Ltd. | 2,589,000 | 22,994,277 |
| | | | 48,001,659 |
| | Software & Services — 13.9% | | |
| | Information Technology Services — 13.4% | | |
| a | Adyen N.V. | 27,524 | 18,131,875 |
| | Capgemini SE | 255,400 | 30,092,155 |
| | Fidelity National Information Services, Inc. | 193,839 | 25,734,184 |
| | Mastercard, Inc. Class A | 120,794 | 32,804,027 |
| a | Network International Holdings plc | 3,115,066 | 20,491,184 |
| | Visa, Inc. Class A | 187,191 | 32,198,724 |
| | Wirecard AG | 214,858 | 34,366,582 |
| | Software — 0.5% | | |
| a | Blue Prism Group plc | 611,224 | 7,139,536 |
| | | | 200,958,267 |
| | Transportation — 1.7% | | |
| | Airlines — 1.7% | | |
| a | Ryanair Holdings plc Sponsored ADR | 364,115 | 24,169,954 |
| | | | 24,169,954 |
| | Total Common Stock(Cost $1,137,603,882) | | 1,305,126,402 |
| | Short-Term Investments — 10.1% | | |
| b | Thornburg Capital Management Fund | 14,611,678 | 146,116,782 |
| | Total Short-Term Investments(Cost $146,116,782) | | 146,116,782 |
| | Total Investments — 100.4%(Cost $1,283,720,664) | | $1,451,243,184 |
Schedule of Investments, Continued
Thornburg International Growth Fund | September 30, 2019
| | | SHARES | VALUE |
| | Liabilities Net of Other Assets — (0.4)% | | (5,088,222) |
| | Net Assets — 100.0% | | $1,446,154,962 |
| Outstanding Forward Currency Contracts To Buy Or Sell At September 30, 2019 |
Contract
Description | Contract
Party* | Buy/Sell | Contract
Amount | Contract
Value Date | Value
USD | Unrealized
Appreciation | Unrealized
Depreciation |
| Great Britain Pound | BBH | Sell | 41,936,700 | 10/15/2019 | 51,590,821 | $ 310,039 | $ — |
| |
| Net unrealized appreciation (depreciation) | | | | | | $310,039 | |
| * | Counterparty includes Brown Brothers Harriman & Co. ("BBH"). |
| Footnote Legend |
| a | Non-income producing. |
| b | Investment in Affiliates. |
Portfolio Abbreviations
To simplify the listings of securities, abbreviations are used per the table below:
| ADR | American Depositary Receipt |
See notes to financial statements.
This page intentionally left blank.
Statement of Assets and Liabilities
Thornburg International Growth Fund | September 30, 2019
| ASSETS | |
| Investments at value (Note 3) | |
| Non-affiliated issuers (cost $1,137,603,882) | $ 1,305,126,402 |
| Non-controlled affiliated issuer (cost $146,116,782) | 146,116,782 |
| Cash | 102,127 |
| Cash denominated in foreign currency (cost $52) | 52 |
| Receivable for investments sold | 1,783,326 |
| Receivable for fund shares sold | 1,388,015 |
| Unrealized appreciation on forward currency contracts (Note 7) | 310,039 |
| Dividends receivable | 2,124,046 |
| Dividend and interest reclaim receivable | 463,335 |
| Prepaid expenses and other assets | 88,593 |
| Total Assets | 1,457,502,717 |
| Liabilities | |
| Payable for investments purchased | 7,980,452 |
| Payable for fund shares redeemed | 1,646,053 |
| Payable to investment advisor and other affiliates (Note 4) | 1,139,102 |
| Accounts payable and accrued expenses | 580,673 |
| Dividends payable | 1,475 |
| Total Liabilities | 11,347,755 |
| Net Assets | $ 1,446,154,962 |
| NET ASSETS CONSIST OF | |
| Distributable earnings | $ 178,038,966 |
| Net capital paid in on shares of beneficial interest | 1,268,115,996 |
| | $ 1,446,154,962 |
Statement of Assets and Liabilities, Continued
Thornburg International Growth Fund | September 30, 2019
| NET ASSET VALUE | |
| Class A Shares: | |
Net asset value and redemption price per share
($107,196,160 applicable to 4,994,461 shares of beneficial interest outstanding - Note 5) | $ 21.46 |
| Maximum sales charge, 4.50% of offering price | 1.01 |
| Maximum offering price per share | $ 22.47 |
| Class C Shares: | |
Net asset value and offering price per share*
($47,979,799 applicable to 2,414,368 shares of beneficial interest outstanding - Note 5) | $ 19.87 |
| Class I Shares: | |
Net asset value, offering and redemption price per share
($1,203,538,211 applicable to 54,382,558 shares of beneficial interest outstanding - Note 5) | $ 22.13 |
| Class R3 Shares: | |
Net asset value, offering and redemption price per share
($6,274,402 applicable to 295,608 shares of beneficial interest outstanding - Note 5) | $ 21.23 |
| Class R4 Shares: | |
Net asset value, offering and redemption price per share
($7,514,745 applicable to 352,190 shares of beneficial interest outstanding - Note 5) | $ 21.34 |
| Class R5 Shares: | |
Net asset value, offering and redemption price per share
($28,728,598 applicable to 1,294,455 shares of beneficial interest outstanding - Note 5) | $ 22.19 |
| Class R6 Shares: | |
Net asset value, offering and redemption price per share
($44,923,047 applicable to 2,018,345 shares of beneficial interest outstanding - Note 5) | $ 22.26 |
| * | Redemption price per share is equal to net asset value less any applicable contingent deferred sales charge. |
See notes to financial statements.
Statement of Operations
Thornburg International Growth Fund | Year Ended September 30, 2019
| INVESTMENT INCOME | |
| Dividend income | |
| Non-affiliated issuers (net of foreign taxes withheld of $1,169,704) | $ 17,506,565 |
| Non-controlled affiliated issuer | 2,678,237 |
| Total Income | 20,184,802 |
| EXPENSES | |
| Investment advisory fees (Note 4) | 12,489,108 |
| Administration fees (Note 4) | |
| Class A Shares | 94,365 |
| Class C Shares | 52,737 |
| Class I Shares | 1,100,975 |
| Class R3 Shares | 6,412 |
| Class R4 Shares | 8,388 |
| Class R5 Shares | 28,025 |
| Class R6 Shares | 41,323 |
| Distribution and service fees (Note 4) | |
| Class A Shares | 268,667 |
| Class C Shares | 601,071 |
| Class R3 Shares | 36,523 |
| Class R4 Shares | 23,905 |
| Transfer agent fees | |
| Class A Shares | 111,235 |
| Class C Shares | 66,385 |
| Class I Shares | 972,457 |
| Class R3 Shares | 28,902 |
| Class R4 Shares | 55,269 |
| Class R5 Shares | 95,002 |
| Class R6 Shares | 7,247 |
| Registration and filing fees | |
| Class A Shares | 14,015 |
| Class C Shares | 13,019 |
| Class I Shares | 35,279 |
| Class R3 Shares | 12,662 |
| Class R4 Shares | 12,664 |
| Class R5 Shares | 13,532 |
| Class R6 Shares | 12,666 |
| Custodian fees | 219,859 |
| Professional fees | 138,346 |
| Trustee and officer fees (Note 4) | 81,136 |
| Other expenses | 165,530 |
| Total Expenses | 16,806,704 |
| Less: | |
| Expenses reimbursed by investment advisor (Note 4) | (747,767) |
| Net Expenses | 16,058,937 |
| Net Investment Income | $ 4,125,865 |
Statement of Operations, Continued
Thornburg International Growth Fund | Year Ended September 30, 2019
| REALIZED AND UNREALIZED GAIN (LOSS) | |
| Net realized gain (loss) on: | |
| Non-affiliated issuer investments | $ 7,666,949 |
| Forward currency contracts (Note 7) | 4,600,793 |
| Foreign currency transactions | (4,869) |
| | 12,262,873 |
| Net change in unrealized appreciation (depreciation) on: | |
| Non-affiliated issuer investments (net of change in deferred taxes payable of $85,938) | (132,477,143) |
| Forward currency contracts (Note 7) | 627,741 |
| Foreign currency translations | (22,023) |
| | (131,871,425) |
| Net Realized and Unrealized Loss | (119,608,552) |
| Net Decrease in Net Assets Resulting from Operations | $ (115,482,687) |
See notes to financial statements.
Statements of Changes in Net Assets
Thornburg International Growth Fund
| | Year Ended
September 30, 2019 | Year Ended
September 30, 2018 |
| INCREASE (DECREASE) IN NET ASSETS FROM | | |
| OPERATIONS | | |
| Net investment income | $ 4,125,865 | $ 6,336,516 |
| Net realized gain (loss) on investments, forward currency contracts and foreign currency transactions | 12,262,873 | 70,339,435 |
| Net change in unrealized appreciation (depreciation) on investments, forward currency contracts, foreign currency translations and deferred taxes | (131,871,425) | (31,901,578) |
| Net Increase (Decrease) in Net Assets Resulting from Operations | (115,482,687) | 44,774,373 |
| DIVIDENDS TO SHAREHOLDERS | | |
| From distributable earnings | | |
| Class A Shares | (3,914,434) | (4,353,047) |
| Class C Shares | (2,516,390) | (3,292,844) |
| Class I Shares | (50,306,025) | (39,027,537) |
| Class R3 Shares | (267,010) | (362,877) |
| Class R4 Shares | (355,180) | (585,837) |
| Class R5 Shares | (1,314,036) | (1,479,337) |
| Class R6 Shares | (1,827,702) | (427,325) |
| FUND SHARE TRANSACTIONS (NOTE 5) | | |
| Class A Shares | (8,526,596) | 6,349,924 |
| Class C Shares | (21,012,442) | (13,195,591) |
| Class I Shares | (121,377,075) | 344,647,497 |
| Class R3 Shares | (1,339,119) | (2,096,023) |
| Class R4 Shares | (3,982,891) | (4,571,543) |
| Class R5 Shares | (5,662,040) | (7,747,585) |
| Class R6 Shares | (1,509,937) | 39,857,628 |
| Net Increase (Decrease) in Net Assets | (339,393,564) | 358,489,876 |
| NET ASSETS | | |
| Beginning of Year | 1,785,548,526 | 1,427,058,650 |
| End of Year | $ 1,446,154,962 | $ 1,785,548,526 |
See notes to financial statements.
Notes to Financial Statements
Thornburg International Growth Fund | September 30, 2019
NOTE 1 – ORGANIZATION
Thornburg International Growth Fund (the “Fund”) is a diversified series of Thornburg Investment Trust (the “Trust”). The Trust was organized as a Massachusetts business trust under a Declaration of Trust dated June 3, 1987 and is registered as a diversified, open-end management investment company under the Investment Company Act of 1940, as amended (the "1940 Act"). The Fund is currently one of twenty-two separate series of the Trust. Each series is considered to be a separate entity for financial reporting and tax purposes and bears expenses directly attributable to it. The Fund seeks long-term capital appreciation by investing in equity securities selected for their growth potential.
The Fund currently offers seven classes of shares of beneficial interest: Class A, Class C, Institutional Class (“Class I”), and Retirement Classes (“Class R3”, “Class R4”, “Class R5”, and “Class R6”). Each class of shares of the Fund represents an interest in the same portfolio of investments, except that (i) Class A shares are sold subject to a front-end sales charge collected at the time the shares are purchased and bear a service fee, (ii) Class C shares are sold at net asset value without a sales charge at the time of purchase, but are subject to a contingent deferred sales charge upon redemption within one year of purchase, and bear both a service fee and a distribution fee, (iii) Class I and Class R5 shares are sold at net asset value without a sales charge at the time of purchase and may be subject to a service fee, (iv) Class R3 shares are sold at net asset value without a sales charge at the time of purchase, but bear both a service fee and distribution fee, (v) Class R4 shares are sold at net asset value without a sales charge at the time of purchase, but bear a service fee, (vi) Class R6 shares are sold at net asset value without a sales charge at the time of purchase, and (vii) the respective classes may have different reinvestment privileges and conversion rights. Additionally, the Fund may allocate among its classes certain expenses, to the extent allocable to specific classes, including administration fees, transfer agent fees, government registration fees, certain printing and postage costs, and administrative and legal expenses. Currently, class specific expenses of the Fund are limited to service and distribution fees and certain registration and transfer agent expenses.
The following is a summary of significant accounting policies followed by the Fund in the preparation of its financial statements. The Fund prepares its financial statements in conformity with United States generally accepted accounting principles (“GAAP”), including investment company accounting and reporting guidance in the Financial Accounting Standards Board (the “FASB”) Accounting Standard Codification Topic 946.
NOTE 2 – SIGNIFICANT ACCOUNTING POLICIES
Security Valuation: All investments in securities held by the Fund are valued as described in Note 3.
Allocation of Income, Gains, Losses and Expenses: Net investment income (other than class specific expenses) and realized and unrealized gains and losses are allocated daily to each class of shares based upon the relative net asset value of outstanding shares (or the value of the dividend-eligible shares, as appropriate) of each class of shares at the beginning of the day (after adjusting for the current capital shares activity of the respective class). Expenses common to all Funds are allocated among the Funds comprising the Trust based upon their relative net asset values or other appropriate allocation methods. Operating expenses directly attributable to a specific class are charged against the operating income of that class.
Dividends and Distributions to Shareholders: Dividends and distributions to shareholders, which are determined in accordance with federal income tax regulations and may differ from GAAP, are recorded on the ex-dividend date. Ordinary income dividends, if any, are declared and paid annually. Capital gain distributions, if any, are declared and paid annually and more often if deemed necessary by Thornburg Investment Management, Inc., the Trust’s investment advisor (the “Advisor”). Dividends and distributions are paid and are reinvested in additional shares of the Fund at net asset value per share at the close of business on the ex-dividend date, or at the shareholder’s option, paid in cash.
Investment Income: Dividend income is recorded on the ex-dividend date. Certain income from foreign investments is recognized as soon as information is available to the Fund. Interest income is accrued as earned. Premiums and discounts are amortized and accreted, respectively, to first call dates or maturity dates using the effective yield method of the respective investments. These amounts are included in Investment Income in the Statement of Operations.
Investment Transactions: Investment transactions are accounted for on a trade date basis. Realized gains and losses from the sale of investments are recorded on an identified cost basis.
When-Issued and Delayed Delivery Transactions: The Fund may engage in when-issued or delayed delivery transactions. To the extent the Fund engages in such transactions, it will do so for the purpose of acquiring portfolio investments consistent with the Fund’s investment objectives and not for the purpose of investment leverage or to speculate on interest rate or market changes. At the time the Fund makes a commitment to purchase an investment on a when-issued or delayed delivery basis, the Fund will record the transaction and reflect the value in determining its net asset value. When effecting such transactions, assets of an amount sufficient to make payment for the portfolio investments to be purchased will be segregated on the Fund’s records on the trade date. Investments purchased on a when-issued or
Notes to Financial Statements, Continued
Thornburg International Growth Fund | September 30, 2019
delayed delivery basis do not earn interest until the settlement date. The values of these securities held at September 30, 2019 are detailed in the Schedule of Investments.
Foreign Currency Translation: Portfolio investments and other assets and liabilities denominated in foreign currencies are translated into U.S. dollars based on the exchange rate of such currencies against the U.S. dollar on the date of valuation. Purchases and sales of investments and income items denominated in foreign currencies are translated into U.S. dollars at the exchange rate in effect on the transaction date. When the Fund purchases or sells foreign investments, it will customarily enter into a foreign exchange contract to minimize foreign exchange risk from the trade date to the settlement date of such transactions. The values of such spot contracts are included in receivable for investments sold and payable for investments purchased on the Statement of Assets and Liabilities.
The Fund does not separately report the effect of changes in foreign exchange rates from changes in market prices on investments held. Such changes are included in net unrealized appreciation (depreciation) from investments in the Statement of Operations.
Reported net realized gains and losses from foreign currency transactions arise due to purchases and sales of foreign currencies, currency gains and losses realized between the trade and settlement dates on investment transactions and the difference between the amounts of dividends, interest, and foreign withholding taxes recorded on the Fund’s books, and the U.S. dollar equivalent of the amounts actually received or paid. These amounts are included in foreign currency transactions in the Statement of Operations.
Net change in unrealized appreciation (depreciation) on foreign currency translations arise from changes in the fair value of assets and liabilities, other than investments at period end, resulting from changes in exchange rates.
Guarantees and Indemnifications: Under the Trust’s organizational documents (and under separate agreements with the independent Trustees), its officers and Trustees are provided with an indemnification against certain liabilities arising out of the performance of their duties to the Fund. In the normal course of business the Trust may also enter into contracts with service providers that contain general indemnifications. The Trust’s maximum exposure under these arrangements is unknown. However, based on experience, the Trust expects the risk of loss to be remote.
Use of Estimates: The preparation of financial statements in conformity with GAAP requires management to make estimates and assumptions that affect the reported amounts of assets and liabilities and disclosure of contingent assets and liabilities at the date of the financial statements and the reported amounts of increases (decreases) in net assets from operations during the reporting period. Actual results could differ from those estimates.
Federal Income Taxes: It is the policy of the Trust to comply with the provisions of the Internal Revenue Code applicable to regulated investment companies and to distribute to shareholders substantially all investment company taxable income including net realized gains on investments (if any), and tax exempt income of the Fund. Therefore, no provision for federal income or excise tax is required.
The Fund files income tax returns in United States federal and applicable state jurisdictions. The statute of limitations on the Fund’s tax return filings generally remains open for the three years following a return’s filing date. The Fund has analyzed each uncertain tax position believed to be material in the preparation of the Fund’s financial statements for the fiscal year ended September 30, 2019, including open tax years, to assess whether it is more likely than not that the position would be sustained upon examination, based on the technical merits of the position. The Fund has not identified any such position for which an asset or liability must be reflected in the Statement of Assets and Liabilities.
At September 30, 2019, information on the tax components of capital was as follows:
| Cost of investments for tax purposes | $ 1,284,929,098 |
| Gross unrealized appreciation on a tax basis | 249,877,336 |
| Gross unrealized depreciation on a tax basis | (83,253,211) |
| Net unrealized appreciation (depreciation) on investments (tax basis) | $ 166,624,125 |
Temporary book tax adjustments made to the cost of investments and net unrealized appreciation (depreciation) for tax purposes result primarily from deferral of outstanding wash sale losses and marked-to-market adjustments of outstanding forward currency contacts.
In order to account for permanent book to tax differences, the Fund decreased distributable earnings by $1,377,143 and increased net capital paid in on shares of beneficial interest by $1,377,143. Reclassifications have no impact upon the net asset value of the Fund and resulted primarily from equalization of undistributed capital gains to shareholders.
At September 30, 2019, the Fund had $4,149,094 of undistributed tax basis ordinary investment income and $7,275,182 of undistributed tax basis capital gains.
Notes to Financial Statements, Continued
Thornburg International Growth Fund | September 30, 2019
Foreign Withholding Taxes: The Fund is subject to foreign tax withholding imposed by certain foreign countries in which the Fund may invest. Withholding taxes are incurred on certain foreign dividends and are accrued at the time the dividend is recognized based on applicable foreign tax laws. The Fund may file withholding tax reclaims in certain jurisdictions to recover a portion of amounts previously withheld, in view of various considerations, including recent decisions rendered by the courts in those and other jurisdictions. The Fund would expect to record a receivable for such a reclaim based on a variety of factors, including assessment of a jurisdiction’s legal obligation to pay reclaims, the jurisdiction’s administrative practices and payment history, and industry convention. To date the Fund has recorded no such receivable because there is limited precedent for collecting such prior year reclaims and the likelihood of collection remains uncertain.
Deferred Foreign Capital Gain Taxes: The Fund is subject to a tax imposed on net realized gains of securities of certain foreign countries. The Fund records an estimated deferred tax liability for net unrealized gains on these investments as reflected in the accompanying financial statements. Such changes are included in net unrealized appreciation (depreciation) from investments in the Statement of Operations.
The tax character of distributions paid during the year ended September 30, 2019, and September 30, 2018, was as follows:
| | 2019 | 2018 |
| Distributions from: | | |
| Ordinary income | $ 6,590,447 | $ 3,100,661 |
| Capital gains | 53,910,330 | 46,428,143 |
| Total | $ 60,500,777 | $ 49,528,804 |
NOTE 3 – SECURITY VALUATION
Valuation of the Fund’s portfolio investment securities is performed in accordance with policies and procedures adopted by and under the oversight of the Trustees.
The Trustees of the Trust have appointed the Advisor to assist the Trustees with obtaining fair market values for portfolio investments, evaluating and monitoring professional pricing service providers appointed by the Trustees’ Audit Committee (the “Audit Committee”) to assist in determining fair values for portfolio investments, assisting in calculating fair values for portfolio investments in certain circumstances, and performing other functions in connection with the valuation of investments. The Advisor acts through its Valuation and Pricing Committee (the “Committee”) and other employees of the Advisor. The Committee regularly reviews its own valuation calculations, reviews the valuations, valuation techniques and services furnished by pricing service providers, considers circumstances which may require valuation calculations by the Committee, and reviews previous valuation calculations. The Committee reports to the Audit Committee on the Committee’s activities, the performance of pricing service providers, and other matters relating to valuation of portfolio investments.
In those instances when the Committee assists in calculating a fair value for a portfolio investment, the Committee seeks to determine the price that the Fund would reasonably expect to receive upon a sale of the investment in an orderly transaction between market participants on the valuation date. The Committee customarily utilizes quotations from securities broker dealers in calculating valuations, but also may utilize prices obtained from pricing service providers or other methods approved by the Audit Committee. Because fair values calculated by the Committee are estimates, the calculation of a value for an investment may differ from the price that would be realized by the Fund upon a sale of the investment, and the difference could be material to the Fund’s financial statements. The Committee’s calculation of a fair value for an investment may also differ from the prices obtained by other persons (including other mutual funds) for the investment.
Valuation of Securities: Securities and other portfolio investments which are listed or traded on a United States securities exchange are valued at the last reported sale price on the valuation date. Investments listed or traded on an exchange for which there has been no sale that day are valued at the mean between the last reported bid and asked prices on that valuation date. Portfolio investments reported by NASDAQ are valued at the official closing price on the valuation date. If an investment is traded on more than one exchange, the investment is considered traded on the exchange that is normally the primary market for that investment. Securities and other portfolio investments which are listed or traded on exchanges outside the United States are valued at the last price or the closing price of the investment on the exchange that is normally the primary market for the investment, as of the close of the exchange preceding the Fund’s valuation date. Foreign investments listed or traded on an exchange for which there has been no sale that day are valued at the mean between the last reported bid and asked prices on that valuation date.
In any case when a market quotation is not readily available for a portfolio investment ordinarily valued by market quotation, the Committee calculates a fair value for the investment using alternative methods approved by the Audit Committee. A market quotation is not readily available when the primary market or exchange for the investment is not open for the entire scheduled day of trading. Market quotations for an investment also may not be readily available if developments after the most recent close of the investment’s primary exchange or market, but prior to the close of business on any Fund business day, or an unusual event or significant period of time occurring since the
Notes to Financial Statements, Continued
Thornburg International Growth Fund | September 30, 2019
availability of a market quotation, create a serious question concerning the reliability of the most recent market quotation available for the investment. In particular, on days when market volatility thresholds established by the Audit Committee are exceeded, foreign equity investments held by the Fund may be valued using alternative methods. The Committee customarily obtains valuations in these instances from pricing service providers approved by the Audit Committee. Pricing service providers ordinarily calculate valuations using multi-factor models to adjust market prices based upon various inputs, including exchange data, depository receipt prices, futures, index data and other data.
Debt obligations held by the Fund which are not listed or traded on exchanges or for which no reported market exists are ordinarily valued at the valuation obtained from a pricing service provider approved by the Audit Committee.
In any case when a pricing service provider fails to provide a valuation for a debt obligation held by the Fund, the Committee calculates a fair value for the obligation using alternative methods under procedures approved by the Audit Committee. Additionally, in cases when management believes that a valuation obtained from a pricing service provider is stale, does not reflect material factors affecting the valuation of the investment, is significantly different than the value the Fund is likely to obtain if it sought a bid for the investment, or is otherwise unreliable, the Committee calculates a fair value for the obligation using an alternative method approved by the Audit Committee.
Quotations for foreign investments expressed in foreign currency amounts are converted to U.S. dollar equivalents using a foreign exchange quotation from a third party service provider at the time of valuation. Foreign investments held by the Fund may be traded on days and at times when the Fund is not open for business. Consequently, the value of Fund investments may be significantly affected on days when shareholders cannot purchase or sell Fund shares.
Valuation Hierarchy: The Fund categorizes its investments based upon the inputs used in valuing those investments, according to a three-level hierarchy established in guidance from the FASB. Categorization of investments using this hierarchy is intended by the FASB to maximize the use of observable inputs in valuing investments and minimize the use of unobservable inputs by requiring that the most observable inputs be used when available. Observable inputs are those that market participants would use in valuing an investment based on available market information. Unobservable inputs are those that reflect assumptions about the information market participants would use in valuing an investment. An investment’s level within the hierarchy is based on the lowest level input that is deemed significant to the valuation. The methodologies and inputs used to value investments are not necessarily indications of the risk or liquidity associated with those investments.
Various inputs are used in calculating valuations for the Fund’s investments. These inputs are generally summarized according to the three-level hierarchy below:
Level 1: Quoted prices in active markets for identical investments.
Level 2: Other direct or indirect significant observable inputs (including quoted prices for similar investments in active markets and other observable inputs, such as interest rates, prepayment rates, credit ratings, etc.).
Level 3: Significant unobservable inputs (including the Committee’s own assumptions in calculating the fair values of investments).
Valuations for debt obligations held by the Fund are typically calculated by pricing service providers approved by the Audit Committee and are generally characterized as Level 2 within the valuation hierarchy.
On days when market volatility thresholds established by the Audit Committee are exceeded, foreign securities for which valuations are obtained from pricing service providers are fair valued. On these days, the foreign securities are characterized as Level 2 within the valuation hierarchy and revert to Level 1 after the threshold is no longer exceeded.
In a limited number of cases the Committee calculates a fair value for investments using broker quotations or other methods approved by the Audit Committee. When the Committee uses a single broker quotation to calculate a fair value for an investment without other significant observable inputs, or if a fair value is calculated using other significant inputs that are considered unobservable, the investment is characterized as Level 3 within the hierarchy. Other significant unobservable inputs used to calculate a fair value in these instances might include an income-based valuation approach which considers discounted anticipated future cash flows from the investment and application of discounts due to the nature or duration of any restrictions on the disposition of the investment.
Valuations based upon the use of inputs from Levels 1, 2 or 3 may not represent the actual price received upon the disposition of an investment, and a Fund may receive a price that is lower than the valuation based upon these inputs when it sells the investment.
Notes to Financial Statements, Continued
Thornburg International Growth Fund | September 30, 2019
The following table displays a summary of the fair value hierarchy measurements of the Fund’s investments as of September 30, 2019:
| | Fair Value Measurements at September 30, 2019 |
| | TOTAL | LEVEL 1 | LEVEL 2 | LEVEL 3 |
| Assets | | | | |
| Investments in Securities* | | | | |
| Common Stock(a) | $ 1,305,126,402 | $ 1,282,132,125 | $ 22,994,277 | $ — |
| Short-Term Investments | 146,116,782 | 146,116,782 | — | — |
| Total Investments in Securities | $1,451,243,184 | $1,428,248,907 | $22,994,277 | $— |
| Other Financial Instruments | | | | |
| Forward Currency Contracts | $ 310,039 | $ — | $ 310,039 | $ — |
| Total Assets | $1,451,553,223 | $1,428,248,907 | $23,304,316 | $— |
| * | See Schedule of Investments for a summary of the industry exposure as grouped according to the Global Industry Classification Standard (GICS), which is an industry taxonomy developed by MSCI, Inc. and Standard & Poor’s (S&P). |
| (a) | At September 30, 2019, industry classifications for Common Stock in level 2 consist of $22,994,277 in Semiconductors & Semiconductor Equipment. |
A rollforward of fair value measurements using significant unobservable inputs (Level 3) for the year ended September 30, 2019 is as follows:
| | COMMON
STOCK | TOTAL |
| Beginning Balance 9/30/2018 | $ 9,788,157 | $ 9,788,157 |
| Accrued Discounts (Premiums) | – | – |
| Net Realized Gain (Loss)(a) | (2,329,064) | (2,329,064) |
| Gross Purchases | – | – |
| Gross Sales | (9,870,684) | (9,870,684) |
| Net Change in Unrealized Appreciation (Depreciation)(b)(c) | 2,411,591 | 2,411,591 |
| Transfers into Level 3 | – | – |
| Transfers out of Level 3 | – | – |
| Ending Balance 9/30/2019 | $– | $– |
| (a) | Amount of net realized gain (loss) from investments is included in the Fund’s Statement of Operations for the year ended September 30, 2019. |
| (b) | Amount of net change in unrealized appreciation (depreciation) on investments is included in the Fund’s Statement of Operations for the year ended September 30, 2019. |
| (c) | The net change in unrealized appreciation (depreciation) attributable to securities owned at September 30, 2019, which were valued using significant unobservable inputs, was $0. |
NOTE 4 – INVESTMENT ADVISORY FEE AND OTHER TRANSACTIONS WITH AFFILIATES
Pursuant to an investment advisory agreement, the Advisor serves as the investment advisor and performs services for the Fund for which the fees are payable at the end of each month. Under the investment advisory agreement, the Fund pays the Advisor a management fee based on the average daily net assets of the Fund at an annual rate as shown in the following table:
| Management Fee Schedule |
| DAILY NET ASSETS | FEE RATE |
| Up to $500 million | 0.875% |
| Next $500 million | 0.825 |
| Next $500 million | 0.775 |
| Next $500 million | 0.725 |
| Over $2 billion | 0.675 |
The Fund’s effective management fee for the year ended September 30, 2019 was 0.823% of the Fund’s average daily net assets. Total management fees incurred by the Fund for the year ended September 30, 2019 are set forth in the Statement of Operations.
Notes to Financial Statements, Continued
Thornburg International Growth Fund | September 30, 2019
The Trust has entered into an administrative services agreement with the Advisor, whereby the Advisor will perform certain administrative services related to each class of the Fund’s shares. The fees are computed as an annual percentage of the aggregate average daily net assets of all shares classes of all Funds in the Trust as follows:
| Administration Fee Schedule |
| Daily Net Assets | Fee Rate |
| Up to $20 billion | 0.100% |
| $20 billion to $40 billion | 0.075 |
| $40 billion to $60 billion | 0.040 |
| Over $60 billion | 0.030 |
The aggregate fee amount is allocated on a daily basis to each Fund based on net assets and subsequently allocated to each class of shares of the Fund. Total administrative service fees incurred by each class of shares of the Fund for the year ended September 30, 2019, are set forth in the Statement of Operations.
The Trust has an underwriting agreement with Thornburg Securities Corporation (the “Distributor”), an affiliate of the Advisor, which acts as the distributor of the Fund’s shares. For the year ended September 30, 2019, the Distributor has advised the Fund that it earned net commissions aggregating $5,979 from the sale of Class A shares, and collected contingent deferred sales charges aggregating $7,443 from redemptions of Class C shares of the Fund.
Pursuant to a service plan under Rule 12b-1 of the 1940 Act, the Fund may pay to the Distributor or securities dealers and other financial institutions at the Distributor’s direction an amount not to exceed .25 of 1% per annum of the average daily net assets attributable to Class A, Class C, Class I, Class R3, Class R4, and Class R5 shares of the Fund to obtain various shareholder and distribution related services. For the year ended September 30, 2019, there were no 12b-1 service plan fees charged for Class I or Class R5 shares. Class R6 shares are not subject to a service plan. The Advisor and Distributor each may pay out of its own resources additional expenses for distribution of the Fund’s shares and shareholder services.
The Trust has also adopted a distribution plan pursuant to Rule 12b-1, applicable only to the Fund’s Class C and Class R3 shares, under which the Fund compensates the Distributor for services in promoting the sale of Class C and Class R3 shares of the Fund at an annual rate of up to .75 of 1% per annum of the average daily net assets attributable to Class C shares, and an annual rate of up to .25 of 1% per annum of the average daily net assets attributable to Class R3 shares.
Total fees incurred by each class of shares of the Fund under their respective service and distribution plans for the year ended September 30, 2019, are set forth in the Statement of Operations.
The Advisor has contractually agreed to waive fees and reimburse expenses incurred by the Fund so that actual expenses of certain share classes do not exceed levels as specified in each Fund’s most recent prospectus (Class R3 shares, 1.50%; Class R4 shares, 1.40%; Class R5 shares, 0.99%; Class R6 shares, 0.89%). The agreement may be terminated by the Fund at any time, but may not be terminated by the Advisor before February 1, 2020, unless the Advisor ceases to be the investment advisor to the Fund prior to that date. The Advisor may recoup amounts waived or reimbursed during the fiscal year ended September 30, 2019 if, during that year, expenses fall below the contractual limit that was in place at the time those fees and expenses were waived or reimbursed. The Advisor will not recoup fees or expenses as described in the preceding sentence if that recoupment would cause the Fund’s total annual operating expenses (after the recoupment is taken into account) to exceed the lesser of: (a) the expense cap that was in place at the time the waiver or reimbursement occurred; or (b) the expense cap that is in place at the time of the recoupment.
For the year ended September 30, 2019, the Advisor contractually reimbursed certain class specific expenses and distribution fees of $37,953 for Class R3 shares, $48,828 for Class R4 shares, $95,998 for Class R5 shares, and $48,478 for Class R6 shares and voluntarily reimbursed $516,510 for Class I shares.
Certain officers and Trustees of the Trust are also officers or directors of the Advisor and Distributor. The compensation of the independent Trustees is borne by the Trust. The Trust also pays a portion of the Chief Compliance Officer’s compensation. These amounts are reflected as Trustee and officer fees in the Statement of Operations.
The percentage of direct investments in the Fund held by the Trustees, officers of the Trust, and the Advisor is approximately 2.52%.
The Fund may purchase or sell securities from or to an affiliated fund, provided the affiliation is due solely to having a common investment advisor, common officers, or common trustees, and provided that all such transactions will comply with Rule 17a-7 under the 1940 Act. For the year ended September 30, 2019, the Fund had no such transactions with affiliated funds.
Notes to Financial Statements, Continued
Thornburg International Growth Fund | September 30, 2019
Shown below are holdings of voting securities of each portfolio company which is considered "affiliated" to the Fund under the 1940 Act, including companies for which the Fund’s holding represented 5% or more of the company’s voting securities, and a series of the Thornburg Investment Trust in which the Fund invested for cash management purposes during the period:
| Fund | Market Value
9/30/18 | Purchases
at Cost | Sales
Proceeds | Realized
Gain
(Loss) | Change in
Unrealized
Appr./(Depr.) | Market Value
9/30/19 | Dividend
Income |
| Thornburg Capital Management Fund | $175,966,031 | $461,285,770 | $(491,135,019) | $- | $- | $146,116,782 | $2,678,237 |
NOTE 5 – SHARES OF BENEFICIAL INTEREST
At September 30, 2019, there were an unlimited number of shares with no par value of beneficial interest authorized. Transactions in shares of beneficial interest were as follows:
| | YEAR ENDED
September 30, 2019 | YEAR ENDED
September 30, 2018 |
| | SHARES | AMOUNT | SHARES | AMOUNT |
| Class A Shares | | | | |
| Shares sold | 1,359,532 | $ 28,489,373 | 2,180,402 | $ 53,138,767 |
Shares issued to shareholders in
reinvestment of dividends | 177,269 | 3,634,307 | 176,065 | 3,991,389 |
| Shares repurchased | (1,919,924) | (40,650,276) | (2,094,009) | (50,780,232) |
| Net increase (decrease) | (383,123) | $ (8,526,596) | 262,458 | $ 6,349,924 |
| Class C Shares | | | | |
| Shares sold | 227,972 | $ 4,288,260 | 707,448 | $ 16,029,623 |
Shares issued to shareholders in
reinvestment of dividends | 120,517 | 2,309,109 | 141,824 | 3,023,696 |
| Shares repurchased | (1,412,167) | (27,609,811) | (1,401,958) | (32,248,910) |
| Net decrease | (1,063,678) | $ (21,012,442) | (552,686) | $ (13,195,591) |
| Class I Shares | | | | |
| Shares sold | 19,144,670 | $ 410,939,079 | 23,812,798 | $ 594,176,730 |
Shares issued to shareholders in
reinvestment of dividends | 2,184,161 | 45,702,448 | 1,552,672 | 36,192,788 |
| Shares repurchased | (26,924,382) | (578,018,602) | (11,496,975) | (285,722,021) |
| Net increase (decrease) | (5,595,551) | $ (121,377,075) | 13,868,495 | $ 344,647,497 |
| Class R3 Shares | | | | |
| Shares sold | 78,781 | $ 1,662,558 | 127,377 | $ 3,040,248 |
Shares issued to shareholders in
reinvestment of dividends | 10,759 | 219,052 | 12,148 | 273,090 |
| Shares repurchased | (151,941) | (3,220,729) | (226,411) | (5,409,361) |
| Net decrease | (62,401) | $ (1,339,119) | (86,886) | $ (2,096,023) |
| Class R4 Shares | | | | |
| Shares sold | 96,637 | $ 2,047,446 | 236,526 | $ 5,641,354 |
Shares issued to shareholders in
reinvestment of dividends | 8,904 | 182,073 | 11,955 | 269,581 |
| Shares repurchased | (288,377) | (6,212,410) | (438,404) | (10,482,478) |
| Net decrease | (182,836) | $ (3,982,891) | (189,923) | $ (4,571,543) |
| Class R5 Shares | | | | |
| Shares sold | 262,504 | $ 5,796,872 | 419,136 | $ 10,484,556 |
Shares issued to shareholders in
reinvestment of dividends | 61,537 | 1,291,266 | 63,259 | 1,478,349 |
| Shares repurchased | (577,968) | (12,750,178) | (791,632) | (19,710,490) |
| Net decrease | (253,927) | $ (5,662,040) | (309,237) | $ (7,747,585) |
Notes to Financial Statements, Continued
Thornburg International Growth Fund | September 30, 2019
| | YEAR ENDED
September 30, 2019 | YEAR ENDED
September 30, 2018 |
| | SHARES | AMOUNT | SHARES | AMOUNT |
| Class R6 Shares | | | | |
| Shares sold | 407,174 | $ 8,774,427 | 1,720,938 | $ 43,557,545 |
Shares issued to shareholders in
reinvestment of dividends | 84,527 | 1,777,102 | 18,246 | 427,324 |
| Shares repurchased | (545,823) | (12,061,466) | (165,298) | (4,127,241) |
| Net increase (decrease) | (54,122) | $ (1,509,937) | 1,573,886 | $ 39,857,628 |
NOTE 6 – INVESTMENT TRANSACTIONS
For the year ended September 30, 2019, the Fund had purchase and sale transactions of investments (excluding short-term investments) of $364,296,313 and $544,327,826, respectively.
NOTE 7 – DERIVATIVE FINANCIAL INSTRUMENTS WITH OFF-BALANCE
SHEET RISK AND FOREIGN INVESTMENT RISK
The Fund may use a variety of derivative financial instruments to hedge or adjust the risks affecting its investment portfolio or to enhance investment returns. Provisions of the FASB Accounting Standards Codification 815-10-50 (“ASC 815”) require certain disclosures. The disclosures are intended to provide users of financial statements with an understanding of the use of derivative instruments by the Fund and how these derivatives affect the financial position, financial performance and cash flows of the Fund. The Fund does not designate any derivative instruments as hedging instruments under ASC 815. During the year ended September 30, 2019, the Fund’s principal exposure to derivative financial instruments of the type addressed by ASC 815 was investment in foreign currency contracts. A foreign currency contract is an agreement between two parties to exchange different currencies at a specified rate of exchange at an agreed upon future date. Foreign currency contracts involve risks to the Fund, including the risk that a contract’s counterparty will not meet its obligations to the Fund, the risk that a change in a contract’s value may not correlate perfectly with the currency the contract was intended to track, and the risk that the Fund’s Advisor is unable to correctly implement its strategy in using a contract. In any such instance, the Fund may not achieve the intended benefit of entering into a contract, and may experience a loss.
The Fund entered into forward currency contracts during the year ended September 30, 2019 in the normal course of pursuing its investment objectives, with the objective of purchasing foreign investments or with the intent of reducing the risk to the value of the Fund’s foreign investments from adverse changes in the relationship between the U.S. dollar and foreign currencies. In each case these contracts have been initiated in conjunction with foreign investment transactions. The monthly average value of open forward currency sell contracts for the year ended September 30, 2019 was $89,666,941.
These contracts are accounted for by the Fund under ASC 815. Unrealized appreciation and depreciation on outstanding contracts are reported in the Fund’s Statement of Assets and Liabilities, as measured by the difference between the forward exchange rates at the reporting date and the forward exchange rates at each contract’s inception date. Net realized gain (loss) on contracts closed during the period, and changes in net unrealized appreciation (depreciation) on outstanding contracts are recognized in the Fund’s Statement of Operations.
The outstanding forward currency contracts in the table located in the Schedule of Investments, which were entered into with Brown Brothers Harriman & Co. (“BBH”), were entered into pursuant to a written agreement with BBH. In the event of a default or termination under the agreement with BBH, the non-defaulting party has the right to close out all outstanding forward currency contracts between the parties and to net any payment amounts under those contracts, resulting in a single net amount payable by one party to the other.
Because the agreement with BBH does not result in an offset of reported amounts of financial assets and liabilities in the Fund’s Statement of Assets and Liabilities unless there has been an event of default or termination event under that agreement, the Fund does not net its outstanding forward currency contracts for purposes of the disclosure in the Fund’s Statement of Assets and Liabilities. Instead the Fund recognizes the unrealized appreciation (depreciation) on those forward currency contracts on a gross basis in the Fund’s Statement of Assets and Liabilities.
Notes to Financial Statements, Continued
Thornburg International Growth Fund | September 30, 2019
The unrealized appreciation (depreciation) of the outstanding forward currency contracts recognized in the Fund’s Statement of Assets and Liabilities at September 30, 2019 is disclosed in the following table:
| FAIR VALUES OF DERIVATIVE FINANCIAL INSTRUMENTS AT SEPTEMBER 30, 2019 |
| ASSET DERIVATIVES | BALANCE SHEET LOCATION | FAIR VALUE |
| Foreign currency contracts | Assets - Unrealized appreciation on forward currency contracts | $ 310,039 |
Because the Fund does not receive or post cash collateral in connection with its currency forward contracts during the period, the net amounts of the Fund’s assets and liabilities which are attributable to those contracts at September 30, 2019 can be determined by offsetting the dollar amounts shown in the preceding table. Based on those amounts, the net amount of the Fund’s assets which is attributable to its outstanding forward currency contracts at September 30, 2019 is $310,039, and the net amount of the Fund’s liabilities which is attributable to those contracts at that date is $0. The Fund’s forward currency contracts are valued each day, and the net amounts of the Fund’s assets and liabilities which are attributable to those contracts are expected to vary over time.
The net realized gain (loss) from forward currency contracts and the net change in unrealized appreciation (depreciation) on outstanding forward currency contracts recognized in the Fund’s Statement of Operations for the year ended September 30, 2019 are disclosed in the following tables:
NET REALIZED GAIN (LOSS) ON DERIVATIVE FINANCIAL INSTRUMENTS
RECOGNIZED IN INCOME FOR THE YEAR ENDED September 30, 2019 |
| | TOTAL | FORWARD CURRENCY CONTRACTS |
| Foreign currency contracts | $ 4,600,793 | $ 4,600,793 |
NET CHANGE IN UNREALIZED APPRECIATION (DEPRECIATION) OF DERIVATIVE FINANCIAL INSTRUMENTS
RECOGNIZED IN INCOME FOR THE YEAR ENDED September 30, 2019 |
| | TOTAL | FORWARD CURRENCY CONTRACTS |
| Foreign currency contracts | $ 627,741 | $ 627,741 |
NOTE 8 – RECENT ACCOUNTING PRONOUNCEMENTS
In August 2018, the FASB issued ASU 2018-13, Fair Value Measurement (Topic 820): Changes to the Disclosure Requirements for Fair Value Measurement, which adds, removes, and modifies certain aspects of the fair value disclosure. ASU 2018-13 is effective for annual periods beginning after December 15, 2019, and early adoption is permitted. The Funds have elected to early adopt, and had applied ASU 2018-13 for the fiscal year ended September 30, 2019. The adoption of this accounting guidance did not have a material impact on the Funds’ financial statements.
In March 2017, the FASB issued Accounting Standards Update (ASU) 2017-08, Premium Amortization of Purchased Callable Debt Securities. The amendments in the ASU shorten the premium amortization period on a purchased callable debt security from the security’s contractual life to the earliest call date. It is anticipated that this change will enhance disclosures by reducing losses recognized when a security is called on an earlier date. This ASU is effective for fiscal years beginning after December 15, 2018. Management has evaluated the implications of these changes and the amendments will have no material effect on the Funds’ net assets or results of operations.
OTHER NOTES
Risks: The Fund’s investments subject it to risks including, but not limited to, management risk, market and economic risk, risks affecting specific issuers, foreign investment risk, developing country risk, risks affecting specific countries or regions, small and mid-cap company risk, credit risk, interest rate risk, and liquidity risk. Please see the Fund’s prospectus for a discussion of the risks associated with an investment in the Fund.
Subsequent Events: Fund management believes no events have occurred between September 30, 2019 and the date of issuance of the financial statements that require adjustment to or disclosure in the accompanying financial statements.
Financial Highlights
Thornburg International Growth Fund
| | PER SHARE PERFORMANCE (FOR A SHARE OUTSTANDING THROUGHOUT THE YEAR) |
UNLESS OTHERWISE
NOTED, PERIODS ARE
FISCAL YEARS ENDED
SEPTEMBER 30, | Net Asset
Value,
Beginning of
YEAR | Net
Investment
Income
(Loss)+ | Net Realized &
Unrealized Gain
(Loss) on
Investments | Total from
Investment
Operations | Dividends
from Net
Investment
Income | Dividends
from Net
Realized
Gains | Total
Dividends | Net Asset
Value,
End of YEAR |
| CLASS A SHARES(b) |
| 2019 | $ 23.78 | —(c) | (1.55) | (1.55) | (0.02) | (0.75) | (0.77) | $ 21.46 |
| 2018 | $ 23.85 | 0.02 | 0.72 | 0.74 | (0.05) | (0.76) | (0.81) | $ 23.78 |
| 2017 | $ 19.22 | (0.01) | 4.65 | 4.64 | (0.01) | — | (0.01) | $ 23.85 |
| 2016 | $ 17.78 | —(c) | 1.45 | 1.45 | (0.01) | — | (0.01) | $ 19.22 |
| 2015 | $ 19.10 | (0.01) | (0.33) | (0.34) | — | (0.98) | (0.98) | $ 17.78 |
| CLASS C SHARES |
| 2019 | $ 22.21 | (0.15) | (1.44) | (1.59) | — | (0.75) | (0.75) | $ 19.87 |
| 2018 | $ 22.50 | (0.15) | 0.67 | 0.52 | (0.05) | (0.76) | (0.81) | $ 22.21 |
| 2017 | $ 18.26 | (0.13) | 4.37 | 4.24 | — | — | — | $ 22.50 |
| 2016 | $ 17.01 | (0.13) | 1.38 | 1.25 | — | — | — | $ 18.26 |
| 2015 | $ 18.45 | (0.14) | (0.32) | (0.46) | — | (0.98) | (0.98) | $ 17.01 |
| CLASS I SHARES |
| 2019 | $ 24.51 | 0.07 | (1.60) | (1.53) | (0.10) | (0.75) | (0.85) | $ 22.13 |
| 2018 | $ 24.48 | 0.12 | 0.72 | 0.84 | (0.05) | (0.76) | (0.81) | $ 24.51 |
| 2017 | $ 19.69 | 0.10 | 4.75 | 4.85 | (0.06) | — | (0.06) | $ 24.48 |
| 2016 | $ 18.20 | 0.08 | 1.49 | 1.57 | (0.08) | — | (0.08) | $ 19.69 |
| 2015 | $ 19.51 | 0.09 | (0.37) | (0.28) | (0.05) | (0.98) | (1.03) | $ 18.20 |
| CLASS R3 SHARES |
| 2019 | $ 23.54 | (0.04) | (1.52) | (1.56) | — | (0.75) | (0.75) | $ 21.23 |
| 2018 | $ 23.66 | (0.02) | 0.71 | 0.69 | (0.05) | (0.76) | (0.81) | $ 23.54 |
| 2017 | $ 19.07 | (0.01) | 4.60 | 4.59 | — | — | — | $ 23.66 |
| 2016 | $ 17.66 | —(c) | 1.42 | 1.42 | (0.01) | — | (0.01) | $ 19.07 |
| 2015 | $ 18.99 | (0.02) | (0.33) | (0.35) | — | (0.98) | (0.98) | $ 17.66 |
| CLASS R4 SHARES |
| 2019 | $ 23.63 | (0.02) | (1.52) | (1.54) | — | (0.75) | (0.75) | $ 21.34 |
| 2018 | $ 23.73 | (0.01) | 0.72 | 0.71 | (0.05) | (0.76) | (0.81) | $ 23.63 |
| 2017 | $ 19.11 | 0.01 | 4.61 | 4.62 | —(d) | — | — | $ 23.73 |
| 2016 | $ 17.68 | 0.01 | 1.43 | 1.44 | (0.01) | — | (0.01) | $ 19.11 |
| 2015 | $ 19.00 | 0.02 | (0.36) | (0.34) | — | (0.98) | (0.98) | $ 17.68 |
| CLASS R5 SHARES |
| 2019 | $ 24.58 | 0.07 | (1.61) | (1.54) | (0.10) | (0.75) | (0.85) | $ 22.19 |
| 2018 | $ 24.54 | 0.10 | 0.75 | 0.85 | (0.05) | (0.76) | (0.81) | $ 24.58 |
| 2017 | $ 19.73 | 0.08 | 4.79 | 4.87 | (0.06) | — | (0.06) | $ 24.54 |
| 2016 | $ 18.25 | 0.09 | 1.47 | 1.56 | (0.08) | — | (0.08) | $ 19.73 |
| 2015 | $ 19.55 | 0.09 | (0.36) | (0.27) | (0.05) | (0.98) | (1.03) | $ 18.25 |
| CLASS R6 SHARES |
| 2019 | $ 24.65 | 0.10 | (1.61) | (1.51) | (0.13) | (0.75) | (0.88) | $ 22.26 |
| 2018 | $ 24.59 | 0.21 | 0.66 | 0.87 | (0.05) | (0.76) | (0.81) | $ 24.65 |
| 2017 | $ 19.77 | 0.09 | 4.81 | 4.90 | (0.08) | — | (0.08) | $ 24.59 |
| 2016 | $ 18.29 | 0.11 | 1.47 | 1.58 | (0.10) | — | (0.10) | $ 19.77 |
| 2015 | $ 19.59 | 0.13 | (0.38) | (0.25) | (0.07) | (0.98) | (1.05) | $ 18.29 |
| (a) | Not annualized for periods less than one year. |
| (b) | Sales loads are not reflected in computing total return. |
| (c) | Net investment income (loss) was less than $0.01 per share. |
| (d) | Dividends from net investment income per share were less than $(0.01). |
| + | Based on weighted average shares outstanding. |
See notes to financial statements.
Financial Highlights, Continued
Thornburg International Growth Fund
| RATIOS TO AVERAGE NET ASSETS | | SUPPLEMENTAL DATA |
Net Investment
Income (Loss) (%) | Expenses, After
Expense
Reductions (%) | Expenses,
Before Expense
Reductions (%) | | Total
Return (%)(a) | Portfolio
Turnover
Rate (%)(a) | Net Assets
at End of YEAR
(Thousands) |
| |
| 0.02 | 1.32 | 1.32 | | (6.36) | 25.83 | $ 107,196 |
| 0.09 | 1.32 | 1.32 | | 3.28 | 33.28 | $ 127,863 |
| (0.05) | 1.42 | 1.43 | | 24.12 | 60.88 | $ 121,989 |
| 0.03 | 1.39 | 1.39 | | 8.23 | 104.60 | $ 169,248 |
| (0.06) | 1.42 | 1.42 | | (2.01) | 92.01 | $ 220,897 |
| |
| (0.78) | 2.08 | 2.08 | | (7.04) | 25.83 | $ 47,980 |
| (0.65) | 2.08 | 2.08 | | 2.47 | 33.28 | $ 77,262 |
| (0.69) | 2.15 | 2.16 | | 23.22 | 60.88 | $ 90,689 |
| (0.73) | 2.15 | 2.15 | | 7.35 | 104.60 | $ 98,633 |
| (0.77) | 2.20 | 2.20 | | (2.72) | 92.01 | $ 108,062 |
| |
| 0.34 | 0.99 | 1.03 | | (6.02) | 25.83 | $ 1,203,538 |
| 0.47 | 0.99 | 0.99 | | 3.61 | 33.28 | $ 1,470,211 |
| 0.50 | 0.99 | 1.03 | | 24.66 | 60.88 | $ 1,128,804 |
| 0.45 | 0.99 | 1.00 | | 8.63 | 104.60 | $ 1,030,921 |
| 0.47 | 0.99 | 1.01 | | (1.58) | 92.01 | $ 1,079,791 |
| |
| (0.17) | 1.50 | 2.02 | | (6.50) | 25.83 | $ 6,274 |
| (0.10) | 1.50 | 1.98 | | 3.08 | 33.28 | $ 8,426 |
| (0.03) | 1.50 | 2.08 | | 24.07 | 60.88 | $ 10,525 |
| (0.02) | 1.50 | 2.04 | | 8.03 | 104.60 | $ 13,086 |
| (0.13) | 1.50 | 1.98 | | (2.03) | 92.01 | $ 15,851 |
| |
| (0.09) | 1.40 | 1.91 | | (6.39) | 25.83 | $ 7,515 |
| (0.02) | 1.40 | 1.88 | | 3.16 | 33.28 | $ 12,644 |
| 0.07 | 1.40 | 1.84 | | 24.19 | 60.88 | $ 17,200 |
| 0.04 | 1.40 | 1.68 | | 8.17 | 104.60 | $ 40,999 |
| 0.10 | 1.40 | 1.65 | | (1.97) | 92.01 | $ 38,038 |
| |
| 0.32 | 0.99 | 1.29 | | (6.05) | 25.83 | $ 28,729 |
| 0.40 | 0.99 | 1.25 | | 3.64 | 33.28 | $ 38,052 |
| 0.40 | 0.99 | 1.28 | | 24.68 | 60.88 | $ 45,591 |
| 0.45 | 0.99 | 1.21 | | 8.56 | 104.60 | $ 66,271 |
| 0.46 | 0.99 | 1.20 | | (1.53) | 92.01 | $ 66,646 |
| |
| 0.47 | 0.89 | 0.99 | | (5.91) | 25.83 | $ 44,923 |
| 0.82 | 0.89 | 0.99 | | 3.72 | 33.28 | $ 51,091 |
| 0.44 | 0.89 | 1.03 | | 24.82 | 60.88 | $ 12,261 |
| 0.60 | 0.89 | 1.34 | | 8.65 | 104.60 | $ 5,854 |
| 0.66 | 0.89 | 1.43 | | (1.43) | 92.01 | $ 4,191 |
Report of Independent Registered Public Accounting Firm
Thornburg International Growth Fund
To the Board of Trustees of Thornburg Investment Trust and Shareholders of
Thornburg International Growth Fund
Opinion on the Financial Statements
We have audited the accompanying statement of assets and liabilities, including the schedule of investments, of Thornburg International Growth Fund (one of the funds constituting Thornburg Investment Trust, referred to hereafter as the "Fund") as of September 30, 2019, the related statement of operations for the year ended September 30, 2019, the statements of changes in net assets for each of the two years in the period ended September 30, 2019, including the related notes, and the financial highlights for each of the five years in the period ended September 30, 2019 (collectively referred to as the “financial statements”). In our opinion, the financial statements present fairly, in all material respects, the financial position of the Fund as of September 30, 2019, the results of its operations for the year then ended, the changes in its net assets for each of the two years in the period ended September 30, 2019 and the financial highlights for each of the five years in the period ended September 30, 2019 in conformity with accounting principles generally accepted in the United States of America.
Basis for Opinion
These financial statements are the responsibility of the Fund’s management. Our responsibility is to express an opinion on the Fund’s financial statements based on our audits. We are a public accounting firm registered with the Public Company Accounting Oversight Board (United States) (PCAOB) and are required to be independent with respect to the Fund in accordance with the U.S. federal securities laws and the applicable rules and regulations of the Securities and Exchange Commission and the PCAOB.
We conducted our audits of these financial statements in accordance with the standards of the PCAOB. Those standards require that we plan and perform the audit to obtain reasonable assurance about whether the financial statements are free of material misstatement, whether due to error or fraud.
Our audits included performing procedures to assess the risks of material misstatement of the financial statements, whether due to error or fraud, and performing procedures that respond to those risks. Such procedures included examining, on a test basis, evidence regarding the amounts and disclosures in the financial statements. Our audits also included evaluating the accounting principles used and significant estimates made by management, as well as evaluating the overall presentation of the financial statements. Our procedures included confirmation of securities owned as of September 30, 2019 by correspondence with the custodian, transfer agent and brokers; when replies were not received from brokers, we performed other auditing procedures. We believe that our audits provide a reasonable basis for our opinion.
/s/PricewaterhouseCoopers LLP
New York, New York
November 22, 2019
We have served as the auditor of one or more investment companies in Thornburg Investment Trust since 1999.
Expense Example
Thornburg International Growth Fund | September 30, 2019 (Unaudited)
As a shareholder of the Fund, you incur two types of costs:
| (1) | transaction costs, including |
| (a) | sales charges (loads) on purchase payments, for Class A shares; |
| (b) | a deferred sales charge on redemptions of any part or all of a purchase of $1 million of Class A shares within 12 months of purchase; |
| (c) | a deferred sales charge on redemptions of Class C shares within 12 months of purchase; |
| (2) | ongoing costs, including management fees; distribution and/or service (12b-1) fees; and other Fund expenses. |
This example is intended to help you understand your ongoing costs (in dollars) of investing in the Fund and to compare these costs with the ongoing costs of investing in other mutual funds.
The example is based on a $1,000 investment beginning on April 1, 2019, and held until September 30, 2019.
ACTUAL EXPENSES
For each class of shares, the first line of the accompanying table provides information about actual account values and actual expenses. You may use the information in this line, together with the amount you invested, to estimate the expenses that you paid over the period. Simply divide your account value by $1,000 (for example, an $8,600 account value divided by $1,000 = 8.6), then multiply the result by the number in the first line for your class of shares under the heading entitled “Expenses Paid During Period” to estimate the expenses you paid on your account during this period.
| | BEGINNING
ACCOUNT VALUE
4/1/19 | ENDING
ACCOUNT VALUE
9/30/19 | EXPENSES PAID
DURING PERIOD†
4/1/19—9/30/19 |
| CLASS A SHARES |
| Actual | $1,000.00 | $990.31 | $6.49 |
| Hypothetical* | $1,000.00 | $1,018.55 | $6.58 |
| CLASS C SHARES |
| Actual | $1,000.00 | $986.60 | $10.26 |
| Hypothetical* | $1,000.00 | $1,014.74 | $10.40 |
| CLASS I SHARES |
| Actual | $1,000.00 | $991.94 | $4.94 |
| Hypothetical* | $1,000.00 | $1,020.10 | $5.01 |
| CLASS R3 SHARES |
| Actual | $1,000.00 | $989.75 | $7.48 |
| Hypothetical* | $1,000.00 | $1,017.55 | $7.59 |
| CLASS R4 SHARES |
| Actual | $1,000.00 | $990.26 | $6.98 |
| Hypothetical* | $1,000.00 | $1,018.05 | $7.08 |
| CLASS R5 SHARES |
| Actual | $1,000.00 | $991.96 | $4.94 |
| Hypothetical* | $1,000.00 | $1,020.10 | $5.01 |
| CLASS R6 SHARES |
| Actual | $1,000.00 | $992.87 | $4.45 |
| Hypothetical* | $1,000.00 | $1,020.61 | $4.51 |
| † | Expenses are equal to the annualized expense ratio for each class (A: 1.30%; C: 2.06%; I: 0.99%; R3: 1.50%; R4: 1.40%; R5: 0.99%; R6: 0.89%) multiplied by the average account value over the period, multiplied by 183/365 to reflect the one-half year period. |
| * | Hypothetical assumes a rate of return of 5% per year before expenses. |
HYPOTHETICAL EXAMPLE FOR COMPARISON PURPOSES
For each class of shares, the second line of the accompanying table provides information about hypothetical account values and hypothetical expenses based on the Fund’s actual expense ratio and an assumed rate of return of 5% per year before expenses, which is not the Fund’s actual return. The hypothetical account values and expenses may not be used to estimate the actual ending account balance or expenses you paid for the period. You may use this information to compare the ongoing costs of investing in the Fund and other funds. To do so, compare this 5% hypothetical example with the 5% hypothetical examples that appear in the shareholder reports of the other funds.
Please note that the expenses shown in the table are meant to highlight your ongoing costs only and do not reflect any transactional costs, such as sales charges (loads), redemption fees, or exchange fees. Therefore, the second line of the table for each class of shares is useful in comparing ongoing costs only, and will not help you determine the relative total costs of owning different funds. In addition, if these transactional costs were included, your costs would have been higher.
Trustees and Officers
Thornburg International Growth Fund | September 30, 2019 (Unaudited)
NAME, AGE, YEAR ELECTED
POSITION HELD WITH FUND | PRINCIPAL OCCUPATION(S) DURING PAST FIVE YEARS | OTHER DIRECTORSHIPS
HELD BY TRUSTEE |
| INTERESTED TRUSTEES(1)(2) |
Garrett Thornburg, 73
Trustee since 1984,
Chairman of Trustees(3) | Chairman and controlling shareholder of Thornburg Investment Management, Inc. (investment advisor); Chairman and controlling shareholder of Thornburg Securities Corporation (securities dealer); President of the Thornburg Foundation (nonprofit). | None |
Brian J. McMahon, 64
Trustee since 2001,
Vice Chairman of Trustees,
Member of Governance and
Nominating Committee &
Operations Risk Oversight
Committee(4) | Vice Chairman, Chief Investment Strategist, Managing Director, and Portfolio Manager and, until 2016, CEO and President of Thornburg Investment Management, Inc.; Vice President of Thornburg Securities Corporation. | None |
| INDEPENDENT TRUSTEES(1)(2)(5) |
David A. Ater, 74
Trustee since 1994,
Lead Independent Trustee,
Chairman of Governance and
Nominating Committee &
Member of Audit Committee | Principal in Ater & Associates, Santa Fe, NM (developer, planner and broker of residential and commercial real estate); owner, developer and broker for various real estate projects. | None |
Sally Corning, 58
Trustee since 2012,
Chairman of Audit Committee | Partner in Sun Mountain Capital, Santa Fe, NM (private equity firm with investment programs encompassing venture capital, mezzanine debt, and growth equity). | None |
Susan H. Dubin, 70
Trustee since 2004,
Member of Audit
Committee & Governance
and Nominating Committee | President of Dubin Investments, Ltd., Greenwich, CT (private investment fund); Director and officer of various charitable organizations. | None |
David L. Gardner, 56
Trustee since 2015,
Member of Operations Risk
Oversight Committee | Until 2012, head of EMEA (Europe, Middle East and Africa) Sales for iShares of Blackrock, Inc., EMEA Executive Committee Member and EMEA Operating Committee Member at Blackrock, Inc. | None |
Patrick J. Talamantes, 55
Trustee since 2019,
Member of Audit Committee | President of Talamantes Strategies, LLC, a management consulting firm, since 2018; until 2017, President and Chief Executive Officer of The McClatchy Company, Sacramento, CA (news and media company). | None |
Owen D. Van Essen, 65
Trustee since 2004,
Chairman of Operations Risk
Oversight Committee &
Member of Governance and
Nominating Committee | President of Dirks, Van Essen, Murray & April, Santa Fe, NM (newspaper mergers and acquisitions). | None |
James W. Weyhrauch, 60
Trustee since 1996,
Member of Audit
Committee & Operations Risk
Oversight Committee | Real estate broker, Santa Fe Properties, Santa Fe, NM; General Partner, Investments of Genext LLC (a family investment partnership); until 2019, Vice Chairman of Nambe LLC, Santa Fe, NM (manufacturing & design company). | None |
Trustees and Officers, Continued
Thornburg International Growth Fund | September 30, 2019 (Unaudited)
NAME, AGE, YEAR ELECTED
POSITION HELD WITH FUND | PRINCIPAL OCCUPATION(S) DURING PAST FIVE YEARS | OTHER DIRECTORSHIPS
HELD BY TRUSTEE |
| OFFICERS OF THE FUND (WHO ARE NOT TRUSTEES)(1)(6) |
David Ashley, 49
Vice President since 2019 | Portfolio Manager and Managing Director since 2019 and Associate Portfolio Manager from 2011-2019 of Thornburg Investment Management, Inc. | Not applicable |
Nimish Bhatt, 56
Chief Financial Officer
since 2019; Treasurer
2016-2019; Secretary
(2018-2019)(7) | Chief Financial Officer and Treasurer of Thornburg Investment Management, Inc. and Thornburg Securities Corporation since 2016 and Secretary of Thornburg Securities Corporation since 2018; Senior Vice President (2004-2016), Chief Financial Officer (2011-2016), and Head of Fund Administration (2011-2016) of Calamos Asset Management, Inc., Calamos Investments LLC, Calamos Advisors LLC, and Calamos Wealth Management; Director of Calamos Global Funds plc (2007-2016). | Not applicable |
Jason Brady, 45
President since 2016(7) | Director since 2017, CEO and President since 2016, and Portfolio Manager and Managing Director of Thornburg Investment Management, Inc.; Vice President of Thornburg Securities Corporation since 2016. | Not applicable |
Connor Browne, 40
Vice President since 2006 | Portfolio Manager and Managing Director of Thornburg Investment Management, Inc. | Not applicable |
Randy Dry, 45
Vice President since 2014 | Managing Director, Director of Institutional Group from 2014-2016, and since 2016, Chief Administrative Officer of Thornburg Investment Management, Inc. | Not applicable |
Greg Dunn, 43
Vice President since 2014 | Portfolio Manager and Managing Director of Thornburg Investment Management, Inc. | Not applicable |
Lon Erickson, 44
Vice President since 2008 | Portfolio Manager and Managing Director of Thornburg Investment Management, Inc. | Not applicable |
Thomas Garcia, 48
Vice President since 2006 | Managing Director, Head Equity Trader, and Associate Portfolio Manager of Thornburg Investment Management, Inc. | Not applicable |
Christian Hoffmann, 37
Vice President since 2018 | Portfolio Manager and Managing Director since 2018, and Associate Portfolio Manager from 2014-2018, of Thornburg Investment Management, Inc. | Not applicable |
Curtis Holloway, 52
Treasurer since 2019(7) | Director of Fund Administration since 2019 of Thornburg Investment Management, Inc.; Senior Vice President, Head of Fund Administration (2017-2019) and Vice President, Fund Administration (2010-2017) of Calamos Investments, and Chief Financial Officer (2017-2019) and Treasurer (2010-2019) of Calamos Funds. | Not applicable |
Ben Kirby, 39
Vice President since 2014 | Head of Investments since 2019, Portfolio Manager and Managing Director since 2013. | Not applicable |
Jeff Klingelhofer, 38
Vice President since 2016 | Head of Investments since 2019, Portfolio Manager and Managing Director since 2015, and Associate Portfolio Manager from 2012–2015, of Thornburg Investment Management, Inc. | Not applicable |
Ponn Lithiluxa, 48
Vice President since 2017 | Manager, Tax & Fund Administration of Thornburg Investment Management, Inc.; Senior Vice President, Citi Fund Services, Inc. (2014–2017); Vice President, Citi Fund Services, Inc. (2007–2014). | Not applicable |
Rob MacDonald, 43
Vice President since 2016 | Managing Director since 2015, Portfolio Manager since 2014, and Associate Portfolio Manager from 2011–2014 of Thornburg Investment Management, Inc. | Not applicable |
Michael Mastroianni, 42
Secretary and Vice President since 2019(7) | Director of Fund Operations since 2019 of Thornburg Investment Management, Inc.; Executive Director, Global Head of Client Services - Global Liquidity (2018-2019), Executive Director, North American Head of Transfer Agency Relationship Management (2011-2019), Executive Director, North American Head of Transfer Agency Service Delivery (2011-2018) of J.P. Morgan Asset Management. | Not applicable |
Leigh Moiola, 52
Vice President since 2001 | Managing Director and Director of Marketing of Thornburg Investment Management, Inc.; Vice President of Thornburg Securities Corporation. | Not applicable |
Christopher Ryon, 63
Vice President since 2008 | Portfolio Manager and Managing Director of Thornburg Investment Management, Inc. | Not applicable |
Trustees and Officers, Continued
Thornburg International Growth Fund | September 30, 2019 (Unaudited)
NAME, AGE, YEAR ELECTED
POSITION HELD WITH FUND | PRINCIPAL OCCUPATION(S) DURING PAST FIVE YEARS | OTHER DIRECTORSHIPS
HELD BY TRUSTEE |
Sean Koung Sun, 38
Vice President since 2017 | Portfolio Manager and Managing Director since 2017, Associate Portfolio Manager from 2015-2016, and Equity Research Analyst from 2012-2014 of Thornburg Investment Management, Inc. | Not applicable |
Stephen Velie, 52
Chief Compliance Officer since 2009 | Chief Compliance Officer of Thornburg Investment Trust and Thornburg Investment Management, Inc. | Not applicable |
Nicholos Venditti, 38
Vice President since 2016 | Portfolio Manager and Managing Director since 2015 and Associate Portfolio Manager from 2011–2015 of Thornburg Investment Management, Inc. | Not applicable |
Vinson Walden, 49
Vice President since 2004 | Portfolio Manager and Managing Director of Thornburg Investment Management, Inc. | Not applicable |
Lei Wang, 48
Vice President since 2006 | Portfolio Manager and Managing Director of Thornburg Investment Management, Inc. | Not applicable |
Charles Wilson, 44
Vice President since 2016 | Portfolio Manager and Managing Director since 2014 and Associate Portfolio Manager from 2012–2014 of Thornburg Investment Management, Inc. | Not applicable |
Di Zhou, 41
Vice President since 2016 | Portfolio Manager and Managing Director since 2016, Associate Portfolio Manager from 2014–2016, and Equity Research Analyst from 2010–2014 of Thornburg Investment Management, Inc. | Not applicable |
| (1) | Each person’s address is 2300 North Ridgetop Road, Santa Fe, New Mexico 87506. |
| (2) | The Fund is a separate investment “Fund” or “series” of Thornburg Investment Trust (the “Trust”), which comprises the Thornburg mutual fund complex and is organized as a Massachusetts business trust. Thornburg Investment Management, Inc. is the investment advisor to, and manages, all the Funds of the Trust. Each Trustee oversees all the Funds of the Trust. |
| (3) | Mr. Thornburg is considered an “interested” Trustee under the Investment Company Act of 1940 because he is a director and controlling shareholder of Thornburg Investment Management, Inc., the investment advisor to the Trust, and is the sole director and controlling shareholder of Thornburg Securities Corporation, the distributor of shares for the Trust. |
| (4) | Mr. McMahon is considered an “interested” Trustee under the Investment Company Act of 1940 because he is a director and the chief investment strategist of Thornburg Investment Management, Inc. |
| (5) | The Bylaws of the Trust currently require that each Independent Trustee shall retire by the end of the calendar year during which the Trustee reached the age of 75 years. Otherwise each Trustee serves in office until the election and qualification of a successor or until the Trustee sooner dies, resigns, retires or is removed. |
| (6) | Assistant vice presidents and assistant secretaries are not shown. |
| (7) | The Trust’s president, chief financial officer, secretary, and treasurer each serves a one-year term or until the election and qualification of a successor; each other officer serves at the pleasure of the Trustees. |
The Statement of Additional Information for each Fund of the Trust includes additional information about the Trustees and is available, without charge and upon request, by calling 1-800-847-0200.
Other Information
Thornburg International Growth Fund | September 30, 2019 (Unaudited)
PORTFOLIO PROXY VOTING
Policies and Procedures:
The Trust has delegated to the Advisor voting decisions respecting proxies for the Fund’s voting securities. The Advisor makes voting decisions in accordance with its Proxy Voting Policy and Procedures. A description of the Policy and Procedures is available (i) without charge, upon request, by calling the Advisor toll-free at 1-800-847-0200, (ii) on the Thornburg website at www.thornburg.com, and (iii) on the U.S. Securities and Exchange Commission’s website at www.sec.gov.
Information regarding how proxies were voted is available on or before August 31 of each year for the twelve months ending the preceding June 30. This information is available (i) without charge, upon request by calling the Advisor toll-free at 1-800-847-0200, (ii) on the Thornburg website at www.thornburg.com, and (iii) on the U.S. Securities and Exchange Commission’s website at www.sec.gov.
TAX INFORMATION
For the tax year ended September 30, 2019, dividends paid by the Thornburg International Growth Fund of $6,590,447 are being reported as taxable ordinary investment income dividends and $53,910,330 are being report as long term capital gain dividends for federal income tax purposes.
For the tax year ended September 30, 2019, the Fund is reporting 100.00% (or the maximum allowed) of the dividends paid from tax basis net ordinary income as qualifying for the reduced rate under the Jobs and Growth Tax Relief and Reconciliation Act of 2003.
The Fund is reporting 5.65% (or the maximum allowed) of the ordinary income distributions paid by the Fund for the fiscal year ended September 30, 2019 as qualified for the corporate dividends received deduction.
For the year ended September 30, 2019, foreign source income and foreign taxes paid is $17,933,013 and $1,169,465, respectively.
The information and distributions reported herein may differ from the information and distributions reported to the shareholders for the calendar year ending December 31, 2019. Complete information will be reported in conjunction with your 2019 Form 1099.
AVAILABILITY OF QUARTERLY PORTFOLIO SCHEDULE
The Fund files with the Securities and Exchange Commission schedules of its portfolio holdings on Form N-Q for the first and third quarters of each fiscal year. The Fund’s Forms N-Q are available on the Commission’s website at www.sec.gov, or may be reviewed and copied at the Commission’s Public Reference Room in Washington, D.C. Information on the operation of the Public Reference Room may be obtained by calling 1-800-SEC-0330. The Fund also makes this information available on its website at www.thornburg.com/download or upon request by calling 1-800-847-0200.
STATEMENT RESPECTING RENEWAL OF INVESTMENT ADVISORY AGREEMENT
Thornburg Investment Management, Inc. (the “Advisor”) provides investment management services to Thornburg International Growth Fund (the “Fund”) pursuant to an investment advisory agreement. The Trustees consider the renewal of this agreement annually, and most recently determined to renew the agreement on September 17, 2019.
Planning for their recent consideration of the advisory agreement’s renewal, the independent Trustees met in May 2019 to consider aspects of their annual evaluation of the Advisor’s service to all of the funds of Thornburg Investment Trust, to plan the annual evaluation of the Advisor’s performance and to discuss preliminarily the information the Advisor would present to the Trustees for their review. The independent Trustees met in a second independent session in July 2019 to further define certain portions of the information to be submitted by the Advisor. The independent Trustees met again in an independent session in September 2019 with a mutual fund analyst firm engaged by the independent Trustees to provide explanations of comparative cost and expense information, comparative investment performance information, and other data obtained and analyzed by the analyst firm. In that session the independent Trustees discussed their evaluations of the Advisor’s services to the Fund and the Fund’s fee and expense levels, investment performance, and other information presented for the Fund, conferred independently with legal counsel respecting the factors typically considered in evaluating renewal of an advisory agreement, and conferred with representatives of management to receive explanations of certain aspects of the information they had requested. Representatives of the Advisor subsequently reviewed portions of the information with the Trustees and addressed questions from the Trustees at a full meeting session of the Trustees scheduled in September for that purpose, and the independent Trustees thereafter met again in an independent session to consider the Advisor’s presentations and various specific issues
Other Information, Continued
Thornburg International Growth Fund | September 30, 2019 (Unaudited)
respecting their consideration of the advisory agreement’s renewal. Following these sessions, the Trustees met to consider renewal of the advisory agreement, and the independent Trustees voted unanimously at that meeting to renew the agreement for an additional term of one year.
The information below summarizes certain factors considered by the Trustees in connection with the determination to renew the advisory agreement with the Advisor. In determining to renew the advisory agreement, the Trustees considered a wide range of information and did not identify any single factor as controlling, and this summary does not describe all of the factors and other matters considered by the Trustees in making their determination.
Nature, Extent and Quality of Services. The Trustees considered in their evaluation of the advisory agreement the written and oral reports provided to the Trustees and their standing committees throughout the year on a wide variety of topics by personnel from the Advisor’s portfolio management, administration, operations and compliance staffs. The Trustees also considered in this evaluation presentations and explanations made by representatives of the Advisor in meeting sessions scheduled for consideration of the renewal of the advisory agreement. The Trustees further noted in their evaluation the consideration they had given to a number of topics in previous years, reports from their standing committees, and advice received from counsel.
Information noted by the Trustees as having been considered in relation to the nature, extent and quality of services provided by the Advisor under the advisory agreement and contributing (together with other information considered) to their conclusions respecting the nature, extent and quality of the services rendered to the Fund by the Advisor included: (1) reports from portfolio managers and other personnel throughout the year demonstrating that the Fund was managed in conformity with stated strategies and objectives and conformed to investment restrictions and limitations; (2) reports demonstrating that management of the Fund remained faithful and competent, and demonstrating sufficient skill by portfolio managers in executing the Fund’s strategies in varying environments, managers’ cognizance of and strategies to pursue the Fund’s objectives and address pertinent market and economic trends and conditions, the evaluation and selection of individual investments, management to achieve tax efficiencies, and the structuring and composition of the Fund’s portfolio and management of Fund liquidity requirements; (3) the Fund’s achievement of its investment objectives over different periods of time; (4) presentations by and interactions with members of the Advisor’s fund administration, operations and compliance staffs; (5) reports from standing committees of the Trustees on their respective proceedings throughout the year, including in particular reports from and interactions with the Advisor’s personnel; (6) the sufficiency of the resources the Advisor devotes to the services it provides to the Fund, including the expertise of its personnel and staffing levels and its enhancements to the electronic systems it utilizes in providing these services, and also including the Advisor’s own financial management and sufficiency of its resources; and (7) the measures employed to achieve efficient trade execution for the Fund, including the evaluation and selection of firms to execute transactions for the Fund. As in past years, the Trustees noted particularly their assessments of the Advisor’s personnel developed in meetings throughout the year, measures to expand and improve the depth and experience of the Advisor’s staff, and the Advisor’s collaborative approach to investment management, continued commitment to observance of compliance and regulatory requirements in managing investments by the Fund, responsiveness to the Trustees, and other factors.
Based upon these and other considerations, the Trustees concluded that the Advisor’s management of the Fund’s investments continued to conform to the Fund’s stated objectives and policies, and that the nature, extent and quality of the services provided to the Fund by the Advisor remained sufficient.
Investment Performance. The Trustees noted in their evaluation of the Fund’s investment performance the written and oral reports they had received in each regular meeting over the course of the year from the Advisor’s portfolio management personnel. The Trustees also noted their consideration of information provided to them at their request in anticipation of their annual evaluation of the Advisor’s services, including the following items of information respecting the investment performance of the Fund: (1) the Fund’s absolute investment performance and achievement of stated objectives; (2) the Advisor’s explanations and commentary on the Fund’s performance in the context of the Fund’s objectives and reasonable expectations, and business, market and economic conditions; (3) performance data for the most recent ten calendar years, comparing the Fund’s annual investment returns to a broad-based securities index and to the applicable Morningstar category of funds; (4) the Fund’s investment performance for the three-month, year-to-date, one-year, three-year, five-year, ten-year, and since inception periods ending with the second quarter of the current year, comparing the Fund’s annualized returns to two mutual fund categories selected by independent mutual fund analyst firms and to a broad-based securities index, and assigning a percentage rank to the Fund’s performance for each period relative to each of the fund categories; (5) analyses of specified performance and risk metrics for the Fund relative to its benchmark and to a selected peer group of funds, prepared by an independent financial analyst firm engaged by the independent Trustees; (6) the Fund’s cash flows; (7) comparative performance data for fund peer groups selected by an independent mutual fund analyst firm engaged by the independent Trustees, and the analysis and observations of the analyst firm respecting those data; (8) comparison of the Fund’s annualized return to the Fund’s benchmark index over various periods since the Fund’s inception; and (9) comparative measures of estimated earnings growth, and risk and return statistics. The Trustees generally attach additional significance to investment performance from the perspective of longer-term shareholders. Based upon their consideration of this and other information, the Trustees concluded that the Fund’s absolute and relative investment performance over a range of pertinent holding periods on the whole was satisfactory in view of its objectives and strategies.
Other Information, Continued
Thornburg International Growth Fund | September 30, 2019 (Unaudited)
Comparisons of Fee and Expense Levels. Information noted by the Trustees as having been considered in this context included a variety of comparative data respecting the Fund’s fee and expense levels. This information included comparisons of the Fund’s advisory fee and overall Fund expenses to median and average fees and expenses charged to funds in the applicable Morningstar category, comparisons of the advisory fee and total expenses for two Fund share classes to the fee levels and expenses of fund peer groups selected from the category by an independent mutual fund analyst firm engaged by the independent Trustees, the perspectives and advice from that mutual fund analyst firm respecting comparisons of fund fee levels and expenses to fund peer groups, and other information. Comparative fee and expense data noted as having been considered by the Trustees showed that the level of total expense for one share class of the Fund was higher than the median and average levels charged to funds in the applicable Morningstar category, and that the level of total expense for a second share class was lower than the median and average levels for that category. Peer group data showed that the Fund’s stated advisory fee was comparable to or lower than the median level for the two peer groups, and that the total expense levels of two representative share classes were higher than the medians of their respective peer groups but comparable to other funds in the peer groups. The Trustees did not find the differences significant in view of their findings and conclusions respecting the other factors considered.
The Trustees noted their consideration of information respecting the advisory fees charged by the Advisor to other investment management clients, including sub-advised mutual funds and other institutional clients, together with information about fees charged by other advisors to different clients, analysis of the differences between the requirements of institutional clients and mutual funds, analysis of the differences between the requirements of a sub-advised mutual fund and a fund as to which the investment advisor is the primary advisor and sponsor, and the consequently different investment management services provided to the different categories of clients and the differing contexts in which these arrangements are entered into. The Trustees confirmed their previous observations that the differences between the fees charged by the Advisor or by other investment advisors to different types of clients did not appear exceptional and had limited relevance to the evaluation of the fee rate charged to mutual funds as to which the Advisor or such other advisors are the primary advisor and sponsor.
Costs and Profitability of Advisor. In reviewing the profitability of the Advisor’s services to the Fund, the Trustees considered an analysis of the Advisor’s costs and the estimated profitability to the Advisor of its services, together with data respecting the overall profitability of a selection of other investment management firms. The Trustees considered in this regard information from the Advisor respecting investment of its profits to maintain staffing levels, and noted that a portion of the Advisor’s profits is an important element in the compensation of shareholder employees. The Trustees considered information from the Advisor respecting the use of profits to enhance staff competencies through training and other measures, hire personnel to expand and develop the scope of senior management expertise, pay competitive levels of compensation, and add to the Advisor’s electronic and information technology systems to maintain or improve service levels. The Trustees also considered the contribution of the Advisor’s cost management to its profitability, and the relationship of the Advisor’s financial resources and profitability in previous years to its ability to attract necessary personnel, invest in systems and other assets required for its service to the Fund, and maintain or improve service levels for the Fund notwithstanding fluctuations in revenues and profitability. The information considered did not indicate to the Trustees that the Advisor’s profitability was excessive.
Potential Economies of Scale. In reviewing the extent to which economies of scale would be realized by the Fund as it grows and whether fee levels reflect potential economies of scale, the Trustees considered the breakpoint structure for advisory fees chargeable to the Fund, comparisons of the fee breakpoint structure for the Fund with breakpoint structures (or the absence of such structures) for other funds in a peer group selected by an independent mutual fund analyst firm, the effects of the breakpoint structure and other expense factors realized by certain funds of the Trust as their asset levels had increased, the Advisor’s undertakings to waive or reimburse certain fees and expenses of the Fund, and the Advisor’s expenditures from its own profits and resources to maintain staffing levels and expand staff competencies, pay competitive levels of compensation, and add to its electronic and information technology systems so as to maintain or improve service levels. The information provided demonstrated to the Trustees that the Fund’s advisory fee breakpoint structure is reasonable in relation to the structures observed in the other funds in its peer group, and that shareholders may be expected to benefit from any economies of scale, due to the advisory agreement’s breakpoint fee structure for the Fund and other factors.
Potential Ancillary Benefits. In reviewing potential benefits to the Advisor because of its relationship to the Fund, the Trustees considered explanations from the Advisor respecting its receipt of certain research services from broker dealers, and the benefits to both the Fund and the Advisor of the Advisor’s expansion of its staffing, compliance and systems capabilities and other resources to serve a broader variety of investment management clients. No unusual or unfair benefits to the Advisor from its relationship to the Fund were identified by the Trustees.
Summary of Conclusions. The Trustees concluded that the general nature, extent and quality of the Advisor’s services performed under the advisory agreement remained sufficient, the Advisor had continued to actively and competently pursue the Fund’s stated investment objectives and adhere to the Fund’s investment policies, and that the absolute and relative investment performance of the Fund over pertinent holding periods on the whole was satisfactory in the context of the Fund’s objectives and strategies. The Trustees further concluded that the level of the advisory fee charged to the Fund by the Advisor is fair and reasonable in relation to the services provided by the Advisor, in view of the nature, extent and quality of those services, the investment performance of the Fund after fees and expenses, the clear disclosure of fees and expenses in the Fund’s prospectuses, comparisons of fees and expenses charged to the Fund to fees and
Other Information, Continued
Thornburg International Growth Fund | September 30, 2019 (Unaudited)
expenses charged to other mutual funds, and the other factors considered. The Trustees accordingly determined to renew the Fund’s investment advisory agreement with the Advisor for an additional term of one year.
Trustees’ Statement to Shareholders (Unaudited)
Readopted September 17, 2019
The Trustees believe current and prospective shareholders should know how we discharge our responsibilities in supervising the Funds’ investment advisor and in reviewing the advisor’s contract for renewal. Since 2005, we have issued a statement which sets out clearly the three principal guidelines that we follow in supervising the Trust’s investment advisor on your behalf. In accordance with our customary practice, in September of this year we again reviewed our statement and concluded we should reissue this statement outlining the principal features of our supervision of the advisor’s performance of investment management services for the Funds.
We begin with the premise that each shareholder selected his or her Fund because its investments are managed by the investment advisor identified in the prospectus and in accordance with the objective and policies described in the prospectus. We realize, as each of you do, that if you believe that your Fund’s stated objective and policies no longer serve your personal investment goals, you can sell your shares and leave the Fund.
Therefore, we believe that our primary supervisory task—our principal obligation to you—is to assess the nature and quality of the advisor’s services, and to confirm that the advisor actively and competently pursues the Fund’s objective, in accordance with the policies set out in the prospectus. To do this, we meet regularly with management to review your Fund’s portfolio and to discuss the advisor’s specific actions and judgments in pursuing the Fund’s objective. We do not substitute our own judgment for the advisor’s decisions in selecting investments; the advisor is paid to exercise its informed judgment on investment decisions, and we seek to confirm, in reviewing the advisor’s performance, that the advisor is doing just that.
Second, we are conscious of costs and the effect that costs have on shareholders’ returns. We try to make sure that your Fund’s fees and costs are reasonable in relationship to the services rendered and that they are generally in line with those charged by other expert investment advisors, consistent with our belief that the Fund’s investors searched for and expect that expertise and attention and have decided to pay a reasonable price for it. We do not put the management contract “out to bid” as a matter of course, and we would not do so unless we had concluded that the advisor materially had failed to pursue the Fund’s objectives in accordance with its policies, or for other equally important reasons. We believe that any other approach would be inconsistent with your interests and contrary to your expectations when you bought shares of the Fund in the first place.
Finally, because we believe that most Thornburg Fund shareholders have invested with a long-term perspective, we try not to focus too much on the fashions of the moment and on short-term performance. The market will not favor any specific investment objective or set of policies at all times and under all economic circumstances. A fund will experience periods of both high and low returns relative to other funds and other investments. Even if one of our Funds is not favored by the market at a particular time, we believe that the advisor is nonetheless obliged to remain true to the Fund’s objective and policies, and we watch to see that it does so.
Trustees of Thornburg Investment Trust
Thornburg Investment Management is a privately-owned global investment firm that offers a range of solutions for retail and institutional investors. Founded in 1982 and headquartered in Santa Fe, New Mexico, we manage approximately $41.9 billion (as of September 30, 2019) across U.S. mutual funds, separate accounts for high-net-worth investors, institutional accounts, and UCITS funds for non-U.S. investors.
The fund outlined in this report is one of many equity and fixed-income products available from Thornburg Investment Management.
EQUITY FUNDS
| ■ | Thornburg Global Opportunities Fund |
| ■ | Thornburg International Value Fund |
| ■ | Thornburg Better World International Fund |
| ■ | Thornburg International Growth Fund |
| ■ | Thornburg Developing World Fund |
| ■ | Thornburg Value Fund |
| ■ | Thornburg Core Growth Fund |
MULTI_ASSET FUNDS
| ■ | Thornburg Investment Income Builder Fund |
| ■ | Thornburg Summit Fund |
FIXED INCOME FUNDS
| ■ | Thornburg Low Duration Income Fund |
| ■ | Thornburg Limited Term U.S. Government Fund |
| ■ | Thornburg Limited Term Income Fund |
| ■ | Thornburg Strategic Income Fund |
| ■ | Thornburg Low Duration Municipal Fund |
| ■ | Thornburg Limited Term Municipal Fund |
| ■ | Thornburg Intermediate Municipal Fund |
| ■ | Thornburg California Limited Term Municipal Fund |
| ■ | Thornburg New Mexico Intermediate Municipal Fund |
| ■ | Thornburg New York Intermediate Municipal Fund |
| ■ | Thornburg Strategic Municipal Income Fund |
ALTERNATIVE FUNDS
| ■ | Thornburg Long/Short Equity Fund |
Before investing, carefully consider the Fund’s investment goals, risks, charges, and expenses. For a prospectus or summary prospectus containing this and other information, contact your financial advisor or visit thornburg.com. Read it carefully before investing.
For additional information, please visit thornburg.com
Thornburg Investment Management, Inc. 2300 North Ridgetop Road, Santa Fe, NM 87506
This page intentionally left blank.
To receive shareholder reports, prospectuses, and proxy statements electronically, go to www.thornburg.com/edelivery.
This Annual Report is submitted for the general information of shareholders of the Fund. It is not authorized for distribution to prospective investors in the Fund unless preceded or accompanied by an effective prospectus.
Investment Advisor:
Thornburg Investment Management®
800.847.0200
Distributor:
Thornburg Securities Corporation®
Annual Report
September 30, 2019
Beginning on January 1, 2021, as permitted by regulations adopted by the Securities and Exchange Commission, paper copies of the Fund’s shareholder reports will no longer be sent by mail, unless you specifically request paper copies of the reports from the Fund or from your financial intermediary, such as a broker-dealer or bank. Instead, the reports will be made available on a website, and you will be notified by mail each time a report is posted and provided with a website link to access the report.
If you already elected to receive shareholder reports electronically, you will not be affected by this change and you need not take any action. You may elect to receive shareholder reports and other communications from the Fund or your financial intermediary electronically by going to thornburg.com/edelivery.
You may elect to receive all future reports in paper free of charge. You can inform the Fund or your financial intermediary that you wish to continue receiving paper copies of your shareholder reports by calling 800.847.0200 or your financial intermediary directly. Your election to receive reports in paper will apply to all funds held with the fund complex/your financial intermediary.
At Thornburg, we believe unconstrained investing leads to better outcomes for our clients. Our investment solutions are highly active, high conviction, and benchmark agnostic. When it comes to finding economic opportunity for clients, it’s more than what we do.
It’s how we do it. Active Asbottom-up, fundamental, active managers, we look beyond conventional benchmarks. Long Term We take a long-term view in how we manage our firm and our portfolios. Benchmark Agnostic Investment strategies should have the flexibility to pursue solutions for clients, not stay within the conventional confines of benchmarks. Flexible Perspective Our approach to portfolio construction is guided by our convictions rather than convention. High Conviction We focus our attention and capital on thoroughly researched, well-understood positions. The best form of risk management is to know what you own, and why. Repeatable & Robust Our long-term outperformance of benchmarks verifies that our process works and outperforms conventional thinking. Independent We are independently owned and far from the herd of other investment managers. Investment Driven All members of the investment team are resources for all of our strategies. Collaborative Our team collaborates on opportunities across geography, sector, or asset class.
Thornburg Investment Income Builder Fund
Annual Report | September 30, 2019
Table of Contents
| 4 |
| 8 |
| 10 |
| 11 |
| 14 |
| 22 |
| 24 |
| 26 |
| 27 |
| 38 |
| 40 |
| 41 |
| 42 |
| 45 |
| 48 |
| SHARE CLASS | NASDAQ SYMBOL | CUSIP |
| Class A | TIBAX | 885-215-558 |
| Class C | TIBCX | 885-215-541 |
| Class I | TIBIX | 885-215-467 |
| Class R3 | TIBRX | 885-215-384 |
| Class R4 | TIBGX | 885-215-186 |
| Class R5 | TIBMX | 885-215-236 |
| Class R6 | TIBOX | 885-216-663 |
Class I, R3, R4, R5, and R6 shares may not be available to all investors. Minimum investments for Class I shares may be higher than those for other classes.
Investments carry risks, including possible loss of principal. Additional risks may be associated with investments outside the United States, especially in emerging markets, including currency fluctuations, illiquidity, volatility, and political and economic risks. Investments in small- and mid-capitalization companies may increase the risk of greater price fluctuations. Portfolios investing in bonds have the same interest rate, inflation, and credit risks that are associated with the underlying bonds. The value of bonds will fluctuate relative to changes in interest rates, decreasing when interest rates rise. Please see the Fund’s prospectus for a discussion of the risks associated with an investment in the Fund. Investments in the Fund are not FDIC insured, nor are they deposits of or guaranteed by a bank or any other entity.
Letter to Shareholders
Thornburg Investment Income Builder Fund | September 30, 2019 (Unaudited)
October 29, 2019
Dear Fellow Shareholder:
This letter highlights the results of your Fund’s investment activities for the six- and 12-month periods ended September 30, 2019. Your Fund’s fiscal year ended on September 30. In addition, we will comment on the overall investment landscape, which continues to evolve.
The Thornburg Investment Income Builder Fund paid dividends of $0.993 per Class I share in the 12-month period ended September 30, 2019, up 1% from the $0.983 per share paid in the comparable prior-year period. The dividends per share were higher for Class R6 shares and lower on the Class A, Class C, R3 and R4 shares, to account for varying class-specific expenses. The net asset value (NAV) per Class I share decreased by $0.08 per share during the 12-month period, from $21.96 to $21.88, giving a total return including dividends of 4.39% at NAV. The Fund’s total return for the six-month period ended September 30, 2019 was 4.50%.
For the fiscal year, the Thornburg Investment Income Builder Fund Class I shares outperformed the blended index of 75% MSCI World Index/25% Bloomberg Barclays U.S. Aggregate Bond Index (total return of 4.19%). Performance relative to indices for all share classes over various periods is set forth on page 10.
The quarter ended September 30, 2019 was the 67th full calendar quarter since the inception of the Thornburg Investment Income Builder Fund in December 2002. In 50 of these quarters the Fund delivered a positive total return. The Fund has delivered positive total returns in 13 of its 16 calendar years of existence. As of September 30, 2019, Thornburg Investment Income Builder has delivered tax-efficient average annual total returns in excess of 9% since its inception.
We do not expect to pay any capital gain dividend for 2019. At September 30, 2019, the Fund had realized capital losses of more than $500 million, which may be carried forward to offset future capital gains to the extent permitted by regulations.
In assessing the overall performance of Thornburg Investment Income Builder for the period under review, it is constructive to consider the performance in U.S. dollars of the sector components of the MSCI World Index over the 12 months ended September 30, 2019. The MSCI World Index comprises 75%, and the entire equity portion, of the Fund’s global performance:
1. The MSCI World Index showed a return of 1.83% for the 12 months ended September 30, 2019. Six of 11 index sectors showed positive total returns, with individual sector returns ranging from 20.6% (utilities) to negative 17% (energy). Stocks in the real estate, consumer staples, information technology and communication services sectors joined utility stocks in outperforming the index. Stocks of firms in the materials, health care, industrials, financials and consumer discretionary sectors joined energy sector stocks in underperforming the index.
2. Relative to the MSCI World Index, Thornburg Investment Income Builder’s portfolio was significantly overweight the
higher dividend-paying financial, communication services and energy sectors, as it has been for most of its history.
3. Fund investments in firms in the following sectors comprised the largest average sector weightings in the portfolio during period under review:
| • | Financial sector (24% average weighting in the Fund’s equity portfolio) |
| • | Communication services sector (16% average weighting in the Fund’s equity portfolio) |
| • | Energy sector (12% average weighting in the Fund’s equity portfolio) |
| • | Information technology sector (9% average weighting in the Fund’s equity portfolio) |
| • | Health care sector (8% average weighting in the Fund’s equity portfolio) |
| • | Industrials sector (6% average weighting in the Fund’s equity portfolio) |
| • | Utilities sector (5% average weighting in the Fund’s equity portfolio) |
| • | Consumer discretionary sector (5% average weighting in the Fund’s equity portfolio) |
4. In the Income Builder portfolio, 40 equity investments contributed positive returns of at least 0.05% (5 basis points) to the portfolio during the 12-month period, considering both portfolio weights and individual security returns. Two dozen of the Fund’s equity investments contributed negative returns of 0.05% or worse for the period.
5. It is instructive to extend the preceding analysis that considers both portfolio weights and individual security returns to a longer 10-year period ended September 30, 2019, for your Fund: 49 equity investments in the Income Builder Portfolio contributed at least 1% to the Fund’s trailing 10-year total return of 111% (Class I shares), while eight equity investments detracted at least 1% from overall portfolio return over that period. We believe these data point to the resilience and favorable balance of reward versus risk of Thornburg Investment Income Builder’s diversified portfolio of dividend-paying businesses.
Investment Income Builder’s bond holdings delivered positive returns during the fiscal year and over longer time periods. A strong bond price rebound on declining interest rates in 2019 overcame price weakness in the December 2018 quarter.
Your Fund’s average return from its investments in the financial sector was positive for the fiscal year and outperformed the equities in the finance sector of the MSCI World Index for the period. CME Group was one of the strongest performers in the portfolio, recovering from a weak March quarter even as expectations for future interest rate volatility and the consequent need for hedging activity receded. Ares Capital Corporation, Chimera Investment Corporation, MFA Financial, JPMorgan Chase, Axa Equitable Holdings and Apollo Investment Corporation were also strong performers for the year. Most of your Fund’s European-based financial intermediaries detracted from portfolio performance. These included NN Group, ING
Letter to Shareholders, Continued
Thornburg Investment Income Builder Fund | September 30, 2019 (Unaudited)
Group, UBS Group and BNP Paribas. In general, portfolio credit quality for these firms is holding up reasonably well in 2019, but the indefinite extension of negative euro interest rate policies and quantitative easing clouds the forward earnings outlook.
Your Fund’s significant holdings in the communications services sector delivered mixed performances in the fiscal year. Vodafone, Dutch network operator KPN, Deutsche Telekom and AT&T each made positive contributions to portfolio performance. England’s BT Group and China Mobile each detracted from portfolio performance for the 12-month period. Deutsche Telekom is the controlling shareholder of the third-largest U.S. mobile network operator, T-Mobile, which contributes approximately half of group operating profit. T-Mobile has made frequent headlines in recent quarters as a result of its pending merger with Sprint, the fourth-largest U.S. mobile communications network operator. We see expanding consumer and business demand for digital communications around the world, using both wireless and terrestrial networks. We will focus on investing in those firms that we believe can grow their customer bases while managing operating expenses and capital budgets well enough to sustain and grow their dividends over time. In most geographies there are a small number of competitors, relative to many other industries.
Stock prices for most firms in the energy sector were burdened by the 28% drop in the Brent oil price to $60.90/barrel during the fiscal year. Among Income Builder’s investments in the energy sector, only Russian-based Lukoil made a positive contribution to portfolio performance during the fiscal year. The price of Brent crude oil fluctuated significantly during the period under review, ranging from more than $80 per barrel at September 30, 2018, to a low of around $50 per barrel in December. Integrated oil and gas giants Total, Royal Dutch Shell and ENI joined refiners Valero Energy and Repsol as detractors from portfolio performance for the period. For perspective on the $60.90/barrel September 30, 2019, benchmark oil price, the average Brent oil price fell from approximately $115/barrel in June 2014 to a January 2016 low of $28/barrel. We expect volatile oil prices to persist. Demand fundamentals appear positive for both oil and gas, though a global consumption increase for 2019 will fall short of the more than 1.4 million barrels per day growth seen in 2018. Our investments in this sector are focused on resilient dividend payors with strong balance sheets. Business prospects for these firms appear sound within recent ranges for oil and gas prices.
Income Builder’s investments in the technology sector delivered positive returns in the period under review. Strong positive contributions to your portfolio came from component supplier Broadcom, semiconductor supplier Qualcomm, semiconductor manufacturer Taiwan Semiconductor and Thai fiber optic cable supplier Jasmine Broadband. We expect most of these firms to benefit from the ongoing proliferation of “connected” digital devices and associated data flows since they hold important positions in the value chain for producing the devices as well as enabling networks with data transmission and storage capability. That noted, trade tensions, patent disputes and evolving consumer preferences create uncertainty around the near-term outlook for device sales and optimizing the geographic spread of
component manufacturing networks. Over the last year, Broadcom, Taiwan Semiconductor and Qualcomm have increased dividends by more than 50%, 20% and 4%, respectively. Qualcomm’s stock price has increased by almost 40% from March 31, 2019, to the date of this letter, following settlement of a patent and royalty dispute with Apple, Inc. in mid-April.
The performance of Investment Income Builder’s holdings in the health care sector was strongly positive during the fiscal year, thanks to double-digit percentage positive contributions from Roche Holding, Merck & Co., AbbVie, AstraZeneca and Novartis. With the exception of AbbVie, most of these are establishing leading positions in “immuno-therapies” that channel the body’s own defenses to fight disease, especially cancers. In the future it appears that solid scientific advancement will be the most important contributor to earnings generation and share price performance. Your Fund’s portfolio holdings generate sufficient cash flow to fund both world class-research programs and interesting dividends, and we are monitoring their scientific progress. Pfizer detracted from portfolio performance during the period.
Your Fund’s investments in the industrials sector delivered overall positive performances, led by Italian toll road and airport operator Atlantia, Chinese conglomerate Hopewell Holdings, French construction/infrastructure operator Vinci and Spanish airport operator Aena. Hopewell received an acquisition bid from its principal shareholder at a significant premium to its then current market price, while Atlantia recovered from a share price drop following a disastrous bridge collapse on one of its managed toll roads in August 2018. U.K defense contractor BAE Systems detracted from Fund performance over the period under review.
Your Fund’s investments in the utilities sector trailed the performance of this sector in the index portfolio for the 12-month period. A double-digit percentage share price decline from Electricite de France more than offset a positive contribution from Italy-based multinational electric utility ENEL SpA.
Among other portfolio holdings, notable positive contributors to performance included miner Norilsk Nickel, Home Depot, communications infrastructure operator Crown Castle, display advertiser Outfront Media and Nestle. Negative contributors included Walgreens Boots Alliance, diversified miner Glencore and chemicals producer LyondellBasell Industries.
A stronger U.S. dollar decreased the dollar value of our non-U.S. assets during the period under review by an overall average of minus 4%, before hedging. The strong U.S. dollar also created a similar percentage headwind against your portfolio’s non-dollar dividend income. We hedged significant portions of the currency exposure of our asset positions denominated in the Australian dollar, the British pound, the euro, the Chinese yuan and the Swiss franc. These hedges added to the relative performance of Thornburg Investment Income Builder, since benchmark indices are not hedged. We are more focused on risk control than on reaping possible currency gains from exposure to assets denominated in these currencies. Looking ahead, we believe increasing U.S. government fiscal deficits could create
Letter to Shareholders, Continued
Thornburg Investment Income Builder Fund | September 30, 2019 (Unaudited)
conditions that would lead us to reduce hedges. We will monitor the facts as data are released.
Bond prices appreciated significantly during the fiscal year. The U.S. Federal Reserve cut the benchmark Federal funds rate and guided down forward interest rate expectations. Inflation measures around the world were low enough to give other central banks room to continue easy money policies. In summary:
| • | The 10-year U.S. Treasury bond yields hit 1.67% on September 30, 2019, down from 3.05% at September 30, 2018. |
| • | The investment grade corporate bond yield also dropped, as the Bloomberg Barclays U.S. Aggregate Corporate Index (yield-to-worst) fell from 4.07% to 2.91% during the fiscal year. |
| • | Yields declined less significantly for sub-investment grade bonds, with the Bloomberg Barclays U.S. Corporate High-Yield Index (yield-to-worst) declining to 5.65% from 6.24% at September 30, 2018. As recently as December 31, 2018, this index showed a yield of 7.95%. |
Readers of this commentary who are longtime shareholders of Income Builder will recall that the interest-bearing debt portion of the Fund’s portfolio has varied over time, ranging from less than 9% in 2015 to 45% at June 30, 2009.
As of September 30, 2019, your Fund portfolio included more than 80 bonds and hybrid securities.
The table below compares the dividend yields for the equities of the 10-largest investments held in the Income Builder portfolio with the current marketable debt yields of specific bonds issued by the same firms as of September 30, 2019. Nine of the 10 firms shown below have issued marketable debt that trades in the secondary market. For eight of these nine debt issuers, the dividend yields on their stocks exceed their debt yields by differentials ranging from 6.06% (Royal Dutch Shell) to 0.02% (CME Group). Until recent years, it was extremely rare in the investment lifetime of anyone reading this letter to see equity dividend yields exceed debt yields of the same issuer. As of the date of this letter, we expect around three out of four of your Fund’s equity holdings to increase their 2020 dividends in local currency terms. Of course, this is subject to change if earnings
expectations change for the worse, companies make acquisitions, or tilt the disposition of earnings and profits in favor of share buybacks or debt reduction.
Today, investors debate the future direction of the economies of China, Europe, various emerging markets and the U.S. They consider potential policy actions by the U.S. Federal Reserve, Congress, the Trump administration and foreign government regulatory and policy actions. Concerns about tariffs and trade policy changes impact share price movements of global producers of tradeable goods, which are volatile day to day. Most economic data tracking business expectations of manufacturers around the world are indicating slowing growth. We expect business expectations and the share prices of producers of tradeable goods to remain subject to heightened volatility until new trade policies are established.
We believe that people around the world will continue to buy goods and services and trade with each other. Importantly, overall global consumer spending has grown in 2019, along with global population, industrial production, energy consumption, loans, deposits and digital communications volumes. Despite uncertainty around macro-economic policies and expectations for slowing future economic growth, employment and wage growth trends remain positive, consumer debt is under control and many governments around the world other than the U.S., have room to implement expansionary fiscal policies.
Most firms held in Thornburg Investment Income Builder’s portfolio delivered positive year-over-year earnings in 2018 and are expected to deliver operating earnings growth in 2019. Major central banks around the world continue to pursue very easy monetary conditions, which artificially suppress interest rates and support prices of financial assets.
While low interest rates are good news for borrowers, they have negative consequences for conservative savers. Interest income as a percentage of the aggregate adjusted gross income of U.S. households fell from 4% in 2007 to 1.5% in 2017, according to Statistics of Income published by the Internal Revenue Service.
Letter to Shareholders, Continued
Thornburg Investment Income Builder Fund | September 30, 2019 (Unaudited)
Investors must consider other options. Banks in the U.S. offer below-inflation yields on most deposits. A very large pool of investor dollars is looking for better returns elsewhere, but in sensible investments. We are optimistic that the types of income producing investments owned by the Thornburg Investment Income Builder Fund will experience sustainable popularity among investors as their intrinsic values for income production are recognized. A high percentage of investor funds belong to people over the age of 55, for whom income is an increasingly necessary and desirable attribute.
Thank you for being a shareholder of the Thornburg Investment Income Builder Fund. Remember that you can review additional information about your portfolio at your leisure by going to our website, www.thornburg.com/IIB.
Best wishes for a wonderful 2020!

| 
|
Brian McMahon
Portfolio Manager
Chief Investment Officer
and Managing Director | Jason Brady,cfa
Portfolio Manager
CEO, President, and
Managing Director |

| 
|
Ben Kirby,cfa
Portfolio Manager
Managing Director | Matt Burdett
Portfolio Manager
Managing Director |
The matters discussed in this report may constitute forward-looking statements made pursuant to the safe harbor provisions of the Securities Litigation Reform Act of 1995. These include any advisor or portfolio manager prediction, assessment, analysis or outlook for individual securities, industries, investment styles, market sectors and/or markets. These statements involve risks and uncertainties. In addition to the general risks described for each fund in its current prospectus, other factors bearing on these reports include the accuracy of the advisor’s or portfolio manager’s forecasts and predictions, the appropriateness of the investment strategies designed by the advisor or portfolio manager and the ability of the advisor or portfolio manager to implement their strategies efficiently and successfully. Any one or more of these factors, as well as other risks affecting the securities markets generally, could cause the actual results of any fund to differ materially as compared to its benchmarks.
The views expressed are subject to change and do not necessarily reflect the views of Thornburg Investment Management, Inc. This information should not be relied upon as a recommendation or investment advice and is not intended to predict the performance of any investment or market.
Performance results of individual share classes will vary based on the fees and expenses associated with each share class, and may be higher or lower than other share classes within the same Fund. Please see Performance Summary for performance results of each share class.
The Dividend Landscape
Thornburg Investment Income Builder Fund | September 30, 2019 (Unaudited)
To appreciate the investment environment in which Thornburg Investment Income Builder Fund operates, you may wish to review these highlights of the “dividend landscape.”
The S&P 500 Index Payout Ratio — A Historical Perspective
The dividend payout ratio is a fraction that expresses dividend payments as a percentage of per-share earnings. As the economy slowed in the wake of the financial crisis, earnings-per-share on average declined, causing the payout ratio to spike, even as dividends paid by the S&P 500 portfolio declined. Earnings have since materially improved, bringing the payout ratio back in line with the overall trend in recent times.
Corporate Willingness to Pay Dividends is Key to the Fund’s Investment Process
The Russell 1000 Index includes approximately 1,000 public companies that are supposed to be generally representative of corporate America. Between 1980 and 1993, at least 75% of these firms paid some dividend. Between 1994 and 2001, the percentage of Russell 1000 companies paying dividends sank to just over 50%, indicating a preference towards reinvesting retained earnings in growth initiatives. Dividends returned to fashion between 2002 and 2008. A reduction in the number of Russell 1000 firms paying dividends followed the 2008 recession. However, from early 2010, the number steadily climbed back to around 70%.
Rising Dividend Payments Despite Decreasing Dividend Yields
Over time, the dollar dividend per unit of the S&P 500 Index has generally increased. Because the price of the index itself has increased even more, the yield on the S&P 500 Index, as a percentage of the current index price, has generally decreased in recent decades. You should note, however, that the dollar yield on an original investment made at a fixed point in time (say, 1970 or 1989) has increased, even without reinvestment of dividends.
S&P 500 Index Payout Ratio
Source: Bloomberg, beginning in 1999 (uses operating earnings); “Irrational Exuberance”
by Robert J. Shiller, through 1998 (uses reported earnings).
Percentage of Companies Paying Dividends in Russell 1000 Index
Source: CSFB Quantitative and Equity Derivatives Strategy, Baseline, and FactSet.
S&P 500 Index Average Yield vs. Annual Dividends from a Hypothetical $100,000 Investment(Dividends not Reinvested)
Source: Bloomberg and FactSet as of 12/31/18
Past performance does not guarantee future results.
The Dividend Landscape, Continued
Thornburg Investment Income Builder Fund | September 30, 2019 (Unaudited)
The Top 100 Dividend Yields
| | RUSSELL 1000
INDEX | RUSSELL 2000
INDEX |
| Real Estate | 29% | 33% |
| Financials | 20% | 27% |
| Consumer Discretionary | 15% | 10% |
| Energy | 12% | 8% |
| Materials | 8% | 2% |
| Industrials | 5% | 7% |
| Consumer Staples | 4% | 4% |
| Communication Services | 3% | 6% |
| Utilities | 2% | 2% |
| Health Care | 1% | 0% |
| Information Technology | 1% | 1% |
Source: FactSet as of September 30, 2019.
Estimated Average Dividend Yields (MSCI Indices) of Markets Around the Globe
Source: Bloomberg as of September 30, 2019.
A Truly Diversified Dividend-Paying Portfolio Must Look Beyond the Obvious High-Yield Stocks!
In the (large cap) Russell 1000 Index, 49% of the top 100 dividend payers are in the real estate and financials sectors. In the (small cap) Russell 2000 Index, 60% of the top 100 dividend-yielding stocks are real estate or financials companies. To construct a diversified portfolio of attractive yielding stocks, one must look beyond these sectors. We certainly do.
Dividend yield is a ratio that shows how much a company pays out in dividends each year relative to its share price.
Global Diversification Can Improve the Portfolio Yield
Since firms outside the U.S. tend to pay higher dividends than U.S. firms, particularly outside the financial and utility sectors, we maintain the ability to diversify the Thornburg Investment Income Builder Fund into foreign dividend-paying stocks to try to take advantage of these opportunities.
Diversification does not assure or guarantee better performance and cannot eliminate the risk of investment losses.
Dividends are not guaranteed.
Performance Summary
Thornburg Investment Income Builder Fund | September 30, 2019 (Unaudited)
AVERAGE ANNUAL TOTAL RETURNS
| | 1-YR | 3-YR | 5-YR | 10-YR | SINCE
INCEP. |
| Class A Shares(Incep: 12/24/02) | | | | | |
| Without sales charge | 4.13% | 7.57% | 4.59% | 7.43% | 9.10% |
| With sales charge | -0.56% | 5.94% | 3.63% | 6.94% | 8.81% |
| Class C Shares(Incep: 12/24/02) | | | | | |
| Without sales charge | 3.35% | 6.78% | 3.83% | 6.67% | 8.42% |
| With sales charge | 2.36% | 6.78% | 3.83% | 6.67% | 8.42% |
| Class I Shares(Incep: 11/3/03) | 4.39% | 7.87% | 4.90% | 7.77% | 8.50% |
| Class R3 Shares(Incep: 2/1/05) | 3.72% | 7.20% | 4.25% | 7.10% | 7.00% |
| Class R4 Shares(Incep: 2/1/08) | 3.79% | 7.30% | 4.34% | 7.18% | 5.28% |
| Class R5 Shares(Incep: 2/1/07) | 4.20% | 7.74% | 4.76% | 7.64% | 6.02% |
| Class R6 Shares(Incep: 4/10/17) | 4.47% | - | - | - | 7.44% |
| MSCI World Index Net(USD) (Since 12/24/02) | 1.83% | 10.21% | 7.18% | 9.01% | 8.32% |
GROWTH OF A HYPOTHETICAL $10,000 INVESTMENT
Performance data shown represents past performance and is no guarantee of future results. Investment return and principal value will fluctuate so shares, when redeemed, may be worth more or less than their original cost. Current performance may be lower or higher than quoted. For performance current to the most recent month end, visit thornburg.com or call 800-847-0200. The performance information does not reflect the deduction of taxes that a shareholder would pay on distributions or the redemption of Fund shares. Returns reflect the reinvestment of dividends and capital gains. Class A shares are sold with a maximum sales charge of 4.50%. Class C shares are subject to a 1% CDSC for the first year only. There is no sales charge for Class I, R3, R4, R5 and R6 shares. As disclosed in the most recent prospectus, the total annual fund operating expenses before fee waivers and expense reimbursements are as follows: A shares, 1.33%; C shares, 2.08%; I shares, 1.04%; R3 shares, 1.79%; R4 shares, 1.74%; R5 shares, 1.30% and R6 shares, 1.00%. Thornburg Investment Management has contractually agreed to waive fees and reimburse expenses until at least February 1, 2020, for some of the share classes, resulting in net expense ratios of the following: R3 shares, 1.68%; R4 shares, 1.58%; R5 shares, 1.17% and R6 shares, 0.98%. For more detailed information on fund expenses and waivers/reimbursements please see the Fund’s prospectus.
30-day SEC Yield as of 9/30/19 (A Shares): 2.94%
The Bloomberg Barclays U.S. Aggregate Bond Index is composed of approximately 8,000 publicly traded bonds including U.S. government, mortgage-backed, corporate and Yankee bonds. The index is weighted by the market value of the bonds included in the index.
TheBloomberg Barclays U.S. Corporate High-Yield Index measures the market of USD-denominated, non-investment grade, fixed-rate, taxable corporate bonds. Securities are classified as high yield if the middle rating of Moody’s, Fitch, and S&P is Ba1/BB+/BB+ or below. The index excludes emerging market debt.
TheBloomberg Barclays U.S. Corporate Index is a broad-based benchmark that measures the investment grade, U.S. dollar-denominated, fixed-rate, taxable corporate bond market. It includes USD-denominated securities publicly issued by U.S. and non-U.S. industrial, utility, and financial issuers that meet specified maturity, liquidity, and quality requirements.
TheMSCI World Index is an unmanaged market-weighted index that consists of securities traded in 23 of the world’s most developed countries. Securities are listed on exchanges in the U.S., Europe, Canada, Australia, New Zealand, and the Far East. The index is calculated with net dividends reinvested in U.S. dollars.
Thornburg Investment Income Builder Fund’s Blended Index is composed of 25% Bloomberg Barclays U.S. Aggregate Bond Index and 75% MSCI World Index, rebalanced monthly.
The performance of any index is not indicative of the performance of any particular investment. Unless otherwise noted, index returns reflect the reinvestment of income dividends and capital gains, if any, but do not reflect fees, brokerage commissions or other expenses of investing. Investors may not make direct investments into any index.
Yield to Worst (YTW) – The lowest potential yield that can be received on a bond without the issuer actually defaulting.
The information given should not be considered tax advice. Please consult your tax advisor for personal tax questions and concerns.
Fund Summary
Thornburg Investment Income Builder Fund | September 30, 2019 (Unaudited)
OBJECTIVES AND STRATEGIES
The Fund seeks to provide a level of current income which exceeds the average yield on U.S. stocks generally, and which will generally grow, subject to periodic fluctuations, over the years on a per share basis. The Fund’s secondary investment objective is long-term capital appreciation.
The Fund may invest in any domestic or foreign equity or debt security which Thornburg Investment Management believes may assist the Fund in pursuing its investment goals, although the Fund expects that equity securities in its portfolio will normally be weighted in favor of companies that pay dividends or other current income.
PORTFOLIO COMPOSITION
| TOP TEN EQUITY HOLDINGS |
| Orange SA | 4.5% |
| CME Group, Inc. | 4.0% |
| China Mobile Ltd. | 3.4% |
| Taiwan Semiconductor Manufacturing Co. Ltd. | 3.4% |
| JPMorgan Chase & Co. | 3.0% |
| TOTAL S.A. | 2.6% |
| Home Depot, Inc. | 2.5% |
| Vodafone Group plc | 2.5% |
| Royal Dutch Shell plc Class A | 2.4% |
| QUALCOMM, Inc. | 2.3% |
SECTOR EXPOSURE
(percent of equity holdings) |
| Financials | 24.3% |
| Communication Services | 15.8% |
| Energy | 12.7% |
| Information Technology | 10.8% |
| Health Care | 9.1% |
| Materials | 5.3% |
| Consumer Discretionary | 5.0% |
| Utilities | 4.7% |
| Consumer Staples | 4.2% |
| Real Estate | 4.1% |
| Industrials | 4.0% |
COUNTRY EXPOSURE *
(percent of Fund) |
| United States | 43.0% |
| France | 10.7% |
| Italy | 6.4% |
| Netherlands | 5.7% |
| Switzerland | 5.2% |
| United Kingdom | 4.7% |
| China | 4.0% |
| South Korea | 3.5% |
| Taiwan | 3.4% |
| Spain | 2.1% |
| Germany | 1.9% |
| Russian Federation | 1.9% |
| Australia | 0.7% |
| South Africa | 0.4% |
| Jamaica | 0.3% |
| Canada | 0.2% |
| Colombia | 0.2% |
| Brazil | 0.1% |
| Cayman Islands | 0.1% |
| Belgium | 0.1% |
| Japan | 0.1% |
| Chile | 0.0%** |
| Saint Lucia | 0.0%** |
| Other Assets Less Liabilities | 5.3% |
| * | Holdings are classified by country of risk as determined by MSCI and Bloomberg. |
| ** | Country percentage was less than 0.1%. |
There is no guarantee that the Fund will meet its investment objectives.
All data is subject to change. Charts may not add up to 100% due to rounding.
Fund Summary, Continued
Thornburg Investment Income Builder Fund | September 30, 2019 (Unaudited)
| QUARTERLY DIVIDEND HISTORY, CLASS A |
| YEAR | Q1 | Q2 | Q3 | Q4 | TOTAL |
| 2003 | 9.2¢ | 11.2¢ | 12.4¢ | 17.5¢ | 50.3¢ |
| 2004 | 10.2¢ | 12.5¢ | 15.0¢ | 21.8¢ | 59.5¢ |
| 2005 | 11.0¢ | 13.6¢ | 17.4¢ | 29.0¢ | 71.0¢ |
| 2006 | 12.5¢ | 16.0¢ | 19.2¢ | 33.0¢ | 80.7¢ |
| 2007 | 14.2¢ | 18.5¢ | 21.5¢ | 36.8¢ | 91.0¢ |
| 2008 | 17.9¢ | 21.8¢ | 26.0¢ | 36.8¢ | 102.5¢ |
| 2009 | 18.0¢ | 24.2¢ | 28.0¢ | 34.5¢ | 104.7¢ |
| 2010 | 19.8¢ | 25.0¢ | 32.0¢ | 36.0¢ | 112.8¢ |
| 2011 | 21.0¢ | 26.0¢ | 32.0¢ | 37.5¢ | 116.5¢ |
| 2012 | 21.5¢ | 26.0¢ | 28.5¢ | 36.0¢ | 112.0¢ |
| 2013 | 21.5¢ | 25.3¢ | 25.0¢ | 24.5¢ | 96.3¢ |
| 2014 | 22.5¢ | 24.0¢ | 27.0¢ | 26.0¢ | 99.5¢ |
| 2015 | 16.5¢ | 20.0¢ | 20.0¢ | 25.3¢ | 81.8¢ |
| 2016 | 17.0¢ | 18.5¢ | 19.5¢ | 21.5¢ | 76.5¢ |
| 2017 | 17.0¢ | 20.0¢ | 26.0¢ | 29.5¢ | 92.5¢ |
| 2018 | 18.0¢ | 20.0¢ | 24.0¢ | 28.0¢ | 90.0¢ |
| 2019 | 19.0¢ | 21.5¢ | 25.0¢ | | |
We do not expect each sequential quarter’s dividend to increase over that of the prior quarter, since dividend payments outside the United States tend to be seasonal. Rather, the Fund aspires to increase the dividend paid on an annual basis.
Fund Summary, Continued
Thornburg Investment Income Builder Fund | September 30, 2019 (Unaudited)
EVOLUTION OF INDUSTRY GROUP EXPOSURE
Top 10 industry groups quarter by quarter (percent of equity holdings)
| As of 9/30/2019 | |
| Telecommunication Services | 15.8% |
| Diversified Financials | 15.7% |
| Energy | 12.7% |
| Pharmaceuticals, Biotechnology & Life Sciences | 9.1% |
| Semiconductors & Semiconductor Equipment | 8.5% |
| Banks | 5.5% |
| Materials | 5.3% |
| Utilities | 4.7% |
| Real Estate | 4.1% |
| Insurance | 3.0% |
| As of 3/31/2019 | |
| Telecommunication Services | 16.8% |
| Diversified Financials | 15.4% |
| Energy | 10.8% |
| Pharmaceuticals, Biotechnology & Life Sciences | 8.3% |
| Semiconductors & Semiconductor Equipment | 7.2% |
| Utilities | 4.9% |
| Materials | 4.7% |
| Banks | 4.7% |
| Insurance | 4.6% |
| Capital Goods | 4.5% |
| As of 6/30/2019 | |
| Telecommunication Services | 17.3% |
| Diversified Financials | 15.1% |
| Energy | 13.1% |
| Pharmaceuticals, Biotechnology & Life Sciences | 7.9% |
| Semiconductors & Semiconductor Equipment | 7.8% |
| Banks | 5.9% |
| Materials | 5.1% |
| Utilities | 4.7% |
| Real Estate | 3.9% |
| Transportation | 3.9% |
| As of 12/31/2018 | |
| Telecommunication Services | 16.6% |
| Diversified Financials | 15.8% |
| Energy | 13.6% |
| Semiconductors & Semiconductor Equipment | 7.4% |
| Pharmaceuticals, Biotechnology & Life Sciences | 7.1% |
| Utilities | 6.1% |
| Banks | 5.3% |
| Capital Goods | 5.0% |
| Materials | 4.9% |
| Real Estate | 3.4% |
Schedule of Investments
Thornburg Investment Income Builder Fund | September 30, 2019
| | | SHARES/
PRINCIPAL AMOUNT | VALUE |
| | Common Stock — 86.2% | | |
| | Automobiles & Components — 0.3% | | |
| | Automobiles — 0.3% | | |
| | Fiat Chrysler Automobiles N.V. | 3,735,094 | $ 48,331,707 |
| | | | 48,331,707 |
| | Banks — 4.7% | | |
| | Banks — 4.7% | | |
| | BNP Paribas S.A. | 1,962,772 | 95,563,603 |
| | Citigroup, Inc. | 400,000 | 27,632,000 |
| | ING Groep N.V. | 11,256,600 | 117,832,771 |
| | JPMorgan Chase & Co. | 3,650,000 | 429,568,500 |
| | | | 670,596,874 |
| | Capital Goods — 1.0% | | |
| | Aerospace & Defense — 0.4% | | |
| | BAE Systems plc | 7,389,500 | 51,788,810 |
| | Construction & Engineering — 0.6% | | |
| | Eiffage S.A. | 268,461 | 27,832,983 |
| | Vinci S.A. | 521,519 | 56,172,234 |
| | | | 135,794,027 |
| | Consumer Services — 1.5% | | |
| | Hotels, Restaurants & Leisure — 1.5% | | |
| | Las Vegas Sands Corp. | 3,717,000 | 214,693,920 |
| | | | 214,693,920 |
| | Diversified Financials — 13.6% | | |
| | Capital Markets — 8.7% | | |
| a | Apollo Investment Corp. | 8,167,081 | 131,408,333 |
| | Ares Capital Corp. | 15,809,312 | 294,606,529 |
| | CME Group, Inc. | 2,668,500 | 563,960,790 |
| | Lazard Ltd. Class A | 429,000 | 15,015,000 |
| a | Solar Capital Ltd. | 4,607,900 | 95,153,135 |
| | UBS Group AG | 11,662,172 | 132,390,571 |
| | Diversified Financial Services — 1.8% | | |
| | AXA Equitable Holdings, Inc. | 11,482,100 | 254,443,336 |
| | Mortgage Real Estate Investment Trusts — 3.1% | | |
| | Chimera Investment Corp. | 8,838,507 | 172,881,197 |
| | Granite Point Mortgage Trust, Inc. | 1,417,500 | 26,563,950 |
| a | MFA Financial, Inc. | 33,270,000 | 244,867,200 |
| | | | 1,931,290,041 |
| | Energy — 10.8% | | |
| | Oil, Gas & Consumable Fuels — 10.8% | | |
| | China Petroleum & Chemical Corp. Class H | 137,802,000 | 81,931,858 |
| | Eni SpA | 19,721,652 | 301,669,547 |
| b,c,d | Malamute Energy, Inc., | 12,439 | 130,610 |
| | Repsol S.A. | 11,786,023 | 184,214,216 |
| | Royal Dutch Shell plc Sponsored ADR Class A | 5,847,000 | 344,095,950 |
| | Targa Resources Corp. | 1,641,100 | 65,922,987 |
| | TOTAL S.A. | 6,980,900 | 364,349,028 |
| | Valero Energy Corp. | 2,295,000 | 195,625,800 |
| | | | 1,537,939,996 |
| | Food & Staples Retailing — 1.9% | | |
| | Food & Staples Retailing — 1.9% | | |
| | Walgreens Boots Alliance, Inc. | 4,950,000 | 273,784,500 |
| | | | 273,784,500 |
| | Food, Beverage & Tobacco — 1.7% | | |
| | Food Products — 0.4% | | |
Schedule of Investments, Continued
Thornburg Investment Income Builder Fund | September 30, 2019
| | | SHARES/
PRINCIPAL AMOUNT | VALUE |
| | Nestle S.A. | 493,100 | $ 53,497,187 |
| | Tobacco — 1.3% | | |
| | KT&G Corp. | 2,200,400 | 194,074,489 |
| | | | 247,571,676 |
| | Insurance — 2.6% | | |
| | Insurance — 2.6% | | |
| | Assicurazioni Generali SpA | 725,047 | 14,050,916 |
| | AXA S.A. | 1,567,000 | 40,017,319 |
| | Legal & General Group plc | 7,920,800 | 24,191,715 |
| | NN Group N.V. | 8,095,300 | 287,115,874 |
| | | | 365,375,824 |
| | Materials — 4.6% | | |
| | Chemicals — 1.4% | | |
| | LG Chem Ltd. | 131,600 | 32,950,884 |
| | LyondellBasell Industries N.V. Class A | 1,870,000 | 167,308,900 |
| | Metals & Mining — 3.2% | | |
| | Glencore plc | 60,788,800 | 182,933,100 |
| | MMC Norilsk Nickel PJSC ADR | 10,417,300 | 266,682,880 |
| | | | 649,875,764 |
| | Pharmaceuticals, Biotechnology & Life Sciences — 7.9% | | |
| | Biotechnology — 1.5% | | |
| | AbbVie, Inc. | 2,716,994 | 205,730,786 |
| | Pharmaceuticals — 6.4% | | |
| | AstraZeneca plc | 1,814,100 | 161,958,477 |
| | Merck & Co., Inc. | 3,643,000 | 306,667,740 |
| | Novartis AG | 1,200,100 | 104,059,570 |
| | Pfizer, Inc. | 2,606,000 | 93,633,580 |
| | Roche Holding AG | 855,700 | 249,023,661 |
| | | | 1,121,073,814 |
| | Real Estate — 3.6% | | |
| | Equity Real Estate Investment Trusts — 3.6% | | |
| | Crown Castle International Corp. | 1,472,881 | 204,745,188 |
| | Lamar Advertising Co. Class A | 1,621,351 | 132,837,287 |
| | Outfront Media, Inc. | 3,016,100 | 83,787,258 |
| | Washington Real Estate Investment Trust | 3,147,000 | 86,101,920 |
| | | | 507,471,653 |
| | Retailing — 2.5% | | |
| | Specialty Retail — 2.5% | | |
| | Home Depot, Inc. | 1,538,100 | 356,869,962 |
| | | | 356,869,962 |
| | Semiconductors & Semiconductor Equipment — 7.4% | | |
| | Semiconductors & Semiconductor Equipment — 7.4% | | |
| | Broadcom, Inc. | 895,000 | 247,082,650 |
| | QUALCOMM, Inc. | 4,300,000 | 328,004,000 |
| c | Taiwan Semiconductor Manufacturing Co., Ltd. | 53,830,000 | 478,092,671 |
| | | | 1,053,179,321 |
| | Technology Hardware & Equipment — 1.9% | | |
| | Technology Hardware, Storage & Peripherals — 1.9% | | |
| | Samsung Electronics Co., Ltd. | 6,629,500 | 271,853,008 |
| | | | 271,853,008 |
| | Telecommunication Services — 13.6% | | |
| | Diversified Telecommunication Services — 7.3% | | |
| | AT&T, Inc. | 2,880,000 | 108,979,200 |
| | BT Group plc | 9,420,820 | 20,685,573 |
| | Deutsche Telekom AG | 13,736,100 | 230,473,838 |
Schedule of Investments, Continued
Thornburg Investment Income Builder Fund | September 30, 2019
| | | SHARES/
PRINCIPAL AMOUNT | VALUE |
| | Koninklijke KPN N.V. | 9,060,800 | $ 28,254,727 |
| | Orange S.A. | 41,129,580 | 645,316,324 |
| | Wireless Telecommunication Services — 6.3% | | |
| | China Mobile Ltd. | 58,587,774 | 484,761,747 |
| | MTN Group Ltd. | 8,286,886 | 52,692,448 |
| | Vodafone Group plc | 178,732,524 | 356,011,991 |
| | | | 1,927,175,848 |
| | Transportation — 2.5% | | |
| | Transportation Infrastructure — 2.5% | | |
| | Atlantia SpA | 12,466,878 | 301,523,884 |
| | Sydney Airport | 10,835,656 | 58,727,623 |
| | | | 360,251,507 |
| | Utilities — 4.1% | | |
| | Electric Utilities — 4.1% | | |
| | Electricite de France S.A. | 25,533,784 | 285,819,813 |
| | Enel SpA | 38,743,171 | 289,304,933 |
| | | | 575,124,746 |
| | Total Common Stock(Cost $10,133,235,172) | | 12,248,254,188 |
| | Preferred Stock — 0.4% | | |
| | Banks — 0.1% | | |
| | Banks — 0.1% | | |
| b,e,f,g | First Tennessee Bank N.A., 3.75% (LIBOR 3 Month + 0.85%) | 12,000 | 8,880,000 |
| | | | 8,880,000 |
| | Diversified Financials — 0.0% | | |
| | Capital Markets — 0.0% | | |
| f,g | Morgan Stanley, Series A 4.00% (LIBOR 3 Month + 0.70%) | 120,000 | 2,623,200 |
| | | | 2,623,200 |
| | Energy — 0.1% | | |
| | Oil, Gas & Consumable Fuels — 0.1% | | |
| g | Crestwood Equity Partners L.P., 9.25% | 2,166,596 | 20,008,514 |
| | | | 20,008,514 |
| | Miscellaneous — 0.1% | | |
| | U.S. Government Agencies — 0.1% | | |
| g | Farm Credit Bank of Texas, Series 1, 10.00% | 9,000 | 10,001,250 |
| | | | 10,001,250 |
| | Telecommunication Services — 0.1% | | |
| | Diversified Telecommunication Services — 0.1% | | |
| b,e,h | Centaur Funding Corp., 9.08%, 4/21/2020 | 15,000 | 15,547,500 |
| | | | 15,547,500 |
| | Total Preferred Stock(Cost $60,828,706) | | 57,060,464 |
| | Asset Backed Securities — 0.1% | | |
| | Other Asset Backed — 0.1% | | |
| e | CFG Investments Ltd. Series 2019-1 Class A, 5.56%, 8/15/2029 | $ 13,500,000 | 13,519,633 |
| b,c,e,f | Northwind Holdings, LLC, Series 2007-1A Class A1, 3.30% (LIBOR 3 Month + 0.78%), 12/1/2037 | 831,250 | 819,613 |
| | | | 14,339,246 |
| | Total Asset Backed Securities(Cost $14,237,536) | | 14,339,246 |
| | Corporate Bonds — 7.1% | | |
| | Automobiles & Components — 0.0% | | |
| | Auto Components — 0.0% | | |
| e,h | Nexteer Automotive Group Ltd., 5.875%, 11/15/2021 | 4,300,000 | 4,374,465 |
Schedule of Investments, Continued
Thornburg Investment Income Builder Fund | September 30, 2019
| | | SHARES/
PRINCIPAL AMOUNT | VALUE |
| | | | 4,374,465 |
| | Capital Goods — 0.1% | | |
| | Machinery — 0.1% | | |
| | Mueller Industries, Inc., 6.00%, 3/1/2027 | $ 7,679,000 | $ 7,755,790 |
| | | | 7,755,790 |
| | Commercial & Professional Services — 0.2% | | |
| | Commercial Services & Supplies — 0.2% | | |
| e,h | Cimpress N.V., 7.00%, 6/15/2026 | 26,610,000 | 27,469,503 |
| e | ServiceMaster Co., LLC, 5.125%, 11/15/2024 | 2,480,000 | 2,573,000 |
| | | | 30,042,503 |
| | Consumer Durables & Apparel — 0.1% | | |
| | Leisure Products — 0.1% | | |
| | Vista Outdoor, Inc., 5.875%, 10/1/2023 | 22,764,000 | 21,170,520 |
| | | | 21,170,520 |
| | Consumer Services — 0.0% | | |
| | Hotels, Restaurants & Leisure — 0.0% | | |
| e | Nathan’s Famous, Inc., 6.625%, 11/1/2025 | 6,188,000 | 6,157,060 |
| | | | 6,157,060 |
| | Diversified Financials — 0.4% | | |
| | Capital Markets — 0.1% | | |
| e | Compass Group Diversified Holdings, LLC, 8.00%, 5/1/2026 | 17,000,000 | 17,977,500 |
| b,c,e | JPR Royalty Sub, LLC, 14.00%, 9/1/2020 | 5,000,000 | 500,000 |
| | Consumer Finance — 0.1% | | |
| e | FirstCash, Inc., 5.375%, 6/1/2024 | 7,500,000 | 7,725,000 |
| | Diversified Financial Services — 0.2% | | |
| e | Antares Holdings L.P., 6.00%, 8/15/2023 | 18,000,000 | 18,647,922 |
| f,g | JPMorgan Chase & Co., Series I, 5.736% (LIBOR 3 Month + 3.47%), 10/30/2019 | 10,759,000 | 10,809,427 |
| | | | 55,659,849 |
| | Energy — 2.1% | | |
| | Energy Equipment & Services — 0.2% | | |
| | Enviva Partners L.P. / Enviva Partners Finance Corp., 8.50%, 11/1/2021 | 17,373,000 | 17,763,892 |
| | Odebrecht Offshore Drilling Finance Ltd., | | |
| e,h | 6.72%, 12/1/2022 | 3,836,283 | 3,750,005 |
| e,h,i | 7.72%, 12/1/2026 PIK | 16,351,207 | 4,277,803 |
| e,g,h | Odebrecht Oil & Gas Finance Ltd. (Guaranty: Odebrecht Oleo e Gas S.A.) Zero Coupon , 12/31/2099 | 2,337,727 | 20,455 |
| d,e,h,j | Schahin II Finance Co. SPV Ltd., 5.875%, 9/25/2023 | 11,640,133 | 811,550 |
| | Oil, Gas & Consumable Fuels — 1.9% | | |
| e | Enable Oklahoma Intrastate Transmission, LLC (Guaranty: Enable Midstream Partners L.P.), 6.25%, 3/15/2020 | 2,500,000 | 2,536,795 |
| f | Energy Transfer Operating L.P., 5.271% (LIBOR 3 Month + 3.02%), 11/1/2066 | 13,820,000 | 10,366,382 |
| b,f | Enterprise TE Partners L.P., Series 1, 4.909% (LIBOR 3 Month + 2.78%), 6/1/2067 | 7,000,000 | 6,483,323 |
| | Kinder Morgan Energy Partners L.P., | | |
| | 5.00%, 3/1/2043 | 10,000,000 | 10,973,425 |
| | 5.80%, 3/15/2035 | 10,000,000 | 11,743,838 |
| | Kinder Morgan, Inc., | | |
| | 5.30%, 12/1/2034 | 23,630,000 | 27,137,340 |
| | 5.55%, 6/1/2045 | 5,000,000 | 5,893,560 |
| b,c,d,e,j | Linc USA GP / Linc Energy Finance USA, Inc., 9.625%, 10/31/2017 | 15,590,162 | 646,992 |
| e | Par Petroleum, LLC / Par Petroleum Finance Corp., 7.75%, 12/15/2025 | 5,560,000 | 5,518,300 |
| d,j | RAAM Global Energy Co., 12.50%, 10/1/2015 | 15,000,000 | 18,750 |
| c,e,h,i | Schahin II Finance Co. SPV Ltd., 8.00%, 5/25/2020 PIK | 680,014 | 639,213 |
| | Summit Midstream Holdings, LLC / Summit Midstream Finance Corp., 5.50%, 8/15/2022 | 7,497,000 | 6,841,013 |
| g,k | Summit Midstream Partners L.P., Series A, 9.50% (LIBOR 3 Month + 7.43%), 12/15/2022 | 27,036,000 | 19,465,920 |
| | Transcontinental Gas Pipe Line Co., LLC, 7.85%, 2/1/2026 | 32,700,000 | 41,476,625 |
| | Williams Companies, Inc., | | |
| | 3.70%, 1/15/2023 | 29,129,000 | 30,123,244 |
| | 4.55%, 6/24/2024 | 69,318,000 | 74,607,384 |
| | 5.75%, 6/24/2044 | 14,198,000 | 16,384,467 |
Schedule of Investments, Continued
Thornburg Investment Income Builder Fund | September 30, 2019
| | | SHARES/
PRINCIPAL AMOUNT | VALUE |
| | | | 297,480,276 |
| | Food & Staples Retailing — 0.1% | | |
| | Food & Staples Retailing — 0.1% | | |
| e | C&S Group Enterprises, LLC, 5.375%, 7/15/2022 | $ 7,860,000 | $ 7,948,425 |
| e | KeHE Distributors, LLC / KeHE Finance Corp. 8.625%, 10/15/2026 | 5,852,000 | 5,969,040 |
| | | | 13,917,465 |
| | Food, Beverage & Tobacco — 0.4% | | |
| | Food Products — 0.1% | | |
| | B&G Foods, Inc., 5.25%, 4/1/2025 | 10,000,000 | 10,212,500 |
| | Tobacco — 0.3% | | |
| | Vector Group Ltd., | | |
| e | 6.125%, 2/1/2025 | 8,826,000 | 8,450,895 |
| e | 10.50%, 11/1/2026 | 41,900,000 | 42,738,000 |
| | | | 61,401,395 |
| | Healthcare Equipment & Services — 0.2% | | |
| | Health Care Providers & Services — 0.2% | | |
| e | Tenet Healthcare Corp., 6.25%, 2/1/2027 | 23,500,000 | 24,476,425 |
| | | | 24,476,425 |
| | Insurance — 0.5% | | |
| | Insurance — 0.5% | | |
| e,g,h,k | Dai-ichi Life Insurance Co. Ltd., 7.25% (LIBOR 3 Month + 4.56%), 7/25/2021 | 9,000,000 | 9,663,930 |
| e | MetLife, Inc., 9.25%, 4/8/2038 | 12,000,000 | 17,430,000 |
| e,h,k | QBE Insurance Group Ltd., 7.50% (USSW10 + 6.03%), 11/24/2043 | 40,000,000 | 44,560,000 |
| | | | 71,653,930 |
| | Materials — 0.4% | | |
| | Chemicals — 0.2% | | |
| | Consolidated Energy Finance S.A., | | |
| e,f,h | 5.869% (LIBOR 3 Month + 3.75%), 6/15/2022 | 5,500,000 | 5,487,192 |
| e,h | 6.875%, 6/15/2025 | 13,000,000 | 13,032,500 |
| e,h | Kissner Holdings L.P. / Kissner Milling Co. Ltd. / BSC Holding, Inc. / Kissner USA, 8.375%, 12/1/2022 | 14,520,000 | 15,137,100 |
| | Construction Materials — 0.1% | | |
| e,h | CIMPOR Financial Operations B.V., 5.75%, 7/17/2024 | 8,000,000 | 6,000,000 |
| | Containers & Packaging — 0.1% | | |
| e | Matthews International Corp. 5.25%, 12/1/2025 | 11,965,000 | 11,336,837 |
| | | | 50,993,629 |
| | Media & Entertainment — 0.3% | | |
| | Hotels, Restaurants & Leisure — 0.1% | | |
| | Speedway Motorsports, Inc. 5.125%, 2/1/2023 | 10,771,000 | 10,932,565 |
| | Media — 0.2% | | |
| e | CCO Holdings, LLC / CCO Holdings Capital Corp., 5.375%, 6/1/2029 | 4,390,000 | 4,675,350 |
| e | CSC Holdings LLC, 6.50%, 2/1/2029 | 4,000,000 | 4,445,900 |
| | DISH DBS Corp., 5.125%, 5/1/2020 | 4,000,000 | 4,045,000 |
| e | Salem Media Group, Inc., 6.75%, 6/1/2024 | 16,742,000 | 14,481,830 |
| e,h | Telenet Finance Luxembourg Notes Sarl, 5.50%, 3/1/2028 | 10,000,000 | 10,475,000 |
| | | | 49,055,645 |
| | Real Estate — 0.3% | | |
| | Equity Real Estate Investment Trusts — 0.3% | | |
| | CoreCivic, Inc. | | |
| | 4.625%, 5/1/2023 | 16,756,000 | 16,234,721 |
| | 4.75%, 10/15/2027 | 23,901,000 | 21,003,004 |
| | | | 37,237,725 |
| | Retailing — 0.1% | | |
| | Specialty Retail — 0.1% | | |
| e | Michaels Stores, Inc. 8.00%, 7/15/2027 | 18,500,000 | 18,523,125 |
| | | | 18,523,125 |
Schedule of Investments, Continued
Thornburg Investment Income Builder Fund | September 30, 2019
| | | SHARES/
PRINCIPAL AMOUNT | VALUE |
| | Software & Services — 0.0% | | |
| | Information Technology Services — 0.0% | | |
| e | Harland Clarke Holdings Corp., 8.375%, 8/15/2022 | $ 6,500,000 | $ 5,330,000 |
| | | | 5,330,000 |
| | Technology Hardware & Equipment — 0.1% | | |
| | Communications Equipment — 0.1% | | |
| | Anixter, Inc. 6.00%, 12/1/2025 | 8,000,000 | 8,840,000 |
| | | | 8,840,000 |
| | Telecommunication Services — 1.7% | | |
| | Diversified Telecommunication Services — 1.4% | | |
| h | Deutsche Telekom International Finance B.V. (Guaranty: Deutsche Telekom AG), 8.75%, 6/15/2030 | 26,150,000 | 38,612,392 |
| e,h | Digicel Ltd., 6.00%, 4/15/2021 | 51,737,000 | 36,475,102 |
| | Qwest Corp., 6.75%, 12/1/2021 | 9,000,000 | 9,726,840 |
| h | Telefonica Emisiones SAU (Guaranty: Telefonica S.A.), 7.045%, 6/20/2036 | 85,390,000 | 117,889,864 |
| | Wireless Telecommunication Services — 0.3% | | |
| e,h | Digicel International Finance Ltd., 8.75%, 5/25/2024 | 4,300,000 | 4,085,000 |
| e,h | Millicom International Cellular S.A., 6.00%, 3/15/2025 | 28,423,000 | 29,453,334 |
| | | | 236,242,532 |
| | Transportation — 0.1% | | |
| | Airlines — 0.1% | | |
| | American Airlines Pass Through Trust, Series 2013-2 Class A, 4.95%, 7/15/2024 | 2,644,444 | 2,771,906 |
| e,h | Guanay Finance Ltd., 6.00%, 12/15/2020 | 4,328,391 | 4,371,676 |
| | US Airways Pass Through Trust, Series 2010-1 Class A, 6.25%, 10/22/2024 | 1,450,581 | 1,577,361 |
| | | | 8,720,943 |
| | Total Corporate Bonds(Cost $935,810,741) | | 1,009,033,277 |
| | Municipal Bonds — 0.0% | | |
| | San Bernardino County Redevelopment Agency Successor Agency, Class A, 8.45%, 9/1/2030 | 2,555,000 | 2,667,522 |
| | Total Municipal Bonds(Cost $2,513,639) | | 2,667,522 |
| | Other Government — 0.1% | | |
| | Brazilian Government International Bond (BRL), 12.50%, 1/5/2022 | 20,000,000 | 5,517,178 |
| | Total Other Government(Cost $12,498,520) | | 5,517,178 |
| | Mortgage Backed — 0.0% | | |
| l | Bear Stearns ARM Trust, Whole Loan Securities Trust CMO, Series 2003-6 Class 2B1, 4.774%, 8/25/2033 | 57,725 | 55,617 |
| l | Citigroup Mortgage Loan Trust, Inc., Whole Loan Securities Trust CMO, Series 2004-HYB2 Class B1, 4.917%, 3/25/2034 | 346,973 | 305,569 |
| l | Merrill Lynch Mortgage Investors Trust, Whole Loan Securities Trust CMO, Series 2004-A4 Class M1, 4.38%, 8/25/2034 | 2,234,530 | 1,981,448 |
| | Total Mortgage Backed(Cost $2,710,496) | | 2,342,634 |
| | Loan Participations — 0.8% | | |
| | Commercial & Professional Services — 0.4% | | |
| | Professional Services — 0.4% | | |
| m | Harland Clarke Holdings Corp., 6.854% (LIBOR 3 Month + 4.75%), 11/3/2023 | 13,083,942 | 10,172,765 |
| m | Par Pacific Holdings, Inc., 9.10% (LIBOR 3 Month + 6.75%), 12/17/2025 | 9,945,000 | 9,920,138 |
| m | R.R. Donnelley & Sons Company, 7.044% (LIBOR 3 Month + 5.00%), 1/15/2024 | 16,872,500 | 16,914,681 |
| | RGIS Services, LLC, | | |
| m | 9.756% (LIBOR 3 Month + 7.50%), 3/31/2023 | 3,438,610 | 2,951,462 |
| m | 9.544% (LIBOR 1 Month + 7.50%), 3/31/2023 | 3,918,296 | 6,788,364 |
| m | 9.624% (LIBOR 3 Month + 7.50%), 3/31/2023 | 7,908,804 | 3,363,191 |
| | | | 50,110,601 |
| | Energy — 0.1% | | |
| | Oil, Gas & Consumable Fuels — 0.1% | | |
| c,i | Malamute Energy, Inc., 2.104% (LIBOR 3 Month + 1.50% PIK), 11/22/2022 | 313,684 | 313,684 |
| m,n,o | McDermott Technology Americas, Inc., 7.104% (LIBOR 3 Month + 5.00%), 5/9/2025 | 12,614,849 | 7,931,587 |
Schedule of Investments, Continued
Thornburg Investment Income Builder Fund | September 30, 2019
| | | SHARES/
PRINCIPAL AMOUNT | VALUE |
| | | | 8,245,271 |
| | Materials — 0.0% | | |
| | Chemicals — 0.0% | | |
| m | US Salt LLC, 6.794% (LIBOR 1 Month + 4.75%), 1/16/2026 | $ 5,434,690 | $ 5,455,070 |
| | | | 5,455,070 |
| | Media & Entertainment — 0.1% | | |
| | Media — 0.1% | | |
| m | ABG Intermediate Holdings 2, LLC, 9.794% (LIBOR 1 Month + 7.75%), 9/29/2025 | 14,711,566 | 14,660,076 |
| | | | 14,660,076 |
| | Retailing — 0.0% | | |
| | Specialty Retail — 0.0% | | |
| m | Office Depot, Inc., 7.307% (LIBOR 1 Month + 5.25%), 11/8/2022 | 2,550,647 | 2,566,588 |
| | | | 2,566,588 |
| | Software & Services — 0.1% | | |
| | Internet Software & Services — 0.1% | | |
| m | Dun & Bradstreet Corporation (The), 7.054% (LIBOR 1 Month + 5.00%), 2/6/2026 | 16,910,000 | 17,009,600 |
| | | | 17,009,600 |
| | Transportation — 0.1% | | |
| | Airlines — 0.1% | | |
| b,c,m | Wheels Up Partners, LLC, 8.632% (LIBOR 3 Month + 6.50%), 8/17/2025 | 11,346,957 | 11,120,017 |
| | | | 11,120,017 |
| | Total Loan Participations(Cost $116,253,437) | | 109,167,223 |
| | Short-Term Investments — 4.3% | | |
| a | Thornburg Capital Management Fund | 61,443,044 | 614,430,438 |
| | Total Short-Term Investments(Cost $614,430,438) | | 614,430,438 |
| | Total Investments — 99.0%(Cost $11,892,518,685) | | $14,062,812,170 |
| | Other Assets Less Liabilities — 1.0% | | 143,410,865 |
| | Net Assets — 100.0% | | $14,206,223,035 |
| Outstanding Forward Currency Contracts To Buy Or Sell At September 30, 2019 |
Contract
Description | Contract
Party* | Buy/Sell | Contract
Amount | Contract
Value Date | Value
USD | Unrealized
Appreciation | Unrealized
Depreciation |
| Great Britain Pound | SSB | Sell | 489,170,800 | 10/10/2019 | 601,660,068 | $ 12,391,145 | $ — |
| Swiss Franc | SSB | Sell | 48,415,700 | 10/23/2019 | 48,598,730 | 1,118,058 | — |
| Swiss Franc | SSB | Buy | 8,150,100 | 10/23/2019 | 8,180,911 | — | (236,710) |
| Chinese Yuan Renminbi | SSB | Sell | 1,737,154,800 | 10/25/2019 | 243,180,070 | 8,987,156 | — |
| Korean Won | SSB | Sell | 80,214,552,000 | 10/30/2019 | 67,110,322 | 870,992 | — |
| Korean Won | SSB | Sell | 25,682,416,000 | 10/30/2019 | 21,486,815 | 53,415 | — |
| Euro | SSB | Sell | 1,360,650,600 | 11/15/2019 | 1,487,876,827 | 45,091,871 | — |
| Euro | SSB | Buy | 57,083,400 | 11/15/2019 | 62,420,924 | — | (1,043,075) |
| Thailand Baht | BBH | Sell | 1,234,996,300 | 11/21/2019 | 40,415,253 | — | (483,919) |
| Thailand Baht | BBH | Buy | 234,532,100 | 11/21/2019 | 7,675,063 | 1,588 | — |
| Thailand Baht | BBH | Buy | 187,414,700 | 11/21/2019 | 6,133,146 | 6,681 | — |
| Thailand Baht | BBH | Buy | 356,338,500 | 11/21/2019 | 11,661,177 | 40,054 | — |
| Thailand Baht | BBH | Buy | 151,468,800 | 11/21/2019 | 4,956,816 | — | (1,570) |
| Thailand Baht | BBH | Buy | 111,781,700 | 11/21/2019 | 3,658,056 | — | (27,460) |
| Thailand Baht | BBH | Buy | 33,578,300 | 11/21/2019 | 1,098,850 | — | (1,321) |
| Thailand Baht | BBH | Buy | 58,717,400 | 11/21/2019 | 1,921,527 | 1,703 | — |
Schedule of Investments, Continued
Thornburg Investment Income Builder Fund | September 30, 2019
| Outstanding Forward Currency Contracts To Buy Or Sell At September 30, 2019 |
Contract
Description | Contract
Party* | Buy/Sell | Contract
Amount | Contract
Value Date | Value
USD | Unrealized
Appreciation | Unrealized
Depreciation |
| Thailand Baht | BBH | Buy | 101,164,800 | 11/21/2019 | 3,310,618 | $ 5,227 | $ — |
| |
| Total | | | | | | $68,567,890 | $(1,794,055) |
| |
| Net unrealized appreciation (depreciation) | | | | | | $66,773,835 | |
| * | Counterparties include State Street Bank and Trust Company (“SSB”) and Brown Brothers Harriman & Co. (“BBH”). |
| Footnote Legend |
| a | Investment in Affiliates. |
| b | Illiquid security. |
| c | Security currently fair valued by the Valuation and Pricing Committee using procedures approved by the Trustees’ Audit Committee. |
| d | Non-income producing. |
| e | Securities exempt from registration under Rule 144A of the Securities Act of 1933, as amended. These securities are restricted and may only be resold in the ordinary course of business in transactions exempt from registration, normally to qualified institutional buyers. As of September 30, 2019, the aggregate value of these securities in the Fund’s portfolio was $486,938,970, representing 3.43% of the Fund’s net assets. |
| f | Floating Rate Security. Stated interest/floor rate was in effect at September 30, 2019. |
| g | Securities are perpetual and, thus, do not have a predetermined maturity date. The date shown, if applicable, reflects the next call date. |
| h | Yankee bond denominated in U.S. dollars and is issued in the U.S. by foreign banks and corporations. |
| i | Pay-In-Kind Payments (PIK). The issuer may pay cash interest and/or interest in additional debt securities. Rates shown are the rates in effect at September 30, 2019. |
| j | Bond in default. |
| k | Fixed to floating security that initially pays a fixed rate and converts to a floating rate coupon at a specified date in the future. The rate presented is a fixed rate. |
| l | Variable rate coupon, rate shown as of September 30, 2019. |
| m | The stated coupon rate represents the greater of the LIBOR or the LIBOR floor rate plus a spread at September 30, 2019. |
| n | This position or a portion of this position represents an unsettled loan purchase. The coupon rate will be effective at the time of settlement and will be based upon the London-Interbank Offered Rate ("LIBOR") plus a premium which was determined at the time of purchase. |
| o | When-issued security. |
Portfolio Abbreviations
To simplify the listings of securities, abbreviations are used per the table below:
| ADR | American Depositary Receipt |
| ARM | Adjustable Rate Mortgage |
| BRL | Denominated in Brazilian Real |
| CMO | Collateralized Mortgage Obligation |
| LIBOR | London Interbank Offered Rates |
| MFA | Mortgage Finance Authority |
| SPV | Special Purpose Vehicle |
See notes to financial statements.
Statement of Assets and Liabilities
Thornburg Investment Income Builder Fund | September 30, 2019
| ASSETS | |
| Investments at value (Note 3) | |
| Non-affiliated issuers (cost $10,768,070,531) | $ 12,976,953,064 |
| Non-controlled affiliated issuers (cost $1,124,448,154) | 1,085,859,106 |
| Cash | 7,519,492 |
| Cash denominated in foreign currency (cost $29) | 29 |
| Receivable for investments sold | 27,643,440 |
| Receivable for fund shares sold | 11,529,997 |
| Unrealized appreciation on forward currency contracts (Note 7) | 68,567,890 |
| Dividends receivable | 37,527,145 |
| Dividend and interest reclaim receivable | 31,178,498 |
| Interest receivable | 19,872,487 |
| Prepaid expenses and other assets | 195,297 |
| Total Assets | 14,266,846,445 |
| Liabilities | |
| Payable for investments purchased | 14,616,259 |
| Payable for fund shares redeemed | 14,125,736 |
| Unrealized depreciation on forward currency contracts (Note 7) | 1,794,055 |
| Payable to investment advisor and other affiliates (Note 4) | 12,062,268 |
| Deferred taxes payable (Note 2) | 99,071 |
| Accounts payable and accrued expenses | 4,631,604 |
| Dividends payable | 13,294,417 |
| Total Liabilities | 60,623,410 |
| Commitments and contingencies (Note 2) | |
| Net Assets | $ 14,206,223,035 |
| NET ASSETS CONSIST OF | |
| Distributable earnings | $ 1,541,875,161 |
| Net capital paid in on shares of beneficial interest | 12,664,347,874 |
| | $ 14,206,223,035 |
Statement of Assets and Liabilities, Continued
Thornburg Investment Income Builder Fund | September 30, 2019
| NET ASSET VALUE | |
| Class A Shares: | |
Net asset value and redemption price per share
($3,458,384,626 applicable to 159,236,101 shares of beneficial interest outstanding - Note 5) | $ 21.72 |
| Maximum sales charge, 4.50% of offering price | 1.02 |
| Maximum offering price per share | $ 22.74 |
| Class C Shares: | |
Net asset value and offering price per share*
($2,658,580,692 applicable to 122,558,268 shares of beneficial interest outstanding - Note 5) | $ 21.69 |
| Class I Shares: | |
Net asset value, offering and redemption price per share
($7,810,067,531 applicable to 356,998,002 shares of beneficial interest outstanding - Note 5) | $ 21.88 |
| Class R3 Shares: | |
Net asset value, offering and redemption price per share
($36,154,829 applicable to 1,665,272 shares of beneficial interest outstanding - Note 5) | $ 21.71 |
| Class R4 Shares: | |
Net asset value, offering and redemption price per share
($25,221,613 applicable to 1,160,132 shares of beneficial interest outstanding - Note 5) | $ 21.74 |
| Class R5 Shares: | |
Net asset value, offering and redemption price per share
($59,890,011 applicable to 2,739,413 shares of beneficial interest outstanding - Note 5) | $ 21.86 |
| Class R6 Shares: | |
Net asset value, offering and redemption price per share
($157,923,733 applicable to 7,242,238 shares of beneficial interest outstanding - Note 5) | $ 21.81 |
| * | Redemption price per share is equal to net asset value less any applicable contingent deferred sales charge. |
See notes to financial statements.
Statement of Operations
Thornburg Investment Income Builder Fund | Year Ended September 30, 2019
| INVESTMENT INCOME | |
| Dividend income | |
| Non-affiliated issuers (net of foreign taxes withheld of $54,692,363) | $ 641,689,782 |
| Non-controlled affiliated issuer | 57,278,271 |
| Interest income (net of premium amortized of $1,002,818) | 88,068,574 |
| Total Income | 787,036,627 |
| EXPENSES | |
| Investment advisory fees (Note 4) | 98,478,084 |
| Administration fees (Note 4) | |
| Class A Shares | 2,870,438 |
| Class C Shares | 2,737,134 |
| Class I Shares | 6,633,628 |
| Class R3 Shares | 35,731 |
| Class R4 Shares | 23,869 |
| Class R5 Shares | 49,074 |
| Class R6 Shares | 136,557 |
| Distribution and service fees (Note 4) | |
| Class A Shares | 8,169,212 |
| Class C Shares | 31,181,369 |
| Class R3 Shares | 203,552 |
| Class R4 Shares | 67,987 |
| Transfer agent fees | |
| Class A Shares | 2,349,054 |
| Class C Shares | 2,052,358 |
| Class I Shares | 5,409,475 |
| Class R3 Shares | 97,783 |
| Class R4 Shares | 107,221 |
| Class R5 Shares | 138,554 |
| Class R6 Shares | 9,901 |
| Registration and filing fees | |
| Class A Shares | 36,293 |
| Class C Shares | 24,759 |
| Class I Shares | 72,604 |
| Class R3 Shares | 12,798 |
| Class R4 Shares | 12,932 |
| Class R5 Shares | 13,647 |
| Class R6 Shares | 13,471 |
| Custodian fees | 1,374,334 |
| Professional fees | 450,661 |
| Trustee and officer fees (Note 4) | 829,745 |
| Other expenses | 1,138,250 |
| Total Expenses | 164,730,475 |
| Less: | |
| Expenses reimbursed by investment advisor (Note 4) | (143,560) |
| Net Expenses | 164,586,915 |
| Net Investment Income | $ 622,449,712 |
Statement of Operations, Continued
Thornburg Investment Income Builder Fund | Year Ended September 30, 2019
| REALIZED AND UNREALIZED GAIN (LOSS) | |
| Net realized gain (loss) on: | |
| Investments | |
| Non-affiliated issuer investments (net of realized capital gain taxes paid of $1,161,339) | $ (55,247,066) |
| Non-controlled affiliated issuers | (1,758,255) |
| Forward currency contracts (Note 7) | 151,956,001 |
| Foreign currency transactions | (976,801) |
| | 93,973,879 |
| Net change in unrealized appreciation (depreciation) on: | |
| Investments | |
| Non-affiliated issuers investments (net of change in deferred taxes payable of $329,206) | (249,340,612) |
| Non-controlled affiliated issuers | (500,364) |
| Forward currency contracts (Note 7) | 80,726,550 |
| Foreign currency translations | (589,339) |
| | (169,703,765) |
| Net Realized and Unrealized Loss | (75,729,886) |
| Net Increase in Net Assets Resulting from Operations | $ 546,719,826 |
See notes to financial statements.
Statements of Changes in Net Assets
Thornburg Investment Income Builder Fund
| | Year Ended
September 30, 2019 | Year Ended
September 30, 2018 |
| INCREASE (DECREASE) IN NET ASSETS FROM | | |
| OPERATIONS | | |
| Net investment income | $ 622,449,712 | $ 657,775,372 |
| Net realized gain (loss) on investments, forward currency contracts, foreign currency transactions and capital gain taxes | 93,973,879 | 100,294,935 |
| Net change in unrealized appreciation (depreciation) on investments, forward currency contracts, foreign currency translations and deferred taxes | (169,703,765) | 114,483,110 |
| Net Increase in Net Assets Resulting from Operations | 546,719,826 | 872,553,417 |
| DIVIDENDS TO SHAREHOLDERS | | |
| From distributable earnings | | |
| Class A Shares | (145,285,706) | (138,833,506) |
| Class C Shares | (115,848,620) | (149,227,867) |
| Class I Shares | (353,388,550) | (350,849,203) |
| Class R3 Shares | (1,660,148) | (2,187,106) |
| Class R4 Shares | (1,133,088) | (1,478,685) |
| Class R5 Shares | (2,557,558) | (3,118,926) |
| Class R6 Shares | (7,383,222) | (4,471,743) |
| FUND SHARE TRANSACTIONS (NOTE 5) | | |
| Class A Shares | 83,585,956 | (47,263,859) |
| Class C Shares | (888,620,255) | (1,141,224,379) |
| Class I Shares | 35,004,150 | (109,066,905) |
| Class R3 Shares | (10,267,472) | (21,579,289) |
| Class R4 Shares | (5,668,174) | (13,511,065) |
| Class R5 Shares | 422,399 | (33,806,568) |
| Class R6 Shares | 1,725,253 | 117,160,492 |
| Net Decrease in Net Assets | (864,355,209) | (1,026,905,192) |
| NET ASSETS | | |
| Beginning of Year | 15,070,578,244 | 16,097,483,436 |
| End of Year | $ 14,206,223,035 | $ 15,070,578,244 |
See notes to financial statements.
Notes to Financial Statements
Thornburg Investment Income Builder Fund | September 30, 2019
NOTE 1 – ORGANIZATION
Thornburg Investment Income Builder Fund (the “Fund”) is a diversified series of Thornburg Investment Trust (the “Trust”). The Trust was organized as a Massachusetts business trust under a Declaration of Trust dated June 3, 1987 and is registered as a diversified, open-end management investment company under the Investment Company Act of 1940, as amended (the "1940 Act"). The Fund is currently one of twenty-two separate series of the Trust. Each series is considered to be a separate entity for financial reporting and tax purposes and bears expenses directly attributable to it. The Fund’s primary investment goal is to provide a level of current income which exceeds the average yield on U.S. stocks generally, and which will generally grow, subject to periodic fluctuations, over the years on a per share basis. The Fund’s secondary investment goal is long-term capital appreciation.
The Fund currently offers seven classes of shares of beneficial interest: Class A, Class C, Institutional Class (“Class I”), and Retirement Classes (“Class R3”, “Class R4”, “Class R5”, and “Class R6”). Each class of shares of the Fund represents an interest in the same portfolio of investments, except that (i) Class A shares are sold subject to a front-end sales charge collected at the time the shares are purchased and bear a service fee, (ii) Class C shares are sold at net asset value without a sales charge at the time of purchase, but are subject to a contingent deferred sales charge upon redemption within one year of purchase, and bear both a service fee and a distribution fee, (iii) Class I and Class R5 shares are sold at net asset value without a sales charge at the time of purchase and may be subject to a service fee, (iv) Class R3 shares are sold at net asset value without a sales charge at the time of purchase, but bear both a service fee and distribution fee, (v) Class R4 shares are sold at net asset value without a sales charge at the time of purchase, but bear a service fee, (vi) Class R6 shares are sold at net asset value without a sales charge at the time of purchase, and (vii) the respective classes may have different reinvestment privileges and conversion rights. Additionally, the Fund may allocate among its classes certain expenses, to the extent allocable to specific classes, including administration fees, transfer agent fees, government registration fees, certain printing and postage costs, and administrative and legal expenses. Currently, class specific expenses of the Fund are limited to service and distribution fees and certain registration and transfer agent expenses.
The following is a summary of significant accounting policies followed by the Fund in the preparation of its financial statements. The Fund prepares its financial statements in conformity with United States generally accepted accounting principles (“GAAP”), including investment company accounting and reporting guidance in the Financial Accounting Standards Board (the “FASB”) Accounting Standard Codification Topic 946.
NOTE 2 – SIGNIFICANT ACCOUNTING POLICIES
Security Valuation: All investments in securities held by the Fund are valued as described in Note 3.
Allocation of Income, Gains, Losses and Expenses: Net investment income (other than class specific expenses) and realized and unrealized gains and losses are allocated daily to each class of shares based upon the relative net asset value of outstanding shares (or the value of the dividend-eligible shares, as appropriate) of each class of shares at the beginning of the day (after adjusting for the current capital shares activity of the respective class). Expenses common to all Funds are allocated among the Funds comprising the Trust based upon their relative net asset values or other appropriate allocation methods. Operating expenses directly attributable to a specific class are charged against the operating income of that class.
Dividends and Distributions to Shareholders: Dividends and distributions to shareholders, which are determined in accordance with federal income tax regulations and may differ from GAAP, are recorded on the ex-dividend date. Ordinary income dividends, if any, are declared and paid annually. Capital gain distributions, if any, are declared and paid annually and more often if deemed necessary by Thornburg Investment Management, Inc., the Trust’s investment advisor (the “Advisor”). Dividends and distributions are paid and are reinvested in additional shares of the Fund at net asset value per share at the close of business on the ex-dividend date, or at the shareholder’s option, paid in cash.
Investment Income: Dividend income is recorded on the ex-dividend date. Certain income from foreign investments is recognized as soon as information is available to the Fund. Interest income is accrued as earned. Premiums and discounts are amortized and accreted, respectively, to first call dates or maturity dates using the effective yield method of the respective investments. These amounts are included in Investment Income in the Statement of Operations.
Investment Transactions: Investment transactions are accounted for on a trade date basis. Realized gains and losses from the sale of investments are recorded on an identified cost basis.
Unfunded Loan Commitments: The Fund has entered into a loan commitment with Malamute Energy, Inc., of which at September 30, 2019, $313,684 of the $632,434 par commitment had been funded. The maturity date is December 31, 2019.
When-Issued and Delayed Delivery Transactions: The Fund may engage in when-issued or delayed delivery transactions. To the extent the Fund engages in such transactions, it will do so for the purpose of acquiring portfolio investments consistent with the Fund’s investment
Notes to Financial Statements, Continued
Thornburg Investment Income Builder Fund | September 30, 2019
objectives and not for the purpose of investment leverage or to speculate on interest rate or market changes. At the time the Fund makes a commitment to purchase an investment on a when-issued or delayed delivery basis, the Fund will record the transaction and reflect the value in determining its net asset value. When effecting such transactions, assets of an amount sufficient to make payment for the portfolio investments to be purchased will be segregated on the Fund’s records on the trade date. Investments purchased on a when-issued or delayed delivery basis do not earn interest until the settlement date. The values of these securities held at September 30, 2019 are detailed in the Schedule of Investments.
Foreign Currency Translation: Portfolio investments and other assets and liabilities denominated in foreign currencies are translated into U.S. dollars based on the exchange rate of such currencies against the U.S. dollar on the date of valuation. Purchases and sales of investments and income items denominated in foreign currencies are translated into U.S. dollars at the exchange rate in effect on the transaction date. When the Fund purchases or sells foreign investments, it will customarily enter into a foreign exchange contract to minimize foreign exchange risk from the trade date to the settlement date of such transactions. The values of such spot contracts are included in receivable for investments sold and payable for investments purchased on the Statement of Assets and Liabilities.
The Fund does not separately report the effect of changes in foreign exchange rates from changes in market prices on investments held. Such changes are included in net unrealized appreciation (depreciation) from investments in the Statement of Operations.
Reported net realized gains and losses from foreign currency transactions arise due to purchases and sales of foreign currencies, currency gains and losses realized between the trade and settlement dates on investment transactions and the difference between the amounts of dividends, interest, and foreign withholding taxes recorded on the Fund’s books, and the U.S. dollar equivalent of the amounts actually received or paid. These amounts are included in foreign currency transactions in the Statement of Operations.
Net change in unrealized appreciation (depreciation) on foreign currency translations arise from changes in the fair value of assets and liabilities, other than investments at period end, resulting from changes in exchange rates.
Guarantees and Indemnifications: Under the Trust’s organizational documents (and under separate agreements with the independent Trustees), its officers and Trustees are provided with an indemnification against certain liabilities arising out of the performance of their duties to the Fund. In the normal course of business the Trust may also enter into contracts with service providers that contain general indemnifications. The Trust’s maximum exposure under these arrangements is unknown. However, based on experience, the Trust expects the risk of loss to be remote.
Use of Estimates: The preparation of financial statements in conformity with GAAP requires management to make estimates and assumptions that affect the reported amounts of assets and liabilities and disclosure of contingent assets and liabilities at the date of the financial statements and the reported amounts of increases (decreases) in net assets from operations during the reporting period. Actual results could differ from those estimates.
Federal Income Taxes: It is the policy of the Trust to comply with the provisions of the Internal Revenue Code applicable to regulated investment companies and to distribute to shareholders substantially all investment company taxable income including net realized gains on investments (if any), and tax exempt income of the Fund. Therefore, no provision for federal income or excise tax is required.
The Fund files income tax returns in United States federal and applicable state jurisdictions. The statute of limitations on the Fund’s tax return filings generally remains open for the three years following a return’s filing date. The Fund has analyzed each uncertain tax position believed to be material in the preparation of the Fund’s financial statements for the fiscal year ended September 30, 2019, including open tax years, to assess whether it is more likely than not that the position would be sustained upon examination, based on the technical merits of the position. The Fund has not identified any such position for which an asset or liability must be reflected in the Statement of Assets and Liabilities.
At September 30, 2019, information on the tax components of capital was as follows:
| Cost of investments for tax purposes | $ 12,098,182,278 |
| Gross unrealized appreciation on a tax basis | 2,606,306,105 |
| Gross unrealized depreciation on a tax basis | (574,902,378) |
| Net unrealized appreciation (depreciation) on investments (tax basis) | $ 2,031,403,727 |
Temporary book to tax adjustments to cost of investments and net unrealized appreciation (depreciation) for tax purposes result primarily from deferral of outstanding wash sales, outstanding tax basis adjustments for publicly traded partnerships (“PTP”), real estate investment trusts (“REITs”), marked-to-market of foreign currency contracts, and return of capital basis adjustments on non-REIT securities.
At September 30, 2019, the Fund had deferred tax basis capital losses occurring subsequent to October 31, 2018 through September 30, 2019 of $74,824,138. For tax purposes, such losses will be recognized in the year ending September 30, 2020.
Notes to Financial Statements, Continued
Thornburg Investment Income Builder Fund | September 30, 2019
At September 30, 2019, the Fund had cumulative tax basis capital losses of $480,015,129 (of which $480,015,129 are short-term and $0 are long-term), which may be carried forward to offset future capital gains. To the extent such carryforwards are used, capital gain distributions may be reduced to the extent provided by regulations. Such capital loss carryforwards do not expire.
During the year ended September 30, 2019, the Fund utilized $194,381,743 of capital loss carryforwards generated after September 30, 2011.
In order to account for permanent book to tax differences, the Fund increased distributable earnings by $2, and decreased net capital paid in on shares of beneficial interest by $2. Reclassifications have no impact upon the net asset value of the Fund and resulted primarily from foreign currency gains (losses), publicly traded partnerships (“PTP”), and real estate investment trusts (“REITs”), disposition of passive foreign investment company ("PFIC") investments, mortgage-backed securities (“MBS”) losses, return of capital basis adjustments on non-REIT securities, and foreign capital gain taxes.
At September 30, 2019, the Fund had $79,021,005 of undistributed tax basis ordinary investment income and no undistributed tax basis capital gains.
Foreign Withholding Taxes: The Fund is subject to foreign tax withholding imposed by certain foreign countries in which the Fund may invest. Withholding taxes are incurred on certain foreign dividends and are accrued at the time the dividend is recognized based on applicable foreign tax laws. The Fund may file withholding tax reclaims in certain jurisdictions to recover a portion of amounts previously withheld, in view of various considerations, including recent decisions rendered by the courts in those and other jurisdictions. The Fund would expect to record a receivable for such a reclaim based on a variety of factors, including assessment of a jurisdiction’s legal obligation to pay reclaims, the jurisdiction’s administrative practices and payment history, and industry convention. To date the Fund has recorded no such receivable because there is limited precedent for collecting such prior year reclaims and the likelihood of collection remains uncertain.
Deferred Foreign Capital Gain Taxes: The Fund is subject to a tax imposed on net realized gains of securities of certain foreign countries. The Fund records an estimated deferred tax liability for net unrealized gains on these investments as reflected in the accompanying financial statements. Such changes are included in net unrealized appreciation (depreciation) from investments in the Statement of Operations.
The tax character of distributions paid during the year ended September 30, 2019, and September 30, 2018, was as follows:
| | 2019 | 2018 |
| Distributions from: | | |
| Ordinary income | $ 627,256,892 | $ 650,167,036 |
| Total | $ 627,256,892 | $ 650,167,036 |
NOTE 3 – SECURITY VALUATION
Valuation of the Fund’s portfolio investment securities is performed in accordance with policies and procedures adopted by and under the oversight of the Trustees.
The Trustees of the Trust have appointed the Advisor to assist the Trustees with obtaining fair market values for portfolio investments, evaluating and monitoring professional pricing service providers appointed by the Trustees’ Audit Committee (the “Audit Committee”) to assist in determining fair values for portfolio investments, assisting in calculating fair values for portfolio investments in certain circumstances, and performing other functions in connection with the valuation of investments. The Advisor acts through its Valuation and Pricing Committee (the “Committee”) and other employees of the Advisor. The Committee regularly reviews its own valuation calculations, reviews the valuations, valuation techniques and services furnished by pricing service providers, considers circumstances which may require valuation calculations by the Committee, and reviews previous valuation calculations. The Committee reports to the Audit Committee on the Committee’s activities, the performance of pricing service providers, and other matters relating to valuation of portfolio investments.
In those instances when the Committee assists in calculating a fair value for a portfolio investment, the Committee seeks to determine the price that the Fund would reasonably expect to receive upon a sale of the investment in an orderly transaction between market participants on the valuation date. The Committee customarily utilizes quotations from securities broker dealers in calculating valuations, but also may utilize prices obtained from pricing service providers or other methods approved by the Audit Committee. Because fair values calculated by the Committee are estimates, the calculation of a value for an investment may differ from the price that would be realized by the Fund upon a sale of the investment, and the difference could be material to the Fund’s financial statements. The Committee’s calculation of a fair value for an investment may also differ from the prices obtained by other persons (including other mutual funds) for the investment.
Notes to Financial Statements, Continued
Thornburg Investment Income Builder Fund | September 30, 2019
Valuation of Securities: Securities and other portfolio investments which are listed or traded on a United States securities exchange are valued at the last reported sale price on the valuation date. Investments listed or traded on an exchange for which there has been no sale that day are valued at the mean between the last reported bid and asked prices on that valuation date. Portfolio investments reported by NASDAQ are valued at the official closing price on the valuation date. If an investment is traded on more than one exchange, the investment is considered traded on the exchange that is normally the primary market for that investment. Securities and other portfolio investments which are listed or traded on exchanges outside the United States are valued at the last price or the closing price of the investment on the exchange that is normally the primary market for the investment, as of the close of the exchange preceding the Fund’s valuation date. Foreign investments listed or traded on an exchange for which there has been no sale that day are valued at the mean between the last reported bid and asked prices on that valuation date.
In any case when a market quotation is not readily available for a portfolio investment ordinarily valued by market quotation, the Committee calculates a fair value for the investment using alternative methods approved by the Audit Committee. A market quotation is not readily available when the primary market or exchange for the investment is not open for the entire scheduled day of trading. Market quotations for an investment also may not be readily available if developments after the most recent close of the investment’s primary exchange or market, but prior to the close of business on any Fund business day, or an unusual event or significant period of time occurring since the availability of a market quotation, create a serious question concerning the reliability of the most recent market quotation available for the investment. In particular, on days when market volatility thresholds established by the Audit Committee are exceeded, foreign equity investments held by the Fund may be valued using alternative methods. The Committee customarily obtains valuations in these instances from pricing service providers approved by the Audit Committee. Pricing service providers ordinarily calculate valuations using multi-factor models to adjust market prices based upon various inputs, including exchange data, depository receipt prices, futures, index data and other data.
Debt obligations held by the Fund which are not listed or traded on exchanges or for which no reported market exists are ordinarily valued at the valuation obtained from a pricing service provider approved by the Audit Committee.
In any case when a pricing service provider fails to provide a valuation for a debt obligation held by the Fund, the Committee calculates a fair value for the obligation using alternative methods under procedures approved by the Audit Committee. Additionally, in cases when management believes that a valuation obtained from a pricing service provider is stale, does not reflect material factors affecting the valuation of the investment, is significantly different than the value the Fund is likely to obtain if it sought a bid for the investment, or is otherwise unreliable, the Committee calculates a fair value for the obligation using an alternative method approved by the Audit Committee.
Quotations for foreign investments expressed in foreign currency amounts are converted to U.S. dollar equivalents using a foreign exchange quotation from a third party service provider at the time of valuation. Foreign investments held by the Fund may be traded on days and at times when the Fund is not open for business. Consequently, the value of Fund investments may be significantly affected on days when shareholders cannot purchase or sell Fund shares.
Valuation Hierarchy: The Fund categorizes its investments based upon the inputs used in valuing those investments, according to a three-level hierarchy established in guidance from the FASB. Categorization of investments using this hierarchy is intended by the FASB to maximize the use of observable inputs in valuing investments and minimize the use of unobservable inputs by requiring that the most observable inputs be used when available. Observable inputs are those that market participants would use in valuing an investment based on available market information. Unobservable inputs are those that reflect assumptions about the information market participants would use in valuing an investment. An investment’s level within the hierarchy is based on the lowest level input that is deemed significant to the valuation. The methodologies and inputs used to value investments are not necessarily indications of the risk or liquidity associated with those investments.
Various inputs are used in calculating valuations for the Fund’s investments. These inputs are generally summarized according to the three-level hierarchy below:
Level 1: Quoted prices in active markets for identical investments.
Level 2: Other direct or indirect significant observable inputs (including quoted prices for similar investments in active markets and other observable inputs, such as interest rates, prepayment rates, credit ratings, etc.).
Level 3: Significant unobservable inputs (including the Committee’s own assumptions in calculating the fair values of investments).
Valuations for debt obligations held by the Fund are typically calculated by pricing service providers approved by the Audit Committee and are generally characterized as Level 2 within the valuation hierarchy.
On days when market volatility thresholds established by the Audit Committee are exceeded, foreign securities for which valuations are obtained from pricing service providers are fair valued. On these days, the foreign securities are characterized as Level 2 within the valuation hierarchy and revert to Level 1 after the threshold is no longer exceeded.
Notes to Financial Statements, Continued
Thornburg Investment Income Builder Fund | September 30, 2019
In a limited number of cases the Committee calculates a fair value for investments using broker quotations or other methods approved by the Audit Committee. When the Committee uses a single broker quotation to calculate a fair value for an investment without other significant observable inputs, or if a fair value is calculated using other significant inputs that are considered unobservable, the investment is characterized as Level 3 within the hierarchy. Other significant unobservable inputs used to calculate a fair value in these instances might include an income-based valuation approach which considers discounted anticipated future cash flows from the investment and application of discounts due to the nature or duration of any restrictions on the disposition of the investment.
Valuations based upon the use of inputs from Levels 1, 2 or 3 may not represent the actual price received upon the disposition of an investment, and a Fund may receive a price that is lower than the valuation based upon these inputs when it sells the investment.
The following table displays a summary of the fair value hierarchy measurements of the Fund’s investments as of September 30, 2019:
| | Fair Value Measurements at September 30, 2019 |
| | TOTAL | LEVEL 1 | LEVEL 2 | LEVEL 3 |
| Assets | | | | |
| Investments in Securities* | | | | |
| Common Stock(a) | $ 12,248,254,188 | $ 11,770,030,907 | $ 478,092,671 | $ 130,610 |
| Preferred Stock(a) | 57,060,464 | 22,631,714 | 34,428,750 | — |
| Asset Backed Securities | 14,339,246 | — | 13,519,633 | 819,613 |
| Corporate Bonds | 1,009,033,277 | — | 1,007,247,072 | 1,786,205 |
| Municipal Bonds | 2,667,522 | — | 2,667,522 | — |
| Other Government | 5,517,178 | — | 5,517,178 | — |
| Mortgage Backed | 2,342,634 | — | 2,342,634 | — |
| Loan Participations | 109,167,223 | — | 97,733,522 | 11,433,701 |
| Short-Term Investments | 614,430,438 | 614,430,438 | — | — |
| Total Investments in Securities | $14,062,812,170 | $12,407,093,059 | $1,641,548,982 | $14,170,129(b)(c) |
| Other Financial Instruments | | | | |
| Forward Currency Contracts | $ 68,567,890 | $ — | $ 68,567,890 | $ — |
| Total Assets | $14,131,380,060 | $12,407,093,059 | $1,710,116,872 | $14,170,129 |
| Liabilities | | | | |
| Other Financial Instruments | | | | |
| Forward Currency Contracts | $ (1,794,055) | $ — | $ (1,794,055) | $ — |
| Total Liabilities | $(1,794,055) | $— | $(1,794,055) | $— |
| * | See Schedule of Investments for a summary of the industry exposure as grouped according to the Global Industry Classification Standard (GICS), which is an industry taxonomy developed by MSCI, Inc. and Standard & Poor’s (S&P). |
| (a) | At September 30, 2019, industry classifications for Common Stock and Preferred Stock in level 2 and Level 3 consist of $8,880,000 in Banks, $130,610 in Energy, $10,001,250 in Miscellaneous, $478,092,671 in Semiconductors & Semiconductor Equipment and $15,547,500 in Telecommunication Services. |
| (b) | Level 3 investments at the beginning and/or end of the period in relation to net assets were not significant and accordingly, a reconciliation of Level 3 assets for the period ended September 30, 2019 is not presented. |
| (c) | During the fiscal year ended September 30, 2019, there were no significant transfers into or out of Level 3 of the fair value hierarchy. |
NOTE 4 – INVESTMENT ADVISORY FEE AND OTHER TRANSACTIONS WITH AFFILIATES
Pursuant to an investment advisory agreement, the Advisor serves as the investment advisor and performs services for the Fund for which the fees are payable at the end of each month. Under the investment advisory agreement, the Fund pays the Advisor a management fee based on the average daily net assets of the Fund at an annual rate as shown in the following table:
| Management Fee Schedule |
| DAILY NET ASSETS | FEE RATE |
| Up to $500 million | 0.875% |
| Next $500 million | 0.825 |
| Next $500 million | 0.775 |
| Next $500 million | 0.725 |
| Over $2 billion | 0.675 |
Notes to Financial Statements, Continued
Thornburg Investment Income Builder Fund | September 30, 2019
The Fund’s effective management fee for the year ended September 30, 2019 was 0.693% of the Fund’s average daily net assets. Total management fees incurred by the Fund for the year ended September 30, 2019 are set forth in the Statement of Operations.
The Trust has entered into an administrative services agreement with the Advisor, whereby the Advisor will perform certain administrative services related to each class of the Fund’s shares. The fees are computed as an annual percentage of the aggregate average daily net assets of all shares classes of all Funds in the Trust as follows:
| Administration Fee Schedule |
| Daily Net Assets | Fee Rate |
| Up to $20 billion | 0.100% |
| $20 billion to $40 billion | 0.075 |
| $40 billion to $60 billion | 0.040 |
| Over $60 billion | 0.030 |
The aggregate fee amount is allocated on a daily basis to each Fund based on net assets and subsequently allocated to each class of shares of the Fund. Total administrative service fees incurred by each class of shares of the Fund for the year ended September 30, 2019, are set forth in the Statement of Operations.
The Trust has an underwriting agreement with Thornburg Securities Corporation (the “Distributor”), an affiliate of the Advisor, which acts as the distributor of the Fund’s shares. For the year ended September 30, 2019, the Distributor has advised the Fund that it earned net commissions aggregating $310,734 from the sale of Class A shares, and collected contingent deferred sales charges aggregating $76,974 from redemptions of Class C shares of the Fund.
Pursuant to a service plan under Rule 12b-1 of the 1940 Act, the Fund may pay to the Distributor or securities dealers and other financial institutions at the Distributor’s direction an amount not to exceed .25 of 1% per annum of the average daily net assets attributable to Class A, Class C, Class I, Class R3, Class R4, and Class R5 shares of the Fund to obtain various shareholder and distribution related services. For the year ended September 30, 2019, there were no 12b-1 service plan fees charged for Class I or Class R5 shares. Class R6 shares are not subject to a service plan. The Advisor and Distributor each may pay out of its own resources additional expenses for distribution of the Fund’s shares and shareholder services.
The Trust has also adopted a distribution plan pursuant to Rule 12b-1, applicable only to the Fund’s Class C and Class R3 shares, under which the Fund compensates the Distributor for services in promoting the sale of Class C and Class R3 shares of the Fund at an annual rate of up to .75 of 1% per annum of the average daily net assets attributable to Class C shares, and an annual rate of up to .25 of 1% per annum of the average daily net assets attributable to Class R3 shares.
Total fees incurred by each class of shares of the Fund under their respective service and distribution plans for the year ended September 30, 2019, are set forth in the Statement of Operations.
The Advisor has contractually agreed to waive fees and reimburse expenses incurred by the Fund so that actual expenses of certain share classes do not exceed levels as specified in each Fund’s most recent prospectus (Class R3 shares, 1.50%; Class R4 shares, 1.50%; Class R5 shares, 0.99%; Class R6 shares, 0.80%). The agreement may be terminated by the Fund at any time, but may not be terminated by the Advisor before February 1, 2020, unless the Advisor ceases to be the investment advisor to the Fund prior to that date. The Advisor may recoup amounts waived or reimbursed during the fiscal year ended September 30, 2019 if, during that year, expenses fall below the contractual limit that was in place at the time those fees and expenses were waived or reimbursed. The Advisor will not recoup fees or expenses as described in the preceding sentence if that recoupment would cause the Fund’s total annual operating expenses (after the recoupment is taken into account) to exceed the lesser of: (a) the expense cap that was in place at the time the waiver or reimbursement occurred; or (b) the expense cap that is in place at the time of the recoupment.
For the year ended September 30, 2019, the Advisor contractually reimbursed certain class specific expenses and distribution fees of $31,862 for Class R3 shares, $26,781 for Class R4 shares, $50,278 for Class R5 shares, and $34,639 for Class R6 shares.
Certain officers and Trustees of the Trust are also officers or directors of the Advisor and Distributor. The compensation of the independent Trustees is borne by the Trust. The Trust also pays a portion of the Chief Compliance Officer’s compensation. These amounts are reflected as Trustee and officer fees in the Statement of Operations.
The percentage of direct investments in the Fund held by the Trustees, officers of the Trust, and the Advisor is approximately 1.13%.
Notes to Financial Statements, Continued
Thornburg Investment Income Builder Fund | September 30, 2019
The Fund may purchase or sell securities from or to an affiliated fund, provided the affiliation is due solely to having a common investment advisor, common officers, or common trustees, and provided that all such transactions will comply with Rule 17a-7 under the 1940 Act. For the year ended September 30, 2019, the Fund had no such transactions with affiliated funds.
Shown below are holdings of voting securities of each portfolio company which is considered "affiliated" to the Fund under the 1940 Act, including companies for which the Fund’s holding represented 5% or more of the company’s voting securities, and a series of the Thornburg Investment Trust in which the Fund invested for cash management purposes during the period:
| Fund | Market Value
9/30/18 | Purchases
at Cost | Sales
Proceeds | Realized
Gain
(Loss) | Change in
Unrealized
Appr./(Depr.) | Market Value
9/30/19 | Dividend
Income |
| Apollo Investment Corp. | $132,562,769 | $676,750 | $(2,193,372) | $(84,649) | $446,835 | $131,408,333 | $12,609,337 |
| MFA Financial, Inc. | 251,518,110 | 5,049,401 | (12,443,273) | (1,673,606) | 2,416,568 | 244,867,200 | 27,739,651 |
| Solar Capital Ltd. | 98,516,902 | - | - | - | (3,363,767) | 95,153,135 | 7,556,956 |
| Thornburg Capital Management Fund | 454,730,939 | 2,598,593,973 | (2,438,894,474) | - | - | 614,430,438 | 9,372,327 |
| Total | $937,328,720 | $2,604,320,124 | $(2,453,531,119) | $(1,758,255) | $(500,364) | $1,085,859,106 | $57,278,271 |
NOTE 5 – SHARES OF BENEFICIAL INTEREST
At September 30, 2019, there were an unlimited number of shares with no par value of beneficial interest authorized. Transactions in shares of beneficial interest were as follows:
| | YEAR ENDED
September 30, 2019 | YEAR ENDED
September 30, 2018 |
| | SHARES | AMOUNT | SHARES | AMOUNT |
| Class A Shares | | | | |
| Shares sold | 33,705,434 | $ 707,103,365 | 31,856,039 | $ 688,622,514 |
Shares issued to shareholders in
reinvestment of dividends | 6,463,698 | 135,920,991 | 5,998,878 | 129,605,482 |
| Shares repurchased | (35,866,394) | (759,438,400) | (39,921,237) | (865,491,855) |
| Net increase (decrease) | 4,302,738 | $ 83,585,956 | (2,066,320) | $ (47,263,859) |
| Class C Shares | | | | |
| Shares sold | 7,061,223 | $ 148,341,647 | 7,570,345 | $ 164,120,547 |
Shares issued to shareholders in
reinvestment of dividends | 5,004,929 | 104,768,735 | 6,344,473 | 136,903,349 |
| Shares repurchased | (54,396,665) | (1,141,730,637) | (66,777,524) | (1,442,248,275) |
| Net decrease | (42,330,513) | $ (888,620,255) | (52,862,706) | $ (1,141,224,379) |
| Class I Shares | | | | |
| Shares sold | 73,615,316 | $ 1,562,786,242 | 66,657,528 | $ 1,454,578,318 |
Shares issued to shareholders in
reinvestment of dividends | 14,703,460 | 311,369,187 | 14,043,398 | 305,431,773 |
| Shares repurchased | (86,778,222) | (1,839,151,279) | (85,737,737) | (1,869,076,996) |
| Net increase (decrease) | 1,540,554 | $ 35,004,150 | (5,036,811) | $ (109,066,905) |
| Class R3 Shares | | | | |
| Shares sold | 209,743 | $ 4,403,248 | 241,442 | $ 5,220,231 |
Shares issued to shareholders in
reinvestment of dividends | 71,195 | 1,492,405 | 91,705 | 1,979,749 |
| Shares repurchased | (767,138) | (16,163,125) | (1,327,941) | (28,779,269) |
| Net decrease | (486,200) | $ (10,267,472) | (994,794) | $ (21,579,289) |
| Class R4 Shares | | | | |
| Shares sold | 326,458 | $ 6,855,745 | 289,894 | $ 6,287,155 |
Shares issued to shareholders in
reinvestment of dividends | 34,362 | 721,871 | 43,177 | 933,935 |
| Shares repurchased | (626,921) | (13,245,790) | (954,262) | (20,732,155) |
| Net decrease | (266,101) | $ (5,668,174) | (621,191) | $ (13,511,065) |
Notes to Financial Statements, Continued
Thornburg Investment Income Builder Fund | September 30, 2019
| | YEAR ENDED
September 30, 2019 | YEAR ENDED
September 30, 2018 |
| | SHARES | AMOUNT | SHARES | AMOUNT |
| Class R5 Shares | | | | |
| Shares sold | 623,849 | $ 13,230,266 | 664,323 | $ 14,452,609 |
Shares issued to shareholders in
reinvestment of dividends | 114,673 | 2,425,762 | 135,493 | 2,949,321 |
| Shares repurchased | (712,201) | (15,233,629) | (2,326,307) | (51,208,498) |
| Net increase (decrease) | 26,321 | $ 422,399 | (1,526,491) | $ (33,806,568) |
| Class R6 Shares | | | | |
| Shares sold | 638,809 | $ 13,481,559 | 5,722,657 | $ 123,069,973 |
Shares issued to shareholders in
reinvestment of dividends | 315,339 | 6,657,506 | 183,009 | 3,973,843 |
| Shares repurchased | (873,000) | (18,413,812) | (455,176) | (9,883,324) |
| Net increase | 81,148 | $ 1,725,253 | 5,450,490 | $ 117,160,492 |
NOTE 6 – INVESTMENT TRANSACTIONS
For the year ended September 30, 2019, the Fund had purchase and sale transactions of investments (excluding short-term investments and U.S. Government obligations) of $6,041,097,636 and $6,847,364,222, respectively.
NOTE 7 – DERIVATIVE FINANCIAL INSTRUMENTS WITH OFF-BALANCE
SHEET RISK AND FOREIGN INVESTMENT RISK
The Fund may use a variety of derivative financial instruments to hedge or adjust the risks affecting its investment portfolio or to enhance investment returns. Provisions of the FASB Accounting Standards Codification 815-10-50 (“ASC 815”) require certain disclosures. The disclosures are intended to provide users of financial statements with an understanding of the use of derivative instruments by the Fund and how these derivatives affect the financial position, financial performance and cash flows of the Fund. The Fund does not designate any derivative instruments as hedging instruments under ASC 815. During the year ended September 30, 2019, the Fund’s principal exposure to derivative financial instruments of the type addressed by ASC 815 was investment in foreign currency contracts. A foreign currency contract is an agreement between two parties to exchange different currencies at a specified rate of exchange at an agreed upon future date. Foreign currency contracts involve risks to the Fund, including the risk that a contract’s counterparty will not meet its obligations to the Fund, the risk that a change in a contract’s value may not correlate perfectly with the currency the contract was intended to track, and the risk that the Fund’s Advisor is unable to correctly implement its strategy in using a contract. In any such instance, the Fund may not achieve the intended benefit of entering into a contract, and may experience a loss.
The Fund entered into forward currency contracts during the year ended September 30, 2019 in the normal course of pursuing its investment objectives, with the objective of purchasing foreign investments or with the intent of reducing the risk to the value of the Fund’s foreign investments from adverse changes in the relationship between the U.S. dollar and foreign currencies. In each case these contracts have been initiated in conjunction with foreign investment transactions. The monthly average value of open forward currency sell contracts for the year ended September 30, 2019 was $3,132,138,732.
These contracts are accounted for by the Fund under ASC 815. Unrealized appreciation and depreciation on outstanding contracts are reported in the Fund’s Statement of Assets and Liabilities, as measured by the difference between the forward exchange rates at the reporting date and the forward exchange rates at each contract’s inception date. Net realized gain (loss) on contracts closed during the period, and changes in net unrealized appreciation (depreciation) on outstanding contracts are recognized in the Fund’s Statement of Operations.
The outstanding forward currency contracts in the table located in the Schedule of Investments, which were entered into with State Street Bank and Trust Company (“SSB”), were entered into pursuant to an International Swaps and Derivatives Association (“ISDA”) Master Agreement. Outstanding forward currency contracts, which were entered into with Brown Brothers Harriman & Co. (“BBH”), were entered into pursuant to a written agreement with BBH. In the event of a default or termination under the ISDA Master Agreement with SSB or the agreement with BBH, the non-defaulting party has the right to close out all outstanding forward currency contracts between the parties and to net any payment amounts under those contracts, resulting in a single net amount payable by one party to the other.
Because the ISDA Master Agreement with SSB and the agreement with BBH do not result in an offset of reported amounts of financial assets and liabilities in the Fund’s Statement of Assets and Liabilities unless there has been an event of default or termination event under
Notes to Financial Statements, Continued
Thornburg Investment Income Builder Fund | September 30, 2019
such agreements, the Fund does not net its outstanding forward currency contracts for the purpose of disclosure in the Fund’s Statement of Assets and Liabilities. Instead the Fund recognizes the unrealized appreciation (depreciation) on those forward currency contracts on a gross basis in the Fund’s Statement of Assets and Liabilities.
The unrealized appreciation (depreciation) of the outstanding forward currency contracts recognized in the Fund’s Statement of Assets and Liabilities at September 30, 2019 is disclosed in the following tables:
| FAIR VALUES OF DERIVATIVE FINANCIAL INSTRUMENTS AT SEPTEMBER 30, 2019 |
| ASSET DERIVATIVES | BALANCE SHEET LOCATION | FAIR VALUE |
| Foreign currency contracts | Assets - Unrealized appreciation on forward currency contracts | $ 68,567,890 |
| FAIR VALUES OF DERIVATIVE FINANCIAL INSTRUMENTS AT SEPTEMBER 30, 2019 |
| LIABILITY DERIVATIVES | BALANCE SHEET LOCATION | FAIR VALUE |
| Foreign currency contracts | Liabilities - Unrealized depreciation on forward currency contracts | $ (1,794,055) |
Because the Fund does not receive or post cash collateral in connection with its currency forward contracts during the period, the net amounts of the Fund’s assets and liabilities which are attributable to those contracts at September 30, 2019 can be determined by offsetting the dollar amounts shown in the preceding table. Based on those amounts, the net amount of the Fund’s assets which is attributable to its outstanding forward currency contracts at September 30, 2019 is $67,232,852 attributable to the Fund’s contracts with SSB, and the net amount of the Funds’s liabilities is $459,017 attributable to the Fund’s contracts with BBH. The Fund’s forward currency contracts are valued each day, and the net amounts of the Fund’s assets and liabilities which are attributable to those contracts are expected to vary over time.
The net realized gain (loss) from forward currency contracts and the net change in unrealized appreciation (depreciation) on outstanding forward currency contracts recognized in the Fund’s Statement of Operations for the year ended September 30, 2019 are disclosed in the following tables:
NET REALIZED GAIN (LOSS) ON DERIVATIVE FINANCIAL INSTRUMENTS
RECOGNIZED IN INCOME FOR THE YEAR ENDED September 30, 2019 |
| | TOTAL | FORWARD CURRENCY CONTRACTS |
| Foreign currency contracts | $ 151,956,001 | $ 151,956,001 |
NET CHANGE IN UNREALIZED APPRECIATION (DEPRECIATION) OF DERIVATIVE FINANCIAL INSTRUMENTS
RECOGNIZED IN INCOME FOR THE YEAR ENDED September 30, 2019 |
| | TOTAL | FORWARD CURRENCY CONTRACTS |
| Foreign currency contracts | $ 80,726,550 | $ 80,726,550 |
NOTE 8 – RECENT ACCOUNTING PRONOUNCEMENTS
In August 2018, the FASB issued ASU 2018-13, Fair Value Measurement (Topic 820): Changes to the Disclosure Requirements for Fair Value Measurement, which adds, removes, and modifies certain aspects of the fair value disclosure. ASU 2018-13 is effective for annual periods beginning after December 15, 2019, and early adoption is permitted. The Funds have elected to early adopt, and had applied ASU 2018-13 for the fiscal year ended September 30, 2019. The adoption of this accounting guidance did not have a material impact on the Funds’ financial statements.
In March 2017, the FASB issued Accounting Standards Update (ASU) 2017-08, Premium Amortization of Purchased Callable Debt Securities. The amendments in the ASU shorten the premium amortization period on a purchased callable debt security from the security’s contractual life to the earliest call date. It is anticipated that this change will enhance disclosures by reducing losses recognized when a security is called on an earlier date. This ASU is effective for fiscal years beginning after December 15, 2018. Management has evaluated the implications of these changes and the amendments will have no material effect on the Funds’ net assets or results of operations.
OTHER NOTES
Risks: The Fund’s investments subject it to risks including, but not limited to, management risk, market and economic risk, risks affecting specific issuers, small and mid-cap company risk, credit risk, high-yield risk, interest rate risk, prepayment risk, foreign investment risk,
Notes to Financial Statements, Continued
Thornburg Investment Income Builder Fund | September 30, 2019
developing country risk, risks affecting specific countries or regions, liquidity risk, and real estate risk. Please see the Fund’s prospectus for a discussion of the risks associated with an investment in the Fund.
Subsequent Events: Fund management believes no events have occurred between September 30, 2019 and the date of issuance of the financial statements that require adjustment to or disclosure in the accompanying financial statements.
This page intentionally left blank.
Financial Highlights
Thornburg Investment Income Builder Fund
| | PER SHARE PERFORMANCE (FOR A SHARE OUTSTANDING THROUGHOUT THE YEAR) |
UNLESS OTHERWISE
NOTED, PERIODS ARE
FISCAL YEARS ENDED
SEPTEMBER 30, | Net Asset
Value,
Beginning of
PERIOD | Net
Investment
Income
(Loss)+ | Net Realized &
Unrealized Gain
(Loss) on
Investments | Total from
Investment
Operations | Dividends
from Net
Investment
Income | Dividends
from Net
Realized
Gains | Total
Dividends | Net Asset
Value,
End of PERIOD |
| CLASS A SHARES(b) |
| 2019 | $ 21.80 | 0.93 | (0.07) | 0.86 | (0.94) | — | (0.94) | $ 21.72 |
| 2018 | $ 21.50 | 0.92 | 0.30 | 1.22 | (0.92) | — | (0.92) | $ 21.80 |
| 2017 | $ 19.82 | 0.92 | 1.61 | 2.53 | (0.85) | — | (0.85) | $ 21.50 |
| 2016 | $ 19.07 | 0.93 | 0.62 | 1.55 | (0.80) | — | (0.80) | $ 19.82 |
| 2015 | $ 21.38 | 0.85 | (2.34) | (1.49) | (0.82) | — | (0.82) | $ 19.07 |
| CLASS C SHARES |
| 2019 | $ 21.78 | 0.76 | (0.06) | 0.70 | (0.79) | — | (0.79) | $ 21.69 |
| 2018 | $ 21.48 | 0.76 | 0.30 | 1.06 | (0.76) | — | (0.76) | $ 21.78 |
| 2017 | $ 19.81 | 0.78 | 1.60 | 2.38 | (0.71) | — | (0.71) | $ 21.48 |
| 2016 | $ 19.06 | 0.79 | 0.62 | 1.41 | (0.66) | — | (0.66) | $ 19.81 |
| 2015 | $ 21.37 | 0.70 | (2.34) | (1.64) | (0.67) | — | (0.67) | $ 19.06 |
| CLASS I SHARES |
| 2019 | $ 21.96 | 0.99 | (0.07) | 0.92 | (1.00) | — | (1.00) | $ 21.88 |
| 2018 | $ 21.65 | 1.00 | 0.29 | 1.29 | (0.98) | — | (0.98) | $ 21.96 |
| 2017 | $ 19.97 | 1.02 | 1.59 | 2.61 | (0.93) | — | (0.93) | $ 21.65 |
| 2016 | $ 19.21 | 1.00 | 0.62 | 1.62 | (0.86) | — | (0.86) | $ 19.97 |
| 2015 | $ 21.53 | 0.93 | (2.35) | (1.42) | (0.90) | — | (0.90) | $ 19.21 |
| CLASS R3 SHARES |
| 2019 | $ 21.80 | 0.84 | (0.07) | 0.77 | (0.86) | — | (0.86) | $ 21.71 |
| 2018 | $ 21.49 | 0.83 | 0.32 | 1.15 | (0.84) | — | (0.84) | $ 21.80 |
| 2017 | $ 19.82 | 0.87 | 1.59 | 2.46 | (0.79) | — | (0.79) | $ 21.49 |
| 2016 | $ 19.07 | 0.87 | 0.62 | 1.49 | (0.74) | — | (0.74) | $ 19.82 |
| 2015 | $ 21.37 | 0.78 | (2.32) | (1.54) | (0.76) | — | (0.76) | $ 19.07 |
| CLASS R4 SHARES |
| 2019 | $ 21.83 | 0.86 | (0.07) | 0.79 | (0.88) | — | (0.88) | $ 21.74 |
| 2018 | $ 21.52 | 0.85 | 0.33 | 1.18 | (0.87) | — | (0.87) | $ 21.83 |
| 2017 | $ 19.85 | 0.89 | 1.59 | 2.48 | (0.81) | — | (0.81) | $ 21.52 |
| 2016 | $ 19.10 | 0.89 | 0.62 | 1.51 | (0.76) | — | (0.76) | $ 19.85 |
| 2015 | $ 21.42 | 0.81 | (2.35) | (1.54) | (0.78) | — | (0.78) | $ 19.10 |
| CLASS R5 SHARES |
| 2019 | $ 21.95 | 0.97 | (0.09) | 0.88 | (0.97) | — | (0.97) | $ 21.86 |
| 2018 | $ 21.64 | 0.94 | 0.33 | 1.27 | (0.96) | — | (0.96) | $ 21.95 |
| 2017 | $ 19.95 | 0.98 | 1.61 | 2.59 | (0.90) | — | (0.90) | $ 21.64 |
| 2016 | $ 19.20 | 0.98 | 0.62 | 1.60 | (0.85) | — | (0.85) | $ 19.95 |
| 2015 | $ 21.52 | 0.90 | (2.35) | (1.45) | (0.87) | — | (0.87) | $ 19.20 |
| CLASS R6 SHARES |
| 2019 | $ 21.89 | 1.01 | (0.08) | 0.93 | (1.01) | — | (1.01) | $ 21.81 |
| 2018 | $ 21.58 | 1.16 | 0.14 | 1.30 | (0.99) | — | (0.99) | $ 21.89 |
| 2017(c) | $ 20.55 | 0.44 | 1.12 | 1.56 | (0.53) | — | (0.53) | $ 21.58 |
| (a) | Not annualized for periods less than one year. |
| (b) | Sales loads are not reflected in computing total return. |
| (c) | Effective date of this class of shares was April 10, 2017. |
| (d) | Annualized. |
| + | Based on weighted average shares outstanding. |
See notes to financial statements.
Financial Highlights, Continued
Thornburg Investment Income Builder Fund
| RATIOS TO AVERAGE NET ASSETS | | SUPPLEMENTAL DATA |
Net Investment
Income (Loss) (%) | Expenses, After
Expense
Reductions (%) | Expenses,
Before Expense
Reductions (%) | | Total
Return (%)(a) | Portfolio
Turnover
Rate (%)(a) | Net Assets
at End of PERIOD
(Thousands) |
| |
| 4.42 | 1.13 | 1.13 | | 4.13 | 43.69 | $ 3,458,385 |
| 4.25 | 1.15 | 1.15 | | 5.79 | 41.17 | $ 3,378,149 |
| 4.52 | 1.19 | 1.19 | | 13.01 | 37.37 | $ 3,374,895 |
| 4.82 | 1.18 | 1.18 | | 8.35 | 42.81 | $ 3,778,863 |
| 4.02 | 1.17 | 1.17 | | (7.27) | 47.71 | $ 4,257,943 |
| |
| 3.60 | 1.87 | 1.87 | | 3.35 | 43.69 | $ 2,658,581 |
| 3.51 | 1.90 | 1.90 | | 5.01 | 41.17 | $ 3,591,856 |
| 3.80 | 1.90 | 1.93 | | 12.19 | 37.37 | $ 4,677,322 |
| 4.11 | 1.90 | 1.93 | | 7.59 | 42.81 | $ 5,356,153 |
| 3.30 | 1.90 | 1.92 | | (7.93) | 47.71 | $ 5,906,206 |
| |
| 4.67 | 0.88 | 0.88 | | 4.39 | 43.69 | $ 7,810,067 |
| 4.58 | 0.86 | 0.86 | | 6.12 | 41.17 | $ 7,806,245 |
| 4.93 | 0.86 | 0.86 | | 13.30 | 37.37 | $ 7,804,930 |
| 5.15 | 0.86 | 0.86 | | 8.71 | 42.81 | $ 6,928,783 |
| 4.35 | 0.85 | 0.85 | | (6.94) | 47.71 | $ 7,472,344 |
| |
| 3.97 | 1.50 | 1.58 | | 3.72 | 43.69 | $ 36,155 |
| 3.84 | 1.50 | 1.61 | | 5.47 | 41.17 | $ 46,901 |
| 4.24 | 1.47 | 1.56 | | 12.63 | 37.37 | $ 67,623 |
| 4.53 | 1.50 | 1.59 | | 8.01 | 42.81 | $ 78,188 |
| 3.70 | 1.50 | 1.55 | | (7.52) | 47.71 | $ 79,834 |
| |
| 4.09 | 1.40 | 1.50 | | 3.79 | 43.69 | $ 25,221 |
| 3.91 | 1.40 | 1.56 | | 5.58 | 41.17 | $ 31,132 |
| 4.35 | 1.40 | 1.51 | | 12.72 | 37.37 | $ 44,069 |
| 4.63 | 1.40 | 1.48 | | 8.12 | 42.81 | $ 45,968 |
| 3.81 | 1.40 | 1.46 | | (7.48) | 47.71 | $ 42,392 |
| |
| 4.55 | 0.99 | 1.08 | | 4.20 | 43.69 | $ 59,890 |
| 4.30 | 0.99 | 1.12 | | 5.99 | 41.17 | $ 59,545 |
| 4.76 | 0.99 | 1.09 | | 13.22 | 37.37 | $ 91,735 |
| 5.08 | 0.99 | 1.07 | | 8.52 | 42.81 | $ 86,535 |
| 4.23 | 0.98 | 1.07 | | (7.06) | 47.71 | $ 78,945 |
| |
| 4.76 | 0.80 | 0.82 | | 4.47 | 43.69 | $ 157,924 |
| 5.39 | 0.80 | 0.82 | | 6.20 | 41.17 | $ 156,750 |
| 4.37(d) | 0.80(d) | 1.09(d) | | 7.65 | 37.37 | $ 36,909 |
Report of Independent Registered Public Accounting Firm
Thornburg Investment Income Builder Fund
To the Board of Trustees of Thornburg Investment Trust and Shareholders of
Thornburg Investment Income Builder Fund
Opinion on the Financial Statements
We have audited the accompanying statement of assets and liabilities, including the schedule of investments, of Thornburg Investment Income Builder Fund (one of the funds constituting Thornburg Investment Trust, referred to hereafter as the "Fund") as of September 30, 2019, the related statement of operations for the year ended September 30, 2019, the statements of changes in net assets for each of the two years in the period ended September 30, 2019, including the related notes, and the financial highlights for each of the periods indicated therein (collectively referred to as the “financial statements”). In our opinion, the financial statements present fairly, in all material respects, the financial position of the Fund as of September 30, 2019, the results of its operations for the year then ended, the changes in its net assets for each of the two years in the period ended September 30, 2019 and the financial highlights for each of the periods indicated therein in conformity with accounting principles generally accepted in the United States of America.
Basis for Opinion
These financial statements are the responsibility of the Fund’s management. Our responsibility is to express an opinion on the Fund’s financial statements based on our audits. We are a public accounting firm registered with the Public Company Accounting Oversight Board (United States) (PCAOB) and are required to be independent with respect to the Fund in accordance with the U.S. federal securities laws and the applicable rules and regulations of the Securities and Exchange Commission and the PCAOB.
We conducted our audits of these financial statements in accordance with the standards of the PCAOB. Those standards require that we plan and perform the audit to obtain reasonable assurance about whether the financial statements are free of material misstatement, whether due to error or fraud.
Our audits included performing procedures to assess the risks of material misstatement of the financial statements, whether due to error or fraud, and performing procedures that respond to those risks. Such procedures included examining, on a test basis, evidence regarding the amounts and disclosures in the financial statements. Our audits also included evaluating the accounting principles used and significant estimates made by management, as well as evaluating the overall presentation of the financial statements. Our procedures included confirmation of securities owned as of September 30, 2019 by correspondence with the custodian, transfer agent, agent banks and brokers; when replies were not received from brokers, we performed other auditing procedures. We believe that our audits provide a reasonable basis for our opinion.
/s/PricewaterhouseCoopers LLP
New York, New York
November 22, 2019
We have served as the auditor of one or more investment companies in Thornburg Investment Trust since 1999.
Expense Example
Thornburg Investment Income Builder Fund | September 30, 2019 (Unaudited)
As a shareholder of the Fund, you incur two types of costs:
| (1) | transaction costs, including |
| (a) | sales charges (loads) on purchase payments, for Class A shares; |
| (b) | a deferred sales charge on redemptions of any part or all of a purchase of $1 million of Class A shares within 12 months of purchase; |
| (c) | a deferred sales charge on redemptions of Class C shares within 12 months of purchase; |
| (2) | ongoing costs, including management fees; distribution and/or service (12b-1) fees; and other Fund expenses. |
This example is intended to help you understand your ongoing costs (in dollars) of investing in the Fund and to compare these costs with the ongoing costs of investing in other mutual funds.
The example is based on a $1,000 investment beginning on April 1, 2019, and held until September 30, 2019.
ACTUAL EXPENSES
For each class of shares, the first line of the accompanying table provides information about actual account values and actual expenses. You may use the information in this line, together with the amount you invested, to estimate the expenses that you paid over the period. Simply divide your account value by $1,000 (for example, an $8,600 account value divided by $1,000 = 8.6), then multiply the result by the number in the first line for your class of shares under the heading entitled “Expenses Paid During Period” to estimate the expenses you paid on your account during this period.
| | BEGINNING
ACCOUNT VALUE
4/1/19 | ENDING
ACCOUNT VALUE
9/30/19 | EXPENSES PAID
DURING PERIOD†
4/1/19—9/30/19 |
| CLASS A SHARES |
| Actual | $1,000.00 | $1,043.94 | $5.79 |
| Hypothetical* | $1,000.00 | $1,019.40 | $5.72 |
| CLASS C SHARES |
| Actual | $1,000.00 | $1,039.87 | $9.51 |
| Hypothetical* | $1,000.00 | $1,015.74 | $9.40 |
| CLASS I SHARES |
| Actual | $1,000.00 | $1,044.97 | $4.56 |
| Hypothetical* | $1,000.00 | $1,020.61 | $4.51 |
| CLASS R3 SHARES |
| Actual | $1,000.00 | $1,041.61 | $7.68 |
| Hypothetical* | $1,000.00 | $1,017.55 | $7.59 |
| CLASS R4 SHARES |
| Actual | $1,000.00 | $1,042.57 | $7.17 |
| Hypothetical* | $1,000.00 | $1,018.05 | $7.08 |
| CLASS R5 SHARES |
| Actual | $1,000.00 | $1,044.48 | $5.07 |
| Hypothetical* | $1,000.00 | $1,020.10 | $5.01 |
| CLASS R6 SHARES |
| Actual | $1,000.00 | $1,045.47 | $4.10 |
| Hypothetical* | $1,000.00 | $1,021.06 | $4.05 |
| † | Expenses are equal to the annualized expense ratio for each class (A: 1.13%; C: 1.86%; I: 0.89%; R3: 1.50%; R4: 1.40%; R5: 0.99%; R6: 0.80%) multiplied by the average account value over the period, multiplied by 183/365 to reflect the one-half year period. |
| * | Hypothetical assumes a rate of return of 5% per year before expenses. |
HYPOTHETICAL EXAMPLE FOR COMPARISON PURPOSES
For each class of shares, the second line of the accompanying table provides information about hypothetical account values and hypothetical expenses based on the Fund’s actual expense ratio and an assumed rate of return of 5% per year before expenses, which is not the Fund’s actual return. The hypothetical account values and expenses may not be used to estimate the actual ending account balance or expenses you paid for the period. You may use this information to compare the ongoing costs of investing in the Fund and other funds. To do so, compare this 5% hypothetical example with the 5% hypothetical examples that appear in the shareholder reports of the other funds.
Please note that the expenses shown in the table are meant to highlight your ongoing costs only and do not reflect any transactional costs, such as sales charges (loads), redemption fees, or exchange fees. Therefore, the second line of the table for each class of shares is useful in comparing ongoing costs only, and will not help you determine the relative total costs of owning different funds. In addition, if these transactional costs were included, your costs would have been higher.
Trustees and Officers
Thornburg Investment Income Builder Fund | September 30, 2019 (Unaudited)
NAME, AGE, YEAR ELECTED
POSITION HELD WITH FUND | PRINCIPAL OCCUPATION(S) DURING PAST FIVE YEARS | OTHER DIRECTORSHIPS
HELD BY TRUSTEE |
| INTERESTED TRUSTEES(1)(2) |
Garrett Thornburg, 73
Trustee since 1984,
Chairman of Trustees(3) | Chairman and controlling shareholder of Thornburg Investment Management, Inc. (investment advisor); Chairman and controlling shareholder of Thornburg Securities Corporation (securities dealer); President of the Thornburg Foundation (nonprofit). | None |
Brian J. McMahon, 64
Trustee since 2001,
Vice Chairman of Trustees,
Member of Governance and
Nominating Committee &
Operations Risk Oversight
Committee(4) | Vice Chairman, Chief Investment Strategist, Managing Director, and Portfolio Manager and, until 2016, CEO and President of Thornburg Investment Management, Inc.; Vice President of Thornburg Securities Corporation. | None |
| INDEPENDENT TRUSTEES(1)(2)(5) |
David A. Ater, 74
Trustee since 1994,
Lead Independent Trustee,
Chairman of Governance and
Nominating Committee &
Member of Audit Committee | Principal in Ater & Associates, Santa Fe, NM (developer, planner and broker of residential and commercial real estate); owner, developer and broker for various real estate projects. | None |
Sally Corning, 58
Trustee since 2012,
Chairman of Audit Committee | Partner in Sun Mountain Capital, Santa Fe, NM (private equity firm with investment programs encompassing venture capital, mezzanine debt, and growth equity). | None |
Susan H. Dubin, 70
Trustee since 2004,
Member of Audit
Committee & Governance
and Nominating Committee | President of Dubin Investments, Ltd., Greenwich, CT (private investment fund); Director and officer of various charitable organizations. | None |
David L. Gardner, 56
Trustee since 2015,
Member of Operations Risk
Oversight Committee | Until 2012, head of EMEA (Europe, Middle East and Africa) Sales for iShares of Blackrock, Inc., EMEA Executive Committee Member and EMEA Operating Committee Member at Blackrock, Inc. | None |
Patrick J. Talamantes, 55
Trustee since 2019,
Member of Audit Committee | President of Talamantes Strategies, LLC, a management consulting firm, since 2018; until 2017, President and Chief Executive Officer of The McClatchy Company, Sacramento, CA (news and media company). | None |
Owen D. Van Essen, 65
Trustee since 2004,
Chairman of Operations Risk
Oversight Committee &
Member of Governance and
Nominating Committee | President of Dirks, Van Essen, Murray & April, Santa Fe, NM (newspaper mergers and acquisitions). | None |
James W. Weyhrauch, 60
Trustee since 1996,
Member of Audit
Committee & Operations Risk
Oversight Committee | Real estate broker, Santa Fe Properties, Santa Fe, NM; General Partner, Investments of Genext LLC (a family investment partnership); until 2019, Vice Chairman of Nambe LLC, Santa Fe, NM (manufacturing & design company). | None |
Trustees and Officers, Continued
Thornburg Investment Income Builder Fund | September 30, 2019 (Unaudited)
NAME, AGE, YEAR ELECTED
POSITION HELD WITH FUND | PRINCIPAL OCCUPATION(S) DURING PAST FIVE YEARS | OTHER DIRECTORSHIPS
HELD BY TRUSTEE |
| OFFICERS OF THE FUND (WHO ARE NOT TRUSTEES)(1)(6) |
David Ashley, 49
Vice President since 2019 | Portfolio Manager and Managing Director since 2019 and Associate Portfolio Manager from 2011-2019 of Thornburg Investment Management, Inc. | Not applicable |
Nimish Bhatt, 56
Chief Financial Officer
since 2019; Treasurer
2016-2019; Secretary
(2018-2019)(7) | Chief Financial Officer and Treasurer of Thornburg Investment Management, Inc. and Thornburg Securities Corporation since 2016 and Secretary of Thornburg Securities Corporation since 2018; Senior Vice President (2004-2016), Chief Financial Officer (2011-2016), and Head of Fund Administration (2011-2016) of Calamos Asset Management, Inc., Calamos Investments LLC, Calamos Advisors LLC, and Calamos Wealth Management; Director of Calamos Global Funds plc (2007-2016). | Not applicable |
Jason Brady, 45
President since 2016(7) | Director since 2017, CEO and President since 2016, and Portfolio Manager and Managing Director of Thornburg Investment Management, Inc.; Vice President of Thornburg Securities Corporation since 2016. | Not applicable |
Connor Browne, 40
Vice President since 2006 | Portfolio Manager and Managing Director of Thornburg Investment Management, Inc. | Not applicable |
Randy Dry, 45
Vice President since 2014 | Managing Director, Director of Institutional Group from 2014-2016, and since 2016, Chief Administrative Officer of Thornburg Investment Management, Inc. | Not applicable |
Greg Dunn, 43
Vice President since 2014 | Portfolio Manager and Managing Director of Thornburg Investment Management, Inc. | Not applicable |
Lon Erickson, 44
Vice President since 2008 | Portfolio Manager and Managing Director of Thornburg Investment Management, Inc. | Not applicable |
Thomas Garcia, 48
Vice President since 2006 | Managing Director, Head Equity Trader, and Associate Portfolio Manager of Thornburg Investment Management, Inc. | Not applicable |
Christian Hoffmann, 37
Vice President since 2018 | Portfolio Manager and Managing Director since 2018, and Associate Portfolio Manager from 2014-2018, of Thornburg Investment Management, Inc. | Not applicable |
Curtis Holloway, 52
Treasurer since 2019(7) | Director of Fund Administration since 2019 of Thornburg Investment Management, Inc.; Senior Vice President, Head of Fund Administration (2017-2019) and Vice President, Fund Administration (2010-2017) of Calamos Investments, and Chief Financial Officer (2017-2019) and Treasurer (2010-2019) of Calamos Funds. | Not applicable |
Ben Kirby, 39
Vice President since 2014 | Head of Investments since 2019, Portfolio Manager and Managing Director since 2013. | Not applicable |
Jeff Klingelhofer, 38
Vice President since 2016 | Head of Investments since 2019, Portfolio Manager and Managing Director since 2015, and Associate Portfolio Manager from 2012–2015, of Thornburg Investment Management, Inc. | Not applicable |
Ponn Lithiluxa, 48
Vice President since 2017 | Manager, Tax & Fund Administration of Thornburg Investment Management, Inc.; Senior Vice President, Citi Fund Services, Inc. (2014–2017); Vice President, Citi Fund Services, Inc. (2007–2014). | Not applicable |
Rob MacDonald, 43
Vice President since 2016 | Managing Director since 2015, Portfolio Manager since 2014, and Associate Portfolio Manager from 2011–2014 of Thornburg Investment Management, Inc. | Not applicable |
Michael Mastroianni, 42
Secretary and Vice President since 2019(7) | Director of Fund Operations since 2019 of Thornburg Investment Management, Inc.; Executive Director, Global Head of Client Services - Global Liquidity (2018-2019), Executive Director, North American Head of Transfer Agency Relationship Management (2011-2019), Executive Director, North American Head of Transfer Agency Service Delivery (2011-2018) of J.P. Morgan Asset Management. | Not applicable |
Leigh Moiola, 52
Vice President since 2001 | Managing Director and Director of Marketing of Thornburg Investment Management, Inc.; Vice President of Thornburg Securities Corporation. | Not applicable |
Christopher Ryon, 63
Vice President since 2008 | Portfolio Manager and Managing Director of Thornburg Investment Management, Inc. | Not applicable |
Trustees and Officers, Continued
Thornburg Investment Income Builder Fund | September 30, 2019 (Unaudited)
NAME, AGE, YEAR ELECTED
POSITION HELD WITH FUND | PRINCIPAL OCCUPATION(S) DURING PAST FIVE YEARS | OTHER DIRECTORSHIPS
HELD BY TRUSTEE |
Sean Koung Sun, 38
Vice President since 2017 | Portfolio Manager and Managing Director since 2017, Associate Portfolio Manager from 2015-2016, and Equity Research Analyst from 2012-2014 of Thornburg Investment Management, Inc. | Not applicable |
Stephen Velie, 52
Chief Compliance Officer since 2009 | Chief Compliance Officer of Thornburg Investment Trust and Thornburg Investment Management, Inc. | Not applicable |
Nicholos Venditti, 38
Vice President since 2016 | Portfolio Manager and Managing Director since 2015 and Associate Portfolio Manager from 2011–2015 of Thornburg Investment Management, Inc. | Not applicable |
Vinson Walden, 49
Vice President since 2004 | Portfolio Manager and Managing Director of Thornburg Investment Management, Inc. | Not applicable |
Lei Wang, 48
Vice President since 2006 | Portfolio Manager and Managing Director of Thornburg Investment Management, Inc. | Not applicable |
Charles Wilson, 44
Vice President since 2016 | Portfolio Manager and Managing Director since 2014 and Associate Portfolio Manager from 2012–2014 of Thornburg Investment Management, Inc. | Not applicable |
Di Zhou, 41
Vice President since 2016 | Portfolio Manager and Managing Director since 2016, Associate Portfolio Manager from 2014–2016, and Equity Research Analyst from 2010–2014 of Thornburg Investment Management, Inc. | Not applicable |
| (1) | Each person’s address is 2300 North Ridgetop Road, Santa Fe, New Mexico 87506. |
| (2) | The Fund is a separate investment “Fund” or “series” of Thornburg Investment Trust (the “Trust”), which comprises the Thornburg mutual fund complex and is organized as a Massachusetts business trust. Thornburg Investment Management, Inc. is the investment advisor to, and manages, all the Funds of the Trust. Each Trustee oversees all the Funds of the Trust. |
| (3) | Mr. Thornburg is considered an “interested” Trustee under the Investment Company Act of 1940 because he is a director and controlling shareholder of Thornburg Investment Management, Inc., the investment advisor to the Trust, and is the sole director and controlling shareholder of Thornburg Securities Corporation, the distributor of shares for the Trust. |
| (4) | Mr. McMahon is considered an “interested” Trustee under the Investment Company Act of 1940 because he is a director and the chief investment strategist of Thornburg Investment Management, Inc. |
| (5) | The Bylaws of the Trust currently require that each Independent Trustee shall retire by the end of the calendar year during which the Trustee reached the age of 75 years. Otherwise each Trustee serves in office until the election and qualification of a successor or until the Trustee sooner dies, resigns, retires or is removed. |
| (6) | Assistant vice presidents and assistant secretaries are not shown. |
| (7) | The Trust’s president, chief financial officer, secretary, and treasurer each serves a one-year term or until the election and qualification of a successor; each other officer serves at the pleasure of the Trustees. |
The Statement of Additional Information for each Fund of the Trust includes additional information about the Trustees and is available, without charge and upon request, by calling 1-800-847-0200.
Other Information
Thornburg Investment Income Builder Fund | September 30, 2019 (Unaudited)
PORTFOLIO PROXY VOTING
Policies and Procedures:
The Trust has delegated to the Advisor voting decisions respecting proxies for the Fund’s voting securities. The Advisor makes voting decisions in accordance with its Proxy Voting Policy and Procedures. A description of the Policy and Procedures is available (i) without charge, upon request, by calling the Advisor toll-free at 1-800-847-0200, (ii) on the Thornburg website at www.thornburg.com, and (iii) on the U.S. Securities and Exchange Commission’s website at www.sec.gov.
Information regarding how proxies were voted is available on or before August 31 of each year for the twelve months ending the preceding June 30. This information is available (i) without charge, upon request by calling the Advisor toll-free at 1-800-847-0200, (ii) on the Thornburg website at www.thornburg.com, and (iii) on the U.S. Securities and Exchange Commission’s website at www.sec.gov.
TAX INFORMATION
For the tax year ended September 30, 2019, dividends paid by the Thornburg Investment Income Builder Fund of $627,256,892 are being reported as ordinary investment income for federal income tax purposes.
For the tax year ended September 30, 2019, the Fund is reporting 82.16% (or the maximum allowed) of the dividends paid from tax basis net ordinary income as qualifying for the reduced rate under the Jobs and Growth Tax Relief and Reconciliation Act of 2003.
The Fund is reporting 19.47% (or the maximum allowed) of the ordinary income distributions paid by the Fund for the fiscal year ended September 30, 2019 as qualified for the corporate dividends received deduction.
For the year ended September 30, 2019, foreign source income and foreign taxes paid are $512,141,262 and $52,429,175, respectively.
The information and distributions reported herein may differ from the information and distributions reported to the shareholders for the calendar year ending December 31, 2019. Complete information will be reported in conjunction with your 2019 Form 1099.
AVAILABILITY OF QUARTERLY PORTFOLIO SCHEDULE
The Fund files with the Securities and Exchange Commission schedules of its portfolio holdings on Form N-Q for the first and third quarters of each fiscal year. The Fund’s Forms N-Q are available on the Commission’s website at www.sec.gov, or may be reviewed and copied at the Commission’s Public Reference Room in Washington, D.C. Information on the operation of the Public Reference Room may be obtained by calling 1-800-SEC-0330. The Fund also makes this information available on its website at www.thornburg.com/download or upon request by calling 1-800-847-0200.
STATEMENT RESPECTING RENEWAL OF INVESTMENT ADVISORY AGREEMENT
Thornburg Investment Management, Inc. (the “Advisor”) provides investment management services to Thornburg Investment Income Builder Fund (the “Fund”) pursuant to an investment advisory agreement. The Trustees consider the renewal of this agreement annually, and most recently determined to renew the agreement on September 17, 2019.
Planning for their recent consideration of the advisory agreement’s renewal, the independent Trustees met in May 2019 to consider aspects of their annual evaluation of the Advisor’s service to all of the funds of Thornburg Investment Trust, to plan the annual evaluation of the Advisor’s performance and to discuss preliminarily the information the Advisor would present to the Trustees for their review. The independent Trustees met in a second independent session in July 2019 to further define certain portions of the information to be submitted by the Advisor. The independent Trustees met again in an independent session in September 2019 with a mutual fund analyst firm engaged by the independent Trustees to provide explanations of comparative cost and expense information, comparative investment performance information, and other data obtained and analyzed by the analyst firm. In that session the independent Trustees discussed their evaluations of the Advisor’s services to the Fund and the Fund’s fee and expense levels, investment performance, and other information presented for the Fund, conferred independently with legal counsel respecting the factors typically considered in evaluating renewal of an advisory agreement, and conferred with representatives of management to receive explanations of certain aspects of the information they had requested. Representatives of the Advisor subsequently reviewed portions of the information with the Trustees and addressed questions from the Trustees at a full meeting session of the Trustees scheduled in September for that purpose, and the independent Trustees thereafter met again in an independent session to consider the Advisor’s presentations and various specific issues respecting their consideration of the advisory agreement’s renewal. Following these sessions, the Trustees met to consider renewal of the advisory agreement, and the independent Trustees voted unanimously at that meeting to renew the agreement for an additional term of one year.
Other Information, Continued
Thornburg Investment Income Builder Fund | September 30, 2019 (Unaudited)
The information below summarizes certain factors considered by the Trustees in connection with the determination to renew the advisory agreement with the Advisor. In determining to renew the advisory agreement, the Trustees considered a wide range of information and did not identify any single factor as controlling, and this summary does not describe all of the factors and other matters considered by the Trustees in making their determination.
Nature, Extent and Quality of Services. The Trustees considered in their evaluation of the advisory agreement the written and oral reports provided to the Trustees and their standing committees throughout the year on a wide variety of topics by personnel from the Advisor’s portfolio management, administration, operations and compliance staffs. The Trustees also considered in this evaluation presentations and explanations made by representatives of the Advisor in meeting sessions scheduled for consideration of the renewal of the advisory agreement. The Trustees further noted in their evaluation the consideration they had given to a number of topics in previous years, reports from their standing committees, and advice received from counsel.
Information noted by the Trustees as having been considered in relation to the nature, extent and quality of services provided by the Advisor under the advisory agreement and contributing (together with other information considered) to their conclusions respecting the nature, extent and quality of the services rendered to the Fund by the Advisor included: (1) reports from portfolio managers and other personnel throughout the year demonstrating that the Fund was managed in conformity with stated strategies and objectives and conformed to investment restrictions and limitations; (2) reports demonstrating that management of the Fund remained faithful and competent, and demonstrating sufficient skill by portfolio managers in executing the Fund’s strategies in varying environments, managers’ cognizance of and strategies to pursue the Fund’s objectives and address pertinent market and economic trends and conditions, the evaluation and selection of individual investments, management to achieve tax efficiencies, and the structuring and composition of the Fund’s portfolio and management of Fund liquidity requirements; (3) the Fund’s achievement of its investment objectives over different periods of time; (4) presentations by and interactions with members of the Advisor’s fund administration, operations and compliance staffs; (5) reports from standing committees of the Trustees on their respective proceedings throughout the year, including in particular reports from and interactions with the Advisor’s personnel; (6) the sufficiency of the resources the Advisor devotes to the services it provides to the Fund, including the expertise of its personnel and staffing levels and its enhancements to the electronic systems it utilizes in providing these services, and also including the Advisor’s own financial management and sufficiency of its resources; and (7) the measures employed to achieve efficient trade execution for the Fund, including the evaluation and selection of firms to execute transactions for the Fund. As in past years, the Trustees noted particularly their assessments of the Advisor’s personnel developed in meetings throughout the year, measures to expand and improve the depth and experience of the Advisor’s staff, and the Advisor’s collaborative approach to investment management, continued commitment to observance of compliance and regulatory requirements in managing investments by the Fund, responsiveness to the Trustees, and other factors.
Based upon these and other considerations, the Trustees concluded that the Advisor’s management of the Fund’s investments continued to conform to the Fund’s stated objectives and policies, and that the nature, extent and quality of the services provided to the Fund by the Advisor remained sufficient.
Investment Performance. The Trustees noted in their evaluation of the Fund’s investment performance the written and oral reports they had received in each regular meeting over the course of the year from the Advisor’s portfolio management personnel. The Trustees also noted their consideration of information provided to them at their request in anticipation of their annual evaluation of the Advisor’s services, including the following items of information respecting the investment performance of the Fund: (1) the Fund’s absolute investment performance and achievement of stated objectives; (2) the Advisor’s explanations and commentary on the Fund’s performance in the context of the Fund’s objectives and reasonable expectations, and business, market and economic conditions; (3) performance data for the most recent ten calendar years, comparing the Fund’s annual investment returns to its benchmark and to the applicable Morningstar category of funds; (4) the Fund’s investment performance for the three-month, year-to-date, one-year, three-year, five-year, ten-year, and since inception periods ending with the second quarter of the current year, comparing the Fund’s annualized returns to two mutual fund categories created by independent mutual fund analyst firms, to the Fund’s benchmark, and to a separate broad-based securities index, and assigning a percentage rank to the Fund’s performance for each period relative to each of the fund categories; (5) analyses of specified performance and risk metrics for the Fund relative to its benchmark and to a selected peer group of funds, prepared by an independent financial analyst firm engaged by the independent Trustees; (6) the Fund’s cash flows; (7) comparative performance data for fund peer groups selected by an independent mutual fund analyst firm engaged by the independent Trustees, and the analysis and observations of the analyst firm respecting those data; (8) comparative risk and return statistics; and (9) dividend distributions by the Fund. Dividends paid with respect to shares of the Fund were noted as consistent with expectations and prevailing conditions. Measures of risk and relative return demonstrated that the Fund’s performance relative to these measures continued to fulfill expectations in current conditions. The Trustees generally attach additional significance to the investment performance of the Fund from the perspective of longer-term shareholders. Based upon their consideration of this and other information, the Trustees concluded that the Fund’s absolute and relative investment performance over a range of pertinent holding periods on the whole was satisfactory in view of its objectives and strategies.
Comparisons of Fee and Expense Levels. Information noted by the Trustees as having been considered in this context included a variety of comparative data respecting the Fund’s fee and expense levels. This information included comparisons of the Fund’s advisory fee and overall Fund expenses to median and average fees and expenses charged to funds in the applicable Morningstar category, comparisons of
Other Information, Continued
Thornburg Investment Income Builder Fund | September 30, 2019 (Unaudited)
the advisory fee and total expenses for three Fund share classes to the fee levels and expenses of fund peer groups selected from the category by an independent mutual fund analyst firm engaged by the independent Trustees, the perspectives and advice from that mutual fund analyst firm respecting comparisons of fund fee levels and expenses to fund peer groups, and other information. Comparative fee and expense data noted as having been considered by the Trustees showed that the level of total expense for one share class of the Fund was lower than the median level and comparable to the average level charged to funds in the applicable Morningstar category, that the level of total expense for a second share class was lower than the median and average levels for that category, and that the level of total expense for a third share class was higher than the median and average levels for that category. Peer group data showed that the Fund’s stated advisory fee was lower than the median level for the three peer groups, and that the total expense levels of three representative share classes were equal to or lower than the medians of their respective peer groups. The Trustees did not find the differences significant in view of their findings and conclusions respecting the other factors considered.
The Trustees noted their consideration of information respecting the advisory fees charged by the Advisor to other investment management clients, including sub-advised mutual funds and other institutional clients, together with information about fees charged by other advisors to different clients, analysis of the differences between the requirements of institutional clients and mutual funds, analysis of the differences between the requirements of a sub-advised mutual fund and a fund as to which the investment advisor is the primary advisor and sponsor, and the consequently different investment management services provided to the different categories of clients and the differing contexts in which these arrangements are entered into. The Trustees confirmed their previous observations that the differences between the fees charged by the Advisor or by other investment advisors to different types of clients did not appear exceptional and had limited relevance to the evaluation of the fee rate charged to mutual funds as to which the Advisor or such other advisors are the primary advisor and sponsor.
Costs and Profitability of Advisor. In reviewing the profitability of the Advisor’s services to the Fund, the Trustees considered an analysis of the Advisor’s costs and the estimated profitability to the Advisor of its services, together with data respecting the overall profitability of a selection of other investment management firms. The Trustees considered in this regard information from the Advisor respecting investment of its profits to maintain staffing levels, and noted that a portion of the Advisor’s profits is an important element in the compensation of shareholder employees. The Trustees considered information from the Advisor respecting the use of profits to enhance staff competencies through training and other measures, hire personnel to expand and develop the scope of senior management expertise, pay competitive levels of compensation, and add to the Advisor’s electronic and information technology systems to maintain or improve service levels. The Trustees also considered the contribution of the Advisor’s cost management to its profitability, and the relationship of the Advisor’s financial resources and profitability in previous years to its ability to attract necessary personnel, invest in systems and other assets required for its service to the Fund, and maintain or improve service levels for the Fund notwithstanding fluctuations in revenues and profitability. The information considered did not indicate to the Trustees that the Advisor’s profitability was excessive.
Potential Economies of Scale. In reviewing the extent to which economies of scale would be realized by the Fund as it grows and whether fee levels reflect potential economies of scale, the Trustees considered the breakpoint structure for advisory fees chargeable to the Fund, comparisons of the fee breakpoint structure for the Fund with breakpoint structures (or the absence of such structures) for other funds in a peer group selected by an independent mutual fund analyst firm, the effects of the breakpoint structure and other expense factors realized by certain funds of the Trust as their asset levels had increased, the Advisor’s undertakings to waive or reimburse certain fees and expenses of the Fund, and the Advisor’s expenditures from its own profits and resources to maintain staffing levels and expand staff competencies, pay competitive levels of compensation, and add to its electronic and information technology systems so as to maintain or improve service levels. The information provided demonstrated to the Trustees that the Fund’s advisory fee breakpoint structure is reasonable in relation to the structures observed in the other funds in its peer group, and that shareholders may be expected to benefit from any economies of scale, due to the advisory agreement’s breakpoint fee structure for the Fund and other factors.
Potential Ancillary Benefits. In reviewing potential benefits to the Advisor because of its relationship to the Fund, the Trustees considered explanations from the Advisor respecting its receipt of certain research services from broker dealers, and the benefits to both the Fund and the Advisor of the Advisor’s expansion of its staffing, compliance and systems capabilities and other resources to serve a broader variety of investment management clients. No unusual or unfair benefits to the Advisor from its relationship to the Fund were identified by the Trustees.
Summary of Conclusions. The Trustees concluded that the general nature, extent and quality of the Advisor’s services performed under the advisory agreement remained sufficient, the Advisor had continued to actively and competently pursue the Fund’s stated investment objectives and adhere to the Fund’s investment policies, and that the absolute and relative investment performance of the Fund over pertinent holding periods on the whole was satisfactory in the context of the Fund’s objectives and strategies. The Trustees further concluded that the level of the advisory fee charged to the Fund by the Advisor is fair and reasonable in relation to the services provided by the Advisor, in view of the nature, extent and quality of those services, the investment performance of the Fund after fees and expenses, the clear disclosure of fees and expenses in the Fund’s prospectuses, comparisons of fees and expenses charged to the Fund to fees and expenses charged to other mutual funds, and the other factors considered. The Trustees accordingly determined to renew the Fund’s investment advisory agreement with the Advisor for an additional term of one year.
Trustees’ Statement to Shareholders (Unaudited)
Readopted September 17, 2019
The Trustees believe current and prospective shareholders should know how we discharge our responsibilities in supervising the Funds’ investment advisor and in reviewing the advisor’s contract for renewal. Since 2005, we have issued a statement which sets out clearly the three principal guidelines that we follow in supervising the Trust’s investment advisor on your behalf. In accordance with our customary practice, in September of this year we again reviewed our statement and concluded we should reissue this statement outlining the principal features of our supervision of the advisor’s performance of investment management services for the Funds.
We begin with the premise that each shareholder selected his or her Fund because its investments are managed by the investment advisor identified in the prospectus and in accordance with the objective and policies described in the prospectus. We realize, as each of you do, that if you believe that your Fund’s stated objective and policies no longer serve your personal investment goals, you can sell your shares and leave the Fund.
Therefore, we believe that our primary supervisory task—our principal obligation to you—is to assess the nature and quality of the advisor’s services, and to confirm that the advisor actively and competently pursues the Fund’s objective, in accordance with the policies set out in the prospectus. To do this, we meet regularly with management to review your Fund’s portfolio and to discuss the advisor’s specific actions and judgments in pursuing the Fund’s objective. We do not substitute our own judgment for the advisor’s decisions in selecting investments; the advisor is paid to exercise its informed judgment on investment decisions, and we seek to confirm, in reviewing the advisor’s performance, that the advisor is doing just that.
Second, we are conscious of costs and the effect that costs have on shareholders’ returns. We try to make sure that your Fund’s fees and costs are reasonable in relationship to the services rendered and that they are generally in line with those charged by other expert investment advisors, consistent with our belief that the Fund’s investors searched for and expect that expertise and attention and have decided to pay a reasonable price for it. We do not put the management contract “out to bid” as a matter of course, and we would not do so unless we had concluded that the advisor materially had failed to pursue the Fund’s objectives in accordance with its policies, or for other equally important reasons. We believe that any other approach would be inconsistent with your interests and contrary to your expectations when you bought shares of the Fund in the first place.
Finally, because we believe that most Thornburg Fund shareholders have invested with a long-term perspective, we try not to focus too much on the fashions of the moment and on short-term performance. The market will not favor any specific investment objective or set of policies at all times and under all economic circumstances. A fund will experience periods of both high and low returns relative to other funds and other investments. Even if one of our Funds is not favored by the market at a particular time, we believe that the advisor is nonetheless obliged to remain true to the Fund’s objective and policies, and we watch to see that it does so.
Trustees of Thornburg Investment Trust
Thornburg Investment Management is a privately-owned global investment firm that offers a range of solutions for retail and institutional investors. Founded in 1982 and headquartered in Santa Fe, New Mexico, we manage approximately $41.9 billion (as of September 30, 2019) across U.S. mutual funds, separate accounts for high-net-worth investors, institutional accounts, and UCITS funds for non-U.S. investors.
The fund outlined in this report is one of many equity and fixed-income products available from Thornburg Investment Management.
EQUITY FUNDS
| ■ | Thornburg Global Opportunities Fund |
| ■ | Thornburg International Value Fund |
| ■ | Thornburg Better World International Fund |
| ■ | Thornburg International Growth Fund |
| ■ | Thornburg Developing World Fund |
| ■ | Thornburg Value Fund |
| ■ | Thornburg Core Growth Fund |
MULTI_ASSET FUNDS
| ■ | Thornburg Investment Income Builder Fund |
| ■ | Thornburg Summit Fund |
FIXED INCOME FUNDS
| ■ | Thornburg Low Duration Income Fund |
| ■ | Thornburg Limited Term U.S. Government Fund |
| ■ | Thornburg Limited Term Income Fund |
| ■ | Thornburg Strategic Income Fund |
| ■ | Thornburg Low Duration Municipal Fund |
| ■ | Thornburg Limited Term Municipal Fund |
| ■ | Thornburg Intermediate Municipal Fund |
| ■ | Thornburg California Limited Term Municipal Fund |
| ■ | Thornburg New Mexico Intermediate Municipal Fund |
| ■ | Thornburg New York Intermediate Municipal Fund |
| ■ | Thornburg Strategic Municipal Income Fund |
ALTERNATIVE FUNDS
| ■ | Thornburg Long/Short Equity Fund |
Before investing, carefully consider the Fund’s investment goals, risks, charges, and expenses. For a prospectus or summary prospectus containing this and other information, contact your financial advisor or visit thornburg.com. Read it carefully before investing.
For additional information, please visit thornburg.com
Thornburg Investment Management, Inc. 2300 North Ridgetop Road, Santa Fe, NM 87506
This page intentionally left blank.
This page intentionally left blank.
To receive shareholder reports, prospectuses, and proxy statements electronically, go to www.thornburg.com/edelivery.
This Annual Report is submitted for the general information of shareholders of the Fund. It is not authorized for distribution to prospective investors in the Fund unless preceded or accompanied by an effective prospectus.
Investment Advisor:
Thornburg Investment Management®
800.847.0200
Distributor:
Thornburg Securities Corporation®
Annual Report
September 30, 2019
Beginning on January 1, 2021, as permitted by regulations adopted by the Securities and Exchange Commission, paper copies of the Fund’s shareholder reports will no longer be sent by mail, unless you specifically request paper copies of the reports from the Fund or from your financial intermediary, such as a broker-dealer or bank. Instead, the reports will be made available on a website, and you will be notified by mail each time a report is posted and provided with a website link to access the report.
If you already elected to receive shareholder reports electronically, you will not be affected by this change and you need not take any action. You may elect to receive shareholder reports and other communications from the Fund or your financial intermediary electronically by going to thornburg.com/edelivery.
You may elect to receive all future reports in paper free of charge. You can inform the Fund or your financial intermediary that you wish to continue receiving paper copies of your shareholder reports by calling 800.847.0200 or your financial intermediary directly. Your election to receive reports in paper will apply to all funds held with the fund complex/your financial intermediary.
At Thornburg, we believe unconstrained investing leads to better outcomes for our clients. Our investment solutions are highly active, high conviction, and benchmark agnostic. When it comes to finding economic opportunity for clients, it’s more than what we do.
It’s how we do it. Active Asbottom-up, fundamental, active managers, we look beyond conventional benchmarks. Long Term We take a long-term view in how we manage our firm and our portfolios. Benchmark Agnostic Investment strategies should have the flexibility to pursue solutions for clients, not stay within the conventional confines of benchmarks. Flexible Perspective Our approach to portfolio construction is guided by our convictions rather than convention. High Conviction We focus our attention and capital on thoroughly researched, well-understood positions. The best form of risk management is to know what you own, and why. Repeatable & Robust Our long-term outperformance of benchmarks verifies that our process works and outperforms conventional thinking. Independent We are independently owned and far from the herd of other investment managers. Investment Driven All members of the investment team are resources for all of our strategies. Collaborative Our team collaborates on opportunities across geography, sector, or asset class.
Thornburg Global Opportunities Fund
Annual Report | September 30, 2019
Table of Contents
| SHARE CLASS | NASDAQ SYMBOL | CUSIP |
| Class A | THOAX | 885-215-343 |
| Class C | THOCX | 885-215-335 |
| Class I | THOIX | 885-215-327 |
| Class R3 | THORX | 885-215-145 |
| Class R4 | THOVX | 885-215-137 |
| Class R5 | THOFX | 885-215-129 |
| Class R6 | THOGX | 885-216-655 |
Class I, R3, R4, R5, and R6 shares may not be available to all investors. Minimum investments for Class I shares may be higher than those for other classes.
Investments carry risks, including possible loss of principal. Additional risks may be associated with investments outside the United States, especially in emerging markets, including currency fluctuations, illiquidity, volatility, and political and economic risks. Investments in small- and mid-capitalization companies may increase the risk of greater price fluctuations. Please see the Fund’s prospectus for a discussion of the risks associated with an investment in the Fund. Investments in the Fund are not FDIC insured, nor are they deposits of or guaranteed by a bank or any other entity.
Funds invested in a smaller number of holdings may expose an investor to greater volatility.
Letter to Shareholders
Thornburg Global Opportunities Fund | September 30, 2019 (Unaudited)
November 4, 2019
Dear Fellow Shareholders:
This letter will highlight the results of the Thornburg Global Opportunities Fund’s investment activities for the 12-month period ended September 30, 2019. In addition, we will comment on the overall investment landscape. Recall that the Thornburg Global Opportunities Fund seeks capital appreciation from a portfolio of typically 30–40 equity investments from around the world. We believe that the structure of the Fund—built on our core investment principles of flexibility, focus and value—gives us a durable framework for value-added investing.
The Fund’s total return for the fiscal year ended September 30, 2019 was negative 5.46% (Class I shares), underperforming the 1.38% return of the benchmark MSCI All Country World Index (ACWI). The net asset value (NAV) per share decreased from $30.07 to $27.67, and the Class I shares paid 0.65 cents per share in dividend income. Dividend amounts for other classes of Fund shares varied based on class-specific expenses. Most of the underperformance of the Thornburg Global Opportunities Fund, in absolute terms and relative to its benchmark, occurred in the December 2018 quarter when the Fund delivered a total return of negative 15.92%. We communicated in early January of 2019 that consensus earnings expectations for per share earnings for 2019 that had been published by outside analysts tracking our portfolio holdings actually increased over the course of calendar year 2018 (+3.5% versus prior EPS growth expectations on a portfolio weighted average basis), even as the stock prices of most of our investments declined. Simply stated, your portfolio stocks became cheaper, with a year-end 2018 weighted average P/E multiple of approximately 13.6x expected earnings for this year, 2019.
The Fund has seen a recovery in absolute performance thus far in calendar 2019, posting total returns of 12.43% (Class I shares) for the nine-month period ended September 30, and 21.94% as of November 4, 2019. But we recognize that our results in calendar 2018 were disappointing. We continue to manage the Fund with a long-term orientation, and we have adjusted portfolio holdings as business outlooks and share prices of the individual businesses in your portfolio have evolved. Despite the positive performance of the Fund in 2019 to date, earnings per share growth of our portfolio companies has kept the weighted average P/E multiple of the portfolio around 14x forward-year earnings, a significant discount to the P/E multiple of the ACWI Index.
Performance comparisons of the Fund to the MSCI ACWI Index over various time periods are shown on page 7 of this report, and on our website www.thornburg.com. From its inception on July 28, 2006, through September 30, 2019, the Class I shares of the Thornburg Global Opportunities Fund have outperformed the MSCI ACWI Index by an average margin of roughly 278 basis points (or 2.78%) per year, resulting
in a total cumulative return since inception of 195% versus 109% for the index. Since inception, the Fund has exhibited share-price volatility, as measured by weekly beta, nominally lower than that of the index.1
Source: Thornburg
Performance data shown represents past performance and is no guarantee of future results. Investment return and principal value will fluctuate so shares, when redeemed, may be worth more or less than their original cost. Current performance may be lower or higher than quoted. For performance current to the most recent month end, visit thornburg.com or call 877-215-1330.
In assessing the performance of the Fund over the fiscal year ended September 30, 2019, it is instructive to consider the performance in U.S. dollars of the sector components of your Fund’s benchmark, the MSCI All Country World Index. For the index, sector returns ranged from negative 15% (energy) to 19% (utilities), with six sectors showing positive results. Information technology, consumer staples, utilities and real estate were the top performing sectors for the index, while energy and health care were the largest detractors. The Fund’s investments in the following sectors comprised the largest average weightings in the portfolio during the year under review: communication services (19% average weight), industrials (18% average weight), financials (14% average weight), materials (11% average weight) and consumer discretionary (10% average weight).
1. The Fund was generally underweight investments in firms in the least economically sensitive sectors that performed best during the period under review, including utilities and consumer staples.
2. The Fund had heavier than index average weightings in firms in the more macro-economically sensitive sectors that performed worst during the period under review, including industrials and materials. We were conscious of this portfolio allocation, seeing value in the cost-advantaged positions of these investments.
3. Seven portfolio investments contributed at least 0.25% to portfolio performance during the fiscal year. Fourteen investments contributed overall portfolio declines in value of more than negative 0.25%.
Letter to Shareholders, Continued
Thornburg Global Opportunities Fund | September 30, 2019 (Unaudited)
Your Fund’s investments in the communication services sector delivered generally positive performance during the fiscal year. T-Mobile US and Facebook made positive contributions to portfolio performance as both businesses increased customers and user engagement. Chinese internet search engine developer Baidu was a significant detractor. We sold the entire Baidu investment earlier this year as the company is being challenged in key areas while it pours cash into as yet unproductive endeavors like autonomous driving.
Your Fund’s investments in the industrials sector delivered disappointing share price performance for the year under review, with market prices generally falling short of their underlying business performance. European airlines Ryanair and easyJet, while both growing customer bases, saw falling average passenger fares as industry capacity rationalization grinds on more slowly than expected. Agricultural equipment, commercial vehicle and construction equipment manufacturer CNH Industrial also detracted from portfolio performance. Investor sentiment toward CNH deteriorated as uncertainty around global macro-economic growth has increased. Each of these three detractors delivered strong share price recoveries between September 30 and the date of this letter. European toll road and airport operator Atlantia made a positive contribution to portfolio performance for fiscal 2019, but this was insufficient to offset the negative headwinds of the aforementioned detractors.
Fund investments in the financials sector made a negative contribution to portfolio performance during the period. French multi-national bank BNP Paribas and Dutch insurer NN Group each detracted from portfolio performance. Portfolio credit quality for these European firms is holding up reasonably well in 2019, but the indefinite extension of negative euro interest rate policies and quantitative easing clouds the forward earnings outlook. U.S.-listed Capital One Financial and Citigroup each saw per share revenue, normalized net income and book value growth in 2018 and 2019 to date. But this progress was met by contracting valuation multiples, so these investments modestly detracted from portfolio performance.
Your Fund invested in three firms in the materials sector during the period under review: CF Industries and OCI each produce fertilizers and industrial chemicals, while Mineral Resources is an Australia-based mining services firm that also produces its own iron ore and lithium used in lithium-ion batteries. Each of these delivered negative contributions to portfolio performance for fiscal 2019. We maintain constructive views of the nitrogen fertilizer end market, and of the cost-advantaged positions of CF Industries and OCI as suppliers to this market with access to low cost natural gas supplies. Growth of the end market for lithium-ion batteries will be tied primarily to growth of battery electric powered vehicles. Mineral Resources has been nimble and opportunistic in adding value in various segments of the mining industry in Australia.
Fund investments in the consumer discretionary sector delivered positive overall returns for the fiscal year. Our longtime U.K.
holding Barratt Developments contributed significantly to portfolio returns as the company continued to deliver promised improvements in margins while investors’ fears of a “hard Brexit” receded. Barratt has been a strong contributor to the Thornburg Global Opportunities Fund performance since our initial purchase in 2014. Shares in gaming and hospitality company Galaxy Entertainment also made a positive portfolio contribution for the year. Hong Kong-based Galaxy is a leading gaming and leisure group, benefiting from ongoing growth in Macau tourism and visitation from mainland China.
The Fund’s information technology investments delivered a mixed contribution to portfolio performance. Two newer holdings, GDS Holdings and Qorvo made positive contributions while Samsung Electronics was a negative contributor. GDS Holdings, a leading owner and operator of data centers in China, reported strong customer demand in 2018 and plans to expand its business in the coming years as its customers grow in China. Qorvo, a market leader in the design and manufacturing of radio frequency (RF) chips, appears poised to gain from increasing the value of its components in mobile phones and other connected devices.
Other detractors from portfolio performance included drugstore chain and pharmaceuticals distributor Walgreens Boots Alliance, pharmaceuticals manufacturer Allergan, French electric utility Electricite de France, coal producer Peabody Energy and chemicals conglomerate Bayer AG. We sold our positions in Electricite de France, Peabody Energy and Bayer, and significantly reduced the portfolio holding of Walgreens. On the positive side, India’s multi-industry conglomerate Reliance Industries again made a significant positive contribution to portfolio performance for fiscal 2019.
We highlight your portfolio’s holding in renewable energy leader Vestas Wind Systems—the world’s largest producer of wind turbines. Vestas made a modest positive contribution to portfolio performance in fiscal 2019. Vestas is in the process of delivering the largest backlog in its history while also taking in significant future orders at attractive prices. Near-term margin expectations are below average due to tariff and other transitory effects, but we are optimistic about the future for Vestas due to its exposure to several structural global trends (e.g. electrification and replacement of coal and nuclear-powered electricity generation with renewable energy).
Illustrated below is the cost of wind as compared to Closed Cycle Gas Turbines (CCGT), one of the cheapest fossil fuel-based power technologies available, for the United States. As the chart indicates, most new-build onshore wind generation is already cheaper than gas-fired generation, and wind costs are expected to further decline, boosting the relative appeal of Vestas’ products.
Letter to Shareholders, Continued
Thornburg Global Opportunities Fund | September 30, 2019 (Unaudited)
Source: Bloomberg New Energy Finance – “2H 2019 LCOE Update: Solar, wind and power prices at the crossroads”
At September 30, 2019, U.S. headquartered firms comprised approximately 40% of your portfolio, foreign firms were 57%, and cash made up the remaining 3%. The average one-year forward price-to-earnings multiple of the companies owned in the Thornburg Global Opportunities Fund stands at 14.1x versus 16.1x for the MSCI ACWI. Consensus analyst estimates forecast our portfolio firms to grow earnings faster than the market in the years ahead.
Top equity holdings and other portfolio data about Global Opportunities Fund are summarized on page 8 of this report.
We invest based on fundamental analysis of individual businesses. That noted, political and macro-economic events on the horizon continue to present both uncertainties and potential opportunities. Today, investors debate the future direction of the economies of China, Europe, various emerging markets and the U.S. They consider potential policy actions by the U.S. Federal Reserve, Congress, the Trump administration and foreign government regulatory and policy actions. Concerns about tariffs and trade policy changes impact share price movements of
global producers of tradeable goods, which are volatile day to day. The 2020 U.S. elections have entered investor consciousness. Most economic data tracking business expectations of manufacturers around the world are indicating slowing growth. We expect business expectations and the share prices of producers of tradeable goods to remain subject to heightened volatility until new trade policies are established.
Importantly, overall global consumer spending appears poised to grow in 2020, along with global population, industrial production, energy consumption, bank loans, deposits and communications traffic. Despite uncertainty around macroeconomic policies and expectations for slowing future economic growth, employment and wage growth trends remain positive, consumer debt is under control and many governments around the world have room to implement expansionary fiscal policies.
Patience and a long-term investment orientation have served the Thornburg Global Opportunities Fund well over the past 13 years. Given the market’s extended strength, we remind fellow shareholders that we encourage a similar mindset in the years ahead. We continue to follow our core investment principles of flexibility, focus and value, as we have through a wide variety of macroeconomic settings over the Fund’s life.
Thank you for your support of the Thornburg Global Opportunities Fund. Remember that you can review our periodic portfolio commentary, as well as descriptions of many of the stocks in your portfolio, at www.thornburg.com/global.
Best wishes for a great holiday season and new year.
Sincerely,

| 
|
Brian McMahon
Portfolio Manager
Chief Investment Officer
and Managing Director | W. Vinson Walden,cfa
Portfolio Manager
Managing Director |
1. Source: Weekly beta as measured by Bloomberg.
Holdings are classified by country of risk as determined by MSCI and Bloomberg.
The matters discussed in this report may constitute forward-looking statements made pursuant to the safe harbor provisions of the Securities Litigation Reform Act of 1995. These include any advisor or portfolio manager prediction, assessment, analysis or outlook for individual securities, industries, investment styles, market sectors and/or markets. These statements involve risks and uncertainties. In addition to the general risks described for each fund in its current prospectus, other factors bearing on these reports include the accuracy of the advisor’s or portfolio manager’s forecasts and predictions, the appropriateness of the investment strategies designed by the advisor or portfolio manager and the ability of the advisor or portfolio manager to implement their strategies efficiently and successfully. Any one or more of these factors, as well as other risks affecting the securities markets generally, could cause the actual results of any fund to differ materially as compared to its benchmarks.
The views expressed are subject to change and do not necessarily reflect the views of Thornburg Investment Management, Inc. This information should not be relied upon as a recommendation or investment advice and is not intended to predict the performance of any investment or market.
Performance results of individual share classes will vary based on the fees and expenses associated with each share class, and may be higher or lower than other share classes within the same Fund. Please see Performance Summary for performance results of each share class.
Performance Summary
Thornburg Global Opportunities Fund | September 30, 2019 (Unaudited)
AVERAGE ANNUAL TOTAL RETURNS
| | 1-YR | 3-YR | 5-YR | 10-YR | SINCE
INCEP. |
| Class A Shares(Incep: 7/28/06) | | | | | |
| Without sales charge | -5.78% | 4.44% | 3.74% | 8.63% | 8.09% |
| With sales charge | -10.02% | 2.85% | 2.78% | 8.13% | 7.71% |
| Class C Shares(Incep: 7/28/06) | | | | | |
| Without sales charge | -6.49% | 3.64% | 2.95% | 7.81% | 7.26% |
| With sales charge | -7.42% | 3.64% | 2.95% | 7.81% | 7.26% |
| Class I Shares(Incep: 7/28/06) | -5.46% | 4.78% | 4.08% | 9.08% | 8.55% |
| Class R3 Shares(Incep: 2/1/08) | -5.95% | 4.24% | 3.55% | 8.52% | 5.00% |
| Class R4 Shares(Incep: 2/1/08) | -5.84% | 4.36% | 3.65% | 8.62% | 5.09% |
| Class R5 Shares(Incep: 2/1/08) | -5.45% | 4.77% | 4.08% | 9.07% | 5.54% |
| Class R6 Shares(Incep: 4/10/17) | -5.34% | - | - | - | 0.51% |
| MSCI AC World Index(Since 7/28/06) | 1.38% | 9.71% | 6.65% | 8.35% | 5.77% |
GROWTH OF A HYPOTHETICAL $10,000 INVESTMENT
Performance data shown represents past performance and is no guarantee of future results. Investment return and principal value will fluctuate so shares, when redeemed, may be worth more or less than their original cost. Current performance may be lower or higher than quoted. For performance current to the most recent month end, visit thornburg.com or call 800-847-0200. The performance information does not reflect the deduction of taxes that a shareholder would pay on distributions or the redemption of Fund shares. Returns reflect the reinvestment of dividends and capital gains. Class A shares are sold with a maximum sales charge of 4.50%. Class C shares are subject to a 1% CDSC for the first year only. There is no sales charge for Class I, R3, R4, R5 and R6 shares. As disclosed in the most recent prospectus, the total annual fund operating expenses before fee waivers and expense reimbursements are as follows: A shares, 1.28%; C shares, 2.03%; I shares, 0.97%; R3 shares, 1.92%; R4 shares, 1.61%; R5 shares, 1.16% and R6, 0.98%. Thornburg Investment Management has contractually agreed to waive fees and reimburse expenses until at least February 1, 2020, for some of the share classes, resulting in net expense ratios of the following: R3 shares, 1.50%; R4 shares, 1.40%; R5 shares, 0.99%, and R6 shares, 0.85%. For more detailed information on fund expenses and waivers/reimbursements please see the Fund’s prospectus.
TheMSCI All Country (AC) World Index is a market capitalization weighted index that is representative of the market structure of 46 developed and emerging market countries in North and South America, Europe, Africa, and the Pacific Rim. The index is calculated with net dividends reinvested in U.S. dollars.
The performance of any index is not indicative of the performance of any particular investment. Unless otherwise noted, index returns reflect the reinvestment of income dividends and capital gains, if any, but do not reflect fees, brokerage commissions or other expenses of investing. Investors may not make direct investments into any index.
P/E- Price/Earnings ratio (P/E ratio) is a valuation ratio of a company’s current share price compared to its per-share earnings. P/E equals a company’s market value per share divided by earnings per share. Forecasted P/E is not intended to be a forecast of the Fund’s future performance.
Price/Book ratio (P/B ratio) – A ratio used to compare a stock’s market value to its book value. It is calculated by dividing the current closing price of the stock by the latest quarter’s book value per share.
Fund Summary
Thornburg Global Opportunities Fund | September 30, 2019 (Unaudited)
OBJECTIVES AND STRATEGIES
The Fund seeks long-term capital appreciation by investing in equity and debt securities of all types from issuers around the world.
The Fund pursues its investment goals by investing primarily in a broad range of equity securities, including common stocks, preferred stocks, real estate investment trusts, other equity trusts, and partnership interests. The Fund may invest in any stock or other equity security which the investment advisor believes may assist the Fund in pursuing its goals, including smaller companies with market capitalizations of less than $500 million. The Fund may also invest in debt obligations of any kind.
ASSET STRUCTURE
MARKET CAPITALIZATION EXPOSURE
| TOP TEN EQUITY HOLDINGS |
| Alphabet, Inc. Class A | 5.8% |
| Capital One Financial Corp. | 5.2% |
| T-Mobile US, Inc. | 5.1% |
| Reliance Industries Ltd. | 5.1% |
| Facebook, Inc. Class A | 4.8% |
| Atlantia S.p.A. | 4.7% |
| Ryanair Holdings plc | 4.5% |
| Citigroup, Inc. | 4.4% |
| OCI N.V. | 4.3% |
| New World Development Co. Ltd. | 3.8% |
| SECTOR EXPOSURE |
| Industrials | 18.7% |
| Communication Services | 17.8% |
| Information Technology | 12.9% |
| Financials | 12.2% |
| Consumer Discretionary | 9.3% |
| Materials | 9.1% |
| Energy | 5.1% |
| Real Estate | 3.8% |
| Health Care | 3.7% |
| Consumer Staples | 0.1% |
| Utilities | 0.1% |
| Other Assets Less Liabilities | 7.2% |
| TOP TEN INDUSTRY GROUPS |
| Media & Entertainment | 12.7% |
| Transportation | 12.3% |
| Materials | 9.1% |
| Capital Goods | 6.4% |
| Consumer Services | 5.5% |
| Technology Hardware & Equipment | 5.5% |
| Diversified Financials | 5.2% |
| Telecommunication Services | 5.1% |
| Energy | 5.1% |
| Banks | 4.9% |
COUNTRY EXPOSURE*
(percent of equity holdings) |
| United States | 40.7% |
| China | 7.9% |
| Netherlands | 7.5% |
| United Kingdom | 7.1% |
| Macao | 6.0% |
| India | 5.4% |
| Italy | 5.0% |
| Ireland | 4.8% |
| Hong Kong | 4.1% |
| Denmark | 3.5% |
| South Korea | 3.4% |
| Australia | 2.8% |
| Taiwan | 1.7% |
| France | 0.1% |
| * | Holdings are classified by country of risk as determined by MSCI and Bloomberg. |
There is no guarantee that the Fund will meet its investment objectives.
All data is subject to change. Charts may not add up to 100% due to rounding.
Schedule of Investments
Thornburg Global Opportunities Fund | September 30, 2019
| | | SHARES | VALUE |
| | Common Stock — 92.8% | | |
| | Banks — 4.9% | | |
| | Banks — 4.9% | | |
| | Citigroup, Inc. | 804,047 | $ 55,543,567 |
| | ING Groep N.V. | 598,900 | 6,269,215 |
| | | | 61,812,782 |
| | Capital Goods — 6.4% | | |
| | Electrical Equipment — 3.2% | | |
| | Vestas Wind Systems A/S | 516,780 | 40,120,527 |
| | Machinery — 3.2% | | |
| | CNH Industrial N.V. | 3,951,495 | 40,226,757 |
| | | | 80,347,284 |
| | Consumer Durables & Apparel — 0.2% | | |
| | Household Durables — 0.2% | | |
| | Barratt Developments plc | 348,866 | 2,779,583 |
| | | | 2,779,583 |
| | Consumer Services — 5.5% | | |
| | Hotels, Restaurants & Leisure — 5.5% | | |
| | Galaxy Entertainment Group Ltd. | 5,988,555 | 37,248,435 |
| | MGM China Holdings Ltd. | 20,542,689 | 32,028,740 |
| | | | 69,277,175 |
| | Diversified Financials — 5.2% | | |
| | Consumer Finance — 5.2% | | |
| | Capital One Financial Corp. | 710,896 | 64,677,318 |
| | | | 64,677,318 |
| | Energy — 5.1% | | |
| | Oil, Gas & Consumable Fuels — 5.1% | | |
| | Reliance Industries Ltd. | 3,367,288 | 63,355,691 |
| | | | 63,355,691 |
| | Food & Staples Retailing — 0.1% | | |
| | Food & Staples Retailing — 0.1% | | |
| | Walgreens Boots Alliance, Inc. | 10,934 | 604,760 |
| | | | 604,760 |
| | Healthcare Equipment & Services — 3.6% | | |
| | Health Care Providers & Services — 3.6% | | |
| a | DaVita, Inc. | 786,919 | 44,909,467 |
| | | | 44,909,467 |
| | Insurance — 2.1% | | |
| | Insurance — 2.1% | | |
| | NN Group N.V. | 741,229 | 26,289,157 |
| | | | 26,289,157 |
| | Materials — 9.1% | | |
| | Chemicals — 6.5% | | |
| | CF Industries Holdings, Inc. | 543,561 | 26,743,201 |
| a | OCI N.V. | 2,293,722 | 54,150,933 |
| | Metals & Mining — 2.6% | | |
| | Mineral Resources Ltd. | 3,632,479 | 32,804,309 |
| | | | 113,698,443 |
| | Media & Entertainment — 12.7% | | |
| | Entertainment — 1.6% | | |
| a | Sea Ltd. ADR | 630,400 | 19,510,880 |
Schedule of Investments, Continued
Thornburg Global Opportunities Fund | September 30, 2019
| | | SHARES | VALUE |
| | Interactive Media & Services — 10.6% | | |
| a | Alphabet, Inc. Class A | 59,897 | $ 73,142,622 |
| a | Facebook, Inc. Class A | 336,985 | 60,010,289 |
| | Media — 0.5% | | |
| a | DISH Network Corp. Class A | 171,669 | 5,848,763 |
| | | | 158,512,554 |
| | Pharmaceuticals, Biotechnology & Life Sciences — 0.1% | | |
| | Pharmaceuticals — 0.1% | | |
| | Allergan plc | 7,717 | 1,298,694 |
| | | | 1,298,694 |
| | Real Estate — 3.8% | | |
| | Real Estate Management & Development — 3.8% | | |
| | New World Development Co., Ltd. | 36,382,910 | 47,255,958 |
| | | | 47,255,958 |
| | Retailing — 3.6% | | |
| | Internet & Direct Marketing Retail — 3.6% | | |
| a | Alibaba Group Holding Ltd. Sponsored ADR | 266,074 | 44,495,555 |
| | | | 44,495,555 |
| | Semiconductors & Semiconductor Equipment — 3.7% | | |
| | Semiconductors & Semiconductor Equipment — 3.7% | | |
| a | Qorvo, Inc. | 632,041 | 46,859,520 |
| | | | 46,859,520 |
| | Software & Services — 3.7% | | |
| | Information Technology Services — 3.7% | | |
| a | GDS Holdings Ltd. ADR | 1,168,834 | 46,846,867 |
| | | | 46,846,867 |
| | Technology Hardware & Equipment — 5.5% | | |
| | Communications Equipment — 2.3% | | |
| a | EchoStar Corp. Class A | 729,771 | 28,913,527 |
| | Technology Hardware, Storage & Peripherals — 3.2% | | |
| | Samsung Electronics Co., Ltd. | 975,636 | 40,007,479 |
| | | | 68,921,006 |
| | Telecommunication Services — 5.1% | | |
| | Wireless Telecommunication Services — 5.1% | | |
| a | T-Mobile US, Inc. | 816,569 | 64,321,140 |
| | | | 64,321,140 |
| | Transportation — 12.3% | | |
| | Airlines — 7.6% | | |
| | easyJet plc | 2,828,648 | 39,996,572 |
| a | Ryanair Holdings plc Sponsored ADR | 842,620 | 55,933,116 |
| | Transportation Infrastructure — 4.7% | | |
| | Atlantia SpA | 2,419,097 | 58,508,275 |
| | | | 154,437,963 |
| | Utilities — 0.1% | | |
| | Electric Utilities — 0.1% | | |
| | Electricite de France S.A. | 115,559 | 1,293,543 |
| | | | 1,293,543 |
| | Total Common Stock(Cost $980,071,443) | | 1,161,994,460 |
| | Short-Term Investments — 6.9% | | |
| b | Thornburg Capital Management Fund | 8,705,041 | 87,050,413 |
| | Total Short-Term Investments(Cost $87,050,413) | | 87,050,413 |
| | Total Investments — 99.7%(Cost $1,067,121,856) | | $1,249,044,873 |
Schedule of Investments, Continued
Thornburg Global Opportunities Fund | September 30, 2019
| | | SHARES | VALUE |
| | Other Assets Less Liabilities — 0.3% | | 3,305,581 |
| | Net Assets — 100.0% | | $1,252,350,454 |
| Outstanding Forward Currency Contracts To Buy Or Sell At September 30, 2019 |
Contract
Description | Contract
Party* | Buy/Sell | Contract
Amount | Contract
Value Date | Value
USD | Unrealized
Appreciation | Unrealized
Depreciation |
| Great Britain Pound | SSB | Sell | 17,439,200 | 10/10/2019 | 21,449,502 | $ 441,751 | $ — |
| Great Britain Pound | SSB | Buy | 2,047,100 | 10/10/2019 | 2,517,849 | 33,755 | — |
| Great Britain Pound | SSB | Buy | 1,259,700 | 10/10/2019 | 1,549,379 | 16,965 | — |
| Australian Dollar | BBH | Sell | 24,451,400 | 10/31/2019 | 16,520,288 | 399,102 | — |
| Australian Dollar | BBH | Buy | 4,792,400 | 10/31/2019 | 3,237,926 | — | (15,251) |
| Euro | SSB | Sell | 112,676,800 | 11/15/2019 | 123,212,528 | 3,734,102 | — |
| Euro | SSB | Buy | 15,470,700 | 11/15/2019 | 16,917,272 | — | (83,001) |
| |
| Total | | | | | | $4,625,675 | $(98,252) |
| |
| Net unrealized appreciation (depreciation) | | | | | | $4,527,423 | |
| * | Counterparties include State Street Bank and Trust Company (“SSB”) and Brown Brothers Harriman & Co. (“BBH”). |
| Footnote Legend |
| a | Non-income producing. |
| b | Investment in Affiliates. |
Portfolio Abbreviations
To simplify the listings of securities, abbreviations are used per the table below:
| ADR | American Depositary Receipt |
See notes to financial statements.
Statement of Assets and Liabilities
Thornburg Global Opportunities Fund | September 30, 2019
| ASSETS | |
| Investments at value (Note 3) | |
| Non-affiliated issuers (cost $980,071,443) | $ 1,161,994,460 |
| Non-controlled affiliated issuer (cost $87,050,413) | 87,050,413 |
| Cash denominated in foreign currency (cost $21) | 21 |
| Receivable for investments sold | 4,244,564 |
| Receivable for fund shares sold | 527,004 |
| Unrealized appreciation on forward currency contracts (Note 7) | 4,625,675 |
| Dividends receivable | 1,174,559 |
| Dividend and interest reclaim receivable | 60,466 |
| Prepaid expenses and other assets | 89,071 |
| Total Assets | 1,259,766,233 |
| Liabilities | |
| Payable for fund shares redeemed | 3,337,045 |
| Unrealized depreciation on forward currency contracts (Note 7) | 98,252 |
| Payable to investment advisor and other affiliates (Note 4) | 1,131,430 |
| Deferred taxes payable (Note 2) | 2,141,711 |
| Accounts payable and accrued expenses | 707,152 |
| Dividends payable | 189 |
| Total Liabilities | 7,415,779 |
| Net Assets | $ 1,252,350,454 |
| NET ASSETS CONSIST OF | |
| Distributable earnings | $ 188,157,225 |
| Net capital paid in on shares of beneficial interest | 1,064,193,229 |
| | $ 1,252,350,454 |
Statement of Assets and Liabilities, Continued
Thornburg Global Opportunities Fund | September 30, 2019
| NET ASSET VALUE | |
| Class A Shares: | |
Net asset value and redemption price per share
($236,560,531 applicable to 8,582,368 shares of beneficial interest outstanding - Note 5) | $ 27.56 |
| Maximum sales charge, 4.50% of offering price | 1.30 |
| Maximum offering price per share | $ 28.86 |
| Class C Shares: | |
Net asset value and offering price per share*
($151,468,837 applicable to 5,704,240 shares of beneficial interest outstanding - Note 5) | $ 26.55 |
| Class I Shares: | |
Net asset value, offering and redemption price per share
($762,696,858 applicable to 27,562,721 shares of beneficial interest outstanding - Note 5) | $ 27.67 |
| Class R3 Shares: | |
Net asset value, offering and redemption price per share
($4,317,014 applicable to 158,269 shares of beneficial interest outstanding - Note 5) | $ 27.28 |
| Class R4 Shares: | |
Net asset value, offering and redemption price per share
($9,254,008 applicable to 338,788 shares of beneficial interest outstanding - Note 5) | $ 27.32 |
| Class R5 Shares: | |
Net asset value, offering and redemption price per share
($42,354,276 applicable to 1,529,232 shares of beneficial interest outstanding - Note 5) | $ 27.70 |
| Class R6 Shares: | |
Net asset value, offering and redemption price per share
($45,698,930 applicable to 1,645,673 shares of beneficial interest outstanding - Note 5) | $ 27.77 |
| * | Redemption price per share is equal to net asset value less any applicable contingent deferred sales charge. |
See notes to financial statements.
Statement of Operations
Thornburg Global Opportunities Fund | Year Ended September 30, 2019
| INVESTMENT INCOME | |
| Dividend income | |
| Non-affiliated issuers (net of foreign taxes withheld of $1,596,343) | $ 29,239,910 |
| Non-controlled affiliated issuer | 1,017,682 |
| Total Income | 30,257,592 |
| EXPENSES | |
| Investment advisory fees (Note 4) | 12,213,377 |
| Administration fees (Note 4) | |
| Class A Shares | 242,786 |
| Class C Shares | 164,483 |
| Class I Shares | 788,028 |
| Class R3 Shares | 4,777 |
| Class R4 Shares | 13,086 |
| Class R5 Shares | 46,432 |
| Class R6 Shares | 41,956 |
| Distribution and service fees (Note 4) | |
| Class A Shares | 691,293 |
| Class C Shares | 1,873,957 |
| Class R3 Shares | 27,210 |
| Class R4 Shares | 37,266 |
| Transfer agent fees | |
| Class A Shares | 319,535 |
| Class C Shares | 232,832 |
| Class I Shares | 872,599 |
| Class R3 Shares | 27,918 |
| Class R4 Shares | 84,833 |
| Class R5 Shares | 156,052 |
| Class R6 Shares | 7,525 |
| Registration and filing fees | |
| Class A Shares | 17,174 |
| Class C Shares | 15,563 |
| Class I Shares | 33,427 |
| Class R3 Shares | 12,767 |
| Class R4 Shares | 12,767 |
| Class R5 Shares | 12,936 |
| Class R6 Shares | 12,928 |
| Custodian fees | 191,934 |
| Professional fees | 98,357 |
| Trustee and officer fees (Note 4) | 98,635 |
| Other expenses | 258,126 |
| Total Expenses | 18,610,559 |
| Less: | |
| Expenses reimbursed by investment advisor (Note 4) | (741,242) |
| Investment advisory fees waived by investment advisor (Note 4) | (286,478) |
| Net Expenses | 17,582,839 |
| Net Investment Income | $ 12,674,753 |
Statement of Operations, Continued
Thornburg Global Opportunities Fund | Year Ended September 30, 2019
| REALIZED AND UNREALIZED GAIN (LOSS) | |
| Net realized gain (loss) on: | |
| Non-affiliated issuer investments (net of realized capital gain taxes paid of $337,315) | $ 8,889,154 |
| Forward currency contracts (Note 7) | 11,711,758 |
| Foreign currency transactions | (207,136) |
| | 20,393,776 |
| Net change in unrealized appreciation (depreciation) on: | |
| Non-affiliated issuer investments (net of change in deferred taxes payable of $98,961) | (170,161,142) |
| Forward currency contracts (Note 7) | 5,648,942 |
| Foreign currency translations | (19,827) |
| | (164,532,027) |
| Net Realized and Unrealized Loss | (144,138,251) |
| Net Decrease in Net Assets Resulting from Operations | $ (131,463,498) |
See notes to financial statements.
Statements of Changes in Net Assets
Thornburg Global Opportunities Fund
| | Year Ended
September 30, 2019 | Year Ended
September 30, 2018 |
| INCREASE (DECREASE) IN NET ASSETS FROM | | |
| OPERATIONS | | |
| Net investment income | $ 12,674,753 | $ 37,984,910 |
| Net realized gain (loss) on investments, forward currency contracts, foreign currency transactions and capital gain taxes | 20,393,776 | 77,745,003 |
| Net change in unrealized appreciation (depreciation) on investments, forward currency contracts, foreign currency translations and deferred taxes | (164,532,027) | (180,296,250) |
| Net Decrease in Net Assets Resulting from Operations | (131,463,498) | (64,566,337) |
| DIVIDENDS TO SHAREHOLDERS | | |
| From distributable earnings | | |
| Class A Shares | (6,084,601) | (1,042,666) |
| Class C Shares | (1,977,267) | (214,888) |
| Class I Shares | (23,054,670) | (5,175,786) |
| Class R3 Shares | (108,092) | (21,199) |
| Class R4 Shares | (288,231) | (52,807) |
| Class R5 Shares | (1,405,780) | (248,810) |
| Class R6 Shares | (1,209,350) | (10,671) |
| FUND SHARE TRANSACTIONS (NOTE 5) | | |
| Class A Shares | (101,269,120) | (63,131,768) |
| Class C Shares | (82,379,964) | (114,771,553) |
| Class I Shares | (333,371,480) | (270,875,265) |
| Class R3 Shares | (2,626,610) | (4,185,580) |
| Class R4 Shares | (9,917,215) | (6,500,787) |
| Class R5 Shares | (22,285,902) | (8,168,594) |
| Class R6 Shares | (2,114,070) | 51,865,696 |
| Net Decrease in Net Assets | (719,555,850) | (487,101,015) |
| NET ASSETS | | |
| Beginning of Year | 1,971,906,304 | 2,459,007,319 |
| End of Year | $ 1,252,350,454 | $ 1,971,906,304 |
See notes to financial statements.
Notes to Financial Statements
Thornburg Global Opportunities Fund | September 30, 2019
NOTE 1 – ORGANIZATION
Thornburg Global Opportunities Fund (the “Fund”) is a diversified series of Thornburg Investment Trust (the “Trust”). The Trust was organized as a Massachusetts business trust under a Declaration of Trust dated June 3, 1987 and is registered as a diversified, open-end management investment company under the Investment Company Act of 1940, as amended (the "1940 Act"). The Fund is currently one of twenty-two separate series of the Trust. Each series is considered to be a separate entity for financial reporting and tax purposes and bears expenses directly attributable to it. The Fund seeks long-term capital appreciation by investing in equity and debt securities of all types from issuers around the world.
The Fund currently offers seven classes of shares of beneficial interest: Class A, Class C, Institutional Class (“Class I”), and Retirement Classes (“Class R3”, “Class R4”, “Class R5”, and “Class R6”). Each class of shares of the Fund represents an interest in the same portfolio of investments, except that (i) Class A shares are sold subject to a front-end sales charge collected at the time the shares are purchased and bear a service fee, (ii) Class C shares are sold at net asset value without a sales charge at the time of purchase, but are subject to a contingent deferred sales charge upon redemption within one year of purchase, and bear both a service fee and a distribution fee, (iii) Class I and Class R5 shares are sold at net asset value without a sales charge at the time of purchase and may be subject to a service fee, (iv) Class R3 shares are sold at net asset value without a sales charge at the time of purchase, but bear both a service fee and distribution fee, (v) Class R4 shares are sold at net asset value without a sales charge at the time of purchase, but bear a service fee, (vi) Class R6 shares are sold at net asset value without a sales charge at the time of purchase, and (vii) the respective classes may have different reinvestment privileges and conversion rights. Additionally, the Fund may allocate among its classes certain expenses, to the extent allocable to specific classes, including administration fees, transfer agent fees, government registration fees, certain printing and postage costs, and administrative and legal expenses. Currently, class specific expenses of the Fund are limited to service and distribution fees and certain registration and transfer agent expenses.
The following is a summary of significant accounting policies followed by the Fund in the preparation of its financial statements. The Fund prepares its financial statements in conformity with United States generally accepted accounting principles (“GAAP”), including investment company accounting and reporting guidance in the Financial Accounting Standards Board (the “FASB”) Accounting Standard Codification Topic 946.
NOTE 2 – SIGNIFICANT ACCOUNTING POLICIES
Security Valuation: All investments in securities held by the Fund are valued as described in Note 3.
Allocation of Income, Gains, Losses and Expenses: Net investment income (other than class specific expenses) and realized and unrealized gains and losses are allocated daily to each class of shares based upon the relative net asset value of outstanding shares (or the value of the dividend-eligible shares, as appropriate) of each class of shares at the beginning of the day (after adjusting for the current capital shares activity of the respective class). Expenses common to all Funds are allocated among the Funds comprising the Trust based upon their relative net asset values or other appropriate allocation methods. Operating expenses directly attributable to a specific class are charged against the operating income of that class.
Dividends and Distributions to Shareholders: Dividends and distributions to shareholders, which are determined in accordance with federal income tax regulations and may differ from GAAP, are recorded on the ex-dividend date. Ordinary income dividends, if any, are declared and paid annually. Capital gain distributions, if any, are declared and paid annually and more often if deemed necessary by Thornburg Investment Management, Inc., the Trust’s investment advisor (the “Advisor”). Dividends and distributions are paid and are reinvested in additional shares of the Fund at net asset value per share at the close of business on the ex-dividend date, or at the shareholder’s option, paid in cash.
Investment Income: Dividend income is recorded on the ex-dividend date. Certain income from foreign investments is recognized as soon as information is available to the Fund. Interest income is accrued as earned. Premiums and discounts are amortized and accreted, respectively, to first call dates or maturity dates using the effective yield method of the respective investments. These amounts are included in Investment Income in the Statement of Operations.
Investment Transactions: Investment transactions are accounted for on a trade date basis. Realized gains and losses from the sale of investments are recorded on an identified cost basis.
When-Issued and Delayed Delivery Transactions: The Fund may engage in when-issued or delayed delivery transactions. To the extent the Fund engages in such transactions, it will do so for the purpose of acquiring portfolio investments consistent with the Fund’s investment objectives and not for the purpose of investment leverage or to speculate on interest rate or market changes. At the time the Fund makes a commitment to purchase an investment on a when-issued or delayed delivery basis, the Fund will record the transaction and reflect the value in determining its net asset value. When effecting such transactions, assets of an amount sufficient to make payment for the portfolio investments to be purchased will be segregated on the Fund’s records on the trade date. Investments purchased on a when-issued or
Notes to Financial Statements, Continued
Thornburg Global Opportunities Fund | September 30, 2019
delayed delivery basis do not earn interest until the settlement date. The values of these securities held at September 30, 2019 are detailed in the Schedule of Investments.
Foreign Currency Translation: Portfolio investments and other assets and liabilities denominated in foreign currencies are translated into U.S. dollars based on the exchange rate of such currencies against the U.S. dollar on the date of valuation. Purchases and sales of investments and income items denominated in foreign currencies are translated into U.S. dollars at the exchange rate in effect on the transaction date. When the Fund purchases or sells foreign investments, it will customarily enter into a foreign exchange contract to minimize foreign exchange risk from the trade date to the settlement date of such transactions. The values of such spot contracts are included in receivable for investments sold and payable for investments purchased on the Statement of Assets and Liabilities.
The Fund does not separately report the effect of changes in foreign exchange rates from changes in market prices on investments held. Such changes are included in net unrealized appreciation (depreciation) from investments in the Statement of Operations.
Reported net realized gains and losses from foreign currency transactions arise due to purchases and sales of foreign currencies, currency gains and losses realized between the trade and settlement dates on investment transactions and the difference between the amounts of dividends, interest, and foreign withholding taxes recorded on the Fund’s books, and the U.S. dollar equivalent of the amounts actually received or paid. These amounts are included in foreign currency transactions in the Statement of Operations.
Net change in unrealized appreciation (depreciation) on foreign currency translations arise from changes in the fair value of assets and liabilities, other than investments at period end, resulting from changes in exchange rates.
Guarantees and Indemnifications: Under the Trust’s organizational documents (and under separate agreements with the independent Trustees), its officers and Trustees are provided with an indemnification against certain liabilities arising out of the performance of their duties to the Fund. In the normal course of business the Trust may also enter into contracts with service providers that contain general indemnifications. The Trust’s maximum exposure under these arrangements is unknown. However, based on experience, the Trust expects the risk of loss to be remote.
Use of Estimates: The preparation of financial statements in conformity with GAAP requires management to make estimates and assumptions that affect the reported amounts of assets and liabilities and disclosure of contingent assets and liabilities at the date of the financial statements and the reported amounts of increases (decreases) in net assets from operations during the reporting period. Actual results could differ from those estimates.
Federal Income Taxes: It is the policy of the Trust to comply with the provisions of the Internal Revenue Code applicable to regulated investment companies and to distribute to shareholders substantially all investment company taxable income including net realized gains on investments (if any), and tax exempt income of the Fund. Therefore, no provision for federal income or excise tax is required.
The Fund files income tax returns in United States federal and applicable state jurisdictions. The statute of limitations on the Fund’s tax return filings generally remains open for the three years following a return’s filing date. The Fund has analyzed each uncertain tax position believed to be material in the preparation of the Fund’s financial statements for the fiscal year ended September 30, 2019, including open tax years, to assess whether it is more likely than not that the position would be sustained upon examination, based on the technical merits of the position. The Fund has not identified any such position for which an asset or liability must be reflected in the Statement of Assets and Liabilities.
At September 30, 2019, information on the tax components of capital was as follows:
| Cost of investments for tax purposes | $ 1,073,604,353 |
| Gross unrealized appreciation on a tax basis | 218,042,538 |
| Gross unrealized depreciation on a tax basis | (38,074,595) |
| Net unrealized appreciation (depreciation) on investments (tax basis) | $ 179,967,943 |
Temporary book to tax adjustments to cost of investments and net unrealized appreciation (depreciation) for tax purposes result primarily from deferral of outstanding wash sales and marked-to-market adjustments of outstanding forward currency contracts.
In order to account for permanent book to tax differences, the Fund increased distributable earnings by $21,112,655 and decreased net capital paid in on shares of beneficial interest by $21,112,655. Reclassifications have no impact upon the net asset value of the Fund and resulted primarily from expired capital losses carried forward and equalization of undistributed capital gains to shareholders.
At September 30, 2019, the Fund had $7,850,242 of undistributed tax basis ordinary investment income and $2,495,857 of undistributed tax basis capital gains.
Notes to Financial Statements, Continued
Thornburg Global Opportunities Fund | September 30, 2019
Foreign Withholding Taxes: The Fund is subject to foreign tax withholding imposed by certain foreign countries in which the Fund may invest. Withholding taxes are incurred on certain foreign dividends and are accrued at the time the dividend is recognized based on applicable foreign tax laws. The Fund may file withholding tax reclaims in certain jurisdictions to recover a portion of amounts previously withheld, in view of various considerations, including recent decisions rendered by the courts in those and other jurisdictions. The Fund would expect to record a receivable for such a reclaim based on a variety of factors, including assessment of a jurisdiction’s legal obligation to pay reclaims, the jurisdiction’s administrative practices and payment history, and industry convention. To date the Fund has recorded no such receivable because there is limited precedent for collecting such prior year reclaims and the likelihood of collection remains uncertain.
Deferred Foreign Capital Gain Taxes: The Fund is subject to a tax imposed on net realized gains of securities of certain foreign countries. The Fund records an estimated deferred tax liability for net unrealized gains on these investments as reflected in the accompanying financial statements. Such changes are included in net unrealized appreciation (depreciation) from investments in the Statement of Operations.
The tax character of distributions paid during the year ended September 30, 2019, and September 30, 2018, was as follows:
| | 2019 | 2018 |
| Distributions from: | | |
| Ordinary income | $ 34,127,991 | $ 6,766,827 |
| Total | $ 34,127,991 | $ 6,766,827 |
NOTE 3 – SECURITY VALUATION
Valuation of the Fund’s portfolio investment securities is performed in accordance with policies and procedures adopted by and under the oversight of the Trustees.
The Trustees of the Trust have appointed the Advisor to assist the Trustees with obtaining fair market values for portfolio investments, evaluating and monitoring professional pricing service providers appointed by the Trustees’ Audit Committee (the “Audit Committee”) to assist in determining fair values for portfolio investments, assisting in calculating fair values for portfolio investments in certain circumstances, and performing other functions in connection with the valuation of investments. The Advisor acts through its Valuation and Pricing Committee (the “Committee”) and other employees of the Advisor. The Committee regularly reviews its own valuation calculations, reviews the valuations, valuation techniques and services furnished by pricing service providers, considers circumstances which may require valuation calculations by the Committee, and reviews previous valuation calculations. The Committee reports to the Audit Committee on the Committee’s activities, the performance of pricing service providers, and other matters relating to valuation of portfolio investments.
In those instances when the Committee assists in calculating a fair value for a portfolio investment, the Committee seeks to determine the price that the Fund would reasonably expect to receive upon a sale of the investment in an orderly transaction between market participants on the valuation date. The Committee customarily utilizes quotations from securities broker dealers in calculating valuations, but also may utilize prices obtained from pricing service providers or other methods approved by the Audit Committee. Because fair values calculated by the Committee are estimates, the calculation of a value for an investment may differ from the price that would be realized by the Fund upon a sale of the investment, and the difference could be material to the Fund’s financial statements. The Committee’s calculation of a fair value for an investment may also differ from the prices obtained by other persons (including other mutual funds) for the investment.
Valuation of Securities: Securities and other portfolio investments which are listed or traded on a United States securities exchange are valued at the last reported sale price on the valuation date. Investments listed or traded on an exchange for which there has been no sale that day are valued at the mean between the last reported bid and asked prices on that valuation date. Portfolio investments reported by NASDAQ are valued at the official closing price on the valuation date. If an investment is traded on more than one exchange, the investment is considered traded on the exchange that is normally the primary market for that investment. Securities and other portfolio investments which are listed or traded on exchanges outside the United States are valued at the last price or the closing price of the investment on the exchange that is normally the primary market for the investment, as of the close of the exchange preceding the Fund’s valuation date. Foreign investments listed or traded on an exchange for which there has been no sale that day are valued at the mean between the last reported bid and asked prices on that valuation date.
In any case when a market quotation is not readily available for a portfolio investment ordinarily valued by market quotation, the Committee calculates a fair value for the investment using alternative methods approved by the Audit Committee. A market quotation is not readily available when the primary market or exchange for the investment is not open for the entire scheduled day of trading. Market quotations for an investment also may not be readily available if developments after the most recent close of the investment’s primary exchange or market, but prior to the close of business on any Fund business day, or an unusual event or significant period of time occurring since the availability of a market quotation, create a serious question concerning the reliability of the most recent market quotation available for the
Notes to Financial Statements, Continued
Thornburg Global Opportunities Fund | September 30, 2019
investment. In particular, on days when market volatility thresholds established by the Audit Committee are exceeded, foreign equity investments held by the Fund may be valued using alternative methods. The Committee customarily obtains valuations in these instances from pricing service providers approved by the Audit Committee. Pricing service providers ordinarily calculate valuations using multi-factor models to adjust market prices based upon various inputs, including exchange data, depository receipt prices, futures, index data and other data.
Debt obligations held by the Fund which are not listed or traded on exchanges or for which no reported market exists are ordinarily valued at the valuation obtained from a pricing service provider approved by the Audit Committee.
In any case when a pricing service provider fails to provide a valuation for a debt obligation held by the Fund, the Committee calculates a fair value for the obligation using alternative methods under procedures approved by the Audit Committee. Additionally, in cases when management believes that a valuation obtained from a pricing service provider is stale, does not reflect material factors affecting the valuation of the investment, is significantly different than the value the Fund is likely to obtain if it sought a bid for the investment, or is otherwise unreliable, the Committee calculates a fair value for the obligation using an alternative method approved by the Audit Committee.
Quotations for foreign investments expressed in foreign currency amounts are converted to U.S. dollar equivalents using a foreign exchange quotation from a third party service provider at the time of valuation. Foreign investments held by the Fund may be traded on days and at times when the Fund is not open for business. Consequently, the value of Fund investments may be significantly affected on days when shareholders cannot purchase or sell Fund shares.
Valuation Hierarchy: The Fund categorizes its investments based upon the inputs used in valuing those investments, according to a three-level hierarchy established in guidance from the FASB. Categorization of investments using this hierarchy is intended by the FASB to maximize the use of observable inputs in valuing investments and minimize the use of unobservable inputs by requiring that the most observable inputs be used when available. Observable inputs are those that market participants would use in valuing an investment based on available market information. Unobservable inputs are those that reflect assumptions about the information market participants would use in valuing an investment. An investment’s level within the hierarchy is based on the lowest level input that is deemed significant to the valuation. The methodologies and inputs used to value investments are not necessarily indications of the risk or liquidity associated with those investments.
Various inputs are used in calculating valuations for the Fund’s investments. These inputs are generally summarized according to the three-level hierarchy below:
Level 1: Quoted prices in active markets for identical investments.
Level 2: Other direct or indirect significant observable inputs (including quoted prices for similar investments in active markets and other observable inputs, such as interest rates, prepayment rates, credit ratings, etc.).
Level 3: Significant unobservable inputs (including the Committee’s own assumptions in calculating the fair values of investments).
Valuations for debt obligations held by the Fund are typically calculated by pricing service providers approved by the Audit Committee and are generally characterized as Level 2 within the valuation hierarchy.
On days when market volatility thresholds established by the Audit Committee are exceeded, foreign securities for which valuations are obtained from pricing service providers are fair valued. On these days, the foreign securities are characterized as Level 2 within the valuation hierarchy and revert to Level 1 after the threshold is no longer exceeded.
In a limited number of cases the Committee calculates a fair value for investments using broker quotations or other methods approved by the Audit Committee. When the Committee uses a single broker quotation to calculate a fair value for an investment without other significant observable inputs, or if a fair value is calculated using other significant inputs that are considered unobservable, the investment is characterized as Level 3 within the hierarchy. Other significant unobservable inputs used to calculate a fair value in these instances might include an income-based valuation approach which considers discounted anticipated future cash flows from the investment and application of discounts due to the nature or duration of any restrictions on the disposition of the investment.
Valuations based upon the use of inputs from Levels 1, 2 or 3 may not represent the actual price received upon the disposition of an investment, and a Fund may receive a price that is lower than the valuation based upon these inputs when it sells the investment.
Notes to Financial Statements, Continued
Thornburg Global Opportunities Fund | September 30, 2019
The following table displays a summary of the fair value hierarchy measurements of the Fund’s investments as of September 30, 2019:
| | Fair Value Measurements at September 30, 2019 |
| | TOTAL | LEVEL 1 | LEVEL 2 | LEVEL 3 |
| Assets | | | | |
| Investments in Securities* | | | | |
| Common Stock | $ 1,161,994,460 | $ 1,161,994,460 | $ — | $ — |
| Short-Term Investments | 87,050,413 | 87,050,413 | — | — |
| Total Investments in Securities | $1,249,044,873 | $1,249,044,873 | $— | $— |
| Other Financial Instruments | | | | |
| Forward Currency Contracts | $ 4,625,675 | $ — | $ 4,625,675 | $ — |
| Total Assets | $1,253,670,548 | $1,249,044,873 | $4,625,675 | $— |
| Liabilities | | | | |
| Other Financial Instruments | | | | |
| Forward Currency Contracts | $ (98,252) | $ — | $ (98,252) | $ — |
| Total Liabilities | $(98,252) | $— | $(98,252) | $— |
| * | See Schedule of Investments for a summary of the industry exposure as grouped according to the Global Industry Classification Standard (GICS), which is an industry taxonomy developed by MSCI, Inc. and Standard & Poor’s (S&P). |
NOTE 4 – INVESTMENT ADVISORY FEE AND OTHER TRANSACTIONS WITH AFFILIATES
Pursuant to an investment advisory agreement, the Advisor serves as the investment advisor and performs services for the Fund for which the fees are payable at the end of each month. Under the investment advisory agreement, the Fund pays the Advisor a management fee based on the average daily net assets of the Fund at an annual rate as shown in the following table:
| Management Fee Schedule |
| DAILY NET ASSETS | FEE RATE |
| Up to $500 million | 0.875% |
| Next $500 million | 0.825 |
| Next $500 million | 0.775 |
| Next $500 million | 0.725 |
| Over $2 billion | 0.675 |
The Fund’s effective management fee for the year ended September 30, 2019 was 0.824% of the Fund’s average daily net assets (before applicable management fee waiver of $286,478). Total management fees incurred by the Fund for the year ended September 30, 2019 are set forth in the Statement of Operations.
The Trust has entered into an administrative services agreement with the Advisor, whereby the Advisor will perform certain administrative services related to each class of the Fund’s shares. The fees are computed as an annual percentage of the aggregate average daily net assets of all shares classes of all Funds in the Trust as follows:
| Administration Fee Schedule |
| Daily Net Assets | Fee Rate |
| Up to $20 billion | 0.100% |
| $20 billion to $40 billion | 0.075 |
| $40 billion to $60 billion | 0.040 |
| Over $60 billion | 0.030 |
The aggregate fee amount is allocated on a daily basis to each Fund based on net assets and subsequently allocated to each class of shares of the Fund. Total administrative service fees incurred by each class of shares of the Fund for the year ended September 30, 2019, are set forth in the Statement of Operations.
The Trust has an underwriting agreement with Thornburg Securities Corporation (the “Distributor”), an affiliate of the Advisor, which acts as the distributor of the Fund’s shares. For the year ended September 30, 2019, the Distributor has advised the Fund that it earned net
Notes to Financial Statements, Continued
Thornburg Global Opportunities Fund | September 30, 2019
commissions aggregating $12,443 from the sale of Class A shares, and collected contingent deferred sales charges aggregating $14,389 from redemptions of Class C shares of the Fund.
Pursuant to a service plan under Rule 12b-1 of the 1940 Act, the Fund may pay to the Distributor or securities dealers and other financial institutions at the Distributor’s direction an amount not to exceed .25 of 1% per annum of the average daily net assets attributable to Class A, Class C, Class I, Class R3, Class R4, and Class R5 shares of the Fund to obtain various shareholder and distribution related services. For the year ended September 30, 2019, there were no 12b-1 service plan fees charged for Class I or Class R5 shares. Class R6 shares are not subject to a service plan. The Advisor and Distributor each may pay out of its own resources additional expenses for distribution of the Fund’s shares and shareholder services.
The Trust has also adopted a distribution plan pursuant to Rule 12b-1, applicable only to the Fund’s Class C and Class R3 shares, under which the Fund compensates the Distributor for services in promoting the sale of Class C and Class R3 shares of the Fund at an annual rate of up to .75 of 1% per annum of the average daily net assets attributable to Class C shares, and an annual rate of up to .25 of 1% per annum of the average daily net assets attributable to Class R3 shares.
Total fees incurred by each class of shares of the Fund under their respective service and distribution plans for the year ended September 30, 2019, are set forth in the Statement of Operations.
The Advisor has contractually agreed to waive fees and reimburse expenses incurred by the Fund so that actual expenses of certain share classes do not exceed levels as specified in each Fund’s most recent prospectus (Class R3 shares, 1.50%; Class R4 shares, 1.40%; Class R5 shares, 0.99%; Class R6 shares, 0.85%). The agreement may be terminated by the Fund at any time, but may not be terminated by the Advisor before February 1, 2020, unless the Advisor ceases to be the investment advisor to the Fund prior to that date. The Advisor may recoup amounts waived or reimbursed during the fiscal year ended September 30, 2019 if, during that year, expenses fall below the contractual limit that was in place at the time those fees and expenses were waived or reimbursed. The Advisor will not recoup fees or expenses as described in the preceding sentence if that recoupment would cause the Fund’s total annual operating expenses (after the recoupment is taken into account) to exceed the lesser of: (a) the expense cap that was in place at the time the waiver or reimbursement occurred; or (b) the expense cap that is in place at the time of the recoupment.
For the year ended September 30, 2019, the Advisor voluntarily waived Fund level investment advisory fees of $286,478. The Advisor contractually reimbursed certain class specific expenses and distribution fees of $37,183 for Class R3 shares, $65,728 for Class R4 shares, $140,232 for Class R5 shares, and $62,409 for Class R6 shares and voluntarily reimbursed $435,690 for Class I shares.
Certain officers and Trustees of the Trust are also officers or directors of the Advisor and Distributor. The compensation of the independent Trustees is borne by the Trust. The Trust also pays a portion of the Chief Compliance Officer’s compensation. These amounts are reflected as Trustee and officer fees in the Statement of Operations.
The percentage of direct investments in the Fund held by the Trustees, officers of the Trust, and the Advisor is approximately 3.62%.
The Fund may purchase or sell securities from or to an affiliated fund, provided the affiliation is due solely to having a common investment advisor, common officers, or common trustees, and provided that all such transactions will comply with Rule 17a-7 under the 1940 Act. For the year ended September 30, 2019, the Fund had no such transactions with affiliated funds.
Shown below are holdings of voting securities of each portfolio company which is considered "affiliated" to the Fund under the 1940 Act, including companies for which the Fund’s holding represented 5% or more of the company’s voting securities, and a series of the Thornburg Investment Trust in which the Fund invested for cash management purposes during the period:
| Fund | Market Value
9/30/18 | Purchases
at Cost | Sales
Proceeds | Realized
Gain
(Loss) | Change in
Unrealized
Appr./(Depr.) | Market Value
9/30/19 | Dividend
Income |
| Thornburg Capital Management Fund | $68,176,932 | $617,295,857 | $(598,422,376) | $- | $- | $87,050,413 | $1,017,682 |
NOTE 5 – SHARES OF BENEFICIAL INTEREST
At September 30, 2019, there were an unlimited number of shares with no par value of beneficial interest authorized. Transactions in shares of beneficial interest were as follows:
Notes to Financial Statements, Continued
Thornburg Global Opportunities Fund | September 30, 2019
| | YEAR ENDED
September 30, 2019 | YEAR ENDED
September 30, 2018 |
| | SHARES | AMOUNT | SHARES | AMOUNT |
| Class A Shares | | | | |
| Shares sold | 781,038 | $ 20,906,242 | 3,335,136 | $ 103,488,392 |
Shares issued to shareholders in
reinvestment of dividends | 242,411 | 5,769,379 | 31,011 | 981,179 |
| Shares repurchased | (4,718,077) | (127,944,741) | (5,371,593) | (167,601,339) |
| Net decrease | (3,694,628) | $ (101,269,120) | (2,005,446) | $ (63,131,768) |
| Class C Shares | | | | |
| Shares sold | 321,134 | $ 8,203,210 | 1,138,197 | $ 34,385,916 |
Shares issued to shareholders in
reinvestment of dividends | 79,218 | 1,826,769 | 6,530 | 199,285 |
| Shares repurchased | (3,542,700) | (92,409,943) | (5,015,148) | (149,356,754) |
| Net decrease | (3,142,348) | $ (82,379,964) | (3,870,421) | $ (114,771,553) |
| Class I Shares | | | | |
| Shares sold | 6,403,173 | $ 173,821,046 | 13,805,603 | $ 433,679,560 |
Shares issued to shareholders in
reinvestment of dividends | 865,374 | 20,630,523 | 141,477 | 4,487,662 |
| Shares repurchased | (19,616,732) | (527,823,049) | (22,775,847) | (709,042,487) |
| Net decrease | (12,348,185) | $ (333,371,480) | (8,828,767) | $ (270,875,265) |
| Class R3 Shares | | | | |
| Shares sold | 30,849 | $ 826,958 | 65,621 | $ 2,020,196 |
Shares issued to shareholders in
reinvestment of dividends | 2,888 | 68,136 | 403 | 12,620 |
| Shares repurchased | (131,740) | (3,521,704) | (203,071) | (6,218,396) |
| Net decrease | (98,003) | $ (2,626,610) | (137,047) | $ (4,185,580) |
| Class R4 Shares | | | | |
| Shares sold | 152,774 | $ 3,989,913 | 193,209 | $ 5,994,773 |
Shares issued to shareholders in
reinvestment of dividends | 8,800 | 207,684 | 1,264 | 39,602 |
| Shares repurchased | (524,575) | (14,114,812) | (407,089) | (12,535,162) |
| Net decrease | (363,001) | $ (9,917,215) | (212,616) | $ (6,500,787) |
| Class R5 Shares | | | | |
| Shares sold | 296,661 | $ 8,089,436 | 525,744 | $ 16,426,879 |
Shares issued to shareholders in
reinvestment of dividends | 56,561 | 1,349,546 | 7,656 | 243,146 |
| Shares repurchased | (1,152,006) | (31,724,884) | (800,724) | (24,838,619) |
| Net decrease | (798,784) | $ (22,285,902) | (267,324) | $ (8,168,594) |
| Class R6 Shares | | | | |
| Shares sold | 301,553 | $ 8,281,671 | 1,807,910 | $ 56,306,121 |
Shares issued to shareholders in
reinvestment of dividends | 43,624 | 1,042,604 | 335 | 10,671 |
| Shares repurchased | (416,053) | (11,438,345) | (142,283) | (4,451,096) |
| Net increase (decrease) | (70,876) | $ (2,114,070) | 1,665,962 | $ 51,865,696 |
NOTE 6 – INVESTMENT TRANSACTIONS
For the year ended September 30, 2019, the Fund had purchase and sale transactions of investments (excluding short-term investments) of $420,931,158 and $1,003,781,186, respectively.
Notes to Financial Statements, Continued
Thornburg Global Opportunities Fund | September 30, 2019
NOTE 7 – DERIVATIVE FINANCIAL INSTRUMENTS WITH OFF-BALANCE
SHEET RISK AND FOREIGN INVESTMENT RISK
The Fund may use a variety of derivative financial instruments to hedge or adjust the risks affecting its investment portfolio or to enhance investment returns. Provisions of the FASB Accounting Standards Codification 815-10-50 (“ASC 815”) require certain disclosures. The disclosures are intended to provide users of financial statements with an understanding of the use of derivative instruments by the Fund and how these derivatives affect the financial position, financial performance and cash flows of the Fund. The Fund does not designate any derivative instruments as hedging instruments under ASC 815. During the year ended September 30, 2019, the Fund’s principal exposure to derivative financial instruments of the type addressed by ASC 815 was investment in foreign currency contracts. A foreign currency contract is an agreement between two parties to exchange different currencies at a specified rate of exchange at an agreed upon future date. Foreign currency contracts involve risks to the Fund, including the risk that a contract’s counterparty will not meet its obligations to the Fund, the risk that a change in a contract’s value may not correlate perfectly with the currency the contract was intended to track, and the risk that the Fund’s Advisor is unable to correctly implement its strategy in using a contract. In any such instance, the Fund may not achieve the intended benefit of entering into a contract, and may experience a loss.
The Fund entered into forward currency contracts during the year ended September 30, 2019 in the normal course of pursuing its investment objectives, with the objective of purchasing foreign investments or with the intent of reducing the risk to the value of the Fund’s foreign investments from adverse changes in the relationship between the U.S. dollar and foreign currencies. In each case these contracts have been initiated in conjunction with foreign investment transactions. The monthly average value of open forward currency sell contracts for the year ended September 30, 2019 was $243,743,504.
These contracts are accounted for by the Fund under ASC 815. Unrealized appreciation and depreciation on outstanding contracts are reported in the Fund’s Statement of Assets and Liabilities, as measured by the difference between the forward exchange rates at the reporting date and the forward exchange rates at each contract’s inception date. Net realized gain (loss) on contracts closed during the period, and changes in net unrealized appreciation (depreciation) on outstanding contracts are recognized in the Fund’s Statement of Operations.
The outstanding forward currency contracts in the table located in the Schedule of Investments, which were entered into with State Street Bank and Trust Company (“SSB”), were entered into pursuant to an International Swaps and Derivatives Association (“ISDA”) Master Agreement. Outstanding forward currency contracts, which were entered into with Brown Brothers Harriman & Co. (“BBH”), were entered into pursuant to a written agreement with BBH. In the event of a default or termination under the ISDA Master Agreement with SSB or the agreement with BBH, the non-defaulting party has the right to close out all outstanding forward currency contracts between the parties and to net any payment amounts under those contracts, resulting in a single net amount payable by one party to the other.
Because the ISDA Master Agreement with SSB and the agreement with BBH do not result in an offset of reported amounts of financial assets and liabilities in the Fund’s Statement of Assets and Liabilities unless there has been an event of default or termination event under such agreements, the Fund does not net its outstanding forward currency contracts for the purpose of disclosure in the Fund’s Statement of Assets and Liabilities. Instead the Fund recognizes the unrealized appreciation (depreciation) on those forward currency contracts on a gross basis in the Fund’s Statement of Assets and Liabilities.
The unrealized appreciation (depreciation) of the outstanding forward currency contracts recognized in the Fund’s Statement of Assets and Liabilities at September 30, 2019 is disclosed in the following tables:
| FAIR VALUES OF DERIVATIVE FINANCIAL INSTRUMENTS AT SEPTEMBER 30, 2019 |
| ASSET DERIVATIVES | BALANCE SHEET LOCATION | FAIR VALUE |
| Foreign currency contracts | Assets - Unrealized appreciation on forward currency contracts | $ 4,625,675 |
| FAIR VALUES OF DERIVATIVE FINANCIAL INSTRUMENTS AT SEPTEMBER 30, 2019 |
| LIABILITY DERIVATIVES | BALANCE SHEET LOCATION | FAIR VALUE |
| Foreign currency contracts | Liabilities - Unrealized depreciation on forward currency contracts | $ (98,252) |
Because the Fund does not receive or post cash collateral in connection with its currency forward contracts during the period, the net amounts of the Fund’s assets and liabilities which are attributable to those contracts at September 30, 2019 can be determined by offsetting the dollar amounts shown in the preceding table. Based on those amounts, the net amount of the Fund’s assets which is attributable to its outstanding forward currency contracts at September 30, 2019 is $4,143,572 attributable to the Fund’s contracts with SSB, and $383,851 attributable to the Fund’s contracts with BBH. The Fund’s forward currency contracts are valued each day, and the net amounts of the Fund’s assets and liabilities which are attributable to those contracts are expected to vary over time.
Notes to Financial Statements, Continued
Thornburg Global Opportunities Fund | September 30, 2019
The net realized gain (loss) from forward currency contracts and the net change in unrealized appreciation (depreciation) on outstanding forward currency contracts recognized in the Fund’s Statement of Operations for the year ended September 30, 2019 are disclosed in the following tables:
NET REALIZED GAIN (LOSS) ON DERIVATIVE FINANCIAL INSTRUMENTS
RECOGNIZED IN INCOME FOR THE YEAR ENDED September 30, 2019 |
| | TOTAL | FORWARD CURRENCY CONTRACTS |
| Foreign currency contracts | $ 11,711,758 | $ 11,711,758 |
NET CHANGE IN UNREALIZED APPRECIATION (DEPRECIATION) OF DERIVATIVE FINANCIAL INSTRUMENTS
RECOGNIZED IN INCOME FOR THE YEAR ENDED September 30, 2019 |
| | TOTAL | FORWARD CURRENCY CONTRACTS |
| Foreign currency contracts | $ 5,648,942 | $ 5,648,942 |
NOTE 8 – RECENT ACCOUNTING PRONOUNCEMENTS
In August 2018, the FASB issued ASU 2018-13, Fair Value Measurement (Topic 820): Changes to the Disclosure Requirements for Fair Value Measurement, which adds, removes, and modifies certain aspects of the fair value disclosure. ASU 2018-13 is effective for annual periods beginning after December 15, 2019, and early adoption is permitted. The Funds have elected to early adopt, and had applied ASU 2018-13 for the fiscal year ended September 30, 2019. The adoption of this accounting guidance did not have a material impact on the Funds’ financial statements.
In March 2017, the FASB issued Accounting Standards Update (ASU) 2017-08, Premium Amortization of Purchased Callable Debt Securities. The amendments in the ASU shorten the premium amortization period on a purchased callable debt security from the security’s contractual life to the earliest call date. It is anticipated that this change will enhance disclosures by reducing losses recognized when a security is called on an earlier date. This ASU is effective for fiscal years beginning after December 15, 2018. Management has evaluated the implications of these changes and the amendments will have no material effect on the Funds’ net assets or results of operations.
OTHER NOTES
Risks: The Fund’s investments subject it to risks including, but not limited to, management risk, market and economic risk, risks affecting specific issuers, foreign investment risk, developing country risk, risks affecting specific countries or regions, small and mid-cap company risk, credit risk, interest rate risk, liquidity risk, and real estate risk. Please see the Fund’s prospectus for a discussion of the risks associated with an investment in the Fund.
Subsequent Events: Fund management believes no events have occurred between September 30, 2019 and the date of issuance of the financial statements that require adjustment to or disclosure in the accompanying financial statements.
Financial Highlights
Thornburg Global Opportunities Fund
| | PER SHARE PERFORMANCE (FOR A SHARE OUTSTANDING THROUGHOUT THE YEAR) |
UNLESS OTHERWISE
NOTED, PERIODS ARE
FISCAL YEARS ENDED
SEPTEMBER 30, | Net Asset
Value,
Beginning of
PERIOD | Net
Investment
Income
(Loss)+ | Net Realized &
Unrealized Gain
(Loss) on
Investments | Total from
Investment
Operations | Dividends
from Net
Investment
Income | Dividends
from Net
Realized
Gains | Total
Dividends | Net Asset
Value,
End of PERIOD |
| CLASS A SHARES(b) |
| 2019 | $ 29.93 | 0.20 | (2.02) | (1.82) | (0.55) | — | (0.55) | $ 27.56 |
| 2018 | $ 30.98 | 0.44 | (1.42) | (0.98) | (0.07) | — | (0.07) | $ 29.93 |
| 2017 | $ 24.90 | 0.13 | 6.05 | 6.18 | (0.10) | — | (0.10) | $ 30.98 |
| 2016 | $ 24.41 | 0.25 | 0.38 | 0.63 | (0.14) | — | (0.14) | $ 24.90 |
| 2015 | $ 23.74 | (0.11) | 0.78 | 0.67 | — | — | — | $ 24.41 |
| CLASS C SHARES |
| 2019 | $ 28.70 | (0.01) | (1.89) | (1.90) | (0.25) | — | (0.25) | $ 26.55 |
| 2018 | $ 29.88 | 0.23 | (1.39) | (1.16) | (0.02) | — | (0.02) | $ 28.70 |
| 2017 | $ 24.13 | (0.08) | 5.84 | 5.76 | (0.01) | — | (0.01) | $ 29.88 |
| 2016 | $ 23.70 | 0.07 | 0.36 | 0.43 | — | — | — | $ 24.13 |
| 2015 | $ 23.23 | (0.31) | 0.78 | 0.47 | — | — | — | $ 23.70 |
| CLASS I SHARES |
| 2019 | $ 30.07 | 0.29 | (2.04) | (1.75) | (0.65) | — | (0.65) | $ 27.67 |
| 2018 | $ 31.06 | 0.56 | (1.45) | (0.89) | (0.10) | — | (0.10) | $ 30.07 |
| 2017 | $ 24.96 | 0.23 | 6.07 | 6.30 | (0.20) | — | (0.20) | $ 31.06 |
| 2016 | $ 24.53 | 0.34 | 0.37 | 0.71 | (0.28) | — | (0.28) | $ 24.96 |
| 2015 | $ 23.79 | (0.02) | 0.77 | 0.75 | (0.01) | — | (0.01) | $ 24.53 |
| CLASS R3 SHARES |
| 2019 | $ 29.57 | 0.15 | (1.98) | (1.83) | (0.46) | — | (0.46) | $ 27.28 |
| 2018 | $ 30.66 | 0.38 | (1.41) | (1.03) | (0.06) | — | (0.06) | $ 29.57 |
| 2017 | $ 24.66 | 0.08 | 5.99 | 6.07 | (0.07) | — | (0.07) | $ 30.66 |
| 2016 | $ 24.18 | 0.20 | 0.38 | 0.58 | (0.10) | — | (0.10) | $ 24.66 |
| 2015 | $ 23.55 | (0.15) | 0.78 | 0.63 | — | — | — | $ 24.18 |
| CLASS R4 SHARES |
| 2019 | $ 29.62 | 0.19 | (2.00) | (1.81) | (0.49) | — | (0.49) | $ 27.32 |
| 2018 | $ 30.69 | 0.46 | (1.47) | (1.01) | (0.06) | — | (0.06) | $ 29.62 |
| 2017 | $ 24.67 | 0.11 | 6.00 | 6.11 | (0.09) | — | (0.09) | $ 30.69 |
| 2016 | $ 24.22 | 0.24 | 0.35 | 0.59 | (0.14) | — | (0.14) | $ 24.67 |
| 2015 | $ 23.57 | (0.13) | 0.78 | 0.65 | — | — | — | $ 24.22 |
| CLASS R5 SHARES |
| 2019 | $ 30.10 | 0.28 | (2.02) | (1.74) | (0.66) | — | (0.66) | $ 27.70 |
| 2018 | $ 31.10 | 0.57 | (1.47) | (0.90) | (0.10) | — | (0.10) | $ 30.10 |
| 2017 | $ 24.99 | 0.22 | 6.08 | 6.30 | (0.19) | — | (0.19) | $ 31.10 |
| 2016 | $ 24.55 | 0.34 | 0.37 | 0.71 | (0.27) | — | (0.27) | $ 24.99 |
| 2015 | $ 23.81 | (0.03) | 0.78 | 0.75 | (0.01) | — | (0.01) | $ 24.55 |
| CLASS R6 SHARES |
| 2019 | $ 30.20 | 0.32 | (2.05) | (1.73) | (0.70) | — | (0.70) | $ 27.77 |
| 2018 | $ 31.16 | 0.90 | (1.75) | (0.85) | (0.11) | — | (0.11) | $ 30.20 |
| 2017(c) | $ 28.35 | 0.11 | 2.73 | 2.84 | (0.03) | — | (0.03) | $ 31.16 |
| (a) | Not annualized for periods less than one year. |
| (b) | Sales loads are not reflected in computing total return. |
| (c) | Effective date of this class of shares was April 10, 2017. |
| (d) | Annualized. |
| (e) | Due to the size of net assets and fixed expenses, ratios may appear disproportionate. |
| + | Based on weighted average shares outstanding. |
See notes to financial statements.
Financial Highlights, Continued
Thornburg Global Opportunities Fund
| RATIOS TO AVERAGE NET ASSETS | | SUPPLEMENTAL DATA |
Net Investment
Income (Loss) (%) | Expenses, After
Expense
Reductions (%) | Expenses,
Before Expense
Reductions (%) | | Total
Return (%)(a) | Portfolio
Turnover
Rate (%)(a) | Net Assets
at End of PERIOD
(Thousands) |
| |
| 0.73 | 1.31 | 1.33 | | (5.78) | 29.12 | $ 236,560 |
| 1.40 | 1.28 | 1.28 | | (3.16) | 41.99 | $ 367,449 |
| 0.46 | 1.33 | 1.33 | | 24.85 | 43.70 | $ 442,522 |
| 1.02 | 1.35 | 1.35 | | 2.57 | 37.11 | $ 443,072 |
| (0.42) | 1.32 | 1.32 | | 2.82 | 45.41 | $ 550,327 |
| |
| (0.02) | 2.07 | 2.09 | | (6.49) | 29.12 | $ 151,469 |
| 0.78 | 2.03 | 2.03 | | (3.90) | 41.99 | $ 253,907 |
| (0.30) | 2.08 | 2.08 | | 23.88 | 43.70 | $ 380,046 |
| 0.29 | 2.09 | 2.09 | | 1.81 | 37.11 | $ 359,426 |
| (1.20) | 2.10 | 2.10 | | 2.02 | 45.41 | $ 363,615 |
| |
| 1.05 | 0.99 | 1.06 | | (5.46) | 29.12 | $ 762,697 |
| 1.79 | 0.97 | 0.97 | | (2.88) | 41.99 | $ 1,200,267 |
| 0.80 | 0.97 | 0.98 | | 25.31 | 43.70 | $ 1,514,039 |
| 1.39 | 0.99 | 0.99 | | 2.91 | 37.11 | $ 996,970 |
| (0.08) | 0.97 | 0.98 | | 3.17 | 45.41 | $ 1,285,609 |
| |
| 0.55 | 1.50 | 2.20 | | (5.95) | 29.12 | $ 4,317 |
| 1.22 | 1.50 | 1.92 | | (3.38) | 41.99 | $ 7,577 |
| 0.28 | 1.50 | 1.97 | | 24.66 | 43.70 | $ 12,059 |
| 0.84 | 1.50 | 2.01 | | 2.38 | 37.11 | $ 10,645 |
| (0.58) | 1.50 | 2.15 | | 2.68 | 45.41 | $ 8,936 |
| |
| 0.71 | 1.40 | 1.86 | | (5.84) | 29.12 | $ 9,254 |
| 1.49 | 1.40 | 1.61 | | (3.29) | 41.99 | $ 20,786 |
| 0.38 | 1.40 | 1.65 | | 24.81 | 43.70 | $ 28,061 |
| 0.98 | 1.40 | 1.66 | | 2.45 | 37.11 | $ 21,415 |
| (0.51) | 1.40 | 1.76 | | 2.76 | 45.41 | $ 13,175 |
| |
| 1.04 | 0.99 | 1.27 | | (5.45) | 29.12 | $ 42,354 |
| 1.82 | 0.99 | 1.16 | | (2.92) | 41.99 | $ 70,084 |
| 0.79 | 0.99 | 1.16 | | 25.29 | 43.70 | $ 80,704 |
| 1.38 | 0.99 | 1.07 | | 2.91 | 37.11 | $ 60,252 |
| (0.11) | 0.98 | 1.02 | | 3.17 | 45.41 | $ 108,654 |
| |
| 1.17 | 0.85 | 1.00 | | (5.34) | 29.12 | $ 45,699 |
| 2.93 | 0.85 | 0.98 | | (2.75) | 41.99 | $ 51,836 |
| 0.77(d) | 0.85(d) | 13.31(d)(e) | | 10.02 | 43.70 | $ 1,576 |
Report of Independent Registered Public Accounting Firm
Thornburg Global Opportunities Fund
To the Board of Trustees of Thornburg Investment Trust and Shareholders of
Thornburg Global Opportunities Fund
Opinion on the Financial Statements
We have audited the accompanying statement of assets and liabilities, including the schedule of investments, of Thornburg Global Opportunities Fund (one of the funds constituting Thornburg Investment Trust, referred to hereafter as the "Fund") as of September 30, 2019, the related statement of operations for the year ended September 30, 2019, the statements of changes in net assets for each of the two years in the period ended September 30, 2019, including the related notes, and the financial highlights for each of the periods indicated therein (collectively referred to as the “financial statements”). In our opinion, the financial statements present fairly, in all material respects, the financial position of the Fund as of September 30, 2019, the results of its operations for the year then ended, the changes in its net assets for each of the two years in the period ended September 30, 2019 and the financial highlights for each of the periods indicated therein in conformity with accounting principles generally accepted in the United States of America.
Basis for Opinion
These financial statements are the responsibility of the Fund’s management. Our responsibility is to express an opinion on the Fund’s financial statements based on our audits. We are a public accounting firm registered with the Public Company Accounting Oversight Board (United States) (PCAOB) and are required to be independent with respect to the Fund in accordance with the U.S. federal securities laws and the applicable rules and regulations of the Securities and Exchange Commission and the PCAOB.
We conducted our audits of these financial statements in accordance with the standards of the PCAOB. Those standards require that we plan and perform the audit to obtain reasonable assurance about whether the financial statements are free of material misstatement, whether due to error or fraud.
Our audits included performing procedures to assess the risks of material misstatement of the financial statements, whether due to error or fraud, and performing procedures that respond to those risks. Such procedures included examining, on a test basis, evidence regarding the amounts and disclosures in the financial statements. Our audits also included evaluating the accounting principles used and significant estimates made by management, as well as evaluating the overall presentation of the financial statements. Our procedures included confirmation of securities owned as of September 30, 2019 by correspondence with the custodian, transfer agent and brokers. We believe that our audits provide a reasonable basis for our opinion.
/s/PricewaterhouseCoopers LLP
New York, New York
November 22, 2019
We have served as the auditor of one or more investment companies in Thornburg Investment Trust since 1999.
Expense Example
Thornburg Global Opportunities Fund | September 30, 2019 (Unaudited)
As a shareholder of the Fund, you incur two types of costs:
| (1) | transaction costs, including |
| (a) | sales charges (loads) on purchase payments, for Class A shares; |
| (b) | a deferred sales charge on redemptions of any part or all of a purchase of $1 million of Class A shares within 12 months of purchase; |
| (c) | a deferred sales charge on redemptions of Class C shares within 12 months of purchase; |
| (2) | ongoing costs, including management fees; distribution and/or service (12b-1) fees; and other Fund expenses. |
This example is intended to help you understand your ongoing costs (in dollars) of investing in the Fund and to compare these costs with the ongoing costs of investing in other mutual funds.
The example is based on a $1,000 investment beginning on April 1, 2019, and held until September 30, 2019.
ACTUAL EXPENSES
For each class of shares, the first line of the accompanying table provides information about actual account values and actual expenses. You may use the information in this line, together with the amount you invested, to estimate the expenses that you paid over the period. Simply divide your account value by $1,000 (for example, an $8,600 account value divided by $1,000 = 8.6), then multiply the result by the number in the first line for your class of shares under the heading entitled “Expenses Paid During Period” to estimate the expenses you paid on your account during this period.
| | BEGINNING
ACCOUNT VALUE
4/1/19 | ENDING
ACCOUNT VALUE
9/30/19 | EXPENSES PAID
DURING PERIOD†
4/1/19—9/30/19 |
| CLASS A SHARES |
| Actual | $1,000.00 | $998.19 | $6.36 |
| Hypothetical* | $1,000.00 | $1,018.70 | $6.43 |
| CLASS C SHARES |
| Actual | $1,000.00 | $994.39 | $10.15 |
| Hypothetical* | $1,000.00 | $1,014.89 | $10.25 |
| CLASS I SHARES |
| Actual | $1,000.00 | $999.64 | $4.96 |
| Hypothetical* | $1,000.00 | $1,020.10 | $5.01 |
| CLASS R3 SHARES |
| Actual | $1,000.00 | $997.08 | $7.51 |
| Hypothetical* | $1,000.00 | $1,017.55 | $7.59 |
| CLASS R4 SHARES |
| Actual | $1,000.00 | $997.81 | $7.01 |
| Hypothetical* | $1,000.00 | $1,018.05 | $7.08 |
| CLASS R5 SHARES |
| Actual | $1,000.00 | $999.64 | $4.96 |
| Hypothetical* | $1,000.00 | $1,020.10 | $5.01 |
| CLASS R6 SHARES |
| Actual | $1,000.00 | $1,000.36 | $4.26 |
| Hypothetical* | $1,000.00 | $1,020.81 | $4.31 |
| † | Expenses are equal to the annualized expense ratio for each class (A: 1.27%; C: 2.03%; I: 0.99%; R3: 1.50%; R4: 1.40%; R5: 0.99%; R6: 0.85%) multiplied by the average account value over the period, multiplied by 183/365 to reflect the one-half year period. |
| * | Hypothetical assumes a rate of return of 5% per year before expenses. |
HYPOTHETICAL EXAMPLE FOR COMPARISON PURPOSES
For each class of shares, the second line of the accompanying table provides information about hypothetical account values and hypothetical expenses based on the Fund’s actual expense ratio and an assumed rate of return of 5% per year before expenses, which is not the Fund’s actual return. The hypothetical account values and expenses may not be used to estimate the actual ending account balance or expenses you paid for the period. You may use this information to compare the ongoing costs of investing in the Fund and other funds. To do so, compare this 5% hypothetical example with the 5% hypothetical examples that appear in the shareholder reports of the other funds.
Please note that the expenses shown in the table are meant to highlight your ongoing costs only and do not reflect any transactional costs, such as sales charges (loads), redemption fees, or exchange fees. Therefore, the second line of the table for each class of shares is useful in comparing ongoing costs only, and will not help you determine the relative total costs of owning different funds. In addition, if these transactional costs were included, your costs would have been higher.
Trustees and Officers
Thornburg Global Opportunities Fund | September 30, 2019 (Unaudited)
NAME, AGE, YEAR ELECTED
POSITION HELD WITH FUND | PRINCIPAL OCCUPATION(S) DURING PAST FIVE YEARS | OTHER DIRECTORSHIPS
HELD BY TRUSTEE |
| INTERESTED TRUSTEES(1)(2) |
Garrett Thornburg, 73
Trustee since 1984,
Chairman of Trustees(3) | Chairman and controlling shareholder of Thornburg Investment Management, Inc. (investment advisor); Chairman and controlling shareholder of Thornburg Securities Corporation (securities dealer); President of the Thornburg Foundation (nonprofit). | None |
Brian J. McMahon, 64
Trustee since 2001,
Vice Chairman of Trustees,
Member of Governance and
Nominating Committee &
Operations Risk Oversight
Committee(4) | Vice Chairman, Chief Investment Strategist, Managing Director, and Portfolio Manager and, until 2016, CEO and President of Thornburg Investment Management, Inc.; Vice President of Thornburg Securities Corporation. | None |
| INDEPENDENT TRUSTEES(1)(2)(5) |
David A. Ater, 74
Trustee since 1994,
Lead Independent Trustee,
Chairman of Governance and
Nominating Committee &
Member of Audit Committee | Principal in Ater & Associates, Santa Fe, NM (developer, planner and broker of residential and commercial real estate); owner, developer and broker for various real estate projects. | None |
Sally Corning, 58
Trustee since 2012,
Chairman of Audit Committee | Partner in Sun Mountain Capital, Santa Fe, NM (private equity firm with investment programs encompassing venture capital, mezzanine debt, and growth equity). | None |
Susan H. Dubin, 70
Trustee since 2004,
Member of Audit
Committee & Governance
and Nominating Committee | President of Dubin Investments, Ltd., Greenwich, CT (private investment fund); Director and officer of various charitable organizations. | None |
David L. Gardner, 56
Trustee since 2015,
Member of Operations Risk
Oversight Committee | Until 2012, head of EMEA (Europe, Middle East and Africa) Sales for iShares of Blackrock, Inc., EMEA Executive Committee Member and EMEA Operating Committee Member at Blackrock, Inc. | None |
Patrick J. Talamantes, 55
Trustee since 2019,
Member of Audit Committee | President of Talamantes Strategies, LLC, a management consulting firm, since 2018; until 2017, President and Chief Executive Officer of The McClatchy Company, Sacramento, CA (news and media company). | None |
Owen D. Van Essen, 65
Trustee since 2004,
Chairman of Operations Risk
Oversight Committee &
Member of Governance and
Nominating Committee | President of Dirks, Van Essen, Murray & April, Santa Fe, NM (newspaper mergers and acquisitions). | None |
James W. Weyhrauch, 60
Trustee since 1996,
Member of Audit
Committee & Operations Risk
Oversight Committee | Real estate broker, Santa Fe Properties, Santa Fe, NM; General Partner, Investments of Genext LLC (a family investment partnership); until 2019, Vice Chairman of Nambe LLC, Santa Fe, NM (manufacturing & design company). | None |
Trustees and Officers, Continued
Thornburg Global Opportunities Fund | September 30, 2019 (Unaudited)
NAME, AGE, YEAR ELECTED
POSITION HELD WITH FUND | PRINCIPAL OCCUPATION(S) DURING PAST FIVE YEARS | OTHER DIRECTORSHIPS
HELD BY TRUSTEE |
| OFFICERS OF THE FUND (WHO ARE NOT TRUSTEES)(1)(6) |
David Ashley, 49
Vice President since 2019 | Portfolio Manager and Managing Director since 2019 and Associate Portfolio Manager from 2011-2019 of Thornburg Investment Management, Inc. | Not applicable |
Nimish Bhatt, 56
Chief Financial Officer
since 2019; Treasurer
2016-2019; Secretary
(2018-2019)(7) | Chief Financial Officer and Treasurer of Thornburg Investment Management, Inc. and Thornburg Securities Corporation since 2016 and Secretary of Thornburg Securities Corporation since 2018; Senior Vice President (2004-2016), Chief Financial Officer (2011-2016), and Head of Fund Administration (2011-2016) of Calamos Asset Management, Inc., Calamos Investments LLC, Calamos Advisors LLC, and Calamos Wealth Management; Director of Calamos Global Funds plc (2007-2016). | Not applicable |
Jason Brady, 45
President since 2016(7) | Director since 2017, CEO and President since 2016, and Portfolio Manager and Managing Director of Thornburg Investment Management, Inc.; Vice President of Thornburg Securities Corporation since 2016. | Not applicable |
Connor Browne, 40
Vice President since 2006 | Portfolio Manager and Managing Director of Thornburg Investment Management, Inc. | Not applicable |
Randy Dry, 45
Vice President since 2014 | Managing Director, Director of Institutional Group from 2014-2016, and since 2016, Chief Administrative Officer of Thornburg Investment Management, Inc. | Not applicable |
Greg Dunn, 43
Vice President since 2014 | Portfolio Manager and Managing Director of Thornburg Investment Management, Inc. | Not applicable |
Lon Erickson, 44
Vice President since 2008 | Portfolio Manager and Managing Director of Thornburg Investment Management, Inc. | Not applicable |
Thomas Garcia, 48
Vice President since 2006 | Managing Director, Head Equity Trader, and Associate Portfolio Manager of Thornburg Investment Management, Inc. | Not applicable |
Christian Hoffmann, 37
Vice President since 2018 | Portfolio Manager and Managing Director since 2018, and Associate Portfolio Manager from 2014-2018, of Thornburg Investment Management, Inc. | Not applicable |
Curtis Holloway, 52
Treasurer since 2019(7) | Director of Fund Administration since 2019 of Thornburg Investment Management, Inc.; Senior Vice President, Head of Fund Administration (2017-2019) and Vice President, Fund Administration (2010-2017) of Calamos Investments, and Chief Financial Officer (2017-2019) and Treasurer (2010-2019) of Calamos Funds. | Not applicable |
Ben Kirby, 39
Vice President since 2014 | Head of Investments since 2019, Portfolio Manager and Managing Director since 2013. | Not applicable |
Jeff Klingelhofer, 38
Vice President since 2016 | Head of Investments since 2019, Portfolio Manager and Managing Director since 2015, and Associate Portfolio Manager from 2012–2015, of Thornburg Investment Management, Inc. | Not applicable |
Ponn Lithiluxa, 48
Vice President since 2017 | Manager, Tax & Fund Administration of Thornburg Investment Management, Inc.; Senior Vice President, Citi Fund Services, Inc. (2014–2017); Vice President, Citi Fund Services, Inc. (2007–2014). | Not applicable |
Rob MacDonald, 43
Vice President since 2016 | Managing Director since 2015, Portfolio Manager since 2014, and Associate Portfolio Manager from 2011–2014 of Thornburg Investment Management, Inc. | Not applicable |
Michael Mastroianni, 42
Secretary and Vice President since 2019(7) | Director of Fund Operations since 2019 of Thornburg Investment Management, Inc.; Executive Director, Global Head of Client Services - Global Liquidity (2018-2019), Executive Director, North American Head of Transfer Agency Relationship Management (2011-2019), Executive Director, North American Head of Transfer Agency Service Delivery (2011-2018) of J.P. Morgan Asset Management. | Not applicable |
Leigh Moiola, 52
Vice President since 2001 | Managing Director and Director of Marketing of Thornburg Investment Management, Inc.; Vice President of Thornburg Securities Corporation. | Not applicable |
Christopher Ryon, 63
Vice President since 2008 | Portfolio Manager and Managing Director of Thornburg Investment Management, Inc. | Not applicable |
Trustees and Officers, Continued
Thornburg Global Opportunities Fund | September 30, 2019 (Unaudited)
NAME, AGE, YEAR ELECTED
POSITION HELD WITH FUND | PRINCIPAL OCCUPATION(S) DURING PAST FIVE YEARS | OTHER DIRECTORSHIPS
HELD BY TRUSTEE |
Sean Koung Sun, 38
Vice President since 2017 | Portfolio Manager and Managing Director since 2017, Associate Portfolio Manager from 2015-2016, and Equity Research Analyst from 2012-2014 of Thornburg Investment Management, Inc. | Not applicable |
Stephen Velie, 52
Chief Compliance Officer since 2009 | Chief Compliance Officer of Thornburg Investment Trust and Thornburg Investment Management, Inc. | Not applicable |
Nicholos Venditti, 38
Vice President since 2016 | Portfolio Manager and Managing Director since 2015 and Associate Portfolio Manager from 2011–2015 of Thornburg Investment Management, Inc. | Not applicable |
Vinson Walden, 49
Vice President since 2004 | Portfolio Manager and Managing Director of Thornburg Investment Management, Inc. | Not applicable |
Lei Wang, 48
Vice President since 2006 | Portfolio Manager and Managing Director of Thornburg Investment Management, Inc. | Not applicable |
Charles Wilson, 44
Vice President since 2016 | Portfolio Manager and Managing Director since 2014 and Associate Portfolio Manager from 2012–2014 of Thornburg Investment Management, Inc. | Not applicable |
Di Zhou, 41
Vice President since 2016 | Portfolio Manager and Managing Director since 2016, Associate Portfolio Manager from 2014–2016, and Equity Research Analyst from 2010–2014 of Thornburg Investment Management, Inc. | Not applicable |
| (1) | Each person’s address is 2300 North Ridgetop Road, Santa Fe, New Mexico 87506. |
| (2) | The Fund is a separate investment “Fund” or “series” of Thornburg Investment Trust (the “Trust”), which comprises the Thornburg mutual fund complex and is organized as a Massachusetts business trust. Thornburg Investment Management, Inc. is the investment advisor to, and manages, all the Funds of the Trust. Each Trustee oversees all the Funds of the Trust. |
| (3) | Mr. Thornburg is considered an “interested” Trustee under the Investment Company Act of 1940 because he is a director and controlling shareholder of Thornburg Investment Management, Inc., the investment advisor to the Trust, and is the sole director and controlling shareholder of Thornburg Securities Corporation, the distributor of shares for the Trust. |
| (4) | Mr. McMahon is considered an “interested” Trustee under the Investment Company Act of 1940 because he is a director and the chief investment strategist of Thornburg Investment Management, Inc. |
| (5) | The Bylaws of the Trust currently require that each Independent Trustee shall retire by the end of the calendar year during which the Trustee reached the age of 75 years. Otherwise each Trustee serves in office until the election and qualification of a successor or until the Trustee sooner dies, resigns, retires or is removed. |
| (6) | Assistant vice presidents and assistant secretaries are not shown. |
| (7) | The Trust’s president, chief financial officer, secretary, and treasurer each serves a one-year term or until the election and qualification of a successor; each other officer serves at the pleasure of the Trustees. |
The Statement of Additional Information for each Fund of the Trust includes additional information about the Trustees and is available, without charge and upon request, by calling 1-800-847-0200.
Other Information
Thornburg Global Opportunities Fund | September 30, 2019 (Unaudited)
PORTFOLIO PROXY VOTING
Policies and Procedures:
The Trust has delegated to the Advisor voting decisions respecting proxies for the Fund’s voting securities. The Advisor makes voting decisions in accordance with its Proxy Voting Policy and Procedures. A description of the Policy and Procedures is available (i) without charge, upon request, by calling the Advisor toll-free at 1-800-847-0200, (ii) on the Thornburg website at www.thornburg.com, and (iii) on the U.S. Securities and Exchange Commission’s website at www.sec.gov.
Information regarding how proxies were voted is available on or before August 31 of each year for the twelve months ending the preceding June 30. This information is available (i) without charge, upon request by calling the Advisor toll-free at 1-800-847-0200, (ii) on the Thornburg website at www.thornburg.com, and (iii) on the U.S. Securities and Exchange Commission’s website at www.sec.gov.
TAX INFORMATION
For the tax year ended September 30, 2019, dividends paid by the Thornburg Global Opportunities Fund of $34,127,991 are being reported as taxable ordinary investment income dividends for federal income tax purposes.
For the tax year ended September 30, 2019, the Fund is reporting 100.00% (or the maximum allowed) of the dividends paid from tax basis net ordinary income as qualifying for the reduced rate under the Jobs and Growth Tax Relief and Reconciliation Act of 2003.
The Fund is reporting 33.72% (or the maximum allowed) of the ordinary income distributions paid by the Fund for the fiscal year ended September 30, 2019 as qualified for the corporate dividends received deduction.
For the year ended September 30, 2019, foreign source income and foreign taxes paid is $23,511,026 and $1,596,343, respectively.
The information and distributions reported herein may differ from the information and distributions reported to the shareholders for the calendar year ending December 31, 2019. Complete information will be reported in conjunction with your 2019 Form 1099.
AVAILABILITY OF QUARTERLY PORTFOLIO SCHEDULE
The Fund files with the Securities and Exchange Commission schedules of its portfolio holdings on Form N-Q for the first and third quarters of each fiscal year. The Fund’s Forms N-Q are available on the Commission’s website at www.sec.gov, or may be reviewed and copied at the Commission’s Public Reference Room in Washington, D.C. Information on the operation of the Public Reference Room may be obtained by calling 1-800-SEC-0330. The Fund also makes this information available on its website at www.thornburg.com/download or upon request by calling 1-800-847-0200.
STATEMENT RESPECTING RENEWAL OF INVESTMENT ADVISORY AGREEMENT
Thornburg Investment Management, Inc. (the “Advisor”) provides investment management services to Thornburg Global Opportunities Fund (the “Fund”) pursuant to an investment advisory agreement. The Trustees consider the renewal of this agreement annually, and most recently determined to renew the agreement on September 17, 2019.
Planning for their recent consideration of the advisory agreement’s renewal, the independent Trustees met in May 2019 to consider aspects of their annual evaluation of the Advisor’s service to all of the funds of Thornburg Investment Trust, to plan the annual evaluation of the Advisor’s performance and to discuss preliminarily the information the Advisor would present to the Trustees for their review. The independent Trustees met in a second independent session in July 2019 to further define certain portions of the information to be submitted by the Advisor. The independent Trustees met again in an independent session in September 2019 with a mutual fund analyst firm engaged by the independent Trustees to provide explanations of comparative cost and expense information, comparative investment performance information, and other data obtained and analyzed by the analyst firm. In that session the independent Trustees discussed their evaluations of the Advisor’s services to the Fund and the Fund’s fee and expense levels, investment performance, and other information presented for the Fund, conferred independently with legal counsel respecting the factors typically considered in evaluating renewal of an advisory agreement, and conferred with representatives of management to receive explanations of certain aspects of the information they had requested. Representatives of the Advisor subsequently reviewed portions of the information with the Trustees and addressed questions from the Trustees at a full meeting session of the Trustees scheduled in September for that purpose, and the independent Trustees thereafter met again in an independent session to consider the Advisor’s presentations and various specific issues respecting their consideration of the advisory agreement’s renewal. Following these sessions, the Trustees met to consider renewal of the advisory agreement, and the independent Trustees voted unanimously at that meeting to renew the agreement for an additional term of one year.
Other Information, Continued
Thornburg Global Opportunities Fund | September 30, 2019 (Unaudited)
The information below summarizes certain factors considered by the Trustees in connection with the determination to renew the advisory agreement with the Advisor. In determining to renew the advisory agreement, the Trustees considered a wide range of information and did not identify any single factor as controlling, and this summary does not describe all of the factors and other matters considered by the Trustees in making their determination.
Nature, Extent and Quality of Services. The Trustees considered in their evaluation of the advisory agreement the written and oral reports provided to the Trustees and their standing committees throughout the year on a wide variety of topics by personnel from the Advisor’s portfolio management, administration, operations and compliance staffs. The Trustees also considered in this evaluation presentations and explanations made by representatives of the Advisor in meeting sessions scheduled for consideration of the renewal of the advisory agreement. The Trustees further noted in their evaluation the consideration they had given to a number of topics in previous years, reports from their standing committees, and advice received from counsel.
Information noted by the Trustees as having been considered in relation to the nature, extent and quality of services provided by the Advisor under the advisory agreement and contributing (together with other information considered) to their conclusions respecting the nature, extent and quality of the services rendered to the Fund by the Advisor included: (1) reports from portfolio managers and other personnel throughout the year demonstrating that the Fund was managed in conformity with stated strategies and objectives and conformed to investment restrictions and limitations; (2) reports demonstrating that management of the Fund remained faithful and competent, and demonstrating sufficient skill by portfolio managers in executing the Fund’s strategies in varying environments, managers’ cognizance of and strategies to pursue the Fund’s objectives and address pertinent market and economic trends and conditions, the evaluation and selection of individual investments, management to achieve tax efficiencies, and the structuring and composition of the Fund’s portfolio and management of Fund liquidity requirements; (3) the Fund’s achievement of its investment objectives over different periods of time; (4) presentations by and interactions with members of the Advisor’s fund administration, operations and compliance staffs; (5) reports from standing committees of the Trustees on their respective proceedings throughout the year, including in particular reports from and interactions with the Advisor’s personnel; (6) the sufficiency of the resources the Advisor devotes to the services it provides to the Fund, including the expertise of its personnel and staffing levels and its enhancements to the electronic systems it utilizes in providing these services, and also including the Advisor’s own financial management and sufficiency of its resources; and (7) the measures employed to achieve efficient trade execution for the Fund, including the evaluation and selection of firms to execute transactions for the Fund. As in past years, the Trustees noted particularly their assessments of the Advisor’s personnel developed in meetings throughout the year, measures to expand and improve the depth and experience of the Advisor’s staff, and the Advisor’s collaborative approach to investment management, continued commitment to observance of compliance and regulatory requirements in managing investments by the Fund, responsiveness to the Trustees, and other factors.
Based upon these and other considerations, the Trustees concluded that the Advisor’s management of the Fund’s investments continued to conform to the Fund’s stated objectives and policies, and that the nature, extent and quality of the services provided to the Fund by the Advisor remained sufficient.
Investment Performance.The Trustees noted in their evaluation of the Fund’s investment performance the written and oral reports they had received in each regular meeting over the course of the year from the Advisor’s portfolio management personnel. The Trustees also noted their consideration of information provided to them at their request in anticipation of their annual evaluation of the Advisor’s services, including the following items of information respecting the investment performance of the Fund: (1) the Fund’s absolute investment performance and achievement of stated objectives; (2) the Advisor’s explanations and commentary on the Fund’s performance in the context of the Fund’s objectives and reasonable expectations, and business, market and economic conditions; (3) performance data for the most recent ten calendar years, comparing the Fund’s annual investment returns to a broad-based securities index and to the applicable Morningstar category of funds; (4) the Fund’s investment performance for the three-month, year-to-date, one-year, three-year, five-year, ten-year, and since inception periods ending with the second quarter of the current year, comparing the Fund’s annualized returns to two mutual fund categories selected by independent mutual fund analyst firms and to a broad-based securities index, and assigning a percentage rank to the Fund’s performance for each period relative to each of the fund categories; (5) analyses of specified performance and risk metrics for the Fund relative to its benchmark and to a selected peer group of funds, prepared by an independent financial analyst firm engaged by the independent Trustees; (6) the Fund’s cash flows; (7) comparative performance data for fund peer groups selected by an independent mutual fund analyst firm engaged by the independent Trustees, and the analysis and observations of the analyst firm respecting those data; (8) comparison of the Fund’s annualized return to the Fund’s benchmark index over various periods since the Fund’s inception; and (9) comparative measures of estimated earnings growth, and risk and return statistics. The Trustees generally attach additional significance to investment performance from the perspective of longer-term shareholders.
The Trustees considered explanations from the Advisor respecting performance of the Fund in some recent periods that had compared less favorably to some comparative measures, together with the reports they had received from the Advisor throughout the year, explanations of the comparisons by reference to the investment strategies of the Fund, the effects of market and economic conditions, the investment decisions by the Advisor in view of the Fund’s strategies, and where pertinent the Advisor’s measures and expectations for improvement in the Fund’s relative investment performance. The Trustees noted their understanding that strategies pursued for a fund may produce intermittent lower relative performance, other funds managed by the Advisor have in the past returned to favor as conditions
Other Information, Continued
Thornburg Global Opportunities Fund | September 30, 2019 (Unaudited)
changed or the strategies of those funds gained traction, and that the Advisor has successfully remediated lower relative performance of other funds in cases where execution of investment strategies had contributed to lower performance. Based upon their consideration of this and other information, the Trustees concluded that the Fund’s absolute and relative investment performance over a range of pertinent holding periods on the whole was satisfactory in view of its objectives and strategies.
Comparisons of Fee and Expense Levels. Information noted by the Trustees as having been considered in this context included a variety of comparative data respecting the Fund’s fee and expense levels. This information included comparisons of the Fund’s advisory fee and overall Fund expenses to median and average fees and expenses charged to funds in the applicable Morningstar category, comparisons of the advisory fee and total expenses for two Fund share classes to the fee levels and expenses of fund peer groups selected from the category by an independent mutual fund analyst firm engaged by the independent Trustees, the perspectives and advice from that mutual fund analyst firm respecting comparisons of fund fee levels and expenses to fund peer groups, and other information. Comparative fee and expense data noted as having been considered by the Trustees showed that the level of total expense for one share class of the Fund was higher than the median and average levels charged to funds in the applicable Morningstar category, and that the level of total expense for a second share class was lower than the median and average levels for that category. Peer group data showed that the Fund’s stated advisory fee was comparable to the median level for the two peer groups, that the total expense level of one representative share class was higher than the median of the respective peer group but comparable to other funds in the peer groups, and that the total expense level of another representative share class was comparable to the median of the respective peer group. The Trustees did not find the differences significant in view of their findings and conclusions respecting the other factors considered.
The Trustees noted their consideration of information respecting the advisory fees charged by the Advisor to other investment management clients, including sub-advised mutual funds and other institutional clients, together with information about fees charged by other advisors to different clients, analysis of the differences between the requirements of institutional clients and mutual funds, analysis of the differences between the requirements of a sub-advised mutual fund and a fund as to which the investment advisor is the primary advisor and sponsor, and the consequently different investment management services provided to the different categories of clients and the differing contexts in which these arrangements are entered into. The Trustees confirmed their previous observations that the differences between the fees charged by the Advisor or by other investment advisors to different types of clients did not appear exceptional and had limited relevance to the evaluation of the fee rate charged to mutual funds as to which the Advisor or such other advisors are the primary advisor and sponsor.
Costs and Profitability of Advisor. In reviewing the profitability of the Advisor’s services to the Fund, the Trustees considered an analysis of the Advisor’s costs and the estimated profitability to the Advisor of its services, together with data respecting the overall profitability of a selection of other investment management firms. The Trustees considered in this regard information from the Advisor respecting investment of its profits to maintain staffing levels, and noted that a portion of the Advisor’s profits is an important element in the compensation of shareholder employees. The Trustees considered information from the Advisor respecting the use of profits to enhance staff competencies through training and other measures, hire personnel to expand and develop the scope of senior management expertise, pay competitive levels of compensation, and add to the Advisor’s electronic and information technology systems to maintain or improve service levels. The Trustees also considered the contribution of the Advisor’s cost management to its profitability, and the relationship of the Advisor’s financial resources and profitability in previous years to its ability to attract necessary personnel, invest in systems and other assets required for its service to the Fund, and maintain or improve service levels for the Fund notwithstanding fluctuations in revenues and profitability. The information considered did not indicate to the Trustees that the Advisor’s profitability was excessive.
Potential Economies of Scale. In reviewing the extent to which economies of scale would be realized by the Fund as it grows and whether fee levels reflect potential economies of scale, the Trustees considered the breakpoint structure for advisory fees chargeable to the Fund, comparisons of the fee breakpoint structure for the Fund with breakpoint structures (or the absence of such structures) for other funds in a peer group selected by an independent mutual fund analyst firm, the effects of the breakpoint structure and other expense factors realized by certain funds of the Trust as their asset levels had increased, the Advisor’s undertakings to waive or reimburse certain fees and expenses of the Fund, and the Advisor’s expenditures from its own profits and resources to maintain staffing levels and expand staff competencies, pay competitive levels of compensation, and add to its electronic and information technology systems so as to maintain or improve service levels. The information provided demonstrated to the Trustees that the Fund’s advisory fee breakpoint structure is reasonable in relation to the structures observed in the other funds in its peer group, and that shareholders may be expected to benefit from any economies of scale, due to the advisory agreement’s breakpoint fee structure for the Fund and other factors.
Potential Ancillary Benefits. In reviewing potential benefits to the Advisor because of its relationship to the Fund, the Trustees considered explanations from the Advisor respecting its receipt of certain research services from broker dealers, and the benefits to both the Fund and the Advisor of the Advisor’s expansion of its staffing, compliance and systems capabilities and other resources to serve a broader variety of investment management clients. No unusual or unfair benefits to the Advisor from its relationship to the Fund were identified by the Trustees.
Summary of Conclusions. The Trustees concluded that the general nature, extent and quality of the Advisor’s services performed under the advisory agreement remained sufficient, the Advisor had continued to actively and competently pursue the Fund’s stated investment objectives and adhere to the Fund’s investment policies, and that the absolute and relative investment performance of the Fund over
Other Information, Continued
Thornburg Global Opportunities Fund | September 30, 2019 (Unaudited)
pertinent holding periods on the whole was satisfactory in the context of the Fund’s objectives and strategies. The Trustees further concluded that the level of the advisory fee charged to the Fund by the Advisor is fair and reasonable in relation to the services provided by the Advisor, in view of the nature, extent and quality of those services, the investment performance of the Fund after fees and expenses, the clear disclosure of fees and expenses in the Fund’s prospectuses, comparisons of fees and expenses charged to the Fund to fees and expenses charged to other mutual funds, and the other factors considered. The Trustees accordingly determined to renew the Fund’s investment advisory agreement with the Advisor for an additional term of one year.
Trustees’ Statement to Shareholders (Unaudited)
Readopted September 17, 2019
The Trustees believe current and prospective shareholders should know how we discharge our responsibilities in supervising the Funds’ investment advisor and in reviewing the advisor’s contract for renewal. Since 2005, we have issued a statement which sets out clearly the three principal guidelines that we follow in supervising the Trust’s investment advisor on your behalf. In accordance with our customary practice, in September of this year we again reviewed our statement and concluded we should reissue this statement outlining the principal features of our supervision of the advisor’s performance of investment management services for the Funds.
We begin with the premise that each shareholder selected his or her Fund because its investments are managed by the investment advisor identified in the prospectus and in accordance with the objective and policies described in the prospectus. We realize, as each of you do, that if you believe that your Fund’s stated objective and policies no longer serve your personal investment goals, you can sell your shares and leave the Fund.
Therefore, we believe that our primary supervisory task—our principal obligation to you—is to assess the nature and quality of the advisor’s services, and to confirm that the advisor actively and competently pursues the Fund’s objective, in accordance with the policies set out in the prospectus. To do this, we meet regularly with management to review your Fund’s portfolio and to discuss the advisor’s specific actions and judgments in pursuing the Fund’s objective. We do not substitute our own judgment for the advisor’s decisions in selecting investments; the advisor is paid to exercise its informed judgment on investment decisions, and we seek to confirm, in reviewing the advisor’s performance, that the advisor is doing just that.
Second, we are conscious of costs and the effect that costs have on shareholders’ returns. We try to make sure that your Fund’s fees and costs are reasonable in relationship to the services rendered and that they are generally in line with those charged by other expert investment advisors, consistent with our belief that the Fund’s investors searched for and expect that expertise and attention and have decided to pay a reasonable price for it. We do not put the management contract “out to bid” as a matter of course, and we would not do so unless we had concluded that the advisor materially had failed to pursue the Fund’s objectives in accordance with its policies, or for other equally important reasons. We believe that any other approach would be inconsistent with your interests and contrary to your expectations when you bought shares of the Fund in the first place.
Finally, because we believe that most Thornburg Fund shareholders have invested with a long-term perspective, we try not to focus too much on the fashions of the moment and on short-term performance. The market will not favor any specific investment objective or set of policies at all times and under all economic circumstances. A fund will experience periods of both high and low returns relative to other funds and other investments. Even if one of our Funds is not favored by the market at a particular time, we believe that the advisor is nonetheless obliged to remain true to the Fund’s objective and policies, and we watch to see that it does so.
Trustees of Thornburg Investment Trust
Thornburg Investment Management is a privately-owned global investment firm that offers a range of solutions for retail and institutional investors. Founded in 1982 and headquartered in Santa Fe, New Mexico, we manage approximately $41.9 billion (as of September 30, 2019) across U.S. mutual funds, separate accounts for high-net-worth investors, institutional accounts, and UCITS funds for non-U.S. investors.
The fund outlined in this report is one of many equity and fixed-income products available from Thornburg Investment Management.
EQUITY FUNDS
| ■ | Thornburg Global Opportunities Fund |
| ■ | Thornburg International Value Fund |
| ■ | Thornburg Better World International Fund |
| ■ | Thornburg International Growth Fund |
| ■ | Thornburg Developing World Fund |
| ■ | Thornburg Value Fund |
| ■ | Thornburg Core Growth Fund |
MULTI_ASSET FUNDS
| ■ | Thornburg Investment Income Builder Fund |
| ■ | Thornburg Summit Fund |
FIXED INCOME FUNDS
| ■ | Thornburg Low Duration Income Fund |
| ■ | Thornburg Limited Term U.S. Government Fund |
| ■ | Thornburg Limited Term Income Fund |
| ■ | Thornburg Strategic Income Fund |
| ■ | Thornburg Low Duration Municipal Fund |
| ■ | Thornburg Limited Term Municipal Fund |
| ■ | Thornburg Intermediate Municipal Fund |
| ■ | Thornburg California Limited Term Municipal Fund |
| ■ | Thornburg New Mexico Intermediate Municipal Fund |
| ■ | Thornburg New York Intermediate Municipal Fund |
| ■ | Thornburg Strategic Municipal Income Fund |
ALTERNATIVE FUNDS
| ■ | Thornburg Long/Short Equity Fund |
Before investing, carefully consider the Fund’s investment goals, risks, charges, and expenses. For a prospectus or summary prospectus containing this and other information, contact your financial advisor or visit thornburg.com. Read it carefully before investing.
For additional information, please visit thornburg.com
Thornburg Investment Management, Inc. 2300 North Ridgetop Road, Santa Fe, NM 87506
This page intentionally left blank.
To receive shareholder reports, prospectuses, and proxy statements electronically, go to www.thornburg.com/edelivery.
This Annual Report is submitted for the general information of shareholders of the Fund. It is not authorized for distribution to prospective investors in the Fund unless preceded or accompanied by an effective prospectus.
Investment Advisor:
Thornburg Investment Management®
800.847.0200
Distributor:
Thornburg Securities Corporation®
Annual Report
September 30, 2019
Beginning on January 1, 2021, as permitted by regulations adopted by the Securities and Exchange Commission, paper copies of the Fund’s shareholder reports will no longer be sent by mail, unless you specifically request paper copies of the reports from the Fund or from your financial intermediary, such as a broker-dealer or bank. Instead, the reports will be made available on a website, and you will be notified by mail each time a report is posted and provided with a website link to access the report.
If you already elected to receive shareholder reports electronically, you will not be affected by this change and you need not take any action. You may elect to receive shareholder reports and other communications from the Fund or your financial intermediary electronically by going to thornburg.com/edelivery.
You may elect to receive all future reports in paper free of charge. You can inform the Fund or your financial intermediary that you wish to continue receiving paper copies of your shareholder reports by calling 800.847.0200 or your financial intermediary directly. Your election to receive reports in paper will apply to all funds held with the fund complex/your financial intermediary.
At Thornburg, we believe unconstrained investing leads to better outcomes for our clients. Our investment solutions are highly active, high conviction, and benchmark agnostic. When it comes to finding economic opportunity for clients, it’s more than what we do.
It’s how we do it. Active Asbottom-up, fundamental, active managers, we look beyond conventional benchmarks. Long Term We take a long-term view in how we manage our firm and our portfolios. Benchmark Agnostic Investment strategies should have the flexibility to pursue solutions for clients, not stay within the conventional confines of benchmarks. Flexible Perspective Our approach to portfolio construction is guided by our convictions rather than convention. High Conviction We focus our attention and capital on thoroughly researched, well-understood positions. The best form of risk management is to know what you own, and why. Repeatable & Robust Our long-term outperformance of benchmarks verifies that our process works and outperforms conventional thinking. Independent We are independently owned and far from the herd of other investment managers. Investment Driven All members of the investment team are resources for all of our strategies. Collaborative Our team collaborates on opportunities across geography, sector, or asset class.
Thornburg Developing World Fund
Annual Report | September 30, 2019
Table of Contents
| SHARE CLASS | NASDAQ SYMBOL | CUSIP |
| Class A | THDAX | 885-216-408 |
| Class C | THDCX | 885-216-507 |
| Class I | THDIX | 885-216-606 |
| Class R5 | THDRX | 885-216-846 |
| Class R6 | TDWRX | 885-216-838 |
Class I, R5, and R6 shares may not be available to all investors. Minimum investments for Class I shares may be higher than those for other classes.
Investments carry risks, including possible loss of principal. Additional risks may be associated with investments outside the United States, especially in emerging markets, including currency fluctuations, illiquidity, volatility, and political and economic risks. Investments in small- and mid-capitalization companies may increase the risk of greater price fluctuations. Please see the Fund’s prospectus for a discussion of the risks associated with an investment in the Fund. Investments in the Fund are not FDIC insured, nor are they deposits of or guaranteed by a bank or any other entity.
Funds invested in a smaller number of holdings may expose an investor to greater volatility.
Letter to Shareholders
Thornburg Developing World Fund | September 30, 2019 (Unaudited)
October 30, 2019
Dear Fellow Shareholder:
Over the past 12 months, we have seen investor sentiment swing wildly from concerns about global growth, to cautious optimism to outright bullishness, followed by another collapse in confidence. Investors are once again focused on global growth concerns. The markets have tracked and even amplified these swings in sentiment, as one might expect, during a period where global growth remains sluggish and short-term returns are driven primarily by news headlines and tweets and less by underlying fundamentals.
The increased volatility has also driven multiple, abrupt rotations in style leadership. Over the last four quarters, we have seen the MSCI Emerging Markets Value Index outperform twice, while the MSCI Emerging Markets Growth Index also outperformed twice. The Thornburg Developing World Fund’s philosophy of pursuing stock-specific alpha with three layers of risk management (strong businesses, balanced three-basket portfolio construction and currency awareness) has helped the portfolio to navigate these rotations while allowing stock selection to drive the returns of our concentrated portfolio. During the fiscal year ended September 30, 2019, the Thornburg Developing World Fund (Class I shares) outperformed the index in all four periods while delivering a 8.14% total return over the trailing one year, versus the MSCI Emerging Markets Index return of negative 2.02% over the same period.
Top Performers
| • | Azul is the fastest-growing Airline in Brazil. Despite headwinds related to currency and fuel prices, the Brazilian airline delivered strong performance on margin improvement driven by operational efficiency and capacity growth. They also benefited from the bankruptcy of an important competitor which led to significant capacity reduction in the market. |
| • | ICICI Bank is India’s largest private-sector bank and a leading retail lender across consumer-finance segments. Shares advanced over the period as ICICI continued to improve its core operating profit and reported strong earnings and balance sheet performance. Asset quality trends also surprised to the upside, as loan loss provisions decreased significantly year-over-year. |
| • | B3 is the leading platform for trading equities, options and fixed income in Brazil. Lower Brazilian interest rates have made equity investing relatively more attractive for domestic investors, and expectations are that foreign investors will be more interested in Brazilian investments as the country’s pension reform bill passed this October. Incremental volume growth and the company’s tie to Brazil’s improving capital markets environment led to solid performance over the period. |
| • | Itau Unibanco is a large multinational Brazilian bank and financial services provider. Beginning in 4Q18, shares progressed strongly as it became clear the market-friendly |
presidential candidate won the election. While controversial, President Jair Bolsonaro has adopted a market-friendly policy agenda focused on fiscal reform and privatization of public sector assets.
| • | Hapvida is the third-largest healthcare operator in Brazil and maintains a presence in both the medical and dental segments. The company has a strong network of more than 1,500 hospital beds, clinics and diagnostic centers and continues to build a durable competitive advantage through organic growth and attractively valued acquisitions. The stock rose as the company successfully grew market share and drove margin expansion through strong cost management. |
Bottom Performers
| • | Groupo Financiero Banorte is one of the largest commercial banks in Mexico. Shares sold off early in the fiscal year following comments made by incoming Mexican president Andres Manuel Lopez Obrador regarding the completion of a new but partially built airport for Mexico City. While Banorte’s exposure to the airport is small, there was concern that the incoming president was tacking harder to the left and that he might burden the private sector with increased regulation and taxation. As a leading bank in Mexico, economic growth is a key driver for the bank. While the bank has delivered solid earnings results, political tensions and a softening macro environment have been a major headwind on the stock’s performance. |
| • | Qualcomm is a multinational semiconductor and telecommunications equipment company. We sold the stock during 4Q18. Shares had underperformed due to concerns about ongoing legal issues, which could invalidate part of its business model focused on charging for its intellectual property. |
| • | Glencore is a diversified natural resources company that operates in metals and minerals, energy products and agricultural products. The stock declined on weaker production and earnings coupled with weaker prices of the commodities that the company is exposed to, most notably coal and cobalt. Moreover, global economic uncertainty broadly put downward pressure on global mining and metals stocks. We exited the position in 3Q19 on concerns about certain end-market fundamentals and increasing scrutiny of the company’s operations in Africa. |
| • | Haliburton provides energy and engineering and construction services, as well as manufactures products for the energy industry. We sold the stock in January 2019. Shares had fallen due to ongoing delays of North American onshore capex and in sympathy with weaker oil prices. Weaker oil prices usually drive weaker cash flow and ultimately production spending in the near term. |
| • | Baidu is a Chinese search engine company. We sold out of Baidu in February 2019. Shares sold off as the strength of their position in the Chinese online advertising market came into |
Letter to Shareholders, Continued
Thornburg Developing World Fund | September 30, 2019 (Unaudited)
question due to sluggish revenue growth in their core search business.
The real and perceived headwinds that have driven the market gyrations over the last year remain, and in some cases, such as the trade war, have only increased. During the most recent quarter, global growth expectations have consistently disappointed and, in our view, have been revised lower primarily due to direct and indirect impacts of the trade war between the U.S. and almost all of its major trading partners. Trade-related uncertainty is not only disrupting normal purchasing behavior along global supply chains but also incremental investment in capacity, which has dampened global investment expectations. Only China and a handful of European and emerging market countries appear to be implementing fiscal or regulatory stimulus to protect their economic growth.
Central banks are doing their best to fill the void created by low corporate confidence and limited visibility, with a renewed focus on easing monetary policy. Since May, we note at least 45 easing moves by major central banks. Every central bank in the top-ten largest economies has lowered interest rates this year. Most notably, the U.S. Federal Reserve (Fed) reversed recent interest rate increases with two interest rate cuts through the end of September 2019 to offset trade-related headwinds. Historically, a slowdown in developed market growth and a shift toward a more accommodative stance from the Fed have led to dollar stabilization and emerging market equity outperformance. While that is still our base case, we admit that for this scenario to evolve we need to see some de-escalation of the trade war, particularly the dispute between the U.S. and China.
It may seem hard to remain optimistic about emerging markets, or equity markets in general, given elevated headwinds. But while economic activity has slowed, global central banks have acted quickly to moderate the deceleration. For a decade, global investors have been wise to expand the long-held U.S. mantra—“Don’t fight the Fed!”—to a broader group of global central banks. So much liquidity and policy attention is being directed at the global slowdown that it is difficult to imagine the deceleration extending beyond the first half of 2020, if not the
end of 2019. That would imply that the current ebbing in growth is more a pause that refreshes before growth stabilizes and possibly reaccelerates. In this context, modest developed market growth and stable developed market interest rates are a notably attractive backdrop for emerging market returns.
Multiples have contracted and underlying earnings expectations have been drifting lower for most of the last year. But, as noted, policy support is on the way. We are cautiously optimistic that even without a meaningful resolution to the U.S.-China trade dispute, earnings could begin to drive share prices again. However, until the case for a reacceleration can be made more confidently, we would expect headlines and tweets to continue to cause choppy market moves.
We believe our portfolio construction process is well suited for this type of market environment, as was demonstrated by its lower volatility and ability to perform in various environments over the last 12 months. We will maintain disciplined portfolio balance while continuing to take advantage of price dislocations caused by broad market volatility or the failure of other market participants to recognize the prospects of an individual stock whose business fundamentals we determine to be inaccurately reflected in its share price.
We remain focused on investing in attractively valued and fundamentally driven opportunities in emerging markets, with risk management, as always, top of mind.
Thank you for your continued support and for investing alongside us in the Thornburg Developing World Fund.
Sincerely,

| 
|
Ben Kirby,cfa
Portfolio Manager
Managing Director | Charlie Wilson, PhD
Portfolio Manager
Managing Director |
The matters discussed in this report may constitute forward-looking statements made pursuant to the safe harbor provisions of the Securities Litigation Reform Act of 1995. These include any advisor or portfolio manager prediction, assessment, analysis or outlook for individual securities, industries, investment styles, market sectors and/or markets. These statements involve risks and uncertainties. In addition to the general risks described for each fund in its current prospectus, other factors bearing on these reports include the accuracy of the advisor’s or portfolio manager’s forecasts and predictions, the appropriateness of the investment strategies designed by the advisor or portfolio manager and the ability of the advisor or portfolio manager to implement their strategies efficiently and successfully. Any one or more of these factors, as well as other risks affecting the securities markets generally, could cause the actual results of any fund to differ materially as compared to its benchmarks.
The views expressed are subject to change and do not necessarily reflect the views of Thornburg Investment Management, Inc. This information should not be relied upon as a recommendation or investment advice and is not intended to predict the performance of any investment or market.
Performance results of individual share classes will vary based on the fees and expenses associated with each share class, and may be higher or lower than other share classes within the same Fund. Please see Performance Summary for performance results of each share class.
Performance Summary
Thornburg Developing World Fund | September 30, 2019 (Unaudited)
AVERAGE ANNUAL TOTAL RETURNS
| | 1-YR | 3-YR | 5-YR | SINCE
INCEP. |
| Class A Shares(Incep: 12/16/09) | | | | |
| Without sales charge | 7.74% | 6.86% | 2.24% | 5.85% |
| With sales charge | 2.90% | 5.23% | 1.30% | 5.35% |
| Class C Shares(Incep: 12/16/09) | | | | |
| Without sales charge | 6.91% | 6.04% | 1.46% | 5.09% |
| With sales charge | 5.91% | 6.04% | 1.46% | 5.09% |
| Class I Shares(Incep: 12/16/09) | 8.14% | 7.29% | 2.67% | 6.36% |
| Class R5 Shares(Incep: 2/1/13) | 8.16% | 7.29% | 2.67% | 3.25% |
| Class R6 Shares(Incep: 2/1/13) | 8.25% | 7.39% | 2.77% | 3.36% |
| MSCI Emerging Markets Index(Since 12/16/09) | -2.02% | 5.97% | 2.33% | 2.76% |
GROWTH OF A HYPOTHETICAL $10,000 INVESTMENT
Performance data shown represents past performance and is no guarantee of future results. Investment return and principal value will fluctuate so shares, when redeemed, may be worth more or less than their original cost. Current performance may be lower or higher than quoted. For performance current to the most recent month end, visit thornburg.com or call 800-847-0200. The performance information does not reflect the deduction of taxes that a shareholder would pay on distributions or the redemption of Fund shares. Returns reflect the reinvestment of dividends and capital gains as well as applicable sales charges. Class A shares are sold with a maximum sales charge of 4.50%. Class C shares are subject to a 1% CDSC for the first year only. There is no sales charge for Class I, R5 and R6 shares. As disclosed in the most recent prospectus, the total annual fund operating expenses before any fee waivers or expense reimbursements are as follows: A shares, 1.48%; C shares, 2.25%; I shares, 1.16%; R5 shares, 1.71% and R6 shares, 1.14%. Thornburg Investment Management has contractually agreed to waive fees and reimburse expenses until at least February 1, 2020, for some of the share classes, resulting in net expense ratios of the following: I shares, 1.09%; R5 shares, 1.09% and R6 shares, 0.99%. For more detailed information on fund expenses and waivers/reimbursements please see the Fund’s prospectus.
TheMSCI Emerging Markets Index is a free float-adjusted market capitalization index that is designed to measure equity market performance of emerging markets. The MSCI Emerging Markets Index consists of the following 23 emerging market country indexes: Brazil, Chile, China, Colombia, Czech Republic, Egypt, Greece, Hungary, India, Indonesia, Korea, Malaysia, Mexico, Peru, Philippines, Poland, Qatar, Russia, South Africa, Taiwan, Thailand, Turkey and United Arab Emirates.
The MSCI Emerging Markets Growth Index captures large- and mid-cap securities exhibiting overall growth style characteristics across 26 Emerging Markets (EM) countries. The growth investment style characteristics for index construction are defined using five variables: long-term forward EPS growth rate, short-term forward EPS growth rate, current internal growth rate and long-term historical EPS growth trend and long-term historical sales per share growth trend.
The MSCI Emerging Markets Value Index captures large- and mid-cap securities exhibiting overall value style characteristics across 26 Emerging Markets (EM) countries. The value investment style characteristics for index construction are defined using three variables: book value to price, 12-month forward earnings to price and dividend yield.
The performance of any index is not indicative of the performance of any particular investment. Unless otherwise noted, index returns reflect the reinvestment of income dividends and capital gains, if any, but do not reflect fees, brokerage commissions or other expenses of investing. Investors may not make direct investments into any index.
Fund Summary
Thornburg Developing World Fund | September 30, 2019 (Unaudited)
OBJECTIVES AND STRATEGIES
The Fund seeks long-term capital appreciation. Under normal market conditions the Fund invests at least 80% of its assets in equity securities and debt obligations of developing country issuers. A developing country issuer is a company or sovereign entity that is domiciled or otherwise tied economically to one or more developing countries. The Fund expects that investments in the Fund’s portfolio normally will be weighted in favor of equity securities.
MARKET CAPITALIZATION EXPOSURE
BASKET STRUCTURE
| TOP TEN EQUITY HOLDINGS |
| Alibaba Group Holding Ltd. Sponsored ADR | 6.5% |
| Tencent Holdings Ltd. | 5.8% |
| Samsung Electronics Co. Ltd. | 5.4% |
| Taiwan Semiconductor Manufacturing Co. Ltd. | 4.6% |
| AIA Group Ltd. | 3.9% |
| Industrial & Commercial Bank of China Ltd. Class H | 3.9% |
| Unilever N.V. | 3.5% |
| ICICI Bank Ltd. | 3.4% |
| HDFC Bank Ltd. | 3.3% |
| Petroleo Brasileiro S.A. | 2.7% |
| SECTOR EXPOSURE |
| Financials | 26.5% |
| Consumer Discretionary | 15.7% |
| Information Technology | 15.5% |
| Communication Services | 10.2% |
| Energy | 9.3% |
| Industrials | 7.9% |
| Consumer Staples | 5.3% |
| Health Care | 3.7% |
| Materials | 2.1% |
| Other Assets Less Liabilities | 3.8% |
| TOP TEN INDUSTRY GROUPS |
| Banks | 19.0% |
| Retailing | 9.5% |
| Energy | 9.3% |
| Media & Entertainment | 8.9% |
| Transportation | 7.9% |
| Technology Hardware & Equipment | 7.3% |
| Semiconductors & Semiconductor Equipment | 7.1% |
| Insurance | 5.5% |
| Consumer Services | 4.0% |
| Healthcare Equipment & Services | 3.7% |
COUNTRY EXPOSURE*
(percent of equity holdings) |
| China | 24.4% |
| India | 12.9% |
| Brazil | 11.4% |
| Russian Federation | 6.0% |
| South Korea | 5.7% |
| Taiwan | 5.4% |
| United States | 4.4% |
| Hong Kong | 4.0% |
| Indonesia | 3.7% |
| Mexico | 3.6% |
| United Kingdom | 3.6% |
| South Africa | 2.8% |
| United Arab Emirates | 2.2% |
| Chile | 2.1% |
| Netherlands | 2.0% |
| Panama | 1.5% |
| France | 1.2% |
| Vietnam | 1.1% |
| Macao | 1.0% |
| Peru | 1.0% |
| * | Holdings are classified by country of risk as determined by MSCI and Bloomberg. |
Schedule of Investments
Thornburg Developing World Fund | September 30, 2019
| | | SHARES | VALUE |
| | Common Stock — 96.2% | | |
| | Banks — 19.0% | | |
| | Banks — 19.0% | | |
| | Bank Central Asia Tbk PT | 6,311,232 | $ 13,493,899 |
| | Bank Rakyat Indonesia Persero Tbk PT | 52,928,206 | 15,362,043 |
| | Credicorp Ltd. | 35,719 | 7,445,268 |
| | Grupo Financiero Banorte SAB de C.V. | 3,080,052 | 16,600,503 |
| | HDFC Bank Ltd. | 1,555,104 | 26,935,551 |
| | ICICI Bank Ltd. Sponsored ADR | 2,255,726 | 27,474,743 |
| | Industrial & Commercial Bank of China Ltd. Class H | 46,654,959 | 31,251,328 |
| | Sberbank of Russia PJSC Sponsored ADR | 1,059,238 | 15,014,699 |
| | | | 153,578,034 |
| | Consumer Durables & Apparel — 2.2% | | |
| | Textiles, Apparel & Luxury Goods — 2.2% | | |
| | LVMH Moet Hennessy Louis Vuitton SE | 23,134 | 9,194,617 |
| | Shenzhou International Group Holdings Ltd. | 679,440 | 8,876,923 |
| | | | 18,071,540 |
| | Consumer Services — 4.0% | | |
| | Diversified Consumer Services — 1.3% | | |
| a | TAL Education Group ADR | 310,743 | 10,639,840 |
| | Hotels, Restaurants & Leisure — 2.7% | | |
| | Galaxy Entertainment Group Ltd. | 1,302,424 | 8,100,995 |
| | Huazhu Group Ltd. ADR | 411,577 | 13,590,273 |
| | | | 32,331,108 |
| | Diversified Financials — 2.0% | | |
| | Capital Markets — 2.0% | | |
| | B3 S.A. - Brasil Bolsa Balcao | 1,549,555 | 16,271,456 |
| | | | 16,271,456 |
| | Energy — 9.3% | | |
| | Oil, Gas & Consumable Fuels — 9.3% | | |
| | LUKOIL PJSC Sponsored ADR | 103,341 | 8,550,434 |
| | Novatek PJSC Sponsored GDR | 61,858 | 12,544,802 |
| | Petroleo Brasileiro S.A. | 3,300,484 | 21,884,339 |
| | Reliance Industries Ltd. | 897,929 | 16,894,579 |
| | Royal Dutch Shell plc Sponsored ADR Class A | 263,462 | 15,504,739 |
| | | | 75,378,893 |
| | Food, Beverage & Tobacco — 1.8% | | |
| | Beverages — 0.7% | | |
| | Kweichow Moutai Co. Ltd. Class A | 36,936 | 5,950,409 |
| | Food Products — 1.1% | | |
| | Vietnam Dairy Products, JSC | 1,524,492 | 8,522,332 |
| | | | 14,472,741 |
| | Healthcare Equipment & Services — 3.7% | | |
| | Health Care Providers & Services — 3.7% | | |
| | Hapvida Participacoes e Investimentos S.A. | 1,178,697 | 15,276,437 |
| | NMC Health plc | 230,317 | 7,674,345 |
| | Odontoprev S.A. | 1,774,007 | 6,899,711 |
| | | | 29,850,493 |
| | Household & Personal Products — 3.5% | | |
| | Personal Products — 3.5% | | |
| | Unilever N.V. | 466,833 | 28,023,985 |
| | | | 28,023,985 |
| | Insurance — 5.5% | | |
| | Insurance — 5.5% | | |
| | AIA Group Ltd. | 3,314,647 | 31,316,535 |
Schedule of Investments, Continued
Thornburg Developing World Fund | September 30, 2019
| | | SHARES | VALUE |
| | Sanlam Ltd. | 2,748,722 | $ 13,535,800 |
| | | | 44,852,335 |
| | Materials — 2.1% | | |
| | Chemicals — 2.1% | | |
| | Sociedad Quimica y Minera de Chile S.A. Sponsored ADR | 602,464 | 16,742,475 |
| | | | 16,742,475 |
| | Media & Entertainment — 8.9% | | |
| | Entertainment — 0.5% | | |
| a | Sea Ltd. ADR | 134,761 | 4,170,853 |
| | Interactive Media & Services — 7.0% | | |
| | Tencent Holdings Ltd. | 1,107,222 | 46,646,938 |
| a | Yandex N.V. Class A | 293,112 | 10,261,851 |
| | Media — 1.4% | | |
| | Zee Entertainment Enterprises Ltd. | 2,898,247 | 10,816,979 |
| | | | 71,896,621 |
| | Pharmaceuticals, Biotechnology & Life Sciences — 0.0% | | |
| | Pharmaceuticals — 0.0% | | |
| a,b,c | China Animal Healthcare Ltd. | 35,787,582 | 0 |
| | | | 0 |
| | Retailing — 9.5% | | |
| | Internet & Direct Marketing Retail — 8.0% | | |
| a | Alibaba Group Holding Ltd. Sponsored ADR | 315,362 | 52,737,987 |
| | Naspers Ltd. Class N | 54,736 | 8,294,609 |
| a | Prosus N.V. | 54,736 | 4,018,069 |
| | Multiline Retail — 1.5% | | |
| | Lojas Renner S.A. | 963,438 | 11,702,840 |
| | | | 76,753,505 |
| | Semiconductors & Semiconductor Equipment — 7.1% | | |
| | Semiconductors & Semiconductor Equipment — 7.1% | | |
| a | Micron Technology, Inc. | 463,886 | 19,877,515 |
| | Taiwan Semiconductor Manufacturing Co., Ltd. | 4,228,605 | 37,556,475 |
| | | | 57,433,990 |
| | Software & Services — 1.1% | | |
| | Information Technology Services — 1.1% | | |
| a | Network International Holdings plc | 1,390,720 | 9,148,281 |
| | | | 9,148,281 |
| | Technology Hardware & Equipment — 7.3% | | |
| | Electronic Equipment, Instruments & Components — 1.8% | | |
| a | IPG Photonics Corp. | 108,217 | 14,674,225 |
| | Technology Hardware, Storage & Peripherals — 5.5% | | |
| | Samsung Electronics Co., Ltd. | 1,075,851 | 44,116,952 |
| | | | 58,791,177 |
| | Telecommunication Services — 1.3% | | |
| | Wireless Telecommunication Services — 1.3% | | |
| | China Mobile Ltd. | 1,313,106 | 10,864,785 |
| | | | 10,864,785 |
| | Transportation — 7.9% | | |
| | Airlines — 3.6% | | |
| a | Azul S.A. ADR | 476,590 | 17,071,454 |
| | Copa Holdings S.A. Class A | 118,812 | 11,732,685 |
| | Transportation Infrastructure — 4.3% | | |
| | Adani Ports & Special Economic Zone Ltd. | 3,123,717 | 18,292,148 |
| | Grupo Aeroportuario del Pacifico SAB de CV Class B | 1,206,196 | 11,641,435 |
| | Shanghai International Airport Co., Ltd. Class A | 468,460 | 5,235,590 |
| | | | 63,973,312 |
Schedule of Investments, Continued
Thornburg Developing World Fund | September 30, 2019
| | | SHARES | VALUE |
| | Total Common Stock(Cost $632,945,947) | | 778,434,731 |
| | Short-Term Investments — 3.7% | | |
| d | Thornburg Capital Management Fund | 3,035,100 | $ 30,350,997 |
| | Total Short-Term Investments(Cost $30,350,997) | | 30,350,997 |
| | Total Investments — 99.9%(Cost $663,296,944) | | $808,785,728 |
| | Other Assets Less Liabilities — 0.1% | | 636,567 |
| | Net Assets — 100.0% | | $809,422,295 |
| Footnote Legend |
| a | Non-income producing. |
| b | Illiquid security. |
| c | Security currently fair valued by the Valuation and Pricing Committee using procedures approved by the Trustees’ Audit Committee. |
| d | Investment in Affiliates. |
Portfolio Abbreviations
To simplify the listings of securities, abbreviations are used per the table below:
| ADR | American Depositary Receipt |
| GDR | Global Depositary Receipt |
See notes to financial statements.
Statement of Assets and Liabilities
Thornburg Developing World Fund | September 30, 2019
| ASSETS | |
| Investments at value (Note 3) | |
| Non-affiliated issuers (cost $632,945,947) | $ 778,434,731 |
| Non-controlled affiliated issuer (cost $30,350,997) | 30,350,997 |
| Cash denominated in foreign currency (cost $8,418) | 8,437 |
| Receivable for fund shares sold | 1,959,184 |
| Dividends receivable | 789,472 |
| Dividend and interest reclaim receivable | 458,012 |
| Prepaid expenses and other assets | 37,826 |
| Total Assets | 812,038,659 |
| Liabilities | |
| Payable for fund shares redeemed | 606,584 |
| Payable to investment advisor and other affiliates (Note 4) | 750,135 |
| Deferred taxes payable (Note 2) | 754,348 |
| Accounts payable and accrued expenses | 505,215 |
| Dividends payable | 82 |
| Total Liabilities | 2,616,364 |
| Net Assets | $ 809,422,295 |
| NET ASSETS CONSIST OF | |
| Distributable earnings | $ 2,056,277 |
| Net capital paid in on shares of beneficial interest | 807,366,018 |
| | $ 809,422,295 |
| NET ASSET VALUE | |
| Class A Shares: | |
Net asset value and redemption price per share
($96,935,249 applicable to 4,744,629 shares of beneficial interest outstanding - Note 5) | $ 20.43 |
| Maximum sales charge, 4.50% of offering price | 0.96 |
| Maximum offering price per share | $ 21.39 |
| Class C Shares: | |
Net asset value and offering price per share*
($63,202,505 applicable to 3,266,077 shares of beneficial interest outstanding - Note 5) | $ 19.35 |
| Class I Shares: | |
Net asset value, offering and redemption price per share
($590,196,519 applicable to 28,296,862 shares of beneficial interest outstanding - Note 5) | $ 20.86 |
| Class R5 Shares: | |
Net asset value, offering and redemption price per share
($2,430,040 applicable to 116,884 shares of beneficial interest outstanding - Note 5) | $ 20.79 |
| Class R6 Shares: | |
Net asset value, offering and redemption price per share
($56,657,982 applicable to 2,713,397 shares of beneficial interest outstanding - Note 5) | $ 20.88 |
| * | Redemption price per share is equal to net asset value less any applicable contingent deferred sales charge. |
See notes to financial statements.
Statement of Operations
Thornburg Developing World Fund | Year Ended September 30, 2019
| INVESTMENT INCOME | |
| Dividend income | |
| Non-affiliated issuers (net of foreign taxes withheld of $1,996,344) | $ 20,754,261 |
| Non-controlled affiliated issuer | 865,663 |
| Total Income | 21,619,924 |
| EXPENSES | |
| Investment advisory fees (Note 4) | 7,899,621 |
| Administration fees (Note 4) | |
| Class A Shares | 91,630 |
| Class C Shares | 63,097 |
| Class I Shares | 520,300 |
| Class R5 Shares | 2,549 |
| Class R6 Shares | 48,642 |
| Distribution and service fees (Note 4) | |
| Class A Shares | 261,000 |
| Class C Shares | 718,887 |
| Transfer agent fees | |
| Class A Shares | 138,830 |
| Class C Shares | 99,852 |
| Class I Shares | 490,342 |
| Class R5 Shares | 14,979 |
| Class R6 Shares | 10,991 |
| Registration and filing fees | |
| Class A Shares | 13,927 |
| Class C Shares | 13,247 |
| Class I Shares | 21,545 |
| Class R5 Shares | 13,164 |
| Class R6 Shares | 13,537 |
| Custodian fees | 208,553 |
| Professional fees | 77,703 |
| Trustee and officer fees (Note 4) | 48,416 |
| Other expenses | 130,665 |
| Total Expenses | 10,901,477 |
| Less: | |
| Expenses reimbursed by investment advisor (Note 4) | (539,347) |
| Investment advisory fees waived by investment advisor (Note 4) | (181,848) |
| Net Expenses | 10,180,282 |
| Net Investment Income | $ 11,439,642 |
| REALIZED AND UNREALIZED GAIN (LOSS) | |
| Net realized gain (loss) on: | |
| Non-affiliated issuer investments (net of realized capital gain taxes paid of $209,407) | 15,458,596 |
| Foreign currency transactions | (270,143) |
| | 15,188,453 |
| Net change in unrealized appreciation (depreciation) on: | |
| Non-affiliated issuer investments (net of change in deferred taxes payable of $96,794) | 33,788,807 |
| Foreign currency translations | 45,064 |
| | 33,833,871 |
| Net Realized and Unrealized Gain | 49,022,324 |
| Net Increase in Net Assets Resulting from Operations | $ 60,461,966 |
See notes to financial statements.
Statements of Changes in Net Assets
Thornburg Developing World Fund
| | Year Ended
September 30, 2019 | Year Ended
September 30, 2018 |
| INCREASE (DECREASE) IN NET ASSETS FROM | | |
| OPERATIONS | | |
| Net investment income | $ 11,439,642 | $ 8,108,374 |
| Net realized gain (loss) on investments, foreign currency transactions and capital gain taxes | 15,188,453 | 63,923,655 |
| Net change in unrealized appreciation (depreciation) on investments, foreign currency translations and deferred taxes | 33,833,871 | (102,076,534) |
| Net Increase (Decrease) in Net Assets Resulting from Operations | 60,461,966 | (30,044,505) |
| DIVIDENDS TO SHAREHOLDERS | | |
| From distributable earnings | | |
| Class A Shares | (832,625) | - |
| Class I Shares | (7,328,575) | - |
| Class R5 Shares | (35,726) | - |
| Class R6 Shares | (703,702) | - |
| FUND SHARE TRANSACTIONS (NOTE 5) | | |
| Class A Shares | (21,799,926) | (8,956,839) |
| Class C Shares | (22,061,241) | (25,277,644) |
| Class I Shares | (80,785,547) | (140,840,162) |
| Class R5 Shares | (1,089,073) | (2,071,263) |
| Class R6 Shares | (3,312,730) | 32,219,385 |
| Net Decrease in Net Assets | (77,487,179) | (174,971,028) |
| NET ASSETS | | |
| Beginning of Year | 886,909,474 | 1,061,880,502 |
| End of Year | $ 809,422,295 | $ 886,909,474 |
See notes to financial statements.
Notes to Financial Statements
Thornburg Developing World Fund | September 30, 2019
NOTE 1 – ORGANIZATION
Thornburg Developing World Fund (the “Fund”) is a diversified series of Thornburg Investment Trust (the “Trust”). The Trust was organized as a Massachusetts business trust under a Declaration of Trust dated June 3, 1987 and is registered as a diversified, open-end management investment company under the Investment Company Act of 1940, as amended (the "1940 Act"). The Fund is currently one of twenty-two separate series of the Trust. Each series is considered to be a separate entity for financial reporting and tax purposes and bears expenses directly attributable to it. The Fund seeks long-term capital appreciation.
The Fund currently offers five classes of shares of beneficial interest: Class A, Class C, Institutional Class (“Class I”) and Retirement Classes (“Class R5” and “Class R6”). Each class of shares of the Fund represents an interest in the same portfolio of investments, except that (i) Class A shares are sold subject to a front-end sales charge collected at the time the shares are purchased and bear a service fee, (ii) Class C shares are sold at net asset value without a sales charge at the time of purchase, but are subject to a contingent deferred sales charge upon redemption within one year of purchase, and bear both a service fee and a distribution fee, (iii) Class I and Class R5 shares are sold at net asset value without a sales charge at the time of purchase and may be subject to a service fee, (iv) Class R6 shares are sold at net asset value without a sales charge at the time of purchase, and (v) the respective classes may have different reinvestment privileges and conversion rights. Additionally, the Fund may allocate among its classes certain expenses, to the extent allocable to specific classes, including administration fees, transfer agent fees, government registration fees, certain printing and postage costs, and administrative and legal expenses. Currently, class specific expenses of the Fund are limited to service and distribution fees and certain registration and transfer agent expenses.
The following is a summary of significant accounting policies followed by the Fund in the preparation of its financial statements. The Fund prepares its financial statements in conformity with United States generally accepted accounting principles (“GAAP”), including investment company accounting and reporting guidance in the Financial Accounting Standards Board (the “FASB”) Accounting Standard Codification Topic 946.
NOTE 2 – SIGNIFICANT ACCOUNTING POLICIES
Security Valuation: All investments in securities held by the Fund are valued as described in Note 3.
Allocation of Income, Gains, Losses and Expenses: Net investment income (other than class specific expenses) and realized and unrealized gains and losses are allocated daily to each class of shares based upon the relative net asset value of outstanding shares (or the value of the dividend-eligible shares, as appropriate) of each class of shares at the beginning of the day (after adjusting for the current capital shares activity of the respective class). Expenses common to all Funds are allocated among the Funds comprising the Trust based upon their relative net asset values or other appropriate allocation methods. Operating expenses directly attributable to a specific class are charged against the operating income of that class.
Dividends and Distributions to Shareholders: Dividends and distributions to shareholders, which are determined in accordance with federal income tax regulations and may differ from GAAP, are recorded on the ex-dividend date. Ordinary income dividends, if any, are declared and paid annually. Capital gain distributions, if any, are declared and paid annually and more often if deemed necessary by Thornburg Investment Management, Inc., the Trust’s investment advisor (the “Advisor”). Dividends and distributions are paid and are reinvested in additional shares of the Fund at net asset value per share at the close of business on the ex-dividend date, or at the shareholder’s option, paid in cash.
Investment Income: Dividend income is recorded on the ex-dividend date. Certain income from foreign investments is recognized as soon as information is available to the Fund. Interest income is accrued as earned. Premiums and discounts are amortized and accreted, respectively, to first call dates or maturity dates using the effective yield method of the respective investments. These amounts are included in Investment Income in the Statement of Operations.
Investment Transactions: Investment transactions are accounted for on a trade date basis. Realized gains and losses from the sale of investments are recorded on an identified cost basis.
When-Issued and Delayed Delivery Transactions: The Fund may engage in when-issued or delayed delivery transactions. To the extent the Fund engages in such transactions, it will do so for the purpose of acquiring portfolio investments consistent with the Fund’s investment objectives and not for the purpose of investment leverage or to speculate on interest rate or market changes. At the time the Fund makes a commitment to purchase an investment on a when-issued or delayed delivery basis, the Fund will record the transaction and reflect the value in determining its net asset value. When effecting such transactions, assets of an amount sufficient to make payment for the portfolio investments to be purchased will be segregated on the Fund’s records on the trade date. Investments purchased on a when-issued or delayed delivery basis do not earn interest until the settlement date. The values of these securities held at September 30, 2019 are detailed in the Schedule of Investments.
Notes to Financial Statements, Continued
Thornburg Developing World Fund | September 30, 2019
Foreign Currency Translation: Portfolio investments and other assets and liabilities denominated in foreign currencies are translated into U.S. dollars based on the exchange rate of such currencies against the U.S. dollar on the date of valuation. Purchases and sales of investments and income items denominated in foreign currencies are translated into U.S. dollars at the exchange rate in effect on the transaction date. When the Fund purchases or sells foreign investments, it will customarily enter into a foreign exchange contract to minimize foreign exchange risk from the trade date to the settlement date of such transactions. The values of such spot contracts are included in receivable for investments sold and payable for investments purchased on the Statement of Assets and Liabilities.
The Fund does not separately report the effect of changes in foreign exchange rates from changes in market prices on investments held. Such changes are included in net unrealized appreciation (depreciation) from investments in the Statement of Operations.
Reported net realized gains and losses from foreign currency transactions arise due to purchases and sales of foreign currencies, currency gains and losses realized between the trade and settlement dates on investment transactions and the difference between the amounts of dividends, interest, and foreign withholding taxes recorded on the Fund’s books, and the U.S. dollar equivalent of the amounts actually received or paid. These amounts are included in foreign currency transactions in the Statement of Operations.
Net change in unrealized appreciation (depreciation) on foreign currency translations arise from changes in the fair value of assets and liabilities, other than investments at period end, resulting from changes in exchange rates.
Guarantees and Indemnifications: Under the Trust’s organizational documents (and under separate agreements with the independent Trustees), its officers and Trustees are provided with an indemnification against certain liabilities arising out of the performance of their duties to the Fund. In the normal course of business the Trust may also enter into contracts with service providers that contain general indemnifications. The Trust’s maximum exposure under these arrangements is unknown. However, based on experience, the Trust expects the risk of loss to be remote.
Use of Estimates: The preparation of financial statements in conformity with GAAP requires management to make estimates and assumptions that affect the reported amounts of assets and liabilities and disclosure of contingent assets and liabilities at the date of the financial statements and the reported amounts of increases (decreases) in net assets from operations during the reporting period. Actual results could differ from those estimates.
Federal Income Taxes: It is the policy of the Trust to comply with the provisions of the Internal Revenue Code applicable to regulated investment companies and to distribute to shareholders substantially all investment company taxable income including net realized gains on investments (if any), and tax exempt income of the Fund. Therefore, no provision for federal income or excise tax is required.
The Fund files income tax returns in United States federal and applicable state jurisdictions. The statute of limitations on the Fund’s tax return filings generally remains open for the three years following a return’s filing date. The Fund has analyzed each uncertain tax position believed to be material in the preparation of the Fund’s financial statements for the fiscal year ended September 30, 2019, including open tax years, to assess whether it is more likely than not that the position would be sustained upon examination, based on the technical merits of the position. The Fund has not identified any such position for which an asset or liability must be reflected in the Statement of Assets and Liabilities.
At September 30, 2019, information on the tax components of capital was as follows:
| Cost of investments for tax purposes | $ 663,936,180 |
| Gross unrealized appreciation on a tax basis | 190,426,137 |
| Gross unrealized depreciation on a tax basis | (45,576,589) |
| Net unrealized appreciation (depreciation) on investments (tax basis) | $ 144,849,548 |
Temporary book to tax adjustments made to the cost of investments and net unrealized appreciation (depreciation) for tax purposes result primarily from deferral of outstanding wash sale losses.
At September 30, 2019, the Fund had deferred tax basis capital losses occurring subsequent to October 31, 2018 through September 30, 2019 of $7,235,226. For tax purposes, such losses will be recognized in the year ending September 30, 2020.
At September 30, 2019, the Fund had cumulative tax basis capital losses of $145,451,455 (of which $145,451,455 are short-term and $0 are long-term), which may be carried forward to offset future capital gains. To the extent such carryforwards are used, capital gain distributions may be reduced to the extent provided by regulations. Such capital loss carryforwards do not expire.
During the year ended September 30, 2019, the Fund utilized $23,119,991 of capital loss carryforwards generated after September 30, 2011.
Notes to Financial Statements, Continued
Thornburg Developing World Fund | September 30, 2019
At September 30, 2019, the Fund had $10,659,656 of undistributed tax basis ordinary investment income and no undistributed tax basis capital gains.
Foreign Withholding Taxes: The Fund is subject to foreign tax withholding imposed by certain foreign countries in which the Fund may invest. Withholding taxes are incurred on certain foreign dividends and are accrued at the time the dividend is recognized based on applicable foreign tax laws. The Fund may file withholding tax reclaims in certain jurisdictions to recover a portion of amounts previously withheld, in view of various considerations, including recent decisions rendered by the courts in those and other jurisdictions. The Fund would expect to record a receivable for such a reclaim based on a variety of factors, including assessment of a jurisdiction’s legal obligation to pay reclaims, the jurisdiction’s administrative practices and payment history, and industry convention. To date the Fund has recorded no such receivable because there is limited precedent for collecting such prior year reclaims and the likelihood of collection remains uncertain.
Deferred Foreign Capital Gain Taxes: The Fund is subject to a tax imposed on net realized gains of securities of certain foreign countries. The Fund records an estimated deferred tax liability for net unrealized gains on these investments as reflected in the accompanying financial statements. Such changes are included in net unrealized appreciation (depreciation) from investments in the Statement of Operations.
The tax character of distributions paid during the year ended September 30, 2019, and September 30, 2018, was as follows:
| | 2019 | 2018 |
| Distributions from: | | |
| Ordinary income | $ 8,900,628 | $ - |
| Total | $ 8,900,628 | $ - |
NOTE 3 – SECURITY VALUATION
Valuation of the Fund’s portfolio investment securities is performed in accordance with policies and procedures adopted by and under the oversight of the Trustees.
The Trustees of the Trust have appointed the Advisor to assist the Trustees with obtaining fair market values for portfolio investments, evaluating and monitoring professional pricing service providers appointed by the Trustees’ Audit Committee (the “Audit Committee”) to assist in determining fair values for portfolio investments, assisting in calculating fair values for portfolio investments in certain circumstances, and performing other functions in connection with the valuation of investments. The Advisor acts through its Valuation and Pricing Committee (the “Committee”) and other employees of the Advisor. The Committee regularly reviews its own valuation calculations, reviews the valuations, valuation techniques and services furnished by pricing service providers, considers circumstances which may require valuation calculations by the Committee, and reviews previous valuation calculations. The Committee reports to the Audit Committee on the Committee’s activities, the performance of pricing service providers, and other matters relating to valuation of portfolio investments.
In those instances when the Committee assists in calculating a fair value for a portfolio investment, the Committee seeks to determine the price that the Fund would reasonably expect to receive upon a sale of the investment in an orderly transaction between market participants on the valuation date. The Committee customarily utilizes quotations from securities broker dealers in calculating valuations, but also may utilize prices obtained from pricing service providers or other methods approved by the Audit Committee. Because fair values calculated by the Committee are estimates, the calculation of a value for an investment may differ from the price that would be realized by the Fund upon a sale of the investment, and the difference could be material to the Fund’s financial statements. The Committee’s calculation of a fair value for an investment may also differ from the prices obtained by other persons (including other mutual funds) for the investment.
Valuation of Securities: Securities and other portfolio investments which are listed or traded on a United States securities exchange are valued at the last reported sale price on the valuation date. Investments listed or traded on an exchange for which there has been no sale that day are valued at the mean between the last reported bid and asked prices on that valuation date. Portfolio investments reported by NASDAQ are valued at the official closing price on the valuation date. If an investment is traded on more than one exchange, the investment is considered traded on the exchange that is normally the primary market for that investment. Securities and other portfolio investments which are listed or traded on exchanges outside the United States are valued at the last price or the closing price of the investment on the exchange that is normally the primary market for the investment, as of the close of the exchange preceding the Fund’s valuation date. Foreign investments listed or traded on an exchange for which there has been no sale that day are valued at the mean between the last reported bid and asked prices on that valuation date.
In any case when a market quotation is not readily available for a portfolio investment ordinarily valued by market quotation, the Committee calculates a fair value for the investment using alternative methods approved by the Audit Committee. A market quotation is not readily available when the primary market or exchange for the investment is not open for the entire scheduled day of trading. Market quotations for
Notes to Financial Statements, Continued
Thornburg Developing World Fund | September 30, 2019
an investment also may not be readily available if developments after the most recent close of the investment’s primary exchange or market, but prior to the close of business on any Fund business day, or an unusual event or significant period of time occurring since the availability of a market quotation, create a serious question concerning the reliability of the most recent market quotation available for the investment. In particular, on days when market volatility thresholds established by the Audit Committee are exceeded, foreign equity investments held by the Fund may be valued using alternative methods. The Committee customarily obtains valuations in these instances from pricing service providers approved by the Audit Committee. Pricing service providers ordinarily calculate valuations using multi-factor models to adjust market prices based upon various inputs, including exchange data, depository receipt prices, futures, index data and other data.
Debt obligations held by the Fund which are not listed or traded on exchanges or for which no reported market exists are ordinarily valued at the valuation obtained from a pricing service provider approved by the Audit Committee.
In any case when a pricing service provider fails to provide a valuation for a debt obligation held by the Fund, the Committee calculates a fair value for the obligation using alternative methods under procedures approved by the Audit Committee. Additionally, in cases when management believes that a valuation obtained from a pricing service provider is stale, does not reflect material factors affecting the valuation of the investment, is significantly different than the value the Fund is likely to obtain if it sought a bid for the investment, or is otherwise unreliable, the Committee calculates a fair value for the obligation using an alternative method approved by the Audit Committee.
Quotations for foreign investments expressed in foreign currency amounts are converted to U.S. dollar equivalents using a foreign exchange quotation from a third party service provider at the time of valuation. Foreign investments held by the Fund may be traded on days and at times when the Fund is not open for business. Consequently, the value of Fund investments may be significantly affected on days when shareholders cannot purchase or sell Fund shares.
Valuation Hierarchy: The Fund categorizes its investments based upon the inputs used in valuing those investments, according to a three-level hierarchy established in guidance from the FASB. Categorization of investments using this hierarchy is intended by the FASB to maximize the use of observable inputs in valuing investments and minimize the use of unobservable inputs by requiring that the most observable inputs be used when available. Observable inputs are those that market participants would use in valuing an investment based on available market information. Unobservable inputs are those that reflect assumptions about the information market participants would use in valuing an investment. An investment’s level within the hierarchy is based on the lowest level input that is deemed significant to the valuation. The methodologies and inputs used to value investments are not necessarily indications of the risk or liquidity associated with those investments.
Various inputs are used in calculating valuations for the Fund’s investments. These inputs are generally summarized according to the three-level hierarchy below:
Level 1: Quoted prices in active markets for identical investments.
Level 2: Other direct or indirect significant observable inputs (including quoted prices for similar investments in active markets and other observable inputs, such as interest rates, prepayment rates, credit ratings, etc.).
Level 3: Significant unobservable inputs (including the Committee’s own assumptions in calculating the fair values of investments).
Valuations for debt obligations held by the Fund are typically calculated by pricing service providers approved by the Audit Committee and are generally characterized as Level 2 within the valuation hierarchy.
On days when market volatility thresholds established by the Audit Committee are exceeded, foreign securities for which valuations are obtained from pricing service providers are fair valued. On these days, the foreign securities are characterized as Level 2 within the valuation hierarchy and revert to Level 1 after the threshold is no longer exceeded.
In a limited number of cases the Committee calculates a fair value for investments using broker quotations or other methods approved by the Audit Committee. When the Committee uses a single broker quotation to calculate a fair value for an investment without other significant observable inputs, or if a fair value is calculated using other significant inputs that are considered unobservable, the investment is characterized as Level 3 within the hierarchy. Other significant unobservable inputs used to calculate a fair value in these instances might include an income-based valuation approach which considers discounted anticipated future cash flows from the investment and application of discounts due to the nature or duration of any restrictions on the disposition of the investment.
Valuations based upon the use of inputs from Levels 1, 2 or 3 may not represent the actual price received upon the disposition of an investment, and a Fund may receive a price that is lower than the valuation based upon these inputs when it sells the investment.
Notes to Financial Statements, Continued
Thornburg Developing World Fund | September 30, 2019
The following table displays a summary of the fair value hierarchy measurements of the Fund’s investments as of September 30, 2019:
| | Fair Value Measurements at September 30, 2019 |
| | TOTAL | LEVEL 1 | LEVEL 2 | LEVEL 3 |
| Assets | | | | |
| Investments in Securities* | | | | |
| Common Stock(a) | $ 778,434,731 | $ 740,878,256 | $ 37,556,475 | $ — |
| Short-Term Investments | 30,350,997 | 30,350,997 | — | — |
| Total Investments in Securities | $808,785,728 | $771,229,253 | $37,556,475 | $— |
| Total Assets | $808,785,728 | $771,229,253 | $37,556,475 | $— |
| * | See Schedule of Investments for a summary of the industry exposure as grouped according to the Global Industry Classification Standard (GICS), which is an industry taxonomy developed by MSCI, Inc. and Standard & Poor’s (S&P). |
| (a) | At September 30, 2019, industry classifications for Common Stock in Level 2 and Level 3 consist of $0 in Pharmaceuticals, Biotechnology & Life Sciences and $37,556,475 in Semiconductors & Semiconductor Equipment. |
A rollforward of fair value measurements using significant unobservable inputs (Level 3) for the year ended September 30, 2019 is as follows:
| | COMMON
STOCK | TOTAL |
| Beginning Balance 9/30/2018 | $ 9,343,578 | $ 9,343,578 |
| Accrued Discounts (Premiums) | – | – |
| Net Realized Gain (Loss)(a) | (1,099,449) | (1,099,449) |
| Gross Purchases | 899,292 | 899,292 |
| Gross Sales | (12,580,790) | (12,580,790) |
| Net Change in Unrealized Appreciation (Depreciation)(b)(c) | 3,437,369 | 3,437,369 |
| Transfers into Level 3 | – | – |
| Transfers out of Level 3 | – | – |
| Ending Balance 9/30/2019 | $– | $– |
| (a) | Amount of net realized gain (loss) from investments is included in the Fund’s Statement of Operations for the year ended September 30, 2019. |
| (b) | Amount of net change in unrealized appreciation (depreciation) on investments is included in the Fund’s Statement of Operations for the year ended September 30, 2019. |
| (c) | The net change in unrealized appreciation (depreciation) attributable to securities owned at September 30, 2019, which were valued using significant unobservable inputs, was $0. |
NOTE 4 – INVESTMENT ADVISORY FEE AND OTHER TRANSACTIONS WITH AFFILIATES
Pursuant to an investment advisory agreement, the Advisor serves as the investment advisor and performs services for the Fund for which the fees are payable at the end of each month. Under the investment advisory agreement, the Fund pays the Advisor a management fee based on the average daily net assets of the Fund at an annual rate as shown in the following table:
| Management Fee Schedule |
| DAILY NET ASSETS | FEE RATE |
| Up to $500 million | 0.975% |
| Next $500 million | 0.925 |
| Next $500 million | 0.875 |
| Next $500 million | 0.825 |
| Over $2 billion | 0.775 |
The Fund’s effective management fee for the year ended September 30, 2019 was 0.955% of the Fund’s average daily net assets (before applicable management fee waiver of $181,848). Total management fees incurred by the Fund for the year ended September 30, 2019 are set forth in the Statement of Operations.
Notes to Financial Statements, Continued
Thornburg Developing World Fund | September 30, 2019
The Trust has entered into an administrative services agreement with the Advisor, whereby the Advisor will perform certain administrative services related to each class of the Fund’s shares. The fees are computed as an annual percentage of the aggregate average daily net assets of all shares classes of all Funds in the Trust as follows:
| Administration Fee Schedule |
| Daily Net Assets | Fee Rate |
| Up to $20 billion | 0.100% |
| $20 billion to $40 billion | 0.075 |
| $40 billion to $60 billion | 0.040 |
| Over $60 billion | 0.030 |
The aggregate fee amount is allocated on a daily basis to each Fund based on net assets and subsequently allocated to each class of shares of the Fund. Total administrative service fees incurred by each class of shares of the Fund for the year ended September 30, 2019, are set forth in the Statement of Operations.
The Trust has an underwriting agreement with Thornburg Securities Corporation (the “Distributor”), an affiliate of the Advisor, which acts as the distributor of the Fund’s shares. For the year ended September 30, 2019, the Distributor has advised the Fund that it earned net commissions aggregating $5,771 from the sale of Class A shares, and collected contingent deferred sales charges aggregating $3,709 from redemptions of Class C shares of the Fund.
Pursuant to a service plan under Rule 12b-1 of the 1940 Act, the Fund may pay to the Distributor or securities dealers and other financial institutions at the Distributor’s direction an amount not to exceed .25 of 1% per annum of the average daily net assets attributable to Class A, Class C, Class I, and Class R5 shares of the Fund to obtain various shareholder and distribution related services. For the year ended September 30, 2019, there were no 12b-1 service plan fees charged for Class I or Class R5 shares. Class R6 shares are not subject to a service plan. The Advisor and Distributor each may pay out of its own resources additional expenses for distribution of the Fund’s shares and shareholder services.
The Trust has also adopted a distribution plan pursuant to Rule 12b-1, applicable only to the Fund’s Class C shares, under which the Fund compensates the Distributor for services in promoting the sale of Class C shares of the Fund at an annual rate of up to .75 of 1% per annum of the average daily net assets attributable to Class C shares.
Total fees incurred by each class of shares of the Fund under their respective service and distribution plans for the year ended September 30, 2019, are set forth in the Statement of Operations.
The Advisor has contractually agreed to waive fees and reimburse expenses incurred by the Fund so that actual expenses of certain share classes do not exceed levels as specified in each Fund’s most recent prospectus (Class l shares, 1.09%; Class R5 shares, 1.09%; Class R6 shares, 0.99%). The agreement may be terminated by the Fund at any time, but may not be terminated by the Advisor before February 1, 2020, unless the Advisor ceases to be the investment advisor to the Fund prior to that date. The Advisor may recoup amounts waived or reimbursed during the fiscal year ended September 30, 2019 if, during that year, expenses fall below the contractual limit that was in place at the time those fees and expenses were waived or reimbursed. The Advisor will not recoup fees or expenses as described in the preceding sentence if that recoupment would cause the Fund’s total annual operating expenses (after the recoupment is taken into account) to exceed the lesser of: (a) the expense cap that was in place at the time the waiver or reimbursement occurred; or (b) the expense cap that is in place at the time of the recoupment.
For the year ended September 30, 2019, the Advisor voluntarily waived Fund level investment advisory fees of $181,848. The Advisor contractually reimbursed certain class specific expenses and distribution fees of $438,440 for Class I shares, $27,737 for Class R5 shares, and $73,170 for Class R6 shares.
Certain officers and Trustees of the Trust are also officers or directors of the Advisor and Distributor. The compensation of the independent Trustees is borne by the Trust. The Trust also pays a portion of the Chief Compliance Officer’s compensation. These amounts are reflected as Trustee and officer fees in the Statement of Operations.
The percentage of direct investments in the Fund held by the Trustees, officers of the Trust, and the Advisor is approximately 4.84%.
The Fund may purchase or sell securities from or to an affiliated fund, provided the affiliation is due solely to having a common investment advisor, common officers, or common trustees, and provided that all such transactions will comply with Rule 17a-7 under the 1940 Act. For the year ended September 30, 2019, the Fund had no such transactions with affiliated funds.
Notes to Financial Statements, Continued
Thornburg Developing World Fund | September 30, 2019
Shown below are holdings of voting securities of each portfolio company which is considered "affiliated" to the Fund under the 1940 Act, including companies for which the Fund’s holding represented 5% or more of the company’s voting securities, and a series of the Thornburg Investment Trust in which the Fund invested for cash management purposes during the period:
| Fund | Market Value
9/30/18 | Purchases
at Cost | Sales
Proceeds | Realized
Gain
(Loss) | Change in
Unrealized
Appr./(Depr.) | Market Value
9/30/19 | Dividend
Income |
| Thornburg Capital Management Fund | $52,180,825 | $269,224,391 | $(291,054,219) | $- | $- | $30,350,997 | $865,663 |
NOTE 5 – SHARES OF BENEFICIAL INTEREST
At September 30, 2019, there were an unlimited number of shares with no par value of beneficial interest authorized. Transactions in shares of beneficial interest were as follows:
| | YEAR ENDED
September 30, 2019 | YEAR ENDED
September 30, 2018 |
| | SHARES | AMOUNT | SHARES | AMOUNT |
| Class A Shares | | | | |
| Shares sold | 1,085,323 | $ 21,275,188 | 1,295,267 | $ 26,954,368 |
Shares issued to shareholders in
reinvestment of dividends | 45,605 | 787,592 | - | - |
| Shares repurchased | (2,244,922) | (43,862,706) | (1,753,167) | (35,911,207) |
| Net decrease | (1,113,994) | $ (21,799,926) | (457,900) | $ (8,956,839) |
| Class C Shares | | | | |
| Shares sold | 165,190 | $ 3,021,325 | 328,433 | $ 6,527,715 |
Shares issued to shareholders in
reinvestment of dividends | - | - | - | - |
| Shares repurchased | (1,359,589) | (25,082,566) | (1,637,558) | (31,805,359) |
| Net decrease | (1,194,399) | $ (22,061,241) | (1,309,125) | $ (25,277,644) |
| Class I Shares | | | | |
| Shares sold | 6,414,296 | $ 128,136,137 | 7,202,047 | $ 153,189,862 |
Shares issued to shareholders in
reinvestment of dividends | 401,425 | 7,057,046 | - | - |
| Shares repurchased | (10,980,973) | (215,978,730) | (13,981,994) | (294,030,024) |
| Net decrease | (4,165,252) | $ (80,785,547) | (6,779,947) | $ (140,840,162) |
| Class R5 Shares | | | | |
| Shares sold | 77,485 | $ 1,515,534 | 121,330 | $ 2,601,663 |
Shares issued to shareholders in
reinvestment of dividends | 2,039 | 35,726 | - | - |
| Shares repurchased | (134,103) | (2,640,333) | (223,238) | (4,672,926) |
| Net decrease | (54,579) | $ (1,089,073) | (101,908) | $ (2,071,263) |
| Class R6 Shares | | | | |
| Shares sold | 412,093 | $ 8,203,299 | 2,069,640 | $ 45,037,356 |
Shares issued to shareholders in
reinvestment of dividends | 36,173 | 636,287 | - | - |
| Shares repurchased | (609,784) | (12,152,316) | (612,074) | (12,817,971) |
| Net increase (decrease) | (161,518) | $ (3,312,730) | 1,457,566 | $ 32,219,385 |
NOTE 6 – INVESTMENT TRANSACTIONS
For the year ended September 30, 2019, the Fund had purchase and sale transactions of investments (excluding short-term investments) of $345,491,283 and $456,453,314, respectively.
Notes to Financial Statements, Continued
Thornburg Developing World Fund | September 30, 2019
NOTE 7 – DERIVATIVE FINANCIAL INSTRUMENTS WITH OFF-BALANCE
SHEET RISK AND FOREIGN INVESTMENT RISK
The Fund may use a variety of derivative financial instruments to hedge or adjust the risks affecting its investment portfolio or to enhance investment returns. Provisions of FASB Accounting Standards Codification ASC 815-10-50 (“ASC 815”) require certain disclosures. The disclosures are intended to provide users of financial statements with an understanding of the use of derivative instruments by the Fund and how these derivatives affect the financial position, financial performance and cash flows of the Fund. The Fund does not designate any derivative instruments as hedging instruments under ASC 815. Additionally, the Fund’s risk of loss may exceed the amounts recognized on the Statement of Assets and Liabilities.
During the year ended September 30, 2019, the Fund did not invest in any derivative financial instruments of the type addressed by ASC 815.
NOTE 8 – RECENT ACCOUNTING PRONOUNCEMENTS
In August 2018, the FASB issued ASU 2018-13, Fair Value Measurement (Topic 820): Changes to the Disclosure Requirements for Fair Value Measurement, which adds, removes, and modifies certain aspects of the fair value disclosure. ASU 2018-13 is effective for annual periods beginning after December 15, 2019, and early adoption is permitted. The Funds have elected to early adopt, and had applied ASU 2018-13 for the fiscal year ended September 30, 2019. The adoption of this accounting guidance did not have a material impact on the Funds’ financial statements.
In March 2017, the FASB issued Accounting Standards Update (ASU) 2017-08, Premium Amortization of Purchased Callable Debt Securities. The amendments in the ASU shorten the premium amortization period on a purchased callable debt security from the security’s contractual life to the earliest call date. It is anticipated that this change will enhance disclosures by reducing losses recognized when a security is called on an earlier date. This ASU is effective for fiscal years beginning after December 15, 2018. Management has evaluated the implications of these changes and the amendments will have no material effect on the Funds’ net assets or results of operations.
OTHER NOTES
Risks: The Fund’s investments subject it to risks including, but not limited to, management risk, market and economic risk, risks affecting specific issuers, foreign investment risk, developing country risk, risks affecting specific countries or regions, risks affecting investments in China, small and mid-cap company risk, credit risk, interest rate risk, and liquidity risk. Please see the Fund’s prospectus for a discussion of the risks associated with an investment in the Fund.
Subsequent Events: Fund management believes no events have occurred between September 30, 2019 and the date of issuance of the financial statements that require adjustment to or disclosure in the accompanying financial statements.
Financial Highlights
Thornburg Developing World Fund
| | PER SHARE PERFORMANCE (FOR A SHARE OUTSTANDING THROUGHOUT THE YEAR) |
UNLESS OTHERWISE
NOTED, PERIODS ARE
FISCAL YEARS ENDED
SEPTEMBER 30, | Net Asset
Value,
Beginning of
YEAR | Net
Investment
Income
(Loss)+ | Net Realized &
Unrealized Gain
(Loss) on
Investments | Total from
Investment
Operations | Dividends
from Net
Investment
Income | Dividends
from Net
Realized
Gains | Total
Dividends | Net Asset
Value,
End of YEAR |
| CLASS A SHARES(b) |
| 2019 | $ 19.13 | 0.23 | 1.22 | 1.45 | (0.15) | — | (0.15) | $ 20.43 |
| 2018 | $ 19.86 | 0.11 | (0.84) | (0.73) | — | — | — | $ 19.13 |
| 2017 | $ 16.98 | 0.09 | 2.89 | 2.98 | (0.10) | — | (0.10) | $ 19.86 |
| 2016 | $ 15.03 | 0.04 | 1.94 | 1.98 | (0.03) | — | (0.03) | $ 16.98 |
| 2015 | $ 18.61 | 0.02 | (3.58) | (3.56) | (0.02) | — | (0.02) | $ 15.03 |
| CLASS C SHARES |
| 2019 | $ 18.10 | 0.06 | 1.19 | 1.25 | — | — | — | $ 19.35 |
| 2018 | $ 18.93 | (0.05) | (0.78) | (0.83) | — | — | — | $ 18.10 |
| 2017 | $ 16.26 | (0.03) | 2.74 | 2.71 | (0.04) | — | (0.04) | $ 18.93 |
| 2016 | $ 14.48 | (0.08) | 1.86 | 1.78 | — | — | — | $ 16.26 |
| 2015 | $ 18.03 | (0.09) | (3.46) | (3.55) | — | — | — | $ 14.48 |
| CLASS I SHARES |
| 2019 | $ 19.55 | 0.31 | 1.24 | 1.55 | (0.24) | — | (0.24) | $ 20.86 |
| 2018 | $ 20.21 | 0.19 | (0.85) | (0.66) | — | — | — | $ 19.55 |
| 2017 | $ 17.26 | 0.19 | 2.92 | 3.11 | (0.16) | — | (0.16) | $ 20.21 |
| 2016 | $ 15.27 | 0.11 | 1.97 | 2.08 | (0.09) | — | (0.09) | $ 17.26 |
| 2015 | $ 18.92 | 0.10 | (3.65) | (3.55) | (0.10) | — | (0.10) | $ 15.27 |
| CLASS R5 SHARES |
| 2019 | $ 19.48 | 0.27 | 1.28 | 1.55 | (0.24) | — | (0.24) | $ 20.79 |
| 2018 | $ 20.14 | 0.19 | (0.85) | (0.66) | — | — | — | $ 19.48 |
| 2017 | $ 17.20 | 0.18 | 2.92 | 3.10 | (0.16) | — | (0.16) | $ 20.14 |
| 2016 | $ 15.22 | 0.12 | 1.96 | 2.08 | (0.10) | — | (0.10) | $ 17.20 |
| 2015 | $ 18.86 | 0.12 | (3.65) | (3.53) | (0.11) | — | (0.11) | $ 15.22 |
| CLASS R6 SHARES |
| 2019 | $ 19.57 | 0.33 | 1.24 | 1.57 | (0.26) | — | (0.26) | $ 20.88 |
| 2018 | $ 20.21 | 0.24 | (0.88) | (0.64) | — | — | — | $ 19.57 |
| 2017 | $ 17.25 | 0.20 | 2.93 | 3.13 | (0.17) | — | (0.17) | $ 20.21 |
| 2016 | $ 15.25 | 0.13 | 1.98 | 2.11 | (0.11) | — | (0.11) | $ 17.25 |
| 2015 | $ 18.91 | 0.15 | (3.68) | (3.53) | (0.13) | — | (0.13) | $ 15.25 |
| (a) | Not annualized for periods less than one year. |
| (b) | Sales loads are not reflected in computing total return. |
| + | Based on weighted average shares outstanding. |
See notes to financial statements.
Financial Highlights, Continued
Thornburg Developing World Fund
| RATIOS TO AVERAGE NET ASSETS | | SUPPLEMENTAL DATA |
Net Investment
Income (Loss) (%) | Expenses, After
Expense
Reductions (%) | Expenses,
Before Expense
Reductions (%) | | Total
Return (%)(a) | Portfolio
Turnover
Rate (%)(a) | Net Assets
at End of YEAR
(Thousands) |
| |
| 1.18 | 1.47 | 1.50 | | 7.74 | 43.52 | $ 96,935 |
| 0.55 | 1.46 | 1.48 | | (3.68) | 58.28 | $ 112,082 |
| 0.54 | 1.52 | 1.60 | | 17.58 | 77.61 | $ 125,427 |
| 0.25 | 1.52 | 1.57 | | 13.20 | 94.68 | $ 166,655 |
| 0.14 | 1.53 | 1.53 | | (19.12) | 96.74 | $ 207,282 |
| |
| 0.30 | 2.23 | 2.26 | | 6.91 | 43.52 | $ 63,203 |
| (0.23) | 2.23 | 2.25 | | (4.38) | 58.28 | $ 80,728 |
| (0.16) | 2.26 | 2.34 | | 16.65 | 77.61 | $ 109,227 |
| (0.51) | 2.29 | 2.34 | | 12.29 | 94.68 | $ 134,129 |
| (0.55) | 2.27 | 2.27 | | (19.69) | 96.74 | $ 154,943 |
| |
| 1.53 | 1.09 | 1.19 | | 8.14 | 43.52 | $ 590,196 |
| 0.93 | 1.08 | 1.16 | | (3.27) | 58.28 | $ 634,501 |
| 1.05 | 1.07 | 1.20 | | 18.06 | 77.61 | $ 793,069 |
| 0.70 | 1.07 | 1.16 | | 13.68 | 94.68 | $ 853,866 |
| 0.52 | 1.09 | 1.14 | | (18.75) | 96.74 | $ 1,016,898 |
| |
| 1.38 | 1.09 | 2.07 | | 8.16 | 43.52 | $ 2,430 |
| 0.90 | 1.09 | 1.71 | | (3.28) | 58.28 | $ 3,340 |
| 1.04 | 1.08 | 1.77 | | 18.06 | 77.61 | $ 5,506 |
| 0.74 | 1.08 | 1.75 | | 13.65 | 94.68 | $ 6,208 |
| 0.66 | 1.09 | 1.67 | | (18.72) | 96.74 | $ 5,363 |
| |
| 1.65 | 0.99 | 1.14 | | 8.25 | 43.52 | $ 56,658 |
| 1.16 | 0.99 | 1.14 | | (3.17) | 58.28 | $ 56,258 |
| 1.14 | 0.97 | 1.13 | | 18.16 | 77.61 | $ 28,652 |
| 0.80 | 0.97 | 1.12 | | 13.81 | 94.68 | $ 48,598 |
| 0.84 | 0.99 | 1.10 | | (18.68) | 96.74 | $ 21,055 |
Report of Independent Registered Public Accounting Firm
Thornburg Developing World Fund
To the Board of Trustees of Thornburg Investment Trust and Shareholders of
Thornburg Developing World Fund
Opinion on the Financial Statements
We have audited the accompanying statement of assets and liabilities, including the schedule of investments, of Thornburg Developing World Fund (one of the funds constituting Thornburg Investment Trust, referred to hereafter as the "Fund") as of September 30, 2019, the related statement of operations for the year ended September 30, 2019, the statements of changes in net assets for each of the two years in the period ended September 30, 2019, including the related notes, and the financial highlights for each of the five years in the period ended September 30, 2019 (collectively referred to as the “financial statements”). In our opinion, the financial statements present fairly, in all material respects, the financial position of the Fund as of September 30, 2019, the results of its operations for the year then ended, the changes in its net assets for each of the two years in the period ended September 30, 2019 and the financial highlights for each of the five years in the period ended September 30, 2019 in conformity with accounting principles generally accepted in the United States of America.
Basis for Opinion
These financial statements are the responsibility of the Fund’s management. Our responsibility is to express an opinion on the Fund’s financial statements based on our audits. We are a public accounting firm registered with the Public Company Accounting Oversight Board (United States) (PCAOB) and are required to be independent with respect to the Fund in accordance with the U.S. federal securities laws and the applicable rules and regulations of the Securities and Exchange Commission and the PCAOB.
We conducted our audits of these financial statements in accordance with the standards of the PCAOB. Those standards require that we plan and perform the audit to obtain reasonable assurance about whether the financial statements are free of material misstatement, whether due to error or fraud.
Our audits included performing procedures to assess the risks of material misstatement of the financial statements, whether due to error or fraud, and performing procedures that respond to those risks. Such procedures included examining, on a test basis, evidence regarding the amounts and disclosures in the financial statements. Our audits also included evaluating the accounting principles used and significant estimates made by management, as well as evaluating the overall presentation of the financial statements. Our procedures included confirmation of securities owned as of September 30, 2019 by correspondence with the custodian and transfer agent. We believe that our audits provide a reasonable basis for our opinion.
/s/PricewaterhouseCoopers LLP
New York, New York
November 22, 2019
We have served as the auditor of one or more investment companies in Thornburg Investment Trust since 1999.
Expense Example
Thornburg Developing World Fund | September 30, 2019 (Unaudited)
As a shareholder of the Fund, you incur two types of costs:
| (1) | transaction costs, including |
| (a) | sales charges (loads) on purchase payments, for Class A shares; |
| (b) | a deferred sales charge on redemptions of any part or all of a purchase of $1 million of Class A shares within 12 months of purchase; |
| (c) | a deferred sales charge on redemptions of Class C shares within 12 months of purchase; |
| (2) | ongoing costs, including management fees; distribution and/or service (12b-1) fees; and other Fund expenses. |
This example is intended to help you understand your ongoing costs (in dollars) of investing in the Fund and to compare these costs with the ongoing costs of investing in other mutual funds.
The example is based on a $1,000 investment beginning on April 1, 2019, and held until September 30, 2019.
ACTUAL EXPENSES
For each class of shares, the first line of the accompanying table provides information about actual account values and actual expenses. You may use the information in this line, together with the amount you invested, to estimate the expenses that you paid over the period. Simply divide your account value by $1,000 (for example, an $8,600 account value divided by $1,000 = 8.6), then multiply the result by the number in the first line for your class of shares under the heading entitled “Expenses Paid During Period” to estimate the expenses you paid on your account during this period.
| | BEGINNING
ACCOUNT VALUE
4/1/19 | ENDING
ACCOUNT VALUE
9/30/19 | EXPENSES PAID
DURING PERIOD†
4/1/19—9/30/19 |
| CLASS A SHARES |
| Actual | $1,000.00 | $1,002.45 | $7.33 |
| Hypothetical* | $1,000.00 | $1,017.75 | $7.38 |
| CLASS C SHARES |
| Actual | $1,000.00 | $998.97 | $11.17 |
| Hypothetical* | $1,000.00 | $1,013.89 | $11.26 |
| CLASS I SHARES |
| Actual | $1,000.00 | $1,004.81 | $5.48 |
| Hypothetical* | $1,000.00 | $1,019.60 | $5.52 |
| CLASS R5 SHARES |
| Actual | $1,000.00 | $1,004.34 | $5.48 |
| Hypothetical* | $1,000.00 | $1,019.60 | $5.52 |
| CLASS R6 SHARES |
| Actual | $1,000.00 | $1,004.81 | $4.98 |
| Hypothetical* | $1,000.00 | $1,020.10 | $5.01 |
| † | Expenses are equal to the annualized expense ratio for each class (A: 1.46%; C: 2.23%; I: 1.09%; R5: 1.09%; R6: 0.99%) multiplied by the average account value over the period, multiplied by 183/365 to reflect the one-half year period. |
| * | Hypothetical assumes a rate of return of 5% per year before expenses. |
HYPOTHETICAL EXAMPLE FOR COMPARISON PURPOSES
For each class of shares, the second line of the accompanying table provides information about hypothetical account values and hypothetical expenses based on the Fund’s actual expense ratio and an assumed rate of return of 5% per year before expenses, which is not the Fund’s actual return. The hypothetical account values and expenses may not be used to estimate the actual ending account balance or expenses you paid for the period. You may use this information to compare the ongoing costs of investing in the Fund and other funds. To do so, compare this 5% hypothetical example with the 5% hypothetical examples that appear in the shareholder reports of the other funds.
Please note that the expenses shown in the table are meant to highlight your ongoing costs only and do not reflect any transactional costs, such as sales charges (loads), redemption fees, or exchange fees. Therefore, the second line of the table for each class of shares is useful in comparing ongoing costs only, and will not help you determine the relative total costs of owning different funds. In addition, if these transactional costs were included, your costs would have been higher.
Trustees and Officers
Thornburg Developing World Fund | September 30, 2019 (Unaudited)
NAME, AGE, YEAR ELECTED
POSITION HELD WITH FUND | PRINCIPAL OCCUPATION(S) DURING PAST FIVE YEARS | OTHER DIRECTORSHIPS
HELD BY TRUSTEE |
| INTERESTED TRUSTEES(1)(2) |
Garrett Thornburg, 73
Trustee since 1984,
Chairman of Trustees(3) | Chairman and controlling shareholder of Thornburg Investment Management, Inc. (investment advisor); Chairman and controlling shareholder of Thornburg Securities Corporation (securities dealer); President of the Thornburg Foundation (nonprofit). | None |
Brian J. McMahon, 64
Trustee since 2001,
Vice Chairman of Trustees,
Member of Governance and
Nominating Committee &
Operations Risk Oversight
Committee(4) | Vice Chairman, Chief Investment Strategist, Managing Director, and Portfolio Manager and, until 2016, CEO and President of Thornburg Investment Management, Inc.; Vice President of Thornburg Securities Corporation. | None |
| INDEPENDENT TRUSTEES(1)(2)(5) |
David A. Ater, 74
Trustee since 1994,
Lead Independent Trustee,
Chairman of Governance and
Nominating Committee &
Member of Audit Committee | Principal in Ater & Associates, Santa Fe, NM (developer, planner and broker of residential and commercial real estate); owner, developer and broker for various real estate projects. | None |
Sally Corning, 58
Trustee since 2012,
Chairman of Audit Committee | Partner in Sun Mountain Capital, Santa Fe, NM (private equity firm with investment programs encompassing venture capital, mezzanine debt, and growth equity). | None |
Susan H. Dubin, 70
Trustee since 2004,
Member of Audit
Committee & Governance
and Nominating Committee | President of Dubin Investments, Ltd., Greenwich, CT (private investment fund); Director and officer of various charitable organizations. | None |
David L. Gardner, 56
Trustee since 2015,
Member of Operations Risk
Oversight Committee | Until 2012, head of EMEA (Europe, Middle East and Africa) Sales for iShares of Blackrock, Inc., EMEA Executive Committee Member and EMEA Operating Committee Member at Blackrock, Inc. | None |
Patrick J. Talamantes, 55
Trustee since 2019,
Member of Audit Committee | President of Talamantes Strategies, LLC, a management consulting firm, since 2018; until 2017, President and Chief Executive Officer of The McClatchy Company, Sacramento, CA (news and media company). | None |
Owen D. Van Essen, 65
Trustee since 2004,
Chairman of Operations Risk
Oversight Committee &
Member of Governance and
Nominating Committee | President of Dirks, Van Essen, Murray & April, Santa Fe, NM (newspaper mergers and acquisitions). | None |
James W. Weyhrauch, 60
Trustee since 1996,
Member of Audit
Committee & Operations Risk
Oversight Committee | Real estate broker, Santa Fe Properties, Santa Fe, NM; General Partner, Investments of Genext LLC (a family investment partnership); until 2019, Vice Chairman of Nambe LLC, Santa Fe, NM (manufacturing & design company). | None |
Trustees and Officers, Continued
Thornburg Developing World Fund | September 30, 2019 (Unaudited)
NAME, AGE, YEAR ELECTED
POSITION HELD WITH FUND | PRINCIPAL OCCUPATION(S) DURING PAST FIVE YEARS | OTHER DIRECTORSHIPS
HELD BY TRUSTEE |
| OFFICERS OF THE FUND (WHO ARE NOT TRUSTEES)(1)(6) |
David Ashley, 49
Vice President since 2019 | Portfolio Manager and Managing Director since 2019 and Associate Portfolio Manager from 2011-2019 of Thornburg Investment Management, Inc. | Not applicable |
Nimish Bhatt, 56
Chief Financial Officer
since 2019; Treasurer
2016-2019; Secretary
(2018-2019)(7) | Chief Financial Officer and Treasurer of Thornburg Investment Management, Inc. and Thornburg Securities Corporation since 2016 and Secretary of Thornburg Securities Corporation since 2018; Senior Vice President (2004-2016), Chief Financial Officer (2011-2016), and Head of Fund Administration (2011-2016) of Calamos Asset Management, Inc., Calamos Investments LLC, Calamos Advisors LLC, and Calamos Wealth Management; Director of Calamos Global Funds plc (2007-2016). | Not applicable |
Jason Brady, 45
President since 2016(7) | Director since 2017, CEO and President since 2016, and Portfolio Manager and Managing Director of Thornburg Investment Management, Inc.; Vice President of Thornburg Securities Corporation since 2016. | Not applicable |
Connor Browne, 40
Vice President since 2006 | Portfolio Manager and Managing Director of Thornburg Investment Management, Inc. | Not applicable |
Randy Dry, 45
Vice President since 2014 | Managing Director, Director of Institutional Group from 2014-2016, and since 2016, Chief Administrative Officer of Thornburg Investment Management, Inc. | Not applicable |
Greg Dunn, 43
Vice President since 2014 | Portfolio Manager and Managing Director of Thornburg Investment Management, Inc. | Not applicable |
Lon Erickson, 44
Vice President since 2008 | Portfolio Manager and Managing Director of Thornburg Investment Management, Inc. | Not applicable |
Thomas Garcia, 48
Vice President since 2006 | Managing Director, Head Equity Trader, and Associate Portfolio Manager of Thornburg Investment Management, Inc. | Not applicable |
Christian Hoffmann, 37
Vice President since 2018 | Portfolio Manager and Managing Director since 2018, and Associate Portfolio Manager from 2014-2018, of Thornburg Investment Management, Inc. | Not applicable |
Curtis Holloway, 52
Treasurer since 2019(7) | Director of Fund Administration since 2019 of Thornburg Investment Management, Inc.; Senior Vice President, Head of Fund Administration (2017-2019) and Vice President, Fund Administration (2010-2017) of Calamos Investments, and Chief Financial Officer (2017-2019) and Treasurer (2010-2019) of Calamos Funds. | Not applicable |
Ben Kirby, 39
Vice President since 2014 | Head of Investments since 2019, Portfolio Manager and Managing Director since 2013. | Not applicable |
Jeff Klingelhofer, 38
Vice President since 2016 | Head of Investments since 2019, Portfolio Manager and Managing Director since 2015, and Associate Portfolio Manager from 2012–2015, of Thornburg Investment Management, Inc. | Not applicable |
Ponn Lithiluxa, 48
Vice President since 2017 | Manager, Tax & Fund Administration of Thornburg Investment Management, Inc.; Senior Vice President, Citi Fund Services, Inc. (2014–2017); Vice President, Citi Fund Services, Inc. (2007–2014). | Not applicable |
Rob MacDonald, 43
Vice President since 2016 | Managing Director since 2015, Portfolio Manager since 2014, and Associate Portfolio Manager from 2011–2014 of Thornburg Investment Management, Inc. | Not applicable |
Michael Mastroianni, 42
Secretary and Vice President since 2019(7) | Director of Fund Operations since 2019 of Thornburg Investment Management, Inc.; Executive Director, Global Head of Client Services - Global Liquidity (2018-2019), Executive Director, North American Head of Transfer Agency Relationship Management (2011-2019), Executive Director, North American Head of Transfer Agency Service Delivery (2011-2018) of J.P. Morgan Asset Management. | Not applicable |
Leigh Moiola, 52
Vice President since 2001 | Managing Director and Director of Marketing of Thornburg Investment Management, Inc.; Vice President of Thornburg Securities Corporation. | Not applicable |
Christopher Ryon, 63
Vice President since 2008 | Portfolio Manager and Managing Director of Thornburg Investment Management, Inc. | Not applicable |
Trustees and Officers, Continued
Thornburg Developing World Fund | September 30, 2019 (Unaudited)
NAME, AGE, YEAR ELECTED
POSITION HELD WITH FUND | PRINCIPAL OCCUPATION(S) DURING PAST FIVE YEARS | OTHER DIRECTORSHIPS
HELD BY TRUSTEE |
Sean Koung Sun, 38
Vice President since 2017 | Portfolio Manager and Managing Director since 2017, Associate Portfolio Manager from 2015-2016, and Equity Research Analyst from 2012-2014 of Thornburg Investment Management, Inc. | Not applicable |
Stephen Velie, 52
Chief Compliance Officer since 2009 | Chief Compliance Officer of Thornburg Investment Trust and Thornburg Investment Management, Inc. | Not applicable |
Nicholos Venditti, 38
Vice President since 2016 | Portfolio Manager and Managing Director since 2015 and Associate Portfolio Manager from 2011–2015 of Thornburg Investment Management, Inc. | Not applicable |
Vinson Walden, 49
Vice President since 2004 | Portfolio Manager and Managing Director of Thornburg Investment Management, Inc. | Not applicable |
Lei Wang, 48
Vice President since 2006 | Portfolio Manager and Managing Director of Thornburg Investment Management, Inc. | Not applicable |
Charles Wilson, 44
Vice President since 2016 | Portfolio Manager and Managing Director since 2014 and Associate Portfolio Manager from 2012–2014 of Thornburg Investment Management, Inc. | Not applicable |
Di Zhou, 41
Vice President since 2016 | Portfolio Manager and Managing Director since 2016, Associate Portfolio Manager from 2014–2016, and Equity Research Analyst from 2010–2014 of Thornburg Investment Management, Inc. | Not applicable |
| (1) | Each person’s address is 2300 North Ridgetop Road, Santa Fe, New Mexico 87506. |
| (2) | The Fund is a separate investment “Fund” or “series” of Thornburg Investment Trust (the “Trust”), which comprises the Thornburg mutual fund complex and is organized as a Massachusetts business trust. Thornburg Investment Management, Inc. is the investment advisor to, and manages, all the Funds of the Trust. Each Trustee oversees all the Funds of the Trust. |
| (3) | Mr. Thornburg is considered an “interested” Trustee under the Investment Company Act of 1940 because he is a director and controlling shareholder of Thornburg Investment Management, Inc., the investment advisor to the Trust, and is the sole director and controlling shareholder of Thornburg Securities Corporation, the distributor of shares for the Trust. |
| (4) | Mr. McMahon is considered an “interested” Trustee under the Investment Company Act of 1940 because he is a director and the chief investment strategist of Thornburg Investment Management, Inc. |
| (5) | The Bylaws of the Trust currently require that each Independent Trustee shall retire by the end of the calendar year during which the Trustee reached the age of 75 years. Otherwise each Trustee serves in office until the election and qualification of a successor or until the Trustee sooner dies, resigns, retires or is removed. |
| (6) | Assistant vice presidents and assistant secretaries are not shown. |
| (7) | The Trust’s president, chief financial officer, secretary, and treasurer each serves a one-year term or until the election and qualification of a successor; each other officer serves at the pleasure of the Trustees. |
The Statement of Additional Information for each Fund of the Trust includes additional information about the Trustees and is available, without charge and upon request, by calling 1-800-847-0200.
Other Information
Thornburg Developing World Fund | September 30, 2019 (Unaudited)
PORTFOLIO PROXY VOTING
Policies and Procedures:
The Trust has delegated to the Advisor voting decisions respecting proxies for the Fund’s voting securities. The Advisor makes voting decisions in accordance with its Proxy Voting Policy and Procedures. A description of the Policy and Procedures is available (i) without charge, upon request, by calling the Advisor toll-free at 1-800-847-0200, (ii) on the Thornburg website at www.thornburg.com, and (iii) on the U.S. Securities and Exchange Commission’s website at www.sec.gov.
Information regarding how proxies were voted is available on or before August 31 of each year for the twelve months ending the preceding June 30. This information is available (i) without charge, upon request by calling the Advisor toll-free at 1-800-847-0200, (ii) on the Thornburg website at www.thornburg.com, and (iii) on the U.S. Securities and Exchange Commission’s website at www.sec.gov.
TAX INFORMATION
For tax year ended September 30, 2019, dividends paid by Thornburg Developing World Fund of $8,900,628 are being reported as taxable ordinary investment income dividends for federal income tax purposes.
For the tax year ended September 30, 2019, the Fund is reporting 100.00% (or the maximum allowed) of the dividends paid from tax basis net ordinary income as qualifying for the reduced rate under the Jobs and Growth Tax Relief and Reconciliation Act of 2003.
The Fund is reporting 100% (or the maximum allowed) of the ordinary income distributions paid by the Fund for the fiscal year ended September 30, 2019 as qualified for the corporate dividends received deduction.
For the year ended September 30, 2019, foreign source income and foreign taxes paid is $22,541,010 and $1,997102, respectively.
The information and distributions reported herein may differ from the information and distributions reported to the shareholders for the calendar year ending December 31, 2019. Complete information will be reported in conjunction with your 2019 Form 1099.
AVAILABILITY OF QUARTERLY PORTFOLIO SCHEDULE
The Fund files with the Securities and Exchange Commission schedules of its portfolio holdings on Form N-Q for the first and third quarters of each fiscal year. The Fund’s Forms N-Q are available on the Commission’s website at www.sec.gov, or may be reviewed and copied at the Commission’s Public Reference Room in Washington, D.C. Information on the operation of the Public Reference Room may be obtained by calling 1-800-SEC-0330. The Fund also makes this information available on its website at www.thornburg.com/download or upon request by calling 1-800-847-0200.
STATEMENT RESPECTING RENEWAL OF INVESTMENT ADVISORY AGREEMENT
Thornburg Investment Management, Inc. (the “Advisor”) provides investment management services to Thornburg Developing World Fund (the “Fund”) pursuant to an investment advisory agreement. The Trustees consider the renewal of this agreement annually, and most recently determined to renew the agreement on September 17, 2019.
Planning for their recent consideration of the advisory agreement’s renewal, the independent Trustees met in May 2019 to consider aspects of their annual evaluation of the Advisor’s service to all of the funds of Thornburg Investment Trust, to plan the annual evaluation of the Advisor’s performance and to discuss preliminarily the information the Advisor would present to the Trustees for their review. The independent Trustees met in a second independent session in July 2019 to further define certain portions of the information to be submitted by the Advisor. The independent Trustees met again in an independent session in September 2019 with a mutual fund analyst firm engaged by the independent Trustees to provide explanations of comparative cost and expense information, comparative investment performance information, and other data obtained and analyzed by the analyst firm. In that session the independent Trustees discussed their evaluations of the Advisor’s services to the Fund and the Fund’s fee and expense levels, investment performance, and other information presented for the Fund, conferred independently with legal counsel respecting the factors typically considered in evaluating renewal of an advisory agreement, and conferred with representatives of management to receive explanations of certain aspects of the information they had requested. Representatives of the Advisor subsequently reviewed portions of the information with the Trustees and addressed questions from the Trustees at a full meeting session of the Trustees scheduled in September for that purpose, and the independent Trustees thereafter met again in an independent session to consider the Advisor’s presentations and various specific issues respecting their consideration of the advisory agreement’s renewal. Following these sessions, the Trustees met to consider renewal of the advisory agreement, and the independent Trustees voted unanimously at that meeting to renew the agreement for an additional term of one year.
Other Information, Continued
Thornburg Developing World Fund | September 30, 2019 (Unaudited)
The information below summarizes certain factors considered by the Trustees in connection with the determination to renew the advisory agreement with the Advisor. In determining to renew the advisory agreement, the Trustees considered a wide range of information and did not identify any single factor as controlling, and this summary does not describe all of the factors and other matters considered by the Trustees in making their determination.
Nature, Extent and Quality of Services. The Trustees considered in their evaluation of the advisory agreement the written and oral reports provided to the Trustees and their standing committees throughout the year on a wide variety of topics by personnel from the Advisor’s portfolio management, administration, operations and compliance staffs. The Trustees also considered in this evaluation presentations and explanations made by representatives of the Advisor in meeting sessions scheduled for consideration of the renewal of the advisory agreement. The Trustees further noted in their evaluation the consideration they had given to a number of topics in previous years, reports from their standing committees, and advice received from counsel.
Information noted by the Trustees as having been considered in relation to the nature, extent and quality of services provided by the Advisor under the advisory agreement and contributing (together with other information considered) to their conclusions respecting the nature, extent and quality of the services rendered to the Fund by the Advisor included: (1) reports from portfolio managers and other personnel throughout the year demonstrating that the Fund was managed in conformity with stated strategies and objectives and conformed to investment restrictions and limitations; (2) reports demonstrating that management of the Fund remained faithful and competent, and demonstrating sufficient skill by portfolio managers in executing the Fund’s strategies in varying environments, managers’ cognizance of and strategies to pursue the Fund’s objectives and address pertinent market and economic trends and conditions, the evaluation and selection of individual investments, management to achieve tax efficiencies, and the structuring and composition of the Fund’s portfolio and management of Fund liquidity requirements; (3) the Fund’s achievement of its investment objectives over different periods of time; (4) presentations by and interactions with members of the Advisor’s fund administration, operations and compliance staffs; (5) reports from standing committees of the Trustees on their respective proceedings throughout the year, including in particular reports from and interactions with the Advisor’s personnel; (6) the sufficiency of the resources the Advisor devotes to the services it provides to the Fund, including the expertise of its personnel and staffing levels and its enhancements to the electronic systems it utilizes in providing these services, and also including the Advisor’s own financial management and sufficiency of its resources; and (7) the measures employed to achieve efficient trade execution for the Fund, including the evaluation and selection of firms to execute transactions for the Fund. As in past years, the Trustees noted particularly their assessments of the Advisor’s personnel developed in meetings throughout the year, measures to expand and improve the depth and experience of the Advisor’s staff, and the Advisor’s collaborative approach to investment management, continued commitment to observance of compliance and regulatory requirements in managing investments by the Fund, responsiveness to the Trustees, and other factors.
Based upon these and other considerations, the Trustees concluded that the Advisor’s management of the Fund’s investments continued to conform to the Fund’s stated objectives and policies, and that the nature, extent and quality of the services provided to the Fund by the Advisor remained sufficient.
Investment Performance. The Trustees noted in their evaluation of the Fund’s investment performance the written and oral reports they had received in each regular meeting over the course of the year from the Advisor’s portfolio management personnel. The Trustees also noted their consideration of information provided to them at their request in anticipation of their annual evaluation of the Advisor’s services, including the following items of information respecting the investment performance of the Fund: (1) the Fund’s absolute investment performance and achievement of stated objectives; (2) the Advisor’s explanations and commentary on the Fund’s performance in the context of the Fund’s objectives and reasonable expectations, and business, market and economic conditions; (3) performance data for the nine calendar years since the Fund’s inception, comparing the Fund’s annual investment returns to a broad-based securities index and to the applicable Morningstar category of funds; (4) the Fund’s investment performance for the three-month, year-to-date, one-year, three-year, five-year, and since inception periods ending with the second quarter of the current year, comparing the Fund’s annualized returns to two mutual fund categories selected by independent mutual fund analyst firms and to a broad-based securities index, and assigning a percentage rank to the Fund’s performance for each period relative to each of the fund categories; (5) analyses of specified performance and risk metrics for the Fund relative to its benchmark and to a selected peer group of funds, prepared by an independent financial analyst firm engaged by the independent Trustees; (6) the Fund’s cash flows; (7) comparative performance data for fund peer groups selected by an independent mutual fund analyst firm engaged by the independent Trustees, and the analysis and observations of the analyst firm respecting those data; (8) comparison of the Fund’s annualized return to the Fund’s benchmark index over various periods since the Fund’s inception; and (9) comparative measures of estimated earnings growth, and risk and return statistics. The Trustees generally attach additional significance to investment performance from the perspective of longer-term shareholders. Based upon their consideration of this and other information, the Trustees concluded that the Fund’s absolute and relative investment performance over a range of pertinent holding periods on the whole was satisfactory in view of its objectives and strategies.
Comparisons of Fee and Expense Levels. Information noted by the Trustees as having been considered in this context included a variety of comparative data respecting the Fund’s fee and expense levels. This information included comparisons of the Fund’s advisory fee and overall Fund expenses to median and average fees and expenses charged to funds in the applicable Morningstar category, comparisons of the advisory fee and total expenses for two Fund share classes to the fee levels and expenses of fund peer groups selected from the
Other Information, Continued
Thornburg Developing World Fund | September 30, 2019 (Unaudited)
category by an independent mutual fund analyst firm engaged by the independent Trustees, the perspectives and advice from that mutual fund analyst firm respecting comparisons of fund fee levels and expenses to fund peer groups, and other information. The Trustees considered that the Advisor has agreed to certain fee waivers and expense reimbursements for the current period. Comparative fee and expense data noted as having been considered by the Trustees showed that, after fee waivers and expense reimbursements, the level of total expense for one share class of the Fund was higher than the median and average levels charged to funds in the applicable Morningstar category, and that the level of total expense for a second share class was lower than the median and average levels for that category. Peer group data showed that the Fund’s stated advisory fee and the total expense levels of two representative share classes were each lower than the median level for the two peer groups. The Trustees did not find the differences significant in view of their findings and conclusions respecting the other factors considered.
The Trustees noted their consideration of information respecting the advisory fees charged by the Advisor to other investment management clients, including sub-advised mutual funds and other institutional clients, together with information about fees charged by other advisors to different clients, analysis of the differences between the requirements of institutional clients and mutual funds, analysis of the differences between the requirements of a sub-advised mutual fund and a fund as to which the investment advisor is the primary advisor and sponsor, and the consequently different investment management services provided to the different categories of clients and the differing contexts in which these arrangements are entered into. The Trustees confirmed their previous observations that the differences between the fees charged by the Advisor or by other investment advisors to different types of clients did not appear exceptional and had limited relevance to the evaluation of the fee rate charged to mutual funds as to which the Advisor or such other advisors are the primary advisor and sponsor.
Costs and Profitability of Advisor. In reviewing the profitability of the Advisor’s services to the Fund, the Trustees considered an analysis of the Advisor’s costs and the estimated profitability to the Advisor of its services, together with data respecting the overall profitability of a selection of other investment management firms. The Trustees considered in this regard information from the Advisor respecting investment of its profits to maintain staffing levels, and noted that a portion of the Advisor’s profits is an important element in the compensation of shareholder employees. The Trustees considered information from the Advisor respecting the use of profits to enhance staff competencies through training and other measures, hire personnel to expand and develop the scope of senior management expertise, pay competitive levels of compensation, and add to the Advisor’s electronic and information technology systems to maintain or improve service levels. The Trustees also considered the contribution of the Advisor’s cost management to its profitability, and the relationship of the Advisor’s financial resources and profitability in previous years to its ability to attract necessary personnel, invest in systems and other assets required for its service to the Fund, and maintain or improve service levels for the Fund notwithstanding fluctuations in revenues and profitability. The information considered did not indicate to the Trustees that the Advisor’s profitability was excessive.
Potential Economies of Scale. In reviewing the extent to which economies of scale would be realized by the Fund as it grows and whether fee levels reflect potential economies of scale, the Trustees considered the breakpoint structure for advisory fees chargeable to the Fund, comparisons of the fee breakpoint structure for the Fund with breakpoint structures (or the absence of such structures) for other funds in a peer group selected by an independent mutual fund analyst firm, the effects of the breakpoint structure and other expense factors realized by certain funds of the Trust as their asset levels had increased, the Advisor’s undertakings to waive or reimburse certain fees and expenses of the Fund, and the Advisor’s expenditures from its own profits and resources to maintain staffing levels and expand staff competencies, pay competitive levels of compensation, and add to its electronic and information technology systems so as to maintain or improve service levels. The information provided demonstrated to the Trustees that the Fund’s advisory fee breakpoint structure is reasonable in relation to the structures observed in the other funds in its peer group, and that shareholders may be expected to benefit from any economies of scale, due to the advisory agreement’s breakpoint fee structure for the Fund and other factors.
Potential Ancillary Benefits. In reviewing potential benefits to the Advisor because of its relationship to the Fund, the Trustees considered explanations from the Advisor respecting its receipt of certain research services from broker dealers, and the benefits to both the Fund and the Advisor of the Advisor’s expansion of its staffing, compliance and systems capabilities and other resources to serve a broader variety of investment management clients. No unusual or unfair benefits to the Advisor from its relationship to the Fund were identified by the Trustees.
Summary of Conclusions. The Trustees concluded that the general nature, extent and quality of the Advisor’s services performed under the advisory agreement remained sufficient, the Advisor had continued to actively and competently pursue the Fund’s stated investment objectives and adhere to the Fund’s investment policies, and that the absolute and relative investment performance of the Fund over pertinent holding periods on the whole was satisfactory in the context of the Fund’s objectives and strategies. The Trustees further concluded that the level of the advisory fee charged to the Fund by the Advisor is fair and reasonable in relation to the services provided by the Advisor, in view of the nature, extent and quality of those services, the investment performance of the Fund after fees and expenses, the clear disclosure of fees and expenses in the Fund’s prospectuses, comparisons of fees and expenses charged to the Fund to fees and expenses charged to other mutual funds, and the other factors considered. The Trustees accordingly determined to renew the Fund’s investment advisory agreement with the Advisor for an additional term of one year.
Trustees’ Statement to Shareholders (Unaudited)
Readopted September 17, 2019
The Trustees believe current and prospective shareholders should know how we discharge our responsibilities in supervising the Funds’ investment advisor and in reviewing the advisor’s contract for renewal. Since 2005, we have issued a statement which sets out clearly the three principal guidelines that we follow in supervising the Trust’s investment advisor on your behalf. In accordance with our customary practice, in September of this year we again reviewed our statement and concluded we should reissue this statement outlining the principal features of our supervision of the advisor’s performance of investment management services for the Funds.
We begin with the premise that each shareholder selected his or her Fund because its investments are managed by the investment advisor identified in the prospectus and in accordance with the objective and policies described in the prospectus. We realize, as each of you do, that if you believe that your Fund’s stated objective and policies no longer serve your personal investment goals, you can sell your shares and leave the Fund.
Therefore, we believe that our primary supervisory task—our principal obligation to you—is to assess the nature and quality of the advisor’s services, and to confirm that the advisor actively and competently pursues the Fund’s objective, in accordance with the policies set out in the prospectus. To do this, we meet regularly with management to review your Fund’s portfolio and to discuss the advisor’s specific actions and judgments in pursuing the Fund’s objective. We do not substitute our own judgment for the advisor’s decisions in selecting investments; the advisor is paid to exercise its informed judgment on investment decisions, and we seek to confirm, in reviewing the advisor’s performance, that the advisor is doing just that.
Second, we are conscious of costs and the effect that costs have on shareholders’ returns. We try to make sure that your Fund’s fees and costs are reasonable in relationship to the services rendered and that they are generally in line with those charged by other expert investment advisors, consistent with our belief that the Fund’s investors searched for and expect that expertise and attention and have decided to pay a reasonable price for it. We do not put the management contract “out to bid” as a matter of course, and we would not do so unless we had concluded that the advisor materially had failed to pursue the Fund’s objectives in accordance with its policies, or for other equally important reasons. We believe that any other approach would be inconsistent with your interests and contrary to your expectations when you bought shares of the Fund in the first place.
Finally, because we believe that most Thornburg Fund shareholders have invested with a long-term perspective, we try not to focus too much on the fashions of the moment and on short-term performance. The market will not favor any specific investment objective or set of policies at all times and under all economic circumstances. A fund will experience periods of both high and low returns relative to other funds and other investments. Even if one of our Funds is not favored by the market at a particular time, we believe that the advisor is nonetheless obliged to remain true to the Fund’s objective and policies, and we watch to see that it does so.
Trustees of Thornburg Investment Trust
Thornburg Investment Management is a privately-owned global investment firm that offers a range of solutions for retail and institutional investors. Founded in 1982 and headquartered in Santa Fe, New Mexico, we manage approximately $41.9 billion (as of September 30, 2019) across U.S. mutual funds, separate accounts for high-net-worth investors, institutional accounts, and UCITS funds for non-U.S. investors.
The fund outlined in this report is one of many equity and fixed-income products available from Thornburg Investment Management.
EQUITY FUNDS
| ■ | Thornburg Global Opportunities Fund |
| ■ | Thornburg International Value Fund |
| ■ | Thornburg Better World International Fund |
| ■ | Thornburg International Growth Fund |
| ■ | Thornburg Developing World Fund |
| ■ | Thornburg Value Fund |
| ■ | Thornburg Core Growth Fund |
MULTI_ASSET FUNDS
| ■ | Thornburg Investment Income Builder Fund |
| ■ | Thornburg Summit Fund |
FIXED INCOME FUNDS
| ■ | Thornburg Low Duration Income Fund |
| ■ | Thornburg Limited Term U.S. Government Fund |
| ■ | Thornburg Limited Term Income Fund |
| ■ | Thornburg Strategic Income Fund |
| ■ | Thornburg Low Duration Municipal Fund |
| ■ | Thornburg Limited Term Municipal Fund |
| ■ | Thornburg Intermediate Municipal Fund |
| ■ | Thornburg California Limited Term Municipal Fund |
| ■ | Thornburg New Mexico Intermediate Municipal Fund |
| ■ | Thornburg New York Intermediate Municipal Fund |
| ■ | Thornburg Strategic Municipal Income Fund |
ALTERNATIVE FUNDS
| ■ | Thornburg Long/Short Equity Fund |
Before investing, carefully consider the Fund’s investment goals, risks, charges, and expenses. For a prospectus or summary prospectus containing this and other information, contact your financial advisor or visit thornburg.com. Read it carefully before investing.
For additional information, please visit thornburg.com
Thornburg Investment Management, Inc. 2300 North Ridgetop Road, Santa Fe, NM 87506
This page intentionally left blank.
This page intentionally left blank.
To receive shareholder reports, prospectuses, and proxy statements electronically, go to www.thornburg.com/edelivery.
This Annual Report is submitted for the general information of shareholders of the Fund. It is not authorized for distribution to prospective investors in the Fund unless preceded or accompanied by an effective prospectus.
Investment Advisor:
Thornburg Investment Management®
800.847.0200
Distributor:
Thornburg Securities Corporation®
Annual Report
September 30, 2019
Beginning on January 1, 2021, as permitted by regulations adopted by the Securities and Exchange Commission, paper copies of the Fund’s shareholder reports will no longer be sent by mail, unless you specifically request paper copies of the reports from the Fund or from your financial intermediary, such as a broker-dealer or bank. Instead, the reports will be made available on a website, and you will be notified by mail each time a report is posted and provided with a website link to access the report.
If you already elected to receive shareholder reports electronically, you will not be affected by this change and you need not take any action. You may elect to receive shareholder reports and other communications from the Fund or your financial intermediary electronically by going to thornburg.com/edelivery.
You may elect to receive all future reports in paper free of charge. You can inform the Fund or your financial intermediary that you wish to continue receiving paper copies of your shareholder reports by calling 800.847.0200 or your financial intermediary directly. Your election to receive reports in paper will apply to all funds held with the fund complex/your financial intermediary.
At Thornburg, we believe unconstrained investing leads to better outcomes for our clients. Our investment solutions are highly active, high conviction, and benchmark agnostic. When it comes to finding economic opportunity for clients, it’s more than what we do.
It’s how we do it. Active Asbottom-up, fundamental, active managers, we look beyond conventional benchmarks. Long Term We take a long-term view in how we manage our firm and our portfolios. Benchmark Agnostic Investment strategies should have the flexibility to pursue solutions for clients, not stay within the conventional confines of benchmarks. Flexible Perspective Our approach to portfolio construction is guided by our convictions rather than convention. High Conviction We focus our attention and capital on thoroughly researched, well-understood positions. The best form of risk management is to know what you own, and why. Repeatable & Robust Our long-term outperformance of benchmarks verifies that our process works and outperforms conventional thinking. Independent We are independently owned and far from the herd of other investment managers. Investment Driven All members of the investment team are resources for all of our strategies. Collaborative Our team collaborates on opportunities across geography, sector, or asset class.
Thornburg Better World International Fund
Annual Report | September 30, 2019
Table of Contents
| SHARE CLASS | NASDAQ SYMBOL | CUSIP |
| Class A | TBWAX | 885-216-721 |
| Class C | TBWCX | 885-216-713 |
| Class I | TBWIX | 885-216-697 |
Class I shares may not be available to all investors. Minimum investments for Class I shares may be higher than those for other classes.
Investments carry risks, including possible loss of principal. Additional risks may be associated with investments outside the United States, especially in emerging markets, including currency fluctuations, illiquidity, volatility, and political and economic risks. Investments in small- and mid-capitalization companies may increase the risk of greater price fluctuations. Please see the Fund’s prospectus for a discussion of the risks associated with an investment in the Fund. Investments in the Fund are not FDIC insured, nor are they bank deposits or guaranteed by a bank or any other entity.
Funds invested in a smaller number of holdings may expose an investor to greater volatility.
Letter to Shareholders
Thornburg Better World International Fund | September 30, 2019 (Unaudited)
October 22, 2019
Dear Fellow Shareholder:
Returns in international equity markets were modestly negative for the fiscal year ended September 30, 2019. Developed markets, represented by the MSCI EAFE Index, lost 1.34% while the Fund’s benchmark, the MSCI AC World ex U.S. Index, which includes emerging markets, lost 1.23%. For the 12-month period the Thornburg Better World International Fund (Class I shares) returned negative 2.54%.
Most global markets were down sharply in the fourth quarter of 2018, driven by concerns about a synchronized global slowdown, the potential for tighter-than-expected monetary policy in the U.S., the U.S.-China trade war, slowing growth in China, Brexit and other issues. For the quarter, the MSCI AC World ex U.S. Index lost 11.46% and the MSCI EAFE Index was down 12.54%. U.S. markets were down sharply as well, with the S&P 500 Index down 13.52%. The Thornburg Better World International Fund (Class I shares) returned negative 12.83% during the quarter.
In our view, the global macro headwinds experienced during 2018, particularly in the fourth quarter, created valuation dislocations which drove many markets and individual stocks below their intrinsic value and created attractive entry points for many stocks. In the first four months of 2019, global equity markets rebounded strongly and the MSCI AC World ex U.S. Index returned 13.22%. The Better World International Fund (Class I shares) returned 15.21% during that period.
While both the Fund and its benchmark generated negative returns in the five months from April 30, 2019 through September 30, 2019 for the first nine months of 2019 the Better World International Fund (Class I shares) returned 11.81% versus 11.56% for the MSCI AC World ex U.S. Index. In the year-to-date period substantially all of the Fund’s outperformance versus its benchmark index was driven by bottom-up stock selection, which is central to the Fund’s investment process.
As we look forward, many of the issues that concerned markets in the fourth quarter of 2018 remain. While we may see some
progress in the U.S.-China trade dispute in the form of a narrower initial agreement, a more meaningful agreement that addresses the larger issues which remain will be more difficult, will take time, and will likely continue to generate periodic market volatility. While both the U.S. Federal Reserve and the European Central Bank have eased monetary policy in 2019 and China has taken a number of macro measures to stimulate its economy, many indicators of economic activity continue to show weakness. Both the U.S. Institute of Supply Management (ISM) Purchasing Managers Index (PMI) and the Eurozone Manufacturing PMI are below 50, indicating contraction, with the U.S. indicator at a 10-year low. Reflecting the slower economic growth, global bond yields have fallen through much of the last 12 months. As we approach the October 31 Brexit deadline, concerns over the potential impact to growth in Europe and the U.K. remain.
We see global growth bottoming at low, but not necessarily negative, levels. Recent stimulus measures and other policy tools which global policy makers still have at their disposal may help, although the path for global markets from here may remain bumpy given the risks and unresolved issues which remain. We expect to see a wider dispersion of investing outcomes, with gains less broad-based in a slower global environment. Those conditions should favor bottom-up stock selection and our investment process. While the international outlook from a top-down perspective may remain uncertain, on a bottom-up basis we remain optimistic that there will continue to be attractive opportunities.
Thank you for investing alongside us in the Thornburg Better World International Fund.

| |
Di Zhou,cfa,frm®
Portfolio Manager
Managing Director | |
Past performance does not guarantee future results.
The matters discussed in this report may constitute forward-looking statements made pursuant to the safe harbor provisions of the Securities Litigation Reform Act of 1995. These include any advisor or portfolio manager prediction, assessment, analysis or outlook for individual securities, industries, investment styles, market sectors and/or markets. These statements involve risks and uncertainties. In addition to the general risks described for each fund in its current prospectus, other factors bearing on these reports include the accuracy of the advisor’s or portfolio manager’s forecasts and predictions, the appropriateness of the investment strategies designed by the advisor or portfolio manager and the ability of the advisor or portfolio manager to implement their strategies efficiently and successfully. Any one or more of these factors, as well as other risks affecting the securities markets generally, could cause the actual results of any fund to differ materially as compared to its benchmarks.
The views expressed are subject to change and do not necessarily reflect the views of Thornburg Investment Management, Inc. This information should not be relied upon as a recommendation or investment advice and is not intended to predict the performance of any investment or market.
Performance results of individual share classes will vary based on the fees and expenses associated with each share class, and may be higher or lower than other share classes within the same Fund. Please see Performance Summary for performance results of each share class.
Performance Summary
Thornburg Better World International Fund | September 30, 2019 (Unaudited)
AVERAGE ANNUAL TOTAL RETURNS
| | 1-YR | 3-YR | SINCE
INCEP. |
| Class A Shares(Incep: 10/1/15) | | | |
| Without sales charge | -3.19% | 3.47% | 6.61% |
| With sales charge | -7.52% | 1.90% | 5.39% |
| Class C Shares(Incep: 10/1/15) | | | |
| Without sales charge | -3.75% | 2.89% | 6.01% |
| With sales charge | -4.64% | 2.89% | 6.01% |
| Class I Shares(Incep: 10/1/15) | -2.54% | 4.27% | 7.42% |
| MSCI AC World ex U.S. Index(Since 10/1/15) | -1.23% | 6.33% | 7.06% |
GROWTH OF A HYPOTHETICAL $10,000 INVESTMENT
Performance data shown represents past performance and is no guarantee of future results. Investment return and principal value will fluctuate so shares, when redeemed, may be worth more or less than their original cost. Current performance may be lower or higher than quoted. For performance current to the most recent month end, visit thornburg.com or call 800-847-0200. The performance information does not reflect the deduction of taxes that a shareholder would pay on distributions or the redemption of Fund shares. Returns reflect the reinvestment of dividends and capital gains. The maximum sales charge for the Fund’s A shares is 4.50%. C shares are subject to a 1% contingent deferred sales charge (CDSC) for the first year only. There is no sales charge for Class I shares. As disclosed in the most recent prospectus, the total annual fund operating expenses before any fee waivers or expense reimbursements are as follows: A shares, 2.12%; C shares, 3.09% and I shares, 1.35%. Thornburg Investment Management has contractually agreed to waive fees and reimburse expenses until at least February 1, 2020, for these share classes, resulting in net expense ratios of the following: A shares, 1.83%; C shares, 2.38% and I shares, 1.09%. For more detailed information on fund expenses and waivers/reimbursements please see the Fund’s prospectus.
Due to the Fund’s relatively small asset base, performance was positively impacted by IPOs to a greater degree than it may be in the future. IPO investments are not an integral component of the Fund’s investment process and may not be utilized to the same extent in the future.
TheMSCI All Country (AC) World ex U.S. Index is a market capitalization weighted index representative of the market structure of 45 developed and emerging market countries in North and South America, Europe, Africa, and the Pacific Rim, excluding securities of United States issuers. Beginning in January 2001, the index is calculated with net dividends reinvested in U.S. dollars. Prior data is calculated with gross dividends.
TheMSCI EAFE (Europe, Australasia, Far East) Index is an unmanaged index. It is a generally accepted benchmark for major overseas markets. Index weightings represent the relative capitalizations of the major overseas developed markets on a U.S. dollar adjusted basis. The index is calculated with net dividends reinvested in U.S. dollars.
The performance of any index is not indicative of the performance of any particular investment. Unless otherwise noted, index returns reflect the reinvestment of income dividends and capital gains, if any, but do not reflect fees, brokerage commissions or other expenses of investing. Investors may not make direct investments into any index.
The Eurozone Manufacturing Purchasing Managers Index (PMI)measures the activity level of purchasing managers in the eurozone manufacturing sector. A reading above 50 indicates expansion in the sector; below 50 indicates contraction.
The U.S. Institute of Supply Management (ISM) Purchasing Managers Index (PMI) Report on Business is based on data compiled from monthly replies to questions asked of purchasing and supply executives in over 400 industrial companies. For each of the indicators measured (New Orders, Backlog of Orders, New Export Orders, Imports, Production, Supplier Deliveries, Inventories, Customers Inventories, Employment, and Prices), this report shows the percentage reporting each response, the net difference between the number of responses in the positive economic direction and the negative economic direction and the diffusion index.
Fund Summary
Thornburg Better World International Fund | September 30, 2019 (Unaudited)
OBJECTIVES AND STRATEGIES
The Fund seeks long-term capital appreciation.
The Fund invests primarily in a broad range of foreign companies that demonstrate one or more positive environmental, social, and governance (ESG) characteristics that the investment manager identifies as significant. The Fund targets companies of any size or country of origin, and which we believe are high-quality and attractively valued.
MARKET CAPITALIZATION EXPOSURE
BASKET STRUCTURE
| TOP TEN EQUITY HOLDINGS |
| Alibaba Group Holding Ltd. Sponsored ADR | 3.5% |
| Tencent Holdings Ltd. | 3.4% |
| Sony Corp. | 3.0% |
| AIA Group Ltd. | 3.0% |
| Resona Holdings, Inc. | 2.4% |
| Enel S.p.A. | 2.4% |
| AXA S.A. | 2.3% |
| CRH PLC | 2.3% |
| NN Group N.V. | 2.3% |
| Deutsche Telekom AG | 2.2% |
| SECTOR EXPOSURE |
| Industrials | 16.4% |
| Financials | 16.3% |
| Health Care | 13.5% |
| Communication Services | 11.6% |
| Consumer Discretionary | 10.5% |
| Information Technology | 10.5% |
| Consumer Staples | 6.7% |
| Materials | 6.2% |
| Utilities | 2.4% |
| Real Estate | 0.5% |
| Other Assets Less Liabilities | 5.4% |
| TOP TEN INDUSTRY GROUPS |
| Capital Goods | 9.9% |
| Healthcare Equipment & Services | 8.6% |
| Insurance | 7.6% |
| Banks | 7.1% |
| Materials | 6.2% |
| Media & Entertainment | 5.8% |
| Telecommunication Services | 5.8% |
| Semiconductors & Semiconductor Equipment | 5.6% |
| Household & Personal Products | 5.3% |
| Retailing | 5.1% |
COUNTRY EXPOSURE*
(percent of equity holdings) |
| Japan | 16.2% |
| Germany | 14.8% |
| United Kingdom | 12.4% |
| China | 10.2% |
| France | 7.2% |
| Switzerland | 7.2% |
| Netherlands | 6.8% |
| United States | 4.6% |
| Italy | 4.5% |
| Hong Kong | 3.2% |
| Ireland | 2.4% |
| Norway | 2.3% |
| Mexico | 1.7% |
| Spain | 1.7% |
| Taiwan | 1.7% |
| Sweden | 1.5% |
| Denmark | 1.1% |
| Singapore | 0.5% |
| * | Holdings are classified by country of risk as determined by MSCI and Bloomberg. |
There is no guarantee that the Fund will meet its investment objectives.
All data is subject to change. Charts may not add up to 100% due to rounding.
Schedule of Investments
Thornburg Better World International Fund | September 30, 2019
| | | SHARES | VALUE |
| | Common Stock — 94.6% | | |
| | Banks — 7.1% | | |
| | Banks — 7.1% | | |
| | DNB ASA | 87,118 | $ 1,534,535 |
| | ING Groep N.V. | 136,576 | 1,429,662 |
| | Resona Holdings, Inc. | 397,422 | 1,701,793 |
| | United Overseas Bank Ltd. | 18,505 | 343,550 |
| | | | 5,009,540 |
| | Capital Goods — 9.9% | | |
| | Electrical Equipment — 1.9% | | |
| | Prysmian SpA | 63,160 | 1,356,173 |
| | Industrial Conglomerates — 1.0% | | |
| | Siemens AG | 6,805 | 728,731 |
| | Machinery — 4.1% | | |
| | CNH Industrial N.V. | 102,483 | 1,043,291 |
| | Knorr-Bremse AG | 8,931 | 839,490 |
| | Weir Group plc | 57,972 | 1,016,089 |
| | Trading Companies & Distributors — 2.9% | | |
| | Brenntag AG | 24,788 | 1,199,585 |
| | Ferguson plc | 11,642 | 850,849 |
| | | | 7,034,208 |
| | Commercial & Professional Services — 2.5% | | |
| | Commercial Services & Supplies — 0.5% | | |
| | Focused Photonics Hangzhou, Inc. Class A | 135,751 | 323,669 |
| | Professional Services — 2.0% | | |
| | SGS S.A. | 580 | 1,437,724 |
| | | | 1,761,393 |
| | Consumer Durables & Apparel — 3.0% | | |
| | Household Durables — 3.0% | | |
| | Sony Corp. | 36,462 | 2,140,341 |
| | | | 2,140,341 |
| | Consumer Services — 2.4% | | |
| | Hotels, Restaurants & Leisure — 2.4% | | |
| | Compass Group plc | 40,615 | 1,045,206 |
| | GreenTree Hospitality Group Ltd. ADR | 64,976 | 649,760 |
| | | | 1,694,966 |
| | Diversified Financials — 1.6% | | |
| | Capital Markets — 1.6% | | |
| | St James’s Place plc | 29,279 | 352,584 |
| | UBS Group AG | 71,837 | 815,503 |
| | | | 1,168,087 |
| | Food, Beverage & Tobacco — 1.4% | | |
| | Food Products — 1.4% | | |
| a | Nomad Foods Ltd. | 47,612 | 976,046 |
| | | | ���976,046 |
| | Healthcare Equipment & Services — 8.6% | | |
| | Health Care Equipment & Supplies — 5.3% | | |
| a | Alcon, Inc. | 14,833 | 864,968 |
| | Hoya Corp. | 5,817 | 474,452 |
| | Siemens Healthineers AG | 32,538 | 1,280,102 |
| | Terumo Corp. | 36,045 | 1,160,107 |
| | Health Care Providers & Services — 2.2% | | |
| | Fresenius Medical Care AG & Co. KGaA | 22,570 | 1,517,831 |
| | Health Care Technology — 1.1% | | |
| | M3, Inc. | 33,482 | 805,735 |
Schedule of Investments, Continued
Thornburg Better World International Fund | September 30, 2019
| | | SHARES | VALUE |
| | | | 6,103,195 |
| | Household & Personal Products — 5.3% | | |
| | Household Products — 1.9% | | |
| | Reckitt Benckiser Group plc | 17,222 | $ 1,343,361 |
| | Personal Products — 3.4% | | |
| | Kao Corp. | 16,191 | 1,195,551 |
| | Unilever plc | 20,422 | 1,227,872 |
| | | | 3,766,784 |
| | Insurance — 7.6% | | |
| | Insurance — 7.6% | | |
| | AIA Group Ltd. | 225,805 | 2,133,388 |
| | AXA S.A. | 64,077 | 1,636,369 |
| | NN Group N.V. | 45,997 | 1,631,375 |
| | | | 5,401,132 |
| | Materials — 6.2% | | |
| | Chemicals — 2.0% | | |
| | Novozymes A/S Class B | 16,726 | 703,230 |
| | Sika AG | 4,799 | 702,023 |
| | Construction Materials — 2.3% | | |
| | CRH plc | 47,657 | 1,633,674 |
| | Paper & Forest Products — 1.9% | | |
| | Mondi plc | 69,269 | 1,326,943 |
| | | | 4,365,870 |
| | Media & Entertainment — 5.8% | | |
| | Entertainment — 2.5% | | |
| a | DouYu International Holdings Ltd. ADR | 44,670 | 365,847 |
| a | Netflix, Inc. | 2,447 | 654,866 |
| a | Ubisoft Entertainment S.A. | 10,262 | 742,018 |
| | Interactive Media & Services — 3.3% | | |
| | Tencent Holdings Ltd. | 56,338 | 2,373,503 |
| | | | 4,136,234 |
| | Pharmaceuticals, Biotechnology & Life Sciences — 4.9% | | |
| | Life Sciences Tools & Services — 2.4% | | |
| | Lonza Group AG | 1,312 | 443,534 |
| | Thermo Fisher Scientific, Inc. | 4,322 | 1,258,869 |
| | Pharmaceuticals — 2.5% | | |
| | Novartis AG | 6,331 | 548,955 |
| | Takeda Pharmaceutical Co. Ltd. | 36,400 | 1,242,229 |
| | | | 3,493,587 |
| | Real Estate — 0.5% | | |
| | Equity Real Estate Investment Trusts — 0.5% | | |
| | Equinix, Inc. | 608 | 350,694 |
| | | | 350,694 |
| | Retailing — 5.1% | | |
| | Internet & Direct Marketing Retail — 3.5% | | |
| a | Alibaba Group Holding Ltd. Sponsored ADR | 14,856 | 2,484,369 |
| | Specialty Retail — 1.6% | | |
| | Industria de Diseno Textil S.A. | 36,983 | 1,144,794 |
| | | | 3,629,163 |
| | Semiconductors & Semiconductor Equipment — 5.6% | | |
| | Semiconductors & Semiconductor Equipment — 5.6% | | |
| | ASML Holding N.V. | 5,934 | 1,469,800 |
| | Infineon Technologies AG | 74,656 | 1,343,603 |
| | Taiwan Semiconductor Manufacturing Co. Ltd. Sponsored ADR | 24,614 | 1,144,059 |
| | | | 3,957,462 |
Schedule of Investments, Continued
Thornburg Better World International Fund | September 30, 2019
| | | SHARES | VALUE |
| | Software & Services — 3.5% | | |
| | Information Technology Services — 1.4% | | |
| | Capgemini SE | 8,658 | $ 1,020,117 |
| | Software — 2.1% | | |
| | SAP SE | 12,570 | 1,478,029 |
| | | | 2,498,146 |
| | Technology Hardware & Equipment — 1.4% | | |
| | Electronic Equipment, Instruments & Components — 1.4% | | |
| | Hexagon AB Class B | 20,262 | 976,869 |
| | | | 976,869 |
| | Telecommunication Services — 5.8% | | |
| | Diversified Telecommunication Services — 5.8% | | |
| | Deutsche Telekom AG | 92,146 | 1,546,090 |
| | Nippon Telegraph & Telephone Corp. | 22,950 | 1,094,383 |
| | Orange S.A. | 91,634 | 1,437,722 |
| | | | 4,078,195 |
| | Transportation — 4.0% | | |
| | Road & Rail — 1.5% | | |
| | East Japan Railway Co. | 11,344 | 1,081,680 |
| | Transportation Infrastructure — 2.5% | | |
| | Grupo Aeroportuario del Pacifico SAB de CV Class B | 121,243 | 1,170,160 |
| | Shanghai International Airport Co., Ltd. Class A | 55,077 | 615,550 |
| | | | 2,867,390 |
| | Utilities — 2.4% | | |
| | Electric Utilities — 2.4% | | |
| | Enel SpA | 226,493 | 1,691,280 |
| | | | 1,691,280 |
| | Total Common Stock(Cost $65,850,200) | | 67,100,582 |
| | Short-Term Investments — 6.5% | | |
| b | Thornburg Capital Management Fund | 460,994 | 4,609,937 |
| | Total Short-Term Investments(Cost $4,609,937) | | 4,609,937 |
| | Total Investments — 101.1%(Cost $70,460,137) | | $71,710,519 |
| | Liabilities Net of Other Assets — (1.1)% | | (812,146) |
| | Net Assets — 100.0% | | $70,898,373 |
| Footnote Legend |
| a | Non-income producing. |
| b | Investment in Affiliates. |
Portfolio Abbreviations
To simplify the listings of securities, abbreviations are used per the table below:
| ADR | American Depositary Receipt |
See notes to financial statements.
Statement of Assets and Liabilities
Thornburg Better World International Fund | September 30, 2019
| ASSETS | |
| Investments at value (Note 3) | |
| Non-affiliated issuers (cost $65,850,200) | $ 67,100,582 |
| Non-controlled affiliated issuer (cost $4,609,937) | 4,609,937 |
| Cash denominated in foreign currency (cost $28) | 28 |
| Receivable for fund shares sold | 9,643 |
| Dividends receivable | 127,056 |
| Dividend and interest reclaim receivable | 36,679 |
| Prepaid expenses and other assets | 31,709 |
| Total Assets | 71,915,634 |
| Liabilities | |
| Payable for fund shares redeemed | 841,491 |
| Payable to investment advisor and other affiliates (Note 4) | 44,838 |
| Accounts payable and accrued expenses | 130,932 |
| Total Liabilities | 1,017,261 |
| Net Assets | $ 70,898,373 |
| NET ASSETS CONSIST OF | |
| Distributable earnings | $ 1,194,494 |
| Net capital paid in on shares of beneficial interest | 69,703,879 |
| | $ 70,898,373 |
| NET ASSET VALUE | |
| Class A Shares: | |
Net asset value and redemption price per share
($9,377,749 applicable to 729,957 shares of beneficial interest outstanding - Note 5) | $ 12.85 |
| Maximum sales charge, 4.50% of offering price | 0.61 |
| Maximum offering price per share | $ 13.46 |
| Class C Shares: | |
Net asset value and offering price per share*
($1,687,675 applicable to 132,686 shares of beneficial interest outstanding - Note 5) | $ 12.72 |
| Class I Shares: | |
Net asset value, offering and redemption price per share
($59,832,949 applicable to 4,546,042 shares of beneficial interest outstanding - Note 5) | $ 13.16 |
| * | Redemption price per share is equal to net asset value less any applicable contingent deferred sales charge. |
See notes to financial statements.
Statement of Operations
Thornburg Better World International Fund | Year Ended September 30, 2019
| INVESTMENT INCOME | |
| Dividend income | |
| Non-affiliated issuers (net of foreign taxes withheld of $179,136) | $ 1,615,963 |
| Non-controlled affiliated issuer | 87,393 |
| Total Income | 1,703,356 |
| EXPENSES | |
| Investment advisory fees (Note 4) | 622,504 |
| Administration fees (Note 4) | |
| Class A Shares | 8,396 |
| Class C Shares | 1,670 |
| Class I Shares | 46,003 |
| Distribution and service fees (Note 4) | |
| Class A Shares | 23,911 |
| Class C Shares | 19,056 |
| Transfer agent fees | |
| Class A Shares | 33,132 |
| Class C Shares | 6,927 |
| Class I Shares | 36,394 |
| Registration and filing fees | |
| Class A Shares | 14,710 |
| Class C Shares | 14,710 |
| Class I Shares | 14,669 |
| Custodian fees | 53,638 |
| Professional fees | 64,010 |
| Trustee and officer fees (Note 4) | 3,758 |
| Other expenses | 60,256 |
| Total Expenses | 1,023,744 |
| Less: | |
| Expenses reimbursed by investment advisor (Note 4) | (124,873) |
| Investment advisory fees waived by investment advisor (Note 4) | (108,292) |
| Net Expenses | 790,579 |
| Net Investment Income | $ 912,777 |
| REALIZED AND UNREALIZED GAIN (LOSS) | |
| Net realized gain (loss) on: | |
| Non-affiliated issuer investments (net of realized capital gain taxes refunded of $836) | (762,952) |
| Foreign currency transactions | (1,605) |
| | (764,557) |
| Net change in unrealized appreciation (depreciation) on: | |
| Non-affiliated issuer investments | (2,220,217) |
| Foreign currency translations | (11) |
| | (2,220,228) |
| Net Realized and Unrealized Loss | (2,984,785) |
| Net Decrease in Net Assets Resulting from Operations | $ (2,072,008) |
See notes to financial statements.
Statements of Changes in Net Assets
Thornburg Better World International Fund
| | Year Ended
September 30, 2019 | Year Ended
September 30, 2018 |
| INCREASE (DECREASE) IN NET ASSETS FROM | | |
| OPERATIONS | | |
| Net investment income | $ 912,777 | $ 776,603 |
| Net realized gain (loss) on investments, foreign currency transactions and capital gain taxes | (764,557) | 6,232,775 |
| Net change in unrealized appreciation (depreciation) on investments and foreign currency translations | (2,220,228) | (2,723,436) |
| Net Increase (Decrease) in Net Assets Resulting from Operations | (2,072,008) | 4,285,942 |
| DIVIDENDS TO SHAREHOLDERS | | |
| From distributable earnings | | |
| Class A Shares | (794,041) | (169,562) |
| Class C Shares | (158,603) | (62,136) |
| Class I Shares | (4,524,294) | (1,613,511) |
| FUND SHARE TRANSACTIONS (NOTE 5) | | |
| Class A Shares | 1,776,230 | 1,938,084 |
| Class C Shares | (343,821) | 39,251 |
| Class I Shares | 10,196,900 | (6,205,887) |
| Net Increase (Decrease) in Net Assets | 4,080,363 | (1,787,819) |
| NET ASSETS | | |
| Beginning of Year | 66,818,010 | 68,605,829 |
| End of Year | $ 70,898,373 | $ 66,818,010 |
See notes to financial statements.
Notes to Financial Statements
Thornburg Better World International Fund | September 30, 2019
NOTE 1 – ORGANIZATION
Thornburg Better World International Fund (the “Fund”) is a diversified series of Thornburg Investment Trust (the “Trust”). The Trust was organized as a Massachusetts business trust under a Declaration of Trust dated June 3, 1987 and is registered as a diversified, open-end management investment company under the Investment Company Act of 1940, as amended (the "1940 Act"). The Fund is currently one of twenty-two separate series of the Trust. Each series is considered to be a separate entity for financial reporting and tax purposes and bears expenses directly attributable to it. The Fund seeks long-term capital appreciation.
The Fund currently offers three classes of shares of beneficial interest: Class A, Class C, and Institutional Class (“Class I”). Each class of shares of the Fund represents an interest in the same portfolio of investments, except that (i) Class A shares are sold subject to a front-end sales charge collected at the time the shares are purchased and bear a service fee, (ii) Class C shares are sold at net asset value without a sales charge at the time of purchase, but are subject to a contingent deferred sales charge upon redemption within one year of purchase, and bear both a service fee and a distribution fee, (iii) Class I shares are sold at net asset value without a sales charge at the time of purchase and may be subject to a service fee, and (iv) the respective classes may have different reinvestment privileges and conversion rights. Additionally, the Fund may allocate among its classes certain expenses, to the extent allocable to specific classes, including administration fees, transfer agent fees, government registration fees, certain printing and postage costs, and administrative and legal expenses. Currently, class specific expenses of the Fund are limited to service and distribution fees and certain registration and transfer agent expenses.
The following is a summary of significant accounting policies followed by the Fund in the preparation of its financial statements. The Fund prepares its financial statements in conformity with United States generally accepted accounting principles (“GAAP”), including investment company accounting and reporting guidance in the Financial Accounting Standards Board (the “FASB”) Accounting Standard Codification Topic 946.
NOTE 2 – SIGNIFICANT ACCOUNTING POLICIES
Security Valuation: All investments in securities held by the Fund are valued as described in Note 3.
Allocation of Income, Gains, Losses and Expenses: Net investment income (other than class specific expenses) and realized and unrealized gains and losses are allocated daily to each class of shares based upon the relative net asset value of outstanding shares (or the value of the dividend-eligible shares, as appropriate) of each class of shares at the beginning of the day (after adjusting for the current capital shares activity of the respective class). Expenses common to all Funds are allocated among the Funds comprising the Trust based upon their relative net asset values or other appropriate allocation methods. Operating expenses directly attributable to a specific class are charged against the operating income of that class.
Dividends and Distributions to Shareholders: Dividends and distributions to shareholders, which are determined in accordance with federal income tax regulations and may differ from GAAP, are recorded on the ex-dividend date. Ordinary income dividends, if any, are declared and paid annually. Capital gain distributions, if any, are declared and paid annually and more often if deemed necessary by Thornburg Investment Management, Inc., the Trust’s investment advisor (the “Advisor”). Dividends and distributions are paid and are reinvested in additional shares of the Fund at net asset value per share at the close of business on the ex-dividend date, or at the shareholder’s option, paid in cash.
Investment Income: Dividend income is recorded on the ex-dividend date. Certain income from foreign investments is recognized as soon as information is available to the Fund. Interest income is accrued as earned. Premiums and discounts are amortized and accreted, respectively, to first call dates or maturity dates using the effective yield method of the respective investments. These amounts are included in Investment Income in the Statement of Operations.
Investment Transactions: Investment transactions are accounted for on a trade date basis. Realized gains and losses from the sale of investments are recorded on an identified cost basis.
When-Issued and Delayed Delivery Transactions: The Fund may engage in when-issued or delayed delivery transactions. To the extent the Fund engages in such transactions, it will do so for the purpose of acquiring portfolio investments consistent with the Fund’s investment objectives and not for the purpose of investment leverage or to speculate on interest rate or market changes. At the time the Fund makes a commitment to purchase an investment on a when-issued or delayed delivery basis, the Fund will record the transaction and reflect the value in determining its net asset value. When effecting such transactions, assets of an amount sufficient to make payment for the portfolio investments to be purchased will be segregated on the Fund’s records on the trade date. Investments purchased on a when-issued or delayed delivery basis do not earn interest until the settlement date. The values of these securities held at September 30, 2019 are detailed in the Schedule of Investments.
Notes to Financial Statements, Continued
Thornburg Better World International Fund | September 30, 2019
Foreign Currency Translation: Portfolio investments and other assets and liabilities denominated in foreign currencies are translated into U.S. dollars based on the exchange rate of such currencies against the U.S. dollar on the date of valuation. Purchases and sales of investments and income items denominated in foreign currencies are translated into U.S. dollars at the exchange rate in effect on the transaction date. When the Fund purchases or sells foreign investments, it will customarily enter into a foreign exchange contract to minimize foreign exchange risk from the trade date to the settlement date of such transactions. The values of such spot contracts are included in receivable for investments sold and payable for investments purchased on the Statement of Assets and Liabilities.
The Fund does not separately report the effect of changes in foreign exchange rates from changes in market prices on investments held. Such changes are included in net unrealized appreciation (depreciation) from investments in the Statement of Operations.
Reported net realized gains and losses from foreign currency transactions arise due to purchases and sales of foreign currencies, currency gains and losses realized between the trade and settlement dates on investment transactions and the difference between the amounts of dividends, interest, and foreign withholding taxes recorded on the Fund’s books, and the U.S. dollar equivalent of the amounts actually received or paid. These amounts are included in foreign currency transactions in the Statement of Operations.
Net change in unrealized appreciation (depreciation) on foreign currency translations arise from changes in the fair value of assets and liabilities, other than investments at period end, resulting from changes in exchange rates.
Guarantees and Indemnifications: Under the Trust’s organizational documents (and under separate agreements with the independent Trustees), its officers and Trustees are provided with an indemnification against certain liabilities arising out of the performance of their duties to the Fund. In the normal course of business the Trust may also enter into contracts with service providers that contain general indemnifications. The Trust’s maximum exposure under these arrangements is unknown. However, based on experience, the Trust expects the risk of loss to be remote.
Use of Estimates: The preparation of financial statements in conformity with GAAP requires management to make estimates and assumptions that affect the reported amounts of assets and liabilities and disclosure of contingent assets and liabilities at the date of the financial statements and the reported amounts of increases (decreases) in net assets from operations during the reporting period. Actual results could differ from those estimates.
Federal Income Taxes: It is the policy of the Trust to comply with the provisions of the Internal Revenue Code applicable to regulated investment companies and to distribute to shareholders substantially all investment company taxable income including net realized gains on investments (if any), and tax exempt income of the Fund. Therefore, no provision for federal income or excise tax is required.
The Fund files income tax returns in United States federal and applicable state jurisdictions. The statute of limitations on the Fund’s tax return filings generally remains open for the three years following a return’s filing date. The Fund has analyzed each uncertain tax position believed to be material in the preparation of the Fund’s financial statements for the fiscal year ended September 30, 2019, including open tax years, to assess whether it is more likely than not that the position would be sustained upon examination, based on the technical merits of the position. The Fund has not identified any such position for which an asset or liability must be reflected in the Statement of Assets and Liabilities.
At September 30, 2019, information on the tax components of capital was as follows:
| Cost of investments for tax purposes | $ 70,743,749 |
| Gross unrealized appreciation on a tax basis | 5,232,733 |
| Gross unrealized depreciation on a tax basis | (4,265,964) |
| Net unrealized appreciation (depreciation) on investments (tax basis) | $ 966,769 |
Temporary book tax adjustments made to the cost of investments and net unrealized appreciation (depreciation) for tax purposes result primarily from deferral of wash sale losses.
At September 30, 2019, the Fund had deferred tax basis capital losses occurring subsequent to October 31, 2018 through September 30, 2019 of $300,012. For tax purposes, such losses will be recognized in the year ending September 30, 2020.
At September 30, 2019, the Fund had cumulative tax basis capital losses of $383,731 (of which $356,445 are short-term and $27,286 are long-term), which may be carried forward to offset future capital gains. To the extent such carryforwards are used, capital gain distributions may be reduced to the extent provided by regulations. Such capital loss carryforwards do not expire.
At September 30, 2019, the Fund had $912,007 of undistributed tax basis ordinary investment income and no undistributed tax basis capital gains.
Notes to Financial Statements, Continued
Thornburg Better World International Fund | September 30, 2019
Foreign Withholding Taxes: The Fund is subject to foreign tax withholding imposed by certain foreign countries in which the Fund may invest. Withholding taxes are incurred on certain foreign dividends and are accrued at the time the dividend is recognized based on applicable foreign tax laws. The Fund may file withholding tax reclaims in certain jurisdictions to recover a portion of amounts previously withheld, in view of various considerations, including recent decisions rendered by the courts in those and other jurisdictions. The Fund would expect to record a receivable for such a reclaim based on a variety of factors, including assessment of a jurisdiction’s legal obligation to pay reclaims, the jurisdiction’s administrative practices and payment history, and industry convention. To date the Fund has recorded no such receivable because there is limited precedent for collecting such prior year reclaims and the likelihood of collection remains uncertain.
Deferred Foreign Capital Gain Taxes: The Fund is subject to a tax imposed on net realized gains of securities of certain foreign countries. The Fund records an estimated deferred tax liability for net unrealized gains on these investments as reflected in the accompanying financial statements. Such changes are included in net unrealized appreciation (depreciation) from investments in the Statement of Operations.
The tax character of distributions paid during the year ended September 30, 2019, and September 30, 2018, was as follows:
| | 2019 | 2018 |
| Distributions from: | | |
| Ordinary income | $ 3,160,279 | $ 1,501,866 |
| Capital gains | 2,316,659 | 343,343 |
| Total | $ 5,476,938 | $ 1,845,209 |
NOTE 3 – SECURITY VALUATION
Valuation of the Fund’s portfolio investment securities is performed in accordance with policies and procedures adopted by and under the oversight of the Trustees.
The Trustees of the Trust have appointed the Advisor to assist the Trustees with obtaining fair market values for portfolio investments, evaluating and monitoring professional pricing service providers appointed by the Trustees’ Audit Committee (the “Audit Committee”) to assist in determining fair values for portfolio investments, assisting in calculating fair values for portfolio investments in certain circumstances, and performing other functions in connection with the valuation of investments. The Advisor acts through its Valuation and Pricing Committee (the “Committee”) and other employees of the Advisor. The Committee regularly reviews its own valuation calculations, reviews the valuations, valuation techniques and services furnished by pricing service providers, considers circumstances which may require valuation calculations by the Committee, and reviews previous valuation calculations. The Committee reports to the Audit Committee on the Committee’s activities, the performance of pricing service providers, and other matters relating to valuation of portfolio investments.
In those instances when the Committee assists in calculating a fair value for a portfolio investment, the Committee seeks to determine the price that the Fund would reasonably expect to receive upon a sale of the investment in an orderly transaction between market participants on the valuation date. The Committee customarily utilizes quotations from securities broker dealers in calculating valuations, but also may utilize prices obtained from pricing service providers or other methods approved by the Audit Committee. Because fair values calculated by the Committee are estimates, the calculation of a value for an investment may differ from the price that would be realized by the Fund upon a sale of the investment, and the difference could be material to the Fund’s financial statements. The Committee’s calculation of a fair value for an investment may also differ from the prices obtained by other persons (including other mutual funds) for the investment.
Valuation of Securities: Securities and other portfolio investments which are listed or traded on a United States securities exchange are valued at the last reported sale price on the valuation date. Investments listed or traded on an exchange for which there has been no sale that day are valued at the mean between the last reported bid and asked prices on that valuation date. Portfolio investments reported by NASDAQ are valued at the official closing price on the valuation date. If an investment is traded on more than one exchange, the investment is considered traded on the exchange that is normally the primary market for that investment. Securities and other portfolio investments which are listed or traded on exchanges outside the United States are valued at the last price or the closing price of the investment on the exchange that is normally the primary market for the investment, as of the close of the exchange preceding the Fund’s valuation date. Foreign investments listed or traded on an exchange for which there has been no sale that day are valued at the mean between the last reported bid and asked prices on that valuation date.
In any case when a market quotation is not readily available for a portfolio investment ordinarily valued by market quotation, the Committee calculates a fair value for the investment using alternative methods approved by the Audit Committee. A market quotation is not readily available when the primary market or exchange for the investment is not open for the entire scheduled day of trading. Market quotations for an investment also may not be readily available if developments after the most recent close of the investment’s primary exchange or market, but prior to the close of business on any Fund business day, or an unusual event or significant period of time occurring since the
Notes to Financial Statements, Continued
Thornburg Better World International Fund | September 30, 2019
availability of a market quotation, create a serious question concerning the reliability of the most recent market quotation available for the investment. In particular, on days when market volatility thresholds established by the Audit Committee are exceeded, foreign equity investments held by the Fund may be valued using alternative methods. The Committee customarily obtains valuations in these instances from pricing service providers approved by the Audit Committee. Pricing service providers ordinarily calculate valuations using multi-factor models to adjust market prices based upon various inputs, including exchange data, depository receipt prices, futures, index data and other data.
Debt obligations held by the Fund which are not listed or traded on exchanges or for which no reported market exists are ordinarily valued at the valuation obtained from a pricing service provider approved by the Audit Committee.
In any case when a pricing service provider fails to provide a valuation for a debt obligation held by the Fund, the Committee calculates a fair value for the obligation using alternative methods under procedures approved by the Audit Committee. Additionally, in cases when management believes that a valuation obtained from a pricing service provider is stale, does not reflect material factors affecting the valuation of the investment, is significantly different than the value the Fund is likely to obtain if it sought a bid for the investment, or is otherwise unreliable, the Committee calculates a fair value for the obligation using an alternative method approved by the Audit Committee.
Quotations for foreign investments expressed in foreign currency amounts are converted to U.S. dollar equivalents using a foreign exchange quotation from a third party service provider at the time of valuation. Foreign investments held by the Fund may be traded on days and at times when the Fund is not open for business. Consequently, the value of Fund investments may be significantly affected on days when shareholders cannot purchase or sell Fund shares.
Valuation Hierarchy: The Fund categorizes its investments based upon the inputs used in valuing those investments, according to a three-level hierarchy established in guidance from the FASB. Categorization of investments using this hierarchy is intended by the FASB to maximize the use of observable inputs in valuing investments and minimize the use of unobservable inputs by requiring that the most observable inputs be used when available. Observable inputs are those that market participants would use in valuing an investment based on available market information. Unobservable inputs are those that reflect assumptions about the information market participants would use in valuing an investment. An investment’s level within the hierarchy is based on the lowest level input that is deemed significant to the valuation. The methodologies and inputs used to value investments are not necessarily indications of the risk or liquidity associated with those investments.
Various inputs are used in calculating valuations for the Fund’s investments. These inputs are generally summarized according to the three-level hierarchy below:
Level 1: Quoted prices in active markets for identical investments.
Level 2: Other direct or indirect significant observable inputs (including quoted prices for similar investments in active markets and other observable inputs, such as interest rates, prepayment rates, credit ratings, etc.).
Level 3: Significant unobservable inputs (including the Committee’s own assumptions in calculating the fair values of investments).
Valuations for debt obligations held by the Fund are typically calculated by pricing service providers approved by the Audit Committee and are generally characterized as Level 2 within the valuation hierarchy.
On days when market volatility thresholds established by the Audit Committee are exceeded, foreign securities for which valuations are obtained from pricing service providers are fair valued. On these days, the foreign securities are characterized as Level 2 within the valuation hierarchy and revert to Level 1 after the threshold is no longer exceeded.
In a limited number of cases the Committee calculates a fair value for investments using broker quotations or other methods approved by the Audit Committee. When the Committee uses a single broker quotation to calculate a fair value for an investment without other significant observable inputs, or if a fair value is calculated using other significant inputs that are considered unobservable, the investment is characterized as Level 3 within the hierarchy. Other significant unobservable inputs used to calculate a fair value in these instances might include an income-based valuation approach which considers discounted anticipated future cash flows from the investment and application of discounts due to the nature or duration of any restrictions on the disposition of the investment.
Valuations based upon the use of inputs from Levels 1, 2 or 3 may not represent the actual price received upon the disposition of an investment, and a Fund may receive a price that is lower than the valuation based upon these inputs when it sells the investment.
Notes to Financial Statements, Continued
Thornburg Better World International Fund | September 30, 2019
The following table displays a summary of the fair value hierarchy measurements of the Fund’s investments as of September 30, 2019:
| | Fair Value Measurements at September 30, 2019 |
| | TOTAL | LEVEL 1 | LEVEL 2 | LEVEL 3 |
| Assets | | | | |
| Investments in Securities* | | | | |
| Common Stock | $ 67,100,582 | $ 67,100,582 | $ — | $ — |
| Short-Term Investments | 4,609,937 | 4,609,937 | — | — |
| Total Investments in Securities | $71,710,519 | $71,710,519 | $— | $— |
| Total Assets | $71,710,519 | $71,710,519 | $— | $— |
| * | See Schedule of Investments for a summary of the industry exposure as grouped according to the Global Industry Classification Standard (GICS), which is an industry taxonomy developed by MSCI, Inc. and Standard & Poor’s (S&P). |
NOTE 4 – INVESTMENT ADVISORY FEE AND OTHER TRANSACTIONS WITH AFFILIATES
Pursuant to an investment advisory agreement, the Advisor serves as the investment advisor and performs services for the Fund for which the fees are payable at the end of each month. Under the investment advisory agreement, the Fund pays the Advisor a management fee based on the average daily net assets of the Fund at an annual rate as shown in the following table:
| Management Fee Schedule |
| DAILY NET ASSETS | FEE RATE |
| Up to $500 million | 0.975% |
| Next $500 million | 0.925 |
| Next $500 million | 0.875 |
| Next $500 million | 0.825 |
| Over $2 billion | 0.775 |
The Fund’s effective management fee for the year ended September 30, 2019 was 0.975% of the Fund’s average daily net assets (before applicable management fee waiver of $108,292). Total management fees incurred by the Fund for the year ended September 30, 2019 are set forth in the Statement of Operations.
The Trust has entered into an administrative services agreement with the Advisor, whereby the Advisor will perform certain administrative services related to each class of the Fund’s shares. The fees are computed as an annual percentage of the aggregate average daily net assets of all shares classes of all Funds in the Trust as follows:
| Administration Fee Schedule |
| Daily Net Assets | Fee Rate |
| Up to $20 billion | 0.100% |
| $20 billion to $40 billion | 0.075 |
| $40 billion to $60 billion | 0.040 |
| Over $60 billion | 0.030 |
The aggregate fee amount is allocated on a daily basis to each Fund based on net assets and subsequently allocated to each class of shares of the Fund. Total administrative service fees incurred by each class of shares of the Fund for the year ended September 30, 2019, are set forth in the Statement of Operations.
The Trust has an underwriting agreement with Thornburg Securities Corporation (the “Distributor”), an affiliate of the Advisor, which acts as the distributor of the Fund’s shares. For the year ended September 30, 2019, the Distributor has advised the Fund that it earned net commissions aggregating $1,848 from the sale of Class A shares, and collected contingent deferred sales charges aggregating $41 from redemptions of Class C shares of the Fund.
Pursuant to a service plan under Rule 12b-1 of the 1940 Act, the Fund may pay to the Distributor or securities dealers and other financial institutions at the Distributor’s direction an amount not to exceed .25 of 1% per annum of the average daily net assets attributable to Class A, Class C and Class I shares of the Fund to obtain various shareholder and distribution related services. For the year ended September 30, 2019, there were no 12b-1 service plan fees charged for Class I shares. The Advisor and Distributor each may pay out of its own resources additional expenses for distribution of the Fund’s shares and shareholder services.
Notes to Financial Statements, Continued
Thornburg Better World International Fund | September 30, 2019
The Trust has also adopted a distribution plan pursuant to Rule 12b-1, applicable only to the Fund’s Class C shares, under which the Fund compensates the Distributor for services in promoting the sale of Class C shares of the Fund at an annual rate of up to .75 of 1% per annum of the average daily net assets attributable to Class C shares.
Total fees incurred by each class of shares of the Fund under their respective service and distribution plans for the year ended September 30, 2019, are set forth in the Statement of Operations.
The Advisor has contractually agreed to waive fees and reimburse expenses incurred by the Fund so that actual expenses of certain share classes do not exceed levels as specified in each Fund’s most recent prospectus (Class A shares, 1.83%; Class C shares, 2.38%; Class I shares, 1.09%). The agreement may be terminated by the Fund at any time, but may not be terminated by the Advisor before February 1, 2020, unless the Advisor ceases to be the investment advisor to the Fund prior to that date. The Advisor may recoup amounts waived or reimbursed during the fiscal year ended September 30, 2019 if, during that year, expenses fall below the contractual limit that was in place at the time those fees and expenses were waived or reimbursed. The Advisor will not recoup fees or expenses as described in the preceding sentence if that recoupment would cause the Fund’s total annual operating expenses (after the recoupment is taken into account) to exceed the lesser of: (a) the expense cap that was in place at the time the waiver or reimbursement occurred; or (b) the expense cap that is in place at the time of the recoupment.
For the year ended September 30, 2019, the Advisor voluntarily waived Fund level investment advisory fees of $108,292. For the year ended September 30, 2019, the Advisor contractually reimbursed certain class specific expenses and distribution fees of $10,115 for Class A shares, $17,691 for Class C shares, and $97,067 for Class I shares.
Certain officers and Trustees of the Trust are also officers or directors of the Advisor and Distributor. The compensation of the independent Trustees is borne by the Trust. The Trust also pays a portion of the Chief Compliance Officer’s compensation. These amounts are reflected as Trustee and officer fees in the Statement of Operations.
The percentage of direct investments in the Fund held by the Trustees, officers of the Trust, and the Advisor is approximately 44.15%.
The Fund may purchase or sell securities from or to an affiliated fund, provided the affiliation is due solely to having a common investment advisor, common officers, or common trustees, and provided that all such transactions will comply with Rule 17a-7 under the 1940 Act. For the year ended September 30, 2019, the Fund had no such transactions with affiliated funds.
Shown below are holdings of voting securities of each portfolio company which is considered "affiliated" to the Fund under the 1940 Act, including companies for which the Fund’s holding represented 5% or more of the company’s voting securities, and a series of the Thornburg Investment Trust in which the Fund invested for cash management purposes during the period:
| Fund | Market Value
9/30/18 | Purchases
at Cost | Sales
Proceeds | Realized
Gain
(Loss) | Change in
Unrealized
Appr./(Depr.) | Market Value
9/30/19 | Dividend
Income |
| Thornburg Capital Management Fund | $2,894,980 | $32,565,864 | $(30,850,907) | $- | $- | $4,609,937 | $87,393 |
NOTE 5 – SHARES OF BENEFICIAL INTEREST
At September 30, 2019, there were an unlimited number of shares with no par value of beneficial interest authorized. Transactions in shares of beneficial interest were as follows:
| | YEAR ENDED
September 30, 2019 | YEAR ENDED
September 30, 2018 |
| | SHARES | AMOUNT | SHARES | AMOUNT |
| Class A Shares | | | | |
| Shares sold | 285,435 | $ 3,639,837 | 159,116 | $ 2,341,246 |
Shares issued to shareholders in
reinvestment of dividends | 65,598 | 793,951 | 11,866 | 169,052 |
| Shares repurchased | (209,272) | (2,657,558) | (39,319) | (572,214) |
| Net increase | 141,761 | $ 1,776,230 | 131,663 | $ 1,938,084 |
Notes to Financial Statements, Continued
Thornburg Better World International Fund | September 30, 2019
| | YEAR ENDED
September 30, 2019 | YEAR ENDED
September 30, 2018 |
| | SHARES | AMOUNT | SHARES | AMOUNT |
| Class C Shares | | | | |
| Shares sold | 19,928 | $ 242,846 | 49,146 | $ 710,327 |
Shares issued to shareholders in
reinvestment of dividends | 13,178 | 158,604 | 4,397 | 62,136 |
| Shares repurchased | (60,397) | (745,271) | (50,802) | (733,212) |
| Net increase (decrease) | (27,291) | $ (343,821) | 2,741 | $ 39,251 |
| Class I Shares | | | | |
| Shares sold | 1,565,202 | $ 20,168,241 | 862,967 | $ 12,809,809 |
Shares issued to shareholders in
reinvestment of dividends | 333,731 | 4,122,477 | 104,734 | 1,514,453 |
| Shares repurchased | (1,128,238) | (14,093,818) | (1,377,372) | (20,530,149) |
| Net increase (decrease) | 770,695 | $ 10,196,900 | (409,671) | $ (6,205,887) |
NOTE 6 – INVESTMENT TRANSACTIONS
For the year ended September 30, 2019, the Fund had purchase and sale transactions of investments (excluding short-term investments) of $44,260,869 and $37,984,386, respectively.
NOTE 7 – DERIVATIVE FINANCIAL INSTRUMENTS WITH OFF-BALANCE
SHEET RISK AND FOREIGN INVESTMENT RISK
The Fund may use a variety of derivative financial instruments to hedge or adjust the risks affecting its investment portfolio or to enhance investment returns. Provisions of FASB Accounting Standards Codification ASC 815-10-50 (“ASC 815”) require certain disclosures. The disclosures are intended to provide users of financial statements with an understanding of the use of derivative instruments by the Fund and how these derivatives affect the financial position, financial performance and cash flows of the Fund. The Fund does not designate any derivative instruments as hedging instruments under ASC 815. Additionally, the Fund’s risk of loss may exceed the amounts recognized on the Statement of Assets and Liabilities.
During the year ended September 30, 2019, the Fund did not invest in any derivative financial instruments of the type addressed by ASC 815.
NOTE 8 – RECENT ACCOUNTING PRONOUNCEMENTS
In August 2018, the FASB issued ASU 2018-13, Fair Value Measurement (Topic 820): Changes to the Disclosure Requirements for Fair Value Measurement, which adds, removes, and modifies certain aspects of the fair value disclosure. ASU 2018-13 is effective for annual periods beginning after December 15, 2019, and early adoption is permitted. The Funds have elected to early adopt, and had applied ASU 2018-13 for the fiscal year ended September 30, 2019. The adoption of this accounting guidance did not have a material impact on the Funds’ financial statements.
In March 2017, the FASB issued Accounting Standards Update (ASU) 2017-08, Premium Amortization of Purchased Callable Debt Securities. The amendments in the ASU shorten the premium amortization period on a purchased callable debt security from the security’s contractual life to the earliest call date. It is anticipated that this change will enhance disclosures by reducing losses recognized when a security is called on an earlier date. This ASU is effective for fiscal years beginning after December 15, 2018. Management has evaluated the implications of these changes and the amendments will have no material effect on the Funds’ net assets or results of operations.
OTHER NOTES
Risks: The Fund’s investments subject it to risks including, but not limited to, management risk, market and economic risk, risks affecting specific issuers, foreign investment risk, developing country risk, risks affecting specific countries or regions, small and mid-cap company risk, credit risk, interest rate risk, liquidity risk, social investing risk, and real estate risk. Please see the Fund’s prospectus for a discussion of the risks associated with an investment in the Fund.
Notes to Financial Statements, Continued
Thornburg Better World International Fund | September 30, 2019
Subsequent Events: Fund management believes no events have occurred between September 30, 2019 and the date of issuance of the financial statements that require adjustment to or disclosure in the accompanying financial statements.
This page intentionally left blank.
Financial Highlights
Thornburg Better World International Fund
| | PER SHARE PERFORMANCE (FOR A SHARE OUTSTANDING THROUGHOUT THE YEAR) |
UNLESS OTHERWISE
NOTED, PERIODS ARE
FISCAL YEARS ENDED
SEPTEMBER 30, | Net Asset
Value,
Beginning of
YEAR | Net
Investment
Income
(Loss)+ | Net Realized &
Unrealized Gain
(Loss) on
Investments | Total from
Investment
Operations | Dividends
from Net
Investment
Income | Dividends
from Net
Realized
Gains | Total
Dividends | Net Asset
Value,
End of YEAR |
| CLASS A SHARES(b) |
| 2019 | $ 14.51 | 0.12 | (0.66) | (0.54) | (0.15) | (0.97) | (1.12) | $ 12.85 |
| 2018 | $ 14.13 | 0.09 | 0.66 | 0.75 | — | (0.37) | (0.37) | $ 14.51 |
| 2017 | $ 13.86 | 0.09 | 0.99 | 1.08 | (0.12) | (0.69) | (0.81) | $ 14.13 |
| 2016(c) | $ 11.94 | 0.03 | 2.04 | 2.07 | (0.15) | — | (0.15) | $ 13.86 |
| CLASS C SHARES |
| 2019 | $ 14.32 | 0.03 | (0.62) | (0.59) | (0.04) | (0.97) | (1.01) | $ 12.72 |
| 2018 | $ 14.02 | —(e) | 0.67 | 0.67 | — | (0.37) | (0.37) | $ 14.32 |
| 2017 | $ 13.79 | 0.02 | 0.97 | 0.99 | (0.07) | (0.69) | (0.76) | $ 14.02 |
| 2016(c) | $ 11.94 | (0.05) | 2.04 | 1.99 | (0.14) | — | (0.14) | $ 13.79 |
| CLASS I SHARES |
| 2019 | $ 14.83 | 0.20 | (0.67) | (0.47) | (0.23) | (0.97) | (1.20) | $ 13.16 |
| 2018 | $ 14.33 | 0.18 | 0.69 | 0.87 | — | (0.37) | (0.37) | $ 14.83 |
| 2017 | $ 13.96 | 0.20 | 1.02 | 1.22 | (0.16) | (0.69) | (0.85) | $ 14.33 |
| 2016(c) | $ 11.94 | 0.10 | 2.01 | 2.11 | (0.09) | — | (0.09) | $ 13.96 |
| (a) | Not annualized for periods less than one year. |
| (b) | Sales loads are not reflected in computing total return. |
| (c) | Fund commenced operations on October 1, 2015. |
| (d) | Due to the size of net assets and fixed expenses, ratios may appear disproportionate. |
| (e) | Net investment income (loss) was less than $0.01 per share. |
| + | Based on weighted average shares outstanding. |
See notes to financial statements.
Financial Highlights, Continued
Thornburg Better World International Fund
| RATIOS TO AVERAGE NET ASSETS | | SUPPLEMENTAL DATA |
Net Investment
Income (Loss) (%) | Expenses, After
Expense
Reductions (%) | Expenses,
Before Expense
Reductions (%) | | Total
Return (%)(a) | Portfolio
Turnover
Rate (%)(a) | Net Assets
at End of YEAR
(Thousands) |
| |
| 0.91 | 1.82 | 2.10 | | (3.19) | 62.33 | $ 9,378 |
| 0.64 | 1.82 | 2.12 | | 5.37 | 111.99 | $ 8,537 |
| 0.64 | 1.79 | 3.21 | | 8.61 | 105.55 | $ 6,450 |
| 0.21 | 1.83 | 7.27(d) | | 16.60 | 180.60 | $ 1,666 |
| |
| 0.25 | 2.38 | 3.48 | | (3.75) | 62.33 | $ 1,687 |
| (0.03) | 2.38 | 3.09 | | 4.82 | 111.99 | $ 2,292 |
| 0.18 | 2.32 | 4.48 | | 7.97 | 105.55 | $ 2,205 |
| (0.40) | 2.38 | 13.13(d) | | 15.94 | 180.60 | $ 822 |
| |
| 1.57 | 1.09 | 1.44 | | (2.54) | 62.33 | $ 59,833 |
| 1.20 | 1.09 | 1.35 | | 6.15 | 111.99 | $ 55,989 |
| 1.48 | 0.94 | 1.62 | | 9.58 | 105.55 | $ 59,951 |
| 0.76 | 1.09 | 2.28 | | 17.44 | 180.60 | $ 27,781 |
Report of Independent Registered Public Accounting Firm
Thornburg Better World International Fund
To the Board of Trustees of Thornburg Investment Trust and Shareholders of
Thornburg Better World International Fund
Opinion on the Financial Statements
We have audited the accompanying statement of assets and liabilities, including the schedule of investments, of Thornburg Better World International Fund (one of the funds constituting Thornburg Investment Trust, referred to hereafter as the "Fund") as of September 30, 2019, the related statement of operations for the year ended September 30, 2019, the statements of changes in net assets for each of the two years in the period ended September 30, 2019, including the related notes, and the financial highlights for each of the three years in the period ended September 30, 2019 and for the period October 1, 2015 (commencement of operations) through September 30, 2016 (collectively referred to as the “financial statements”). In our opinion, the financial statements present fairly, in all material respects, the financial position of the Fund as of September 30, 2019, the results of its operations for the year then ended, the changes in its net assets for each of the two years in the period ended September 30, 2019 and the financial highlights for each of the three years in the period ended September 30, 2019 and for the period October 1, 2015 (commencement of operations) through September 30, 2016 in conformity with accounting principles generally accepted in the United States of America.
Basis for Opinion
These financial statements are the responsibility of the Fund’s management. Our responsibility is to express an opinion on the Fund’s financial statements based on our audits. We are a public accounting firm registered with the Public Company Accounting Oversight Board (United States) (PCAOB) and are required to be independent with respect to the Fund in accordance with the U.S. federal securities laws and the applicable rules and regulations of the Securities and Exchange Commission and the PCAOB.
We conducted our audits of these financial statements in accordance with the standards of the PCAOB. Those standards require that we plan and perform the audit to obtain reasonable assurance about whether the financial statements are free of material misstatement, whether due to error or fraud.
Our audits included performing procedures to assess the risks of material misstatement of the financial statements, whether due to error or fraud, and performing procedures that respond to those risks. Such procedures included examining, on a test basis, evidence regarding the amounts and disclosures in the financial statements. Our audits also included evaluating the accounting principles used and significant estimates made by management, as well as evaluating the overall presentation of the financial statements. Our procedures included confirmation of securities owned as of September 30, 2019 by correspondence with the custodian and transfer agent. We believe that our audits provide a reasonable basis for our opinion.
/s/PricewaterhouseCoopers LLP
New York, New York
November 22, 2019
We have served as the auditor of one or more investment companies in Thornburg Investment Trust since 1999.
Expense Example
Thornburg Better World International Fund | September 30, 2019 (Unaudited)
As a shareholder of the Fund, you incur two types of costs:
| (1) | transaction costs, including |
| (a) | sales charges (loads) on purchase payments, for Class A shares; |
| (b) | a deferred sales charge on redemptions of any part or all of a purchase of $1 million of Class A shares within 12 months of purchase; |
| (c) | a deferred sales charge on redemptions of Class C shares within 12 months of purchase; |
| (2) | ongoing costs, including management fees; distribution and/or service (12b-1) fees; and other Fund expenses. |
This example is intended to help you understand your ongoing costs (in dollars) of investing in the Fund and to compare these costs with the ongoing costs of investing in other mutual funds.
The example is based on a $1,000 investment beginning on April 1, 2019, and held until September 30, 2019.
| | BEGINNING
ACCOUNT VALUE
4/1/19 | ENDING
ACCOUNT VALUE
9/30/19 | EXPENSES PAID
DURING PERIOD†
4/1/19—9/30/19 |
| CLASS A SHARES |
| Actual | $1,000.00 | $1,011.81 | $9.18 |
| Hypothetical* | $1,000.00 | $1,015.94 | $9.20 |
| CLASS C SHARES |
| Actual | $1,000.00 | $1,008.72 | $11.98 |
| Hypothetical* | $1,000.00 | $1,013.14 | $12.01 |
| CLASS I SHARES |
| Actual | $1,000.00 | $1,015.43 | $5.51 |
| Hypothetical* | $1,000.00 | $1,019.60 | $5.52 |
| † | Expenses are equal to the annualized expense ratio for each class (A: 1.82%; C: 2.38%; I: 1.09%) multiplied by the average account value over the period, multiplied by 183/365 to reflect the one-half year period. |
| * | Hypothetical assumes a rate of return of 5% per year before expenses. |
ACTUAL EXPENSES
For each class of shares, the first line of the accompanying table provides information about actual account values and actual expenses. You may use the information in this line, together with the amount you invested, to estimate the expenses that you paid over the period. Simply divide your account value by $1,000 (for example, an $8,600 account value divided by $1,000 = 8.6), then multiply the result by the number in the first line for your class of shares under the heading entitled “Expenses Paid During Period” to estimate the expenses you paid on your account during this period.
HYPOTHETICAL EXAMPLE FOR COMPARISON PURPOSES
For each class of shares, the second line of the accompanying table provides information about hypothetical account values and hypothetical expenses based on the Fund’s actual expense ratio and an assumed rate of return of 5% per year before expenses, which is not the Fund’s actual return. The hypothetical account values and expenses may not be used to estimate the actual ending account balance or expenses you paid for the period. You may use this information to compare the ongoing costs of investing in the Fund and other funds. To do so, compare this 5% hypothetical example with the 5% hypothetical examples that appear in the shareholder reports of the other funds.
Please note that the expenses shown in the table are meant to highlight your ongoing costs only and do not reflect any transactional costs, such as sales charges (loads), redemption fees, or exchange fees. Therefore, the second line of the table for each class of shares is useful in comparing ongoing costs only, and will not help you determine the relative total costs of owning different funds. In addition, if these transactional costs were included, your costs would have been higher.
Trustees and Officers
Thornburg Better World International Fund | September 30, 2019 (Unaudited)
NAME, AGE, YEAR ELECTED
POSITION HELD WITH FUND | PRINCIPAL OCCUPATION(S) DURING PAST FIVE YEARS | OTHER DIRECTORSHIPS
HELD BY TRUSTEE |
| INTERESTED TRUSTEES(1)(2) |
Garrett Thornburg, 73
Trustee since 1984,
Chairman of Trustees(3) | Chairman and controlling shareholder of Thornburg Investment Management, Inc. (investment advisor); Chairman and controlling shareholder of Thornburg Securities Corporation (securities dealer); President of the Thornburg Foundation (nonprofit). | None |
Brian J. McMahon, 64
Trustee since 2001,
Vice Chairman of Trustees,
Member of Governance and
Nominating Committee &
Operations Risk Oversight
Committee(4) | Vice Chairman, Chief Investment Strategist, Managing Director, and Portfolio Manager and, until 2016, CEO and President of Thornburg Investment Management, Inc.; Vice President of Thornburg Securities Corporation. | None |
| INDEPENDENT TRUSTEES(1)(2)(5) |
David A. Ater, 74
Trustee since 1994,
Lead Independent Trustee,
Chairman of Governance and
Nominating Committee &
Member of Audit Committee | Principal in Ater & Associates, Santa Fe, NM (developer, planner and broker of residential and commercial real estate); owner, developer and broker for various real estate projects. | None |
Sally Corning, 58
Trustee since 2012,
Chairman of Audit Committee | Partner in Sun Mountain Capital, Santa Fe, NM (private equity firm with investment programs encompassing venture capital, mezzanine debt, and growth equity). | None |
Susan H. Dubin, 70
Trustee since 2004,
Member of Audit
Committee & Governance
and Nominating Committee | President of Dubin Investments, Ltd., Greenwich, CT (private investment fund); Director and officer of various charitable organizations. | None |
David L. Gardner, 56
Trustee since 2015,
Member of Operations Risk
Oversight Committee | Until 2012, head of EMEA (Europe, Middle East and Africa) Sales for iShares of Blackrock, Inc., EMEA Executive Committee Member and EMEA Operating Committee Member at Blackrock, Inc. | None |
Patrick J. Talamantes, 55
Trustee since 2019,
Member of Audit Committee | President of Talamantes Strategies, LLC, a management consulting firm, since 2018; until 2017, President and Chief Executive Officer of The McClatchy Company, Sacramento, CA (news and media company). | None |
Owen D. Van Essen, 65
Trustee since 2004,
Chairman of Operations Risk
Oversight Committee &
Member of Governance and
Nominating Committee | President of Dirks, Van Essen, Murray & April, Santa Fe, NM (newspaper mergers and acquisitions). | None |
James W. Weyhrauch, 60
Trustee since 1996,
Member of Audit
Committee & Operations Risk
Oversight Committee | Real estate broker, Santa Fe Properties, Santa Fe, NM; General Partner, Investments of Genext LLC (a family investment partnership); until 2019, Vice Chairman of Nambe LLC, Santa Fe, NM (manufacturing & design company). | None |
Trustees and Officers, Continued
Thornburg Better World International Fund | September 30, 2019 (Unaudited)
NAME, AGE, YEAR ELECTED
POSITION HELD WITH FUND | PRINCIPAL OCCUPATION(S) DURING PAST FIVE YEARS | OTHER DIRECTORSHIPS
HELD BY TRUSTEE |
| OFFICERS OF THE FUND (WHO ARE NOT TRUSTEES)(1)(6) |
David Ashley, 49
Vice President since 2019 | Portfolio Manager and Managing Director since 2019 and Associate Portfolio Manager from 2011-2019 of Thornburg Investment Management, Inc. | Not applicable |
Nimish Bhatt, 56
Chief Financial Officer
since 2019; Treasurer
2016-2019; Secretary
(2018-2019)(7) | Chief Financial Officer and Treasurer of Thornburg Investment Management, Inc. and Thornburg Securities Corporation since 2016 and Secretary of Thornburg Securities Corporation since 2018; Senior Vice President (2004-2016), Chief Financial Officer (2011-2016), and Head of Fund Administration (2011-2016) of Calamos Asset Management, Inc., Calamos Investments LLC, Calamos Advisors LLC, and Calamos Wealth Management; Director of Calamos Global Funds plc (2007-2016). | Not applicable |
Jason Brady, 45
President since 2016(7) | Director since 2017, CEO and President since 2016, and Portfolio Manager and Managing Director of Thornburg Investment Management, Inc.; Vice President of Thornburg Securities Corporation since 2016. | Not applicable |
Connor Browne, 40
Vice President since 2006 | Portfolio Manager and Managing Director of Thornburg Investment Management, Inc. | Not applicable |
Randy Dry, 45
Vice President since 2014 | Managing Director, Director of Institutional Group from 2014-2016, and since 2016, Chief Administrative Officer of Thornburg Investment Management, Inc. | Not applicable |
Greg Dunn, 43
Vice President since 2014 | Portfolio Manager and Managing Director of Thornburg Investment Management, Inc. | Not applicable |
Lon Erickson, 44
Vice President since 2008 | Portfolio Manager and Managing Director of Thornburg Investment Management, Inc. | Not applicable |
Thomas Garcia, 48
Vice President since 2006 | Managing Director, Head Equity Trader, and Associate Portfolio Manager of Thornburg Investment Management, Inc. | Not applicable |
Christian Hoffmann, 37
Vice President since 2018 | Portfolio Manager and Managing Director since 2018, and Associate Portfolio Manager from 2014-2018, of Thornburg Investment Management, Inc. | Not applicable |
Curtis Holloway, 52
Treasurer since 2019(7) | Director of Fund Administration since 2019 of Thornburg Investment Management, Inc.; Senior Vice President, Head of Fund Administration (2017-2019) and Vice President, Fund Administration (2010-2017) of Calamos Investments, and Chief Financial Officer (2017-2019) and Treasurer (2010-2019) of Calamos Funds. | Not applicable |
Ben Kirby, 39
Vice President since 2014 | Head of Investments since 2019, Portfolio Manager and Managing Director since 2013. | Not applicable |
Jeff Klingelhofer, 38
Vice President since 2016 | Head of Investments since 2019, Portfolio Manager and Managing Director since 2015, and Associate Portfolio Manager from 2012–2015, of Thornburg Investment Management, Inc. | Not applicable |
Ponn Lithiluxa, 48
Vice President since 2017 | Manager, Tax & Fund Administration of Thornburg Investment Management, Inc.; Senior Vice President, Citi Fund Services, Inc. (2014–2017); Vice President, Citi Fund Services, Inc. (2007–2014). | Not applicable |
Rob MacDonald, 43
Vice President since 2016 | Managing Director since 2015, Portfolio Manager since 2014, and Associate Portfolio Manager from 2011–2014 of Thornburg Investment Management, Inc. | Not applicable |
Michael Mastroianni, 42
Secretary and Vice President since 2019(7) | Director of Fund Operations since 2019 of Thornburg Investment Management, Inc.; Executive Director, Global Head of Client Services - Global Liquidity (2018-2019), Executive Director, North American Head of Transfer Agency Relationship Management (2011-2019), Executive Director, North American Head of Transfer Agency Service Delivery (2011-2018) of J.P. Morgan Asset Management. | Not applicable |
Leigh Moiola, 52
Vice President since 2001 | Managing Director and Director of Marketing of Thornburg Investment Management, Inc.; Vice President of Thornburg Securities Corporation. | Not applicable |
Christopher Ryon, 63
Vice President since 2008 | Portfolio Manager and Managing Director of Thornburg Investment Management, Inc. | Not applicable |
Trustees and Officers, Continued
Thornburg Better World International Fund | September 30, 2019 (Unaudited)
NAME, AGE, YEAR ELECTED
POSITION HELD WITH FUND | PRINCIPAL OCCUPATION(S) DURING PAST FIVE YEARS | OTHER DIRECTORSHIPS
HELD BY TRUSTEE |
Sean Koung Sun, 38
Vice President since 2017 | Portfolio Manager and Managing Director since 2017, Associate Portfolio Manager from 2015-2016, and Equity Research Analyst from 2012-2014 of Thornburg Investment Management, Inc. | Not applicable |
Stephen Velie, 52
Chief Compliance Officer since 2009 | Chief Compliance Officer of Thornburg Investment Trust and Thornburg Investment Management, Inc. | Not applicable |
Nicholos Venditti, 38
Vice President since 2016 | Portfolio Manager and Managing Director since 2015 and Associate Portfolio Manager from 2011–2015 of Thornburg Investment Management, Inc. | Not applicable |
Vinson Walden, 49
Vice President since 2004 | Portfolio Manager and Managing Director of Thornburg Investment Management, Inc. | Not applicable |
Lei Wang, 48
Vice President since 2006 | Portfolio Manager and Managing Director of Thornburg Investment Management, Inc. | Not applicable |
Charles Wilson, 44
Vice President since 2016 | Portfolio Manager and Managing Director since 2014 and Associate Portfolio Manager from 2012–2014 of Thornburg Investment Management, Inc. | Not applicable |
Di Zhou, 41
Vice President since 2016 | Portfolio Manager and Managing Director since 2016, Associate Portfolio Manager from 2014–2016, and Equity Research Analyst from 2010–2014 of Thornburg Investment Management, Inc. | Not applicable |
| (1) | Each person’s address is 2300 North Ridgetop Road, Santa Fe, New Mexico 87506. |
| (2) | The Fund is a separate investment “Fund” or “series” of Thornburg Investment Trust (the “Trust”), which comprises the Thornburg mutual fund complex and is organized as a Massachusetts business trust. Thornburg Investment Management, Inc. is the investment advisor to, and manages, all the Funds of the Trust. Each Trustee oversees all the Funds of the Trust. |
| (3) | Mr. Thornburg is considered an “interested” Trustee under the Investment Company Act of 1940 because he is a director and controlling shareholder of Thornburg Investment Management, Inc., the investment advisor to the Trust, and is the sole director and controlling shareholder of Thornburg Securities Corporation, the distributor of shares for the Trust. |
| (4) | Mr. McMahon is considered an “interested” Trustee under the Investment Company Act of 1940 because he is a director and the chief investment strategist of Thornburg Investment Management, Inc. |
| (5) | The Bylaws of the Trust currently require that each Independent Trustee shall retire by the end of the calendar year during which the Trustee reached the age of 75 years. Otherwise each Trustee serves in office until the election and qualification of a successor or until the Trustee sooner dies, resigns, retires or is removed. |
| (6) | Assistant vice presidents and assistant secretaries are not shown. |
| (7) | The Trust’s president, chief financial officer, secretary, and treasurer each serves a one-year term or until the election and qualification of a successor; each other officer serves at the pleasure of the Trustees. |
The Statement of Additional Information for each Fund of the Trust includes additional information about the Trustees and is available, without charge and upon request, by calling 1-800-847-0200.
Other Information
Thornburg Better World International Fund | September 30, 2019 (Unaudited)
PORTFOLIO PROXY VOTING
Policies and Procedures:
The Trust has delegated to the Advisor voting decisions respecting proxies for the Fund’s voting securities. The Advisor makes voting decisions in accordance with its Proxy Voting Policy and Procedures. A description of the Policy and Procedures is available (i) without charge, upon request, by calling the Advisor toll-free at 1-800-847-0200, (ii) on the Thornburg website at www.thornburg.com, and (iii) on the U.S. Securities and Exchange Commission’s website at www.sec.gov.
Information regarding how proxies were voted is available on or before August 31 of each year for the twelve months ending the preceding June 30. This information is available (i) without charge, upon request by calling the Advisor toll-free at 1-800-847-0200, (ii) on the Thornburg website at www.thornburg.com, and (iii) on the U.S. Securities and Exchange Commission’s website at www.sec.gov.
TAX INFORMATION
For tax year ended September 30, 2019, dividends paid by Thornburg Better World International Fund of $3,160,279 are being reported as taxable ordinary investment income dividends and $2,316,659 are being reported as long term capital gain dividends for federal income tax purposes.
For the tax year ended September 30, 2019, the Fund is reporting 36.68% (or the maximum allowed) of the dividends paid from tax basis net ordinary income as qualifying for the reduced rate under the Jobs and Growth Tax Relief and Reconciliation Act of 2003.
The Fund is reporting 0.28% (or the maximum allowed) of the ordinary income distributions paid by the Fund for the fiscal year ended September 30, 2019 as qualified for the corporate dividends received deduction.
For the year ended September 30, 2019, foreign source income and foreign taxes paid are $1,770,384 and $179,108, respectively.
The information and distributions reported herein may differ from the information and distributions reported to the shareholders for the calendar year ending December 31, 2019. Complete information will be reported in conjunction with your 2019 Form 1099.
AVAILABILITY OF QUARTERLY PORTFOLIO SCHEDULE
The Fund files with the Securities and Exchange Commission schedules of its portfolio holdings on Form N-Q for the first and third quarters of each fiscal year. The Fund’s Forms N-Q are available on the Commission’s website at www.sec.gov, or may be reviewed and copied at the Commission’s Public Reference Room in Washington, D.C. Information on the operation of the Public Reference Room may be obtained by calling 1-800-SEC-0330. The Fund also makes this information available on its website at www.thornburg.com/download or upon request by calling 1-800-847-0200.
STATEMENT RESPECTING RENEWAL OF INVESTMENT ADVISORY AGREEMENT
Thornburg Investment Management, Inc. (the “Advisor”) provides investment management services to Thornburg Better World International Fund (the “Fund”) pursuant to an investment advisory agreement. The Trustees consider the renewal of this agreement annually, and most recently determined to renew the agreement on September 17, 2019.
Planning for their recent consideration of the advisory agreement’s renewal, the independent Trustees met in May 2019 to consider aspects of their annual evaluation of the Advisor’s service to all of the funds of Thornburg Investment Trust, to plan the annual evaluation of the Advisor’s performance and to discuss preliminarily the information the Advisor would present to the Trustees for their review. The independent Trustees met in a second independent session in July 2019 to further define certain portions of the information to be submitted by the Advisor. The independent Trustees met again in an independent session in September 2019 with a mutual fund analyst firm engaged by the independent Trustees to provide explanations of comparative cost and expense information, comparative investment performance information, and other data obtained and analyzed by the analyst firm. In that session the independent Trustees discussed their evaluations of the Advisor’s services to the Fund and the Fund’s fee and expense levels, investment performance, and other information presented for the Fund, conferred independently with legal counsel respecting the factors typically considered in evaluating renewal of an advisory agreement, and conferred with representatives of management to receive explanations of certain aspects of the information they had requested. Representatives of the Advisor subsequently reviewed portions of the information with the Trustees and addressed questions from the Trustees at a full meeting session of the Trustees scheduled in September for that purpose, and the independent Trustees thereafter met again in an independent session to consider the Advisor’s presentations and various specific issues
Other Information, Continued
Thornburg Better World International Fund | September 30, 2019 (Unaudited)
respecting their consideration of the advisory agreement’s renewal. Following these sessions, the Trustees met to consider renewal of the advisory agreement, and the independent Trustees voted unanimously at that meeting to renew the agreement for an additional term of one year.
The information below summarizes certain factors considered by the Trustees in connection with the determination to renew the advisory agreement with the Advisor. In determining to renew the advisory agreement, the Trustees considered a wide range of information and did not identify any single factor as controlling, and this summary does not describe all of the factors and other matters considered by the Trustees in making their determination.
Nature, Extent and Quality of Services. The Trustees considered in their evaluation of the advisory agreement the written and oral reports provided to the Trustees and their standing committees throughout the year on a wide variety of topics by personnel from the Advisor’s portfolio management, administration, operations and compliance staffs. The Trustees also considered in this evaluation presentations and explanations made by representatives of the Advisor in meeting sessions scheduled for consideration of the renewal of the advisory agreement. The Trustees further noted in their evaluation the consideration they had given to a number of topics in previous years, reports from their standing committees, and advice received from counsel.
Information noted by the Trustees as having been considered in relation to the nature, extent and quality of services provided by the Advisor under the advisory agreement and contributing (together with other information considered) to their conclusions respecting the nature, extent and quality of the services rendered to the Fund by the Advisor included: (1) reports from portfolio managers and other personnel throughout the year demonstrating that the Fund was managed in conformity with stated strategies and objectives and conformed to investment restrictions and limitations; (2) reports demonstrating that management of the Fund remained faithful and competent, and demonstrating sufficient skill by portfolio managers in executing the Fund’s strategies in varying environments, managers’ cognizance of and strategies to pursue the Fund’s objectives and address pertinent market and economic trends and conditions, the evaluation and selection of individual investments, management to achieve tax efficiencies, and the structuring and composition of the Fund’s portfolio and management of Fund liquidity requirements; (3) the Fund’s achievement of its investment objectives over different periods of time; (4) presentations by and interactions with members of the Advisor’s fund administration, operations and compliance staffs; (5) reports from standing committees of the Trustees on their respective proceedings throughout the year, including in particular reports from and interactions with the Advisor’s personnel; (6) the sufficiency of the resources the Advisor devotes to the services it provides to the Fund, including the expertise of its personnel and staffing levels and its enhancements to the electronic systems it utilizes in providing these services, and also including the Advisor’s own financial management and sufficiency of its resources; and (7) the measures employed to achieve efficient trade execution for the Fund, including the evaluation and selection of firms to execute transactions for the Fund. As in past years, the Trustees noted particularly their assessments of the Advisor’s personnel developed in meetings throughout the year, measures to expand and improve the depth and experience of the Advisor’s staff, and the Advisor’s collaborative approach to investment management, continued commitment to observance of compliance and regulatory requirements in managing investments by the Fund, responsiveness to the Trustees, and other factors.
Based upon these and other considerations, the Trustees concluded that the Advisor’s management of the Fund’s investments continued to conform to the Fund’s stated objectives and policies, and that the nature, extent and quality of the services provided to the Fund by the Advisor remained sufficient.
Investment Performance. The Trustees noted in their evaluation of the Fund’s investment performance the written and oral reports they had received in each regular meeting over the course of the year from the Advisor’s portfolio management personnel. The Trustees also noted their consideration of information provided to them at their request in anticipation of their annual evaluation of the Advisor’s services, including the following items of information respecting the investment performance of the Fund: (1) the Fund’s absolute investment performance and achievement of stated objectives; (2) the Advisor’s explanations and commentary on the Fund’s performance in the context of the Fund’s objectives and reasonable expectations, and business, market and economic conditions; (3) the Fund’s investment performance for the three-month, year-to-date, one-year, three-year, and since inception periods ending with the second quarter of the current year, comparing the Fund’s annualized returns to two mutual fund categories selected by independent mutual fund analyst firms and to a broad-based securities index, and assigning a percentage rank to the Fund’s performance for each period relative to each of the fund categories; (4) analyses of specified performance and risk metrics for the Fund relative to its benchmark and to a selected peer group of funds, prepared by an independent financial analyst firm engaged by the independent Trustees; (5) the Fund’s cash flows; (6) comparative performance data for fund peer groups selected by an independent mutual fund analyst firm engaged by the independent Trustees, and the analysis and observations of the analyst firm respecting those data; (7) comparison of the Fund’s annualized return to the Fund’s benchmark index over various periods since the Fund’s inception; and (8) comparative measures of estimated earnings growth, and risk and return statistics. The Trustees generally attach additional significance to investment performance from the perspective of longer-term shareholders, and noted the more limited information available for the Fund because it has only been operating since 2015. Based upon their consideration of this and other information, the Trustees concluded that the Fund’s absolute and relative investment performance over a range of pertinent holding periods on the whole was satisfactory in view of its objectives and strategies.
Other Information, Continued
Thornburg Better World International Fund | September 30, 2019 (Unaudited)
Comparisons of Fee and Expense Levels. Information noted by the Trustees as having been considered in this context included a variety of comparative data respecting the Fund’s fee and expense levels. This information included comparisons of the Fund’s advisory fee and overall Fund expenses to median and average fees and expenses charged to funds in the applicable Morningstar category, comparisons of the advisory fee and total expenses for two Fund share classes to the fee levels and expenses of fund peer groups selected from the category by an independent mutual fund analyst firm engaged by the independent Trustees, the perspectives and advice from that mutual fund analyst firm respecting comparisons of fund fee levels and expenses to fund peer groups, and other information. The Trustees considered that the Advisor has agreed to certain fee waivers and expense reimbursements for the current period. Comparative fee and expense data noted as having been considered by the Trustees showed that, after fee waivers and expense reimbursements, the level of total expense for one share class of the Fund was higher than the median and average levels charged to funds in the applicable Morningstar category, and that the level of total expense for a second share class was higher than the median and lower than the average levels for that category. Peer group data showed that the Fund’s stated advisory fee was higher than the median level for the two peer groups but comparable to other funds in the peer group, and that the total expense levels of two representative share classes were higher than the medians of their respective peer groups but comparable to other funds in the peer groups after waivers of fees and reimbursement of expenses. The Trustees did not find the differences significant in view of their findings and conclusions respecting the other factors considered.
The Trustees noted their consideration of information respecting the advisory fees charged by the Advisor to other investment management clients, including sub-advised mutual funds and other institutional clients, together with information about fees charged by other advisors to different clients, analysis of the differences between the requirements of institutional clients and mutual funds, analysis of the differences between the requirements of a sub-advised mutual fund and a fund as to which the investment advisor is the primary advisor and sponsor, and the consequently different investment management services provided to the different categories of clients and the differing contexts in which these arrangements are entered into. The Trustees confirmed their previous observations that the differences between the fees charged by the Advisor or by other investment advisors to different types of clients did not appear exceptional and had limited relevance to the evaluation of the fee rate charged to mutual funds as to which the Advisor or such other advisors are the primary advisor and sponsor.
Costs and Profitability of Advisor. The Trustees noted the costs incurred by the Advisor in initiating and managing the Fund and the Advisor’s waivers of fees and reimbursements of expenses for the Fund, and further noted that the Fund is not currently profitable to the Advisor.
Potential Economies of Scale. In reviewing the extent to which economies of scale would be realized by the Fund as it grows and whether fee levels reflect potential economies of scale, the Trustees considered the breakpoint structure for advisory fees chargeable to the Fund, comparisons of the fee breakpoint structure for the Fund with breakpoint structures (or the absence of such structures) for other funds in a peer group selected by an independent mutual fund analyst firm, the effects of the breakpoint structure and other expense factors realized by certain funds of the Trust as their asset levels had increased, the Advisor’s undertakings to waive or reimburse certain fees and expenses of the Fund, and the Advisor’s expenditures from its own profits and resources to maintain staffing levels and expand staff competencies, pay competitive levels of compensation, and add to its electronic and information technology systems so as to maintain or improve service levels. The information provided demonstrated to the Trustees that the Fund’s advisory fee breakpoint structure is reasonable in relation to the structures observed in the other funds in its peer group, and that shareholders may be expected to benefit from any economies of scale, due to the advisory agreement’s breakpoint fee structure for the Fund and other factors.
Potential Ancillary Benefits. In reviewing potential benefits to the Advisor because of its relationship to the Fund, the Trustees considered explanations from the Advisor respecting its receipt of certain research services from broker dealers, and the benefits to both the Fund and the Advisor of the Advisor’s expansion of its staffing, compliance and systems capabilities and other resources to serve a broader variety of investment management clients. No unusual or unfair benefits to the Advisor from its relationship to the Fund were identified by the Trustees.
Summary of Conclusions. The Trustees concluded that the general nature, extent and quality of the Advisor’s services performed under the advisory agreement remained sufficient, the Advisor had continued to actively and competently pursue the Fund’s stated investment objectives and adhere to the Fund’s investment policies, and that the absolute and relative investment performance of the Fund over pertinent holding periods on the whole was satisfactory in the context of the Fund’s objectives and strategies. The Trustees further concluded that the level of the advisory fee charged to the Fund by the Advisor is fair and reasonable in relation to the services provided by the Advisor, in view of the nature, extent and quality of those services, the investment performance of the Fund after fees and expenses, the clear disclosure of fees and expenses in the Fund’s prospectuses, comparisons of fees and expenses charged to the Fund to fees and expenses charged to other mutual funds, and the other factors considered. The Trustees accordingly determined to renew the Fund’s investment advisory agreement with the Advisor for an additional term of one year.
Trustees’ Statement to Shareholders (Unaudited)
Readopted September 17, 2019
The Trustees believe current and prospective shareholders should know how we discharge our responsibilities in supervising the Funds’ investment advisor and in reviewing the advisor’s contract for renewal. Since 2005, we have issued a statement which sets out clearly the three principal guidelines that we follow in supervising the Trust’s investment advisor on your behalf. In accordance with our customary practice, in September of this year we again reviewed our statement and concluded we should reissue this statement outlining the principal features of our supervision of the advisor’s performance of investment management services for the Funds.
We begin with the premise that each shareholder selected his or her Fund because its investments are managed by the investment advisor identified in the prospectus and in accordance with the objective and policies described in the prospectus. We realize, as each of you do, that if you believe that your Fund’s stated objective and policies no longer serve your personal investment goals, you can sell your shares and leave the Fund.
Therefore, we believe that our primary supervisory task—our principal obligation to you—is to assess the nature and quality of the advisor’s services, and to confirm that the advisor actively and competently pursues the Fund’s objective, in accordance with the policies set out in the prospectus. To do this, we meet regularly with management to review your Fund’s portfolio and to discuss the advisor’s specific actions and judgments in pursuing the Fund’s objective. We do not substitute our own judgment for the advisor’s decisions in selecting investments; the advisor is paid to exercise its informed judgment on investment decisions, and we seek to confirm, in reviewing the advisor’s performance, that the advisor is doing just that.
Second, we are conscious of costs and the effect that costs have on shareholders’ returns. We try to make sure that your Fund’s fees and costs are reasonable in relationship to the services rendered and that they are generally in line with those charged by other expert investment advisors, consistent with our belief that the Fund’s investors searched for and expect that expertise and attention and have decided to pay a reasonable price for it. We do not put the management contract “out to bid” as a matter of course, and we would not do so unless we had concluded that the advisor materially had failed to pursue the Fund’s objectives in accordance with its policies, or for other equally important reasons. We believe that any other approach would be inconsistent with your interests and contrary to your expectations when you bought shares of the Fund in the first place.
Finally, because we believe that most Thornburg Fund shareholders have invested with a long-term perspective, we try not to focus too much on the fashions of the moment and on short-term performance. The market will not favor any specific investment objective or set of policies at all times and under all economic circumstances. A fund will experience periods of both high and low returns relative to other funds and other investments. Even if one of our Funds is not favored by the market at a particular time, we believe that the advisor is nonetheless obliged to remain true to the Fund’s objective and policies, and we watch to see that it does so.
Trustees of Thornburg Investment Trust
Thornburg Investment Management is a privately-owned global investment firm that offers a range of solutions for retail and institutional investors. Founded in 1982 and headquartered in Santa Fe, New Mexico, we manage approximately $41.9 billion (as of September 30, 2019) across U.S. mutual funds, separate accounts for high-net-worth investors, institutional accounts, and UCITS funds for non-U.S. investors.
The fund outlined in this report is one of many equity and fixed-income products available from Thornburg Investment Management.
EQUITY FUNDS
| ■ | Thornburg Global Opportunities Fund |
| ■ | Thornburg International Value Fund |
| ■ | Thornburg Better World International Fund |
| ■ | Thornburg International Growth Fund |
| ■ | Thornburg Developing World Fund |
| ■ | Thornburg Value Fund |
| ■ | Thornburg Core Growth Fund |
MULTI_ASSET FUNDS
| ■ | Thornburg Investment Income Builder Fund |
| ■ | Thornburg Summit Fund |
FIXED INCOME FUNDS
| ■ | Thornburg Low Duration Income Fund |
| ■ | Thornburg Limited Term U.S. Government Fund |
| ■ | Thornburg Limited Term Income Fund |
| ■ | Thornburg Strategic Income Fund |
| ■ | Thornburg Low Duration Municipal Fund |
| ■ | Thornburg Limited Term Municipal Fund |
| ■ | Thornburg Intermediate Municipal Fund |
| ■ | Thornburg California Limited Term Municipal Fund |
| ■ | Thornburg New Mexico Intermediate Municipal Fund |
| ■ | Thornburg New York Intermediate Municipal Fund |
| ■ | Thornburg Strategic Municipal Income Fund |
ALTERNATIVE FUNDS
| ■ | Thornburg Long/Short Equity Fund |
Before investing, carefully consider the Fund’s investment goals, risks, charges, and expenses. For a prospectus or summary prospectus containing this and other information, contact your financial advisor or visit thornburg.com. Read it carefully before investing.
For additional information, please visit thornburg.com
Thornburg Investment Management, Inc. 2300 North Ridgetop Road, Santa Fe, NM 87506
This page intentionally left blank.
This page intentionally left blank.
To receive shareholder reports, prospectuses, and proxy statements electronically, go to www.thornburg.com/edelivery.
This Annual Report is submitted for the general information of shareholders of the Fund. It is not authorized for distribution to prospective investors in the Fund unless preceded or accompanied by an effective prospectus.
Investment Advisor:
Thornburg Investment Management®
800.847.0200
Distributor:
Thornburg Securities Corporation®
Annual Report
September 30, 2019
Beginning on January 1, 2021, as permitted by regulations adopted by the Securities and Exchange Commission, paper copies of the Fund’s shareholder reports will no longer be sent by mail, unless you specifically request paper copies of the reports from the Fund or from your financial intermediary, such as a broker-dealer or bank. Instead, the reports will be made available on a website, and you will be notified by mail each time a report is posted and provided with a website link to access the report.
If you already elected to receive shareholder reports electronically, you will not be affected by this change and you need not take any action. You may elect to receive shareholder reports and other communications from the Fund or your financial intermediary electronically by going to thornburg.com/edelivery.
You may elect to receive all future reports in paper free of charge. You can inform the Fund or your financial intermediary that you wish to continue receiving paper copies of your shareholder reports by calling 800.847.0200 or your financial intermediary directly. Your election to receive reports in paper will apply to all funds held with the fund complex/your financial intermediary.
At Thornburg, we believe unconstrained investing leads to better outcomes for our clients. Our investment solutions are highly active, high conviction, and benchmark agnostic. When it comes to finding economic opportunity for clients, it’s more than what we do.
It’s how we do it. Active Asbottom-up, fundamental, active managers, we look beyond conventional benchmarks. Long Term We take a long-term view in how we manage our firm and our portfolios. Benchmark Agnostic Investment strategies should have the flexibility to pursue solutions for clients, not stay within the conventional confines of benchmarks. Flexible Perspective Our approach to portfolio construction is guided by our convictions rather than convention. High Conviction We focus our attention and capital on thoroughly researched, well-understood positions. The best form of risk management is to know what you own, and why. Repeatable & Robust Our long-term outperformance of benchmarks verifies that our process works and outperforms conventional thinking. Independent We are independently owned and far from the herd of other investment managers. Investment Driven All members of the investment team are resources for all of our strategies. Collaborative Our team collaborates on opportunities across geography, sector, or asset class.
Thornburg Capital Management Fund
Annual Report | September 30, 2019
Table of Contents
| SHARE CLASS | NASDAQ SYMBOL | CUSIP |
| Class I | N/A | 885-216-739 |
Letter to Shareholders
Thornburg Capital Management Fund | September 30, 2019 (Unaudited)
October 28, 2019
Dear Shareholder:
Thornburg Capital Management Fund (TCMF) was started with the goal of providing superior risk exposures—higher returns and lower costs—for cash management across the Thornburg family of funds. Through September 30, 2019, we have generally invested approximately $1.56 billion of Thornburg Investment Trust cash and other accredited investors’ cash in high-quality, short-term instruments.
As a reminder to shareholders, by combining the cash balances of eligible Thornburg Investment Trust and accredited investor portfolios into a single pool, we reduce the costs of investing and significantly diversify and reduce risk exposures in any given portfolio. While individual transaction costs appear low (ticketing costs are $2 and an additional $2 for every maturity), these costs add up quickly in a portfolio of overnight securities. Duplicate trades in different portfolios incur separate charges, and with 12 currently invested portfolios, the multiplier effect on costs is high. The creation and continued management of Thornburg Capital Management Fund helps illustrate our long-standing culture of efficient capital stewardship, benefiting all eligible portfolios through reduced transaction costs and more efficient management.
In a special development related to the Fund, near the end of the reporting period, overnight repurchase (repo) market rates spiked, dominating headlines around the globe. Within the Fund, we were able to take advantage of the temporary turmoil, receiving yields as high as 4.5% in a few issues. However, opportunities were extremely short-lived. We remain vigilant. The immediate cause of the turmoil seemed to be an abnormally large U.S. Treasury settlement coinciding with a U.S. tax payment day, as U.S. firms (and probably to a lesser extent individuals) pulled cash from money market funds. The resultant large supply/demand mismatch caused rates to spike, leading to questions surrounding the health of liquidity markets. The U.S. Federal Reserve (the "Fed") stepped in with a special overnight repo operation and an additional 14-day repo program, calming markets. While some have called this “quantitative easing” (QE), we disagree. The action was designed to fix a temporary market supply/demand imbalance, whereas QE was aimed at stimulating the economy. Policy makers are starting to acknowledge that bank demand for
reserves is higher than originally thought. The Fed has chosen to correct this shortfall by allowing its balance sheet to grow along with the natural rate of the economy, just as it had in the past.
All but 2.6% of the Fund’s investments are rated A-1+, A-1, or A-2 by S&P. As of September 30, 2019, 34% of the portfolio was invested in instruments with maturities of one day. As of that same date, 79.6% of the total portfolio had maturities of 14 days or less. The weighted average maturity (WAM) of the portfolio, ex-cash, was 7.1 days. Atlantic City Electric currently represents our largest single exposure outside of supranationals or U.S. government entities. At the end of the period, this exposure represented 1.55% of the portfolio. Keep in mind that at the investing fund level, this is 1.55% of the cash position. As an example, if cash in the investing fund sat at 10%, the investing fund’s Atlantic City Electric position would be 0.155%. As we generally expect to have a large pool of assets, we have the ability to purchase a large number of different issues and still expect to have a vast cost advantage versus splitting investments amongst portfolios. The above figures should give investors a picture of a very high-quality, very short-term, very-liquid portfolio that avoids undue fees.
We continue to believe this structure is a significant improvement over a fragmented, costly, less diversified outcome of investing the cash of each fund separately and should be a benefit to all of the participating portfolios.

| 
|
Jason Brady,cfa
Portfolio Manager
CEO, President, and
Managing Director | Lon R. Erickson,cfa
Portfolio Manager
Managing Director |

| |
Jeff Klingelhofer,cfa
Portfolio Manager
Managing Director | |
The matters discussed in this report may constitute forward-looking statements made pursuant to the safe harbor provisions of the Securities Litigation Reform Act of 1995. These include any advisor or portfolio manager prediction, assessment, analysis or outlook for individual securities, industries, investment styles, market sectors and/or markets. These statements involve risks and uncertainties. In addition to the general risks described for each fund in its current prospectus, other factors bearing on these reports include the accuracy of the advisor’s or portfolio manager’s forecasts and predictions, the appropriateness of the investment strategies designed by the advisor or portfolio manager and the ability of the advisor or portfolio manager to implement their strategies efficiently and successfully. Any one or more of these factors, as well as other risks affecting the securities markets generally, could cause the actual results of any fund to differ materially as compared to its benchmarks.
The views expressed are subject to change and do not necessarily reflect the views of Thornburg Investment Management, Inc. This information should not be relied upon as a recommendation or investment advice and is not intended to predict the performance of any investment or market.
Performance results of individual share classes will vary based on the fees and expenses associated with each share class, and may be higher or lower than other share classes within the same Fund. Please see Performance Summary for performance results of each share class.
Performance Summary
Thornburg Capital Management Fund | September 30, 2019 (Unaudited)
AVERAGE ANNUAL TOTAL RETURNS
| | 1-YR | 3-YR | SINCE
INCEP. |
| Class I Shares(Incep: 7/31/15) | 2.48% | 1.71% | 1.35% |
| FTSE 1-Month T-Bill Index(Since 7/31/15) | 2.33% | 1.48% | 1.10% |
30-DAY YIELDS, I SHARES(with sales charge)
| Annualized Distribution Yield | 2.01% |
| SEC Yield | 2.02% |
GROWTH OF A HYPOTHETICAL $10,000 INVESTMENT
Performance data shown represents past performance and is no guarantee of future results. Investment return and principal value will fluctuate so shares, when redeemed, may be worth more or less than their original cost. Current performance may be lower or higher than quoted. For performance current to the most recent month end, call 800-847-0200. There is no sales charge for class I shares.
Fund Summary
PORTFOLIO COMPOSITION
Glossary
FTSE 1-Month Treasury Bill Index - Measures monthly return equivalents of yield averages that are not marked to market. The One-Month Treasury Bill Index consists of the last one-month Treasury bill issue.
The performance of any index is not indicative of the performance of any particular investment. Unless otherwise noted, index returns reflect the reinvestment of income dividends and capital gains, if any, but do not reflect fees, brokerage commissions or other expenses of investing. Investors may not make direct investments into any index.
Annualized Distribution Yield – The distribution yield reflects actual distributions made to shareholders. The annualized distribution yield is calculated by summing the last 30 days of income at a given month end and annualizing to a 360-day year. The result is divided by the ending maximum offering price or net asset value.
Short-Term Credit Ratings - A bond credit rating assesses the financial ability of a debt issuer to make timely payments of principal and interest. Short-term obligation ratings of A-1 (the highest), A-2 and A-3 are investment-grade quality. Ratings of B, C and D (the lowest) are considered below investment grade, speculative grade, or junk bonds.
Schedule of Investments
Thornburg Capital Management Fund | September 30, 2019
| | | SHARES/
PRINCIPAL AMOUNT | VALUE |
| SHORT-TERM INVESTMENTS — 100.0% |
| | Ameren Illinois Co., | | |
| | 2.120%, 10/1/2019 | $ 2,000,000 | $ 2,000,000 |
| | 2.160%, 10/23/2019 | 22,000,000 | 21,970,960 |
| | American Honda Finance, 2.000%, 10/7/2019 | 540,000 | 539,820 |
| a | Amphenol Corp., 2.170%, 10/1/2019 | 9,000,000 | 9,000,000 |
| | Anthem, Inc., | | |
| a | 2.080%, 10/4/2019 | 2,000,000 | 1,999,653 |
| a | 2.120%, 10/3/2019 | 20,000,000 | 19,997,644 |
| | Apple, Inc., | | |
| a | 1.832%, 10/21/2019 | 19,600,000 | 19,579,311 |
| a | 1.900%, 10/21/2019 | 2,400,000 | 2,397,467 |
| | Atlantic City Electric, 2.150%, 10/1/2019 | 24,000,000 | 24,000,000 |
| a | Atmos Energy Corp., 2.350%, 10/1/2019 | 21,000,000 | 21,000,000 |
| | AutoZone, Inc., | | |
| a | 2.090%, 10/1/2019 | 19,000,000 | 19,000,000 |
| a | 2.090%, 10/4/2019 | 2,000,000 | 1,999,652 |
| a | 2.170%, 10/2/2019 | 3,000,000 | 2,999,819 |
| | AVANGRID, Inc., | | |
| a | 2.150%, 10/1/2019 | 9,700,000 | 9,700,000 |
| a | 2.150%, 10/2/2019 | 4,470,000 | 4,469,733 |
| a | 2.350%, 10/3/2019 | 6,830,000 | 6,829,108 |
| a | Avery Dennison Corp., 2.250%, 10/18/2019 | 3,700,000 | 3,696,069 |
| | Bank of New York Tri-Party Repurchase Agreement 2.02% dated 9/30/2019 due 10/1/2019, repurchase price $40,002,241 collateralized by 30 corporate debt securities, having an average coupon of 3.85%, a minimum credit rating of BBB-, maturity dates from 8/1/2022 to 6/1/2065, and having an aggregate market value of $42,924,839 at 9/30/2019 | 40,000,000 | 40,000,000 |
| a,b | Bell Canada, Inc., 2.250%, 10/3/2019 | 2,000,000 | 1,999,750 |
| | Berkshire Hathaway Energy, | | |
| a | 2.150%, 10/7/2019 | 12,425,000 | 12,420,548 |
| a | 2.200%, 10/3/2019 | 5,300,000 | 5,299,352 |
| a | 2.200%, 10/4/2019 | 4,275,000 | 4,274,216 |
| | Bridgestone Americas, Inc., | | |
| a | 1.900%, 10/1/2019 | 2,000,000 | 2,000,000 |
| a | 1.900%, 10/4/2019 | 22,000,000 | 21,996,517 |
| a,b | Canadian National Railway Co., 2.060%, 10/2/2019 | 9,500,000 | 9,499,456 |
| | Canadian Pacific Ltd., | | |
| a,b | 2.250%, 10/11/2019 | 7,200,000 | 7,195,500 |
| a,b | 2.270%, 10/11/2019 | 800,000 | 799,496 |
| a | CenterPoint Energy, Inc., 2.220%, 10/1/2019 | 22,000,000 | 22,000,000 |
| | Chevron Corp., | | |
| a | 1.920%, 10/28/2019 | 2,000,000 | 1,997,120 |
| a | 1.930%, 10/17/2019 | 2,000,000 | 1,998,284 |
| a | 2.010%, 10/15/2019 | 20,000,000 | 19,984,367 |
| a | Church & Dwight Co., Inc., 2.100%, 10/9/2019 | 9,100,000 | 9,095,753 |
| a | Cintas Executive, 2.100%, 10/1/2019 | 24,000,000 | 24,000,000 |
| a | CME Group, Inc., 2.000%, 10/1/2019 | 21,000,000 | 21,000,000 |
| a | Con Edison, Inc., 2.140%, 10/8/2019 | 6,000,000 | 5,997,503 |
| a | Consolidated Edison, Inc., 2.200%, 10/18/2019 | 5,000,000 | 4,994,806 |
| a | CVS Corp., 2.100%, 10/1/2019 | 24,000,000 | 24,000,000 |
| | Daimler Finance North America, | | |
| a | 2.030%, 10/10/2019 | 650,000 | 649,670 |
| a | 2.070%, 10/11/2019 | 21,000,000 | 20,987,925 |
| | Delmarva Power & Light, 2.150%, 10/1/2019 | 24,000,000 | 24,000,000 |
| | Diageo Capital plc, | | |
| a,b | 2.150%, 10/7/2019 | 20,000,000 | 19,992,833 |
| a,b | 2.200%, 10/8/2019 | 2,000,000 | 1,999,144 |
| a,b | 2.210%, 10/3/2019 | 2,000,000 | 1,999,754 |
| | Electricite de France S.A., | | |
| a,b | 2.140%, 10/11/2019 | 1,000,000 | 999,406 |
| a,b | 2.220%, 10/7/2019 | 2,000,000 | 1,999,260 |
| a,b | 2.230%, 10/11/2019 | 21,000,000 | 20,986,992 |
| a | Eli Lilly & Co., 1.980%, 10/21/2019 | 2,017,000 | 2,014,781 |
| a | Emerson Electric Co., 1.900%, 10/7/2019 | 22,000,000 | 21,993,033 |
Schedule of Investments, Continued
Thornburg Capital Management Fund | September 30, 2019
| | | SHARES/
PRINCIPAL AMOUNT | VALUE |
| a | Eni Finance USA, Inc., 2.220%, 10/7/2019 | $20,000,000 | $ 19,992,600 |
| a | Entergy Corp., 2.120%, 10/1/2019 | 15,000,000 | 15,000,000 |
| | Experian Finance plc, | | |
| a,b | 2.100%, 10/10/2019 | 9,400,000 | 9,395,065 |
| a,b | 2.250%, 10/24/2019 | 5,200,000 | 5,192,525 |
| a,b | 2.350%, 10/15/2019 | 2,000,000 | 1,998,172 |
| | Farmer Mac Discount Notes, 1.700%, 10/1/2019 | 48,997,000 | 48,997,000 |
| | Federal Farm Credit Discount Notes, 1.700%, 10/1/2019 | 14,800,000 | 14,800,000 |
| | Federal Home Loan Bank Discount Notes, | | |
| | 1.770%, 10/25/2019 | 2,600,000 | 2,596,932 |
| | 1.885%, 10/25/2019 | 3,000,000 | 2,996,230 |
| | 1.900%, 10/18/2019 | 50,000,000 | 49,955,139 |
| | 1.920%, 10/2/2019 | 1,400,000 | 1,399,925 |
| | 1.940%, 10/18/2019 | 3,000,000 | 2,997,252 |
| | Florida Power & Light Co., | | |
| | 2.050%, 10/9/2019 | 23,000,000 | 22,989,522 |
| | 2.100%, 10/3/2019 | 1,000,000 | 999,883 |
| | General Electric Co., | | |
| | 2.190%, 10/3/2019 | 9,750,000 | 9,748,814 |
| | 2.210%, 10/30/2019 | 2,000,000 | 1,996,439 |
| | 2.230%, 10/16/2019 | 11,250,000 | 11,239,547 |
| | 2.240%, 10/25/2019 | 1,000,000 | 998,507 |
| | General Mills, Inc., | | |
| a | 2.160%, 10/15/2019 | 15,301,000 | 15,288,147 |
| a | 2.230%, 10/1/2019 | 6,699,000 | 6,699,000 |
| | Hitachi America Capital Ltd., 2.250%, 10/25/2019 | 1,000,000 | 998,500 |
| | Home Depot (The), | | |
| a | 1.830%, 10/3/2019 | 22,000,000 | 21,997,763 |
| a | 1.850%, 10/1/2019 | 2,000,000 | 2,000,000 |
| | IADB Discount Notes, | | |
| b | 1.920%, 10/25/2019 | 7,000,000 | 6,991,040 |
| b | 1.950%, 10/23/2019 | 50,000,000 | 49,940,417 |
| b | IFC Discount Notes, 1.870%, 10/21/2019 | 27,000,000 | 26,971,950 |
| c | Indiana Finance Authority (Marion County Capital Improvement Board; SPA U.S. Bank, N.A.), 1.770%, 2/1/2037 (put 10/1/2019) | 1,900,000 | 1,900,000 |
| a | Intercontinental Exchange, Inc., 2.040%, 10/4/2019 | 1,500,000 | 1,499,745 |
| | JM Smucker Co., | | |
| a | 2.150%, 10/3/2019 | 18,000,000 | 17,997,850 |
| a | 2.150%, 10/7/2019 | 4,000,000 | 3,998,567 |
| a | Kansas City Power and Light Co., 2.160%, 10/2/2019 | 24,000,000 | 23,998,560 |
| a | Keurig Dr Pepper, 2.350%, 10/11/2019 | 5,000,000 | 4,996,736 |
| | Kimberly-Clark Corp., | | |
| a | 1.920%, 10/10/2019 | 4,800,000 | 4,797,696 |
| a | 1.930%, 10/9/2019 | 1,066,000 | 1,065,543 |
| a | Kroger Co., 2.180%, 10/7/2019 | 24,000,000 | 23,991,280 |
| a | Leggett & Platt, 2.170%, 10/1/2019 | 3,000,000 | 3,000,000 |
| a | Louisville Gas & Electric Co., 2.250%, 10/7/2019 | 22,000,000 | 21,991,750 |
| | Marriott International, Inc., | | |
| a | 2.120%, 10/1/2019 | 2,000,000 | 2,000,000 |
| a | 2.160%, 10/24/2019 | 1,000,000 | 998,620 |
| a | 2.200%, 10/9/2019 | 15,000,000 | 14,992,667 |
| a | 2.210%, 10/9/2019 | 2,790,000 | 2,788,630 |
| a | 2.230%, 10/7/2019 | 3,210,000 | 3,208,807 |
| | McCormick & Company, Inc., | | |
| a | 2.150%, 10/2/2019 | 993,000 | 992,941 |
| a | 2.150%, 10/11/2019 | 8,820,000 | 8,814,733 |
| | Mondelez International, Inc., | | |
| a | 2.170%, 10/10/2019 | 12,050,000 | 12,043,463 |
| a | 2.200%, 10/1/2019 | 3,450,000 | 3,450,000 |
| a | 2.200%, 10/3/2019 | 4,190,000 | 4,189,488 |
| a | Nestle Capital Corp., 1.850%, 10/7/2019 | 24,000,000 | 23,992,600 |
| c | New Hampshire Health and Education Facilities Authority Act (University System of New Hampshire; SPA Wells Fargo Bank, N.A.), 1.770%, 7/1/2033 (put 10/1/2019) | 15,000,000 | 15,000,000 |
| c | New York City Water & Sewer System (SPA Mizuho Bank, Ltd.), 1.770%, 6/15/2048 (put 10/1/2019) | 7,200,000 | 7,200,000 |
Schedule of Investments, Continued
Thornburg Capital Management Fund | September 30, 2019
| | | SHARES/
PRINCIPAL AMOUNT | VALUE |
| a | NextEra Energy Capital Holdings, Inc., 2.220%, 10/7/2019 | $ 3,700,000 | $ 3,698,631 |
| | Nike, Inc., | | |
| a | 1.950%, 10/8/2019 | 21,000,000 | 20,992,037 |
| a | 1.950%, 10/10/2019 | 1,000,000 | 999,513 |
| | Northern Il Gas Corp., 1.940%, 10/2/2019 | 24,000,000 | 23,998,707 |
| a | Novartis Finance Corp., 1.990%, 10/7/2019 | 22,000,000 | 21,992,703 |
| a | Oglethorpe Power Corp., 2.250%, 10/9/2019 | 569,000 | 568,716 |
| | One Gas, Inc., | | |
| a | 2.070%, 10/21/2019 | 3,000,000 | 2,996,550 |
| a | 2.090%, 10/18/2019 | 18,000,000 | 17,982,235 |
| a | 2.090%, 10/23/2019 | 1,000,000 | 998,723 |
| | Peoples Gas Light & Coke Co., 2.050%, 10/1/2019 | 23,000,000 | 23,000,000 |
| a | Pinnacle West Capital Corp., 2.170%, 10/1/2019 | 13,475,000 | 13,475,000 |
| a | Roche Holding, Inc., 1.860%, 10/4/2019 | 1,000,000 | 999,845 |
| | Ryder System, Inc., 2.120%, 10/7/2019 | 2,000,000 | 1,999,293 |
| | Sempra Energy Holdings, | | |
| a | 2.250%, 10/1/2019 | 800,000 | 800,000 |
| a | 2.250%, 10/3/2019 | 1,000,000 | 999,875 |
| a | 2.500%, 10/3/2019 | 17,000,000 | 16,997,639 |
| a | Snap-on, Inc., 2.030%, 10/7/2019 | 800,000 | 799,729 |
| | Sonoco Products Co., 2.150%, 10/1/2019 | 24,000,000 | 24,000,000 |
| | Southern Co. Gas Capital Corp., | | |
| a | 1.960%, 10/1/2019 | 7,000,000 | 7,000,000 |
| a | 2.040%, 10/2/2019 | 15,000,000 | 14,999,150 |
| | Stanley Works (The), | | |
| a | 2.080%, 10/4/2019 | 17,625,000 | 17,621,945 |
| a | 2.120%, 10/7/2019 | 4,375,000 | 4,373,454 |
| | Tennessee Valley Authority Discount Notes, 2.200%, 10/2/2019 | 25,000,000 | 24,998,472 |
| a,b | Total Cap Cda Ltd., 1.980%, 10/23/2019 | 770,000 | 769,068 |
| a,b | Total Fina Elf Holdings USA, Inc., 1.800%, 10/1/2019 | 23,230,000 | 23,230,000 |
| | Tyson Foods, Inc., | | |
| a | 2.130%, 10/7/2019 | 17,500,000 | 17,493,788 |
| a | 2.140%, 10/4/2019 | 4,500,000 | 4,499,198 |
| c | Uinta County (Guaranty: Chevron Corp.), 1.770%, 8/15/2020 (put 10/1/2019) | 24,000,000 | 24,000,000 |
| | Union Electric Co., | | |
| | 2.150%, 10/1/2019 | 24,000,000 | 24,000,000 |
| a | 2.200%, 10/7/2019 | 21,000,000 | 20,992,300 |
| a | United Parcel Service, Inc., 1.750%, 10/1/2019 | 24,000,000 | 24,000,000 |
| | United States Treasury Bill, | | |
| | 1.731%, 10/10/2019 | 9,169,000 | 9,165,033 |
| | 1.742%, 10/15/2019 | 32,456,000 | 32,434,019 |
| | Wec Energy Group, Inc., | | |
| a | 2.200%, 10/8/2019 | 15,250,000 | 15,243,459 |
| a | 2.210%, 10/9/2019 | 1,000,000 | 999,509 |
| a | 2.220%, 10/10/2019 | 2,085,000 | 2,083,843 |
| a | 2.280%, 10/1/2019 | 3,200,000 | 3,200,000 |
| a | Western Union Co., 2.250%, 10/2/2019 | 1,750,000 | 1,749,891 |
| | Wisconsin Gas Co., 2.000%, 10/4/2019 | 10,000,000 | 9,998,333 |
| | TOTAL SHORT-TERM INVESTMENTS(Cost $1,552,595,405) | | 1,552,595,405 |
| | Total Investments — 100.0%(Cost $1,552,595,405) | | $1,552,595,405 |
| | Other Assets Less Liabilities — 0.0% | | 81,743 |
| | Net Assets — 100.0% | | $1,552,677,148 |
| Footnote Legend |
| a | Securities exempt from registration under Rule 144A of the Securities Act of 1933, as amended. These securities are restricted and may only be resold in the ordinary course of business in transactions exempt from registration, normally to qualified institutional buyers. As of September 30, 2019, the aggregate value of these securities in the Fund’s portfolio was $961,773,671, representing 61.94% of the Fund’s net assets. |
| b | Yankee bond denominated in U.S. dollars and is issued in the U.S. by foreign banks and corporations. |
Schedule of Investments, Continued
Thornburg Capital Management Fund | September 30, 2019
| c | Variable Rate Demand Notes are instruments whose interest rates change on a specific date (such as coupon date or interest payment date) or whose interest rates vary with changes in a designated base rate (such as the prime interest rate). This instrument is payable on demand and is secured by letters of credit or other credit support agreements from major banks. |
Portfolio Abbreviations
To simplify the listings of securities, abbreviations are used per the table below:
| SPA | Stand-by Purchase Agreement |
See notes to financial statements.
There is no guarantee that the Fund will meet its investment objectives.All data is subject to change. Charts may not add up to 100% due to rounding.
Statement of Assets and Liabilities
Thornburg Capital Management Fund | September 30, 2019
| ASSETS | |
| Investments at value (cost $1,552,595,405) (Note 3) | $ 1,552,595,405 |
| Cash | 86,024 |
| Interest receivable | 52,580 |
| Total Assets | 1,552,734,009 |
| Liabilities | |
| Accounts payable and accrued expenses | 56,861 |
| Total Liabilities | 56,861 |
| Net Assets | $ 1,552,677,148 |
| NET ASSETS CONSIST OF | |
| Distributable earnings | $ 23,695 |
| Net capital paid in on shares of beneficial interest | 1,552,653,453 |
| | $ 1,552,677,148 |
| NET ASSET VALUE | |
| Class I Shares: | |
Net asset value, offering and redemption price per share
($1,552,677,148 applicable to 155,267,715 shares of beneficial interest outstanding - Note 5) | $ 10.00 |
See notes to financial statements.
Statement of Operations
Thornburg Capital Management Fund | Year Ended September 30, 2019
| INVESTMENT INCOME | |
| Interest income | $ 27,436,013 |
| EXPENSES | |
| Transfer agent fees | 5,294 |
| Custodian fees | 83,724 |
| Professional fees | 43,702 |
| Officer fees | 7,848 |
| Other expenses | 38,317 |
| Total Expenses | 178,885 |
| Net Investment Income | $ 27,257,128 |
See notes to financial statements.
Statements of Changes in Net Assets
Thornburg Capital Management Fund
| | Year Ended
September 30, 2019 | Year Ended
September 30, 2018 |
| INCREASE (DECREASE) IN NET ASSETS FROM | | |
| OPERATIONS | | |
| Net investment income | $ 27,257,128 | $ 18,648,377 |
| Net Increase in Net Assets Resulting from Operations | 27,257,128 | 18,648,377 |
| DIVIDENDS TO SHAREHOLDERS | | |
| From distributable earnings | | |
| Class I Shares | (27,257,128) | (18,648,377) |
| FUND SHARE TRANSACTIONS (NOTE 5) | | |
| Class I Shares | 227,151,860 | 195,504,453 |
| Net Increase in Net Assets | 227,151,860 | 195,504,453 |
| NET ASSETS | | |
| Beginning of Year | 1,325,525,288 | 1,130,020,835 |
| End of Year | $ 1,552,677,148 | $ 1,325,525,288 |
See notes to financial statements.
Notes to Financial Statements
Thornburg Capital Management Fund | September 30, 2019
NOTE 1 – ORGANIZATION
Thornburg Capital Management Fund (the “Fund”) is a non-diversified series of Thornburg Investment Trust (the “Trust”). The Trust was organized as a Massachusetts business trust under a Declaration of Trust dated June 3, 1987 and is registered as a diversified, open-end management investment company under the Investment Company Act of 1940, as amended (the "1940 Act"). The Fund is currently one of twenty-two separate series of the Trust. Each series is considered to be a separate entity for financial reporting and tax purposes and bears expenses directly attributable to it. The Fund’s investment objective is to seek current income consistent with liquidity management and safety of capital.
The Fund currently offers one class of shares of beneficial interest: Institutional Class (“Class I”). This class of shares of the Fund represents all interest in the portfolio of investments. Class I shares are sold at net asset value without a sales charge at the time of purchase and may be subject to a service fee. All expenses are allocated to the class including administration fees, transfer agent fees, government registration fees, printing and postage costs, and legal expenses.
Shares of the Fund are issued solely in private placement transactions that do not involve any “public offering” within the meaning of Section (4)2 of the 1933 Act. Investments in the Fund may only be made by investment companies, or other persons that are “accredited investors” within the meaning of Regulation D under the 1933 Act. Thornburg Investment Management, Inc. (the "Advisor"), acting as the agent for the other series of the Trust, will affect all purchases and sells of shares of the Fund on behalf of any series of the Trust.
The following is a summary of significant accounting policies followed by the Fund in the preparation of its financial statements. The Fund prepares its financial statements in conformity with United States generally accepted accounting principles (“GAAP”), including investment company accounting and reporting guidance in the Financial Accounting Standards Board (the “FASB”) Accounting Standard Codification Topic 946.
NOTE 2 – SIGNIFICANT ACCOUNTING POLICIES
Security Valuation: All investments in securities held by the Fund are valued as described in Note 3.
Allocation of Expenses: Expenses common to all Funds are allocated among the Funds comprising the Trust based upon their relative net asset values or other appropriate allocation methods.
Dividends and Distributions to Shareholders: Dividends and distributions to shareholders, which are determined in accordance with federal income tax regulations and may differ from GAAP, are recorded on the ex-dividend date. Ordinary income dividends, if any, are declared daily and paid monthly. Capital gain distributions, if any, are declared and paid annually and more often if deemed necessary by the Advisor. Dividends and distributions are paid and are reinvested in additional shares of the Fund at net asset value per share at the close of business on the ex-dividend date, or at the shareholder’s option, paid in cash.
Investment Income: Interest income is accrued as earned. Premiums and discounts are amortized and accreted, respectively, to first call dates or maturity dates using the effective yield method of the respective investments. These amounts are included in Investment Income in the Statement of Operations.
Investment Transactions: Investment transactions are accounted for on a trade date basis. Realized gains and losses from the sale of investments are recorded on an identified cost basis.
Repurchase Agreements: The Fund may invest excess cash in repurchase agreements whereby the Fund purchases investments, which serve as collateral, with an agreement to resell such collateral to the seller at an agreed upon price at the maturity date of the repurchase agreement. Investments pledged as collateral for repurchase agreements are held in custody until maturity of the repurchase agreement. Provisions in the agreements require that the market value of the collateral is at least equal to the repurchase value in the event of default. In the event of default, the Fund has the right to liquidate the collateral and apply the proceeds in satisfaction of the obligation. Under certain circumstances, in the event of default or bankruptcy by the other party to the agreement, realization and/or retention of the collateral may be subject to legal proceedings.
When-Issued and Delayed Delivery Transactions: The Fund may engage in when-issued or delayed delivery transactions. To the extent the Fund engages in such transactions, it will do so for the purpose of acquiring portfolio investments consistent with the Fund’s investment objectives and not for the purpose of investment leverage or to speculate on interest rate or market changes. At the time the Fund makes a commitment to purchase an investment on a when-issued or delayed delivery basis, the Fund will record the transaction and reflect the value in determining its net asset value. When effecting such transactions, assets of an amount sufficient to make payment for the portfolio investments to be purchased will be segregated on the Fund’s records on the trade date. Investments purchased on a when-issued or delayed delivery basis do not earn interest until the settlement date. The values of these securities held at September 30, 2019 are detailed in the Schedule of Investments.
Notes to Financial Statements, Continued
Thornburg Capital Management Fund | September 30, 2019
Guarantees and Indemnifications: Under the Trust’s organizational documents (and under separate agreements with the independent Trustees), its officers and Trustees are provided with an indemnification against certain liabilities arising out of the performance of their duties to the Fund. In the normal course of business the Trust may also enter into contracts with service providers that contain general indemnifications. The Trust’s maximum exposure under these arrangements is unknown. However, based on experience, the Trust expects the risk of loss to be remote.
Use of Estimates: The preparation of financial statements in conformity with GAAP requires management to make estimates and assumptions that affect the reported amounts of assets and liabilities and disclosure of contingent assets and liabilities at the date of the financial statements and the reported amounts of increases (decreases) in net assets from operations during the reporting period. Actual results could differ from those estimates.
Federal Income Taxes: It is the policy of the Trust to comply with the provisions of the Internal Revenue Code applicable to regulated investment companies and to distribute to shareholders substantially all investment company taxable income including net realized gains on investments (if any), and tax exempt income of the Fund. Therefore, no provision for federal income or excise tax is required.
The Fund files income tax returns in United States federal and applicable state jurisdictions. The statute of limitations on the Fund’s tax return filings generally remains open for the three years following a return’s filing date. The Fund has analyzed each uncertain tax position believed to be material in the preparation of the Fund’s financial statements for the fiscal year ended September 30, 2019, including open tax years, to assess whether it is more likely than not that the position would be sustained upon examination, based on the technical merits of the position. The Fund has not identified any such position for which an asset or liability must be reflected in the Statement of Assets and Liabilities.
At September 30, 2019, information on the tax components of capital was as follows:
| Cost of investments for tax purposes | $ 1,552,595,405 |
| Net unrealized appreciation (depreciation) on investments (tax basis) | $ - |
There is no unrealized gain (loss) in the Fund at September 30, 2019 due to all securities with less than 60 days to maturity being valued by the amortized cost method.
At September 30, 2019, the Fund had $23,695 of undistributed tax basis ordinary investment income and no undistributed tax basis capital gains.
The tax character of distributions paid during the year ended September 30, 2019, and September 30, 2018, was as follows:
| | 2019 | 2018 |
| Distributions from: | | |
| Ordinary income | $ 27,257,128 | $ 18,648,377 |
| Total | $ 27,257,128 | $ 18,648,377 |
NOTE 3 – SECURITY VALUATION
Valuation of the Fund’s portfolio investment securities is performed in accordance with policies and procedures adopted by and under the oversight of the Trustees.
The Trustees of the Trust have appointed the Advisor to assist the Trustees with obtaining fair market values for portfolio investments, evaluating and monitoring professional pricing service providers appointed by the Trustees’ Audit Committee (the “Audit Committee”) to assist in determining fair values for portfolio investments, assisting in calculating fair values for portfolio investments in certain circumstances, and performing other functions in connection with the valuation of investments. The Advisor acts through its Valuation and Pricing Committee (the “Committee”) and other employees of the Advisor. The Committee regularly reviews its own valuation calculations, reviews the valuations, valuation techniques and services furnished by pricing service providers, considers circumstances which may require valuation calculations by the Committee, and reviews previous valuation calculations. The Committee reports to the Audit Committee on the Committee’s activities, the performance of pricing service providers, and other matters relating to valuation of portfolio investments.
In those instances when the Committee assists in calculating a fair value for a portfolio investment, the Committee seeks to determine the price that the Fund would reasonably expect to receive upon a sale of the investment in an orderly transaction between market participants on the valuation date. The Committee customarily utilizes quotations from securities broker dealers in calculating valuations, but also may
Notes to Financial Statements, Continued
Thornburg Capital Management Fund | September 30, 2019
utilize prices obtained from pricing service providers or other methods approved by the Audit Committee. Because fair values calculated by the Committee are estimates, the calculation of a value for an investment may differ from the price that would be realized by the Fund upon a sale of the investment, and the difference could be material to the Fund’s financial statements. The Committee’s calculation of a fair value for an investment may also differ from the prices obtained by other persons (including other mutual funds) for the investment.
Valuation of Securities: Securities held with a maturity of less than 60 days are valued using the amortized cost method. The amortized cost method of valuation involves valuing a security at its cost initially and thereafter assuming a constant amortization to maturity of any discount or premium, regardless of the impact of fluctuating interest rates on the market value of the security. This method may result in periods during which value, as determined by amortized cost, is higher or lower than the price each Fund would receive if it sold the security. The market value of securities in the Fund can be expected to vary inversely with changes in prevailing interest rates.
Debt obligations held by the Fund which are not listed or traded on exchanges or for which no reported market exists are ordinarily valued at the valuation obtained from a pricing service provider approved by the Audit Committee.
In any case when a pricing service provider fails to provide a valuation for a debt obligation held by the Fund, the Committee calculates a fair value for the obligation using alternative methods under procedures approved by the Audit Committee. Additionally, in cases when management believes that a valuation obtained from a pricing service provider is stale, does not reflect material factors affecting the valuation of the investment, is significantly different than the value the Fund is likely to obtain if it sought a bid for the investment, or is otherwise unreliable, the Committee calculates a fair value for the obligation using an alternative method approved by the Audit Committee.
Valuation Hierarchy: The Fund categorizes its investments based upon the inputs used in valuing those investments, according to a three-level hierarchy established in guidance from the FASB. Categorization of investments using this hierarchy is intended by the FASB to maximize the use of observable inputs in valuing investments and minimize the use of unobservable inputs by requiring that the most observable inputs be used when available. Observable inputs are those that market participants would use in valuing an investment based on available market information. Unobservable inputs are those that reflect assumptions about the information market participants would use in valuing an investment. An investment’s level within the hierarchy is based on the lowest level input that is deemed significant to the valuation. The methodologies and inputs used to value investments are not necessarily indications of the risk or liquidity associated with those investments.
Various inputs are used in calculating valuations for the Fund’s investments. These inputs are generally summarized according to the three-level hierarchy below:
Level 1: Quoted prices in active markets for identical investments.
Level 2: Other direct or indirect significant observable inputs (including quoted prices for similar investments in active markets and other observable inputs, such as interest rates, prepayment rates, credit ratings, etc.).
Level 3: Significant unobservable inputs (including the Committee’s own assumptions in calculating the fair values of investments).
Valuations for debt obligations held by the Fund are typically calculated by pricing service providers approved by the Audit Committee and are generally characterized as Level 2 within the valuation hierarchy.
In a limited number of cases the Committee calculates a fair value for investments using broker quotations or other methods approved by the Audit Committee. When the Committee uses a single broker quotation to calculate a fair value for an investment without other significant observable inputs, or if a fair value is calculated using other significant inputs that are considered unobservable, the investment is characterized as Level 3 within the hierarchy. Other significant unobservable inputs used to calculate a fair value in these instances might include an income-based valuation approach which considers discounted anticipated future cash flows from the investment and application of discounts due to the nature or duration of any restrictions on the disposition of the investment.
Valuations based upon the use of inputs from Levels 1, 2 or 3 may not represent the actual price received upon the disposition of an investment, and a Fund may receive a price that is lower than the valuation based upon these inputs when it sells the investment.
Notes to Financial Statements, Continued
Thornburg Capital Management Fund | September 30, 2019
The following table displays a summary of the fair value hierarchy measurements of the Fund’s investments as of September 30, 2019:
| | Fair Value Measurements at September 30, 2019 |
| | TOTAL | LEVEL 1 | LEVEL 2 | LEVEL 3 |
| Assets | | | | |
| Investments in Securities | | | | |
| Short-Term Investments | $ 1,552,595,405 | $ — | $ 1,552,595,405 | $ — |
| Total Investments in Securities | $1,552,595,405 | $— | $1,552,595,405 | $— |
| Total Assets | $1,552,595,405 | $— | $1,552,595,405 | $— |
NOTE 4 – INVESTMENT ADVISORY FEE AND OTHER TRANSACTIONS WITH AFFILIATES
Pursuant to an investment advisory agreement, the Advisor serves as the investment advisor and performs services for the Fund. The Fund does not pay an advisory fee to the Advisor under this agreement.
The Advisor provides certain administrative services to the Fund. No fees are charged for these services.
The Fund may purchase or sell securities from or to an affiliated fund, provided the affiliation is due solely to having a common investment advisor, common officers, or common trustees, and provided that all such transactions will comply with Rule 17a-7 under the 1940 Act. For the year ended September 30, 2019, the Fund had no such transactions with affiliated funds.
NOTE 5 – SHARES OF BENEFICIAL INTEREST
At September 30, 2019, there were an unlimited number of shares with no par value of beneficial interest authorized. Transactions in shares of beneficial interest were as follows:
| | YEAR ENDED
September 30, 2019 | YEAR ENDED
September 30, 2018 |
| | SHARES | AMOUNT | SHARES | AMOUNT |
| Class I Shares | | | | |
| Shares sold | 710,137,132 | $ 7,101,371,322 | 800,929,556 | $ 8,009,295,565 |
| Shares issued to shareholders in reinvestment of dividends | 2,724,210 | 27,242,096 | 1,866,541 | 18,665,413 |
| Shares repurchased | (690,146,156) | (6,901,461,558) | (783,245,652) | (7,832,456,525) |
| Net increase | 22,715,186 | $ 227,151,860 | 19,550,445 | $ 195,504,453 |
NOTE 6 – INVESTMENT TRANSACTIONS
For the year ended September 30, 2019, the Fund had no purchase and sale transactions of investments other than short-term investments.
NOTE 7 – RECENT ACCOUNTING PRONOUNCEMENTS
In August 2018, the FASB issued ASU 2018-13, Fair Value Measurement (Topic 820): Changes to the Disclosure Requirements for Fair Value Measurement, which adds, removes, and modifies certain aspects of the fair value disclosure. ASU 2018-13 is effective for annual periods beginning after December 15, 2019, and early adoption is permitted. The Funds have elected to early adopt, and had applied ASU 2018-13 for the fiscal year ended September 30, 2019. The adoption of this accounting guidance did not have a material impact on the Funds’ financial statements.
In March 2017, the FASB issued Accounting Standards Update (ASU) 2017-08, Premium Amortization of Purchased Callable Debt Securities. The amendments in the ASU shorten the premium amortization period on a purchased callable debt security from the security’s contractual life to the earliest call date. It is anticipated that this change will enhance disclosures by reducing losses recognized when a security is called on an earlier date. This ASU is effective for fiscal years beginning after December 15, 2018. Management has evaluated the implications of these changes and the amendments will have no material effect on the Funds’ net assets or results of operations.
Notes to Financial Statements, Continued
Thornburg Capital Management Fund | September 30, 2019
OTHER NOTES
Risks: The Fund’s investments subject it to risks including, but not limited to, management risk, interest rate risk, prepayment and extension risk, credit risk, market and economic risk, foreign investment risk, liquidity risk, diversification risk, and risks of investments in mortgage- and asset-backed securities. Please see the Fund’s prospectus for a discussion of the risks associated with an investment in the Fund.
Subsequent Events: Fund management believes no events have occurred between September 30, 2019 and the date of issuance of the financial statements that require adjustment to or disclosure in the accompanying financial statements.
Financial Highlights
Thornburg Capital Management Fund
| | Per Share Performance (For a Share Outstanding throughout the Year) |
UNLESS OTHERWISE
NOTED, PERIODS ARE
FISCAL YEARS ENDED
SEPTEMBER 30, | Net Asset
Value,
Beginning of
Period | Net
Investment
Income
(Loss)+ | Net Realized &
Unrealized Gain
(Loss) on
Investments | Total from
Investment
Operations | Dividends
from Net
Investment
Income | Dividends
from Net
Realized
Gains | Total
Dividends | Net Asset
Value,
End of Period |
| Class I |
| 2019 | $ 10.00 | 0.24 | — | 0.24 | (0.24) | — | (0.24) | $ 10.00 |
| 2018 | $ 10.00 | 0.18 | — | 0.18 | (0.18) | — | (0.18) | $ 10.00 |
| 2017 | $ 10.00 | 0.09 | — | 0.09 | (0.09) | — | (0.09) | $ 10.00 |
| 2016 | $ 10.00 | 0.05 | — | 0.05 | (0.05) | — | (0.05) | $ 10.00 |
| 2015(c) | $ 10.00 | —(d) | —(e) | —(f) | —(g) | — | — | $ 10.00 |
| (a) | Not annualized for periods less than one year. |
| (b) | Portfolio turnover rate equals zero due to no long term investment transactions in the period. |
| (c) | Fund commenced operations on July 31, 2015. |
| (d) | Net investment income (loss) was less than $0.01 per share. |
| (e) | Net realized and unrealized gain (loss) on investments was less than $0.01 per share. |
| (f) | Total from investment operations was less than $0.01 per share. |
| (g) | Dividends from net investment income per share were less than $(0.01). |
| (h) | Annualized. |
| + | Based on weighted average shares outstanding. |
See notes to financial statements.
Financial Highlights, Continued
Thornburg Capital Management Fund
| Ratios to Average Net Assets | | Supplemental Data |
Net Investment
Income (Loss) (%) | Expenses, After
Expense
Reductions (%) | Expenses,
Before Expense
Reductions (%) | | Total
Return (%)(a) | Portfolio
Turnover
Rate (%)(a) | Net Assets
at End of Period
(Thousands) |
| |
| 2.44 | 0.02 | 0.02 | | 2.48 | —(b) | $ 1,552,677 |
| 1.76 | 0.02 | 0.02 | | 1.76 | —(b) | $ 1,325,525 |
| 0.89 | 0.03 | 0.03 | | 0.87 | —(b) | $ 1,130,021 |
| 0.45 | 0.03 | 0.03 | | 0.45 | —(b) | $ 1,393,536 |
| 0.26(h) | 0.03(h) | 0.03(h) | | 0.04 | —(b) | $ 1,772,860 |
Report of Independent Registered Public Accounting Firm
Thornburg Capital Management Fund
To the Board of Trustees of Thornburg Investment Trust and Shareholders of
Thornburg Capital Management Fund
Opinion on the Financial Statements
We have audited the accompanying statement of assets and liabilities, including the schedule of investments, of Thornburg Capital Management Fund (one of the funds constituting Thornburg Investment Trust, referred to hereafter as the "Fund") as of September 30, 2019, the related statement of operations for the year ended September 30, 2019, the statements of changes in net assets for each of the two years in the period ended September 30, 2019, including the related notes, and the financial highlights for each of the four years in the period ended September 30, 2019 and for the period July 31, 2015 (commencement of operations) through September 30, 2015 (collectively referred to as the “financial statements”). In our opinion, the financial statements present fairly, in all material respects, the financial position of the Fund as of September 30, 2019, the results of its operations for the year then ended, the changes in its net assets for each of the two years in the period ended September 30, 2019 and the financial highlights for each of the four years in the period ended September 30, 2019 and for the period July 31, 2015 (commencement of operations) through September 30, 2015 in conformity with accounting principles generally accepted in the United States of America.
Basis for Opinion
These financial statements are the responsibility of the Fund’s management. Our responsibility is to express an opinion on the Fund’s financial statements based on our audits. We are a public accounting firm registered with the Public Company Accounting Oversight Board (United States) (PCAOB) and are required to be independent with respect to the Fund in accordance with the U.S. federal securities laws and the applicable rules and regulations of the Securities and Exchange Commission and the PCAOB.
We conducted our audits of these financial statements in accordance with the standards of the PCAOB. Those standards require that we plan and perform the audit to obtain reasonable assurance about whether the financial statements are free of material misstatement, whether due to error or fraud.
Our audits included performing procedures to assess the risks of material misstatement of the financial statements, whether due to error or fraud, and performing procedures that respond to those risks. Such procedures included examining, on a test basis, evidence regarding the amounts and disclosures in the financial statements. Our audits also included evaluating the accounting principles used and significant estimates made by management, as well as evaluating the overall presentation of the financial statements. Our procedures included confirmation of securities owned as of September 30, 2019 by correspondence with the custodian and broker. We believe that our audits provide a reasonable basis for our opinion.
/s/PricewaterhouseCoopers LLP
New York, New York
November 22, 2019
We have served as the auditor of one or more investment companies in Thornburg Investment Trust since 1999.
Expense Example
Thornburg Capital Management Fund | September 30, 2019 (Unaudited)
As a shareholder of the Fund, you incur ongoing costs of investing in the Fund. Because the Fund does not pay any management fee or distribution and/or service (12b-1) fee, the Fund’s ongoing costs are comprised of other Fund expenses. Shareholders of the Fund do not incur any transaction costs.
This example is intended to help you understand your ongoing costs (in dollars) of investing in the Fund and to compare these costs with the ongoing costs of investing in other mutual funds.
The example is based on a $1,000 investment beginning on April 1, 2019, and held until September 30, 2019.
| | BEGINNING
ACCOUNT VALUE
4/1/19 | ENDING
ACCOUNT VALUE
9/30/19 | EXPENSES PAID
DURING PERIOD†
4/1/19—9/30/19 |
| CLASS I SHARES |
| Actual | $1,000.00 | $1,012.21 | $0.10 |
| Hypothetical* | $1,000.00 | $1,024.97 | $0.10 |
| † | Expenses are equal to the annualized expense ratio for each class (I: 0.02%) multiplied by the average account value over the period, multiplied by 183/365 to reflect the one-half year period. |
| * | Hypothetical assumes a rate of return of 5% per year before expenses. |
ACTUAL EXPENSES
For each class of shares, the first line of the accompanying table provides information about actual account values and actual expenses. You may use the information in this line, together with the amount you invested, to estimate the expenses that you paid over the period. Simply divide your account value by $1,000 (for example, an $8,600 account value divided by $1,000 = 8.6), then multiply the result by the number in the first line for your class of shares under the heading entitled “Expenses Paid During Period” to estimate the expenses you paid on your account during this period.
HYPOTHETICAL EXAMPLE FOR COMPARISON PURPOSES
For each class of shares, the second line of the accompanying table provides information about hypothetical account values and hypothetical expenses based on the Fund’s actual expense ratio and an assumed rate of return of 5% per year before expenses, which is not the Fund’s actual return. The hypothetical account values and expenses may not be used to estimate the actual ending account balance or expenses you paid for the period. You may use this information to compare the ongoing costs of investing in the Fund and other funds. To do so, compare this 5% hypothetical example with the 5% hypothetical examples that appear in the shareholder reports of the other funds.
Please note that the expenses shown in the table are meant to highlight your ongoing costs only and do not reflect any transactional costs, such as sales charges (loads), redemption fees, or exchange fees. Therefore, the second line of the table for each class of shares is useful in comparing ongoing costs only, and will not help you determine the relative total costs of owning different funds. In addition, if these transactional costs were included, your costs would have been higher.
Trustees and Officers
Thornburg Capital Management Fund | September 30, 2019 (Unaudited)
NAME, AGE, YEAR ELECTED
POSITION HELD WITH FUND | PRINCIPAL OCCUPATION(S) DURING PAST FIVE YEARS | OTHER DIRECTORSHIPS
HELD BY TRUSTEE |
| INTERESTED TRUSTEES(1)(2) |
Garrett Thornburg, 73
Trustee since 1984,
Chairman of Trustees(3) | Chairman and controlling shareholder of Thornburg Investment Management, Inc. (investment advisor); Chairman and controlling shareholder of Thornburg Securities Corporation (securities dealer); President of the Thornburg Foundation (nonprofit). | None |
Brian J. McMahon, 64
Trustee since 2001,
Vice Chairman of Trustees,
Member of Governance and
Nominating Committee &
Operations Risk Oversight
Committee(4) | Vice Chairman, Chief Investment Strategist, Managing Director, and Portfolio Manager and, until 2016, CEO and President of Thornburg Investment Management, Inc.; Vice President of Thornburg Securities Corporation. | None |
| INDEPENDENT TRUSTEES(1)(2)(5) |
David A. Ater, 74
Trustee since 1994,
Lead Independent Trustee,
Chairman of Governance and
Nominating Committee &
Member of Audit Committee | Principal in Ater & Associates, Santa Fe, NM (developer, planner and broker of residential and commercial real estate); owner, developer and broker for various real estate projects. | None |
Sally Corning, 58
Trustee since 2012,
Chairman of Audit Committee | Partner in Sun Mountain Capital, Santa Fe, NM (private equity firm with investment programs encompassing venture capital, mezzanine debt, and growth equity). | None |
Susan H. Dubin, 70
Trustee since 2004,
Member of Audit
Committee & Governance
and Nominating Committee | President of Dubin Investments, Ltd., Greenwich, CT (private investment fund); Director and officer of various charitable organizations. | None |
David L. Gardner, 56
Trustee since 2015,
Member of Operations Risk
Oversight Committee | Until 2012, head of EMEA (Europe, Middle East and Africa) Sales for iShares of Blackrock, Inc., EMEA Executive Committee Member and EMEA Operating Committee Member at Blackrock, Inc. | None |
Patrick J. Talamantes, 55
Trustee since 2019,
Member of Audit Committee | President of Talamantes Strategies, LLC, a management consulting firm, since 2018; until 2017, President and Chief Executive Officer of The McClatchy Company, Sacramento, CA (news and media company). | None |
Owen D. Van Essen, 65
Trustee since 2004,
Chairman of Operations Risk
Oversight Committee &
Member of Governance and
Nominating Committee | President of Dirks, Van Essen, Murray & April, Santa Fe, NM (newspaper mergers and acquisitions). | None |
James W. Weyhrauch, 60
Trustee since 1996,
Member of Audit
Committee & Operations Risk
Oversight Committee | Real estate broker, Santa Fe Properties, Santa Fe, NM; General Partner, Investments of Genext LLC (a family investment partnership); until 2019, Vice Chairman of Nambe LLC, Santa Fe, NM (manufacturing & design company). | None |
Trustees and Officers, Continued
Thornburg Capital Management Fund | September 30, 2019 (Unaudited)
NAME, AGE, YEAR ELECTED
POSITION HELD WITH FUND | PRINCIPAL OCCUPATION(S) DURING PAST FIVE YEARS | OTHER DIRECTORSHIPS
HELD BY TRUSTEE |
| OFFICERS OF THE FUND (WHO ARE NOT TRUSTEES)(1)(6) |
David Ashley, 49
Vice President since 2019 | Portfolio Manager and Managing Director since 2019 and Associate Portfolio Manager from 2011-2019 of Thornburg Investment Management, Inc. | Not applicable |
Nimish Bhatt, 56
Chief Financial Officer
since 2019; Treasurer
2016-2019; Secretary
(2018-2019)(7) | Chief Financial Officer and Treasurer of Thornburg Investment Management, Inc. and Thornburg Securities Corporation since 2016 and Secretary of Thornburg Securities Corporation since 2018; Senior Vice President (2004-2016), Chief Financial Officer (2011-2016), and Head of Fund Administration (2011-2016) of Calamos Asset Management, Inc., Calamos Investments LLC, Calamos Advisors LLC, and Calamos Wealth Management; Director of Calamos Global Funds plc (2007-2016). | Not applicable |
Jason Brady, 45
President since 2016(7) | Director since 2017, CEO and President since 2016, and Portfolio Manager and Managing Director of Thornburg Investment Management, Inc.; Vice President of Thornburg Securities Corporation since 2016. | Not applicable |
Connor Browne, 40
Vice President since 2006 | Portfolio Manager and Managing Director of Thornburg Investment Management, Inc. | Not applicable |
Randy Dry, 45
Vice President since 2014 | Managing Director, Director of Institutional Group from 2014-2016, and since 2016, Chief Administrative Officer of Thornburg Investment Management, Inc. | Not applicable |
Greg Dunn, 43
Vice President since 2014 | Portfolio Manager and Managing Director of Thornburg Investment Management, Inc. | Not applicable |
Lon Erickson, 44
Vice President since 2008 | Portfolio Manager and Managing Director of Thornburg Investment Management, Inc. | Not applicable |
Thomas Garcia, 48
Vice President since 2006 | Managing Director, Head Equity Trader, and Associate Portfolio Manager of Thornburg Investment Management, Inc. | Not applicable |
Christian Hoffmann, 37
Vice President since 2018 | Portfolio Manager and Managing Director since 2018, and Associate Portfolio Manager from 2014-2018, of Thornburg Investment Management, Inc. | Not applicable |
Curtis Holloway, 52
Treasurer since 2019(7) | Director of Fund Administration since 2019 of Thornburg Investment Management, Inc.; Senior Vice President, Head of Fund Administration (2017-2019) and Vice President, Fund Administration (2010-2017) of Calamos Investments, and Chief Financial Officer (2017-2019) and Treasurer (2010-2019) of Calamos Funds. | Not applicable |
Ben Kirby, 39
Vice President since 2014 | Head of Investments since 2019, Portfolio Manager and Managing Director since 2013. | Not applicable |
Jeff Klingelhofer, 38
Vice President since 2016 | Head of Investments since 2019, Portfolio Manager and Managing Director since 2015, and Associate Portfolio Manager from 2012–2015, of Thornburg Investment Management, Inc. | Not applicable |
Ponn Lithiluxa, 48
Vice President since 2017 | Manager, Tax & Fund Administration of Thornburg Investment Management, Inc.; Senior Vice President, Citi Fund Services, Inc. (2014–2017); Vice President, Citi Fund Services, Inc. (2007–2014). | Not applicable |
Rob MacDonald, 43
Vice President since 2016 | Managing Director since 2015, Portfolio Manager since 2014, and Associate Portfolio Manager from 2011–2014 of Thornburg Investment Management, Inc. | Not applicable |
Michael Mastroianni, 42
Secretary and Vice President since 2019(7) | Director of Fund Operations since 2019 of Thornburg Investment Management, Inc.; Executive Director, Global Head of Client Services - Global Liquidity (2018-2019), Executive Director, North American Head of Transfer Agency Relationship Management (2011-2019), Executive Director, North American Head of Transfer Agency Service Delivery (2011-2018) of J.P. Morgan Asset Management. | Not applicable |
Leigh Moiola, 52
Vice President since 2001 | Managing Director and Director of Marketing of Thornburg Investment Management, Inc.; Vice President of Thornburg Securities Corporation. | Not applicable |
Christopher Ryon, 63
Vice President since 2008 | Portfolio Manager and Managing Director of Thornburg Investment Management, Inc. | Not applicable |
Trustees and Officers, Continued
Thornburg Capital Management Fund | September 30, 2019 (Unaudited)
NAME, AGE, YEAR ELECTED
POSITION HELD WITH FUND | PRINCIPAL OCCUPATION(S) DURING PAST FIVE YEARS | OTHER DIRECTORSHIPS
HELD BY TRUSTEE |
Sean Koung Sun, 38
Vice President since 2017 | Portfolio Manager and Managing Director since 2017, Associate Portfolio Manager from 2015-2016, and Equity Research Analyst from 2012-2014 of Thornburg Investment Management, Inc. | Not applicable |
Stephen Velie, 52
Chief Compliance Officer since 2009 | Chief Compliance Officer of Thornburg Investment Trust and Thornburg Investment Management, Inc. | Not applicable |
Nicholos Venditti, 38
Vice President since 2016 | Portfolio Manager and Managing Director since 2015 and Associate Portfolio Manager from 2011–2015 of Thornburg Investment Management, Inc. | Not applicable |
Vinson Walden, 49
Vice President since 2004 | Portfolio Manager and Managing Director of Thornburg Investment Management, Inc. | Not applicable |
Lei Wang, 48
Vice President since 2006 | Portfolio Manager and Managing Director of Thornburg Investment Management, Inc. | Not applicable |
Charles Wilson, 44
Vice President since 2016 | Portfolio Manager and Managing Director since 2014 and Associate Portfolio Manager from 2012–2014 of Thornburg Investment Management, Inc. | Not applicable |
Di Zhou, 41
Vice President since 2016 | Portfolio Manager and Managing Director since 2016, Associate Portfolio Manager from 2014–2016, and Equity Research Analyst from 2010–2014 of Thornburg Investment Management, Inc. | Not applicable |
| (1) | Each person’s address is 2300 North Ridgetop Road, Santa Fe, New Mexico 87506. |
| (2) | The Fund is a separate investment “Fund” or “series” of Thornburg Investment Trust (the “Trust”), which comprises the Thornburg mutual fund complex and is organized as a Massachusetts business trust. Thornburg Investment Management, Inc. is the investment advisor to, and manages, all the Funds of the Trust. Each Trustee oversees all the Funds of the Trust. |
| (3) | Mr. Thornburg is considered an “interested” Trustee under the Investment Company Act of 1940 because he is a director and controlling shareholder of Thornburg Investment Management, Inc., the investment advisor to the Trust, and is the sole director and controlling shareholder of Thornburg Securities Corporation, the distributor of shares for the Trust. |
| (4) | Mr. McMahon is considered an “interested” Trustee under the Investment Company Act of 1940 because he is a director and the chief investment strategist of Thornburg Investment Management, Inc. |
| (5) | The Bylaws of the Trust currently require that each Independent Trustee shall retire by the end of the calendar year during which the Trustee reached the age of 75 years. Otherwise each Trustee serves in office until the election and qualification of a successor or until the Trustee sooner dies, resigns, retires or is removed. |
| (6) | Assistant vice presidents and assistant secretaries are not shown. |
| (7) | The Trust’s president, chief financial officer, secretary, and treasurer each serves a one-year term or until the election and qualification of a successor; each other officer serves at the pleasure of the Trustees. |
The Statement of Additional Information for each Fund of the Trust includes additional information about the Trustees and is available, without charge and upon request, by calling 1-800-847-0200.
Other Information
Thornburg Capital Management Fund | September 30, 2019 (Unaudited)
PORTFOLIO PROXY VOTING
Policies and Procedures:
The Trust has delegated to the Advisor voting decisions respecting proxies for the Fund’s voting securities. The Advisor makes voting decisions in accordance with its Proxy Voting Policy and Procedures. A description of the Policy and Procedures is available (i) without charge, upon request, by calling the Advisor toll-free at 1-800-847-0200, (ii) on the Thornburg website at www.thornburg.com, and (iii) on the U.S. Securities and Exchange Commission’s website at www.sec.gov.
Information regarding how proxies were voted is available on or before August 31 of each year for the twelve months ending the preceding June 30. This information is available (i) without charge, upon request by calling the Advisor toll-free at 1-800-847-0200, (ii) on the Thornburg website at www.thornburg.com, and (iii) on the U.S. Securities and Exchange Commission’s website at www.sec.gov.
AVAILABILITY OF QUARTERLY PORTFOLIO SCHEDULE
The Fund files with the Securities and Exchange Commission schedules of its portfolio holdings on Form N-Q for the first and third quarters of each fiscal year. The Fund’s Forms N-Q are available on the Commission’s website at www.sec.gov, or may be reviewed and copied at the Commission’s Public Reference Room in Washington, D.C. Information on the operation of the Public Reference Room may be obtained by calling 1-800-SEC-0330. The Fund also makes this information available on its website at www.thornburg.com/download or upon request by calling 1-800-847-0200.
STATEMENT RESPECTING RENEWAL OF INVESTMENT ADVISORY AGREEMENT
Thornburg Investment Management, Inc. (the “Advisor”) provides investment management services to Thornburg Capital Management Fund (the “Fund”) pursuant to an investment advisory agreement. The Trustees consider the renewal of this agreement annually, and most recently determined to renew the agreement on September 17, 2019.
The information below summarizes certain factors considered by the Trustees in connection with the determination to renew the advisory agreement with the Advisor. In determining to renew the advisory agreement, the Trustees did not identify any single factor as controlling, and this summary does not describe all of the factors and other matters considered by the Trustees in making their determination.
Nature, Extent and Quality of Services. Information noted by the Trustees in their evaluation as having been considered included oral and written reports received from the Advisor respecting the Advisor’s selection of investments and execution of the Fund’s investment strategies, achievement of the Fund’s investment objectives, and other factors. The Trustees noted their assessments of the Advisor’s personnel developed in meetings throughout the year, the Advisor’s staffing resources and competencies, measures to expand and improve the Advisor’s staff competencies and the value and quality of the work produced by members of its staff, and the Advisor’s collaborative approach to investment management. The Trustees also noted the Advisor’s reports respecting additions to its information management and other electronic systems. The Trustees also noted in this regard their consideration of the Advisor’s performance of other services, the Advisor’s continued commitment to observance of compliance and regulatory requirements, the Advisor’s responsiveness to the Trustees, the quality and extent of written and oral reports to the Trustees over the course of the year, and other factors. Portfolio holdings and related information confirmed that the Advisor had managed the Fund since commencement of investment operations in accordance with the Fund’s prospectus. Reports on services rendered by the Advisor to the Fund over the course of the year confirmed to the Trustees that the nature, extent and quality of those services remained sufficient.
Investment Performance. Dividend distribution and other information received by the Trustees respecting the investments by the Fund was viewed as consistent with expectations respecting the Fund’s investment performance in view of current market conditions.
Comparisons of Fee and Expense Levels. The Trustees did not consider fee levels because the Advisor does not charge fees to the Fund. Expense levels were consistent with expectations.
Costs and Profitability of Advisor. The Trustees did not consider the profitability of the Advisor in reviewing the advisory agreement, because the Advisor does not charge fees under that agreement.
Potential Economies of Scale. The Trustees did not consider any economies of scale potentially available to the Fund in reviewing the advisory agreement, because the Advisor does not receive a fee under that agreement.
Potential Ancillary Benefits. The Trustees did not identify any collateral benefits to the Advisor because of its relationship to the Fund.
Summary of Conclusions. The Trustees concluded that the general nature, extent and quality of the Advisor’s services performed under the advisory agreement remained sufficient, the Advisor had continued to actively and competently pursue the Fund’s stated investment
Other Information, Continued
Thornburg Capital Management Fund | September 30, 2019 (Unaudited)
objectives and adhere to the Fund’s investment policies, and that the Fund’s investment performance remained satisfactory in view of its objectives and strategies. The Trustees further concluded that the level of the Fund’s expenses was reasonable. The Trustees accordingly determined to renew the Fund’s investment advisory agreement with the Advisor for an additional term of one year.
Trustees’ Statement to Shareholders (Unaudited)
Readopted September 17, 2019
The Trustees believe current and prospective shareholders should know how we discharge our responsibilities in supervising the Funds’ investment advisor and in reviewing the advisor’s contract for renewal. Since 2005, we have issued a statement which sets out clearly the three principal guidelines that we follow in supervising the Trust’s investment advisor on your behalf. In accordance with our customary practice, in September of this year we again reviewed our statement and concluded we should reissue this statement outlining the principal features of our supervision of the advisor’s performance of investment management services for the Funds.
We begin with the premise that each shareholder selected his or her Fund because its investments are managed by the investment advisor identified in the prospectus and in accordance with the objective and policies described in the prospectus. We realize, as each of you do, that if you believe that your Fund’s stated objective and policies no longer serve your personal investment goals, you can sell your shares and leave the Fund.
Therefore, we believe that our primary supervisory task—our principal obligation to you—is to assess the nature and quality of the advisor’s services, and to confirm that the advisor actively and competently pursues the Fund’s objective, in accordance with the policies set out in the prospectus. To do this, we meet regularly with management to review your Fund’s portfolio and to discuss the advisor’s specific actions and judgments in pursuing the Fund’s objective. We do not substitute our own judgment for the advisor’s decisions in selecting investments; the advisor is paid to exercise its informed judgment on investment decisions, and we seek to confirm, in reviewing the advisor’s performance, that the advisor is doing just that.
Second, we are conscious of costs and the effect that costs have on shareholders’ returns. We try to make sure that your Fund’s fees and costs are reasonable in relationship to the services rendered and that they are generally in line with those charged by other expert investment advisors, consistent with our belief that the Fund’s investors searched for and expect that expertise and attention and have decided to pay a reasonable price for it. We do not put the management contract “out to bid” as a matter of course, and we would not do so unless we had concluded that the advisor materially had failed to pursue the Fund’s objectives in accordance with its policies, or for other equally important reasons. We believe that any other approach would be inconsistent with your interests and contrary to your expectations when you bought shares of the Fund in the first place.
Finally, because we believe that most Thornburg Fund shareholders have invested with a long-term perspective, we try not to focus too much on the fashions of the moment and on short-term performance. The market will not favor any specific investment objective or set of policies at all times and under all economic circumstances. A fund will experience periods of both high and low returns relative to other funds and other investments. Even if one of our Funds is not favored by the market at a particular time, we believe that the advisor is nonetheless obliged to remain true to the Fund’s objective and policies, and we watch to see that it does so.
Trustees of Thornburg Investment Trust
Thornburg Investment Management is a privately-owned global investment firm that offers a range of solutions for retail and institutional investors. Founded in 1982 and headquartered in Santa Fe, New Mexico, we manage approximately $41.9 billion (as of September 30, 2019) across U.S. mutual funds, separate accounts for high-net-worth investors, institutional accounts, and UCITS funds for non-U.S. investors.
The fund outlined in this report is one of many equity and fixed-income products available from Thornburg Investment Management.
EQUITY FUNDS
| ■ | Thornburg Global Opportunities Fund |
| ■ | Thornburg International Value Fund |
| ■ | Thornburg Better World International Fund |
| ■ | Thornburg International Growth Fund |
| ■ | Thornburg Developing World Fund |
| ■ | Thornburg Value Fund |
| ■ | Thornburg Core Growth Fund |
MULTI_ASSET FUNDS
| ■ | Thornburg Investment Income Builder Fund |
| ■ | Thornburg Summit Fund |
FIXED INCOME FUNDS
| ■ | Thornburg Low Duration Income Fund |
| ■ | Thornburg Limited Term U.S. Government Fund |
| ■ | Thornburg Limited Term Income Fund |
| ■ | Thornburg Strategic Income Fund |
| ■ | Thornburg Low Duration Municipal Fund |
| ■ | Thornburg Limited Term Municipal Fund |
| ■ | Thornburg Intermediate Municipal Fund |
| ■ | Thornburg California Limited Term Municipal Fund |
| ■ | Thornburg New Mexico Intermediate Municipal Fund |
| ■ | Thornburg New York Intermediate Municipal Fund |
| ■ | Thornburg Strategic Municipal Income Fund |
ALTERNATIVE FUNDS
| ■ | Thornburg Long/Short Equity Fund |
Before investing, carefully consider the Fund’s investment goals, risks, charges, and expenses. For a prospectus or summary prospectus containing this and other information, contact your financial advisor or visit thornburg.com. Read it carefully before investing.
For additional information, please visit thornburg.com
Thornburg Investment Management, Inc. 2300 North Ridgetop Road, Santa Fe, NM 87506
This page intentionally left blank.
This page intentionally left blank.
This page intentionally left blank.
To receive shareholder reports, prospectuses, and proxy statements electronically, go to www.thornburg.com/edelivery.
This Annual Report is submitted for the general information of shareholders of the Fund. It is not authorized for distribution to prospective investors in the Fund unless preceded or accompanied by an effective prospectus.
Investment Advisor:
Thornburg Investment Management®
800.847.0200
Distributor:
Thornburg Securities Corporation®
Annual Report
September 30, 2019
Beginning on January 1, 2021, as permitted by regulations adopted by the Securities and Exchange Commission, paper copies of the Fund’s shareholder reports will no longer be sent by mail, unless you specifically request paper copies of the reports from the Fund or from your financial intermediary, such as a broker-dealer or bank. Instead, the reports will be made available on a website, and you will be notified by mail each time a report is posted and provided with a website link to access the report.
If you already elected to receive shareholder reports electronically, you will not be affected by this change and you need not take any action. You may elect to receive shareholder reports and other communications from the Fund or your financial intermediary electronically by going to thornburg.com/edelivery.
You may elect to receive all future reports in paper free of charge. You can inform the Fund or your financial intermediary that you wish to continue receiving paper copies of your shareholder reports by calling 800.847.0200 or your financial intermediary directly. Your election to receive reports in paper will apply to all funds held with the fund complex/your financial intermediary.
At Thornburg, we believe unconstrained investing leads to better outcomes for our clients. Our investment solutions are highly active, high conviction, and benchmark agnostic. When it comes to finding economic opportunity for clients, it’s more than what we do.
It’s how we do it. Active Asbottom-up, fundamental, active managers, we look beyond conventional benchmarks. Long Term We take a long-term view in how we manage our firm and our portfolios. Benchmark Agnostic Investment strategies should have the flexibility to pursue solutions for clients, not stay within the conventional confines of benchmarks. Flexible Perspective Our approach to portfolio construction is guided by our convictions rather than convention. High Conviction We focus our attention and capital on thoroughly researched, well-understood positions. The best form of risk management is to know what you own, and why. Repeatable & Robust Our long-term outperformance of benchmarks verifies that our process works and outperforms conventional thinking. Independent We are independently owned and far from the herd of other investment managers. Investment Driven All members of the investment team are resources for all of our strategies. Collaborative Our team collaborates on opportunities across geography, sector, or asset class.
Thornburg Long/Short Equity Fund
Annual Report | September 30, 2019
Table of Contents
| 4 |
| 6 |
| 7 |
| 8 |
| 13 |
| 14 |
| 15 |
| 16 |
| 17 |
| 24 |
| 26 |
| 27 |
| 28 |
| 31 |
| 35 |
| SHARE CLASS | NASDAQ SYMBOL | CUSIP |
| Class I | THLSX | 885-216-689 |
Investments carry risks, including possible loss of principal. Additional risks may be associated with investments outside the United States, especially in emerging markets, including currency fluctuations, illiquidity, volatility, and political and economic risks. Investments in small- and mid-capitalization companies may increase the risk of greater price fluctuations. A short position will lose value as the security’s price increases. Theoretically, the loss on a short sale can be unlimited. Investments in derivatives are subject to the risks associated with the securities or other assets underlying the pool of securities, including illiquidity and difficulty in valuation. Non-diversified funds can be more volatile than diversified funds. Please see the Fund’s prospectus for a discussion of the risks associated with an investment in the Fund. Investments in the Fund are not FDIC insured, nor are they bank deposits or guaranteed by a bank or any other entity.
Letter to Shareholders
Thornburg Long/Short Equity Fund | September 30, 2019 (Unaudited)
October 9, 2019
Dear Fellow Shareholder:
The Thornburg Long/Short Equity Fund underperformed its benchmark during the most recent annual period ended September 30, 2019, both in gross and net-adjusted terms. Over the 12 months, the Fund returned negative 2.10% (Class I shares) versus the S&P 500 Index’s return of 4.25%. During the period the Fund’s short book provided excess returns, offsetting some challenging individual stock results within the long book.
| (Oct 1, 2018 - Sept 30, 2019) |
| | Average Weight % | Total Return % | Contribution*% |
| Long Book | 105.28 | -0.61 | -0.64 |
| Short Book | -72.50 | -0.77 | 0.56 |
| Fund | 32.78 | -2.10 | -- |
| S&P 500 Index | -- | 4.25 | -- |
| Russell 2000 Index | -- | -8.89 | -- |
| Net Adjusted S&P 500 Index | -- | 1.39 | -- |
| *Gross of Fees | | | |
| Source: Kiski, Thornburg |
Over the annual period, the Fund’s performance was largely driven by the performance of individual names rather than sector or market capitalization forces on both the long and short sides of the portfolio. We could point to a couple of trends that impacted both the stock market and the Fund.
The first was the continued outperformance of growth versus value. As a reminder, our portfolio is built around a Growth at a Reasonable Price (GARP) philosophy, both as a whole and when considering each of the long and short books in isolation. At times, it felt like the market was only interested in rewarding growth-at-any-price, which generally didn’t flatter much of our bottom-up, fundamental analysis.
The second is that, in keeping with the growth-at-any-price trend, stocks that had even the slightest wobble in their earnings progression were often pummeled beyond reason, at least in our opinion. All in all, these trends created wide valuation gaps, which we consider very appealing going forward. Thus, we believe that our portfolio is well-positioned for what may come next.
As a relatively focused portfolio of high-conviction stock ideas, our performance is largely influenced by the individual securities we choose to own (or sell short). Below is a discussion of our primary top and bottom performers during the period.
Top Performers:
Starbucks Corp. - Starbucks continues to post impressive results with same-store sales up 6% globally in the most recent quarter. U.S. sales were up a very strong +7%, a return to previous highs, with improvements in both store traffic and sales per order. Investors continue to gain confidence that the company is past the operational issues that caused the slowdown last year. The
growth story in China also continues to look good, with sales back up to +6% compared to flat growth earlier in the year.
U.S. Foods Holdings Corp. - U.S. Foods continues to gain share within its key Independent Restaurant channel, where margins are much higher. As they’ve proven out this operational momentum over time, the stock has closed some of the valuation gap with its closest peers.
Comcast Corp. - Comcast owns an irreplaceable position in the delivery of internet service via cable and fiber across their markets, which, in our opinion, is the key driver for their overall business. They continue to invest in their footprint to get their network closer to homes, thus expanding their moat/competitive advantage.
Oaktree Capital Group LLC - Oaktree outperformed the market during the annual period as Brookfield Asset Management acquired the company at a premium. When the deal closed, we received a mix of cash and Brookfield stock.
CarMax - CarMax saw better than expected same-store sales while continuing to hold their profit per car sold at a steady, above industry average level. The roll out of their new omni-channel strategy, which allows potential buyers to purchase a car in person or online, is progressing rapidly and should be accessible in most of their markets much sooner than anticipated.
Bottom Performers:
Beyond Meat, Inc. - Beyond Meat is a developer of plant-based protein products, most notably its Beyond Burger. The recent price appreciation against us is due to a combination of a low float, an active short name, and headline risk as fast food chains have explored and signed up to sell plant-based burgers from Beyond Meat and its competitor, Impossible Burger.
Manhattan Associates, Inc. - Manhattan Associates is a software company that specializes in supply chain and logistics solutions. We believe the company’s end markets (brick-and-mortar retailers) are structurally challenged and thus the company’s long-term financial goals appear unachievable, in our estimation which is why we determined to short the stock .
FTI Consulting, Inc. - FTI Consulting is a business advisory firm. While company’s revenues have grown in recent quarters, our thesis for shorting the stock is that organic revenue growth will be volatile in the future and that the market is assigning a high earnings multiple to a cyclically high earnings per share number.
Generac Holdings, Inc. - Generac is a manufacturer of standby and portable generators. Our thesis for shorting the stock centered around the pull forward of demand from a highly active 2018 hurricane season, but results have continued to be stronger than expected driven by growth in home standby generators and their commercial segment. The company also announced small
Letter to Shareholders, Continued
Thornburg Long/Short Equity Fund | September 30, 2019 (Unaudited)
acquisitions within energy storage, which could potentially be a future growth driver for the company.
Afterpay Touch Group Ltd. - Afterpay is a Buy Now Pay Later (BNPL) company, with fast growing U.S. and U.K. businesses. While this stock trades like a Paymentech company, we believe this is a consumer finance company lacking a sustainable competitive advantage and thus determined to short the stock.
We value your partnership and thank you for investing alongside us in the Thornburg Long/Short Equity Fund.

| 
|
Connor Browne,cfa
Portfolio Manager
Managing Director | Bimal Shah,cfa
Portfolio Manager
Managing Director |
The matters discussed in this report may constitute forward-looking statements made pursuant to the safe harbor provisions of the Securities Litigation Reform Act of 1995. These include any advisor or portfolio manager prediction, assessment, analysis or outlook for individual securities, industries, investment styles, market sectors and/or markets. These statements involve risks and uncertainties. In addition to the general risks described for each fund in its current prospectus, other factors bearing on these reports include the accuracy of the advisor’s or portfolio manager’s forecasts and predictions, the appropriateness of the investment strategies designed by the advisor or portfolio manager and the ability of the advisor or portfolio manager to implement their strategies efficiently and successfully. Any one or more of these factors, as well as other risks affecting the securities markets generally, could cause the actual results of any fund to differ materially as compared to its benchmarks.
The views expressed are subject to change and do not necessarily reflect the views of Thornburg Investment Management, Inc. This information should not be relied upon as a recommendation or investment advice and is not intended to predict the performance of any investment or market.
Performance results of individual share classes will vary based on the fees and expenses associated with each share class, and may be higher or lower than other share classes within the same Fund. Please see Performance Summary for performance results of each share class.
Performance Summary
Thornburg Long/Short Equity Fund | September 30, 2019 (Unaudited)
AVERAGE ANNUAL TOTAL RETURNS
| | 1-YR | 3-YR | 5-YR | 10-YR | SINCE
INCEP. |
| Class I Shares(Incep: 12/30/16) | -2.10% | 5.60% | 4.38% | 7.65% | 6.27% |
| S&P 500 Index | 4.25% | 13.39% | 10.84% | 13.24% | 9.13% |
GROWTH OF A HYPOTHETICAL $10,000 INVESTMENT
Performance data shown represents past performance and is no guarantee of future results. Investment return and principal value will fluctuate so shares, when redeemed, may be worth more or less than their original cost. Due to the Fund’s relatively small asset base in initial stages, performance was positively impacted by IPOs to a greater degree than it may be in the future. IPO investments are generally not an integral component of the Fund’s investment process and may not be utilized to the same extent in the future. Current performance may be lower or higher than quoted. For performance current to the most recent month end, visit thornburg.com or call 800-847-0200. The performance information does not reflect the deduction of taxes that a shareholder would pay on distributions or the redemption of Fund shares. Returns reflect the reinvestment of dividends and capital gains. There is no sales charge for Class I shares. As disclosed in the most recent prospectus, the total annual fund operating expenses are as follows: I shares, 2.82%. For more detailed information on fund expenses and waivers/reimbursements please see the Fund’s prospectus.
Performance prior to 12/30/2016 is from the predecessor fund, which was managed in a materially equivalent manner to the Thornburg Long/Short Equity Fund. The predecessor fund was not a registered mutual fund and was not subject to the same investment restrictions as the Long/Short Equity Fund. If the predecessor fund had been registered under the 1940 Act, the performance may have been different.
TheS&P 500 Index is an unmanaged broad measure of the U.S. stock market.
TheRussell 2000 Index measures the performance of the small-cap segment of the U.S. equity universe. The Russell 2000 Index is a subset of the Russell 3000 Index including approximately 2,000 of the smallest securities based on a combination of their market cap and current index membership. Source: Frank Russell Company.
Net Adjusted S&P 500 Index – For illustration purposes, the net adjusted S&P 500 Index adjusts the total return of the S&P 500 Index to reflect the same net exposure as the Fund.
The performance of any index is not indicative of the performance of any particular investment. Unless otherwise noted, index returns reflect the reinvestment of income dividends and capital gains, if any, but do not reflect fees, brokerage commissions or other expenses of investing. Investors may not make direct investments into any index.
Fund Summary
Thornburg Long/Short Equity Fund | September 30, 2019 (Unaudited)
OBJECTIVES AND STRATEGIES
The Fund seeks long-term capital appreciation. There is no guarantee that the Fund will meet its objective.
The Fund pursues its investment goal by investing a significant amount of its assets in long and short positions in a broad range of equity securities. While the Fund normally expects to invest a larger portion of its portfolio in long positions than short positions, the Fund expects to invest a significant portion of its assets in short positions.
| SECTOR EXPOSURE |
| Health Care | 15.7% |
| Communication Services | 12.4% |
| Financials | 7.6% |
| Consumer Staples | 5.8% |
| Materials | 5.7% |
| Energy | 1.9% |
| Industrials | -1.2% |
| Real Estate | -2.8% |
| Consumer Discretionary | -4.4% |
| Information Technology | -7.8% |
| Other Assets Less Liabilities | 67.1% |
| PORTFOLIO EXPOSURE | | |
| | 3Q19 | 2Q19 |
| Gross Long | 104.3% | 108.3% |
| Gross Short | -71.0% | -76.1% |
| Net Equity | 33.3% | 32.2% |
| ASSETS BY GEOGRAPHY | | |
| | Long | Short |
| United States | 57.9% | 42.1% |
| Ex-U.S | 66.9% | 33.1% |
| TOP TEN LONG HOLDINGS |
| Gilead Sciences, Inc. | 5.2% |
| US Foods Holding Corp. | 5.1% |
| Thermo Fisher Scientific, Inc. | 5.1% |
| Comcast Corp. Class A | 5.0% |
| Alphabet, Inc. Class C | 5.0% |
| Medtronic plc | 4.0% |
| CarMax, Inc. | 3.8% |
| Danone S.A. | 3.7% |
| United Parcel Service, Inc. Class B | 3.5% |
| Starbucks Corp. | 3.5% |
There is no guarantee that the Fund will meet its investment objectives.
All data is subject to change. Charts may not add up to 100% due to rounding.
Schedule of Investments
Thornburg Long/Short Equity Fund | September 30, 2019
| | | SHARES | VALUE |
| | Common Stock — 103.5% | | |
| | Capital Goods — 3.0% | | |
| | Electrical Equipment — 3.0% | | |
| | Vestas Wind Systems A/S | 83,845 | $ 6,509,357 |
| | | | 6,509,357 |
| | Consumer Durables & Apparel — 2.3% | | |
| | Household Durables — 0.9% | | |
| a | Mohawk Industries, Inc. | 15,932 | 1,976,683 |
| | Textiles, Apparel & Luxury Goods — 1.4% | | |
| a | Capri Holdings Ltd. | 92,650 | 3,072,274 |
| | | | 5,048,957 |
| | Consumer Services — 3.5% | | |
| | Hotels, Restaurants & Leisure — 3.5% | | |
| b | Starbucks Corp. | 87,218 | 7,711,815 |
| | | | 7,711,815 |
| | Diversified Financials — 7.9% | | |
| | Capital Markets — 3.7% | | |
| | Apollo Global Management, Inc., Class A | 71,772 | 2,714,417 |
| | Brookfield Asset Management, Inc., Class A | 100,879 | 5,334,490 |
| | Consumer Finance — 3.0% | | |
| | Capital One Financial Corp. | 22,422 | 2,039,954 |
| b | Navient Corp. | 358,274 | 4,585,907 |
| | Mortgage Real Estate Investment Trusts — 1.2% | | |
| | PennyMac Mortgage Investment Trust | 123,443 | 2,744,138 |
| | | | 17,418,906 |
| | Energy — 1.9% | | |
| | Oil, Gas & Consumable Fuels — 1.9% | | |
| | Teekay LNG Partners L.P. | 304,281 | 4,153,436 |
| | | | 4,153,436 |
| | Food & Staples Retailing — 5.1% | | |
| | Food & Staples Retailing — 5.1% | | |
| a,b | US Foods Holding Corp. | 273,008 | 11,220,629 |
| | | | 11,220,629 |
| | Food, Beverage & Tobacco — 7.2% | | |
| | Food Products — 7.2% | | |
| | Danone S.A. | 93,215 | 8,211,289 |
| a | Nomad Foods Ltd. | 369,375 | 7,572,188 |
| | | | 15,783,477 |
| | Healthcare Equipment & Services — 4.0% | | |
| | Health Care Equipment & Supplies — 4.0% | | |
| | Medtronic plc | 80,954 | 8,793,223 |
| | | | 8,793,223 |
| | Insurance — 2.9% | | |
| | Insurance — 2.9% | | |
| b | Assured Guaranty Ltd. | 143,660 | 6,387,124 |
| | | | 6,387,124 |
| | Materials — 5.7% | | |
| | Chemicals — 2.3% | | |
| b | Huntsman Corp. | 215,800 | 5,019,508 |
| | Containers & Packaging — 3.4% | | |
| a,b | Crown Holdings, Inc. | 115,930 | 7,658,336 |
| | | | 12,677,844 |
| | Media & Entertainment — 21.2% | | |
Schedule of Investments, Continued
Thornburg Long/Short Equity Fund | September 30, 2019
| | | SHARES | VALUE |
| | Entertainment — 8.4% | | |
| b | Activision Blizzard, Inc. | 111,124 | $ 5,880,682 |
| a | Lions Gate Entertainment Corp., Class B | 187,073 | 1,635,018 |
| a,b | Netflix, Inc. | 24,524 | 6,563,113 |
| a | Ubisoft Entertainment S.A. | 60,351 | 4,363,818 |
| | Interactive Media & Services — 7.8% | | |
| a,b | Alphabet, Inc., Class C | 8,971 | 10,935,649 |
| a,b | Zillow Group, Inc., Class C | 206,137 | 6,147,005 |
| | Media — 5.0% | | |
| b | Comcast Corp., Class A | 246,073 | 11,092,971 |
| | | | 46,618,256 |
| | Pharmaceuticals, Biotechnology & Life Sciences — 16.1% | | |
| | Biotechnology — 8.4% | | |
| a | Alkermes plc | 367,445 | 7,168,852 |
| b | Gilead Sciences, Inc. | 179,754 | 11,392,808 |
| | Life Sciences Tools & Services — 5.1% | | |
| b | Thermo Fisher Scientific, Inc. | 38,328 | 11,163,797 |
| | Pharmaceuticals — 2.6% | | |
| b | Allergan plc | 34,534 | 5,811,727 |
| | | | 35,537,184 |
| | Retailing — 9.2% | | |
| | Internet & Direct Marketing Retail — 5.4% | | |
| a | Alibaba Group Holding Ltd. Sponsored ADR | 24,298 | 4,063,354 |
| a,b | Amazon.com, Inc. | 2,799 | 4,858,812 |
| b | Expedia Group, Inc. | 22,541 | 3,029,736 |
| | Specialty Retail — 3.8% | | |
| a,b | CarMax, Inc. | 94,068 | 8,277,984 |
| | | | 20,229,886 |
| | Software & Services — 4.2% | | |
| | Information Technology Services — 1.7% | | |
| b | Cognizant Technology Solutions Corp., Class A | 64,394 | 3,880,704 |
| | Software — 2.5% | | |
| a | PTC, Inc. | 80,500 | 5,488,490 |
| | | | 9,369,194 |
| | Technology Hardware & Equipment — 2.0% | | |
| | Communications Equipment — 0.3% | | |
| a | Casa Systems, Inc. | 95,479 | 749,988 |
| | Technology Hardware, Storage & Peripherals — 1.7% | | |
| a,b | Pure Storage, Inc., Class A | 214,378 | 3,631,563 |
| | | | 4,381,551 |
| | Telecommunication Services — 1.8% | | |
| | Wireless Telecommunication Services — 1.8% | | |
| | China Mobile Ltd. | 493,000 | 4,079,137 |
| | | | 4,079,137 |
| | Transportation — 5.5% | | |
| | Air Freight & Logistics — 3.5% | | |
| b | United Parcel Service, Inc., Class B | 64,974 | 7,785,185 |
| | Airlines — 2.0% | | |
| b | Alaska Air Group, Inc. | 66,500 | 4,316,515 |
| | | | 12,101,700 |
| | Total Common Stock(Cost $210,064,108) | | 228,021,676 |
| | Total Long-Term Investments — 103.5%(Cost $210,064,108) | | 228,021,676 |
| | Short-Term Investments — 22.3% | | |
| c | Thornburg Capital Management Fund | 4,917,150 | 49,171,496 |
| | Total Short-Term Investments(Cost $49,171,496) | | 49,171,496 |
Schedule of Investments, Continued
Thornburg Long/Short Equity Fund | September 30, 2019
| | | SHARES | VALUE |
| | Liabilities Net of Other Assets — (25.8)% | | (56,817,681) |
| | Common Stock Sold Short — (70.6)% | | |
| | Banks — (0.9)% | | |
| | Banks — (0.9)% | | |
| | Westamerica Bancorporation | (30,509) | $ (1,897,050) |
| | | | (1,897,050) |
| | Capital Goods — (6.7)% | | |
| | Electrical Equipment — (2.6)% | | |
| a | Generac Holdings, Inc. | (72,207) | (5,656,697) |
| | Machinery — (2.0)% | | |
| | Snap-on, Inc. | (28,695) | (4,491,915) |
| | Trading Companies & Distributors — (2.1)% | | |
| | GATX Corp. | (60,655) | (4,702,582) |
| | | | (14,851,194) |
| | Commercial & Professional Services — (3.0)% | | |
| | Professional Services — (3.0)% | | |
| a | FTI Consulting, Inc. | (50,848) | (5,389,380) |
| a | TriNet Group, Inc. | (21,363) | (1,328,565) |
| | | | (6,717,945) |
| | Consumer Durables & Apparel — (5.2)% | | |
| | Household Durables — (1.9)% | | |
| a | Roku, Inc. | (41,310) | (4,203,706) |
| | Leisure Products — (3.3)% | | |
| a | Peloton Interactive, Inc., Class A | (138,300) | (3,471,330) |
| a | YETI Holdings, Inc. | (135,431) | (3,792,068) |
| | | | (11,467,104) |
| | Consumer Services — (5.0)% | | |
| | Diversified Consumer Services — (0.9)% | | |
| | H&R Block, Inc. | (83,000) | (1,960,460) |
| | Hotels, Restaurants & Leisure — (4.1)% | | |
| | Brinker International, Inc. | (51,291) | (2,188,587) |
| | Cracker Barrel Old Country Store, Inc. | (27,670) | (4,500,526) |
| a | Luckin Coffee, Inc. ADR | (130,409) | (2,477,771) |
| | | | (11,127,344) |
| | Diversified Financials — (2.3)% | | |
| | Capital Markets — (2.3)% | | |
| | FactSet Research Systems, Inc. | (20,678) | (5,024,134) |
| | | | (5,024,134) |
| | Food & Staples Retailing — (2.1)% | | |
| | Food & Staples Retailing — (2.1)% | | |
| a | Chefs’ Warehouse, Inc. | (115,185) | (4,644,259) |
| | | | (4,644,259) |
| | Food, Beverage & Tobacco — (3.9)% | | |
| | Beverages — (2.2)% | | |
| a | Boston Beer Co., Inc., Class A | (13,606) | (4,953,672) |
| | Food Products — (1.7)% | | |
| a | Beyond Meat, Inc. | (24,974) | (3,711,636) |
| | | | (8,665,308) |
| | Healthcare Equipment & Services — (2.3)% | | |
| | Health Care Equipment & Supplies — (2.3)% | | |
| | DiaSorin S.p.A. | (43,856) | (5,100,352) |
| | | | (5,100,352) |
| | Household & Personal Products — (0.5)% | | |
Schedule of Investments, Continued
Thornburg Long/Short Equity Fund | September 30, 2019
| | | SHARES | VALUE |
| | Household Products — (0.5)% | | |
| | Church & Dwight Co., Inc. | (14,172) | $ (1,066,301) |
| | | | (1,066,301) |
| | Media & Entertainment — (5.8)% | | |
| | Entertainment — (1.8)% | | |
| a | Tencent Music Entertainment Group ADR | (313,924) | (4,008,809) |
| | Media — (4.0)% | | |
| a | Discovery, Inc., Class A | (160,513) | (4,274,461) |
| | New York Times Co., Class A | (155,514) | (4,429,039) |
| | | | (12,712,309) |
| | Pharmaceuticals, Biotechnology & Life Sciences — (2.1)% | | |
| | Pharmaceuticals — (2.1)% | | |
| | Shionogi & Co. Ltd. | (81,730) | (4,534,550) |
| | | | (4,534,550) |
| | Real Estate — (2.8)% | | |
| | Equity Real Estate Investment Trusts — (2.3)% | | |
| | Extra Space Storage, Inc. | (43,045) | (5,028,517) |
| | Real Estate Management & Development — (0.5)% | | |
| a | Redfin Corp. | (66,672) | (1,122,756) |
| | | | (6,151,273) |
| | Retailing — (9.2)% | | |
| | Internet & Direct Marketing Retail — (1.5)% | | |
| a | Chewy, Inc., Class A | (134,597) | (3,308,394) |
| | Specialty Retail — (7.7)% | | |
| a | Carvana Co., Class A | (39,100) | (2,580,600) |
| a | Murphy USA, Inc. | (57,650) | (4,917,545) |
| | Rent-A-Center, Inc. | (205,700) | (5,305,003) |
| a | Sleep Number Corp. | (99,184) | (4,098,283) |
| | | | (20,209,825) |
| | Software & Services — (14.0)% | | |
| | Information Technology Services — (7.1)% | | |
| a | Afterpay Touch Group Ltd. | (242,600) | (5,873,457) |
| | Paychex, Inc. | (65,483) | (5,420,028) |
| | Western Union Co. | (188,500) | (4,367,545) |
| | Software — (6.9)% | | |
| a | Alarm.com Holdings, Inc. | (93,694) | (4,369,888) |
| | Blackbaud, Inc. | (20,144) | (1,819,809) |
| a | Manhattan Associates, Inc. | (69,768) | (5,628,185) |
| a | Teradata Corp. | (105,774) | (3,278,994) |
| | | | (30,757,906) |
| | Telecommunication Services — (4.8)% | | |
| | Diversified Telecommunication Services — (4.8)% | | |
| | AT&T, Inc. | (149,642) | (5,662,453) |
| | Cogent Communications Holdings, Inc. | (89,543) | (4,933,820) |
| | | | (10,596,273) |
| | Total Common Stock Sold Short(Proceeds $140,593,910) | | (155,523,127) |
| | Exchange-Traded Funds Sold Short — (0.0)% | | |
| | Direxion Daily Developed Markets Bear 3X | (550) | (6,771) |
| | Direxion Daily Emerging Markets Bear 3X | (919) | (43,827) |
| | Direxion Daily Energy Bear 3X | (535) | (25,760) |
| | Direxion Daily Financial Bear 3X | (720) | (24,919) |
| | Direxion Daily S&P 500 Bear 3X | (266) | (4,562) |
| | Direxion Daily Semiconductors Bear 3x | (6) | (226) |
| | Direxion Daily Small Cap Bear 3X | (51) | (2,397) |
| | ProShares UltraPro Short QQQ | (55) | (1,788) |
| | Total Exchange-Traded Funds Sold Short(Proceeds $4,118,542) | | (110,250) |
Schedule of Investments, Continued
Thornburg Long/Short Equity Fund | September 30, 2019
| | | SHARES | VALUE |
| | Total Securities Sold Short(Proceeds $144,712,452) | | $(155,633,377) |
| | Net Assets — 100.0% | | $220,375,491 |
| Footnote Legend |
| a | Non-income producing. |
| b | All or a portion of the security is pledged as collateral for securities sold short. At September 30, 2019, the value of securities pledged was $86,297,475. An additional $101,278,305 in cash has been segregated for collateral on securities sold short. |
| c | Investment in Affiliates. |
Portfolio Abbreviations
To simplify the listings of securities, abbreviations are used per the table below:
| ADR | American Depositary Receipt |
See notes to financial statements.
Statement of Assets and Liabilities
Thornburg Long/Short Equity Fund | September 30, 2019
| ASSETS | |
| Investments at value (Note 3) | |
| Non-affiliated issuers (cost $210,064,108) | $ 228,021,676 |
| Non-controlled affiliated issuer (cost $49,171,496) | 49,171,496 |
| Cash | 3,418,747 |
| Cash segregated as collateral on securities sold short | 101,278,305 |
| Receivable for investments sold | 6,749,456 |
| Receivable for fund shares sold | 2,029,585 |
| Dividends receivable | 114,930 |
| Dividend and interest reclaim receivable | 10,015 |
| Prepaid expenses and other assets | 18,548 |
| Total Assets | 390,812,758 |
| Liabilities | |
| Securities sold short (proceeds $144,712,452) | 155,633,377 |
| Payable for investments purchased | 14,035,283 |
| Payable for fund shares redeemed | 5,467 |
| Payable to investment advisor and other affiliates (Note 4) | 205,695 |
| Payable for short sale financing | 319,214 |
| Accounts payable and accrued expenses | 126,988 |
| Dividends payable for short sales | 111,243 |
| Total Liabilities | 170,437,267 |
| Net Assets | $ 220,375,491 |
| NET ASSETS CONSIST OF | |
| Distributable earnings | $ 6,591,488 |
| Net capital paid in on shares of beneficial interest | 213,784,003 |
| | $ 220,375,491 |
| NET ASSET VALUE | |
| Class I Shares: | |
Net asset value, offering and redemption price per share
($220,375,491 applicable to 20,391,513 shares of beneficial interest outstanding - Note 5) | $ 10.81 |
See notes to financial statements.
Statement of Operations
Thornburg Long/Short Equity Fund | Year Ended September 30, 2019
| INVESTMENT INCOME | |
| Dividend income | |
| Non-affiliated issuers (net of foreign taxes withheld of $20,981) | $ 2,852,811 |
| Non-controlled affiliated issuer | 1,003,831 |
| Total Income | 3,856,642 |
| EXPENSES | |
| Investment advisory fees (Note 4) | 2,540,618 |
| Administration fees (Note 4) | |
| Class I Shares | 178,487 |
| Transfer agent fees | |
| Class I Shares | 182,238 |
| Registration and filing fees | |
| Class I Shares | 25,769 |
| Dividend expense on securities sold short | 1,970,797 |
| Short sale financing fees | 1,981,071 |
| Custodian fees | 35,257 |
| Professional fees | 94,814 |
| Trustee and officer fees (Note 4) | 9,015 |
| Other expenses | 42,086 |
| Total Expenses | 7,060,152 |
| Less: | |
| Expenses reimbursed by investment advisor (Note 4) | (59,542) |
| Net Expenses | 7,000,610 |
| Net Investment Loss | $ (3,143,968) |
| REALIZED AND UNREALIZED GAIN (LOSS) | |
| Net realized gain (loss) on: | |
| Non-affiliated issuer investments | |
| Long positions | 2,706,530 |
| Short positions | 1,469,027 |
| Foreign currency transactions | (7,536) |
| | 4,168,021 |
| Net change in unrealized appreciation (depreciation) on: | |
| Non-affiliated issuer investments | |
| Long positions | (5,710,199) |
| Short positions | 848,007 |
| Foreign currency translations | (1,502) |
| | (4,863,694) |
| Net Realized and Unrealized Loss | (695,673) |
| Net Decrease in Net Assets Resulting from Operations | $ (3,839,641) |
See notes to financial statements.
Statements of Changes in Net Assets
Thornburg Long/Short Equity Fund
| | Year Ended
September 30, 2019 | Year Ended
September 30, 2018 |
| INCREASE (DECREASE) IN NET ASSETS FROM | | |
| OPERATIONS | | |
| Net investment loss | $ (3,143,968) | $ (1,104,589) |
| Net realized gain (loss) on investments and foreign currency transactions | 4,168,021 | 9,092,978 |
| Net change in unrealized appreciation (depreciation) on investments and foreign currency translations | (4,863,694) | (1,657,155) |
| Net Increase (Decrease) in Net Assets Resulting from Operations | (3,839,641) | 6,331,234 |
| DIVIDENDS TO SHAREHOLDERS | | |
| From distributable earnings | | |
| Class I Shares | (8,099,318) | (2,992,574) |
| FUND SHARE TRANSACTIONS (NOTE 5) | | |
| Class I Shares | 28,510,781 | 120,726,370 |
| Net Increase in Net Assets | 16,571,822 | 124,065,030 |
| NET ASSETS | | |
| Beginning of Year | 203,803,669 | 79,738,639 |
| End of Year | $ 220,375,491 | $ 203,803,669 |
See notes to financial statements.
Statement of Cash Flows
Thornburg Long/Short Equity Fund | Year Ended September 30, 2019
| Cash Flows from Operating Activities: | |
| Net change in net assets resulting from operations | $ (3,839,641) |
| Adjustments to reconcile net increase in net assets resulting from operations to net cash provided by (used for) operating activities: | |
| Purchases of investments in securities | (147,312,220) |
| Payments to cover securities sold short | (102,858,659) |
| Proceeds from disposition of investments in securities | 138,457,276 |
| Proceeds from securities sold short | 118,958,263 |
| Purchases of short term investments, net | 7,477,122 |
| Net realized (gain) loss: | |
| Investment transactions | (2,706,530) |
| Securities sold short | (1,469,027) |
| Net unrealized (gain) loss: | |
| Investments | 5,710,199 |
| Securities sold short | (848,007) |
| Changes in assets and liabilities: | |
| (Increase) decrease in assets: | |
| Cash segregated as collateral on securities sold short | (27,424,190) |
| Dividend and interest reclaim receivable | 58,830 |
| Prepaid expenses and other assets | (11,555) |
| Increase (decrease) in liabilities: | |
| Payable for short sale financing | 234,310 |
| Payable for dividends on securities sold short | (52,232) |
| Payable to investment adviser | (11,835) |
| Accrued expenses and other payables | 68,047 |
| Net cash used in operating activities | $ (15,569,849) |
| Cash Flows from Financing Activities: | |
| Fund shares sold | $ 102,742,614 |
| Fund shares redeemed | (83,167,502) |
| Fund distributions paid and not reinvested | (586,516) |
| Net cash received from financing activities | $ 18,988,596 |
| Net increase in cash during the period | $ 3,418,747 |
| Cash and foreign currency, beginning of period: | $ - |
| Cash and foreign currency, end of period: | $ 3,418,747 |
| Non-cash Activities: | |
| Reinvestment of Fund distributions | 7,512,802 |
See notes to financial statements.
Notes to Financial Statements
Thornburg Long/Short Equity Fund | September 30, 2019
NOTE 1 – ORGANIZATION
Thornburg Long/Short Equity Fund (the “Fund”) is a non-diversified series of Thornburg Investment Trust (the “Trust”). The Trust was organized as a Massachusetts business trust under a Declaration of Trust dated June 3, 1987 and is registered as a diversified, open-end management investment company under the Investment Company Act of 1940, as amended (the "1940 Act"). The Fund is currently one of twenty-two separate series of the Trust. Each series is considered to be a separate entity for financial reporting and tax purposes and bears expenses directly attributable to it. The Fund seeks long-term capital appreciation.
The Fund currently offers one class of shares of beneficial interest: Institutional Class (“Class I”). This class of shares of the Fund represents all interest in the portfolio of investments. Class I shares are sold at net asset value without a sales charge at the time of purchase and may be subject to a service fee. All expenses are allocated to the class including administration fees, transfer agent fees, government registration fees, printing and postage costs, and legal expenses.
The following is a summary of significant accounting policies followed by the Fund in the preparation of its financial statements. The Fund prepares its financial statements in conformity with United States generally accepted accounting principles (“GAAP”), including investment company accounting and reporting guidance in the Financial Accounting Standards Board (the “FASB”) Accounting Standard Codification Topic 946.
NOTE 2 – SIGNIFICANT ACCOUNTING POLICIES
Security Valuation: All investments in securities held by the Fund are valued as described in Note 3.
Restricted Cash: As of September 30, 2019, the Fund has restricted cash in the amount of $101,278,305. The restricted cash represents collateral pledged in relation to short sale securities. The carrying value of the restricted cash approximates fair value.
Allocation of Expenses: Expenses common to all Funds are allocated among the Funds comprising the Trust based upon their relative net asset values or other appropriate allocation methods.
Dividends and Distributions to Shareholders: Dividends and distributions to shareholders, which are determined in accordance with federal income tax regulations and may differ from GAAP, are recorded on the ex-dividend date. Ordinary income dividends, if any, are declared and paid annually. Capital gain distributions, if any, are declared and paid annually and more often if deemed necessary by Thornburg Investment Management, Inc., the Trust’s investment advisor (the “Advisor”). Dividends and distributions are paid and are reinvested in additional shares of the Fund at net asset value per share at the close of business on the ex-dividend date, or at the shareholder’s option, paid in cash.
Investment Income: Dividend income is recorded on the ex-dividend date. Certain income from foreign investments is recognized as soon as information is available to the Fund. Interest income is accrued as earned. Premiums and discounts are amortized and accreted, respectively, to first call dates or maturity dates using the effective yield method of the respective investments. These amounts are included in Investment Income in the Statement of Operations. For securities sold short, the Fund is generally required to pay the lender amounts equal to any dividend or interest which accrues on the borrowed security during the period of the loan. These amounts, if applicable, are included in Dividend expense on securities sold short on the Statement of Operations. Interest income, if applicable, is comprised of credits which exceeded prime brokerage fees.
Investment Transactions: Investment transactions are accounted for on a trade date basis. Realized gains and losses from the sale of investments are recorded on an identified cost basis.
Short Sales: A short sale involves the sale by the Fund of a security that the Fund does not own. The Fund borrows the security that it intends to sell from a broker or other institution, and at a later date the Fund completes the short sale by purchasing that same security on the open market and delivering it to the lending institution. The Fund may be required to pay a premium, fee, or other amount to the lender in exchange for borrowing the security. These amounts are included in Short sale financing fees on the Statement of Operations. When it enters into a short sale, the Fund seeks to profit on a decline in the price of the security between the date the Fund borrows the security and the date the Fund purchases the security to deliver it to the lender. If, however, the price of the security increases between those dates, or if the price of the security declines by an amount which is not sufficient to cover the expenses of borrowing the security, the Fund will experience a loss. Although the potential for gain as a result of a short sale is limited to the price at which the Fund sold the security short less the cost of borrowing the security, the potential for loss is theoretically unlimited because there is no limit to the cost of replacing the borrowed security. Short sales held by the Fund during the fiscal year were fully collateralized by segregated cash or other securities, which are denoted on the Schedule of Investments.
When-Issued and Delayed Delivery Transactions: The Fund may engage in when-issued or delayed delivery transactions. To the extent the Fund engages in such transactions, it will do so for the purpose of acquiring portfolio investments consistent with the Fund’s investment
Notes to Financial Statements, Continued
Thornburg Long/Short Equity Fund | September 30, 2019
objectives and not for the purpose of investment leverage or to speculate on interest rate or market changes. At the time the Fund makes a commitment to purchase an investment on a when-issued or delayed delivery basis, the Fund will record the transaction and reflect the value in determining its net asset value. When effecting such transactions, assets of an amount sufficient to make payment for the portfolio investments to be purchased will be segregated on the Fund’s records on the trade date. Investments purchased on a when-issued or delayed delivery basis do not earn interest until the settlement date. The values of these securities held at September 30, 2019 are detailed in the Schedule of Investments.
Foreign Currency Translation: Portfolio investments and other assets and liabilities denominated in foreign currencies are translated into U.S. dollars based on the exchange rate of such currencies against the U.S. dollar on the date of valuation. Purchases and sales of investments and income items denominated in foreign currencies are translated into U.S. dollars at the exchange rate in effect on the transaction date. When the Fund purchases or sells foreign investments, it will customarily enter into a foreign exchange contract to minimize foreign exchange risk from the trade date to the settlement date of such transactions. The values of such spot contracts are included in receivable for investments sold and payable for investments purchased on the Statement of Assets and Liabilities.
The Fund does not separately report the effect of changes in foreign exchange rates from changes in market prices on investments held. Such changes are included in net unrealized appreciation (depreciation) from investments in the Statement of Operations.
Reported net realized gains and losses from foreign currency transactions arise due to purchases and sales of foreign currencies, currency gains and losses realized between the trade and settlement dates on investment transactions and the difference between the amounts of dividends, interest, and foreign withholding taxes recorded on the Fund’s books, and the U.S. dollar equivalent of the amounts actually received or paid. These amounts are included in foreign currency transactions in the Statement of Operations.
Net change in unrealized appreciation (depreciation) on foreign currency translations arise from changes in the fair value of assets and liabilities, other than investments at period end, resulting from changes in exchange rates.
Guarantees and Indemnifications: Under the Trust’s organizational documents (and under separate agreements with the independent Trustees), its officers and Trustees are provided with an indemnification against certain liabilities arising out of the performance of their duties to the Fund. In the normal course of business the Trust may also enter into contracts with service providers that contain general indemnifications. The Trust’s maximum exposure under these arrangements is unknown. However, based on experience, the Trust expects the risk of loss to be remote.
Use of Estimates: The preparation of financial statements in conformity with GAAP requires management to make estimates and assumptions that affect the reported amounts of assets and liabilities and disclosure of contingent assets and liabilities at the date of the financial statements and the reported amounts of increases (decreases) in net assets from operations during the reporting period. Actual results could differ from those estimates.
Federal Income Taxes: It is the policy of the Trust to comply with the provisions of the Internal Revenue Code applicable to regulated investment companies and to distribute to shareholders substantially all investment company taxable income including net realized gains on investments (if any), and tax exempt income of the Fund. Therefore, no provision for federal income or excise tax is required.
The Fund files income tax returns in United States federal and applicable state jurisdictions. The statute of limitations on the Fund’s tax return filings generally remains open for the three years following a return’s filing date. The Fund has analyzed each uncertain tax position believed to be material in the preparation of the Fund’s financial statements for the fiscal year ended September 30, 2019, including open tax years, to assess whether it is more likely than not that the position would be sustained upon examination, based on the technical merits of the position. The Fund has not identified any such position for which an asset or liability must be reflected in the Statement of Assets and Liabilities.
At September 30, 2019, information on the tax components of capital was as follows:
| Cost of investments for tax purposes | $ 115,152,052 |
| Gross unrealized appreciation on a tax basis | 43,253,744 |
| Gross unrealized depreciation on a tax basis | (36,846,001) |
| Net unrealized appreciation (depreciation) on investments (tax basis) | $ 6,407,743 |
Temporary book to tax adjustments to cost of investments and net unrealized appreciation (depreciation) for tax purposes result primarily from deferral of outstanding wash sales, outstanding tax basis adjustments for publicly traded partnerships (“PTPs”), real estate investment trusts (“REITs”), organizational expenses, and loss deferral of unsettled short positions.
At September 30, 2019, the Fund had deferred tax basis late-year ordinary losses occurring subsequent to October 31, 2018 through September 30, 2019 of $3,460,244. For tax purposes, such ordinary losses will be recognized in the year ending September 30, 2020.
Notes to Financial Statements, Continued
Thornburg Long/Short Equity Fund | September 30, 2019
At September 30, 2019, the Fund had deferred tax basis capital losses occurring subsequent to October 31, 2018 through September 30, 2019 of $234,573. For tax purposes, such losses will be recognized in the year ending September 30, 2020.
In order to account for permanent book to tax differences, the Fund increased distributable earnings by $1,243,298, and decreased net capital paid in on shares of beneficial interest by $1,243,298. Reclassifications have no impact upon the net asset value of the Fund and resulted primarily from investments in publicly traded partnerships (“PTPs”) and net operating losses.
At September 30, 2019, the Fund had no undistributed tax basis net ordinary investment income and $3,953,263 of undistributed tax basis capital gains.
Foreign Withholding Taxes: The Fund is subject to foreign tax withholding imposed by certain foreign countries in which the Fund may invest. Withholding taxes are incurred on certain foreign dividends and are accrued at the time the dividend is recognized based on applicable foreign tax laws. The Fund may file withholding tax reclaims in certain jurisdictions to recover a portion of amounts previously withheld, in view of various considerations, including recent decisions rendered by the courts in those and other jurisdictions. The Fund would expect to record a receivable for such a reclaim based on a variety of factors, including assessment of a jurisdiction’s legal obligation to pay reclaims, the jurisdiction’s administrative practices and payment history, and industry convention. To date the Fund has recorded no such receivable because there is limited precedent for collecting such prior year reclaims and the likelihood of collection remains uncertain.
Deferred Foreign Capital Gain Taxes: The Fund is subject to a tax imposed on net realized gains of securities of certain foreign countries. The Fund records an estimated deferred tax liability for net unrealized gains on these investments as reflected in the accompanying financial statements. Such changes are included in net unrealized appreciation (depreciation) from investments in the Statement of Operations.
The tax character of distributions paid during the year ended September 30, 2019, and September 30, 2018, was as follows:
| | 2019 | 2018 |
| Distributions from: | | |
| Ordinary income | $ 341,872 | $ 1,117,416 |
| Capital gains | 7,757,446 | 1,875,158 |
| Total | $ 8,099,318 | $ 2,992,574 |
NOTE 3 – SECURITY VALUATION
Valuation of the Fund’s portfolio investment securities is performed in accordance with policies and procedures adopted by and under the oversight of the Trustees.
The Trustees of the Trust have appointed the Advisor to assist the Trustees with obtaining fair market values for portfolio investments, evaluating and monitoring professional pricing service providers appointed by the Trustees’ Audit Committee (the “Audit Committee”) to assist in determining fair values for portfolio investments, assisting in calculating fair values for portfolio investments in certain circumstances, and performing other functions in connection with the valuation of investments. The Advisor acts through its Valuation and Pricing Committee (the “Committee”) and other employees of the Advisor. The Committee regularly reviews its own valuation calculations, reviews the valuations, valuation techniques and services furnished by pricing service providers, considers circumstances which may require valuation calculations by the Committee, and reviews previous valuation calculations. The Committee reports to the Audit Committee on the Committee’s activities, the performance of pricing service providers, and other matters relating to valuation of portfolio investments.
In those instances when the Committee assists in calculating a fair value for a portfolio investment, the Committee seeks to determine the price that the Fund would reasonably expect to receive upon a sale of the investment in an orderly transaction between market participants on the valuation date. The Committee customarily utilizes quotations from securities broker dealers in calculating valuations, but also may utilize prices obtained from pricing service providers or other methods approved by the Audit Committee. Because fair values calculated by the Committee are estimates, the calculation of a value for an investment may differ from the price that would be realized by the Fund upon a sale of the investment, and the difference could be material to the Fund’s financial statements. The Committee’s calculation of a fair value for an investment may also differ from the prices obtained by other persons (including other mutual funds) for the investment.
Valuation of Securities: Securities and other portfolio investments which are listed or traded on a United States securities exchange are valued at the last reported sale price on the valuation date. Investments listed or traded on an exchange for which there has been no sale that day are valued at the mean between the last reported bid and asked prices on that valuation date. Portfolio investments reported by NASDAQ are valued at the official closing price on the valuation date. If an investment is traded on more than one exchange, the investment is considered traded on the exchange that is normally the primary market for that investment. Securities and other portfolio
Notes to Financial Statements, Continued
Thornburg Long/Short Equity Fund | September 30, 2019
investments which are listed or traded on exchanges outside the United States are valued at the last price or the closing price of the investment on the exchange that is normally the primary market for the investment, as of the close of the exchange preceding the Fund’s valuation date. Foreign investments listed or traded on an exchange for which there has been no sale that day are valued at the mean between the last reported bid and asked prices on that valuation date.
In any case when a market quotation is not readily available for a portfolio investment ordinarily valued by market quotation, the Committee calculates a fair value for the investment using alternative methods approved by the Audit Committee. A market quotation is not readily available when the primary market or exchange for the investment is not open for the entire scheduled day of trading. Market quotations for an investment also may not be readily available if developments after the most recent close of the investment’s primary exchange or market, but prior to the close of business on any Fund business day, or an unusual event or significant period of time occurring since the availability of a market quotation, create a serious question concerning the reliability of the most recent market quotation available for the investment. In particular, on days when market volatility thresholds established by the Audit Committee are exceeded, foreign equity investments held by the Fund may be valued using alternative methods. The Committee customarily obtains valuations in these instances from pricing service providers approved by the Audit Committee. Pricing service providers ordinarily calculate valuations using multi-factor models to adjust market prices based upon various inputs, including exchange data, depository receipt prices, futures, index data and other data.
Debt obligations held by the Fund which are not listed or traded on exchanges or for which no reported market exists are ordinarily valued at the valuation obtained from a pricing service provider approved by the Audit Committee.
In any case when a pricing service provider fails to provide a valuation for a debt obligation held by the Fund, the Committee calculates a fair value for the obligation using alternative methods under procedures approved by the Audit Committee. Additionally, in cases when management believes that a valuation obtained from a pricing service provider is stale, does not reflect material factors affecting the valuation of the investment, is significantly different than the value the Fund is likely to obtain if it sought a bid for the investment, or is otherwise unreliable, the Committee calculates a fair value for the obligation using an alternative method approved by the Audit Committee.
Quotations for foreign investments expressed in foreign currency amounts are converted to U.S. dollar equivalents using a foreign exchange quotation from a third party service provider at the time of valuation. Foreign investments held by the Fund may be traded on days and at times when the Fund is not open for business. Consequently, the value of Fund investments may be significantly affected on days when shareholders cannot purchase or sell Fund shares.
Valuation Hierarchy: The Fund categorizes its investments based upon the inputs used in valuing those investments, according to a three-level hierarchy established in guidance from the FASB. Categorization of investments using this hierarchy is intended by the FASB to maximize the use of observable inputs in valuing investments and minimize the use of unobservable inputs by requiring that the most observable inputs be used when available. Observable inputs are those that market participants would use in valuing an investment based on available market information. Unobservable inputs are those that reflect assumptions about the information market participants would use in valuing an investment. An investment’s level within the hierarchy is based on the lowest level input that is deemed significant to the valuation. The methodologies and inputs used to value investments are not necessarily indications of the risk or liquidity associated with those investments.
Various inputs are used in calculating valuations for the Fund’s investments. These inputs are generally summarized according to the three-level hierarchy below:
Level 1: Quoted prices in active markets for identical investments.
Level 2: Other direct or indirect significant observable inputs (including quoted prices for similar investments in active markets and other observable inputs, such as interest rates, prepayment rates, credit ratings, etc.).
Level 3: Significant unobservable inputs (including the Committee’s own assumptions in calculating the fair values of investments).
Valuations for debt obligations held by the Fund are typically calculated by pricing service providers approved by the Audit Committee and are generally characterized as Level 2 within the valuation hierarchy.
On days when market volatility thresholds established by the Audit Committee are exceeded, foreign securities for which valuations are obtained from pricing service providers are fair valued. On these days, the foreign securities are characterized as Level 2 within the valuation hierarchy and revert to Level 1 after the threshold is no longer exceeded.
In a limited number of cases the Committee calculates a fair value for investments using broker quotations or other methods approved by the Audit Committee. When the Committee uses a single broker quotation to calculate a fair value for an investment without other significant observable inputs, or if a fair value is calculated using other significant inputs that are considered unobservable, the investment is characterized as Level 3 within the hierarchy. Other significant unobservable inputs used to calculate a fair value in these instances might
Notes to Financial Statements, Continued
Thornburg Long/Short Equity Fund | September 30, 2019
include an income-based valuation approach which considers discounted anticipated future cash flows from the investment and application of discounts due to the nature or duration of any restrictions on the disposition of the investment.
Valuations based upon the use of inputs from Levels 1, 2 or 3 may not represent the actual price received upon the disposition of an investment, and a Fund may receive a price that is lower than the valuation based upon these inputs when it sells the investment.
The following table displays a summary of the fair value hierarchy measurements of the Fund’s investments as of September 30, 2019:
| | Fair Value Measurements at September 30, 2019 |
| | TOTAL | LEVEL 1 | LEVEL 2 | LEVEL 3 |
| Assets | | | | |
| Investments in Securities* | | | | |
| Common Stock(a) | $ 228,021,676 | $ 222,687,186 | $ 5,334,490 | $ — |
| Short-Term Investments | 49,171,496 | 49,171,496 | — | — |
| Total Investments in Securities | $277,193,172 | $271,858,682 | $5,334,490 | $— |
| Total Assets | $277,193,172 | $271,858,682 | $5,334,490 | $— |
| Liabilities | | | | |
| Investment in Securities Sold Short | | | | |
| Common Stock | $ (155,523,127) | $ (155,523,127) | $ — | $ — |
| Exchange-Traded Funds | (110,250) | (110,250) | — | — |
| Total Investment in Securities Sold Short | $(155,633,377) | $(155,633,377) | $— | $— |
| Total Liabilities | $(155,633,377) | $(155,633,377) | $— | $— |
| * | See Schedule of Investments for a summary of the industry exposure as grouped according to the Global Industry Classification Standard (GICS), which is an industry taxonomy developed by MSCI, Inc. and Standard & Poor’s (S&P). |
| (a) | At September 30, 2019, industry classifications for Common Stock in Level 2 consist of $5,334,490 in Diversified Financials. |
NOTE 4 – INVESTMENT ADVISORY FEE AND OTHER TRANSACTIONS WITH AFFILIATES
Pursuant to an investment advisory agreement, the Advisor serves as the investment advisor and performs services for the Fund for which the fees are payable at the end of each month. Under the investment advisory agreement, the Fund pays the Advisor a management fee based on the average daily net assets of the Fund at an annual rate as shown in the following table:
| Management Fee Schedule |
| DAILY NET ASSETS | FEE RATE |
| Up to $500 million | 1.250% |
| Next $500 million | 1.200 |
| Next $1 billion | 1.150 |
| Over $2 billion | 1.100 |
The Fund’s effective management fee for the year ended September 30, 2019 was 1.25% of the Fund’s average daily net assets. Total management fees incurred by the Fund for the year ended September 30, 2019 are set forth in the Statement of Operations.
The Trust has entered into an administrative services agreement with the Advisor, whereby the Advisor will perform certain administrative services related to each class of the Fund’s shares. The fees are computed as an annual percentage of the aggregate average daily net assets of all shares classes of all Funds in the Trust as follows:
| Administration Fee Schedule |
| Daily Net Assets | Fee Rate |
| Up to $20 billion | 0.100% |
| $20 billion to $40 billion | 0.075 |
| $40 billion to $60 billion | 0.040 |
| Over $60 billion | 0.030 |
Notes to Financial Statements, Continued
Thornburg Long/Short Equity Fund | September 30, 2019
The aggregate fee amount is allocated on a daily basis to each Fund based on net assets and subsequently allocated to each class of shares of the Fund. Total administrative service fees incurred by each class of shares of the Fund for the year ended September 30, 2019, are set forth in the Statement of Operations.
The Trust has an underwriting agreement with Thornburg Securities Corporation (the “Distributor”), an affiliate of the Advisor, which acts as the distributor of the Fund’s shares.
For the year ended September 30, 2019, the Advisor voluntarily reimbursed certain class specific expenses of $59,542 for Class I shares.
Certain officers and Trustees of the Trust are also officers or directors of the Advisor and Distributor. The compensation of the independent Trustees is borne by the Trust. The Trust also pays a portion of the Chief Compliance Officer’s compensation. These amounts are reflected as Trustee and officer fees in the Statement of Operations.
The percentage of direct investments in the Fund held by the Trustees, officers of the Trust, and the Advisor is approximately 21.23%.
The Fund may purchase or sell securities from or to an affiliated fund, provided the affiliation is due solely to having a common investment advisor, common officers, or common trustees, and provided that all such transactions will comply with Rule 17a-7 under the 1940 Act. For the year ended September 30, 2019, the Fund had no such transactions with affiliated funds.
Shown below are holdings of voting securities of each portfolio company which is considered "affiliated" to the Fund under the 1940 Act, including companies for which the Fund’s holding represented 5% or more of the company’s voting securities, and a series of the Thornburg Investment Trust in which the Fund invested for cash management purposes during the period:
| Fund | Market Value
9/30/18 | Purchases
at Cost | Sales
Proceeds | Realized
Gain
(Loss) | Change in
Unrealized
Appr./(Depr.) | Market Value
9/30/19 | Dividend
Income |
| Thornburg Capital Management Fund | $56,648,618 | $189,682,721 | $(197,159,843) | $- | $- | $49,171,496 | $1,003,831 |
NOTE 5 – SHARES OF BENEFICIAL INTEREST
At September 30, 2019, there were an unlimited number of shares with no par value of beneficial interest authorized. Transactions in shares of beneficial interest were as follows:
| | YEAR ENDED
September 30, 2019 | YEAR ENDED
September 30, 2018 |
| | SHARES | AMOUNT | SHARES | AMOUNT |
| Class I Shares | | | | |
| Shares sold | 9,825,404 | $ 104,129,031 | 11,071,577 | $ 127,384,872 |
| Shares issued to shareholders in reinvestment of dividends | 716,187 | 7,512,802 | 257,814 | 2,915,877 |
| Shares repurchased | (7,805,884) | (83,131,052) | (834,836) | (9,574,379) |
| Net increase | 2,735,707 | $ 28,510,781 | 10,494,555 | $ 120,726,370 |
NOTE 6 – INVESTMENT TRANSACTIONS
For the year ended September 30, 2019, the Fund had purchase and sale transactions of long investments of $159,103,149 and $135,703,444, respectively, and cover and sale transactions of securities sold short of $104,482,177 and $123,617,313, respectively (excluding short term investments).
NOTE 7 – DERIVATIVE FINANCIAL INSTRUMENTS WITH OFF-BALANCE
SHEET RISK AND FOREIGN INVESTMENT RISK
The Fund may use a variety of derivative financial instruments to hedge or adjust the risks affecting its investment portfolio or to enhance investment returns. Provisions of FASB Accounting Standards Codification ASC 815-10-50 (“ASC 815”) require certain disclosures. The disclosures are intended to provide users of financial statements with an understanding of the use of derivative instruments by the Fund and how these derivatives affect the financial position, financial performance and cash flows of the Fund. The Fund does not designate any derivative instruments as hedging instruments under ASC 815. Additionally, the Fund’s risk of loss may exceed the amounts recognized on the Statement of Assets and Liabilities.
Notes to Financial Statements, Continued
Thornburg Long/Short Equity Fund | September 30, 2019
During the year ended September 30, 2019, the Fund did not invest in any derivative financial instruments of the type addressed by ASC 815.
NOTE 8 – RECENT ACCOUNTING PRONOUNCEMENTS
In August 2018, the FASB issued ASU 2018-13, Fair Value Measurement (Topic 820): Changes to the Disclosure Requirements for Fair Value Measurement, which adds, removes, and modifies certain aspects of the fair value disclosure. ASU 2018-13 is effective for annual periods beginning after December 15, 2019, and early adoption is permitted. The Funds have elected to early adopt, and had applied ASU 2018-13 for the fiscal year ended September 30, 2019. The adoption of this accounting guidance did not have a material impact on the Funds’ financial statements.
In March 2017, the FASB issued Accounting Standards Update (ASU) 2017-08, Premium Amortization of Purchased Callable Debt Securities. The amendments in the ASU shorten the premium amortization period on a purchased callable debt security from the security’s contractual life to the earliest call date. It is anticipated that this change will enhance disclosures by reducing losses recognized when a security is called on an earlier date. This ASU is effective for fiscal years beginning after December 15, 2018. Management has evaluated the implications of these changes and the amendments will have no material effect on the Funds’ net assets or results of operations.
OTHER NOTES
Risks: The Fund’s investments subject it to risks including, but not limited to, management risk, market and economic risk, risks affecting specific issuers, foreign investment risk, developing country risk, small and mid-cap company risk, short sale risk, non-diversification risk, derivatives risk, credit risk, interest rate risk, and liquidity risk. Please see the Fund’s prospectus for a discussion of the risks associated with an investment in the Fund.
Subsequent Events: Fund management believes no events have occurred between September 30, 2019 and the date of issuance of the financial statements that require adjustment to or disclosure in the accompanying financial statements.
Financial Highlights
Thornburg Long/Short Equity Fund
| | Per Share Performance (For a Share Outstanding throughout the Year) |
UNLESS OTHERWISE
NOTED, PERIODS ARE
FISCAL YEARS ENDED
SEPTEMBER 30, | Net Asset
Value,
Beginning of
Period | Net
Investment
Income
(Loss)+ | Net Realized &
Unrealized Gain
(Loss) on
Investments | Total from
Investment
Operations | Dividends
from Net
Investment
Income | Dividends
from Net
Realized
Gains | Total
Dividends | Net Asset
Value,
End of Period |
| Class I |
| 2019 | $ 11.54 | (0.17) | (0.09) | (0.26) | — | (0.47) | (0.47) | $ 10.81 |
| 2018 | $ 11.13 | (0.08) | 0.83 | 0.75 | — | (0.34) | (0.34) | $ 11.54 |
| 2017(e) | $ 10.00 | (0.13) | 1.26 | 1.13 | — | — | — | $ 11.13 |
| (a) | The Fund incurs certain expenses and fees in connection with investments in short positions. If such expenses and fees had not occurred, the Expenses After Expense Reductions ratios for 2019, 2018 and 2017 would have been 1.50%, 1.48% and 1.45%, respectively. |
| (b) | The Fund incurs certain expenses and fees in connection with investments in short positions. If such expenses and fees had not occurred, the Expenses Before Expense Reductions ratios for 2019, 2018 and 2017 would have been 1.53%, 1.48% and 1.81%, respectively. |
| (c) | Not annualized for periods less than one year. |
| (d) | The amounts reported for periods prior to the year ended September 30, 2019 have been revised to include certain expenses and fees in connection with investments in short positions in order to conform to current year presentation. The amounts reported in 2018 and 2017 were 1.48% and 1.45%, respectively. |
| (e) | Fund commenced operations on December 30, 2016. |
| (f) | Annualized. |
| + | Based on weighted average shares outstanding. |
See notes to financial statements.
Financial Highlights, Continued
Thornburg Long/Short Equity Fund
| Ratios to Average Net Assets | | Supplemental Data |
Net Investment
Income (Loss) (%) | Expenses, After
Expense
Reductions (%)(a) | Expenses,
Before Expense
Reductions (%)(b) | | Total
Return (%)(c) | Portfolio
Turnover
Rate (%)(c) | Net Assets
at End of Period
(Thousands) |
| |
| (1.55) | 3.44 | 3.47 | | (2.10) | 71.43 | $ 220,375 |
| (0.74) | 2.82(d) | 2.82 | | 6.83 | 65.72 | $ 203,804 |
| (1.56)(f) | 3.42(d)(f) | 3.78(f) | | 11.30 | 61.69 | $ 79,739 |
Report of Independent Registered Public Accounting Firm
Thornburg Long/Short Equity Fund
To the Board of Trustees of Thornburg Investment Trust and Shareholders of
Thornburg Long/Short Equity Fund
Opinion on the Financial Statements
We have audited the accompanying statement of assets and liabilities, including the schedule of investments, of Thornburg Long/Short Equity Fund (one of the funds constituting Thornburg Investment Trust, referred to hereafter as the "Fund") as of September 30, 2019, the related statements of operations and cash flows for the year ended September 30, 2019, the statements of changes in net assets for each of the two years in the period ended September 30, 2019, including the related notes, and the financial highlights for each of the two years in the period ended September 30, 2019 and for the period December 30, 2016 (commencement of operations) through September 30, 2017 (collectively referred to as the “financial statements”). In our opinion, the financial statements present fairly, in all material respects, the financial position of the Fund as of September 30, 2019, the results of its operations and its cash flows for the year then ended, the changes in its net assets for each of the two years in the period ended September 30, 2019 and the financial highlights for each of the two years in the period ended September 30, 2019 and for the period December 30, 2016 (commencement of operations) through September 30, 2017 in conformity with accounting principles generally accepted in the United States of America.
Basis for Opinion
These financial statements are the responsibility of the Fund’s management. Our responsibility is to express an opinion on the Fund’s financial statements based on our audits. We are a public accounting firm registered with the Public Company Accounting Oversight Board (United States) (PCAOB) and are required to be independent with respect to the Fund in accordance with the U.S. federal securities laws and the applicable rules and regulations of the Securities and Exchange Commission and the PCAOB.
We conducted our audits of these financial statements in accordance with the standards of the PCAOB. Those standards require that we plan and perform the audit to obtain reasonable assurance about whether the financial statements are free of material misstatement, whether due to error or fraud.
Our audits included performing procedures to assess the risks of material misstatement of the financial statements, whether due to error or fraud, and performing procedures that respond to those risks. Such procedures included examining, on a test basis, evidence regarding the amounts and disclosures in the financial statements. Our audits also included evaluating the accounting principles used and significant estimates made by management, as well as evaluating the overall presentation of the financial statements. Our procedures included confirmation of securities owned as of September 30, 2019 by correspondence with the custodian, transfer agent and brokers; when replies were not received from brokers, we performed other auditing procedures. We believe that our audits provide a reasonable basis for our opinion.
/s/PricewaterhouseCoopers LLP
New York, New York
November 22, 2019
We have served as the auditor of one or more investment companies in Thornburg Investment Trust since 1999.
Expense Example
Thornburg Long/Short Equity Fund | September 30, 2019 (Unaudited)
This example is intended to help you understand your ongoing costs (in dollars) of investing in the Fund and to compare these costs with the ongoing costs of investing in other mutual funds.
The example is based on a $1,000 investment beginning on April 1, 2019, and held until September 30, 2019.
| | BEGINNING
ACCOUNT VALUE
4/1/19 | ENDING
ACCOUNT VALUE
9/30/19 | EXPENSES PAID
DURING PERIOD†
4/1/19—9/30/19 |
| CLASS I SHARES |
| Actual | $1,000.00 | $983.63 | $23.17 |
| Hypothetical* | $1,000.00 | $1,001.70 | $23.38 |
| † | Expenses are equal to the annualized expense ratio for each class (I: 4.66%) multiplied by the average account value over the period, multiplied by 183/365 to reflect the one-half year period. |
| * | Hypothetical assumes a rate of return of 5% per year before expenses. |
ACTUAL EXPENSES
For each class of shares, the first line of the accompanying table provides information about actual account values and actual expenses. You may use the information in this line, together with the amount you invested, to estimate the expenses that you paid over the period. Simply divide your account value by $1,000 (for example, an $8,600 account value divided by $1,000 = 8.6), then multiply the result by the number in the first line for your class of shares under the heading entitled “Expenses Paid During Period” to estimate the expenses you paid on your account during this period.
HYPOTHETICAL EXAMPLE FOR COMPARISON PURPOSES
For each class of shares, the second line of the accompanying table provides information about hypothetical account values and hypothetical expenses based on the Fund’s actual expense ratio and an assumed rate of return of 5% per year before expenses, which is not the Fund’s actual return. The hypothetical account values and expenses may not be used to estimate the actual ending account balance or expenses you paid for the period. You may use this information to compare the ongoing costs of investing in the Fund and other funds. To do so, compare this 5% hypothetical example with the 5% hypothetical examples that appear in the shareholder reports of the other funds.
Please note that the expenses shown in the table are meant to highlight your ongoing costs only and do not reflect any transactional costs, such as sales charges (loads), redemption fees, or exchange fees. Therefore, the second line of the table for each class of shares is useful in comparing ongoing costs only, and will not help you determine the relative total costs of owning different funds. In addition, if these transactional costs were included, your costs would have been higher.
Trustees and Officers
Thornburg Long/Short Equity Fund | September 30, 2019 (Unaudited)
NAME, AGE, YEAR ELECTED
POSITION HELD WITH FUND | PRINCIPAL OCCUPATION(S) DURING PAST FIVE YEARS | OTHER DIRECTORSHIPS
HELD BY TRUSTEE |
| INTERESTED TRUSTEES(1)(2) |
Garrett Thornburg, 73
Trustee since 1984,
Chairman of Trustees(3) | Chairman and controlling shareholder of Thornburg Investment Management, Inc. (investment advisor); Chairman and controlling shareholder of Thornburg Securities Corporation (securities dealer); President of the Thornburg Foundation (nonprofit). | None |
Brian J. McMahon, 64
Trustee since 2001,
Vice Chairman of Trustees,
Member of Governance and
Nominating Committee &
Operations Risk Oversight
Committee(4) | Vice Chairman, Chief Investment Strategist, Managing Director, and Portfolio Manager and, until 2016, CEO and President of Thornburg Investment Management, Inc.; Vice President of Thornburg Securities Corporation. | None |
| INDEPENDENT TRUSTEES(1)(2)(5) |
David A. Ater, 74
Trustee since 1994,
Lead Independent Trustee,
Chairman of Governance and
Nominating Committee &
Member of Audit Committee | Principal in Ater & Associates, Santa Fe, NM (developer, planner and broker of residential and commercial real estate); owner, developer and broker for various real estate projects. | None |
Sally Corning, 58
Trustee since 2012,
Chairman of Audit Committee | Partner in Sun Mountain Capital, Santa Fe, NM (private equity firm with investment programs encompassing venture capital, mezzanine debt, and growth equity). | None |
Susan H. Dubin, 70
Trustee since 2004,
Member of Audit
Committee & Governance
and Nominating Committee | President of Dubin Investments, Ltd., Greenwich, CT (private investment fund); Director and officer of various charitable organizations. | None |
David L. Gardner, 56
Trustee since 2015,
Member of Operations Risk
Oversight Committee | Until 2012, head of EMEA (Europe, Middle East and Africa) Sales for iShares of Blackrock, Inc., EMEA Executive Committee Member and EMEA Operating Committee Member at Blackrock, Inc. | None |
Patrick J. Talamantes, 55
Trustee since 2019,
Member of Audit Committee | President of Talamantes Strategies, LLC, a management consulting firm, since 2018; until 2017, President and Chief Executive Officer of The McClatchy Company, Sacramento, CA (news and media company). | None |
Owen D. Van Essen, 65
Trustee since 2004,
Chairman of Operations Risk
Oversight Committee &
Member of Governance and
Nominating Committee | President of Dirks, Van Essen, Murray & April, Santa Fe, NM (newspaper mergers and acquisitions). | None |
James W. Weyhrauch, 60
Trustee since 1996,
Member of Audit
Committee & Operations Risk
Oversight Committee | Real estate broker, Santa Fe Properties, Santa Fe, NM; General Partner, Investments of Genext LLC (a family investment partnership); until 2019, Vice Chairman of Nambe LLC, Santa Fe, NM (manufacturing & design company). | None |
Trustees and Officers, Continued
Thornburg Long/Short Equity Fund | September 30, 2019 (Unaudited)
NAME, AGE, YEAR ELECTED
POSITION HELD WITH FUND | PRINCIPAL OCCUPATION(S) DURING PAST FIVE YEARS | OTHER DIRECTORSHIPS
HELD BY TRUSTEE |
| OFFICERS OF THE FUND (WHO ARE NOT TRUSTEES)(1)(6) |
David Ashley, 49
Vice President since 2019 | Portfolio Manager and Managing Director since 2019 and Associate Portfolio Manager from 2011-2019 of Thornburg Investment Management, Inc. | Not applicable |
Nimish Bhatt, 56
Chief Financial Officer
since 2019; Treasurer
2016-2019; Secretary
(2018-2019)(7) | Chief Financial Officer and Treasurer of Thornburg Investment Management, Inc. and Thornburg Securities Corporation since 2016 and Secretary of Thornburg Securities Corporation since 2018; Senior Vice President (2004-2016), Chief Financial Officer (2011-2016), and Head of Fund Administration (2011-2016) of Calamos Asset Management, Inc., Calamos Investments LLC, Calamos Advisors LLC, and Calamos Wealth Management; Director of Calamos Global Funds plc (2007-2016). | Not applicable |
Jason Brady, 45
President since 2016(7) | Director since 2017, CEO and President since 2016, and Portfolio Manager and Managing Director of Thornburg Investment Management, Inc.; Vice President of Thornburg Securities Corporation since 2016. | Not applicable |
Connor Browne, 40
Vice President since 2006 | Portfolio Manager and Managing Director of Thornburg Investment Management, Inc. | Not applicable |
Randy Dry, 45
Vice President since 2014 | Managing Director, Director of Institutional Group from 2014-2016, and since 2016, Chief Administrative Officer of Thornburg Investment Management, Inc. | Not applicable |
Greg Dunn, 43
Vice President since 2014 | Portfolio Manager and Managing Director of Thornburg Investment Management, Inc. | Not applicable |
Lon Erickson, 44
Vice President since 2008 | Portfolio Manager and Managing Director of Thornburg Investment Management, Inc. | Not applicable |
Thomas Garcia, 48
Vice President since 2006 | Managing Director, Head Equity Trader, and Associate Portfolio Manager of Thornburg Investment Management, Inc. | Not applicable |
Christian Hoffmann, 37
Vice President since 2018 | Portfolio Manager and Managing Director since 2018, and Associate Portfolio Manager from 2014-2018, of Thornburg Investment Management, Inc. | Not applicable |
Curtis Holloway, 52
Treasurer since 2019(7) | Director of Fund Administration since 2019 of Thornburg Investment Management, Inc.; Senior Vice President, Head of Fund Administration (2017-2019) and Vice President, Fund Administration (2010-2017) of Calamos Investments, and Chief Financial Officer (2017-2019) and Treasurer (2010-2019) of Calamos Funds. | Not applicable |
Ben Kirby, 39
Vice President since 2014 | Head of Investments since 2019, Portfolio Manager and Managing Director since 2013. | Not applicable |
Jeff Klingelhofer, 38
Vice President since 2016 | Head of Investments since 2019, Portfolio Manager and Managing Director since 2015, and Associate Portfolio Manager from 2012–2015, of Thornburg Investment Management, Inc. | Not applicable |
Ponn Lithiluxa, 48
Vice President since 2017 | Manager, Tax & Fund Administration of Thornburg Investment Management, Inc.; Senior Vice President, Citi Fund Services, Inc. (2014–2017); Vice President, Citi Fund Services, Inc. (2007–2014). | Not applicable |
Rob MacDonald, 43
Vice President since 2016 | Managing Director since 2015, Portfolio Manager since 2014, and Associate Portfolio Manager from 2011–2014 of Thornburg Investment Management, Inc. | Not applicable |
Michael Mastroianni, 42
Secretary and Vice President since 2019(7) | Director of Fund Operations since 2019 of Thornburg Investment Management, Inc.; Executive Director, Global Head of Client Services - Global Liquidity (2018-2019), Executive Director, North American Head of Transfer Agency Relationship Management (2011-2019), Executive Director, North American Head of Transfer Agency Service Delivery (2011-2018) of J.P. Morgan Asset Management. | Not applicable |
Leigh Moiola, 52
Vice President since 2001 | Managing Director and Director of Marketing of Thornburg Investment Management, Inc.; Vice President of Thornburg Securities Corporation. | Not applicable |
Christopher Ryon, 63
Vice President since 2008 | Portfolio Manager and Managing Director of Thornburg Investment Management, Inc. | Not applicable |
Trustees and Officers, Continued
Thornburg Long/Short Equity Fund | September 30, 2019 (Unaudited)
NAME, AGE, YEAR ELECTED
POSITION HELD WITH FUND | PRINCIPAL OCCUPATION(S) DURING PAST FIVE YEARS | OTHER DIRECTORSHIPS
HELD BY TRUSTEE |
Sean Koung Sun, 38
Vice President since 2017 | Portfolio Manager and Managing Director since 2017, Associate Portfolio Manager from 2015-2016, and Equity Research Analyst from 2012-2014 of Thornburg Investment Management, Inc. | Not applicable |
Stephen Velie, 52
Chief Compliance Officer since 2009 | Chief Compliance Officer of Thornburg Investment Trust and Thornburg Investment Management, Inc. | Not applicable |
Nicholos Venditti, 38
Vice President since 2016 | Portfolio Manager and Managing Director since 2015 and Associate Portfolio Manager from 2011–2015 of Thornburg Investment Management, Inc. | Not applicable |
Vinson Walden, 49
Vice President since 2004 | Portfolio Manager and Managing Director of Thornburg Investment Management, Inc. | Not applicable |
Lei Wang, 48
Vice President since 2006 | Portfolio Manager and Managing Director of Thornburg Investment Management, Inc. | Not applicable |
Charles Wilson, 44
Vice President since 2016 | Portfolio Manager and Managing Director since 2014 and Associate Portfolio Manager from 2012–2014 of Thornburg Investment Management, Inc. | Not applicable |
Di Zhou, 41
Vice President since 2016 | Portfolio Manager and Managing Director since 2016, Associate Portfolio Manager from 2014–2016, and Equity Research Analyst from 2010–2014 of Thornburg Investment Management, Inc. | Not applicable |
| (1) | Each person’s address is 2300 North Ridgetop Road, Santa Fe, New Mexico 87506. |
| (2) | The Fund is a separate investment “Fund” or “series” of Thornburg Investment Trust (the “Trust”), which comprises the Thornburg mutual fund complex and is organized as a Massachusetts business trust. Thornburg Investment Management, Inc. is the investment advisor to, and manages, all the Funds of the Trust. Each Trustee oversees all the Funds of the Trust. |
| (3) | Mr. Thornburg is considered an “interested” Trustee under the Investment Company Act of 1940 because he is a director and controlling shareholder of Thornburg Investment Management, Inc., the investment advisor to the Trust, and is the sole director and controlling shareholder of Thornburg Securities Corporation, the distributor of shares for the Trust. |
| (4) | Mr. McMahon is considered an “interested” Trustee under the Investment Company Act of 1940 because he is a director and the chief investment strategist of Thornburg Investment Management, Inc. |
| (5) | The Bylaws of the Trust currently require that each Independent Trustee shall retire by the end of the calendar year during which the Trustee reached the age of 75 years. Otherwise each Trustee serves in office until the election and qualification of a successor or until the Trustee sooner dies, resigns, retires or is removed. |
| (6) | Assistant vice presidents and assistant secretaries are not shown. |
| (7) | The Trust’s president, chief financial officer, secretary, and treasurer each serves a one-year term or until the election and qualification of a successor; each other officer serves at the pleasure of the Trustees. |
The Statement of Additional Information for each Fund of the Trust includes additional information about the Trustees and is available, without charge and upon request, by calling 1-800-847-0200.
Other Information
Thornburg Long/Short Equity Fund | September 30, 2019 (Unaudited)
PORTFOLIO PROXY VOTING
Policies and Procedures:
The Trust has delegated to the Advisor voting decisions respecting proxies for the Fund’s voting securities. The Advisor makes voting decisions in accordance with its Proxy Voting Policy and Procedures. A description of the Policy and Procedures is available (i) without charge, upon request, by calling the Advisor toll-free at 1-800-847-0200, (ii) on the Thornburg website at www.thornburg.com, and (iii) on the U.S. Securities and Exchange Commission’s website at www.sec.gov.
Information regarding how proxies were voted is available on or before August 31 of each year for the twelve months ending the preceding June 30. This information is available (i) without charge, upon request by calling the Advisor toll-free at 1-800-847-0200, (ii) on the Thornburg website at www.thornburg.com, and (iii) on the U.S. Securities and Exchange Commission’s website at www.sec.gov.
TAX INFORMATION
For the year ended September 30, 2019, dividends paid by Thornburg Long/Short Equity Fund of $341,872 are being reported as taxable ordinary investment income dividends and $7,757,446 are being reported as long term capital gain dividends for federal income tax purposes.
For the tax year ended September 30, 2019, the Fund is reporting 99.96% (or the maximum allowed) of the dividends paid from tax basis net ordinary income as qualifying for the reduced rate under the Jobs and Growth Tax Relief and Reconciliation Act of 2003.
The Fund is reporting 88.29% (or the maximum allowed) of the ordinary income distributions paid by the Fund for the fiscal year ended September 30, 2019 as qualified for the corporate dividends received deduction.
The information and distributions reported herein may differ from the information and distributions reported to the shareholders for the calendar year ending December 31, 2019. Complete information will be reported in conjunction with your 2019 Form 1099.
AVAILABILITY OF QUARTERLY PORTFOLIO SCHEDULE
The Fund files with the Securities and Exchange Commission schedules of its portfolio holdings on Form N-Q for the first and third quarters of each fiscal year. The Fund’s Forms N-Q are available on the Commission’s website at www.sec.gov, or may be reviewed and copied at the Commission’s Public Reference Room in Washington, D.C. Information on the operation of the Public Reference Room may be obtained by calling 1-800-SEC-0330. The Fund also makes this information available on its website at www.thornburg.com/download or upon request by calling 1-800-847-0200.
STATEMENT RESPECTING RENEWAL OF INVESTMENT ADVISORY AGREEMENT
Thornburg Investment Management, Inc. (the “Advisor”) provides investment management services to Thornburg Long/Short Equity Fund (the “Fund”) pursuant to an investment advisory agreement. The Trustees consider the renewal of this agreement annually, and most recently determined to renew the agreement on September 17, 2019.
Planning for their recent consideration of the advisory agreement’s renewal, the independent Trustees met in May 2019 to consider aspects of their annual evaluation of the Advisor’s service to all of the funds of Thornburg Investment Trust, to plan the annual evaluation of the Advisor’s performance and to discuss preliminarily the information the Advisor would present to the Trustees for their review. The independent Trustees met in a second independent session in July 2019 to further define certain portions of the information to be submitted by the Advisor. The independent Trustees met again in an independent session in September 2019 with a mutual fund analyst firm engaged by the independent Trustees to provide explanations of comparative cost and expense information, comparative investment performance information, and other data obtained and analyzed by the analyst firm. In that session the independent Trustees discussed their evaluations of the Advisor’s services to the Fund and the Fund’s fee and expense levels, investment performance, and other information presented for the Fund, conferred independently with legal counsel respecting the factors typically considered in evaluating renewal of an advisory agreement, and conferred with representatives of management to receive explanations of certain aspects of the information they had requested. Representatives of the Advisor subsequently reviewed portions of the information with the Trustees and addressed questions from the Trustees at a full meeting session of the Trustees scheduled in September for that purpose, and the independent Trustees thereafter met again in an independent session to consider the Advisor’s presentations and various specific issues respecting their consideration of the advisory agreement’s renewal. Following these sessions, the Trustees met to consider renewal of the advisory agreement, and the independent Trustees voted unanimously at that meeting to renew the agreement for an additional term of one year.
Other Information, Continued
Thornburg Long/Short Equity Fund | September 30, 2019 (Unaudited)
The information below summarizes certain factors considered by the Trustees in connection with the determination to renew the advisory agreement with the Advisor. In determining to renew the advisory agreement, the Trustees considered a wide range of information and did not identify any single factor as controlling, and this summary does not describe all of the factors and other matters considered by the Trustees in making their determination.
Nature, Extent and Quality of Services. The Trustees considered in their evaluation of the advisory agreement the written and oral reports provided to the Trustees and their standing committees throughout the year on a wide variety of topics by personnel from the Advisor’s portfolio management, administration, operations and compliance staffs. The Trustees also considered in this evaluation presentations and explanations made by representatives of the Advisor in meeting sessions scheduled for consideration of the renewal of the advisory agreement. The Trustees further noted in their evaluation the consideration they had given to a number of topics in previous years, reports from their standing committees, and advice received from counsel.
Information noted by the Trustees as having been considered in relation to the nature, extent and quality of services provided by the Advisor under the advisory agreement and contributing (together with other information considered) to their conclusions respecting the nature, extent and quality of the services rendered to the Fund by the Advisor included: (1) reports from portfolio managers and other personnel throughout the year demonstrating that the Fund was managed in conformity with stated strategies and objectives and conformed to investment restrictions and limitations; (2) reports demonstrating that management of the Fund remained faithful and competent, and demonstrating sufficient skill by portfolio managers in executing the Fund’s strategies in varying environments, managers’ cognizance of and strategies to pursue the Fund’s objectives and address pertinent market and economic trends and conditions, the evaluation and selection of individual investments, management to achieve tax efficiencies, and the structuring and composition of the Fund’s portfolio and management of Fund liquidity requirements; (3) the Fund’s achievement of its investment objectives over different periods of time; (4) presentations by and interactions with members of the Advisor’s fund administration, operations and compliance staffs; (5) reports from standing committees of the Trustees on their respective proceedings throughout the year, including in particular reports from and interactions with the Advisor’s personnel; (6) the sufficiency of the resources the Advisor devotes to the services it provides to the Fund, including the expertise of its personnel and staffing levels and its enhancements to the electronic systems it utilizes in providing these services, and also including the Advisor’s own financial management and sufficiency of its resources; and (7) the measures employed to achieve efficient trade execution for the Fund, including the evaluation and selection of firms to execute transactions for the Fund. As in past years, the Trustees noted particularly their assessments of the Advisor’s personnel developed in meetings throughout the year, measures to expand and improve the depth and experience of the Advisor’s staff, and the Advisor’s collaborative approach to investment management, continued commitment to observance of compliance and regulatory requirements in managing investments by the Fund, responsiveness to the Trustees, and other factors.
Based upon these and other considerations, the Trustees concluded that the Advisor’s management of the Fund’s investments continued to conform to the Fund’s stated objectives and policies, and that the nature, extent and quality of the services provided to the Fund by the Advisor remained sufficient.
Investment Performance. The Trustees noted in their evaluation of the Fund’s investment performance the written and oral reports they had received in each regular meeting over the course of the year from the Advisor’s portfolio management personnel. The Trustees also noted their consideration of information provided to them at their request in anticipation of their annual evaluation of the Advisor’s services, including the following items of information respecting the investment performance of the Fund: (1) the Fund’s absolute investment performance and achievement of stated objectives; (2) the Advisor’s explanations and commentary on the Fund’s performance in the context of the Fund’s objectives and reasonable expectations, and business, market and economic conditions; (3) performance data for the most recent ten calendar years (which included data for a predecessor fund), comparing the Fund’s annual investment returns to a broad-based securities index and to the applicable Morningstar category of funds; (4) the Fund’s investment performance (which included data for a predecessor fund) for the three-month, year-to-date, one-year, three-year, five-year, ten-year, and since inception periods ending with the second quarter of the current year, comparing the Fund’s annualized returns to two mutual fund categories selected by independent mutual fund analyst firms and to a broad-based securities index, and assigning a percentage rank to the Fund’s performance for each period relative to each of the fund categories; (5) analyses of specified performance and risk metrics for the Fund relative to its benchmark and to a selected peer group of funds, prepared by an independent financial analyst firm engaged by the independent Trustees; (6) the Fund’s cash flows; (7) comparative performance data for a fund peer group selected by an independent mutual fund analyst firm engaged by the independent Trustees, and the analysis and observations of the analyst firm respecting those data; (8) comparison of the Fund’s annualized return to the Fund’s benchmark index over various periods since the Fund’s inception; and (9) comparative measures of estimated earnings growth, and risk and return statistics. The Trustees generally attach additional significance to investment performance from the perspective of longer-term shareholders.
The Trustees considered explanations from the Advisor respecting performance of the Fund in some recent periods that had compared less favorably to some comparative measures, together with the reports they had received from the Advisor throughout the year, explanations of the comparisons by reference to the investment strategies of the Fund, the effects of market and economic conditions, the investment decisions by the Advisor in view of the Fund’s strategies, and where pertinent the Advisor’s measures and expectations for improvement in the Fund’s relative investment performance. The Trustees noted their understanding that strategies pursued for a fund may
Other Information, Continued
Thornburg Long/Short Equity Fund | September 30, 2019 (Unaudited)
produce intermittent lower relative performance, other funds managed by the Advisor have in the past returned to favor as conditions changed or the strategies of those funds gained traction, and that the Advisor has successfully remediated lower relative performance of other funds in cases where execution of investment strategies had contributed to lower performance. Based upon their consideration of this and other information, the Trustees concluded that the Fund’s absolute and relative investment performance over a range of pertinent holding periods, including the performance of the predecessor fund, on the whole was satisfactory in view of its objectives and strategies.
Comparisons of Fee and Expense Levels. Information noted by the Trustees as having been considered in this context included a variety of comparative data respecting the Fund’s fee and expense levels. This information included comparisons of the Fund’s advisory fee and overall Fund expenses to median and average fees and expenses charged to funds in the applicable Morningstar category, comparisons of the advisory fee and total expenses for the Fund’s sole share class to the fee levels and expenses of a fund peer group selected from the category by an independent mutual fund analyst firm engaged by the independent Trustees, the perspectives and advice from that mutual fund analyst firm respecting comparisons of fund fee levels and expenses to fund peer groups, and other information. Comparative fee and expense data noted as having been considered by the Trustees showed that the level of total expense for the Fund was lower than the median and average levels charged to funds in the applicable Morningstar category. Peer group data showed that the Fund’s stated advisory fee and total expense level were each lower than the median level for the peer group.
The Trustees noted their consideration of information respecting the advisory fees charged by the Advisor to other investment management clients, including sub-advised mutual funds and other institutional clients, together with information about fees charged by other advisors to different clients, analysis of the differences between the requirements of institutional clients and mutual funds, analysis of the differences between the requirements of a sub-advised mutual fund and a fund as to which the investment advisor is the primary advisor and sponsor, and the consequently different investment management services provided to the different categories of clients and the differing contexts in which these arrangements are entered into. The Trustees confirmed their previous observations that the differences between the fees charged by the Advisor or by other investment advisors to different types of clients did not appear exceptional and had limited relevance to the evaluation of the fee rate charged to mutual funds as to which the Advisor or such other advisors are the primary advisor and sponsor.
Costs and Profitability of Advisor. In reviewing the profitability of the Advisor’s services to the Fund, the Trustees considered an analysis of the Advisor’s costs and the estimated profitability to the Advisor of its services, together with data respecting the overall profitability of a selection of other investment management firms. The Trustees considered in this regard information from the Advisor respecting investment of its profits to maintain staffing levels, and noted that a portion of the Advisor’s profits is an important element in the compensation of shareholder employees. The Trustees considered information from the Advisor respecting the use of profits to enhance staff competencies through training and other measures, hire personnel to expand and develop the scope of senior management expertise, pay competitive levels of compensation, and add to the Advisor’s electronic and information technology systems to maintain or improve service levels. The Trustees also considered the contribution of the Advisor’s cost management to its profitability, and the relationship of the Advisor’s financial resources and profitability in previous years to its ability to attract necessary personnel, invest in systems and other assets required for its service to the Fund, and maintain or improve service levels for the Fund notwithstanding fluctuations in revenues and profitability. The information considered did not indicate to the Trustees that the Advisor’s profitability was excessive.
Potential Economies of Scale. In reviewing the extent to which economies of scale would be realized by the Fund as it grows and whether fee levels reflect potential economies of scale, the Trustees considered the breakpoint structure for advisory fees chargeable to the Fund, comparisons of the fee breakpoint structure for the Fund with breakpoint structures (or the absence of such structures) for other funds in a peer group selected by an independent mutual fund analyst firm, the effects of the breakpoint structure and other expense factors realized by certain funds of the Trust as their asset levels had increased, and the Advisor’s expenditures from its own profits and resources to maintain staffing levels and expand staff competencies, pay competitive levels of compensation, and add to its electronic and information technology systems so as to maintain or improve service levels. The information provided demonstrated to the Trustees that the Fund’s advisory fee breakpoint structure is reasonable in relation to the structures observed in the other funds in its peer group, and that shareholders may be expected to benefit from any economies of scale, due to the advisory agreement’s breakpoint fee structure for the Fund and other factors.
Potential Ancillary Benefits. In reviewing potential benefits to the Advisor because of its relationship to the Fund, the Trustees considered explanations from the Advisor respecting its receipt of certain research services from broker dealers, and the benefits to both the Fund and the Advisor of the Advisor’s expansion of its staffing, compliance and systems capabilities and other resources to serve a broader variety of investment management clients. No unusual or unfair benefits to the Advisor from its relationship to the Fund were identified by the Trustees.
Summary of Conclusions. The Trustees concluded that the general nature, extent and quality of the Advisor’s services performed under the advisory agreement remained sufficient, the Advisor had continued to actively and competently pursue the Fund’s stated investment objectives and adhere to the Fund’s investment policies, and that the absolute and relative investment performance of the Fund over pertinent holding periods on the whole was satisfactory in the context of the Fund’s objectives and strategies. The Trustees further concluded that the level of the advisory fee charged to the Fund by the Advisor is fair and reasonable in relation to the services provided by the Advisor, in view of the nature, extent and quality of those services, the investment performance of the Fund after fees and expenses,
Other Information, Continued
Thornburg Long/Short Equity Fund | September 30, 2019 (Unaudited)
the clear disclosure of fees and expenses in the Fund’s prospectus, comparisons of fees and expenses charged to the Fund to fees and expenses charged to other mutual funds, and the other factors considered. The Trustees accordingly determined to renew the Fund’s investment advisory agreement with the Advisor for an additional term of one year.
Trustees’ Statement to Shareholders (Unaudited)
Readopted September 17, 2019
The Trustees believe current and prospective shareholders should know how we discharge our responsibilities in supervising the Funds’ investment advisor and in reviewing the advisor’s contract for renewal. Since 2005, we have issued a statement which sets out clearly the three principal guidelines that we follow in supervising the Trust’s investment advisor on your behalf. In accordance with our customary practice, in September of this year we again reviewed our statement and concluded we should reissue this statement outlining the principal features of our supervision of the advisor’s performance of investment management services for the Funds.
We begin with the premise that each shareholder selected his or her Fund because its investments are managed by the investment advisor identified in the prospectus and in accordance with the objective and policies described in the prospectus. We realize, as each of you do, that if you believe that your Fund’s stated objective and policies no longer serve your personal investment goals, you can sell your shares and leave the Fund.
Therefore, we believe that our primary supervisory task—our principal obligation to you—is to assess the nature and quality of the advisor’s services, and to confirm that the advisor actively and competently pursues the Fund’s objective, in accordance with the policies set out in the prospectus. To do this, we meet regularly with management to review your Fund’s portfolio and to discuss the advisor’s specific actions and judgments in pursuing the Fund’s objective. We do not substitute our own judgment for the advisor’s decisions in selecting investments; the advisor is paid to exercise its informed judgment on investment decisions, and we seek to confirm, in reviewing the advisor’s performance, that the advisor is doing just that.
Second, we are conscious of costs and the effect that costs have on shareholders’ returns. We try to make sure that your Fund’s fees and costs are reasonable in relationship to the services rendered and that they are generally in line with those charged by other expert investment advisors, consistent with our belief that the Fund’s investors searched for and expect that expertise and attention and have decided to pay a reasonable price for it. We do not put the management contract “out to bid” as a matter of course, and we would not do so unless we had concluded that the advisor materially had failed to pursue the Fund’s objectives in accordance with its policies, or for other equally important reasons. We believe that any other approach would be inconsistent with your interests and contrary to your expectations when you bought shares of the Fund in the first place.
Finally, because we believe that most Thornburg Fund shareholders have invested with a long-term perspective, we try not to focus too much on the fashions of the moment and on short-term performance. The market will not favor any specific investment objective or set of policies at all times and under all economic circumstances. A fund will experience periods of both high and low returns relative to other funds and other investments. Even if one of our Funds is not favored by the market at a particular time, we believe that the advisor is nonetheless obliged to remain true to the Fund’s objective and policies, and we watch to see that it does so.
Trustees of Thornburg Investment Trust
Thornburg Investment Management is a privately-owned global investment firm that offers a range of solutions for retail and institutional investors. Founded in 1982 and headquartered in Santa Fe, New Mexico, we manage approximately $41.9 billion (as of September 30, 2019) across U.S. mutual funds, separate accounts for high-net-worth investors, institutional accounts, and UCITS funds for non-U.S. investors.
The fund outlined in this report is one of many equity and fixed-income products available from Thornburg Investment Management.
EQUITY FUNDS
| ■ | Thornburg Global Opportunities Fund |
| ■ | Thornburg International Value Fund |
| ■ | Thornburg Better World International Fund |
| ■ | Thornburg International Growth Fund |
| ■ | Thornburg Developing World Fund |
| ■ | Thornburg Value Fund |
| ■ | Thornburg Core Growth Fund |
MULTI_ASSET FUNDS
| ■ | Thornburg Investment Income Builder Fund |
| ■ | Thornburg Summit Fund |
FIXED INCOME FUNDS
| ■ | Thornburg Low Duration Income Fund |
| ■ | Thornburg Limited Term U.S. Government Fund |
| ■ | Thornburg Limited Term Income Fund |
| ■ | Thornburg Strategic Income Fund |
| ■ | Thornburg Low Duration Municipal Fund |
| ■ | Thornburg Limited Term Municipal Fund |
| ■ | Thornburg Intermediate Municipal Fund |
| ■ | Thornburg California Limited Term Municipal Fund |
| ■ | Thornburg New Mexico Intermediate Municipal Fund |
| ■ | Thornburg New York Intermediate Municipal Fund |
| ■ | Thornburg Strategic Municipal Income Fund |
ALTERNATIVE FUNDS
| ■ | Thornburg Long/Short Equity Fund |
Before investing, carefully consider the Fund’s investment goals, risks, charges, and expenses. For a prospectus or summary prospectus containing this and other information, contact your financial advisor or visit thornburg.com. Read it carefully before investing.
For additional information, please visit thornburg.com
Thornburg Investment Management, Inc. 2300 North Ridgetop Road, Santa Fe, NM 87506
This page intentionally left blank.
This page intentionally left blank.
This page intentionally left blank.
To receive shareholder reports, prospectuses, and proxy statements electronically, go to www.thornburg.com/edelivery.
This Annual Report is submitted for the general information of shareholders of the Fund. It is not authorized for distribution to prospective investors in the Fund unless preceded or accompanied by an effective prospectus.
Investment Advisor:
Thornburg Investment Management®
800.847.0200
Distributor:
Thornburg Securities Corporation®
Annual Report
September 30, 2019
Commencement Date: March 1, 2019
Beginning on January 1, 2021, as permitted by regulations adopted by the Securities and Exchange Commission, paper copies of the Fund’s shareholder reports will no longer be sent by mail, unless you specifically request paper copies of the reports from the Fund or from your financial intermediary, such as a broker-dealer or bank. Instead, the reports will be made available on a website, and you will be notified by mail each time a report is posted and provided with a website link to access the report.
If you already elected to receive shareholder reports electronically, you will not be affected by this change and you need not take any action. You may elect to receive shareholder reports and other communications from the Fund or your financial intermediary electronically by going to thornburg.com/edelivery.
You may elect to receive all future reports in paper free of charge. You can inform the Fund or your financial intermediary that you wish to continue receiving paper copies of your shareholder reports by calling 800.847.0200 or your financial intermediary directly. Your election to receive reports in paper will apply to all funds held with the fund complex/your financial intermediary.
At Thornburg, we believe unconstrained investing leads to better outcomes for our clients. Our investment solutions are highly active, high conviction, and benchmark agnostic. When it comes to finding economic opportunity for clients, it’s more than what we do.
It’s how we do it. Active Asbottom-up, fundamental, active managers, we look beyond conventional benchmarks. Long Term We take a long-term view in how we manage our firm and our portfolios. Benchmark Agnostic Investment strategies should have the flexibility to pursue solutions for clients, not stay within the conventional confines of benchmarks. Flexible Perspective Our approach to portfolio construction is guided by our convictions rather than convention. High Conviction We focus our attention and capital on thoroughly researched, well-understood positions. The best form of risk management is to know what you own, and why. Repeatable & Robust Our long-term outperformance of benchmarks verifies that our process works and outperforms conventional thinking. Independent We are independently owned and far from the herd of other investment managers. Investment Driven All members of the investment team are resources for all of our strategies. Collaborative Our team collaborates on opportunities across geography, sector, or asset class.
Thornburg Summit Fund
Annual Report | September 30, 2019
Table of Contents
| SHARE CLASS | NASDAQ SYMBOL | CUSIP |
| Class I | TSUMX | 885-216-580 |
Investments carry risks, including possible loss of principal. Additional risks may be associated with investments outside the United States, especially in emerging markets, including currency fluctuations, illiquidity, volatility, and political and economic risks. Investments in small- and mid-capitalization companies may increase the risk of greater price fluctuations. A short position will lose value as the security’s price increases. Theoretically, the loss on a short sale can be unlimited. Investments in derivatives are subject to the risks associated with the securities or other assets underlying the pool of securities, including illiquidity and difficulty in valuation. Portfolios investing in bonds have the same interest rate, inflation and credit risks that are associated with the underlying bonds. The value of bonds will fluctuate relative to changes in interest rates, decreasing when interest rates rise. Please see the Fund’s prospectus for a discussion of the risks associated with an investment in the Fund. Investments in the Fund are not FDIC insured, nor are they bank deposits or guaranteed by a bank or any other entity.
Letter to Shareholders
Thornburg Summit Fund | September 30, 2019 (Unaudited)
October 22, 2019
Dear Fellow Shareholder,
The Thornburg Summit Fund was launched on March 1, 2019. For the Fund’s seven months of existence during the fiscal year ended September 30, 2019, the Thornburg Summit Fund returned 5.45% (Class I shares) versus its blended benchmark index return of 5.03% (60% MSCI All Country World Index/40% Bloomberg Barclays Global Aggregate Bond Index).
The goal of the portfolio is to grow real wealth over time. Real wealth is defined as a mix of capital appreciation and current income that is intended to exceed the rate of inflation. Under normal conditions, the Fund’s investments are expected to emphasize long positions in equity and fixed income securities, though the Fund may also invest a significant amount of its assets in short positions in equity and fixed income securities, commodities-related investments, derivative instruments, currencies and in cash or cash equivalents.
Given the stated goal and mix of assets available, we generally seek to provide solid downside protection during times of market volatility, while broadly keeping up with the Fund’s stated benchmark index during up markets. Over the past seven months of live performance, we were pleased with our ability to deliver upon our goals.
Broadly, our long investments in equities were positive contributors during the fiscal year. In particular, stock selection
within the industrials and consumer discretionary sectors aided returns. Our allocation to fixed income proved to be a headwind to relative returns as we were underweight long-maturity Treasuries, which performed well as rates rallied. Lastly, the portfolio’s cash position was a drag on relative returns in an upmarket.
Going forward, it should be expected that we will be opportunistic around our portfolio positioning decisions when valuations present compelling compensation for assumed risk. Perhaps more importantly, the inverse is also true; we will remain defensive when we feel that compensation does not reward us for adding risk to the portfolio.
Thank you for investing alongside us in the Thornburg Summit Fund.

| 
|
Jeff Klingelhofer,cfa
Portfolio Manager
Managing Director | Ben Kirby,cfa
Portfolio Manager
Managing Director |
The matters discussed in this report may constitute forward-looking statements made pursuant to the safe harbor provisions of the Securities Litigation Reform Act of 1995. These include any advisor or portfolio manager prediction, assessment, analysis or outlook for individual securities, industries, investment styles, market sectors and/or markets. These statements involve risks and uncertainties. In addition to the general risks described for each fund in its current prospectus, other factors bearing on these reports include the accuracy of the advisor’s or portfolio manager’s forecasts and predictions, the appropriateness of the investment strategies designed by the advisor or portfolio manager and the ability of the advisor or portfolio manager to implement their strategies efficiently and successfully. Any one or more of these factors, as well as other risks affecting the securities markets generally, could cause the actual results of any fund to differ materially as compared to its benchmarks.
The views expressed are subject to change and do not necessarily reflect the views of Thornburg Investment Management, Inc. This information should not be relied upon as a recommendation or investment advice and is not intended to predict the performance of any investment or market.
Performance results of individual share classes will vary based on the fees and expenses associated with each share class, and may be higher or lower than other share classes within the same Fund. Please see Performance Summary for performance results of each share class.
TheMSCI All Country (AC) World Index is a market capitalization weighted index that is representative of the market structure of 47 developed and emerging market countries in North and South America, Europe, Africa, the Middle East, and the Pacific Rim. The index is calculated with net dividends reinvested in U.S. dollars.
TheBloomberg Barclays Global Aggregate Bond Index provides a broad-based measure of the global investment-grade fixed-rate debt markets. It is comprised of the U.S. Aggregate, Pan European Aggregate, and the Asian-Pacific Aggregate indices. It also
includes a wide range of standard and customized sub-indices by liquidity constraint, sector, quality, and maturity.
The performance of any index is not indicative of the performance of any particular investment. Unless otherwise noted, index returns reflect the reinvestment of income dividends and capital gains, if any, but do not reflect fees, brokerage commissions or other expenses of investing. Investors may not make direct investments into any index.
Fund Summary
Thornburg Summit Fund | September 30, 2019 (Unaudited)
OBJECTIVES AND STRATEGIES
The Fund seeks to grow real wealth over time. “Real wealth” for this purpose is a mix of capital appreciation and current income that is intended to exceed the rate of inflation. While the Fund seeks to achieve its goal over a variety of different market environments by selecting investments from a range of asset classes, the value of an investment in the Fund will fluctuate and the Fund may not achieve its goal in every environment or in all environments. Under normal conditions the Fund’s investments are expected to emphasize long positions in equity securities and fixed income obligations, though the Fund may also invest a significant amount of its assets in short positions in equity securities and fixed income obligations, in commodities-related investments, in derivative instruments, in currencies, and in cash or cash equivalents. There are no specific percentage limitations on the amount of the Fund’s portfolio that may be invested in a particular asset class, and the proportions of the Fund’s assets that are invested in the respective asset classes are expected to vary over time and from time to time depending upon Thornburg’s perceptions of which types of investments represent better values and opportunities to achieve the Fund’s investment goal.
With respect to its equity investments, the Fund may invest in any stock or equity security, including common stocks, preferred stocks, convertible securities, warrants, depositary receipts, partnership interests, publicly traded real estate investment trusts, and shares in exchange traded funds. The Fund may invest in companies of any size. The Fund’s portfolio may include investments in United States issuers and the securities of issuers domiciled outside the United States, including developing countries. The relative proportions of the Fund’s U.S. and foreign investments will vary over time depending upon Thornburg’s view of specific investment opportunities and macroeconomic factors.
PORTFOLIO COMPOSITION
SECTOR EXPOSURE
(percent of equity holdings) |
| Information Technology | 21.2% |
| Consumer Discretionary | 13.8% |
| Financials | 13.6% |
| Health Care | 10.5% |
| Consumer Staples | 9.8% |
| Communication Services | 9.2% |
| Energy | 8.3% |
| Industrials | 7.3% |
| Materials | 3.7% |
| Utilities | 2.6% |
COUNTRY EXPOSURE *
(percent of Fund) |
| United States | 71.0% |
| United Kingdom | 4.5% |
| Japan | 2.0% |
| China | 1.8% |
| Taiwan | 1.4% |
| India | 1.2% |
| Chile | 1.0% |
| Switzerland | 1.0% |
| France | 0.9% |
| Netherlands | 0.9% |
| Australia | 0.7% |
| Brazil | 0.7% |
| Ireland | 0.6% |
| Germany | 0.6% |
| Hong Kong | 0.5% |
| South Africa | 0.5% |
| Indonesia | 0.3% |
| Argentina | 0.3% |
| Mexico | 0.1% |
| Canada | 0.1% |
| Other Assets Less Liabilities | 9.9% |
| * | Holdings are classified by country of risk as determined by MSCI and Bloomberg. |
| TOP TEN LONG HOLDINGS |
| Gilead Sciences, Inc. | 1.8% |
| Visa, Inc. Class A | 1.8% |
| Unilever N.V. | 1.5% |
| Capital One Financial Corp. | 1.3% |
| JPMorgan Chase & Co. | 1.3% |
| Comcast Corp. Class A | 1.3% |
| Microsoft Corp. | 1.2% |
| Alphabet, Inc. Class A | 1.2% |
| Lockheed Martin Corp. | 1.2% |
| Keyence Corp. | 1.2% |
There is no guarantee that the Fund will meet its investment objectives.
All data is subject to change. Charts may not add up to 100% due to rounding.
Schedule of Investments
Thornburg Summit Fund | September 30, 2019
| | | SHARES/
PRINCIPAL AMOUNT | VALUE |
| | Common Stock — 44.9% | | |
| | Banks — 2.6% | | |
| | Banks — 2.6% | | |
| | Bank Rakyat Indonesia Persero Tbk PT | 428,100 | $ 124,253 |
| | HDFC Bank Ltd. ADR | 3,080 | 175,714 |
| a | JPMorgan Chase & Co. | 3,951 | 464,993 |
| | Royal Bank of Scotland Group plc | 61,095 | 155,948 |
| | | | 920,908 |
| | Capital Goods — 1.2% | | |
| | Aerospace & Defense — 1.2% | | |
| | Lockheed Martin Corp. | 1,120 | 436,867 |
| | | | 436,867 |
| | Commercial & Professional Services — 1.4% | | |
| | Commercial Services & Supplies — 0.9% | | |
| | Brink’s Co. | 3,622 | 300,445 |
| | Professional Services — 0.5% | | |
| | SGS S.A. | 74 | 183,434 |
| | | | 483,879 |
| | Consumer Durables & Apparel — 1.3% | | |
| | Household Durables — 0.4% | | |
| | Sony Corp. | 2,779 | 163,129 |
| | Textiles, Apparel & Luxury Goods — 0.9% | | |
| | LVMH Moet Hennessy Louis Vuitton SE | 785 | 311,999 |
| | | | 475,128 |
| | Consumer Services — 1.5% | | |
| | Hotels, Restaurants & Leisure — 1.5% | | |
| a | Starbucks Corp. | 1,983 | 175,337 |
| | Wynn Resorts Ltd. | 3,200 | 347,904 |
| | | | 523,241 |
| | Diversified Financials — 2.4% | | |
| | Capital Markets — 1.1% | | |
| a | CME Group, Inc. | 1,738 | 367,309 |
| | Consumer Finance — 1.3% | | |
| a | Capital One Financial Corp. | 5,154 | 468,911 |
| | | | 836,220 |
| | Energy — 3.3% | | |
| | Oil, Gas & Consumable Fuels — 3.3% | | |
| | Devon Energy Corp. | 4,356 | 104,805 |
| a | Enterprise Products Partners L.P. | 9,672 | 276,426 |
| a | Petroleo Brasileiro S.A. Sponsored ADR | 15,979 | 231,216 |
| | Reliance Industries Ltd. | 13,816 | 259,949 |
| | Royal Dutch Shell plc | 10,358 | 303,619 |
| | | | 1,176,015 |
| | Food & Staples Retailing — 1.7% | | |
| | Food & Staples Retailing — 1.7% | | |
| b | US Foods Holding Corp. | 7,055 | 289,960 |
| a | Walgreens Boots Alliance, Inc. | 5,902 | 326,440 |
| | | | 616,400 |
| | Food, Beverage & Tobacco — 0.7% | | |
| | Beverages — 0.7% | | |
| | Treasury Wine Estates Ltd. | 21,176 | 265,416 |
| | | | 265,416 |
| | Healthcare Equipment & Services — 0.7% | | |
Schedule of Investments, Continued
Thornburg Summit Fund | September 30, 2019
| | | SHARES/
PRINCIPAL AMOUNT | VALUE |
| | Health Care Equipment & Supplies — 0.7% | | |
| b | Boston Scientific Corp. | 6,135 | $ 249,633 |
| | | | 249,633 |
| | Household & Personal Products — 1.5% | | |
| | Personal Products — 1.5% | | |
| | Unilever N.V. | 8,580 | 515,750 |
| | | | 515,750 |
| | Insurance — 0.5% | | |
| | Insurance — 0.5% | | |
| | AIA Group Ltd. | 18,400 | 173,842 |
| | | | 173,842 |
| | Materials — 1.5% | | |
| | Chemicals — 1.0% | | |
| | LyondellBasell Industries N.V. Class A | 1,576 | 141,005 |
| | Sociedad Quimica y Minera de Chile S.A. Sponsored ADR | 7,300 | 202,867 |
| | Containers & Packaging — 0.5% | | |
| b | Crown Holdings, Inc. | 2,700 | 178,362 |
| | | | 522,234 |
| | Media & Entertainment — 4.8% | | |
| | Entertainment — 2.3% | | |
| b | Netflix, Inc. | 1,242 | 332,384 |
| | Nintendo Co. Ltd. | 919 | 340,147 |
| b | Sea Ltd. ADR | 4,570 | 141,441 |
| | Interactive Media & Services — 1.2% | | |
| a,b | Alphabet, Inc. Class A | 361 | 440,832 |
| | Media — 1.3% | | |
| a | Comcast Corp. Class A | 10,002 | 450,890 |
| | | | 1,705,694 |
| | Pharmaceuticals, Biotechnology & Life Sciences — 4.1% | | |
| | Biotechnology — 1.8% | | |
| a | Gilead Sciences, Inc. | 10,198 | 646,349 |
| | Pharmaceuticals — 2.3% | | |
| | AstraZeneca plc | 3,139 | 280,242 |
| | Novartis AG | 1,826 | 158,331 |
| a | Pfizer, Inc. | 10,071 | 361,851 |
| | | | 1,446,773 |
| | Retailing — 4.3% | | |
| | Internet & Direct Marketing Retail — 3.6% | | |
| a,b | Alibaba Group Holding Ltd. Sponsored ADR | 2,131 | 356,367 |
| a,b | Amazon.com, Inc. | 203 | 352,390 |
| | Expedia Group, Inc. | 1,471 | 197,717 |
| b | MercadoLibre, Inc. | 185 | 101,977 |
| | Naspers Ltd. Class N | 1,108 | 167,905 |
| b | Prosus N.V. | 1,108 | 81,336 |
| | Specialty Retail — 0.7% | | |
| | Home Depot, Inc. | 1,082 | 251,046 |
| | | | 1,508,738 |
| | Semiconductors & Semiconductor Equipment — 2.4% | | |
| | Semiconductors & Semiconductor Equipment — 2.4% | | |
| | KLA Corp. | 1,331 | 212,228 |
| b | Micron Technology, Inc. | 6,918 | 296,436 |
| a | Taiwan Semiconductor Manufacturing Co. Ltd. Sponsored ADR | 7,727 | 359,151 |
| | | | 867,815 |
| | Software & Services — 4.9% | | |
| | Information Technology Services — 2.8% | | |
Schedule of Investments, Continued
Thornburg Summit Fund | September 30, 2019
| | | SHARES/
PRINCIPAL AMOUNT | VALUE |
| | Accenture plc Class A | 1,083 | $ 208,315 |
| | Fidelity National Information Services, Inc. | 1,038 | 137,805 |
| a | Visa, Inc. Class A | 3,692 | 635,061 |
| | Software — 2.1% | | |
| a | Microsoft Corp. | 3,181 | 442,255 |
| | SAP SE | 1,739 | 204,478 |
| a,b | ServiceNow, Inc. | 414 | 105,094 |
| | | | 1,733,008 |
| | Technology Hardware & Equipment — 1.2% | | |
| | Electronic Equipment, Instruments & Components — 1.2% | | |
| | Keyence Corp. | 673 | 416,404 |
| | | | 416,404 |
| | Telecommunication Services — 0.9% | | |
| | Wireless Telecommunication Services — 0.9% | | |
| | China Mobile Ltd. | 39,000 | 322,690 |
| | | | 322,690 |
| | Transportation — 1.0% | | |
| | Airlines — 1.0% | | |
| | easyJet plc | 24,725 | 349,607 |
| | | | 349,607 |
| | Utilities — 1.0% | | |
| | Electric Utilities — 1.0% | | |
| | NextEra Energy, Inc. | 1,591 | 370,687 |
| | | | 370,687 |
| | Total Common Stock(Cost $15,247,761) | | 15,916,949 |
| | Asset Backed Securities — 8.1% | | |
| | Asset-Backed - Finance & Insurance — 2.8% | | |
| c | Aqua Finance Trust, Series 2019-A Class A, 3.14%, 7/16/2040 | $ 100,000 | 100,130 |
| c | Freed ABS Trust, Series 2019-1 Class-A, 3.42%, 6/18/2026 | 70,692 | 71,041 |
| c | Meltel Land Funding, LLC, Series 2019-1A Class A, 3.768%, 4/15/2049 | 100,000 | 102,503 |
| c | NRZ Advance Receivables Trust, Series 2019-T1 Class AT1, 2.59%, 7/15/2052 | 175,000 | 175,804 |
| c,d | SBA Tower Trust, Series 2014-2A Class C, 3.869%, 10/15/2049 | 30,000 | 31,236 |
| c | SCF Equipment Leasing, Series 2019-1A Class A1, 3.04%, 3/20/2023 | 133,341 | 133,853 |
| c | Sierra Timeshare Receivables Funding, LLC, Series 2019-1A Class A, 3.20%, 1/20/2036 | 74,097 | 76,134 |
| c,e | Towd Point Mortgage Trust, Series 2018-5 Class A1, 3.25%, 7/25/2058 | 131,680 | 134,695 |
| c | Upstart Securitization Trust, Series 2019-1 Class B, 4.19%, 4/20/2026 | 150,000 | 151,565 |
| | | | 976,961 |
| | Auto Receivables — 1.1% | | |
| f | CarMax Auto Owner Trust, Series 2017-4 Class A2B, 2.158% (LIBOR 1 Month + 0.13%), 4/15/2021 | 349 | 349 |
| c | CarNow Auto Receivables Trust, Series 2017-1A Class B, 4.35%, 9/15/2022 | 100,000 | 100,858 |
| c | Chesapeake Funding II, LLC, Series 2016-2A Class A1, 1.88%, 6/15/2028 | 37,177 | 37,150 |
| c | CIG Auto Receivables Trust, Series 2017-1A Class A, 2.71%, 5/15/2023 | 56,636 | 56,659 |
| c | Flagship Credit Auto Trust, Series 2018-3 Class A, 3.07%, 2/15/2023 | 56,362 | 56,712 |
| | Toyota Auto Receivables, | | |
| | Series 2016-C Class A3, 1.14%, 8/17/2020 | 1,652 | 1,652 |
| | Series 2016-D Class A3, 1.23%, 10/15/2020 | 5,216 | 5,211 |
| c | U.S. Auto Funding, LLC, Series 2019-1A Class A, 3.61%, 4/15/2022 | 147,809 | 148,521 |
| | | | 407,112 |
| | Other Asset Backed — 3.5% | | |
| c | Avant Loans Funding Trust, Series 2019-A Class A, 3.48%, 7/15/2022 | 90,670 | 91,071 |
| c | AXIS Equipment Finance Receivables VI, LLC, Series 2018-2A Class A2, 3.89%, 7/20/2022 | 149,793 | 151,138 |
| c | Consumer Loan Underlying Bond Credit Trust, Series 2019-A Class A, 3.52%, 4/15/2026 | 62,473 | 62,846 |
| c | Diamond Resorts Owner Trust, Series 2018-1 Class A, 3.70%, 1/21/2031 | 57,578 | 58,670 |
| c,g | ECAF I Ltd., Series 2015-1A Class A2, 4.947%, 6/15/2040 | 227,833 | 227,869 |
| c | Foundation Finance Trust, Series 2019-1A Class A, 3.86%, 11/15/2034 | 167,332 | 171,269 |
Schedule of Investments, Continued
Thornburg Summit Fund | September 30, 2019
| | | SHARES/
PRINCIPAL AMOUNT | VALUE |
| c | Marlette Funding Trust, Series 2019-3A Class A, 2.69%, 9/17/2029 | $ 266,670 | $ 267,132 |
| c | Ocwen Master Advance Receivables Trust, Series 2019-T1 Class AT1, 2.514%, 8/15/2050 | 200,000 | 200,495 |
| | | | 1,230,490 |
| | Student Loan — 0.7% | | |
| c,f | Navient Private Education Refinance Loan Trust, Series 2019-D Class A2B, 3.078% (LIBOR 1 Month + 1.05%), 12/15/2059 | 100,000 | 99,999 |
| c | SMB Private Education Loan Trust, Series 2015-C Class A2A, 2.75%, 7/15/2027 | 96,995 | 98,306 |
| c | SoFi Professional Loan Program, LLC, Series 2015-B Class A2, 2.51%, 9/27/2032 | 45,117 | 45,521 |
| | | | 243,826 |
| | Total Asset Backed Securities(Cost $2,838,492) | | 2,858,389 |
| | Corporate Bonds — 10.6% | | |
| | Automobiles & Components — 0.5% | | |
| | Automobiles — 0.5% | | |
| f | American Honda Finance Corp. 2.638% (LIBOR 3 Month + 0.47%), 11/16/2022 | 175,000 | 175,173 |
| | | | 175,173 |
| | Commercial & Professional Services — 0.9% | | |
| | Commercial Services & Supplies — 0.6% | | |
| c | Nielsen Finance, LLC / Nielsen Finance Co., 5.00%, 4/15/2022 | 120,000 | 120,336 |
| c | ServiceMaster Co., LLC, 5.125%, 11/15/2024 | 100,000 | 103,750 |
| | Leisure Products — 0.3% | | |
| | Mattel, Inc., 2.35%, 8/15/2021 | 100,000 | 97,250 |
| | | | 321,336 |
| | Diversified Financials — 2.6% | | |
| | Capital Markets — 0.6% | | |
| | Ares Capital Corp., 4.20%, 6/10/2024 | 70,000 | 71,750 |
| c | Ares Finance Co., LLC, 4.00%, 10/8/2024 | 140,000 | 137,842 |
| | Consumer Finance — 0.1% | | |
| c | FirstCash, Inc., 5.375%, 6/1/2024 | 50,000 | 51,500 |
| | Diversified Financial Services — 1.9% | | |
| | Bank of America Corp. MTN, 4.20%, 8/26/2024 | 40,000 | 42,904 |
| f,g | Barclays plc 4.291% (LIBOR 3 Month + 2.11%), 8/10/2021 | 200,000 | 204,009 |
| f | Goldman Sachs Group, Inc., 3.377% (LIBOR 3 Month + 1.11%), 4/26/2022 | 130,000 | 131,116 |
| f | JPMorgan Chase & Co., 3.618% (LIBOR 3 Month + 1.48%), 3/1/2021 | 140,000 | 142,122 |
| f | Morgan Stanley, 2.738% (SOFR+ 0.83%), 6/10/2022 | 150,000 | 150,432 |
| | | | 931,675 |
| | Energy — 0.4% | | |
| | Oil, Gas & Consumable Fuels — 0.4% | | |
| c | Citgo Holding, Inc., 9.25%, 8/1/2024 | 150,000 | 159,375 |
| | | | 159,375 |
| | Food, Beverage & Tobacco — 0.4% | | |
| | Tobacco — 0.4% | | |
| c | Vector Group Ltd., 10.50%, 11/1/2026 | 125,000 | 127,500 |
| | | | 127,500 |
| | Insurance — 1.9% | | |
| | Insurance — 1.9% | | |
| c | Jackson National Life Global Funding, 3.25%, 1/30/2024 | 225,000 | 233,974 |
| c,f | Metropolitan Life Global Funding, 2.39% (SOFR + 0.57%), 9/7/2020 | 150,000 | 150,403 |
| c | Reliance Standard Life Global Funding II, 2.625%, 7/22/2022 | 300,000 | 302,506 |
| | | | 686,883 |
| | Materials — 0.3% | | |
| | Paper & Forest Products — 0.3% | | |
| c | Neenah, Inc., 5.25%, 5/15/2021 | 100,000 | 100,000 |
| | | | 100,000 |
| | Pharmaceuticals, Biotechnology & Life Sciences — 0.3% | | |
Schedule of Investments, Continued
Thornburg Summit Fund | September 30, 2019
| | | SHARES/
PRINCIPAL AMOUNT | VALUE |
| | Pharmaceuticals — 0.3% | | |
| f,g | AstraZeneca plc, 2.789% (LIBOR 3 Month + 0.67%), 8/17/2023 | $ 100,000 | $ 99,505 |
| | | | 99,505 |
| | Real Estate — 1.3% | | |
| | Equity Real Estate Investment Trusts — 1.3% | | |
| | American Tower Corp., 3.375%, 5/15/2024 | 50,000 | 51,969 |
| | CoreCivic, Inc. 4.75%, 10/15/2027 | 80,000 | 70,300 |
| | GEO Group, Inc., 6.00%, 4/15/2026 | 250,000 | 201,750 |
| | Hudson Pacific Properties L.P., 4.65%, 4/1/2029 | 100,000 | 110,221 |
| | Service Properties Trust, 4.95%, 2/15/2027 | 40,000 | 40,527 |
| | | | 474,767 |
| | Software & Services — 0.2% | | |
| | Software — 0.2% | | |
| c | Fair Isaac Corp. 5.25%, 5/15/2026 | 50,000 | 53,375 |
| | | | 53,375 |
| | Telecommunication Services — 1.1% | | |
| | Diversified Telecommunication Services — 0.1% | | |
| c | GTT Communications, Inc. 7.875%, 12/31/2024 | 60,000 | 33,600 |
| | Wireless Telecommunication Services — 1.0% | | |
| | Sprint Communications, Inc., 9.25%, 4/15/2022 | 310,000 | 359,213 |
| | | | 392,813 |
| | Transportation — 0.7% | | |
| | Airlines — 0.7% | | |
| c | American Airlines Pass Through Trust, Series 2013-2 Class B, 5.60%, 1/15/2022 | 78,367 | 79,692 |
| c,g | Guanay Finance Ltd., 6.00%, 12/15/2020 | 162,859 | 164,487 |
| | | | 244,179 |
| | Total Corporate Bonds(Cost $3,721,903) | | 3,766,581 |
| | Convertible Bonds — 0.3% | | |
| | Food, Beverage & Tobacco — 0.3% | | |
| | Tobacco — 0.3% | | |
| e | Vector Group Ltd., 1.75%, 4/15/2020 | 80,000 | 83,150 |
| | | | 83,150 |
| | Total Convertible Bonds(Cost $80,506) | | 83,150 |
| | Other Government — 0.1% | | |
| | Mexican Bonos, 8.00%, 12/7/2023 | 750,000 | 39,790 |
| | Total Other Government(Cost $38,748) | | 39,790 |
| | U.S. Treasury Securities — 17.9% | | |
| | United States Treasury Notes Inflationary Index, | | |
| | 0.50%, 1/15/2028 | 1,164,912 | 1,191,009 |
| | 0.875%, 1/15/2029 | 2,692,559 | 2,856,637 |
| | 3.625%, 4/15/2028 | 421,937 | 540,936 |
| | United States Treasury Notes, | | |
| | 1.375%, 8/31/2020 | 125,000 | 124,463 |
| | 1.625%, 8/15/2029 | 325,000 | 323,603 |
| | 1.875%, 12/31/2019 | 1,000,000 | 999,805 |
| | 2.75%, 2/15/2028 | 300,000 | 325,717 |
| | Total U.S. Treasury Securities(Cost $6,188,712) | | 6,362,170 |
| | Mortgage Backed — 8.4% | | |
| c,e | Angel Oak Mortgage Trust I, LLC, Whole Loan Securities Trust CMO, Series 2019-2 Class A1, 3.628%, 3/25/2049 | 150,214 | 152,873 |
| c,e | Arroyo Mortgage Trust, Whole Loan Securities Trust CMO, Series 2019-3 Class A1, 2.962%, 10/25/2048 | 191,069 | 190,105 |
| c | Bravo Residential Funding Trust, Whole Loan Securities Trust CMO, Series 2019-1 Class A1C, 3.50%, 3/25/2058 | 273,421 | 275,494 |
| | Federal Home Loan Mtg Corp., 3.50%, 9/1/2032 | 334,677 | 351,886 |
Schedule of Investments, Continued
Thornburg Summit Fund | September 30, 2019
| | | SHARES/
PRINCIPAL AMOUNT | VALUE |
| | Federal Home Loan Mtg Corp., Seasoned Credit Risk Transfer, Whole Loan Securities Trust CMO, Series 2019-1 Class MA, 3.50%, 7/25/2058 | $ 111,903 | $ 117,154 |
| | Federal Home Loan Mtg Corp., Whole Loan Securities Trust CMO, Series 2017-SC02 Class 1A, 3.00%, 5/25/2047 | 317,174 | 320,420 |
| | Federal National Mtg Assoc., | | |
| | Pool AL9445, 3.00%, 7/1/2031 | 374,602 | 386,572 |
| | Pool CA3904, 3.00%, 7/1/2034 | 344,237 | 356,098 |
| c,e | FWD Securitization Trust, Whole Loan Securities Trust CMO, Series 2019-INV1 Class A1, 2.81%, 6/25/2049 | 191,326 | 192,167 |
| c,e | Homeward Opportunities Fund I Trust, Whole Loan Securities Trust CMO, Series 2019-1 Class A1, 3.454%, 1/25/2059 | 147,349 | 149,428 |
| | JPMorgan Mortgage Trust, Whole Loan Securities Trust CMO, | | |
| c,e | Series 2017-6 Class A5, 3.50%, 12/25/2048 | 66,322 | 67,428 |
| c,e | Series 2018-6 Class 1A4, 3.50%, 12/25/2048 | 19,399 | 19,558 |
| c,e | Metlife Securitization Trust, Whole Loan Securities Trust CMO, Series 2019-1A Class A1A, 3.75%, 4/25/2058 | 184,688 | 191,985 |
| | New Residential Mortgage Loan Trust, Whole Loan Securities Trust CMO, | | |
| c,e | Series 2017-4 Class A1, 3.60%, 4/25/2049 | 104,763 | 106,769 |
| c,e | Series 2017-4A Class A1, 4.00%, 5/25/2057 | 107,495 | 112,887 |
| | Total Mortgage Backed(Cost $2,957,167) | | 2,990,824 |
| | Exchange-Traded Funds — 3.6% | | |
| a | Invesco DB Agriculture Fund | 22,307 | 353,789 |
| a | Invesco DB Base Metals Fund | 29,684 | 438,433 |
| a,b | SPDR Gold Shares Fund | 3,519 | 488,683 |
| | Total Exchange-Traded Funds(Cost $1,265,942) | | 1,280,905 |
| | Investment Company — 1.1% | | |
| b | United States Oil Fund L.P. | 35,290 | 400,189 |
| | Total Investment Company(Cost $388,034) | | 400,189 |
| | Total Long-Term Investments — 95.0%(Cost $32,727,265) | | 33,698,947 |
| | Short-Term Investments — 9.0% | | |
| h | Thornburg Capital Management Fund | 320,447 | 3,204,470 |
| | Total Short-Term Investments(Cost $3,204,470) | | 3,204,470 |
| | Total Investments — 104.0%(Cost $35,931,735) | | $36,903,417 |
| | Liabilities Net of Other Assets — (4.0)% | | (1,414,000) |
| | Common Stock Sold Short — (4.8)% | | |
| | Commercial & Professional Services — (0.6)% | | |
| | Professional Services — (0.6)% | | |
| b | FTI Consulting, Inc. | (2,189) | (232,012) |
| | | | (232,012) |
| | Consumer Durables & Apparel — (0.4)% | | |
| | Leisure Products — (0.4)% | | |
| b | YETI Holdings, Inc. | (4,542) | (127,176) |
| | | | (127,176) |
| | Consumer Services — (0.6)% | | |
| | Hotels, Restaurants & Leisure — (0.6)% | | |
| | Brinker International, Inc. | (5,067) | (216,209) |
| | | | (216,209) |
| | Media & Entertainment — (1.5)% | | |
| | Entertainment — (0.3)% | | |
| b | Tencent Music Entertainment Group ADR | (9,891) | (126,308) |
| | Media — (1.2)% | | |
| b | Discovery, Inc., Class A | (8,181) | (217,860) |
| | New York Times Co., Class A | (7,319) | (208,445) |
| | | | (552,613) |
Schedule of Investments, Continued
Thornburg Summit Fund | September 30, 2019
| | | SHARES/
PRINCIPAL AMOUNT | VALUE |
| | Pharmaceuticals, Biotechnology & Life Sciences — (0.6)% | | |
| | Pharmaceuticals — (0.6)% | | |
| | Shionogi & Co. Ltd. | (3,800) | $ (210,832) |
| | | | (210,832) |
| | Retailing — (0.6)% | | |
| | Specialty Retail — (0.6)% | | |
| | Rent-A-Center, Inc. | (7,887) | (203,406) |
| | | | (203,406) |
| | Telecommunication Services — (0.5)% | | |
| | Diversified Telecommunication Services — (0.5)% | | |
| | Cogent Communications Holdings, Inc. | (3,179) | (175,163) |
| | | | (175,163) |
| | Total Common Stock Sold Short(Proceeds $1,788,162) | | (1,717,411) |
| | Net Assets — 100.0% | | $35,489,417 |
| Footnote Legend |
| a | All or a portion of the security is pledged as collateral for securities sold short. At September 30, 2019, the value of securities pledged was $2,069,608. |
| b | Non-income producing. |
| c | Securities exempt from registration under Rule 144A of the Securities Act of 1933, as amended. These securities are restricted and may only be resold in the ordinary course of business in transactions exempt from registration, normally to qualified institutional buyers. As of September 30, 2019, the aggregate value of these securities in the Fund’s portfolio was $6,128,211, representing 17.27% of the Fund’s net assets. |
| d | Coupon rate adjusts periodically based upon a predetermined schedule. Stated interest rate in effect at September 30, 2019. |
| e | Variable rate coupon, rate shown as of September 30, 2019. |
| f | Floating Rate Security. Stated interest/floor rate was in effect at September 30, 2019. |
| g | Yankee bond denominated in U.S. dollars and is issued in the U.S. by foreign banks and corporations. |
| h | Investment in Affiliates. |
Portfolio Abbreviations
To simplify the listings of securities, abbreviations are used per the table below:
| ADR | American Depositary Receipt |
| CMO | Collateralized Mortgage Obligation |
| LIBOR | London Interbank Offered Rates |
| Mtg | Mortgage |
| MTN | Medium-Term Note |
| SBA | Small Business Administration |
| SOFR | Secured Overnight Financing Rate |
See notes to financial statements.
Statement of Assets and Liabilities
Thornburg Summit Fund | September 30, 2019
| ASSETS | |
| Investments at value (Note 3) | |
| Non-affiliated issuers (cost $32,727,265) | $ 33,698,947 |
| Non-controlled affiliated issuer (cost $3,204,470) | 3,204,470 |
| Cash denominated in foreign currency (cost $48) | 48 |
| Receivable for investments sold | 357,823 |
| Dividends receivable | 14,868 |
| Dividend and interest reclaim receivable | 5,668 |
| Interest receivable | 88,533 |
| Prepaid expenses and other assets | 24,640 |
| Total Assets | 37,394,997 |
| Liabilities | |
| Securities sold short (proceeds $1,788,162) | 1,717,411 |
| Payable for investments purchased | 100,242 |
| Payable to investment advisor and other affiliates (Note 4) | 3,637 |
| Payable for short sale financing | 1,891 |
| Deferred taxes payable (Note 2) | 133 |
| Accounts payable and accrued expenses | 78,537 |
| Dividends payable for short sales | 3,729 |
| Total Liabilities | 1,905,580 |
| Net Assets | $ 35,489,417 |
| NET ASSETS CONSIST OF | |
| Distributable earnings | $ 1,242,340 |
| Net capital paid in on shares of beneficial interest | 34,247,077 |
| | $ 35,489,417 |
| NET ASSET VALUE | |
| Class I Shares: | |
Net asset value, offering and redemption price per share
($35,489,417 applicable to 3,390,377 shares of beneficial interest outstanding - Note 5) | $ 10.47 |
See notes to financial statements.
Statement of Operations
Thornburg Summit Fund | Period Ended September 30, 2019*
| INVESTMENT INCOME | |
| Dividend income | |
| Non-affiliated issuers (net of foreign taxes withheld of $16,683) | $ 297,410 |
| Non-controlled affiliated issuer | 56,941 |
| Interest income (net of premium amortized of $24,352) | 272,407 |
| Total Income | 626,758 |
| EXPENSES | |
| Investment advisory fees (Note 4) | 134,204 |
| Administration fees (Note 4) | |
| Class I Shares | 15,725 |
| Transfer agent fees | |
| Class I Shares | 1,262 |
| Registration and filing fees | |
| Class I Shares | 3,632 |
| Dividend expense on securities sold short | 16,748 |
| Short sale financing fees | 114,193 |
| Custodian fees | 26,980 |
| Professional fees | 58,298 |
| Trustee and officer fees (Note 4) | 643 |
| Other expenses | 65,215 |
| Total Expenses | 436,900 |
| Less: | |
| Expenses reimbursed by investment advisor (Note 4) | (128,811) |
| Net Expenses | 308,089 |
| Net Investment Income | $ 318,669 |
| REALIZED AND UNREALIZED GAIN (LOSS) | |
| Net realized gain (loss) on: | |
| Non-affiliated issuer investments | |
| Long positions | 285,269 |
| Short positions | (156,174) |
| Foreign currency transactions | 4,234 |
| | 133,329 |
| Net change in unrealized appreciation (depreciation) on: | |
| Non-affiliated issuer investments | |
| Long positions (net of change in deferred taxes payable of $133) | 971,549 |
| Short positions | 70,751 |
| Foreign currency translations | (135) |
| | 1,042,165 |
| Net Realized and Unrealized Gain | 1,175,494 |
| Net Increase in Net Assets Resulting from Operations | $ 1,494,163 |
| * | The Fund commenced operations on March 01, 2019. |
See notes to financial statements.
Statement of Changes in Net Assets
Thornburg Summit Fund
| | Period Ended
September 30, 2019* |
| INCREASE (DECREASE) IN NET ASSETS FROM | |
| OPERATIONS | |
| Net investment income | $ 318,669 |
| Net realized gain (loss) on investments and foreign currency transactions | 133,329 |
| Net change in unrealized appreciation (depreciation) on investments, foreign currency translations and deferred taxes | 1,042,165 |
| Net Increase in Net Assets Resulting from Operations | 1,494,163 |
| DIVIDENDS TO SHAREHOLDERS | |
| From distributable earnings | |
| Class I Shares | (251,823) |
| FUND SHARE TRANSACTIONS (NOTE 5) | |
| Class I Shares | 34,247,077 |
| Net Increase in Net Assets | 35,489,417 |
| NET ASSETS | |
| Beginning of Period | 0 |
| End of Period | $ 35,489,417 |
| * | For the period from commencement of operations on March 01, 2019 through September 30, 2019. |
See notes to financial statements.
Notes to Financial Statements
Thornburg Summit Fund | September 30, 2019
NOTE 1 – ORGANIZATION
Thornburg Summit Fund (the “Fund”) is a diversified series of Thornburg Investment Trust (the “Trust”). The Trust was organized as a Massachusetts business trust under a Declaration of Trust dated June 3, 1987 and is registered as a diversified, open-end management investment company under the Investment Company Act of 1940, as amended (the "1940 Act"). The Fund is currently one of twenty-two separate series of the Trust. Each series is considered to be a separate entity for financial reporting and tax purposes and bears expenses directly attributable to it. The Fund’s investment goal is to seek to grow real wealth over time.
The Fund currently offers one class of shares of beneficial interest: Institutional Class (“Class I”). This class of shares of the Fund represents all interest in the portfolio of investments. Class I shares are sold at net asset value without a sales charge at the time of purchase and may be subject to a service fee. All expenses are allocated to the class including administration fees, transfer agent fees, government registration fees, printing and postage costs, and legal expenses.
The following is a summary of significant accounting policies followed by the Fund in the preparation of its financial statements. The Fund prepares its financial statements in conformity with United States generally accepted accounting principles (“GAAP”), including investment company accounting and reporting guidance in the Financial Accounting Standards Board (the “FASB”) Accounting Standard Codification Topic 946.
NOTE 2 – SIGNIFICANT ACCOUNTING POLICIES
Security Valuation: All investments in securities held by the Fund are valued as described in Note 3.
Allocation of Expenses: Expenses common to all Funds are allocated among the Funds comprising the Trust based upon their relative net asset values or other appropriate allocation methods.
Dividends and Distributions to Shareholders: Dividends and distributions to shareholders, which are determined in accordance with federal income tax regulations and may differ from GAAP, are recorded on the ex-dividend date. Ordinary income dividends, if any, are declared and paid annually. Capital gain distributions, if any, are declared and paid annually and more often if deemed necessary by Thornburg Investment Management, Inc., the Trust’s investment advisor (the “Advisor”). Dividends and distributions are paid and are reinvested in additional shares of the Fund at net asset value per share at the close of business on the ex-dividend date, or at the shareholder’s option, paid in cash.
Investment Income: Dividend income is recorded on the ex-dividend date. Certain income from foreign investments is recognized as soon as information is available to the Fund. Interest income is accrued as earned. Premiums and discounts are amortized and accreted, respectively, to first call dates or maturity dates using the effective yield method of the respective investments. These amounts are included in Investment Income in the Statement of Operations. For securities sold short, the Fund is generally required to pay the lender amounts equal to any dividend or interest which accrues on the borrowed security during the period of the loan. These amounts, if applicable, are included in Dividend expense on securities sold short on the Statement of Operations. Interest income, if applicable, is comprised of credits which exceeded prime brokerage fees.
Investment Transactions: Investment transactions are accounted for on a trade date basis. Realized gains and losses from the sale of investments are recorded on an identified cost basis.
Short Sales: A short sale involves the sale by the Fund of a security that the Fund does not own. The Fund borrows the security that it intends to sell from a broker or other institution, and at a later date the Fund completes the short sale by purchasing that same security on the open market and delivering it to the lending institution. The Fund may be required to pay a premium, fee, or other amount to the lender in exchange for borrowing the security. These amounts are included in Short sale financing fees on the Statement of Operations. When it enters into a short sale, the Fund seeks to profit on a decline in the price of the security between the date the Fund borrows the security and the date the Fund purchases the security to deliver it to the lender. If, however, the price of the security increases between those dates, or if the price of the security declines by an amount which is not sufficient to cover the expenses of borrowing the security, the Fund will experience a loss. Although the potential for gain as a result of a short sale is limited to the price at which the Fund sold the security short less the cost of borrowing the security, the potential for loss is theoretically unlimited because there is no limit to the cost of replacing the borrowed security. Short sales held by the Fund during the fiscal year were fully collateralized by segregated cash or other securities, which are denoted on the Schedule of Investments.
When-Issued and Delayed Delivery Transactions: The Fund may engage in when-issued or delayed delivery transactions. To the extent the Fund engages in such transactions, it will do so for the purpose of acquiring portfolio investments consistent with the Fund’s investment objectives and not for the purpose of investment leverage or to speculate on interest rate or market changes. At the time the Fund makes a commitment to purchase an investment on a when-issued or delayed delivery basis, the Fund will record the transaction and reflect the value in determining its net asset value. When effecting such transactions, assets of an amount sufficient to make payment for the portfolio
Notes to Financial Statements, Continued
Thornburg Summit Fund | September 30, 2019
investments to be purchased will be segregated on the Fund’s records on the trade date. Investments purchased on a when-issued or delayed delivery basis do not earn interest until the settlement date. The values of these securities held at September 30, 2019 are detailed in the Schedule of Investments.
Foreign Currency Translation: Portfolio investments and other assets and liabilities denominated in foreign currencies are translated into U.S. dollars based on the exchange rate of such currencies against the U.S. dollar on the date of valuation. Purchases and sales of investments and income items denominated in foreign currencies are translated into U.S. dollars at the exchange rate in effect on the transaction date. When the Fund purchases or sells foreign investments, it will customarily enter into a foreign exchange contract to minimize foreign exchange risk from the trade date to the settlement date of such transactions. The values of such spot contracts are included in receivable for investments sold and payable for investments purchased on the Statement of Assets and Liabilities.
The Fund does not separately report the effect of changes in foreign exchange rates from changes in market prices on investments held. Such changes are included in net unrealized appreciation (depreciation) from investments in the Statement of Operations.
Reported net realized gains and losses from foreign currency transactions arise due to purchases and sales of foreign currencies, currency gains and losses realized between the trade and settlement dates on investment transactions and the difference between the amounts of dividends, interest, and foreign withholding taxes recorded on the Fund’s books, and the U.S. dollar equivalent of the amounts actually received or paid. These amounts are included in foreign currency transactions in the Statement of Operations.
Net change in unrealized appreciation (depreciation) on foreign currency translations arise from changes in the fair value of assets and liabilities, other than investments at period end, resulting from changes in exchange rates.
Guarantees and Indemnifications: Under the Trust’s organizational documents (and under separate agreements with the independent Trustees), its officers and Trustees are provided with an indemnification against certain liabilities arising out of the performance of their duties to the Fund. In the normal course of business the Trust may also enter into contracts with service providers that contain general indemnifications. The Trust’s maximum exposure under these arrangements is unknown. However, based on experience, the Trust expects the risk of loss to be remote.
Use of Estimates: The preparation of financial statements in conformity with GAAP requires management to make estimates and assumptions that affect the reported amounts of assets and liabilities and disclosure of contingent assets and liabilities at the date of the financial statements and the reported amounts of increases (decreases) in net assets from operations during the reporting period. Actual results could differ from those estimates.
Federal Income Taxes: It is the policy of the Trust to comply with the provisions of the Internal Revenue Code applicable to regulated investment companies and to distribute to shareholders substantially all investment company taxable income including net realized gains on investments (if any), and tax exempt income of the Fund. Therefore, no provision for federal income or excise tax is required.
The Fund files income tax returns in United States federal and applicable state jurisdictions. The statute of limitations on the Fund’s tax return filings generally remains open for the three years following a return’s filing date. The Fund has analyzed each uncertain tax position believed to be material in the preparation of the Fund’s financial statements for the fiscal year ended September 30, 2019, including open tax years, to assess whether it is more likely than not that the position would be sustained upon examination, based on the technical merits of the position. The Fund has not identified any such position for which an asset or liability must be reflected in the Statement of Assets and Liabilities.
At September 30, 2019, information on the tax components of capital was as follows:
| Cost of investments for tax purposes | $ 34,176,505 |
| Gross unrealized appreciation on a tax basis | 1,583,421 |
| Gross unrealized depreciation on a tax basis | (573,920) |
| Net unrealized appreciation (depreciation) on investments (tax basis) | $ 1,009,501 |
Temporary book to tax adjustments to cost of investments and net unrealized appreciation (depreciation) for tax purposes result primarily from deferral of outstanding wash sales and outstanding tax basis adjustments for publicly traded partnerships (“PTP”).
At September 30, 2019, the Fund had $273,087 of undistributed tax basis ordinary investment income and no undistributed tax basis capital gains.
Foreign Withholding Taxes: The Fund is subject to foreign tax withholding imposed by certain foreign countries in which the Fund may invest. Withholding taxes are incurred on certain foreign dividends and are accrued at the time the dividend is recognized based on applicable foreign tax laws. The Fund may file withholding tax reclaims in certain jurisdictions to recover a portion of amounts previously
Notes to Financial Statements, Continued
Thornburg Summit Fund | September 30, 2019
withheld, in view of various considerations, including recent decisions rendered by the courts in those and other jurisdictions. The Fund would expect to record a receivable for such a reclaim based on a variety of factors, including assessment of a jurisdiction’s legal obligation to pay reclaims, the jurisdiction’s administrative practices and payment history, and industry convention. To date the Fund has recorded no such receivable because there is limited precedent for collecting such prior year reclaims and the likelihood of collection remains uncertain.
Deferred Foreign Capital Gain Taxes: The Fund is subject to a tax imposed on net realized gains of securities of certain foreign countries. The Fund records an estimated deferred tax liability for net unrealized gains on these investments as reflected in the accompanying financial statements. Such changes are included in net unrealized appreciation (depreciation) from investments in the Statement of Operations.
The tax character of distributions paid during the year ended September 30, 2019 was as follows:
| | 2019 |
| Distributions from: | |
| Ordinary income | $ 251,823 |
| Total | $ 251,823 |
NOTE 3 – SECURITY VALUATION
Valuation of the Fund’s portfolio investment securities is performed in accordance with policies and procedures adopted by and under the oversight of the Trustees.
The Trustees of the Trust have appointed the Advisor to assist the Trustees with obtaining fair market values for portfolio investments, evaluating and monitoring professional pricing service providers appointed by the Trustees’ Audit Committee (the “Audit Committee”) to assist in determining fair values for portfolio investments, assisting in calculating fair values for portfolio investments in certain circumstances, and performing other functions in connection with the valuation of investments. The Advisor acts through its Valuation and Pricing Committee (the “Committee”) and other employees of the Advisor. The Committee regularly reviews its own valuation calculations, reviews the valuations, valuation techniques and services furnished by pricing service providers, considers circumstances which may require valuation calculations by the Committee, and reviews previous valuation calculations. The Committee reports to the Audit Committee on the Committee’s activities, the performance of pricing service providers, and other matters relating to valuation of portfolio investments.
In those instances when the Committee assists in calculating a fair value for a portfolio investment, the Committee seeks to determine the price that the Fund would reasonably expect to receive upon a sale of the investment in an orderly transaction between market participants on the valuation date. The Committee customarily utilizes quotations from securities broker dealers in calculating valuations, but also may utilize prices obtained from pricing service providers or other methods approved by the Audit Committee. Because fair values calculated by the Committee are estimates, the calculation of a value for an investment may differ from the price that would be realized by the Fund upon a sale of the investment, and the difference could be material to the Fund’s financial statements. The Committee’s calculation of a fair value for an investment may also differ from the prices obtained by other persons (including other mutual funds) for the investment.
Valuation of Securities: Securities and other portfolio investments which are listed or traded on a United States securities exchange are valued at the last reported sale price on the valuation date. Investments listed or traded on an exchange for which there has been no sale that day are valued at the mean between the last reported bid and asked prices on that valuation date. Portfolio investments reported by NASDAQ are valued at the official closing price on the valuation date. If an investment is traded on more than one exchange, the investment is considered traded on the exchange that is normally the primary market for that investment. Securities and other portfolio investments which are listed or traded on exchanges outside the United States are valued at the last price or the closing price of the investment on the exchange that is normally the primary market for the investment, as of the close of the exchange preceding the Fund’s valuation date. Foreign investments listed or traded on an exchange for which there has been no sale that day are valued at the mean between the last reported bid and asked prices on that valuation date.
In any case when a market quotation is not readily available for a portfolio investment ordinarily valued by market quotation, the Committee calculates a fair value for the investment using alternative methods approved by the Audit Committee. A market quotation is not readily available when the primary market or exchange for the investment is not open for the entire scheduled day of trading. Market quotations for an investment also may not be readily available if developments after the most recent close of the investment’s primary exchange or market, but prior to the close of business on any Fund business day, or an unusual event or significant period of time occurring since the availability of a market quotation, create a serious question concerning the reliability of the most recent market quotation available for the investment. In particular, on days when market volatility thresholds established by the Audit Committee are exceeded, foreign equity investments held by the Fund may be valued using alternative methods. The Committee customarily obtains valuations in these instances
Notes to Financial Statements, Continued
Thornburg Summit Fund | September 30, 2019
from pricing service providers approved by the Audit Committee. Pricing service providers ordinarily calculate valuations using multi-factor models to adjust market prices based upon various inputs, including exchange data, depository receipt prices, futures, index data and other data.
Debt obligations held by the Fund which are not listed or traded on exchanges or for which no reported market exists are ordinarily valued at the valuation obtained from a pricing service provider approved by the Audit Committee.
In any case when a pricing service provider fails to provide a valuation for a debt obligation held by the Fund, the Committee calculates a fair value for the obligation using alternative methods under procedures approved by the Audit Committee. Additionally, in cases when management believes that a valuation obtained from a pricing service provider is stale, does not reflect material factors affecting the valuation of the investment, is significantly different than the value the Fund is likely to obtain if it sought a bid for the investment, or is otherwise unreliable, the Committee calculates a fair value for the obligation using an alternative method approved by the Audit Committee.
Quotations for foreign investments expressed in foreign currency amounts are converted to U.S. dollar equivalents using a foreign exchange quotation from a third party service provider at the time of valuation. Foreign investments held by the Fund may be traded on days and at times when the Fund is not open for business. Consequently, the value of Fund investments may be significantly affected on days when shareholders cannot purchase or sell Fund shares.
Valuation Hierarchy: The Fund categorizes its investments based upon the inputs used in valuing those investments, according to a three-level hierarchy established in guidance from the FASB. Categorization of investments using this hierarchy is intended by the FASB to maximize the use of observable inputs in valuing investments and minimize the use of unobservable inputs by requiring that the most observable inputs be used when available. Observable inputs are those that market participants would use in valuing an investment based on available market information. Unobservable inputs are those that reflect assumptions about the information market participants would use in valuing an investment. An investment’s level within the hierarchy is based on the lowest level input that is deemed significant to the valuation. The methodologies and inputs used to value investments are not necessarily indications of the risk or liquidity associated with those investments.
Various inputs are used in calculating valuations for the Fund’s investments. These inputs are generally summarized according to the three-level hierarchy below:
Level 1: Quoted prices in active markets for identical investments.
Level 2: Other direct or indirect significant observable inputs (including quoted prices for similar investments in active markets and other observable inputs, such as interest rates, prepayment rates, credit ratings, etc.).
Level 3: Significant unobservable inputs (including the Committee’s own assumptions in calculating the fair values of investments).
Valuations for debt obligations held by the Fund are typically calculated by pricing service providers approved by the Audit Committee and are generally characterized as Level 2 within the valuation hierarchy.
On days when market volatility thresholds established by the Audit Committee are exceeded, foreign securities for which valuations are obtained from pricing service providers are fair valued. On these days, the foreign securities are characterized as Level 2 within the valuation hierarchy and revert to Level 1 after the threshold is no longer exceeded.
In a limited number of cases the Committee calculates a fair value for investments using broker quotations or other methods approved by the Audit Committee. When the Committee uses a single broker quotation to calculate a fair value for an investment without other significant observable inputs, or if a fair value is calculated using other significant inputs that are considered unobservable, the investment is characterized as Level 3 within the hierarchy. Other significant unobservable inputs used to calculate a fair value in these instances might include an income-based valuation approach which considers discounted anticipated future cash flows from the investment and application of discounts due to the nature or duration of any restrictions on the disposition of the investment.
Valuations based upon the use of inputs from Levels 1, 2 or 3 may not represent the actual price received upon the disposition of an investment, and a Fund may receive a price that is lower than the valuation based upon these inputs when it sells the investment.
Notes to Financial Statements, Continued
Thornburg Summit Fund | September 30, 2019
The following table displays a summary of the fair value hierarchy measurements of the Fund’s investments as of September 30, 2019:
| | Fair Value Measurements at September 30, 2019 |
| | TOTAL | LEVEL 1 | LEVEL 2 | LEVEL 3 |
| Assets | | | | |
| Investments in Securities* | | | | |
| Common Stock | $ 15,916,949 | $ 15,916,949 | $ — | $ — |
| Asset Backed Securities | 2,858,389 | — | 2,858,389 | — |
| Corporate Bonds | 3,766,581 | — | 3,766,581 | — |
| Convertible Bonds | 83,150 | — | 83,150 | — |
| Other Government | 39,790 | — | 39,790 | — |
| U.S. Treasury Securities | 6,362,170 | 6,362,170 | — | — |
| Mortgage Backed | 2,990,824 | — | 2,990,824 | — |
| Exchange-Traded Funds | 1,280,905 | 1,280,905 | — | — |
| Investment Company | 400,189 | 400,189 | — | — |
| Short-Term Investments | 3,204,470 | 3,204,470 | — | — |
| Total Investments in Securities | $36,903,417 | $27,164,683 | $9,738,734 | $— |
| Total Assets | $36,903,417 | $27,164,683 | $9,738,734 | $— |
| Liabilities | | | | |
| Investment in Securities Sold Short | | | | |
| Common Stock | $ (1,717,411) | $ (1,717,411) | $ �� — | $ — |
| Total Liabilities | $(1,717,411) | $(1,717,411) | $— | $— |
| * | See Schedule of Investments for a summary of the industry exposure as grouped according to the Global Industry Classification Standard (GICS), which is an industry taxonomy developed by MSCI, Inc. and Standard & Poor’s (S&P). |
NOTE 4 – INVESTMENT ADVISORY FEE AND OTHER TRANSACTIONS WITH AFFILIATES
Pursuant to an investment advisory agreement, the Advisor serves as the investment advisor and performs services for the Fund for which the fees are payable at the end of each month. Under the investment advisory agreement, the Fund pays the Advisor a management fee based on the average daily net assets of the Fund at an annual rate as shown in the following table:
| Management Fee Schedule |
| DAILY NET ASSETS | FEE RATE |
| Up to $500 million | 0.750% |
| Next $500 million | 0.700 |
| Next $500 million | 0.650 |
| Next $500 million | 0.625 |
| Over $2 billion | 0.600 |
The Fund’s effective management fee for the period ended September 30, 2019 was 0.75% of the Fund’s average daily net assets. Total management fees incurred by the Fund for the period ended September 30, 2019 are set forth in the Statement of Operations.
The Trust has entered into an administrative services agreement with the Advisor, whereby the Advisor will perform certain administrative services related to each class of the Fund’s shares. The fees are computed as an annual percentage of the aggregate average daily net assets of all shares classes of all Funds in the Trust as follows:
| Administration Fee Schedule |
| Daily Net Assets | Fee Rate |
| Up to $20 billion | 0.100% |
| $20 billion to $40 billion | 0.075 |
| $40 billion to $60 billion | 0.040 |
| Over $60 billion | 0.030 |
Notes to Financial Statements, Continued
Thornburg Summit Fund | September 30, 2019
The aggregate fee amount is allocated on a daily basis to each Fund based on net assets and subsequently allocated to each class of shares of the Fund. Total administrative service fees incurred by each class of shares of the Fund for the period ended September 30, 2019, are set forth in the Statement of Operations.
The Trust has an underwriting agreement with Thornburg Securities Corporation (the “Distributor”), an affiliate of the Advisor, which acts as the distributor of the Fund’s shares.
The Advisor has contractually agreed to waive fees and reimburse expenses incurred by the Fund so that actual expenses do not exceed levels as specified in each Fund’s most recent prospectus (Class I shares, 0.99%, not including the effects of expenses relating to the Fund’s short sales and interest expenses, and not including taxes, acquired fund fees and expenses, and certain extraordinary expenses to the extent incurred by the Fund). The agreement may be terminated by the Fund at any time, but may not be terminated by the Advisor before March 1, 2020, unless the Advisor ceases to be the investment advisor to the Fund prior to that date. The Advisor may recoup amounts waived or reimbursed during the fiscal year ended September 30, 2019 if, during that year, expenses fall below the contractual that was in place at the time those fees and expenses were waived or reimbursed. The Advisor will not recoup fees or expenses as described in the preceding sentence if that recoupment would cause the Fund’s total annual operating expenses (after the recoupment is taken into account) to exceed the lesser of: (a) the expense cap that was in place at the time the waiver or reimbursement occurred; or (b) the expense cap that is in place at the time of the recoupment.
For the period ended September 30, 2019, the Advisor contractually reimbursed certain class specific expenses of $128,811 for Class I shares.
Certain officers and Trustees of the Trust are also officers or directors of the Advisor and Distributor. The compensation of the independent Trustees is borne by the Trust. The Trust also pays a portion of the Chief Compliance Officer’s compensation. These amounts are reflected as Trustee and officer fees in the Statement of Operations.
The percentage of direct investments in the Fund held by the Trustees, officers of the Trust, and the Advisor is approximately 99.64%.
The Fund may purchase or sell securities from or to an affiliated fund, provided the affiliation is due solely to having a common investment advisor, common officers, or common trustees, and provided that all such transactions will comply with Rule 17a-7 under the 1940 Act. For the period ended September 30, 2019, the Fund had no such transactions with affiliated funds.
Shown below are holdings of voting securities of each portfolio company which is considered "affiliated" to the Fund under the 1940 Act, including companies for which the Fund’s holding represented 5% or more of the company’s voting securities, and a series of the Thornburg Investment Trust in which the Fund invested for cash management purposes during the period:
| Fund | Market Value
9/30/18 | Purchases
at Cost | Sales
Proceeds | Realized
Gain
(Loss) | Change in
Unrealized
Appr./(Depr.) | Market Value
9/30/19 | Dividend
Income |
| Thornburg Capital Management Fund | $- | $32,735,356 | $(29,530,886) | $- | $- | $3,204,470 | $56,941 |
NOTE 5 – SHARES OF BENEFICIAL INTEREST
At September 30, 2019, there were an unlimited number of shares with no par value of beneficial interest authorized. Transactions in shares of beneficial interest were as follows:
| | PERIOD ENDED
September 30, 2019* |
| | SHARES | AMOUNT |
| Class I Shares | | |
| Shares sold | 3,370,232 | $ 34,036,328 |
| Shares issued to shareholders in reinvestment of dividends | 20,145 | 210,749 |
| Net increase | 3,390,377 | $ 34,247,077 |
| * | The Fund commenced operations on March 01, 2019. |
Notes to Financial Statements, Continued
Thornburg Summit Fund | September 30, 2019
NOTE 6 – INVESTMENT TRANSACTIONS
For the period ended September 30, 2019, the Fund had purchase and sale transactions of long investments of $46,346,828 and $13,804,353, respectively, and cover and sale transactions of securities sold short of $1,167,846 and $2,799,835, respectively (excluding short term investments).
NOTE 7 – DERIVATIVE FINANCIAL INSTRUMENTS WITH OFF-BALANCE
SHEET RISK AND FOREIGN INVESTMENT RISK
The Fund may use a variety of derivative financial instruments to hedge or adjust the risks affecting its investment portfolio or to enhance investment returns. Provisions of FASB Accounting Standards Codification ASC 815-10-50 (“ASC 815”) require certain disclosures. The disclosures are intended to provide users of financial statements with an understanding of the use of derivative instruments by the Fund and how these derivatives affect the financial position, financial performance and cash flows of the Fund. The Fund does not designate any derivative instruments as hedging instruments under ASC 815. Additionally, the Fund’s risk of loss may exceed the amounts recognized on the Statement of Assets and Liabilities.
During the period ended September 30, 2019, the Fund did not invest in any derivative financial instruments of the type addressed by ASC 815.
NOTE 8 – RECENT ACCOUNTING PRONOUNCEMENTS
In August 2018, the FASB issued ASU 2018-13, Fair Value Measurement (Topic 820): Changes to the Disclosure Requirements for Fair Value Measurement, which adds, removes, and modifies certain aspects of the fair value disclosure. ASU 2018-13 is effective for annual periods beginning after December 15, 2019, and early adoption is permitted. The Funds have elected to early adopt, and had applied ASU 2018-13 for the fiscal year ended September 30, 2019. The adoption of this accounting guidance did not have a material impact on the Funds’ financial statements.
In March 2017, the FASB issued Accounting Standards Update (ASU) 2017-08, Premium Amortization of Purchased Callable Debt Securities. The amendments in the ASU shorten the premium amortization period on a purchased callable debt security from the security’s contractual life to the earliest call date. It is anticipated that this change will enhance disclosures by reducing losses recognized when a security is called on an earlier date. This ASU is effective for fiscal years beginning after December 15, 2018. Management has evaluated the implications of these changes and the amendments will have no material effect on the Funds’ net assets or results of operations.
OTHER NOTES
Risks: The Fund’s investments subject it to risks including, but not limited to, management risk, market and economic risk, risks affecting specific issuers, foreign investment risk, developing country risk, small and mid-cap company risk, short sale risk, credit risk, high yield risk, interest rate risk, prepayment and extension risk, liquidity risk, inflation risk, structured products risk, commodities-related investment risk, real estate risk and derivatives risk. Please see the Fund’s prospectus for a discussion of the risks associated with an investment in the Fund.
Subsequent Events: Fund management believes no events have occurred between September 30, 2019 and the date of issuance of the financial statements that require adjustment to or disclosure in the accompanying financial statements.
Financial Highlights
Thornburg Summit Fund
| | Per Share Performance (For a Share Outstanding throughout the Year) |
UNLESS OTHERWISE
NOTED, PERIODS ARE
FISCAL YEARS ENDED
SEPTEMBER 30, | Net Asset
Value,
Beginning of
Period | Net
Investment
Income
(Loss)+ | Net Realized &
Unrealized Gain
(Loss) on
Investments | Total from
Investment
Operations | Dividends
from Net
Investment
Income | Dividends
from Net
Realized
Gains | Total
Dividends | Net Asset
Value,
End of Period |
| Class I |
| 2019(d) | $ 10.00 | 0.11 | 0.43 | 0.54 | (0.07) | — | (0.07) | $ 10.47 |
| (a) | The Fund incurs certain expenses and fees in connection with investments in short positions. If such expenses and fees had not occurred, the Expenses After Expense Reductions ratio would have been 0.99%. |
| (b) | The Fund incurs certain expenses and fees in connection with investments in short positions. If such expenses and fees had not occurred, the Expenses Before Expense Reductions ratio would have been 1.71%. |
| (c) | Not annualized for periods less than one year. |
| (d) | Fund commenced operations on March 1, 2019. |
| (e) | Annualized. |
| + | Based on weighted average shares outstanding. |
See notes to financial statements.
Financial Highlights, Continued
Thornburg Summit Fund
| Ratios to Average Net Assets | | Supplemental Data |
Net Investment
Income (Loss) (%) | Expenses, After
Expense
Reductions (%)(a) | Expenses,
Before Expense
Reductions (%)(b) | | Total
Return (%)(c) | Portfolio
Turnover
Rate (%)(c) | Net Assets
at End of Period
(Thousands) |
| |
| 1.78(e) | 1.72(e) | 2.44(e) | | 5.45 | 53.38 | $ 35,489 |
Report of Independent Registered Public Accounting Firm
Thornburg Summit Fund
To the Board of Trustees of Thornburg Investment Trust and Shareholders of
Thornburg Summit Fund
Opinion on the Financial Statements
We have audited the accompanying statement of assets and liabilities, including the schedule of investments, of Thornburg Summit Fund (one of the funds constituting Thornburg Investment Trust, referred to hereafter as the "Fund") as of September 30, 2019, and the related statements of operations and changes in net assets, including the related notes, and the financial highlights for the period March 1, 2019 (commencement of operations) through September 30, 2019 (collectively referred to as the “financial statements”). In our opinion, the financial statements present fairly, in all material respects, the financial position of the Fund as of September 30, 2019, and the results of its operations, changes in its net assets, and the financial highlights for the period March 1, 2019 (commencement of operations) through September 30, 2019 in conformity with accounting principles generally accepted in the United States of America.
Basis for Opinion
These financial statements are the responsibility of the Fund’s management. Our responsibility is to express an opinion on the Fund’s financial statements based on our audit. We are a public accounting firm registered with the Public Company Accounting Oversight Board (United States) (PCAOB) and are required to be independent with respect to the Fund in accordance with the U.S. federal securities laws and the applicable rules and regulations of the Securities and Exchange Commission and the PCAOB.
We conducted our audit of these financial statements in accordance with the standards of the PCAOB. Those standards require that we plan and perform the audit to obtain reasonable assurance about whether the financial statements are free of material misstatement, whether due to error or fraud.
Our audit included performing procedures to assess the risks of material misstatement of the financial statements, whether due to error or fraud, and performing procedures that respond to those risks. Such procedures included examining, on a test basis, evidence regarding the amounts and disclosures in the financial statements. Our audit also included evaluating the accounting principles used and significant estimates made by management, as well as evaluating the overall presentation of the financial statements. Our procedures included confirmation of securities owned as of September 30, 2019 by correspondence with the custodian, transfer agent and brokers; when replies were not received from brokers, we performed other auditing procedures. We believe that our audit provides a reasonable basis for our opinion.
/s/PricewaterhouseCoopers LLP
New York, New York
November 22, 2019
We have served as the auditor of one or more investment companies in Thornburg Investment Trust since 1999.
Expense Example
Thornburg Summit Fund | September 30, 2019 (Unaudited)
This example is intended to help you understand your ongoing costs (in dollars) of investing in the Fund and to compare these costs with the ongoing costs of investing in other mutual funds.
The example is based on a $1,000 investment beginning on April 1, 2019, and held until September 30, 2019.
| | BEGINNING
ACCOUNT VALUE
4/1/19 | ENDING
ACCOUNT VALUE
9/30/19 | EXPENSES PAID
DURING PERIOD†
4/1/19—9/30/19 |
| CLASS I SHARES |
| Actual | $1,000.00 | $1,034.84 | $9.03 |
| Hypothetical* | $1,000.00 | $1,016.19 | $8.95 |
| † | Expenses are equal to the annualized expense ratio for each class (I: 1.77%) multiplied by the average account value over the period, multiplied by 183/365 to reflect the one-half year period. |
| * | Hypothetical assumes a rate of return of 5% per year before expenses. |
ACTUAL EXPENSES
For each class of shares, the first line of the accompanying table provides information about actual account values and actual expenses. You may use the information in this line, together with the amount you invested, to estimate the expenses that you paid over the period. Simply divide your account value by $1,000 (for example, an $8,600 account value divided by $1,000 = 8.6), then multiply the result by the number in the first line for your class of shares under the heading entitled “Expenses Paid During Period” to estimate the expenses you paid on your account during this period.
HYPOTHETICAL EXAMPLE FOR COMPARISON PURPOSES
For each class of shares, the second line of the accompanying table provides information about hypothetical account values and hypothetical expenses based on the Fund’s actual expense ratio and an assumed rate of return of 5% per year before expenses, which is not the Fund’s actual return. The hypothetical account values and expenses may not be used to estimate the actual ending account balance or expenses you paid for the period. You may use this information to compare the ongoing costs of investing in the Fund and other funds. To do so, compare this 5% hypothetical example with the 5% hypothetical examples that appear in the shareholder reports of the other funds.
Please note that the expenses shown in the table are meant to highlight your ongoing costs only and do not reflect any transactional costs, such as sales charges (loads), redemption fees, or exchange fees. Therefore, the second line of the table for each class of shares is useful in comparing ongoing costs only, and will not help you determine the relative total costs of owning different funds. In addition, if these transactional costs were included, your costs would have been higher.
Trustees and Officers
Thornburg Summit Fund | September 30, 2019 (Unaudited)
NAME, AGE, YEAR ELECTED
POSITION HELD WITH FUND | PRINCIPAL OCCUPATION(S) DURING PAST FIVE YEARS | OTHER DIRECTORSHIPS
HELD BY TRUSTEE |
| INTERESTED TRUSTEES(1)(2) |
Garrett Thornburg, 73
Trustee since 1984,
Chairman of Trustees(3) | Chairman and controlling shareholder of Thornburg Investment Management, Inc. (investment advisor); Chairman and controlling shareholder of Thornburg Securities Corporation (securities dealer); President of the Thornburg Foundation (nonprofit). | None |
Brian J. McMahon, 64
Trustee since 2001,
Vice Chairman of Trustees,
Member of Governance and
Nominating Committee &
Operations Risk Oversight
Committee(4) | Vice Chairman, Chief Investment Strategist, Managing Director, and Portfolio Manager and, until 2016, CEO and President of Thornburg Investment Management, Inc.; Vice President of Thornburg Securities Corporation. | None |
| INDEPENDENT TRUSTEES(1)(2)(5) |
David A. Ater, 74
Trustee since 1994,
Lead Independent Trustee,
Chairman of Governance and
Nominating Committee &
Member of Audit Committee | Principal in Ater & Associates, Santa Fe, NM (developer, planner and broker of residential and commercial real estate); owner, developer and broker for various real estate projects. | None |
Sally Corning, 58
Trustee since 2012,
Chairman of Audit Committee | Partner in Sun Mountain Capital, Santa Fe, NM (private equity firm with investment programs encompassing venture capital, mezzanine debt, and growth equity). | None |
Susan H. Dubin, 70
Trustee since 2004,
Member of Audit
Committee & Governance
and Nominating Committee | President of Dubin Investments, Ltd., Greenwich, CT (private investment fund); Director and officer of various charitable organizations. | None |
David L. Gardner, 56
Trustee since 2015,
Member of Operations Risk
Oversight Committee | Until 2012, head of EMEA (Europe, Middle East and Africa) Sales for iShares of Blackrock, Inc., EMEA Executive Committee Member and EMEA Operating Committee Member at Blackrock, Inc. | None |
Patrick J. Talamantes, 55
Trustee since 2019,
Member of Audit Committee | President of Talamantes Strategies, LLC, a management consulting firm, since 2018; until 2017, President and Chief Executive Officer of The McClatchy Company, Sacramento, CA (news and media company). | None |
Owen D. Van Essen, 65
Trustee since 2004,
Chairman of Operations Risk
Oversight Committee &
Member of Governance and
Nominating Committee | President of Dirks, Van Essen, Murray & April, Santa Fe, NM (newspaper mergers and acquisitions). | None |
James W. Weyhrauch, 60
Trustee since 1996,
Member of Audit
Committee & Operations Risk
Oversight Committee | Real estate broker, Santa Fe Properties, Santa Fe, NM; General Partner, Investments of Genext LLC (a family investment partnership); until 2019, Vice Chairman of Nambe LLC, Santa Fe, NM (manufacturing & design company). | None |
Trustees and Officers, Continued
Thornburg Summit Fund | September 30, 2019 (Unaudited)
NAME, AGE, YEAR ELECTED
POSITION HELD WITH FUND | PRINCIPAL OCCUPATION(S) DURING PAST FIVE YEARS | OTHER DIRECTORSHIPS
HELD BY TRUSTEE |
| OFFICERS OF THE FUND (WHO ARE NOT TRUSTEES)(1)(6) |
David Ashley, 49
Vice President since 2019 | Portfolio Manager and Managing Director since 2019 and Associate Portfolio Manager from 2011-2019 of Thornburg Investment Management, Inc. | Not applicable |
Nimish Bhatt, 56
Chief Financial Officer
since 2019; Treasurer
2016-2019; Secretary
(2018-2019)(7) | Chief Financial Officer and Treasurer of Thornburg Investment Management, Inc. and Thornburg Securities Corporation since 2016 and Secretary of Thornburg Securities Corporation since 2018; Senior Vice President (2004-2016), Chief Financial Officer (2011-2016), and Head of Fund Administration (2011-2016) of Calamos Asset Management, Inc., Calamos Investments LLC, Calamos Advisors LLC, and Calamos Wealth Management; Director of Calamos Global Funds plc (2007-2016). | Not applicable |
Jason Brady, 45
President since 2016(7) | Director since 2017, CEO and President since 2016, and Portfolio Manager and Managing Director of Thornburg Investment Management, Inc.; Vice President of Thornburg Securities Corporation since 2016. | Not applicable |
Connor Browne, 40
Vice President since 2006 | Portfolio Manager and Managing Director of Thornburg Investment Management, Inc. | Not applicable |
Randy Dry, 45
Vice President since 2014 | Managing Director, Director of Institutional Group from 2014-2016, and since 2016, Chief Administrative Officer of Thornburg Investment Management, Inc. | Not applicable |
Greg Dunn, 43
Vice President since 2014 | Portfolio Manager and Managing Director of Thornburg Investment Management, Inc. | Not applicable |
Lon Erickson, 44
Vice President since 2008 | Portfolio Manager and Managing Director of Thornburg Investment Management, Inc. | Not applicable |
Thomas Garcia, 48
Vice President since 2006 | Managing Director, Head Equity Trader, and Associate Portfolio Manager of Thornburg Investment Management, Inc. | Not applicable |
Christian Hoffmann, 37
Vice President since 2018 | Portfolio Manager and Managing Director since 2018, and Associate Portfolio Manager from 2014-2018, of Thornburg Investment Management, Inc. | Not applicable |
Curtis Holloway, 52
Treasurer since 2019(7) | Director of Fund Administration since 2019 of Thornburg Investment Management, Inc.; Senior Vice President, Head of Fund Administration (2017-2019) and Vice President, Fund Administration (2010-2017) of Calamos Investments, and Chief Financial Officer (2017-2019) and Treasurer (2010-2019) of Calamos Funds. | Not applicable |
Ben Kirby, 39
Vice President since 2014 | Head of Investments since 2019, Portfolio Manager and Managing Director since 2013. | Not applicable |
Jeff Klingelhofer, 38
Vice President since 2016 | Head of Investments since 2019, Portfolio Manager and Managing Director since 2015, and Associate Portfolio Manager from 2012–2015, of Thornburg Investment Management, Inc. | Not applicable |
Ponn Lithiluxa, 48
Vice President since 2017 | Manager, Tax & Fund Administration of Thornburg Investment Management, Inc.; Senior Vice President, Citi Fund Services, Inc. (2014–2017); Vice President, Citi Fund Services, Inc. (2007–2014). | Not applicable |
Rob MacDonald, 43
Vice President since 2016 | Managing Director since 2015, Portfolio Manager since 2014, and Associate Portfolio Manager from 2011–2014 of Thornburg Investment Management, Inc. | Not applicable |
Michael Mastroianni, 42
Secretary and Vice President since 2019(7) | Director of Fund Operations since 2019 of Thornburg Investment Management, Inc.; Executive Director, Global Head of Client Services - Global Liquidity (2018-2019), Executive Director, North American Head of Transfer Agency Relationship Management (2011-2019), Executive Director, North American Head of Transfer Agency Service Delivery (2011-2018) of J.P. Morgan Asset Management. | Not applicable |
Leigh Moiola, 52
Vice President since 2001 | Managing Director and Director of Marketing of Thornburg Investment Management, Inc.; Vice President of Thornburg Securities Corporation. | Not applicable |
Christopher Ryon, 63
Vice President since 2008 | Portfolio Manager and Managing Director of Thornburg Investment Management, Inc. | Not applicable |
Trustees and Officers, Continued
Thornburg Summit Fund | September 30, 2019 (Unaudited)
NAME, AGE, YEAR ELECTED
POSITION HELD WITH FUND | PRINCIPAL OCCUPATION(S) DURING PAST FIVE YEARS | OTHER DIRECTORSHIPS
HELD BY TRUSTEE |
Sean Koung Sun, 38
Vice President since 2017 | Portfolio Manager and Managing Director since 2017, Associate Portfolio Manager from 2015-2016, and Equity Research Analyst from 2012-2014 of Thornburg Investment Management, Inc. | Not applicable |
Stephen Velie, 52
Chief Compliance Officer since 2009 | Chief Compliance Officer of Thornburg Investment Trust and Thornburg Investment Management, Inc. | Not applicable |
Nicholos Venditti, 38
Vice President since 2016 | Portfolio Manager and Managing Director since 2015 and Associate Portfolio Manager from 2011–2015 of Thornburg Investment Management, Inc. | Not applicable |
Vinson Walden, 49
Vice President since 2004 | Portfolio Manager and Managing Director of Thornburg Investment Management, Inc. | Not applicable |
Lei Wang, 48
Vice President since 2006 | Portfolio Manager and Managing Director of Thornburg Investment Management, Inc. | Not applicable |
Charles Wilson, 44
Vice President since 2016 | Portfolio Manager and Managing Director since 2014 and Associate Portfolio Manager from 2012–2014 of Thornburg Investment Management, Inc. | Not applicable |
Di Zhou, 41
Vice President since 2016 | Portfolio Manager and Managing Director since 2016, Associate Portfolio Manager from 2014–2016, and Equity Research Analyst from 2010–2014 of Thornburg Investment Management, Inc. | Not applicable |
| (1) | Each person’s address is 2300 North Ridgetop Road, Santa Fe, New Mexico 87506. |
| (2) | The Fund is a separate investment “Fund” or “series” of Thornburg Investment Trust (the “Trust”), which comprises the Thornburg mutual fund complex and is organized as a Massachusetts business trust. Thornburg Investment Management, Inc. is the investment advisor to, and manages, all the Funds of the Trust. Each Trustee oversees all the Funds of the Trust. |
| (3) | Mr. Thornburg is considered an “interested” Trustee under the Investment Company Act of 1940 because he is a director and controlling shareholder of Thornburg Investment Management, Inc., the investment advisor to the Trust, and is the sole director and controlling shareholder of Thornburg Securities Corporation, the distributor of shares for the Trust. |
| (4) | Mr. McMahon is considered an “interested” Trustee under the Investment Company Act of 1940 because he is a director and the chief investment strategist of Thornburg Investment Management, Inc. |
| (5) | The Bylaws of the Trust currently require that each Independent Trustee shall retire by the end of the calendar year during which the Trustee reached the age of 75 years. Otherwise each Trustee serves in office until the election and qualification of a successor or until the Trustee sooner dies, resigns, retires or is removed. |
| (6) | Assistant vice presidents and assistant secretaries are not shown. |
| (7) | The Trust’s president, chief financial officer, secretary, and treasurer each serves a one-year term or until the election and qualification of a successor; each other officer serves at the pleasure of the Trustees. |
The Statement of Additional Information for each Fund of the Trust includes additional information about the Trustees and is available, without charge and upon request, by calling 1-800-847-0200.
Other Information
Thornburg Summit Fund | September 30, 2019 (Unaudited)
PORTFOLIO PROXY VOTING
Policies and Procedures:
The Trust has delegated to the Advisor voting decisions respecting proxies for the Fund’s voting securities. The Advisor makes voting decisions in accordance with its Proxy Voting Policy and Procedures. A description of the Policy and Procedures is available (i) without charge, upon request, by calling the Advisor toll-free at 1-800-847-0200, (ii) on the Thornburg website at www.thornburg.com, and (iii) on the U.S. Securities and Exchange Commission’s website at www.sec.gov.
Information regarding how proxies were voted is available on or before August 31 of each year for the twelve months ending the preceding June 30. This information is available (i) without charge, upon request by calling the Advisor toll-free at 1-800-847-0200, (ii) on the Thornburg website at www.thornburg.com, and (iii) on the U.S. Securities and Exchange Commission’s website at www.sec.gov.
TAX INFORMATION
For the year ended September 30, 2019, dividends paid by Thornburg Summit Fund of $251,823 are being reported as taxable ordinary investment income dividends for federal income tax purposes.
For the tax year ended September 30, 2019, the Fund is reporting 55.40% (or the maximum allowed) of the dividends paid from tax basis net ordinary income as qualifying for the reduced rate under the Jobs and Growth Tax Relief and Reconciliation Act of 2003.
The Fund is reporting 11.40% (or the maximum allowed) of the ordinary income distributions paid by the Fund for the fiscal year ended September 30, 2019 as qualified for the corporate dividends received deduction.
The information and distributions reported herein may differ from the information and distributions reported to the shareholders for the calendar year ending December 31, 2019. Complete information will be reported in conjunction with your 2019 Form 1099.
AVAILABILITY OF QUARTERLY PORTFOLIO SCHEDULE
The Fund files with the Securities and Exchange Commission schedules of its portfolio holdings on Form N-Q for the first and third quarters of each fiscal year. The Fund’s Forms N-Q are available on the Commission’s website at www.sec.gov, or may be reviewed and copied at the Commission’s Public Reference Room in Washington, D.C. Information on the operation of the Public Reference Room may be obtained by calling 1-800-SEC-0330. The Fund also makes this information available on its website at www.thornburg.com/download or upon request by calling 1-800-847-0200.
STATEMENT RESPECTING APPROVAL OF INVESTMENT ADVISORY AGREEMENT
Thornburg Investment Management, Inc. (the “Advisor”) provides investment management services to Thornburg Summit Fund (the “Fund”) pursuant to an investment advisory agreement. The Trustees consider the renewal of this agreement annually, and most recently determined to renew the agreement on September 17, 2019.
Planning for their recent consideration of the advisory agreement’s renewal, the independent Trustees met in May 2019 to consider aspects of their annual evaluation of the Advisor’s service to all of the funds of Thornburg Investment Trust, to plan the annual evaluation of the Advisor’s performance and to discuss preliminarily the information the Advisor would present to the Trustees for their review. The independent Trustees met in a second independent session in July 2019 to further define certain portions of the information to be submitted by the Advisor. The independent Trustees met again in an independent session in September 2019 with a mutual fund analyst firm engaged by the independent Trustees to provide explanations of comparative cost and expense information, comparative investment performance information, and other data obtained and analyzed by the analyst firm. In that session the independent Trustees discussed their evaluations of the Advisor’s services to the Fund and the Fund’s fee and expense levels, investment performance, and other information presented for the Fund, conferred independently with legal counsel respecting the factors typically considered in evaluating renewal of an advisory agreement, and conferred with representatives of management to receive explanations of certain aspects of the information they had requested. Representatives of the Advisor subsequently reviewed portions of the information with the Trustees and addressed questions from the Trustees at a full meeting session of the Trustees scheduled in September for that purpose, and the independent Trustees thereafter met again in an independent session to consider the Advisor’s presentations and various specific issues respecting their consideration of the advisory agreement’s renewal. Following these sessions, the Trustees met to consider renewal of the advisory agreement, and the independent Trustees voted unanimously at that meeting to renew the agreement for an additional term of one year.
Other Information, Continued
Thornburg Summit Fund | September 30, 2019 (Unaudited)
The information below summarizes certain factors considered by the Trustees in connection with the determination to renew the advisory agreement with the Advisor. In determining to renew the advisory agreement, the Trustees considered a wide range of information and did not identify any single factor as controlling, and this summary does not describe all of the factors and other matters considered by the Trustees in making their determination.
Nature, Extent and Quality of Services. The Trustees considered in their evaluation of the advisory agreement the written and oral reports provided to the Trustees and their standing committees throughout the year on a wide variety of topics by personnel from the Advisor’s portfolio management, administration, operations and compliance staffs. The Trustees also considered in this evaluation presentations and explanations made by representatives of the Advisor in meeting sessions scheduled for consideration of the renewal of the advisory agreement. The Trustees further noted in their evaluation the consideration they had given to a number of topics in previous years, reports from their standing committees, and advice received from counsel.
Information noted by the Trustees as having been considered in relation to the nature, extent and quality of services provided by the Advisor under the advisory agreement and contributing (together with other information considered) to their conclusions respecting the nature, extent and quality of the services rendered to the Fund by the Advisor included: (1) reports from portfolio managers and other personnel since the Fund’s inception demonstrating that the Fund was managed in conformity with stated strategies and objectives and conformed to investment restrictions and limitations; (2) reports demonstrating that management of the Fund remained faithful and competent, and demonstrating sufficient skill by portfolio managers in executing the Fund’s strategies in varying environments, managers’ cognizance of and strategies to pursue the Fund’s objectives and address pertinent market and economic trends and conditions, the evaluation and selection of individual investments, management to achieve tax efficiencies, and the structuring and composition of the Fund’s portfolio and management of Fund liquidity requirements; (3) the Fund’s achievement of its investment objectives over different periods of time since the Fund’s inception; (4) presentations by and interactions with members of the Advisor’s fund administration, operations and compliance staffs; (5) reports from standing committees of the Trustees on their respective proceedings throughout the year, including in particular reports from and interactions with the Advisor’s personnel; (6) the sufficiency of the resources the Advisor devotes to the services it provides to the Fund, including the expertise of its personnel and staffing levels and its enhancements to the electronic systems it utilizes in providing these services, and also including the Advisor’s own financial management and sufficiency of its resources; and (7) the measures employed to achieve efficient trade execution for the Fund, including the evaluation and selection of firms to execute transactions for the Fund. As in past years, the Trustees noted particularly their assessments of the Advisor’s personnel developed in meetings throughout the year, measures to expand and improve the depth and experience of the Advisor’s staff, and the Advisor’s collaborative approach to investment management, continued commitment to observance of compliance and regulatory requirements in managing investments by the Fund, responsiveness to the Trustees, and other factors.
Based upon these and other considerations, the Trustees concluded that the Advisor’s management of the Fund’s investments continued to conform to the Fund’s stated objectives and policies, and that the nature, extent and quality of the services provided to the Fund by the Advisor remained sufficient.
Investment Performance. The Trustees noted in their evaluation of the Fund’s investment performance the written and oral reports they had received in each regular meeting since the Fund’s inception from the Advisor’s portfolio management personnel. The Trustees also noted their consideration of information provided to them at their request in anticipation of their annual evaluation of the Advisor’s services, including the following items of information respecting the investment performance of the Fund: (1) the Fund’s absolute investment performance and achievement of stated objectives; (2) the Advisor’s explanations and commentary on the Fund’s performance in the context of the Fund’s objectives and reasonable expectations, and business, market and economic conditions; (3) the Fund’s investment performance for the three-month and since inception periods ending with the second quarter of the current year, comparing the Fund’s annualized returns to two mutual fund categories selected by independent mutual fund analyst firms and to a broad-based securities index, and assigning a percentage rank to the Fund’s performance for each period relative to each of the fund categories; (4) analyses of specified performance and risk metrics for the Fund relative to its benchmark and to a selected peer group of funds, prepared by an independent financial analyst firm engaged by the independent Trustees; (5) the Fund’s cash flows; (6) comparative performance data for a fund peer group selected by an independent mutual fund analyst firm engaged by the independent Trustees, and the analysis and observations of the analyst firm respecting those data; and (7) comparison of the Fund’s annualized return to the Fund’s benchmark index since the Fund’s inception;. The Trustees generally attach additional significance to investment performance from the perspective of longer-term shareholders, and noted the more limited information available for the Fund because it has only been operating since March 2019.
Comparisons of Fee and Expense Levels. Information noted by the Trustees as having been considered in this context included a variety of comparative data respecting the Fund’s fee and expense levels. This information included comparisons of the Fund’s advisory fee and overall Fund expenses to median and average fees and expenses charged to funds in the applicable Morningstar category, comparisons of the advisory fee and total expenses for the Fund’s sole share class to the fee levels and expenses of a fund peer group selected from the category by an independent mutual fund analyst firm engaged by the independent Trustees, the perspectives and advice from that mutual fund analyst firm respecting comparisons of fund fee levels and expenses to fund peer groups, and other information. The Trustees considered that the Advisor has agreed to certain fee waivers and expense reimbursements for the current period. Comparative fee and expense data noted as having been considered by the Trustees showed that, after fee waivers and expense reimbursements, the level of
Other Information, Continued
Thornburg Summit Fund | September 30, 2019 (Unaudited)
total expense for the Fund was lower than the median and average levels charged to funds in the applicable Morningstar category. Peer group data showed that the Fund’s stated advisory fee was lower than the median level for the peer group, and that the Fund’s total expense level was equal to the median level for the peer group after waivers of fees and reimbursement of expenses.
The Trustees noted their consideration of information respecting the advisory fees charged by the Advisor to other investment management clients, including sub-advised mutual funds and other institutional clients, together with information about fees charged by other advisors to different clients, analysis of the differences between the requirements of institutional clients and mutual funds, analysis of the differences between the requirements of a sub-advised mutual fund and a fund as to which the investment advisor is the primary advisor and sponsor, and the consequently different investment management services provided to the different categories of clients and the differing contexts in which these arrangements are entered into. The Trustees confirmed their previous observations that the differences between the fees charged by the Advisor or by other investment advisors to different types of clients did not appear exceptional and had limited relevance to the evaluation of the fee rate charged to mutual funds as to which the Advisor or such other advisors are the primary advisor and sponsor.
Costs and Profitability of Advisor. The Trustees noted the costs incurred by the Advisor in initiating and managing the Fund and the Advisor’s waivers of fees and reimbursements of expenses for the Fund, and further noted that the Fund is not currently profitable to the Advisor.
Potential Economies of Scale. In reviewing the extent to which economies of scale would be realized by the Fund as it grows and whether fee levels reflect potential economies of scale, the Trustees considered the breakpoint structure for advisory fees chargeable to the Fund, comparisons of the fee breakpoint structure for the Fund with breakpoint structures (or the absence of such structures) for other funds in a peer group selected by an independent mutual fund analyst firm, the effects of the breakpoint structure and other expense factors realized by certain funds of the Trust as their asset levels had increased, the Advisor’s undertakings to waive or reimburse certain fees and expenses of the Fund, and the Advisor’s expenditures from its own profits and resources to maintain staffing levels and expand staff competencies, pay competitive levels of compensation, and add to its electronic and information technology systems so as to maintain or improve service levels. The information provided demonstrated to the Trustees that the Fund’s advisory fee breakpoint structure is reasonable in relation to the structures observed in the other funds in its peer group, and that shareholders may be expected to benefit from any economies of scale, due to the advisory agreement’s breakpoint fee structure for the Fund and other factors.
Potential Ancillary Benefits. In reviewing potential benefits to the Advisor because of its relationship to the Fund, the Trustees considered explanations from the Advisor respecting its receipt of certain research services from broker dealers, and the benefits to both the Fund and the Advisor of the Advisor’s expansion of its staffing, compliance and systems capabilities and other resources to serve a broader variety of investment management clients. No unusual or unfair benefits to the Advisor from its relationship to the Fund were identified by the Trustees.
Summary of Conclusions. The Trustees concluded that the general nature, extent and quality of the Advisor’s services performed under the advisory agreement remained sufficient, the Advisor had continued to actively and competently pursue the Fund’s stated investment objectives and adhere to the Fund’s investment policies, and that the absolute and relative investment performance of the Fund over pertinent holding periods on the whole was satisfactory in the context of the Fund’s objectives and strategies. The Trustees further concluded that the level of the advisory fee charged to the Fund by the Advisor is fair and reasonable in relation to the services provided by the Advisor, in view of the nature, extent and quality of those services, the investment performance of the Fund after fees and expenses, the clear disclosure of fees and expenses in the Fund’s prospectus, comparisons of fees and expenses charged to the Fund to fees and expenses charged to other mutual funds, and the other factors considered. The Trustees accordingly determined to renew the Fund’s investment advisory agreement with the Advisor for an additional term of one year.
Trustees’ Statement to Shareholders (Unaudited)
Readopted September 17, 2019
The Trustees believe current and prospective shareholders should know how we discharge our responsibilities in supervising the Funds’ investment advisor and in reviewing the advisor’s contract for renewal. Since 2005, we have issued a statement which sets out clearly the three principal guidelines that we follow in supervising the Trust’s investment advisor on your behalf. In accordance with our customary practice, in September of this year we again reviewed our statement and concluded we should reissue this statement outlining the principal features of our supervision of the advisor’s performance of investment management services for the Funds.
We begin with the premise that each shareholder selected his or her Fund because its investments are managed by the investment advisor identified in the prospectus and in accordance with the objective and policies described in the prospectus. We realize, as each of you do, that if you believe that your Fund’s stated objective and policies no longer serve your personal investment goals, you can sell your shares and leave the Fund.
Therefore, we believe that our primary supervisory task—our principal obligation to you—is to assess the nature and quality of the advisor’s services, and to confirm that the advisor actively and competently pursues the Fund’s objective, in accordance with the policies set out in the prospectus. To do this, we meet regularly with management to review your Fund’s portfolio and to discuss the advisor’s specific actions and judgments in pursuing the Fund’s objective. We do not substitute our own judgment for the advisor’s decisions in selecting investments; the advisor is paid to exercise its informed judgment on investment decisions, and we seek to confirm, in reviewing the advisor’s performance, that the advisor is doing just that.
Second, we are conscious of costs and the effect that costs have on shareholders’ returns. We try to make sure that your Fund’s fees and costs are reasonable in relationship to the services rendered and that they are generally in line with those charged by other expert investment advisors, consistent with our belief that the Fund’s investors searched for and expect that expertise and attention and have decided to pay a reasonable price for it. We do not put the management contract “out to bid” as a matter of course, and we would not do so unless we had concluded that the advisor materially had failed to pursue the Fund’s objectives in accordance with its policies, or for other equally important reasons. We believe that any other approach would be inconsistent with your interests and contrary to your expectations when you bought shares of the Fund in the first place.
Finally, because we believe that most Thornburg Fund shareholders have invested with a long-term perspective, we try not to focus too much on the fashions of the moment and on short-term performance. The market will not favor any specific investment objective or set of policies at all times and under all economic circumstances. A fund will experience periods of both high and low returns relative to other funds and other investments. Even if one of our Funds is not favored by the market at a particular time, we believe that the advisor is nonetheless obliged to remain true to the Fund’s objective and policies, and we watch to see that it does so.
Trustees of Thornburg Investment Trust
Thornburg Investment Management is a privately-owned global investment firm that offers a range of solutions for retail and institutional investors. Founded in 1982 and headquartered in Santa Fe, New Mexico, we manage approximately $41.9 billion (as of September 30, 2019) across U.S. mutual funds, separate accounts for high-net-worth investors, institutional accounts, and UCITS funds for non-U.S. investors.
The fund outlined in this report is one of many equity and fixed-income products available from Thornburg Investment Management.
EQUITY FUNDS
| ■ | Thornburg Global Opportunities Fund |
| ■ | Thornburg International Value Fund |
| ■ | Thornburg Better World International Fund |
| ■ | Thornburg International Growth Fund |
| ■ | Thornburg Developing World Fund |
| ■ | Thornburg Value Fund |
| ■ | Thornburg Core Growth Fund |
MULTI_ASSET FUNDS
| ■ | Thornburg Investment Income Builder Fund |
| ■ | Thornburg Summit Fund |
FIXED INCOME FUNDS
| ■ | Thornburg Low Duration Income Fund |
| ■ | Thornburg Limited Term U.S. Government Fund |
| ■ | Thornburg Limited Term Income Fund |
| ■ | Thornburg Strategic Income Fund |
| ■ | Thornburg Low Duration Municipal Fund |
| ■ | Thornburg Limited Term Municipal Fund |
| ■ | Thornburg Intermediate Municipal Fund |
| ■ | Thornburg California Limited Term Municipal Fund |
| ■ | Thornburg New Mexico Intermediate Municipal Fund |
| ■ | Thornburg New York Intermediate Municipal Fund |
| ■ | Thornburg Strategic Municipal Income Fund |
ALTERNATIVE FUNDS
| ■ | Thornburg Long/Short Equity Fund |
Before investing, carefully consider the Fund’s investment goals, risks, charges, and expenses. For a prospectus or summary prospectus containing this and other information, contact your financial advisor or visit thornburg.com. Read it carefully before investing.
For additional information, please visit thornburg.com
Thornburg Investment Management, Inc. 2300 North Ridgetop Road, Santa Fe, NM 87506
To receive shareholder reports, prospectuses, and proxy statements electronically, go to www.thornburg.com/edelivery.
This Annual Report is submitted for the general information of shareholders of the Fund. It is not authorized for distribution to prospective investors in the Fund unless preceded or accompanied by an effective prospectus.
Investment Advisor:
Thornburg Investment Management®
800.847.0200
Distributor:
Thornburg Securities Corporation®
Item 2.Code of Ethics
Thornburg Investment Trust (the “Trust”) has adopted a code of ethics described in Item 2 of Form N-CSR. A copy of the code of ethics is filed as an exhibit to this Form N-CSR.
Item 3.Audit Committee Financial Expert
The Trustees of the Trust have determined that three members of the Trust’s audit committee, David A. Ater, Sally Corning, and Patrick J. Talamantes, are each audit committee financial experts as defined in Item 3 of Form N-CSR. Mr. Ater, Ms. Corning and Mr. Talamantes are each independent for purposes of Item 3 of Form N-CSR. The Trustees’ determinations in this regard were based upon their current understandings of the definition of “audit committee financial expert” and current interpretations of the definition. The Trustees call attention to the lack of clarity in the definition, and that shareholders and prospective investors may wish to evaluate independently this definition and the qualifications of the Trust’s audit committee. The definition of “audit committee financial expert,” together with comments on the definition, is set forth in the Securities and Exchange Commission’s website (www.sec.gov).
Item 4.Principal Accountant Fees and Services
Audit Fees
The aggregate fees billed to the Trust in each of the last two fiscal years for the audit of the Trust’s financial statements and for services that are normally provided by PricewaterhouseCoopers LLP, registered independent public accounting firm (“PWC”), in connection with statutory and regulatory filings or requirements for those fiscal years are set out below.
| | | | | | | | |
| | | Year Ended
September 30, 2018 | | | Year Ended
September 30, 2019 | |
Thornburg Investment Trust | | $ | 736,325 | | | $ | 796,908 | |
Audit-Related Fees
The fees billed to the Trust by PWC in each of the last two fiscal years for assurance and related services that are reasonably related to the audit or review of the Trust’s financial statements (and that are not reflected in “Audit Fees,” above) are set out below.
| | | | | | | | |
| | | Year Ended
September 30, 2018 | | | Year Ended
September 30, 2019 | |
Thornburg Investment Trust | | $ | 5,000 | | | $ | 0 | |
Tax Fees
The fees billed to the Trust by PWC in each of the last two fiscal years for professional services rendered by PWC for tax compliance, tax advice or tax planning, including amounts paid in connection with filing foreign tax reclaims, are set out below.
| | | | | | | | |
| | | Year Ended
September 30, 2018 | | | Year Ended
September 30, 2019 | |
Thornburg Investment Trust | | $ | 515,500 | | | $ | 588,458 | |
All Other Fees
The fees billed to the Trust by PWC in each of the last two fiscal years for all other services rendered by PWC to the Trust are set out below.
| | | | | | | | |
| | | Year Ended
September 30, 2018 | | | Year Ended
September 30, 2019 | |
Thornburg Investment Trust | | $ | 9,345 | | | $ | 11,325 | |
The figure shown under All Other Fees for the year ended September 30, 2018 includes amounts from out of pocket expenses during the 2017 annual audit. The figure shown under All Other Fees for the year ended September 30, 2019 includes amounts from out of pocket expenses during the 2018 annual audit.
PWC performs no services for the investment advisor, the Funds’ principal underwriter or any other person controlling, controlled by, or under common control with the investment advisor which provides ongoing services to the Funds.
Audit Committee Pre-Approval Policies and Procedures
As of September 30, 2019, the Trust’s Audit Committee has not adopted pre-approval policies and procedures.
Item 5.Audit Committee of Listed Registrants
Not applicable.
Item 6.Schedule of Investments
Filed as part of the reports to shareholders filed under item 1 of this Form.
Item 7.Disclosure of Proxy Voting Policies and Procedures for Closed-End Management Investment Companies
Not applicable.
Item 8.Portfolio Managers of Closed-End Management Investment Companies
Not applicable.
Item 9.Purchases of Equity Securities by Closed-End Management Investment Companies and Affiliated Purchasers.
Not applicable.
Item 10.Submission of Matters to a Vote of Security Holders
The authority to consider candidates recommended by the shareholders in accordance with the Trust’s Procedures for Shareholder Communications is committed to the Governance and Nominating Committee.
Item 11.Controls and Procedures
(a) The principal executive officer and the principal financial officer have concluded that the Trust’s disclosure controls and procedures provide reasonable assurance that material information relating to the Trust is made known to them by the appropriate persons, based on their evaluation of these controls and procedures as of a date within 90 days prior to the filing date of this report.
(b) There was no change in the Trust’s internal control over financial reporting that occurred during the registrant’s second fiscal quarter of the period covered by this report (that is, the registrant’s fourth fiscal quarter) that has materially affected, or is reasonably likely to materially affect, the registrant’s internal control over financial reporting.
Item 12.Disclosure of Securities Lending Activities for Closed-End Management Investment Companies
Not applicable.
Item 13.Exhibits
| | |
| |
(a) (1) | | Code of Business Conduct and Ethics. |
| |
(a) (2) | | Certifications pursuant to Rule 30a-2(a) under the Investment Company Act of 1940 (17 CFR 70.30a-2(a)) attached hereto as Exhibit 99.CERT. |
| |
(a) (3) | | Not Applicable |
| |
(b) | | Certification pursuant to Section 906 of the Sarbanes-Oxley Act of 2002 and Rule 30a-2(b) under the Investment Company Act of 1940 (17 CFR 70.30a-2(b)) attached hereto as Exhibit 99.906CERT. |
SIGNATURES
Pursuant to the requirements of the Securities Exchange Act of 1934 and the Investment Company Act of 1940, the registrant has duly caused this report to be signed on its behalf by the undersigned, thereunto duly authorized.
Thornburg Investment Trust, in respect of the following Thornburg Funds: Low Duration Municipal Fund, Limited Term Municipal Fund, California Limited Term Municipal Fund, Intermediate Municipal Fund, New Mexico Intermediate Municipal Fund, New York Intermediate Municipal Fund, Low Duration Income Fund, Limited Term U.S. Government Fund, Limited Term Income Fund, Value Fund, International Value Fund, Core Growth Fund, Investment Income Builder Fund, Global Opportunities Fund, International Growth Fund, Strategic Income Fund, Strategic Municipal Income Fund, Developing World Fund, Better World International Fund, Capital Management Fund, Long/Short Equity Fund and Summit Fund.
| | |
| By: | | /s/ Jason H. Brady |
| | Jason H. Brady |
| | President and principal executive officer |
| |
| Date: | | November 27, 2019 |
Pursuant to the requirements of the Securities Exchange Act of 1934 and the Investment Company Act of 1940, this report has been signed below by the following persons on behalf of the registrant and in the capacities and on the dates indicated.
| | |
| By: | | /s/ Jason H. Brady |
| | Jason H. Brady |
| | President and principal executive officer |
| |
| Date: | | November 27, 2019 |
| |
| By: | | /s/ Nimish Bhatt |
| | Nimish Bhatt |
| | Treasurer and principal financial officer |
| |
| Date: | | November 27, 2019 |
THORNBURG INVESTMENT TRUST
Code of Business Conduct and Ethics
September 10, 2003 (as revised to December 6, 2009)
Introduction
Honesty and integrity are hallmarks of Thornburg Investment Trust (the “Trust”). We pride ourselves on maintaining the highest standards of ethics and conduct in all of our business relationships. This Code of Business Conduct and Ethics covers a wide range of business practices and procedures and applies to the officers and Trustees of the Trust in their conduct of the business and affairs of the Trust. It does not cover every issue that may arise, but it sets out basic principles to guide the officers and Trustees of the Trust in discharging their duties for the Trust. This Code has been adopted by the Trustees of the Trust with the objectives of deterring wrongdoing and promoting (1) honest and ethical conduct, including the ethical handling of actual or apparent conflicts of interest between personal and professional relationships, (2) full, fair, accurate, timely and understandable disclosure in reports and documents which the Trust files with the Securities and Exchange Commission and in other public communications made by the Trust, (3) compliance with applicable governmental laws, rules and regulations, (4) prompt internal reporting of violations of this Code, and (5) accountability for adherence to this Code.
This Code is intended as a code of ethics under Section 406 of the Sarbanes-Oxley Act of 2002 and Item 2 of FormN-CSR under the Investment Company Act of 1940, and is specifically applicable to the principal executive officer, principal financial officer, and principal accounting officer (or persons performing similar functions, whether or not as officers or employees of the Trust) of the Trust (each a “Covered Officer”).
All records and reports created or maintained pursuant to this Code are intended solely for the internal use of the Trust, are confidential, and in no event constitute an admission by any person as to any fact, circumstance or legal conclusion.
Compliance with Laws, Rules and Regulations
The Trust expects its officers and Trustees to comply with all laws, rules and regulations applicable to the Trust’s operations and business. Officers and Trustees should seek guidance whenever they are in doubt as to the applicability of any law, rule or regulation regarding any contemplated course of action. The Trust and its investment adviser hold information and training sessions to promote compliance with laws, rules and regulations, including insider-trading laws. Please consult the various guidelines and policies which the Trust has prepared in accordance with specific laws and regulations.A good guideline, if in doubt on a course of action, is to always ask first, act later — if you are unsure of what to do in any situation, seek guidance before you act.
As a registered investment company, we are subject to regulation by the Securities and Exchange Commission, and compliance with federal, state and local laws. The Trust and its Trustees insist on strict compliance with the spirit and the letter of these laws and regulations.
Conflicts of Interest
Each officer and Trustee of the Trust should be scrupulous in avoiding any conflict of interest or appearance of such a conflict with regard to the Trust’s interests. A “conflict of interest” occurs when an individual’s private interest interferes with the interests of the Trust. The appearance of a conflict occurs for purposes of this Code when an individual enters into a transaction, has a relationship with or receives a benefit from a third party, or engages in any other conduct, which would cause an unrelated observer to reasonably conclude that an actual conflict exists. A conflict may arise when an officer or Trustee pursues interests that prevent the individual from performing his duties to the Trust objectively and effectively. A conflict also may arise when an officer or Trustee or member of the individual’s family receives undisclosed, improper benefits as a result of the individual’s position with the Trust. The appearance of a conflict may arise when an individual or his family member has a relationship with a person who does business with the Trust or its investment adviser.Any conflict of interest that arises in a specific situation or transaction must be disclosed by the individual and resolved before taking any action.
Matters involving a conflict of interest or appearance of a conflict are prohibited as a matter of Trust policy, except when approved by the Trustees or the Trust’s audit committee for any Covered Officer or Trustee, or except when approved by the Trust’s president for any other individual. Conflicts of interest may not always be evident, and individuals should consult with higher levels of management or the Trust’s legal counsel if they are uncertain about any situation. In no event, however, shall investment in any security made in accordance with the Trust’s Policy on Personal Securities Transactions (or comparable policy or code then in effect) be considered a conflict of interest with the Trust.
Corporate Opportunities
Officers and Trustees shall not take for themselves personally opportunities that are discovered through the use of their position with the Trust, except with the approval of the Trustees or the Trust’s audit committee for any Covered Officer or Trustee, or except with the approval by the Trust’s president for any other individual. Officers and Trustees owe a duty to the Trust to advance its legitimate interests when the opportunity to do so arises. In no event, however, shall investment in any security made in accordance with the Trust’s Policy on Personal Securities Transactions (or comparable policy or code then in effect) be considered a business opportunity of the Trust.
Confidentiality
Officers and Trustees shall exercise care in maintaining the confidentiality of any confidential information respecting the Trust, except where disclosure is authorized or legally mandated. Officers and Trustees should consult with the Trust’s legal counsel if they believe they have a legal obligation to disclose confidential information. Confidential information includes non-public information of the Trust that may be helpful to competitors, or otherwise harmful to the Trust or its shareholders. The obligation to preserve confidentiality of this information continues after association with the Trust ends.
Fair Dealing
Officers and Trustees should endeavor to deal fairly with the Trust’s shareholders, service providers and competitors, and shall not seek unfair advantage through improper concealment, abuse of improperly acquired confidential information, misrepresentation of material facts when the other party is known by the officer or Trustee to rely justifiably on the individual to disclose those facts truthfully, or improper and unfair dealing.
Business Gifts and Entertainment
The purpose of business entertainment and gifts in a commercial setting is to create goodwill and sound working relationships, not to gain unfair advantage. No gift or entertainment should ever be offered, given, provided or accepted by any officer or Trustee in connection with the Trust’s business unless it (1) is not a cash gift, (2) is consistent with customary business practices, (3) is not excessive in value, (4) cannot be construed as a bribe, payoff or kickback and (5) does not violate any laws or regulations.
Protection and Proper Use of Trust Assets
All officers and Trustees should endeavor to protect the Trust’s assets and pursue their efficient investment in accordance with the Trust’s business purposes and declaration of trust. Any suspected incident of fraud or theft should be immediately reported for investigation.
The obligation of officers and Trustees to protect the Trust’s assets includes its proprietary information. Proprietary information includes intellectual property such as trademarks and copyrights, as well as business, marketing and service plans, databases, records, salary information and any unpublished financial data and reports. Unauthorized use or distribution of this information violates this Code.
Insider Trading
All officers and Trustees should pay particular attention to potential violations of insider trading laws. Insider trading is both unethical and illegal and will be dealt with decisively if it occurs.Officers and Trustees are expected to familiarize themselves with the Policy Statement on Insider Trading, adopted by the Trust’s investment adviser. If they have questions about these guidelines, they should consult with the Trust’s president, the investment adviser’s compliance office, or the Trust’s legal counsel.
Certain Political Contributions Proscribed
Contributions or solicitations for contributions, by any officer or Trustee of the Trust who is an employee, officer or director of the Trust’s investment advisor or distributor, to any political campaign in which an independent Trustee is a candidate, are prohibited. This prohibition does not apply to (i) a contribution by an independent Trustee to a political campaign of another independent Trustee, or (ii) a solicitation by an independent Trustee for the political campaign of another independent Trustee if the solicitation is made to an individual with whom the soliciting Trustee has some relationship, or to an individual who either has a relationship with the candidate Trustee or who would be expected to have an interest in the outcome of the campaign.
Reporting Illegal or Unethical Behavior
The Trustees encourage each officer to talk to senior officers, the investment adviser’s compliance officers, or the Trustees about observed illegal or unethical behavior, or when the officer is in doubt about the best course of action in a particular situation. Officers should report actual and suspected violations of laws, rules, regulations or this Code to appropriate personnel. If an individual does not believe it appropriate or is not comfortable approaching senior officers or the investment adviser’s compliance officers about their concerns, then the individual may contact any member of the Trust’s audit committee. If the individual’s concerns require confidentiality, then this confidentiality will be protected, subject to applicable law, regulation or legal proceedings. The Trust will not permit retaliation of any kind by or on behalf of the Trust or its officers and Trustees against good faith reports or complaints of violations of this Code or other illegal or unethical conduct.
Reporting and Disclosure
As a registered investment company, it is of critical importance that the Trust’s filings with the Securities and Exchange Commission contain full, fair, accurate, timely and understandable disclosure. Each officer and Trustee should become familiar with the disclosure laws and regulations applicable to the Trust, consistent with the individual’s authority and duties. Depending on the Trust, each officer and Trustee may be called upon to provide necessary information to ensure that the Trust’s public reports are complete, fair and understandable. The Trustees expect officers and Trustees to take this responsibility very seriously and to provide prompt and accurate answers to inquiries related to the Trust’s public disclosure requirements. Officers may be asked to certify as to the accuracy of all responses and information provided for inclusion in the Trust’s public reports and filings.
Recordkeeping
The Trust requires accurate recording and reporting of information in order to make responsible business decisions. The Trustees expect each of the Trust’s officers, consistent with the officer’s individual authority and duties, to maintain the Trust’s books, records, accounts and financial statements in reasonable detail, and to appropriately reflect the Trust’s transactions in conformity with applicable legal requirements and the Trust’s system of internal controls.
Accounting and Financial Reporting Concerns
The Trust seeks to comply with all applicable financial reporting and accounting regulations applicable to the Trust. Officers who have concerns or complaints regarding questionable accounting or auditing matters or procedures involving the Trust are encouraged to submit those concerns or complaints to the Trust’s audit committee which will, subject to its duties arising under applicable law, regulations and legal proceedings, treat such submissions confidentially. These submissions may be directed to the attention of the audit committee chairman, or any Trustee who is a member of the audit committee, at the principal executive offices of the Trust or at the Trustee’s residence address.
Waivers of the Code of Business Conduct and Ethics
Any waiver of this Code for any Covered Officer or Trustee may be made only by the Trustees or the Trust’s audit committee and will be promptly disclosed as required by law or by Securities and Exchange Commission regulations. Waivers of this Code for any other individual may be made by the president only upon the individual’s making full disclosure in advance of the transaction in question. This Code may be amended or modified at any time by the Trustees.
| | |
| HISTORY: | | APPROVED AND ADOPTED BY TRUSTEES OF THORNBURG INVESTMENT TRUST ON SEPTEMBER 10, 2003, EFFECTIVE THE SAME DATE; AMENDED EFFECTIVE JULY 20, 2005 TO REVISE PROVISIONS RESPECTING CONFLICTS OF INTEREST; AMENDED EFFECTIVE DECEMBER 6, 2009 TO ADD A PARAGRAPH RESPECTING CAMPAIGN CONTRIBUTIONS. |
THORNBURG INVESTMENT MANAGEMENT
Code of Business Conduct and Ethics
March 2019
Policy Objectives
Honesty and integrity are hallmarks of Thornburg Investment Management, Inc.(“TIM”).TIM has a fiduciary obligation to its Investment Clients and seeks the highest standards of ethics and conduct in all of its business relationships.
This Code has been adopted by TIM pursuant to paragraphs (a)(1), (2), (4) and (5) of Rule204A-1 under the Investment Advisers Act of 1940 with the objectives of deterring wrongdoing and promoting (1) honest and ethical conduct, including the ethical handling of actual or apparent conflicts of interest between personal and professional relationships, (2) full, fair, accurate, timely and understandable disclosure in reports and documents which TIM files with the Securities and Exchange Commission and in other public communications made by TIM, (3) compliance with applicable governmental laws, rules and regulations, (4) prompt internal reporting of violations of this Code, and (5) accountability for adherence to this Code.
This Code, together with the separately adopted Personal Securities Transactions Policy, is intended to comprise TIM’s code of ethics described inRule 204A-1 under the Investment Advisers Act of 1940.
All records and reports created or maintained pursuant to this Code are intended solely for the internal use of TIM, are confidential, and in no event constitute an admission by any person as to any fact, circumstance or legal conclusion.
This Code is intended to function and harmonize with the Thornburg Investment Trust Code of Business Conduct and Ethics. Where appropriate or necessary, specific sections of this Code include a coordinating provision referencing the appropriate section of the Thornburg Investment Trust Code of Business Conduct and Ethics.
See the Glossary of Terms for definitions of terms used in this Code.
Compliance with Laws, Rules and Regulations
As a registered investment adviser, TIM is subject to regulation by the Securities and Exchange Commission, and compliance with federal, state and local laws. TIM insists on strict compliance with the spirit and the letter of these laws and regulations. TIM expects its Supervised Persons to comply with all laws, rules and regulations applicable to its operation and business. Supervised Persons should seek guidance whenever they are in doubt as to the applicability of any law, rule or regulation regarding any contemplated course of action. TIM holds information and training sessions to promote compliance with laws, rules and regulations, including insider trading laws. Consult the various guidelines and policies which TIM has prepared in accordance with specific laws and regulations.
A good guideline, if in doubt on a course of action, is toalways ask first, act later – if you are unsure of what to do in any situation, seek guidance before you act.
Whistleblowing/Reporting Fraudulent, Illegal or Unethical Activity
All Supervised Persons are required to report suspected fraudulent, illegal, or other unethical activity (including violations of this Code) to his or her supervisor immediately. Supervisors who are notified of any such activity must immediately report it to TIM’s Chief Compliance Officer. Anyone who does not feel comfortable reporting this activity to the relevant supervisor may instead contact TIM’s Chief Compliance Officer. No TIM employee shall take any disciplinary or retaliatory action against any individual for acting in good faith, reporting, or causing to be reported, violations of this Code or fraudulent, illegal, or unethical activity occurring at TIM, Thornburg Investment Trust or Thornburg Securities Corporation (or for assisting in an authorized investigation of such activity), whether such reporting is internal or involves any federal government agency, as described below. This prohibition against disciplinary action does not extend to disciplinary action for self-reported violations.
TIM has established an anonymous Contact Compliance form on the Thornburg intranet:https://www.gothornburg.com/compliance/contact. An employee may also send a hard copy report anonymously to the Chief Compliance Officer via inter office mail.
Notwithstanding the foregoing, nothing in this Code or any employment agreement with TIM prohibits any Supervised Person from reporting possible violations of federal law or regulation to any government agency or entity, including but not limited to the Department of Justice, the SEC at the Office of the Whistleblower, or any agency Inspector General, or making other disclosures protected under the whistleblower provisions of federal law or regulation. Supervised Persons do not need the prior authorization of TIM to make such reports or disclosures and are not required to notify TIM if he or she makes such reports or disclosures.
SEC Office of the Whistleblower Telephone: 202.551.4790
Conflicts of Interest
Each Supervised Person shall be scrupulous in avoiding any conflict of interest with regard to TIM’s interest. A conflict of interest occurs when an individual’s private interest interferes with the interests of TIM or its Investment Clients. A conflict situation can arise when a Supervised Person pursues interests that prevent the individual from performing his or her duties for TIM or an Investment Client objectively and effectively. Conflicts of interest also arise when a Supervised Person or member of the individual’s family receives undisclosed, improper benefits as a result of the individual’s positions with TIM.Any conflict of interest that arises in a specific situation or transaction, including Reportable Outside Business Activities as discussed below, must be disclosed by the individual and approved in writing by the Compliance Department before taking any action.
Matters involving a conflict of interest are prohibited as a matter of policy, except when approved by TIM’s president or Chief Compliance Officer. Conflicts of interest may not always be evident, and individuals should consult with higher levels of management or legal counsel if they are uncertain about any situation. In no event, however, shall investment in any security made in accordance with TIM’s Policy on Personal Securities Transactions (or comparable policy or code then in effect) be considered a conflict of interest with TIM.
Comment: This section relating to conflicts of interest is substantially similar to the comparable section in the Thornburg Investment Trust Code of Business Conduct and Ethics, but Supervised Persons should recognize that (i) the Trust’s Code of Business Conduct and Ethics governs conflicts with interest of the Trust, rather than TIM and its Clients, and (ii) the procedures for reporting and resolving conflict under the Trust’s Code of Business Conduct and Ethics is different from the Procedure under this Code. If an interest of the Supervised Person appears to conflict with an interest of the Trustand TIM), the Supervised Person should make a disclosure and seek any approval under the Trust’s Code of Business Conduct and Ethics.
Obtaining Prior Approval for Outside Business Activities. Prior to engaging in any Reportable Outside Business Activity, a Supervised Person must complete and submit an “Outside Business Activity Disclosure Form” (obtained from Compliance or TIM’s intranet) to the Compliance Department and receive written approval from the Compliance Department. Failure to obtain such written approval may result in disciplinary action up to and including termination. On an annual basis, all Supervised Persons will be required to certify their Reportable Outside Business Activities.
Family Member Serving as a Director of a Public Company. Supervised Persons must disclose to Compliance any immediate family member (a child, stepchild, grandchild, parent, stepparent, grandparent, spouse, sibling,mother-in-law,father-in-law,son-in-law,daughter-in-law,brother-in-law, orsister-in-law, and shall include adoptive relationships) sharing the same household who serves as a director of a public company. Failure to disclose may result in disciplinary action up to and including termination. On an annual basis, all Supervised Persons will be required to certify the accuracy of their disclosure.
Corporate Opportunities
Supervised Persons shall not take for themselves personally opportunities that are discovered through the use of their position with TIM, except with the approval of TIM’s President or Chief Compliance Officer. Supervised Persons of TIM owe a duty to TIM to advance its legitimate interests when the opportunity to do so arises. In no event, however, shall investment in any security made in accordance with TIM’s Policy on Personal Securities Transactions (or comparable policy or code then in effect) be considered a business opportunity of TIM.
Comment: This section relating to corporate opportunities is substantially the same as the comparable section on the Thornburg Investment Trust Code of Business Conduct and Ethics, but Supervised Persons should recognize that (i) the Trust’s Code of Business Conduct and Ethics governs opportunities of the Trust, rather than TIM, and (ii) the procedures for reporting and obtaining an approval under the Trust’s Code of Business Conduct and Ethics is different from the procedure under this Code. If an opportunity appears to relate both to the business of the Trustand TIM, the Supervised Person should make disclosure and seek any approval under the Trust’s Code of Business Conduct and Ethics.
Confidentiality
Supervised Persons shall exercise care in maintaining the confidentiality of any confidential information respecting TIM or its Investment Clients, except when disclosure is authorized or legally mandated. Supervised Persons should consult with TIM’s Chief Compliance Officer or legal counsel if they believe that have a legal obligation to disclose confidential information. Confidential information includes
nonpublic information of TIM that may be helpful to competitors, or otherwise harmful to TIM, or its Investment Clients. Confidential information also includes information respecting the portfolio holdings of Investment Clients (including particularly Investment Company Clients). The obligation to preserve confidentiality of this information continues after association with TIM ends.
Comment: Attention is directed to the Internal Confidentiality and Privacy Protections Policy, which appears in TIM’s Manual of Policies and Procedures, and which was adopted by TIM to protect the nonpublic personal information of the Investment Clients of TIM and the shareholders of Thornburg Investment Trust. This section respecting confidentiality is substantially the same as the comparable section in the Thornburg Investment Trust Code of Business Conduct and Ethics, except that a specific reference is made to information respecting portfolio holdings of Investment Clients.
Fair Dealing
Supervised Persons should endeavor to deal fairly with Investment Clients, service providers and competitors, and shall not seek unfair advantage through improper concealment, abuse of improperly acquired confidential information, misrepresentation of material facts when the other party is known by the Supervised Persons to rely justifiably on the individual to disclose those facts truthfully, or improper and unfair dealing.
Foreign Corrupt Practices Act
The Foreign Corrupt Practices Act (the“FCPA”)strictly prohibits unauthorized facilitation payments to government officials of foreign countries, including the payment of any money or anything of value to a foreign official for the purposes of:
| | • | | Influencing any act or decision of a foreign official in his or her official capacity (including, but not limited to, obtaining approval for government issued permits, licenses or work visas); |
| | • | | Inducing a foreign official to perform or abstain from performing any act in violation of the foreign official’s lawful duty; |
| | • | | Securing any improper business advantage; or |
| | • | | Inducing a foreign official to use his or her official influence with a foreign government (or instrumentality thereof) to affect or influence any act or decision of such government in order to assist the inducer in obtaining or retaining business with the government or directing such business to any person. |
In addition, many foreign countries have rules and regulations restricting gifts to people who are employed by the government of that country. TIM intends to fully comply with all of those rules and regulations. If you are at all uncertain about the applicability of the FCPA, or similar laws, to any entertainment, gift or anything of value to anynon-U.S. official, consult a Compliance Officer.
Business Gifts and Entertainment
The purpose of business entertainment and gifts in a commercial setting is to create goodwill and sound working relationships, not to gain unfair advantage. Receipt of gifts or entertainment by TIM personnel involved in the purchase or sale of registered investment company property that satisfies the criteria herein will not be deemed to be compensation for the purchase or sale of property as prohibited under Section 17(e)(1) of the Investment Company Act of 1940.
Gifts
No gift should ever be offered, given, provided or accepted by any Supervised Person in connection with TIM’s business unless it:
(1) is consistent with customary business practices,
(2) is not excessive in value (a gift or multiple gifts in excess of $100/year to or from a person or entity must bepre-approved in writing by Compliance; nominal logo or promotional items are excluded from the $100 limit),
(3) cannot be construed as a bribe, payoff or kickback, and
(4) does not violate any laws or regulations.
Comment: See below for additional restrictions that apply to “Gifts and Entertainment to Government Affiliated Persons” and “Gifts and Entertainment in Conjunction withTIM-organized Due Diligence or Sales Meetings.”
No Supervised Person may give or accept cash or cash equivalent gifts – gift cards that are not exchangeable for cash, are not considered “cash equivalents.”
Gifts received that are not in compliance with the restrictions stated herein must be promptly returned to the gifting party. If it is not feasible to return the gift, it may be donated to a charity, or, if the value of the gift is greater than $100, shared with multiple employees so that the value per employee falls below the above limit for each employee. One Supervised Person must report the gift receipt, noting the ultimate disposition of the gift.
Similarly, on occasion, a client or prospective client, or person or entity that does or seeks to do business with or on behalf of TIM may present the firm (rather than any one Supervised Person) with a gift that exceeds the valuation limit detailed above. The Supervised Person accepting the gift on behalf of the firm must report to the Chief Compliance Officer, or their designee, the name of the gifting party, a description of the gift, and an estimated value of the gift. The gift will be reported on that Supervised Person’s next quarterly compliance certification as a gift received, noting that it was a gift to the firm.
On a quarterly basis, all Access Persons will be required to report by midnight on the last day of the second month after quarter end, all gifts that were given and received within the previous quarter.
Entertainment
No entertainment should ever be offered, given, provided or accepted by any Supervised Person in connection with TIM’s business unless it:
(1) is consistent with customary business practices,
(2) is not excessive in value,
(3) cannot be construed as a bribe, payoff or kickback, and
(4) does not violate any laws or regulations.
Comment: See below for additional restrictions that apply to “Gifts and Entertainment to Government Affiliated Persons” and “Gifts and Entertainment in Conjunction withTIM-organized Due Diligence or Sales Meetings.”
Supervised Persons may provide to, or accept from, any client or prospective client, or person or entity that does or seeks to do business with or on behalf of TIM, a business entertainment event such as a dinner, golf outing, theater or sporting event if the person or entity providing the entertainment is present and as long as the event is not extravagant or excessive so as to give the appearance of impropriety. Meals provided in TIM’s office, a client’s office, or in a similar business setting, shall not be deemed entertainment and TIM does not require Access Persons to report these activities in their quarterly reports, as described below.
On a quarterly basis, all Access Persons will be required to report by midnight on the last day of the second month after quarter end, all entertainment that was given and received within the previous quarter.
Gifts and Entertainment to ERISA Entities and Government Affiliated Persons.
In addition to the restrictions noted above, no gift, entertainment or any other thing of value may be given, directly or indirectly, to any person affiliated with an ERISA entity, or any government affiliated person, unless the giving of such thing of value ispre-approvedin writing by Compliance. A“government affiliated person”includes, but is not limited to, any person affiliated with a governmental plan or a governmental entity, at any jurisdictional level. “Anything of value” is very broadly defined and includes, but is not limited to, logo/promotional items, meals (regardless of setting), drinks, business entertainment events, including participation in Thornburg campus seminars/events, and tickets to any type of event.
Gifts and Entertainment in Conjunction withTIM-organized Due Diligence or Sales Meetings
Due diligence or sales meetings for financial advisors, prospects, or clients which are held at TIM’s main campus or at an appropriate business location within a reasonable distance from TIM’s main campus shall have an appropriate agenda intended to provide training or education related to TIM products and/or its services or relating to the securities industry. The agenda may include reasonable meals and/or entertainment as is appropriate to the business line and audience. Participant “gift bags” of a nominal value may be presented where appropriate and in conjunction with the limits of this policy. The business line organizing such events shall bear the responsibility for ensuring the reasonableness of the provided gifts and entertainment and shall maintain records of attendees, venues for any activities (including but not limited to meals or entertainment), and the contents of any gift items distributed, including any logo items given in conjunction with the events.
Political Contributions and Political Activity
Several federal and state regulations seek to preventso-called “pay to play” practices by investment advisors, such as when an investment advisor makes campaign contributions to an elected official in order to influence the award of advisory contracts to manage government investment accounts. Many of these regulations restrict the ability of an investment advisor’s directors, officers and employees to make or solicit political contributions.
In order to avoid a violation of these regulations,all Supervised Persons are prohibited from any of the following activities, whether done individually or in the name of TIM, unless prior approval has been obtained from TIM’s Chief Compliance Officer or another person designated by TIM’s Chief Compliance Officer.If, after considering all relevant factors, the Chief Compliance Officer or his designee determines that the proposed activity will not violate applicable regulations, then the Chief Compliance Officer or his designee shall approve the proposed activity. In making these determinations, the Chief Compliance Officer or his designee may consult with other persons, including TIM’s president and legal counsel.
| | 1. | Making a gift, subscription, loan, advance or deposit of money, or giving anything else of value (each, a“Contribution”),to an incumbent, candidate or successful candidate for elective office of any State of the United States or political subdivision of a State of the United States. |
| | 2. | Making a Contribution to a political action committee, political party or other entity organized to fund the political activities of an incumbent, candidate or successful candidate for elective office of any State of the United States or political subdivision of a State of the United States. |
| | 3. | Working on behalf of an incumbent, candidate or successful candidate for elective office of any State of the United States or political subdivision of a State of the United States (e.g., volunteering on a political campaign), unless such work occurs outside of your normal working hours with TIM and involves no use of TIM’s resources (e.g., TIM’s office space or telephones). |
| | 4. | Coordinating or soliciting any person (including a family member) or political action committee to make a Contribution to an incumbent, candidate or successful candidate for elective office of any State of the United States or political subdivision of a State of the United States, or to a state or local political party (e.g., hosting a fundraising event on behalf of any such candidate). |
Comment: Attention is also directed to TIM’s Third-Party Marketer Policy, which places certain restrictions on the ability of TIM to use a third party to solicit clients.
| | 5. | Doing indirectly anything which the preceding four numbered paragraphs would prohibit the Supervised Person from doing directly |
Comment: Examples of the types of indirect actions which are prohibited include, but are not limited to, (a) a Supervised Person could not form his own political action committee and make Contributions through that political action committee which the Supervised Person would be prohibited from making in his own name; (b) a Supervised Person could not funnel Contributions through third parties, such as attorneys, family members, friends or affiliated companies; (c) making a contribution to a charitable organization at the request of an incumbent, candidate or successful candidate for elective office of any State of the United States or political subdivision of a State of the United States, if the purpose in making such a contribution is to induce that incumbent, candidate or successful candidate to provide investment advisory business to TIM.
If you have any questions about these restrictions on political contributions and political activities, contact TIM’s Chief Compliance Officer or, in his/her absence, another member of the Compliance Department, before making the political contribution or participating in the political activity.
Protection and Proper Use of Firm Assets
All Supervised Persons should endeavor to protect the assets of TIM and its Investment Clients, and pursue their efficient investment in accordance with TIM’s business purposes. Any suspected incident of fraud or theft should be immediately reported for investigation as hereinafter described under the caption “Administration and Enforcement of the Code.”
The obligation of Supervised Persons to protect the assets of TIM includes its proprietary information. Proprietary information includes intellectual property such as trademarks and copyrights, as well as business, marketing and service plans, databases, records, salary information, unpublished financial data and reports. Unauthorized use or distribution of this information violates this Code.
Insider Trading
All Supervised Persons should pay particular attention to potential violations of insider trading laws. Insider trading (also referred to as “trading on material nonpublic information,” and which may include giving inside information to other persons) is both unethical and illegal, and will be dealt with if it occurs.Supervised Persons are expected to familiarize themselves with the Policy on Insider Trading, adopted by TIM. If they have questions about these guidelines, they should consult with TIM’s president, the Chief Compliance Officer, or TIM’s legal counsel before making any trade for TIM or any personal trade, and before giving information to other persons.
Comment: Attention is directed to TIM’s Policy on Insider Trading, which appears in Compliance’s Manual of Policies and Procedures.
Administration and Enforcement of the Code
Certification
Each newly hired Supervised Person of TIM will be provided a copy of the Code. Each such individual must certify in writing within 30 days that they have received a copy of the Code, read and understand all provisions of the Code, and agree to comply with the applicable terms of the Code. TIM will provide its Supervised Persons with any amendments to the Code and will require all such individuals to certify in writing that they have received, read and understand the amendments. Each year the Chief Compliance Officer, or their designee, will conduct an annual meeting with Supervised Persons to review the Code. Supervised Persons will annually certify that they have read, understood and complied with the Code, that they have made all of the reports required by the Code and have not engaged in any prohibited conduct.
Reporting Violations
All Supervised Persons are required to report suspected fraudulent, illegal, or other unethical activity (including violations of this Code) to his or her supervisor immediately. Supervisors who are notified of any such activity must immediately report it to TIM’s Chief Compliance Officer. Anyone who does not feel comfortable reporting this activity to the relevant supervisor may instead contact TIM’s Chief Compliance Officer. All reports will be treated confidentially to the extent permitted by law and investigated promptly.
Sanctions
Upon discovering a violation of this Policy, TIM may impose such sanctions as it deems appropriate, including, but not limited to, a letter of censure, fine, suspension or termination of the violator’s employment.
Glossary
“Access Person”means:
i. Any director or officer of TIM.
ii. Any Supervised Person of TIM, unless, in the Chief Compliance Officer’s sole discretion, a particular Supervised Person does not have ongoing access to the Companies’ headquarters or information systems.
iii. Individuals who are registered with the FINRA as an associated person of Thornburg Securities Corporation.
iv. Any director, officer, general partner or employee of any company in a Control relationship with TIM who, in connection with their regular functions or duties, make, participate in, or obtain information regarding the purchase or sale of Securities by any Investment Client, or whose functions relate to the making of any recommendations with respect to those purchases or sales.
v. Any natural person who is in a Control relationship with TIM and who obtains information concerning recommendations made to any Investment Client with regard to the purchase or sale of Securities by the Investment Client.
“Chief Compliance Officer”means, for purposes of this Code, TIM’s chief compliance officer.
“Fund”means any series of Thornburg Investment Trust or any other Investment Company as to which TIM is an investment adviser orsub-adviser.
“Investment Client”means any person with whom TIM has a contract to perform discretionary investment management services, including any series of an Investment Company.
“Investment Company”means a company registered as such under the Investment Company Act of 1940.
“Investment Company Client”means any Investment Company (or series thereof) as to which TIM is an investment adviser or investmentsub-adviser.
“Policy on Personal Securities Transactions”means TIM’s written policy of that name, as revised from time to time. This Policy can be found in TIM’s Manual of Policies and Procedures.
“ReportableOutside Business Activity”means any activity wherein a TIM Supervised Person acts as an employee, independent contractor, sole proprietor, officer, director or partner of another person, or is compensated, or has a reasonable expectation of compensation, from any other person as a result of any business activity outside the scope of their relationship with the TIM or TSC.
“Supervised Person”means any director, managing director, officer (or other person occupying a similar status or performing functions similar to any of those persons) or employee of TIM, and any other persons who are subject to TIM’s supervision and control.
“Trust”means Thornburg Investment Trust.
“TSC”means Thornburg Securities Corporation.
Item 13(a)(2)
Exhibit 99.CERT
CERTIFICATION
I, Jason H. Brady, certify that:
1. I have reviewed this report onForm N-CSR of Thornburg Investment Trust;
2. Based on my knowledge, this report does not contain any untrue statement of a material fact or omit to state a material fact necessary to make the statements made, in light of the circumstances under which such statements were made, not misleading with respect to the period covered by this report;
3. Based on my knowledge, the financial statements, and other financial information included in this report, fairly present in all material respects the financial condition, results of operations, changes in net assets, and cash flows (if the financial statements are required to include a statement of cash flows) of the registrant as of, and for, the periods presented in this report;
4. The registrant’s other certifying officer(s) and I are responsible for establishing and maintaining disclosure controls and procedures (as defined inRule 30a-3(c) under the Investment Company Act of 1940) and internal control over financial reporting (as defined inRule 30a-3(d) under the Investment Company Act of 1940) for the registrant and have:
(a) Designed such disclosure controls and procedures, or caused such disclosure controls and procedures to be designed under our supervision, to ensure that material information relating to the registrant, including its consolidated subsidiaries, is made known to us by others within those entities, particularly during the period in which this report is being prepared;
(b) Designed such internal control over financial reporting, or caused such internal control over financial reporting to be designed under our supervision, to provide reasonable assurance regarding the reliability of financial reporting and the preparation of financial statements for external purposes in accordance with generally accepted accounting principles;
(c) Evaluated the effectiveness of the registrant’s disclosure controls and procedures and presented in this report our conclusions about the effectiveness of the disclosure controls and procedures, as of a date within 90 days prior to the filing date of this report based on such evaluation; and
(d) Disclosed in this report any change in the registrant’s internal control over financial reporting that occurred during the second fiscal quarter of the period covered by this report that has materially affected, or is reasonably likely to materially affect, the registrant’s internal control over financial reporting; and
5. The registrant’s other certifying officer(s) and I have disclosed to the registrant’s auditors and the audit committee of the registrant’s board of directors (or persons performing the equivalent functions):
(a) All significant deficiencies and material weaknesses in the design or operation of internal control over financial reporting which are reasonably likely to adversely affect the registrant’s ability to record, process, summarize, and report financial information; and
(b) Any fraud, whether or not material, that involves management or other employees who have a significant role in the registrant’s internal control over financial reporting.
| | | | |
| | | Date: | | November 27, 2019 |
| |
| | /s/ Jason H. Brady |
| | Jason H. Brady |
| |
| | President and principal executive officer |
Item 13(a)(2)
Exhibit 99.CERT
CERTIFICATION
I, Nimish Bhatt, certify that:
1. I have reviewed this report onForm N-CSR of Thornburg Investment Trust;
2. Based on my knowledge, this report does not contain any untrue statement of a material fact or omit to state a material fact necessary to make the statements made, in light of the circumstances under which such statements were made, not misleading with respect to the period covered by this report;
3. Based on my knowledge, the financial statements, and other financial information included in this report, fairly present in all material respects the financial condition, results of operations, changes in net assets, and cash flows (if the financial statements are required to include a statement of cash flows) of the registrant as of, and for, the periods presented in this report;
4. The registrant’s other certifying officer(s) and I are responsible for establishing and maintaining disclosure controls and procedures (as defined inRule 30a-3(c) under the Investment Company Act of 1940) and internal control over financial reporting (as defined inRule 30a-3(d) under the Investment Company Act of 1940) for the registrant and have:
(a) Designed such disclosure controls and procedures, or caused such disclosure controls and procedures to be designed under our supervision, to ensure that material information relating to the registrant, including its consolidated subsidiaries, is made known to us by others within those entities, particularly during the period in which this report is being prepared;
(b) Designed such internal control over financial reporting, or caused such internal control over financial reporting to be designed under our supervision, to provide reasonable assurance regarding the reliability of financial reporting and the preparation of financial statements for external purposes in accordance with generally accepted accounting principles;
(c) Evaluated the effectiveness of the registrant’s disclosure controls and procedures and presented in this report our conclusions about the effectiveness of the disclosure controls and procedures, as of a date within 90 days prior to the filing date of this report based on such evaluation; and
(d) Disclosed in this report any change in the registrant’s internal control over financial reporting that occurred during the second fiscal quarter of the period covered by this report that has materially affected, or is reasonably likely to materially affect, the registrant’s internal control over financial reporting; and
5. The registrant’s other certifying officer(s) and I have disclosed to the registrant’s auditors and the audit committee of the registrant’s board of directors (or persons performing the equivalent functions):
(a) All significant deficiencies and material weaknesses in the design or operation of internal control over financial reporting which are reasonably likely to adversely affect the registrant’s ability to record, process, summarize, and report financial information; and
(b) Any fraud, whether or not material, that involves management or other employees who have a significant role in the registrant’s internal control over financial reporting.
| | | | |
| | | | | |
| | Date: | | November 27, 2019 |
| |
| | /s/ Nimish Bhatt |
| | Nimish Bhatt |
| |
| | Treasurer and principal financial officer |
| | | | | | | | |
| | | | | | | | Item 13(b) Exhibit 99.906CERT |
Certification Pursuant to Section 906 of the Sarbanes-Oxley Act of 2002 (subsections (a) and (b) of section 1350, chapter 63 of title 18, United States Code)
In connection with the attached Report onForm N-CSR of Thornburg Investment Trust in respect of the following Thornburg Funds: Low Duration Municipal Fund, Limited Term Municipal Fund, California Limited Term Municipal Fund, Intermediate Municipal Fund, New Mexico Intermediate Municipal Fund, New York Intermediate Municipal Fund, Limited Term U.S. Government Fund, Limited Term Income Fund, Low Duration Income Fund, Value Fund, International Value Fund, Core Growth Fund, Investment Income Builder Fund, Global Opportunities Fund, International Growth Fund, Strategic Income Fund, Strategic Municipal Income Fund, Developing World Fund, Better World International Fund, Capital Management Fund, Long/Short Equity Fund and Summit Fund (hereafter referred to as the “Funds”) to be filed with the Securities and Exchange Commission (the “Report”), each of the undersigned officers of the Trust does hereby certify pursuant to Section 906 of theSarbanes-Oxley Act of 2002 that, to the best of such officer’s knowledge:
1. The Report fully complies with the requirements of 13(a) or 15(d) of the Securities Exchange Act of 1934; and
2. The information contained in the Report fairly presents, in all material respects, the financial condition and results of operations of Thornburg Investment Trust, in respect of the Funds as of, and for, the periods presented in the Report.
|
| Dated: November 27, 2019 |
|
| /s/ Jason H. Brady |
| Jason H. Brady |
| President and principal executive officer |
|
| Dated: November 27, 2019 |
|
| /s/ Nimish Bhatt |
| Nimish Bhatt |
| Treasurer and principal financial officer |
A signed original of this written statement required by Section 906, or other document authenticating, acknowledging, or otherwise adopting the signature that appears in typed form within the electronic version of this written statement required by Section 906, has been provided to the Trust and will be retained by the Trust and furnished to the Securities and Exchange Commission or its staff upon request.
This certification is being furnished solely pursuant to Section 906 of theSarbanes-Oxley Act of 2002 and is not being filed as part of the Report or as a separate disclosure document.