NOTE 1 – ORGANIZATION
Thornburg Investment Income Builder Fund ("Income Builder Fund"), Thornburg Summit Fund ("Summit Fund"), Thornburg Global Opportunities Fund ("Global Opportunities Fund"), Thornburg International Equity Fund ("International Equity Fund", prior to February 1, 2021, the Thornburg International Value Fund), Thornburg Better World International Fund ("Better World International Fund"), Thornburg International Growth Fund ("International Growth Fund"), Thornburg Developing World Fund ("Developing World Fund"), Thornburg Small/Mid Cap Core Fund ("Small/Mid Cap Core Fund", prior to December 18, 2020, the Thornburg Value Fund), and Thornburg Small/Mid Cap Growth Fund ("Small/Mid Cap Growth Fund", prior to December 18, 2020, the Thornburg Core Growth Fund), collectively the ("Funds"), are diversified series of Thornburg Investment Trust (the “Trust”). The Trust is organized as a Massachusetts business trust under a Declaration of Trust dated June 3, 1987 and is registered as a diversified, open-end management investment company under the Investment Company Act of 1940, as amended (the "1940 Act"). The Funds are currently nine of twenty-one separate series of the Trust. Each series is considered to be a separate entity for financial reporting and tax purposes and bears expenses directly attributable to it.
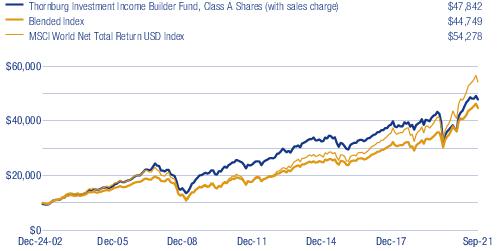
Income Builder Fund: The Fund’s primary investment goal is to provide a level of current income which exceeds the average yield on U.S. stocks generally, and which will generally grow, subject to periodic fluctuations, over the years on a per share basis. The Fund’s secondary investment goal is long-term capital appreciation. The Fund’s investments subject it to risks including, but not limited to, management risk, market and economic risk, equity risk, risks affecting specific issuers, small and mid-cap company risk, credit risk, high-yield risk, interest rate risk, prepayment and extension risk, foreign investment risk, developing country risk, foreign currency risk, risks affecting specific countries or regions, liquidity risk, and real estate risk. Please see the Fund’s prospectus for a discussion of the risks associated with an investment in the Fund.
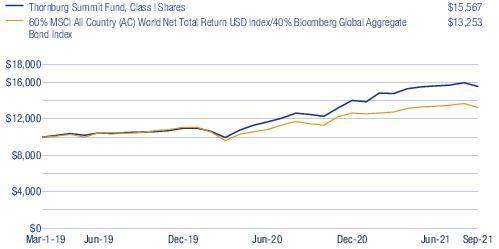
Summit Fund: The Fund’s investment goal is to seek to grow real wealth over time. The Fund’s investments subject it to risks including, but not limited to, management risk, market and economic risk, equity risk, risks affecting specific issuers, foreign investment risk, developing country risk, foreign currency risk, small and mid-cap company risk, short sale risk, credit risk, high yield risk, interest rate risk, prepayment and extension risk, liquidity risk, inflation risk, structured products risk, commodities-related investment risk, real estate risk and derivatives risk. Please see the Fund’s prospectus for a discussion of the risks associated with an investment in the Fund.
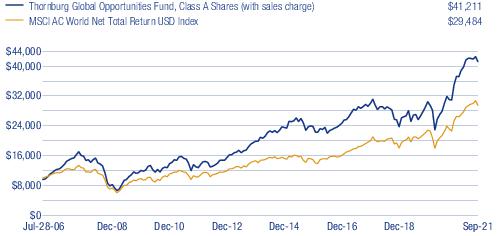
Global Opportunities Fund: The Fund seeks long-term capital appreciation by investing in equity and debt securities of all types from issuers around the world. The Fund’s investments subject it to risks including, but not limited to, management risk, market and economic risk, equity risk, risks affecting specific issuers, foreign investment risk, developing country risk, foreign currency risk, risks affecting specific countries or regions, small and mid-cap company risk, credit risk, liquidity risk, and real estate risk. Please see the Fund’s prospectus for a discussion of the risks associated with an investment in the Fund.
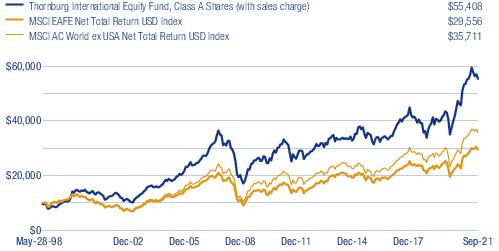
International Equity Fund: The Fund seeks long-term capital appreciation by investing in equity and debt securities of all types. As a secondary objective, the Fund also seeks some current income. The Fund’s investments subject it to risks including, but not limited to, management risk, market and economic risk, equity risk, risks affecting specific issuers, foreign investment risk, developing country risk, foreign currency risk, risks affecting specific countries or regions, risks affecting investments in China, small and mid-cap company risk, credit risk, and liquidity risk. Please see the Fund’s prospectus for a discussion of the risks associated with an investment in the Fund.
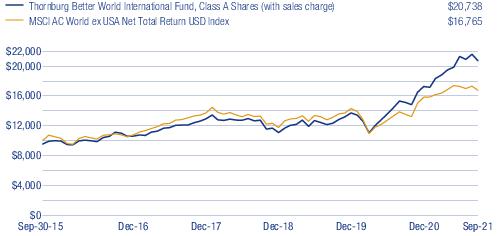
Better World International Fund: The Fund seeks long-term capital appreciation. The Fund’s investments subject it to risks including, but not limited to, management risk, market and economic risk, equity risk, risks affecting specific issuers, foreign investment risk, developing country risk, foreign currency risk, risks affecting specific countries or regions, small and mid-cap company risk, credit risk, liquidity risk, social investing risk, and real estate risk. Please see the Fund’s prospectus for a discussion of the risks associated with an investment in the Fund.
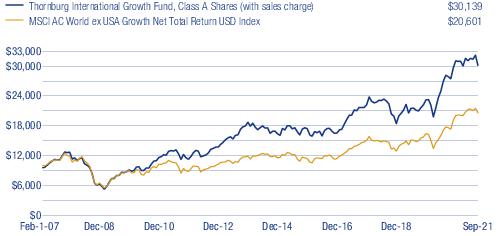
International Growth Fund: The Fund seeks long-term capital appreciation by investing in equity securities selected for their growth potential. The Fund’s investments subject it to risks including, but not limited to, management risk, market and economic risk, equity risk, risks affecting specific issuers, foreign investment risk, developing country risk, foreign currency risk, risks affecting specific countries or regions, small and mid-cap company risk, credit risk, and liquidity risk. Please see the Fund’s prospectus for a discussion of the risks associated with an investment in the Fund.
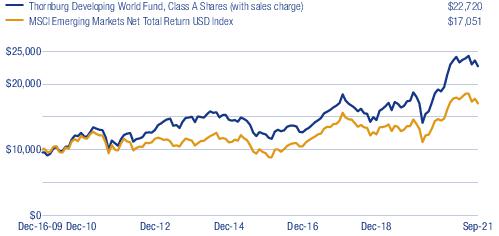
Developing World Fund: The Fund seeks long-term capital appreciation. The Fund’s investments subject it to risks including, but not limited to, management risk, market and economic risk, equity risk, risks affecting specific issuers, foreign investment risk, developing country risk, foreign currency risk, risks affecting specific countries or regions, risks affecting investments in China, small and mid-cap company risk, credit risk, and liquidity risk. Please see the Fund’s prospectus for a discussion of the risks associated with an investment in the Fund.
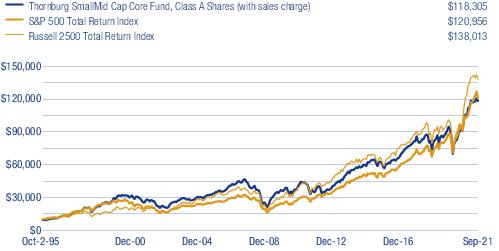
Small/Mid Cap Core Fund: The Fund seeks long-term capital appreciation by investing in equity and debt securities of all types. As a secondary objective, the Fund also seeks some current income. The Fund’s investments subject it to risks including, but not limited to, management risk, market and economic risk, equity risk, risks affecting specific issuers, small and mid-cap company risk, foreign investment risk, and liquidity risk. Please see the Fund’s prospectus for a discussion of the risks associated with an investment in the Fund.