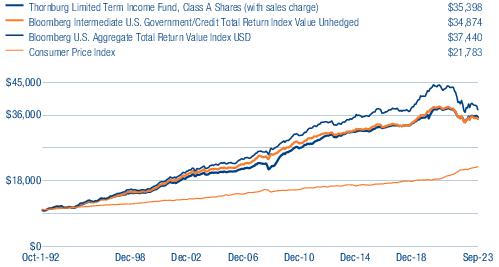
The Bloomberg U.S. Aggregate Bond Total Return Index Value USD is composed of approximately 8,000 publicly traded bonds including U.S. government, mortgage-backed, corporate and Yankee bonds. The index is weighted by the market value of the bonds included in the index.
The Bloomberg Global Aggregate Bond Index provides a broad-based measure of the global investment-grade fixed-rate debt markets. It is comprised of the U.S. Aggregate, Pan European Aggregate, and the Asian-Pacific Aggregate indices. It also includes a wide range of standard and customized sub-indices by liquidity constraint, sector, quality, and maturity.
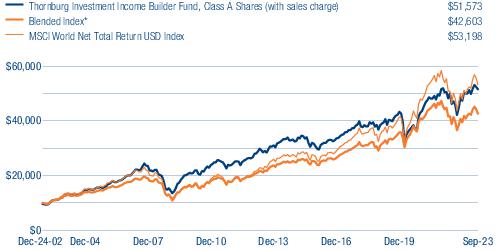
Thornburg Investment Income Builder Fund’s Blended Index is composed of 25% Bloomberg U.S. Aggregate Bond Total Return Index Value USD and 75% MSCI World Net Total Return USD Index, rebalanced monthly.
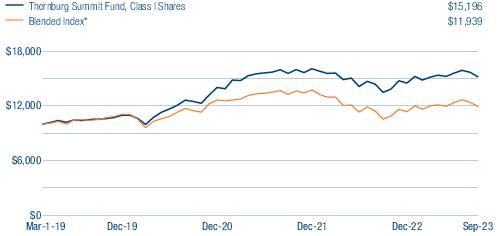
Thornburg Summit Fund’s Blended Index is composed of 60% MSCI All Country World Net Total Return USD Index and 40% Bloomberg Global Aggregate Bond Index, rebalanced monthly.
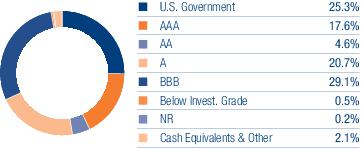
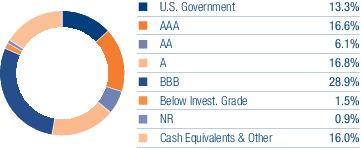
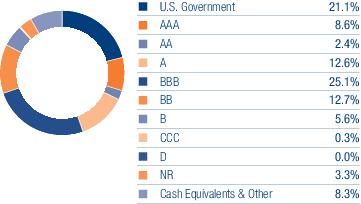
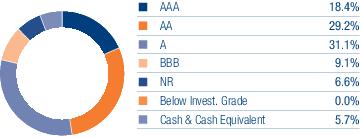
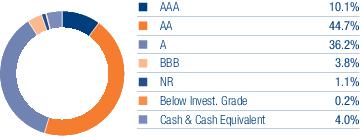
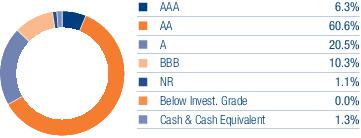
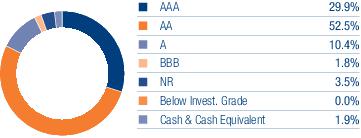
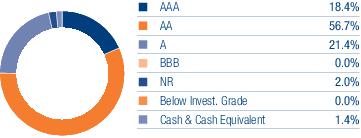
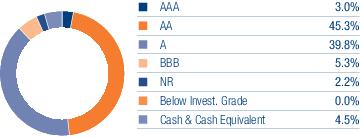
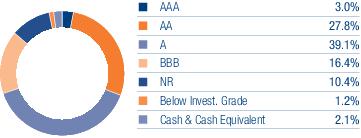
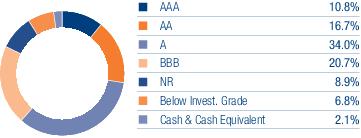
Bond Credit Ratings (Credit Quality) – A bond credit rating assesses the financial ability of a debt issuer to make timely payments of principal and interest. Ratings of AAA (the highest), AA, A, and BBB are investment-grade quality. Ratings of BB, B, CCC, CC, C and D (the lowest) are considered below investment grade, speculative grade, or junk bonds.
The MSCI World Net Total Return USD Index is an unmanaged market-weighted index that consists of securities traded in 23 of the world’s most developed countries. Securities are listed on exchanges in the U.S., Europe, Canada, Australia, New Zealand, and the Far East. The index is calculated with net dividends reinvested in U.S. dollars.
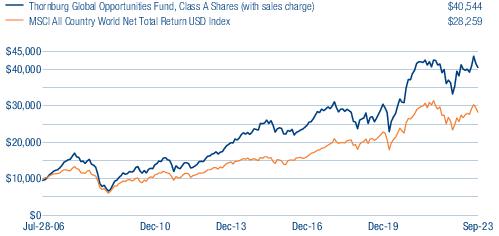
The MSCI All Country World Net Total Return USD Index is a market capitalization weighted index that is representative of the market structure of 47 developed and emerging market countries in North and South America, Europe, Africa, the Middle East, and the Pacific Rim. The index is calculated with net dividends reinvested in U.S. dollars.
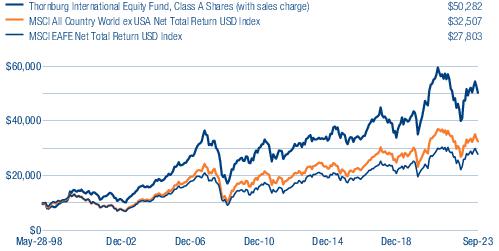
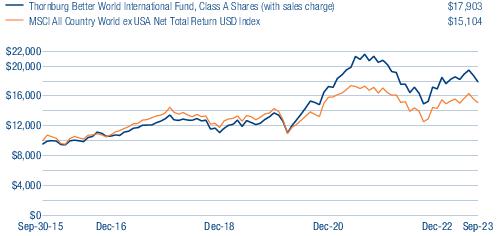
The MSCI All Country World ex USA Net Total Return USD Index is a market capitalization weighted index representative of the market structure of 45 developed and emerging market countries in North and South America, Europe, Africa, and the Pacific Rim, excluding securities of United States issuers. Beginning in January 2001, the index is calculated with net dividends reinvested in U.S. dollars. Prior data is calculated with gross dividends.
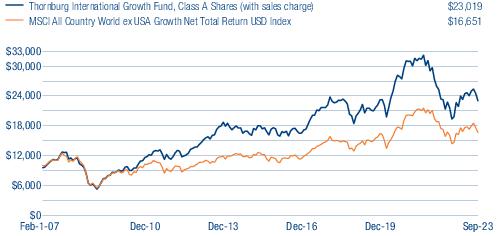
The MSCI All Country World ex USA Growth Net Total Return USD Index is a market capitalization weighted index that includes growth companies in developed and emerging markets throughout the world, excluding the United States.
The MSCI All Country World ex USA ESG Leaders Index is a capitalization weighted index that provides exposure to companies with high Environmental, Social and Governance (ESG) performance relative to their sector peers. The Index consists of large and mid-cap companies across 22 Developed Markets (DM) and 24 Emerging Markets (EM) countries.
The MSCI All Country World ex USA Value Index captures large- and mid-cap securities exhibiting overall value style characteristics across 22 Developed and 24 Emerging Markets countries. The value investment style characteristics for index construction are defined using three variables: book value to price, 12-month forward earnings to price and dividend yield.
The MSCI All Country World ex USA Growth Index captures large- and mid-cap securities exhibiting overall growth style characteristics across 22 Developed Markets (DM) countries and 24 Emerging Markets (EM) countries. The growth investment style characteristics for index construction are defined using five variables: long-term forward EPS growth rate, short-term forward EPS growth rate, current internal growth rate and long-term historical EPS growth trend and long-term historical sales per share growth trend.
The MSCI World ESG Leaders Index is a capitalization weighted index that provides exposure to companies with high Environmental, Social and Governance (ESG) performance relative to their sector peers. MSCI World ESG Leaders Index is constructed by aggregating the following regional Index MSCI Pacific ESG Leaders Index, MSCI Europe & Middle East ESG Leaders Index, MSCI Canada ESG Leaders Index and MSCI USA ESG Leaders Index. The parent index is MSCI World Index, which consists of large and mid-cap companies in 23 Developed Markets Countries.
The MSCI EAFE (Europe, Australasia, Far East) Net Total Return USD Index is an unmanaged index. It is a generally accepted benchmark for major overseas markets. Index weightings represent the relative capitalizations of the major overseas developed markets on a U.S. dollar adjusted basis. The index is calculated with net dividends reinvested in U.S. dollars.
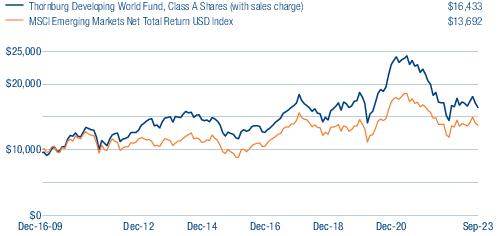
The MSCI Emerging Markets Index is a free float-adjusted market capitalization index that is designed to measure equity market performance of emerging markets. The MSCI Emerging Markets Index consists of the following 23 emerging market country indexes: Brazil, Chile, China, Colombia, Czech Republic, Egypt, Greece, Hungary, India, Indonesia, Korea, Malaysia, Mexico, Peru, Philippines, Poland, Qatar, Russia, South Africa, Taiwan, Thailand, Turkey and United Arab Emirates.
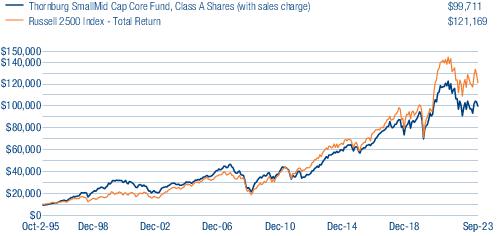
The Russell 2500 Index - Total Return measures the performance of the 2,500 smallest companies in the Russell 3000 Index, with a weighted average market capitalization of approximately $4.3 billion, median capitalization of $1.2 billion and market capitalization of the largest company of $18.7 billion.
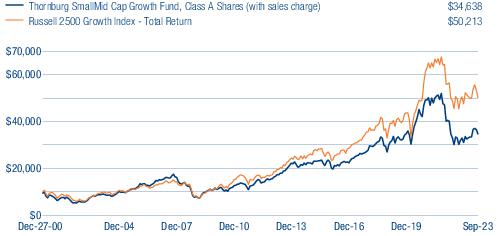
The Russell 2500 Growth Index - Total Return measures the performance of the small to mid-cap growth segment of the U.S. equity universe. It includes those Russell 2500™ companies with higher growth earning potential as defined by FTSE Russell’s leading style methodology. Source: Frank Russell Company.
Net Adjusted S&P 500 Index – For illustration purposes, the net adjusted S&P 500 Index adjusts the total return of the S&P 500 Index to reflect the same net exposure as the Fund.
P/E - Price-to-Earnings ratio (P/E ratio) is a valuation ratio of a company’s current share price compared to its per-share earnings. P/E equals a company’s market value per share divided by earnings per share. Forecasted P/E is not intended to be a forecast of the Fund’s future performance.
Price/Book ratio (P/B ratio) – A ratio used to compare a stock’s market value to its book value. It is calculated by dividing the current closing price of the stock by the latest quarter’s book value per share.
Yield to Worst (YTW) – The lowest potential yield that can be received on a bond without the issuer actually defaulting.
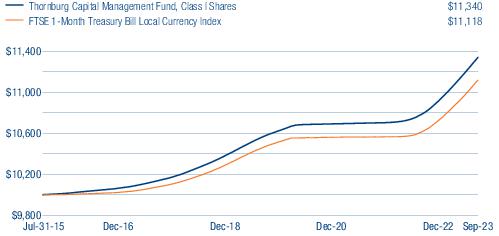
The performance of any index is not indicative of the performance of any particular investment. Unless otherwise noted, index returns reflect the reinvestment of income dividends and capital gains, if any, but do not reflect fees, brokerage commissions or other expenses of investing. Investors may not make direct investments into any index.
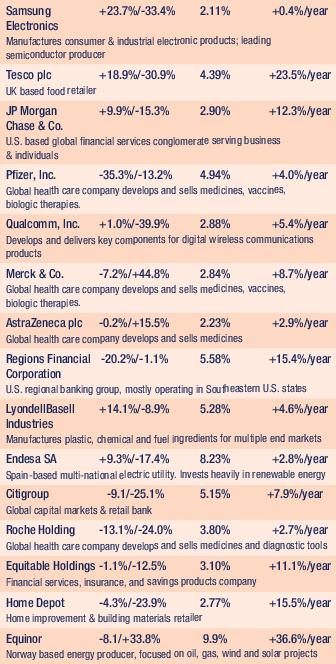
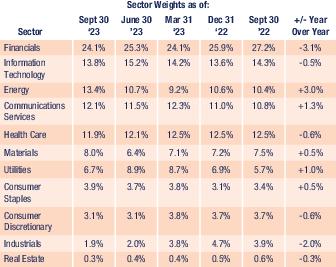
Any securities, sectors, or countries mentioned are for illustration purposes only. Holdings are subject to change. Under no circumstances does the information contained within represent a recommendation to buy or sell any security.
The information given should not be considered tax advice. Please consult your tax advisor for personal tax questions and concerns.