UNITED STATES
SECURITIES AND EXCHANGE COMMISSION
Washington, D.C. 20549
FORM N-CSR
CERTIFIED SHAREHOLDER REPORT OF REGISTERED MANAGEMENT INVESTMENT
COMPANIES
Investment Company Act file number 811-05201
Thornburg Investment Trust
(Exact name of registrant as specified in charter)
c/o Thornburg Investment Management, Inc.
2300 North Ridgetop Road, Santa Fe, New Mexico 87506
(Address of principal executive offices) (Zip code)
Garrett Thornburg, 2300 North Ridgetop Road, Santa Fe, New Mexico 87506
(Name and address of agent for service)
Registrant’s telephone number, including area code: 505-984-0200
Date of fiscal year end: September 30
Date of reporting period: March 31, 2019
Item 1.Reports to Stockholders
The following Semi-annual reports are attached hereto, in order:
Thornburg Low Duration Municipal Fund
Thornburg Limited Term Municipal Fund
Thornburg Intermediate Municipal Fund
Thornburg Strategic Municipal Income Fund
Thornburg California Limited Term Municipal Fund
Thornburg New Mexico Intermediate Municipal Fund
Thornburg New York Intermediate Municipal Fund
Thornburg Limited Term U.S. Government Fund
Thornburg Limited Term Income Fund
Thornburg Low Duration Income Fund
Thornburg Strategic Income Fund
Thornburg Value Fund
Thornburg International Value Fund
Thornburg Core Growth Fund
Thornburg International Growth Fund
Thornburg Investment Income Builder Fund
Thornburg Global Opportunities Fund
Thornburg Developing World Fund
Thornburg Better World International Fund
Thornburg Capital Management Fund
Thornburg Long/Short Equity Fund
Thornburg Summit Fund

| 4 | |
| 6 | |
| 7 | |
| 8 | |
| 12 | |
| 13 | |
| 14 | |
| 15 | |
| 20 | |
| 22 | |
| 23 | |
| 24 |
| SHARE CLASS | NASDAQ SYMBOL | CUSIP |
| Class A | TLMAX | 885-216-788 |
| Class I | TLMIX | 885-216-770 |
Thornburg Low Duration Municipal Fund | March 31, 2019 (Unaudited)
 |  |
| Christopher Ryon,cfa Portfolio Manager Managing Director | Nicholos Venditti,cfa Portfolio Manager Managing Director |
 | |
| David Ashley,cfa Portfolio Manager Managing Director |
Thornburg Low Duration Municipal Fund | March 31, 2019 (Unaudited)
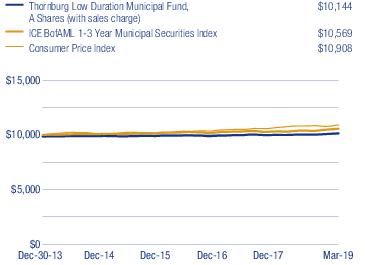
| 1-YR | 3-YR | 5-YR | SINCE INCEP. | |
| Class A Shares(Incep: 12/30/13) | ||||
| Without sales charge | 1.52% | 0.73% | 0.58% | 0.57% |
| With sales charge | -0.03% | 0.22% | 0.27% | 0.27% |
| Class I Shares(Incep: 12/30/13) | 1.64% | 0.93% | 0.76% | 0.75% |
| Annualized Distribution Yield | 1.30% |
| SEC Yield | 1.12% |
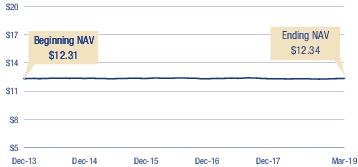
| FINAL VALUE |
Thornburg Low Duration Municipal Fund | March 31, 2019 (Unaudited)
| KEY PORTFOLIO ATTRIBUTES | |
| Number of Bonds | 169 |
| Effective Duration | 1.1 Yrs |
| Average Maturity | 1.4 Yrs |
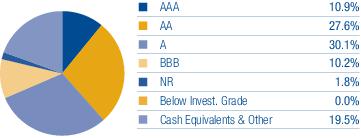

| 20% | 30% | 18% | 17% | 10% | 6% |
Thornburg Low Duration Municipal Fund | March 31, 2019 (Unaudited)
| PRINCIPAL AMOUNT | VALUE | ||
| Municipal Bonds — 97.7% | |||
| Alabama — 1.2% | |||
| a | City of Mobile Industrial Development Board (Alabama Power Company Barry Plant), 1.85% due 6/1/2034 (put 3/24/2020) | $1,000,000 | $ 993,660 |
| Southeast Alabama Gas Supply District, Series A, 4.00% due 6/1/2019 - 6/1/2020 | 1,665,000 | 1,692,251 | |
| Alaska — 2.6% | |||
| Alaska Industrial Development & Export Authority, Series A, 5.25% due 4/1/2024 | 3,780,000 | 3,910,599 | |
| City of Valdez (BP Pipelines (Alaska), Inc. Project), Series B, 5.00% due 1/1/2021 | 1,725,000 | 1,818,874 | |
| Arizona — 0.6% | |||
| Mesa Utility System Revenue, | |||
| 3.00% due 7/1/2019 | 325,000 | 326,183 | |
| 4.00% due 7/1/2020 | 915,000 | 943,026 | |
| California — 8.7% | |||
| a | Bay Area Toll Authority, 1.375% due 4/1/2053 (put 4/1/2020) | 1,200,000 | 1,196,400 |
| b | California Infrastructure and Economic Development Bank (California Academy of Sciences), Series D, 2.129% (LIBOR 1 Month + 0.38%) due 8/1/2047 (put 8/1/2021) | 2,000,000 | 2,000,160 |
| b | California Infrastructure and Economic Development Bank (Los Angeles County Museum of Art), Series A, 2.399% (LIBOR 1 Month + 0.65%) due 12/1/2050 (put 2/1/2021) | 1,000,000 | 1,003,290 |
| a | California Municipal Finance Authority (Republic Services, Inc. Project), 2.15% due 9/1/2021 (put 7/1/2019) | 2,000,000 | 2,000,000 |
| a,c | California Municipal Finance Authority, Series A, 2.00% due 2/1/2039 (put 2/3/2020) | 2,000,000 | 2,005,280 |
| a,c | California Pollution Control Financing Authority (Republic Services, Inc. Project), Series B, 1.95% due 8/1/2024 (put 5/1/2019) | 1,250,000 | 1,250,112 |
| California Statewide Communities Development Authority (Irvine East Campus Apartments), 5.00% due 5/15/2019 - 5/15/2020 | 1,220,000 | 1,243,144 | |
| City of Los Angeles (Cash Flow Management) GO, 4.00% due 6/27/2019 | 3,000,000 | 3,017,670 | |
| County of Los Angeles (Fiscal Year 2017-2018 Expenditures) GO, 4.00% due 6/28/2019 | 3,000,000 | 3,018,030 | |
| Riverside Financing Authority (Educational Facilities; Insured: BAM) USD, 4.00% due 6/28/2019 | 2,000,000 | 2,012,020 | |
| State of California GO, 2.00% due 12/1/2019 | 500,000 | 501,775 | |
| Colorado — 6.9% | |||
| d | City & County of Denver COP (SPA JP Morgan Chase Bank, N.A) Series A1, 1.50% due 12/1/2029 (put 4/1/2019) | 4,370,000 | 4,370,000 |
| City of Aurora (Sports Park and E-911 Projects) COP, 5.00% due 12/1/2019 | 365,000 | 373,377 | |
| Colorado (Catholic Health Initiatives), HFA, Series A, 5.00% due 2/1/2020 | 2,885,000 | 2,956,836 | |
| Interlocken Metropolitan District (Insured: AGM) GO, Series A-1, 5.00% due 12/1/2020 - 12/1/2023 | 2,000,000 | 2,219,245 | |
| State of Colorado 5.00% due 6/26/2019 | 2,000,000 | 2,016,180 | |
| State of Colorado Education Loan Program, Series A, 4.00% due 6/27/2019 | 3,200,000 | 3,218,464 | |
| Connecticut — 1.6% | |||
| State of Connecticut GO, | |||
| Series C, 5.00% due 6/15/2022 | 1,715,000 | 1,880,635 | |
| Series F, 5.00% due 9/15/2023 | 1,000,000 | 1,128,440 | |
| State of Connecticut Special Tax Revenue, Series B, 5.00% due 10/1/2021 | 525,000 | 565,813 | |
| Florida — 3.5% | |||
| d | City of Gainesville (Utilities System; SPA Landesbank Hessen-Thuringen), Series A-REMK 1.49% due 10/1/2026 (put 4/1/2019) | 1,025,000 | 1,025,000 |
| City of Jacksonville, Series C, 5.00% due 10/1/2019 - 10/1/2020 | 1,500,000 | 1,556,205 | |
| City of Orlando (Senior Tourist Development; Insured: AGM), Series A, 4.00% due 11/1/2020 | 850,000 | 879,809 | |
| City of Orlando,(Insured: AGM), Series A, 4.00% due 11/1/2021 | 900,000 | 951,471 | |
| d | Miami-Dade County Industrial Development Authority, (Florida Power & Light Co.), 1.51% due 6/1/2021 (put 4/1/2019) | 3,400,000 | 3,400,000 |
| Georgia — 2.3% | |||
| City of Atlanta (Atlantic Station Project), 5.00% due 12/1/2019 - 12/1/2021 | 1,000,000 | 1,058,422 | |
| Main Street Natural Gas, Inc, Series A, 5.00% due 5/15/2022 | 1,000,000 | 1,079,670 | |
| a | Monroe County Development Authority (Gulf Power Co.), 2.00% due 9/1/2037 (put 6/25/2020) | 3,000,000 | 2,981,520 |
| Guam — 0.6% | |||
| Guam Power Authority (Electric Power System; Insured: AGM), Series A, 5.00% due 10/1/2019 - 10/1/2020 | 1,200,000 | 1,228,041 | |
| Hawaii — 0.5% | |||
| b | City and County of Honolulu (Rail Transit Project) GO, 1.82% (MUNIPSA + 0.32%) due 9/1/2028 (put 9/1/2020) | 1,000,000 | 999,620 |
| Illinois — 7.9% | |||
| Chicago Park District (Capital Improvement Plan) GO, Series D, 5.00% due 1/1/2020 | 500,000 | 510,115 | |
| Chicago Park District GO, Series B, 5.00% due 1/1/2022 | 400,000 | 426,484 | |
| City of Chicago (Water System), | |||
| 5.00% due 11/1/2020 | 600,000 | 628,242 | |
| Series 2017-2, 5.00% due 11/1/2019 - 11/1/2022 | 2,200,000 | 2,291,026 | |
| City of Chicago ETM, 5.00% due 1/1/2020 | 600,000 | 615,216 | |
| Cook County School District No. 170 Chicago Heights (Insured AGM) GO, Series D, 5.00% due 12/1/2022 | 1,500,000 | 1,630,065 | |
| County of Cook (Capital Improvement Plan) GO, Series A, 5.00% due 11/15/2019 | 615,000 | 626,790 |
| PRINCIPAL AMOUNT | VALUE | ||
| County of Cook GO, Series C, 4.25% due 11/15/2019 | $ 200,000 | $ 202,914 | |
| Du Page County High School District No. 88 (Addison Trail and Willowbrook High Schools GO, 3.00% due 1/15/2020 | 1,245,000 | 1,257,960 | |
| d | Illinois Finance Authority (Northwestern Memorial Healthcare Obligated Group; SPA JP Morgan Chase Bank, N.A) 1.50% due 8/15/2042 (put 4/1/2019) | 1,000,000 | 1,000,000 |
| a | Illinois Finance Authority (Peoples Gas Light & Coke Co.), 1.875% due 2/1/2033 (put 8/1/2020) | 3,600,000 | 3,582,360 |
| d | Illinois Finance Authority (University of Chicago Medical Center Obligated Group; LOC Sumitomo Mitsui Banking Corp.), 1.51% due 8/1/2044 (put 4/5/2019) | 800,000 | 800,000 |
| State of Illinois (Build Illinois Program), | |||
| 5.00% due 6/15/2020 | 535,000 | 553,120 | |
| Series A, 4.00% due 6/15/2019 | 520,000 | 522,064 | |
| State of Illinois (Insured: Natl-Re) 5.75% due 6/15/2019 | 75,000 | 75,561 | |
| State of Illinois (State Facilities Improvements) GO, | |||
| 5.00% due 7/1/2021 - 3/1/2022 | 1,575,000 | 1,666,001 | |
| Series A, 5.00% due 10/1/2022 | 1,000,000 | 1,076,480 | |
| Indiana — 0.9% | |||
| a | City of Whiting, 1.85% due 6/1/2044 (put 10/1/2019) | 2,000,000 | 1,999,720 |
| Kentucky — 1.8% | |||
| Commonwealth of Kentucky State Property and Buildings Commission (Project No. 112), Series B, 5.00% due 11/1/2019 - 11/1/2021 | 2,600,000 | 2,742,480 | |
| a,e | Louisville/Jefferson County Metropolitan Government (Louisville Gas & Electric Co.), 1.85% due 10/1/2033 (put 4/1/2021) | 1,200,000 | 1,201,644 |
| Louisiana — 2.7% | |||
| Louisiana Energy & Power Authority (Rodemacher Unit No. 2 Power), 5.00% due 1/1/2021 | 600,000 | 630,528 | |
| a | Parish of St. Charles (Valero Energy Corp. Refinery), 4.00% due 12/1/2040 (put 6/1/2022) | 1,000,000 | 1,043,770 |
| Shreveport Water & Sewer Revenue (Insured:BAM), Series C, 5.00% due 12/1/2023 | 860,000 | 975,102 | |
| State of Louisiana GO, Series C, 5.00% due 8/1/2021 | 2,960,000 | 3,187,950 | |
| Maryland — 0.7% | |||
| d | Maryland Stadium Authority (LOC Sumitomo Mitsui Banking Corp.), 1.49% due 3/1/2026 (put 4/5/2019) | 715,000 | 715,000 |
| Washington County (Diakon Lutheran Social Ministries Obligated Group), Series B, 5.00% due 1/1/2020 - 1/1/2023 | 770,000 | 825,454 | |
| Massachusetts — 0.2% | |||
| Massachusetts Housing Finance Agency (Low and Moderate Income Housing), Series B, 2.00% due 6/1/2019 | 350,000 | 350,053 | |
| Michigan — 3.8% | |||
| Detroit Downtown Development Authority (Catalyst Development Project), Insured:AGM, Series A, 5.00% due 7/1/2021 - 7/1/2022 | 500,000 | 539,013 | |
| Detroit Sewage Disposal System Revenue (Great Lakes Water Authority Sewage Disposal System Revenue; Insured :AGM), Series A, 5.25% due 7/1/2020 | 2,800,000 | 2,921,016 | |
| Livonia Public Schools School District (Insured: BAM) GO, 5.00% due 5/1/2021 - 5/1/2022 | 985,000 | 1,058,762 | |
| Michigan Strategic Fund (Detroit Edison Company; Insured: AMBAC), 7.00% due 5/1/2021 | 2,000,000 | 2,200,020 | |
| Northern Michigan University, Series A, 5.00% due 12/1/2019 - 12/1/2021 | 1,535,000 | 1,612,830 | |
| Mississippi — 0.5% | |||
| Mississippi Development Bank (Jackson Public School District), 4.00% due 10/1/2019 | 750,000 | 758,543 | |
| Mississippi Development Bank (Jackson Public School District; Insured: BAM), 5.00% due 10/1/2022 | 375,000 | 414,371 | |
| Nebraska — 1.0% | |||
| a,f | Central Plains Energy Project, 5.00% due 3/1/2050 (put 1/1/2024) | 2,000,000 | 2,216,960 |
| Nevada — 1.1% | |||
| Clark County Department of Aviation, Series A, 5.00% due 7/1/2021 | 2,000,000 | 2,143,640 | |
| Clark County School District (School Facilities Improvements) GO, Series C, 5.00% due 6/15/2021 | 250,000 | 267,948 | |
| New Jersey — 4.2% | |||
| City of Trenton (Various Capital Improvements; Insured: AGM) (State Aid Withholding) GO, 5.00% due 7/15/2020 | 500,000 | 520,760 | |
| New Jersey (Cigarette Tax) EDA, 5.00% due 6/15/2019 | 550,000 | 553,377 | |
| New Jersey (School Facilities Construction; Insured: AMBAC) EDA, Series K, 5.50% due 12/15/2019 | 200,000 | 205,154 | |
| New Jersey Transit Corp. (Urban Public Transportation Capital Improvement), Series A, 5.00% due 9/15/2019 | 1,250,000 | 1,268,400 | |
| New Jersey Transportation Trust Fund Authority (State Transportation System Improvements), 5.00% due 6/15/2020 | 500,000 | 517,785 | |
| New Jersey Transportation Trust Fund Authority (State Transportation System Improvements; Insured: Natl-Re), Series B, 5.50% due 12/15/2020 | 2,000,000 | 2,117,940 | |
| New Jersey Transportation Trust Fund Authority, Series A, 5.00% due 6/15/2019 | 1,000,000 | 1,006,620 | |
| Passaic Valley Sewer Commissioners (Sewer System) GO, Series G, 5.75% due 12/1/2021 | 500,000 | 548,990 | |
| Tobacco Settlement Financing Corp., Series A, 5.00% due 6/1/2019 - 6/1/2021 | 2,480,000 | 2,592,934 | |
| New Mexico — 2.6% | |||
| a | City of Farmington (Southern California Edison Co.-Four Corners Project), 2.125% due 6/1/2040 (put 6/1/2022) | 2,500,000 | 2,475,375 |
| New Mexico Hospital Equipment Loan Council (Presbyterian Healthcare Services Obligated Group; SPA Wells Fargo Bank, N.A.), | |||
| d | Series C, 1.50% due 8/1/2034 (put 4/1/2019) | 2,800,000 | 2,800,000 |
| d | Series D, 1.50% due 8/1/2034 (put 4/1/2019) | 500,000 | 500,000 |
| New York — 13.2% | |||
| City of New York (Capital Projects) GO, Series C, 5.00% due 8/1/2019 | 450,000 | 455,175 | |
| d | City of New York (SPA Barclays Bank plc) GO, 1.35% due 10/1/2046 | 1,000,000 | 1,000,000 |
Thornburg Low Duration Municipal Fund | March 31, 2019 (Unaudited)
| PRINCIPAL AMOUNT | VALUE | ||
| d | City of New York (SPA Landesbank Hessen-Thuringen) GO, Series A-3 1.53% due 8/1/2035 (put 4/1/2019) | $2,950,000 | $ 2,950,000 |
| b | Long Island Power Authority, Series C 2.493% (LIBOR 1 Month + 0.750%) due 5/1/2033 (put 10/1/2023) | 3,500,000 | 3,507,035 |
| Metropolitan Transportation Authority (Transit and Commuter System), | |||
| Series A-1, 4.00% due 8/15/2019 | 1,000,000 | 1,008,700 | |
| Series C-1, 5.00% due 9/1/2020 | 2,350,000 | 2,452,671 | |
| Metropolitan Transportation Authority, Series A, 4.00% due 2/3/2020 | 1,000,000 | 1,019,060 | |
| d | New York City Transitional Finance Authority Future Tax Secured Revenue, (SPA Barclays Bank plc) 1.52% due 11/1/2042 (put 4/1/2019) | 4,400,000 | 4,400,000 |
| d | New York City Transitional Finance Authority Future Tax Secured Revenue, (SPA JP Morgan Chase Bank, N.A) 1.50% due 2/1/2045 (put 4/1/2019) | 1,450,000 | 1,450,000 |
| d | New York City Water & Sewer System, (SPA JP Morgan Chase Bank, N.A) 1.50% due 6/15/2043 (put 4/1/2019) | 750,000 | 750,000 |
| d | New York City Water & Sewer System, (SPA Landesbank Hessen-Thuringen) 1.49% due 6/15/2039 (put 4/1/2019) | 600,000 | 600,000 |
| New York State Dormitory Authority (NYSARC, Inc. Developmental Disability Programs), Series A, 5.00% due 7/1/2020 | 1,175,000 | 1,222,764 | |
| Suffolk County GO, 5.00% due 7/24/2019 | 4,000,000 | 4,039,880 | |
| Tobacco Settlement Asset Securitization Corp., Series A, 5.00% due 6/1/2021 | 1,000,000 | 1,063,740 | |
| Town of Oyster Bay GO, Series B, 3.00% due 2/1/2020 - 3/13/2020 | 3,150,000 | 3,173,374 | |
| North Carolina — 0.8% | |||
| d | North Carolina Medical Care Commission (Novant Health Obligated Group), Series B 1.52% due 11/1/2034 (put 4/5/2019) | 900,000 | 900,000 |
| North Carolina Turnpike Authority, | |||
| f | 4.00% due 1/1/2020 | 400,000 | 406,132 |
| f | 5.00% due 1/1/2021 - 1/1/2022 | 415,000 | 442,194 |
| North Dakota — 1.8% | |||
| County of McKenzie, 5.00% due 8/1/2022 | 2,000,000 | 2,199,100 | |
| Ward County Insured: AGM, 3.00% due 4/1/2021 | 1,680,000 | 1,697,506 | |
| Ohio — 1.8% | |||
| Clty of Cleveland (Parking Facility; Insured: AGM), 5.25% due 9/15/2021 | 500,000 | 537,685 | |
| County of Scioto (Southern Ohio Medical Center), 5.00% due 2/15/2022 - 2/15/2023 | 3,130,000 | 3,451,735 | |
| Pennsylvania — 4.3% | |||
| City of Philadelphia (Pennsylvania Gas Works), 5.00% due 10/1/2020 | 500,000 | 524,595 | |
| Coatesville Area School District (Insured: AGM) (State Aid Withholding) GO, 5.00% due 8/1/2021 | 1,000,000 | 1,063,040 | |
| Cumberland County Municipal Authority (Diakon Lutheran Social Ministries Obligated Group), 5.00% due 7/1/2019 | 300,000 | 302,106 | |
| East Penn School District (State Aid Withholding) GO, 2.00% due 9/15/2020 | 555,000 | 555,144 | |
| d | Hospitals & Higher Education Facilities Authority of Philadelphia (Children’s Hospital of Philadelphia Obligated Group SPA Wells Fargo Bank, N.A.), 1.49% due 2/15/2021 - 7/1/2041 (put 4/1/2019) | 3,095,000 | 3,095,000 |
| Luzerne County Industrial Development Authority (Insured: AGM) GO, 5.00% due 12/15/2019 - 12/15/2020 | 1,000,000 | 1,032,265 | |
| Philadelphia Authority for Industrial Development, 5.00% due 5/1/2020 - 5/1/2022 | 745,000 | 794,746 | |
| State Public School Building Authority (School District of Philadelphia), 5.00% due 6/1/2019 | 2,000,000 | 2,010,100 | |
| Rhode Island — 0.7% | |||
| g | State of Rhode Island and Providence Plantations (Training School) COP, Series B, 5.00% due 10/1/2019 | 1,575,000 | 1,601,177 |
| South Carolina — 1.1% | |||
| b | City of Charleston Waterworks & Sewer System Revenue (Capital Improvement), Series B, 2.119% ( LIBOR 1 Month + 0.37%) due 1/1/2035 (put 1/1/2022) | 2,500,000 | 2,499,450 |
| Tennessee — 0.7% | |||
| Tennessee Energy Acquisition Corp. (The Gas Project), Series C, 5.00% due 2/1/2023 | 1,310,000 | 1,430,861 | |
| Texas — 12.8% | |||
| City of Brownsville (Water, Wastewater & Electric Utilities Systems), 5.00% due 9/1/2020 | 1,000,000 | 1,046,180 | |
| City of Dallas (Trinity River Corridor Infrastructure) GO, 5.00% due 2/15/2021 | 1,000,000 | 1,061,970 | |
| b | City of Houston (Combined Utility System), Series C, 2.107% (LIBOR 1 Month + 0.36%) due 5/15/2034 (put 8/1/2021) | 3,200,000 | 3,195,168 |
| City of Olmos Park Higher Education Facilities Corp. (University of the Incarnate Word), 5.00% due 12/1/2022 | 1,000,000 | 1,101,830 | |
| City of San Antonio (Electric and Gas Systems), | |||
| a | 2.25% due 2/1/2033 (put 12/1/2019) | 1,000,000 | 1,003,470 |
| a | Series C, 3.00% due 12/1/2045 (put 12/1/2019) | 265,000 | 267,226 |
| City of Texas City Industrial Development Corp. (ARCO Pipe Line Co. Project), 7.375% due 10/1/2020 | 1,000,000 | 1,081,840 | |
| County of La Salle (Insured: AGM) GO, 5.00% due 3/1/2020 - 3/1/2021 | 1,900,000 | 1,987,397 | |
| a | Dallas Independent School District (School District Buildings Renovations; Insured: PSF-GTD) GO, Series B-4, 5.00% due 2/15/2036 (put 2/15/2020) | 325,000 | 334,324 |
| Harris County Cultural Education Facilities Finance Corp (Texas Medical Center; LOC JPMorgan Chase Bank N.A.) | |||
| d | Series A 1.50% due 9/1/2031 (put 4/1/2019) | 2,550,000 | 2,550,000 |
| d | Series B-1 1.50% due 9/1/2031 (put 4/1/2019) | 700,000 | 700,000 |
| Harris County Cultural Education Facilities Finance Corp. (Texas Medical Center Central Heating & Cooling Service Corp.), 5.00% due 11/15/2020 | 1,145,000 | 1,204,139 | |
| Houston Airport System Revenue, Series B, 5.00% due 7/1/2022 - 7/1/2023 | 780,000 | 867,195 | |
| a | Houston Independent School District, GO (Insured: PSF-GTD) Series B-REM, 2.40% due 6/1/2036 (put 6/1/2021) | 3,275,000 | 3,314,038 |
| North Texas Tollway Authority, Series A, 5.00% due 1/1/2022 | 1,000,000 | 1,090,770 | |
| Red River Authority (Insured: Natl-Re), 4.45% due 6/1/2020 | 2,500,000 | 2,568,300 | |
| Sam Rayburn Municipal Power Agency, 5.00% due 10/1/2021 | 510,000 | 543,874 |
| PRINCIPAL AMOUNT | VALUE | ||
| Texas Transportation Commission (Highway Improvements) GO, 4.00% due 8/29/2019 | $4,295,000 | $ 4,337,392 | |
| Utah — 3.5% | |||
| d | Murray (IHC Health Services, Inc. Obligated Group), (SPA Barclays Bank Plc) Series C, 1.50% due 5/15/2037 (put 4/1/2019) | 1,395,000 | 1,395,000 |
| d | Murray (IHC Health Services, Inc. Obligated Group; SPA JP Morgan Chase Bank, N.A) Series B, 1.50% due 5/15/2037 (put 4/1/2019) | 2,750,000 | 2,750,000 |
| d | Weber County (IHC Health Services, Inc. Obligated Group), (SPA The Bank of NY Mellon) Series C, 1.50% due 2/15/2035 (put 4/1/2019) | 3,600,000 | 3,600,000 |
| West Virginia — 1.1% | |||
| Mason County (Appalachian Power Co.), Series L, 2.75% due 10/1/2022 | 1,000,000 | 1,017,060 | |
| a | West Virginia Economic Development Authority (Appalachian Power Co.), 2.625% due 12/1/2042 (put 6/1/2022) | 1,425,000 | 1,447,757 |
| Total Investments — 97.7%(Cost $214,348,151) | $215,297,924 | ||
| Other Assets Less Liabilities — 2.3% | 5,101,551 | ||
| Net Assets — 100.0% | $220,399,475 |
| Footnote Legend | |
| a | Variable Rate Demand Obligations are instruments whose interest rates change on a mandatory date (demand date) or whose interest rates will vary with changes in a designated base rate. The rate disclosed is the rate at March 31, 2019. |
| b | Floating Rate Security. Stated interest/floor rate was in effect at March 31, 2019. |
| c | Securities exempt from registration under Rule 144A of the Securities Act of 1933, as amended. These securities are restricted but liquid and may only be resold in the ordinary course of business in transactions exempt from registration, normally to qualified institutional buyers. As of March 31, 2019, the aggregate value of these securities in the Fund’s portfolio was $3,255,392, representing 1.48% of the Fund’s net assets. |
| d | Variable Rate Demand Notes are instruments whose interest rates change on a specific date (such as coupon date or interest payment date) or whose interest rates vary with changes in a designated base rate (such as the prime interest rate). This instrument is payable on demand and is secured by letters of credit or other credit support agreements from major banks. |
| e | When-issued security. |
| f | Illiquid security. |
| g | Segregated as collateral for a when-issued security. |
To simplify the listings of securities, abbreviations are used per the table below:
| AGM | Insured by Assured Guaranty Municipal Corp. |
| AMBAC | Insured by American Municipal Bond Assurance Corp. |
| BAM | Insured by Build America Mutual Insurance Co. |
| COP | Certificates of Participation |
| EDA | Economic Development Authority |
| ETM | Escrowed to Maturity |
| GO | General Obligation |
| HFA | Health Facilities Authority |
| LIBOR | London Interbank Offered Rates |
| LOC | Letter of Credit |
| MUNIPSA | Securities Industry and Financial Markets Association (SIFMA) Municipal Swap Index |
| Natl-Re | Insured by National Public Finance Guarantee Corp. |
| SPA | Stand-by Purchase Agreement |
| USD | Unified School District |
Thornburg Low Duration Municipal Fund | March 31, 2019 (Unaudited)
| ASSETS | |
| Investments at value (cost $214,348,151) (Note 3) | $ 215,297,924 |
| Cash | 664,158 |
| Receivable for investments sold | 8,140,000 |
| Receivable for fund shares sold | 137 |
| Interest receivable | 2,337,959 |
| Prepaid expenses and other assets | 198,985 |
| Total Assets | 226,639,163 |
| Liabilities | |
| Payable for investments purchased | 3,200,000 |
| Payable for fund shares redeemed | 2,923,848 |
| Payable to investment advisor and other affiliates (Note 4) | 71,063 |
| Accounts payable and accrued expenses | 35,218 |
| Dividends payable | 9,559 |
| Total Liabilities | 6,239,688 |
| Net Assets | $ 220,399,475 |
| NET ASSETS CONSIST OF | |
| Distributable earnings | $ 705,656 |
| Net capital paid in on shares of beneficial interest | 219,693,819 |
| $ 220,399,475 | |
| NET ASSET VALUE | |
| Class A Shares: | |
| Net asset value and redemption price per share ($19,443,103 applicable to 1,576,082 shares of beneficial interest outstanding - Note 5) | $ 12.34 |
| Maximum sales charge, 1.50% of offering price | 0.19 |
| Maximum offering price per share | $ 12.53 |
| Class I Shares: | |
| Net asset value, offering and redemption price per share ($200,956,372 applicable to 16,294,954 shares of beneficial interest outstanding - Note 5) | $ 12.33 |
Thornburg Low Duration Municipal Fund | Six Months Ended March 31, 2019 (Unaudited)
| INVESTMENT INCOME | |
| Interest income (net of premium amortized of $1,410,004) | $ 2,038,728 |
| EXPENSES | |
| Investment advisory fees (Note 4) | 414,537 |
| Administration fees (Note 4) | |
| Class A Shares | 10,635 |
| Class I Shares | 80,357 |
| Distribution and service fees (Note 4) | |
| Class A Shares | 24,193 |
| Transfer agent fees | |
| Class A Shares | 16,832 |
| Class I Shares | 40,874 |
| Registration and filing fees | |
| Class A Shares | 8,524 |
| Class I Shares | 10,606 |
| Custodian fees (Note 2) | 16,380 |
| Professional fees | 22,016 |
| Trustee and officer fees (Note 4) | 5,086 |
| Other expenses | 12,668 |
| Total Expenses | 662,708 |
| Less: | |
| Expenses reimbursed by investment advisor (Note 4) | (120,344) |
| Net Expenses | 542,364 |
| Net Investment Income | $ 1,496,364 |
| REALIZED AND UNREALIZED GAIN (LOSS) | |
| Net realized gain (loss) on investments | (192,255) |
| Net change in unrealized appreciation (depreciation) on investments | 1,349,688 |
| Net Realized and Unrealized Gain | 1,157,433 |
| Net Increase in Net Assets Resulting from Operations | $ 2,653,797 |
Thornburg Low Duration Municipal Fund
| Six Months Ended March 31, 2019* | Year Ended September 30, 2018 | |
| INCREASE (DECREASE) IN NET ASSETS FROM | ||
| OPERATIONS | ||
| Net investment income | $ 1,496,364 | $ 1,224,067 |
| Net realized gain (loss) on investments | (192,255) | (10,655) |
| Net unrealized appreciation (depreciation) on investments | 1,349,688 | (744,589) |
| Net Increase in Net Assets Resulting from Operations | 2,653,797 | 468,823 |
| DIVIDENDS TO SHAREHOLDERS | ||
| From distributable earnings | ||
| Class A Shares | (152,325) | (166,761) |
| Class I Shares | (1,344,039) | (1,057,306) |
| FUND SHARE TRANSACTIONS (NOTE 5) | ||
| Class A Shares | (189,785) | 3,245,973 |
| Class I Shares | 37,675,914 | 109,088,169 |
| Net Increase in Net Assets | 38,643,562 | 111,578,898 |
| NET ASSETS | ||
| Beginning of Period | 181,755,913 | 70,177,015 |
| End of Period | $ 220,399,475 | $ 181,755,913 |
| * | Unaudited. |
Thornburg Low Duration Municipal Fund | March 31, 2019 (Unaudited)
Thornburg Low Duration Municipal Fund | March 31, 2019 (Unaudited)
| Cost of investments for tax purposes | $ 214,348,151 |
| Gross unrealized appreciation on a tax basis | 1,009,032 |
| Gross unrealized depreciation on a tax basis | (59,259) |
| Net unrealized appreciation (depreciation) on investments (tax basis) | $ 949,773 |
| Fair Value Measurements at March 31, 2019 | ||||
| TOTAL | LEVEL 1 | LEVEL 2 | LEVEL 3 | |
| Assets | ||||
| Investments in Securities | ||||
| Municipal Bonds | $ 215,297,924 | $ — | $ 215,297,924 | $ — |
| Total Investments in Securities | $215,297,924 | $— | $215,297,924 | $— |
| Total Assets | $215,297,924 | $— | $215,297,924 | $— |
Thornburg Low Duration Municipal Fund | March 31, 2019 (Unaudited)
| Management Fee Schedule | |
| DAILY NET ASSETS | FEE RATE |
| Up to $1 billion | 0.400% |
| Next $500 million | 0.300 |
| Next $500 million | 0.250 |
| Over $2 billion | 0.225 |
| Administration Fee Schedule | |
| Daily Net Assets | Fee Rate |
| Up to $20 billion | 0.100% |
| $20 billion to $40 billion | 0.075 |
| $40 billion to $60 billion | 0.040 |
| Over $60 billion | 0.030 |
| SIX MONTHS ENDED March 31, 2019 (UNAUDITED) | YEAR ENDED September 30, 2018 (AUDITED) | |||
| SHARES | AMOUNT | SHARES | AMOUNT | |
| Class A Shares | ||||
| Shares sold | 958,615 | $ 11,764,369 | 1,063,545 | $ 13,097,781 |
| Shares issued to shareholders in reinvestment of dividends | 12,282 | 151,077 | 12,892 | 158,574 |
| Shares repurchased | (983,689) | (12,105,231) | (813,563) | (10,010,382) |
| Net increase (decrease) | (12,792) | $ (189,785) | 262,874 | $ 3,245,973 |
| Class I Shares | ||||
| Shares sold | 4,464,979 | $ 54,835,542 | 10,776,875 | $ 132,406,952 |
| Shares issued to shareholders in reinvestment of dividends | 104,605 | 1,286,131 | 82,245 | 1,011,086 |
| Shares repurchased | (1,501,539) | (18,445,759) | (1,977,745) | (24,329,869) |
| Net increase | 3,068,045 | $ 37,675,914 | 8,881,375 | $ 109,088,169 |
Thornburg Low Duration Municipal Fund
| PER SHARE PERFORMANCE (FOR A SHARE OUTSTANDING THROUGHOUT THE PERIOD) | ||||||||
| UNLESS OTHERWISE NOTED, PERIODS ARE FISCAL YEARS ENDED SEPTEMBER 30, | Net Asset Value, Beginning of PERIOD | Net Investment Income (Loss)+ | Net Realized & Unrealized Gain (Loss) on Investments | Total from Investment Operations | Dividends from Net Investment Income | Dividends from Net Realized Gains | Total Dividends | Net Asset Value, End of PERIOD |
| CLASS A SHARES | ||||||||
| 2019(b)(c) | $ 12.27 | 0.08 | 0.07 | 0.15 | (0.08) | — | (0.08) | $ 12.34 |
| 2018(b) | $ 12.38 | 0.11 | (0.11) | —(e) | (0.11) | — | (0.11) | $ 12.27 |
| 2017(b) | $ 12.34 | 0.08 | 0.04 | 0.12 | (0.08) | — | (0.08) | $ 12.38 |
| 2016(b) | $ 12.35 | 0.03 | (0.01) | 0.02 | (0.03) | — | (0.03) | $ 12.34 |
| 2015(b) | $ 12.34 | 0.02 | 0.01 | 0.03 | (0.02) | — | (0.02) | $ 12.35 |
| 2014(b)(f) | $ 12.31 | 0.02 | 0.03 | 0.05 | (0.02) | — | (0.02) | $ 12.34 |
| CLASS I SHARES | ||||||||
| 2019(c) | $ 12.27 | 0.09 | 0.06 | 0.15 | (0.09) | — | (0.09) | $ 12.33 |
| 2018 | $ 12.37 | 0.14 | (0.10) | 0.04 | (0.14) | — | (0.14) | $ 12.27 |
| 2017 | $ 12.34 | 0.10 | 0.03 | 0.13 | (0.10) | — | (0.10) | $ 12.37 |
| 2016 | $ 12.35 | 0.05 | (0.01) | 0.04 | (0.05) | — | (0.05) | $ 12.34 |
| 2015 | $ 12.34 | 0.04 | 0.01 | 0.05 | (0.04) | — | (0.04) | $ 12.35 |
| 2014(f) | $ 12.31 | 0.04 | 0.03 | 0.07 | (0.04) | — | (0.04) | $ 12.34 |
| (a) | Not annualized for periods less than one year. |
| (b) | Sales loads are not reflected in computing total return. |
| (c) | Unaudited Six Month Period Ended March 31. |
| (d) | Annualized. |
| (e) | Total from investment operations was less than $0.01 per share. |
| (f) | Fund commenced operations on December 30, 2013. |
| + | Based on weighted average shares outstanding. |
| RATIOS TO AVERAGE NET ASSETS | SUPPLEMENTAL DATA | ||||||
| Net Investment Income (Loss) (%) | Expenses, After Expense Reductions (%) | Expenses, After Expense Reductions and Net of Custody Credits (%) | Expenses, Before Expense Reductions (%) | Total Return (%)(a) | Portfolio Turnover Rate (%)(a) | Net Assets at End of PERIOD (Thousands) | |
| 1.26(d) | 0.70(d) | 0.70(d) | 0.95(d) | 1.21 | 16.53 | $ 19,443 | |
| 0.92 | 0.70 | 0.70 | 1.06 | 0.02 | 35.36 | $ 19,497 | |
| 0.72 | 0.67 | 0.67 | 1.16 | 0.98 | 42.94 | $ 16,412 | |
| 0.24 | 0.70 | 0.70 | 2.19 | 0.15 | 21.17 | $ 4,241 | |
| 0.15 | 0.67 | 0.67 | 2.85 | 0.22 | 15.75 | $ 3,273 | |
| 0.20(d) | 0.66(d) | 0.65(d) | 3.14(d) | 0.40 | 4.54 | $ 2,751 | |
| 1.47(d) | 0.50(d) | 0.50(d) | 0.60(d) | 1.22 | 16.53 | $ 200,956 | |
| 1.12 | 0.50 | 0.50 | 0.64 | 0.30 | 35.36 | $ 162,259 | |
| 0.85 | 0.49 | 0.49 | 0.67 | 1.09 | 42.94 | $ 53,765 | |
| 0.43 | 0.50 | 0.50 | 0.72 | 0.36 | 21.17 | $ 38,572 | |
| 0.32 | 0.50 | 0.50 | 0.82 | 0.40 | 15.75 | $ 41,755 | |
| 0.42(d) | 0.44(d) | 0.44(d) | 1.77(d) | 0.56 | 4.54 | $ 12,672 | |
Thornburg Low Duration Municipal Fund | March 31, 2019 (Unaudited)
| (1) | transaction costs, including |
| (a) | sales charges (loads) on purchase payments, for Class A shares; |
| (b) | a deferred sales charge on redemptions of any part or all of a purchase of $1 million of Class A shares within 12 months of purchase; |
| (2) | ongoing costs, including management fees; distribution and/or service (12b-1) fees; and other Fund expenses. |
| BEGINNING ACCOUNT VALUE 10/1/18 | ENDING ACCOUNT VALUE 3/31/19 | EXPENSES PAID DURING PERIOD† 10/1/18—3/31/19 | |
| CLASS A SHARES | |||
| Actual | $1,000.00 | $1,012.06 | $3.51 |
| Hypothetical* | $1,000.00 | $1,021.44 | $3.53 |
| CLASS I SHARES | |||
| Actual | $1,000.00 | $1,012.24 | $2.51 |
| Hypothetical* | $1,000.00 | $1,022.44 | $2.52 |
| † | Expenses are equal to the annualized expense ratio for each class (A: 0.70%; I: 0.50%) multiplied by the average account value over the period, multiplied by 182/365 to reflect the one-half year period. |
| * | Hypothetical assumes a rate of return of 5% per year before expenses. |
Thornburg Low Duration Municipal Fund | March 31, 2019 (Unaudited)
| ■ | Thornburg Investment Income Builder Fund |
| ■ | Thornburg Global Opportunities Fund |
| ■ | Thornburg International Value Fund |
| ■ | Thornburg Better World International Fund |
| ■ | Thornburg International Growth Fund |
| ■ | Thornburg Developing World Fund |
| ■ | Thornburg Value Fund |
| ■ | Thornburg Core Growth Fund |
| ■ | Thornburg Investment Income Builder Fund |
| ■ | Thornburg Summit Fund |
| ■ | Thornburg Low Duration Income Fund |
| ■ | Thornburg Limited Term U.S. Government Fund |
| ■ | Thornburg Limited Term Income Fund |
| ■ | Thornburg Strategic Income Fund |
| ■ | Thornburg Low Duration Municipal Fund |
| ■ | Thornburg Limited Term Municipal Fund |
| ■ | Thornburg Intermediate Municipal Fund |
| ■ | Thornburg California Limited Term Municipal Fund |
| ■ | Thornburg New Mexico Intermediate Municipal Fund |
| ■ | Thornburg New York Intermediate Municipal Fund |
| ■ | Thornburg Strategic Municipal Income Fund |
| ■ | Thornburg Long/Short Equity Fund |

| 800.847.0200 | TH3053 |

| 4 | |
| 6 | |
| 7 | |
| 8 | |
| 26 | |
| 27 | |
| 28 | |
| 29 | |
| 34 | |
| 36 | |
| 37 | |
| 38 |
| SHARE CLASS | NASDAQ SYMBOL | CUSIP |
| Class A | LTMFX | 885-215-459 |
| Class C | LTMCX | 885-215-442 |
| Class I | LTMIX | 885-215-434 |
Thornburg Limited Term Municipal Fund | March 31, 2019 (Unaudited)
 |  |
| Christopher Ryon,cfa Portfolio Manager Managing Director | Nicholos Venditti,cfa Portfolio Manager Managing Director |
 | |
| David Ashley,cfa Portfolio Manager Managing Director |
Thornburg Limited Term Municipal Fund | March 31, 2019 (Unaudited)
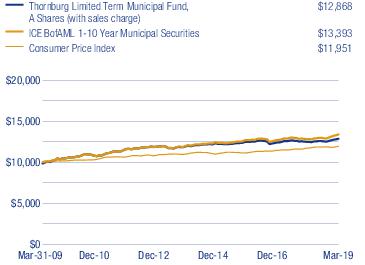
| 1-YR | 3-YR | 5-YR | 10-YR | SINCE INCEP. | |
| Class A Shares(Incep: 9/28/84) | |||||
| Without sales charge | 3.07% | 1.04% | 1.49% | 2.71% | 4.69% |
| With sales charge | 1.49% | 0.54% | 1.18% | 2.55% | 4.64% |
| Class C Shares(Incep: 9/1/94) | |||||
| Without sales charge | 2.81% | 0.80% | 1.26% | 2.45% | 3.15% |
| With sales charge | 2.31% | 0.80% | 1.26% | 2.45% | 3.15% |
| Class I Shares(Incep: 7/5/96) | 3.25% | 1.33% | 1.79% | 3.03% | 3.72% |
| Annualized Distribution Yield | 1.71% |
| SEC Yield | 1.19% |
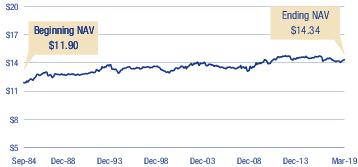
| FINAL VALUE |
Thornburg Limited Term Municipal Fund | March 31, 2019 (Unaudited)
| KEY PORTFOLIO ATTRIBUTES | |
| Number of Bonds | 1,701 |
| Effective Duration | 3.0 Yrs |
| Average Maturity | 3.5 Yrs |
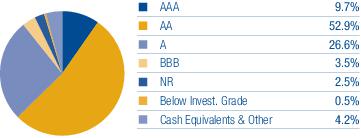

| 4% | 19% | 11% | 14% | 12% | 11% | 11% | 8% | 5% | 3% | 2% |
Thornburg Limited Term Municipal Fund | March 31, 2019 (Unaudited)
| PRINCIPAL AMOUNT | VALUE | ||
| Municipal Bonds — 98.3% | |||
| Alabama — 0.9% | |||
| Alabama Public School & College Authority (Education System Capital Improvements), | |||
| Series A, 5.00% due 6/1/2019 - 6/1/2022 | $ 20,865,000 | $ 22,079,487 | |
| Series B, 5.00% due 6/1/2019 - 6/1/2023 | 1,505,000 | 1,609,559 | |
| Alabama State Board of Education (Calhoun Community College), 4.00% due 5/1/2019 - 5/1/2022 | 5,425,000 | 5,573,711 | |
| East Alabama Health Care Authority GO, 5.00% due 9/1/2021 - 9/1/2022 | 2,045,000 | 2,197,157 | |
| Lower Alabama Gas District, 5.00% due 9/1/2029 | 3,625,000 | 4,278,370 | |
| Montgomery Waterworks and Sanitation, 5.00% due 9/1/2019 | 3,375,000 | 3,384,079 | |
| UAB Medicine Finance Authority (University Hospital), Series B, 5.00% due 9/1/2025 - 9/1/2027 | 8,915,000 | 10,709,713 | |
| Water Works Board of the City of Birmingham, 5.00% due 1/1/2029 | 2,230,000 | 2,747,694 | |
| Alaska — 0.3% | |||
| Alaska Energy Authority (Bradley Lake Hydroelectric Project; Insured: AGM), 6.00% due 7/1/2020 | 1,790,000 | 1,884,995 | |
| City of Valdez (BP Pipelines (Alaska), Inc. Project), | |||
| 5.00% due 1/1/2021 | 12,000,000 | 12,653,040 | |
| Series B, 5.00% due 1/1/2021 | 6,485,000 | 6,837,914 | |
| Arizona — 1.9% | |||
| Arizona (Dignity Health) HFA, 5.00% due 7/1/2019 - 7/1/2020 | 2,655,000 | 2,677,351 | |
| Arizona (Scottsdale Lincoln Hospitals) HFA, 5.00% due 12/1/2022 - 12/1/2024 | 3,100,000 | 3,523,962 | |
| Arizona Board of Regents (Arizona State University) COP, | |||
| Series A, 5.00% due 9/1/2019 - 9/1/2023 | 18,235,000 | 19,989,413 | |
| Series C, 5.00% due 6/1/2022 | 6,080,000 | 6,703,869 | |
| Arizona Board of Regents (Northern Arizona University Projects) COP, | |||
| 3.00% due 9/1/2019 | 2,525,000 | 2,538,963 | |
| 5.00% due 9/1/2020 - 9/1/2023 | 6,825,000 | 7,449,137 | |
| Arizona Board of Regents (University of Arizona) COP, 5.00% due 6/1/2022 - 6/1/2028 | 1,690,000 | 1,972,299 | |
| Arizona Board of Regents (University of Arizona), 5.00% due 8/1/2020 - 8/1/2024 | 1,925,000 | 2,148,096 | |
| Arizona Transportation Board, Series A, 5.00% due 7/1/2019 - 7/1/2022 | 15,975,000 | 16,947,781 | |
| City of Phoenix Civic Improvement Corp., Series A, 5.00% due 7/1/2022 - 7/1/2025 | 8,580,000 | 9,988,295 | |
| City of Tucson (Street and Highway Projects), Series A, 5.00% due 7/1/2022 | 2,135,000 | 2,362,420 | |
| Pima County (Ina & Roger Road Wastewater Reclamation Facilities), | |||
| Series A, | |||
| 3.00% due 7/1/2021 - 7/1/2022 | 2,525,000 | 2,622,552 | |
| 5.00% due 7/1/2020 - 7/1/2022 | 1,400,000 | 1,505,766 | |
| Pima County (Sewer System & Fleet Services Facilities Expansion) COP, 5.00% due 12/1/2019 - 12/1/2022 | 4,760,000 | 5,093,035 | |
| Pinal County (Detention and Training Facilities), Series A, 5.00% due 8/1/2019 - 8/1/2025 | 6,190,000 | 6,884,436 | |
| Pinal County (Hunt Highway (Phases III-V), Ironwood Drive, Public Safety Radio & Court Buildings), 5.00% due 8/1/2025 | 3,000,000 | 3,479,910 | |
| Salt River Project Agricultural Improvement and Power District (Salt River Electric System), 5.00% due 1/1/2026 - 1/1/2028 | 7,000,000 | 8,639,120 | |
| State of Arizona Department of Administration (State Lottery; Insured: AGM), 5.00% due 7/1/2020 | 8,705,000 | 9,079,837 | |
| Arkansas — 0.1% | |||
| Board of Trustees of the University of Arkansas (Fayetteville Campus Athletic Facilities), 3.00% due 11/1/2023 | 615,000 | 649,317 | |
| City of Fort Smith (Water and Sewer System Construction; Insured: AGM), 4.00% due 10/1/2019 | 1,670,000 | 1,688,938 | |
| Jefferson County (Jefferson Regional Medical Center; Insured: AGM), 4.50% due 6/1/2019 | 1,580,000 | 1,586,604 | |
| California — 6.3% | |||
| Alameda County Joint Powers Authority (Alameda County Medical Center Highland Hospital), Series A, 5.00% due 12/1/2021 - 12/1/2023 | 6,200,000 | 7,059,652 | |
| Anaheim Public Financing Authority (Public Improvements; Insured: AGM), Series C, Zero Coupon due 9/1/2022 | 3,250,000 | 3,044,535 | |
| Brentwood Infrastructure Financing Authority (Redevelopment Agency of the City of Brentwood; Insured: AGM), 5.25% due 11/1/2019 | 725,000 | 741,204 | |
| Cabrillo (Educational Facilities; Insured: AMBAC) USD GO, Series A, Zero Coupon due 8/1/2021 | 1,000,000 | 958,680 | |
| California (Community Developmental Disabilities Program; Insured: California Mtg Insurance) HFFA, 5.75% due 2/1/2020 - 2/1/2021 | 3,670,000 | 3,870,417 | |
| California (Dignity Health) HFFA, | |||
| Series A, | |||
| 5.00% due 3/1/2020 - 3/1/2021 | 7,850,000 | 8,201,663 | |
| 5.25% due 3/1/2022 | 7,020,000 | 7,470,754 | |
| a | California (St. Joseph Health System) HFFA, Series D, 5.00% due 7/1/2043 (put 10/15/2020) | 5,000,000 | 5,244,400 |
| California Educational Facilities Authority (Chapman University), 5.00% due 4/1/2021 | 4,870,000 | 5,215,137 | |
| b | California Infrastructure and Economic Development Bank (Los Angeles County Museum of Art), Series A, 2.399% (LIBOR 1 Month + 0.65%) due 12/1/2050 (put 2/1/2021) | 5,000,000 | 5,016,450 |
| California State Economic Recovery GO, Series A, 5.00% due 7/1/2020 (pre-refunded 7/1/2019) | 4,200,000 | 4,237,800 | |
| California State Public Works Board (California School for the Deaf Riverside Campus), Series H, 5.00% due 4/1/2020 - 4/1/2021 | 2,475,000 | 2,591,075 | |
| California State Public Works Board (California State University), Series A, 5.00% due 10/1/2020 | 1,000,000 | 1,051,930 | |
| California State Public Works Board (Coalinga State Hospital), 5.00% due 6/1/2020 - 6/1/2022 | 22,240,000 | 24,067,115 |
| PRINCIPAL AMOUNT | VALUE | ||
| California State Public Works Board (Laboratory Facility and San Diego Courthouse), | |||
| Series I, | |||
| 5.00% due 11/1/2021 | $ 750,000 | $ 815,708 | |
| c | 5.00% due 11/1/2022 | 10,075,000 | 11,278,962 |
| California State Public Works Board (Various Capital Projects), | |||
| Series A, 5.00% due 10/1/2021 | 1,000,000 | 1,084,890 | |
| Series G, 5.00% due 11/1/2020 - 11/1/2021 | 3,250,000 | 3,485,488 | |
| California Statewide Communities Development Authority (Kaiser Foundation Hospitals), Series A, 5.00% due 4/1/2019 | 27,000,000 | 27,000,000 | |
| Castaic Lake Water Agency (Water System Improvement; Insured: AMBAC) COP, Zero Coupon due 8/1/2023 | 10,125,000 | 9,337,882 | |
| Central Valley Financing Authority (Carson Ice), 5.00% due 7/1/2019 | 1,750,000 | 1,765,925 | |
| Clovis (Insured: Natl-Re) USD GO, Series B, Zero Coupon due 8/1/2019 | 2,685,000 | 2,671,494 | |
| Community Facilities District No. 86-1 of the Irvine (Educational Facilities; Insured: AGM) USD, 5.25% due 9/1/2019 | 3,000,000 | 3,049,230 | |
| County of Los Angeles Redevelopment Refunding Authority (Bunker Hill Project), | |||
| 5.00% due 12/1/2020 - 12/1/2024 | 26,635,000 | 30,159,765 | |
| Series C, 5.00% due 6/1/2020 - 6/1/2024 | 8,960,000 | 10,141,758 | |
| Escondido Union High School District (Insured: Natl-Re) GO, Zero Coupon due 11/1/2020 | 2,655,000 | 2,587,085 | |
| Los Angeles (Educational Facilities and Information Technology Infrastructure) USD COP, Series B-2, 5.50% due 12/1/2019 | 7,040,000 | 7,223,744 | |
| Los Angeles (Educational Facilities and Information Technology Infrastructure) USD GO, | |||
| Series A, 5.00% due 7/1/2023 | 8,950,000 | 10,180,983 | |
| Series B, 5.00% due 7/1/2023 | 11,950,000 | 13,593,603 | |
| Series D, 5.00% due 7/1/2022 - 7/1/2024 | 22,900,000 | 25,966,113 | |
| Los Angeles County Public Works Financing Authority (Multiple Capital Projects), Series A, 5.00% due 8/1/2019 | 17,935,000 | 18,155,242 | |
| Needles USD GO, Series B, Zero Coupon due 8/1/2023 | 1,005,000 | 915,424 | |
| North City West School Facilities Financing Authority (Carmel Valley Educational Facilities; Insured: AGM), Series A, 5.00% due 9/1/2023 | 4,545,000 | 5,054,404 | |
| a,c | Northern California Energy Authority (Commodity Supply Revenue), Series A, 4.00% due 7/1/2049 (put 7/1/2024) | 35,000,000 | 37,747,150 |
| Northern California Power Agency (Hydroelectric Project) ETM, Series A, 5.00% due 7/1/2019 | 1,000,000 | 1,008,880 | |
| Northern California Power Agency (Hydroelectric Project), Series A, 5.00% due 7/1/2020 | 1,325,000 | 1,336,766 | |
| Palo Alto USD GO, Zero Coupon due 8/1/2019 | 1,000,000 | 995,100 | |
| Palomar Community College District GO, Series B, Zero Coupon due 8/1/2021 | 2,560,000 | 2,467,891 | |
| Rocklin (Insured: Natl-Re) USD GO, Zero Coupon due 8/1/2022 | 3,910,000 | 3,679,779 | |
| Sacramento City (Educational Facilities Improvements) USD GO, 5.00% due 7/1/2021 | 3,265,000 | 3,474,123 | |
| Sacramento City Financing Authority (Merged Downtown & Oak Park; Insured: Natl-Re), Zero Coupon due 12/1/2019 - 12/1/2021 | 4,520,000 | 4,409,388 | |
| San Diego (Educational System Capital Projects; Insured: Natl-Re) GO, Series D-1, 5.50% due 7/1/2020 | 10,000,000 | 10,517,700 | |
| San Diego Convention Center Expansion Financing Authority, Series A, 5.00% due 4/15/2020 - 4/15/2022 | 15,000,000 | 16,218,960 | |
| Santa Ana (Insured: Natl-Re) USD GO, Series B, Zero Coupon due 8/1/2019 | 3,425,000 | 3,406,882 | |
| Santa Fe Springs Community Development Commission (Consolidated Redevelopment Project; Insured: Natl-Re), Zero Coupon due 9/1/2024 | 7,000,000 | 6,218,800 | |
| State of California (Various Purposes) GO, 5.00% due 9/1/2020 - 9/1/2021 | 15,000,000 | 15,913,650 | |
| West Contra Costa (Educational Facilities; Insured: AGM) USD GO, Series C-1, Zero Coupon due 8/1/2022 | 4,000,000 | 3,776,920 | |
| c | West Covina Redevelopment Agency (Fashion Plaza), 6.00% due 9/1/2022 | 5,110,000 | 5,506,434 |
| Colorado — 1.8% | |||
| City & County of Denver (Buell Theatre Property) COP, 5.00% due 12/1/2020 - 12/1/2023 | 8,610,000 | 9,380,312 | |
| d | City & County of Denver COP (SPA JP Morgan Chase Bank, N.A) Series A1, 1.50% due 12/1/2029 (put 4/1/2019) | 3,200,000 | 3,200,000 |
| City & County of Denver School District No. 1 (Eastbridge Elementary and Conservatory Green K-8 Schools) COP, | |||
| 4.00% due 12/15/2019 - 12/15/2020 | 1,000,000 | 1,031,318 | |
| 5.00% due 12/15/2021 - 12/15/2023 | 3,210,000 | 3,594,920 | |
| City of Longmont, 6.00% due 5/15/2019 | 1,655,000 | 1,663,788 | |
| Colorado (Northern Colorado Medical Center) HFA, 5.00% due 5/15/2025 - 5/15/2026 | 1,305,000 | 1,539,173 | |
| Colorado (Northern Colorado Medical Center; Insured: AGM) HFA ETM, Series B-REMK, 5.25% due 5/15/2019 | 2,225,000 | 2,234,879 | |
| Colorado Educational & Cultural Facilities Authority (National Conference of State Legislatures), 5.00% due 6/1/2020 - 6/1/2021 | 2,805,000 | 2,905,594 | |
| El Paso County (Judicial Complex; Insured: AGM), 5.00% due 12/1/2022 - 12/1/2028 | 2,500,000 | 2,988,887 | |
| El Paso County (Pikes Peak Regional Development Center) COP, | |||
| 4.00% due 12/1/2021 | 1,000,000 | 1,060,810 | |
| 5.00% due 12/1/2023 | 1,330,000 | 1,523,329 | |
| El Paso County Falcon School District No. 49 COP, 5.00% due 12/15/2020 - 12/15/2024 | 1,950,000 | 2,215,183 | |
| Interlocken Metropolitan District (Insured: AGM) GO, Series A-1, 5.00% due 12/1/2024 - 12/1/2026 | 2,375,000 | 2,793,610 | |
| Park Creek Metropolitan District (Insured: AGM) ETM, 5.50% due 12/1/2019 | 1,000,000 | 1,026,240 | |
| Regional Transportation District (FasTracks Transportation System) COP, 5.00% due 6/1/2019 - 6/1/2020 | 8,385,000 | 8,554,427 | |
| Regional Transportation District (North Metro Rail Line) COP, Series A, 5.00% due 6/1/2023 - 6/1/2024 | 8,000,000 | 9,034,120 | |
| Regional Transportation District COP, | |||
| Series A, | |||
| 5.50% due 6/1/2021 | 205,000 | 213,905 | |
| 5.50% due 6/1/2021 (pre-refunded 6/1/2020) | 2,165,000 | 2,262,706 | |
| State of Colorado COP, Series A, 5.00% due 9/1/2024 - 9/1/2028 | 4,610,000 | 5,541,398 |
Thornburg Limited Term Municipal Fund | March 31, 2019 (Unaudited)
| PRINCIPAL AMOUNT | VALUE | ||
| State of Colorado Education Loan Program, Series A, 4.00% due 6/27/2019 | $ 46,960,000 | $ 47,230,959 | |
| Connecticut — 1.1% | |||
| City of Hartford (Various Public Improvements; Insured: AGM) GO, | |||
| 5.00% due 10/1/2022 | 1,765,000 | 1,953,467 | |
| Series A, 5.00% due 7/1/2024 - 7/1/2025 | 1,820,000 | 2,110,144 | |
| State of Connecticut 5.00% due 6/15/2023 - 6/15/2027 | 4,825,000 | 5,679,993 | |
| State of Connecticut (Educational Facilities) GO, 5.00% due 9/1/2023 - 6/15/2025 | 35,950,000 | 41,265,436 | |
| State of Connecticut (Various Capital Projects) GO, | |||
| 5.00% due 8/15/2024 | 1,845,000 | 2,071,714 | |
| Series B, 5.00% due 5/15/2027 | 5,000,000 | 5,864,150 | |
| b | Series D, 2.42% (MUNIPSA + 0.92%) due 9/15/2019 | 1,000,000 | 1,002,720 |
| State of Connecticut GO, | |||
| 5.00% due 6/15/2028 | 1,855,000 | 2,244,902 | |
| Series E, 5.00% due 9/15/2028 | 2,560,000 | 3,105,971 | |
| State of Connecticut Special Tax Revenue, Series B, 5.00% due 10/1/2021 | 2,200,000 | 2,371,028 | |
| Delaware — 0.0% | |||
| Delaware Transportation Authority (Transportation System), 5.00% due 7/1/2020 - 7/1/2022 | 1,940,000 | 2,115,204 | |
| District of Columbia — 0.2% | |||
| District of Columbia 5.00% due 12/1/2027 | 925,000 | 960,640 | |
| District of Columbia (Insured: Syncora) GO, Series B, 5.25% due 6/1/2020 | 3,005,000 | 3,133,043 | |
| District of Columbia (National Public Radio), Series A, 5.00% due 4/1/2019 - 4/1/2020 | 2,695,000 | 2,756,028 | |
| Washington Metropolitan Area Transit Authority, 5.00% due 7/1/2020 - 7/1/2028 | 6,705,000 | 7,792,864 | |
| Florida — 6.4% | |||
| Alachua County School Board (Educational Facilities) COP, 5.00% due 7/1/2022 - 7/1/2023 | 3,850,000 | 4,308,109 | |
| Broward County (Airport, Marina & Port Improvements), | |||
| 4.00% due 10/1/2020 | 1,660,000 | 1,721,470 | |
| 5.00% due 10/1/2019 - 10/1/2020 | 3,000,000 | 3,120,930 | |
| Broward County (Port Facilities), 5.50% due 9/1/2019 | 2,800,000 | 2,844,940 | |
| Broward County School Board (Educational Facilities) COP, | |||
| Series A, 5.00% due 7/1/2021 - 7/1/2025 | 22,580,000 | 25,691,966 | |
| Series B, 5.00% due 7/1/2023 - 7/1/2025 | 9,000,000 | 10,517,730 | |
| Series C, 5.00% due 7/1/2025 - 7/1/2026 | 12,830,000 | 15,386,347 | |
| Central Florida Expressway Authority, 5.00% due 7/1/2022 - 7/1/2026 | 4,100,000 | 4,713,943 | |
| City of Cape Coral (Water and Sewer System Improvements), 5.00% due 10/1/2022 - 10/1/2026 | 5,435,000 | 6,497,335 | |
| d | City of Gainesville (Utilities System; SPA Landesbank Hessen-Thuringen), Series A-REMK 1.49% due 10/1/2026 (put 4/1/2019) | 560,000 | 560,000 |
| City of Jacksonville, Series C, 5.00% due 10/1/2023 | 1,105,000 | 1,254,319 | |
| City of Lakeland (Energy System; Insured: AGM), 5.00% due 10/1/2019 - 10/1/2020 | 6,695,000 | 6,864,511 | |
| City of Lakeland (Lakeland Regional Health Systems), 5.00% due 11/15/2019 - 11/15/2026 | 7,580,000 | 8,061,214 | |
| City of Miami (Stormwater Management Utility System), 5.00% due 9/1/2026 - 9/1/2028 | 2,675,000 | 3,258,975 | |
| City of North Miami Beach (North Miami Beach Water Project), 5.00% due 8/1/2019 - 8/1/2021 | 3,430,000 | 3,560,927 | |
| City of Orlando (Senior Tourist Development; Insured: AGM), 5.00% due 11/1/2023 - 11/1/2027 | 3,530,000 | 4,160,645 | |
| Florida Higher Educational Facilities Financing Authority (Nova Southeastern University) ETM, 5.50% due 4/1/2019 | 1,705,000 | 1,705,000 | |
| Florida Higher Educational Facilities Financing Authority (Nova Southeastern University), 5.00% due 4/1/2019 - 4/1/2020 | 2,225,000 | 2,263,306 | |
| Florida Higher Educational Facilities Financing Authority (University of Tampa), Series A, 5.00% due 4/1/2019 - 4/1/2022 | 1,845,000 | 1,900,099 | |
| Florida State Board of Governors (University System Capital Improvements), Series A, 4.00% due 7/1/2020 - 7/1/2022 | 12,655,000 | 13,327,208 | |
| Fort Myers Utility System Revenue, | |||
| 5.00% due 10/1/2023 | 990,000 | 1,069,735 | |
| 5.00% due 10/1/2023 (pre-refunded 10/1/2021) | 2,370,000 | 2,567,089 | |
| d | Gainesville Utilities System Revenue, (SPA Landesbank Hessen-Thuringen) Series C, 1.50% due 10/1/2026 (put 4/1/2019) | 2,890,000 | 2,890,000 |
| Highlands County Health Facilities Authority ETM, 5.00% due 11/15/2019 | 5,000 | 5,104 | |
| Highlands County Health Facilities Authority, 5.00% due 11/15/2019 | 2,995,000 | 3,056,517 | |
| Hillsborough County (Court Facilities), Series B, 5.00% due 11/1/2019 - 11/1/2021 | 13,945,000 | 14,695,321 | |
| Hillsborough County (Jail and Storm Water Projects), Series A, 5.00% due 11/1/2021 - 11/1/2022 | 5,305,000 | 5,847,843 | |
| Hillsborough County School Board (Master Lease Program) COP, 5.00% due 7/1/2027 - 7/1/2028 | 10,035,000 | 12,349,681 | |
| Jacksonville Electric Authority (Electric System) ETM, Series A, 5.00% due 10/1/2023 | 1,395,000 | 1,594,806 | |
| Jacksonville Electric Authority (Electric System), Series A, 5.00% due 10/1/2024 (pre-refunded 10/1/2023) | 1,200,000 | 1,371,876 | |
| Lee County School Board (School Facilities Improvements) COP, 5.00% due 8/1/2023 - 8/1/2024 | 3,000,000 | 3,456,180 | |
| Manatee County (County Capital Projects), 5.00% due 10/1/2021 | 2,775,000 | 3,001,329 | |
| d | Manatee County (Florida Power & Light Co.), 1.50% due 9/1/2024 (put 4/1/2019) | 1,500,000 | 1,500,000 |
| Manatee County (Public Utilities Improvements), 5.00% due 10/1/2024 - 10/1/2025 | 970,000 | 1,139,526 | |
| Manatee County School District (School Facilities Improvements; Insured: AGM), 5.00% due 10/1/2025 - 10/1/2027 | 2,900,000 | 3,502,451 | |
| Marion County School Board (Insured: BAM) COP, Series B, 5.00% due 6/1/2019 - 6/1/2024 | 10,965,000 | 11,665,223 |
| PRINCIPAL AMOUNT | VALUE | ||
| Miami Beach GO, | |||
| 4.00% due 9/1/2019 - 9/1/2021 | $ 3,760,000 | $ 3,841,037 | |
| 5.00% due 9/1/2020 - 9/1/2022 | 4,720,000 | 4,981,314 | |
| Miami-Dade County (Miami International Airport), Series B, 5.00% due 10/1/2025 | 2,500,000 | 2,920,875 | |
| Miami-Dade County (Professional Sports Franchise Facilities; Insured: AGM), Series C, Zero Coupon due 10/1/2019 | 2,170,000 | 2,152,228 | |
| Miami-Dade County (Transit System), 5.00% due 7/1/2023 - 7/1/2025 | 10,215,000 | 11,964,680 | |
| Miami-Dade County Expressway Authority (Toll System), Series B, 5.00% due 7/1/2024 - 7/1/2025 | 4,000,000 | 4,629,700 | |
| Miami-Dade County Expressway Authority (Toll System; Insured: AGM), 5.00% due 7/1/2019 | 7,530,000 | 7,592,650 | |
| d | Miami-Dade County Industrial Development Authority, (Florida Power & Light Co.), 1.51% due 6/1/2021 (put 4/1/2019) | 12,800,000 | 12,800,000 |
| Miami-Dade County School Board (Educational Facilities Improvements) COP, | |||
| Series A, | |||
| 5.00% due 5/1/2022 - 5/1/2024 | 15,535,000 | 17,576,327 | |
| a | 5.00% due 5/1/2031 (put 5/1/2024) | 2,550,000 | 2,912,610 |
| Series C, 5.00% due 5/1/2025 | 15,000,000 | 17,588,400 | |
| Orange County (Orlando Health, Inc.) HFA, | |||
| 5.25% due 10/1/2019 | 6,050,000 | 6,161,683 | |
| 5.375% due 10/1/2023 | 4,150,000 | 4,229,140 | |
| Orange County (Orlando Health, Inc.; Insured: Natl-Re) HFA ETM, 6.25% due 10/1/2021 | 1,190,000 | 1,269,813 | |
| Orange County School Board (Educational Facilities) COP, Series D, 5.00% due 8/1/2019 - 8/1/2025 | 10,795,000 | 11,909,781 | |
| Palm Beach County (Boca Raton Regional Hospital) HFA, 5.00% due 12/1/2020 | 600,000 | 628,920 | |
| Palm Beach County School Board (Educational Facilities) COP, | |||
| Series B, 5.00% due 8/1/2022 - 8/1/2024 | 10,370,000 | 11,901,021 | |
| Series C, | |||
| 4.00% due 8/1/2019 - 8/1/2021 | 4,775,000 | 4,987,000 | |
| 5.00% due 8/1/2020 - 8/1/2022 | 2,750,000 | 2,976,871 | |
| Palm Beach County School District COP, Series C, 5.00% due 8/1/2021 - 8/1/2026 | 10,130,000 | 11,630,278 | |
| Polk County (Water and Wastewater Utility Systems), 5.00% due 10/1/2023 | 1,420,000 | 1,581,326 | |
| Polk County (Water and Wastewater Utility Systems; Insured: AGM), | |||
| 3.00% due 10/1/2021 | 3,125,000 | 3,214,437 | |
| 4.00% due 10/1/2020 | 3,100,000 | 3,213,367 | |
| Reedy Creek Improvement District (Buena Vista Drive Corridor Improvements) GO, 5.00% due 6/1/2023 | 1,940,000 | 2,201,221 | |
| Reedy Creek Improvement District (Walt Disney World Resort Complex Utility Systems) GO, Series A, 5.00% due 6/1/2021 - 6/1/2025 | 4,210,000 | 4,865,094 | |
| Reedy Creek Improvement District (Walt Disney World Resort Complex Utility Systems), Series 1, 5.00% due 10/1/2021 - 10/1/2023 | 2,575,000 | 2,845,457 | |
| South Florida Water Management District (Everglades Restoration Plan) COP, 5.00% due 10/1/2019 - 10/1/2022 | 7,030,000 | 7,514,923 | |
| South Lake County Hospital District, 5.00% due 10/1/2025 | 4,140,000 | 4,276,620 | |
| Sunshine State Governmental Financing Commission (Miami-Dade County Program), 5.00% due 9/1/2021 - 9/1/2024 | 7,275,000 | 8,111,541 | |
| Sunshine State Governmental Financing Commission (Miami-Dade County Program; Insured: AGM), 5.00% due 9/1/2021 | 5,000,000 | 5,383,550 | |
| Tampa Bay Regional Water Supply Authority, 5.00% due 10/1/2019 | 3,000,000 | 3,051,810 | |
| Volusia County Educational Facilities Authority (Embry-Riddle Aeronautical University, Inc.), 5.00% due 10/15/2023 - 10/15/2025 | 1,750,000 | 2,015,449 | |
| Volusia County Educational Facilities Authority (Embry-Riddle Aeronautical University, Inc.; Insured: AGM) ETM, 5.00% due 10/15/2019 | 2,350,000 | 2,393,616 | |
| Volusia County School Board (University High School, River Springs Middle School) COP, 5.00% due 8/1/2024 | 1,000,000 | 1,157,350 | |
| Georgia — 1.4% | |||
| Athens-Clarke County Unified Government Development Authority (UGAREF Bolton Commons, LLC), | |||
| 4.00% due 6/15/2020 | 395,000 | 406,672 | |
| 5.00% due 6/15/2019 | 400,000 | 402,820 | |
| Athens-Clarke County Unified Government Development Authority (UGAREF Central Precinct, LLC), 5.00% due 6/15/2022 - 6/15/2024 | 1,790,000 | 2,017,082 | |
| City of Atlanta (Airport Passenger Facility), | |||
| 5.00% due 1/1/2024 - 1/1/2025 | 3,850,000 | 4,447,487 | |
| Series B, 5.00% due 1/1/2023 - 1/1/2025 | 2,645,000 | 3,026,944 | |
| City of Atlanta (Atlantic Station Project), 5.00% due 12/1/2020 - 12/1/2024 | 4,100,000 | 4,548,436 | |
| City of Atlanta (BeltLine Project), Series A, 5.00% due 1/1/2020 - 1/1/2021 | 585,000 | 599,052 | |
| City of Atlanta (Hartsfield-Jackson Atlanta International Airport), | |||
| Series B, 5.00% due 1/1/2020 - 1/1/2021 | 13,000,000 | 13,332,050 | |
| Series C, | |||
| 5.25% due 1/1/2020 | 5,000,000 | 5,137,150 | |
| 5.50% due 1/1/2021 | 3,525,000 | 3,762,726 | |
| City of Atlanta (Water & Wastewater System), | |||
| 5.00% due 11/1/2021 - 11/1/2025 | 6,630,000 | 7,505,136 | |
| 6.00% due 11/1/2019 | 5,650,000 | 5,795,657 | |
| Fulton County Development Authority (Georgia Tech Athletic Association), 5.00% due 10/1/2022 | 4,550,000 | 5,014,691 | |
| Fulton County Facilities Corp. (Public Purpose Project) COP, 5.00% due 11/1/2019 | 6,600,000 | 6,730,614 | |
| Hospital Authority of Gwinnett County (Gwinnett Hospital System, Inc.; Insured: AGM), Series A, 5.00% due 7/1/2023 | 5,000,000 | 5,032,850 |
Thornburg Limited Term Municipal Fund | March 31, 2019 (Unaudited)
| PRINCIPAL AMOUNT | VALUE | ||
| Main Street Natural Gas, Inc., Series A, 5.00% due 5/15/2023 - 5/15/2029 | $ 12,265,000 | $ 14,144,548 | |
| a | Monroe County Development Authority (Gulf Power Co.), 2.00% due 9/1/2037 (put 6/25/2020) | 1,300,000 | 1,291,992 |
| Guam — 0.7% | |||
| Government of Guam (Layon Solid Waste Disposal Facility ETM, Series A, 5.50% due 12/1/2019 | 2,000,000 | 2,053,560 | |
| Government of Guam (Various Capital Projects), Series D, 5.00% due 11/15/2019 - 11/15/2024 | 18,450,000 | 20,072,898 | |
| Guam Government Waterworks Authority (Water & Wastewater System Improvements), 5.25% due 7/1/2020 - 7/1/2023 | 1,995,000 | 2,175,741 | |
| Guam Government, 5.00% due 1/1/2025 | 305,000 | 322,391 | |
| Guam Power Authority (Electric Power System), Series A, 5.00% due 10/1/2023 - 10/1/2026 | 5,070,000 | 5,696,449 | |
| Guam Power Authority (Electric Power System; Insured: AGM), Series A, 5.00% due 10/1/2019 - 10/1/2022 | 8,840,000 | 9,559,535 | |
| Hawaii — 1.3% | |||
| City and County of Honolulu (Capital Improvements) GO ETM, 5.00% due 11/1/2022 | 1,750,000 | 1,954,295 | |
| City and County of Honolulu (Capital Improvements) GO, 5.00% due 11/1/2019 - 11/1/2022 | 21,350,000 | 22,909,981 | |
| b | City and County of Honolulu (Rail Transit Project) GO, 1.82% (MUNIPSA + 0.32%) due 9/1/2025 - 9/1/2028 (put 9/1/2020) | 17,075,000 | 17,068,511 |
| County of Hawaii (Capital Improvements) GO, | |||
| 5.00% due 9/1/2023 | 800,000 | 913,960 | |
| Series B, 5.00% due 9/1/2023 | 1,500,000 | 1,713,675 | |
| Series C, 5.00% due 9/1/2021 - 9/1/2026 | 7,250,000 | 8,304,610 | |
| Series D, 5.00% due 9/1/2023 - 9/1/2026 | 4,515,000 | 5,330,530 | |
| Series E, 5.00% due 9/1/2021 - 9/1/2026 | 6,180,000 | 6,971,733 | |
| State of Hawaii (Hawaiian Home Lands Settlement) GO ETM, | |||
| Series DZ, 5.00% due 12/1/2019 | 1,545,000 | 1,579,407 | |
| Series DZ-2017, 5.00% due 12/1/2019 | 60,000 | 61,357 | |
| State of Hawaii (Hawaiian Home Lands Settlement) GO, | |||
| Series DZ, 5.00% due 12/1/2022 (pre-refunded 12/1/2021) | 4,000,000 | 4,352,704 | |
| Series DZ-2017, 5.00% due 12/1/2019 | 1,395,000 | 1,426,736 | |
| Series EA, 5.00% due 12/1/2020 - 12/1/2021 | 5,500,000 | 5,911,690 | |
| Idaho — 0.3% | |||
| Idaho (Trinity Health Credit Group) HFA, Series D, 5.00% due 12/1/2022 - 12/1/2024 | 4,200,000 | 4,803,810 | |
| a | Regents of the University of Idaho, 5.25% due 4/1/2041 (put 4/1/2021) | 12,295,000 | 13,077,331 |
| Illinois — 6.4% | |||
| Board of Education of the City of Chicago (Educational Facilities; Insured: BHAC) GO, Zero Coupon due 12/1/2020 | 12,000,000 | 11,558,160 | |
| Board of Trustees of Southern Illinois University (Housing & Auxiliary Facilities; Insured: Natl-re), Series A, 5.25% due 4/1/2020 | 1,000,000 | 1,027,320 | |
| Chicago Midway International Airport, Series B, 5.00% due 1/1/2022 - 1/1/2024 | 3,700,000 | 4,113,128 | |
| Chicago O’Hare International Airport (2015 Airport Projects), Series B, 5.00% due 1/1/2020 - 1/1/2021 | 5,350,000 | 5,581,563 | |
| Chicago O’Hare International Airport (2016 Airport Projects), Series C, 5.00% due 1/1/2027 | 1,750,000 | 2,073,015 | |
| Chicago O’Hare International Airport (Capital Development Programs), Series B, 5.00% due 1/1/2022 (pre-refunded 1/1/2021) | 5,835,000 | 6,188,893 | |
| Chicago Park District Series B 5.00% due 1/1/2020 | 3,185,000 | 3,249,433 | |
| Chicago Park District (Capital Improvement Plan) GO, | |||
| 4.00% due 1/1/2020 | 815,000 | 825,000 | |
| 5.00% due 1/1/2023 - 1/1/2025 | 5,350,000 | 5,879,713 | |
| Series B, | |||
| 4.00% due 1/1/2020 | 2,730,000 | 2,763,497 | |
| 5.00% due 1/1/2021 - 1/1/2024 | 7,270,000 | 7,769,009 | |
| Series C, 5.00% due 1/1/2022 - 1/1/2023 | 5,155,000 | 5,555,918 | |
| Series D, 5.00% due 1/1/2020 | 530,000 | 540,722 | |
| Chicago Park District GO, | |||
| Series D 5.00% due 1/1/2021 | 1,790,000 | 1,870,049 | |
| Series D, 5.00% due 1/1/2024 | 1,060,000 | 1,168,894 | |
| Chicago School Reform Board of Trustees of the Board of Education (School District Capital Improvement Program; Insured: Natl-Re) GO, Series A, 5.25% due 12/1/2021 | 1,500,000 | 1,598,565 | |
| City of Chicago (Chicago Midway Airport), Series B, 5.00% due 1/1/2023 - 1/1/2024 | 22,275,000 | 24,781,345 | |
| City of Chicago (Project Fund), Series A, 5.00% due 1/1/2024 - 1/1/2027 (pre-refunded 1/1/2020) | 17,850,000 | 18,302,677 | |
| City of Chicago (Riverwalk Expansion Project; Insured: AGM), 5.00% due 1/1/2021 - 1/1/2023 | 2,410,000 | 2,524,647 | |
| City of Chicago (Wastewater Transmission System), Series C-REMK-10/, 5.00% due 1/1/2020 - 1/1/2025 | 17,750,000 | 19,733,380 | |
| City of Chicago (Wastewater Transmission System; Insured: BHAC), Series A, 5.50% due 1/1/2020 | 1,400,000 | 1,404,270 | |
| City of Chicago (Water System), | |||
| 5.00% due 11/1/2027 | 6,250,000 | 7,292,375 | |
| Series 2017-2, 5.00% due 11/1/2020 - 11/1/2024 | 4,150,000 | 4,523,668 | |
| City of Chicago (Water System; Insured: AGM), Series 2017-2, 5.00% due 11/1/2028 | 2,000,000 | 2,377,420 | |
| City of Mount Vernon (Various Municipal Capital Improvements; Insured: AGM) GO, 4.00% due 12/15/2019 - 12/15/2021 | 3,425,000 | 3,528,821 | |
| City of Waukegan (Lakehurst Redevelopment Project; Insured: AGM) GO, Series A, 5.00% due 12/30/2019 - 12/30/2022 | 6,035,000 | 6,423,885 | |
| Community College District No. 503 (Black Hawk College; Insured: AGM) GO, 5.00% due 12/1/2021 - 12/1/2024 | 10,935,000 | 12,318,127 |
| PRINCIPAL AMOUNT | VALUE | ||
| Community College District No. 516 (Waubonsee Community College) GO, | |||
| 4.50% due 12/15/2020 | $ 1,325,000 | $ 1,388,812 | |
| 5.00% due 12/15/2021 | 6,175,000 | 6,711,422 | |
| Community High School District No. 127 (Lake County-Grayslake Educational Facilities.; Insured: Syncora) GO, 7.375% due 2/1/2020 | 1,000,000 | 1,046,910 | |
| Community Unit School District No. 200 (DuPage County Educational Facilities; Insured: FSA) GO, Series D, 5.25% due 10/1/2023 | 1,000,000 | 1,016,500 | |
| Community Unit School District No. 302 (Kane & DeKalb County Educational Facilities; Insured: Natl-Re) GO, Zero Coupon due 2/1/2021 | 3,165,000 | 3,044,635 | |
| Community Unit School District No. 428 (DeKalb County Educational Facilities) GO, Zero Coupon due 1/1/2021 | 6,140,000 | 5,843,131 | |
| Community Unit School District No. 5 (Insured: BAM) GO, 5.00% due 4/15/2024 - 4/15/2026 | 1,650,000 | 1,924,733 | |
| Cook County Community College District No. 508 (City Colleges of Chicago) GO, | |||
| 5.00% due 12/1/2020 - 12/1/2024 | 8,020,000 | 8,582,339 | |
| 5.25% due 12/1/2025 - 12/1/2026 | 3,365,000 | 3,608,557 | |
| Cook County School District No.170 (Insured: AGM) GO., Series D, 5.00% due 12/1/2024 | 1,190,000 | 1,339,357 | |
| County of Cook (Capital Improvement Plan) GO, | |||
| Series A, 5.00% due 11/15/2021 | 5,000,000 | 5,373,300 | |
| Series C, | |||
| 4.00% due 11/15/2020 - 11/15/2022 | 3,925,000 | 4,117,227 | |
| 5.00% due 11/15/2020 - 11/15/2022 | 9,195,000 | 9,664,139 | |
| Series D, 5.00% due 11/15/2019 | 3,690,000 | 3,760,737 | |
| County of Cook Sales Tax Revenue, 5.00% due 11/15/2028 | 2,250,000 | 2,716,222 | |
| Du Page County High School District No. 88 (Addison Trail and Willowbrook High Schools GO, 3.00% due 1/15/2020 | 2,630,000 | 2,657,378 | |
| Forest Preserve District of Cook County GO, Series A, 5.00% due 11/15/2021 | 1,500,000 | 1,598,595 | |
| Forest Preserve District of DuPage County GO, 5.00% due 11/1/2020 - 11/1/2024 | 9,455,000 | 10,776,451 | |
| d | Illinois Development Finance Authority (NorthShore University HealthSystem), (SPA JP Morgan Chase Bank, N.A) 1.50% due 5/1/2031 (put 4/1/2019) | 5,620,000 | 5,620,000 |
| Illinois Finance Authority (Advocate Health Care), | |||
| 5.00% due 8/1/2023 - 8/1/2024 | 1,365,000 | 1,569,143 | |
| a | Series A-1, 5.00% due 11/1/2030 (put 1/15/2020) | 1,575,000 | 1,615,493 |
| Illinois Finance Authority (Rush University Medical Center), Series A, 5.00% due 11/15/2020 - 11/15/2025 | 3,020,000 | 3,453,817 | |
| Illinois Finance Authority (Trinity Health), Series L, 4.00% due 12/1/2021 | 1,000,000 | 1,060,550 | |
| Illinois State Toll Highway Authority, | |||
| Series A-1, 5.00% due 1/1/2025 | 6,500,000 | 6,661,850 | |
| Series D, 5.00% due 1/1/2023 - 1/1/2024 | 10,500,000 | 11,954,750 | |
| Kane McHenry Cook & DeKalb Counties Unit School District No. 300 (Insured: AMBAC) GO ETM, Zero Coupon due 12/1/2021 | 765,000 | 732,426 | |
| Kane McHenry Cook & DeKalb Counties Unit School District No. 300 (Insured: AMBAC) GO, Zero Coupon due 12/1/2021 | 1,235,000 | 1,164,580 | |
| Kane McHenry Cook & DeKalb Counties Unit School District No. 300 GO, 5.00% due 1/1/2024 | 7,150,000 | 8,108,171 | |
| McHenry County Conservation District GO, 5.00% due 2/1/2021 - 2/1/2025 | 4,325,000 | 4,806,166 | |
| Metropolitan Pier & Exposition Authority (McCormick Place Expansion), Series B, 5.00% due 12/15/2020 | 4,000,000 | 4,153,320 | |
| Metropolitan Water Reclamation District of Greater Chicago GO, Series E-GREEN BOND 5.00% due 12/1/2025 | 1,000,000 | 1,181,420 | |
| Railsplitter Tobacco Settlement Authority, | |||
| 5.00% due 6/1/2019 | 22,000,000 | 22,116,600 | |
| 5.125% due 6/1/2019 | 6,780,000 | 6,817,290 | |
| State of Illinois (Build Illinois), | |||
| Series B 5.00% due 6/15/2019 | 1,285,000 | 1,292,684 | |
| Series B, 5.00% due 6/15/2021 (pre-refunded 6/15/2019) | 9,945,000 | 10,013,919 | |
| State of Illinois (State Facilities Improvements) GO, 5.00% due 7/1/2021 | 1,735,000 | 1,828,499 | |
| State of Illinois GO, 5.00% due 12/1/2021 | 4,500,000 | 4,784,895 | |
| State of Illinois, Series B, 5.00% due 6/15/2026 - 6/15/2029 | 20,000,000 | 22,418,800 | |
| Town of Cicero Cook County (Cicero and Laramie Development Areas; Insured: AGM) GO, Series A, 5.00% due 1/1/2020 - 1/1/2021 | 2,700,000 | 2,793,550 | |
| University of Illinois Board of Trustees (Insured: AGM) COP, Series B, 5.00% due 10/1/2019 | 955,000 | 957,273 | |
| Village of Tinley Park GO, 4.00% due 12/1/2022 | 625,000 | 670,831 | |
| Will & Kendall Counties Plainfield Community Consolidated School District 202 (Capital Improvements; Insured: BAM) GO, Series A, 5.00% due 1/1/2023 - 1/1/2025 | 21,125,000 | 23,977,987 | |
| Indiana — 1.7% | |||
| Avon Community School Building Corp., | |||
| 4.00% due 7/15/2019 | 1,000,000 | 1,006,850 | |
| 5.00% due 7/15/2021 - 7/15/2027 | 6,730,000 | 7,679,976 | |
| Board of Trustees for the Vincennes University, Series J, 5.00% due 6/1/2020 | 1,000,000 | 1,039,620 | |
| City of Carmel Redevelopment Authority (Road and Intersection Improvements), 5.00% due 8/1/2021 - 8/1/2022 | 4,915,000 | 5,328,865 | |
| City of Carmel Redevelopment District (CFP Energy Center, LLC Installment Purchase Agreement) COP, 5.75% due 7/15/2022 (pre-refunded 1/15/2021) | 1,855,000 | 1,948,084 | |
| a | City of Whiting, 1.85% due 6/1/2044 (put 10/1/2019) | 700,000 | 699,902 |
| Duneland School Building Corp. (State Aid Withholding), Zero Coupon due 2/1/2020 - 8/1/2021 | 12,480,000 | 12,105,913 |
Thornburg Limited Term Municipal Fund | March 31, 2019 (Unaudited)
| PRINCIPAL AMOUNT | VALUE | ||
| Hamilton Southeastern Consolidated School Building Corp. (Educational Facilities; Insured: State Intercept), Series D, 5.00% due 7/15/2021 - 1/15/2024 | $ 3,210,000 | $ 3,549,884 | |
| Indiana Bond Bank (Columbus Learning Center), 5.00% due 8/1/2021 | 1,300,000 | 1,390,350 | |
| Indiana Finance Authority (Community Health Network), Series A, 5.00% due 5/1/2019 - 5/1/2022 | 6,130,000 | 6,429,329 | |
| Indiana Finance Authority (CWA Authority, Inc. Wastewater System Project), Series A, 5.00% due 10/1/2021 - 10/1/2024 | 2,000,000 | 2,257,995 | |
| d | Indiana Finance Authority (Franciscan Alliance, Inc. Obligated Group; LOC Barclays Bank plc), 1.52% due 11/1/2037 (put 4/1/2019) | 7,635,000 | 7,635,000 |
| Indiana Finance Authority (Indiana University Health System), | |||
| Series N, | |||
| 5.00% due 3/1/2020 - 3/1/2021 | 14,880,000 | 15,651,582 | |
| 5.00% due 3/1/2022 (pre-refunded 3/1/2021) | 3,240,000 | 3,451,216 | |
| Indiana Finance Authority (Marian University Health Sciences), 5.00% due 9/15/2019 - 9/15/2021 | 5,815,000 | 6,083,555 | |
| Indiana Finance Authority (Parkview Health System), 5.00% due 5/1/2022 | 1,135,000 | 1,243,315 | |
| d | Indiana Finance Authority, (SPA Wells Fargo Bank, N.A.) 1.48% due 2/1/2037 (put 4/1/2019) | 2,600,000 | 2,600,000 |
| Indiana Municipal Power Agency (Power Supply System), Series A, 5.00% due 1/1/2026 - 1/1/2028 | 4,235,000 | 5,148,759 | |
| Knox Middle School Building Corp. (Insured: Natl-Re) (State Aid Withholding), Zero Coupon due 1/15/2020 | 1,295,000 | 1,271,237 | |
| Lake Central Multi-District School Building Corp. (Educational Facilities) (State Aid Withholding), | |||
| Series B, | |||
| 4.00% due 1/15/2020 - 1/15/2022 | 4,050,000 | 4,217,097 | |
| 5.00% due 7/15/2019 - 7/15/2022 | 5,100,000 | 5,360,898 | |
| Perry Township Multischool Building Corp. (Educational Facilities) (State Aid Withholding), | |||
| 4.00% due 7/10/2019 | 1,000,000 | 1,006,520 | |
| 5.00% due 7/10/2020 - 7/10/2021 | 3,090,000 | 3,252,669 | |
| Zionsville Community Schools Building Corp. (Insured: AGM) (State Aid Withholding), 5.00% due 7/15/2019 | 560,000 | 565,202 | |
| Iowa — 0.3% | |||
| Des Moines Independent Community School District (School Infrastructure; Insured: AGM), 4.00% due 6/1/2019 - 6/1/2022 | 14,125,000 | 14,435,783 | |
| Iowa Finance Authority (Genesis Health System), 5.00% due 7/1/2022 - 7/1/2024 | 6,085,000 | 6,788,060 | |
| Kansas — 1.0% | |||
| Kansas (National Bio and Agro-Defense Facility) DFA, 5.00% due 4/1/2020 - 4/1/2025 | 39,450,000 | 43,142,016 | |
| Kansas (New Jobs Training; Insured: BAM) DFA, 5.00% due 12/1/2020 | 1,500,000 | 1,533,510 | |
| Seward County No. 480 USD GO, Series B, 5.00% due 9/1/2024 - 9/1/2027 | 6,120,000 | 7,220,395 | |
| Unified Government of Wyandotte County/Kansas City (Utility Systems Improvement), Series A, 5.00% due 9/1/2022 - 9/1/2024 | 3,600,000 | 4,040,294 | |
| Wyandotte County No. 500 (General Improvement) USD GO, Series A, 5.00% due 9/1/2025 - 9/1/2026 | 5,675,000 | 6,837,674 | |
| Kentucky — 2.1% | |||
| Kentucky Economic (Norton Healthcare, Inc.; Insured: Natl-Re) DFA, Series B, Zero Coupon due 10/1/2019 - 10/1/2023 | 21,680,000 | 20,646,621 | |
| a,c | Kentucky Public Energy Authority (Gas Supply System), Series C-1, 4.00% due 12/1/2049 (put 6/1/2025) | 77,500,000 | 83,933,275 |
| Lexington-Fayette Urban County Government Public Facilities Corp. (Eastern State Hospital), Series A, 5.00% due 6/1/2022 | 6,165,000 | 6,572,877 | |
| a,e | Louisville/Jefferson County Metropolitan Government (Louisville Gas & Electric Co.), 1.85% due 10/1/2033 (put 4/1/2021) | 6,500,000 | 6,508,905 |
| Louisville/Jefferson County Metropolitan Government (Norton Healthcare, Inc.), 5.00% due 10/1/2024 - 10/1/2026 | 4,000,000 | 4,736,010 | |
| Turnpike Authority of Kentucky (Revitalization Projects), Series B, 5.00% due 7/1/2025 - 7/1/2026 | 5,615,000 | 6,619,560 | |
| Louisiana — 2.5% | |||
| City of Bossier (Public Improvements; Insured: AGM), Series ST-2010, 4.50% due 12/1/2021 | 2,240,000 | 2,397,405 | |
| City of Lafayette (Utilities System Improvements), 5.00% due 11/1/2019 | 1,000,000 | 1,019,200 | |
| City of New Orleans (Public Improvements) GO, | |||
| 4.00% due 12/1/2019 | 750,000 | 761,573 | |
| 5.00% due 12/1/2020 - 12/1/2021 | 2,515,000 | 2,684,055 | |
| City of New Orleans (Public Improvements; Insured: AGM) GO, 5.00% due 12/1/2019 - 12/1/2021 | 12,030,000 | 12,743,886 | |
| City of Shreveport (Water and Sewer System; Insured: BAM), Series A, 5.00% due 12/1/2020 - 12/1/2024 | 31,150,000 | 34,252,903 | |
| East Baton Rouge Sewerage Commission (Wastewater System Improvements), Series B, 5.00% due 2/1/2023 - 2/1/2025 | 2,150,000 | 2,460,209 | |
| Ernest N. Morial - New Orleans Exhibition Hall Authority (Convention Center), 5.00% due 7/15/2020 - 7/15/2023 | 3,780,000 | 4,075,507 | |
| Louisiana Energy & Power Authority (LEPA Unit No. 1 Power; Insured: AGM), Series A, 5.00% due 6/1/2022 - 6/1/2023 | 1,750,000 | 1,951,003 | |
| Louisiana Energy & Power Authority (Rodemacher Unit No. 2 Power), 5.00% due 1/1/2020 - 1/1/2023 | 4,240,000 | 4,526,072 | |
| Louisiana Local Govt Environmental Facilities & Community Development Authority (Bossier Parish Community College - Campus Facilities, Inc. Project), | |||
| 4.00% due 12/1/2019 | 1,310,000 | 1,330,135 | |
| 5.00% due 12/1/2020 | 1,200,000 | 1,264,668 | |
| Louisiana Local Govt Environmental Facilities & Community Development Authority (LCTCS Act 391 Project; Insured: BAM), 5.00% due 10/1/2022 - 10/1/2027 | 19,015,000 | 22,160,272 | |
| Louisiana Local Govt Environmental Facilities & Community Development Authority (Town of Vinton Public Power Authority; Insured: AGM) ETM, 4.50% due 10/1/2019 | 1,000,000 | 1,014,760 | |
| Louisiana Public Facilities Authority (Hurricane Recovery Program), 5.00% due 6/1/2022 - 6/1/2023 | 7,945,000 | 8,852,129 | |
| Louisiana State Office Facilities Corp. (State Capitol), Series A, 5.00% due 5/1/2021 | 4,595,000 | 4,745,532 | |
| New Orleans Regional Transit Authority (Streetcar Rail Lines; Insured: AGM), 5.00% due 12/1/2019 - 12/1/2022 | 3,110,000 | 3,246,184 |
| PRINCIPAL AMOUNT | VALUE | ||
| Parish of LaFourche (Roads, Highways & Bridges), 5.00% due 1/1/2022 - 1/1/2023 | $ 930,000 | $ 1,023,726 | |
| Parish of Orleans School District (Insured: AGM) GO, 5.00% due 9/1/2020 | 3,840,000 | 4,020,096 | |
| Parish of Plaquemines Law Enforcement District GO, | |||
| 5.00% due 9/1/2019 | 515,000 | 521,129 | |
| 5.00% due 9/1/2021 (pre-refunded 9/1/2019) | 1,115,000 | 1,130,978 | |
| a | Parish of St. Charles (Valero Energy Corp. Refinery), 4.00% due 12/1/2040 (put 6/1/2022) | 16,395,000 | 17,112,609 |
| Parish of Terrebonne Hospital Service District No. 1 (Terrebonne General Medical Center), | |||
| 5.00% due 4/1/2019 - 4/1/2021 | 3,295,000 | 3,341,005 | |
| 5.00% due 4/1/2021 (pre-refunded 4/1/2020) | 835,000 | 863,231 | |
| Shreveport Water & Sewer Revenue Series C 5.00% due 12/1/2024 - 12/1/2026 | 2,420,000 | 2,825,084 | |
| State of Louisiana GO, Series C, 5.00% due 8/1/2021 | 11,175,000 | 12,035,587 | |
| Maine — 0.1% | |||
| Maine Governmental Facilities Authority (Augusta & Machias Courthouses), 5.00% due 10/1/2020 - 10/1/2023 | 5,180,000 | 5,694,249 | |
| Maryland — 0.6% | |||
| Maryland Economic Development Corp. (Public Health Laboratory), | |||
| 4.00% due 6/1/2022 | 8,245,000 | 8,666,402 | |
| 5.00% due 6/1/2021 | 8,725,000 | 9,363,932 | |
| Prince County George’s GO, 5.00% due 9/15/2026 | 6,110,000 | 7,498,253 | |
| State of Maryland GO, Series B 5.00% due 8/1/2024 | 6,955,000 | 8,149,521 | |
| Massachusetts — 1.1% | |||
| Berkshire Wind Power Cooperative Corp., | |||
| 5.00% due 7/1/2019 | 2,765,000 | 2,788,226 | |
| 5.00% due 7/1/2020 (pre-refunded 1/1/2020) | 2,965,000 | 3,042,416 | |
| Massachusetts (Insured: BHAC-CR FGIC), 5.50% due 1/1/2029 | 8,300,000 | 10,867,024 | |
| Massachusetts Development Finance Agency (CareGroup Healthcare System), | |||
| Series H-1, 5.00% due 7/1/2020 | 5,000,000 | 5,203,900 | |
| Series I, 5.00% due 7/1/2023 - 7/1/2026 | 11,020,000 | 12,639,731 | |
| Massachusetts Development Finance Agency (CareGroup Obligated Group), Series I, 5.00% due 7/1/2027 | 450,000 | 526,860 | |
| Massachusetts Development Finance Agency (Dominion Energy Brayton Point Station Units 1 and 2), 5.75% due 12/1/2042 (pre-refunded 5/1/2019) | 2,000,000 | 2,006,860 | |
| Massachusetts Development Finance Agency (Mount Auburn Hospital Health Records System), Series H-1, 5.00% due 7/1/2022 - 7/1/2025 | 15,265,000 | 17,196,416 | |
| Massachusetts Development Finance Agency (Simmons College), Series J, 5.25% due 10/1/2023 | 595,000 | 674,367 | |
| Massachusetts Educational Financing Authority, 5.75% due 1/1/2020 | 7,500,000 | 7,726,650 | |
| Massachusetts Housing Finance Agency (Low and Moderate Income Housing), Series B, 2.00% due 6/1/2019 | 2,785,000 | 2,785,418 | |
| Michigan — 2.7% | |||
| Board of Governors of Wayne State University (Educational Facilities and Equipment), Series A, 5.00% due 11/15/2022 - 11/15/2025 | 1,870,000 | 2,151,081 | |
| Byron Center Michigan Public Schools (Insured: AGM/Q-SBLF) GO, 4.00% due 5/1/2020 | 1,000,000 | 1,026,470 | |
| County of Genesee (Water Supply System; Insured: BAM) GO, 5.00% due 11/1/2022 | 600,000 | 663,960 | |
| County of Livingston (Howell Public Schools; Insured: Q-SBLF) GO, 4.00% due 5/1/2020 - 5/1/2021 | 2,000,000 | 2,072,980 | |
| Kalamazoo Hospital Finance Authority (Bronson Methodist Hospital; Insured: AGM), | |||
| 5.00% due 5/15/2020 - 5/15/2021 | 2,785,000 | 2,877,300 | |
| 5.00% due 5/15/2021 (pre-refunded 5/15/2020) | 1,300,000 | 1,348,529 | |
| Livonia Public Schools School District (School Building & Site) GO, | |||
| Series I, | |||
| 4.00% due 5/1/2020 | 800,000 | 820,040 | |
| 5.00% due 5/1/2021 | 900,000 | 954,684 | |
| Michigan Finance Authority (Beaumont Health Credit Group), 5.00% due 8/1/2023 - 8/1/2025 | 18,800,000 | 21,677,418 | |
| Michigan Finance Authority (Henry Ford Health System), 5.00% due 11/15/2027 | 1,000,000 | 1,194,860 | |
| Michigan Finance Authority (Trinity Health Credit Group), 5.00% due 12/1/2022 - 12/1/2028 | 10,500,000 | 12,366,440 | |
| Michigan Finance Authority (Ypsilanti Community Schools), 5.00% due 8/1/2019 - 8/1/2022 | 5,040,000 | 5,322,138 | |
| Michigan Municipal Bond Authority (Clean Water Fund), 5.00% due 10/1/2020 | 35,000 | 35,432 | |
| Michigan State Building Authority (Facilities Program), Series I, 5.00% due 4/15/2023 - 4/15/2026 | 4,305,000 | 5,043,371 | |
| a | Michigan State Hospital Finance Authority (Ascension Health), Series F-2-REM, 1.90% due 11/15/2047 (put 4/1/2021) | 2,900,000 | 2,909,367 |
| Michigan Strategic Fund (Detroit Edison Company; Insured: AMBAC), 7.00% due 5/1/2021 | 4,115,000 | 4,526,541 | |
| Novi Community School District (Michigan School Bond Qualification and Loan Program; Insured: Q-SBLF) GO, 5.00% due 5/1/2019 | 800,000 | 802,216 | |
| Plymouth-Canton Community Schools (Insured: Q-SBLF) GO, | |||
| Series A, | |||
| 4.00% due 5/1/2019 | 1,000,000 | 1,001,950 | |
| 5.00% due 5/1/2020 | 1,000,000 | 1,036,810 | |
| Royal Oak Hospital Finance Authority (William Beaumont Hospital), 5.00% due 9/1/2020 - 9/1/2024 | 6,940,000 | 7,651,363 | |
| School District of the City of Dearborn (Insured: Q-SBLF) (State Aid Withholding) GO, | |||
| 3.00% due 5/1/2019 | 445,000 | 445,503 |
Thornburg Limited Term Municipal Fund | March 31, 2019 (Unaudited)
| PRINCIPAL AMOUNT | VALUE | ||
| 4.00% due 5/1/2020 - 5/1/2023 | $ 2,080,000 | $ 2,206,808 | |
| School District of the City of Detroit (Wayne County School Building & Site; Insured: Q-SBLF) GO, Series A, 5.00% due 5/1/2020 - 5/1/2022 | 9,200,000 | 9,817,220 | |
| Sparta Area Schools, Counties of Kent and Ottawa (School Building & Site; Insured: Q-SBLF) GO, 5.00% due 5/1/2020 | 1,335,000 | 1,383,714 | |
| St. Johns Public Schools (Insured: Natl-Re/FGIC/Q-SBLF) GO, 5.00% due 5/1/2021 | 1,000,000 | 1,035,270 | |
| State Building Authority of the State of Michigan (Higher Education Facilities Program), Series I-A, 5.00% due 10/15/2020 - 10/15/2023 | 12,715,000 | 14,327,538 | |
| Utica Community Schools County of Macomb (Technology Infrastructure Improvements; Insured: Q-SBLF) GO, 4.00% due 5/1/2019 | 9,925,000 | 9,943,758 | |
| Warren Consolidated School District (Insured: Q-SBLF) GO, 5.00% due 5/1/2020 - 5/1/2021 | 2,000,000 | 2,102,060 | |
| Wayne County Airport Authority (Detroit Metropolitan Airport), | |||
| Series C, | |||
| 5.00% due 12/1/2019 | 12,645,000 | 12,931,789 | |
| 5.50% due 12/1/2020 | 4,395,000 | 4,678,214 | |
| Series D, 5.50% due 12/1/2019 - 12/1/2020 | 5,715,000 | 5,983,253 | |
| Wayne State University, Series A, 5.00% due 11/15/2023 - 11/15/2026 | 17,480,000 | 20,576,579 | |
| Minnesota — 0.4% | |||
| City of St. Cloud (CentraCare Health System), Series A, 5.00% due 5/1/2019 - 5/1/2020 | 6,805,000 | 6,931,767 | |
| Le Sueur-Henderson No. 2397 (Minnesota School District Credit Enhancement Program) ISD, 3.00% due 4/1/2021 | 1,125,000 | 1,157,861 | |
| d | Minneapolis MN/St Paul Housing & Redevelopment Authority (Allina Health Obligated Group; LOC JPMorgan Chase Bank, N.A.), Series B-2, 1.50% due 11/15/2035 (put 4/1/2019) | 900,000 | 900,000 |
| Northern Municipal Power Agency (Electric System), Series A1, 5.00% due 1/1/2020 | 3,500,000 | 3,588,235 | |
| Port Authority of the City of St. Paul (Minnesota Andersen Office Building), Series 3, 5.00% due 12/1/2021 - 12/1/2022 | 2,215,000 | 2,448,908 | |
| Port Authority of the City of St. Paul (Minnesota Freeman Office Building), Series 2, 5.00% due 12/1/2019 - 12/1/2020 | 4,675,000 | 4,873,789 | |
| St. Paul Housing and Redevelopment Authority (HealthPartners), 5.00% due 7/1/2023 - 7/1/2025 | 1,850,000 | 2,120,174 | |
| Mississippi — 0.3% | |||
| Mississippi Development Bank (MDOT-Harrison County Highway), Series A-GA, 5.00% due 1/1/2020 - 1/1/2023 | 6,500,000 | 6,941,660 | |
| Mississippi Development Bank (MDOT-Madison County Highway), 5.00% due 1/1/2020 - 1/1/2023 | 5,250,000 | 5,621,650 | |
| Mississippi Development Bank, 5.00% due 10/1/2024 - 10/1/2028 | 2,400,000 | 2,846,994 | |
| Missouri — 0.8% | |||
| Cass County COP, | |||
| 4.50% due 5/1/2019 | 1,270,000 | 1,272,858 | |
| 5.00% due 5/1/2020 - 5/1/2021 | 4,005,000 | 4,141,142 | |
| Jackson County (Parking Facility Projects), 4.00% due 12/1/2019 - 12/1/2021 | 1,500,000 | 1,567,320 | |
| Kansas City Municipal Assistance Corp. (H. Roe Bartle Convention Center & Infrastructure Project; Insured: AMBAC), Series B-1, Zero Coupon due 4/15/2021 - 4/15/2022 | 15,095,000 | 14,326,280 | |
| Missouri Development Finance Board (City of Independence Electric System), | |||
| Series B, 5.00% due 6/1/2019 - 6/1/2020 | 2,790,000 | 2,837,866 | |
| Series F, 4.00% due 6/1/2019 - 6/1/2022 | 7,885,000 | 8,189,897 | |
| Missouri Health and Educational Facilities Authority (Children’s Mercy Hospital), | |||
| 5.00% due 5/15/2019 - 5/15/2020 | 1,170,000 | 1,174,694 | |
| 5.00% due 5/15/2020 (pre-refunded 5/15/2019) | 830,000 | 833,386 | |
| Platte County (Community & Resource Centers), 5.00% due 4/1/2019 - 4/1/2021 | 4,440,000 | 4,329,370 | |
| Southeast Missouri State University (City of Cape Girardeau Campus System Facilities), 5.00% due 4/1/2020 | 2,825,000 | 2,917,660 | |
| Special Administrative Board of the Transitional School District of the City of St. Louis (State Aid Withholding) GO, 4.00% due 4/1/2019 - 4/1/2022 | 8,570,000 | 8,936,988 | |
| Nebraska — 1.0% | |||
| a,c | Central Plains Energy Project, 5.00% due 3/1/2050 (put 1/1/2024) | 48,000,000 | 53,207,040 |
| Douglas County Hospital Authority No. 3 (Nebraska Methodist Health System), 5.00% due 11/1/2022 - 11/1/2025 | 6,980,000 | 7,941,766 | |
| Nevada — 3.3% | |||
| Carson City (Carson Tahoe Regional Healthcare), 5.00% due 9/1/2019 - 9/1/2027 | 6,155,000 | 6,687,783 | |
| Clark County Department of Aviation, Series A, 5.00% due 7/1/2021 | 1,855,000 | 1,988,226 | |
| Clark County School District (Acquisition of Transportation & Technology Equipment) GO, | |||
| Series C, 5.00% due 6/15/2022 | 2,560,000 | 2,816,461 | |
| Series D, 5.00% due 6/15/2021 - 6/15/2022 | 47,150,000 | 51,305,687 | |
| Series E, 5.00% due 6/15/2021 | 21,405,000 | 22,941,665 | |
| Las Vegas Convention and Visitors Authority, Series C, 5.00% due 7/1/2023 - 7/1/2026 | 6,205,000 | 7,243,819 | |
| Las Vegas Valley Water District GO ETM, Series D, 5.00% due 6/1/2019 | 1,000,000 | 1,005,680 | |
| Las Vegas Valley Water District GO, | |||
| Series A, 5.00% due 6/1/2023 - 6/1/2026 | 55,955,000 | 65,274,268 | |
| Series B, 5.00% due 12/1/2025 | 20,000,000 | 23,742,200 | |
| Series C, 5.00% due 6/1/2020 - 6/1/2021 | 9,255,000 | 9,789,654 | |
| Series D, 5.00% due 6/1/2020 | 5,080,000 | 5,282,489 | |
| Washoe County (Reno-Sparks Convention & Visitors Authority) GO, 5.00% due 7/1/2021 - 7/1/2022 | 4,200,000 | 4,515,948 |
| PRINCIPAL AMOUNT | VALUE | ||
| New Hampshire — 0.3% | |||
| d | New Hampshire Health and Education Facilities Authority Act (University System of New Hampshire), (SPA State Street Bank and Trust Co.) 1.52% due 7/1/2035 (put 4/1/2019) | $ 4,510,000 | $ 4,510,000 |
| d | New Hampshire Health and Education Facilities Authority Act (University System of New Hampshire), (SPA Wells Fargo Bank, N.A.) 1.52% due 7/1/2033 (put 4/1/2019) | 4,385,000 | 4,385,000 |
| New Hampshire Municipal Bond Bank, 5.25% due 8/15/2020 - 8/15/2022 | 3,770,000 | 4,155,512 | |
| New Hampshire Turnpike System, Series B, 5.00% due 2/1/2020 - 2/1/2021 | 2,260,000 | 2,363,866 | |
| New Jersey — 2.4% | |||
| City of Jersey City (Qualified General Improvement; Insured: BAM) (State Aid Withholding) GO, | |||
| Series A, | |||
| 4.00% due 8/1/2020 - 8/1/2021 | 5,455,000 | 5,686,055 | |
| 5.00% due 8/1/2022 - 8/1/2023 | 4,985,000 | 5,569,377 | |
| Essex County Improvement Authority (County Correctional Facilities & Gibraltar Facilities; Insured: Natl-Re), 5.50% due 10/1/2024 | 5,000,000 | 5,957,700 | |
| Hudson County Improvement Authority (Hudson County Lease; Insured: AGM), | |||
| 4.75% due 10/1/2019 | 4,390,000 | 4,458,221 | |
| 5.375% due 10/1/2020 | 2,020,000 | 2,123,747 | |
| New Jersey (New Jersey Transit Corporation) EDA, Series B, 5.00% due 11/1/2024 | 8,000,000 | 9,010,240 | |
| New Jersey (School Facilities Construction) EDA ETM, 5.00% due 9/1/2020 | 365,000 | 382,170 | |
| New Jersey (School Facilities Construction) EDA, | |||
| 5.00% due 9/1/2020 - 6/15/2028 | 8,065,000 | 8,798,686 | |
| Series G, 5.75% due 9/1/2023 (pre-refunded 3/1/2021) | 4,955,000 | 5,342,927 | |
| Series GG, 5.75% due 9/1/2023 | 550,000 | 584,458 | |
| New Jersey (School Facilities Construction; Insured: AMBAC) EDA, Series K, 5.50% due 12/15/2019 | 5,525,000 | 5,667,379 | |
| New Jersey Health Care Facilities Financing Authority (Virtua Health Issue), 5.00% due 7/1/2023 - 7/1/2024 | 1,535,000 | 1,754,645 | |
| New Jersey Higher Educational Assistance Authority, Series 1A, 5.25% due 12/1/2019 | 5,650,000 | 5,783,622 | |
| New Jersey Transit Corp. (Urban Public Transportation Capital Improvement), Series A, 5.00% due 9/15/2021 | 3,395,000 | 3,631,530 | |
| New Jersey Transportation Trust Fund Authority (State Transportation System Improvements), | |||
| b | 2.70% (MUNIPSA + 1.20%) due 6/15/2034 (put 12/15/2021) | 6,250,000 | 6,298,687 |
| 5.00% due 6/15/2020 - 6/15/2028 | 43,525,000 | 49,853,231 | |
| Series A, 5.25% due 12/15/2022 | 2,000,000 | 2,205,360 | |
| Series B, 5.00% due 6/15/2019 - 6/15/2021 | 4,570,000 | 4,768,448 | |
| New Jersey Transportation Trust Fund Authority (State Transportation System Improvements; Insured: AMBAC), Series B, 5.25% due 12/15/2023 | 3,545,000 | 3,992,875 | |
| Passaic Valley Sewer Commissioners (Sewer System) GO, Series G, 5.75% due 12/1/2019 - 12/1/2021 | 10,750,000 | 11,511,512 | |
| New Mexico — 0.6% | |||
| Albuquerque Municipal School District No. 12 (Bernalillo and Sandoval Counties School Facilities) (State Aid Withholding) GO, 5.00% due 8/1/2019 | 5,885,000 | 5,952,089 | |
| Carlsbad Municipal School District (Educational Facilities) GO, 5.00% due 8/1/2023 | 1,650,000 | 1,878,772 | |
| City of Albuquerque (City Infrastructure Improvements) GO, 5.00% due 7/1/2023 | 1,360,000 | 1,547,653 | |
| City of Farmington (Southern California Edison Co.-Four Corners Project), | |||
| a | 1.875% due 4/1/2029 (put 4/1/2020) | 3,000,000 | 2,979,030 |
| a | 2.125% due 6/1/2040 (put 6/1/2022) | 2,000,000 | 1,980,300 |
| City of Santa Fe (El Castillo Retirement Residences), 4.50% due 5/15/2022 | 2,110,000 | 2,217,673 | |
| New Mexico Educational Assistance Foundation (Student Loans), Series A-1, 5.00% due 12/1/2021 | 3,000,000 | 3,164,400 | |
| New Mexico Hospital Equipment Loan Council (Presbyterian Healthcare Services), 5.00% due 8/1/2024 - 8/1/2025 | 1,780,000 | 2,084,230 | |
| New Mexico State University ETM, Series B, 5.00% due 4/1/2020 - 4/1/2022 | 3,175,000 | 3,364,551 | |
| New Mexico State University, Series B, 5.00% due 4/1/2020 - 4/1/2022 | 3,015,000 | 3,180,306 | |
| Rio Rancho Public School District No. 94 GO, 5.00% due 8/1/2026 | 1,085,000 | 1,308,488 | |
| Santa Fe County (County Buildings & Facilities) GRT, Series A, 5.00% due 6/1/2025 | 1,250,000 | 1,485,725 | |
| State of New Mexico (Educational Facilities), 5.00% due 7/1/2020 | 4,000,000 | 4,170,720 | |
| State of New Mexico Severance Tax Permanent Fund, 5.00% due 7/1/2019 | 2,000,000 | 2,017,140 | |
| New York — 12.6% | |||
| City of Long Beach School District (Insured: AGM) (State Aid Withholding) GO, 3.50% due 5/1/2022 | 1,600,000 | 1,635,024 | |
| City of New York (City Budget Financial Management) GO, | |||
| 5.00% due 8/1/2021 - 8/1/2022 | 15,625,000 | 17,065,182 | |
| Series D, 5.00% due 8/1/2021 - 8/1/2022 | 6,000,000 | 6,567,540 | |
| Series G, 5.00% due 8/1/2023 | 9,520,000 | 10,857,084 | |
| Series J, | |||
| f | 5.00% due 8/1/2021 | 7,350,000 | 7,928,298 |
| 5.00% due 8/1/2022 - 8/1/2024 | 73,130,000 | 83,902,483 | |
| Series K, 5.00% due 8/1/2021 - 8/1/2022 | 20,850,000 | 22,906,524 | |
| d | City of New York (SPA JP Morgan Chase Bank, N.A) GO, 1.50% due 6/1/2044 (put 4/1/2019) | 2,000,000 | 2,000,000 |
| d | City of New York, (SPA JP Morgan Chase Bank, N.A) 1.50% due 1/1/2036 (put 4/1/2019) | 600,000 | 600,000 |
| Metropolitan Transportation Authority (Green Bond), Series A2, 5.00% due 11/15/2026 - 11/15/2027 | 34,040,000 | 40,871,839 | |
| Metropolitan Transportation Authority, |
Thornburg Limited Term Municipal Fund | March 31, 2019 (Unaudited)
| PRINCIPAL AMOUNT | VALUE | ||
| Series A, | |||
| 4.00% due 2/3/2020 | $ 18,000,000 | $ 18,343,080 | |
| 5.00% due 11/15/2020 | 2,000,000 | 2,110,880 | |
| Series A2-GREEN BOND, 5.00% due 11/15/2025 | 10,480,000 | 12,370,802 | |
| Series C 5.00% due 9/1/2021 | 14,500,000 | 15,538,780 | |
| a | Series C-2B, 5.00% due 11/15/2034 (put 2/15/2020) | 550,000 | 564,669 |
| Series D, 5.00% due 11/15/2020 - 11/15/2021 | 37,280,000 | 39,943,015 | |
| Monroe County Industrial Development Corp. (St. John Fisher College), Series A, 5.00% due 6/1/2019 - 6/1/2022 | 3,030,000 | 3,237,532 | |
| Nassau County (New York Institute of Technology) IDA ETM, Series A, 5.25% due 3/1/2020 | 1,715,000 | 1,772,332 | |
| New York City Health and Hospital Corp. (Healthcare Facilities Improvements) GO, Series A, 5.00% due 2/15/2020 - 2/15/2021 | 12,615,000 | 12,999,776 | |
| d | New York City Transitional Finance Authority Future Tax Secured Revenue (SPA Landesbank Hessen-Thuringen), 1.51% due 8/1/2031 (put 4/1/2019) | 16,350,000 | 16,350,000 |
| d | New York City Transitional Finance Authority Future Tax Secured Revenue, (SPA Barclays Bank plc) 1.52% due 11/1/2042 (put 4/1/2019) | 25,930,000 | 25,930,000 |
| New York City Transitional Finance Authority Future Tax Secured Revenue, (SPA JP Morgan Chase Bank, N.A) | |||
| d | 1.50% due 2/1/2045 (put 4/1/2019) | 6,825,000 | 6,825,000 |
| d | Series C-4, 1.50% due 11/1/2036 (put 4/1/2019) | 2,985,000 | 2,985,000 |
| d | New York City Transitional Finance Authority Future Tax Secured Revenue, (SPA Landesbank Hessen-Thuringen) Series 1-SUB 1D, 1.51% due 11/1/2022 (put 4/1/2019) | 12,940,000 | 12,940,000 |
| d | New York City Transitional Finance Authority Future Tax Secured Revenue, (SPA State Street Bank and Trust Co.) 1.48% due 8/1/2039 (put 4/1/2019) | 1,700,000 | 1,700,000 |
| d | New York City Transitional Finance Authority Future Tax Secured Revenue, (SPA U.S. Bank, N.A.) 1.48% due 8/1/2039 (put 4/1/2019) | 700,000 | 700,000 |
| New York City Trust for Cultural Resources (Lincoln Center for the Performing Arts, Inc.), 5.00% due 12/1/2026 | 2,500,000 | 3,060,175 | |
| d | New York City Water & Sewer System (SPA JP Morgan Chase Bank, N.A.), Series AA1, 1.50% due 6/15/2050 (put 4/1/2019) | 3,745,000 | 3,745,000 |
| d | New York City Water & Sewer System, (SPA JP Morgan Chase Bank, N.A) 1.50% due 6/15/2043 - 6/15/2050 (put 4/1/2019) | 5,795,000 | 5,795,000 |
| New York City Water & Sewer System, (SPA Landesbank Hessen-Thuringen) | |||
| d | 1.49% due 6/15/2039 (put 4/1/2019) | 23,990,000 | 23,990,000 |
| d | Series R, 1.50% due 6/15/2044 (put 4/1/2019) | 6,700,000 | 6,700,000 |
| New York City Water & Sewer System, (SPA Mizuho Bank, Ltd.) | |||
| d | 1.50% due 6/15/2048 (put 4/1/2019) | 4,215,000 | 4,215,000 |
| d | 1.52% due 6/15/2044 (put 4/1/2019) | 6,055,000 | 6,055,000 |
| d | New York City Water & Sewer System, (SPA State Street Bank and Trust Co.) 1.48% due 6/15/2043 - 6/15/2045 (put 4/1/2019) | 14,020,000 | 14,020,000 |
| d | New York City Water & Sewer System, (SPA U.S. Bank, N.A.) 1.48% due 6/15/2043 - 6/15/2045 (put 4/1/2019) | 22,940,000 | 22,940,000 |
| New York State Dormitory Authority (Metropolitan Transportation Authority Service Contract), Series A, 5.00% due 12/15/2019 | 60,000,000 | 61,470,000 | |
| New York State Dormitory Authority (NYSARC, Inc. Developmental Disability Programs), Series A, 5.00% due 7/1/2020 | 1,000,000 | 1,040,650 | |
| New York State Dormitory Authority (School Districts Financing Program) (State Aid Withholding), | |||
| 5.25% due 10/1/2023 | 140,000 | 153,131 | |
| 5.25% due 10/1/2023 (pre-refunded 10/1/2021) | 1,860,000 | 2,032,255 | |
| Series G, 5.00% due 4/1/2019 - 10/1/2022 | 2,360,000 | 2,458,168 | |
| Series H, 5.00% due 10/1/2019 - 10/1/2021 | 3,335,000 | 3,476,201 | |
| Series J, 5.00% due 10/1/2019 - 10/1/2020 | 5,420,000 | 5,606,287 | |
| New York State Dormitory Authority (School Districts Financing Program; Insured: AGM) (State Aid Withholding), Series F, 5.00% due 10/1/2019 - 10/1/2021 | 5,450,000 | 5,698,128 | |
| New York State Dormitory Authority (School Districts Financing Program; Insured: AGM), Series A, 5.00% due 10/1/2020 - 10/1/2024 | 8,650,000 | 9,736,079 | |
| d | New York State Housing Finance Agency (160 Madison Ave, LLC; LOC Landesbank Hessen-Thuringen), 1.51% due 11/1/2046 (put 4/1/2019) | 1,300,000 | 1,300,000 |
| New York State Thruway Authority (Governor Thomas E. Dewey Thruway), | |||
| 5.00% due 1/1/2020 - 1/1/2022 | 7,500,000 | 7,983,745 | |
| Series K, 5.00% due 1/1/2024 - 1/1/2025 | 3,000,000 | 3,527,720 | |
| New York State Thruway Authority (Highway, Bridge, Multi-Modal and MTA Projects), Series A, 5.00% due 3/15/2024 | 18,300,000 | 19,513,107 | |
| New York State Thruway Authority (New NY Bridge), 5.00% due 5/1/2019 | 5,000,000 | 5,013,850 | |
| Suffolk County Economic Development Corp. (Catholic Health Services), 5.00% due 7/1/2020 - 7/1/2022 | 15,000,000 | 15,875,950 | |
| Suffolk County GO, 5.00% due 7/24/2019 | 62,650,000 | 63,274,620 | |
| Town of Oyster Bay GO, Series B, 3.00% due 2/1/2020 - 3/13/2020 | 81,635,000 | 82,265,010 | |
| Triborough Bridge and Tunnel Authority (MTA Bridges and Tunnels), | |||
| 5.00% due 11/15/2026 | 4,000,000 | 4,953,240 | |
| Series A, 5.00% due 11/15/2021 | 5,140,000 | 5,598,180 | |
| United Nations Development Corp. (One, Two and Three U.N. Plaza), Series A, 5.00% due 7/1/2019 | 4,000,000 | 4,034,680 | |
| West Seneca Central School District (Insured: BAM) (State Aid Withholding) GO, 5.00% due 11/15/2022 | 1,000,000 | 1,118,850 | |
| North Carolina — 2.1% | |||
| Charlotte-Mecklenburg Hospital Authority (Carolinas HealthCare System), | |||
| Series A, | |||
| 3.00% due 1/15/2021 | 1,595,000 | 1,632,148 | |
| 4.00% due 1/15/2022 | 845,000 | 898,860 | |
| 5.00% due 1/15/2023 - 1/15/2024 | 4,255,000 | 4,758,252 |
| PRINCIPAL AMOUNT | VALUE | ||
| City of Charlotte (Equipment Acquisition & Public Facilities) COP, Series C, 5.00% due 12/1/2020 - 12/1/2025 | $ 8,940,000 | $ 10,169,885 | |
| County of Buncombe (Primary, Middle School & Community College Facilities), Series A, 5.00% due 6/1/2022 - 6/1/2024 | 2,350,000 | 2,657,118 | |
| County of Dare (Educational Facility Capital Projects), | |||
| Series A, | |||
| 4.00% due 6/1/2019 - 6/1/2022 | 1,755,000 | 1,812,007 | |
| 5.00% due 6/1/2021 - 6/1/2024 | 1,925,000 | 2,101,482 | |
| County of Randolph, | |||
| Series B, 5.00% due 10/1/2021 - 10/1/2023 | 3,560,000 | 3,948,941 | |
| Series C, 5.00% due 10/1/2020 - 10/1/2023 | 1,400,000 | 1,524,790 | |
| North Carolina Eastern Municipal Power Agency ETM, | |||
| 5.00% due 1/1/2022 | 4,715,000 | 5,152,080 | |
| Series B, 5.00% due 1/1/2021 | 5,000,000 | 5,303,250 | |
| North Carolina Municipal Power Agency (Catawba Electric) ETM, | |||
| Series A, | |||
| 4.00% due 1/1/2020 | 945,000 | 962,331 | |
| 5.00% due 1/1/2020 | 280,000 | 287,207 | |
| North Carolina Municipal Power Agency (Catawba Electric), | |||
| 4.00% due 1/1/2022 | 1,000,000 | 1,064,010 | |
| Series A, | |||
| 4.00% due 1/1/2020 | 605,000 | 615,733 | |
| 5.00% due 1/1/2020 | 720,000 | 738,094 | |
| North Carolina Turnpike Authority 5.00% due 1/1/2024 | 475,000 | 535,767 | |
| North Carolina Turnpike Authority, 5.00% due 1/1/2023 - 1/1/2029 | 12,655,000 | 14,854,865 | |
| State of North Carolina (State Capital Projects and Correctional Facilities), Series B, 5.00% due 11/1/2019 | 23,635,000 | 24,113,845 | |
| b | University of North Carolina at Chapel Hill, Series A, 2.018% (LIBOR 1 Month + 0.35%) due 12/1/2041 (put 12/1/2021) | 40,500,000 | 40,524,705 |
| Winston-Salem State University (Student Housing and Student Services Facilities), 5.00% due 4/1/2019 - 4/1/2022 | 1,760,000 | 1,840,533 | |
| North Dakota — 0.3% | |||
| County of Mckenzie, 5.00% due 8/1/2019 - 8/1/2023 | 11,955,000 | 12,681,166 | |
| County of McKenzie, 5.00% due 8/1/2022 | 1,425,000 | 1,566,859 | |
| County of Ward (Insured: AGM), 4.00% due 4/1/2020 | 2,445,000 | 2,500,135 | |
| Ohio — 4.1% | |||
| Akron, Bath & Copley Joint Township Hospital District (Children’s Hospital Medical Center), 5.00% due 11/15/2021 | 1,000,000 | 1,081,630 | |
| American Municipal Power, Inc. (AMP Fremont Energy Center), 5.00% due 2/15/2020 - 2/15/2022 | 5,915,000 | 6,306,363 | |
| Cincinnati City School District Board of Education (Educational Facilities; Insured: Natl-Re) GO, 5.25% due 12/1/2023 | 2,690,000 | 3,122,821 | |
| City of Akron (Community Learning Centers), 5.00% due 12/1/2021 | 4,120,000 | 4,480,830 | |
| City of Akron (Various Municipal Capital Projects) GO, Series A, 5.00% due 12/1/2019 | 1,685,000 | 1,723,216 | |
| City of Cleveland (City Capital Projects; Insured: AMBAC) GO, 5.50% due 10/1/2019 | 1,260,000 | 1,284,242 | |
| City of Cleveland (Cleveland Stadium) COP, 4.75% due 11/15/2020 | 2,000,000 | 2,087,180 | |
| City of Cleveland (Municipal Street System Improvements) GO, | |||
| Series A, | |||
| 3.00% due 12/1/2020 - 12/1/2021 | 2,980,000 | 3,075,089 | |
| 4.00% due 12/1/2022 - 12/1/2023 | 6,725,000 | 7,342,369 | |
| 5.00% due 12/1/2024 - 12/1/2026 | 10,895,000 | 12,907,559 | |
| City of Cleveland (Parks & Recreation Facilities), | |||
| 4.00% due 10/1/2019 | 520,000 | 526,157 | |
| 5.00% due 10/1/2020 - 10/1/2023 | 3,375,000 | 3,723,389 | |
| City of Cleveland (Police & Fire Pension Payment), 5.00% due 5/15/2019 - 5/15/2021 | 4,105,000 | 4,224,232 | |
| City of Cleveland (Public Facilities Improvements), 5.00% due 10/1/2025 - 10/1/2028 | 2,855,000 | 3,474,301 | |
| City of Cleveland (Public Facilities), | |||
| 4.00% due 10/1/2019 | 600,000 | 607,104 | |
| 5.00% due 10/1/2020 - 10/1/2023 | 2,570,000 | 2,859,714 | |
| City of Toledo (Water System Improvements), 5.00% due 11/15/2019 - 11/15/2023 | 11,265,000 | 12,187,159 | |
| Cleveland Package Facilities (Insured: AGM) ETM, 5.25% due 9/15/2021 | 965,000 | 1,048,405 | |
| Cleveland State University (Campus Capital Projects), 5.00% due 6/1/2019 - 6/1/2022 | 4,700,000 | 4,968,636 | |
| Cleveland-Cuyahoga County Port Authority (Cleveland Museum of Art), 5.00% due 10/1/2019 | 2,000,000 | 2,032,640 | |
| Clty of Cleveland (Parking Facility; Insured: AGM), 5.25% due 9/15/2021 | 2,035,000 | 2,188,378 | |
| County of Clermont (Sanitary Sewer System), 4.00% due 8/1/2019 | 1,420,000 | 1,422,641 | |
| County of Cuyahoga (Convention Hotel Project) COP, 5.00% due 12/1/2019 - 12/1/2024 | 29,470,000 | 32,978,863 | |
| County of Hamilton, Series A, 5.00% due 12/1/2019 - 12/1/2025 | 7,600,000 | 8,409,312 | |
| County of Scioto (Southern Ohio Medical Center), 5.00% due 2/15/2024 - 2/15/2025 | 3,335,000 | 3,821,352 | |
| Franklin County Convention Facilities Authority (Greater Columbus Convention Center), 5.00% due 12/1/2021 - 12/1/2024 | 2,500,000 | 2,807,230 | |
| Kent State University (Insured: AGC), | |||
| Series B, |
Thornburg Limited Term Municipal Fund | March 31, 2019 (Unaudited)
| PRINCIPAL AMOUNT | VALUE | ||
| 5.00% due 5/1/2020 | $ 85,000 | $ 85,230 | |
| 5.00% due 5/1/2020 (pre-refunded 5/1/2019) | 915,000 | 917,553 | |
| d | Ohio Higher Educational Facility Commission (Cleveland Clinic Health System Obligated Group), (SPA Barclays Bank Plc) 1.52% due 1/1/2043 (put 4/1/2019) | 14,155,000 | 14,155,000 |
| Ohio State Building Authority, 5.00% due 10/1/2020 | 1,700,000 | 1,729,274 | |
| Ohio Turnpike & Infrastructure Commission, 5.00% due 2/15/2027 - 2/15/2028 | 14,555,000 | 17,916,093 | |
| RiverSouth Authority (RiverSouth Area Redevelopment), 5.00% due 12/1/2019 | 2,500,000 | 2,557,375 | |
| State of Ohio (Common Schools Capital Facilities) GO, Series D, 5.50% due 9/15/2019 | 4,150,000 | 4,224,202 | |
| State of Ohio (Cultural and Sports Capital Facilities), 5.00% due 10/1/2020 | 3,845,000 | 4,040,557 | |
| State of Ohio (Major New Street Infrastructure Project), | |||
| 4.00% due 12/15/2019 | 1,000,000 | 1,017,110 | |
| 5.00% due 12/15/2020 - 12/15/2026 | 10,500,000 | 12,014,665 | |
| State of Ohio GO, 5.00% due 5/1/2021 - 5/1/2028 | 46,260,000 | 53,267,763 | |
| Youngstown City School District (Educational Facilities) (State Aid Withholding) GO, 4.00% due 12/1/2019 - 12/1/2023 | 8,515,000 | 8,816,080 | |
| Oklahoma — 0.7% | |||
| Canadian County Educational Facilities Authority (Mustang Public Schools), | |||
| 4.00% due 9/1/2019 | 1,410,000 | 1,424,410 | |
| 4.50% due 9/1/2020 - 9/1/2021 | 4,980,000 | 5,236,416 | |
| 5.00% due 9/1/2027 | 1,000,000 | 1,190,900 | |
| Cleveland County Educational Facilities Authority (Moore Public Schools), 5.00% due 6/1/2023 | 5,355,000 | 6,025,392 | |
| Oklahoma (INTEGRIS Health) DFA, Series A, 5.00% due 8/15/2022 - 8/15/2025 | 4,725,000 | 5,400,215 | |
| Oklahoma Capitol Improvement Authority (State Highway Capital Improvement), 5.00% due 7/1/2023 - 7/1/2024 | 1,125,000 | 1,302,756 | |
| Oklahoma County Finance Authority (Midwest City Public Service), 5.00% due 10/1/2022 - 10/1/2026 | 3,200,000 | 3,660,332 | |
| Oklahoma County Finance Authority (Western Heights Public Schools), 5.00% due 9/1/2020 | 2,000,000 | 2,092,940 | |
| Tulsa County Industrial Authority (Broken Arrow Public Schools), 4.50% due 9/1/2020 - 9/1/2021 | 10,360,000 | 11,010,353 | |
| Tulsa County Industrial Authority, 5.00% due 9/1/2020 - 9/1/2022 | 4,215,000 | 4,550,041 | |
| Oregon — 0.3% | |||
| Hillsboro School District No. 1J (School Capital Improvements) GO, 5.00% due 6/15/2025 - 6/15/2027 | 9,130,000 | 11,130,688 | |
| Polk County Dallas School District No. 2 (Capital Improvements) GO, Zero Coupon due 6/15/2019 - 6/15/2021 | 1,990,000 | 1,932,281 | |
| Tri-County Metropolitan Transportation District of Oregon, 5.00% due 10/1/2028 | 2,845,000 | 3,491,697 | |
| Pennsylvania — 5.5% | |||
| Adams County (Gettysburg College) IDA, 5.00% due 8/15/2019 | 1,765,000 | 1,786,445 | |
| Allegheny County Higher Education Building Authority (Duquesne University of the Holy Spirit), Series A, 5.00% due 3/1/2020 - 3/1/2025 | 2,195,000 | 2,498,881 | |
| Allegheny County Sanitary Authority (2015 Capital Project), 5.00% due 12/1/2023 - 12/1/2024 | 19,150,000 | 21,984,289 | |
| Allegheny County Sanitary Authority (2015 Capital Project; Insured: BAM), 5.00% due 12/1/2025 | 1,000,000 | 1,195,860 | |
| Altoona Area School District (Insured: AGM) (State Aid Withholding) GO, 3.00% due 12/1/2022 | 1,335,000 | 1,390,229 | |
| Athens Area School District (Insured: AGM) (State Aid Withholding) GO, Series B, 3.00% due 4/15/2019 | 2,680,000 | 2,681,447 | |
| City of Philadelphia (Insured: AGM) GO, 5.00% due 8/1/2025 - 8/1/2027 | 28,685,000 | 34,164,147 | |
| City of Philadelphia (Pennsylvania Gas Works), 5.00% due 10/1/2020 - 8/1/2025 | 12,200,000 | 13,848,834 | |
| City of Philadelphia (Water and Wastewater System), 5.00% due 10/1/2024 - 10/1/2026 | 5,455,000 | 6,464,652 | |
| City of Philadelphia GO, Series A, 5.00% due 8/1/2025 - 8/1/2026 | 25,130,000 | 29,732,115 | |
| City of Pittsburgh (Insured: BAM) GO, 5.00% due 9/1/2022 | 1,100,000 | 1,224,058 | |
| Commonwealth Financing Authority (Tobacco Master Settlement), 5.00% due 6/1/2023 | 930,000 | 1,041,665 | |
| Commonwealth of Pennsylvania (Capital Facilities Projects) GO, 5.00% due 3/15/2022 | 12,485,000 | 13,692,050 | |
| Commonwealth of Pennsylvania (Capital Facilities) GO, Series D, 5.00% due 8/15/2023 - 8/15/2025 | 49,450,000 | 57,431,030 | |
| Economy Borough Municipal Authority (Beaver County Sewer System; Insured: BAM), 4.00% due 12/15/2020 - 12/15/2022 | 1,785,000 | 1,901,343 | |
| Lancaster County Solid Waste Management Authority (Harrisburg Resource Recovery Facility), | |||
| 5.00% due 12/15/2023 | 2,680,000 | 3,034,886 | |
| 5.25% due 12/15/2024 | 4,770,000 | 5,438,420 | |
| Luzerne County (Insured: AGM) GO, Series A, 5.00% due 11/15/2021 - 11/15/2024 | 11,840,000 | 13,222,554 | |
| Luzerne County Industrial Development Authority (Insured: AGM) GO, 5.00% due 12/15/2020 - 12/15/2027 | 6,545,000 | 7,256,319 | |
| Monroeville Finance Authority (University of Pittsburgh Medical Center), 5.00% due 2/15/2021 - 2/15/2022 | 3,650,000 | 3,911,247 | |
| Montgomery County Higher Education & Health Authority (Abington Memorial Hospital), 5.00% due 6/1/2022 | 3,000,000 | 3,297,090 | |
| Northampton Borough Municipal Authority (Water System; Insured: AGM), | |||
| 3.00% due 5/15/2023 | 1,255,000 | 1,295,875 | |
| 4.00% due 5/15/2021 - 5/15/2022 | 1,685,000 | 1,783,135 | |
| Pennsylvania Economic Development Financing Authority, Series A, 5.00% due 11/15/2026 | 2,310,000 | 2,790,642 | |
| Pennsylvania Higher Educational Facilities Authority (Saint Joseph’s University), Series A, 5.00% due 11/1/2023 | 1,075,000 | 1,127,374 | |
| Pennsylvania Higher Educational Facilities Authority (Shippensburg University Student Services, Inc. Student Housing) ETM, 4.00% due 10/1/2022 | 2,075,000 | 2,183,024 | |
| Pennsylvania Higher Educational Facilities Authority (University of Pennsylvania Health System), 5.00% due 8/15/2027 | 1,000,000 | 1,231,580 | |
| Pennsylvania Higher Educational Facilities Authority (University of Pittsburgh Medical Center), Series E, 5.00% due 5/15/2019 - 5/15/2020 | 10,700,000 | 10,913,288 | |
| Pennsylvania Turnpike Commission, 5.00% due 12/1/2022 - 12/1/2027 | 6,725,000 | 7,981,169 | |
| Philadelphia Authority for Industrial Development (Mast Charter School) ETM, 5.00% due 8/1/2020 | 220,000 | 225,513 |
| PRINCIPAL AMOUNT | VALUE | ||
| Philadelphia Authority for Industrial Development, 5.00% due 5/1/2024 - 5/1/2028 | $ 2,975,000 | $ 3,512,838 | |
| Philadelphia Municipal Authority (Juvenile Justice Services Center), 5.00% due 4/1/2021 - 4/1/2027 | 7,850,000 | 8,876,207 | |
| Philadelphia School District (State Aid Withholding) GO, | |||
| Series C, 5.00% due 9/1/2019 | 18,410,000 | 18,645,280 | |
| Series E, | |||
| 5.00% due 9/1/2019 | 4,210,000 | 4,263,804 | |
| 5.25% due 9/1/2021 | 2,265,000 | 2,364,139 | |
| Pittsburgh Water and Sewer Authority ETM, Series B, 5.00% due 9/1/2023 | 2,520,000 | 2,868,692 | |
| Pittsburgh Water and Sewer Authority, | |||
| Series A, 5.00% due 9/1/2024 | 7,365,000 | 8,316,853 | |
| Series B, 5.00% due 9/1/2024 (pre-refunded 9/1/2023) | 2,395,000 | 2,726,396 | |
| Plum Borough School District (Insured: BAM) (State Aid Withholding) GO, | |||
| 4.00% due 9/15/2019 - 9/15/2021 | 5,055,000 | 5,197,558 | |
| 5.00% due 9/15/2022 - 9/15/2024 | 5,260,000 | 5,889,250 | |
| School District of Philadelphia GO, 5.00% due 9/1/2023 - 9/1/2028 | 2,400,000 | 2,784,551 | |
| Southeastern Pennsylvania Transportation Authority, 5.00% due 6/1/2022 - 6/1/2028 | 7,705,000 | 9,189,667 | |
| Wayne County Hospital and (Wayne Memorial Hospital; Insured: AGM) HFA, 3.00% due 7/1/2019 | 1,185,000 | 1,186,078 | |
| Rhode Island — 1.6% | |||
| Rhode Island Clean Water Finance Agency (Public Drinking Water Supply or Treatment Facilities), Series B, 5.00% due 10/1/2019 - 10/1/2023 | 9,210,000 | ��10,082,204 | |
| Rhode Island Convention Center Authority (Convention Center and Parking Projects), 5.00% due 5/15/2019 - 5/15/2020 | 13,200,000 | 13,435,417 | |
| Rhode Island Health and Educational Building Corp. (University of Rhode Island Auxiliary Enterprise), Series C, 5.00% due 9/15/2020 - 9/15/2023 | 2,150,000 | 2,371,651 | |
| Rhode Island Health and Educational Building Corp. (University of Rhode Island), Series B, 5.00% due 9/15/2020 - 9/15/2025 | 1,320,000 | 1,473,376 | |
| State of Rhode Island and Providence Plantations (Consolidated Capital Development Loan) GO, | |||
| 5.00% due 8/1/2020 - 8/1/2022 | 34,725,000 | 37,457,392 | |
| Series A, 5.00% due 10/1/2019 | 5,000,000 | 5,086,100 | |
| Series B, 4.00% due 10/15/2020 - 10/15/2022 | 3,200,000 | 3,383,278 | |
| State of Rhode Island and Providence Plantations (Energy Conservation) COP, 5.00% due 4/1/2022 | 2,020,000 | 2,210,042 | |
| State of Rhode Island and Providence Plantations (Information Technology) COP, 5.00% due 11/1/2024 | 3,010,000 | 3,493,677 | |
| State of Rhode Island and Providence Plantations (Kent County Courthouse) COP, Series A, 5.00% due 10/1/2019 - 10/1/2023 | 7,575,000 | 8,241,997 | |
| State of Rhode Island and Providence Plantations (Training School) COP, Series B, 5.00% due 10/1/2020 - 10/1/2023 | 10,270,000 | 11,243,151 | |
| South Carolina — 0.7% | |||
| Beaufort-Jasper Water & Sewer Authority (Waterworks & Sewer System), Series B, 5.00% due 3/1/2021 - 3/1/2025 | 4,750,000 | 5,366,152 | |
| Berkeley County School District (School Facility Equipment Acquisition), 5.00% due 12/1/2020 - 12/1/2024 | 3,550,000 | 4,001,629 | |
| Charleston County (South Aviation Ave. Construction), 5.00% due 12/1/2022 - 12/1/2023 | 4,270,000 | 4,852,166 | |
| City of Charleston Public Facilities Corp. (City of Charleston Project), 5.00% due 9/1/2019 - 9/1/2025 | 3,250,000 | 3,606,441 | |
| b | City of Charleston Waterworks & Sewer System Revenue (Capital Improvement), Series B, 2.119% ( LIBOR 1 Month + 0.37%) due 1/1/2035 (put 1/1/2022) | 17,800,000 | 17,796,084 |
| Greenwood County (Self Regional Healthcare), Series B, 5.00% due 10/1/2022 | 1,000,000 | 1,095,000 | |
| SCAGO Educational Facilities Corp. (School District of Pickens County), 5.00% due 12/1/2021 - 12/1/2025 | 5,320,000 | 6,020,792 | |
| South Dakota — 0.2% | |||
| South Dakota Building Authority, 5.00% due 6/1/2022 - 6/1/2024 | 1,500,000 | 1,682,075 | |
| South Dakota Health & Educational Facilities Authority (Avera Health), Series A, 5.00% due 7/1/2021 | 1,670,000 | 1,794,148 | |
| South Dakota Health & Educational Facilities Authority (Prairie Lakes Health), 5.00% due 4/1/2019 | 2,440,000 | 2,440,000 | |
| South Dakota Health & Educational Facilities Authority (Regional Health) ETM, 5.00% due 9/1/2020 | 1,000,000 | 1,048,480 | |
| South Dakota Health & Educational Facilities Authority (Sanford Health), 5.00% due 11/1/2021 - 11/1/2025 | 2,825,000 | 3,227,254 | |
| Tennessee — 0.5% | |||
| Clarksville Natural Gas Acquisition Corp., 5.00% due 12/15/2019 | 6,000,000 | 6,135,060 | |
| State of Tennessee GO, | |||
| 5.00% due 8/1/2019 - 8/1/2020 | 5,000,000 | 5,126,810 | |
| Series B, 5.00% due 8/1/2019 - 8/1/2020 | 4,000,000 | 4,115,240 | |
| Tennessee Energy Acquisition Corp. (The Gas Project), | |||
| 5.25% due 9/1/2023 | 1,025,000 | 1,142,496 | |
| a | Series A, 4.00% due 5/1/2048 (put 5/1/2023) | 13,750,000 | 14,543,100 |
| Tennessee Energy Acquisition Corp., 5.25% due 9/1/2020 | 1,190,000 | 1,237,778 | |
| Texas — 14.2% | |||
| Austin Convention Enterprises, Inc. (Convention Center Hotel First Tier), 5.00% due 1/1/2021 - 1/1/2027 | 3,680,000 | 4,150,934 | |
| Bexar County Hospital District (University Health System) GO, 5.00% due 2/15/2022 - 2/15/2027 | 8,855,000 | 10,279,865 | |
| Cities of Dallas and Fort Worth (DFW International Airport Terminal Renewal & Improvement Program), Series D, 5.25% due 11/1/2023 | 3,000,000 | 3,307,440 | |
| City of Austin (Water and Wastewater System), | |||
| 5.00% due 11/15/2022 | 2,565,000 | 2,787,437 | |
| 5.00% due 11/15/2022 (pre-refunded 11/15/2021) | 75,000 | 81,535 | |
| City of Beaumont (Waterworks & Sewer System Improvements; Insured: AGM), Series A, 5.00% due 9/1/2023 - 9/1/2024 | 7,500,000 | 8,510,175 |
Thornburg Limited Term Municipal Fund | March 31, 2019 (Unaudited)
| PRINCIPAL AMOUNT | VALUE | ||
| City of Beaumont GO, 5.00% due 3/1/2022 - 3/1/2026 | $ 8,490,000 | $ 9,820,107 | |
| City of Brownsville (Water, Wastewater & Electric Utilities Systems), | |||
| 5.00% due 9/1/2022 | 1,300,000 | 1,434,758 | |
| Series A, 5.00% due 9/1/2020 - 9/1/2023 | 5,400,000 | 5,926,903 | |
| City of Bryan (Electric System Improvements), 5.00% due 7/1/2019 - 7/1/2026 | 8,535,000 | 8,709,315 | |
| City of Dallas (Public Improvements) GO, 5.00% due 2/15/2022 - 2/15/2025 | 5,500,000 | 6,261,740 | |
| City of Dallas (Trinity River Corridor Infrastructure) GO, | |||
| 5.00% due 2/15/2021 - 2/15/2026 | 22,605,000 | 25,743,828 | |
| Series A, 5.00% due 2/15/2024 | 10,235,000 | 11,477,529 | |
| City of Dallas GO, 5.00% due 2/15/2022 - 2/15/2023 | 18,955,000 | 20,707,434 | |
| City of Denton GO, 5.00% due 2/15/2020 | 4,195,000 | 4,206,285 | |
| City of Houston (Combined Utility System), | |||
| Series C, | |||
| b | 2.107% (LIBOR 1 Month + 0.36%) due 5/15/2034 (put 8/1/2021) | 23,525,000 | 23,489,477 |
| 5.00% due 5/15/2022 - 5/15/2024 | 14,695,000 | 16,759,969 | |
| Series D, 5.00% due 11/15/2022 - 11/15/2024 | 17,535,000 | 20,044,924 | |
| City of Houston (Convention & Entertainment Facilities), 5.00% due 9/1/2020 - 9/1/2024 | 3,965,000 | 4,357,186 | |
| City of Houston (Convention & Entertainment Facilities; Insured: AGM/AMBAC), Series B, Zero Coupon due 9/1/2020 | 3,650,000 | 3,562,947 | |
| City of Houston (Public Improvements) GO, Series A, 5.00% due 3/1/2020 - 3/1/2028 | 62,905,000 | 72,130,018 | |
| City of Houston GO, 4.00% due 6/28/2019 | 4,000,000 | 4,023,840 | |
| City of Laredo (Acquire & Purchase Personal Property) GO, 5.00% due 2/15/2020 - 2/15/2026 | 6,015,000 | 6,776,703 | |
| City of Laredo (City Infrastructure Improvements) GO, | |||
| Series A, | |||
| 4.00% due 2/15/2020 | 110,000 | 112,298 | |
| 5.00% due 2/15/2021 - 2/15/2027 | 2,875,000 | 3,367,058 | |
| City of Laredo (Sports Venues; Insured: AGM), 5.00% due 3/15/2021 - 3/15/2024 | 4,400,000 | 4,834,524 | |
| City of Lubbock (Waterworks System) GO, 5.00% due 2/15/2020 - 2/15/2025 | 41,750,000 | 46,936,582 | |
| City of McAllen (International Toll Bridge System; Insured: AGM), Series A, 5.00% due 3/1/2024 - 3/1/2027 | 3,015,000 | 3,522,329 | |
| City of Olmos Park Higher Education Facilities Corp. (University of the Incarnate Word), 5.00% due 12/1/2020 - 12/1/2021 | 4,620,000 | 4,889,330 | |
| City of San Antonio (CPS Energy), 5.25% due 2/1/2024 | 7,000,000 | 8,169,630 | |
| City of San Antonio (Electric and Gas Systems), | |||
| a | 2.25% due 2/1/2033 (put 12/1/2019) | 4,655,000 | 4,671,153 |
| a | Series C, 3.00% due 12/1/2045 (put 12/1/2019) | 5,200,000 | 5,243,680 |
| City of San Antonio (San Antonio Water System), Series A, 5.00% due 5/15/2023 - 5/15/2026 | 5,200,000 | 6,075,146 | |
| City of San Antonio Public Facilities Corp. (Convention Center Refinancing & Expansion), 5.00% due 9/15/2022 | 1,450,000 | 1,602,946 | |
| City of Texas City Industrial Development Corp. (ARCO Pipe Line Co. Project), 7.375% due 10/1/2020 | 4,000,000 | 4,327,360 | |
| Clifton Higher Education Finance Corp. (IDEA Public Schools), 5.00% due 8/15/2019 - 8/15/2023 | 1,545,000 | 1,634,821 | |
| Corpus Christi Business and Job Development Corp. (Seawall Project), 5.00% due 3/1/2021 | 625,000 | 664,275 | |
| Dallas County Utility & Reclamation District GO, 5.00% due 2/15/2020 - 2/15/2027 | 16,485,000 | 18,790,682 | |
| Dallas Independent School District GO, | |||
| a | 5.00% due 2/15/2036 (pre-refunded 2/15/2022) | 760,000 | 832,398 |
| a | 5.00% due 2/15/2036 (put 2/15/2022) | 3,155,000 | 3,437,814 |
| a | Dallas Independent School District, 5.00% due 2/15/2036 (pre-refunded 2/15/2022) | 60,000 | 65,716 |
| Grayson County (State Highway Toll System) GO, | |||
| 4.00% due 1/1/2020 | 2,000,000 | 2,036,820 | |
| 5.00% due 1/1/2022 | 3,000,000 | 3,259,650 | |
| Gulf Coast Waste Disposal Authority (Bayport Area Wastewater Treatment System; Insured: AGM), 5.00% due 10/1/2019 - 10/1/2025 | 6,485,000 | 7,076,099 | |
| Harris County (Flood Control), 5.00% due 10/1/2025 - 10/1/2027 | 14,305,000 | 17,574,554 | |
| Harris County (Tax Road) GO, Series A, 5.00% due 10/1/2025 - 10/1/2028 | 8,985,000 | 11,008,098 | |
| Harris County (Texas Permanent Improvement) GO, | |||
| Series A, 5.00% due 10/1/2025 - 10/1/2027 | 11,565,000 | 14,144,978 | |
| Series B, 5.00% due 10/1/2019 - 10/1/2020 | 1,200,000 | 1,237,269 | |
| Harris County Cultural Education Facilities Finance Corp. (Memorial Hermann Health), Series A, 5.00% due 12/1/2022 - 12/1/2025 | 6,445,000 | 7,478,903 | |
| Harris County Cultural Education Facilities Finance Corp. (TECO Project), 5.00% due 11/15/2020 - 11/15/2027 | 5,825,000 | 6,812,527 | |
| Harris County Cultural Education Facilities Finance Corp. (Texas Medical Center Central Heating & Cooling Services Corp.), Series A, 5.00% due 11/15/2019 | 1,000,000 | 1,020,670 | |
| Harris County-Houston Sports Authority (Insured: AGM), Series A, 5.00% due 11/15/2022 - 11/15/2024 | 23,315,000 | 26,606,271 | |
| Hays County GO, 5.00% due 2/15/2022 - 2/15/2025 | 4,050,000 | 4,575,560 | |
| Houston Airport System Revenue, | |||
| Series B, 5.00% due 7/1/2019 - 7/1/2028 | 11,660,000 | 13,696,055 | |
| Series D, 5.00% due 7/1/2027 | 3,355,000 | 4,129,200 | |
| Houston Higher Education Finance Corp. (Cosmos Foundation, Inc.) ETM, Series A, 5.875% due 5/15/2021 | 895,000 | 933,655 | |
| Houston Higher Education Finance Corp. (KIPP, Inc.; Guaranty: PSF), 5.00% due 8/15/2019 - 8/15/2022 | 2,505,000 | 2,662,575 |
| PRINCIPAL AMOUNT | VALUE | ||
| Houston Independent School District | |||
| a | 2.40% due 6/1/2030 (put 6/1/2021) | $ 4,000,000 | $ 4,047,680 |
| a | Series A-1B- 2.20% due 6/1/2039 (put 6/1/2020) | 7,715,000 | 7,745,011 |
| a | Houston Independent School District, GO (Insured: PSF-GTD) Series B-REM, 2.40% due 6/1/2036 (put 6/1/2021) | 1,725,000 | 1,745,562 |
| Katy (Educational Facilities Improvements; Guaranty: PSF) ISD GO, Series A, 5.00% due 2/15/2023 - 2/15/2026 | 9,670,000 | 11,340,905 | |
| Keller ISD GO, Series A, 5.00% due 8/15/2023 | 1,715,000 | 1,958,616 | |
| La Salle County (Insured: AGM) GO, 5.00% due 3/1/2022 - 3/1/2028 | 18,885,000 | 22,265,733 | |
| Laredo Community College District (School Facilities Improvements) GO, 5.00% due 8/1/2019 - 8/1/2024 | 4,220,000 | 4,547,792 | |
| Lower Colorado River Authority, | |||
| Series A, | |||
| 5.00% due 5/15/2025 | 8,020,000 | 8,785,669 | |
| 5.00% due 5/15/2025 (pre-refunded 5/15/2022) | 55,000 | 60,561 | |
| Metropolitan Transit Authority of Harris County, 5.00% due 11/1/2019 - 11/1/2028 | 31,630,000 | 36,974,320 | |
| New Caney (Guaranty: PSF) ISD GO, 5.00% due 2/15/2024 | 865,000 | 961,949 | |
| a | North East (Educational Facilities; Guaranty: PSF) ISD GO, 2.00% due 8/1/2044 (put 8/1/2019) | 10,075,000 | 10,086,385 |
| North Harris County Regional Water Authority (Regional Water Production Design, Acquisition and Construction), 5.00% due 12/15/2020 - 12/15/2026 | 6,490,000 | 7,495,193 | |
| a | Northside (Educational Facilities; Guaranty: PSF) ISD GO, Series A, 2.00% due 6/1/2039 (put 6/1/2019) | 2,030,000 | 2,030,995 |
| a | Pasadena (Educational Facilities; Guaranty: PSF) ISD GO, Series B, 3.00% due 2/15/2044 (put 8/15/2019) | 9,155,000 | 9,202,240 |
| Round Rock (Educational Facilities Improvements) ISD GO, 5.00% due 8/1/2026 - 8/1/2027 | 2,100,000 | 2,572,584 | |
| Round Rock (Educational Facilities Improvements; Guaranty: PSF) ISD GO, 5.00% due 8/1/2019 - 8/1/2026 | 7,050,000 | 7,886,901 | |
| Sam Rayburn Municipal Power Agency, 5.00% due 10/1/2019 - 10/1/2021 | 5,390,000 | 5,569,322 | |
| San Antonio Public Facilities Corp. (Convention Center Refinancing & Expansion), 5.00% due 9/15/2020 | 915,000 | 960,713 | |
| San Antonio Water System Series A 5.00% due 5/15/2020 - 5/15/2023 | 1,080,000 | 1,160,545 | |
| San Juan Higher Education Finance Authority (IDEA Public Schools), Series A, 5.125% due 8/15/2020 | 585,000 | 597,677 | |
| d | Tarrant County Cultural Education Facilities Finance Corp. (Baylor Scott & White Health Obligated Group; LOC TD Bank N.A.) 1.50% due 11/15/2050 (put 4/01/2019) | 810,000 | 810,000 |
| Tarrant Regional Water District, | |||
| 2.00% due 3/1/2020 | 800,000 | 803,320 | |
| 5.00% due 3/1/2021 - 3/1/2027 | 8,850,000 | 10,298,924 | |
| Texas Transportation Commission (Central Texas Turnpike System), Series C, 5.00% due 8/15/2022 - 8/15/2024 | 2,130,000 | 2,401,433 | |
| Texas Transportation Commission (Highway Improvements) GO, | |||
| 4.00% due 8/29/2019 | 162,435,000 | 164,038,233 | |
| 5.00% due 4/1/2022 - 4/1/2024 | 10,380,000 | 11,761,106 | |
| Texas Transportation Commission State Highway Fund, Series A, 5.00% due 4/1/2024 | 1,650,000 | 1,910,287 | |
| Uptown Development Authority (Infrastructure Improvements), 5.00% due 9/1/2019 | 1,945,000 | 1,971,160 | |
| Walnut Creek Special Utility District (Water System Improvements; Insured: BAM), | |||
| 4.00% due 1/10/2020 - 1/10/2021 | 965,000 | 991,242 | |
| 5.00% due 1/10/2022 - 1/10/2024 | 1,275,000 | 1,418,558 | |
| U. S. Virgin Islands — 0.0% | |||
| Virgin Islands Public Finance Authority (Diageo Project), 6.75% due 10/1/2019 | 1,750,000 | 1,728,125 | |
| Utah — 0.5% | |||
| a | County of Utah, (IHC Health Services, Inc. Obligated Group), Series B- 5.00% due 5/15/2056 (put 8/1/2022) | 7,500,000 | 8,221,800 |
| d | Murray (IHC Health Services, Inc. Obligated Group), (SPA Barclays Bank Plc) Series C, 1.50% due 5/15/2037 (put 4/1/2019) | 1,365,000 | 1,365,000 |
| Murray (IHC Health Services, Inc. Obligated Group; SPA JP Morgan Chase Bank, N.A) | |||
| d | Series A, 1.50% due 5/15/2037 (put 4/1/2019) | 3,275,000 | 3,275,000 |
| d | Series B, 1.50% due 5/15/2037 (put 4/1/2019) | 9,075,000 | 9,075,000 |
| Utah Transit Authority (Integrated Mass Transit System), Series A-SUB, 5.00% due 6/15/2022 - 6/15/2025 | 3,545,000 | 4,090,228 | |
| Weber County (IHC Health Services, Inc. Obligated Group), (SPA The Bank of NY Mellon) | |||
| d | Series A, 1.50% due 2/15/2031 (put 4/1/2019) | 1,000,000 | 1,000,000 |
| d | Series C, 1.50% due 2/15/2035 (put 4/1/2019) | 5,110,000 | 5,110,000 |
| Vermont — 0.2% | |||
| c | Vermont (Vermont Public Service Corp.) EDA, 5.00% due 12/15/2020 | 14,250,000 | 14,895,668 |
| Virginia — 0.2% | |||
| Fairfax County (Inova Health System) IDA, | |||
| 4.00% due 5/15/2022 | 5,500,000 | 5,897,210 | |
| 5.00% due 5/15/2022 | 5,000,000 | 5,512,600 | |
| Washington — 2.6% | |||
| Energy Northwest (Nine Canyon Wind Project Phase I-III), 5.00% due 7/1/2019 - 7/1/2025 | 8,850,000 | 9,453,404 | |
| Marysville School District No. 25 (Snohomish County Educational Facilities) (State Aid Withholding) GO, 5.00% due 12/1/2019 - 12/1/2023 | 9,085,000 | 9,907,794 | |
| Skagit County Public Hospital District No. 1 (Skagit Regional Health) GO, 5.00% due 12/1/2019 - 12/1/2022 | 10,035,000 | 10,818,191 | |
| Skagit County Public Hospital District No. 1 (Skagit Regional Health), Series A, 5.00% due 12/1/2019 - 12/1/2023 | 3,245,000 | 3,482,878 |
Thornburg Limited Term Municipal Fund | March 31, 2019 (Unaudited)
| PRINCIPAL AMOUNT | VALUE | ||
| Skagit County Public Hospital District No. 2 (Island Hospital) GO, | |||
| 4.00% due 12/1/2019 - 12/1/2021 | $ 3,000,000 | $ 3,111,310 | |
| 5.00% due 12/1/2022 | 1,700,000 | 1,891,539 | |
| State of Washington (Capital Projects) GO, 5.00% due 7/1/2025 | 10,475,000 | 12,346,149 | |
| State of Washington (Public Highway, Bridge, Ferry Capital and Operating Costs; Insured: Natl-Re) GO, Series F, Zero Coupon due 12/1/2019 | 3,030,000 | 2,997,337 | |
| State of Washington (State and Local Agency Real and Personal Property Projects) (State Aid Withholding) COP, 5.00% due 7/1/2019 - 7/1/2022 | 10,415,000 | 11,117,946 | |
| State of Washington (State and Local Agency Real and Personal Property Projects) COP, Series A, 5.00% due 7/1/2024 - 7/1/2027 | 17,775,000 | 21,382,176 | |
| State of Washington (Various Purposes) GO, Series C, 5.00% due 2/1/2025 - 2/1/2029 | 50,385,000 | 62,000,390 | |
| Tacoma School District No.10 (Pierce County Capital Projects) GO, 5.00% due 12/1/2019 - 12/1/2020 | 4,500,000 | 4,687,685 | |
| Washington Health Care Facilities Authority (Overlake Hospital Medical Center) ETM, | |||
| 4.75% due 7/1/2020 | 1,000,000 | 1,039,100 | |
| 5.00% due 7/1/2019 | 1,050,000 | 1,058,841 | |
| West Virginia — 0.5% | |||
| Mason County (Appalachian Power Co.), Series L, 2.75% due 10/1/2022 | 15,000,000 | 15,255,900 | |
| a | West Virginia Economic Development Authority (Appalachian Power Co.), 2.625% due 12/1/2042 (put 6/1/2022) | 8,500,000 | 8,635,745 |
| West Virginia Higher Education Policy Commission (Higher Education Facilities), Series A, 5.00% due 4/1/2020 - 4/1/2022 | 3,500,000 | 3,740,470 | |
| Wisconsin — 1.2% | |||
| Wisconsin Health & Educational Facilities Authority (Advocate Aurora Health Obligated Group), | |||
| a | 5.00% due 8/15/2054 (put 1/25/2023) | 10,485,000 | 11,711,850 |
| a | 5.00% due 8/15/2054 (put 1/26/2022) | 9,520,000 | 10,361,092 |
| a | 5.00% due 8/15/2054 (put 1/29/2025) | 16,065,000 | 18,691,788 |
| Wisconsin Health & Educational Facilities Authority (Agnesian Healthcare, Inc.) ETM, 5.00% due 7/1/2019 - 7/1/2020 | 3,110,000 | 3,207,419 | |
| Wisconsin Health & Educational Facilities Authority (Ascension Health Alliance System), | |||
| 5.00% due 11/15/2024 - 11/15/2026 | 3,860,000 | 4,597,429 | |
| a | 5.00% due 11/15/2043 (put 6/1/2021) | 10,000,000 | 10,690,200 |
| Wisconsin Health & Educational Facilities Authority (ProHealth Care, Inc.), 5.00% due 8/15/2020 - 8/15/2022 | 5,250,000 | 5,609,770 | |
| Wisconsin Health & Educational Facilities Authority (UnityPoint Health), Series A, 5.00% due 12/1/2022 | 1,000,000 | 1,113,800 | |
| WPPI Energy (Power Supply System), 5.00% due 7/1/2021 | 4,100,000 | 4,409,509 | |
| WPPI Energy, Series A, 5.00% due 7/1/2022 - 7/1/2028 | 1,835,000 | 2,141,058 | |
| Total Investments — 98.3%(Cost $5,828,556,616) | $5,954,654,772 | ||
| Other Assets Less Liabilities — 1.7% | 105,585,480 | ||
| Net Assets — 100.0% | $6,060,240,252 |
| Footnote Legend | |
| a | Variable Rate Demand Obligations are instruments whose interest rates change on a mandatory date (demand date) or whose interest rates will vary with changes in a designated base rate. The rate disclosed is the rate at March 31, 2019. |
| b | Floating Rate Security. Stated interest/floor rate was in effect at March 31, 2019. |
| c | Illiquid security. |
| d | Variable Rate Demand Notes are instruments whose interest rates change on a specific date (such as coupon date or interest payment date) or whose interest rates vary with changes in a designated base rate (such as the prime interest rate). This instrument is payable on demand and is secured by letters of credit or other credit support agreements from major banks. |
| e | When-issued security. |
| f | Segregated as collateral for a when-issued security. |
To simplify the listings of securities, abbreviations are used per the table below:
| AGC | Insured by Associated General Contractors |
| AGM | Insured by Assured Guaranty Municipal Corp. |
| AMBAC | Insured by American Municipal Bond Assurance Corp. |
| BAM | Insured by Build America Mutual Insurance Co. |
| BHAC | Insured by Berkshire Hathaway Assurance Corp. |
| COP | Certificates of Participation |
| DFA | Development Finance Authority |
| EDA | Economic Development Authority |
| ETM | Escrowed to Maturity |
| FGIC | Insured by Financial Guaranty Insurance Co. |
| FSA | Insured by Financial Security Assurance Co. |
| GO | General Obligation |
| GRT | Gross Receipts Tax |
| HFA | Health Facilities Authority |
| HFFA | Health Facilities Financing Authority |
| IDA | Industrial Development Authority |
| ISD | Independent School District |
| LIBOR | London Interbank Offered Rates |
| LOC | Letter of Credit |
| Mtg | Mortgage |
| MUNIPSA | Securities Industry and Financial Markets Association (SIFMA) Municipal Swap Index |
| Natl-Re | Insured by National Public Finance Guarantee Corp. |
| PSF | Guaranteed by Permanent School Fund |
| Q-SBLF | Insured by Qualified School Bond Loan Fund |
| SPA | Stand-by Purchase Agreement |
| Syncora | Insured by Syncora Guarantee Inc. |
| USD | Unified School District |
Thornburg Limited Term Municipal Fund | March 31, 2019 (Unaudited)
| ASSETS | |
| Investments at value (cost $5,828,556,616) (Note 3) | $ 5,954,654,772 |
| Cash | 872,033 |
| Receivable for investments sold | 36,970,000 |
| Receivable for fund shares sold | 17,104,643 |
| Interest receivable | 70,732,024 |
| Prepaid expenses and other assets | 231,641 |
| Total Assets | 6,080,565,113 |
| Liabilities | |
| Payable for investments purchased | 6,500,000 |
| Payable for fund shares redeemed | 9,191,853 |
| Payable to investment advisor and other affiliates (Note 4) | 2,271,888 |
| Accounts payable and accrued expenses | 1,389,133 |
| Dividends payable | 971,987 |
| Total Liabilities | 20,324,861 |
| Net Assets | $ 6,060,240,252 |
| NET ASSETS CONSIST OF | |
| Distributable earnings | $ 90,267,692 |
| Net capital paid in on shares of beneficial interest | 5,969,972,560 |
| $ 6,060,240,252 | |
| NET ASSET VALUE | |
| Class A Shares: | |
| Net asset value and redemption price per share ($986,804,043 applicable to 68,800,437 shares of beneficial interest outstanding - Note 5) | $ 14.34 |
| Maximum sales charge, 1.50% of offering price | 0.22 |
| Maximum offering price per share | $ 14.56 |
| Class C Shares: | |
| Net asset value and offering price per share* ($391,156,129 applicable to 27,221,707 shares of beneficial interest outstanding - Note 5) | $ 14.37 |
| Class I Shares: | |
| Net asset value, offering and redemption price per share ($4,682,280,080 applicable to 326,407,127 shares of beneficial interest outstanding - Note 5) | $ 14.34 |
| * | Redemption price per share is equal to net asset value less any applicable contingent deferred sales charge. |
Thornburg Limited Term Municipal Fund | Six Months Ended March 31, 2019 (Unaudited)
| INVESTMENT INCOME | |
| Interest income (net of premium amortized of $52,807,027) | $ 78,960,241 |
| EXPENSES | |
| Investment advisory fees (Note 4) | 8,430,132 |
| Administration fees (Note 4) | |
| Class A Shares | 435,123 |
| Class C Shares | 185,215 |
| Class I Shares | 2,132,963 |
| Distribution and service fees (Note 4) | |
| Class A Shares | 1,238,716 |
| Class C Shares | 1,054,748 |
| Transfer agent fees | |
| Class A Shares | 398,630 |
| Class C Shares | 152,920 |
| Class I Shares | 1,976,030 |
| Registration and filing fees | |
| Class A Shares | 12,011 |
| Class C Shares | 8,889 |
| Class I Shares | 24,498 |
| Custodian fees (Note 2) | 154,750 |
| Professional fees | 76,870 |
| Trustee and officer fees (Note 4) | 178,340 |
| Other expenses | 192,832 |
| Total Expenses | 16,652,667 |
| Net Investment Income | $ 62,307,574 |
| REALIZED AND UNREALIZED GAIN (LOSS) | |
| Net realized gain (loss) on investments | (13,066,715) |
| Net change in unrealized appreciation (depreciation) on investments | 119,943,398 |
| Net Realized and Unrealized Gain | 106,876,683 |
| Net Increase in Net Assets Resulting from Operations | $ 169,184,257 |
Thornburg Limited Term Municipal Fund
| Six Months Ended March 31, 2019* | Year Ended September 30, 2018 | |
| INCREASE (DECREASE) IN NET ASSETS FROM | ||
| OPERATIONS | ||
| Net investment income | $ 62,307,574 | $ 128,531,531 |
| Net realized gain (loss) on investments | (13,066,715) | 2,140,529 |
| Net unrealized appreciation (depreciation) on investments | 119,943,398 | (166,568,493) |
| Net Increase (Decrease) in Net Assets Resulting from Operations | 169,184,257 | (35,896,433) |
| DIVIDENDS TO SHAREHOLDERS | ||
| From distributable earnings | ||
| Class A Shares | (8,964,833) | (19,574,441) |
| Class C Shares | (3,300,400) | (7,623,811) |
| Class I Shares | (50,043,238) | (101,333,279) |
| FUND SHARE TRANSACTIONS (NOTE 5) | ||
| Class A Shares | (67,957,235) | (248,125,740) |
| Class C Shares | (66,402,759) | (142,631,526) |
| Class I Shares | (490,206,232) | (52,452,302) |
| Net Decrease in Net Assets | (517,690,440) | (607,637,532) |
| NET ASSETS | ||
| Beginning of Period | 6,577,930,692 | 7,185,568,224 |
| End of Period | $ 6,060,240,252 | $ 6,577,930,692 |
| * | Unaudited. |
Thornburg Limited Term Municipal Fund | March 31, 2019 (Unaudited)
Thornburg Limited Term Municipal Fund | March 31, 2019 (Unaudited)
| Cost of investments for tax purposes | $ 5,828,556,616 |
| Gross unrealized appreciation on a tax basis | 127,747,122 |
| Gross unrealized depreciation on a tax basis | (1,648,966) |
| Net unrealized appreciation (depreciation) on investments (tax basis) | $ 126,098,156 |
| Fair Value Measurements at March 31, 2019 | ||||
| TOTAL | LEVEL 1 | LEVEL 2 | LEVEL 3 | |
| Assets | ||||
| Investments in Securities | ||||
| Municipal Bonds | $ 5,954,654,772 | $ — | $ 5,954,654,772 | $ — |
| Total Investments in Securities | $5,954,654,772 | $— | $5,954,654,772 | $— |
| Total Assets | $5,954,654,772 | $— | $5,954,654,772 | $— |
Thornburg Limited Term Municipal Fund | March 31, 2019 (Unaudited)
| Management Fee Schedule | |
| DAILY NET ASSETS | FEE RATE |
| Up to $500 million | 0.500% |
| Next $500 million | 0.400 |
| Next $500 million | 0.300 |
| Next $500 million | 0.250 |
| Over $2 billion | 0.225 |
| Administration Fee Schedule | |
| Daily Net Assets | Fee Rate |
| Up to $20 billion | 0.100% |
| $20 billion to $40 billion | 0.075 |
| $40 billion to $60 billion | 0.040 |
| Over $60 billion | 0.030 |
| SIX MONTHS ENDED March 31, 2019 (UNAUDITED) | YEAR ENDED September 30, 2018 (AUDITED) | |||
| SHARES | AMOUNT | SHARES | AMOUNT | |
| Class A Shares | ||||
| Shares sold | 7,423,547 | $ 105,344,667 | 10,903,871 | $ 155,220,953 |
| Shares issued to shareholders in reinvestment of dividends | 584,456 | 8,302,129 | 1,276,035 | 18,129,763 |
| Shares repurchased | (12,826,336) | (181,604,031) | (29,617,720) | (421,476,456) |
| Net decrease | (4,818,333) | $ (67,957,235) | (17,437,814) | $ (248,125,740) |
| Class C Shares | ||||
| Shares sold | 925,457 | $ 13,150,764 | 1,992,579 | $ 28,459,923 |
| Shares issued to shareholders in reinvestment of dividends | 204,428 | 2,908,716 | 472,032 | 6,719,090 |
| Shares repurchased | (5,801,359) | (82,462,239) | (12,478,365) | (177,810,539) |
| Net decrease | (4,671,474) | $ (66,402,759) | (10,013,754) | $ (142,631,526) |
| Class I Shares | ||||
| Shares sold | 55,781,884 | $ 791,434,226 | 100,614,374 | $ 1,432,688,087 |
| Shares issued to shareholders in reinvestment of dividends | 3,140,631 | 44,611,026 | 6,390,337 | 90,797,213 |
| Shares repurchased | (93,536,777) | (1,326,251,484) | (110,796,332) | (1,575,937,602) |
| Net decrease | (34,614,262) | $ (490,206,232) | (3,791,621) | $ (52,452,302) |
Thornburg Limited Term Municipal Fund
| PER SHARE PERFORMANCE (FOR A SHARE OUTSTANDING THROUGHOUT THE PERIOD) | ||||||||
| UNLESS OTHERWISE NOTED, PERIODS ARE FISCAL YEARS ENDED SEPTEMBER 30, | Net Asset Value, Beginning of PERIOD | Net Investment Income (Loss)+ | Net Realized & Unrealized Gain (Loss) on Investments | Total from Investment Operations | Dividends from Net Investment Income | Dividends from Net Realized Gains | Total Dividends | Net Asset Value, End of PERIOD |
| CLASS A SHARES | ||||||||
| 2019(b)(c) | $ 14.10 | 0.13 | 0.24 | 0.37 | (0.13) | — | (0.13) | $ 14.34 |
| 2018(b) | $ 14.43 | 0.24 | (0.33) | (0.09) | (0.24) | — | (0.24) | $ 14.10 |
| 2017(b) | $ 14.63 | 0.23 | (0.20) | 0.03 | (0.23) | — | (0.23) | $ 14.43 |
| 2016(b) | $ 14.52 | 0.22 | 0.11 | 0.33 | (0.22) | — | (0.22) | $ 14.63 |
| 2015(b) | $ 14.58 | 0.23 | (0.06) | 0.17 | (0.23) | — | (0.23) | $ 14.52 |
| 2014(b) | $ 14.38 | 0.26 | 0.20 | 0.46 | (0.26) | — | (0.26) | $ 14.58 |
| CLASS C SHARES | ||||||||
| 2019(c) | $ 14.12 | 0.11 | 0.25 | 0.36 | (0.11) | — | (0.11) | $ 14.37 |
| 2018 | $ 14.46 | 0.20 | (0.34) | (0.14) | (0.20) | — | (0.20) | $ 14.12 |
| 2017 | $ 14.66 | 0.20 | (0.20) | — | (0.20) | — | (0.20) | $ 14.46 |
| 2016 | $ 14.55 | 0.19 | 0.11 | 0.30 | (0.19) | — | (0.19) | $ 14.66 |
| 2015 | $ 14.60 | 0.19 | (0.05) | 0.14 | (0.19) | — | (0.19) | $ 14.55 |
| 2014 | $ 14.41 | 0.22 | 0.19 | 0.41 | (0.22) | — | (0.22) | $ 14.60 |
| CLASS I SHARES | ||||||||
| 2019(c) | $ 14.10 | 0.15 | 0.24 | 0.39 | (0.15) | — | (0.15) | $ 14.34 |
| 2018 | $ 14.43 | 0.28 | (0.33) | (0.05) | (0.28) | — | (0.28) | $ 14.10 |
| 2017 | $ 14.64 | 0.28 | (0.21) | 0.07 | (0.28) | — | (0.28) | $ 14.43 |
| 2016 | $ 14.53 | 0.27 | 0.11 | 0.38 | (0.27) | — | (0.27) | $ 14.64 |
| 2015 | $ 14.58 | 0.27 | (0.05) | 0.22 | (0.27) | — | (0.27) | $ 14.53 |
| 2014 | $ 14.38 | 0.30 | 0.20 | 0.50 | (0.30) | — | (0.30) | $ 14.58 |
| (a) | Not annualized for periods less than one year. |
| (b) | Sales loads are not reflected in computing total return. |
| (c) | Unaudited Six Month Period Ended March 31. |
| (d) | Annualized. |
| + | Based on weighted average shares outstanding. |
| RATIOS TO AVERAGE NET ASSETS | SUPPLEMENTAL DATA | ||||||
| Net Investment Income (Loss) (%) | Expenses, After Expense Reductions (%) | Expenses, After Expense Reductions and Net of Custody Credits (%) | Expenses, Before Expense Reductions (%) | Total Return (%)(a) | Portfolio Turnover Rate (%)(a) | Net Assets at End of PERIOD (Thousands) | |
| 1.81(d) | 0.71(d) | 0.71(d) | 0.71(d) | 2.62 | 11.23 | $ 986,804 | |
| 1.67 | 0.71 | 0.71 | 0.71 | (0.64) | 16.29 | $ 1,037,769 | |
| 1.62 | 0.73 | 0.73 | 0.73 | 0.24 | 17.56 | $ 1,314,094 | |
| 1.54 | 0.72 | 0.72 | 0.72 | 2.32 | 14.53 | $ 1,697,329 | |
| 1.56 | 0.73 | 0.73 | 0.73 | 1.15 | 18.56 | $ 1,700,127 | |
| 1.78 | 0.72 | 0.71 | 0.72 | 3.20 | 14.46 | $ 1,865,213 | |
| 1.56(d) | 0.95(d) | 0.95(d) | 0.95(d) | 2.57 | 11.23 | $ 391,156 | |
| 1.43 | 0.95 | 0.95 | 0.95 | (0.94) | 16.29 | $ 450,402 | |
| 1.38 | 0.97 | 0.97 | 0.97 | 0.01 | 17.56 | $ 605,898 | |
| 1.30 | 0.96 | 0.96 | 0.96 | 2.07 | 14.53 | $ 741,637 | |
| 1.32 | 0.96 | 0.96 | 0.96 | 0.98 | 18.56 | $ 730,395 | |
| 1.52 | 0.97 | 0.96 | 0.97 | 2.87 | 14.46 | $ 749,648 | |
| 2.06(d) | 0.46(d) | 0.46(d) | 0.46(d) | 2.75 | 11.23 | $ 4,682,280 | |
| 1.95 | 0.43 | 0.43 | 0.43 | (0.36) | 16.29 | $ 5,089,760 | |
| 1.93 | 0.42 | 0.42 | 0.42 | 0.49 | 17.56 | $ 5,265,576 | |
| 1.85 | 0.41 | 0.41 | 0.41 | 2.64 | 14.53 | $ 5,506,166 | |
| 1.88 | 0.41 | 0.41 | 0.41 | 1.54 | 18.56 | $ 4,832,467 | |
| 2.09 | 0.40 | 0.40 | 0.40 | 3.53 | 14.46 | $ 4,417,547 | |
Thornburg Limited Term Municipal Fund | March 31, 2019 (Unaudited)
| (1) | transaction costs, including |
| (a) | sales charges (loads) on purchase payments, for Class A shares; |
| (b) | a deferred sales charge on redemptions of any part or all of a purchase of $1 million of Class A shares within 12 months of purchase; |
| (c) | a deferred sales charge on redemptions of Class C shares within 12 months of purchase; |
| (2) | ongoing costs, including management fees; distribution and/or service (12b-1) fees; and other Fund expenses. |
| BEGINNING ACCOUNT VALUE 10/1/18 | ENDING ACCOUNT VALUE 3/31/19 | EXPENSES PAID DURING PERIOD† 10/1/18—3/31/19 | |
| CLASS A SHARES | |||
| Actual | $1,000.00 | $1,026.22 | $3.59 |
| Hypothetical* | $1,000.00 | $1,021.39 | $3.58 |
| CLASS C SHARES | |||
| Actual | $1,000.00 | $1,025.67 | $4.80 |
| Hypothetical* | $1,000.00 | $1,020.19 | $4.78 |
| CLASS I SHARES | |||
| Actual | $1,000.00 | $1,027.50 | $2.33 |
| Hypothetical* | $1,000.00 | $1,022.64 | $2.32 |
| † | Expenses are equal to the annualized expense ratio for each class (A: 0.71%; C: 0.95%; I: 0.46%) multiplied by the average account value over the period, multiplied by 182/365 to reflect the one-half year period. |
| * | Hypothetical assumes a rate of return of 5% per year before expenses. |
Thornburg Limited Term Municipal Fund | March 31, 2019 (Unaudited)
| ■ | Thornburg Investment Income Builder Fund |
| ■ | Thornburg Global Opportunities Fund |
| ■ | Thornburg International Value Fund |
| ■ | Thornburg Better World International Fund |
| ■ | Thornburg International Growth Fund |
| ■ | Thornburg Developing World Fund |
| ■ | Thornburg Value Fund |
| ■ | Thornburg Core Growth Fund |
| ■ | Thornburg Investment Income Builder Fund |
| ■ | Thornburg Summit Fund |
| ■ | Thornburg Low Duration Income Fund |
| ■ | Thornburg Limited Term U.S. Government Fund |
| ■ | Thornburg Limited Term Income Fund |
| ■ | Thornburg Strategic Income Fund |
| ■ | Thornburg Low Duration Municipal Fund |
| ■ | Thornburg Limited Term Municipal Fund |
| ■ | Thornburg Intermediate Municipal Fund |
| ■ | Thornburg California Limited Term Municipal Fund |
| ■ | Thornburg New Mexico Intermediate Municipal Fund |
| ■ | Thornburg New York Intermediate Municipal Fund |
| ■ | Thornburg Strategic Municipal Income Fund |
| ■ | Thornburg Long/Short Equity Fund |

| 800.847.0200 | TH1072 |

| 4 | |
| 6 | |
| 7 | |
| 8 | |
| 16 | |
| 17 | |
| 18 | |
| 19 | |
| 24 | |
| 26 | |
| 27 | |
| 28 |
| SHARE CLASS | NASDAQ SYMBOL | CUSIP |
| Class A | THIMX | 885-215-202 |
| Class C | THMCX | 885-215-780 |
| Class I | THMIX | 885-215-673 |
Thornburg Intermediate Municipal Fund | March 31, 2019 (Unaudited)
 |  |
| Christopher Ryon,cfa Portfolio Manager Managing Director | Nicholos Venditti,cfa Portfolio Manager Managing Director |
 | |
| David Ashley,cfa Portfolio Manager Managing Director |
Thornburg Intermediate Municipal Fund | March 31, 2019 (Unaudited)
| 1-YR | 3-YR | 5-YR | 10-YR | SINCE INCEP. | |
| Class A Shares(Incep: 7/22/91) | |||||
| Without sales charge | 3.80% | 1.52% | 2.40% | 3.97% | 4.58% |
| With sales charge | 1.75% | 0.85% | 1.99% | 3.76% | 4.51% |
| Class C Shares(Incep: 9/1/94) | |||||
| Without sales charge | 3.44% | 1.18% | 2.06% | 3.65% | 3.78% |
| With sales charge | 2.84% | 1.18% | 2.06% | 3.65% | 3.78% |
| Class I Shares(Incep: 7/5/96) | 4.12% | 1.80% | 2.70% | 4.29% | 4.31% |
| Annualized Distribution Yield | 2.22% |
| SEC Yield | 1.38% |
| FINAL VALUE |
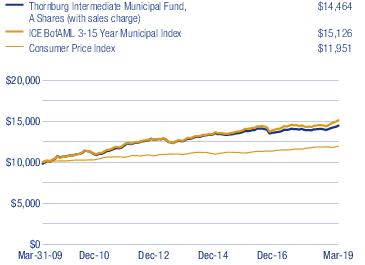
Thornburg Intermediate Municipal Fund | March 31, 2019 (Unaudited)
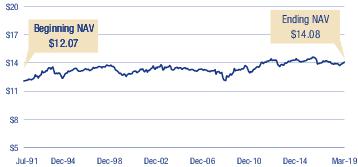
| KEY PORTFOLIO ATTRIBUTES | |
| Number of Bonds | 527 |
| Effective Duration | 4.0 Yrs |
| Average Maturity | 7.4 Yrs |
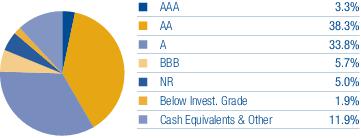

| 12% | 12% | 8% | 12% | 12% | 11% | 11% | 10% | 6% | 8% |
Thornburg Intermediate Municipal Fund | March 31, 2019 (Unaudited)
| PRINCIPAL AMOUNT | VALUE | ||
| Municipal Bonds — 98.6% | |||
| Alabama — 1.1% | |||
| Alabama Public School & College Authority (Educational Facilities), Series B, 5.00% due 6/1/2021 - 6/1/2026 | $ 5,155,000 | $ 5,777,163 | |
| East Alabama Health Care Authority (Health Care Facilities Capital Improvements) GO, 5.00% due 9/1/2027 | 1,250,000 | 1,335,750 | |
| UAB Medicine Finance Authority (University Hospital), Series B, 5.00% due 9/1/2032 | 6,000,000 | 6,981,960 | |
| Alaska — 0.2% | |||
| Alaska Housing Finance Corp. (State Capital Project) GO, Series A, 5.00% due 12/1/2021 (pre-refunded 12/1/2020) | 500,000 | 528,470 | |
| City of Valdez (BP Pipelines (Alaska), Inc. Project), 5.00% due 1/1/2021 | 2,000,000 | 2,108,840 | |
| Arizona — 2.1% | |||
| Arizona (Scottsdale Lincoln Hospitals) HFA, 5.00% due 12/1/2031 | 2,500,000 | 2,833,500 | |
| Arizona Board of Regents (University of Arizona SPEED), 5.00% due 8/1/2024 - 8/1/2029 | 2,635,000 | 2,899,472 | |
| a | Arizona Health Facilities Authority (Banner Health Obligated Group; LOC Bank Of America N.A.), Series C-RMK 1.50% due 1/1/2046 (put 4/1/2019) | 3,675,000 | 3,675,000 |
| City of Flagstaff (Urban Trail, Street and Utilities Improvements) GO, | |||
| 3.00% due 7/1/2020 | 700,000 | 712,831 | |
| 4.00% due 7/1/2022 - 7/1/2023 | 620,000 | 671,619 | |
| County of Pima (Providence Day School Project) IDA, 5.00% due 12/1/2030 | 2,000,000 | 2,070,000 | |
| b | Industrial Development Authority of the County of Yavapai, (Waste Management, Inc.) AMT 2.80% due 6/1/2027 (put 6/1/2021) | 2,000,000 | 2,024,280 |
| Salt River Project Agricultural Improvement and Power District (Salt River Electric System), 5.00% due 1/1/2033 - 1/1/2037 | 7,000,000 | 8,476,605 | |
| Salt Verde Financial Corp. (Gas Supply Acquisition), 5.25% due 12/1/2022 - 12/1/2028 | 2,770,000 | 3,161,154 | |
| Arkansas — 0.3% | |||
| Board of Trustees of the University of Arkansas (Fayetteville Campus), 5.00% due 11/1/2031 - 11/1/2034 | 3,655,000 | 4,151,717 | |
| California — 5.7% | |||
| Alameda County Joint Powers Authority (Alameda County Medical Center Highland Hospital), Series A, 5.25% due 12/1/2027 - 12/1/2029 | 3,650,000 | 4,226,058 | |
| Brentwood Infrastructure Financing Authority (Insured: AGM), 5.00% due 11/1/2026 | 2,000,000 | 2,155,660 | |
| California (Adventist Health System/West) HFFA, Series A, 5.00% due 3/1/2026 | 3,020,000 | 3,396,715 | |
| California (Children’s Hospital Los Angeles) HFFA, Series A, 5.00% due 11/15/2022 - 8/15/2033 | 1,950,000 | 2,220,174 | |
| California (Dignity Health) HFFA, Series A, 5.25% due 3/1/2027 | 5,250,000 | 5,596,342 | |
| California Educational Facilities Authority (Pitzer College), 5.50% due 4/1/2029 (pre-refunded 4/1/2020) | 3,000,000 | 3,123,210 | |
| California Infrastructure and Economic Development Bank (King City Joint Union High School District), 5.75% due 8/15/2029 | 1,500,000 | 1,554,705 | |
| c | California Infrastructure and Economic Development Bank (Los Angeles County Museum of Art), Series A, 2.399% (LIBOR 1 Month + 0.65%) due 12/1/2050 (put 2/1/2021) | 3,000,000 | 3,009,870 |
| Carson Redevelopment Agency (Redevelopment Project Area No. 1), | |||
| Series A, | |||
| 6.25% due 10/1/2022 (pre-refunded 10/1/2019) | 1,620,000 | 1,659,366 | |
| 6.375% due 10/1/2024 (pre-refunded 10/1/2019) | 1,300,000 | 1,332,396 | |
| Corona-Norco (Insured: AGM) USD COP, 5.00% due 4/15/2021 | 1,000,000 | 1,033,850 | |
| Delano Financing Authority (City of Delano Police Station and Woollomes Avenue Bridge), Series A, 5.00% due 12/1/2025 | 2,555,000 | 2,688,908 | |
| Franklin-McKinley School District (Insured: Natl-Re) GO, 5.25% due 8/1/2027 | 1,000,000 | 1,282,620 | |
| Fresno (Educational Facilities and Improvements; Insured: Natl-Re) USD GO, Series A, 6.00% due 8/1/2026 | 1,410,000 | 1,672,147 | |
| Jurupa Public Financing Authority (Eastvale Community Services; Insured: AGM), 5.50% due 9/1/2025 - 9/1/2027 | 2,530,000 | 2,921,906 | |
| M-S-R Energy Authority, 6.125% due 11/1/2029 | 2,500,000 | 3,130,050 | |
| North City West School Facilities Financing Authority (Carmel Valley Schools; Insured: AGM), Series A, 5.00% due 9/1/2024 | 1,080,000 | 1,200,668 | |
| b,d | Northern California Energy Authority (Commodity Supply Revenue), Series A, 4.00% due 7/1/2049 (put 7/1/2024) | 8,000,000 | 8,627,920 |
| Oakland (County of Alameda Educational Facilities) USD GO, 5.00% due 8/1/2032 - 8/1/2034 | 3,000,000 | 3,413,040 | |
| Redwood City Redevelopment Agency (Redevelopment Area A-2; Insured: AMBAC), Zero Coupon due 7/15/2023 | 2,065,000 | 1,890,074 | |
| San Jose Redevelopment Agency (Merged Area Redevelopment Project), | |||
| 5.25% due 8/1/2027 (pre-refunded 8/1/2020) | 2,400,000 | 2,523,288 | |
| 5.375% due 8/1/2028 (pre-refunded 8/1/2020) | 1,175,000 | 1,237,299 | |
| San Mateo Union High School District (Educational Facilities; Insured: Natl-Re) GO, Series B, Zero Coupon due 9/1/2019 | 3,000,000 | 2,981,730 | |
| Saratoga Union School District (Insured: Natl-Re) GO, Series B, Zero Coupon due 9/1/2023 | 900,000 | 833,346 | |
| State of California (Kindergarten-University Facilities) GO, 5.25% due 9/1/2026 | 5,000,000 | 5,435,250 | |
| Turlock Irrigation District, | |||
| Series A, | |||
| 5.00% due 1/1/2021 | 1,005,000 | 1,031,783 | |
| 5.00% due 1/1/2021 (pre-refunded 1/1/2020) | 745,000 | 765,473 | |
| William S. Hart Union High School District (Educational Facilities; Insured: AGM) GO, Series B, Zero Coupon due 9/1/2021 | 800,000 | 768,696 | |
| Colorado — 1.7% | |||
| City & County of Denver (SPA JP Morgan Chase Bank, N.A), | |||
| a | Series A2 1.50% due 12/1/2029 (put 4/1/2019) | 4,895,000 | 4,895,000 |
| a | Series A3 1.50% due 12/1/2031 (put 4/1/2019) | 2,630,000 | 2,630,000 |
| Housing Authority of the City and County of Denver (Three Towers Rehabilitation; Insured: AGM) AMT, 5.20% due 11/1/2027 | 1,335,000 | 1,338,538 | |
| Park Creek Metropolitan District (Insured: AGM), 5.25% due 12/1/2020 (pre-refunded 12/1/2019) | 1,120,000 | 1,147,541 | |
| Regional Transportation District (North Metro Rail Line) COP, Series A, 5.00% due 6/1/2028 | 1,550,000 | 1,732,171 | |
| Regional Transportation District (Public Mass Transportation System) COP, | |||
| Series A, |
| PRINCIPAL AMOUNT | VALUE | ||
| 5.50% due 6/1/2022 | $ 260,000 | $ 271,235 | |
| 5.50% due 6/1/2022 (pre-refunded 6/1/2020) | 2,740,000 | 2,863,656 | |
| State of Colorado COP, Series A, 5.00% due 9/1/2029 - 9/1/2032 | 5,205,000 | 6,331,144 | |
| Connecticut — 1.8% | |||
| City of Hartford (Various Public Improvements; Insured: AGM) GO, Series A, 5.00% due 7/1/2031 | 1,700,000 | 1,932,492 | |
| Connecticut Health & Educational Facilities Authority (Ethel Walker School), Series B, 5.75% due 7/1/2029 (pre-refunded 7/1/2019) | 1,350,000 | 1,364,202 | |
| State of Connecticut GO, | |||
| 5.00% due 6/15/2028 - 4/15/2034 | 12,305,000 | 14,480,699 | |
| Series A/E, 5.00% due 9/15/2033 - 4/15/2035 | 4,650,000 | 5,455,227 | |
| District of Columbia — 1.1% | |||
| Metropolitan Airports Authority (Dulles Toll Road; Insured: AGM), Zero Coupon due 10/1/2023 - 10/1/2024 | 9,890,000 | 8,687,872 | |
| Washington Convention & Sports Authority, Series A, 5.00% due 10/1/2028 | 1,105,000 | 1,355,968 | |
| Washington Metropolitan Area Transit Authority, 5.00% due 7/1/2032 - 7/1/2037 | 3,325,000 | 3,950,784 | |
| Florida — 7.1% | |||
| Broward County (Airport System Improvements) AMT, 5.00% due 10/1/2034 - 10/1/2035 | 3,500,000 | 4,092,750 | |
| Central Florida Expressway Authority, 5.00% due 7/1/2037 | 1,095,000 | 1,288,804 | |
| a | City of Gainesville (Utilities System; SPA Landesbank Hessen-Thuringen), Series A-REMK 1.49% due 10/1/2026 (put 4/1/2019) | 1,000,000 | 1,000,000 |
| City of Jacksonville (Better Jacksonville Plan), Series A, 5.00% due 10/1/2026 | 2,075,000 | 2,293,601 | |
| City of Lakeland (Electric Power System Smart Grid Project; Insured: AGM), 5.25% due 10/1/2027 - 10/1/2036 | 6,450,000 | 8,271,132 | |
| City of Miami (Stormwater Management Utility System), 5.00% due 9/1/2022 - 9/1/2025 | 3,270,000 | 3,783,147 | |
| City of Orlando (Senior Tourist Development; Insured: AGM), 5.00% due 11/1/2032 - 11/1/2037 | 3,430,000 | 3,983,883 | |
| Escambia County (Florida Health Care Facility Loan Program; Insured: AMBAC) HFA ETM, 5.95% due 7/1/2020 | 260,000 | 274,004 | |
| Florida State Department of Children & Families (South Florida Evaluation Treatment Center) COP, 5.00% due 10/1/2019 | 2,255,000 | 2,261,246 | |
| Lake County School Board (School District Facility Projects) COP, Series B, 5.00% due 6/1/2026 | 1,210,000 | 1,318,489 | |
| Manatee County (Public Utilities System Improvements), 5.00% due 10/1/2026 - 10/1/2033 | 6,080,000 | 7,098,142 | |
| Miami-Dade County (Miami International Airport), Series B, 5.00% due 10/1/2028 - 10/1/2031 | 5,335,000 | 6,117,986 | |
| Miami-Dade County (Seaport Properties) GO, Series C, 5.00% due 10/1/2023 | 1,040,000 | 1,125,894 | |
| Miami-Dade County Educational Facilities Authority (University of Miami; Insured: AMBAC), Series B, 5.25% due 4/1/2024 | 1,000,000 | 1,157,210 | |
| Miami-Dade County Health Facilities Authority (Nicklaus Children’s Hospital), 5.00% due 8/1/2035 - 8/1/2037 | 2,905,000 | 3,346,200 | |
| a | Miami-Dade County Industrial Development Authority, (Florida Power & Light Co.), 1.51% due 6/1/2021 (put 4/1/2019) | 2,500,000 | 2,500,000 |
| Miami-Dade County School Board (Insured: AMBAC) COP, Series D, 5.00% due 10/1/2021 | 3,035,000 | 3,275,584 | |
| Miami-Dade County School Board COP, Series A, 5.00% due 5/1/2030 | 3,250,000 | 3,735,745 | |
| Orange County (Orlando Health, Inc.) HFA, 5.125% due 10/1/2026 | 2,000,000 | 2,035,680 | |
| Orange County (Tourist Development), Series A, 5.00% due 10/1/2031 | 2,000,000 | 2,364,520 | |
| Palm Beach County (Boca Raton Regional Hospital) HFA, 5.00% due 12/1/2025 | 500,000 | 567,855 | |
| Palm Beach County School District COP, Series C, 5.00% due 8/1/2028 | 595,000 | 743,536 | |
| Sarasota County Public Hospital Board (Sarasota Memorial Hospital; Insured: Natl-Re), 2.548% due 10/1/2021 | 2,000,000 | 2,067,000 | |
| School Board of Broward County (Educational Facilities and Equipment) COP, Series A, 5.00% due 7/1/2027 | 2,000,000 | 2,180,020 | |
| School Board of Broward County (Educational Facilities) COP, | |||
| Series A, 5.00% due 7/1/2030 | 1,250,000 | 1,441,187 | |
| Series B, 5.00% due 7/1/2032 | 2,000,000 | 2,289,440 | |
| Series C, 5.00% due 7/1/2022 - 7/1/2024 | 7,880,000 | 8,956,701 | |
| School District of Broward County COP, | |||
| Series A, | |||
| 5.00% due 7/1/2026 | 545,000 | 595,009 | |
| 5.00% due 7/1/2026 (pre-refunded 7/1/2022) | 2,455,000 | 2,715,574 | |
| School District of Manatee County (School Facilities Improvement; Insured: AGM), 5.00% due 10/1/2032 | 2,250,000 | 2,643,750 | |
| Sunshine State Governmental Finance Commission (Miami-Dade County Program), 5.00% due 9/1/2028 | 3,500,000 | 3,938,130 | |
| Georgia — 1.4% | |||
| Athens-Clarke County Unified Government Development Authority (UGAREF Bolton Commons, LLC), 5.00% due 6/15/2024 - 6/15/2028 | 2,320,000 | 2,619,131 | |
| City of Atlanta (Water & Wastewater System; Insured: AGM), | |||
| Series B, | |||
| 5.50% due 11/1/2024 | 1,740,000 | 1,779,133 | |
| 5.50% due 11/1/2024 (pre-refunded 11/1/2019) | 3,260,000 | 3,335,828 | |
| City of Atlanta (Water & Wastewater System; Insured: Natl-Re), Series A, 5.50% due 11/1/2022 | 530,000 | 583,249 | |
| Clarke County Hospital Authority (Athens Regional Medical Center), 5.00% due 1/1/2023 - 1/1/2026 (pre-refunded 1/1/2022) | 5,620,000 | 6,140,973 | |
| Development Authority of Fulton County (Georgia Tech Athletic Assoc.), 5.00% due 10/1/2019 | 3,000,000 | 3,049,410 | |
| Guam — 2.3% | |||
| Government of Guam (Economic Development), Series D, 5.00% due 11/15/2031 | 5,500,000 | 6,023,435 | |
| Government of Guam (Various Capital Projects), Series D, 5.00% due 11/15/2032 | 12,000,000 | 13,083,480 | |
| Guam Power Authority (Electric Power System), Series A, 5.00% due 10/1/2033 | 1,650,000 | 1,852,092 | |
| Guam Power Authority (Electric Power System; Insured: AGM), Series A, 5.00% due 10/1/2023 - 10/1/2025 | 6,500,000 | 7,147,270 | |
| Guam Waterworks Authority (Water and Wastewater System), 5.25% due 7/1/2024 | 1,000,000 | 1,111,470 | |
| Hawaii — 1.0% | |||
| County of Hawaii GO, 5.00% due 9/1/2033 | 1,250,000 | 1,465,538 |
Thornburg Intermediate Municipal Fund | March 31, 2019 (Unaudited)
| PRINCIPAL AMOUNT | VALUE | ||
| State of Hawaii GO, | |||
| Series DZ, 5.00% due 12/1/2027 (pre-refunded 12/1/2021) | $ 3,635,000 | $ 3,952,008 | |
| Series DZ-2016, 5.00% due 12/1/2027 (pre-refunded 12/1/2021) | 6,365,000 | 6,939,265 | |
| Illinois — 8.7% | |||
| Board of Trustees of Southern Illinois University (Housing & Auxiliary Facilities; Insured: Natl-Re), Series A, 5.25% due 4/1/2019 | 1,000,000 | 1,000,000 | |
| Chicago O’Hare International Airport (2015 Airport Projects), Series B, 5.00% due 1/1/2020 - 1/1/2021 | 2,000,000 | 2,082,600 | |
| Chicago O’Hare International Airport (2016 Airport Projects), Series C, 5.00% due 1/1/2029 - 1/1/2030 | 1,765,000 | 2,062,172 | |
| Chicago O’Hare International Airport (2017 Airport Projects), Series B, 5.00% due 1/1/2034 - 1/1/2037 | 8,160,000 | 9,426,805 | |
| Chicago Park District (Capital Improvement Plan) GO, | |||
| Series A, 5.00% due 1/1/2027 - 1/1/2029 | 3,940,000 | 4,301,443 | |
| Series B, 5.00% due 1/1/2025 - 1/1/2030 | 4,500,000 | 4,907,855 | |
| Series D, 5.00% due 1/1/2028 | 3,450,000 | 3,764,191 | |
| City of Chicago (Midway Airport), | |||
| Series B, | |||
| 5.00% due 1/1/2032 - 1/1/2033 | 9,805,000 | 10,890,918 | |
| 5.25% due 1/1/2034 | 4,700,000 | 5,170,235 | |
| City of Chicago (Wastewater Transmission System), Series C, 5.00% due 1/1/2028 - 1/1/2029 | 7,865,000 | 8,827,965 | |
| City of Chicago (Wastewater Transmission System; Insured: AGM), Series B-AGM-CR, 5.00% due 1/1/2034 | 1,375,000 | 1,587,919 | |
| City of Chicago (Water System; Insured: AGM), 5.00% due 11/1/2037 | 4,250,000 | 4,808,110 | |
| City of Chicago (Water System; Insured: AMBAC), 5.75% due 11/1/2030 | 1,270,000 | 1,560,779 | |
| City of Mount Vernon (Various Municipal Capital Improvements; Insured: AGM) GO, 4.00% due 12/15/2025 | 1,900,000 | 1,965,113 | |
| Cook County GO, Series A, 5.25% due 11/15/2024 | 3,000,000 | 3,142,080 | |
| Cook County School District No. 104 (Argo Summit Elementary School Facilities; Insured: AGM) GO ETM, Series D, Zero Coupon due 12/1/2022 | 2,000,000 | 1,872,220 | |
| Forest Preserve District of DuPage County (Land Acquisition and Development) GO, 4.00% due 11/1/2022 | 750,000 | 810,330 | |
| Illinois (Midwest Care Center I, Inc.; Collateralized: GNMA) HFA, 5.70% due 2/20/2021 | 190,000 | 190,289 | |
| a | Illinois Educational Facilities Authority (National-Louis University; LOC JP Morgan Chase Bank, N.A.) Series B 1.60% due 6/1/2029 (put 4/5/2019) | 980,000 | 980,000 |
| a | Illinois Finance Authority (Northwestern Memorial Healthcare Obligated Group; SPA JP Morgan Chase Bank, N.A) 1.50% due 8/15/2042 (put 4/1/2019) | 5,950,000 | 5,950,000 |
| Illinois Finance Authority (Rush University Medical Center), Series A, 5.00% due 11/15/2033 | 1,000,000 | 1,123,750 | |
| Illinois Finance Authority (Silver Cross Hospital and Medical Centers), 5.00% due 8/15/2024 | 1,000,000 | 1,132,090 | |
| Illinois Toll Highway Authority (Move Illinois Program), Series A, 5.00% due 1/1/2037 | 5,550,000 | 6,290,148 | |
| Metropolitan Pier & Exposition Authority (McCormick Place Expansion Project), Series B, 5.00% due 12/15/2022 | 1,000,000 | 1,068,110 | |
| Monroe and St. Clair Counties (Community Unit School District No. 5; Insured: BAM) GO, 5.00% due 4/15/2027 - 4/15/2031 | 6,285,000 | 7,297,676 | |
| Niles Park District (Parks and Recreation Projects) GO, 3.00% due 12/1/2019 - 12/1/2020 | 730,000 | 741,630 | |
| State of Illinois Series B, 5.00% due 6/15/2030 - 6/15/2032 | 12,165,000 | 13,621,409 | |
| Tazewell County School District (Insured: Natl-Re) GO, 9.00% due 12/1/2024 | 1,205,000 | 1,607,771 | |
| a | University of Illinois (VAR-REF-UIC South Campus Dev; LOC JP Morgan Chase Bank, N.A.), 1.60% due 1/15/2022 (put 4/5/2019) | 615,000 | 615,000 |
| Village of Tinley Park GO, | |||
| 4.00% due 12/1/2021 | 585,000 | 617,122 | |
| 5.00% due 12/1/2024 | 870,000 | 985,606 | |
| Indiana — 3.4% | |||
| Board of Trustees for the Vincennes University, Series J, 5.375% due 6/1/2022 | 895,000 | 933,020 | |
| City of Carmel Redevelopment Authority (Performing Arts Center), Zero Coupon due 2/1/2021 | 2,000,000 | 1,931,620 | |
| City of Carmel Redevelopment District (Performing Arts Center) COP, Series C, 6.50% due 7/15/2035 (pre-refunded 1/15/2021) | 2,730,000 | 2,963,006 | |
| b | City of Whiting Environmental Facilities (BP Products North America Inc. Project) AMT, Series A, 5.00% due 3/1/2046 (put 3/1/2023) | 1,000,000 | 1,105,150 |
| Hobart Building Corp. (Insured: Natl-Re) (State Aid Withholding) ETM, 6.50% due 7/15/2019 | 515,000 | 522,277 | |
| Indiana (Ascension Health Credit Group) HFFA, 5.00% due 11/15/2034 - 11/15/2036 | 8,325,000 | 9,555,609 | |
| Indiana Bond Bank (Hendricks Regional Health Financing Program; Insured: AMBAC), 5.25% due 4/1/2023 | 2,000,000 | 2,250,640 | |
| Indiana Bond Bank (Natural Gas Utility Improvements), Series A, 5.25% due 10/15/2020 | 5,340,000 | 5,599,043 | |
| a | Indiana Finance Authority 1.52% due 11/1/2037 (put 4/1/2019) | 5,600,000 | 5,600,000 |
| a | Indiana Finance Authority (Franciscan Alliance, Inc. Obligated Group; LOC Barclays Bank plc), 1.52% due 11/1/2037 (put 4/1/2019) | 2,400,000 | 2,400,000 |
| Indiana Finance Authority (Marian University), 5.25% due 9/15/2022 - 9/15/2023 | 5,085,000 | 5,447,173 | |
| Indiana Finance Authority (Sisters of St. Francis Health Services, Inc.), 5.00% due 11/1/2021 | 605,000 | 614,728 | |
| a | Indiana Finance Authority, (SPA U.S. Bank, N.A.) 1.48% due 2/1/2037 (put 4/1/2019) | 2,645,000 | 2,645,000 |
| a | Indiana Finance Authority, (SPA Wells Fargo Bank, N.A.) 1.48% due 2/1/2037 (put 4/1/2019) | 1,500,000 | 1,500,000 |
| Iowa — 0.4% | |||
| Iowa Finance Authority (UnityPoint Health), Series C, 5.00% due 2/15/2030 - 2/15/2032 | 4,100,000 | 4,589,351 | |
| Kansas — 0.1% | |||
| Kansas (Wichita State University) DFA, Series A, 5.00% due 6/1/2020 | 575,000 | 597,442 | |
| e | Unified Government of Wyandotte County/Kansas City (School Improvement Project; Insured: AGM) GO, 5.00% due 9/1/2030 - 9/1/2031 | 640,000 | 761,525 |
| Kentucky — 1.9% | |||
| Commonwealth of Kentucky State Property and Buildings Commission (Project No. 112), Series B, 5.00% due 11/1/2023 | 2,440,000 | 2,751,124 | |
| b,d | Kentucky Public Energy Authority (Gas Supply System), Series C-1, 4.00% due 12/1/2049 (put 6/1/2025) | 17,500,000 | 18,952,675 |
| Louisville/Jefferson County Metropolitan Government (Norton Suburban Hospital and Kosair Children’s Hospital), 5.25% due 10/1/2026 | 2,320,000 | 2,644,429 | |
| Louisiana — 2.4% |
| PRINCIPAL AMOUNT | VALUE | ||
| City of New Orleans (Sewerage System; Insured: AGM), 6.00% due 6/1/2024 (pre-refunded 6/1/2019) | $ 750,000 | $ 755,482 | |
| East Baton Rouge Sewerage Commission, Series B, 5.00% due 2/1/2030 - 2/1/2032 | 6,825,000 | 7,813,061 | |
| Jefferson Sales Tax District (Insured: AGM), 5.00% due 12/1/2034 | 1,000,000 | 1,184,600 | |
| Louisiana Energy and Power Authority (LEPA Unit No. 1; Insured: AGM), Series A, 5.25% due 6/1/2029 - 6/1/2031 | 6,100,000 | 6,822,359 | |
| New Orleans Regional Transit Authority (Insured: AGM), 5.00% due 12/1/2023 - 12/1/2024 | 2,000,000 | 2,105,840 | |
| Parish of Lafourche (Roads, Highways and Bridges), 5.00% due 1/1/2024 - 1/1/2025 | 3,685,000 | 4,248,319 | |
| Parish of Plaquemines Law Enforcement District GO, | |||
| 5.00% due 9/1/2023 - 9/1/2025 (pre-refunded 9/1/2019) | 2,580,000 | 2,616,971 | |
| 5.15% due 9/1/2027 (pre-refunded 9/1/2019) | 1,490,000 | 1,512,261 | |
| 5.30% due 9/1/2029 (pre-refunded 9/1/2019) | 1,650,000 | 1,675,674 | |
| Terrebonne Parish Hospital Service District No. 1 (General Medical Center), | |||
| 5.00% due 4/1/2028 | 960,000 | 983,395 | |
| 5.00% due 4/1/2028 (pre-refunded 4/1/2020) | 540,000 | 558,257 | |
| Maryland — 0.1% | |||
| a | Maryland Stadium Authority (LOC Sumitomo Mitsui Banking Corp.), 1.49% due 3/1/2026 (put 4/5/2019) | 780,000 | 780,000 |
| Massachusetts — 1.6% | |||
| Massachusetts (Insured: BHAC-CR FGIC), 5.50% due 1/1/2029 | 8,370,000 | 10,958,673 | |
| Massachusetts Bay Transportation Authority (Transportation Capital Program), Series A, 5.25% due 7/1/2030 | 1,000,000 | 1,313,770 | |
| Massachusetts Development Finance Agency (CareGroup Healthcare System), | |||
| Series H-1, 5.00% due 7/1/2021 | 2,330,000 | 2,480,821 | |
| Series I, 5.00% due 7/1/2036 | 1,750,000 | 1,977,500 | |
| Massachusetts Development Finance Agency (Simmons College), Series J, 5.50% due 10/1/2025 - 10/1/2028 | 1,790,000 | 2,039,825 | |
| Massachusetts Educational Financing Authority (Higher Education Student Loans), Series A, 5.50% due 1/1/2022 | 1,130,000 | 1,162,680 | |
| Michigan — 2.0% | |||
| Board of Governors of Wayne State University (Educational Facilities and Equipment), Series A, 5.00% due 11/15/2031 | 1,010,000 | 1,157,581 | |
| City of Troy (Downtown Development Authority-Community Center Facilities) GO, 5.00% due 11/1/2025 | 300,000 | 325,806 | |
| County of Genesee (Water Supply System; Insured: BAM) GO, | |||
| 5.00% due 11/1/2024 - 11/1/2030 | 3,360,000 | 3,720,771 | |
| 5.125% due 11/1/2032 | 750,000 | 830,228 | |
| 5.25% due 11/1/2026 - 11/1/2028 | 2,920,000 | 3,264,516 | |
| Detroit City School District (School Building & Site Improvement; Insured: AGM/Q-SBLF) GO, Series A, 5.25% due 5/1/2026 | 3,150,000 | 3,753,508 | |
| Detroit City School District (School Building & Site; Insured: Q-SBLF) GO, Series A, 5.25% due 5/1/2027 | 1,100,000 | 1,331,088 | |
| Kalamazoo Hospital Finance Authority (Bronson Healthcare), | |||
| 5.25% due 5/15/2026 | 175,000 | 186,953 | |
| 5.25% due 5/15/2026 (pre-refunded 5/15/2021) | 1,110,000 | 1,193,117 | |
| Kalamazoo Hospital Finance Authority (Bronson Healthcare; Insured: AGM), | |||
| 5.00% due 5/15/2022 | 1,105,000 | 1,140,227 | |
| 5.00% due 5/15/2022 (pre-refunded 5/15/2020) | 1,365,000 | 1,415,955 | |
| Michigan Finance Authority (Government Loan Program), Series F, 5.00% due 4/1/2026 | 1,580,000 | 1,690,647 | |
| Michigan Public School Academy (Will Carleton Charter School), 8.00% due 8/1/2035 | 870,000 | 878,108 | |
| Michigan State Hospital Finance Authority (Henry Ford Health System), 5.625% due 11/15/2029 (pre-refunded 11/15/2019) | 2,500,000 | 2,562,350 | |
| State of Michigan (Trunk Line Fund; Insured: AGM), 5.50% due 11/1/2020 | 1,500,000 | 1,593,105 | |
| Minnesota — 0.2% | |||
| Minnesota Agriculture & Economic Development Board (Essentia Health; Insured: AGM), 5.50% due 2/15/2025 | 2,500,000 | 2,582,475 | |
| Mississippi — 1.0% | |||
| Mississippi Development Bank (Capital City Convention Center) GO, 5.00% due 3/1/2025 | 2,850,000 | 3,231,729 | |
| Mississippi Development Bank (Department of Corrections), Series D, 5.25% due 8/1/2027 (pre-refunded 8/1/2020) | 3,415,000 | 3,584,384 | |
| Mississippi Development Bank (Jackson Public School District; Insured BAM) GO, 5.25% due 10/1/2037 - 10/1/2038 | 5,250,000 | 6,215,032 | |
| Missouri — 0.4% | |||
| Missouri Health and Educational Facilities Authority (Webster University) ETM, 5.00% due 4/1/2019 - 4/1/2021 | 4,755,000 | 4,923,790 | |
| Tax Increment Financing Commission of Kansas City (Union Hill Redevelopment Project), 5.00% due 5/1/2022 | 500,000 | 504,990 | |
| Nebraska — 0.7% | |||
| b,d | Central Plains Energy Project, 5.00% due 3/1/2050 (put 1/1/2024) | 8,350,000 | 9,255,808 |
| Nevada — 1.1% | |||
| Carson City (Carson Tahoe Regional Healthcare), 5.00% due 9/1/2027 - 9/1/2032 | 3,180,000 | 3,503,290 | |
| Clark County School District (School Facilities Improvements) GO, Series C, 5.00% due 6/15/2022 | 1,110,000 | 1,221,200 | |
| Washoe County (Reno Sparks Convention & Visitors Authority) GO, | |||
| 5.00% due 7/1/2026 - 7/1/2029 | 7,000,000 | 7,503,890 | |
| 5.00% due 7/1/2032 (pre-refunded 7/1/2021) | 95,000 | 102,121 | |
| Washoe County NV GO, | |||
| 5.00% due 7/1/2032 | 1,780,000 | 1,904,564 | |
| 5.00% due 7/1/2032 (pre-refunded 7/1/2021) | 125,000 | 134,370 | |
| New Hampshire — 0.5% | |||
| a | New Hampshire Health and Education Facilities Authority (University System of New Hampshire; SPA Wells Fargo Bank, N.A.) 1.52% due 7/1/2033 (put 4/1/2019) | 500,000 | 500,000 |
Thornburg Intermediate Municipal Fund | March 31, 2019 (Unaudited)
| PRINCIPAL AMOUNT | VALUE | ||
| New Hampshire Municipal Bond Bank, 5.00% due 8/15/2026 | $ 1,860,000 | $ 2,109,891 | |
| State of New Hampshire (Turnpike System), Series B, 5.00% due 2/1/2022 - 2/1/2024 | 4,005,000 | 4,366,762 | |
| New Jersey — 3.1% | |||
| Cape May County Industrial Pollution Control Financing Authority (Atlantic City Electric Company; Insured: Natl-Re), Series A, 6.80% due 3/1/2021 | 675,000 | 729,027 | |
| Essex County Improvement Authority (County Correctional Facilities & Gibraltar Facilities; Insured: Natl-Re), 5.50% due 10/1/2024 | 2,500,000 | 2,978,850 | |
| New Jersey (School Facilities Construction) EDA, 5.00% due 3/1/2026 | 2,000,000 | 2,166,440 | |
| New Jersey (School Facilities Construction; Insured: AMBAC) EDA, Series N-1, 5.50% due 9/1/2026 | 3,000,000 | 3,591,240 | |
| New Jersey (School Facilities Construction; Insured: Natl-Re) EDA, Series N-1, 5.50% due 9/1/2027 | 1,700,000 | 2,062,440 | |
| New Jersey State Health Care Facilities Financing Authority (Virtua Health), 5.00% due 7/1/2027 - 7/1/2028 | 3,000,000 | 3,418,100 | |
| New Jersey Transportation Trust Fund Authority (State Transportation System Improvements), | |||
| c | 2.70% (MUNIPSA + 1.20%) due 6/15/2034 (put 12/15/2021) | 2,000,000 | 2,015,580 |
| 5.00% due 6/15/2023 - 6/15/2031 | 13,250,000 | 15,219,430 | |
| New Jersey Transportation Trust Fund Authority (State Transportation System Improvements; Insured: Natl-Re), Series B, 5.50% due 12/15/2020 | 3,185,000 | 3,372,819 | |
| Passaic Valley Sewage Commissioners GO, Series G, 5.75% due 12/1/2022 | 3,000,000 | 3,392,370 | |
| New Mexico — 0.8% | |||
| City of Farmington (Arizona Public Service Co.-Four Corners Project), Series B, 4.70% due 9/1/2024 | 3,000,000 | 3,121,860 | |
| City of Las Cruces (NMFA Loan), 5.00% due 6/1/2030 | 2,040,000 | 2,114,990 | |
| New Mexico Hospital Equipment Loan Council (Haverland Carter Lifestyle Group), 5.00% due 7/1/2032 | 2,130,000 | 2,223,550 | |
| Regents of New Mexico State University (Campus Buildings Acquisition & Improvements), Series A, 5.00% due 4/1/2034 | 1,810,000 | 2,123,673 | |
| New York — 12.9% | |||
| City of New York (City Budget Financial Management) GO, | |||
| 5.00% due 8/1/2027 | 4,530,000 | 5,186,895 | |
| Series J, 5.00% due 8/1/2030 - 8/1/2031 | 9,000,000 | 10,304,250 | |
| a | City of New York (Public Improvements) GO, 1.60% due 4/1/2042 (put 4/1/2019) | 1,100,000 | 1,100,000 |
| a | City of New York (Public Improvements; SPA JPMorgan Chase Bank, N.A.) GO, Series 1-SUBSER I-2 1.50% due 3/1/2040 (put 4/1/2019) | 5,800,000 | 5,800,000 |
| a | City of New York (SPA JP Morgan Chase Bank, N.A) GO, 1.50% due 6/1/2044 (put 4/1/2019) | 500,000 | 500,000 |
| a | City of New York (SPA Landesbank Hessen-Thuringen) GO, Series A-3 1.53% due 8/1/2035 (put 4/1/2019) | 8,800,000 | 8,800,000 |
| County of Nassau (Insured: BAM) GO, Series B, 5.00% due 4/1/2026 | 1,300,000 | 1,478,594 | |
| Erie County Industrial Development Agency (City of Buffalo School District) (State Aid Withholding) ETM, 5.00% due 5/1/2019 | 1,190,000 | 1,193,368 | |
| Erie County Industrial Development Agency (City of Buffalo School District) (State Aid Withholding), 5.00% due 5/1/2019 - 5/1/2027 | 6,810,000 | 7,446,645 | |
| Metropolitan Transportation Authority (Green Bond), Series C-1 5.00% due 11/15/2030 | 8,500,000 | 10,180,280 | |
| Metropolitan Transportation Authority (Transit and Commuter System), Series A2-GREEN BOND, 5.00% due 11/15/2024 | 5,435,000 | 6,297,643 | |
| Metropolitan Transportation Authority, Series A2-GREEN BOND, 5.00% due 11/15/2025 | 7,500,000 | 8,853,150 | |
| a | New York City Transitional Finance Authority Future Tax Secured Revenue, (Barclays Bank plc) Series B-3, 1.52% due 11/1/2042 (put 4/1/2019) | 22,800,000 | 22,800,000 |
| New York City Transitional Finance Authority Future Tax Secured Revenue, (SPA JP Morgan Chase Bank, N.A) | |||
| a | 1.50% due 2/1/2045 (put 4/1/2019) | 500,000 | 500,000 |
| a | Series C-4, 1.50% due 11/1/2036 (put 4/1/2019) | 700,000 | 700,000 |
| a | New York City Transitional Finance Authority Future Tax Secured Revenue, (SPA U.S. Bank, N.A.) 1.48% due 8/1/2039 (put 4/1/2019) | 900,000 | 900,000 |
| a | New York City Water & Sewer System Series F-SUBSER F-2-REMK 10/2 1.48% due 6/15/2035 (put 4/1/2019) | 24,900,000 | 24,900,000 |
| a | New York City Water & Sewer System (SPA JP Morgan Chase Bank, N.A.), Series AA1, 1.50% due 6/15/2050 (put 4/1/2019) | 1,800,000 | 1,800,000 |
| a | New York City Water & Sewer System, (SPA JP Morgan Chase Bank, N.A) 1.50% due 6/15/2050 (put 4/1/2019) | 500,000 | 500,000 |
| a | New York City Water & Sewer System, (SPA Landesbank Hessen-Thuringen) Series R, 1.50% due 6/15/2044 (put 4/1/2019) | 700,000 | 700,000 |
| a | New York City Water & Sewer System, (SPA Mizuho Bank Ltd.) 1.52% due 6/15/2044 (put 4/1/2019) | 4,500,000 | 4,500,000 |
| New York City Water & Sewer System, (SPA State Street Bank and Trust Co.) | |||
| a | 1.48% due 6/15/2043 - 6/15/2045 (put 4/1/2019) | 7,300,000 | 7,300,000 |
| a | 1.50% due 6/15/2032 (put 4/1/2019) | 10,080,000 | 10,080,000 |
| New York State Dormitory Authority (Metropolitan Transportation Authority & State Urban Development Corp.), Series A, 5.00% due 12/15/2027 | 2,500,000 | 2,796,875 | |
| New York State Dormitory Authority (Miriam Osborn Memorial Home Assoc.), 5.00% due 7/1/2023 | 2,180,000 | 2,202,192 | |
| New York State Dormitory Authority (State University Educational Facilities), Series A, 5.25% due 5/15/2021 | 500,000 | 528,930 | |
| a | New York State Housing Finance Agency (160 Madison Ave, LLC; LOC Landesbank Hessen-Thuringen), 1.51% due 11/1/2046 (put 4/1/2019) | 1,000,000 | 1,000,000 |
| a | New York State Housing Finance Agency (LOC Landesbank Hessen-Thuringen), 1.51% due 11/1/2046 (put 4/1/2019) | 600,000 | 600,000 |
| Town of Oyster Bay GO, Series B, 3.00% due 2/1/2020 - 3/13/2020 | 12,750,000 | 12,845,998 | |
| United Nations Development Corp. (One, Two and Three U.N. Plaza), Series A, 5.00% due 7/1/2025 | 1,700,000 | 1,713,719 | |
| North Carolina — 0.5% | |||
| Charlotte-Mecklenburg Hospital Authority (Carolinas HealthCare System), Series A, 5.00% due 1/15/2028 | 2,190,000 | 2,434,295 | |
| a | North Carolina Medical Care Commission (Novant Health Obligated Group; SPA JPMorgan Chase Bank, N.A.), Series A 1.57% due 11/1/2034 (put 4/5/2019) | 600,000 | 600,000 |
| North Carolina Medical Care Commission (Vidant Health), 5.00% due 6/1/2030 | 3,000,000 | 3,457,740 | |
| Ohio — 4.4% | |||
| Akron, Bath and Copley Joint Township Hospital District (Children’s Hospital Medical Center of Akron), 5.00% due 11/15/2024 | 1,000,000 | 1,089,750 | |
| American Municipal Power, Inc. (AMP Fremont Energy Center), Series B, 5.25% due 2/15/2028 (pre-refunded 2/15/2022) | 4,000,000 | 4,409,000 | |
| Cincinnati City School District (School Improvement Project) COP, 5.00% due 12/15/2031 | 3,075,000 | 3,509,743 | |
| City of Cleveland (Bridges and Roadways), 5.00% due 10/1/2028 - 10/1/2029 (pre-refunded 10/1/2023) | 2,520,000 | 2,886,811 | |
| City of Cleveland (Public Facilities Improvements), | |||
| 5.00% due 10/1/2029 | 1,500,000 | 1,827,150 |
| PRINCIPAL AMOUNT | VALUE | ||
| Series A-1, 5.00% due 11/15/2027 - 11/15/2030 (pre-refunded 11/15/2023) | $ 5,185,000 | $ 5,959,432 | |
| City of Cleveland (Various Municipal Capital Improvements) GO, 5.00% due 12/1/2024 - 12/1/2026 | 2,230,000 | 2,487,729 | |
| City of Cleveland Income Tax Revenue, 5.00% due 10/1/2033 - 10/1/2035 | 1,450,000 | 1,726,528 | |
| Cleveland-Cuyahoga County Port Authority (Cleveland Museum of Art), 5.00% due 10/1/2021 | 2,040,000 | 2,144,693 | |
| Cleveland-Cuyahoga County Port Authority (County Administration Offices), 5.00% due 7/1/2025 | 1,780,000 | 2,074,821 | |
| County of Allen (Catholic Health Partners-Mercy Health West Facility), Series A, 5.00% due 5/1/2025 - 5/1/2026 | 8,325,000 | 9,098,931 | |
| County of Cuyahoga (Convention Center Hotel) COP, 5.00% due 12/1/2026 | 2,910,000 | 3,296,448 | |
| County of Hamilton (Cincinnati Children’s Hospital Medical Center), 5.00% due 5/15/2028 - 5/15/2031 | 8,085,000 | 9,222,786 | |
| Deerfield Township (Public Street Improvements-Wilkens Blvd.), 5.00% due 12/1/2025 | 925,000 | 927,451 | |
| Greene County Vocational School District (School Facilities Construction and Improvement) GO, 5.00% due 12/1/2030 - 12/1/2033 | 2,580,000 | 3,167,338 | |
| Lucas County Health Care Facility (Sunset Retirement Community), | |||
| 5.00% due 8/15/2021 | 740,000 | 766,840 | |
| 5.125% due 8/15/2025 | 1,250,000 | 1,326,563 | |
| Oklahoma — 0.2% | |||
| Oklahoma (INTEGRIS Health) DFA, Series A, 5.00% due 8/15/2026 - 8/15/2027 | 2,230,000 | 2,609,743 | |
| Oregon — 0.0% | |||
| a | Clackamas County Hospital Facility Authority (Legacy Health; LOC U.S. Bank N.A.), Series A 1.50% due 6/1/2037 (put 4/5/2019) | 500,000 | 500,000 |
| Pennsylvania — 6.9% | |||
| Allegheny County (Propel Charter School-McKeesport) IDA, | |||
| Series C, | |||
| 5.90% due 8/15/2026 | 765,000 | 790,612 | |
| 6.375% due 8/15/2035 | 1,130,000 | 1,164,589 | |
| Allegheny County Hospital Development Authority (University of Pittsburgh Medical Center), Series A, 5.00% due 5/15/2019 | 2,500,000 | 2,509,975 | |
| Bethlehem Area School District (Northampton and Lehigh Counties District; Insured: AGM) (State Aid Withholding) GO, | |||
| Series A, | |||
| 5.00% due 10/15/2020 | 380,000 | 380,475 | |
| 5.00% due 10/15/2020 (pre-refunded 4/15/2019) | 95,000 | 95,118 | |
| Bucks County Industrial Development Authority (Waste Management, Inc.) AMT, 2.75% due 12/1/2022 | 7,000,000 | 7,054,110 | |
| City of Philadelphia (Pennsylvania Gas Works), 5.00% due 8/1/2032 - 8/1/2034 | 2,300,000 | 2,616,372 | |
| City of Philadelphia (Philadelphia Gas Works), 5.00% due 8/1/2036 - 8/1/2037 | 5,485,000 | 6,297,868 | |
| City of Philadelphia (Water and Wastewater System), 5.00% due 10/1/2029 - 10/1/2030 | 3,510,000 | 4,160,346 | |
| City of Pittsburgh (Capital Projects) GO, 5.00% due 9/1/2024 - 9/1/2036 | 1,715,000 | 2,009,004 | |
| County of Luzerne (Insured: AGM) GO, Series A, 5.00% due 11/15/2029 | 3,000,000 | 3,465,870 | |
| Dallastown Area School District (State Aid Withholding) GO, Series A, 4.00% due 5/1/2021 | 460,000 | 481,694 | |
| Lancaster County Solid Waste Management Authority (Acquisition of Susquehanna Resource Management Facility), 5.25% due 12/15/2030 | 3,000,000 | 3,349,230 | |
| Monroeville Financing Authority (University of Pittsburgh Medical Center), 5.00% due 2/15/2026 | 3,490,000 | 4,161,127 | |
| Pennsylvania Higher Educational Facilities Authority (Insured: AMBAC), Series 14, Zero Coupon due 7/1/2020 | 2,032,839 | 1,859,641 | |
| Pennsylvania State Public School Building Authority (Philadelphia School District; Insured: AGM) (State Aid Withholding) GO, Series B, 5.00% due 6/1/2027 | 5,000,000 | 5,929,300 | |
| Pennsylvania Turnpike Commission (Highway Improvements), | |||
| 5.00% due 12/1/2035 - 12/1/2036 | 1,750,000 | 2,057,410 | |
| 5.35% due 12/1/2030 (pre-refunded 12/1/2020) | 1,540,000 | 1,632,585 | |
| Series C-2, 5.35% due 12/1/2030 (pre-refunded 12/1/2020) | 2,460,000 | 2,614,168 | |
| Philadelphia Authority for Industrial Development (Thomas Jefferson University), 5.00% due 9/1/2032 - 9/1/2034 | 5,685,000 | 6,560,618 | |
| Philadelphia Municipal Authority (Juvenile Justice Services Center), 5.00% due 4/1/2032 - 4/1/2036 | 11,125,000 | 12,686,082 | |
| Pittsburgh Water & Sewer Authority (Water and Sewer System; Insured: AGM), | |||
| Series A, 5.00% due 9/1/2030 - 9/1/2031 | 8,740,000 | 9,800,006 | |
| Series B, 5.00% due 9/1/2031 (pre-refunded 9/1/2023) | 3,665,000 | 4,172,126 | |
| Plum Borough School District (Insured: BAM) (State Aid Withholding) GO, | |||
| 4.00% due 9/15/2020 - 9/15/2021 | 1,215,000 | 1,259,945 | |
| 5.00% due 9/15/2021 | 430,000 | 461,562 | |
| Rhode Island — 0.4% | |||
| State of Rhode Island and Providence Plantations (Consolidated Capital Development Loan) GO, Series B, 4.00% due 10/15/2023 | 800,000 | 861,576 | |
| State of Rhode Island and Providence Plantations (Training School Project) COP, Series B, 5.00% due 10/1/2024 | 3,595,000 | 4,072,488 | |
| South Carolina — 0.2% | |||
| City of Myrtle Beach (Municipal Sports Complex), Series B, 5.00% due 6/1/2028 - 6/1/2030 | 2,000,000 | 2,268,890 | |
| South Dakota — 0.4% | |||
| South Dakota Health and Educational Facilities Authority (Avera Health), Series A, 5.00% due 7/1/2023 | 1,575,000 | 1,687,754 | |
| South Dakota Health and Educational Facilities Authority (Sanford Health), 5.00% due 11/1/2024 - 11/1/2029 | 3,500,000 | 3,829,244 | |
| Tennessee — 1.6% | |||
| County of Shelby Health, Educational and Housing Facility Board (Methodist Le Bonheur Healthcare), 5.00% due 5/1/2027 - 5/1/2035 | 3,560,000 | 4,215,482 | |
| Metropolitan Government of Nashville and Davidson County (Green Projects), Series B, 5.00% due 7/1/2033 - 7/1/2036 | 3,000,000 | 3,576,120 | |
| Tennessee Energy Acquisition Corp. (The Gas Project), | |||
| 5.25% due 9/1/2023 | 7,000,000 | 7,802,410 | |
| b | Series A, 4.00% due 5/1/2048 (put 5/1/2023) | 1,850,000 | 1,956,708 |
Thornburg Intermediate Municipal Fund | March 31, 2019 (Unaudited)
| PRINCIPAL AMOUNT | VALUE | ||
| Series C, 5.00% due 2/1/2023 | $ 2,500,000 | $ 2,730,650 | |
| Texas — 9.6% | |||
| City of Dallas (Public Improvements) GO, 5.00% due 2/15/2025 - 2/15/2034 | 9,720,000 | 11,206,490 | |
| City of Dallas (Trinity River Corridor Infrastructure) GO, 5.00% due 2/15/2028 | 1,000,000 | 1,138,540 | |
| City of Galveston (Galveston Island Convention Center; Insured: AGM), | |||
| Series A, 5.00% due 9/1/2021 | 545,000 | 580,403 | |
| Series B, 5.00% due 9/1/2024 | 1,115,000 | 1,227,849 | |
| City of Houston (Convention & Entertainment Facilities), 5.00% due 9/1/2032 | 3,560,000 | 4,003,790 | |
| City of Houston (Public Improvements) GO, Series A, 5.00% due 3/1/2027 | 1,175,000 | 1,401,810 | |
| City of McAllen (International Toll Bridge; Insured: AGM), Series A, 5.00% due 3/1/2028 - 3/1/2032 | 6,120,000 | 7,099,123 | |
| City of Pharr Higher Education Finance Authority (IDEA Public Schools), Series A, 5.75% due 8/15/2024 (pre-refunded 8/15/2019) | 4,445,000 | 4,513,542 | |
| City of San Antonio (Airport System Capital Improvements) AMT, 5.00% due 7/1/2024 - 7/1/2025 | 3,225,000 | 3,533,980 | |
| City of San Antonio (Water System), Series A, 5.00% due 5/15/2033 - 5/15/2034 | 3,075,000 | 3,599,866 | |
| City of Texas City Industrial Development Corp. (ARCO Pipe Line Co. Project), 7.375% due 10/1/2020 | 2,705,000 | 2,926,377 | |
| Dallas Area Rapid Transit, Series A, 5.00% due 12/1/2035 - 12/1/2036 | 7,000,000 | 8,131,500 | |
| Dallas County Utility & Reclamation District GO, 5.00% due 2/15/2027 | 1,905,000 | 2,306,193 | |
| Harris County Cultural Education Facilities Finance Corp. (Memorial Hermann Health System), Series A, 5.00% due 12/1/2028 | 3,000,000 | 3,444,630 | |
| Harris County Cultural Education Facilities Finance Corp. (TECO Project), 5.00% due 11/15/2028 - 11/15/2033 | 2,225,000 | 2,671,038 | |
| Houston Airport System Revenue, Series D, 5.00% due 7/1/2035 | 1,750,000 | 2,097,707 | |
| Houston Higher Education Finance Corp. (Cosmos Foundation, Inc.), 6.50% due 5/15/2031 (pre-refunded 5/15/2021) | 775,000 | 851,245 | |
| La Vernia Higher Education Finance Corp. (Kipp, Inc.), Series A, 5.75% due 8/15/2024 (pre-refunded 8/15/2019) | 3,000,000 | 3,045,720 | |
| Lower Colorado River Authority, | |||
| Series A, | |||
| 5.00% due 5/15/2026 | 9,415,000 | 10,295,867 | |
| 5.00% due 5/15/2026 (pre-refunded 5/15/2022) | 55,000 | 60,561 | |
| Metropolitan Transit Authority of Harris County, 5.00% due 11/1/2029 - 11/1/2030 | 4,040,000 | 5,048,361 | |
| North Central Texas Health Facilities Development Corp. (Children’s Medical Center of Dallas), 5.00% due 8/15/2019 | 270,000 | 273,310 | |
| North Texas Tollway Authority (NTTA System), Series A, 5.00% due 1/1/2020 - 1/1/2037 | 3,750,000 | 4,088,170 | |
| Round Rock (Educational Facilities Improvements; Guaranty: PSF) ISD GO, 5.00% due 8/1/2028 - 8/1/2029 | 5,820,000 | 6,932,844 | |
| a | San Antonio Education Facilities Corp. 1.55% due 6/1/2033 (put 4/5/2019) | 500,000 | 500,000 |
| San Antonio Water System, Series A, 5.00% due 5/15/2037 | 500,000 | 596,140 | |
| San Juan Higher Education Finance Authority (IDEA Public Schools), Series A, 5.75% due 8/15/2024 (pre-refunded 8/15/2020) | 1,590,000 | 1,678,547 | |
| Stephen F Austin State University (Financing System), | |||
| Series A, | |||
| f | 5.00% due 10/15/2030 | 415,000 | 504,574 |
| 5.00% due 10/15/2031 - 10/15/2033 | 850,000 | 1,019,645 | |
| Texas Public Finance Authority Charter School Finance Corp. (Cosmos Foundation, Inc.), Series A, 6.00% due 2/15/2030 (pre-refunded 2/15/2020) | 1,750,000 | 1,815,100 | |
| Texas Transportation Commission (Central Texas Turnpike System), Series C, 5.00% due 8/15/2024 - 8/15/2025 | 2,250,000 | 2,570,295 | |
| Texas Transportation Commission (Highway Improvements) GO, 4.00% due 8/29/2019 | 20,875,000 | 21,081,036 | |
| Uptown Development Authority (Infrastructure Improvements), 5.50% due 9/1/2029 (pre-refunded 9/1/2019) | 1,250,000 | 1,270,063 | |
| U. S. Virgin Islands — 0.4% | |||
| Virgin Islands Public Finance Authority, 6.625% due 10/1/2029 | 5,000,000 | 4,900,000 | |
| Utah — 1.4% | |||
| b | County of Utah, (IHC Health Services, Inc. Obligated Group), Series B- 5.00% due 5/15/2056 (put 8/1/2022) | 2,500,000 | 2,740,600 |
| Murray (IHC Health Services, Inc. Obligated Group; SPA JP Morgan Chase Bank, N.A) | |||
| a | Series A, 1.50% due 5/15/2037 (put 4/1/2019) | 1,325,000 | 1,325,000 |
| a | Series B, 1.50% due 5/15/2037 (put 4/1/2019) | 7,230,000 | 7,230,000 |
| Weber County (IHC Health Services, Inc. Obligated Group), (SPA The Bank of NY Mellon) | |||
| a | Series A, 1.50% due 2/15/2031 (put 4/1/2019) | 600,000 | 600,000 |
| a | Series C, 1.50% due 2/15/2035 (put 4/1/2019) | 5,930,000 | 5,930,000 |
| Virginia — 0.0% | |||
| County of Hanover (FirstHealth Richmond Memorial Hospital; Insured: Natl-Re) IDA ETM, 6.00% due 10/1/2021 | 380,000 | 387,851 | |
| Washington — 2.8% | |||
| King County Public Hospital District No. 2 (EvergreenHealth Medical Center) GO, 5.00% due 12/1/2028 - 12/1/2030 | 4,545,000 | 5,238,712 | |
| Skagit County Public Hospital District No. 1 (Skagit Regional Health) GO, 5.00% due 12/1/2025 - 12/1/2028 | 7,860,000 | 8,672,883 | |
| Skagit County Public Hospital District No. 2 (Island Hospital) GO, 5.00% due 12/1/2027 - 12/1/2028 | 4,640,000 | 5,080,125 | |
| State of Washington (Acquisition and Improvements of Real and Personal Property) COP, Series A, 5.00% due 7/1/2030 | 4,415,000 | 5,326,874 | |
| State of Washington GO, Series C 5.00% due 2/1/2036 - 2/1/2037 | 7,425,000 | 9,012,938 | |
| Tacoma School District No.10 (Pierce County Capital Projects) GO, 5.00% due 12/1/2019 - 12/1/2020 | 2,000,000 | 2,079,650 | |
| West Virginia — 0.3% | |||
| b | West Virginia Economic Development Authority (Appalachian Power Co.), 2.625% due 12/1/2042 (put 6/1/2022) | 2,000,000 | 2,031,940 |
| b | West Virginia Economic Development Authority, (Appalachian Power Co.) AMT, Series A, 1.70% due 1/1/2041 (put 9/1/2020) | 1,500,000 | 1,493,955 |
| Wisconsin — 2.4% | |||
| b | Wisconsin Health & Educational Facilities Authority (Advocate Aurora Health Obligated Group), 5.00% due 8/15/2054 (put 1/26/2022) | 6,500,000 | 7,074,275 |
| Wisconsin Health & Educational Facilities Authority (Agnesian Healthcare), |
| PRINCIPAL AMOUNT | VALUE | ||
| 5.00% due 7/1/2021 (pre-refunded 7/1/2020) | $ 2,170,000 | $ 2,261,531 | |
| 5.50% due 7/1/2025 (pre-refunded 7/1/2020) | 5,000,000 | 5,241,600 | |
| Wisconsin Health & Educational Facilities Authority (ProHealth Care, Inc.), 5.00% due 8/15/2023 - 8/15/2026 | 10,925,000 | 11,699,769 | |
| WPPI Energy, | |||
| Series A, | |||
| 5.00% due 7/1/2029 - 7/1/2036 | 2,580,000 | 3,099,397 | |
| f | 5.00% due 7/1/2031 | 400,000 | 483,840 |
| Total Investments — 98.6%(Cost $1,197,723,195) | $1,249,103,938 | ||
| Other Assets Less Liabilities — 1.4% | 18,257,627 | ||
| Net Assets — 100.0% | $1,267,361,565 |
| Footnote Legend | |
| a | Variable Rate Demand Notes are instruments whose interest rates change on a specific date (such as coupon date or interest payment date) or whose interest rates vary with changes in a designated base rate (such as the prime interest rate). This instrument is payable on demand and is secured by letters of credit or other credit support agreements from major banks. |
| b | Variable Rate Demand Obligations are instruments whose interest rates change on a mandatory date (demand date) or whose interest rates will vary with changes in a designated base rate. The rate disclosed is the rate at March 31, 2019. |
| c | Floating Rate Security. Stated interest/floor rate was in effect at March 31, 2019. |
| d | Illiquid security. |
| e | When-issued security. |
| f | Segregated as collateral for a when-issued security. |
To simplify the listings of securities, abbreviations are used per the table below:
| AGM | Insured by Assured Guaranty Municipal Corp. |
| AMBAC | Insured by American Municipal Bond Assurance Corp. |
| AMT | Alternative Minimum Tax |
| BAM | Insured by Build America Mutual Insurance Co. |
| COP | Certificates of Participation |
| DFA | Development Finance Authority |
| EDA | Economic Development Authority |
| ETM | Escrowed to Maturity |
| FGIC | Insured by Financial Guaranty Insurance Co. |
| GNMA | Collateralized by Government National Mortgage Association |
| GO | General Obligation |
| HFA | Health Facilities Authority |
| HFFA | Health Facilities Financing Authority |
| IDA | Industrial Development Authority |
| ISD | Independent School District |
| LIBOR | London Interbank Offered Rates |
| LOC | Letter of Credit |
| MUNIPSA | Securities Industry and Financial Markets Association (SIFMA) Municipal Swap Index |
| Natl-Re | Insured by National Public Finance Guarantee Corp. |
| PSF | Guaranteed by Permanent School Fund |
| Q-SBLF | Insured by Qualified School Bond Loan Fund |
| SPA | Stand-by Purchase Agreement |
| USD | Unified School District |
Thornburg Intermediate Municipal Fund | March 31, 2019 (Unaudited)
| ASSETS | |
| Investments at value (cost $1,197,723,195) (Note 3) | $ 1,249,103,938 |
| Cash | 1,957,046 |
| Receivable for investments sold | 4,700,000 |
| Receivable for fund shares sold | 1,826,135 |
| Interest receivable | 14,420,086 |
| Prepaid expenses and other assets | 76,044 |
| Total Assets | 1,272,083,249 |
| Liabilities | |
| Payable for investments purchased | 871,548 |
| Payable for fund shares redeemed | 2,330,014 |
| Payable to investment advisor and other affiliates (Note 4) | 699,956 |
| Accounts payable and accrued expenses | 350,402 |
| Dividends payable | 469,764 |
| Total Liabilities | 4,721,684 |
| Net Assets | $ 1,267,361,565 |
| NET ASSETS CONSIST OF | |
| Distributable earnings | $ 40,458,348 |
| Net capital paid in on shares of beneficial interest | 1,226,903,217 |
| $ 1,267,361,565 | |
| NET ASSET VALUE | |
| Class A Shares: | |
| Net asset value and redemption price per share ($305,535,087 applicable to 21,693,946 shares of beneficial interest outstanding - Note 5) | $ 14.08 |
| Maximum sales charge, 2.00% of offering price | 0.29 |
| Maximum offering price per share | $ 14.37 |
| Class C Shares: | |
| Net asset value and offering price per share* ($90,503,629 applicable to 6,418,089 shares of beneficial interest outstanding - Note 5) | $ 14.10 |
| Class I Shares: | |
| Net asset value, offering and redemption price per share ($871,322,849 applicable to 61,945,942 shares of beneficial interest outstanding - Note 5) | $ 14.07 |
| * | Redemption price per share is equal to net asset value less any applicable contingent deferred sales charge. |
Thornburg Intermediate Municipal Fund | Six Months Ended March 31, 2019 (Unaudited)
| INVESTMENT INCOME | |
| Interest income (net of premium amortized of $6,780,976) | $ 21,161,854 |
| EXPENSES | |
| Investment advisory fees (Note 4) | 2,932,295 |
| Administration fees (Note 4) | |
| Class A Shares | 135,657 |
| Class C Shares | 43,157 |
| Class I Shares | 382,490 |
| Distribution and service fees (Note 4) | |
| Class A Shares | 386,094 |
| Class C Shares | 294,820 |
| Transfer agent fees | |
| Class A Shares | 109,400 |
| Class C Shares | 40,600 |
| Class I Shares | 344,710 |
| Registration and filing fees | |
| Class A Shares | 8,330 |
| Class C Shares | 7,206 |
| Class I Shares | 12,196 |
| Custodian fees (Note 2) | 46,440 |
| Professional fees | 31,660 |
| Trustee and officer fees (Note 4) | 36,632 |
| Other expenses | 49,041 |
| Total Expenses | 4,860,728 |
| Less: | |
| Expenses reimbursed by investment advisor (Note 4) | (14,531) |
| Net Expenses | 4,846,197 |
| Net Investment Income | $ 16,315,657 |
| REALIZED AND UNREALIZED GAIN (LOSS) | |
| Net realized gain (loss) on investments | (2,974,258) |
| Net change in unrealized appreciation (depreciation) on investments | 28,520,103 |
| Net Realized and Unrealized Gain | 25,545,845 |
| Net Increase in Net Assets Resulting from Operations | $ 41,861,502 |
Thornburg Intermediate Municipal Fund
| Six Months Ended March 31, 2019* | Year Ended September 30, 2018 | |
| INCREASE (DECREASE) IN NET ASSETS FROM | ||
| OPERATIONS | ||
| Net investment income | $ 16,315,657 | $ 34,344,102 |
| Net realized gain (loss) on investments | (2,974,258) | (508,141) |
| Net unrealized appreciation (depreciation) on investments | 28,520,103 | (34,817,777) |
| Net Increase (Decrease) in Net Assets Resulting from Operations | 41,861,502 | (981,816) |
| DIVIDENDS TO SHAREHOLDERS | ||
| From distributable earnings | ||
| Class A Shares | (3,726,016) | (8,110,815) |
| Class C Shares | (1,017,844) | (2,463,091) |
| Class I Shares | (11,571,797) | (23,770,196) |
| FUND SHARE TRANSACTIONS (NOTE 5) | ||
| Class A Shares | (24,810,274) | (54,640,103) |
| Class C Shares | (15,512,985) | (32,956,483) |
| Class I Shares | (51,794,278) | (22,998,283) |
| Net Decrease in Net Assets | (66,571,692) | (145,920,787) |
| NET ASSETS | ||
| Beginning of Period | 1,333,933,257 | 1,479,854,044 |
| End of Period | $ 1,267,361,565 | $ 1,333,933,257 |
| * | Unaudited. |
Thornburg Intermediate Municipal Fund | March 31, 2019 (Unaudited)
Thornburg Intermediate Municipal Fund | March 31, 2019 (Unaudited)
| Cost of investments for tax purposes | $ 1,197,723,195 |
| Gross unrealized appreciation on a tax basis | 51,510,869 |
| Gross unrealized depreciation on a tax basis | (130,126) |
| Net unrealized appreciation (depreciation) on investments (tax basis) | $ 51,380,743 |
| Fair Value Measurements at March 31, 2019 | ||||
| TOTAL | LEVEL 1 | LEVEL 2 | LEVEL 3 | |
| Assets | ||||
| Investments in Securities | ||||
| Municipal Bonds | $ 1,249,103,938 | $ — | $ 1,249,103,938 | $ — |
| Total Investments in Securities | $1,249,103,938 | $— | $1,249,103,938 | $— |
| Total Assets | $1,249,103,938 | $— | $1,249,103,938 | $— |
Thornburg Intermediate Municipal Fund | March 31, 2019 (Unaudited)
| Management Fee Schedule | |
| DAILY NET ASSETS | FEE RATE |
| Up to $500 million | 0.500% |
| Next $500 million | 0.450 |
| Next $500 million | 0.400 |
| Next $500 million | 0.350 |
| Over $2 billion | 0.275 |
| Administration Fee Schedule | |
| Daily Net Assets | Fee Rate |
| Up to $20 billion | 0.100% |
| $20 billion to $40 billion | 0.075 |
| $40 billion to $60 billion | 0.040 |
| Over $60 billion | 0.030 |
| SIX MONTHS ENDED March 31, 2019 (UNAUDITED) | YEAR ENDED September 30, 2018 (AUDITED) | |||
| SHARES | AMOUNT | SHARES | AMOUNT | |
| Class A Shares | ||||
| Shares sold | 1,819,989 | $ 25,270,255 | 3,440,093 | $ 48,061,162 |
| Shares issued to shareholders in reinvestment of dividends | 249,108 | 3,459,699 | 540,781 | 7,537,537 |
| Shares repurchased | (3,866,162) | (53,540,228) | (7,900,250) | (110,238,802) |
| Net decrease | (1,797,065) | $ (24,810,274) | (3,919,376) | $ (54,640,103) |
| Class C Shares | ||||
| Shares sold | 337,122 | $ 4,678,515 | 610,549 | $ 8,566,397 |
| Shares issued to shareholders in reinvestment of dividends | 61,707 | 858,033 | 152,703 | 2,131,447 |
| Shares repurchased | (1,513,860) | (21,049,533) | (3,125,429) | (43,654,327) |
| Net decrease | (1,115,031) | $ (15,512,985) | (2,362,177) | $ (32,956,483) |
| Class I Shares | ||||
| Shares sold | 13,930,145 | $ 192,500,224 | 20,029,348 | $ 278,934,355 |
| Shares issued to shareholders in reinvestment of dividends | 634,503 | 8,800,455 | 1,368,222 | 19,052,210 |
| Shares repurchased | (18,324,665) | (253,094,957) | (23,058,970) | (320,984,848) |
| Net decrease | (3,760,017) | $ (51,794,278) | (1,661,400) | $ (22,998,283) |
Thornburg Intermediate Municipal Fund
| PER SHARE PERFORMANCE (FOR A SHARE OUTSTANDING THROUGHOUT THE PERIOD) | ||||||||
| UNLESS OTHERWISE NOTED, PERIODS ARE FISCAL YEARS ENDED SEPTEMBER 30, | Net Asset Value, Beginning of PERIOD | Net Investment Income (Loss)+ | Net Realized & Unrealized Gain (Loss) on Investments | Total from Investment Operations | Dividends from Net Investment Income | Dividends from Net Realized Gains | Total Dividends | Net Asset Value, End of PERIOD |
| CLASS A SHARES | ||||||||
| 2019(b)(c) | $ 13.80 | 0.17 | 0.28 | 0.45 | (0.17) | — | (0.17) | $ 14.08 |
| 2018(b) | $ 14.15 | 0.32 | (0.35) | (0.03) | (0.32) | — | (0.32) | $ 13.80 |
| 2017(b) | $ 14.47 | 0.30 | (0.32) | (0.02) | (0.30) | — | (0.30) | $ 14.15 |
| 2016(b) | $ 14.17 | 0.29 | 0.30 | 0.59 | (0.29) | — | (0.29) | $ 14.47 |
| 2015(b) | $ 14.23 | 0.30 | (0.06) | 0.24 | (0.30) | — | (0.30) | $ 14.17 |
| 2014(b) | $ 13.76 | 0.34 | 0.47 | 0.81 | (0.34) | — | (0.34) | $ 14.23 |
| CLASS C SHARES | ||||||||
| 2019(c) | $ 13.82 | 0.14 | 0.28 | 0.42 | (0.14) | — | (0.14) | $ 14.10 |
| 2018 | $ 14.17 | 0.27 | (0.35) | (0.08) | (0.27) | — | (0.27) | $ 13.82 |
| 2017 | $ 14.49 | 0.26 | (0.32) | (0.06) | (0.26) | — | (0.26) | $ 14.17 |
| 2016 | $ 14.19 | 0.24 | 0.30 | 0.54 | (0.24) | — | (0.24) | $ 14.49 |
| 2015 | $ 14.25 | 0.25 | (0.06) | 0.19 | (0.25) | — | (0.25) | $ 14.19 |
| 2014 | $ 13.78 | 0.30 | 0.47 | 0.77 | (0.30) | — | (0.30) | $ 14.25 |
| CLASS I SHARES | ||||||||
| 2019(c) | $ 13.78 | 0.18 | 0.29 | 0.47 | (0.18) | — | (0.18) | $ 14.07 |
| 2018 | $ 14.13 | 0.36 | (0.35) | 0.01 | (0.36) | — | (0.36) | $ 13.78 |
| 2017 | $ 14.46 | 0.35 | (0.33) | 0.02 | (0.35) | — | (0.35) | $ 14.13 |
| 2016 | $ 14.15 | 0.33 | 0.31 | 0.64 | (0.33) | — | (0.33) | $ 14.46 |
| 2015 | $ 14.22 | 0.34 | (0.07) | 0.27 | (0.34) | — | (0.34) | $ 14.15 |
| 2014 | $ 13.75 | 0.38 | 0.47 | 0.85 | (0.38) | — | (0.38) | $ 14.22 |
| (a) | Not annualized for periods less than one year. |
| (b) | Sales loads are not reflected in computing total return. |
| (c) | Unaudited Six Month Period Ended March 31. |
| (d) | Annualized. |
| + | Based on weighted average shares outstanding. |
| RATIOS TO AVERAGE NET ASSETS | SUPPLEMENTAL DATA | ||||||
| Net Investment Income (Loss) (%) | Expenses, After Expense Reductions (%) | Expenses, After Expense Reductions and Net of Custody Credits (%) | Expenses, Before Expense Reductions (%) | Total Return (%)(a) | Portfolio Turnover Rate (%)(a) | Net Assets at End of PERIOD (Thousands) | |
| 2.41(d) | 0.90(d) | 0.90(d) | 0.90(d) | 3.26 | 10.61 | $ 305,535 | |
| 2.29 | 0.89 | 0.89 | 0.89 | (0.21) | 20.68 | $ 324,199 | |
| 2.15 | 0.92 | 0.92 | 0.92 | (0.08) | 24.04 | $ 387,790 | |
| 2.00 | 0.92 | 0.92 | 0.92 | 4.17 | 10.80 | $ 467,335 | |
| 2.09 | 0.92 | 0.92 | 0.92 | 1.68 | 13.49 | $ 423,113 | |
| 2.43 | 0.92 | 0.92 | 0.92 | 5.95 | 14.85 | $ 417,369 | |
| 2.07(d) | 1.24(d) | 1.24(d) | 1.27(d) | 3.08 | 10.61 | $ 90,504 | |
| 1.94 | 1.24 | 1.24 | 1.26 | (0.55) | 20.68 | $ 104,093 | |
| 1.83 | 1.24 | 1.24 | 1.27 | (0.40) | 24.04 | $ 140,176 | |
| 1.68 | 1.24 | 1.24 | 1.27 | 3.84 | 10.80 | $ 170,149 | |
| 1.77 | 1.24 | 1.24 | 1.28 | 1.35 | 13.49 | $ 160,042 | |
| 2.11 | 1.24 | 1.24 | 1.29 | 5.61 | 14.85 | $ 157,126 | |
| 2.65(d) | 0.65(d) | 0.65(d) | 0.65(d) | 3.46 | 10.61 | $ 871,323 | |
| 2.55 | 0.63 | 0.63 | 0.63 | 0.05 | 20.68 | $ 905,641 | |
| 2.45 | 0.62 | 0.62 | 0.62 | 0.15 | 24.04 | $ 951,888 | |
| 2.30 | 0.61 | 0.61 | 0.61 | 4.57 | 10.80 | $ 958,674 | |
| 2.39 | 0.62 | 0.62 | 0.62 | 1.91 | 13.49 | $ 751,486 | |
| 2.73 | 0.62 | 0.61 | 0.62 | 6.28 | 14.85 | $ 618,280 | |
Thornburg Intermediate Municipal Fund | March 31, 2019 (Unaudited)
| (1) | transaction costs, including |
| (a) | sales charges (loads) on purchase payments, for Class A shares; |
| (b) | a deferred sales charge on redemptions of any part or all of a purchase of $1 million of Class A shares within 12 months of purchase; |
| (c) | a deferred sales charge on redemptions of Class C shares within 12 months of purchase; |
| (2) | ongoing costs, including management fees; distribution and/or service (12b-1) fees; and other Fund expenses. |
| BEGINNING ACCOUNT VALUE 10/1/18 | ENDING ACCOUNT VALUE 3/31/19 | EXPENSES PAID DURING PERIOD† 10/1/18—3/31/19 | |
| CLASS A SHARES | |||
| Actual | $1,000.00 | $1,032.61 | $4.56 |
| Hypothetical* | $1,000.00 | $1,020.44 | $4.53 |
| CLASS C SHARES | |||
| Actual | $1,000.00 | $1,030.83 | $6.28 |
| Hypothetical* | $1,000.00 | $1,018.75 | $6.24 |
| CLASS I SHARES | |||
| Actual | $1,000.00 | $1,034.63 | $3.30 |
| Hypothetical* | $1,000.00 | $1,021.69 | $3.28 |
| † | Expenses are equal to the annualized expense ratio for each class (A: 0.90%; C: 1.24%; I: 0.65%) multiplied by the average account value over the period, multiplied by 182/365 to reflect the one-half year period. |
| * | Hypothetical assumes a rate of return of 5% per year before expenses. |
Thornburg Intermediate Municipal Fund | March 31, 2019 (Unaudited)
| ■ | Thornburg Investment Income Builder Fund |
| ■ | Thornburg Global Opportunities Fund |
| ■ | Thornburg International Value Fund |
| ■ | Thornburg Better World International Fund |
| ■ | Thornburg International Growth Fund |
| ■ | Thornburg Developing World Fund |
| ■ | Thornburg Value Fund |
| ■ | Thornburg Core Growth Fund |
| ■ | Thornburg Investment Income Builder Fund |
| ■ | Thornburg Summit Fund |
| ■ | Thornburg Low Duration Income Fund |
| ■ | Thornburg Limited Term U.S. Government Fund |
| ■ | Thornburg Limited Term Income Fund |
| ■ | Thornburg Strategic Income Fund |
| ■ | Thornburg Low Duration Municipal Fund |
| ■ | Thornburg Limited Term Municipal Fund |
| ■ | Thornburg Intermediate Municipal Fund |
| ■ | Thornburg California Limited Term Municipal Fund |
| ■ | Thornburg New Mexico Intermediate Municipal Fund |
| ■ | Thornburg New York Intermediate Municipal Fund |
| ■ | Thornburg Strategic Municipal Income Fund |
| ■ | Thornburg Long/Short Equity Fund |

| 800.847.0200 | TH172 |

| 4 | |
| 6 | |
| 7 | |
| 8 | |
| 13 | |
| 14 | |
| 15 | |
| 16 | |
| 22 | |
| 24 | |
| 25 | |
| 26 |
| SHARE CLASS | NASDAQ SYMBOL | CUSIP |
| Class A | TSSAX | 885-216-101 |
| Class C | TSSCX | 885-216-200 |
| Class I | TSSIX | 885-216-309 |
Thornburg Strategic Municipal Income Fund | March 31, 2019 (Unaudited)
 |  |
| Christopher Ryon,cfa Portfolio Manager Managing Director | Nicholos Venditti,cfa Portfolio Manager Managing Director |
 | |
| David Ashley,cfa Portfolio Manager Managing Director |
Thornburg Strategic Municipal Income Fund | March 31, 2019 (Unaudited)
| 1-YR | 3-YR | 5-YR | SINCE INCEP. | |
| Class A Shares(Incep: 4/1/09) | ||||
| Without sales charge | 3.71% | 1.70% | 2.90% | 5.72% |
| With sales charge | 1.67% | 1.03% | 2.49% | 5.51% |
| Class C Shares(Incep: 4/1/09) | ||||
| Without sales charge | 3.23% | 1.24% | 2.50% | 5.37% |
| With sales charge | 2.63% | 1.24% | 2.50% | 5.37% |
| Class I Shares(Incep: 4/1/09) | 3.94% | 1.93% | 3.17% | 6.02% |
| Annualized Distribution Yield | 2.45% |
| SEC Yield | 1.54% |
| FINAL VALUE |
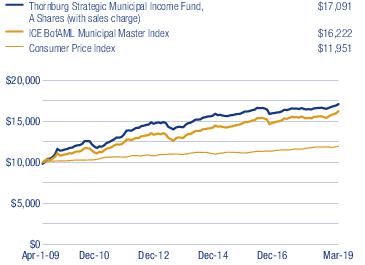
Thornburg Strategic Municipal Income Fund | March 31, 2019 (Unaudited)
| KEY PORTFOLIO ATTRIBUTES | |
| Number of Bonds | 218 |
| Effective Duration | 4.2 Yrs |
| Average Maturity | 8.7 Yrs |
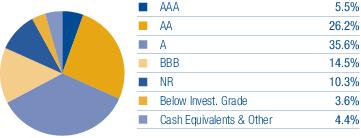
Thornburg Strategic Municipal Income Fund | March 31, 2019 (Unaudited)
| PRINCIPAL AMOUNT | VALUE | ||
| Municipal Bonds — 98.4% | |||
| Arizona — 1.8% | |||
| Arizona (Scottsdale Lincoln Hospitals) HFA, 5.00% due 12/1/2031 | $2,500,000 | $ 2,833,500 | |
| a | Industrial Development Authority of the County of Yavapai, (Waste Management, Inc.) AMT 2.80% due 6/1/2027 (put 6/1/2021) | 1,500,000 | 1,518,210 |
| Pima County (Providence Day School) IDA, 5.125% due 12/1/2040 | 710,000 | 727,026 | |
| Arkansas — 0.4% | |||
| University of Arkansas Board of Trustees (Fayetteville Campus), 5.00% due 11/1/2036 | 1,000,000 | 1,126,280 | |
| California — 13.2% | |||
| ABAG Finance Authority for Nonprofit Corporations (Episcopal Senior Communities), 5.00% due 7/1/2047 | 1,635,000 | 1,728,031 | |
| Benicia (Benicia High School; Insured: AGM) USD GO, Series C, Zero Coupon due 8/1/2026 | 830,000 | 701,981 | |
| California (Children’s Hospital Los Angeles) HFFA, | |||
| 5.00% due 11/15/2034 | 420,000 | 455,444 | |
| Series A, 5.00% due 8/15/2036 | 500,000 | 576,015 | |
| California (Community Program Developmental Disabilities; Insured: California Mtg Insurance) HFFA, 6.25% due 2/1/2026 | 1,500,000 | 1,622,475 | |
| b | California Infrastructure and Economic Development Bank (Los Angeles County Museum of Art), Series A, 2.399% (LIBOR 1 Month + 0.65%) due 12/1/2050 (put 2/1/2021) | 1,000,000 | 1,003,290 |
| California Municipal Finance Authority (Harbor Regional Center), 8.50% due 11/1/2039 (pre-refunded 11/1/2019) | 1,000,000 | 1,040,110 | |
| c | California Pollution Control Financing Authority (Poseidon Resources (Channelside) L.P. Desalination Project) AMT, 5.00% due 11/21/2045 | 1,000,000 | 1,054,730 |
| Calipatria (Educational Facilities; Insured: ACA) USD GO, Series B, Zero Coupon due 8/1/2025 | 2,025,000 | 1,573,810 | |
| Carson Redevelopment Agency (Project Area 1), Series A, 7.00% due 10/1/2036 (pre-refunded 10/1/2019) | 500,000 | 513,875 | |
| City of Los Angeles (Cash Flow Management) GO, 4.00% due 6/27/2019 | 3,000,000 | 3,017,670 | |
| City of Moorpark Mobile Home Park (Villa Del Arroyo), Series A, 6.15% due 5/15/2031 | 1,000,000 | 1,073,230 | |
| City of Palm Springs Financing Authority (Downtown Revitalization Project), 5.25% due 6/1/2027 | 1,620,000 | 1,796,013 | |
| Corona-Norco (Insured: AGM) USD COP, Series A, 5.00% due 4/15/2031 | 1,750,000 | 1,802,797 | |
| County of El Dorado (El Dorado Hills Development-Community Facilities), 5.00% due 9/1/2026 | 630,000 | 694,166 | |
| County of Los Angeles (Fiscal Year 2017-2018 Expenditures) GO, 4.00% due 6/28/2019 | 4,000,000 | 4,024,040 | |
| Daly County Housing Development Finance Agency (Franciscan Country Club Mobile Home Park Acquisition), 5.25% due 12/15/2023 | 650,000 | 651,872 | |
| M-S-R Energy Authority, Series A, 6.50% due 11/1/2039 | 1,000,000 | 1,450,190 | |
| a,d | Northern California Energy Authority (Commodity Supply Revenue), Series A, 4.00% due 7/1/2049 (put 7/1/2024) | 2,000,000 | 2,156,980 |
| Oakland (County of Alameda Educational Facilities) USD GO, Series A, 5.00% due 8/1/2035 | 1,000,000 | 1,132,640 | |
| Redwood City Redevelopment Agency (Redevelopment Project Area 2; Insured: AMBAC), Zero Coupon due 7/15/2021 | 1,285,000 | 1,231,531 | |
| Riverside County Asset Leasing Corp. (Riverside County Hospital; Insured: Natl-Re), Zero Coupon due 6/1/2021 | 535,000 | 512,947 | |
| Riverside Financing Authority (Educational Facilities; Insured: BAM) USD, 4.00% due 6/28/2019 | 3,000,000 | 3,018,030 | |
| San Francisco City & County Redevelopment Financing Authority (Mission Bay North Redevelopment), | |||
| Series C, | |||
| 6.50% due 8/1/2039 (pre-refunded 8/1/2019) | 250,000 | 254,233 | |
| 6.75% due 8/1/2041 (pre-refunded 2/1/2021) | 500,000 | 549,030 | |
| San Francisco City & County Redevelopment Financing Authority (Redevelopment Project; Insured: Natl-Re), Zero Coupon due 8/1/2023 | 1,025,000 | 942,887 | |
| San Jose Redevelopment Agency (Merged Area Redevelopment), 5.50% due 8/1/2035 (pre-refunded 8/1/2020) | 1,000,000 | 1,054,660 | |
| Union Elementary School District (Santa Clara County District Schools; Insured: Natl-Re), Series D, Zero Coupon due 9/1/2027 | 905,000 | 751,865 | |
| Colorado — 1.2% | |||
| Denver Convention Center Hotel Authority, 5.00% due 12/1/2028 | 1,000,000 | 1,139,900 | |
| Eagle River Fire District COP, | |||
| 6.625% due 12/1/2024 (pre-refunded 12/1/2019) | 225,000 | 232,400 | |
| 6.875% due 12/1/2030 (pre-refunded 12/1/2019) | 400,000 | 413,812 | |
| Public Authority for Colorado Energy (Natural Gas Purchase), 6.50% due 11/15/2038 | 260,000 | 378,698 | |
| Regional Transportation District (FasTracks Transportation System) COP, | |||
| Series A, | |||
| 5.00% due 6/1/2044 | 565,000 | 615,584 | |
| 5.375% due 6/1/2031 | 500,000 | 519,765 | |
| Connecticut — 2.7% | |||
| Connecticut Health & Educational Facilities Authority (Ethel Walker School), Series B, 6.00% due 7/1/2039 (pre-refunded 7/1/2019) | 1,000,000 | 1,011,130 | |
| State of Connecticut GO, Series A/E, 5.00% due 9/15/2033 - 4/15/2035 | 3,350,000 | 3,922,813 | |
| University of Connecticut (Insured: AGM-CR), Series A, 5.00% due 4/15/2028 | 1,975,000 | 2,384,220 | |
| Delaware — 0.4% | |||
| Delaware (Nanticoke Memorial Hospital) HFA, 5.00% due 7/1/2021 | 1,000,000 | 1,054,780 | |
| District of Columbia — 0.4% | |||
| Metropolitan Washington Airports Authority (Dulles Toll Road; Insured: AGM), Zero Coupon due 10/1/2027 | 1,500,000 | 1,169,550 | |
| Florida — 3.9% | |||
| Broward County (Airport System Improvements) AMT, 5.00% due 10/1/2037 | 1,000,000 | 1,158,680 | |
| e | City of Gainesville (Utilities System; SPA Landesbank Hessen-Thuringen), Series A-REMK 1.49% due 10/1/2026 (put 4/1/2019) | 100,000 | 100,000 |
| PRINCIPAL AMOUNT | VALUE | ||
| Florida Higher Educational Facilities Financing Authority (Nova Southeastern University), 5.00% due 4/1/2027 - 4/1/2028 | $2,250,000 | $ 2,531,060 | |
| Miami-Dade County Expressway Authority (Toll System Five-Year Work Program), Series A, 5.00% due 7/1/2022 - 7/1/2024 | 1,250,000 | 1,413,425 | |
| Miami-Dade County School Board (District School Facilities and Infrastructure) COP, Series A, 5.00% due 8/1/2027 | 1,100,000 | 1,203,521 | |
| Orange County (Tourist Development), Series A, 5.00% due 10/1/2031 | 1,000,000 | 1,182,260 | |
| Sarasota County Public Hospital Board (Sarasota Memorial Hospital; Insured: Natl-Re), 2.548% due 10/1/2021 | 1,000,000 | 1,033,500 | |
| Tampa Sports Authority (Tampa Bay Arena; Insured: Natl-Re), 5.75% due 10/1/2020 | 325,000 | 334,948 | |
| Volusia County Educational Facilities Authority (Embry-Riddle Aeronautical University, Inc.), Series B, 5.00% due 10/15/2030 | 1,500,000 | 1,711,395 | |
| Georgia — 1.8% | |||
| City of Atlanta (Water and Wastewater Capital Improvement Program), Series A, 6.25% due 11/1/2034 (pre-refunded 11/1/2019) | 500,000 | 513,790 | |
| Development Authority of Fulton County (Georgia Tech Athletic Assoc.), 5.00% due 10/1/2019 | 1,000,000 | 1,016,470 | |
| Main Street Natural Gas, Inc. (Georgia Gas), Series A, 5.50% due 9/15/2023 | 350,000 | 398,374 | |
| Main Street Natural Gas, Inc., Series A, 5.00% due 5/15/2037 | 2,640,000 | 3,145,903 | |
| Guam — 3.6% | |||
| Government of Guam (Economic Development) GO, Series A, 7.00% due 11/15/2039 (pre-refunded 11/15/2019) | 520,000 | 537,623 | |
| Government of Guam (Economic Development), Series D, 5.00% due 11/15/2031 | 2,000,000 | 2,190,340 | |
| Government of Guam (Layon Solid Waste Disposal Facility), Series A, 5.75% due 12/1/2034 (pre-refunded 12/1/2019) | 500,000 | 514,210 | |
| Government of Guam (Various Capital Projects), Series D, 5.00% due 11/15/2032 | 3,000,000 | 3,270,870 | |
| Guam Power Authority (Electric Power System), Series A, 5.00% due 10/1/2033 | 1,000,000 | 1,122,480 | |
| Guam Power Authority (Electric Power System; Insured: AGM), Series A, 5.00% due 10/1/2027 | 1,000,000 | 1,099,770 | |
| Guam Waterworks Authority (Water and Wastewater System), | |||
| 5.00% due 7/1/2028 | 500,000 | 542,700 | |
| 5.25% due 7/1/2024 | 500,000 | 555,735 | |
| Hawaii — 0.4% | |||
| b | City and County of Honolulu (Rail Transit Project) GO, 1.82% (MUNIPSA + 0.32%) due 9/1/2028 (put 9/1/2020) | 1,000,000 | 999,620 |
| Illinois — 11.1% | |||
| Chicago Park District (Various Capital Projects) GO, Series A, 5.00% due 1/1/2035 | 2,000,000 | 2,149,080 | |
| Chicago Park District GO, Series A, 5.00% due 1/1/2027 | 825,000 | 933,207 | |
| City of Chicago (Chicago O’Hare International Airport), Series C, 5.00% due 1/1/2031 | 500,000 | 578,260 | |
| City of Chicago (Riverwalk Expansion Project; Insured: AGM), 5.00% due 1/1/2031 | 500,000 | 543,760 | |
| City of Chicago (Wastewater Transmission System), Series C, 5.00% due 1/1/2030 | 1,500,000 | 1,674,315 | |
| City of Chicago (Water System Improvements), 5.00% due 11/1/2029 | 200,000 | 215,664 | |
| City of Chicago (Water System; Insured: AGM), 5.00% due 11/1/2037 | 1,500,000 | 1,696,980 | |
| f | City of Chicago GO, Series A, 5.00% due 1/1/2039 | 1,000,000 | 1,070,650 |
| City of Chicago, 5.00% due 1/1/2022 | 1,195,000 | 1,256,232 | |
| Cook County GO, Series A, 5.25% due 11/15/2033 | 1,000,000 | 1,041,730 | |
| Illinois Finance Authority (Advocate Health Care Network), 5.00% due 8/1/2029 | 2,195,000 | 2,509,236 | |
| Illinois Finance Authority (OSF Healthcare System), 6.00% due 5/15/2039 (pre-refunded 5/15/2020) | 990,000 | 1,037,886 | |
| Illinois Finance Authority (Silver Cross Hospital & Medical Centers), 5.00% due 8/15/2035 | 2,355,000 | 2,616,429 | |
| Illinois Finance Authority (Southern Illinois Healthcare), 5.00% due 3/1/2032 - 3/1/2034 | 700,000 | 800,936 | |
| Illinois State University (Insured: AGM), Series A, 5.00% due 4/1/2021 - 4/1/2036 | 1,915,000 | 2,169,116 | |
| Illinois Toll Highway Authority (Move Illinois Program), Series A, 5.00% due 1/1/2037 | 1,000,000 | 1,133,360 | |
| Kane, Cook, & DuPage Counties School District No. 46 GO, | |||
| Series A, 5.00% due 1/1/2031 | 2,255,000 | 2,507,199 | |
| Series D, 5.00% due 1/1/2028 | 1,000,000 | 1,120,540 | |
| Metropolitan Water Reclamation District of Greater Chicago (Various Capital Improvement Projects) GO, Series C, 5.25% due 12/1/2032 | 40,000 | 50,266 | |
| State of Illinois Series B, 5.00% due 6/15/2032 | 2,000,000 | 2,226,040 | |
| State of Illinois, Series B, 5.00% due 6/15/2035 | 2,500,000 | 2,748,825 | |
| Will County School District No. 114 (Educational Facilities; Insured: Natl-Re) GO, Series C, Zero Coupon due 12/1/2023 | 570,000 | 501,805 | |
| Indiana — 0.8% | |||
| City of Carmel Redevelopment District (Performing Arts Center) COP, Series C, 6.50% due 7/15/2035 (pre-refunded 1/15/2021) | 1,000,000 | 1,085,350 | |
| Indiana Finance Authority (Marian University), 6.375% due 9/15/2041 | 1,000,000 | 1,071,030 | |
| Kansas — 0.8% | |||
| Unified Government of Wyandotte County/Kansas City (Utility System Improvement), Series A, 5.00% due 9/1/2031 - 9/1/2032 | 2,000,000 | 2,258,530 | |
| Kentucky — 3.3% | |||
| County of Owen (Kentucky-American Water Co. Project), Series A-KY, 6.25% due 6/1/2039 | 540,000 | 543,580 | |
| Kentucky Economic (Norton Healthcare, Inc.; Insured: Natl-Re) DFA, Series B, Zero Coupon due 10/1/2021 - 10/1/2022 | 3,365,000 | 3,094,880 | |
| a,d | Kentucky Public Energy Authority (Gas Supply System), Series C-1, 4.00% due 12/1/2049 (put 6/1/2025) | 5,000,000 | 5,415,050 |
| Louisiana — 2.1% | |||
| City of New Orleans (Water System Facilities Improvement), 5.00% due 12/1/2034 | 400,000 | 443,448 | |
| Louisiana Energy and Power Authority (LEPA Unit No. 1; Insured: AGM), Series A, 5.25% due 6/1/2038 | 2,000,000 | 2,226,360 | |
| New Orleans Aviation Board (Louis Armstrong New Orleans International Airport CFC Revenue; Insured: AGM) 5.00% due 1/1/2029 | 700,000 | 841,414 | |
| a | Parish of St. Charles (Valero Energy Corp. Refinery), 4.00% due 12/1/2040 (put 6/1/2022) | 2,250,000 | 2,348,482 |
Thornburg Strategic Municipal Income Fund | March 31, 2019 (Unaudited)
| PRINCIPAL AMOUNT | VALUE | ||
| Massachusetts — 0.3% | |||
| Massachusetts Development Finance Agency (Jordan Hospital and Milton Hospital), Series H-1, 5.00% due 7/1/2032 - 7/1/2033 | $ 555,000 | $ 626,555 | |
| Massachusetts Educational Financing Authority (MEFA Loan Program), Series I, 6.00% due 1/1/2028 | 125,000 | 127,946 | |
| Michigan — 6.0% | |||
| Board of Governors of Wayne State University (Educational Facilities and Equipment), Series A, 5.00% due 11/15/2033 | 1,250,000 | 1,429,812 | |
| City of Detroit GO, 5.00% due 4/1/2023 - 4/1/2024 | 900,000 | 966,564 | |
| City of Troy (Downtown Development Authority-Community Center Facilities) GO, 5.25% due 11/1/2032 | 1,025,000 | 1,119,074 | |
| County of Genesee (Water Supply System; Insured: BAM) GO, 5.375% due 11/1/2038 | 1,000,000 | 1,118,510 | |
| Detroit City School District (School Building & Site; Insured: Q-SBLF) GO, Series A, 5.25% due 5/1/2027 | 1,000,000 | 1,210,080 | |
| Detroit City School District (School Building & Site; Insured: Q-SBLF), Series A, 5.00% due 5/1/2025 | 1,000,000 | 1,090,260 | |
| Detroit Downtown Development Authority (Catalyst Development Project; Insured: AGM), Series A, 5.00% due 7/1/2024 | 850,000 | 958,392 | |
| Kalamazoo Hospital Finance Authority (Bronson Methodist Hospital), | |||
| 5.00% due 5/15/2036 | 450,000 | 462,074 | |
| 5.00% due 5/15/2036 (pre-refunded 5/15/2020) | 550,000 | 570,532 | |
| 5.25% due 5/15/2041 | 140,000 | 148,569 | |
| 5.25% due 5/15/2041 (pre-refunded 5/15/2021) | 860,000 | 924,397 | |
| Livonia Public School District (School Building & Site) GO, Series I, 5.00% due 5/1/2036 | 225,000 | 250,182 | |
| Michigan Finance Authority (State Dept. of Human Services Office Buildings), Series F, 5.00% due 4/1/2031 | 1,000,000 | 1,068,460 | |
| Michigan Public School Academy (Will Carleton Charter School), 8.00% due 8/1/2035 | 950,000 | 958,854 | |
| Michigan State Hospital Finance Authority (Henry Ford Health System), 5.75% due 11/15/2039 (pre-refunded 11/15/2019) | 1,000,000 | 1,025,710 | |
| Michigan Strategic Fund (Detroit Edison Company; Insured: Natl-Re/AMBAC), 7.00% due 5/1/2021 | 250,000 | 274,950 | |
| Wayne County Airport Authority (Detroit Metropolitan Wayne County Airport), | |||
| Series B, | |||
| 5.00% due 12/1/2031 - 12/1/2033 | 1,475,000 | 1,687,580 | |
| g | 5.00% due 12/1/2034 | 1,140,000 | 1,297,890 |
| Missouri — 1.0% | |||
| Platte County 5.00% due 4/1/2020 | 350,000 | 341,579 | |
| Tax Increment Financing Commission of Kansas City (Union Hill Redevelopment Project), 6.00% due 5/1/2030 | 2,505,000 | 2,532,856 | |
| Nebraska — 1.4% | |||
| a,d | Central Plains Energy Project, 5.00% due 3/1/2050 (put 1/1/2024) | 1,650,000 | 1,828,992 |
| Douglas County Health Facilities (Nebraska Methodist Health System), 5.00% due 11/1/2029 - 11/1/2030 | 1,750,000 | 2,003,839 | |
| Nevada — 0.4% | |||
| Carson City (Carson Tahoe Regional Healthcare), 5.00% due 9/1/2037 | 1,000,000 | 1,114,030 | |
| New Jersey — 3.3% | |||
| New Jersey (School Facilities Construction) EDA, 5.00% due 3/1/2026 | 1,000,000 | 1,083,220 | |
| New Jersey (School Facilities Construction; Insured: Natl-Re) EDA, Series N-1, 5.50% due 9/1/2027 | 1,000,000 | 1,213,200 | |
| New Jersey Transit Corp. (Federal Transit Administration Section 5307 Urbanized Area Formula Funds), Series A, 5.00% due 9/15/2020 | 1,000,000 | 1,044,500 | |
| New Jersey Transportation Trust Fund Authority (State Transportation System Improvements), | |||
| b | 2.70% (MUNIPSA + 1.20%) due 6/15/2034 (put 12/15/2021) | 1,000,000 | 1,007,790 |
| 5.00% due 6/15/2027 | 3,000,000 | 3,475,620 | |
| Tobacco Settlement Financing Corp., Series A, 5.00% due 6/1/2019 | 1,310,000 | 1,316,327 | |
| New Mexico — 1.3% | |||
| City of Farmington (Arizona Public Service Co.-Four Corners Project), Series B, 4.70% due 9/1/2024 | 1,000,000 | 1,040,620 | |
| New Mexico Hospital Equipment Loan Council (Haverland Carter Lifestyle Group), 5.00% due 7/1/2032 | 2,500,000 | 2,609,800 | |
| New York — 10.2% | |||
| City of New York (City Budget Financial Management) GO, | |||
| Series G, 5.00% due 8/1/2023 | 3,000,000 | 3,421,350 | |
| Series J, 5.00% due 8/1/2031 | 2,000,000 | 2,287,000 | |
| Metropolitan Transportation Authority (Transit and Commuter System), Series C-1, 5.00% due 9/1/2020 | 5,000,000 | 5,218,450 | |
| Metropolitan Transportation Authority, Series A, 4.00% due 2/3/2020 | 1,000,000 | 1,019,060 | |
| e | New York City Transitional Finance Authority Future Tax Secured Revenue (SPA Landesbank Hessen-Thuringen), 1.51% due 8/1/2031 (put 4/1/2019) | 2,550,000 | 2,550,000 |
| e | New York City Transitional Finance Authority Future Tax Secured Revenue, (Barclays Bank plc) Series B-3, 1.52% due 11/1/2042 (put 4/1/2019) | 2,300,000 | 2,300,000 |
| e | New York City Transitional Finance Authority Future Tax Secured Revenue, (SPA JP Morgan Chase Bank, N.A) Series C-4, 1.50% due 11/1/2036 (put 4/1/2019) | 500,000 | 500,000 |
| e | New York City Water & Sewer System, (SPA Landesbank Hessen-Thuringen) Series R, 1.50% due 6/15/2044 (put 4/1/2019) | 4,700,000 | 4,700,000 |
| Town of Oyster Bay GO, Series B, 3.00% due 2/1/2020 - 3/13/2020 | 6,000,000 | 6,045,490 | |
| North Carolina — 1.4% | |||
| North Carolina Medical Care Commission (Vidant Health), 5.00% due 6/1/2029 | 1,500,000 | 1,738,200 | |
| North Carolina Turnpike Authority, 5.00% due 1/1/2029 - 1/1/2030 | 1,000,000 | 1,192,145 | |
| b | University of North Carolina at Chapel Hill, Series A, 2.018% (LIBOR 1 Month + 0.35%) due 12/1/2041 (put 12/1/2021) | 1,000,000 | 1,000,610 |
| Ohio — 1.2% |
| PRINCIPAL AMOUNT | VALUE | ||
| Akron, Bath and Copley Joint Hospital District (Summa Health), 5.25% due 11/15/2030 | $1,420,000 | $ 1,663,999 | |
| City of Akron (Community Learning Centers), 5.00% due 12/1/2031 | 625,000 | 683,662 | |
| Cleveland-Cuyahoga County Port Authority (Flats East Development Project; LOC Fifth Third Bank), 7.00% due 5/15/2040 | 915,000 | 980,066 | |
| Pennsylvania — 6.3% | |||
| Allegheny County (Propel Charter School) IDA, Series A, 6.75% due 8/15/2035 | 885,000 | 916,462 | |
| Bucks County Industrial Development Authority (Waste Management, Inc.) AMT, 2.75% due 12/1/2022 | 5,000,000 | 5,038,650 | |
| Coatesville Area School District (Insured: AGM) (State Aid Withholding) GO, 5.00% due 8/1/2024 - 8/1/2025 | 1,475,000 | 1,677,296 | |
| Commonwealth Financing Authority, 5.00% due 6/1/2029 | 1,000,000 | 1,199,930 | |
| County of Luzerne (Insured: AGM) GO, Series A, 5.00% due 11/15/2029 | 1,000,000 | 1,155,290 | |
| Pennsylvania Turnpike Commission (Highway Improvements), | |||
| 5.35% due 12/1/2030 (pre-refunded 12/1/2020) | 770,000 | 816,292 | |
| Series C-2, 5.35% due 12/1/2030 (pre-refunded 12/1/2020) | 1,230,000 | 1,307,084 | |
| Pennsylvania Turnpike Commission, Series A-1, 5.00% due 12/1/2037 | 750,000 | 877,508 | |
| Philadelphia (Mast Charter School) IDA, 6.00% due 8/1/2035 (pre-refunded 8/1/2020) | 1,000,000 | 1,056,720 | |
| Philadelphia Authority for Industrial Development (Thomas Jefferson University), 5.00% due 9/1/2035 | 1,500,000 | 1,716,780 | |
| Philadelphia Municipal Authority (Juvenile Justice Services Center), 5.00% due 4/1/2038 | 1,360,000 | 1,528,286 | |
| School District of Philadelphia GO, Series A, 5.00% due 9/1/2038 | 100,000 | 113,677 | |
| Rhode Island — 0.3% | |||
| Pawtucket Housing Authority, | |||
| 5.50% due 9/1/2022 - 9/1/2024 | 475,000 | 511,736 | |
| 5.50% due 9/1/2022 - 9/1/2024 (pre-refunded 9/1/2020) | 190,000 | 205,690 | |
| South Dakota — 0.4% | |||
| South Dakota Health & Educational Facilities Authority (Avera Health), Series A, 5.00% due 7/1/2027 | 400,000 | 425,892 | |
| South Dakota Health & Educational Facilities Authority (Sanford Health), 5.50% due 11/1/2040 | 750,000 | 764,888 | |
| Tennessee — 0.9% | |||
| Shelby County Health, Educational and Housing Facility (Methodist Le Bonheur Healthcare), 5.00% due 5/1/2036 | 1,000,000 | 1,166,610 | |
| a | Tennessee Energy Acquisition Corp. (The Gas Project), Series A, 4.00% due 5/1/2048 (put 5/1/2023) | 750,000 | 793,260 |
| Tennessee Energy Acquisition Corp., Series A, 5.25% due 9/1/2024 | 500,000 | 565,485 | |
| Texas — 11.3% | |||
| Austin Convention Enterprises, Inc. (Convention Center Hotel First Tier), 5.00% due 1/1/2032 - 1/1/2034 | 1,600,000 | 1,818,126 | |
| City of Dallas (Public Improvements) GO, 5.00% due 2/15/2031 | 1,930,000 | 2,205,623 | |
| City of Houston (Combined Utility System), Series D, 5.00% due 11/15/2028 | 2,500,000 | 2,899,675 | |
| City of Houston (Convention & Entertainment Facilities Department), 5.00% due 9/1/2025 - 9/1/2034 | 2,875,000 | 3,252,120 | |
| City of Houston (Public Improvements) GO, Series A, 5.00% due 3/1/2032 | 3,000,000 | 3,504,930 | |
| City of Texas City Industrial Development Corp. (ARCO Pipe Line Co. Project), 7.375% due 10/1/2020 | 1,165,000 | 1,260,344 | |
| Harris County-Houston Sports Authority, Series A, 5.00% due 11/15/2030 | 2,000,000 | 2,270,000 | |
| Kimble County Hospital District, Series A, 6.25% due 8/15/2033 (pre-refunded 8/15/2019) | 500,000 | 508,630 | |
| La Vernia Higher Education Finance Corp. (Kipp, Inc.), Series A, 6.25% due 8/15/2039 (pre-refunded 8/15/2019) | 1,000,000 | 1,017,070 | |
| Lower Colorado River Authority, | |||
| Series A, | |||
| 5.00% due 5/15/2026 | 2,980,000 | 3,258,809 | |
| 5.00% due 5/15/2026 (pre-refunded 5/15/2022) | 20,000 | 22,022 | |
| North Texas Tollway Authority (NTTA System), Series A, 5.00% due 1/1/2034 | 750,000 | 950,790 | |
| Red River Authority (Insured: Natl-Re), 4.45% due 6/1/2020 | 2,500,000 | 2,568,300 | |
| San Antonio Energy Acquisition Public Facilities Corp. (Natural Gas Supply Agreement), 5.50% due 8/1/2021 | 40,000 | 42,832 | |
| San Juan Higher Education Finance Authority (IDEA Public Schools), Series A, 6.70% due 8/15/2040 (pre-refunded 8/15/2020) | 1,000,000 | 1,068,360 | |
| Texas Public Finance Authority Charter School Finance Corp. (Cosmos Foundation, Inc.), Series A, 6.20% due 2/15/2040 (pre-refunded 2/15/2020) | 1,000,000 | 1,038,920 | |
| Texas Transportation Commission (Central Texas Turnpike System), Series C, 5.00% due 8/15/2034 | 1,000,000 | 1,105,630 | |
| Texas Transportation Commission (Highway Improvements) GO, 4.00% due 8/29/2019 | 2,450,000 | 2,474,181 | |
| U. S. Virgin Islands — 0.6% | |||
| Virgin Islands Public Finance Authority (Diageo Project), 6.75% due 10/1/2037 | 1,650,000 | 1,617,000 | |
| Utah — 1.2% | |||
| Herriman City (Towne Center Access and Utility Improvements), 4.75% due 11/1/2022 (pre-refunded 5/1/2020) | 1,000,000 | 1,035,020 | |
| Utah Transit Authority (Integrated Mass Transit System), Series A, 5.00% due 6/15/2033 | 1,000,000 | 1,143,480 | |
| e | Weber County (IHC Health Services, Inc. Obligated Group), (SPA The Bank of NY Mellon) Series C, 1.50% due 2/15/2035 (put 4/1/2019) | 1,000,000 | 1,000,000 |
| Washington — 1.2% | |||
| Washington Health Care Facilities Authority (Catholic Health Initiatives), Series A, 5.75% due 1/1/2045 | 2,000,000 | 2,202,740 | |
| Washington Health Care Facilities Authority (Overlake Hospital Medical Center), 5.70% due 7/1/2038 (pre-refunded 7/1/2020) | 1,000,000 | 1,050,780 | |
| West Virginia — 0.9% | |||
| a | West Virginia Economic Development Authority (Appalachian Power Co.), 2.625% due 12/1/2042 (put 6/1/2022) | 1,500,000 | 1,523,955 |
| a | West Virginia Economic Development Authority, (Appalachian Power Co.) AMT, Series A, 1.70% due 1/1/2041 (put 9/1/2020) | 1,000,000 | 995,970 |
Thornburg Strategic Municipal Income Fund | March 31, 2019 (Unaudited)
| PRINCIPAL AMOUNT | VALUE | ||
| Wisconsin — 0.9% | |||
| c | Public Finance Authority (Alabama Proton Therapy Center), 6.25% due 10/1/2031 | $1,000,000 | $ 1,073,450 |
| a | Wisconsin Health & Educational Facilities Authority (Advocate Aurora Health Obligated Group), 5.00% due 8/15/2054 (put 1/29/2025) | 1,250,000 | 1,454,387 |
| Total Investments — 98.4%(Cost $257,960,296) | $271,348,000 | ||
| Other Assets Less Liabilities — 1.6% | 4,353,126 | ||
| Net Assets — 100.0% | $275,701,126 |
| Footnote Legend | |
| a | Variable Rate Demand Obligations are instruments whose interest rates change on a mandatory date (demand date) or whose interest rates will vary with changes in a designated base rate. The rate disclosed is the rate at March 31, 2019. |
| b | Floating Rate Security. Stated interest/floor rate was in effect at March 31, 2019. |
| c | Securities exempt from registration under Rule 144A of the Securities Act of 1933, as amended. These securities are restricted but liquid and may only be resold in the ordinary course of business in transactions exempt from registration, normally to qualified institutional buyers. As of March 31, 2019, the aggregate value of these securities in the Fund’s portfolio was $2,128,180, representing 0.77% of the Fund’s net assets. |
| d | Illiquid security. |
| e | Variable Rate Demand Notes are instruments whose interest rates change on a specific date (such as coupon date or interest payment date) or whose interest rates vary with changes in a designated base rate (such as the prime interest rate). This instrument is payable on demand and is secured by letters of credit or other credit support agreements from major banks. |
| f | When-issued security. |
| g | Segregated as collateral for a when-issued security. |
To simplify the listings of securities, abbreviations are used per the table below:
| ABAG | Association of Bay Area Governments |
| ACA | Insured by American Capital Access |
| AGM | Insured by Assured Guaranty Municipal Corp. |
| AMBAC | Insured by American Municipal Bond Assurance Corp. |
| AMT | Alternative Minimum Tax |
| BAM | Insured by Build America Mutual Insurance Co. |
| COP | Certificates of Participation |
| DFA | Development Finance Authority |
| EDA | Economic Development Authority |
| GO | General Obligation |
| HFA | Health Facilities Authority |
| HFFA | Health Facilities Financing Authority |
| IDA | Industrial Development Authority |
| LIBOR | London Interbank Offered Rates |
| LOC | Letter of Credit |
| Mtg | Mortgage |
| MUNIPSA | Securities Industry and Financial Markets Association (SIFMA) Municipal Swap Index |
| Natl-Re | Insured by National Public Finance Guarantee Corp. |
| Q-SBLF | Insured by Qualified School Bond Loan Fund |
| SPA | Stand-by Purchase Agreement |
| USD | Unified School District |
Thornburg Strategic Municipal Income Fund | March 31, 2019 (Unaudited)
| ASSETS | |
| Investments at value (cost $257,960,296) (Note 3) | $ 271,348,000 |
| Cash | 1,890,712 |
| Receivable for investments sold | 605,000 |
| Receivable for fund shares sold | 633,431 |
| Interest receivable | 3,494,671 |
| Prepaid expenses and other assets | 58,914 |
| Total Assets | 278,030,728 |
| Liabilities | |
| Payable for investments purchased | 1,200,405 |
| Payable for fund shares redeemed | 862,766 |
| Payable to investment advisor and other affiliates (Note 4) | 168,537 |
| Accounts payable and accrued expenses | 72,861 |
| Dividends payable | 25,033 |
| Total Liabilities | 2,329,602 |
| Net Assets | $ 275,701,126 |
| NET ASSETS CONSIST OF | |
| Distributable earnings | $ 11,988,248 |
| Net capital paid in on shares of beneficial interest | 263,712,878 |
| $ 275,701,126 | |
| NET ASSET VALUE | |
| Class A Shares: | |
| Net asset value and redemption price per share ($54,754,326 applicable to 3,633,424 shares of beneficial interest outstanding - Note 5) | $ 15.07 |
| Maximum sales charge, 2.00% of offering price | 0.31 |
| Maximum offering price per share | $ 15.38 |
| Class C Shares: | |
| Net asset value and offering price per share* ($22,153,167 applicable to 1,468,577 shares of beneficial interest outstanding - Note 5) | $ 15.08 |
| Class I Shares: | |
| Net asset value, offering and redemption price per share ($198,793,633 applicable to 13,179,960 shares of beneficial interest outstanding - Note 5) | $ 15.08 |
| * | Redemption price per share is equal to net asset value less any applicable contingent deferred sales charge. |
Thornburg Strategic Municipal Income Fund | Six Months Ended March 31, 2019 (Unaudited)
| INVESTMENT INCOME | |
| Interest income (net of premium amortized of $1,073,130) | $ 4,819,614 |
| EXPENSES | |
| Investment advisory fees (Note 4) | 991,233 |
| Administration fees (Note 4) | |
| Class A Shares | 23,048 |
| Class C Shares | 10,321 |
| Class I Shares | 82,632 |
| Distribution and service fees (Note 4) | |
| Class A Shares | 65,620 |
| Class C Shares | 70,555 |
| Transfer agent fees | |
| Class A Shares | 30,860 |
| Class C Shares | 10,920 |
| Class I Shares | 71,060 |
| Registration and filing fees | |
| Class A Shares | 6,816 |
| Class C Shares | 6,879 |
| Class I Shares | 7,853 |
| Custodian fees (Note 2) | 21,400 |
| Professional fees | 23,840 |
| Trustee and officer fees (Note 4) | 7,088 |
| Other expenses | 19,619 |
| Total Expenses | 1,449,744 |
| Less: | |
| Expenses reimbursed by investment advisor (Note 4) | (81,732) |
| Investment advisory fees waived by investment advisor (Note 4) | (198,247) |
| Net Expenses | 1,169,765 |
| Net Investment Income | $ 3,649,849 |
| REALIZED AND UNREALIZED GAIN (LOSS) | |
| Net realized gain (loss) on investments | (558,095) |
| Net change in unrealized appreciation (depreciation) on investments | 4,980,476 |
| Net Realized and Unrealized Gain | 4,422,381 |
| Net Increase in Net Assets Resulting from Operations | $ 8,072,230 |
Thornburg Strategic Municipal Income Fund
| Six Months Ended March 31, 2019* | Year Ended September 30, 2018 | |
| INCREASE (DECREASE) IN NET ASSETS FROM | ||
| OPERATIONS | ||
| Net investment income | $ 3,649,849 | $ 6,904,272 |
| Net realized gain (loss) on investments | (558,095) | 565,924 |
| Net unrealized appreciation (depreciation) on investments | 4,980,476 | (6,324,250) |
| Net Increase in Net Assets Resulting from Operations | 8,072,230 | 1,145,946 |
| DIVIDENDS TO SHAREHOLDERS | ||
| From distributable earnings | ||
| Class A Shares | (695,258) | (1,457,674) |
| Class C Shares | (255,934) | (591,918) |
| Class I Shares | (2,698,657) | (4,854,680) |
| FUND SHARE TRANSACTIONS (NOTE 5) | ||
| Class A Shares | 183,748 | (6,585,158) |
| Class C Shares | (3,172,703) | (7,341,022) |
| Class I Shares | 10,068,905 | 14,540,613 |
| Net Increase (Decrease) in Net Assets | 11,502,331 | (5,143,893) |
| NET ASSETS | ||
| Beginning of Period | 264,198,795 | 269,342,688 |
| End of Period | $ 275,701,126 | $ 264,198,795 |
| * | Unaudited. |
Thornburg Strategic Municipal Income Fund | March 31, 2019 (Unaudited)
| Cost of investments for tax purposes | $ 257,960,296 |
| Gross unrealized appreciation on a tax basis | 13,419,362 |
| Gross unrealized depreciation on a tax basis | (31,658) |
| Net unrealized appreciation (depreciation) on investments (tax basis) | $ 13,387,704 |
Thornburg Strategic Municipal Income Fund | March 31, 2019 (Unaudited)
| Fair Value Measurements at March 31, 2019 | ||||
| TOTAL | LEVEL 1 | LEVEL 2 | LEVEL 3 | |
| Assets | ||||
| Investments in Securities | ||||
| Municipal Bonds | $ 271,348,000 | $ — | $ 271,348,000 | $ — |
| Total Investments in Securities | $271,348,000 | $— | $271,348,000 | $— |
| Total Assets | $271,348,000 | $— | $271,348,000 | $— |
| Management Fee Schedule | |
| DAILY NET ASSETS | FEE RATE |
| Up to $500 million | 0.750% |
| Next $500 million | 0.675 |
| Next $500 million | 0.625 |
| Next $500 million | 0.575 |
| Over $2 billion | 0.500 |
| Administration Fee Schedule | |
| Daily Net Assets | Fee Rate |
| Up to $20 billion | 0.100% |
| $20 billion to $40 billion | 0.075 |
| $40 billion to $60 billion | 0.040 |
| Over $60 billion | 0.030 |
Thornburg Strategic Municipal Income Fund | March 31, 2019 (Unaudited)
| SIX MONTHS ENDED March 31, 2019 (UNAUDITED) | YEAR ENDED September 30, 2018 (AUDITED) | |||
| SHARES | AMOUNT | SHARES | AMOUNT | |
| Class A Shares | ||||
| Shares sold | 728,369 | $ 10,830,551 | 807,030 | $ 12,094,444 |
| Shares issued to shareholders in reinvestment of dividends | 46,093 | 686,086 | 96,102 | 1,437,053 |
| Shares repurchased | (763,621) | (11,332,889) | (1,343,468) | (20,116,655) |
| Net increase (decrease) | 10,841 | $ 183,748 | (440,336) | $ (6,585,158) |
| Class C Shares | ||||
| Shares sold | 96,734 | $ 1,437,587 | 197,098 | $ 2,958,861 |
| Shares issued to shareholders in reinvestment of dividends | 16,051 | 239,095 | 36,988 | 553,863 |
| Shares repurchased | (325,876) | (4,849,385) | (724,556) | (10,853,746) |
| Net decrease | (213,091) | $ (3,172,703) | (490,470) | $ (7,341,022) |
| Class I Shares | ||||
| Shares sold | 3,022,042 | $ 44,961,534 | 3,992,645 | $ 59,838,166 |
| Shares issued to shareholders in reinvestment of dividends | 175,672 | 2,617,791 | 308,845 | 4,621,743 |
| Shares repurchased | (2,525,285) | (37,510,420) | (3,332,449) | (49,919,296) |
| Net increase | 672,429 | $ 10,068,905 | 969,041 | $ 14,540,613 |
Thornburg Strategic Municipal Income Fund
| PER SHARE PERFORMANCE (FOR A SHARE OUTSTANDING THROUGHOUT THE PERIOD) | ||||||||
| UNLESS OTHERWISE NOTED, PERIODS ARE FISCAL YEARS ENDED SEPTEMBER 30, | Net Asset Value, Beginning of PERIOD | Net Investment Income (Loss)+ | Net Realized & Unrealized Gain (Loss) on Investments | Total from Investment Operations | Dividends from Net Investment Income | Dividends from Net Realized Gains | Total Dividends | Net Asset Value, End of PERIOD |
| CLASS A SHARES | ||||||||
| 2019(b)(c) | $ 14.82 | 0.20 | 0.25 | 0.45 | (0.20) | — | (0.20) | $ 15.07 |
| 2018(b) | $ 15.14 | 0.37 | (0.32) | 0.05 | (0.37) | — | (0.37) | $ 14.82 |
| 2017(b) | $ 15.53 | 0.35 | (0.39) | (0.04) | (0.35) | — | (0.35) | $ 15.14 |
| 2016(b) | $ 15.16 | 0.33 | 0.37 | 0.70 | (0.33) | — | (0.33) | $ 15.53 |
| 2015(b) | $ 15.19 | 0.35 | (0.02) | 0.33 | (0.35) | (0.01) | (0.36) | $ 15.16 |
| 2014(b) | $ 14.40 | 0.41 | 0.85 | 1.26 | (0.42) | (0.05) | (0.47) | $ 15.19 |
| CLASS C SHARES | ||||||||
| 2019(c) | $ 14.84 | 0.16 | 0.24 | 0.40 | (0.16) | — | (0.16) | $ 15.08 |
| 2018 | $ 15.16 | 0.30 | (0.32) | (0.02) | (0.30) | — | (0.30) | $ 14.84 |
| 2017 | $ 15.54 | 0.28 | (0.38) | (0.10) | (0.28) | — | (0.28) | $ 15.16 |
| 2016 | $ 15.17 | 0.28 | 0.37 | 0.65 | (0.28) | — | (0.28) | $ 15.54 |
| 2015 | $ 15.20 | 0.30 | (0.02) | 0.28 | (0.30) | (0.01) | (0.31) | $ 15.17 |
| 2014 | $ 14.41 | 0.37 | 0.84 | 1.21 | (0.37) | (0.05) | (0.42) | $ 15.20 |
| CLASS I SHARES | ||||||||
| 2019(c) | $ 14.84 | 0.21 | 0.24 | 0.45 | (0.21) | — | (0.21) | $ 15.08 |
| 2018 | $ 15.16 | 0.41 | (0.32) | 0.09 | (0.41) | — | (0.41) | $ 14.84 |
| 2017 | $ 15.54 | 0.39 | (0.38) | 0.01 | (0.39) | — | (0.39) | $ 15.16 |
| 2016 | $ 15.17 | 0.38 | 0.37 | 0.75 | (0.38) | — | (0.38) | $ 15.54 |
| 2015 | $ 15.20 | 0.39 | (0.01) | 0.38 | (0.40) | (0.01) | (0.41) | $ 15.17 |
| 2014 | $ 14.41 | 0.46 | 0.85 | 1.31 | (0.47) | (0.05) | (0.52) | $ 15.20 |
| (a) | Not annualized for periods less than one year. |
| (b) | Sales loads are not reflected in computing total return. |
| (c) | Unaudited Six Month Period Ended March 31. |
| (d) | Annualized. |
| + | Based on weighted average shares outstanding. |
| RATIOS TO AVERAGE NET ASSETS | SUPPLEMENTAL DATA | ||||||
| Net Investment Income (Loss) (%) | Expenses, After Expense Reductions (%) | Expenses, After Expense Reductions and Net of Custody Credits (%) | Expenses, Before Expense Reductions (%) | Total Return (%)(a) | Portfolio Turnover Rate (%)(a) | Net Assets at End of PERIOD (Thousands) | |
| 2.65(d) | 1.00(d) | 1.00(d) | 1.29(d) | 3.03 | 11.71 | $ 54,754 | |
| 2.49 | 1.00 | 1.00 | 1.28 | 0.36 | 21.06 | $ 53,693 | |
| 2.30 | 1.09 | 1.09 | 1.30 | (0.23) | 27.35 | $ 61,525 | |
| 2.11 | 1.25 | 1.25 | 1.29 | 4.63 | 11.24 | $ 79,058 | |
| 2.28 | 1.25 | 1.25 | 1.31 | 2.18 | 12.13 | $ 66,722 | |
| 2.82 | 1.25 | 1.25 | 1.31 | 8.93 | 21.89 | $ 61,424 | |
| 2.18(d) | 1.47(d) | 1.47(d) | 1.64(d) | 2.72 | 11.71 | $ 22,153 | |
| 2.01 | 1.48 | 1.48 | 1.64 | (0.12) | 21.06 | $ 24,951 | |
| 1.88 | 1.52 | 1.52 | 1.66 | (0.59) | 27.35 | $ 32,926 | |
| 1.80 | 1.55 | 1.55 | 1.66 | 4.32 | 11.24 | $ 38,773 | |
| 1.98 | 1.55 | 1.55 | 1.70 | 1.87 | 12.13 | $ 29,073 | |
| 2.53 | 1.55 | 1.55 | 1.72 | 8.60 | 21.89 | $ 26,168 | |
| 2.87(d) | 0.78(d) | 0.78(d) | 0.98(d) | 3.08 | 11.71 | $ 198,794 | |
| 2.72 | 0.78 | 0.78 | 0.96 | 0.59 | 21.06 | $ 185,555 | |
| 2.56 | 0.83 | 0.83 | 0.94 | 0.09 | 27.35 | $ 174,892 | |
| 2.42 | 0.93 | 0.93 | 0.93 | 4.96 | 11.24 | $ 190,658 | |
| 2.60 | 0.93 | 0.93 | 0.93 | 2.50 | 12.13 | $ 151,992 | |
| 3.12 | 0.94 | 0.93 | 0.94 | 9.27 | 21.89 | $ 137,109 | |
Thornburg Strategic Municipal Income Fund | March 31, 2019 (Unaudited)
| (1) | transaction costs, including |
| (a) | sales charges (loads) on purchase payments, for Class A shares; |
| (b) | a deferred sales charge on redemptions of any part or all of a purchase of $1 million of Class A shares within 12 months of purchase; |
| (c) | a deferred sales charge on redemptions of Class C shares within 12 months of purchase; |
| (2) | ongoing costs, including management fees; distribution and/or service (12b-1) fees; and other Fund expenses. |
| BEGINNING ACCOUNT VALUE 10/1/18 | ENDING ACCOUNT VALUE 3/31/19 | EXPENSES PAID DURING PERIOD† 10/1/18—3/31/19 | |
| CLASS A SHARES | |||
| Actual | $1,000.00 | $1,030.35 | $5.06 |
| Hypothetical* | $1,000.00 | $1,019.95 | $5.04 |
| CLASS C SHARES | |||
| Actual | $1,000.00 | $1,027.24 | $7.43 |
| Hypothetical* | $1,000.00 | $1,017.60 | $7.39 |
| CLASS I SHARES | |||
| Actual | $1,000.00 | $1,030.76 | $3.95 |
| Hypothetical* | $1,000.00 | $1,021.04 | $3.93 |
| † | Expenses are equal to the annualized expense ratio for each class (A: 1.00%; C: 1.47%; I: 0.78%) multiplied by the average account value over the period, multiplied by 182/365 to reflect the one-half year period. |
| * | Hypothetical assumes a rate of return of 5% per year before expenses. |
Thornburg Strategic Municipal Income Fund | March 31, 2019 (Unaudited)
| ■ | Thornburg Investment Income Builder Fund |
| ■ | Thornburg Global Opportunities Fund |
| ■ | Thornburg International Value Fund |
| ■ | Thornburg Better World International Fund |
| ■ | Thornburg International Growth Fund |
| ■ | Thornburg Developing World Fund |
| ■ | Thornburg Value Fund |
| ■ | Thornburg Core Growth Fund |
| ■ | Thornburg Investment Income Builder Fund |
| ■ | Thornburg Summit Fund |
| ■ | Thornburg Low Duration Income Fund |
| ■ | Thornburg Limited Term U.S. Government Fund |
| ■ | Thornburg Limited Term Income Fund |
| ■ | Thornburg Strategic Income Fund |
| ■ | Thornburg Low Duration Municipal Fund |
| ■ | Thornburg Limited Term Municipal Fund |
| ■ | Thornburg Intermediate Municipal Fund |
| ■ | Thornburg California Limited Term Municipal Fund |
| ■ | Thornburg New Mexico Intermediate Municipal Fund |
| ■ | Thornburg New York Intermediate Municipal Fund |
| ■ | Thornburg Strategic Municipal Income Fund |
| ■ | Thornburg Long/Short Equity Fund |

| 800.847.0200 | TH1979 |

| 4 | |
| 6 | |
| 7 | |
| 8 | |
| 12 | |
| 13 | |
| 14 | |
| 15 | |
| 20 | |
| 22 | |
| 23 | |
| 24 |
| SHARE CLASS | NASDAQ SYMBOL | CUSIP |
| Class A | LTCAX | 885-215-426 |
| Class C | LTCCX | 885-215-418 |
| Class I | LTCIX | 885-215-392 |
Thornburg California Limited Term Municipal Fund | March 31, 2019 (Unaudited)
 |  |
| Christopher Ryon,cfa Portfolio Manager Managing Director | Nicholos Venditti,cfa Portfolio Manager Managing Director |
 | |
| David Ashley,cfa Portfolio Manager Managing Director |
Thornburg California Limited Term Municipal Fund | March 31, 2019 (Unaudited)
| 1-YR | 3-YR | 5-YR | 10-YR | SINCE INCEP. | |
| Class A Shares(Incep: 2/19/87) | |||||
| Without sales charge | 2.64% | 0.67% | 1.40% | 2.75% | 4.08% |
| With sales charge | 1.07% | 0.17% | 1.09% | 2.60% | 4.03% |
| Class C Shares(Incep: 9/1/94) | |||||
| Without sales charge | 2.29% | 0.41% | 1.15% | 2.49% | 3.05% |
| With sales charge | 1.78% | 0.41% | 1.15% | 2.49% | 3.05% |
| Class I Shares(Incep: 4/1/97) | 2.83% | 0.93% | 1.70% | 3.08% | 3.53% |
| Annualized Distribution Yield | 1.50% |
| SEC Yield | 0.84% |
| FINAL VALUE |
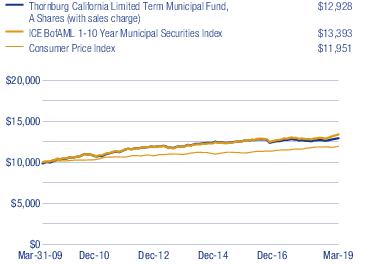
Thornburg California Limited Term Municipal Fund | March 31, 2019 (Unaudited)
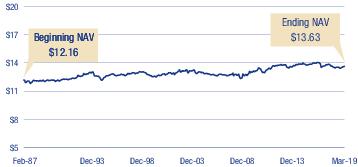
| KEY PORTFOLIO ATTRIBUTES | |
| Number of Bonds | 336 |
| Effective Duration | 3.0 Yrs |
| Average Maturity | 3.6 Yrs |
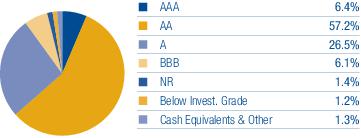

| 1% | 20% | 11% | 14% | 9% | 11% | 12% | 9% | 7% | 4% | 2% |
Thornburg California Limited Term Municipal Fund | March 31, 2019 (Unaudited)
| Issuer-Description | PRINCIPAL AMOUNT | VALUE | |
| MUNICIPAL BONDS — 98.9% | |||
| Alameda County Joint Powers Authority (Alameda County Medical Center Highland Hospital), Series A, 5.00% due 12/1/2019 - 12/1/2024 | $ 3,975,000 | $ 4,437,742 | |
| Alameda County Joint Powers Authority (Juvenile Justice), 5.00% due 12/1/2021 | 500,000 | 546,810 | |
| Alameda County Joint Powers Authority (Public Facilities Capital Projects), 5.00% due 12/1/2021 | 1,000,000 | 1,093,620 | |
| Anaheim Public Financing Authority (Public Improvements; Insured: AGM), Series C, Zero Coupon due 9/1/2022 | 3,000,000 | 2,810,340 | |
| Bay Area Toll Authority (San Francisco Bay Area Toll Bridge), | |||
| a | Series A, 2.95% due 4/1/2047 (put 4/1/2026) | 4,775,000 | 5,028,266 |
| a | Series E, 2.00% due 4/1/2034 (put 4/1/2021) | 5,300,000 | 5,317,914 |
| Bonita (Educational Facilities) USD GO, 5.00% due 8/1/2024 | 1,000,000 | 1,113,600 | |
| Brentwood Infrastructure Financing Authority (Residential Single Family Development; Insured: AGM), Series A, 5.00% due 9/2/2020 - 9/2/2023 | 6,225,000 | 6,900,216 | |
| California (Cedars-Sinai Medical Center) HFFA, Series A, 5.00% due 8/15/2019 | 1,450,000 | 1,469,299 | |
| California (Children’s Hospital Los Angeles) HFFA, Series A, 5.00% due 11/15/2020 - 11/15/2023 | 3,025,000 | 3,278,108 | |
| California (Dignity Health) HFFA, Series A, 5.25% due 3/1/2022 | 1,000,000 | 1,064,210 | |
| California (Kaiser Permanente) HFFA, Series A-1, 5.00% due 11/1/2027 | 3,000,000 | 3,813,390 | |
| California (St. Joseph Health System) HFFA, | |||
| Series A, 5.00% due 7/1/2024 | 1,000,000 | 1,146,400 | |
| a | Series D, 5.00% due 7/1/2043 (put 10/15/2020) | 5,000,000 | 5,244,400 |
| California Educational Facilities Authority (Chapman University), 5.00% due 4/1/2022 | 2,000,000 | 2,140,860 | |
| California Educational Facilities Authority (Loyola Marymount University; Insured: Natl-Re), Series A, Zero Coupon due 10/1/2019 | 2,025,000 | 2,009,225 | |
| California Educational Facilities Authority (Pitzer College) ETM, 5.00% due 4/1/2020 | 1,445,000 | 1,497,222 | |
| California Educational Facilities Authority (Stanford University), 1.75% due 4/4/2019 | 3,500,000 | 3,500,000 | |
| California Infrastructure and Economic Development Bank (California Academy of Sciences), | |||
| b | Series C, 2.123% (LIBOR 1 Month + 0.38%) due 8/1/2047 (put 8/1/2021) | 4,985,000 | 4,985,399 |
| b | Series D, 2.129% (LIBOR 1 Month + 0.38%) due 8/1/2047 (put 8/1/2021) | 6,000,000 | 6,000,480 |
| b | California Infrastructure and Economic Development Bank (J Paul Getty Trust), Series B, 1.942% (LIBOR 1 Month + 0.20%) due 10/1/2047 (put 4/1/2021) | 1,000,000 | 999,670 |
| California Infrastructure and Economic Development Bank (King City High School), 5.25% due 8/15/2020 | 1,000,000 | 1,034,110 | |
| b | California Infrastructure and Economic Development Bank (Los Angeles County Museum of Art), Series A, 2.399% (LIBOR 1 Month + 0.65%) due 12/1/2050 (put 2/1/2021) | 6,250,000 | 6,270,562 |
| California Infrastructure and Economic Development Bank (The Scripps Research Institute), 5.00% due 7/1/2019 - 7/1/2027 | 1,650,000 | 1,864,110 | |
| California Municipal Finance Authority (Biola University Residential Hall and Parking Structure), 5.00% due 10/1/2021 - 10/1/2023 | 435,000 | 479,641 | |
| California Municipal Finance Authority (Biola University), | |||
| 4.00% due 10/1/2019 | 405,000 | 409,815 | |
| 5.00% due 10/1/2020 - 10/1/2027 | 2,855,000 | 3,221,655 | |
| California Municipal Finance Authority (CHF-DAVIS I, LLC-WEST VILLAGE; Insured BAM-TCRS), 5.00% due 5/15/2028 | 2,905,000 | 3,557,870 | |
| a | California Municipal Finance Authority (Republic Services, Inc. Project), 2.15% due 9/1/2021 (put 7/1/2019) | 8,200,000 | 8,200,000 |
| a,c | California Municipal Finance Authority, Series A, 2.00% due 2/1/2039 (put 2/3/2020) | 3,000,000 | 3,007,920 |
| a,c | California Pollution Control Financing Authority (Republic Services, Inc. Project), Series B, 1.95% due 8/1/2024 (put 5/1/2019) | 2,000,000 | 2,000,180 |
| a,c | California Pollution Control Financing Authority (Republic Services, Inc.) AMT, 2.30% due 11/1/2042 (put 4/15/2019) | 1,800,000 | 1,800,108 |
| California State Housing Finance Agency (Multi-Family Housing; Insured: FHA), Series A, 3.05% due 12/1/2019 | 735,000 | 735,485 | |
| California State Public Works Board (California School for the Deaf Riverside Campus), Series H, 5.00% due 4/1/2022 | 565,000 | 621,980 | |
| California State Public Works Board (Correctional and Rehabilitation Facilities), | |||
| Series A, 5.00% due 9/1/2022 - 9/1/2024 | 13,780,000 | 15,615,283 | |
| Series G, 5.00% due 11/1/2022 | 1,500,000 | 1,679,250 | |
| California State Public Works Board (Judicial Council Projects), | |||
| Series A, 5.00% due 3/1/2023 - 3/1/2024 | 2,400,000 | 2,708,860 | |
| Series D, 5.00% due 12/1/2021 - 12/1/2022 | 4,300,000 | 4,689,372 | |
| California State Public Works Board (Laboratory Facility and San Diego Courthouse), Series I, 5.00% due 11/1/2023 - 11/1/2024 | 7,000,000 | 8,036,900 | |
| California State Public Works Board (University of California; Insured: Natl-Re) ETM, Series A, 5.00% due 6/1/2020 | 1,185,000 | 1,235,599 | |
| California State Public Works Board (Various State Participating Agency Capital Projects), Series A1, 5.125% due 3/1/2021 (pre-refunded 3/1/2020) | 1,635,000 | 1,691,767 | |
| California State Public Works Board (Yuba City Courthouse), Series D, 5.00% due 6/1/2022 | 1,950,000 | 2,157,070 | |
| California Statewide Communities Development Authority (CHF-Irvine, LLC), Series A, 5.00% due 5/15/2027 | 500,000 | 597,855 | |
| California Statewide Communities Development Authority (Cottage Health System), | |||
| 4.00% due 11/1/2021 | 150,000 | 158,891 | |
| 5.00% due 11/1/2020 - 11/1/2025 | 710,000 | 807,306 | |
| California Statewide Communities Development Authority (Irvine East Campus Apartments), 5.00% due 5/15/2021 - 5/15/2027 | 2,260,000 | 2,535,485 | |
| California Statewide Communities Development Authority (Kaiser Foundation Hospitals), Series A, 5.00% due 4/1/2019 | 3,715,000 | 3,715,000 | |
| California Statewide Communities Development Authority (Methodist Hospital of Southern California Obligated Group), 5.00% due 1/1/2020 - 1/1/2024 | 1,460,000 | 1,581,020 | |
| a | California Statewide Communities Development Authority (Southern California Edison Company), 2.625% due 11/1/2033 (put 12/1/2023) | 4,195,000 | 4,178,304 |
| Calipatria (Educational Facilities; Insured: ACA) USD GO, Series B, Zero Coupon due 8/1/2025 | 4,180,000 | 3,248,654 | |
| Carson Redevelopment Agency (Project Area 1) ETM, Series A, 6.00% due 10/1/2019 | 540,000 | 552,317 | |
| CDC Successor Agency of the City of Santee (Redevelopment and Low and Moderate Income Housing; Insured: BAM), Series A, 5.00% due 8/1/2025 | 550,000 | 657,553 | |
| Central Valley Financing Authority (Carson Ice), 5.25% due 7/1/2020 | 500,000 | 524,410 | |
| Issuer-Description | PRINCIPAL AMOUNT | VALUE | |
| Chabot-Las Positas Community College District (Educational Facilities) GO, | |||
| 4.00% due 8/1/2019 | $ 360,000 | $ 363,236 | |
| 5.00% due 8/1/2020 - 8/1/2021 | 885,000 | 942,436 | |
| City and County of San Francisco (525 Golden Gate Avenue-Public Utilities Commission Office Project) COP, Series C, 5.00% due 11/1/2022 | 700,000 | 714,966 | |
| City of Antioch Public Financing Authority (Municipal Facilities Project), 5.00% due 5/1/2022 - 5/1/2024 | 1,400,000 | 1,609,325 | |
| City of Burbank (Burbank Water and Power System), Series A, 5.00% due 6/1/2020 | 625,000 | 651,913 | |
| City of Chula Vista (Capital Facilities Project) COP ETM, 5.25% due 3/1/2020 | 1,300,000 | 1,345,994 | |
| City of Chula Vista (Police Facility Project) COP, 5.00% due 10/1/2024 | 1,700,000 | 2,015,554 | |
| City of Chula Vista Financing Authority (Infrastructure, Facilities and Equipment), 5.00% due 5/1/2026 - 5/1/2027 | 3,500,000 | 4,300,260 | |
| City of Clovis (Water System Facilities; Insured: BAM), 5.00% due 3/1/2021 - 3/1/2023 | 2,270,000 | 2,504,662 | |
| City of Los Angeles (Cash Flow Management) GO, 4.00% due 6/27/2019 | 8,500,000 | 8,550,065 | |
| City of Manteca (Water Supply System), 5.00% due 7/1/2019 - 7/1/2023 | 2,050,000 | 2,198,359 | |
| City of San Jose Financing Authority (Civic Center Project), | |||
| Series A, | |||
| 4.00% due 6/1/2021 | 1,000,000 | 1,055,760 | |
| 5.00% due 6/1/2019 - 6/1/2024 | 3,745,000 | 4,109,897 | |
| City of Torrance (Torrance Memorial Medical Center), Series A, 5.00% due 9/1/2020 | 1,155,000 | 1,209,666 | |
| b | Contra Costa Transportation Authority Series A, 1.992% (LIBOR 1 Month + 0.25%) due 3/1/2034 (put 9/1/2021) | 7,500,000 | 7,504,575 |
| County of El Dorado Community Facilities District (El Dorado Hills Development), 5.00% due 9/1/2019 | 1,700,000 | 1,725,007 | |
| County of Los Angeles (Fiscal Year 2017-2018 Expenditures) GO, 4.00% due 6/28/2019 | 10,000,000 | 10,060,100 | |
| County of Los Angeles Redevelopment Refunding Authority (Bunker Hill Project), Series C, 5.00% due 6/1/2020 - 6/1/2024 | 6,000,000 | 6,579,670 | |
| County of Monterey (Natividad Medical Center; Insured: AGM) COP, 5.25% due 8/1/2021 | 3,700,000 | 3,814,626 | |
| Delano Financing Authority (Police Station and Capital Improvements), Series A, 5.00% due 12/1/2019 | 1,195,000 | 1,223,632 | |
| Desert Sands (Educational Facilities; Insured: BAM) USD COP, 5.00% due 3/1/2020 - 3/1/2021 | 1,780,000 | 1,876,933 | |
| Downey Public Financing Authority (Public Capital Improvements), 5.00% due 12/1/2025 - 12/1/2027 | 1,445,000 | 1,786,658 | |
| Elk Grove Finance Authority (Poppy Ridge CFD No. 2003-1 and East Franklin CFD No. 2002-1), | |||
| 4.00% due 9/1/2020 | 575,000 | 595,769 | |
| 5.00% due 9/1/2021 - 9/1/2025 | 1,200,000 | 1,379,188 | |
| Emeryville Redevelopment Agency (Emeryville and Shellmound Park Projects; Insured: AGM), Series A, 5.00% due 9/1/2022 - 9/1/2024 | 9,095,000 | 10,474,286 | |
| Fresno County (Educational Facilities; Insured: Natl-Re) USD GO, | |||
| Series B, 5.00% due 2/1/2020 | 2,510,000 | 2,581,133 | |
| Series C, 5.90% due 8/1/2019 - 8/1/2020 | 1,395,000 | 1,446,600 | |
| Government of Guam (Various Capital Projects), Series D, 5.00% due 11/15/2023 - 11/15/2025 | 5,425,000 | 6,090,479 | |
| Guam Power Authority (Electric Power System), Series A, 5.00% due 10/1/2027 - 10/1/2028 | 3,810,000 | 4,406,198 | |
| Guam Power Authority (Electric Power System; Insured: AGM), Series A, 5.00% due 10/1/2021 | 1,275,000 | 1,369,898 | |
| Guam Waterworks Authority (Water and Wastewater System), 5.00% due 7/1/2021 - 7/1/2027 | 2,735,000 | 3,064,124 | |
| Hacienda La Puente (Educational Facilities; Insured: AGM) USD COP, 5.00% due 6/1/2019 - 6/1/2025 | 4,370,000 | 4,857,127 | |
| d | Irvine Unified School District (Irvine Unified School District Community Facilities District No 09-1; LOC U.S. Bank N.A.), Series C, 1.30% due 9/1/2054 (put 4/1/2019) | 3,400,000 | 3,400,000 |
| Jurupa Public Financing Authority (Community Services District-Eastvale Area; Insured: AGM), Series A, 4.50% due 9/1/2019 - 9/1/2020 | 1,850,000 | 1,900,304 | |
| La Quinta Redevelopment Agency (Redevelopment Project Areas No. 1 and 2), Series A, 5.00% due 9/1/2021 - 9/1/2023 | 4,500,000 | 5,055,675 | |
| Lodi Public Financing Authority (City Police Building and Jail), 5.00% due 10/1/2020 - 10/1/2023 | 4,145,000 | 4,482,852 | |
| Los Angeles (Educational Facilities and Information Technology Infrastructure) USD GO, | |||
| Series B, 5.00% due 7/1/2023 | 3,000,000 | 3,412,620 | |
| Series D, 5.00% due 7/1/2022 - 7/1/2024 | 5,750,000 | 6,538,987 | |
| Los Angeles Community College District (Facilities Projects) GO, Series J, 5.00% due 8/1/2026 | 1,000,000 | 1,243,790 | |
| Los Angeles County Schools Regionalized Business Services Corp. (Insured: AMBAC) COP, Series A, Zero Coupon due 8/1/2021 | 2,135,000 | 2,040,185 | |
| Los Angeles Department of Airports AMT, | |||
| Series A, 5.00% due 5/15/2029 | 4,000,000 | 4,738,240 | |
| Series B, 5.00% due 5/15/2025 - 5/15/2026 | 10,220,000 | 12,236,084 | |
| Los Angeles Department of Water and Power (Power System Capital Improvements), Series A, 5.00% due 7/1/2025 - 7/1/2026 | 800,000 | 971,455 | |
| Los Angeles Department of Water, Series A, 5.00% due 7/1/2027 | 1,565,000 | 1,975,077 | |
| Lynwood (Insured: AGM) USD GO, 5.00% due 8/1/2023 | 1,000,000 | 1,141,800 | |
| Manteca Community Facilities District No. 1989-2 (Educational Facilities; Insured: AGM) USD, | |||
| Series F, | |||
| 4.00% due 9/1/2019 | 870,000 | 879,396 | |
| 5.00% due 9/1/2020 - 9/1/2023 | 2,675,000 | 2,881,848 | |
| Mark West Union School District (Educational Facilities; Insured: Natl-Re) GO, 4.125% due 8/1/2020 | 1,275,000 | 1,277,907 | |
| Milpitas Redevelopment Agency (Redevelopment Project Area No. 1), 5.00% due 9/1/2025 | 2,300,000 | 2,784,311 | |
| Modesto Irrigation District (San Joaquin Valley Electric System), Series A, 5.00% due 7/1/2022 | 1,000,000 | 1,116,280 | |
| Moreno Valley Public Financing Authority (Public Improvements), 5.00% due 11/1/2024 | 1,455,000 | 1,710,687 | |
| Murrieta Valley Public Financing Authority (Educational Facilities; Insured: BAM) USD GO, 5.00% due 9/1/2023 | 1,080,000 | 1,239,311 | |
| North City West School Facilities Financing Authority (Carmel Valley; Insured: AGM), Series A, 5.00% due 9/1/2021 - 9/1/2022 | 4,415,000 | 4,853,312 | |
Thornburg California Limited Term Municipal Fund | March 31, 2019 (Unaudited)
| Issuer-Description | PRINCIPAL AMOUNT | VALUE | |
| a,e | Northern California Energy Authority (Commodity Supply Revenue), Series A, 4.00% due 7/1/2049 (put 7/1/2024) | $ 5,000,000 | $ 5,392,450 |
| Northern California Power Agency (Lodi Energy Center), Series A, 5.00% due 6/1/2019 | 2,340,000 | 2,354,157 | |
| Oakland (County of Alameda Educational Facilities) USD GO, Series A, 5.00% due 8/1/2022 - 8/1/2025 | 2,745,000 | 3,144,630 | |
| Palomar Pomerado Health (Insured: AGM) GO, Series A, Zero Coupon due 8/1/2019 | 2,000,000 | 1,988,960 | |
| Palomar Pomerado Health (Insured: Natl-Re) GO, Series A, Zero Coupon due 8/1/2021 | 2,850,000 | 2,718,415 | |
| Pasadena (2019 Crossover) USD GO, Series B, 5.00% due 8/1/2025 | 1,000,000 | 1,210,230 | |
| Pasadena (Educational Facilities Improvements) USD GO, 5.00% due 8/1/2024 - 8/1/2025 | 615,000 | 737,194 | |
| Pomona (Educational Facilities Improvements; Insured: Natl-Re) USD GO, Series A, 6.10% due 2/1/2020 | 465,000 | 482,461 | |
| Pomona Public Financing Authority (Facilities Improvements), Series BC, 3.00% due 6/1/2020 | 250,000 | 254,715 | |
| Pomona Public Financing Authority (Facilities Improvements; Insured: AGM), Series BC, 4.00% due 6/1/2024 - 6/1/2026 | 725,000 | 814,380 | |
| Rancho Santa Fe Community Services District Financing Authority, | |||
| Series A, | |||
| 3.00% due 9/1/2019 | 750,000 | 754,365 | |
| 4.00% due 9/1/2020 - 9/1/2021 | 1,550,000 | 1,614,276 | |
| 5.00% due 9/1/2025 | 1,745,000 | 2,090,039 | |
| Redevelopment Agency of the City and County of San Francisco (Yerba Buena Center Redevelopment Project Area; Insured: AGM), 5.00% due 6/1/2020 | 1,730,000 | 1,802,020 | |
| Redevelopment Agency of the City of Rialto (Merged Project Area; Insured: BAM), Series A, 5.00% due 9/1/2023 - 9/1/2024 | 1,050,000 | 1,220,404 | |
| Ridgecrest Redevelopment Agency (Redevelopment Project) ETM, 5.50% due 6/30/2019 - 6/30/2020 | 2,090,000 | 2,153,040 | |
| Riverside County Infrastructure Financing Authority (Capital Improvement Projects), | |||
| Series A, | |||
| 4.00% due 11/1/2019 | 1,700,000 | 1,726,843 | |
| 5.00% due 11/1/2020 - 11/1/2021 | 1,105,000 | 1,186,263 | |
| Riverside County Public Financing Authority (Capital Facilities Project), | |||
| 4.00% due 11/1/2020 | 465,000 | 484,874 | |
| 5.00% due 11/1/2019 - 11/1/2025 | 4,000,000 | 4,329,880 | |
| Riverside County Public Financing Authority, 4.00% due 5/1/2021 | 295,000 | 309,718 | |
| Riverside Financing Authority (Educational Facilities; Insured: BAM) USD, | |||
| 4.00% due 6/28/2019 | 7,000,000 | 7,042,070 | |
| 5.00% due 9/1/2019 - 9/1/2025 | 2,195,000 | 2,407,639 | |
| Sacramento City (Educational Facilities Improvements) USD GO, | |||
| 4.00% due 7/1/2019 | 5,455,000 | 5,482,930 | |
| 5.00% due 7/1/2021 | 3,600,000 | 3,830,580 | |
| Sacramento City (Educational Facilities Improvements; Insured: AGM) USD GO, 5.00% due 7/1/2019 - 7/1/2022 | 2,235,000 | 2,354,802 | |
| Sacramento City Schools Joint Power Financing Authority (Sacramento City USD Educational Facility Sublease; Insured: BAM), Series A, 5.00% due 3/1/2021 - 3/1/2025 | 5,360,000 | 6,033,405 | |
| Sacramento Cogeneration Authority (Procter & Gamble Project), 5.00% due 7/1/2019 | 625,000 | 630,688 | |
| Salinas Valley Solid Waste Authority AMT (Insured: AGM), Series A, 5.00% due 8/1/2023 | 1,530,000 | 1,719,628 | |
| San Diego (Educational System Capital Projects) GO, Series R-3, 5.00% due 7/1/2023 - 7/1/2024 | 8,000,000 | 9,236,000 | |
| San Diego (Educational System Capital Projects; Insured: Natl-Re) GO, Series D-1, 5.50% due 7/1/2020 | 1,390,000 | 1,461,960 | |
| e | San Diego Redevelopment Agency (Centre City Redevelopment; Insured: AGM), Zero Coupon due 9/1/2019 | 1,910,000 | 1,897,509 |
| San Francisco City and County Airports Commission (San Francisco International Airport), Series A, 5.00% due 5/1/2026 | 5,000,000 | 6,163,100 | |
| San Jose, Series A1, 3.50% due 10/1/2021 | 125,000 | 127,159 | |
| San Mateo County Joint Powers Financing Authority (Maple Street Correctional Center), 5.00% due 6/15/2021 - 6/15/2023 | 1,995,000 | 2,228,288 | |
| San Mateo Union High School District (Educational Facilities; Insured: Natl-Re) GO, Series B, Zero Coupon due 9/1/2019 | 2,000,000 | 1,987,820 | |
| Santa Ana (Insured: Natl-Re) USD GO, Series B, Zero Coupon due 8/1/2020 | 2,035,000 | 1,990,108 | |
| Santa Clara County Financing Authority (Multiple Facilities Projects), Series P, 5.00% due 5/15/2025 | 6,755,000 | 8,164,836 | |
| Santa Clara Valley California Water District (Commercial Paper Iam 41), Series A, 1.66% due 4/4/2019 | 2,980,000 | 2,980,000 | |
| Santa Margarita Water District (Talega Community Facilities), Series A, 5.00% due 9/1/2026 - 9/1/2027 | 1,050,000 | 1,302,417 | |
| Semitropic Water Storage Improvement District (Irrigation Water System; Insured: AGM), Series A, 5.00% due 12/1/2019 - 12/1/2027 | 4,060,000 | 4,718,258 | |
| Southern California Public Power Authority (Magnolia Power Project A), | |||
| d | 1.30% due 7/1/2036 (put 4/1/2019) | 1,300,000 | 1,300,000 |
| a | Series 1, 2.00% due 7/1/2036 (put 7/1/2020) | 3,000,000 | 3,005,610 |
| Southwestern Community College District GO, Series B, 4.00% due 8/1/2024 - 8/1/2026 | 1,125,000 | 1,290,924 | |
| State of California (Various Capital Projects) GO, 5.00% due 9/1/2020 | 2,000,000 | 2,099,840 | |
| Stockton Public Financing Authority (Stockton Water Revenue; Green Bond; Insured BAM), Series A, 5.00% due 10/1/2019 - 10/1/2027 | 4,465,000 | 5,073,811 | |
| Successor Agency to the City of Colton Redevelopment Agency (Multiple Redevelopment Project Areas; Insured: BAM), 5.00% due 8/1/2021 - 8/1/2025 | 2,815,000 | 3,200,446 | |
| Successor Agency to the City of Riverside Redevelopment Agency (Multiple Redevelopment Project Areas), Series A, 5.00% due 9/1/2023 - 9/1/2024 | 2,985,000 | 3,495,369 | |
| Successor Agency to the City of San Diego Redevelopment Agency (Multiple Redevelopment Project Areas), Series A, 5.00% due 9/1/2025 - 9/1/2026 | 1,770,000 | 2,143,530 | |
| Successor Agency to the Commerce Community Development Commission (Multiple Redevelopment Project Areas; Insured: AGM), Series A, 5.00% due 8/1/2027 | 1,760,000 | 2,124,866 | |
| Issuer-Description | PRINCIPAL AMOUNT | VALUE | |
| Successor Agency to the Community Development Agency of the City of Menlo Park (Las Pulgas Community Development Project), 5.00% due 10/1/2019 - 10/1/2020 | $ 725,000 | $ 749,615 | |
| Successor Agency to the Community Development Agency of the City of Menlo Park (Las Pulgas Community Development Project; Insured: AGM), 5.00% due 10/1/2022 - 10/1/2025 | 1,400,000 | 1,614,162 | |
| Successor Agency to the Community Redevelopment Agency of the City of Palmdale (Merged Redevelopment Project Areas), Series A, 5.00% due 9/1/2024 - 9/1/2026 | 1,600,000 | 1,909,938 | |
| Successor Agency to the Poway Redevelopment Agency (Paguay Redevelopment Project), Series A, 5.00% due 6/15/2025 | 4,665,000 | 5,622,445 | |
| Successor Agency to the Rancho Cucamonga Redevelopment Project (Rancho Redevelopment Project Area; Insured: AGM), 5.00% due 9/1/2023 - 9/1/2024 | 3,000,000 | 3,504,050 | |
| Successor Agency to the Redevelopment Agency of the City and County of San Francisco (San Francisco Redevelopment Projects), Series C, 5.00% due 8/1/2019 - 8/1/2021 | 4,735,000 | 4,926,762 | |
| Successor Agency to the Redevelopment Agency of the City of San Mateo (Multiple Redevelopment Project Areas), Series A, 5.00% due 8/1/2025 | 425,000 | 513,205 | |
| Successor Agency to the Redevelopment Agency of the City of Stockton (Redevelopment of Midtown, North and South Stockton and Waterfront Areas; Insured: AGM), Series A, 5.00% due 9/1/2026 - 9/1/2027 | 2,000,000 | 2,416,160 | |
| Successor Agency to the Richmond County Redevelopment Agency (Joint Powers Financing Authority & Harbour Redevelopment Project; Insured: BAM), Series A, 5.00% due 9/1/2022 - 9/1/2024 | 1,250,000 | 1,427,581 | |
| Successor Agency to the Rosemead Community Development Commission (Rosemead Merged Project Area; Insured: BAM), 5.00% due 10/1/2020 - 10/1/2026 | 4,835,000 | 5,513,029 | |
| Temecula Valley Financing Authority (Educational Facilities; Insured: BAM) USD, 5.00% due 9/1/2019 - 9/1/2025 | 2,465,000 | 2,709,408 | |
| Temecula Valley Unified School District Financing Authority (Insured BAM), 5.00% due 9/1/2027 | 2,220,000 | 2,592,960 | |
| Trustees of the California State University (Educational Facilities Improvements), Series A, 5.00% due 11/1/2026 | 1,000,000 | 1,230,890 | |
| Tulare Public Financing Authority (Insured BAM), | |||
| 3.00% due 4/1/2019 | 200,000 | 200,000 | |
| 4.00% due 4/1/2020 - 4/1/2022 | 725,000 | 763,266 | |
| 5.00% due 4/1/2023 - 4/1/2028 | 1,410,000 | 1,672,728 | |
| Ukiah (Insured: Natl-Re) USD GO, Zero Coupon due 8/1/2019 | 2,000,000 | 1,989,420 | |
| Upper Lake Union High School District (Insured: Natl-Re) GO, Series A, Zero Coupon due 8/1/2020 | 680,000 | 650,692 | |
| Ventura County Public Financing Authority (Office Building Purchase and Improvements), Series B, 5.00% due 11/1/2023 - 11/1/2024 | 1,560,000 | 1,805,353 | |
| Vista Redevelopment Agency (Vista Redevelopment Project; Insured: AGM), Series B1, 5.00% due 9/1/2019 - 9/1/2023 | 1,575,000 | 1,710,302 | |
| West Sacramento Financing Authority (Ser. A; Insured XLCA), Series A, 5.00% due 9/1/2020 | 1,040,000 | 1,083,638 | |
| Total Investments — 98.9%(Cost $484,904,830) | $499,128,231 | ||
| Other Assets Less Liabilities — 1.1% | 5,493,356 | ||
| Net Assets — 100.0% | $504,621,587 | ||
| Footnote Legend | |
| a | Variable Rate Demand Obligations are instruments whose interest rates change on a mandatory date (demand date) or whose interest rates will vary with changes in a designated base rate. The rate disclosed is the rate at March 31, 2019. |
| b | Floating Rate Security. Stated interest/floor rate was in effect at March 31, 2019. |
| c | Securities exempt from registration under Rule 144A of the Securities Act of 1933, as amended. These securities are restricted but liquid and may only be resold in the ordinary course of business in transactions exempt from registration, normally to qualified institutional buyers. As of March 31, 2019, the aggregate value of these securities in the Fund’s portfolio was $6,808,208, representing 1.35% of the Fund’s net assets. |
| d | Variable Rate Demand Notes are instruments whose interest rates change on a specific date (such as coupon date or interest payment date) or whose interest rates vary with changes in a designated base rate (such as the prime interest rate). This instrument is payable on demand and is secured by letters of credit or other credit support agreements from major banks. |
| e | Illiquid security. |
To simplify the listings of securities, abbreviations are used per the table below:
| ACA | Insured by American Capital Access |
| AGM | Insured by Assured Guaranty Municipal Corp. |
| AMBAC | Insured by American Municipal Bond Assurance Corp. |
| AMT | Alternative Minimum Tax |
| BAM | Insured by Build America Mutual Insurance Co. |
| COP | Certificates of Participation |
| ETM | Escrowed to Maturity |
| FHA | Insured by Federal Housing Administration |
| GO | General Obligation |
| HFFA | Health Facilities Financing Authority |
| LIBOR | London Interbank Offered Rates |
| LOC | Letter of Credit |
| Natl-Re | Insured by National Public Finance Guarantee Corp. |
| USD | Unified School District |
Thornburg California Limited Term Municipal Fund | March 31, 2019 (Unaudited)
| ASSETS | |
| Investments at value (cost $484,904,830) (Note 3) | $ 499,128,231 |
| Cash | 61,028 |
| Receivable for investments sold | 8,415,359 |
| Receivable for fund shares sold | 864,537 |
| Interest receivable | 5,490,396 |
| Prepaid expenses and other assets | 23,598 |
| Total Assets | 513,983,149 |
| Liabilities | |
| Payable for investments purchased | 8,200,000 |
| Payable for fund shares redeemed | 565,578 |
| Payable to investment advisor and other affiliates (Note 4) | 287,575 |
| Accounts payable and accrued expenses | 159,372 |
| Dividends payable | 149,037 |
| Total Liabilities | 9,361,562 |
| Net Assets | $ 504,621,587 |
| NET ASSETS CONSIST OF | |
| Distributable earnings | $ 9,338,126 |
| Net capital paid in on shares of beneficial interest | 495,283,461 |
| $ 504,621,587 | |
| NET ASSET VALUE | |
| Class A Shares: | |
| Net asset value and redemption price per share ($119,669,944 applicable to 8,780,292 shares of beneficial interest outstanding - Note 5) | $ 13.63 |
| Maximum sales charge, 1.50% of offering price | 0.21 |
| Maximum offering price per share | $ 13.84 |
| Class C Shares: | |
| Net asset value and offering price per share* ($34,312,472 applicable to 2,515,357 shares of beneficial interest outstanding - Note 5) | $ 13.64 |
| Class I Shares: | |
| Net asset value, offering and redemption price per share ($350,639,171 applicable to 25,700,627 shares of beneficial interest outstanding - Note 5) | $ 13.64 |
| * | Redemption price per share is equal to net asset value less any applicable contingent deferred sales charge. |
Thornburg California Limited Term Municipal Fund | Six Months Ended March 31, 2019 (Unaudited)
| INVESTMENT INCOME | |
| Interest income (net of premium amortized of $3,645,979) | $ 6,465,999 |
| EXPENSES | |
| Investment advisory fees (Note 4) | 1,264,029 |
| Administration fees (Note 4) | |
| Class A Shares | 52,901 |
| Class C Shares | 16,466 |
| Class I Shares | 153,428 |
| Distribution and service fees (Note 4) | |
| Class A Shares | 150,529 |
| Class C Shares | 93,702 |
| Transfer agent fees | |
| Class A Shares | 34,860 |
| Class C Shares | 14,290 |
| Class I Shares | 112,470 |
| Registration and filing fees | |
| Class A Shares | 3,270 |
| Class C Shares | 2,619 |
| Class I Shares | 3,703 |
| Custodian fees (Note 2) | 30,500 |
| Professional fees | 24,560 |
| Trustee and officer fees (Note 4) | 14,176 |
| Other expenses | 23,096 |
| Total Expenses | 1,994,599 |
| Less: | |
| Expenses reimbursed by investment advisor (Note 4) | (31,693) |
| Net Expenses | 1,962,906 |
| Net Investment Income | $ 4,503,093 |
| REALIZED AND UNREALIZED GAIN (LOSS) | |
| Net realized gain (loss) on investments | (1,271,940) |
| Net change in unrealized appreciation (depreciation) on investments | 7,887,451 |
| Net Realized and Unrealized Gain | 6,615,511 |
| Net Increase in Net Assets Resulting from Operations | $ 11,118,604 |
Thornburg California Limited Term Municipal Fund
| Six Months Ended March 31, 2019* | Year Ended September 30, 2018 | |
| INCREASE (DECREASE) IN NET ASSETS FROM | ||
| OPERATIONS | ||
| Net investment income | $ 4,503,093 | $ 9,698,816 |
| Net realized gain (loss) on investments | (1,271,940) | (1,747,276) |
| Net unrealized appreciation (depreciation) on investments | 7,887,451 | (12,993,888) |
| Net Increase (Decrease) in Net Assets Resulting from Operations | 11,118,604 | (5,042,348) |
| DIVIDENDS TO SHAREHOLDERS | ||
| From distributable earnings | ||
| Class A Shares | (971,233) | (2,112,942) |
| Class C Shares | (250,352) | (604,775) |
| Class I Shares | (3,281,534) | (6,981,099) |
| FUND SHARE TRANSACTIONS (NOTE 5) | ||
| Class A Shares | (9,245,726) | (27,285,984) |
| Class C Shares | (6,780,416) | (14,914,594) |
| Class I Shares | (22,745,285) | (56,019,128) |
| Net Decrease in Net Assets | (32,155,942) | (112,960,870) |
| NET ASSETS | ||
| Beginning of Period | 536,777,529 | 649,738,399 |
| End of Period | $ 504,621,587 | $ 536,777,529 |
| * | Unaudited. |
Thornburg California Limited Term Municipal Fund | March 31, 2019 (Unaudited)
Thornburg California Limited Term Municipal Fund | March 31, 2019 (Unaudited)
| Cost of investments for tax purposes | $ 484,904,830 |
| Gross unrealized appreciation on a tax basis | 14,380,172 |
| Gross unrealized depreciation on a tax basis | (156,771) |
| Net unrealized appreciation (depreciation) on investments (tax basis) | $ 14,223,401 |
| Fair Value Measurements at March 31, 2019 | ||||
| TOTAL | LEVEL 1 | LEVEL 2 | LEVEL 3 | |
| Assets | ||||
| Investments in Securities | ||||
| Municipal Bonds | $ 499,128,231 | $ — | $ 499,128,231 | $ — |
| Total Investments in Securities | $499,128,231 | $— | $499,128,231 | $— |
| Total Assets | $499,128,231 | $— | $499,128,231 | $— |
Thornburg California Limited Term Municipal Fund | March 31, 2019 (Unaudited)
| Management Fee Schedule | |
| DAILY NET ASSETS | FEE RATE |
| Up to $500 million | 0.500% |
| Next $500 million | 0.400 |
| Next $500 million | 0.300 |
| Next $500 million | 0.250 |
| Over $2 billion | 0.225 |
| Administration Fee Schedule | |
| Daily Net Assets | Fee Rate |
| Up to $20 billion | 0.100% |
| $20 billion to $40 billion | 0.075 |
| $40 billion to $60 billion | 0.040 |
| Over $60 billion | 0.030 |
| SIX MONTHS ENDED March 31, 2019 (UNAUDITED) | YEAR ENDED September 30, 2018 (AUDITED) | |||
| SHARES | AMOUNT | SHARES | AMOUNT | |
| Class A Shares | ||||
| Shares sold | 625,244 | $ 8,441,712 | 2,057,216 | $ 27,886,865 |
| Shares issued to shareholders in reinvestment of dividends | 65,056 | 879,629 | 137,683 | 1,865,179 |
| Shares repurchased | (1,378,574) | (18,567,067) | (4,205,146) | (57,038,028) |
| Net decrease | (688,274) | $ (9,245,726) | (2,010,247) | $ (27,285,984) |
| Class C Shares | ||||
| Shares sold | 68,630 | $ 928,746 | 155,781 | $ 2,117,566 |
| Shares issued to shareholders in reinvestment of dividends | 14,589 | 197,371 | 36,042 | 488,741 |
| Shares repurchased | (584,669) | (7,906,533) | (1,289,977) | (17,520,901) |
| Net decrease | (501,450) | $ (6,780,416) | (1,098,154) | $ (14,914,594) |
| Class I Shares | ||||
| Shares sold | 5,608,217 | $ 75,855,188 | 10,542,473 | $ 143,344,996 |
| Shares issued to shareholders in reinvestment of dividends | 183,739 | 2,487,265 | 391,001 | 5,304,088 |
| Shares repurchased | (7,487,236) | (101,087,738) | (15,071,222) | (204,668,212) |
| Net decrease | (1,695,280) | $ (22,745,285) | (4,137,748) | $ (56,019,128) |
Thornburg California Limited Term Municipal Fund
| PER SHARE PERFORMANCE (FOR A SHARE OUTSTANDING THROUGHOUT THE PERIOD) | ||||||||
| UNLESS OTHERWISE NOTED, PERIODS ARE FISCAL YEARS ENDED SEPTEMBER 30, | Net Asset Value, Beginning of PERIOD | Net Investment Income (Loss)+ | Net Realized & Unrealized Gain (Loss) on Investments | Total from Investment Operations | Dividends from Net Investment Income | Dividends from Net Realized Gains | Total Dividends | Net Asset Value, End of PERIOD |
| CLASS A SHARES | ||||||||
| 2019(b)(c) | $ 13.45 | 0.11 | 0.18 | 0.29 | (0.11) | — | (0.11) | $ 13.63 |
| 2018(b) | $ 13.78 | 0.20 | (0.33) | (0.13) | (0.20) | — | (0.20) | $ 13.45 |
| 2017(b) | $ 13.98 | 0.18 | (0.20) | (0.02) | (0.18) | — | (0.18) | $ 13.78 |
| 2016(b) | $ 13.84 | 0.18 | 0.14 | 0.32 | (0.18) | — | (0.18) | $ 13.98 |
| 2015(b) | $ 13.84 | 0.19 | —(e) | 0.19 | (0.19) | — | (0.19) | $ 13.84 |
| 2014(b) | $ 13.54 | 0.23 | 0.30 | 0.53 | (0.23) | — | (0.23) | $ 13.84 |
| CLASS C SHARES | ||||||||
| 2019(c) | $ 13.46 | 0.09 | 0.18 | 0.27 | (0.09) | — | (0.09) | $ 13.64 |
| 2018 | $ 13.79 | 0.17 | (0.33) | (0.16) | (0.17) | — | (0.17) | $ 13.46 |
| 2017 | $ 13.99 | 0.15 | (0.20) | (0.05) | (0.15) | — | (0.15) | $ 13.79 |
| 2016 | $ 13.85 | 0.14 | 0.14 | 0.28 | (0.14) | — | (0.14) | $ 13.99 |
| 2015 | $ 13.85 | 0.16 | —(e) | 0.16 | (0.16) | — | (0.16) | $ 13.85 |
| 2014 | $ 13.55 | 0.19 | 0.30 | 0.49 | (0.19) | — | (0.19) | $ 13.85 |
| CLASS I SHARES | ||||||||
| 2019(c) | $ 13.46 | 0.13 | 0.18 | 0.31 | (0.13) | — | (0.13) | $ 13.64 |
| 2018 | $ 13.79 | 0.24 | (0.33) | (0.09) | (0.24) | — | (0.24) | $ 13.46 |
| 2017 | $ 13.99 | 0.22 | (0.20) | 0.02 | (0.22) | — | (0.22) | $ 13.79 |
| 2016 | $ 13.85 | 0.22 | 0.14 | 0.36 | (0.22) | — | (0.22) | $ 13.99 |
| 2015 | $ 13.85 | 0.24 | —(e) | 0.24 | (0.24) | — | (0.24) | $ 13.85 |
| 2014 | $ 13.55 | 0.27 | 0.30 | 0.57 | (0.27) | — | (0.27) | $ 13.85 |
| (a) | Not annualized for periods less than one year. |
| (b) | Sales loads are not reflected in computing total return. |
| (c) | Unaudited Six Month Period Ended March 31. |
| (d) | Annualized. |
| (e) | Net realized and unrealized gain (loss) on investments was less than $0.01 per share. |
| + | Based on weighted average shares outstanding. |
| RATIOS TO AVERAGE NET ASSETS | SUPPLEMENTAL DATA | ||||||
| Net Investment Income (Loss) (%) | Expenses, After Expense Reductions (%) | Expenses, After Expense Reductions and Net of Custody Credits (%) | Expenses, Before Expense Reductions (%) | Total Return (%)(a) | Portfolio Turnover Rate (%)(a) | Net Assets at End of PERIOD (Thousands) | |
| 1.61(d) | 0.94(d) | 0.94(d) | 0.94(d) | 2.16 | 5.65 | $ 119,670 | |
| 1.50 | 0.92 | 0.92 | 0.92 | (0.92) | 25.20 | $ 127,346 | |
| 1.33 | 0.93 | 0.93 | 0.93 | (0.11) | 18.25 | $ 158,142 | |
| 1.28 | 0.93 | 0.93 | 0.93 | 2.32 | 16.47 | $ 193,321 | |
| 1.39 | 0.94 | 0.94 | 0.94 | 1.40 | 14.43 | $ 171,344 | |
| 1.67 | 0.95 | 0.94 | 0.95 | 3.93 | 16.85 | $ 160,151 | |
| 1.34(d) | 1.21(d) | 1.21(d) | 1.21(d) | 2.01 | 5.65 | $ 34,313 | |
| 1.23 | 1.19 | 1.19 | 1.19 | (1.18) | 25.20 | $ 40,608 | |
| 1.08 | 1.19 | 1.19 | 1.19 | (0.36) | 18.25 | $ 56,737 | |
| 1.04 | 1.18 | 1.18 | 1.18 | 2.06 | 16.47 | $ 68,229 | |
| 1.15 | 1.18 | 1.18 | 1.18 | 1.15 | 14.43 | $ 64,216 | |
| 1.41 | 1.21 | 1.20 | 1.21 | 3.66 | 16.85 | $ 62,858 | |
| 1.88(d) | 0.67(d) | 0.67(d) | 0.69(d) | 2.29 | 5.65 | $ 350,639 | |
| 1.76 | 0.66 | 0.66 | 0.67 | (0.65) | 25.20 | $ 368,824 | |
| 1.62 | 0.64 | 0.64 | 0.64 | 0.19 | 18.25 | $ 434,859 | |
| 1.60 | 0.62 | 0.62 | 0.62 | 2.64 | 16.47 | $ 476,364 | |
| 1.70 | 0.63 | 0.63 | 0.63 | 1.72 | 14.43 | $ 407,557 | |
| 1.99 | 0.62 | 0.62 | 0.62 | 4.27 | 16.85 | $ 361,015 | |
Thornburg California Limited Term Municipal Fund | March 31, 2019 (Unaudited)
| (1) | transaction costs, including |
| (a) | sales charges (loads) on purchase payments, for Class A shares; |
| (b) | a deferred sales charge on redemptions of any part or all of a purchase of $1 million of Class A shares within 12 months of purchase; |
| (c) | a deferred sales charge on redemptions of Class C shares within 12 months of purchase; |
| (2) | ongoing costs, including management fees; distribution and/or service (12b-1) fees; and other Fund expenses. |
| BEGINNING ACCOUNT VALUE 10/1/18 | ENDING ACCOUNT VALUE 3/31/19 | EXPENSES PAID DURING PERIOD† 10/1/18—3/31/19 | |
| CLASS A SHARES | |||
| Actual | $1,000.00 | $1,021.56 | $4.74 |
| Hypothetical* | $1,000.00 | $1,020.24 | $4.73 |
| CLASS C SHARES | |||
| Actual | $1,000.00 | $1,020.14 | $6.09 |
| Hypothetical* | $1,000.00 | $1,018.90 | $6.09 |
| CLASS I SHARES | |||
| Actual | $1,000.00 | $1,022.89 | $3.38 |
| Hypothetical* | $1,000.00 | $1,021.59 | $3.38 |
| † | Expenses are equal to the annualized expense ratio for each class (A: 0.94%; C: 1.21%; I: 0.67%) multiplied by the average account value over the period, multiplied by 182/365 to reflect the one-half year period. |
| * | Hypothetical assumes a rate of return of 5% per year before expenses. |
Thornburg California Limited Term Municipal Fund | March 31, 2019 (Unaudited)
| ■ | Thornburg Investment Income Builder Fund |
| ■ | Thornburg Global Opportunities Fund |
| ■ | Thornburg International Value Fund |
| ■ | Thornburg Better World International Fund |
| ■ | Thornburg International Growth Fund |
| ■ | Thornburg Developing World Fund |
| ■ | Thornburg Value Fund |
| ■ | Thornburg Core Growth Fund |
| ■ | Thornburg Investment Income Builder Fund |
| ■ | Thornburg Summit Fund |
| ■ | Thornburg Low Duration Income Fund |
| ■ | Thornburg Limited Term U.S. Government Fund |
| ■ | Thornburg Limited Term Income Fund |
| ■ | Thornburg Strategic Income Fund |
| ■ | Thornburg Low Duration Municipal Fund |
| ■ | Thornburg Limited Term Municipal Fund |
| ■ | Thornburg Intermediate Municipal Fund |
| ■ | Thornburg California Limited Term Municipal Fund |
| ■ | Thornburg New Mexico Intermediate Municipal Fund |
| ■ | Thornburg New York Intermediate Municipal Fund |
| ■ | Thornburg Strategic Municipal Income Fund |
| ■ | Thornburg Long/Short Equity Fund |

| 800.847.0200 | TH1070 |

| 4 | |
| 6 | |
| 7 | |
| 8 | |
| 10 | |
| 11 | |
| 12 | |
| 13 | |
| 18 | |
| 20 | |
| 21 | |
| 22 |
| SHARE CLASS | NASDAQ SYMBOL | CUSIP |
| Class A | THNMX | 885-215-301 |
| Class D | THNDX | 885-215-624 |
| Class I | THNIX | 885-215-285 |
Thornburg New Mexico Intermediate Municipal Fund | March 31, 2019 (Unaudited)
 |  |
| Christopher Ryon,cfa Portfolio Manager Managing Director | Nicholos Venditti,cfa Portfolio Manager Managing Director |
 | |
| David Ashley,cfa Portfolio Manager Managing Director |
Thornburg New Mexico Intermediate Municipal Fund | March 31, 2019 (Unaudited)
| 1-YR | 3-YR | 5-YR | 10-YR | SINCE INCEP. | |
| Class A Shares(Incep: 6/18/91) | |||||
| Without sales charge | 3.77% | 1.21% | 2.10% | 2.95% | 4.17% |
| With sales charge | 1.67% | 0.53% | 1.69% | 2.74% | 4.09% |
| Class D Shares(Incep: 6/1/99) | |||||
| Without sales charge | 3.42% | 0.94% | 1.85% | 2.69% | 3.07% |
| Class I Shares(Incep: 2/1/07) | 4.08% | 1.50% | 2.42% | 3.29% | 3.36% |
| Annualized Distribution Yield | 2.21% |
| SEC Yield | 1.39% |
| FINAL VALUE |

Thornburg New Mexico Intermediate Municipal Fund | March 31, 2019 (Unaudited)
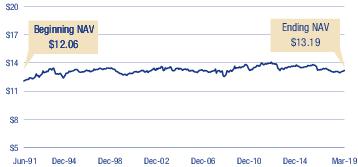
| KEY PORTFOLIO ATTRIBUTES | |
| Number of Bonds | 121 |
| Effective Duration | 3.7 Yrs |
| Average Maturity | 8.1 Yrs |
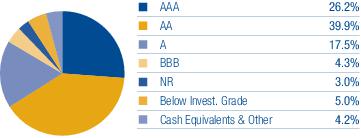
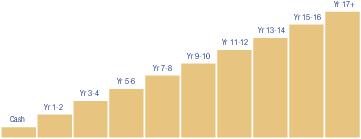
| 4% | 12% | 14% | 10% | 14% | 11% | 6% | 8% | 8% | 14% |
Thornburg New Mexico Intermediate Municipal Fund | March 31, 2019 (Unaudited)
| Issuer-Description | PRINCIPAL AMOUNT | VALUE | |
| MUNICIPAL BONDS — 98.2% | |||
| Albuquerque Bernalillo County Water Utility Authority (2005 NMFA Loan and Joint Water and Sewer System Improvements), Series A, 5.00% due 7/1/2026 | $ 2,000,000 | $ 2,318,720 | |
| Albuquerque Bernalillo County Water Utility Authority (2007 NMFA Loan and Joint Water and Sewer System Improvements), 5.00% due 7/1/2031 - 7/1/2032 | 1,500,000 | 1,743,520 | |
| Albuquerque Bernalillo County Water Utility Authority (New Mexico Utilities, Inc. Water System), | |||
| Series A-1, | |||
| 5.00% due 7/1/2021 (pre-refunded 7/1/2019) | 1,760,000 | 1,775,259 | |
| 5.50% due 7/1/2025 (pre-refunded 7/1/2019) | 1,000,000 | 1,009,900 | |
| Albuquerque Municipal School District No. 12 (Bernalillo and Sandoval Counties School Facilities) GO, | |||
| 5.00% due 8/1/2031 - 8/1/2034 | 2,260,000 | 2,719,836 | |
| Series A, 4.00% due 8/1/2029 | 1,300,000 | 1,399,671 | |
| Bernalillo County (Government Services), | |||
| 5.25% due 4/1/2027 | 300,000 | 354,408 | |
| Series B, 5.70% due 4/1/2027 | 3,000,000 | 3,618,000 | |
| Bernalillo County (Government Services; Insured: AMBAC), 5.25% due 10/1/2022 - 10/1/2025 | 8,295,000 | 9,706,045 | |
| Bernalillo County (Government Services; Insured: Natl-Re), | |||
| 5.70% due 4/1/2027 | 815,000 | 982,890 | |
| Series B, 5.00% due 4/1/2021 | 1,890,000 | 1,954,449 | |
| Central New Mexico Community College (Campus Buildings Acquisition & Improvements) GO, | |||
| 4.00% due 8/15/2023 | 1,920,000 | 2,025,331 | |
| 5.00% due 8/15/2020 - 8/15/2022 | 3,910,000 | 4,208,513 | |
| City of Albuquerque (City Infrastructure Improvements) GO, 5.00% due 7/1/2026 | 870,000 | 1,061,461 | |
| City of Albuquerque (City Infrastructure Improvements), 5.00% due 7/1/2033 - 7/1/2034 | 2,300,000 | 2,671,669 | |
| City of Albuquerque (I-25/Paseo del Norte Interchange), 5.00% due 7/1/2025 - 7/1/2027 | 1,095,000 | 1,238,126 | |
| City of Albuquerque (Lodgers’ Tax Obligation Reserve Fund), | |||
| Series A, 5.00% due 7/1/2021 | 1,340,000 | 1,351,323 | |
| Series B, 5.00% due 7/1/2021 | 3,000,000 | 3,025,350 | |
| City of Albuquerque GO, Series A, 4.00% due 7/1/2024 | 2,500,000 | 2,569,900 | |
| City of Farmington (Arizona Public Service Co.-Four Corners Project), | |||
| 4.70% due 5/1/2024 | 965,000 | 1,004,198 | |
| Series B, 4.70% due 9/1/2024 | 4,000,000 | 4,162,480 | |
| City of Farmington (San Juan Regional Medical Center), | |||
| Series A, | |||
| 5.00% due 6/1/2022 | 2,315,000 | 2,321,575 | |
| 5.125% due 6/1/2019 | 645,000 | 646,625 | |
| City of Gallup (City Infrastructure Improvements), Series A, 5.125% due 6/1/2019 | 310,000 | 311,290 | |
| City of Las Cruces (Joint Utility System), Series A, 4.00% due 6/1/2021 - 6/1/2025 | 2,215,000 | 2,429,269 | |
| City of Las Cruces (NMFA Loan), 5.00% due 6/1/2021 - 6/1/2037 | 10,135,000 | 10,501,143 | |
| City of Roswell (Joint Water and Sewer Improvement; Insured: BAM), 5.00% due 6/1/2026 - 6/1/2036 | 2,050,000 | 2,384,058 | |
| City of Santa Fe Series A, 5.00% due 6/1/2035 - 6/1/2038 | 1,450,000 | 1,732,717 | |
| City of Santa Fe (El Castillo Retirement Residences), | |||
| 4.50% due 5/15/2027 | 3,275,000 | 3,351,406 | |
| 5.00% due 5/15/2034 | 1,465,000 | 1,510,972 | |
| City of Santa Fe (Public Facilities) GRT, 5.00% due 6/1/2028 - 6/1/2029 | 1,880,000 | 2,164,139 | |
| City of Santa Fe, Series A, 5.00% due 6/1/2034 | 420,000 | 505,726 | |
| Colfax County (Government Center Facility) ETM, 5.00% due 9/1/2019 | 125,000 | 126,791 | |
| Colfax County (Government Center Facility), 5.50% due 9/1/2029 (pre-refunded 9/1/2019) | 2,510,000 | 2,551,114 | |
| County of Sandoval GO, 5.00% due 8/1/2025 - 8/1/2029 | 2,015,000 | 2,456,358 | |
| County of Santa Fe GO, 5.00% due 7/1/2024 | 825,000 | 962,973 | |
| Farmington Municipal School District No. 5 (Educational Facilities) GO, 5.00% due 9/1/2019 | 600,000 | 608,496 | |
| Government of Guam (Economic Development), Series D, 5.00% due 11/15/2031 | 2,500,000 | 2,737,925 | |
| Government of Guam (Layon Solid Waste Disposal Facility), Series A, 5.375% due 12/1/2024 (pre-refunded 12/1/2019) | 2,000,000 | 2,051,900 | |
| Government of Guam (Various Capital Projects), Series D, 5.00% due 11/15/2033 | 2,500,000 | 2,716,850 | |
| Guam Government Waterworks Authority, 5.625% due 7/1/2040 (pre-refunded 7/1/2020) | 1,000,000 | 1,050,240 | |
| Guam Power Authority (Electric Power System), Series A, 5.00% due 10/1/2034 | 1,825,000 | 2,039,145 | |
| Guam Power Authority (Electric Power System; Insured: AGM), Series A, 5.00% due 10/1/2026 | 2,000,000 | 2,199,600 | |
| Guam Waterworks Authority (Water and Wastewater System), 5.00% due 7/1/2035 - 7/1/2037 | 2,200,000 | 2,450,218 | |
| New Mexico Educational Assistance Foundation (Student Loans), Series A-1, 5.00% due 12/1/2019 - 12/1/2022 | 4,000,000 | 4,187,970 | |
| New Mexico Finance Authority (State Highway Infrastructure), Series A, 5.00% due 6/15/2026 - 6/15/2027 | 2,415,000 | 2,796,244 | |
| New Mexico Finance Authority (The Public Project Revolving Fund Program), Series A, 5.00% due 6/15/2031 | 1,000,000 | 1,164,000 | |
| New Mexico Finance Authority, 5.00% due 6/15/2029 | 300,000 | 367,149 | |
| New Mexico Hospital Equipment Loan Council (Haverland Carter Lifestyle Group), 5.00% due 7/1/2032 | 2,000,000 | 2,087,840 | |
| Issuer-Description | PRINCIPAL AMOUNT | VALUE | |
| New Mexico Hospital Equipment Loan Council (Presbyterian Healthcare Services Obligated Group; SPA Wells Fargo Bank, N.A.), | |||
| a | Series C, 1.50% due 8/1/2034 (put 4/1/2019) | $ 500,000 | $ 500,000 |
| a | Series D, 1.50% due 8/1/2034 (put 4/1/2019) | 3,300,000 | 3,300,000 |
| New Mexico Hospital Equipment Loan Council (Presbyterian Healthcare Services), | |||
| 5.00% due 8/1/2031 | 1,750,000 | 2,069,538 | |
| 5.00% due 8/1/2039 (pre-refunded 8/1/2019) | 3,000,000 | 3,034,320 | |
| New Mexico Housing Authority (El Paseo Apartments; Insured: AMBAC) AMT, Series A, 5.30% due 12/1/2022 | 370,000 | 370,259 | |
| New Mexico Institute of Mining and Technology (Campus Buildings Acquisition & Improvements), 5.00% due 7/1/2020 - 7/1/2028 | 3,805,000 | 4,044,614 | |
| New Mexico Mortgage Finance Authority (NIBP SFM Loan Program; Collateralized: GNMA, FNMA, FHLMC), 4.625% due 3/1/2028 | 650,000 | 663,741 | |
| Regents of New Mexico State University (Campus Buildings Acquisition & Improvements), Series A, 5.00% due 4/1/2032 - 4/1/2036 | 4,095,000 | 4,770,421 | |
| Regents of the University of New Mexico (Campus Buildings Acquisition & Improvements), | |||
| Series A, | |||
| 4.50% due 6/1/2034 - 6/1/2036 | 4,500,000 | 5,007,945 | |
| 6.00% due 6/1/2021 | 225,000 | 232,569 | |
| Regents of the University of New Mexico (Campus Buildings Acquisition & Improvements; SPA U.S. Bank N.A.), | |||
| a | 1.50% due 6/1/2026 (put 4/5/2019) | 520,000 | 520,000 |
| a | Series C, 1.50% due 6/1/2030 (put 4/5/2019) | 1,500,000 | 1,500,000 |
| Rio Rancho Public School District No. 94 (Insured: BAM) GO, 5.00% due 8/1/2019 - 8/1/2020 | 1,100,000 | 1,130,927 | |
| San Juan County (County Capital Improvements), Series B, 5.00% due 6/15/2028 - 6/15/2030 | 2,645,000 | 3,014,160 | |
| Santa Fe County (County Buildings & Facilities) GRT, Series A, 5.00% due 6/1/2026 - 6/1/2027 | 940,000 | 1,112,982 | |
| Santa Fe County (County Correctional System; Insured: AGM), 6.00% due 2/1/2027 | 1,390,000 | 1,612,247 | |
| Santa Fe Gasoline Tax, 5.00% due 6/1/2024 - 6/1/2028 | 1,540,000 | 1,846,734 | |
| State of New Mexico (Capital Improvements), Series A, 5.00% due 7/1/2022 (pre-refunded 7/1/2019) | 350,000 | 353,035 | |
| State of New Mexico (Educational Facilities), Series A, 5.00% due 7/1/2025 | 2,040,000 | 2,429,110 | |
| State of New Mexico Severance Tax Permanent Fund, Series A, 5.00% due 7/1/2023 (pre-refunded 7/1/2019) | 1,100,000 | 1,109,537 | |
| Taos Municipal School District No. 1 (Educational Facilities) GO, 5.00% due 9/1/2021 | 520,000 | 561,558 | |
| Town of Silver City (Joint Utility System Improvement; Insured: BAM), Series B, 2.00% due 12/1/2019 | 265,000 | 265,835 | |
| Town of Silver City (Public Facility Capital Projects), | |||
| Series A, | |||
| 4.00% due 6/1/2029 | 1,000,000 | 1,024,040 | |
| 4.25% due 6/1/2032 | 1,050,000 | 1,077,373 | |
| Village of Los Ranchos de Albuquerque (Albuquerque Academy), 4.50% due 9/1/2040 | 3,000,000 | 3,074,580 | |
| Virgin Islands Public Finance Authority, 6.625% due 10/1/2029 | 2,500,000 | 2,450,000 | |
| Zuni Public School District (Teacher Housing Projects), 5.00% due 8/1/2028 | 1,600,000 | 1,746,272 | |
| Total Investments — 98.2%(Cost $154,982,808) | $160,136,579 | ||
| Other Assets Less Liabilities — 1.8% | 2,890,107 | ||
| Net Assets — 100.0% | $163,026,686 | ||
| Footnote Legend | |
| a | Variable Rate Demand Notes are instruments whose interest rates change on a specific date (such as coupon date or interest payment date) or whose interest rates vary with changes in a designated base rate (such as the prime interest rate). This instrument is payable on demand and is secured by letters of credit or other credit support agreements from major banks. |
To simplify the listings of securities, abbreviations are used per the table below:
| AGM | Insured by Assured Guaranty Municipal Corp. |
| AMBAC | Insured by American Municipal Bond Assurance Corp. |
| AMT | Alternative Minimum Tax |
| BAM | Insured by Build America Mutual Insurance Co. |
| ETM | Escrowed to Maturity |
| FHLMC | Insured by Federal Home Loan Mortgage Corp. |
| FNMA | Collateralized by Federal National Mortgage Association |
| GNMA | Collateralized by Government National Mortgage Association |
| GO | General Obligation |
| GRT | Gross Receipts Tax |
| Natl-Re | Insured by National Public Finance Guarantee Corp. |
| SPA | Stand-by Purchase Agreement |
Thornburg New Mexico Intermediate Municipal Fund | March 31, 2019 (Unaudited)
| ASSETS | |
| Investments at value (cost $154,982,808) (Note 3) | $ 160,136,579 |
| Cash | 974,892 |
| Receivable for fund shares sold | 12,875 |
| Interest receivable | 2,232,902 |
| Prepaid expenses and other assets | 15,435 |
| Total Assets | 163,372,683 |
| Liabilities | |
| Payable for fund shares redeemed | 154,191 |
| Payable to investment advisor and other affiliates (Note 4) | 112,107 |
| Accounts payable and accrued expenses | 54,617 |
| Dividends payable | 25,082 |
| Total Liabilities | 345,997 |
| Net Assets | $ 163,026,686 |
| NET ASSETS CONSIST OF | |
| Distributable earnings | $ 3,639,075 |
| Net capital paid in on shares of beneficial interest | 159,387,611 |
| $ 163,026,686 | |
| NET ASSET VALUE | |
| Class A Shares: | |
| Net asset value and redemption price per share ($90,330,259 applicable to 6,850,459 shares of beneficial interest outstanding - Note 5) | $ 13.19 |
| Maximum sales charge, 2.00% of offering price | 0.27 |
| Maximum offering price per share | $ 13.46 |
| Class D Shares: | |
| Net asset value, offering and redemption price per share ($16,837,262 applicable to 1,276,294 shares of beneficial interest outstanding - Note 5) | $ 13.19 |
| Class I Shares: | |
| Net asset value, offering and redemption price per share ($55,859,165 applicable to 4,237,991 shares of beneficial interest outstanding - Note 5) | $ 13.18 |
Thornburg New Mexico Intermediate Municipal Fund | Six Months Ended March 31, 2019 (Unaudited)
| INVESTMENT INCOME | |
| Interest income (net of premium amortized of $817,365) | $ 2,770,101 |
| EXPENSES | |
| Investment advisory fees (Note 4) | 405,644 |
| Administration fees (Note 4) | |
| Class A Shares | 39,804 |
| Class D Shares | 7,694 |
| Class I Shares | 23,705 |
| Distribution and service fees (Note 4) | |
| Class A Shares | 113,366 |
| Class D Shares | 43,813 |
| Transfer agent fees | |
| Class A Shares | 29,310 |
| Class D Shares | 6,286 |
| Class I Shares | 6,734 |
| Registration and filing fees | |
| Class A Shares | 2,385 |
| Class D Shares | 2,063 |
| Class I Shares | 2,452 |
| Custodian fees (Note 2) | 15,740 |
| Professional fees | 22,200 |
| Trustee and officer fees (Note 4) | 4,636 |
| Other expenses | 13,840 |
| Total Expenses | 739,672 |
| Less: | |
| Expenses reimbursed by investment advisor (Note 4) | (6,816) |
| Net Expenses | 732,856 |
| Net Investment Income | $ 2,037,245 |
| REALIZED AND UNREALIZED GAIN (LOSS) | |
| Net realized gain (loss) on investments | (104,235) |
| Net change in unrealized appreciation (depreciation) on investments | 2,389,729 |
| Net Realized and Unrealized Gain | 2,285,494 |
| Net Increase in Net Assets Resulting from Operations | $ 4,322,739 |
Thornburg New Mexico Intermediate Municipal Fund
| Six Months Ended March 31, 2019* | Year Ended September 30, 2018 | |
| INCREASE (DECREASE) IN NET ASSETS FROM | ||
| OPERATIONS | ||
| Net investment income | $ 2,037,245 | $ 4,667,064 |
| Net realized gain (loss) on investments | (104,235) | (129,992) |
| Net unrealized appreciation (depreciation) on investments | 2,389,729 | (4,117,035) |
| Net Increase in Net Assets Resulting from Operations | 4,322,739 | 420,037 |
| DIVIDENDS TO SHAREHOLDERS | ||
| From distributable earnings | ||
| Class A Shares | (1,105,433) | (2,599,663) |
| Class D Shares | (190,685) | (471,656) |
| Class I Shares | (741,127) | (1,595,745) |
| FUND SHARE TRANSACTIONS (NOTE 5) | ||
| Class A Shares | (5,617,428) | (19,812,373) |
| Class D Shares | (1,838,870) | (3,739,263) |
| Class I Shares | 1,400,556 | (7,228,636) |
| Net Decrease in Net Assets | (3,770,248) | (35,027,299) |
| NET ASSETS | ||
| Beginning of Period | 166,796,934 | 201,824,233 |
| End of Period | $ 163,026,686 | $ 166,796,934 |
| * | Unaudited. |
Thornburg New Mexico Intermediate Municipal Fund | March 31, 2019 (Unaudited)
Thornburg New Mexico Intermediate Municipal Fund | March 31, 2019 (Unaudited)
| Cost of investments for tax purposes | $ 154,982,808 |
| Gross unrealized appreciation on a tax basis | 5,219,490 |
| Gross unrealized depreciation on a tax basis | (65,719) |
| Net unrealized appreciation (depreciation) on investments (tax basis) | $ 5,153,771 |
| Fair Value Measurements at March 31, 2019 | ||||
| TOTAL | LEVEL 1 | LEVEL 2 | LEVEL 3 | |
| Assets | ||||
| Investments in Securities | ||||
| Municipal Bonds | $ 160,136,579 | $ — | $ 160,136,579 | $ — |
| Total Investments in Securities | $160,136,579 | $— | $160,136,579 | $— |
| Total Assets | $160,136,579 | $— | $160,136,579 | $— |
Thornburg New Mexico Intermediate Municipal Fund | March 31, 2019 (Unaudited)
| Management Fee Schedule | |
| DAILY NET ASSETS | FEE RATE |
| Up to $500 million | 0.500% |
| Next $500 million | 0.450 |
| Next $500 million | 0.400 |
| Next $500 million | 0.350 |
| Over $2 billion | 0.275 |
| Administration Fee Schedule | |
| Daily Net Assets | Fee Rate |
| Up to $20 billion | 0.100% |
| $20 billion to $40 billion | 0.075 |
| $40 billion to $60 billion | 0.040 |
| Over $60 billion | 0.030 |
| SIX MONTHS ENDED March 31, 2019 (UNAUDITED) | YEAR ENDED September 30, 2018 (AUDITED) | |||
| SHARES | AMOUNT | SHARES | AMOUNT | |
| Class A Shares | ||||
| Shares sold | 187,799 | $ 2,454,477 | 142,988 | $ 1,880,897 |
| Shares issued to shareholders in reinvestment of dividends | 74,979 | 979,160 | 175,091 | 2,291,097 |
| Shares repurchased | (695,348) | (9,051,065) | (1,826,448) | (23,984,367) |
| Net decrease | (432,570) | $ (5,617,428) | (1,508,369) | $ (19,812,373) |
| Class D Shares | ||||
| Shares sold | 38,963 | $ 509,279 | 148,304 | $ 1,955,850 |
| Shares issued to shareholders in reinvestment of dividends | 13,865 | 181,129 | 34,493 | 451,653 |
| Shares repurchased | (193,904) | (2,529,278) | (468,941) | (6,146,766) |
| Net decrease | (141,076) | $ (1,838,870) | (286,144) | $ (3,739,263) |
| Class I Shares | ||||
| Shares sold | 575,029 | $ 7,474,269 | 667,719 | $ 8,786,130 |
| Shares issued to shareholders in reinvestment of dividends | 51,092 | 666,964 | 109,625 | 1,434,193 |
| Shares repurchased | (518,314) | (6,740,677) | (1,329,549) | (17,448,959) |
| Net increase (decrease) | 107,807 | $ 1,400,556 | (552,205) | $ (7,228,636) |
Thornburg New Mexico Intermediate Municipal Fund
| PER SHARE PERFORMANCE (FOR A SHARE OUTSTANDING THROUGHOUT THE PERIOD) | ||||||||
| UNLESS OTHERWISE NOTED, PERIODS ARE FISCAL YEARS ENDED SEPTEMBER 30, | Net Asset Value, Beginning of PERIOD | Net Investment Income (Loss)+ | Net Realized & Unrealized Gain (Loss) on Investments | Total from Investment Operations | Dividends from Net Investment Income | Dividends from Net Realized Gains | Total Dividends | Net Asset Value, End of PERIOD |
| CLASS A SHARES | ||||||||
| 2019(b)(c) | $ 13.00 | 0.16 | 0.19 | 0.35 | (0.16) | — | (0.16) | $ 13.19 |
| 2018(b) | $ 13.30 | 0.33 | (0.30) | 0.03 | (0.33) | — | (0.33) | $ 13.00 |
| 2017(b) | $ 13.67 | 0.31 | (0.37) | (0.06) | (0.31) | — | (0.31) | $ 13.30 |
| 2016(b) | $ 13.55 | 0.30 | 0.12 | 0.42 | (0.30) | — | (0.30) | $ 13.67 |
| 2015(b) | $ 13.60 | 0.34 | (0.05) | 0.29 | (0.34) | — | (0.34) | $ 13.55 |
| 2014(b) | $ 13.35 | 0.39 | 0.25 | 0.64 | (0.39) | — | (0.39) | $ 13.60 |
| CLASS D SHARES | ||||||||
| 2019(c) | $ 13.01 | 0.14 | 0.18 | 0.32 | (0.14) | — | (0.14) | $ 13.19 |
| 2018 | $ 13.31 | 0.30 | (0.30) | — | (0.30) | — | (0.30) | $ 13.01 |
| 2017 | $ 13.68 | 0.28 | (0.37) | (0.09) | (0.28) | — | (0.28) | $ 13.31 |
| 2016 | $ 13.55 | 0.28 | 0.12 | 0.40 | (0.27) | — | (0.27) | $ 13.68 |
| 2015 | $ 13.61 | 0.31 | (0.06) | 0.25 | (0.31) | — | (0.31) | $ 13.55 |
| 2014 | $ 13.36 | 0.35 | 0.25 | 0.60 | (0.35) | — | (0.35) | $ 13.61 |
| CLASS I SHARES | ||||||||
| 2019(c) | $ 13.00 | 0.18 | 0.18 | 0.36 | (0.18) | — | (0.18) | $ 13.18 |
| 2018 | $ 13.29 | 0.37 | (0.29) | 0.08 | (0.37) | — | (0.37) | $ 13.00 |
| 2017 | $ 13.67 | 0.36 | (0.38) | (0.02) | (0.36) | — | (0.36) | $ 13.29 |
| 2016 | $ 13.54 | 0.35 | 0.12 | 0.47 | (0.34) | — | (0.34) | $ 13.67 |
| 2015 | $ 13.59 | 0.38 | (0.05) | 0.33 | (0.38) | — | (0.38) | $ 13.54 |
| 2014 | $ 13.35 | 0.43 | 0.24 | 0.67 | (0.43) | — | (0.43) | $ 13.59 |
| (a) | Not annualized for periods less than one year. |
| (b) | Sales loads are not reflected in computing total return. |
| (c) | Unaudited Six Month Period Ended March 31. |
| (d) | Annualized. |
| + | Based on weighted average shares outstanding. |
| RATIOS TO AVERAGE NET ASSETS | SUPPLEMENTAL DATA | ||||||
| Net Investment Income (Loss) (%) | Expenses, After Expense Reductions (%) | Expenses, After Expense Reductions and Net of Custody Credits (%) | Expenses, Before Expense Reductions (%) | Total Return (%)(a) | Portfolio Turnover Rate (%)(a) | Net Assets at End of PERIOD (Thousands) | |
| 2.44(d) | 0.98(d) | 0.98(d) | 0.98(d) | 2.70 | 5.70 | $ 90,330 | |
| 2.51 | 0.97 | 0.97 | 0.97 | 0.24 | 7.77 | $ 94,686 | |
| 2.36 | 0.98 | 0.98 | 0.98 | (0.38) | 8.61 | $ 116,915 | |
| 2.18 | 0.97 | 0.97 | 0.97 | 3.11 | 6.80 | $ 136,743 | |
| 2.50 | 0.98 | 0.98 | 0.98 | 2.15 | 19.01 | $ 139,939 | |
| 2.87 | 0.97 | 0.97 | 0.97 | 4.83 | 10.79 | $ 143,994 | |
| 2.18(d) | 1.24(d) | 1.24(d) | 1.25(d) | 2.49 | 5.70 | $ 16,838 | |
| 2.26 | 1.23 | 1.23 | 1.23 | (0.02) | 7.77 | $ 18,436 | |
| 2.13 | 1.21 | 1.21 | 1.21 | (0.61) | 8.61 | $ 22,666 | |
| 1.94 | 1.21 | 1.21 | 1.21 | 2.94 | 6.80 | $ 28,489 | |
| 2.27 | 1.20 | 1.20 | 1.20 | 1.84 | 19.01 | $ 28,953 | |
| 2.60 | 1.23 | 1.23 | 1.23 | 4.55 | 10.79 | $ 28,438 | |
| 2.74(d) | 0.67(d) | 0.67(d) | 0.69(d) | 2.78 | 5.70 | $ 55,859 | |
| 2.82 | 0.67 | 0.67 | 0.68 | 0.62 | 7.77 | $ 53,675 | |
| 2.68 | 0.66 | 0.66 | 0.66 | (0.13) | 8.61 | $ 62,243 | |
| 2.52 | 0.63 | 0.63 | 0.63 | 3.53 | 6.80 | $ 65,843 | |
| 2.80 | 0.65 | 0.65 | 0.65 | 2.48 | 19.01 | $ 57,958 | |
| 3.19 | 0.65 | 0.64 | 0.65 | 5.09 | 10.79 | $ 37,380 | |
Thornburg New Mexico Intermediate Municipal Fund | March 31, 2019 (Unaudited)
| (1) | transaction costs, including |
| (a) | sales charges (loads) on purchase payments, for Class A shares; |
| (b) | a deferred sales charge on redemptions of any part or all of a purchase of $1 million of Class A shares within 12 months of purchase; |
| (2) | ongoing costs, including management fees; distribution and/or service (12b-1) fees; and other Fund expenses. This example is intended to help you understand your ongoing costs (in dollars) of investing in the Fund and to compare these costs with the ongoing costs of investing in other mutual funds. |
| BEGINNING ACCOUNT VALUE 10/1/18 | ENDING ACCOUNT VALUE 3/31/19 | EXPENSES PAID DURING PERIOD† 10/1/18—3/31/19 | |
| CLASS A SHARES | |||
| Actual | $1,000.00 | $1,027.00 | $4.95 |
| Hypothetical* | $1,000.00 | $1,020.04 | $4.94 |
| CLASS D SHARES | |||
| Actual | $1,000.00 | $1,024.87 | $6.26 |
| Hypothetical* | $1,000.00 | $1,018.75 | $6.24 |
| CLASS I SHARES | |||
| Actual | $1,000.00 | $1,027.79 | $3.39 |
| Hypothetical* | $1,000.00 | $1,021.59 | $3.38 |
| † | Expenses are equal to the annualized expense ratio for each class (A: 0.98%; D: 1.24%; I: 0.67%) multiplied by the average account value over the period, multiplied by 182/365 to reflect the one-half year period. |
| * | Hypothetical assumes a rate of return of 5% per year before expenses. |
Thornburg New Mexico Intermediate Municipal Fund | March 31, 2019 (Unaudited)
| ■ | Thornburg Investment Income Builder Fund |
| ■ | Thornburg Global Opportunities Fund |
| ■ | Thornburg International Value Fund |
| ■ | Thornburg Better World International Fund |
| ■ | Thornburg International Growth Fund |
| ■ | Thornburg Developing World Fund |
| ■ | Thornburg Value Fund |
| ■ | Thornburg Core Growth Fund |
| ■ | Thornburg Investment Income Builder Fund |
| ■ | Thornburg Summit Fund |
| ■ | Thornburg Low Duration Income Fund |
| ■ | Thornburg Limited Term U.S. Government Fund |
| ■ | Thornburg Limited Term Income Fund |
| ■ | Thornburg Strategic Income Fund |
| ■ | Thornburg Low Duration Municipal Fund |
| ■ | Thornburg Limited Term Municipal Fund |
| ■ | Thornburg Intermediate Municipal Fund |
| ■ | Thornburg California Limited Term Municipal Fund |
| ■ | Thornburg New Mexico Intermediate Municipal Fund |
| ■ | Thornburg New York Intermediate Municipal Fund |
| ■ | Thornburg Strategic Municipal Income Fund |
| ■ | Thornburg Long/Short Equity Fund |

| 800.847.0200 | TH178 |


| 4 | |
| 6 | |
| 7 | |
| 8 | |
| 10 | |
| 11 | |
| 12 | |
| 13 | |
| 18 | |
| 20 | |
| 21 | |
| 22 |
| SHARE CLASS | NASDAQ SYMBOL | CUSIP |
| Class A | THNYX | 885-215-665 |
| Class I | TNYIX | 885-216-705 |
Thornburg New York Intermediate Municipal Fund | March 31, 2019 (Unaudited)
 |  |
| Christopher Ryon,cfa Portfolio Manager Managing Director | Nicholos Venditti,cfa Portfolio Manager Managing Director |
 | |
| David Ashley,cfa Portfolio Manager Managing Director |
Thornburg New York Intermediate Municipal Fund | March 31, 2019 (Unaudited)
| 1-YR | 3-YR | 5-YR | 10-YR | SINCE INCEP. | |
| Class A Shares(Incep: 9/5/97) | |||||
| Without sales charge | 3.13% | 0.99% | 2.05% | 3.16% | 3.65% |
| With sales charge | 1.07% | 0.32% | 1.65% | 2.96% | 3.55% |
| Class I Shares(Incep: 2/1/10) | 3.46% | 1.31% | 2.38% | - | 3.22% |
| Annualized Distribution Yield | 2.25% |
| SEC Yield | 1.08% |
| FINAL VALUE |
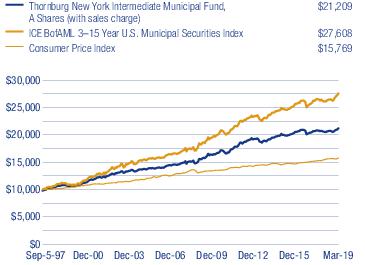
Thornburg New York Intermediate Municipal Fund | March 31, 2019 (Unaudited)
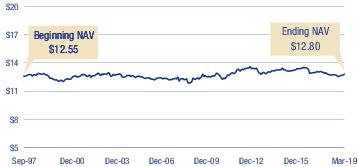
| KEY PORTFOLIO ATTRIBUTES | |
| Number of Bonds | 56 |
| Effective Duration | 3.8 Yrs |
| Average Maturity | 8.1 Yrs |
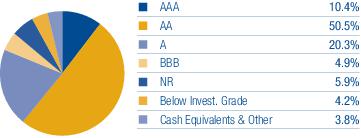

| 4% | 14% | 8% | 16% | 6% | 15% | 13% | 9% | 9% | 8% |
Thornburg New York Intermediate Municipal Fund | March 31, 2019 (Unaudited)
| Issuer-Description | PRINCIPAL AMOUNT | VALUE | |
| MUNICIPAL BONDS — 98.8% | |||
| City of New York (City Budget Financial Management) GO, 5.00% due 8/1/2030 | $1,000,000 | $ 1,132,530 | |
| City of New York GO, 5.00% due 4/1/2037 | 940,000 | 1,119,869 | |
| County of Nassau (Insured: BAM) GO, Series B, 5.00% due 4/1/2026 | 1,000,000 | 1,137,380 | |
| Dutchess County Local Development Corp. (Health Quest Systems, Inc.; Insured: AGM), Series A, 5.00% due 7/1/2021 - 7/1/2022 | 1,045,000 | 1,086,086 | |
| Erie County Fiscal Stability Authority, 5.00% due 9/1/2034 | 850,000 | 1,017,815 | |
| Erie County Industrial Development Agency (Buffalo City School District), Series A, 5.25% due 5/1/2025 (pre-refunded 5/1/2019) | 1,000,000 | 1,003,070 | |
| Government of Guam (Layon Solid Waste Disposal Facility), Series A, 5.375% due 12/1/2024 (pre-refunded 12/1/2019) | 1,000,000 | 1,025,950 | |
| Government of Guam (Various Capital Projects), Series D, 5.00% due 11/15/2033 | 2,000,000 | 2,173,480 | |
| Guam Waterworks Authority (Water and Wastewater System), 5.00% due 7/1/2028 - 7/1/2036 | 1,500,000 | 1,656,820 | |
| Hempstead Town Local Development Corp. (Hofstra University), 5.00% due 7/1/2028 | 500,000 | 534,420 | |
| Hudson Yards Infrastructure Corp. (Hudson Yards Subway Station), Series A, 5.00% due 2/15/2035 | 1,000,000 | 1,184,270 | |
| Long Island Power Authority (Electric System Capital Improvements), Series C, 5.25% due 9/1/2029 | 645,000 | 808,998 | |
| a | Long Island Power Authority, Series C 2.493% (LIBOR 1 Month + 0.750%) due 5/1/2033 (put 10/1/2023) | 500,000 | 501,005 |
| Metropolitan Transportation Authority (Green Bond), Series C-1, 5.00% due 11/15/2028 | 1,000,000 | 1,218,930 | |
| Monroe County Industrial Development Corp. (Monroe Community College Association, Inc.; Insured: AGM), 5.00% due 1/15/2028 - 1/15/2029 | 550,000 | 616,028 | |
| Nassau County (New York Institute of Technology) IDA, Series A, 4.75% due 3/1/2026 (pre-refunded 3/1/2020) | 1,000,000 | 1,028,910 | |
| Nassau County Sewer & Storm Water Finance Authority (Sewerage and Storm Water Resource Facilities), Series A, 5.00% due 10/1/2021 - 10/1/2031 | 1,675,000 | 1,924,837 | |
| New York City Health and Hospitals Corp. (Healthcare Facilities Improvements) GO, Series A, 5.00% due 2/15/2025 | 1,000,000 | 1,028,340 | |
| New York City Transitional Finance Authority Future Tax Secured Revenue 5.00% due 8/1/2038 | 1,000,000 | 1,191,770 | |
| b | New York City Transitional Finance Authority Future Tax Secured Revenue (SPA Landesbank Hessen-Thuringen), 1.51% due 8/1/2031 (put 4/1/2019) | 1,000,000 | 1,000,000 |
| b | New York City Water & Sewer System (SPA JP Morgan Chase Bank, N.A.), Series AA1, 1.50% due 6/15/2050 (put 4/1/2019) | 1,005,000 | 1,005,000 |
| New York State Dormitory Authority (Columbia University Teachers College), Series A, 5.00% due 7/1/2027 | 750,000 | 820,222 | |
| New York State Dormitory Authority (Health Quest Systems; Insured: AGM), Series A, 5.25% due 7/1/2027 | 460,000 | 461,357 | |
| New York State Dormitory Authority (Metropolitan Transportation Authority & State Urban Development Corp.), Series A, 5.00% due 12/15/2027 | 2,500,000 | 2,796,875 | |
| New York State Dormitory Authority (Miriam Osborn Memorial Home Assoc.), 5.00% due 7/1/2024 | 1,540,000 | 1,555,662 | |
| New York State Dormitory Authority (North Shore Long Island Jewish Medical), 5.25% due 5/1/2030 (pre-refunded 5/1/2019) | 1,000,000 | 1,003,030 | |
| New York State Dormitory Authority (School District Financing Program) (State Aid Withholding), Series C, 5.00% due 10/1/2023 | 575,000 | 658,317 | |
| New York State Dormitory Authority (School District Financing Program; Insured: AGM) (State Aid Withholding), | |||
| 5.00% due 10/1/2024 | 480,000 | 519,888 | |
| 5.00% due 10/1/2024 (pre-refunded 10/1/2021) | 520,000 | 565,651 | |
| New York State Dormitory Authority (School District Financing Program; Insured: AGM), Series A, 5.00% due 10/1/2028 | 200,000 | 229,950 | |
| New York State Dormitory Authority (St. John’s University; Insured: Natl-Re), Series C, 5.25% due 7/1/2022 | 1,000,000 | 1,111,030 | |
| New York State Dormitory Authority, Series A, 5.00% due 2/15/2032 | 1,000,000 | 1,192,840 | |
| c | New York State Environmental Facilities Corp. (Waste Management, Inc.) AMT, 2.35% due 5/1/2030 (put 5/1/2019) | 1,000,000 | 1,000,090 |
| Onondaga Civic Development Corp. (Le Moyne College), 5.00% due 7/1/2021 | 1,000,000 | 1,045,010 | |
| Onondaga Civic Development Corp. (State University of New York Upstate Medical University), 5.50% due 12/1/2031 | 1,000,000 | 1,093,200 | |
| Sales Tax Asset Receivable Corp. (New York Local Government Assistance Corp.), Series A, 5.00% due 10/15/2029 - 10/15/2031 | 2,250,000 | 2,603,848 | |
| Syracuse Industrial Development Agency (Syracuse City School District), 5.25% due 5/1/2026 | 2,150,000 | 2,307,487 | |
| Tompkins County Development Corp. (Ithaca College Project), 5.00% due 7/1/2034 - 7/1/2037 | 820,000 | 964,599 | |
| Town of Amherst Development Corp. (University at Buffalo Foundation Facility-Student Housing; Insured: AGM) ETM, 5.00% due 10/1/2020 | 1,000,000 | 1,052,390 | |
| Town of Oyster Bay GO, Series B, 3.00% due 2/1/2020 - 3/13/2020 | 1,000,000 | 1,007,225 | |
| Triborough Bridge & Tunnel Authority (MTA Bridges and Tunnels) GO, | |||
| 5.00% due 11/15/2028 (pre-refunded 5/15/2024) | 1,000,000 | 1,171,300 | |
| 5.00% due 11/15/2029 | 1,000,000 | 1,152,040 | |
| United Nations Development Corp. (One, Two and Three U.N. Plaza), Series A, 5.00% due 7/1/2025 | 710,000 | 715,730 | |
| Utility Debt Securitization Authority (Long Island Power Authority-Electric Service), Series TE, 5.00% due 12/15/2029 - 12/15/2030 | 2,000,000 | 2,290,450 | |
| West Seneca Central School District (Facilities Improvements; Insured: BAM) (State Aid Withholding) GO, 5.00% due 11/15/2023 | 1,300,000 | 1,490,463 | |
| Total Investments — 98.8%(Cost $49,993,070) | $52,204,162 | ||
| Other Assets Less Liabilities — 1.2% | 628,309 | ||
| Net Assets — 100.0% | $52,832,471 | ||
| Footnote Legend | |
| a | Floating Rate Security. Stated interest/floor rate was in effect at March 31, 2019. |
| b | Variable Rate Demand Notes are instruments whose interest rates change on a specific date (such as coupon date or interest payment date) or whose interest rates vary with changes in a designated base rate (such as the prime interest rate). This instrument is payable on demand and is secured by letters of credit or other credit support agreements from major banks. |
| c | Variable Rate Demand Obligations are instruments whose interest rates change on a mandatory date (demand date) or whose interest rates will vary with changes in a designated base rate. The rate disclosed is the rate at March 31, 2019. |
To simplify the listings of securities, abbreviations are used per the table below:
| AGM | Insured by Assured Guaranty Municipal Corp. |
| AMT | Alternative Minimum Tax |
| BAM | Insured by Build America Mutual Insurance Co. |
| ETM | Escrowed to Maturity |
| GO | General Obligation |
| IDA | Industrial Development Authority |
| LIBOR | London Interbank Offered Rates |
| Natl-Re | Insured by National Public Finance Guarantee Corp. |
| SPA | Stand-by Purchase Agreement |
Thornburg New York Intermediate Municipal Fund | March 31, 2019 (Unaudited)
| ASSETS | |
| Investments at value (cost $49,993,070) (Note 3) | $ 52,204,162 |
| Cash | 1,752 |
| Receivable for fund shares sold | 33,939 |
| Interest receivable | 704,470 |
| Prepaid expenses and other assets | 12,559 |
| Total Assets | 52,956,882 |
| Liabilities | |
| Payable for fund shares redeemed | 39,565 |
| Payable to investment advisor and other affiliates (Note 4) | 24,830 |
| Accounts payable and accrued expenses | 43,736 |
| Dividends payable | 16,280 |
| Total Liabilities | 124,411 |
| Net Assets | $ 52,832,471 |
| NET ASSETS CONSIST OF | |
| Distributable earnings | $ 1,541,597 |
| Net capital paid in on shares of beneficial interest | 51,290,874 |
| $ 52,832,471 | |
| NET ASSET VALUE | |
| Class A Shares: | |
| Net asset value and redemption price per share ($31,029,155 applicable to 2,424,166 shares of beneficial interest outstanding - Note 5) | $ 12.80 |
| Maximum sales charge, 2.00% of offering price | 0.26 |
| Maximum offering price per share | $ 13.06 |
| Class I Shares: | |
| Net asset value, offering and redemption price per share ($21,803,316 applicable to 1,703,403 shares of beneficial interest outstanding - Note 5) | $ 12.80 |
Thornburg New York Intermediate Municipal Fund | Six Months Ended March 31, 2019 (Unaudited)
| INVESTMENT INCOME | |
| Interest income (net of premium amortized of $243,240) | $ 945,815 |
| EXPENSES | |
| Investment advisory fees (Note 4) | 135,925 |
| Administration fees (Note 4) | |
| Class A Shares | 14,072 |
| Class I Shares | 9,784 |
| Distribution and service fees (Note 4) | |
| Class A Shares | 40,068 |
| Transfer agent fees | |
| Class A Shares | 12,570 |
| Class I Shares | 12,740 |
| Registration and filing fees | |
| Class A Shares | 3,315 |
| Class I Shares | 2,400 |
| Custodian fees (Note 2) | 11,830 |
| Professional fees | 21,016 |
| Trustee and officer fees (Note 4) | 1,544 |
| Other expenses | 12,113 |
| Total Expenses | 277,377 |
| Less: | |
| Expenses reimbursed by investment advisor (Note 4) | (43,951) |
| Net Expenses | 233,426 |
| Net Investment Income | $ 712,389 |
| REALIZED AND UNREALIZED GAIN (LOSS) | |
| Net realized gain (loss) on investments | (26,685) |
| Net change in unrealized appreciation (depreciation) on investments | 820,673 |
| Net Realized and Unrealized Gain | 793,988 |
| Net Increase in Net Assets Resulting from Operations | $ 1,506,377 |
Thornburg New York Intermediate Municipal Fund
| Six Months Ended March 31, 2019* | Year Ended September 30, 2018 | |
| INCREASE (DECREASE) IN NET ASSETS FROM | ||
| OPERATIONS | ||
| Net investment income | $ 712,389 | $ 1,570,023 |
| Net realized gain (loss) on investments | (26,685) | (9,562) |
| Net unrealized appreciation (depreciation) on investments | 820,673 | (1,951,804) |
| Net Increase (Decrease) in Net Assets Resulting from Operations | 1,506,377 | (391,343) |
| DIVIDENDS TO SHAREHOLDERS | ||
| From distributable earnings | ||
| Class A Shares | (399,152) | (861,533) |
| Class I Shares | (313,237) | (708,490) |
| FUND SHARE TRANSACTIONS (NOTE 5) | ||
| Class A Shares | (3,216,787) | (1,663,676) |
| Class I Shares | (2,532,542) | (2,380,889) |
| Net Decrease in Net Assets | (4,955,341) | (6,005,931) |
| NET ASSETS | ||
| Beginning of Period | 57,787,812 | 63,793,743 |
| End of Period | $ 52,832,471 | $ 57,787,812 |
| * | Unaudited. |
Thornburg New York Intermediate Municipal Fund | March 31, 2019 (Unaudited)
Thornburg New York Intermediate Municipal Fund | March 31, 2019 (Unaudited)
| Cost of investments for tax purposes | $ 49,993,070 |
| Gross unrealized appreciation on a tax basis | 2,218,216 |
| Gross unrealized depreciation on a tax basis | (7,124) |
| Net unrealized appreciation (depreciation) on investments (tax basis) | $ 2,211,092 |
| Fair Value Measurements at March 31, 2019 | ||||
| TOTAL | LEVEL 1 | LEVEL 2 | LEVEL 3 | |
| Assets | ||||
| Investments in Securities | ||||
| Municipal Bonds | $ 52,204,162 | $ — | $ 52,204,162 | $ — |
| Total Investments in Securities | $52,204,162 | $— | $52,204,162 | $— |
| Total Assets | $52,204,162 | $— | $52,204,162 | $— |
Thornburg New York Intermediate Municipal Fund | March 31, 2019 (Unaudited)
| Management Fee Schedule | |
| DAILY NET ASSETS | FEE RATE |
| Up to $500 million | 0.500% |
| Next $500 million | 0.450 |
| Next $500 million | 0.400 |
| Next $500 million | 0.350 |
| Over $2 billion | 0.275 |
| Administration Fee Schedule | |
| Daily Net Assets | Fee Rate |
| Up to $20 billion | 0.100% |
| $20 billion to $40 billion | 0.075 |
| $40 billion to $60 billion | 0.040 |
| Over $60 billion | 0.030 |
| SIX MONTHS ENDED March 31, 2019 (UNAUDITED) | YEAR ENDED September 30, 2018 (AUDITED) | |||
| SHARES | AMOUNT | SHARES | AMOUNT | |
| Class A Shares | ||||
| Shares sold | 48,095 | $ 608,391 | 509,755 | $ 6,596,193 |
| Shares issued to shareholders in reinvestment of dividends | 26,114 | 330,388 | 56,051 | 715,470 |
| Shares repurchased | (328,744) | (4,155,566) | (700,474) | (8,975,339) |
| Net decrease | (254,535) | $ (3,216,787) | (134,668) | $ (1,663,676) |
| Class I Shares | ||||
| Shares sold | 278,519 | $ 3,521,584 | 591,763 | $ 7,620,816 |
| Shares issued to shareholders in reinvestment of dividends | 22,485 | 284,461 | 51,601 | 658,900 |
| Shares repurchased | (501,733) | (6,338,587) | (832,821) | (10,660,605) |
| Net decrease | (200,729) | $ (2,532,542) | (189,457) | $ (2,380,889) |
Thornburg New York Intermediate Municipal Fund
| PER SHARE PERFORMANCE (FOR A SHARE OUTSTANDING THROUGHOUT THE PERIOD) | ||||||||
| UNLESS OTHERWISE NOTED, PERIODS ARE FISCAL YEARS ENDED SEPTEMBER 30, | Net Asset Value, Beginning of PERIOD | Net Investment Income (Loss)+ | Net Realized & Unrealized Gain (Loss) on Investments | Total from Investment Operations | Dividends from Net Investment Income | Dividends from Net Realized Gains | Total Dividends | Net Asset Value, End of PERIOD |
| CLASS A SHARES | ||||||||
| 2019(b)(c) | $ 12.61 | 0.16 | 0.19 | 0.35 | (0.16) | — | (0.16) | $ 12.80 |
| 2018(b) | $ 13.00 | 0.30 | (0.39) | (0.09) | (0.30) | — | (0.30) | $ 12.61 |
| 2017(b) | $ 13.40 | 0.33 | (0.40) | (0.07) | (0.33) | — | (0.33) | $ 13.00 |
| 2016(b) | $ 13.18 | 0.29 | 0.22 | 0.51 | (0.29) | — | (0.29) | $ 13.40 |
| 2015(b) | $ 13.22 | 0.29 | (0.04) | 0.25 | (0.29) | — | (0.29) | $ 13.18 |
| 2014(b) | $ 12.93 | 0.30 | 0.29 | 0.59 | (0.30) | — | (0.30) | $ 13.22 |
| CLASS I SHARES | ||||||||
| 2019(c) | $ 12.61 | 0.18 | 0.19 | 0.37 | (0.18) | — | (0.18) | $ 12.80 |
| 2018 | $ 13.00 | 0.34 | (0.39) | (0.05) | (0.34) | — | (0.34) | $ 12.61 |
| 2017 | $ 13.40 | 0.37 | (0.40) | (0.03) | (0.37) | — | (0.37) | $ 13.00 |
| 2016 | $ 13.18 | 0.33 | 0.22 | 0.55 | (0.33) | — | (0.33) | $ 13.40 |
| 2015 | $ 13.22 | 0.33 | (0.04) | 0.29 | (0.33) | — | (0.33) | $ 13.18 |
| 2014 | $ 12.93 | 0.33 | 0.30 | 0.63 | (0.34) | — | (0.34) | $ 13.22 |
| (a) | Not annualized for periods less than one year. |
| (b) | Sales loads are not reflected in computing total return. |
| (c) | Unaudited Six Month Period Ended March 31. |
| (d) | Annualized. |
| + | Based on weighted average shares outstanding. |
| RATIOS TO AVERAGE NET ASSETS | SUPPLEMENTAL DATA | ||||||
| Net Investment Income (Loss) (%) | Expenses, After Expense Reductions (%) | Expenses, After Expense Reductions and Net of Custody Credits (%) | Expenses, Before Expense Reductions (%) | Total Return (%)(a) | Portfolio Turnover Rate (%)(a) | Net Assets at End of PERIOD (Thousands) | |
| 2.49(d) | 0.99(d) | 0.99(d) | 1.11(d) | 2.77 | 7.32 | $ 31,029 | |
| 2.36 | 0.99 | 0.99 | 1.08 | (0.68) | 15.88 | $ 33,778 | |
| 2.50 | 0.99 | 0.99 | 1.09 | (0.52) | 11.11 | $ 36,576 | |
| 2.18 | 0.96 | 0.96 | 1.03 | 3.91 | 7.02 | $ 45,009 | |
| 2.16 | 0.98 | 0.98 | 1.05 | 1.87 | 7.72 | $ 49,845 | |
| 2.27 | 0.99 | 0.99 | 1.05 | 4.59 | 14.12 | $ 54,301 | |
| 2.81(d) | 0.67(d) | 0.67(d) | 0.89(d) | 2.94 | 7.32 | $ 21,803 | |
| 2.68 | 0.67 | 0.67 | 0.82 | (0.36) | 15.88 | $ 24,010 | |
| 2.81 | 0.67 | 0.67 | 0.77 | (0.20) | 11.11 | $ 27,217 | |
| 2.51 | 0.63 | 0.63 | 0.72 | 4.25 | 7.02 | $ 31,498 | |
| 2.47 | 0.67 | 0.67 | 0.76 | 2.19 | 7.72 | $ 30,242 | |
| 2.57 | 0.67 | 0.67 | 0.73 | 4.93 | 14.12 | $ 23,922 | |
Thornburg New York Intermediate Municipal Fund | March 31, 2019 (Unaudited)
| (1) | transaction costs, including |
| (a) | sales charges (loads) on purchase payments, for Class A shares; |
| (b) | a deferred sales charge on redemptions of any part or all of a purchase of $1 million of Class A shares within 12 months of purchase; |
| (2) | ongoing costs, including management fees; distribution and/or service (12b-1) fees; and other Fund expenses. |
| BEGINNING ACCOUNT VALUE 10/1/18 | ENDING ACCOUNT VALUE 3/31/19 | EXPENSES PAID DURING PERIOD† 10/1/18—3/31/19 | |
| CLASS A SHARES | |||
| Actual | $1,000.00 | $1,027.73 | $5.00 |
| Hypothetical* | $1,000.00 | $1,020.00 | $4.99 |
| CLASS I SHARES | |||
| Actual | $1,000.00 | $1,029.36 | $3.39 |
| Hypothetical* | $1,000.00 | $1,021.59 | $3.38 |
| † | Expenses are equal to the annualized expense ratio for each class (A: 0.99%; I: 0.67%) multiplied by the average account value over the period, multiplied by 182/365 to reflect the one-half year period. |
| * | Hypothetical assumes a rate of return of 5% per year before expenses. |
Thornburg New York Intermediate Municipal Fund | March 31, 2019 (Unaudited)
| ■ | Thornburg Investment Income Builder Fund |
| ■ | Thornburg Global Opportunities Fund |
| ■ | Thornburg International Value Fund |
| ■ | Thornburg Better World International Fund |
| ■ | Thornburg International Growth Fund |
| ■ | Thornburg Developing World Fund |
| ■ | Thornburg Value Fund |
| ■ | Thornburg Core Growth Fund |
| ■ | Thornburg Investment Income Builder Fund |
| ■ | Thornburg Summit Fund |
| ■ | Thornburg Low Duration Income Fund |
| ■ | Thornburg Limited Term U.S. Government Fund |
| ■ | Thornburg Limited Term Income Fund |
| ■ | Thornburg Strategic Income Fund |
| ■ | Thornburg Low Duration Municipal Fund |
| ■ | Thornburg Limited Term Municipal Fund |
| ■ | Thornburg Intermediate Municipal Fund |
| ■ | Thornburg California Limited Term Municipal Fund |
| ■ | Thornburg New Mexico Intermediate Municipal Fund |
| ■ | Thornburg New York Intermediate Municipal Fund |
| ■ | Thornburg Strategic Municipal Income Fund |
| ■ | Thornburg Long/Short Equity Fund |

| 800.847.0200 | TH1069 |

| 4 | |
| 6 | |
| Fund Summary and Schedule of Investments | |
| 8 | |
| 13 | |
| 30 | |
| 40 | |
| 42 | |
| Statements of Changes in Net Assets | |
| 43 | |
| 44 | |
| 45 |
| LIMITED TERM U.S. GOVERNMENT FUND | NASDAQ SYMBOLS | CUSIPS |
| Class A | LTUSX | 885-215-103 |
| Class C | LTUCX | 885-215-830 |
| Class I | LTUIX | 885-215-699 |
| Class R3 | LTURX | 885-215-491 |
| Class R4 | LTUGX | 885-216-747 |
| Class R5 | LTGRX | 885-216-861 |
| LIMITED TERM INCOME FUND | ||
| Class A | THIFX | 885-215-509 |
| Class C | THICX | 885-215-764 |
| Class I | THIIX | 885-215-681 |
| Class R3 | THIRX | 885-215-483 |
| Class R4 | THRIX | 885-216-762 |
| Class R5 | THRRX | 885-216-853 |
| Class R6 | THRLX | 885-216-671 |
| LOW DURATION INCOME FUND | ||
| Class A | TLDAX | 885-216-812 |
| Class I | TLDIX | 885-216-796 |
March 31, 2019 (Unaudited)
March 31, 2019 (Unaudited)
 |  |
| Jason Brady,cfa Portfolio Manager CEO, President, and Managing Director | Lon R. Erickson,cfa Portfolio Manager Managing Director |
 | |
| Jeff Klingelhofer,cfa Portfolio Manager Managing Director |
March 31, 2019 (Unaudited)
| LIMITED TERM U.S. GOVERNMENT FUND | 1-YR | 3-YR | 5-YR | 10-YR | SINCE INCEP. |
| Class A Shares(Incep: 11/16/87) | |||||
| Without sales charge | 2.69% | 0.68% | 1.08% | 1.62% | 4.64% |
| With sales charge | 1.11% | 0.18% | 0.78% | 1.46% | 4.59% |
| Class C Shares(Incep: 9/1/94) | |||||
| Without sales charge | 2.41% | 0.38% | 0.78% | 1.32% | 3.53% |
| With sales charge | 1.91% | 0.38% | 0.78% | 1.32% | 3.53% |
| Class I Shares(Incep: 7/5/96) | 2.97% | 1.00% | 1.39% | 1.94% | 4.01% |
| Class R3 Shares(Incep: 7/1/03) | 2.59% | 0.62% | 1.01% | 1.54% | 2.27% |
| Class R4 Shares(Incep: 2/1/14) | 2.59% | 0.61% | 1.02% | - | 0.96% |
| Class R5 Shares(Incep: 5/1/12) | 2.92% | 0.96% | 1.36% | - | 1.07% |
| THORNBURG LIMITED TERM U.S. GOVERNMENT FUND | FINAL VALUE |
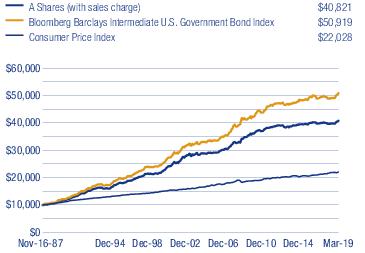
| LIMITED TERM INCOME FUND | 1-YR | 3-YR | 5-YR | 10-YR | SINCE INCEP. |
| Class A Shares(Incep: 10/1/92) | |||||
| Without sales charge | 3.55% | 2.20% | 2.13% | 4.47% | 4.81% |
| With sales charge | 2.01% | 1.69% | 1.83% | 4.31% | 4.75% |
| Class C Shares(Incep: 9/1/94) | |||||
| Without sales charge | 3.34% | 1.98% | 1.91% | 4.23% | 4.49% |
| With sales charge | 2.84% | 1.98% | 1.91% | 4.23% | 4.49% |
| Class I Shares(Incep: 7/5/96) | 3.79% | 2.55% | 2.48% | 4.83% | 5.00% |
| Class R3 Shares(Incep: 7/1/03) | 3.38% | 2.06% | 2.00% | 4.37% | 3.54% |
| Class R4 Shares(Incep: 2/1/14) | 3.31% | 2.05% | 2.00% | - | 2.00% |
| Class R5 Shares(Incep: 5/1/12) | 3.74% | 2.40% | 2.35% | - | 2.60% |
| Class R6 Shares(Incep: 4/10/17) | 3.95% | - | - | - | 2.90% |
| THORNBURG LIMITED TERM INCOME FUND | FINAL VALUE |
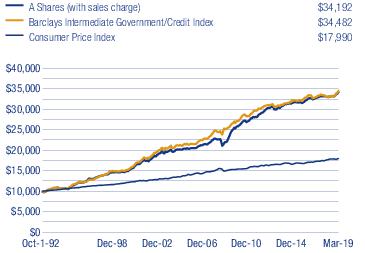
March 31, 2019 (Unaudited)
| LOW DURATION INCOME FUND | 1-YR | 3-YR | 5-YR | 10-YR | SINCE INCEP. |
| Class A Shares(Incep: 12/30/13) | |||||
| Without sales charge | 2.89% | 1.61% | 1.35% | - | 1.41% |
| With sales charge | 1.33% | 1.10% | 1.04% | - | 1.12% |
| Class I Shares(Incep: 12/30/13) | 3.01% | 1.78% | 1.52% | - | 1.59% |
| THORNBURG LOW DURATION INCOME FUND | FINAL VALUE |

| THORNBURG LIMITED TERM U.S. GOVERNMENT FUND | |
| Annualized Distribution Yield | 1.78% |
| SEC Yield | 1.78% |
| THORNBURG LIMITED TERM INCOME FUND | |
| Annualized Distribution Yield | 2.44% |
| SEC Yield | 2.43% |
| THORNBURG LOW DURATION INCOME FUND | |
| Annualized Distribution Yield | 2.25% |
| SEC Yield | 1.93% |
Thornburg Limited Term U.S. Government Fund | March 31, 2019 (Unaudited)
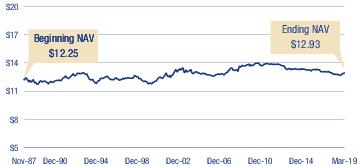
| KEY PORTFOLIO ATTRIBUTES | |
| Number of Bonds | 142 |
| Effective Duration | 2.6 Yrs |
| Average Maturity | 3.4 Yrs |
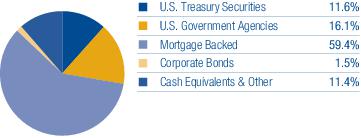

| 11% | 5% | 8% | 19% | 27% | 10% | 7% | 4% | 5% | 3% | 1% |
Thornburg Limited Term U.S. Government Fund | March 31, 2019 (Unaudited)
| PRINCIPAL AMOUNT | VALUE | ||
| U.S. Treasury Securities — 11.6% | |||
| United States Treasury Notes Inflationary Index, 0.125% due 7/15/2022 - 1/15/2023 | $ 8,198,650 | $ 8,136,647 | |
| United States Treasury Notes, | |||
| 1.375% due 10/31/2020 | 1,480,000 | 1,457,719 | |
| 1.625% due 12/31/2019 - 6/30/2020 | 11,500,000 | 11,416,573 | |
| 1.875% due 1/31/2022 | 2,600,000 | 2,573,533 | |
| 2.00% due 7/31/2022 | 3,100,000 | 3,076,774 | |
| Total U.S. Treasury Securities(Cost $26,609,009) | 26,661,246 | ||
| U.S. Government Agencies — 16.1% | |||
| a | Durrah MSN 35603 (Guaranty: Export-Import Bank of the United States), 1.684% due 1/22/2025 | 757,542 | 736,484 |
| HNA Group LLC (Guaranty: Export-Import Bank of the United States), Series 2015 2.291% due 6/30/2027 | 2,248,130 | 2,224,668 | |
| Mortgage-Linked Amortizing Notes, Series 2012-1 Class A10, 2.06% due 1/15/2022 | 432,190 | 427,298 | |
| a | MSN 41079 and 41084 Ltd. (Guaranty: Export-Import Bank of the United States), 1.717% due 7/13/2024 | 762,837 | 743,525 |
| Petroleos Mexicanos (Guaranty: Export-Import Bank of the United States), | |||
| a | 1.70% due 12/20/2022 | 2,090,000 | 2,048,698 |
| a | 2.46% due 12/15/2025 | 1,750,000 | 1,742,065 |
| a,b | 3.137% (LIBOR 3 Month + 0.35%) due 4/15/2025 | 2,187,500 | 2,194,674 |
| Reliance Industries Ltd. (Guaranty: Export-Import Bank of the United States), | |||
| a | 1.87% due 1/15/2026 | 1,871,579 | 1,819,859 |
| a | 2.06% due 1/15/2026 | 2,450,000 | 2,406,697 |
| a | 2.512% due 1/15/2026 | 3,692,500 | 3,670,854 |
| Small Business Administration Participation Certificates, | |||
| Series 2001-20D Class 1, 6.35% due 4/1/2021 | 191,542 | 196,935 | |
| Series 2001-20F Class 1, 6.44% due 6/1/2021 | 190,076 | 194,556 | |
| Series 2002-20A Class 1, 6.14% due 1/1/2022 | 116,187 | 119,242 | |
| Series 2002-20K Class 1, 5.08% due 11/1/2022 | 135,512 | 138,650 | |
| Series 2005-20H Class 1, 5.11% due 8/1/2025 | 124,452 | 128,472 | |
| Series 2007-20D Class 1, 5.32% due 4/1/2027 | 334,901 | 356,161 | |
| Series 2007-20F Class 1, 5.71% due 6/1/2027 | 189,137 | 197,907 | |
| Series 2007-20I Class 1, 5.56% due 9/1/2027 | 618,588 | 645,165 | |
| Series 2007-20K Class 1, 5.51% due 11/1/2027 | 383,194 | 407,060 | |
| Series 2008-20G Class 1, 5.87% due 7/1/2028 | 1,069,227 | 1,139,559 | |
| Series 2015-20G Class 1, 2.88% due 7/1/2035 | 1,901,265 | 1,946,210 | |
| Series 2015-20I Class 1, 2.82% due 9/1/2035 | 2,027,308 | 2,058,119 | |
| Small Business Administration, | |||
| Series 2011-20G Class 1, 3.74% due 7/1/2031 | 1,487,668 | 1,550,430 | |
| Series 2011-20K Class 1, 2.87% due 11/1/2031 | 1,780,667 | 1,771,115 | |
| Ulani MSN 35940 LLC (Guaranty: Export-Import Bank of the United States), 2.227% due 5/16/2025 | 2,604,167 | 2,572,406 | |
| Union 13 Leasing LLC (Guaranty: Export-Import Bank of the United States), 1.87% due 6/28/2024 | 1,401,201 | 1,370,253 | |
| a,b | Washington Aircraft 2 Co. Ltd. (Guaranty: Export-Import Bank of the United States), 3.04% (LIBOR 3 Month + 0.43%) due 6/26/2024 | 4,373,660 | 4,377,326 |
| Total U.S. Government Agencies(Cost $37,357,917) | 37,184,388 | ||
| Mortgage Backed — 59.4% | |||
| Federal Home Loan Mtg Corp. Whole Loan Securities Trust CMO, Series 2017-SC01 Class 1A, 3.00% due 12/25/2046 | 2,350,730 | 2,292,257 | |
| Federal Home Loan Mtg Corp., | |||
| Pool AK6768, 3.00% due 3/1/2027 | 1,364,388 | 1,377,526 | |
| Pool B14155, 3.50% due 5/1/2019 | 3,176 | 3,174 | |
| Pool D98887, 3.50% due 1/1/2032 | 880,509 | 904,773 | |
| Pool G12079, 4.50% due 4/1/2019 | 4 | 4 | |
| Pool G13804, 5.00% due 3/1/2025 | 244,524 | 254,485 | |
| Pool G15227, 3.50% due 12/1/2029 | 2,254,718 | 2,320,227 | |
| Pool G18435, 2.50% due 5/1/2027 | 1,613,476 | 1,614,272 | |
| Pool J11371, 4.50% due 12/1/2024 | 255,833 | 264,363 | |
| Pool J13583, 3.50% due 11/1/2025 | 462,744 | 473,586 | |
| Pool J14888, 3.50% due 4/1/2026 | 495,398 | 507,074 | |
| Pool T61943, 3.50% due 8/1/2045 | 700,671 | 707,309 | |
| Pool T65457 3.00% due 1/1/2048 | 3,231,768 | 3,199,705 | |
| Federal Home Loan Mtg Corp., CMO, | |||
| Series 1351 Class TE, 7.00% due 8/15/2022 | 60,171 | 62,519 | |
| Series 3291 Class BY, 4.50% due 3/15/2022 | 148,160 | 149,759 | |
| Series 3640 Class EL, 4.00% due 3/15/2020 | 73,159 | 73,398 |
Thornburg Limited Term U.S. Government Fund | March 31, 2019 (Unaudited)
| PRINCIPAL AMOUNT | VALUE | ||
| Series 3704 Class DC, 4.00% due 11/15/2036 | $ 325,021 | $ 331,651 | |
| Series 3867 Class VA, 4.50% due 3/15/2024 | 1,304,630 | 1,360,425 | |
| Series 3922 Class PQ, 2.00% due 4/15/2041 | 624,719 | 616,358 | |
| Series 4050 Class MV, 3.50% due 8/15/2023 | 1,539,578 | 1,564,878 | |
| Series 4097 Class TE, 1.75% due 5/15/2039 | 1,155,604 | 1,115,789 | |
| b | Series 4105 Class FG, 2.884% (LIBOR 1 Month + 0.40%) due 9/15/2042 | 1,463,227 | 1,457,108 |
| Series 4120 Class TC, 1.50% due 10/15/2027 | 1,591,082 | 1,530,328 | |
| Series 4120 Class UE, 2.00% due 10/15/2027 | 1,691,309 | 1,649,614 | |
| Series K018 Class A1, 1.781% due 10/25/2020 | 470,506 | 466,952 | |
| Series K035 Class A1, 2.615% due 3/25/2023 | 1,894,207 | 1,892,176 | |
| Series K037 Class A1, 2.592% due 4/25/2023 | 1,137,677 | 1,137,067 | |
| Series K038 Class A1, 2.604% due 10/25/2023 | 3,631,209 | 3,632,879 | |
| Series K042 Class A1, 2.267% due 6/25/2024 | 2,850,080 | 2,824,037 | |
| Series K716 Class A1, 2.413% due 1/25/2021 | 728,425 | 725,512 | |
| b | Series KF15 Class A, 3.16% (LIBOR 1 Month + 0.67%) due 2/25/2023 | 1,029,882 | 1,030,489 |
| b | Series KLH1 Class A, 3.19% (LIBOR 1 Month + 0.70%) due 11/25/2022 | 1,108,197 | 1,109,715 |
| c | Series KP02 Class A2, 2.355% due 4/25/2021 | 892,414 | 893,091 |
| Series KS03 Class A2, 2.79% due 6/25/2022 | 2,500,000 | 2,506,917 | |
| b | Federal Home Loan Mtg Corp., Multi-Family Structured Pass Through, Series KLH3 Class A, 3.19% (LIBOR 1 Month + 0.70%) due 11/25/2022 | 2,366,399 | 2,365,723 |
| Federal Home Loan Mtg Corp., REMIC, Series 4072 Class VA, 3.50% due 10/15/2023 | 1,364,190 | 1,387,307 | |
| Federal Home Loan Mtg Corp., Seasoned Credit Risk Transfer, | |||
| d | Series 2017-3 Class HA, 2.75% due 7/25/2056 | 2,136,257 | 2,172,647 |
| d | Series 2017-4 Class HT, 2.75% due 6/25/2057 | 1,200,355 | 1,194,871 |
| d | Series 2018-1 Class HA, 2.50% due 5/25/2057 | 2,689,490 | 2,681,678 |
| c | Series 2018-2 Class HA, 3.00% due 11/25/2057 | 1,587,200 | 1,601,864 |
| Series 2018-3 Class HA, | |||
| 3.00% due 8/25/2057 | 1,864,171 | 1,871,076 | |
| 3.50% due 8/25/2057 | 587,236 | 591,607 | |
| Series 2018-4 Class HA, 3.00% due 3/25/2058 | 1,932,492 | 1,914,312 | |
| Series 2019-1 Class MA, 3.50% due 7/25/2058 | 2,980,967 | 3,025,496 | |
| Federal Home Loan Mtg Corp., Whole Loan Securities, | |||
| Series 2015-SC02 Class 2A, 3.50% due 9/25/2045 | 1,433,950 | 1,434,538 | |
| Series 2016-SC01 Class 2A, 3.50% due 7/25/2046 | 1,575,581 | 1,589,686 | |
| Series 2016-SC02 Class 2A, 3.50% due 10/25/2046 | 1,271,596 | 1,280,055 | |
| Series 2017-SC02 Class 2A1, 3.50% due 5/25/2047 | 692,643 | 693,329 | |
| Federal National Mtg Assoc., | |||
| 1.875% due 12/28/2020 | 2,000,000 | 1,983,519 | |
| Pool 252648, 6.50% due 5/1/2022 | 10,069 | 10,494 | |
| Pool 342947, 7.25% due 4/1/2024 | 21,368 | 22,571 | |
| b | Pool 895572, 4.555% (LIBOR 12 Month + 1.82%) due 6/1/2036 | 197,372 | 207,553 |
| Pool 930986, 4.50% due 4/1/2019 | 888 | 887 | |
| Pool AA2870, 4.00% due 3/1/2024 | 253,333 | 260,830 | |
| Pool AB7997, 2.50% due 2/1/2023 | 361,809 | 362,802 | |
| Pool AB8447, 2.50% due 2/1/2028 | 1,421,323 | 1,421,248 | |
| Pool AD8191, 4.00% due 9/1/2025 | 435,506 | 448,394 | |
| Pool AE0704, 4.00% due 1/1/2026 | 1,707,061 | 1,758,476 | |
| Pool AH3487, 3.50% due 2/1/2026 | 1,997,067 | 2,042,019 | |
| Pool AJ1752, 3.50% due 9/1/2026 | 1,375,308 | 1,407,669 | |
| Pool AK6518, 3.00% due 3/1/2027 | 1,050,220 | 1,059,349 | |
| Pool AL9821, 2.50% due 1/1/2032 | 4,775,021 | 4,753,878 | |
| Pool AS9749, 4.00% due 6/1/2047 | 2,244,404 | 2,325,104 | |
| Pool AU2669, 2.50% due 10/1/2028 | 1,393,237 | 1,391,858 | |
| Pool BF0130 3.50% due 8/1/2056 | 666,009 | 674,580 | |
| Pool BF0144 3.50% due 10/1/2056 | 895,357 | 908,279 | |
| Pool BM4864 3.50% due 5/1/2033 | 2,347,986 | 2,412,577 | |
| Pool BM5490 3.50% due 11/1/2031 | 2,965,106 | 3,040,187 | |
| Pool MA0071, 4.50% due 5/1/2019 | 1,178 | 1,177 | |
| Pool MA0125, 4.50% due 7/1/2019 | 2,888 | 2,887 | |
| Pool MA0380, 4.00% due 4/1/2020 | 34,820 | 34,971 | |
| Pool MA1582, 3.50% due 9/1/2043 | 3,672,607 | 3,743,974 | |
| Pool MA1585, 2.00% due 9/1/2023 | 1,074,741 | 1,071,560 | |
| Pool MA2322, 2.50% due 7/1/2025 | 1,031,191 | 1,036,937 | |
| Pool MA2353, 3.00% due 8/1/2035 | 2,100,066 | 2,124,660 |
| PRINCIPAL AMOUNT | VALUE | ||
| Pool MA2480, 4.00% due 12/1/2035 | $ 2,029,574 | $ 2,110,794 | |
| Pool MA2499, 2.50% due 1/1/2026 | 1,756,699 | 1,763,194 | |
| Pool MA3465 4.00% due 9/1/2038 | 2,381,818 | 2,468,947 | |
| Pool MA3557, 4.00% due 1/1/2029 | 2,862,963 | 2,956,631 | |
| Federal National Mtg Assoc., CMO, | |||
| Series 1993-32 Class H, 6.00% due 3/25/2023 | 7,799 | 8,100 | |
| c | Series 2009-17 Class AH, 0.642% due 3/25/2039 | 350,921 | 290,729 |
| Series 2009-52 Class AJ, 4.00% due 7/25/2024 | 15,394 | 15,493 | |
| Series 2009-70 Class NK, 4.50% due 8/25/2019 | 30 | 30 | |
| Series 2009-78 Class A, 4.50% due 8/25/2019 | 74 | 74 | |
| Series 2011-45 Class VA, 4.00% due 3/25/2024 | 1,281,938 | 1,283,109 | |
| Series 2011-63 Class MV, 3.50% due 7/25/2024 | 694,503 | 694,402 | |
| Series 2011-70 Class CA, 3.00% due 8/25/2026 | 3,228,635 | 3,156,799 | |
| Series 2012-20 Class VT, 3.50% due 3/25/2025 | 2,546,576 | 2,579,044 | |
| Series 2012-36 Class CV, 4.00% due 6/25/2023 | 1,688,897 | 1,730,055 | |
| b | Series 2013-81 Class FW, 2.786% (LIBOR 1 Month + 0.30%) due 1/25/2043 | 2,427,042 | 2,405,365 |
| b | Series 2013-92 Class FA, 3.036% (LIBOR 1 Month + 0.55%) due 9/25/2043 | 1,716,755 | 1,722,380 |
| b | Series 2015-SB5 Class A10, 3.15% (LIBOR 1 Month + 3.15%) due 9/25/2035 | 1,569,986 | 1,566,105 |
| b | Series 2018-SB47 Class A5H, 2.92% (LIBOR 1 Month + 2.92%) due 1/25/2038 | 1,469,126 | 1,475,690 |
| Federal National Mtg Assoc., Grantor Trust, Series 2017-T1 Class A, 2.898% due 6/25/2027 | 998,749 | 994,217 | |
| Government National Mtg Assoc., | |||
| Pool 3550, 5.00% due 5/20/2019 | 1,638 | 1,637 | |
| c | Pool 721652, 5.05% due 5/20/2061 | 108,488 | 109,102 |
| c | Pool 751388, 5.305% due 1/20/2061 | 1,003,489 | 1,014,607 |
| c | Pool 751392, 5.00% due 2/20/2061 | 4,194,720 | 4,356,788 |
| b | Pool 894205, 3.75% (H15T1Y + 1.50%) due 8/20/2039 | 336,488 | 345,616 |
| b | Pool MA0100, 3.625% (H15T1Y + 1.50%) due 5/20/2042 | 664,466 | 681,638 |
| Pool MA0907, 2.00% due 4/20/2028 | 1,898,397 | 1,853,722 | |
| Government National Mtg Assoc., CMO, | |||
| Series 2010-160 Class VY, 4.50% due 1/20/2022 | 301,133 | 307,314 | |
| Series 2017-186 3.00% due 2/20/2031 | 2,789,873 | 2,801,002 | |
| Total Mortgage Backed(Cost $137,711,403) | 137,054,630 | ||
| Corporate Bonds — 1.5% | |||
| Telecommunication Services — 1.5% | |||
| Wireless Telecommunication Services — 1.5% | |||
| Sprint Communications, Inc., 9.25% due 4/15/2022 | 3,000,000 | 3,495,000 | |
| 3,495,000 | |||
| Total Corporate Bonds(Cost $3,519,036) | 3,495,000 | ||
| Short-Term Investments — 10.5% | |||
| Bank of New York Tri-Party Repurchase Agreement 2.52% dated 3/29/2019 due 4/1/2019, repurchase price $11,002,316 collateralized by 20 U.S. Government debt securities, having an average coupon of 4.46%, a minimum credit rating of BBB-, maturity dates from 2/25/2027 to 5/20/2048, and having an aggregate market value of $11,199,715 at 3/31/2019 | 11,000,000 | 11,000,000 | |
| Federal Home Loan Bank Discount Notes,2.25% due 4/1/2019 | 10,000,000 | 10,000,000 | |
| United States Treasury Bill,2.16% due 4/2/2019 | 3,123,000 | 3,122,817 | |
| Total Short-Term Investments(Cost $24,122,816) | 24,122,817 | ||
| Total Investments — 99.1%(Cost $229,320,181) | $228,518,081 | ||
| Other Assets Less Liabilities — 0.9% | 2,052,358 | ||
| Net Assets — 100.0% | $230,570,439 |
| Footnote Legend | |
| a | Yankee bond denominated in U.S. dollars and is issued in the U.S. by foreign banks and corporations. |
| b | Floating Rate Security. Stated interest/floor rate was in effect at March 31, 2019. |
| c | Variable rate coupon, rate shown as of March 31, 2019. |
| d | Coupon rate adjusts periodically based upon a predetermined schedule. Stated interest rate in effect at March 31, 2019. |
Thornburg Limited Term U.S. Government Fund | March 31, 2019 (Unaudited)
To simplify the listings of securities, abbreviations are used per the table below:
| CMO | Collateralized Mortgage Obligation |
| H15T1Y | US Treasury Yield Curve Rate T-Note Constant Maturity 1 Year |
| LIBOR | London Interbank Offered Rates |
| Mtg | Mortgage |
| REMIC | Real Estate Mortgage Investment Conduit |
Thornburg Limited Term Income Fund | March 31, 2019 (Unaudited)
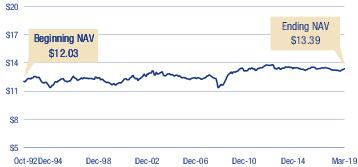
| KEY PORTFOLIO ATTRIBUTES | |
| Number of Bonds | 614 |
| Effective Duration | 2.6 Yrs |
| Average Maturity | 3.4 Yrs |
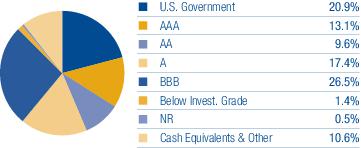
| 11% | 13% | 16% | 12% | 12% | 10% | 9% | 5% | 3% | 5% | 3% |
Thornburg Limited Term Income Fund | March 31, 2019 (Unaudited)
| PRINCIPAL AMOUNT | VALUE | ||
| U.S. Treasury Securities — 8.0% | |||
| United States Treasury Notes Inflationary Index, | |||
| 0.125% due 4/15/2020 | $ 17,796,538 | $ 17,710,754 | |
| 0.25% due 1/15/2025 | 5,844,685 | 5,780,713 | |
| 0.375% due 7/15/2027 | 45,993,618 | 45,624,234 | |
| United States Treasury Notes, | |||
| 1.375% due 5/31/2020 - 8/31/2020 | 36,075,000 | 35,638,815 | |
| 1.50% due 5/15/2020 | 30,000,000 | 29,708,556 | |
| 1.625% due 12/31/2019 - 2/15/2026 | 107,200,000 | 104,520,087 | |
| 2.00% due 11/15/2026 | 51,855,000 | 50,592,652 | |
| 2.25% due 11/15/2025 - 11/15/2027 | 78,390,000 | 77,679,839 | |
| 2.50% due 5/31/2020 | 7,000,000 | 7,008,941 | |
| 2.75% due 2/15/2028 | 7,254,000 | 7,460,852 | |
| 2.875% due 5/15/2028 | 35,017,000 | 36,374,182 | |
| Total U.S. Treasury Securities(Cost $408,006,898) | 418,099,625 | ||
| U.S. Government Agencies — 1.2% | |||
| a | Durrah MSN 35603 (Guaranty: Export-Import Bank of the United States), 1.684% due 1/22/2025 | 7,836,643 | 7,618,799 |
| Mortgage-Linked Amortizing Notes, Series 2012-1 Class A10, 2.06% due 1/15/2022 | 365,699 | 361,560 | |
| a | MSN 41079 and 41084 Ltd. (Guaranty: Export-Import Bank of the United States), 1.717% due 7/13/2024 | 5,830,604 | 5,682,993 |
| Petroleos Mexicanos (Guaranty: Export-Import Bank of the United States), | |||
| a | 1.70% due 12/20/2022 | 4,160,000 | 4,077,792 |
| a | 2.46% due 12/15/2025 | 5,250,000 | 5,226,195 |
| a,b | 3.137% (LIBOR 3 Month + 0.35%) due 4/15/2025 | 6,475,000 | 6,496,236 |
| Reliance Industries Ltd. (Guaranty: Export-Import Bank of the United States), | |||
| a | 1.87% due 1/15/2026 | 5,025,263 | 4,886,393 |
| a | 2.06% due 1/15/2026 | 1,050,000 | 1,031,441 |
| a | 2.512% due 1/15/2026 | 4,550,000 | 4,523,328 |
| Small Business Administration, | |||
| Series 2011-20G Class 1, 3.74% due 7/1/2031 | 5,950,671 | 6,201,719 | |
| Series 2011-20K Class 1, 2.87% due 11/1/2031 | 6,931,244 | 6,894,067 | |
| c,d,e | U.S. Department of Transportation, 6.001% due 12/7/2031 | 3,000,000 | 3,236,250 |
| a,b | Washington Aircraft 2 Co. Ltd. (Guaranty: Export-Import Bank of the United States), 3.04% (LIBOR 3 Month + 0.43%) due 6/26/2024 | 5,452,418 | 5,456,988 |
| Total U.S. Government Agencies(Cost $62,676,890) | 61,693,761 | ||
| Other Government — 0.9% | |||
| a,f | Bermuda Government International Bond, 4.75% due 2/15/2029 | 8,000,000 | 8,469,720 |
| Carpintero Finance Ltd. (Guaranty: Export Credits Guarantee Department), | |||
| a,f | 2.004% due 9/18/2024 | 5,615,154 | 5,517,141 |
| a,f | 2.581% due 11/11/2024 | 8,079,077 | 8,068,037 |
| a,f | Khadrawy Ltd. (Guaranty: Export Credits Guarantee Department), 2.471% due 3/31/2025 | 3,954,846 | 3,801,793 |
| a | North American Development Bank, 4.375% due 2/11/2020 | 15,500,000 | 15,716,962 |
| a,b,f | Seven & Seven Ltd. (Guaranty: Export-Import Bank of Korea), 3.683% (LIBOR 6 Month + 1.00%) due 9/11/2019 | 3,418,500 | 3,422,524 |
| Total Other Government(Cost $44,787,626) | 44,996,177 | ||
| Mortgage Backed — 9.1% | |||
| Federal Home Loan Mtg Corp. CMO REMIC, Series 3195 Class PD, 6.50% due 7/15/2036 | 615,807 | 683,039 | |
| Federal Home Loan Mtg Corp. Multifamily Structured Pass Through Certificates IO, | |||
| g,h | Series K008 Class X1, 1.511% due 6/25/2020 | 30,060,517 | 413,541 |
| g,h | Series K710 Class X1, 1.85% due 5/25/2019 | 18,617,379 | 48,352 |
| Federal Home Loan Mtg Corp. Multifamily Structured Pass Through Certificates, | |||
| h | Series K031 Class A2, 3.30% due 4/25/2023 | 9,203,000 | 9,449,592 |
| Series K039 Class A1, 2.683% due 12/25/2023 | 4,418,987 | 4,424,420 | |
| h | Series K719 Class A2, 2.731% due 6/25/2022 | 6,355,000 | 6,372,689 |
| Series K722 Class A2, 2.406% due 3/25/2023 | 4,800,000 | 4,768,489 | |
| Series K725 Class A1, 2.666% due 5/25/2023 | 7,380,473 | 7,386,466 | |
| Federal Home Loan Mtg Corp. Whole Loan Securities Trust CMO, Series 2017-SC01 Class 1A, 3.00% due 12/25/2046 | 48,788,332 | 47,574,756 | |
| Federal Home Loan Mtg Corp., | |||
| Pool D98887, 3.50% due 1/1/2032 | 2,947,499 | 3,028,724 | |
| Pool J17504, 3.00% due 12/1/2026 | 1,148,191 | 1,159,227 | |
| Pool T65457 3.00% due 1/1/2048 | 29,016,662 | 28,728,779 |
| PRINCIPAL AMOUNT | VALUE | ||
| Federal Home Loan Mtg Corp., CMO, | |||
| Series 2682 Class JG, 4.50% due 10/15/2023 | $ 315,886 | $ 323,839 | |
| Series 3291 Class BY, 4.50% due 3/15/2022 | 197,546 | 199,679 | |
| Series 3504 Class PC, 4.00% due 1/15/2039 | 23,114 | 23,271 | |
| Series 3838 Class GV, 4.00% due 3/15/2024 | 5,451,382 | 5,600,921 | |
| Series 3919 Class VB, 4.00% due 8/15/2024 | 2,884,982 | 2,988,285 | |
| Series 3922 Class PQ, 2.00% due 4/15/2041 | 937,079 | 924,538 | |
| Series 4050 Class MV, 3.50% due 8/15/2023 | 1,759,015 | 1,787,921 | |
| Series 4079 Class WV, 3.50% due 3/15/2027 | 2,302,415 | 2,352,859 | |
| Series 4097 Class TE, 1.75% due 5/15/2039 | 3,466,813 | 3,347,368 | |
| Series 4120 Class TC, 1.50% due 10/15/2027 | 2,066,033 | 1,987,145 | |
| Series K038 Class A1, 2.604% due 10/25/2023 | 8,518,212 | 8,522,130 | |
| Series K716 Class A1, 2.413% due 1/25/2021 | 2,239,907 | 2,230,950 | |
| Federal Home Loan Mtg Corp., Multi-Family Structured Pass Through, | |||
| Series K030 Class A1, 2.779% due 9/25/2022 | 2,763,275 | 2,768,205 | |
| Series K710 Class A2, 1.883% due 5/25/2019 | 3,184,697 | 3,175,994 | |
| Series K717 Class A2, 2.991% due 9/25/2021 | 4,700,000 | 4,735,704 | |
| b | Series KLH3 Class A, 3.19% (LIBOR 1 Month + 0.70%) due 11/25/2022 | 13,902,596 | 13,898,620 |
| Federal Home Loan Mtg Corp., REMIC, Series 4072 Class VA, 3.50% due 10/15/2023 | 1,372,749 | 1,396,012 | |
| Federal Home Loan Mtg Corp., Seasoned Credit Risk Transfer, | |||
| e | Series 2017-3 Class HA, 2.75% due 7/25/2056 | 17,827,489 | 18,131,174 |
| e | Series 2017-4 Class HT, 2.75% due 6/25/2057 | 15,398,838 | 15,328,494 |
| e | Series 2018-1 Class HA, 2.50% due 5/25/2057 | 10,690,724 | 10,659,668 |
| h | Series 2018-2 Class HA, 3.00% due 11/25/2057 | 25,395,205 | 25,629,819 |
| Series 2018-3 Class HA, 3.00% due 8/25/2057 | 26,844,057 | 26,943,491 | |
| Series 2018-4 Class HA, 3.00% due 3/25/2058 | 21,856,481 | 21,650,869 | |
| Series 2019-1 Class MA, 3.50% due 7/25/2058 | 20,648,164 | 20,956,605 | |
| Federal Home Loan Mtg Corp., Whole Loan Securities, | |||
| Series 2016-SC01 Class 2A, 3.50% due 7/25/2046 | 6,039,727 | 6,093,795 | |
| Series 2017-SC02 Class 2A1, 3.50% due 5/25/2047 | 5,294,723 | 5,299,970 | |
| Federal National Mtg Assoc. CMO REMIC, | |||
| Series 2005-48 Class AR, 5.50% due 2/25/2035 | 34,882 | 35,073 | |
| Series 2007-42 Class PA, 5.50% due 4/25/2037 | 144,704 | 149,397 | |
| Series 2012-129 Class LA, 3.50% due 12/25/2042 | 6,524,892 | 6,673,512 | |
| Federal National Mtg Assoc., | |||
| Pool 469616, 3.50% due 11/1/2021 | 3,583,716 | 3,664,657 | |
| Pool 897936, 5.50% due 8/1/2021 | 138,794 | 141,767 | |
| Pool AB7997, 2.50% due 2/1/2023 | 1,969,766 | 1,975,172 | |
| Pool AE0160, 4.416% due 6/1/2020 | 4,485,914 | 4,532,594 | |
| Pool AE0704, 4.00% due 1/1/2026 | 4,440,028 | 4,573,756 | |
| Pool AK6518, 3.00% due 3/1/2027 | 1,464,924 | 1,477,656 | |
| Pool AL9612, 3.50% due 11/1/2043 | 7,136,095 | 7,290,376 | |
| Pool AS9733, 4.00% due 6/1/2047 | 28,466,268 | 29,845,629 | |
| Pool AS9749, 4.00% due 6/1/2047 | 19,054,233 | 19,739,347 | |
| Pool BM5490 3.50% due 11/1/2031 | 9,784,851 | 10,032,618 | |
| Pool MA1278, 2.50% due 12/1/2022 | 2,784,658 | 2,791,082 | |
| Pool MA1585, 2.00% due 9/1/2023 | 4,070,581 | 4,058,534 | |
| Pool MA2815, 3.00% due 11/1/2026 | 2,783,812 | 2,822,797 | |
| Pool MA3465 4.00% due 9/1/2038 | 21,360,140 | 22,141,515 | |
| Federal National Mtg Assoc., CMO, | |||
| h | Series 2009-17 Class AH, 0.642% due 3/25/2039 | 584,868 | 484,548 |
| Series 2009-52 Class AJ, 4.00% due 7/25/2024 | 25,657 | 25,822 | |
| Series 2009-70 Class NK, 4.50% due 8/25/2019 | 75 | 74 | |
| Series 2012-36 Class CV, 4.00% due 6/25/2023 | 1,540,696 | 1,578,243 | |
| b | Series 2013-81 Class FW, 2.786% (LIBOR 1 Month + 0.30%) due 1/25/2043 | 8,818,580 | 8,739,819 |
| Federal National Mtg Assoc., Grantor Trust, Series 2017-T1 Class A, 2.898% due 6/25/2027 | 17,977,484 | 17,895,900 | |
| Government National Mtg Assoc. CMO, Series 2009-68 Class DP, 4.50% due 11/16/2038 | 192,451 | 197,269 | |
| Government National Mtg Assoc., | |||
| h | Pool 721652, 5.05% due 5/20/2061 | 158,170 | 159,066 |
| h | Pool 731491, 5.193% due 12/20/2060 | 877,226 | 893,858 |
| h | Pool 751388, 5.305% due 1/20/2061 | 1,576,912 | 1,594,383 |
| Pool 783299, 4.50% due 2/15/2022 | 39,477 | 39,617 | |
| b | Pool MA0100, 3.625% (H15T1Y + 1.50%) due 5/20/2042 | 671,178 | 688,523 |
Thornburg Limited Term Income Fund | March 31, 2019 (Unaudited)
| PRINCIPAL AMOUNT | VALUE | ||
| Total Mortgage Backed(Cost $473,142,215) | 475,238,004 | ||
| Asset Backed Securities — 19.5% | |||
| Advance Receivables — 0.4% | |||
| f | New Residential Advance Receivables Trust, Series 2016-T2 Class AT2, 2.575% due 10/15/2049 | $ 11,350,000 | $ 11,314,507 |
| f | SPS Servicer Advance Receivables Trust Advance Receivables Backed Notes, Series 2018-T1 3.62% due 10/17/2050 | 9,507,000 | 9,569,499 |
| 20,884,006 | |||
| Asset-Backed - Finance & Insurance — 0.4% | |||
| f | Sierra Timeshare Receivables Funding, LLC, Series 2019-1A Class A, 3.20% due 1/20/2036 | 4,900,000 | 4,922,043 |
| f | Sofi Consumer Loan Program Trust Series 2018-1 Class A2, 3.14% due 2/25/2027 | 450,000 | 450,175 |
| f | Upstart Securitization Trust, Series 2019-1 Class B, 4.19% due 4/20/2026 | 14,850,000 | 14,900,749 |
| 20,272,967 | |||
| Auto Receivables — 1.6% | |||
| American Credit Acceptance Receivables Trust, | |||
| f | Series 2016-4 Class C, 2.91% due 2/13/2023 | 1,353,366 | 1,351,555 |
| f | Series 2018-3 Class B, 3.49% due 6/13/2022 | 3,815,000 | 3,824,517 |
| f | Avis Budget Rental Car Funding AESOP, LLC, Series 2015-2A Class A, 2.63% due 12/20/2021 | 6,000,000 | 5,969,828 |
| f | Chesapeake Funding II, LLC, Series 2016-1A Class A1, 2.11% due 3/15/2028 | 2,148,915 | 2,146,143 |
| f | CIG Auto Receivables Trust, Series 2017-1A Class A, 2.71% due 5/15/2023 | 1,839,939 | 1,834,973 |
| f | CPS Auto Receivables Trust, Series 2019-1 Class B, 3.58% due 12/16/2024 | 11,800,000 | 11,861,137 |
| f | Enterprise Fleet Financing, LLC, Series 2017-1 Class A2, 2.13% due 7/20/2022 | 2,554,961 | 2,546,422 |
| f | Foursight Capital Automobile Receivables Trust, Series 2016-1 Class A2, 2.87% due 10/15/2021 | 4,306,857 | 4,303,184 |
| GLS Auto Receivables Trust, | |||
| f | Series 2018-2A Class A, 3.25% due 4/18/2022 | 4,974,640 | 4,978,116 |
| f | Series 2018-3A 3.35% due 8/15/2022 | 7,145,371 | 7,157,156 |
| f | Series 2019-1A Class A, 3.37% due 1/17/2023 | 13,838,615 | 13,860,157 |
| Harley-Davidson Motorcycle Trust, Series 2015-2 Class A4, 1.66% due 12/15/2022 | 6,489,795 | 6,476,882 | |
| b,f | Hertz Fleet Lease Funding LP, Series 2016-1 Class A1, 3.593% (LIBOR 1 Month + 1.10%) due 4/10/2030 | 5,074,253 | 5,075,828 |
| a,b,f | OSCAR US Funding Trust VII, LLC, Series 2017-2A Class A2B, 3.143% (LIBOR 1 Month + 0.65%) due 11/10/2020 | 1,474,599 | 1,475,126 |
| f | OSCAR US Funding Trust, Series 2016-2A Class A3, 2.73% due 12/15/2020 | 3,927,870 | 3,925,614 |
| f | Tesla Auto Lease Trust, Series B, 3.71% due 8/20/2021 | 6,316,975 | 6,384,802 |
| f | Veros Automobile Receivables Trust, Series 2017-1 Class A, 2.84% due 4/17/2023 | 1,615,579 | 1,612,413 |
| 84,783,853 | |||
| Commercial MTG Trust — 2.0% | |||
| f | Barclays Commercial Mortgage Securities, LLC, Series 2015-STP Class A, 3.323% due 9/10/2028 | 4,401,731 | 4,423,250 |
| b,f | Bayview Commercial Asset Trust, Series 2004-3 Class A2, 3.116% (LIBOR 1 Month + 0.63%) due 1/25/2035 | 1,730,301 | 1,715,069 |
| h | CHL Mortgage Pass-Through Trust CMO, Series 2004-HYB2 Class 1A, 5.116% due 7/20/2034 | 56,653 | 57,646 |
| h | Citigroup Mortgage Loan Trust, Inc. CMO, Series 2004-HYB2 Class B1, 4.896% due 3/25/2034 | 113,001 | 95,092 |
| i | COMM Mortgage Trust, Series 2016-DC2 Class A1, 1.82% due 2/10/2049 | 11,828,955 | 11,727,972 |
| f,h | Credit Suisse Mortgage Trust, Series 2017-HL2 Class A3, 3.50% due 10/25/2047 | 13,837,846 | 13,817,272 |
| b,f | DBUBS Mortgage Trust, CMO, Series 2011-LC2A Class A1FL, 3.842% (LIBOR 1 Month + 1.35%) due 7/12/2044 | 1,975,819 | 1,987,858 |
| f | FDIC Trust CMO, Series 2013-R1 Class A, 1.15% due 3/25/2033 | 1,031,084 | 1,015,182 |
| f,h | GAHR Commercial Mortgage Trust, Series 2015-NRF Class BFX, 3.382% due 12/15/2034 | 25,010,000 | 24,905,831 |
| f,h | Galton Funding Mortgage Trust CMO, Series 2018-1 Class A43, 3.50% due 11/25/2057 | 3,538,454 | 3,534,758 |
| f,h | Mello Mortgage Capital Acceptance, Series 2018-MTG1 Class A3, 3.50% due 5/25/2048 | 12,430,562 | 12,440,083 |
| RAMP Trust CMO, Series 2003-SL1 Class A31, 7.125% due 4/25/2031 | 989,877 | 1,012,420 | |
| e | Seasoned Credit Risk Transfer Trust Series CMO, Series 2017-1 Class HA, 2.75% due 1/25/2056 | 10,045,064 | 9,993,913 |
| f,h | Shellpoint Asset Funding Trust CMO, Series 2013-1 Class A1, 3.75% due 7/25/2043 | 5,006,052 | 5,100,615 |
| h | Structured Asset Securities Corp. Mortgage Pass-Through Ctfs CMO, Series 2003-9A Class 2A2, 4.533% due 3/25/2033 | 985,702 | 989,616 |
| f,h | Wells Fargo Commercial Mortgage Trust, Series 2013-120B Class A, 2.71% due 3/18/2028 | 15,000,000 | 14,956,920 |
| 107,773,497 | |||
| Commercial Services — 0.3% | |||
| a,b,f | Korea Expressway Corp., 3.461% (LIBOR 3 Month + 0.70%) due 4/20/2020 | 15,000,000 | 15,027,750 |
| 15,027,750 | |||
| Other Asset Backed — 9.0% | |||
| Appalachian Consumer Rate Relief Funding, LLC, Series 2013-1 Class A1, 2.008% due 2/1/2024 | 6,923,929 | 6,829,884 |
| PRINCIPAL AMOUNT | VALUE | ||
| Avant Loans Funding Trust, | |||
| f | Series 2018-A Class A, 3.09% due 6/15/2021 | $ 4,642,825 | $ 4,639,263 |
| f | Series 2019-A Class A, 3.48% due 7/15/2022 | 13,950,000 | 13,949,118 |
| f | AXIS Equipment Finance Receivables VI, LLC, Series 2018-2A Class A2, 3.89% due 7/20/2022 | 5,250,000 | 5,271,915 |
| f,h | Bayview Opportunity Master Fund IVa Trust, Series 2017-RT1 Class A1, 3.00% due 3/28/2057 | 3,451,300 | 3,419,818 |
| f | BCC Funding XIV, LLC, Series 2018-1A Class A2, 2.96% due 6/20/2023 | 3,352,469 | 3,355,874 |
| f | BRE Grand Islander Timeshare Issuer, LLC, Series 2017-1A Class A, 2.94% due 5/25/2029 | 3,698,086 | 3,675,413 |
| f,h | CIM Trust, Series 18-INV1 4.00% due 8/25/2048 | 8,320,277 | 8,435,264 |
| Consumer Loan Underlying Bond Credit Trust, | |||
| f | Series 2017-P1 Class A, 2.42% due 9/15/2023 | 655,850 | 655,468 |
| f | Series 2018-P2 Class A, 3.47% due 10/15/2025 | 6,366,414 | 6,376,723 |
| f | Series A, 3.82% due 1/15/2026 | 6,612,749 | 6,649,009 |
| f | Credit Suisse ABS Trust, Series 2018-LD1 Class A, 3.42% due 7/25/2024 | 3,015,644 | 3,015,430 |
| Dell Equipment Finance Trust, | |||
| f | Series 2017-2 Class A2A, 1.97% due 2/24/2020 | 1,412,238 | 1,410,142 |
| f | Series 2018-1 Class A2A, 2.97% due 10/22/2020 | 6,622,306 | 6,631,134 |
| f | Diamond Resorts Owner Trust, Series 2018-1 Class A, 3.70% due 1/21/2031 | 11,302,633 | 11,479,951 |
| a,f | ECAF I Ltd., Series 2015-1A Class A2, 4.947% due 6/15/2040 | 4,556,666 | 4,583,221 |
| f | Engs Commercial Finance Trust, Series 2018-1A Class A1, 2.97% due 2/22/2021 | 4,456,735 | 4,454,954 |
| Entergy New Orleans Storm Recovery Funding I, LLC, Series 2015-1 Class A, 2.67% due 6/1/2027 | 9,976,554 | 9,896,547 | |
| Foundation Finance Trust, | |||
| f | Series 2017-1A Class A, 3.30% due 7/15/2033 | 4,490,773 | 4,479,858 |
| f | Series 2019-1A Class A, 3.86% due 11/15/2034 | 14,650,000 | 14,647,731 |
| a,f | Global SC Finance IV Ltd., Series 2017-1A Class A, 3.85% due 4/15/2037 | 6,944,313 | 6,992,710 |
| HERO Funding Trust, | |||
| f | Series 2015-1A Class A, 3.84% due 9/21/2040 | 8,023,527 | 8,453,973 |
| f | Series 2017-2A Class A1, 3.28% due 9/20/2048 | 1,500,515 | 1,480,693 |
| Homeward Opportunities Fund I Trust, | |||
| f,h | Series 2018-1 Class A1, 3.766% due 6/25/2048 | 8,131,370 | 8,214,645 |
| d,f,j | Series 2019-1 Class A1, 3.454% due 1/25/2059 | 18,225,000 | 18,224,754 |
| Louisiana Local Government Environmental Facilities & Community Development Authority, Series 2014-ELL Class A1, 1.66% due 2/1/2022 | 1,061,855 | 1,060,549 | |
| f | Marlette Funding Trust, Series 2017-2A Class A, 2.39% due 7/15/2024 | 233,376 | 233,321 |
| Nationstar HECM Loan Trust, | |||
| f,h | Series 2017-2A Class A1, 2.038% due 9/25/2027 | 3,191,712 | 3,160,752 |
| d,f,h | Series 2018-1A Class A, 2.76% due 2/25/2028 | 5,043,422 | 5,033,336 |
| f,h | Series 2018-2A Class A, 3.188% due 7/25/2028 | 3,910,648 | 3,916,905 |
| b,f | Navient Private Education Loan Trust, Series 2015-AA Class A2B, 3.684% (LIBOR 1 Month + 1.20%) due 12/15/2028 | 4,384,183 | 4,403,517 |
| b | Navient Student Loan Trust, Series 2014-1 Class A3, 2.996% (LIBOR 1 Month + 0.51%) due 6/25/2031 | 9,079,617 | 9,011,573 |
| b,f | Nelnet Student Loan Trust, Series 2013-1A Class A, 3.086% (LIBOR 1 Month + 0.60%) due 6/25/2041 | 6,170,152 | 6,116,149 |
| b,c,d | Northwind Holdings, LLC, Series 2007-1A Class A1, 3.406% (LIBOR 3 Month + 0.78%) due 12/1/2037 | 1,093,750 | 1,072,969 |
| Ocwen Master Advance Receivables Trust, | |||
| f | Series 2018-T1 Class AT1, 3.301% due 8/15/2049 | 5,800,000 | 5,801,160 |
| f | Series 2018-T2 Class AT2, 3.598% due 8/15/2050 | 3,000,000 | 3,016,680 |
| f | OneMain Financial Issuance Trust, Series 2016-2A Class A, 4.10% due 3/20/2028 | 1,333,224 | 1,334,838 |
| f | Oportun Funding VI, LLC, Series 2017-A Class A, 3.23% due 6/8/2023 | 5,500,000 | 5,494,893 |
| f | Oportun Funding VII, LLC, Series 2017-B Class A, 3.22% due 10/10/2023 | 7,500,000 | 7,473,313 |
| b,f | Pennsylvania Higher Education Assistance Agency, Series 2012-1A Class A1, 3.036% (LIBOR 1 Month + 0.55%) due 5/25/2057 | 1,686,893 | 1,688,162 |
| PFS Financing Corp., | |||
| f | Series 2016-BA Class A, 1.87% due 10/15/2021 | 5,610,000 | 5,579,250 |
| b,f | Series 2017-BA Class A1, 3.084% (LIBOR 1 Month + 0.60%) due 7/15/2022 | 16,900,000 | 16,942,441 |
| f | Series 2017-D Class A, 2.40% due 10/17/2022 | 10,000,000 | 9,936,808 |
| f | Series 2018-B Class A, 2.89% due 2/15/2023 | 7,400,000 | 7,374,845 |
| f | Prosper Marketplace Issuance Trust, Series 2017-3A Class A, 2.36% due 11/15/2023 | 568,472 | 567,930 |
| f | Purchasing Power Funding, LLC, Series 2018-A Class A, 3.34% due 8/15/2022 | 9,400,000 | 9,380,056 |
| SBA Tower Trust, | |||
| f | 2.877% due 7/15/2046 | 9,500,000 | 9,412,963 |
| f | 3.156% due 10/10/2045 | 5,000,000 | 5,000,236 |
| e,f | Series 2014-1A Class C, 2.898% due 10/15/2044 | 17,900,000 | 17,879,374 |
| d,f | Scala Funding Co., LLC, Series 2016-1 3.91% due 2/15/2021 | 2,000,000 | 1,956,000 |
| f | SCF Equipment Leasing, LLC, Series 2018-1A Class A2, 3.63% due 10/20/2024 | 8,250,117 | 8,254,375 |
Thornburg Limited Term Income Fund | March 31, 2019 (Unaudited)
| PRINCIPAL AMOUNT | VALUE | ||
| Sierra Timeshare Receivables Funding, LLC, | |||
| f | Series 2015-1A Class A, 2.40% due 3/22/2032 | $ 1,448,858 | $ 1,437,292 |
| f | Series 2015-2A Class A, 2.43% due 6/20/2032 | 1,023,641 | 1,015,542 |
| f | Series 2015-3A Class A, 2.58% due 9/20/2032 | 2,827,099 | 2,812,252 |
| f | SLM Private Education Loan Trust, Series 2011-B Class A2, 3.74% due 2/15/2029 | 455,647 | 456,033 |
| b | SLM Student Loan Trust, Series 2013-6 Class A3, 3.136% (LIBOR 1 Month + 0.65%) due 6/25/2055 | 19,139,882 | 19,111,161 |
| Small Business Administration, | |||
| Series 2001-20J Class 1, 5.76% due 10/1/2021 | 75,502 | 77,461 | |
| Series 2008-20D Class 1, 5.37% due 4/1/2028 | 1,052,498 | 1,112,956 | |
| Series 2009-20E Class 1, 4.43% due 5/1/2029 | 614,190 | 634,229 | |
| Series 2009-20K Class 1, 4.09% due 11/1/2029 | 4,194,537 | 4,346,829 | |
| Series 2011-20E Class 1, 3.79% due 5/1/2031 | 5,361,595 | 5,442,018 | |
| Series 2011-20F Class 1, 3.67% due 6/1/2031 | 846,896 | 876,442 | |
| Series 2011-20I Class 1, 2.85% due 9/1/2031 | 8,356,442 | 8,362,962 | |
| Series 2012-20D Class 1, 2.67% due 4/1/2032 | 6,611,706 | 6,564,590 | |
| Series 2012-20J Class 1, 2.18% due 10/1/2032 | 5,475,276 | 5,334,524 | |
| Series 2012-20K Class 1, 2.09% due 11/1/2032 | 3,357,284 | 3,264,554 | |
| b,f | SMB Private Education Loan Trust, Series 2015-A Class A3, 3.984% (LIBOR 1 Month + 1.50%) due 2/17/2032 | 10,000,000 | 10,194,556 |
| Social Professional Loan Program, LLC, | |||
| b,f | Series 2014-A Class A1, 4.086% (LIBOR 1 Month + 1.60%) due 6/25/2025 | 443,851 | 444,698 |
| f | Series 2014-B Class A2, 2.55% due 8/27/2029 | 283,634 | 280,826 |
| f | Sofi Consumer Loan Program, LLC, Series 2017-3 Class A, 2.77% due 5/25/2026 | 1,764,421 | 1,761,483 |
| f | SoFi Professional Loan Program, LLC, Series 2017-E Class A2B, 2.72% due 11/26/2040 | 6,000,000 | 5,936,531 |
| f | Sonic Capital, LLC, Series 2016-1A Class A2, 4.472% due 5/20/2046 | 8,790,251 | 8,913,675 |
| f | Springleaf Funding Trust, Series 2015-AA Class A, 3.16% due 11/15/2024 | 1,631,236 | 1,631,298 |
| f | Tax Ease Funding, LLC, Series 2016-1A Class A, 3.131% due 6/15/2028 | 4,721,410 | 4,690,019 |
| Towd Point Mortgage Trust, | |||
| f,h | Series 2016-5 Class A1, 2.50% due 10/25/2056 | 9,102,865 | 8,894,092 |
| f,h | Series 2017-1 Class A1, 2.75% due 10/25/2056 | 4,972,532 | 4,895,416 |
| f,h | Series 2018-2 Class A1, 3.25% due 3/25/2058 | 10,859,613 | 10,816,663 |
| f,h | Series 2018-3 Class A1, 3.75% due 5/25/2058 | 7,122,441 | 7,194,368 |
| f,h | Series 2018-6 Class A1A, 3.75% due 3/25/2058 | 13,818,189 | 13,936,627 |
| b,f | Volvo Financial Equipment Master Owner Trust, Series 2017-A Class A, 2.984% (LIBOR 1 Month + 0.50%) due 11/15/2022 | 3,350,000 | 3,358,061 |
| f | Westgate Resorts, LLC, Series 2016-1A Class A, 3.50% due 12/20/2028 | 4,405,127 | 4,410,300 |
| 466,533,345 | |||
| Residential MTG Trust — 4.7% | |||
| Angel Oak Mortgage Trust, LLC, | |||
| f,h | Series 2017-1 Class A2, 3.085% due 1/25/2047 | 1,598,558 | 1,584,302 |
| f,h | Series 2017-3 Class A1, 2.708% due 11/25/2047 | 4,511,207 | 4,453,634 |
| f,h | Series 2018-1 Class A1, 3.258% due 4/27/2048 | 6,862,964 | 6,877,441 |
| f,h | Series 2018-2 Class A1, 3.674% due 7/27/2048 | 7,313,451 | 7,372,683 |
| Arroyo Mortgage Trust, | |||
| f,h | Series 2018-1 Class A1, 3.763% due 4/25/2048 | 13,383,485 | 13,665,791 |
| f,h | Series 2019-1 Class A1, 3.805% due 1/25/2049 | 20,631,964 | 20,658,102 |
| f,h | Citigroup Mortgage Loan Trust CMO, Series 2014-A Class A, 4.00% due 1/25/2035 | 1,781,703 | 1,816,521 |
| f,h | Finance of America Structured Securities Trust, Series 2018-HB1 3.375% due 9/25/2028 | 10,340,959 | 10,336,822 |
| f,h | Flagstar Mortgage Trust, Series 2017-1 Class 2A2, 3.00% due 3/25/2047 | 9,934,283 | 9,815,585 |
| JPMorgan Mortgage Trust, | |||
| f,h | Series 2017-2 Class A6, 3.00% due 5/25/2047 | 16,998,616 | 16,797,330 |
| f,h | Series 2017-6 Class A5, 3.50% due 12/25/2048 | 19,597,766 | 19,660,797 |
| h | Merrill Lynch Mortgage Investors Trust CMO, Series 2004-A4 Class M1, 4.076% due 8/25/2034 | 394,031 | 362,763 |
| New Residential Mortgage Loan Trust CMO, | |||
| f,h | Series 2017-2A Class A3, 4.00% due 3/25/2057 | 8,377,300 | 8,565,921 |
| f,h | Series 2017-3A Class A1, 4.00% due 4/25/2057 | 10,749,310 | 10,940,990 |
| f,h | Series 2017-4A Class A1, 4.00% due 5/25/2057 | 13,490,999 | 13,790,752 |
| f,h | Series 2018-NQM1 3.986% due 11/25/2048 | 20,057,559 | 20,562,421 |
| New Residential Mortgage Loan Trust, | |||
| b,f | Series 2017-5A Class A1, 3.986% (LIBOR 1 Month + 1.50%) due 6/25/2057 | 1,166,874 | 1,186,245 |
| f,h | Series 2017-6A Class A1, 4.00% due 8/27/2057 | 4,763,533 | 4,840,138 |
| f,h | Series 2018-1A Class A1A, 4.00% due 12/25/2057 | 5,614,299 | 5,703,213 |
| f,h | Series 2018-2A Class A1, 4.50% due 2/25/2058 | 12,273,255 | 12,634,770 |
| f,h | Series 2018-RPL1 Class A1, 3.50% due 12/25/2057 | 7,277,278 | 7,300,567 |
| PRINCIPAL AMOUNT | VALUE | ||
| Sequoia Mortgage Trust CMO, | |||
| f,h | Series 2017-4 Class A4, 3.50% due 7/25/2047 | $ 3,695,705 | $ 3,711,297 |
| f,h | Series 2017-5 Class A4, 3.50% due 8/25/2047 | 9,041,795 | 9,049,133 |
| Verus Securitization Trust CMO, | |||
| f,h | Series 2017-2A Class A1, 2.485% due 7/25/2047 | 9,822,700 | 9,647,702 |
| f,h | Series 2018-3 Class A1, 4.108% due 10/25/2058 | 11,640,610 | 11,812,811 |
| f,h | Verus Securitization Trust, Series 2018-2 Class A1, 3.677% due 6/1/2058 | 11,306,138 | 11,419,997 |
| 244,567,728 | |||
| Sovereign — 0.1% | |||
| a,c | Bermuda Government International Bond, 4.138% due 1/3/2023 | 4,000,000 | 4,060,000 |
| 4,060,000 | |||
| Student Loan — 1.0% | |||
| f | Commonbond Student Loan Trust, Series 18-CGS 3.87% due 2/25/2046 | 10,576,396 | 10,784,844 |
| f | Navient Private Education Refinance Loan Trust, Series 2018-CA Class A1, 3.01% due 6/16/2042 | 3,887,096 | 3,891,955 |
| b,f | Navient Student Loan Trust, Series 2016-6A Class A2, 3.236% (LIBOR 1 Month + 0.75%) due 3/25/2066 | 13,016,137 | 13,079,010 |
| b,f | Nelnet Student Loan Trust, Series 2016-A Class A1A, 4.236% (LIBOR 1 Month + 1.75%) due 12/26/2040 | 7,379,467 | 7,356,107 |
| SLM Student Loan Trust, | |||
| b,f | Series 2011-A Class A3, 4.984% (LIBOR 1 Month + 2.50%) due 1/15/2043 | 10,788,263 | 10,896,221 |
| b,f | Series 2013-B Class A2B, 3.584% (LIBOR 1 Month + 1.10%) due 6/17/2030 | ��� 240,566 | 241,022 |
| SoFi Professional Loan Program, LLC, | |||
| f | Series 2014-A Class A2, 3.02% due 10/25/2027 | 3,630,801 | 3,627,050 |
| b,f | Series 2014-B Class A1, 3.736% (LIBOR 1 Month + 1.25%) due 8/25/2032 | 895,181 | 899,161 |
| 50,775,370 | |||
| Total Asset Backed Securities(Cost $1,015,971,584) | 1,014,678,516 | ||
| Corporate Bonds — 47.7% | |||
| Automobiles & Components — 2.2% | |||
| Automobiles — 2.1% | |||
| BMW US Capital, LLC, | |||
| f | 3.25% due 8/14/2020 | 3,892,200 | 3,918,479 |
| f | 3.40% due 8/13/2021 | 2,994,000 | 3,032,309 |
| Daimler Finance North America, LLC | |||
| f | 3.40% due 2/22/2022 | 12,000,000 | 12,106,071 |
| f | 3.75% due 11/5/2021 | 6,675,000 | 6,791,944 |
| Harley-Davidson Financial Services, Inc. | |||
| f | 2.40% due 6/15/2020 | 9,827,000 | 9,714,283 |
| f | Series CO 4.05% due 2/4/2022 | 7,976,000 | 8,063,620 |
| f,k | Hyundai Capital America, 3.95% due 2/1/2022 | 22,900,000 | 23,227,783 |
| a,f | Hyundai Capital Services, Inc., 3.75% due 3/5/2023 | 7,000,000 | 7,080,433 |
| Nissan Motor Acceptance Corp., | |||
| b,f | 3.287% (LIBOR 3 Month + 0.69%) due 9/28/2022 | 2,453,000 | 2,397,849 |
| b,f | 3.447% (LIBOR 3 Month + 0.65%) due 7/13/2022 | 1,560,000 | 1,523,845 |
| Toyota Motor Credit Corp., | |||
| b | 3.088% (LIBOR 3 Month + 0.40%) due 2/13/2020 | 20,090,000 | 20,089,908 |
| b | 3.344% (LIBOR 3 Month + 0.54%) due 1/8/2021 | 4,830,000 | 4,854,333 |
| f | Volkswagen Group of America Finance, LLC 4.00% due 11/12/2021 | 4,500,000 | 4,590,786 |
| Trading Companies & Distributors — 0.1% | |||
| Altitude Investments 12, LLC (Guaranty: Export-Import Bank of the United States), 2.454% due 12/9/2025 | 4,176,653 | 4,151,430 | |
| a,f | Mitsubishi UFJ Lease & Finance Co. Ltd., 3.406% due 2/28/2022 | 2,800,000 | 2,825,284 |
| 114,368,357 | |||
| Banks — 2.8% | |||
| Banks — 2.8% | |||
| a,b,f | ABN AMRO Bank N.V., 3.209% (LIBOR 3 Month + 0.57%) due 8/27/2021 | 6,800,000 | 6,807,154 |
| a,b | Barclays Bank plc, 3.259% (LIBOR 3 Month + 0.46%) due 1/11/2021 | 7,000,000 | 6,954,095 |
| b | Capital One NA/Mclean VA, 3.558% (LIBOR 3 Month + 0.82%) due 8/8/2022 | 28,150,000 | 28,129,986 |
| b | Citizens Bank N.A./Providence RI, 3.551% (LIBOR 3 Month + 0.95%) due 3/29/2023 | 20,500,000 | 20,515,026 |
| First Tennessee Bank N.A., 2.95% due 12/1/2019 | 7,000,000 | 6,995,198 | |
| Goldman Sachs Bank USA, 3.20% due 6/5/2020 | 5,000,000 | 5,030,887 | |
| a,f | Mizuho Bank Ltd. (Guaranty: Mizuho Financial Group, Inc.), 2.45% due 4/16/2019 | 7,000,000 | 6,998,530 |
Thornburg Limited Term Income Fund | March 31, 2019 (Unaudited)
| PRINCIPAL AMOUNT | VALUE | ||
| Santander Holdings USA, Inc., | |||
| 3.40% due 1/18/2023 | $ 7,937,000 | $ 7,932,540 | |
| 4.45% due 12/3/2021 | 4,940,000 | 5,089,879 | |
| f | Sovereign Bank Lease Pass-Through Trust, 12.18% due 6/30/2020 | 1,621,919 | 1,767,259 |
| a,b | Sumitomo Mitsui Banking Corp. (Guaranty: Sumitomo Mitsui Banking Corp/New York), 3.09% (LIBOR 3 Month + 0.31%) due 10/18/2019 | 15,000,000 | 15,015,300 |
| a | Sumitomo Mitsui Banking Corp., 2.65% due 7/23/2020 | 10,600,000 | 10,585,476 |
| a | Svenska Handelsbanken AB 3.90% due 11/20/2023 | 16,750,000 | 17,423,836 |
| Zions Bancorp N.A., 3.35% due 3/4/2022 | 6,750,000 | 6,809,353 | |
| 146,054,519 | |||
| Capital Goods — 0.9% | |||
| Industrial Conglomerates — 0.2% | |||
| Carlisle Companies, Inc., 3.50% due 12/1/2024 | 6,787,000 | 6,781,467 | |
| b | General Electric Co. MTN, 3.611% (LIBOR 3 Month + 1.00%) due 3/15/2023 | 2,625,000 | 2,553,151 |
| Ingersoll-Rand Co. (Guaranty: Ingersoll-Rand plc), 6.391% due 11/15/2027 | 3,000,000 | 3,438,090 | |
| Machinery — 0.7% | |||
| Nvent Finance Sarl, | |||
| a | 3.95% due 4/15/2023 | 7,980,000 | 7,957,555 |
| a | 4.55% due 4/15/2028 | 16,970,000 | 17,078,999 |
| Wabtec Corp., 4.375% due 8/15/2023 | 10,590,000 | 10,725,905 | |
| 48,535,167 | |||
| Commercial & Professional Services — 0.4% | |||
| Commercial Services & Supplies — 0.1% | |||
| Cintas Corp. No. 2, 2.90% due 4/1/2022 | 2,622,000 | 2,631,610 | |
| Leisure Products — 0.2% | |||
| Mattel, Inc., 2.35% due 8/15/2021 | 9,915,000 | 9,344,887 | |
| Professional Services — 0.1% | |||
| Verisk Analytics, Inc., 4.00% due 6/15/2025 | 6,930,000 | 7,226,285 | |
| 19,202,782 | |||
| Consumer Durables & Apparel — 0.2% | |||
| Household Durables — 0.2% | |||
| Tupperware Brands Corp. (Guaranty: Dart Industries, Inc.), 4.75% due 6/1/2021 | 10,000,000 | 10,252,705 | |
| 10,252,705 | |||
| Consumer Services — 0.1% | |||
| Transportation Infrastructure — 0.1% | |||
| Mexico City Airport Trust, | |||
| a,f | 3.875% due 4/30/2028 | 2,439,000 | 2,204,271 |
| a,f | 4.25% due 10/31/2026 | 1,864,000 | 1,792,236 |
| 3,996,507 | |||
| Diversified Financials — 9.2% | |||
| Capital Markets — 2.2% | |||
| f | Ares Finance Co., LLC, 4.00% due 10/8/2024 | 5,000,000 | 4,835,414 |
| CBOE Holdings, Inc., 1.95% due 6/28/2019 | 1,745,000 | 1,741,514 | |
| DY8 Leasing, LLC (Guaranty: Export-Import Bank of the United States), 2.627% due 4/29/2026 | 3,096,354 | 3,096,437 | |
| Export Leasing (2009), LLC (Guaranty: Export-Import Bank of the United States), 1.859% due 8/28/2021 | 2,260,880 | 2,237,245 | |
| FS Investment Corp., 4.00% due 7/15/2019 | 12,000,000 | 12,021,922 | |
| a | Genpact Luxembourg Sarl, 3.70% due 4/1/2022 | 12,000,000 | 11,852,173 |
| f | GTP Acquisition Partners I, LLC (Guaranty: American Tower Holding Sub II, LLC), 2.35% due 6/15/2045 | 10,000,000 | 9,886,679 |
| Legg Mason, Inc., | |||
| 2.70% due 7/15/2019 | 1,660,000 | 1,658,942 | |
| 4.75% due 3/15/2026 | 5,000,000 | 5,166,844 | |
| Sandalwood 2013, LLC (Guaranty: Export-Import Bank of the United States), 2.821% due 2/12/2026 | 4,351,321 | 4,386,721 | |
| Solar Capital Ltd., 4.50% due 1/20/2023 | 12,000,000 | 11,577,171 | |
| a,f | SumitG Guaranteed Secured Obligation Issuer DAC, 2.251% due 11/2/2020 | 15,000,000 | 14,822,401 |
| TD Ameritrade Holding Corp., 3.75% due 4/1/2024 | 21,025,000 | 21,757,813 | |
| TPG Specialty Lending, Inc., 4.50% due 1/22/2023 | 7,440,000 | 7,467,720 | |
| Consumer Finance — 1.1% | |||
| Citibank N.A., | |||
| b | 3.048% (LIBOR 3 Month + 0.35%) due 2/12/2021 | 5,750,000 | 5,751,952 |
| PRINCIPAL AMOUNT | VALUE | ||
| 3.65% due 1/23/2024 | $ 4,500,000 | $ 4,643,070 | |
| Wells Fargo & Co. 3.75% due 1/24/2024 | 25,000,000 | 25,726,934 | |
| Wells Fargo Bank N.A., 3.625% due 10/22/2021 | 19,750,000 | 20,120,115 | |
| Diversified Financial Services — 4.7% | |||
| Barclays plc, | |||
| a,b | 4.063% (LIBOR 3 Month + 1.38%) due 5/16/2024 | 17,500,000 | 16,985,181 |
| a,l | 4.61% (LIBOR 3 Month + 1.40%) due 2/15/2023 | 13,000,000 | 13,268,137 |
| BNP Paribas S.A., | |||
| a,f | 3.375% due 1/9/2025 | 6,000,000 | 5,878,723 |
| a,f,l | 4.705% (LIBOR 3 Month + 2.24%) due 1/10/2025 | 11,000,000 | 11,409,542 |
| Citigroup, Inc., | |||
| 2.50% due 7/29/2019 | 2,925,000 | 2,923,521 | |
| 2.65% due 10/26/2020 | 4,890,000 | 4,877,776 | |
| Credit Suisse Group Funding Guernsey Ltd. (Guaranty: Credit Suisse Group AG), | |||
| a | 3.125% due 12/10/2020 | 10,000,000 | 10,025,428 |
| a | 3.80% due 9/15/2022 | 7,000,000 | 7,130,900 |
| Deutsche Bank AG, | |||
| a,b | 3.576% (LIBOR 3 Month + 0.82%) due 1/22/2021 | 8,650,000 | 8,478,511 |
| a,b | 3.869% (LIBOR 3 Month + 1.23%) due 2/27/2023 | 17,100,000 | 16,417,571 |
| a | 5.00% due 2/14/2022 | 6,350,000 | 6,490,771 |
| Goldman Sachs Group, Inc., | |||
| b | 3.792% (LIBOR 3 Month + 1.02%) due 10/23/2019 | 4,517,000 | 4,537,482 |
| b | 3.811% (LIBOR 3 Month + 1.20%) due 9/15/2020 | 7,930,000 | 8,011,667 |
| b | 3.875% (LIBOR 3 Month + 1.11%) due 4/26/2022 | 10,847,000 | 10,905,093 |
| HSBC Holdings plc, | |||
| a,l | 3.803% (LIBOR 3 Month + 1.21%) due 3/11/2025 | 7,000,000 | 7,095,786 |
| a,l | 4.292% (LIBOR 3 Month + 1.35%) due 9/12/2026 | 5,000,000 | 5,156,172 |
| JPMorgan Chase & Co., | |||
| b | 3.151% (LIBOR 3 Month + 0.55%) due 3/9/2021 | 6,440,000 | 6,446,128 |
| l | 3.797% (LIBOR 3 Month + 0.89%) due 7/23/2024 | 11,870,000 | 12,187,996 |
| b | 4.106% (LIBOR 3 Month + 1.48%) due 3/1/2021 | 7,000,000 | 7,130,137 |
| a,l | Mizuho Financial Group, Inc., 3.922% (LIBOR 3 Month + 1.00%) due 9/11/2024 | 15,500,000 | 15,951,060 |
| Morgan Stanley, 2.80% due 6/16/2020 | 1,350,000 | 1,351,042 | |
| Private Export Funding Corp. (Guaranty: Export-Import Bank of the United States), Series KK, 3.55% due 1/15/2024 | 10,000,000 | 10,478,713 | |
| Royal Bank of Scotland Group plc, | |||
| a,b | 4.154% (LIBOR 3 Month + 1.47%) due 5/15/2023 | 1,952,000 | 1,944,301 |
| a,l | 4.269% (LIBOR 3 Month + 1.76%) due 3/22/2025 | 10,000,000 | 10,106,345 |
| Societe Generale S.A., | |||
| a,f | 3.875% due 3/28/2024 | 8,000,000 | 8,025,558 |
| a,f | 4.25% due 9/14/2023 | 12,000,000 | 12,307,226 |
| Synchrony Financial, 3.00% due 8/15/2019 | 1,950,000 | 1,950,401 | |
| UBS AG, | |||
| a | 2.375% due 8/14/2019 | 4,500,000 | 4,495,393 |
| a,b,f | 3.175% (LIBOR 3 Month + 0.58%) due 6/8/2020 | 5,000,000 | 5,018,000 |
| a,b,f | UBS Group Funding Switzerland AG, 4.577% (LIBOR 3 Month + 1.78%) due 4/14/2021 | 5,800,000 | 5,942,837 |
| Insurance — 0.8% | |||
| b,f | AIG Global Funding, 3.08% (LIBOR 3 Month + 0.48%) due 7/2/2020 | 3,000,000 | 3,006,155 |
| ALEX Alpha, LLC (Guaranty: Export-Import Bank of the United States), 1.617% due 8/15/2024 | 2,391,304 | 2,323,212 | |
| a | Gate Capital Cayman One Ltd. (Guaranty: Export-Import Bank of the United States), 1.839% due 3/27/2021 | 3,371,455 | 3,335,330 |
| Helios Leasing I, LLC (Guaranty: Export-Import Bank of the United States), 1.562% due 9/28/2024 | 2,897,450 | 2,805,599 | |
| f | Protective Life Global Funding, 2.615% due 8/22/2022 | 15,000,000 | 14,868,817 |
| Santa Rosa Leasing, LLC (Guaranty: Export-Import Bank of the United States), | |||
| 1.472% due 11/3/2024 | 8,052,463 | 7,794,940 | |
| 1.693% due 8/15/2024 | 2,861,794 | 2,787,580 | |
| Union 13 Leasing, LLC (Guaranty: Export-Import Bank of the United States), 1.682% due 12/19/2024 | 7,553,574 | 7,345,690 | |
| Mortgage Real Estate Investment Trusts — 0.4% | |||
| Senior Housing Properties Trust, 4.75% due 2/15/2028 | 20,960,000 | 19,429,473 | |
| 475,375,261 | |||
| Energy — 3.3% | |||
| Energy Equipment & Services — 0.2% | |||
| Oceaneering International, Inc., 4.65% due 11/15/2024 | 10,000,000 | 9,225,000 | |
| a,c,m,n | Schahin II Finance Co. SPV Ltd., 5.875% due 9/25/2023 | 4,082,733 | 408,280 |
Thornburg Limited Term Income Fund | March 31, 2019 (Unaudited)
| PRINCIPAL AMOUNT | VALUE | ||
| Oil, Gas & Consumable Fuels — 3.1% | |||
| b | BP Capital Markets America, Inc., 3.275% (LIBOR 3 Month + 0.65%) due 9/19/2022 | $ 6,771,000 | $ 6,783,549 |
| Buckeye Partners L.P., 4.15% due 7/1/2023 | 7,000,000 | 7,141,095 | |
| a,f | CNPC General Capital Ltd. (Guaranty: CNPC Finance HK Ltd.), 2.75% due 5/14/2019 | 5,000,000 | 4,999,614 |
| f | Colorado Interstate Gas Co., LLC / Colorado Interstate Issuing Corp., 4.15% due 8/15/2026 | 17,544,000 | 17,839,610 |
| f | Enable Oklahoma Intrastate Transmission, LLC (Guaranty: Enable Midstream Partners L.P.), 6.25% due 3/15/2020 | 3,640,000 | 3,740,680 |
| Energen Corp., 4.625% due 9/1/2021 | 10,000,000 | 10,087,500 | |
| EQT Midstream Partners L.P., Series 5Y, 4.75% due 7/15/2023 | 11,440,000 | 11,667,481 | |
| f | Florida Gas Transmission Co., LLC, 3.875% due 7/15/2022 | 10,435,000 | 10,627,802 |
| Gulf South Pipeline Co. L.P., 4.00% due 6/15/2022 | 13,850,000 | 13,938,218 | |
| a,f | Harvest Operations Corp., 4.20% due 6/1/2023 | 4,000,000 | 4,182,623 |
| HollyFrontier Corp., 5.875% due 4/1/2026 | 2,650,000 | 2,835,590 | |
| Midwest Connector Capital Co., LLC, | |||
| f | 3.625% due 4/1/2022 | 5,520,000 | 5,597,903 |
| f | 3.90% due 4/1/2024 | 5,555,000 | 5,644,547 |
| NuStar Logistics L.P., 4.75% due 2/1/2022 | 5,000,000 | 5,025,000 | |
| a | Petroleos Mexicanos (Guaranty: Export-Import Bank of the United States), 6.50% due 1/23/2029 | 14,980,000 | 14,845,180 |
| a,f | Sinopec Group Overseas Development 2018 Ltd., 3.75% due 9/12/2023 | 17,800,000 | 18,153,027 |
| f | Texas Gas Transmission, LLC, 4.50% due 2/1/2021 | 17,624,000 | 17,904,388 |
| 170,647,087 | |||
| Food & Staples Retailing — 0.4% | |||
| Food & Staples Retailing — 0.4% | |||
| a,f | Alimentation Couche-Tard, Inc., 2.70% due 7/26/2022 | 15,850,000 | 15,684,364 |
| Sysco Corp., 3.55% due 3/15/2025 | 4,990,000 | 5,059,538 | |
| 20,743,902 | |||
| Food, Beverage & Tobacco — 2.5% | |||
| Beverages — 0.3% | |||
| a,f | Becle SAB de CV, 3.75% due 5/13/2025 | 13,750,000 | 13,442,929 |
| Food Products — 1.6% | |||
| Conagra Brands, Inc., | |||
| b | 3.297% (LIBOR 3 Month + 0.50%) due 10/9/2020 | 14,850,000 | 14,771,164 |
| 3.80% due 10/22/2021 | 6,892,000 | 7,021,144 | |
| General Mills, Inc., | |||
| 2.60% due 10/12/2022 | 7,850,000 | 7,757,544 | |
| b | 3.319% (LIBOR 3 Month + 0.54%) due 4/16/2021 | 3,380,000 | 3,373,676 |
| b | 3.783% (LIBOR 3 Month + 1.01%) due 10/17/2023 | 6,375,000 | 6,420,519 |
| JM Smucker Co., 2.50% due 3/15/2020 | 10,494,000 | 10,464,823 | |
| Kraft Heinz Foods Co. (Guaranty: Kraft Heinz Co.), | |||
| b | 3.117% (LIBOR 3 Month + 0.42%) due 8/9/2019 | 14,925,000 | 14,930,836 |
| b | 3.267% (LIBOR 3 Month + 0.57%) due 2/10/2021 | 6,693,000 | 6,675,933 |
| Kraft Heinz Foods Co., 4.00% due 6/15/2023 | 7,257,000 | 7,454,791 | |
| Mead Johnson Nutrition Co. (Guaranty: Reckitt Benckiser Group plc), 3.00% due 11/15/2020 | 1,900,000 | 1,906,616 | |
| b | Tyson Foods, Inc., 3.165% (LIBOR 3 Month + 0.55%) due 6/2/2020 | 2,850,000 | 2,847,687 |
| Tobacco — 0.6% | |||
| Altria Group, Inc. (Guaranty: Philip Morris USA, Inc.), 2.625% due 1/14/2020 | 5,790,000 | 5,776,865 | |
| Altria Group, Inc., 4.40% due 2/14/2026 | 3,683,000 | 3,785,525 | |
| BAT Capital Corp., | |||
| 3.222% due 8/15/2024 | 2,980,000 | 2,913,726 | |
| b | 3.283% (LIBOR 3 Month + 0.59%) due 8/14/2020 | 7,370,000 | 7,354,164 |
| b | 3.564% (LIBOR 3 Month + 0.88%) due 8/15/2022 | 5,000,000 | 4,982,154 |
| a,f | BAT International Finance plc, 3.95% due 6/15/2025 | 3,000,000 | 3,006,399 |
| Reynolds American, Inc., 6.875% due 5/1/2020 | 5,000,000 | 5,202,869 | |
| 130,089,364 | |||
| Healthcare Equipment & Services — 1.2% | |||
| Health Care Equipment & Supplies — 0.1% | |||
| Boston Scientific Corp., 3.75% due 3/1/2026 | 4,980,000 | 5,077,326 | |
| Health Care Providers & Services — 1.1% | |||
| Anthem, Inc., | |||
| 2.25% due 8/15/2019 | 10,000,000 | 9,981,353 | |
| 2.50% due 11/21/2020 | 7,905,000 | 7,864,682 |
| PRINCIPAL AMOUNT | VALUE | ||
| Catholic Health Initiatives, 2.95% due 11/1/2022 | $ 7,000,000 | $ 6,951,888 | |
| b | CVS Health Corp., 3.231% (LIBOR 3 Month + 0.63%) due 3/9/2020 | 7,786,000 | 7,803,713 |
| Express Scripts Holding Co., 2.60% due 11/30/2020 | 9,750,000 | 9,708,226 | |
| f | Halfmoon Parent, Inc., 4.125% due 11/15/2025 | 4,975,000 | 5,149,039 |
| Quest Diagnostics, Inc. 4.20% due 6/30/2029 | 6,950,000 | 7,142,730 | |
| 59,678,957 | |||
| Household & Personal Products — 0.2% | |||
| Household Products — 0.2% | |||
| Church & Dwight Co., Inc., | |||
| 2.45% due 8/1/2022 | 4,716,000 | 4,642,105 | |
| 2.875% due 10/1/2022 | 2,414,000 | 2,417,068 | |
| a,f | Kimberly-Clark de Mexico SAB de CV, 3.80% due 4/8/2024 | 3,000,000 | 2,946,102 |
| Personal Products — 0.0% | |||
| Edgewell Personal Care Co., 4.70% due 5/24/2022 | 2,000,000 | 2,010,000 | |
| 12,015,275 | |||
| Insurance — 4.7% | |||
| Insurance — 4.6% | |||
| AIG Global Funding, | |||
| f | 1.95% due 10/18/2019 | 3,000,000 | 2,984,685 |
| b,f | 3.062% (LIBOR 3 Month + 0.46%) due 6/25/2021 | 9,910,000 | 9,912,142 |
| a,f | DaVinciRe Holdings Ltd., 4.75% due 5/1/2025 | 10,260,000 | 10,435,849 |
| a | Enstar Group Ltd., 4.50% due 3/10/2022 | 1,950,000 | 1,985,641 |
| a | Fairfax Financial Holdings Ltd., 4.85% due 4/17/2028 | 15,970,000 | 15,914,101 |
| f | Guardian Life Global Funding, 3.40% due 4/25/2023 | 6,918,000 | 7,063,742 |
| Hanover Insurance Group, Inc., 4.50% due 4/15/2026 | 5,020,000 | 5,117,783 | |
| Horace Mann Educators Corp., 4.50% due 12/1/2025 | 4,800,000 | 4,892,122 | |
| Infinity Property & Casualty Corp., 5.00% due 9/19/2022 | 4,690,000 | 4,852,356 | |
| Jackson National Life Global Funding, | |||
| f | 2.20% due 1/30/2020 | 8,000,000 | 7,961,691 |
| b,f | 3.081% (LIBOR 3 Month + 0.48%) due 6/11/2021 | 6,150,000 | 6,162,676 |
| f | 3.25% due 1/30/2024 | 10,000,000 | 10,051,376 |
| Kemper Corp., 4.35% due 2/15/2025 | 5,253,000 | 5,375,209 | |
| a,f | Lancashire Holdings Ltd., 5.70% due 10/1/2022 | 11,000,000 | 11,399,487 |
| f | MassMutual Global Funding II, 2.95% due 1/11/2025 | 25,000,000 | 24,902,046 |
| Mercury General Corp., 4.40% due 3/15/2027 | 16,000,000 | 15,899,216 | |
| f | Metropolitan Life Global Funding I, 3.45% due 10/9/2021 | 5,000,000 | 5,064,883 |
| b,f | Metropolitan Life Global Funding, 3.00% (SOFR + 0.57%) due 9/7/2020 | 7,760,000 | 7,759,947 |
| a | Montpelier Re Holdings Ltd., 4.70% due 10/15/2022 | 5,000,000 | 5,134,007 |
| f | Pricoa Global Funding, 3.45% due 9/1/2023 | 9,850,000 | 10,083,637 |
| f | Principal Life Global Funding II (Guaranty: Principal Financial Group, Inc.), 2.375% due 9/11/2019 | 2,450,000 | 2,446,190 |
| b,f | Protective Life Global Funding, 3.117% (LIBOR 3 Month + 0.52%) due 6/28/2021 | 16,850,000 | 16,875,330 |
| f | Reliance Standard Life Global Funding II, 2.50% due 1/15/2020 | 15,000,000 | 14,934,465 |
| f | Reliance Standard Life Global Funding, 3.85% due 9/19/2023 | 9,950,000 | 10,153,975 |
| Reliance Standard Life Insurance Co., | |||
| f | 2.50% due 4/24/2019 | 9,900,000 | 9,897,580 |
| f | 3.05% due 1/20/2021 | 4,662,000 | 4,657,552 |
| f | Sammons Financial Group, Inc., 4.45% due 5/12/2027 | 7,950,000 | 7,968,409 |
| Semiconductors & Semiconductor Equipment — 0.1% | |||
| a,f | NXP B.V.//NXP Funding , LLC 5.35% due 3/1/2026 | 2,991,000 | 3,218,555 |
| 243,104,652 | |||
| Materials — 1.4% | |||
| Chemicals — 1.1% | |||
| b,f | Chevron Phillips Chemical Co., LLC, 3.486% (LIBOR 3 Month + 0.75%) due 5/1/2020 | 29,900,000 | 29,966,340 |
| DowDuPont, Inc. | |||
| 3.766% due 11/15/2020 | 4,000,000 | 4,073,054 | |
| 4.205% due 11/15/2023 | 7,900,000 | 8,261,277 | |
| f | Incitec Pivot Finance, LLC (Guaranty: Incitec Pivot Ltd.), 6.00% due 12/10/2019 | 4,538,000 | 4,622,801 |
| a,f | OCP S.A., 5.625% due 4/25/2024 | 8,555,000 | 8,972,843 |
| Metals & Mining — 0.3% |
Thornburg Limited Term Income Fund | March 31, 2019 (Unaudited)
| PRINCIPAL AMOUNT | VALUE | ||
| AngloGold Ashanti Holdings plc (Guaranty: AngloGold Ashanti Ltd.), | |||
| a | 5.125% due 8/1/2022 | $ 6,500,000 | $ 6,732,570 |
| a | 5.375% due 4/15/2020 | 9,100,000 | 9,252,880 |
| 71,881,765 | |||
| Media & Entertainment — 0.3% | |||
| Interactive Media & Services — 0.3% | |||
| a | Baidu, Inc., 3.875% due 9/29/2023 | 11,442,000 | 11,677,007 |
| a,f | Tencent Holdings Ltd., 2.985% due 1/19/2023 | 6,450,000 | 6,421,865 |
| 18,098,872 | |||
| Pharmaceuticals, Biotechnology & Life Sciences — 1.7% | |||
| Biotechnology — 0.2% | |||
| Celgene Corp., | |||
| 2.75% due 2/15/2023 | 2,265,000 | 2,243,215 | |
| 3.25% due 2/20/2023 | 9,936,000 | 10,018,120 | |
| Pharmaceuticals — 1.5% | |||
| AbbVie, Inc., 3.75% due 11/14/2023 | 6,820,000 | 7,001,185 | |
| Allergan Funding SCS, | |||
| a | 3.45% due 3/15/2022 | 5,000,000 | 5,045,025 |
| a,b | 3.852% (LIBOR 3 Month + 1.26%) due 3/12/2020 | 5,000,000 | 5,042,717 |
| AstraZeneca plc, | |||
| a,b | 3.348% (LIBOR 3 Month + 0.67%) due 8/17/2023 | 10,524,000 | 10,468,802 |
| a | 3.50% due 8/17/2023 | 9,723,000 | 9,917,904 |
| Bayer US Finance II, LLC, | |||
| b,f | 3.232% (LIBOR 3 Month + 0.63%) due 6/25/2021 | 9,500,000 | 9,417,871 |
| f | 4.25% due 12/15/2025 | 2,500,000 | 2,526,795 |
| a | Shire Acquisitions Investments Ireland DAC, 2.40% due 9/23/2021 | 9,776,000 | 9,655,357 |
| Takeda Pharmaceutical Co. Ltd., | |||
| a,f | 4.00% due 11/26/2021 | 5,500,000 | 5,639,887 |
| a,f | 4.40% due 11/26/2023 | 7,500,000 | 7,873,567 |
| Zoetis, Inc., 3.45% due 11/13/2020 | 2,000,000 | 2,018,217 | |
| 86,868,662 | |||
| Real Estate — 1.3% | |||
| Equity Real Estate Investment Trusts — 1.3% | |||
| American Tower Corp., 3.375% due 5/15/2024 | 26,600,000 | 26,787,401 | |
| Crown Castle International Corp., 3.20% due 9/1/2024 | 17,870,000 | 17,733,412 | |
| Hospitality Properties Trust, 4.95% due 2/15/2027 | 2,000,000 | 1,982,578 | |
| Washington Real Estate Investment Trust, 4.95% due 10/1/2020 | 19,100,000 | 19,411,985 | |
| 65,915,376 | |||
| Retailing — 0.6% | |||
| Internet & Direct Marketing Retail — 0.1% | |||
| Booking Holdings, Inc., 2.75% due 3/15/2023 | 7,925,000 | 7,885,570 | |
| Multiline Retail — 0.5% | |||
| b | Dollar Tree, Inc., 3.473% (LIBOR 3 Month + 0.70%) due 4/17/2020 | 6,185,000 | 6,186,363 |
| Family Dollar Stores, Inc., 5.00% due 2/1/2021 | 18,475,000 | 18,996,841 | |
| 33,068,774 | |||
| Semiconductors & Semiconductor Equipment — 0.5% | |||
| Semiconductors & Semiconductor Equipment — 0.5% | |||
| Broadcom Corp. / Broadcom Cayman Finance Ltd., | |||
| 2.375% due 1/15/2020 | 8,875,000 | 8,827,521 | |
| 3.625% due 1/15/2024 | 18,000,000 | 17,953,713 | |
| 26,781,234 | |||
| Software & Services — 1.7% | |||
| Information Technology Services — 0.8% | |||
| Capital One Bank USA N.A., 2.30% due 6/5/2019 | 3,000,000 | 2,997,810 | |
| Leidos Holdings, Inc. (Guaranty: Leidos, Inc.), 4.45% due 12/1/2020 | 2,000,000 | 2,030,000 | |
| S&P Global, Inc. (Guaranty: Standard & Poor’s Financial Services, LLC), 3.30% due 8/14/2020 | 2,450,000 | 2,470,819 | |
| Total System Services, Inc., |
| PRINCIPAL AMOUNT | VALUE | ||
| 3.80% due 4/1/2021 | $ 3,000,000 | $ 3,045,891 | |
| 4.00% due 6/1/2023 | 14,665,000 | 15,067,106 | |
| Western Union Co., | |||
| 3.35% due 5/22/2019 | 11,350,000 | 11,355,872 | |
| b | 3.463% (LIBOR 3 Month + 0.80%) due 5/22/2019 | 5,410,000 | 5,411,708 |
| Interactive Media & Services — 0.1% | |||
| a | Baidu, Inc., 4.375% due 5/14/2024 | 6,376,000 | 6,610,420 |
| Software — 0.8% | |||
| Autodesk, Inc., 3.125% due 6/15/2020 | 1,945,000 | 1,949,286 | |
| Broadridge Financial Solutions, Inc., 3.95% due 9/1/2020 | 8,000,000 | 8,096,597 | |
| CA, Inc., 3.60% due 8/1/2020 - 8/15/2022 | 16,905,000 | 16,990,554 | |
| CDK Global, Inc., 3.80% due 10/15/2019 | 5,000,000 | 5,000,000 | |
| VMware, Inc., 2.30% due 8/21/2020 | 7,925,000 | 7,851,645 | |
| 88,877,708 | |||
| Technology Hardware & Equipment — 1.8% | |||
| Communications Equipment — 1.0% | |||
| Juniper Networks, Inc., 3.30% due 6/15/2020 | 4,825,000 | 4,843,755 | |
| Motorola Solutions, Inc., 4.60% due 2/23/2028 | 24,340,000 | 24,538,773 | |
| a | Telefonaktiebolaget LM Ericsson, 4.125% due 5/15/2022 | 21,215,000 | 21,505,009 |
| Electronic Equipment, Instruments & Components — 0.5% | |||
| Ingram Micro, Inc., 5.45% due 12/15/2024 | 5,596,000 | 5,548,252 | |
| Tech Data Corp., 4.95% due 2/15/2027 | 6,000,000 | 6,082,895 | |
| Trimble, Inc., 4.75% due 12/1/2024 | 17,000,000 | 17,463,843 | |
| Office Electronics — 0.1% | |||
| Lexmark International, Inc., 7.125% due 3/15/2020 | 5,375,000 | 5,039,116 | |
| Technology Hardware, Storage & Peripherals — 0.2% | |||
| Hewlett Packard Enterprise Co., 3.50% due 10/5/2021 | 9,701,000 | 9,828,401 | |
| 94,850,044 | |||
| Telecommunication Services — 2.2% | |||
| Diversified Telecommunication Services — 0.9% | |||
| AT&T, Inc., | |||
| b | 3.531% (LIBOR 3 Month + 0.93%) due 6/30/2020 | 4,950,000 | 4,985,472 |
| b | 3.777% (LIBOR 3 Month + 1.18%) due 6/12/2024 | 15,975,000 | 15,846,964 |
| 7.85% due 1/15/2022 | 3,000,000 | 3,371,032 | |
| a,f | Deutsche Telekom International Finance B.V., 4.375% due 6/21/2028 | 21,000,000 | 21,878,488 |
| Qwest Corp., 6.75% due 12/1/2021 | 3,000,000 | 3,192,150 | |
| Media — 0.2% | |||
| b,f | NBCUniversal Enterprise, Inc., 2.992% (LIBOR 3 Month + 0.40%) due 4/1/2021 | 7,800,000 | 7,809,695 |
| Wireless Telecommunication Services — 1.1% | |||
| Sprint Communications, Inc., 9.25% due 4/15/2022 | 40,779,000 | 47,507,535 | |
| a | Vodafone Group plc, 4.125% due 5/30/2025 | 8,960,000 | 9,131,251 |
| 113,722,587 | |||
| Transportation — 0.8% | |||
| Air Freight & Logistics — 0.1% | |||
| TTX Co., | |||
| f | 4.15% due 1/15/2024 | 6,000,000 | 6,189,920 |
| f | 5.453% due 1/2/2022 | 1,646,648 | 1,689,790 |
| Airlines — 0.2% | |||
| American Airlines Pass Through Trust, Series 2013-2 Class A, 4.95% due 7/15/2024 | 3,820,391 | 3,956,015 | |
| Northwest Airlines Pass Through Trust, Series 2007-1 Class A, 7.027% due 5/1/2021 | 3,354,714 | 3,424,157 | |
| US Airways Pass Through Trust, Series 2010-1 Class A, 6.25% due 10/22/2024 | 3,875,256 | 4,155,049 | |
| Diversified Consumer Services — 0.0% | |||
| University of Chicago, Series 12-B, 3.065% due 10/1/2024 | 1,022,000 | 1,021,537 | |
| Hotels, Restaurants & Leisure — 0.1% | |||
| a | Sands China Ltd., 5.125% due 8/8/2025 | 3,000,000 | 3,126,866 |
| Road & Rail — 0.4% |
Thornburg Limited Term Income Fund | March 31, 2019 (Unaudited)
| PRINCIPAL AMOUNT | VALUE | ||
| Penske Truck Leasing Co. L.P. / PTL Finance Corp., | |||
| f | 3.65% due 7/29/2021 | $ 4,950,000 | $ 5,016,902 |
| f | 4.125% due 8/1/2023 | 15,000,000 | 15,437,884 |
| 44,018,120 | |||
| Utilities — 7.3% | |||
| Electric Utilities — 6.3% | |||
| f | Alliant Energy Finance, LLC, 3.75% due 6/15/2023 | 11,865,000 | 12,100,464 |
| Appalachian Power Co., 3.40% due 6/1/2025 | 7,000,000 | 7,092,167 | |
| Avangrid, Inc., 3.15% due 12/1/2024 | 8,870,000 | 8,767,249 | |
| CenterPoint Energy, Inc. 3.60% due 11/1/2021 | 8,901,000 | 9,032,654 | |
| b | Consolidated Edison Co. of New York, Inc., Series C, 3.002% (LIBOR 3 Month + 0.40%) due 6/25/2021 | 19,496,000 | 19,466,593 |
| Duke Energy Florida Project Finance, LLC, Series 2018, 1.196% due 3/1/2022 | 4,640,627 | 4,593,877 | |
| Edison International, 2.40% due 9/15/2022 | 4,900,000 | 4,527,545 | |
| a,f | Electricite de France S.A., 4.60% due 1/27/2020 | 5,955,000 | 6,056,565 |
| a,f | Enel Finance International N.V., 4.625% due 9/14/2025 | 25,000,000 | 25,856,217 |
| Entergy Louisiana, LLC, 4.80% due 5/1/2021 | 4,300,000 | 4,422,432 | |
| Entergy Mississippi, Inc., 3.25% due 12/1/2027 | 4,727,000 | 4,652,522 | |
| Entergy Texas, Inc., 3.45% due 12/1/2027 | 12,000,000 | 11,745,077 | |
| Exelon Corp., 2.85% due 6/15/2020 | 2,950,000 | 2,946,790 | |
| f | Jersey Central Power & Light Co., 4.30% due 1/15/2026 | 18,892,000 | 19,667,131 |
| f | Metropolitan Edison Co. 4.30% due 1/15/2029 | 7,970,000 | 8,341,520 |
| f | Midland Cogeneration Venture L.P., 6.00% due 3/15/2025 | 4,823,440 | 4,846,477 |
| b | Mississippi Power Co., 3.259% (LIBOR 3 Month + 0.65%) due 3/27/2020 | 7,971,000 | 7,967,947 |
| f | Monongahela Power Co., 4.10% due 4/15/2024 | 12,500,000 | 12,986,707 |
| NextEra Energy Capital Holdings, Inc., 3.342% due 9/1/2020 | 9,742,000 | 9,812,652 | |
| f | Niagara Mohawk Power Corp., 4.881% due 8/15/2019 | 10,000,000 | 10,081,492 |
| Northern States Power Co., 3.30% due 6/15/2024 | 10,000,000 | 10,186,386 | |
| PNM Resources, Inc., 3.25% due 3/9/2021 | 7,784,000 | 7,779,330 | |
| Public Service Co. of New Mexico, 5.35% due 10/1/2021 | 3,000,000 | 3,139,490 | |
| f | Rochester Gas & Electric Corp., 5.90% due 7/15/2019 | 11,732,000 | 11,831,023 |
| San Diego Gas & Electric Co., 3.60% due 9/1/2023 | 4,212,000 | 4,295,741 | |
| SCANA Corp., 4.125% due 2/1/2022 | 3,937,000 | 3,985,475 | |
| b | Sempra Energy, 3.037% (LIBOR 3 Month + 0.25%) due 7/15/2019 | 16,800,000 | 16,775,810 |
| Southern Co., 3.25% due 7/1/2026 | 8,075,000 | 7,909,171 | |
| Southern Power Co., | |||
| b,f | 3.183% (LIBOR 3 Month + 0.55%) due 12/20/2020 | 1,875,000 | 1,866,706 |
| Series 15B, 2.375% due 6/1/2020 | 9,793,000 | 9,750,566 | |
| a,f | State Grid Overseas Investment (2014) Ltd. (Guaranty: State Grid Corp. of China), 2.75% due 5/7/2019 | 14,800,000 | 14,802,625 |
| a,f | State Grid Overseas Investment (2016) Ltd. (Guaranty: State Grid Corp. of China), 2.25% due 5/4/2020 | 10,000,000 | 9,917,642 |
| Toledo Edison Co., 7.25% due 5/1/2020 | 167,000 | 173,856 | |
| a,f | Transelec S.A., 4.25% due 1/14/2025 | 6,000,000 | 6,055,560 |
| UIL Holdings Corp., 4.625% due 10/1/2020 | 13,335,000 | 13,586,497 | |
| WEC Energy Group, Inc., | |||
| 3.10% due 3/8/2022 | 4,791,000 | 4,828,715 | |
| 3.375% due 6/15/2021 | 4,660,000 | 4,715,050 | |
| Gas Utilities — 1.0% | |||
| Dominion Energy Gas Holdings, LLC, 2.80% due 11/15/2020 | 5,225,000 | 5,224,082 | |
| Dominion Gas Holdings, LLC, 2.50% due 12/15/2019 | 3,900,000 | 3,889,094 | |
| f | SEMCO Energy, Inc., 5.15% due 4/21/2020 | 3,000,000 | 3,063,936 |
| Southern Co. Gas Capital Corp., 3.50% due 9/15/2021 | 9,925,000 | 10,048,513 | |
| Spire, Inc., 2.55% due 8/15/2019 | 2,350,000 | 2,343,434 | |
| WGL Holdings, Inc., | |||
| b | 3.029% (LIBOR 3 Month + 0.40%) due 11/29/2019 | 13,883,000 | 13,837,528 |
| b | 3.147% (LIBOR 3 Month + 0.55%) due 3/12/2020 | 12,318,000 | 12,266,519 |
| 377,236,827 | |||
| Total Corporate Bonds(Cost $2,457,765,436) | 2,475,384,504 | ||
| Municipal Bonds — 2.1% | |||
| Anaheim Public Financing Authority (Insured NATL), Series B, 5.486% due 9/1/2020 | 2,040,000 | 2,074,864 | |
| Brentwood Infrastructure Financing Authority, Series A, 6.16% due 10/1/2019 | 730,000 | 742,695 | |
| California School Finance Authority (LOC City National Bank), 5.041% due 7/1/2020 | 4,000,000 | 4,120,880 |
| PRINCIPAL AMOUNT | VALUE | ||
| Camden County Improvement Authority, 5.62% due 7/1/2019 | $ 3,025,000 | $ 3,040,881 | |
| Colorado Educational & Cultural Facilities Authority, | |||
| Series B, | |||
| 2.244% due 3/1/2021 | 450,000 | 447,745 | |
| 2.474% due 3/1/2022 | 600,000 | 599,028 | |
| 2.691% due 3/1/2023 | 580,000 | 582,436 | |
| Connecticut Housing Finance Authority, Series D, 5.071% due 11/15/2019 | 560,000 | 565,326 | |
| Denver City & County School District No. 1 COP, Series B, 2.018% due 12/15/2019 | 3,000,000 | 2,988,420 | |
| Fort Collins Electric Utility Enterprise Revenue ETM, Series B-QUALIFIED ENERGY, 4.92% due 12/1/2020 | 2,250,000 | 2,310,997 | |
| Kentucky Asset Liability Commission, 2.099% due 4/1/2019 | 3,000,000 | 3,000,000 | |
| Los Angeles County Public Works Financing Authority, 5.591% due 8/1/2020 | 3,350,000 | 3,471,605 | |
| Municipal Improvement Corp. of Los Angeles (Build America-BDS-Recovery Zone), Series B, 6.165% due 11/1/2020 | 11,885,000 | 12,321,774 | |
| New York City Transitional Finance Authority Future Tax Secured Revenue (Build America Bonds), 4.075% due 11/1/2020 | 2,500,000 | 2,561,425 | |
| New York State Urban Development Corp., Series D-1, 2.55% due 3/15/2022 | 29,675,000 | 29,616,243 | |
| i | Oklahoma Development Finance Authority, 8.00% due 5/1/2020 | 410,000 | 412,013 |
| Orleans Parish Parishwide School District (Insured AGM) GO, Series B, 4.40% due 2/1/2021 | 10,000,000 | 10,292,100 | |
| Redlands Redevelopment Agency Successor Agency (Insured AMBAC) ETM, Series A, 5.818% due 8/1/2022 | 1,050,000 | 1,114,050 | |
| Rutgers The State University of New Jersey, | |||
| Series K, | |||
| 2.342% due 5/1/2019 | 3,485,000 | 3,483,014 | |
| 3.028% due 5/1/2021 | 1,500,000 | 1,499,715 | |
| San Bernardino County Redevelopment Agency Successor Agency, Series A, 7.135% due 9/1/2020 | 560,000 | 579,561 | |
| San Francisco City & County Redevelopment Financing Authority ETM, 8.00% due 8/1/2019 | 2,650,000 | 2,698,018 | |
| San Francisco City & County Redevelopment Financing Authority, 8.00% due 8/1/2019 | 270,000 | 274,501 | |
| State of Connecticut GO, | |||
| Series A | |||
| 3.471% due 9/15/2022 | 4,695,000 | 4,781,247 | |
| 4.00% due 9/15/2021 | 3,980,000 | 4,101,310 | |
| Tampa-Hillsborough County Expressway Authority, | |||
| Series C, | |||
| 2.49% due 7/1/2019 | 2,500,000 | 2,496,075 | |
| 2.84% due 7/1/2020 | 1,750,000 | 1,745,905 | |
| Wallenpaupack Area School District GO, | |||
| Series B, | |||
| 3.80% due 9/1/2019 | 3,000,000 | 3,012,150 | |
| 4.00% due 9/1/2020 | 2,750,000 | 2,803,075 | |
| Total Municipal Bonds(Cost $106,352,974) | 107,737,053 | ||
| Short-Term Investments — 11.2% | |||
| Bank of New York Tri-Party Repurchase Agreement 2.60% dated 03/29/2019 due 04/01/2019, repurchase price $115,024,986 collateralized by 47 corporate debt securities, having an average coupon of 3.89%, a minimum credit rating of BBB-, maturity dates from 05/14/2021 to 03/15/2055, and having an aggregate market value of $122,936,741 at 03/31/2019 | 115,000,000 | 115,000,000 | |
| f | Berkshire Hathway Energy Co.,2.53% due 4/1/2019 | 1,000,000 | 1,000,000 |
| f | Bridgestone Americas, Inc.,2.43% due 4/1/2019 | 23,000,000 | 23,000,000 |
| f | Cintas Corp. No. 22.65% due 4/2/2019 | 2,285,000 | 2,284,832 |
| f | Cintas Executive2.58% due 4/1/2019 | 20,715,000 | 20,715,000 |
| Consolidated Edison Co. of New York, Inc., | |||
| f | 2.64% due 4/9/2019 | 22,158,000 | 22,145,001 |
| f | 2.66% due 4/4/2019 | 842,000 | 841,813 |
| a,f | Electricite de France S.A.,2.61% due 4/12/2019 | 23,000,000 | 22,981,657 |
| a,f | Experian Finance plc,2.60% due 4/1/2019 | 20,000,000 | 20,000,000 |
| Federal Agricultural Mortgage Corp. Discount Notes,2.25% due 4/1/2019 | 25,000,000 | 25,000,000 | |
| Federal Home Loan Bank Discount Notes, | |||
| 2.20% due 4/1/2019 | 16,000,000 | 16,000,000 | |
| 2.385% due 4/8/2019 | 23,467,000 | 23,456,117 | |
| 2.39% due 4/11/2019 | 6,700,000 | 6,695,552 | |
| 2.40% due 4/9/2019 | 15,100,000 | 15,091,947 | |
| 2.40% due 4/10/2019 | 3,500,000 | 3,497,900 | |
| Florida Gas Transmission Co., LLC,2.63% due 4/9/2019 | 23,000,000 | 22,986,558 | |
| f | Home Depot, Inc.,2.43% due 4/12/2019 | 23,000,000 | 22,982,922 |
| f | Illinois Tool Work, Inc.,2.41% due 4/3/2019 | 11,500,000 | 11,498,460 |
| f | Intercontinental Exchange, Inc.2.41% due 4/1/2019 | 4,550,000 | 4,550,000 |
Thornburg Limited Term Income Fund | March 31, 2019 (Unaudited)
| PRINCIPAL AMOUNT | VALUE | ||
| Kentucky Utilities Co., | |||
| f | 2.69% due 4/2/2019 | $ 1,800,000 | $ 1,799,865 |
| f | 2.71% due 4/2/2019 | 21,200,000 | 21,198,404 |
| f | Kimberly-Clark de Mexico SAB de CV,2.43% due 4/3/2019 | 3,238,000 | 3,237,563 |
| f | Louisville Gas & Electric Co.2.64% due 4/1/2019 | 15,000,000 | 15,000,000 |
| f | Louisville Gas & Electric Co.,2.65% due 4/2/2019 | 8,000,000 | 7,999,411 |
| LOWE’S Companies, | |||
| 2.60% due 4/1/2019 | 18,800,000 | 18,800,000 | |
| 2.62% due 4/5/2019 | 6,871,000 | 6,869,000 | |
| Northern IL Gas Corp.,2.57% due 4/2/2019 | 1,758,000 | 1,757,875 | |
| Nstar Electric Co.,2.50% due 4/3/2019 | 23,000,000 | 22,996,806 | |
| a,f | Reckitt Benckiser Treas,2.58% due 4/1/2019 | 23,000,000 | 23,000,000 |
| f | Roche Holdings, Inc.,2.36% due 4/1/2019 | 23,000,000 | 23,000,000 |
| f | San Diego Gas & Electric Co.2.60% due 4/1/2019 | 7,242,000 | 7,242,000 |
| San Diego Gas & Electric Co., | |||
| f | 2.75% due 4/5/2019 | 8,000,000 | 7,997,556 |
| f | 2.77% due 4/4/2019 | 7,758,000 | 7,756,209 |
| f | Sempra Energy,2.65% due 4/4/2019 | 23,000,000 | 22,994,921 |
| f | Southern Co. Gas Capital Corp.2.40% due 4/1/2019 | 10,000,000 | 10,000,000 |
| Total Short-Term Investments(Cost $581,377,369) | 581,377,369 | ||
| Total Investments — 99.7%(Cost $5,150,080,992) | $5,179,205,009 | ||
| Other Assets Less Liabilities — 0.3% | 15,263,316 | ||
| Net Assets — 100.0% | $5,194,468,325 |
| Footnote Legend | |
| a | Yankee bond denominated in U.S. dollars and is issued in the U.S. by foreign banks and corporations. |
| b | Floating Rate Security. Stated interest/floor rate was in effect at March 31, 2019. |
| c | Securities exempt from registration under Rule 144A of the Securities Act of 1933, as amended. These securities are restricted and illiquid. As of March 31, 2019, the aggregate value of these securities in the Fund’s portfolio was $8,777,499, representing 0.17% of the Fund’s net assets. Additional information is as follows: |
| 144A/Restricted & Illiquid Securities | Acquisition Date | Cost | Market Value | Percentage of Net Assets |
| Schahin II Finance Co. SPV Ltd., 5.875%, 9/25/2023 | 4/16/2014 | $ 3,997,417 | $ 408,280 | 0.0% |
| Bermuda Government International Bond, 4.138%, 1/03/2023 | 6/26/2012 | 4,000,000 | 4,060,000 | 0.1 |
| Northwind Holdings, LLC, 3.406%, 12/01/2037 | 1/29/2010 | 967,133 | 1,072,969 | 0.0 |
| U.S. Department of Transportation, 6.001%, 12/07/2031 | 12/16/2011 | 3,163,805 | 3,236,250 | 0.1 |
| d | Security currently fair valued by the Valuation and Pricing Committee using procedures approved by the Trustees’ Audit Committee. |
| e | Coupon rate adjusts periodically based upon a predetermined schedule. Stated interest rate in effect at March 31, 2019. |
| f | Securities exempt from registration under Rule 144A of the Securities Act of 1933, as amended. These securities are restricted but liquid and may only be resold in the ordinary course of business in transactions exempt from registration, normally to qualified institutional buyers. As of March 31, 2019, the aggregate value of these securities in the Fund’s portfolio was $2,024,043,238, representing 38.97% of the Fund’s net assets. |
| g | Interest Only |
| h | Variable rate coupon, rate shown as of March 31, 2019. |
| i | Illiquid security. |
| j | When-issued security. |
| k | Segregated as collateral for a when-issued security. |
| l | Fixed to floating security that initially pays a fixed rate and converts to a floating rate coupon at a specified date in the future. The rate presented is a fixed rate. |
| m | Bond in default. |
| n | Non-income producing. |
To simplify the listings of securities, abbreviations are used per the table below:
| AGM | Insured by Assured Guaranty Municipal Corp. |
| AMBAC | Insured by American Municipal Bond Assurance Corp. |
| CHL | Denominated in Chilean Peso |
| CMO | Collateralized Mortgage Obligation |
| COP | Certificates of Participation |
| ETM | Escrowed to Maturity |
| FDIC | Federal Deposit Insurance Corporation |
| GO | General Obligation |
| H15T1Y | US Treasury Yield Curve Rate T-Note Constant Maturity 1 Year |
| IO | Interest Only Security |
| LIBOR | London Interbank Offered Rates |
| LOC | Letter of Credit |
| Mtg | Mortgage |
| MTN | Medium-Term Note |
| REMIC | Real Estate Mortgage Investment Conduit |
| SOFR | Secured Overnight Financing Rate |
| SPV | Special Purpose Vehicle |
| VA | Veterans Affairs |
Thornburg Low Duration Income Fund | March 31, 2019 (Unaudited)

| KEY PORTFOLIO ATTRIBUTES | |
| Number of Bonds | 267 |
| Effective Duration | 1.5 Yrs |
| Average Maturity | 2.0 Yrs |
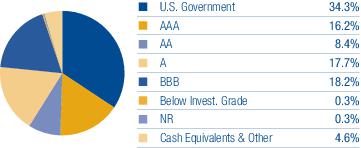
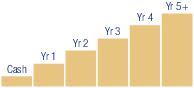
| 5% | 27% | 29% | 23% | 9% | 8% |
Thornburg Low Duration Income Fund | March 31, 2019 (Unaudited)
| PRINCIPAL AMOUNT | VALUE | ||
| U.S. Treasury Securities — 24.0% | |||
| United States Treasury Notes Inflationary Index, 0.125% due 4/15/2019 - 4/15/2022 | $ 955,224 | $ 950,140 | |
| United States Treasury Notes, | |||
| 1.25% due 8/31/2019 - 10/31/2019 | 1,800,000 | 1,788,477 | |
| 1.375% due 3/31/2020 - 1/31/2021 | 1,402,000 | 1,382,985 | |
| 1.625% due 12/31/2019 - 11/30/2020 | 700,000 | 694,707 | |
| 2.00% due 1/15/2021 | 146,000 | 145,196 | |
| 2.25% due 2/29/2020 | 1,237,000 | 1,235,333 | |
| 2.375% due 4/30/2020 - 12/31/2020 | 988,000 | 988,138 | |
| 2.875% due 10/31/2020 | 1,087,000 | 1,095,814 | |
| Total U.S. Treasury Securities(Cost $8,274,933) | 8,280,790 | ||
| U.S. Government Agencies — 3.5% | |||
| a | Durrah MSN 35603 (Guaranty: Export-Import Bank of the United States), 1.684% due 1/22/2025 | 417,954 | 406,336 |
| a | MSN 41079 and 41084 Ltd. (Guaranty: Export-Import Bank of the United States), 1.717% due 7/13/2024 | 437,295 | 426,224 |
| Petroleos Mexicanos (Guaranty: Export-Import Bank of the United States), | |||
| a | 1.70% due 12/20/2022 | 40,000 | 39,209 |
| a,b | 3.137% (LIBOR 3 Month + 0.35%) due 4/15/2025 | 62,500 | 62,705 |
| a | Reliance Industries Ltd. (Guaranty: Export-Import Bank of the United States), 1.87% due 1/15/2026 | 165,790 | 161,208 |
| a,b | Washington Aircraft 2 Co. Ltd. (Guaranty: Export-Import Bank of the United States), 3.04% (LIBOR 3 Month + 0.43%) due 6/26/2024 | 117,257 | 117,355 |
| Total U.S. Government Agencies(Cost $1,213,526) | 1,213,037 | ||
| Other Government — 0.1% | |||
| a,b,c | Seven & Seven Ltd. (Guaranty: Export-Import Bank of Korea), 3.683% (LIBOR 6 Month + 1.00%) due 9/11/2019 | 20,000 | 20,024 |
| Total Other Government(Cost $19,963) | 20,024 | ||
| Mortgage Backed — 5.1% | |||
| Federal Home Loan Mtg Corp., Pool G15523, 2.50% due 8/1/2025 | 89,820 | 90,201 | |
| Federal Home Loan Mtg Corp., CMO, Series K716 Class A1, 2.413% due 1/25/2021 | 36,421 | 36,276 | |
| Federal Home Loan Mtg Corp., Multi-Family Structured Pass Through, | |||
| Series K030 Class A1, 2.779% due 9/25/2022 | 69,723 | 69,847 | |
| Series K036 Class A1, 2.777% due 4/25/2023 | 144,835 | 145,396 | |
| Series K710 Class A2, 1.883% due 5/25/2019 | 115,160 | 114,845 | |
| Series K717 Class A2, 2.991% due 9/25/2021 | 100,000 | 100,760 | |
| Federal Home Loan Mtg Corp., Seasoned Credit Risk Transfer, | |||
| d | Series 2017-3 Class HA, 2.75% due 7/25/2056 | 64,088 | 65,179 |
| d | Series 2018-1 Class HA, 2.50% due 5/25/2057 | 44,825 | 44,695 |
| e | Series 2018-2 Class HA, 3.00% due 11/25/2057 | 181,394 | 183,070 |
| Series 2018-3 Class HA, 3.00% due 8/25/2057 | 93,208 | 93,554 | |
| Series 2018-4 Class HA, 3.00% due 3/25/2058 | 289,874 | 287,147 | |
| Series 2019-1 Class MA, 3.50% due 7/25/2058 | 49,683 | 50,425 | |
| Federal Home Loan Mtg Corp., Whole Loan Securities, Series 2017-SC02 Class 2A1, 3.50% due 5/25/2047 | 33,300 | 33,333 | |
| Federal National Mtg Assoc., | |||
| Pool AS3705, 2.50% due 11/1/2024 | 51,443 | 51,727 | |
| Pool AS8538, 2.50% due 12/1/2026 | 198,545 | 198,907 | |
| Pool MA3557, 4.00% due 1/1/2029 | 191,457 | 197,721 | |
| Total Mortgage Backed(Cost $1,748,144) | 1,763,083 | ||
| Asset Backed Securities — 22.9% | |||
| Advance Receivables — 0.7% | |||
| c | New Residential Advance Receivables Trust, Series 2016-T2 Class AT2, 2.575% due 10/15/2049 | 50,000 | 49,844 |
| c | SPS Servicer Advance Receivables Trust Advance Receivables Backed Notes, Series 2018-T1 3.62% due 10/17/2050 | 200,000 | 201,315 |
| 251,159 | |||
| Asset-Backed - Finance & Insurance — 2.7% | |||
| c | Ascentium Equipment Receivables Trust, Series 2018-2A Class A2, 3.27% due 10/12/2021 | 98,000 | 98,510 |
| Barclays Dryrock Issuance Trust, Series 2016-1 Class A, 1.52% due 5/16/2022 | 135,000 | 134,545 | |
| c | CCG Receivables Trust, Series 2017-1 Class A2, 1.84% due 11/14/2023 | 60,529 | �� 60,217 |
| c | MMAF Equipment Finance, LLC, 1.93% due 7/16/2021 | 85,755 | 85,593 |
| c | PFS Financing Corp., Series 2018-F 3.52% due 10/16/2023 | 100,000 | 101,575 |
Thornburg Low Duration Income Fund | March 31, 2019 (Unaudited)
| PRINCIPAL AMOUNT | VALUE | ||
| c | Upgrade Receivables Trust, Series 2018-1A 3.76% due 11/15/2024 | $ 148,064 | $ 148,483 |
| Upstart Securitization Trust, | |||
| c | Series 2018-2 Class B, 4.445% due 12/22/2025 | 150,000 | 150,520 |
| c | Series 2019-1 Class B, 4.19% due 4/20/2026 | 150,000 | 150,513 |
| 929,956 | |||
| Auto Receivables — 2.8% | |||
| c | American Credit Acceptance Receivables Trust, Series 2018-3 Class B, 3.49% due 6/13/2022 | 125,000 | 125,312 |
| c | Chesapeake Funding II, LLC, Series 2016-1A Class A1, 2.11% due 3/15/2028 | 31,144 | 31,104 |
| c | CIG Auto Receivables Trust, Series 2017-1A Class A, 2.71% due 5/15/2023 | 28,168 | 28,092 |
| c | CPS Auto Receivables Trust, Series 2019-1 Class B, 3.58% due 12/16/2024 | 100,000 | 100,518 |
| c | Drive Auto Receivables Trust, Series 2016-BA Class C, 3.19% due 7/15/2022 | 45,899 | 45,915 |
| Ford Credit Auto Lease Trust, Series 2017-B Class A2A, 1.80% due 6/15/2020 | 21,053 | 21,031 | |
| c | Foursight Capital Automobile Receivables Trust, Series 2016-1 Class A2, 2.87% due 10/15/2021 | 19,756 | 19,740 |
| GLS Auto Receivables Trust, | |||
| c | Series 2018-2A Class A, 3.25% due 4/18/2022 | 27,854 | 27,873 |
| c | Series 2018-3A 3.35% due 8/15/2022 | 78,091 | 78,220 |
| c | Series 2019-1A Class A, 3.37% due 1/17/2023 | 48,017 | 48,092 |
| Harley-Davidson Motorcycle Trust, Series 2015-2 Class A4, 1.66% due 12/15/2022 | 28,787 | 28,730 | |
| b,c | Hertz Fleet Lease Funding LP, Series 2016-1 Class A1, 3.593% (LIBOR 1 Month + 1.10%) due 4/10/2030 | 51,255 | 51,271 |
| OSCAR US Funding Trust, | |||
| c | Series 2016-2A Class A3, 2.73% due 12/15/2020 | 37,006 | 36,984 |
| a,c | Series 2018-1A Class A3, 3.23% due 5/10/2022 | 180,000 | 180,601 |
| c | Skopos Auto Receivables Trust, Series 2018-1A Class A, 3.19% due 9/15/2021 | 48,957 | 48,954 |
| c | Veros Automobile Receivables Trust, Series 2018-1 Class A, 3.63% due 5/15/2023 | 100,546 | 100,695 |
| 973,132 | |||
| Commercial MTG Trust — 0.9% | |||
| f | Barclays Commercial Mortgage Securities, LLC, Series 2015-STP Class A, 3.323% due 9/10/2028 | 74,606 | 74,970 |
| g | COMM Mortgage Trust, Series 2016-DC2 Class A1, 1.82% due 2/10/2049 | 62,473 | 61,939 |
| c,e | Credit Suisse Mortgage Trust, Series 2017-HL2 Class A3, 3.50% due 10/25/2047 | 135,831 | 135,630 |
| b,f | DBUBS Mortgage Trust, CMO, Series 2011-LC2A Class A1FL, 3.842% (LIBOR 1 Month + 1.35%) due 7/12/2044 | 20,110 | 20,233 |
| 292,772 | |||
| Other Asset Backed — 9.3% | |||
| Avant Loans Funding Trust, | |||
| c | Series 2018-A Class A, 3.09% due 6/15/2021 | 43,938 | 43,905 |
| c | Series 2019-A Class A, 3.48% due 7/15/2022 | 150,000 | 149,990 |
| c | AXIS Equipment Finance Receivables VI, LLC, Series 2018-2A Class A2, 3.89% due 7/20/2022 | 150,000 | 150,626 |
| c,e | Bayview Mortgage Fund IVc Trust, Series 2017-RT3 Class A, 3.50% due 1/28/2058 | 72,931 | 73,126 |
| c,e,h | Bayview Opportunity Master Fund IVa Trust, Series 2017-RT1 Class A1, 3.00% due 3/28/2057 | 122,364 | 121,248 |
| c | BCC Funding XIV, LLC, Series 2018-1A Class A2, 2.96% due 6/20/2023 | 83,812 | 83,897 |
| c | BRE Grand Islander Timeshare Issuer, LLC, Series 2017-1A Class A, 2.94% due 5/25/2029 | 57,783 | 57,428 |
| Consumer Loan Underlying Bond Credit Trust, | |||
| c | Series 2017-P1 Class A, 2.42% due 9/15/2023 | 4,555 | 4,552 |
| c | Series 2018-P2 Class A, 3.47% due 10/15/2025 | 74,461 | 74,582 |
| c | Series 2019-A Class A, 3.52% due 4/15/2026 | 118,462 | 118,462 |
| c | Series A, 3.82% due 1/15/2026 | 88,111 | 88,594 |
| Dell Equipment Finance Trust, | |||
| c | Series 2017-2 Class A2A, 1.97% due 2/24/2020 | 22,066 | 22,033 |
| c | Series 2018-1 Class A2A, 2.97% due 10/22/2020 | 89,491 | 89,610 |
| c | Engs Commercial Finance Trust, Series 2018-1A Class A1, 2.97% due 2/22/2021 | 95,311 | 95,273 |
| Foundation Finance Trust, | |||
| c | Series 2017-1A Class A, 3.30% due 7/15/2033 | 56,135 | 55,998 |
| c | Series 2019-1A Class A, 3.86% due 11/15/2034 | 150,000 | 149,977 |
| Homeward Opportunities Fund I Trust, | |||
| c,e | Series 2018-1 Class A1, 3.766% due 6/25/2048 | 81,969 | 82,809 |
| e,f,i,j | Series 2019-1 Class A1, 3.454% due 1/25/2059 | 100,000 | 99,999 |
| Louisiana Local Government Environmental Facilities & Community Development Authority, Series 2014-ELL Class A1, 1.66% due 2/1/2022 | 12,717 | 12,701 | |
| MVW Owner Trust, 2.15% due 4/22/2030 | 14,337 | 14,217 | |
| Nationstar HECM Loan Trust, | |||
| c,e | Series 2017-2A Class A1, 2.038% due 9/25/2027 | 72,025 | 71,327 |
| c,e | Series 2018-2A Class A, 3.188% due 7/25/2028 | 49,502 | 49,581 |
| c | Ocwen Master Advance Receivables Trust, Series 2018-T1 Class AT1, 3.301% due 8/15/2049 | 100,000 | 100,020 |
| PRINCIPAL AMOUNT | VALUE | ||
| c | OneMain Financial Issuance Trust, Series 2016-2A Class A, 4.10% due 3/20/2028 | $ 10,335 | $ 10,348 |
| b,c | Pennsylvania Higher Education Assistance Agency, Series 2012-1A Class A1, 3.036% (LIBOR 1 Month + 0.55%) due 5/25/2057 | 30,671 | 30,694 |
| c | PFS Financing Corp., Series 2018-B Class A, 2.89% due 2/15/2023 | 100,000 | 99,660 |
| c | Prosper Marketplace Issuance Trust, Series 2017-3A Class A, 2.36% due 11/15/2023 | 8,063 | 8,056 |
| PSNH Funding, LLC 3, Series 2018-1 Class A1, 3.094% due 2/1/2026 | 86,975 | 87,920 | |
| c | Purchasing Power Funding, LLC, Series 2018-A Class A, 3.34% due 8/15/2022 | 100,000 | 99,788 |
| c,d | SBA Tower Trust, Series 2014-1A Class C, 2.898% due 10/15/2044 | 100,000 | 99,885 |
| SCF Equipment Leasing, LLC, | |||
| c | Series 2017-2A Class A, 3.41% due 12/20/2023 | 91,708 | 91,783 |
| c | Series 2018-1A Class A2, 3.63% due 10/20/2024 | 83,334 | 83,377 |
| Sierra Timeshare Receivables Funding, LLC, | |||
| c | Series 2015-1A Class A, 2.40% due 3/22/2032 | 41,212 | 40,883 |
| c | Series 2015-2A Class A, 2.43% due 6/20/2032 | 43,870 | 43,523 |
| c | Series 2015-3A Class A, 2.58% due 9/20/2032 | 17,780 | 17,687 |
| Small Business Administration Participation Certificates, Series 2005-20K Class 1, 5.36% due 11/1/2025 | 18,400 | 18,951 | |
| Small Business Administration, Series 2009-20E Class 1, 4.43% due 5/1/2029 | 61,419 | 63,423 | |
| Social Professional Loan Program, LLC, | |||
| b,c | Series 2014-A Class A1, 4.086% (LIBOR 1 Month + 1.60%) due 6/25/2025 | 21,433 | 21,474 |
| c | Series 2014-B Class A2, 2.55% due 8/27/2029 | 11,818 | 11,701 |
| c | Tax Ease Funding, LLC, Series 2016-1A Class A, 3.131% due 6/15/2028 | 55,114 | 54,747 |
| Towd Point Mortgage Trust, | |||
| c,e | Series 2016-5 Class A1, 2.50% due 10/25/2056 | 61,093 | 59,692 |
| c,e | Series 2018-2 Class A1, 3.25% due 3/25/2058 | 88,290 | 87,940 |
| c,e | Series 2018-6 Class A1A, 3.75% due 3/25/2058 | 282,004 | 284,421 |
| b,c | Volvo Financial Equipment Master Owner Trust, Series 2017-A Class A, 2.984% (LIBOR 1 Month + 0.50%) due 11/15/2022 | 100,000 | 100,241 |
| 3,226,149 | |||
| Residential MTG Trust — 4.8% | |||
| Angel Oak Mortgage Trust, LLC, | |||
| e,f | Series 2017-1 Class A2, 3.085% due 1/25/2047 | 21,354 | 21,164 |
| e,f | Series 2017-3 Class A1, 2.708% due 11/25/2047 | 22,784 | 22,493 |
| e,f | Series 2018-1 Class A1, 3.258% due 4/27/2048 | 47,114 | 47,214 |
| e,f | Series 2018-2 Class A1, 3.674% due 7/27/2048 | 82,638 | 83,307 |
| c,e | Arroyo Mortgage Trust, Series 2018-1 Class A1, 3.763% due 4/25/2048 | 84,173 | 85,948 |
| c,e | Finance of America Structured Securities Trust, Series 2018-HB1 3.375% due 9/25/2028 | 59,774 | 59,750 |
| e,f | Flagstar Mortgage Trust, Series 2017-1 Class 2A2, 3.00% due 3/25/2047 | 77,010 | 76,090 |
| JPMorgan Mortgage Trust, | |||
| c,e | Series 2017-2 Class A6, 3.00% due 5/25/2047 | 38,810 | 38,350 |
| c,e | Series 2017-6 Class A5, 3.50% due 12/25/2048 | 86,032 | 86,309 |
| c,e | Series 2018-6 Class 1A4, 3.50% due 12/25/2048 | 182,157 | 182,315 |
| New Residential Mortgage Loan Trust CMO, | |||
| e,f | Series 2017-2A Class A3, 4.00% due 3/25/2057 | 265,698 | 271,680 |
| e,f | Series 2018-NQM1 3.986% due 11/25/2048 | 92,007 | 94,323 |
| New Residential Mortgage Loan Trust, | |||
| b,c | Series 2017-5A Class A1, 3.986% (LIBOR 1 Month + 1.50%) due 6/25/2057 | 61,414 | 62,434 |
| e,f | Series 2018-RPL1 Class A1, 3.50% due 12/25/2057 | 90,966 | 91,257 |
| c,e | Verus Securitization Trust CMO, Series 2018-3 Class A1, 4.108% due 10/25/2058 | 270,712 | 274,716 |
| c,e | Verus Securitization Trust, Series 2018-2 Class A1, 3.677% due 6/1/2058 | 80,328 | 81,137 |
| e,f | WinWater Mortgage Loan Trust, Series 2014-3 Class A7, 3.00% due 11/20/2044 | 79,543 | 79,335 |
| 1,657,822 | |||
| Student Loan — 1.7% | |||
| Navient Student Loan Trust, | |||
| b,c | Series 2016-6A Class A2, 3.236% (LIBOR 1 Month + 0.75%) due 3/25/2066 | 93,641 | 94,094 |
| c | Series 2018-EA Class A1, 3.43% due 12/15/2059 | 179,556 | 180,699 |
| b,c | Nelnet Student Loan Trust, Series 2016-A Class A1A, 4.236% (LIBOR 1 Month + 1.75%) due 12/26/2040 | 61,729 | 61,533 |
| SLM Student Loan Trust, | |||
| b,c | Series 2011-A Class A3, 4.984% (LIBOR 1 Month + 2.50%) due 1/15/2043 | 79,035 | 79,826 |
| b | Series 2013-4 Class A, 3.036% (LIBOR 1 Month + 0.55%) due 6/25/2043 | 40,185 | 39,990 |
| b,c | Series 2013-B Class A2B, 3.584% (LIBOR 1 Month + 1.10%) due 6/17/2030 | 48,113 | 48,204 |
| c | Sofi Professional Loan Program, LLC, Series 2016-B Class A2B, 2.74% due 10/25/2032 | 81,521 | 80,999 |
| 585,345 | |||
| Total Asset Backed Securities(Cost $7,897,605) | 7,916,335 |
Thornburg Low Duration Income Fund | March 31, 2019 (Unaudited)
| PRINCIPAL AMOUNT | VALUE | ||
| Corporate Bonds — 38.2% | |||
| Automobiles & Components — 2.2% | |||
| Automobiles — 1.6% | |||
| c | Daimler Finance North America, LLC 3.75% due 11/5/2021 | $ 175,000 | $ 178,066 |
| c | Harley-Davidson Financial Services, Inc. 2.40% due 6/15/2020 | 144,000 | 142,348 |
| c | Hyundai Capital America, 3.95% due 2/1/2022 | 70,000 | 71,002 |
| b,c | Nissan Motor Acceptance Corp., 3.287% (LIBOR 3 Month + 0.69%) due 9/28/2022 | 33,000 | 32,258 |
| Toyota Motor Credit Corp., | |||
| b | 3.088% (LIBOR 3 Month + 0.40%) due 2/13/2020 | 100,000 | 100,000 |
| b | 3.344% (LIBOR 3 Month + 0.54%) due 1/8/2021 | 50,000 | 50,252 |
| Trading Companies & Distributors — 0.6% | |||
| a,c | Mitsubishi UFJ Lease & Finance Co. Ltd., 3.406% due 2/28/2022 | 200,000 | 201,806 |
| 775,732 | |||
| Banks — 3.4% | |||
| Banks — 3.4% | |||
| a,b,c | ABN AMRO Bank N.V., 3.209% (LIBOR 3 Month + 0.57%) due 8/27/2021 | 200,000 | 200,210 |
| a | Lloyds Bank plc, 3.30% due 5/7/2021 | 200,000 | 201,561 |
| a,c | Mizuho Bank Ltd., 2.70% due 10/20/2020 | 200,000 | 199,408 |
| Santander Holdings USA, Inc., | |||
| 3.40% due 1/18/2023 | 43,000 | 42,976 | |
| 4.45% due 12/3/2021 | 40,000 | 41,214 | |
| k | SunTrust Bank, 3.525% (LIBOR 3 Month + 0.50%) due 10/26/2021 | 225,000 | 227,341 |
| Zions Bancorp N.A., 3.35% due 3/4/2022 | 250,000 | 252,198 | |
| 1,164,908 | |||
| Capital Goods — 0.6% | |||
| Aerospace & Defense — 0.3% | |||
| b | General Dynamics Corp., 3.077% (LIBOR 3 Month + 0.38%) due 5/11/2021 | 100,000 | 100,424 |
| Machinery — 0.3% | |||
| b | Wabtec Corp., 3.911% (LIBOR 3 Month + 1.05%) due 9/15/2021 | 100,000 | 99,882 |
| 200,306 | |||
| Commercial & Professional Services — 0.6% | |||
| Leisure Products — 0.3% | |||
| Mattel, Inc., 2.35% due 8/15/2021 | 125,000 | 117,813 | |
| Professional Services — 0.3% | |||
| Verisk Analytics, Inc., 5.80% due 5/1/2021 | 100,000 | 105,642 | |
| 223,455 | |||
| Consumer Durables & Apparel — 0.4% | |||
| Household Durables — 0.4% | |||
| Tupperware Brands Corp. (Guaranty: Dart Industries, Inc.), 4.75% due 6/1/2021 | 125,000 | 128,159 | |
| 128,159 | |||
| Diversified Financials — 5.1% | |||
| Capital Markets — 1.1% | |||
| CBOE Holdings, Inc., 1.95% due 6/28/2019 | 100,000 | 99,800 | |
| Export Leasing (2009), LLC (Guaranty: Export-Import Bank of the United States), 1.859% due 8/28/2021 | 32,766 | 32,424 | |
| c | GTP Acquisition Partners I, LLC (Guaranty: American Tower Holding Sub II, LLC), 2.35% due 6/15/2045 | 100,000 | 98,867 |
| Legg Mason, Inc., 2.70% due 7/15/2019 | 100,000 | 99,936 | |
| TPG Specialty Lending, Inc., 4.50% due 1/22/2023 | 40,000 | 40,149 | |
| Consumer Finance — 0.7% | |||
| Wells Fargo Bank N.A., 3.625% due 10/22/2021 | 250,000 | 254,685 | |
| Diversified Financial Services — 3.3% | |||
| Bank of New York Mellon Corp., 2.05% due 5/3/2021 | 154,000 | 152,004 | |
| Citigroup, Inc., 2.65% due 10/26/2020 | 100,000 | 99,750 | |
| a,b | Deutsche Bank AG, 3.869% (LIBOR 3 Month + 1.23%) due 2/27/2023 | 100,000 | 96,009 |
| Goldman Sachs Group, Inc., | |||
| b | 3.811% (LIBOR 3 Month + 1.20%) due 9/15/2020 | 100,000 | 101,030 |
| b | 3.875% (LIBOR 3 Month + 1.11%) due 4/26/2022 | 84,000 | 84,450 |
| PRINCIPAL AMOUNT | VALUE | ||
| JPMorgan Chase & Co., | |||
| b | 3.151% (LIBOR 3 Month + 0.55%) due 3/9/2021 | $ 42,000 | $ 42,040 |
| b | 3.957% (LIBOR 3 Month + 1.21%) due 10/29/2020 | 125,000 | 126,737 |
| b | Morgan Stanley, 3.905% (LIBOR 3 Month + 1.14%) due 1/27/2020 | 75,000 | 75,486 |
| b | State Street Corp., 3.583% (LIBOR 3 Month + 0.90%) due 8/18/2020 | 100,000 | 101,007 |
| Synchrony Financial, 3.00% due 8/15/2019 | 50,000 | 50,010 | |
| a,b,c | UBS Group Funding Switzerland AG, 4.577% (LIBOR 3 Month + 1.78%) due 4/14/2021 | 200,000 | 204,925 |
| 1,759,309 | |||
| Energy — 1.9% | |||
| Oil, Gas & Consumable Fuels — 1.9% | |||
| EQT Midstream Partners L.P., Series 5Y, 4.75% due 7/15/2023 | 60,000 | 61,193 | |
| c | Midwest Connector Capital Co., LLC, 3.625% due 4/1/2022 | 99,000 | 100,397 |
| a | Petroleos Mexicanos, 4.875% due 1/24/2022 | 150,000 | 151,277 |
| a,c | Sinopec Group Overseas Development 2018 Ltd., 3.75% due 9/12/2023 | 200,000 | 203,967 |
| c | Texas Gas Transmission, LLC, 4.50% due 2/1/2021 | 129,000 | 131,052 |
| 647,886 | |||
| Food & Staples Retailing — 0.3% | |||
| Food & Staples Retailing — 0.3% | |||
| a,c | Alimentation Couche-Tard, Inc., 2.70% due 7/26/2022 | 100,000 | 98,955 |
| 98,955 | |||
| Food, Beverage & Tobacco — 3.6% | |||
| Beverages — 0.6% | |||
| Molson Coors Brewing Co., 2.10% due 7/15/2021 | 150,000 | 147,159 | |
| b | PepsiCo, Inc., 3.325% (LIBOR 3 Month + 0.53%) due 10/6/2021 | 75,000 | 75,560 |
| Food Products — 1.8% | |||
| Conagra Brands, Inc., | |||
| b | 3.297% (LIBOR 3 Month + 0.50%) due 10/9/2020 | 100,000 | 99,469 |
| 3.80% due 10/22/2021 | 92,000 | 93,724 | |
| General Mills, Inc., | |||
| b | 3.319% (LIBOR 3 Month + 0.54%) due 4/16/2021 | 20,000 | 19,963 |
| b | 3.783% (LIBOR 3 Month + 1.01%) due 10/17/2023 | 100,000 | 100,714 |
| JM Smucker Co., 2.50% due 3/15/2020 | 50,000 | 49,861 | |
| b | Kraft Heinz Foods Co. (Guaranty: Kraft Heinz Co.), 3.117% (LIBOR 3 Month + 0.42%) due 8/9/2019 | 50,000 | 50,019 |
| Mead Johnson Nutrition Co. (Guaranty: Reckitt Benckiser Group plc), 3.00% due 11/15/2020 | 100,000 | 100,348 | |
| b | Tyson Foods, Inc., 3.165% (LIBOR 3 Month + 0.55%) due 6/2/2020 | 100,000 | 99,919 |
| Tobacco — 1.2% | |||
| Altria Group, Inc. (Guaranty: Philip Morris USA, Inc.), | |||
| 2.625% due 1/14/2020 | 200,000 | 199,546 | |
| 3.49% due 2/14/2022 | 120,000 | 121,884 | |
| b | BAT Capital Corp., 3.283% (LIBOR 3 Month + 0.59%) due 8/14/2020 | 100,000 | 99,785 |
| 1,257,951 | |||
| Healthcare Equipment & Services — 1.3% | |||
| Health Care Providers & Services — 1.3% | |||
| Anthem, Inc., 2.50% due 11/21/2020 | 75,000 | 74,618 | |
| b | CVS Health Corp., 3.231% (LIBOR 3 Month + 0.63%) due 3/9/2020 | 40,000 | 40,091 |
| Express Scripts Holding Co., 2.60% due 11/30/2020 | 62,000 | 61,734 | |
| c | Halfmoon Parent, Inc., 3.40% due 9/17/2021 | 75,000 | 75,763 |
| b,c | Roche Holdings, Inc. (Guaranty: Roche Holding AG), 2.941% (LIBOR 3 Month + 0.34%) due 9/30/2019 | 200,000 | 200,256 |
| 452,462 | |||
| Household & Personal Products — 0.1% | |||
| Household Products — 0.1% | |||
| Church & Dwight Co., Inc., 2.45% due 8/1/2022 | 50,000 | 49,217 | |
| 49,217 | |||
| Insurance — 3.9% | |||
| Insurance — 3.9% | |||
| b,c | AIG Global Funding, 3.062% (LIBOR 3 Month + 0.46%) due 6/25/2021 | 50,000 | 50,011 |
| a | Enstar Group Ltd., 4.50% due 3/10/2022 | 50,000 | 50,914 |
Thornburg Low Duration Income Fund | March 31, 2019 (Unaudited)
| PRINCIPAL AMOUNT | VALUE | ||
| c | Guardian Life Global Funding, 3.40% due 4/25/2023 | $ 57,000 | $ 58,201 |
| Infinity Property & Casualty Corp., 5.00% due 9/19/2022 | 100,000 | 103,462 | |
| Jackson National Life Global Funding, | |||
| c | 2.10% due 10/25/2021 | 100,000 | 98,137 |
| b,c | 3.081% (LIBOR 3 Month + 0.48%) due 6/11/2021 | 100,000 | 100,206 |
| c | MassMutual Global Funding II, 2.00% due 4/15/2021 | 200,000 | 197,313 |
| b,c | Metropolitan Life Global Funding, 3.00% (SOFR + 0.57%) due 9/7/2020 | 150,000 | 149,999 |
| c | Principal Life Global Funding II (Guaranty: Principal Financial Group, Inc.), 2.375% due 9/11/2019 | 50,000 | 49,922 |
| b,c | Protective Life Global Funding, 3.117% (LIBOR 3 Month + 0.52%) due 6/28/2021 | 150,000 | 150,225 |
| c | Reliance Standard Life Global Funding, 3.85% due 9/19/2023 | 50,000 | 51,025 |
| Reliance Standard Life Insurance Co., | |||
| c | 2.50% due 4/24/2019 | 100,000 | 99,976 |
| c | 3.05% due 1/20/2021 | 25,000 | 24,976 |
| a | Willis Towers Watson plc, 5.75% due 3/15/2021 | 170,000 | 178,003 |
| 1,362,370 | |||
| Materials — 0.5% | |||
| Chemicals — 0.5% | |||
| b,c | Chevron Phillips Chemical Co., LLC, 3.486% (LIBOR 3 Month + 0.75%) due 5/1/2020 | 100,000 | 100,222 |
| DowDuPont, Inc. 3.766% due 11/15/2020 | 70,000 | 71,278 | |
| 171,500 | |||
| Media & Entertainment — 0.5% | |||
| Media — 0.5% | |||
| c | Cox Communications, Inc., 3.25% due 12/15/2022 | 160,000 | 161,111 |
| 161,111 | |||
| Pharmaceuticals, Biotechnology & Life Sciences — 0.7% | |||
| Biotechnology — 0.4% | |||
| Celgene Corp., | |||
| 2.75% due 2/15/2023 | 100,000 | 99,038 | |
| 3.25% due 2/20/2023 | 44,000 | 44,364 | |
| Pharmaceuticals — 0.3% | |||
| a,b | AstraZeneca plc, 3.348% (LIBOR 3 Month + 0.67%) due 8/17/2023 | 65,000 | 64,659 |
| a | Shire Acquisitions Investments Ireland DAC, 2.40% due 9/23/2021 | 44,000 | 43,457 |
| 251,518 | |||
| Real Estate — 0.3% | |||
| Equity Real Estate Investment Trusts — 0.3% | |||
| Crown Castle International Corp., 3.20% due 9/1/2024 | 115,000 | 114,121 | |
| 114,121 | |||
| Retailing — 0.7% | |||
| Internet & Direct Marketing Retail — 0.2% | |||
| Booking Holdings, Inc., 2.75% due 3/15/2023 | 50,000 | 49,751 | |
| Multiline Retail — 0.5% | |||
| b | Dollar Tree, Inc., 3.473% (LIBOR 3 Month + 0.70%) due 4/17/2020 | 175,000 | 175,039 |
| 224,790 | |||
| Semiconductors & Semiconductor Equipment — 0.4% | |||
| Semiconductors & Semiconductor Equipment — 0.4% | |||
| Broadcom Corp. / Broadcom Cayman Finance Ltd., 2.375% due 1/15/2020 | 125,000 | 124,331 | |
| 124,331 | |||
| Software & Services — 0.8% | |||
| Information Technology Services — 0.4% | |||
| Total System Services, Inc., 4.00% due 6/1/2023 | 70,000 | 71,919 | |
| b | Western Union Co., 3.463% (LIBOR 3 Month + 0.80%) due 5/22/2019 | 60,000 | 60,019 |
| Software — 0.4% | |||
| Autodesk, Inc., 3.125% due 6/15/2020 | 100,000 | 100,221 | |
| VMware, Inc., 2.30% due 8/21/2020 | 50,000 | 49,537 | |
| 281,696 |
| PRINCIPAL AMOUNT | VALUE | ||
| Technology Hardware & Equipment — 0.7% | |||
| Communications Equipment — 0.3% | |||
| Juniper Networks, Inc., 3.30% due 6/15/2020 | $ 100,000 | $ 100,389 | |
| Technology Hardware, Storage & Peripherals — 0.4% | |||
| Hewlett Packard Enterprise Co., 3.50% due 10/5/2021 | 132,000 | 133,733 | |
| 234,122 | |||
| Telecommunication Services — 2.8% | |||
| Diversified Telecommunication Services — 0.7% | |||
| AT&T, Inc., | |||
| 2.45% due 6/30/2020 | 100,000 | 99,623 | |
| b | 3.531% (LIBOR 3 Month + 0.93%) due 6/30/2020 | 50,000 | 50,358 |
| a | Deutsche Telekom International Finance B.V., 6.00% due 7/8/2019 | 91,000 | 91,747 |
| Media — 0.3% | |||
| b,c | NBCUniversal Enterprise, Inc., 2.992% (LIBOR 3 Month + 0.40%) due 4/1/2021 | 100,000 | 100,124 |
| Wireless Telecommunication Services — 1.8% | |||
| Sprint Communications, Inc., 9.25% due 4/15/2022 | 400,000 | 466,000 | |
| a | Vodafone Group plc, 2.50% due 9/26/2022 | 160,000 | 157,116 |
| 964,968 | |||
| Transportation — 0.4% | |||
| Road & Rail — 0.4% | |||
| Penske Truck Leasing Co. L.P. / PTL Finance Corp., | |||
| c | 3.20% due 7/15/2020 | 100,000 | 100,211 |
| c | 3.65% due 7/29/2021 | 35,000 | 35,473 |
| 135,684 | |||
| Utilities — 7.0% | |||
| Electric Utilities — 6.4% | |||
| c | Alliant Energy Finance, LLC, 3.75% due 6/15/2023 | 100,000 | 101,985 |
| American Electric Power Co., Inc. 2.15% due 11/13/2020 | 225,000 | 222,890 | |
| CenterPoint Energy, Inc. 3.60% due 11/1/2021 | 150,000 | 152,219 | |
| b | Consolidated Edison Co. of New York, Inc., Series C, 3.002% (LIBOR 3 Month + 0.40%) due 6/25/2021 | 100,000 | 99,849 |
| Duke Energy Florida Project Finance, LLC, Series 2018, 1.196% due 3/1/2022 | 52,142 | 51,617 | |
| a,c | Electricite de France S.A., 4.60% due 1/27/2020 | 25,000 | 25,426 |
| a,c | Enel Finance International N.V., 4.25% due 9/14/2023 | 200,000 | 204,388 |
| Exelon Corp., 2.85% due 6/15/2020 | 50,000 | 49,946 | |
| b | Mississippi Power Co., 3.259% (LIBOR 3 Month + 0.65%) due 3/27/2020 | 200,000 | 199,923 |
| NextEra Energy Capital Holdings, Inc., 3.342% due 9/1/2020 | 130,000 | 130,943 | |
| PNM Resources, Inc., 3.25% due 3/9/2021 | 100,000 | 99,940 | |
| Public Service Enterprise Group, 2.65% due 11/15/2022 | 50,000 | 49,578 | |
| SCANA Corp., 4.125% due 2/1/2022 | 22,000 | 22,271 | |
| b | Sempra Energy, 3.037% (LIBOR 3 Month + 0.25%) due 7/15/2019 | 110,000 | 109,842 |
| b,c | Southern Power Co., 3.183% (LIBOR 3 Month + 0.55%) due 12/20/2020 | 115,000 | 114,491 |
| a,c | State Grid Overseas Investment (2014) Ltd. (Guaranty: State Grid Corp. of China), 2.75% due 5/7/2019 | 200,000 | 200,035 |
| Tampa Electric Co., 2.60% due 9/15/2022 | 185,000 | 183,708 | |
| Virginia Electric & Power Co., 2.95% due 1/15/2022 | 100,000 | 100,363 | |
| WEC Energy Group, Inc., 3.375% due 6/15/2021 | 100,000 | 101,181 | |
| Gas Utilities — 0.6% | |||
| Dominion Gas Holdings, LLC, 2.50% due 12/15/2019 | 100,000 | 99,720 | |
| WGL Holdings, Inc., | |||
| b | 3.029% (LIBOR 3 Month + 0.40%) due 11/29/2019 | 50,000 | 49,836 |
| b | 3.147% (LIBOR 3 Month + 0.55%) due 3/12/2020 | 58,000 | 57,758 |
| 2,427,909 | |||
| Total Corporate Bonds(Cost $13,128,823) | 13,212,460 | ||
| Municipal Bonds — 1.1% | |||
| Colorado Educational & Cultural Facilities Authority, | |||
| Series B, | |||
| 2.244% due 3/1/2021 | 50,000 | 49,750 | |
| 2.474% due 3/1/2022 | 50,000 | 49,919 | |
| Los Angeles County Public Works Financing Authority, 5.591% due 8/1/2020 | 100,000 | 103,630 |
Thornburg Low Duration Income Fund | March 31, 2019 (Unaudited)
| PRINCIPAL AMOUNT | VALUE | ||
| New York State Urban Development Corp., Series D-1, 2.55% due 3/15/2022 | $ 120,000 | $ 119,762 | |
| State of Connecticut GO, | |||
| Series A | |||
| 3.471% due 9/15/2022 | 20,000 | 20,367 | |
| 4.00% due 9/15/2021 | 20,000 | 20,610 | |
| Total Municipal Bonds(Cost $364,984) | 364,038 | ||
| Short-Term Investments — 11.3% | |||
| l | Thornburg Capital Management Fund | 392,036 | 3,920,359 |
| Total Short-Term Investments(Cost $3,920,359) | 3,920,359 | ||
| Total Investments — 106.2%(Cost $36,568,337) | $36,690,126 | ||
| Liabilities Net of Other Assets — (6.2)% | (2,149,155) | ||
| Net Assets — 100.0% | $34,540,971 |
| Footnote Legend | |
| a | Yankee bond denominated in U.S. dollars and is issued in the U.S. by foreign banks and corporations. |
| b | Floating Rate Security. Stated interest/floor rate was in effect at March 31, 2019. |
| c | Securities exempt from registration under Rule 144A of the Securities Act of 1933, as amended. These securities are restricted but liquid and may only be resold in the ordinary course of business in transactions exempt from registration, normally to qualified institutional buyers. As of March 31, 2019, the aggregate value of these securities in the Fund’s portfolio was $10,783,584, representing 31.22% of the Fund’s net assets. |
| d | Coupon rate adjusts periodically based upon a predetermined schedule. Stated interest rate in effect at March 31, 2019. |
| e | Variable rate coupon, rate shown as of March 31, 2019. |
| f | Securities exempt from registration under Rule 144A of the Securities Act of 1933, as amended. These securities are restricted and illiquid. As of March 31, 2019, the aggregate value of these securities in the Fund’s portfolio was $982,065, representing 2.84% of the Fund’s net assets. Additional information is as follows: |
| 144A/Restricted & Illiquid Securities | Acquisition Date | Cost | Market Value | Percentage of Net Assets |
| Angel Oak Mortgage Trust, LLC, 3.085%, 1/25/2047 | 3/03/2017 | $ 21,351 | $ 21,164 | 0.1% |
| Angel Oak Mortgage Trust, LLC, 2.708%, 11/25/2047 | 11/22/2017 | 22,782 | 22,493 | 0.1 |
| Barclays Commercial Mortgage Securities, LLC, 3.323%, 9/10/2028 | 10/08/2015 | 76,269 | 74,970 | 0.2 |
| DBUBS Mortgage Trust, CMO, 3.842%, 7/12/2044 | 3/31/2015 | 20,362 | 20,233 | 0.1 |
| Flagstar Mortgage Trust, 3.00%, 3/25/2047 | 7/27/2017 | 77,977 | 76,090 | 0.2 |
| New Residential Mortgage Loan Trust CMO, 4.00%, 3/25/2057 | 4/19/2017 | 270,095 | 271,680 | 0.8 |
| WinWater Mortgage Loan Trust, 3.00%, 11/20/2044 | 9/21/2017 | 79,834 | 79,335 | 0.2 |
| Angel Oak Mortgage Trust, LLC, 3.258%, 4/27/2048 | 3/28/2018 | 47,111 | 47,214 | 0.1 |
| Angel Oak Mortgage Trust, LLC, 3.674%, 7/27/2048 | 6/21/2018 | 82,634 | 83,307 | 0.2 |
| New Residential Mortgage Loan Trust, 3.50%, 12/25/2057 | 6/07/2018 | 90,404 | 91,257 | 0.3 |
| New Residential Mortgage Loan Trust CMO, 3.986%, 11/25/2048 | 10/19/2018 | 92,004 | 94,323 | 0.3 |
| Homeward Opportunities Fund I Trust, 3.454%, 1/25/2059 | 3/29/2019 | 99,999 | 99,999 | 0.3 |
| g | Illiquid security. |
| h | Segregated as collateral for a when-issued security. |
| i | Security currently fair valued by the Valuation and Pricing Committee using procedures approved by the Trustees’ Audit Committee. |
| j | When-issued security. |
| k | Fixed to floating security that initially pays a fixed rate and converts to a floating rate coupon at a specified date in the future. The rate presented is a fixed rate. |
| l | Investment in Affiliates. |
| CMO | Collateralized Mortgage Obligation |
| GO | General Obligation |
| LIBOR | London Interbank Offered Rates |
| Mtg | Mortgage |
| SOFR | Secured Overnight Financing Rate |
March 31, 2019 (Unaudited)
| THORNBURG LIMITED TERM U.S. GOVERNMENT FUND | THORNBURG LIMITED TERM INCOME FUND | THORNBURG LOW DURATION INCOME FUND | |
| ASSETS | |||
| Investments at value (Note 3) | |||
| Non-affiliated issuers (cost $229,320,181, $5,150,080,992 and $32,647,978, respectively) | $ 228,518,081 | $ 5,179,205,009 | $ 32,769,767 |
| Non-controlled affiliated issuer (cost $0, $0 and $3,920,359, respectively) | - | - | 3,920,359 |
| Cash | 30,579 | 235,103 | 1,537 |
| Receivable for investments sold | 1,339,815 | 1,520,000 | - |
| Receivable for fund shares sold | 1,126,130 | 15,251,896 | 57,474 |
| Dividends receivable | - | - | 11,870 |
| Dividend and interest reclaim receivable | - | 2,958 | 48 |
| Interest receivable | 765,913 | 29,159,481 | 168,205 |
| Prepaid expenses and other assets | 64,433 | 262,277 | 37,864 |
| Total Assets | 231,844,951 | 5,225,636,724 | 36,967,124 |
| Liabilities | |||
| Payable for investments purchased | - | 18,284,206 | 2,309,384 |
| Payable for fund shares redeemed | 967,020 | 8,293,708 | 74,962 |
| Payable to investment advisor and other affiliates (Note 4) | 110,965 | 2,014,646 | 3,516 |
| Accounts payable and accrued expenses | 108,863 | 994,947 | 32,116 |
| Dividends payable | 87,664 | 1,580,892 | 6,175 |
| Total Liabilities | 1,274,512 | 31,168,399 | 2,426,153 |
| Commitments and contingencies (Note 2) | |||
| Net Assets | $ 230,570,439 | $ 5,194,468,325 | $ 34,540,971 |
| NET ASSETS CONSIST OF | |||
| Distributable earnings (accumulated loss) | $ (13,210,847) | $ 34,853,347 | $ 190,187 |
| Net capital paid in on shares of beneficial interest | 243,781,286 | 5,159,614,978 | 34,350,784 |
| $ 230,570,439 | $ 5,194,468,325 | $ 34,540,971 |
March 31, 2019 (Unaudited)
| THORNBURG LIMITED TERM U.S. GOVERNMENT FUND | THORNBURG LIMITED TERM INCOME FUND | THORNBURG LOW DURATION INCOME FUND | |
| NET ASSET VALUE | |||
| Class A Shares: | |||
| Net asset value and redemption price per share ($67,245,882, $611,262,854 and $8,751,022 applicable to 5,199,217, 45,646,481 and 705,984 shares of beneficial interest outstanding - Note 5) | $ 12.93 | $ 13.39 | $ 12.40 |
| Maximum sales charge, 1.50% of offering price | 0.20 | 0.20 | 0.19 |
| Maximum offering price per share | $ 13.13 | $ 13.59 | $ 12.59 |
| Class C Shares: | |||
| Net asset value and offering price per share* ($18,411,198 and $384,187,615 applicable to 1,415,078 and 28,734,831 shares of beneficial interest outstanding - Note 5) | $ 13.01 | $ 13.37 | $ - |
| Class I Shares: | |||
| Net asset value, offering and redemption price per share ($132,667,576, $3,974,143,844 and $25,789,949 applicable to 10,257,692, 296,712,705 and 2,081,765 shares of beneficial interest outstanding - Note 5) | $ 12.93 | $ 13.39 | $ 12.39 |
| Class R3 Shares: | |||
| Net asset value, offering and redemption price per share ($9,383,295 and $74,349,111 applicable to 725,057 and 5,548,040 shares of beneficial interest outstanding - Note 5) | $ 12.94 | $ 13.40 | $ - |
| Class R4 Shares: | |||
| Net asset value, offering and redemption price per share ($2,226,535 and $9,713,413 applicable to 172,198 and 725,699 shares of beneficial interest outstanding - Note 5) | $ 12.93 | $ 13.38 | $ - |
| Class R5 Shares: | |||
| Net asset value, offering and redemption price per share ($635,953 and $103,386,536 applicable to 49,128 and 7,721,273 shares of beneficial interest outstanding - Note 5) | $ 12.94 | $ 13.39 | $ - |
| Class R6 Shares: | |||
| Net asset value, offering and redemption price per share ($37,424,952 applicable to 2,788,807 shares of beneficial interest outstanding - Note 5) | $ - | $ 13.42 | $ - |
| * | Redemption price per share is equal to net asset value less any applicable contingent deferred sales charge. |
Six Months Ended March 31, 2019 (Unaudited)
| THORNBURG LIMITED TERM U.S. GOVERNMENT FUND | THORNBURG LIMITED TERM INCOME FUND | THORNBURG LOW DURATION INCOME FUND | |
| INVESTMENT INCOME | |||
| Dividend income non-controlled affiliated issuer | $ - | $ - | $ 57,191 |
| Interest income (net of premium amortized of $207,985, $2,611,873, and $14,675, respectively) | 2,535,772 | 84,294,592 | 474,977 |
| Total Income | 2,535,772 | 84,294,592 | 532,168 |
| EXPENSES | |||
| Investment advisory fees (Note 4) | 433,247 | 8,493,623 | 72,561 |
| Administration fees (Note 4) | |||
| Class A Shares | 30,522 | 279,458 | 3,857 |
| Class C Shares | 8,435 | 181,707 | - |
| Class I Shares | 57,165 | 1,655,939 | 12,067 |
| Class R3 Shares | 3,999 | 39,699 | - |
| Class R4 Shares | 1,001 | 3,927 | - |
| Class R5 Shares | 284 | 55,704 | - |
| Class R6 Shares | - | 17,056 | - |
| Distribution and service fees (Note 4) | |||
| Class A Shares | 86,888 | 796,278 | 8,742 |
| Class C Shares | 48,022 | 1,034,810 | - |
| Class R3 Shares | 22,781 | 225,872 | - |
| Class R4 Shares | 2,858 | 11,164 | - |
| Transfer agent fees | |||
| Class A Shares | 32,290 | 430,500 | 16,284 |
| Class C Shares | 14,850 | 185,250 | - |
| Class I Shares | 53,250 | 1,626,500 | 3,092 |
| Class R3 Shares | 12,200 | 54,970 | - |
| Class R4 Shares | 7,008 | 25,662 | - |
| Class R5 Shares | 1,638 | 163,202 | - |
| Class R6 Shares | - | 1,546 | - |
| Registration and filing fees | |||
| Class A Shares | 5,957 | 10,582 | 8,072 |
| Class C Shares | 5,780 | 8,016 | - |
| Class I Shares | 6,823 | 28,593 | 7,580 |
| Class R3 Shares | 5,803 | 6,447 | - |
| Class R4 Shares | 5,535 | 5,759 | - |
| Class R5 Shares | 6,030 | 6,308 | - |
| Class R6 Shares | - | 5,717 | - |
| Custodian fees (Note 2) | 25,470 | 115,570 | 24,100 |
| Professional fees | 23,750 | 65,940 | 21,562 |
| Trustee and officer fees (Note 4) | 5,996 | 138,860 | 908 |
| Other expenses | 20,988 | 218,862 | 6,919 |
| Total Expenses | 928,570 | 15,893,521 | 185,744 |
| Less: | |||
| Expenses reimbursed by investment advisor (Note 4) | (37,470) | (376,522) | (51,230) |
| Investment advisory fees waived by investment advisor (Note 4) | - | - | (35,071) |
| Net Expenses | 891,100 | 15,516,999 | 99,443 |
| Net Investment Income | $ 1,644,672 | $ 68,777,593 | $ 432,725 |
| REALIZED AND UNREALIZED GAIN (LOSS) | |||
| Net realized gain (loss) on investments | (602,722) | 9,975,745 | 84,314 |
| Net change in unrealized appreciation (depreciation) on investments | 5,368,284 | 80,036,956 | 274,616 |
| Net Realized and Unrealized Gain | 4,765,562 | 90,012,701 | 358,930 |
| Net Increase in Net Assets Resulting from Operations | $ 6,410,234 | $ 158,790,294 | $ 791,655 |
Thornburg Limited Term U.S. Government Fund
| Six Months Ended March 31, 2019* | Year Ended September 30, 2018 | |
| INCREASE (DECREASE) IN NET ASSETS FROM | ||
| OPERATIONS | ||
| Net investment income | $ 1,644,672 | $ 4,024,275 |
| Net realized gain (loss) on investments | (602,722) | (7,773) |
| Net unrealized appreciation (depreciation) on investments | 5,368,284 | (5,807,249) |
| Net Increase (Decrease) in Net Assets Resulting from Operations | 6,410,234 | (1,790,747) |
| DIVIDENDS TO SHAREHOLDERS | ||
| From distributable earnings | ||
| Class A Shares | (555,132) | (1,281,346) |
| Class C Shares | (119,567) | (399,126) |
| Class I Shares | (1,215,354) | (2,841,403) |
| Class R3 Shares | (68,332) | (163,648) |
| Class R4 Shares | (17,050) | (48,362) |
| Class R5 Shares | (5,885) | (30,541) |
| FUND SHARE TRANSACTIONS (NOTE 5) | ||
| Class A Shares | (3,744,374) | (13,133,162) |
| Class C Shares | (1,634,422) | (14,392,126) |
| Class I Shares | (1,711,073) | (12,028,799) |
| Class R3 Shares | 171,834 | (1,579,987) |
| Class R4 Shares | (326,633) | (782,019) |
| Class R5 Shares | (37,613) | (3,430,735) |
| Net Decrease in Net Assets | (2,853,367) | (51,902,001) |
| NET ASSETS | ||
| Beginning of Period | 233,423,806 | 285,325,807 |
| End of Period | $ 230,570,439 | $ 233,423,806 |
| * | Unaudited. |
Thornburg Limited Term Income Fund
| Six Months Ended March 31, 2019* | Year Ended September 30, 2018 | |
| INCREASE (DECREASE) IN NET ASSETS FROM | ||
| OPERATIONS | ||
| Net investment income | $ 68,777,593 | $ 117,668,835 |
| Net realized gain (loss) on investments | 9,975,745 | 1,476,259 |
| Net unrealized appreciation (depreciation) on investments | 80,036,956 | (104,119,301) |
| Net Increase in Net Assets Resulting from Operations | 158,790,294 | 15,025,793 |
| DIVIDENDS TO SHAREHOLDERS | ||
| From distributable earnings | ||
| Class A Shares | (8,047,138) | (17,119,570) |
| Class C Shares | (4,809,157) | (10,088,457) |
| Class I Shares | (53,647,608) | (88,345,810) |
| Class R3 Shares | (1,070,185) | (1,923,947) |
| Class R4 Shares | (106,195) | (172,865) |
| Class R5 Shares | (1,733,269) | (2,536,903) |
| Class R6 Shares | (567,229) | (342,075) |
| FUND SHARE TRANSACTIONS (NOTE 5) | ||
| Class A Shares | (79,939,969) | (193,537,163) |
| Class C Shares | (61,984,663) | (117,451,478) |
| Class I Shares | 221,494,511 | 526,525,749 |
| Class R3 Shares | (15,422,655) | (6,441,054) |
| Class R4 Shares | 1,587,552 | 37,813 |
| Class R5 Shares | (12,005,145) | 14,319,765 |
| Class R6 Shares | 7,131,211 | 29,035,669 |
| Net Increase in Net Assets | 149,670,355 | 146,985,467 |
| NET ASSETS | ||
| Beginning of Period | 5,044,797,970 | 4,897,812,503 |
| End of Period | $ 5,194,468,325 | $ 5,044,797,970 |
| * | Unaudited. |
Thornburg Low Duration Income Fund
| Six Months Ended March 31, 2019* | Year Ended September 30, 2018 | |
| INCREASE (DECREASE) IN NET ASSETS FROM | ||
| OPERATIONS | ||
| Net investment income | $ 432,725 | $ 444,861 |
| Net realized gain (loss) on investments | 84,314 | (2,466) |
| Net unrealized appreciation (depreciation) on investments | 274,616 | (229,583) |
| Net Increase in Net Assets Resulting from Operations | 791,655 | 212,812 |
| DIVIDENDS TO SHAREHOLDERS | ||
| From distributable earnings | ||
| Class A Shares | (98,996) | (128,246) |
| Class I Shares | (336,554) | (329,263) |
| FUND SHARE TRANSACTIONS (NOTE 5) | ||
| Class A Shares | 1,523,782 | 683,438 |
| Class I Shares | 2,773,128 | 10,063,257 |
| Net Increase in Net Assets | 4,653,015 | 10,501,998 |
| NET ASSETS | ||
| Beginning of Period | 29,887,956 | 19,385,958 |
| End of Period | $ 34,540,971 | $ 29,887,956 |
| * | Unaudited. |
March 31, 2019 (Unaudited)
March 31, 2019 (Unaudited)
| GOVERNMENT FUND | INCOME FUND | LOW DURATION FUND | |
| Cost of investments for tax purposes | $ 229,320,181 | $ 5,150,080,992 | $ 36,568,337 |
| Gross unrealized appreciation on a tax basis | 1,117,498 | 51,928,278 | 185,045 |
| Gross unrealized depreciation on a tax basis | (1,919,598) | (22,804,261) | (63,256) |
| Net unrealized appreciation (depreciation) on investments (tax basis) | $ (802,100) | $ 29,124,017 | $ 121,789 |
March 31, 2019 (Unaudited)
| GOVERNMENT FUND | INCOME FUND | LOW DURATION FUND | |
| Deferred tax basis capital losses | $ 689,996 | $ 1,246,322 | $ 8,905 |
March 31, 2019 (Unaudited)
| Fair Value Measurements at March 31, 2019 | ||||
| TOTAL | LEVEL 1 | LEVEL 2 | LEVEL 3 | |
| Assets | ||||
| Investments in Securities | ||||
| U.S. Treasury Securities | $ 26,661,246 | $ 26,661,246 | $ — | $ — |
| U.S. Government Agencies | 37,184,388 | — | 37,184,388 | — |
| Mortgage Backed | 137,054,630 | — | 137,054,630 | — |
| Corporate Bonds | 3,495,000 | — | 3,495,000 | — |
| Short-Term Investments | 24,122,817 | — | 24,122,817 | — |
| Total Investments in Securities | $228,518,081 | $26,661,246 | $201,856,835 | $— |
| Total Assets | $228,518,081 | $26,661,246 | $201,856,835 | $— |
March 31, 2019 (Unaudited)
| Fair Value Measurements at March 31, 2019 | ||||
| TOTAL | LEVEL 1 | LEVEL 2 | LEVEL 3 | |
| Assets | ||||
| Investments in Securities | ||||
| U.S. Treasury Securities | $ 418,099,625 | $ 418,099,625 | $ — | $ — |
| U.S. Government Agencies | 61,693,761 | — | 58,457,511 | 3,236,250 |
| Other Government | 44,996,177 | — | 44,996,177 | — |
| Mortgage Backed | 475,238,004 | — | 475,238,004 | — |
| Asset Backed Securities | 1,014,678,516 | — | 988,391,457 | 26,287,059 |
| Corporate Bonds | 2,475,384,504 | — | 2,475,384,504 | — |
| Municipal Bonds | 107,737,053 | — | 107,737,053 | — |
| Short-Term Investments | 581,377,369 | — | 581,377,369 | — |
| Total Investments in Securities | $5,179,205,009 | $418,099,625 | $4,731,582,075 | $29,523,309(a) |
| Total Assets | $5,179,205,009 | $418,099,625 | $4,731,582,075 | $29,523,309 |
| (a) | In accordance with the guidance prescribed in Accounting Standards Update ("ASU") No. 2011-04, the following table displays a summary of the valuation techniques and unobservable inputs used to value portfolio securities characterized as Level 3 investments for the period ended at March 31, 2019. |
| FAIR VALUE AT March 31, 2019 | VALUATION TECHNIQUE(S) | UNOBSERVABLE INPUT | RANGE (WEIGHTED AVERAGE) | |
| U.S. Government Agencies | $ 3,236,250 | Market comparable securities yield method | Yields of comparable securities | 2.96%/(N/A) |
| Asset-Backed Securities | 8,062,304 | Discounted cash flows | Third party vendor discounted cash flows | 3.4%-5.3%/(4.07%) |
| 18,224,755 | Recent trade | Trade price | $99.99865/(N/A) | |
| Total | $ 29,523,309 |
| U.S.GOVERNMENT AGENCIES | ASSET BACKED SECURITIES | TOTAL(e) | |
| Beginning Balance 9/30/2018 | $ 3,221,250 | $ 26,357,393 | $ 29,578,643 |
| Accrued Discounts (Premiums) | (4,451) | 20,985 | 16,534 |
| Net Realized Gain (Loss)(a) | – | 30,723 | 30,723 |
| Gross Purchases | – | 18,224,755 | 18,224,755 |
| Gross Sales | – | (4,043,268) | (4,043,268) |
| Net Change in Unrealized Appreciation (Depreciation)(b)(c) | 19,451 | 1,228 | 20,679 |
| Transfers into Level 3(d) | – | 1,934,600 | 1,934,600 |
| Transfers out of Level 3(d) | – | (16,239,357) | (16,239,357) |
| Ending Balance 3/31/2019 | $3,236,250 | $26,287,059 | $29,523,309 |
| (a) | Amount of net realized gain (loss) from investments recognized in income is included in the Fund’s Statement of Operations for the six months ended March 31, 2019. |
| (b) | Amount of net change in unrealized appreciation (depreciation) on investments recognized in income is included in the Fund’s Statement of Operations for the six months ended March 31, 2019. |
| (c) | The net change in unrealized appreciation (depreciation) attributable to securities owned at March 31, 2019, which were valued using significant unobservable inputs, was $20,679. This is included within net change in unrealized appreciation (depreciation) on investments in the Fund’s the Statement of Operations for the six months ended March 31, 2019. |
| (d) | Transfers into or out of Level 3 were out of or into Level 2, and were due to changes in other significant observable inputs available during the six months ended March 31, 2019. Transfers into or out of Level 3 are based on the beginning market value of the period in which they occurred. |
| (e) | Level 3 investments represent 0.57% of total net assets at the six months ended March 31, 2019. Significant fluctuations of the unobservable inputs applied to portfolio securities characterized as Level 3 investments could be expected to increase or decrease the fair value of these portfolio securities. |
March 31, 2019 (Unaudited)
| Fair Value Measurements at March 31, 2019 | ||||
| TOTAL | LEVEL 1 | LEVEL 2 | LEVEL 3 | |
| Assets | ||||
| Investments in Securities | ||||
| U.S. Treasury Securities | $ 8,280,790 | $ 8,280,790 | $ — | $ — |
| U.S. Government Agencies | 1,213,037 | — | 1,213,037 | — |
| Other Government | 20,024 | — | 20,024 | — |
| Mortgage Backed | 1,763,083 | — | 1,763,083 | — |
| Asset Backed Securities | 7,916,335 | — | 7,816,336 | 99,999 |
| Corporate Bonds | 13,212,460 | — | 13,212,460 | — |
| Municipal Bonds | 364,038 | — | 364,038 | — |
| Short-Term Investments | 3,920,359 | 3,920,359 | — | — |
| Total Investments in Securities | $36,690,126 | $12,201,149 | $24,388,978 | $99,999(a) |
| Total Assets | $36,690,126 | $12,201,149 | $24,388,978 | $99,999 |
| (a) | In accordance with the guidance prescribed in Accounting Standards Update ("ASU") No. 2011-04, the following table displays a summary of the valuation techniques and unobservable inputs used to value portfolio securities characterized as Level 3 investments for the period ended at March 31, 2019. |
| FAIR VALUE AT March 31, 2019 | VALUATION TECHNIQUE(S) | UNOBSERVABLE INPUT | RANGE (WEIGHTED AVERAGE) | |
| Other Asset Backed | $ 99,999 | Recent trade | Trade price | $99.99865/(N/A) |
| Total | $ 99,999 |
| ASSET BACKED SECURITIES | TOTAL(b) | |
| Beginning Balance 9/30/2018 | $ 69,650 | $ 69,650 |
| Accrued Discounts (Premiums) | – | – |
| Net Realized Gain (Loss) | – | – |
| Gross Purchases | 99,999 | 99,999 |
| Gross Sales | – | – |
| Net Change in Unrealized Appreciation (Depreciation) | – | – |
| Transfers into Level 3(a) | – | – |
| Transfers out of Level 3(a) | (69,650) | (69,650) |
| Ending Balance 3/31/2019 | $99,999 | $99,999 |
| (a) | Transfers into or out of Level 3 were out of or into Level 2, and were due to changes in other significant observable inputs available during the six months ended March 31, 2019. Transfers into or out of Level 3 are based on the beginning market value of the period in which they occurred. |
| (b) | Level 3 investments represent 0.29% of total net assets at the six months ended March 31, 2019. Significant fluctuations of the unobservable inputs applied to portfolio securities characterized as Level 3 investments could be expected to increase or decrease the fair value of these portfolio securities. |
March 31, 2019 (Unaudited)
| Management Fee Schedule | |||||
| GOVERNMENT FUND | INCOME FUND | LOW DURATION FUND | |||
| DAILY NET ASSETS | FEE RATE | DAILY NET ASSETS | FEE RATE | DAILY NET ASSETS | FEE RATE |
| Up to $1 billion | 0.375% | Up to $500 million | 0.500% | Up to $1 Billion | 0.400% |
| Next $1 billion | 0.325 | Next $500 million | 0.450 | Next $500 million | 0.300 |
| Over $2 billion | 0.275 | Next $500 million | 0.400 | Next $500 million | 0.250 |
| Next $500 million | 0.350 | Over $2 billion | 0.225 | ||
| Over $2 billion | 0.275 | ||||
| Administration Fee Schedule | |
| Daily Net Assets | Fee Rate |
| Up to $20 billion | 0.100% |
| $20 billion to $40 billion | 0.075 |
| $40 billion to $60 billion | 0.040 |
| Over $60 billion | 0.030 |
| GOVERNMENT FUND | INCOME FUND | LOW DURATION FUND | |
| Commissions | $ 157 | $ 1,466 | $ 86 |
| CDSC fees | $ — | $ 5,689 | $ — |
March 31, 2019 (Unaudited)
| GOVERNMENT FUND | INCOME FUND | LOW DURATION FUND | |
| Contractual: | |||
| Class A | $ — | $ — | $ 28,490 |
| Class C | $ — | $ — | $ — |
| Class I | $ — | $ 255,117 | $ 22,740 |
| Class R3 | $ 19,769 | $ 40,265 | $ — |
| Class R4 | $ 10,113 | $ 18,185 | $ — |
| Class R5 | $ 7,213 | $ 55,065 | $ — |
| Class R6 | $ — | $ 7,890 | $ — |
| GOVERNMENT FUND | INCOME FUND | LOW DURATION FUND | |
| Voluntary: | |||
| Class A | $ — | $ — | $ 8,487 |
| Class C | $375 | $— | $— |
| Class I | $ — | $ — | $ 26,584 |
| Fund | Market Value 9/30/18 | Purchases at Cost | Sales Proceeds | Realized Gain (Loss) | Change in Unrealized Appr./(Depr.) | Market Value 3/31/19 | Dividend Income |
| Thornburg Capital Management Fund | $3,393,011 | $24,324,910 | $(23,797,562) | $- | $- | $3,920,359 | $57,191 |
March 31, 2019 (Unaudited)
| GOVERNMENT FUND | ||||
| SIX MONTHS ENDED March 31, 2019 (UNAUDITED) | YEAR ENDED September 30, 2018 (AUDITED) | |||
| SHARES | AMOUNT | SHARES | AMOUNT | |
| Class A Shares | ||||
| Shares sold | 1,424,148 | $ 18,163,998 | 1,099,905 | $ 14,065,102 |
| Shares issued to shareholders in reinvestment of dividends | 41,384 | 529,594 | 93,726 | 1,200,485 |
| Shares repurchased | (1,753,680) | (22,437,966) | (2,215,498) | (28,398,749) |
| Net decrease | (288,148) | $ (3,744,374) | (1,021,867) | $ (13,133,162) |
| Class C Shares | ||||
| Shares sold | 255,344 | $ 3,278,331 | 166,565 | $ 2,149,930 |
| Shares issued to shareholders in reinvestment of dividends | 8,562 | 110,214 | 28,965 | 373,400 |
| Shares repurchased | (390,932) | (5,022,967) | (1,314,476) | (16,915,456) |
| Net decrease | (127,026) | $ (1,634,422) | (1,118,946) | $ (14,392,126) |
| Class I Shares | ||||
| Shares sold | 1,296,220 | $ 16,553,999 | 4,630,618 | $ 59,387,148 |
| Shares issued to shareholders in reinvestment of dividends | 66,165 | 846,787 | 148,236 | 1,898,568 |
| Shares repurchased | (1,498,818) | (19,111,859) | (5,720,914) | (73,314,515) |
| Net decrease | (136,433) | $ (1,711,073) | (942,060) | $ (12,028,799) |
| Class R3 Shares | ||||
| Shares sold | 117,976 | $ 1,506,682 | 158,351 | $ 2,034,020 |
| Shares issued to shareholders in reinvestment of dividends | 4,363 | 55,879 | 10,523 | 134,890 |
| Shares repurchased | (108,954) | (1,390,727) | (292,383) | (3,748,897) |
| Net increase (decrease) | 13,385 | $ 171,834 | (123,509) | $ (1,579,987) |
| Class R4 Shares | ||||
| Shares sold | 44,677 | $ 571,289 | 52,835 | $ 677,337 |
| Shares issued to shareholders in reinvestment of dividends | 1,247 | 15,963 | 3,429 | 43,918 |
| Shares repurchased | (71,463) | (913,885) | (117,232) | (1,503,274) |
| Net decrease | (25,539) | $ (326,633) | (60,968) | $ (782,019) |
| Class R5 Shares | ||||
| Shares sold | 8,054 | $ 103,110 | 42,582 | $ 548,472 |
| Shares issued to shareholders in reinvestment of dividends | 441 | 5,651 | 2,303 | 29,698 |
| Shares repurchased | (11,421) | (146,374) | (310,027) | (4,008,905) |
| Net decrease | (2,926) | $ (37,613) | (265,142) | $ (3,430,735) |
| INCOME FUND | ||||
| SIX MONTHS ENDED March 31, 2019 (UNAUDITED) | YEAR ENDED September 30, 2018 (AUDITED) | |||
| SHARES | AMOUNT | SHARES | AMOUNT | |
| Class A Shares | ||||
| Shares sold | 5,769,239 | $ 76,307,878 | 12,078,839 | $ 160,306,743 |
| Shares issued to shareholders in reinvestment of dividends | 552,552 | 7,309,168 | 1,178,150 | 15,633,345 |
| Shares repurchased | (12,374,028) | (163,557,015) | (27,847,379) | (369,477,251) |
| Net decrease | (6,052,237) | $ (79,939,969) | (14,590,390) | $ (193,537,163) |
March 31, 2019 (Unaudited)
| INCOME FUND (Continued) | ||||
| SIX MONTHS ENDED March 31, 2019 (UNAUDITED) | YEAR ENDED September 30, 2018 (AUDITED) | |||
| SHARES | AMOUNT | SHARES | AMOUNT | |
| Class C Shares | ||||
| Shares sold | 1,492,720 | $ 19,659,293 | 3,244,802 | $ 43,127,640 |
| Shares issued to shareholders in reinvestment of dividends | 332,678 | 4,393,650 | 698,398 | 9,250,695 |
| Shares repurchased | (6,519,586) | (86,037,606) | (12,824,015) | (169,829,813) |
| Net decrease | (4,694,188) | $ (61,984,663) | (8,880,815) | $ (117,451,478) |
| Class I Shares | ||||
| Shares sold | 70,022,750 | $ 924,702,501 | 117,645,362 | $ 1,562,648,935 |
| Shares issued to shareholders in reinvestment of dividends | 3,476,672 | 46,020,737 | 5,803,751 | 76,986,129 |
| Shares repurchased | (56,765,449) | (749,228,727) | (83,909,122) | (1,113,109,315) |
| Net increase | 16,733,973 | $ 221,494,511 | 39,539,991 | $ 526,525,749 |
| Class R3 Shares | ||||
| Shares sold | 2,683,567 | $ 35,394,359 | 3,135,687 | $ 41,637,292 |
| Shares issued to shareholders in reinvestment of dividends | 76,559 | 1,013,010 | 130,756 | 1,735,498 |
| Shares repurchased | (3,915,696) | (51,830,024) | (3,753,356) | (49,813,844) |
| Net decrease | (1,155,570) | $ (15,422,655) | (486,913) | $ (6,441,054) |
| Class R4 Shares | ||||
| Shares sold | 250,851 | $ 3,305,437 | 200,886 | $ 2,665,572 |
| Shares issued to shareholders in reinvestment of dividends | 4,438 | 58,717 | 6,258 | 82,958 |
| Shares repurchased | (134,832) | (1,776,602) | (204,900) | (2,710,717) |
| Net increase | 120,457 | $ 1,587,552 | 2,244 | $ 37,813 |
| Class R5 Shares | ||||
| Shares sold | 4,997,003 | $ 65,775,421 | 3,375,058 | $ 44,760,496 |
| Shares issued to shareholders in reinvestment of dividends | 127,460 | 1,685,282 | 187,976 | 2,492,025 |
| Shares repurchased | (6,014,785) | (79,465,848) | (2,480,942) | (32,932,756) |
| Net increase (decrease) | (890,322) | $ (12,005,145) | 1,082,092 | $ 14,319,765 |
| Class R6 Shares | ||||
| Shares sold | 2,233,369 | $ 29,472,826 | 2,493,017 | $ 33,131,663 |
| Shares issued to shareholders in reinvestment of dividends | 42,673 | 565,972 | 25,652 | 339,948 |
| Shares repurchased | (1,729,216) | (22,907,587) | (333,838) | (4,435,942) |
| Net increase | 546,826 | $ 7,131,211 | 2,184,831 | $ 29,035,669 |
| LOW DURATION FUND | ||||
| SIX MONTHS ENDED March 31, 2019 (UNAUDITED) | YEAR ENDED September 30, 2018 (AUDITED) | |||
| SHARES | AMOUNT | SHARES | AMOUNT | |
| Class A Shares | ||||
| Shares sold | 435,971 | $ 5,352,953 | 262,967 | $ 3,246,041 |
| Shares issued to shareholders in reinvestment of dividends | 8,002 | 98,610 | 10,348 | 127,521 |
| Shares repurchased | (319,003) | (3,927,781) | (218,266) | (2,690,124) |
| Net increase | 124,970 | $ 1,523,782 | 55,049 | $ 683,438 |
March 31, 2019 (Unaudited)
| LOW DURATION FUND (Continued) | ||||
| SIX MONTHS ENDED March 31, 2019 (UNAUDITED) | YEAR ENDED September 30, 2018 (AUDITED) | |||
| SHARES | AMOUNT | SHARES | AMOUNT | |
| Class I Shares | ||||
| Shares sold | 2,063,442 | $ 25,419,513 | 1,058,651 | $ 13,051,377 |
| Shares issued to shareholders in reinvestment of dividends | 24,362 | 300,134 | 23,119 | 284,692 |
| Shares repurchased | (1,858,005) | (22,946,519) | (265,402) | (3,272,812) |
| Net increase | 229,799 | $ 2,773,128 | 816,368 | $ 10,063,257 |
Thornburg Limited Term U.S. Government Fund
| PER SHARE PERFORMANCE (FOR A SHARE OUTSTANDING THROUGHOUT THE PERIOD) | ||||||||
| UNLESS OTHERWISE NOTED, PERIODS ARE FISCAL YEARS ENDED SEPTEMBER 30, | Net Asset Value, Beginning of PERIOD | Net Investment Income (Loss)+ | Net Realized & Unrealized Gain (Loss) on Investments | Total from Investment Operations | Dividends from Net Investment Income | Dividends from Net Realized Gains | Total Dividends | Net Asset Value, End of PERIOD |
| CLASS A SHARES | ||||||||
| 2019(b)(c) | $ 12.69 | 0.08 | 0.26 | 0.34 | (0.10) | — | (0.10) | $ 12.93 |
| 2018(b) | $ 13.01 | 0.18 | (0.28) | (0.10) | (0.22) | — | (0.22) | $ 12.69 |
| 2017(b) | $ 13.25 | 0.14 | (0.20) | (0.06) | (0.18) | — | (0.18) | $ 13.01 |
| 2016(b)(e) | $ 13.26 | 0.14 | 0.05 | 0.19 | (0.20) | — | (0.20) | $ 13.25 |
| 2015(b) | $ 13.27 | 0.15 | 0.06 | 0.21 | (0.22) | — | (0.22) | $ 13.26 |
| 2014(b) | $ 13.36 | 0.19 | (0.02) | 0.17 | (0.26) | — | (0.26) | $ 13.27 |
| CLASS C SHARES | ||||||||
| 2019(c) | $ 12.77 | 0.06 | 0.26 | 0.32 | (0.08) | — | (0.08) | $ 13.01 |
| 2018 | $ 13.09 | 0.14 | (0.28) | (0.14) | (0.18) | — | (0.18) | $ 12.77 |
| 2017 | $ 13.33 | 0.10 | (0.20) | (0.10) | (0.14) | — | (0.14) | $ 13.09 |
| 2016 | $ 13.34 | 0.11 | 0.04 | 0.15 | (0.16) | — | (0.16) | $ 13.33 |
| 2015 | $ 13.35 | 0.12 | 0.06 | 0.18 | (0.19) | — | (0.19) | $ 13.34 |
| 2014 | $ 13.45 | 0.15 | (0.02) | 0.13 | (0.23) | — | (0.23) | $ 13.35 |
| CLASS I SHARES | ||||||||
| 2019(c) | $ 12.69 | 0.10 | 0.26 | 0.36 | (0.12) | — | (0.12) | $ 12.93 |
| 2018 | $ 13.01 | 0.22 | (0.28) | (0.06) | (0.26) | — | (0.26) | $ 12.69 |
| 2017 | $ 13.26 | 0.18 | (0.20) | (0.02) | (0.23) | — | (0.23) | $ 13.01 |
| 2016 | $ 13.26 | 0.19 | 0.05 | 0.24 | (0.24) | — | (0.24) | $ 13.26 |
| 2015 | $ 13.27 | 0.19 | 0.06 | 0.25 | (0.26) | — | (0.26) | $ 13.26 |
| 2014 | $ 13.36 | 0.23 | (0.02) | 0.21 | (0.30) | — | (0.30) | $ 13.27 |
| CLASS R3 SHARES | ||||||||
| 2019(c) | $ 12.70 | 0.08 | 0.26 | 0.34 | (0.10) | — | (0.10) | $ 12.94 |
| 2018 | $ 13.02 | 0.17 | (0.28) | (0.11) | (0.21) | — | (0.21) | $ 12.70 |
| 2017 | $ 13.26 | 0.13 | (0.19) | (0.06) | (0.18) | — | (0.18) | $ 13.02 |
| 2016 | $ 13.27 | 0.14 | 0.04 | 0.18 | (0.19) | — | (0.19) | $ 13.26 |
| 2015 | $ 13.28 | 0.14 | 0.06 | 0.20 | (0.21) | — | (0.21) | $ 13.27 |
| 2014 | $ 13.37 | 0.18 | (0.02) | 0.16 | (0.25) | — | (0.25) | $ 13.28 |
| CLASS R4 SHARES | ||||||||
| 2019(c) | $ 12.69 | 0.08 | 0.26 | 0.34 | (0.10) | — | (0.10) | $ 12.93 |
| 2018 | $ 13.01 | 0.17 | (0.28) | (0.11) | (0.21) | — | (0.21) | $ 12.69 |
| 2017 | $ 13.25 | 0.12 | (0.19) | (0.07) | (0.17) | — | (0.17) | $ 13.01 |
| 2016 | $ 13.26 | 0.14 | 0.04 | 0.18 | (0.19) | — | (0.19) | $ 13.25 |
| 2015 | $ 13.27 | 0.13 | 0.08 | 0.21 | (0.22) | — | (0.22) | $ 13.26 |
| 2014(g) | $ 13.36 | 0.14 | (0.03) | 0.11 | (0.20) | — | (0.20) | $ 13.27 |
| CLASS R5 SHARES | ||||||||
| 2019(c) | $ 12.70 | 0.10 | 0.26 | 0.36 | (0.12) | — | (0.12) | $ 12.94 |
| 2018 | $ 13.02 | 0.21 | (0.28) | (0.07) | (0.25) | — | (0.25) | $ 12.70 |
| 2017 | $ 13.28 | 0.18 | (0.21) | (0.03) | (0.23) | — | (0.23) | $ 13.02 |
| 2016 | $ 13.27 | 0.17 | 0.07 | 0.24 | (0.23) | — | (0.23) | $ 13.28 |
| 2015 | $ 13.27 | 0.19 | 0.07 | 0.26 | (0.26) | — | (0.26) | $ 13.27 |
| 2014 | $ 13.36 | 0.21 | —(h) | 0.21 | (0.30) | — | (0.30) | $ 13.27 |
| (a) | Not annualized for periods less than one year. |
| (b) | Sales loads are not reflected in computing total return. |
| (c) | Unaudited Six Month Period Ended March 31. |
| (d) | Annualized. |
| (e) | Class B shares converted to Class A shares on August 29, 2016. |
| (f) | Due to the size of net assets and fixed expenses, ratios may appear disproportionate. |
| (g) | Effective date of this class of shares was February 1, 2014. |
| (h) | Net realized and unrealized gain (loss) on investments was less than $0.01 per share. |
| + | Based on weighted average shares outstanding. |
| RATIOS TO AVERAGE NET ASSETS | SUPPLEMENTAL DATA | ||||||
| Net Investment Income (Loss) (%) | Expenses, After Expense Reductions (%) | Expenses, After Expense Reductions and Net of Custody Credits (%) | Expenses, Before Expense Reductions (%) | Total Return (%)(a) | Portfolio Turnover Rate (%)(a) | Net Assets at End of PERIOD (Thousands) | |
| 1.31(d) | 0.89(d) | 0.89(d) | 0.89(d) | 2.70 | 20.94 | $ 67,246 | |
| 1.42 | 0.91 | 0.91 | 0.91 | (0.77) | 5.93 | $ 69,634 | |
| 1.03 | 0.93 | 0.93 | 0.93 | (0.43) | 11.05 | $ 84,674 | |
| 1.08 | 0.91 | 0.91 | 0.91 | 1.41 | 9.78 | $ 111,874 | |
| 1.15 | 0.92 | 0.92 | 0.92 | 1.62 | 14.15 | $ 104,933 | |
| 1.41 | 0.93 | 0.93 | 0.94 | 1.30 | 8.14 | $ 132,916 | |
| 0.95(d) | 1.24(d) | 1.24(d) | 1.24(d) | 2.51 | 20.94 | $ 18,411 | |
| 1.10 | 1.23 | 1.23 | 1.23 | (1.08) | 5.93 | $ 19,686 | |
| 0.73 | 1.23 | 1.23 | 1.24 | (0.72) | 11.05 | $ 34,821 | |
| 0.81 | 1.19 | 1.19 | 1.20 | 1.13 | 9.78 | $ 48,369 | |
| 0.88 | 1.20 | 1.20 | 1.21 | 1.34 | 14.15 | $ 46,777 | |
| 1.14 | 1.19 | 1.19 | 1.20 | 0.96 | 8.14 | $ 51,001 | |
| 1.57(d) | 0.62(d) | 0.62(d) | 0.62(d) | 2.84 | 20.94 | $ 132,667 | |
| 1.73 | 0.60 | 0.60 | 0.60 | (0.47) | 5.93 | $ 131,898 | |
| 1.36 | 0.60 | 0.60 | 0.60 | (0.18) | 11.05 | $ 147,464 | |
| 1.43 | 0.57 | 0.57 | 0.57 | 1.83 | 9.78 | $ 144,437 | |
| 1.45 | 0.62 | 0.62 | 0.62 | 1.93 | 14.15 | $ 112,853 | |
| 1.73 | 0.61 | 0.61 | 0.61 | 1.62 | 8.14 | $ 69,309 | |
| 1.21(d) | 0.99(d) | 0.99(d) | 1.42(d) | 2.65 | 20.94 | $ 9,383 | |
| 1.34 | 0.99 | 0.99 | 1.45 | (0.85) | 5.93 | $ 9,036 | |
| 1.00 | 0.97 | 0.97 | 1.40 | (0.47) | 11.05 | $ 10,871 | |
| 1.03 | 0.98 | 0.98 | 1.30 | 1.34 | 9.78 | $ 28,036 | |
| 1.09 | 0.99 | 0.99 | 1.35 | 1.55 | 14.15 | $ 16,320 | |
| 1.35 | 0.99 | 0.99 | 1.31 | 1.23 | 8.14 | $ 13,748 | |
| 1.20(d) | 0.99(d) | 0.99(d) | 1.87(d) | 2.65 | 20.94 | $ 2,227 | |
| 1.35 | 0.99 | 0.99 | 1.75 | (0.85) | 5.93 | $ 2,509 | |
| 0.96 | 0.99 | 0.99 | 1.95 | (0.49) | 11.05 | $ 3,365 | |
| 1.04 | 0.99 | 0.99 | 2.71 | 1.33 | 9.78 | $ 2,097 | |
| 1.00 | 0.99 | 0.99 | 17.30(f) | 1.55 | 14.15 | $ 706 | |
| 1.57(d) | 0.99(d) | 0.99(d) | 64.66(d)(f) | 0.78 | 8.14 | $ 15 | |
| 1.53(d) | 0.67(d) | 0.67(d) | 2.90(d) | 2.81 | 20.94 | $ 636 | |
| 1.60 | 0.65 | 0.65 | 1.94 | (0.52) | 5.93 | $ 661 | |
| 1.40 | 0.58 | 0.58 | 1.21 | (0.23) | 11.05 | $ 4,131 | |
| 1.30 | 0.67 | 0.67 | 2.05 | 1.80 | 9.78 | $ 570 | |
| 1.40 | 0.67 | 0.67 | 2.02 | 1.95 | 14.15 | $ 2,170 | |
| 1.59 | 0.67 | 0.67 | 2.87 | 1.56 | 8.14 | $ 1,859 | |
Thornburg Limited Term Income Fund
| PER SHARE PERFORMANCE (FOR A SHARE OUTSTANDING THROUGHOUT THE PERIOD) | ||||||||
| UNLESS OTHERWISE NOTED, PERIODS ARE FISCAL YEARS ENDED SEPTEMBER 30, | Net Asset Value, Beginning of PERIOD | Net Investment Income (Loss)+ | Net Realized & Unrealized Gain (Loss) on Investments | Total from Investment Operations | Dividends from Net Investment Income | Dividends from Net Realized Gains | Total Dividends | Net Asset Value, End of PERIOD |
| CLASS A SHARES | ||||||||
| 2019(b)(c) | $ 13.16 | 0.16 | 0.24 | 0.40 | (0.17) | — | (0.17) | $ 13.39 |
| 2018(b) | $ 13.44 | 0.28 | (0.27) | 0.01 | (0.29) | — | (0.29) | $ 13.16 |
| 2017(b) | $ 13.51 | 0.24 | (0.07) | 0.17 | (0.24) | — | (0.24) | $ 13.44 |
| 2016(b) | $ 13.32 | 0.24 | 0.20 | 0.44 | (0.25) | — | (0.25) | $ 13.51 |
| 2015(b) | $ 13.49 | 0.26 | (0.09) | 0.17 | (0.27) | (0.07) | (0.34) | $ 13.32 |
| 2014(b) | $ 13.42 | 0.29 | 0.19 | 0.48 | (0.30) | (0.11) | (0.41) | $ 13.49 |
| CLASS C SHARES | ||||||||
| 2019(c) | $ 13.14 | 0.15 | 0.23 | 0.38 | (0.15) | — | (0.15) | $ 13.37 |
| 2018 | $ 13.42 | 0.25 | (0.27) | (0.02) | (0.26) | — | (0.26) | $ 13.14 |
| 2017 | $ 13.49 | 0.21 | (0.06) | 0.15 | (0.22) | — | (0.22) | $ 13.42 |
| 2016 | $ 13.30 | 0.21 | 0.20 | 0.41 | (0.22) | — | (0.22) | $ 13.49 |
| 2015 | $ 13.47 | 0.23 | (0.09) | 0.14 | (0.24) | (0.07) | (0.31) | $ 13.30 |
| 2014 | $ 13.39 | 0.26 | 0.20 | 0.46 | (0.27) | (0.11) | (0.38) | $ 13.47 |
| CLASS I SHARES | ||||||||
| 2019(c) | $ 13.16 | 0.18 | 0.24 | 0.42 | (0.19) | — | (0.19) | $ 13.39 |
| 2018 | $ 13.44 | 0.33 | (0.28) | 0.05 | (0.33) | — | (0.33) | $ 13.16 |
| 2017 | $ 13.52 | 0.29 | (0.08) | 0.21 | (0.29) | — | (0.29) | $ 13.44 |
| 2016 | $ 13.33 | 0.29 | 0.20 | 0.49 | (0.30) | — | (0.30) | $ 13.52 |
| 2015 | $ 13.49 | 0.31 | (0.08) | 0.23 | (0.32) | (0.07) | (0.39) | $ 13.33 |
| 2014 | $ 13.42 | 0.33 | 0.20 | 0.53 | (0.35) | (0.11) | (0.46) | $ 13.49 |
| CLASS R3 SHARES | ||||||||
| 2019(c) | $ 13.17 | 0.15 | 0.24 | 0.39 | (0.16) | — | (0.16) | $ 13.40 |
| 2018 | $ 13.45 | 0.26 | (0.27) | (0.01) | (0.27) | — | (0.27) | $ 13.17 |
| 2017 | $ 13.52 | 0.22 | (0.06) | 0.16 | (0.23) | — | (0.23) | $ 13.45 |
| 2016 | $ 13.33 | 0.23 | 0.20 | 0.43 | (0.24) | — | (0.24) | $ 13.52 |
| 2015 | $ 13.50 | 0.24 | (0.09) | 0.15 | (0.25) | (0.07) | (0.32) | $ 13.33 |
| 2014 | $ 13.43 | 0.27 | 0.19 | 0.46 | (0.28) | (0.11) | (0.39) | $ 13.50 |
| CLASS R4 SHARES | ||||||||
| 2019(c) | $ 13.16 | 0.15 | 0.23 | 0.38 | (0.16) | — | (0.16) | $ 13.38 |
| 2018 | $ 13.43 | 0.26 | (0.26) | —(e) | (0.27) | — | (0.27) | $ 13.16 |
| 2017 | $ 13.51 | 0.22 | (0.07) | 0.15 | (0.23) | — | (0.23) | $ 13.43 |
| 2016 | $ 13.32 | 0.23 | 0.20 | 0.43 | (0.24) | — | (0.24) | $ 13.51 |
| 2015 | $ 13.48 | 0.24 | (0.08) | 0.16 | (0.25) | (0.07) | (0.32) | $ 13.32 |
| 2014(f) | $ 13.42 | 0.18 | 0.07 | 0.25 | (0.19) | — | (0.19) | $ 13.48 |
| CLASS R5 SHARES | ||||||||
| 2019(c) | $ 13.16 | 0.18 | 0.23 | 0.41 | (0.18) | — | (0.18) | $ 13.39 |
| 2018 | $ 13.44 | 0.31 | (0.28) | 0.03 | (0.31) | — | (0.31) | $ 13.16 |
| 2017 | $ 13.51 | 0.27 | (0.07) | 0.20 | (0.27) | — | (0.27) | $ 13.44 |
| 2016 | $ 13.32 | 0.27 | 0.20 | 0.47 | (0.28) | — | (0.28) | $ 13.51 |
| 2015 | $ 13.49 | 0.29 | (0.09) | 0.20 | (0.30) | (0.07) | (0.37) | $ 13.32 |
| 2014 | $ 13.42 | 0.32 | 0.19 | 0.51 | (0.33) | (0.11) | (0.44) | $ 13.49 |
| CLASS R6 SHARES | ||||||||
| 2019(c) | $ 13.19 | 0.19 | 0.23 | 0.42 | (0.19) | — | (0.19) | $ 13.42 |
| 2018 | $ 13.46 | 0.35 | (0.28) | 0.07 | (0.34) | — | (0.34) | $ 13.19 |
| 2017(h) | $ 13.40 | 0.15 | 0.11 | 0.26 | (0.20) | — | (0.20) | $ 13.46 |
| (a) | Not annualized for periods less than one year. |
| (b) | Sales loads are not reflected in computing total return. |
| (c) | Unaudited Six Month Period Ended March 31. |
| (d) | Annualized. |
| (e) | Total from investment operations was less than $0.01 per share. |
| (f) | Effective date of this class of shares was February 1, 2014. |
| (g) | Due to the size of net assets and fixed expenses, ratios may appear disproportionate. |
| (h) | Effective date of this class of shares was April 10, 2017. |
| + | Based on weighted average shares outstanding. |
| RATIOS TO AVERAGE NET ASSETS | SUPPLEMENTAL DATA | ||||||
| Net Investment Income (Loss) (%) | Expenses, After Expense Reductions (%) | Expenses, After Expense Reductions and Net of Custody Credits (%) | Expenses, Before Expense Reductions (%) | Total Return (%)(a) | Portfolio Turnover Rate (%)(a) | Net Assets at End of PERIOD (Thousands) | |
| 2.48(d) | 0.83(d) | 0.83(d) | 0.83(d) | 3.04 | 21.25 | $ 611,263 | |
| 2.12 | 0.84 | 0.84 | 0.84 | 0.09 | 33.62 | $ 680,473 | |
| 1.76 | 0.87 | 0.87 | 0.87 | 1.31 | 26.90 | $ 890,990 | |
| 1.82 | 0.86 | 0.86 | 0.86 | 3.36 | 20.56 | $ 1,111,441 | |
| 1.94 | 0.87 | 0.87 | 0.87 | 1.27 | 18.71 | $ 977,470 | |
| 2.15 | 0.89 | 0.89 | 0.89 | 3.61 | 29.41 | $ 906,708 | |
| 2.28(d) | 1.04(d) | 1.04(d) | 1.04(d) | 2.93 | 21.25 | $ 384,188 | |
| 1.91 | 1.05 | 1.05 | 1.05 | (0.13) | 33.62 | $ 439,305 | |
| 1.56 | 1.08 | 1.08 | 1.08 | 1.10 | 26.90 | $ 567,771 | |
| 1.59 | 1.08 | 1.08 | 1.08 | 3.13 | 20.56 | $ 667,680 | |
| 1.71 | 1.10 | 1.10 | 1.10 | 1.04 | 18.71 | $ 611,555 | |
| 1.92 | 1.11 | 1.11 | 1.11 | 3.46 | 29.41 | $ 593,658 | |
| 2.80(d) | 0.52(d) | 0.52(d) | 0.53(d) | 3.20 | 21.25 | $ 3,974,144 | |
| 2.46 | 0.51 | 0.51 | 0.51 | 0.41 | 33.62 | $ 3,685,859 | |
| 2.14 | 0.50 | 0.50 | 0.50 | 1.61 | 26.90 | $ 3,232,277 | |
| 2.17 | 0.50 | 0.50 | 0.50 | 3.73 | 20.56 | $ 2,792,249 | |
| 2.29 | 0.52 | 0.52 | 0.52 | 1.71 | 18.71 | $ 1,982,536 | |
| 2.49 | 0.54 | 0.54 | 0.54 | 3.98 | 29.41 | $ 1,578,168 | |
| 2.32(d) | 0.99(d) | 0.99(d) | 1.08(d) | 2.95 | 21.25 | $ 74,349 | |
| 1.98 | 0.99 | 0.99 | 1.09 | (0.06) | 33.62 | $ 88,298 | |
| 1.65 | 0.99 | 0.99 | 1.12 | 1.19 | 26.90 | $ 96,715 | |
| 1.69 | 0.98 | 0.98 | 1.10 | 3.23 | 20.56 | $ 104,309 | |
| 1.82 | 0.99 | 0.99 | 1.11 | 1.16 | 18.71 | $ 172,992 | |
| 2.04 | 0.99 | 0.99 | 1.12 | 3.51 | 29.41 | $ 120,013 | |
| 2.33(d) | 0.99(d) | 0.99(d) | 1.40(d) | 2.88 | 21.25 | $ 9,713 | |
| 1.98 | 0.99 | 0.99 | 1.45 | 0.01 | 33.62 | $ 7,962 | |
| 1.65 | 0.99 | 0.99 | 1.56 | 1.11 | 26.90 | $ 8,101 | |
| 1.70 | 0.99 | 0.99 | 1.97 | 3.23 | 20.56 | $ 6,328 | |
| 1.82 | 0.98 | 0.98 | 1.66 | 1.24 | 18.71 | $ 3,908 | |
| 1.99(d) | 0.99(d) | 0.99(d) | 61.75(d)(g) | 1.84 | 29.41 | $ 47 | |
| 2.69(d) | 0.62(d) | 0.62(d) | 0.71(d) | 3.15 | 21.25 | $ 103,386 | |
| 2.31 | 0.67 | 0.67 | 0.69 | 0.26 | 33.62 | $ 113,333 | |
| 1.99 | 0.65 | 0.65 | 0.67 | 1.53 | 26.90 | $ 101,189 | |
| 2.05 | 0.62 | 0.62 | 0.72 | 3.60 | 20.56 | $ 71,864 | |
| 2.17 | 0.64 | 0.64 | 0.67 | 1.50 | 18.71 | $ 96,326 | |
| 2.38 | 0.64 | 0.64 | 0.72 | 3.86 | 29.41 | $ 16,825 | |
| 2.88(d) | 0.44(d) | 0.44(d) | 0.48(d) | 3.23 | 21.25 | $ 37,425 | |
| 2.62 | 0.45 | 0.45 | 0.57 | 0.56 | 33.62 | $ 29,568 | |
| 2.28(d) | 0.45(d) | 0.45(d) | 24.38(d)(g) | 1.92 | 26.90 | $ 770 | |
Thornburg Low Duration Income Fund
| PER SHARE PERFORMANCE (FOR A SHARE OUTSTANDING THROUGHOUT THE PERIOD) | ||||||||
| UNLESS OTHERWISE NOTED, PERIODS ARE FISCAL YEARS ENDED SEPTEMBER 30, | Net Asset Value, Beginning of PERIOD | Net Investment Income (Loss)+ | Net Realized & Unrealized Gain (Loss) on Investments | Total from Investment Operations | Dividends from Net Investment Income | Dividends from Net Realized Gains | Total Dividends | Net Asset Value, End of PERIOD |
| CLASS A SHARES | ||||||||
| 2019(b)(c) | $ 12.29 | 0.14 | 0.11 | 0.25 | (0.14) | — | (0.14) | $ 12.40 |
| 2018(b) | $ 12.42 | 0.22 | (0.13) | 0.09 | (0.22) | — | (0.22) | $ 12.29 |
| 2017(b) | $ 12.46 | 0.16 | (0.03) | 0.13 | (0.17) | — | (0.17) | $ 12.42 |
| 2016(b) | $ 12.38 | 0.11 | 0.09 | 0.20 | (0.12) | — | (0.12) | $ 12.46 |
| 2015(b) | $ 12.38 | 0.08 | —(e) | 0.08 | (0.08) | — | (0.08) | $ 12.38 |
| 2014(b)(f) | $ 12.31 | 0.08 | 0.08 | 0.16 | (0.09) | — | (0.09) | $ 12.38 |
| CLASS I SHARES | ||||||||
| 2019(c) | $ 12.28 | 0.15 | 0.11 | 0.26 | (0.15) | — | (0.15) | $ 12.39 |
| 2018 | $ 12.41 | 0.24 | (0.12) | 0.12 | (0.25) | — | (0.25) | $ 12.28 |
| 2017 | $ 12.45 | 0.18 | (0.03) | 0.15 | (0.19) | — | (0.19) | $ 12.41 |
| 2016 | $ 12.37 | 0.14 | 0.08 | 0.22 | (0.14) | — | (0.14) | $ 12.45 |
| 2015 | $ 12.38 | 0.11 | (0.01) | 0.10 | (0.11) | — | (0.11) | $ 12.37 |
| 2014(f) | $ 12.31 | 0.11 | 0.07 | 0.18 | (0.11) | — | (0.11) | $ 12.38 |
| (a) | Not annualized for periods less than one year. |
| (b) | Sales loads are not reflected in computing total return. |
| (c) | Unaudited Six Month Period Ended March 31. |
| (d) | Annualized. |
| (e) | Net realized and unrealized gain (loss) on investments was less than $0.01 per share. |
| (f) | Fund commenced operations on December 30, 2013. |
| + | Based on weighted average shares outstanding. |
| RATIOS TO AVERAGE NET ASSETS | SUPPLEMENTAL DATA | ||||||
| Net Investment Income (Loss) (%) | Expenses, After Expense Reductions (%) | Expenses, After Expense Reductions and Net of Custody Credits (%) | Expenses, Before Expense Reductions (%) | Total Return (%)(a) | Portfolio Turnover Rate (%)(a) | Net Assets at End of PERIOD (Thousands) | |
| 2.25(d) | 0.70(d) | 0.70(d) | 1.55(d) | 2.04 | 46.50 | $ 8,751 | |
| 1.75 | 0.70 | 0.70 | 1.82 | 0.75 | 20.93 | $ 7,140 | |
| 1.30 | 0.65 | 0.65 | 1.77 | 1.03 | 34.79 | $ 6,532 | |
| 0.89 | 0.69 | 0.69 | 1.74 | 1.60 | 42.99 | $ 10,235 | |
| 0.67 | 0.70 | 0.70 | 2.10 | 0.68 | 29.22 | $ 9,940 | |
| 0.92(d) | 0.62(d) | 0.61(d) | 3.14(d) | 1.33 | 23.70 | $ 6,678 | |
| 2.43(d) | 0.50(d) | 0.50(d) | 0.86(d) | 2.14 | 46.50 | $ 25,790 | |
| 1.96 | 0.50 | 0.50 | 1.09 | 0.95 | 20.93 | $ 22,748 | |
| 1.46 | 0.50 | 0.50 | 1.03 | 1.19 | 34.79 | $ 12,854 | |
| 1.15 | 0.48 | 0.48 | 1.18 | 1.81 | 42.99 | $ 17,106 | |
| 0.87 | 0.50 | 0.50 | 1.89 | 0.80 | 29.22 | $ 8,056 | |
| 1.19(d) | 0.41(d) | 0.41(d) | 3.19(d) | 1.48 | 23.70 | $ 3,698 | |
March 31, 2019 (Unaudited)
| (1) | transaction costs, including |
| (a) | sales charges (loads) on purchase payments, for Class A shares; |
| (b) | a deferred sales charge on redemptions of any part or all of a purchase of $1 million of Class A shares within 12 months of purchase; |
| (c) | a deferred sales charge on redemptions of Class C shares within 12 months of purchase; |
| (2) | ongoing costs, including management fees; distribution and/or service (12b-1) fees; and other Fund expenses. |
| BEGINNING ACCOUNT VALUE 10/1/18 | ENDING ACCOUNT VALUE 3/31/19 | EXPENSES PAID DURING PERIOD† 10/1/18—3/31/19 | |
| LIMITED TERM U.S. GOVERNMENT FUND | |||
| CLASS A SHARES | |||
| Actual | $1,000.00 | $1,027.04 | $4.50 |
| Hypothetical* | $1,000.00 | $1,020.49 | $4.48 |
| CLASS C SHARES | |||
| Actual | $1,000.00 | $1,025.14 | $6.26 |
| Hypothetical* | $1,000.00 | $1,018.75 | $6.24 |
| CLASS I SHARES | |||
| Actual | $1,000.00 | $1,028.41 | $3.14 |
| Hypothetical* | $1,000.00 | $1,021.84 | $3.13 |
| CLASS R3 SHARES | |||
| Actual | $1,000.00 | $1,026.51 | $5.00 |
| Hypothetical* | $1,000.00 | $1,020.00 | $4.99 |
| CLASS R4 SHARES | |||
| Actual | $1,000.00 | $1,026.51 | $5.00 |
| Hypothetical* | $1,000.00 | $1,020.00 | $4.99 |
| CLASS R5 SHARES | |||
| Actual | $1,000.00 | $1,028.15 | $3.39 |
| Hypothetical* | $1,000.00 | $1,021.59 | $3.38 |
| LIMITED TERM INCOME FUND | |||
| CLASS A SHARES | |||
| Actual | $1,000.00 | $1,030.36 | $4.20 |
| Hypothetical* | $1,000.00 | $1,020.79 | $4.18 |
| CLASS C SHARES | |||
| Actual | $1,000.00 | $1,029.34 | $5.26 |
| Hypothetical* | $1,000.00 | $1,019.75 | $5.24 |
| CLASS I SHARES | |||
| Actual | $1,000.00 | $1,031.97 | $2.63 |
| Hypothetical* | $1,000.00 | $1,022.34 | $2.62 |
| CLASS R3 SHARES | |||
| Actual | $1,000.00 | $1,029.54 | $5.01 |
| Hypothetical* | $1,000.00 | $1,020.00 | $4.99 |
| CLASS R4 SHARES | |||
| Actual | $1,000.00 | $1,028.78 | $5.01 |
| Hypothetical* | $1,000.00 | $1,020.00 | $4.99 |
| CLASS R5 SHARES | |||
| Actual | $1,000.00 | $1,031.49 | $3.14 |
| Hypothetical* | $1,000.00 | $1,021.84 | $3.13 |
| CLASS R6 SHARES | |||
| Actual | $1,000.00 | $1,032.33 | $2.23 |
| Hypothetical* | $1,000.00 | $1,022.74 | $2.22 |
| LOW DURATION INCOME FUND | |||
| CLASS A SHARES | |||
| Actual | $1,000.00 | $1,020.36 | $3.53 |
| Hypothetical* | $1,000.00 | $1,021.44 | $3.53 |
| CLASS I SHARES | |||
| Actual | $1,000.00 | $1,021.37 | $2.52 |
| Hypothetical* | $1,000.00 | $1,022.44 | $2.52 |
| † | Thornburg Limited Term U.S. Government Fund Expenses are equal to the annualized expense ratio for each class (A: 0.89%; C: 1.24%; I: 0.62%; R3: 0.99%; R4: 0.99%; R5: 0.67%) multiplied by the average account value over the period, multiplied by 182/365 to reflect the one-half year period. |
| † | Thornburg Limited Term Income Fund Expenses are equal to the annualized expense ratio for each class (A: 0.83%; C: 1.04%; I: 0.52%; R3: 0.99%; R4: 0.99%; R5: 0.62%; R6: 0.44%) multiplied by the average account value over the period, multiplied by 182/365 to reflect the one-half year period. |
| † | Thornburg Low Duration Income Fund Expenses are equal to the annualized expense ratio for each class (A: 0.70%; I: 0.50%) multiplied by the average account value over the period, multiplied by 182/365 to reflect the one-half year period. |
| * | Hypothetical assumes a rate of return of 5% per year before expenses. |
March 31, 2019 (Unaudited)
| ■ | Thornburg Investment Income Builder Fund |
| ■ | Thornburg Global Opportunities Fund |
| ■ | Thornburg International Value Fund |
| ■ | Thornburg Better World International Fund |
| ■ | Thornburg International Growth Fund |
| ■ | Thornburg Developing World Fund |
| ■ | Thornburg Value Fund |
| ■ | Thornburg Core Growth Fund |
| ■ | Thornburg Investment Income Builder Fund |
| ■ | Thornburg Summit Fund |
| ■ | Thornburg Low Duration Income Fund |
| ■ | Thornburg Limited Term U.S. Government Fund |
| ■ | Thornburg Limited Term Income Fund |
| ■ | Thornburg Strategic Income Fund |
| ■ | Thornburg Low Duration Municipal Fund |
| ■ | Thornburg Limited Term Municipal Fund |
| ■ | Thornburg Intermediate Municipal Fund |
| ■ | Thornburg California Limited Term Municipal Fund |
| ■ | Thornburg New Mexico Intermediate Municipal Fund |
| ■ | Thornburg New York Intermediate Municipal Fund |
| ■ | Thornburg Strategic Municipal Income Fund |
| ■ | Thornburg Long/Short Equity Fund |

| 800.847.0200 | TH174 |

| 4 | |
| 6 | |
| 7 | |
| 8 | |
| 22 | |
| 24 | |
| 26 | |
| 27 | |
| 38 | |
| 40 | |
| 41 | |
| 42 |
| SHARE CLASS | NASDAQ SYMBOL | CUSIP |
| Class A | TSIAX | 885-215-228 |
| Class C | TSICX | 885-215-210 |
| Class I | TSIIX | 885-215-194 |
| Class R3 | TSIRX | 885-216-887 |
| Class R4 | TSRIX | 885-216-754 |
| Class R5 | TSRRX | 885-216-879 |
| Class R6 | TSRSX | 885-216-648 |
Thornburg Strategic Income Fund | March 31, 2019 (Unaudited)
 |  |
| Jason Brady,cfa Portfolio Manager CEO, President, and Managing Director | Lon R. Erickson,cfa Portfolio Manager Managing Director |
 |  |
| Christian Hoffmann,cfa Portfolio Manager Managing Director | Jeff Klingelhofer,cfa Portfolio Manager Managing Director |
Thornburg Strategic Income Fund | March 31, 2019 (Unaudited)
| 1-YR | 3-YR | 5-YR | 10-YR | SINCE INCEP. | |
| Class A Shares(Incep: 12/19/07) | |||||
| Without sales charge | 3.79% | 5.04% | 3.02% | 8.35% | 5.87% |
| With sales charge | -0.87% | 3.45% | 2.08% | 7.85% | 5.45% |
| Class C Shares(Incep: 12/19/07) | |||||
| Without sales charge | 3.04% | 4.32% | 2.37% | 7.71% | 5.25% |
| With sales charge | 2.04% | 4.32% | 2.37% | 7.71% | 5.25% |
| Class I Shares(Incep: 12/19/07) | 4.11% | 5.42% | 3.39% | 8.70% | 6.22% |
| Class R3 Shares(Incep: 5/1/12) | 3.60% | 4.98% | 2.95% | - | 4.30% |
| Class R4 Shares(Incep: 2/1/14) | 3.61% | 4.91% | 2.94% | - | 3.25% |
| Class R5 Shares(Incep: 5/1/12) | 4.20% | 5.44% | 3.37% | - | 4.68% |
| Class R6 Shares(Incep: 4/10/17) | 4.24% | - | - | - | 4.37% |
| Bloomberg Barclays U.S. Universal Bond Index(Since 12/19/07) | 4.53% | 2.65% | 3.00% | 4.36% | 4.14% |
| Annualized Distribution Yield | 3.30% |
| SEC Yield | 2.98% |
| FINAL VALUE |
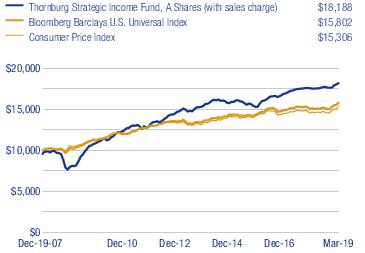
Thornburg Strategic Income Fund | March 31, 2019 (Unaudited)
| PORTFOLIO COMPOSITION | |
| Corporate/Convertible Bonds | 60.0% |
| Asset Backed Securities | 17.6% |
| Bank Loans | 3.5% |
| Common & Preferred Stock | 1.2% |
| U.S. Treasury Securities | 0.4% |
| Other Fixed Income | 2.0% |
| Other Assets Less Liabilities | 15.3% |
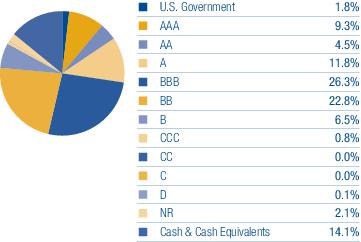
| * | Excludes equity securities. |
| TOP TEN INDUSTRY GROUPS | |
| Diversified Financials | 8.8% |
| Energy | 6.0% |
| Materials | 4.9% |
| Telecommunication Services | 4.6% |
| Software & Services | 3.8% |
| Utilities | 3.8% |
| Media & Entertainment | 3.6% |
| Technology Hardware & Equipment | 3.1% |
| Insurance | 3.0% |
| Healthcare Equipment & Services | 2.7% |
| COUNTRY EXPOSURE * (percent of Fund) | |
| United States | 65.4% |
| Canada | 2.8% |
| United Kingdom | 1.8% |
| Germany | 1.6% |
| South Korea | 1.4% |
| China | 1.2% |
| France | 1.1% |
| Japan | 0.9% |
| Bermuda | 0.7% |
| Cayman Islands | 0.7% |
| Sweden | 0.7% |
| Belgium | 0.6% |
| Netherlands | 0.6% |
| Switzerland | 0.6% |
| Mexico | 0.5% |
| Brazil | 0.5% |
| Italy | 0.4% |
| Ireland | 0.4% |
| Guatemala | 0.4% |
| Morocco | 0.4% |
| Jamaica | 0.4% |
| Colombia | 0.3% |
| South Africa | 0.3% |
| Australia | 0.3% |
| Trinidad And Tobago | 0.2% |
| Turkey | 0.2% |
| Barbados | 0.2% |
| Chile | 0.2% |
| Macao | 0.2% |
| Luxembourg | 0.1% |
| Saint Lucia | 0.0%** |
| Panama | 0.0%** |
| Other Assets Less Liabilities | 15.3% |
| * | Holdings are classified by country of risk as determined by MSCI and Bloomberg. |
| ** | Country percentage was less than 0.1%. |
Thornburg Strategic Income Fund | March 31, 2019 (Unaudited)
| SHARES/ PRINCIPAL AMOUNT | VALUE | ||
| Common Stock — 0.0% | |||
| Energy — 0.0% | |||
| Oil, Gas & Consumable Fuels — 0.0% | |||
| a,b,c | Malamute Energy, Inc., | 847 | $ 8,893 |
| 8,893 | |||
| Total Common Stock(Cost $0) | 8,893 | ||
| Preferred Stock — 1.2% | |||
| Banks — 0.7% | |||
| Banks — 0.7% | |||
| d,e | AgriBank FCB, 6.875% (LIBOR 3 Month + 4.23%) | 40,000 | 4,140,000 |
| d,e | CoBank ACB, Series F, 6.25% (LIBOR 3 Month + 4.56%) | 50,000 | 5,162,500 |
| 9,302,500 | |||
| Energy — 0.2% | |||
| Oil, Gas & Consumable Fuels — 0.2% | |||
| a,e | Crestwood Equity Partners L.P., 9.25% | 320,654 | 2,985,225 |
| 2,985,225 | |||
| Miscellaneous — 0.1% | |||
| U.S. Government Agencies — 0.1% | |||
| e | Farm Credit Bank of Texas, Series 1, 10.00% | 1,000 | 1,125,000 |
| 1,125,000 | |||
| Telecommunication Services — 0.2% | |||
| Diversified Telecommunication Services — 0.2% | |||
| f,g | Centaur Funding Corp., 9.08%, 4/21/2020 | 2,380 | 2,509,796 |
| 2,509,796 | |||
| Total Preferred Stock(Cost $16,017,996) | 15,922,521 | ||
| Asset Backed Securities — 17.6% | |||
| Advance Receivables — 0.2% | |||
| h | New Residential Advance Receivables Trust, Series 2016-T2 Class AT2, 2.575%, 10/15/2049 | $ 2,500,000 | 2,492,182 |
| 2,492,182 | |||
| Asset-Backed - Finance & Insurance — 0.8% | |||
| h | Ocwen Master Advance Receivables Trust, Series 2016-T2 2.722%, 8/16/2049 | 2,000,000 | 1,996,120 |
| Upstart Securitization Trust, | |||
| h | Series 2017-1 6.35%, 6/20/2024 | 3,000,000 | 3,059,448 |
| h | Series 2018-2 Class B, 4.445%, 12/22/2025 | 450,000 | 451,559 |
| h | Series 2019-1 Class B, 4.19%, 4/20/2026 | 5,000,000 | 5,017,087 |
| 10,524,214 | |||
| Auto Receivables — 2.0% | |||
| h | ACC Trust, Series 2018-1 Class A, 3.70%, 12/21/2020 | 1,043,629 | 1,043,326 |
| h | American Credit Acceptance Receivables Trust, Series 2016-4 Class C, 2.91%, 2/13/2023 | 2,279,353 | 2,276,303 |
| h | Avis Budget Rental Car Funding AESOP, LLC, Series 2015-1A Class A, 2.50%, 7/20/2021 | 2,900,000 | 2,887,071 |
| h | CIG Auto Receivables Trust, Series 2017-1A Class A, 2.71%, 5/15/2023 | 631,971 | 630,265 |
| h | CPS Auto Receivables Trust, Series 2019-1 Class B, 3.58%, 12/16/2024 | 3,000,000 | 3,015,543 |
| Foursight Capital Automobile Receivables Trust, | |||
| h | Series 2016-1 Class A2, 2.87%, 10/15/2021 | 898,711 | 897,944 |
| h | Series 2018-1 Class E, 5.56%, 1/16/2024 | 1,000,000 | 1,029,204 |
| h | Series 2018-2 5.50%, 10/15/2024 | 1,370,000 | 1,415,377 |
| h | GLS Auto Receivables Trust, Series 2018-2A Class A, 3.25%, 4/18/2022 | 1,671,212 | 1,672,379 |
| h | Hertz Vehicle Financing II L.P., Series 2015-1A Class A, 2.73%, 3/25/2021 | 4,000,000 | 3,986,470 |
| d,g,h | OSCAR US Funding Trust VII, LLC, Series 2017-2A Class A2B, 3.143% (LIBOR 1 Month + 0.65%), 11/10/2020 | 568,368 | 568,571 |
| h | Sierra Auto Receivables Securitization Trust, Series 2016-1A Class B, 6.84%, 1/18/2022 | 2,948,875 | 2,971,519 |
| h | Skopos Auto Receivables Trust, Series 2018-1A Class A, 3.19%, 9/15/2021 | 704,224 | 704,188 |
| h | Tesla Auto Lease Trust, Series B, 3.71%, 8/20/2021 | 2,782,808 | 2,812,688 |
| h | Veros Automobile Receivables Trust, Series 2017-1 Class A, 2.84%, 4/17/2023 | 404,907 | 404,114 |
| SHARES/ PRINCIPAL AMOUNT | VALUE | ||
| 26,314,962 | |||
| Commercial MTG Trust — 1.1% | |||
| h,i | CFCRE Commercial Mortgage Trust, Series 2011-C1 Class C, 6.071%, 4/15/2044 | $ 6,200,000 | $ 6,460,163 |
| i | Citigroup Mortgage Loan Trust, Inc. CMO, Series 2004-HYB2 Class B1, 4.896%, 3/25/2034 | 50,901 | 42,834 |
| h,i | Credit Suisse Mortgage Trust, Series 2017-HL2 Class A3, 3.50%, 10/25/2047 | 3,005,274 | 3,000,806 |
| d,h | FREMF Mortgage Trust, Series 2016-KF24 Class B, 7.49% (LIBOR 1 Month + 5.00%), 10/25/2026 | 943,670 | 1,010,863 |
| h,i | Galton Funding Mortgage Trust CMO, Series 2018-1 Class A43, 3.50%, 11/25/2057 | 1,608,388 | 1,606,708 |
| h,i | Mello Mortgage Capital Acceptance, Series 2018-MTG1 Class A3, 3.50%, 5/25/2048 | 2,663,692 | 2,665,732 |
| 14,787,106 | |||
| Credit Card — 0.2% | |||
| h | Genesis Sales Finance Master Trust, Series 2019-AA 4.68%, 8/20/2023 | 3,000,000 | 3,035,546 |
| 3,035,546 | |||
| Other Asset Backed — 8.2% | |||
| d,h | 321 Henderson Receivables II, LLC, Series 2006-3A Class A1, 2.684% (LIBOR 1 Month + 0.20%), 9/15/2041 | 2,003,665 | 1,918,246 |
| Avant Loans Funding Trust, | |||
| h | Series 2017-A, Class B, 3.65%, 9/15/2022 | 422,044 | 422,108 |
| h | Series 2018-A Class A, 3.09%, 6/15/2021 | 585,845 | 585,396 |
| h | Series 2019-A Class A, 3.48%, 7/15/2022 | 3,000,000 | 2,999,810 |
| h | AXIS Equipment Finance Receivables VI, LLC, Series 2018-2A Class A2, 3.89%, 7/20/2022 | 3,000,000 | 3,012,523 |
| h | BCC Funding XIV, LLC, Series 2018-1A Class A2, 2.96%, 6/20/2023 | 1,592,423 | 1,594,040 |
| g,h | CFG Investments Ltd., Series 2017-1 Class A, 7.87%, 11/15/2026 | 3,000,000 | 3,026,131 |
| h,i | CIM Trust, Series 18-INV1 4.00%, 8/25/2048 | 1,869,725 | 1,895,565 |
| h | CLUB Credit Trust, Series 2017-P2 Class A, 2.61%, 1/15/2024 | 608,905 | 606,447 |
| h | Consumer Loan Underlying Bond Credit Trust, Series 2019-A Class A, 3.52%, 4/15/2026 | 3,031,671 | 3,031,671 |
| h | Credit Suisse ABS Trust, Series 2018-LD1 Class A, 3.42%, 7/25/2024 | 1,292,419 | 1,292,327 |
| h | Diamond Resorts Owner Trust, Series 2018-1 Class A, 3.70%, 1/21/2031 | 3,096,612 | 3,145,192 |
| g,h | ECAF I Ltd., Series 2015-1A Class B1, 5.802%, 6/15/2040 | 5,484,208 | 5,427,241 |
| h | Engs Commercial Finance Trust, Series 2018-1A Class A1, 2.97%, 2/22/2021 | 1,191,386 | 1,190,909 |
| Foundation Finance Trust, | |||
| h | Series 2017-1A Class A, 3.30%, 7/15/2033 | 2,189,252 | 2,183,931 |
| h | Series 2019-1A Class A, 3.86%, 11/15/2034 | 5,000,000 | 4,999,225 |
| g,h | Global SC Finance II SRL, Series 2014-1A Class A1, 3.19%, 7/17/2029 | 2,533,333 | 2,510,695 |
| h | HERO Funding Trust, Series 2017-2A Class A1, 3.28%, 9/20/2048 | 3,001,030 | 2,961,386 |
| Homeward Opportunities Fund I Trust, | |||
| h,i | Series 2018-1 Class A1, 3.766%, 6/25/2048 | 1,639,389 | 1,656,178 |
| b,h,i,j | Series 2019-1 Class A1, 3.454%, 1/25/2059 | 6,500,000 | 6,499,912 |
| f | JPR Royalty Sub, LLC, 14.00%, 9/1/2020 | 2,000,000 | 1,000,000 |
| Marlette Funding Trust, | |||
| h | Series 2017-2A Class A, 2.39%, 7/15/2024 | 72,828 | 72,810 |
| h | Series 2018-1A Class A, 2.61%, 3/15/2028 | 1,438,966 | 1,435,908 |
| Nationstar HECM Loan Trust, | |||
| b,h,i | Series 2018-1A Class A, 2.76%, 2/25/2028 | 1,217,378 | 1,214,943 |
| h,i | Series 2018-2A Class A, 3.188%, 7/25/2028 | 990,037 | 991,622 |
| b,d,f | Northwind Holdings, LLC, Series 2007-1A Class A1, 3.406% (LIBOR 3 Month + 0.78%), 12/1/2037 | 312,500 | 306,563 |
| h | Ocwen Master Advance Receivables Trust, Series 2018-T2 Class AT2, 3.598%, 8/15/2050 | 3,000,000 | 3,016,680 |
| h | Oportun Funding VI, LLC, Series 2017-A Class A, 3.23%, 6/8/2023 | 4,000,000 | 3,996,286 |
| h | PFS Financing Corp., Series 2018-B Class A, 2.89%, 2/15/2023 | 3,000,000 | 2,989,802 |
| h | Prosper Marketplace Issuance Trust, Series 2017-3A Class A, 2.36%, 11/15/2023 | 149,174 | 149,031 |
| h | Purchasing Power Funding, LLC, Series 2018-A Class A, 3.34%, 8/15/2022 | 3,000,000 | 2,993,635 |
| SBA Tower Trust, | |||
| h | 2.877%, 7/15/2046 | 2,275,000 | 2,254,157 |
| h | 3.156%, 10/10/2045 | 3,750,000 | 3,750,177 |
| b,h | Scala Funding Co., LLC, Series 2016-1 Class B, 5.21%, 2/15/2021 | 4,000,000 | 3,936,000 |
| SCF Equipment Leasing, LLC, | |||
| h | Series 2017-2A Class A, 3.41%, 12/20/2023 | 670,688 | 671,244 |
| h | Series 2018-1A Class A2, 3.63%, 10/20/2024 | 2,500,036 | 2,501,326 |
| h | Sierra Timeshare Receivables Funding, LLC, Series 2015-2A Class A, 2.43%, 6/20/2032 | 1,901,047 | 1,886,006 |
| h | Sofi Consumer Loan Program, LLC, Series 2017-3 Class A, 2.77%, 5/25/2026 | 548,931 | 548,017 |
| h | SolarCity LMC Series I, LLC, Series 2013-1 Class A, 4.80%, 11/20/2038 | 2,323,693 | 2,403,433 |
| h | Solarcity LMC Series II, LLC, Series 2014-1 Class A, 4.59%, 4/20/2044 | 2,629,503 | 2,680,140 |
| h | Sonic Capital, LLC, Series 2016-1A Class A2, 4.472%, 5/20/2046 | 2,898,912 | 2,939,616 |
Thornburg Strategic Income Fund | March 31, 2019 (Unaudited)
| SHARES/ PRINCIPAL AMOUNT | VALUE | ||
| g,h | Textainer Marine Containers V Ltd., Series 2017-1A Class A, 3.72%, 5/20/2042 | $ 3,843,136 | $ 3,863,298 |
| Towd Point Mortgage Trust, | |||
| h,i | Series 2018-2 Class A1, 3.25%, 3/25/2058 | 3,531,581 | 3,517,614 |
| h,i | Series 2018-3 Class A1, 3.75%, 5/25/2058 | 2,670,916 | 2,697,888 |
| h,i | Series 2018-6 Class A1A, 3.75%, 3/25/2058 | 2,820,039 | 2,844,210 |
| h | Westgate Resorts, LLC, Series 2016-1A Class A, 3.50%, 12/20/2028 | 1,053,318 | 1,054,555 |
| 106,673,894 | |||
| Residential MTG Trust — 4.1% | |||
| Angel Oak Mortgage Trust, LLC, | |||
| h,i | Series 2017-3 Class A1, 2.708%, 11/25/2047 | 911,355 | 899,724 |
| h,i | Series 2018-1 Class A1, 3.258%, 4/27/2048 | 1,570,472 | 1,573,785 |
| h,i | Series 2018-2 Class A1, 3.674%, 7/27/2048 | 2,479,136 | 2,499,214 |
| Arroyo Mortgage Trust, | |||
| h,i | Series 2018-1 Class A1, 3.763%, 4/25/2048 | 3,366,914 | 3,437,935 |
| h,i | Series 2019-1 Class A1, 3.805%, 1/25/2049 | 3,929,898 | 3,934,877 |
| i | Bear Stearns ARM Trust CMO, Series 2003-6 Class 2B1, 4.489%, 8/25/2033 | 60,702 | 60,021 |
| h,i | Citigroup Mortgage Loan Trust CMO, Series 2014-A Class A, 4.00%, 1/25/2035 | 1,371,912 | 1,398,721 |
| h,i | Finance of America Structured Securities Trust, Series 2018-HB1 3.375%, 9/25/2028 | 2,988,716 | 2,987,521 |
| h,i | Flagstar Mortgage Trust, Series 2017-1 Class 2A2, 3.00%, 3/25/2047 | 1,540,199 | 1,521,796 |
| JPMorgan Mortgage Trust, | |||
| h,i | Series 2017-2 Class A6, 3.00%, 5/25/2047 | 2,328,577 | 2,301,004 |
| h,i | Series 2017-6 Class A5, 3.50%, 12/25/2048 | 2,580,974 | 2,589,275 |
| i | Merrill Lynch Mortgage Investors Trust CMO, Series 2004-A4 Class M1, 4.076%, 8/25/2034 | 157,612 | 145,105 |
| New Residential Mortgage Loan Trust CMO, | |||
| h,i | Series 2017-3A Class A1, 4.00%, 4/25/2057 | 2,704,229 | 2,752,450 |
| h,i | Series 2017-4A Class A1, 4.00%, 5/25/2057 | 2,569,714 | 2,626,810 |
| h,i | Series 2018-NQM1 3.986%, 11/25/2048 | 3,680,286 | 3,772,921 |
| New Residential Mortgage Loan Trust, | |||
| h,i | Series 2017-5A Class A1, 3.986% (LIBOR 1 Month + 1.50%), 6/25/2057 | 1,842,433 | 1,873,019 |
| h,i | Series 2017-6A Class A1, 4.00%, 8/27/2057 | 1,099,277 | 1,116,955 |
| h,i | Series 2018-1A Class A1A, 4.00%, 12/25/2057 | 2,005,107 | 2,036,862 |
| h,i | Series 2018-RPL1 Class A1, 3.50%, 12/25/2057 | 2,638,013 | 2,646,456 |
| Sequoia Mortgage Trust CMO, | |||
| h,i | Series 2017-4 Class A4, 3.50%, 7/25/2047 | 1,508,451 | 1,514,815 |
| h,i | Series 2017-5 Class A4, 3.50%, 8/25/2047 | 3,287,926 | 3,290,594 |
| Verus Securitization Trust CMO, | |||
| h,i | Series 2017-2A Class A1, 2.485%, 7/25/2047 | 2,067,937 | 2,031,095 |
| h,i | Series 2018-3 Class A1, 4.108%, 10/25/2058 | 2,707,119 | 2,747,165 |
| h,i | Verus Securitization Trust, Series 2018-2 Class A1, 3.677%, 6/1/2058 | 3,213,112 | 3,245,470 |
| 53,003,590 | |||
| Student Loan — 1.0% | |||
| h | Commonbond Student Loan Trust, Series 18-CGS 3.87%, 2/25/2046 | 2,884,472 | 2,941,321 |
| h | Earnest Student Loan Program, LLC, Series 2016-C Class A2, 2.68%, 7/25/2035 | 1,443,780 | 1,447,833 |
| d,h | Nelnet Student Loan Trust, Series 2016-A Class A1A, 4.236% (LIBOR 1 Month + 1.75%), 12/26/2040 | 1,851,863 | 1,846,001 |
| SLM Student Loan Trust, | |||
| d | Series 2008-2 Class A3, 3.521% (LIBOR 3 Month + 0.75%), 4/25/2023 | 1,022,929 | 1,016,208 |
| d | Series 2008-5 Class A4, 4.471% (LIBOR 3 Month + 1.70%), 7/25/2023 | 1,570,799 | 1,587,090 |
| d | Series 2012-1 Class A3, 3.436% (LIBOR 1 Month + 0.95%), 9/25/2028 | 2,655,525 | 2,645,991 |
| SoFi Professional Loan Program, LLC, | |||
| h | Series 2014-A Class A2, 3.02%, 10/25/2027 | 718,559 | 717,817 |
| d,h | Series 2014-B Class A1, 3.736% (LIBOR 1 Month + 1.25%), 8/25/2032 | 596,002 | 598,652 |
| 12,800,913 | |||
| Total Asset Backed Securities(Cost $230,761,800) | 229,632,407 | ||
| Corporate Bonds — 58.6% | |||
| Automobiles & Components — 1.0% | |||
| Auto Components — 0.1% | |||
| g,h | Nexteer Automotive Group Ltd., 5.875%, 11/15/2021 | 2,000,000 | 2,030,028 |
| Automobiles — 0.9% | |||
| h | Daimler Finance North America, LLC 3.75%, 11/5/2021 | 3,000,000 | 3,052,559 |
| SHARES/ PRINCIPAL AMOUNT | VALUE | ||
| h | Hyundai Capital America, 3.95%, 2/1/2022 | $ 2,000,000 | $ 2,028,627 |
| g,h | Hyundai Capital Services, Inc., 3.75%, 3/5/2023 | 3,000,000 | 3,034,471 |
| Nissan Motor Acceptance Corp., | |||
| d,h | 3.287% (LIBOR 3 Month + 0.69%), 9/28/2022 | 460,000 | 449,658 |
| d,h | 3.447% (LIBOR 3 Month + 0.65%), 7/13/2022 | 440,000 | 429,802 |
| h | Volkswagen Group of America Finance, LLC 4.00%, 11/12/2021 | 2,500,000 | 2,550,437 |
| 13,575,582 | |||
| Banks — 1.1% | |||
| Banks — 1.1% | |||
| d | Capital One NA/Mclean VA, 3.558% (LIBOR 3 Month + 0.82%), 8/8/2022 | 3,000,000 | 2,997,867 |
| d | Citizens Bank N.A./Providence RI, 3.551% (LIBOR 3 Month + 0.95%), 3/29/2023 | 4,000,000 | 4,002,932 |
| Santander Holdings USA, Inc., 3.40%, 1/18/2023 | 2,000,000 | 1,998,876 | |
| g | Sumitomo Mitsui Banking Corp., 2.65%, 7/23/2020 | 2,000,000 | 1,997,260 |
| g | Svenska Handelsbanken AB 3.90%, 11/20/2023 | 3,000,000 | 3,120,687 |
| 14,117,622 | |||
| Capital Goods — 2.3% | |||
| Aerospace & Defense — 0.4% | |||
| h | BWX Technologies, Inc., 5.375%, 7/15/2026 | 5,375,000 | 5,455,625 |
| Machinery — 0.9% | |||
| g,h | ATS Automation Tooling Systems, Inc., 6.50%, 6/15/2023 | 4,005,000 | 4,140,168 |
| Mueller Industries, Inc., 6.00%, 3/1/2027 | 2,216,000 | 2,171,680 | |
| Nvent Finance Sarl, | |||
| g | 3.95%, 4/15/2023 | 2,000,000 | 1,994,375 |
| g | 4.55%, 4/15/2028 | 3,000,000 | 3,019,269 |
| Trading Companies & Distributors — 1.0% | |||
| Global Partners L.P. / GLP Finance Corp., 6.25%, 7/15/2022 | 4,975,000 | 4,912,813 | |
| k | LKQ Corp., 4.75%, 5/15/2023 | 8,045,000 | 8,093,672 |
| 29,787,602 | |||
| Commercial & Professional Services — 1.8% | |||
| Commercial Services & Supplies — 1.3% | |||
| h | ACCO Brands Corp., 5.25%, 12/15/2024 | 3,636,000 | 3,563,280 |
| g,h | Cimpress N.V., 7.00%, 6/15/2026 | 3,190,000 | 3,070,375 |
| h | Nielsen Finance, LLC / Nielsen Finance Co., 5.00%, 4/15/2022 | 4,420,000 | 4,364,750 |
| h | ServiceMaster Co., LLC, 5.125%, 11/15/2024 | 5,830,000 | 5,851,863 |
| Leisure Products — 0.2% | |||
| Mattel, Inc., 2.35%, 8/15/2021 | 3,000,000 | 2,827,500 | |
| Professional Services — 0.3% | |||
| Verisk Analytics, Inc., 4.00%, 6/15/2025 | 3,920,000 | 4,087,595 | |
| 23,765,363 | |||
| Consumer Durables & Apparel — 1.2% | |||
| Household Durables — 0.2% | |||
| TRI Pointe Group, Inc. 4.875%, 7/1/2021 | 3,000,000 | 3,003,750 | |
| Leisure Products — 0.4% | |||
| Vista Outdoor, Inc., 5.875%, 10/1/2023 | 5,490,000 | 5,105,700 | |
| Textiles, Apparel & Luxury Goods — 0.6% | |||
| h | Hanesbrands, Inc. 4.875%, 5/15/2026 | 2,000,000 | 1,973,200 |
| h | Michael Kors USA, Inc., 4.00%, 11/1/2024 | 3,420,000 | 3,298,363 |
| Under Armour, Inc., 3.25%, 6/15/2026 | 3,200,000 | 2,919,976 | |
| 16,300,989 | |||
| Consumer Services — 0.7% | |||
| Hotels, Restaurants & Leisure — 0.6% | |||
| Aramark Services, Inc., 4.75%, 6/1/2026 | 5,000,000 | 4,987,500 | |
| h | Nathan’s Famous, Inc., 6.625%, 11/1/2025 | 3,780,000 | 3,671,325 |
| Transportation Infrastructure — 0.1% | |||
| Mexico City Airport Trust, | |||
| g,h | 3.875%, 4/30/2028 | 488,000 | 441,035 |
| g,h | 4.25%, 10/31/2026 | 419,000 | 402,868 |
Thornburg Strategic Income Fund | March 31, 2019 (Unaudited)
| SHARES/ PRINCIPAL AMOUNT | VALUE | ||
| 9,502,728 | |||
| Diversified Financials — 8.2% | |||
| Capital Markets — 2.2% | |||
| h | Ares Finance Co., LLC, 4.00%, 10/8/2024 | $ 4,025,000 | $ 3,892,508 |
| h | Compass Group Diversified Holdings, LLC, 8.00%, 5/1/2026 | 3,000,000 | 3,120,000 |
| FS Investment Corp., 4.00%, 7/15/2019 | 6,286,000 | 6,297,483 | |
| g | Genpact Luxembourg Sarl, 3.70%, 4/1/2022 | 6,000,000 | 5,926,086 |
| Solar Capital Ltd., 4.50%, 1/20/2023 | 3,000,000 | 2,894,293 | |
| TD Ameritrade Holding Corp., 3.75%, 4/1/2024 | 3,563,000 | 3,687,186 | |
| TPG Specialty Lending, Inc., 4.50%, 1/22/2023 | 2,500,000 | 2,509,315 | |
| Consumer Finance — 1.2% | |||
| d | Citibank N.A., 3.048% (LIBOR 3 Month + 0.35%), 2/12/2021 | 3,000,000 | 3,001,019 |
| h | FirstCash, Inc., 5.375%, 6/1/2024 | 7,500,000 | 7,668,825 |
| d | Wells Fargo Bank N.A., 3.271% (LIBOR 3 Month + 0.51%), 10/22/2021 | 5,000,000 | 5,009,720 |
| Diversified Financial Services — 4.3% | |||
| h | Antares Holdings L.P., 6.00%, 8/15/2023 | 4,435,000 | 4,359,673 |
| Bank of America Corp. MTN, 4.20%, 8/26/2024 | 3,200,000 | 3,311,912 | |
| Barclays plc, | |||
| d,g | 4.063% (LIBOR 3 Month + 1.38%), 5/16/2024 | 2,500,000 | 2,426,454 |
| g,l | 4.61% (LIBOR 3 Month + 1.40%), 2/15/2023 | 2,000,000 | 2,041,252 |
| g,h | BNP Paribas S.A., 3.375%, 1/9/2025 | 5,000,000 | 4,898,936 |
| g | Credit Suisse Group Funding Guernsey Ltd. (Guaranty: Credit Suisse Group AG), 3.80%, 9/15/2022 - 6/9/2023 | 2,850,000 | 2,902,046 |
| Deutsche Bank AG, | |||
| d,g | 3.576% (LIBOR 3 Month + 0.82%), 1/22/2021 | 1,350,000 | 1,323,236 |
| d,g | 3.869% (LIBOR 3 Month + 1.23%), 2/27/2023 | 2,800,000 | 2,688,257 |
| g | 5.00%, 2/14/2022 | 3,500,000 | 3,577,590 |
| d | Goldman Sachs Group, Inc., 3.875% (LIBOR 3 Month + 1.11%), 4/26/2022 | 4,000,000 | 4,021,423 |
| HSBC Holdings plc, | |||
| g,l | 3.803% (LIBOR 3 Month + 1.21%), 3/11/2025 | 1,000,000 | 1,013,684 |
| g,l | 4.292% (LIBOR 3 Month + 1.35%), 9/12/2026 | 2,000,000 | 2,062,469 |
| g,l | Mizuho Financial Group, Inc., 3.922% (LIBOR 3 Month + 1.00%), 9/11/2024 | 4,500,000 | 4,630,953 |
| d | Morgan Stanley MTN, 4.161% (LIBOR 3 Month + 1.40%), 4/21/2021 | 3,000,000 | 3,053,170 |
| d | Morgan Stanley, 3.691% (LIBOR 3 Month + 0.93%), 7/22/2022 | 3,000,000 | 3,015,792 |
| Royal Bank of Scotland Group plc, | |||
| d,g | 4.154% (LIBOR 3 Month + 1.47%), 5/15/2023 | 1,398,000 | 1,392,486 |
| g | 6.125%, 12/15/2022 | 2,000,000 | 2,127,605 |
| Societe Generale S.A., | |||
| g,h | 3.875%, 3/28/2024 | 2,000,000 | 2,006,389 |
| g,h | 4.25%, 9/14/2023 | 3,000,000 | 3,076,807 |
| d,g,h | UBS Group Funding Switzerland AG (Guaranty: UBS Group AG), 3.634% (LIBOR 3 Month + 0.95%), 8/15/2023 | 2,000,000 | 1,990,734 |
| Insurance — 0.1% | |||
| d,h | AIG Global Funding, 3.08% (LIBOR 3 Month + 0.48%), 7/2/2020 | 2,000,000 | 2,004,103 |
| f | Citicorp Lease Pass-Through Trust 1999-1, 8.04%, 12/15/2019 | 186,087 | 192,633 |
| Mortgage Real Estate Investment Trusts — 0.4% | |||
| Senior Housing Properties Trust, | |||
| 3.25%, 5/1/2019 | 1,708,000 | 1,708,194 | |
| 4.75%, 2/15/2028 | 4,000,000 | 3,707,914 | |
| 107,540,147 | |||
| Energy — 5.5% | |||
| Energy Equipment & Services — 0.5% | |||
| Enviva Partners L.P. / Enviva Partners Finance Corp., 8.50%, 11/1/2021 | 4,145,000 | 4,321,162 | |
| Odebrecht Offshore Drilling Finance Ltd., | |||
| g,h | 6.72%, 12/1/2022 | 528,850 | 503,730 |
| g,h,m | 7.72%, 12/1/2026 PIK | 2,062,720 | 510,111 |
| e,g,h | Odebrecht Oil & Gas Finance Ltd. (Guaranty: Odebrecht Oleo e Gas S.A.), 4/29/2019 | 304,899 | 1,524 |
| c,g,h,n | Schahin II Finance Co. SPV Ltd., 5.875%, 9/25/2023 | 10,684,600 | 1,068,476 |
| Oil, Gas & Consumable Fuels — 5.0% | |||
| h | Citgo Holding, Inc., 10.75%, 2/15/2020 | 2,910,000 | 2,983,332 |
| h | CITGO Petroleum Corp., 6.25%, 8/15/2022 | 2,410,000 | 2,394,938 |
| h | Colorado Interstate Gas Co., LLC / Colorado Interstate Issuing Corp., 4.15%, 8/15/2026 | 3,000,000 | 3,050,549 |
| SHARES/ PRINCIPAL AMOUNT | VALUE | ||
| d | Energy Transfer Operating L.P., 5.754% (LIBOR 3 Month + 3.02%), 11/1/2066 | $ 1,200,000 | $ 972,000 |
| EQT Midstream Partners L.P., Series 5Y, 4.75%, 7/15/2023 | 3,475,000 | 3,544,099 | |
| h | Florida Gas Transmission Co., LLC, 3.875%, 7/15/2022 | 4,765,000 | 4,853,041 |
| Gulf South Pipeline Co. L.P., 4.00%, 6/15/2022 | 4,860,000 | 4,890,956 | |
| h | Gulfstream Natural Gas System, LLC, 4.60%, 9/15/2025 | 5,000,000 | 5,265,251 |
| g,h | Harvest Operations Corp. (Guaranty: Korea National Oil Corp.), 3.00%, 9/21/2022 | 4,000,000 | 4,012,187 |
| g,h | Harvest Operations Corp., 4.20%, 6/1/2023 | 1,000,000 | 1,045,656 |
| HollyFrontier Corp., 5.875%, 4/1/2026 | 2,774,000 | 2,968,274 | |
| b,c,f,n | Linc USA GP / Linc Energy Finance USA, Inc., 9.625%, 10/31/2017 | 1,062,182 | 44,081 |
| Midwest Connector Capital Co., LLC, | |||
| h | 3.625%, 4/1/2022 | 1,310,000 | 1,328,488 |
| h | 3.90%, 4/1/2024 | 1,350,000 | 1,371,762 |
| Northern Border Pipeline Co., Series A, 7.50%, 9/15/2021 | 2,150,000 | 2,346,700 | |
| h | Par Petroleum, LLC / Par Petroleum Finance Corp., 7.75%, 12/15/2025 | 1,500,000 | 1,392,750 |
| h | Petroleos Mexicanos 7.19%, 9/12/2024 | 100,000,000 | 4,304,380 |
| a,c,n | RAAM Global Energy Co., 12.50%, 10/1/2015 | 2,000,000 | 60,000 |
| b,g,h,m | Schahin II Finance Co. SPV Ltd., 8.00%, 5/25/2020 PIK | 597,503 | 556,275 |
| g,h | Sinopec Group Overseas Development Ltd., 4.125%, 9/12/2025 | 6,000,000 | 6,249,600 |
| Summit Midstream Holdings, LLC / Summit Midstream Finance Corp., 5.50%, 8/15/2022 | 1,210,000 | 1,197,900 | |
| e,l | Summit Midstream Partners L.P., Series A, 9.50% (LIBOR 3 Month + 7.43%), 12/15/2022 | 3,150,000 | 2,913,750 |
| Tennessee Gas Pipeline Co., LLC, 7.00%, 3/15/2027 | 2,251,000 | 2,679,023 | |
| h | Texas Gas Transmission, LLC, 4.50%, 2/1/2021 | 4,940,000 | 5,018,593 |
| 71,848,588 | |||
| Food & Staples Retailing — 1.0% | |||
| Food & Staples Retailing — 1.0% | |||
| g,h | Alimentation Couche-Tard, Inc., 2.70%, 7/26/2022 | 4,000,000 | 3,958,199 |
| h | C&S Group Enterprises, LLC, 5.375%, 7/15/2022 | 3,935,000 | 3,949,757 |
| Ingles Markets, Inc., 5.75%, 6/15/2023 | 4,500,000 | 4,584,375 | |
| 12,492,331 | |||
| Food, Beverage & Tobacco — 2.6% | |||
| Beverages — 0.6% | |||
| g,h | Central American Bottling Corp., 5.75%, 1/31/2027 | 5,000,000 | 5,131,250 |
| g,h | Coca-Cola Icecek A/S, 4.215%, 9/19/2024 | 3,000,000 | 2,798,466 |
| Food Products — 1.3% | |||
| g,h | Barry Callebaut Services N.V., 5.50%, 6/15/2023 | 4,000,000 | 4,215,000 |
| g,h | BRF S.A., 4.75%, 5/22/2024 | 4,650,000 | 4,376,812 |
| d | General Mills, Inc., 3.783% (LIBOR 3 Month + 1.01%), 10/17/2023 | 3,500,000 | 3,524,991 |
| Kraft Heinz Foods Co., 4.00%, 6/15/2023 | 2,500,000 | 2,568,138 | |
| h | Lamb Weston Holdings, Inc., 4.625%, 11/1/2024 | 2,500,000 | 2,528,125 |
| Tobacco — 0.7% | |||
| Altria Group, Inc., 4.40%, 2/14/2026 | 1,000,000 | 1,027,838 | |
| d | BAT Capital Corp., 3.283% (LIBOR 3 Month + 0.59%), 8/14/2020 | 2,500,000 | 2,494,628 |
| Vector Group Ltd., | |||
| h | 6.125%, 2/1/2025 | 2,194,000 | 1,947,833 |
| h | 10.50%, 11/1/2026 | 3,000,000 | 2,827,500 |
| 33,440,581 | |||
| Healthcare Equipment & Services — 2.5% | |||
| Health Care Equipment & Supplies — 0.3% | |||
| h | Hologic, Inc. 4.625%, 2/1/2028 | 3,890,000 | 3,821,925 |
| Health Care Providers & Services — 2.2% | |||
| Anthem, Inc., 2.50%, 11/21/2020 | 2,000,000 | 1,989,799 | |
| h | Centene Escrow I Corp., 5.375%, 6/1/2026 | 2,000,000 | 2,087,500 |
| d | CVS Health Corp., 3.231% (LIBOR 3 Month + 0.63%), 3/9/2020 | 2,000,000 | 2,004,550 |
| DaVita, Inc., 5.00%, 5/1/2025 | 6,450,000 | 6,180,712 | |
| HCA, Inc., | |||
| 5.25%, 4/15/2025 | 3,735,000 | 4,010,564 | |
| 6.50%, 2/15/2020 | 3,598,000 | 3,702,572 | |
| h | Tenet Healthcare Corp., 6.25%, 2/1/2027 | 4,350,000 | 4,515,518 |
| WellCare Health Plans, Inc., |
Thornburg Strategic Income Fund | March 31, 2019 (Unaudited)
| SHARES/ PRINCIPAL AMOUNT | VALUE | ||
| 5.25%, 4/1/2025 | $ 3,000,000 | $ 3,105,000 | |
| h | 5.375%, 8/15/2026 | 1,000,000 | 1,046,250 |
| 32,464,390 | |||
| Household & Personal Products — 1.7% | |||
| Household Products — 0.8% | |||
| Central Garden & Pet Co., 5.125%, 2/1/2028 | 3,500,000 | 3,211,250 | |
| h | Energizer Gamma Acquisition B.V., 4.625%, 7/15/2026 | 2,000,000 | 2,302,141 |
| Energizer Gamma Acquisition, Inc., | |||
| h | 6.375%, 7/15/2026 | 500,000 | 512,500 |
| h | 7.75%, 1/15/2027 | 130,000 | 138,450 |
| h | Prestige Brands, Inc., 6.375%, 3/1/2024 | 3,880,000 | 3,947,900 |
| Personal Products — 0.9% | |||
| Edgewell Personal Care Co., 4.70%, 5/24/2022 | 6,000,000 | 6,030,000 | |
| First Quality Finance Co., Inc., | |||
| h | 4.625%, 5/15/2021 | 3,030,000 | 3,022,425 |
| h | 5.00%, 7/1/2025 | 3,000,000 | 2,917,590 |
| 22,082,256 | |||
| Insurance — 3.0% | |||
| Insurance — 2.7% | |||
| g,h | DaVinciRe Holdings Ltd., 4.75%, 5/1/2025 | 4,790,000 | 4,872,097 |
| g | Enstar Group Ltd., 4.50%, 3/10/2022 | 2,000,000 | 2,036,555 |
| g | Fairfax Financial Holdings Ltd., 4.85%, 4/17/2028 | 4,000,000 | 3,985,999 |
| Kemper Corp., 4.35%, 2/15/2025 | 1,113,000 | 1,138,893 | |
| g,h | Lancashire Holdings Ltd., 5.70%, 10/1/2022 | 4,900,000 | 5,077,953 |
| Mercury General Corp., 4.40%, 3/15/2027 | 4,000,000 | 3,974,804 | |
| d,h | Metropolitan Life Global Funding, 3.00% (SOFR + 0.57%), 9/7/2020 | 1,940,000 | 1,939,987 |
| h,l | National Life Insurance Co., 5.25% (LIBOR 3 Month + 3.31%), 7/19/2068 | 1,725,000 | 1,774,491 |
| d,h | Protective Life Global Funding, 3.117% (LIBOR 3 Month + 0.52%), 6/28/2021 | 3,000,000 | 3,004,510 |
| h | Reliance Standard Life Global Funding, 3.85%, 9/19/2023 | 5,000,000 | 5,102,500 |
| h | Sammons Financial Group, Inc., 4.45%, 5/12/2027 | 2,000,000 | 2,004,631 |
| Semiconductors & Semiconductor Equipment — 0.3% | |||
| g,h | NXP B.V.//NXP Funding , LLC 5.35%, 3/1/2026 | 4,000,000 | 4,304,320 |
| 39,216,740 | |||
| Materials — 4.6% | |||
| Chemicals — 2.8% | |||
| CF Industries, Inc. 7.125%, 5/1/2020 | 5,540,000 | 5,782,375 | |
| d,h | Chevron Phillips Chemical Co., LLC, 3.486% (LIBOR 3 Month + 0.75%), 5/1/2020 | 4,000,000 | 4,008,875 |
| g,h | Consolidated Energy Finance S.A., 6.875%, 6/15/2025 | 3,000,000 | 3,022,500 |
| DowDuPont, Inc. | |||
| 3.766%, 11/15/2020 | 889,000 | 905,236 | |
| 4.205%, 11/15/2023 | 1,738,000 | 1,817,481 | |
| g,h | Kissner Holdings L.P. / Kissner Milling Co. Ltd. / BSC Holding, Inc. / Kissner USA, 8.375%, 12/1/2022 | 4,170,000 | 4,352,437 |
| NOVA Chemicals Corp., | |||
| g,h | 4.875%, 6/1/2024 | 1,500,000 | 1,473,750 |
| g,h | 5.25%, 6/1/2027 | 2,000,000 | 1,962,500 |
| g,h | Nufarm Australia Ltd. / Nufarm Americas, Inc. 5.75%, 4/30/2026 | 3,885,000 | 3,593,625 |
| g,h | OCP S.A., 5.625%, 4/25/2024 | 4,710,000 | 4,940,046 |
| Valvoline, Inc., | |||
| 4.375%, 8/15/2025 | 2,920,000 | 2,795,900 | |
| 5.50%, 7/15/2024 | 1,945,000 | 1,979,038 | |
| Containers & Packaging — 1.0% | |||
| Ball Corp., | |||
| 4.375%, 12/15/2020 | 2,000,000 | 2,032,800 | |
| 4.875%, 3/15/2026 | 1,500,000 | 1,545,000 | |
| Graphic Packaging International, LLC, 4.125%, 8/15/2024 | 3,225,000 | 3,152,437 | |
| h | Sealed Air Corp. 5.50%, 9/15/2025 | 4,000,000 | 4,210,800 |
| Silgan Holdings, Inc., 4.75%, 3/15/2025 | 2,000,000 | 1,962,500 | |
| Metals & Mining — 0.2% | |||
| h | International Wire Group, Inc., 10.75%, 8/1/2021 | 3,271,000 | 3,271,000 |
| SHARES/ PRINCIPAL AMOUNT | VALUE | ||
| Paper & Forest Products — 0.6% | |||
| h | Neenah, Inc., 5.25%, 5/15/2021 | $ 7,575,000 | $ 7,556,063 |
| 60,364,363 | |||
| Media & Entertainment — 2.7% | |||
| Hotels, Restaurants & Leisure — 0.4% | |||
| Speedway Motorsports, Inc. 5.125%, 2/1/2023 | 4,862,000 | 4,880,233 | |
| Interactive Media & Services — 0.2% | |||
| g | Baidu, Inc., 3.875%, 9/29/2023 | 2,558,000 | 2,610,539 |
| Media — 2.1% | |||
| h | Cable One, Inc., 5.75%, 6/15/2022 | 5,000,000 | 5,075,000 |
| CSC Holdings, LLC, | |||
| h | 5.375%, 2/1/2028 | 2,000,000 | 2,005,000 |
| h | 5.50%, 4/15/2027 | 1,825,000 | 1,863,599 |
| h | 6.50%, 2/1/2029 | 1,000,000 | 1,065,000 |
| DISH DBS Corp., 5.125%, 5/1/2020 | 1,000,000 | 1,006,250 | |
| h | Lamar Media Corp., 5.75%, 2/1/2026 | 1,940,000 | 2,027,300 |
| a,i,m | Mood Media Borrower, LLC / Mood Media Co-Issuer, Inc., 14.00%, 7/1/2024 PIK | 2,972,117 | 2,578,311 |
| h | Salem Media Group, Inc., 6.75%, 6/1/2024 | 3,351,000 | 3,032,655 |
| h | Sirius XM Radio, Inc., 3.875%, 8/1/2022 | 5,000,000 | 4,962,500 |
| g,h | Telenet Finance Luxembourg Notes Sarl, 5.50%, 3/1/2028 | 4,000,000 | 3,920,000 |
| 35,026,387 | |||
| Pharmaceuticals, Biotechnology & Life Sciences — 0.6% | |||
| Pharmaceuticals — 0.6% | |||
| a,b,c,n | Atlas U.S. Royalty, LLC Participation Rights, 3/15/2027, 3/15/2027 | 5,450,000 | 0 |
| Bayer US Finance II, LLC, | |||
| d,h | 3.232% (LIBOR 3 Month + 0.63%), 6/25/2021 | 500,000 | 495,677 |
| h | 4.25%, 12/15/2025 | 2,500,000 | 2,526,795 |
| Takeda Pharmaceutical Co. Ltd., | |||
| g,h | 4.00%, 11/26/2021 | 1,500,000 | 1,538,151 |
| g,h | 4.40%, 11/26/2023 | 2,500,000 | 2,624,523 |
| 7,185,146 | |||
| Real Estate — 1.3% | |||
| Equity Real Estate Investment Trusts — 1.3% | |||
| American Tower Corp., 3.375%, 5/15/2024 | 3,000,000 | 3,021,135 | |
| CoreCivic, Inc. | |||
| 4.625%, 5/1/2023 | 1,735,000 | 1,669,937 | |
| 4.75%, 10/15/2027 | 4,917,000 | 4,182,548 | |
| Crown Castle International Corp., 3.20%, 9/1/2024 | 2,000,000 | 1,984,713 | |
| Hospitality Properties Trust, 4.95%, 2/15/2027 | 2,850,000 | 2,825,174 | |
| h | Iron Mountain, Inc. 4.875%, 9/15/2027 | 2,000,000 | 1,920,000 |
| Retail Opportunity Investments Partnership L.P. (Guaranty: Retail Opportunity Investments Corp.), 5.00%, 12/15/2023 | 1,500,000 | 1,530,675 | |
| 17,134,182 | |||
| Retailing — 0.5% | |||
| Internet & Direct Marketing Retail — 0.2% | |||
| Booking Holdings, Inc., 2.75%, 3/15/2023 | 2,000,000 | 1,990,049 | |
| Zillow Group, Inc., 2.00%, 12/1/2021 | 1,000,000 | 1,020,167 | |
| Multiline Retail — 0.3% | |||
| d | Dollar Tree, Inc., 3.473% (LIBOR 3 Month + 0.70%), 4/17/2020 | 4,000,000 | 4,000,881 |
| 7,011,097 | |||
| Semiconductors & Semiconductor Equipment — 0.9% | |||
| Semiconductors & Semiconductor Equipment — 0.9% | |||
| Broadcom Corp. / Broadcom Cayman Finance Ltd., | |||
| 2.375%, 1/15/2020 | 1,000,000 | 994,650 | |
| 3.625%, 1/15/2024 | 2,000,000 | 1,994,857 | |
| b,h,j | Broadcom, Inc. 3.625%, 10/15/2024 | 2,965,000 | 2,941,814 |
| g,h | Sensata Technologies B.V., 5.00%, 10/1/2025 | 5,880,000 | 6,027,000 |
| 11,958,321 |
Thornburg Strategic Income Fund | March 31, 2019 (Unaudited)
| SHARES/ PRINCIPAL AMOUNT | VALUE | ||
| Software & Services — 3.1% | |||
| Information Technology Services — 0.8% | |||
| h | Alliance Data Systems Corp., 5.375%, 8/1/2022 | $ 4,190,000 | $ 4,237,137 |
| S&P Global, Inc. (Guaranty: Standard & Poor’s Financial Services, LLC), 3.30%, 8/14/2020 | 1,975,000 | 1,991,783 | |
| d | Western Union Co., 3.463% (LIBOR 3 Month + 0.80%), 5/22/2019 | 3,500,000 | 3,501,105 |
| Interactive Media & Services — 0.1% | |||
| g | Baidu, Inc., 4.375%, 5/14/2024 | 1,424,000 | 1,476,355 |
| Software — 2.2% | |||
| Autodesk, Inc., 3.125%, 6/15/2020 | 2,350,000 | 2,355,178 | |
| CDK Global, Inc., | |||
| 3.80%, 10/15/2019 | 4,315,000 | 4,315,000 | |
| 5.875%, 6/15/2026 | 2,000,000 | 2,095,600 | |
| Citrix Systems, Inc., 4.50%, 12/1/2027 | 3,000,000 | 2,952,101 | |
| h | Fair Isaac Corp. 5.25%, 5/15/2026 | 2,460,000 | 2,533,800 |
| h | j2 Cloud Services, LLC / j2 Global Co-Obligor, Inc., 6.00%, 7/15/2025 | 4,165,000 | 4,326,394 |
| MSCI, Inc., | |||
| h | 5.25%, 11/15/2024 | 2,625,000 | 2,716,350 |
| h | 5.75%, 8/15/2025 | 2,000,000 | 2,100,000 |
| g,h | Open Text Corp., 5.875%, 6/1/2026 | 3,320,000 | 3,469,400 |
| VMware, Inc., 2.30%, 8/21/2020 | 2,000,000 | 1,981,488 | |
| 40,051,691 | |||
| Technology Hardware & Equipment — 3.1% | |||
| Communications Equipment — 1.5% | |||
| h | Anixter, Inc. 6.00%, 12/1/2025 | 2,000,000 | 2,100,000 |
| Anixter, Inc. (Guaranty: Anixter International, Inc.), 5.125%, 10/1/2021 | 6,395,000 | 6,586,850 | |
| Motorola Solutions, Inc., 4.60%, 2/23/2028 | 5,370,000 | 5,413,854 | |
| g | Telefonaktiebolaget LM Ericsson, 4.125%, 5/15/2022 | 5,456,000 | 5,530,584 |
| Electronic Equipment, Instruments & Components — 1.0% | |||
| Ingram Micro, Inc., 5.45%, 12/15/2024 | 1,951,000 | 1,934,353 | |
| Tech Data Corp., 4.95%, 2/15/2027 | 4,000,000 | 4,055,263 | |
| Trimble, Inc., 4.75%, 12/1/2024 | 6,525,000 | 6,703,034 | |
| Office Electronics — 0.6% | |||
| CDW, LLC / CDW Finance Corp., 5.00%, 9/1/2025 | 2,000,000 | 2,050,000 | |
| Lexmark International, Inc., 7.125%, 3/15/2020 | 1,797,000 | 1,684,705 | |
| Pitney Bowes, Inc., 4.70%, 4/1/2023 | 4,000,000 | 3,810,000 | |
| 39,868,643 | |||
| Telecommunication Services — 4.0% | |||
| Diversified Telecommunication Services — 1.9% | |||
| d | AT&T, Inc., 3.777% (LIBOR 3 Month + 1.18%), 6/12/2024 | 3,750,000 | 3,719,945 |
| g,h | Deutsche Telekom International Finance B.V., 4.375%, 6/21/2028 | 4,000,000 | 4,167,331 |
| g,h | Digicel Ltd., 6.00%, 4/15/2021 | 5,750,000 | 4,788,083 |
| Qwest Corp., 6.75%, 12/1/2021 | 3,700,000 | 3,936,985 | |
| h | Unison Ground Lease Funding, LLC, 5.78%, 3/15/2043 | 1,920,000 | 1,918,477 |
| g,h | Videotron Ltd., 5.375%, 6/15/2024 | 6,000,000 | 6,262,500 |
| Wireless Telecommunication Services — 2.1% | |||
| America Movil SAB de C.V., 6.45%, 12/5/2022 | 45,000,000 | 2,132,894 | |
| g,h | Digicel International Finance Ltd., 8.75%, 5/25/2024 | 500,000 | 493,750 |
| Millicom International Cellular SA | |||
| g,h,k | 5.125%, 1/15/2028 | 3,700,000 | 3,538,125 |
| g,h | 6.625%, 10/15/2026 | 800,000 | 840,000 |
| g,h | MTN Mauritius Investment Ltd., 4.755%, 11/11/2024 | 4,125,000 | 3,914,592 |
| g,h | SK Telecom Co. Ltd., 3.75%, 4/16/2023 | 3,000,000 | 3,067,395 |
| Sprint Communications, Inc., 9.25%, 4/15/2022 | 6,000,000 | 6,990,000 | |
| WCP Issuer, LLC, | |||
| f | 6.657%, 8/15/2043 | 386,000 | 405,068 |
| f | 7.143%, 8/15/2043 | 6,000,000 | 6,328,260 |
| 52,503,405 | |||
| Transportation — 1.4% | |||
| Airlines — 1.2% |
| SHARES/ PRINCIPAL AMOUNT | VALUE | ||
| American Airlines Pass Through Trust, | |||
| Series 2013-2 Class A, 4.95%, 7/15/2024 | $ 1,531,833 | $ 1,586,213 | |
| h | Series 2013-2 Class B, 5.60%, 1/15/2022 | 7,185,296 | 7,293,075 |
| Continental Airlines Pass Through Trust, Series 2005-ERJ1, 9.798%, 10/1/2022 | 1,902,284 | 1,982,180 | |
| g,h | Guanay Finance Ltd., 6.00%, 12/15/2020 | 2,384,148 | 2,410,970 |
| US Airways Pass Through Trust, | |||
| Series 2010-1 Class A, 6.25%, 10/22/2024 | 1,031,613 | 1,106,096 | |
| Series 2012-1 Class A, 5.90%, 4/1/2026 | 1,310,049 | 1,421,010 | |
| US Airways Pass Through Trust, (MBIA Insurance Corp), Series 2001-1G, 7.076%, 9/20/2022 | 351,308 | 367,117 | |
| Hotels, Restaurants & Leisure — 0.2% | |||
| g | Sands China Ltd., 5.125%, 8/8/2025 | 2,000,000 | 2,084,577 |
| 18,251,238 | |||
| Utilities — 3.8% | |||
| Electric Utilities — 3.6% | |||
| Avangrid, Inc., 3.15%, 12/1/2024 | 3,000,000 | 2,965,248 | |
| CenterPoint Energy, Inc. 3.60%, 11/1/2021 | 3,000,000 | 3,044,373 | |
| h | Duquesne Light Holdings, Inc., 6.40%, 9/15/2020 | 2,000,000 | 2,087,599 |
| g,h | Electricite de France S.A., 4.60%, 1/27/2020 | 4,000,000 | 4,068,221 |
| g,h | Enel Finance International N.V., 4.625%, 9/14/2025 | 5,500,000 | 5,688,368 |
| Entergy Texas, Inc., 3.45%, 12/1/2027 | 3,000,000 | 2,936,269 | |
| h | Jersey Central Power & Light Co., 4.30%, 1/15/2026 | 4,065,000 | 4,231,785 |
| h | Metropolitan Edison Co. 4.30%, 1/15/2029 | 1,940,000 | 2,030,433 |
| h | Midland Cogeneration Venture L.P., 6.00%, 3/15/2025 | 1,205,860 | 1,211,619 |
| PNM Resources, Inc., 3.25%, 3/9/2021 | 2,835,000 | 2,833,299 | |
| Puget Energy, Inc., | |||
| 5.625%, 7/15/2022 | 2,500,000 | 2,667,281 | |
| 6.50%, 12/15/2020 | 2,000,000 | 2,109,912 | |
| SCANA Corp., 4.125%, 2/1/2022 | 528,000 | 534,501 | |
| d | Sempra Energy, 3.037% (LIBOR 3 Month + 0.25%), 7/15/2019 | 3,000,000 | 2,995,680 |
| Southern Co., 3.25%, 7/1/2026 | 3,500,000 | 3,428,124 | |
| g,h | State Grid Overseas Investment (2014) Ltd. (Guaranty: State Grid Corp. of China), 2.75%, 5/7/2019 | 4,000,000 | 4,000,709 |
| Gas Utilities — 0.2% | |||
| g,h | Rockpoint Gas Storage Canada Ltd., 7.00%, 3/31/2023 | 2,562,000 | 2,539,583 |
| 49,373,004 | |||
| Total Corporate Bonds(Cost $769,509,094) | 764,862,396 | ||
| Convertible Bonds — 1.4% | |||
| Diversified Financials — 0.5% | |||
| Consumer Finance — 0.5% | |||
| EZCORP, Inc., 2.125%, 6/15/2019 | 7,284,000 | 7,262,138 | |
| 7,262,138 | |||
| Food, Beverage & Tobacco — 0.2% | |||
| Tobacco — 0.2% | |||
| i | Vector Group Ltd., 1.75%, 4/15/2020 | 2,260,000 | 2,291,075 |
| 2,291,075 | |||
| Media & Entertainment — 0.7% | |||
| Media — 0.7% | |||
| a | Comcast Holdings Corp. (Guaranty: Comcast Corp.), 2.00%, 10/15/2029 | 18,000,000 | 9,109,800 |
| 9,109,800 | |||
| Total Convertible Bonds(Cost $19,193,425) | 18,663,013 | ||
| Municipal Bonds — 0.5% | |||
| California Health Facilities Financing Authority, 7.875%, 2/1/2026 | 1,940,000 | 2,102,048 | |
| City of Chicago IL GO, Series B, 7.045%, 1/1/2029 | 3,000,000 | 3,347,370 | |
| a | Oklahoma Development Finance Authority, 8.00%, 5/1/2020 | 140,000 | 140,688 |
| San Bernardino County Redevelopment Agency Successor Agency, Class A 8.45%, 9/1/2030 | 1,000,000 | 1,060,030 | |
| Total Municipal Bonds(Cost $6,050,713) | 6,650,136 |
Thornburg Strategic Income Fund | March 31, 2019 (Unaudited)
| SHARES/ PRINCIPAL AMOUNT | VALUE | ||
| Other Government — 0.3% | |||
| g,h | Bermuda Government International Bond, 4.75%, 2/15/2029 | $ 2,000,000 | $ 2,117,430 |
| d,g,h | Seven & Seven Ltd. (Guaranty: Export-Import Bank of Korea), 3.683% (LIBOR 6 Month + 1.00%), 9/11/2019 | 1,100,000 | 1,101,295 |
| Total Other Government(Cost $3,084,596) | 3,218,725 | ||
| U.S. Treasury Securities — 0.4% | |||
| United States Treasury Notes, 2.50%, 5/31/2020 | 4,865,000 | 4,871,214 | |
| Total U.S. Treasury Securities(Cost $4,869,114) | 4,871,214 | ||
| Mortgage Backed — 1.2% | |||
| i,o | Federal Home Loan Mtg Corp. Multifamily Structured Pass Through Certificates IO, Series KIR1 Class X, 1.077%, 3/25/2026 | 36,370,184 | 2,250,303 |
| Federal Home Loan Mtg Corp., Seasoned Credit Risk Transfer, | |||
| p | Series 2017-4 Class HT, 2.75%, 6/25/2057 | 1,714,793 | 1,706,959 |
| Series 2018-3 Class HA, 3.00%, 8/25/2057 | 3,728,341 | 3,742,152 | |
| Series 2019-1 Class MA, 3.50%, 7/25/2058 | 4,968,278 | 5,042,494 | |
| Federal Home Loan Mtg Corp., Whole Loan Securities, Series 2017-SC02 Class 2A1, 3.50%, 5/25/2047 | 666,003 | 666,663 | |
| Federal National Mtg Assoc. CMO REMIC, Series 1994-37 Class L, 6.50%, 3/25/2024 | 1,208 | 1,277 | |
| Federal National Mtg Assoc., Pool AS9733, 4.00%, 6/1/2047 | 2,591,769 | 2,717,356 | |
| b,f | Reilly 1997 A Mtg 1, 6.896%, 7/1/2020 | 75,984 | 75,985 |
| Total Mortgage Backed(Cost $16,011,276) | 16,203,189 | ||
| Loan Participations — 3.5% | |||
| Commercial & Professional Services — 0.9% | |||
| Professional Services — 0.9% | |||
| q | Harland Clarke Holdings Corp., 7.351% (LIBOR 3 Month + 4.75%), 11/3/2023 | 3,560,598 | 3,186,735 |
| q,r | Par Pacific Holdings, Inc. 9.55% (LIBOR 1 Month + 6.75%), 12/17/2025 | 1,800,000 | 1,797,750 |
| q | R.R. Donnelley & Sons Company 7.499% (LIBOR 1 Month + 5.00%), 1/15/2024 | 2,992,500 | 2,981,278 |
| q,r | RGIS Services, LLC, 10.111% (LIBOR 1 Month + 7.50%), 3/31/2023 | 4,153,836 | 3,471,070 |
| 11,436,833 | |||
| Consumer Services — 0.5% | |||
| Hotels, Restaurants & Leisure — 0.5% | |||
| q,r | Hanjin International Corp., 4.982% (LIBOR 3 Month + 2.50%), 10/18/2020 | 6,475,000 | 6,394,063 |
| 6,394,063 | |||
| Energy — 0.2% | |||
| Oil, Gas & Consumable Fuels — 0.2% | |||
| b,m | Malamute Energy, Inc., 1.358%, 11/22/2022 | 21,196 | 21,196 |
| q | McDermott Technology Americas, Inc., 7.499% (LIBOR 1 Month + 5.00%), 5/10/2025 | 2,974,975 | 2,845,147 |
| 2,866,343 | |||
| Healthcare Equipment & Services — 0.2% | |||
| Health Care Providers & Services — 0.2% | |||
| q | Prospect Medical Holdings, Inc., 8.00% (LIBOR 1 Month + 5.50%), 2/22/2024 | 3,617,166 | 3,282,578 |
| 3,282,578 | |||
| Materials — 0.3% | |||
| Chemicals — 0.1% | |||
| q | US Salt LLC, 7.232% (LIBOR 3 Month + 4.75%), 1/18/2026 | 1,463,000 | 1,459,342 |
| Containers & Packaging — 0.2% | |||
| Crown Americas, LLC | |||
| q | 2.375% (EURIBOR + 2.37%), 4/3/2025 | 992,519 | 1,116,609 |
| q | 4.484% (LIBOR 1 Month + 2.00%), 4/3/2025 | 804,945 | 806,097 |
| 3,382,048 | |||
| Media & Entertainment — 0.2% | |||
| Media — 0.2% | |||
| q | ABG Intermediate Holdings 2, LLC, 10.249% (LIBOR 1 Month + 7.75%), 9/29/2025 | 3,000,000 | 2,955,000 |
| 2,955,000 | |||
| Retailing — 0.1% |
| SHARES/ PRINCIPAL AMOUNT | VALUE | ||
| Specialty Retail — 0.1% | |||
| q | Office Depot, Inc., 7.734% (LIBOR 1 Month + 5.25%), 11/8/2022 | $ 925,235 | $ 941,426 |
| 941,426 | |||
| Software & Services — 0.7% | |||
| Information Technology Services — 0.4% | |||
| q | Cypress Intermediate Holdings III, Inc., 9.249% (LIBOR 1 Month + 6.75%), 4/27/2025 | 1,000,000 | 991,250 |
| q,r | First Data Corporation 4.486% (LIBOR 1 Month + 2.00%), 7/8/2022 | 4,595,341 | 4,583,761 |
| Internet Software & Services — 0.3% | |||
| q | CareerBuilder, LLC, 9.351% (LIBOR 3 Month + 6.75%), 7/31/2023 | 1,131,191 | 1,131,191 |
| q | Dun & Bradstreet Corporation (The), 7.49% (LIBOR 1 Month + 5.00%), 2/1/2026 | 3,000,000 | 2,958,750 |
| 9,664,952 | |||
| Telecommunication Services — 0.4% | |||
| Diversified Telecommunication Services — 0.4% | |||
| q | Colorado Buyer, Inc., 9.86% (LIBOR 3 Month + 7.25%), 5/1/2025 | 3,000,000 | 2,715,000 |
| g,q | Intelsat Jackson Holdings S.A., 6.99% (LIBOR 1 Month + 4.50%), 1/2/2024 | 2,000,000 | 2,001,500 |
| 4,716,500 | |||
| Transportation — 0.0% | |||
| Airlines — 0.0% | |||
| a,b,c,f,n | OS Two, LLC, 12/15/2020 | 654,564 | 0 |
| 0 | |||
| Total Loan Participations(Cost $47,371,147) | 45,639,743 | ||
| Short-Term Investments — 14.7% | |||
| s | Thornburg Capital Management Fund | 19,130,718 | 191,307,181 |
| Total Short-Term Investments(Cost $191,307,181) | 191,307,181 | ||
| Total Investments — 99.4%(Cost $1,304,176,342) | $1,296,979,418 | ||
| Other Assets Less Liabilities — 0.6% | 8,066,404 | ||
| Net Assets — 100.0% | $1,305,045,822 |
| Outstanding Forward Currency Contracts To Buy Or Sell At March 31, 2019 | |||||||
| Contract Description | Contract Party* | Buy/Sell | Contract Amount | Contract Value Date | Value USD | Unrealized Appreciation | Unrealized Depreciation |
| Euro | SSB | Sell | 2,781,100 | 7/22/2019 | 3,148,883 | $ 64,080 | $ — |
| Net unrealized appreciation/depreciation | $64,080 | ||||||
| * | Counterparty includes State Street Bank and Trust Company ("SSB"). |
| Footnote Legend | |
| a | Illiquid security. |
| b | Security currently fair valued by the Valuation and Pricing Committee using procedures approved by the Trustees’ Audit Committee. |
| c | Non-income producing. |
| d | Floating Rate Security. Stated interest/floor rate was in effect at March 31, 2019. |
| e | Securities are perpetual and, thus, do not have a predetermined maturity date. The date shown, if applicable, reflects the next call date. |
| f | Securities exempt from registration under Rule 144A of the Securities Act of 1933, as amended. These securities are restricted and illiquid. As of March 31, 2019, the aggregate value of these securities in the Fund’s portfolio was $10,862,386, representing 0.83% of the Fund’s net assets. Additional information is as follows: |
| 144A/Restricted & Illiquid Securities | Acquisition Date | Cost | Market Value | Percentage of Net Assets |
| Centaur Funding Corp., 9.08%, 4/21/2020 | 1/22/2014 | $ 2,908,487 | $ 2,509,796 | 0.2% |
| Citicorp Lease Pass-Through Trust 1999-1, 8.04%, 12/15/2019 | 12/31/2008 | 183,640 | 192,633 | 0.0 |
| Linc USA GP / Linc Energy Finance USA, Inc., 9.625%, 10/31/2017 | 8/08/2014 | 1,062,182 | 44,081 | 0.0 |
Thornburg Strategic Income Fund | March 31, 2019 (Unaudited)
| 144A/Restricted & Illiquid Securities | Acquisition Date | Cost | Market Value | Percentage of Net Assets |
| WCP Issuer, LLC, 6.657%, 8/15/2043 | 6/23/2016 | $ 357,173 | $ 405,068 | 0.0% |
| WCP Issuer, LLC, 7.143%, 8/15/2043 | 8/01/2013 | 6,000,000 | 6,328,260 | 0.5 |
| JPR Royalty Sub, LLC, 14.00%, 9/01/2020 | 3/01/2011 | 2,000,000 | 1,000,000 | 0.1 |
| Northwind Holdings, LLC, 3.406%, 12/01/2037 | 1/29/2010 | 276,324 | 306,563 | 0.0 |
| OS Two, LLC 0.000%, 12/15/2020 | 12/04/2015 | 438,169 | 0 | 0.0 |
| Reilly 1997 A Mtg 1, 6.896%, 7/01/2020 | 3/07/2013 | 76,472 | 75,985 | 0.0 |
| g | Yankee bond denominated in U.S. dollars and is issued in the U.S. by foreign banks and corporations. |
| h | Securities exempt from registration under Rule 144A of the Securities Act of 1933, as amended. These securities are restricted but liquid and may only be resold in the ordinary course of business in transactions exempt from registration, normally to qualified institutional buyers. As of March 31, 2019, the aggregate value of these securities in the Fund’s portfolio was $605,362,308, representing 46.39% of the Fund’s net assets. |
| i | Variable rate coupon, rate shown as of March 31, 2019. |
| j | When-issued security. |
| k | Segregated as collateral for a when-issued security. |
| l | Fixed to floating security that initially pays a fixed rate and converts to a floating rate coupon at a specified date in the future. The rate presented is a fixed rate. |
| m | Pay-In-Kind Payments (PIK). The issuer may pay cash interest and/or interest in additional debt securities. Rates shown are the rates in effect at March 31, 2019. |
| n | Bond in default. |
| o | Interest Only |
| p | Coupon rate adjusts periodically based upon a predetermined schedule. Stated interest rate in effect at March 31, 2019. |
| q | The stated coupon rate represents the greater of the LIBOR or the LIBOR floor rate plus a spread at March 31, 2019. |
| r | This position or a portion of this position represents an unsettled loan purchase. The coupon rate will be effective at the time of settlement and will be based upon the London-Interbank Offered Rate ("LIBOR") plus a premium which was determined at the time of purchase. |
| s | Investment in Affiliates. |
To simplify the listings of securities, abbreviations are used per the table below:
| ARM | Adjustable Rate Mortgage |
| CMO | Collateralized Mortgage Obligation |
| FCB | Farm Credit Bank |
| GO | General Obligation |
| IO | Interest Only Security |
| LIBOR | London Interbank Offered Rates |
| Mtg | Mortgage |
| MTN | Medium-Term Note |
| REMIC | Real Estate Mortgage Investment Conduit |
| SOFR | Secured Overnight Financing Rate |
| SPV | Special Purpose Vehicle |
| VA | Veterans Affairs |
Thornburg Strategic Income Fund | March 31, 2019 (Unaudited)
| ASSETS | |
| Investments at value (Note 3) | |
| Non-affiliated issuers (cost $1,112,869,161) | $ 1,105,672,237 |
| Non-controlled affiliated issuer (cost $191,307,181) | 191,307,181 |
| Cash | 203,044 |
| Receivable for investments sold | 7,932,305 |
| Receivable for fund shares sold | 5,404,938 |
| Unrealized appreciation on forward currency contracts (Note 7) | 64,080 |
| Dividends receivable | 525,072 |
| Dividend and interest reclaim receivable | 6,740 |
| Interest receivable | 11,351,395 |
| Prepaid expenses and other assets | 172,667 |
| Total Assets | 1,322,639,659 |
| Liabilities | |
| Payable for investments purchased | 13,825,970 |
| Payable for fund shares redeemed | 2,212,887 |
| Payable to investment advisor and other affiliates (Note 4) | 735,738 |
| Accounts payable and accrued expenses | 285,777 |
| Dividends payable | 533,465 |
| Total Liabilities | 17,593,837 |
| Commitments and contingencies (Note 2) | |
| Net Assets | $ 1,305,045,822 |
| NET ASSETS CONSIST OF | |
| Accumulated loss | $ (36,990,918) |
| Net capital paid in on shares of beneficial interest | 1,342,036,740 |
| $ 1,305,045,822 |
| NET ASSET VALUE | |
| Class A Shares: | |
| Net asset value and redemption price per share ($200,619,730 applicable to 17,070,538 shares of beneficial interest outstanding - Note 5) | $ 11.75 |
| Maximum sales charge, 4.50% of offering price | 0.55 |
| Maximum offering price per share | $ 12.30 |
| Class C Shares: | |
| Net asset value and offering price per share* ($133,638,741 applicable to 11,390,079 shares of beneficial interest outstanding - Note 5) | $ 11.73 |
| Class I Shares: | |
| Net asset value, offering and redemption price per share ($950,386,572 applicable to 81,059,199 shares of beneficial interest outstanding - Note 5) | $ 11.72 |
| Class R3 Shares: | |
| Net asset value, offering and redemption price per share ($1,841,864 applicable to 156,819 shares of beneficial interest outstanding - Note 5) | $ 11.75 |
| Class R4 Shares: | |
| Net asset value, offering and redemption price per share ($1,020,809 applicable to 86,974 shares of beneficial interest outstanding - Note 5) | $ 11.74 |
| Class R5 Shares: | |
| Net asset value, offering and redemption price per share ($7,389,924 applicable to 630,176 shares of beneficial interest outstanding - Note 5) | $ 11.73 |
| Class R6 Shares: | |
| Net asset value, offering and redemption price per share ($10,148,182 applicable to 862,827 shares of beneficial interest outstanding - Note 5) | $ 11.76 |
| * | Redemption price per share is equal to net asset value less any applicable contingent deferred sales charge. |
Thornburg Strategic Income Fund | Six Months Ended March 31, 2019 (Unaudited)
| INVESTMENT INCOME | |
| Dividend income | |
| Non-affiliated issuers | $ 523,105 |
| Non-controlled affiliated issuer | 1,610,138 |
| Interest income (net of premium amortized of $605,139) | 25,360,233 |
| Total Income | 27,493,476 |
| EXPENSES | |
| Investment advisory fees (Note 4) | 4,111,830 |
| Administration fees (Note 4) | |
| Class A Shares | 84,877 |
| Class C Shares | 62,128 |
| Class I Shares | 360,098 |
| Class R3 Shares | 839 |
| Class R4 Shares | 768 |
| Class R5 Shares | 3,243 |
| Class R6 Shares | 4,245 |
| Distribution and service fees (Note 4) | |
| Class A Shares | 241,573 |
| Class C Shares | 707,724 |
| Class R3 Shares | 4,778 |
| Class R4 Shares | 2,206 |
| Transfer agent fees | |
| Class A Shares | 92,410 |
| Class C Shares | 72,380 |
| Class I Shares | 322,990 |
| Class R3 Shares | 5,278 |
| Class R4 Shares | 4,368 |
| Class R5 Shares | 7,004 |
| Class R6 Shares | 818 |
| Registration and filing fees | |
| Class A Shares | 6,905 |
| Class C Shares | 6,393 |
| Class I Shares | 22,300 |
| Class R3 Shares | 6,089 |
| Class R4 Shares | 5,594 |
| Class R5 Shares | 6,238 |
| Class R6 Shares | 5,492 |
| Custodian fees (Note 2) | 69,120 |
| Professional fees | 48,400 |
| Trustee and officer fees (Note 4) | 30,984 |
| Other expenses | 64,962 |
| Total Expenses | 6,362,034 |
| Less: | |
| Expenses reimbursed by investment advisor (Note 4) | (613,298) |
| Investment advisory fees waived by investment advisor (Note 4) | (672,777) |
| Net Expenses | 5,075,959 |
| Net Investment Income | $ 22,417,517 |
| REALIZED AND UNREALIZED GAIN (LOSS) | |
| Net realized gain (loss) on: | |
| Non-affiliated issuer investments | $ (1,755,135) |
| Forward currency contracts (Note 7) | 118,108 |
| Foreign currency transactions | (11,522) |
| (1,648,549) | |
| Net change in unrealized appreciation (depreciation) on: | |
| Non-affiliated issuer investments | 12,884,381 |
| Forward currency contracts (Note 7) | 45,382 |
| Foreign currency translations | (4,152) |
| 12,925,611 | |
| Net Realized and Unrealized Gain | 11,277,062 |
| Net Increase in Net Assets Resulting from Operations | $ 33,694,579 |
Thornburg Strategic Income Fund
| Six Months Ended March 31, 2019* | Year Ended September 30, 2018 | |
| INCREASE (DECREASE) IN NET ASSETS FROM | ||
| OPERATIONS | ||
| Net investment income | $ 22,417,517 | $ 38,820,653 |
| Net realized gain (loss) on investments, forward currency contracts and foreign currency transactions | (1,648,549) | 4,472,928 |
| Net unrealized appreciation (depreciation) on investments, forward currency contracts and foreign currency translations | 12,925,611 | (27,376,113) |
| Net Increase in Net Assets Resulting from Operations | 33,694,579 | 15,917,468 |
| DIVIDENDS TO SHAREHOLDERS | ||
| From distributable earnings | ||
| Class A Shares | (3,337,922) | (6,046,721) |
| Class C Shares | (1,925,445) | (3,851,817) |
| Class I Shares | (15,868,481) | (22,085,177) |
| Class R3 Shares | (31,231) | (63,112) |
| Class R4 Shares | (28,127) | (68,696) |
| Class R5 Shares | (142,448) | (233,736) |
| Class R6 Shares | (188,792) | (174,873) |
| FUND SHARE TRANSACTIONS (NOTE 5) | ||
| Class A Shares | 550,990 | (31,322,121) |
| Class C Shares | (17,900,052) | (51,986,964) |
| Class I Shares | 179,083,352 | 151,633,298 |
| Class R3 Shares | (143,348) | (661,921) |
| Class R4 Shares | (1,167,717) | (548,403) |
| Class R5 Shares | (85,737) | 1,226,187 |
| Class R6 Shares | 378,312 | 9,728,794 |
| Net Increase in Net Assets | 172,887,933 | 61,462,206 |
| NET ASSETS | ||
| Beginning of Period | 1,132,157,889 | 1,070,695,683 |
| End of Period | $ 1,305,045,822 | $ 1,132,157,889 |
| * | Unaudited. |
Thornburg Strategic Income Fund | March 31, 2019 (Unaudited)
Thornburg Strategic Income Fund | March 31, 2019 (Unaudited)
| Cost of investments for tax purposes | $ 1,304,176,342 |
| Gross unrealized appreciation on a tax basis | 17,191,583 |
| Gross unrealized depreciation on a tax basis | (24,388,507) |
| Net unrealized appreciation (depreciation) on investments (tax basis) | $ (7,196,924) |
Thornburg Strategic Income Fund | March 31, 2019 (Unaudited)
| Fair Value Measurements at March 31, 2019 | ||||
| TOTAL | LEVEL 1 | LEVEL 2 | LEVEL 3 | |
| Assets | ||||
| Investments in Securities* | ||||
| Common Stock(a) | $ 8,893 | $ — | $ — | $ 8,893 |
| Preferred Stock(a) | 15,922,521 | — | 15,922,521 | — |
| Asset Backed Securities | 229,632,407 | — | 217,674,989 | 11,957,418 |
| Corporate Bonds | 764,862,396 | — | 761,320,226 | 3,542,170 |
| Convertible Bonds | 18,663,013 | — | 18,663,013 | — |
| Municipal Bonds | 6,650,136 | — | 6,650,136 | — |
| Other Government | 3,218,725 | — | 3,218,725 | — |
| U.S. Treasury Securities | 4,871,214 | 4,871,214 | — | — |
| Mortgage Backed | 16,203,189 | — | 16,127,204 | 75,985 |
| Loan Participations | 45,639,743 | — | 45,618,547 | 21,196 |
| Short-Term Investments | 191,307,181 | 191,307,181 | — | — |
| Total Investments in Securities | $1,296,979,418 | $196,178,395 | $1,085,195,361 | $15,605,662(b) |
| Other Financial Instruments | ||||
| Forward Currency Contracts | $ 64,080 | $ — | $ 64,080 | $ — |
| Total Assets | $1,297,043,498 | $196,178,395 | $1,085,259,441 | $15,605,662 |
| * | See Schedule of Investments for a summary of the industry exposure as grouped according to the Global Industry Classification Standard (GICS), which is an industry taxonomy developed by MSCI, Inc. and Standard & Poor’s (S&P). |
| (a) | At March 31, 2019, industry classifications for Common Stock and Preferred Stock in level 2 and Level 3 consist of $9,302,500 in Banks, $2,994,118 in Energy, $1,125,000 in Miscellaneous, and $2,509,796 Telecommunication Services. |
| (b) | In accordance with the guidance prescribed in Accounting Standards Update ("ASU") No. 2011-04, the following table displays a summary of the valuation techniques and unobservable inputs used to value portfolio securities characterized as Level 3 investments for the period ended at March 31, 2019. |
Thornburg Strategic Income Fund | March 31, 2019 (Unaudited)
| FAIR VALUE AT March 31, 2019 | VALUATION TECHNIQUE(S) | UNOBSERVABLE INPUT | RANGE (WEIGHTED AVERAGE) | |
| Common Stock | $ 8,893 | Discount to valuation | Valuation and Pricing Committee value due to halt in trading of the security and lack of information as well as liquidity | $10.50/(N/A) |
| Asset-Backed Securities | 5,457,506 | Discounted cash flows | Third party vendor discounted cash flows | 3.4%-6.3%/(5.58%) |
| 6,499,912 | Recent Trade | Trade Price | $99.99865/(N/A) | |
| Corporate Bond | 44,081 | Discount to valuation | Valuation and Pricing Committee value due to halt in trading of the security and lack of information as well as liquidity | $4.15/(N/A) |
| 556,275 | Discounted cash flows | Third Party Vendor Discounted cash flows | 15.0%/(N/A) | |
| 2,941,814 | Recent trade | Trade price | $99.218/(N/A) | |
| Mortgage Backed | 75,985 | Unadjusted Broker Quote | Unadjusted Broker Quote | $100.00/(N/A) |
| Loan Participations | 0 | Discounted cash flows | Third party vendor discounted cash flows | 0.0%/(N/A) |
| 21,196 | Discount to valuation | Valuation and Pricing Committee value due to halt in trading of the security and lack of information as well as liquidity | $100.00/(N/A) | |
| Total | $15,605,662 |
| COMMON STOCK | ASSET BACKED SECURITIES | CORPORATE BONDS | MORTGAGE BACKED | LOAN PARTICIPATIONS | TOTAL(e) | |
| Beginning Balance 9/30/2018 | $ 8,893 | $ 4,543,975 | $ 44,081 | $ 104,670 | $ 248,379 | $ 4,949,998 |
| Accrued Discounts (Premiums) | – | 1,102 | 9,808 | (222) | – | 10,688 |
| Net Realized Gain (Loss)(a) | – | 8,780 | – | (217) | – | 8,563 |
| Gross Purchases | – | 6,499,912 | 3,497,491 | – | 6,496 | 10,003,899 |
| Gross Sales | – | (1,043,165) | – | (28,685) | – | (1,071,850) |
| Net Change in Unrealized Appreciation (Depreciation)(b)(c) | – | 39,993 | (9,210) | 439 | (233,679) | (202,457) |
| Transfers into Level 3(d) | – | 3,894,800 | – | – | – | 3,894,800 |
| Transfers out of Level 3(d) | – | (1,987,979) | – | – | – | (1,987,979) |
| Ending Balance 3/31/2019 | $8,893 | $11,957,418 | $3,542,170 | $75,985 | $21,196 | $15,605,662 |
| (a) | Amount of net realized gain (loss) from investments recognized in income is included in the Fund’s Statement of Operations for the six months ended March 31, 2019. |
| (b) | Amount of net change in unrealized appreciation (depreciation) on investments recognized in income is included in the Fund’s Statement of Operations for the six months ended March 31, 2019. |
| (c) | The net change in unrealized appreciation (depreciation) attributable to securities owned at March 31, 2019, which were valued using significant unobservable inputs, was $(202,457). This is included within net change in unrealized appreciation (depreciation) on investments in the Fund’s the Statement of Operations for the six months ended March 31, 2019. |
| (d) | Transfers into or out of Level 3 were out of or into Level 2, and were due to changes in other significant observable inputs available during the six months ended March 31, 2019. Transfers into or out of Level 3 are based on the beginning market value of the period in which they occurred. |
| (e) | Level 3 investments represent 1.20% of total net assets at the six months ended March 31, 2019. Significant fluctuations of the unobservable inputs applied to portfolio securities characterized as Level 3 investments could be expected to increase or decrease the fair value of these portfolio securities. |
| Management Fee Schedule | |
| DAILY NET ASSETS | FEE RATE |
| Up to $500 million | 0.750% |
| Next $500 million | 0.675 |
| Next $500 million | 0.625 |
| Next $500 million | 0.575 |
| Over $2 billion | 0.500 |
| Administration Fee Schedule | |
| Daily Net Assets | Fee Rate |
| Up to $20 billion | 0.100% |
| $20 billion to $40 billion | 0.075 |
| $40 billion to $60 billion | 0.040 |
| Over $60 billion | 0.030 |
Thornburg Strategic Income Fund | March 31, 2019 (Unaudited)
| Fund | Market Value 9/30/18 | Purchases at Cost | Sales Proceeds | Realized Gain (Loss) | Change in Unrealized Appr./(Depr.) | Market Value 3/31/19 | Dividend Income |
| Thornburg Capital Management Fund | $139,164,733 | $239,966,304 | $(187,823,856) | $- | $- | $191,307,181 | $1,610,138 |
| SIX MONTHS ENDED March 31, 2019 (UNAUDITED) | YEAR ENDED September 30, 2018 (AUDITED) | |||
| SHARES | AMOUNT | SHARES | AMOUNT | |
| Class A Shares | ||||
| Shares sold | 2,003,116 | $ 23,292,282 | 3,743,553 | $ 43,800,920 |
| Shares issued to shareholders in reinvestment of dividends | 267,356 | 3,104,330 | 476,454 | 5,580,759 |
| Shares repurchased | (2,229,376) | (25,845,622) | (6,889,844) | (80,703,800) |
| Net increase (decrease) | 41,096 | $ 550,990 | (2,669,837) | $ (31,322,121) |
| Class C Shares | ||||
| Shares sold | 707,930 | $ 8,192,367 | 1,374,316 | $ 16,093,680 |
| Shares issued to shareholders in reinvestment of dividends | 150,979 | 1,750,074 | 298,369 | 3,489,800 |
| Shares repurchased | (2,401,465) | (27,842,493) | (6,126,306) | (71,570,444) |
| Net decrease | (1,542,556) | $ (17,900,052) | (4,453,621) | $ (51,986,964) |
| Class I Shares | ||||
| Shares sold | 27,527,419 | $ 318,613,525 | 28,836,011 | $ 336,883,252 |
| Shares issued to shareholders in reinvestment of dividends | 1,165,540 | 13,511,680 | 1,562,832 | 18,254,037 |
| Shares repurchased | (13,243,069) | (153,041,853) | (17,411,738) | (203,503,991) |
| Net increase | 15,449,890 | $ 179,083,352 | 12,987,105 | $ 151,633,298 |
| SIX MONTHS ENDED March 31, 2019 (UNAUDITED) | YEAR ENDED September 30, 2018 (AUDITED) | |||
| SHARES | AMOUNT | SHARES | AMOUNT | |
| Class R3 Shares | ||||
| Shares sold | 12,670 | $ 147,219 | 77,122 | $ 906,267 |
| Shares issued to shareholders in reinvestment of dividends | 1,273 | 14,771 | 2,313 | 27,086 |
| Shares repurchased | (26,231) | (305,338) | (135,984) | (1,595,274) |
| Net decrease | (12,288) | $ (143,348) | (56,549) | $ (661,921) |
| Class R4 Shares | ||||
| Shares sold | 35,638 | $ 413,677 | 40,422 | $ 475,669 |
| Shares issued to shareholders in reinvestment of dividends | 2,191 | 25,364 | 4,590 | 53,698 |
| Shares repurchased | (138,395) | (1,606,758) | (92,068) | (1,077,770) |
| Net decrease | (100,566) | $ (1,167,717) | (47,056) | $ (548,403) |
| Class R5 Shares | ||||
| Shares sold | 122,744 | $ 1,425,352 | 413,985 | $ 4,848,911 |
| Shares issued to shareholders in reinvestment of dividends | 11,507 | 133,391 | 18,076 | 211,166 |
| Shares repurchased | (141,463) | (1,644,480) | (327,434) | (3,833,890) |
| Net increase (decrease) | (7,212) | $ (85,737) | 104,627 | $ 1,226,187 |
| Class R6 Shares | ||||
| Shares sold | 80,396 | $ 934,978 | 859,057 | $ 10,062,046 |
| Shares issued to shareholders in reinvestment of dividends | 8,882 | 103,247 | 7,722 | 90,009 |
| Shares repurchased | (56,928) | (659,913) | (36,324) | (423,261) |
| Net increase | 32,350 | $ 378,312 | 830,455 | $ 9,728,794 |
SHEET RISK AND FOREIGN INVESTMENT RISK
Thornburg Strategic Income Fund | March 31, 2019 (Unaudited)
| FAIR VALUES OF DERIVATIVE FINANCIAL INSTRUMENTS AT MARCH 31, 2019 | ||
| ASSET DERIVATIVES | BALANCE SHEET LOCATION | FAIR VALUE |
| Foreign exchange contracts | Assets - Unrealized appreciation on forward currency contracts | $ 64,080 |
| NET REALIZED GAIN (LOSS) ON DERIVATIVE FINANCIAL INSTRUMENTS RECOGNIZED IN INCOME FOR THE SIX MONTHS ENDED March 31, 2019 | ||
| TOTAL | FORWARD CURRENCY CONTRACTS | |
| Foreign exchange contracts | $ 118,108 | $ 118,108 |
| NET CHANGE IN UNREALIZED APPRECIATION (DEPRECIATION) OF DERIVATIVE FINANCIAL INSTRUMENTS RECOGNIZED IN INCOME FOR THE SIX MONTHS ENDED March 31, 2019 | ||
| TOTAL | FORWARD CURRENCY CONTRACTS | |
| Foreign exchange contracts | $ 45,382 | $ 45,382 |
Thornburg Strategic Income Fund
| PER SHARE PERFORMANCE (FOR A SHARE OUTSTANDING THROUGHOUT THE PERIOD) | ||||||||
| UNLESS OTHERWISE NOTED, PERIODS ARE FISCAL YEARS ENDED SEPTEMBER 30, | Net Asset Value, Beginning of PERIOD | Net Investment Income (Loss)+ | Net Realized & Unrealized Gain (Loss) on Investments | Total from Investment Operations | Dividends from Net Investment Income | Dividends from Net Realized Gains | Total Dividends | Net Asset Value, End of PERIOD |
| CLASS A SHARES | ||||||||
| 2019(b)(c) | $ 11.65 | 0.21 | 0.09 | 0.30 | (0.20) | — | (0.20) | $ 11.75 |
| 2018(b) | $ 11.82 | 0.40 | (0.24) | 0.16 | (0.33) | — | (0.33) | $ 11.65 |
| 2017(b) | $ 11.56 | 0.42 | 0.20 | 0.62 | (0.36) | — | (0.36) | $ 11.82 |
| 2016(b) | $ 11.22 | 0.46 | 0.28 | 0.74 | (0.37) | (0.03) | (0.40) | $ 11.56 |
| 2015(b) | $ 12.18 | 0.47 | (0.82) | (0.35) | (0.46) | (0.15) | (0.61) | $ 11.22 |
| 2014(b) | $ 12.19 | 0.52 | 0.28 | 0.80 | (0.54) | (0.27) | (0.81) | $ 12.18 |
| CLASS C SHARES | ||||||||
| 2019(c) | $ 11.63 | 0.17 | 0.09 | 0.26 | (0.16) | — | (0.16) | $ 11.73 |
| 2018 | $ 11.81 | 0.32 | (0.25) | 0.07 | (0.25) | — | (0.25) | $ 11.63 |
| 2017 | $ 11.55 | 0.35 | 0.19 | 0.54 | (0.28) | — | (0.28) | $ 11.81 |
| 2016 | $ 11.20 | 0.40 | 0.28 | 0.68 | (0.30) | (0.03) | (0.33) | $ 11.55 |
| 2015 | $ 12.17 | 0.41 | (0.83) | (0.42) | (0.40) | (0.15) | (0.55) | $ 11.20 |
| 2014 | $ 12.17 | 0.45 | 0.29 | 0.74 | (0.47) | (0.27) | (0.74) | $ 12.17 |
| CLASS I SHARES | ||||||||
| 2019(c) | $ 11.62 | 0.23 | 0.09 | 0.32 | (0.22) | — | (0.22) | $ 11.72 |
| 2018 | $ 11.80 | 0.45 | (0.25) | 0.20 | (0.38) | — | (0.38) | $ 11.62 |
| 2017 | $ 11.54 | 0.47 | 0.19 | 0.66 | (0.40) | — | (0.40) | $ 11.80 |
| 2016 | $ 11.19 | 0.50 | 0.28 | 0.78 | (0.40) | (0.03) | (0.43) | $ 11.54 |
| 2015 | $ 12.16 | 0.51 | (0.83) | (0.32) | (0.50) | (0.15) | (0.65) | $ 11.19 |
| 2014 | $ 12.17 | 0.56 | 0.28 | 0.84 | (0.58) | (0.27) | (0.85) | $ 12.16 |
| CLASS R3 SHARES | ||||||||
| 2019(c) | $ 11.64 | 0.20 | 0.10 | 0.30 | (0.19) | — | (0.19) | $ 11.75 |
| 2018 | $ 11.82 | 0.38 | (0.25) | 0.13 | (0.31) | — | (0.31) | $ 11.64 |
| 2017 | $ 11.55 | 0.42 | 0.20 | 0.62 | (0.35) | — | (0.35) | $ 11.82 |
| 2016 | $ 11.21 | 0.46 | 0.27 | 0.73 | (0.36) | (0.03) | (0.39) | $ 11.55 |
| 2015 | $ 12.18 | 0.47 | (0.83) | (0.36) | (0.46) | (0.15) | (0.61) | $ 11.21 |
| 2014 | $ 12.19 | 0.49 | 0.31 | 0.80 | (0.54) | (0.27) | (0.81) | $ 12.18 |
| CLASS R4 SHARES | ||||||||
| 2019(c) | $ 11.63 | 0.20 | 0.10 | 0.30 | (0.19) | — | (0.19) | $ 11.74 |
| 2018 | $ 11.82 | 0.38 | (0.25) | 0.13 | (0.32) | — | (0.32) | $ 11.63 |
| 2017 | $ 11.56 | 0.41 | 0.20 | 0.61 | (0.35) | — | (0.35) | $ 11.82 |
| 2016 | $ 11.21 | 0.46 | 0.28 | 0.74 | (0.36) | (0.03) | (0.39) | $ 11.56 |
| 2015 | $ 12.18 | 0.48 | (0.84) | (0.36) | (0.46) | (0.15) | (0.61) | $ 11.21 |
| 2014(e) | $ 12.00 | 0.35 | 0.17 | 0.52 | (0.34) | — | (0.34) | $ 12.18 |
| CLASS R5 SHARES | ||||||||
| 2019(c) | $ 11.62 | 0.23 | 0.10 | 0.33 | (0.22) | — | (0.22) | $ 11.73 |
| 2018 | $ 11.80 | 0.45 | (0.25) | 0.20 | (0.38) | — | (0.38) | $ 11.62 |
| 2017 | $ 11.54 | 0.47 | 0.19 | 0.66 | (0.40) | — | (0.40) | $ 11.80 |
| 2016 | $ 11.19 | 0.49 | 0.28 | 0.77 | (0.39) | (0.03) | (0.42) | $ 11.54 |
| 2015 | $ 12.15 | 0.50 | (0.82) | (0.32) | (0.49) | (0.15) | (0.64) | $ 11.19 |
| 2014 | $ 12.16 | 0.55 | 0.28 | 0.83 | (0.57) | (0.27) | (0.84) | $ 12.15 |
| CLASS R6 SHARES | ||||||||
| 2019(c) | $ 11.65 | 0.24 | 0.10 | 0.34 | (0.23) | — | (0.23) | $ 11.76 |
| 2018 | $ 11.85 | 0.45 | (0.26) | 0.19 | (0.39) | — | (0.39) | $ 11.65 |
| 2017(g) | $ 11.63 | 0.33 | 0.13 | 0.46 | (0.24) | — | (0.24) | $ 11.85 |
| (a) | Not annualized for periods less than one year. |
| (b) | Sales loads are not reflected in computing total return. |
| (c) | Unaudited Six Month Period Ended March 31. |
| (d) | Annualized. |
| (e) | Effective date of this class of shares was February 1, 2014. |
| (f) | Due to the size of net assets and fixed expenses, ratios may appear disproportionate. |
| (g) | Effective date of this class of shares was April 10, 2017. |
| (h) | Net Assets at End of Period was less than $1,000. |
| + | Based on weighted average shares outstanding. |
Thornburg Strategic Income Fund
| RATIOS TO AVERAGE NET ASSETS | SUPPLEMENTAL DATA | ||||||
| Net Investment Income (Loss) (%) | Expenses, After Expense Reductions (%) | Expenses, After Expense Reductions and Net of Custody Credits (%) | Expenses, Before Expense Reductions (%) | Total Return (%)(a) | Portfolio Turnover Rate (%)(a) | Net Assets at End of PERIOD (Thousands) | |
| 3.62(d) | 1.06(d) | 1.06(d) | 1.18(d) | 2.61 | 13.14 | $ 200,620 | |
| 3.41 | 1.09 | 1.09 | 1.21 | 1.39 | 29.90 | $ 198,320 | |
| 3.61 | 1.17 | 1.17 | 1.25 | 5.41 | 44.74 | $ 232,938 | |
| 4.12 | 1.24 | 1.24 | 1.24 | 6.70 | 29.48 | $ 283,398 | |
| 4.04 | 1.23 | 1.23 | 1.23 | (2.97) | 38.40 | $ 338,387 | |
| 4.30 | 1.22 | 1.22 | 1.24 | 6.79 | 51.20 | $ 392,604 | |
| 2.88(d) | 1.80(d) | 1.80(d) | 1.94(d) | 2.24 | 13.14 | $ 133,639 | |
| 2.70 | 1.80 | 1.80 | 1.96 | 0.59 | 29.90 | $ 150,364 | |
| 2.98 | 1.80 | 1.80 | 1.99 | 4.76 | 44.74 | $ 205,253 | |
| 3.56 | 1.80 | 1.80 | 1.99 | 6.20 | 29.48 | $ 272,691 | |
| 3.47 | 1.80 | 1.80 | 1.97 | (3.61) | 38.40 | $ 306,085 | |
| 3.73 | 1.80 | 1.80 | 1.98 | 6.27 | 51.20 | $ 348,334 | |
| 4.02(d) | 0.66(d) | 0.66(d) | 0.91(d) | 2.81 | 13.14 | $ 950,386 | |
| 3.81 | 0.69 | 0.69 | 0.91 | 1.71 | 29.90 | $ 762,239 | |
| 4.02 | 0.75 | 0.75 | 0.92 | 5.85 | 44.74 | $ 620,780 | |
| 4.45 | 0.91 | 0.91 | 0.91 | 7.15 | 29.48 | $ 480,143 | |
| 4.38 | 0.89 | 0.89 | 0.89 | (2.73) | 38.40 | $ 531,849 | |
| 4.60 | 0.90 | 0.90 | 0.90 | 7.15 | 51.20 | $ 552,182 | |
| 3.43(d) | 1.25(d) | 1.25(d) | 2.51(d) | 2.60 | 13.14 | $ 1,842 | |
| 3.24 | 1.25 | 1.25 | 2.46 | 1.16 | 29.90 | $ 1,968 | |
| 3.65 | 1.12 | 1.12 | 2.58 | 5.49 | 44.74 | $ 2,667 | |
| 4.07 | 1.25 | 1.25 | 3.09 | 6.69 | 29.48 | $ 2,819 | |
| 3.98 | 1.25 | 1.25 | 2.70 | (3.07) | 38.40 | $ 1,430 | |
| 4.10 | 1.25 | 1.25 | 3.10 | 6.76 | 51.20 | $ 3,049 | |
| 3.37(d) | 1.25(d) | 1.25(d) | 2.20(d) | 2.60 | 13.14 | $ 1,021 | |
| 3.25 | 1.25 | 1.25 | 2.14 | 1.08 | 29.90 | $ 2,182 | |
| 3.52 | 1.25 | 1.25 | 2.30 | 5.35 | 44.74 | $ 2,772 | |
| 4.10 | 1.25 | 1.25 | 2.50 | 6.79 | 29.48 | $ 3,218 | |
| 4.15 | 1.25 | 1.25 | 2.64 | (3.07) | 38.40 | $ 2,106 | |
| 4.25(d) | 1.25(d) | 1.25(d) | 60.66(d)(f) | 4.29 | 51.20 | $ 16 | |
| 4.02(d) | 0.66(d) | 0.66(d) | 1.18(d) | 2.90 | 13.14 | $ 7,390 | |
| 3.82 | 0.69 | 0.69 | 1.20 | 1.71 | 29.90 | $ 7,406 | |
| 4.03 | 0.74 | 0.74 | 1.36 | 5.84 | 44.74 | $ 6,286 | |
| 4.34 | 0.99 | 0.99 | 1.37 | 7.07 | 29.48 | $ 7,191 | |
| 4.33 | 0.99 | 0.99 | 1.55 | (2.75) | 38.40 | $ 6,399 | |
| 4.51 | 0.99 | 0.99 | 2.11 | 7.05 | 51.20 | $ 2,565 | |
| 4.07(d) | 0.61(d) | 0.61(d) | 0.96(d) | 2.92 | 13.14 | $ 10,148 | |
| 3.91 | 0.65 | 0.65 | 1.13 | 1.66 | 29.90 | $ 9,679 | |
| 5.83(d) | 0.00(d) | 0.00(d) | 200.66(d)(f) | 3.99 | 44.74 | $ —(h) | |
Thornburg Strategic Income Fund | March 31, 2019 (Unaudited)
| (1) | transaction costs, including |
| (a) | sales charges (loads) on purchase payments, for Class A shares; |
| (b) | a deferred sales charge on redemptions of any part or all of a purchase of $1 million of Class A shares within 12 months of purchase; |
| (c) | a deferred sales charge on redemptions of Class C shares within 12 months of purchase; |
| (2) | ongoing costs, including management fees; distribution and/or service (12b-1) fees; and other Fund expenses. |
| BEGINNING ACCOUNT VALUE 10/1/18 | ENDING ACCOUNT VALUE 3/31/19 | EXPENSES PAID DURING PERIOD† 10/1/18—3/31/19 | |
| CLASS A SHARES | |||
| Actual | $1,000.00 | $1,026.08 | $5.35 |
| Hypothetical* | $1,000.00 | $1,019.65 | $5.34 |
| CLASS C SHARES | |||
| Actual | $1,000.00 | $1,022.39 | $9.08 |
| Hypothetical* | $1,000.00 | $1,015.96 | $9.05 |
| CLASS I SHARES | |||
| Actual | $1,000.00 | $1,028.13 | $3.34 |
| Hypothetical* | $1,000.00 | $1,021.64 | $3.33 |
| CLASS R3 SHARES | |||
| Actual | $1,000.00 | $1,026.02 | $6.31 |
| Hypothetical* | $1,000.00 | $1,018.70 | $6.29 |
| CLASS R4 SHARES | |||
| Actual | $1,000.00 | $1,026.03 | $6.31 |
| Hypothetical* | $1,000.00 | $1,018.70 | $6.29 |
| CLASS R5 SHARES | |||
| Actual | $1,000.00 | $1,029.01 | $3.34 |
| Hypothetical* | $1,000.00 | $1,021.64 | $3.33 |
| CLASS R6 SHARES | |||
| Actual | $1,000.00 | $1,029.24 | $3.09 |
| Hypothetical* | $1,000.00 | $1,021.89 | $3.07 |
| † | Expenses are equal to the annualized expense ratio for each class (A: 1.06%; C: 1.80%; I: 0.66%; R3: 1.25%; R4: 1.25%; R5: 0.66%; R6: 0.61%) multiplied by the average account value over the period, multiplied by 182/365 to reflect the one-half year period. |
| * | Hypothetical assumes a rate of return of 5% per year before expenses. |
Thornburg Strategic Income Fund | March 31, 2019 (Unaudited)
| ■ | Thornburg Investment Income Builder Fund |
| ■ | Thornburg Global Opportunities Fund |
| ■ | Thornburg International Value Fund |
| ■ | Thornburg Better World International Fund |
| ■ | Thornburg International Growth Fund |
| ■ | Thornburg Developing World Fund |
| ■ | Thornburg Value Fund |
| ■ | Thornburg Core Growth Fund |
| ■ | Thornburg Investment Income Builder Fund |
| ■ | Thornburg Summit Fund |
| ■ | Thornburg Low Duration Income Fund |
| ■ | Thornburg Limited Term U.S. Government Fund |
| ■ | Thornburg Limited Term Income Fund |
| ■ | Thornburg Strategic Income Fund |
| ■ | Thornburg Low Duration Municipal Fund |
| ■ | Thornburg Limited Term Municipal Fund |
| ■ | Thornburg Intermediate Municipal Fund |
| ■ | Thornburg California Limited Term Municipal Fund |
| ■ | Thornburg New Mexico Intermediate Municipal Fund |
| ■ | Thornburg New York Intermediate Municipal Fund |
| ■ | Thornburg Strategic Municipal Income Fund |
| ■ | Thornburg Long/Short Equity Fund |

| 800.847.0200 | TH1663 |


| 4 | |
| 6 | |
| 7 | |
| 8 | |
| 12 | |
| 13 | |
| 15 | |
| 16 | |
| 26 | |
| 28 | |
| 29 | |
| 30 |
| SHARE CLASS | NASDAQ SYMBOL | CUSIP |
| Class A | TVAFX | 885-215-731 |
| Class C | TVCFX | 885-215-715 |
| Class I | TVIFX | 885-215-632 |
| Class R3 | TVRFX | 885-215-533 |
| Class R4 | TVIRX | 885-215-277 |
| Class R5 | TVRRX | 885-215-376 |
Thornburg Value Fund | March 31, 2019 (Unaudited)
 |  |
| Connor Browne,cfa Portfolio Manager Managing Director | Robert MacDonald,cfa Portfolio Manager Managing Director |
Thornburg Value Fund | March 31, 2019 (Unaudited)
| 1-YR | 3-YR | 5-YR | 10-YR | SINCE INCEP. | |
| Class A Shares(Incep: 10/2/95) | |||||
| Without sales charge | 4.74% | 11.53% | 8.75% | 13.67% | 9.68% |
| With sales charge | 0.02% | 9.83% | 7.76% | 13.15% | 9.46% |
| Class C Shares(Incep: 10/2/95) | |||||
| Without sales charge | 3.80% | 10.64% | 7.91% | 12.79% | 8.83% |
| With sales charge | 2.80% | 10.64% | 7.91% | 12.79% | 8.83% |
| Class I Shares(Incep: 11/2/98) | 5.10% | 11.94% | 9.17% | 14.10% | 7.70% |
| Class R3 Shares(Incep: 7/1/03) | 4.70% | 11.53% | 8.77% | 13.67% | 7.87% |
| Class R4 Shares(Incep: 2/1/07) | 4.81% | 11.65% | 8.88% | 13.78% | 5.79% |
| Class R5 Shares(Incep: 2/1/05) | 5.09% | 11.95% | 9.17% | 14.08% | 7.89% |
| S&P 500 Index (Since 10/2/95) | 9.50% | 13.51% | 10.91% | 15.92% | 9.03% |
| FINAL VALUE |
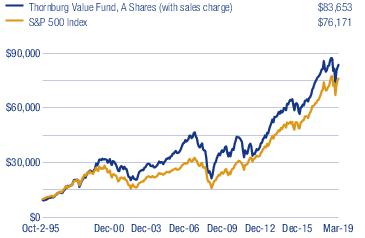
Thornburg Value Fund | March 31, 2019 (Unaudited)
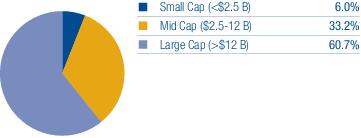
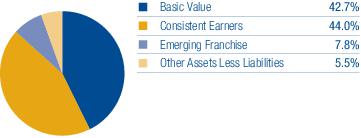
| TOP TEN EQUITY HOLDINGS | |
| Thermo Fisher Scientific, Inc. | 5.2% |
| US Foods Holding Corp. | 4.7% |
| Alphabet, Inc. Class C | 4.4% |
| JPMorgan Chase & Co. | 4.3% |
| Assured Guaranty Ltd. | 4.0% |
| Gilead Sciences, Inc. | 3.8% |
| Enterprise Products Partners L.P. | 3.4% |
| Nomad Foods Ltd. | 3.3% |
| Comcast Corp. Class A | 3.1% |
| Oaktree Capital Group, LLC | 3.0% |
| SECTOR EXPOSURE | |
| Financials | 21.8% |
| Communication Services | 15.0% |
| Health Care | 14.0% |
| Information Technology | 9.7% |
| Consumer Discretionary | 9.3% |
| Consumer Staples | 8.0% |
| Energy | 7.6% |
| Materials | 4.9% |
| Industrials | 3.0% |
| Utilities | 1.2% |
| Other Assets Less Liabilities | 5.5% |
| TOP TEN INDUSTRY GROUPS | |
| Media & Entertainment | 12.2% |
| Pharmaceuticals, Biotechnology & Life Sciences | 11.1% |
| Diversified Financials | 10.9% |
| Energy | 7.6% |
| Technology Hardware & Equipment | 7.4% |
| Banks | 6.9% |
| Materials | 4.9% |
| Food & Staples Retailing | 4.7% |
| Retailing | 4.5% |
| Insurance | 4.0% |
Thornburg Value Fund | March 31, 2019 (Unaudited)
| SHARES | VALUE | ||
| Common Stock — 94.5% | |||
| Banks — 6.9% | |||
| Banks — 6.9% | |||
| Citigroup, Inc. | 391,156 | $ 24,337,726 | |
| JPMorgan Chase & Co. | 382,211 | 38,691,220 | |
| 63,028,946 | |||
| Capital Goods — 1.1% | |||
| Machinery — 1.1% | |||
| ITT, Inc. | 163,890 | 9,505,620 | |
| 9,505,620 | |||
| Consumer Durables & Apparel — 1.0% | |||
| Household Durables — 1.0% | |||
| a | Mohawk Industries, Inc. | 68,996 | 8,703,845 |
| 8,703,845 | |||
| Consumer Services — 3.8% | |||
| Hotels, Restaurants & Leisure — 3.8% | |||
| Domino’s Pizza Group plc | 2,656,084 | 8,371,786 | |
| Starbucks Corp. | 355,700 | 26,442,738 | |
| 34,814,524 | |||
| Diversified Financials — 10.9% | |||
| Capital Markets — 4.1% | |||
| Apollo Global Management, LLC Class A | 357,443 | 10,097,765 | |
| Oaktree Capital Group, LLC | 555,021 | 27,556,792 | |
| Consumer Finance — 3.4% | |||
| Capital One Financial Corp. | 278,206 | 22,726,648 | |
| Navient Corp. | 734,797 | 8,501,601 | |
| Diversified Financial Services — 1.1% | |||
| AXA Equitable Holdings, Inc. | 469,490 | 9,455,529 | |
| Mortgage Real Estate Investment Trusts — 2.3% | |||
| PennyMac Mortgage Investment Trust | 1,017,045 | 21,063,002 | |
| 99,401,337 | |||
| Energy — 7.6% | |||
| Energy Equipment & Services — 0.4% | |||
| a | McDermott International, Inc. | 510,510 | 3,798,195 |
| Oil, Gas & Consumable Fuels — 7.2% | |||
| Devon Energy Corp. | 637,700 | 20,125,812 | |
| Enterprise Products Partners L.P. | 1,072,386 | 31,206,432 | |
| Teekay LNG Partners L.P. | 914,908 | 13,687,024 | |
| 68,817,463 | |||
| Food & Staples Retailing — 4.7% | |||
| Food & Staples Retailing — 4.7% | |||
| a | US Foods Holding Corp. | 1,227,123 | 42,838,864 |
| 42,838,864 | |||
| Food, Beverage & Tobacco — 3.3% | |||
| Food Products — 3.3% | |||
| a | Nomad Foods Ltd. | 1,446,470 | 29,580,311 |
| 29,580,311 | |||
| Healthcare Equipment & Services — 2.9% | |||
| Health Care Equipment & Supplies — 2.9% | |||
| Medtronic plc | 284,725 | 25,932,753 | |
| 25,932,753 | |||
| Insurance — 4.0% | |||
| Insurance — 4.0% | |||
| Assured Guaranty Ltd. | 828,063 | 36,790,839 |
| SHARES | VALUE | ||
| 36,790,839 | |||
| Materials — 4.9% | |||
| Chemicals — 1.7% | |||
| Huntsman Corp. | 687,704 | $ 15,466,463 | |
| Containers & Packaging — 3.2% | |||
| a | Crown Holdings, Inc. | 504,199 | 27,514,139 |
| Owens-Illinois, Inc. | 102,374 | 1,943,059 | |
| 44,923,661 | |||
| Media & Entertainment — 12.2% | |||
| Entertainment — 2.9% | |||
| Activision Blizzard, Inc. | 567,774 | 25,850,750 | |
| Interactive Media & Services — 6.2% | |||
| a | Alphabet, Inc. Class C | 33,858 | 39,725,930 |
| a | Facebook, Inc. Class A | 101,836 | 16,975,043 |
| Media — 3.1% | |||
| Comcast Corp. Class A | 711,400 | 28,441,772 | |
| 110,993,495 | |||
| Pharmaceuticals, Biotechnology & Life Sciences — 11.1% | |||
| Biotechnology — 5.9% | |||
| a | Alkermes plc | 513,767 | 18,747,358 |
| Gilead Sciences, Inc. | 533,439 | 34,678,869 | |
| Life Sciences Tools & Services — 5.2% | |||
| Thermo Fisher Scientific, Inc. | 173,694 | 47,543,522 | |
| 100,969,749 | |||
| Retailing — 4.5% | |||
| Internet & Direct Marketing Retail — 3.3% | |||
| a | Alibaba Group Holding Ltd. Sponsored ADR | 115,172 | 21,013,131 |
| Expedia Group, Inc. | 75,856 | 9,026,864 | |
| Specialty Retail — 1.2% | |||
| a | CarMax, Inc. | 160,566 | 11,207,507 |
| 41,247,502 | |||
| Software & Services — 2.3% | |||
| Information Technology Services — 2.3% | |||
| Cognizant Technology Solutions Corp. Class A | 291,980 | 21,153,951 | |
| 21,153,951 | |||
| Technology Hardware & Equipment — 7.4% | |||
| Communications Equipment — 0.6% | |||
| a | Casa Systems, Inc. | 592,001 | 4,913,608 |
| Electronic Equipment, Instruments & Components — 1.2% | |||
| a | Flex Ltd. | 1,090,901 | 10,909,010 |
| Technology Hardware, Storage & Peripherals — 5.6% | |||
| Apple, Inc. | 92,267 | 17,526,117 | |
| HP, Inc. | 867,177 | 16,849,249 | |
| a | Pure Storage, Inc. Class A | 773,287 | 16,849,924 |
| 67,047,908 | |||
| Telecommunication Services — 2.8% | |||
| Wireless Telecommunication Services — 2.8% | |||
| China Mobile Ltd. | 2,519,332 | 25,674,885 | |
| 25,674,885 | |||
| Transportation — 1.9% | |||
| Air Freight & Logistics — 1.9% | |||
| United Parcel Service, Inc. Class B | 151,101 | 16,884,026 | |
| 16,884,026 | |||
| Utilities — 1.2% | |||
| Electric Utilities — 1.2% |
Thornburg Value Fund | March 31, 2019 (Unaudited)
| SHARES | VALUE | ||
| Fortis, Inc. | 302,670 | $ 11,195,763 | |
| 11,195,763 | |||
| Total Common Stock(Cost $811,082,851) | 859,505,442 | ||
| Short-Term Investments — 5.6% | |||
| b | Thornburg Capital Management Fund | 5,113,389 | 51,133,893 |
| Total Short-Term Investments(Cost $51,133,893) | 51,133,893 | ||
| Total Investments — 100.1%(Cost $862,216,744) | $910,639,335 | ||
| Liabilities Net of Other Assets — (0.1)% | (698,476) | ||
| Net Assets — 100.0% | $909,940,859 |
| Outstanding Forward Currency Contracts To Buy Or Sell At March 31, 2019 | |||||||
| Contract Description | Contract Party* | Buy/Sell | Contract Amount | Contract Value Date | Value USD | Unrealized Appreciation | Unrealized Depreciation |
| Great Britain Pound | SSB | Sell | 6,489,900 | 5/8/2019 | 8,468,020 | $ — | $ (23,096) |
| Great Britain Pound | SSB | Buy | 446,600 | 5/8/2019 | 582,723 | — | (2,973) |
| Great Britain Pound | SSB | Buy | 381,100 | 5/8/2019 | 497,259 | — | (9,691) |
| Euro | SSB | Sell | 16,665,400 | 5/31/2019 | 18,787,211 | 315,553 | — |
| Total | $315,553 | $(35,760) | |||||
| Net unrealized appreciation/depreciation | $279,793 | ||||||
| * | Counterparty includes State Street Bank and Trust Company ("SSB"). |
| Footnote Legend | |
| a | Non-income producing. |
| b | Investment in Affiliates. |
To simplify the listings of securities, abbreviations are used per the table below:
| ADR | American Depositary Receipt |
Thornburg Value Fund | March 31, 2019 (Unaudited)
| ASSETS | |
| Investments at value (Note 3) | |
| Non-affiliated issuers (cost $811,082,851) | $ 859,505,442 |
| Non-controlled affiliated issuer (cost $51,133,893) | 51,133,893 |
| Receivable for investments sold | 18,074 |
| Receivable for fund shares sold | 363,874 |
| Unrealized appreciation on forward currency contracts (Note 7) | 315,553 |
| Dividends receivable | 871,543 |
| Prepaid expenses and other assets | 60,297 |
| Total Assets | 912,268,676 |
| Liabilities | |
| Payable for investments purchased | 134,551 |
| Payable for fund shares redeemed | 949,210 |
| Unrealized depreciation on forward currency contracts (Note 7) | 35,760 |
| Payable to investment advisor and other affiliates (Note 4) | 820,815 |
| Accounts payable and accrued expenses | 387,481 |
| Total Liabilities | 2,327,817 |
| Net Assets | $ 909,940,859 |
| NET ASSETS CONSIST OF | |
| Distributable earnings | $ 44,641,377 |
| Net capital paid in on shares of beneficial interest | 865,299,482 |
| $ 909,940,859 | |
| NET ASSET VALUE | |
| Class A Shares: | |
| Net asset value and redemption price per share ($429,520,805 applicable to 6,209,246 shares of beneficial interest outstanding - Note 5) | $ 69.17 |
| Maximum sales charge, 4.50% of offering price | 3.26 |
| Maximum offering price per share | $ 72.43 |
| Class C Shares: | |
| Net asset value and offering price per share* ($42,990,312 applicable to 681,936 shares of beneficial interest outstanding - Note 5) | $ 63.04 |
| Class I Shares: | |
| Net asset value, offering and redemption price per share ($379,773,681 applicable to 5,334,182 shares of beneficial interest outstanding - Note 5) | $ 71.20 |
| Class R3 Shares: | |
| Net asset value, offering and redemption price per share ($32,769,874 applicable to 476,140 shares of beneficial interest outstanding - Note 5) | $ 68.82 |
| Class R4 Shares: | |
| Net asset value, offering and redemption price per share ($6,693,513 applicable to 96,222 shares of beneficial interest outstanding - Note 5) | $ 69.56 |
| Class R5 Shares: | |
| Net asset value, offering and redemption price per share ($18,192,674 applicable to 255,891 shares of beneficial interest outstanding - Note 5) | $ 71.10 |
| * | Redemption price per share is equal to net asset value less any applicable contingent deferred sales charge. |
Thornburg Value Fund | Six Months Ended March 31, 2019 (Unaudited)
| INVESTMENT INCOME | |
| Dividend income | |
| Non-affiliated issuers (net of foreign taxes withheld of $30,850) | $ 8,577,707 |
| Non-controlled affiliated issuer | 828,151 |
| Total Income | 9,405,858 |
| EXPENSES | |
| Investment advisory fees (Note 4) | 3,840,768 |
| Administration fees (Note 4) | |
| Class A Shares | 185,825 |
| Class C Shares | 19,825 |
| Class I Shares | 163,963 |
| Class R3 Shares | 14,961 |
| Class R4 Shares | 3,000 |
| Class R5 Shares | 7,668 |
| Distribution and service fees (Note 4) | |
| Class A Shares | 529,416 |
| Class C Shares | 226,073 |
| Class R3 Shares | 85,306 |
| Class R4 Shares | 8,550 |
| Transfer agent fees | |
| Class A Shares | 212,470 |
| Class C Shares | 58,810 |
| Class I Shares | 191,250 |
| Class R3 Shares | 57,780 |
| Class R4 Shares | 15,834 |
| Class R5 Shares | 38,948 |
| Registration and filing fees | |
| Class A Shares | 6,925 |
| Class C Shares | 6,065 |
| Class I Shares | 7,289 |
| Class R3 Shares | 6,023 |
| Class R4 Shares | 5,786 |
| Class R5 Shares | 5,758 |
| Custodian fees (Note 2) | 29,120 |
| Professional fees | 42,310 |
| Trustee and officer fees (Note 4) | 26,092 |
| Other expenses | 56,314 |
| Total Expenses | 5,852,129 |
| Less: | |
| Expenses reimbursed by investment advisor (Note 4) | (318,831) |
| Net Expenses | 5,533,298 |
| Net Investment Income | $ 3,872,560 |
Thornburg Value Fund | Six Months Ended March 31, 2019 (Unaudited)
| REALIZED AND UNREALIZED GAIN (LOSS) | |
| Net realized gain (loss) on: | |
| Non-affiliated issuer investments | $ (7,328,334) |
| Forward currency contracts (Note 7) | 1,158,895 |
| Foreign currency transactions | (6,255) |
| (6,175,694) | |
| Net change in unrealized appreciation (depreciation) on: | |
| Non-affiliated issuer investments | (42,041,954) |
| Forward currency contracts (Note 7) | 234,820 |
| Foreign currency translations | (2,111) |
| (41,809,245) | |
| Net Realized and Unrealized Loss | (47,984,939) |
| Net Decrease in Net Assets Resulting from Operations | $ (44,112,379) |
Thornburg Value Fund
| Six Months Ended March 31, 2019* | Year Ended September 30, 2018 | |
| INCREASE (DECREASE) IN NET ASSETS FROM | ||
| OPERATIONS | ||
| Net investment income | $ 3,872,560 | $ 5,975,880 |
| Net realized gain (loss) on investments, forward currency contracts and foreign currency transactions | (6,175,694) | 241,438,605 |
| Net unrealized appreciation (depreciation) on investments, forward currency contracts and foreign currency translations | (41,809,245) | (137,958,472) |
| Net Increase (Decrease) in Net Assets Resulting from Operations | (44,112,379) | 109,456,013 |
| DIVIDENDS TO SHAREHOLDERS | ||
| From distributable earnings | ||
| Class A Shares | (1,836,449) | (2,045,321) |
| Class C Shares | - | (643,910) |
| Class I Shares | (2,694,843) | (2,283,277) |
| Class R3 Shares | (114,235) | (248,385) |
| Class R4 Shares | (29,384) | (51,776) |
| Class R5 Shares | (128,320) | (113,541) |
| FUND SHARE TRANSACTIONS (NOTE 5) | ||
| Class A Shares | (21,883,787) | 48,921,442 |
| Class C Shares | (6,507,559) | (122,477,269) |
| Class I Shares | (21,721,339) | 12,485,587 |
| Class R3 Shares | (4,517,714) | (11,000,791) |
| Class R4 Shares | (772,308) | (3,261,498) |
| Class R5 Shares | 29,958 | 34,360 |
| Net Increase (Decrease) in Net Assets | (104,288,359) | 28,771,634 |
| NET ASSETS | ||
| Beginning of Period | 1,014,229,218 | 985,457,584 |
| End of Period | $ 909,940,859 | $ 1,014,229,218 |
| * | Unaudited. |
Thornburg Value Fund | March 31, 2019 (Unaudited)
| Cost of investments for tax purposes | $ 862,216,744 |
| Gross unrealized appreciation on a tax basis | 117,605,834 |
| Gross unrealized depreciation on a tax basis | (69,183,243) |
| Net unrealized appreciation (depreciation) on investments (tax basis) | $ 48,422,591 |
Thornburg Value Fund | March 31, 2019 (Unaudited)
| Fair Value Measurements at March 31, 2019 | ||||
| TOTAL | LEVEL 1 | LEVEL 2 | LEVEL 3 | |
| Assets | ||||
| Investments in Securities* | ||||
| Common Stock | $ 859,505,442 | $ 859,505,442 | $ — | $ — |
| Short-Term Investments | 51,133,893 | 51,133,893 | — | — |
| Total Investments in Securities | $910,639,335 | $910,639,335 | $— | $— |
Thornburg Value Fund | March 31, 2019 (Unaudited)
| Fair Value Measurements at March 31, 2019 | ||||
| TOTAL | LEVEL 1 | LEVEL 2 | LEVEL 3 | |
| Other Financial Instruments | ||||
| Forward Currency Contracts | $ 315,553 | $ — | $ 315,553 | $ — |
| Total Assets | $910,954,888 | $910,639,335 | $315,553 | $— |
| Liabilities | ||||
| Other Financial Instruments | ||||
| Forward Currency Contracts | $ (35,760) | $ — | $ (35,760) | $ — |
| Total Liabilities | $(35,760) | $— | $(35,760) | $— |
| * | See Schedule of Investments for a summary of the industry exposure as grouped according to the Global Industry Classification Standard (GICS), which is an industry taxonomy developed by MSCI, Inc. and Standard & Poor’s (S&P). |
| Management Fee Schedule | |
| DAILY NET ASSETS | FEE RATE |
| Up to $500 million | 0.875% |
| Next $500 million | 0.825 |
| Next $500 million | 0.775 |
| Next $500 million | 0.725 |
| Over $2 billion | 0.675 |
| Administration Fee Schedule | |
| Daily Net Assets | Fee Rate |
| Up to $20 billion | 0.100% |
| $20 billion to $40 billion | 0.075 |
| $40 billion to $60 billion | 0.040 |
| Over $60 billion | 0.030 |
| Fund | Market Value 9/30/18 | Purchases at Cost | Sales Proceeds | Realized Gain (Loss) | Change in Unrealized Appr./(Depr.) | Market Value 3/31/19 | Dividend Income |
| Thornburg Capital Management Fund | $112,260,426 | $84,181,387 | $(145,307,920) | $- | $- | $51,133,893 | $828,151 |
| SIX MONTHS ENDED March 31, 2019 (UNAUDITED) | YEAR ENDED September 30, 2018 (AUDITED) | |||
| SHARES | AMOUNT | SHARES | AMOUNT | |
| Class A Shares | ||||
| Shares sold | 150,614 | $ 9,983,979 | 1,753,542 | $ 124,113,117 |
| Shares issued to shareholders in reinvestment of dividends | 29,836 | 1,759,754 | 28,581 | 1,940,082 |
| Shares repurchased | (508,925) | (33,627,520) | (1,114,963) | (77,131,757) |
| Net increase (decrease) | (328,475) | $ (21,883,787) | 667,160 | $ 48,921,442 |
Thornburg Value Fund | March 31, 2019 (Unaudited)
| SIX MONTHS ENDED March 31, 2019 (UNAUDITED) | YEAR ENDED September 30, 2018 (AUDITED) | |||
| SHARES | AMOUNT | SHARES | AMOUNT | |
| Class C Shares | ||||
| Shares sold | 66,096 | $ 3,843,865 | 95,949 | $ 6,089,425 |
| Shares issued to shareholders in reinvestment of dividends | - | - | 10,013 | 623,226 |
| Shares repurchased | (172,077) | (10,351,424) | (2,001,456) | (129,189,920) |
| Net decrease | (105,981) | $ (6,507,559) | (1,895,494) | $ (122,477,269) |
| Class I Shares | ||||
| Shares sold | 275,063 | $ 18,729,840 | 1,261,932 | $ 90,593,694 |
| Shares issued to shareholders in reinvestment of dividends | 41,897 | 2,541,041 | 30,761 | 2,147,141 |
| Shares repurchased | (635,821) | (42,992,220) | (1,135,822) | (80,255,248) |
| Net increase (decrease) | (318,861) | $ (21,721,339) | 156,871 | $ 12,485,587 |
| Class R3 Shares | ||||
| Shares sold | 30,523 | $ 2,013,040 | 86,863 | $ 5,923,634 |
| Shares issued to shareholders in reinvestment of dividends | 1,862 | 109,276 | 3,543 | 239,041 |
| Shares repurchased | (100,698) | (6,640,030) | (249,858) | (17,163,466) |
| Net decrease | (68,313) | $ (4,517,714) | (159,452) | $ (11,000,791) |
| Class R4 Shares | ||||
| Shares sold | 3,202 | $ 212,001 | 17,806 | $ 1,229,724 |
| Shares issued to shareholders in reinvestment of dividends | 402 | 23,796 | 541 | 36,893 |
| Shares repurchased | (15,407) | (1,008,105) | (65,297) | (4,528,115) |
| Net decrease | (11,803) | $ (772,308) | (46,950) | $ (3,261,498) |
| Class R5 Shares | ||||
| Shares sold | 18,046 | $ 1,245,147 | 53,918 | $ 3,798,893 |
| Shares issued to shareholders in reinvestment of dividends | 2,117 | 128,201 | 1,616 | 112,647 |
| Shares repurchased | (20,116) | (1,343,390) | (54,291) | (3,877,180) |
| Net increase | 47 | $ 29,958 | 1,243 | $ 34,360 |
SHEET RISK AND FOREIGN INVESTMENT RISK
| FAIR VALUES OF DERIVATIVE FINANCIAL INSTRUMENTS AT MARCH 31, 2019 | ||
| ASSET DERIVATIVES | BALANCE SHEET LOCATION | FAIR VALUE |
| Foreign exchange contracts | Assets - Unrealized appreciation on forward currency contracts | $ 315,553 |
| FAIR VALUES OF DERIVATIVE FINANCIAL INSTRUMENTS AT MARCH 31, 2019 | ||
| LIABILITY DERIVATIVES | BALANCE SHEET LOCATION | FAIR VALUE |
| Foreign exchange contracts | Liabilities - Unrealized depreciation on forward currency contracts | $ (35,760) |
| NET REALIZED GAIN (LOSS) ON DERIVATIVE FINANCIAL INSTRUMENTS RECOGNIZED IN INCOME FOR THE SIX MONTHS ENDED March 31, 2019 | ||
| TOTAL | FORWARD CURRENCY CONTRACTS | |
| Foreign exchange contracts | $ 1,158,895 | $ 1,158,895 |
| NET CHANGE IN UNREALIZED APPRECIATION (DEPRECIATION) OF DERIVATIVE FINANCIAL INSTRUMENTS RECOGNIZED IN INCOME FOR THE SIX MONTHS ENDED March 31, 2019 | ||
| TOTAL | FORWARD CURRENCY CONTRACTS | |
| Foreign exchange contracts | $ 234,820 | $ 234,820 |
Thornburg Value Fund | March 31, 2019 (Unaudited)
Thornburg Value Fund
| PER SHARE PERFORMANCE (FOR A SHARE OUTSTANDING THROUGHOUT THE PERIOD) | ||||||||
| UNLESS OTHERWISE NOTED, PERIODS ARE FISCAL YEARS ENDED SEPTEMBER 30, | Net Asset Value, Beginning of PERIOD | Net Investment Income (Loss)+ | Net Realized & Unrealized Gain (Loss) on Investments | Total from Investment Operations | Dividends from Net Investment Income | Dividends from Net Realized Gains | Total Dividends | Net Asset Value, End of PERIOD |
| CLASS A SHARES | ||||||||
| 2019(b)(c) | $ 72.46 | 0.25 | (3.25) | (3.00) | (0.29) | — | (0.29) | $ 69.17 |
| 2018(b) | $ 65.26 | 0.39 | 7.17 | 7.56 | (0.36) | — | (0.36) | $ 72.46 |
| 2017(b) | $ 54.08 | 0.16 | 11.04 | 11.20 | (0.02) | — | (0.02) | $ 65.26 |
| 2016(b)(e) | $ 49.17 | 0.32 | 4.76 | 5.08 | (0.17) | — | (0.17) | $ 54.08 |
| 2015(b) | $ 48.09 | 0.07 | 1.03 | 1.10 | (0.02) | — | (0.02) | $ 49.17 |
| 2014(b) | $ 40.84 | 0.10 | 7.41 | 7.51 | (0.26) | — | (0.26) | $ 48.09 |
| CLASS C SHARES | ||||||||
| 2019(c) | $ 66.03 | (0.05) | (2.94) | (2.99) | — | — | — | $ 63.04 |
| 2018 | $ 59.87 | (0.11) | 6.52 | 6.41 | (0.25) | — | (0.25) | $ 66.03 |
| 2017 | $ 49.97 | (0.27) | 10.17 | 9.90 | — | — | — | $ 59.87 |
| 2016 | $ 45.63 | (0.06) | 4.40 | 4.34 | — | — | — | $ 49.97 |
| 2015 | $ 44.95 | (0.29) | 0.97 | 0.68 | — | — | — | $ 45.63 |
| 2014 | $ 38.26 | (0.24) | 6.93 | 6.69 | — | — | — | $ 44.95 |
| CLASS I SHARES | ||||||||
| 2019(c) | $ 74.70 | 0.37 | (3.37) | (3.00) | (0.50) | — | (0.50) | $ 71.20 |
| 2018 | $ 67.10 | 0.64 | 7.38 | 8.02 | (0.42) | — | (0.42) | $ 74.70 |
| 2017 | $ 55.58 | 0.42 | 11.35 | 11.77 | (0.25) | — | (0.25) | $ 67.10 |
| 2016 | $ 50.53 | 0.54 | 4.90 | 5.44 | (0.39) | — | (0.39) | $ 55.58 |
| 2015 | $ 49.28 | 0.28 | 1.04 | 1.32 | (0.07) | — | (0.07) | $ 50.53 |
| 2014 | $ 41.96 | 0.28 | 7.62 | 7.90 | (0.58) | — | (0.58) | $ 49.28 |
| CLASS R3 SHARES | ||||||||
| 2019(c) | $ 72.02 | 0.24 | (3.22) | (2.98) | (0.22) | — | (0.22) | $ 68.82 |
| 2018 | $ 64.88 | 0.39 | 7.11 | 7.50 | (0.36) | — | (0.36) | $ 72.02 |
| 2017 | $ 53.76 | 0.18 | 10.97 | 11.15 | (0.03) | — | (0.03) | $ 64.88 |
| 2016 | $ 48.86 | 0.34 | 4.74 | 5.08 | (0.18) | — | (0.18) | $ 53.76 |
| 2015 | $ 47.79 | 0.08 | 1.01 | 1.09 | (0.02) | — | (0.02) | $ 48.86 |
| 2014 | $ 40.56 | 0.11 | 7.37 | 7.48 | (0.25) | — | (0.25) | $ 47.79 |
| CLASS R4 SHARES | ||||||||
| 2019(c) | $ 72.83 | 0.28 | (3.27) | (2.99) | (0.28) | — | (0.28) | $ 69.56 |
| 2018 | $ 65.55 | 0.47 | 7.19 | 7.66 | (0.38) | — | (0.38) | $ 72.83 |
| 2017 | $ 54.31 | 0.25 | 11.08 | 11.33 | (0.09) | — | (0.09) | $ 65.55 |
| 2016 | $ 49.36 | 0.40 | 4.78 | 5.18 | (0.23) | — | (0.23) | $ 54.31 |
| 2015 | $ 48.24 | 0.14 | 1.01 | 1.15 | (0.03) | — | (0.03) | $ 49.36 |
| 2014 | $ 40.89 | 0.16 | 7.43 | 7.59 | (0.24) | — | (0.24) | $ 48.24 |
| CLASS R5 SHARES | ||||||||
| 2019(c) | $ 74.60 | 0.38 | (3.38) | (3.00) | (0.50) | — | (0.50) | $ 71.10 |
| 2018 | $ 67.01 | 0.63 | 7.38 | 8.01 | (0.42) | — | (0.42) | $ 74.60 |
| 2017 | $ 55.50 | 0.41 | 11.35 | 11.76 | (0.25) | — | (0.25) | $ 67.01 |
| 2016 | $ 50.45 | 0.53 | 4.90 | 5.43 | (0.38) | — | (0.38) | $ 55.50 |
| 2015 | $ 49.21 | 0.27 | 1.04 | 1.31 | (0.07) | — | (0.07) | $ 50.45 |
| 2014 | $ 41.89 | 0.28 | 7.61 | 7.89 | (0.57) | — | (0.57) | $ 49.21 |
| (a) | Not annualized for periods less than one year. |
| (b) | Sales loads are not reflected in computing total return. |
| (c) | Unaudited Six Month Period Ended March 31. |
| (d) | Annualized. |
| (e) | Class B shares converted to Class A shares on August 29, 2016. |
| + | Based on weighted average shares outstanding. |
Thornburg Value Fund
| RATIOS TO AVERAGE NET ASSETS | SUPPLEMENTAL DATA | ||||||
| Net Investment Income (Loss) (%) | Expenses, After Expense Reductions (%) | Expenses, After Expense Reductions and Net of Custody Credits (%) | Expenses, Before Expense Reductions (%) | Total Return (%)(a) | Portfolio Turnover Rate (%)(a) | Net Assets at End of PERIOD (Thousands) | |
| 0.76(d) | 1.33(d) | 1.33(d) | 1.33(d) | (4.08) | 15.10 | $ 429,521 | |
| 0.56 | 1.33 | 1.33 | 1.33 | 11.62 | 57.33 | $ 473,740 | |
| 0.27 | 1.39 | 1.39 | 1.39 | 20.72 | 43.53 | $ 383,118 | |
| 0.63 | 1.39 | 1.39 | 1.39 | 10.33 | 31.10 | $ 374,237 | |
| 0.14 | 1.37 | 1.37 | 1.37 | 2.28 | 59.70 | $ 377,299 | |
| 0.22 | 1.37 | 1.37 | 1.37 | 18.40 | 72.43 | $ 395,216 | |
| (0.18)(d) | 2.26(d) | 2.26(d) | 2.26(d) | (4.53) | 15.10 | $ 42,990 | |
| (0.17) | 2.11 | 2.11 | 2.11 | 10.73 | 57.33 | $ 52,023 | |
| (0.49) | 2.14 | 2.14 | 2.14 | 19.81 | 43.53 | $ 160,663 | |
| (0.12) | 2.14 | 2.14 | 2.14 | 9.51 | 31.10 | $ 168,821 | |
| (0.61) | 2.12 | 2.12 | 2.12 | 1.51 | 59.70 | $ 168,321 | |
| (0.55) | 2.14 | 2.14 | 2.14 | 17.49 | 72.43 | $ 175,495 | |
| 1.10(d) | 0.99(d) | 0.99(d) | 1.08(d) | (3.90) | 15.10 | $ 379,774 | |
| 0.90 | 0.99 | 0.99 | 1.06 | 12.00 | 57.33 | $ 422,302 | |
| 0.68 | 0.99 | 0.99 | 1.06 | 21.20 | 43.53 | $ 368,790 | |
| 1.02 | 0.99 | 0.99 | 1.07 | 10.77 | 31.10 | $ 280,570 | |
| 0.53 | 0.99 | 0.99 | 1.06 | 2.68 | 59.70 | $ 288,642 | |
| 0.60 | 0.99 | 0.99 | 1.06 | 18.86 | 72.43 | $ 299,568 | |
| 0.74(d) | 1.35(d) | 1.35(d) | 1.85(d) | (4.09) | 15.10 | $ 32,770 | |
| 0.57 | 1.35 | 1.35 | 1.78 | 11.60 | 57.33 | $ 39,211 | |
| 0.30 | 1.35 | 1.35 | 1.82 | 20.75 | 43.53 | $ 45,668 | |
| 0.67 | 1.35 | 1.35 | 1.81 | 10.40 | 31.10 | $ 50,089 | |
| 0.16 | 1.35 | 1.35 | 1.77 | 2.28 | 59.70 | $ 59,150 | |
| 0.23 | 1.35 | 1.35 | 1.77 | 18.45 | 72.43 | $ 74,579 | |
| 0.84(d) | 1.25(d) | 1.25(d) | 1.86(d) | (4.04) | 15.10 | $ 6,693 | |
| 0.68 | 1.25 | 1.25 | 1.77 | 11.72 | 57.33 | $ 7,868 | |
| 0.42 | 1.24 | 1.24 | 1.78 | 20.87 | 43.53 | $ 10,159 | |
| 0.78 | 1.25 | 1.25 | 1.75 | 10.50 | 31.10 | $ 9,539 | |
| 0.26 | 1.25 | 1.25 | 1.67 | 2.39 | 59.70 | $ 10,167 | |
| 0.36 | 1.24 | 1.24 | 1.69 | 18.56 | 72.43 | $ 11,330 | |
| 1.10(d) | 0.99(d) | 0.99(d) | 1.49(d) | (3.91) | 15.10 | $ 18,193 | |
| 0.89 | 0.99 | 0.99 | 1.38 | 12.00 | 57.33 | $ 19,085 | |
| 0.68 | 0.99 | 0.99 | 1.42 | 21.21 | 43.53 | $ 17,060 | |
| 1.00 | 0.99 | 0.99 | 1.46 | 10.78 | 31.10 | $ 14,738 | |
| 0.51 | 0.99 | 0.99 | 1.20 | 2.65 | 59.70 | $ 19,270 | |
| 0.59 | 0.98 | 0.98 | 1.42 | 18.88 | 72.43 | $ 30,676 | |
Thornburg Value Fund | March 31, 2019 (Unaudited)
| (1) | transaction costs, including |
| (a) | sales charges (loads) on purchase payments, for Class A shares; |
| (b) | a deferred sales charge on redemptions of any part or all of a purchase of $1 million of Class A shares within 12 months of purchase; |
| (c) | a deferred sales charge on redemptions of Class C shares within 12 months of purchase; |
| (2) | ongoing costs, including management fees; distribution and/or service (12b-1) fees; and other Fund expenses. |
| BEGINNING ACCOUNT VALUE 10/1/18 | ENDING ACCOUNT VALUE 3/31/19 | EXPENSES PAID DURING PERIOD† 10/1/18—3/31/19 | |
| CLASS A SHARES | |||
| Actual | $1,000.00 | $959.24 | $6.50 |
| Hypothetical* | $1,000.00 | $1,018.30 | $6.69 |
| CLASS C SHARES | |||
| Actual | $1,000.00 | $954.72 | $11.01 |
| Hypothetical* | $1,000.00 | $1,013.66 | $11.35 |
| CLASS I SHARES | |||
| Actual | $1,000.00 | $960.99 | $4.84 |
| Hypothetical* | $1,000.00 | $1,020.00 | $4.99 |
| CLASS R3 SHARES | |||
| Actual | $1,000.00 | $959.09 | $6.59 |
| Hypothetical* | $1,000.00 | $1,018.20 | $6.79 |
| CLASS R4 SHARES | |||
| Actual | $1,000.00 | $959.61 | $6.11 |
| Hypothetical* | $1,000.00 | $1,018.70 | $6.29 |
| CLASS R5 SHARES | |||
| Actual | $1,000.00 | $960.91 | $4.84 |
| Hypothetical* | $1,000.00 | $1,020.00 | $4.99 |
| † | Expenses are equal to the annualized expense ratio for each class (A: 1.33%; C: 2.26%; I: 0.99%; R3: 1.35%; R4: 1.25%; R5: 0.99%) multiplied by the average account value over the period, multiplied by 182/365 to reflect the one-half year period. |
| * | Hypothetical assumes a rate of return of 5% per year before expenses. |
Thornburg Value Fund | March 31, 2019 (Unaudited)
| ■ | Thornburg Investment Income Builder Fund |
| ■ | Thornburg Global Opportunities Fund |
| ■ | Thornburg International Value Fund |
| ■ | Thornburg Better World International Fund |
| ■ | Thornburg International Growth Fund |
| ■ | Thornburg Developing World Fund |
| ■ | Thornburg Value Fund |
| ■ | Thornburg Core Growth Fund |
| ■ | Thornburg Investment Income Builder Fund |
| ■ | Thornburg Summit Fund |
| ■ | Thornburg Low Duration Income Fund |
| ■ | Thornburg Limited Term U.S. Government Fund |
| ■ | Thornburg Limited Term Income Fund |
| ■ | Thornburg Strategic Income Fund |
| ■ | Thornburg Low Duration Municipal Fund |
| ■ | Thornburg Limited Term Municipal Fund |
| ■ | Thornburg Intermediate Municipal Fund |
| ■ | Thornburg California Limited Term Municipal Fund |
| ■ | Thornburg New Mexico Intermediate Municipal Fund |
| ■ | Thornburg New York Intermediate Municipal Fund |
| ■ | Thornburg Strategic Municipal Income Fund |
| ■ | Thornburg Long/Short Equity Fund |

| 800.847.0200 | TH170 |


| 4 | |
| 6 | |
| 7 | |
| 8 | |
| 12 | |
| 14 | |
| 16 | |
| 17 | |
| 26 | |
| 28 | |
| 29 | |
| 30 |
| SHARE CLASS | NASDAQ SYMBOL | CUSIP |
| Class A | TGVAX | 885-215-657 |
| Class C | THGCX | 885-215-640 |
| Class I | TGVIX | 885-215-566 |
| Class R3 | TGVRX | 885-215-525 |
| Class R4 | THVRX | 885-215-269 |
| Class R5 | TIVRX | 885-215-368 |
| Class R6 | TGIRX | 885-216-804 |
Thornburg International Value Fund | March 31, 2019 (Unaudited)
 |  |
| Lei Wang,cfa Portfolio Manager Managing Director | Di Zhou,cfa,frm® Portfolio Manager Managing Director |
Thornburg International Value Fund | March 31, 2019 (Unaudited)
| 1-YR | 3-YR | 5-YR | 10-YR | SINCE INCEP. | |
| Class A Shares(Incep: 5/28/98) | |||||
| Without sales charge | -5.35% | 5.48% | 3.34% | 8.04% | 6.99% |
| With sales charge | -9.62% | 3.87% | 2.40% | 7.54% | 6.76% |
| Class C Shares(Incep: 5/28/98) | |||||
| Without sales charge | -6.09% | 4.69% | 2.58% | 7.24% | 6.16% |
| With sales charge | -7.03% | 4.69% | 2.58% | 7.24% | 6.16% |
| Class I Shares(Incep: 3/30/01) | -5.08% | 5.86% | 3.71% | 8.45% | 6.72% |
| Class R3 Shares(Incep: 7/1/03) | -5.51% | 5.31% | 3.17% | 7.86% | 7.56% |
| Class R4 Shares(Incep: 2/1/07) | -5.34% | 5.53% | 3.37% | 8.08% | 2.96% |
| Class R5 Shares(Incep: 2/1/05) | -5.07% | 5.82% | 3.65% | 8.36% | 5.94% |
| Class R6 Shares(Incep: 5/1/12) | -4.89% | 6.02% | 3.88% | - | 4.98% |
| MSCI EAFE Index(Since 5/28/98) | -3.71% | 7.27% | 2.33% | 8.96% | 4.04% |
| MSCI AC World ex-U.S. Index(Net) (Since 5/28/98) | -4.22% | 8.09% | 2.57% | 8.85% | 4.55% |
| FINAL VALUE |
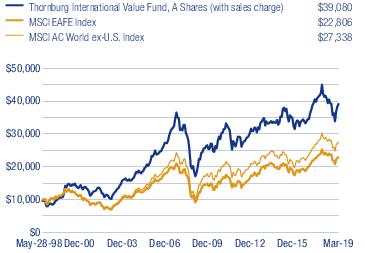
Thornburg International Value Fund | March 31, 2019 (Unaudited)
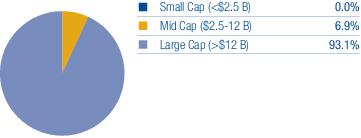
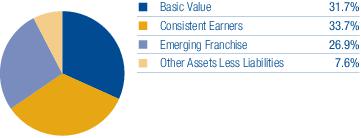
| TOP TEN EQUITY HOLDINGS | |
| Ping An Insurance Group Co. of China Ltd. Class H | 4.8% |
| SoftBank Group Corp. | 3.4% |
| Tencent Holdings Ltd. | 3.1% |
| Reliance Industries Ltd. | 3.0% |
| Inner Mongolia Yili Industrial Group Co. Ltd. Class A | 2.9% |
| SAP SE | 2.9% |
| Alibaba Group Holding Ltd. Sponsored ADR | 2.8% |
| Shin-Etsu Chemical Co. Ltd. | 2.8% |
| Canadian Pacific Railway Ltd. | 2.8% |
| Danone S.A. | 2.7% |
| SECTOR EXPOSURE | |
| Industrials | 18.0% |
| Financials | 16.2% |
| Consumer Staples | 12.1% |
| Communication Services | 10.2% |
| Consumer Discretionary | 9.8% |
| Information Technology | 8.4% |
| Energy | 5.2% |
| Health Care | 4.8% |
| Materials | 4.5% |
| Utilities | 3.2% |
| Other Assets Less Liabilities | 7.6% |
| TOP TEN INDUSTRY GROUPS | |
| Capital Goods | 11.9% |
| Food, Beverage & Tobacco | 8.3% |
| Media & Entertainment | 6.8% |
| Insurance | 6.5% |
| Diversified Financials | 6.2% |
| Energy | 5.2% |
| Software & Services | 4.8% |
| Materials | 4.5% |
| Consumer Durables & Apparel | 4.0% |
| Retailing | 3.9% |
| COUNTRY EXPOSURE* (percent of equity holdings) | |
| China | 21.5% |
| France | 15.6% |
| Japan | 15.3% |
| Germany | 14.4% |
| Spain | 6.5% |
| United Kingdom | 6.1% |
| Canada | 4.8% |
| Netherlands | 4.0% |
| India | 3.7% |
| Hong Kong | 2.4% |
| Italy | 2.2% |
| Switzerland | 2.2% |
| Israel | 1.3% |
| * | Holdings are classified by country of risk as determined by MSCI and Bloomberg. |
Thornburg International Value Fund | March 31, 2019 (Unaudited)
| SHARES | VALUE | ||
| Common Stock — 92.4% | |||
| Banks — 3.5% | |||
| Banks — 3.5% | |||
| Barclays plc | 26,720,089 | $ 53,831,069 | |
| ING Groep N.V. | 4,477,477 | 54,163,839 | |
| UniCredit S.p.A. | 1,389,006 | 17,806,171 | |
| 125,801,079 | |||
| Capital Goods — 11.9% | |||
| Aerospace & Defense — 4.0% | |||
| BAE Systems plc | 8,841,003 | 55,548,173 | |
| Safran S.A. | 634,914 | 87,068,279 | |
| Construction & Engineering — 5.3% | |||
| Ferrovial S.A. | 4,171,958 | 97,716,210 | |
| Vinci S.A. | 938,063 | 91,253,066 | |
| Electrical Equipment — 0.5% | |||
| Prysmian S.p.A. | 921,623 | 17,435,557 | |
| Machinery — 2.1% | |||
| CNH Industrial N.V. | 3,928,301 | 39,941,176 | |
| a | Knorr-Bremse AG | 373,985 | 37,139,909 |
| 426,102,370 | |||
| Commercial & Professional Services — 2.3% | |||
| Professional Services — 2.3% | |||
| Recruit Holdings Co. Ltd. | 2,849,771 | 81,278,770 | |
| 81,278,770 | |||
| Consumer Durables & Apparel — 4.0% | |||
| Textiles, Apparel & Luxury Goods — 4.0% | |||
| adidas AG | 370,585 | 90,041,450 | |
| Kering S.A. | 96,590 | 55,388,448 | |
| 145,429,898 | |||
| Consumer Services — 1.9% | |||
| Diversified Consumer Services — 1.9% | |||
| a | TAL Education Group ADR | 1,932,532 | 69,725,755 |
| 69,725,755 | |||
| Diversified Financials — 6.2% | |||
| Capital Markets — 6.2% | |||
| Deutsche Boerse AG | 568,088 | 72,838,004 | |
| Hong Kong Exchanges & Clearing Ltd. | 2,272,790 | 79,215,198 | |
| UBS Group AG | 5,965,279 | 72,308,227 | |
| 224,361,429 | |||
| Energy — 5.2% | |||
| Oil, Gas & Consumable Fuels — 5.2% | |||
| China Petroleum & Chemical Corp. Class H | 11,270,169 | 8,886,980 | |
| Reliance Industries Ltd. | 5,449,555 | 107,225,059 | |
| Royal Dutch Shell plc Sponsored ADR Class A | 1,121,696 | 70,206,952 | |
| 186,318,991 | |||
| Food, Beverage & Tobacco — 8.3% | |||
| Beverages — 2.6% | |||
| Kweichow Moutai Co. Ltd. Class A | 735,662 | 93,486,502 | |
| Food Products — 5.7% | |||
| Danone S.A. | 1,278,825 | 98,537,338 | |
| Inner Mongolia Yili Industrial Group Co. Ltd. Class A | 24,466,276 | 105,980,967 | |
| 298,004,807 | |||
| Healthcare Equipment & Services — 2.1% | |||
| Health Care Providers & Services — 2.1% | |||
| Fresenius Medical Care AG & Co. KGaA | 948,038 | 76,462,911 |
| SHARES | VALUE | ||
| 76,462,911 | |||
| Household & Personal Products — 3.8% | |||
| Household Products — 1.5% | |||
| Reckitt Benckiser Group plc | 645,933 | $ 53,691,460 | |
| Personal Products — 2.3% | |||
| Kose Corp. | 444,761 | 81,584,329 | |
| 135,275,789 | |||
| Insurance — 6.5% | |||
| Insurance — 6.5% | |||
| AXA S.A. | 2,462,382 | 61,955,646 | |
| Ping An Insurance Group Co. of China Ltd. Class H | 15,392,417 | 172,356,952 | |
| 234,312,598 | |||
| Materials — 4.5% | |||
| Chemicals — 4.5% | |||
| Nutrien Ltd. | 1,155,186 | 60,947,613 | |
| Shin-Etsu Chemical Co. Ltd. | 1,211,617 | 101,450,923 | |
| 162,398,536 | |||
| Media & Entertainment — 6.8% | |||
| Entertainment — 3.3% | |||
| Nintendo Co. Ltd. | 125,200 | 35,652,008 | |
| a | Ubisoft Entertainment S.A. | 930,011 | 82,791,535 |
| Interactive Media & Services — 3.0% | |||
| Tencent Holdings Ltd. | 2,386,871 | 109,766,359 | |
| Media — 0.5% | |||
| Zee Entertainment Enterprises Ltd. | 2,726,792 | 17,449,107 | |
| 245,659,009 | |||
| Pharmaceuticals, Biotechnology & Life Sciences — 2.7% | |||
| Pharmaceuticals — 2.7% | |||
| a | Teva Pharmaceutical Industries Ltd. Sponsored ADR | 2,819,590 | 44,211,171 |
| Yunnan Baiyao Group Co. Ltd. Class A | 4,170,724 | 53,063,436 | |
| 97,274,607 | |||
| Retailing — 3.9% | |||
| Internet & Direct Marketing Retail — 3.7% | |||
| a | Alibaba Group Holding Ltd. Sponsored ADR | 556,107 | 101,461,722 |
| a | Zalando SE | 776,160 | 30,255,355 |
| Specialty Retail — 0.2% | |||
| Industria de Diseno Textil S.A. | 304,374 | 8,945,509 | |
| 140,662,586 | |||
| Semiconductors & Semiconductor Equipment — 1.2% | |||
| Semiconductors & Semiconductor Equipment — 1.2% | |||
| Infineon Technologies AG | 1,784,067 | 35,392,596 | |
| NXP Semiconductors N.V. | 102,286 | 9,041,059 | |
| 44,433,655 | |||
| Software & Services — 4.8% | |||
| Information Technology Services — 1.8% | |||
| Amadeus IT Group S.A. | 454,603 | 36,410,505 | |
| Wirecard AG | 235,618 | 29,522,819 | |
| Software — 3.0% | |||
| SAP SE | 916,341 | 105,874,296 | |
| 171,807,620 | |||
| Technology Hardware & Equipment — 2.4% | |||
| Electronic Equipment, Instruments & Components — 2.4% | |||
| Keyence Corp. | 137,795 | 85,750,439 | |
| 85,750,439 |
Thornburg International Value Fund | March 31, 2019 (Unaudited)
| SHARES | VALUE | ||
| Telecommunication Services — 3.4% | |||
| Wireless Telecommunication Services — 3.4% | |||
| SoftBank Group Corp. | 1,252,476 | $ 121,427,904 | |
| 121,427,904 | |||
| Transportation — 3.8% | |||
| Road & Rail — 2.8% | |||
| Canadian Pacific Railway Ltd. | 480,128 | 98,920,772 | |
| Transportation Infrastructure — 1.0% | |||
| Atlantia SPA | 1,454,856 | 37,682,537 | |
| 136,603,309 | |||
| Utilities — 3.2% | |||
| Electric Utilities — 3.2% | |||
| Electricite de France S.A. | 3,089,696 | 42,248,924 | |
| Iberdrola S.A. | 8,333,118 | 73,154,924 | |
| 115,403,848 | |||
| Total Common Stock(Cost $2,894,072,285) | 3,324,495,910 | ||
| Short-Term Investments — 7.8% | |||
| b | Thornburg Capital Management Fund | 27,857,716 | 278,577,159 |
| Total Short-Term Investments(Cost $278,577,159) | 278,577,159 | ||
| Total Investments — 100.2%(Cost $3,172,649,444) | $3,603,073,069 | ||
| Liabilities Net of Other Assets — (0.2)% | (5,590,499) | ||
| Net Assets — 100.0% | $3,597,482,570 |
| Outstanding Forward Currency Contracts To Buy Or Sell At March 31, 2019 | |||||||
| Contract Description | Contract Party* | Buy/Sell | Contract Amount | Contract Value Date | Value USD | Unrealized Appreciation | Unrealized Depreciation |
| Euro | CBK | Sell | 127,887,400 | 5/2/2019 | 143,822,207 | $ 4,066,782 | $ — |
| Euro | CBK | Sell | 128,471,600 | 5/2/2019 | 144,479,199 | 4,071,228 | — |
| Euro | CBK | Buy | 256,359,000 | 5/2/2019 | 288,301,406 | — | (4,824,602) |
| Euro | SSB | Sell | 121,534,400 | 6/25/2019 | 137,300,226 | 2,651,497 | — |
| Total | $10,789,507 | $(4,824,602) | |||||
| Net unrealized appreciation/depreciation | $5,964,905 | ||||||
| * | Counterparties include State Street Bank and Trust Company (“SSB”) and Citibank N.A. ("CBK"). |
| Footnote Legend | |
| a | Non-income producing. |
| b | Investment in Affiliates. |
To simplify the listings of securities, abbreviations are used per the table below:
| ADR | American Depositary Receipt |
| SPA | Stand-by Purchase Agreement |
Thornburg International Value Fund | March 31, 2019 (Unaudited)
| ASSETS | |
| Investments at value (Note 3) | |
| Non-affiliated issuers (cost $2,894,072,285) | $ 3,324,495,910 |
| Non-controlled affiliated issuer (cost $278,577,159) | 278,577,159 |
| Cash denominated in foreign currency (cost $22) | 22 |
| Receivable for investments sold | 46,827,260 |
| Receivable for fund shares sold | 17,975,061 |
| Unrealized appreciation on forward currency contracts (Note 7) | 10,789,507 |
| Dividends receivable | 4,624,820 |
| Dividend and interest reclaim receivable | 1,937,410 |
| Prepaid expenses and other assets | 156,145 |
| Total Assets | 3,685,383,294 |
| Liabilities | |
| Payable for investments purchased | 58,122,035 |
| Payable for fund shares redeemed | 15,894,434 |
| Unrealized depreciation on forward currency contracts (Note 7) | 4,824,602 |
| Payable to investment advisor and other affiliates (Note 4) | 2,766,797 |
| Deferred taxes payable (Note 2) | 2,799,289 |
| Accounts payable and accrued expenses | 3,492,870 |
| Dividends payable | 697 |
| Total Liabilities | 87,900,724 |
| Net Assets | $ 3,597,482,570 |
| NET ASSETS CONSIST OF | |
| Distributable earnings | $ 442,788,275 |
| Net capital paid in on shares of beneficial interest | 3,154,694,295 |
| $ 3,597,482,570 |
| NET ASSET VALUE | |
| Class A Shares: | |
| Net asset value and redemption price per share ($685,420,096 applicable to 30,730,432 shares of beneficial interest outstanding - Note 5) | $ 22.30 |
| Maximum sales charge, 4.50% of offering price | 1.05 |
| Maximum offering price per share | $ 23.35 |
| Class C Shares: | |
| Net asset value and offering price per share* ($116,136,285 applicable to 5,842,948 shares of beneficial interest outstanding - Note 5) | $ 19.88 |
| Class I Shares: | |
| Net asset value, offering and redemption price per share ($1,850,727,603 applicable to 80,351,038 shares of beneficial interest outstanding - Note 5) | $ 23.03 |
| Class R3 Shares: | |
| Net asset value, offering and redemption price per share ($185,322,790 applicable to 8,307,710 shares of beneficial interest outstanding - Note 5) | $ 22.31 |
| Class R4 Shares: | |
| Net asset value, offering and redemption price per share ($152,304,632 applicable to 6,879,413 shares of beneficial interest outstanding - Note 5) | $ 22.14 |
| Class R5 Shares: | |
| Net asset value, offering and redemption price per share ($183,764,408 applicable to 7,983,841 shares of beneficial interest outstanding - Note 5) | $ 23.02 |
| Class R6 Shares: | |
| Net asset value, offering and redemption price per share ($423,806,756 applicable to 18,477,417 shares of beneficial interest outstanding - Note 5) | $ 22.94 |
| * | Redemption price per share is equal to net asset value less any applicable contingent deferred sales charge. |
Thornburg International Value Fund | Six Months Ended March 31, 2019 (Unaudited)
| INVESTMENT INCOME | |
| Dividend income | |
| Non-affiliated issuers (net of foreign taxes withheld of $191,416) | $ 18,196,235 |
| Non-controlled affiliated issuer | 2,175,354 |
| Total Income | 20,371,589 |
| EXPENSES | |
| Investment advisory fees (Note 4) | 13,672,221 |
| Administration fees (Note 4) | |
| Class A Shares | 295,971 |
| Class C Shares | 56,006 |
| Class I Shares | 855,129 |
| Class R3 Shares | 81,245 |
| Class R4 Shares | 63,498 |
| Class R5 Shares | 84,645 |
| Class R6 Shares | 178,464 |
| Distribution and service fees (Note 4) | |
| Class A Shares | 842,713 |
| Class C Shares | 638,804 |
| Class R3 Shares | 462,642 |
| Class R4 Shares | 180,770 |
| Transfer agent fees | |
| Class A Shares | 545,050 |
| Class C Shares | 147,100 |
| Class I Shares | 1,128,580 |
| Class R3 Shares | 332,040 |
| Class R4 Shares | 301,220 |
| Class R5 Shares | 298,940 |
| Class R6 Shares | 6,190 |
| Registration and filing fees | |
| Class A Shares | 8,411 |
| Class C Shares | 7,505 |
| Class I Shares | 12,717 |
| Class R3 Shares | 6,657 |
| Class R4 Shares | 6,341 |
| Class R5 Shares | 5,994 |
| Class R6 Shares | 6,791 |
| Custodian fees (Note 2) | 340,500 |
| Professional fees | 103,560 |
| Trustee and officer fees (Note 4) | 115,550 |
| Other expenses | 227,513 |
| Total Expenses | 21,012,767 |
| Less: | |
| Expenses reimbursed by investment advisor (Note 4) | (862,691) |
| Net Expenses | 20,150,076 |
| Net Investment Income | $ 221,513 |
| REALIZED AND UNREALIZED GAIN (LOSS) | |
| Net realized gain (loss) on: | |
| Non-affiliated issuer investments (net of realized capital gain taxes paid of $163,980) | $ 60,313,145 |
| Forward currency contracts (Note 7) | 19,401,762 |
| Foreign currency transactions | (512,566) |
| 79,202,341 | |
| Net change in unrealized appreciation (depreciation) on: | |
| Non-affiliated issuer investments (net of change in deferred taxes payable of $1,365,563) | (156,938,711) |
| Forward currency contracts (Note 7) | (3,904,753) |
| Foreign currency translations | (120,329) |
| (160,963,793) | |
| Net Realized and Unrealized Loss | (81,761,452) |
| Net Decrease in Net Assets Resulting from Operations | $ (81,539,939) |
Thornburg International Value Fund
| Six Months Ended March 31, 2019* | Year Ended September 30, 2018 | |
| INCREASE (DECREASE) IN NET ASSETS FROM | ||
| OPERATIONS | ||
| Net investment income | $ 221,513 | $ 54,098,205 |
| Net realized gain (loss) on investments, forward currency contracts, foreign currency transactions and capital gain taxes | 79,202,341 | (3,667,466) |
| Net unrealized appreciation (depreciation) on investments, forward currency contracts, foreign currency translations and deferred taxes | (160,963,793) | (234,416,570) |
| Net Decrease in Net Assets Resulting from Operations | (81,539,939) | (183,985,831) |
| DIVIDENDS TO SHAREHOLDERS | ||
| From distributable earnings | ||
| Class A Shares | (8,986,188) | (119,664,083) |
| Class C Shares | - | (62,573,001) |
| Class I Shares | (30,860,690) | (450,919,825) |
| Class R3 Shares | (1,984,958) | (40,754,715) |
| Class R4 Shares | (1,906,286) | (30,158,902) |
| Class R5 Shares | (3,078,981) | (40,624,260) |
| Class R6 Shares | (7,281,194) | (76,239,643) |
| FUND SHARE TRANSACTIONS (NOTE 5) | ||
| Class A Shares | (78,318,064) | 91,509,368 |
| Class C Shares | (39,554,271) | (167,868,829) |
| Class I Shares | (522,767,001) | (358,945,418) |
| Class R3 Shares | (23,404,587) | (23,143,248) |
| Class R4 Shares | (8,954,131) | (7,395,851) |
| Class R5 Shares | (39,746,062) | (20,256,219) |
| Class R6 Shares | (23,019,630) | 18,030,208 |
| Net Decrease in Net Assets | (871,401,982) | (1,472,990,249) |
| NET ASSETS | ||
| Beginning of Period | 4,468,884,552 | 5,941,874,801 |
| End of Period | $ 3,597,482,570 | $ 4,468,884,552 |
| * | Unaudited. |
Thornburg International Value Fund | March 31, 2019 (Unaudited)
Thornburg International Value Fund | March 31, 2019 (Unaudited)
| Cost of investments for tax purposes | $ 3,172,649,444 |
| Gross unrealized appreciation on a tax basis | 473,028,085 |
| Gross unrealized depreciation on a tax basis | (42,604,460) |
| Net unrealized appreciation (depreciation) on investments (tax basis) | $ 430,423,625 |
Thornburg International Value Fund | March 31, 2019 (Unaudited)
| Fair Value Measurements at March 31, 2019 | ||||
| TOTAL | LEVEL 1 | LEVEL 2 | LEVEL 3 | |
| Assets | ||||
| Investments in Securities* | ||||
| Common Stock | $ 3,324,495,910 | $ 3,324,495,910 | $ — | $ — |
| Short-Term Investments | 278,577,159 | 278,577,159 | — | — |
| Total Investments in Securities | $3,603,073,069 | $3,603,073,069 | $— | $— |
| Other Financial Instruments | ||||
| Forward Currency Contracts | $ 10,789,507 | $ — | $ 10,789,507 | $ — |
| Total Assets | $3,613,862,576 | $3,603,073,069 | $10,789,507 | $— |
| Liabilities | ||||
| Other Financial Instruments | ||||
| Forward Currency Contracts | $ (4,824,602) | $ — | $ (4,824,602) | $ — |
| Total Liabilities | $(4,824,602) | $— | $(4,824,602) | $— |
| * | See Schedule of Investments for a summary of the industry exposure as grouped according to the Global Industry Classification Standard (GICS), which is an industry taxonomy developed by MSCI, Inc. and Standard & Poor’s (S&P). |
| COMMON STOCK | TOTAL | |
| Beginning Balance 9/30/2018 | $ 69,188,477 | $ 69,188,477 |
| Accrued Discounts (Premiums) | – | – |
| Net Realized Gain (Loss)(a) | (827,789) | (827,789) |
| Gross Purchases | – | – |
| Gross Sales | (2,105,459) | (2,105,459) |
| Net Change in Unrealized Appreciation (Depreciation)(b)(c) | 609,506 | 609,506 |
| Transfers into Level 3(d) | – | – |
| Transfers out of Level 3(d) | (66,864,735) | (66,864,735) |
| Ending Balance 3/31/2019 | $– | $– |
| (a) | Amount of net realized gain (loss) from investments recognized in income is included in the Fund’s Statement of Operations for the six months ended March 31, 2019. |
| (b) | Amount of net change in unrealized appreciation (depreciation) on investments recognized in income is included in the Fund’s Statement of Operations for the six months ended March 31, 2019. |
| (c) | The net change in unrealized appreciation (depreciation) attributable to securities owned at March 31, 2019, which were valued using significant unobservable inputs, was $0. |
| (d) | Transfers out of Level 3 were due to changes in market activity (e.g.) frequency of trades, which resulted in available market inputs to determine price during the six months ended March 31, 2019. Transfers into or out of Level 3 are based on the beginning market value of the period in which they occured. |
Thornburg International Value Fund | March 31, 2019 (Unaudited)
| Management Fee Schedule | |
| DAILY NET ASSETS | FEE RATE |
| Up to $500 million | 0.875% |
| Next $500 million | 0.825 |
| Next $500 million | 0.775 |
| Next $500 million | 0.725 |
| Over $2 billion | 0.675 |
| Administration Fee Schedule | |
| Daily Net Assets | Fee Rate |
| Up to $20 billion | 0.100% |
| $20 billion to $40 billion | 0.075 |
| $40 billion to $60 billion | 0.040 |
| Over $60 billion | 0.030 |
| Fund | Market Value 9/30/18 | Purchases at Cost | Sales Proceeds | Realized Gain (Loss) | Change in Unrealized Appr./(Depr.) | Market Value 3/31/19 | Dividend Income |
| Thornburg Capital Management Fund | $214,290,589 | $1,018,330,759 | $(954,044,189) | $- | $- | $278,577,159 | $2,175,354 |
| SIX MONTHS ENDED March 31, 2019 (UNAUDITED) | YEAR ENDED September 30, 2018 (AUDITED) | |||
| SHARES | AMOUNT | SHARES | AMOUNT | |
| Class A Shares | ||||
| Shares sold | 2,038,163 | $ 42,160,652 | 9,801,105 | $ 232,103,746 |
| Shares issued to shareholders in reinvestment of dividends | 432,321 | 8,153,571 | 4,440,886 | 106,847,709 |
| Shares repurchased | (6,215,356) | (128,632,287) | (10,172,663) | (247,442,087) |
| Net increase (decrease) | (3,744,872) | $ (78,318,064) | 4,069,328 | $ 91,509,368 |
| Class C Shares | ||||
| Shares sold | 193,858 | $ 3,500,733 | 765,525 | $ 16,811,768 |
| Shares issued to shareholders in reinvestment of dividends | - | - | 2,608,037 | 55,707,675 |
| Shares repurchased | (2,336,345) | (43,055,004) | (11,423,876) | (240,388,272) |
| Net decrease | (2,142,487) | $ (39,554,271) | (8,050,314) | $ (167,868,829) |
| Class I Shares | ||||
| Shares sold | 8,473,596 | $ 179,285,461 | 21,186,332 | $ 538,039,749 |
| Shares issued to shareholders in reinvestment of dividends | 1,426,129 | 27,752,470 | 15,260,323 | 378,932,754 |
| Shares repurchased | (34,455,704) | (729,804,932) | (50,362,898) | (1,275,917,921) |
| Net decrease | (24,555,979) | $ (522,767,001) | (13,916,243) | $ (358,945,418) |
| Class R3 Shares | ||||
| Shares sold | 513,982 | $ 10,633,015 | 1,528,944 | $ 37,523,777 |
| Shares issued to shareholders in reinvestment of dividends | 94,905 | 1,790,857 | 1,519,952 | 36,554,848 |
| Shares repurchased | (1,707,033) | (35,828,459) | (3,976,568) | (97,221,873) |
| Net decrease | (1,098,146) | $ (23,404,587) | (927,672) | $ (23,143,248) |
Thornburg International Value Fund | March 31, 2019 (Unaudited)
| SIX MONTHS ENDED March 31, 2019 (UNAUDITED) | YEAR ENDED September 30, 2018 (AUDITED) | |||
| SHARES | AMOUNT | SHARES | AMOUNT | |
| Class R4 Shares | ||||
| Shares sold | 1,025,536 | $ 21,306,911 | 2,063,382 | $ 50,114,257 |
| Shares issued to shareholders in reinvestment of dividends | 66,011 | 1,235,734 | 847,935 | 20,240,210 |
| Shares repurchased | (1,525,249) | (31,496,776) | (3,215,582) | (77,750,318) |
| Net decrease | (433,702) | $ (8,954,131) | (304,265) | $ (7,395,851) |
| Class R5 Shares | ||||
| Shares sold | 706,540 | $ 15,241,868 | 1,805,671 | $ 45,657,236 |
| Shares issued to shareholders in reinvestment of dividends | 154,892 | 3,012,644 | 1,570,374 | 38,946,199 |
| Shares repurchased | (2,666,859) | (58,000,574) | (4,132,147) | (104,859,654) |
| Net decrease | (1,805,427) | $ (39,746,062) | (756,102) | $ (20,256,219) |
| Class R6 Shares | ||||
| Shares sold | 1,787,260 | $ 38,802,267 | 4,840,622 | $ 121,564,541 |
| Shares issued to shareholders in reinvestment of dividends | 358,774 | 6,949,445 | 3,027,489 | 74,876,752 |
| Shares repurchased | (3,195,013) | (68,771,342) | (7,309,496) | (178,411,085) |
| Net increase (decrease) | (1,048,979) | $ (23,019,630) | 558,615 | $ 18,030,208 |
SHEET RISK AND FOREIGN INVESTMENT RISK
| FAIR VALUES OF DERIVATIVE FINANCIAL INSTRUMENTS AT MARCH 31, 2019 | ||
| ASSET DERIVATIVES | BALANCE SHEET LOCATION | FAIR VALUE |
| Foreign exchange contracts | Assets - Unrealized appreciation on forward currency contracts | $ 10,789,507 |
| FAIR VALUES OF DERIVATIVE FINANCIAL INSTRUMENTS AT MARCH 31, 2019 | ||
| LIABILITY DERIVATIVES | BALANCE SHEET LOCATION | FAIR VALUE |
| Foreign exchange contracts | Liabilities - Unrealized depreciation on forward currency contracts | $ (4,824,602) |
| NET REALIZED GAIN (LOSS) ON DERIVATIVE FINANCIAL INSTRUMENTS RECOGNIZED IN INCOME FOR THE SIX MONTHS ENDED March 31, 2019 | ||
| TOTAL | FORWARD CURRENCY CONTRACTS | |
| Foreign exchange contracts | $ 19,401,762 | $ 19,401,762 |
| NET CHANGE IN UNREALIZED APPRECIATION (DEPRECIATION) OF DERIVATIVE FINANCIAL INSTRUMENTS RECOGNIZED IN INCOME FOR THE SIX MONTHS ENDED March 31, 2019 | ||
| TOTAL | FORWARD CURRENCY CONTRACTS | |
| Foreign exchange contracts | $ (3,904,753) | $ (3,904,753) |
Thornburg International Value Fund
| PER SHARE PERFORMANCE (FOR A SHARE OUTSTANDING THROUGHOUT THE PERIOD) | ||||||||
| UNLESS OTHERWISE NOTED, PERIODS ARE FISCAL YEARS ENDED SEPTEMBER 30, | Net Asset Value, Beginning of PERIOD | Net Investment Income (Loss)+ | Net Realized & Unrealized Gain (Loss) on Investments | Total from Investment Operations | Dividends from Net Investment Income | Dividends from Net Realized Gains | Total Dividends | Net Asset Value, End of PERIOD |
| CLASS A SHARES | ||||||||
| 2019(b)(c) | $ 22.69 | (0.02) | (0.09) | (0.11) | (0.28) | — | (0.28) | $ 22.30 |
| 2018(b) | $ 27.63 | 0.19 | (1.10) | (0.91) | — | (4.03) | (4.03) | $ 22.69 |
| 2017(b) | $ 23.43 | 0.16 | 4.24 | 4.40 | (0.20) | — | (0.20) | $ 27.63 |
| 2016(b)(e) | $ 27.46 | 0.36 | 0.25 | 0.61 | (0.39) | (4.25) | (4.64) | $ 23.43 |
| 2015(b) | $ 29.84 | 0.24 | 0.16 | 0.40 | (0.26) | (2.52) | (2.78) | $ 27.46 |
| 2014(b) | $ 30.12 | 0.19 | (0.23) | (0.04) | (0.24) | — | (0.24) | $ 29.84 |
| CLASS C SHARES | ||||||||
| 2019(c) | $ 20.01 | (0.09) | (0.04) | (0.13) | — | — | — | $ 19.88 |
| 2018 | $ 25.00 | 0.02 | (0.98) | (0.96) | — | (4.03) | (4.03) | $ 20.01 |
| 2017 | $ 21.29 | (0.02) | 3.84 | 3.82 | (0.11) | — | (0.11) | $ 25.00 |
| 2016 | $ 25.40 | 0.17 | 0.24 | 0.41 | (0.27) | (4.25) | (4.52) | $ 21.29 |
| 2015 | $ 27.86 | 0.05 | 0.11 | 0.16 | (0.10) | (2.52) | (2.62) | $ 25.40 |
| 2014 | $ 28.17 | —(f) | (0.23) | (0.23) | (0.08) | — | (0.08) | $ 27.86 |
| CLASS I SHARES | ||||||||
| 2019(c) | $ 23.47 | 0.01 | (0.10) | (0.09) | (0.35) | — | (0.35) | $ 23.03 |
| 2018 | $ 28.37 | 0.29 | (1.15) | (0.86) | (0.01) | (4.03) | (4.04) | $ 23.47 |
| 2017 | $ 24.02 | 0.25 | 4.37 | 4.62 | (0.27) | — | (0.27) | $ 28.37 |
| 2016 | $ 28.04 | 0.47 | 0.23 | 0.70 | (0.47) | (4.25) | (4.72) | $ 24.02 |
| 2015 | $ 30.43 | 0.38 | 0.13 | 0.51 | (0.38) | (2.52) | (2.90) | $ 28.04 |
| 2014 | $ 30.76 | 0.33 | (0.25) | 0.08 | (0.41) | — | (0.41) | $ 30.43 |
| CLASS R3 SHARES | ||||||||
| 2019(c) | $ 22.65 | (0.04) | (0.08) | (0.12) | (0.22) | — | (0.22) | $ 22.31 |
| 2018 | $ 27.63 | 0.14 | (1.09) | (0.95) | — | (4.03) | (4.03) | $ 22.65 |
| 2017 | $ 23.44 | 0.14 | 4.22 | 4.36 | (0.17) | — | (0.17) | $ 27.63 |
| 2016 | $ 27.47 | 0.31 | 0.25 | 0.56 | (0.34) | (4.25) | (4.59) | $ 23.44 |
| 2015 | $ 29.86 | 0.21 | 0.13 | 0.34 | (0.21) | (2.52) | (2.73) | $ 27.47 |
| 2014 | $ 30.14 | 0.15 | (0.24) | (0.09) | (0.19) | — | (0.19) | $ 29.86 |
| CLASS R4 SHARES | ||||||||
| 2019(c) | $ 22.52 | (0.02) | (0.09) | (0.11) | (0.27) | — | (0.27) | $ 22.14 |
| 2018 | $ 27.45 | 0.20 | (1.10) | (0.90) | — | (4.03) | (4.03) | $ 22.52 |
| 2017 | $ 23.26 | 0.18 | 4.21 | 4.39 | (0.20) | — | (0.20) | $ 27.45 |
| 2016 | $ 27.30 | 0.37 | 0.23 | 0.60 | (0.39) | (4.25) | (4.64) | $ 23.26 |
| 2015 | $ 29.69 | 0.25 | 0.15 | 0.40 | (0.27) | (2.52) | (2.79) | $ 27.30 |
| 2014 | $ 29.98 | 0.21 | (0.24) | (0.03) | (0.26) | — | (0.26) | $ 29.69 |
| CLASS R5 SHARES | ||||||||
| 2019(c) | $ 23.44 | 0.01 | (0.09) | (0.08) | (0.34) | — | (0.34) | $ 23.02 |
| 2018 | $ 28.35 | 0.27 | (1.15) | (0.88) | —(h) | (4.03) | (4.03) | $ 23.44 |
| 2017 | $ 24.01 | 0.24 | 4.35 | 4.59 | (0.25) | — | (0.25) | $ 28.35 |
| 2016 | $ 28.03 | 0.46 | 0.23 | 0.69 | (0.46) | (4.25) | (4.71) | $ 24.01 |
| 2015 | $ 30.41 | 0.30 | 0.19 | 0.49 | (0.35) | (2.52) | (2.87) | $ 28.03 |
| 2014 | $ 30.71 | 0.30 | (0.24) | 0.06 | (0.36) | — | (0.36) | $ 30.41 |
| CLASS R6 SHARES | ||||||||
| 2019 | $ 23.40 | 0.03 | (0.10) | (0.07) | (0.39) | — | (0.39) | $ 22.94 |
| 2018 | $ 28.27 | 0.33 | (1.15) | (0.82) | (0.02) | (4.03) | (4.05) | $ 23.40 |
| 2017 | $ 23.95 | 0.31 | 4.33 | 4.64 | (0.32) | — | (0.32) | $ 28.27 |
| 2016 | $ 27.97 | 0.53 | 0.21 | 0.74 | (0.51) | (4.25) | (4.76) | $ 23.95 |
| 2015 | $ 30.36 | 0.39 | 0.17 | 0.56 | (0.43) | (2.52) | (2.95) | $ 27.97 |
| 2014 | $ 30.70 | 0.40 | (0.26) | 0.14 | (0.48) | — | (0.48) | $ 30.36 |
| (a) | Not annualized for periods less than one year. |
| (b) | Sales loads are not reflected in computing total return. |
| (c) | Unaudited Six Month Period Ended March 31. |
| (d) | Annualized. |
| (e) | Class B shares converted to Class A shares on August 29, 2016. |
| (f) | Net investment income (loss) was less than $0.01 per share. |
| (g) | Net investment income (loss) is less than 0.01%. |
| (h) | Dividends from net investment income per share were less than $(0.01). |
| + | Based on weighted average shares outstanding. |
Thornburg International Value Fund
| RATIOS TO AVERAGE NET ASSETS | SUPPLEMENTAL DATA | ||||||
| Net Investment Income (Loss) (%) | Expenses, After Expense Reductions (%) | Expenses, After Expense Reductions and Net of Custody Credits (%) | Expenses, Before Expense Reductions (%) | Total Return (%)(a) | Portfolio Turnover Rate (%)(a) | Net Assets at End of PERIOD (Thousands) | |
| (0.18)(d) | 1.29(d) | 1.29(d) | 1.29(d) | (0.26) | 37.20 | $ 685,420 | |
| 0.77 | 1.27 | 1.27 | 1.27 | (4.13) | 44.41 | $ 782,371 | |
| 0.65 | 1.31 | 1.31 | 1.31 | 18.78 | 86.88 | $ 840,244 | |
| 1.51 | 1.28 | 1.28 | 1.28 | 1.90 | 103.90 | $ 990,194 | |
| 0.82 | 1.27 | 1.27 | 1.27 | 1.25 | 70.88 | $ 1,361,529 | |
| 0.63 | 1.26 | 1.26 | 1.26 | (0.14) | 37.25 | $ 2,601,689 | |
| (1.01)(d) | 2.11(d) | 2.11(d) | 2.11(d) | (0.65) | 37.20 | $ 116,136 | |
| 0.07 | 2.02 | 2.02 | 2.02 | (4.86) | 44.41 | $ 159,789 | |
| (0.08) | 2.04 | 2.04 | 2.04 | 17.94 | 86.88 | $ 400,859 | |
| 0.77 | 2.02 | 2.02 | 2.02 | 1.12 | 103.90 | $ 535,169 | |
| 0.19 | 1.99 | 1.99 | 1.99 | 0.52 | 70.88 | $ 706,606 | |
| —(g) | 1.99 | 1.99 | 1.99 | (0.83) | 37.25 | $ 874,358 | |
| 0.12(d) | 0.99(d) | 0.99(d) | 0.99(d) | (0.10) | 37.20 | $ 1,850,728 | |
| 1.15 | 0.91 | 0.91 | 0.91 | (3.81) | 44.41 | $ 2,462,564 | |
| 0.99 | 0.92 | 0.92 | 0.92 | 19.29 | 86.88 | $ 3,370,930 | |
| 1.91 | 0.90 | 0.90 | 0.90 | 2.21 | 103.90 | $ 4,375,955 | |
| 1.27 | 0.90 | 0.90 | 0.90 | 1.65 | 70.88 | $ 5,895,731 | |
| 1.05 | 0.88 | 0.88 | 0.88 | 0.23 | 37.25 | $ 7,748,950 | |
| (0.35)(d) | 1.45(d) | 1.45(d) | 1.74(d) | (0.34) | 37.20 | $ 185,323 | |
| 0.59 | 1.45 | 1.45 | 1.64 | (4.29) | 44.41 | $ 213,007 | |
| 0.55 | 1.45 | 1.45 | 1.64 | 18.63 | 86.88 | $ 285,510 | |
| 1.31 | 1.45 | 1.45 | 1.62 | 1.67 | 103.90 | $ 325,135 | |
| 0.71 | 1.45 | 1.45 | 1.58 | 1.09 | 70.88 | $ 479,223 | |
| 0.51 | 1.45 | 1.45 | 1.61 | (0.30) | 37.25 | $ 754,139 | |
| (0.15)(d) | 1.25(d) | 1.25(d) | 1.55(d) | (0.25) | 37.20 | $ 152,305 | |
| 0.81 | 1.25 | 1.25 | 1.47 | (4.11) | 44.41 | $ 164,663 | |
| 0.74 | 1.25 | 1.25 | 1.46 | 18.90 | 86.88 | $ 209,066 | |
| 1.55 | 1.25 | 1.25 | 1.39 | 1.87 | 103.90 | $ 267,623 | |
| 0.86 | 1.24 | 1.24 | 1.37 | 1.30 | 70.88 | $ 333,247 | |
| 0.70 | 1.25 | 1.25 | 1.49 | (0.12) | 37.25 | $ 722,349 | |
| 0.11(d) | 0.99(d) | 0.99(d) | 1.19(d) | (0.08) | 37.20 | $ 183,764 | |
| 1.06 | 0.99 | 0.99 | 1.17 | (3.87) | 44.41 | $ 229,485 | |
| 0.96 | 0.99 | 0.99 | 1.15 | 19.17 | 86.88 | $ 298,970 | |
| 1.88 | 0.95 | 0.95 | 0.95 | 2.19 | 103.90 | $ 529,330 | |
| 1.01 | 0.98 | 0.98 | 1.11 | 1.57 | 70.88 | $ 685,617 | |
| 0.97 | 0.99 | 0.99 | 1.12 | 0.17 | 37.25 | $ 2,171,673 | |
| 0.32(d) | 0.79(d) | 0.79(d) | 0.88(d) | 0.03 | 37.20 | $ 423,807 | |
| 1.33 | 0.79 | 0.79 | 0.83 | (3.68) | 44.41 | $ 457,006 | |
| 1.23 | 0.78 | 0.78 | 0.79 | 19.40 | 86.88 | $ 536,296 | |
| 2.19 | 0.74 | 0.74 | 0.74 | 2.40 | 103.90 | $ 473,941 | |
| 1.33 | 0.74 | 0.74 | 0.74 | 1.81 | 70.88 | $ 420,849 | |
| 1.28 | 0.73 | 0.73 | 0.73 | 0.42 | 37.25 | $ 872,512 | |
Thornburg International Value Fund | March 31, 2019 (Unaudited)
| (1) | transaction costs, including |
| (a) | sales charges (loads) on purchase payments, for Class A shares; |
| (b) | a deferred sales charge on redemptions of any part or all of a purchase of $1 million of Class A shares within 12 months of purchase; |
| (c) | a deferred sales charge on redemptions of Class C shares within 12 months of purchase; |
| (2) | ongoing costs, including management fees; distribution and/or service (12b-1) fees; and other Fund expenses. |
| BEGINNING ACCOUNT VALUE 10/1/18 | ENDING ACCOUNT VALUE 3/31/19 | EXPENSES PAID DURING PERIOD† 10/1/18—3/31/19 | |
| CLASS A SHARES | |||
| Actual | $1,000.00 | $997.42 | $6.42 |
| Hypothetical* | $1,000.00 | $1,018.50 | $6.49 |
| CLASS C SHARES | |||
| Actual | $1,000.00 | $993.51 | $10.49 |
| Hypothetical* | $1,000.00 | $1,014.41 | $10.60 |
| CLASS I SHARES | |||
| Actual | $1,000.00 | $998.96 | $4.93 |
| Hypothetical* | $1,000.00 | $1,020.00 | $4.99 |
| CLASS R3 SHARES | |||
| Actual | $1,000.00 | $996.60 | $7.22 |
| Hypothetical* | $1,000.00 | $1,017.70 | $7.29 |
| CLASS R4 SHARES | |||
| Actual | $1,000.00 | $997.51 | $6.23 |
| Hypothetical* | $1,000.00 | $1,018.70 | $6.29 |
| CLASS R5 SHARES | |||
| Actual | $1,000.00 | $999.16 | $4.93 |
| Hypothetical* | $1,000.00 | $1,020.00 | $4.99 |
| CLASS R6 SHARES | |||
| Actual | $1,000.00 | $1,000.28 | $3.94 |
| Hypothetical* | $1,000.00 | $1,020.99 | $3.98 |
| † | Expenses are equal to the annualized expense ratio for each class (A: 1.29%; C: 2.11%; I: 0.99%; R3: 1.45%; R4: 1.25%; R5: 0.99%; R6: 0.79%) multiplied by the average account value over the period, multiplied by 182/365 to reflect the one-half year period. |
| * | Hypothetical assumes a rate of return of 5% per year before expenses. |
Thornburg International Value Fund | March 31, 2019 (Unaudited)
| ■ | Thornburg Investment Income Builder Fund |
| ■ | Thornburg Global Opportunities Fund |
| ■ | Thornburg International Value Fund |
| ■ | Thornburg Better World International Fund |
| ■ | Thornburg International Growth Fund |
| ■ | Thornburg Developing World Fund |
| ■ | Thornburg Value Fund |
| ■ | Thornburg Core Growth Fund |
| ■ | Thornburg Investment Income Builder Fund |
| ■ | Thornburg Summit Fund |
| ■ | Thornburg Low Duration Income Fund |
| ■ | Thornburg Limited Term U.S. Government Fund |
| ■ | Thornburg Limited Term Income Fund |
| ■ | Thornburg Strategic Income Fund |
| ■ | Thornburg Low Duration Municipal Fund |
| ■ | Thornburg Limited Term Municipal Fund |
| ■ | Thornburg Intermediate Municipal Fund |
| ■ | Thornburg California Limited Term Municipal Fund |
| ■ | Thornburg New Mexico Intermediate Municipal Fund |
| ■ | Thornburg New York Intermediate Municipal Fund |
| ■ | Thornburg Strategic Municipal Income Fund |
| ■ | Thornburg Long/Short Equity Fund |

| 800.847.0200 | TH176 |


| 4 | |
| 6 | |
| 7 | |
| 8 | |
| 12 | |
| 13 | |
| 15 | |
| 16 | |
| 24 | |
| 26 | |
| 27 | |
| 28 |
| SHARE CLASS | NASDAQ SYMBOL | CUSIP |
| Class A | THCGX | 885-215-582 |
| Class C | TCGCX | 885-215-574 |
| Class I | THIGX | 885-215-475 |
| Class R3 | THCRX | 885-215-517 |
| Class R4 | TCGRX | 885-215-251 |
| Class R5 | THGRX | 885-215-350 |
Thornburg Core Growth Fund | March 31, 2019 (Unaudited)
 |  |
| Greg Dunn Managing Director Portfolio Manager | Ted Chang,cfa Portfolio Manager Managing Director |
Thornburg Core Growth Fund | March 31, 2019 (Unaudited)
| 1-YR | 3-YR | 5-YR | 10-YR | SINCE INCEP. | |
| Class A Shares(Incep: 12/27/00) | |||||
| Without sales charge | 8.50% | 14.43% | 7.95% | 15.05% | 6.81% |
| With sales charge | 3.61% | 12.69% | 6.96% | 14.52% | 6.54% |
| Class C Shares(Incep: 12/27/00) | |||||
| Without sales charge | 7.54% | 13.52% | 7.10% | 14.17% | 5.97% |
| With sales charge | 6.54% | 13.52% | 7.10% | 14.17% | 5.97% |
| Class I Shares(Incep: 11/3/03) | 8.85% | 14.87% | 8.37% | 15.55% | 9.28% |
| Class R3 Shares(Incep: 7/1/03) | 8.29% | 14.28% | 7.82% | 14.95% | 9.40% |
| Class R4 Shares(Incep: 2/1/07) | 8.41% | 14.40% | 7.93% | 15.07% | 6.19% |
| Class R5 Shares(Incep: 10/3/05) | 8.88% | 14.88% | 8.37% | 15.54% | 8.36% |
| Russell 3000 Growth Index(Since 12/27/00) | 12.06% | 16.40% | 13.10% | 17.44% | 6.20% |
| FINAL VALUE |
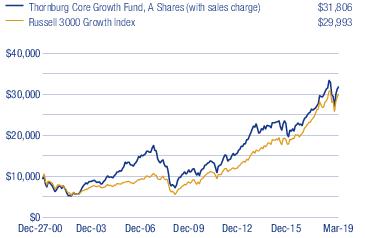
Thornburg Core Growth Fund | March 31, 2019 (Unaudited)
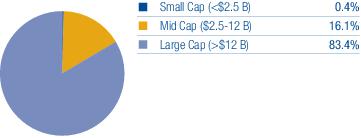
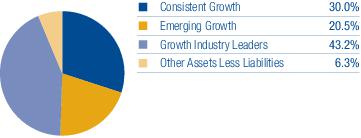
| TOP TEN EQUITY HOLDINGS | |
| Amazon.com, Inc. | 4.6% |
| Visa, Inc. Class A | 3.8% |
| FleetCor Technologies, Inc. | 3.8% |
| Alphabet, Inc. Class C | 3.5% |
| Worldpay, Inc. Class A | 3.5% |
| Comcast Corp. Class A | 3.4% |
| Facebook, Inc. Class A | 3.3% |
| SS&C Technologies Holdings, Inc. | 3.2% |
| TJX Companies, Inc. | 3.1% |
| Arista Networks Inc | 2.7% |
| SECTOR EXPOSURE | |
| Information Technology | 35.4% |
| Consumer Discretionary | 16.7% |
| Communication Services | 16.3% |
| Financials | 7.4% |
| Health Care | 6.9% |
| Consumer Staples | 4.5% |
| Energy | 2.8% |
| Industrials | 2.2% |
| Materials | 1.5% |
| Other Assets Less Liabilities | 6.3% |
| TOP TEN INDUSTRY GROUPS | |
| Software & Services | 29.0% |
| Media & Entertainment | 16.3% |
| Retailing | 14.4% |
| Diversified Financials | 5.0% |
| Technology Hardware & Equipment | 4.5% |
| Food, Beverage & Tobacco | 4.5% |
| Pharmaceuticals, Biotechnology & Life Sciences | 3.5% |
| Healthcare Equipment & Services | 3.4% |
| Energy | 2.8% |
| Banks | 2.4% |
| COUNTRY EXPOSURE* (percent of equity holdings) | |
| United States | 89.8% |
| China | 2.7% |
| Ireland | 2.7% |
| Mexico | 2.1% |
| Israel | 1.7% |
| Argentina | 1.0% |
| * | Holdings are classified by country of risk as determined by MSCI and Bloomberg. |
Thornburg Core Growth Fund | March 31, 2019
| SHARES | VALUE | ||
| Common Stock — 93.7% | |||
| Banks — 2.4% | |||
| Banks — 2.4% | |||
| JPMorgan Chase & Co. | 152,434 | $ 15,430,894 | |
| 15,430,894 | |||
| Commercial & Professional Services — 1.5% | |||
| Commercial Services & Supplies — 1.5% | |||
| Brink’s Co. | 131,272 | 9,899,222 | |
| 9,899,222 | |||
| Consumer Services — 2.3% | |||
| Hotels, Restaurants & Leisure — 2.3% | |||
| Las Vegas Sands Corp. | 242,700 | 14,794,992 | |
| 14,794,992 | |||
| Diversified Financials — 5.0% | |||
| Capital Markets — 5.0% | |||
| Affiliated Managers Group, Inc. | 103,465 | 11,082,136 | |
| Charles Schwab Corp. | 254,500 | 10,882,420 | |
| CME Group, Inc. | 64,650 | 10,640,097 | |
| 32,604,653 | |||
| Energy — 2.8% | |||
| Oil, Gas & Consumable Fuels — 2.8% | |||
| Concho Resources, Inc. | 77,309 | 8,578,206 | |
| Pioneer Natural Resources Co. | 65,924 | 10,038,907 | |
| 18,617,113 | |||
| Food, Beverage & Tobacco — 4.5% | |||
| Beverages — 2.0% | |||
| Fomento Economico Mexicano SAB de CV Sponsored ADR | 141,500 | 13,057,620 | |
| Food Products — 2.5% | |||
| Kerry Group plc Class A | 149,820 | 16,722,033 | |
| 29,779,653 | |||
| Healthcare Equipment & Services — 3.4% | |||
| Health Care Equipment & Supplies — 1.8% | |||
| a | DexCom, Inc. | 76,257 | 9,082,209 |
| a | Inogen, Inc. | 27,837 | 2,654,814 |
| Health Care Providers & Services — 1.6% | |||
| a | DaVita, Inc. | 201,007 | 10,912,670 |
| 22,649,693 | |||
| Materials — 1.5% | |||
| Chemicals — 1.5% | |||
| CF Industries Holdings, Inc. | 247,268 | 10,108,316 | |
| 10,108,316 | |||
| Media & Entertainment — 16.3% | |||
| Entertainment — 4.7% | |||
| Activision Blizzard, Inc. | 380,893 | 17,342,058 | |
| a | Netflix, Inc. | 38,306 | 13,658,388 |
| Interactive Media & Services — 8.3% | |||
| a | Alphabet, Inc. Class C | 19,785 | 23,213,938 |
| a | Cargurus, Inc. | 239,300 | 9,586,358 |
| a | Facebook, Inc. Class A | 129,500 | 21,586,355 |
| Media — 3.3% | |||
| Comcast Corp. Class A | 550,763 | 22,019,505 | |
| 107,406,602 | |||
| Pharmaceuticals, Biotechnology & Life Sciences — 3.5% | |||
| Biotechnology — 3.5% | |||
| a | Alexion Pharmaceuticals, Inc. | 105,225 | 14,224,315 |
| SHARES | VALUE | ||
| Gilead Sciences, Inc. | 136,300 | $ 8,860,863 | |
| 23,085,178 | |||
| Retailing — 14.4% | |||
| Internet & Direct Marketing Retail — 11.3% | |||
| a | Alibaba Group Holding Ltd. Sponsored ADR | 92,839 | 16,938,475 |
| a | Amazon.com, Inc. | 17,005 | 30,281,654 |
| a | Booking Holdings, Inc. | 6,991 | 12,198,666 |
| Expedia Group, Inc. | 123,576 | 14,705,544 | |
| Specialty Retail �� 3.1% | |||
| TJX Companies, Inc. | 383,684 | 20,415,826 | |
| 94,540,165 | |||
| Semiconductors & Semiconductor Equipment — 1.9% | |||
| Semiconductors & Semiconductor Equipment — 1.9% | |||
| a | Micron Technology, Inc. | 131,100 | 5,418,363 |
| Texas Instruments, Inc. | 66,800 | 7,085,476 | |
| 12,503,839 | |||
| Software & Services — 29.0% | |||
| Information Technology Services — 16.7% | |||
| a | FleetCor Technologies, Inc. | 101,090 | 24,927,783 |
| a | PayPal Holdings, Inc. | 128,700 | 13,364,208 |
| a | Square, Inc. Class A | 174,700 | 13,088,524 |
| Visa, Inc. Class A | 161,000 | 25,146,590 | |
| a | Wix.com Ltd. | 85,982 | 10,389,205 |
| a | Worldpay, Inc. Class A | 204,527 | 23,213,815 |
| Software — 12.3% | |||
| a | Globant S.A. | 84,863 | 6,059,218 |
| a | Pivotal Software, Inc. Class A | 531,900 | 11,090,115 |
| a | Proofpoint, Inc. | 93,486 | 11,352,005 |
| a | ServiceNow, Inc. | 47,006 | 11,586,509 |
| a | Splunk, Inc. | 74,967 | 9,340,888 |
| SS&C Technologies Holdings, Inc. | 325,181 | 20,710,778 | |
| a | Workday, Inc. Class A | 54,928 | 10,592,865 |
| 190,862,503 | |||
| Technology Hardware & Equipment — 4.5% | |||
| Communications Equipment — 2.7% | |||
| a | Arista Networks, Inc. | 57,229 | 17,996,231 |
| Technology Hardware, Storage & Peripherals — 1.8% | |||
| Apple, Inc. | 62,522 | 11,876,054 | |
| 29,872,285 | |||
| Transportation — 0.7% | |||
| Road & Rail — 0.7% | |||
| a | LYFT, Inc. Class A | 57,625 | 4,511,461 |
| 4,511,461 | |||
| Total Common Stock(Cost $514,010,036) | 616,666,569 | ||
| Short-Term Investments — 7.5% | |||
| b | Thornburg Capital Management Fund | 4,895,562 | 48,955,618 |
| Total Short-Term Investments(Cost $48,955,618) | 48,955,618 | ||
| Total Investments — 101.2%(Cost $562,965,654) | $665,622,187 | ||
| Liabilities Net of Other Assets — (1.2)% | (7,762,986) | ||
| Net Assets — 100.0% | $657,859,201 |
| Footnote Legend | |
| a | Non-income producing. |
| b | Investment in Affiliates. |
Thornburg Core Growth Fund | March 31, 2019
To simplify the listings of securities, abbreviations are used per the table below:
| ADR | American Depositary Receipt |
Thornburg Core Growth Fund | March 31, 2019 (Unaudited)
| ASSETS | |
| Investments at value (Note 3) | |
| Non-affiliated issuers (cost $514,010,036) | $ 616,666,569 |
| Non-controlled affiliated issuer (cost $48,955,618) | 48,955,618 |
| Receivable for investments sold | 5,025,900 |
| Receivable for fund shares sold | 833,760 |
| Dividends receivable | 260,850 |
| Dividend and interest reclaim receivable | 1,089 |
| Prepaid expenses and other assets | 65,290 |
| Total Assets | 671,809,076 |
| Liabilities | |
| Payable for investments purchased | 8,396,916 |
| Payable for fund shares redeemed | 4,687,942 |
| Payable to investment advisor and other affiliates (Note 4) | 609,751 |
| Accounts payable and accrued expenses | 255,266 |
| Total Liabilities | 13,949,875 |
| Net Assets | $ 657,859,201 |
| NET ASSETS CONSIST OF | |
| Distributable earnings | $ 117,763,543 |
| Net capital paid in on shares of beneficial interest | 540,095,658 |
| $ 657,859,201 | |
| NET ASSET VALUE | |
| Class A Shares: | |
| Net asset value and redemption price per share ($272,862,178 applicable to 6,982,001 shares of beneficial interest outstanding - Note 5) | $ 39.08 |
| Maximum sales charge, 4.50% of offering price | 1.84 |
| Maximum offering price per share | $ 40.92 |
| Class C Shares: | |
| Net asset value and offering price per share* ($46,654,497 applicable to 1,380,536 shares of beneficial interest outstanding - Note 5) | $ 33.79 |
| Class I Shares: | |
| Net asset value, offering and redemption price per share ($277,656,456 applicable to 6,616,740 shares of beneficial interest outstanding - Note 5) | $ 41.96 |
| Class R3 Shares: | |
| Net asset value, offering and redemption price per share ($34,368,893 applicable to 885,943 shares of beneficial interest outstanding - Note 5) | $ 38.79 |
| Class R4 Shares: | |
| Net asset value, offering and redemption price per share ($4,759,298 applicable to 121,406 shares of beneficial interest outstanding - Note 5) | $ 39.20 |
| Class R5 Shares: | |
| Net asset value, offering and redemption price per share ($21,557,879 applicable to 514,288 shares of beneficial interest outstanding - Note 5) | $ 41.92 |
| * | Redemption price per share is equal to net asset value less any applicable contingent deferred sales charge. |
Thornburg Core Growth Fund | Six Months Ended March 31, 2019 (Unaudited)
| INVESTMENT INCOME | |
| Dividend income | |
| Non-affiliated issuers (net of foreign taxes withheld of $1,853) | $ 2,447,449 |
| Non-controlled affiliated issuer | 358,140 |
| Total Income | 2,805,589 |
| EXPENSES | |
| Investment advisory fees (Note 4) | 2,724,919 |
| Administration fees (Note 4) | |
| Class A Shares | 114,394 |
| Class C Shares | 20,590 |
| Class I Shares | 113,119 |
| Class R3 Shares | 15,117 |
| Class R4 Shares | 1,812 |
| Class R5 Shares | 11,530 |
| Distribution and service fees (Note 4) | |
| Class A Shares | 325,943 |
| Class C Shares | 234,723 |
| Class R3 Shares | 86,242 |
| Class R4 Shares | 5,175 |
| Transfer agent fees | |
| Class A Shares | 111,440 |
| Class C Shares | 47,570 |
| Class I Shares | 96,910 |
| Class R3 Shares | 58,490 |
| Class R4 Shares | 8,554 |
| Class R5 Shares | 48,958 |
| Registration and filing fees | |
| Class A Shares | 6,269 |
| Class C Shares | 5,955 |
| Class I Shares | 6,187 |
| Class R3 Shares | 6,048 |
| Class R4 Shares | 5,669 |
| Class R5 Shares | 5,869 |
| Custodian fees (Note 2) | 25,020 |
| Professional fees | 32,030 |
| Trustee and officer fees (Note 4) | 18,372 |
| Other expenses | 41,561 |
| Total Expenses | 4,178,466 |
| Less: | |
| Expenses reimbursed by investment advisor (Note 4) | (230,836) |
| Net Expenses | 3,947,630 |
| Net Investment Loss | $ (1,142,041) |
Thornburg Core Growth Fund | Six Months Ended March 31, 2019 (Unaudited)
| REALIZED AND UNREALIZED GAIN (LOSS) | |
| Net realized gain (loss) on: | |
| Non-affiliated issuer investments | $ 20,641,005 |
| Foreign currency transactions | (13,057) |
| 20,627,948 | |
| Net change in unrealized appreciation (depreciation) on: | |
| Non-affiliated issuer investments | (44,585,978) |
| Foreign currency translations | 612 |
| (44,585,366) | |
| Net Realized and Unrealized Loss | (23,957,418) |
| Net Decrease in Net Assets Resulting from Operations | $ (25,099,459) |
Thornburg Core Growth Fund
| Six Months Ended March 31, 2019* | Year Ended September 30, 2018 | |
| INCREASE (DECREASE) IN NET ASSETS FROM | ||
| OPERATIONS | ||
| Net investment loss | $ (1,142,041) | $ (3,700,426) |
| Net realized gain (loss) on investments and foreign currency transactions | 20,627,948 | 165,765,366 |
| Net unrealized appreciation (depreciation) on investments and foreign currency translations | (44,585,366) | (16,297,238) |
| Net Increase (Decrease) in Net Assets Resulting from Operations | (25,099,459) | 145,767,702 |
| FUND SHARE TRANSACTIONS (NOTE 5) | ||
| Class A Shares | (12,725,705) | 63,051,371 |
| Class C Shares | (5,035,902) | (101,970,153) |
| Class I Shares | 437,562 | (4,992,603) |
| Class R3 Shares | (4,796,485) | (15,683,490) |
| Class R4 Shares | 320,223 | (7,673,126) |
| Class R5 Shares | (8,605,362) | (1,875,573) |
| Net Increase (Decrease) in Net Assets | (55,505,128) | 76,624,128 |
| NET ASSETS | ||
| Beginning of Period | 713,364,329 | 636,740,201 |
| End of Period | $ 657,859,201 | $ 713,364,329 |
| * | Unaudited. |
Thornburg Core Growth Fund | March 31, 2019 (Unaudited)
| Cost of investments for tax purposes | $ 562,965,654 |
| Gross unrealized appreciation on a tax basis | 117,025,712 |
| Gross unrealized depreciation on a tax basis | (14,369,179) |
| Net unrealized appreciation (depreciation) on investments (tax basis) | $ 102,656,533 |
Thornburg Core Growth Fund | March 31, 2019 (Unaudited)
Thornburg Core Growth Fund | March 31, 2019 (Unaudited)
| Fair Value Measurements at March 31, 2019 | ||||
| TOTAL | LEVEL 1 | LEVEL 2 | LEVEL 3 | |
| Assets | ||||
| Investments in Securities* | ||||
| Common Stock | $ 616,666,569 | $ 616,666,569 | $ — | $ — |
| Short-Term Investments | 48,955,618 | 48,955,618 | — | — |
| Total Investments in Securities | $665,622,187 | $665,622,187 | $— | $— |
| Total Assets | $665,622,187 | $665,622,187 | $— | $— |
| * | See Schedule of Investments for a summary of the industry exposure as grouped according to the Global Industry Classification Standard (GICS), which is an industry taxonomy developed by MSCI, Inc. and Standard & Poor’s (S&P). |
| Management Fee Schedule | |
| DAILY NET ASSETS | FEE RATE |
| Up to $500 million | 0.875% |
| Next $500 million | 0.825 |
| Next $500 million | 0.775 |
| Next $500 million | 0.725 |
| Over $2 billion | 0.675 |
| Administration Fee Schedule | |
| Daily Net Assets | Fee Rate |
| Up to $20 billion | 0.100% |
| $20 billion to $40 billion | 0.075 |
| $40 billion to $60 billion | 0.040 |
| Over $60 billion | 0.030 |
| Fund | Market Value 9/30/18 | Purchases at Cost | Sales Proceeds | Realized Gain (Loss) | Change in Unrealized Appr./(Depr.) | Market Value 3/31/19 | Dividend Income |
| Thornburg Capital Management Fund | $43,785,824 | $157,102,923 | $(151,933,129) | $- | $- | $48,955,618 | $358,140 |
| SIX MONTHS ENDED March 31, 2019 (UNAUDITED) | YEAR ENDED September 30, 2018 (AUDITED) | |||
| SHARES | AMOUNT | SHARES | AMOUNT | |
| Class A Shares | ||||
| Shares sold | 270,581 | $ 9,845,092 | 2,648,691 | $ 102,848,390 |
| Shares issued to shareholders in reinvestment of dividends | - | - | - | - |
| Shares repurchased | (621,276) | (22,570,797) | (1,078,735) | (39,797,019) |
| Net increase (decrease) | (350,695) | $ (12,725,705) | 1,569,956 | $ 63,051,371 |
Thornburg Core Growth Fund | March 31, 2019 (Unaudited)
| SIX MONTHS ENDED March 31, 2019 (UNAUDITED) | YEAR ENDED September 30, 2018 (AUDITED) | |||
| SHARES | AMOUNT | SHARES | AMOUNT | |
| Class C Shares | ||||
| Shares sold | 119,602 | $ 3,685,277 | 142,699 | $ 4,669,918 |
| Shares issued to shareholders in reinvestment of dividends | - | - | - | - |
| Shares repurchased | (274,210) | (8,721,179) | (3,186,362) | (106,640,071) |
| Net decrease | (154,608) | $ (5,035,902) | (3,043,663) | $ (101,970,153) |
| Class I Shares | ||||
| Shares sold | 339,541 | $ 13,216,772 | 1,000,610 | $ 39,866,402 |
| Shares issued to shareholders in reinvestment of dividends | - | - | - | - |
| Shares repurchased | (326,372) | (12,779,210) | (1,172,618) | (44,859,005) |
| Net increase (decrease) | 13,169 | $ 437,562 | (172,008) | $ (4,992,603) |
| Class R3 Shares | ||||
| Shares sold | 76,620 | $ 2,763,167 | 152,644 | $ 5,576,446 |
| Shares issued to shareholders in reinvestment of dividends | - | - | - | - |
| Shares repurchased | (210,589) | (7,559,652) | (589,803) | (21,259,936) |
| Net decrease | (133,969) | $ (4,796,485) | (437,159) | $ (15,683,490) |
| Class R4 Shares | ||||
| Shares sold | 139,024 | $ 5,117,710 | 180,163 | $ 8,379,103 |
| Shares issued to shareholders in reinvestment of dividends | - | - | - | - |
| Shares repurchased | (128,175) | (4,797,487) | (233,164) | (16,052,229) |
| Net increase (decrease) | 10,849 | $ 320,223 | (53,001) | $ (7,673,126) |
| Class R5 Shares | ||||
| Shares sold | 51,527 | $ 2,024,745 | 211,055 | $ 6,542,444 |
| Shares issued to shareholders in reinvestment of dividends | - | - | - | - |
| Shares repurchased | (263,390) | (10,630,107) | (414,498) | (8,418,017) |
| Net decrease | (211,863) | $ (8,605,362) | (203,443) | $ (1,875,573) |
SHEET RISK AND FOREIGN INVESTMENT RISK
Thornburg Core Growth Fund
| PER SHARE PERFORMANCE (FOR A SHARE OUTSTANDING THROUGHOUT THE PERIOD) | ||||||||
| UNLESS OTHERWISE NOTED, PERIODS ARE FISCAL YEARS ENDED SEPTEMBER 30, | Net Asset Value, Beginning of PERIOD | Net Investment Income (Loss)+ | Net Realized & Unrealized Gain (Loss) on Investments | Total from Investment Operations | Dividends from Net Investment Income | Dividends from Net Realized Gains | Total Dividends | Net Asset Value, End of PERIOD |
| CLASS A SHARES | ||||||||
| 2019(b)(c) | $ 40.43 | (0.08) | (1.27) | (1.35) | — | — | — | $ 39.08 |
| 2018(b) | $ 32.46 | (0.21) | 8.18 | 7.97 | — | — | — | $ 40.43 |
| 2017(b) | $ 28.22 | (0.24) | 4.48 | 4.24 | — | — | — | $ 32.46 |
| 2016(b) | $ 26.09 | (0.27) | 2.40 | 2.13 | — | — | — | $ 28.22 |
| 2015(b) | $ 26.44 | (0.26) | (0.09) | (0.35) | — | — | — | $ 26.09 |
| 2014(b) | $ 24.35 | (0.28) | 2.37 | 2.09 | — | — | — | $ 26.44 |
| CLASS C SHARES | ||||||||
| 2019 | $ 35.11 | (0.21) | (1.11) | (1.32) | — | — | — | $ 33.79 |
| 2018 | $ 28.43 | (0.42) | 7.10 | 6.68 | — | — | — | $ 35.11 |
| 2017 | $ 24.90 | (0.41) | 3.94 | 3.53 | — | — | — | $ 28.43 |
| 2016 | $ 23.20 | (0.41) | 2.11 | 1.70 | — | — | — | $ 24.90 |
| 2015 | $ 23.69 | (0.42) | (0.07) | (0.49) | — | — | — | $ 23.20 |
| 2014 | $ 21.98 | (0.43) | 2.14 | 1.71 | — | — | — | $ 23.69 |
| CLASS I SHARES | ||||||||
| 2019(c) | $ 43.33 | (0.02) | (1.35) | (1.37) | — | — | — | $ 41.96 |
| 2018 | $ 34.67 | (0.08) | 8.74 | 8.66 | — | — | — | $ 43.33 |
| 2017 | $ 30.01 | (0.12) | 4.78 | 4.66 | — | — | — | $ 34.67 |
| 2016 | $ 27.64 | (0.17) | 2.54 | 2.37 | — | — | — | $ 30.01 |
| 2015 | $ 27.90 | (0.16) | (0.10) | (0.26) | — | — | — | $ 27.64 |
| 2014 | $ 25.59 | (0.18) | 2.49 | 2.31 | — | — | — | $ 27.90 |
| CLASS R3 SHARES | ||||||||
| 2019(c) | $ 40.16 | (0.11) | (1.26) | (1.37) | — | — | — | $ 38.79 |
| 2018 | $ 32.30 | (0.26) | 8.12 | 7.86 | — | — | — | $ 40.16 |
| 2017 | $ 28.10 | (0.27) | 4.47 | 4.20 | — | — | — | $ 32.30 |
| 2016 | $ 26.01 | (0.29) | 2.38 | 2.09 | — | — | — | $ 28.10 |
| 2015 | $ 26.39 | (0.29) | (0.09) | (0.38) | — | — | — | $ 26.01 |
| 2014 | $ 24.33 | (0.31) | 2.37 | 2.06 | — | — | — | $ 26.39 |
| CLASS R4 SHARES | ||||||||
| 2019(c) | $ 40.56 | (0.09) | (1.27) | (1.36) | — | — | — | $ 39.20 |
| 2018 | $ 32.59 | (0.23) | 8.20 | 7.97 | — | — | — | $ 40.56 |
| 2017 | $ 28.33 | (0.24) | 4.50 | 4.26 | — | — | — | $ 32.59 |
| 2016 | $ 26.19 | (0.27) | 2.41 | 2.14 | — | — | — | $ 28.33 |
| 2015 | $ 26.54 | (0.26) | (0.09) | (0.35) | — | — | — | $ 26.19 |
| 2014 | $ 24.44 | (0.28) | 2.38 | 2.10 | — | — | — | $ 26.54 |
| CLASS R5 SHARES | ||||||||
| 2019(c) | $ 43.29 | (0.02) | (1.35) | (1.37) | — | — | — | $ 41.92 |
| 2018 | $ 34.64 | (0.08) | 8.73 | 8.65 | — | — | — | $ 43.29 |
| 2017 | $ 29.98 | (0.12) | 4.78 | 4.66 | — | — | — | $ 34.64 |
| 2016 | $ 27.61 | (0.17) | 2.54 | 2.37 | — | — | — | $ 29.98 |
| 2015 | $ 27.87 | (0.16) | (0.10) | (0.26) | — | — | — | $ 27.61 |
| 2014 | $ 25.56 | (0.18) | 2.49 | 2.31 | — | — | — | $ 27.87 |
| (a) | Not annualized for periods less than one year. |
| (b) | Sales loads are not reflected in computing total return. |
| (c) | Unaudited Six Month Period Ended March 31. |
| (d) | Annualized. |
| + | Based on weighted average shares outstanding. |
Thornburg Core Growth Fund
| RATIOS TO AVERAGE NET ASSETS | SUPPLEMENTAL DATA | ||||||
| Net Investment Income (Loss) (%) | Expenses, After Expense Reductions (%) | Expenses, After Expense Reductions and Net of Custody Credits (%) | Expenses, Before Expense Reductions (%) | Total Return (%)(a) | Portfolio Turnover Rate (%)(a) | Net Assets at End of PERIOD (Thousands) | |
| (0.44)(d) | 1.33(d) | 1.33(d) | 1.33(d) | (3.34) | 19.00 | $ 272,862 | |
| (0.57) | 1.34 | 1.34 | 1.34 | 24.55 | 54.98 | $ 296,429 | |
| (0.79) | 1.40 | 1.40 | 1.40 | 15.02 | 72.03 | $ 187,062 | |
| (1.00) | 1.40 | 1.40 | 1.40 | 8.16 | 86.24 | $ 199,178 | |
| (0.93) | 1.39 | 1.39 | 1.39 | (1.32) | 96.02 | $ 234,284 | |
| (1.06) | 1.40 | 1.40 | 1.40 | 8.58 | 100.62 | $ 277,099 | |
| (1.33)(d) | 2.22(d) | 2.22(d) | 2.22(d) | (3.76) | 19.00 | $ 46,655 | |
| (1.33) | 2.14 | 2.14 | 2.14 | 23.50 | 54.98 | $ 53,903 | |
| (1.56) | 2.16 | 2.16 | 2.16 | 14.18 | 72.03 | $ 130,165 | |
| (1.76) | 2.16 | 2.16 | 2.16 | 7.33 | 86.24 | $ 156,115 | |
| (1.69) | 2.15 | 2.15 | 2.15 | (2.07) | 96.02 | $ 176,422 | |
| (1.81) | 2.14 | 2.14 | 2.14 | 7.78 | 100.62 | $ 200,664 | |
| (0.10)(d) | 0.99(d) | 0.99(d) | 1.07(d) | (3.16) | 19.00 | $ 277,656 | |
| (0.20) | 0.99 | 0.99 | 1.05 | 24.98 | 54.98 | $ 286,152 | |
| (0.37) | 0.99 | 0.99 | 1.05 | 15.53 | 72.03 | $ 234,922 | |
| (0.59) | 0.99 | 0.99 | 1.05 | 8.57 | 86.24 | $ 198,658 | |
| (0.53) | 0.99 | 0.99 | 1.05 | (0.93) | 96.02 | $ 244,691 | |
| (0.65) | 0.99 | 0.99 | 1.03 | 9.03 | 100.62 | $ 251,122 | |
| (0.61)(d) | 1.50(d) | 1.50(d) | 1.86(d) | (3.41) | 19.00 | $ 34,369 | |
| (0.72) | 1.50 | 1.50 | 1.80 | 24.33 | 54.98 | $ 40,963 | |
| (0.90) | 1.50 | 1.50 | 1.84 | 14.95 | 72.03 | $ 47,064 | |
| (1.10) | 1.50 | 1.50 | 1.81 | 8.04 | 86.24 | $ 55,809 | |
| (1.05) | 1.50 | 1.50 | 1.79 | (1.44) | 96.02 | $ 70,310 | |
| (1.16) | 1.50 | 1.50 | 1.80 | 8.47 | 100.62 | $ 90,788 | |
| (0.51)(d) | 1.40(d) | 1.40(d) | 1.92(d) | (3.35) | 19.00 | $ 4,759 | |
| (0.62) | 1.40 | 1.40 | 1.97 | 24.46 | 54.98 | $ 4,484 | |
| (0.80) | 1.40 | 1.40 | 2.00 | 15.04 | 72.03 | $ 5,330 | |
| (1.00) | 1.40 | 1.40 | 1.86 | 8.17 | 86.24 | $ 6,821 | |
| (0.94) | 1.40 | 1.40 | 1.82 | (1.32) | 96.02 | $ 9,632 | |
| (1.06) | 1.40 | 1.40 | 1.77 | 8.59 | 100.62 | $ 11,306 | |
| (0.10)(d) | 0.99(d) | 0.99(d) | 1.41(d) | (3.16) | 19.00 | $ 21,558 | |
| (0.21) | 0.99 | 0.99 | 1.33 | 24.97 | 54.98 | $ 31,433 | |
| (0.38) | 0.99 | 0.99 | 1.34 | 15.54 | 72.03 | $ 32,197 | |
| (0.59) | 0.99 | 0.99 | 1.30 | 8.58 | 86.24 | $ 38,629 | |
| (0.54) | 0.99 | 0.99 | 1.24 | (0.93) | 96.02 | $ 45,126 | |
| (0.65) | 0.99 | 0.99 | 1.28 | 9.04 | 100.62 | $ 61,818 | |
Thornburg Core Growth Fund | March 31, 2019 (Unaudited)
| (1) | transaction costs, including |
| (a) | sales charges (loads) on purchase payments, for Class A shares; |
| (b) | a deferred sales charge on redemptions of any part or all of a purchase of $1 million of Class A shares within 12 months of purchase; |
| (c) | a deferred sales charge on redemptions of Class C shares within 12 months of purchase; |
| (2) | ongoing costs, including management fees; distribution and/or service (12b-1) fees; and other Fund expenses. |
| BEGINNING ACCOUNT VALUE 10/1/18 | ENDING ACCOUNT VALUE 3/31/19 | EXPENSES PAID DURING PERIOD† 10/1/18—3/31/19 | |
| CLASS A SHARES | |||
| Actual | $1,000.00 | $966.61 | $6.52 |
| Hypothetical* | $1,000.00 | $1,018.30 | $6.69 |
| CLASS C SHARES | |||
| Actual | $1,000.00 | $962.41 | $10.86 |
| Hypothetical* | $1,000.00 | $1,013.86 | $11.15 |
| CLASS I SHARES | |||
| Actual | $1,000.00 | $968.39 | $4.86 |
| Hypothetical* | $1,000.00 | $1,020.00 | $4.99 |
| CLASS R3 SHARES | |||
| Actual | $1,000.00 | $965.89 | $7.35 |
| Hypothetical* | $1,000.00 | $1,017.45 | $7.54 |
| CLASS R4 SHARES | |||
| Actual | $1,000.00 | $966.47 | $6.86 |
| Hypothetical* | $1,000.00 | $1,017.95 | $7.04 |
| CLASS R5 SHARES | |||
| Actual | $1,000.00 | $968.36 | $4.86 |
| Hypothetical* | $1,000.00 | $1,020.00 | $4.99 |
| † | Expenses are equal to the annualized expense ratio for each class (A: 1.33%; C: 2.22%; I: 0.99%; R3: 1.50%; R4: 1.40%; R5: 0.99%) multiplied by the average account value over the period, multiplied by 182/365 to reflect the one-half year period. |
| * | Hypothetical assumes a rate of return of 5% per year before expenses. |
Thornburg Core Growth Fund | March 31, 2019 (Unaudited)
| ■ | Thornburg Investment Income Builder Fund |
| ■ | Thornburg Global Opportunities Fund |
| ■ | Thornburg International Value Fund |
| ■ | Thornburg Better World International Fund |
| ■ | Thornburg International Growth Fund |
| ■ | Thornburg Developing World Fund |
| ■ | Thornburg Value Fund |
| ■ | Thornburg Core Growth Fund |
| ■ | Thornburg Investment Income Builder Fund |
| ■ | Thornburg Summit Fund |
| ■ | Thornburg Low Duration Income Fund |
| ■ | Thornburg Limited Term U.S. Government Fund |
| ■ | Thornburg Limited Term Income Fund |
| ■ | Thornburg Strategic Income Fund |
| ■ | Thornburg Low Duration Municipal Fund |
| ■ | Thornburg Limited Term Municipal Fund |
| ■ | Thornburg Intermediate Municipal Fund |
| ■ | Thornburg California Limited Term Municipal Fund |
| ■ | Thornburg New Mexico Intermediate Municipal Fund |
| ■ | Thornburg New York Intermediate Municipal Fund |
| ■ | Thornburg Strategic Municipal Income Fund |
| ■ | Thornburg Long/Short Equity Fund |

| 800.847.0200 | TH180 |


| 4 | |
| 6 | |
| 7 | |
| 8 | |
| 12 | |
| 14 | |
| 16 | |
| 17 | |
| 26 | |
| 28 | |
| 29 | |
| 30 |
| SHARE CLASS | NASDAQ SYMBOL | CUSIP |
| Class A | TIGAX | 885-215-319 |
| Class C | TIGCX | 885-215-293 |
| Class I | TINGX | 885-215-244 |
| Class R3 | TIGVX | 885-215-178 |
| Class R4 | TINVX | 885-215-160 |
| Class R5 | TINFX | 885-215-152 |
| Class R6 | THGIX | 885-216-820 |
Thornburg International Growth Fund | March 31, 2019 (Unaudited)
 |  |
| Greg Dunn Managing Director Portfolio Manager | Sean Koung Sun,cfa Managing Director Portfolio Manager |
Thornburg International Growth Fund | March 31, 2019 (Unaudited)
| 1-YR | 3-YR | 5-YR | 10-YR | SINCE INCEP. | |
| Class A Shares(Incep: 2/1/07) | |||||
| Without sales charge | -6.35% | 7.97% | 3.63% | 13.86% | 6.77% |
| With sales charge | -10.55% | 6.34% | 2.68% | 13.33% | 6.37% |
| Class C Shares(Incep: 2/1/07) | |||||
| Without sales charge | -7.08% | 7.17% | 2.86% | 13.05% | 6.02% |
| With sales charge | -7.97% | 7.17% | 2.86% | 13.05% | 6.02% |
| Class I Shares(Incep: 2/1/07) | -6.06% | 8.39% | 4.05% | 14.38% | 7.29% |
| Class R3 Shares(Incep: 2/1/08) | -6.52% | 7.84% | 3.52% | 13.78% | 5.66% |
| Class R4 Shares(Incep: 2/1/08) | -6.45% | 7.94% | 3.62% | 13.92% | 5.77% |
| Class R5 Shares(Incep: 2/1/08) | -6.05% | 8.38% | 4.04% | 14.37% | 6.19% |
| Class R6 Shares(Incep: 2/1/13) | -6.00% | 8.49% | 4.14% | - | 6.95% |
| MSCI AC World ex-U.S. Growth Index(Since 2/1/07) | -3.05% | 8.42% | 4.01% | 9.47% | 3.09% |
| FINAL VALUE |
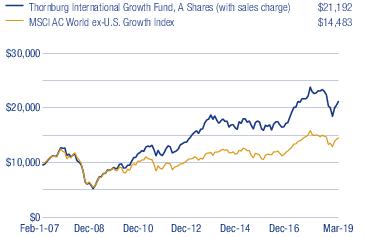

Thornburg International Growth Fund | March 31, 2019 (Unaudited)
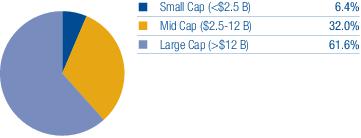
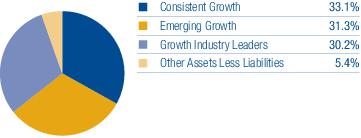
| TOP TEN EQUITY HOLDINGS | |
| Alibaba Group Holding Ltd. Sponsored ADR | 4.1% |
| Tencent Holdings Ltd. | 3.7% |
| Worldpay, Inc. Class A | 3.5% |
| AstraZeneca plc | 3.1% |
| Fresenius Medical Care AG & Co. KGaA | 2.8% |
| Just Eat plc | 2.8% |
| TAL Education Group | 2.7% |
| Yandex N.V. Class A | 2.7% |
| Royal Dutch Shell plc Class A | 2.6% |
| Ubisoft Entertainment S.A. | 2.5% |
| SECTOR EXPOSURE | |
| Consumer Discretionary | 29.9% |
| Communication Services | 15.7% |
| Information Technology | 11.8% |
| Health Care | 11.0% |
| Consumer Staples | 10.8% |
| Financials | 7.8% |
| Industrials | 5.0% |
| Energy | 2.6% |
| Other Assets Less Liabilities | 5.4% |
| TOP TEN INDUSTRY GROUPS | |
| Retailing | 16.0% |
| Media & Entertainment | 15.7% |
| Consumer Services | 11.2% |
| Software & Services | 11.0% |
| Food, Beverage & Tobacco | 9.1% |
| Pharmaceuticals, Biotechnology & Life Sciences | 6.2% |
| Diversified Financials | 5.7% |
| Healthcare Equipment & Services | 4.8% |
| Commercial & Professional Services | 3.3% |
| Consumer Durables & Apparel | 2.7% |
| COUNTRY EXPOSURE* (percent of equity holdings) | |
| United Kingdom | 21.4% |
| China | 12.7% |
| United States | 12.1% |
| Germany | 10.5% |
| France | 7.9% |
| Japan | 6.6% |
| Ireland | 4.4% |
| Macao | 4.3% |
| Australia | 3.3% |
| India | 3.2% |
| Mexico | 3.2% |
| Russian Federation | 2.9% |
| Netherlands | 2.7% |
| Switzerland | 2.2% |
| Sweden | 1.8% |
| South Korea | 0.8% |
| * | Holdings are classified by country of risk as determined by MSCI and Bloomberg. |
Thornburg International Growth Fund | March 31, 2019 (Unaudited)
| SHARES | VALUE | ||
| Common Stock — 94.6% | |||
| Banks — 2.1% | |||
| Banks — 1.1% | |||
| a | Commerzbank AG | 2,188,171 | $ 16,936,612 |
| Thrifts & Mortgage Finance — 1.0% | |||
| Housing Development Finance Corp. Ltd. | 550,469 | 15,606,223 | |
| 32,542,835 | |||
| Commercial & Professional Services — 3.3% | |||
| Commercial Services & Supplies — 1.5% | |||
| Edenred | 525,765 | 23,927,254 | |
| Professional Services — 1.8% | |||
| Nihon M&A Center, Inc. | 1,013,700 | 27,713,715 | |
| 51,640,969 | |||
| Consumer Durables & Apparel — 2.7% | |||
| Textiles, Apparel & Luxury Goods — 2.7% | |||
| adidas AG | 100,144 | 24,332,099 | |
| Essilor International Cie Generale d’Optique S.A. | 164,500 | 17,969,329 | |
| 42,301,428 | |||
| Consumer Services — 11.2% | |||
| Diversified Consumer Services — 2.7% | |||
| a | TAL Education Group ADR | 1,193,138 | 43,048,419 |
| Hotels, Restaurants & Leisure — 8.5% | |||
| Alsea SAB de CV | 4,554,851 | 9,536,670 | |
| Domino’s Pizza Enterprises Ltd. | 237,272 | 7,315,181 | |
| Domino’s Pizza Group plc | 9,110,156 | 28,714,557 | |
| Evolution Gaming Group AB | 101,221 | 7,974,830 | |
| Galaxy Entertainment Group Ltd. | 5,447,658 | 37,092,888 | |
| Merlin Entertainments plc | 3,305,114 | 14,778,188 | |
| Sands China Ltd. | 5,422,200 | 27,249,319 | |
| 175,710,052 | |||
| Diversified Financials — 5.7% | |||
| Capital Markets — 5.7% | |||
| Hargreaves Lansdown plc | 817,950 | 19,852,587 | |
| Japan Exchange Group, Inc. | 2,041,513 | 36,343,094 | |
| St James’s Place plc | 2,464,497 | 32,997,600 | |
| 89,193,281 | |||
| Energy — 2.6% | |||
| Oil, Gas & Consumable Fuels — 2.6% | |||
| Royal Dutch Shell plc Class A | 1,288,629 | 40,445,648 | |
| 40,445,648 | |||
| Food, Beverage & Tobacco — 9.1% | |||
| Beverages — 2.4% | |||
| Fomento Economico Mexicano SAB de CV Sponsored ADR | 410,019 | 37,836,553 | |
| Food Products — 4.6% | |||
| Danone S.A. | 450,342 | 34,700,215 | |
| Kerry Group plc Class A | 336,048 | 37,507,713 | |
| Tobacco — 2.1% | |||
| ITC Ltd. | 7,561,419 | 32,368,658 | |
| 142,413,139 | |||
| Healthcare Equipment & Services — 4.8% | |||
| Health Care Equipment & Supplies — 2.0% | |||
| Siemens Healthineers AG | 741,400 | 30,896,379 | |
| Health Care Providers & Services — 2.8% | |||
| Fresenius Medical Care AG & Co. KGaA | 549,126 | 44,289,124 | |
| 75,185,503 |
| SHARES | VALUE | ||
| Household & Personal Products — 1.7% | |||
| Personal Products — 1.7% | |||
| Kose Corp. | 149,100 | $ 27,350,023 | |
| 27,350,023 | |||
| Media & Entertainment — 15.7% | |||
| Entertainment — 4.2% | |||
| Activision Blizzard, Inc. | 564,253 | 25,690,439 | |
| a | Ubisoft Entertainment S.A. | 447,372 | 39,825,996 |
| Interactive Media & Services — 11.5% | |||
| Auto Trader Group plc | 4,609,227 | 31,313,140 | |
| a | Baidu, Inc. Sponsored ADR | 144,732 | 23,859,070 |
| Carsales.com Ltd. | 2,733,510 | 24,552,741 | |
| Tencent Holdings Ltd. | 1,249,600 | 57,466,048 | |
| a | Yandex N.V. Class A | 1,227,917 | 42,166,670 |
| 244,874,104 | |||
| Pharmaceuticals, Biotechnology & Life Sciences — 6.2% | |||
| Biotechnology — 1.0% | |||
| CSL Ltd. | 119,093 | 16,484,508 | |
| Life Sciences Tools & Services — 2.1% | |||
| Lonza Group AG | 106,900 | 33,151,614 | |
| Pharmaceuticals — 3.1% | |||
| AstraZeneca plc | 599,265 | 47,884,441 | |
| 97,520,563 | |||
| Retailing — 16.0% | |||
| Internet & Direct Marketing Retail — 10.7% | |||
| a | Alibaba Group Holding Ltd. Sponsored ADR | 350,161 | 63,886,874 |
| a | ASOS plc | 747,954 | 31,173,518 |
| a | Booking Holdings, Inc. | 12,555 | 21,907,345 |
| a | Boozt AB | 2,597,563 | 18,719,061 |
| a | Farfetch Ltd. Class A | 725,658 | 19,527,457 |
| a | Zalando SE | 306,769 | 11,958,108 |
| Internet Software & Services — 3.1% | |||
| a | Just Eat plc | 4,406,002 | 43,096,854 |
| a | Mercari, Inc. | 193,365 | 5,931,977 |
| Multiline Retail — 2.2% | |||
| B&M European Value Retail S.A. | 6,916,508 | 33,655,395 | |
| 249,856,589 | |||
| Semiconductors & Semiconductor Equipment — 0.8% | |||
| Semiconductors & Semiconductor Equipment — 0.8% | |||
| SK Hynix, Inc. | 183,800 | 12,014,765 | |
| 12,014,765 | |||
| Software & Services — 11.0% | |||
| Information Technology Services — 10.1% | |||
| Mastercard, Inc. Class A | 167,664 | 39,476,489 | |
| Visa, Inc. Class A | 240,954 | 37,634,605 | |
| Wirecard AG | 214,858 | 26,921,602 | |
| a | Worldpay, Inc. Class A | 487,294 | 54,525,006 |
| Software — 0.9% | |||
| a | Blue Prism Group plc | 611,224 | 13,199,147 |
| 171,756,849 | |||
| Transportation — 1.7% | |||
| Airlines — 1.7% | |||
| a | Ryanair Holdings plc Sponsored ADR | 364,115 | 27,286,778 |
| 27,286,778 | |||
| Total Common Stock(Cost $1,275,691,398) | 1,480,092,526 |
Thornburg International Growth Fund | March 31, 2019 (Unaudited)
| SHARES | VALUE | ||
| Short-Term Investments — 5.2% | |||
| b | Thornburg Capital Management Fund | 8,070,847 | $ 80,708,471 |
| Total Short-Term Investments(Cost $80,708,471) | 80,708,471 | ||
| Total Investments — 99.8%(Cost $1,356,399,869) | $1,560,800,997 | ||
| Other Assets Less Liabilities — 0.2% | 3,459,920 | ||
| Net Assets — 100.0% | $1,564,260,917 |
| Outstanding Forward Currency Contracts To Buy Or Sell At March 31, 2019 | |||||||
| Contract Description | Contract Party* | Buy/Sell | Contract Amount | Contract Value Date | Value USD | Unrealized Appreciation | Unrealized Depreciation |
| Great Britain Pound | BBH | Sell | 122,854,600 | 4/10/2019 | 160,077,675 | $ — | $ (3,171,466) |
| Net unrealized appreciation/depreciation | $(3,171,466) | ||||||
| * | Counterparty includes Brown Brothers Harriman & Co. ("BBH"). |
| Footnote Legend | |
| a | Non-income producing. |
| b | Investment in Affiliates. |
To simplify the listings of securities, abbreviations are used per the table below:
| ADR | American Depositary Receipt |
Thornburg International Growth Fund | March 31, 2019 (Unaudited)
| ASSETS | |
| Investments at value (Note 3) | |
| Non-affiliated issuers (cost $1,275,691,398) | $ 1,480,092,526 |
| Non-controlled affiliated issuer (cost $80,708,471) | 80,708,471 |
| Cash denominated in foreign currency (cost $55) | 55 |
| Receivable for investments sold | 5,187,898 |
| Receivable for fund shares sold | 3,274,516 |
| Dividends receivable | 2,584,153 |
| Dividend and interest reclaim receivable | 463,335 |
| Prepaid expenses and other assets | 151,843 |
| Total Assets | 1,572,462,797 |
| Liabilities | |
| Payable for investments purchased | 1,071,155 |
| Payable for fund shares redeemed | 2,225,138 |
| Unrealized depreciation on forward currency contracts (Note 7) | 3,171,466 |
| Payable to investment advisor and other affiliates (Note 4) | 1,194,248 |
| Deferred taxes payable (Note 2) | 26,201 |
| Accounts payable and accrued expenses | 512,197 |
| Dividends payable | 1,475 |
| Total Liabilities | 8,201,880 |
| Net Assets | $ 1,564,260,917 |
| NET ASSETS CONSIST OF | |
| Distributable earnings | $ 188,826,746 |
| Net capital paid in on shares of beneficial interest | 1,375,434,171 |
| $ 1,564,260,917 |
| NET ASSET VALUE | |
| Class A Shares: | |
| Net asset value and redemption price per share ($108,170,321 applicable to 4,992,826 shares of beneficial interest outstanding - Note 5) | $ 21.67 |
| Maximum sales charge, 4.50% of offering price | 1.02 |
| Maximum offering price per share | $ 22.69 |
| Class C Shares: | |
| Net asset value and offering price per share* ($61,174,426 applicable to 3,037,851 shares of beneficial interest outstanding - Note 5) | $ 20.14 |
| Class I Shares: | |
| Net asset value, offering and redemption price per share ($1,295,195,481 applicable to 58,067,236 shares of beneficial interest outstanding - Note 5) | $ 22.31 |
| Class R3 Shares: | |
| Net asset value, offering and redemption price per share ($7,481,926 applicable to 348,844 shares of beneficial interest outstanding - Note 5) | $ 21.45 |
| Class R4 Shares: | |
| Net asset value, offering and redemption price per share ($9,703,263 applicable to 450,279 shares of beneficial interest outstanding - Note 5) | $ 21.55 |
| Class R5 Shares: | |
| Net asset value, offering and redemption price per share ($32,036,092 applicable to 1,432,215 shares of beneficial interest outstanding - Note 5) | $ 22.37 |
| Class R6 Shares: | |
| Net asset value, offering and redemption price per share ($50,499,408 applicable to 2,252,269 shares of beneficial interest outstanding - Note 5) | $ 22.42 |
| * | Redemption price per share is equal to net asset value less any applicable contingent deferred sales charge. |
Thornburg International Growth Fund | Six Months Ended March 31, 2019 (Unaudited)
| INVESTMENT INCOME | |
| Dividend income | |
| Non-affiliated issuers (net of foreign taxes withheld of $298,634) | $ 6,336,173 |
| Non-controlled affiliated issuer | 1,355,929 |
| Total Income | 7,692,102 |
| EXPENSES | |
| Investment advisory fees (Note 4) | 6,252,523 |
| Administration fees (Note 4) | |
| Class A Shares | 46,802 |
| Class C Shares | 27,826 |
| Class I Shares | 549,727 |
| Class R3 Shares | 3,236 |
| Class R4 Shares | 4,398 |
| Class R5 Shares | 14,476 |
| Class R6 Shares | 20,511 |
| Distribution and service fees (Note 4) | |
| Class A Shares | 133,421 |
| Class C Shares | 317,283 |
| Class R3 Shares | 18,448 |
| Class R4 Shares | 12,542 |
| Transfer agent fees | |
| Class A Shares | 64,900 |
| Class C Shares | 39,960 |
| Class I Shares | 506,760 |
| Class R3 Shares | 16,290 |
| Class R4 Shares | 19,750 |
| Class R5 Shares | 61,860 |
| Class R6 Shares | 1,910 |
| Registration and filing fees | |
| Class A Shares | 6,318 |
| Class C Shares | 5,782 |
| Class I Shares | 11,969 |
| Class R3 Shares | 5,608 |
| Class R4 Shares | 5,608 |
| Class R5 Shares | 6,165 |
| Class R6 Shares | 5,573 |
| Custodian fees (Note 2) | 138,140 |
| Professional fees | 67,980 |
| Trustee and officer fees (Note 4) | 46,476 |
| Other expenses | 83,423 |
| Total Expenses | 8,495,665 |
| Less: | |
| Expenses reimbursed by investment advisor (Note 4) | (416,550) |
| Net Expenses | 8,079,115 |
| Net Investment Loss | $ (387,013) |
| REALIZED AND UNREALIZED GAIN (LOSS) | |
| Net realized gain (loss) on: | |
| Non-affiliated issuer investments | $ (6,707,406) |
| Forward currency contracts (Note 7) | (423,293) |
| Foreign currency transactions | (55,887) |
| (7,186,586) | |
| Net change in unrealized appreciation (depreciation) on: | |
| Non-affiliated issuer investments (net of change in deferred taxes payable of $59,737) | (95,624,736) |
| Forward currency contracts (Note 7) | (2,853,764) |
| Foreign currency translations | (19,951) |
| (98,498,451) | |
| Net Realized and Unrealized Loss | (105,685,037) |
| Net Decrease in Net Assets Resulting from Operations | $ (106,072,050) |
Thornburg International Growth Fund
| Six Months Ended March 31, 2019* | Year Ended September 30, 2018 | |
| INCREASE (DECREASE) IN NET ASSETS FROM | ||
| OPERATIONS | ||
| Net investment income (loss) | $ (387,013) | $ 6,336,516 |
| Net realized gain (loss) on investments, forward currency contracts and foreign currency transactions | (7,186,586) | 70,339,435 |
| Net unrealized appreciation (depreciation) on investments, forward currency contracts, foreign currency translations and deferred taxes | (98,498,451) | (31,901,578) |
| Net Increase (Decrease) in Net Assets Resulting from Operations | (106,072,050) | 44,774,373 |
| DIVIDENDS TO SHAREHOLDERS | ||
| From distributable earnings | ||
| Class A Shares | (3,914,434) | (4,353,047) |
| Class C Shares | (2,516,390) | (3,292,844) |
| Class I Shares | (50,306,025) | (39,027,537) |
| Class R3 Shares | (267,010) | (362,877) |
| Class R4 Shares | (355,180) | (585,837) |
| Class R5 Shares | (1,314,036) | (1,479,337) |
| Class R6 Shares | (1,827,702) | (427,325) |
| FUND SHARE TRANSACTIONS (NOTE 5) | ||
| Class A Shares | (8,434,823) | 6,349,924 |
| Class C Shares | (8,464,597) | (13,195,591) |
| Class I Shares | (36,934,426) | 344,647,497 |
| Class R3 Shares | (191,190) | (2,096,023) |
| Class R4 Shares | (1,838,377) | (4,571,543) |
| Class R5 Shares | (2,510,974) | (7,747,585) |
| Class R6 Shares | 3,659,605 | 39,857,628 |
| Net Increase (Decrease) in Net Assets | (221,287,609) | 358,489,876 |
| NET ASSETS | ||
| Beginning of Period | 1,785,548,526 | 1,427,058,650 |
| End of Period | $ 1,564,260,917 | $ 1,785,548,526 |
| * | Unaudited. |
Thornburg International Growth Fund | March 31, 2019 (Unaudited)
Thornburg International Growth Fund | March 31, 2019 (Unaudited)
| Cost of investments for tax purposes | $ 1,356,399,869 |
| Gross unrealized appreciation on a tax basis | 286,481,115 |
| Gross unrealized depreciation on a tax basis | (82,079,987) |
| Net unrealized appreciation (depreciation) on investments (tax basis) | $ 204,401,128 |
Thornburg International Growth Fund | March 31, 2019 (Unaudited)
| Fair Value Measurements at March 31, 2019 | ||||
| TOTAL | LEVEL 1 | LEVEL 2 | LEVEL 3 | |
| Assets | ||||
| Investments in Securities* | ||||
| Common Stock | $ 1,480,092,526 | $ 1,480,092,526 | $ — | $ — |
| Short-Term Investments | 80,708,471 | 80,708,471 | — | — |
| Total Investments in Securities | $1,560,800,997 | $1,560,800,997 | $— | $— |
| Total Assets | $1,560,800,997 | $1,560,800,997 | $— | $— |
| Fair Value Measurements at March 31, 2019 | ||||
| TOTAL | LEVEL 1 | LEVEL 2 | LEVEL 3 | |
| Liabilities | ||||
| Other Financial Instruments | ||||
| Forward Currency Contracts | $ (3,171,466) | $ — | $ (3,171,466) | $ — |
| Total Liabilities | $(3,171,466) | $— | $(3,171,466) | $— |
| * | See Schedule of Investments for a summary of the industry exposure as grouped according to the Global Industry Classification Standard (GICS), which is an industry taxonomy developed by MSCI, Inc. and Standard & Poor’s (S&P). |
| COMMON STOCK | TOTAL | |
| Beginning Balance 9/30/2018 | $ 9,788,157 | $ 9,788,157 |
| Accrued Discounts (Premiums) | – | – |
| Net Realized Gain (Loss)(a) | (2,329,064) | (2,329,064) |
| Gross Purchases | – | – |
| Gross Sales | (9,870,684) | 9,870,684 |
| Net Change in Unrealized Appreciation (Depreciation)(b)(c) | 2,411,591 | 2,411,591 |
| Transfers into Level 3 | – | – |
| Transfers out of Level 3 | – | – |
| Ending Balance 3/31/2019 | $– | $– |
| (a) | Amount of net realized gain (loss) from investments recognized in income is included in the Fund’s Statement of Operations for the six months ended March 31, 2019. |
| (b) | Amount of net change in unrealized appreciation (depreciation) on investments recognized in income is included in the Fund’s Statement of Operations for the six months ended March 31, 2019. |
| (c) | The net change in unrealized appreciation (depreciation) attributable to securities owned at March 31, 2019, which were valued using significant unobservable inputs, was $0. |
| Management Fee Schedule | |
| DAILY NET ASSETS | FEE RATE |
| Up to $500 million | 0.875% |
| Next $500 million | 0.825 |
| Next $500 million | 0.775 |
| Next $500 million | 0.725 |
| Over $2 billion | 0.675 |
Thornburg International Growth Fund | March 31, 2019 (Unaudited)
| Administration Fee Schedule | |
| Daily Net Assets | Fee Rate |
| Up to $20 billion | 0.100% |
| $20 billion to $40 billion | 0.075 |
| $40 billion to $60 billion | 0.040 |
| Over $60 billion | 0.030 |
| Fund | Market Value 9/30/18 | Purchases at Cost | Sales Proceeds | Realized Gain (Loss) | Change in Unrealized Appr./(Depr.) | Market Value 3/31/19 | Dividend Income |
| Thornburg Capital Management Fund | $175,966,031 | $160,942,189 | $(256,199,749) | $- | $- | $80,708,471 | $1,355,929 |
| SIX MONTHS ENDED March 31, 2019 (UNAUDITED) | YEAR ENDED September 30, 2018 (AUDITED) | |||
| SHARES | AMOUNT | SHARES | AMOUNT | |
| Class A Shares | ||||
| Shares sold | 656,138 | $ 13,240,077 | 2,180,402 | $ 53,138,767 |
| Shares issued to shareholders in reinvestment of dividends | 177,270 | 3,634,307 | 176,065 | 3,991,389 |
| Shares repurchased | (1,218,166) | (25,309,207) | (2,094,009) | (50,780,232) |
| Net increase (decrease) | (384,758) | $ (8,434,823) | 262,458 | $ 6,349,924 |
| Class C Shares | ||||
| Shares sold | 184,957 | $ 3,414,023 | 707,448 | $ 16,029,623 |
| Shares issued to shareholders in reinvestment of dividends | 120,517 | 2,309,110 | 141,824 | 3,023,696 |
| Shares repurchased | (745,669) | (14,187,730) | (1,401,958) | (32,248,910) |
| Net decrease | (440,195) | $ (8,464,597) | (552,686) | $ (13,195,591) |
| Class I Shares | ||||
| Shares sold | 12,914,838 | $ 270,506,427 | 23,812,798 | $ 594,176,730 |
| Shares issued to shareholders in reinvestment of dividends | 2,184,161 | 45,702,448 | 1,552,672 | 36,192,788 |
| Shares repurchased | (17,009,872) | (353,143,301) | (11,496,975) | (285,722,021) |
| Net increase (decrease) | (1,910,873) | $ (36,934,426) | 13,868,495 | $ 344,647,497 |
| Class R3 Shares | ||||
| Shares sold | 49,013 | $ 1,014,419 | 127,377 | $ 3,040,248 |
| Shares issued to shareholders in reinvestment of dividends | 10,759 | 219,052 | 12,148 | 273,090 |
| Shares repurchased | (68,937) | (1,424,661) | (226,411) | (5,409,361) |
| Net decrease | (9,165) | $ (191,190) | (86,886) | $ (2,096,023) |
| Class R4 Shares | ||||
| Shares sold | 45,963 | $ 932,573 | 236,526 | $ 5,641,354 |
| Shares issued to shareholders in reinvestment of dividends | 8,903 | 182,072 | 11,955 | 269,581 |
| Shares repurchased | (139,613) | (2,953,022) | (438,404) | (10,482,478) |
| Net decrease | (84,747) | $ (1,838,377) | (189,923) | $ (4,571,543) |
| Class R5 Shares | ||||
| Shares sold | 124,809 | $ 2,668,956 | 419,136 | $ 10,484,556 |
| Shares issued to shareholders in reinvestment of dividends | 61,537 | 1,291,266 | 63,259 | 1,478,349 |
| Shares repurchased | (302,513) | (6,471,196) | (791,632) | (19,710,490) |
| Net decrease | (116,167) | $ (2,510,974) | (309,237) | $ (7,747,585) |
Thornburg International Growth Fund | March 31, 2019 (Unaudited)
| SIX MONTHS ENDED March 31, 2019 (UNAUDITED) | YEAR ENDED September 30, 2018 (AUDITED) | |||
| SHARES | AMOUNT | SHARES | AMOUNT | |
| Class R6 Shares | ||||
| Shares sold | 302,139 | $ 6,393,042 | 1,720,938 | $ 43,557,545 |
| Shares issued to shareholders in reinvestment of dividends | 84,527 | 1,777,102 | 18,246 | 427,324 |
| Shares repurchased | (206,864) | (4,510,539) | (165,298) | (4,127,241) |
| Net increase | 179,802 | $ 3,659,605 | 1,573,886 | $ 39,857,628 |
SHEET RISK AND FOREIGN INVESTMENT RISK
| FAIR VALUES OF DERIVATIVE FINANCIAL INSTRUMENTS AT MARCH 31, 2019 | ||
| LIABILITY DERIVATIVES | BALANCE SHEET LOCATION | FAIR VALUE |
| Foreign exchange contracts | Liabilities - Unrealized depreciation on forward currency contracts | $ (3,171,466) |
| NET REALIZED GAIN (LOSS) ON DERIVATIVE FINANCIAL INSTRUMENTS RECOGNIZED IN INCOME FOR THE SIX MONTHS ENDED March 31, 2019 | ||
| TOTAL | FORWARD CURRENCY CONTRACTS | |
| Foreign exchange contracts | $ (423,293) | $ (423,293) |
| NET CHANGE IN UNREALIZED APPRECIATION (DEPRECIATION) OF DERIVATIVE FINANCIAL INSTRUMENTS RECOGNIZED IN INCOME FOR THE SIX MONTHS ENDED March 31, 2019 | ||
| TOTAL | FORWARD CURRENCY CONTRACTS | |
| Foreign exchange contracts | $ (2,853,764) | $ (2,853,764) |
Thornburg International Growth Fund
| PER SHARE PERFORMANCE (FOR A SHARE OUTSTANDING THROUGHOUT THE PERIOD) | ||||||||
| UNLESS OTHERWISE NOTED, PERIODS ARE FISCAL YEARS ENDED SEPTEMBER 30, | Net Asset Value, Beginning of PERIOD | Net Investment Income (Loss)+ | Net Realized & Unrealized Gain (Loss) on Investments | Total from Investment Operations | Dividends from Net Investment Income | Dividends from Net Realized Gains | Total Dividends | Net Asset Value, End of PERIOD |
| CLASS A SHARES | ||||||||
| 2019(b)(c) | $ 23.78 | (0.03) | (1.31) | (1.34) | (0.02) | (0.75) | (0.77) | $ 21.67 |
| 2018(b) | $ 23.85 | 0.02 | 0.72 | 0.74 | (0.05) | (0.76) | (0.81) | $ 23.78 |
| 2017(b) | $ 19.22 | (0.01) | 4.65 | 4.64 | (0.01) | — | (0.01) | $ 23.85 |
| 2016(b) | $ 17.78 | —(e) | 1.45 | 1.45 | (0.01) | — | (0.01) | $ 19.22 |
| 2015(b) | $ 19.10 | (0.01) | (0.33) | (0.34) | — | (0.98) | (0.98) | $ 17.78 |
| 2014(b) | $ 20.54 | 0.02 | (0.89) | (0.87) | — | (0.57) | (0.57) | $ 19.10 |
| CLASS C SHARES | ||||||||
| 2019(c) | $ 22.21 | (0.11) | (1.21) | (1.32) | — | (0.75) | (0.75) | $ 20.14 |
| 2018 | $ 22.50 | (0.15) | 0.67 | 0.52 | (0.05) | (0.76) | (0.81) | $ 22.21 |
| 2017 | $ 18.26 | (0.13) | 4.37 | 4.24 | — | — | — | $ 22.50 |
| 2016 | $ 17.01 | (0.13) | 1.38 | 1.25 | — | — | — | $ 18.26 |
| 2015 | $ 18.45 | (0.14) | (0.32) | (0.46) | — | (0.98) | (0.98) | $ 17.01 |
| 2014 | $ 20.01 | (0.13) | (0.86) | (0.99) | — | (0.57) | (0.57) | $ 18.45 |
| CLASS I SHARES | ||||||||
| 2019(c) | $ 24.51 | —(e) | (1.35) | (1.35) | (0.10) | (0.75) | (0.85) | $ 22.31 |
| 2018 | $ 24.48 | 0.12 | 0.72 | 0.84 | (0.05) | (0.76) | (0.81) | $ 24.51 |
| 2017 | $ 19.69 | 0.10 | 4.75 | 4.85 | (0.06) | — | (0.06) | $ 24.48 |
| 2016 | $ 18.20 | 0.08 | 1.49 | 1.57 | (0.08) | — | (0.08) | $ 19.69 |
| 2015 | $ 19.51 | 0.09 | (0.37) | (0.28) | (0.05) | (0.98) | (1.03) | $ 18.20 |
| 2014 | $ 20.96 | 0.10 | (0.91) | (0.81) | (0.07) | (0.57) | (0.64) | $ 19.51 |
| CLASS R3 SHARES | ||||||||
| 2019(c) | $ 23.54 | (0.05) | (1.29) | (1.34) | — | (0.75) | (0.75) | $ 21.45 |
| 2018 | $ 23.66 | (0.02) | 0.71 | 0.69 | (0.05) | (0.76) | (0.81) | $ 23.54 |
| 2017 | $ 19.07 | (0.01) | 4.60 | 4.59 | — | — | — | $ 23.66 |
| 2016 | $ 17.66 | —(e) | 1.42 | 1.42 | (0.01) | — | (0.01) | $ 19.07 |
| 2015 | $ 18.99 | (0.02) | (0.33) | (0.35) | — | (0.98) | (0.98) | $ 17.66 |
| 2014 | $ 20.46 | —(e) | (0.90) | (0.90) | — | (0.57) | (0.57) | $ 18.99 |
| CLASS R4 SHARES | ||||||||
| 2019(c) | $ 23.63 | (0.04) | (1.29) | (1.33) | — | (0.75) | (0.75) | $ 21.55 |
| 2018 | $ 23.73 | (0.01) | 0.72 | 0.71 | (0.05) | (0.76) | (0.81) | $ 23.63 |
| 2017 | $ 19.11 | 0.01 | 4.61 | 4.62 | —(g) | — | — | $ 23.73 |
| 2016 | $ 17.68 | 0.01 | 1.43 | 1.44 | (0.01) | — | (0.01) | $ 19.11 |
| 2015 | $ 19.00 | 0.02 | (0.36) | (0.34) | — | (0.98) | (0.98) | $ 17.68 |
| 2014 | $ 20.45 | 0.01 | (0.89) | (0.88) | — | (0.57) | (0.57) | $ 19.00 |
| CLASS R5 SHARES | ||||||||
| 2019(c) | $ 24.58 | —(e) | (1.36) | (1.36) | (0.10) | (0.75) | (0.85) | $ 22.37 |
| 2018 | $ 24.54 | 0.10 | 0.75 | 0.85 | (0.05) | (0.76) | (0.81) | $ 24.58 |
| 2017 | $ 19.73 | 0.08 | 4.79 | 4.87 | (0.06) | — | (0.06) | $ 24.54 |
| 2016 | $ 18.25 | 0.09 | 1.47 | 1.56 | (0.08) | — | (0.08) | $ 19.73 |
| 2015 | $ 19.55 | 0.09 | (0.36) | (0.27) | (0.05) | (0.98) | (1.03) | $ 18.25 |
| 2014 | $ 21.01 | 0.10 | (0.93) | (0.83) | (0.06) | (0.57) | (0.63) | $ 19.55 |
| CLASS R6 SHARES | ||||||||
| 2019(c) | $ 24.65 | 0.02 | (1.37) | (1.35) | (0.13) | (0.75) | (0.88) | $ 22.42 |
| 2018 | $ 24.59 | 0.21 | 0.66 | 0.87 | (0.05) | (0.76) | (0.81) | $ 24.65 |
| 2017 | $ 19.77 | 0.09 | 4.81 | 4.90 | (0.08) | — | (0.08) | $ 24.59 |
| 2016 | $ 18.29 | 0.11 | 1.47 | 1.58 | (0.10) | — | (0.10) | $ 19.77 |
| 2015 | $ 19.59 | 0.13 | (0.38) | (0.25) | (0.07) | (0.98) | (1.05) | $ 18.29 |
| 2014 | $ 21.05 | 0.12 | (0.93) | (0.81) | (0.08) | (0.57) | (0.65) | $ 19.59 |
| (a) | Not annualized for periods less than one year. |
| (b) | Sales loads are not reflected in computing total return. |
| (c) | Unaudited Six Month Period Ended March 31. |
| (d) | Annualized. |
| (e) | Net investment income (loss) was less than $0.01 per share. |
| (f) | Net investment income (loss) is less than 0.01%. |
| (g) | Dividends from net investment income per share were less than $(0.01). |
| + | Based on weighted average shares outstanding. |
| RATIOS TO AVERAGE NET ASSETS | SUPPLEMENTAL DATA | ||||||
| Net Investment Income (Loss) (%) | Expenses, After Expense Reductions (%) | Expenses, After Expense Reductions and Net of Custody Credits (%) | Expenses, Before Expense Reductions (%) | Total Return (%)(a) | Portfolio Turnover Rate (%)(a) | Net Assets at End of PERIOD (Thousands) | |
| (0.33)(d) | 1.34(d) | 1.34(d) | 1.34(d) | (5.44) | 11.30 | $ 108,170 | |
| 0.09 | 1.32 | 1.32 | 1.32 | 3.28 | 33.28 | $ 127,863 | |
| (0.05) | 1.42 | 1.42 | 1.43 | 24.12 | 60.88 | $ 121,989 | |
| 0.03 | 1.39 | 1.39 | 1.39 | 8.23 | 104.60 | $ 169,248 | |
| (0.06) | 1.42 | 1.42 | 1.42 | (2.01) | 92.01 | $ 220,897 | |
| 0.07 | 1.33 | 1.33 | 1.33 | (4.46) | 106.18 | $ 508,044 | |
| (1.11)(d) | 2.10(d) | 2.10(d) | 2.10(d) | (5.78) | 11.30 | $ 61,175 | |
| (0.65) | 2.08 | 2.08 | 2.08 | 2.47 | 33.28 | $ 77,262 | |
| (0.69) | 2.15 | 2.15 | 2.16 | 23.22 | 60.88 | $ 90,689 | |
| (0.73) | 2.15 | 2.15 | 2.15 | 7.35 | 104.60 | $ 98,633 | |
| (0.77) | 2.20 | 2.20 | 2.20 | (2.72) | 92.01 | $ 108,062 | |
| (0.65) | 2.09 | 2.09 | 2.09 | (5.19) | 106.18 | $ 146,399 | |
| 0.02(d) | 0.99(d) | 0.99(d) | 1.04(d) | (5.25) | 11.30 | $ 1,295,196 | |
| 0.47 | 0.99 | 0.99 | 0.99 | 3.61 | 33.28 | $ 1,470,211 | |
| 0.50 | 0.99 | 0.99 | 1.03 | 24.66 | 60.88 | $ 1,128,804 | |
| 0.45 | 0.99 | 0.99 | 1.00 | 8.63 | 104.60 | $ 1,030,921 | |
| 0.47 | 0.99 | 0.99 | 1.01 | (1.58) | 92.01 | $ 1,079,791 | |
| 0.47 | 0.98 | 0.98 | 0.98 | (4.09) | 106.18 | $ 1,171,032 | |
| (0.49)(d) | 1.50(d) | 1.50(d) | 2.05(d) | (5.53) | 11.30 | $ 7,482 | |
| (0.10) | 1.50 | 1.50 | 1.98 | 3.08 | 33.28 | $ 8,426 | |
| (0.03) | 1.50 | 1.50 | 2.08 | 24.07 | 60.88 | $ 10,525 | |
| (0.02) | 1.50 | 1.50 | 2.04 | 8.03 | 104.60 | $ 13,086 | |
| (0.13) | 1.50 | 1.50 | 1.98 | (2.03) | 92.01 | $ 15,851 | |
| —(f) | 1.50 | 1.50 | 1.86 | (4.63) | 106.18 | $ 22,739 | |
| (0.41)(d) | 1.40(d) | 1.40(d) | 1.71(d) | (5.47) | 11.30 | $ 9,703 | |
| (0.02) | 1.40 | 1.40 | 1.88 | 3.16 | 33.28 | $ 12,644 | |
| 0.07 | 1.40 | 1.40 | 1.84 | 24.19 | 60.88 | $ 17,200 | |
| 0.04 | 1.40 | 1.40 | 1.68 | 8.17 | 104.60 | $ 40,999 | |
| 0.10 | 1.40 | 1.40 | 1.65 | (1.97) | 92.01 | $ 38,038 | |
| 0.04 | 1.39 | 1.39 | 1.63 | (4.53) | 106.18 | $ 38,575 | |
| 0.01(d) | 0.99(d) | 0.99(d) | 1.37(d) | (5.29) | 11.30 | $ 32,036 | |
| 0.40 | 0.99 | 0.99 | 1.25 | 3.64 | 33.28 | $ 38,052 | |
| 0.40 | 0.99 | 0.99 | 1.28 | 24.68 | 60.88 | $ 45,591 | |
| 0.45 | 0.99 | 0.99 | 1.21 | 8.56 | 104.60 | $ 66,271 | |
| 0.46 | 0.99 | 0.99 | 1.20 | (1.53) | 92.01 | $ 66,646 | |
| 0.46 | 0.99 | 0.99 | 1.18 | (4.15) | 106.18 | $ 69,217 | |
| 0.15(d) | 0.89(d) | 0.89(d) | 0.99(d) | (5.23) | 11.30 | $ 50,499 | |
| 0.82 | 0.89 | 0.89 | 0.99 | 3.72 | 33.28 | $ 51,091 | |
| 0.44 | 0.89 | 0.89 | 1.03 | 24.82 | 60.88 | $ 12,261 | |
| 0.60 | 0.89 | 0.89 | 1.34 | 8.65 | 104.60 | $ 5,854 | |
| 0.66 | 0.89 | 0.89 | 1.43 | (1.43) | 92.01 | $ 4,191 | |
| 0.58 | 0.89 | 0.89 | 1.34 | (4.05) | 106.18 | $ 3,950 | |
Thornburg International Growth Fund | March 31, 2019 (Unaudited)
| (1) | transaction costs, including |
| (a) | sales charges (loads) on purchase payments, for Class A shares; |
| (b) | a deferred sales charge on redemptions of any part or all of a purchase of $1 million of Class A shares within 12 months of purchase; |
| (c) | a deferred sales charge on redemptions of Class C shares within 12 months of purchase; |
| (2) | ongoing costs, including management fees; distribution and/or service (12b-1) fees; and other Fund expenses. |
| BEGINNING ACCOUNT VALUE 10/1/18 | ENDING ACCOUNT VALUE 3/31/19 | EXPENSES PAID DURING PERIOD† 10/1/18—3/31/19 | |
| CLASS A SHARES | |||
| Actual | $1,000.00 | $945.61 | $6.50 |
| Hypothetical* | $1,000.00 | $1,018.25 | $6.74 |
| CLASS C SHARES | |||
| Actual | $1,000.00 | $942.22 | $10.17 |
| Hypothetical* | $1,000.00 | $1,014.46 | $10.55 |
| CLASS I SHARES | |||
| Actual | $1,000.00 | $947.49 | $4.81 |
| Hypothetical* | $1,000.00 | $1,020.00 | $4.99 |
| CLASS R3 SHARES | |||
| Actual | $1,000.00 | $944.71 | $7.27 |
| Hypothetical* | $1,000.00 | $1,017.45 | $7.54 |
| CLASS R4 SHARES | |||
| Actual | $1,000.00 | $945.35 | $6.79 |
| Hypothetical* | $1,000.00 | $1,017.95 | $7.04 |
| CLASS R5 SHARES | |||
| Actual | $1,000.00 | $947.10 | $4.81 |
| Hypothetical* | $1,000.00 | $1,020.00 | $4.99 |
| CLASS R6 SHARES | |||
| Actual | $1,000.00 | $947.67 | $4.32 |
| Hypothetical* | $1,000.00 | $1,020.49 | $4.48 |
| † | Expenses are equal to the annualized expense ratio for each class (A: 1.34%; C: 2.10%; I: 0.99%; R3: 1.50%; R4: 1.40%; R5: 0.99%; R6: 0.89%) multiplied by the average account value over the period, multiplied by 182/365 to reflect the one-half year period. |
| * | Hypothetical assumes a rate of return of 5% per year before expenses. |
Thornburg International Growth Fund | March 31, 2019 (Unaudited)
| ■ | Thornburg Investment Income Builder Fund |
| ■ | Thornburg Global Opportunities Fund |
| ■ | Thornburg International Value Fund |
| ■ | Thornburg Better World International Fund |
| ■ | Thornburg International Growth Fund |
| ■ | Thornburg Developing World Fund |
| ■ | Thornburg Value Fund |
| ■ | Thornburg Core Growth Fund |
| ■ | Thornburg Investment Income Builder Fund |
| ■ | Thornburg Summit Fund |
| ■ | Thornburg Low Duration Income Fund |
| ■ | Thornburg Limited Term U.S. Government Fund |
| ■ | Thornburg Limited Term Income Fund |
| ■ | Thornburg Strategic Income Fund |
| ■ | Thornburg Low Duration Municipal Fund |
| ■ | Thornburg Limited Term Municipal Fund |
| ■ | Thornburg Intermediate Municipal Fund |
| ■ | Thornburg California Limited Term Municipal Fund |
| ■ | Thornburg New Mexico Intermediate Municipal Fund |
| ■ | Thornburg New York Intermediate Municipal Fund |
| ■ | Thornburg Strategic Municipal Income Fund |
| ■ | Thornburg Long/Short Equity Fund |

| 800.847.0200 | TH1409 |


| 4 | |
| 8 | |
| 10 | |
| 11 | |
| 14 | |
| 24 | |
| 26 | |
| 28 | |
| 29 | |
| 40 | |
| 42 | |
| 43 | |
| 44 |
| SHARE CLASS | NASDAQ SYMBOL | CUSIP |
| Class A | TIBAX | 885-215-558 |
| Class C | TIBCX | 885-215-541 |
| Class I | TIBIX | 885-215-467 |
| Class R3 | TIBRX | 885-215-384 |
| Class R4 | TIBGX | 885-215-186 |
| Class R5 | TIBMX | 885-215-236 |
| Class R6 | TIBOX | 885-216-663 |
Thornburg Investment Income Builder Fund | March 31, 2019 (Unaudited)
| • | Financial sector (23% average weighting in the Fund’s equity portfolio) |
| • | Communication services sector (16% weighting in the Fund’s equity portfolio) |
| • | Energy sector (13% weighting in the Fund’s equity portfolio) |
| • | Information technology sector (8% weighting in the Fund’s equity portfolio) |
| • | Health care sector (7% weighting in the Fund’s equity portfolio) |
| • | Industrials sector (7% weighting in the Fund’s equity portfolio) |
| • | Consumer staples sector (5% weighting in the Fund’s equity portfolio) |
| • | Utilities sector (5% weighting in the Fund’s equity portfolio) |
| • | 10-year U.S. Treasury bond yields ended the March quarter at 2.41%, down from 3.05% at September 30, 2018. |
| • | Corporate bond prices outperformed U.S. government bonds in the first quarter of 2019, as credit spreads narrowed and the FINRA-Bloomberg Active Investment Grade U.S. Corporate Bond Index dropped from 4.07% to 3.63% during the period. |
| • | The FINRA-Bloomberg Active High Yield U.S. Corporate Bond Index rose slightly to 6.43% from 6.24% over the period, with a brief spike to approximately 8% during December. |
Thornburg Investment Income Builder Fund | March 31, 2019 (Unaudited)

 |  |
| Brian McMahon Portfolio Manager Chief Investment Officer and Managing Director | Jason Brady,cfa Portfolio Manager CEO, President, and Managing Director |
 |  |
| Ben Kirby,cfa Portfolio Manager Managing Director | Matt Burdett Portfolio Manager Managing Director |
Thornburg Investment Income Builder Fund | March 31, 2019 (Unaudited)
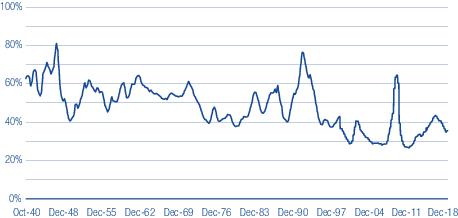
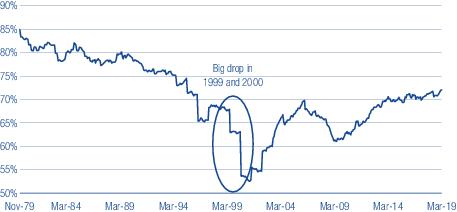
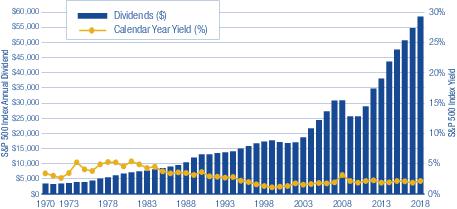
| RUSSELL 1000 INDEX | RUSSELL 2000 INDEX | |
| Real Estate | 34% | 32% |
| Financials | 21% | 28% |
| Consumer Discretionary | 14% | 11% |
| Energy | 8% | 5% |
| Consumer Staples | 4% | 3% |
| Information Technology | 4% | 1% |
| Materials | 4% | 2% |
| Utilities | 4% | 4% |
| Industrials | 3% | 6% |
| Communication Services | 3% | 7% |
| Health Care | 1% | 1% |
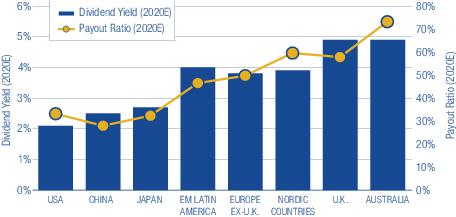
Thornburg Investment Income Builder Fund | March 31, 2019 (Unaudited)
| 1-YR | 3-YR | 5-YR | 10-YR | SINCE INCEP. | |
| Class A Shares(Incep: 12/24/02) | |||||
| Without sales charge | 4.66% | 8.12% | 4.24% | 10.83% | 9.11% |
| With sales charge | -0.05% | 6.48% | 3.29% | 10.32% | 8.80% |
| Class C Shares(Incep: 12/24/02) | |||||
| Without sales charge | 3.90% | 7.34% | 3.50% | 10.06% | 8.43% |
| With sales charge | 2.90% | 7.34% | 3.50% | 10.06% | 8.43% |
| Class I Shares(Incep: 11/3/03) | 4.98% | 8.47% | 4.57% | 11.17% | 8.47% |
| Class R3 Shares(Incep: 2/1/05) | 4.34% | 7.79% | 3.92% | 10.50% | 6.95% |
| Class R4 Shares(Incep: 2/1/08) | 4.38% | 7.85% | 4.00% | 10.58% | 5.13% |
| Class R5 Shares(Incep: 2/1/07) | 4.79% | 8.31% | 4.43% | 11.05% | 5.90% |
| Class R6 Shares(Incep: 4/10/17) | 5.05% | - | - | - | 6.98% |
| MSCI WORLD INDEX Net(USD) (Since 12/24/02) | 4.01% | 10.68% | 6.78% | 12.38% | 8.29% |
| FINAL VALUE |
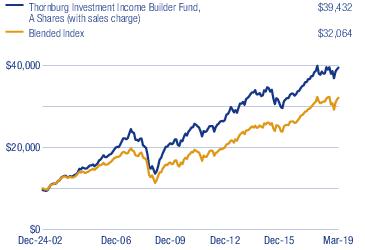
Thornburg Investment Income Builder Fund | March 31, 2019 (Unaudited)
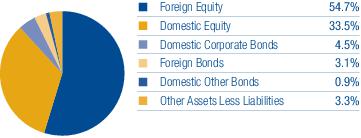
| TOP TEN EQUITY HOLDINGS | |
| Orange SA | 3.6% |
| Deutsche Telekom AG | 3.6% |
| China Mobile Ltd. | 3.6% |
| CME Group, Inc. | 3.5% |
| Royal Dutch Shell plc Class A | 3.1% |
| JPMorgan Chase & Co. | 2.7% |
| TOTAL S.A. | 2.6% |
| Electricite de France S.A. | 2.5% |
| Taiwan Semiconductor Manufacturing Co. Ltd. | 2.4% |
| Atlantia S.p.A. | 2.2% |
| SECTOR EXPOSURE (percent of equity holdings) | |
| Financials | 24.8% |
| Communication Services | 16.8% |
| Energy | 10.8% |
| Industrials | 8.7% |
| Health Care | 8.3% |
| Information Technology | 8.1% |
| Utilities | 4.9% |
| Materials | 4.7% |
| Consumer Discretionary | 4.5% |
| Consumer Staples | 4.5% |
| Real Estate | 3.9% |
| COUNTRY EXPOSURE * (percent of Fund) | |
| United States | 38.9% |
| France | 11.5% |
| Switzerland | 8.0% |
| Netherlands | 6.4% |
| Italy | 5.7% |
| Germany | 5.6% |
| United Kingdom | 3.7% |
| China | 3.6% |
| Spain | 2.6% |
| Taiwan | 2.5% |
| South Korea | 2.3% |
| Russian Federation | 1.4% |
| Hong Kong | 1.0% |
| Australia | 0.7% |
| Macao | 0.4% |
| Thailand | 0.4% |
| South Africa | 0.3% |
| Jamaica | 0.3% |
| Canada | 0.3% |
| Cayman Islands | 0.3% |
| Colombia | 0.2% |
| Brazil | 0.2% |
| Trinidad And Tobago | 0.2% |
| Belgium | 0.1% |
| Japan | 0.1% |
| Chile | 0.0%** |
| Saint Lucia | 0.0%** |
| Panama | 0.0%** |
| Other Assets Less Liabilities | 3.3% |
| * | Holdings are classified by country of risk as determined by MSCI and Bloomberg. |
| ** | Country percentage was less than 0.1%. |
Thornburg Investment Income Builder Fund | March 31, 2019 (Unaudited)
| QUARTERLY DIVIDEND HISTORY, CLASS A | |||||
| YEAR | Q1 | Q2 | Q3 | Q4 | TOTAL |
| 2003 | 9.2¢ | 11.2¢ | 12.4¢ | 17.5¢ | 50.3¢ |
| 2004 | 10.2¢ | 12.5¢ | 15.0¢ | 21.8¢ | 59.5¢ |
| 2005 | 11.0¢ | 13.6¢ | 17.4¢ | 29.0¢ | 71.0¢ |
| 2006 | 12.5¢ | 16.0¢ | 19.2¢ | 33.0¢ | 80.7¢ |
| 2007 | 14.2¢ | 18.5¢ | 21.5¢ | 36.8¢ | 91.0¢ |
| 2008 | 17.9¢ | 21.8¢ | 26.0¢ | 36.8¢ | 102.5¢ |
| 2009 | 18.0¢ | 24.2¢ | 28.0¢ | 34.5¢ | 104.7¢ |
| 2010 | 19.8¢ | 25.0¢ | 32.0¢ | 36.0¢ | 112.8¢ |
| 2011 | 21.0¢ | 26.0¢ | 32.0¢ | 37.5¢ | 116.5¢ |
| 2012 | 21.5¢ | 26.0¢ | 28.5¢ | 36.0¢ | 112.0¢ |
| 2013 | 21.5¢ | 25.3¢ | 25.0¢ | 24.5¢ | 96.3¢ |
| 2014 | 22.5¢ | 24.0¢ | 27.0¢ | 26.0¢ | 99.5¢ |
| 2015 | 16.5¢ | 20.0¢ | 20.0¢ | 25.3¢ | 81.8¢ |
| 2016 | 17.0¢ | 18.5¢ | 19.5¢ | 21.5¢ | 76.5¢ |
| 2017 | 17.0¢ | 20.0¢ | 26.0¢ | 29.5¢ | 92.5¢ |
| 2018 | 18.0¢ | 20.0¢ | 24.0¢ | 28.0¢ | 90.0¢ |
| 2019 | 19.0¢ | ||||
| As of 3/31/2019 | |
| Telecommunication Services | 16.4% |
| Diversified Financials | 14.1% |
| Energy | 11.8% |
| Pharmaceuticals, Biotechnology & Life Sciences | 7.3% |
| Semiconductors & Semiconductor Equipment | 6.4% |
| Materials | 4.6% |
| Insurance | 4.5% |
| Utilities | 4.4% |
| Banks | 4.3% |
| Capital Goods | 4.0% |
| As of 9/30/2018 | |
| Telecommunication Services | 16.5% |
| Energy | 16.0% |
| Diversified Financials | 13.8% |
| Semiconductors & Semiconductor Equipment | 6.5% |
| Pharmaceuticals, Biotechnology & Life Sciences | 6.1% |
| Banks | 4.8% |
| Utilities | 4.7% |
| Materials | 4.4% |
| Capital Goods | 3.6% |
| Real Estate | 3.5% |
| As of 12/31/2018 | |
| Telecommunication Services | 14.9% |
| Diversified Financials | 14.2% |
| Energy | 12.2% |
| Semiconductors & Semiconductor Equipment | 6.7% |
| Pharmaceuticals, Biotechnology & Life Sciences | 6.4% |
| Utilities | 5.5% |
| Banks | 4.8% |
| Capital Goods | 4.5% |
| Materials | 4.4% |
| Real Estate | 3.1% |
| As of 6/30/2018 | |
| Telecommunication Services | 15.9% |
| Energy | 15.0% |
| Diversified Financials | 14.9% |
| Banks | 7.3% |
| Pharmaceuticals, Biotechnology & Life Sciences | 6.7% |
| Semiconductors & Semiconductor Equipment | 5.9% |
| Utilities | 4.4% |
| Materials | 4.1% |
| Insurance | 4.0% |
| Food, Beverage & Tobacco | 4.0% |
Thornburg Investment Income Builder Fund | March 31, 2019 (Unaudited)
| SHARES/ PRINCIPAL AMOUNT | VALUE | ||
| Common Stock — 87.8% | |||
| Banks — 4.1% | |||
| Banks — 4.1% | |||
| BNP Paribas S.A. | 2,402,672 | $ 114,842,387 | |
| ING Groep N.V. | 7,473,600 | 90,407,804 | |
| JPMorgan Chase & Co. | 3,781,000 | 382,750,630 | |
| 588,000,821 | |||
| Capital Goods — 4.0% | |||
| Aerospace & Defense — 0.4% | |||
| BAE Systems plc | 8,555,500 | 53,754,353 | |
| Construction & Engineering — 1.3% | |||
| Ferrovial S.A. | 1,585,400 | 37,133,470 | |
| Vinci S.A. | 1,625,719 | 158,146,994 | |
| Industrial Conglomerates — 2.3% | |||
| Hopewell Holdings Ltd. | 28,564,340 | 140,457,394 | |
| a | Jasmine Broadband Internet Infrastructure Fund | 177,442,000 | 57,591,070 |
| Siemens AG | 1,208,900 | 130,102,692 | |
| 577,185,973 | |||
| Consumer Services — 1.9% | |||
| Hotels, Restaurants & Leisure — 1.9% | |||
| Las Vegas Sands Corp. | 3,717,000 | 226,588,320 | |
| Sands China Ltd. | 7,087,600 | 35,618,803 | |
| Wynn Macau Ltd. | 8,439,600 | 19,889,630 | |
| 282,096,753 | |||
| Diversified Financials — 13.6% | |||
| Capital Markets — 9.0% | |||
| b | Apollo Investment Corp. | 8,172,718 | 123,734,950 |
| Ares Capital Corp. | 15,865,000 | 271,926,100 | |
| CME Group, Inc. | 3,032,409 | 499,073,873 | |
| Deutsche Boerse AG | 420,200 | 53,876,388 | |
| Lazard Ltd. Class A | 1,227,500 | 44,361,850 | |
| a,b | Solar Capital Ltd. | 4,607,900 | 96,028,636 |
| UBS Group AG | 17,314,372 | 209,876,445 | |
| Diversified Financial Services — 1.5% | |||
| AXA Equitable Holdings, Inc. | 10,453,100 | 210,525,434 | |
| Mortgage Real Estate Investment Trusts — 3.1% | |||
| Chimera Investment Corp. | 8,900,000 | 166,786,000 | |
| Granite Point Mortgage Trust, Inc. | 1,417,500 | 26,322,975 | |
| b | MFA Financial, Inc. | 34,982,751 | 254,324,600 |
| 1,956,837,251 | |||
| Energy — 9.3% | |||
| Oil, Gas & Consumable Fuels — 9.3% | |||
| Eni S.p.A. | 14,805,852 | 261,649,817 | |
| a,c,d | Malamute Energy, Inc., | 12,439 | 130,610 |
| Repsol S.A. | 5,374,040 | 91,992,330 | |
| Royal Dutch Shell plc Sponsored ADR Class A | 7,124,100 | 445,897,419 | |
| Suncor Energy, Inc. | 312,600 | 10,131,108 | |
| TOTAL S.A. | 6,826,300 | 379,194,646 | |
| Valero Energy Corp. | 1,854,000 | 157,274,820 | |
| 1,346,270,750 | |||
| Food & Staples Retailing — 2.2% | |||
| Food & Staples Retailing — 2.2% | |||
| Walgreens Boots Alliance, Inc. | 4,950,000 | 313,186,500 | |
| 313,186,500 | |||
| Food, Beverage & Tobacco — 1.8% | |||
| Food Products — 0.6% |
| SHARES/ PRINCIPAL AMOUNT | VALUE | ||
| Nestle S.A. | 877,700 | $ 83,649,239 | |
| Tobacco — 1.2% | |||
| KT&G Corp. | 1,876,400 | 171,092,767 | |
| 254,742,006 | |||
| Insurance — 4.0% | |||
| Insurance — 4.0% | |||
| Assicurazioni Generali S.p.A. | 765,047 | 14,160,163 | |
| AXA S.A. | 4,465,500 | 112,355,816 | |
| Legal & General Group plc | 9,940,500 | 35,643,092 | |
| NN Group N.V. | 5,951,300 | 247,207,559 | |
| Swiss Re AG | 661,700 | 64,644,917 | |
| Zurich Insurance Group AG | 326,200 | 107,974,411 | |
| 581,985,958 | |||
| Materials — 4.2% | |||
| Chemicals — 1.3% | |||
| LG Chem Ltd. | 131,600 | 42,432,913 | |
| LyondellBasell Industries N.V. Class A | 1,780,000 | 149,662,400 | |
| Metals & Mining — 2.9% | |||
| Glencore plc | 49,437,100 | 204,725,886 | |
| MMC Norilsk Nickel PJSC ADR | 9,785,800 | 206,676,096 | |
| 603,497,295 | |||
| Pharmaceuticals, Biotechnology & Life Sciences — 7.3% | |||
| Pharmaceuticals — 7.3% | |||
| AstraZeneca plc | 1,814,100 | 144,956,179 | |
| Bayer AG | 284,103 | 18,356,695 | |
| Merck & Co., Inc. | 3,643,000 | 302,988,310 | |
| Novartis AG | 2,461,000 | 236,720,643 | |
| Pfizer, Inc. | 2,281,000 | 96,874,070 | |
| Roche Holding AG | 910,600 | 250,889,390 | |
| 1,050,785,287 | |||
| Real Estate — 3.4% | |||
| Equity Real Estate Investment Trusts — 3.4% | |||
| Crown Castle International Corp. | 1,555,648 | 199,122,944 | |
| Lamar Advertising Co. Class A | 1,621,351 | 128,508,280 | |
| Outfront Media, Inc. | 3,177,100 | 74,344,140 | |
| Washington Real Estate Investment Trust | 3,139,840 | 89,108,659 | |
| 491,084,023 | |||
| Retailing — 2.0% | |||
| Specialty Retail — 2.0% | |||
| Home Depot, Inc. | 1,538,100 | 295,146,009 | |
| 295,146,009 | |||
| Semiconductors & Semiconductor Equipment — 6.4% | |||
| Semiconductors & Semiconductor Equipment — 6.4% | |||
| ASE Technology Holding Co. Ltd. | 8,473,977 | 18,558,863 | |
| Broadcom, Inc. | 850,000 | 255,603,500 | |
| QUALCOMM, Inc. | 5,279,135 | 301,069,069 | |
| Taiwan Semiconductor Manufacturing Co., Ltd. | 43,064,000 | 343,025,324 | |
| 918,256,756 | |||
| Technology Hardware & Equipment — 0.8% | |||
| Technology Hardware, Storage & Peripherals — 0.8% | |||
| Samsung Electronics Co., Ltd. | 2,914,600 | 114,647,952 | |
| 114,647,952 | |||
| Telecommunication Services — 14.7% | |||
| Diversified Telecommunication Services — 9.7% | |||
| AT&T, Inc. | 3,980,000 | 124,812,800 |
Thornburg Investment Income Builder Fund | March 31, 2019 (Unaudited)
| SHARES/ PRINCIPAL AMOUNT | VALUE | ||
| BT Group plc | 42,504,320 | $ 123,424,533 | |
| Deutsche Telekom AG | 31,326,800 | 519,908,831 | |
| Koninklijke KPN N.V. | 33,431,200 | 105,979,121 | |
| Orange S.A. | 32,003,980 | 520,556,870 | |
| Wireless Telecommunication Services — 5.0% | |||
| China Mobile Ltd. | 50,329,774 | 512,918,161 | |
| MTN Group Ltd. | 8,286,886 | 50,897,260 | |
| Vodafone Group plc | 86,273,224 | 157,088,409 | |
| 2,115,585,985 | |||
| Transportation — 3.7% | |||
| Airlines — 0.1% | |||
| easyJet plc | 1,304,000 | 18,979,557 | |
| Transportation Infrastructure — 3.6% | |||
| e | Aena SME S.A. | 782,300 | 140,846,013 |
| Atlantia SPA | 12,216,878 | 316,431,974 | |
| Sydney Airport | 10,835,656 | 57,165,342 | |
| 533,422,886 | |||
| Utilities — 4.4% | |||
| Electric Utilities — 4.1% | |||
| Electricite de France S.A. | 26,076,484 | 356,573,389 | |
| Enel S.p.A. | 35,546,271 | 227,441,523 | |
| Multi-Utilities — 0.3% | |||
| E.ON SE | 4,071,541 | 45,270,605 | |
| 629,285,517 | |||
| Total Common Stock(Cost $10,591,198,584) | 12,652,017,722 | ||
| Preferred Stock — 0.4% | |||
| Banks — 0.1% | |||
| Banks — 0.1% | |||
| f,g,h | First Tennessee Bank N.A., 3.75% (LIBOR 3 Month + 0.85%) | 12,000 | 8,829,936 |
| 8,829,936 | |||
| Diversified Financials — 0.0% | |||
| Capital Markets — 0.0% | |||
| g,h | Morgan Stanley, Series A 4.00% (LIBOR 3 Month + 0.70%) | 120,000 | 2,322,000 |
| 2,322,000 | |||
| Energy — 0.1% | |||
| Oil, Gas & Consumable Fuels — 0.1% | |||
| a,h | Crestwood Equity Partners L.P., 9.25% | 2,166,596 | 20,170,575 |
| 20,170,575 | |||
| Miscellaneous — 0.1% | |||
| U.S. Government Agencies — 0.1% | |||
| h | Farm Credit Bank of Texas, Series 1, 10.00% | 9,000 | 10,125,000 |
| 10,125,000 | |||
| Telecommunication Services — 0.1% | |||
| Diversified Telecommunication Services — 0.1% | |||
| f,i | Centaur Funding Corp., 9.08%, 4/21/2020 | 15,000 | 15,818,040 |
| 15,818,040 | |||
| Total Preferred Stock(Cost $60,828,706) | 57,265,551 | ||
| Asset Backed Securities — 0.2% | |||
| Commercial MTG Trust — 0.0% | |||
| j | Citigroup Mortgage Loan Trust, Inc. CMO, Series 2004-HYB2 Class B1, 4.896%, 3/25/2034 | $ 407,210 | 342,675 |
| 342,675 |
| SHARES/ PRINCIPAL AMOUNT | VALUE | ||
| Other Asset Backed — 0.2% | |||
| e,i | CFG Investments Ltd., Series 2017-1 Class A, 7.87%, 11/15/2026 | $ 26,000,000 | $ 26,226,470 |
| f | JPR Royalty Sub, LLC, 14.00%, 9/1/2020 | 5,000,000 | 2,500,000 |
| c,f,g | Northwind Holdings, LLC, Series 2007-1A Class A1, 3.406% (LIBOR 3 Month + 0.78%), 12/1/2037 | 1,093,750 | 1,072,969 |
| 29,799,439 | |||
| Residential MTG Trust — 0.0% | |||
| j | Bear Stearns ARM Trust CMO, Series 2003-6 Class 2B1, 4.489%, 8/25/2033 | 60,702 | 60,021 |
| j | Merrill Lynch Mortgage Investors Trust CMO, Series 2004-A4 Class M1, 4.076%, 8/25/2034 | 2,900,065 | 2,669,935 |
| 2,729,956 | |||
| Total Asset Backed Securities(Cost $35,405,845) | 32,872,070 | ||
| Corporate Bonds — 7.3% | |||
| Automobiles & Components — 0.0% | |||
| Auto Components — 0.0% | |||
| e,i | Nexteer Automotive Group Ltd., 5.875%, 11/15/2021 | 4,300,000 | 4,364,559 |
| 4,364,559 | |||
| Banks — 0.1% | |||
| Banks — 0.1% | |||
| e,h,i,k | BPCE S.A., 12.50% (LIBOR 3 Month + 12.98%), 9/30/2019 | 10,211,000 | 10,638,126 |
| 10,638,126 | |||
| Capital Goods — 0.0% | |||
| Machinery — 0.0% | |||
| Mueller Industries, Inc., 6.00%, 3/1/2027 | 7,679,000 | 7,525,420 | |
| 7,525,420 | |||
| Commercial & Professional Services — 0.2% | |||
| Commercial Services & Supplies — 0.2% | |||
| e,i | Cimpress N.V., 7.00%, 6/15/2026 | 28,610,000 | 27,537,125 |
| e | ServiceMaster Co., LLC, 5.125%, 11/15/2024 | 2,480,000 | 2,489,300 |
| 30,026,425 | |||
| Consumer Durables & Apparel — 0.1% | |||
| Leisure Products — 0.1% | |||
| Vista Outdoor, Inc., 5.875%, 10/1/2023 | 22,764,000 | 21,170,520 | |
| 21,170,520 | |||
| Consumer Services — 0.0% | |||
| Hotels, Restaurants & Leisure — 0.0% | |||
| e | Nathan’s Famous, Inc., 6.625%, 11/1/2025 | 6,188,000 | 6,010,095 |
| 6,010,095 | |||
| Diversified Financials — 0.4% | |||
| Capital Markets — 0.1% | |||
| e | Compass Group Diversified Holdings, LLC, 8.00%, 5/1/2026 | 17,000,000 | 17,680,000 |
| Consumer Finance — 0.1% | |||
| e | FirstCash, Inc., 5.375%, 6/1/2024 | 7,500,000 | 7,668,825 |
| Diversified Financial Services — 0.2% | |||
| e | Antares Holdings L.P., 6.00%, 8/15/2023 | 18,000,000 | 17,694,277 |
| h,j | JPMorgan Chase & Co., Series I 6.221% (LIBOR 3 Month + 3.47%), 4/30/2019 | 10,759,000 | 10,812,795 |
| 53,855,897 | |||
| Energy — 2.3% | |||
| Energy Equipment & Services — 0.2% | |||
| Enviva Partners L.P. / Enviva Partners Finance Corp., 8.50%, 11/1/2021 | 17,373,000 | 18,111,352 | |
| Odebrecht Offshore Drilling Finance Ltd., | |||
| e,i | 6.72%, 12/1/2022 | 4,054,810 | 3,862,206 |
| e,i,l | 7.72%, 12/1/2026 PIK | 15,815,349 | 3,911,136 |
| e,h,i | Odebrecht Oil & Gas Finance Ltd. (Guaranty: Odebrecht Oleo e Gas S.A.), 4/29/2019 | 2,337,727 | 11,689 |
| d,f,i,m | Schahin II Finance Co. SPV Ltd., 5.875%, 9/25/2023 | 11,640,133 | 1,164,031 |
Thornburg Investment Income Builder Fund | March 31, 2019 (Unaudited)
| SHARES/ PRINCIPAL AMOUNT | VALUE | ||
| Oil, Gas & Consumable Fuels — 2.1% | |||
| e | CITGO Petroleum Corp., 6.25%, 8/15/2022 | $ 27,000,000 | $ 26,831,250 |
| e | Enable Oklahoma Intrastate Transmission, LLC (Guaranty: Enable Midstream Partners L.P.), 6.25%, 3/15/2020 | 2,500,000 | 2,569,148 |
| g | Energy Transfer Operating L.P., 5.754% (LIBOR 3 Month + 3.02%), 11/1/2066 | 13,820,000 | �� 11,194,200 |
| a,j | Enterprise TE Partners L.P., Series 1 5.404% (LIBOR 3 Month + 2.78%), 6/1/2067 | 7,000,000 | 6,440,000 |
| HollyFrontier Corp., 5.875%, 4/1/2026 | 10,345,000 | 11,069,502 | |
| Kinder Morgan Energy Partners L.P., | |||
| 5.00%, 3/1/2043 | 10,000,000 | 10,012,249 | |
| 5.80%, 3/15/2035 | 10,000,000 | 11,020,336 | |
| Kinder Morgan, Inc., | |||
| 5.30%, 12/1/2034 | 23,630,000 | 25,596,117 | |
| 5.55%, 6/1/2045 | 5,000,000 | 5,453,145 | |
| c,d,f,m | Linc USA GP / Linc Energy Finance USA, Inc., 9.625%, 10/31/2017 | 15,590,161 | 646,992 |
| e | Par Petroleum, LLC / Par Petroleum Finance Corp., 7.75%, 12/15/2025 | 5,560,000 | 5,162,460 |
| e,i | Petroleum Co. of Trinidad & Tobago Ltd., 9.75%, 8/14/2019 | 4,000,000 | 3,978,000 |
| a,m | RAAM Global Energy Co., 12.50%, 10/1/2015 | 15,000,000 | 450,000 |
| c,f,i,l | Schahin II Finance Co. SPV Ltd., 8.00%, 5/25/2020 PIK | 650,939 | 606,024 |
| Summit Midstream Holdings, LLC / Summit Midstream Finance Corp., 5.50%, 8/15/2022 | 7,497,000 | 7,422,030 | |
| h,k | Summit Midstream Partners L.P., Series A, 9.50% (LIBOR 3 Month + 7.43%), 12/15/2022 | 17,867,000 | 16,526,975 |
| Transcontinental Gas Pipe Line Co., LLC, 7.85%, 2/1/2026 | 32,700,000 | 40,885,057 | |
| Williams Companies, Inc., | |||
| 3.70%, 1/15/2023 | 29,129,000 | 29,654,293 | |
| 4.55%, 6/24/2024 | 69,318,000 | 73,171,525 | |
| 5.75%, 6/24/2044 | 14,198,000 | 15,616,680 | |
| 331,366,397 | |||
| Food & Staples Retailing — 0.1% | |||
| Food & Staples Retailing — 0.1% | |||
| e | C&S Group Enterprises, LLC, 5.375%, 7/15/2022 | 7,860,000 | 7,889,475 |
| 7,889,475 | |||
| Food, Beverage & Tobacco — 0.4% | |||
| Food Products — 0.1% | |||
| B&G Foods, Inc., 5.25%, 4/1/2025 | 10,000,000 | 9,587,500 | |
| e,i | BRF S.A., 4.75%, 5/22/2024 | 6,000,000 | 5,647,500 |
| Tobacco — 0.3% | |||
| Vector Group Ltd., | |||
| e | 6.125%, 2/1/2025 | 8,826,000 | 7,835,723 |
| e | 10.50%, 11/1/2026 | 41,900,000 | 39,490,750 |
| 62,561,473 | |||
| Healthcare Equipment & Services — 0.2% | |||
| Health Care Providers & Services — 0.2% | |||
| e | Tenet Healthcare Corp., 6.25%, 2/1/2027 | 23,500,000 | 24,394,175 |
| 24,394,175 | |||
| Household & Personal Products — 0.1% | |||
| Household Products — 0.1% | |||
| Energizer Gamma Acquisition, Inc., | |||
| e | 6.375%, 7/15/2026 | 2,500,000 | 2,562,500 |
| e | 7.75%, 1/15/2027 | 800,000 | 852,000 |
| e | Energizer Holdings, Inc., 5.50%, 6/15/2025 | 7,500,000 | 7,422,600 |
| 10,837,100 | |||
| Insurance — 0.5% | |||
| Insurance — 0.5% | |||
| e,h,i,k | Dai-ichi Life Insurance Co. Ltd., 7.25% (LIBOR 3 Month + 4.56%), 7/25/2021 | 9,000,000 | 9,652,500 |
| e | MetLife, Inc., 9.25%, 4/8/2038 | 12,000,000 | 16,140,000 |
| e,k | National Life Insurance Co., 5.25% (LIBOR 3 Month + 3.31%), 7/19/2068 | 3,450,000 | 3,548,982 |
| e,i,k | QBE Insurance Group Ltd., 7.50% (USSW10 + 6.03%), 11/24/2043 | 40,000,000 | 43,350,000 |
| 72,691,482 | |||
| Materials — 0.4% |
| SHARES/ PRINCIPAL AMOUNT | VALUE | ||
| Chemicals — 0.2% | |||
| Consolidated Energy Finance S.A., | |||
| e,g,i | 6.361% (LIBOR 3 Month + 3.75%), 6/15/2022 | $ 5,500,000 | $ 5,481,181 |
| e,i | 6.875%, 6/15/2025 | 13,000,000 | 13,097,500 |
| e,i | Kissner Holdings L.P. / Kissner Milling Co. Ltd. / BSC Holding, Inc. / Kissner USA, 8.375%, 12/1/2022 | 14,520,000 | 15,155,250 |
| Construction Materials — 0.1% | |||
| e,i | CIMPOR Financial Operations B.V., 5.75%, 7/17/2024 | 8,000,000 | 7,060,080 |
| Metals & Mining — 0.1% | |||
| e | International Wire Group, Inc., 10.75%, 8/1/2021 | 16,624,000 | 16,624,000 |
| 57,418,011 | |||
| Media & Entertainment — 0.3% | |||
| Hotels, Restaurants & Leisure — 0.1% | |||
| Speedway Motorsports, Inc. 5.125%, 2/1/2023 | 10,771,000 | 10,811,391 | |
| Media — 0.2% | |||
| e | CSC Holdings, LLC, 6.50%, 2/1/2029 | 4,000,000 | 4,260,000 |
| DISH DBS Corp., 5.125%, 5/1/2020 | 4,000,000 | 4,025,000 | |
| e | Salem Media Group, Inc., 6.75%, 6/1/2024 | 16,742,000 | 15,151,510 |
| e,i | Telenet Finance Luxembourg Notes Sarl, 5.50%, 3/1/2028 | 10,000,000 | 9,800,000 |
| 44,047,901 | |||
| Real Estate — 0.3% | |||
| Equity Real Estate Investment Trusts — 0.3% | |||
| CoreCivic, Inc. | |||
| 4.625%, 5/1/2023 | 16,756,000 | 16,127,650 | |
| 4.75%, 10/15/2027 | 23,901,000 | 20,330,908 | |
| 36,458,558 | |||
| Software & Services — 0.1% | |||
| Information Technology Services — 0.1% | |||
| e | Alliance Data Systems Corp., 5.375%, 8/1/2022 | 10,000,000 | 10,112,500 |
| e | Harland Clarke Holdings Corp., 8.375%, 8/15/2022 | 6,500,000 | 5,861,050 |
| 15,973,550 | |||
| Technology Hardware & Equipment — 0.1% | |||
| Communications Equipment — 0.1% | |||
| e | Anixter, Inc. 6.00%, 12/1/2025 | 8,000,000 | 8,400,000 |
| 8,400,000 | |||
| Telecommunication Services — 1.6% | |||
| Diversified Telecommunication Services — 1.3% | |||
| i | Deutsche Telekom International Finance B.V. (Guaranty: Deutsche Telekom AG), 8.75%, 6/15/2030 | 26,150,000 | 35,973,230 |
| e,i | Digicel Ltd., 6.00%, 4/15/2021 | 51,737,000 | 43,081,917 |
| Qwest Corp., 6.75%, 12/1/2021 | 9,000,000 | 9,576,450 | |
| i | Telefonica Emisiones SAU (Guaranty: Telefonica S.A.), 7.045%, 6/20/2036 | 85,390,000 | 103,918,483 |
| Wireless Telecommunication Services — 0.3% | |||
| e,i | Digicel International Finance Ltd., 8.75%, 5/25/2024 | 4,300,000 | 4,246,250 |
| Millicom International Cellular SA | |||
| e,i | 5.125%, 1/15/2028 | 2,800,000 | 2,677,500 |
| e,i | 6.00%, 3/15/2025 | 28,423,000 | 29,133,575 |
| e,i | 6.625%, 10/15/2026 | 2,200,000 | 2,310,000 |
| 230,917,405 | |||
| Transportation — 0.1% | |||
| Airlines — 0.1% | |||
| American Airlines Pass Through Trust, Series 2013-2 Class A, 4.95%, 7/15/2024 | 2,719,003 | 2,815,528 | |
| e,i | Guanay Finance Ltd., 6.00%, 12/15/2020 | 5,927,685 | 5,994,371 |
| US Airways Pass Through Trust, Series 2010-1 Class A, 6.25%, 10/22/2024 | 1,547,420 | 1,659,144 | |
| Hotels, Restaurants & Leisure — 0.0% | |||
| i | Sands China Ltd., 5.40%, 8/8/2028 | 7,000,000 | 7,333,199 |
| 17,802,242 | |||
| Total Corporate Bonds(Cost $993,383,992) | 1,054,348,811 |
Thornburg Investment Income Builder Fund | March 31, 2019 (Unaudited)
| SHARES/ PRINCIPAL AMOUNT | VALUE | ||
| Convertible Bonds — 0.1% | |||
| Diversified Financials — 0.1% | |||
| Consumer Finance — 0.1% | |||
| EZCORP, Inc., 2.125%, 6/15/2019 | $ 4,353,000 | $ 4,339,935 | |
| 4,339,935 | |||
| Total Convertible Bonds(Cost $4,333,876) | 4,339,935 | ||
| Municipal Bonds — 0.0% | |||
| San Bernardino County Redevelopment Agency Successor Agency, Class A 8.45%, 9/1/2030 | 2,555,000 | 2,708,377 | |
| Total Municipal Bonds(Cost $2,512,518) | 2,708,377 | ||
| Other Government — 0.1% | |||
| Brazilian Government International Bond (BRL), 12.50%, 1/5/2022 | 20,000,000 | 5,759,281 | |
| Total Other Government(Cost $12,551,900) | 5,759,281 | ||
| Loan Participations — 0.8% | |||
| Commercial & Professional Services — 0.4% | |||
| Professional Services — 0.4% | |||
| n | Harland Clarke Holdings Corp., 7.351% (LIBOR 3 Month + 4.75%), 11/3/2023 | 13,495,654 | 12,078,611 |
| n | Par Pacific Holdings, Inc. 9.55% (LIBOR 1 Month + 6.75%), 12/17/2025 | 10,200,000 | 10,187,250 |
| n | R.R. Donnelley & Sons Company 7.499% (LIBOR 1 Month + 5.00%), 1/15/2024 | 16,957,500 | 16,893,909 |
| n | RGIS Services, LLC, 10.111% (LIBOR 1 Month + 7.50%), 3/31/2023 | 15,375,746 | 12,848,435 |
| 52,008,205 | |||
| Energy — 0.1% | |||
| Oil, Gas & Consumable Fuels — 0.1% | |||
| c,l | Malamute Energy, Inc., 1.358%, 11/22/2022 | 311,280 | 311,280 |
| n | McDermott Technology Americas, Inc., 7.499% (LIBOR 1 Month + 5.00%), 5/10/2025 | 8,924,925 | 8,535,441 |
| 8,846,721 | |||
| Materials — 0.0% | |||
| Chemicals — 0.0% | |||
| n | US Salt LLC, 7.232% (LIBOR 3 Month + 4.75%), 1/18/2026 | 5,462,000 | 5,448,345 |
| 5,448,345 | |||
| Media & Entertainment — 0.1% | |||
| Media — 0.1% | |||
| n | ABG Intermediate Holdings 2, LLC, 10.249% (LIBOR 1 Month + 7.75%), 9/29/2025 | 15,000,000 | 14,775,000 |
| 14,775,000 | |||
| Retailing — 0.0% | |||
| Specialty Retail — 0.0% | |||
| n | Office Depot, Inc., 7.734% (LIBOR 1 Month + 5.25%), 11/8/2022 | 2,775,704 | 2,824,279 |
| 2,824,279 | |||
| Software & Services — 0.1% | |||
| Internet Software & Services — 0.1% | |||
| n | CareerBuilder, LLC, 9.351% (LIBOR 3 Month + 6.75%), 7/31/2023 | 5,655,954 | 5,655,954 |
| n | Dun & Bradstreet Corporation (The), 7.49% (LIBOR 1 Month + 5.00%), 2/1/2026 | 16,910,000 | 16,677,488 |
| 22,333,442 | |||
| Transportation — 0.1% | |||
| Airlines — 0.1% | |||
| a,c,d,m | OS Two, LLC, 12/15/2020 | 4,254,414 | 0 |
| a,c,n | Wheels Up Partners, LLC, 9.126% (LIBOR 3 Month + 6.50%), 8/17/2025 | 11,982,609 | 11,934,678 |
| 11,934,678 | |||
| Total Loan Participations(Cost $123,593,992) | 118,170,670 |
| SHARES/ PRINCIPAL AMOUNT | VALUE | ||
| Short-Term Investments — 2.3% | |||
| b | Thornburg Capital Management Fund | 34,004,924 | $ 340,049,233 |
| Total Short-Term Investments(Cost $340,049,233) | 340,049,233 | ||
| Total Investments — 99.0%(Cost $12,163,858,646) | $14,267,531,650 | ||
| Other Assets Less Liabilities — 1.0% | 137,851,650 | ||
| Net Assets — 100.0% | $14,405,383,300 |
| Outstanding Forward Currency Contracts To Buy Or Sell At March 31, 2019 | |||||||
| Contract Description | Contract Party* | Buy/Sell | Contract Amount | Contract Value Date | Value USD | Unrealized Appreciation | Unrealized Depreciation |
| Great Britain Pound | SSB | Sell | 465,084,600 | 4/10/2019 | 605,998,161 | $ — | $ (11,454,937) |
| Swiss Franc | SSB | Sell | 84,660,600 | 4/23/2019 | 85,191,938 | 450,119 | — |
| Swiss Franc | SSB | Sell | 22,478,900 | 4/23/2019 | 22,619,980 | — | (137,528) |
| Swiss Franc | SSB | Sell | 13,734,700 | 4/23/2019 | 13,820,900 | 3,562 | — |
| Swiss Franc | SSB | Sell | 30,761,500 | 4/23/2019 | 30,954,562 | — | (208,435) |
| Chinese Yuan Renminbi | SSB | Sell | 2,685,000,000 | 4/25/2019 | 399,363,786 | — | (4,288,324) |
| Korean Won | SSB | Sell | 182,019,960,000 | 5/2/2019 | 160,497,275 | 2,720,049 | — |
| Korean Won | SSB | Buy | 18,664,740,000 | 5/2/2019 | 16,457,755 | — | (231,033) |
| Euro | SSB | Sell | 1,687,910,600 | 5/15/2019 | 1,900,278,637 | 18,993,869 | — |
| Thailand Baht | BBH | Sell | 1,107,238,100 | 5/21/2019 | 34,933,537 | 451,657 | — |
| Total | $22,619,256 | $(16,320,257) | |||||
| Net unrealized appreciation/depreciation | $6,298,999 | ||||||
| * | Counterparties include State Street Bank and Trust Company (“SSB”) and Brown Brothers Harriman & Co. (“BBH”). |
| Footnote Legend | |
| a | Illiquid security. |
| b | Investment in Affiliates. |
| c | Security currently fair valued by the Valuation and Pricing Committee using procedures approved by the Trustees’ Audit Committee. |
| d | Non-income producing. |
| e | Securities exempt from registration under Rule 144A of the Securities Act of 1933, as amended. These securities are restricted but liquid and may only be resold in the ordinary course of business in transactions exempt from registration, normally to qualified institutional buyers. As of March 31, 2019, the aggregate value of these securities in the Fund’s portfolio was $674,713,568, representing 4.68% of the Fund’s net assets. |
| f | Securities exempt from registration under Rule 144A of the Securities Act of 1933, as amended. These securities are restricted and illiquid. As of March 31, 2019, the aggregate value of these securities in the Fund’s portfolio was $30,637,992, representing 0.21% of the Fund’s net assets. Additional information is as follows: |
| 144A/Restricted & Illiquid Securities | Acquisition Date | Cost | Market Value | Percentage of Net Assets |
| Centaur Funding Corp., 9.08%, 4/21/2020 | 6/30/2010 | $ 15,937,500 | $ 15,818,040 | 0.1% |
| First Tennessee Bank N.A., 3.75% | 3/17/2005 | 11,968,750 | 8,829,936 | 0.1 |
| Schahin II Finance Co. SPV Ltd., 5.875%, 9/25/2023 | 4/16/2014 | 7,144,305 | 1,164,031 | 0.0 |
| Linc USA GP / Linc Energy Finance USA, Inc., 9.625%, 10/31/2017 | 8/08/2014 | 15,590,162 | 646,992 | 0.0 |
| Schahin II Finance Co. SPV Ltd., 8.00%, 5/25/2020 | 10/26/2018 | 616,057 | 606,024 | 0.0 |
| JPR Royalty Sub, LLC, 14.00%, 9/01/2020 | 3/01/2011 | 5,000,000 | 2,500,000 | 0.0 |
| Northwind Holdings, LLC, 3.406%, 12/01/2037 | 1/29/2010 | 967,133 | 1,072,969 | 0.0 |
| g | Floating Rate Security. Stated interest/floor rate was in effect at March 31, 2019. |
| h | Securities are perpetual and, thus, do not have a predetermined maturity date. The date shown, if applicable, reflects the next call date. |
| i | Yankee bond denominated in U.S. dollars and is issued in the U.S. by foreign banks and corporations. |
| j | Variable rate coupon, rate shown as of March 31, 2019. |
Thornburg Investment Income Builder Fund | March 31, 2019 (Unaudited)
| k | Fixed to floating security that initially pays a fixed rate and converts to a floating rate coupon at a specified date in the future. The rate presented is a fixed rate. |
| l | Pay-In-Kind Payments (PIK). The issuer may pay cash interest and/or interest in additional debt securities. Rates shown are the rates in effect at March 31, 2019. |
| m | Bond in default. |
| n | The stated coupon rate represents the greater of the LIBOR or the LIBOR floor rate plus a spread at March 31, 2019. |
To simplify the listings of securities, abbreviations are used per the table below:
| ADR | American Depositary Receipt |
| ARM | Adjustable Rate Mortgage |
| BRL | Denominated in Brazilian Real |
| CMO | Collateralized Mortgage Obligation |
| LIBOR | London Interbank Offered Rates |
| MFA | Mortgage Finance Authority |
| SPA | Stand-by Purchase Agreement |
| SPV | Special Purpose Vehicle |
Thornburg Investment Income Builder Fund | March 31, 2019 (Unaudited)
| ASSETS | |
| Investments at value (Note 3) | |
| Non-affiliated issuers (cost $11,297,396,813) | $ 13,453,394,231 |
| Non-controlled affiliated issuers (cost $866,461,833) | 814,137,419 |
| Cash | 582,595 |
| Cash denominated in foreign currency (cost $3,826) | 3,822 |
| Receivable for investments sold | 83,905,743 |
| Receivable for fund shares sold | 26,426,750 |
| Unrealized appreciation on forward currency contracts (Note 7) | 22,619,256 |
| Dividends receivable | 66,033,023 |
| Dividend and interest reclaim receivable | 27,817,738 |
| Interest receivable | 21,312,558 |
| Prepaid expenses and other assets | 290,327 |
| Total Assets | 14,516,523,462 |
| Liabilities | |
| Payable for investments purchased | 45,100,655 |
| Payable for fund shares redeemed | 19,469,110 |
| Unrealized depreciation on forward currency contracts (Note 7) | 16,320,257 |
| Payable to investment advisor and other affiliates (Note 4) | 13,004,318 |
| Deferred taxes payable (Note 2) | 167,741 |
| Accounts payable and accrued expenses | 7,173,203 |
| Dividends payable | 9,904,878 |
| Total Liabilities | 111,140,162 |
| Commitments and contingencies (Note 2) | |
| Net Assets | $ 14,405,383,300 |
| NET ASSETS CONSIST OF | |
| Distributable earnings | $ 1,243,516,298 |
| Net capital paid in on shares of beneficial interest | 13,161,867,002 |
| $ 14,405,383,300 |
| NET ASSET VALUE | |
| Class A Shares: | |
| Net asset value and redemption price per share ($3,302,780,050 applicable to 155,344,677 shares of beneficial interest outstanding - Note 5) | $ 21.26 |
| Maximum sales charge, 4.50% of offering price | 1.00 |
| Maximum offering price per share | $ 22.26 |
| Class C Shares: | |
| Net asset value and offering price per share* ($3,145,082,460 applicable to 148,092,317 shares of beneficial interest outstanding - Note 5) | $ 21.24 |
| Class I Shares: | |
| Net asset value, offering and redemption price per share ($7,669,333,042 applicable to 358,121,604 shares of beneficial interest outstanding - Note 5) | $ 21.42 |
| Class R3 Shares: | |
| Net asset value, offering and redemption price per share ($41,207,897 applicable to 1,938,746 shares of beneficial interest outstanding - Note 5) | $ 21.25 |
| Class R4 Shares: | |
| Net asset value, offering and redemption price per share ($28,658,745 applicable to 1,346,524 shares of beneficial interest outstanding - Note 5) | $ 21.28 |
| Class R5 Shares: | |
| Net asset value, offering and redemption price per share ($55,557,360 applicable to 2,595,983 shares of beneficial interest outstanding - Note 5) | $ 21.40 |
| Class R6 Shares: | |
| Net asset value, offering and redemption price per share ($162,763,746 applicable to 7,625,184 shares of beneficial interest outstanding - Note 5) | $ 21.35 |
| * | Redemption price per share is equal to net asset value less any applicable contingent deferred sales charge. |
Thornburg Investment Income Builder Fund | Six Months Ended March 31, 2019 (Unaudited)
| INVESTMENT INCOME | |
| Dividend income | |
| Non-affiliated issuers (net of foreign taxes withheld of $15,235,482) | $ 261,675,669 |
| Non-controlled affiliated issuer | 28,798,530 |
| Interest income (net of premium amortized of $504,963) | 43,685,308 |
| Total Income | 334,159,507 |
| EXPENSES | |
| Investment advisory fees (Note 4) | 48,999,067 |
| Administration fees (Note 4) | |
| Class A Shares | 1,394,095 |
| Class C Shares | 1,437,786 |
| Class I Shares | 3,253,714 |
| Class R3 Shares | 18,613 |
| Class R4 Shares | 12,521 |
| Class R5 Shares | 23,992 |
| Class R6 Shares | 67,631 |
| Distribution and service fees (Note 4) | |
| Class A Shares | 3,969,939 |
| Class C Shares | 16,386,827 |
| Class R3 Shares | 106,094 |
| Class R4 Shares | 35,678 |
| Transfer agent fees | |
| Class A Shares | 1,220,330 |
| Class C Shares | 1,333,270 |
| Class I Shares | 2,480,290 |
| Class R3 Shares | 62,340 |
| Class R4 Shares | 74,620 |
| Class R5 Shares | 90,730 |
| Class R6 Shares | 3,460 |
| Registration and filing fees | |
| Class A Shares | 12,036 |
| Class C Shares | 10,203 |
| Class I Shares | 19,642 |
| Class R3 Shares | 5,736 |
| Class R4 Shares | 5,933 |
| Class R5 Shares | 5,886 |
| Class R6 Shares | 5,898 |
| Custodian fees (Note 2) | 652,950 |
| Professional fees | 198,770 |
| Trustee and officer fees (Note 4) | 397,720 |
| Other expenses | 571,694 |
| Total Expenses | 82,857,465 |
| Less: | |
| Expenses reimbursed by investment advisor (Note 4) | (119,350) |
| Net Expenses | 82,738,115 |
| Net Investment Income | $ 251,421,392 |
| REALIZED AND UNREALIZED GAIN (LOSS) | |
| Net realized gain (loss) on: | |
| Investments | |
| Non-affiliated issuer investments | $ (102,353,298) |
| Non-controlled affiliated issuers | (6) |
| Forward currency contracts (Note 7) | 83,685,674 |
| Foreign currency transactions | 519,396 |
| (18,148,234) | |
| Net change in unrealized appreciation (depreciation) on: | |
| Investments | |
| Non-affiliated issuers investments (net of change in deferred taxes payable of $161,465) | (302,393,468) |
| Non-controlled affiliated issuers | (14,235,730) |
| Forward currency contracts (Note 7) | 20,251,714 |
| Foreign currency translations | (666,077) |
| (297,043,561) | |
| Net Realized and Unrealized Loss | (315,191,795) |
| Net Decrease in Net Assets Resulting from Operations | $ (63,770,403) |
Thornburg Investment Income Builder Fund
| Six Months Ended March 31, 2019* | Year Ended September 30, 2018 | |
| INCREASE (DECREASE) IN NET ASSETS FROM | ||
| OPERATIONS | ||
| Net investment income | $ 251,421,392 | $ 657,775,372 |
| Net realized gain (loss) on investments, forward currency contracts, foreign currency transactions and capital gain taxes | (18,148,234) | 100,294,935 |
| Net unrealized appreciation (depreciation) on investments, forward currency contracts, foreign currency translations and deferred taxes | (297,043,561) | 114,483,110 |
| Net Increase (Decrease) in Net Assets Resulting from Operations | (63,770,403) | 872,553,417 |
| DIVIDENDS TO SHAREHOLDERS | ||
| From distributable earnings | ||
| Class A Shares | (71,280,793) | (138,833,506) |
| Class C Shares | (61,799,669) | (149,227,867) |
| Class I Shares | (175,599,439) | (350,849,203) |
| Class R3 Shares | (878,050) | (2,187,106) |
| Class R4 Shares | (603,986) | (1,478,685) |
| Class R5 Shares | (1,263,124) | (3,118,926) |
| Class R6 Shares | (3,700,463) | (4,471,743) |
| FUND SHARE TRANSACTIONS (NOTE 5) | ||
| Class A Shares | 8,120,914 | (47,263,859) |
| Class C Shares | (351,341,289) | (1,141,224,379) |
| Class I Shares | 55,984,969 | (109,066,905) |
| Class R3 Shares | (4,460,149) | (21,579,289) |
| Class R4 Shares | (1,669,688) | (13,511,065) |
| Class R5 Shares | (2,574,854) | (33,806,568) |
| Class R6 Shares | 9,641,080 | 117,160,492 |
| Net Decrease in Net Assets | (665,194,944) | (1,026,905,192) |
| NET ASSETS | ||
| Beginning of Period | 15,070,578,244 | 16,097,483,436 |
| End of Period | $ 14,405,383,300 | $ 15,070,578,244 |
| * | Unaudited. |
Thornburg Investment Income Builder Fund | March 31, 2019 (Unaudited)
Thornburg Investment Income Builder Fund | March 31, 2019 (Unaudited)
| Cost of investments for tax purposes | $ 12,163,858,646 |
| Gross unrealized appreciation on a tax basis | 2,556,164,928 |
| Gross unrealized depreciation on a tax basis | (452,491,924) |
| Net unrealized appreciation (depreciation) on investments (tax basis) | $ 2,103,673,004 |
Thornburg Investment Income Builder Fund | March 31, 2019 (Unaudited)
| Fair Value Measurements at March 31, 2019 | ||||
| TOTAL | LEVEL 1 | LEVEL 2 | LEVEL 3 | |
| Assets | ||||
| Investments in Securities* | ||||
| Common Stock(a) | $ 12,652,017,722 | $ 12,594,296,042 | $ 57,591,070 | $ 130,610 |
| Preferred Stock(a) | 57,265,551 | 2,322,000 | 54,943,551 | — |
| Asset Backed Securities | 32,872,070 | �� — | 31,799,101 | 1,072,969 |
| Corporate Bonds | 1,054,348,811 | — | 1,053,095,795 | 1,253,016 |
| Convertible Bonds | 4,339,935 | — | 4,339,935 | — |
| Municipal Bonds | 2,708,377 | — | 2,708,377 | — |
| Other Government | 5,759,281 | — | 5,759,281 | — |
| Loan Participations | 118,170,670 | — | 105,924,712 | 12,245,958 |
| Short-Term Investments | 340,049,233 | 340,049,233 | — | — |
| Total Investments in Securities | $14,267,531,650 | $12,936,667,275 | $1,316,161,822 | $14,702,553(b) |
| Other Financial Instruments | ||||
| Forward Currency Contracts | $ 22,619,256 | $ — | $ 22,619,256 | $ — |
| Total Assets | $14,290,150,906 | $12,936,667,275 | $1,338,781,078 | $14,702,553 |
| Liabilities | ||||
| Other Financial Instruments | ||||
| Forward Currency Contracts | $ (16,320,257) | $ — | $ (16,320,257) | $ — |
| Total Liabilities | $(16,320,257) | $— | $(16,320,257) | $— |
| * | See Schedule of Investments for a summary of the industry exposure as grouped according to the Global Industry Classification Standard (GICS), which is an industry taxonomy developed by MSCI, Inc. and Standard & Poor’s (S&P). |
| (a) | At March 31, 2019, industry classifications for Common Stock and Preferred Stock in level 2 and Level 3 consist of $8,829,936 in Banks, $57,591,070 in Capital Goods, $20,301,185 in Energy, $10,125,000 in Miscellaneous, and $15,818,040 Telecommunication Services. |
| (b) | In accordance with the guidance prescribed in Accounting Standards Update ("ASU") No. 2011-04, the following table displays a summary of the valuation techniques and unobservable inputs used to value portfolio securities characterized as Level 3 investments for the period ended at March 31, 2019. |
Thornburg Investment Income Builder Fund | March 31, 2019 (Unaudited)
| FAIR VALUE AT March 31, 2019 | VALUATION TECHNIQUE(S) | UNOBSERVABLE INPUT | RANGE (WEIGHTED AVERAGE) | |
| Common Stock | $ 130,610 | Discount to valuation | Valuaton and Pricing Committee value due to halt in trading of the security and lack of information as well as liquidity. | $10.50/(N/A) |
| Asset-Backed Securities | 1,072,969 | Discounted cash flows | Third Party Vendor Discounted cash flows | 5.0%/(N/A) |
| Corporate Bond | 606,024 | Discounted cash flows | Third Party Vendor Discounted cash flows | 15.0%/(N/A) |
| 646,992 | Discount to valuation | Valuaton and Pricing Committee value due to halt in trading of the security and lack of information as well as liquidity. | $4.15/(N/A) | |
| Loan Participations | 11,934,678 | Discounted cash flows | Third Party Vendor Discounted cash flows | 0.0%-9.2%/(9.2%) |
| 311,280 | Discount to valuation | Valuaton and Pricing Committee value due to halt in trading of the security and lack of information as well as liquidity. | $100.00/(N/A) | |
| Total | 14,702,553 |
| COMMON STOCK | ASSET BACKED SECURITIES | CORPORATE BONDS | LOAN PARTICIPATIONS | TOTAL(d) | |
| Beginning Balance 9/30/2018 | $ 130,610 | $ 1,311,494 | $ 646,992 | $ 14,243,057 | $ 16,332,153 |
| Accrued Discounts (Premiums) | – | 3,856 | 10,685 | 6,630 | 21,171 |
| Net Realized Gain (Loss)(a) | – | 30,722 | – | 4,388 | 35,110 |
| Gross Purchases | – | – | 605,372 | 95,395 | 700,767 |
| Gross Sales | – | (262,500) | – | (613,913) | (876,413) |
| Net Change in Unrealized Appreciation (Depreciation)(b)(c) | – | (10,603) | (10,033) | (1,489,599) | (1,510,235) |
| Transfers into Level 3 | – | – | – | – | – |
| Transfers out of Level 3 | – | – | – | – | – |
| Ending Balance 3/31/2019 | $130,610 | $1,072,969 | $1,253,016 | $12,245,958 | $14,702,553 |
| (a) | Amount of net realized gain (loss) from investments recognized in income is included in the Fund’s Statement of Operations for the six months ended March 31, 2019. |
| (b) | Amount of net change in unrealized appreciation (depreciation) on investments recognized in income is included in the Fund’s Statement of Operations for the six months ended March 31, 2019. |
| (c) | The net change in unrealized appreciation (depreciation) attributable to securities owned at March 31, 2019, which were valued using significant unobservable inputs, was $1,510,235. This is included within net change in unrealized appreciation (depreciation) on investments in the Fund’s the Statement of Operations for the six months ended March 31, 2019. |
| (d) | Level 3 investments represent 0.10% of total net assets at the six months ended March 31, 2019. Significant fluctuations of the unobservable inputs applied to portfolio securities characterized as Level 3 investments could be expected to increase or decrease the fair value of these portfolio securities. |
| Management Fee Schedule | |
| DAILY NET ASSETS | FEE RATE |
| Up to $500 million | 0.875% |
| Next $500 million | 0.825 |
| Next $500 million | 0.775 |
| Next $500 million | 0.725 |
| Over $2 billion | 0.675 |
| Administration Fee Schedule | |
| Daily Net Assets | Fee Rate |
| Up to $20 billion | 0.100% |
| $20 billion to $40 billion | 0.075 |
| $40 billion to $60 billion | 0.040 |
| Over $60 billion | 0.030 |
Thornburg Investment Income Builder Fund | March 31, 2019 (Unaudited)
| Fund | Market Value 9/30/18 | Purchases at Cost | Sales Proceeds | Realized Gain (Loss) | Change in Unrealized Appr./(Depr.) | Market Value 3/31/19 | Dividend Income |
| Apollo Investment Corp. | $132,562,769 | $676,750 | $(10) | $(6) | $(9,504,553) | $123,734,950 | $7,355,446 |
| MFA Financial Inc. | 251,518,110 | 5,049,401 | - | - | (2,242,911) | 254,324,600 | 13,993,101 |
| Solar Capital Ltd. | 98,516,902 | - | - | - | (2,488,266) | 96,028,636 | 3,778,478 |
| Thornburg Capital Management Fund | 454,730,939 | 1,242,915,886 | (1,357,597,592) | - | - | 340,049,233 | 3,671,505 |
| Total | $937,328,720 | $1,248,642,037 | $(1,357,597,602) | $(6) | $(14,235,730) | $814,137,419 | $28,798,530 |
| SIX MONTHS ENDED March 31, 2019 (UNAUDITED) | YEAR ENDED September 30, 2018 (AUDITED) | |||
| SHARES | AMOUNT | SHARES | AMOUNT | |
| Class A Shares | ||||
| Shares sold | 11,800,497 | $ 246,076,401 | 31,856,039 | $ 688,622,514 |
| Shares issued to shareholders in reinvestment of dividends | 3,300,630 | 67,337,995 | 5,998,878 | 129,605,482 |
| Shares repurchased | (14,689,813) | (305,293,482) | (39,921,237) | (865,491,855) |
| Net increase (decrease) | 411,314 | $ 8,120,914 | (2,066,320) | $ (47,263,859) |
| Class C Shares | ||||
| Shares sold | 3,931,442 | $ 81,460,414 | 7,570,345 | $ 164,120,547 |
| Shares issued to shareholders in reinvestment of dividends | 2,778,592 | 56,560,833 | 6,344,473 | 136,903,349 |
| Shares repurchased | (23,506,498) | (489,362,536) | (66,777,524) | (1,442,248,275) |
| Net decrease | (16,796,464) | $ (351,341,289) | (52,862,706) | $ (1,141,224,379) |
| Class I Shares | ||||
| Shares sold | 38,323,943 | $ 801,109,532 | 66,657,528 | $ 1,454,578,318 |
| Shares issued to shareholders in reinvestment of dividends | 7,580,586 | 155,838,619 | 14,043,398 | 305,431,773 |
| Shares repurchased | (43,240,373) | (900,963,182) | (85,737,737) | (1,869,076,996) |
| Net increase (decrease) | 2,664,156 | $ 55,984,969 | (5,036,811) | $ (109,066,905) |
| Class R3 Shares | ||||
| Shares sold | 113,399 | $ 2,348,415 | 241,442 | $ 5,220,231 |
| Shares issued to shareholders in reinvestment of dividends | 39,069 | 796,139 | 91,705 | 1,979,749 |
| Shares repurchased | (365,194) | (7,604,703) | (1,327,941) | (28,779,269) |
| Net decrease | (212,726) | $ (4,460,149) | (994,794) | $ (21,579,289) |
| SIX MONTHS ENDED March 31, 2019 (UNAUDITED) | YEAR ENDED September 30, 2018 (AUDITED) | |||
| SHARES | AMOUNT | SHARES | AMOUNT | |
| Class R4 Shares | ||||
| Shares sold | 186,231 | $ 3,850,861 | 289,894 | $ 6,287,155 |
| Shares issued to shareholders in reinvestment of dividends | 18,622 | 380,343 | 43,177 | 933,935 |
| Shares repurchased | (284,562) | (5,900,892) | (954,262) | (20,732,155) |
| Net decrease | (79,709) | $ (1,669,688) | (621,191) | $ (13,511,065) |
| Class R5 Shares | ||||
| Shares sold | 224,041 | $ 4,703,135 | 664,323 | $ 14,452,609 |
| Shares issued to shareholders in reinvestment of dividends | 59,826 | 1,228,678 | 135,493 | 2,949,321 |
| Shares repurchased | (400,976) | (8,506,667) | (2,326,307) | (51,208,498) |
| Net decrease | (117,109) | $ (2,574,854) | (1,526,491) | $ (33,806,568) |
| Class R6 Shares | ||||
| Shares sold | 404,622 | $ 8,455,032 | 5,722,657 | $ 123,069,973 |
| Shares issued to shareholders in reinvestment of dividends | 163,166 | 3,345,562 | 183,009 | 3,973,843 |
| Shares repurchased | (103,694) | (2,159,514) | (455,176) | (9,883,324) |
| Net increase | 464,094 | $ 9,641,080 | 5,450,490 | $ 117,160,492 |
SHEET RISK AND FOREIGN INVESTMENT RISK
Thornburg Investment Income Builder Fund | March 31, 2019 (Unaudited)
| FAIR VALUES OF DERIVATIVE FINANCIAL INSTRUMENTS AT MARCH 31, 2019 | ||
| ASSET DERIVATIVES | BALANCE SHEET LOCATION | FAIR VALUE |
| Foreign exchange contracts | Assets - Unrealized appreciation on forward currency contracts | $ 22,619,256 |
| FAIR VALUES OF DERIVATIVE FINANCIAL INSTRUMENTS AT MARCH 31, 2019 | ||
| LIABILITY DERIVATIVES | BALANCE SHEET LOCATION | FAIR VALUE |
| Foreign exchange contracts | Liabilities - Unrealized depreciation on forward currency contracts | $ (16,320,257) |
| NET REALIZED GAIN (LOSS) ON DERIVATIVE FINANCIAL INSTRUMENTS RECOGNIZED IN INCOME FOR THE SIX MONTHS ENDED March 31, 2019 | ||
| TOTAL | FORWARD CURRENCY CONTRACTS | |
| Foreign exchange contracts | $ 83,685,674 | $ 83,685,674 |
| NET CHANGE IN UNREALIZED APPRECIATION (DEPRECIATION) OF DERIVATIVE FINANCIAL INSTRUMENTS RECOGNIZED IN INCOME FOR THE SIX MONTHS ENDED March 31, 2019 | ||
| TOTAL | FORWARD CURRENCY CONTRACTS | |
| Foreign exchange contracts | $ 20,251,714 | $ 20,251,714 |
Thornburg Investment Income Builder Fund
| PER SHARE PERFORMANCE (FOR A SHARE OUTSTANDING THROUGHOUT THE PERIOD) | ||||||||
| UNLESS OTHERWISE NOTED, PERIODS ARE FISCAL YEARS ENDED SEPTEMBER 30, | Net Asset Value, Beginning of PERIOD | Net Investment Income (Loss)+ | Net Realized & Unrealized Gain (Loss) on Investments | Total from Investment Operations | Dividends from Net Investment Income | Dividends from Net Realized Gains | Total Dividends | Net Asset Value, End of PERIOD |
| CLASS A SHARES | ||||||||
| 2019(b)(c) | $ 21.80 | 0.37 | (0.44) | (0.07) | (0.47) | — | (0.47) | $ 21.26 |
| 2018(b) | $ 21.50 | 0.92 | 0.30 | 1.22 | (0.92) | — | (0.92) | $ 21.80 |
| 2017(b) | $ 19.82 | 0.92 | 1.61 | 2.53 | (0.85) | — | (0.85) | $ 21.50 |
| 2016(b) | $ 19.07 | 0.93 | 0.62 | 1.55 | (0.80) | — | (0.80) | $ 19.82 |
| 2015(b) | $ 21.38 | 0.85 | (2.34) | (1.49) | (0.82) | — | (0.82) | $ 19.07 |
| 2014(b) | $ 20.13 | 1.10 | 1.13 | 2.23 | (0.98) | — | (0.98) | $ 21.38 |
| CLASS C SHARES | ||||||||
| 2019(c) | $ 21.78 | 0.29 | (0.44) | (0.15) | (0.39) | — | (0.39) | $ 21.24 |
| 2018 | $ 21.48 | 0.76 | 0.30 | 1.06 | (0.76) | — | (0.76) | $ 21.78 |
| 2017 | $ 19.81 | 0.78 | 1.60 | 2.38 | (0.71) | — | (0.71) | $ 21.48 |
| 2016 | $ 19.06 | 0.79 | 0.62 | 1.41 | (0.66) | — | (0.66) | $ 19.81 |
| 2015 | $ 21.37 | 0.70 | (2.34) | (1.64) | (0.67) | — | (0.67) | $ 19.06 |
| 2014 | $ 20.13 | 0.94 | 1.13 | 2.07 | (0.83) | — | (0.83) | $ 21.37 |
| CLASS I SHARES | ||||||||
| 2019(c) | $ 21.96 | 0.40 | (0.44) | (0.04) | (0.50) | — | (0.50) | $ 21.42 |
| 2018 | $ 21.65 | 1.00 | 0.29 | 1.29 | (0.98) | — | (0.98) | $ 21.96 |
| 2017 | $ 19.97 | 1.02 | 1.59 | 2.61 | (0.93) | — | (0.93) | $ 21.65 |
| 2016 | $ 19.21 | 1.00 | 0.62 | 1.62 | (0.86) | — | (0.86) | $ 19.97 |
| 2015 | $ 21.53 | 0.93 | (2.35) | (1.42) | (0.90) | — | (0.90) | $ 19.21 |
| 2014 | $ 20.27 | 1.16 | 1.15 | 2.31 | (1.05) | — | (1.05) | $ 21.53 |
| CLASS R3 SHARES | ||||||||
| 2019(c) | $ 21.80 | 0.33 | (0.45) | (0.12) | (0.43) | — | (0.43) | $ 21.25 |
| 2018 | $ 21.49 | 0.83 | 0.32 | 1.15 | (0.84) | — | (0.84) | $ 21.80 |
| 2017 | $ 19.82 | 0.87 | 1.59 | 2.46 | (0.79) | — | (0.79) | $ 21.49 |
| 2016 | $ 19.07 | 0.87 | 0.62 | 1.49 | (0.74) | — | (0.74) | $ 19.82 |
| 2015 | $ 21.37 | 0.78 | (2.32) | (1.54) | (0.76) | — | (0.76) | $ 19.07 |
| 2014 | $ 20.13 | 1.03 | 1.12 | 2.15 | (0.91) | — | (0.91) | $ 21.37 |
| CLASS R4 SHARES | ||||||||
| 2019(c) | $ 21.83 | 0.34 | (0.45) | (0.11) | (0.44) | — | (0.44) | $ 21.28 |
| 2018 | $ 21.52 | 0.85 | 0.33 | 1.18 | (0.87) | — | (0.87) | $ 21.83 |
| 2017 | $ 19.85 | 0.89 | 1.59 | 2.48 | (0.81) | — | (0.81) | $ 21.52 |
| 2016 | $ 19.10 | 0.89 | 0.62 | 1.51 | (0.76) | — | (0.76) | $ 19.85 |
| 2015 | $ 21.42 | 0.81 | (2.35) | (1.54) | (0.78) | — | (0.78) | $ 19.10 |
| 2014 | $ 20.17 | 1.04 | 1.16 | 2.20 | (0.95) | — | (0.95) | $ 21.42 |
| CLASS R5 SHARES | ||||||||
| 2019(c) | $ 21.95 | 0.39 | (0.46) | (0.07) | (0.48) | — | (0.48) | $ 21.40 |
| 2018 | $ 21.64 | 0.94 | 0.33 | 1.27 | (0.96) | — | (0.96) | $ 21.95 |
| 2017 | $ 19.95 | 0.98 | 1.61 | 2.59 | (0.90) | — | (0.90) | $ 21.64 |
| 2016 | $ 19.20 | 0.98 | 0.62 | 1.60 | (0.85) | — | (0.85) | $ 19.95 |
| 2015 | $ 21.52 | 0.90 | (2.35) | (1.45) | (0.87) | — | (0.87) | $ 19.20 |
| 2014 | $ 20.26 | 1.10 | 1.19 | 2.29 | (1.03) | — | (1.03) | $ 21.52 |
| CLASS R6 SHARES | ||||||||
| 2019(c) | $ 21.89 | 0.41 | (0.45) | (0.04) | (0.50) | — | (0.50) | $ 21.35 |
| 2018 | $ 21.58 | 1.16 | 0.14 | 1.30 | (0.99) | — | (0.99) | $ 21.89 |
| 2017(e) | $ 20.55 | 0.44 | 1.12 | 1.56 | (0.53) | — | (0.53) | $ 21.58 |
| (a) | Not annualized for periods less than one year. |
| (b) | Sales loads are not reflected in computing total return. |
| (c) | Unaudited Six Month Period Ended March 31. |
| (d) | Annualized. |
| (e) | Effective date of this class of shares was April 10, 2017. |
| + | Based on weighted average shares outstanding. |
| RATIOS TO AVERAGE NET ASSETS | SUPPLEMENTAL DATA | ||||||
| Net Investment Income (Loss) (%) | Expenses, After Expense Reductions (%) | Expenses, After Expense Reductions and Net of Custody Credits (%) | Expenses, Before Expense Reductions (%) | Total Return (%)(a) | Portfolio Turnover Rate (%)(a) | Net Assets at End of PERIOD (Thousands) | |
| 3.60(d) | 1.13(d) | 1.13(d) | 1.13(d) | (0.25) | 22.38 | $ 3,302,780 | |
| 4.25 | 1.15 | 1.15 | 1.15 | 5.79 | 41.17 | $ 3,378,149 | |
| 4.52 | 1.19 | 1.19 | 1.19 | 13.01 | 37.37 | $ 3,374,895 | |
| 4.82 | 1.18 | 1.18 | 1.18 | 8.35 | 42.81 | $ 3,778,863 | |
| 4.02 | 1.17 | 1.17 | 1.17 | (7.27) | 47.71 | $ 4,257,943 | |
| 5.21 | 1.18 | 1.18 | 1.18 | 11.19 | 38.81 | $ 4,588,033 | |
| 2.79(d) | 1.89(d) | 1.89(d) | 1.89(d) | (0.61) | 22.38 | $ 3,145,082 | |
| 3.51 | 1.90 | 1.90 | 1.90 | 5.01 | 41.17 | $ 3,591,856 | |
| 3.80 | 1.90 | 1.90 | 1.93 | 12.19 | 37.37 | $ 4,677,322 | |
| 4.11 | 1.90 | 1.90 | 1.93 | 7.59 | 42.81 | $ 5,356,153 | |
| 3.30 | 1.90 | 1.90 | 1.92 | (7.93) | 47.71 | $ 5,906,206 | |
| 4.44 | 1.90 | 1.90 | 1.93 | 10.36 | 38.81 | $ 6,266,270 | |
| 3.86(d) | 0.87(d) | 0.87(d) | 0.87(d) | (0.11) | 22.38 | $ 7,669,333 | |
| 4.58 | 0.86 | 0.86 | 0.86 | 6.12 | 41.17 | $ 7,806,245 | |
| 4.93 | 0.86 | 0.86 | 0.86 | 13.30 | 37.37 | $ 7,804,930 | |
| 5.15 | 0.86 | 0.86 | 0.86 | 8.71 | 42.81 | $ 6,928,783 | |
| 4.35 | 0.85 | 0.85 | 0.85 | (6.94) | 47.71 | $ 7,472,344 | |
| 5.45 | 0.86 | 0.86 | 0.86 | 11.54 | 38.81 | $ 7,454,275 | |
| 3.19(d) | 1.50(d) | 1.50(d) | 1.63(d) | (0.42) | 22.38 | $ 41,208 | |
| 3.84 | 1.50 | 1.50 | 1.61 | 5.47 | 41.17 | $ 46,901 | |
| 4.24 | 1.47 | 1.47 | 1.56 | 12.63 | 37.37 | $ 67,623 | |
| 4.53 | 1.50 | 1.50 | 1.59 | 8.01 | 42.81 | $ 78,188 | |
| 3.70 | 1.50 | 1.50 | 1.55 | (7.52) | 47.71 | $ 79,834 | |
| 4.84 | 1.49 | 1.49 | 1.55 | 10.80 | 38.81 | $ 83,670 | |
| 3.30(d) | 1.40(d) | 1.40(d) | 1.62(d) | (0.45) | 22.38 | $ 28,659 | |
| 3.91 | 1.40 | 1.40 | 1.56 | 5.58 | 41.17 | $ 31,132 | |
| 4.35 | 1.40 | 1.40 | 1.51 | 12.72 | 37.37 | $ 44,069 | |
| 4.63 | 1.40 | 1.40 | 1.48 | 8.12 | 42.81 | $ 45,968 | |
| 3.81 | 1.40 | 1.40 | 1.46 | (7.48) | 47.71 | $ 42,392 | |
| 4.88 | 1.35 | 1.35 | 1.40 | 11.00 | 38.81 | $ 39,890 | |
| 3.73(d) | 0.99(d) | 0.99(d) | 1.16(d) | (0.24) | 22.38 | $ 55,557 | |
| 4.30 | 0.99 | 0.99 | 1.12 | 5.99 | 41.17 | $ 59,545 | |
| 4.76 | 0.99 | 0.99 | 1.09 | 13.22 | 37.37 | $ 91,735 | |
| 5.08 | 0.99 | 0.99 | 1.07 | 8.52 | 42.81 | $ 86,535 | |
| 4.23 | 0.98 | 0.98 | 1.07 | (7.06) | 47.71 | $ 78,945 | |
| 5.15 | 0.99 | 0.99 | 1.10 | 11.40 | 38.81 | $ 64,748 | |
| 3.96(d) | 0.80(d) | 0.80(d) | 0.82(d) | (0.08) | 22.38 | $ 162,764 | |
| 5.39 | 0.80 | 0.80 | 0.82 | 6.20 | 41.17 | $ 156,750 | |
| 4.37(d) | 0.80(d) | 0.80(d) | 1.09(d) | 7.65 | 37.37 | $ 36,909 | |
Thornburg Investment Income Builder Fund | March 31, 2019 (Unaudited)
| (1) | transaction costs, including |
| (a) | sales charges (loads) on purchase payments, for Class A shares; |
| (b) | a deferred sales charge on redemptions of any part or all of a purchase of $1 million of Class A shares within 12 months of purchase; |
| (c) | a deferred sales charge on redemptions of Class C shares within 12 months of purchase; |
| (2) | ongoing costs, including management fees; distribution and/or service (12b-1) fees; and other Fund expenses. |
| BEGINNING ACCOUNT VALUE 10/1/18 | ENDING ACCOUNT VALUE 3/31/19 | EXPENSES PAID DURING PERIOD† 10/1/18—3/31/19 | |
| CLASS A SHARES | |||
| Actual | $1,000.00 | $997.52 | $5.63 |
| Hypothetical* | $1,000.00 | $1,019.30 | $5.69 |
| CLASS C SHARES | |||
| Actual | $1,000.00 | $993.93 | $9.40 |
| Hypothetical* | $1,000.00 | $1,015.51 | $9.50 |
| CLASS I SHARES | |||
| Actual | $1,000.00 | $998.95 | $4.34 |
| Hypothetical* | $1,000.00 | $1,020.59 | $4.38 |
| CLASS R3 SHARES | |||
| Actual | $1,000.00 | $995.77 | $7.46 |
| Hypothetical* | $1,000.00 | $1,017.45 | $7.54 |
| CLASS R4 SHARES | |||
| Actual | $1,000.00 | $995.55 | $6.97 |
| Hypothetical* | $1,000.00 | $1,017.95 | $7.04 |
| CLASS R5 SHARES | |||
| Actual | $1,000.00 | $997.61 | $4.93 |
| Hypothetical* | $1,000.00 | $1,020.00 | $4.99 |
| CLASS R6 SHARES | |||
| Actual | $1,000.00 | $999.24 | $3.99 |
| Hypothetical* | $1,000.00 | $1,020.94 | $4.03 |
| † | Expenses are equal to the annualized expense ratio for each class (A: 1.13%; C: 1.89%; I: 0.87%; R3: 1.50%; R4: 1.40%; R5: 0.99%; R6: 0.80%) multiplied by the average account value over the period, multiplied by 182/365 to reflect the one-half year period. |
| * | Hypothetical assumes a rate of return of 5% per year before expenses. |
Thornburg Investment Income Builder Fund | March 31, 2019 (Unaudited)
| ■ | Thornburg Investment Income Builder Fund |
| ■ | Thornburg Global Opportunities Fund |
| ■ | Thornburg International Value Fund |
| ■ | Thornburg Better World International Fund |
| ■ | Thornburg International Growth Fund |
| ■ | Thornburg Developing World Fund |
| ■ | Thornburg Value Fund |
| ■ | Thornburg Core Growth Fund |
| ■ | Thornburg Investment Income Builder Fund |
| ■ | Thornburg Summit Fund |
| ■ | Thornburg Low Duration Income Fund |
| ■ | Thornburg Limited Term U.S. Government Fund |
| ■ | Thornburg Limited Term Income Fund |
| ■ | Thornburg Strategic Income Fund |
| ■ | Thornburg Low Duration Municipal Fund |
| ■ | Thornburg Limited Term Municipal Fund |
| ■ | Thornburg Intermediate Municipal Fund |
| ■ | Thornburg California Limited Term Municipal Fund |
| ■ | Thornburg New Mexico Intermediate Municipal Fund |
| ■ | Thornburg New York Intermediate Municipal Fund |
| ■ | Thornburg Strategic Municipal Income Fund |
| ■ | Thornburg Long/Short Equity Fund |

| 800.847.0200 | TH1075 |


| 4 | |
| 7 | |
| 8 | |
| 9 | |
| 12 | |
| 14 | |
| 16 | |
| 17 | |
| 26 | |
| 28 | |
| 29 | |
| 30 |
| SHARE CLASS | NASDAQ SYMBOL | CUSIP |
| Class A | THOAX | 885-215-343 |
| Class C | THOCX | 885-215-335 |
| Class I | THOIX | 885-215-327 |
| Class R3 | THORX | 885-215-145 |
| Class R4 | THOVX | 885-215-137 |
| Class R5 | THOFX | 885-215-129 |
| Class R6 | THOGX | 885-216-655 |
Thornburg Global Opportunities Fund | March 31, 2019 (Unaudited)

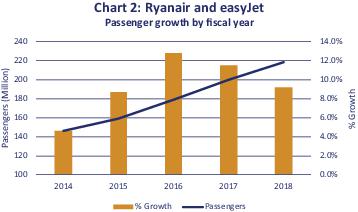
| Table 1 | Largest Geographic Weightings | |
| COUNTRY | WEIGHTING AS OF 3/31/2019 |
| United States | 40% |
| Hong Kong | 12% |
| Italy | 8% |
| Netherlands | 7% |
| India | 5% |
| As a percent of the equity holdings. Holdings are classified by country of risk as determined by MSCI and Bloomberg. | |
Thornburg Global Opportunities Fund | March 31, 2019 (Unaudited)
 |  |
| Brian McMahon Portfolio Manager Chief Investment Officer and Managing Director | W. Vinson Walden,cfa Portfolio Manager Managing Director |
Thornburg Global Opportunities Fund | March 31, 2019 (Unaudited)
| 1-YR | 3-YR | 5-YR | 10-YR | SINCE INCEP. | |
| Class A Shares(Incep: 7/28/06) | |||||
| Without sales charge | -5.92% | 4.66% | 5.25% | 14.25% | 8.44% |
| With sales charge | -10.17% | 3.07% | 4.29% | 13.73% | 8.04% |
| Class C Shares(Incep: 7/28/06) | |||||
| Without sales charge | -6.65% | 3.88% | 4.45% | 13.37% | 7.60% |
| With sales charge | -7.57% | 3.88% | 4.45% | 13.37% | 7.60% |
| Class I Shares(Incep: 7/28/06) | -5.62% | 5.02% | 5.62% | 14.72% | 8.91% |
| Class R3 Shares(Incep: 2/1/08) | -6.09% | 4.48% | 5.07% | 14.13% | 5.25% |
| Class R4 Shares(Incep: 2/1/08) | -5.99% | 4.59% | 5.17% | 14.23% | 5.35% |
| Class R5 Shares(Incep: 2/1/08) | -5.60% | 5.01% | 5.61% | 14.71% | 5.80% |
| Class R6 Shares(Incep: 4/10/17) | -5.47% | - | - | - | 0.63% |
| MSCI AC World Index(Since 7/28/06) | 2.60% | 10.67% | 6.45% | 11.98% | 5.71% |
| FINAL VALUE |
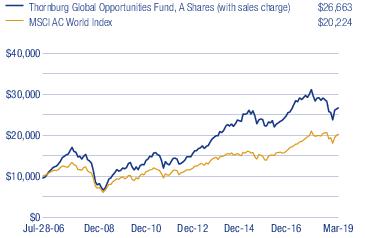
Thornburg Global Opportunities Fund | March 31, 2019 (Unaudited)
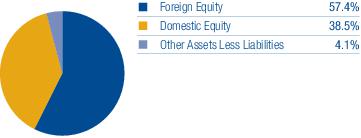
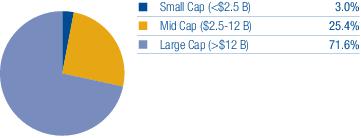
| TOP TEN EQUITY HOLDINGS | |
| Alphabet, Inc. Class A | 5.4% |
| OCI N.V. | 5.2% |
| Capital One Financial Corp. | 4.9% |
| Reliance Industries Ltd. | 4.9% |
| Facebook, Inc. Class A | 4.9% |
| Atlantia S.p.A. | 4.8% |
| New World Development Co. Ltd. | 4.5% |
| Ryanair Holdings plc | 4.4% |
| Galaxy Entertainment Group Ltd. | 4.3% |
| Citigroup, Inc. | 4.2% |
| SECTOR EXPOSURE | |
| Industrials | 19.6% |
| Communication Services | 17.7% |
| Financials | 13.1% |
| Materials | 11.1% |
| Consumer Discretionary | 9.7% |
| Information Technology | 7.1% |
| Energy | 6.5% |
| Real Estate | 4.5% |
| Consumer Staples | 2.5% |
| Health Care | 2.2% |
| Utilities | 1.9% |
| Other Assets Less Liabilities | 4.1% |
| TOP TEN INDUSTRY GROUPS | |
| Transportation | 14.1% |
| Materials | 11.1% |
| Media & Entertainment | 10.3% |
| Telecommunication Services | 7.4% |
| Consumer Services | 7.2% |
| Energy | 6.5% |
| Banks | 6.4% |
| Capital Goods | 5.5% |
| Technology Hardware & Equipment | 5.1% |
| Diversified Financials | 4.9% |
| COUNTRY EXPOSURE* (percent of equity holdings) | |
| United States | 40.2% |
| Macao | 7.5% |
| Netherlands | 7.2% |
| United Kingdom | 7.0% |
| India | 5.1% |
| Italy | 5.0% |
| Hong Kong | 4.7% |
| Ireland | 4.6% |
| France | 4.4% |
| China | 3.8% |
| Australia | 3.0% |
| South Korea | 2.8% |
| Denmark | 2.7% |
| Spain | 1.9% |
| Germany | 0.1% |
| * | Holdings are classified by country of risk as determined by MSCI and Bloomberg. |
Thornburg Global Opportunities Fund | March 31, 2019 (Unaudited)
| SHARES | VALUE | ||
| Common Stock — 95.9% | |||
| Banks — 6.4% | |||
| Banks — 6.4% | |||
| BNP Paribas S.A. | 701,709 | $ 33,540,133 | |
| Citigroup, Inc. | 982,283 | 61,117,648 | |
| 94,657,781 | |||
| Capital Goods — 5.5% | |||
| Electrical Equipment — 2.6% | |||
| Vestas Wind Systems A/S | 450,737 | 37,926,003 | |
| Machinery — 2.9% | |||
| CNH Industrial N.V. | 4,238,420 | 43,094,324 | |
| 81,020,327 | |||
| Consumer Durables & Apparel — 0.8% | |||
| Household Durables — 0.8% | |||
| Barratt Developments plc | 1,475,498 | 11,515,197 | |
| 11,515,197 | |||
| Consumer Services — 7.2% | |||
| Hotels, Restaurants & Leisure — 7.2% | |||
| Galaxy Entertainment Group Ltd. | 9,201,335 | �� 62,651,527 | |
| MGM China Holdings Ltd. | 20,787,289 | 43,481,460 | |
| 106,132,987 | |||
| Diversified Financials — 4.9% | |||
| Consumer Finance — 4.9% | |||
| Capital One Financial Corp. | 888,264 | 72,562,286 | |
| 72,562,286 | |||
| Energy — 6.5% | |||
| Oil, Gas & Consumable Fuels — 6.5% | |||
| Peabody Energy Corp. | 837,631 | 23,730,086 | |
| Reliance Industries Ltd. | 3,648,112 | 71,779,994 | |
| 95,510,080 | |||
| Food & Staples Retailing — 2.5% | |||
| Food & Staples Retailing — 2.5% | |||
| Walgreens Boots Alliance, Inc. | 586,701 | 37,120,572 | |
| 37,120,572 | |||
| Insurance — 1.8% | |||
| Insurance — 1.8% | |||
| NN Group N.V. | 626,560 | 26,026,308 | |
| 26,026,308 | |||
| Materials — 11.1% | |||
| Chemicals — 8.2% | |||
| CF Industries Holdings, Inc. | 1,104,586 | 45,155,476 | |
| a | OCI N.V. | 2,765,251 | 75,997,067 |
| Metals & Mining — 2.9% | |||
| Mineral Resources Ltd. | 3,799,379 | 42,624,421 | |
| 163,776,964 | |||
| Media & Entertainment — 10.3% | |||
| Interactive Media & Services — 10.3% | |||
| a | Alphabet, Inc. Class A | 67,512 | 79,454,198 |
| a | Facebook, Inc. Class A | 428,826 | 71,481,006 |
| 150,935,204 | |||
| Pharmaceuticals, Biotechnology & Life Sciences — 2.2% | |||
| Pharmaceuticals — 2.2% | |||
| Allergan plc | 210,412 | 30,806,421 |
Thornburg Global Opportunities Fund | March 31, 2019 (Unaudited)
| SHARES | VALUE | ||
| Bayer AG | 12,112 | $ 782,590 | |
| 31,589,011 | |||
| Real Estate — 4.5% | |||
| Real Estate Management & Development — 4.5% | |||
| New World Development Co. Ltd. | 40,026,910 | 66,389,005 | |
| 66,389,005 | |||
| Retailing — 1.7% | |||
| Internet & Direct Marketing Retail — 1.7% | |||
| a | Alibaba Group Holding Ltd. Sponsored ADR | 132,883 | 24,244,503 |
| 24,244,503 | |||
| Software & Services — 2.0% | |||
| Information Technology Services — 2.0% | |||
| a | GDS Holdings Ltd. ADR | 820,346 | 29,278,149 |
| 29,278,149 | |||
| Technology Hardware & Equipment — 5.1% | |||
| Communications Equipment — 2.5% | |||
| a | EchoStar Corp. Class A | 1,002,809 | 36,552,388 |
| Technology Hardware, Storage & Peripherals — 2.6% | |||
| Samsung Electronics Co., Ltd. | 986,336 | 38,798,258 | |
| 75,350,646 | |||
| Telecommunication Services — 7.4% | |||
| Diversified Telecommunication Services — 3.3% | |||
| a | Zayo Group Holdings, Inc. | 1,713,196 | 48,689,030 |
| Wireless Telecommunication Services — 4.1% | |||
| a | T-Mobile US, Inc. | 862,569 | 59,603,518 |
| 108,292,548 | |||
| Transportation — 14.1% | |||
| Airlines — 7.4% | |||
| easyJet plc | 2,973,448 | 43,278,163 | |
| a | Ryanair Holdings plc Sponsored ADR | 870,520 | 65,236,769 |
| Transportation Infrastructure — 6.7% | |||
| Aena SME S.A. | 150,164 | 27,035,665 | |
| Atlantia SPA | 2,740,335 | 70,978,004 | |
| 206,528,601 | |||
| Utilities — 1.9% | |||
| Electric Utilities — 1.9% | |||
| Electricite de France S.A. | 2,088,335 | 28,556,177 | |
| 28,556,177 | |||
| Total Common Stock(Cost $1,246,279,266) | 1,409,486,346 | ||
| Short-Term Investments — 3.7% | |||
| b | Thornburg Capital Management Fund | 5,388,275 | 53,882,749 |
| Total Short-Term Investments(Cost $53,882,749) | 53,882,749 | ||
| Total Investments — 99.6%(Cost $1,300,162,015) | $1,463,369,095 | ||
| Other Assets Less Liabilities — 0.4% | 6,478,985 | ||
| Net Assets — 100.0% | $1,469,848,080 |
| Outstanding Forward Currency Contracts To Buy Or Sell At March 31, 2019 | |||||||
| Contract Description | Contract Party* | Buy/Sell | Contract Amount | Contract Value Date | Value USD | Unrealized Appreciation | Unrealized Depreciation |
| Great Britain Pound | SSB | Sell | 56,203,100 | 4/10/2019 | 73,231,785 | $ — | $ (1,384,270) |
| Great Britain Pound | SSB | Sell | 2,880,200 | 4/10/2019 | 3,752,857 | — | (37,517) |
| Great Britain Pound | SSB | Sell | 4,585,400 | 4/10/2019 | 5,974,706 | 23,185 | — |
| Great Britain Pound | SSB | Buy | 11,157,800 | 4/10/2019 | 14,538,444 | — | (241,959) |
| Great Britain Pound | SSB | Buy | 10,681,900 | 4/10/2019 | 13,918,353 | — | (78,397) |
| Great Britain Pound | SSB | Buy | 13,290,900 | 4/10/2019 | 17,317,841 | — | (342,031) |
| Great Britain Pound | SSB | Buy | 4,809,500 | 4/10/2019 | 6,266,705 | — | (75,178) |
| Australian Dollar | BBH | Sell | 30,225,400 | 4/30/2019 | 21,473,418 | 161,017 | — |
| Australian Dollar | BBH | Buy | 6,089,900 | 4/30/2019 | 4,326,526 | — | (26,998) |
| Euro | SSB | Sell | 137,478,100 | 5/15/2019 | 154,775,197 | 1,547,025 | — |
| Total | $1,731,227 | $(2,186,350) | |||||
| Net unrealized appreciation/depreciation | $(455,123) | ||||||
| * | Counterparties include State Street Bank and Trust Company (“SSB”) and Brown Brothers Harriman & Co. (“BBH”). |
| Footnote Legend | |
| a | Non-income producing. |
| b | Investment in Affiliates. |
To simplify the listings of securities, abbreviations are used per the table below:
| ADR | American Depositary Receipt |
| SPA | Stand-by Purchase Agreement |
Thornburg Global Opportunities Fund | March 31, 2019 (Unaudited)
| ASSETS | |
| Investments at value (Note 3) | |
| Non-affiliated issuers (cost $1,246,279,266) | $ 1,409,486,346 |
| Non-controlled affiliated issuer (cost $53,882,749) | 53,882,749 |
| Cash denominated in foreign currency (cost $26) | 26 |
| Receivable for investments sold | 11,750,904 |
| Receivable for fund shares sold | 1,046,953 |
| Unrealized appreciation on forward currency contracts (Note 7) | 1,731,227 |
| Dividends receivable | 1,856,898 |
| Prepaid expenses and other assets | 121,866 |
| Total Assets | 1,479,876,969 |
| Liabilities | |
| Payable for investments purchased | 94,329 |
| Payable for fund shares redeemed | 3,228,395 |
| Unrealized depreciation on forward currency contracts (Note 7) | 2,186,350 |
| Payable to investment advisor and other affiliates (Note 4) | 1,267,606 |
| Deferred taxes payable (Note 2) | 2,312,331 |
| Accounts payable and accrued expenses | 939,689 |
| Dividends payable | 189 |
| Total Liabilities | 10,028,889 |
| Net Assets | $ 1,469,848,080 |
| NET ASSETS CONSIST OF | |
| Distributable earnings | $ 169,683,115 |
| Net capital paid in on shares of beneficial interest | 1,300,164,965 |
| $ 1,469,848,080 |
| NET ASSET VALUE | |
| Class A Shares: | |
| Net asset value and redemption price per share ($275,361,416 applicable to 9,972,908 shares of beneficial interest outstanding - Note 5) | $ 27.61 |
| Maximum sales charge, 4.50% of offering price | 1.30 |
| Maximum offering price per share | $ 28.91 |
| Class C Shares: | |
| Net asset value and offering price per share* ($186,642,403 applicable to 6,989,985 shares of beneficial interest outstanding - Note 5) | $ 26.70 |
| Class I Shares: | |
| Net asset value, offering and redemption price per share ($884,082,181 applicable to 31,939,468 shares of beneficial interest outstanding - Note 5) | $ 27.68 |
| Class R3 Shares: | |
| Net asset value, offering and redemption price per share ($5,433,497 applicable to 198,625 shares of beneficial interest outstanding - Note 5) | $ 27.36 |
| Class R4 Shares: | |
| Net asset value, offering and redemption price per share ($16,489,246 applicable to 602,237 shares of beneficial interest outstanding - Note 5) | $ 27.38 |
| Class R5 Shares: | |
| Net asset value, offering and redemption price per share ($52,700,940 applicable to 1,902,175 shares of beneficial interest outstanding - Note 5) | $ 27.71 |
| Class R6 Shares: | |
| Net asset value, offering and redemption price per share ($49,138,397 applicable to 1,770,168 shares of beneficial interest outstanding - Note 5) | $ 27.76 |
| * | Redemption price per share is equal to net asset value less any applicable contingent deferred sales charge. |
Thornburg Global Opportunities Fund | Six Months Ended March 31, 2019 (Unaudited)
| INVESTMENT INCOME | |
| Dividend income | |
| Non-affiliated issuers (net of foreign taxes withheld of $195,708) | $ 16,250,278 |
| Non-controlled affiliated issuer | 558,055 |
| Total Income | 16,808,333 |
| EXPENSES | |
| Investment advisory fees (Note 4) | 6,498,912 |
| Administration fees (Note 4) | |
| Class A Shares | 130,558 |
| Class C Shares | 89,816 |
| Class I Shares | 419,520 |
| Class R3 Shares | 2,631 |
| Class R4 Shares | 7,354 |
| Class R5 Shares | 25,634 |
| Class R6 Shares | 20,700 |
| Distribution and service fees (Note 4) | |
| Class A Shares | 371,980 |
| Class C Shares | 1,023,887 |
| Class R3 Shares | 14,996 |
| Class R4 Shares | 20,922 |
| Transfer agent fees | |
| Class A Shares | 213,270 |
| Class C Shares | 151,610 |
| Class I Shares | 621,500 |
| Class R3 Shares | 17,930 |
| Class R4 Shares | 51,500 |
| Class R5 Shares | 116,010 |
| Class R6 Shares | 2,984 |
| Registration and filing fees | |
| Class A Shares | 7,881 |
| Class C Shares | 7,595 |
| Class I Shares | 14,188 |
| Class R3 Shares | 5,772 |
| Class R4 Shares | 5,772 |
| Class R5 Shares | 5,795 |
| Class R6 Shares | 5,897 |
| Custodian fees (Note 2) | 109,300 |
| Professional fees | 51,420 |
| Trustee and officer fees (Note 4) | 50,224 |
| Other expenses | 130,082 |
| Total Expenses | 10,195,640 |
| Less: | |
| Expenses reimbursed by investment advisor (Note 4) | (607,124) |
| Investment advisory fees waived by investment advisor (Note 4) | (58,626) |
| Net Expenses | 9,529,890 |
| Net Investment Income | $ 7,278,443 |
| REALIZED AND UNREALIZED GAIN (LOSS) | |
| Net realized gain (loss) on: | |
| Non-affiliated issuer investments (net of realized capital gain taxes paid of $143,286) | $ 43,632,603 |
| Forward currency contracts (Note 7) | 8,771,348 |
| Foreign currency transactions | (208,503) |
| 52,195,448 | |
| Net change in unrealized appreciation (depreciation) on: | |
| Non-affiliated issuer investments (net of change in deferred taxes payable of $180,197) | (188,958,315) |
| Forward currency contracts (Note 7) | 666,396 |
| Foreign currency translations | (6,925) |
| (188,298,844) | |
| Net Realized and Unrealized Loss | (136,103,396) |
| Net Decrease in Net Assets Resulting from Operations | $ (128,824,953) |
Thornburg Global Opportunities Fund
| Six Months Ended March 31, 2019* | Year Ended September 30, 2018 | |
| INCREASE (DECREASE) IN NET ASSETS FROM | ||
| OPERATIONS | ||
| Net investment income | $ 7,278,443 | $ 37,984,910 |
| Net realized gain (loss) on investments, forward currency contracts, foreign currency transactions and capital gain taxes | 52,195,448 | 77,745,003 |
| Net unrealized appreciation (depreciation) on investments, forward currency contracts, foreign currency translations and deferred taxes | (188,298,844) | (180,296,250) |
| Net Decrease in Net Assets Resulting from Operations | (128,824,953) | (64,566,337) |
| DIVIDENDS TO SHAREHOLDERS | ||
| From distributable earnings | ||
| Class A Shares | (6,084,601) | (1,042,666) |
| Class C Shares | (1,977,267) | (214,888) |
| Class I Shares | (23,054,670) | (5,175,786) |
| Class R3 Shares | (108,092) | (21,199) |
| Class R4 Shares | (288,231) | (52,807) |
| Class R5 Shares | (1,405,780) | (248,810) |
| Class R6 Shares | (1,209,350) | (10,671) |
| FUND SHARE TRANSACTIONS (NOTE 5) | ||
| Class A Shares | (62,660,804) | (63,131,768) |
| Class C Shares | (48,196,326) | (114,771,553) |
| Class I Shares | (213,287,733) | (270,875,265) |
| Class R3 Shares | (1,510,074) | (4,185,580) |
| Class R4 Shares | (2,801,014) | (6,500,787) |
| Class R5 Shares | (11,955,801) | (8,168,594) |
| Class R6 Shares | 1,306,472 | 51,865,696 |
| Net Decrease in Net Assets | (502,058,224) | (487,101,015) |
| NET ASSETS | ||
| Beginning of Period | 1,971,906,304 | 2,459,007,319 |
| End of Period | $ 1,469,848,080 | $ 1,971,906,304 |
| * | Unaudited. |
Thornburg Global Opportunities Fund | March 31, 2019 (Unaudited)
Thornburg Global Opportunities Fund | March 31, 2019 (Unaudited)
| Cost of investments for tax purposes | $ 1,300,162,015 |
| Gross unrealized appreciation on a tax basis | 263,920,624 |
| Gross unrealized depreciation on a tax basis | (100,713,544) |
| Net unrealized appreciation (depreciation) on investments (tax basis) | $ 163,207,080 |
Thornburg Global Opportunities Fund | March 31, 2019 (Unaudited)
| Fair Value Measurements at March 31, 2019 | ||||
| TOTAL | LEVEL 1 | LEVEL 2 | LEVEL 3 | |
| Assets | ||||
| Investments in Securities* | ||||
| Common Stock | $ 1,409,486,346 | $ 1,409,486,346 | $ — | $ — |
| Short-Term Investments | 53,882,749 | 53,882,749 | — | — |
| Total Investments in Securities | $1,463,369,095 | $1,463,369,095 | $— | $— |
| Other Financial Instruments | ||||
| Forward Currency Contracts | $ 1,731,227 | $ — | $ 1,731,227 | $ — |
| Total Assets | $1,465,100,322 | $1,463,369,095 | $1,731,227 | $— |
| Liabilities | ||||
| Other Financial Instruments | ||||
| Forward Currency Contracts | $ (2,186,350) | $ — | $ (2,186,350) | $ — |
| Total Liabilities | $(2,186,350) | $— | $(2,186,350) | $— |
| * | See Schedule of Investments for a summary of the industry exposure as grouped according to the Global Industry Classification Standard (GICS), which is an industry taxonomy developed by MSCI, Inc. and Standard & Poor’s (S&P). |
| Management Fee Schedule | |
| DAILY NET ASSETS | FEE RATE |
| Up to $500 million | 0.875% |
| Next $500 million | 0.825 |
| Next $500 million | 0.775 |
| Next $500 million | 0.725 |
| Over $2 billion | 0.675 |
| Administration Fee Schedule | |
| Daily Net Assets | Fee Rate |
| Up to $20 billion | 0.100% |
| $20 billion to $40 billion | 0.075 |
| $40 billion to $60 billion | 0.040 |
| Over $60 billion | 0.030 |
Thornburg Global Opportunities Fund | March 31, 2019 (Unaudited)
| Fund | Market Value 9/30/18 | Purchases at Cost | Sales Proceeds | Realized Gain (Loss) | Change in Unrealized Appr./(Depr.) | Market Value 3/31/19 | Dividend Income |
| Thornburg Capital Management Fund | $68,176,932 | $337,893,711 | $(352,187,894) | $- | $- | $53,882,749 | $558,055 |
| SIX MONTHS ENDED March 31, 2019 (UNAUDITED) | YEAR ENDED September 30, 2018 (AUDITED) | |||
| SHARES | AMOUNT | SHARES | AMOUNT | |
| Class A Shares | ||||
| Shares sold | 486,790 | $ 12,866,973 | 3,335,136 | $ 103,488,392 |
| Shares issued to shareholders in reinvestment of dividends | 242,411 | 5,769,379 | 31,011 | 981,179 |
| Shares repurchased | (3,033,289) | (81,297,156) | (5,371,593) | (167,601,339) |
| Net decrease | (2,304,088) | $ (62,660,804) | (2,005,446) | $ (63,131,768) |
| Class C Shares | ||||
| Shares sold | 225,201 | $ 5,653,717 | 1,138,197 | $ 34,385,916 |
| Shares issued to shareholders in reinvestment of dividends | 79,218 | 1,826,769 | 6,530 | 199,285 |
| Shares repurchased | (2,161,022) | (55,676,812) | (5,015,148) | (149,356,754) |
| Net decrease | (1,856,603) | $ (48,196,326) | (3,870,421) | $ (114,771,553) |
| Class I Shares | ||||
| Shares sold | 4,203,483 | $ 112,375,195 | 13,805,603 | $ 433,679,560 |
| Shares issued to shareholders in reinvestment of dividends | 865,374 | 20,630,523 | 141,477 | 4,487,662 |
| Shares repurchased | (13,040,295) | (346,293,451) | (22,775,847) | (709,042,487) |
| Net decrease | (7,971,438) | $ (213,287,733) | (8,828,767) | $ (270,875,265) |
| Class R3 Shares | ||||
| Shares sold | 19,500 | $ 516,022 | 65,621 | $ 2,020,196 |
| Shares issued to shareholders in reinvestment of dividends | 2,888 | 68,136 | 403 | 12,620 |
| Shares repurchased | (80,035) | (2,094,232) | (203,071) | (6,218,396) |
| Net decrease | (57,647) | $ (1,510,074) | (137,047) | $ (4,185,580) |
| Class R4 Shares | ||||
| Shares sold | 125,536 | $ 3,244,508 | 193,209 | $ 5,994,773 |
| Shares issued to shareholders in reinvestment of dividends | 8,800 | 207,684 | 1,264 | 39,602 |
| Shares repurchased | (233,888) | (6,253,206) | (407,089) | (12,535,162) |
| Net decrease | (99,552) | $ (2,801,014) | (212,616) | $ (6,500,787) |
| Class R5 Shares | ||||
| Shares sold | 190,297 | $ 5,134,843 | 525,744 | $ 16,426,879 |
| Shares issued to shareholders in reinvestment of dividends | 56,561 | 1,349,546 | 7,656 | 243,146 |
| Shares repurchased | (672,699) | (18,440,190) | (800,724) | (24,838,619) |
| Net decrease | (425,841) | $ (11,955,801) | (267,324) | $ (8,168,594) |
| Class R6 Shares | ||||
| Shares sold | 80,287 | $ 2,144,626 | 1,807,910 | $ 56,306,121 |
| Shares issued to shareholders in reinvestment of dividends | 43,624 | 1,042,604 | 335 | 10,671 |
| Shares repurchased | (70,292) | (1,880,758) | (142,283) | (4,451,096) |
| Net increase | 53,619 | $ 1,306,472 | 1,665,962 | $ 51,865,696 |
Thornburg Global Opportunities Fund | March 31, 2019 (Unaudited)
SHEET RISK AND FOREIGN INVESTMENT RISK
| FAIR VALUES OF DERIVATIVE FINANCIAL INSTRUMENTS AT MARCH 31, 2019 | ||
| ASSET DERIVATIVES | BALANCE SHEET LOCATION | FAIR VALUE |
| Foreign exchange contracts | Assets - Unrealized appreciation on forward currency contracts | $ 1,731,227 |
| FAIR VALUES OF DERIVATIVE FINANCIAL INSTRUMENTS AT MARCH 31, 2019 | ||
| LIABILITY DERIVATIVES | BALANCE SHEET LOCATION | FAIR VALUE |
| Foreign exchange contracts | Liabilities - Unrealized depreciation on forward currency contracts | $ (2,186,350) |
| NET REALIZED GAIN (LOSS) ON DERIVATIVE FINANCIAL INSTRUMENTS RECOGNIZED IN INCOME FOR THE SIX MONTHS ENDED March 31, 2019 | ||
| TOTAL | FORWARD CURRENCY CONTRACTS | |
| Foreign exchange contracts | $ 8,771,348 | $ 8,771,348 |
| NET CHANGE IN UNREALIZED APPRECIATION (DEPRECIATION) OF DERIVATIVE FINANCIAL INSTRUMENTS RECOGNIZED IN INCOME FOR THE SIX MONTHS ENDED March 31, 2019 | ||
| TOTAL | FORWARD CURRENCY CONTRACTS | |
| Foreign exchange contracts | $ 666,396 | $ 666,396 |
Thornburg Global Opportunities Fund
| PER SHARE PERFORMANCE (FOR A SHARE OUTSTANDING THROUGHOUT THE PERIOD) | ||||||||
| UNLESS OTHERWISE NOTED, PERIODS ARE FISCAL YEARS ENDED SEPTEMBER 30, | Net Asset Value, Beginning of PERIOD | Net Investment Income (Loss)+ | Net Realized & Unrealized Gain (Loss) on Investments | Total from Investment Operations | Dividends from Net Investment Income | Dividends from Net Realized Gains | Total Dividends | Net Asset Value, End of PERIOD |
| CLASS A SHARES | ||||||||
| 2019(b)(c) | $ 29.93 | 0.10 | (1.87) | (1.77) | (0.55) | — | (0.55) | $ 27.61 |
| 2018(b) | $ 30.98 | 0.44 | (1.42) | (0.98) | (0.07) | — | (0.07) | $ 29.93 |
| 2017(b) | $ 24.90 | 0.13 | 6.05 | 6.18 | (0.10) | — | (0.10) | $ 30.98 |
| 2016(b) | $ 24.41 | 0.25 | 0.38 | 0.63 | (0.14) | — | (0.14) | $ 24.90 |
| 2015(b) | $ 23.74 | (0.11) | 0.78 | 0.67 | — | — | — | $ 24.41 |
| 2014(b) | $ 19.72 | (0.03) | 4.13 | 4.10 | (0.08) | — | (0.08) | $ 23.74 |
| CLASS C SHARES | ||||||||
| 2019(c) | $ 28.70 | —(e) | (1.75) | (1.75) | (0.25) | — | (0.25) | $ 26.70 |
| 2018 | $ 29.88 | 0.23 | (1.39) | (1.16) | (0.02) | — | (0.02) | $ 28.70 |
| 2017 | $ 24.13 | (0.08) | 5.84 | 5.76 | (0.01) | — | (0.01) | $ 29.88 |
| 2016 | $ 23.70 | 0.07 | 0.36 | 0.43 | — | — | — | $ 24.13 |
| 2015 | $ 23.23 | (0.31) | 0.78 | 0.47 | — | — | — | $ 23.70 |
| 2014 | $ 19.38 | (0.20) | 4.07 | 3.87 | (0.02) | — | (0.02) | $ 23.23 |
| CLASS I SHARES | ||||||||
| 2019(c) | $ 30.07 | 0.15 | (1.89) | (1.74) | (0.65) | — | (0.65) | $ 27.68 |
| 2018 | $ 31.06 | 0.56 | (1.45) | (0.89) | (0.10) | — | (0.10) | $ 30.07 |
| 2017 | $ 24.96 | 0.23 | 6.07 | 6.30 | (0.20) | — | (0.20) | $ 31.06 |
| 2016 | $ 24.53 | 0.34 | 0.37 | 0.71 | (0.28) | — | (0.28) | $ 24.96 |
| 2015 | $ 23.79 | (0.02) | 0.77 | 0.75 | (0.01) | — | (0.01) | $ 24.53 |
| 2014 | $ 19.74 | 0.06 | 4.15 | 4.21 | (0.16) | — | (0.16) | $ 23.79 |
| CLASS R3 SHARES | ||||||||
| 2019(c) | $ 29.57 | 0.08 | (1.83) | (1.75) | (0.46) | — | (0.46) | $ 27.36 |
| 2018 | $ 30.66 | 0.38 | (1.41) | (1.03) | (0.06) | — | (0.06) | $ 29.57 |
| 2017 | $ 24.66 | 0.08 | 5.99 | 6.07 | (0.07) | — | (0.07) | $ 30.66 |
| 2016 | $ 24.18 | 0.20 | 0.38 | 0.58 | (0.10) | — | (0.10) | $ 24.66 |
| 2015 | $ 23.55 | (0.15) | 0.78 | 0.63 | — | — | — | $ 24.18 |
| 2014 | $ 19.55 | (0.06) | 4.11 | 4.05 | (0.05) | — | (0.05) | $ 23.55 |
| CLASS R4 SHARES | ||||||||
| 2019(c) | $ 29.62 | 0.10 | (1.85) | (1.75) | (0.49) | — | (0.49) | $ 27.38 |
| 2018 | $ 30.69 | 0.46 | (1.47) | (1.01) | (0.06) | — | (0.06) | $ 29.62 |
| 2017 | $ 24.67 | 0.11 | 6.00 | 6.11 | (0.09) | — | (0.09) | $ 30.69 |
| 2016 | $ 24.22 | 0.24 | 0.35 | 0.59 | (0.14) | — | (0.14) | $ 24.67 |
| 2015 | $ 23.57 | (0.13) | 0.78 | 0.65 | — | — | — | $ 24.22 |
| 2014 | $ 19.59 | (0.03) | 4.10 | 4.07 | (0.09) | — | (0.09) | $ 23.57 |
| CLASS R5 SHARES | ||||||||
| 2019(c) | $ 30.10 | 0.15 | (1.88) | (1.73) | (0.66) | — | (0.66) | $ 27.71 |
| 2018 | $ 31.10 | 0.57 | (1.47) | (0.90) | (0.10) | — | (0.10) | $ 30.10 |
| 2017 | $ 24.99 | 0.22 | 6.08 | 6.30 | (0.19) | — | (0.19) | $ 31.10 |
| 2016 | $ 24.55 | 0.34 | 0.37 | 0.71 | (0.27) | — | (0.27) | $ 24.99 |
| 2015 | $ 23.81 | (0.03) | 0.78 | 0.75 | (0.01) | — | (0.01) | $ 24.55 |
| 2014 | $ 19.76 | 0.06 | 4.15 | 4.21 | (0.16) | — | (0.16) | $ 23.81 |
| CLASS R6 SHARES | ||||||||
| 2019(c) | $ 30.20 | 0.17 | (1.91) | (1.74) | (0.70) | — | (0.70) | $ 27.76 |
| 2018 | $ 31.16 | 0.90 | (1.75) | (0.85) | (0.11) | — | (0.11) | $ 30.20 |
| 2017(f) | $ 28.35 | 0.11 | 2.73 | 2.84 | (0.03) | — | (0.03) | $ 31.16 |
| (a) | Not annualized for periods less than one year. |
| (b) | Sales loads are not reflected in computing total return. |
| (c) | Unaudited Six Month Period Ended March 31. |
| (d) | Annualized. |
| (e) | Net investment income (loss) was less than $0.01 per share. |
| (f) | Effective date of this class of shares was April 10, 2017. |
| (g) | Due to the size of net assets and fixed expenses, ratios may appear disproportionate. |
| + | Based on weighted average shares outstanding. |
| RATIOS TO AVERAGE NET ASSETS | SUPPLEMENTAL DATA | ||||||
| Net Investment Income (Loss) (%) | Expenses, After Expense Reductions (%) | Expenses, After Expense Reductions and Net of Custody Credits (%) | Expenses, Before Expense Reductions (%) | Total Return (%)(a) | Portfolio Turnover Rate (%)(a) | Net Assets at End of PERIOD (Thousands) | |
| 0.77(d) | 1.34(d) | 1.34(d) | 1.35(d) | (5.61) | 15.16 | $ 275,361 | |
| 1.40 | 1.28 | 1.28 | 1.28 | (3.16) | 41.99 | $ 367,449 | |
| 0.46 | 1.33 | 1.33 | 1.33 | 24.85 | 43.70 | $ 442,522 | |
| 1.02 | 1.35 | 1.35 | 1.35 | 2.57 | 37.11 | $ 443,072 | |
| (0.42) | 1.32 | 1.32 | 1.32 | 2.82 | 45.41 | $ 550,327 | |
| (0.15) | 1.41 | 1.41 | 1.41 | 20.85 | 60.29 | $ 207,227 | |
| 0.02(d) | 2.10(d) | 2.10(d) | 2.11(d) | (5.97) | 15.16 | $ 186,642 | |
| 0.78 | 2.03 | 2.03 | 2.03 | (3.90) | 41.99 | $ 253,907 | |
| (0.30) | 2.08 | 2.08 | 2.08 | 23.88 | 43.70 | $ 380,046 | |
| 0.29 | 2.09 | 2.09 | 2.09 | 1.81 | 37.11 | $ 359,426 | |
| (1.20) | 2.10 | 2.10 | 2.10 | 2.02 | 45.41 | $ 363,615 | |
| (0.92) | 2.17 | 2.17 | 2.17 | 19.96 | 60.29 | $ 143,506 | |
| 1.13(d) | 0.99(d) | 0.99(d) | 1.08(d) | (5.43) | 15.16 | $ 884,082 | |
| 1.79 | 0.97 | 0.97 | 0.97 | (2.88) | 41.99 | $ 1,200,267 | |
| 0.80 | 0.97 | 0.97 | 0.98 | 25.31 | 43.70 | $ 1,514,039 | |
| 1.39 | 0.99 | 0.99 | 0.99 | 2.91 | 37.11 | $ 996,970 | |
| (0.08) | 0.97 | 0.97 | 0.98 | 3.17 | 45.41 | $ 1,285,609 | |
| 0.26 | 0.99 | 0.99 | 1.08 | 21.39 | 60.29 | $ 453,511 | |
| 0.61(d) | 1.50(d) | 1.50(d) | 2.24(d) | (5.68) | 15.16 | $ 5,433 | |
| 1.22 | 1.50 | 1.50 | 1.92 | (3.38) | 41.99 | $ 7,577 | |
| 0.28 | 1.50 | 1.50 | 1.97 | 24.66 | 43.70 | $ 12,059 | |
| 0.84 | 1.50 | 1.50 | 2.01 | 2.38 | 37.11 | $ 10,645 | |
| (0.58) | 1.50 | 1.50 | 2.15 | 2.68 | 45.41 | $ 8,936 | |
| (0.26) | 1.50 | 1.50 | 2.59 | 20.75 | 60.29 | $ 2,182 | |
| 0.74(d) | 1.40(d) | 1.40(d) | 1.89(d) | (5.64) | 15.16 | $ 16,489 | |
| 1.49 | 1.40 | 1.40 | 1.61 | (3.29) | 41.99 | $ 20,786 | |
| 0.38 | 1.40 | 1.40 | 1.65 | 24.81 | 43.70 | $ 28,061 | |
| 0.98 | 1.40 | 1.40 | 1.66 | 2.45 | 37.11 | $ 21,415 | |
| (0.51) | 1.40 | 1.40 | 1.76 | 2.76 | 45.41 | $ 13,175 | |
| (0.14) | 1.40 | 1.40 | 2.23 | 20.82 | 60.29 | $ 4,462 | |
| 1.10(d) | 0.99(d) | 0.99(d) | 1.37(d) | (5.41) | 15.16 | $ 52,701 | |
| 1.82 | 0.99 | 0.99 | 1.16 | (2.92) | 41.99 | $ 70,084 | |
| 0.79 | 0.99 | 0.99 | 1.16 | 25.29 | 43.70 | $ 80,704 | |
| 1.38 | 0.99 | 0.99 | 1.07 | 2.91 | 37.11 | $ 60,252 | |
| (0.11) | 0.98 | 0.98 | 1.02 | 3.17 | 45.41 | $ 108,654 | |
| 0.26 | 0.99 | 0.99 | 1.10 | 21.36 | 60.29 | $ 74,212 | |
| 1.27(d) | 0.85(d) | 0.85(d) | 0.99(d) | (5.38) | 15.16 | $ 49,138 | |
| 2.93 | 0.85 | 0.85 | 0.98 | (2.75) | 41.99 | $ 51,836 | |
| 0.77(d) | 0.85(d) | 0.85(d) | 13.31(d)(g) | 10.02 | 43.70 | $ 1,576 | |
Thornburg Global Opportunities Fund | March 31, 2019 (Unaudited)
| (1) | transaction costs, including |
| (a) | sales charges (loads) on purchase payments, for Class A shares; |
| (b) | a deferred sales charge on redemptions of any part or all of a purchase of $1 million of Class A shares within 12 months of purchase; |
| (c) | a deferred sales charge on redemptions of Class C shares within 12 months of purchase; |
| (2) | ongoing costs, including management fees; distribution and/or service (12b-1) fees; and other Fund expenses. |
| BEGINNING ACCOUNT VALUE 10/1/18 | ENDING ACCOUNT VALUE 3/31/19 | EXPENSES PAID DURING PERIOD† 10/1/18—3/31/19 | |
| CLASS A SHARES | |||
| Actual | $1,000.00 | $943.89 | $6.49 |
| Hypothetical* | $1,000.00 | $1,018.25 | $6.74 |
| CLASS C SHARES | |||
| Actual | $1,000.00 | $940.35 | $10.16 |
| Hypothetical* | $1,000.00 | $1,014.46 | $10.55 |
| CLASS I SHARES | |||
| Actual | $1,000.00 | $945.70 | $4.80 |
| Hypothetical* | $1,000.00 | $1,020.00 | $4.99 |
| CLASS R3 SHARES | |||
| Actual | $1,000.00 | $943.24 | $7.27 |
| Hypothetical* | $1,000.00 | $1,017.45 | $7.54 |
| CLASS R4 SHARES | |||
| Actual | $1,000.00 | $943.63 | $6.78 |
| Hypothetical* | $1,000.00 | $1,017.95 | $7.04 |
| CLASS R5 SHARES | |||
| Actual | $1,000.00 | $945.88 | $4.80 |
| Hypothetical* | $1,000.00 | $1,020.00 | $4.99 |
| CLASS R6 SHARES | |||
| Actual | $1,000.00 | $946.22 | $4.12 |
| Hypothetical* | $1,000.00 | $1,020.69 | $4.28 |
| † | Expenses are equal to the annualized expense ratio for each class (A: 1.34%; C: 2.10%; I: 0.99%; R3: 1.50%; R4: 1.40%; R5: 0.99%; R6: 0.85%) multiplied by the average account value over the period, multiplied by 182/365 to reflect the one-half year period. |
| * | Hypothetical assumes a rate of return of 5% per year before expenses. |
Thornburg Global Opportunities Fund | March 31, 2019 (Unaudited)
| ■ | Thornburg Investment Income Builder Fund |
| ■ | Thornburg Global Opportunities Fund |
| ■ | Thornburg International Value Fund |
| ■ | Thornburg Better World International Fund |
| ■ | Thornburg International Growth Fund |
| ■ | Thornburg Developing World Fund |
| ■ | Thornburg Value Fund |
| ■ | Thornburg Core Growth Fund |
| ■ | Thornburg Investment Income Builder Fund |
| ■ | Thornburg Summit Fund |
| ■ | Thornburg Low Duration Income Fund |
| ■ | Thornburg Limited Term U.S. Government Fund |
| ■ | Thornburg Limited Term Income Fund |
| ■ | Thornburg Strategic Income Fund |
| ■ | Thornburg Low Duration Municipal Fund |
| ■ | Thornburg Limited Term Municipal Fund |
| ■ | Thornburg Intermediate Municipal Fund |
| ■ | Thornburg California Limited Term Municipal Fund |
| ■ | Thornburg New Mexico Intermediate Municipal Fund |
| ■ | Thornburg New York Intermediate Municipal Fund |
| ■ | Thornburg Strategic Municipal Income Fund |
| ■ | Thornburg Long/Short Equity Fund |

| 800.847.0200 | TH1411 |


| 4 | |
| 6 | |
| 7 | |
| 8 | |
| 12 | |
| 13 | |
| 14 | |
| 15 | |
| 24 | |
| 26 | |
| 27 | |
| 28 |
| SHARE CLASS | NASDAQ SYMBOL | CUSIP |
| Class A | THDAX | 885-216-408 |
| Class C | THDCX | 885-216-507 |
| Class I | THDIX | 885-216-606 |
| Class R5 | THDRX | 885-216-846 |
| Class R6 | TDWRX | 885-216-838 |
Thornburg Developing World Fund | March 31, 2019 (Unaudited)
 |  |
| Ben Kirby,cfa Portfolio Manager Managing Director | Charlie Wilson, PhD Portfolio Manager Managing Director |
Thornburg Developing World Fund | March 31, 2019 (Unaudited)
| 1-YR | 3-YR | 5-YR | SINCE INCEP. | |
| Class A Shares(Incep: 12/16/09) | ||||
| Without sales charge | -2.23% | 9.28% | 2.13% | 6.15% |
| With sales charge | -6.63% | 7.61% | 1.19% | 5.62% |
| Class C Shares(Incep: 12/16/09) | ||||
| Without sales charge | -3.00% | 8.42% | 1.35% | 5.38% |
| With sales charge | -3.97% | 8.42% | 1.35% | 5.38% |
| Class I Shares(Incep: 12/16/09) | -1.86% | 9.70% | 2.55% | 6.66% |
| Class R5 Shares(Incep: 2/1/13) | -1.83% | 9.70% | 2.57% | 3.45% |
| Class R6 Shares(Incep: 2/1/13) | -1.76% | 9.82% | 2.66% | 3.55% |
| MSCI Emerging Markets Index(Since 12/16/09) | -7.41% | 10.68% | 3.68% | 3.32% |
| FINAL VALUE |
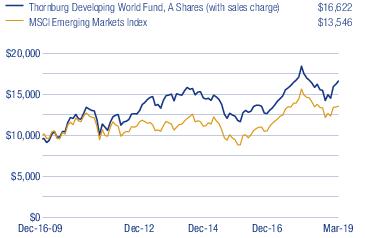
Thornburg Developing World Fund | March 31, 2019 (Unaudited)
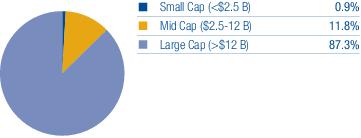
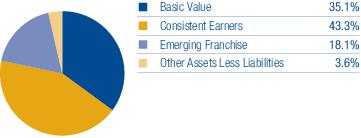
| TOP TEN EQUITY HOLDINGS | |
| Alibaba Group Holding Ltd. Sponsored ADR | 6.3% |
| Tencent Holdings Ltd. | 6.1% |
| ICICI Bank Ltd. | 4.4% |
| AIA Group Ltd. | 4.2% |
| Taiwan Semiconductor Manufacturing Co. Ltd. | 3.7% |
| Samsung Electronics Co. Ltd. | 3.6% |
| Unilever N.V. | 3.5% |
| Industrial & Commercial Bank of China Ltd. Class H | 3.5% |
| Reliance Industries Ltd. | 3.3% |
| Novartis AG Sponsored ADR | 3.2% |
| SECTOR EXPOSURE | |
| Financials | 29.7% |
| Consumer Discretionary | 15.6% |
| Communication Services | 11.4% |
| Information Technology | 11.4% |
| Energy | 8.5% |
| Consumer Staples | 6.1% |
| Industrials | 5.6% |
| Health Care | 4.7% |
| Materials | 3.4% |
| Other Assets Less Liabilities | 3.6% |
| TOP TEN INDUSTRY GROUPS | |
| Banks | 21.9% |
| Energy | 8.5% |
| Media & Entertainment | 8.5% |
| Retailing | 8.5% |
| Technology Hardware & Equipment | 6.5% |
| Insurance | 5.9% |
| Transportation | 5.6% |
| Semiconductors & Semiconductor Equipment | 4.9% |
| Consumer Services | 4.8% |
| Household & Personal Products | 3.5% |
| COUNTRY EXPOSURE* (percent of equity holdings) | |
| China | 28.9% |
| India | 13.7% |
| Brazil | 10.9% |
| Russian Federation | 6.6% |
| Switzerland | 5.6% |
| Hong Kong | 4.4% |
| Taiwan | 3.8% |
| Mexico | 3.8% |
| South Korea | 3.7% |
| United Kingdom | 3.6% |
| South Africa | 2.9% |
| Indonesia | 2.6% |
| Macao | 2.4% |
| United States | 1.7% |
| Panama | 1.2% |
| Vietnam | 1.1% |
| Netherlands | 1.0% |
| France | 0.8% |
| Zambia | 0.8% |
| Chile | 0.5% |
| * | Holdings are classified by country of risk as determined by MSCI and Bloomberg. |
Thornburg Developing World Fund | March 31, 2019 (Unaudited)
| SHARES | VALUE | ||
| Common Stock — 96.4% | |||
| Automobiles & Components — 0.5% | |||
| Automobiles — 0.5% | |||
| Geely Automobile Holdings Ltd. | 2,399,815 | $ 4,585,663 | |
| 4,585,663 | |||
| Banks — 21.9% | |||
| Banks — 21.9% | |||
| Bank Central Asia Tbk PT | 6,311,232 | 12,298,925 | |
| Bank Rakyat Indonesia Persero Tbk PT | 30,706,044 | 8,884,052 | |
| Grupo Financiero Banorte SAB de C.V. | 3,652,295 | 19,841,811 | |
| HDFC Bank Ltd. | 777,552 | 25,995,098 | |
| HDFC Bank Ltd. ADR | 91,445 | 10,599,390 | |
| ICICI Bank Ltd. Sponored ADR | 3,258,266 | 37,339,728 | |
| Industrial & Commercial Bank of China Ltd. Class H | 40,463,450 | 29,639,022 | |
| Itau Unibanco Holding S.A. ADR | 2,220,459 | 19,562,244 | |
| Sberbank of Russia PJSC Sponsored ADR | 1,702,339 | 22,573,015 | |
| 186,733,285 | |||
| Consumer Durables & Apparel — 1.8% | |||
| Household Durables — 1.0% | |||
| Midea Group Co. Ltd. Class A | 1,170,257 | 8,485,852 | |
| Textiles, Apparel & Luxury Goods — 0.8% | |||
| LVMH Moet Hennessy Louis Vuitton SE | 18,229 | 6,705,026 | |
| 15,190,878 | |||
| Consumer Services — 4.8% | |||
| Diversified Consumer Services — 0.6% | |||
| a | TAL Education Group ADR | 146,293 | 5,278,251 |
| Hotels, Restaurants & Leisure — 4.2% | |||
| Galaxy Entertainment Group Ltd. | 2,860,794 | 19,479,034 | |
| Huazhu Group Ltd. ADR | 379,267 | 15,982,311 | |
| 40,739,596 | |||
| Diversified Financials — 1.9% | |||
| Capital Markets — 1.9% | |||
| B3 S.A. - Brasil Bolsa Balcao | 2,007,452 | 16,468,351 | |
| 16,468,351 | |||
| Energy — 8.5% | |||
| Oil, Gas & Consumable Fuels — 8.5% | |||
| LUKOIL PJSC Sponsored ADR | 83,931 | 7,520,218 | |
| Novatek PJSC Sponsored GDR | 82,326 | 14,110,676 | |
| Petroleo Brasileiro S.A. | 2,093,281 | 15,001,843 | |
| Reliance Industries Ltd. | 1,422,358 | 27,986,215 | |
| Royal Dutch Shell plc Sponsored ADR Class A | 128,222 | 8,025,415 | |
| 72,644,367 | |||
| Food, Beverage & Tobacco — 2.6% | |||
| Beverages — 1.5% | |||
| Kweichow Moutai Co. Ltd. Class A | 101,189 | 12,858,902 | |
| Food Products — 1.1% | |||
| Vietnam Dairy Products, JSC | 1,524,492 | 8,856,297 | |
| 21,715,199 | |||
| Healthcare Equipment & Services — 1.5% | |||
| Health Care Providers & Services — 1.5% | |||
| Hapvida Participacoes e Investimentos S.A. | 679,706 | 5,339,946 | |
| Odontoprev S.A. | 1,774,007 | 7,430,680 | |
| 12,770,626 | |||
| Household & Personal Products — 3.5% | |||
| Personal Products — 3.5% |
| SHARES | VALUE | ||
| Unilever N.V. | 511,459 | $ 29,812,945 | |
| 29,812,945 | |||
| Insurance — 5.9% | |||
| Insurance — 5.9% | |||
| AIA Group Ltd. | 3,607,877 | 35,918,138 | |
| Sanlam Ltd. | 2,851,522 | 14,577,026 | |
| 50,495,164 | |||
| Materials — 3.4% | |||
| Chemicals — 0.5% | |||
| Sociedad Quimica y Minera de Chile S.A. Sponsored ADR | 106,872 | 4,108,160 | |
| Metals & Mining — 2.9% | |||
| First Quantum Minerals Ltd. | 578,262 | 6,555,670 | |
| Glencore plc | 4,469,920 | 18,510,558 | |
| 29,174,388 | |||
| Media & Entertainment — 8.5% | |||
| Interactive Media & Services — 7.3% | |||
| Tencent Holdings Ltd. | 1,125,022 | 51,737,010 | |
| a | Yandex N.V. Class A | 293,112 | 10,065,466 |
| Media — 1.2% | |||
| Zee Entertainment Enterprises Ltd. | 1,613,240 | 10,323,339 | |
| 72,125,815 | |||
| Pharmaceuticals, Biotechnology & Life Sciences — 3.2% | |||
| Pharmaceuticals — 3.2% | |||
| a,b,c | China Animal Healthcare Ltd. | 35,787,582 | 0 |
| Novartis AG Sponsored ADR | 282,509 | 27,160,415 | |
| 27,160,415 | |||
| Retailing — 8.5% | |||
| Internet & Direct Marketing Retail — 7.5% | |||
| a | Alibaba Group Holding Ltd. Sponsored ADR | 294,842 | 53,793,923 |
| Naspers Ltd. Class N | 41,309 | 9,539,799 | |
| Multiline Retail — 1.0% | |||
| Lojas Renner S.A. | 782,637 | 8,755,156 | |
| 72,088,878 | |||
| Semiconductors & Semiconductor Equipment — 4.9% | |||
| Semiconductors & Semiconductor Equipment — 4.9% | |||
| a | Micron Technology, Inc. | 237,016 | 9,795,871 |
| Taiwan Semiconductor Manufacturing Co., Ltd. | 3,959,081 | 31,535,971 | |
| 41,331,842 | |||
| Technology Hardware & Equipment — 6.5% | |||
| Electronic Equipment, Instruments & Components — 2.9% | |||
| Hangzhou Hikvision Digital Technology Co. Ltd. Class A | 1,881,914 | 9,820,947 | |
| a | IPG Photonics Corp. | 27,953 | 4,242,706 |
| Sunny Optical Technology Group Co. Ltd. | 867,840 | 10,364,397 | |
| Technology Hardware, Storage & Peripherals — 3.6% | |||
| Samsung Electronics Co., Ltd. | 776,873 | 30,558,875 | |
| 54,986,925 | |||
| Telecommunication Services — 2.9% | |||
| Diversified Telecommunication Services — 2.9% | |||
| China Unicom Hong Kong Ltd. | 19,683,194 | 24,948,921 | |
| 24,948,921 | |||
| Transportation — 5.6% | |||
| Airlines — 3.2% | |||
| a | Azul S.A. ADR | 590,258 | 17,241,436 |
| Copa Holdings S.A. Class A | 118,812 | 9,577,436 | |
| Transportation Infrastructure — 2.4% |
Thornburg Developing World Fund | March 31, 2019 (Unaudited)
| SHARES | VALUE | ||
| Grupo Aeroportuario del Pacifico SAB de CV Class B | 1,288,196 | $ 11,420,397 | |
| Shanghai International Airport Co. Ltd. Class A | 1,004,234 | 9,287,394 | |
| 47,526,663 | |||
| Total Common Stock(Cost $642,489,825) | 820,499,921 | ||
| Short-Term Investments — 3.8% | |||
| d | Thornburg Capital Management Fund | 3,219,600 | 32,195,995 |
| Total Short-Term Investments(Cost $32,195,995) | 32,195,995 | ||
| Total Investments — 100.2%(Cost $674,685,820) | $852,695,916 | ||
| Liabilities Net of Other Assets — (0.2)% | (1,887,773) | ||
| Net Assets — 100.0% | $850,808,143 |
| Footnote Legend | |
| a | Non-income producing. |
| b | Security currently fair valued by the Valuation and Pricing Committee using procedures approved by the Trustees’ Audit Committee. |
| c | Illiquid security. |
| d | Investment in Affiliates. |
To simplify the listings of securities, abbreviations are used per the table below:
| ADR | American Depositary Receipt |
| GDR | Global Depositary Receipt |
Thornburg Developing World Fund | March 31, 2019 (Unaudited)
| ASSETS | |
| Investments at value (Note 3) | |
| Non-affiliated issuers (cost $642,489,825) | $ 820,499,921 |
| Non-controlled affiliated issuer (cost $32,195,995) | 32,195,995 |
| Cash denominated in foreign currency (cost $12) | 12 |
| Receivable for fund shares sold | 605,406 |
| Dividends receivable | 729,472 |
| Dividend and interest reclaim receivable | 458,012 |
| Prepaid expenses and other assets | 76,036 |
| Total Assets | 854,564,854 |
| Liabilities | |
| Payable for investments purchased | 93,780 |
| Payable for fund shares redeemed | 961,326 |
| Payable to investment advisor and other affiliates (Note 4) | 767,732 |
| Deferred taxes payable (Note 2) | 1,424,201 |
| Accounts payable and accrued expenses | 509,590 |
| Dividends payable | 82 |
| Total Liabilities | 3,756,711 |
| Net Assets | $ 850,808,143 |
| NET ASSETS CONSIST OF | |
| Accumulated loss | $ (1,801,908) |
| Net capital paid in on shares of beneficial interest | 852,610,051 |
| $ 850,808,143 | |
| NET ASSET VALUE | |
| Class A Shares: | |
| Net asset value and redemption price per share ($108,514,302 applicable to 5,325,602 shares of beneficial interest outstanding - Note 5) | $ 20.38 |
| Maximum sales charge, 4.50% of offering price | 0.96 |
| Maximum offering price per share | $ 21.34 |
| Class C Shares: | |
| Net asset value and offering price per share* ($74,154,350 applicable to 3,827,373 shares of beneficial interest outstanding - Note 5) | $ 19.37 |
| Class I Shares: | |
| Net asset value, offering and redemption price per share ($606,990,894 applicable to 29,233,843 shares of beneficial interest outstanding - Note 5) | $ 20.76 |
| Class R5 Shares: | |
| Net asset value, offering and redemption price per share ($2,858,123 applicable to 138,094 shares of beneficial interest outstanding - Note 5) | $ 20.70 |
| Class R6 Shares: | |
| Net asset value, offering and redemption price per share ($58,290,474 applicable to 2,805,605 shares of beneficial interest outstanding - Note 5) | $ 20.78 |
| * | Redemption price per share is equal to net asset value less any applicable contingent deferred sales charge. |
Thornburg Developing World Fund | Six Months Ended March 31, 2019 (Unaudited)
| INVESTMENT INCOME | |
| Dividend income | |
| Non-affiliated issuers (net of foreign taxes withheld of $558,852) | $ 4,043,179 |
| Non-controlled affiliated issuer | 487,452 |
| Total Income | 4,530,631 |
| EXPENSES | |
| Investment advisory fees (Note 4) | 3,894,866 |
| Administration fees (Note 4) | |
| Class A Shares | 44,518 |
| Class C Shares | 32,172 |
| Class I Shares | 256,084 |
| Class R5 Shares | 1,328 |
| Class R6 Shares | 23,589 |
| Distribution and service fees (Note 4) | |
| Class A Shares | 126,797 |
| Class C Shares | 366,686 |
| Transfer agent fees | |
| Class A Shares | 76,020 |
| Class C Shares | 52,350 |
| Class I Shares | 295,340 |
| Class R5 Shares | 10,920 |
| Class R6 Shares | 1,006 |
| Registration and filing fees | |
| Class A Shares | 6,425 |
| Class C Shares | 6,189 |
| Class I Shares | 9,702 |
| Class R5 Shares | 5,866 |
| Class R6 Shares | 6,240 |
| Custodian fees (Note 2) | 105,060 |
| Professional fees | 36,850 |
| Trustee and officer fees (Note 4) | 22,558 |
| Other expenses | 66,408 |
| Total Expenses | 5,446,974 |
| Less: | |
| Expenses reimbursed by investment advisor (Note 4) | (314,089) |
| Investment advisory fees waived by investment advisor (Note 4) | (93,933) |
| Net Expenses | 5,038,952 |
| Net Investment Loss | $ (508,321) |
| REALIZED AND UNREALIZED GAIN (LOSS) | |
| Net realized gain (loss) on: | |
| Non-affiliated issuer investments | (8,458,286) |
| Foreign currency transactions | (70,881) |
| (8,529,167) | |
| Net change in unrealized appreciation (depreciation) on: | |
| Non-affiliated issuer investments (net of change in deferred taxes payable of $573,059) | 65,640,266 |
| Foreign currency translations | 1,003 |
| 65,641,269 | |
| Net Realized and Unrealized Gain | 57,112,102 |
| Net Increase in Net Assets Resulting from Operations | $ 56,603,781 |
Thornburg Developing World Fund
| Six Months Ended March 31, 2019* | Year Ended September 30, 2018 | |
| INCREASE (DECREASE) IN NET ASSETS FROM | ||
| OPERATIONS | ||
| Net investment income (loss) | $ (508,321) | $ 8,108,374 |
| Net realized gain (loss) on investments and foreign currency transactions | (8,529,167) | 63,923,655 |
| Net unrealized appreciation (depreciation) on investments, foreign currency translations and deferred taxes | 65,641,269 | (102,076,534) |
| Net Increase (Decrease) in Net Assets Resulting from Operations | 56,603,781 | (30,044,505) |
| DIVIDENDS TO SHAREHOLDERS | ||
| From distributable earnings | ||
| Class A Shares | (832,625) | - |
| Class I Shares | (7,328,575) | - |
| Class R5 Shares | (35,726) | - |
| Class R6 Shares | (703,702) | - |
| FUND SHARE TRANSACTIONS (NOTE 5) | ||
| Class A Shares | (9,684,236) | (8,956,839) |
| Class C Shares | (11,251,396) | (25,277,644) |
| Class I Shares | (60,858,436) | (140,840,162) |
| Class R5 Shares | (655,046) | (2,071,263) |
| Class R6 Shares | (1,355,370) | 32,219,385 |
| Net Decrease in Net Assets | (36,101,331) | (174,971,028) |
| NET ASSETS | ||
| Beginning of Period | 886,909,474 | 1,061,880,502 |
| End of Period | $ 850,808,143 | $ 886,909,474 |
| * | Unaudited. |
Thornburg Developing World Fund | March 31, 2019 (Unaudited)
Thornburg Developing World Fund | March 31, 2019 (Unaudited)
| Cost of investments for tax purposes | $ 674,685,820 |
| Gross unrealized appreciation on a tax basis | 217,095,830 |
| Gross unrealized depreciation on a tax basis | (39,085,734) |
| Net unrealized appreciation (depreciation) on investments (tax basis) | $ 178,010,096 |
Thornburg Developing World Fund | March 31, 2019 (Unaudited)
| Fair Value Measurements at March 31, 2019 | ||||
| TOTAL | LEVEL 1 | LEVEL 2 | LEVEL 3 | |
| Assets | ||||
| Investments in Securities* | ||||
| Common Stock(a) | $ 820,499,921 | $ 820,499,921 | $ — | $ — |
| Short-Term Investments | 32,195,995 | 32,195,995 | — | — |
| Total Investments in Securities | $852,695,916 | $852,695,916 | $— | $—(b) |
| Total Assets | $852,695,916 | $852,695,916 | $— | $— |
| * | See Schedule of Investments for a summary of the industry exposure as grouped according to the Global Industry Classification Standard (GICS), which is an industry taxonomy developed by MSCI, Inc. and Standard & Poor’s (S&P). |
| (a) | At March 31, 2019, industry classifications for Common Stock in Level 3 consist of $0 in Pharmaceuticals, Biotechnology & Life Sciences. |
| (b) | In accordance with the guidance prescribed in Accounting Standards Update ("ASU") No. 2011-04, the following table displays a summary of the valuation techniques and unobservable inputs used to value portfolio securities characterized as Level 3 investments for the period ended at March 31, 2019. |
| FAIR VALUE AT March 31, 2019 | VALUATION TECHNIQUE(S) | UNOBSERVABLE INPUT | RANGE (WEIGHTED AVERAGE) | |
| Common Stock | $ 0 | Last traded price | Discount rate | 100%/(N/A) |
| Total | $0 |
| COMMON STOCK | TOTAL | |
| Beginning Balance 9/30/2018 | $ 9,343,578 | $ 9,343,578 |
| Accrued Discounts (Premiums) | – | – |
| Net Realized Gain (Loss) | – | – |
| Gross Purchases | – | – |
| Gross Sales | – | – |
| Net Change in Unrealized Appreciation (Depreciation) | – | – |
| Transfers into Level 3(a) | – | – |
| Transfers out of Level 3(a) | 9,343,578 | 9,343,578 |
| Ending Balance 3/31/2019 | $– | $– |
| (a) | Transfers out of Level 3 were due to changes in market activity (e.g.) frequency of trades, which resulted in available market inputs to determine price during the six months ended March 31, 2019. Transfers into or out of Level 3 are based on the beginning market value of the period in which they occurred. |
| Management Fee Schedule | |
| DAILY NET ASSETS | FEE RATE |
| Up to $500 million | 0.975% |
| Next $500 million | 0.925 |
| Next $500 million | 0.875 |
| Next $500 million | 0.825 |
| Over $2 billion | 0.775 |
Thornburg Developing World Fund | March 31, 2019 (Unaudited)
| Administration Fee Schedule | |
| Daily Net Assets | Fee Rate |
| Up to $20 billion | 0.100% |
| $20 billion to $40 billion | 0.075 |
| $40 billion to $60 billion | 0.040 |
| Over $60 billion | 0.030 |
| Fund | Market Value 9/30/18 | Purchases at Cost | Sales Proceeds | Realized Gain (Loss) | Change in Unrealized Appr./(Depr.) | Market Value 3/31/19 | Dividend Income |
| Thornburg Capital Management Fund | $52,180,825 | $132,431,527 | $(152,416,357) | $- | $- | $32,195,995 | $487,452 |
| SIX MONTHS ENDED March 31, 2019 (UNAUDITED) | YEAR ENDED September 30, 2018 (AUDITED) | |||
| SHARES | AMOUNT | SHARES | AMOUNT | |
| Class A Shares | ||||
| Shares sold | 490,414 | $ 9,162,496 | 1,295,267 | $ 26,954,368 |
| Shares issued to shareholders in reinvestment of dividends | 45,605 | 787,591 | - | - |
| Shares repurchased | (1,069,040) | (19,634,323) | (1,753,167) | (35,911,207) |
| Net decrease | (533,021) | $ (9,684,236) | (457,900) | $ (8,956,839) |
| Class C Shares | ||||
| Shares sold | 111,469 | $ 1,974,162 | 328,433 | $ 6,527,715 |
| Shares issued to shareholders in reinvestment of dividends | - | - | - | - |
| Shares repurchased | (744,572) | (13,225,558) | (1,637,558) | (31,805,359) |
| Net decrease | (633,103) | $ (11,251,396) | (1,309,125) | $ (25,277,644) |
| Class I Shares | ||||
| Shares sold | 3,198,049 | $ 60,467,322 | 7,202,047 | $ 153,189,862 |
| Shares issued to shareholders in reinvestment of dividends | 401,424 | 7,057,046 | - | - |
| Shares repurchased | (6,827,744) | (128,382,804) | (13,981,994) | (294,030,024) |
| Net decrease | (3,228,271) | $ (60,858,436) | (6,779,947) | $ (140,840,162) |
| Class R5 Shares | ||||
| Shares sold | 55,511 | $ 1,053,068 | 121,330 | $ 2,601,663 |
| Shares issued to shareholders in reinvestment of dividends | 2,039 | 35,726 | - | - |
| Shares repurchased | (90,919) | (1,743,840) | (223,238) | (4,672,926) |
| Net decrease | (33,369) | $ (655,046) | (101,908) | $ (2,071,263) |
| Class R6 Shares | ||||
| Shares sold | 184,366 | $ 3,524,319 | 2,069,640 | $ 45,037,356 |
| Shares issued to shareholders in reinvestment of dividends | 36,174 | 636,287 | - | - |
| Shares repurchased | (289,850) | (5,515,976) | (612,074) | (12,817,971) |
| Net increase (decrease) | (69,310) | $ (1,355,370) | 1,457,566 | $ 32,219,385 |
Thornburg Developing World Fund | March 31, 2019 (Unaudited)
SHEET RISK AND FOREIGN INVESTMENT RISK
Thornburg Developing World Fund
| PER SHARE PERFORMANCE (FOR A SHARE OUTSTANDING THROUGHOUT THE PERIOD) | ||||||||
| UNLESS OTHERWISE NOTED, PERIODS ARE FISCAL YEARS ENDED SEPTEMBER 30, | Net Asset Value, Beginning of PERIOD | Net Investment Income (Loss)+ | Net Realized & Unrealized Gain (Loss) on Investments | Total from Investment Operations | Dividends from Net Investment Income | Dividends from Net Realized Gains | Total Dividends | Net Asset Value, End of PERIOD |
| CLASS A SHARES | ||||||||
| 2019(b)(c) | $ 19.13 | (0.03) | 1.43 | 1.40 | (0.15) | — | (0.15) | $ 20.38 |
| 2018(b) | $ 19.86 | 0.11 | (0.84) | (0.73) | — | — | — | $ 19.13 |
| 2017(b) | $ 16.98 | 0.09 | 2.89 | 2.98 | (0.10) | — | (0.10) | $ 19.86 |
| 2016(b) | $ 15.03 | 0.04 | 1.94 | 1.98 | (0.03) | — | (0.03) | $ 16.98 |
| 2015(b) | $ 18.61 | 0.02 | (3.58) | (3.56) | (0.02) | — | (0.02) | $ 15.03 |
| 2014(b) | $ 17.77 | 0.03 | 0.81 | 0.84 | — | — | — | $ 18.61 |
| CLASS C SHARES | ||||||||
| 2019(c) | $ 18.10 | (0.10) | 1.37 | 1.27 | — | — | — | $ 19.37 |
| 2018 | $ 18.93 | (0.05) | (0.78) | (0.83) | — | — | — | $ 18.10 |
| 2017 | $ 16.26 | (0.03) | 2.74 | 2.71 | (0.04) | — | (0.04) | $ 18.93 |
| 2016 | $ 14.48 | (0.08) | 1.86 | 1.78 | — | — | — | $ 16.26 |
| 2015 | $ 18.03 | (0.09) | (3.46) | (3.55) | — | — | — | $ 14.48 |
| 2014 | $ 17.34 | (0.11) | 0.80 | 0.69 | — | — | — | $ 18.03 |
| CLASS I SHARES | ||||||||
| 2019(c) | $ 19.55 | —(d) | 1.45 | 1.45 | (0.24) | — | (0.24) | $ 20.76 |
| 2018 | $ 20.21 | 0.19 | (0.85) | (0.66) | — | — | — | $ 19.55 |
| 2017 | $ 17.26 | 0.19 | 2.92 | 3.11 | (0.16) | — | (0.16) | $ 20.21 |
| 2016 | $ 15.27 | 0.11 | 1.97 | 2.08 | (0.09) | — | (0.09) | $ 17.26 |
| 2015 | $ 18.92 | 0.10 | (3.65) | (3.55) | (0.10) | — | (0.10) | $ 15.27 |
| 2014 | $ 18.05 | 0.10 | 0.84 | 0.94 | (0.07) | — | (0.07) | $ 18.92 |
| CLASS R5 SHARES | ||||||||
| 2019(c) | $ 19.48 | —(d) | 1.46 | 1.46 | (0.24) | — | (0.24) | $ 20.70 |
| 2018 | $ 20.14 | 0.19 | (0.85) | (0.66) | — | — | — | $ 19.48 |
| 2017 | $ 17.20 | 0.18 | 2.92 | 3.10 | (0.16) | — | (0.16) | $ 20.14 |
| 2016 | $ 15.22 | 0.12 | 1.96 | 2.08 | (0.10) | — | (0.10) | $ 17.20 |
| 2015 | $ 18.86 | 0.12 | (3.65) | (3.53) | (0.11) | — | (0.11) | $ 15.22 |
| 2014 | $ 18.04 | 0.13 | 0.80 | 0.93 | (0.11) | — | (0.11) | $ 18.86 |
| CLASS R6 SHARES | ||||||||
| 2019(c) | $ 19.57 | 0.01 | 1.46 | 1.47 | (0.26) | — | (0.26) | $ 20.78 |
| 2018 | $ 20.21 | 0.24 | (0.88) | (0.64) | — | — | — | $ 19.57 |
| 2017 | $ 17.25 | 0.20 | 2.93 | 3.13 | (0.17) | — | (0.17) | $ 20.21 |
| 2016 | $ 15.25 | 0.13 | 1.98 | 2.11 | (0.11) | — | (0.11) | $ 17.25 |
| 2015 | $ 18.91 | 0.15 | (3.68) | (3.53) | (0.13) | — | (0.13) | $ 15.25 |
| 2014 | $ 18.08 | 0.11 | 0.84 | 0.95 | (0.12) | — | (0.12) | $ 18.91 |
| (a) | Not annualized for periods less than one year. |
| (b) | Sales loads are not reflected in computing total return. |
| (c) | Unaudited Six Month Period Ended March 31. |
| (d) | Net investment income (loss) was less than $0.01 per share. |
| + | Based on weighted average shares outstanding. |
Thornburg Developing World Fund
| RATIOS TO AVERAGE NET ASSETS | SUPPLEMENTAL DATA | ||||||
| Net Investment Income (Loss) (%) | Expenses, After Expense Reductions (%) | Expenses, After Expense Reductions and Net of Custody Credits (%) | Expenses, Before Expense Reductions (%) | Total Return (%)(a) | Portfolio Turnover Rate (%)(a) | Net Assets at End of PERIOD (Thousands) | |
| (0.37) | 1.49 | 1.49 | 1.51 | 7.48 | 18.88 | $ 108,514 | |
| 0.55 | 1.46 | 1.46 | 1.48 | (3.68) | 58.28 | $ 112,082 | |
| 0.54 | 1.52 | 1.52 | 1.60 | 17.58 | 77.61 | $ 125,427 | |
| 0.25 | 1.52 | 1.52 | 1.57 | 13.20 | 94.68 | $ 166,655 | |
| 0.14 | 1.53 | 1.53 | 1.53 | (19.12) | 96.74 | $ 207,282 | |
| 0.15 | 1.45 | 1.45 | 1.45 | 4.73 | 61.46 | $ 459,121 | |
| (1.13) | 2.24 | 2.24 | 2.26 | 7.02 | 18.88 | $ 74,154 | |
| (0.23) | 2.23 | 2.23 | 2.25 | (4.38) | 58.28 | $ 80,728 | |
| (0.16) | 2.26 | 2.26 | 2.34 | 16.65 | 77.61 | $ 109,227 | |
| (0.51) | 2.29 | 2.29 | 2.34 | 12.29 | 94.68 | $ 134,129 | |
| (0.55) | 2.27 | 2.27 | 2.27 | (19.69) | 96.74 | $ 154,943 | |
| (0.62) | 2.23 | 2.23 | 2.23 | 3.98 | 61.46 | $ 232,493 | |
| 0.02 | 1.09 | 1.09 | 1.20 | 7.63 | 18.88 | $ 606,991 | |
| 0.93 | 1.08 | 1.08 | 1.16 | (3.27) | 58.28 | $ 634,501 | |
| 1.05 | 1.07 | 1.07 | 1.20 | 18.06 | 77.61 | $ 793,069 | |
| 0.70 | 1.07 | 1.07 | 1.16 | 13.68 | 94.68 | $ 853,866 | |
| 0.52 | 1.09 | 1.09 | 1.14 | (18.75) | 96.74 | $ 1,016,898 | |
| 0.54 | 1.09 | 1.09 | 1.09 | 5.20 | 61.46 | $ 2,376,420 | |
| (0.02) | 1.09 | 1.09 | 2.20 | 7.69 | 18.88 | $ 2,858 | |
| 0.90 | 1.09 | 1.09 | 1.71 | (3.28) | 58.28 | $ 3,340 | |
| 1.04 | 1.08 | 1.08 | 1.77 | 18.06 | 77.61 | $ 5,506 | |
| 0.74 | 1.08 | 1.08 | 1.75 | 13.65 | 94.68 | $ 6,208 | |
| 0.66 | 1.09 | 1.09 | 1.67 | (18.72) | 96.74 | $ 5,363 | |
| 0.67 | 1.09 | 1.09 | 1.90 | 5.17 | 61.46 | $ 7,433 | |
| 0.13 | 0.99 | 0.99 | 1.13 | 7.73 | 18.88 | $ 58,291 | |
| 1.16 | 0.99 | 0.99 | 1.14 | (3.17) | 58.28 | $ 56,258 | |
| 1.14 | 0.97 | 0.97 | 1.13 | 18.16 | 77.61 | $ 28,652 | |
| 0.80 | 0.97 | 0.97 | 1.12 | 13.81 | 94.68 | $ 48,598 | |
| 0.84 | 0.99 | 0.99 | 1.10 | (18.68) | 96.74 | $ 21,055 | |
| 0.57 | 0.99 | 0.99 | 1.10 | 5.26 | 61.46 | $ 22,727 | |
Thornburg Developing World Fund | March 31, 2019 (Unaudited)
| (1) | transaction costs, including |
| (a) | sales charges (loads) on purchase payments, for Class A shares; |
| (b) | a deferred sales charge on redemptions of any part or all of a purchase of $1 million of Class A shares within 12 months of purchase; |
| (c) | a deferred sales charge on redemptions of Class C shares within 12 months of purchase; |
| (2) | ongoing costs, including management fees; distribution and/or service (12b-1) fees; and other Fund expenses. |
| BEGINNING ACCOUNT VALUE 10/1/18 | ENDING ACCOUNT VALUE 3/31/19 | EXPENSES PAID DURING PERIOD† 10/1/18—3/31/19 | |
| CLASS A SHARES | |||
| Actual | $1,000.00 | $1,074.78 | $7.71 |
| Hypothetical* | $1,000.00 | $1,017.50 | $7.49 |
| CLASS C SHARES | |||
| Actual | $1,000.00 | $1,070.17 | $11.56 |
| Hypothetical* | $1,000.00 | $1,013.76 | $11.25 |
| CLASS I SHARES | |||
| Actual | $1,000.00 | $1,076.25 | $5.64 |
| Hypothetical* | $1,000.00 | $1,019.50 | $5.49 |
| CLASS R5 SHARES | |||
| Actual | $1,000.00 | $1,076.89 | $5.64 |
| Hypothetical* | $1,000.00 | $1,019.50 | $5.49 |
| CLASS R6 SHARES | |||
| Actual | $1,000.00 | $1,077.28 | $5.13 |
| Hypothetical* | $1,000.00 | $1,020.00 | $4.99 |
| † | Expenses are equal to the annualized expense ratio for each class (A: 1.49%; C: 2.24%; I: 1.09%; R5: 1.09%; R6: 0.99%) multiplied by the average account value over the period, multiplied by 182/365 to reflect the one-half year period. |
| * | Hypothetical assumes a rate of return of 5% per year before expenses. |
Thornburg Developing World Fund | March 31, 2019 (Unaudited)
| ■ | Thornburg Investment Income Builder Fund |
| ■ | Thornburg Global Opportunities Fund |
| ■ | Thornburg International Value Fund |
| ■ | Thornburg Better World International Fund |
| ■ | Thornburg International Growth Fund |
| ■ | Thornburg Developing World Fund |
| ■ | Thornburg Value Fund |
| ■ | Thornburg Core Growth Fund |
| ■ | Thornburg Investment Income Builder Fund |
| ■ | Thornburg Summit Fund |
| ■ | Thornburg Low Duration Income Fund |
| ■ | Thornburg Limited Term U.S. Government Fund |
| ■ | Thornburg Limited Term Income Fund |
| ■ | Thornburg Strategic Income Fund |
| ■ | Thornburg Low Duration Municipal Fund |
| ■ | Thornburg Limited Term Municipal Fund |
| ■ | Thornburg Intermediate Municipal Fund |
| ■ | Thornburg California Limited Term Municipal Fund |
| ■ | Thornburg New Mexico Intermediate Municipal Fund |
| ■ | Thornburg New York Intermediate Municipal Fund |
| ■ | Thornburg Strategic Municipal Income Fund |
| ■ | Thornburg Long/Short Equity Fund |

| 800.847.0200 | TH2148 |


| 4 | |
| 6 | |
| 7 | |
| 8 | |
| 11 | |
| 12 | |
| 13 | |
| 14 | |
| 22 | |
| 24 | |
| 25 | |
| 26 |
| SHARE CLASS | NASDAQ SYMBOL | CUSIP |
| Class A | TBWAX | 885-216-721 |
| Class C | TBWCX | 885-216-713 |
| Class I | TBWIX | 885-216-697 |
Thornburg Better World International Fund | March 31, 2019 (Unaudited)
 |  |
| Jim Gassman Portfolio Manager Managing Director | Di Zhou,cfa,frm® Portfolio Manager Managing Director |
Thornburg Better World International Fund | March 31, 2019 (Unaudited)
| 1-YR | 3-YR | SINCE INCEP. | |
| Class A Shares(Incep: 9/30/15) | |||
| Without sales charge | -4.12% | 6.95% | 7.23% |
| With sales charge | -8.42% | 5.32% | 5.83% |
| Class C Shares(Incep: 9/30/15) | |||
| Without sales charge | -4.65% | 6.37% | 6.63% |
| With sales charge | -5.53% | 6.37% | 6.63% |
| Class I Shares(Incep: 9/30/15) | -3.50% | 7.76% | 8.04% |
| MSCI AC World ex-U.S. Index(Since 9/30/15) | -4.22% | 8.09% | 7.75% |
| FINAL VALUE |
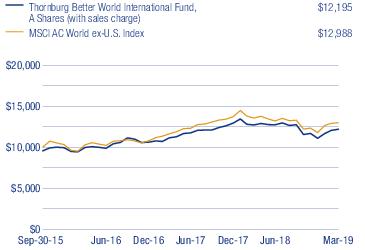
Thornburg Better World International Fund | March 31, 2019 (Unaudited)
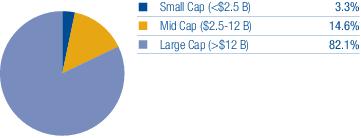
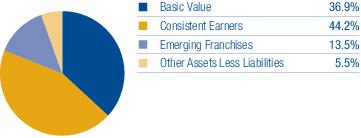
| TOP TEN EQUITY HOLDINGS | |
| AIA Group Ltd. | 3.3% |
| Alibaba Group Holding Ltd. Sponsored ADR | 3.3% |
| Resona Holdings, Inc. | 3.3% |
| Novartis AG | 2.9% |
| Enel S.p.A. | 2.6% |
| Compass Group PLC | 2.5% |
| Aena SME S.A. | 2.5% |
| ING Groep N.V. | 2.4% |
| Reckitt Benckiser Group plc | 2.3% |
| Tencent Holdings Ltd. | 2.3% |
| SECTOR EXPOSURE | |
| Industrials | 19.9% |
| Financials | 19.5% |
| Consumer Discretionary | 12.3% |
| Health Care | 10.7% |
| Communication Services | 8.9% |
| Information Technology | 6.8% |
| Consumer Staples | 6.6% |
| Materials | 5.8% |
| Utilities | 2.6% |
| Real Estate | 1.5% |
| Other Assets Less Liabilities | 5.4% |
| TOP TEN INDUSTRY GROUPS | |
| Banks | 11.1% |
| Capital Goods | 9.8% |
| Household & Personal Products | 6.6% |
| Retailing | 6.3% |
| Insurance | 6.2% |
| Pharmaceuticals, Biotechnology & Life Sciences | 5.8% |
| Materials | 5.8% |
| Transportation | 5.6% |
| Telecommunication Services | 5.1% |
| Healthcare Equipment & Services | 4.9% |
| COUNTRY EXPOSURE* (percent of equity holdings) | |
| United Kingdom | 13.1% |
| Germany | 12.1% |
| Japan | 11.4% |
| China | 11.1% |
| Switzerland | 9.2% |
| Netherlands | 7.9% |
| France | 6.3% |
| Italy | 5.4% |
| Spain | 4.5% |
| United States | 4.5% |
| Hong Kong | 3.5% |
| Ireland | 2.4% |
| Norway | 2.0% |
| Sweden | 1.6% |
| Canada | 1.5% |
| Mexico | 1.5% |
| Denmark | 0.8% |
| Singapore | 0.7% |
| Taiwan | 0.6% |
| * | Holdings are classified by country of risk as determined by MSCI and Bloomberg. |
Thornburg Better World International Fund | March 31, 2019 (Unaudited)
| SHARES | VALUE | ||
| Common Stock — 94.6% | |||
| Banks — 11.1% | |||
| Banks — 11.1% | |||
| BNP Paribas S.A. | 9,454 | $ 451,880 | |
| DNB ASA | 62,380 | 1,148,522 | |
| ING Groep N.V. | 122,254 | 1,478,901 | |
| Intesa Sanpaolo S.p.A. | 252,266 | 614,348 | |
| Resona Holdings, Inc. | 461,622 | 1,998,016 | |
| Royal Bank of Scotland Group plc | 219,843 | 707,246 | |
| United Overseas Bank Ltd. | 23,305 | 433,170 | |
| 6,832,083 | |||
| Capital Goods — 9.8% | |||
| Building Products — 1.5% | |||
| Assa Abloy AB Class B | 43,414 | 937,174 | |
| Electrical Equipment — 1.5% | |||
| Prysmian S.p.A. | 49,117 | 929,211 | |
| Machinery — 3.9% | |||
| CNH Industrial N.V. | 90,485 | 920,010 | |
| a | Knorr-Bremse AG | 6,356 | 631,205 |
| Weir Group plc | 41,681 | 845,798 | |
| Trading Companies & Distributors — 2.9% | |||
| Brenntag AG | 20,851 | 1,073,584 | |
| Ferguson plc | 10,616 | 675,301 | |
| 6,012,283 | |||
| Commercial & Professional Services — 4.5% | |||
| Commercial Services & Supplies — 1.7% | |||
| Focused Photonics Hangzhou, Inc. Class A | 250,990 | 1,027,086 | |
| Professional Services — 2.8% | |||
| SGS S.A. | 344 | 856,071 | |
| Thomson Reuters Corp. | 15,166 | 897,827 | |
| 2,780,984 | |||
| Consumer Durables & Apparel — 2.0% | |||
| Household Durables — 2.0% | |||
| Sony Corp. | 29,486 | 1,235,789 | |
| 1,235,789 | |||
| Consumer Services — 4.0% | |||
| Hotels, Restaurants & Leisure — 4.0% | |||
| Compass Group plc | 66,627 | 1,565,915 | |
| GreenTree Hospitality Group Ltd. ADR | 64,976 | 898,618 | |
| 2,464,533 | |||
| Diversified Financials — 2.2% | |||
| Capital Markets — 2.2% | |||
| UBS Group AG | 110,578 | 1,340,373 | |
| 1,340,373 | |||
| Healthcare Equipment & Services — 4.9% | |||
| Health Care Equipment & Supplies — 2.7% | |||
| Hoya Corp. | 10,500 | 692,452 | |
| Terumo Corp. | 30,784 | 938,825 | |
| Health Care Providers & Services — 2.2% | |||
| Fresenius Medical Care AG & Co. KGaA | 17,008 | 1,371,760 | |
| 3,003,037 | |||
| Household & Personal Products — 6.6% | |||
| Household Products — 3.3% | |||
| Henkel AG & Co. KGaA | 5,826 | 594,714 | |
| Reckitt Benckiser Group plc | 17,222 | 1,431,533 |
| SHARES | VALUE | ||
| Personal Products — 3.3% | |||
| Kao Corp. | 12,400 | $ 975,397 | |
| Unilever plc | 18,752 | 1,073,414 | |
| 4,075,058 | |||
| Insurance — 6.2% | |||
| Insurance — 6.2% | |||
| AIA Group Ltd. | 202,449 | 2,015,477 | |
| AXA S.A. | 34,317 | 863,445 | |
| NN Group N.V. | 22,641 | 940,471 | |
| 3,819,393 | |||
| Materials — 5.8% | |||
| Chemicals — 1.7% | |||
| Novozymes A/S | 9,700 | 445,984 | |
| Sika AG | 4,363 | 609,483 | |
| Construction Materials — 2.3% | |||
| CRH plc | 44,771 | 1,384,909 | |
| Paper & Forest Products — 1.8% | |||
| Mondi plc | 49,178 | 1,087,601 | |
| 3,527,977 | |||
| Media & Entertainment — 3.8% | |||
| Entertainment — 1.5% | |||
| a | Ubisoft Entertainment S.A. | 10,262 | 913,545 |
| Interactive Media & Services — 2.3% | |||
| Tencent Holdings Ltd. | 30,584 | 1,406,483 | |
| 2,320,028 | |||
| Pharmaceuticals, Biotechnology & Life Sciences — 5.8% | |||
| Life Sciences Tools & Services — 2.8% | |||
| Lonza Group AG | 2,255 | 699,316 | |
| Thermo Fisher Scientific, Inc. | 3,797 | 1,039,315 | |
| Pharmaceuticals — 3.0% | |||
| Novartis AG | 18,821 | 1,810,369 | |
| 3,549,000 | |||
| Real Estate — 1.5% | |||
| Equity Real Estate Investment Trusts — 1.5% | |||
| Equinix, Inc. | 1,967 | 891,366 | |
| 891,366 | |||
| Retailing — 6.3% | |||
| Internet & Direct Marketing Retail — 3.3% | |||
| a | Alibaba Group Holding Ltd. Sponsored ADR | 10,981 | 2,003,484 |
| Specialty Retail — 3.0% | |||
| GrandVision N.V. | 35,121 | 760,362 | |
| Industria de Diseno Textil S.A. | 37,530 | 1,103,001 | |
| 3,866,847 | |||
| Semiconductors & Semiconductor Equipment — 4.5% | |||
| Semiconductors & Semiconductor Equipment — 4.5% | |||
| ASML Holding N.V. | 5,342 | 1,001,927 | |
| Infineon Technologies AG | 51,142 | 1,014,563 | |
| NXP Semiconductors N.V. | 4,869 | 430,371 | |
| Taiwan Semiconductor Manufacturing Co. Ltd. Sponsored ADR | 7,780 | 318,669 | |
| 2,765,530 | |||
| Software & Services — 2.3% | |||
| Software — 2.3% | |||
| SAP SE | 11,976 | 1,383,710 | |
| 1,383,710 | |||
| Telecommunication Services — 5.1% |
Thornburg Better World International Fund | March 31, 2019 (Unaudited)
| SHARES | VALUE | ||
| Diversified Telecommunication Services — 5.1% | |||
| Deutsche Telekom AG | 56,122 | $ 931,417 | |
| Nippon Telegraph & Telephone Corp. | 18,531 | 786,351 | |
| Orange S.A. | 86,200 | 1,402,076 | |
| 3,119,844 | |||
| Transportation — 5.6% | |||
| Transportation Infrastructure — 5.6% | |||
| Aena SME S.A. | 8,504 | 1,531,068 | |
| Grupo Aeroportuario del Pacifico SAB de CV Class B | 95,185 | 843,855 | |
| Shanghai International Airport Co. Ltd. Class A | 117,834 | 1,089,757 | |
| 3,464,680 | |||
| Utilities — 2.6% | |||
| Electric Utilities — 2.6% | |||
| Enel S.p.A. | 252,745 | 1,617,180 | |
| 1,617,180 | |||
| Total Common Stock(Cost $56,149,370) | 58,069,695 | ||
| Short-Term Investments — 5.1% | |||
| b | Thornburg Capital Management Fund | 314,149 | 3,141,487 |
| Total Short-Term Investments(Cost $3,141,487) | 3,141,487 | ||
| Total Investments — 99.7%(Cost $59,290,857) | $61,211,182 | ||
| Other Assets Less Liabilities — 0.3% | 209,898 | ||
| Net Assets — 100.0% | $61,421,080 |
| Footnote Legend | |
| a | Non-income producing. |
| b | Investment in Affiliates. |
To simplify the listings of securities, abbreviations are used per the table below:
| ADR | American Depositary Receipt |
Thornburg Better World International Fund | March 31, 2019 (Unaudited)
| ASSETS | |
| Investments at value (Note 3) | |
| Non-affiliated issuers (cost $56,149,370) | $ 58,069,695 |
| Non-controlled affiliated issuer (cost $3,141,487) | 3,141,487 |
| Cash denominated in foreign currency (cost $18) | 18 |
| Receivable for investments sold | 887,861 |
| Receivable for fund shares sold | 63,750 |
| Dividends receivable | 184,109 |
| Dividend and interest reclaim receivable | 36,394 |
| Prepaid expenses and other assets | 27,010 |
| Total Assets | 62,410,324 |
| Liabilities | |
| Payable for investments purchased | 775,426 |
| Payable for fund shares redeemed | 108,045 |
| Payable to investment advisor and other affiliates (Note 4) | 37,764 |
| Accounts payable and accrued expenses | 68,009 |
| Total Liabilities | 989,244 |
| Net Assets | $ 61,421,080 |
| NET ASSETS CONSIST OF | |
| Distributable earnings | $ 195,826 |
| Net capital paid in on shares of beneficial interest | 61,225,254 |
| $ 61,421,080 | |
| NET ASSET VALUE | |
| Class A Shares: | |
| Net asset value and redemption price per share ($10,217,184 applicable to 804,532 shares of beneficial interest outstanding - Note 5) | $ 12.70 |
| Maximum sales charge, 4.50% of offering price | 0.60 |
| Maximum offering price per share | $ 13.30 |
| Class C Shares: | |
| Net asset value and offering price per share* ($1,907,653 applicable to 151,296 shares of beneficial interest outstanding - Note 5) | $ 12.61 |
| Class I Shares: | |
| Net asset value, offering and redemption price per share ($49,296,243 applicable to 3,802,908 shares of beneficial interest outstanding - Note 5) | $ 12.96 |
| * | Redemption price per share is equal to net asset value less any applicable contingent deferred sales charge. |
Thornburg Better World International Fund | Six Months Ended March 31, 2019 (Unaudited)
| INVESTMENT INCOME | |
| Dividend income | |
| Non-affiliated issuers (net of foreign taxes withheld of $38,537) | $ 442,834 |
| Non-controlled affiliated issuer | 41,173 |
| Total Income | 484,007 |
| EXPENSES | |
| Investment advisory fees (Note 4) | 292,342 |
| Administration fees (Note 4) | |
| Class A Shares | 4,103 |
| Class C Shares | 845 |
| Class I Shares | 21,363 |
| Distribution and service fees (Note 4) | |
| Class A Shares | 11,655 |
| Class C Shares | 9,639 |
| Transfer agent fees | |
| Class A Shares | 18,380 |
| Class C Shares | 2,548 |
| Class I Shares | 21,750 |
| Registration and filing fees | |
| Class A Shares | ��� 6,790 |
| Class C Shares | 6,790 |
| Class I Shares | 6,769 |
| Custodian fees (Note 2) | 14,880 |
| Professional fees | 31,932 |
| Trustee and officer fees (Note 4) | 1,636 |
| Other expenses | 30,514 |
| Total Expenses | 481,936 |
| Less: | |
| Expenses reimbursed by investment advisor (Note 4) | (64,085) |
| Investment advisory fees waived by investment advisor (Note 4) | (44,094) |
| Net Expenses | 373,757 |
| Net Investment Income | $ 110,250 |
| REALIZED AND UNREALIZED GAIN (LOSS) | |
| Net realized gain (loss) on: | |
| Non-affiliated issuer investments (net of realized capital gain taxes refunded of $836) | (1,624,999) |
| Foreign currency transactions | (5,065) |
| (1,630,064) | |
| Net change in unrealized appreciation (depreciation) on: | |
| Non-affiliated issuer investments | (1,550,274) |
| Foreign currency translations | (587) |
| (1,550,861) | |
| Net Realized and Unrealized Loss | (3,180,925) |
| Net Decrease in Net Assets Resulting from Operations | $ (3,070,675) |
Thornburg Better World International Fund
| Six Months Ended March 31, 2019* | Year Ended September 30, 2018 | |
| INCREASE (DECREASE) IN NET ASSETS FROM | ||
| OPERATIONS | ||
| Net investment income | $ 110,250 | $ 776,603 |
| Net realized gain (loss) on investments, foreign currency transactions and capital gain taxes | (1,630,064) | 6,232,775 |
| Net unrealized appreciation (depreciation) on investments, foreign currency translations and deferred taxes | (1,550,861) | (2,723,436) |
| Net Increase (Decrease) in Net Assets Resulting from Operations | (3,070,675) | 4,285,942 |
| DIVIDENDS TO SHAREHOLDERS | ||
| From distributable earnings | ||
| Class A Shares | (794,042) | (169,562) |
| Class C Shares | (158,603) | (62,136) |
| Class I Shares | (4,524,294) | (1,613,511) |
| FUND SHARE TRANSACTIONS (NOTE 5) | ||
| Class A Shares | 2,736,087 | 1,938,084 |
| Class C Shares | (103,413) | 39,251 |
| Class I Shares | 518,010 | (6,205,887) |
| Net Decrease in Net Assets | (5,396,930) | (1,787,819) |
| NET ASSETS | ||
| Beginning of Period | 66,818,010 | 68,605,829 |
| End of Period | $ 61,421,080 | $ 66,818,010 |
| * | Unaudited. |
Thornburg Better World International Fund | March 31, 2019 (Unaudited)
| Cost of investments for tax purposes | $ 59,290,857 |
| Gross unrealized appreciation on a tax basis | 4,986,394 |
| Gross unrealized depreciation on a tax basis | (3,066,069) |
| Net unrealized appreciation (depreciation) on investments (tax basis) | $ 1,920,325 |
Thornburg Better World International Fund | March 31, 2019 (Unaudited)
| Fair Value Measurements at March 31, 2019 | ||||
| TOTAL | LEVEL 1 | LEVEL 2 | LEVEL 3 | |
| Assets | ||||
| Investments in Securities* | ||||
| Common Stock | $ 58,069,695 | $ 58,069,695 | $ — | $ — |
| Short-Term Investments | 3,141,487 | 3,141,487 | — | — |
| Total Investments in Securities | $61,211,182 | $61,211,182 | $— | $— |
| Total Assets | $61,211,182 | $61,211,182 | $— | $— |
Thornburg Better World International Fund | March 31, 2019 (Unaudited)
| * | See Schedule of Investments for a summary of the industry exposure as grouped according to the Global Industry Classification Standard (GICS), which is an industry taxonomy developed by MSCI, Inc. and Standard & Poor’s (S&P). |
| Management Fee Schedule | |
| DAILY NET ASSETS | FEE RATE |
| Up to $500 million | 0.975% |
| Next $500 million | 0.925 |
| Next $500 million | 0.875 |
| Next $500 million | 0.825 |
| Over $2 billion | 0.775 |
| Administration Fee Schedule | |
| Daily Net Assets | Fee Rate |
| Up to $20 billion | 0.100% |
| $20 billion to $40 billion | 0.075 |
| $40 billion to $60 billion | 0.040 |
| Over $60 billion | 0.030 |
| Fund | Market Value 9/30/18 | Purchases at Cost | Sales Proceeds | Realized Gain (Loss) | Change in Unrealized Appr./(Depr.) | Market Value 3/31/19 | Dividend Income |
| Thornburg Capital Management Fund | $2,894,980 | $15,376,456 | $(15,129,949) | $- | $- | $3,141,487 | $41,173 |
| SIX MONTHS ENDED March 31, 2019 (UNAUDITED) | YEAR ENDED September 30, 2018 (AUDITED) | |||
| SHARES | AMOUNT | SHARES | AMOUNT | |
| Class A Shares | ||||
| Shares sold | 225,938 | $ 2,878,021 | 159,116 | $ 2,341,246 |
| Shares issued to shareholders in reinvestment of dividends | 65,598 | 793,952 | 11,866 | 169,052 |
| Shares repurchased | (75,200) | (935,886) | (39,319) | (572,214) |
| Net increase | 216,336 | $ 2,736,087 | 131,663 | $ 1,938,084 |
| Class C Shares | ||||
| Shares sold | 18,357 | $ 222,962 | 49,146 | $ 710,327 |
| Shares issued to shareholders in reinvestment of dividends | 13,178 | 158,604 | 4,397 | 62,136 |
| Shares repurchased | (40,216) | (484,979) | (50,802) | (733,212) |
| Net increase (decrease) | (8,681) | $ (103,413) | 2,741 | $ 39,251 |
Thornburg Better World International Fund | March 31, 2019 (Unaudited)
| SIX MONTHS ENDED March 31, 2019 (UNAUDITED) | YEAR ENDED September 30, 2018 (AUDITED) | |||
| SHARES | AMOUNT | SHARES | AMOUNT | |
| Class I Shares | ||||
| Shares sold | 434,917 | $ 5,393,606 | 862,967 | $ 12,809,809 |
| Shares issued to shareholders in reinvestment of dividends | 333,731 | 4,122,477 | 104,734 | 1,514,453 |
| Shares repurchased | (741,087) | (8,998,073) | (1,377,372) | (20,530,149) |
| Net increase (decrease) | 27,561 | $ 518,010 | (409,671) | $ (6,205,887) |
SHEET RISK AND FOREIGN INVESTMENT RISK
Thornburg Better World International Fund
| PER SHARE PERFORMANCE (FOR A SHARE OUTSTANDING THROUGHOUT THE PERIOD) | ||||||||
| UNLESS OTHERWISE NOTED, PERIODS ARE FISCAL YEARS ENDED SEPTEMBER 30, | Net Asset Value, Beginning of PERIOD | Net Investment Income (Loss)+ | Net Realized & Unrealized Gain (Loss) on Investments | Total from Investment Operations | Dividends from Net Investment Income | Dividends from Net Realized Gains | Total Dividends | Net Asset Value, End of PERIOD |
| CLASS A SHARES | ||||||||
| 2019(b)(c) | $ 14.51 | (0.01) | (0.68) | (0.69) | (0.15) | (0.97) | (1.12) | $ 12.70 |
| 2018(b) | $ 14.13 | 0.09 | 0.66 | 0.75 | — | (0.37) | (0.37) | $ 14.51 |
| 2017(b) | $ 13.86 | 0.09 | 0.99 | 1.08 | (0.12) | (0.69) | (0.81) | $ 14.13 |
| 2016(b)(e) | $ 11.94 | 0.03 | 2.04 | 2.07 | (0.15) | — | (0.15) | $ 13.86 |
| CLASS C SHARES | ||||||||
| 2019(c) | $ 14.32 | (0.05) | (0.65) | (0.70) | (0.04) | (0.97) | (1.01) | $ 12.61 |
| 2018 | $ 14.02 | —(g) | 0.67 | 0.67 | — | (0.37) | (0.37) | $ 14.32 |
| 2017 | $ 13.79 | 0.02 | 0.97 | 0.99 | (0.07) | (0.69) | (0.76) | $ 14.02 |
| 2016(e) | $ 11.94 | (0.05) | 2.04 | 1.99 | (0.14) | — | (0.14) | $ 13.79 |
| CLASS I SHARES | ||||||||
| 2019(c) | $ 14.83 | 0.03 | (0.70) | (0.67) | (0.23) | (0.97) | (1.20) | $ 12.96 |
| 2018 | $ 14.33 | 0.18 | 0.69 | 0.87 | — | (0.37) | (0.37) | $ 14.83 |
| 2017 | $ 13.96 | 0.20 | 1.02 | 1.22 | (0.16) | (0.69) | (0.85) | $ 14.33 |
| 2016(e) | $ 11.94 | 0.10 | 2.01 | 2.11 | (0.09) | — | (0.09) | $ 13.96 |
| (a) | Not annualized for periods less than one year. |
| (b) | Sales loads are not reflected in computing total return. |
| (c) | Unaudited Six Month Period Ended March 31. |
| (d) | Annualized. |
| (e) | Fund commenced operations on October 01, 2015. |
| (f) | Due to the size of net assets and fixed expenses, ratios may appear disproportionate. |
| (g) | Net investment income (loss) was less than $0.01 per share. |
| + | Based on weighted average shares outstanding. |
| RATIOS TO AVERAGE NET ASSETS | SUPPLEMENTAL DATA | ||||||
| Net Investment Income (Loss) (%) | Expenses, After Expense Reductions (%) | Expenses, After Expense Reductions and Net of Custody Credits (%) | Expenses, Before Expense Reductions (%) | Total Return (%)(a) | Portfolio Turnover Rate (%)(a) | Net Assets at End of PERIOD (Thousands) | |
| (0.14)(d) | 1.83(d) | 1.83(d) | 2.12(d) | (4.32) | 30.19 | $ 10,217 | |
| 0.64 | 1.82 | 1.82 | 2.12 | 5.37 | 111.99 | $ 8,537 | |
| 0.64 | 1.79 | 1.79 | 3.21 | 8.61 | 105.55 | $ 6,450 | |
| 0.21 | 1.83 | 1.83 | 7.27(f) | 16.60 | 180.60 | $ 1,666 | |
| (0.78)(d) | 2.38(d) | 2.38(d) | 3.29(d) | (4.58) | 30.19 | $ 1,908 | |
| (0.03) | 2.38 | 2.38 | 3.09 | 4.82 | 111.99 | $ 2,292 | |
| 0.18 | 2.32 | 2.32 | 4.48 | 7.97 | 105.55 | $ 2,205 | |
| (0.40) | 2.38 | 2.38 | 13.13(f) | 15.94 | 180.60 | $ 822 | |
| 0.51(d) | 1.09(d) | 1.09(d) | 1.44(d) | (4.02) | 30.19 | $ 49,296 | |
| 1.20 | 1.09 | 1.09 | 1.35 | 6.15 | 111.99 | $ 55,989 | |
| 1.48 | 0.94 | 0.94 | 1.62 | 9.58 | 105.55 | $ 59,951 | |
| 0.76 | 1.09 | 1.09 | 2.28 | 17.44 | 180.60 | $ 27,781 | |
Thornburg Better World International Fund | March 31, 2019 (Unaudited)
| (1) | transaction costs, including |
| (a) | sales charges (loads) on purchase payments, for Class A shares; |
| (b) | a deferred sales charge on redemptions of any part or all of a purchase of $1 million of Class A shares within 12 months of purchase; |
| (c) | a deferred sales charge on redemptions of Class C shares within 12 months of purchase; |
| (2) | ongoing costs, including management fees; distribution and/or service (12b-1) fees; and other Fund expenses. |
| BEGINNING ACCOUNT VALUE 10/1/18 | ENDING ACCOUNT VALUE 3/31/19 | EXPENSES PAID DURING PERIOD† 10/1/18—3/31/19 | |
| CLASS A SHARES | |||
| Actual | $1,000.00 | $956.79 | $8.93 |
| Hypothetical* | $1,000.00 | $1,015.81 | $9.20 |
| CLASS C SHARES | |||
| Actual | $1,000.00 | $954.20 | $11.60 |
| Hypothetical* | $1,000.00 | $1,013.06 | $11.94 |
| CLASS I SHARES | |||
| Actual | $1,000.00 | $959.79 | $5.33 |
| Hypothetical* | $1,000.00 | $1,019.50 | $5.49 |
| † | Expenses are equal to the annualized expense ratio for each class (A: 1.83%; C: 2.38%; I: 1.09%) multiplied by the average account value over the period, multiplied by 182/365 to reflect the one-half year period. |
| * | Hypothetical assumes a rate of return of 5% per year before expenses. |
Thornburg Better World International Fund | March 31, 2019 (Unaudited)
| ■ | Thornburg Investment Income Builder Fund |
| ■ | Thornburg Global Opportunities Fund |
| ■ | Thornburg International Value Fund |
| ■ | Thornburg Better World International Fund |
| ■ | Thornburg International Growth Fund |
| ■ | Thornburg Developing World Fund |
| ■ | Thornburg Value Fund |
| ■ | Thornburg Core Growth Fund |
| ■ | Thornburg Investment Income Builder Fund |
| ■ | Thornburg Summit Fund |
| ■ | Thornburg Low Duration Income Fund |
| ■ | Thornburg Limited Term U.S. Government Fund |
| ■ | Thornburg Limited Term Income Fund |
| ■ | Thornburg Strategic Income Fund |
| ■ | Thornburg Low Duration Municipal Fund |
| ■ | Thornburg Limited Term Municipal Fund |
| ■ | Thornburg Intermediate Municipal Fund |
| ■ | Thornburg California Limited Term Municipal Fund |
| ■ | Thornburg New Mexico Intermediate Municipal Fund |
| ■ | Thornburg New York Intermediate Municipal Fund |
| ■ | Thornburg Strategic Municipal Income Fund |
| ■ | Thornburg Long/Short Equity Fund |

| 800.847.0200 | TH3645 |


| SHARE CLASS | NASDAQ SYMBOL | CUSIP |
| Class I | N/A | 885-216-739 |
Thornburg Capital Management Fund | March 31, 2019 (Unaudited)
| 1-YR | 3-YR | SINCE INCEP. | |
| Class I Shares(Incep: 7/31/15) | 2.27% | 1.37% | 1.19% |
| FTSE 1-Month T-Bill Index(Since 7/31/15) | 2.09% | 1.13% | 0.94% |
| Annualized Distribution Yield | 2.58% |
| SEC Yield | 2.67% |
| FINAL VALUE |
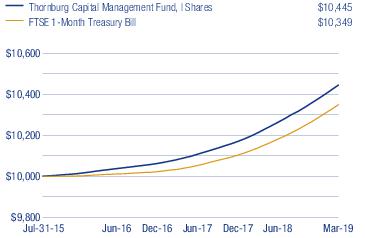
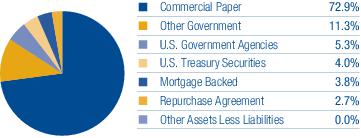
Thornburg Capital Management Fund | March 31, 2019 (Unaudited)
| SHARES/ PRINCIPAL AMOUNT | VALUE | ||
| SHORT-TERM INVESTMENTS — 100.0% | |||
| a | AbbVie, Inc., 2.630%, 4/18/2019 | $18,000,000 | $ 17,977,645 |
| a | Air Liquide U.S. LLC, 2.600%, 4/4/2019 | 17,000,000 | 16,996,317 |
| Ameren Corp., 2.700%, 4/4/2019 | 4,000,000 | 3,999,100 | |
| Ameren Illinois Co., 2.650%, 4/1/2019 | 13,000,000 | 13,000,000 | |
| Amphenol Corp., | |||
| a | 2.600%, 4/2/2019 | 5,000,000 | 4,999,639 |
| a | 2.600%, 4/3/2019 | 12,000,000 | 11,998,267 |
| a | Anthem, Inc., 2.620%, 4/1/2019 | 16,300,000 | 16,300,000 |
| Atlantic City Electric, 1.928%, 4/1/2019 | 17,000,000 | 17,000,000 | |
| AutoZone, Inc., | |||
| a | 2.620%, 4/1/2019 | 5,000,000 | 5,000,000 |
| a | 2.680%, 4/8/2019 | 3,371,000 | 3,369,243 |
| AVANGRID, Inc., | |||
| a | 2.650%, 4/3/2019 | 1,750,000 | 1,749,742 |
| a | 2.670%, 4/16/2019 | 12,550,000 | 12,536,038 |
| a | 2.720%, 4/17/2019 | 3,700,000 | 3,695,527 |
| B.A.T. International Finance plc, | |||
| a,b | 2.680%, 4/4/2019 | 15,000,000 | 14,996,650 |
| a,b | 2.700%, 4/11/2019 | 1,000,000 | 999,250 |
| a,b | 2.720%, 4/5/2019 | 2,000,000 | 1,999,396 |
| Bank of New York Tri-Party Repurchase Agreement 2.60% dated 03/29/2019 due 04/01/2019, repurchase price $30,006,518 collateralized by 23 corporate debt securities, having an average coupon of 4.01%, a minimum credit rating of BBB-, maturity dates from 04/01/2019 to 06/01/2045, and having an aggregate market value of $32,147,376 at 03/31/2019 | 30,000,000 | 30,000,000 | |
| Basf Aktiengesellsch, | |||
| a,b | 2.460%, 4/23/2019 | 2,600,000 | 2,596,091 |
| a,b | 2.460%, 4/26/2019 | 14,400,000 | 14,375,400 |
| Baxter International Inc., | |||
| a | 2.660%, 4/1/2019 | 5,000,000 | 5,000,000 |
| a | 2.660%, 4/5/2019 | 12,000,000 | 11,996,453 |
| Brown-Forman Corp., | |||
| a | 2.382%, 4/1/2019 | 2,143,000 | 2,143,000 |
| a | 2.470%, 4/1/2019 | 2,884,000 | 2,884,000 |
| a | 2.550%, 4/4/2019 | 11,973,000 | 11,970,456 |
| Centerpoint Energy, Inc., | |||
| a | 2.720%, 4/3/2019 | 3,000,000 | 2,999,547 |
| a | 2.740%, 4/23/2019 | 1,000,000 | 998,326 |
| a | 2.750%, 4/16/2019 | 10,858,000 | 10,845,559 |
| a | 2.760%, 4/18/2019 | 3,142,000 | 3,137,905 |
| a | Church & Dwight Co., Inc., 2.570%, 4/3/2019 | 8,140,000 | 8,138,838 |
| Cintas Corp. No. 2, | |||
| a | 2.650%, 4/2/2019 | 13,715,000 | 13,713,990 |
| a | 2.720%, 4/10/2019 | 2,045,000 | 2,043,609 |
| Consolidated Edison, Inc., | |||
| a | 2.630%, 4/4/2019 | 1,000,000 | 999,781 |
| a | 2.660%, 4/1/2019 | 17,000,000 | 17,000,000 |
| a | CVS Corp., 2.620%, 4/1/2019 | 18,000,000 | 18,000,000 |
| a | Dollar General Corp., 2.650%, 4/1/2019 | 17,000,000 | 17,000,000 |
| Ecolab, Inc., | |||
| a | 2.590%, 4/3/2019 | 14,480,000 | 14,477,916 |
| a | 2.590%, 4/9/2019 | 3,520,000 | 3,517,974 |
| Electricite de France S.A., | |||
| a,b | 2.600%, 4/1/2019 | 1,000,000 | 1,000,000 |
| a,b | 2.670%, 4/3/2019 | 17,000,000 | 16,997,478 |
| Eni Finance USA, Inc., | |||
| a | 2.690%, 4/1/2019 | 16,000,000 | 16,000,000 |
| a | 2.700%, 4/3/2019 | 1,000,000 | 999,850 |
| a | 2.750%, 4/5/2019 | 1,000,000 | 999,694 |
| ENTERGY Corp., | |||
| a | 2.580%, 4/1/2019 | 16,000,000 | 16,000,000 |
| a | 2.700%, 4/10/2019 | 1,000,000 | 999,325 |
| a,b | Experian Finance plc, 2.700%, 4/12/2019 | 3,301,000 | 3,298,277 |
| Federal Agricultural Mortgage Corp. Discount Notes, 2.365%, 4/3/2019 | 42,000,000 | 41,994,482 | |
Thornburg Capital Management Fund | March 31, 2019 (Unaudited)
| SHARES/ PRINCIPAL AMOUNT | VALUE | ||
| Federal Home Loan Bank Discount Notes, | |||
| 2.375%, 4/3/2019 | $ 7,800,000 | $ 7,798,971 | |
| 2.400%, 4/3/2019 | 6,000,000 | 5,999,200 | |
| 2.400%, 4/17/2019 | 19,000,000 | 18,979,733 | |
| 2.420%, 4/26/2019 | 10,000,000 | 9,983,194 | |
| General Electric Co., | |||
| 2.670%, 4/5/2019 | 16,000,000 | 15,995,253 | |
| 2.760%, 4/11/2019 | 1,000,000 | 999,233 | |
| General Mills, Inc., | |||
| a | 2.580%, 4/8/2019 | 7,194,000 | 7,190,391 |
| a | 2.610%, 4/9/2019 | 2,806,000 | 2,804,373 |
| a | 2.700%, 4/3/2019 | 6,000,000 | 5,999,100 |
| b | IBRD Discount Notes, 2.320%, 4/22/2019 | 45,000,000 | 44,939,100 |
| IFC Discount Notes, | |||
| b | 2.300%, 4/1/2019 | 21,243,000 | 21,243,000 |
| b | 2.390%, 4/26/2019 | 20,000,000 | 19,966,806 |
| b | Inter-American Development Bank, 2.390%, 4/22/2019 | 42,000,000 | 41,941,445 |
| a | Johnson Controls International plc, 2.850%, 4/25/2019 | 1,176,000 | 1,173,766 |
| a | KCP&L Greater Missouri operations, 2.680%, 4/1/2019 | 18,000,000 | 18,000,000 |
| Kellogg Co., | |||
| a | 2.610%, 4/3/2019 | 1,000,000 | 999,855 |
| a | 2.650%, 4/10/2019 | 14,000,000 | 13,990,725 |
| a | 2.680%, 4/4/2019 | 1,000,000 | 999,777 |
| a | Kentucky Utilities Co., 2.700%, 4/1/2019 | 18,000,000 | 18,000,000 |
| a | Keurig Dr Pepper, Inc., 2.750%, 4/4/2019 | 2,000,000 | 1,999,542 |
| Kimberly-Clark Corp., | |||
| a | 2.430%, 4/4/2019 | 5,060,000 | 5,058,975 |
| a | 2.470%, 4/17/2019 | 5,700,000 | 5,693,743 |
| a | Kroger Co., 1.913%, 4/1/2019 | 17,000,000 | 17,000,000 |
| a | L’oreal USA, Inc., 2.430%, 4/18/2019 | 7,000,000 | 6,991,967 |
| Leggett & Platt, | |||
| a | 2.314%, 4/12/2019 | 5,000,000 | 4,995,875 |
| a | 2.650%, 4/8/2019 | 4,003,000 | 4,000,937 |
| a | 2.700%, 4/12/2019 | 3,047,000 | 3,044,486 |
| a | Lockheed Martin Corp., 2.550%, 4/1/2019 | 17,000,000 | 17,000,000 |
| Louisville Gas & Electric Co., | |||
| a | 2.640%, 4/1/2019 | 7,593,000 | 7,593,000 |
| a | 2.700%, 4/1/2019 | 7,000,000 | 7,000,000 |
| a | 2.730%, 4/2/2019 | 3,407,000 | 3,406,742 |
| Low’s Companies, Inc., 2.670%, 4/4/2019 | 15,000,000 | 14,996,662 | |
| a | Marriott International, Inc., 2.700%, 4/3/2019 | 2,000,000 | 1,999,700 |
| McCormick & Co., Inc., | |||
| a | 2.600%, 4/1/2019 | 3,000,000 | 3,000,000 |
| a | 2.600%, 4/2/2019 | 2,950,000 | 2,949,787 |
| a | 2.620%, 4/8/2019 | 3,050,000 | 3,048,446 |
| Mondelez International, Inc., | |||
| a | 2.620%, 4/8/2019 | 2,427,000 | 2,425,764 |
| a | 2.650%, 4/11/2019 | 2,600,000 | 2,598,086 |
| a | 2.650%, 4/16/2019 | 8,973,000 | 8,963,092 |
| a | 2.680%, 4/15/2019 | 4,000,000 | 3,995,831 |
| a | One Gas, Inc., 2.430%, 4/8/2019 | 17,000,000 | 16,991,967 |
| Potomac Electric Power Co., 1.928%, 4/1/2019 | 17,000,000 | 17,000,000 | |
| PPG Industries, Inc., 2.670%, 4/10/2019 | 17,000,000 | 16,988,652 | |
| a | Public Service Co. of Colorado, 2.650%, 4/12/2019 | 17,000,000 | 16,986,235 |
| a,b | Reckitt Benckiser Treasury Services plc, 2.690%, 4/3/2019 | 1,000,000 | 999,851 |
| Royal Bank of Canada, | |||
| a,b | 2.670%, 4/10/2019 | 16,000,000 | 15,989,320 |
| a,b | 2.700%, 4/17/2019 | 2,000,000 | 1,997,600 |
| Ryder System, Inc., | |||
| 2.660%, 4/4/2019 | 11,000,000 | 10,997,562 | |
| 2.680%, 4/1/2019 | 4,079,000 | 4,079,000 | |
| 2.710%, 4/4/2019 | 1,000,000 | 999,774 |
| SHARES/ PRINCIPAL AMOUNT | VALUE | ||
| San Diego Gas & Electric Co., | |||
| a | 2.600%, 4/1/2019 | $ 2,758,000 | $ 2,758,000 |
| a | 2.750%, 4/3/2019 | 4,000,000 | 3,999,389 |
| a | 2.770%, 4/2/2019 | 10,000,000 | 9,999,231 |
| Sempra Energy Holdings, | |||
| a | 2.670%, 4/1/2019 | 15,000,000 | 15,000,000 |
| a | 2.700%, 4/2/2019 | 2,700,000 | 2,699,797 |
| a | 2.700%, 4/3/2019 | 1,000,000 | 999,850 |
| Southern Co. Gas Capital Corp., | |||
| a | 2.400%, 4/1/2019 | 10,000,000 | 10,000,000 |
| a | 2.680%, 4/4/2019 | 13,000,000 | 12,997,097 |
| a | Stanley Works (The), 2.620%, 4/8/2019 | 6,400,000 | 6,396,740 |
| Telstra Corp., Ltd., | |||
| a,b | 2.550%, 4/4/2019 | 7,000,000 | 6,998,512 |
| a,b | 2.600%, 4/17/2019 | 1,832,000 | 1,829,883 |
| Tennessee Valley Authority Discount Notes, 2.440%, 4/16/2019 | 17,600,000 | 17,582,107 | |
| a | The Clorox Co., 2.650%, 4/5/2019 | 14,000,000 | 13,995,878 |
| a,b | Tyco Electronics Group S.A., 2.570%, 4/1/2019 | 4,805,000 | 4,805,000 |
| Union Electric Co., 2.660%, 4/1/2019 | 17,000,000 | 17,000,000 | |
| United States Treasury Bill, | |||
| 2.382%, 4/2/2019 | 25,000,000 | 24,998,346 | |
| 2.388%, 4/9/2019 | 7,000,000 | 6,996,285 | |
| 2.420%, 4/16/2019 | 13,000,000 | 12,986,892 | |
| a | Wec Energy Group, Inc., 2.740%, 4/17/2019 | 18,000,000 | 17,978,080 |
| a | Whirlpool Corp., 2.660%, 4/10/2019 | 12,000,000 | 11,992,020 |
| TOTAL SHORT-TERM INVESTMENTS(Cost $1,128,554,390) | 1,128,554,390 | ||
| Total Investments — 100.0%(Cost $1,128,554,390) | $1,128,554,390 | ||
| Other Assets Less Liabilities — 0.0% | 147,777 | ||
| Net Assets — 100.0% | $1,128,702,167 |
| Footnote Legend | |
| a | Securities exempt from registration under Rule 144A of the Securities Act of 1933, as amended. These securities are restricted but liquid and may only be resold in the ordinary course of business in transactions exempt from registration, normally to qualified institutional buyers. As of March 31, 2019, the aggregate value of these securities in the Fund’s portfolio was $690,089,593, representing 61.14% of the Fund’s net assets. |
| b | Yankee bond denominated in U.S. dollars and is issued in the U.S. by foreign banks and corporations. |
Thornburg Capital Management Fund | March 31, 2019 (Unaudited)
| ASSETS | |
| Investments at value (cost $1,128,554,390) (Note 3) | $ 1,128,554,390 |
| Cash | 158,657 |
| Interest receivable | 6,500 |
| Prepaid expenses and other assets | 4,486 |
| Total Assets | 1,128,724,033 |
| Liabilities | |
| Accounts payable and accrued expenses | 21,866 |
| Total Liabilities | 21,866 |
| Net Assets | $ 1,128,702,167 |
| NET ASSETS CONSIST OF | |
| Distributable earnings | $ 23,695 |
| Net capital paid in on shares of beneficial interest | 1,128,678,472 |
| $ 1,128,702,167 | |
| NET ASSET VALUE | |
| Class I Shares: | |
| Net asset value, offering and redemption price per share ($1,128,702,167 applicable to 112,870,217 shares of beneficial interest outstanding - Note 5) | $ 10.00 |
Thornburg Capital Management Fund | Six Months Ended March 31, 2019 (Unaudited)
| INVESTMENT INCOME | |
| Interest income | $ 11,762,961 |
| EXPENSES | |
| Transfer agent fees | 2,552 |
| Custodian fees (Note 2) | 40,445 |
| Professional fees | 13,367 |
| Officer fees | 3,369 |
| Other expenses | 18,428 |
| Total Expenses | 78,161 |
| Net Investment Income | $ 11,684,800 |
Thornburg Capital Management Fund
| Six Months Ended March 31, 2019* | Year Ended September 30, 2018 | |
| INCREASE (DECREASE) IN NET ASSETS FROM | ||
| OPERATIONS | ||
| Net investment income | $ 11,684,800 | $ 18,648,377 |
| Net Increase in Net Assets Resulting from Operations | 11,684,800 | 18,648,377 |
| DIVIDENDS TO SHAREHOLDERS | ||
| From distributable earnings | ||
| Class I Shares | (11,684,800) | (18,648,377) |
| FUND SHARE TRANSACTIONS (NOTE 5) | ||
| Class I Shares | (196,823,121) | 195,504,453 |
| Net Increase (Decrease) in Net Assets | (196,823,121) | 195,504,453 |
| NET ASSETS | ||
| Beginning of Period | 1,325,525,288 | 1,130,020,835 |
| End of Period | $ 1,128,702,167 | $ 1,325,525,288 |
| * | Unaudited. |
Thornburg Capital Management Fund | March 31, 2019 (Unaudited)
Thornburg Capital Management Fund | March 31, 2019 (Unaudited)
| Cost of investments for tax purposes | $ 1,128,554,390 |
| Net unrealized appreciation (depreciation) on investments (tax basis) | $ - |
| Fair Value Measurements at March 31, 2019 | ||||
| TOTAL | LEVEL 1 | LEVEL 2 | LEVEL 3 | |
| Assets | ||||
| Investments in Securities | ||||
| Short-Term Investments | $ 1,128,554,390 | $ — | $ 1,128,554,390 | $ — |
| Total Investments in Securities | $1,128,554,390 | $— | $1,128,554,390 | $— |
| Total Assets | $1,128,554,390 | $— | $1,128,554,390 | $— |
Thornburg Capital Management Fund | March 31, 2019 (Unaudited)
| SIX MONTHS ENDED March 31, 2019 (UNAUDITED) | YEAR ENDED September 30, 2018 (AUDITED) | |||
| SHARES | AMOUNT | SHARES | AMOUNT | |
| Class I Shares | ||||
| Shares sold | 352,031,138 | $ 3,520,311,385 | 800,929,556 | $ 8,009,295,565 |
| Shares issued to shareholders in reinvestment of dividends | 1,166,977 | 11,669,768 | 1,866,541 | 18,665,413 |
| Shares repurchased | (372,880,427) | (3,728,804,274) | (783,245,652) | (7,832,456,525) |
| Net increase (decrease) | (19,682,312) | $ (196,823,121) | 19,550,445 | $ 195,504,453 |
Thornburg Capital Management Fund
| Per Share Performance (For a Share Outstanding throughout the Period) | ||||||||
| UNLESS OTHERWISE NOTED, PERIODS ARE FISCAL YEARS ENDED SEPTEMBER 30, | Net Asset Value, Beginning of Period | Net Investment Income (Loss)+ | Net Realized & Unrealized Gain (Loss) on Investments | Total from Investment Operations | Dividends from Net Investment Income | Dividends from Net Realized Gains | Total Dividends | Net Asset Value, End of Period |
| Class I | ||||||||
| 2019(b) | $ 10.00 | 0.12 | — | 0.12 | (0.12) | — | (0.12) | $ 10.00 |
| 2018(b) | $ 10.00 | 0.18 | — | 0.18 | (0.18) | — | (0.18) | $ 10.00 |
| 2017(b) | $ 10.00 | 0.09 | — | 0.09 | (0.09) | — | (0.09) | $ 10.00 |
| 2016(b) | $ 10.00 | 0.05 | — | 0.05 | (0.05) | — | (0.05) | $ 10.00 |
| 2015(b)* | $ 10.00 | —(e) | —(f) | —(g) | —(h) | — | — | $ 10.00 |
| (a) | Not annualized for periods less than one year. |
| (b) | Sales loads are not reflected in computing total return. |
| (c) | Annualized. |
| (d) | Portfolio turnover rate equals zero due to no long term investment transactions in the period. |
| (e) | Net investment income (loss) was less than $0.01 per share. |
| (f) | Net realized and unrealized gain (loss) on investments was less than $0.01 per share. |
| (g) | Total from investment operations was less than $0.01 per share. |
| (h) | Dividends from net investment income per share were less than $(0.01). |
| (i) | Annualized. |
| + | Based on weighted average shares outstanding. |
| * | The Fund commenced operations on July 31, 2015. |
| Ratios to Average Net Assets | Supplemental Data | |||||
| Net Investment Income (Loss) (%) | Expenses, After Expense Reductions (%) | Expenses, Before Expense Reductions (%) | Total Return (%)(a) | Portfolio Turnover Rate (%)(a) | Net Assets at End of Period (Thousands) | |
| 2.48(c) | 0.02(c) | 0.02(c) | 1.25 | —(d) | $ 1,128,702 | |
| 1.76 | 0.02 | 0.02 | 1.76 | —(d) | $ 1,325,525 | |
| 0.89 | 0.03 | 0.03 | 0.87 | —(d) | $ 1,130,021 | |
| 0.45 | 0.03 | 0.03 | 0.45 | —(d) | $ 1,393,536 | |
| 0.26(i) | 0.03(i) | 0.03(i) | 0.04 | —(d) | $ 1,772,860 | |
Thornburg Capital Management Fund | March 31, 2019 (Unaudited)
| BEGINNING ACCOUNT VALUE 10/1/18 | ENDING ACCOUNT VALUE 3/31/19 | EXPENSES PAID DURING PERIOD† 10/1/18—3/31/19 | |
| CLASS I SHARES | |||
| Actual | $1,000.00 | $1,012.48 | $0.10 |
| Hypothetical* | $1,000.00 | $1,024.83 | $0.10 |
| † | Expenses are equal to the annualized expense ratio for each class (I: 0.02%) multiplied by the average account value over the period, multiplied by 182/365 to reflect the one-half year period. |
| * | Hypothetical assumes a rate of return of 5% per year before expenses. |
Thornburg Capital Management Fund | March 31, 2019 (Unaudited)
| ■ | Thornburg Investment Income Builder Fund |
| ■ | Thornburg Global Opportunities Fund |
| ■ | Thornburg International Value Fund |
| ■ | Thornburg Better World International Fund |
| ■ | Thornburg International Growth Fund |
| ■ | Thornburg Developing World Fund |
| ■ | Thornburg Value Fund |
| ■ | Thornburg Core Growth Fund |
| ■ | Thornburg Investment Income Builder Fund |
| ■ | Thornburg Summit Fund |
| ■ | Thornburg Low Duration Income Fund |
| ■ | Thornburg Limited Term U.S. Government Fund |
| ■ | Thornburg Limited Term Income Fund |
| ■ | Thornburg Strategic Income Fund |
| ■ | Thornburg Low Duration Municipal Fund |
| ■ | Thornburg Limited Term Municipal Fund |
| ■ | Thornburg Intermediate Municipal Fund |
| ■ | Thornburg California Limited Term Municipal Fund |
| ■ | Thornburg New Mexico Intermediate Municipal Fund |
| ■ | Thornburg New York Intermediate Municipal Fund |
| ■ | Thornburg Strategic Municipal Income Fund |
| ■ | Thornburg Long/Short Equity Fund |

| 800.847.0200 | TH3478 |

| 4 | |
| 6 | |
| 7 | |
| 8 | |
| 13 | |
| 14 | |
| 15 | |
| 16 | |
| 17 | |
| 24 | |
| 26 | |
| 27 | |
| 28 |
| SHARE CLASS | NASDAQ SYMBOL | CUSIP |
| Class I | THLSX | 885-216-689 |
Thornburg Long/Short Equity Fund | March 31, 2019 (Unaudited)
| (Sept 30, 2018 - Mar 31, 2019) | |||
| Average Weight % | Total Return % | Contribution*% | |
| Long Book | 104.97 | -3.33 | -3.50 |
| Short Book | -71.68 | -4.08 | 2.92 |
| Fund | 33.29 | -0.47 | -- |
| S&P 500 Index | -- | -1.72 | -- |
| Russell 2000 Index | -- | -8.59 | -- |
| Net Adjusted S&P 500 Index | -- | -0.57 | -- |
| *Gross of Fees | |||
| Source: Kiski, Thornburg | |||
 |  |
| Connor Browne,cfa Portfolio Manager Managing Director | Bimal Shah,cfa Portfolio Manager Managing Director |
Thornburg Long/Short Equity Fund | March 31, 2019 (Unaudited)
| 1-YR | 3-YR | 5-YR | 10-YR | SINCE INCEP. | |
| Class I Shares(Incep: 12/30/16) | 1.82% | 8.34% | 5.29% | 10.79% | 6.72% |
| S&P 500 Index | 9.50% | 13.51% | 10.91% | 15.92% | 8.98% |
| FINAL VALUE |
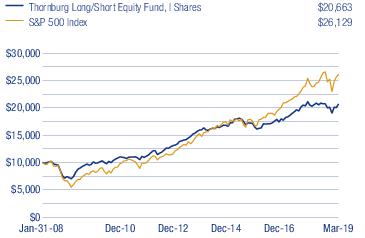
Thornburg Long/Short Equity Fund | March 31, 2019 (Unaudited)
| SECTOR EXPOSURE | |
| Health Care | 11.3% |
| Financials | 10.9% |
| Communication Services | 6.2% |
| Materials | 5.3% |
| Energy | 2.9% |
| Consumer Discretionary | 0.8% |
| Information Technology | 0.6% |
| Consumer Staples | -0.7% |
| Industrials | -2.2% |
| Real Estate | -2.8% |
| Other Assets Less Liabilities | 67.8% |
| PORTFOLIO EXPOSURE | ||
| 1Q19 | 4Q18 | |
| Gross Long | 105.4% | 118.6% |
| Gross Short | -72.8% | -79.9% |
| Net Equity | 32.6% | 38.7% |
| ASSETS BY GEOGRAPHY | ||
| Long | Short | |
| United States | 59.3% | 40.7% |
| Ex-U.S | 58.4% | 41.6% |
| TOP TEN LONG HOLDINGS | |
| Gilead Sciences, Inc. | 5.5% |
| Thermo Fisher Scientific, Inc. | 4.7% |
| Comcast Corp. Class A | 4.7% |
| Alphabet, Inc. Class C | 4.4% |
| US Foods Holding Corp. | 4.3% |
| Nomad Foods Ltd. | 4.0% |
| Assured Guaranty Ltd. | 4.0% |
| CarMax, Inc. | 3.9% |
| Oaktree Capital Group, LLC | 3.8% |
| Alkermes plc | 3.7% |
Thornburg Long/Short Equity Fund | March 31, 2019 (Unaudited)
| SHARES | VALUE | ||
| Common Stock — 104.9% | |||
| Capital Goods — 2.7% | |||
| Electrical Equipment — 2.7% | |||
| a | Vestas Wind Systems A/S | 67,873 | $ 5,710,984 |
| 5,710,984 | |||
| Consumer Durables & Apparel — 0.9% | |||
| Household Durables — 0.9% | |||
| b | Mohawk Industries, Inc. | 15,932 | 2,009,822 |
| 2,009,822 | |||
| Consumer Services — 5.3% | |||
| Hotels, Restaurants & Leisure — 5.3% | |||
| a | Galaxy Entertainment Group Ltd. | 629,100 | 4,283,517 |
| a | Starbucks Corp. | 92,377 | 6,867,306 |
| 11,150,823 | |||
| Diversified Financials — 10.6% | |||
| Capital Markets — 5.0% | |||
| Apollo Global Management, LLC, Class A | 87,072 | 2,459,784 | |
| Oaktree Capital Group, LLC | 163,420 | 8,113,803 | |
| Consumer Finance — 3.7% | |||
| Capital One Financial Corp. | 44,844 | 3,663,307 | |
| Navient Corp. | 358,274 | 4,145,230 | |
| Mortgage Real Estate Investment Trusts — 1.9% | |||
| PennyMac Mortgage Investment Trust | 196,686 | 4,073,367 | |
| 22,455,491 | |||
| Energy — 2.9% | |||
| Oil, Gas & Consumable Fuels — 2.9% | |||
| Teekay LNG Partners L.P. | 417,309 | 6,242,943 | |
| 6,242,943 | |||
| Food & Staples Retailing — 4.3% | |||
| Food & Staples Retailing — 4.3% | |||
| a,b | US Foods Holding Corp. | 263,869 | 9,211,667 |
| 9,211,667 | |||
| Food, Beverage & Tobacco — 4.0% | |||
| Food Products — 4.0% | |||
| b | Nomad Foods Ltd. | 411,984 | 8,425,073 |
| 8,425,073 | |||
| Healthcare Equipment & Services — 3.5% | |||
| Health Care Equipment & Supplies — 3.5% | |||
| Medtronic plc | 80,954 | 7,373,290 | |
| 7,373,290 | |||
| Insurance — 4.0% | |||
| Insurance — 4.0% | |||
| a | Assured Guaranty Ltd. | 188,715 | 8,384,607 |
| 8,384,607 | |||
| Materials — 5.3% | |||
| Chemicals — 2.3% | |||
| Huntsman Corp. | 215,800 | 4,853,342 | |
| Containers & Packaging — 3.0% | |||
| b | Crown Holdings, Inc. | 115,930 | 6,326,300 |
| 11,179,642 | |||
| Media & Entertainment — 19.1% | |||
| Entertainment — 6.6% | |||
| a | Activision Blizzard, Inc. | 111,124 | 5,059,476 |
| SHARES | VALUE | ||
| Lions Gate Entertainment Corp., Class B | 312,773 | $ 4,722,872 | |
| a,b | Ubisoft Entertainment S.A. | 47,926 | 4,266,473 |
| Interactive Media & Services — 7.8% | |||
| a,b | Alphabet, Inc., Class C | 7,981 | 9,364,187 |
| a,b | Zillow Group, Inc., Class C | 205,694 | 7,145,810 |
| Media — 4.7% | |||
| a | Comcast Corp., Class A | 246,073 | 9,837,999 |
| 40,396,817 | |||
| Pharmaceuticals, Biotechnology & Life Sciences — 16.7% | |||
| Biotechnology — 9.2% | |||
| b | Alkermes plc | 210,952 | 7,697,638 |
| a | Gilead Sciences, Inc. | 179,754 | 11,685,808 |
| Life Sciences Tools & Services — 4.7% | |||
| a | Thermo Fisher Scientific, Inc. | 36,428 | 9,971,072 |
| Pharmaceuticals — 2.8% | |||
| a | Allergan plc | 40,981 | 6,000,028 |
| 35,354,546 | |||
| Retailing — 10.2% | |||
| Internet & Direct Marketing Retail — 6.3% | |||
| b | Alibaba Group Holding Ltd. Sponsored ADR | 31,413 | 5,731,302 |
| a,b | Amazon.com, Inc. | 2,509 | 4,467,901 |
| a | Expedia Group, Inc. | 26,320 | 3,132,080 |
| Specialty Retail — 3.9% | |||
| a,b | CarMax, Inc. | 118,641 | 8,281,142 |
| 21,612,425 | |||
| Software & Services — 5.8% | |||
| Information Technology Services — 2.7% | |||
| a | Cognizant Technology Solutions Corp., Class A | 77,193 | 5,592,633 |
| Software — 3.1% | |||
| a | SS&C Technologies Holdings, Inc. | 104,364 | 6,646,943 |
| 12,239,576 | |||
| Technology Hardware & Equipment — 4.1% | |||
| Communications Equipment — 1.3% | |||
| b | Casa Systems, Inc. | 341,921 | 2,837,944 |
| Technology Hardware, Storage & Peripherals — 2.8% | |||
| a,b | Pure Storage, Inc., Class A | 268,092 | 5,841,725 |
| 8,679,669 | |||
| Transportation — 5.5% | |||
| Air Freight & Logistics — 3.5% | |||
| a | United Parcel Service, Inc., Class B | 64,974 | 7,260,195 |
| Airlines — 2.0% | |||
| Alaska Air Group, Inc. | 76,400 | 4,287,568 | |
| 11,547,763 | |||
| Total Common Stock(Cost $205,769,143) | 221,975,138 | ||
| Total Long-Term Investments — 104.9%(Cost $205,769,143) | 221,975,138 | ||
| Short-Term Investments — 19.9% | |||
| c | Thornburg Capital Management Fund | 4,197,446 | 41,974,458 |
| Total Short-Term Investments(Cost $41,974,458) | 41,974,458 | ||
| Liabilities Net of Other Assets — (24.8)% | (52,380,797) | ||
| Common Stock Sold Short — (72.6)% | |||
| Banks — (0.9)% | |||
| Banks — (0.9)% |
Thornburg Long/Short Equity Fund | March 31, 2019 (Unaudited)
| SHARES | VALUE | ||
| Westamerica Bancorporation | (30,509) | $ (1,885,456) | |
| (1,885,456) | |||
| Capital Goods — (7.4)% | |||
| Electrical Equipment — (2.1)% | |||
| b | Generac Holdings, Inc. | (87,643) | (4,489,951) |
| Machinery — (2.2)% | |||
| Snap-on, Inc. | (28,695) | (4,491,341) | |
| Trading Companies & Distributors — (3.1)% | |||
| GATX Corp. | (60,655) | (4,632,223) | |
| WW Grainger, Inc. | (6,499) | (1,955,744) | |
| (15,569,259) | |||
| Commercial & Professional Services — (3.0)% | |||
| Professional Services — (3.0)% | |||
| b | FTI Consulting, Inc. | (65,437) | (5,026,870) |
| b | TriNet Group, Inc. | (21,363) | (1,276,226) |
| (6,303,096) | |||
| Consumer Durables & Apparel — (4.8)% | |||
| Leisure Products — (3.5)% | |||
| b | Spin Master Corp. | (138,122) | (3,865,576) |
| b | YETI Holdings, Inc. | (116,131) | (3,512,963) |
| Textiles, Apparel & Luxury Goods — (1.3)% | |||
| b | Crocs, Inc. | (111,500) | (2,871,125) |
| (10,249,664) | |||
| Consumer Services — (6.4)% | |||
| Diversified Consumer Services — (2.4)% | |||
| b | Chegg, Inc. | (83,406) | (3,179,437) |
| H&R Block, Inc. | (75,400) | (1,805,076) | |
| Hotels, Restaurants & Leisure — (4.0)% | |||
| Brinker International, Inc. | (97,783) | (4,339,609) | |
| Cracker Barrel Old Country Store, Inc. | (25,455) | (4,113,783) | |
| (13,437,905) | |||
| Diversified Financials — (2.8)% | |||
| Capital Markets — (2.4)% | |||
| FactSet Research Systems, Inc. | (20,678) | (5,133,727) | |
| Consumer Finance — (0.4)% | |||
| b | Credit Acceptance Corp. | (1,646) | (743,877) |
| (5,877,604) | |||
| Food & Staples Retailing — (4.2)% | |||
| Food & Staples Retailing — (4.2)% | |||
| b | Chefs’ Warehouse, Inc. | (104,800) | (3,254,040) |
| Colruyt S.A. | (76,651) | (5,666,298) | |
| (8,920,338) | |||
| Food, Beverage & Tobacco — (2.4)% | |||
| Beverages — (2.4)% | |||
| b | Boston Beer Co., Inc., Class A | (17,267) | (5,089,103) |
| (5,089,103) | |||
| Healthcare Equipment & Services — (6.5)% | |||
| Health Care Equipment & Supplies — (2.3)% | |||
| DiaSorin S.p.A. | (48,556) | (4,885,753) | |
| Health Care Technology — (4.2)% | |||
| Computer Programs & Systems, Inc. | (171,269) | (5,084,977) | |
| b | Inovalon Holdings, Inc., Class A | (303,815) | (3,776,420) |
| (13,747,150) | |||
| Household & Personal Products — (2.4)% | |||
| Household Products — (2.4)% |
| SHARES | VALUE | ||
| Church & Dwight Co., Inc. | (70,364) | $ (5,012,028) | |
| (5,012,028) | |||
| Media & Entertainment — (8.3)% | |||
| Entertainment — (2.5)% | |||
| b | Tencent Music Entertainment Group ADR | (292,430) | (5,292,983) |
| Interactive Media & Services — (1.8)% | |||
| b | TripAdvisor, Inc. | (75,914) | (3,905,776) |
| Media — (4.0)% | |||
| b | Discovery, Inc., Class A | (152,913) | (4,131,709) |
| New York Times Co., Class A | (132,000) | (4,336,200) | |
| (17,666,668) | |||
| Pharmaceuticals, Biotechnology & Life Sciences — (2.4)% | |||
| Pharmaceuticals — (2.4)% | |||
| Shionogi & Co. Ltd. | (81,730) | (5,052,909) | |
| (5,052,909) | |||
| Real Estate — (2.8)% | |||
| Equity Real Estate Investment Trusts — (2.3)% | |||
| Extra Space Storage, Inc. | (47,675) | (4,858,559) | |
| Real Estate Management & Development — (0.5)% | |||
| b | Redfin Corp. | (56,672) | (1,148,742) |
| (6,007,301) | |||
| Retailing — (4.5)% | |||
| Specialty Retail — (4.5)% | |||
| Foot Locker, Inc. | (75,245) | (4,559,847) | |
| b | Murphy USA, Inc. | (57,650) | (4,935,993) |
| (9,495,840) | |||
| Software & Services — (9.3)% | |||
| Information Technology Services — (2.5)% | |||
| Paychex, Inc. | (65,483) | (5,251,736) | |
| Software — (6.8)% | |||
| b | Alarm.com Holdings, Inc. | (72,892) | (4,730,691) |
| b | Manhattan Associates, Inc. | (92,390) | (5,091,613) |
| b | Teradata Corp. | (105,774) | (4,617,035) |
| (19,691,075) | |||
| Telecommunication Services — (4.5)% | |||
| Diversified Telecommunication Services — (4.5)% | |||
| AT&T, Inc. | (149,642) | (4,692,773) | |
| Cogent Communications Holdings, Inc. | (89,543) | (4,857,708) | |
| (9,550,481) | |||
| Total Common Stock Sold Short(Proceeds $139,451,990) | (153,555,877) | ||
| Exchange-Traded Funds Sold Short — (0.0)% | |||
| Direxion Daily Developed Markets Bear 3X | (550) | (7,386) | |
| Direxion Daily Emerging Markets Bear 3X | (919) | (40,298) | |
| Direxion Daily Energy Bear 3X | (535) | (21,218) | |
| Direxion Daily Financial Bear 3X | (3,601) | (34,029) | |
| Direxion Daily S&P 500 Bear 3X | (266) | (5,549) | |
| Direxion Daily Semiconductors Bear 3x | (66) | (434) | |
| Direxion Daily Small Cap Bear 3X | (255) | (2,512) | |
| ProShares UltraPro Short QQQ | (221) | (2,248) | |
| Total Exchange-Traded Funds Sold Short(Proceeds $4,138,776) | (113,674) | ||
| Total Securities Sold Short(Proceeds $143,590,766) | $(153,669,551) | ||
| Net Assets — 100.0% | $211,568,799 |
Thornburg Long/Short Equity Fund | March 31, 2019 (Unaudited)
| Footnote Legend | |
| a | All or a portion of the security is pledged as collateral for securities sold short. At March 31, 2019, the value of securities pledged was $88,625,195. An additional $100,919,424 in cash has been segregated for collateral on securities sold short. |
| b | Non-income producing. |
| c | Investment in Affiliates. |
To simplify the listings of securities, abbreviations are used per the table below:
| ADR | American Depositary Receipt |
Thornburg Long/Short Equity Fund | March 31, 2019 (Unaudited)
| ASSETS | |
| Investments at value (Note 3) | |
| Non-affiliated issuers (cost $205,769,143) | $ 221,975,138 |
| Non-controlled affiliated issuer (cost $41,974,458) | 41,974,458 |
| Cash segregated as collateral on securities sold short | 100,919,424 |
| Receivable for investments sold | 4,890,912 |
| Receivable for fund shares sold | 731,534 |
| Dividends receivable | 222,093 |
| Dividend and interest reclaim receivable | 910 |
| Prepaid expenses and other assets | 30,602 |
| Total Assets | 370,745,071 |
| Liabilities | |
| Securities sold short (proceeds $143,590,766) | 153,669,551 |
| Payable for investments purchased | 4,885,074 |
| Payable for fund shares redeemed | 154,960 |
| Payable to investment advisor and other affiliates (Note 4) | 237,140 |
| Payable for short sale financing | 65,237 |
| Accounts payable and accrued expenses | 85,112 |
| Dividends payable for short sales | 79,198 |
| Total Liabilities | 159,176,272 |
| Net Assets | $ 211,568,799 |
| NET ASSETS CONSIST OF | |
| Distributable earnings | $ 8,780,107 |
| Net capital paid in on shares of beneficial interest | 202,788,692 |
| $ 211,568,799 | |
| NET ASSET VALUE | |
| Class I Shares: | |
| Net asset value, offering and redemption price per share ($211,568,799 applicable to 19,251,416 shares of beneficial interest outstanding - Note 5) | $ 10.99 |
Thornburg Long/Short Equity Fund | Six Months Ended March 31, 2019 (Unaudited)
| INVESTMENT INCOME | |
| Dividend income | |
| Non-affiliated issuers (net of foreign taxes withheld of $5) | $ 1,498,840 |
| Non-controlled affiliated issuer | 534,661 |
| Interest income | 674,077 |
| Total Income | 2,707,578 |
| EXPENSES | |
| Investment advisory fees (Note 4) | 1,221,928 |
| Administration fees (Note 4) | |
| Class I Shares | 85,783 |
| Transfer agent fees | |
| Class I Shares | 23,680 |
| Registration and filing fees | |
| Class I Shares | 12,056 |
| Dividend expense on securities sold short | 881,566 |
| Short sale financing fees | 456,054 |
| Custodian fees (Note 2) | 18,200 |
| Professional fees | 29,570 |
| Trustee and officer fees (Note 4) | 5,176 |
| Other expenses | 20,929 |
| Total Expenses | 2,754,942 |
| Net Investment Loss | $ (47,364) |
| REALIZED AND UNREALIZED GAIN (LOSS) | |
| Net realized gain (loss) on: | |
| Non-affiliated issuer investments | |
| Long positions | 208,341 |
| Short positions | 5,208,710 |
| Foreign currency transactions | (5,740) |
| 5,411,311 | |
| Net change in unrealized appreciation (depreciation) on: | |
| Non-affiliated issuer investments | |
| Long positions | (7,461,772) |
| Short positions | 1,690,147 |
| Foreign currency translations | (46) |
| (5,771,671) | |
| Net Realized and Unrealized Loss | (360,360) |
| Net Decrease in Net Assets Resulting from Operations | $ (407,724) |
Thornburg Long/Short Equity Fund
| Six Months Ended March 31, 2019* | Year Ended September 30, 2018 | |
| INCREASE (DECREASE) IN NET ASSETS FROM | ||
| OPERATIONS | ||
| Net investment loss | $ (47,364) | $ (1,104,589) |
| Net realized gain (loss) on investments and foreign currency transactions | 5,411,311 | 9,092,978 |
| Net unrealized appreciation (depreciation) on investments and foreign currency translations | (5,771,671) | (1,657,155) |
| Net Increase (Decrease) in Net Assets Resulting from Operations | (407,724) | 6,331,234 |
| DIVIDENDS TO SHAREHOLDERS | ||
| From distributable earnings | ||
| Class I Shares | (8,099,318) | (2,992,574) |
| FUND SHARE TRANSACTIONS (NOTE 5) | ||
| Class I Shares | 16,272,172 | 120,726,370 |
| Net Increase in Net Assets | 7,765,130 | 124,065,030 |
| NET ASSETS | ||
| Beginning of Period | 203,803,669 | 79,738,639 |
| End of Period | $ 211,568,799 | $ 203,803,669 |
| * | Unaudited. |
Thornburg Long/Short Equity Fund | Six Months Ended March 31, 2019 (Unaudited)
| Cash Flows from Operating Activities: | |
| Net change in net assets resulting from operations | $ (407,724) |
| Adjustments to reconcile net increase in net assets resulting from operations to net cash provided by (used for) operating activities: | |
| Purchases of investments in securities | (104,064,414) |
| Payments to cover securities sold short | (48,816,900) |
| Proceeds from disposition of investments in securities | 86,679,049 |
| Proceeds from securities sold short | 70,570,033 |
| Purchases of short term investments, net | 14,674,160 |
| Net realized (gain) loss: | |
| Investment transactions | (208,341) |
| Short sales | (5,208,710) |
| Net unrealized (gain) loss: | |
| Investments | 7,461,772 |
| Short sales | (1,690,147) |
| Changes in assets and liabilities: | |
| (Increase) decrease in assets: | |
| Cash segregated as collateral on securities sold short | (27,065,309) |
| Dividend and interest receivable | (48,333) |
| Prepaid expenses and other assets | (14,504) |
| Increase (decrease) in liabilities: | |
| Payable for short sale financing | (19,667) |
| Payable for dividends on short sales | (84,277) |
| Payable to investment adviser | 19,610 |
| Accrued expenses and other payables | 26,171 |
| Net cash used in operating activities | $ (8,197,531) |
| Cash Flows from Financing Activities: | |
| Fund shares sold | $ 65,340,774 |
| Fund shares redeemed | (56,556,728) |
| Fund distributions paid and not reinvested | (586,515) |
| Net cash received from financing activities | $ 8,197,531 |
| Net increase in cash during the period | $ - |
| Cash and foreign currency, beginning of period: | $ - |
| Cash and foreign currency, end of period: | $ - |
| Non-cash Activities: | |
| Reinvestment of Fund distributions | 7,512,803 |
Thornburg Long/Short Equity Fund | March 31, 2019 (Unaudited)
Thornburg Long/Short Equity Fund | March 31, 2019 (Unaudited)
| Cost of investments for tax purposes | $ 104,152,835 |
| Gross unrealized appreciation on a tax basis | 32,896,169 |
| Gross unrealized depreciation on a tax basis | (26,768,959) |
| Net unrealized appreciation (depreciation) on investments (tax basis) | $ 6,127,210 |
Thornburg Long/Short Equity Fund | March 31, 2019 (Unaudited)
| Fair Value Measurements at March 31, 2019 | ||||
| TOTAL | LEVEL 1 | LEVEL 2 | LEVEL 3 | |
| Assets | ||||
| Investments in Securities* | ||||
| Common Stock | $ 221,975,138 | $ 221,975,138 | $ — | $ — |
| Short-Term Investments | 41,974,458 | 41,974,458 | — | — |
| Total Investments in Securities | $263,949,596 | $263,949,596 | $— | $— |
| Total Assets | $263,949,596 | $263,949,596 | $— | $— |
| Liabilities | ||||
| Investment in Securities Sold Short* | ||||
| Common Stock | $ (153,555,877) | $ (153,555,877) | $ — | $ — |
| Exchange-Traded Funds | (113,674) | (113,674) | — | — |
| Total Investment in Securities Sold Short | $(153,669,551) | $(153,669,551) | $— | $— |
| Total Liabilities | $(153,669,551) | $(153,669,551) | $— | $— |
| * | See Schedule of Investments for a summary of the industry exposure as grouped according to the Global Industry Classification Standard (GICS), which is an industry taxonomy developed by MSCI, Inc. and Standard & Poor’s (S&P). |
| Management Fee Schedule | |
| DAILY NET ASSETS | FEE RATE |
| Up to $500 million | 1.250% |
| Next $500 million | 1.200 |
| Next $1 billion | 1.150 |
| Over $2 billion | 1.100 |
| Administration Fee Schedule | |
| Daily Net Assets | Fee Rate |
| Up to $20 billion | 0.100% |
| $20 billion to $40 billion | 0.075 |
| $40 billion to $60 billion | 0.040 |
| Over $60 billion | 0.030 |
Thornburg Long/Short Equity Fund | March 31, 2019 (Unaudited)
| Fund | Market Value 9/30/18 | Purchases at Cost | Sales Proceeds | Realized Gain (Loss) | Change in Unrealized Appr./(Depr.) | Market Value 3/31/19 | Dividend Income |
| Thornburg Capital Management Fund | $56,648,618 | $103,874,256 | $(118,548,416) | $- | $- | $41,974,458 | $534,661 |
| SIX MONTHS ENDED March 31, 2019 (UNAUDITED) | YEAR ENDED September 30, 2018 (AUDITED) | |||
| SHARES | AMOUNT | SHARES | AMOUNT | |
| Class I Shares | ||||
| Shares sold | 6,243,824 | $ 65,429,140 | 11,071,577 | $ 127,384,872 |
| Shares issued to shareholders in reinvestment of dividends | 716,187 | 7,512,803 | 257,814 | 2,915,877 |
| Shares repurchased | (5,364,401) | (56,669,771) | (834,836) | (9,574,379) |
| Net increase | 1,595,610 | $ 16,272,172 | 10,494,555 | $ 120,726,370 |
SHEET RISK AND FOREIGN INVESTMENT RISK
Thornburg Long/Short Equity Fund
| Per Share Performance (For a Share Outstanding throughout the Period) | ||||||||
| UNLESS OTHERWISE NOTED, PERIODS ARE FISCAL YEARS ENDED SEPTEMBER 30, | Net Asset Value, Beginning of Period | Net Investment Income (Loss)+ | Net Realized & Unrealized Gain (Loss) on Investments | Total from Investment Operations | Dividends from Net Investment Income | Dividends from Net Realized Gains | Total Dividends | Net Asset Value, End of Period |
| Class I | ||||||||
| 2019(d) | $ 11.54 | —(e) | (0.08) | (0.08) | — | (0.47) | (0.47) | $ 10.99 |
| 2018 | $ 11.13 | (0.08) | 0.83 | 0.75 | — | (0.34) | (0.34) | $ 11.54 |
| 2017(h) | $ 10.00 | (0.13) | 1.26 | 1.13 | — | — | — | $ 11.13 |
| (a) | The Fund incurs certain expenses and fees in connection with investments in short positions. If such expenses and fees had not occurred, the Expenses After Expense Reductions ratios for 2019, 2018 and 2017 would have been 1.45%, 1.48% and 1.45%, respectively. |
| (b) | The Fund incurs certain expenses and fees in connection with investments in short positions. If such expenses and fees had not occurred, the Expenses Before Expense Reductions ratios for 2019, 2018 and 2017 would have been 1.45%, 1.48% and 1.81%, respectively. |
| (c) | Not annualized for periods less than one year. |
| (d) | Unaudited Six Month Period Ended March 31. |
| (e) | Net investment income (loss) was less than $0.01 per share. |
| (f) | Annualized. |
| (g) | The amounts reported for periods prior to the period ending March 31, 2019 have been revised to include certain expenses and fees in connection with investments in short positions in order to conform to current year presentation. The amounts reported in 2018 and 2017 were 1.48% and 1.45%, respectively. |
| (h) | Fund commenced operations on December 30, 2016. |
| + | Based on weighted average shares outstanding. |
Thornburg Long/Short Equity Fund
| Ratios to Average Net Assets | Supplemental Data | |||||
| Net Investment Income (Loss) (%) | Expenses, After Expense Reductions (%)(a) | Expenses, Before Expense Reductions (%)(b) | Total Return (%)(c) | Portfolio Turnover Rate (%)(c) | Net Assets at End of Period (Thousands) | |
| (0.05)(f) | 2.82(f) | 2.82(f) | (0.47) | 38.77 | $ 211,569 | |
| (0.74) | 2.82(g) | 2.82 | 6.83 | 65.72 | $ 203,804 | |
| (1.56)(f) | 3.42(f)(g) | 3.78(f) | 11.30 | 61.69 | $ 79,739 | |
Thornburg Long/Short Equity Fund | March 31, 2019 (Unaudited)
| BEGINNING ACCOUNT VALUE 10/1/18 | ENDING ACCOUNT VALUE 3/31/19 | EXPENSES PAID DURING PERIOD† 10/1/18—3/31/19 | |
| CLASS I SHARES | |||
| Actual | $1,000.00 | $995.28 | $14.03 |
| Hypothetical* | $1,000.00 | $1,010.87 | $14.14 |
| † | Expenses are equal to the annualized expense ratio for each class (I: 2.82%) multiplied by the average account value over the period, multiplied by 182/365 to reflect the one-half year period. |
| * | Hypothetical assumes a rate of return of 5% per year before expenses. |
Thornburg Long/Short Equity Fund | March 31, 2019 (Unaudited)
| ■ | Thornburg Investment Income Builder Fund |
| ■ | Thornburg Global Opportunities Fund |
| ■ | Thornburg International Value Fund |
| ■ | Thornburg Better World International Fund |
| ■ | Thornburg International Growth Fund |
| ■ | Thornburg Developing World Fund |
| ■ | Thornburg Value Fund |
| ■ | Thornburg Core Growth Fund |
| ■ | Thornburg Investment Income Builder Fund |
| ■ | Thornburg Summit Fund |
| ■ | Thornburg Low Duration Income Fund |
| ■ | Thornburg Limited Term U.S. Government Fund |
| ■ | Thornburg Limited Term Income Fund |
| ■ | Thornburg Strategic Income Fund |
| ■ | Thornburg Low Duration Municipal Fund |
| ■ | Thornburg Limited Term Municipal Fund |
| ■ | Thornburg Intermediate Municipal Fund |
| ■ | Thornburg California Limited Term Municipal Fund |
| ■ | Thornburg New Mexico Intermediate Municipal Fund |
| ■ | Thornburg New York Intermediate Municipal Fund |
| ■ | Thornburg Strategic Municipal Income Fund |
| ■ | Thornburg Long/Short Equity Fund |

| 800.847.0200 | TH3932 |


| SHARE CLASS | NASDAQ SYMBOL | CUSIP |
| Class I | TSUMX | 885-216-580 |
Thornburg Summit Fund | March 31, 2019 (Unaudited)
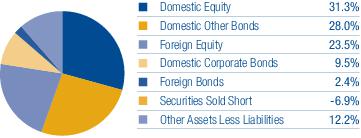
| SECTOR EXPOSURE (percent of equity holdings) | |
| Financials | 20.9% |
| Information Technology | 18.9% |
| Consumer Discretionary | 12.6% |
| Health Care | 10.8% |
| Consumer Staples | 10.3% |
| Industrials | 9.7% |
| Communication Services | 5.6% |
| Energy | 5.0% |
| Materials | 3.1% |
| Utilities | 3.1% |
| COUNTRY EXPOSURE * (percent of Fund) | |
| United States | 63.1% |
| United Kingdom | 3.1% |
| France | 2.9% |
| Switzerland | 2.7% |
| Hong Kong | 2.4% |
| Italy | 2.3% |
| Germany | 1.9% |
| Japan | 1.5% |
| Netherlands | 1.4% |
| China | 1.3% |
| Ireland | 0.9% |
| India | 0.8% |
| Brazil | 0.7% |
| Mexico | 0.7% |
| Argentina | 0.5% |
| Indonesia | 0.5% |
| Taiwan | 0.5% |
| Russian Federation | 0.5% |
| Other Assets Less Liabilities | 12.2% |
| * | Holdings are classified by country of risk as determined by MSCI and Bloomberg. |
| TOP TEN LONG HOLDINGS | |
| Alphabet, Inc. Class A | 2.0% |
| CME Group, Inc. | 1.9% |
| Unilever N.V. | 1.8% |
| Visa, Inc. Class A | 1.8% |
| LVMH Moet Hennessy Louis Vuitton SE | 1.7% |
| Hopewell Holdings Ltd. | 1.6% |
| Amazon.com, Inc. | 1.5% |
| JPMorgan Chase & Co. | 1.4% |
| Starbucks Corp. | 1.3% |
| Novartis AG | 1.3% |
Thornburg Summit Fund | March 31, 2019 (Unaudited)
| SHARES/ PRINCIPAL AMOUNT | VALUE | ||
| Common Stock — 48.3% | |||
| Banks — 3.7% | |||
| Banks — 3.7% | |||
| Bank Rakyat Indonesia Persero Tbk PT | 428,100 | $ 123,860 | |
| Grupo Financiero Banorte SAB de C.V. | 22,261 | 120,937 | |
| HDFC Bank Ltd. ADR | 1,705 | 197,627 | |
| a | JPMorgan Chase & Co. | 3,207 | 324,645 |
| Sberbank of Russia PJSC Sponsored ADR | 9,284 | 123,106 | |
| 890,175 | |||
| Capital Goods — 2.8% | |||
| Aerospace & Defense — 1.2% | |||
| Lockheed Martin Corp. | 1,013 | 304,062 | |
| Industrial Conglomerates — 1.6% | |||
| Hopewell Holdings Ltd. | 77,500 | 381,085 | |
| 685,147 | |||
| Commercial & Professional Services — 0.7% | |||
| Professional Services — 0.7% | |||
| SGS S.A. | 65 | 161,758 | |
| 161,758 | |||
| Consumer Durables & Apparel — 2.2% | |||
| Household Durables — 0.5% | |||
| Sony Corp. | 2,779 | 116,471 | |
| Textiles, Apparel & Luxury Goods — 1.7% | |||
| LVMH Moet Hennessy Louis Vuitton SE | 1,159 | 426,305 | |
| 542,776 | |||
| Consumer Services — 1.8% | |||
| Diversified Consumer Services — 0.5% | |||
| b | TAL Education Group ADR | 3,375 | 121,770 |
| Hotels, Restaurants & Leisure — 1.3% | |||
| a | Starbucks Corp. | 4,219 | 313,641 |
| 435,411 | |||
| Diversified Financials — 5.2% | |||
| Capital Markets — 3.8% | |||
| a | CME Group, Inc. | 2,842 | 467,736 |
| Deutsche Boerse AG | 2,132 | 273,357 | |
| Hong Kong Exchanges & Clearing Ltd. | 5,429 | 189,221 | |
| Consumer Finance — 0.9% | |||
| Capital One Financial Corp. | 2,723 | 222,442 | |
| Diversified Financial Services — 0.5% | |||
| AXA Equitable Holdings, Inc. | 5,589 | 112,562 | |
| 1,265,318 | |||
| Energy — 2.1% | |||
| Oil, Gas & Consumable Fuels — 2.1% | |||
| a | Enterprise Products Partners L.P. | 4,150 | 120,765 |
| Petroleo Brasileiro S.A. Sponsored ADR | 10,169 | 161,890 | |
| Royal Dutch Shell plc | 6,959 | 218,754 | |
| 501,409 | |||
| Food & Staples Retailing — 1.9% | |||
| Food & Staples Retailing — 1.9% | |||
| a,b | US Foods Holding Corp. | 4,856 | 169,523 |
| a | Walgreens Boots Alliance, Inc. | 4,698 | 297,242 |
| 466,765 | |||
| Healthcare Equipment & Services — 1.3% |
Thornburg Summit Fund | March 31, 2019 (Unaudited)
| SHARES/ PRINCIPAL AMOUNT | VALUE | ||
| Health Care Equipment & Supplies — 1.3% | |||
| b | Boston Scientific Corp. | 7,851 | $ 301,321 |
| 301,321 | |||
| Household & Personal Products — 2.3% | |||
| Personal Products — 2.3% | |||
| Kose Corp. | 694 | 127,303 | |
| Unilever N.V. | 7,569 | 439,640 | |
| 566,943 | |||
| Insurance — 0.5% | |||
| Insurance — 0.5% | |||
| Assured Guaranty Ltd. | 2,661 | 118,228 | |
| 118,228 | |||
| Materials — 1.3% | |||
| Chemicals — 0.5% | |||
| OCI N.V. | 4,424 | 121,584 | |
| Metals & Mining — 0.8% | |||
| Glencore plc | 45,345 | 187,780 | |
| 309,364 | |||
| Media & Entertainment — 4.0% | |||
| Interactive Media & Services — 2.8% | |||
| a,b | Alphabet, Inc. Class A | 421 | 495,471 |
| Tencent Holdings Ltd. | 4,100 | 188,549 | |
| Media — 1.2% | |||
| a | Comcast Corp. Class A | 7,046 | 281,699 |
| 965,719 | |||
| Pharmaceuticals, Biotechnology & Life Sciences — 3.7% | |||
| Biotechnology — 1.2% | |||
| a | Gilead Sciences, Inc. | 4,386 | 285,134 |
| Pharmaceuticals — 2.5% | |||
| Novartis AG | 3,230 | 310,690 | |
| a | Pfizer, Inc. | 7,109 | 301,919 |
| 897,743 | |||
| Retailing — 3.5% | |||
| Internet & Direct Marketing Retail — 3.5% | |||
| a | Alibaba Group Holding Ltd. Sponsored ADR | 1,052 | 191,938 |
| a,b | Amazon.com, Inc. | 203 | 361,492 |
| Expedia Group, Inc. | 1,471 | 175,049 | |
| b | MercadoLibre, Inc. | 248 | 125,917 |
| 854,396 | |||
| Semiconductors & Semiconductor Equipment — 0.5% | |||
| Semiconductors & Semiconductor Equipment — 0.5% | |||
| a | Taiwan Semiconductor Manufacturing Co. Ltd. Sponsored ADR | 3,016 | 123,535 |
| 123,535 | |||
| Software & Services — 6.3% | |||
| Information Technology Services — 3.1% | |||
| a,b | PayPal Holdings, Inc. | 1,683 | 174,763 |
| a | Visa, Inc. Class A | 2,795 | 436,551 |
| a,b | Worldpay, Inc. Class A | 1,118 | 126,893 |
| Software — 3.2% | |||
| a | Microsoft Corp. | 2,554 | 301,219 |
| b | Palo Alto Networks, Inc. | 743 | 180,460 |
| SAP SE | 1,511 | 174,581 | |
| a,b | ServiceNow, Inc. | 495 | 122,012 |
| 1,516,479 |
| SHARES/ PRINCIPAL AMOUNT | VALUE | ||
| Technology Hardware & Equipment — 1.1% | |||
| Electronic Equipment, Instruments & Components — 1.1% | |||
| Keyence Corp. | 407 | $ 253,278 | |
| 253,278 | |||
| Telecommunication Services — 1.1% | |||
| Diversified Telecommunication Services — 1.1% | |||
| Orange S.A. | 16,247 | 264,264 | |
| 264,264 | |||
| Transportation — 1.0% | |||
| Transportation Infrastructure — 1.0% | |||
| Atlantia SPA | 9,410 | 243,731 | |
| 243,731 | |||
| Utilities — 1.3% | |||
| Electric Utilities — 1.3% | |||
| Enel S.p.A. | 48,030 | 307,318 | |
| 307,318 | |||
| Total Common Stock(Cost $11,457,553) | 11,671,078 | ||
| Asset Backed Securities — 9.1% | |||
| Asset-Backed - Finance & Insurance — 1.1% | |||
| c,d | SBA Tower Trust, 3.869%, 10/15/2049 | $ 30,000 | 30,544 |
| c | Sierra Timeshare Receivables Funding, LLC, Series 2019-1A Class A, 3.20%, 1/20/2036 | 100,000 | 100,450 |
| c | Sofi Consumer Loan Program, LLC, Series 2017-5 Class A1, 2.14%, 9/25/2026 | 121,093 | 120,775 |
| 251,769 | |||
| Auto Receivables — 1.2% | |||
| e | CarMax Auto Owner Trust, Series 2017-4 Class A2B 2.614% (LIBOR 1 Month + 0.13%), 4/15/2021 | 12,225 | 12,223 |
| c | Chesapeake Funding II, LLC, Series 2016-2A Class A1 1.88%, 6/15/2028 | 112,416 | 112,045 |
| c | CIG Auto Receivables Trust, Series 2017-1A Class A, 2.71%, 5/15/2023 | 27,807 | 27,732 |
| c | CPS Auto Receivables Trust, Series 2014-B Class D 4.62%, 5/15/2020 | 100,000 | 100,158 |
| Toyota Auto Receivables, | |||
| 1.14%, 8/17/2020 | 13,764 | 13,708 | |
| Series 2016-D Class A3, 1.23%, 10/15/2020 | 22,860 | 22,757 | |
| 288,623 | |||
| Other Asset Backed — 5.0% | |||
| c | Avant Loans Funding Trust, Series 2019-A Class A, 3.48%, 7/15/2022 | 150,000 | 149,990 |
| c | AXIS Equipment Finance Receivables VI, LLC, Series 2018-2A Class A2, 3.89%, 7/20/2022 | 150,000 | 150,626 |
| c | Consumer Loan Underlying Bond Credit Trust, Series 2019-A Class A, 3.52%, 4/15/2026 | 94,770 | 94,769 |
| c | Diamond Resorts Owner Trust, Series 2018-1 Class A, 3.70%, 1/21/2031 | 77,415 | 78,630 |
| c,f | ECAF I Ltd., Series 2015-1A Class A2, 4.947%, 6/15/2040 | 227,833 | 229,161 |
| c | Foundation Finance Trust, Series 2019-1A Class A, 3.86%, 11/15/2034 | 200,000 | 199,969 |
| c,g,h,i | Homeward Opportunities Fund I Trust, Series 2019-1 Class A1, 3.454%, 1/25/2059 | 175,000 | 174,998 |
| c,d | SBA Tower Trust, Series 2014-1A Class C, 2.898%, 10/15/2044 | 120,000 | 119,862 |
| 1,198,005 | |||
| Residential MTG Trust — 0.9% | |||
| JPMorgan Mortgage Trust, | |||
| c,h | Series 2017-6 Class A5, 3.50%, 12/25/2048 | 73,988 | 74,226 |
| c,h | Series 2018-6 Class 1A4, 3.50%, 12/25/2048 | 26,788 | 26,811 |
| c,h | New Residential Mortgage Loan Trust CMO, 3.60%, 4/25/2049 | 120,000 | 120,568 |
| 221,605 | |||
| Student Loan — 0.2% | |||
| c | SoFi Professional Loan Program, LLC, Series 2015-B Class A2, 2.51%, 9/27/2032 | 55,301 | 54,853 |
| 54,853 | |||
| Whole Loan Collateral CMO — 0.7% | |||
| c,h | Angel Oak Mortgage Trust I, LLC, Series 2019-2 Class A1 3.628%, 3/25/2049 | 175,000 | 174,942 |
| 174,942 |
Thornburg Summit Fund | March 31, 2019 (Unaudited)
| SHARES/ PRINCIPAL AMOUNT | VALUE | ||
| Total Asset Backed Securities(Cost $2,188,648) | 2,189,797 | ||
| Corporate Bonds — 10.4% | |||
| Automobiles & Components — 0.7% | |||
| Automobiles — 0.7% | |||
| e | American Honda Finance Corp. 3.153% (LIBOR 3 Month + 0.47%), 11/16/2022 | $ 175,000 | $ 174,285 |
| 174,285 | |||
| Commercial & Professional Services — 1.1% | |||
| Commercial Services & Supplies — 0.7% | |||
| c | Nielsen Finance, LLC / Nielsen Finance Co., 5.00%, 4/15/2022 | 120,000 | 118,500 |
| c | ServiceMaster Co., LLC, 5.125%, 11/15/2024 | 50,000 | 50,187 |
| Leisure Products — 0.4% | |||
| Mattel, Inc., 2.35%, 8/15/2021 | 100,000 | 94,250 | |
| 262,937 | |||
| Diversified Financials — 2.4% | |||
| Consumer Finance — 0.2% | |||
| c | FirstCash, Inc., 5.375%, 6/1/2024 | 50,000 | 51,125 |
| Diversified Financial Services — 2.2% | |||
| Bank of America Corp. MTN, 4.20%, 8/26/2024 | 40,000 | 41,399 | |
| e,f | Barclays plc 4.807% (LIBOR 3 Month + 2.11%), 8/10/2021 | 200,000 | 203,821 |
| e | Goldman Sachs Group, Inc., 3.875% (LIBOR 3 Month + 1.11%), 4/26/2022 | 130,000 | 130,696 |
| e | JPMorgan Chase & Co., 4.106% (LIBOR 3 Month + 1.48%), 3/1/2021 | 140,000 | 142,603 |
| 569,644 | |||
| Energy — 0.4% | |||
| Oil, Gas & Consumable Fuels — 0.4% | |||
| c | Citgo Holding, Inc., 10.75%, 2/15/2020 | 100,000 | 102,520 |
| 102,520 | |||
| Food, Beverage & Tobacco — 0.5% | |||
| Tobacco — 0.5% | |||
| c | Vector Group Ltd., 10.50%, 11/1/2026 | 125,000 | 117,812 |
| 117,812 | |||
| Household & Personal Products — 0.5% | |||
| Personal Products — 0.5% | |||
| Edgewell Personal Care Co., 4.70%, 5/24/2022 | 120,000 | 120,600 | |
| 120,600 | |||
| Insurance — 1.5% | |||
| Insurance — 1.5% | |||
| c,j | Jackson National Life Global Funding, 3.25%, 1/30/2024 | 225,000 | 226,156 |
| c,e | Metropolitan Life Global Funding, 3.00% (SOFR + 0.57%), 9/7/2020 | 150,000 | 149,999 |
| 376,155 | |||
| Materials — 0.4% | |||
| Paper & Forest Products — 0.4% | |||
| c | Neenah, Inc., 5.25%, 5/15/2021 | 100,000 | 99,750 |
| 99,750 | |||
| Pharmaceuticals, Biotechnology & Life Sciences — 0.4% | |||
| Pharmaceuticals — 0.4% | |||
| e,f | AstraZeneca plc, 3.348% (LIBOR 3 Month + 0.67%), 8/17/2023 | 100,000 | 99,476 |
| 99,476 | |||
| Real Estate — 1.1% | |||
| Equity Real Estate Investment Trusts — 1.1% | |||
| American Tower Corp., 3.375%, 5/15/2024 | 50,000 | 50,352 | |
| CoreCivic, Inc. 4.75%, 10/15/2027 | 80,000 | 68,050 | |
| Hospitality Properties Trust, 4.95%, 2/15/2027 | 40,000 | 39,652 |
| SHARES/ PRINCIPAL AMOUNT | VALUE | ||
| Hudson Pacific Properties L.P., 4.65%, 4/1/2029 | $ 100,000 | $ 101,872 | |
| 259,926 | |||
| Software & Services — 0.2% | |||
| Software — 0.2% | |||
| c | Fair Isaac Corp. 5.25%, 5/15/2026 | 50,000 | 51,500 |
| 51,500 | |||
| Telecommunication Services — 0.8% | |||
| Wireless Telecommunication Services — 0.8% | |||
| Sprint Communications, Inc., 9.25%, 4/15/2022 | 160,000 | 186,400 | |
| 186,400 | |||
| Transportation — 0.4% | |||
| Airlines — 0.4% | |||
| c | American Airlines Pass Through Trust, Series 2013-2 Class B, 5.60%, 1/15/2022 | 90,873 | 92,236 |
| 92,236 | |||
| Total Corporate Bonds(Cost $2,513,434) | 2,513,241 | ||
| Convertible Bonds — 0.4% | |||
| Diversified Financials — 0.4% | |||
| Capital Markets — 0.4% | |||
| Ares Capital Corp. 4.625%, 3/1/2024 | 100,000 | 99,250 | |
| 99,250 | |||
| Total Convertible Bonds(Cost $98,510) | 99,250 | ||
| Other Government — 0.1% | |||
| Mexican Bonos 8.00%, 12/7/2023 | 750,000 | 38,897 | |
| Total Other Government(Cost $38,746) | 38,897 | ||
| U.S. Treasury Securities — 19.4% | |||
| United States Treasury Bonds, 5.25%, 2/15/2029 | 329,000 | 410,155 | |
| United States Treasury Notes Inflationary Index, | |||
| 0.50%, 1/15/2028 | 1,142,848 | 1,139,571 | |
| 3.625%, 4/15/2028 | 802,989 | 1,018,704 | |
| United States Treasury Notes, | |||
| 1.375%, 8/31/2020 | 125,000 | 123,261 | |
| 1.875%, 12/31/2019 | 1,000,000 | 995,836 | |
| 2.00%, 2/28/2021 | 582,000 | 578,704 | |
| 2.75%, 2/15/2028 | 400,000 | 411,406 | |
| Total U.S. Treasury Securities(Cost $4,622,591) | 4,677,637 | ||
| Mortgage Backed — 0.5% | |||
| Federal Home Loan Mtg Corp., Seasoned Credit Risk Transfer, Series 2019-1 Class MA, 3.50%, 7/25/2058 | 119,239 | 121,020 | |
| Total Mortgage Backed(Cost $119,922) | 121,020 | ||
| Exchange-Traded Funds — 5.5% | |||
| a | Invesco DB Agriculture Fund | 14,456 | 238,091 |
| a | Invesco DB Base Metals Fund | 14,276 | 243,263 |
| iShares MSCI India ETF | 6,792 | 239,418 | |
| a,b | SPDR Gold Shares | 4,916 | 599,801 |
| Total Exchange-Traded Funds(Cost $1,312,680) | 1,320,573 | ||
| Investment Company — 1.0% | |||
| b | United States Oil Fund L.P. | 19,549 | 244,363 |
| Total Investment Company(Cost $233,323) | 244,363 | ||
| Total Long-Term Investments — 94.7%(Cost $22,585,407) | 22,875,856 |
Thornburg Summit Fund | March 31, 2019 (Unaudited)
| SHARES/ PRINCIPAL AMOUNT | VALUE | ||
| Short-Term Investments — 11.8% | |||
| k | Thornburg Capital Management Fund | 285,556 | $ 2,855,564 |
| Total Short-Term Investments(Cost $2,855,564) | 2,855,564 | ||
| Total Investments — 106.5%(Cost $25,440,971) | $25,731,420 | ||
| Liabilities Net of Other Assets — (6.5)% | (1,571,939) | ||
| Common Stock Sold Short — (6.9)% | |||
| Commercial & Professional Services — (0.5)% | |||
| Professional Services — (0.5)% | |||
| b | FTI Consulting, Inc. | (1,622) | (124,602) |
| (124,602) | |||
| Consumer Durables & Apparel — (0.8)% | |||
| Textiles, Apparel & Luxury Goods — (0.8)% | |||
| Crocs, Inc. | (7,188) | (185,091) | |
| (185,091) | |||
| Consumer Services — (0.7)% | |||
| Hotels, Restaurants & Leisure — (0.7)% | |||
| Brinker International, Inc. | (4,067) | (180,494) | |
| (180,494) | |||
| Diversified Financials — (0.8)% | |||
| Capital Markets — (0.8)% | |||
| FactSet Research Systems, Inc. | (764) | (189,678) | |
| (189,678) | |||
| Media & Entertainment — (2.3)% | |||
| Entertainment — (0.8)% | |||
| b | Tencent Music Entertainment Group ADR | (9,891) | (179,027) |
| Media — (1.5)% | |||
| b | Discovery, Inc., Class A | (6,478) | (175,036) |
| New York Times Co., Class A | (5,810) | (190,858) | |
| (544,921) | |||
| Pharmaceuticals, Biotechnology & Life Sciences — (0.5)% | |||
| Pharmaceuticals — (0.5)% | |||
| Shionogi & Co. Ltd. | (2,000) | (123,649) | |
| (123,649) | |||
| Retailing — (0.8)% | |||
| Specialty Retail — (0.8)% | |||
| Foot Locker, Inc. | (3,355) | (203,313) | |
| (203,313) | |||
| Telecommunication Services — (0.5)% | |||
| Diversified Telecommunication Services — (0.5)% | |||
| Cogent Communications Holdings, Inc. | (2,324) | (126,077) | |
| (126,077) | |||
| Total Common Stock Sold Short(Cost $(1,664,788)) | (1,677,825) | ||
| Net Assets — 100.0% | $24,159,481 |
| Footnote Legend | |
| a | All or a portion of the security is pledged as collateral for securities sold short. At March 31, 2019, the value of securities pledged was $2,000,930. |
| b | Non-income producing. |
| c | Securities exempt from registration under Rule 144A of the Securities Act of 1933, as amended. These securities are restricted but liquid and may only be resold in the ordinary course of business in transactions exempt from registration, normally to qualified institutional buyers. As of March 31, 2019, the aggregate value of these securities in the Fund’s portfolio was $3,200,894, representing 13.25% of the Fund’s net assets. |
| d | Coupon rate adjusts periodically based upon a predetermined schedule. Stated interest rate in effect at March 31, 2019. |
| e | Floating Rate Security. Stated interest/floor rate was in effect at March 31, 2019. |
| f | Yankee bond denominated in U.S. dollars and is issued in the U.S. by foreign banks and corporations. |
| g | Security currently fair valued by the Valuation and Pricing Committee using procedures approved by the Trustees’ Audit Committee. |
| h | Variable rate coupon, rate shown as of March 31, 2019. |
| i | When-issued security. |
| j | Segregated as collateral for a when-issued security. |
| k | Investment in Affiliates. |
To simplify the listings of securities, abbreviations are used per the table below:
| ADR | American Depositary Receipt |
| CMO | Collateralized Mortgage Obligation |
| LIBOR | London Interbank Offered Rates |
| Mtg | Mortgage |
| MTN | Medium-Term Note |
| SBA | Small Business Administration |
| SOFR | Secured Overnight Financing Rate |
| SPA | Stand-by Purchase Agreement |
Thornburg Summit Fund | March 31, 2019 (Unaudited)
| ASSETS | |
| Investments at value (Note 3) | |
| Non-affiliated issuers (cost $22,585,407) | $ 22,875,856 |
| Non-controlled affiliated issuer (cost $2,855,564) | 2,855,564 |
| Cash | 12,634 |
| Cash denominated in foreign currency (cost $3,311) | 3,310 |
| Receivable for investments sold | 451,035 |
| Receivable from investment advisor | 15,676 |
| Dividends receivable | 11,727 |
| Dividend and interest reclaim receivable | 1,718 |
| Interest receivable | 65,902 |
| Prepaid expenses and other assets | 39,010 |
| Total Assets | 26,332,432 |
| Liabilities | |
| Securities sold short (proceeds $1,664,788) | 1,677,825 |
| Payable for investments purchased | 487,822 |
| Payable for short sale financing | 887 |
| Accounts payable and accrued expenses | 5,623 |
| Dividends payable for short sales | 794 |
| Total Liabilities | 2,172,951 |
| Net Assets | $ 24,159,481 |
| NET ASSETS CONSIST OF | |
| Distributable earnings | $ 348,773 |
| Net capital paid in on shares of beneficial interest | 23,810,708 |
| $ 24,159,481 | |
| NET ASSET VALUE | |
| Class I Shares: | |
| Net asset value, offering and redemption price per share ($24,159,481 applicable to 2,370,137 shares of beneficial interest outstanding - Note 5) | $ 10.19 |
Thornburg Summit Fund | Period Ended March 31, 2019* (Unaudited)
| INVESTMENT INCOME | |
| Dividend income | |
| Non-affiliated issuers (net of foreign taxes withheld of $1,368) | $ 12,723 |
| Non-controlled affiliated issuer | 9,056 |
| Interest income (net of premium amortized of $2,840) | 14,934 |
| Total Income | 36,713 |
| EXPENSES | |
| Investment advisory fees (Note 4) | 10,703 |
| Administration fees (Note 4) | |
| Class I Shares | 1,253 |
| Transfer agent fees | |
| Class I Shares | 310 |
| Registration and filing fees | |
| Class I Shares | 310 |
| Dividend expense on securities sold short | 2,171 |
| Short sale financing fees | 887 |
| Custodian fees (Note 2) | 310 |
| Professional fees | 6,355 |
| Trustee and officer fees (Note 4) | 62 |
| Organizational and offering costs | 22,146 |
| Other expenses | 310 |
| Total Expenses | 44,817 |
| Less: | |
| Expenses reimbursed by investment advisor (Note 4) | (27,632) |
| Net Expenses | 17,185 |
| Net Investment Income | $ 19,528 |
| REALIZED AND UNREALIZED GAIN (LOSS) | |
| Net realized gain (loss) on: | |
| Non-affiliated issuer investments | |
| Long positions | 39,025 |
| Short positions | 9,244 |
| Foreign currency transactions | 3,574 |
| 51,843 | |
| Net change in unrealized appreciation (depreciation) on: | |
| Non-affiliated issuer investments | |
| Long positions | 290,449 |
| Short positions | (13,037) |
| Foreign currency translations | (10) |
| 277,402 | |
| Net Realized and Unrealized Gain | 329,245 |
| Net Increase in Net Assets Resulting from Operations | $ 348,773 |
| * | The Fund commenced operations on March 01, 2019. |
Thornburg Summit Fund
| Period Ended March 31, 2019* | |
| INCREASE (DECREASE) IN NET ASSETS FROM | |
| OPERATIONS | |
| Net investment income | $ 19,528 |
| Net realized gain (loss) on investments and foreign currency transactions | 51,843 |
| Net unrealized appreciation (depreciation) on investments and foreign currency translations | 277,402 |
| Net Increase in Net Assets Resulting from Operations | 348,773 |
| FUND SHARE TRANSACTIONS (NOTE 5) | |
| Class I Shares | 23,810,708 |
| Net Increase in Net Assets | 24,159,481 |
| NET ASSETS | |
| Beginning of Period | 0 |
| End of Period | $ 24,159,481 |
| * | For the unaudited period from commencement of operations on March 01, 2019 through March 31, 2019. |
Thornburg Summit Fund | March 31, 2019 (Unaudited)
Thornburg Summit Fund | March 31, 2019 (Unaudited)
| Cost of investments for tax purposes | $ 23,776,183 |
| Gross unrealized appreciation on a tax basis | 415,725 |
| Gross unrealized depreciation on a tax basis | (138,313) |
| Net unrealized appreciation (depreciation) on investments (tax basis) | $ 277,412 |
Thornburg Summit Fund | March 31, 2019 (Unaudited)
| Fair Value Measurements at March 31, 2019 | ||||
| TOTAL | LEVEL 1 | LEVEL 2 | LEVEL 3 | |
| Assets | ||||
| Investments in Securities* | ||||
| Common Stock | $ 11,671,078 | $ 11,671,078 | $ — | $ — |
| Asset Backed Securities | 2,189,797 | — | 2,014,799 | 174,998 |
| Corporate Bonds | 2,513,241 | — | 2,513,241 | — |
| Convertible Bonds | 99,250 | — | 99,250 | — |
| Other Government | 38,897 | — | 38,897 | — |
| U.S. Treasury Securities | 4,677,637 | 4,677,637 | — | — |
| Mortgage Backed | 121,020 | — | 121,020 | — |
| Exchange-Traded Funds | 1,320,573 | 1,320,573 | — | — |
| Investment Company | 244,363 | 244,363 | — | — |
| Short-Term Investments | 2,855,564 | 2,855,564 | — | — |
| Total Investments in Securities | $25,731,420 | $20,769,215 | $4,787,207 | $174,998(a) |
| Total Assets | $25,731,420 | $20,769,215 | $4,787,207 | $174,998 |
| Liabilities | ||||
| Investment in Securities Sold Short | ||||
| Common Stock | $ (1,677,825) | $ (1,677,825) | $ — | $ — |
| Total Liabilities | $(1,677,825) | $(1,677,825) | $— | $— |
| * | See Schedule of Investments for a summary of the industry exposure as grouped according to the Global Industry Classification Standard (GICS), which is an industry taxonomy developed by MSCI, Inc. and Standard & Poor’s (S&P). |
| (a) | In accordance with the guidance prescribed in Accounting Standards Update ("ASU") No. 2011-04, the following table displays a summary of the valuation techniques and unobservable inputs used to value portfolio securities characterized as Level 3 investments for the period ended at March 31, 2019. |
| FAIR VALUE AT March 31, 2019 | VALUATION TECHNIQUE(S) | UNOBSERVABLE INPUT | RANGE (WEIGHTED AVERAGE) | |
| Asset Backed Securities | $ 174,998 | Recent trade | Trade price | $99.99865/(N/A) |
| Total | $174,998 |
| COMMON STOCK | TOTAL(a) | |
| Beginning Balance 3/1/2019(b) | $ – | $ – |
| Accrued Discounts (Premiums) | – | – |
| Net Realized Gain (Loss) | – | – |
| Gross Purchases | 174,998 | 174,998 |
| Gross Sales | – | – |
| Net Change in Unrealized Appreciation (Depreciation) | – | – |
| Transfers into Level 3 | – | – |
| Transfers out of Level 3 | – | – |
| Ending Balance 3/31/2019 | $174,998 | $174,998 |
| (a) | Level 3 investments represent 0.72% of total net assets at the one month ended March 31, 2019. Significant fluctuations of the unobservable inputs applied to portfolio securities characterized as Level 3 investments could be expected to increase or decrease the fair value of these portfolio securities. |
| (b) | The Fund commenced operations on March 01, 2019. |
Thornburg Summit Fund | March 31, 2019 (Unaudited)
| Management Fee Schedule | |
| DAILY NET ASSETS | FEE RATE |
| Up to $500 million | 0.750% |
| Next $500 million | 0.700 |
| Next $500 million | 0.650 |
| Next $500 million | 0.625 |
| Over $2 billion | 0.600 |
| Administration Fee Schedule | |
| Daily Net Assets | Fee Rate |
| Up to $20 billion | 0.100% |
| $20 billion to $40 billion | 0.075 |
| $40 billion to $60 billion | 0.040 |
| Over $60 billion | 0.030 |
| Fund | Market Value 3/01/19 | Purchases at Cost | Sales Proceeds | Realized Gain (Loss) | Change in Unrealized Appr./(Depr.) | Market Value 3/31/19 | Dividend Income |
| Thornburg Capital Management Fund | $- | $16,673,227 | $(13,817,663) | $- | $- | $2,855,564 | $9,056 |
| PERIOD ENDED March 31, 2019* (UNAUDITED) | ||
| SHARES | AMOUNT | |
| Class I Shares | ||
| Shares sold | 2,370,137 | $ 23,810,708 |
| Net increase | 2,370,137 | $ 23,810,708 |
| * | The Fund commenced operations on March 01, 2019. |
SHEET RISK AND FOREIGN INVESTMENT RISK
Thornburg Summit Fund
| Per Share Performance (For a Share Outstanding throughout the Period) | ||||||||
| UNLESS OTHERWISE NOTED, PERIODS ARE FISCAL YEARS ENDED SEPTEMBER 30, | Net Asset Value, Beginning of Period | Net Investment Income (Loss)+ | Net Realized & Unrealized Gain (Loss) on Investments | Total from Investment Operations | Dividends from Net Investment Income | Dividends from Net Realized Gains | Total Dividends | Net Asset Value, End of Period |
| Class I | ||||||||
| 2019(d) | $ 10.00 | 0.01 | 0.18 | 0.19 | — | — | — | $ 10.19 |
| (a) | The Fund incurs certain expenses and fees in connection with investments in short positions. If such expenses and fees had not occurred, the Expenses After Expense Reductions ratio would have been 0.99%. |
| (b) | The Fund incurs certain expenses and fees in connection with investments in short positions. If such expenses and fees had not occurred, the Expenses Before Expense Reductions ratio would have been 2.93%. |
| (c) | Not annualized for periods less than one year. |
| (d) | Fund commenced operations on March 01, 2019. |
| (e) | Annualized. |
| + | Based on weighted average shares outstanding. |
Thornburg Summit Fund
| Ratios to Average Net Assets | Supplemental Data | |||||
| Net Investment Income (Loss) (%) | Expenses, After Expense Reductions (%)(a) | Expenses, Before Expense Reductions (%)(b) | Total Return (%)(c) | Portfolio Turnover Rate (%)(c) | Net Assets at End of Period (Thousands) | |
| 1.37(e) | 1.20(e) | 3.14(e) | 1.90 | 10.98 | $ 24,159 | |
Thornburg Summit Fund | March 31, 2019 (Unaudited)
| BEGINNING ACCOUNT VALUE 10/1/18 | ENDING ACCOUNT VALUE 3/31/19 | EXPENSES PAID DURING PERIOD† 10/1/18—3/31/19 | |
| CLASS I SHARES | |||
| Actual | $1,000.00 | $1,019.00 | $6.04 |
| Hypothetical* | $1,000.00 | $1,018.95 | $6.04 |
| † | Expenses are equal to the annualized expense ratio for each class (I: 1.20%) multiplied by the average account value over the period, multiplied by 182/365 to reflect the one-half year period. |
| * | Hypothetical assumes a rate of return of 5% per year before expenses. |
Thornburg Summit Fund | March 31, 2019 (Unaudited)
Thornburg Summit Fund | March 31, 2019 (Unaudited)
| ■ | Thornburg Investment Income Builder Fund |
| ■ | Thornburg Global Opportunities Fund |
| ■ | Thornburg International Value Fund |
| ■ | Thornburg Better World International Fund |
| ■ | Thornburg International Growth Fund |
| ■ | Thornburg Developing World Fund |
| ■ | Thornburg Value Fund |
| ■ | Thornburg Core Growth Fund |
| ■ | Thornburg Investment Income Builder Fund |
| ■ | Thornburg Summit Fund |
| ■ | Thornburg Low Duration Income Fund |
| ■ | Thornburg Limited Term U.S. Government Fund |
| ■ | Thornburg Limited Term Income Fund |
| ■ | Thornburg Strategic Income Fund |
| ■ | Thornburg Low Duration Municipal Fund |
| ■ | Thornburg Limited Term Municipal Fund |
| ■ | Thornburg Intermediate Municipal Fund |
| ■ | Thornburg California Limited Term Municipal Fund |
| ■ | Thornburg New Mexico Intermediate Municipal Fund |
| ■ | Thornburg New York Intermediate Municipal Fund |
| ■ | Thornburg Strategic Municipal Income Fund |
| ■ | Thornburg Long/Short Equity Fund |

| 800.847.0200 | TH4399 |
Item 2.Code of Ethics
Not applicable.
Item 3.Audit Committee Financial Expert
Not applicable.
Item 4.Principal Accountant Fees and Services
Not applicable.
Item 5.Audit Committee of Listed Registrants
Not applicable.
Item 6.Schedule of Investments
Filed as part of the reports to shareholders filed under item 1 of this Form.
Item 7.Disclosure of Proxy Voting Policies and Procedures for Closed-End Management Investment Companies
Not applicable.
Item 8.Portfolio Managers of Closed-End Management Investment Companies
Not applicable.
Item 9.Purchases of Equity Securities by Closed-End Management Investment Companies and Affiliated Purchasers.
Not applicable.
Item 10.Submission of Matters to a Vote of Security Holders
The authority to consider candidates recommended by the shareholders in accordance with the Trust’s Procedures for Shareholder Communications is committed to the Governance and Nominating Committee.
Item 11.Controls and Procedures
(a) The principal executive officer and the principal financial officer have concluded that Thornburg Investment Trust’s disclosure controls and procedures provide reasonable assurance that material information relating to Thornburg Investment Trust is made known to them by the appropriate persons, based on their evaluation of these controls and procedures as of a date within 90 days prior to the filing date of this report.
(b) There was no change in Thornburg Investment Trust’s internal control over financial reporting that occurred during the registrant’s second fiscal quarter of the period covered by this report (that is, the registrant’s second fiscal quarter) that has materially affected, or is reasonably likely to materially affect, the registrant’s internal control over financial reporting.
Item 12.Disclosure of Securities Lending Activities for Closed-End Management Investment Companies
Not applicable.
Item 13.Exhibits
| (a) (1) | Not Applicable |
| (a) (2) | Certifications pursuant to Rule 30a-2(a) under the Investment Company Act of 1940 (17 CFR 70.30a-2(a)) attached hereto as Exhibit 99.CERT. |
| (a) (3) | Not Applicable |
| (b) | Certification pursuant to Section 906 of the Sarbanes-Oxley Act of 2002 and Rule 30a-2(b) under the Investment Company Act of 1940 (17 CFR 70.30a-2(b)) attached hereto as Exhibit 99.906CERT. |
SIGNATURES
Pursuant to the requirements of the Securities Exchange Act of 1934 and the Investment Company Act of 1940, the registrant has duly caused this report to be signed on its behalf by the undersigned, thereunto duly authorized.
Thornburg Investment Trust, in respect of the following Thornburg Funds: Low Duration Municipal Fund, Limited Term Municipal Fund, Intermediate Municipal Fund, Strategic Municipal Income Fund, California Limited Term Municipal Fund, New Mexico Intermediate Municipal Fund, New York Intermediate Municipal Fund, Limited Term U.S. Government Fund, Limited Term Income Fund, Low Duration Income Fund, Strategic Income Fund, Value Fund, International Value Fund, Core Growth Fund, International Growth Fund, Investment Income Builder Fund, Global Opportunities Fund, Developing World Fund, Better World International Fund, Capital Management Fund, Long/Short Equity Fund and Summit Fund.
| By: | /s/ Jason H. Brady | |
| Jason H. Brady | ||
| President and principal executive officer | ||
| Date: | May 17, 2019 | |
Pursuant to the requirements of the Securities Exchange Act of 1934 and the Investment Company Act of 1940, this report has been signed below by the following persons on behalf of the registrant and in the capacities and on the dates indicated.
| By: | /s/ Jason H. Brady | |
| Jason H. Brady | ||
| President and principal executive officer | ||
| Date: | May 17, 2019 | |
| By: | /s/ Nimish Bhatt | |
| Nimish Bhatt | ||
| Treasurer and principal financial officer | ||
| Date: | May 17, 2019 | |