UNITED STATES
SECURITIES AND EXCHANGE COMMISSION
Washington, D.C. 20549
FORM N-CSR
CERTIFIED SHAREHOLDER REPORT OF REGISTERED MANAGEMENT INVESTMENT
COMPANIES
Investment Company Act file number 811-05201
Thornburg Investment Trust
(Exact name of registrant as specified in charter)
c/o Thornburg Investment Management, Inc.
2300 North Ridgetop Road, Santa Fe, New Mexico 87506
(Address of principal executive offices) (Zip code)
Garrett Thornburg, 2300 North Ridgetop Road, Santa Fe, New Mexico 87506
(Name and address of agent for service)
Registrant’s telephone number, including area code: 505-984-0200
Date of fiscal year end: September 30
Date of reporting period: March 31, 2024
Item 1. Reports to Stockholders
The following Semi-annual reports are attached hereto, in order:
Thornburg Global Opportunities
Thornburg International Equity Fund
Thornburg Better World International Fund
Thornburg International Growth Fund
Thornburg Developing World Fund
Thornburg Small/Mid Cap Core Fund
Thornburg Small/Mid Cap Growth Fund
Thornburg Investment Income Builder Fund
Thornburg Summit Fund
Thornburg Ultra Short Income Fund
Thornburg Limited Term U.S. Government Fund
Thornburg Limited Term Income Fund
Thornburg Core Plus Bond Fund
Thornburg Strategic Income Fund
Thornburg Short Duration Municipal Fund
Thornburg Limited Term Municipal Fund
Thornburg Intermediate Municipal Fund
Thornburg Strategic Municipal Income Fund
Thornburg California Limited Term Municipal Fund
Thornburg New Mexico Intermediate Municipal Fund
Thornburg New York Intermediate Municipal Fund
Thornburg Capital Management Fund
Thornburg Emerging Markets Managed Account Fund
Thornburg Municipal Managed Account Fund

| EQUITY FUNDS |
| Global Equity |
| Thornburg Global Opportunities Fund |
| International Equity |
| Thornburg International Equity Fund |
| Thornburg Better World International Fund |
| Thornburg International Growth Fund |
| Thornburg Developing World Fund |
| U.S. Equity |
| Thornburg Small/Mid Cap Core Fund |
| Thornburg Small/Mid Cap Growth Fund |
| Multi Asset |
| Thornburg Investment Income Builder Fund |
| Thornburg Summit Fund |
| 4 | |
| 10 | |
| 20 | |
| 22 | |
| Schedule of Investments | |
| 33 | |
| 36 | |
| 40 | |
| 44 | |
| 48 | |
| 52 | |
| 55 | |
| 58 | |
| 70 | |
| 80 | |
| 84 | |
| 88 | |
| 93 | |
| 116 | |
| 134 | |
| 136 | |
| 139 | |
| 141 |
March 31, 2024 (Unaudited)
March 31, 2024 ( (Unaudited)
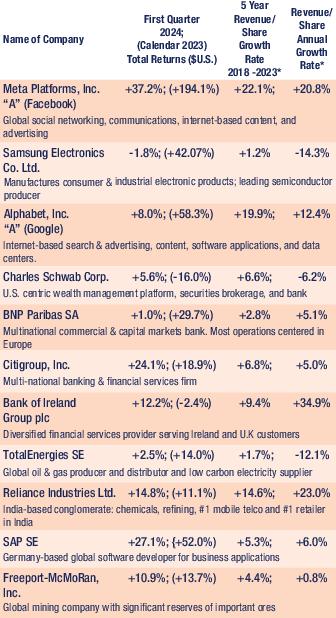
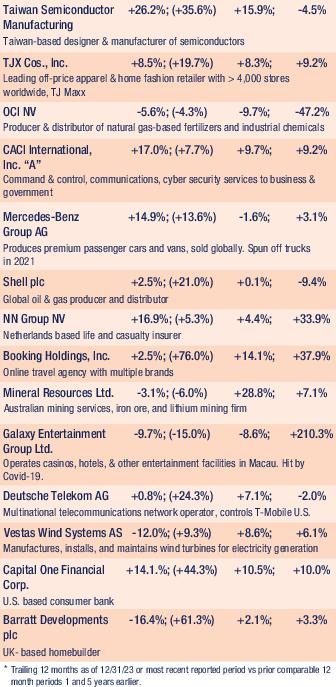
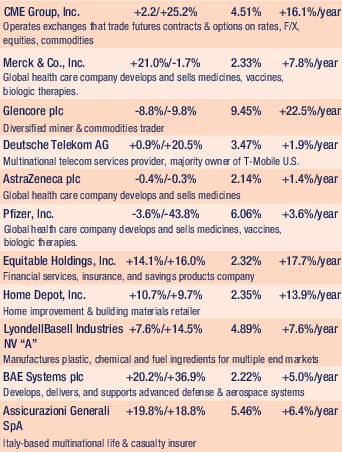
| • | The trailing 5-year weighted average revenue growth rate of the 2,841 businesses included in the Index was +2.7%/year through December 31, 2023. The annualized average revenue growth rate was +4.7% through the most recently reported trailing 12-month period which ended December 31, 2023 for most of these businesses. |
| • | The trailing 5-year weighted average annual revenue per share growth rate of the 36 equity holdings in the Fund’s portfolio was +9.4%/year through December 31, 2023. The weighted average revenue growth rate of these companies was +8.89% through the most recently reported trailing 12-month period, which ended December 31, 2023 for many of these businesses. The weighted average portfolio revenue growth rates of the Fund’s portfolio has significantly exceeded that of the Index. |
March 31, 2024 (Unaudited)
March 31, 2024 (Unaudited)
 |  |
| Brian McMahon Portfolio Manager Chief Investment Strategist and Managing Director | Miguel Oleaga Portfolio Manager and Managing Director |
March 31, 2024 (Unaudited)
31 March, 2024 (Unaudited)
March 31, 2024 (Unaudited)
March 31, 2024 (Unaudited)
 |  |
| Brian McMahon Portfolio Manager Chief Investment Strategist and Managing Director | Ben Kirby, cfa Portfolio Manager Head of Investments and Managing Director |
 |  |
| Matt Burdett Portfolio Manager and Managing Director | Christian Hoffmann, cfa Portfolio Manager and Managing Director |
Fund Overview
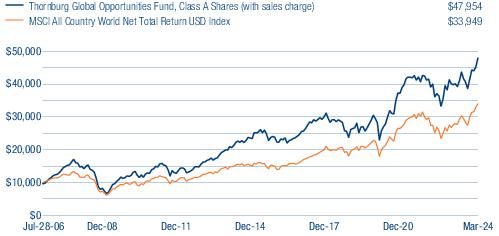
| THORNBURG GLOBAL OPPORTUNITIES FUND | FINAL VALUE |
| THORNBURG GLOBAL OPPORTUNITIES FUND | 1-YR | 3-YR | 5-YR | 10-YR | SINCE INCEPTION |
| Class A Shares (Incep: 7/28/06) | |||||
| Without sales charge | 20.49% | 6.43% | 12.46% | 8.79% | 9.56% |
| With sales charge | 15.07% | 4.81% | 11.43% | 8.30% | 9.28% |
| Class C Shares (Incep: 7/28/06) | |||||
| Without sales charge | 19.51% | 5.59% | 11.60% | 7.96% | 8.72% |
| With sales charge | 18.51% | 5.59% | 11.60% | 7.96% | 8.72% |
| Class I Shares (Incep: 7/28/06) | 20.88% | 6.76% | 12.79% | 9.14% | 9.99% |
| Class R3 Shares (Incep: 2/1/08) | 20.34% | 6.24% | 12.23% | 8.59% | 7.37% |
| Class R4 Shares (Incep: 2/1/08) | 20.41% | 6.33% | 12.33% | 8.69% | 7.46% |
| Class R5 Shares (Incep: 2/1/08) | 20.87% | 6.76% | 12.78% | 9.14% | 7.91% |
| Class R6 Shares (Incep: 4/10/17) | 21.09% | 6.92% | 12.95% | - | 9.32% |
| MSCI All Country World Net Total Return USD Index (Since 7/28/06) | 23.22% | 6.96% | 10.92% | 8.66% | 7.16% |
Fund Overview
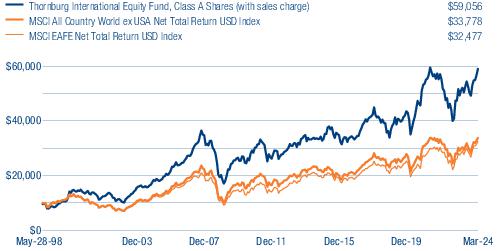
| THORNBURG INTERNATIONAL EQUITY FUND | FINAL VALUE |
| THORNBURG INTERNATIONAL EQUITY FUND | 1-YR | 3-YR | 5-YR | 10-YR | SINCE INCEPTION |
| Class A Shares (Incep: 5/28/98) | |||||
| Without sales charge | 15.40% | 2.11% | 8.61% | 5.94% | 7.30% |
| With sales charge | 10.20% | 0.55% | 7.61% | 5.46% | 7.11% |
| Class C Shares (Incep: 5/28/98) | |||||
| Without sales charge | 14.32% | 1.32% | 7.80% | 5.15% | 6.48% |
| With sales charge | 13.32% | 1.32% | 7.80% | 5.15% | 6.48% |
| Class I Shares (Incep: 3/30/01) | 15.72% | 2.44% | 8.95% | 6.30% | 7.20% |
| Class R3 Shares (Incep: 7/1/03) | 15.13% | 1.93% | 8.40% | 5.75% | 7.76% |
| Class R4 Shares (Incep: 2/1/07) | 15.38% | 2.15% | 8.62% | 5.96% | 4.57% |
| Class R5 Shares (Incep: 2/1/05) | 15.67% | 2.41% | 8.90% | 6.24% | 6.70% |
| Class R6 Shares (Incep: 5/1/12) | 15.88% | 2.62% | 9.11% | 6.47% | 6.69% |
| MSCI All Country World ex USA Net Total Return USD Index (Since 5/28/98) | 13.26% | 1.94% | 5.97% | 4.25% | 4.82% |
| MSCI EAFE Net Total Return USD Index (Since 5/28/98) | 15.32% | 4.78% | 7.33% | 4.80% | 4.66% |
Fund Overview
| THORNBURG BETTER WORLD INTERNATIONAL FUND | FINAL VALUE |
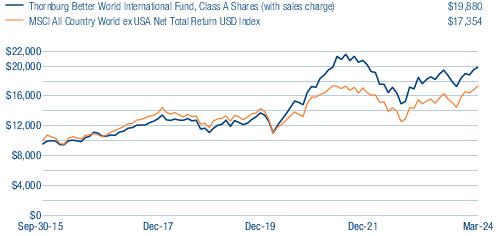
| THORNBURG BETTER WORLD INTERNATIONAL FUND | 1-YR | 3-YR | 5-YR | 10-YR | SINCE INCEPTION |
| Class A Shares (Incep: 10/1/15) | |||||
| Without sales charge | 9.01% | 1.84% | 10.27% | - | 9.00% |
| With sales charge | 4.12% | 0.28% | 9.25% | - | 8.42% |
| Class C Shares (Incep: 10/1/15) | |||||
| Without sales charge | 8.20% | 1.07% | 9.51% | - | 8.31% |
| With sales charge | 7.20% | 1.07% | 9.51% | - | 8.31% |
| Class I Shares (Incep: 10/1/15) | 9.57% | 2.37% | 10.93% | - | 9.73% |
| MSCI All Country World ex USA Net Total Return USD Index (Since 9/30/15) | 13.26% | 1.94% | 5.97% | - | 6.70% |
Fund Overview
| THORNBURG INTERNATIONAL GROWTH FUND | FINAL VALUE |
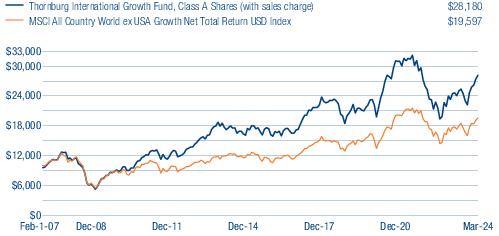
| THORNBURG INTERNATIONAL GROWTH FUND | 1-YR | 3-YR | 5-YR | 10-YR | SINCE INCEPTION |
| Class A Shares (Incep: 2/1/07) | |||||
| Without sales charge | 15.21% | -2.12% | 5.87% | 4.74% | 6.51% |
| With sales charge | 10.03% | -3.61% | 4.90% | 4.26% | 6.22% |
| Class C Shares (Incep: 2/1/07) | |||||
| Without sales charge | 14.13% | -2.99% | 4.98% | 3.91% | 5.71% |
| With sales charge | 13.13% | -2.99% | 4.98% | 3.91% | 5.71% |
| Class I Shares (Incep: 2/1/07) | 15.67% | -1.77% | 6.22% | 5.13% | 6.98% |
| Class R3 Shares (Incep: 2/1/08) | 15.15% | -2.24% | 5.70% | 4.60% | 5.67% |
| Class R4 Shares (Incep: 2/1/08) | 15.23% | -2.17% | 5.80% | 4.70% | 5.78% |
| Class R5 Shares (Incep: 2/1/08) | 15.69% | -1.76% | 6.23% | 5.13% | 6.20% |
| Class R6 Shares (Incep: 2/1/13) | 15.84% | -1.66% | 6.34% | 5.24% | 6.68% |
| MSCI All Country World ex USA Growth Net Total Return USD Index (Since 2/1/07) | 11.22% | -0.76% | 6.24% | 5.12% | 4.00% |
Fund Overview
| THORNBURG DEVELOPING WORLD FUND | FINAL VALUE |
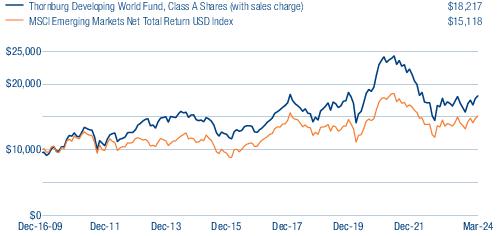
| THORNBURG DEVELOPING WORLD FUND | 1-YR | 3-YR | 5-YR | 10-YR | SINCE INCEPTION |
| Class A Shares (Incep: 12/16/09) | |||||
| Without sales charge | 5.39% | -7.88% | 1.85% | 1.99% | 4.62% |
| With sales charge | 0.63% | -9.28% | 0.92% | 1.52% | 4.29% |
| Class C Shares (Incep: 12/16/09) | |||||
| Without sales charge | 4.52% | -8.63% | 1.05% | 1.20% | 3.84% |
| With sales charge | 3.52% | -8.63% | 1.05% | 1.20% | 3.84% |
| Class I Shares (Incep: 12/16/09) | 5.95% | -7.51% | 2.25% | 2.40% | 5.09% |
| Class R5 Shares (Incep: 2/1/13) | 5.92% | -7.52% | 2.24% | 2.40% | 2.90% |
| Class R6 Shares (Incep: 2/1/13) | 5.99% | -7.42% | 2.34% | 2.50% | 3.01% |
| MSCI Emerging Markets Net Total Return USD Index (Since 12/16/09) | 8.15% | -5.05% | 2.22% | 2.95% | 2.94% |
Fund Overview
| THORNBURG SMALL/MID CAP CORE FUND | FINAL VALUE |
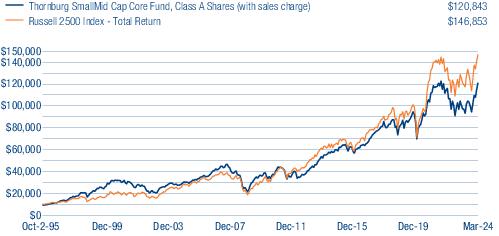
| THORNBURG SMALL/MID CAP CORE FUND | 1-YR | 3-YR | 5-YR | 10-YR | SINCE INCEPTION |
| Class A Shares (Incep: 10/2/95) | |||||
| Without sales charge | 24.31% | 2.39% | 7.63% | 8.19% | 9.31% |
| With sales charge | 18.71% | 0.83% | 6.65% | 7.70% | 9.14% |
| Class C Shares (Incep: 10/2/95) | |||||
| Without sales charge | 23.07% | 1.43% | 6.69% | 7.30% | 8.45% |
| With sales charge | 22.07% | 1.43% | 6.69% | 7.30% | 8.45% |
| Class I Shares (Incep: 11/2/98) | 24.82% | 2.79% | 8.03% | 8.60% | 7.76% |
| Class R3 Shares (Incep: 7/1/03) | 24.37% | 2.42% | 7.65% | 8.21% | 7.82% |
| Class R4 Shares (Incep: 2/1/07) | 24.51% | 2.53% | 7.76% | 8.32% | 6.36% |
| Class R5 Shares (Incep: 2/1/05) | 24.82% | 2.79% | 8.03% | 8.60% | 7.93% |
| Russell 2500 Index - Total Return (Since 10/2/95) | 21.43% | 2.97% | 9.90% | 8.84% | 9.89% |
Fund Overview
| THORNBURG SMALL/MID CAP GROWTH FUND | FINAL VALUE |
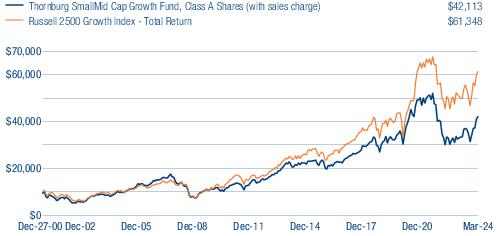
| THORNBURG SMALL/MID CAP GROWTH FUND | 1-YR | 3-YR | 5-YR | 10-YR | SINCE INCEPTION |
| Class A Shares (Incep: 12/27/00) | |||||
| Without sales charge | 27.57% | -3.54% | 5.77% | 6.86% | 6.59% |
| With sales charge | 21.83% | -5.01% | 4.81% | 6.36% | 6.38% |
| Class C Shares (Incep: 12/27/00) | |||||
| Without sales charge | 26.41% | -4.40% | 4.89% | 5.99% | 5.74% |
| With sales charge | 25.41% | -4.40% | 4.89% | 5.99% | 5.74% |
| Class I Shares (Incep: 11/3/03) | 28.21% | -3.11% | 6.21% | 7.28% | 8.52% |
| Class R3 Shares (Incep: 7/1/03) | 27.57% | -3.59% | 5.67% | 6.74% | 8.49% |
| Class R4 Shares (Incep: 2/1/07) | 27.69% | -3.51% | 5.78% | 6.85% | 6.07% |
| Class R5 Shares (Incep: 10/3/05) | 28.22% | -3.11% | 6.20% | 7.28% | 7.77% |
| Russell 2500 Growth Index - Total Return (Since 12/27/00) | 21.12% | -0.81% | 9.39% | 9.56% | 8.11% |
Fund Overview
| THORNBURG INVESTMENT INCOME BUILDER FUND | FINAL VALUE |
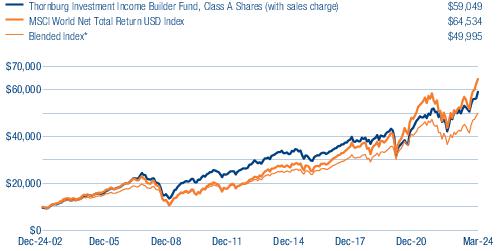
| THORNBURG INVESTMENT INCOME BUILDER FUND | 1-YR | 3-YR | 5-YR | 10-YR | SINCE INCEPTION |
| Class A Shares (Incep: 12/24/02) | |||||
| Without sales charge | 18.17% | 8.11% | 8.42% | 6.31% | 8.94% |
| With sales charge | 12.87% | 6.47% | 7.43% | 5.83% | 8.71% |
| Class C Shares (Incep: 12/24/02) | |||||
| Without sales charge | 17.32% | 7.31% | 7.61% | 5.53% | 8.24% |
| With sales charge | 16.32% | 7.31% | 7.61% | 5.53% | 8.24% |
| Class I Shares (Incep: 11/3/03) | 18.38% | 8.37% | 8.67% | 6.60% | 8.52% |
| Class R3 Shares (Incep: 2/1/05) | 17.72% | 7.71% | 8.02% | 5.95% | 7.23% |
| Class R4 Shares (Incep: 2/1/08) | 17.86% | 7.83% | 8.13% | 6.05% | 6.05% |
| Class R5 Shares (Incep: 2/1/07) | 18.32% | 8.27% | 8.57% | 6.48% | 6.67% |
| Class R6 Shares (Incep: 4/10/17) | 18.51% | 8.47% | 8.77% | - | 8.26% |
| MSCI World Net Total Return USD Index (Since 12/24/02) | 25.11% | 8.60% | 12.07% | 9.39% | 9.16% |
| Blended Index* (Since 12/24/02) | 18.93% | 5.89% | 9.29% | 7.57% | 7.86% |
Fund Overview
| THORNBURG SUMMIT FUND | FINAL VALUE |
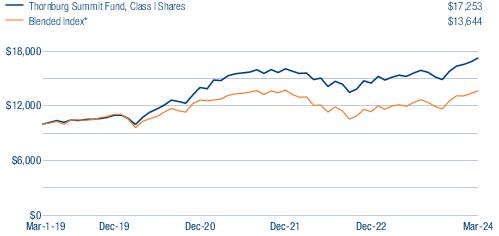
| THORNBURG SUMMIT FUND | 1-YR | 3-YR | 5-YR | 10-YR | SINCE INCEPTION |
| Class A Shares (Incep: 1/26/22) | |||||
| Without sales charge | 13.52% | - | - | - | 4.85% |
| With sales charge | 8.41% | - | - | - | 2.65% |
| Class I Shares (Incep: 3/1/19) | 13.80% | 5.29% | 11.11% | - | 11.33% |
| Blended Index* (Since 3/1/19) | 13.71% | 2.28% | 6.18% | - | 6.30% |
Thornburg Investment Income Builder Fund | March 31, 2024 (Unaudited)
| RUSSELL 1000 INDEX | RUSSELL 2000 INDEX | |
| Real Estate | 29% | 32% |
| Financials | 27% | 39% |
| Utilities | 13% | 0% |
| Consumer Discretionary | 7% | 6% |
| Materials | 6% | 1% |
| Consumer Staples | 5% | 4% |
| Energy | 5% | 11% |
| Health Care | 3% | 1% |
| Industrials | 3% | 1% |
| Communication Services | 2% | 4% |
| Information Technology | 0% | 1% |
Thornburg Global Opportunities Fund | March 31, 2024 (Unaudited)
| TOP TEN EQUITY HOLDINGS | |
| Meta Platforms, Inc. Class A | 6.5% |
| Samsung Electronics Co. Ltd. | 5.0% |
| Alphabet, Inc. Class A | 4.8% |
| Charles Schwab Corp. | 4.5% |
| BNP Paribas SA | 4.4% |
| Citigroup, Inc. | 4.4% |
| Bank of Ireland Group plc | 4.2% |
| TotalEnergies SE | 4.2% |
| Reliance Industries Ltd. | 4.0% |
| SAP SE | 3.5% |
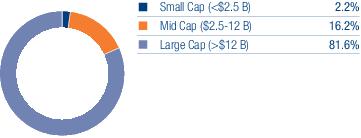
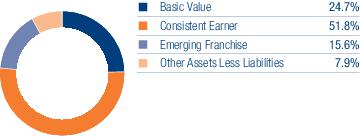
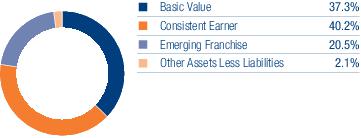
| SECTOR EXPOSURE | |
| Financials | 21.9% |
| Communication Services | 17.2% |
| Consumer Discretionary | 13.5% |
| Information Technology | 12.4% |
| Energy | 10.8% |
| Materials | 8.5% |
| Industrials | 7.8% |
| Consumer Staples | 2.9% |
| Health Care | 2.9% |
| Other Assets Less Liabilities | 2.1% |
| TOP TEN INDUSTRY GROUPS | |
| Media & Entertainment | 13.1% |
| Banks | 13.0% |
| Energy | 10.8% |
| Materials | 8.5% |
| Financial Services | 6.4% |
| Capital Goods | 5.0% |
| Technology Hardware & Equipment | 5.0% |
| Consumer Services | 4.5% |
| Consumer Discretionary Distribution & Retail | 4.3% |
| Telecommunication Services | 4.1% |
| THORNBURG GLOBAL OPPORTUNITIES FUND | NASDAQ SYMBOLS | CUSIPS |
| Class A | THOAX | 885-215-343 |
| Class C | THOCX | 885-215-335 |
| Class I | THOIX | 885-215-327 |
| Class R3 | THORX | 885-215-145 |
| Class R4 | THOVX | 885-215-137 |
| Class R5 | THOFX | 885-215-129 |
| Class R6 | THOGX | 885-216-655 |
Thornburg International Equity Fund | March 31, 2024 (Unaudited)
| TOP TEN EQUITY HOLDINGS | |
| TotalEnergies SE | 4.1% |
| NN Group NV | 3.1% |
| Hitachi Ltd. | 3.0% |
| Safran SA | 3.0% |
| Canadian Pacific Kansas City Ltd. | 3.0% |
| Schneider Electric SE | 2.9% |
| Linde plc | 2.9% |
| Tencent Holdings Ltd. | 2.8% |
| L’Oreal SA | 2.8% |
| Taiwan Semiconductor Manufacturing Co. Ltd. Sponsored ADR | 2.7% |
| SECTOR EXPOSURE | |
| Industrials | 21.3% |
| Financials | 16.3% |
| Information Technology | 11.0% |
| Consumer Staples | 9.3% |
| Communication Services | 7.6% |
| Utilities | 7.6% |
| Health Care | 5.7% |
| Materials | 5.7% |
| Consumer Discretionary | 5.6% |
| Energy | 5.3% |
| Other Assets Less Liabilities | 4.6% |
| TOP TEN INDUSTRY GROUPS | |
| Capital Goods | 17.1% |
| Utilities | 7.6% |
| Insurance | 6.1% |
| Banks | 6.1% |
| Materials | 5.7% |
| Energy | 5.3% |
| Pharmaceuticals, Biotechnology & Life Sciences | 4.7% |
| Semiconductors & Semiconductor Equipment | 4.7% |
| Media & Entertainment | 4.5% |
| Financial Services | 4.1% |
| THORNBURG INTERNATIONAL EQUITY FUND | NASDAQ SYMBOLS | CUSIPS |
| Class A | TGVAX | 885-215-657 |
| Class C | THGCX | 885-215-640 |
| Class I | TGVIX | 885-215-566 |
| Class R3 | TGVRX | 885-215-525 |
| Class R4 | THVRX | 885-215-269 |
| Class R5 | TIVRX | 885-215-368 |
| Class R6 | TGIRX | 885-216-804 |
Thornburg Better World International Fund | March 31, 2024 (Unaudited)
| TOP TEN EQUITY HOLDINGS | |
| Hitachi Ltd. | 3.3% |
| Canadian Pacific Kansas City Ltd. | 3.0% |
| Meituan Class B | 3.0% |
| Tencent Holdings Ltd. | 3.0% |
| Constellation Software, Inc. | 2.9% |
| L’Oreal SA | 2.8% |
| BNP Paribas SA | 2.7% |
| Novo Nordisk AS Class B | 2.6% |
| Hong Kong Exchanges & Clearing Ltd. | 2.5% |
| SAP SE | 2.5% |
| SECTOR EXPOSURE | |
| Industrials | 19.7% |
| Consumer Staples | 14.7% |
| Financials | 13.7% |
| Health Care | 12.0% |
| Information Technology | 9.3% |
| Consumer Discretionary | 9.2% |
| Communication Services | 8.6% |
| Utilities | 3.3% |
| Materials | 1.6% |
| Other Assets Less Liabilities | 7.9% |
| TOP TEN INDUSTRY GROUPS | |
| Pharmaceuticals, Biotechnology & Life Sciences | 8.8% |
| Capital Goods | 8.8% |
| Commercial & Professional Services | 7.9% |
| Banks | 6.4% |
| Media & Entertainment | 6.2% |
| Household & Personal Products | 6.1% |
| Consumer Staples Distribution & Retail | 6.1% |
| Consumer Services | 5.6% |
| Financial Services | 5.5% |
| Software & Services | 5.4% |
| THORNBURG BETTER WORLD INTERNATIONAL FUND | NASDAQ SYMBOLS | CUSIPS |
| Class A | TBWAX | 885-216-721 |
| Class C | TBWCX | 885-216-713 |
| Class I | TBWIX | 885-216-697 |
Thornburg International Growth Fund | March 31, 2024 (Unaudited)
| TOP TEN EQUITY HOLDINGS | |
| Novo Nordisk AS Sponsored ADR | 6.1% |
| ASML Holding NV | 5.7% |
| Taiwan Semiconductor Manufacturing Co. Ltd. | 4.6% |
| Nestle SA | 4.3% |
| AstraZeneca plc | 3.4% |
| Mastercard, Inc. Class A | 3.3% |
| Beiersdorf AG | 2.8% |
| Lonza Group AG | 2.6% |
| Diageo plc | 2.6% |
| ICON plc ADR | 2.5% |
| SECTOR EXPOSURE | |
| Information Technology | 25.3% |
| Health Care | 18.9% |
| Financials | 14.4% |
| Consumer Staples | 12.9% |
| Consumer Discretionary | 11.6% |
| Materials | 5.0% |
| Communication Services | 4.8% |
| Industrials | 4.7% |
| Energy | 1.4% |
| Other Assets Less Liabilities | 1.0% |
| TOP TEN INDUSTRY GROUPS | |
| Semiconductors & Semiconductor Equipment | 17.5% |
| Pharmaceuticals, Biotechnology & Life Sciences | 17.1% |
| Financial Services | 10.5% |
| Food, Beverage & Tobacco | 6.9% |
| Software & Services | 5.9% |
| Materials | 5.0% |
| Media & Entertainment | 4.8% |
| Household & Personal Products | 4.6% |
| Automobiles & Components | 3.9% |
| Capital Goods | 3.5% |
| THORNBURG INTERNATIONAL GROWTH FUND | NASDAQ SYMBOLS | CUSIPS |
| Class A | TIGAX | 885-215-319 |
| Class C | TIGCX | 885-215-293 |
| Class I | TINGX | 885-215-244 |
| Class R3 | TIGVX | 885-215-178 |
| Class R4 | TINVX | 885-215-160 |
| Class R5 | TINFX | 885-215-152 |
| Class R6 | THGIX | 885-216-820 |
Thornburg Developing World Fund | March 31, 2024 (Unaudited)
| TOP TEN EQUITY HOLDINGS | |
| Taiwan Semiconductor Manufacturing Co. Ltd. | 9.4% |
| Naspers Ltd. Class N | 4.6% |
| Samsung Electronics Co. Ltd. | 4.5% |
| SK Hynix, Inc. | 3.5% |
| Varun Beverages Ltd. | 3.0% |
| Max Healthcare Institute Ltd. | 2.8% |
| Dino Polska SA | 2.4% |
| PRIO SA | 2.1% |
| ASMPT Ltd. | 2.0% |
| Chailease Holding Co. Ltd. | 2.0% |
| SECTOR EXPOSURE | |
| Information Technology | 23.1% |
| Financials | 19.3% |
| Consumer Discretionary | 17.6% |
| Consumer Staples | 14.1% |
| Health Care | 5.8% |
| Industrials | 4.8% |
| Energy | 4.4% |
| Real Estate | 4.2% |
| Communication Services | 2.5% |
| Materials | 1.3% |
| Utilities | 0.9% |
| Other Assets Less Liabilities | 2.0% |
| TOP TEN INDUSTRY GROUPS | |
| Semiconductors & Semiconductor Equipment | 17.1% |
| Banks | 11.4% |
| Consumer Discretionary Distribution & Retail | 8.4% |
| Consumer Staples Distribution & Retail | 8.1% |
| Technology Hardware & Equipment | 6.0% |
| Food, Beverage & Tobacco | 5.0% |
| Health Care Equipment & Services | 4.7% |
| Financial Services | 4.7% |
| Energy | 4.4% |
| Real Estate Management & Development | 4.2% |
| THORNBURG DEVELOPING WORLD FUND | NASDAQ SYMBOLS | CUSIPS |
| Class A | THDAX | 885-216-408 |
| Class C | THDCX | 885-216-507 |
| Class I | THDIX | 885-216-606 |
| Class R5 | THDRX | 885-216-846 |
| Class R6 | TDWRX | 885-216-838 |
Thornburg Small/Mid Cap Core Fund | March 31, 2024 (Unaudited)
| TOP TEN EQUITY HOLDINGS | |
| Casella Waste Systems, Inc. Class A | 3.5% |
| Builders FirstSource, Inc. | 3.0% |
| Vertiv Holdings Co. Class A | 2.8% |
| Clean Harbors, Inc. | 2.8% |
| MYR Group, Inc. | 2.7% |
| Repay Holdings Corp. Class A | 2.7% |
| ITT, Inc. | 2.6% |
| LPL Financial Holdings, Inc. | 2.5% |
| TechnipFMC plc | 2.5% |
| Applied Industrial Technologies, Inc. | 2.5% |
| SECTOR EXPOSURE | |
| Industrials | 28.1% |
| Financials | 17.3% |
| Information Technology | 15.0% |
| Consumer Discretionary | 9.7% |
| Health Care | 9.2% |
| Energy | 5.6% |
| Consumer Staples | 4.6% |
| Real Estate | 3.9% |
| Materials | 3.8% |
| Utilities | 1.8% |
| Other Assets Less Liabilities | 1.0% |
| TOP TEN INDUSTRY GROUPS | |
| Capital Goods | 17.3% |
| Financial Services | 9.0% |
| Commercial & Professional Services | 8.5% |
| Software & Services | 6.0% |
| Energy | 5.6% |
| Technology Hardware & Equipment | 5.4% |
| Health Care Equipment & Services | 5.4% |
| Consumer Durables & Apparel | 4.5% |
| Insurance | 4.2% |
| Banks | 4.1% |
| THORNBURG SMALL/MID CAP CORE FUND | NASDAQ SYMBOLS | CUSIPS |
| Class A | TVAFX | 885-215-731 |
| Class C | TVCFX | 885-215-715 |
| Class I | TVIFX | 885-215-632 |
| Class R3 | TVRFX | 885-215-533 |
| Class R4 | TVIRX | 885-215-277 |
| Class R5 | TVRRX | 885-215-376 |
Thornburg Small/Mid Cap Growth Fund | March 31, 2024 (Unaudited)
| TOP TEN EQUITY HOLDINGS | |
| Vertiv Holdings Co. Class A | 4.3% |
| Shockwave Medical, Inc. | 3.9% |
| Casella Waste Systems, Inc. Class A | 3.8% |
| Freshpet, Inc. | 3.0% |
| Celsius Holdings, Inc. | 2.9% |
| Bentley Systems, Inc. Class B | 2.9% |
| MYR Group, Inc. | 2.9% |
| TechnipFMC plc | 2.7% |
| Saia, Inc. | 2.7% |
| CCC Intelligent Solutions Holdings, Inc. | 2.6% |
| SECTOR EXPOSURE | |
| Industrials | 26.2% |
| Information Technology | 26.2% |
| Health Care | 18.9% |
| Consumer Discretionary | 8.3% |
| Financials | 7.1% |
| Consumer Staples | 5.9% |
| Energy | 2.7% |
| Communication Services | 1.8% |
| Real Estate | 1.8% |
| Other Assets Less Liabilities | 1.1% |
| TOP TEN INDUSTRY GROUPS | |
| Software & Services | 16.2% |
| Capital Goods | 15.4% |
| Pharmaceuticals, Biotechnology & Life Sciences | 12.1% |
| Commercial & Professional Services | 8.1% |
| Semiconductors & Semiconductor Equipment | 7.5% |
| Health Care Equipment & Services | 6.8% |
| Food, Beverage & Tobacco | 5.9% |
| Financial Services | 4.6% |
| Consumer Durables & Apparel | 4.2% |
| Energy | 2.7% |
| THORNBURG SMALL/MID CAP GROWTH FUND | NASDAQ SYMBOLS | CUSIPS |
| Class A | THCGX | 885-215-582 |
| Class C | TCGCX | 885-215-574 |
| Class I | THIGX | 885-215-475 |
| Class R3 | THCRX | 885-215-517 |
| Class R4 | TCGRX | 885-215-251 |
| Class R5 | THGRX | 885-215-350 |
Thornburg Investment Income Builder Fund | March 31, 2024 (Unaudited)
| TOP TEN LONG HOLDINGS | |
| Orange SA | 4.8% |
| TotalEnergies SE | 4.4% |
| Broadcom, Inc. | 3.8% |
| BNP Paribas SA | 3.7% |
| Taiwan Semiconductor Manufacturing Co. Ltd. | 3.5% |
| NN Group NV | 3.3% |
| Citigroup, Inc. | 2.9% |
| Enel SpA | 2.8% |
| AT&T, Inc. | 2.6% |
| Vodafone Group plc | 2.6% |
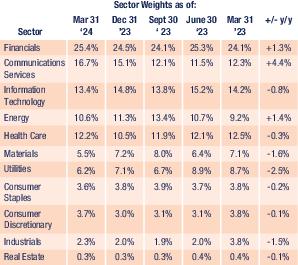
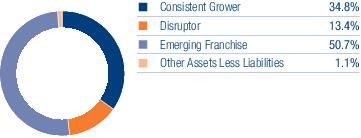
| SECTOR EXPOSURE (percent of equity holdings) | |
| Financials | 25.7% |
| Communication Services | 16.9% |
| Information Technology | 13.4% |
| Health Care | 12.3% |
| Energy | 10.5% |
| Utilities | 6.3% |
| Materials | 5.0% |
| Consumer Discretionary | 3.7% |
| Consumer Staples | 3.6% |
| Industrials | 2.3% |
| Real Estate | 0.3% |
Thornburg Investment Income Builder Fund | March 31, 2024 (Unaudited)
| QUARTERLY DIVIDEND HISTORY, CLASS A | |||||
| YEAR | Q1 | Q2 | Q3 | Q4 | TOTAL |
| 2003 | 9.2¢ | 11.2¢ | 12.4¢ | 17.5¢ | 50.3¢ |
| 2004 | 10.2¢ | 12.5¢ | 15.0¢ | 21.8¢ | 59.5¢ |
| 2005 | 11.0¢ | 13.6¢ | 17.4¢ | 29.0¢ | 71.0¢ |
| 2006 | 12.5¢ | 16.0¢ | 19.2¢ | 33.0¢ | 80.7¢ |
| 2007 | 14.2¢ | 18.5¢ | 21.5¢ | 36.8¢ | 91.0¢ |
| 2008 | 17.9¢ | 21.8¢ | 26.0¢ | 36.8¢ | 102.5¢ |
| 2009 | 18.0¢ | 24.2¢ | 28.0¢ | 34.5¢ | 104.7¢ |
| 2010 | 19.8¢ | 25.0¢ | 32.0¢ | 36.0¢ | 112.8¢ |
| 2011 | 21.0¢ | 26.0¢ | 32.0¢ | 37.5¢ | 116.5¢ |
| 2012 | 21.5¢ | 26.0¢ | 28.5¢ | 36.0¢ | 112.0¢ |
| 2013 | 21.5¢ | 25.3¢ | 25.0¢ | 24.5¢ | 96.3¢ |
| 2014 | 22.5¢ | 24.0¢ | 27.0¢ | 26.0¢ | 99.5¢ |
| 2015 | 16.5¢ | 20.0¢ | 20.0¢ | 25.3¢ | 81.8¢ |
| 2016 | 17.0¢ | 18.5¢ | 19.5¢ | 21.5¢ | 76.5¢ |
| 2017 | 17.0¢ | 20.0¢ | 26.0¢ | 29.5¢ | 92.5¢ |
| 2018 | 18.0¢ | 20.0¢ | 24.0¢ | 28.0¢ | 90.0¢ |
| 2019 | 19.0¢ | 21.5¢ | 25.0¢ | 30.0¢ | 95.5¢ |
| 2020 | 19.0¢ | 19.0¢ | 21.0¢ | 29.0¢ | 88.0¢ |
| 2021 | 22.5¢ | 27.5¢ | 31.0¢ | 43.5¢ | 124.5¢ |
| 2022 | 20.0¢ | 25.0¢ | 29.0¢ | 38.8¢ | 112.8¢ |
| 2023 | 21.0¢ | 25.0¢ | 29.0¢ | 36.5¢ | 111.5¢ |
| 2024 | 22.5¢ | ||||
| As of 3/31/2024 | |
| Telecommunication Services | 16.8% |
| Banks | 13.6% |
| Pharmaceuticals, Biotechnology & Life Sciences | 11.4% |
| Energy | 10.5% |
| Semiconductors & Semiconductor Equipment | 9.3% |
| Utilities | 6.3% |
| Insurance | 6.2% |
| Financial Services | 5.8% |
| Materials | 5.0% |
| Technology Hardware & Equipment | 3.8% |
| As of 12/31/2023 | |
| Telecommunication Services | 15.3% |
| Banks | 12.8% |
| Energy | 11.3% |
| Semiconductors & Semiconductor Equipment | 10.5% |
| Pharmaceuticals, Biotechnology & Life Sciences | 10.0% |
| Utilities | 7.1% |
| Materials | 6.7% |
| Financial Services | 6.5% |
| Insurance | 5.6% |
| Technology Hardware & Equipment | 4.1% |
| As of 9/30/2023 | |
| Energy | 13.6% |
| Telecommunication Services | 12.3% |
| Pharmaceuticals, Biotechnology & Life Sciences | 11.3% |
| Banks | 11.2% |
| Semiconductors & Semiconductor Equipment | 9.4% |
| Financial Services | 7.6% |
| Materials | 7.5% |
| Utilities | 6.8% |
| Insurance | 5.6% |
| Technology Hardware & Equipment | 4.3% |
| As of 6/30/2023 | |
| Pharmaceuticals, Biotechnology & Life Sciences | 11.6% |
| Telecommunication Services | 11.6% |
| Banks | 11.1% |
| Energy | 10.8% |
| Semiconductors & Semiconductor Equipment | 10.7% |
| Utilities | 8.9% |
| Financial Services | 7.5% |
| Insurance | 7.1% |
| Materials | 5.9% |
| Technology Hardware & Equipment | 4.4% |
| THORNBURG INVESTMENT INCOME BUILDER FUND | NASDAQ SYMBOLS | CUSIPS |
| Class A | TIBAX | 885-215-558 |
| Class C | TIBCX | 885-215-541 |
| Class I | TIBIX | 885-215-467 |
| Class R3 | TIBRX | 885-215-384 |
| Class R4 | TIBGX | 885-215-186 |
| Class R5 | TIBMX | 885-215-236 |
| Class R6 | TIBOX | 885-216-663 |
Thornburg Summit Fund | March 31, 2024 (Unaudited)
| SECTOR EXPOSURE (percent of equity holdings) | |
| Information Technology | 24.9% |
| Financials | 14.6% |
| Communication Services | 13.7% |
| Consumer Discretionary | 10.9% |
| Health Care | 10.4% |
| Industrials | 7.3% |
| Exchange Traded Funds | 6.3% |
| Energy | 6.2% |
| Materials | 2.0% |
| Utilities | 1.9% |
| Consumer Staples | 1.8% |
| TOP TEN LONG HOLDINGS | |
| NVIDIA Corp. | 2.1% |
| AT&T, Inc. | 1.9% |
| Amazon.com, Inc. | 1.8% |
| Taiwan Semiconductor Manufacturing Co. Ltd. | 1.8% |
| Alphabet, Inc. Class A | 1.6% |
| Apple, Inc. | 1.5% |
| Meta Platforms, Inc. Class A | 1.4% |
| Microsoft Corp. | 1.4% |
| Visa, Inc. Class A | 1.4% |
| Zegona Communications plc | 1.3% |
| THORNBURG SUMMIT FUND | NASDAQ SYMBOLS | CUSIPS |
| Class A | TSAMX | 885-216-358 |
| Class I | TSUMX | 885-216-580 |
Thornburg Global Opportunities Fund | March 31, 2024 (Unaudited)
| Issuer-Description | SHARES | VALUE | |
| Common Stock — 97.9% | |||
| Automobiles & Components — 2.8% | |||
| Automobiles — 2.8% | |||
| Mercedes-Benz Group AG | 400,248 | $ 31,871,713 | |
| 31,871,713 | |||
| Banks — 13.0% | |||
| Banks — 13.0% | |||
| Bank of Ireland Group plc | 4,803,087 | 48,968,104 | |
| BNP Paribas SA | 715,177 | 50,815,510 | |
| Citigroup, Inc. | 794,731 | 50,258,789 | |
| 150,042,403 | |||
| Capital Goods — 5.0% | |||
| Aerospace & Defense — 1.3% | |||
| L3Harris Technologies, Inc. | 72,951 | 15,545,858 | |
| Electrical Equipment — 1.9% | |||
| a | Vestas Wind Systems AS | 789,850 | 22,031,760 |
| Machinery — 1.8% | |||
| Techtronic Industries Co. Ltd. | 1,514,669 | 20,532,571 | |
| 58,110,189 | |||
| Commercial & Professional Services — 2.8% | |||
| Professional Services — 2.8% | |||
| a | CACI International, Inc. Class A | 84,611 | 32,053,185 |
| 32,053,185 | |||
| Consumer Discretionary Distribution & Retail — 4.3% | |||
| Broadline Retail — 1.3% | |||
| Alibaba Group Holding Ltd. Sponsored ADR | 203,842 | 14,750,007 | |
| Specialty Retail — 3.0% | |||
| TJX Cos., Inc. | 339,711 | 34,453,490 | |
| 49,203,497 | |||
| Consumer Durables & Apparel — 1.9% | |||
| Household Durables — 1.9% | |||
| Barratt Developments plc | 3,573,789 | 21,452,685 | |
| 21,452,685 | |||
| Consumer Services — 4.5% | |||
| Hotels, Restaurants & Leisure — 4.5% | |||
| Booking Holdings, Inc. | 7,525 | 27,299,797 | |
| Galaxy Entertainment Group Ltd. | 4,850,928 | 24,357,213 | |
| 51,657,010 | |||
| Consumer Staples Distribution & Retail — 1.6% | |||
| Consumer Staples Distribution & Retail — 1.6% | |||
| Tesco plc | 4,801,589 | 17,974,922 | |
| 17,974,922 | |||
| Energy — 10.8% | |||
| Oil, Gas & Consumable Fuels — 10.8% | |||
| Reliance Industries Ltd. | 1,289,311 | 45,917,574 | |
| Shell plc | 937,260 | 31,300,547 | |
| TotalEnergies SE | 698,605 | 47,836,700 | |
| 125,054,821 | |||
| Financial Services — 6.4% | |||
| Capital Markets — 4.5% | |||
| Charles Schwab Corp. | 722,760 | 52,284,458 | |
| Consumer Finance — 1.9% | |||
| Capital One Financial Corp. | 144,190 | 21,468,449 | |
| 73,752,907 |
| See notes to financial statements. | Thornburg Equity Funds Semi-Annual Report | 33 |
Thornburg Global Opportunities Fund | March 31, 2024 (Unaudited)
| Issuer-Description | SHARES | VALUE | |
| Food, Beverage & Tobacco — 1.3% | |||
| Beverages — 1.3% | |||
| Coca-Cola Icecek AS | 880,539 | $ 15,306,380 | |
| 15,306,380 | |||
| Insurance — 2.5% | |||
| Insurance — 2.5% | |||
| NN Group NV | 636,830 | 29,419,223 | |
| 29,419,223 | |||
| Materials — 8.5% | |||
| Chemicals — 2.8% | |||
| OCI NV | 1,191,376 | 32,634,170 | |
| Metals & Mining — 5.7% | |||
| Freeport-McMoRan, Inc. | 853,306 | 40,122,448 | |
| Mineral Resources Ltd. | 549,665 | 25,384,870 | |
| 98,141,488 | |||
| Media & Entertainment — 13.1% | |||
| Interactive Media & Services — 13.1% | |||
| a | Alphabet, Inc. Class A | 369,578 | 55,780,408 |
| Meta Platforms, Inc. Class A | 154,324 | 74,936,648 | |
| Tencent Holdings Ltd. | 537,813 | 20,875,134 | |
| 151,592,190 | |||
| Pharmaceuticals, Biotechnology & Life Sciences — 2.9% | |||
| Pharmaceuticals — 2.9% | |||
| Pfizer, Inc. | 571,041 | 15,846,388 | |
| Roche Holding AG | 68,837 | 17,532,692 | |
| 33,379,080 | |||
| Semiconductors & Semiconductor Equipment — 3.9% | |||
| Semiconductors & Semiconductor Equipment — 3.9% | |||
| a | Qorvo, Inc. | 63,906 | 7,338,326 |
| Taiwan Semiconductor Manufacturing Co. Ltd. | 1,577,114 | 37,895,876 | |
| 45,234,202 | |||
| Software & Services — 3.5% | |||
| Software — 3.5% | |||
| SAP SE | 209,040 | 40,697,842 | |
| 40,697,842 | |||
| Technology Hardware & Equipment — 5.0% | |||
| Technology Hardware, Storage & Peripherals — 5.0% | |||
| Samsung Electronics Co. Ltd. | 959,451 | 57,584,877 | |
| 57,584,877 | |||
| Telecommunication Services — 4.1% | |||
| Diversified Telecommunication Services — 4.1% | |||
| a | Converge Information & Communications Technology Solutions, Inc. | 49,879,315 | 8,842,349 |
| Deutsche Telekom AG | 955,691 | 23,198,561 | |
| a | Zegona Communications plc | 5,429,333 | 15,486,947 |
| 47,527,857 | |||
| Total Common Stock (Cost $705,274,531) | 1,130,056,471 | ||
| Short-Term Investments — 2.2% | |||
| b | Thornburg Capital Management Fund | 2,506,975 | 25,069,745 |
| Total Short-Term Investments (Cost $25,069,745) | 25,069,745 | ||
| Total Investments — 100.1% (Cost $730,344,276) | $1,155,126,216 | ||
| Liabilities Net of Other Assets — (0.1)% | (1,162,576) |
| 34 | Thornburg Equity Funds Semi-Annual Report | See notes to financial statements. |
| Issuer-Description | SHARES | VALUE | |
| Net Assets — 100.0% | $1,153,963,640 |
| Outstanding Forward Currency Contracts To Buy Or Sell At March 31, 2024 | |||||||
| Contract Description | Contract Party* | Buy/Sell | Contract Amount | Contract Value Date | Value USD | Unrealized Appreciation | Unrealized Depreciation |
| Euro | SSB | Sell | 60,026,000 | 6/20/2024 | 64,963,494 | $ 538,077 | $ — |
| Euro | BBH | Sell | 60,026,000 | 6/20/2024 | 64,963,494 | 529,074 | — |
| Great Britain Pound | SSB | Sell | 12,262,000 | 6/20/2024 | 15,482,873 | 124,262 | — |
| Total | $ 1,191,413 | — | |||||
| Net unrealized appreciation (depreciation) | $ 1,191,413 | ||||||
| * | Counterparties include State Street Bank and Trust Company (“SSB”) and Brown Brothers Harriman & Co. (“BBH”). |
| Footnote Legend | |
| a | Non-income producing. |
| b | Investment in Affiliates. |
To simplify the listings of securities, abbreviations are used per the table below:
| ADR | American Depositary Receipt |
| COUNTRY EXPOSURE * (percent of equity holdings) | |
| United States | 42.1% |
| France | 8.7% |
| Germany | 8.5% |
| Netherlands | 5.5% |
| South Korea | 5.1% |
| United Kingdom | 4.9% |
| Ireland | 4.3% |
| India | 4.1% |
| Taiwan | 3.4% |
| China | 3.1% |
| Australia | 2.2% |
| Macao | 2.2% |
| Denmark | 1.9% |
| Hong Kong | 1.8% |
| Turkey | 1.4% |
| Philippines | 0.8% |
| * | Holdings are classified by country of risk as determined by MSCI and Bloomberg. |
| See notes to financial statements. | Thornburg Equity Funds Semi-Annual Report | 35 |
Thornburg International Equity Fund | March 31, 2024 (Unaudited)
| Issuer-Description | SHARES | VALUE | |
| Common Stock — 95.4% | |||
| Banks — 6.1% | |||
| Banks — 6.1% | |||
| BNP Paribas SA | 696,455 | $ 49,485,255 | |
| HDFC Bank Ltd. | 2,137,567 | 37,085,932 | |
| ING Groep NV Series N, | 2,695,163 | 44,330,434 | |
| Mitsubishi UFJ Financial Group, Inc. | 2,939,663 | 29,808,315 | |
| 160,709,936 | |||
| Capital Goods — 17.1% | |||
| Aerospace & Defense — 6.5% | |||
| MTU Aero Engines AG | 88,324 | 22,411,817 | |
| Rheinmetall AG | 124,340 | 69,889,127 | |
| Safran SA | 349,425 | 79,184,045 | |
| Construction & Engineering — 2.1% | |||
| Ferrovial SE | 1,377,111 | 54,495,332 | |
| Electrical Equipment — 5.5% | |||
| ABB Ltd. | 1,449,169 | 67,312,402 | |
| Schneider Electric SE | 345,230 | 78,084,426 | |
| Industrial Conglomerates — 3.0% | |||
| Hitachi Ltd. | 884,468 | 80,366,345 | |
| 451,743,494 | |||
| Commercial & Professional Services — 1.2% | |||
| Professional Services — 1.2% | |||
| Recruit Holdings Co. Ltd. | 738,258 | 32,328,658 | |
| 32,328,658 | |||
| Consumer Durables & Apparel — 2.6% | |||
| Household Durables — 2.4% | |||
| Sony Group Corp. | 729,624 | 62,320,243 | |
| Textiles, Apparel & Luxury Goods — 0.2% | |||
| LVMH Moet Hennessy Louis Vuitton SE | 7,522 | 6,765,566 | |
| 69,085,809 | |||
| Consumer Services — 3.0% | |||
| Hotels, Restaurants & Leisure — 3.0% | |||
| Galaxy Entertainment Group Ltd. | 2,571,304 | 12,910,890 | |
| a,b | Meituan Class B | 5,460,337 | 67,531,286 |
| 80,442,176 | |||
| Consumer Staples Distribution & Retail — 3.7% | |||
| Consumer Staples Distribution & Retail — 3.7% | |||
| Alimentation Couche-Tard, Inc. | 517,802 | 29,553,190 | |
| Seven & i Holdings Co. Ltd. | 4,759,830 | 69,174,435 | |
| 98,727,625 | |||
| Energy — 5.3% | |||
| Oil, Gas & Consumable Fuels — 5.3% | |||
| Shell plc | 965,617 | 32,247,551 | |
| TotalEnergies SE | 1,574,144 | 107,788,886 | |
| 140,036,437 | |||
| Financial Services — 4.1% | |||
| Capital Markets — 3.1% | |||
| B3 SA - Brasil Bolsa Balcao | 9,376,668 | 22,416,208 | |
| Hong Kong Exchanges & Clearing Ltd. | 2,009,414 | 58,483,500 | |
| Financial Services — 1.0% | |||
| Edenred SE | 512,341 | 27,338,473 | |
| 108,238,181 | |||
| Food, Beverage & Tobacco — 2.8% | |||
| Beverages — 0.9% |
| 36 | Thornburg Equity Funds Semi-Annual Report | See notes to financial statements. |
| Issuer-Description | SHARES | VALUE | |
| Diageo plc | 643,769 | $ 23,770,650 | |
| Food Products — 1.9% | |||
| Danone SA | 351,997 | 22,743,343 | |
| Nestle SA | 247,876 | 26,317,156 | |
| Nissin Foods Holdings Co. Ltd. | 92,435 | 2,546,267 | |
| 75,377,416 | |||
| Health Care Equipment & Services — 1.0% | |||
| Health Care Equipment & Supplies — 1.0% | |||
| Alcon, Inc. | 323,070 | 26,908,500 | |
| 26,908,500 | |||
| Household & Personal Products — 2.8% | |||
| Personal Care Products — 2.8% | |||
| L’Oreal SA | 155,306 | 73,496,625 | |
| 73,496,625 | |||
| Insurance — 6.1% | |||
| Insurance — 6.1% | |||
| AIA Group Ltd. | 5,652,615 | 37,951,797 | |
| Assicurazioni Generali SpA | 1,642,992 | 41,583,830 | |
| NN Group NV | 1,758,962 | 81,257,629 | |
| 160,793,256 | |||
| Materials — 5.7% | |||
| Chemicals — 5.7% | |||
| Air Liquide SA | 243,343 | 50,626,395 | |
| Akzo Nobel NV | 326,555 | 24,372,379 | |
| Linde plc | 166,907 | 77,149,964 | |
| 152,148,738 | |||
| Media & Entertainment — 4.5% | |||
| Entertainment — 1.0% | |||
| Nexon Co. Ltd. | 1,220,556 | 20,237,783 | |
| Nintendo Co. Ltd. | 114,199 | 6,230,477 | |
| Interactive Media & Services — 3.5% | |||
| Kanzhun Ltd. ADR | 938,020 | 16,443,490 | |
| Tencent Holdings Ltd. | 1,931,579 | 74,973,962 | |
| 117,885,712 | |||
| Pharmaceuticals, Biotechnology & Life Sciences — 4.7% | |||
| Pharmaceuticals — 4.7% | |||
| AstraZeneca plc | 469,030 | 63,212,276 | |
| Roche Holding AG | 242,958 | 61,881,081 | |
| 125,093,357 | |||
| Semiconductors & Semiconductor Equipment — 4.7% | |||
| Semiconductors & Semiconductor Equipment — 4.7% | |||
| Disco Corp. | 36,209 | 13,201,048 | |
| NVIDIA Corp. | 42,854 | 38,721,160 | |
| Taiwan Semiconductor Manufacturing Co. Ltd. Sponsored ADR | 525,253 | 71,460,671 | |
| 123,382,879 | |||
| Software & Services — 3.5% | |||
| Software — 3.5% | |||
| Constellation Software, Inc. | 16,647 | 45,471,854 | |
| SAP SE | 236,804 | 46,103,194 | |
| 91,575,048 | |||
| Technology Hardware & Equipment — 2.8% | |||
| Electronic Equipment, Instruments & Components — 1.7% | |||
| Keyence Corp. | 97,500 | 45,143,183 | |
| Technology Hardware, Storage & Peripherals — 1.1% | |||
| Samsung Electronics Co. Ltd. | 466,723 | 28,012,047 |
| See notes to financial statements. | Thornburg Equity Funds Semi-Annual Report | 37 |
Thornburg International Equity Fund | March 31, 2024 (Unaudited)
| Issuer-Description | SHARES | VALUE | |
| 73,155,230 | |||
| Telecommunication Services — 3.1% | |||
| Diversified Telecommunication Services — 2.1% | |||
| Orange SA | 4,884,565 | $ 57,376,629 | |
| Wireless Telecommunication Services — 1.0% | |||
| Vodafone Group plc | 29,064,854 | 25,847,687 | |
| 83,224,316 | |||
| Transportation — 3.0% | |||
| Ground Transportation — 3.0% | |||
| Canadian Pacific Kansas City Ltd. | 888,344 | 78,325,290 | |
| 78,325,290 | |||
| Utilities — 7.6% | |||
| Electric Utilities — 5.6% | |||
| Endesa SA | 2,280,834 | 42,237,530 | |
| Enel SpA | 8,772,378 | 57,910,700 | |
| Iberdrola SA | 3,798,970 | 47,112,469 | |
| Multi-Utilities — 2.0% | |||
| E.ON SE | 3,912,110 | 54,382,167 | |
| 201,642,866 | |||
| Total Common Stock (Cost $1,936,411,007) | 2,524,321,549 | ||
| Warrant — 0.0% | |||
| Software & Services — 0.0% | |||
| Software — 0.0% | |||
| b,c | Constellation Software, Inc., 3/31/2040 | 16,647 | 1 |
| 1 | |||
| Total Warrants (Cost $0) | 1 | ||
| Short-Term Investments — 4.7% | |||
| d | Thornburg Capital Management Fund | 12,345,130 | 123,451,296 |
| Total Short-Term Investments (Cost $123,451,296) | 123,451,296 | ||
| Total Investments — 100.1% (Cost $2,059,862,303) | $2,647,772,846 | ||
| Liabilities Net of Other Assets — (0.1)% | (3,239,736) | ||
| Net Assets — 100.0% | $2,644,533,110 |
| Footnote Legend | |
| a | Securities exempt from registration under Rule 144A of the Securities Act of 1933, as amended. These securities are restricted but liquid and may only be resold in the ordinary course of business in transactions exempt from registration, normally to qualified institutional buyers. As of March 31, 2024, the aggregate value of these securities in the Fund’s portfolio was $67,531,286, representing 2.55% of the Fund’s net assets. |
| b | Non-income producing. |
| c | Security currently fair valued by Thornburg Investment Management, Inc.’s Valuation and Pricing Committee. |
| d | Investment in Affiliates. |
To simplify the listings of securities, abbreviations are used per the table below:
| ADR | American Depositary Receipt |
| 38 | Thornburg Equity Funds Semi-Annual Report | See notes to financial statements. |
| COUNTRY EXPOSURE * (percent of equity holdings) | |
| France | 18.8% |
| United States | 14.6% |
| Japan | 14.3% |
| Germany | 7.6% |
| China | 6.3% |
| Canada | 6.1% |
| Netherlands | 6.0% |
| United Kingdom | 4.5% |
| Italy | 4.0% |
| Hong Kong | 3.8% |
| Switzerland | 3.7% |
| Spain | 3.5% |
| Taiwan | 2.8% |
| India | 1.5% |
| South Korea | 1.1% |
| Brazil | 0.9% |
| Macao | 0.5% |
| * | Holdings are classified by country of risk as determined by MSCI and Bloomberg. |
| See notes to financial statements. | Thornburg Equity Funds Semi-Annual Report | 39 |
Thornburg Better World International Fund | March 31, 2024 (Unaudited)
| Issuer-Description | SHARES | VALUE | |
| Common Stock — 92.1% | |||
| Automobiles & Components — 0.9% | |||
| Automobiles — 0.9% | |||
| Mercedes-Benz Group AG | 62,754 | $ 4,997,096 | |
| 4,997,096 | |||
| Banks — 6.4% | |||
| Banks — 6.4% | |||
| BNP Paribas SA | 226,883 | 16,120,730 | |
| HDFC Bank Ltd. ADR | 143,075 | 8,007,908 | |
| ING Groep NV Series N, | 97,919 | 1,610,586 | |
| Mitsubishi UFJ Financial Group, Inc. | 1,164,700 | 11,810,110 | |
| 37,549,334 | |||
| Capital Goods — 8.8% | |||
| Electrical Equipment — 4.3% | |||
| ABB Ltd. | 233,261 | 10,834,732 | |
| Schneider Electric SE | 64,454 | 14,578,263 | |
| Industrial Conglomerates — 3.3% | |||
| Hitachi Ltd. | 209,800 | 19,063,278 | |
| Machinery — 1.2% | |||
| FANUC Corp. | 262,200 | 7,309,314 | |
| 51,785,587 | |||
| Commercial & Professional Services — 7.9% | |||
| Commercial Services & Supplies — 5.8% | |||
| Daiei Kankyo Co. Ltd. | 461,600 | 8,062,296 | |
| Rentokil Initial plc | 1,224,661 | 7,291,093 | |
| Tetra Tech, Inc. | 35,362 | 6,531,715 | |
| Waste Connections, Inc. | 70,034 | 12,046,549 | |
| Professional Services — 2.1% | |||
| Recruit Holdings Co. Ltd. | 150,500 | 6,590,464 | |
| a | Visional, Inc. | 87,100 | 5,569,613 |
| 46,091,730 | |||
| Consumer Durables & Apparel — 2.7% | |||
| Household Durables — 2.5% | |||
| Sony Group Corp. | 170,283 | 14,544,585 | |
| Textiles, Apparel & Luxury Goods — 0.2% | |||
| LVMH Moet Hennessy Louis Vuitton SE | 1,691 | 1,520,948 | |
| 16,065,533 | |||
| Consumer Services — 5.6% | |||
| Diversified Consumer Services — 1.0% | |||
| a | New Oriental Education & Technology Group, Inc. ADR | 67,674 | 5,875,457 |
| Hotels, Restaurants & Leisure — 4.6% | |||
| a,b | Meituan Class B | 1,411,977 | 17,462,772 |
| Yum China Holdings, Inc. | 243,691 | 9,696,465 | |
| 33,034,694 | |||
| Consumer Staples Distribution & Retail — 6.1% | |||
| Consumer Staples Distribution & Retail — 6.1% | |||
| Alimentation Couche-Tard, Inc. | 214,996 | 12,270,746 | |
| Costco Wholesale Corp. | 12,734 | 9,329,310 | |
| Seven & i Holdings Co. Ltd. | 977,100 | 14,200,159 | |
| 35,800,215 | |||
| Financial Services — 5.5% | |||
| Capital Markets — 3.5% | |||
| B3 SA - Brasil Bolsa Balcao | 2,448,545 | 5,853,582 | |
| Hong Kong Exchanges & Clearing Ltd. | 506,464 | 14,740,510 | |
| Financial Services — 2.0% |
| 40 | Thornburg Equity Funds Semi-Annual Report | See notes to financial statements. |
| Issuer-Description | SHARES | VALUE | |
| Edenred SE | 217,483 | $ 11,604,875 | |
| 32,198,967 | |||
| Food, Beverage & Tobacco — 2.5% | |||
| Food Products — 2.5% | |||
| Danone SA | 178,271 | 11,518,503 | |
| Nissin Foods Holdings Co. Ltd. | 104,100 | 2,867,598 | |
| 14,386,101 | |||
| Health Care Equipment & Services — 3.2% | |||
| Health Care Equipment & Supplies — 2.2% | |||
| Alcon, Inc. | 154,060 | 12,767,583 | |
| Health Care Technology — 1.0% | |||
| Pro Medicus Ltd. | 91,727 | 6,201,542 | |
| 18,969,125 | |||
| Household & Personal Products — 6.1% | |||
| Personal Care Products — 6.1% | |||
| a | BellRing Brands, Inc. | 154,240 | 9,104,787 |
| Estee Lauder Cos., Inc. Class A | 66,939 | 10,318,647 | |
| L’Oreal SA | 35,092 | 16,606,851 | |
| 36,030,285 | |||
| Insurance — 1.8% | |||
| Insurance — 1.8% | |||
| AIA Group Ltd. | 1,569,500 | 10,537,662 | |
| 10,537,662 | |||
| Materials — 1.6% | |||
| Chemicals — 1.6% | |||
| Linde plc | 19,709 | 9,110,155 | |
| 9,110,155 | |||
| Media & Entertainment — 6.2% | |||
| Entertainment — 2.1% | |||
| NetEase, Inc. ADR | 119,642 | 12,379,358 | |
| Interactive Media & Services — 4.1% | |||
| Kanzhun Ltd. ADR | 383,217 | 6,717,794 | |
| Tencent Holdings Ltd. | 445,600 | 17,295,900 | |
| 36,393,052 | |||
| Pharmaceuticals, Biotechnology & Life Sciences — 8.8% | |||
| Life Sciences Tools & Services — 1.0% | |||
| Lonza Group AG | 10,008 | 5,994,701 | |
| Pharmaceuticals — 7.8% | |||
| Novartis AG | 60,951 | 5,904,850 | |
| Novo Nordisk AS Class B | 119,952 | 15,386,646 | |
| Pfizer, Inc. | 377,958 | 10,488,335 | |
| Roche Holding AG | 55,042 | 14,019,124 | |
| 51,793,656 | |||
| Semiconductors & Semiconductor Equipment — 1.1% | |||
| Semiconductors & Semiconductor Equipment — 1.1% | |||
| a | ARM Holdings plc ADR | 10,669 | 1,333,518 |
| Disco Corp. | 13,300 | 4,848,904 | |
| 6,182,422 | |||
| Software & Services — 5.4% | |||
| Software — 5.4% | |||
| Constellation Software, Inc. | 6,273 | 17,134,916 | |
| SAP SE | 75,388 | 14,677,233 | |
| 31,812,149 | |||
| Technology Hardware & Equipment — 2.8% |
| See notes to financial statements. | Thornburg Equity Funds Semi-Annual Report | 41 |
Thornburg Better World International Fund | March 31, 2024 (Unaudited)
| Issuer-Description | SHARES | VALUE | |
| Electronic Equipment, Instruments & Components — 1.2% | |||
| Hexagon AB Class B | 132,306 | $ 1,566,066 | |
| Keyence Corp. | 12,300 | 5,694,986 | |
| Technology Hardware, Storage & Peripherals — 1.6% | |||
| Samsung Electronics Co. Ltd. | 156,002 | 9,363,017 | |
| 16,624,069 | |||
| Telecommunication Services — 2.4% | |||
| Diversified Telecommunication Services — 2.4% | |||
| Orange SA | 893,777 | 10,498,767 | |
| a | Zegona Communications plc | 1,273,160 | 3,631,636 |
| 14,130,403 | |||
| Transportation — 3.0% | |||
| Ground Transportation — 3.0% | |||
| Canadian Pacific Kansas City Ltd. | 202,200 | 17,827,974 | |
| 17,827,974 | |||
| Utilities — 3.3% | |||
| Electric Utilities — 3.3% | |||
| Endesa SA | 406,239 | 7,522,920 | |
| Enel SpA | 1,321,818 | 8,725,958 | |
| Iberdrola SA | 254,728 | 3,158,979 | |
| 19,407,857 | |||
| Total Common Stock (Cost $485,871,727) | 540,728,066 | ||
| Warrant — 0.0% | |||
| Software & Services — 0.0% | |||
| Software — 0.0% | |||
| a,c | Constellation Software, Inc., 3/31/2040 | 6,276 | 1 |
| 1 | |||
| Total Warrants (Cost $0) | 1 | ||
| Short-Term Investments — 7.4% | |||
| d | Thornburg Capital Management Fund | 4,377,460 | 43,774,599 |
| Total Short-Term Investments (Cost $43,774,599) | 43,774,599 | ||
| Total Investments — 99.5% (Cost $529,646,326) | $584,502,666 | ||
| Other Assets Less Liabilities — 0.5% | 2,677,169 | ||
| Net Assets — 100.0% | $587,179,835 |
| Footnote Legend | |
| a | Non-income producing. |
| b | Securities exempt from registration under Rule 144A of the Securities Act of 1933, as amended. These securities are restricted but liquid and may only be resold in the ordinary course of business in transactions exempt from registration, normally to qualified institutional buyers. As of March 31, 2024, the aggregate value of these securities in the Fund’s portfolio was $17,462,772, representing 2.97% of the Fund’s net assets. |
| c | Security currently fair valued by Thornburg Investment Management, Inc.’s Valuation and Pricing Committee. |
| d | Investment in Affiliates. |
To simplify the listings of securities, abbreviations are used per the table below:
| ADR | American Depositary Receipt |
| 42 | Thornburg Equity Funds Semi-Annual Report | See notes to financial statements. |
| COUNTRY EXPOSURE * (percent of equity holdings) | |
| Japan | 18.6% |
| United States | 17.9% |
| China | 12.8% |
| France | 12.6% |
| Canada | 8.7% |
| Switzerland | 6.6% |
| Hong Kong | 4.7% |
| Germany | 3.6% |
| Denmark | 2.8% |
| United Kingdom | 2.0% |
| Spain | 2.0% |
| South Korea | 1.7% |
| Italy | 1.6% |
| India | 1.5% |
| Australia | 1.2% |
| Brazil | 1.1% |
| Netherlands | 0.3% |
| Sweden | 0.3% |
| * | Holdings are classified by country of risk as determined by MSCI and Bloomberg. |
| See notes to financial statements. | Thornburg Equity Funds Semi-Annual Report | 43 |
Thornburg International Growth Fund | March 31, 2024 (Unaudited)
| Issuer-Description | SHARES | VALUE | |
| Common Stock — 99.0% | |||
| Automobiles & Components — 3.9% | |||
| Automobile Components — 1.8% | |||
| a | Mobileye Global, Inc. Class A | 503,080 | $ 16,174,022 |
| Automobiles — 2.1% | |||
| Ferrari NV | 43,777 | 19,084,145 | |
| 35,258,167 | |||
| Banks — 2.6% | |||
| Banks — 2.6% | |||
| HDFC Bank Ltd. | 865,535 | 15,016,686 | |
| a | NU Holdings Ltd. Class A | 758,804 | 9,052,532 |
| 24,069,218 | |||
| Capital Goods — 3.5% | |||
| Machinery — 0.4% | |||
| a | ATS Corp. | 117,037 | 3,938,243 |
| Trading Companies & Distributors — 3.1% | |||
| Ashtead Group plc | 249,723 | 17,776,593 | |
| Diploma plc | 220,687 | 10,367,261 | |
| 32,082,097 | |||
| Commercial & Professional Services — 1.2% | |||
| Professional Services — 1.2% | |||
| Wolters Kluwer NV | 72,801 | 11,404,204 | |
| 11,404,204 | |||
| Consumer Discretionary Distribution & Retail — 3.0% | |||
| Broadline Retail — 3.0% | |||
| B&M European Value Retail SA | 1,354,166 | 9,328,597 | |
| a | MercadoLibre, Inc. | 12,196 | 18,439,864 |
| 27,768,461 | |||
| Consumer Durables & Apparel — 3.5% | |||
| Textiles, Apparel & Luxury Goods — 3.5% | |||
| Brunello Cucinelli SpA | 113,072 | 12,930,698 | |
| LVMH Moet Hennessy Louis Vuitton SE | 20,755 | 18,667,818 | |
| 31,598,516 | |||
| Consumer Services — 1.2% | |||
| Hotels, Restaurants & Leisure — 1.2% | |||
| Booking Holdings, Inc. | 2,914 | 10,571,642 | |
| 10,571,642 | |||
| Consumer Staples Distribution & Retail — 1.4% | |||
| Consumer Staples Distribution & Retail — 1.4% | |||
| a | BBB Foods, Inc. Class A | 120,941 | 2,875,977 |
| Raia Drogasil SA | 1,796,797 | 9,805,466 | |
| 12,681,443 | |||
| Energy — 1.4% | |||
| Oil, Gas & Consumable Fuels — 1.4% | |||
| TotalEnergies SE | 187,228 | 12,820,363 | |
| 12,820,363 | |||
| Financial Services — 10.5% | |||
| Capital Markets — 6.5% | |||
| Blue Owl Capital, Inc. Class A | 477,101 | 8,998,125 | |
| Deutsche Boerse AG | 78,642 | 16,090,458 | |
| Hong Kong Exchanges & Clearing Ltd. | 440,100 | 12,809,002 | |
| Japan Exchange Group, Inc. | 533,600 | 14,399,234 | |
| a | M&A Research Institute Holdings, Inc. | 162,500 | 7,235,104 |
| Financial Services — 4.0% |
| 44 | Thornburg Equity Funds Semi-Annual Report | See notes to financial statements. |
| Issuer-Description | SHARES | VALUE | |
| Mastercard, Inc. Class A | 61,549 | $ 29,640,152 | |
| Visa, Inc. Class A | 22,762 | 6,352,419 | |
| 95,524,494 | |||
| Food, Beverage & Tobacco — 6.9% | |||
| Beverages — 2.6% | |||
| Diageo plc | 633,746 | 23,400,559 | |
| Food Products — 4.3% | |||
| Nestle SA | 372,261 | 39,523,192 | |
| 62,923,751 | |||
| Health Care Equipment & Services — 1.8% | |||
| Health Care Equipment & Supplies — 1.8% | |||
| Hoya Corp. | 129,300 | 16,087,763 | |
| 16,087,763 | |||
| Household & Personal Products — 4.6% | |||
| Personal Care Products — 4.6% | |||
| Beiersdorf AG | 174,233 | 25,366,721 | |
| L’Oreal SA | 35,356 | 16,731,785 | |
| 42,098,506 | |||
| Insurance — 1.3% | |||
| Insurance — 1.3% | |||
| a | PB Fintech Ltd. | 914,200 | 12,309,542 |
| 12,309,542 | |||
| Materials — 5.0% | |||
| Chemicals — 1.9% | |||
| Air Liquide SA | 81,472 | 16,949,876 | |
| Containers & Packaging — 1.1% | |||
| SIG Group AG | 450,870 | 9,998,780 | |
| Metals & Mining — 2.0% | |||
| Teck Resources Ltd. Class B | 395,572 | 18,105,987 | |
| 45,054,643 | |||
| Media & Entertainment — 4.8% | |||
| Entertainment — 0.5% | |||
| a | Sea Ltd. ADR | 77,152 | 4,143,834 |
| Interactive Media & Services — 3.2% | |||
| Hemnet Group AB | 376,310 | 11,524,142 | |
| Tencent Holdings Ltd. | 461,700 | 17,920,820 | |
| Media — 1.1% | |||
| Schibsted ASA Class A | 302,943 | 9,677,210 | |
| 43,266,006 | |||
| Pharmaceuticals, Biotechnology & Life Sciences — 17.1% | |||
| Biotechnology — 1.6% | |||
| CSL Ltd. | 77,866 | 14,609,459 | |
| Life Sciences Tools & Services — 6.0% | |||
| a | ICON plc ADR | 67,263 | 22,597,005 |
| Lonza Group AG | 39,650 | 23,749,992 | |
| a | Sartorius Stedim Biotech | 27,819 | 7,932,310 |
| Pharmaceuticals — 9.5% | |||
| AstraZeneca plc | 232,507 | 31,335,515 | |
| Novo Nordisk AS Sponsored ADR | 428,623 | 55,035,193 | |
| 155,259,474 | |||
| Semiconductors & Semiconductor Equipment — 17.5% | |||
| Semiconductors & Semiconductor Equipment — 17.5% | |||
| a | Advanced Micro Devices, Inc. | 92,015 | 16,607,788 |
| ASML Holding NV | 53,435 | 51,433,853 | |
| BE Semiconductor Industries NV | 87,365 | 13,374,603 |
| See notes to financial statements. | Thornburg Equity Funds Semi-Annual Report | 45 |
Thornburg International Growth Fund | March 31, 2024 (Unaudited)
| Issuer-Description | SHARES | VALUE | |
| Disco Corp. | 47,900 | $ 17,463,344 | |
| SK Hynix, Inc. | 135,666 | 17,957,795 | |
| Taiwan Semiconductor Manufacturing Co. Ltd. | 1,750,000 | 42,050,088 | |
| 158,887,471 | |||
| Software & Services — 5.9% | |||
| Information Technology Services — 4.8% | |||
| a | Globant SA | 48,277 | 9,747,126 |
| Nomura Research Institute Ltd. | 647,400 | 18,205,720 | |
| a | Shopify, Inc. Class A | 197,149 | 15,213,988 |
| Software — 1.1% | |||
| a | Money Forward, Inc. | 227,600 | 10,111,045 |
| 53,277,879 | |||
| Technology Hardware & Equipment — 1.9% | |||
| Electronic Equipment, Instruments & Components — 1.9% | |||
| Keyence Corp. | 36,900 | 17,084,958 | |
| 17,084,958 | |||
| Total Common Stock (Cost $586,333,448) | 900,028,598 | ||
| Short-Term Investments — 0.4% | |||
| b | Thornburg Capital Management Fund | 389,712 | 3,897,124 |
| Total Short-Term Investments (Cost $3,897,124) | 3,897,124 | ||
| Total Investments — 99.4% (Cost $590,230,572) | $903,925,722 | ||
| Other Assets Less Liabilities — 0.6% | 5,103,088 | ||
| Net Assets — 100.0% | $909,028,810 |
| Footnote Legend | |
| a | Non-income producing. |
| b | Investment in Affiliates. |
To simplify the listings of securities, abbreviations are used per the table below:
| ADR | American Depositary Receipt |
| 46 | Thornburg Equity Funds Semi-Annual Report | See notes to financial statements. |
| COUNTRY EXPOSURE * (percent of equity holdings) | |
| United States | 17.6% |
| Japan | 11.2% |
| United Kingdom | 10.2% |
| Netherlands | 8.5% |
| France | 8.1% |
| Denmark | 6.1% |
| Taiwan | 4.7% |
| Germany | 4.6% |
| Brazil | 4.1% |
| Canada | 4.1% |
| Switzerland | 3.8% |
| Italy | 3.6% |
| India | 3.0% |
| South Korea | 2.0% |
| China | 2.0% |
| Israel | 1.8% |
| Hong Kong | 1.4% |
| Sweden | 1.3% |
| Norway | 1.1% |
| Singapore | 0.5% |
| Mexico | 0.3% |
| * | Holdings are classified by country of risk as determined by MSCI and Bloomberg. |
| See notes to financial statements. | Thornburg Equity Funds Semi-Annual Report | 47 |
Thornburg Developing World Fund | March 31, 2024 (Unaudited)
| Issuer-Description | SHARES | VALUE | |
| Common Stock — 96.7% | |||
| Automobiles & Components — 3.2% | |||
| Automobile Components — 1.0% | |||
| Zhejiang Shuanghuan Driveline Co. Ltd. Class A, | 2,919,761 | $ 9,323,909 | |
| Automobiles — 2.2% | |||
| Kia Corp. | 133,137 | 11,076,207 | |
| Tata Motors Ltd. | 740,935 | 8,839,427 | |
| 29,239,543 | |||
| Banks — 10.1% | |||
| Banks — 10.1% | |||
| Bank Rakyat Indonesia Persero Tbk. PT | 23,444,867 | 8,946,165 | |
| Credicorp Ltd. | 68,836 | 11,662,884 | |
| Grupo Financiero Banorte SAB de CV Class O | 1,090,409 | 11,600,702 | |
| ICICI Bank Ltd. | 1,257,283 | 16,522,827 | |
| IndusInd Bank Ltd. | 506,583 | 9,413,111 | |
| KB Financial Group, Inc. | 196,563 | 10,264,348 | |
| a | NU Holdings Ltd. Class A | 760,311 | 9,070,510 |
| SCB X PCL | 4,672,525 | 14,598,639 | |
| 92,079,186 | |||
| Capital Goods — 0.9% | |||
| Machinery — 0.9% | |||
| Shenzhen Inovance Technology Co. Ltd. Class A | 1,041,899 | 8,682,672 | |
| 8,682,672 | |||
| Consumer Discretionary Distribution & Retail — 8.4% | |||
| Broadline Retail — 7.6% | |||
| a | MercadoLibre, Inc. | 5,809 | 8,782,976 |
| Naspers Ltd. Class N | 236,761 | 41,971,325 | |
| a | PDD Holdings, Inc. ADR | 158,677 | 18,446,201 |
| Specialty Retail — 0.8% | |||
| K Car Co. Ltd. | 705,055 | 7,159,221 | |
| 76,359,723 | |||
| Consumer Durables & Apparel — 2.0% | |||
| Textiles, Apparel & Luxury Goods — 2.0% | |||
| Kalyan Jewellers India Ltd. | 3,456,835 | 17,975,832 | |
| 17,975,832 | |||
| Consumer Services — 4.0% | |||
| Diversified Consumer Services — 1.0% | |||
| a | New Oriental Education & Technology Group, Inc. ADR | 101,619 | 8,822,562 |
| Hotels, Restaurants & Leisure — 3.0% | |||
| Galaxy Entertainment Group Ltd. | 1,810,000 | 9,088,272 | |
| a | Trip.com Group Ltd. ADR | 207,063 | 9,087,995 |
| a | Zomato Ltd. | 4,415,457 | 9,643,302 |
| 36,642,131 | |||
| Consumer Staples Distribution & Retail — 8.1% | |||
| Consumer Staples Distribution & Retail — 8.1% | |||
| a | BBB Foods, Inc. Class A | 460,483 | 10,950,286 |
| BIM Birlesik Magazalar AS | 715,453 | 7,778,467 | |
| a,b | Dino Polska SA | 223,341 | 21,678,218 |
| Raia Drogasil SA | 2,230,120 | 12,170,193 | |
| Sendas Distribuidora SA | 3,986,700 | 11,692,857 | |
| Wal-Mart de Mexico SAB de CV | 2,454,307 | 9,910,250 | |
| 74,180,271 | |||
| Energy — 4.4% | |||
| Energy Equipment & Services — 1.1% | |||
| ADNOC Drilling Co. PJSC | 9,143,979 | 9,885,383 | |
| Oil, Gas & Consumable Fuels — 3.3% |
| 48 | Thornburg Equity Funds Semi-Annual Report | See notes to financial statements. |
| Issuer-Description | SHARES | VALUE | |
| PRIO SA | 1,962,270 | $ 19,069,474 | |
| a | Vista Energy SAB de CV ADR | 263,472 | 10,902,471 |
| 39,857,328 | |||
| Financial Services — 4.7% | |||
| Capital Markets — 1.3% | |||
| Saudi Tadawul Group Holding Co. | 168,767 | 12,275,600 | |
| Consumer Finance — 1.1% | |||
| Bajaj Finance Ltd. | 113,562 | 9,851,344 | |
| Financial Services — 2.3% | |||
| Chailease Holding Co. Ltd. | 3,448,038 | 18,477,308 | |
| b | Home First Finance Co. India Ltd. | 203,479 | 2,193,311 |
| 42,797,563 | |||
| Food, Beverage & Tobacco — 5.0% | |||
| Beverages — 4.0% | |||
| Kweichow Moutai Co. Ltd. Class A | 42,880 | 10,095,721 | |
| Varun Beverages Ltd. | 1,611,616 | 27,033,372 | |
| Food Products — 1.0% | |||
| China Mengniu Dairy Co. Ltd. | 4,131,600 | 8,868,247 | |
| 45,997,340 | |||
| Health Care Equipment & Services — 4.7% | |||
| Health Care Providers & Services — 4.7% | |||
| Aier Eye Hospital Group Co. Ltd. Class A | 4,676,793 | 8,321,546 | |
| Max Healthcare Institute Ltd. | 2,662,849 | 26,088,114 | |
| a | Oncoclinicas do Brasil Servicos Medicos SA | 4,921,373 | 8,684,083 |
| 43,093,743 | |||
| Household & Personal Products — 1.0% | |||
| Personal Care Products — 1.0% | |||
| Proya Cosmetics Co. Ltd. Class A | 676,927 | 8,738,530 | |
| 8,738,530 | |||
| Insurance — 3.2% | |||
| Insurance — 3.2% | |||
| AIA Group Ltd. | 2,663,992 | 17,886,108 | |
| a | PB Fintech Ltd. | 846,425 | 11,396,964 |
| 29,283,072 | |||
| Materials — 1.3% | |||
| Metals & Mining — 1.3% | |||
| Freeport-McMoRan, Inc. | 247,435 | 11,634,394 | |
| 11,634,394 | |||
| Media & Entertainment — 1.4% | |||
| Entertainment — 1.1% | |||
| a | Tencent Music Entertainment Group ADR | 901,023 | 10,082,447 |
| Interactive Media & Services — 0.3% | |||
| Tencent Holdings Ltd. | 72,309 | 2,806,664 | |
| 12,889,111 | |||
| Pharmaceuticals, Biotechnology & Life Sciences — 1.1% | |||
| Biotechnology — 1.1% | |||
| Imeik Technology Development Co. Ltd. Class A | 205,998 | 9,645,134 | |
| 9,645,134 | |||
| Real Estate Management & Development — 4.2% | |||
| Real Estate Management & Development — 4.2% | |||
| Aldar Properties PJSC | 6,790,235 | 10,206,848 | |
| Corp. Inmobiliaria Vesta SAB de CV ADR | 318,950 | 12,515,598 | |
| b | Macrotech Developers Ltd. | 1,176,336 | 15,909,679 |
| 38,632,125 |
| See notes to financial statements. | Thornburg Equity Funds Semi-Annual Report | 49 |
Thornburg Developing World Fund | March 31, 2024 (Unaudited)
| Issuer-Description | SHARES | VALUE | |
| Semiconductors & Semiconductor Equipment — 17.1% | |||
| Semiconductors & Semiconductor Equipment — 17.1% | |||
| Alchip Technologies Ltd. | 85,000 | $ 8,406,112 | |
| ASMPT Ltd. | 1,475,400 | 18,548,769 | |
| MediaTek, Inc. | 314,000 | 11,381,255 | |
| SK Hynix, Inc. | 239,028 | 31,639,584 | |
| Taiwan Semiconductor Manufacturing Co. Ltd. | 3,595,000 | 86,382,895 | |
| 156,358,615 | |||
| Technology Hardware & Equipment — 6.0% | |||
| Electronic Equipment, Instruments & Components — 1.6% | |||
| Lotes Co. Ltd. | 333,000 | 14,411,080 | |
| Technology Hardware, Storage & Peripherals — 4.4% | |||
| Samsung Electronics Co. Ltd. | 678,302 | 40,710,716 | |
| 55,121,796 | |||
| Telecommunication Services — 1.1% | |||
| Diversified Telecommunication Services — 1.1% | |||
| a | Converge Information & Communications Technology Solutions, Inc. | 58,574,534 | 10,383,793 |
| 10,383,793 | |||
| Transportation — 3.9% | |||
| Ground Transportation — 1.7% | |||
| Localiza Rent a Car SA | 1,387,808 | 15,130,467 | |
| Transportation Infrastructure — 2.2% | |||
| Adani Ports & Special Economic Zone Ltd. | 589,900 | 9,498,590 | |
| Salik Co. PJSC | 10,758,938 | 10,869,538 | |
| 35,498,595 | |||
| Utilities — 0.9% | |||
| Independent Power and Renewable Electricity Producers — 0.9% | |||
| China Longyuan Power Group Corp. Ltd. Class H | 12,381,000 | 8,668,551 | |
| 8,668,551 | |||
| Total Common Stock (Cost $697,449,148) | 883,759,048 | ||
| Preferred Stock — 1.3% | |||
| Banks — 1.3% | |||
| Banks — 1.3% | |||
| Itau Unibanco Holding SA 6.818% | 1,632,892 | 11,277,940 | |
| 11,277,940 | |||
| Total Preferred Stock (Cost $8,783,436) | 11,277,940 | ||
| Short-Term Investments — 2.2% | |||
| c | Thornburg Capital Management Fund | 2,048,295 | 20,482,950 |
| Total Short-Term Investments (Cost $20,482,950) | 20,482,950 | ||
| Total Investments — 100.2% (Cost $726,715,534) | $915,519,938 | ||
| Liabilities Net of Other Assets — (0.2)% | (1,771,305) | ||
| Net Assets — 100.0% | $913,748,633 |
| Footnote Legend | |
| a | Non-income producing. |
| b | Securities exempt from registration under Rule 144A of the Securities Act of 1933, as amended. These securities are restricted but liquid and may only be resold in the ordinary course of business in transactions exempt from registration, normally to qualified institutional buyers. As of March 31, 2024, the aggregate value of these securities in the Fund’s portfolio was $39,781,208, representing 4.35% of the Fund’s net assets. |
| c | Investment in Affiliates. |
| 50 | Thornburg Equity Funds Semi-Annual Report | See notes to financial statements. |
To simplify the listings of securities, abbreviations are used per the table below:
| ADR | American Depositary Receipt |
| COUNTRY EXPOSURE * (percent of equity holdings) | |
| India | 18.4% |
| Taiwan | 15.5% |
| China | 13.6% |
| South Korea | 11.3% |
| Brazil | 10.7% |
| Mexico | 6.2% |
| South Africa | 4.7% |
| Hong Kong | 4.1% |
| United Arab Emirates | 3.4% |
| Poland | 2.4% |
| Thailand | 1.6% |
| Saudi Arabia | 1.4% |
| Peru | 1.3% |
| United States | 1.3% |
| Philippines | 1.2% |
| Macao | 1.0% |
| Indonesia | 1.0% |
| Turkey | 0.9% |
| * | Holdings are classified by country of risk as determined by MSCI and Bloomberg. |
| See notes to financial statements. | Thornburg Equity Funds Semi-Annual Report | 51 |
Thornburg Small/Mid Cap Core Fund | March 31, 2024 (Unaudited)
| Issuer-Description | SHARES | VALUE | |
| Common Stock — 99.0% | |||
| Banks — 4.1% | |||
| Banks — 4.1% | |||
| Pinnacle Financial Partners, Inc. | 144,898 | $ 12,443,840 | |
| Western Alliance Bancorp | 166,535 | 10,689,882 | |
| 23,133,722 | |||
| Capital Goods — 17.3% | |||
| Building Products — 3.0% | |||
| a | Builders FirstSource, Inc. | 80,358 | 16,758,661 |
| Construction & Engineering — 6.4% | |||
| AECOM | 117,929 | 11,566,476 | |
| Arcosa, Inc. | 102,065 | 8,763,301 | |
| a | MYR Group, Inc. | 85,613 | 15,132,098 |
| Electrical Equipment — 2.8% | |||
| Vertiv Holdings Co. Class A | 191,979 | 15,678,925 | |
| Machinery — 2.6% | |||
| ITT, Inc. | 108,157 | 14,712,597 | |
| Trading Companies & Distributors — 2.5% | |||
| Applied Industrial Technologies, Inc. | 70,103 | 13,848,847 | |
| 96,460,905 | |||
| Commercial & Professional Services — 8.5% | |||
| Commercial Services & Supplies — 6.3% | |||
| a | Casella Waste Systems, Inc. Class A | 198,920 | 19,667,220 |
| a | Clean Harbors, Inc. | 77,619 | 15,625,481 |
| Professional Services — 2.2% | |||
| TransUnion | 153,343 | 12,236,772 | |
| 47,529,473 | |||
| Consumer Discretionary Distribution & Retail — 3.5% | |||
| Distributors — 1.7% | |||
| Pool Corp. | 23,984 | 9,677,544 | |
| Specialty Retail — 1.8% | |||
| Group 1 Automotive, Inc. | 33,143 | 9,685,379 | |
| 19,362,923 | |||
| Consumer Durables & Apparel — 4.5% | |||
| Household Durables — 2.3% | |||
| SharkNinja, Inc. | 137,403 | 8,558,833 | |
| a | Smith Douglas Homes Corp. | 145,000 | 4,306,500 |
| Textiles, Apparel & Luxury Goods — 2.2% | |||
| a | Deckers Outdoor Corp. | 12,918 | 12,159,197 |
| 25,024,530 | |||
| Consumer Services — 1.7% | |||
| Hotels, Restaurants & Leisure — 1.7% | |||
| Wyndham Hotels & Resorts, Inc. | 123,847 | 9,505,257 | |
| 9,505,257 | |||
| Consumer Staples Distribution & Retail — 2.3% | |||
| Consumer Staples Distribution & Retail — 2.3% | |||
| a | BJ’s Wholesale Club Holdings, Inc. | 172,639 | 13,060,140 |
| 13,060,140 | |||
| Energy — 5.6% | |||
| Energy Equipment & Services — 3.7% | |||
| Liberty Energy, Inc. Class A | 329,472 | 6,826,660 | |
| TechnipFMC plc | 558,646 | 14,027,601 | |
| Oil, Gas & Consumable Fuels — 1.9% | |||
| Matador Resources Co. | 153,764 | 10,266,822 | |
| 31,121,083 |
| 52 | Thornburg Equity Funds Semi-Annual Report | See notes to financial statements. |
| Issuer-Description | SHARES | VALUE | |
| Equity Real Estate Investment Trusts (REITs) — 1.7% | |||
| Retail REITs — 1.7% | |||
| Kite Realty Group Trust | 427,254 | $ 9,262,867 | |
| 9,262,867 | |||
| Financial Services — 9.0% | |||
| Capital Markets — 4.4% | |||
| Bridge Investment Group Holdings, Inc. Class A | 754,261 | 5,166,688 | |
| LPL Financial Holdings, Inc. | 53,552 | 14,148,439 | |
| PJT Partners, Inc. Class A | 57,843 | 5,452,281 | |
| Financial Services — 4.6% | |||
| a | Repay Holdings Corp. Class A | 1,369,601 | 15,065,611 |
| Walker & Dunlop, Inc. | 105,737 | 10,685,781 | |
| 50,518,800 | |||
| Food, Beverage & Tobacco — 2.3% | |||
| Food Products — 2.3% | |||
| a | SunOpta, Inc. | 1,842,505 | 12,658,009 |
| 12,658,009 | |||
| Health Care Equipment & Services — 5.4% | |||
| Health Care Equipment & Supplies — 1.6% | |||
| CONMED Corp. | 107,184 | 8,583,295 | |
| Health Care Providers & Services — 3.8% | |||
| a | Acadia Healthcare Co., Inc. | 115,931 | 9,184,054 |
| a | PetIQ, Inc. Class A | 665,583 | 12,166,857 |
| 29,934,206 | |||
| Insurance — 4.2% | |||
| Insurance — 4.2% | |||
| Assurant, Inc. | 64,230 | 12,090,655 | |
| Kemper Corp. | 187,536 | 11,612,229 | |
| 23,702,884 | |||
| Materials — 3.8% | |||
| Chemicals — 3.8% | |||
| Scotts Miracle-Gro Co. | 133,036 | 9,923,155 | |
| Sensient Technologies Corp. | 160,320 | 11,092,541 | |
| 21,015,696 | |||
| Pharmaceuticals, Biotechnology & Life Sciences — 3.8% | |||
| Biotechnology — 1.3% | |||
| a | BioMarin Pharmaceutical, Inc. | 85,367 | 7,455,954 |
| Life Sciences Tools & Services — 2.5% | |||
| a | Avantor, Inc. | 539,959 | 13,806,751 |
| 21,262,705 | |||
| Real Estate Management & Development — 2.2% | |||
| Real Estate Management & Development — 2.2% | |||
| DigitalBridge Group, Inc. | 645,379 | 12,436,453 | |
| 12,436,453 | |||
| Semiconductors & Semiconductor Equipment — 3.6% | |||
| Semiconductors & Semiconductor Equipment — 3.6% | |||
| Entegris, Inc. | 81,225 | 11,415,362 | |
| a | MACOM Technology Solutions Holdings, Inc. | 91,038 | 8,706,874 |
| 20,122,236 | |||
| Software & Services — 6.0% | |||
| Software — 6.0% | |||
| a | Agilysys, Inc. | 140,382 | 11,828,588 |
| a | Aspen Technology, Inc. | 44,575 | 9,506,956 |
| a | CCC Intelligent Solutions Holdings, Inc. | 1,033,845 | 12,364,786 |
| 33,700,330 |
| See notes to financial statements. | Thornburg Equity Funds Semi-Annual Report | 53 |
Thornburg Small/Mid Cap Core Fund | March 31, 2024 (Unaudited)
| Issuer-Description | SHARES | VALUE | |
| Technology Hardware & Equipment — 5.4% | |||
| Communications Equipment — 1.4% | |||
| a | Harmonic, Inc. | 589,951 | $ 7,928,941 |
| Electronic Equipment, Instruments & Components — 2.2% | |||
| a | Coherent Corp. | 204,996 | 12,426,858 |
| Technology Hardware, Storage & Peripherals — 1.8% | |||
| a | Pure Storage, Inc. Class A | 191,801 | 9,971,734 |
| 30,327,533 | |||
| Transportation — 2.3% | |||
| Ground Transportation — 2.3% | |||
| a | XPO, Inc. | 102,959 | 12,564,087 |
| 12,564,087 | |||
| Utilities — 1.8% | |||
| Electric Utilities — 1.8% | |||
| PNM Resources, Inc. | 268,671 | 10,112,776 | |
| 10,112,776 | |||
| Total Common Stock (Cost $430,582,017) | 552,816,615 | ||
| Short-Term Investments — 1.2% | |||
| b | Thornburg Capital Management Fund | 662,077 | 6,620,772 |
| Total Short-Term Investments (Cost $6,620,772) | 6,620,772 | ||
| Total Investments — 100.2% (Cost $437,202,789) | $559,437,387 | ||
| Liabilities Net of Other Assets — (0.2)% | (939,099) | ||
| Net Assets — 100.0% | $558,498,288 |
| Footnote Legend | |
| a | Non-income producing. |
| b | Investment in Affiliates. |
| 54 | Thornburg Equity Funds Semi-Annual Report | See notes to financial statements. |
Thornburg Small/Mid Cap Growth Fund | March 31, 2024 (Unaudited)
| Issuer-Description | SHARES | VALUE | |
| Common Stock — 98.9% | |||
| Capital Goods — 15.4% | |||
| Building Products — 2.0% | |||
| a | Builders FirstSource, Inc. | 26,674 | $ 5,562,863 |
| Construction & Engineering — 6.6% | |||
| Arcosa, Inc. | 48,106 | 4,130,381 | |
| a | MYR Group, Inc. | 46,551 | 8,227,889 |
| a | WillScot Mobile Mini Holdings Corp. | 138,199 | 6,426,254 |
| Electrical Equipment — 4.3% | |||
| Vertiv Holdings Co. Class A | 150,251 | 12,270,999 | |
| Trading Companies & Distributors — 2.5% | |||
| Applied Industrial Technologies, Inc. | 36,574 | 7,225,193 | |
| 43,843,579 | |||
| Commercial & Professional Services — 8.1% | |||
| Commercial Services & Supplies — 5.9% | |||
| a | Casella Waste Systems, Inc. Class A | 109,722 | 10,848,214 |
| Tetra Tech, Inc. | 31,439 | 5,807,098 | |
| Professional Services — 2.2% | |||
| TransUnion | 79,549 | 6,348,010 | |
| 23,003,322 | |||
| Consumer Discretionary Distribution & Retail — 1.9% | |||
| Distributors — 1.9% | |||
| Pool Corp. | 13,093 | 5,283,025 | |
| 5,283,025 | |||
| Consumer Durables & Apparel — 4.2% | |||
| Household Durables — 2.1% | |||
| SharkNinja, Inc. | 93,057 | 5,796,520 | |
| Textiles, Apparel & Luxury Goods — 2.1% | |||
| a | On Holding AG Class A | 169,647 | 6,002,111 |
| 11,798,631 | |||
| Consumer Services — 2.2% | |||
| Hotels, Restaurants & Leisure — 2.2% | |||
| Churchill Downs, Inc. | 50,657 | 6,268,804 | |
| 6,268,804 | |||
| Energy — 2.7% | |||
| Energy Equipment & Services — 2.7% | |||
| TechnipFMC plc | 308,918 | 7,756,931 | |
| 7,756,931 | |||
| Financial Services — 4.6% | |||
| Capital Markets — 2.7% | |||
| Blue Owl Capital, Inc. Class A | 198,004 | 3,734,355 | |
| Tradeweb Markets, Inc. Class A | 36,317 | 3,783,142 | |
| Financial Services — 1.9% | |||
| a | Shift4 Payments, Inc. Class A | 82,394 | 5,443,772 |
| 12,961,269 | |||
| Food, Beverage & Tobacco — 5.9% | |||
| Beverages — 2.9% | |||
| a | Celsius Holdings, Inc. | 100,113 | 8,301,370 |
| Food Products — 3.0% | |||
| a | Freshpet, Inc. | 71,803 | 8,319,096 |
| 16,620,466 | |||
| Health Care Equipment & Services — 6.8% |
| See notes to financial statements. | Thornburg Equity Funds Semi-Annual Report | 55 |
Thornburg Small/Mid Cap Growth Fund | March 31, 2024 (Unaudited)
| Issuer-Description | SHARES | VALUE | |
| Health Care Equipment & Supplies — 5.8% | |||
| a | Inspire Medical Systems, Inc. | 25,808 | $ 5,543,300 |
| a | Shockwave Medical, Inc. | 33,780 | 10,999,782 |
| Health Care Providers & Services — 1.0% | |||
| a | Surgery Partners, Inc. | 93,077 | 2,776,487 |
| 19,319,569 | |||
| Insurance — 2.5% | |||
| Insurance — 2.5% | |||
| Ryan Specialty Holdings, Inc. Class A | 129,334 | 7,178,037 | |
| 7,178,037 | |||
| Media & Entertainment — 1.8% | |||
| Entertainment — 1.8% | |||
| a | Liberty Media Corp.-Liberty Formula One Class C | 78,977 | 5,180,891 |
| 5,180,891 | |||
| Pharmaceuticals, Biotechnology & Life Sciences — 12.1% | |||
| Biotechnology — 5.6% | |||
| a | BioMarin Pharmaceutical, Inc. | 70,659 | 6,171,357 |
| a | Cytokinetics, Inc. | 83,761 | 5,872,484 |
| a | Sarepta Therapeutics, Inc. | 28,998 | 3,754,081 |
| Life Sciences Tools & Services — 6.5% | |||
| a | Avantor, Inc. | 230,747 | 5,900,201 |
| a | Repligen Corp. | 34,064 | 6,265,051 |
| Stevanato Group SpA | 196,840 | 6,318,564 | |
| 34,281,738 | |||
| Real Estate Management & Development — 1.8% | |||
| Real Estate Management & Development — 1.8% | |||
| DigitalBridge Group, Inc. | 263,444 | 5,076,566 | |
| 5,076,566 | |||
| Semiconductors & Semiconductor Equipment — 7.5% | |||
| Semiconductors & Semiconductor Equipment — 7.5% | |||
| a | Credo Technology Group Holding Ltd. | 237,327 | 5,028,959 |
| Monolithic Power Systems, Inc. | 6,786 | 4,596,972 | |
| a | Onto Innovation, Inc. | 37,049 | 6,708,833 |
| a | Rambus, Inc. | 80,273 | 4,961,674 |
| 21,296,438 | |||
| Software & Services — 16.2% | |||
| Software — 16.2% | |||
| a | Agilysys, Inc. | 76,143 | 6,415,809 |
| Bentley Systems, Inc. Class B | 158,118 | 8,256,922 | |
| a | CCC Intelligent Solutions Holdings, Inc. | 620,432 | 7,420,367 |
| a | Clearwater Analytics Holdings, Inc. Class A | 331,285 | 5,860,432 |
| a | CyberArk Software Ltd. | 24,725 | 6,567,702 |
| a | JFrog Ltd. | 120,692 | 5,337,000 |
| a | Monday.com Ltd. | 26,944 | 6,085,841 |
| 45,944,073 | |||
| Technology Hardware & Equipment — 2.5% | |||
| Technology Hardware, Storage & Peripherals — 2.5% | |||
| a | Pure Storage, Inc. Class A | 136,814 | 7,112,960 |
| 7,112,960 | |||
| Transportation — 2.7% | |||
| Ground Transportation — 2.7% | |||
| a | Saia, Inc. | 13,138 | 7,685,730 |
| 7,685,730 | |||
| Total Common Stock (Cost $208,958,250) | 280,612,029 |
| 56 | Thornburg Equity Funds Semi-Annual Report | See notes to financial statements. |
| Issuer-Description | SHARES | VALUE | |
| Short-Term Investments — 1.2% | |||
| b | Thornburg Capital Management Fund | 335,851 | $ 3,358,509 |
| Total Short-Term Investments (Cost $3,358,509) | 3,358,509 | ||
| Total Investments — 100.1% (Cost $212,316,759) | $283,970,538 | ||
| Liabilities Net of Other Assets — (0.1)% | (349,275) | ||
| Net Assets — 100.0% | $283,621,263 |
| Footnote Legend | |
| a | Non-income producing. |
| b | Investment in Affiliates. |
| See notes to financial statements. | Thornburg Equity Funds Semi-Annual Report | 57 |
Thornburg Investment Income Builder Fund | March 31, 2024 (Unaudited)
| Issuer-Description | SHARES/ PRINCIPAL AMOUNT | VALUE | |
| Common Stock — 84.9% | |||
| Automobiles & Components — 1.7% | |||
| Automobiles — 1.7% | |||
| Mercedes-Benz Group AG | 1,247,000 | $ 99,298,499 | |
| Stellantis NV | 4,138,200 | 117,617,165 | |
| 216,915,664 | |||
| Banks — 11.5% | |||
| Banks — 11.5% | |||
| Bank of Ireland Group plc | 16,525,250 | 168,477,098 | |
| BNP Paribas SA | 6,677,600 | 474,463,877 | |
| Citigroup, Inc. | 5,954,378 | 376,554,865 | |
| JPMorgan Chase & Co. | 1,520,220 | 304,500,066 | |
| Regions Financial Corp. | 7,854,921 | 165,267,538 | |
| 1,489,263,444 | |||
| Capital Goods — 1.4% | |||
| Aerospace & Defense — 1.4% | |||
| BAE Systems plc | 10,930,100 | 186,169,236 | |
| 186,169,236 | |||
| Consumer Discretionary Distribution & Retail — 1.5% | |||
| Specialty Retail — 1.5% | |||
| Home Depot, Inc. | 505,482 | 193,902,895 | |
| 193,902,895 | |||
| Consumer Staples Distribution & Retail — 2.6% | |||
| Consumer Staples Distribution & Retail — 2.6% | |||
| BIM Birlesik Magazalar AS | 2,799,600 | 30,437,494 | |
| Tesco plc | 81,260,030 | 304,199,865 | |
| 334,637,359 | |||
| Energy — 8.9% | |||
| Oil, Gas & Consumable Fuels — 8.9% | |||
| a,b | Drillco Holdings Luxembourg SA | 147,823 | 3,025,937 |
| Enbridge, Inc. | 3,309,521 | 119,597,691 | |
| Eni SpA | 4,369,900 | 69,057,501 | |
| Equinor ASA | 3,529,100 | 94,630,662 | |
| a | LUKOIL PJSC | 314,000 | 226,080 |
| a,b,c | Malamute Energy, Inc. | 12,439 | 12,439 |
| Petroleo Brasileiro SA Sponsored ADR | 7,310,155 | 111,187,458 | |
| Shell plc | 2,680,600 | 88,812,115 | |
| TC Energy Corp. | 2,370,000 | 95,251,412 | |
| TotalEnergies SE | 8,267,100 | 566,086,393 | |
| 1,147,887,688 | |||
| Equity Real Estate Investment Trusts (REITs) — 0.3% | |||
| Residential REITs — 0.3% | |||
| Elme Communities | 2,454,592 | 34,167,921 | |
| 34,167,921 | |||
| Financial Services — 4.9% | |||
| Capital Markets — 2.9% | |||
| CME Group, Inc. | 1,197,705 | 257,853,910 | |
| MidCap Financial Investment Corp. | 2,937,783 | 44,184,256 | |
| c | SLR Investment Corp. | 4,307,900 | 66,126,265 |
| Financial Services — 1.5% | |||
| Equitable Holdings, Inc. | 5,226,798 | 198,670,592 | |
| Mortgage Real Estate Investment Trusts — 0.5% | |||
| c | Chimera Investment Corp. | 14,843,587 | 68,428,936 |
| 635,263,959 |
| 58 | Thornburg Equity Funds Semi-Annual Report | See notes to financial statements. |
| Issuer-Description | SHARES/ PRINCIPAL AMOUNT | VALUE | |
| Food, Beverage & Tobacco — 0.5% | |||
| Food Products — 0.5% | |||
| Nestle SA | 549,800 | $ 58,372,623 | |
| 58,372,623 | |||
| Health Care Equipment & Services — 0.8% | |||
| Health Care Equipment & Supplies — 0.8% | |||
| Medtronic plc | 1,180,465 | 102,877,525 | |
| 102,877,525 | |||
| Insurance — 5.3% | |||
| Insurance — 5.3% | |||
| Assicurazioni Generali SpA | 7,232,347 | 183,049,392 | |
| AXA SA | 1,809,000 | 67,946,328 | |
| NN Group NV | 9,352,716 | 432,061,368 | |
| 683,057,088 | |||
| Materials — 4.3% | |||
| Chemicals — 1.9% | |||
| LyondellBasell Industries NV Class A | 1,867,909 | 191,049,733 | |
| OCI NV | 1,908,000 | 52,263,934 | |
| Metals & Mining — 2.4% | |||
| BHP Group Ltd. | 2,295,800 | 66,230,495 | |
| Glencore plc | 43,166,400 | 237,162,156 | |
| a | MMC Norilsk Nickel PJSC | 351,400 | 2,073,260 |
| 548,779,578 | |||
| Pharmaceuticals, Biotechnology & Life Sciences — 9.7% | |||
| Biotechnology — 1.1% | |||
| AbbVie, Inc. | 799,560 | 145,599,876 | |
| Pharmaceuticals — 8.6% | |||
| AstraZeneca plc | 1,549,800 | 208,870,192 | |
| Merck & Co., Inc. | 1,853,403 | 244,556,526 | |
| Novartis AG | 1,610,708 | 156,043,198 | |
| Pfizer, Inc. | 7,402,086 | 205,407,886 | |
| Roche Holding AG | 1,132,800 | 288,522,659 | |
| 1,249,000,337 | |||
| Semiconductors & Semiconductor Equipment — 7.9% | |||
| Semiconductors & Semiconductor Equipment — 7.9% | |||
| Broadcom, Inc. | 369,386 | 489,587,898 | |
| QUALCOMM, Inc. | 485,831 | 82,251,188 | |
| Taiwan Semiconductor Manufacturing Co. Ltd. | 18,565,000 | 446,091,365 | |
| 1,017,930,451 | |||
| Software & Services — 0.3% | |||
| Information Technology Services — 0.3% | |||
| HCL Technologies Ltd. | 2,092,600 | 38,816,065 | |
| 38,816,065 | |||
| Technology Hardware & Equipment — 3.2% | |||
| Communications Equipment — 0.6% | |||
| Cisco Systems, Inc. | 1,619,187 | 80,813,623 | |
| Technology Hardware, Storage & Peripherals — 2.6% | |||
| Samsung Electronics Co. Ltd. | 5,604,000 | 336,344,067 | |
| 417,157,690 | |||
| Telecommunication Services — 14.3% | |||
| Diversified Telecommunication Services — 11.7% | |||
| AT&T, Inc. | 19,411,778 | 341,647,293 | |
| Deutsche Telekom AG | 8,752,500 | 212,459,260 | |
| a,b | Digicel Holdings Ltd. | 220,592 | 200,066 |
| Koninklijke KPN NV | 27,983,000 | 104,636,657 |
| See notes to financial statements. | Thornburg Equity Funds Semi-Annual Report | 59 |
Thornburg Investment Income Builder Fund | March 31, 2024 (Unaudited)
| Issuer-Description | SHARES/ PRINCIPAL AMOUNT | VALUE | |
| KT Corp. | 704,000 | $ 19,845,348 | |
| Orange SA | 52,501,480 | 616,709,566 | |
| Singapore Telecommunications Ltd. | 35,349,200 | 66,234,754 | |
| b | Swisscom AG | 106,700 | 65,237,434 |
| b | Zegona Communications plc | 28,443,000 | 81,132,477 |
| Wireless Telecommunication Services — 2.6% | |||
| Vodafone Group plc | 382,909,524 | 340,525,547 | |
| 1,848,628,402 | |||
| Transportation — 0.5% | |||
| Air Freight & Logistics — 0.5% | |||
| Deutsche Post AG | 1,596,100 | 68,731,727 | |
| 68,731,727 | |||
| Utilities — 5.3% | |||
| Electric Utilities — 4.1% | |||
| Endesa SA | 9,158,357 | 169,598,655 | |
| Enel SpA | 54,201,371 | 357,809,405 | |
| Multi-Utilities — 1.2% | |||
| E.ON SE | 5,039,400 | 70,052,604 | |
| Engie SA | 5,474,972 | 91,612,498 | |
| 689,073,162 | |||
| Total Common Stock (Cost $8,315,858,310) | 10,960,632,814 | ||
| Preferred Stock — 0.1% | |||
| Banks — 0.1% | |||
| Banks — 0.1% | |||
| d,e,f | First Horizon Bank 6.437% (TSFR3M + 1.11%), 4/30/2024 | 12,000 | 7,620,000 |
| 7,620,000 | |||
| Financial Services — 0.0% | |||
| Capital Markets — 0.0% | |||
| e,f | Morgan Stanley Series A, 6.276% (TSFR3M + 0.96%), 4/29/2024 | 120,000 | 2,724,000 |
| 2,724,000 | |||
| Total Preferred Stock (Cost $14,968,750) | 10,344,000 | ||
| Asset Backed Securities — 1.1% | |||
| Auto Receivables — 0.6% | |||
| Carvana Auto Receivables Trust, | |||
| d | Series 2019-4A Class R, due 10/15/2026 | $ 32,000 | 9,123,809 |
| d | Series 2021-P1 Class R, due 12/10/2027 | 24,000 | 2,252,718 |
| d | Series 2021-P2 Class R, due 5/10/2028 | 8,000 | 1,617,512 |
| d | Series 2021-P4 Class R, due 9/11/2028 | 17,500 | 4,262,869 |
| d | Series 2022-P1 Class R, due 1/10/2029 | 24,000 | 5,655,190 |
| CPS Auto Receivables Trust, | |||
| d | Series 2020-A Class E, 4.09% due 12/15/2025 | 1,139,332 | 1,136,452 |
| d | Series 2020-C Class F, 6.67% due 11/15/2027 | 3,000,000 | 2,972,318 |
| d | CPS Auto Securitization Trust, Series 2021-1A Class A, 7.86% due 6/16/2026 | 14,000,000 | 14,247,857 |
| d | Credit Suisse ABS Trust Series 2020-AT1 Class CERT, due 6/15/2026 | 40,000 | 283,176 |
| d | DT Auto Owner Trust, Series 2020-1A Class E, 3.48% due 2/16/2027 | 4,500,000 | 4,451,292 |
| d | FHF Trust, Series 2022-2A Class A, 6.14% due 12/15/2027 | 3,660,667 | 3,650,426 |
| Flagship Credit Auto Trust, | |||
| d | Series 2018-4 Class R, due 3/16/2026 | 53,000 | 2,585,128 |
| d | Series 2019-1 Class R, due 6/15/2026 | 6,000 | 166,726 |
| d | Series 2019-2 Class R, due 12/15/2026 | 33,000 | 1,344,105 |
| d | Series 2019-3 Class R, due 12/15/2026 | 60,000 | 2,806,477 |
| d | Series 2019-4 Class R, due 3/15/2027 | 60,000 | 2,683,779 |
| JPMorgan Chase Bank NA - CACLN, | |||
| d | Series 2020-1 Class R, 33.784% due 1/25/2028 | 1,238,046 | 1,306,186 |
| 60 | Thornburg Equity Funds Semi-Annual Report | See notes to financial statements. |
| Issuer-Description | SHARES/ PRINCIPAL AMOUNT | VALUE | |
| d | Series 2020-2 Class R, 31.355% due 2/25/2028 | $ 3,301,051 | $ 3,594,901 |
| d | Series 2021-1 Class R, 28.348% due 9/25/2028 | 3,633,873 | 4,258,427 |
| d | Santander Consumer Auto Receivables Trust Series 2020-AA Class R, due 1/16/2029 | 45,588 | 4,506,987 |
| d | United Auto Credit Securitization Trust Series 2022-1 Class R, due 11/10/2028 | 37,000 | 465,387 |
| 73,371,722 | |||
| Other Asset Backed — 0.5% | |||
| d | Aqua Finance Trust, Series 2020-AA Class D, 7.15% due 7/17/2046 | 8,200,000 | 7,230,228 |
| d,f | Consumer Loan Underlying Bond Certificate Issuer Trust I Series 2019-HP1 Class CERT, due 12/15/2026 | 400,000 | 1,538,412 |
| d | FAT Brands Fazoli’s Native I LLC, Series 2021-1 Class A2, 7.00% due 7/25/2051 | 14,045,130 | 12,917,178 |
| a,d | Goldman Home Improvement Trust Issuer Trust Series 2021-GRN2 Class R, due 6/20/2051 | 42,000 | 2,352,772 |
| d | LendingPoint Asset Securitization Trust, Series 2020-REV1 Class C, 7.699% due 10/15/2028 | 25,750,000 | 25,566,483 |
| Marlette Funding Trust, | |||
| d | Series 2021-1A Class R, due 6/16/2031 | 9,550 | 180,531 |
| d | Series 2021-2A Class R, due 9/15/2031 | 26,000 | 630,763 |
| d | Series 2021-3A Class R, due 12/15/2031 | 23,881 | 916,429 |
| Mosaic Solar Loan Trust, | |||
| d | Series 2020-2A Class R, due 8/20/2046 | 3,872,620 | 1,488,848 |
| d | Series 2021-1A Class R, due 12/20/2046 | 6,819,752 | 654,798 |
| d | Series 2021-2A Class R, due 4/22/2047 | 10,000,000 | 890,700 |
| d,f | Oportun Funding LLC Series 2022-1 Class CERT, due 6/15/2029 | 11,604 | 607,484 |
| Prosper Pass-Thru Trust II, | |||
| d | Series 2019-ST1 Class CERT, due 7/15/2025 | 38,500,000 | 124,762 |
| d | Series 2019-ST2 Class R1, due 11/15/2025 | 17,477,134 | 596,722 |
| d | Series 2019-ST2 Class R2, due 11/15/2025 | 8,738,067 | 298,344 |
| Upstart Pass-Through Trust, | |||
| d | Series 2020-ST6 Class A, 3.00% due 1/20/2027 | 1,000,295 | 989,336 |
| d | Series 2021-ST4 Class CERT, due 7/20/2027 | 1,375,000 | 145,846 |
| d | Series 2021-ST8 Class CERT, due 10/20/2029 | 4,150,000 | 1,142,470 |
| d | Series 2021-ST9 Class CERT, due 11/20/2029 | 1,415,000 | 381,583 |
| d | Upstart Structured Pass-Through Trust, Series 2022-4A Class A, 7.01% due 11/15/2030 | 2,740,224 | 2,744,683 |
| 61,398,372 | |||
| Student Loan — 0.0% | |||
| d | SoFi Professional Loan Program Trust Series 2021-B Class R1, due 2/15/2047 | 23,000 | 781,056 |
| 781,056 | |||
| Total Asset Backed Securities (Cost $146,895,924) | 135,551,150 | ||
| Corporate Bonds — 7.9% | |||
| Banks — 0.2% | |||
| Banks — 0.2% | |||
| Bank of New York Mellon Corp., | |||
| e,f | Series F, 4.625% (TSFR3M + 3.39%) due 9/20/2026 | 1,935,000 | 1,834,806 |
| e,f | Series I, 3.75% (5-Yr. CMT + 2.630%) due 12/20/2026 | 11,400,000 | 10,456,992 |
| KeyBank NA, 5.00% due 1/26/2033 | 10,250,000 | 9,500,110 | |
| 21,791,908 | |||
| Capital Goods — 0.3% | |||
| Aerospace & Defense — 0.1% | |||
| d | BWX Technologies, Inc., 4.125% due 6/30/2028 | 7,500,000 | 7,005,375 |
| d | TransDigm, Inc., 6.75% due 8/15/2028 | 6,345,000 | 6,438,018 |
| Construction & Engineering — 0.1% | |||
| d,g | IHS Netherlands Holdco BV, 8.00% due 9/18/2027 | 9,995,000 | 9,538,728 |
| Trading Companies & Distributors — 0.1% | |||
| LKQ Corp., 6.25% due 6/15/2033 | 5,840,000 | 6,079,498 | |
| d | Windsor Holdings III LLC, 8.50% due 6/15/2030 | 7,470,000 | 7,844,471 |
| 36,906,090 | |||
| Commercial & Professional Services — 0.2% | |||
| Commercial Services & Supplies — 0.2% | |||
| d | ACCO Brands Corp., 4.25% due 3/15/2029 | 7,500,000 | 6,750,075 |
| g | Cimpress plc, 7.00% due 6/15/2026 | 11,859,000 | 11,858,407 |
| See notes to financial statements. | Thornburg Equity Funds Semi-Annual Report | 61 |
Thornburg Investment Income Builder Fund | March 31, 2024 (Unaudited)
| Issuer-Description | SHARES/ PRINCIPAL AMOUNT | VALUE | |
| CoreCivic, Inc., 8.25% due 4/15/2029 | $ 12,869,000 | $ 13,460,073 | |
| 32,068,555 | |||
| Consumer Durables & Apparel — 0.0% | |||
| Leisure Products — 0.0% | |||
| Polaris, Inc., 6.95% due 3/15/2029 | 5,000,000 | 5,319,400 | |
| 5,319,400 | |||
| Consumer Services — 0.3% | |||
| Hotels, Restaurants & Leisure — 0.3% | |||
| Marriott International, Inc., 4.50% due 10/1/2034 | 4,497,000 | 4,090,066 | |
| d | Nathan’s Famous, Inc., 6.625% due 11/1/2025 | 3,750,000 | 3,743,963 |
| d | SeaWorld Parks & Entertainment, Inc., 8.75% due 5/1/2025 | 24,785,000 | 24,801,854 |
| d | Six Flags Entertainment Corp., 7.25% due 5/15/2031 | 4,912,000 | 4,973,498 |
| 37,609,381 | |||
| Consumer Staples Distribution & Retail — 0.2% | |||
| Consumer Staples Distribution & Retail — 0.2% | |||
| d | KeHE Distributors LLC/KeHE Finance Corp./NextWave Distribution, Inc., 9.00% due 2/15/2029 | 20,667,000 | 20,946,005 |
| d | U.S. Foods, Inc., 4.75% due 2/15/2029 | 5,880,000 | 5,580,708 |
| 26,526,713 | |||
| Energy — 2.1% | |||
| Energy Equipment & Services — 0.1% | |||
| d,g | Empresa Generadora de Electricidad Haina SA, 5.625% due 11/8/2028 | 7,850,000 | 7,133,216 |
| d,e,g | Odebrecht Oil & Gas Finance Ltd. (Guaranty: Odebrecht Oleo e Gas SA), Zero coupon due 4/29/2024 | 2,337,727 | 127,196 |
| Oil, Gas & Consumable Fuels — 2.0% | |||
| d | CITGO Petroleum Corp., 7.00% due 6/15/2025 | 10,750,000 | 10,738,820 |
| d | Delek Logistics Partners LP/Delek Logistics Finance Corp., 8.625% due 3/15/2029 | 3,500,000 | 3,574,480 |
| Energean Israel Finance Ltd., | |||
| g | 5.375% due 3/30/2028 | 6,500,000 | 5,939,050 |
| g | 8.50% due 9/30/2033 | 5,025,000 | 4,974,700 |
| f | Energy Transfer LP, 8.586% (TSFR3M + 3.28%) due 11/1/2066 | 13,820,000 | 12,551,186 |
| f | Enterprise TE Partners LP, Series 1, 8.38% (SOFR + 3.00%) due 6/1/2067 | 7,000,000 | 5,328,750 |
| Kinder Morgan Energy Partners LP, | |||
| 5.00% due 3/1/2043 | 10,000,000 | 8,865,700 | |
| 5.80% due 3/15/2035 | 10,000,000 | 10,151,800 | |
| Kinder Morgan, Inc., | |||
| 5.30% due 12/1/2034 | 23,630,000 | 23,254,047 | |
| 5.55% due 6/1/2045 | 5,000,000 | 4,771,450 | |
| d,g | Medco Maple Tree Pte. Ltd., 8.96% due 4/27/2029 | 7,000,000 | 7,281,470 |
| ONEOK Partners LP, 4.90% due 3/15/2025 | 9,544,000 | 9,475,760 | |
| Petroleos Mexicanos, | |||
| g | 5.95% due 1/28/2031 | 12,070,000 | 9,680,381 |
| g | 6.70% due 2/16/2032 | 3,000,000 | 2,496,030 |
| g | 7.69% due 1/23/2050 | 5,650,000 | 4,056,700 |
| e | Summit Midstream Partners LP, Series A, 13.021% due 4/29/2024 | 16,097,000 | 15,292,150 |
| Sunoco LP/Sunoco Finance Corp., 5.875% due 3/15/2028 | 5,000,000 | 4,962,450 | |
| Transcontinental Gas Pipe Line Co. LLC, 7.85% due 2/1/2026 | 32,700,000 | 33,919,056 | |
| Williams Cos., Inc., | |||
| 4.55% due 6/24/2024 | 69,318,000 | 69,137,080 | |
| 5.75% due 6/24/2044 | 14,198,000 | 14,135,387 | |
| 267,846,859 | |||
| Equity Real Estate Investment Trusts (REITs) — 0.3% | |||
| Diversified REITs — 0.2% | |||
| d | Iron Mountain, Inc., 7.00% due 2/15/2029 | 7,500,000 | 7,646,625 |
| d | SBA Tower Trust, 2.836% due 1/15/2050 | 5,000,000 | 4,880,128 |
| d,g | Trust Fibra Uno, 5.25% due 1/30/2026 | 7,843,000 | 7,658,768 |
| Vornado Realty LP, 2.15% due 6/1/2026 | 8,186,500 | 7,430,231 | |
| Retail REITs — 0.1% | |||
| Retail Opportunity Investments Partnership LP, 6.75% due 10/15/2028 | 9,990,000 | 10,349,840 | |
| 37,965,592 |
| 62 | Thornburg Equity Funds Semi-Annual Report | See notes to financial statements. |
| Issuer-Description | SHARES/ PRINCIPAL AMOUNT | VALUE | |
| Financial Services — 0.7% | |||
| Capital Markets — 0.5% | |||
| Blue Owl Credit Income Corp., 7.75% due 9/16/2027 | $ 2,500,000 | $ 2,561,000 | |
| Blue Owl Technology Finance Corp., | |||
| d | 3.75% due 6/17/2026 | 13,000,000 | 12,014,600 |
| d | 4.75% due 12/15/2025 | 10,000,000 | 9,609,500 |
| d | Burford Capital Global Finance LLC, 9.25% due 7/1/2031 | 11,500,000 | 12,174,245 |
| d | Compass Group Diversified Holdings LLC, 5.25% due 4/15/2029 | 6,272,000 | 5,957,334 |
| d,g | FORESEA Holding SA, 7.50% due 6/15/2030 | 1,520,371 | 1,421,516 |
| Hercules Capital, Inc., 2.625% due 9/16/2026 | 4,098,000 | 3,715,902 | |
| d | Oaktree Strategic Credit Fund, 8.40% due 11/14/2028 | 3,000,000 | 3,182,970 |
| d | StoneX Group, Inc., 8.625% due 6/15/2025 | 17,784,000 | 17,873,454 |
| Financial Services — 0.2% | |||
| Antares Holdings LP, | |||
| d | 3.75% due 7/15/2027 | 3,000,000 | 2,726,340 |
| d | 7.95% due 8/11/2028 | 3,000,000 | 3,120,000 |
| d | 8.50% due 5/18/2025 | 11,500,000 | 11,695,730 |
| d | United Wholesale Mortgage LLC, 5.50% due 11/15/2025 | 5,000,000 | 4,955,250 |
| 91,007,841 | |||
| Food, Beverage & Tobacco — 0.6% | |||
| Beverages — 0.1% | |||
| d,g | Central American Bottling Corp./CBC Bottling Holdco SL/Beliv Holdco SL, 5.25% due 4/27/2029 | 10,443,000 | 9,954,685 |
| Food Products — 0.1% | |||
| d | Darling Ingredients, Inc., 6.00% due 6/15/2030 | 4,050,000 | 4,015,049 |
| d | Post Holdings, Inc., 5.50% due 12/15/2029 | 10,000,000 | 9,660,500 |
| Tobacco — 0.4% | |||
| d,g | Imperial Brands Finance plc, 6.125% due 7/27/2027 | 5,000,000 | 5,102,700 |
| d,g | JT International Financial Services BV, 6.875% due 10/24/2032 | 5,000,000 | 5,572,850 |
| d | Vector Group Ltd., 10.50% due 11/1/2026 | 44,464,000 | 44,719,668 |
| 79,025,452 | |||
| Insurance — 0.4% | |||
| Insurance — 0.4% | |||
| d,g | DaVinciRe Holdings Ltd., 4.75% due 5/1/2025 | 5,000,000 | 4,902,500 |
| f | Enstar Finance LLC, 5.75% (5-Yr. CMT + 5.468%) due 9/1/2040 | 1,632,000 | 1,583,383 |
| g | Enstar Group Ltd., 3.10% due 9/1/2031 | 8,354,000 | 6,939,417 |
| Fidelity National Financial, Inc., | |||
| 2.45% due 3/15/2031 | 1,617,000 | 1,332,359 | |
| 3.40% due 6/15/2030 | 8,383,000 | 7,454,667 | |
| Horace Mann Educators Corp., 7.25% due 9/15/2028 | 10,000,000 | 10,691,900 | |
| d | MetLife, Inc., 9.25% due 4/8/2068 | 12,000,000 | 14,022,600 |
| Stewart Information Services Corp., 3.60% due 11/15/2031 | 8,101,000 | 6,643,387 | |
| 53,570,213 | |||
| Materials — 0.2% | |||
| Chemicals — 0.1% | |||
| d,g | Nufarm Australia Ltd./Nufarm Americas, Inc., 5.00% due 1/27/2030 | 3,000,000 | 2,748,150 |
| OCP SA, | |||
| d,g | 3.75% due 6/23/2031 | 2,000,000 | 1,705,900 |
| d,g | 4.50% due 10/22/2025 | 5,000,000 | 4,875,300 |
| Containers & Packaging — 0.1% | |||
| d | Matthews International Corp., Class C, 5.25% due 12/1/2025 | 14,969,000 | 14,685,487 |
| Metals & Mining — 0.0% | |||
| d | Compass Minerals International, Inc., 6.75% due 12/1/2027 | 3,000,000 | 2,897,520 |
| d,g | WE Soda Investments Holding plc, 9.375% due 2/14/2031 | 4,150,000 | 4,269,354 |
| 31,181,711 | |||
| Media & Entertainment — 0.2% | |||
| Media — 0.2% | |||
| d | CCO Holdings LLC/CCO Holdings Capital Corp., 4.75% due 2/1/2032 | 8,000,000 | 6,536,960 |
| See notes to financial statements. | Thornburg Equity Funds Semi-Annual Report | 63 |
Thornburg Investment Income Builder Fund | March 31, 2024 (Unaudited)
| Issuer-Description | SHARES/ PRINCIPAL AMOUNT | VALUE | |
| Sirius XM Radio, Inc., | |||
| d | 3.125% due 9/1/2026 | $ 5,000,000 | $ 4,687,850 |
| d | 5.00% due 8/1/2027 | 7,500,000 | 7,220,700 |
| d,g | Telenet Finance Luxembourg Notes SARL, 5.50% due 3/1/2028 | 10,000,000 | 9,421,000 |
| 27,866,510 | |||
| Real Estate Management & Development — 0.0% | |||
| Real Estate Management & Development — 0.0% | |||
| d | Cushman & Wakefield U.S. Borrower LLC, 6.75% due 5/15/2028 | 3,000,000 | 2,962,620 |
| d | Greystar Real Estate Partners LLC, 7.75% due 9/1/2030 | 2,490,000 | 2,606,806 |
| 5,569,426 | |||
| Semiconductors & Semiconductor Equipment — 0.1% | |||
| Semiconductors & Semiconductor Equipment — 0.1% | |||
| d | Qorvo, Inc., 3.375% due 4/1/2031 | 9,800,000 | 8,390,858 |
| 8,390,858 | |||
| Software & Services — 0.5% | |||
| Information Technology Services — 0.1% | |||
| d | Boost Newco Borrower LLC, 7.50% due 1/15/2031 | 5,000,000 | 5,235,700 |
| d | Science Applications International Corp., 4.875% due 4/1/2028 | 5,000,000 | 4,775,000 |
| Internet Software & Services — 0.2% | |||
| d | Arches Buyer, Inc., 4.25% due 6/1/2028 | 6,500,000 | 5,720,130 |
| d | Cogent Communications Group, Inc., 7.00% due 6/15/2027 | 10,000,000 | 9,955,300 |
| Prosus NV, | |||
| d,g | 3.061% due 7/13/2031 | 11,800,000 | 9,584,432 |
| d,g | 3.832% due 2/8/2051 | 5,000,000 | 3,076,200 |
| d,g | 4.027% due 8/3/2050 | 5,000,000 | 3,195,400 |
| Software — 0.2% | |||
| d | Fair Isaac Corp., 4.00% due 6/15/2028 | 7,000,000 | 6,541,710 |
| d | GoTo Group, Inc.,5.50% due 5/1/2028 | 4,354,350 | 3,288,661 |
| d,g | Open Text Corp., 3.875% due 12/1/2029 | 10,000,000 | 8,918,700 |
| 60,291,233 | |||
| Technology Hardware & Equipment — 0.1% | |||
| Electronic Equipment, Instruments & Components — 0.1% | |||
| CDW LLC/CDW Finance Corp., 4.25% due 4/1/2028 | 5,000,000 | 4,784,100 | |
| Vontier Corp., 2.40% due 4/1/2028 | 5,832,000 | 5,169,776 | |
| Technology Hardware, Storage & Peripherals — 0.0% | |||
| d,g | Lenovo Group Ltd., 5.831% due 1/27/2028 | 5,000,000 | 5,058,750 |
| 15,012,626 | |||
| Telecommunication Services — 1.3% | |||
| Diversified Telecommunication Services — 1.0% | |||
| g | Deutsche Telekom International Finance BV (Guaranty: Deutsche Telekom AG), 8.75% due 6/15/2030 | 26,150,000 | 30,917,406 |
| g | Telefonica Emisiones SA (Guaranty: Telefonica SA), 7.045% due 6/20/2036 | 85,390,000 | 95,529,209 |
| Wireless Telecommunication Services — 0.3% | |||
| g,h | Digicel Intermediate Holdings Ltd./Digicel International Finance Ltd./Difl U.S., 12.00% due 5/25/2027 PIK | 36,798,296 | 36,158,006 |
| 162,604,621 | |||
| Transportation — 0.1% | |||
| Passenger Airlines — 0.1% | |||
| American Airlines Pass-Through Trust, | |||
| Series 2016-3 Class B, 3.75% due 4/15/2027 | 8,663,597 | 8,332,648 | |
| Series 2019-1 Class B, 3.85% due 8/15/2029 | 6,276,460 | 5,790,348 | |
| 14,122,996 | |||
| Utilities — 0.1% | |||
| Electric Utilities — 0.1% | |||
| d,g | AES Espana BV, 5.70% due 5/4/2028 | 2,000,000 | 1,842,300 |
| g | Comision Federal de Electricidad, 5.00% due 9/29/2036 | 9,884,000 | 8,720,851 |
| 10,563,151 |
| 64 | Thornburg Equity Funds Semi-Annual Report | See notes to financial statements. |
| Issuer-Description | SHARES/ PRINCIPAL AMOUNT | VALUE | |
| Total Corporate Bonds (Cost $960,601,099) | 1,025,241,136 | ||
| Other Government — 0.1% | |||
| d,g | Finance Department Government of Sharjah, 3.625% due 3/10/2033 | $ 7,000,000 | $ 5,908,980 |
| d,g | Nigeria Government International Bonds, 7.625% due 11/28/2047 | 6,000,000 | 4,660,380 |
| Total Other Government (Cost $9,378,363) | 10,569,360 | ||
| Mortgage Backed — 1.7% | |||
| d,f | Angel Oak Mortgage Trust, Whole Loan Securities Trust CMO, Series 2022-6 Class A3, 4.30% due 7/25/2067 | 4,396,825 | 3,996,933 |
| d,f | Barclays Mortgage Loan Trust, Whole Loan Securities Trust CMO, Series 2022-INV1 Class A3, 4.53% due 2/25/2062 | 14,845,329 | 13,812,191 |
| f | Bear Stearns ARM Trust, Whole Loan Securities Trust CMO, Series 2003-6 Class 2B1, 6.058% due 8/25/2033 | 22,907 | 22,904 |
| Chase Home Lending Mortgage Trust, Whole Loan Securities Trust CMO, | |||
| d,f | Series 2019-1 Class B4, 3.889% due 3/25/2050 | 1,008,468 | 839,678 |
| d,f | Series 2019-1 Class B5, 3.889% due 3/25/2050 | 471,784 | 367,345 |
| d,f | Series 2019-1 Class B6, 3.70% due 3/25/2050 | 745,503 | 452,377 |
| d,f | Chase Mortgage Finance Corp., Whole Loan Securities Trust CMO, Series 2016-SH2 Class M4, 3.75% due 12/25/2045 | 684,703 | 610,852 |
| CIM Trust, Whole Loan Securities Trust CMO, | |||
| d,f,i | Series 2020-J1 Class AIO1, 0.445% due 7/25/2050 | 56,132,178 | 1,115,301 |
| d,f,i | Series 2020-J1 Class AIO2, 0.50% due 7/25/2050 | 50,065,320 | 1,239,147 |
| d,f,i | Series 2020-J1 Class AIOS, 0.20% due 6/25/2050 | 68,708,125 | 457,699 |
| d,f | Series 2020-J1 Class B4, 3.445% due 7/25/2050 | 1,337,333 | 1,095,384 |
| d,f | Series 2020-J1 Class B5, 3.445% due 7/25/2050 | 672,877 | 400,511 |
| d,f | Series 2020-J1 Class B6, 3.445% due 7/25/2050 | 1,289,794 | 530,559 |
| d,f,i | Series 2020-J2 Class AX1, 0.259% due 1/25/2051 | 104,052,629 | 1,364,962 |
| d,f,i | Series 2020-J2 Class AXS, 0.21% due 1/25/2051 | 110,885,925 | 1,146,594 |
| d,f | Series 2020-J2 Class B4, 2.759% due 1/25/2051 | 491,000 | 211,169 |
| d,f | Series 2020-J2 Class B5, 2.759% due 1/25/2051 | 164,000 | 68,911 |
| d,f | Series 2020-J2 Class B6, 2.759% due 1/25/2051 | 655,000 | 231,732 |
| d,f | Series 2023-I1 Class M1, 7.121% due 4/25/2058 | 5,000,000 | 4,996,144 |
| Citigroup Mortgage Loan Trust, Whole Loan Securities Trust CMO, | |||
| f | Series 2004-HYB2 Class B1, 6.104% due 3/25/2034 | 160,310 | 122,713 |
| d,f | Series 2020-EXP1 Class B1, 4.467% due 5/25/2060 | 2,150,000 | 1,761,467 |
| d,f | Series 2020-EXP1 Class B2, 4.467% due 5/25/2060 | 1,450,000 | 1,139,144 |
| d,f | Series 2020-EXP1 Class B3, 4.467% due 5/25/2060 | 725,000 | 481,569 |
| d,i | Series 2020-EXP1 Class XS, due 5/25/2060 | 36,544,847 | 1,969,537 |
| d,f | Series 2020-EXP2 Class B5, 4.015% due 8/25/2050 | 585,000 | 349,751 |
| d,f | Series 2020-EXP2 Class B6, 4.015% due 8/25/2050 | 1,400,000 | 670,243 |
| d,f | Series 2021-J1 Class B4, 2.61% due 4/25/2051 | 379,000 | 164,165 |
| d,f | Series 2021-J1 Class B5, 2.61% due 4/25/2051 | 615,000 | 223,306 |
| d,f | Series 2021-J1 Class B6, 2.61% due 4/25/2051 | 459,574 | 141,163 |
| d,f | Series 2021-J3 Class B4, 2.859% due 9/25/2051 | 1,033,000 | 574,322 |
| d,f | Series 2021-J3 Class B6, 2.859% due 9/25/2051 | 590,000 | 197,839 |
| d,f | CSMC Trust, CMBS, Series 2020-522F Class A, 9.179% (TSFR1M + 3.85%) due 9/16/2025 | 15,450,000 | 8,782,860 |
| CSMC Trust, Whole Loan Securities Trust CMO, | |||
| d,f | Series 2020-AFC1 Class M1, 2.841% due 2/25/2050 | 3,808,500 | 3,048,650 |
| d,f,i | Series 2021-AFC1 Class AIOS, 0.25% due 3/25/2056 | 81,664,486 | 656,860 |
| d,f | Series 2021-AFC1 Class B3, 4.334% due 3/25/2056 | 215,000 | 150,187 |
| d,f,i | Series 2021-AFC1 Class XS, 3.286% due 3/25/2056 | 81,664,486 | 14,621,096 |
| d,f | Series 2022-NQM5 Class A3, 5.169% due 5/25/2067 | 3,683,017 | 3,545,790 |
| d | DataBank Issuer LLC, CMBS, Series 2024-1A Class A2, 5.30% due 1/26/2054 | 10,000,000 | 9,483,130 |
| d | DC Office Trust, CMBS, Series 2019-MTC Class A, 2.965% due 9/15/2045 | 3,025,000 | 2,581,455 |
| Flagstar Mortgage Trust, Whole Loan Securities Trust CMO, | |||
| d,f,i | Series 2020-2 Class AX1, 0.664% due 8/25/2050 | 102,589,034 | 3,003,663 |
| d,f,i | Series 2020-2 Class AX2, 0.50% due 8/25/2050 | 17,583,227 | 417,904 |
| d,f | Series 2020-2 Class B4, 3.664% due 8/25/2050 | 824,778 | 649,951 |
| d,f | Series 2020-2 Class B5, 3.664% due 8/25/2050 | 2,474,335 | 1,839,876 |
| d,f | Series 2020-2 Class B6C, 3.512% due 8/25/2050 | 3,299,114 | 1,704,859 |
| d,f,i | Series 2021-13IN Class AX1, 0.179% due 12/30/2051 | 165,324,041 | 1,314,607 |
| d,f,i | Series 2021-13IN Class AX17, 0.18% due 12/30/2051 | 13,705,620 | 131,881 |
| d,f,i | Series 2021-13IN Class AX4, 0.50% due 12/30/2051 | 12,506,378 | 355,715 |
| d,f | Series 2021-13IN Class B4, 3.359% due 12/30/2051 | 2,382,630 | 1,845,623 |
| See notes to financial statements. | Thornburg Equity Funds Semi-Annual Report | 65 |
Thornburg Investment Income Builder Fund | March 31, 2024 (Unaudited)
| Issuer-Description | SHARES/ PRINCIPAL AMOUNT | VALUE | |
| d,f | Series 2021-13IN Class B5, 3.359% due 12/30/2051 | $ 466,995 | $ 334,144 |
| d,f | Series 2021-13IN Class B6C, 3.331% due 12/30/2051 | 4,097,987 | 2,194,021 |
| d,f | Galton Funding Mortgage Trust, Whole Loan Securities Trust CMO, Series 2020-H1 Class B1, 3.386% due 1/25/2060 | 4,379,900 | 2,961,129 |
| GS Mortgage-Backed Securities Trust, Whole Loan Securities Trust CMO, | |||
| d,f,i | Series 2020-INV1 Class A11X, 3.412% due 10/25/2050 | 1,370,675 | 206,075 |
| d,f,i | Series 2020-INV1 Class A12X, 2.925% due 10/25/2050 | 16,411,454 | 2,114,921 |
| d,f,i | Series 2020-INV1 Class AIOS, 0.19% due 10/25/2050 | 88,628,785 | 620,588 |
| d,f,i | Series 2020-INV1 Class AX1, due 10/25/2050 | 59,338,691 | 593 |
| d,f,i | Series 2020-INV1 Class AX2, 0.425% due 10/25/2050 | 2,957,773 | 34,862 |
| d,f,i | Series 2020-INV1 Class AX4, 0.926% due 10/25/2050 | 3,184,295 | 82,430 |
| d,f | Series 2020-INV1 Class B4, 3.851% due 10/25/2050 | 1,855,178 | 1,474,066 |
| d,f | Series 2020-INV1 Class B5, 3.851% due 10/25/2050 | 1,859,569 | 1,601,034 |
| d,f | Series 2020-INV1 Class B6, 3.851% due 10/25/2050 | 4,402,016 | 2,896,426 |
| d,f,i | Series 2020-INV1 Class BX, 0.351% due 10/25/2050 | 21,173,125 | 364,008 |
| d | Houston Galleria Mall Trust, CMBS, Series 2015-HGLR Class A1A2, 3.087% due 3/5/2037 | 8,033,750 | 7,768,399 |
| JP Morgan Mortgage Trust, Whole Loan Securities Trust CMO, | |||
| d,f,i | Series 2020-3 Class AX1, 0.14% due 8/25/2050 | 14,493,188 | 73,749 |
| d,f,i | Series 2020-4 Class A11X, (5.14% - TSFR1M) due 11/25/2050 | 2,763,679 | 141,779 |
| d,f,i | Series 2020-4 Class A3X, 0.50% due 11/25/2050 | 12,528,679 | 286,500 |
| d,f,i | Series 2020-4 Class AX1, 0.081% due 11/25/2050 | 46,276,428 | 144,998 |
| d,f,i | Series 2020-4 Class AX3, 3.50% due 11/25/2050 | 1,280,351 | 207,388 |
| d,f,i | Series 2020-4 Class AX4, 0.55% due 11/25/2050 | 2,954,834 | 74,253 |
| d,f | Series 2020-4 Class B4, 3.631% due 11/25/2050 | 1,913,863 | 1,603,749 |
| d,f | Series 2020-4 Class B5, 3.631% due 11/25/2050 | 883,463 | 640,049 |
| d,f | Series 2020-4 Class B6, 3.516% due 11/25/2050 | 1,582,548 | 732,610 |
| d,f | Series 2020-7 Class B4, 3.508% due 1/25/2051 | 2,333,673 | 1,934,863 |
| d,f | Series 2020-7 Class B5, 3.508% due 1/25/2051 | 1,635,408 | 935,792 |
| d,f | Series 2020-7 Class B6, 3.508% due 1/25/2051 | 2,289,984 | 969,603 |
| d,f | Series 2021-11 Class B5, 3.024% due 1/25/2052 | 3,663,780 | 2,506,983 |
| d,f | Series 2021-11 Class B6, 2.589% due 1/25/2052 | 4,187,607 | 1,825,934 |
| d,f | Series 2022-2 Class B4, 3.129% due 8/25/2052 | 3,210,068 | 2,379,773 |
| d,f | Series 2022-2 Class B5, 3.129% due 8/25/2052 | 1,705,051 | 1,015,089 |
| d,f | Series 2022-2 Class B6, 2.738% due 8/25/2052 | 1,802,416 | 628,482 |
| d,f | Series 2022-3 Class B4, 3.106% due 8/25/2052 | 2,636,142 | 1,948,410 |
| d,f | Series 2022-3 Class B5, 3.106% due 8/25/2052 | 1,677,805 | 776,533 |
| d,f | Series 2022-3 Class B6, 2.449% due 8/25/2052 | 1,459,907 | 462,530 |
| Mello Mortgage Capital Acceptance, Whole Loan Securities Trust CMO, | |||
| d,f,i | Series 2021-INV2 Class AX1, 0.123% due 8/25/2051 | 99,948,540 | 502,311 |
| d,f,i | Series 2021-INV2 Class AX4, 0.70% due 8/25/2051 | 6,848,295 | 274,769 |
| d,f | Series 2021-INV2 Class B5, 3.323% due 8/25/2051 | 311,595 | 216,039 |
| d,f | Series 2021-INV2 Class B6, 3.217% due 8/25/2051 | 1,508,420 | 736,149 |
| d,f,i | Series 2021-INV3 Class AX1, 0.164% due 10/25/2051 | 119,311,285 | 832,494 |
| d,f,i | Series 2021-INV3 Class AX4, 0.55% due 10/25/2051 | 9,662,534 | 263,547 |
| d,f | Series 2021-INV3 Class B5, 3.214% due 10/25/2051 | 435,257 | 306,618 |
| d,f | Series 2021-INV3 Class B6, 3.078% due 10/25/2051 | 1,908,502 | 955,039 |
| f | Merrill Lynch Mortgage Investors Trust, Whole Loan Securities Trust CMO, Series 2004-A4 Class M1, 4.92% due 8/25/2034 | 836,123 | 794,790 |
| New Residential Mortgage Loan Trust, Whole Loan Securities Trust CMO, | |||
| d,f,i | Series 2021-INV1 Class AX1, 0.75% due 6/25/2051 | 97,186,967 | 3,613,684 |
| d,f | Series 2021-INV1 Class B5, 3.25% due 6/25/2051 | 1,076,024 | 801,893 |
| d,f | Series 2021-INV1 Class B6, 2.771% due 6/25/2051 | 1,930,056 | 983,294 |
| d | NYC Commercial Mortgage Trust, CMBS, Series 2021-909 Class A, 2.941% due 4/10/2043 | 5,000,000 | 4,088,446 |
| d,f | Onslow Bay Mortgage Loan Trust, Whole Loan Securities Trust CMO, Series 2021-NQM4 Class A1, 1.957% due 10/25/2061 | 18,507,195 | 15,058,053 |
| d,f | PRPM LLC, Whole Loan Securities Trust CMO, Series 2022-NQM1 Class A1, 5.50% due 8/25/2067 | 8,763,303 | 8,731,722 |
| d,f | Residential Mortgage Loan Trust, Whole Loan Securities Trust CMO, Series 2019-3 Class B1, 3.81% due 9/25/2059 | 1,500,000 | 1,390,111 |
| d | Retained Vantage Data Centers Issuer LLC, CMBS, Series 2023-1A Class A2A, 5.00% due 9/15/2048 | 5,000,000 | 4,825,871 |
| d,f | Saluda Grade Alternative Mortgage Trust, Whole Loan Securities Trust CMO, Series 2020-FIG1 Class C, due 9/25/2050 | 6,002,836 | 2,112,248 |
| d,f | Sequoia Mortgage Trust, Whole Loan Securities Trust CMO, Series 2017-7 Class B3, 3.725% due 10/25/2047 | 2,012,254 | 1,752,841 |
| SG Residential Mortgage Trust, Whole Loan Securities Trust CMO, | |||
| d,f,i | Series 2019-3 Class AIOS, 0.375% due 9/25/2059 | 48,362,953 | 818,190 |
| d,f | Series 2019-3 Class B2, 5.663% due 9/25/2059 | 7,910,000 | 6,688,673 |
| d,f | Series 2019-3 Class B3, 6.10% due 9/25/2059 | 3,366,214 | 2,679,219 |
| a,d,f | Series 2019-3 Class C, due 9/25/2059 | 950 | 950 |
| 66 | Thornburg Equity Funds Semi-Annual Report | See notes to financial statements. |
| Issuer-Description | SHARES/ PRINCIPAL AMOUNT | VALUE | |
| d | Series 2019-3 Class XS1, due 9/25/2059 | $ 47,727,627 | $ 477 |
| d | Series 2019-3 Class XS2, due 9/25/2059 | 47,727,627 | 1,889,460 |
| d,f | Starwood Mortgage Residential Trust, Whole Loan Securities Trust CMO, Series 2019-INV1 Class B1, 3.657% due 9/27/2049 | 10,000,000 | 8,749,446 |
| d,f | Visio Trust, Whole Loan Securities Trust CMO, Series 2022-1 Class M1, 6.22% due 8/25/2057 | 5,351,000 | 5,192,676 |
| Wells Fargo Mortgage Backed Securities Trust, Whole Loan Securities Trust CMO, | |||
| d,f,i | Series 2020-3 Class AIO1, 0.188% due 6/25/2050 | 157,489,430 | 1,423,594 |
| d,f | Series 2020-3 Class B5, 3.188% due 6/25/2050 | 1,046,000 | 533,107 |
| d,f | Series 2020-3 Class B6, 3.188% due 6/25/2050 | 1,912,755 | 831,605 |
| d,f,i | Series 2021-INV1 Class AIO2, 0.50% due 8/25/2051 | 177,809,069 | 4,949,973 |
| d,f | Series 2021-INV1 Class B4, 3.313% due 8/25/2051 | 3,329,631 | 2,538,520 |
| d,f | Series 2021-INV1 Class B5, 3.313% due 8/25/2051 | 2,568,572 | 1,810,585 |
| d,f | Series 2021-INV1 Class B6, 3.313% due 8/25/2051 | 1,965,349 | 834,789 |
| Total Mortgage Backed (Cost $219,095,652) | 224,012,665 | ||
| Loan Participations — 0.2% | |||
| Commercial & Professional Services — 0.1% | |||
| Commercial Services & Supplies — 0.1% | |||
| Imagefirst Holdings LLC, | |||
| j | 9.566% (SOFR + 4.25%), due 4/27/2028 | 3,183,876 | 3,175,917 |
| j | 9.996% (SOFR + 4.75%), due 4/27/2028 | 4,554,876 | 4,543,488 |
| Professional Services — 0.0% | |||
| j | VT Topco, Inc., 9.58% (SOFR + 4.25%) due 8/9/2030 | 997,500 | 998,927 |
| 8,718,332 | |||
| Media & Entertainment — 0.0% | |||
| Media — 0.0% | |||
| j | Simon & Schuster, Inc., 9.317% (SOFR + 4.00%) due 10/30/2030 | 1,500,000 | 1,504,500 |
| 1,504,500 | |||
| Semiconductors & Semiconductor Equipment — 0.0% | |||
| Information Technology Services — 0.0% | |||
| j | Xperi Corp., 8.945% (SOFR + 3.50%) due 6/8/2028 | 7,270,197 | 7,270,197 |
| 7,270,197 | |||
| Software & Services — 0.0% | |||
| Software — 0.0% | |||
| j | GoTo Group, Inc., 10.074% (SOFR + 4.75%) due 8/31/2027 | 2,954,315 | 2,267,437 |
| 2,267,437 | |||
| Technology Hardware & Equipment — 0.1% | |||
| Technology Hardware, Storage & Peripherals — 0.1% | |||
| j | Xerox Holdings Corp., 9.33% (SOFR + 4.00%) due 11/17/2029 | 7,900,000 | 7,917,301 |
| 7,917,301 | |||
| Total Loan Participations (Cost $27,306,469) | 27,677,767 | ||
| Short-Term Investments — 2.6% | |||
| c | Thornburg Capital Management Fund | 33,733,636 | 337,336,359 |
| Total Short-Term Investments (Cost $337,336,359) | 337,336,359 | ||
| Total Investments — 98.6% (Cost $10,031,440,926) | $12,731,365,251 | ||
| Other Assets Less Liabilities — 1.4% | 175,547,531 | ||
| Net Assets — 100.0% | $12,906,912,782 |
| See notes to financial statements. | Thornburg Equity Funds Semi-Annual Report | 67 |
Thornburg Investment Income Builder Fund | March 31, 2024 (Unaudited)
| Outstanding Forward Currency Contracts To Buy Or Sell At March 31, 2024 | |||||||
| Contract Description | Contract Party* | Buy/Sell | Contract Amount | Contract Value Date | Value USD | Unrealized Appreciation | Unrealized Depreciation |
| Swiss Franc | SSB | Sell | 24,166,500 | 6/20/2024 | 27,029,242 | $ 482,524 | $ — |
| Euro | SSB | Sell | 829,116,000 | 6/20/2024 | 897,315,702 | 7,432,260 | — |
| Euro | BBH | Sell | 829,116,000 | 6/20/2024 | 897,315,702 | 7,307,892 | — |
| Great Britain Pound | SSB | Sell | 262,079,600 | 6/20/2024 | 330,920,336 | 2,655,889 | — |
| Total | $ 17,878,565 | — | |||||
| Net unrealized appreciation (depreciation) | $ 17,878,565 | ||||||
| * | Counterparties include State Street Bank and Trust Company (“SSB”) and Brown Brothers Harriman & Co. (“BBH”). |
| Footnote Legend | |
| a | Security currently fair valued by Thornburg Investment Management, Inc.’s Valuation and Pricing Committee. |
| b | Non-income producing. |
| c | Investment in Affiliates. |
| d | Securities exempt from registration under Rule 144A of the Securities Act of 1933, as amended. These securities are restricted but liquid and may only be resold in the ordinary course of business in transactions exempt from registration, normally to qualified institutional buyers. As of March 31, 2024, the aggregate value of these securities in the Fund’s portfolio was $846,358,445, representing 6.56% of the Fund’s net assets. |
| e | Securities are perpetual and, thus, do not have a predetermined maturity date. The date shown, if applicable, reflects the next call date. |
| f | Variable, floating, step, or fixed to floating rate securities are securities for which interest rate changes are based on changes in a designated base rate or on a predetermined schedule. The rates shown are those in effect on March 31, 2024. |
| g | Yankee bond denominated in U.S. dollars and is issued in the U.S. by foreign banks and corporations. |
| h | Pay-In-Kind Payments (PIK). The issuer may pay cash interest and/or interest in additional debt securities. Rates shown are the rates in effect at March 31, 2024. |
| i | Interest only. |
| j | The stated coupon rate represents the greater of the SOFR or the SOFR floor rate plus a spread at March 31, 2024. |
To simplify the listings of securities, abbreviations are used per the table below:
| ABS | Asset Backed Securities |
| ADR | American Depositary Receipt |
| ARM | Adjustable Rate Mortgage |
| CMBS | Commercial Mortgage-Backed Securities |
| CMO | Collateralized Mortgage Obligation |
| CMT | Constant Maturity Rate |
| PIK | Payment-in-kind |
| SOFR | Secured Overnight Financing Rate |
| TSFR1M | Term SOFR 1 Month |
| TSFR3M | Term SOFR 3 Month |
| 68 | Thornburg Equity Funds Semi-Annual Report | See notes to financial statements. |
| COUNTRY EXPOSURE * (percent of net assets) | |
| United States | 40.5% |
| France | 14.1% |
| United Kingdom | 8.7% |
| Italy | 4.7% |
| Netherlands | 4.6% |
| Germany | 3.7% |
| Taiwan | 3.5% |
| South Korea | 2.8% |
| Australia | 2.4% |
| Spain | 2.0% |
| Canada | 1.9% |
| Switzerland | 1.7% |
| Ireland | 1.4% |
| Brazil | 0.9% |
| Norway | 0.7% |
| Singapore | 0.5% |
| India | 0.3% |
| Jamaica | 0.3% |
| Turkey | 0.3% |
| Mexico | 0.2% |
| China | 0.2% |
| Nigeria | 0.1% |
| Israel | 0.1% |
| Guatemala | 0.1% |
| Belgium | 0.1% |
| Dominican Republic | 0.1% |
| Indonesia | 0.1% |
| Morocco | 0.0%** |
| United Arab Emirates | 0.0%** |
| Japan | 0.0%** |
| Bermuda | 0.0%** |
| Cayman Islands | 0.0%** |
| Russian Federation | 0.0%** |
| Luxembourg | 0.0%** |
| Other Assets Less Liabilities | 4.0% |
| * | Holdings are classified by country of risk as determined by MSCI and Bloomberg. |
| ** | Country percentage was less than 0.1%. |
| See notes to financial statements. | Thornburg Equity Funds Semi-Annual Report | 69 |
Thornburg Summit Fund | March 31, 2024 (Unaudited)
| Issuer-Description | SHARES/ PRINCIPAL AMOUNT/ NOTIONAL AMOUNT | VALUE | |
| Common Stock — 53.9% | |||
| Banks — 2.5% | |||
| Banks — 2.5% | |||
| BNP Paribas SA | 9,575 | $ 680,333 | |
| Citigroup, Inc. | 12,653 | 800,176 | |
| JPMorgan Chase & Co. | 5,242 | 1,049,972 | |
| 2,530,481 | |||
| Capital Goods — 2.4% | |||
| Aerospace & Defense — 0.5% | |||
| L3Harris Technologies, Inc. | 2,560 | 545,536 | |
| Electrical Equipment — 0.7% | |||
| Vertiv Holdings Co. Class A | 8,050 | 657,443 | |
| Machinery — 0.6% | |||
| FANUC Corp. | 21,400 | 596,565 | |
| Trading Companies & Distributors — 0.6% | |||
| ITOCHU Corp. | 13,500 | 576,457 | |
| 2,376,001 | |||
| Commercial & Professional Services — 1.0% | |||
| Professional Services — 1.0% | |||
| Jacobs Solutions, Inc. | 6,196 | 952,511 | |
| 952,511 | |||
| Consumer Discretionary Distribution & Retail — 4.1% | |||
| Broadline Retail — 3.4% | |||
| a | Amazon.com, Inc. | 9,760 | 1,760,509 |
| a | MercadoLibre, Inc. | 638 | 964,630 |
| a | PDD Holdings, Inc. ADR | 5,991 | 696,454 |
| Specialty Retail — 0.7% | |||
| Home Depot, Inc. | 1,713 | 657,107 | |
| 4,078,700 | |||
| Consumer Durables & Apparel — 0.7% | |||
| Textiles, Apparel & Luxury Goods — 0.7% | |||
| LVMH Moet Hennessy Louis Vuitton SE | 791 | 711,455 | |
| 711,455 | |||
| Consumer Services — 1.5% | |||
| Hotels, Restaurants & Leisure — 1.5% | |||
| Galaxy Entertainment Group Ltd. | 207,000 | 1,039,377 | |
| Wyndham Hotels & Resorts, Inc. | 5,417 | 415,755 | |
| 1,455,132 | |||
| Consumer Staples Distribution & Retail — 0.5% | |||
| Consumer Staples Distribution & Retail — 0.5% | |||
| Costco Wholesale Corp. | 727 | 532,622 | |
| 532,622 | |||
| Energy — 3.6% | |||
| Energy Equipment & Services — 0.4% | |||
| Liberty Energy, Inc. Class A | 20,838 | 431,763 | |
| Oil, Gas & Consumable Fuels — 3.2% | |||
| Enbridge, Inc. | 19,134 | 691,454 | |
| PRIO SA | 62,900 | 611,267 | |
| Shell plc | 30,828 | 1,021,376 | |
| TotalEnergies SE | 12,107 | 829,022 | |
| 3,584,882 | |||
| Financial Services — 4.3% | |||
| Capital Markets — 1.9% |
| 70 | Thornburg Equity Funds Semi-Annual Report | See notes to financial statements. |
| Issuer-Description | SHARES/ PRINCIPAL AMOUNT/ NOTIONAL AMOUNT | VALUE | |
| Charles Schwab Corp. | 17,608 | $ 1,273,763 | |
| CME Group, Inc. | 2,781 | 598,721 | |
| Financial Services — 2.4% | |||
| Mastercard, Inc. Class A | 2,211 | 1,064,751 | |
| Visa, Inc. Class A | 4,906 | 1,369,167 | |
| 4,306,402 | |||
| Food, Beverage & Tobacco — 0.5% | |||
| Beverages — 0.5% | |||
| Varun Beverages Ltd. | 29,948 | 502,350 | |
| 502,350 | |||
| Health Care Equipment & Services — 0.7% | |||
| Health Care Equipment & Supplies — 0.7% | |||
| Medtronic plc | 8,377 | 730,055 | |
| 730,055 | |||
| Insurance — 1.5% | |||
| Insurance — 1.5% | |||
| NN Group NV | 20,324 | 938,894 | |
| a | PB Fintech Ltd. | 43,001 | 579,001 |
| 1,517,895 | |||
| Materials — 1.2% | |||
| Chemicals — 0.8% | |||
| Linde plc | 1,601 | 743,376 | |
| Metals & Mining — 0.4% | |||
| Glencore plc | 76,743 | 421,637 | |
| 1,165,013 | |||
| Media & Entertainment — 3.1% | |||
| Interactive Media & Services — 3.1% | |||
| a | Alphabet, Inc. Class A | 10,915 | 1,647,401 |
| Meta Platforms, Inc. Class A | 2,934 | 1,424,692 | |
| 3,072,093 | |||
| Pharmaceuticals, Biotechnology & Life Sciences — 5.2% | |||
| Biotechnology — 1.4% | |||
| a | BioMarin Pharmaceutical, Inc. | 5,428 | 474,081 |
| a | Sarepta Therapeutics, Inc. | 7,273 | 941,563 |
| Life Sciences Tools & Services — 0.5% | |||
| a | Repligen Corp. | 2,541 | 467,341 |
| Pharmaceuticals — 3.3% | |||
| AstraZeneca plc | 5,396 | 727,232 | |
| Merck & Co., Inc. | 5,273 | 695,772 | |
| Novo Nordisk AS Class B | 5,098 | 653,938 | |
| Pfizer, Inc. | 20,779 | 576,617 | |
| Roche Holding AG | 2,647 | 674,187 | |
| 5,210,731 | |||
| Semiconductors & Semiconductor Equipment — 7.7% | |||
| Semiconductors & Semiconductor Equipment — 7.7% | |||
| a | Advanced Micro Devices, Inc. | 3,386 | 611,139 |
| ASML Holding NV | 1,220 | 1,174,311 | |
| Broadcom, Inc. | 632 | 837,659 | |
| NVIDIA Corp. | 2,274 | 2,054,696 | |
| SK Hynix, Inc. | 9,016 | 1,193,427 | |
| Taiwan Semiconductor Manufacturing Co. Ltd. | 73,000 | 1,754,089 | |
| 7,625,321 | |||
| Software & Services — 4.3% | |||
| Information Technology Services — 1.6% |
| See notes to financial statements. | Thornburg Equity Funds Semi-Annual Report | 71 |
Thornburg Summit Fund | March 31, 2024 (Unaudited)
| Issuer-Description | SHARES/ PRINCIPAL AMOUNT/ NOTIONAL AMOUNT | VALUE | |
| Nomura Research Institute Ltd. | 27,100 | $ 762,087 | |
| a | Shopify, Inc. Class A | 11,265 | 869,320 |
| Software — 2.7% | |||
| Microsoft Corp. | 3,316 | 1,395,107 | |
| SAP SE | 3,726 | 725,412 | |
| a | ServiceNow, Inc. | 755 | 575,612 |
| 4,327,538 | |||
| Technology Hardware & Equipment — 2.3% | |||
| Electronic Equipment, Instruments & Components — 0.8% | |||
| Keyence Corp. | 1,719 | 795,909 | |
| Technology Hardware, Storage & Peripherals — 1.5% | |||
| Apple, Inc. | 9,002 | 1,543,663 | |
| 2,339,572 | |||
| Telecommunication Services — 4.8% | |||
| Diversified Telecommunication Services — 4.0% | |||
| AT&T, Inc. | 105,251 | 1,852,418 | |
| Orange SA | 73,262 | 860,573 | |
| a | Zegona Communications plc | 458,176 | 1,306,928 |
| Wireless Telecommunication Services — 0.8% | |||
| KDDI Corp. | 25,500 | 752,636 | |
| 4,772,555 | |||
| Transportation — 0.9% | |||
| Ground Transportation — 0.9% | |||
| Canadian Pacific Kansas City Ltd. | 9,828 | 866,535 | |
| 866,535 | |||
| Utilities — 1.1% | |||
| Electric Utilities — 1.1% | |||
| PNM Resources, Inc. | 29,595 | 1,113,956 | |
| 1,113,956 | |||
| Total Common Stock (Cost $41,639,337) | 53,771,800 | ||
| Asset Backed Securities — 4.6% | |||
| Auto Receivables — 1.6% | |||
| b | ACC Auto Trust, Series 2022-A Class A, 4.58% due 7/15/2026 | $ 61,178 | 60,996 |
| b | Ally Auto Receivables Trust Series 2023-1 Class CERT, due 4/15/2034 | 1,000 | 338,396 |
| CarMax Auto Owner Trust, Series 2021-1 Class A3, 0.34% due 12/15/2025 | 108,438 | 107,080 | |
| b | Carvana Auto Receivables Trust, Series 2023-N4 Class A, 6.42% due 1/10/2028 | 126,282 | 126,992 |
| b | Credit Suisse ABS Trust Series 2020-AT1 Class CERT, due 6/15/2026 | 5,883 | 41,648 |
| Exeter Automobile Receivables Trust, | |||
| b | Series 2019-3A Class D, 3.11% due 8/15/2025 | 30,381 | 30,344 |
| Series 2021-3A Class C, 0.96% due 10/15/2026 | 217,896 | 214,517 | |
| Flagship Credit Auto Trust, | |||
| b | Series 2019-4 Class R, due 3/15/2027 | 5,000 | 223,648 |
| b | Series 2022-1 Class A, 1.79% due 10/15/2026 | 136,173 | 134,307 |
| b | Foursight Capital Automobile Receivables Trust, Series 2022-2 Class A2, 4.49% due 3/16/2026 | 17,614 | 17,605 |
| Harley-Davidson Motorcycle Trust, Series 2021-B Class A3, 0.56% due 11/16/2026 | 178,530 | 174,777 | |
| Santander Drive Auto Receivables Trust, Series 2021-3 Class C, 0.95% due 9/15/2027 | 81,908 | 81,588 | |
| 1,551,898 | |||
| Other Asset Backed — 2.3% | |||
| b | Amur Equipment Finance Receivables IX LLC, Series 2021-1A Class F, 6.09% due 2/20/2029 | 600,000 | 582,152 |
| b | Aqua Finance Trust, Series 2019-A Class B, 3.47% due 7/16/2040 | 141,515 | 131,819 |
| b,c | ECAF I Ltd., Series 2015-1A Class A2, 4.947% due 6/15/2040 | 141,783 | 96,405 |
| b | Foundation Finance Trust, Series 2019-1A Class A, 3.86% due 11/15/2034 | 5,177 | 5,144 |
| b,d | Goldman Home Improvement Trust Issuer Trust Series 2021-GRN2 Class R, due 6/20/2051 | 2,000 | 112,037 |
| b | LendingPoint Pass-Through Trust, Series 2022-ST1 Class A, 2.50% due 3/15/2028 | 67,111 | 65,079 |
| 72 | Thornburg Equity Funds Semi-Annual Report | See notes to financial statements. |
| Issuer-Description | SHARES/ PRINCIPAL AMOUNT/ NOTIONAL AMOUNT | VALUE | |
| Marlette Funding Trust, | |||
| b | Series 2019-4A Class C, 3.76% due 12/17/2029 | $ 121,900 | $ 121,778 |
| b | Series 2021-1A Class R, due 6/16/2031 | 1,200 | 22,685 |
| b | Series 2021-2A Class R, due 9/15/2031 | 1,150 | 27,899 |
| b | Series 2021-3A Class R, due 12/15/2031 | 1,200 | 46,050 |
| b | Momnt Technologies Trust, Series 2023-1A Class A, 6.92% due 3/20/2045 | 182,412 | 183,533 |
| b | Mosaic Solar Loan Trust Series 2021-2A Class R, due 4/22/2047 | 1,150,000 | 102,431 |
| Pagaya AI Debt Trust, | |||
| b | Series 2022-1 Class A, 2.03% due 10/15/2029 | 87,056 | 86,097 |
| b,e | Series 2023-5 Class AB, 7.31% due 4/15/2031 | 137,600 | 138,342 |
| b | Republic Finance Issuance Trust, Series 2021-A Class A, 2.30% due 12/22/2031 | 100,000 | 95,618 |
| b,e | SBA Tower Trust, Series 2014-2A Class C, 3.869% due 10/15/2049 | 30,000 | 29,643 |
| b | SPS Servicer Advance Receivables Trust, Series 2020-T2 Class A, 1.83% due 11/15/2055 | 300,000 | 281,078 |
| b | Upstart Pass-Through Trust Series 2021-ST4 Class CERT, due 7/20/2027 | 500,000 | 53,035 |
| Upstart Securitization Trust, | |||
| b,f | Series 2018-2 Class CERT, due 12/22/2025 | 8,000 | 85,402 |
| b | Series 2020-1 Class C, 4.899% due 4/22/2030 | 47,135 | 46,973 |
| 2,313,200 | |||
| Student Loan — 0.7% | |||
| b | EDvestinU Private Education Loan Issue No. 3 LLC, Series 2021-A Class A, 1.80% due 11/25/2045 | 324,020 | 288,128 |
| b | SMB Private Education Loan Trust, Series 2020-B Class A1A, 1.29% due 7/15/2053 | 107,370 | 97,909 |
| b | SoFi Professional Loan Program LLC, Series 2021-B Class AFX, 1.14% due 2/15/2047 | 322,914 | 277,433 |
| 663,470 | |||
| Total Asset Backed Securities (Cost $5,101,164) | 4,528,568 | ||
| Corporate Bonds — 16.1% | |||
| Automobiles & Components — 0.3% | |||
| Automobiles — 0.3% | |||
| b | Hyundai Capital America, 0.875% due 6/14/2024 | 300,000 | 296,961 |
| 296,961 | |||
| Banks — 0.9% | |||
| Banks — 0.9% | |||
| e,g | Bank of New York Mellon Corp., Series F, 4.625% (TSFR3M + 3.39%) due 9/20/2026 | 100,000 | 94,822 |
| b,c,e | Credit Agricole SA, 5.335% (SOFR + 1.69%) due 1/10/2030 | 300,000 | 299,217 |
| e | Santander Holdings USA, Inc., 6.174% (SOFR + 2.50%) due 1/9/2030 | 200,000 | 201,944 |
| e | Wells Fargo & Co., 6.303% (SOFR + 1.79%) due 10/23/2029 | 300,000 | 312,537 |
| 908,520 | |||
| Capital Goods — 1.1% | |||
| Aerospace & Defense — 0.4% | |||
| b | TransDigm, Inc., 6.75% due 8/15/2028 | 400,000 | 405,864 |
| Construction & Engineering — 0.2% | |||
| b,c | IHS Netherlands Holdco BV, 8.00% due 9/18/2027 | 200,000 | 190,870 |
| Machinery — 0.3% | |||
| b | Regal Rexnord Corp., 6.05% due 2/15/2026 | 250,000 | 251,500 |
| Trading Companies & Distributors — 0.2% | |||
| LKQ Corp., 6.25% due 6/15/2033 | 200,000 | 208,202 | |
| 1,056,436 | |||
| Commercial & Professional Services — 0.2% | |||
| Professional Services — 0.2% | |||
| b | Korn Ferry, 4.625% due 12/15/2027 | 250,000 | 238,310 |
| 238,310 | |||
| Consumer Services — 0.3% | |||
| Hotels, Restaurants & Leisure — 0.3% | |||
| b | Six Flags Entertainment Corp., 7.25% due 5/15/2031 | 250,000 | 253,130 |
| 253,130 |
| See notes to financial statements. | Thornburg Equity Funds Semi-Annual Report | 73 |
Thornburg Summit Fund | March 31, 2024 (Unaudited)
| Issuer-Description | SHARES/ PRINCIPAL AMOUNT/ NOTIONAL AMOUNT | VALUE | |
| Energy — 1.1% | |||
| Energy Equipment & Services — 0.3% | |||
| b,c | Empresa Generadora de Electricidad Haina SA, 5.625% due 11/8/2028 | $ 350,000 | $ 318,042 |
| Oil, Gas & Consumable Fuels — 0.8% | |||
| Ecopetrol SA, | |||
| c | 6.875% due 4/29/2030 | 125,000 | 122,061 |
| c | 8.875% due 1/13/2033 | 117,000 | 123,688 |
| Petroleos Mexicanos, | |||
| c | 5.95% due 1/28/2031 | 120,000 | 96,242 |
| c | 7.69% due 1/23/2050 | 315,000 | 226,170 |
| b,c | Raizen Fuels Finance SA, 6.45% due 3/5/2034 | 200,000 | 204,994 |
| 1,091,197 | |||
| Equity Real Estate Investment Trusts (REITs) — 0.8% | |||
| Diversified REITs — 0.5% | |||
| b | American Tower Trust #1, 3.652% due 3/15/2048 | 300,000 | 284,251 |
| Extra Space Storage LP, 5.70% due 4/1/2028 | 250,000 | 254,463 | |
| Retail REITs — 0.3% | |||
| Brixmor Operating Partnership LP, 3.85% due 2/1/2025 | 300,000 | 294,867 | |
| 833,581 | |||
| Financial Services — 2.6% | |||
| Capital Markets — 1.5% | |||
| b | Blue Owl Technology Finance Corp., 4.75% due 12/15/2025 | 179,000 | 172,010 |
| b | Boost Newco Borrower LLC/GTCR W Dutch Finance Sub BV (GBP), 8.50% due 1/15/2031 | 250,000 | 340,354 |
| b | Burford Capital Global Finance LLC, 9.25% due 7/1/2031 | 250,000 | 264,658 |
| b | Compass Group Diversified Holdings LLC, 5.00% due 1/15/2032 | 250,000 | 223,670 |
| Hercules Capital, Inc., 2.625% due 9/16/2026 | 250,000 | 226,690 | |
| Main Street Capital Corp., 6.95% due 3/1/2029 | 300,000 | 304,821 | |
| Financial Services — 1.1% | |||
| b | Antares Holdings LP, 6.50% due 2/8/2029 | 250,000 | 248,140 |
| c,e | HSBC Holdings plc, 3.973% (TSFR3M + 1.87%) due 5/22/2030 | 350,000 | 326,718 |
| e | Truist Financial Corp., 7.161% (SOFR + 2.45%) due 10/30/2029 | 200,000 | 213,362 |
| b,c,e | UBS Group AG, 5.428% (H15T1Y + 1.52%) due 2/8/2030 | 250,000 | 250,270 |
| 2,570,693 | |||
| Food, Beverage & Tobacco — 0.5% | |||
| Food Products — 0.2% | |||
| b | Darling Global Finance BV (EUR), 3.625% due 5/15/2026 | 200,000 | 213,613 |
| Tobacco — 0.3% | |||
| b | Vector Group Ltd., 10.50% due 11/1/2026 | 251,000 | 252,443 |
| 466,056 | |||
| Industrials — 0.5% | |||
| Transportation Infrastructure — 0.5% | |||
| Penske Truck Leasing Co. LP/PTL Finance Corp., | |||
| b | 6.05% due 8/1/2028 | 250,000 | 257,412 |
| b | 6.20% due 6/15/2030 | 200,000 | 208,150 |
| 465,562 | |||
| Insurance — 1.4% | |||
| Insurance — 1.4% | |||
| b | GA Global Funding Trust, 5.50% due 1/8/2029 | 250,000 | 250,927 |
| c | Pentair Finance SARL, 5.90% due 7/15/2032 | 400,000 | 412,472 |
| b | Principal Life Global Funding II, 5.50% due 6/28/2028 | 250,000 | 251,255 |
| b | Protective Life Global Funding, 5.467% due 12/8/2028 | 150,000 | 152,721 |
| Reinsurance Group of America, Inc., 6.00% due 9/15/2033 | 154,000 | 159,777 | |
| b | RGA Global Funding, 5.50% due 1/11/2031 | 200,000 | 200,662 |
| 1,427,814 | |||
| Materials — 1.3% | |||
| Chemicals — 0.4% |
| 74 | Thornburg Equity Funds Semi-Annual Report | See notes to financial statements. |
| Issuer-Description | SHARES/ PRINCIPAL AMOUNT/ NOTIONAL AMOUNT | VALUE | |
| FMC Corp., 5.15% due 5/18/2026 | $ 200,000 | $ 198,954 | |
| b,c | NOVA Chemicals Corp., 5.25% due 6/1/2027 | 250,000 | 235,870 |
| Metals & Mining — 0.9% | |||
| b | Compass Minerals International, Inc., 6.75% due 12/1/2027 | 500,000 | 482,920 |
| b,c | POSCO, 5.625% due 1/17/2026 | 200,000 | 200,488 |
| b,c | WE Soda Investments Holding plc, 9.375% due 2/14/2031 | 200,000 | 205,752 |
| 1,323,984 | |||
| Media & Entertainment — 0.6% | |||
| Media — 0.6% | |||
| b | CCO Holdings LLC/CCO Holdings Capital Corp.,4.25% due 2/1/2031 - 1/15/2034 | 750,000 | 595,650 |
| 595,650 | |||
| Pharmaceuticals, Biotechnology & Life Sciences — 0.1% | |||
| Life Sciences Tools & Services — 0.1% | |||
| b | Avantor Funding, Inc. (EUR), 2.625% due 11/1/2025 | 100,000 | 105,367 |
| 105,367 | |||
| Real Estate Management & Development — 0.2% | |||
| Real Estate Management & Development — 0.2% | |||
| b | Cushman & Wakefield U.S. Borrower LLC, 6.75% due 5/15/2028 | 250,000 | 246,885 |
| 246,885 | |||
| Semiconductors & Semiconductor Equipment — 0.4% | |||
| Semiconductors & Semiconductor Equipment — 0.4% | |||
| b | Qorvo, Inc., 3.375% due 4/1/2031 | 200,000 | 171,242 |
| b,c | SK Hynix, Inc., 6.25% due 1/17/2026 | 200,000 | 202,180 |
| 373,422 | |||
| Software & Services — 0.8% | |||
| Internet Software & Services — 0.3% | |||
| b | Prosus NV (EUR), 1.288% due 7/13/2029 | 285,000 | 260,693 |
| Software — 0.5% | |||
| b | GoTo Group, Inc.,5.50% due 5/1/2028 | 184,029 | 138,990 |
| b,c | Open Text Corp., 3.875% due 12/1/2029 | 400,000 | 356,748 |
| 756,431 | |||
| Technology Hardware & Equipment — 0.8% | |||
| Electronic Equipment, Instruments & Components — 0.5% | |||
| Arrow Electronics, Inc., 6.125% due 3/1/2026 | 300,000 | 299,670 | |
| CDW LLC/CDW Finance Corp., 3.25% due 2/15/2029 | 250,000 | 226,622 | |
| Technology Hardware, Storage & Peripherals — 0.3% | |||
| b,c | Lenovo Group Ltd., 5.831% due 1/27/2028 | 300,000 | 303,525 |
| 829,817 | |||
| Telecommunication Services — 0.3% | |||
| Diversified Telecommunication Services — 0.3% | |||
| AT&T, Inc., 5.539% due 2/20/2026 | 250,000 | 249,990 | |
| 249,990 | |||
| Utilities — 1.9% | |||
| Electric Utilities — 1.9% | |||
| AEP Texas, Inc., 5.40% due 6/1/2033 | 300,000 | 299,514 | |
| Black Hills Corp., 6.15% due 5/15/2034 | 250,000 | 257,815 | |
| Duke Energy Corp., 5.75% due 9/15/2033 | 425,000 | 437,113 | |
| Eversource Energy, 5.125% due 5/15/2033 | 450,000 | 441,211 | |
| b | ITC Holdings Corp., 5.40% due 6/1/2033 | 200,000 | 200,094 |
| System Energy Resources, Inc., 6.00% due 4/15/2028 | 260,000 | 265,135 | |
| 1,900,882 | |||
| Total Corporate Bonds (Cost $15,684,002) | 15,990,688 |
| See notes to financial statements. | Thornburg Equity Funds Semi-Annual Report | 75 |
Thornburg Summit Fund | March 31, 2024 (Unaudited)
| Issuer-Description | SHARES/ PRINCIPAL AMOUNT/ NOTIONAL AMOUNT | VALUE | |
| Other Government — 1.2% | |||
| Australia Government Bonds (AUD), Series 166, 3.00% due 11/21/2033 | $ 1,000,000 | $ 600,893 | |
| Egypt Treasury Bills (EGP), Series 364D, due 3/11/2025 | 12,650,000 | 211,159 | |
| c | Panama Bonos del Tesoro, Series DOM, 6.375% due 7/25/2033 | 100,000 | 93,797 |
| U.K. Gilts (GBP), 1.625% due 10/22/2028 | 275,000 | 316,158 | |
| Total Other Government (Cost $1,208,019) | 1,222,007 | ||
| U.S. Treasury Securities — 8.1% | |||
| U.S. Treasury Inflation-Indexed Bonds, 0.125%, 2/15/2052 | 553,865 | 326,405 | |
| U.S. Treasury Inflation-Indexed Notes, | |||
| 0.125%, 7/15/2024 - 1/15/2031 | 3,102,702 | 2,791,369 | |
| 1.125%, 1/15/2033 | 227,746 | 213,855 | |
| 1.25%, 4/15/2028 | 205,610 | 199,897 | |
| U.S. Treasury Notes, | |||
| 0.875%, 9/30/2026 | 400,000 | 366,063 | |
| 1.125%, 2/15/2031 | 1,200,000 | 984,375 | |
| 3.50%, 2/15/2039 | 900,000 | 826,453 | |
| 3.875%, 8/15/2033 | 250,000 | 243,516 | |
| 4.125%, 11/15/2032 | 550,000 | 546,477 | |
| 4.50%, 11/15/2033 | 1,550,000 | 1,585,117 | |
| Total U.S. Treasury Securities (Cost $8,227,620) | 8,083,527 | ||
| Mortgage Backed — 9.8% | |||
| b,e | Arroyo Mortgage Trust, Whole Loan Securities Trust CMO, Series 2019-1 Class A1, 3.805% due 1/25/2049 | 30,878 | 29,349 |
| b | BXP Trust, CMBS, Series 2021-601L Class A, 2.618% due 1/15/2044 | 325,000 | 261,007 |
| b | Century Plaza Towers, CMBS, Series 2019-CPT Class A, 2.865% due 11/13/2039 | 245,000 | 210,249 |
| Citigroup Mortgage Loan Trust, Whole Loan Securities Trust CMO, | |||
| b,e | Series 2021-J1 Class B4, 2.61% due 4/25/2051 | 100,000 | 43,315 |
| b,e | Series 2021-J1 Class B5, 2.61% due 4/25/2051 | 100,000 | 36,310 |
| b,e | Series 2021-J1 Class B6, 2.61% due 4/25/2051 | 99,908 | 30,688 |
| COMM Mortgage Trust, CMBS, Series 2015-LC23 Class ASB, 3.598% due 10/10/2048 | 185,854 | 182,701 | |
| b,e | CSMC Trust, CMBS, Series 2020-522F Class A, 9.179% (TSFR1M + 3.85%) due 9/16/2025 | 100,000 | 56,847 |
| b | DataBank Issuer LLC, CMBS, Series 2024-1A Class A2, 5.30% due 1/26/2054 | 200,000 | 189,663 |
| b | DC Office Trust, CMBS, Series 2019-MTC Class A, 2.965% due 9/15/2045 | 250,000 | 213,343 |
| b,e | Ellington Financial Mortgage Trust, Whole Loan Securities Trust CMO, Series 2022-1 Class A1, 2.206% due 1/25/2067 | 240,955 | 204,472 |
| Federal Home Loan Mtg Corp., Pool SE9046, 3.00% due 12/1/2051 | 252,123 | 216,860 | |
| Federal Home Loan Mtg Corp., UMBS Collateral, | |||
| Pool SD1669, 2.50% due 1/1/2052 | 277,683 | 229,570 | |
| Pool SD4175, 2.50% due 6/1/2052 | 1,102,332 | 912,355 | |
| Pool SD8242, 3.00% due 9/1/2052 | 604,555 | 520,498 | |
| Federal Home Loan Mtg Corp., Whole Loan Securities Trust CMO, Series 2017-SC02 Class 1A, 3.00% due 5/25/2047 | 65,249 | 55,945 | |
| Federal National Mtg Assoc., UMBS Collateral, | |||
| Pool CB1388, 2.50% due 8/1/2051 | 550,873 | 457,563 | |
| Pool FS5447, 2.50% due 9/1/2052 | 361,844 | 300,510 | |
| Pool FS6130, 2.50% due 7/1/2052 | 550,825 | 455,896 | |
| Pool FS6157, 3.00% due 9/1/2052 | 1,034,431 | 890,926 | |
| Pool MA4512, 2.50% due 1/1/2052 | 763,128 | 632,353 | |
| Pool MA4548, 2.50% due 2/1/2052 | 548,247 | 454,126 | |
| Pool MA4653, 3.00% due 7/1/2052 | 532,404 | 458,420 | |
| b,e | Flagstar Mortgage Trust, Whole Loan Securities Trust CMO, Series 2019-2 Class B3, 4.007% due 12/25/2049 | 113,323 | 98,476 |
| GCAT Trust, Whole Loan Securities Trust CMO, | |||
| b,e | Series 2021-CM2 Class A1, 2.352% due 8/25/2066 | 205,751 | 185,666 |
| b,e | Series 2023-NQM4 Class A1, 4.25% due 5/25/2067 | 242,829 | 224,836 |
| b | Houston Galleria Mall Trust, CMBS, Series 2015-HGLR Class A1A2, 3.087% due 3/5/2037 | 215,000 | 207,899 |
| b,e | Hudson Yards Mortgage Trust, CMBS, Series 2019-55HY Class A, 2.943% due 12/10/2041 | 245,000 | 214,709 |
| Imperial Fund Mortgage Trust, Whole Loan Securities Trust CMO, | |||
| b,e | Series 2021-NQM2 Class A1, 1.073% due 9/25/2056 | 203,200 | 166,507 |
| b,e | Series 2021-NQM3 Class A1, 1.595% due 11/25/2056 | 308,183 | 255,665 |
| b,e | Metlife Securitization Trust, Whole Loan Securities Trust CMO, Series 2019-1A Class A1A, 3.75% due 4/25/2058 | 37,219 | 35,979 |
| b,e | MFRA Trust, Whole Loan Securities Trust CMO, Series 2022-CHM1 Class A1, 3.875% due 9/25/2056 | 268,017 | 253,853 |
| b,e | New Residential Mortgage Loan Trust, Whole Loan Securities Trust CMO, Series 2022-NQM3 Class A1, 3.90% due 4/25/2062 | 347,936 | 318,577 |
| 76 | Thornburg Equity Funds Semi-Annual Report | See notes to financial statements. |
| Issuer-Description | SHARES/ PRINCIPAL AMOUNT/ NOTIONAL AMOUNT | VALUE | |
| b | One Bryant Park Trust, CMBS, Series 2019-OBP Class A, 2.516% due 9/15/2054 | $ 250,000 | $ 213,593 |
| Seasoned Credit Risk Transfer, Whole Loan Securities Trust CMO, Series 2019-1 Class MA, 3.50% due 7/25/2058 | 42,258 | 39,707 | |
| b | SLG Office Trust, CMBS, Series 2021-OVA Class A, 2.585% due 7/15/2041 | 250,000 | 206,417 |
| b,e | TIAA Bank Mortgage Loan Trust, Whole Loan Securities Trust CMO, Series 2018-2 Class B3, 3.675% due 7/25/2048 | 155,499 | 137,422 |
| b,e | WB Commercial Mortgage Trust, CMBS, Series 2024-HQ Class A, 6.134% due 3/15/2040 | 205,000 | 206,097 |
| Total Mortgage Backed (Cost $9,875,640) | 9,808,369 | ||
| Loan Participations — 0.2% | |||
| Commercial & Professional Services — 0.2% | |||
| Commercial Services & Supplies — 0.2% | |||
| h | Imagefirst Holdings LLC, 9.996% (SOFR + 4.75%) due 4/27/2028 | 198,474 | 197,978 |
| 197,978 | |||
| Total Loan Participations (Cost $195,862) | 197,978 | ||
| Exchange-Traded Funds — 3.6% | |||
| a | Invesco DB Agriculture Fund | 19,822 | 490,793 |
| a | Invesco DB Base Metals Fund | 34,412 | 618,040 |
| a | SPDR Gold Shares Fund | 5,318 | 1,094,019 |
| a | U.S. Oil Fund LP | 18,036 | 1,419,974 |
| Total Exchange-Traded Funds (Cost $2,900,988) | 3,622,826 | ||
| Total Long-Term Investments — 97.5% (Cost $84,832,632) | 97,225,763 | ||
| Short-Term Investments — 2.2% | |||
| i | Thornburg Capital Management Fund | 215,565 | 2,155,656 |
| Total Short-Term Investments (Cost $2,155,656) | 2,155,656 | ||
| Total Investments — 99.7% (Cost $86,988,288) | $99,381,419 | ||
| Other Assets Less Liabilities — 0.3% | 323,303 | ||
| Net Assets — 100.0% | $99,704,722 |
| Outstanding Forward Currency Contracts To Buy Or Sell At March 31, 2024 | |||||||
| Contract Description | Contract Party* | Buy/Sell | Contract Amount | Contract Value Date | Value USD | Unrealized Appreciation | Unrealized Depreciation |
| Euro | SSB | Buy | 2,193,820 | 4/30/2024 | 2,369,360 | $ — | $ (10,243) |
| Japanese Yen | MSC | Buy | 246,842,000 | 4/30/2024 | 1,637,591 | — | (57,429) |
| Total | — | $ (67,672) | |||||
| Net unrealized appreciation (depreciation) | $ (67,672) | ||||||
| * | Counterparties include State Street Bank and Trust Company (“SSB”) and Morgan Stanely & Co. Inc. ("MSC"). |
| See notes to financial statements. | Thornburg Equity Funds Semi-Annual Report | 77 |
Thornburg Summit Fund | March 31, 2024 (Unaudited)
| Footnote Legend | |
| a | Non-income producing. |
| b | Securities exempt from registration under Rule 144A of the Securities Act of 1933, as amended. These securities are restricted but liquid and may only be resold in the ordinary course of business in transactions exempt from registration, normally to qualified institutional buyers. As of March 31, 2024, the aggregate value of these securities in the Fund’s portfolio was $17,687,373, representing 17.74% of the Fund’s net assets. |
| c | Yankee bond denominated in U.S. dollars and is issued in the U.S. by foreign banks and corporations. |
| d | Security currently fair valued by Thornburg Investment Management, Inc.’s Valuation and Pricing Committee. |
| e | Variable, floating, step, or fixed to floating rate securities are securities for which interest rate changes are based on changes in a designated base rate or on a predetermined schedule. The rates shown are those in effect on March 31, 2024. |
| f | Interest only. |
| g | Securities are perpetual and, thus, do not have a predetermined maturity date. The date shown, if applicable, reflects the next call date. |
| h | The stated coupon rate represents the greater of the SOFR or the SOFR floor rate plus a spread at March 31, 2024. |
| i | Investment in Affiliates. |
To simplify the listings of securities, abbreviations are used per the table below:
| ABS | Asset Backed Securities |
| ADR | American Depositary Receipt |
| AUD | Denominated in Australian Dollar |
| CMBS | Commercial Mortgage-Backed Securities |
| CMO | Collateralized Mortgage Obligation |
| EGP | Denominated in Egyptian Pound |
| EUR | Denominated in Euro |
| GBP | Denominated in Pound Sterling |
| H15T1Y | US Treasury Yield Curve Rate T-Note Constant Maturity 1 Year |
| Mtg | Mortgage |
| SOFR | Secured Overnight Financing Rate |
| TSFR1M | Term SOFR 1 Month |
| TSFR3M | Term SOFR 3 Month |
| UMBS | Uniform Mortgage Backed Securities |
| COUNTRY EXPOSURE * (percent of net assets) | |
| United States | 69.3% |
| Japan | 3.5% |
| France | 3.4% |
| Canada | 3.3% |
| United Kingdom | 2.7% |
| Netherlands | 2.5% |
| Brazil | 1.8% |
| Taiwan | 1.8% |
| South Korea | 1.6% |
| China | 1.3% |
| India | 1.1% |
| Macao | 1.0% |
| Australia | 1.0% |
| Germany | 0.7% |
| Denmark | 0.7% |
| Mexico | 0.3% |
| Dominican Republic | 0.3% |
| Switzerland | 0.2% |
| Colombia | 0.2% |
| Egypt | 0.2% |
| Turkey | 0.2% |
| Nigeria | 0.2% |
| Cayman Islands | 0.1% |
| Panama | 0.1% |
| Other Assets Less Liabilities | 2.5% |
| * | Holdings are classified by country of risk as determined by MSCI and Bloomberg. |
| 78 | Thornburg Equity Funds Semi-Annual Report | See notes to financial statements. |
March 31, 2024 (Unaudited)
| THORNBURG GLOBAL OPPORTUNITIES FUND | THORNBURG INTERNATIONAL EQUITY FUND | THORNBURG BETTER WORLD INTERNATIONAL FUND | THORNBURG INTERNATIONAL GROWTH FUND | THORNBURG DEVELOPING WORLD FUND | |
| ASSETS | |||||
| Investments at cost | |||||
| Non-affiliated issuers | $ 705,274,531 | $ 1,936,411,007 | $ 485,871,727 | $ 586,333,448 | $ 706,232,584 |
| Non-controlled affiliated issuers | 25,069,745 | 123,451,296 | 43,774,599 | 3,897,124 | 20,482,950 |
| Investments at value | |||||
| Non-affiliated issuers | 1,130,056,471 | 2,524,321,550 | 540,728,067 | 900,028,598 | 895,036,988 |
| Non-controlled affiliated issuers | 25,069,745 | 123,451,296 | 43,774,599 | 3,897,124 | 20,482,950 |
| Foreign currency at value (a) | 666 | 35,179 | 1,575 | 35,555 | 476,920 |
| Unrealized appreciation on forward currency contracts | 1,191,413 | - | - | - | - |
| Receivable for investments sold | - | - | 4,239,975 | 5,773,571 | 8,024,000 |
| Receivable for fund shares sold | 791,457 | 7,352,127 | 828,006 | 133,751 | 1,243,712 |
| Dividends receivable | 1,163,189 | 4,717,079 | 765,078 | 1,568,994 | 2,403,495 |
| Tax reclaims receivable | 1,154,817 | 7,765,547 | 1,000,695 | 1,772,864 | 160,133 |
| Prepaid expenses and other assets | 112,948 | 85,452 | 61,235 | 86,137 | 65,885 |
| Total Assets | 1,159,540,706 | 2,667,728,230 | 591,399,230 | 913,296,594 | 927,894,083 |
| Liabilities | |||||
| Payable for investments purchased | - | 13,114,036 | 2,813,952 | 2,447,166 | 5,746,553 |
| Payable for fund shares redeemed | 654,324 | 6,999,222 | 898,781 | 515,619 | 750,063 |
| Payable to investment advisor and other affiliates | 952,006 | 1,903,058 | 381,272 | 740,543 | 679,575 |
| Deferred taxes payable | 3,734,088 | - | - | - | 6,313,049 |
| Accounts payable and accrued expenses | 236,638 | 1,175,328 | 125,390 | 564,456 | 656,210 |
| Dividends payable | 10 | 3,476 | - | - | - |
| Total Liabilities | 5,577,066 | 23,195,120 | 4,219,395 | 4,267,784 | 14,145,450 |
| Net Assets | $ 1,153,963,640 | $ 2,644,533,110 | $ 587,179,835 | $ 909,028,810 | $ 913,748,633 |
| NET ASSETS CONSIST OF | |||||
| Net capital paid in on shares of beneficial interest | $ 716,542,098 | $ 1,975,477,227 | $ 583,880,416 | $ 571,536,806 | $ 933,208,373 |
| Distributable earnings (accumulated loss) | 437,421,542 | 669,055,883 | 3,299,419 | 337,492,004 | (19,459,740) |
| Net Assets | $ 1,153,963,640 | $ 2,644,533,110 | $ 587,179,835 | $ 909,028,810 | $ 913,748,633 |
March 31, 2024 (Unaudited)
| THORNBURG GLOBAL OPPORTUNITIES FUND | THORNBURG INTERNATIONAL EQUITY FUND | THORNBURG BETTER WORLD INTERNATIONAL FUND | THORNBURG INTERNATIONAL GROWTH FUND | THORNBURG DEVELOPING WORLD FUND | |
| NET ASSET VALUE | |||||
| Class A Shares: | |||||
| Net assets applicable to shares outstanding | $ 326,362,946 | $ 406,163,437 | $ 40,444,456 | $ 96,746,129 | $ 80,754,782 |
| Shares outstanding | 8,944,817 | 15,708,836 | 2,286,194 | 3,668,316 | 3,762,140 |
| Net asset value and redemption price per share | $ 36.49 | $ 25.86 | $ 17.69 | $ 26.37 | $ 21.47 |
| Maximum offering price per share (net asset value, plus 4.50% of offering price) | $ 38.21 | $ 27.08 | $ 18.52 | $ 27.61 | $ 22.48 |
| Class C Shares: | |||||
| Net assets applicable to shares outstanding | 31,924,363 | 10,721,697 | 6,239,297 | 8,142,183 | 10,091,638 |
| Shares outstanding | 920,957 | 483,766 | 363,210 | 347,649 | 500,018 |
| Net asset value and redemption price per share* | 34.66 | 22.16 | 17.18 | 23.42 | 20.18 |
| Class I Shares: | |||||
| Net assets applicable to shares outstanding | 697,661,701 | 1,538,793,262 | 540,496,082 | 691,419,400 | 753,462,748 |
| Shares outstanding | 19,034,984 | 57,100,082 | 29,651,665 | 25,238,833 | 34,253,724 |
| Net asset value and redemption price per share | 36.65 | 26.95 | 18.23 | 27.40 | 22.00 |
| Class R3 Shares: | |||||
| Net assets applicable to shares outstanding | 2,670,498 | 121,905,912 | - | 5,148,964 | - |
| Shares outstanding | 74,104 | 4,721,928 | - | 198,663 | - |
| Net asset value and redemption price per share | 36.04 | 25.82 | - | 25.92 | - |
| Class R4 Shares: | |||||
| Net assets applicable to shares outstanding | 5,350,734 | 91,498,306 | - | 7,213,916 | - |
| Shares outstanding | 147,841 | 3,578,734 | - | 276,280 | - |
| Net asset value and redemption price per share | 36.19 | 25.57 | - | 26.11 | - |
| Class R5 Shares: | |||||
| Net assets applicable to shares outstanding | 18,187,738 | 106,426,450 | - | 11,299,668 | 3,203,085 |
| Shares outstanding | 495,383 | 3,953,705 | - | 411,075 | 146,114 |
| Net asset value and redemption price per share | 36.71 | 26.92 | - | 27.49 | 21.92 |
| Class R6 Shares: | |||||
| Net assets applicable to shares outstanding | 71,805,660 | 369,024,046 | - | 89,058,550 | 66,236,380 |
| Shares outstanding | 1,950,897 | 13,773,293 | - | 3,225,999 | 3,004,821 |
| Net asset value and redemption price per share | 36.81 | 26.79 | - | 27.61 | 22.04 |
| (a) | Cost of foreign currency is $669; $35,197; $1,589; $35,563; $477,321 respectively. |
| * | Redemption price per share is equal to net asset value less any applicable contingent deferred sales charge. |
March 31, 2024 (Unaudited)
| THORNBURG SMALL/MID CAP CORE FUND | THORNBURG SMALL/MID CAP GROWTH FUND | THORNBURG INVESTMENT INCOME BUILDER FUND | THORNBURG SUMMIT FUND | |
| ASSETS | ||||
| Investments at cost | ||||
| Non-affiliated issuers | $ 430,582,017 | $ 208,958,250 | $ 9,485,150,528 | $ 84,832,632 |
| Non-controlled affiliated issuers | 6,620,772 | 3,358,509 | 546,290,398 | 2,155,656 |
| Investments at value | ||||
| Non-affiliated issuers | 552,816,615 | 280,612,029 | 12,259,461,252 | 97,225,763 |
| Non-controlled affiliated issuers | 6,620,772 | 3,358,509 | 471,903,999 | 2,155,656 |
| Cash | - | - | 68,127,855 | 24,812 |
| Foreign currency at value (a) | - | - | 27 | 276 |
| Unrealized appreciation on forward currency contracts | - | - | 17,878,565 | - |
| Receivable for investments sold | - | - | 51,055,005 | - |
| Receivable for fund shares sold | 199,881 | 83,426 | 11,007,469 | 227,583 |
| Dividends receivable | 139,254 | 27,071 | 25,618,405 | 70,344 |
| Tax reclaims receivable | - | - | 44,978,254 | 53,833 |
| Principal and interest receivable | - | - | 21,840,776 | 339,229 |
| Prepaid expenses and other assets | 57,684 | 54,216 | 111,265 | 25,705 |
| Total Assets | 559,834,206 | 284,135,251 | 12,971,982,872 | 100,123,201 |
| Liabilities | ||||
| Unrealized depreciation on forward currency contracts | - | - | - | 67,672 |
| Payable for investments purchased | - | - | 29,686,767 | - |
| Payable for fund shares redeemed | 479,669 | 76,851 | 8,064,361 | 265,320 |
| Payable to investment advisor and other affiliates | 544,850 | 279,000 | 10,418,783 | 35,533 |
| Deferred taxes payable | - | - | 1,673,698 | 30,510 |
| Accounts payable and accrued expenses | 311,399 | 158,137 | 2,231,599 | 19,444 |
| Dividends payable | - | - | 12,994,102 | - |
| Total Liabilities | 1,335,918 | 513,988 | 65,069,310 | 418,479 |
| Commitments and contingencies | ||||
| Unrealized depreciation on unfunded commmitments | - | - | (780) | - |
| Net Assets | $ 558,498,288 | $ 283,621,263 | $ 12,906,912,782 | $ 99,704,722 |
| NET ASSETS CONSIST OF | ||||
| Net capital paid in on shares of beneficial interest | $ 482,573,738 | $ 329,497,699 | $ 10,266,507,231 | $ 88,485,014 |
| Distributable earnings (accumulated loss) | 75,924,550 | (45,876,436) | 2,640,405,551 | 11,219,708 |
| Net Assets | $ 558,498,288 | $ 283,621,263 | $ 12,906,912,782 | $ 99,704,722 |
March 31, 2024 (Unaudited)
| THORNBURG SMALL/MID CAP CORE FUND | THORNBURG SMALL/MID CAP GROWTH FUND | THORNBURG INVESTMENT INCOME BUILDER FUND | THORNBURG SUMMIT FUND | |
| NET ASSET VALUE | ||||
| Class A Shares: | ||||
| Net assets applicable to shares outstanding | $ 309,142,373 | $ 146,386,790 | $ 4,275,016,399 | $ 8,737,701 |
| Shares outstanding | 4,203,987 | 4,958,214 | 171,172,274 | 688,667 |
| Net asset value and redemption price per share | $ 73.54 | $ 29.52 | $ 24.97 | $ 12.69 |
| Maximum offering price per share (net asset value, plus 4.50% of offering price) | $ 77.01 | $ 30.91 | $ 26.15 | $ 13.29 |
| Class C Shares: | ||||
| Net assets applicable to shares outstanding | 4,055,436 | 3,323,049 | 507,895,477 | - |
| Shares outstanding | 65,482 | 156,349 | 20,368,245 | - |
| Net asset value and redemption price per share* | 61.93 | 21.25 | 24.94 | - |
| Class I Shares: | ||||
| Net assets applicable to shares outstanding | 226,591,146 | 108,647,861 | 7,800,606,295 | 90,967,021 |
| Shares outstanding | 2,935,436 | 3,178,533 | 309,984,096 | 7,165,962 |
| Net asset value and redemption price per share | 77.19 | 34.18 | 25.16 | 12.69 |
| Class R3 Shares: | ||||
| Net assets applicable to shares outstanding | 13,093,539 | 15,624,837 | 21,072,035 | - |
| Shares outstanding | 179,064 | 540,312 | 844,163 | - |
| Net asset value and redemption price per share | 73.12 | 28.92 | 24.96 | - |
| Class R4 Shares: | ||||
| Net assets applicable to shares outstanding | 2,600,706 | 895,394 | 11,985,613 | - |
| Shares outstanding | 34,968 | 30,199 | 479,452 | - |
| Net asset value and redemption price per share | 74.37 | 29.65 | 25.00 | - |
| Class R5 Shares: | ||||
| Net assets applicable to shares outstanding | 3,015,088 | 8,743,332 | 20,444,773 | - |
| Shares outstanding | 39,131 | 256,234 | 813,070 | - |
| Net asset value and redemption price per share | 77.05 | 34.12 | 25.15 | - |
| Class R6 Shares: | ||||
| Net assets applicable to shares outstanding | - | - | 269,892,190 | - |
| Shares outstanding | - | - | 10,757,873 | - |
| Net asset value and redemption price per share | - | - | 25.09 | - |
| (a) | Cost of foreign currency is $0; $0; $27; $271 respectively. |
| * | Redemption price per share is equal to net asset value less any applicable contingent deferred sales charge. |
Six Months Ended March 31, 2024 (Unaudited)
| THORNBURG GLOBAL OPPORTUNITIES FUND | THORNBURG INTERNATIONAL EQUITY FUND | THORNBURG BETTER WORLD INTERNATIONAL FUND | THORNBURG INTERNATIONAL GROWTH FUND | THORNBURG DEVELOPING WORLD FUND | |
| INVESTMENT INCOME | |||||
| Dividend income | |||||
| Non-affiliated issuers | $ 7,879,786 | $ 22,023,839 | $ 4,862,136 | $ 4,128,480 | $ 8,047,565 |
| Non-controlled affiliated issuers | 901,368 | 4,175,751 | 1,480,917 | 394,147 | 277,233 |
| Dividend taxes withheld | (442,563) | (1,607,092) | (366,521) | (303,380) | (1,107,335) |
| Interest income | 629 | 880 | 50 | 2,422 | 129 |
| Foreign withholding tax claims | 206,901 | 519,952 | 15,186 | 164,556 | - |
| Total Income | 8,546,121 | 25,113,330 | 5,991,768 | 4,386,225 | 7,217,592 |
| EXPENSES | |||||
| Investment management fees | 4,500,823 | 9,607,373 | 2,773,891 | 3,669,381 | 4,429,892 |
| Administration fees | 468,437 | 1,089,403 | 251,982 | 378,010 | 409,560 |
| Distribution and service fees | |||||
| Class A Shares | 371,258 | 483,456 | 50,974 | 112,940 | 100,688 |
| Class C Shares | 172,463 | 55,712 | 30,153 | 40,877 | 52,535 |
| Class R3 Shares | 6,754 | 285,682 | - | 11,835 | - |
| Class R4 Shares | 6,120 | 107,742 | - | 9,238 | - |
| Transfer agent fees | |||||
| Class A Shares | 153,565 | 235,457 | 26,940 | 56,054 | 67,778 |
| Class C Shares | 30,410 | 8,504 | 3,159 | 8,140 | 11,342 |
| Class I Shares | 276,035 | 548,963 | 205,547 | 175,695 | 369,568 |
| Class R3 Shares | 5,764 | 148,396 | - | 9,277 | - |
| Class R4 Shares | 14,800 | 129,524 | - | 20,497 | - |
| Class R5 Shares | 23,313 | 131,321 | - | 33,488 | 5,488 |
| Class R6 Shares | 4,661 | 17,007 | - | 6,859 | 12,712 |
| Registration and filing fees | |||||
| Class A Shares | 10,383 | 8,895 | 8,907 | 8,148 | 7,667 |
| Class C Shares | 7,717 | 7,183 | 8,864 | 7,249 | 7,552 |
| Class I Shares | 14,245 | 23,467 | 16,139 | 10,465 | 15,408 |
| Class R3 Shares | 7,671 | 7,370 | - | 7,449 | - |
| Class R4 Shares | 7,671 | 7,226 | - | 7,453 | - |
| Class R5 Shares | 7,661 | 7,226 | - | 7,412 | 7,769 |
| Class R6 Shares | 7,738 | 8,117 | - | 7,464 | 7,769 |
| Custodian fees | 88,278 | 220,125 | 72,093 | 81,584 | 417,267 |
| Professional fees | 41,789 | 118,008 | 35,226 | 49,917 | 36,750 |
| Trustee and officer fees | 33,061 | 77,671 | 20,217 | 28,052 | 32,632 |
| Other expenses | 116,340 | 187,473 | 67,227 | 35,787 | 114,795 |
| Total Expenses | 6,376,957 | 13,521,301 | 3,571,319 | 4,783,271 | 6,107,172 |
| Less: | |||||
| Expenses reimbursed | (216,524) | (447,480) | (459,006) | (272,942) | (401,151) |
| Investment management fees waived | (258,599) | (1,548,754) | (391,527) | (42,369) | (658,553) |
| Net Expenses | 5,901,834 | 11,525,067 | 2,720,786 | 4,467,960 | 5,047,468 |
| Net Investment Income (Loss) | $ 2,644,287 | $ 13,588,263 | $ 3,270,982 | $ (81,735) | $ 2,170,124 |
| THORNBURG GLOBAL OPPORTUNITIES FUND | THORNBURG INTERNATIONAL EQUITY FUND | THORNBURG BETTER WORLD INTERNATIONAL FUND | THORNBURG INTERNATIONAL GROWTH FUND | THORNBURG DEVELOPING WORLD FUND | |
| REALIZED AND UNREALIZED GAIN (LOSS) | |||||
| Net realized gain (loss) on: | |||||
| Non-affiliated issuers investments* | $ 20,993,520 | $ 64,803,832 | $ (4,922,854) | $ 36,746,546 | $ (2,086,592) |
| Forward currency contracts | 1,600,892 | 14,029,708 | - | - | - |
| Foreign currency transactions | (49,170) | (162,778) | (41,718) | (9,769) | (318,588) |
| Net realized gain (loss) | 22,545,242 | 78,670,762 | (4,964,572) | 36,736,777 | (2,405,180) |
| Net change in unrealized appreciation (depreciation) on: | |||||
| Non-affiliated issuers investments** | 161,689,353 | 322,197,284 | 63,498,320 | 139,374,898 | 97,686,504 |
| Forward currency contracts | (4,089,824) | (8,997,761) | - | - | - |
| Foreign currency translations | 13,416 | 166,299 | 8,403 | 39,492 | (5,837) |
| Change in net unrealized appreciation (depreciation) | 157,612,945 | 313,365,822 | 63,506,723 | 139,414,390 | 97,680,667 |
| Net Realized and Unrealized Gain (Loss) | 180,158,187 | 392,036,584 | 58,542,151 | 176,151,167 | 95,275,487 |
| Change in Net Assets Resulting from Operations | $ 182,802,474 | $ 405,624,847 | $ 61,813,133 | $ 176,069,432 | $ 97,445,611 |
| * Net of foreign capital gain taxes | $ 651,917 | $ - | $ - | $ - | $ 2,158,559 |
| ** Net of change in deferred taxes | $ (645,405) | $ - | $ - | $ - | $ (3,190,365) |
Six Months Ended March 31, 2024 (Unaudited)
| THORNBURG SMALL/MID CAP CORE FUND | THORNBURG SMALL/MID CAP GROWTH FUND | THORNBURG INVESTMENT INCOME BUILDER FUND | THORNBURG SUMMIT FUND | |
| INVESTMENT INCOME | ||||
| Dividend income | ||||
| Non-affiliated issuers | $ 1,847,010 | $ 269,014 | $ 209,592,236 | $ 442,177 |
| Non-controlled affiliated issuers | 141,534 | 90,458 | 18,106,701 | 109,489 |
| Dividend taxes withheld | - | - | (12,722,250) | (18,108) |
| Interest income | - | - | 43,222,845 | 744,894 |
| Foreign withholding tax claims | - | - | - | 27,333 |
| Total Income | 1,988,544 | 359,472 | 258,199,532 | 1,305,785 |
| EXPENSES | ||||
| Investment management fees | 2,219,207 | 1,125,410 | 41,742,214 | 339,344 |
| Administration fees | 223,521 | 113,165 | 5,278,244 | 39,807 |
| Distribution and service fees | ||||
| Class A Shares | 353,550 | 165,713 | 5,032,999 | 9,477 |
| Class C Shares | 20,408 | 17,052 | 2,454,576 | - |
| Class R3 Shares | 31,420 | 35,198 | 50,776 | - |
| Class R4 Shares | 3,037 | 1,044 | 13,674 | - |
| Transfer agent fees | ||||
| Class A Shares | 173,276 | 98,241 | 1,257,600 | 3,907 |
| Class C Shares | 12,526 | 10,972 | 189,659 | - |
| Class I Shares | 79,138 | 23,689 | 2,549,782 | 14,813 |
| Class R3 Shares | 16,645 | 19,486 | 28,227 | - |
| Class R4 Shares | 4,392 | 1,921 | 17,235 | - |
| Class R5 Shares | 7,325 | 5,211 | 36,596 | - |
| Class R6 Shares | - | - | 12,526 | - |
| Registration and filing fees | ||||
| Class A Shares | 8,381 | 7,666 | 39,354 | 9,066 |
| Class C Shares | 7,562 | 7,200 | 21,549 | - |
| Class I Shares | 7,712 | 7,226 | 80,047 | 8,970 |
| Class R3 Shares | 7,307 | 7,253 | 16,883 | - |
| Class R4 Shares | 7,375 | 7,346 | 16,849 | - |
| Class R5 Shares | 7,378 | 7,236 | 16,930 | - |
| Class R6 Shares | - | - | 16,951 | - |
| Custodian fees | 16,995 | 14,542 | 405,449 | 35,364 |
| Professional fees | 35,137 | 28,083 | 193,092 | 32,091 |
| Trustee and officer fees | 15,907 | 9,275 | 384,984 | 3,093 |
| Other expenses | 21,409 | 20,200 | 825,807 | 24,694 |
| Total Expenses | 3,279,608 | 1,733,129 | 60,682,003 | 520,626 |
| Less: | ||||
| Expenses reimbursed | (210,763) | (132,367) | (126,123) | (76,546) |
| Investment management fees waived | - | - | - | (122,407) |
| Net Expenses | 3,068,845 | 1,600,762 | 60,555,880 | 321,673 |
| Net Investment Income (Loss) | $ (1,080,301) | $ (1,241,290) | $ 197,643,652 | $ 984,112 |
| THORNBURG SMALL/MID CAP CORE FUND | THORNBURG SMALL/MID CAP GROWTH FUND | THORNBURG INVESTMENT INCOME BUILDER FUND | THORNBURG SUMMIT FUND | |
| REALIZED AND UNREALIZED GAIN (LOSS) | ||||
| Net realized gain (loss) on: | ||||
| Non-affiliated issuers investments* | $ 4,218,202 | $ (6,253,192) | $ 332,753,929 | $ 478,835 |
| Forward currency contracts | - | - | 30,954,485 | (191,699) |
| Foreign currency transactions | - | (788) | (67,923) | (4,592) |
| Net realized gain (loss) | 4,218,202 | (6,253,980) | 363,640,491 | 282,544 |
| Net change in unrealized appreciation (depreciation) on: | ||||
| Non-affiliated issuers investments** | 96,899,512 | 57,910,850 | 1,165,821,436 | 10,141,942 |
| Non-controlled affiliated issuers | - | - | (12,789,365) | - |
| Forward currency contracts | - | - | (58,518,581) | 149,417 |
| Foreign currency translations | - | - | 522,346 | (2,988) |
| Change in net unrealized appreciation (depreciation) | 96,899,512 | 57,910,850 | 1,095,035,836 | 10,288,371 |
| Net Realized and Unrealized Gain (Loss) | 101,117,714 | 51,656,870 | 1,458,676,327 | 10,570,915 |
| Change in Net Assets Resulting from Operations | $ 100,037,413 | $ 50,415,580 | $ 1,656,319,979 | $ 11,555,027 |
| * Net of foreign capital gain taxes | $ - | $ - | $ - | $ 13,773 |
| ** Net of change in deferred taxes | $ - | $ - | $ (947,894) | $ (30,510) |
| THORNBURG GLOBAL OPPORTUNITIES FUND | THORNBURG INTERNATIONAL EQUITY FUND | |||
| Six Months Ended March 31, 2024* | Year Ended September 30, 2023 | Six Months Ended March 31, 2024* | Year Ended September 30, 2023 | |
| INCREASE (DECREASE) IN NET ASSETS FROM | ||||
| OPERATIONS | ||||
| Net investment income (loss) | $ 2,644,287 | $ 22,966,683 | $ 13,588,263 | $ 45,245,909 |
| Net realized gain (loss) | 22,545,242 | 42,293,182 | 78,670,762 | 42,874,938 |
| Net change in unrealized appreciation (depreciation) | 157,612,945 | 121,450,660 | 313,365,822 | 445,485,130 |
| Net Increase (Decrease) in Net Assets Resulting from Operations | 182,802,474 | 186,710,525 | 405,624,847 | 533,605,977 |
| DIVIDENDS TO SHAREHOLDERS | ||||
| From distributable earnings | ||||
| Class A Shares | (16,081,299) | (9,456,995) | (8,698,557) | (6,396,784) |
| Class C Shares | (1,610,420) | (1,959,214) | (175,163) | (180,196) |
| Class I Shares | (36,940,875) | (22,157,893) | (34,545,635) | (27,585,467) |
| Class R3 Shares | (144,111) | (100,397) | (2,284,889) | (1,851,400) |
| Class R4 Shares | (268,120) | (189,199) | (1,907,091) | (1,536,366) |
| Class R5 Shares | (1,026,988) | (660,145) | (2,400,229) | (2,007,059) |
| Class R6 Shares | (3,542,680) | (2,165,798) | (8,275,441) | (6,118,423) |
| FUND SHARE TRANSACTIONS | ||||
| Class A Shares | 7,121,000 | 25,050,330 | (18,975,091) | (48,099,827) |
| Class C Shares | (11,803,316) | (35,106,383) | (3,193,641) | (4,907,521) |
| Class I Shares | (3,365,918) | 94,529,948 | (55,886,473) | (150,959,707) |
| Class R3 Shares | (399,744) | (347,655) | (4,472,679) | (14,278,178) |
| Class R4 Shares | (231,416) | (381,691) | (3,160,979) | (4,541,851) |
| Class R5 Shares | (1,402,361) | (642,889) | (9,418,420) | (5,295,441) |
| Class R6 Shares | 6,428,451 | 2,091,987 | 28,574,219 | (4,922,712) |
| Net Increase (Decrease) in Net Assets | 119,534,677 | 235,214,531 | 280,804,778 | 254,925,045 |
| NET ASSETS | ||||
| Beginning of Period | 1,034,428,963 | 799,214,432 | 2,363,728,332 | 2,108,803,287 |
| End of Period | $ 1,153,963,640 | $ 1,034,428,963 | $ 2,644,533,110 | $ 2,363,728,332 |
| * | Unaudited. |
| THORNBURG BETTER WORLD INTERNATIONAL FUND | THORNBURG INTERNATIONAL GROWTH FUND | |||
| Six Months Ended March 31, 2024* | Year Ended September 30, 2023 | Six Months Ended March 31, 2024* | Year Ended September 30, 2023 | |
| INCREASE (DECREASE) IN NET ASSETS FROM | ||||
| OPERATIONS | ||||
| Net investment income (loss) | $ 3,270,982 | $ 6,931,440 | $ (81,735) | $ 3,980,329 |
| Net realized gain (loss) | (4,964,572) | 2,557,196 | 36,736,777 | 33,111,710 |
| Net change in unrealized appreciation (depreciation) | 63,506,723 | 65,793,514 | 139,414,390 | 136,078,025 |
| Net Increase (Decrease) in Net Assets Resulting from Operations | 61,813,133 | 75,282,150 | 176,069,432 | 173,170,064 |
| DIVIDENDS TO SHAREHOLDERS | ||||
| From distributable earnings | ||||
| Class A Shares | (441,083) | (110,786) | (205,276) | (255,104) |
| Class C Shares | (23,443) | - | - | - |
| Class I Shares | (8,100,820) | (3,365,207) | (3,944,778) | (5,140,255) |
| Class R3 Shares | - | - | (6,666) | (7,298) |
| Class R4 Shares | - | - | (16,845) | (24,867) |
| Class R5 Shares | - | - | (74,501) | (170,516) |
| Class R6 Shares | - | - | (555,216) | (626,086) |
| FUND SHARE TRANSACTIONS | ||||
| Class A Shares | (3,946,889) | 1,010,983 | (8,334,503) | (14,839,351) |
| Class C Shares | (518,513) | 1,007,401 | (2,030,226) | (4,338,314) |
| Class I Shares | (21,697,155) | 102,433,867 | (66,294,973) | (228,228,192) |
| Class R3 Shares | - | - | (317,170) | (570,566) |
| Class R4 Shares | - | - | (1,356,886) | (800,493) |
| Class R5 Shares | - | - | (4,123,514) | (12,274,626) |
| Class R6 Shares | - | - | (84,846) | (6,278,518) |
| Net Increase (Decrease) in Net Assets | 27,085,230 | 176,258,408 | 88,724,032 | (100,384,122) |
| NET ASSETS | ||||
| Beginning of Period | 560,094,605 | 383,836,197 | 820,304,778 | 920,688,900 |
| End of Period | $ 587,179,835 | $ 560,094,605 | $ 909,028,810 | $ 820,304,778 |
| * | Unaudited. |
| THORNBURG DEVELOPING WORLD FUND | THORNBURG SMALL/MID CAP CORE FUND | |||
| Six Months Ended March 31, 2024* | Year Ended September 30, 2023 | Six Months Ended March 31, 2024* | Year Ended September 30, 2023 | |
| INCREASE (DECREASE) IN NET ASSETS FROM | ||||
| OPERATIONS | ||||
| Net investment income (loss) | $ 2,170,124 | $ 13,014,821 | $ (1,080,301) | $ (1,293,541) |
| Net realized gain (loss) | (2,405,180) | (78,110,701) | 4,218,202 | (21,084,817) |
| Net change in unrealized appreciation (depreciation) | 97,680,667 | 141,980,715 | 96,899,512 | 73,412,671 |
| Net Increase (Decrease) in Net Assets Resulting from Operations | 97,445,611 | 76,884,835 | 100,037,413 | 51,034,313 |
| DIVIDENDS TO SHAREHOLDERS | ||||
| From distributable earnings | ||||
| Class A Shares | (1,337,723) | (1,251,706) | - | (136,460) |
| Class C Shares | (66,116) | (41,004) | - | - |
| Class I Shares | (16,040,523) | (13,972,476) | - | (1,088,874) |
| Class R3 Shares | - | - | - | (15,650) |
| Class R4 Shares | - | - | - | (6,736) |
| Class R5 Shares | (66,847) | (57,870) | - | (29,855) |
| Class R6 Shares | (1,351,847) | (1,105,768) | - | - |
| FUND SHARE TRANSACTIONS | ||||
| Class A Shares | (9,583,233) | (10,748,385) | (22,716,481) | (44,442,447) |
| Class C Shares | (2,485,017) | (6,854,299) | (1,205,853) | (3,590,500) |
| Class I Shares | (113,839,778) | (19,576,461) | (10,620,907) | (29,769,151) |
| Class R3 Shares | - | - | (2,001,468) | (2,018,695) |
| Class R4 Shares | - | - | (171,253) | (806,342) |
| Class R5 Shares | (275,218) | 593,489 | (434,301) | (3,866,821) |
| Class R6 Shares | 107,578 | 2,710,356 | - | - |
| Net Increase (Decrease) in Net Assets | (47,493,113) | 26,580,711 | 62,887,150 | (34,737,218) |
| NET ASSETS | ||||
| Beginning of Period | 961,241,746 | 934,661,035 | 495,611,138 | 530,348,356 |
| End of Period | $ 913,748,633 | $ 961,241,746 | $ 558,498,288 | $ 495,611,138 |
| * | Unaudited. |
| THORNBURG SMALL/MID CAP GROWTH FUND | THORNBURG INVESTMENT INCOME BUILDER FUND | |||
| Six Months Ended March 31, 2024* | Year Ended September 30, 2023 | Six Months Ended March 31, 2024* | Year Ended September 30, 2023 | |
| INCREASE (DECREASE) IN NET ASSETS FROM | ||||
| OPERATIONS | ||||
| Net investment income (loss) | $ (1,241,290) | $ (2,881,209) | $ 197,643,652 | $ 568,370,299 |
| Net realized gain (loss) | (6,253,980) | (16,541,247) | 363,640,491 | 17,376,938 |
| Net change in unrealized appreciation (depreciation) | 57,910,850 | 59,027,788 | 1,095,035,836 | 1,497,653,372 |
| Net Increase (Decrease) in Net Assets Resulting from Operations | 50,415,580 | 39,605,332 | 1,656,319,979 | 2,083,400,609 |
| DIVIDENDS TO SHAREHOLDERS | ||||
| From distributable earnings | ||||
| Class A Shares | - | - | (98,191,191) | (198,693,407) |
| Class C Shares | - | - | (10,142,197) | (25,228,489) |
| Class I Shares | - | - | (183,972,586) | (340,484,174) |
| Class R3 Shares | - | - | (457,641) | (1,007,983) |
| Class R4 Shares | - | - | (251,754) | (558,366) |
| Class R5 Shares | - | - | (481,504) | (1,414,560) |
| Class R6 Shares | - | - | (6,111,719) | (9,645,525) |
| FUND SHARE TRANSACTIONS | ||||
| Class A Shares | (12,765,820) | (34,425,116) | (67,159,499) | 1,283,935 |
| Class C Shares | (1,049,565) | (2,503,123) | (40,429,349) | (165,858,454) |
| Class I Shares | (20,924,370) | (18,693,030) | 185,945,719 | 742,990,448 |
| Class R3 Shares | (1,087,293) | (2,165,143) | (1,180,110) | (2,989,507) |
| Class R4 Shares | (128,805) | (407,355) | 561,681 | (1,677,122) |
| Class R5 Shares | (699,427) | (2,576,183) | (40,182) | (15,865,894) |
| Class R6 Shares | - | - | 42,989,735 | 43,901,859 |
| Net Increase (Decrease) in Net Assets | 13,760,300 | (21,164,618) | 1,477,399,382 | 2,108,153,370 |
| NET ASSETS | ||||
| Beginning of Period | 269,860,963 | 291,025,581 | 11,429,513,400 | 9,321,360,030 |
| End of Period | $ 283,621,263 | $ 269,860,963 | $ 12,906,912,782 | $ 11,429,513,400 |
| * | Unaudited. |
| THORNBURG SUMMIT FUND | ||
| Six Months Ended March 31, 2024* | Year Ended September 30, 2023 | |
| INCREASE (DECREASE) IN NET ASSETS FROM | ||
| OPERATIONS | ||
| Net investment income (loss) | $ 984,112 | $ 1,912,535 |
| Net realized gain (loss) | 282,544 | 369,559 |
| Net change in unrealized appreciation (depreciation) | 10,288,371 | 5,120,076 |
| Net Increase (Decrease) in Net Assets Resulting from Operations | 11,555,027 | 7,402,170 |
| DIVIDENDS TO SHAREHOLDERS | ||
| From distributable earnings | ||
| Class A Shares | (77,881) | (110,469) |
| Class I Shares | (940,266) | (1,952,484) |
| FUND SHARE TRANSACTIONS | ||
| Class A Shares | 1,887,161 | 5,450,972 |
| Class I Shares | 6,433,824 | 13,513,853 |
| Net Increase (Decrease) in Net Assets | 18,857,865 | 24,304,042 |
| NET ASSETS | ||
| Beginning of Period | 80,846,857 | 56,542,815 |
| End of Period | $ 99,704,722 | $ 80,846,857 |
| * | Unaudited. |
March 31, 2024 (Unaudited)
March 31, 2024 (Unaudited)
| Class A | Class C | Class I | Class R3 | Class R4 | Class R5 | Class R6 | |
| Global Opportunities Fund | X | X | X | X | X | X | X |
| International Equity Fund | X | X | X | X | X | X | X |
| Better World International Fund | X | X | X | ||||
| International Growth Fund | X | X | X | X | X | X | X |
| Developing World Fund | X | X | X | X | X | ||
| Small/Mid Cap Core Fund | X | X | X | X | X | X | |
| Small/Mid Cap Growth Fund | X | X | X | X | X | X | |
| Income Builder Fund | X | X | X | X | X | X | X |
| Summit Fund | X | X |
March 31, 2024 (Unaudited)
March 31, 2024 (Unaudited)
March 31, 2024 (Unaudited)
March 31, 2024 (Unaudited)
| GLOBAL OPPORTUNITIES FUND | TOTAL | LEVEL 1 | LEVEL 2 | LEVEL 3 |
| Assets | ||||
| Investments in Securities | ||||
| Common Stock | $ 1,130,056,471 | $ 1,130,056,471 | $ — | $ — |
| Short-Term Investments | 25,069,745 | 25,069,745 | — | — |
| Total Investments in Securities | $ 1,155,126,216 | $ 1,155,126,216 | $ — | $ — |
| Other Financial Instruments | ||||
| Forward Currency Contracts | $ 1,191,413 | $ — | $ 1,191,413 | $ — |
| Total Assets | $ 1,156,317,629 | $ 1,155,126,216 | $ 1,191,413 | $ — |
| INTERNATIONAL EQUITY FUND | TOTAL | LEVEL 1 | LEVEL 2 | LEVEL 3 |
| Assets | ||||
| Investments in Securities | ||||
| Common Stock | $ 2,524,321,549 | $ 2,524,321,549 | $ — | $ — |
| Warrant | 1 | — | — | 1 |
| Short-Term Investments | 123,451,296 | 123,451,296 | — | — |
| Total Investments in Securities | $ 2,647,772,846 | $ 2,647,772,845 | $ — | $ 1(a) |
| Total Assets | $ 2,647,772,846 | $ 2,647,772,845 | $ — | $1 |
| (a) | Level 3 investments at the beginning and/or end of the period in relation to net assets were not significant and accordingly, a reconciliation of Level 3 assets for the period ended March 31, 2024 is not presented. |
| BETTER WORLD INTERNATIONAL FUND | TOTAL | LEVEL 1 | LEVEL 2 | LEVEL 3 |
| Assets | ||||
| Investments in Securities | ||||
| Common Stock | $ 540,728,066 | $ 540,728,066 | $ — | $ — |
| Warrant | 1 | — | — | 1 |
| Short-Term Investments | 43,774,599 | 43,774,599 | — | — |
| Total Investments in Securities | $ 584,502,666 | $ 584,502,665 | $ — | $ 1(a) |
| Total Assets | $ 584,502,666 | $ 584,502,665 | $ — | $1 |
| (a) | Level 3 investments at the beginning and/or end of the period in relation to net assets were not significant and accordingly, a reconciliation of Level 3 assets for the period ended March 31, 2024 is not presented. |
| INTERNATIONAL GROWTH FUND | TOTAL | LEVEL 1 | LEVEL 2 | LEVEL 3 |
| Assets | ||||
| Investments in Securities | ||||
| Common Stock | $ 900,028,598 | $ 900,028,598 | $ — | $ — |
| Short-Term Investments | 3,897,124 | 3,897,124 | — | — |
| Total Investments in Securities | $ 903,925,722 | $ 903,925,722 | $ — | $ — |
| Total Assets | $ 903,925,722 | $ 903,925,722 | $ — | $ — |
| DEVELOPING WORLD FUND | TOTAL | LEVEL 1 | LEVEL 2 | LEVEL 3 |
| Assets | ||||
| Investments in Securities | ||||
| Common Stock | $ 883,759,048 | $ 883,759,048 | $ — | $ — |
| Preferred Stock | 11,277,940 | 11,277,940 | — | — |
| Short-Term Investments | 20,482,950 | 20,482,950 | — | — |
| Total Investments in Securities | $ 915,519,938 | $ 915,519,938 | $ — | $ — |
| Total Assets | $ 915,519,938 | $ 915,519,938 | $ — | $— |
March 31, 2024 (Unaudited)
| SMALL/MID CAP CORE FUND | TOTAL | LEVEL 1 | LEVEL 2 | LEVEL 3 |
| Assets | ||||
| Investments in Securities | ||||
| Common Stock | $ 552,816,615 | $ 552,816,615 | $ — | $ — |
| Short-Term Investments | 6,620,772 | 6,620,772 | — | — |
| Total Investments in Securities | $ 559,437,387 | $ 559,437,387 | $ — | $ — |
| Total Assets | $ 559,437,387 | $ 559,437,387 | $ — | $ — |
| SMALL/MID CAP GROWTH FUND | TOTAL | LEVEL 1 | LEVEL 2 | LEVEL 3 |
| Assets | ||||
| Investments in Securities | ||||
| Common Stock | $ 280,612,029 | $ 280,612,029 | $ — | $ — |
| Short-Term Investments | 3,358,509 | 3,358,509 | — | — |
| Total Investments in Securities | $ 283,970,538 | $ 283,970,538 | $ — | $ — |
| Total Assets | $ 283,970,538 | $ 283,970,538 | $ — | $ — |
| INCOME BUILDER FUND | TOTAL | LEVEL 1 | LEVEL 2 | LEVEL 3 |
| Assets | ||||
| Investments in Securities | ||||
| Common Stock | $ 10,960,632,814 | $ 10,955,095,032 | $ — | $ 5,537,782 |
| Preferred Stock | 10,344,000 | 2,724,000 | 7,620,000 | — |
| Asset Backed Securities | 135,551,150 | — | 133,198,378 | 2,352,772 |
| Corporate Bonds | 1,025,241,136 | — | 1,025,241,136 | — |
| Other Government | 10,569,360 | — | 10,569,360 | — |
| Mortgage Backed | 224,012,665 | — | 224,011,715 | 950 |
| Loan Participations | 27,677,767 | — | 27,677,767 | — |
| Short-Term Investments | 337,336,359 | 337,336,359 | — | — |
| Total Investments in Securities | $ 12,731,365,251 | $ 11,295,155,391 | $ 1,428,318,356 | $ 7,891,504 |
| Other Financial Instruments | ||||
| Forward Currency Contracts | $ 17,878,565 | $ — | $ 17,878,565 | $ — |
| Total Assets | $ 12,749,243,816 | $ 11,295,155,391 | $ 1,446,196,921 | $7,891,504(a) |
| (a) | Level 3 investments at the beginning and/or end of the period in relation to net assets were not significant and accordingly, a reconciliation of Level 3 assets for the period ended March 31, 2024 is not presented. |
| SUMMIT FUND | TOTAL | LEVEL 1 | LEVEL 2 | LEVEL 3 |
| Assets | ||||
| Investments in Securities | ||||
| Common Stock | $ 53,771,800 | $ 53,771,800 | $ — | $ — |
| Asset Backed Securities | 4,528,568 | — | 4,416,531 | 112,037 |
| Corporate Bonds | 15,990,688 | — | 15,990,688 | — |
| Other Government | 1,222,007 | — | 1,222,007 | — |
| U.S. Treasury Securities | 8,083,527 | 8,083,527 | — | — |
| Mortgage Backed | 9,808,369 | — | 9,808,369 | — |
| Loan Participations | 197,978 | — | 197,978 | — |
| Exchange-Traded Funds | 3,622,826 | 3,622,826 | — | — |
| Short-Term Investments | 2,155,656 | 2,155,656 | — | — |
| Total Investments in Securities | $ 99,381,419 | $ 67,633,809 | $ 31,635,573 | $ 112,037 |
| Total Assets | $ 99,381,419 | $ 67,633,809 | $ 31,635,573 | $ 112,037(a) |
| Liabilities | ||||
| Other Financial Instruments | ||||
| Forward Currency Contracts | $ (67,672) | $ — | $ (67,672) | $ — |
| Total Other Financial Instruments | $ (67,672) | $ — | $ (67,672) | $ — |
| Total Liabilities | $ (67,672) | $ — | $ (67,672) | $— |
March 31, 2024 (Unaudited)
| (a) | Level 3 investments at the beginning and/or end of the period in relation to net assets were not significant and accordingly, a reconciliation of Level 3 assets for the period ended March 31, 2024 is not presented. |
| GLOBAL OPPORTUNITIES FUND, INTERNATIONAL EQUITY FUND, INTERNATIONAL GROWTH FUND, SMALL/MID CAP CORE FUND, SMALL/MID CAP GROWTH FUND, INCOME BUILDER FUND | BETTER WORLD INTERNATIONAL FUND, DEVELOPING WORLD FUND | SUMMIT FUND | |||
| DAILY NET ASSETS | FEE RATE | DAILY NET ASSETS | FEE RATE | DAILY NET ASSETS | FEE RATE |
| Up to $500 million | 0.875% | Up to $500 million | 0.975% | Up to $500 million | 0.750% |
| Next $500 million | 0.825 | Next $500 million | 0.925 | Next $500 million | 0.700 |
| Next $500 million | 0.775 | Next $500 million | 0.875 | Next $500 million | 0.650 |
| Next $500 million | 0.725 | Next $500 million | 0.825 | Next $500 million | 0.625 |
| Over $2 billion | 0.675 | Over $2 billion | 0.775 | Over $2 billion | 0.600 |
| Effective Management Fee | |
| Global Opportunities Fund | 0.845% |
| International Equity Fund | 0.776 |
| Better World International Fund | 0.969 |
| International Growth Fund | 0.854 |
| Developing World Fund | 0.952 |
| Small/Mid Cap Core Fund | 0.874 |
| Small/Mid Cap Growth Fund | 0.875 |
| Income Builder Fund | 0.696 |
| Summit Fund | 0.750 |
| Administrative Services Fee Schedule | |
| Daily Net Assets | Fee Rate |
| Up to $20 billion | 0.100% |
| $20 billion to $40 billion | 0.075 |
| $40 billion to $60 billion | 0.040 |
| Over $60 billion | 0.030 |
March 31, 2024 (Unaudited)
| Commissions | CDSC fees | |
| Global Opportunities Fund | $ 4,904 | $ 152 |
| International Equity Fund | 755 | 28 |
| Better World International Fund | 689 | 988 |
| International Growth Fund | 514 | 4 |
| Developing World Fund | 353 | 13 |
| Small/Mid Cap Core Fund | 1,335 | 76 |
| Small/Mid Cap Growth Fund | 588 | 4 |
| Income Builder Fund | 144,706 | 11,958 |
| Summit Fund | 1,379 | — |
| Class A | Class C | Class I | Class R3 | Class R4 | Class R5 | Class R6 | |
| Global Opportunities Fund | —% | —% | 0.99% | 1.50% | 1.40% | 0.99% | 0.85% |
| International Equity Fund | — | — | 0.90 | 1.36 | 1.16 | 0.90 | 0.70 |
| Better World International Fund | — | 2.19 | 0.90 | — | — | — | — |
| International Growth Fund | — | — | 0.99 | 1.50 | 1.40 | 0.99 | 0.89 |
| Developing World Fund | — | 2.33 | 1.04 | — | — | 1.04 | 0.94 |
| Small/Mid Cap Core Fund | — | 2.34 | 0.95 | 1.31 | 1.21 | 0.95 | — |
| Small/Mid Cap Growth Fund | — | 2.34 | 0.95 | 1.46 | 1.36 | 0.95 | — |
| Income Builder Fund | — | — | — | 1.50 | 1.40 | 0.99 | 0.80 |
| Summit Fund | 0.94 | — | 0.69 | — | — | — | — |
March 31, 2024 (Unaudited)
| Contractual: | Class A | Class C | Class I | Class R3 | Class R4 | Class R5 | Class R6 | Total |
| Global Opportunities Fund | $ — | $ — | $ 120,358 | $ 12,557 | $ 17,275 | $ 26,263 | $ 40,071 | $ 216,524 |
| International Equity Fund | — | — | — | 114,348 | 83,975 | 80,980 | 168,177 | 447,480 |
| Better World International Fund | — | 5,924 | 453,082 | — | — | — | — | 459,006 |
| International Growth Fund | — | — | 145,348 | 16,196 | 21,571 | 40,137 | 49,690 | 272,942 |
| Developing World Fund | — | 2,960 | 336,923 | — | — | 13,052 | 48,216 | 401,151 |
| Small/Mid Cap Core Fund | — | 4,918 | 134,467 | 35,658 | 12,214 | 15,355 | — | 202,612 |
| Small/Mid Cap Growth Fund | — | 12,682 | 64,721 | 30,905 | 8,890 | 15,169 | — | 132,367 |
| Income Builder Fund | — | — | — | 26,191 | 15,713 | 36,573 | 47,646 | 126,123 |
| Summit Fund | 16,292 | — | 60,254 | — | — | — | — | 76,546 |
| Voluntary: | Class A | Class C | Class I | Class R3 | Class R4 | Class R5 | Class R6 | Total |
| Global Opportunities Fund | $ 72,137 | $ 8,360 | $ 156,660 | $ 654 | $ 1,190 | $ 4,320 | $ 15,278 | $ 258,599 |
| International Equity Fund | 241,881 | 6,955 | 907,210 | 71,465 | 53,907 | 63,938 | 203,398 | 1,548,754 |
| Better World International Fund | 27,862 | 4,122 | 359,543 | — | — | — | — | 391,527 |
| International Growth Fund | 4,454 | 403 | 32,346 | 233 | 364 | 604 | 3,965 | 42,369 |
| Developing World Fund | 56,988 | 7,426 | 547,275 | — | — | 2,260 | 44,604 | 658,553 |
| Small/Mid Cap Core Fund | — | 8,151 | — | — | — | — | — | 8,151 |
| Summit Fund | 10,261 | — | 112,146 | — | — | — | — | 122,407 |
| Percentage of Direct Investments | |
| Global Opportunities Fund | 5.68% |
| International Equity Fund | 1.81 |
| Better World International Fund | 7.61 |
| International Growth Fund | 4.09 |
| Developing World Fund | 3.98 |
| Small/Mid Cap Core Fund | 7.41 |
| Small/Mid Cap Growth Fund | 8.79 |
| Income Builder Fund | 1.70 |
| Summit Fund | 45.53 |
| GLOBAL OPPORTUNITIES FUND | Market Value 9/30/23 | Purchases at Cost | Sales Proceeds | Realized Gain (Loss) | Change in Unrealized Appr./(Depr.) | Market Value 3/31/24 | Dividend Income |
| Thornburg Capital Mgmt. Fund | $ 28,657,059 | $103,062,525 | $ (106,649,839) | $- | $ - | $ 25,069,745 | $ 901,368 |
| INTERNATIONAL EQUITY FUND | |||||||
| Thornburg Capital Mgmt. Fund | $204,881,109 | $271,961,358 | $ (353,391,171) | $- | $ - | $123,451,296 | $ 4,175,751 |
March 31, 2024 (Unaudited)
| BETTER WORLD INTERNATIONAL FUND | Market Value 9/30/23 | Purchases at Cost | Sales Proceeds | Realized Gain (Loss) | Change in Unrealized Appr./(Depr.) | Market Value 3/31/24 | Dividend Income |
| Thornburg Capital Mgmt. Fund | $ 60,081,518 | $105,307,334 | $ (121,614,253) | $- | $ - | $ 43,774,599 | $ 1,480,917 |
| INTERNATIONAL GROWTH FUND | |||||||
| Thornburg Capital Mgmt. Fund | $ 25,575,164 | $120,952,618 | $ (142,630,658) | $- | $ - | $ 3,897,124 | $ 394,147 |
| DEVELOPING WORLD FUND | |||||||
| Thornburg Capital Mgmt. Fund | $ 31,140,363 | $162,567,841 | $ (173,225,254) | $- | $ - | $ 20,482,950 | $ 277,233 |
| SMALL/MID CAP CORE FUND | |||||||
| Thornburg Capital Mgmt. Fund | $ 2,222,573 | $ 72,121,988 | $ (67,723,789) | $- | $ - | $ 6,620,772 | $ 141,534 |
| SMALL/MID CAP GROWTH FUND | |||||||
| Thornburg Capital Mgmt. Fund | $ 3,331,787 | $ 37,206,601 | $ (37,179,879) | $- | $ - | $ 3,358,509 | $ 90,458 |
| INCOME BUILDER FUND | |||||||
| Chimera Investment Corp | $ 81,045,985 | $ - | $ - | $- | $(12,617,049) | $ 68,428,936 | $ 1,632,795 |
| Malamute Energy, Inc. | 12,439 | - | - | - | - | 12,439 | - |
| SLR Investment Corp | 66,298,581 | - | - | - | (172,316) | 66,126,265 | 3,532,478 |
| Thornburg Capital Mgmt. Fund | 616,523,198 | 839,484,874 | (1,118,671,713) | - | - | 337,336,359 | 12,941,428 |
| Total | $763,880,203 | $839,484,874 | $(1,118,671,713) | $- | $(12,789,365) | $471,903,999 | $18,106,701 |
| SUMMIT FUND | |||||||
| Thornburg Capital Mgmt. Fund | $ 4,641,593 | $ 20,727,094 | $ (23,213,031) | $- | $ - | $ 2,155,656 | $ 109,489 |
March 31, 2024 (Unaudited)
| Cost | Unrealized Appreciation | Unrealized Depreciation | Net Unrealized Appreciation (Depreciation) | |
| Global Opportunities Fund | $ 730,344,276 | $ 451,701,575 | $ (26,919,635) | $ 424,781,940 |
| International Equity Fund | 2,059,862,303 | 657,900,770 | (69,990,227) | 587,910,543 |
| Better World International Fund | 529,646,326 | 85,241,630 | (30,385,290) | 54,856,340 |
| International Growth Fund | 590,230,572 | 323,425,681 | (9,730,531) | 313,695,150 |
| Developing World Fund | 726,715,534 | 233,161,327 | (44,356,923) | 188,804,404 |
| Small/Mid Cap Core Fund | 437,202,789 | 144,200,593 | (21,965,995) | 122,234,598 |
| Small/Mid Cap Growth Fund | 212,316,759 | 74,482,101 | (2,828,322) | 71,653,779 |
| Income Builder Fund | 10,031,440,926 | 3,365,053,596 | (665,129,271) | 2,699,924,325 |
| Summit Fund | 86,988,288 | 14,415,137 | (2,022,006) | 12,393,131 |
| Deferred Tax Basis | |
| Late-Year Ordinary Losses | |
| Small/Mid Cap Core Fund | $ 1,302,272 |
| Small/Mid Cap Growth Fund | 2,132,450 |
| Cumulative Capital Losses | ||
| Short-Term | Long-Term | |
| Better World International Fund | $ 48,636,367 | $ — |
| International Growth Fund | 8,719,523 | — |
| Developing World Fund | 157,418,334 | 36,615,339 |
| Small/Mid Cap Core Fund | 7,744,956 | 38,130,248 |
| Small/Mid Cap Growth Fund | 40,215,296 | 65,451,819 |
| Income Builder Fund | 250,083,277 | — |
| Summit Fund | 1,049,460 | — |
March 31, 2024 (Unaudited)
| SIX MONTHS ENDED March 31, 2024 | YEAR ENDED September 30, 2023 | |||
| GLOBAL OPPORTUNITIES FUND | SHARES | AMOUNT | SHARES | AMOUNT |
| Class A Shares | ||||
| Shares sold | 572,225 | $ 18,957,546 | 1,973,169 | $ 62,289,387 |
| Shares issued to shareholders in reinvestment of dividends | 474,492 | 15,180,833 | 286,501 | 8,832,745 |
| Shares repurchased | (815,102) | (27,017,379) | (1,435,099) | (46,071,802) |
| Net increase (decrease) | 231,615 | $ 7,121,000 | 824,571 | $ 25,050,330 |
| Class C Shares | ||||
| Shares sold | 24,067 | $ 759,871 | 70,051 | $ 2,092,029 |
| Shares issued to shareholders in reinvestment of dividends | 52,823 | 1,582,206 | 66,415 | 1,933,568 |
| Shares repurchased | (450,939) | (14,145,393) | (1,282,660) | (39,131,980) |
| Net increase (decrease) | (374,049) | $ (11,803,316) | (1,146,194) | $ (35,106,383) |
| Class I Shares | ||||
| Shares sold | 1,774,683 | $ 59,006,658 | 6,841,982 | $ 213,696,940 |
| Shares issued to shareholders in reinvestment of dividends | 1,077,890 | 34,707,454 | 667,251 | 20,667,164 |
| Shares repurchased | (2,921,033) | (97,080,030) | (4,395,367) | (139,834,156) |
| Net increase (decrease) | (68,460) | $ (3,365,918) | 3,113,866 | $ 94,529,948 |
| Class R3 Shares | ||||
| Shares sold | 2,683 | $ 87,223 | 10,289 | $ 322,839 |
| Shares issued to shareholders in reinvestment of dividends | 4,569 | 144,105 | 3,300 | 100,393 |
| Shares repurchased | (18,884) | (631,072) | (24,277) | (770,887) |
| Net increase (decrease) | (11,632) | $ (399,744) | (10,688) | $ (347,655) |
| Class R4 Shares | ||||
| Shares sold | 23,541 | $ 783,781 | 31,219 | $ 985,890 |
| Shares issued to shareholders in reinvestment of dividends | 6,692 | 212,163 | 4,888 | 149,433 |
| Shares repurchased | (37,627) | (1,227,360) | (47,011) | (1,517,014) |
| Net increase (decrease) | (7,394) | $ (231,416) | (10,904) | $ (381,691) |
| Class R5 Shares | ||||
| Shares sold | 62,279 | $ 2,070,430 | 165,294 | $ 5,364,183 |
| Shares issued to shareholders in reinvestment of dividends | 26,661 | 859,773 | 18,221 | 565,110 |
| Shares repurchased | (128,759) | (4,332,564) | (203,337) | (6,572,182) |
| Net increase (decrease) | (39,819) | $ (1,402,361) | (19,822) | $ (642,889) |
March 31, 2024 (Unaudited)
| SIX MONTHS ENDED March 31, 2024 | YEAR ENDED September 30, 2023 | |||
| GLOBAL OPPORTUNITIES FUND | SHARES | AMOUNT | SHARES | AMOUNT |
| Class R6 Shares | ||||
| Shares sold | 140,931 | $ 4,712,757 | 79,117 | $ 2,576,009 |
| Shares issued to shareholders in reinvestment of dividends | 103,441 | 3,343,892 | 65,982 | 2,052,294 |
| Shares repurchased | (47,984) | (1,628,198) | (78,043) | (2,536,316) |
| Net increase (decrease) | 196,388 | $ 6,428,451 | 67,056 | $ 2,091,987 |
| SIX MONTHS ENDED March 31, 2024 | YEAR ENDED September 30, 2023 | |||
| INTERNATIONAL EQUITY FUND | SHARES | AMOUNT | SHARES | AMOUNT |
| Class A Shares | ||||
| Shares sold | 573,475 | $ 13,605,767 | 958,627 | $ 21,441,973 |
| Shares issued to shareholders in reinvestment of dividends | 332,206 | 7,864,729 | 272,209 | 5,792,603 |
| Shares repurchased | (1,682,786) | (40,445,587) | (3,414,315) | (75,334,403) |
| Net increase (decrease) | (777,105) | $ (18,975,091) | (2,183,479) | $ (48,099,827) |
| Class C Shares | ||||
| Shares sold | 36,647 | $ 764,572 | 38,922 | $ 720,919 |
| Shares issued to shareholders in reinvestment of dividends | 8,282 | 167,683 | 9,319 | 170,731 |
| Shares repurchased | (203,594) | (4,125,896) | (301,230) | (5,799,171) |
| Net increase (decrease) | (158,665) | $ (3,193,641) | (252,989) | $ (4,907,521) |
| Class I Shares | ||||
| Shares sold | 3,515,440 | $ 86,938,699 | 7,966,745 | $ 184,784,897 |
| Shares issued to shareholders in reinvestment of dividends | 1,295,190 | 31,956,670 | 1,155,316 | 25,578,700 |
| Shares repurchased | (7,011,094) | (174,781,842) | (15,936,850) | (361,323,304) |
| Net increase (decrease) | (2,200,464) | $ (55,886,473) | (6,814,789) | $ (150,959,707) |
| Class R3 Shares | ||||
| Shares sold | 405,645 | $ 9,692,954 | 767,878 | $ 17,159,971 |
| Shares issued to shareholders in reinvestment of dividends | 96,113 | 2,271,486 | 86,320 | 1,835,166 |
| Shares repurchased | (693,659) | (16,437,119) | (1,487,151) | (33,273,315) |
| Net increase (decrease) | (191,901) | $ (4,472,679) | (632,953) | $ (14,278,178) |
| Class R4 Shares | ||||
| Shares sold | 291,453 | $ 6,880,475 | 1,086,901 | $ 23,264,851 |
| Shares issued to shareholders in reinvestment of dividends | 66,517 | 1,557,309 | 60,137 | 1,265,884 |
| Shares repurchased | (491,242) | (11,598,763) | (1,308,585) | (29,072,586) |
| Net increase (decrease) | (133,272) | $ (3,160,979) | (161,547) | $ (4,541,851) |
| Class R5 Shares | ||||
| Shares sold | 454,231 | $ 11,292,168 | 910,913 | $ 21,417,736 |
| Shares issued to shareholders in reinvestment of dividends | 96,280 | 2,372,344 | 87,952 | 1,945,490 |
| Shares repurchased | (926,777) | (23,082,932) | (1,230,400) | (28,658,667) |
| Net increase (decrease) | (376,266) | $ (9,418,420) | (231,535) | $ (5,295,441) |
March 31, 2024 (Unaudited)
| SIX MONTHS ENDED March 31, 2024 | YEAR ENDED September 30, 2023 | |||
| INTERNATIONAL EQUITY FUND | SHARES | AMOUNT | SHARES | AMOUNT |
| Class R6 Shares | ||||
| Shares sold | 1,685,550 | $ 42,202,784 | 2,065,947 | $ 47,957,012 |
| Shares issued to shareholders in reinvestment of dividends | 298,157 | 7,313,121 | 243,087 | 5,347,922 |
| Shares repurchased | (847,135) | (20,941,686) | (2,559,868) | (58,227,646) |
| Net increase (decrease) | 1,136,572 | $ 28,574,219 | (250,834) | $ (4,922,712) |
| SIX MONTHS ENDED March 31, 2024 | YEAR ENDED September 30, 2023 | |||
| BETTER WORLD INTERNATIONAL FUND | SHARES | AMOUNT | SHARES | AMOUNT |
| Class A Shares | ||||
| Shares sold | 168,980 | $ 2,798,147 | 670,874 | $ 10,677,311 |
| Shares issued to shareholders in reinvestment of dividends | 26,486 | 440,725 | 7,172 | 109,299 |
| Shares repurchased | (429,473) | (7,185,761) | (609,070) | (9,775,627) |
| Net increase (decrease) | (234,007) | $ (3,946,889) | 68,976 | $ 1,010,983 |
| Class C Shares | ||||
| Shares sold | 18,912 | $ 308,684 | 125,030 | $ 1,989,268 |
| Shares issued to shareholders in reinvestment of dividends | 1,448 | 23,443 | - | - |
| Shares repurchased | (53,225) | (850,640) | (63,960) | (981,867) |
| Net increase (decrease) | (32,865) | $ (518,513) | 61,070 | $ 1,007,401 |
| Class I Shares | ||||
| Shares sold | 4,644,468 | $ 79,598,203 | 13,217,836 | $ 219,934,154 |
| Shares issued to shareholders in reinvestment of dividends | 459,512 | 7,866,834 | 207,000 | 3,245,758 |
| Shares repurchased | (6,309,933) | (109,162,192) | (7,435,794) | (120,746,045) |
| Net increase (decrease) | (1,205,953) | $ (21,697,155) | 5,989,042 | $ 102,433,867 |
| SIX MONTHS ENDED March 31, 2024 | YEAR ENDED September 30, 2023 | |||
| INTERNATIONAL GROWTH FUND | SHARES | AMOUNT | SHARES | AMOUNT |
| Class A Shares | ||||
| Shares sold | 323,412 | $ 7,749,527 | 578,109 | $ 12,679,011 |
| Shares issued to shareholders in reinvestment of dividends | 8,080 | 192,231 | 11,150 | 232,369 |
| Shares repurchased | (692,183) | (16,276,261) | (1,288,447) | (27,750,731) |
| Net increase (decrease) | (360,691) | $ (8,334,503) | (699,188) | $ (14,839,351) |
| Class C Shares | ||||
| Shares sold | 3,512 | $ 74,589 | 8,990 | $ 174,379 |
| Shares issued to shareholders in reinvestment of dividends | - | - | - | - |
| Shares repurchased | (101,809) | (2,104,815) | (233,053) | (4,512,693) |
| Net increase (decrease) | (98,297) | $ (2,030,226) | (224,063) | $ (4,338,314) |
| Class I Shares | ||||
| Shares sold | 1,135,462 | $ 27,894,278 | 3,789,292 | $ 84,031,408 |
| Shares issued to shareholders in reinvestment of dividends | 149,145 | 3,680,897 | 221,806 | 4,795,444 |
| Shares repurchased | (3,958,666) | (97,870,148) | (14,293,232) | (317,055,044) |
| Net increase (decrease) | (2,674,059) | $ (66,294,973) | (10,282,134) | $ (228,228,192) |
March 31, 2024 (Unaudited)
| SIX MONTHS ENDED March 31, 2024 | YEAR ENDED September 30, 2023 | |||
| INTERNATIONAL GROWTH FUND | SHARES | AMOUNT | SHARES | AMOUNT |
| Class R3 Shares | ||||
| Shares sold | 13,146 | $ 307,941 | 38,644 | $ 837,250 |
| Shares issued to shareholders in reinvestment of dividends | 282 | 6,584 | 351 | 7,201 |
| Shares repurchased | (27,330) | (631,695) | (68,867) | (1,415,017) |
| Net increase (decrease) | (13,902) | $ (317,170) | (29,872) | $ (570,566) |
| Class R4 Shares | ||||
| Shares sold | 23,750 | $ 557,381 | 53,972 | $ 1,179,309 |
| Shares issued to shareholders in reinvestment of dividends | 307 | 7,228 | 545 | 11,257 |
| Shares repurchased | (79,127) | (1,921,495) | (92,569) | (1,991,059) |
| Net increase (decrease) | (55,070) | $ (1,356,886) | (38,052) | $ (800,493) |
| Class R5 Shares | ||||
| Shares sold | 42,044 | $ 1,064,641 | 140,396 | $ 3,239,664 |
| Shares issued to shareholders in reinvestment of dividends | 2,995 | 74,150 | 7,816 | 169,448 |
| Shares repurchased | (210,077) | (5,262,305) | (688,032) | (15,683,738) |
| Net increase (decrease) | (165,038) | $ (4,123,514) | (539,820) | $ (12,274,626) |
| Class R6 Shares | ||||
| Shares sold | 70,395 | $ 1,771,179 | 184,989 | $ 4,241,064 |
| Shares issued to shareholders in reinvestment of dividends | 19,758 | 491,183 | 25,612 | 557,839 |
| Shares repurchased | (93,011) | (2,347,208) | (477,558) | (11,077,421) |
| Net increase (decrease) | (2,858) | $ (84,846) | (266,957) | $ (6,278,518) |
| SIX MONTHS ENDED March 31, 2024 | YEAR ENDED September 30, 2023 | |||
| DEVELOPING WORLD FUND | SHARES | AMOUNT | SHARES | AMOUNT |
| Class A Shares | ||||
| Shares sold | 503,099 | $ 10,144,758 | 831,891 | $ 16,932,746 |
| Shares issued to shareholders in reinvestment of dividends | 63,772 | 1,288,201 | 60,652 | 1,196,665 |
| Shares repurchased | (1,041,660) | (21,016,192) | (1,423,791) | (28,877,796) |
| Net increase (decrease) | (474,789) | $ (9,583,233) | (531,248) | $ (10,748,385) |
| Class C Shares | ||||
| Shares sold | 30,302 | $ 580,127 | 46,605 | $ 859,875 |
| Shares issued to shareholders in reinvestment of dividends | 3,471 | 66,087 | 2,206 | 40,950 |
| Shares repurchased | (165,367) | (3,131,231) | (409,111) | (7,755,124) |
| Net increase (decrease) | (131,594) | $ (2,485,017) | (360,300) | $ (6,854,299) |
| Class I Shares | ||||
| Shares sold | 3,621,169 | $ 75,057,766 | 13,630,885 | $ 284,495,601 |
| Shares issued to shareholders in reinvestment of dividends | 762,019 | 15,758,554 | 680,314 | 13,735,542 |
| Shares repurchased | (9,820,646) | (204,656,098) | (15,447,650) | (317,807,604) |
| Net increase (decrease) | (5,437,458) | $ (113,839,778) | (1,136,451) | $ (19,576,461) |
March 31, 2024 (Unaudited)
| SIX MONTHS ENDED March 31, 2024 | YEAR ENDED September 30, 2023 | |||
| DEVELOPING WORLD FUND | SHARES | AMOUNT | SHARES | AMOUNT |
| Class R5 Shares | ||||
| Shares sold | 12,118 | $ 251,274 | 64,298 | $ 1,260,653 |
| Shares issued to shareholders in reinvestment of dividends | 3,239 | 66,745 | 2,871 | 57,789 |
| Shares repurchased | (28,405) | (593,237) | (35,359) | (724,953) |
| Net increase (decrease) | (13,048) | $ (275,218) | 31,810 | $ 593,489 |
| Class R6 Shares | ||||
| Shares sold | 223,206 | $ 4,703,911 | 402,990 | $ 8,389,832 |
| Shares issued to shareholders in reinvestment of dividends | 59,957 | 1,241,706 | 50,092 | 1,013,358 |
| Shares repurchased | (275,998) | (5,838,039) | (322,162) | (6,692,834) |
| Net increase (decrease) | 7,165 | $ 107,578 | 130,920 | $ 2,710,356 |
| SIX MONTHS ENDED March 31, 2024 | YEAR ENDED September 30, 2023 | |||
| SMALL/MID CAP CORE FUND | SHARES | AMOUNT | SHARES | AMOUNT |
| Class A Shares | ||||
| Shares sold | 35,769 | $ 2,342,208 | 80,057 | $ 4,815,941 |
| Shares issued to shareholders in reinvestment of dividends | - | - | 2,209 | 130,588 |
| Shares repurchased | (388,661) | (25,058,689) | (823,989) | (49,388,976) |
| Net increase (decrease) | (352,892) | $ (22,716,481) | (741,723) | $ (44,442,447) |
| Class C Shares | ||||
| Shares sold | 1,376 | $ 77,083 | 3,207 | $ 164,823 |
| Shares issued to shareholders in reinvestment of dividends | - | - | - | - |
| Shares repurchased | (23,894) | (1,282,936) | (73,298) | (3,755,323) |
| Net increase (decrease) | (22,518) | $ (1,205,853) | (70,091) | $ (3,590,500) |
| Class I Shares | ||||
| Shares sold | 59,819 | $ 4,094,558 | 101,666 | $ 6,454,179 |
| Shares issued to shareholders in reinvestment of dividends | - | - | 16,489 | 1,017,848 |
| Shares repurchased | (219,850) | (14,715,465) | (595,212) | (37,241,178) |
| Net increase (decrease) | (160,031) | $ (10,620,907) | (477,057) | $ (29,769,151) |
| Class R3 Shares | ||||
| Shares sold | 7,946 | $ 503,246 | 25,100 | $ 1,501,124 |
| Shares issued to shareholders in reinvestment of dividends | - | - | 266 | 15,650 |
| Shares repurchased | (38,453) | (2,504,714) | (59,406) | (3,535,469) |
| Net increase (decrease) | (30,507) | $ (2,001,468) | (34,040) | $ (2,018,695) |
| Class R4 Shares | ||||
| Shares sold | 1,886 | $ 124,005 | 5,518 | $ 336,921 |
| Shares issued to shareholders in reinvestment of dividends | - | - | 107 | 6,387 |
| Shares repurchased | (4,230) | (295,258) | (18,697) | (1,149,650) |
| Net increase (decrease) | (2,344) | $ (171,253) | (13,072) | $ (806,342) |
March 31, 2024 (Unaudited)
| SIX MONTHS ENDED March 31, 2024 | YEAR ENDED September 30, 2023 | |||
| SMALL/MID CAP CORE FUND | SHARES | AMOUNT | SHARES | AMOUNT |
| Class R5 Shares | ||||
| Shares sold | 3,015 | $ 200,528 | 9,468 | $ 593,423 |
| Shares issued to shareholders in reinvestment of dividends | - | - | 484 | 29,855 |
| Shares repurchased | (9,534) | (634,829) | (69,751) | (4,490,099) |
| Net increase (decrease) | (6,519) | $ (434,301) | (59,799) | $ (3,866,821) |
| SIX MONTHS ENDED March 31, 2024 | YEAR ENDED September 30, 2023 | |||
| SMALL/MID CAP GROWTH FUND | SHARES | AMOUNT | SHARES | AMOUNT |
| Class A Shares | ||||
| Shares sold | 92,677 | $ 2,422,062 | 195,052 | $ 4,608,839 |
| Shares issued to shareholders in reinvestment of dividends | - | - | - | - |
| Shares repurchased | (598,357) | (15,187,882) | (1,697,313) | (39,033,955) |
| Net increase (decrease) | (505,680) | $ (12,765,820) | (1,502,261) | $ (34,425,116) |
| Class C Shares | ||||
| Shares sold | 5,483 | $ 98,329 | 5,569 | $ 94,146 |
| Shares issued to shareholders in reinvestment of dividends | - | - | - | - |
| Shares repurchased | (62,296) | (1,147,894) | (154,543) | (2,597,269) |
| Net increase (decrease) | (56,813) | $ (1,049,565) | (148,974) | $ (2,503,123) |
| Class I Shares | ||||
| Shares sold | 60,269 | $ 1,851,886 | 134,409 | $ 3,559,163 |
| Shares issued to shareholders in reinvestment of dividends | - | - | - | - |
| Shares repurchased | (835,604) | (22,776,256) | (842,729) | (22,252,193) |
| Net increase (decrease) | (775,335) | $ (20,924,370) | (708,320) | $ (18,693,030) |
| Class R3 Shares | ||||
| Shares sold | 24,657 | $ 619,094 | 67,079 | $ 1,543,065 |
| Shares issued to shareholders in reinvestment of dividends | - | - | - | - |
| Shares repurchased | (67,422) | (1,706,387) | (164,259) | (3,708,208) |
| Net increase (decrease) | (42,765) | $ (1,087,293) | (97,180) | $ (2,165,143) |
| Class R4 Shares | ||||
| Shares sold | 883 | $ 22,652 | 4,685 | $ 107,643 |
| Shares issued to shareholders in reinvestment of dividends | - | - | - | - |
| Shares repurchased | (6,015) | (151,457) | (21,567) | (514,998) |
| Net increase (decrease) | (5,132) | $ (128,805) | (16,882) | $ (407,355) |
| Class R5 Shares | ||||
| Shares sold | 21,469 | $ 613,179 | 63,782 | $ 1,783,353 |
| Shares issued to shareholders in reinvestment of dividends | - | - | - | - |
| Shares repurchased | (45,725) | (1,312,606) | (163,354) | (4,359,536) |
| Net increase (decrease) | (24,256) | $ (699,427) | (99,572) | $ (2,576,183) |
March 31, 2024 (Unaudited)
| SIX MONTHS ENDED March 31, 2024 | YEAR ENDED September 30, 2023 | |||
| INCOME BUILDER FUND | SHARES | AMOUNT | SHARES | AMOUNT |
| Class A Shares | ||||
| Shares sold | 5,868,474 | $ 136,997,350 | 17,596,421 | $ 385,599,031 |
| Shares issued to shareholders in reinvestment of dividends | 3,902,253 | 94,311,327 | 8,296,992 | 183,332,988 |
| Shares repurchased | (12,715,714) | (298,468,176) | (25,830,307) | (567,648,084) |
| Net increase (decrease) | (2,944,987) | $ (67,159,499) | 63,106 | $ 1,283,935 |
| Class C Shares | ||||
| Shares sold | 1,595,445 | $ 37,312,123 | 2,870,931 | $ 63,315,846 |
| Shares issued to shareholders in reinvestment of dividends | 419,020 | 10,107,080 | 1,113,980 | 24,504,174 |
| Shares repurchased | (3,774,735) | (87,848,552) | (11,575,054) | (253,678,474) |
| Net increase (decrease) | (1,760,270) | $ (40,429,349) | (7,590,143) | $ (165,858,454) |
| Class I Shares | ||||
| Shares sold | 28,178,104 | $ 662,032,078 | 64,411,465 | $ 1,435,919,240 |
| Shares issued to shareholders in reinvestment of dividends | 7,234,917 | 176,224,911 | 14,007,229 | 312,275,940 |
| Shares repurchased | (27,607,050) | (652,311,270) | (45,547,584) | (1,005,204,732) |
| Net increase (decrease) | 7,805,971 | $ 185,945,719 | 32,871,110 | $ 742,990,448 |
| Class R3 Shares | ||||
| Shares sold | 34,608 | $ 811,132 | 73,395 | $ 1,622,458 |
| Shares issued to shareholders in reinvestment of dividends | 19,248 | 464,864 | 44,819 | 988,379 |
| Shares repurchased | (105,519) | (2,456,106) | (255,363) | (5,600,344) |
| Net increase (decrease) | (51,663) | $ (1,180,110) | (137,149) | $ (2,989,507) |
| Class R4 Shares | ||||
| Shares sold | 42,918 | $ 986,061 | 59,372 | $ 1,302,050 |
| Shares issued to shareholders in reinvestment of dividends | 9,343 | 226,048 | 21,972 | 485,428 |
| Shares repurchased | (28,292) | (650,428) | (155,126) | (3,464,600) |
| Net increase (decrease) | 23,969 | $ 561,681 | (73,782) | $ (1,677,122) |
| Class R5 Shares | ||||
| Shares sold | 92,892 | $ 2,195,684 | 172,160 | $ 3,781,989 |
| Shares issued to shareholders in reinvestment of dividends | 19,238 | 468,216 | 50,269 | 1,114,795 |
| Shares repurchased | (114,021) | (2,704,082) | (922,962) | (20,762,678) |
| Net increase (decrease) | (1,891) | $ (40,182) | (700,533) | $ (15,865,894) |
| Class R6 Shares | ||||
| Shares sold | 2,032,668 | $ 47,210,410 | 1,979,752 | $ 43,778,848 |
| Shares issued to shareholders in reinvestment of dividends | 241,320 | 5,866,032 | 397,853 | 8,855,951 |
| Shares repurchased | (428,761) | (10,086,707) | (393,241) | (8,732,940) |
| Net increase (decrease) | 1,845,227 | $ 42,989,735 | 1,984,364 | $ 43,901,859 |
March 31, 2024 (Unaudited)
| SIX MONTHS ENDED March 31, 2024 | YEAR ENDED September 30, 2023 | |||
| SUMMIT FUND | SHARES | AMOUNT | SHARES | AMOUNT |
| Class A Shares | ||||
| Shares sold | 321,342 | $ 3,776,396 | 579,948 | $ 6,585,955 |
| Shares issued to shareholders in reinvestment of dividends | 6,328 | 77,880 | 9,556 | 110,469 |
| Shares repurchased | (168,200) | (1,967,115) | (109,451) | (1,245,452) |
| Net increase (decrease) | 159,470 | $ 1,887,161 | 480,053 | $ 5,450,972 |
| Class I Shares | ||||
| Shares sold | 729,771 | $ 8,639,970 | 1,638,376 | $ 18,606,705 |
| Shares issued to shareholders in reinvestment of dividends | 68,766 | 844,484 | 153,205 | 1,755,389 |
| Shares repurchased | (257,156) | (3,050,630) | (601,699) | (6,848,241) |
| Net increase (decrease) | 541,381 | $ 6,433,824 | 1,189,882 | $ 13,513,853 |
| Purchases | Sales | |
| Global Opportunities Fund | $ 50,918,352 | $ 106,991,596 |
| International Equity Fund | 433,989,479 | 432,941,440 |
| Better World International Fund | 158,708,958 | 176,871,086 |
| International Growth Fund | 173,633,976 | 242,996,720 |
| Developing World Fund | 476,103,778 | 603,742,527 |
| Small/Mid Cap Core Fund | 100,991,440 | 141,402,786 |
| Small/Mid Cap Growth Fund | 48,635,703 | 87,327,262 |
| Income Builder Fund | 1,737,961,022 | 1,468,074,435 |
| Summit Fund | 35,913,624 | 25,415,818 |
March 31, 2024 (Unaudited)
| Forward currency purchase | Forward currency sell | |
| Global Opportunities Fund | $ — | $ 146,611,453 |
| International Equity Fund | 38,388,385 | 165,174,819 |
| Income Builder Fund | 1,010,877 | 2,082,626,671 |
| Summit Fund | 4,064,009 | — |
March 31, 2024 (Unaudited)
| Type of Derivative(a) | Principal Risk | Counter Party | Asset Derivatives | Liability Derivatives | Net Amount | |
| Global Opportunities Fund | Forward currency contracts | Foreign currency risk | SSB | $ 662,339 | $ — | $ 662,339 |
| Forward currency contracts | Foreign currency risk | BBH | 529,074 | — | 529,074 | |
| $ 1,191,413 | $ — | $ 1,191,413 | ||||
| Income Builder Fund | Forward currency contracts | Foreign currency risk | SSB | 10,570,673 | — | 10,570,673 |
| Forward currency contracts | Foreign currency risk | BBH | 7,307,892 | — | 7,307,892 | |
| $ 17,878,565 | $ — | $ 17,878,565 | ||||
| Summit Fund | Forward currency contracts | Foreign currency risk | SSB | — | (10,243) | (10,243) |
| Forward currency contracts | Foreign currency risk | MSC | — | (57,429) | (57,429) | |
| $ — | $ (67,672) | $ (67,672) |
| (a) | Generally, the Statement of Assets and Liabilities location for forward currency contracts is Assets - Unrealized appreciation on forward currency contracts for asset derivatives and Liabilities - Unrealized depreciation on forward currency contracts for liabilities derivatives. |
| Net Realized | Net Change in Unrealized | |||
| Type of Derivative(a) | Principal Risk | Gain (Loss) | Appreciation (Depreciation) | |
| Global Opportunities Fund | Forward currency contracts | Foreign currency risk | $ 1,600,892 | $ (4,089,824) |
| International Equity Fund | Forward currency contracts | Foreign currency risk | 14,029,708 | (8,997,761) |
| Income Builder Fund | Forward currency contracts | Foreign currency risk | 30,954,485 | (58,518,581) |
| Summit Fund | Forward currency contracts | Foreign currency risk | (191,699) | 149,417 |
| (a) | Generally, the Statement of Operations location for forward currency contracts is Net realized gain (loss) on: forward currency contracts and Net change in unrealized appreciation (depreciation) on: forward currency contracts. |
Global Opportunities Fund
| PER SHARE PERFORMANCE (FOR A SHARE OUTSTANDING THROUGHOUT THE PERIOD) | ||||||||||
| UNLESS OTHERWISE NOTED, PERIODS ARE FISCAL YEARS ENDED SEPTEMBER 30, | Net Asset Value, Beginning of PERIOD | Net Investment Income (Loss)+ | Net Realized & Unrealized Gain (Loss) on Investments | Total from Investment Operations | Dividends from Net Investment Income | Dividends from Net Realized Gains | Dividends from Return of Capital | Total Dividends | Net Asset Value, End of PERIOD | |
| CLASS A SHARES(c) | ||||||||||
| 2024 (d) | $ 32.63 | 0.05 | 5.64 | 5.69 | (0.63) | (1.20) | — | (1.83) | $ 36.49 | |
| 2023 | $ 27.76 | 0.67 | 5.35 | 6.02 | (0.36) | (0.79) | — | (1.15) | $ 32.63 | |
| 2022 | $ 39.32 | 0.28 | (6.80) | (6.52) | (0.49) | (4.55) | — | (5.04) | $ 27.76 | |
| 2021 | $ 31.69 | 0.53 | 9.40 | 9.93 | — (g) | (2.30) | — | (2.30) | $ 39.32 | |
| 2020 | $ 27.56 | 0.08 | 4.47 | 4.55 | (0.14) | (0.28) | — | (0.42) | $ 31.69 | |
| 2019 | $ 29.93 | 0.20 | (2.02) | (1.82) | (0.55) | — | — | (0.55) | $ 27.56 | |
| CLASS C SHARES | ||||||||||
| 2024 (d) | $ 30.82 | (0.09) | 5.34 | 5.25 | (0.21) | (1.20) | — | (1.41) | $ 34.66 | |
| 2023 | $ 26.21 | 0.40 | 5.06 | 5.46 | (0.06) | (0.79) | — | (0.85) | $ 30.82 | |
| 2022 | $ 37.36 | — (h) | (6.41) | (6.41) | (0.19) | (4.55) | — | (4.74) | $ 26.21 | |
| 2021 | $ 30.44 | 0.22 | 9.00 | 9.22 | — | (2.30) | — | (2.30) | $ 37.36 | |
| 2020 | $ 26.55 | (0.14) | 4.31 | 4.17 | — | (0.28) | — | (0.28) | $ 30.44 | |
| 2019 | $ 28.70 | (0.01) | (1.89) | (1.90) | (0.25) | — | — | (0.25) | $ 26.55 | |
| CLASS I SHARES | ||||||||||
| 2024 (d) | $ 32.82 | 0.10 | 5.66 | 5.76 | (0.73) | (1.20) | — | (1.93) | $ 36.65 | |
| 2023 | $ 27.91 | 0.78 | 5.37 | 6.15 | (0.45) | (0.79) | — | (1.24) | $ 32.82 | |
| 2022 | $ 39.49 | 0.39 | (6.83) | (6.44) | (0.59) | (4.55) | — | (5.14) | $ 27.91 | |
| 2021 | $ 31.81 | 0.64 | 9.43 | 10.07 | (0.09) | (2.30) | — | (2.39) | $ 39.49 | |
| 2020 | $ 27.67 | 0.15 | 4.50 | 4.65 | (0.23) | (0.28) | — | (0.51) | $ 31.81 | |
| 2019 | $ 30.07 | 0.29 | (2.04) | (1.75) | (0.65) | — | — | (0.65) | $ 27.67 | |
| CLASS R3 SHARES | ||||||||||
| 2024 (d) | $ 32.20 | 0.02 | 5.57 | 5.59 | (0.55) | (1.20) | — | (1.75) | $ 36.04 | |
| 2023 | $ 27.37 | 0.61 | 5.28 | 5.89 | (0.27) | (0.79) | — | (1.06) | $ 32.20 | |
| 2022 | $ 38.81 | 0.20 | (6.69) | (6.49) | (0.40) | (4.55) | — | (4.95) | $ 27.37 | |
| 2021 | $ 31.38 | 0.42 | 9.31 | 9.73 | — | (2.30) | — | (2.30) | $ 38.81 | |
| 2020 | $ 27.28 | 0.01 | 4.42 | 4.43 | (0.05) | (0.28) | — | (0.33) | $ 31.38 | |
| 2019 | $ 29.57 | 0.15 | (1.98) | (1.83) | (0.46) | — | — | (0.46) | $ 27.28 | |
| CLASS R4 SHARES | ||||||||||
| 2024 (d) | $ 32.36 | 0.03 | 5.59 | 5.62 | (0.59) | (1.20) | — | (1.79) | $ 36.19 | |
| 2023 | $ 27.53 | 0.64 | 5.30 | 5.94 | (0.32) | (0.79) | — | (1.11) | $ 32.36 | |
| 2022 | $ 39.01 | 0.24 | (6.73) | (6.49) | (0.44) | (4.55) | — | (4.99) | $ 27.53 | |
| 2021 | $ 31.50 | 0.49 | 9.32 | 9.81 | — | (2.30) | — | (2.30) | $ 39.01 | |
| 2020 | $ 27.32 | 0.03 | 4.43 | 4.46 | — | (0.28) | — | (0.28) | $ 31.50 | |
| 2019 | $ 29.62 | 0.19 | (2.00) | (1.81) | (0.49) | — | — | (0.49) | $ 27.32 | |
| CLASS R5 SHARES | ||||||||||
| 2024 (d) | $ 32.87 | 0.10 | 5.67 | 5.77 | (0.73) | (1.20) | — | (1.93) | $ 36.71 | |
| 2023 | $ 27.95 | 0.79 | 5.37 | 6.16 | (0.45) | (0.79) | — | (1.24) | $ 32.87 | |
| 2022 | $ 39.53 | 0.38 | (6.83) | (6.45) | (0.58) | (4.55) | — | (5.13) | $ 27.95 | |
| 2021 | $ 31.84 | 0.61 | 9.47 | 10.08 | (0.09) | (2.30) | — | (2.39) | $ 39.53 | |
| 2020 | $ 27.70 | 0.15 | 4.50 | 4.65 | (0.23) | (0.28) | — | (0.51) | $ 31.84 | |
| 2019 | $ 30.10 | 0.28 | (2.02) | (1.74) | (0.66) | — | — | (0.66) | $ 27.70 | |
| CLASS R6 SHARES | ||||||||||
| 2024 (d) | $ 32.97 | 0.13 | 5.69 | 5.82 | (0.78) | (1.20) | — | (1.98) | $ 36.81 | |
| 2023 | $ 28.03 | 0.82 | 5.40 | 6.22 | (0.49) | (0.79) | — | (1.28) | $ 32.97 | |
| 2022 | $ 39.64 | 0.44 | (6.86) | (6.42) | (0.64) | (4.55) | — | (5.19) | $ 28.03 | |
| 2021 | $ 31.93 | 0.70 | 9.44 | 10.14 | (0.13) | (2.30) | — | (2.43) | $ 39.64 | |
| 2020 | $ 27.77 | 0.21 | 4.50 | 4.71 | (0.27) | (0.28) | — | (0.55) | $ 31.93 | |
| 2019 | $ 30.20 | 0.32 | (2.05) | (1.73) | (0.70) | — | — | (0.70) | $ 27.77 | |
| (a) | Net investment income (loss) includes income from foreign withholding tax claims adjusted for IRS compliance fees and/or tax reclaim collection fees. Without these proceeds, the Net Investment Income (Loss) ratios would have been as follows: |
| Class A | Class C | Class I | Class R3 | Class R4 | Class R5 | Class R6 | |
| 2024 | 0.27% | (0.59)% | 0.58% | 0.06% | 0.17% | 0.57% | 0.72% |
| 2023 | 2.07% | 1.28% | 2.38% | 1.91% | 1.97% | 2.41% | 2.52% |
| 2022 | 0.79% | (0.04)% | 1.10% | 0.56% | 0.67% | 1.08% | 1.24% |
| 2021 | 1.36% | 0.57% | 1.64% | 1.10% | 1.27% | 1.60% | 1.80% |
| (b) | Not annualized for periods less than one year. |
| (c) | Sales loads are not reflected in computing total return. |
| (d) | Unaudited Six Month Period Ended March 31. |
| (e) | Annualized. |
Global Opportunities Fund
| RATIOS TO AVERAGE NET ASSETS | Supplemental Data | ||||||
| UNLESS OTHERWISE NOTED, PERIODS ARE FISCAL YEARS ENDED SEPTEMBER 30, | Net Investment Income (Loss) (%)(a) | Expenses, After Expense Reductions (%) | Expenses, Before Expense Reductions (%) | Total Return (%)(b) | Portfolio Turnover Rate (%)(b) | Net Assets at End of PERIOD (Thousands) | |
| CLASS A SHARES(c) | |||||||
| 2024 (d) | 0.31 (e) | 1.30 (e) | 1.35 (e) | 18.28 (f) | 4.91 | $ 326,363 | |
| 2023 | 2.09 | 1.29 | 1.33 | 21.93 | 17.07 | $ 284,351 | |
| 2022 | 0.83 | 1.29 | 1.35 | (19.31) | 26.92 | $ 218,968 | |
| 2021 | 1.42 | 1.27 | 1.31 | 32.82 | 25.48 | $ 277,126 | |
| 2020 | 0.27 | 1.28 | 1.32 | 16.59 | 35.63 | $ 215,473 | |
| 2019 | 0.73 | 1.31 | 1.33 | (5.78) | 29.12 | $ 236,560 | |
| CLASS C SHARES | |||||||
| 2024 (d) | (0.55) (e) | 2.16 (e) | 2.21 (e) | 17.77 | 4.91 | $ 31,924 | |
| 2023 | 1.31 | 2.09 | 2.13 | 20.99 | 17.07 | $ 39,916 | |
| 2022 | — (h) | 2.06 | 2.11 | (19.94) | 26.92 | $ 63,994 | |
| 2021 | 0.63 | 2.04 | 2.08 | 31.77 | 25.48 | $ 112,420 | |
| 2020 | (0.49) | 2.02 | 2.06 | 15.78 | 35.63 | $ 116,705 | |
| 2019 | (0.02) | 2.07 | 2.09 | (6.49) | 29.12 | $ 151,469 | |
| CLASS I SHARES | |||||||
| 2024 (d) | 0.61 (e) | 0.99 (e) | 1.08 (e) | 18.45 | 4.91 | $ 697,662 | |
| 2023 | 2.41 | 0.99 | 1.06 | 22.32 | 17.07 | $ 626,942 | |
| 2022 | 1.14 | 0.99 | 1.06 | (19.06) | 26.92 | $ 446,228 | |
| 2021 | 1.69 | 0.99 | 1.06 | 33.17 | 25.48 | $ 605,581 | |
| 2020 | 0.50 | 0.99 | 1.08 | 16.91 | 35.63 | $ 523,175 | |
| 2019 | 1.05 | 0.99 | 1.06 | (5.46) | 29.12 | $ 762,697 | |
| CLASS R3 SHARES | |||||||
| 2024 (d) | 0.10 (e) | 1.50 (e) | 2.48 (e) | 18.21 | 4.91 | $ 2,670 | |
| 2023 | 1.94 | 1.50 | 2.43 | 21.76 | 17.07 | $ 2,761 | |
| 2022 | 0.61 | 1.50 | 2.40 | (19.47) | 26.92 | $ 2,639 | |
| 2021 | 1.15 | 1.50 | 2.07 | 32.48 | 25.48 | $ 3,776 | |
| 2020 | 0.03 | 1.50 | 2.00 | 16.32 | 35.63 | $ 3,633 | |
| 2019 | 0.55 | 1.50 | 2.20 | (5.95) | 29.12 | $ 4,317 | |
| CLASS R4 SHARES | |||||||
| 2024 (d) | 0.20 (e) | 1.40 (e) | 2.15 (e) | 18.21 | 4.91 | $ 5,351 | |
| 2023 | 2.00 | 1.40 | 2.10 | 21.82 | 17.07 | $ 5,023 | |
| 2022 | 0.72 | 1.40 | 2.09 | (19.37) | 26.92 | $ 4,573 | |
| 2021 | 1.32 | 1.40 | 1.83 | 32.62 | 25.48 | $ 6,177 | |
| 2020 | 0.09 | 1.40 | 1.62 | 16.41 | 35.63 | $ 5,093 | |
| 2019 | 0.71 | 1.40 | 1.86 | (5.84) | 29.12 | $ 9,254 | |
| CLASS R5 SHARES | |||||||
| 2024 (d) | 0.61 (e) | 0.99 (e) | 1.33 (e) | 18.45 | 4.91 | $ 18,188 | |
| 2023 | 2.43 | 0.99 | 1.20 | 22.32 | 17.07 | $ 17,592 | |
| 2022 | 1.12 | 0.99 | 1.38 | (19.06) | 26.92 | $ 15,512 | |
| 2021 | 1.64 | 0.99 | 1.36 | 33.18 | 25.48 | $ 20,673 | |
| 2020 | 0.53 | 0.99 | 1.28 | 16.89 | 35.63 | $ 32,817 | |
| 2019 | 1.04 | 0.99 | 1.27 | (5.45) | 29.12 | $ 42,354 | |
| CLASS R6 SHARES | |||||||
| 2024 (d) | 0.76 (e) | 0.85 (e) | 1.03 (e) | 18.55 | 4.91 | $ 71,806 | |
| 2023 | 2.54 | 0.85 | 1.02 | 22.50 | 17.07 | $ 57,844 | |
| 2022 | 1.28 | 0.85 | 1.03 | (18.95) | 26.92 | $ 47,300 | |
| 2021 | 1.85 | 0.85 | 1.00 | 33.32 | 25.48 | $ 57,072 | |
| 2020 | 0.70 | 0.85 | 1.03 | 17.08 | 35.63 | $ 43,911 | |
| 2019 | 1.17 | 0.85 | 1.00 | (5.34) | 29.12 | $ 45,699 | |
| (f) | The total return based on the NAV which reflects adjustments in accordance with U.S. GAAP is 18.31%. |
| (g) | Dividends From Net Investment Income was less than 0.01. |
| (h) | Net investment income (loss) was less than $0.01 per share. |
| + | Based on weighted average shares outstanding. |
International Equity Fund
| PER SHARE PERFORMANCE (FOR A SHARE OUTSTANDING THROUGHOUT THE PERIOD) | ||||||||||
| UNLESS OTHERWISE NOTED, PERIODS ARE FISCAL YEARS ENDED SEPTEMBER 30, | Net Asset Value, Beginning of PERIOD | Net Investment Income (Loss)+ | Net Realized & Unrealized Gain (Loss) on Investments | Total from Investment Operations | Dividends from Net Investment Income | Dividends from Net Realized Gains | Dividends from Return of Capital | Total Dividends | Net Asset Value, End of PERIOD | |
| CLASS A SHARES(d) | ||||||||||
| 2024 (e) | $ 22.51 | 0.10 | 3.79 | 3.89 | (0.44) | (0.10) | — | (0.54) | $ 25.86 | |
| 2023 | $ 18.19 | 0.38 | 4.30 | 4.68 | (0.36) | — | — | (0.36) | $ 22.51 | |
| 2022 | $ 28.75 | 0.29 | (7.15) | (6.86) | (0.27) | (3.43) | — | (3.70) | $ 18.19 | |
| 2021 | $ 24.78 | 0.31 | 4.49 | 4.80 | (0.06) | (0.77) | — | (0.83) | $ 28.75 | |
| 2020 | $ 22.91 | 0.07 | 3.29 | 3.36 | (0.21) | (1.28) | — | (1.49) | $ 24.78 | |
| 2019 | $ 22.69 | 0.19 | 0.31 | 0.50 | (0.28) | — | — | (0.28) | $ 22.91 | |
| CLASS C SHARES | ||||||||||
| 2024 (e) | $ 19.24 | (0.01) | 3.24 | 3.23 | (0.21) | (0.10) | — | (0.31) | $ 22.16 | |
| 2023 | $ 15.61 | 0.15 | 3.69 | 3.84 | (0.21) | — | — | (0.21) | $ 19.24 | |
| 2022 | $ 25.20 | 0.11 | (6.13) | (6.02) | (0.14) | (3.43) | — | (3.57) | $ 15.61 | |
| 2021 | $ 21.91 | 0.06 | 4.00 | 4.06 | — | (0.77) | — | (0.77) | $ 25.20 | |
| 2020 | $ 20.33 | (0.08) | 2.94 | 2.86 | — | (1.28) | — | (1.28) | $ 21.91 | |
| 2019 | $ 20.01 | — (h) | 0.32 | 0.32 | — | — | — | — | $ 20.33 | |
| CLASS I SHARES | ||||||||||
| 2024 (e) | $ 23.46 | 0.14 | 3.94 | 4.08 | (0.49) | (0.10) | — | (0.59) | $ 26.95 | |
| 2023 | $ 18.98 | 0.44 | 4.48 | 4.92 | (0.44) | — | — | (0.44) | $ 23.46 | |
| 2022 | $ 29.88 | 0.41 | (7.47) | (7.06) | (0.41) | (3.43) | — | (3.84) | $ 18.98 | |
| 2021 | $ 25.70 | 0.39 | 4.68 | 5.07 | (0.12) | (0.77) | — | (0.89) | $ 29.88 | |
| 2020 | $ 23.69 | 0.15 | 3.42 | 3.57 | (0.28) | (1.28) | — | (1.56) | $ 25.70 | |
| 2019 | $ 23.47 | 0.25 | 0.32 | 0.57 | (0.35) | — | — | (0.35) | $ 23.69 | |
| CLASS R3 SHARES | ||||||||||
| 2024 (e) | $ 22.44 | 0.08 | 3.78 | 3.86 | (0.38) | (0.10) | — | (0.48) | $ 25.82 | |
| 2023 | $ 18.17 | 0.32 | 4.29 | 4.61 | (0.34) | — | — | (0.34) | $ 22.44 | |
| 2022 | $ 28.75 | 0.27 | (7.16) | (6.89) | (0.26) | (3.43) | — | (3.69) | $ 18.17 | |
| 2021 | $ 24.77 | 0.23 | 4.52 | 4.75 | — | (0.77) | — | (0.77) | $ 28.75 | |
| 2020 | $ 22.89 | 0.03 | 3.29 | 3.32 | (0.16) | (1.28) | — | (1.44) | $ 24.77 | |
| 2019 | $ 22.65 | 0.15 | 0.31 | 0.46 | (0.22) | — | — | (0.22) | $ 22.89 | |
| CLASS R4 SHARES | ||||||||||
| 2024 (e) | $ 22.25 | 0.10 | 3.75 | 3.85 | (0.43) | (0.10) | — | (0.53) | $ 25.57 | |
| 2023 | $ 18.03 | 0.36 | 4.25 | 4.61 | (0.39) | — | — | (0.39) | $ 22.25 | |
| 2022 | $ 28.56 | 0.32 | (7.10) | (6.78) | (0.32) | (3.43) | — | (3.75) | $ 18.03 | |
| 2021 | $ 24.60 | 0.28 | 4.49 | 4.77 | (0.04) | (0.77) | — | (0.81) | $ 28.56 | |
| 2020 | $ 22.74 | 0.07 | 3.27 | 3.34 | (0.20) | (1.28) | — | (1.48) | $ 24.60 | |
| 2019 | $ 22.52 | 0.19 | 0.30 | 0.49 | (0.27) | — | — | (0.27) | $ 22.74 | |
| CLASS R5 SHARES | ||||||||||
| 2024 (e) | $ 23.43 | 0.14 | 3.94 | 4.08 | (0.49) | (0.10) | — | (0.59) | $ 26.92 | |
| 2023 | $ 18.96 | 0.44 | 4.47 | 4.91 | (0.44) | — | — | (0.44) | $ 23.43 | |
| 2022 | $ 29.84 | 0.39 | (7.44) | (7.05) | (0.40) | (3.43) | — | (3.83) | $ 18.96 | |
| 2021 | $ 25.66 | 0.38 | 4.67 | 5.05 | (0.10) | (0.77) | — | (0.87) | $ 29.84 | |
| 2020 | $ 23.67 | 0.13 | 3.42 | 3.55 | (0.28) | (1.28) | — | (1.56) | $ 25.66 | |
| 2019 | $ 23.44 | 0.25 | 0.32 | 0.57 | (0.34) | — | — | (0.34) | $ 23.67 | |
| CLASS R6 SHARES | ||||||||||
| 2024 (e) | $ 23.34 | 0.17 | 3.92 | 4.09 | (0.54) | (0.10) | — | (0.64) | $ 26.79 | |
| 2023 | $ 18.89 | 0.48 | 4.46 | 4.94 | (0.49) | — | — | (0.49) | $ 23.34 | |
| 2022 | $ 29.75 | 0.45 | (7.43) | (6.98) | (0.45) | (3.43) | — | (3.88) | $ 18.89 | |
| 2021 | $ 25.59 | 0.44 | 4.65 | 5.09 | (0.16) | (0.77) | — | (0.93) | $ 29.75 | |
| 2020 | $ 23.61 | 0.18 | 3.41 | 3.59 | (0.33) | (1.28) | — | (1.61) | $ 25.59 | |
| 2019 | $ 23.40 | 0.31 | 0.29 | 0.60 | (0.39) | — | — | (0.39) | $ 23.61 | |
| (a) | Net investment income (loss) includes income from foreign withholding tax claims adjusted for IRS compliance fees and/or tax reclaim collection fees. Without these proceeds, the Net Investment Income (Loss) ratios would have been as follows: |
| Class A | Class C | Class I | Class R3 | Class R4 | Class R5 | Class R6 | |
| 2024 | 0.82% | -0.14% | 1.12% | 0.63% | 0.82% | 1.07% | 1.31% |
| 2023 | 1.77% | 0.87% | 1.99% | 1.51% | 1.72% | 1.98% | 2.18% |
| 2022 | 1.20% | 0.52% | 1.61% | 1.11% | 1.32% | 1.53% | 1.80% |
| 2021 | 0.99% | 0.16% | 1.23% | 0.71% | 0.90% | 1.18% | 1.40% |
| (b) | Net expenses include tax reclaim collection fees that are excluded from the expense limitation agreement. If such expenses and fees had not occurred, the Expenses After Expense Reductions ratios for 2021 would have been: Class A, 1.25%; Class C, 1.96%; Class I, 0.94%; Class R3, 1.45%; Class R4, 1.25%; Class R5, 0.99%; Class R6, 0.79%. |
| (c) | Not annualized for periods less than one year. |
| (d) | Sales loads are not reflected in computing total return. |
| (e) | Unaudited Six Month Period Ended March 31. |
| (f) | Annualized. |
International Equity Fund
| RATIOS TO AVERAGE NET ASSETS | Supplemental Data | ||||||
| UNLESS OTHERWISE NOTED, PERIODS ARE FISCAL YEARS ENDED SEPTEMBER 30, | Net Investment Income (Loss) (%)(a) | Expenses, After Expense Reductions (%)(b) | Expenses, Before Expense Reductions (%) | Total Return (%)(c) | Portfolio Turnover Rate (%)(c) | Net Assets at End of PERIOD (Thousands) | |
| CLASS A SHARES(d) | |||||||
| 2024 (e) | 0.86 (f) | 1.16 (f) | 1.29 (f) | 17.45 (g) | 18.70 | $ 406,163 | |
| 2023 | 1.68 | 1.10 | 1.23 | 25.83 | 43.13 | $ 371,073 | |
| 2022 | 1.25 | 1.30 | 1.38 | (27.88) | 48.88 | $ 339,638 | |
| 2021 | 1.07 | 1.58 | 1.58 | 19.66 | 42.85 | $ 543,262 | |
| 2020 | 0.31 | 1.25 | 1.26 | 15.33 | 79.05 | $ 825,677 | |
| 2019 | 0.86 | 1.26 | 1.26 | 2.47 | 71.09 | $ 655,807 | |
| CLASS C SHARES | |||||||
| 2024 (e) | (0.09) (f) | 2.07 (f) | 2.19 (f) | 16.94 | 18.70 | $ 10,722 | |
| 2023 | 0.77 | 1.98 | 2.12 | 24.70 | 43.13 | $ 12,360 | |
| 2022 | 0.56 | 1.96 | 2.05 | (28.38) | 48.88 | $ 13,978 | |
| 2021 | 0.24 | 2.26 | 2.26 | 18.83 | 42.85 | $ 27,189 | |
| 2020 | (0.40) | 1.93 | 1.94 | 14.69 | 79.05 | $ 44,594 | |
| 2019 | (0.02) | 2.09 | 2.09 | 1.60 | 71.09 | $ 81,401 | |
| CLASS I SHARES | |||||||
| 2024 (e) | 1.16 (f) | 0.87 (f) | 0.99 (f) | 17.69 | 18.70 | $ 1,538,794 | |
| 2023 | 1.90 | 0.88 | 1.01 | 26.09 (i) | 43.13 | $ 1,390,996 | |
| 2022 | 1.66 | 0.90 | 1.00 | (27.64) | 48.88 | $ 1,254,672 | |
| 2021 | 1.32 | 1.24 | 1.24 | 20.05 | 42.85 | $ 2,000,723 | |
| 2020 | 0.64 | 0.92 | 0.93 | 15.74 | 79.05 | $ 1,713,358 | |
| 2019 | 1.11 | 0.97 | 0.97 | 2.76 | 71.09 | $ 1,694,780 | |
| CLASS R3 SHARES | |||||||
| 2024 (e) | 0.67 (f) | 1.36 (f) | 1.69 (f) | 17.39 | 18.70 | $ 121,906 | |
| 2023 | 1.42 | 1.36 | 1.71 | 25.47 | 43.13 | $ 110,275 | |
| 2022 | 1.16 | 1.40 | 1.70 | (27.97) | 48.88 | $ 100,783 | |
| 2021 | 0.80 | 1.75 | 1.91 | 19.46 | 42.85 | $ 157,724 | |
| 2020 | 0.12 | 1.45 | 1.58 | 15.11 | 79.05 | $ 152,764 | |
| 2019 | 0.67 | 1.45 | 1.65 | 2.25 | 71.09 | $ 164,437 | |
| CLASS R4 SHARES | |||||||
| 2024 (e) | 0.87 (f) | 1.16 (f) | 1.48 (f) | 17.51 | 18.70 | $ 91,498 | |
| 2023 | 1.62 | 1.16 | 1.48 | 25.68 | 43.13 | $ 82,599 | |
| 2022 | 1.37 | 1.19 | 1.50 | (27.81) | 48.88 | $ 69,822 | |
| 2021 | 0.99 | 1.55 | 1.70 | 19.69 | 42.85 | $ 104,735 | |
| 2020 | 0.30 | 1.25 | 1.32 | 15.35 | 79.05 | $ 102,266 | |
| 2019 | 0.88 | 1.25 | 1.44 | 2.45 | 71.09 | $ 125,363 | |
| CLASS R5 SHARES | |||||||
| 2024 (e) | 1.12 (f) | 0.90 (f) | 1.18 (f) | 17.64 | 18.70 | $ 106,426 | |
| 2023 | 1.90 | 0.90 | 1.23 | 26.03 | 43.13 | $ 101,451 | |
| 2022 | 1.57 | 0.94 | 1.28 | (27.60) | 48.88 | $ 86,468 | |
| 2021 | 1.26 | 1.29 | 1.46 | 19.97 | 42.85 | $ 160,007 | |
| 2020 | 0.55 | 0.99 | 1.02 | 15.64 | 79.05 | $ 133,705 | |
| 2019 | 1.10 | 0.99 | 1.12 | 2.74 | 71.09 | $ 153,366 | |
| CLASS R6 SHARES | |||||||
| 2024 (e) | 1.35 (f) | 0.70 (f) | 0.93 (f) | 17.77 | 18.70 | $ 369,024 | |
| 2023 | 2.09 | 0.70 | 0.94 | 26.29 | 43.13 | $ 294,974 | |
| 2022 | 1.85 | 0.73 | 0.92 | (27.47) | 48.88 | $ 243,442 | |
| 2021 | 1.49 | 1.09 | 1.18 | 20.21 | 42.85 | $ 331,621 | |
| 2020 | 0.78 | 0.79 | 0.90 | 15.90 | 79.05 | $ 250,391 | |
| 2019 | 1.37 | 0.79 | 0.88 | 2.95 | 71.09 | $ 219,441 | |
| (g) | The total return based on the NAV which reflects adjustments in accordance with U.S. GAAP is 17.49%. |
| (h) | Net investment income (loss) was less than $(0.01) per share. |
| (i) | The total return based on the NAV which reflects adjustments in accordance with U.S. GAAP is 26.15%. |
| + | Based on weighted average shares outstanding. |
Better World International Fund
| PER SHARE PERFORMANCE (FOR A SHARE OUTSTANDING THROUGHOUT THE PERIOD) | ||||||||||
| UNLESS OTHERWISE NOTED, PERIODS ARE FISCAL YEARS ENDED SEPTEMBER 30, | Net Asset Value, Beginning of PERIOD | Net Investment Income (Loss)+ | Net Realized & Unrealized Gain (Loss) on Investments | Total from Investment Operations | Dividends from Net Investment Income | Dividends from Net Realized Gains | Dividends from Return of Capital | Total Dividends | Net Asset Value, End of PERIOD | |
| CLASS A SHARES(c) | ||||||||||
| 2024 (d) | $ 16.10 | 0.06 | 1.71 | 1.77 | (0.18) | — | — | (0.18) | $ 17.69 | |
| 2023 | $ 13.48 | 0.14 | 2.52 | 2.66 | (0.04) | — | — | (0.04) | $ 16.10 | |
| 2022 | $ 21.46 | 0.06 | (5.18) | (5.12) | — | (2.86) | — | (2.86) | $ 13.48 | |
| 2021 | $ 15.66 | 0.01 | 5.79 | 5.80 | — | — | — | — | $ 21.46 | |
| 2020 | $ 12.85 | — (f) | 2.90 | 2.90 | (0.09) | — | — | (0.09) | $ 15.66 | |
| 2019 | $ 14.51 | 0.12 | (0.66) | (0.54) | (0.15) | (0.97) | — | (1.12) | $ 12.85 | |
| CLASS C SHARES | ||||||||||
| 2024 (d) | $ 15.59 | (0.01) | 1.66 | 1.65 | (0.06) | — | — | (0.06) | $ 17.18 | |
| 2023 | $ 13.11 | 0.02 | 2.46 | 2.48 | — | — | — | — | $ 15.59 | |
| 2022 | $ 21.08 | (0.07) | (5.04) | (5.11) | — | (2.86) | — | (2.86) | $ 13.11 | |
| 2021 | $ 15.51 | (0.15) | 5.72 | 5.57 | — | — | — | — | $ 21.08 | |
| 2020 | $ 12.72 | (0.08) | 2.88 | 2.80 | (0.01) | — | — | (0.01) | $ 15.51 | |
| 2019 | $ 14.32 | 0.03 | (0.62) | (0.59) | (0.04) | (0.97) | — | (1.01) | $ 12.72 | |
| CLASS I SHARES | ||||||||||
| 2024 (d) | $ 16.64 | 0.10 | 1.76 | 1.86 | (0.27) | — | — | (0.27) | $ 18.23 | |
| 2023 | $ 13.93 | 0.24 | 2.61 | 2.85 | (0.14) | — | — | (0.14) | $ 16.64 | |
| 2022 | $ 22.03 | 0.15 | (5.34) | (5.19) | (0.05) | (2.86) | — | (2.91) | $ 13.93 | |
| 2021 | $ 16.06 | 0.11 | 5.93 | 6.04 | (0.07) | — | — | (0.07) | $ 22.03 | |
| 2020 | $ 13.16 | 0.10 | 2.99 | 3.09 | (0.19) | — | — | (0.19) | $ 16.06 | |
| 2019 | $ 14.83 | 0.20 | (0.67) | (0.47) | (0.23) | (0.97) | — | (1.20) | $ 13.16 | |
| (a) | Net investment income (loss) includes income from foreign withholding tax claims adjusted for IRS compliance fees and/or tax reclaim collection fees. Without these proceeds, the Net Investment Income (Loss) ratios would have been as follows: |
| Class A | Class C | Class I | |||||
| 2024 | 0.66% | (0.09)% | 1.19% | ||||
| 2023 | 0.85% | 0.12% | 1.42% | ||||
| 2022 | 0.32% | (0.43)% | 0.88% | ||||
| 2021 | 0.04% | (0.78)% | 0.51% |
| (b) | Not annualized for periods less than one year. |
| (c) | Sales loads are not reflected in computing total return. |
| (d) | Unaudited Six Month Period Ended March 31. |
| (e) | Annualized. |
| (f) | Net investment income (loss) was less than $0.01 per share. |
| + | Based on weighted average shares outstanding. |
Better World International Fund
| RATIOS TO AVERAGE NET ASSETS | Supplemental Data | ||||||
| UNLESS OTHERWISE NOTED, PERIODS ARE FISCAL YEARS ENDED SEPTEMBER 30, | Net Investment Income (Loss) (%)(a) | Expenses, After Expense Reductions (%) | Expenses, Before Expense Reductions (%) | Total Return (%)(b) | Portfolio Turnover Rate (%)(b) | Net Assets at End of PERIOD (Thousands) | |
| CLASS A SHARES(c) | |||||||
| 2024 (d) | 0.67 (e) | 1.41 (e) | 1.55 (e) | 11.04 | 30.73 | $ 40,444 | |
| 2023 | 0.87 | 1.46 | 1.60 | 19.79 | 80.23 | $ 40,587 | |
| 2022 | 0.34 | 1.47 | 1.58 | (27.93) | 140.89 | $ 33,050 | |
| 2021 | 0.05 | 1.57 | 1.57 | 37.04 | 119.96 | $ 40,287 | |
| 2020 | (0.02) | 1.83 | 1.94 | 22.65 | 42.87 | $ 11,859 | |
| 2019 | 0.91 | 1.82 | 2.10 | (3.19) | 62.33 | $ 9,378 | |
| CLASS C SHARES | |||||||
| 2024 (d) | (0.09) (e) | 2.19 (e) | 2.52 (e) | 10.63 | 30.73 | $ 6,239 | |
| 2023 | 0.14 | 2.19 | 2.82 | 18.92 | 80.23 | $ 6,177 | |
| 2022 | (0.42) | 2.24 | 2.50 | (28.44) | 140.89 | $ 4,391 | |
| 2021 | (0.77) | 2.38 | 2.85 | 35.91 | 119.96 | $ 5,597 | |
| 2020 | (0.56) | 2.38 | 3.31 | 22.02 | 42.87 | $ 2,159 | |
| 2019 | 0.25 | 2.38 | 3.48 | (3.75) | 62.33 | $ 1,687 | |
| CLASS I SHARES | |||||||
| 2024 (d) | 1.19 (e) | 0.90 (e) | 1.21 (e) | 11.28 | 30.73 | $ 540,497 | |
| 2023 | 1.44 | 0.90 | 1.26 | 20.49 | 80.23 | $ 513,331 | |
| 2022 | 0.89 | 0.96 | 1.25 | (27.54) | 140.89 | $ 346,395 | |
| 2021 | 0.53 | 1.09 | 1.21 | 37.72 | 119.96 | $ 302,026 | |
| 2020 | 0.74 | 1.09 | 1.33 | 23.62 | 42.87 | $ 83,208 | |
| 2019 | 1.57 | 1.09 | 1.44 | (2.54) | 62.33 | $ 59,833 | |
International Growth Fund
| PER SHARE PERFORMANCE (FOR A SHARE OUTSTANDING THROUGHOUT THE PERIOD) | ||||||||||
| UNLESS OTHERWISE NOTED, PERIODS ARE FISCAL YEARS ENDED SEPTEMBER 30, | Net Asset Value, Beginning of PERIOD | Net Investment Income (Loss)+ | Net Realized & Unrealized Gain (Loss) on Investments | Total from Investment Operations | Dividends from Net Investment Income | Dividends from Net Realized Gains | Dividends from Return of Capital | Total Dividends | Net Asset Value, End of PERIOD | |
| CLASS A SHARES(d) | ||||||||||
| 2024 (e) | $ 21.59 | (0.04) | 4.87 | 4.83 | (0.05) | — | — | (0.05) | $ 26.37 | |
| 2023 | $ 18.22 | 0.02 | 3.41 | 3.43 | (0.06) | — | — | (0.06) | $ 21.59 | |
| 2022 | $ 30.27 | 0.03 | (10.09) | (10.06) | — | (1.99) | — | (1.99) | $ 18.22 | |
| 2021 | $ 28.37 | (0.09) | 2.37 | 2.28 | — | (0.38) | — | (0.38) | $ 30.27 | |
| 2020 | $ 21.46 | (0.08) | 7.10 | 7.02 | — (g) | (0.11) | — | (0.11) | $ 28.37 | |
| 2019 | $ 23.78 | — (h) | (1.55) | (1.55) | (0.02) | (0.75) | — | (0.77) | $ 21.46 | |
| CLASS C SHARES | ||||||||||
| 2024 (e) | $ 19.22 | (0.14) | 4.34 | 4.20 | — | — | — | — | $ 23.42 | |
| 2023 | $ 16.33 | (0.16) | 3.05 | 2.89 | — | — | — | — | $ 19.22 | |
| 2022 | $ 27.55 | (0.17) | (9.06) | (9.23) | — | (1.99) | — | (1.99) | $ 16.33 | |
| 2021 | $ 26.06 | (0.31) | 2.18 | 1.87 | — | (0.38) | — | (0.38) | $ 27.55 | |
| 2020 | $ 19.87 | (0.25) | 6.55 | 6.30 | — | (0.11) | — | (0.11) | $ 26.06 | |
| 2019 | $ 22.21 | (0.15) | (1.44) | (1.59) | — | (0.75) | — | (0.75) | $ 19.87 | |
| CLASS I SHARES | ||||||||||
| 2024 (e) | $ 22.46 | — (h) | 5.09 | 5.09 | (0.15) | — | — | (0.15) | $ 27.40 | |
| 2023 | $ 18.97 | 0.11 | 3.53 | 3.64 | (0.15) | — | — | (0.15) | $ 22.46 | |
| 2022 | $ 31.32 | 0.12 | (10.48) | (10.36) | — | (1.99) | — | (1.99) | $ 18.97 | |
| 2021 | $ 29.27 | (0.01) | 2.44 | 2.43 | — | (0.38) | — | (0.38) | $ 31.32 | |
| 2020 | $ 22.13 | (0.01) | 7.33 | 7.32 | (0.07) | (0.11) | — | (0.18) | $ 29.27 | |
| 2019 | $ 24.51 | 0.07 | (1.60) | (1.53) | (0.10) | (0.75) | — | (0.85) | $ 22.13 | |
| CLASS R3 SHARES | ||||||||||
| 2024 (e) | $ 21.21 | (0.06) | 4.80 | 4.74 | (0.03) | — | — | (0.03) | $ 25.92 | |
| 2023 | $ 17.90 | (0.01) | 3.35 | 3.34 | (0.03) | — | — | (0.03) | $ 21.21 | |
| 2022 | $ 29.80 | — (h) | (9.91) | (9.91) | — | (1.99) | — | (1.99) | $ 17.90 | |
| 2021 | $ 28.01 | (0.16) | 2.33 | 2.17 | — | (0.38) | — | (0.38) | $ 29.80 | |
| 2020 | $ 21.23 | (0.13) | 7.02 | 6.89 | — | (0.11) | — | (0.11) | $ 28.01 | |
| 2019 | $ 23.54 | (0.04) | (1.52) | (1.56) | — | (0.75) | — | (0.75) | $ 21.23 | |
| CLASS R4 SHARES | ||||||||||
| 2024 (e) | $ 21.38 | (0.05) | 4.83 | 4.78 | (0.05) | — | — | (0.05) | $ 26.11 | |
| 2023 | $ 18.06 | 0.02 | 3.37 | 3.39 | (0.07) | — | — | (0.07) | $ 21.38 | |
| 2022 | $ 30.02 | 0.03 | (10.00) | (9.97) | — | (1.99) | — | (1.99) | $ 18.06 | |
| 2021 | $ 28.18 | (0.13) | 2.35 | 2.22 | — | (0.38) | — | (0.38) | $ 30.02 | |
| 2020 | $ 21.34 | (0.03) | 6.98 | 6.95 | — | (0.11) | — | (0.11) | $ 28.18 | |
| 2019 | $ 23.63 | (0.02) | (1.52) | (1.54) | — | (0.75) | — | (0.75) | $ 21.34 | |
| CLASS R5 SHARES | ||||||||||
| 2024 (e) | $ 22.53 | — (h) | 5.09 | 5.09 | (0.13) | — | — | (0.13) | $ 27.49 | |
| 2023 | $ 19.03 | 0.11 | 3.55 | 3.66 | (0.16) | — | — | (0.16) | $ 22.53 | |
| 2022 | $ 31.41 | 0.12 | (10.51) | (10.39) | — | (1.99) | — | (1.99) | $ 19.03 | |
| 2021 | $ 29.35 | (0.01) | 2.45 | 2.44 | — | (0.38) | — | (0.38) | $ 31.41 | |
| 2020 | $ 22.19 | (0.03) | 7.37 | 7.34 | (0.07) | (0.11) | — | (0.18) | $ 29.35 | |
| 2019 | $ 24.58 | 0.07 | (1.61) | (1.54) | (0.10) | (0.75) | — | (0.85) | $ 22.19 | |
| CLASS R6 SHARES | ||||||||||
| 2024 (e) | $ 22.65 | 0.02 | 5.11 | 5.13 | (0.17) | — | — | (0.17) | $ 27.61 | |
| 2023 | $ 19.13 | 0.14 | 3.56 | 3.70 | (0.18) | — | — | (0.18) | $ 22.65 | |
| 2022 | $ 31.54 | 0.15 | (10.57) | (10.42) | — | (1.99) | — | (1.99) | $ 19.13 | |
| 2021 | $ 29.44 | 0.02 | 2.46 | 2.48 | — | (0.38) | — | (0.38) | $ 31.54 | |
| 2020 | $ 22.26 | 0.02 | 7.37 | 7.39 | (0.10) | (0.11) | — | (0.21) | $ 29.44 | |
| 2019 | $ 24.65 | 0.10 | (1.61) | (1.51) | (0.13) | (0.75) | — | (0.88) | $ 22.26 | |
| (a) | Net investment income (loss) includes income from foreign withholding tax claims adjusted for IRS compliance fees and/or tax reclaim collection fees. Without these proceeds, the Net Investment Income (Loss) ratios would have been as follows: |
| Class A | Class C | Class I | Class R3 | Class R4 | Class R5 | Class R6 | |
| 2024 | (0.38)% | (1.39)% | (0.01)% | (0.51)% | (0.43)% | (0.05)% | 0.11% |
| 2023 | 0.08% | (0.83)% | 0.45% | (0.05)% | 0.05% | 0.48% | 0.58% |
| 2022 | 0.08% | (0.83)% | 0.42% | (0.06)% | 0.07% | 0.44% | 0.56% |
| 2021 | (0.37)% | (1.18)% | (0.10)% | (0.60)% | (0.51)% | (0.11)% | (0.02)% |
International Growth Fund
| RATIOS TO AVERAGE NET ASSETS | Supplemental Data | ||||||
| UNLESS OTHERWISE NOTED, PERIODS ARE FISCAL YEARS ENDED SEPTEMBER 30, | Net Investment Income (Loss) (%)(a) | Expenses, After Expense Reductions (%)(b) | Expenses, Before Expense Reductions (%) | Total Return (%)(c) | Portfolio Turnover Rate (%)(c) | Net Assets at End of PERIOD (Thousands) | |
| CLASS A SHARES(d) | |||||||
| 2024 (e) | (0.35) (f) | 1.37 (f) | 1.38 (f) | 22.42 | 20.66 | $ 96,746 | |
| 2023 | 0.10 | 1.37 | 1.38 | 18.82 | 37.24 | $ 86,983 | |
| 2022 | 0.13 | 1.36 | 1.36 | (35.72) | 63.54 | $ 86,145 | |
| 2021 | (0.29) | 1.27 | 1.27 | 8.07 | 34.41 | $ 154,613 | |
| 2020 | (0.35) | 1.31 | 1.31 | 32.88 | 35.88 | $ 139,429 | |
| 2019 | 0.02 | 1.32 | 1.32 | (6.36) | 25.83 | $ 107,196 | |
| CLASS C SHARES | |||||||
| 2024 (e) | (1.36) (f) | 2.35 (f) | 2.36 (f) | 21.85 | 20.66 | $ 8,142 | |
| 2023 | (0.81) | 2.27 | 2.28 | 17.70 | 37.24 | $ 8,572 | |
| 2022 | (0.78) | 2.22 | 2.23 | (36.27) | 63.54 | $ 10,939 | |
| 2021 | (1.10) | 2.07 | 2.07 | 7.21 | 34.41 | $ 27,864 | |
| 2020 | (1.13) | 2.07 | 2.07 | 31.87 | 35.88 | $ 42,164 | |
| 2019 | (0.78) | 2.08 | 2.08 | (7.04) | 25.83 | $ 47,980 | |
| CLASS I SHARES | |||||||
| 2024 (e) | 0.03 (f) | 0.99 (f) | 1.04 (f) | 22.67 (i) | 20.66 | $ 691,419 | |
| 2023 | 0.47 | 0.99 | 1.06 | 19.23 | 37.24 | $ 627,050 | |
| 2022 | 0.47 | 0.99 | 1.06 | (35.47) | 63.54 | $ 724,495 | |
| 2021 | (0.02) | 1.00 | 1.00 | 8.34 | 34.41 | $ 1,584,102 | |
| 2020 | (0.03) | 0.99 | 1.02 | 33.31 | 35.88 | $ 1,454,322 | |
| 2019 | 0.34 | 0.99 | 1.03 | (6.02) | 25.83 | $ 1,203,538 | |
| CLASS R3 SHARES | |||||||
| 2024 (e) | (0.47) (f) | 1.50 (f) | 2.19 (f) | 22.38 | 20.66 | $ 5,149 | |
| 2023 | (0.03) | 1.50 | 2.25 | 18.69 | 37.24 | $ 4,508 | |
| 2022 | (0.01) | 1.50 | 2.29 | (35.79) | 63.54 | $ 4,340 | |
| 2021 | (0.52) | 1.51 | 1.89 | 7.78 | 34.41 | $ 7,643 | |
| 2020 | (0.56) | 1.50 | 2.03 | 32.61 | 35.88 | $ 6,424 | |
| 2019 | (0.17) | 1.50 | 2.02 | (6.50) | 25.83 | $ 6,274 | |
| CLASS R4 SHARES | |||||||
| 2024 (e) | (0.39) (f) | 1.40 (f) | 1.99 (f) | 22.40 | 20.66 | $ 7,214 | |
| 2023 | 0.08 | 1.40 | 2.01 | 18.78 | 37.24 | $ 7,083 | |
| 2022 | 0.12 | 1.40 | 2.00 | (35.72) | 63.54 | $ 6,670 | |
| 2021 | (0.42) | 1.41 | 1.63 | 7.91 | 34.41 | $ 9,903 | |
| 2020 | (0.44) | 1.40 | 1.45 | 32.73 | 35.88 | $ 8,436 | |
| 2019 | (0.09) | 1.40 | 1.91 | (6.39) | 25.83 | $ 7,515 | |
| CLASS R5 SHARES | |||||||
| 2024 (e) | (0.02) (f) | 0.99 (f) | 1.65 (f) | 22.67 | 20.66 | $ 11,300 | |
| 2023 | 0.50 | 0.99 | 1.38 | 19.25 | 37.24 | $ 12,979 | |
| 2022 | 0.49 | 0.99 | 1.45 | (35.46) | 63.54 | $ 21,233 | |
| 2021 | (0.02) | 1.00 | 1.27 | 8.35 | 34.41 | $ 36,396 | |
| 2020 | (0.03) | 0.99 | 1.31 | 33.31 | 35.88 | $ 34,152 | |
| 2019 | 0.32 | 0.99 | 1.29 | (6.05) | 25.83 | $ 28,729 | |
| CLASS R6 SHARES | |||||||
| 2024 (e) | 0.15 (f) | 0.89 (f) | 1.02 (f) | 22.74 | 20.66 | $ 89,059 | |
| 2023 | 0.60 | 0.89 | 1.02 | 19.38 | 37.24 | $ 73,130 | |
| 2022 | 0.61 | 0.89 | 1.01 | (35.41) | 63.54 | $ 66,867 | |
| 2021 | 0.06 | 0.90 | 0.96 | 8.46 | 34.41 | $ 107,884 | |
| 2020 | 0.07 | 0.89 | 0.99 | 33.42 | 35.88 | $ 61,130 | |
| 2019 | 0.47 | 0.89 | 0.99 | (5.91) | 25.83 | $ 44,923 | |
| (b) | Net expenses include tax reclaim collection fees that are excluded from the expense limitation agreement. If such expenses and fees had not occurred, the Expenses After Expense Reductions ratios for 2021 would have been: Class A, 1.26%; Class C, 2.07%; Class I, 0.99%; Class R3, 1.50%; Class R4, 1.40%; Class R5, 0.99%; Class R6, 0.89%. |
| (c) | Not annualized for periods less than one year. |
| (d) | Sales loads are not reflected in computing total return. |
| (e) | Unaudited Six Month Period Ended March 31. |
| (f) | Annualized. |
| (g) | Dividends from net investment income per share were less than $(0.01). |
| (h) | Net investment income (loss) was less than $0.01 per share. |
| (i) | The total return based on the NAV which reflects adjustments in accordance with U.S. GAAP is 22.72%. |
| + | Based on weighted average shares outstanding. |
Developing World Fund
| PER SHARE PERFORMANCE (FOR A SHARE OUTSTANDING THROUGHOUT THE PERIOD) | ||||||||||
| UNLESS OTHERWISE NOTED, PERIODS ARE FISCAL YEARS ENDED SEPTEMBER 30, | Net Asset Value, Beginning of PERIOD | Net Investment Income (Loss)+ | Net Realized & Unrealized Gain (Loss) on Investments | Total from Investment Operations | Dividends from Net Investment Income | Dividends from Net Realized Gains | Dividends from Return of Capital | Total Dividends | Net Asset Value, End of PERIOD | |
| CLASS A SHARES(d) | ||||||||||
| 2024 (e) | $ 19.68 | 0.01 | 2.12 | 2.13 | (0.34) | — | — | (0.34) | $ 21.47 | |
| 2023 | $ 18.43 | 0.18 | 1.34 | 1.52 | (0.27) | — | — | (0.27) | $ 19.68 | |
| 2022 | $ 27.58 | 0.39 | (9.54) | (9.15) | — | — | — | — | $ 18.43 | |
| 2021 | $ 22.92 | — (h) | 4.66 | 4.66 | — | — | — | — | $ 27.58 | |
| 2020 | $ 20.43 | 0.03 | 2.69 | 2.72 | (0.23) | — | — | (0.23) | $ 22.92 | |
| 2019 | $ 19.13 | 0.23 | 1.22 | 1.45 | (0.15) | — | — | (0.15) | $ 20.43 | |
| CLASS C SHARES | ||||||||||
| 2024 (e) | $ 18.40 | (0.07) | 1.97 | 1.90 | (0.12) | — | — | (0.12) | $ 20.18 | |
| 2023 | $ 17.18 | 0.01 | 1.26 | 1.27 | (0.05) | — | — | (0.05) | $ 18.40 | |
| 2022 | $ 25.93 | 0.14 | (8.89) | (8.75) | — | — | — | — | $ 17.18 | |
| 2021 | $ 21.71 | (0.21) | 4.43 | 4.22 | — | — | — | — | $ 25.93 | |
| 2020 | $ 19.35 | (0.13) | 2.54 | 2.41 | (0.05) | — | — | (0.05) | $ 21.71 | |
| 2019 | $ 18.10 | 0.06 | 1.19 | 1.25 | — | — | — | — | $ 19.35 | |
| CLASS I SHARES | ||||||||||
| 2024 (e) | $ 20.21 | 0.05 | 2.17 | 2.22 | (0.43) | — | — | (0.43) | $ 22.00 | |
| 2023 | $ 18.93 | 0.27 | 1.37 | 1.64 | (0.36) | — | — | (0.36) | $ 20.21 | |
| 2022 | $ 28.22 | 0.50 | (9.79) | (9.29) | — | — | — | — | $ 18.93 | |
| 2021 | $ 23.40 | 0.10 | 4.76 | 4.86 | (0.04) | — | — | (0.04) | $ 28.22 | |
| 2020 | $ 20.86 | 0.11 | 2.74 | 2.85 | (0.31) | — | — | (0.31) | $ 23.40 | |
| 2019 | $ 19.55 | 0.31 | 1.24 | 1.55 | (0.24) | — | — | (0.24) | $ 20.86 | |
| CLASS R5 SHARES | ||||||||||
| 2024 (e) | $ 20.15 | 0.05 | 2.15 | 2.20 | (0.43) | — | — | (0.43) | $ 21.92 | |
| 2023 | $ 18.87 | 0.27 | 1.37 | 1.64 | (0.36) | — | — | (0.36) | $ 20.15 | |
| 2022 | $ 28.12 | 0.48 | (9.73) | (9.25) | — | — | — | — | $ 18.87 | |
| 2021 | $ 23.33 | 0.10 | 4.73 | 4.83 | (0.04) | — | — | (0.04) | $ 28.12 | |
| 2020 | $ 20.79 | 0.10 | 2.75 | 2.85 | (0.31) | — | — | (0.31) | $ 23.33 | |
| 2019 | $ 19.48 | 0.27 | 1.28 | 1.55 | (0.24) | — | — | (0.24) | $ 20.79 | |
| CLASS R6 SHARES | ||||||||||
| 2024 (e) | $ 20.26 | 0.07 | 2.16 | 2.23 | (0.45) | — | — | (0.45) | $ 22.04 | |
| 2023 | $ 18.98 | 0.29 | 1.37 | 1.66 | (0.38) | — | — | (0.38) | $ 20.26 | |
| 2022 | $ 28.26 | 0.52 | (9.80) | (9.28) | — | — | — | — | $ 18.98 | |
| 2021 | $ 23.43 | 0.12 | 4.78 | 4.90 | (0.07) | — | — | (0.07) | $ 28.26 | |
| 2020 | $ 20.88 | 0.13 | 2.75 | 2.88 | (0.33) | — | — | (0.33) | $ 23.43 | |
| 2019 | $ 19.57 | 0.33 | 1.24 | 1.57 | (0.26) | — | — | (0.26) | $ 20.88 | |
| (a) | Net investment income (loss) includes income from foreign withholding tax claims adjusted for IRS compliance fees and/or tax reclaim collection fees. Without these proceeds, the Net Investment Income (Loss) ratios would have been as follows: |
| Class A | Class C | Class I | Class R5 | Class R6 | |||
| 2022 | 1.63% | 0.61% | 2.06% | 1.94% | 2.14% | ||
| 2021 | (0.02)% | (0.82)% | 0.33% | 0.34% | 0.42% |
| (b) | Net expenses include tax reclaim collection fees that are excluded from the expense limitation agreement. If such expenses and fees had not occurred, the Expenses After Expense Reductions ratios for 2021 would have been: Class A, 1.43%; Class C, 2.19%; Class I, 1.09%; Class R5, 1.09%; Class R6, 0.99%. |
| (c) | Not annualized for periods less than one year. |
| (d) | Sales loads are not reflected in computing total return. |
| (e) | Unaudited Six Month Period Ended March 31. |
| (f) | Annualized. |
| (g) | The total return based on the NAV which reflects adjustments in accordance with U.S. GAAP is 10.91%. |
| (h) | Net investment income (loss) was less than $0.01 per share. |
| (i) | The total return based on the NAV which reflects adjustments in accordance with U.S. GAAP is 12.47% for 2020 and 19.44% for 2021. |
| + | Based on weighted average shares outstanding. |
Developing World Fund
| RATIOS TO AVERAGE NET ASSETS | Supplemental Data | ||||||
| UNLESS OTHERWISE NOTED, PERIODS ARE FISCAL YEARS ENDED SEPTEMBER 30, | Net Investment Income (Loss) (%)(a) | Expenses, After Expense Reductions (%)(b) | Expenses, Before Expense Reductions (%) | Total Return (%)(c) | Portfolio Turnover Rate (%)(c) | Net Assets at End of PERIOD (Thousands) | |
| CLASS A SHARES(d) | |||||||
| 2024 (e) | 0.09 (f) | 1.46 (f) | 1.61 (f) | 10.86 (g) | 52.20 | $ 80,755 | |
| 2023 | 0.87 | 1.45 | 1.60 | 8.24 | 37.64 | $ 83,389 | |
| 2022 | 1.63 | 1.44 | 1.54 | (33.18) | 68.24 | $ 87,897 | |
| 2021 | (0.01) | 1.43 | 1.43 | 20.33 | 61.50 | $ 131,471 | |
| 2020 | 0.13 | 1.45 | 1.48 | 13.31 | 56.55 | $ 101,723 | |
| 2019 | 1.18 | 1.47 | 1.50 | 7.74 | 43.52 | $ 96,935 | |
| CLASS C SHARES | |||||||
| 2024 (e) | (0.79) (f) | 2.33 (f) | 2.53 (f) | 10.37 | 52.20 | $ 10,092 | |
| 2023 | 0.04 | 2.27 | 2.42 | 7.36 | 37.64 | $ 11,621 | |
| 2022 | 0.62 | 2.26 | 2.36 | (33.74) | 68.24 | $ 17,044 | |
| 2021 | (0.81) | 2.19 | 2.19 | 19.49 (i) | 61.50 | $ 40,933 | |
| 2020 | (0.64) | 2.20 | 2.23 | 12.42 (i) | 56.55 | $ 48,977 | |
| 2019 | 0.30 | 2.23 | 2.26 | 6.91 | 43.52 | $ 63,203 | |
| CLASS I SHARES | |||||||
| 2024 (e) | 0.51 (f) | 1.04 (f) | 1.27 (f) | 11.14 | 52.20 | $ 753,463 | |
| 2023 | 1.31 | 1.04 | 1.28 | 8.66 | 37.64 | $ 802,285 | |
| 2022 | 2.07 | 1.06 | 1.23 | (32.92) | 68.24 | $ 772,911 | |
| 2021 | 0.34 | 1.09 | 1.15 | 20.78 | 61.50 | $ 925,280 | |
| 2020 | 0.50 | 1.09 | 1.18 | 13.68 | 56.55 | $ 668,427 | |
| 2019 | 1.53 | 1.09 | 1.19 | 8.14 | 43.52 | $ 590,196 | |
| CLASS R5 SHARES | |||||||
| 2024 (e) | 0.51 (f) | 1.04 (f) | 2.00 (f) | 11.07 | 52.20 | $ 3,203 | |
| 2023 | 1.31 | 1.04 | 2.05 | 8.69 | 37.64 | $ 3,206 | |
| 2022 | 1.94 | 1.06 | 2.15 | (32.89) | 68.24 | $ 2,403 | |
| 2021 | 0.35 | 1.09 | 1.70 | 20.72 | 61.50 | $ 4,157 | |
| 2020 | 0.49 | 1.09 | 1.89 | 13.73 | 56.55 | $ 2,735 | |
| 2019 | 1.38 | 1.09 | 2.07 | 8.16 | 43.52 | $ 2,430 | |
| CLASS R6 SHARES | |||||||
| 2024 (e) | 0.63 (f) | 0.94 (f) | 1.23 (f) | 11.17 | 52.20 | $ 66,236 | |
| 2023 | 1.40 | 0.94 | 1.24 | 8.75 | 37.64 | $ 60,741 | |
| 2022 | 2.14 | 0.96 | 1.20 | (32.84) | 68.24 | $ 54,406 | |
| 2021 | 0.43 | 0.99 | 1.11 | 20.90 | 61.50 | $ 78,006 | |
| 2020 | 0.60 | 0.99 | 1.15 | 13.82 | 56.55 | $ 62,993 | |
| 2019 | 1.65 | 0.99 | 1.14 | 8.25 | 43.52 | $ 56,658 | |
Small/Mid Cap Core Fund
| PER SHARE PERFORMANCE (FOR A SHARE OUTSTANDING THROUGHOUT THE PERIOD) | ||||||||||
| UNLESS OTHERWISE NOTED, PERIODS ARE FISCAL YEARS ENDED SEPTEMBER 30, | Net Asset Value, Beginning of PERIOD | Net Investment Income (Loss)+ | Net Realized & Unrealized Gain (Loss) on Investments | Total from Investment Operations | Dividends from Net Investment Income | Dividends from Net Realized Gains | Dividends from Return of Capital | Total Dividends | Net Asset Value, End of PERIOD | |
| CLASS A SHARES(c) | ||||||||||
| 2024 (d) | $ 60.68 | (0.19) | 13.05 | 12.86 | — | — | — | — | $ 73.54 | |
| 2023 | $ 55.35 | (0.24) | 5.60 | 5.36 | (0.03) | — | — | (0.03) | $ 60.68 | |
| 2022 | $ 97.60 | (0.27) | (15.33) | (15.60) | (0.30) | (26.35) | — | (26.65) | $ 55.35 | |
| 2021 | $ 74.81 | (0.05) | 22.84 | 22.79 | — | — | — | — | $ 97.60 | |
| 2020 | $ 71.81 | 0.07 | 3.11 | 3.18 | (0.18) | — | — | (0.18) | $ 74.81 | |
| 2019 | $ 72.46 | 0.24 | (0.60) | (0.36) | (0.29) | — | — | (0.29) | $ 71.81 | |
| CLASS C SHARES | ||||||||||
| 2024 (d) | $ 51.36 | (0.42) | 10.99 | 10.57 | — | — | — | — | $ 61.93 | |
| 2023 | $ 47.29 | (0.70) | 4.77 | 4.07 | — | — | — | — | $ 51.36 | |
| 2022 | $ 87.40 | (0.81) | (12.95) | (13.76) | — | (26.35) | — | (26.35) | $ 47.29 | |
| 2021 | $ 67.54 | (0.71) | 20.57 | 19.86 | — | — | — | — | $ 87.40 | |
| 2020 | $ 65.19 | (0.45) | 2.80 | 2.35 | — | — | — | — | $ 67.54 | |
| 2019 | $ 66.03 | (0.31) | (0.53) | (0.84) | — | — | — | — | $ 65.19 | |
| CLASS I SHARES | ||||||||||
| 2024 (d) | $ 63.56 | (0.06) | 13.69 | 13.63 | — | — | — | — | $ 77.19 | |
| 2023 | $ 58.01 | 0.01 | 5.86 | 5.87 | (0.32) | — | — | (0.32) | $ 63.56 | |
| 2022 | $ 100.99 | 0.01 | (16.09) | (16.08) | (0.55) | (26.35) | — | (26.90) | $ 58.01 | |
| 2021 | $ 77.16 | 0.25 | 23.58 | 23.83 | — | — | — | — | $ 100.99 | |
| 2020 | $ 74.04 | 0.33 | 3.22 | 3.55 | (0.43) | — | — | (0.43) | $ 77.16 | |
| 2019 | $ 74.70 | 0.49 | (0.65) | (0.16) | (0.50) | — | — | (0.50) | $ 74.04 | |
| CLASS R3 SHARES | ||||||||||
| 2024 (d) | $ 60.32 | (0.17) | 12.97 | 12.80 | — | — | — | — | $ 73.12 | |
| 2023 | $ 55.03 | (0.21) | 5.57 | 5.36 | (0.07) | — | — | (0.07) | $ 60.32 | |
| 2022 | $ 97.10 | (0.25) | (15.21) | (15.46) | (0.26) | (26.35) | — | (26.61) | $ 55.03 | |
| 2021 | $ 74.46 | (0.08) | 22.72 | 22.64 | — | — | — | — | $ 97.10 | |
| 2020 | $ 71.44 | 0.06 | 3.10 | 3.16 | (0.14) | — | — | (0.14) | $ 74.46 | |
| 2019 | $ 72.02 | 0.23 | (0.59) | (0.36) | (0.22) | — | — | (0.22) | $ 71.44 | |
| CLASS R4 SHARES | ||||||||||
| 2024 (d) | $ 61.32 | (0.14) | 13.19 | 13.05 | — | — | — | — | $ 74.37 | |
| 2023 | $ 55.96 | (0.15) | 5.65 | 5.50 | (0.14) | — | — | (0.14) | $ 61.32 | |
| 2022 | $ 98.30 | (0.16) | (15.50) | (15.66) | (0.33) | (26.35) | — | (26.68) | $ 55.96 | |
| 2021 | $ 75.30 | 0.01 | 22.99 | 23.00 | — | — | — | — | $ 98.30 | |
| 2020 | $ 72.25 | 0.12 | 3.14 | 3.26 | (0.21) | — | — | (0.21) | $ 75.30 | |
| 2019 | $ 72.83 | 0.30 | (0.60) | (0.30) | (0.28) | — | — | (0.28) | $ 72.25 | |
| CLASS R5 SHARES | ||||||||||
| 2024 (d) | $ 63.45 | (0.06) | 13.66 | 13.60 | — | — | — | — | $ 77.05 | |
| 2023 | $ 57.90 | 0.02 | 5.84 | 5.86 | (0.31) | — | — | (0.31) | $ 63.45 | |
| 2022 | $ 100.84 | — (g) | (16.04) | (16.04) | (0.55) | (26.35) | — | (26.90) | $ 57.90 | |
| 2021 | $ 77.05 | 0.26 | 23.53 | 23.79 | — | — | — | — | $ 100.84 | |
| 2020 | $ 73.93 | 0.33 | 3.22 | 3.55 | (0.43) | — | — | (0.43) | $ 77.05 | |
| 2019 | $ 74.60 | 0.49 | (0.66) | (0.17) | (0.50) | — | — | (0.50) | $ 73.93 | |
| (a) | Net investment income (loss) includes income from foreign withholding tax claims adjusted for IRS compliance fees and/or tax reclaim collection fees. Without these proceeds, the Net Investment Income (Loss) ratios would have been as follows: |
| Class A | Class C | Class I | Class R3 | Class R4 | Class R5 | ||
| 2021 | (0.15)% | (0.95)% | 0.17% | (0.17)% | 0.18% | 0.18% |
| (b) | Not annualized for periods less than one year. |
| (c) | Sales loads are not reflected in computing total return. |
| (d) | Unaudited Six Month Period Ended March 31. |
| (e) | Annualized. |
| (f) | The Fund modified its strategy in December 2020 and due to the change, the Fund experienced a higher portfolio turnover from higher purchases and sales. |
| (g) | Net investment income (loss) was less than $0.01 per share. |
| + | Based on weighted average shares outstanding. |
Small/Mid Cap Core Fund
| RATIOS TO AVERAGE NET ASSETS | Supplemental Data | ||||||
| UNLESS OTHERWISE NOTED, PERIODS ARE FISCAL YEARS ENDED SEPTEMBER 30, | Net Investment Income (Loss) (%)(a) | Expenses, After Expense Reductions (%) | Expenses, Before Expense Reductions (%) | Total Return (%)(b) | Portfolio Turnover Rate (%)(b) | Net Assets at End of PERIOD (Thousands) | |
| CLASS A SHARES(c) | |||||||
| 2024 (d) | (0.59) (e) | 1.38 (e) | 1.38 (e) | 21.19 | 19.95 | $ 309,142 | |
| 2023 | (0.40) | 1.36 | 1.36 | 9.68 | 37.54 | $ 276,512 | |
| 2022 | (0.38) | 1.31 | 1.37 | (23.16) | 46.19 | $ 293,290 | |
| 2021 | (0.06) | 1.18 | 1.33 | 30.46 | 135.80 (f) | $ 454,488 | |
| 2020 | 0.10 | 1.33 | 1.34 | 4.42 | 20.39 | $ 388,895 | |
| 2019 | 0.35 | 1.33 | 1.33 | (0.42) | 24.94 | $ 425,218 | |
| CLASS C SHARES | |||||||
| 2024 (d) | (1.56) (e) | 2.34 (e) | 2.98 (e) | 20.58 | 19.95 | $ 4,055 | |
| 2023 | (1.36) | 2.34 | 2.59 | 8.61 | 37.54 | $ 4,520 | |
| 2022 | (1.31) | 2.22 | 2.34 | (23.86) | 46.19 | $ 7,476 | |
| 2021 | (0.86) | 2.00 | 2.15 | 29.40 | 135.80 (f) | $ 17,364 | |
| 2020 | (0.69) | 2.12 | 2.12 | 3.59 | 20.39 | $ 22,951 | |
| 2019 | (0.50) | 2.19 | 2.19 | (1.26) | 24.94 | $ 35,934 | |
| CLASS I SHARES | |||||||
| 2024 (d) | (0.17) (e) | 0.95 (e) | 1.08 (e) | 21.44 | 19.95 | $ 226,591 | |
| 2023 | 0.01 | 0.95 | 1.08 | 10.13 | 37.54 | $ 196,754 | |
| 2022 | 0.02 | 0.91 | 1.09 | (22.84) | 46.19 | $ 207,251 | |
| 2021 | 0.26 | 0.86 | 1.08 | 30.88 | 135.80 (f) | $ 332,235 | |
| 2020 | 0.44 | 0.99 | 1.09 | 4.77 | 20.39 | $ 287,746 | |
| 2019 | 0.70 | 0.99 | 1.07 | (0.07) | 24.94 | $ 360,070 | |
| CLASS R3 SHARES | |||||||
| 2024 (d) | (0.53) (e) | 1.31 (e) | 1.88 (e) | 21.22 | 19.95 | $ 13,094 | |
| 2023 | (0.34) | 1.31 | 1.93 | 9.74 | 37.54 | $ 12,641 | |
| 2022 | (0.35) | 1.27 | 1.87 | (23.11) | 46.19 | $ 13,406 | |
| 2021 | (0.08) | 1.22 | 1.81 | 30.41 | 135.80 (f) | $ 23,594 | |
| 2020 | 0.09 | 1.35 | 1.73 | 4.40 | 20.39 | $ 24,939 | |
| 2019 | 0.34 | 1.35 | 1.79 | (0.43) | 24.94 | $ 29,601 | |
| CLASS R4 SHARES | |||||||
| 2024 (d) | (0.43) (e) | 1.21 (e) | 2.22 (e) | 21.28 | 19.95 | $ 2,601 | |
| 2023 | (0.24) | 1.21 | 2.30 | 9.83 | 37.54 | $ 2,288 | |
| 2022 | (0.23) | 1.17 | 2.04 | (23.03) | 46.19 | $ 2,819 | |
| 2021 | 0.01 | 1.12 | 1.78 | 30.54 | 135.80 (f) | $ 4,386 | |
| 2020 | 0.17 | 1.25 | 1.74 | 4.50 | 20.39 | $ 4,548 | |
| 2019 | 0.44 | 1.25 | 1.75 | (0.33) | 24.94 | $ 6,434 | |
| CLASS R5 SHARES | |||||||
| 2024 (d) | (0.17) (e) | 0.95 (e) | 2.03 (e) | 21.43 | 19.95 | $ 3,015 | |
| 2023 | 0.03 | 0.95 | 1.75 | 10.13 | 37.54 | $ 2,896 | |
| 2022 | — (g) | 0.90 | 1.64 | (22.83) | 46.19 | $ 6,106 | |
| 2021 | 0.27 | 0.86 | 1.48 | 30.88 | 135.80 (f) | $ 14,710 | |
| 2020 | 0.45 | 0.99 | 1.43 | 4.76 | 20.39 | $ 14,156 | |
| 2019 | 0.70 | 0.99 | 1.43 | (0.07) | 24.94 | $ 18,119 | |
Small/Mid Cap Growth Fund
| PER SHARE PERFORMANCE (FOR A SHARE OUTSTANDING THROUGHOUT THE PERIOD) | ||||||||||
| UNLESS OTHERWISE NOTED, PERIODS ARE FISCAL YEARS ENDED SEPTEMBER 30, | Net Asset Value, Beginning of PERIOD | Net Investment Income (Loss)+ | Net Realized & Unrealized Gain (Loss) on Investments | Total from Investment Operations | Dividends from Net Investment Income | Dividends from Net Realized Gains | Dividends from Return of Capital | Total Dividends | Net Asset Value, End of PERIOD | |
| CLASS A SHARES(b) | ||||||||||
| 2024 (c) | $ 24.28 | (0.15) | 5.39 | 5.24 | — | — | — | — | $ 29.52 | |
| 2023 | $ 21.17 | (0.28) | 3.39 | 3.11 | — | — | — | — | $ 24.28 | |
| 2022 | $ 51.77 | (0.35) | (12.37) | (12.72) | — | (17.88) | — | (17.88) | $ 21.17 | |
| 2021 | $ 48.17 | (0.51) | 7.33 | 6.82 | — | (3.22) | — | (3.22) | $ 51.77 | |
| 2020 | $ 39.37 | (0.30) | 12.72 | 12.42 | — | (3.62) | — | (3.62) | $ 48.17 | |
| 2019 | $ 40.43 | (0.17) | (0.89) | (1.06) | — | — | — | — | $ 39.37 | |
| CLASS C SHARES | ||||||||||
| 2024 (c) | $ 17.56 | (0.19) | 3.88 | 3.69 | — | — | — | — | $ 21.25 | |
| 2023 | $ 15.45 | (0.36) | 2.47 | 2.11 | — | — | — | — | $ 17.56 | |
| 2022 | $ 42.67 | (0.48) | (8.86) | (9.34) | — | (17.88) | — | (17.88) | $ 15.45 | |
| 2021 | $ 40.53 | (0.75) | 6.11 | 5.36 | — | (3.22) | — | (3.22) | $ 42.67 | |
| 2020 | $ 33.91 | (0.51) | 10.75 | 10.24 | — | (3.62) | — | (3.62) | $ 40.53 | |
| 2019 | $ 35.11 | (0.42) | (0.78) | (1.20) | — | — | — | — | $ 33.91 | |
| CLASS I SHARES | ||||||||||
| 2024 (c) | $ 28.04 | (0.10) | 6.24 | 6.14 | — | — | — | — | $ 34.18 | |
| 2023 | $ 24.34 | (0.20) | 3.90 | 3.70 | — | — | — | — | $ 28.04 | |
| 2022 | $ 56.75 | (0.26) | (14.27) | (14.53) | — | (17.88) | — | (17.88) | $ 24.34 | |
| 2021 | $ 52.36 | (0.38) | 7.99 | 7.61 | — | (3.22) | — | (3.22) | $ 56.75 | |
| 2020 | $ 42.35 | (0.17) | 13.80 | 13.63 | — | (3.62) | — | (3.62) | $ 52.36 | |
| 2019 | $ 43.33 | (0.03) | (0.95) | (0.98) | — | — | — | — | $ 42.35 | |
| CLASS R3 SHARES | ||||||||||
| 2024 (c) | $ 23.78 | (0.15) | 5.29 | 5.14 | — | — | — | — | $ 28.92 | |
| 2023 | $ 20.75 | (0.28) | 3.31 | 3.03 | — | — | — | — | $ 23.78 | |
| 2022 | $ 51.09 | (0.36) | (12.10) | (12.46) | — | (17.88) | — | (17.88) | $ 20.75 | |
| 2021 | $ 47.67 | (0.60) | 7.24 | 6.64 | — | (3.22) | — | (3.22) | $ 51.09 | |
| 2020 | $ 39.05 | (0.36) | 12.60 | 12.24 | — | (3.62) | — | (3.62) | $ 47.67 | |
| 2019 | $ 40.16 | (0.23) | (0.88) | (1.11) | — | — | — | — | $ 39.05 | |
| CLASS R4 SHARES | ||||||||||
| 2024 (c) | $ 24.37 | (0.14) | 5.42 | 5.28 | — | — | — | — | $ 29.65 | |
| 2023 | $ 21.24 | (0.27) | 3.40 | 3.13 | — | — | — | — | $ 24.37 | |
| 2022 | $ 51.86 | (0.34) | (12.40) | (12.74) | — | (17.88) | — | (17.88) | $ 21.24 | |
| 2021 | $ 48.30 | (0.55) | 7.33 | 6.78 | — | (3.22) | — | (3.22) | $ 51.86 | |
| 2020 | $ 39.49 | (0.32) | 12.75 | 12.43 | — | (3.62) | — | (3.62) | $ 48.30 | |
| 2019 | $ 40.56 | (0.19) | (0.88) | (1.07) | — | — | — | — | $ 39.49 | |
| CLASS R5 SHARES | ||||||||||
| 2024 (c) | $ 27.99 | (0.10) | 6.23 | 6.13 | — | — | — | — | $ 34.12 | |
| 2023 | $ 24.30 | (0.20) | 3.89 | 3.69 | — | — | — | — | $ 27.99 | |
| 2022 | $ 56.68 | (0.26) | (14.24) | (14.50) | — | (17.88) | — | (17.88) | $ 24.30 | |
| 2021 | $ 52.30 | (0.38) | 7.98 | 7.60 | — | (3.22) | — | (3.22) | $ 56.68 | |
| 2020 | $ 42.31 | (0.16) | 13.77 | 13.61 | — | (3.62) | — | (3.62) | $ 52.30 | |
| 2019 | $ 43.29 | (0.04) | (0.94) | (0.98) | — | — | — | — | $ 42.31 | |
| (a) | Not annualized for periods less than one year. |
| (b) | Sales loads are not reflected in computing total return. |
| (c) | Unaudited Six Month Period Ended March 31. |
| (d) | Annualized. |
| (e) | The Fund modified its strategy in December 2020 and due to the change, the Fund experienced a higher portfolio turnover from higher purchases and sales. |
| + | Based on weighted average shares outstanding. |
Small/Mid Cap Growth Fund
| RATIOS TO AVERAGE NET ASSETS | Supplemental Data | ||||||
| UNLESS OTHERWISE NOTED, PERIODS ARE FISCAL YEARS ENDED SEPTEMBER 30, | Net Investment Income (Loss) (%) | Expenses, After Expense Reductions (%) | Expenses, Before Expense Reductions (%) | Total Return (%)(a) | Portfolio Turnover Rate (%)(a) | Net Assets at End of PERIOD (Thousands) | |
| CLASS A SHARES(b) | |||||||
| 2024 (c) | (1.15) (d) | 1.43 (d) | 1.43 (d) | 21.58 | 19.01 | $ 146,387 | |
| 2023 | (1.20) | 1.42 | 1.42 | 14.69 | 45.46 | $ 132,659 | |
| 2022 | (1.20) | 1.33 | 1.40 | (38.84) | 57.56 | $ 147,493 | |
| 2021 | (0.99) | 1.16 | 1.31 | 14.69 | 161.43 (e) | $ 340,545 | |
| 2020 | (0.72) | 1.33 | 1.33 | 34.37 | 43.82 | $ 326,035 | |
| 2019 | (0.44) | 1.35 | 1.35 | (2.62) | 40.69 | $ 259,799 | |
| CLASS C SHARES | |||||||
| 2024 (c) | (2.06) (d) | 2.34 (d) | 3.08 (d) | 21.01 | 19.01 | $ 3,323 | |
| 2023 | (2.12) | 2.34 | 2.72 | 13.66 | 45.46 | $ 3,743 | |
| 2022 | (2.09) | 2.21 | 2.40 | (39.39) | 57.56 | $ 5,596 | |
| 2021 | (1.76) | 1.94 | 2.09 | 13.80 | 161.43 (e) | $ 23,433 | |
| 2020 | (1.47) | 2.09 | 2.09 | 33.38 | 43.82 | $ 36,917 | |
| 2019 | (1.27) | 2.18 | 2.18 | (3.42) | 40.69 | $ 36,841 | |
| CLASS I SHARES | |||||||
| 2024 (c) | (0.67) (d) | 0.95 (d) | 1.08 (d) | 21.90 | 19.01 | $ 108,648 | |
| 2023 | (0.73) | 0.95 | 1.09 | 15.20 | 45.46 | $ 110,878 | |
| 2022 | (0.76) | 0.90 | 1.10 | (38.54) | 57.56 | $ 113,478 | |
| 2021 | (0.67) | 0.84 | 1.04 | 15.04 | 161.43 (e) | $ 274,357 | |
| 2020 | (0.37) | 0.99 | 1.06 | 34.84 | 43.82 | $ 277,991 | |
| 2019 | (0.08) | 0.99 | 1.05 | (2.26) | 40.69 | $ 254,721 | |
| CLASS R3 SHARES | |||||||
| 2024 (c) | (1.18) (d) | 1.46 (d) | 1.90 (d) | 21.61 | 19.01 | $ 15,625 | |
| 2023 | (1.24) | 1.46 | 1.93 | 14.60 | 45.46 | $ 13,868 | |
| 2022 | (1.27) | 1.41 | 1.92 | (38.84) | 57.56 | $ 14,115 | |
| 2021 | (1.17) | 1.35 | 1.79 | 14.45 | 161.43 (e) | $ 26,881 | |
| 2020 | (0.88) | 1.50 | 1.71 | 34.17 | 43.82 | $ 33,505 | |
| 2019 | (0.60) | 1.50 | 1.80 | (2.76) | 40.69 | $ 30,084 | |
| CLASS R4 SHARES | |||||||
| 2024 (c) | (1.08) (d) | 1.36 (d) | 3.49 (d) | 21.67 | 19.01 | $ 895 | |
| 2023 | (1.14) | 1.36 | 3.29 | 14.74 | 45.46 | $ 861 | |
| 2022 | (1.18) | 1.31 | 2.97 | (38.79) | 57.56 | $ 1,109 | |
| 2021 | (1.07) | 1.25 | 2.17 | 14.56 | 161.43 (e) | $ 2,076 | |
| 2020 | (0.78) | 1.40 | 2.00 | 34.28 | 43.82 | $ 2,771 | |
| 2019 | (0.50) | 1.40 | 1.91 | (2.64) | 40.69 | $ 4,183 | |
| CLASS R5 SHARES | |||||||
| 2024 (c) | (0.67) (d) | 0.95 (d) | 1.34 (d) | 21.90 | 19.01 | $ 8,743 | |
| 2023 | (0.73) | 0.95 | 1.55 | 15.19 | 45.46 | $ 7,852 | |
| 2022 | (0.77) | 0.90 | 1.52 | (38.53) | 57.56 | $ 9,235 | |
| 2021 | (0.67) | 0.84 | 1.31 | 15.04 | 161.43 (e) | $ 22,945 | |
| 2020 | (0.37) | 0.99 | 1.26 | 34.83 | 43.82 | $ 22,691 | |
| 2019 | (0.09) | 0.99 | 1.39 | (2.26) | 40.69 | $ 19,984 | |
Income Builder Fund
| PER SHARE PERFORMANCE (FOR A SHARE OUTSTANDING THROUGHOUT THE PERIOD) | ||||||||||
| UNLESS OTHERWISE NOTED, PERIODS ARE FISCAL YEARS ENDED SEPTEMBER 30, | Net Asset Value, Beginning of PERIOD | Net Investment Income (Loss)+ | Net Realized & Unrealized Gain (Loss) on Investments | Total from Investment Operations | Dividends from Net Investment Income | Dividends from Net Realized Gains | Dividends from Return of Capital | Total Dividends | Net Asset Value, End of PERIOD | |
| CLASS A SHARES(d) | ||||||||||
| 2024 (e) | $ 22.33 | 0.37 | 2.84 | 3.21 | (0.57) | — | — | (0.57) | $ 24.97 | |
| 2023 | $ 19.22 | 1.11 | 3.14 | 4.25 | (1.14) | — | — | (1.14) | $ 22.33 | |
| 2022 | $ 22.96 | 1.18 | (3.75) | (2.57) | (1.17) | — | — | (1.17) | $ 19.22 | |
| 2021 | $ 18.70 | 1.19 | 4.19 | 5.38 | (1.12) | — | — | (1.12) | $ 22.96 | |
| 2020 | $ 21.72 | 0.86 | (2.98) | (2.12) | (0.90) | — | — | (0.90) | $ 18.70 | |
| 2019 | $ 21.80 | 0.93 | (0.07) | 0.86 | (0.94) | — | — | (0.94) | $ 21.72 | |
| CLASS C SHARES | ||||||||||
| 2024 (e) | $ 22.30 | 0.28 | 2.84 | 3.12 | (0.48) | — | — | (0.48) | $ 24.94 | |
| 2023 | $ 19.19 | 0.94 | 3.15 | 4.09 | (0.98) | — | — | (0.98) | $ 22.30 | |
| 2022 | $ 22.93 | 0.98 | (3.72) | (2.74) | (1.00) | — | — | (1.00) | $ 19.19 | |
| 2021 | $ 18.68 | 1.00 | 4.19 | 5.19 | (0.94) | — | — | (0.94) | $ 22.93 | |
| 2020 | $ 21.69 | 0.69 | (2.95) | (2.26) | (0.75) | — | — | (0.75) | $ 18.68 | |
| 2019 | $ 21.78 | 0.76 | (0.06) | 0.70 | (0.79) | — | — | (0.79) | $ 21.69 | |
| CLASS I SHARES | ||||||||||
| 2024 (e) | $ 22.50 | 0.40 | 2.86 | 3.26 | (0.60) | — | — | (0.60) | $ 25.16 | |
| 2023 | $ 19.36 | 1.19 | 3.15 | 4.34 | (1.20) | — | — | (1.20) | $ 22.50 | |
| 2022 | $ 23.13 | 1.25 | (3.78) | (2.53) | (1.24) | — | — | (1.24) | $ 19.36 | |
| 2021 | $ 18.84 | 1.25 | 4.22 | 5.47 | (1.18) | — | — | (1.18) | $ 23.13 | |
| 2020 | $ 21.88 | 0.89 | (2.98) | (2.09) | (0.95) | — | — | (0.95) | $ 18.84 | |
| 2019 | $ 21.96 | 0.99 | (0.07) | 0.92 | (1.00) | — | — | (1.00) | $ 21.88 | |
| CLASS R3 SHARES | ||||||||||
| 2024 (e) | $ 22.32 | 0.33 | 2.84 | 3.17 | (0.53) | — | — | (0.53) | $ 24.96 | |
| 2023 | $ 19.21 | 1.02 | 3.15 | 4.17 | (1.06) | — | — | (1.06) | $ 22.32 | |
| 2022 | $ 22.95 | 1.09 | (3.74) | (2.65) | (1.09) | — | — | (1.09) | $ 19.21 | |
| 2021 | $ 18.70 | 1.10 | 4.18 | 5.28 | (1.03) | — | — | (1.03) | $ 22.95 | |
| 2020 | $ 21.71 | 0.78 | (2.96) | (2.18) | (0.83) | — | — | (0.83) | $ 18.70 | |
| 2019 | $ 21.80 | 0.84 | (0.07) | 0.77 | (0.86) | — | — | (0.86) | $ 21.71 | |
| CLASS R4 SHARES | ||||||||||
| 2024 (e) | $ 22.35 | 0.34 | 2.85 | 3.19 | (0.54) | — | — | (0.54) | $ 25.00 | |
| 2023 | $ 19.24 | 1.06 | 3.13 | 4.19 | (1.08) | — | — | (1.08) | $ 22.35 | |
| 2022 | $ 22.98 | 1.12 | (3.75) | (2.63) | (1.11) | — | — | (1.11) | $ 19.24 | |
| 2021 | $ 18.72 | 1.12 | 4.20 | 5.32 | (1.06) | — | — | (1.06) | $ 22.98 | |
| 2020 | $ 21.74 | 0.77 | (2.94) | (2.17) | (0.85) | — | — | (0.85) | $ 18.72 | |
| 2019 | $ 21.83 | 0.86 | (0.07) | 0.79 | (0.88) | — | — | (0.88) | $ 21.74 | |
| CLASS R5 SHARES | ||||||||||
| 2024 (e) | $ 22.48 | 0.39 | 2.87 | 3.26 | (0.59) | — | — | (0.59) | $ 25.15 | |
| 2023 | $ 19.35 | 1.09 | 3.22 | 4.31 | (1.18) | — | — | (1.18) | $ 22.48 | |
| 2022 | $ 23.11 | 1.21 | (3.76) | (2.55) | (1.21) | — | — | (1.21) | $ 19.35 | |
| 2021 | $ 18.83 | 1.22 | 4.21 | 5.43 | (1.15) | — | — | (1.15) | $ 23.11 | |
| 2020 | $ 21.86 | 0.90 | (3.00) | (2.10) | (0.93) | — | — | (0.93) | $ 18.83 | |
| 2019 | $ 21.95 | 0.97 | (0.09) | 0.88 | (0.97) | — | — | (0.97) | $ 21.86 | |
| CLASS R6 SHARES | ||||||||||
| 2024 (e) | $ 22.43 | 0.41 | 2.86 | 3.27 | (0.61) | — | — | (0.61) | $ 25.09 | |
| 2023 | $ 19.30 | 1.21 | 3.13 | 4.34 | (1.21) | — | — | (1.21) | $ 22.43 | |
| 2022 | $ 23.06 | 1.27 | (3.78) | (2.51) | (1.25) | — | — | (1.25) | $ 19.30 | |
| 2021 | $ 18.78 | 1.27 | 4.20 | 5.47 | (1.19) | — | — | (1.19) | $ 23.06 | |
| 2020 | $ 21.81 | 0.92 | (2.98) | (2.06) | (0.97) | — | — | (0.97) | $ 18.78 | |
| 2019 | $ 21.89 | 1.01 | (0.08) | 0.93 | (1.01) | — | — | (1.01) | $ 21.81 | |
| (a) | Net investment income (loss) includes income from foreign withholding tax claims adjusted for IRS compliance fees and/or tax reclaim collection fees. Without these proceeds, the Net Investment Income (Loss) ratios would have been as follows: |
| Class A | Class C | Class I | Class R3 | Class R4 | Class R5 | Class R6 | |
| 2023 | 5.05 % | 4.25 % | 5.34 % | 4.63 % | 4.81 % | 4.88 % | 5.45 % |
| 2022 | 4.71 % | 3.83 % | 4.96 % | 4.32 % | 4.44 % | 4.79 % | 5.14 % |
| 2021 | 5.07 % | 4.25 % | 5.28 % | 4.68 % | 4.77 % | 5.18 % | 5.40 % |
| (b) | Net expenses include tax reclaim collection fees that are excluded from the expense limitation agreement. If such expenses and fees had not occurred, the Expenses After Expense Reductions ratios for 2021 would have been: Class A, 1.13%; Class C, 1.90%; Class I, 0.89%; Class R3, 1.50%; Class R4, 1.40%; Class R5, 0.99%; Class R6, 0.80%. |
| (c) | Not annualized for periods less than one year. |
| (d) | Sales loads are not reflected in computing total return. |
| (e) | Unaudited Six Month Period Ended March 31. |
| (f) | Annualized. |
Income Builder Fund
| RATIOS TO AVERAGE NET ASSETS | Supplemental Data | ||||||
| UNLESS OTHERWISE NOTED, PERIODS ARE FISCAL YEARS ENDED SEPTEMBER 30, | Net Investment Income (Loss) (%)(a) | Expenses, After Expense Reductions (%)(b) | Expenses, Before Expense Reductions (%) | Total Return (%)(c) | Portfolio Turnover Rate (%)(c) | Net Assets at End of PERIOD (Thousands) | |
| CLASS A SHARES(d) | |||||||
| 2024 (e) | 3.18 (f) | 1.13 (f) | 1.13 (f) | 14.51 (g) | 12.77 | $ 4,275,016 | |
| 2023 | 5.07 | 1.13 | 1.13 | 22.29 | 26.28 | $ 3,888,316 | |
| 2022 | 5.14 | 1.14 | 1.14 | (11.81) | 25.31 | $ 3,344,513 | |
| 2021 | 5.32 | 1.26 | 1.26 | 28.90 | 18.99 | $ 3,876,333 | |
| 2020 | 4.27 | 1.15 | 1.15 | (9.78) | 47.60 | $ 2,912,063 | |
| 2019 | 4.42 | 1.13 | 1.13 | 4.13 | 43.69 | $ 3,458,385 | |
| CLASS C SHARES | |||||||
| 2024 (e) | 2.39 (f) | 1.90 (f) | 1.90 (f) | 14.08 | 12.77 | $ 507,895 | |
| 2023 | 4.26 | 1.86 | 1.86 | 21.46 | 26.28 | $ 493,453 | |
| 2022 | 4.26 | 1.89 | 1.89 | (12.52) | 25.31 | $ 570,348 | |
| 2021 | 4.49 | 2.03 | 2.03 | 27.93 | 18.99 | $ 922,523 | |
| 2020 | 3.40 | 1.88 | 1.88 | (10.44) | 47.60 | $ 1,452,643 | |
| 2019 | 3.60 | 1.87 | 1.87 | 3.35 | 43.69 | $ 2,658,581 | |
| CLASS I SHARES | |||||||
| 2024 (e) | 3.42 (f) | 0.89 (f) | 0.89 (f) | 14.60 | 12.77 | $ 7,800,607 | |
| 2023 | 5.35 | 0.88 | 0.88 | 22.61 | 26.28 | $ 6,799,321 | |
| 2022 | 5.40 | 0.89 | 0.89 | (11.61) | 25.31 | $ 5,213,452 | |
| 2021 | 5.54 | 1.02 | 1.02 | 29.18 | 18.99 | $ 5,858,020 | |
| 2020 | 4.40 | 0.91 | 0.91 | (9.55) | 47.60 | $ 5,094,055 | |
| 2019 | 4.67 | 0.88 | 0.88 | 4.39 | 43.69 | $ 7,810,067 | |
| CLASS R3 SHARES | |||||||
| 2024 (e) | 2.79 (f) | 1.50 (f) | 1.76 (f) | 14.27 | 12.77 | $ 21,072 | |
| 2023 | 4.65 | 1.50 | 1.63 | 21.87 | 26.28 | $ 19,995 | |
| 2022 | 4.76 | 1.50 | 1.63 | (12.15) | 25.31 | $ 19,842 | |
| 2021 | 4.93 | 1.63 | 1.71 | 28.39 | 18.99 | $ 24,971 | |
| 2020 | 3.86 | 1.49 | 1.49 | (10.06) | 47.60 | $ 24,343 | |
| 2019 | 3.97 | 1.50 | 1.58 | 3.72 | 43.69 | $ 36,155 | |
| CLASS R4 SHARES | |||||||
| 2024 (e) | 2.92 (f) | 1.40 (f) | 1.69 (f) | 14.36 | 12.77 | $ 11,986 | |
| 2023 | 4.82 | 1.40 | 1.44 | 21.96 | 26.28 | $ 10,181 | |
| 2022 | 4.87 | 1.40 | 1.50 | (12.08) | 25.31 | $ 10,181 | |
| 2021 | 5.02 | 1.53 | 1.59 | 28.60 (h) | 18.99 | $ 12,751 | |
| 2020 | 3.79 | 1.40 | 1.51 | (10.01) | 47.60 | $ 13,044 | |
| 2019 | 4.09 | 1.40 | 1.50 | 3.79 | 43.69 | $ 25,221 | |
| CLASS R5 SHARES | |||||||
| 2024 (e) | 3.30 (f) | 0.99 (f) | 1.37 (f) | 14.60 | 12.77 | $ 20,445 | |
| 2023 | 4.91 | 0.99 | 1.16 | 22.44 | 26.28 | $ 18,323 | |
| 2022 | 5.21 | 0.99 | 1.12 | (11.71) | 25.31 | $ 29,318 | |
| 2021 | 5.43 | 1.12 | 1.22 | 29.07 (i) | 18.99 | $ 38,749 | |
| 2020 | 4.44 | 0.99 | 1.05 | (9.58) | 47.60 | $ 45,308 | |
| 2019 | 4.55 | 0.99 | 1.08 | 4.20 | 43.69 | $ 59,890 | |
| CLASS R6 SHARES | |||||||
| 2024 (e) | 3.50 (f) | 0.80 (f) | 0.84 (f) | 14.68 | 12.77 | $ 269,892 | |
| 2023 | 5.47 | 0.80 | 0.83 | 22.70 | 26.28 | $ 199,924 | |
| 2022 | 5.55 | 0.80 | 0.85 | (11.54) | 25.31 | $ 133,706 | |
| 2021 | 5.66 | 0.93 | 0.97 | 29.32 | 18.99 | $ 113,387 | |
| 2020 | 4.58 | 0.80 | 0.84 | (9.44) | 47.60 | $ 86,889 | |
| 2019 | 4.76 | 0.80 | 0.82 | 4.47 | 43.69 | $ 157,924 | |
| (g) | The total return based on the NAV which reflects adjustments in accordance with U.S. GAAP is 14.47%. |
| (h) | The total return based on the NAV which reflects adjustments in accordance with U.S. GAAP is 28.55%. |
| (i) | The total return based on the NAV which reflects adjustments in accordance with U.S. GAAP is 29.02%. |
| + | Based on weighted average shares outstanding. |
Summit Fund
| PER SHARE PERFORMANCE (FOR A SHARE OUTSTANDING THROUGHOUT THE PERIOD) | ||||||||||
| UNLESS OTHERWISE NOTED, PERIODS ARE FISCAL YEARS ENDED SEPTEMBER 30, | Net Asset Value, Beginning of PERIOD | Net Investment Income (Loss)+ | Net Realized & Unrealized Gain (Loss) on Investments | Total from Investment Operations | Dividends from Net Investment Income | Dividends from Net Realized Gains | Dividends from Return of Capital | Total Dividends | Net Asset Value, End of PERIOD | |
| CLASS A SHARES(e)(f) | ||||||||||
| 2024 (g) | $ 11.30 | 0.12 | 1.39 | 1.51 | (0.12) | — | — | (0.12) | $ 12.69 | |
| 2023 | $ 10.31 | 0.29 | 0.99 | 1.28 | (0.29) | — | — | (0.29) | $ 11.30 | |
| 2022 | $ 12.06 | 0.18 | (1.74) | (1.56) | (0.19) | — | — | (0.19) | $ 10.31 | |
| CLASS I SHARES | ||||||||||
| 2024 (g) | $ 11.30 | 0.13 | 1.39 | 1.52 | (0.13) | — | — | (0.13) | $ 12.69 | |
| 2023 | $ 10.31 | 0.30 | 1.01 | 1.31 | (0.32) | — | — | (0.32) | $ 11.30 | |
| 2022 | $ 14.25 | 0.28 | (1.81) | (1.53) | (0.24) | (2.17) | — | (2.41) | $ 10.31 | |
| 2021 | $ 12.18 | 0.16 | 2.71 | 2.87 | (0.22) | (0.58) | — | (0.80) | $ 14.25 | |
| 2020 | $ 10.47 | 0.09 | 1.80 | 1.89 | (0.13) | (0.05) | — | (0.18) | $ 12.18 | |
| 2019 (j) | $ 10.00 | 0.11 | 0.43 | 0.54 | (0.07) | — | — | (0.07) | $ 10.47 | |
| (a) | Net investment income (loss) includes income from foreign withholding tax claims adjusted for IRS compliance fees and/or tax reclaim collection fees. Without these proceeds, the Net Investment Income (Loss) ratios would have been as follows: |
| Class A | Class I | ||||||
| 2024 | 1.89% | 2.13% | |||||
| 2023 | 2.57% | 2.61% |
| (b) | The Fund incurs certain expenses and fees in connection with investments in short positions. If such expenses and fees had not occurred, the Expenses After Expense Reductions ratios for 2021, 2020 and 2019 would have been 0.99%, 0.99% and 0.99% respectively. |
| (c) | The Fund incurs certain expenses and fees in connection with investments in short positions. If such expenses and fees had not occurred, the Expenses Before Expense Reductions ratios for 2021, 2020 and 2019 would have been 1.19%, 1.31% and 1.71% respectively. |
| (d) | Not annualized for periods less than one year. |
| (e) | Effective date of this class of shares was January 26, 2022. |
| (f) | Sales loads are not reflected in computing total return. |
| (g) | Unaudited Six Month Period Ended March 31. |
| (h) | Annualized. |
| (i) | Due to the size of net assets and fixed expenses, ratios may appear disproportionate. |
| (j) | Fund commenced operations on March 1, 2019. |
| + | Based on weighted average shares outstanding. |
Summit Fund
| RATIOS TO AVERAGE NET ASSETS | Supplemental Data | ||||||
| UNLESS OTHERWISE NOTED, PERIODS ARE FISCAL YEARS ENDED SEPTEMBER 30, | Net Investment Income (Loss) (%)(a) | Expenses, After Expense Reductions (%)(b) | Expenses, Before Expense Reductions (%)(c) | Total Return (%)(d) | Portfolio Turnover Rate (%)(d) | Net Assets at End of PERIOD (Thousands) | |
| CLASS A SHARES(e)(f) | |||||||
| 2024 (g) | 1.96 (h) | 0.94 (h) | 1.64 (h) | 13.40 | 29.33 | $ 8,738 | |
| 2023 | 2.58 | 0.94 | 2.03 | 12.39 | 80.17 | $ 5,978 | |
| 2022 | 2.40 (h) | 0.99 (h) | 9.32 (h)(i) | (13.02) | 128.69 | $ 507 | |
| CLASS I SHARES | |||||||
| 2024 (g) | 2.19 (h) | 0.69 (h) | 1.11 (h) | 13.53 | 29.33 | $ 90,967 | |
| 2023 | 2.63 | 0.69 | 1.20 | 12.66 | 80.17 | $ 74,869 | |
| 2022 | 2.38 | 0.88 | 1.22 | (13.36) | 128.69 | $ 56,036 | |
| 2021 | 1.20 | 1.01 | 1.21 | 24.63 | 155.26 | $ 62,466 | |
| 2020 | 0.81 | 1.09 | 1.41 | 18.45 | 139.88 | $ 45,886 | |
| 2019 (j) | 1.78 (h) | 1.72 (h) | 2.44 (h) | 5.45 | 53.38 | $ 35,489 | |
March 31, 2024 (Unaudited)
| (1) | transaction costs, including |
| (a) | sales charges (loads) on purchase payments, for Class A shares; |
| (b) | a deferred sales charge on redemptions of any part or all of a purchase of $1 million of Class A shares within 12 months of purchase; |
| (c) | a deferred sales charge on redemptions of Class C shares within 12 months of purchase; |
| (2) | ongoing costs, including management fees; distribution and/or service (12b-1) fees; and other Fund expenses. |
| Actual | Hypothetical * | |||||
| Ending Account Value 3/31/24 | Expenses Paid During Period 10/1/23-3/31/24 | Ending Account Value 3/31/24 | Expenses Paid During Period† 10/1/23-3/31/24 | Annualized Expense Ratio | ||
| GLOBAL OPPORTUNITIES FUND | ||||||
| CLASS A SHARES | $1,182.76 | $ 7.09 | $1,018.50 | $6.56 | 1.30% | |
| CLASS C SHARES | $1,177.68 | $11.76 | $1,014.20 | $10.88 | 2.16% | |
| CLASS I SHARES | $1,184.51 | $ 5.41 | $1,020.05 | $5.00 | 0.99% | |
| CLASS R3 SHARES | $1,182.06 | $ 8.18 | $1,017.50 | $7.57 | 1.50% | |
| CLASS R4 SHARES | $1,182.11 | $ 7.64 | $1,018.00 | $7.06 | 1.40% | |
| CLASS R5 SHARES | $1,184.45 | $ 5.41 | $1,020.05 | $5.00 | 0.99% | |
| CLASS R6 SHARES | $1,185.53 | $ 4.64 | $1,020.75 | $4.29 | 0.85% | |
| INTERNATIONAL EQUITY FUND | ||||||
| CLASS A SHARES | $1,174.48 | $ 6.31 | $1,019.20 | $5.86 | 1.16% | |
| CLASS C SHARES | $1,169.36 | $11.23 | $1,014.65 | $10.43 | 2.07% | |
| CLASS I SHARES | $1,176.91 | $ 4.73 | $1,020.65 | $4.39 | 0.87% | |
| CLASS R3 SHARES | $1,173.90 | $ 7.39 | $1,018.20 | $6.86 | 1.36% | |
| CLASS R4 SHARES | $1,175.07 | $ 6.31 | $1,019.20 | $5.86 | 1.16% | |
| CLASS R5 SHARES | $1,176.44 | $ 4.90 | $1,020.50 | $4.55 | 0.90% | |
| CLASS R6 SHARES | $1,177.68 | $ 3.81 | $1,021.50 | $3.54 | 0.70% | |
| BETTER WORLD INTERNATIONAL FUND | ||||||
| CLASS A SHARES | $1,110.41 | $ 7.44 | $1,017.95 | $7.11 | 1.41% | |
| CLASS C SHARES | $1,106.31 | $11.53 | $1,014.05 | $11.03 | 2.19% | |
| CLASS I SHARES | $1,112.79 | $ 4.75 | $1,020.50 | $4.55 | 0.90% | |
March 31, 2024 (Unaudited)
| Actual | Hypothetical * | |||||
| Ending Account Value 3/31/24 | Expenses Paid During Period 10/1/23-3/31/24 | Ending Account Value 3/31/24 | Expenses Paid During Period† 10/1/23-3/31/24 | Annualized Expense Ratio | ||
| INTERNATIONAL GROWTH FUND | ||||||
| CLASS A SHARES | $1,224.17 | $ 7.62 | $1,018.15 | $6.91 | 1.37% | |
| CLASS C SHARES | $1,218.52 | $13.03 | $1,013.25 | $11.83 | 2.35% | |
| CLASS I SHARES | $1,226.73 | $ 5.51 | $1,020.05 | $5.00 | 0.99% | |
| CLASS R3 SHARES | $1,223.75 | $ 8.34 | $1,017.50 | $7.57 | 1.50% | |
| CLASS R4 SHARES | $1,223.96 | $ 7.78 | $1,018.00 | $7.06 | 1.40% | |
| CLASS R5 SHARES | $1,226.73 | $ 5.51 | $1,020.05 | $5.00 | 0.99% | |
| CLASS R6 SHARES | $1,227.42 | $ 4.96 | $1,020.55 | $4.50 | 0.89% | |
| DEVELOPING WORLD FUND | ||||||
| CLASS A SHARES | $1,108.55 | $ 7.70 | $1,017.70 | $7.36 | 1.46% | |
| CLASS C SHARES | $1,103.68 | $12.25 | $1,013.35 | $11.73 | 2.33% | |
| CLASS I SHARES | $1,111.42 | $ 5.49 | $1,019.80 | $5.25 | 1.04% | |
| CLASS R5 SHARES | $1,110.72 | $ 5.49 | $1,019.80 | $5.25 | 1.04% | |
| CLASS R6 SHARES | $1,111.70 | $ 4.96 | $1,020.30 | $4.75 | 0.94% | |
| SMALL/MID CAP CORE FUND | ||||||
| CLASS A SHARES | $1,211.93 | $ 7.63 | $1,018.10 | $6.96 | 1.38% | |
| CLASS C SHARES | $1,205.80 | $12.90 | $1,013.30 | $11.78 | 2.34% | |
| CLASS I SHARES | $1,214.44 | $ 5.26 | $1,020.25 | $4.80 | 0.95% | |
| CLASS R3 SHARES | $1,212.19 | $ 7.24 | $1,018.45 | $6.61 | 1.31% | |
| CLASS R4 SHARES | $1,212.81 | $ 6.69 | $1,018.95 | $6.11 | 1.21% | |
| CLASS R5 SHARES | $1,214.33 | $ 5.26 | $1,020.25 | $4.80 | 0.95% | |
| SMALL/MID CAP GROWTH FUND | ||||||
| CLASS A SHARES | $1,215.81 | $ 7.92 | $1,017.85 | $7.21 | 1.43% | |
| CLASS C SHARES | $1,210.13 | $12.93 | $1,013.30 | $11.78 | 2.34% | |
| CLASS I SHARES | $1,218.97 | $ 5.27 | $1,020.25 | $4.80 | 0.95% | |
| CLASS R3 SHARES | $1,216.14 | $ 8.09 | $1,017.70 | $7.36 | 1.46% | |
| CLASS R4 SHARES | $1,216.66 | $ 7.54 | $1,018.20 | $6.86 | 1.36% | |
| CLASS R5 SHARES | $1,219.00 | $ 5.27 | $1,020.25 | $4.80 | 0.95% | |
| INCOME BUILDER FUND | ||||||
| CLASS A SHARES | $1,145.13 | $ 6.06 | $1,019.35 | $5.70 | 1.13% | |
| CLASS C SHARES | $1,140.79 | $10.17 | $1,015.50 | $9.57 | 1.90% | |
| CLASS I SHARES | $1,145.99 | $ 4.77 | $1,020.55 | $4.50 | 0.89% | |
| CLASS R3 SHARES | $1,142.74 | $ 8.04 | $1,017.50 | $7.57 | 1.50% | |
| CLASS R4 SHARES | $1,143.56 | $ 7.50 | $1,018.00 | $7.06 | 1.40% | |
| CLASS R5 SHARES | $1,145.95 | $ 5.31 | $1,020.05 | $5.00 | 0.99% | |
| CLASS R6 SHARES | $1,146.77 | $ 4.29 | $1,021.00 | $4.04 | 0.80% | |
| SUMMIT FUND | ||||||
| CLASS A SHARES | $1,133.98 | $ 5.01 | $1,020.30 | $4.75 | 0.94% | |
| CLASS I SHARES | $1,135.32 | $ 3.68 | $1,021.55 | $3.49 | 0.69% | |
| * | Hypothetical assumes a rate of return of 5% per year before expenses. |
| † | Expenses are equal to the annualized expense ratio for each class multiplied by the average account value over the period, multiplied by 183/366 to reflect the one-half year period. |
March 31, 2024 (Unaudited)
| Outstanding Shares | Shares Voted For | % of Voted Shares For | % of Outstanding Shares For | Shares Voted Withhold | % of Voted Shares Withhold | % of Outstanding Shares Withhold | |
| Global Opportunities Fund | 31,608,017.43 | 24,335,811.19 | 97.60% | 76.99% | 599,620.52 | 2.40% | 1.90% |
| International Equity Fund | 103,558,631.28 | 64,496,748.21 | 98.85% | 62.28% | 748,276.48 | 1.15% | 0.72% |
| Better World International Fund | 33,164,191.09 | 23,025,183.35 | 99.01% | 69.43% | 229,525.63 | 0.99% | 0.69% |
| International Growth Fund | 37,629,354.94 | 29,997,845.57 | 99.40% | 79.72% | 179,933.71 | 0.60% | 0.48% |
| Developing World Fund | 50,670,027.99 | 45,585,050.65 | 99.50% | 89.96% | 231,007.81 | 0.50% | 0.46% |
| Small/Mid Cap Core Fund | 8,220,271.33 | 5,591,432.22 | 98.22% | 68.02% | 101,076.33 | 1.78% | 1.23% |
| Small/Mid Cap Growth Fund | 10,775,497.16 | 6,589,279.80 | 97.12% | 61.15% | 195,567.00 | 2.88% | 1.81% |
| Investment Income Builder Fund | 506,647,628.33 | 420,675,941.34 | 98.71% | 83.03% | 5,476,095.86 | 1.29% | 1.08% |
| Summit Fund | 7,102,474.50 | 5,132,558.01 | 99.52% | 72.26% | 24,628.00 | 0.48% | 0.35% |
March 31, 2024 (Unaudited)
| Outstanding Shares | Shares Voted For | % of Voted Shares For | % of Outstanding Shares For | Shares Voted Withhold | % of Voted Shares Withhold | % of Outstanding Shares Withhold | |
| Global Opportunities Fund | 31,608,017.43 | 24,349,422.19 | 97.65% | 77.04% | 586,009.52 | 2.35% | 1.85% |
| International Equity Fund | 103,558,631.28 | 64,540,435.25 | 98.92% | 62.32% | 704,589.44 | 1.08% | 0.68% |
| Better World International Fund | 33,164,191.09 | 22,816,243.35 | 98.11% | 68.80% | 438,465.63 | 1.89% | 1.32% |
| International Growth Fund | 37,629,354.94 | 29,987,028.57 | 99.37% | 79.69% | 190,750.71 | 0.63% | 0.51% |
| Developing World Fund | 50,670,027.99 | 45,582,875.65 | 99.49% | 89.96% | 233,182.81 | 0.51% | 0.46% |
| Small/Mid Cap Core Fund | 8,220,271.33 | 5,589,377.42 | 98.19% | 68.00% | 103,131.12 | 1.81% | 1.25% |
| Small/Mid Cap Growth Fund | 10,775,497.16 | 6,585,119.80 | 97.06% | 61.11% | 199,727.00 | 2.94% | 1.85% |
| Investment Income Builder Fund | 506,647,628.33 | 420,942,933.53 | 98.78% | 83.08% | 5,209,103.68 | 1.22% | 1.03% |
| Summit Fund | 7,102,474.50 | 5,132,558.01 | 99.52% | 72.26% | 24,628.00 | 0.48% | 0.35% |
| Outstanding Shares | Shares Voted For | % of Voted Shares For | % of Outstanding Shares For | Shares Voted Withhold | % of Voted Shares Withhold | % of Outstanding Shares Withhold | |
| Global Opportunities Fund | 31,608,017.43 | 24,181,806.42 | 96.98% | 76.51% | 753,625.29 | 3.02% | 2.38% |
| International Equity Fund | 103,558,631.28 | 63,889,537.33 | 97.92% | 61.69% | 1,355,487.37 | 2.08% | 1.31% |
| Better World International Fund | 33,164,191.09 | 22,794,342.35 | 98.02% | 68.73% | 460,366.63 | 1.98% | 1.39% |
| International Growth Fund | 37,629,354.94 | 29,905,570.57 | 99.10% | 79.47% | 272,208.71 | 0.90% | 0.72% |
| Developing World Fund | 50,670,027.99 | 45,517,585.65 | 99.35% | 89.83% | 298,472.81 | 0.65% | 0.59% |
| Small/Mid Cap Core Fund | 8,220,271.33 | 5,589,123.42 | 98.18% | 67.99% | 103,385.12 | 1.82% | 1.26% |
| Small/Mid Cap Growth Fund | 10,775,497.16 | 6,533,171.80 | 96.29% | 60.63% | 251,675.00 | 3.71% | 2.34% |
| Investment Income Builder Fund | 506,647,628.33 | 419,952,593.07 | 98.55% | 82.89% | 6,199,444.14 | 1.45% | 1.22% |
| Summit Fund | 7,102,474.50 | 5,110,246.01 | 99.09% | 71.95% | 46,940.00 | 0.91% | 0.66% |
| Outstanding Shares | Shares Voted For | % of Voted Shares For | % of Outstanding Shares For | Shares Voted Withhold | % of Voted Shares Withhold | % of Outstanding Shares Withhold | |
| Global Opportunities Fund | 31,608,017.43 | 24,051,439.89 | 96.45% | 76.09% | 883,991.82 | 3.55% | 2.80% |
| International Equity Fund | 103,558,631.28 | 63,485,259.86 | 97.30% | 61.30% | 1,759,764.83 | 2.70% | 1.70% |
| Better World International Fund | 33,164,191.09 | 22,669,917.35 | 97.49% | 68.36% | 584,791.63 | 2.51% | 1.76% |
| International Growth Fund | 37,629,354.94 | 29,848,015.82 | 98.91% | 79.32% | 329,763.46 | 1.09% | 0.88% |
| Developing World Fund | 50,670,027.99 | 43,223,985.58 | 94.34% | 85.30% | 2,592,072.88 | 5.66% | 5.12% |
| Small/Mid Cap Core Fund | 8,220,271.33 | 5,571,394.17 | 97.87% | 67.78% | 121,114.38 | 2.13% | 1.47% |
| Small/Mid Cap Growth Fund | 10,775,497.16 | 6,471,786.15 | 95.39% | 60.06% | 313,060.65 | 4.61% | 2.91% |
| Investment Income Builder Fund | 506,647,628.33 | 416,077,078.75 | 97.64% | 82.12% | 10,074,958.46 | 2.36% | 1.99% |
| Summit Fund | 7,102,474.50 | 5,095,965.01 | 98.81% | 71.75% | 61,221.00 | 1.19% | 0.86% |
March 31, 2024 (Unaudited)
March 31, 2024 (Unaudited)
| NAME, AGE, YEAR ELECTED POSITION HELD WITH FUND | PRINCIPAL OCCUPATION(S) DURING PAST FIVE YEARS | OTHER DIRECTORSHIPS HELD BY TRUSTEE |
| INTERESTED TRUSTEES(1)(2) | ||
| Garrett Thornburg, 78 Trustee Since 1984, Chairman of Trustees(4) | Chairman and controlling shareholder of Thornburg Investment Management, Inc. (investment advisor); Chairman and controlling shareholder of Thornburg Securities Corporation (securities dealer); Chairman of the Thornburg Foundation (nonprofit). | None |
| Brian J. McMahon, 68 Trustee since 2001, Vice Chairman of Trustees, Member of Governance & Nominating Committee and Operations Risk Oversight Committee(5) | Vice Chairman, Chief Investment Strategist, Managing Director, and Portfolio Manager, and until 2019 Chief Investment Officer, and, until 2016, CEO and President, of Thornburg Investment Management, Inc.; Vice President of Thornburg Securities Corporation. | None |
| INDEPENDENT TRUSTEES(1)(2)(3) | ||
| Lisa Black, 64 Trustee since 2023(6), Member of Audit Committee and Operations Risk Oversight Committee | Until 2019, Senior Managing Director, Chief Investment Officer and Head, Taxable Fixed Income, Nuveen LLC, New York, NY; Managing Director, TIAA-CREF, New York, NY (1996-2012). | None |
| Sally Corning, 63 Trustee since 2012, Member of Audit Committee and Governance & Nominating Committee | Partner in Sun Mountain Capital, Santa Fe, NM (private equity firm with investment programs encompassing venture capital, mezzanine debt, and growth equity). | None |
| Susan H. Dubin, 75 Trustee since 2004, Member of Audit Committee and Operations Risk Oversight Committee | President of Dubin Investments, Ltd., Greenwich, CT (private investment fund); Director and officer of various charitable organizations. | None |
| David L. Gardner, 61 Trustee since 2015, Chair of Governance & Nominating Committee and Member of Operations Risk Oversight Committee | Until 2012, head of EMEA (Europe, Middle East and Africa) Sales for iShares of Blackrock, Inc., EMEA Executive Committee Member and EMEA Operating Committee Member at Blackrock, Inc. | None |
| Patrick J. Talamantes, 59 Trustee since 2019, Chair of Audit Committee | President of Talamantes Strategies, a management consulting firm, since 2018. Until 2017, President and Chief Executive Officer of The McClatchy Company, Sacramento, CA (news and media company). | None |
| Owen D. Van Essen, 69 Trustee since 2004, Lead Independent Trustee, Member of Governance & Nominating Committee and Operations Risk Oversight Committee | President of Dirks, Van Essen & April, Santa Fe, New Mexico (newspaper mergers and acquisitions). | None |
| James W. Weyhrauch, 65 Trustee since 1996, Chair of Operations Risk Oversight Committee, Member of Audit Committee | Real estate broker, Santa Fe Properties, Santa Fe, NM; General Partner, Investments of Genext LLC (a family investment partnership); until 2019, Vice Chairman of Nambé LLC, Santa Fe, NM (manufacturing and design company). | None |
March 31, 2024 (Unaudited)
| NAME, AGE, YEAR ELECTED POSITION HELD WITH FUND | PRINCIPAL OCCUPATION(S) DURING PAST FIVE YEARS | OTHER DIRECTORSHIPS HELD BY TRUSTEE |
| OFFICERS OF THE FUND (WHO ARE NOT TRUSTEES)(1) | ||
| Nimish Bhatt, 60 President since 2023, Chief Financial Officer 2019-2023, Treasurer 2016-2019, Secretary 2018-2019(7) | Chief Financial Officer and Treasurer of Thornburg Investment Management, Inc. and Thornburg Securities Corporation since 2016, and Secretary of Thornburg Securities Corporation since 2018; Senior Vice President (2004-2016), Chief Financial Officer (2011-2016), and Head of Fund Administration (2011- 2016) of Calamos Asset Management, Inc., Calamos Investments LLC, Calamos Advisors LLC, and Calamos Wealth Management; Director of Calamos Global Funds plc (2007-2016). | Not applicable |
| Geoffrey Black, 62 Secretary since 2024(6)(7) | Director of Fund Operations of Thornburg Investment Management, Inc. since 2024; Director, Transfer Agent Services at Russell Investments (2010-2024). | Not applicable |
| Randy Dry, 49 Vice President 2014-2024(6) | Managing Director, Chief Operating Officer since 2020, Chief Administrative Officer (2016-2020), and Director of Institutional Group (2014-2016) of Thornburg Investment Management, Inc. | Not applicable |
| Curtis Holloway, 56 Chief Financial Officer since 2023, Secretary 2024(6), Treasurer since 2019(7) | Director of Finance since 2021 and Director of Fund Administration since 2019 of Thornburg Investment Management, Inc.; Senior Vice President, Head of Fund Administration (2017-2019) and Vice President, Fund Administration (2010-2017) of Calamos Investments, and Chief Financial Officer (2017-2019) and Treasurer (2010-2019) of Calamos Funds. | Not applicable |
| Ben Kirby, 43 Vice President since 2014 | Co-Head of Investments since 2019, and Portfolio Manager and Managing Director since 2013, of Thornburg Investment Management, Inc. | Not applicable |
| Jeff Klingelhofer, 43 Vice President since 2016 | Co-Head of Investments since 2019, Portfolio Manager and Managing Director since 2015, Associate Portfolio Manager (2012-2015), of Thornburg Investment Management, Inc. | Not applicable |
| Ponn Lithiluxa, 52 Assistant Treasurer since 2020; Vice President 2017-2020 | Senior Manager & Vice President, Tax & Fund Administration of Thornburg Investment Management, Inc. since 2017; Senior Vice President, Citi Fund Services, Inc. (2014-2017); Vice President, Citi Fund Services, Inc. (2007-2014). | Not applicable |
| Christopher Luckham, 46 Assistant Treasurer since 2022 | Senior Manager, Fund Administration of Thornburg Investment Management, Inc. since 2010. | Not applicable |
| Natasha Rippel, 41 Secretary 2021-2024(6)(7) | Director of Fund Operations since 2021, Supervisor of Fund Operations (2017-2021), and Senior Associate of Fund Operations (2015-2017) of Thornburg Investment Management, Inc. | Not applicable |
| Stephen Velie, 55 Chief Compliance Officer since 2009 | Chief Compliance Officer of Thornburg Investment Trust and Thornburg Investment Management, Inc. | Not applicable |
| (1) | Each person’s address is 2300 North Ridgetop Road, Santa Fe, New Mexico 87506. |
| (2) | The Trust is organized as a Massachusetts business trust, and currently comprises a complex of 24 separate investment “Funds” or “series.” Thornburg Investment Management, Inc. is the investment advisor to, and manages, the 24 Funds of the Trust. Each Trustee oversees the 24 Funds of the Trust. |
| (3) | The Bylaws of the Trust currently require that each Independent Trustee shall retire by the end of the calendar year during which the Trustee reached the age of 75 years. Otherwise, each Trustee serves in office until the election and qualification of a successor or until the Trustee sooner dies, resigns, retires or is removed. |
| (4) | Mr. Thornburg is considered an “interested” Trustee under the Investment Company Act of 1940 because he is a director and controlling shareholder of Thornburg Investment Management, Inc. the investment advisor to the 24 Funds of the Trust, and is the sole director and controlling shareholder of Thornburg Securities Corporation, the distributor of shares of the Trust. |
| (5) | Mr. McMahon is considered an “interested” Trustee under the Investment Company Act of 1940 because he is a director and the chief investment strategist of Thornburg Investment Management, Inc. |
| (6) | Ms. Black served as an Advisory Trustee from April 1, 2023 through October 1, 2023 and was elected as an independent Trustee effective October 2, 2023. Mr. Dry concluded his service as a Vice President of the Trust effective April 15, 2024. Ms. Rippel concluded her service as Secretary of the Trust effective April 19, 2024.Mr. Holloway served as Secretary of the Trust from April 22, 2024 through May 15, 2024, when he was succeeded by Mr. Black, who was appointed as Secretary of the Trust effective May 15, 2024. |
| (7) | The Trust’s president, chief financial officer, secretary and treasurer each serves a one-year term or until the election and qualification of a successor; each other officer serves at the pleasure of the Trustees. |
| ■ | Thornburg Global Opportunities Fund |
| ■ | Thornburg International Equity Fund |
| ■ | Thornburg Better World International Fund |
| ■ | Thornburg International Growth Fund |
| ■ | Thornburg Developing World Fund |
| ■ | Thornburg Small/Mid Cap Core Fund |
| ■ | Thornburg Small/Mid Cap Growth Fund |
| ■ | Thornburg Investment Income Builder Fund |
| ■ | Thornburg Income Builder Opportunities Trust |
| ■ | Thornburg Summit Fund |
| ■ | Thornburg Ultra Short Income Fund |
| ■ | Thornburg Limited Term U.S. Government Fund |
| ■ | Thornburg Limited Term Income Fund |
| ■ | Thornburg Core Plus Bond Fund |
| ■ | Thornburg Strategic Income Fund |
| ■ | Thornburg Short Duration Municipal Fund |
| ■ | Thornburg Limited Term Municipal Fund |
| ■ | Thornburg Intermediate Municipal Fund |
| ■ | Thornburg Strategic Municipal Income Fund |
| ■ | Thornburg California Limited Term Municipal Fund |
| ■ | Thornburg New Mexico Intermediate Municipal Fund |
| ■ | Thornburg New York Intermediate Municipal Fund |


| 800.847.0200 | TH4624 |

| Thornburg Taxable Fixed Income Funds |
| Thornburg Ultra Short Income Fund |
| Thornburg Limited Term U.S. Government Fund |
| Thornburg Limited Term Income Fund |
| Thornburg Core Plus Bond Fund |
| Thornburg Strategic Income Fund |
| 4 | |
| 10 | |
| Schedule of Investments | |
| 15 | |
| 24 | |
| 28 | |
| 44 | |
| 52 | |
| 80 | |
| 82 | |
| 84 | |
| 87 | |
| 104 | |
| 114 | |
| 116 | |
| 119 | |
| 121 |
Fund Overview
| THORNBURG ULTRA SHORT INCOME FUND | FINAL VALUE |
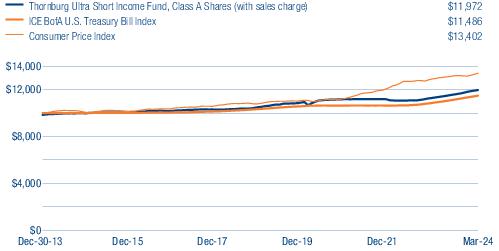
| THORNBURG ULTRA SHORT INCOME FUND | 1-YR | 3-YR | 5-YR | 10-YR | SINCE INCEPTION |
| Class A Shares (Incep: 12/30/13) | |||||
| Without sales charge | 5.58% | 2.30% | 2.46% | 1.90% | 1.92% |
| With sales charge | 3.20% | 1.52% | 2.15% | 1.75% | 1.77% |
| Class I Shares (Incep: 12/30/13) | 5.79% | 2.51% | 2.67% | 2.09% | 2.11% |
| ICE BofA U.S. Treasury Bill Index (Since 12/30/13) | 5.26% | 2.56% | 2.03% | 1.39% | 1.36% |
Fund Overview
| THORNBURG LIMITED TERM U.S. GOVERNMENT FUND | FINAL VALUE |
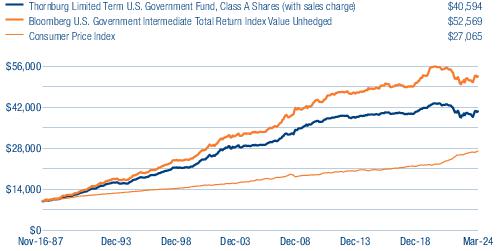
| THORNBURG LIMITED TERM U.S. GOVERNMENT FUND | 1-YR | 3-YR | 5-YR | 10-YR | SINCE INCEPTION |
| Class A Shares (Incep: 11/16/87) | |||||
| Without sales charge | 1.58% | -1.59% | -0.11% | 0.48% | 3.97% |
| With sales charge | -0.67% | -2.33% | -0.42% | 0.33% | 3.93% |
| Class C Shares (Incep: 9/1/94) | |||||
| Without sales charge | 1.23% | -1.93% | -0.44% | 0.17% | 2.85% |
| With sales charge | 0.74% | -1.93% | -0.44% | 0.17% | 2.85% |
| Class C2 Shares (Incep: 10/1/20) | |||||
| Without sales charge | 1.31% | -1.90% | - | - | -2.14% |
| With sales charge | 0.67% | -1.90% | - | - | -2.14% |
| Class I Shares (Incep: 7/5/96) | 1.82% | -1.33% | 0.16% | 0.78% | 3.30% |
| Class R3 Shares (Incep: 7/1/03) | 1.48% | -1.65% | -0.19% | 0.41% | 1.68% |
| Class R4 Shares (Incep: 2/1/14) | 1.48% | -1.68% | -0.20% | 0.41% | 0.38% |
| Class R5 Shares (Incep: 5/1/12) | 1.81% | -1.36% | 0.12% | 0.74% | 0.67% |
| Bloomberg U.S. Government Intermediate Total Return Index Value Unhedged ( Since 11/16/87) | 1.65% | -1.37% | 0.64% | 1.14% | 4.67% |
Fund Overview
| THORNBURG LIMITED TERM INCOME FUND | FINAL VALUE |
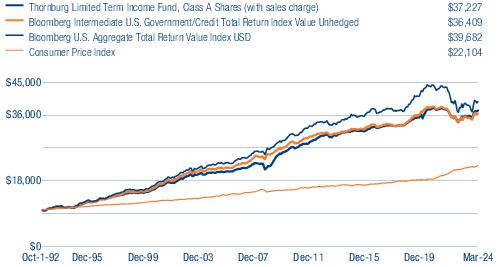
| THORNBURG LIMITED TERM INCOME FUND | 1-YR | 3-YR | 5-YR | 10-YR | SINCE INCEPTION |
| Class A Shares (Incep: 10/1/92) | |||||
| Without sales charge | 4.46% | -0.11% | 1.72% | 1.92% | 4.31% |
| With sales charge | 2.12% | -0.87% | 1.41% | 1.77% | 4.26% |
| Class C Shares (Incep: 9/1/94) | |||||
| Without sales charge | 4.21% | -0.34% | 1.48% | 1.70% | 3.98% |
| With sales charge | 3.71% | -0.34% | 1.48% | 1.70% | 3.98% |
| Class C2 Shares (Incep: 10/1/20) | |||||
| Without sales charge | 3.97% | -0.58% | - | - | -0.74% |
| With sales charge | 3.32% | -0.58% | - | - | -0.74% |
| Class I Shares (Incep: 7/5/96) | 4.75% | 0.18% | 2.02% | 2.25% | 4.45% |
| Class R3 Shares (Incep: 7/1/03) | 4.23% | -0.32% | 1.49% | 1.75% | 3.04% |
| Class R4 Shares (Incep: 2/1/14) | 4.23% | -0.32% | 1.51% | 1.75% | 1.76% |
| Class R5 Shares (Incep: 5/1/12) | 4.75% | 0.18% | 2.00% | 2.18% | 2.35% |
| Class R6 Shares (Incep: 4/10/17) | 4.82% | 0.25% | 2.08% | - | 2.31% |
| Bloomberg Intermediate U.S. Government/Credit Total Return Index Value Unhedged (Since 10/1/92) | 2.69% | -1.06% | 1.09% | 1.61% | 4.19% |
| Bloomberg U.S. Aggregate Bond Total Return Index Value USD (Since 10/1/92) | 1.70% | -2.46% | 0.36% | 1.54% | 4.47% |
Fund Overview
| THORNBURG CORE PLUS BOND FUND | FINAL VALUE |
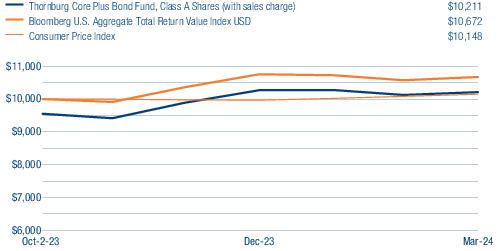
| THORNBURG CORE PLUS BOND FUND | SINCE INCEPTION |
| Class A Shares (Incep: 10/2/23) | |
| Without sales charge | 6.91% |
| With sales charge | 2.11% |
| Class C Shares (Incep: 10/2/23) | |
| Without sales charge | 6.62% |
| With sales charge | 5.62% |
| Class I Shares (Incep: 10/2/23) | 7.05% |
| Class R3 Shares (Incep: 10/2/23) | 6.78% |
| Class R4 Shares (Incep: 10/2/23) | 6.91% |
| Class R5 Shares (Incep: 10/2/23) | 7.05% |
| Class R6 Shares (Incep: 10/2/23) | 7.05% |
| Bloomberg U.S. Aggregate Bond Total Return Index Value USD (Since 10/2/23) | 6.72% |
Fund Overview
| THORNBURG STRATEGIC INCOME FUND | FINAL VALUE |
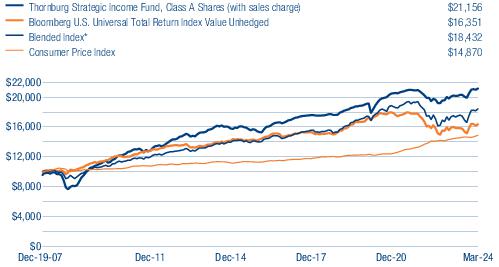
| THORNBURG STRATEGIC INCOME FUND | 1-YR | 3-YR | 5-YR | 10-YR | SINCE INCEPTION |
| Class A Shares (Incep: 12/19/07) | |||||
| Without sales charge | 5.29% | 1.03% | 3.07% | 3.05% | 5.00% |
| With sales charge | 0.56% | -0.51% | 2.13% | 2.57% | 4.71% |
| Class C Shares (Incep: 12/19/07) | |||||
| Without sales charge | 4.48% | 0.29% | 2.31% | 2.34% | 4.34% |
| With sales charge | 3.48% | 0.29% | 2.31% | 2.34% | 4.34% |
| Class I Shares (Incep: 12/19/07) | 5.70% | 1.46% | 3.47% | 3.43% | 5.37% |
| Class R3 Shares (Incep: 5/1/12) | 5.04% | 0.78% | 2.77% | 2.86% | 3.66% |
| Class R4 Shares (Incep: 2/1/14) | 5.04% | 0.78% | 2.79% | 2.87% | 3.03% |
| Class R5 Shares (Incep: 5/1/12) | 5.70% | 1.43% | 3.45% | 3.41% | 4.16% |
| Class R6 Shares (Incep: 4/10/17) | 5.77% | 1.51% | 3.53% | - | 3.76% |
| Bloomberg U.S. Universal Total Return Index Value Unhedged (Since 12/19/07) | 2.67% | -2.11% | 0.69% | 1.83% | 3.07% |
| Blended Index* (Since 12/19/07) | 6.10% | -0.20% | 2.82% | 3.23% | 3.83% |
Thornburg Ultra Short Income Fund | March 31, 2024 (Unaudited)
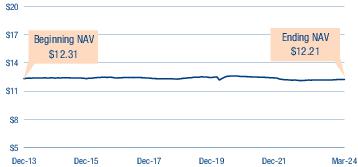
| KEY PORTFOLIO ATTRIBUTES | |
| Number of Bonds | 291 |
| Effective Duration | 0.5 Yrs |
| Average Maturity | 0.5 Yrs |
| Annualized Distribution Yield | 4.99% |
| SEC Yield | 4.64% |
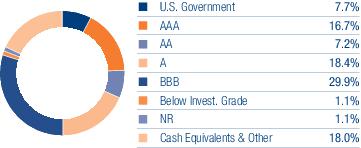
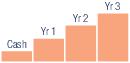
| 18% | 66% | 15% | 1% |
| THORNBURG ULTRA SHORT INCOME FUND | NASDAQ SYMBOLS | CUSIPS |
| Class A | TLDAX | 885-216-812 |
| Class I | TLDIX | 885-216-796 |
Thornburg Limited Term U.S. Government Fund | March 31, 2024 (Unaudited)
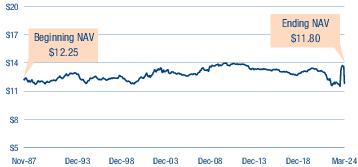
| KEY PORTFOLIO ATTRIBUTES | |
| Number of Bonds | 167 |
| Effective Duration | 4.0 Yrs |
| Average Maturity | 5.2 Yrs |
| Annualized Distribution Yield | 2.89% |
| SEC Yield | 3.03% |
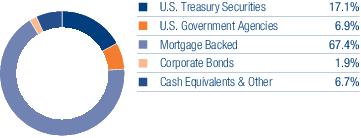

| 7% | 6% | 5% | 9% | 15% | 13% | 10% | 7% | 2% | 5% | 21% |
| THORNBURG LIMITED TERM U.S. GOVERNMENT FUND | NASDAQ SYMBOLS | CUSIPS |
| Class A | LTUSX | 885-215-103 |
| Class C | LTUCX | 885-215-830 |
| Class C2 | LTUQX | 885-216-465 |
| Class I | LTUIX | 885-215-699 |
| Class R3 | LTURX | 885-215-491 |
| Class R4 | LTUGX | 885-216-747 |
| Class R5 | LTGRX | 885-216-861 |
Thornburg Limited Term Income Fund | March 31, 2024 (Unaudited)
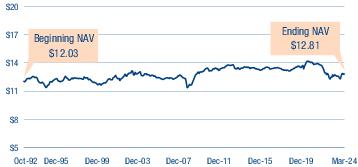
| KEY PORTFOLIO ATTRIBUTES | |
| Number of Bonds | 664 |
| Effective Duration | 3.5 Yrs |
| Average Maturity | 4.5 Yrs |
| Annualized Distribution Yield | 3.59% |
| SEC Yield | 3.93% |
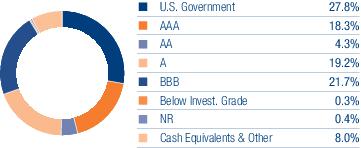
| 8% | 14% | 8% | 11% | 10% | 9% | 7% | 6% | 4% | 6% | 17% |
| THORNBURG LIMITED TERM INCOME FUND | NASDAQ SYMBOLS | CUSIPS |
| Class A | THIFX | 885-215-509 |
| Class C | THICX | 885-215-764 |
| Class C2 | THIQX | 885-216-424 |
| Class I | THIIX | 885-215-681 |
| Class R3 | THIRX | 885-215-483 |
| Class R4 | THRIX | 885-216-762 |
| Class R5 | THRRX | 885-216-853 |
| Class R6 | THRLX | 885-216-671 |
Thornburg Core Plus Bond Fund | March 31, 2024 (Unaudited)
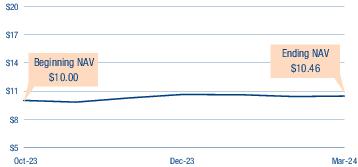
| KEY PORTFOLIO ATTRIBUTES | |
| Number of Bonds | 262 |
| Effective Duration | 6.4 Yrs |
| Average Maturity | 8.6 Yrs |
| Annualized Distribution Yield | 4.02% |
| SEC Yield | 3.62% |
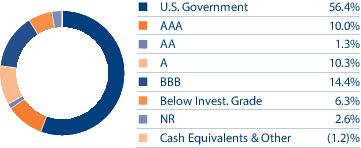
| (1%) | 5% | 4% | 6% | 3% | 6% | 5% | 10% | 4% | 3% | 54% |
| THORNBURG CORE PLUS BOND FUND | NASDAQ SYMBOLS | CUSIPS |
| Class A | THCAX | 885-216-325 |
| Class C | THCCX | 885-216-317 |
| Class I | THCIX | 885-216-291 |
| Class R3 | THCHX | 885-216-283 |
| Class R4 | THCEX | 885-216-275 |
| Class R5 | THCFX | 885-216-267 |
| Class R6 | THCSX | 885-216-259 |
Thornburg Strategic Income Fund | March 31, 2024 (Unaudited)
| PORTFOLIO COMPOSITION | |
| Corporate/Convertible Bonds | 42.1% |
| Asset Backed Securities | 11.1% |
| Bank Loans | 1.0% |
| Common & Preferred Stock | 0.1% |
| U.S. Treasury Securities | 16.9% |
| U.S. Government Agencies | 0.1% |
| Other Fixed Income | 21.1% |
| Other Assets Less Liabilities | 7.6% |
| Annualized Distribution Yield | 3.97% |
| SEC Yield | 4.25% |
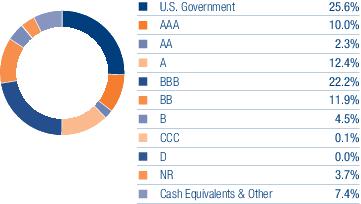
| TOP TEN INDUSTRY GROUPS | |
| Financial Services | 5.3% |
| Utilities | 4.9% |
| Insurance | 4.7% |
| Materials | 3.3% |
| Software & Services | 2.8% |
| Energy | 2.7% |
| Commercial & Professional Services | 2.1% |
| Equity Real Estate Investment Trusts (REITs) | 1.8% |
| Food, Beverage & Tobacco | 1.7% |
| Capital Goods | 1.6% |
| THORNBURG STRATEGIC INCOME FUND | NASDAQ SYMBOLS | CUSIPS |
| Class A | TSIAX | 885-215-228 |
| Class C | TSICX | 885-215-210 |
| Class I | TSIIX | 885-215-194 |
| Class R3 | TSIRX | 885-216-887 |
| Class R4 | TSRIX | 885-216-754 |
| Class R5 | TSRRX | 885-216-879 |
| Class R6 | TSRSX | 885-216-648 |
Thornburg Ultra Short Income Fund | March 31, 2024 (Unaudited)
| Issuer-Description | SHARES/PRINCIPAL AMOUNT | VALUE | |
| U.S. Treasury Securities — 13.4% | |||
| U.S. Treasury Bills, | |||
| 4.042% due 4/30/2024 | $5,800,000 | $ 5,775,482 | |
| 5.296% due 9/5/2024 | 3,000,000 | 2,933,032 | |
| 5.341% due 8/22/2024 | 3,500,000 | 3,428,673 | |
| 5.385% due 4/16/2024 | 4,075,000 | 4,066,070 | |
| 5.391% due 6/25/2024 | 3,000,000 | 2,963,359 | |
| U.S. Treasury Notes, | |||
| 1.75% due 6/30/2024 | 3,000,000 | 2,973,164 | |
| 2.00% due 5/31/2024 | 2,750,000 | 2,734,746 | |
| 2.125% due 7/31/2024 | 3,000,000 | 2,968,477 | |
| 2.25% due 4/30/2024 | 2,700,000 | 2,692,828 | |
| 4.25% due 5/31/2025 | 3,000,000 | 2,975,156 | |
| 5.00% due 8/31/2025 | 2,000,000 | 2,003,984 | |
| Total U.S. Treasury Securities (Cost $35,505,271) | 35,514,971 | ||
| U.S. Government Agencies — 0.0% | |||
| a,b | Petroleos Mexicanos (Guaranty: Export-Import Bank of the United States), 5.926% (TSFR3M + 0.61%) due 4/15/2025 | 12,500 | 12,246 |
| Small Business Administration Participation Certificates, | |||
| Series 2005-20K Class 1, 5.36% due 11/1/2025 | 2,924 | 2,908 | |
| Series 2009-20E Class 1, 4.43% due 5/1/2029 | 13,186 | 12,945 | |
| Total U.S. Government Agencies (Cost $28,698) | 28,099 | ||
| Mortgage Backed — 1.4% | |||
| Arroyo Mortgage Trust, Whole Loan Securities Trust CMO, | |||
| a,c | Series 2019-1 Class A1, 3.805% due 1/25/2049 | 17,645 | 16,771 |
| a,c | Series 2019-3 Class A1, 2.962% due 10/25/2048 | 17,567 | 16,190 |
| c | BRAVO Residential Funding Trust, Whole Loan Securities Trust CMO, Series 2019-1 Class A1C, 3.50% due 3/25/2058 | 4,924 | 4,844 |
| a,c | COLT Mortgage Pass-Through Certificates, Whole Loan Securities Trust CMO, Series 2021-1R Class A1, 0.857% due 5/25/2065 | 225,117 | 187,214 |
| a,c | CSMC Trust, CMBS, Series 2021-BPNY Class A, 9.155% (TSFR1M + 3.83%) due 8/15/2026 | 300,000 | 270,012 |
| a,c | CSMC Trust, Whole Loan Securities Trust CMO, Series 2020-NQM1 Class A1, 1.208% due 5/25/2065 | 80,846 | 73,505 |
| Federal National Mtg Assoc., UMBS Collateral, Pool MA3557, 4.00% due 1/1/2029 | 23,755 | 23,219 | |
| a,c | Flagstar Mortgage Trust, Whole Loan Securities Trust CMO, Series 2017-1 Class 2A2, 3.00% due 3/25/2047 | 10,553 | 9,548 |
| GCAT Trust, Whole Loan Securities Trust CMO, | |||
| a,c | Series 2021-CM1 Class A, 1.469% due 4/25/2065 | 208,988 | 196,008 |
| a,c | Series 2021-CM2 Class A1, 2.352% due 8/25/2066 | 129,948 | 117,263 |
| a,b,c | Greystone Commercial Real Estate Notes Ltd., CMBS, Series 2021-FL3 Class A, 6.46% (TSFR1M + 1.13%) due 7/15/2039 | 100,000 | 98,847 |
| c | Houston Galleria Mall Trust, CMBS, Series 2015-HGLR Class A1A2, 3.087% due 3/5/2037 | 750,000 | 725,228 |
| a,c | Metlife Securitization Trust, Whole Loan Securities Trust CMO, Series 2019-1A Class A1A, 3.75% due 4/25/2058 | 55,828 | 53,968 |
| a,c | MFRA Trust, Whole Loan Securities Trust CMO, Series 2022-CHM1 Class A1, 3.875% due 9/25/2056 | 502,532 | 475,975 |
| a,c | New Residential Mortgage Loan Trust, Whole Loan Securities Trust CMO, Series 2017-5A Class A1, 6.944% (TSFR1M + 1.61%) due 6/25/2057 | 12,966 | 12,967 |
| a,c | Residential Mortgage Loan Trust, Whole Loan Securities Trust CMO, Series 2020-2 Class A1, 1.654% due 5/25/2060 | 199,547 | 195,793 |
| Seasoned Credit Risk Transfer, Whole Loan Securities Trust CMO, | |||
| a | Series 2017-3 Class HA, 3.25% due 7/25/2056 | 26,342 | 24,394 |
| a | Series 2018-1 Class HA, 3.00% due 5/25/2057 | 18,518 | 16,804 |
| a | Series 2018-2 Class HA, 3.00% due 11/25/2057 | 69,840 | 63,825 |
| a,c | SG Residential Mortgage Trust, Whole Loan Securities Trust CMO, Series 2019-3 Class A1, 2.703% due 9/25/2059 | 334,769 | 328,085 |
| Towd Point Mortgage Trust, Whole Loan Securities Trust CMO, | |||
| a,c | Series 2016-5 Class A1, 2.50% due 10/25/2056 | 462 | 460 |
| a,c | Series 2018-2 Class A1, 3.25% due 3/25/2058 | 18,962 | 18,341 |
| a,c | Series 2018-6 Class A1A, 3.75% due 3/25/2058 | 652,288 | 637,152 |
| a,c | Verus Securitization Trust, Whole Loan Securities Trust CMO, Series 2019-INV3 Class A1B, 3.192% due 11/25/2059 | 216,006 | 209,319 |
| Total Mortgage Backed (Cost $3,923,312) | 3,775,732 | ||
| Asset Backed Securities — 27.3% | |||
| Auto Receivables — 15.1% |
| See notes to financial statements. | Thornburg Taxable Fixed Income Funds Semi-Annual Report | 15 |
Thornburg Ultra Short Income Fund | March 31, 2024 (Unaudited)
| Issuer-Description | SHARES/PRINCIPAL AMOUNT | VALUE | |
| ACC Auto Trust, | |||
| c | Series 2021-A Class C, 3.79% due 4/15/2027 | $ 710,371 | $ 708,378 |
| c | Series 2021-A Class D, 6.10% due 6/15/2029 | 575,000 | 567,627 |
| c | Series 2022-A Class A, 4.58% due 7/15/2026 | 72,068 | 71,853 |
| c | ACM Auto Trust, Series 2023-2A Class A, 7.97% due 6/20/2030 | 430,552 | 433,606 |
| American Credit Acceptance Receivables Trust, | |||
| c | Series 2021-4 Class C, 1.32% due 2/14/2028 | 510,474 | 508,351 |
| c | Series 2023-1 Class A, 5.45% due 9/14/2026 | 232,994 | 232,886 |
| AmeriCredit Automobile Receivables Trust, Series 2021-1 Class B, 0.68% due 10/19/2026 | 398,196 | 395,024 | |
| Arivo Acceptance Auto Loan Receivables Trust, | |||
| c | Series 2021-1A Class A, 1.19% due 1/15/2027 | 163,892 | 162,054 |
| c | Series 2022-1A Class A, 3.93% due 5/15/2028 | 692,496 | 681,560 |
| c | Series 2024-1A Class A, 6.46% due 4/17/2028 | 2,000,000 | 2,002,977 |
| c | Avis Budget Rental Car Funding AESOP LLC, Series 2020-1A Class A, 2.33% due 8/20/2026 | 1,500,000 | 1,445,542 |
| BOF URSA VI Funding Trust I, | |||
| c | Series 2023-CAR1 Class B, 6.029% due 10/27/2031 | 195,185 | 194,715 |
| c | Series 2023-CAR2 Class B, 6.029% due 10/27/2031 | 553,440 | 550,536 |
| c | BOF VII AL Funding Trust I, Series 2023-CAR3 Class A2, 6.291% due 7/26/2032 | 908,489 | 913,480 |
| CarMax Auto Owner Trust, | |||
| Series 2020-4 Class A3, 0.50% due 8/15/2025 | 148,219 | 147,598 | |
| Series 2021-1 Class A3, 0.34% due 12/15/2025 | 248,719 | 245,604 | |
| Series 2021-3 Class A3, 0.55% due 6/15/2026 | 1,043,054 | 1,013,860 | |
| Carvana Auto Receivables Trust, | |||
| Series 2021-N4 Class A1, 0.83% due 9/11/2028 | 59,586 | 59,291 | |
| Series 2021-P1 Class A4, 0.86% due 1/11/2027 | 743,789 | 719,717 | |
| c | Series 2022-N1 Class A1, 2.31% due 12/11/2028 | 223,845 | 221,651 |
| c | Series 2023-N1 Class A, 6.36% due 4/12/2027 | 384,591 | 385,421 |
| c | Series 2023-N3 Class A, 6.41% due 9/10/2027 | 504,646 | 506,804 |
| c | Series 2023-N4 Class A, 6.42% due 1/10/2028 | 586,015 | 589,308 |
| CPS Auto Receivables Trust, | |||
| c | Series 2020-B Class E, 7.38% due 6/15/2027 | 1,226,692 | 1,234,809 |
| c | Series 2023-A Class A, 5.54% due 3/16/2026 | 496,807 | 496,280 |
| DT Auto Owner Trust, | |||
| c | Series 2021-2A Class C, 1.10% due 2/16/2027 | 753,835 | 747,757 |
| c | Series 2022-3A Class A, 6.05% due 10/15/2026 | 314,788 | 315,004 |
| Enterprise Fleet Financing LLC, | |||
| c | Series 2021-3 Class A2, 0.77% due 8/20/2027 | 676,064 | 663,169 |
| c | Series 2022-2 Class A2, 4.65% due 5/21/2029 | 883,894 | 876,585 |
| Exeter Automobile Receivables Trust, | |||
| c | Series 2019-3A Class D, 3.11% due 8/15/2025 | 105,977 | 105,847 |
| c | Series 2019-4A Class D, 2.58% due 9/15/2025 | 234,456 | 233,216 |
| Series 2021-1A Class D, 1.08% due 11/16/2026 | 1,222,323 | 1,192,759 | |
| Series 2021-3A Class C, 0.96% due 10/15/2026 | 539,293 | 530,930 | |
| c | FHF Issuer Trust, Series 2024-1A Class A1, 5.769% due 3/17/2025 | 1,287,476 | 1,287,219 |
| FHF Trust, | |||
| c | Series 2021-1A Class A, 1.27% due 3/15/2027 | 18,826 | 18,320 |
| c | Series 2021-2A Class A, 0.83% due 12/15/2026 | 38,688 | 37,635 |
| c | Series 2022-2A Class A, 6.14% due 12/15/2027 | 690,692 | 688,760 |
| c | First Investors Auto Owner Trust, Series 2021-2A Class A, 0.48% due 3/15/2027 | 424,688 | 419,382 |
| Flagship Credit Auto Trust, | |||
| c | Series 2019-2 Class D, 3.53% due 5/15/2025 | 872,899 | 869,253 |
| c | Series 2019-4 Class D, 3.12% due 1/15/2026 | 373,613 | 368,872 |
| c | Series 2022-1 Class A, 1.79% due 10/15/2026 | 453,908 | 447,692 |
| GLS Auto Receivables Issuer Trust, | |||
| c | Series 2019-4A Class C, 3.06% due 8/15/2025 | 20,666 | 20,642 |
| c | Series 2020-1A Class C, 2.72% due 11/17/2025 | 20,763 | 20,736 |
| c | Series 2021-2A Class C, 1.08% due 6/15/2026 | 255,238 | 253,044 |
| c | Series 2022-2A Class A2, 3.55% due 1/15/2026 | 32,870 | 32,843 |
| c | Hertz Vehicle Financing LLC, Series 2021-1A Class A, 1.21% due 12/26/2025 | 2,000,000 | 1,952,748 |
| Hyundai Auto Receivables Trust, Series 2020-A Class A4, 1.72% due 6/15/2026 | 460,406 | 459,112 | |
| Lendbuzz Securitization Trust, | |||
| c | Series 2021-1A Class A, 1.46% due 6/15/2026 | 90,679 | 87,819 |
| c | Series 2022-1A Class A, 4.22% due 5/17/2027 | 461,706 | 452,738 |
| 16 | Thornburg Taxable Fixed Income Funds Semi-Annual Report | See notes to financial statements. |
| Issuer-Description | SHARES/PRINCIPAL AMOUNT | VALUE | |
| c | Series 2023-3A Class A1, 6.03% due 10/15/2024 | $ 152,014 | $ 152,018 |
| c | Series 2024-1A Class A1, 5.789% due 1/15/2025 | 1,140,325 | 1,140,043 |
| Lobel Automobile Receivables Trust, | |||
| c | Series 2023-1 Class A, 6.97% due 7/15/2026 | 750,851 | 752,189 |
| c | Series 2023-2 Class A, 7.59% due 4/16/2029 | 562,420 | 567,779 |
| Octane Receivables Trust, | |||
| c | Series 2022-1A Class A2, 4.18% due 3/20/2028 | 1,542,662 | 1,530,046 |
| c | Series 2022-2A Class A, 5.11% due 2/22/2028 | 330,142 | 328,669 |
| c | OneMain Direct Auto Receivables Trust, Series 2021-1A Class A, 0.87% due 7/14/2028 | 745,105 | 719,486 |
| b,c | Oscar U.S. Funding XV LLC, Series 2023-1A Class A2, 6.07% due 9/10/2026 | 1,108,800 | 1,110,614 |
| Research-Driven Pagaya Motor Asset Trust, | |||
| c | Series 2023-3A Class A, 7.13% due 1/26/2032 | 1,197,228 | 1,204,393 |
| c | Series 2023-4A Class A, 7.54% due 3/25/2032 | 1,478,140 | 1,494,650 |
| c | Research-Driven Pagaya Motor Trust, Series 2024-1A Class A, 7.09% due 6/25/2032 | 250,000 | 250,336 |
| c | SAFCO Auto Receivables Trust, Series 2024-1A Class A, 6.51% due 3/20/2028 | 1,097,201 | 1,098,616 |
| Santander Drive Auto Receivables Trust, | |||
| Series 2020-4 Class D, 1.48% due 1/15/2027 | 403,628 | 396,635 | |
| Series 2021-3 Class C, 0.95% due 9/15/2027 | 452,441 | 450,675 | |
| Series 2022-3 Class A3, 3.40% due 12/15/2026 | 237,514 | 236,419 | |
| c | Veros Auto Receivables Trust, Series 2022-1 Class A, 3.47% due 12/15/2025 | 326,731 | 325,933 |
| c | Westlake Automobile Receivables Trust, Series 2021-2A Class C, 0.89% due 7/15/2026 | 1,341,700 | 1,324,175 |
| World Omni Auto Receivables Trust, Series 2020-C Class A3, 0.48% due 11/17/2025 | 228,908 | 227,588 | |
| 39,881,278 | |||
| Credit Card — 1.0% | |||
| c | Avant Credit Card Master Trust, Series 2021-1A Class A, 1.37% due 4/15/2027 | 1,500,000 | 1,448,181 |
| c | Mercury Financial Credit Card Master Trust, Series 2023-1A Class A, 8.04% due 9/20/2027 | 700,000 | 706,009 |
| c | Mission Lane Credit Card Master Trust, Series 2023-B Class A, 7.69% due 11/15/2028 | 500,000 | 507,261 |
| 2,661,451 | |||
| Other Asset Backed — 10.0% | |||
| c | Affirm Asset Securitization Trust, Series 2021-Z2 Class A, 1.17% due 11/16/2026 | 183,620 | 180,144 |
| c | AMCR ABS Trust, Series 2023-1A Class A, 7.66% due 1/21/2031 | 1,130,427 | 1,137,191 |
| Aqua Finance Trust, | |||
| c | Series 2017-A Class A, 3.72% due 11/15/2035 | 50,538 | 50,538 |
| c | Series 2020-AA Class A, 1.90% due 7/17/2046 | 624,202 | 567,919 |
| c | Auxilior Term Funding LLC, Series 2023-1A Class A1, 5.864% due 11/15/2024 | 1,094,599 | 1,094,739 |
| c | Bankers Healthcare Group Securitization Trust, Series 2020-A Class A, 2.56% due 9/17/2031 | 4,200 | 4,186 |
| c | BHG Securitization Trust, Series 2021-B Class A, 0.90% due 10/17/2034 | 42,197 | 41,234 |
| c | CCG Receivables Trust, Series 2022-1 Class A2, 3.91% due 7/16/2029 | 396,503 | 391,864 |
| c | CFMT Issuer Trust, Series 2021-GRN1 Class A, 1.10% due 3/20/2041 | 733,729 | 698,831 |
| c | Crossroads Asset Trust, Series 2022-A Class A, 6.35% due 4/21/2031 | 812,708 | 814,677 |
| Dext ABS LLC, | |||
| c | Series 2021-1 Class A, 1.12% due 2/15/2028 | 582,695 | 572,141 |
| c | Series 2023-2 Class A2, 6.56% due 5/15/2034 | 654,552 | 658,428 |
| Foundation Finance Trust, | |||
| c | Series 2019-1A Class A, 3.86% due 11/15/2034 | 133,565 | 132,701 |
| c | Series 2020-1A Class A, 3.54% due 7/16/2040 | 156,927 | 153,118 |
| a,c | Gracie Point International Funding LLC, Series 2023-2A Class A, 7.608% (SOFR90A + 2.25%) due 3/1/2027 | 778,512 | 784,960 |
| c | Hilton Grand Vacations Trust, Series 2019-AA Class A, 2.34% due 7/25/2033 | 31,698 | 30,361 |
| c | Kubota Credit Owner Trust, Series 2021-1A Class A3, 0.62% due 8/15/2025 | 217,457 | 214,536 |
| LendingPoint Asset Securitization Trust, | |||
| c | Series 2022-B Class A, 4.77% due 10/15/2029 | 45,032 | 44,811 |
| c | Series 2022-C Class A, 6.56% due 2/15/2030 | 209,781 | 209,838 |
| LendingPoint Pass-Through Trust, | |||
| c | Series 2022-ST1 Class A, 2.50% due 3/15/2028 | 111,851 | 108,466 |
| c | Series 2022-ST2 Class A, 3.25% due 4/15/2028 | 109,037 | 106,299 |
| c | Series 2022-ST3 Class A, 4.00% due 5/15/2028 | 150,949 | 148,573 |
| LL ABS Trust, | |||
| c | Series 2020-1A Class C, 6.54% due 1/17/2028 | 486,267 | 486,267 |
| c | Series 2021-1A Class A, 1.07% due 5/15/2029 | 20,504 | 20,435 |
| Marlette Funding Trust, | |||
| c | Series 2019-4A Class C, 3.76% due 12/17/2029 | 73,140 | 73,067 |
| c | Series 2021-3A Class B, 1.30% due 12/15/2031 | 350,695 | 348,043 |
| See notes to financial statements. | Thornburg Taxable Fixed Income Funds Semi-Annual Report | 17 |
Thornburg Ultra Short Income Fund | March 31, 2024 (Unaudited)
| Issuer-Description | SHARES/PRINCIPAL AMOUNT | VALUE | |
| c | Series 2022-1A Class B, 2.34% due 4/15/2032 | $ 433,002 | $ 428,950 |
| c | Series 2022-3A Class A, 5.18% due 11/15/2032 | 58,015 | 57,913 |
| c | Series 2023-2A Class A, 6.04% due 6/15/2033 | 462,954 | 462,333 |
| c | MMAF Equipment Finance LLC, Series 2020-BA Class A3, 0.49% due 8/14/2025 | 67,673 | 66,643 |
| c | Mosaic Solar Loan Trust, Series 2018-1A Class C, Zero coupon due 6/22/2043 | 85,694 | 79,465 |
| c | NMEF Funding LLC, Series 2022-A Class A2, 2.58% due 10/16/2028 | 555,976 | 550,415 |
| c | Oportun Funding XIV LLC, Series 2021-A Class A, 1.21% due 3/8/2028 | 583,778 | 565,924 |
| c | Oportun Issuance Trust, Series 2021-B Class A, 1.47% due 5/8/2031 | 830,000 | 781,439 |
| c | Pagaya AI Debt Selection Trust, Series 2021-HG1 Class A, 1.22% due 1/16/2029 | 444,694 | 433,742 |
| Pagaya AI Debt Trust, | |||
| c | Series 2022-1 Class A, 2.03% due 10/15/2029 | 234,326 | 231,743 |
| c | Series 2023-1 Class A, 7.556% due 7/15/2030 | 222,382 | 223,406 |
| c | Series 2024-1 Class A, 6.66% due 7/15/2031 | 750,000 | 752,622 |
| c | Pawnee Equipment Receivables LLC, Series 2021-1 Class A2, 1.10% due 7/15/2027 | 1,027,925 | 1,011,229 |
| c | Post Road Equipment Finance, Series 2022-1A Class A1, 3.76% due 8/16/2027 | 13,621 | 13,601 |
| Prosper Marketplace Issuance Trust, | |||
| c | Series 2023-1A Class A, 7.06% due 7/16/2029 | 903,048 | 906,131 |
| c | Series 2024-1A Class A, 6.12% due 8/15/2029 | 1,750,000 | 1,749,693 |
| c | Reach Financial LLC, Series 2023-1A Class A, 7.05% due 2/18/2031 | 824,842 | 828,013 |
| c | Republic Finance Issuance Trust, Series 2021-A Class A, 2.30% due 12/22/2031 | 1,500,000 | 1,434,269 |
| a,c | SBA Tower Trust, Series 2014-2A Class C, 3.869% due 10/15/2049 | 1,548,000 | 1,529,585 |
| c | Service Experts Issuer LLC, Series 2021-1A Class A, 2.67% due 2/2/2032 | 1,456,950 | 1,364,994 |
| c | SpringCastle America Funding LLC, Series 2020-AA Class A, 1.97% due 9/25/2037 | 252,713 | 232,282 |
| c | SPS Servicer Advance Receivables Trust, Series 2020-T2 Class A, 1.83% due 11/15/2055 | 1,660,000 | 1,555,300 |
| c | Theorem Funding Trust, Series 2022-3A Class A, 7.60% due 4/15/2029 | 375,112 | 377,920 |
| Upstart Pass-Through Trust, | |||
| c | Series 2020-ST1 Class A, 3.75% due 2/20/2028 | 8,504 | 8,462 |
| c | Series 2020-ST2 Class A, 3.50% due 3/20/2028 | 18,169 | 17,980 |
| c | Series 2020-ST3 Class A, 3.35% due 4/20/2028 | 7,740 | 7,623 |
| c | Series 2020-ST6 Class A, 3.00% due 1/20/2027 | 441,579 | 436,741 |
| c | Series 2021-ST4 Class A, 2.00% due 7/20/2027 | 201,573 | 193,971 |
| c | Series 2021-ST8 Class A, 1.75% due 10/20/2029 | 115,507 | 114,161 |
| Upstart Securitization Trust, | |||
| c | Series 2020-2 Class A, 2.309% due 11/20/2030 | 70,253 | 69,763 |
| c | Series 2020-3 Class C, 6.25% due 11/20/2030 | 447,100 | 445,802 |
| c | Series 2023-1 Class A, 6.59% due 2/20/2033 | 101,042 | 101,072 |
| c | Series 2023-3 Class A, 6.90% due 10/20/2033 | 352,564 | 354,135 |
| 26,460,689 | |||
| Student Loan — 1.2% | |||
| Laurel Road Prime Student Loan Trust, | |||
| c | Series 2017-B Class BFX, 3.02% due 8/25/2042 | 735,344 | 717,952 |
| c | Series 2019-A Class A2FX, 2.73% due 10/25/2048 | 197,655 | 195,559 |
| a | National Collegiate Student Loan Trust, Series 2006-4 Class A4, 5.754% (TSFR1M + 0.42%) due 5/25/2032 | 202,559 | 196,437 |
| a,c | Navient Private Education Loan Trust, Series 2018-BA Class A2B, 6.16% (TSFR1M + 0.83%) due 12/15/2059 | 33,984 | 33,828 |
| c | Navient Private Education Refi Loan Trust, Series 2018-CA Class A2, 3.52% due 6/16/2042 | 171,256 | 170,418 |
| a,c | Navient Student Loan Trust, Series 2019-BA Class A2B, 6.42% (TSFR1M + 1.09%) due 12/15/2059 | 253,431 | 252,410 |
| Nelnet Student Loan Trust, | |||
| a,c | Series 2012-2A Class A, 6.235% (SOFR30A + 0.91%) due 12/26/2033 | 56,835 | 56,540 |
| a,c | Series 2015-3A Class A2, 6.035% (SOFR30A + 0.71%) due 2/27/2051 | 18,315 | 18,226 |
| a,c | Series 2021-DA Class AFL, 6.133% (TSFR1M + 0.80%) due 4/20/2062 | 123,969 | 122,597 |
| a,b,c | Prodigy Finance DAC, Series 2021-1A Class A, 6.694% (TSFR1M + 1.36%) due 7/25/2051 | 56,429 | 55,967 |
| SLM Student Loan Trust, | |||
| a | Series 2013-4 Class A, 5.985% (SOFR30A + 0.66%) due 6/25/2043 | 19,251 | 18,921 |
| a | Series 2013-6 Class A3, 6.085% (SOFR30A + 0.76%) due 6/26/2028 | 124,137 | 122,726 |
| SMB Private Education Loan Trust, | |||
| a,c | Series 2016-A Class A2B, 6.94% (TSFR1M + 1.61%) due 5/15/2031 | 84,329 | 84,452 |
| a,c | Series 2016-B Class A2B, 6.89% (TSFR1M + 1.56%) due 2/17/2032 | 126,573 | 126,883 |
| a,c | Series 2017-A Class A2B, 6.34% (TSFR1M + 1.01%) due 9/15/2034 | 134,193 | 133,892 |
| a,c | Series 2017-B Class A2B, 6.19% (TSFR1M + 0.86%) due 10/15/2035 | 301,162 | 299,644 |
| a,c | Series 2018-B Class A2B, 6.16% (TSFR1M + 0.83%) due 1/15/2037 | 411,936 | 410,065 |
| a,c | Series 2018-C Class A2B, 6.19% (TSFR1M + 0.86%) due 11/15/2035 | 100,776 | 100,106 |
| 18 | Thornburg Taxable Fixed Income Funds Semi-Annual Report | See notes to financial statements. |
| Issuer-Description | SHARES/PRINCIPAL AMOUNT | VALUE | |
| Towd Point Asset Trust, | |||
| a,c | Series 2018-SL1 Class A, 6.044% (TSFR1M + 0.71%) due 1/25/2046 | $ 3,997 | $ 3,997 |
| a,c | Series 2021-SL1 Class A2, 6.143% (TSFR1M + 0.81%) due 11/20/2061 | 106,805 | 106,366 |
| 3,226,986 | |||
| Total Asset Backed Securities (Cost $71,953,042) | 72,230,404 | ||
| Corporate Bonds — 47.7% | |||
| Automobiles & Components — 1.2% | |||
| Automobiles — 1.2% | |||
| a,c | Daimler Truck Finance North America LLC, 6.348% (SOFR + 1.00%) due 4/5/2024 | 1,545,000 | 1,545,000 |
| c | Hyundai Capital America, 5.80% due 6/26/2025 | 500,000 | 500,840 |
| c | Mercedes-Benz Finance North America LLC, 5.50% due 11/27/2024 | 1,000,000 | 998,990 |
| 3,044,830 | |||
| Banks — 1.0% | |||
| Banks — 1.0% | |||
| HSBC USA, Inc., 3.75% due 5/24/2024 | 750,000 | 747,728 | |
| c | National Securities Clearing Corp., 5.15% due 5/30/2025 | 2,000,000 | 2,000,560 |
| 2,748,288 | |||
| Capital Goods — 3.0% | |||
| Aerospace & Defense — 1.5% | |||
| c | L3Harris Technologies, Inc., due 8/23/2024 | 2,000,000 | 1,952,800 |
| Teledyne Technologies, Inc., 0.95% due 4/1/2024 | 2,000,000 | 2,000,000 | |
| Industrial Conglomerates — 0.4% | |||
| Lennox International, Inc., 1.35% due 8/1/2025 | 1,000,000 | 945,930 | |
| Machinery — 1.1% | |||
| a | Caterpillar Financial Services Corp., 5.60% (SOFR + 0.25%) due 5/17/2024 | 950,000 | 950,067 |
| c | Stanley Black & Decker, Inc., 5.949% due 4/2/2024 | 2,000,000 | 1,999,675 |
| 7,848,472 | |||
| Commercial & Professional Services — 2.2% | |||
| Commercial Services & Supplies — 2.2% | |||
| Avery Dennison Corp., 0.85% due 8/15/2024 | 2,557,000 | 2,509,823 | |
| Equifax, Inc., 2.60% due 12/1/2024 | 1,400,000 | 1,372,574 | |
| Quanta Services, Inc., 0.95% due 10/1/2024 | 2,050,000 | 1,999,201 | |
| 5,881,598 | |||
| Consumer Discretionary Distribution & Retail — 0.5% | |||
| Broadline Retail — 0.5% | |||
| Dollar General Corp., 4.25% due 9/20/2024 | 1,400,000 | 1,389,962 | |
| 1,389,962 | |||
| Consumer Services — 0.8% | |||
| Hotels, Restaurants & Leisure — 0.8% | |||
| c | Nathan’s Famous, Inc., 6.625% due 11/1/2025 | 620,000 | 619,002 |
| Warnermedia Holdings, Inc., 6.412% due 3/15/2026 | 1,500,000 | 1,500,045 | |
| 2,119,047 | |||
| Energy — 2.7% | |||
| Gas Utilities — 0.4% | |||
| Eastern Energy Gas Holdings LLC, 3.60% due 12/15/2024 | 1,000,000 | 985,090 | |
| Oil, Gas & Consumable Fuels — 2.3% | |||
| Columbia Pipeline Group, Inc., 4.50% due 6/1/2025 | 1,000,000 | 986,280 | |
| Energy Transfer LP, 5.75% due 4/1/2025 | 1,300,000 | 1,299,233 | |
| c | Florida Gas Transmission Co. LLC, 4.35% due 7/15/2025 | 629,000 | 617,948 |
| c | Gulfstream Natural Gas System LLC, 6.19% due 11/1/2025 | 750,000 | 752,520 |
| PDC Energy, Inc., 5.75% due 5/15/2026 | 1,250,000 | 1,248,838 | |
| TC PipeLines LP, 4.375% due 3/13/2025 | 1,250,000 | 1,233,725 | |
| 7,123,634 | |||
| Equity Real Estate Investment Trusts (REITs) — 1.7% |
| See notes to financial statements. | Thornburg Taxable Fixed Income Funds Semi-Annual Report | 19 |
Thornburg Ultra Short Income Fund | March 31, 2024 (Unaudited)
| Issuer-Description | SHARES/PRINCIPAL AMOUNT | VALUE | |
| Diversified REITs — 1.2% | |||
| American Tower Corp., 2.40% due 3/15/2025 | $1,000,000 | $ 969,820 | |
| Crown Castle, Inc., 1.35% due 7/15/2025 | 1,218,000 | 1,156,686 | |
| c | SBA Tower Trust, 2.836% due 1/15/2050 | 1,000,000 | 976,026 |
| Retail REITs — 0.5% | |||
| Brixmor Operating Partnership LP, 3.85% due 2/1/2025 | 1,500,000 | 1,474,335 | |
| 4,576,867 | |||
| Financial Services — 4.1% | |||
| Capital Markets — 1.5% | |||
| Ares Capital Corp., 4.20% due 6/10/2024 | 1,250,000 | 1,244,937 | |
| c | Ares Finance Co. LLC, 4.00% due 10/8/2024 | 705,000 | 692,437 |
| Sixth Street Specialty Lending, Inc., 3.875% due 11/1/2024 | 2,000,000 | 1,974,060 | |
| Financial Services — 2.6% | |||
| c | Antares Holdings LP, 8.50% due 5/18/2025 | 750,000 | 762,765 |
| a | Bank of America Corp., 0.976% (SOFR + 0.69%) due 4/22/2025 | 1,250,000 | 1,246,275 |
| a | Citigroup, Inc., 6.039% (SOFR + 0.69%) due 10/30/2024 | 1,250,000 | 1,251,463 |
| a | Goldman Sachs Group, Inc., 5.84% (SOFR + 0.49%) due 10/21/2024 | 1,000,000 | 1,000,440 |
| a | JPMorgan Chase & Co., 0.768% (SOFR + 0.49%) due 8/9/2025 | 1,500,000 | 1,472,085 |
| a,b | Mitsubishi UFJ Financial Group, Inc., 0.953% (H15T1Y + 0.55%) due 7/19/2025 | 1,232,000 | 1,213,865 |
| 10,858,327 | |||
| Food, Beverage & Tobacco — 2.2% | |||
| Beverages — 0.3% | |||
| Constellation Brands, Inc., 5.00% due 2/2/2026 | 700,000 | 695,744 | |
| Food Products — 0.8% | |||
| b,c | Mondelez International Holdings Netherlands BV, 0.75% due 9/24/2024 | 2,100,000 | 2,050,986 |
| Tobacco — 1.1% | |||
| BAT Capital Corp., 3.222% due 8/15/2024 | 1,620,000 | 1,603,767 | |
| b,c | Imperial Brands Finance plc, 3.125% due 7/26/2024 | 1,456,000 | 1,442,474 |
| 5,792,971 | |||
| Health Care Equipment & Services — 0.9% | |||
| Health Care Equipment & Supplies — 0.4% | |||
| a | Baxter International, Inc., 5.797% (SOFRINDX + 0.44%) due 11/29/2024 | 1,000,000 | 999,280 |
| Health Care Providers & Services — 0.5% | |||
| Humana, Inc., 5.70% due 3/13/2026 | 1,500,000 | 1,498,620 | |
| 2,497,900 | |||
| Industrials — 0.4% | |||
| Transportation Infrastructure — 0.4% | |||
| c | Penske Truck Leasing Co. LP/PTL Finance Corp., 2.70% due 11/1/2024 | 1,000,000 | 981,970 |
| 981,970 | |||
| Insurance — 6.8% | |||
| Insurance — 6.8% | |||
| b | Aon Global Ltd., 3.50% due 6/14/2024 | 2,349,000 | 2,338,007 |
| a,c | Brighthouse Financial Global Funding, 6.109% (SOFR + 0.76%) due 4/12/2024 | 1,500,000 | 1,494,375 |
| c | Equitable Financial Life Global Funding, 0.80% due 8/12/2024 | 969,000 | 951,723 |
| c | F&G Global Funding, 0.90% due 9/20/2024 | 1,631,000 | 1,591,579 |
| GA Global Funding Trust, | |||
| c | 1.00% due 4/8/2024 | 170,000 | 169,832 |
| a,c | 5.862% (SOFR + 0.50%) due 9/13/2024 | 220,000 | 219,824 |
| a,c | Jackson National Life Global Funding, 6.516% (SOFR + 1.15%) due 6/28/2024 | 840,000 | 841,184 |
| Lincoln National Corp., 3.35% due 3/9/2025 | 1,250,000 | 1,221,950 | |
| a,c | Nationwide Mutual Insurance Co., 7.881% (SOFR + 2.51%) due 12/15/2024 | 1,375,000 | 1,379,620 |
| a,c | Pacific Life Global Funding II, 6.166% (SOFRINDX + 0.80%) due 3/30/2025 | 235,000 | 235,855 |
| c | Prudential Insurance Co. of America, 8.30% due 7/1/2025 | 1,000,000 | 1,027,520 |
| Reliance Standard Life Global Funding II, | |||
| c | 2.50% due 10/30/2024 | 1,000,000 | 979,400 |
| c | 5.243% due 2/2/2026 | 850,000 | 841,279 |
| RenaissanceRe Finance, Inc., 3.70% due 4/1/2025 | 1,965,000 | 1,926,525 |
| 20 | Thornburg Taxable Fixed Income Funds Semi-Annual Report | See notes to financial statements. |
| Issuer-Description | SHARES/PRINCIPAL AMOUNT | VALUE | |
| c | Security Benefit Global Funding, 1.25% due 5/17/2024 | $1,400,000 | $ 1,388,478 |
| Willis North America, Inc., 3.60% due 5/15/2024 | 1,500,000 | 1,495,470 | |
| 18,102,621 | |||
| Materials — 2.8% | |||
| Chemicals — 1.0% | |||
| c | International Flavors & Fragrances, Inc., 6.105% due 4/2/2024 | 2,670,000 | 2,669,555 |
| Containers & Packaging — 1.8% | |||
| Amcor Flexibles North America, Inc., 4.00% due 5/17/2025 | 1,250,000 | 1,227,200 | |
| c | Berry Global, Inc., 4.875% due 7/15/2026 | 1,520,000 | 1,490,983 |
| c | Graphic Packaging International LLC, 0.821% due 4/15/2024 | 1,080,000 | 1,077,451 |
| Sonoco Products Co., 1.80% due 2/1/2025 | 1,000,000 | 967,840 | |
| 7,433,029 | |||
| Media & Entertainment — 0.8% | |||
| Media — 0.8% | |||
| c | Cox Communications, Inc., 3.15% due 8/15/2024 | 2,000,000 | 1,978,520 |
| 1,978,520 | |||
| Pharmaceuticals, Biotechnology & Life Sciences — 0.7% | |||
| Biotechnology — 0.1% | |||
| Amgen, Inc., 5.507% due 3/2/2026 | 250,000 | 249,888 | |
| Pharmaceuticals — 0.6% | |||
| Cigna Group, 5.685% due 3/15/2026 | 500,000 | 500,020 | |
| McKesson Corp., 5.25% due 2/15/2026 | 686,000 | 684,614 | |
| c | PRA Health Sciences, Inc., 2.875% due 7/15/2026 | 500,000 | 465,880 |
| 1,900,402 | |||
| Semiconductors & Semiconductor Equipment — 1.2% | |||
| Semiconductors & Semiconductor Equipment — 1.2% | |||
| Qorvo, Inc., 1.75% due 12/15/2024 | 1,250,000 | 1,212,425 | |
| b,c | Renesas Electronics Corp., 1.543% due 11/26/2024 | 2,000,000 | 1,941,940 |
| 3,154,365 | |||
| Software & Services — 3.1% | |||
| Information Technology Services — 1.7% | |||
| b | Genpact Luxembourg SARL, 3.375% due 12/1/2024 | 1,250,000 | 1,227,450 |
| Global Payments, Inc., 1.50% due 11/15/2024 | 1,815,000 | 1,768,572 | |
| Leidos, Inc., 3.625% due 5/15/2025 | 1,611,000 | 1,575,188 | |
| Software — 1.4% | |||
| Oracle Corp., 2.50% due 4/1/2025 | 1,082,000 | 1,049,605 | |
| VMware LLC, 1.00% due 8/15/2024 | 2,690,000 | 2,642,064 | |
| 8,262,879 | |||
| Technology Hardware & Equipment — 1.9% | |||
| Electronic Equipment, Instruments & Components — 1.4% | |||
| Arrow Electronics, Inc., 6.125% due 3/1/2026 | 900,000 | 899,010 | |
| TD SYNNEX Corp., 1.25% due 8/9/2024 | 1,731,000 | 1,702,733 | |
| Trimble, Inc., 4.75% due 12/1/2024 | 1,250,000 | 1,238,937 | |
| Technology Hardware, Storage & Peripherals — 0.5% | |||
| Hewlett Packard Enterprise Co., 5.90% due 10/1/2024 | 1,250,000 | 1,251,250 | |
| 5,091,930 | |||
| Telecommunication Services — 1.5% | |||
| Diversified Telecommunication Services — 0.9% | |||
| b,c | NTT Finance Corp., 4.142% due 7/26/2024 | 1,842,000 | 1,833,048 |
| b,c | Videotron Ltd., 5.375% due 6/15/2024 | 502,000 | 500,323 |
| Wireless Telecommunication Services — 0.6% | |||
| Sprint LLC, 7.625% due 2/15/2025 | 1,500,000 | 1,518,660 | |
| 3,852,031 | |||
| Transportation — 0.5% | |||
| Air Freight & Logistics — 0.1% |
| See notes to financial statements. | Thornburg Taxable Fixed Income Funds Semi-Annual Report | 21 |
Thornburg Ultra Short Income Fund | March 31, 2024 (Unaudited)
| Issuer-Description | SHARES/PRINCIPAL AMOUNT | VALUE | |
| Ryder System, Inc., 2.50% due 9/1/2024 | $ 371,000 | $ 365,954 | |
| Ground Transportation — 0.4% | |||
| GATX Corp., 3.25% due 3/30/2025 | 1,000,000 | 975,670 | |
| 1,341,624 | |||
| Utilities — 7.7% | |||
| Electric Utilities — 7.7% | |||
| Allegion U.S. Holding Co., Inc., 3.20% due 10/1/2024 | 1,463,000 | 1,443,264 | |
| Arizona Public Service Co., 3.35% due 6/15/2024 | 1,979,000 | 1,966,691 | |
| Avangrid, Inc., 3.15% due 12/1/2024 | 2,000,000 | 1,966,340 | |
| Black Hills Corp., 1.037% due 8/23/2024 | 1,988,000 | 1,951,123 | |
| a | CenterPoint Energy, Inc., 6.004% (SOFRINDX + 0.65%) due 5/13/2024 | 795,000 | 794,976 |
| Cleveland Electric Illuminating Co., 5.50% due 8/15/2024 | 1,000,000 | 997,910 | |
| a | DTE Energy Co., 4.22% due 11/1/2024 | 907,000 | 898,855 |
| b,c | Enel Finance International NV, 6.80% due 10/14/2025 | 1,000,000 | 1,020,420 |
| Eversource Energy, 4.20% due 6/27/2024 | 1,548,000 | 1,541,777 | |
| c | Jersey Central Power & Light Co., 4.70% due 4/1/2024 | 2,000,000 | 2,000,000 |
| a | Mississippi Power Co., Series A, 5.666% (SOFR + 0.30%) due 6/28/2024 | 750,000 | 749,400 |
| NextEra Energy Capital Holdings, Inc., 4.255% due 9/1/2024 | 750,000 | 745,260 | |
| c | Niagara Mohawk Power Corp., 3.508% due 10/1/2024 | 1,750,000 | 1,727,355 |
| Oncor Electric Delivery Co. LLC, 2.75% due 6/1/2024 | 500,000 | 497,350 | |
| Vistra Operations Co. LLC, | |||
| c | 3.55% due 7/15/2024 | 1,000,000 | 992,100 |
| c | 4.875% due 5/13/2024 | 1,000,000 | 998,580 |
| 20,291,401 | |||
| Total Corporate Bonds (Cost $126,177,084) | 126,272,668 | ||
| Long-Term Municipal Bonds — 0.0% | |||
| New Jersey Transportation Trust Fund Authority, ETM, Series B, 2.631% due 6/15/2024 | 25,000 | 24,852 | |
| Total Long-Term Municipal Bonds (Cost $25,000) | 24,852 | ||
| Short-Term Investments — 9.7% | |||
| d | Thornburg Capital Management Fund | 2,576,715 | 25,767,151 |
| Total Short-Term Investments (Cost $25,767,151) | 25,767,151 | ||
| Total Investments — 99.5% (Cost $263,379,558) | $263,613,877 | ||
| Other Assets Less Liabilities — 0.5% | 1,267,728 | ||
| Net Assets — 100.0% | $264,881,605 |
| Footnote Legend | |
| a | Variable, floating, step, or fixed to floating rate securities are securities for which interest rate changes are based on changes in a designated base rate or on a predetermined schedule. The rates shown are those in effect on March 31, 2024. |
| b | Yankee bond denominated in U.S. dollars and is issued in the U.S. by foreign banks and corporations. |
| c | Securities exempt from registration under Rule 144A of the Securities Act of 1933, as amended. These securities are restricted but liquid and may only be resold in the ordinary course of business in transactions exempt from registration, normally to qualified institutional buyers. As of March 31, 2024, the aggregate value of these securities in the Fund’s portfolio was $117,175,415, representing 44.24% of the Fund’s net assets. |
| d | Investment in Affiliates. |
| 22 | Thornburg Taxable Fixed Income Funds Semi-Annual Report | See notes to financial statements. |
To simplify the listings of securities, abbreviations are used per the table below:
| ABS | Asset Backed Securities |
| CMBS | Commercial Mortgage-Backed Securities |
| CMO | Collateralized Mortgage Obligation |
| DAC | Designated Activity Company |
| ETM | Escrowed to Maturity |
| H15T1Y | US Treasury Yield Curve Rate T-Note Constant Maturity 1 Year |
| Mtg | Mortgage |
| SOFR | Secured Overnight Financing Rate |
| SOFR30A | Secured Overnight Financing Rate 30-Day Average |
| SOFR90A | Secured Overnight Financing Rate 90-Day Average |
| SOFRINDX | Secured Overnight Financing Rate Index |
| TSFR1M | Term SOFR 1 Month |
| TSFR3M | Term SOFR 3 Month |
| UMBS | Uniform Mortgage Backed Securities |
| See notes to financial statements. | Thornburg Taxable Fixed Income Funds Semi-Annual Report | 23 |
Thornburg Limited Term U.S. Government Fund | March 31, 2024 (Unaudited)
| Issuer-Description | PRINCIPAL AMOUNT | VALUE | |
| U.S. Treasury Securities — 17.1% | |||
| U.S. Treasury Inflation-Indexed Bonds, | |||
| 1.75% due 1/15/2028 | $ 2,446,348 | $ 2,427,605 | |
| 2.375% due 1/15/2025 | 395,890 | 395,517 | |
| U.S. Treasury Inflation-Indexed Notes, | |||
| 0.125% due 4/15/2027 - 1/15/2031 | 13,522,610 | 12,226,149 | |
| 0.50% due 4/15/2024 | 405,920 | 406,240 | |
| U.S. Treasury Notes, | |||
| 1.875% due 2/15/2032 | 2,050,000 | 1,731,930 | |
| 3.375% due 5/15/2033 | 5,270,000 | 4,938,978 | |
| 3.50% due 2/15/2033 | 1,700,000 | 1,610,750 | |
| 4.00% due 2/28/2030 | 2,300,000 | 2,273,047 | |
| 4.50% due 11/15/2033 | 580,000 | 593,141 | |
| Total U.S. Treasury Securities (Cost $26,457,537) | 26,603,357 | ||
| U.S. Government Agencies — 6.9% | |||
| a | Durrah MSN 35603 (Guaranty: Export-Import Bank of the United States), 1.684% due 1/22/2025 | 131,030 | 128,898 |
| HNA Group LLC (Guaranty: Export-Import Bank of the United States), 2.291% due 6/30/2027 | 978,158 | 921,164 | |
| a | MSN 41079 & 41084 Ltd. (Guaranty: Export-Import Bank of the United States), 1.717% due 7/13/2024 | 72,593 | 72,045 |
| Petroleos Mexicanos (Guaranty: Export-Import Bank of the United States), | |||
| a | 2.46% due 12/15/2025 | 500,000 | 465,775 |
| a,b | 5.926% (TSFR3M + 0.61%) due 4/15/2025 | 437,500 | 428,627 |
| Reliance Industries Ltd. (Guaranty: Export-Import Bank of the United States), | |||
| a | 2.06% due 1/15/2026 | 700,000 | 668,661 |
| a | 2.512% due 1/15/2026 | 1,055,000 | 1,015,437 |
| Small Business Administration Participation Certificates, | |||
| Series 2005-20H Class 1, 5.11% due 8/1/2025 | 13,111 | 13,012 | |
| Series 2007-20D Class 1, 5.32% due 4/1/2027 | 47,856 | 47,536 | |
| Series 2007-20F Class 1, 5.71% due 6/1/2027 | 32,993 | 32,903 | |
| Series 2007-20I Class 1, 5.56% due 9/1/2027 | 98,508 | 98,160 | |
| Series 2007-20K Class 1, 5.51% due 11/1/2027 | 85,367 | 84,969 | |
| Series 2008-20G Class 1, 5.87% due 7/1/2028 | 176,247 | 176,311 | |
| Series 2011-20G Class 1, 3.74% due 7/1/2031 | 330,595 | 318,157 | |
| Series 2011-20K Class 1, 2.87% due 11/1/2031 | 585,804 | 547,815 | |
| Series 2014-20H Class 1, 2.88% due 8/1/2034 | 373,361 | 345,037 | |
| Series 2015-20B Class 1, 2.46% due 2/1/2035 | 356,523 | 325,791 | |
| Series 2015-20G Class 1, 2.88% due 7/1/2035 | 709,833 | 655,539 | |
| Series 2015-20I Class 1, 2.82% due 9/1/2035 | 744,172 | 684,303 | |
| Series 2017-20I Class 1, 2.59% due 9/1/2037 | 1,653,187 | 1,490,510 | |
| Series 2017-20K Class 1, 2.79% due 11/1/2037 | 822,990 | 749,067 | |
| Thirax 1 LLC (Guaranty: Export-Import Bank of the United States), 0.968% due 1/14/2033 | 1,144,822 | 968,783 | |
| Ulani MSN 35940 LLC (Guaranty: Export-Import Bank of the United States), 2.227% due 5/16/2025 | 520,834 | 504,433 | |
| a,b | Washington Aircraft 2 Co DAC (Guaranty: Export-Import Bank of the United States), 6.004% (TSFR3M + 0.69%) due 6/26/2024 | 52,284 | 52,306 |
| Total U.S. Government Agencies (Cost $11,657,300) | 10,795,239 | ||
| Mortgage Backed — 67.4% | |||
| b,c | Federal Agricultural Mortgage Corp. Mtg Trust, Whole Loan Securities Trust CMO, Seies 2021-1 Class A, 2.18% due 1/25/2051 | 4,169,892 | 3,281,173 |
| Federal Home Loan Mtg Corp., | |||
| b | Pool 1L0049, 6.717% (H15T1Y + 2.15%) due 2/1/2046 | 1,389,729 | 1,408,909 |
| Pool D98887, 3.50% due 1/1/2032 | 194,016 | 186,821 | |
| Pool E09025, 2.50% due 3/1/2028 | 30,449 | 29,232 | |
| Pool G13804, 5.00% due 3/1/2025 | 6,658 | 6,612 | |
| Pool G16710, 3.00% due 11/1/2030 | 850,771 | 816,312 | |
| Pool J11371, 4.50% due 12/1/2024 | 7,074 | 7,018 | |
| Pool J21208, 2.50% due 11/1/2027 | 547,680 | 528,616 | |
| Pool J37586, 3.50% due 9/1/2032 | 138,388 | 133,146 | |
| Pool RE6097, 2.00% due 5/1/2051 | 2,069,033 | 1,592,643 | |
| Pool RE6119, 2.50% due 12/1/2051 | 1,779,505 | 1,440,433 | |
| Pool SE9046, 3.00% due 12/1/2051 | 2,101,022 | 1,807,165 | |
| Pool T61943, 3.50% due 8/1/2045 | 88,134 | 79,869 | |
| Pool T65457, 3.00% due 1/1/2048 | 396,544 | 344,872 | |
| Federal Home Loan Mtg Corp., CMO REMIC, |
| 24 | Thornburg Taxable Fixed Income Funds Semi-Annual Report | See notes to financial statements. |
| Issuer-Description | PRINCIPAL AMOUNT | VALUE | |
| Series 3922 Class PQ, 2.00% due 4/15/2041 | $ 63,084 | $ 60,074 | |
| b | Series 4105 Class FG, 5.833% (SOFR30A + 0.51%) due 9/15/2042 | 476,077 | 465,728 |
| Series 4120 Class TC, 1.50% due 10/15/2027 | 288,387 | 273,396 | |
| Series 4120 Class UE, 2.00% due 10/15/2027 | 345,217 | 328,931 | |
| Federal Home Loan Mtg Corp., Multifamily Structured Pass-Through Certificates, CMBS, | |||
| Series K042 Class A1, 2.267% due 6/25/2024 | 116,865 | 116,074 | |
| Series K043 Class A2, 3.062% due 12/25/2024 | 1,330,570 | 1,307,993 | |
| b | Series K047 Class A2, 3.329% due 5/25/2025 | 1,250,000 | 1,224,345 |
| Series K055 Class A1, 2.263% due 4/25/2025 | 12,564 | 12,416 | |
| b | Series K061 Class A2, 3.347% due 11/25/2026 | 287,862 | 277,872 |
| b | Series K069 Class A2, 3.187% due 9/25/2027 | 180,000 | 171,567 |
| Series K071 Class A2, 3.286% due 11/25/2027 | 2,000,000 | 1,907,595 | |
| Series K072 Class A2, 3.444% due 12/25/2027 | 120,000 | 114,990 | |
| Series K073 Class A2, 3.35% due 1/25/2028 | 3,000,000 | 2,863,070 | |
| Series K095 Class A2, 2.785% due 6/25/2029 | 577,000 | 528,681 | |
| Series K729 Class A2, 3.136% due 10/25/2024 | 2,971,873 | 2,930,997 | |
| b | Series K730 Class A2, 3.59% due 1/25/2025 | 180,024 | 177,501 |
| Series KHG1 Class A3, 3.341% due 12/25/2027 | 300,000 | 286,754 | |
| Series KJ46 Class A2, 4.796% due 10/25/2031 | 216,000 | 216,747 | |
| b | Series KJ47 Class A2, 5.43% due 6/25/2031 | 149,000 | 153,740 |
| Series KJ48 Class A2, 5.028% due 10/25/2031 | 379,000 | 384,678 | |
| Federal Home Loan Mtg Corp., Seasoned Credit Risk Transfer, Whole Loan Securities Trust CMO, | |||
| Series 2017-4 Class MT, 3.50% due 6/25/2057 | 580,400 | 517,240 | |
| Series 2018-4 Class MA, 3.50% due 3/25/2058 | 705,963 | 662,002 | |
| Series 2022-1 Class MTU, 3.25% due 11/25/2061 | 1,016,544 | 872,892 | |
| Federal Home Loan Mtg Corp., UMBS Collateral, | |||
| Pool RA6808, 3.00% due 2/1/2052 | 2,083,267 | 1,800,100 | |
| Pool RD5043, 2.00% due 12/1/2030 | 1,765,150 | 1,629,213 | |
| Pool SB8010, 2.50% due 10/1/2034 | 514,809 | 471,106 | |
| Pool SB8030, 2.00% due 12/1/2034 | 790,178 | 701,529 | |
| Pool SB8118, 1.50% due 9/1/2036 | 1,273,767 | 1,104,852 | |
| Pool SB8502, 2.00% due 8/1/2035 | 478,796 | 427,777 | |
| Pool SD4175, 2.50% due 6/1/2052 | 1,820,184 | 1,506,493 | |
| Pool ZS4730, 3.50% due 8/1/2047 | 754,345 | 686,953 | |
| Pool ZS7299, 3.00% due 10/1/2030 | 447,079 | 427,822 | |
| Federal Home Loan Mtg Corp., Whole Loan Securities Trust CMO, | |||
| Series 2015-SC02 Class 2A, 3.50% due 9/25/2045 | 193,305 | 173,319 | |
| Series 2016-SC01 Class 1A, 3.00% due 7/25/2046 | 762,372 | 658,886 | |
| Series 2016-SC01 Class 2A, 3.50% due 7/25/2046 | 239,079 | 214,251 | |
| Series 2016-SC02 Class 2A, 3.50% due 10/25/2046 | 144,403 | 128,746 | |
| Series 2017-SC01 Class 1A, 3.00% due 12/25/2046 | 1,376,278 | 1,154,787 | |
| Series 2017-SC01 Class 2A, 3.50% due 12/25/2046 | 461,223 | 400,242 | |
| Series 2017-SC02 Class 1A, 3.00% due 5/25/2047 | 294,056 | 252,128 | |
| Series 2017-SC02 Class 2A, 3.50% due 5/25/2047 | 139,748 | 122,935 | |
| Federal National Mtg Assoc., | |||
| b | Pool 895572, 6.07% (RFUCCT1Y + 1.82%) due 6/1/2036 | 61,382 | 62,485 |
| Pool BF0130, 3.50% due 8/1/2056 | 321,482 | 286,374 | |
| Pool BF0144, 3.50% due 10/1/2056 | 456,788 | 410,637 | |
| b | Pool BH4524, 2.178% (5-Yr. CMT + 1.150%) due 6/1/2046 | 1,439,779 | 1,337,936 |
| b | Pool BM6885, 1.617% (2.20% - SOFR30A) due 12/1/2051 | 494,809 | 442,248 |
| Pool BM6983, 3.00% due 3/1/2052 | 1,803,078 | 1,508,251 | |
| b | Pool CB2214, 1.527% (2.20% - SOFR30A) due 11/1/2051 | 525,766 | 470,187 |
| Federal National Mtg Assoc., CMBS, | |||
| b | Series 2015-SB5 Class A10, 3.15% due 9/25/2035 | 288,983 | 282,720 |
| b | Series 2018-SB47 Class A5H, 6.135% (SOFR30A + 0.81%) due 1/25/2038 | 331,070 | 326,133 |
| Federal National Mtg Assoc., CMO REMIC, | |||
| b | Series 2009-17 Class AH, 0.509% due 3/25/2039 | 189,013 | 143,395 |
| Series 2011-70 Class CA, 3.00% due 8/25/2026 | 482,435 | 469,872 | |
| b | Series 2013-81 Class FW, 5.735% (SOFR30A + 0.41%) due 1/25/2043 | 819,954 | 803,292 |
| b | Series 2013-92 Class FA, 5.985% (SOFR30A + 0.66%) due 9/25/2043 | 563,787 | 549,543 |
| Federal National Mtg Assoc., Grantor Trust, CMO, Series 2017-T1 Class A, 2.898% due 6/25/2027 | 990,750 | 933,182 | |
| Federal National Mtg Assoc., UMBS Collateral, | |||
| Pool AE0704, 4.00% due 1/1/2026 | 149,992 | 147,477 |
| See notes to financial statements. | Thornburg Taxable Fixed Income Funds Semi-Annual Report | 25 |
Thornburg Limited Term U.S. Government Fund | March 31, 2024 (Unaudited)
| Issuer-Description | PRINCIPAL AMOUNT | VALUE | |
| Pool AJ1752, 3.50% due 9/1/2026 | $ 217,202 | $ 211,748 | |
| Pool AL6582, 3.50% due 4/1/2030 | 334,149 | 323,712 | |
| Pool AL7801, 2.50% due 11/1/2030 | 1,260,023 | 1,192,350 | |
| Pool AL9445, 3.00% due 7/1/2031 | 9,867 | 9,433 | |
| Pool AL9821, 2.50% due 1/1/2032 | 1,542,502 | 1,453,704 | |
| Pool AS9749, 4.00% due 6/1/2047 | 282,012 | 265,591 | |
| Pool AU2669, 2.50% due 10/1/2028 | 374,945 | 358,319 | |
| Pool AZ3778, 3.00% due 4/1/2030 | 762,590 | 732,430 | |
| Pool BM4153, 3.00% due 6/1/2033 | 1,043,981 | 987,053 | |
| Pool BM4864, 3.50% due 5/1/2033 | 669,695 | 645,359 | |
| Pool CA0942, 2.50% due 12/1/2032 | 687,873 | 641,167 | |
| Pool CA4102, 3.50% due 8/1/2029 | 466,739 | 448,650 | |
| Pool CA5271, 2.50% due 3/1/2035 | 963,174 | 888,346 | |
| Pool CA5282, 3.00% due 3/1/2035 | 1,979,491 | 1,859,218 | |
| Pool CA7535, 1.50% due 10/1/2030 | 1,982,824 | 1,811,646 | |
| Pool FM1523, 2.50% due 8/1/2029 | 426,113 | 402,376 | |
| Pool FM2831, 2.50% due 5/1/2032 | 1,161,171 | 1,097,938 | |
| Pool FM3494, 2.50% due 4/1/2048 | 1,097,551 | 936,210 | |
| Pool FM4936, 2.00% due 12/1/2035 | 1,231,783 | 1,099,008 | |
| Pool FM5458, 1.50% due 12/1/2035 | 1,210,646 | 1,053,198 | |
| Pool FS0916, 3.00% due 3/1/2052 | 2,617,649 | 2,252,820 | |
| Pool FS6096, 2.00% due 3/1/2037 | 3,331,178 | 2,967,319 | |
| Pool FS6130, 2.50% due 7/1/2052 | 1,174,050 | 971,714 | |
| Pool FS6157, 3.00% due 9/1/2052 | 7,032,960 | 6,057,285 | |
| Pool FS6212, 1.50% due 5/1/2032 | 365,835 | 333,353 | |
| Pool MA2353, 3.00% due 8/1/2035 | 583,307 | 542,293 | |
| Pool MA3465, 4.00% due 9/1/2038 | 330,297 | 317,229 | |
| Pool MA3681, 3.00% due 6/1/2034 | 279,107 | 261,912 | |
| Pool MA3826, 3.00% due 11/1/2029 | 560,106 | 529,110 | |
| Pool MA3896, 2.50% due 1/1/2035 | 87,415 | 79,994 | |
| Pool MA4148, 2.00% due 10/1/2030 | 412,040 | 380,308 | |
| Pool MA4390, 2.00% due 7/1/2031 | 2,967,257 | 2,737,584 | |
| Government National Mtg Assoc., | |||
| b | Pool 894205, 3.625% (H15T1Y + 1.50%) due 8/20/2039 | 78,991 | 77,126 |
| b | Pool MA0100, 3.875% (H15T1Y + 1.50%) due 5/20/2042 | 156,192 | 155,664 |
| Pool MA0907, 2.00% due 4/20/2028 | 350,170 | 333,081 | |
| Government National Mtg Assoc., CMBS, | |||
| Series 2022-147 Class B, 2.20% due 10/16/2063 | 1,250,000 | 920,097 | |
| Series 2023-104 Class AD, 4.00% due 1/16/2065 | 422,389 | 397,474 | |
| Government National Mtg Assoc., CMO, | |||
| Series 2016-H04 Class HA, 2.25% due 7/20/2065 | 863,244 | 835,909 | |
| Series 2017-186 Class VA, 3.00% due 2/20/2031 | 1,732,073 | 1,674,224 | |
| Seasoned Credit Risk Transfer, Whole Loan Securities Trust CMO, | |||
| b | Series 2017-3 Class HA, 3.25% due 7/25/2056 | 878,062 | 813,149 |
| b | Series 2017-4 Class HT, 3.25% due 6/25/2057 | 2,583,114 | 2,279,281 |
| b | Series 2018-1 Class HA, 3.00% due 5/25/2057 | 1,111,093 | 1,008,247 |
| b | Series 2018-2 Class HA, 3.00% due 11/25/2057 | 611,098 | 558,471 |
| Series 2018-3 Class HA, 3.00% due 8/25/2057 | 826,175 | 749,482 | |
| b | Series 2018-3 Class MA, 3.50% due 8/25/2057 | 898,025 | 850,200 |
| Series 2018-4 Class HA, 3.00% due 3/25/2058 | 1,028,850 | 930,384 | |
| Series 2019-1 Class MA, 3.50% due 7/25/2058 | 1,936,801 | 1,819,905 | |
| Series 2019-2 Class MA, 3.50% due 8/25/2058 | 1,740,336 | 1,627,008 | |
| Series 2019-3 Class MA, 3.50% due 10/25/2058 | 684,592 | 641,155 | |
| Series 2019-4 Class MA, 3.00% due 2/25/2059 | 1,053,103 | 956,759 | |
| Series 2020-1 Class MA, 2.50% due 8/25/2059 | 1,556,287 | 1,398,885 | |
| Series 2020-2 Class MA, 2.00% due 11/25/2059 | 1,523,723 | 1,330,901 | |
| Series 2020-3 Class MA, 2.00% due 5/25/2060 | 502,796 | 436,895 | |
| Series 2020-3 Class MT, 2.00% due 5/25/2060 | 627,098 | 493,672 | |
| Seasoned Loans Structured Transaction Trust, Whole Loan Securities Trust CMO, | |||
| Series 2020-2 Class A1C, 2.00% due 9/25/2030 | 1,831,649 | 1,641,671 | |
| Series 2020-2 Class A1D, 1.75% due 9/25/2030 | 1,831,649 | 1,627,056 | |
| Total Mortgage Backed (Cost $112,871,164) | 104,958,048 |
| 26 | Thornburg Taxable Fixed Income Funds Semi-Annual Report | See notes to financial statements. |
| Issuer-Description | PRINCIPAL AMOUNT | VALUE | |
| Corporate Bonds — 1.9% | |||
| Utilities — 1.9% | |||
| Electric Utilities — 1.9% | |||
| c | Caledonia Generating LLC, 1.95% due 2/28/2034 | 3,604,619 | $ 2,979,910 |
| 2,979,910 | |||
| Total Corporate Bonds (Cost $3,503,952) | 2,979,910 | ||
| Short-Term Investments — 3.4% | |||
| Federal Home Loan Bank Discount Notes, due 4/1/2024 | 222,000 | 221,867 | |
| U.S. Treasury Bills | |||
| 5.332% due 4/25/2024 | 1,000,000 | 996,509 | |
| 5.356% due 4/2/2024 | 1,000,000 | 999,854 | |
| 5.361% due 4/11/2024 | 1,000,000 | 998,538 | |
| 5.363% due 4/9/2024 | 1,000,000 | 998,829 | |
| 5.366% due 4/23/2024 | 1,000,000 | 996,779 | |
| Total Short-Term Investments (Cost $5,212,509) | 5,212,376 | ||
| Total Investments — 96.7% (Cost $159,702,462) | $150,548,930 | ||
| Other Assets Less Liabilities — 3.3% | 5,149,814 | ||
| Net Assets — 100.0% | $155,698,744 |
| Footnote Legend | |
| a | Yankee bond denominated in U.S. dollars and is issued in the U.S. by foreign banks and corporations. |
| b | Variable, floating, step, or fixed to floating rate securities are securities for which interest rate changes are based on changes in a designated base rate or on a predetermined schedule. The rates shown are those in effect on March 31, 2024. |
| c | Securities exempt from registration under Rule 144A of the Securities Act of 1933, as amended. These securities are restricted but liquid and may only be resold in the ordinary course of business in transactions exempt from registration, normally to qualified institutional buyers. As of March 31, 2024, the aggregate value of these securities in the Fund’s portfolio was $6,261,083, representing 4.02% of the Fund’s net assets. |
To simplify the listings of securities, abbreviations are used per the table below:
| CMBS | Commercial Mortgage-Backed Securities |
| CMO | Collateralized Mortgage Obligation |
| CMT | Constant Maturity Rate |
| DAC | Designated Activity Company |
| H15T1Y | US Treasury Yield Curve Rate T-Note Constant Maturity 1 Year |
| Mtg | Mortgage |
| REMIC | Real Estate Mortgage Investment Conduit |
| RFUCCT1Y | Refinitiv USD Interbank Offered Rate Consumer Cash Fallbacks Term 1 Year |
| SOFR30A | Secured Overnight Financing Rate 30-Day Average |
| TSFR3M | Term SOFR 3 Month |
| UMBS | Uniform Mortgage Backed Securities |
| See notes to financial statements. | Thornburg Taxable Fixed Income Funds Semi-Annual Report | 27 |
Thornburg Limited Term Income Fund | March 31, 2024 (Unaudited)
| Issuer-Description | SHARES/PRINCIPAL AMOUNT | VALUE | |
| U.S. Treasury Securities — 15.9% | |||
| U.S. Treasury Inflation-Indexed Bonds, | |||
| 1.75% due 1/15/2028 | $105,880,341 | $ 105,069,129 | |
| 2.375% due 1/15/2025 | 21,268,466 | 21,248,436 | |
| U.S. Treasury Inflation-Indexed Notes, | |||
| 0.125% due 4/15/2027 - 1/15/2032 | 306,936,462 | 279,036,261 | |
| 0.50% due 4/15/2024 | 14,664,464 | 14,676,048 | |
| 1.125% due 1/15/2033 | 7,189,533 | 6,751,000 | |
| 1.25% due 4/15/2028 | 23,747,955 | 23,088,137 | |
| 1.375% due 7/15/2033 | 5,589,392 | 5,369,660 | |
| U.S. Treasury Notes, | |||
| 1.25% due 5/31/2028 | 25,000,000 | 22,121,094 | |
| 2.75% due 8/15/2032 | 188,537,000 | 169,182,499 | |
| 3.25% due 6/30/2029 | 20,730,000 | 19,774,477 | |
| 3.50% due 2/15/2033 | 60,245,000 | 57,082,137 | |
| 3.875% due 8/15/2033 | 268,724,000 | 261,753,971 | |
| 4.00% due 2/15/2034 | 48,300,000 | 47,515,125 | |
| 4.625% due 9/30/2028 | 4,200,000 | 4,261,359 | |
| Total U.S. Treasury Securities (Cost $1,016,074,606) | 1,036,929,333 | ||
| U.S. Government Agencies — 0.4% | |||
| Petroleos Mexicanos (Guaranty: Export-Import Bank of the United States), | |||
| a,b | 5.926% (TSFR3M + 0.61%) due 4/15/2025 | 1,295,000 | 1,268,738 |
| b | 6.50% due 1/23/2029 | 10,007,000 | 8,941,955 |
| Reliance Industries Ltd. (Guaranty: Export-Import Bank of the United States), | |||
| b | 2.06% due 1/15/2026 | 300,000 | 286,569 |
| b | 2.512% due 1/15/2026 | 1,300,000 | 1,251,250 |
| Santa Rosa Leasing LLC (Guaranty: Export-Import Bank of the United States), 1.693% due 8/15/2024 | 137,118 | 136,234 | |
| Small Business Administration Participation Certificates, | |||
| Series 2008-20D Class 1, 5.37% due 4/1/2028 | 227,952 | 226,780 | |
| Series 2009-20E Class 1, 4.43% due 5/1/2029 | 131,860 | 129,454 | |
| Series 2009-20K Class 1, 4.09% due 11/1/2029 | 976,670 | 955,318 | |
| Series 2011-20E Class 1, 3.79% due 5/1/2031 | 1,246,468 | 1,205,301 | |
| Series 2011-20F Class 1, 3.67% due 6/1/2031 | 263,633 | 253,656 | |
| Series 2011-20G Class 1, 3.74% due 7/1/2031 | 1,322,381 | 1,272,626 | |
| Series 2011-20I Class 1, 2.85% due 9/1/2031 | 2,536,123 | 2,363,136 | |
| Series 2011-20K Class 1, 2.87% due 11/1/2031 | 2,280,241 | 2,132,370 | |
| Series 2012-20D Class 1, 2.67% due 4/1/2032 | 1,957,696 | 1,815,165 | |
| Series 2012-20J Class 1, 2.18% due 10/1/2032 | 1,673,513 | 1,525,986 | |
| Series 2012-20K Class 1, 2.09% due 11/1/2032 | 1,155,388 | 1,059,344 | |
| Total U.S. Government Agencies (Cost $27,002,932) | 24,823,882 | ||
| Other Government — 0.1% | |||
| b,c | Bermuda Government International Bonds, 2.375% due 8/20/2030 | 6,800,000 | 5,696,292 |
| Carpintero Finance Ltd. (Guaranty: Export Credits Guarantee Department), | |||
| b,c | 2.004% due 9/18/2024 | 662,213 | 653,889 |
| b,c | 2.581% due 11/11/2024 | 724,297 | 716,783 |
| b,c | Khadrawy Ltd. (Guaranty: Export Credits Guarantee Department), 2.471% due 3/31/2025 | 843,836 | 826,327 |
| b | Sharjah Sukuk Program Ltd., 4.226% due 3/14/2028 | 2,000,000 | 1,917,880 |
| Total Other Government (Cost $11,132,444) | 9,811,171 | ||
| Mortgage Backed — 26.6% | |||
| Angel Oak Mortgage Trust, Whole Loan Securities Trust CMO, | |||
| a,c | Series 2020-2 Class A3, 5.00% due 1/26/2065 | 4,474,236 | 4,374,106 |
| a,c | Series 2023-1 Class A1, 4.75% due 9/26/2067 | 13,764,643 | 13,282,480 |
| a,c | Series 2023-2 Class A1, 4.65% due 10/25/2067 | 4,916,919 | 4,727,773 |
| a,b,c | Arbor Realty Commercial Real Estate Notes Ltd., CMBS, Series 2022-FL1 Class A, 6.769% (SOFR30A + 1.45%) due 1/15/2037 | 20,000,000 | 19,843,766 |
| Arroyo Mortgage Trust, Whole Loan Securities Trust CMO, | |||
| a,c | Series 2019-1 Class A1, 3.805% due 1/25/2049 | 3,798,012 | 3,609,884 |
| a,c | Series 2019-1 Class A3, 4.208% due 1/25/2049 | 1,987,657 | 1,897,337 |
| a,c | Series 2019-2 Class A1, 3.347% due 4/25/2049 | 1,653,687 | 1,554,188 |
| 28 | Thornburg Taxable Fixed Income Funds Semi-Annual Report | See notes to financial statements. |
| Issuer-Description | SHARES/PRINCIPAL AMOUNT | VALUE | |
| a,c | Series 2019-3 Class A1, 2.962% due 10/25/2048 | $ 4,005,322 | $ 3,691,390 |
| c | Series 2020-1 Class A2, 2.927% due 3/25/2055 | 6,518,000 | 5,767,408 |
| c | Series 2020-1 Class A3, 3.328% due 3/25/2055 | 4,500,000 | 3,731,242 |
| c | Series 2020-1 Class M1, 4.277% due 3/25/2055 | 3,189,000 | 2,672,466 |
| a,c | Series 2021-1R Class A1, 1.175% due 10/25/2048 | 8,058,232 | 6,961,131 |
| c | Series 2022-1 Class M1, 3.65% due 12/25/2056 | 7,338,000 | 5,139,586 |
| a,c | BPR Trust, CMBS, Series 2023-BRK2 Class A, 6.899% due 11/5/2028 | 4,250,000 | 4,408,252 |
| c | BRAVO Residential Funding Trust, Whole Loan Securities Trust CMO, Series 2019-1 Class A1C, 3.50% due 3/25/2058 | 435,772 | 428,669 |
| a,c | Bunker Hill Loan Depositary Trust, Whole Loan Securities Trust CMO, Series 2020-1 Class A3, 3.253% due 2/25/2055 | 3,285,000 | 3,073,418 |
| c | Century Plaza Towers, CMBS, Series 2019-CPT Class A, 2.865% due 11/13/2039 | 4,600,000 | 3,947,542 |
| Chase Mortgage Finance Corp., Whole Loan Securities Trust CMO, | |||
| a,c | Series 2016-SH1 Class M3, 3.75% due 4/25/2045 | 1,755,808 | 1,583,973 |
| a,c | Series 2016-SH2 Class M3, 3.75% due 12/25/2045 | 2,158,110 | 1,944,844 |
| CHNGE Mortgage Trust, Whole Loan Securities Trust CMO, | |||
| a,c | Series 2022-1 Class A1, 3.007% due 1/25/2067 | 13,145,542 | 12,060,004 |
| a,c | Series 2022-2 Class M1, 4.609% due 3/25/2067 | 14,163,000 | 11,864,937 |
| a,c | Series 2023-1 Class A1, 7.065% due 3/25/2058 | 8,751,183 | 8,774,255 |
| a,c | CIM Trust, Whole Loan Securities Trust CMO, Series 2018-INV1 Class A4, 4.00% due 8/25/2048 | 700,180 | 647,481 |
| Citigroup Mortgage Loan Trust, Whole Loan Securities Trust CMO, | |||
| a | Series 2004-HYB2 Class B1, 6.104% due 3/25/2034 | 44,486 | 34,053 |
| a,c | Series 2014-A Class A, 4.00% due 1/25/2035 | 457,996 | 431,866 |
| a,c | Series 2014-J1 Class B4, 3.627% due 6/25/2044 | 1,489,969 | 1,183,610 |
| a,c | Series 2021-J2 Class A7A, 2.50% due 7/25/2051 | 22,203,538 | 19,276,764 |
| CSMC Trust, Whole Loan Securities Trust CMO, | |||
| a,c | Series 2013-HYB1 Class B3, 6.794% due 4/25/2043 | 69,824 | 69,619 |
| a,c | Series 2021-AFC1 Class-A1, 0.83% due 3/25/2056 | 8,616,217 | 6,848,229 |
| a,c | Series 2021-NQM3 Class A1, 1.015% due 4/25/2066 | 10,559,515 | 8,691,486 |
| a,c | Series 2021-NQM8 Class-A1, 1.841% due 10/25/2066 | 2,135,818 | 1,813,878 |
| a,c | Series 2022-ATH2 Class A1, 4.547% due 5/25/2067 | 11,294,525 | 10,820,529 |
| a,c | Series 2022-NQM1 Class A1, 2.265% due 11/25/2066 | 12,306,501 | 10,625,867 |
| c | DataBank Issuer LLC, CMBS, Series 2024-1A Class A2, 5.30% due 1/26/2054 | 13,300,000 | 12,612,564 |
| c | DC Office Trust, CMBS, Series 2019-MTC Class A, 2.965% due 9/15/2045 | 3,020,000 | 2,577,188 |
| a,c | Deephaven Residential Mortgage Trust, Whole Loan Securities Trust CMO, Series 2021-1 Class A1, 0.715% due 5/25/2065 | 2,897,782 | 2,648,819 |
| Ellington Financial Mortgage Trust, Whole Loan Securities Trust CMO, | |||
| a,c | Series 2019-2 Class A1, 2.739% due 11/25/2059 | 2,974,320 | 2,799,346 |
| a,c | Series 2021-2 Class A1, 0.931% due 6/25/2066 | 10,149,598 | 8,078,485 |
| a,c | Series 2022-1 Class A1, 2.206% due 1/25/2067 | 17,429,092 | 14,790,151 |
| a,c,d | FARM Mortgage Trust, Whole Loan Securities Trust CMO, Series 2024-1 Class A, 4.721% due 10/1/2053 | 7,915,000 | 7,536,437 |
| Federal Home Loan Mtg Corp., | |||
| a | Pool 1L0322, 4.053% (H15T1Y + 2.07%) due 2/1/2048 | 2,357,052 | 2,366,407 |
| a | Pool 760025, 3.662% (5-Yr. CMT + 1.310%) due 10/1/2047 | 3,264,764 | 3,123,015 |
| a | Pool 841097, 3.061% (5-Yr. CMT + 1.300%) due 9/1/2048 | 4,989,762 | 4,722,372 |
| a | Pool 841362, 1.717% (2.15% - SOFR30A) due 2/1/2052 | 6,278,994 | 5,569,682 |
| a | Pool 841377, 1.947% (2.23% - SOFR30A) due 4/1/2052 | 6,528,958 | 5,735,977 |
| a | Pool 841463, 2.154% (2.18% - SOFR30A) due 7/1/2052 | 14,743,201 | 12,794,781 |
| Pool D98887, 3.50% due 1/1/2032 | 649,468 | 625,383 | |
| Pool G16710, 3.00% due 11/1/2030 | 230,763 | 221,416 | |
| Pool RE6097, 2.00% due 5/1/2051 | 26,169,128 | 20,143,749 | |
| Pool SE9046, 3.00% due 12/1/2051 | 22,577,724 | 19,419,913 | |
| Federal Home Loan Mtg Corp., CMO REMIC, | |||
| Series 3195 Class PD, 6.50% due 7/15/2036 | 175,898 | 179,505 | |
| Series 3922 Class PQ, 2.00% due 4/15/2041 | 94,626 | 90,111 | |
| Series 4120 Class TC, 1.50% due 10/15/2027 | 374,472 | 355,007 | |
| Federal Home Loan Mtg Corp., Multifamily Structured Pass-Through Certificates, CMBS, | |||
| Series K071 Class A2, 3.286% due 11/25/2027 | 4,420,000 | 4,215,786 | |
| Series KJ46 Class A2, 4.796% due 10/25/2031 | 8,741,000 | 8,771,209 | |
| a | Series KJ47 Class A2, 5.43% due 6/25/2031 | 5,968,000 | 6,157,843 |
| Series KJ48 Class A2, 5.028% due 10/25/2031 | 15,306,000 | 15,535,296 | |
| Federal Home Loan Mtg Corp., UMBS Collateral, | |||
| Pool RA6808, 3.00% due 2/1/2052 | 11,512,131 | 9,947,350 | |
| Pool RA7373, 3.00% due 5/1/2052 | 5,626,772 | 4,865,169 | |
| Pool SD1374, 3.00% due 3/1/2052 | 14,172,768 | 12,195,333 | |
| Pool SD4175, 2.50% due 6/1/2052 | 131,325,148 | 108,692,515 |
| See notes to financial statements. | Thornburg Taxable Fixed Income Funds Semi-Annual Report | 29 |
Thornburg Limited Term Income Fund | March 31, 2024 (Unaudited)
| Issuer-Description | SHARES/PRINCIPAL AMOUNT | VALUE | |
| Pool SD8367, 5.50% due 10/1/2053 | $ 6,715,881 | $ 6,677,724 | |
| Federal Home Loan Mtg Corp., Whole Loan Securities Trust CMO, | |||
| Series 2016-SC01 Class 2A, 3.50% due 7/25/2046 | 916,469 | 821,294 | |
| Series 2017-SC01 Class 1A, 3.00% due 12/25/2046 | 8,311,567 | 6,973,950 | |
| Series 2017-SC02 Class 2A, 3.50% due 5/25/2047 | 532,788 | 468,691 | |
| Federal National Mtg Assoc., | |||
| a | Pool BH4523, 1.852% (5-Yr. CMT + 1.150%) due 4/1/2047 | 5,340,197 | 4,979,664 |
| a | Pool BH4524, 2.178% (5-Yr. CMT + 1.150%) due 6/1/2046 | 10,070,134 | 9,357,819 |
| a | Pool BM6929, 1.92% (2.13% - SOFR30A) due 7/1/2051 | 4,569,704 | 4,162,286 |
| Pool BM7067, 2.50% due 6/1/2051 | 3,326,615 | 2,693,345 | |
| a | Pool BO9998, 2.744% (H15T1Y + 2.03%) due 3/1/2048 | 4,044,902 | 3,825,360 |
| a | Pool BU9934, 1.844% (2.37% - SOFR30A) due 2/1/2052 | 9,211,614 | 7,981,198 |
| a | Pool CB2214, 1.527% (2.20% - SOFR30A) due 11/1/2051 | 5,296,901 | 4,736,955 |
| Federal National Mtg Assoc., CMO REMIC, | |||
| a | Series 2009-17 Class AH, 0.509% due 3/25/2039 | 315,022 | 238,991 |
| Series 2012-129 Class LA, 3.50% due 12/25/2042 | 1,235,666 | 1,129,632 | |
| a | Series 2013-81 Class FW, 5.735% (SOFR30A + 0.41%) due 1/25/2043 | 2,979,276 | 2,918,738 |
| Federal National Mtg Assoc., Grantor Trust, CMO, Series 2017-T1 Class A, 2.898% due 6/25/2027 | 17,833,504 | 16,797,283 | |
| Federal National Mtg Assoc., UMBS Collateral, | |||
| Pool AE0704, 4.00% due 1/1/2026 | 390,127 | 383,584 | |
| Pool AS9749, 4.00% due 6/1/2047 | 8,098 | 7,626 | |
| Pool BM4324, 3.50% due 7/1/2033 | 2,081,402 | 2,001,205 | |
| Pool BP9550, 2.50% due 7/1/2035 | 7,768 | 7,148 | |
| Pool BP9589, 2.50% due 8/1/2035 | 609,744 | 561,033 | |
| Pool FS5447, 2.50% due 9/1/2052 | 41,973,933 | 34,859,113 | |
| Pool FS6130, 2.50% due 7/1/2052 | 19,061,574 | 15,776,495 | |
| Pool FS6157, 3.00% due 9/1/2052 | 125,030,409 | 107,685,069 | |
| Pool FS6212, 1.50% due 5/1/2032 | 2,315,414 | 2,109,827 | |
| Pool MA3465, 4.00% due 9/1/2038 | 2,962,101 | 2,844,909 | |
| Pool MA4390, 2.00% due 7/1/2031 | 1,097,885 | 1,012,906 | |
| Pool MA5138, 5.50% due 9/1/2053 | 4,789,458 | 4,762,569 | |
| Pool MA5139, 6.00% due 9/1/2053 | 4,269,753 | 4,306,857 | |
| a,c | Flagstar Mortgage Trust, Whole Loan Securities Trust CMO, Series 2017-1 Class 2A2, 3.00% due 3/25/2047 | 1,361,300 | 1,231,703 |
| GCAT Trust, Whole Loan Securities Trust CMO, | |||
| a,c | Series 2019-NQM3 Class A1, 3.686% due 11/25/2059 | 3,514,990 | 3,303,302 |
| a,c | Series 2021-CM1 Class A, 1.469% due 4/25/2065 | 8,839,831 | 8,290,775 |
| a,c | Series 2021-CM2 Class A1, 2.352% due 8/25/2066 | 19,066,003 | 17,204,755 |
| a,c | Series 2021-NQM4 Class A1, 1.093% due 8/25/2066 | 11,913,048 | 9,579,432 |
| Government National Mtg Assoc., CMBS, Series 2023-104 Class AD, 4.00% due 1/16/2065 | 23,241,318 | 21,870,397 | |
| a,b,c | Greystone Commercial Real Estate Notes Ltd., CMBS, Series 2021-FL3 Class A, 6.46% (TSFR1M + 1.13%) due 7/15/2039 | 13,382,000 | 13,227,671 |
| GS Mortgage-Backed Securities Corp. Trust, Whole Loan Securities Trust CMO, | |||
| a,c | Series 2020-PJ2 Class B3, 3.55% due 7/25/2050 | 5,039,361 | 4,242,216 |
| a,c | Series 2023-CCM1 Class A1, 6.65% due 8/25/2053 | 12,067,330 | 12,107,842 |
| GS Mortgage-Backed Securities Trust, Whole Loan Securities Trust CMO, | |||
| a,c | Series 2023-PJ2 Class A4, 5.50% due 5/25/2053 | 3,622,134 | 3,555,920 |
| a,c | Series 2024-RPL2 Class A1, 3.75% due 7/25/2061 | 5,219,141 | 4,919,759 |
| a,c | Homeward Opportunities Fund Trust, Whole Loan Securities Trust CMO, Series 2022-1 A Class A1, 5.082% due 7/25/2067 | 5,344,229 | 5,265,967 |
| c | Houston Galleria Mall Trust, CMBS, Series 2015-HGLR Class A1A2, 3.087% due 3/5/2037 | 12,383,750 | 11,974,720 |
| a,c | Hudson Yards Mortgage Trust, CMBS, Series 2019-55HY Class A, 2.943% due 12/10/2041 | 5,870,000 | 5,144,248 |
| Imperial Fund Mortgage Trust, Whole Loan Securities Trust CMO, | |||
| a,c | Series 2021-NQM3 Class A1, 1.595% due 11/25/2056 | 15,100,977 | 12,527,580 |
| a,c | Series 2021-NQM4 Class A1, 2.091% due 1/25/2057 | 20,286,811 | 16,934,986 |
| a,c | Series 2022- NQM1 Class A1, 2.493% due 2/25/2067 | 34,465,106 | 30,313,237 |
| a,c | Series 2022-NQM2 Class A1, 3.638% due 3/25/2067 | 21,299,160 | 19,605,494 |
| a,c | Series 2022-NQM4 Class A1, 4.767% due 6/25/2067 | 26,258,414 | 25,975,023 |
| JP Morgan Mortgage Trust, Whole Loan Securities Trust CMO, | |||
| a,c | Series 2014-IVR3 Class B4, 6.163% due 9/25/2044 | 1,940,616 | 1,945,903 |
| a,c | Series 2018-3 Class B2, 3.709% due 9/25/2048 | 2,357,577 | 2,145,992 |
| a,c | Series 2018-6 Class B2, 3.888% due 12/25/2048 | 960,978 | 863,550 |
| a,c | Series 2019-5 Class B3, 4.454% due 11/25/2049 | 7,777,393 | 7,132,599 |
| a,c | Series 2019-HYB1 Class B3, 4.924% due 10/25/2049 | 5,499,072 | 5,372,513 |
| a,c | Series 2019-INV2 Class B3A, 3.71% due 2/25/2050 | 9,038,944 | 7,653,582 |
| a,c | Series 2021-LTV2 Class A1, 2.52% due 5/25/2052 | 33,712,732 | 27,718,778 |
| 30 | Thornburg Taxable Fixed Income Funds Semi-Annual Report | See notes to financial statements. |
| Issuer-Description | SHARES/PRINCIPAL AMOUNT | VALUE | |
| a,c | Series 2022- LTV1 Class A1, 3.25% due 7/25/2052 | $ 12,711,717 | $ 10,793,206 |
| a,c | Series 2022-2 Class A6A, 2.50% due 8/25/2052 | 30,243,238 | 26,857,820 |
| a,c | Series 2022-DSC1 Class A1, 4.75% due 1/25/2063 | 8,679,264 | 8,261,789 |
| a | Merrill Lynch Mortgage Investors Trust, Whole Loan Securities Trust CMO, Series 2004-A4 Class M1, 4.92% due 8/25/2034 | 113,604 | 107,988 |
| a,c | Metlife Securitization Trust, Whole Loan Securities Trust CMO, Series 2019-1A Class A1A, 3.75% due 4/25/2058 | 976,990 | 944,445 |
| MFA Trust, Whole Loan Securities Trust CMO, | |||
| a,c | Series 2020-NQM3 Class A1, 1.014% due 1/26/2065 | 2,719,315 | 2,472,346 |
| a,c | Series 2021-AEI1 Class A4, 2.50% due 8/25/2051 | 15,786,905 | 13,509,047 |
| a,c | Series 2021-INV1 Class A1, 0.852% due 1/25/2056 | 2,927,229 | 2,719,100 |
| a,c | Series 2021-INV2 Class A1, 1.906% due 11/25/2056 | 22,046,185 | 18,840,322 |
| a,c | Series 2022-INV1 Class A3, 4.25% due 4/25/2066 | 4,995,000 | 4,178,286 |
| a,c | Series 2022-NQM1 Class A3, 4.20% due 12/25/2066 | 13,129,000 | 10,921,105 |
| a,c | Series 2022-NQM2 Class A1, 4.00% due 5/25/2067 | 5,774,119 | 5,500,576 |
| a,c | MFRA Trust, Whole Loan Securities Trust CMO, Series 2022-CHM1 Class A1, 3.875% due 9/25/2056 | 17,973,895 | 17,024,034 |
| a,c | Mill City Mortgage Loan Trust, Whole Loan Securities Trust CMO, Series 2023-NQM1 Class A1, 6.05% due 10/25/2067 | 13,294,268 | 13,200,091 |
| Morgan Stanley Bank of America Merrill Lynch Trust, CMBS, Series 2015-C22 Class A4, 3.306% due 4/15/2048 | 1,100,000 | 1,071,431 | |
| a,c | Morgan Stanley Residential Mortgage Loan Trust, Whole Loan Securities Trust CMO, Series 2024-NQM1 Class A1, 6.152% due 12/25/2068 | 14,398,289 | 14,390,864 |
| New Residential Mortgage Loan Trust, Whole Loan Securities Trust CMO, | |||
| a,c | Series 2017-2A Class A3, 4.00% due 3/25/2057 | 2,690,840 | 2,539,422 |
| a,c | Series 2017-3A Class A1, 4.00% due 4/25/2057 | 3,269,033 | 3,081,985 |
| a,c | Series 2017-4A Class A1, 4.00% due 5/25/2057 | 3,512,261 | 3,313,769 |
| a,c | Series 2017-5A Class A1, 6.944% (TSFR1M + 1.61%) due 6/25/2057 | 246,359 | 246,378 |
| a,c | Series 2017-6A Class A1, 4.00% due 8/27/2057 | 1,533,268 | 1,450,673 |
| a,c | Series 2018-1A Class A1A, 4.00% due 12/25/2057 | 1,906,691 | 1,804,127 |
| a,c | Series 2018-2A Class A1, 4.50% due 2/25/2058 | 3,322,598 | 3,210,096 |
| a,c | Series 2018-RPL1 Class A1, 3.50% due 12/25/2057 | 1,980,166 | 1,874,322 |
| a,c | Series 2022-NQM3 Class A1, 3.90% due 4/25/2062 | 37,992,043 | 34,786,196 |
| c | NYC Commercial Mortgage Trust, CMBS, Series 2021-909 Class A, 2.941% due 4/10/2043 | 4,900,000 | 4,006,678 |
| c | One Bryant Park Trust, CMBS, Series 2019-OBP Class A, 2.516% due 9/15/2054 | 7,655,652 | 6,540,790 |
| a,c | Onslow Bay Mortgage Loan Trust, Whole Loan Securities Trust CMO, Series 2021-NQM4 Class A1, 1.957% due 10/25/2061 | 43,857,884 | 35,684,195 |
| a,c | PRET Trust, Whole Loan Securities Trust CMO, Series 2024-RPL1 Class A1, 3.90% due 10/25/2063 | 3,870,000 | 3,624,159 |
| PRKCM Trust, Whole Loan Securities Trust CMO, | |||
| a,c | Series 2021-AFC1 Class A1, 1.51% due 8/25/2056 | 28,111,010 | 22,977,165 |
| a,c | Series 2021-AFC2 Class A1, 2.071% due 11/25/2056 | 16,193,988 | 13,726,740 |
| a,c | PRPM Trust, Whole Loan Securities Trust CMO, Series 2022-INV1 Class A1, 4.40% due 4/25/2067 | 30,894,154 | 30,031,910 |
| RAMP Trust, Whole Loan Securities Trust CMO, Series 2003-SL1 Class A31, 7.125% due 4/25/2031 | 238,179 | 238,179 | |
| a,c | Rate Mortgage Trust, Whole Loan Securities Trust CMO, Series 2022-J1 Class A9, 2.50% due 1/25/2052 | 48,598,659 | 41,814,332 |
| a,c | RCKT Mortgage Trust, Whole Loan Securities Trust CMO, Series 2020-1 Class B3, 3.466% due 2/25/2050 | 3,036,840 | 2,599,235 |
| c | Retained Vantage Data Centers Issuer LLC, CMBS, Series 2023-1A Class A2A, 5.00% due 9/15/2048 | 12,300,000 | 11,871,644 |
| Seasoned Credit Risk Transfer Trust, Series 2024-1 Class MT, 3.00% due 11/25/2063 | 7,987,050 | 6,652,963 | |
| Seasoned Credit Risk Transfer, Whole Loan Securities Trust CMO, | |||
| a | Series 2017-1 Class HA, 3.00% due 1/25/2056 | 4,181,881 | 3,848,244 |
| a | Series 2017-3 Class HA, 3.25% due 7/25/2056 | 7,327,606 | 6,785,888 |
| a | Series 2017-4 Class HT, 3.25% due 6/25/2057 | 6,924,287 | 6,109,834 |
| a | Series 2018-1 Class HA, 3.00% due 5/25/2057 | 4,416,594 | 4,007,782 |
| a | Series 2018-2 Class HA, 3.00% due 11/25/2057 | 9,777,562 | 8,935,538 |
| Series 2018-3 Class HA, 3.00% due 8/25/2057 | 11,896,922 | 10,792,538 | |
| a | Series 2018-3 Class MA, 3.50% due 8/25/2057 | 7,600,543 | 7,195,764 |
| Series 2018-4 Class HA, 3.00% due 3/25/2058 | 10,118,516 | 9,150,125 | |
| Series 2019-1 Class MA, 3.50% due 7/25/2058 | 19,512,387 | 18,334,713 | |
| Series 2019-2 Class MA, 3.50% due 8/25/2058 | 20,847,128 | 19,489,595 | |
| Series 2019-3 Class MA, 3.50% due 10/25/2058 | 9,663,708 | 9,050,550 | |
| Series 2019-4 Class MA, 3.00% due 2/25/2059 | 16,247,546 | 14,761,126 | |
| Series 2020-1 Class MA, 2.50% due 8/25/2059 | 2,674,602 | 2,404,095 | |
| Series 2020-2 Class MA, 2.00% due 11/25/2059 | 20,131,616 | 17,584,025 | |
| Series 2020-3 Class MA, 2.00% due 5/25/2060 | 11,569,349 | 10,052,959 | |
| Series 2020-3 Class MT, 2.00% due 5/25/2060 | 3,630,895 | 2,858,360 | |
| Seasoned Loans Structured Transaction Trust, Whole Loan Securities Trust CMO, | |||
| Series 2019-2 Class A1C, 2.75% due 9/25/2029 | 14,662,614 | 13,472,527 | |
| Series 2019-3 Class A1C, 2.75% due 11/25/2029 | 2,418,026 | 2,235,798 | |
| Series 2020-2 Class A1C, 2.00% due 9/25/2030 | 21,346,083 | 19,132,078 | |
| Series 2020-2 Class A1D, 1.75% due 9/25/2030 | 28,699,317 | 25,493,649 |
| See notes to financial statements. | Thornburg Taxable Fixed Income Funds Semi-Annual Report | 31 |
Thornburg Limited Term Income Fund | March 31, 2024 (Unaudited)
| Issuer-Description | SHARES/PRINCIPAL AMOUNT | VALUE | |
| Sequoia Mortgage Trust, Whole Loan Securities Trust CMO, | |||
| a | Series 2013-6 Class B4, 3.516% due 5/25/2043 | $ 716,584 | $ 530,705 |
| a | Series 2013-7 Class B4, 3.507% due 6/25/2043 | 408,200 | 303,347 |
| a,c | Series 2023-3 Class A1, 6.00% due 9/25/2053 | 4,086,671 | 4,075,316 |
| SG Residential Mortgage Trust, Whole Loan Securities Trust CMO, | |||
| a,c | Series 2019-3 Class A1, 2.703% due 9/25/2059 | 187,019 | 183,285 |
| a,c | Series 2019-3 Class A3, 3.082% due 9/25/2059 | 324,994 | 319,038 |
| a,c | Series 2020-2 Class A1, 1.381% due 5/25/2065 | 8,897,306 | 7,973,667 |
| a,c | Series 2020-2 Class A2, 1.587% due 5/25/2065 | 1,728,742 | 1,556,666 |
| a,c | Series 2020-2 Class A3, 1.895% due 5/25/2065 | 590,211 | 535,622 |
| a,c | Series 2021-2 Class A1, 1.737% due 12/25/2061 | 14,470,453 | 11,675,716 |
| a,c | Shellpoint Asset Funding Trust, Whole Loan Securities Trust CMO, Series 2013-1 Class A1, 3.75% due 7/25/2043 | 829,864 | 777,372 |
| c | Stack Infrastructure Issuer LLC, CMBS, Series 2021-1A Class A2, 1.877% due 3/26/2046 | 7,500,000 | 6,915,471 |
| a,c | Starwood Mortgage Residential Trust, Whole Loan Securities Trust CMO, Series 2021-5 Class A1, 1.92% due 9/25/2066 | 39,451,285 | 32,064,129 |
| a | Structured Asset Securities Corp., Mortgage Pass-Through Certificates, Whole Loan Securities Trust CMO, Series 2003-9A Class 2A2, 6.674% due 3/25/2033 | 262,877 | 262,877 |
| Towd Point Mortgage Trust, Whole Loan Securities Trust CMO, | |||
| a,c | Series 2016-5 Class A1, 2.50% due 10/25/2056 | 68,882 | 68,593 |
| a,c | Series 2017-1 Class A1, 2.75% due 10/25/2056 | 16,603 | 16,533 |
| a,c | Series 2018-1 Class A1, 3.00% due 1/25/2058 | 229,265 | 222,804 |
| a,c | Series 2018-2 Class A1, 3.25% due 3/25/2058 | 10,462,049 | 10,119,861 |
| a,c | Series 2018-6 Class A1A, 3.75% due 3/25/2058 | 6,202,523 | 6,058,589 |
| a,c | TRK Trust, Whole Loan Securities Trust CMO, Series 2022-INV2 Class A1, 4.35% due 6/25/2057 | 23,172,361 | 21,946,465 |
| Verus Securitization Trust, Whole Loan Securities Trust CMO, | |||
| a,c | Series 2020-1 Class M1, 3.021% due 1/25/2060 | 5,000,000 | 4,385,830 |
| a,c | Series 2021-R1 Class A1, 0.82% due 10/25/2063 | 5,263,582 | 4,811,288 |
| a,c | Vista Point Securitization Trust, Whole Loan Securities Trust CMO, Series 2020-2 Class A1, 1.475% due 4/25/2065 | 3,747,983 | 3,405,780 |
| a,c | WB Commercial Mortgage Trust, CMBS, Series 2024-HQ Class A, 6.134% due 3/15/2040 | 4,050,000 | 4,071,669 |
| a,c | WinWater Mortgage Loan Trust, Whole Loan Securities Trust CMO, Series 2015-3 Class B4, 3.84% due 3/20/2045 | 1,027,439 | 940,601 |
| Total Mortgage Backed (Cost $1,841,743,180) | 1,730,525,877 | ||
| Asset Backed Securities — 12.1% | |||
| Auto Receivables — 1.9% | |||
| c | ACC Auto Trust, Series 2022-A Class A, 4.58% due 7/15/2026 | 1,768,659 | 1,763,395 |
| c | ACM Auto Trust, Series 2023-2A Class A, 7.97% due 6/20/2030 | 5,573,260 | 5,612,787 |
| Arivo Acceptance Auto Loan Receivables Trust, | |||
| c | Series 2021-1A Class A, 1.19% due 1/15/2027 | 614,656 | 607,764 |
| c | Series 2024-1A Class A, 6.46% due 4/17/2028 | 3,755,000 | 3,760,589 |
| c | Avid Automobile Receivables Trust, Series 2023-1 Class A, 6.63% due 7/15/2026 | 2,474,991 | 2,478,223 |
| BOF URSA VI Funding Trust I, | |||
| c | Series 2023-CAR1 Class B, 6.029% due 10/27/2031 | 2,684,548 | 2,678,081 |
| c | Series 2023-CAR2 Class A2, 5.542% due 10/27/2031 | 5,205,366 | 5,180,199 |
| c | Series 2023-CAR2 Class B, 6.029% due 10/27/2031 | 7,064,290 | 7,027,214 |
| c | BOF VII AL Funding Trust I, Series 2023-CAR3 Class A2, 6.291% due 7/26/2032 | 9,575,478 | 9,628,077 |
| Carvana Auto Receivables Trust, | |||
| c | Series 2023-N1 Class A, 6.36% due 4/12/2027 | 4,494,910 | 4,504,603 |
| c | Series 2023-N3 Class A, 6.41% due 9/10/2027 | 3,227,647 | 3,241,448 |
| c | Series 2023-N4 Class A, 6.42% due 1/10/2028 | 7,841,052 | 7,885,112 |
| c | CPS Auto Receivables Trust, Series 2020-B Class E, 7.38% due 6/15/2027 | 2,129,353 | 2,143,442 |
| c | DT Auto Owner Trust, Series 2019-4A Class D, 2.85% due 7/15/2025 | 112,047 | 111,907 |
| c | Exeter Automobile Receivables Trust, Series 2019-3A Class D, 3.11% due 8/15/2025 | 142,968 | 142,794 |
| c | FHF Issuer Trust, Series 2024-1A Class A1, 5.769% due 3/17/2025 | 4,291,585 | 4,290,730 |
| FHF Trust, | |||
| c | Series 2021-1A Class A, 1.27% due 3/15/2027 | 3,738,769 | 3,638,335 |
| c | Series 2021-2A Class A, 0.83% due 12/15/2026 | 3,004,037 | 2,922,292 |
| c | Series 2023-1A Class A2, 6.57% due 6/15/2028 | 3,894,038 | 3,903,127 |
| c | Flagship Credit Auto Trust, Series 2019-2 Class D, 3.53% due 5/15/2025 | 872,899 | 869,253 |
| Lendbuzz Securitization Trust, | |||
| c | Series 2021-1A Class A, 1.46% due 6/15/2026 | 5,468,333 | 5,295,843 |
| c | Series 2022-1A Class A, 4.22% due 5/17/2027 | 5,494,300 | 5,387,583 |
| c | Series 2023-2A Class A2, 7.09% due 10/16/2028 | 4,113,474 | 4,145,903 |
| c | Series 2023-3A Class A1, 6.03% due 10/15/2024 | 404,358 | 404,367 |
| 32 | Thornburg Taxable Fixed Income Funds Semi-Annual Report | See notes to financial statements. |
| Issuer-Description | SHARES/PRINCIPAL AMOUNT | VALUE | |
| Lobel Automobile Receivables Trust, | |||
| c | Series 2023-1 Class A, 6.97% due 7/15/2026 | $ 2,628,179 | $ 2,632,862 |
| c | Series 2023-2 Class A, 7.59% due 4/16/2029 | 3,374,519 | 3,406,672 |
| Research-Driven Pagaya Motor Asset Trust, | |||
| c | Series 2023-3A Class A, 7.13% due 1/26/2032 | 15,517,918 | 15,610,788 |
| c | Series 2023-4A Class A, 7.54% due 3/25/2032 | 8,868,838 | 8,967,902 |
| c | SAFCO Auto Receivables Trust, Series 2024-1A Class A, 6.51% due 3/20/2028 | 6,802,649 | 6,811,419 |
| c | Tricolor Auto Securitization Trust, Series 2023-1A Class A, 6.48% due 8/17/2026 | 1,913,653 | 1,914,955 |
| 126,967,666 | |||
| Credit Card — 0.8% | |||
| c | Avant Credit Card Master Trust, Series 2021-1A Class A, 1.37% due 4/15/2027 | 11,900,000 | 11,488,901 |
| c | Brex Commercial Charge Card Master Trust, Series 2024-1 Class A1, 6.05% due 7/15/2027 | 8,627,000 | 8,620,402 |
| c | Continental Finance Credit Card ABS Master Trust, Series 2020-1A Class A, 2.24% due 12/15/2028 | 11,736,008 | 11,592,855 |
| c | Mercury Financial Credit Card Master Trust, Series 2023-1A Class A, 8.04% due 9/20/2027 | 14,600,000 | 14,725,330 |
| c | Mission Lane Credit Card Master Trust, Series 2023-B Class A, 7.69% due 11/15/2028 | 5,000,000 | 5,072,616 |
| 51,500,104 | |||
| Other Asset Backed — 6.6% | |||
| c | AFG ABS I LLC, Series 2023-1 Class A2, 6.30% due 9/16/2030 | 7,883,281 | 7,895,014 |
| c | AMCR ABS Trust, Series 2023-1A Class A, 7.66% due 1/21/2031 | 4,144,899 | 4,169,699 |
| c | Amur Equipment Finance Receivables X LLC, Series 2022-1A Class A2, 1.64% due 10/20/2027 | 13,011,280 | 12,704,003 |
| Aqua Finance Trust, | |||
| c | Series 2020-AA Class A, 1.90% due 7/17/2046 | 11,305,887 | 10,286,460 |
| c | Series 2020-AA Class C, 3.97% due 7/17/2046 | 6,300,000 | 5,642,630 |
| c | Series 2021-A Class A, 1.54% due 7/17/2046 | 9,513,699 | 8,328,131 |
| c | Auxilior Term Funding LLC, Series 2023-1A Class A2, 6.18% due 12/15/2028 | 3,000,000 | 3,019,595 |
| c | Bankers Healthcare Group Securitization Trust, Series 2020-A Class A, 2.56% due 9/17/2031 | 230,979 | 230,206 |
| BHG Securitization Trust, | |||
| c | Series 2021-B Class A, 0.90% due 10/17/2034 | 3,333,552 | 3,257,464 |
| c | Series 2022-A Class A, 1.71% due 2/20/2035 | 10,628,964 | 10,470,218 |
| b,c | CFG Investments Ltd., Series 2023-1 Class A, 8.56% due 7/25/2034 | 5,000,000 | 5,127,043 |
| c | CFMT Issuer Trust, Series 2021-GRN1 Class A, 1.10% due 3/20/2041 | 2,659,768 | 2,533,264 |
| c | CP EF Asset Securitization I LLC, Series 2022-1A Class A, 5.96% due 4/15/2030 | 4,991,447 | 4,979,535 |
| Dext ABS LLC, | |||
| c | Series 2021-1 Class A, 1.12% due 2/15/2028 | 6,118,297 | 6,007,476 |
| c | Series 2023-2 Class A2, 6.56% due 5/15/2034 | 4,982,373 | 5,011,880 |
| c | Diamond Infrastructure Funding LLC, Series 2021-1A Class A, 1.76% due 4/15/2049 | 36,000,000 | 32,122,944 |
| c | Diamond Issuer, Series 2021-1A Class A, 2.305% due 11/20/2051 | 27,894,000 | 24,890,151 |
| b,c | ECAF I Ltd., Series 2015-1A Class A2, 4.947% due 6/15/2040 | 2,835,670 | 1,928,119 |
| Entergy New Orleans Storm Recovery Funding I LLC, Series 2015-1 Class A, 2.67% due 6/1/2027 | 948,864 | 943,711 | |
| c | EverBright Solar Trust, Series 2024-A Class A, 6.43% due 6/22/2054 | 9,540,000 | 9,511,950 |
| c | ExteNet LLC, Series 2019-1A Class A2, 3.204% due 7/25/2049 | 9,855,000 | 9,742,909 |
| Foundation Finance Trust, | |||
| c | Series 2019-1A Class A, 3.86% due 11/15/2034 | 788,187 | 783,093 |
| c | Series 2020-1A Class A, 3.54% due 7/16/2040 | 2,953,897 | 2,882,199 |
| c | Series 2020-1A Class B, 4.62% due 7/16/2040 | 3,000,000 | 2,871,957 |
| c | Series 2021-1A Class A, 1.27% due 5/15/2041 | 12,029,266 | 10,790,177 |
| c | Series 2021-2A Class A, 2.19% due 1/15/2042 | 8,511,584 | 7,797,145 |
| Goldman Home Improvement Trust Issuer Trust, | |||
| c | Series 2021-GRN2 Class A, 1.15% due 6/25/2051 | 7,664,433 | 7,169,241 |
| c | Series 2022-GRN1 Class A, 4.50% due 6/25/2052 | 3,898,103 | 3,803,174 |
| c | Goodgreen Trust, Series 2021-1A Class A, 2.66% due 10/15/2056 | 15,992,116 | 13,123,271 |
| GoodLeap Sustainable Home Solutions Trust, | |||
| c | Series 2021-3CS Class A, 2.10% due 5/20/2048 | 14,583,978 | 11,382,919 |
| c | Series 2021-4GS Class A, 1.93% due 7/20/2048 | 9,664,402 | 7,379,686 |
| c | Series 2021-5CS Class A, 2.31% due 10/20/2048 | 3,757,776 | 2,990,325 |
| a,c | Gracie Point International Funding LLC, Series 2023-2A Class A, 7.608% (SOFR90A + 2.25%) due 3/1/2027 | 7,318,013 | 7,378,620 |
| HERO Funding Trust, | |||
| c | Series 2015-1A Class A, 3.84% due 9/21/2040 | 2,094,336 | 1,910,785 |
| c | Series 2017-2A Class A1, 3.28% due 9/20/2048 | 429,025 | 373,513 |
| Hilton Grand Vacations Trust, | |||
| c | Series 2019-AA Class A, 2.34% due 7/25/2033 | 2,747,139 | 2,631,288 |
| c | Series 2020-AA Class A, 2.74% due 2/25/2039 | 574,808 | 547,483 |
| See notes to financial statements. | Thornburg Taxable Fixed Income Funds Semi-Annual Report | 33 |
Thornburg Limited Term Income Fund | March 31, 2024 (Unaudited)
| Issuer-Description | SHARES/PRINCIPAL AMOUNT | VALUE | |
| c | HIN Timeshare Trust, Series 2020-A Class A, 1.39% due 10/9/2039 | $ 2,810,564 | $ 2,603,315 |
| c | InStar Leasing III LLC, Series 2021-1A Class A, 2.30% due 2/15/2054 | 8,585,696 | 7,615,083 |
| c | LendingPoint Asset Securitization Trust, Series 2022-B Class A, 4.77% due 10/15/2029 | 2,019,120 | 2,009,211 |
| LendingPoint Pass-Through Trust, | |||
| c | Series 2022-ST1 Class A, 2.50% due 3/15/2028 | 1,472,412 | 1,427,839 |
| c | Series 2022-ST3 Class A, 4.00% due 5/15/2028 | 3,361,883 | 3,308,945 |
| c | LL ABS Trust, Series 2021-1A Class A, 1.07% due 5/15/2029 | 395,163 | 393,841 |
| c | Loanpal Solar Loan Ltd., Series 2021-1GS Class A, 2.29% due 1/20/2048 | 15,262,401 | 12,246,127 |
| c | Marlette Funding Trust, Series 2022-3A Class A, 5.18% due 11/15/2032 | 812,204 | 810,778 |
| c | Momnt Technologies Trust, Series 2023-1A Class A, 6.92% due 3/20/2045 | 5,707,672 | 5,742,758 |
| Mosaic Solar Loan Trust, | |||
| c | Series 2019-1A Class A, 4.37% due 12/21/2043 | 997,066 | 937,192 |
| c | Series 2020-1A Class A, 2.10% due 4/20/2046 | 3,284,842 | 2,854,643 |
| c | Oportun Funding XIV LLC, Series 2021-A Class A, 1.21% due 3/8/2028 | 2,257,275 | 2,188,238 |
| c | Oportun Issuance Trust, Series 2022-A Class A, 5.05% due 6/9/2031 | 22,026,000 | 21,806,770 |
| c | Pagaya AI Debt Selection Trust, Series 2021-HG1 Class A, 1.22% due 1/16/2029 | 2,470,521 | 2,409,677 |
| Pagaya AI Debt Trust, | |||
| c | Series 2022-1 Class A, 2.03% due 10/15/2029 | 5,877,741 | 5,812,947 |
| c | Series 2022-2 Class A, 4.97% due 1/15/2030 | 3,176,077 | 3,160,535 |
| c | Series 2023-1 Class A, 7.556% due 7/15/2030 | 3,224,547 | 3,239,389 |
| a,c | Series 2023-5 Class AB, 7.31% due 4/15/2031 | 3,371,195 | 3,389,378 |
| c | Series 2024-1 Class A, 6.66% due 7/15/2031 | 3,000,000 | 3,010,487 |
| c | Pawnee Equipment Receivables LLC, Series 2021-1 Class A2, 1.10% due 7/15/2027 | 1,839,057 | 1,809,187 |
| c | Post Road Equipment Finance, Series 2022-1A Class A1, 3.76% due 8/16/2027 | 958,753 | 957,329 |
| c | PowerPay Issuance Trust, Series 2024-1A Class A, 6.53% due 2/18/2039 | 6,625,000 | 6,625,000 |
| Prosper Marketplace Issuance Trust, | |||
| c | Series 2023-1A Class A, 7.06% due 7/16/2029 | 1,565,284 | 1,570,628 |
| c | Series 2024-1A Class A, 6.12% due 8/15/2029 | 7,500,000 | 7,498,685 |
| c | Reach Financial LLC, Series 2023-1A Class A, 7.05% due 2/18/2031 | 1,390,448 | 1,395,793 |
| a,c | SBA Tower Trust, Series 2014-2A Class C, 3.869% due 10/15/2049 | 4,610,000 | 4,555,158 |
| c | SCF Equipment Leasing LLC, Series 2019-2A Class C, 3.11% due 6/21/2027 | 2,639,732 | 2,622,017 |
| c | Service Experts Issuer LLC, Series 2021-1A Class A, 2.67% due 2/2/2032 | 12,672,860 | 11,873,012 |
| c | SpringCastle America Funding LLC, Series 2020-AA Class A, 1.97% due 9/25/2037 | 15,093,842 | 13,873,539 |
| c | SPS Servicer Advance Receivables Trust, Series 2020-T2 Class A, 1.83% due 11/15/2055 | 12,915,000 | 12,100,419 |
| Upstart Pass-Through Trust, | |||
| c | Series 2020-ST2 Class A, 3.50% due 3/20/2028 | 83,495 | 82,629 |
| c | Series 2020-ST3 Class A, 3.35% due 4/20/2028 | 450,879 | 444,047 |
| c | Series 2021-ST4 Class A, 2.00% due 7/20/2027 | 937,314 | 901,967 |
| c | Series 2021-ST5 Class A, 2.00% due 7/20/2027 | 1,069,809 | 1,032,310 |
| c | Series 2021-ST6 Class A, 1.85% due 8/20/2027 | 1,318,671 | 1,275,805 |
| c | Series 2021-ST8 Class A, 1.75% due 10/20/2029 | 1,511,780 | 1,494,162 |
| Upstart Securitization Trust, | |||
| c | Series 2023-1 Class A, 6.59% due 2/20/2033 | 1,423,012 | 1,423,434 |
| c | Series 2023-3 Class A, 6.90% due 10/20/2033 | 3,914,322 | 3,931,761 |
| Upstart Structured Pass-Through Trust, | |||
| c | Series 2022-1A Class A, 3.40% due 4/15/2030 | 13,441,302 | 13,185,440 |
| c | Series 2022-4A Class A, 7.01% due 11/15/2030 | 2,685,420 | 2,689,789 |
| 428,926,542 | |||
| Student Loan — 2.8% | |||
| College Avenue Student Loans LLC, | |||
| a,c | Series 2021-A Class A1, 6.544% (TSFR1M + 1.21%) due 7/25/2051 | 7,386,442 | 7,329,495 |
| c | Series 2021-A Class A2, 1.60% due 7/25/2051 | 1,708,130 | 1,499,150 |
| a,c | Series 2021-C Class A1, 6.344% (TSFR1M + 1.01%) due 7/26/2055 | 11,953,218 | 11,608,106 |
| Commonbond Student Loan Trust, | |||
| c | Series 18-CGS Class A1, 3.87% due 2/25/2046 | 1,442,815 | 1,359,315 |
| c | Series 2020-1 Class A, 1.69% due 10/25/2051 | 10,161,180 | 8,956,978 |
| c | Series 2021-AGS Class A, 1.20% due 3/25/2052 | 8,288,053 | 6,858,262 |
| c | Series 2021-BGS Class A, 1.17% due 9/25/2051 | 9,562,869 | 8,080,598 |
| Navient Private Education Refi Loan Trust, | |||
| a,c | Series 2019-D Class A2B, 6.49% (TSFR1M + 1.16%) due 12/15/2059 | 6,979,993 | 6,940,522 |
| c | Series 2021-A Class A, 0.84% due 5/15/2069 | 2,667,239 | 2,329,142 |
| c | Series 2022-BA Class A, 4.16% due 10/15/2070 | 19,309,776 | 18,452,029 |
| 34 | Thornburg Taxable Fixed Income Funds Semi-Annual Report | See notes to financial statements. |
| Issuer-Description | SHARES/PRINCIPAL AMOUNT | VALUE | |
| Navient Student Loan Trust, | |||
| a | Series 2014-1 Class A3, 5.945% (SOFR30A + 0.62%) due 6/25/2031 | $ 3,744,290 | $ 3,695,391 |
| a,c | Series 2019-BA Class A2B, 6.42% (TSFR1M + 1.09%) due 12/15/2059 | 1,013,723 | 1,009,641 |
| Nelnet Student Loan Trust, | |||
| a,c | Series 2013-1A Class A, 6.035% (SOFR30A + 0.71%) due 6/25/2041 | 2,231,404 | 2,199,840 |
| a,c | Series 2015-2A Class A2, 6.035% (SOFR30A + 0.71%) due 9/25/2042 | 17,429,085 | 17,122,647 |
| a,c | Series 2015-3A Class A2, 6.035% (SOFR30A + 0.71%) due 2/27/2051 | 920,316 | 915,838 |
| a,c | Series 2021-CA Class AFL, 6.183% (TSFR1M + 0.85%) due 4/20/2062 | 9,818,837 | 9,711,718 |
| a,c | Series 2021-DA Class AFL, 6.133% (TSFR1M + 0.80%) due 4/20/2062 | 14,146,272 | 13,989,715 |
| a,b,c | Prodigy Finance DAC, Series 2021-1A Class A, 6.694% (TSFR1M + 1.36%) due 7/25/2051 | 1,579,999 | 1,567,067 |
| SLM Student Loan Trust, | |||
| a | Series 2011-2 Class A2, 6.635% (SOFR30A + 1.31%) due 10/25/2034 | 7,170,895 | 7,194,098 |
| a | Series 2013-6 Class A3, 6.085% (SOFR30A + 0.76%) due 6/26/2028 | 21,036,425 | 20,797,420 |
| SMB Private Education Loan Trust, | |||
| a,c | Series 2017-B Class A2B, 6.19% (TSFR1M + 0.86%) due 10/15/2035 | 542,091 | 539,360 |
| a,c | Series 2021-D Class A1B, 6.04% (TSFR1M + 0.71%) due 3/17/2053 | 5,878,694 | 5,797,728 |
| a,c | Series 2021-E Class A1B, 6.07% (TSFR1M + 0.74%) due 2/15/2051 | 16,961,795 | 16,731,487 |
| a,c | Towd Point Asset Trust, Series 2021-SL1 Class A2, 6.143% (TSFR1M + 0.81%) due 11/20/2061 | 4,449,079 | 4,430,793 |
| 179,116,340 | |||
| Total Asset Backed Securities (Cost $823,378,247) | 786,510,652 | ||
| Corporate Bonds — 36.1% | |||
| Automobiles & Components — 0.7% | |||
| Automobile Components — 0.1% | |||
| b | Aptiv plc/Aptiv Corp., 2.396% due 2/18/2025 | 5,434,000 | 5,278,805 |
| Automobiles — 0.6% | |||
| a,c | Daimler Truck Finance North America LLC, 6.111% (SOFR + 0.75%) due 12/13/2024 | 10,414,000 | 10,435,869 |
| Hyundai Capital America, | |||
| c | 0.875% due 6/14/2024 | 8,710,000 | 8,621,768 |
| c | 1.00% due 9/17/2024 | 8,872,000 | 8,676,284 |
| c | 1.80% due 10/15/2025 - 1/10/2028 | 6,797,000 | 6,338,885 |
| c | 3.00% due 2/10/2027 | 2,105,000 | 1,975,795 |
| c | 5.30% due 3/19/2027 | 2,000,000 | 2,000,320 |
| b,c | Kia Corp., 2.375% due 2/14/2025 | 4,800,000 | 4,667,712 |
| 47,995,438 | |||
| Banks — 1.3% | |||
| Banks — 1.3% | |||
| a,b,c | DNB Bank ASA, 5.896% (SOFRINDX + 1.95%) due 10/9/2026 | 7,500,000 | 7,537,650 |
| FNB Corp., 5.15% due 8/25/2025 | 5,748,000 | 5,661,723 | |
| KeyBank NA, 5.00% due 1/26/2033 | 12,100,000 | 11,214,764 | |
| a,b,c | NBK SPC Ltd., 1.625% (SOFR + 1.05%) due 9/15/2027 | 13,033,000 | 11,883,098 |
| Santander Holdings USA, Inc., | |||
| 3.244% due 10/5/2026 | 4,023,000 | 3,799,120 | |
| 3.45% due 6/2/2025 | 4,453,000 | 4,328,850 | |
| a | 6.174% (SOFR + 2.50%) due 1/9/2030 | 2,800,000 | 2,827,216 |
| b,c | Sumitomo Mitsui Trust Bank Ltd., 5.65% due 3/9/2026 | 3,800,000 | 3,826,448 |
| Synchrony Bank, 5.40% due 8/22/2025 | 7,250,000 | 7,184,605 | |
| a | U.S. Bancorp, 5.775% (SOFR + 2.02%) due 6/12/2029 | 15,261,000 | 15,529,288 |
| Wells Fargo & Co., | |||
| a | 3.908% (SOFR + 1.32%) due 4/25/2026 | 8,792,000 | 8,629,260 |
| a | 4.808% (SOFR + 1.98%) due 7/25/2028 | 3,448,000 | 3,397,625 |
| 85,819,647 | |||
| Capital Goods — 0.2% | |||
| Machinery — 0.1% | |||
| Regal Rexnord Corp., | |||
| c | 6.05% due 2/15/2026 | 4,906,000 | 4,935,436 |
| c | 6.30% due 2/15/2030 | 2,939,000 | 3,010,418 |
| Trading Companies & Distributors — 0.1% | |||
| LKQ Corp., 6.25% due 6/15/2033 | 5,840,000 | 6,079,498 |
| See notes to financial statements. | Thornburg Taxable Fixed Income Funds Semi-Annual Report | 35 |
Thornburg Limited Term Income Fund | March 31, 2024 (Unaudited)
| Issuer-Description | SHARES/PRINCIPAL AMOUNT | VALUE | |
| 14,025,352 | |||
| Commercial & Professional Services — 0.6% | |||
| Commercial Services & Supplies — 0.6% | |||
| Element Fleet Management Corp., | |||
| b,c | 5.643% due 3/13/2027 | $ 4,400,000 | $ 4,412,848 |
| b,c | 6.271% due 6/26/2026 | 11,400,000 | 11,534,178 |
| b,c | 6.319% due 12/4/2028 | 3,422,000 | 3,535,576 |
| Quanta Services, Inc., 0.95% due 10/1/2024 | 5,296,000 | 5,164,765 | |
| c | UL Solutions, Inc., 6.50% due 10/20/2028 | 12,800,000 | 13,342,720 |
| 37,990,087 | |||
| Consumer Discretionary Distribution & Retail — 0.1% | |||
| Specialty Retail — 0.1% | |||
| Advance Auto Parts, Inc., 3.90% due 4/15/2030 | 5,231,000 | 4,744,988 | |
| 4,744,988 | |||
| Consumer Durables & Apparel — 0.0% | |||
| Household Durables — 0.0% | |||
| b,c | Panasonic Holdings Corp., 2.679% due 7/19/2024 | 2,000,000 | 1,980,580 |
| 1,980,580 | |||
| Consumer Services — 0.2% | |||
| Hotels, Restaurants & Leisure — 0.2% | |||
| Warnermedia Holdings, Inc., 6.412% due 3/15/2026 | 10,000,000 | 10,000,300 | |
| 10,000,300 | |||
| Energy — 1.6% | |||
| Oil, Gas & Consumable Fuels — 1.6% | |||
| c | Colorado Interstate Gas Co. LLC/Colorado Interstate Issuing Corp., 4.15% due 8/15/2026 | 9,092,000 | 8,779,872 |
| c | El Paso Natural Gas Co. LLC, 3.50% due 2/15/2032 | 4,068,000 | 3,456,254 |
| c | Florida Gas Transmission Co. LLC, 2.30% due 10/1/2031 | 5,684,000 | 4,597,276 |
| Galaxy Pipeline Assets Bidco Ltd., | |||
| b,c | 1.75% due 9/30/2027 | 26,856,531 | 25,231,174 |
| b,c | 2.16% due 3/31/2034 | 8,528,377 | 7,337,219 |
| b,c,e,f | Gazprom PJSC via Gaz Finance plc, 3.50% due 7/14/2031 | 32,475,000 | 16,922,398 |
| c | Gray Oak Pipeline LLC, 3.45% due 10/15/2027 | 12,955,000 | 12,160,081 |
| c | Midwest Connector Capital Co. LLC, 4.625% due 4/1/2029 | 13,090,000 | 12,641,798 |
| b,c | TMS Issuer SARL, 5.78% due 8/23/2032 | 10,700,000 | 11,002,596 |
| 102,128,668 | |||
| Equity Real Estate Investment Trusts (REITs) — 1.6% | |||
| Diversified REITs — 1.6% | |||
| American Tower Corp., | |||
| 1.45% due 9/15/2026 | 4,969,000 | 4,533,865 | |
| 2.40% due 3/15/2025 | 12,850,000 | 12,462,187 | |
| c | American Tower Trust #1, 3.652% due 3/15/2048 | 6,065,000 | 5,746,609 |
| Crown Castle, Inc., | |||
| 1.05% due 7/15/2026 | 2,722,000 | 2,475,632 | |
| 5.00% due 1/11/2028 | 3,801,000 | 3,763,028 | |
| Digital Realty Trust LP, 4.45% due 7/15/2028 | 4,880,000 | 4,727,256 | |
| Realty Income Corp., 5.05% due 1/13/2026 | 6,146,000 | 6,127,132 | |
| SBA Tower Trust, | |||
| c | 1.631% due 5/15/2051 | 26,000,000 | 23,525,642 |
| c | 1.84% due 4/15/2027 | 8,140,000 | 7,294,248 |
| c | 2.836% due 1/15/2050 | 12,661,000 | 12,357,461 |
| c | 6.599% due 1/15/2028 | 7,950,000 | 8,144,351 |
| Sun Communities Operating LP, 2.30% due 11/1/2028 | 4,555,000 | 3,980,797 | |
| Vornado Realty LP, | |||
| 2.15% due 6/1/2026 | 7,000,000 | 6,353,340 | |
| 3.40% due 6/1/2031 | 2,916,000 | 2,307,343 | |
| 103,798,891 | |||
| Financial Services — 6.8% |
| 36 | Thornburg Taxable Fixed Income Funds Semi-Annual Report | See notes to financial statements. |
| Issuer-Description | SHARES/PRINCIPAL AMOUNT | VALUE | |
| Capital Markets — 1.6% | |||
| Blue Owl Credit Income Corp., | |||
| 3.125% due 9/23/2026 | $ 19,056,000 | $ 17,489,406 | |
| 4.70% due 2/8/2027 | 3,162,000 | 2,999,695 | |
| Blue Owl Technology Finance Corp., | |||
| c | 3.75% due 6/17/2026 | 12,276,000 | 11,345,479 |
| c | 4.75% due 12/15/2025 | 28,439,000 | 27,328,457 |
| Hercules Capital, Inc., | |||
| 2.625% due 9/16/2026 | 14,120,000 | 12,803,451 | |
| 3.375% due 1/20/2027 | 7,458,000 | 6,856,885 | |
| Main Street Capital Corp., 3.00% due 7/14/2026 | 8,163,000 | 7,598,937 | |
| Sixth Street Specialty Lending, Inc., 3.875% due 11/1/2024 | 14,960,000 | 14,765,969 | |
| Financial Services — 5.1% | |||
| Antares Holdings LP, | |||
| c | 2.75% due 1/15/2027 | 7,360,000 | 6,596,253 |
| c | 3.75% due 7/15/2027 | 8,520,000 | 7,742,806 |
| c | 3.95% due 7/15/2026 | 14,391,000 | 13,512,717 |
| b | Banco Santander SA, 5.147% due 8/18/2025 | 10,000,000 | 9,929,300 |
| Bank of America Corp., | |||
| a | 0.976% (SOFR + 0.69%) due 4/22/2025 | 9,525,000 | 9,496,615 |
| a | 1.319% (SOFR + 1.15%) due 6/19/2026 | 6,665,000 | 6,335,216 |
| a | 3.841% (SOFR + 1.11%) due 4/25/2025 | 7,305,000 | 7,295,357 |
| a | 4.948% (SOFR + 2.04%) due 7/22/2028 | 6,007,000 | 5,959,605 |
| BNP Paribas SA, | |||
| a,b,c | 2.159% (SOFR + 1.22%) due 9/15/2029 | 3,650,000 | 3,188,019 |
| a,b,c | 2.219% (SOFR + 2.07%) due 6/9/2026 | 7,000,000 | 6,730,920 |
| a,b,c | 2.819% (TSFR3M + 1.37%) due 11/19/2025 | 4,775,000 | 4,684,132 |
| a | Charles Schwab Corp., 6.41% (SOFRINDX + 1.05%) due 3/3/2027 | 18,833,000 | 18,888,934 |
| Citigroup, Inc., | |||
| a | 1.122% (SOFR + 0.77%) due 1/28/2027 | 1,332,000 | 1,232,153 |
| a | 1.462% (SOFR + 0.77%) due 6/9/2027 | 7,328,000 | 6,729,009 |
| a | 3.106% (SOFR + 2.84%) due 4/8/2026 | 4,265,000 | 4,158,076 |
| 3.40% due 5/1/2026 | 2,425,000 | 2,335,518 | |
| a | 6.021% (SOFR + 0.67%) due 5/1/2025 | 5,753,000 | 5,754,036 |
| Deutsche Bank AG, | |||
| b | 0.898% due 5/28/2024 | 10,952,000 | 10,866,684 |
| a,b | 2.552% (SOFR + 1.32%) due 1/7/2028 | 4,940,000 | 4,535,068 |
| Goldman Sachs Group, Inc., | |||
| a | 5.848% (SOFR + 0.50%) due 7/16/2024 | 14,450,000 | 14,370,236 |
| a | 5.861% (SOFR + 0.50%) due 9/10/2024 | 6,506,000 | 6,508,472 |
| a | 6.181% (SOFR + 0.82%) due 9/10/2027 | 10,881,000 | 10,869,901 |
| HSBC Holdings plc, | |||
| a,b | 1.589% (SOFR + 1.29%) due 5/24/2027 | 6,100,000 | 5,612,854 |
| a,b | 1.645% (SOFR + 1.54%) due 4/18/2026 | 3,025,000 | 2,898,373 |
| a,b | 2.099% (SOFR + 1.93%) due 6/4/2026 | 6,800,000 | 6,521,268 |
| a,b | 2.206% (SOFR + 1.29%) due 8/17/2029 | 3,500,000 | 3,067,855 |
| a,b | 2.251% (SOFR + 1.10%) due 11/22/2027 | 3,430,000 | 3,161,843 |
| a,b | 4.18% (SOFR + 1.51%) due 12/9/2025 | 5,400,000 | 5,334,714 |
| JPMorgan Chase & Co., | |||
| a | 1.04% (TSFR3M + 0.70%) due 2/4/2027 | 4,690,000 | 4,338,250 |
| a | 3.54% (TSFR3M + 1.64%) due 5/1/2028 | 3,040,000 | 2,904,234 |
| a | 4.08% (SOFR + 1.32%) due 4/26/2026 | 5,500,000 | 5,415,905 |
| a | 6.277% (SOFR + 0.92%) due 2/24/2026 | 10,418,000 | 10,450,921 |
| Mitsubishi UFJ Financial Group, Inc., | |||
| a,b | 0.953% (H15T1Y + 0.55%) due 7/19/2025 | 21,875,000 | 21,553,000 |
| a,b | 4.788% (H15T1Y + 1.70%) due 7/18/2025 | 4,550,000 | 4,533,938 |
| a,b | 5.017% (H15T1Y + 1.95%) due 7/20/2028 | 6,785,000 | 6,763,492 |
| Morgan Stanley, | |||
| a | 1.164% (SOFR + 0.56%) due 10/21/2025 | 9,635,000 | 9,381,407 |
| a | 5.86% (SOFR + 0.51%) due 1/22/2025 | 11,785,000 | 11,790,775 |
| a,b | NatWest Group plc, 1.642% (H15T1Y + 0.90%) due 6/14/2027 | 3,000,000 | 2,759,460 |
| See notes to financial statements. | Thornburg Taxable Fixed Income Funds Semi-Annual Report | 37 |
Thornburg Limited Term Income Fund | March 31, 2024 (Unaudited)
| Issuer-Description | SHARES/PRINCIPAL AMOUNT | VALUE | |
| Societe Generale SA, | |||
| a,b,c | 1.792% (H15T1Y + 1.00%) due 6/9/2027 | $ 4,933,000 | $ 4,520,059 |
| b,c | 2.625% due 1/22/2025 | 4,000,000 | 3,897,680 |
| a,b,c | 6.40% (SOFR + 1.05%) due 1/21/2026 | 6,400,000 | 6,404,864 |
| b | Sumitomo Mitsui Financial Group, Inc., 1.402% due 9/17/2026 | 11,650,000 | 10,651,828 |
| a,b,c | UBS AG, 5.803% (SOFR + 0.45%) due 8/9/2024 | 2,800,000 | 2,801,316 |
| UBS Group AG, | |||
| a,b,c | 1.494% (H15T1Y + 0.85%) due 8/10/2027 | 7,121,000 | 6,477,404 |
| a,b,c | 2.593% (SOFR + 1.56%) due 9/11/2025 | 6,533,000 | 6,440,950 |
| a,b,c | 4.49% (H15T1Y + 1.60%) due 8/5/2025 | 3,267,000 | 3,250,665 |
| a,b,c | 4.751% (H15T1Y + 1.75%) due 5/12/2028 | 4,300,000 | 4,210,775 |
| Western Union Co., 2.85% due 1/10/2025 | 7,256,000 | 7,094,917 | |
| Mortgage Real Estate Investment Trusts — 0.1% | |||
| Prologis Targeted U.S. Logistics Fund LP, | |||
| c | 5.25% due 4/1/2029 | 4,350,000 | 4,339,299 |
| c | 5.50% due 4/1/2034 | 4,350,000 | 4,373,403 |
| 439,858,755 | |||
| Food, Beverage & Tobacco — 0.7% | |||
| Beverages — 0.5% | |||
| b,c | Becle SAB de CV, 2.50% due 10/14/2031 | 28,038,000 | 22,356,099 |
| Constellation Brands, Inc., 5.00% due 2/2/2026 | 2,750,000 | 2,733,280 | |
| Huntington Ingalls Industries, Inc., 2.043% due 8/16/2028 | 9,771,000 | 8,539,268 | |
| Tobacco — 0.2% | |||
| BAT Capital Corp., | |||
| 2.726% due 3/25/2031 | 2,950,000 | 2,482,956 | |
| 3.215% due 9/6/2026 | 4,632,000 | 4,409,525 | |
| b | BAT International Finance plc, 4.448% due 3/16/2028 | 3,000,000 | 2,914,020 |
| 43,435,148 | |||
| Health Care Equipment & Services — 0.8% | |||
| Health Care Equipment & Supplies — 0.2% | |||
| b,c | Olympus Corp., 2.143% due 12/8/2026 | 14,061,000 | 12,918,403 |
| Health Care Providers & Services — 0.6% | |||
| Centene Corp., 4.625% due 12/15/2029 | 4,906,000 | 4,658,247 | |
| c | Highmark, Inc., 1.45% due 5/10/2026 | 20,542,000 | 18,790,178 |
| Humana, Inc., 5.70% due 3/13/2026 | 11,996,000 | 11,984,964 | |
| Laboratory Corp. of America Holdings, 1.55% due 6/1/2026 | 4,855,000 | 4,496,652 | |
| 52,848,444 | |||
| Household & Personal Products — 0.1% | |||
| Household Products — 0.1% | |||
| b,c | Kimberly-Clark de Mexico SAB de CV, 3.80% due 4/8/2024 | 3,900,000 | 3,898,167 |
| 3,898,167 | |||
| Industrials — 0.1% | |||
| Transportation Infrastructure — 0.1% | |||
| Penske Truck Leasing Co. LP/PTL Finance Corp., | |||
| c | 5.75% due 5/24/2026 | 2,480,000 | 2,498,054 |
| c | 6.05% due 8/1/2028 | 3,053,000 | 3,143,522 |
| 5,641,576 | |||
| Insurance — 7.7% | |||
| Insurance — 7.7% | |||
| c | American National Group LLC, 6.144% due 6/13/2032 | 25,662,000 | 24,221,848 |
| Aon North America, Inc., 5.45% due 3/1/2034 | 7,651,000 | 7,734,549 | |
| b,c | Ascot Group Ltd., 4.25% due 12/15/2030 | 12,308,000 | 10,285,796 |
| c | Belrose Funding Trust, 2.33% due 8/15/2030 | 9,685,000 | 7,771,341 |
| Brighthouse Financial Global Funding, | |||
| c | 1.55% due 5/24/2026 | 7,538,000 | 6,899,230 |
| c | 2.00% due 6/28/2028 | 10,733,000 | 9,251,739 |
| a,c | 6.109% (SOFR + 0.76%) due 4/12/2024 | 7,247,000 | 7,219,824 |
| 38 | Thornburg Taxable Fixed Income Funds Semi-Annual Report | See notes to financial statements. |
| Issuer-Description | SHARES/PRINCIPAL AMOUNT | VALUE | |
| CNO Global Funding, | |||
| c | 1.65% due 1/6/2025 | $ 5,359,000 | $ 5,177,705 |
| c | 1.75% due 10/7/2026 | 9,414,000 | 8,574,554 |
| b,c | DaVinciRe Holdings Ltd., 4.75% due 5/1/2025 | 11,510,000 | 11,285,555 |
| Enstar Group Ltd., | |||
| b | 3.10% due 9/1/2031 | 12,954,000 | 10,760,499 |
| b | 4.95% due 6/1/2029 | 3,284,000 | 3,207,450 |
| Equitable Financial Life Global Funding, | |||
| c | 1.00% due 1/9/2026 | 8,665,000 | 8,013,479 |
| c | 1.40% due 7/7/2025 - 8/27/2027 | 16,048,000 | 14,885,346 |
| c | 1.80% due 3/8/2028 | 6,800,000 | 5,992,568 |
| F&G Global Funding, | |||
| c | 1.75% due 6/30/2026 | 16,912,000 | 15,327,176 |
| c | 2.00% due 9/20/2028 | 6,795,000 | 5,779,623 |
| c | 2.30% due 4/11/2027 | 11,752,000 | 10,551,181 |
| Fairfax Financial Holdings Ltd., | |||
| b | 3.375% due 3/3/2031 | 5,261,000 | 4,602,270 |
| b | 5.625% due 8/16/2032 | 11,202,000 | 11,205,697 |
| b,c | Fidelis Insurance Holdings Ltd., 4.875% due 6/30/2030 | 17,531,000 | 16,923,375 |
| Fidelity National Financial, Inc., | |||
| 2.45% due 3/15/2031 | 8,797,000 | 7,248,464 | |
| 4.50% due 8/15/2028 | 3,720,000 | 3,596,905 | |
| First American Financial Corp., | |||
| 2.40% due 8/15/2031 | 2,261,000 | 1,792,295 | |
| 4.00% due 5/15/2030 | 4,316,000 | 3,922,769 | |
| GA Global Funding Trust, | |||
| c | 1.625% due 1/15/2026 | 1,940,000 | 1,798,147 |
| c | 2.25% due 1/6/2027 | 6,479,000 | 5,928,674 |
| c | 3.85% due 4/11/2025 | 11,960,000 | 11,734,674 |
| a,c | 5.862% (SOFR + 0.50%) due 9/13/2024 | 6,888,000 | 6,882,490 |
| c | Global Atlantic Fin Co., 4.40% due 10/15/2029 | 22,285,000 | 20,713,239 |
| Horace Mann Educators Corp., | |||
| 4.50% due 12/1/2025 | 6,533,000 | 6,391,887 | |
| 7.25% due 9/15/2028 | 2,952,000 | 3,156,249 | |
| Jackson National Life Global Funding, | |||
| c | 5.25% due 4/12/2028 | 8,153,000 | 8,013,665 |
| c | 5.50% due 1/9/2026 | 12,660,000 | 12,602,903 |
| Mercury General Corp., 4.40% due 3/15/2027 | 2,901,000 | 2,792,416 | |
| c | Mutual of Omaha Cos Global Funding, 5.45% due 12/12/2028 | 7,740,000 | 7,888,298 |
| a,c | Nationwide Mutual Insurance Co., 7.881% (SOFR + 2.51%) due 12/15/2024 | 16,096,000 | 16,150,083 |
| a,c | New York Life Global Funding, 5.841% (SOFR + 0.48%) due 6/9/2026 | 22,760,000 | 22,683,526 |
| Pacific Life Global Funding II, | |||
| a,c | 5.98% (SOFR + 0.62%) due 6/4/2026 | 10,530,000 | 10,511,678 |
| a,c | 6.166% (SOFRINDX + 0.80%) due 3/30/2025 | 653,000 | 655,377 |
| c | Protective Life Corp., 3.40% due 1/15/2030 | 16,787,000 | 14,845,416 |
| Protective Life Global Funding, | |||
| c | 1.618% due 4/15/2026 | 14,716,000 | 13,674,401 |
| c | 3.218% due 3/28/2025 | 4,000,000 | 3,918,040 |
| Reinsurance Group of America, Inc., 6.00% due 9/15/2033 | 4,267,000 | 4,427,055 | |
| Reliance Standard Life Global Funding II, | |||
| c | 1.512% due 9/28/2026 | 10,762,000 | 9,641,138 |
| c | 5.243% due 2/2/2026 | 17,412,000 | 17,233,353 |
| RGA Global Funding, | |||
| c | 2.70% due 1/18/2029 | 11,803,000 | 10,524,617 |
| c | 5.50% due 1/11/2031 | 4,148,000 | 4,161,730 |
| c | Sammons Financial Group, Inc., 4.45% due 5/12/2027 | 7,950,000 | 7,574,839 |
| c | Security Benefit Global Funding, 1.25% due 5/17/2024 | 29,169,000 | 28,928,939 |
| Stewart Information Services Corp., 3.60% due 11/15/2031 | 22,401,000 | 18,370,388 | |
| Willis North America, Inc., 4.65% due 6/15/2027 | 7,831,000 | 7,706,722 | |
| 501,141,182 | |||
| Materials — 1.5% |
| See notes to financial statements. | Thornburg Taxable Fixed Income Funds Semi-Annual Report | 39 |
Thornburg Limited Term Income Fund | March 31, 2024 (Unaudited)
| Issuer-Description | SHARES/PRINCIPAL AMOUNT | VALUE | |
| Chemicals — 0.5% | |||
| c | International Flavors & Fragrances, Inc., 6.105% due 4/2/2024 | $ 18,630,000 | $ 18,626,895 |
| b,c | LG Chem Ltd., 4.375% due 7/14/2025 | 5,000,000 | 4,920,750 |
| b,c | OCP SA, 5.625% due 4/25/2024 | 8,555,000 | 8,553,973 |
| b,e,f | Phosagro OAO Via Phosagro Bond Funding DAC, 3.05% due 1/23/2025 | 2,525,000 | 2,046,210 |
| Containers & Packaging — 0.5% | |||
| b,c | CCL Industries, Inc., 3.05% due 6/1/2030 | 9,810,000 | 8,520,279 |
| c | Graphic Packaging International LLC, 1.512% due 4/15/2026 | 6,873,000 | 6,370,859 |
| c | Silgan Holdings, Inc., 1.40% due 4/1/2026 | 14,004,000 | 12,827,524 |
| Sonoco Products Co., 1.80% due 2/1/2025 | 8,725,000 | 8,444,404 | |
| Metals & Mining — 0.5% | |||
| b | AngloGold Ashanti Holdings plc, 3.375% due 11/1/2028 | 19,785,000 | 17,810,259 |
| b,c,e,f | Metalloinvest Finance DAC, 3.375% due 10/22/2028 | 12,700,000 | 7,315,835 |
| b,c | POSCO, 5.625% due 1/17/2026 | 4,700,000 | 4,711,468 |
| 100,148,456 | |||
| Media & Entertainment — 0.2% | |||
| Media — 0.2% | |||
| Charter Communications Operating LLC/Charter Communications Operating Capital, 6.65% due 2/1/2034 | 14,750,000 | 15,117,422 | |
| 15,117,422 | |||
| Pharmaceuticals, Biotechnology & Life Sciences — 0.5% | |||
| Biotechnology — 0.3% | |||
| Amgen, Inc., 5.507% due 3/2/2026 | 7,240,000 | 7,236,742 | |
| Bio-Rad Laboratories, Inc., 3.30% due 3/15/2027 | 2,320,000 | 2,199,221 | |
| Illumina, Inc., 5.80% due 12/12/2025 | 5,600,000 | 5,611,704 | |
| b | Royalty Pharma plc, 1.75% due 9/2/2027 | 3,532,000 | 3,154,041 |
| Pharmaceuticals — 0.2% | |||
| c | Bayer U.S. Finance II LLC, 4.25% due 12/15/2025 | 1,750,000 | 1,706,617 |
| Cigna Group, 5.685% due 3/15/2026 | 11,172,000 | 11,172,447 | |
| Viatris, Inc., 2.30% due 6/22/2027 | 4,935,000 | 4,483,053 | |
| 35,563,825 | |||
| Semiconductors & Semiconductor Equipment — 1.0% | |||
| Semiconductors & Semiconductor Equipment — 1.0% | |||
| Microchip Technology, Inc., 4.25% due 9/1/2025 | 10,634,000 | 10,467,259 | |
| Qorvo, Inc., | |||
| 1.75% due 12/15/2024 | 9,528,000 | 9,241,588 | |
| c | 3.375% due 4/1/2031 | 14,210,000 | 12,166,744 |
| b,c | Renesas Electronics Corp., 1.543% due 11/26/2024 | 19,196,000 | 18,638,740 |
| SK Hynix, Inc., | |||
| b,c | 1.50% due 1/19/2026 | 10,200,000 | 9,498,036 |
| b,c | 6.25% due 1/17/2026 | 3,000,000 | 3,032,700 |
| Skyworks Solutions, Inc., 1.80% due 6/1/2026 | 3,574,000 | 3,316,887 | |
| 66,361,954 | |||
| Software & Services — 1.9% | |||
| Information Technology Services — 1.0% | |||
| Block Financial LLC, 2.50% due 7/15/2028 | 10,392,000 | 9,232,772 | |
| DXC Technology Co., 2.375% due 9/15/2028 | 18,253,000 | 15,861,857 | |
| b | Genpact Luxembourg SARL, 3.375% due 12/1/2024 | 5,100,000 | 5,007,996 |
| b | Genpact Luxembourg SARL/Genpact USA, Inc., 1.75% due 4/10/2026 | 5,335,000 | 4,950,133 |
| Global Payments, Inc., | |||
| 1.20% due 3/1/2026 | 3,534,000 | 3,270,611 | |
| 1.50% due 11/15/2024 | 5,624,000 | 5,480,138 | |
| Kyndryl Holdings, Inc., | |||
| 2.05% due 10/15/2026 | 7,614,000 | 6,975,947 | |
| 2.70% due 10/15/2028 | 5,147,000 | 4,561,941 | |
| c | Wipro IT Services LLC, 1.50% due 6/23/2026 | 10,647,000 | 9,811,317 |
| Internet Software & Services — 0.4% |
| 40 | Thornburg Taxable Fixed Income Funds Semi-Annual Report | See notes to financial statements. |
| Issuer-Description | SHARES/PRINCIPAL AMOUNT | VALUE | |
| Prosus NV, | |||
| b,c | 3.061% due 7/13/2031 | $ 7,816,000 | $ 6,348,468 |
| b,c | 3.257% due 1/19/2027 | 6,400,000 | 5,931,136 |
| b,c | 4.193% due 1/19/2032 | 13,254,000 | 11,471,734 |
| Software — 0.5% | |||
| c | Infor, Inc., 1.75% due 7/15/2025 | 12,382,000 | 11,718,449 |
| c | MSCI, Inc., 3.625% due 9/1/2030 | 10,700,000 | 9,492,505 |
| b,c | Open Text Corp., 6.90% due 12/1/2027 | 9,723,000 | 10,058,930 |
| VMware LLC, 4.50% due 5/15/2025 | 4,543,000 | 4,499,069 | |
| 124,673,003 | |||
| Technology Hardware & Equipment — 1.6% | |||
| Electronic Equipment, Instruments & Components — 1.2% | |||
| Arrow Electronics, Inc., 6.125% due 3/1/2026 | 7,556,000 | 7,547,688 | |
| Avnet, Inc., 6.25% due 3/15/2028 | 3,938,000 | 4,037,237 | |
| CDW LLC/CDW Finance Corp., 3.25% due 2/15/2029 | 16,381,000 | 14,849,213 | |
| TD SYNNEX Corp., 1.75% due 8/9/2026 | 28,691,000 | 26,224,722 | |
| Trimble, Inc., 4.75% due 12/1/2024 | 17,000,000 | 16,849,550 | |
| Vontier Corp., | |||
| 1.80% due 4/1/2026 | 5,272,000 | 4,892,732 | |
| 2.40% due 4/1/2028 | 5,266,000 | 4,668,046 | |
| Technology Hardware, Storage & Peripherals — 0.4% | |||
| Dell International LLC/EMC Corp., 4.90% due 10/1/2026 | 3,476,000 | 3,452,815 | |
| Lenovo Group Ltd., | |||
| b,c | 5.831% due 1/27/2028 | 10,065,000 | 10,183,264 |
| b | 5.875% due 4/24/2025 | 10,600,000 | 10,610,070 |
| 103,315,337 | |||
| Telecommunication Services — 1.0% | |||
| Diversified Telecommunication Services — 0.9% | |||
| AT&T, Inc., 5.539% due 2/20/2026 | 31,242,000 | 31,240,750 | |
| NBN Co. Ltd., | |||
| b,c | 1.45% due 5/5/2026 | 20,000,000 | 18,509,400 |
| b,c | 5.75% due 10/6/2028 | 5,000,000 | 5,158,800 |
| Wireless Telecommunication Services — 0.1% | |||
| T-Mobile USA, Inc., | |||
| 2.25% due 2/15/2026 | 4,275,000 | 4,044,706 | |
| 2.625% due 4/15/2026 | 4,847,000 | 4,604,408 | |
| 63,558,064 | |||
| Transportation — 0.0% | |||
| Diversified Consumer Services — 0.0% | |||
| University of Chicago, Series 12-B, 3.065% due 10/1/2024 | 183,000 | 180,539 | |
| 180,539 | |||
| Utilities — 5.9% | |||
| Electric Utilities — 4.9% | |||
| AEP Texas, Inc., | |||
| 5.40% due 6/1/2033 | 4,350,000 | 4,342,953 | |
| Series I, 2.10% due 7/1/2030 | 12,187,000 | 10,154,574 | |
| Alliant Energy Finance LLC, | |||
| c | 1.40% due 3/15/2026 | 5,240,000 | 4,781,343 |
| c | 5.95% due 3/30/2029 | 3,415,000 | 3,517,211 |
| American Electric Power Co., Inc., 2.30% due 3/1/2030 | 10,780,000 | 9,172,486 | |
| Appalachian Power Co., | |||
| 3.40% due 6/1/2025 | 3,000,000 | 2,925,390 | |
| Series AA, 2.70% due 4/1/2031 | 5,750,000 | 4,844,432 | |
| Avangrid, Inc., | |||
| 3.15% due 12/1/2024 | 8,870,000 | 8,720,718 | |
| 3.20% due 4/15/2025 | 9,395,000 | 9,158,340 | |
| Black Hills Corp., | |||
| 1.037% due 8/23/2024 | 22,410,000 | 21,994,294 | |
| 2.50% due 6/15/2030 | 5,490,000 | 4,597,326 |
| See notes to financial statements. | Thornburg Taxable Fixed Income Funds Semi-Annual Report | 41 |
Thornburg Limited Term Income Fund | March 31, 2024 (Unaudited)
| Issuer-Description | SHARES/PRINCIPAL AMOUNT | VALUE | |
| c | Caledonia Generating LLC, 1.95% due 2/28/2034 | $ 17,256,512 | $ 14,265,820 |
| a | CenterPoint Energy, Inc., 6.004% (SOFRINDX + 0.65%) due 5/13/2024 | 1,145,000 | 1,144,966 |
| Comision Federal de Electricidad, | |||
| b,c | 3.348% due 2/9/2031 | 8,740,000 | 7,259,794 |
| b | 5.00% due 9/29/2036 | 17,791,200 | 15,697,532 |
| Dominion Energy, Inc., | |||
| 5.375% due 11/15/2032 | 2,988,000 | 3,007,512 | |
| Series B, 3.60% due 3/15/2027 | 13,076,000 | 12,551,129 | |
| DTE Energy Co., 4.875% due 6/1/2028 | 8,813,000 | 8,721,433 | |
| Enel Finance International NV, | |||
| b,c | 1.375% due 7/12/2026 | 12,250,000 | 11,208,505 |
| b,c | 1.875% due 7/12/2028 | 8,844,000 | 7,745,487 |
| b,c | 2.25% due 7/12/2031 | 3,049,000 | 2,468,074 |
| b,c | 7.50% due 10/14/2032 | 4,000,000 | 4,516,240 |
| Entergy Mississippi LLC, 3.25% due 12/1/2027 | 4,727,000 | 4,355,363 | |
| Entergy Texas, Inc., | |||
| 1.50% due 9/1/2026 | 8,640,000 | 7,878,989 | |
| 3.45% due 12/1/2027 | 9,000,000 | 8,445,870 | |
| Evergy Metro, Inc., 4.95% due 4/15/2033 | 1,712,000 | 1,687,176 | |
| c | Evergy Missouri West, Inc., 5.15% due 12/15/2027 | 9,711,000 | 9,716,827 |
| FirstEnergy Pennsylvania Electric Co., | |||
| c | 5.15% due 3/30/2026 | 980,000 | 971,454 |
| c | 5.20% due 4/1/2028 | 1,475,000 | 1,477,021 |
| ITC Holdings Corp., | |||
| c | 2.95% due 5/14/2030 | 15,800,000 | 13,971,466 |
| c | 4.95% due 9/22/2027 | 12,703,000 | 12,622,082 |
| c | 5.40% due 6/1/2033 | 3,992,000 | 3,993,876 |
| c | Jersey Central Power & Light Co., 4.30% due 1/15/2026 | 5,914,000 | 5,778,215 |
| c | Liberty Utilities Co., 5.577% due 1/31/2029 | 5,240,000 | 5,272,802 |
| c | Liberty Utilities Finance GP 1, 2.05% due 9/15/2030 | 9,518,000 | 7,710,151 |
| c | Midland Cogeneration Venture LP, 6.00% due 3/15/2025 | 279,364 | 272,877 |
| a | Mississippi Power Co., Series A, 5.666% (SOFR + 0.30%) due 6/28/2024 | 6,780,000 | 6,774,576 |
| NextEra Energy Capital Holdings, Inc., | |||
| 5.749% due 9/1/2025 | 7,416,000 | 7,449,446 | |
| 6.051% due 3/1/2025 | 4,701,000 | 4,719,146 | |
| Northern States Power Co., 3.30% due 6/15/2024 | 2,500,000 | 2,485,900 | |
| Puget Energy, Inc., | |||
| 2.379% due 6/15/2028 | 8,825,000 | 7,870,488 | |
| 4.10% due 6/15/2030 | 4,742,000 | 4,330,632 | |
| c | Vistra Operations Co. LLC, 4.875% due 5/13/2024 | 25,918,000 | 25,881,196 |
| Wisconsin Power & Light Co., 5.375% due 3/30/2034 | 4,510,000 | 4,538,233 | |
| Gas Utilities — 1.0% | |||
| c | Brooklyn Union Gas Co., 4.632% due 8/5/2027 | 10,931,000 | 10,606,131 |
| c | KeySpan Gas East Corp., 5.994% due 3/6/2033 | 14,757,000 | 14,954,449 |
| Southwest Gas Corp., | |||
| 2.20% due 6/15/2030 | 5,120,000 | 4,319,539 | |
| 4.05% due 3/15/2032 | 5,180,000 | 4,746,123 | |
| 5.45% due 3/23/2028 | 3,462,000 | 3,514,795 | |
| 5.80% due 12/1/2027 | 4,828,000 | 4,932,912 | |
| a | Spire Missouri, Inc., 5.86% (SOFR + 0.50%) due 12/2/2024 | 21,347,000 | 21,349,989 |
| 385,423,283 | |||
| Total Corporate Bonds (Cost $2,470,185,378) | 2,349,649,106 | ||
| Long-Term Municipal Bonds — 0.3% | |||
| Canadian County Educational Facilities Authority (Mustang Public Schools Project) ISD, Series B, 5.50% due 9/1/2031 | 5,035,000 | 5,224,517 | |
| Los Angeles Community College District GO, 1.806% due 8/1/2030 | 12,115,000 | 10,451,320 | |
| New Jersey Transportation Trust Fund Authority, ETM, Series B, 2.631% due 6/15/2024 | 860,000 | 854,915 | |
| Total Long-Term Municipal Bonds (Cost $16,844,736) | 16,530,752 | ||
| Preferred Stock — 0.4% | |||
| Financial Services — 0.4% |
| 42 | Thornburg Taxable Fixed Income Funds Semi-Annual Report | See notes to financial statements. |
| Issuer-Description | SHARES/PRINCIPAL AMOUNT | VALUE | |
| Capital Markets — 0.4% | |||
| a,g | Gabelli Dividend & Income Trust, Series J, 4.50% due 3/26/2028 | $ 1,162 | $ 27,416,228 |
| 27,416,228 | |||
| Total Preferred Stock (Cost $29,019,196) | 27,416,228 | ||
| Short-Term Investments — 6.3% | |||
| h | Thornburg Capital Management Fund | 40,754,611 | 407,546,114 |
| Total Short-Term Investments (Cost $407,546,114) | 407,546,114 | ||
| Total Investments — 98.2% (Cost $6,642,926,833) | $6,389,743,115 | ||
| Other Assets Less Liabilities — 1.8% | 115,566,852 | ||
| Net Assets — 100.0% | $6,505,309,967 |
| Footnote Legend | |
| a | Variable, floating, step, or fixed to floating rate securities are securities for which interest rate changes are based on changes in a designated base rate or on a predetermined schedule. The rates shown are those in effect on March 31, 2024. |
| b | Yankee bond denominated in U.S. dollars and is issued in the U.S. by foreign banks and corporations. |
| c | Securities exempt from registration under Rule 144A of the Securities Act of 1933, as amended. These securities are restricted but liquid and may only be resold in the ordinary course of business in transactions exempt from registration, normally to qualified institutional buyers. As of March 31, 2024, the aggregate value of these securities in the Fund’s portfolio was $3,001,876,178, representing 46.15% of the Fund’s net assets. |
| d | When-issued security. |
| e | Bond in default. |
| f | Non-income producing. |
| g | Security currently fair valued by Thornburg Investment Management, Inc.’s Valuation and Pricing Committee. |
| h | Investment in Affiliates. |
To simplify the listings of securities, abbreviations are used per the table below:
| ABS | Asset Backed Securities |
| CMBS | Commercial Mortgage-Backed Securities |
| CMO | Collateralized Mortgage Obligation |
| CMT | Constant Maturity Rate |
| DAC | Designated Activity Company |
| ETM | Escrowed to Maturity |
| GO | General Obligation |
| H15T1Y | US Treasury Yield Curve Rate T-Note Constant Maturity 1 Year |
| ISD | Independent School District |
| Mtg | Mortgage |
| REMIC | Real Estate Mortgage Investment Conduit |
| SOFR | Secured Overnight Financing Rate |
| SOFR30A | Secured Overnight Financing Rate 30-Day Average |
| SOFR90A | Secured Overnight Financing Rate 90-Day Average |
| SOFRINDX | Secured Overnight Financing Rate Index |
| TSFR1M | Term SOFR 1 Month |
| TSFR3M | Term SOFR 3 Month |
| UMBS | Uniform Mortgage Backed Securities |
| See notes to financial statements. | Thornburg Taxable Fixed Income Funds Semi-Annual Report | 43 |
Thornburg Core Plus Bond Fund | March 31, 2024 (Unaudited)
| Issuer-Description | SHARES/PRINCIPAL AMOUNT | VALUE | |
| U.S. Treasury Securities — 38.4% | |||
| U.S. Treasury Inflation-Indexed Bonds, 1.50% due 2/15/2053 | $ 617,235 | $ 539,684 | |
| U.S. Treasury Inflation-Indexed Notes, 1.125% due 1/15/2033 | 755,703 | 709,608 | |
| U.S. Treasury Notes, | |||
| 1.125% due 8/15/2040 | 225,000 | 139,254 | |
| 1.375% due 11/15/2040 | 2,660,000 | 1,711,128 | |
| 1.875% due 11/15/2051 | 295,000 | 176,908 | |
| 2.375% due 2/15/2042 | 1,403,000 | 1,043,920 | |
| 3.875% due 8/15/2033 | 2,637,000 | 2,568,603 | |
| 4.00% due 1/31/2031 - 2/15/2034 | 7,275,000 | 7,171,476 | |
| 4.125% due 8/15/2053 | 155,000 | 149,091 | |
| 4.25% due 2/15/2054 | 860,000 | 846,428 | |
| 4.50% due 11/15/2033 | 9,447,000 | 9,661,034 | |
| Total U.S. Treasury Securities (Cost $24,434,848) | 24,717,134 | ||
| Other Government — 0.3% | |||
| a,b | Finance Department Government of Sharjah, 4.00% due 7/28/2050 | 250,000 | 164,270 |
| Total Other Government (Cost $159,167) | 164,270 | ||
| Mortgage Backed — 28.9% | |||
| a,c | 510 Asset-Backed Trust, Whole Loan Securities Trust CMO, Series 2021-NPL2 Class A1, 2.116% due 6/25/2061 | 231,279 | 224,467 |
| a,c | Ajax Mortgage Loan Trust, Whole Loan Securities Trust CMO, Series 2021-B Class A, 2.239% due 6/25/2066 | 271,956 | 263,508 |
| Angel Oak Mortgage Trust, Whole Loan Securities Trust CMO, | |||
| a,c | Series 2022-1 Class A1, 2.881% due 12/25/2066 | 119,578 | 107,022 |
| a,c | Series 2024-3 Class A1, 4.80% due 11/26/2068 | 198,205 | 192,362 |
| BRAVO Residential Funding Trust, Whole Loan Securities Trust CMO, | |||
| a,c | Series 2021-NQM3 Class A1, 1.699% due 4/25/2060 | 43,649 | 39,298 |
| a,c | Series 2022-NQM3 Class A1, 5.108% due 7/25/2062 | 81,747 | 82,863 |
| CHNGE Mortgage Trust, Whole Loan Securities Trust CMO, | |||
| a,c | Series 2022-1 Class A1, 3.007% due 1/25/2067 | 106,766 | 97,949 |
| a,c | Series 2023-1 Class A1, 7.065% due 3/25/2058 | 337,884 | 338,774 |
| a,c | Citigroup Mortgage Loan Trust, Whole Loan Securities Trust CMO, Series 2021-INV2 Class A3A, 2.50% due 5/25/2051 | 80,179 | 64,611 |
| a,c | Cross Mortgage Trust, Whole Loan Securities Trust CMO, Series 2023-H1 Class A1, 6.615% due 3/25/2068 | 90,706 | 90,787 |
| CSMC Trust, Whole Loan Securities Trust CMO, | |||
| a,c | Series 2021-AFC1 Class-A1, 0.83% due 3/25/2056 | 53,851 | 42,801 |
| a,c | Series 2022-ATH2 Class A1, 4.547% due 5/25/2067 | 117,967 | 113,017 |
| a | DataBank Issuer LLC, CMBS, Series 2024-1A Class A2, 5.30% due 1/26/2054 | 275,000 | 260,786 |
| a | DC Office Trust, CMBS, Series 2019-MTC Class A, 2.965% due 9/15/2045 | 200,000 | 170,675 |
| a,c,d | FARM Mortgage Trust, Whole Loan Securities Trust CMO, Series 2024-1 Class A, 4.721% due 10/1/2053 | 325,000 | 309,456 |
| c | Federal Home Loan Mtg Corp., Pool 841463, 2.154% (2.18% - SOFR30A) due 7/1/2052 | 111,874 | 97,089 |
| Federal Home Loan Mtg Corp., Multifamily Structured Pass-Through Certificates, CMBS, | |||
| c | Series K-154 Class A2, 4.35% due 1/25/2033 | 107,000 | 104,227 |
| Series KJ46 Class A2, 4.796% due 10/25/2031 | 32,000 | 32,111 | |
| c | Series KJ47 Class A2, 5.43% due 6/25/2031 | 22,000 | 22,700 |
| Series KJ48 Class A2, 5.028% due 10/25/2031 | 56,000 | 56,839 | |
| Federal Home Loan Mtg Corp., UMBS Collateral, | |||
| Pool RA6665, 3.00% due 2/1/2052 | 1,217,631 | 1,047,876 | |
| Pool SD8206, 3.00% due 4/1/2052 | 724,365 | 623,819 | |
| Pool SD8213, 3.00% due 5/1/2052 | 1,180,390 | 1,016,452 | |
| Federal National Mtg Assoc., | |||
| c | Pool BM7277, 1.97% (2.08% - SOFR30A) due 8/1/2051 | 120,186 | 104,350 |
| c | Pool BM7341, 2.397% (RFUCCT1Y + 1.61%) due 12/1/2050 | 295,036 | 266,747 |
| Federal National Mtg Assoc., UMBS Collateral, | |||
| Pool CB0199, 3.00% due 4/1/2051 | 422,899 | 363,941 | |
| Pool CB2399, 2.50% due 12/1/2051 | 583,358 | 483,571 | |
| Pool CB2404, 2.50% due 12/1/2051 | 313,235 | 259,122 | |
| Pool CB2665, 3.00% due 1/1/2052 | 280,877 | 241,719 | |
| Pool FS0957, 3.00% due 3/1/2052 | 526,528 | 453,484 | |
| Pool FS2676, 3.00% due 6/1/2052 | 353,689 | 304,380 | |
| Pool FS4862, 2.50% due 10/1/2051 | 284,481 | 235,442 | |
| Pool FS4919, 2.50% due 5/1/2053 | 360,659 | 298,503 | |
| Pool FS7059, 3.00% due 7/1/2052 | 567,616 | 489,884 |
| 44 | Thornburg Taxable Fixed Income Funds Semi-Annual Report | See notes to financial statements. |
| Issuer-Description | SHARES/PRINCIPAL AMOUNT | VALUE | |
| Pool FS7065, 3.00% due 3/1/2053 | $1,240,267 | $ 1,068,013 | |
| Pool MA4399, 2.50% due 8/1/2051 | 356,661 | 296,094 | |
| Pool MA4548, 2.50% due 2/1/2052 | 1,993,866 | 1,651,564 | |
| Pool MA4578, 2.50% due 4/1/2052 | 585,654 | 484,722 | |
| Pool MA4599, 3.00% due 5/1/2052 | 1,273,604 | 1,096,721 | |
| Pool MA4730, 3.00% due 9/1/2052 | 119,313 | 102,724 | |
| GCAT Trust, Whole Loan Securities Trust CMO, | |||
| a,c | Series 2021-CM1 Class A, 1.469% due 4/25/2065 | 101,328 | 95,034 |
| a,c | Series 2023-INV1 Class A1, 6.00% due 8/25/2053 | 281,971 | 281,371 |
| a,c | Series 2023-NQM4 Class A1, 4.25% due 5/25/2067 | 121,415 | 112,418 |
| Government National Mtg Assoc., CMBS, Series 2023-104 Class AD, 4.00% due 1/16/2065 | 64,601 | 60,790 | |
| a,c | GS Mortgage-Backed Securities Trust, Whole Loan Securities Trust CMO, Series 2024-RPL2 Class A1, 3.75% due 7/25/2061 | 194,039 | 182,908 |
| a,c | Homeward Opportunities Fund Trust, Whole Loan Securities Trust CMO, Series 2022-1 A Class A1, 5.082% due 7/25/2067 | 93,524 | 92,154 |
| a | Houston Galleria Mall Trust, CMBS, Series 2015-HGLR Class A1A2, 3.087% due 3/5/2037 | 165,000 | 159,550 |
| a,c | Hudson Yards Mortgage Trust, CMBS, Series 2019-55HY Class A, 2.943% due 12/10/2041 | 250,000 | 219,091 |
| a,c | Imperial Fund Mortgage Trust, Whole Loan Securities Trust CMO, Series 2022-NQM4 Class A1, 4.767% due 6/25/2067 | 104,366 | 103,239 |
| JP Morgan Mortgage Trust, Whole Loan Securities Trust CMO, | |||
| a,c | Series 2021-1 Class A3A, 2.00% due 6/25/2051 | 379,939 | 300,137 |
| a,c | Series 2021-INV6 Class A2, 3.00% due 4/25/2052 | 78,682 | 66,113 |
| MFA Trust, Whole Loan Securities Trust CMO, | |||
| a,c | Series 2021-INV2 Class A1, 1.906% due 11/25/2056 | 77,792 | 66,480 |
| a,c | Series 2022-NQM2 Class A1, 4.00% due 5/25/2067 | 104,452 | 99,504 |
| a,c | Morgan Stanley Residential Mortgage Loan Trust, Whole Loan Securities Trust CMO, Series 2024-NQM1 Class A1, 6.152% due 12/25/2068 | 219,263 | 219,150 |
| a | New Economy Assets Phase 1 Sponsor LLC, CMBS, Series 2021-1 Class A1, 1.91% due 10/20/2061 | 135,000 | 118,225 |
| a,c | New Residential Mortgage Loan Trust, Whole Loan Securities Trust CMO, Series 2022-NQM3 Class A1, 3.90% due 4/25/2062 | 113,079 | 103,537 |
| a,c | NMLT Trust, Whole Loan Securities Trust CMO, Series 2021-INV1 Class A1, 1.185% due 5/25/2056 | 65,564 | 53,854 |
| a,c | OBX Trust, Whole Loan Securities Trust CMO, Series 2022-NQM5 Class A1, 4.31% due 5/25/2062 | 104,260 | 99,884 |
| a | One Bryant Park Trust, CMBS, Series 2019-OBP Class A, 2.516% due 9/15/2054 | 220,000 | 187,962 |
| a,c | PRET LLC, Whole Loan Securities Trust CMO, Series 2021-RN3 Class A1, 1.843% due 9/25/2051 | 341,802 | 325,862 |
| a,c | PRET Trust, Whole Loan Securities Trust CMO, Series 2024-RPL1 Class A1, 3.90% due 10/25/2063 | 195,000 | 182,613 |
| a,c | RCKT Mortgage Trust, Whole Loan Securities Trust CMO, Series 2019-1 Class A13, 3.50% due 9/25/2049 | 32,193 | 28,642 |
| a | Retained Vantage Data Centers Issuer LLC, CMBS, Series 2023-1A Class A2A, 5.00% due 9/15/2048 | 25,000 | 24,129 |
| Seasoned Credit Risk Transfer Trust, Series 2024-1 Class MT, 3.00% due 11/25/2063 | 513,524 | 427,750 | |
| a | SLG Office Trust, CMBS, Series 2021-OVA Class A, 2.585% due 7/15/2041 | 300,000 | 247,700 |
| a,c | Spruce Hill Mortgage Loan Trust, Whole Loan Securities Trust CMO, Series 2022-SH1 Class A1A, 4.10% due 7/25/2057 | 108,203 | 101,788 |
| a,c | Toorak Mortgage Trust, Whole Loan Securities Trust CMO, Series 2024-RRTL1 Class A1, 6.597% due 2/25/2039 | 300,000 | 301,310 |
| a,c | Towd Point Mortgage Trust, Whole Loan Securities Trust CMO, Series 2020-1 Class A2A, 3.10% due 1/25/2060 | 100,000 | 86,588 |
| a,c | UWM Mortgage Trust, Whole Loan Securities Trust CMO, Series 2021-1 Class A3, 2.50% due 6/25/2051 | 76,597 | 62,432 |
| Verus Securitization Trust, Whole Loan Securities Trust CMO, | |||
| a,c | Series 2023-3 Class A1, 5.93% due 3/25/2068 | 104,832 | 104,207 |
| a,c | Series 2023-4 Class A1, 5.811% due 5/25/2068 | 249,994 | 248,197 |
| a,c | WB Commercial Mortgage Trust, CMBS, Series 2024-HQ Class A, 6.134% due 3/15/2040 | 195,000 | 196,043 |
| a,c | Wells Fargo Mortgage Backed Securities Trust, Whole Loan Securities Trust CMO, Series 2021-1 Class A1, 2.50% due 12/25/2050 | 40,332 | 33,008 |
| Total Mortgage Backed (Cost $18,357,647) | 18,592,140 | ||
| Asset Backed Securities — 6.6% | |||
| Auto Receivables — 1.5% | |||
| a | ACC Auto Trust, Series 2022-A Class A, 4.58% due 7/15/2026 | 12,235 | 12,199 |
| a | American Credit Acceptance Receivables Trust, Series 2021-4 Class C, 1.32% due 2/14/2028 | 12,375 | 12,324 |
| AmeriCredit Automobile Receivables Trust, Series 2021-1 Class B, 0.68% due 10/19/2026 | 20,958 | 20,791 | |
| a | Arivo Acceptance Auto Loan Receivables Trust, Series 2024-1A Class A, 6.46% due 4/17/2028 | 325,000 | 325,484 |
| a | Carvana Auto Receivables Trust, Series 2023-N4 Class A, 6.42% due 1/10/2028 | 28,888 | 29,050 |
| Exeter Automobile Receivables Trust, | |||
| Series 2021-1A Class D, 1.08% due 11/16/2026 | 97,786 | 95,421 | |
| Series 2021-3A Class C, 0.96% due 10/15/2026 | 70,816 | 69,718 | |
| a | FHF Issuer Trust, Series 2024-1A Class A1, 5.769% due 3/17/2025 | 85,832 | 85,815 |
| a | Flagship Credit Auto Trust, Series 2021-2 Class B, 0.93% due 6/15/2027 | 54,475 | 54,019 |
| a | Lendbuzz Securitization Trust, Series 2023-3A Class A1, 6.03% due 10/15/2024 | 12,161 | 12,161 |
| a | Lobel Automobile Receivables Trust, Series 2023-2 Class A, 7.59% due 4/16/2029 | 37,495 | 37,852 |
| a | Octane Receivables Trust, Series 2022-2A Class A, 5.11% due 2/22/2028 | 103,759 | 103,296 |
| a | OneMain Direct Auto Receivables Trust, Series 2022-1A Class A1, 4.65% due 3/14/2029 | 50,000 | 49,485 |
| a | Research-Driven Pagaya Motor Asset Trust, Series 2023-4A Class A, 7.54% due 3/25/2032 | 34,490 | 34,875 |
| See notes to financial statements. | Thornburg Taxable Fixed Income Funds Semi-Annual Report | 45 |
Thornburg Core Plus Bond Fund | March 31, 2024 (Unaudited)
| Issuer-Description | SHARES/PRINCIPAL AMOUNT | VALUE | |
| Santander Drive Auto Receivables Trust, Series 2021-3 Class C, 0.95% due 9/15/2027 | $ 35,103 | $ 34,966 | |
| 977,456 | |||
| Credit Card — 0.5% | |||
| a | Avant Credit Card Master Trust, Series 2021-1A Class A, 1.37% due 4/15/2027 | 100,000 | 96,545 |
| a | Brex Commercial Charge Card Master Trust, Series 2024-1 Class A1, 6.05% due 7/15/2027 | 200,000 | 199,847 |
| 296,392 | |||
| Other Asset Backed — 4.3% | |||
| a | Amur Equipment Finance Receivables X LLC, Series 2022-1A Class A2, 1.64% due 10/20/2027 | 104,090 | 101,632 |
| a | Aqua Finance Trust, Series 2020-AA Class D, 7.15% due 7/17/2046 | 165,000 | 145,486 |
| a | Auxilior Term Funding LLC, Series 2023-1A Class A2, 6.18% due 12/15/2028 | 110,000 | 110,718 |
| a | BHG Securitization Trust, Series 2022-C Class A, 5.32% due 10/17/2035 | 33,492 | 33,411 |
| a | Diamond Infrastructure Funding LLC, Series 2021-1A Class A, 1.76% due 4/15/2049 | 100,000 | 89,230 |
| a | EverBright Solar Trust, Series 2024-A Class A, 6.43% due 6/22/2054 | 160,000 | 159,530 |
| GoodLeap Sustainable Home Solutions Trust, | |||
| a | Series 2021-3CS Class A, 2.10% due 5/20/2048 | 238,181 | 185,902 |
| a | Series 2021-4GS Class A, 1.93% due 7/20/2048 | 77,760 | 59,377 |
| a | Series 2021-5CS Class A, 2.31% due 10/20/2048 | 61,414 | 48,871 |
| a,c | Gracie Point International Funding LLC, Series 2023-2A Class A, 7.608% (SOFR90A + 2.25%) due 3/1/2027 | 77,851 | 78,496 |
| a | Loanpal Solar Loan Ltd., Series 2021-1GS Class A, 2.29% due 1/20/2048 | 15,293 | 12,271 |
| a | Marlette Funding Trust, Series 2022-3A Class A, 5.18% due 11/15/2032 | 11,603 | 11,583 |
| a,b | Mill City Solar Loan Ltd., Series 2019-2GS Class A, 3.69% due 7/20/2043 | 106,836 | 93,698 |
| a | MMAF Equipment Finance LLC, Series 2020-BA Class A3, 0.49% due 8/14/2025 | 76,312 | 75,151 |
| a | Momnt Technologies Trust, Series 2023-1A Class A, 6.92% due 3/20/2045 | 114,008 | 114,708 |
| a | NMEF Funding LLC, Series 2023-A Class A2, 6.57% due 6/17/2030 | 96,490 | 97,253 |
| a | Oportun Issuance Trust, Series 2021-B Class A, 1.47% due 5/8/2031 | 100,000 | 94,149 |
| Pagaya AI Debt Trust, | |||
| a | Series 2023-3 Class A, 7.60% due 12/16/2030 | 56,235 | 56,634 |
| a | Series 2024-3 Class A, 6.258% due 10/15/2031 | 130,000 | 129,925 |
| a | PFS Financing Corp., Series 2023-B Class A, 5.27% due 5/15/2028 | 160,000 | 160,076 |
| a | PowerPay Issuance Trust, Series 2024-1A Class A, 6.53% due 2/18/2039 | 190,000 | 190,000 |
| a,c | SBA Tower Trust, Series 2014-2A Class C, 3.869% due 10/15/2049 | 50,000 | 49,405 |
| a | Service Experts Issuer LLC, Series 2021-1A Class A, 2.67% due 2/2/2032 | 52,034 | 48,750 |
| a | SoFi Consumer Loan Program Trust, Series 2021-1 Class B, 1.30% due 9/25/2030 | 21,583 | 21,512 |
| a | SPS Servicer Advance Receivables Trust, Series 2020-T2 Class A, 1.83% due 11/15/2055 | 395,000 | 370,086 |
| a | Upstart Securitization Trust, Series 2021-2 Class C, 3.61% due 6/20/2031 | 220,202 | 214,737 |
| a | Upstart Structured Pass-Through Trust, Series 2022-1A Class A, 3.40% due 4/15/2030 | 31,380 | 30,782 |
| 2,783,373 | |||
| Student Loan — 0.3% | |||
| a | EDvestinU Private Education Loan Issue No. 3 LLC, Series 2021-A Class A, 1.80% due 11/25/2045 | 56,351 | 50,109 |
| a | Navient Private Education Refi Loan Trust, Series 2020-IA Class A1A, 1.33% due 4/15/2069 | 139,668 | 125,650 |
| a | SoFi Professional Loan Program LLC, Series 2021-B Class AFX, 1.14% due 2/15/2047 | 62,099 | 53,353 |
| 229,112 | |||
| Total Asset Backed Securities (Cost $4,265,540) | 4,286,333 | ||
| Corporate Bonds — 26.0% | |||
| Automobiles & Components — 0.1% | |||
| Automobiles — 0.1% | |||
| a | Hyundai Capital America, 0.875% due 6/14/2024 | 97,000 | 96,017 |
| 96,017 | |||
| Banks — 1.6% | |||
| Banks — 1.2% | |||
| b,c | Mizuho Financial Group, Inc., 5.376% (H15T1Y + 1.12%) due 5/26/2030 | 200,000 | 200,940 |
| c | Santander Holdings USA, Inc., 6.174% (SOFR + 2.50%) due 1/9/2030 | 185,000 | 186,798 |
| c | U.S. Bancorp, 5.775% (SOFR + 2.02%) due 6/12/2029 | 165,000 | 167,901 |
| c | Wells Fargo & Co., 5.574% (SOFR + 1.74%) due 7/25/2029 | 225,000 | 227,576 |
| Financial Services — 0.4% | |||
| c | Bank of New York Mellon Corp., 4.975% (SOFR + 1.09%) due 3/14/2030 | 225,000 | 225,106 |
| 1,008,321 |
| 46 | Thornburg Taxable Fixed Income Funds Semi-Annual Report | See notes to financial statements. |
| Issuer-Description | SHARES/PRINCIPAL AMOUNT | VALUE | |
| Capital Goods — 1.0% | |||
| Aerospace & Defense — 0.3% | |||
| a | BWX Technologies, Inc., 4.125% due 4/15/2029 | $ 85,000 | $ 78,402 |
| a | TransDigm, Inc., 6.375% due 3/1/2029 | 100,000 | 100,306 |
| Machinery — 0.3% | |||
| b | nVent Finance SARL, 2.75% due 11/15/2031 | 40,000 | 32,938 |
| a | Regal Rexnord Corp., 6.30% due 2/15/2030 | 185,000 | 189,495 |
| Trading Companies & Distributors — 0.4% | |||
| LKQ Corp., 6.25% due 6/15/2033 | 215,000 | 223,817 | |
| 624,958 | |||
| Commercial & Professional Services — 1.2% | |||
| Commercial Services & Supplies — 1.0% | |||
| CoreCivic, Inc., 8.25% due 4/15/2029 | 168,000 | 175,716 | |
| Element Fleet Management Corp., | |||
| a,b | 5.643% due 3/13/2027 | 130,000 | 130,379 |
| a,b | 6.319% due 12/4/2028 | 216,000 | 223,169 |
| Equifax, Inc., 2.60% due 12/1/2024 | 85,000 | 83,335 | |
| a | UL Solutions, Inc., 6.50% due 10/20/2028 | 35,000 | 36,484 |
| Professional Services — 0.2% | |||
| a | Gartner, Inc., 3.625% due 6/15/2029 | 35,000 | 31,706 |
| a | Korn Ferry, 4.625% due 12/15/2027 | 75,000 | 71,493 |
| 752,282 | |||
| Consumer Discretionary Distribution & Retail — 0.2% | |||
| Broadline Retail — 0.2% | |||
| Dollar General Corp., 4.25% due 9/20/2024 | 100,000 | 99,283 | |
| Specialty Retail — 0.0% | |||
| Advance Auto Parts, Inc., 3.90% due 4/15/2030 | 32,000 | 29,027 | |
| 128,310 | |||
| Consumer Durables & Apparel — 0.3% | |||
| Leisure Products — 0.3% | |||
| Polaris, Inc., 6.95% due 3/15/2029 | 185,000 | 196,818 | |
| 196,818 | |||
| Consumer Services — 0.2% | |||
| Hotels, Restaurants & Leisure — 0.2% | |||
| a | Nathan’s Famous, Inc., 6.625% due 11/1/2025 | 120,000 | 119,807 |
| a | Papa John’s International, Inc., 3.875% due 9/15/2029 | 48,000 | 42,598 |
| 162,405 | |||
| Consumer Staples Distribution & Retail — 0.1% | |||
| Consumer Staples Distribution & Retail — 0.1% | |||
| a | KeHE Distributors LLC/KeHE Finance Corp./NextWave Distribution, Inc., 9.00% due 2/15/2029 | 50,000 | 50,675 |
| a | U.S. Foods, Inc., 4.75% due 2/15/2029 | 45,000 | 42,709 |
| 93,384 | |||
| Energy — 2.2% | |||
| Oil, Gas & Consumable Fuels — 2.2% | |||
| a | Chesapeake Energy Corp., 5.50% due 2/1/2026 | 290,000 | 288,057 |
| a | CITGO Petroleum Corp., 7.00% due 6/15/2025 | 100,000 | 99,896 |
| a | Columbia Pipelines Operating Co. LLC, 5.927% due 8/15/2030 | 190,000 | 194,777 |
| Ecopetrol SA, | |||
| b | 4.625% due 11/2/2031 | 70,000 | 58,239 |
| b | 8.375% due 1/19/2036 | 125,000 | 126,132 |
| b | Energean Israel Finance Ltd., 8.50% due 9/30/2033 | 50,000 | 49,500 |
| Kinder Morgan Energy Partners LP, 5.80% due 3/15/2035 | 80,000 | 81,214 | |
| a,b | Parkland Corp., 5.875% due 7/15/2027 | 250,000 | 247,835 |
| b | Petroleos Mexicanos, 7.69% due 1/23/2050 | 285,000 | 204,630 |
| a | Sunoco LP/Sunoco Finance Corp., 7.00% due 9/15/2028 | 100,000 | 102,192 |
| 1,452,472 |
| See notes to financial statements. | Thornburg Taxable Fixed Income Funds Semi-Annual Report | 47 |
Thornburg Core Plus Bond Fund | March 31, 2024 (Unaudited)
| Issuer-Description | SHARES/PRINCIPAL AMOUNT | VALUE | |
| Equity Real Estate Investment Trusts (REITs) — 1.6% | |||
| Diversified REITs — 1.5% | |||
| Crown Castle, Inc., 5.80% due 3/1/2034 | $ 195,000 | $ 199,631 | |
| Extra Space Storage LP, 3.90% due 4/1/2029 | 205,000 | 193,079 | |
| a | Iron Mountain Information Management Services, Inc., 5.00% due 7/15/2032 | 220,000 | 200,810 |
| SBA Tower Trust, | |||
| a | 1.631% due 5/15/2051 | 70,000 | 63,338 |
| a | 1.884% due 7/15/2050 | 235,000 | 219,368 |
| a | 2.328% due 7/15/2052 | 111,000 | 97,547 |
| Retail REITs — 0.1% | |||
| Retail Opportunity Investments Partnership LP, 6.75% due 10/15/2028 | 35,000 | 36,261 | |
| 1,010,034 | |||
| Financial Services — 3.6% | |||
| Capital Markets — 1.7% | |||
| a | Ares Finance Co. LLC, 4.00% due 10/8/2024 | 200,000 | 196,436 |
| a,b | B3 SA - Brasil Bolsa Balcao, 4.125% due 9/20/2031 | 250,000 | 218,345 |
| a | Blue Owl Technology Finance Corp., 3.75% due 6/17/2026 | 250,000 | 231,050 |
| Hercules Capital, Inc., 3.375% due 1/20/2027 | 210,000 | 193,074 | |
| a | LPL Holdings, Inc., 4.00% due 3/15/2029 | 35,000 | 32,211 |
| Main Street Capital Corp., 6.95% due 3/1/2029 | 155,000 | 157,491 | |
| Nasdaq, Inc., 5.55% due 2/15/2034 | 30,000 | 30,510 | |
| a | Oaktree Strategic Credit Fund, 8.40% due 11/14/2028 | 41,000 | 43,500 |
| Consumer Finance — 0.5% | |||
| FirstCash, Inc., | |||
| a | 4.625% due 9/1/2028 | 100,000 | 94,138 |
| a | 6.875% due 3/1/2032 | 250,000 | 250,170 |
| Financial Services — 1.2% | |||
| c | Capital One Financial Corp., 7.149% (SOFR + 2.44%) due 10/29/2027 | 70,000 | 72,893 |
| c | Citigroup, Inc., 3.785% (SOFR + 1.94%) due 3/17/2033 | 230,000 | 205,471 |
| b,c | HSBC Holdings plc, 5.546% (SOFR + 1.46%) due 3/4/2030 | 250,000 | 251,575 |
| b | Sumitomo Mitsui Financial Group, Inc., 3.544% due 1/17/2028 | 75,000 | 71,394 |
| c | Truist Financial Corp., 5.867% (SOFR + 2.36%) due 6/8/2034 | 190,000 | 192,322 |
| Mortgage Real Estate Investment Trusts — 0.2% | |||
| Prologis Targeted U.S. Logistics Fund LP, | |||
| a | 5.25% due 4/1/2029 | 45,000 | 44,889 |
| a | 5.50% due 4/1/2034 | 45,000 | 45,242 |
| 2,330,711 | |||
| Food, Beverage & Tobacco — 1.4% | |||
| Beverages — 0.6% | |||
| a,b | Becle SAB de CV, 2.50% due 10/14/2031 | 400,000 | 318,940 |
| a,b | Central American Bottling Corp./CBC Bottling Holdco SL/Beliv Holdco SL, 5.25% due 4/27/2029 | 100,000 | 95,324 |
| Food Products — 0.4% | |||
| Post Holdings, Inc., | |||
| a | 4.625% due 4/15/2030 | 150,000 | 137,683 |
| a | 5.50% due 12/15/2029 | 44,000 | 42,506 |
| a | 6.25% due 2/15/2032 | 50,000 | 50,349 |
| Tobacco — 0.4% | |||
| BAT Capital Corp., | |||
| 5.834% due 2/20/2031 | 120,000 | 121,565 | |
| 7.75% due 10/19/2032 | 60,000 | 67,764 | |
| a | Vector Group Ltd., 10.50% due 11/1/2026 | 40,000 | 40,230 |
| 874,361 | |||
| Health Care Equipment & Services — 0.8% | |||
| Health Care Equipment & Supplies — 0.1% | |||
| a | Hologic, Inc., 3.25% due 2/15/2029 | 50,000 | 44,840 |
| Health Care Providers & Services — 0.7% | |||
| Centene Corp., 3.00% due 10/15/2030 | 203,000 | 174,013 | |
| a | Highmark, Inc., 1.45% due 5/10/2026 | 240,000 | 219,533 |
| a | Tenet Healthcare Corp., 6.75% due 5/15/2031 | 40,000 | 40,757 |
| 48 | Thornburg Taxable Fixed Income Funds Semi-Annual Report | See notes to financial statements. |
| Issuer-Description | SHARES/PRINCIPAL AMOUNT | VALUE | |
| Universal Health Services, Inc., 2.65% due 10/15/2030 | $ 40,000 | $ 33,896 | |
| 513,039 | |||
| Industrials — 0.1% | |||
| Transportation Infrastructure — 0.1% | |||
| a | Penske Truck Leasing Co. LP/PTL Finance Corp., 6.20% due 6/15/2030 | 80,000 | 83,260 |
| 83,260 | |||
| Insurance — 3.0% | |||
| Insurance — 3.0% | |||
| Aon North America, Inc., 5.45% due 3/1/2034 | 195,000 | 197,129 | |
| CNA Financial Corp., 5.125% due 2/15/2034 | 195,000 | 189,688 | |
| b | Enstar Group Ltd., 3.10% due 9/1/2031 | 235,000 | 195,208 |
| a | F&G Global Funding, 2.00% due 9/20/2028 | 235,000 | 199,884 |
| b | Fairfax Financial Holdings Ltd., 5.625% due 8/16/2032 | 220,000 | 220,073 |
| Horace Mann Educators Corp., 7.25% due 9/15/2028 | 35,000 | 37,422 | |
| a,b | Intact Financial Corp., 5.459% due 9/22/2032 | 60,000 | 60,041 |
| a | Mutual of Omaha Cos Global Funding, 5.45% due 12/12/2028 | 80,000 | 81,533 |
| a | Reliance Standard Life Global Funding II, 5.243% due 2/2/2026 | 196,000 | 193,989 |
| RenaissanceRe Finance, Inc., 3.70% due 4/1/2025 | 160,000 | 156,867 | |
| b | RenaissanceRe Holdings Ltd., 5.75% due 6/5/2033 | 188,000 | 189,397 |
| a | RGA Global Funding, 2.70% due 1/18/2029 | 65,000 | 57,960 |
| a | Security Benefit Global Funding, 1.25% due 5/17/2024 | 85,000 | 84,300 |
| Stewart Information Services Corp., 3.60% due 11/15/2031 | 90,000 | 73,806 | |
| 1,937,297 | |||
| Materials — 0.8% | |||
| Containers & Packaging — 0.8% | |||
| Ball Corp., 2.875% due 8/15/2030 | 95,000 | 81,134 | |
| a | Berry Global, Inc., 4.875% due 7/15/2026 | 250,000 | 245,227 |
| a,b | CCL Industries, Inc., 3.05% due 6/1/2030 | 185,000 | 160,678 |
| 487,039 | |||
| Media & Entertainment — 0.5% | |||
| Media — 0.5% | |||
| a | CCO Holdings LLC/CCO Holdings Capital Corp., 4.25% due 1/15/2034 | 105,000 | 79,246 |
| a | Sirius XM Radio, Inc., 5.50% due 7/1/2029 | 250,000 | 238,030 |
| 317,276 | |||
| Semiconductors & Semiconductor Equipment — 0.5% | |||
| Semiconductors & Semiconductor Equipment — 0.5% | |||
| a | Broadcom, Inc., 3.187% due 11/15/2036 | 80,000 | 63,594 |
| Micron Technology, Inc., 6.75% due 11/1/2029 | 65,000 | 69,761 | |
| a | Qorvo, Inc., 3.375% due 4/1/2031 | 220,000 | 188,366 |
| 321,721 | |||
| Software & Services — 1.1% | |||
| Information Technology Services — 0.1% | |||
| Kyndryl Holdings, Inc., 2.70% due 10/15/2028 | 25,000 | 22,158 | |
| Internet Software & Services — 0.3% | |||
| a,b | Prosus NV, 3.832% due 2/8/2051 | 200,000 | 123,048 |
| a | Prosus NV (EUR), 1.985% due 7/13/2033 | 100,000 | 83,239 |
| Software — 0.7% | |||
| a,b | Constellation Software, Inc., 5.158% due 2/16/2029 | 121,000 | 120,883 |
| a | Fair Isaac Corp., 4.00% due 6/15/2028 | 85,000 | 79,435 |
| a | MSCI, Inc., 3.625% due 9/1/2030 | 215,000 | 190,737 |
| a,b | Open Text Corp., 3.875% due 12/1/2029 | 88,000 | 78,484 |
| 697,984 | |||
| Technology Hardware & Equipment — 1.0% | |||
| Electronic Equipment, Instruments & Components — 1.0% | |||
| CDW LLC/CDW Finance Corp., 3.25% due 2/15/2029 | 185,000 | 167,701 | |
| b | Flex Ltd., 4.875% due 5/12/2030 | 30,000 | 29,209 |
| See notes to financial statements. | Thornburg Taxable Fixed Income Funds Semi-Annual Report | 49 |
Thornburg Core Plus Bond Fund | March 31, 2024 (Unaudited)
| Issuer-Description | SHARES/PRINCIPAL AMOUNT | VALUE | |
| Vontier Corp., 2.40% due 4/1/2028 | $ 250,000 | $ 221,612 | |
| a | WESCO Distribution, Inc., 6.375% due 3/15/2029 | 200,000 | 202,102 |
| 620,624 | |||
| Telecommunication Services — 0.2% | |||
| Wireless Telecommunication Services — 0.2% | |||
| a | Crown Castle Towers LLC, 4.241% due 7/15/2048 | 125,000 | 119,126 |
| 119,126 | |||
| Transportation — 0.2% | |||
| Air Freight & Logistics — 0.2% | |||
| Ryder System, Inc., 5.30% due 3/15/2027 | 155,000 | 156,149 | |
| 156,149 | |||
| Utilities — 4.3% | |||
| Electric Utilities — 4.2% | |||
| AEP Texas, Inc., Series I, 2.10% due 7/1/2030 | 225,000 | 187,477 | |
| Allegion U.S. Holding Co., Inc., 3.20% due 10/1/2024 | 85,000 | 83,853 | |
| American Electric Power Co., Inc., 2.30% due 3/1/2030 | 220,000 | 187,194 | |
| Black Hills Corp., 6.15% due 5/15/2034 | 220,000 | 226,877 | |
| a | Boston Gas Co., 3.757% due 3/16/2032 | 185,000 | 162,584 |
| Comision Federal de Electricidad, | |||
| a,b | 3.348% due 2/9/2031 | 200,000 | 166,128 |
| b | 5.00% due 9/29/2036 | 141,200 | 124,584 |
| a | Evergy Missouri West, Inc., 3.75% due 3/15/2032 | 65,000 | 57,398 |
| ITC Holdings Corp., 5.30% due 7/1/2043 | 170,000 | 160,482 | |
| a | Kentucky Power Co., 7.00% due 11/15/2033 | 191,000 | 204,261 |
| a | Liberty Utilities Finance GP 1, 2.05% due 9/15/2030 | 285,000 | 230,867 |
| a | Midland Cogeneration Venture LP, 6.00% due 3/15/2025 | 205,847 | 201,067 |
| a | Monongahela Power Co., 3.55% due 5/15/2027 | 80,000 | 76,086 |
| a | Niagara Mohawk Power Corp., 3.508% due 10/1/2024 | 225,000 | 222,089 |
| Public Service Co. of Oklahoma, Series J, 2.20% due 8/15/2031 | 35,000 | 28,573 | |
| Puget Energy, Inc., 4.224% due 3/15/2032 | 205,000 | 185,771 | |
| Wisconsin Power & Light Co., 5.375% due 3/30/2034 | 225,000 | 226,408 | |
| Gas Utilities — 0.1% | |||
| a | KeySpan Gas East Corp., 5.994% due 3/6/2033 | 60,000 | 60,803 |
| 2,792,502 | |||
| Total Corporate Bonds (Cost $16,498,630) | 16,776,090 | ||
| Long-Term Municipal Bonds — 0.2% | |||
| County of Miami-Dade Seaport Department, 6.224% due 11/1/2055 | 100,000 | 106,605 | |
| Total Long-Term Municipal Bonds (Cost $100,000) | 106,605 | ||
| Preferred Stock — 0.1% | |||
| Financial Services — 0.1% | |||
| Capital Markets — 0.1% | |||
| c,e | Gabelli Dividend & Income Trust, Series J, 4.50% due 3/26/2028 | 4 | 94,376 |
| 94,376 | |||
| Total Preferred Stock (Cost $80,000) | 94,376 | ||
| Short-Term Investments — 0.2% | |||
| f | Thornburg Capital Management Fund | 10,715 | 107,148 |
| Total Short-Term Investments (Cost $107,148) | 107,148 | ||
| Total Investments — 100.7% (Cost $64,002,980) | $64,844,096 | ||
| Liabilities Net of Other Assets — (0.7)% | (427,512) | ||
| Net Assets — 100.0% | $64,416,584 |
| 50 | Thornburg Taxable Fixed Income Funds Semi-Annual Report | See notes to financial statements. |
| Outstanding Forward Currency Contracts To Buy Or Sell At March 31, 2024 | |||||||
| Contract Description | Contract Party* | Buy/Sell | Contract Amount | Contract Value Date | Value USD | Unrealized Appreciation | Unrealized Depreciation |
| Euro | SSB | Sell | 73,300 | 9/25/2024 | 79,758 | $ 452 | $ — |
| Net unrealized appreciation (depreciation) | $ 452 | ||||||
| * | Counterparty includes State Street Bank and Trust Company ("SSB"). |
| Footnote Legend | |
| a | Securities exempt from registration under Rule 144A of the Securities Act of 1933, as amended. These securities are restricted but liquid and may only be resold in the ordinary course of business in transactions exempt from registration, normally to qualified institutional buyers. As of March 31, 2024, the aggregate value of these securities in the Fund’s portfolio was $20,118,861, representing 31.23% of the Fund’s net assets. |
| b | Yankee bond denominated in U.S. dollars and is issued in the U.S. by foreign banks and corporations. |
| c | Variable, floating, step, or fixed to floating rate securities are securities for which interest rate changes are based on changes in a designated base rate or on a predetermined schedule. The rates shown are those in effect on March 31, 2024. |
| d | When-issued security. |
| e | Security currently fair valued by Thornburg Investment Management, Inc.’s Valuation and Pricing Committee. |
| f | Investment in Affiliates. |
To simplify the listings of securities, abbreviations are used per the table below:
| ABS | Asset Backed Securities |
| CMBS | Commercial Mortgage-Backed Securities |
| CMO | Collateralized Mortgage Obligation |
| EUR | Denominated in Euro |
| H15T1Y | US Treasury Yield Curve Rate T-Note Constant Maturity 1 Year |
| Mtg | Mortgage |
| RFUCCT1Y | Refinitiv USD Interbank Offered Rate Consumer Cash Fallbacks Term 1 Year |
| SOFR | Secured Overnight Financing Rate |
| SOFR30A | Secured Overnight Financing Rate 30-Day Average |
| SOFR90A | Secured Overnight Financing Rate 90-Day Average |
| UMBS | Uniform Mortgage Backed Securities |
| See notes to financial statements. | Thornburg Taxable Fixed Income Funds Semi-Annual Report | 51 |
Thornburg Strategic Income Fund | March 31, 2024 (Unaudited)
| Issuer-Description | SHARES/ PRINCIPAL AMOUNT | VALUE | |
| Common Stock — 0.0% | |||
| Energy — 0.0% | |||
| Oil, Gas & Consumable Fuels — 0.0% | |||
| a,b | Drillco Holdings Luxembourg SA | 19,278 | $ 394,620 |
| a,b | Malamute Energy, Inc. | 847 | 847 |
| 395,467 | |||
| Telecommunication Services — 0.0% | |||
| Diversified Telecommunication Services — 0.0% | |||
| a,b | Digicel Holdings Ltd. | 24,516 | 22,235 |
| 22,235 | |||
| Total Common Stock (Cost $1,763,028) | 417,702 | ||
| Preferred Stock — 0.1% | |||
| Financial Services — 0.1% | |||
| Capital Markets — 0.1% | |||
| a,c | Gabelli Dividend & Income Trust Series J, 4.50%, 3/26/2028 | 525 | 12,386,850 |
| 12,386,850 | |||
| Total Preferred Stock (Cost $12,882,832) | 12,386,850 | ||
| Asset Backed Securities — 11.1% | |||
| Auto Receivables — 3.5% | |||
| d | ACC Auto Trust, Series 2022-A Class A, 4.58% due 7/15/2026 | $ 826,639 | 824,178 |
| d | ACM Auto Trust, Series 2023-2A Class A, 7.97% due 6/20/2030 | 5,573,260 | 5,612,787 |
| d | Ally Auto Receivables Trust Series 2023-1 Class CERT, due 4/15/2034 | 17,000 | 5,752,733 |
| Arivo Acceptance Auto Loan Receivables Trust, | |||
| d | Series 2021-1A Class A, 1.19% due 1/15/2027 | 251,616 | 248,794 |
| d | Series 2021-1A Class C, 3.77% due 3/15/2027 | 900,000 | 871,549 |
| d | Series 2021-1A Class D, 5.83% due 1/18/2028 | 850,000 | 820,379 |
| d | Series 2024-1A Class A, 6.46% due 4/17/2028 | 4,800,000 | 4,807,145 |
| d | Avid Automobile Receivables Trust, Series 2023-1 Class A, 6.63% due 7/15/2026 | 2,474,991 | 2,478,223 |
| BOF URSA VI Funding Trust I, | |||
| d | Series 2023-CAR1 Class B, 6.029% due 10/27/2031 | 2,685,148 | 2,678,680 |
| d | Series 2023-CAR2 Class A2, 5.542% due 10/27/2031 | 5,983,180 | 5,954,252 |
| d | Series 2023-CAR2 Class B, 6.029% due 10/27/2031 | 7,063,692 | 7,026,619 |
| d | BOF VII AL Funding Trust I, Series 2023-CAR3 Class A2, 6.291% due 7/26/2032 | 9,575,478 | 9,628,077 |
| Carvana Auto Receivables Trust, | |||
| d | Series 2019-4A Class R, due 10/15/2026 | 8,000 | 2,280,952 |
| d | Series 2020-P1 Class R, due 9/8/2027 | 20,000 | 1,654,651 |
| d | Series 2021-N4 Class R, due 9/12/2028 | 11,650 | 630,958 |
| d | Series 2021-P1 Class R, due 12/10/2027 | 23,500 | 2,205,787 |
| d | Series 2021-P2 Class R, due 5/10/2028 | 7,500 | 1,516,417 |
| d | Series 2021-P3 Class R, due 9/11/2028 | 9,000 | 1,780,979 |
| d | Series 2021-P4 Class R, due 9/11/2028 | 8,250 | 2,009,638 |
| d | Series 2022-N1 Class E, 6.01% due 12/11/2028 | 6,000,000 | 5,905,255 |
| d | Series 2022-P1 Class R, due 1/10/2029 | 24,000 | 5,655,190 |
| d | Series 2022-P1 Class XS, due 1/10/2029 | 387,549,398 | 1,792,687 |
| d | Series 2023-N1 Class A, 6.36% due 4/12/2027 | 4,494,910 | 4,504,603 |
| d | Series 2023-N3 Class A, 6.41% due 9/10/2027 | 3,228,343 | 3,242,147 |
| d | Series 2023-N4 Class A, 6.42% due 1/10/2028 | 3,924,653 | 3,946,706 |
| CPS Auto Receivables Trust, | |||
| d | Series 2020-A Class F, 6.93% due 3/15/2027 | 3,500,000 | 3,500,962 |
| d | Series 2020-C Class F, 6.67% due 11/15/2027 | 1,000,000 | 990,773 |
| d | CPS Auto Securitization Trust, Series 2021-1A Class A, 7.86% due 6/16/2026 | 10,000,000 | 10,177,041 |
| d | Credit Suisse ABS Trust Series 2020-AT1 Class CERT, due 6/15/2026 | 10,000 | 70,794 |
| Exeter Automobile Receivables Trust, | |||
| d | Series 2019-3A Class D, 3.11% due 8/15/2025 | 1,038,841 | 1,037,572 |
| Series 2021-1A Class D, 1.08% due 11/16/2026 | 2,461,759 | 2,402,217 | |
| Series 2021-3A Class C, 0.96% due 10/15/2026 | 7,651,425 | 7,532,767 |
| 52 | Thornburg Taxable Fixed Income Funds Semi-Annual Report | See notes to financial statements. |
| Issuer-Description | SHARES/ PRINCIPAL AMOUNT | VALUE | |
| d | FHF Issuer Trust, Series 2024-1A Class A1, 5.769% due 3/17/2025 | $ 12,788,924 | $ 12,786,374 |
| FHF Trust, | |||
| d | Series 2021-2A Class A, 0.83% due 12/15/2026 | 1,076,978 | 1,047,672 |
| d | Series 2022-2A Class A, 6.14% due 12/15/2027 | 3,660,667 | 3,650,426 |
| d | Series 2023-1A Class A2, 6.57% due 6/15/2028 | 3,894,038 | 3,903,127 |
| d | First Investors Auto Owner Trust, Series 2022-1A Class E, 5.41% due 6/15/2029 | 5,000,000 | 4,862,711 |
| Flagship Credit Auto Trust, | |||
| d | Series 2018-4 Class R, due 3/16/2026 | 13,000 | 634,088 |
| d | Series 2019-1 Class E, 5.06% due 6/15/2026 | 2,446,223 | 2,436,534 |
| d | Series 2019-1 Class R, due 6/15/2026 | 24,000 | 666,903 |
| d | Series 2019-2 Class D, 3.53% due 5/15/2025 | 1,245,751 | 1,240,548 |
| d | Series 2019-2 Class R, due 12/15/2026 | 33,000 | 1,344,105 |
| d | Series 2019-3 Class R, due 12/15/2026 | 31,000 | 1,450,013 |
| d | Series 2019-4 Class D, 3.12% due 1/15/2026 | 1,012,670 | 999,820 |
| d | Series 2019-4 Class R, due 3/15/2027 | 26,000 | 1,162,971 |
| d | Series 2022-1 Class E, 5.37% due 6/15/2029 | 6,120,000 | 5,121,016 |
| d | Foursight Capital Automobile Receivables Trust, Series 2021-1 Class F, 4.06% due 8/15/2028 | 3,130,000 | 3,057,376 |
| d | GLS Auto Receivables Issuer Trust, Series 2020-2A Class C, 4.57% due 4/15/2026 | 705,431 | 703,220 |
| d | Hertz Vehicle Financing LLC, Series 2021-1A Class A, 1.21% due 12/26/2025 | 17,535,000 | 17,120,718 |
| JPMorgan Chase Bank NA - CACLN, | |||
| d | Series 2020-1 Class R, 33.784% due 1/25/2028 | 1,234,890 | 1,302,857 |
| d | Series 2020-2 Class R, 31.355% due 2/25/2028 | 10,615,289 | 11,560,231 |
| d | Series 2021-1 Class R, 28.348% due 9/25/2028 | 3,219,887 | 3,773,290 |
| d | Series 2021-2 Class G, 8.482% due 12/26/2028 | 3,950,000 | 3,998,180 |
| Lendbuzz Securitization Trust, | |||
| d | Series 2021-1A Class A, 1.46% due 6/15/2026 | 1,458,748 | 1,412,734 |
| d | Series 2022-1A Class A, 4.22% due 5/17/2027 | 8,560,028 | 8,393,764 |
| d | Series 2023-2A Class A2, 7.09% due 10/16/2028 | 4,113,474 | 4,145,902 |
| d | Series 2023-3A Class A1, 6.03% due 10/15/2024 | 404,358 | 404,367 |
| d | Series 2024-1A Class A1, 5.789% due 1/15/2025 | 2,993,353 | 2,992,614 |
| Lobel Automobile Receivables Trust, | |||
| d | Series 2023-1 Class A, 6.97% due 7/15/2026 | 2,627,779 | 2,632,460 |
| d | Series 2023-2 Class A, 7.59% due 4/16/2029 | 7,146,482 | 7,214,574 |
| d,e | Oscar U.S. Funding XV LLC, Series 2023-1A Class A2, 6.07% due 9/10/2026 | 2,402,400 | 2,406,330 |
| Research-Driven Pagaya Motor Asset Trust, | |||
| d | Series 2023-3A Class A, 7.13% due 1/26/2032 | 15,517,918 | 15,610,788 |
| d | Series 2023-4A Class A, 7.54% due 3/25/2032 | 9,327,061 | 9,431,244 |
| d | Research-Driven Pagaya Motor Trust, Series 2024-1A Class A, 7.09% due 6/25/2032 | 9,750,000 | 9,763,105 |
| d | SAFCO Auto Receivables Trust, Series 2024-1A Class A, 6.51% due 3/20/2028 | 10,972,014 | 10,986,160 |
| Santander Consumer Auto Receivables Trust, | |||
| d | Series 2020-AA Class R, due 1/16/2029 | 25,000 | 2,471,586 |
| d | Series 2021-AA Class F, 5.79% due 8/15/2028 | 3,000,000 | 2,878,734 |
| d | Series 2021-AA Class R, due 8/15/2028 | 28,500 | 1,326,080 |
| Santander Drive Auto Receivables Trust, | |||
| Series 2021-3 Class C, 0.95% due 9/15/2027 | 2,231,159 | 2,222,449 | |
| d | Series 2023-S1 Class R1, 8.14% due 4/18/2028 | 12,784,334 | 12,872,072 |
| d | Skopos Auto Receivables Trust, Series 2019-1A Class D, 5.24% due 4/15/2025 | 170,437 | 170,403 |
| d | Tricolor Auto Securitization Trust, Series 2023-1A Class A, 6.48% due 8/17/2026 | 1,913,653 | 1,914,955 |
| d | United Auto Credit Securitization Trust Series 2022-1 Class R, due 11/10/2028 | 37,000 | 465,387 |
| 292,079,400 | |||
| Credit Card — 0.6% | |||
| d | Avant Credit Card Master Trust, Series 2021-1A Class A, 1.37% due 4/15/2027 | 7,900,000 | 7,627,086 |
| d | Brex Commercial Charge Card Master Trust, Series 2024-1 Class A1, 6.05% due 7/15/2027 | 11,173,000 | 11,164,454 |
| d | Continental Credit Card ABS LLC, Series 2019-1A Class C, 6.16% due 8/15/2026 | 6,440,000 | 6,396,626 |
| Continental Finance Credit Card ABS Master Trust, | |||
| d | Series 2020-1A Class A, 2.24% due 12/15/2028 | 2,011,887 | 1,987,347 |
| d | Series 2020-1A Class B, 3.66% due 12/15/2028 | 3,700,000 | 3,570,860 |
| d | Genesis Private Label Amortizing Trust, Series 2020-1 Class D, 6.63% due 7/20/2030 | 704,080 | 702,372 |
| d | Mercury Financial Credit Card Master Trust, Series 2023-1A Class A, 8.04% due 9/20/2027 | 14,600,000 | 14,725,329 |
| d | Mission Lane Credit Card Master Trust, Series 2023-B Class A, 7.69% due 11/15/2028 | 8,000,000 | 8,116,185 |
| 54,290,259 |
| See notes to financial statements. | Thornburg Taxable Fixed Income Funds Semi-Annual Report | 53 |
Thornburg Strategic Income Fund | March 31, 2024 (Unaudited)
| Issuer-Description | SHARES/ PRINCIPAL AMOUNT | VALUE | |
| Other Asset Backed — 5.7% | |||
| c,d | 321 Henderson Receivables I LLC, Series 2006-3A Class A1, 5.64% (TSFR1M + 0.31%) due 9/15/2041 | $ 548,353 | $ 540,616 |
| d | Affirm Asset Securitization Trust, Series 2021-Z2 Class A, 1.17% due 11/16/2026 | 332,811 | 326,511 |
| d | AFG ABS I LLC, Series 2023-1 Class A2, 6.30% due 9/16/2030 | 7,883,281 | 7,895,014 |
| d | AMCR ABS Trust, Series 2023-1A Class A, 7.66% due 1/21/2031 | 4,144,899 | 4,169,699 |
| d | Amur Equipment Finance Receivables IX LLC, Series 2021-1A Class F, 6.09% due 2/20/2029 | 8,152,000 | 7,909,502 |
| Aqua Finance Trust, | |||
| d | Series 2019-A Class D, 6.07% due 7/16/2040 | 13,373,210 | 11,799,451 |
| d | Series 2020-AA Class A, 1.90% due 7/17/2046 | 2,317,539 | 2,108,571 |
| d | Series 2020-AA Class D, 7.15% due 7/17/2046 | 3,220,000 | 2,839,187 |
| d | Series 2021-A Class A, 1.54% due 7/17/2046 | 4,663,491 | 4,082,341 |
| d | Arm Master Trust LLC Agricultural Loan Backed Notes, Series 2021-T1 Class A, 2.43% due 11/15/2027 | 12,550,000 | 12,067,986 |
| d | Auxilior Term Funding LLC, Series 2023-1A Class A2, 6.18% due 12/15/2028 | 3,640,000 | 3,663,776 |
| BHG Securitization Trust, | |||
| d | Series 2021-A Class C, 3.69% due 11/17/2033 | 2,200,000 | 1,758,447 |
| d | Series 2021-B Class A, 0.90% due 10/17/2034 | 1,265,906 | 1,237,012 |
| d | Series 2022-A Class A, 1.71% due 2/20/2035 | 5,436,810 | 5,355,610 |
| c,d,e | Blackbird Capital Aircraft Lease Securitization Ltd., Series 2016-1A Class A, 4.213% due 12/16/2041 | 2,963,768 | 2,919,311 |
| c,d | Cascade MH Asset Trust, Whole Loan Securities Trust CMO, Series 2021-MH1 Class B3, 7.569% due 2/25/2046 | 1,936,119 | 1,528,214 |
| d,e | CFG Investments Ltd., Series 2023-1 Class A, 8.56% due 7/25/2034 | 7,400,000 | 7,588,024 |
| d | CFMT Issuer Trust, Series 2021-GRN1 Class A, 1.10% due 3/20/2041 | 917,161 | 873,539 |
| c,d | Consumer Lending Receivables Trust Series 2019-A Class CERT, due 4/15/2026 | 3,658 | 1,124 |
| c,d | Consumer Loan Underlying Bond Certificate Issuer Trust I Series 2019-HP1 Class CERT, due 12/15/2026 | 100,000 | 384,603 |
| d | CP EF Asset Securitization I LLC, Series 2022-1A Class A, 5.96% due 4/15/2030 | 4,958,171 | 4,946,338 |
| d | Crossroads Asset Trust, Series 2022-A Class A, 6.35% due 4/21/2031 | 4,490,211 | 4,501,093 |
| Dext ABS LLC, | |||
| d | Series 2021-1 Class A, 1.12% due 2/15/2028 | 3,496,170 | 3,432,844 |
| d | Series 2023-2 Class A2, 6.56% due 5/15/2034 | 4,982,373 | 5,011,880 |
| d | Diamond Infrastructure Funding LLC, Series 2021-1A Class A, 1.76% due 4/15/2049 | 19,150,000 | 17,087,622 |
| d | Diamond Issuer, Series 2021-1A Class A, 2.305% due 11/20/2051 | 10,983,000 | 9,800,263 |
| d,e | ECAF I Ltd., Series 2015-1A Class B1, 5.802% due 6/15/2040 | 4,600,055 | 1,172,959 |
| d | EverBright Solar Trust, Series 2024-A Class A, 6.43% due 6/22/2054 | 12,100,000 | 12,064,423 |
| d | ExteNet LLC, Series 2019-1A Class A2, 3.204% due 7/25/2049 | 5,000,000 | 4,943,130 |
| d | FAT Brands Fazoli’s Native I LLC, Series 2021-1 Class A2, 7.00% due 7/25/2051 | 11,199,870 | 10,300,419 |
| Foundation Finance Trust, | |||
| d | Series 2019-1A Class A, 3.86% due 11/15/2034 | 331,064 | 328,925 |
| d | Series 2019-1A Class C, 5.66% due 11/15/2034 | 575,000 | 544,295 |
| d | Series 2020-1A Class A, 3.54% due 7/16/2040 | 1,673,893 | 1,633,263 |
| d | Series 2020-1A Class C, 5.75% due 7/16/2040 | 4,025,000 | 3,760,184 |
| d | Series 2021-1A Class A, 1.27% due 5/15/2041 | 1,331,334 | 1,194,198 |
| d | Series 2021-1A Class D, 4.96% due 5/15/2041 | 2,012,755 | 1,747,673 |
| d | Series 2021-2A Class A, 2.19% due 1/15/2042 | 1,360,402 | 1,246,214 |
| d | Series 2021-2A Class D, 5.73% due 1/15/2042 | 3,750,000 | 3,277,527 |
| Goldman Home Improvement Trust Issuer Trust, | |||
| d | Series 2021-GRN2 Class A, 1.15% due 6/25/2051 | 4,079,110 | 3,815,563 |
| a,d | Series 2021-GRN2 Class R, due 6/20/2051 | 41,500 | 2,324,763 |
| d | Series 2022-GRN1 Class A, 4.50% due 6/25/2052 | 1,949,051 | 1,901,587 |
| d | Goodgreen Trust, Series 2021-1A Class A, 2.66% due 10/15/2056 | 9,129,358 | 7,491,631 |
| GoodLeap Sustainable Home Solutions Trust, | |||
| d | Series 2021-3CS Class A, 2.10% due 5/20/2048 | 1,966,540 | 1,534,901 |
| d | Series 2021-3CS Class C, 3.50% due 5/20/2048 | 4,193,447 | 2,575,589 |
| d | Series 2021-4GS Class A, 1.93% due 7/20/2048 | 5,924,537 | 4,523,945 |
| d | Series 2021-5CS Class A, 2.31% due 10/20/2048 | 8,959,551 | 7,129,740 |
| c,d | Gracie Point International Funding LLC, Series 2023-2A Class A, 7.608% (SOFR90A + 2.25%) due 3/1/2027 | 15,180,984 | 15,306,711 |
| d | HERO Funding Trust, Series 2017-2A Class A1, 3.28% due 9/20/2048 | 858,050 | 747,026 |
| d | Hilton Grand Vacations Trust, Series 2019-AA Class A, 2.34% due 7/25/2033 | 813,576 | 779,266 |
| InStar Leasing III LLC, | |||
| d | Series 2021-1A Class A, 2.30% due 2/15/2054 | 4,258,505 | 3,777,081 |
| d | Series 2021-1A Class C, 5.29% due 2/15/2054 | 4,891,158 | 4,314,742 |
| LendingPoint Asset Securitization Trust, | |||
| d | Series 2020-REV1 Class C, 7.699% due 10/15/2028 | 4,000,000 | 3,971,493 |
| d | Series 2021-A Class D, 5.73% due 12/15/2028 | 9,000,000 | 7,698,870 |
| d | Series 2021-B Class D, 6.12% due 2/15/2029 | 5,000,000 | 3,690,415 |
| 54 | Thornburg Taxable Fixed Income Funds Semi-Annual Report | See notes to financial statements. |
| Issuer-Description | SHARES/ PRINCIPAL AMOUNT | VALUE | |
| d | Series 2022-A Class E, 7.02% due 6/15/2029 | $ 6,000,000 | $ 3,984,851 |
| d | Series 2022-B Class A, 4.77% due 10/15/2029 | 1,003,272 | 998,348 |
| d | Series 2022-C Class A, 6.56% due 2/15/2030 | 1,342,597 | 1,342,965 |
| d | LendingPoint Pass-Through Trust, Series 2022-ST3 Class A, 4.00% due 5/15/2028 | 413,125 | 406,620 |
| LL ABS Trust, | |||
| d | Series 2020-1A Class C, 6.54% due 1/17/2028 | 1,609,805 | 1,609,805 |
| d | Series 2021-1A Class A, 1.07% due 5/15/2029 | 111,839 | 111,464 |
| Loanpal Solar Loan Ltd., | |||
| d | Series 2021-1GS Class A, 2.29% due 1/20/2048 | 1,208,146 | 969,383 |
| d,f | Series 2021-1GS Class R, due 1/20/2048 | 13,252,480 | 8,336,979 |
| d | Series 2021-2GS Class C, 3.50% due 3/20/2048 | 2,991,078 | 1,796,055 |
| d | LP LMS Asset Securitization Trust, Series 2021-2A Class D, 6.61% due 1/15/2029 | 2,947,000 | 2,582,256 |
| Marlette Funding Trust, | |||
| d | Series 2018-1A Class CERT, due 3/15/2028 | 58,592 | 48,033 |
| d | Series 2019-4A Class C, 3.76% due 12/17/2029 | 292,560 | 292,268 |
| d | Series 2021-1A Class R, due 6/16/2031 | 9,520 | 179,964 |
| d | Series 2021-2A Class R, due 9/15/2031 | 16,347 | 396,580 |
| d | Series 2021-3A Class B, 1.30% due 12/15/2031 | 473,558 | 469,976 |
| d | Series 2021-3A Class R, due 12/15/2031 | 53,946 | 2,070,167 |
| d | Series 2022-3A Class A, 5.18% due 11/15/2032 | 870,218 | 868,691 |
| d | Series 2023-2A Class A, 6.04% due 6/15/2033 | 5,092,491 | 5,085,663 |
| d | Momnt Technologies Trust, Series 2023-1A Class A, 6.92% due 3/20/2045 | 9,120,601 | 9,176,666 |
| Mosaic Solar Loan Trust, | |||
| d | Series 2020-2A Class D, 5.42% due 8/20/2046 | 760,573 | 701,912 |
| d | Series 2020-2A Class R, due 8/20/2046 | 975,660 | 375,097 |
| d | Series 2021-1A Class R, due 12/20/2046 | 6,899,985 | 662,502 |
| d | Series 2021-2A Class R, due 4/22/2047 | 9,930,000 | 884,465 |
| d | Series 2021-3A Class R, due 6/20/2052 | 12,246,439 | 504,908 |
| d | NetCredit Combined Receivables LLC, Series 2023-A Class A, 7.78% due 12/20/2027 | 3,741,170 | 3,742,893 |
| c,d | Oportun Funding LLC Series 2022-1 Class CERT, due 6/15/2029 | 11,000 | 575,864 |
| d | Oportun Funding XIV LLC, Series 2021-A Class A, 1.21% due 3/8/2028 | 5,792,245 | 5,615,093 |
| Oportun Issuance Trust, | |||
| d | Series 2021-B Class A, 1.47% due 5/8/2031 | 7,300,000 | 6,872,895 |
| d | Series 2022-A Class A, 5.05% due 6/9/2031 | 10,588,000 | 10,482,615 |
| Pagaya AI Debt Selection Trust, | |||
| d | Series 2020-4 Class B, 8.25% due 1/25/2028 | 3,037,766 | 3,046,927 |
| d | Series 2021-HG1 Class A, 1.22% due 1/16/2029 | 2,174,058 | 2,120,516 |
| Pagaya AI Debt Trust, | |||
| d | Series 2022-1 Class A, 2.03% due 10/15/2029 | 3,844,980 | 3,802,594 |
| d | Series 2022-2 Class A, 4.97% due 1/15/2030 | 1,484,528 | 1,477,263 |
| d | Series 2023-1 Class A, 7.556% due 7/15/2030 | 3,224,547 | 3,239,389 |
| c,d | Series 2023-5 Class AB, 7.31% due 4/15/2031 | 5,435,191 | 5,464,507 |
| d | Series 2024-1 Class A, 6.66% due 7/15/2031 | 4,500,000 | 4,515,731 |
| d | Post Road Equipment Finance, Series 2022-1A Class A1, 3.76% due 8/16/2027 | 477,019 | 476,310 |
| d | PowerPay Issuance Trust, Series 2024-1A Class A, 6.53% due 2/18/2039 | 8,360,000 | 8,360,000 |
| Prosper Marketplace Issuance Trust, | |||
| c,d | Series 2019-2A Class CERT, due 9/15/2025 | 16,385 | 47,905 |
| c,d | Series 2019-3A Class CERT, due 7/15/2025 | 101,327,127 | 219,069 |
| d | Series 2023-1A Class A, 7.06% due 7/16/2029 | 1,565,284 | 1,570,628 |
| d | Series 2024-1A Class A, 6.12% due 8/15/2029 | 10,025,000 | 10,023,242 |
| Prosper Pass-Thru Trust II, | |||
| d | Series 2019-ST1 Class CERT, due 7/15/2025 | 13,363,728 | 43,306 |
| d | Series 2019-ST2 Class R1, due 11/15/2025 | 6,385,267 | 218,012 |
| d | Series 2019-ST2 Class R2, due 11/15/2025 | 3,193,133 | 109,023 |
| d | Reach Financial LLC, Series 2023-1A Class A, 7.05% due 2/18/2031 | 1,390,448 | 1,395,794 |
| d | Republic Finance Issuance Trust, Series 2021-A Class A, 2.30% due 12/22/2031 | 8,400,000 | 8,031,908 |
| c,d | SBA Tower Trust, Series 2014-2A Class C, 3.869% due 10/15/2049 | 18,307,000 | 18,089,216 |
| d | SCF Equipment Leasing LLC, Series 2019-2A Class C, 3.11% due 6/21/2027 | 6,423,348 | 6,380,240 |
| d | Service Experts Issuer LLC, Series 2021-1A Class A, 2.67% due 2/2/2032 | 12,865,385 | 12,053,386 |
| d | Sierra Timeshare Receivables Funding LLC, Series 2023-1A Class D, 9.80% due 1/20/2040 | 2,347,101 | 2,428,476 |
| d | SolarCity LMC Series I LLC, Series 2013-1 Class A, 4.80% due 11/20/2038 | 813,033 | 796,096 |
| d | SpringCastle America Funding LLC, Series 2020-AA Class A, 1.97% due 9/25/2037 | 3,063,185 | 2,815,533 |
| d | SPS Servicer Advance Receivables Trust, Series 2020-T2 Class A, 1.83% due 11/15/2055 | 11,890,000 | 11,140,068 |
| See notes to financial statements. | Thornburg Taxable Fixed Income Funds Semi-Annual Report | 55 |
Thornburg Strategic Income Fund | March 31, 2024 (Unaudited)
| Issuer-Description | SHARES/ PRINCIPAL AMOUNT | VALUE | |
| d | Theorem Funding Trust, Series 2022-3A Class A, 7.60% due 4/15/2029 | $ 3,376,004 | $ 3,401,282 |
| Upstart Pass-Through Trust, | |||
| d | Series 2020-ST1 Class A, 3.75% due 2/20/2028 | 133,638 | 132,980 |
| d | Series 2020-ST2 Class A, 3.50% due 3/20/2028 | 158,641 | 156,994 |
| d | Series 2020-ST3 Class A, 3.35% due 4/20/2028 | 232,212 | 228,694 |
| d | Series 2020-ST5 Class A, 3.00% due 12/20/2026 | 1,667,258 | 1,655,105 |
| d | Series 2021-ST1 Class A, 2.75% due 2/20/2027 | 1,099,962 | 1,076,496 |
| d | Series 2021-ST2 Class A, 2.50% due 4/20/2027 | 1,233,314 | 1,201,801 |
| d | Series 2021-ST4 Class A, 2.00% due 7/20/2027 | 1,209,438 | 1,163,829 |
| d | Series 2021-ST5 Class A, 2.00% due 7/20/2027 | 1,069,809 | 1,032,311 |
| d | Series 2021-ST6 Class A, 1.85% due 8/20/2027 | 834,602 | 807,472 |
| d | Series 2021-ST8 Class A, 1.75% due 10/20/2029 | 248,000 | 245,110 |
| d | Series 2021-ST8 Class CERT, due 10/20/2029 | 5,400,000 | 1,486,588 |
| d | Series 2021-ST9 Class CERT, due 11/20/2029 | 1,414,000 | 381,313 |
| Upstart Securitization Trust, | |||
| d,f | Series 2018-2 Class CERT, due 12/22/2025 | 84,500 | 902,059 |
| d | Series 2020-1 Class C, 4.899% due 4/22/2030 | 1,510,310 | 1,505,111 |
| d | Series 2020-3 Class C, 6.25% due 11/20/2030 | 2,520,525 | 2,513,211 |
| d | Series 2021-2 Class C, 3.61% due 6/20/2031 | 14,288,660 | 13,934,075 |
| d | Series 2021-3 Class CERT, due 7/20/2031 | 7,165 | 102,589 |
| d | Series 2021-4 Class CERT, due 9/20/2031 | 4,706 | 196,412 |
| d | Series 2023-1 Class A, 6.59% due 2/20/2033 | 1,423,012 | 1,423,434 |
| d | Series 2023-3 Class A, 6.90% due 10/20/2033 | 3,915,182 | 3,932,625 |
| Upstart Structured Pass-Through Trust, | |||
| d | Series 2022-1A Class A, 3.40% due 4/15/2030 | 5,869,179 | 5,757,457 |
| d | Series 2022-4A Class A, 7.01% due 11/15/2030 | 2,740,224 | 2,744,683 |
| d | Verdant Receivables LLC, Series 2023-1A Class A2, 6.24% due 1/13/2031 | 9,808,561 | 9,874,930 |
| 472,491,789 | |||
| Student Loan — 1.3% | |||
| College Avenue Student Loans LLC, | |||
| c,d | Series 2021-A Class A1, 6.544% (TSFR1M + 1.21%) due 7/25/2051 | 2,562,195 | 2,542,441 |
| d | Series 2021-A Class A2, 1.60% due 7/25/2051 | 244,019 | 214,164 |
| c,d | Series 2021-C Class A1, 6.344% (TSFR1M + 1.01%) due 7/26/2055 | 4,857,622 | 4,717,373 |
| d | Series 2021-C Class R, due 7/26/2055 | 38,750 | 9,056,614 |
| Commonbond Student Loan Trust, | |||
| d | Series 18-CGS Class A1, 3.87% due 2/25/2046 | 393,495 | 370,722 |
| d | Series 2020-1 Class A, 1.69% due 10/25/2051 | 1,451,597 | 1,279,568 |
| d | Series 2021-BGS Class A, 1.17% due 9/25/2051 | 4,553,747 | 3,847,904 |
| d | EDvestinU Private Education Loan Issue No. 3 LLC, Series 2021-A Class A, 1.80% due 11/25/2045 | 18,878,832 | 16,787,582 |
| National Collegiate Student Loan Trust, | |||
| c | Series 2004-2 Class B, 5.984% (TSFR1M + 0.65%) due 12/26/2033 | 7,402,780 | 7,224,390 |
| c | Series 2006-1 Class A5, 5.794% (TSFR1M + 0.46%) due 3/25/2033 | 9,388,695 | 9,039,894 |
| c | Series 2006-4 Class A4, 5.754% (TSFR1M + 0.42%) due 5/25/2032 | 3,135,404 | 3,040,634 |
| c | Series 2007-2 Class A4, 5.734% (TSFR1M + 0.40%) due 1/25/2033 | 1,829,883 | 1,719,633 |
| c,d | Navient Private Education Refi Loan Trust, Series 2019-D Class A2B, 6.49% (TSFR1M + 1.16%) due 12/15/2059 | 2,908,331 | 2,891,884 |
| Nelnet Student Loan Trust, | |||
| c,d | Series 2015-2A Class A2, 6.035% (SOFR30A + 0.71%) due 9/25/2042 | 1,581,894 | 1,554,082 |
| c,d | Series 2021-CA Class AFL, 6.183% (TSFR1M + 0.85%) due 4/20/2062 | 2,783,691 | 2,753,322 |
| c,d | Series 2021-DA Class AFL, 6.133% (TSFR1M + 0.80%) due 4/20/2062 | 3,305,847 | 3,269,262 |
| c,d,e | Prodigy Finance DAC, Series 2021-1A Class A, 6.694% (TSFR1M + 1.36%) due 7/25/2051 | 564,285 | 559,667 |
| SLM Student Loan Trust, | |||
| c | Series 2008-2 Class A3, 6.373% (SOFR90A + 1.01%) due 4/25/2023 | 109,426 | 108,377 |
| b,c,g | Series 2008-5 Class A4, 7.323% (SOFR90A + 1.96%) due 7/25/2023 | 550,711 | 550,546 |
| c | Series 2011-2 Class A2, 6.635% (SOFR30A + 1.31%) due 10/25/2034 | 2,685,326 | 2,694,015 |
| c | Series 2012-1 Class A3, 6.385% (SOFR30A + 1.06%) due 9/25/2028 | 1,339,270 | 1,313,998 |
| c | Series 2013-6 Class A3, 6.085% (SOFR30A + 0.76%) due 6/26/2028 | 1,527,838 | 1,510,480 |
| SMB Private Education Loan Trust, | |||
| d | Series 2021-A Class R, due 1/15/2053 | 2,742 | 7,449,116 |
| c,d | Series 2021-D Class A1B, 6.04% (TSFR1M + 0.71%) due 3/17/2053 | 2,150,742 | 2,121,120 |
| d | Series 2022-A Class D, 4.75% due 11/16/2054 | 6,000,000 | 5,680,271 |
| d | SoFi Professional Loan Program LLC, Series 2021-B Class AFX, 1.14% due 2/15/2047 | 17,713,054 | 15,218,303 |
| 56 | Thornburg Taxable Fixed Income Funds Semi-Annual Report | See notes to financial statements. |
| Issuer-Description | SHARES/ PRINCIPAL AMOUNT | VALUE | |
| d | SoFi Professional Loan Program Trust Series 2021-B Class R1, due 2/15/2047 | $ 90,000 | $ 3,056,307 |
| c,d | Towd Point Asset Trust, Series 2021-SL1 Class A2, 6.143% (TSFR1M + 0.81%) due 11/20/2061 | 1,922,494 | 1,914,593 |
| 112,486,262 | |||
| Total Asset Backed Securities (Cost $968,789,813) | 931,347,710 | ||
| Corporate Bonds — 41.9% | |||
| Automobiles & Components — 0.5% | |||
| Automobile Components — 0.1% | |||
| d | LKQ European Holdings BV (EUR), 4.125% due 4/1/2028 | 6,600,000 | 7,139,136 |
| d | Real Hero Merger Sub 2, Inc., 6.25% due 2/1/2029 | 4,616,000 | 4,040,662 |
| Automobiles — 0.4% | |||
| c,d | Daimler Truck Finance North America LLC, 6.111% (SOFR + 0.75%) due 12/13/2024 | 4,099,000 | 4,107,608 |
| Hyundai Capital America, | |||
| d | 0.875% due 6/14/2024 | 3,950,000 | 3,909,987 |
| d | 1.00% due 9/17/2024 | 7,143,000 | 6,985,425 |
| d | 1.80% due 10/15/2025 - 1/10/2028 | 1,933,000 | 1,792,382 |
| d | 3.00% due 2/10/2027 | 2,750,000 | 2,581,205 |
| d | 5.30% due 3/19/2027 | 4,750,000 | 4,750,760 |
| d | 5.50% due 3/30/2026 | 3,000,000 | 3,003,150 |
| d | 5.80% due 6/26/2025 | 4,500,000 | 4,507,560 |
| d | 6.50% due 1/16/2029 | 3,000,000 | 3,149,100 |
| 45,966,975 | |||
| Banks — 1.5% | |||
| Banks — 1.5% | |||
| c,e | Bank Leumi Le-Israel BM, 7.129% (5-Yr. CMT + 3.466%) due 7/18/2033 | 8,239,000 | 8,120,935 |
| Bank of New York Mellon Corp., | |||
| c,h | Series F, 4.625% (TSFR3M + 3.39%) due 9/20/2026 | 1,935,000 | 1,834,806 |
| c,h | Series I, 3.75% (5-Yr. CMT + 2.630%) due 12/20/2026 | 19,575,000 | 17,955,756 |
| c,d,e | DNB Bank ASA, 5.896% (SOFRINDX + 1.95%) due 10/9/2026 | 6,900,000 | 6,934,638 |
| FNB Corp., 5.15% due 8/25/2025 | 3,170,000 | 3,122,418 | |
| KeyBank NA, 5.00% due 1/26/2033 | 12,100,000 | 11,214,764 | |
| d,e | Macquarie Bank Ltd., 3.624% due 6/3/2030 | 2,800,000 | 2,482,256 |
| c,d,e | NBK SPC Ltd., 1.625% (SOFR + 1.05%) due 9/15/2027 | 5,177,000 | 4,720,233 |
| Santander Holdings USA, Inc., | |||
| 3.45% due 6/2/2025 | 1,185,000 | 1,151,962 | |
| c | 6.174% (SOFR + 2.50%) due 1/9/2030 | 11,370,000 | 11,480,516 |
| c | 7.66% (SOFR + 3.28%) due 11/9/2031 | 12,000,000 | 13,060,320 |
| d,e | Sumitomo Mitsui Trust Bank Ltd., 5.65% due 3/9/2026 | 5,800,000 | 5,840,368 |
| Synchrony Bank, 5.40% due 8/22/2025 | 6,660,000 | 6,599,927 | |
| U.S. Bancorp, | |||
| c | 4.653% (SOFR + 1.23%) due 2/1/2029 | 7,808,000 | 7,645,047 |
| c | 5.775% (SOFR + 2.02%) due 6/12/2029 | 6,950,000 | 7,072,181 |
| Wells Fargo & Co., | |||
| c | 4.808% (SOFR + 1.98%) due 7/25/2028 | 3,350,000 | 3,301,057 |
| c | 5.574% (SOFR + 1.74%) due 7/25/2029 | 10,000,000 | 10,114,500 |
| 122,651,684 | |||
| Capital Goods — 1.6% | |||
| Aerospace & Defense — 0.9% | |||
| d | BWX Technologies, Inc.,4.125% due 6/30/2028 - 4/15/2029 | 16,461,000 | 15,234,291 |
| d | L3Harris Technologies, Inc., due 8/23/2024 | 20,000,000 | 19,528,000 |
| Teledyne Technologies, Inc., 0.95% due 4/1/2024 | 13,874,000 | 13,874,000 | |
| TransDigm, Inc., | |||
| d | 6.375% due 3/1/2029 | 14,860,000 | 14,905,472 |
| d | 6.75% due 8/15/2028 | 11,165,000 | 11,328,679 |
| Construction & Engineering — 0.2% | |||
| d,e | IHS Netherlands Holdco BV, 8.00% due 9/18/2027 | 18,475,000 | 17,631,616 |
| Machinery — 0.3% | |||
| d,e | ATS Corp., 4.125% due 12/15/2028 | 9,620,000 | 8,809,419 |
| d,i | Esab Corp., 6.25% due 4/15/2029 | 970,000 | 975,180 |
| See notes to financial statements. | Thornburg Taxable Fixed Income Funds Semi-Annual Report | 57 |
Thornburg Strategic Income Fund | March 31, 2024 (Unaudited)
| Issuer-Description | SHARES/ PRINCIPAL AMOUNT | VALUE | |
| Flowserve Corp., 3.50% due 10/1/2030 | $ 3,431,000 | $ 3,055,374 | |
| nVent Finance SARL, | |||
| e | 2.75% due 11/15/2031 | 4,097,000 | 3,373,633 |
| e | 4.55% due 4/15/2028 | 3,000,000 | 2,915,880 |
| Regal Rexnord Corp., | |||
| d | 6.05% due 2/15/2026 | 4,350,000 | 4,376,100 |
| d | 6.30% due 2/15/2030 | 6,000,000 | 6,145,800 |
| Trading Companies & Distributors — 0.2% | |||
| LKQ Corp., 6.25% due 6/15/2033 | 5,840,000 | 6,079,499 | |
| d | Windsor Holdings III LLC, 8.50% due 6/15/2030 | 7,470,000 | 7,844,471 |
| 136,077,414 | |||
| Commercial & Professional Services — 1.9% | |||
| Commercial Services & Supplies — 1.5% | |||
| d | ACCO Brands Corp., 4.25% due 3/15/2029 | 16,611,000 | 14,950,066 |
| Avery Dennison Corp., 5.75% due 3/15/2033 | 16,449,000 | 17,127,850 | |
| e | Cimpress plc, 7.00% due 6/15/2026 | 12,141,000 | 12,140,393 |
| d | Clean Harbors, Inc., 6.375% due 2/1/2031 | 1,000,000 | 1,007,060 |
| CoreCivic, Inc., 8.25% due 4/15/2029 | 12,869,000 | 13,460,073 | |
| Element Fleet Management Corp., | |||
| d,e | 5.643% due 3/13/2027 | 5,400,000 | 5,415,768 |
| d,e | 6.271% due 6/26/2026 | 17,735,000 | 17,943,741 |
| d,e | 6.319% due 12/4/2028 | 3,422,000 | 3,535,576 |
| Equifax, Inc., | |||
| 2.35% due 9/15/2031 | 9,394,000 | 7,761,699 | |
| 5.10% due 6/1/2028 | 4,667,000 | 4,675,027 | |
| Quanta Services, Inc., 0.95% due 10/1/2024 | 13,381,000 | 13,049,419 | |
| d | UL Solutions, Inc., 6.50% due 10/20/2028 | 16,950,000 | 17,668,680 |
| d | VT Topco, Inc., 8.50% due 8/15/2030 | 1,450,000 | 1,530,069 |
| Professional Services — 0.4% | |||
| Gartner, Inc., | |||
| d | 3.625% due 6/15/2029 | 7,155,000 | 6,481,572 |
| d | 4.50% due 7/1/2028 | 3,749,000 | 3,575,046 |
| d | Korn Ferry, 4.625% due 12/15/2027 | 17,229,000 | 16,423,372 |
| Verisk Analytics, Inc., 5.75% due 4/1/2033 | 3,540,000 | 3,684,078 | |
| 160,429,489 | |||
| Consumer Discretionary Distribution & Retail — 0.2% | |||
| Broadline Retail — 0.2% | |||
| MercadoLibre, Inc., | |||
| 2.375% due 1/14/2026 | 5,460,000 | 5,114,546 | |
| 3.125% due 1/14/2031 | 9,965,000 | 8,336,320 | |
| Specialty Retail — 0.0% | |||
| Advance Auto Parts, Inc., 3.90% due 4/15/2030 | 2,380,000 | 2,158,874 | |
| 15,609,740 | |||
| Consumer Durables & Apparel — 0.3% | |||
| Household Durables — 0.2% | |||
| d | CD&R Smokey Buyer, Inc., 6.75% due 7/15/2025 | 13,833,000 | 13,704,215 |
| Leisure Products — 0.1% | |||
| Polaris, Inc., 6.95% due 3/15/2029 | 9,875,000 | 10,505,815 | |
| 24,210,030 | |||
| Consumer Services — 1.2% | |||
| Hotels, Restaurants & Leisure — 1.2% | |||
| Hyatt Hotels Corp., 5.75% due 4/23/2030 | 4,475,000 | 4,589,605 | |
| Marriott International, Inc., | |||
| Series GG, 3.50% due 10/15/2032 | 8,825,000 | 7,728,405 | |
| Series- II, 2.75% due 10/15/2033 | 2,359,000 | 1,916,334 | |
| d | Nathan’s Famous, Inc., 6.625% due 11/1/2025 | 14,453,000 | 14,429,731 |
| d | Papa John’s International, Inc., 3.875% due 9/15/2029 | 12,568,000 | 11,153,723 |
| d | SeaWorld Parks & Entertainment, Inc., 8.75% due 5/1/2025 | 15,990,000 | 16,000,873 |
| d | Six Flags Entertainment Corp., 7.25% due 5/15/2031 | 8,888,000 | 8,999,278 |
| 58 | Thornburg Taxable Fixed Income Funds Semi-Annual Report | See notes to financial statements. |
| Issuer-Description | SHARES/ PRINCIPAL AMOUNT | VALUE | |
| d | TKC Holdings, Inc., 6.875% due 5/15/2028 | $ 8,650,000 | $ 8,206,601 |
| Warnermedia Holdings, Inc., 6.412% due 3/15/2026 | 13,000,000 | 13,000,390 | |
| d | WMG Acquisition Corp. (EUR), 2.25% due 8/15/2031 | 19,018,000 | 17,801,041 |
| 103,825,981 | |||
| Consumer Staples Distribution & Retail — 0.6% | |||
| Consumer Staples Distribution & Retail — 0.6% | |||
| Albertsons Cos., Inc./Safeway, Inc./New Albertsons LP/Albertsons LLC, | |||
| d | 5.875% due 2/15/2028 | 13,948,000 | 13,802,522 |
| d | 6.50% due 2/15/2028 | 4,725,000 | 4,781,511 |
| d | KeHE Distributors LLC/KeHE Finance Corp./NextWave Distribution, Inc., 9.00% due 2/15/2029 | 20,667,000 | 20,946,005 |
| d | U.S. Foods, Inc., 4.75% due 2/15/2029 | 12,000,000 | 11,389,200 |
| 50,919,238 | |||
| Energy — 2.7% | |||
| Energy Equipment & Services — 0.1% | |||
| d,e | Empresa Generadora de Electricidad Haina SA, 5.625% due 11/8/2028 | 10,800,000 | 9,813,852 |
| d,e,h | Odebrecht Oil & Gas Finance Ltd. (Guaranty: Odebrecht Oleo e Gas SA), Zero coupon due 4/29/2024 | 304,899 | 16,590 |
| Oil, Gas & Consumable Fuels — 2.6% | |||
| d | Chesapeake Energy Corp., 5.50% due 2/1/2026 | 8,550,000 | 8,492,715 |
| d | CITGO Petroleum Corp., 7.00% due 6/15/2025 | 12,200,000 | 12,187,312 |
| d | Colorado Interstate Gas Co. LLC/Colorado Interstate Issuing Corp., 4.15% due 8/15/2026 | 725,000 | 700,111 |
| d | Columbia Pipelines Operating Co. LLC, 5.927% due 8/15/2030 | 11,960,000 | 12,260,675 |
| d | Delek Logistics Partners LP/Delek Logistics Finance Corp., 8.625% due 3/15/2029 | 6,410,000 | 6,546,405 |
| Ecopetrol SA, | |||
| e | 6.875% due 4/29/2030 | 4,860,000 | 4,745,741 |
| e | 8.875% due 1/13/2033 | 10,588,000 | 11,193,210 |
| d | El Paso Natural Gas Co. LLC, 3.50% due 2/15/2032 | 1,989,000 | 1,689,894 |
| Energean Israel Finance Ltd., | |||
| e | 5.375% due 3/30/2028 | 6,500,000 | 5,939,050 |
| e | 8.50% due 9/30/2033 | 7,860,000 | 7,781,321 |
| Energy Transfer LP, | |||
| 6.05% due 12/1/2026 | 14,520,000 | 14,821,000 | |
| c | 8.586% (TSFR3M + 3.28%) due 11/1/2066 | 1,200,000 | 1,089,828 |
| d | Florida Gas Transmission Co. LLC, 2.30% due 10/1/2031 | 2,101,000 | 1,699,310 |
| Galaxy Pipeline Assets Bidco Ltd., | |||
| d,e | 1.75% due 9/30/2027 | 6,659,980 | 6,256,918 |
| d,e | 2.16% due 3/31/2034 | 3,703,559 | 3,186,282 |
| d,e | 2.625% due 3/31/2036 | 6,630,000 | 5,399,737 |
| b,d,e,g | Gazprom PJSC via Gaz Finance plc, 3.50% due 7/14/2031 | 16,000,000 | 8,337,440 |
| d | Gray Oak Pipeline LLC, 3.45% due 10/15/2027 | 6,730,000 | 6,317,047 |
| Gulfstream Natural Gas System LLC, | |||
| d | 4.60% due 9/15/2025 | 5,000,000 | 4,914,800 |
| d | 6.19% due 11/1/2025 | 3,584,000 | 3,596,042 |
| Kinder Morgan Energy Partners LP, 5.80% due 3/15/2035 | 4,450,000 | 4,517,551 | |
| d,e | Medco Maple Tree Pte. Ltd., 8.96% due 4/27/2029 | 13,000,000 | 13,522,730 |
| d | Midwest Connector Capital Co. LLC, 4.625% due 4/1/2029 | 5,487,000 | 5,299,125 |
| MPLX LP, 4.95% due 9/1/2032 | 2,790,000 | 2,712,689 | |
| d,e | Parkland Corp., 5.875% due 7/15/2027 | 5,456,000 | 5,408,751 |
| Petroleos Mexicanos, | |||
| e | 5.95% due 1/28/2031 | 8,312,000 | 6,666,390 |
| e | 6.84% due 1/23/2030 | 10,950,000 | 9,602,165 |
| d,e | Raizen Fuels Finance SA, 6.45% due 3/5/2034 | 4,800,000 | 4,919,856 |
| c,d | Summit Midstream Holdings LLC/Summit Midstream Finance Corp., 9.00% due 10/15/2026 | 848,000 | 857,820 |
| h | Summit Midstream Partners LP, Series A, 13.021% due 4/29/2024 | 2,114,000 | 2,008,300 |
| Sunoco LP/Sunoco Finance Corp., | |||
| 5.875% due 3/15/2028 | 15,530,000 | 15,413,370 | |
| d | 7.00% due 9/15/2028 | 4,470,000 | 4,567,982 |
| Tennessee Gas Pipeline Co. LLC, 7.00% due 3/15/2027 | 2,251,000 | 2,362,515 | |
| d,e | TMS Issuer SARL, 5.78% due 8/23/2032 | 10,700,000 | 11,002,596 |
| 225,847,120 | |||
| Equity Real Estate Investment Trusts (REITs) — 1.8% |
| See notes to financial statements. | Thornburg Taxable Fixed Income Funds Semi-Annual Report | 59 |
Thornburg Strategic Income Fund | March 31, 2024 (Unaudited)
| Issuer-Description | SHARES/ PRINCIPAL AMOUNT | VALUE | |
| Diversified REITs — 1.5% | |||
| American Tower Corp., | |||
| 1.45% due 9/15/2026 | $ 1,842,000 | $ 1,680,696 | |
| 1.875% due 10/15/2030 | 6,000,000 | 4,866,060 | |
| 5.80% due 11/15/2028 | 5,000,000 | 5,122,300 | |
| d | American Tower Trust #1, 3.652% due 3/15/2048 | 14,250,000 | 13,501,926 |
| Crown Castle, Inc., | |||
| 1.05% due 7/15/2026 | 2,636,000 | 2,397,416 | |
| 5.00% due 1/11/2028 | 7,100,000 | 7,029,071 | |
| Digital Realty Trust LP, 4.45% due 7/15/2028 | 4,800,000 | 4,649,760 | |
| Extra Space Storage LP, 5.70% due 4/1/2028 | 3,257,000 | 3,315,137 | |
| d | Iron Mountain Information Management Services, Inc., 5.00% due 7/15/2032 | 6,085,000 | 5,554,205 |
| Iron Mountain, Inc., | |||
| d | 4.875% due 9/15/2029 | 2,000,000 | 1,875,440 |
| d | 7.00% due 2/15/2029 | 7,985,000 | 8,141,107 |
| Realty Income Corp., 4.70% due 12/15/2028 | 4,503,000 | 4,436,851 | |
| SBA Tower Trust, | |||
| d | 1.631% due 5/15/2051 | 13,500,000 | 12,215,237 |
| d | 1.84% due 4/15/2027 | 3,400,000 | 3,046,738 |
| d | 1.884% due 7/15/2050 | 2,420,000 | 2,259,023 |
| d | 6.599% due 1/15/2028 | 15,000,000 | 15,366,699 |
| Sun Communities Operating LP, | |||
| 2.30% due 11/1/2028 | 5,153,000 | 4,503,413 | |
| 2.70% due 7/15/2031 | 9,377,000 | 7,730,305 | |
| d,e | Trust Fibra Uno, 5.25% due 1/30/2026 | 8,699,000 | 8,494,661 |
| Vornado Realty LP, | |||
| 2.15% due 6/1/2026 | 9,336,500 | 8,473,994 | |
| 3.40% due 6/1/2031 | 957,000 | 757,245 | |
| Retail REITs — 0.3% | |||
| Brixmor Operating Partnership LP, 3.85% due 2/1/2025 | 4,362,000 | 4,287,366 | |
| Retail Opportunity Investments Partnership LP, 6.75% due 10/15/2028 | 20,016,000 | 20,736,977 | |
| 150,441,627 | |||
| Financial Services — 5.1% | |||
| Capital Markets — 1.9% | |||
| d,e | B3 SA - Brasil Bolsa Balcao, 4.125% due 9/20/2031 | 14,877,000 | 12,993,274 |
| Blue Owl Capital Corp. III, 3.125% due 4/13/2027 | 6,070,000 | 5,529,042 | |
| Blue Owl Credit Income Corp., | |||
| 3.125% due 9/23/2026 | 2,176,000 | 1,997,111 | |
| 4.70% due 2/8/2027 | 780,000 | 739,963 | |
| 7.75% due 9/16/2027 | 1,350,000 | 1,382,940 | |
| Blue Owl Technology Finance Corp., | |||
| 2.50% due 1/15/2027 | 200,000 | 177,420 | |
| d | 3.75% due 6/17/2026 | 4,232,000 | 3,911,214 |
| d | 4.75% due 12/15/2025 | 24,596,000 | 23,635,526 |
| d | Boost Newco Borrower LLC/GTCR W Dutch Finance Sub BV (GBP), 8.50% due 1/15/2031 | 150,000 | 204,213 |
| d | Burford Capital Global Finance LLC, 9.25% due 7/1/2031 | 18,500,000 | 19,584,655 |
| c | Citigroup Global Markets Holdings, Inc., 6.40% due 1/29/2035 | 4,108,000 | 2,734,342 |
| Compass Group Diversified Holdings LLC, | |||
| d | 5.00% due 1/15/2032 | 800,000 | 715,744 |
| d | 5.25% due 4/15/2029 | 9,633,000 | 9,149,712 |
| d,e | FORESEA Holding SA, 7.50% due 6/15/2030 | 198,293 | 185,400 |
| d | GTP Acquisition Partners I LLC, Series 2015-2 Class A, 3.482% due 6/15/2050 | 2,000,000 | 1,959,580 |
| Hercules Capital, Inc., | |||
| 2.625% due 9/16/2026 | 9,316,000 | 8,447,376 | |
| 3.375% due 1/20/2027 | 4,157,000 | 3,821,946 | |
| LPL Holdings, Inc., | |||
| d | 4.00% due 3/15/2029 | 16,905,000 | 15,558,010 |
| d | 4.625% due 11/15/2027 | 3,515,000 | 3,373,099 |
| d,e | LSEGA Financing plc, 2.00% due 4/6/2028 | 2,065,000 | 1,845,016 |
| Main Street Capital Corp., | |||
| 3.00% due 7/14/2026 | 2,258,000 | 2,101,972 | |
| 6.95% due 3/1/2029 | 3,630,000 | 3,688,334 |
| 60 | Thornburg Taxable Fixed Income Funds Semi-Annual Report | See notes to financial statements. |
| Issuer-Description | SHARES/ PRINCIPAL AMOUNT | VALUE | |
| Nasdaq, Inc., 5.55% due 2/15/2034 | $ 10,156,000 | $ 10,328,550 | |
| d | Oaktree Strategic Credit Fund, 8.40% due 11/14/2028 | 6,938,000 | 7,361,149 |
| Sixth Street Specialty Lending, Inc., 3.875% due 11/1/2024 | 4,054,000 | 4,001,420 | |
| d | StoneX Group, Inc., 8.625% due 6/15/2025 | 13,286,000 | 13,352,829 |
| Consumer Finance — 0.2% | |||
| d | FirstCash, Inc., 5.625% due 1/1/2030 | 17,215,000 | 16,376,802 |
| Financial Services — 2.9% | |||
| Antares Holdings LP, | |||
| d | 2.75% due 1/15/2027 | 1,630,000 | 1,460,855 |
| d | 3.75% due 7/15/2027 | 6,480,000 | 5,888,894 |
| d | 3.95% due 7/15/2026 | 9,451,000 | 8,874,205 |
| d | 7.95% due 8/11/2028 | 5,000,000 | 5,200,000 |
| d | 8.50% due 5/18/2025 | 3,210,000 | 3,264,634 |
| e | Banco Santander SA, 5.147% due 8/18/2025 | 9,500,000 | 9,432,835 |
| Bank of America Corp., | |||
| c | 0.976% (SOFR + 0.69%) due 4/22/2025 | 9,500,000 | 9,471,690 |
| c | 1.319% (SOFR + 1.15%) due 6/19/2026 | 1,275,000 | 1,211,913 |
| c | 3.841% (SOFR + 1.11%) due 4/25/2025 | 2,535,000 | 2,531,654 |
| c | 4.948% (SOFR + 2.04%) due 7/22/2028 | 4,900,000 | 4,861,339 |
| BNP Paribas SA, | |||
| c,d,e | 2.159% (SOFR + 1.22%) due 9/15/2029 | 1,350,000 | 1,179,131 |
| d,e | 3.375% due 1/9/2025 | 5,000,000 | 4,916,600 |
| c | Capital One Financial Corp., 7.149% (SOFR + 2.44%) due 10/29/2027 | 3,737,000 | 3,891,450 |
| c | Charles Schwab Corp., 6.41% (SOFRINDX + 1.05%) due 3/3/2027 | 20,000,000 | 20,059,400 |
| Citigroup, Inc., | |||
| c | 1.122% (SOFR + 0.77%) due 1/28/2027 | 1,070,000 | 989,793 |
| c | 1.462% (SOFR + 0.77%) due 6/9/2027 | 5,881,000 | 5,400,287 |
| c | 6.021% (SOFR + 0.67%) due 5/1/2025 | 3,971,000 | 3,971,715 |
| Deutsche Bank AG, | |||
| e | 0.898% due 5/28/2024 | 3,667,000 | 3,638,434 |
| c,e | 2.552% (SOFR + 1.32%) due 1/7/2028 | 4,760,000 | 4,369,823 |
| Goldman Sachs Group, Inc., | |||
| c | 5.848% (SOFR + 0.50%) due 7/16/2024 | 5,092,000 | 5,063,892 |
| c | 5.861% (SOFR + 0.50%) due 9/10/2024 | 3,687,000 | 3,688,401 |
| c | 6.181% (SOFR + 0.82%) due 9/10/2027 | 3,687,000 | 3,683,239 |
| HSBC Holdings plc, | |||
| c,e | 1.589% (SOFR + 1.29%) due 5/24/2027 | 3,500,000 | 3,220,490 |
| c,e | 1.645% (SOFR + 1.54%) due 4/18/2026 | 3,750,000 | 3,593,025 |
| c,e | 2.206% (SOFR + 1.29%) due 8/17/2029 | 3,500,000 | 3,067,855 |
| c,e | 2.251% (SOFR + 1.10%) due 11/22/2027 | 1,350,000 | 1,244,457 |
| c,e | 4.18% (SOFR + 1.51%) due 12/9/2025 | 2,600,000 | 2,568,566 |
| JPMorgan Chase & Co., | |||
| c | 1.04% (TSFR3M + 0.70%) due 2/4/2027 | 1,896,000 | 1,753,800 |
| c | 3.54% (TSFR3M + 1.64%) due 5/1/2028 | 6,314,000 | 6,032,017 |
| c | 5.04% (SOFR + 1.19%) due 1/23/2028 | 2,925,000 | 2,914,704 |
| c | 6.277% (SOFR + 0.92%) due 2/24/2026 | 7,590,000 | 7,613,984 |
| c,h | Series S, 9.348% (TSFR3M + 4.04%) due 5/1/2024 | 14,850,000 | 14,875,690 |
| Mitsubishi UFJ Financial Group, Inc., | |||
| c,e | 0.962% (H15T1Y + 0.45%) due 10/11/2025 | 9,714,000 | 9,468,042 |
| c,e | 2.309% (H15T1Y + 0.95%) due 7/20/2032 | 7,000,000 | 5,828,480 |
| c,e | 5.017% (H15T1Y + 1.95%) due 7/20/2028 | 1,750,000 | 1,744,453 |
| c,e | 5.475% (H15T1Y + 1.53%) due 2/22/2031 | 2,000,000 | 2,031,960 |
| c | Morgan Stanley, 4.679% (SOFR + 1.67%) due 7/17/2026 | 1,560,000 | 1,543,308 |
| c,e | NatWest Group plc, 1.642% (H15T1Y + 0.90%) due 6/14/2027 | 2,000,000 | 1,839,640 |
| Societe Generale SA, | |||
| c,d,e | 1.792% (H15T1Y + 1.00%) due 6/9/2027 | 1,667,000 | 1,527,455 |
| d,e | 2.625% due 1/22/2025 | 3,000,000 | 2,923,260 |
| c,d,e | 5.634% (H15T1Y + 1.75%) due 1/19/2030 | 2,000,000 | 1,992,520 |
| c,d,e | 6.40% (SOFR + 1.05%) due 1/21/2026 | 2,600,000 | 2,601,976 |
| e | Sumitomo Mitsui Financial Group, Inc., 5.852% due 7/13/2030 | 14,550,000 | 15,086,895 |
| c | Truist Financial Corp., 7.161% (SOFR + 2.45%) due 10/30/2029 | 6,250,000 | 6,667,563 |
| See notes to financial statements. | Thornburg Taxable Fixed Income Funds Semi-Annual Report | 61 |
Thornburg Strategic Income Fund | March 31, 2024 (Unaudited)
| Issuer-Description | SHARES/ PRINCIPAL AMOUNT | VALUE | |
| UBS Group AG, | |||
| c,d,e | 1.494% (H15T1Y + 0.85%) due 8/10/2027 | $ 2,679,000 | $ 2,436,872 |
| c,d,e | 2.593% (SOFR + 1.56%) due 9/11/2025 | 3,467,000 | 3,418,150 |
| c,d,e | 4.49% (H15T1Y + 1.60%) due 8/5/2025 | 1,733,000 | 1,724,335 |
| c,d,e | 4.751% (H15T1Y + 1.75%) due 5/12/2028 | 3,600,000 | 3,525,300 |
| d | United Wholesale Mortgage LLC, 5.50% due 11/15/2025 | 12,301,000 | 12,190,906 |
| Western Union Co., 2.85% due 1/10/2025 | 2,338,000 | 2,286,096 | |
| Mortgage Real Estate Investment Trusts — 0.1% | |||
| Prologis Targeted U.S. Logistics Fund LP, | |||
| d | 5.25% due 4/1/2029 | 5,530,000 | 5,516,396 |
| d | 5.50% due 4/1/2034 | 5,470,000 | 5,499,429 |
| 424,944,447 | |||
| Food, Beverage & Tobacco — 1.7% | |||
| Beverages — 0.6% | |||
| d,e | Becle SAB de CV, 2.50% due 10/14/2031 | 29,514,000 | 23,532,988 |
| d,e | Central American Bottling Corp./CBC Bottling Holdco SL/Beliv Holdco SL, 5.25% due 4/27/2029 | 20,790,000 | 19,817,859 |
| Constellation Brands, Inc., 5.00% due 2/2/2026 | 2,763,000 | 2,746,201 | |
| Huntington Ingalls Industries, Inc., 2.043% due 8/16/2028 | 6,445,000 | 5,632,543 | |
| Food Products — 0.4% | |||
| d | Darling Global Finance BV (EUR), 3.625% due 5/15/2026 | 9,700,000 | 10,360,196 |
| Darling Ingredients, Inc., | |||
| d | 5.25% due 4/15/2027 | 3,700,000 | 3,631,624 |
| d | 6.00% due 6/15/2030 | 1,000,000 | 991,370 |
| Post Holdings, Inc., | |||
| d | 4.625% due 4/15/2030 | 8,860,000 | 8,132,505 |
| d | 5.50% due 12/15/2029 | 8,247,000 | 7,967,014 |
| d | 6.25% due 2/15/2032 | 2,950,000 | 2,970,562 |
| Tobacco — 0.7% | |||
| Altria Group, Inc., 2.45% due 2/4/2032 | 9,890,000 | 8,031,669 | |
| BAT Capital Corp., | |||
| 2.726% due 3/25/2031 | 7,615,000 | 6,409,393 | |
| 6.343% due 8/2/2030 | 6,880,000 | 7,170,474 | |
| 7.75% due 10/19/2032 | 4,862,000 | 5,491,143 | |
| d,e | Imperial Brands Finance plc, 6.125% due 7/27/2027 | 5,000,000 | 5,102,700 |
| d | Vector Group Ltd., 10.50% due 11/1/2026 | 20,927,000 | 21,047,330 |
| 139,035,571 | |||
| Health Care Equipment & Services — 1.5% | |||
| Health Care Equipment & Supplies — 0.2% | |||
| d | Hologic, Inc., 3.25% due 2/15/2029 | 9,957,000 | 8,929,338 |
| d | Medline Borrower LP/Medline Co.-Issuer, Inc., 6.25% due 4/1/2029 | 3,950,000 | 3,967,815 |
| d,e | Olympus Corp., 2.143% due 12/8/2026 | 5,510,000 | 5,062,257 |
| Health Care Providers & Services — 1.3% | |||
| Centene Corp., | |||
| 2.625% due 8/1/2031 | 3,950,000 | 3,243,977 | |
| 3.00% due 10/15/2030 | 6,962,000 | 5,967,896 | |
| 4.625% due 12/15/2029 | 5,775,000 | 5,483,363 | |
| Charles River Laboratories International, Inc., | |||
| d | 3.75% due 3/15/2029 | 4,567,000 | 4,167,844 |
| d | 4.25% due 5/1/2028 | 4,480,000 | 4,228,627 |
| d | Highmark, Inc., 1.45% due 5/10/2026 | 10,580,000 | 9,677,738 |
| Humana, Inc., | |||
| 5.375% due 4/15/2031 | 6,569,000 | 6,575,175 | |
| 5.70% due 3/13/2026 | 21,835,000 | 21,814,912 | |
| IQVIA, Inc., 5.70% due 5/15/2028 | 5,000,000 | 5,073,750 | |
| IQVIA, Inc. (EUR), | |||
| d | 2.25% due 3/15/2029 | 9,460,000 | 9,187,471 |
| d | 2.875% due 6/15/2028 | 5,000,000 | 5,069,354 |
| Tenet Healthcare Corp., | |||
| 6.125% due 6/15/2030 | 4,500,000 | 4,495,005 | |
| d | 6.75% due 5/15/2031 | 16,224,000 | 16,530,958 |
| 62 | Thornburg Taxable Fixed Income Funds Semi-Annual Report | See notes to financial statements. |
| Issuer-Description | SHARES/ PRINCIPAL AMOUNT | VALUE | |
| Universal Health Services, Inc., | |||
| 1.65% due 9/1/2026 | $ 6,179,000 | $ 5,631,417 | |
| 2.65% due 10/15/2030 | 4,646,000 | 3,937,020 | |
| 129,043,917 | |||
| Household & Personal Products — 0.7% | |||
| Household Products — 0.6% | |||
| d | Energizer Holdings, Inc., 4.75% due 6/15/2028 | 7,268,000 | 6,740,416 |
| d | Kronos Acquisition Holdings, Inc./KIK Custom Products, Inc., 5.00% due 12/31/2026 | 4,585,000 | 4,503,295 |
| Prestige Brands, Inc., | |||
| d | 3.75% due 4/1/2031 | 6,386,000 | 5,561,440 |
| d | 5.125% due 1/15/2028 | 12,321,000 | 11,992,892 |
| Scotts Miracle-Gro Co., | |||
| 4.375% due 2/1/2032 | 13,166,000 | 11,355,938 | |
| 5.25% due 12/15/2026 | 2,000,000 | 1,968,700 | |
| Spectrum Brands, Inc. (EUR), | |||
| 4.00% due 10/1/2026 | 2,900,000 | 3,094,437 | |
| d | 4.00% due 10/1/2026 | 2,000,000 | 2,134,094 |
| Personal Care Products — 0.1% | |||
| d | Edgewell Personal Care Co., 5.50% due 6/1/2028 | 9,892,000 | 9,672,101 |
| 57,023,313 | |||
| Industrials — 0.2% | |||
| Transportation Infrastructure — 0.2% | |||
| Penske Truck Leasing Co. LP/PTL Finance Corp., | |||
| d | 5.55% due 5/1/2028 | 9,940,000 | 10,051,924 |
| d | 5.75% due 5/24/2026 | 2,480,000 | 2,498,054 |
| d | 6.05% due 8/1/2028 | 3,053,000 | 3,143,522 |
| d | 6.20% due 6/15/2030 | 2,400,000 | 2,497,800 |
| 18,191,300 | |||
| Insurance — 4.7% | |||
| Insurance — 4.7% | |||
| d | American National Group LLC, 6.144% due 6/13/2032 | 12,684,000 | 11,972,174 |
| Aon North America, Inc., 5.45% due 3/1/2034 | 11,280,000 | 11,403,178 | |
| d,e | Ascot Group Ltd., 4.25% due 12/15/2030 | 6,889,000 | 5,757,137 |
| Brighthouse Financial Global Funding, | |||
| d | 1.55% due 5/24/2026 | 2,089,000 | 1,911,978 |
| d | 2.00% due 6/28/2028 | 4,823,000 | 4,157,378 |
| c,d | 6.109% (SOFR + 0.76%) due 4/12/2024 | 4,500,000 | 4,483,125 |
| Brighthouse Financial, Inc., 5.625% due 5/15/2030 | 6,750,000 | 6,773,490 | |
| CNA Financial Corp., 5.125% due 2/15/2034 | 6,785,000 | 6,600,177 | |
| d | Corebridge Global Funding, 5.75% due 7/2/2026 | 8,940,000 | 8,954,930 |
| d,e | DaVinciRe Holdings Ltd., 4.75% due 5/1/2025 | 7,678,000 | 7,528,279 |
| c | Enstar Finance LLC, 5.75% (5-Yr. CMT + 5.468%) due 9/1/2040 | 3,304,000 | 3,205,574 |
| e | Enstar Group Ltd., 3.10% due 9/1/2031 | 12,701,000 | 10,550,340 |
| Equitable Financial Life Global Funding, | |||
| d | 1.00% due 1/9/2026 | 3,000,000 | 2,774,430 |
| d | 1.40% due 8/27/2027 | 4,620,000 | 4,031,828 |
| d | 1.80% due 3/8/2028 | 5,919,000 | 5,216,178 |
| F&G Annuities & Life, Inc., 7.40% due 1/13/2028 | 11,590,000 | 12,033,897 | |
| F&G Global Funding, | |||
| d | 0.90% due 9/20/2024 | 1,500,000 | 1,463,745 |
| d | 1.75% due 6/30/2026 | 7,973,000 | 7,225,850 |
| d | 2.00% due 9/20/2028 | 8,458,000 | 7,194,121 |
| d | 2.30% due 4/11/2027 | 4,200,000 | 3,770,844 |
| Fairfax Financial Holdings Ltd., | |||
| e | 3.375% due 3/3/2031 | 1,520,000 | 1,329,681 |
| e | 4.625% due 4/29/2030 | 4,673,000 | 4,461,547 |
| e | 5.625% due 8/16/2032 | 10,603,000 | 10,606,499 |
| d,e | Fidelis Insurance Holdings Ltd., 4.875% due 6/30/2030 | 4,409,000 | 4,256,184 |
| Fidelity National Financial, Inc., | |||
| 2.45% due 3/15/2031 | 3,857,000 | 3,178,052 |
| See notes to financial statements. | Thornburg Taxable Fixed Income Funds Semi-Annual Report | 63 |
Thornburg Strategic Income Fund | March 31, 2024 (Unaudited)
| Issuer-Description | SHARES/ PRINCIPAL AMOUNT | VALUE | |
| 4.50% due 8/15/2028 | $ 1,280,000 | $ 1,237,645 | |
| First American Financial Corp., | |||
| 2.40% due 8/15/2031 | 2,261,000 | 1,792,295 | |
| 4.00% due 5/15/2030 | 1,457,000 | 1,324,253 | |
| d | Five Corners Funding Trust III, 5.791% due 2/15/2033 | 7,260,000 | 7,475,695 |
| GA Global Funding Trust, | |||
| d | 1.625% due 1/15/2026 | 610,000 | 565,397 |
| d | 2.25% due 1/6/2027 | 2,971,000 | 2,718,643 |
| d | 3.85% due 4/11/2025 | 5,860,000 | 5,749,598 |
| c,d | 5.862% (SOFR + 0.50%) due 9/13/2024 | 5,322,000 | 5,317,742 |
| d | Global Atlantic Fin Co., 4.40% due 10/15/2029 | 7,275,000 | 6,761,894 |
| Globe Life, Inc., 4.80% due 6/15/2032 | 3,038,000 | 2,963,417 | |
| d | Guardian Life Global Funding, 5.55% due 10/28/2027 | 4,545,000 | 4,641,490 |
| Horace Mann Educators Corp., 7.25% due 9/15/2028 | 6,000,000 | 6,415,140 | |
| d,e | Intact Financial Corp., 5.459% due 9/22/2032 | 5,922,000 | 5,926,086 |
| Jackson Financial, Inc., 5.17% due 6/8/2027 | 2,788,000 | 2,780,082 | |
| Jackson National Life Global Funding, | |||
| d | 5.25% due 4/12/2028 | 6,697,000 | 6,582,548 |
| d | 5.50% due 1/9/2026 | 17,000,000 | 16,923,330 |
| Lincoln National Corp., 5.852% due 3/15/2034 | 5,000,000 | 4,936,300 | |
| Mercury General Corp., 4.40% due 3/15/2027 | 9,408,000 | 9,055,858 | |
| c,d | Nationwide Mutual Insurance Co., 7.881% (SOFR + 2.51%) due 12/15/2024 | 6,178,000 | 6,198,758 |
| d | New York Life Global Funding, 4.55% due 1/28/2033 | 4,400,000 | 4,245,604 |
| c,d | Pacific Life Global Funding II, 5.98% (SOFR + 0.62%) due 6/4/2026 | 4,533,000 | 4,525,112 |
| e | Pentair Finance SARL, 5.90% due 7/15/2032 | 9,193,000 | 9,479,638 |
| d | Principal Life Global Funding II, 5.50% due 6/28/2028 | 6,400,000 | 6,432,128 |
| d | Protective Life Corp., 3.40% due 1/15/2030 | 4,902,000 | 4,335,035 |
| d | Protective Life Global Funding, 5.467% due 12/8/2028 | 4,850,000 | 4,937,979 |
| Reinsurance Group of America, Inc., 6.00% due 9/15/2033 | 9,501,000 | 9,857,382 | |
| Reliance Standard Life Global Funding II, | |||
| d | 1.512% due 9/28/2026 | 4,000,000 | 3,583,400 |
| d | 5.243% due 2/2/2026 | 17,289,000 | 17,111,615 |
| e | RenaissanceRe Holdings Ltd., 5.75% due 6/5/2033 | 9,395,000 | 9,464,805 |
| RGA Global Funding, | |||
| d | 2.70% due 1/18/2029 | 9,687,000 | 8,637,801 |
| d | 5.50% due 1/11/2031 | 5,458,000 | 5,476,066 |
| Sammons Financial Group, Inc., | |||
| d | 4.45% due 5/12/2027 | 2,000,000 | 1,905,620 |
| d | 6.875% due 4/15/2034 | 6,610,000 | 6,659,972 |
| d | Security Benefit Global Funding, 1.25% due 5/17/2024 | 15,809,000 | 15,678,892 |
| Stewart Information Services Corp., 3.60% due 11/15/2031 | 16,620,000 | 13,629,563 | |
| Willis North America, Inc., | |||
| 2.95% due 9/15/2029 | 3,000,000 | 2,689,380 | |
| 5.35% due 5/15/2033 | 9,835,000 | 9,780,907 | |
| 388,637,686 | |||
| Materials — 3.3% | |||
| Chemicals — 1.1% | |||
| FMC Corp., 5.15% due 5/18/2026 | 4,860,000 | 4,834,582 | |
| d | International Flavors & Fragrances, Inc., 6.105% due 4/2/2024 | 23,700,000 | 23,696,050 |
| International Flavors & Fragrances, Inc. (EUR), 1.80% due 9/25/2026 | 13,400,000 | 13,777,996 | |
| NOVA Chemicals Corp., | |||
| d,e | 5.25% due 6/1/2027 | 9,300,000 | 8,774,364 |
| d,e | 9.00% due 2/15/2030 | 5,000,000 | 5,166,650 |
| d,e | Nufarm Australia Ltd./Nufarm Americas, Inc., 5.00% due 1/27/2030 | 12,383,000 | 11,343,447 |
| OCP SA, | |||
| d,e | 3.75% due 6/23/2031 | 7,800,000 | 6,653,010 |
| d,e | 4.50% due 10/22/2025 | 4,800,000 | 4,680,288 |
| d,e | 5.625% due 4/25/2024 | 4,710,000 | 4,709,435 |
| b,e,g | Phosagro OAO Via Phosagro Bond Funding DAC, 3.05% due 1/23/2025 | 933,000 | 756,085 |
| d,e | SNF Group SACA, 3.125% due 3/15/2027 | 8,405,000 | 7,762,942 |
| Containers & Packaging — 1.3% | |||
| d,e | Ardagh Metal Packaging Finance USA LLC/Ardagh Metal Packaging Finance plc, 3.25% due 9/1/2028 | 16,310,000 | 14,090,372 |
| 64 | Thornburg Taxable Fixed Income Funds Semi-Annual Report | See notes to financial statements. |
| Issuer-Description | SHARES/ PRINCIPAL AMOUNT | VALUE | |
| Ball Corp., | |||
| 2.875% due 8/15/2030 | $ 14,300,000 | $ 12,212,772 | |
| 3.125% due 9/15/2031 | 5,414,000 | 4,613,486 | |
| 6.00% due 6/15/2029 | 1,000,000 | 1,009,270 | |
| d | Berry Global, Inc., 4.875% due 7/15/2026 | 8,222,000 | 8,065,042 |
| d | Berry Global, Inc. (EUR), 1.00% due 1/15/2025 | 4,019,000 | 4,221,083 |
| d | Graphic Packaging International LLC,3.50% due 3/15/2028 - 3/1/2029 | 8,150,000 | 7,504,606 |
| d | Matthews International Corp., Class C, 5.25% due 12/1/2025 | 15,091,000 | 14,805,176 |
| d | OI European Group BV (EUR), 6.25% due 5/15/2028 | 3,000,000 | 3,374,103 |
| Sealed Air Corp., | |||
| d | 1.573% due 10/15/2026 | 13,352,000 | 12,064,734 |
| d | 5.00% due 4/15/2029 | 8,460,000 | 8,119,739 |
| d | Sealed Air Corp./Sealed Air Corp. U.S., 7.25% due 2/15/2031 | 500,000 | 520,280 |
| d | Silgan Holdings, Inc., 1.40% due 4/1/2026 | 20,082,000 | 18,394,911 |
| Metals & Mining — 0.9% | |||
| e | AngloGold Ashanti Holdings plc, 3.375% due 11/1/2028 | 15,715,000 | 14,146,486 |
| Cleveland-Cliffs, Inc., 7.00% due 3/15/2027 | 5,000,000 | 5,018,000 | |
| d | Compass Minerals International, Inc., 6.75% due 12/1/2027 | 11,123,000 | 10,743,038 |
| b,d,e,g | Metalloinvest Finance DAC, 3.375% due 10/22/2028 | 7,500,000 | 4,320,375 |
| d,e | POSCO, 5.625% due 1/17/2026 | 4,650,000 | 4,661,346 |
| Stillwater Mining Co., | |||
| d | 4.00% due 11/16/2026 | 14,328,000 | 12,792,755 |
| d | 4.50% due 11/16/2029 | 3,050,000 | 2,400,442 |
| WE Soda Investments Holding plc, | |||
| d,e | 9.375% due 2/14/2031 | 4,150,000 | 4,269,354 |
| d,e | 9.50% due 10/6/2028 | 12,000,000 | 12,450,000 |
| 271,952,219 | |||
| Media & Entertainment — 0.7% | |||
| Media — 0.7% | |||
| CCO Holdings LLC/CCO Holdings Capital Corp., | |||
| d | 4.25% due 2/1/2031 - 1/15/2034 | 11,548,000 | 9,103,279 |
| d | 4.75% due 3/1/2030 - 2/1/2032 | 9,273,000 | 7,917,684 |
| d | Directv Financing LLC/Directv Financing Co.-Obligor, Inc., 5.875% due 8/15/2027 | 3,880,000 | 3,670,984 |
| d | News Corp., 5.125% due 2/15/2032 | 4,980,000 | 4,692,455 |
| d | Sirius XM Radio, Inc., 5.00% due 8/1/2027 | 21,775,000 | 20,964,099 |
| d,e | Telenet Finance Luxembourg Notes SARL, 5.50% due 3/1/2028 | 14,200,000 | 13,377,820 |
| 59,726,321 | |||
| Pharmaceuticals, Biotechnology & Life Sciences — 0.7% | |||
| Biotechnology — 0.3% | |||
| Amgen, Inc., | |||
| 5.25% due 3/2/2033 | 5,000,000 | 5,042,500 | |
| 5.507% due 3/2/2026 | 6,800,000 | 6,796,940 | |
| Bio-Rad Laboratories, Inc., 3.30% due 3/15/2027 | 2,505,000 | 2,374,590 | |
| Illumina, Inc., 5.80% due 12/12/2025 | 5,579,000 | 5,590,660 | |
| e | Royalty Pharma plc, 1.75% due 9/2/2027 | 4,086,000 | 3,648,757 |
| Life Sciences Tools & Services — 0.1% | |||
| d | Avantor Funding, Inc. (EUR), 2.625% due 11/1/2025 | 11,000,000 | 11,590,365 |
| Pharmaceuticals — 0.3% | |||
| a,b,g | Atlas U.S. Royalty LLC Participation Rights, Zero coupon due 3/15/2027 | 5,450,000 | 545 |
| d | Bayer U.S. Finance II LLC, 4.25% due 12/15/2025 | 2,500,000 | 2,438,025 |
| Cigna Group, 5.685% due 3/15/2026 | 16,515,000 | 16,515,661 | |
| d | PRA Health Sciences, Inc., 2.875% due 7/15/2026 | 5,402,000 | 5,033,367 |
| 59,031,410 | |||
| Real Estate Management & Development — 0.2% | |||
| Real Estate Management & Development — 0.2% | |||
| d | Cushman & Wakefield U.S. Borrower LLC, 6.75% due 5/15/2028 | 13,774,000 | 13,602,376 |
| d | Greystar Real Estate Partners LLC, 7.75% due 9/1/2030 | 2,490,000 | 2,606,806 |
| 16,209,182 | |||
| Semiconductors & Semiconductor Equipment — 0.9% |
| See notes to financial statements. | Thornburg Taxable Fixed Income Funds Semi-Annual Report | 65 |
Thornburg Strategic Income Fund | March 31, 2024 (Unaudited)
| Issuer-Description | SHARES/ PRINCIPAL AMOUNT | VALUE | |
| Semiconductors & Semiconductor Equipment — 0.9% | |||
| d | Broadcom, Inc., 3.187% due 11/15/2036 | $ 4,861,000 | $ 3,864,155 |
| Microchip Technology, Inc., 4.25% due 9/1/2025 | 11,300,000 | 11,122,816 | |
| Micron Technology, Inc., | |||
| 4.663% due 2/15/2030 | 1,186,000 | 1,159,303 | |
| 6.75% due 11/1/2029 | 9,820,000 | 10,539,217 | |
| Qorvo, Inc., | |||
| 1.75% due 12/15/2024 | 8,500,000 | 8,244,490 | |
| d | 3.375% due 4/1/2031 | 14,904,000 | 12,760,954 |
| d,e | Renesas Electronics Corp., 1.543% due 11/26/2024 | 19,265,000 | 18,705,737 |
| SK Hynix, Inc., | |||
| d,e | 1.50% due 1/19/2026 | 4,400,000 | 4,097,192 |
| d,e | 6.25% due 1/17/2026 | 6,800,000 | 6,874,120 |
| Skyworks Solutions, Inc., 1.80% due 6/1/2026 | 1,160,000 | 1,076,549 | |
| 78,444,533 | |||
| Software & Services — 2.6% | |||
| Information Technology Services — 1.0% | |||
| Block Financial LLC, 2.50% due 7/15/2028 | 3,605,000 | 3,202,862 | |
| d | Boost Newco Borrower LLC, 7.50% due 1/15/2031 | 8,000,000 | 8,377,120 |
| Booz Allen Hamilton, Inc., 5.95% due 8/4/2033 | 7,440,000 | 7,701,144 | |
| DXC Technology Co., 2.375% due 9/15/2028 | 11,657,000 | 10,129,933 | |
| e | Genpact Luxembourg SARL, 3.375% due 12/1/2024 | 9,909,000 | 9,730,242 |
| e | Genpact Luxembourg SARL/Genpact USA, Inc., 1.75% due 4/10/2026 | 1,626,000 | 1,508,700 |
| Global Payments, Inc., | |||
| 1.20% due 3/1/2026 | 1,401,000 | 1,296,583 | |
| 1.50% due 11/15/2024 | 2,230,000 | 2,172,957 | |
| 5.30% due 8/15/2029 | 4,441,000 | 4,421,904 | |
| Kyndryl Holdings, Inc., | |||
| 2.05% due 10/15/2026 | 3,968,000 | 3,635,481 | |
| 2.70% due 10/15/2028 | 8,296,000 | 7,352,994 | |
| d | Science Applications International Corp., 4.875% due 4/1/2028 | 22,379,000 | 21,371,945 |
| d | Wipro IT Services LLC, 1.50% due 6/23/2026 | 3,953,000 | 3,642,729 |
| Internet Software & Services — 0.7% | |||
| d | Arches Buyer, Inc., 4.25% due 6/1/2028 | 19,319,000 | 17,001,106 |
| d | Cogent Communications Group, Inc., 7.00% due 6/15/2027 | 9,567,000 | 9,524,236 |
| eBay, Inc., 5.90% due 11/22/2025 | 3,650,000 | 3,677,667 | |
| Prosus NV, | |||
| d,e | 3.061% due 7/13/2031 | 656,000 | 532,829 |
| d,e | 4.193% due 1/19/2032 | 11,494,000 | 9,948,402 |
| Prosus NV (EUR), | |||
| d | 1.288% due 7/13/2029 | 8,715,000 | 7,971,730 |
| d | 2.031% due 8/3/2032 | 7,000,000 | 6,064,668 |
| Software — 0.9% | |||
| d,e | Constellation Software, Inc., 5.158% due 2/16/2029 | 9,218,000 | 9,209,059 |
| d | Fair Isaac Corp., 4.00% due 6/15/2028 | 16,087,000 | 15,033,784 |
| Fidelity National Information Services, Inc., 1.15% due 3/1/2026 | 2,000,000 | 1,851,340 | |
| d | GoTo Group, Inc.,5.50% due 5/1/2028 | 5,292,209 | 3,996,987 |
| d | Infor, Inc., 1.75% due 7/15/2025 | 2,250,000 | 2,129,423 |
| MSCI, Inc., | |||
| d | 3.875% due 2/15/2031 | 9,973,000 | 8,889,334 |
| d | 4.00% due 11/15/2029 | 6,289,000 | 5,827,576 |
| Open Text Corp., | |||
| d,e | 3.875% due 2/15/2028 - 12/1/2029 | 20,088,000 | 18,348,477 |
| d,e | 6.90% due 12/1/2027 | 9,150,000 | 9,466,133 |
| VMware LLC, 4.50% due 5/15/2025 | 4,040,000 | 4,000,933 | |
| 218,018,278 | |||
| Technology Hardware & Equipment — 1.4% | |||
| Electronic Equipment, Instruments & Components — 1.2% | |||
| Arrow Electronics, Inc., 6.125% due 3/1/2026 | 18,910,000 | 18,889,199 | |
| Avnet, Inc., 6.25% due 3/15/2028 | 14,700,000 | 15,070,440 | |
| CDW LLC/CDW Finance Corp., |
| 66 | Thornburg Taxable Fixed Income Funds Semi-Annual Report | See notes to financial statements. |
| Issuer-Description | SHARES/ PRINCIPAL AMOUNT | VALUE | |
| 3.25% due 2/15/2029 | $ 5,238,000 | $ 4,748,195 | |
| 4.25% due 4/1/2028 | 8,103,000 | 7,753,112 | |
| Flex Ltd., | |||
| e | 4.875% due 5/12/2030 | 4,671,000 | 4,547,779 |
| e | 6.00% due 1/15/2028 | 3,886,000 | 3,952,723 |
| d,e | Sensata Technologies BV, 5.875% due 9/1/2030 | 2,375,000 | 2,324,270 |
| TD SYNNEX Corp., 1.75% due 8/9/2026 | 13,683,000 | 12,506,809 | |
| Trimble, Inc., 4.75% due 12/1/2024 | 6,525,000 | 6,467,254 | |
| Vontier Corp., | |||
| 1.80% due 4/1/2026 | 4,453,000 | 4,132,651 | |
| 2.40% due 4/1/2028 | 11,380,000 | 10,087,801 | |
| d | WESCO Distribution, Inc., 6.375% due 3/15/2029 | 4,690,000 | 4,739,292 |
| Technology Hardware, Storage & Peripherals — 0.2% | |||
| Dell International LLC/EMC Corp., 4.90% due 10/1/2026 | 3,464,000 | 3,440,895 | |
| Lenovo Group Ltd., | |||
| d,e | 5.831% due 1/27/2028 | 3,885,000 | 3,930,649 |
| e | 5.875% due 4/24/2025 | 10,993,000 | 11,003,443 |
| 113,594,512 | |||
| Telecommunication Services — 0.8% | |||
| Diversified Telecommunication Services — 0.4% | |||
| AT&T, Inc., 5.539% due 2/20/2026 | 22,242,000 | 22,241,110 | |
| Videotron Ltd., | |||
| d,e | 5.125% due 4/15/2027 | 7,150,000 | 7,000,494 |
| d,e | 5.375% due 6/15/2024 | 6,000,000 | 5,979,960 |
| d,e | Virgin Media Secured Finance plc, 5.50% due 5/15/2029 | 1,800,000 | 1,663,938 |
| Wireless Telecommunication Services — 0.4% | |||
| d | Crown Castle Towers LLC, 4.241% due 7/15/2048 | 455,000 | 433,617 |
| e,j | Digicel Intermediate Holdings Ltd./Digicel International Finance Ltd./Difl U.S., 12.00% due 5/25/2027 PIK | 4,868,548 | 4,783,835 |
| T-Mobile USA, Inc., | |||
| 2.25% due 2/15/2026 | 2,232,000 | 2,111,762 | |
| 2.625% due 4/15/2026 | 2,708,000 | 2,572,465 | |
| 3.375% due 4/15/2029 | 10,090,000 | 9,338,396 | |
| 5.375% due 4/15/2027 | 2,965,000 | 2,980,210 | |
| Vmed O2 U.K. Financing I plc, | |||
| d,e | 4.25% due 1/31/2031 | 7,818,000 | 6,623,019 |
| d,e | 4.75% due 7/15/2031 | 1,500,000 | 1,293,030 |
| 67,021,836 | |||
| Transportation — 0.2% | |||
| Air Freight & Logistics — 0.2% | |||
| Ryder System, Inc., | |||
| 5.25% due 6/1/2028 | 6,533,000 | 6,563,378 | |
| 5.65% due 3/1/2028 | 7,244,000 | 7,384,461 | |
| Passenger Airlines — 0.0% | |||
| American Airlines Pass-Through Trust, Series 2016-3 Class B, 3.75% due 4/15/2027 | 610,608 | 587,283 | |
| d | British Airways Pass-Through Trust, Series 2020-1 Class A, 4.25% due 5/15/2034 | 919,584 | 856,418 |
| 15,391,540 | |||
| Utilities — 4.9% | |||
| Electric Utilities — 3.9% | |||
| AEP Texas, Inc., | |||
| 5.40% due 6/1/2033 | 5,106,000 | 5,097,728 | |
| Series I, 2.10% due 7/1/2030 | 3,800,000 | 3,166,274 | |
| d,e | AES Espana BV, 5.70% due 5/4/2028 | 15,177,000 | 13,980,294 |
| Allegion U.S. Holding Co., Inc., 5.411% due 7/1/2032 | 4,659,000 | 4,671,253 | |
| Alliant Energy Finance LLC, | |||
| d | 1.40% due 3/15/2026 | 1,500,000 | 1,368,705 |
| d | 5.95% due 3/30/2029 | 3,415,000 | 3,517,211 |
| American Electric Power Co., Inc., 5.699% due 8/15/2025 | 4,750,000 | 4,758,455 | |
| Appalachian Power Co., | |||
| Series AA, 2.70% due 4/1/2031 | 4,705,000 | 3,964,010 | |
| Series BB, 4.50% due 8/1/2032 | 3,327,000 | 3,122,988 |
| See notes to financial statements. | Thornburg Taxable Fixed Income Funds Semi-Annual Report | 67 |
Thornburg Strategic Income Fund | March 31, 2024 (Unaudited)
| Issuer-Description | SHARES/ PRINCIPAL AMOUNT | VALUE | |
| Black Hills Corp., | |||
| 1.037% due 8/23/2024 | $ 8,226,000 | $ 8,073,408 | |
| 2.50% due 6/15/2030 | 1,000,000 | 837,400 | |
| 5.95% due 3/15/2028 | 5,387,000 | 5,557,930 | |
| 6.15% due 5/15/2034 | 6,135,000 | 6,326,780 | |
| d | Boston Gas Co., 3.757% due 3/16/2032 | 6,140,000 | 5,396,016 |
| c | CenterPoint Energy, Inc., 6.004% (SOFRINDX + 0.65%) due 5/13/2024 | 1,250,000 | 1,249,963 |
| Comision Federal de Electricidad, | |||
| d,e | 3.348% due 2/9/2031 | 14,145,000 | 11,749,403 |
| e | 5.00% due 9/29/2036 | 6,636,400 | 5,855,428 |
| Dominion Energy, Inc., 5.375% due 11/15/2032 | 5,000,000 | 5,032,650 | |
| DTE Energy Co., 4.875% due 6/1/2028 | 12,452,000 | 12,322,624 | |
| Enel Finance International NV, | |||
| d,e | 1.375% due 7/12/2026 | 2,750,000 | 2,516,195 |
| d,e | 1.875% due 7/12/2028 | 16,900,000 | 14,800,851 |
| d,e | 2.25% due 7/12/2031 | 1,951,000 | 1,579,276 |
| d,e | 5.00% due 6/15/2032 | 3,819,000 | 3,699,503 |
| d,e | 7.50% due 10/14/2032 | 2,400,000 | 2,709,744 |
| Entergy Texas, Inc., | |||
| 1.50% due 9/1/2026 | 5,866,000 | 5,349,323 | |
| 3.45% due 12/1/2027 | 3,000,000 | 2,815,290 | |
| Evergy Metro, Inc., 4.95% due 4/15/2033 | 4,663,000 | 4,595,387 | |
| Eversource Energy, | |||
| 5.125% due 5/15/2033 | 4,950,000 | 4,853,326 | |
| 5.45% due 3/1/2028 | 5,181,000 | 5,245,762 | |
| FirstEnergy Pennsylvania Electric Co., | |||
| d | 5.15% due 3/30/2026 | 5,230,000 | 5,184,394 |
| d | 5.20% due 4/1/2028 | 1,475,000 | 1,477,021 |
| Georgia Power Co., 4.70% due 5/15/2032 | 9,681,000 | 9,462,403 | |
| ITC Holdings Corp., | |||
| d | 2.95% due 5/14/2030 | 4,000,000 | 3,537,080 |
| d | 4.95% due 9/22/2027 | 4,910,000 | 4,878,723 |
| d | 5.40% due 6/1/2033 | 15,808,000 | 15,815,430 |
| d | Kentucky Power Co., 7.00% due 11/15/2033 | 7,454,000 | 7,971,531 |
| d | Mid-Atlantic Interstate Transmission LLC, 4.10% due 5/15/2028 | 945,000 | 908,788 |
| d | Midland Cogeneration Venture LP, 6.00% due 3/15/2025 | 4,668,498 | 4,560,095 |
| Monongahela Power Co., | |||
| d | 3.55% due 5/15/2027 | 17,987,000 | 17,107,076 |
| d | 4.10% due 4/15/2024 | 3,000,000 | 2,996,880 |
| d | New York State Electric & Gas Corp., 5.65% due 8/15/2028 | 15,000,000 | 15,361,800 |
| NextEra Energy Capital Holdings, Inc., | |||
| 5.749% due 9/1/2025 | 7,416,000 | 7,449,446 | |
| 6.051% due 3/1/2025 | 4,700,000 | 4,718,142 | |
| Niagara Mohawk Power Corp., | |||
| d | 3.508% due 10/1/2024 | 2,236,000 | 2,207,066 |
| d | 4.278% due 12/15/2028 | 7,700,000 | 7,344,568 |
| Public Service Enterprise Group, Inc., 5.20% due 4/1/2029 | 9,543,000 | 9,547,103 | |
| Puget Energy, Inc., | |||
| 2.379% due 6/15/2028 | 2,980,000 | 2,657,683 | |
| 4.10% due 6/15/2030 | 1,950,000 | 1,780,838 | |
| 4.224% due 3/15/2032 | 3,655,000 | 3,312,161 | |
| Southern Co., | |||
| 3.25% due 7/1/2026 | 6,725,000 | 6,465,886 | |
| 5.113% due 8/1/2027 | 6,096,000 | 6,098,926 | |
| System Energy Resources, Inc., 6.00% due 4/15/2028 | 2,212,000 | 2,255,687 | |
| d | Toledo Edison Co., 2.65% due 5/1/2028 | 3,933,000 | 3,515,866 |
| Vistra Operations Co. LLC, | |||
| d | 3.55% due 7/15/2024 | 2,000,000 | 1,984,200 |
| d | 4.875% due 5/13/2024 | 12,188,000 | 12,170,693 |
| Xcel Energy, Inc., 5.45% due 8/15/2033 | 7,100,000 | 7,062,157 | |
| Gas Utilities — 1.0% | |||
| d | Brooklyn Union Gas Co., 4.632% due 8/5/2027 | 6,711,000 | 6,511,549 |
| d,e | ENN Clean Energy International Investment Ltd., 3.375% due 5/12/2026 | 9,524,000 | 9,009,895 |
| 68 | Thornburg Taxable Fixed Income Funds Semi-Annual Report | See notes to financial statements. |
| Issuer-Description | SHARES/ PRINCIPAL AMOUNT | VALUE | |
| d | KeySpan Gas East Corp., 5.994% due 3/6/2033 | $ 14,587,000 | $ 14,782,174 |
| NiSource, Inc., 5.25% due 3/30/2028 | 3,444,000 | 3,470,002 | |
| Piedmont Natural Gas Co., Inc., 5.40% due 6/15/2033 | 4,945,000 | 4,984,906 | |
| Southern Co. Gas Capital Corp., 5.15% due 9/15/2032 | 6,950,000 | 6,981,345 | |
| Southwest Gas Corp., | |||
| 2.20% due 6/15/2030 | 7,880,000 | 6,648,041 | |
| 4.05% due 3/15/2032 | 5,870,000 | 5,378,329 | |
| 5.45% due 3/23/2028 | 680,000 | 690,370 | |
| 5.80% due 12/1/2027 | 4,610,000 | 4,710,175 | |
| c | Spire Missouri, Inc., 5.86% (SOFR + 0.50%) due 12/2/2024 | 12,345,000 | 12,346,728 |
| Spire, Inc., 5.30% due 3/1/2026 | 9,300,000 | 9,290,235 | |
| Multi-Utilities — 0.0% | |||
| d,e | Aegea Finance SARL, 9.00% due 1/20/2031 | 4,000,000 | 4,236,680 |
| 411,085,249 | |||
| Total Corporate Bonds (Cost $3,560,650,972) | 3,503,330,612 | ||
| Convertible Bonds — 0.2% | |||
| Financial Services — 0.1% | |||
| Financial Services — 0.1% | |||
| d | Repay Holdings Corp., due 2/1/2026 | 5,460,000 | 5,043,730 |
| 5,043,730 | |||
| Media & Entertainment — 0.1% | |||
| Media — 0.1% | |||
| Comcast Holdings Corp. (Guaranty: Comcast Corp.), 2.00% due 10/15/2029 | 15,486,000 | 8,549,201 | |
| 8,549,201 | |||
| Total Convertible Bonds (Cost $14,333,029) | 13,592,931 | ||
| Long-Term Municipal Bonds — 0.1% | |||
| California (Insured: California Mtg Insurance) HFFA, 7.875% due 2/1/2026 | 865,000 | 866,384 | |
| City of Detroit GO, | |||
| Series B, | |||
| 2.189% due 4/1/2024 | 275,000 | 274,885 | |
| 2.511% due 4/1/2025 | 465,000 | 445,957 | |
| New Jersey Transportation Trust Fund Authority, ETM, Series B, 2.631% due 6/15/2024 | 1,565,000 | 1,555,746 | |
| New York Transportation Development Corp. (Research Foundation of State University of New York), 4.248% due 9/1/2035 | 2,530,000 | 2,445,068 | |
| Total Long-Term Municipal Bonds (Cost $5,698,178) | 5,588,040 | ||
| Other Government — 1.1% | |||
| Australia Government Bonds (AUD), Series 166, 3.00% due 11/21/2033 | 36,873,000 | 22,156,728 | |
| Egypt Treasury Bills (EGP), Series 364D, due 3/11/2025 | 952,450,000 | 15,898,681 | |
| d,e | Finance Department Government of Sharjah, 3.625% due 3/10/2033 | 21,382,000 | 18,049,402 |
| Indonesia Treasury Bonds (IDR), | |||
| Series FR75, 7.50% due 5/15/2038 | 36,895,000,000 | 2,456,804 | |
| Series FR79, 8.375% due 4/15/2039 | 44,919,000,000 | 3,214,110 | |
| Series FR82, 7.00% due 9/15/2030 | 45,000,000,000 | 2,893,992 | |
| Series FR83, 7.50% due 4/15/2040 | 44,090,000,000 | 2,941,169 | |
| Nigeria Government International Bonds, | |||
| d,e | 7.625% due 11/28/2047 | 10,000,000 | 7,767,300 |
| d,e | 8.25% due 9/28/2051 | 4,300,000 | 3,517,959 |
| e | Panama Bonos del Tesoro, Series DOM, 6.375% due 7/25/2033 | 12,710,000 | 11,921,599 |
| Total Other Government (Cost $88,798,722) | 90,817,744 | ||
| U.S. Treasury Securities — 16.9% | |||
| U.S. Treasury Inflation-Indexed Bonds, | |||
| 0.125%, 2/15/2051 | 11,844,100 | 7,091,022 | |
| 0.25%, 2/15/2050 | 21,853,250 | 13,816,347 | |
| 1.00%, 2/15/2049 | 19,361,952 | 15,189,586 | |
| 1.75%, 1/15/2028 | 106,968,097 | 106,148,551 |
| See notes to financial statements. | Thornburg Taxable Fixed Income Funds Semi-Annual Report | 69 |
Thornburg Strategic Income Fund | March 31, 2024 (Unaudited)
| Issuer-Description | SHARES/ PRINCIPAL AMOUNT | VALUE | |
| U.S. Treasury Inflation-Indexed Notes, | |||
| 0.125%, 4/15/2025 - 4/15/2027 | $ 94,845,820 | $ 89,902,827 | |
| 1.125%, 1/15/2033 | 31,056,300 | 29,161,986 | |
| 1.25%, 4/15/2028 | 78,616,011 | 76,431,727 | |
| 1.625%, 10/15/2027 | 61,991,250 | 61,413,049 | |
| U.S. Treasury Notes, | |||
| 1.125%, 8/31/2028 | 32,000,000 | 27,985,000 | |
| 1.25%, 5/31/2028 | 50,300,000 | 44,507,641 | |
| 1.375%, 11/15/2040 | 9,700,000 | 6,239,828 | |
| 1.75%, 8/15/2041 | 12,850,000 | 8,673,750 | |
| 2.375%, 2/15/2042 | 12,650,000 | 9,412,391 | |
| 2.75%, 8/15/2032 | 182,653,000 | 163,902,528 | |
| 3.50%, 2/15/2033 | 34,800,000 | 32,973,000 | |
| 3.875%, 8/15/2033 | 618,800,000 | 602,749,875 | |
| 4.00%, 2/15/2034 | 71,365,000 | 70,205,319 | |
| 4.125%, 11/15/2032 | 46,188,000 | 45,892,108 | |
| Total U.S. Treasury Securities (Cost $1,403,391,133) | 1,411,696,535 | ||
| U.S. Government Agencies — 0.1% | |||
| c,d,h | Farm Credit Bank of Texas, Series 4, 5.70% (5-Yr. CMT + 5.420%), 9/15/2025 | 9,580,000 | 9,398,819 |
| Total U.S. Government Agencies (Cost $9,733,901) | 9,398,819 | ||
| Mortgage Backed — 19.9% | |||
| c,d | 510 Asset-Backed Trust, Whole Loan Securities Trust CMO, Series 2021-NPL2 Class A1, 2.116% due 6/25/2061 | 20,418,591 | 19,817,255 |
| c,d | Ajax Mortgage Loan Trust, Whole Loan Securities Trust CMO, Series 2021-B Class A, 2.239% due 6/25/2066 | 12,316,896 | 11,934,262 |
| Angel Oak Mortgage Trust, Whole Loan Securities Trust CMO, | |||
| c,d | Series 2022-1 Class B1, 4.022% due 12/25/2066 | 4,575,000 | 2,927,555 |
| c,d | Series 2022-6 Class A3, 4.30% due 7/25/2067 | 4,396,825 | 3,996,933 |
| c,d | Series 2023-1 Class A1, 4.75% due 9/26/2067 | 13,764,643 | 13,282,480 |
| c,d | Series 2023-2 Class A1, 4.65% due 10/25/2067 | 6,704,889 | 6,446,964 |
| c,d,e | Arbor Realty Commercial Real Estate Notes Ltd., CMBS, Series 2022-FL1 Class A, 6.769% (SOFR30A + 1.45%) due 1/15/2037 | 20,000,000 | 19,843,766 |
| Arroyo Mortgage Trust, Whole Loan Securities Trust CMO, | |||
| c,d | Series 2019-1 Class A1, 3.805% due 1/25/2049 | 705,786 | 670,826 |
| c,d | Series 2019-3 Class A1, 2.962% due 10/25/2048 | 1,416,795 | 1,305,748 |
| c,d | Series 2021-1R Class A1, 1.175% due 10/25/2048 | 2,831,271 | 2,445,803 |
| c,d | Barclays Mortgage Loan Trust, Whole Loan Securities Trust CMO, Series 2022-INV1 Class A3, 4.53% due 2/25/2062 | 14,845,329 | 13,812,191 |
| c | Bear Stearns ARM Trust, Whole Loan Securities Trust CMO, Series 2003-6 Class 2B1, 6.058% due 8/25/2033 | 22,907 | 22,904 |
| c,d | BPR Trust, CMBS, Series 2023-BRK2 Class A, 6.899% due 11/5/2028 | 4,250,000 | 4,408,252 |
| d | BRAVO Residential Funding Trust, Whole Loan Securities Trust CMO, Series 2019-1 Class A1C, 3.50% due 3/25/2058 | 542,130 | 533,294 |
| d | BXP Trust, CMBS, Series 2021-601L Class A, 2.618% due 1/15/2044 | 6,760,000 | 5,428,949 |
| d | Century Plaza Towers, CMBS, Series 2019-CPT Class A, 2.865% due 11/13/2039 | 4,720,000 | 4,050,522 |
| Chase Home Lending Mortgage Trust, Whole Loan Securities Trust CMO, | |||
| c,d | Series 2019-1 Class B4, 3.889% due 3/25/2050 | 704,094 | 586,248 |
| c,d | Series 2019-1 Class B5, 3.889% due 3/25/2050 | 363,274 | 282,856 |
| c,d | Series 2019-1 Class B6, 3.70% due 3/25/2050 | 521,093 | 316,203 |
| c,d | Chase Mortgage Finance Corp., Whole Loan Securities Trust CMO, Series 2016-SH2 Class M4, 3.75% due 12/25/2045 | 2,327,990 | 2,076,898 |
| CHNGE Mortgage Trust, Whole Loan Securities Trust CMO, | |||
| c,d | Series 2022-1 Class A1, 3.007% due 1/25/2067 | 20,245,469 | 18,573,631 |
| c,d | Series 2022-1 Class B2, 4.548% due 1/25/2067 | 4,700,000 | 3,302,813 |
| c,d | Series 2022-2 Class B2, 4.619% due 3/25/2067 | 7,015,000 | 4,994,170 |
| c,d | Series 2023-1 Class A1, 7.065% due 3/25/2058 | 12,670,632 | 12,704,037 |
| CIM Trust, Whole Loan Securities Trust CMO, | |||
| c,d | Series 2018-INV1 Class A4, 4.00% due 8/25/2048 | 157,344 | 145,501 |
| c,d,f | Series 2020-J1 Class AIO1, 0.445% due 7/25/2050 | 14,033,146 | 278,827 |
| c,d,f | Series 2020-J1 Class AIO2, 0.50% due 7/25/2050 | 12,516,330 | 309,787 |
| c,d,f | Series 2020-J1 Class AIOS, 0.20% due 6/25/2050 | 17,176,980 | 114,424 |
| c,d | Series 2020-J1 Class B4, 3.445% due 7/25/2050 | 334,564 | 274,035 |
| c,d | Series 2020-J1 Class B5, 3.445% due 7/25/2050 | 168,219 | 100,128 |
| c,d | Series 2020-J1 Class B6, 3.445% due 7/25/2050 | 322,936 | 132,840 |
| c,d,f | Series 2020-J2 Class AX1, 0.259% due 1/25/2051 | 104,052,629 | 1,364,962 |
| c,d,f | Series 2020-J2 Class AXS, 0.21% due 1/25/2051 | 110,885,601 | 1,146,590 |
| c,d | Series 2020-J2 Class B4, 2.759% due 1/25/2051 | 491,000 | 211,169 |
| 70 | Thornburg Taxable Fixed Income Funds Semi-Annual Report | See notes to financial statements. |
| Issuer-Description | SHARES/ PRINCIPAL AMOUNT | VALUE | |
| c,d | Series 2020-J2 Class B5, 2.759% due 1/25/2051 | $ 164,000 | $ 68,911 |
| c,d | Series 2020-J2 Class B6, 2.759% due 1/25/2051 | 654,523 | 231,563 |
| c,d | Series 2023-I1 Class M1, 7.121% due 4/25/2058 | 10,705,000 | 10,696,745 |
| c,d | Series 2023-I2 Class A1, 6.639% due 12/25/2067 | 13,394,890 | 13,278,329 |
| Citigroup Mortgage Loan Trust, Whole Loan Securities Trust CMO, | |||
| c | Series 2004-HYB2 Class B1, 6.104% due 3/25/2034 | 20,039 | 15,339 |
| c,d | Series 2014-A Class A, 4.00% due 1/25/2035 | 352,657 | 332,537 |
| c,d | Series 2020-EXP1 Class B1, 4.467% due 5/25/2060 | 1,180,900 | 967,496 |
| c,d | Series 2020-EXP1 Class B2, 4.467% due 5/25/2060 | 770,600 | 605,396 |
| c,d | Series 2020-EXP1 Class B3, 4.467% due 5/25/2060 | 386,242 | 256,555 |
| d,f | Series 2020-EXP1 Class XS, due 5/25/2060 | 20,021,984 | 1,079,059 |
| c,d | Series 2020-EXP2 Class B5, 4.015% due 8/25/2050 | 153,000 | 91,473 |
| c,d | Series 2020-EXP2 Class B6, 4.015% due 8/25/2050 | 372,000 | 178,093 |
| c,d | Series 2021-J1 Class B4, 2.61% due 4/25/2051 | 375,000 | 162,432 |
| c,d | Series 2021-J1 Class B5, 2.61% due 4/25/2051 | 616,000 | 223,669 |
| c,d | Series 2021-J1 Class B6, 2.61% due 4/25/2051 | 453,829 | 139,398 |
| c,d | Series 2021-J2 Class B4, 2.769% due 7/25/2051 | 2,281,541 | 967,824 |
| c,d | Series 2021-J2 Class B5, 2.769% due 7/25/2051 | 623,000 | 256,605 |
| c,d | Series 2021-J2 Class B6, 2.769% due 7/25/2051 | 1,247,350 | 392,524 |
| c,d | Series 2021-J3 Class B4, 2.859% due 9/25/2051 | 1,032,000 | 573,766 |
| c,d | Series 2021-J3 Class B5, 2.859% due 9/25/2051 | 173,000 | 88,078 |
| c,d | Series 2021-J3 Class B6, 2.859% due 9/25/2051 | 590,214 | 197,911 |
| c,d,f | Series 2022-INV1 Class A5IX, 0.294% due 11/27/2051 | 198,830,971 | 2,993,778 |
| c,d | Series 2022-INV1 Class B4, 3.294% due 11/27/2051 | 1,316,616 | 1,004,604 |
| c,d | Series 2022-INV1 Class B6, 3.294% due 11/27/2051 | 3,319,208 | 1,460,115 |
| c,d | Series 2022-J1 Class B4, 2.906% due 2/25/2052 | 700,598 | 358,424 |
| c,d | Series 2022-J1 Class B5, 2.906% due 2/25/2052 | 527,000 | 226,167 |
| c,d | Series 2022-J1 Class B6, 2.906% due 2/25/2052 | 1,404,735 | 450,377 |
| c,d | Cross Mortgage Trust, Whole Loan Securities Trust CMO, Series 2023-H1 Class A1, 6.615% due 3/25/2068 | 9,070,614 | 9,078,677 |
| CSMC Trust, CMBS, | |||
| c,d | Series 2020-522F Class A, 9.179% (TSFR1M + 3.85%) due 9/16/2025 | 15,450,000 | 8,782,860 |
| c,d | Series 2021-BPNY Class A, 9.155% (TSFR1M + 3.83%) due 8/15/2026 | 13,600,000 | 12,240,544 |
| CSMC Trust, Whole Loan Securities Trust CMO, | |||
| c,d | Series 2013-HYB1 Class B3, 6.794% due 4/25/2043 | 61,065 | 60,886 |
| c,d | Series 2019-AFC1 Class B2, 5.205% due 7/25/2049 | 2,366,448 | 2,094,910 |
| c,d | Series 2019-RP10 Class A1, 3.14% due 12/26/2059 | 11,818,570 | 11,893,779 |
| c,d,f | Series 2021-AFC1 Class AIOS, 0.25% due 3/25/2056 | 51,162,253 | 411,518 |
| c,d | Series 2021-AFC1 Class B3, 4.334% due 3/25/2056 | 146,228 | 102,146 |
| c,d,f | Series 2021-AFC1 Class XS, 3.286% due 3/25/2056 | 51,162,253 | 9,160,019 |
| c,d | Series 2021-NQM3 Class A1, 1.015% due 4/25/2066 | 2,399,890 | 1,975,338 |
| c,d | Series 2021-NQM3 Class B2, 4.128% due 4/25/2066 | 2,650,000 | 1,841,346 |
| c,d | Series 2021-NQM8 Class B2, 4.219% due 10/25/2066 | 3,478,650 | 2,659,512 |
| c,d | Series 2022-ATH2 Class A1, 4.547% due 5/25/2067 | 5,473,682 | 5,243,969 |
| c,d | Series 2022-NQM5 Class A3, 5.169% due 5/25/2067 | 3,683,017 | 3,545,791 |
| d | DataBank Issuer LLC, CMBS, Series 2024-1A Class A2, 5.30% due 1/26/2054 | 16,375,000 | 15,528,626 |
| d | DC Office Trust, CMBS, Series 2019-MTC Class A, 2.965% due 9/15/2045 | 3,120,000 | 2,662,525 |
| c,d | Deephaven Residential Mortgage Trust, Whole Loan Securities Trust CMO, Series 2021-1 Class A1, 0.715% due 5/25/2065 | 668,719 | 611,266 |
| Ellington Financial Mortgage Trust, Whole Loan Securities Trust CMO, | |||
| c,d | Series 2019-2 Class A1, 2.739% due 11/25/2059 | 870,147 | 818,958 |
| c,d | Series 2021-2 Class A1, 0.931% due 6/25/2066 | 2,819,333 | 2,244,024 |
| c,d | Series 2022-1 Class B2, 3.87% due 1/25/2067 | 6,901,000 | 4,593,952 |
| c,d,i | FARM Mortgage Trust, Whole Loan Securities Trust CMO, Series 2024-1 Class A, 4.721% due 10/1/2053 | 10,140,000 | 9,655,018 |
| Federal Home Loan Mtg Corp., | |||
| c | Pool 1L0322, 4.053% (H15T1Y + 2.07%) due 2/1/2048 | 2,472,636 | 2,482,449 |
| c | Pool 760025, 3.662% (5-Yr. CMT + 1.310%) due 10/1/2047 | 3,370,431 | 3,224,095 |
| c | Pool 841097, 3.061% (5-Yr. CMT + 1.300%) due 9/1/2048 | 5,070,398 | 4,798,687 |
| c | Pool 841355, 1.907% (2.15% - SOFR30A) due 11/1/2051 | 5,328,496 | 4,833,394 |
| c | Pool 841362, 1.717% (2.15% - SOFR30A) due 2/1/2052 | 6,279,139 | 5,569,811 |
| c | Pool 841377, 1.947% (2.23% - SOFR30A) due 4/1/2052 | 6,528,958 | 5,735,977 |
| c | Pool 841463, 2.154% (2.18% - SOFR30A) due 7/1/2052 | 16,781,098 | 14,563,355 |
| Pool RE6097, 2.00% due 5/1/2051 | 12,414,198 | 9,555,858 | |
| Federal Home Loan Mtg Corp., Multifamily Structured Pass-Through Certificates, CMBS, | |||
| c,f | Series KIR1 Class X, 1.023% due 3/25/2026 | 32,544,882 | 535,612 |
| See notes to financial statements. | Thornburg Taxable Fixed Income Funds Semi-Annual Report | 71 |
Thornburg Strategic Income Fund | March 31, 2024 (Unaudited)
| Issuer-Description | SHARES/ PRINCIPAL AMOUNT | VALUE | |
| Series KJ46 Class A2, 4.796% due 10/25/2031 | $ 10,518,000 | $ 10,554,350 | |
| c | Series KJ47 Class A2, 5.43% due 6/25/2031 | 7,257,000 | 7,487,847 |
| Series KJ48 Class A2, 5.028% due 10/25/2031 | 18,483,000 | 18,759,890 | |
| Federal Home Loan Mtg Corp., UMBS Collateral, | |||
| Pool RA7373, 3.00% due 5/1/2052 | 3,223,758 | 2,787,411 | |
| Pool SD1374, 3.00% due 3/1/2052 | 8,115,503 | 6,983,200 | |
| Pool SD1588, 5.00% due 9/1/2052 | 5,575,332 | 5,491,832 | |
| Pool SD1626, 5.00% due 10/1/2052 | 7,797,435 | 7,705,762 | |
| Pool SD4175, 2.50% due 6/1/2052 | 108,354,202 | 89,680,392 | |
| Pool SD4176, 3.00% due 9/1/2052 | 117,897,072 | 101,523,034 | |
| Pool SD8367, 5.50% due 10/1/2053 | 16,886,194 | 16,790,254 | |
| Federal Home Loan Mtg Corp., Whole Loan Securities Trust CMO, | |||
| c,d | Series 2017-SC01 Class M1, 3.645% due 12/25/2046 | 258,298 | 249,810 |
| c,d | Series 2017-SC02 Class M1, 3.865% due 5/25/2047 | 115,139 | 109,882 |
| Federal National Mtg Assoc., | |||
| c | Pool BH4523, 1.852% (5-Yr. CMT + 1.150%) due 4/1/2047 | 5,347,298 | 4,986,286 |
| c | Pool BH4524, 2.178% (5-Yr. CMT + 1.150%) due 6/1/2046 | 10,136,048 | 9,419,070 |
| c | Pool BM6885, 1.617% (2.20% - SOFR30A) due 12/1/2051 | 7,483,280 | 6,688,370 |
| Pool BM6899, 2.50% due 1/1/2052 | 10,678,897 | 8,644,109 | |
| c | Pool BM6929, 1.92% (2.13% - SOFR30A) due 7/1/2051 | 7,479,364 | 6,812,530 |
| c | Pool BO9998, 2.744% (H15T1Y + 2.03%) due 3/1/2048 | 4,109,819 | 3,886,753 |
| c | Pool BU9934, 1.844% (2.37% - SOFR30A) due 2/1/2052 | 15,527,650 | 13,453,587 |
| c | Pool CB2214, 1.527% (2.20% - SOFR30A) due 11/1/2051 | 8,220,852 | 7,351,809 |
| Federal National Mtg Assoc., UMBS Collateral, | |||
| Pool BW8669, 5.00% due 9/1/2052 | 5,131,359 | 5,011,241 | |
| Pool CB3880, 5.00% due 6/1/2052 | 2,924,447 | 2,882,915 | |
| Pool FS5447, 2.50% due 9/1/2052 | 39,235,406 | 32,584,782 | |
| Pool FS6130, 2.50% due 7/1/2052 | 153,604,859 | 127,132,532 | |
| Pool FS6157, 3.00% due 9/1/2052 | 130,707,335 | 112,574,441 | |
| Pool MA5138, 5.50% due 9/1/2053 | 9,483,126 | 9,429,887 | |
| Pool MA5139, 6.00% due 9/1/2053 | 8,634,390 | 8,709,422 | |
| Pool MA5166, 6.00% due 10/1/2053 | 16,767,199 | 16,912,904 | |
| First Republic Mortgage Trust, Whole Loan Securities Trust CMO, | |||
| c,d,f | Series 2020-1 Class A2IO, 1.246% due 4/25/2050 | 119,941,314 | 2,988,038 |
| c,d | Series 2020-1 Class B3, 2.886% due 4/25/2050 | 1,410,231 | 1,206,145 |
| c,d | Series 2020-1 Class B4, 2.886% due 4/25/2050 | 1,325,000 | 941,759 |
| c,d | Series 2020-1 Class B5, 2.886% due 4/25/2050 | 470,000 | 323,448 |
| c,d | Series 2020-1 Class B6, 2.886% due 4/25/2050 | 755,000 | 391,125 |
| Flagstar Mortgage Trust, Whole Loan Securities Trust CMO, | |||
| c,d | Series 2017-1 Class 2A2, 3.00% due 3/25/2047 | 211,054 | 190,962 |
| c,d | Series 2018-3INV Class B4, 4.455% due 5/25/2048 | 5,156,026 | 4,613,594 |
| c,d | Series 2019-2 Class B3, 4.007% due 12/25/2049 | 3,529,333 | 3,066,940 |
| c,d,f | Series 2020-2 Class AX1, 0.664% due 8/25/2050 | 25,155,171 | 736,508 |
| c,d,f | Series 2020-2 Class AX2, 0.50% due 8/25/2050 | 4,310,922 | 102,459 |
| c,d | Series 2020-2 Class B4, 3.664% due 8/25/2050 | 202,951 | 159,932 |
| c,d | Series 2020-2 Class B5, 3.664% due 8/25/2050 | 606,073 | 450,666 |
| c,d | Series 2020-2 Class B6C, 3.512% due 8/25/2050 | 810,089 | 418,624 |
| c,d,f | Series 2021-13IN Class AX1, 0.179% due 12/30/2051 | 165,022,132 | 1,312,206 |
| c,d,f | Series 2021-13IN Class AX17, 0.18% due 12/30/2051 | 13,642,788 | 131,276 |
| c,d,f | Series 2021-13IN Class AX4, 0.50% due 12/30/2051 | 12,477,826 | 354,903 |
| c,d | Series 2021-13IN Class B4, 3.359% due 12/30/2051 | 2,546,603 | 1,972,639 |
| c,d | Series 2021-13IN Class B5, 3.359% due 12/30/2051 | 464,246 | 332,177 |
| c,d | Series 2021-13IN Class B6C, 3.331% due 12/30/2051 | 4,046,352 | 2,166,376 |
| c,d | FREMF Mortgage Trust, CMBS, Series 2016-KF24 Class B, 10.435% (SOFR30A + 5.11%) due 10/25/2026 | 301,543 | 289,193 |
| GCAT Trust, Whole Loan Securities Trust CMO, | |||
| c,d | Series 2019-NQM3 Class A1, 3.686% due 11/25/2059 | 637,206 | 598,831 |
| c,d | Series 2021-CM1 Class A, 1.469% due 4/25/2065 | 3,166,492 | 2,969,816 |
| c,d | Series 2021-CM2 Class A1, 2.352% due 8/25/2066 | 7,363,733 | 6,644,876 |
| c,d | Series 2021-NQM1 Class M1, 2.316% due 1/25/2066 | 6,112,000 | 4,018,467 |
| c,d | Series 2021-NQM4 Class A1, 1.093% due 8/25/2066 | 3,678,848 | 2,958,208 |
| c,d | Series 2023-NQM4 Class A1, 4.25% due 5/25/2067 | 18,673,580 | 17,289,912 |
| c,d,e | Greystone Commercial Real Estate Notes Ltd., CMBS, Series 2021-FL3 Class A, 6.46% (TSFR1M + 1.13%) due 7/15/2039 | 14,000,000 | 13,838,544 |
| c,d | GS Mortgage-Backed Securities Corp. Trust, Whole Loan Securities Trust CMO, Series 2023-CCM1 Class A1, 6.65% due 8/25/2053 | 12,067,330 | 12,107,842 |
| 72 | Thornburg Taxable Fixed Income Funds Semi-Annual Report | See notes to financial statements. |
| Issuer-Description | SHARES/ PRINCIPAL AMOUNT | VALUE | |
| GS Mortgage-Backed Securities Trust, Whole Loan Securities Trust CMO, | |||
| c,d,f | Series 2020-INV1 Class A11X, 3.412% due 10/25/2050 | $ 913,784 | $ 137,383 |
| c,d,f | Series 2020-INV1 Class A12X, 2.925% due 10/25/2050 | 10,941,190 | 1,409,976 |
| c,d,f | Series 2020-INV1 Class AIOS, 0.19% due 10/25/2050 | 59,086,080 | 413,727 |
| c,d,f | Series 2020-INV1 Class AX1, due 10/25/2050 | 39,559,127 | 396 |
| c,d,f | Series 2020-INV1 Class AX2, 0.425% due 10/25/2050 | 1,971,848 | 23,241 |
| c,d,f | Series 2020-INV1 Class AX4, 0.926% due 10/25/2050 | 2,122,671 | 54,948 |
| c,d | Series 2020-INV1 Class B4, 3.851% due 10/25/2050 | 1,237,092 | 982,954 |
| c,d | Series 2020-INV1 Class B5, 3.851% due 10/25/2050 | 1,240,020 | 1,067,620 |
| c,d | Series 2020-INV1 Class B6, 3.851% due 10/25/2050 | 2,935,245 | 1,931,324 |
| c,d,f | Series 2020-INV1 Class BX, 0.351% due 10/25/2050 | 14,114,803 | 242,662 |
| c,d,f | Series 2020-PJ3 Class A11X, 3.50% due 10/25/2050 | 2,407,731 | 308,543 |
| c,d | Series 2023-PJ2 Class A4, 5.50% due 5/25/2053 | 6,882,055 | 6,756,249 |
| c,d | Series 2024-RPL2 Class A1, 3.75% due 7/25/2061 | 6,577,411 | 6,200,116 |
| c,d | Homeward Opportunities Fund I Trust, Whole Loan Securities Trust CMO, Series 2020-2 Class B3, 5.468% due 5/25/2065 | 14,305,000 | 13,222,101 |
| c,d | Homeward Opportunities Fund Trust, Whole Loan Securities Trust CMO, Series 2022-1 A Class A1, 5.082% due 7/25/2067 | 5,344,229 | 5,265,967 |
| d | Houston Galleria Mall Trust, CMBS, Series 2015-HGLR Class A1A2, 3.087% due 3/5/2037 | 16,067,500 | 15,536,798 |
| c,d | Hudson Yards Mortgage Trust, CMBS, Series 2019-55HY Class A, 2.943% due 12/10/2041 | 5,870,000 | 5,144,248 |
| Imperial Fund Mortgage Trust, Whole Loan Securities Trust CMO, | |||
| c,d | Series 2021-NQM3 Class B2, 4.137% due 11/25/2056 | 5,408,000 | 3,903,023 |
| c,d | Series 2021-NQM4 Class A1, 2.091% due 1/25/2057 | 4,073,657 | 3,400,600 |
| c,d | Series 2021-NQM4 Class B2, 4.10% due 1/25/2057 | 2,500,000 | 1,782,400 |
| c,d | Series 2022- NQM1 Class A1, 2.493% due 2/25/2067 | 15,630,433 | 13,747,500 |
| c,d | Series 2022-NQM2 Class B2, 4.20% due 3/25/2067 | 15,600,000 | 10,610,666 |
| c,d | Series 2022-NQM4 Class A1, 4.767% due 6/25/2067 | 12,791,758 | 12,653,704 |
| c,d | Series 2022-NQM4 Class A3, 5.04% due 6/25/2067 | 3,874,577 | 3,699,648 |
| c,d | Series 2022-NQM6 Class A1, 6.819% due 10/25/2067 | 8,384,960 | 8,377,783 |
| JP Morgan Mortgage Trust, Whole Loan Securities Trust CMO, | |||
| c,d | Series 2015-4 Class B4, 3.532% due 6/25/2045 | 830,166 | 554,903 |
| c,d | Series 2017-5 Class B6, 4.257% due 10/26/2048 | 3,020,511 | 2,161,114 |
| c,d | Series 2019-8 Class B4, 4.174% due 3/25/2050 | 3,303,587 | 2,843,987 |
| c,d,f | Series 2020-3 Class AX1, 0.14% due 8/25/2050 | 9,501,090 | 48,346 |
| c,d,f | Series 2020-4 Class A11X, (5.14% - TSFR1M) due 11/25/2050 | 1,842,453 | 94,520 |
| c,d,f | Series 2020-4 Class A3X, 0.50% due 11/25/2050 | 8,352,453 | 191,000 |
| c,d,f | Series 2020-4 Class AX1, 0.081% due 11/25/2050 | 30,850,952 | 96,665 |
| c,d,f | Series 2020-4 Class AX3, 3.50% due 11/25/2050 | 853,516 | 138,250 |
| c,d,f | Series 2020-4 Class AX4, 0.55% due 11/25/2050 | 1,969,889 | 49,502 |
| c,d | Series 2020-4 Class B4, 3.631% due 11/25/2050 | 1,276,521 | 1,069,679 |
| c,d | Series 2020-4 Class B5, 3.631% due 11/25/2050 | 588,669 | 426,477 |
| c,d | Series 2020-4 Class B6, 3.516% due 11/25/2050 | 1,054,996 | 488,390 |
| c,d | Series 2020-7 Class B4, 3.508% due 1/25/2051 | 604,550 | 501,236 |
| c,d | Series 2020-7 Class B5, 3.508% due 1/25/2051 | 421,715 | 241,308 |
| c,d | Series 2020-7 Class B6, 3.508% due 1/25/2051 | 588,627 | 249,231 |
| c,d | Series 2020-LTV1 Class B3A, 3.738% due 6/25/2050 | 2,686,549 | 2,272,823 |
| c,d | Series 2021-11 Class B5, 3.024% due 1/25/2052 | 2,302,138 | 1,575,264 |
| c,d | Series 2021-11 Class B6, 2.589% due 1/25/2052 | 2,641,213 | 1,151,656 |
| c,d | Series 2021-LTV2 Class A1, 2.52% due 5/25/2052 | 13,042,440 | 10,723,560 |
| c,d | Series 2022- LTV1 Class A1, 3.25% due 7/25/2052 | 16,916,471 | 14,363,358 |
| c,d | Series 2022-2 Class B4, 3.129% due 8/25/2052 | 3,211,020 | 2,380,480 |
| c,d | Series 2022-2 Class B5, 3.129% due 8/25/2052 | 1,707,908 | 1,016,790 |
| c,d | Series 2022-2 Class B6, 2.738% due 8/25/2052 | 1,813,305 | 632,279 |
| c,d | Series 2022-3 Class B4, 3.106% due 8/25/2052 | 2,637,097 | 1,949,117 |
| c,d | Series 2022-3 Class B5, 3.106% due 8/25/2052 | 1,677,805 | 776,533 |
| c,d | Series 2022-3 Class B6, 2.449% due 8/25/2052 | 1,460,644 | 462,763 |
| c,d | Series 2022-DSC1 Class A1, 4.75% due 1/25/2063 | 8,678,358 | 8,260,927 |
| c,d | Series 2023-1 Class A2, 5.50% due 6/25/2053 | 7,027,292 | 6,899,656 |
| c,d | Series 2023-3 Class A4B, 5.50% due 10/25/2053 | 8,760,775 | 8,656,550 |
| c,d | JP Morgan Wealth Management, Whole Loan Securities Trust CMO, Series 2021-CL1 Class M1, 6.62% (SOFR30A + 1.30%) due 3/25/2051 | 4,152,658 | 4,177,099 |
| Mello Mortgage Capital Acceptance, Whole Loan Securities Trust CMO, | |||
| c,d,f | Series 2021-INV2 Class AX1, 0.123% due 8/25/2051 | 99,948,540 | 502,311 |
| c,d,f | Series 2021-INV2 Class AX4, 0.70% due 8/25/2051 | 6,848,295 | 274,769 |
| c,d | Series 2021-INV2 Class B5, 3.323% due 8/25/2051 | 312,542 | 216,695 |
| See notes to financial statements. | Thornburg Taxable Fixed Income Funds Semi-Annual Report | 73 |
Thornburg Strategic Income Fund | March 31, 2024 (Unaudited)
| Issuer-Description | SHARES/ PRINCIPAL AMOUNT | VALUE | |
| c,d | Series 2021-INV2 Class B6, 3.217% due 8/25/2051 | $ 1,507,467 | $ 735,683 |
| c,d,f | Series 2021-INV3 Class AX1, 0.164% due 10/25/2051 | 118,376,960 | 825,975 |
| c,d,f | Series 2021-INV3 Class AX4, 0.55% due 10/25/2051 | 9,628,925 | 262,630 |
| c,d | Series 2021-INV3 Class B5, 3.214% due 10/25/2051 | 432,418 | 304,618 |
| c,d | Series 2021-INV3 Class B6, 3.078% due 10/25/2051 | 1,907,543 | 954,560 |
| c | Merrill Lynch Mortgage Investors Trust, Whole Loan Securities Trust CMO, Series 2004-A4 Class M1, 4.92% due 8/25/2034 | 45,441 | 43,195 |
| c,d | Metlife Securitization Trust, Whole Loan Securities Trust CMO, Series 2019-1A Class A1A, 3.75% due 4/25/2058 | 372,187 | 359,788 |
| MFA Trust, Whole Loan Securities Trust CMO, | |||
| c,d | Series 2020-NQM3 Class M1, 2.654% due 1/26/2065 | 800,000 | 679,665 |
| c,d | Series 2021-INV1 Class A1, 0.852% due 1/25/2056 | 3,504,261 | 3,255,104 |
| c,d | Series 2021-INV2 Class A1, 1.906% due 11/25/2056 | 8,634,885 | 7,379,237 |
| c,d | Series 2022-INV1 Class A3, 4.25% due 4/25/2066 | 4,950,000 | 4,140,643 |
| c,d | Series 2022-NQM2 Class A1, 4.00% due 5/25/2067 | 18,383,592 | 17,512,687 |
| c,d | Series 2022-NQM3 Class A1, 5.57% due 9/25/2067 | 8,322,992 | 8,242,081 |
| c,d | MFRA Trust, Whole Loan Securities Trust CMO, Series 2022-CHM1 Class A1, 3.875% due 9/25/2056 | 7,705,491 | 7,298,281 |
| c,d | Mill City Mortgage Loan Trust, Whole Loan Securities Trust CMO, Series 2023-NQM1 Class A1, 6.05% due 10/25/2067 | 17,995,625 | 17,868,143 |
| c,d | Morgan Stanley Residential Mortgage Loan Trust, Whole Loan Securities Trust CMO, Series 2024-NQM1 Class A1, 6.152% due 12/25/2068 | 19,490,069 | 19,480,019 |
| d | New Economy Assets Phase 1 Sponsor LLC, CMBS, Series 2021-1 Class A1, 1.91% due 10/20/2061 | 19,365,000 | 16,958,717 |
| New Residential Mortgage Loan Trust, Whole Loan Securities Trust CMO, | |||
| c,d | Series 2017-3A Class A1, 4.00% due 4/25/2057 | 822,398 | 775,342 |
| c,d | Series 2017-4A Class A1, 4.00% due 5/25/2057 | 669,002 | 631,194 |
| c,d | Series 2017-5A Class A1, 6.944% (TSFR1M + 1.61%) due 6/25/2057 | 388,988 | 389,018 |
| c,d | Series 2017-6A Class A1, 4.00% due 8/27/2057 | 353,831 | 334,771 |
| c,d | Series 2018-1A Class A1A, 4.00% due 12/25/2057 | 680,961 | 644,331 |
| c,d,f | Series 2021-INV1 Class AX1, 0.75% due 6/25/2051 | 100,024,461 | 3,719,190 |
| c,d | Series 2021-INV1 Class B5, 3.25% due 6/25/2051 | 1,173,674 | 874,665 |
| c,d | Series 2021-INV1 Class B6, 2.771% due 6/25/2051 | 2,064,231 | 1,051,652 |
| c,d | Series 2022-NQM3 Class A1, 3.90% due 4/25/2062 | 17,745,625 | 16,248,213 |
| d | NYC Commercial Mortgage Trust, CMBS, Series 2021-909 Class A, 2.941% due 4/10/2043 | 4,450,000 | 3,638,717 |
| c,d | OBX Trust, Whole Loan Securities Trust CMO, Series 2021-NQM2 Class A1, 1.101% due 5/25/2061 | 5,743,415 | 4,546,907 |
| d | One Bryant Park Trust, CMBS, Series 2019-OBP Class A, 2.516% due 9/15/2054 | 16,994,348 | 14,519,530 |
| c,d | Onslow Bay Mortgage Loan Trust, Whole Loan Securities Trust CMO, Series 2021-NQM4 Class A1, 1.957% due 10/25/2061 | 15,367,689 | 12,503,649 |
| c,d | PRET LLC, Whole Loan Securities Trust CMO, Series 2021-RN3 Class A1, 1.843% due 9/25/2051 | 10,254,049 | 9,775,867 |
| c,d | PRET Trust, Whole Loan Securities Trust CMO, Series 2024-RPL1 Class A1, 3.90% due 10/25/2063 | 5,805,000 | 5,436,239 |
| PRKCM Trust, Whole Loan Securities Trust CMO, | |||
| c,d | Series 2021-AFC1 Class A1, 1.51% due 8/25/2056 | 4,335,888 | 3,544,036 |
| c,d | Series 2021-AFC1 Class B2, 3.95% due 8/25/2056 | 2,729,000 | 1,786,562 |
| c,d | PRPM LLC, Whole Loan Securities Trust CMO, Series 2022-NQM1 Class A1, 5.50% due 8/25/2067 | 8,763,303 | 8,731,722 |
| PRPM Trust, Whole Loan Securities Trust CMO, | |||
| c,d | Series 2022-INV1 Class A1, 4.40% due 4/25/2067 | 26,480,703 | 25,741,637 |
| c,d | Series 2022-INV1 Class A3, 4.446% due 4/25/2067 | 8,896,786 | 8,339,781 |
| c,d | Rate Mortgage Trust, Whole Loan Securities Trust CMO, Series 2022-J1 Class A9, 2.50% due 1/25/2052 | 12,676,043 | 10,906,479 |
| d | Retained Vantage Data Centers Issuer LLC, CMBS, Series 2023-1A Class A2A, 5.00% due 9/15/2048 | 12,100,000 | 11,678,609 |
| c,d | Saluda Grade Alternative Mortgage Trust, Whole Loan Securities Trust CMO, Series 2020-FIG1 Class C, due 9/25/2050 | 1,601,029 | 563,362 |
| Seasoned Credit Risk Transfer Trust, Series 2024-1 Class MT, 3.00% due 11/25/2063 | 10,320,345 | 8,596,526 | |
| Seasoned Credit Risk Transfer, Whole Loan Securities Trust CMO, Series 2020-2 Class MA, 2.00% due 11/25/2059 | 2,770,406 | 2,419,820 | |
| Seasoned Loans Structured Transaction Trust, Whole Loan Securities Trust CMO, Series 2020-2 Class A1C, 2.00% due 9/25/2030 | 5,756,610 | 5,159,537 | |
| Sequoia Mortgage Trust, Whole Loan Securities Trust CMO, | |||
| c,d | Series 2015-4 Class B4, 3.124% due 11/25/2030 | 1,686,000 | 1,514,600 |
| c,d | Series 2016-3 Class B3, 3.598% due 11/25/2046 | 2,443,092 | 1,919,200 |
| c,d | Series 2017-7 Class B3, 3.725% due 10/25/2047 | 1,291,867 | 1,125,324 |
| c,d | Series 2018-7 Class B4, 4.257% due 9/25/2048 | 1,802,000 | 1,413,771 |
| c,d | Series 2021-9 Class A1, 2.50% due 1/25/2052 | 13,439,220 | 10,818,707 |
| c,d | Series 2023-3 Class A1, 6.00% due 9/25/2053 | 8,205,449 | 8,182,650 |
| SG Residential Mortgage Trust, Whole Loan Securities Trust CMO, | |||
| c,d | Series 2019-3 Class A1, 2.703% due 9/25/2059 | 59,529 | 58,340 |
| c,d,f | Series 2019-3 Class AIOS, 0.375% due 9/25/2059 | 12,090,767 | 204,548 |
| c,d | Series 2019-3 Class B2, 5.663% due 9/25/2059 | 1,978,000 | 1,672,591 |
| c,d | Series 2019-3 Class B3, 6.10% due 9/25/2059 | 842,000 | 670,160 |
| d | Series 2019-3 Class XS1, due 9/25/2059 | 11,931,931 | 119 |
| d | Series 2019-3 Class XS2, due 9/25/2059 | 11,931,931 | 472,366 |
| c,d | Series 2020-2 Class A3, 1.895% due 5/25/2065 | 1,093,846 | 992,676 |
| 74 | Thornburg Taxable Fixed Income Funds Semi-Annual Report | See notes to financial statements. |
| Issuer-Description | SHARES/ PRINCIPAL AMOUNT | VALUE | |
| c,d | Series 2021-2 Class A1, 1.737% due 12/25/2061 | $ 6,257,493 | $ 5,048,958 |
| c,d | Series 2022-1 Class B2, 3.966% due 3/27/2062 | 4,204,000 | 2,791,824 |
| c,d | Shellpoint Co-Originator Trust, Whole Loan Securities Trust CMO, Series 2016-1 Class B4, 3.555% due 11/25/2046 | 2,544,993 | 2,013,707 |
| d | SLG Office Trust, CMBS, Series 2021-OVA Class A, 2.585% due 7/15/2041 | 5,000,000 | 4,128,340 |
| c,d | Spruce Hill Mortgage Loan Trust, Whole Loan Securities Trust CMO, Series 2022-SH1 Class A1A, 4.10% due 7/25/2057 | 5,580,106 | 5,249,260 |
| d | Stack Infrastructure Issuer LLC, CMBS, Series 2021-1A Class A2, 1.877% due 3/26/2046 | 7,500,000 | 6,915,471 |
| c,d | Starwood Mortgage Residential Trust, Whole Loan Securities Trust CMO, Series 2021-5 Class A1, 1.92% due 9/25/2066 | 15,226,812 | 12,375,629 |
| TIAA Bank Mortgage Loan Trust, Whole Loan Securities Trust CMO, | |||
| c,d | Series 2018-2 Class B3, 3.675% due 7/25/2048 | 2,452,677 | 2,167,552 |
| c,d | Series 2018-2 Class B4, 3.675% due 7/25/2048 | 2,040,000 | 1,274,349 |
| c,d | Toorak Mortgage Trust, Whole Loan Securities Trust CMO, Series 2024-RRTL1 Class A1, 6.597% due 2/25/2039 | 11,200,000 | 11,248,917 |
| Towd Point Mortgage Trust, Whole Loan Securities Trust CMO, | |||
| c,d | Series 2017-1 Class A1, 2.75% due 10/25/2056 | 9,744 | 9,703 |
| c,d | Series 2018-2 Class A1, 3.25% due 3/25/2058 | 1,327,310 | 1,283,897 |
| c,d | TRK Trust, Whole Loan Securities Trust CMO, Series 2022-INV2 Class A1, 4.35% due 6/25/2057 | 11,116,958 | 10,528,833 |
| c,d | Visio Trust, Whole Loan Securities Trust CMO, Series 2022-1 Class M1, 6.22% due 8/25/2057 | 10,000,000 | 9,704,122 |
| c,d | Vista Point Securitization Trust, Whole Loan Securities Trust CMO, Series 2020-2 Class A2, 1.986% due 4/25/2065 | 954,942 | 890,671 |
| c,d | WB Commercial Mortgage Trust, CMBS, Series 2024-HQ Class A, 6.134% due 3/15/2040 | 4,050,000 | 4,071,669 |
| Wells Fargo Commercial Mortgage Trust, CMBS, | |||
| Series 2016-C34 Class A2, 2.603% due 6/15/2049 | 1,257,056 | 1,213,332 | |
| c,d | Series 2018-1745 Class A, 3.749% due 6/15/2036 | 4,000,000 | 3,502,123 |
| Wells Fargo Mortgage Backed Securities Trust, Whole Loan Securities Trust CMO, | |||
| c,d,f | Series 2021-INV1 Class AIO2, 0.50% due 8/25/2051 | 89,098,508 | 2,480,387 |
| c,d | Series 2021-INV1 Class B4, 3.313% due 8/25/2051 | 1,632,470 | 1,244,600 |
| c,d | Series 2021-INV1 Class B5, 3.313% due 8/25/2051 | 1,309,972 | 923,398 |
| c,d | Series 2021-INV1 Class B6, 3.313% due 8/25/2051 | 1,001,900 | 425,561 |
| Total Mortgage Backed (Cost $1,664,259,756) | 1,658,541,213 | ||
| Loan Participations — 1.0% | |||
| Commercial & Professional Services — 0.2% | |||
| Commercial Services & Supplies — 0.1% | |||
| Imagefirst Holdings LLC, | |||
| k | 10.32% (SOFR + 5.00%), due 4/27/2028 | 6,218,750 | 6,203,203 |
| k | 9.566% (SOFR + 4.25%), due 4/27/2028 | 3,183,877 | 3,175,917 |
| k | 9.996% (SOFR + 4.75%), due 4/27/2028 | 1,786,267 | 1,781,802 |
| Professional Services — 0.1% | |||
| k | GTCR W Merger Sub LLC, 8.309% (SOFR + 3.00%) due 1/31/2031 | 3,000,000 | 3,008,130 |
| k | VT Topco, Inc., 9.58% (SOFR + 4.25%) due 8/9/2030 | 2,992,500 | 2,996,779 |
| 17,165,831 | |||
| Consumer Durables & Apparel — 0.1% | |||
| Textiles, Apparel & Luxury Goods — 0.1% | |||
| k | Hanesbrands, Inc., 9.08% (SOFR + 3.75%) due 3/8/2030 | 4,950,000 | 4,943,813 |
| 4,943,813 | |||
| Consumer Services — 0.1% | |||
| Hotels, Restaurants & Leisure — 0.1% | |||
| k | TKC Holdings, Inc., 10.942% (SOFR + 5.50%) due 5/15/2028 | 4,508,271 | 4,454,172 |
| 4,454,172 | |||
| Household & Personal Products — 0.0% | |||
| Household Products — 0.0% | |||
| k | Energizer Holdings, Inc., 7.693% (SOFR + 2.25%) due 12/22/2027 | 3,945,692 | 3,935,827 |
| 3,935,827 | |||
| Media & Entertainment — 0.2% | |||
| Media — 0.2% | |||
| k | ABG Intermediate Holdings 2 LLC, 8.926% (SOFR + 3.50%) due 12/21/2028 | 9,170,350 | 9,199,603 |
| k | DirecTV Financing LLC, 10.445% (SOFR + 5.00%) due 8/2/2027 | 3,907,692 | 3,909,334 |
| k | Simon & Schuster, Inc., 9.317% (SOFR + 4.00%) due 10/30/2030 | 3,500,000 | 3,510,500 |
| 16,619,437 |
| See notes to financial statements. | Thornburg Taxable Fixed Income Funds Semi-Annual Report | 75 |
Thornburg Strategic Income Fund | March 31, 2024 (Unaudited)
| Issuer-Description | SHARES/ PRINCIPAL AMOUNT | VALUE | |
| Semiconductors & Semiconductor Equipment — 0.1% | |||
| Information Technology Services — 0.1% | |||
| k | Xperi Corp., 8.945% (SOFR + 3.50%) due 6/8/2028 | $ 8,327,162 | $ 8,327,162 |
| 8,327,162 | |||
| Software & Services — 0.2% | |||
| Internet Software & Services — 0.1% | |||
| k | Titan AcquisitionCo New Zealand Ltd., 9.571% (SOFR + 4.00%) due 10/18/2028 | 7,310,800 | 7,297,129 |
| Software — 0.1% | |||
| k | GoTo Group, Inc., 10.074% (SOFR + 4.75%) due 8/31/2027 | 6,624,197 | 5,084,071 |
| 12,381,200 | |||
| Technology Hardware & Equipment — 0.1% | |||
| Technology Hardware, Storage & Peripherals — 0.1% | |||
| k | Xerox Holdings Corp., 9.33% (SOFR + 4.00%) due 11/17/2029 | 11,850,000 | 11,875,951 |
| 11,875,951 | |||
| Total Loan Participations (Cost $78,913,961) | 79,703,393 | ||
| Short-Term Investments — 5.6% | |||
| l | Thornburg Capital Management Fund | 47,038,352 | 470,383,516 |
| Total Short-Term Investments (Cost $470,383,516) | 470,383,516 | ||
| Total Investments — 98.0% (Cost $8,279,598,841) | $8,187,205,065 | ||
| Other Assets Less Liabilities — 2.0% | 167,253,132 | ||
| Net Assets — 100.0% | $8,354,458,197 |
| Outstanding Forward Currency Contracts To Buy Or Sell At March 31, 2024 | |||||||
| Contract Description | Contract Party* | Buy/Sell | Contract Amount | Contract Value Date | Value USD | Unrealized Appreciation | Unrealized Depreciation |
| Euro | SSB | Sell | 90,256,700 | 9/25/2024 | 98,105,355 | $ 659,122 | $ — |
| Net unrealized appreciation (depreciation) | $ 659,122 | ||||||
| * | Counterparty includes State Street Bank and Trust Company ("SSB"). |
| 76 | Thornburg Taxable Fixed Income Funds Semi-Annual Report | See notes to financial statements. |
| Footnote Legend | |
| a | Security currently fair valued by Thornburg Investment Management, Inc.’s Valuation and Pricing Committee. |
| b | Non-income producing. |
| c | Variable, floating, step, or fixed to floating rate securities are securities for which interest rate changes are based on changes in a designated base rate or on a predetermined schedule. The rates shown are those in effect on March 31, 2024. |
| d | Securities exempt from registration under Rule 144A of the Securities Act of 1933, as amended. These securities are restricted but liquid and may only be resold in the ordinary course of business in transactions exempt from registration, normally to qualified institutional buyers. As of March 31, 2024, the aggregate value of these securities in the Fund’s portfolio was $3,909,759,113, representing 46.80% of the Fund’s net assets. |
| e | Yankee bond denominated in U.S. dollars and is issued in the U.S. by foreign banks and corporations. |
| f | Interest only. |
| g | Bond in default. |
| h | Securities are perpetual and, thus, do not have a predetermined maturity date. The date shown, if applicable, reflects the next call date. |
| i | When-issued security. |
| j | Pay-In-Kind Payments (PIK). The issuer may pay cash interest and/or interest in additional debt securities. Rates shown are the rates in effect at March 31, 2024. |
| k | The stated coupon rate represents the greater of the SOFR or the SOFR floor rate plus a spread at March 31, 2024. |
| l | Investment in Affiliates. |
To simplify the listings of securities, abbreviations are used per the table below:
| ABS | Asset Backed Securities |
| ARM | Adjustable Rate Mortgage |
| AUD | Denominated in Australian Dollar |
| CMBS | Commercial Mortgage-Backed Securities |
| CMO | Collateralized Mortgage Obligation |
| CMT | Constant Maturity Rate |
| DAC | Designated Activity Company |
| EGP | Denominated in Egyptian Pound |
| ETM | Escrowed to Maturity |
| EUR | Denominated in Euro |
| GBP | Denominated in Pound Sterling |
| GO | General Obligation |
| H15T1Y | US Treasury Yield Curve Rate T-Note Constant Maturity 1 Year |
| HFFA | Health Facilities Financing Authority |
| IDR | Denominated in Indonesian Rupiah |
| Mtg | Mortgage |
| PIK | Payment-in-kind |
| SOFR | Secured Overnight Financing Rate |
| SOFR30A | Secured Overnight Financing Rate 30-Day Average |
| SOFR90A | Secured Overnight Financing Rate 90-Day Average |
| SOFRINDX | Secured Overnight Financing Rate Index |
| TSFR1M | Term SOFR 1 Month |
| TSFR3M | Term SOFR 3 Month |
| UMBS | Uniform Mortgage Backed Securities |
| See notes to financial statements. | Thornburg Taxable Fixed Income Funds Semi-Annual Report | 77 |
Thornburg Strategic Income Fund | March 31, 2024 (Unaudited)
| COUNTRY EXPOSURE * (percent of net assets) | |
| United States | 80.7% |
| Canada | 1.9% |
| Japan | 0.8% |
| Mexico | 0.8% |
| United Kingdom | 0.7% |
| Australia | 0.6% |
| China | 0.6% |
| Cayman Islands | 0.6% |
| Brazil | 0.4% |
| United Arab Emirates | 0.4% |
| Nigeria | 0.3% |
| Bermuda | 0.3% |
| Italy | 0.3% |
| Indonesia | 0.3% |
| Dominican Republic | 0.3% |
| France | 0.3% |
| Israel | 0.3% |
| Guatemala | 0.2% |
| Turkey | 0.2% |
| Morocco | 0.2% |
| Colombia | 0.2% |
| Egypt | 0.2% |
| South Korea | 0.2% |
| South Africa | 0.2% |
| Germany | 0.2% |
| Ireland | 0.2% |
| Russian Federation | 0.2% |
| Belgium | 0.2% |
| Panama | 0.1% |
| Switzerland | 0.1% |
| Saudi Arabia | 0.1% |
| Spain | 0.1% |
| Norway | 0.1% |
| Jamaica | 0.1% |
| Kuwait | 0.0%** |
| India | 0.0%** |
| Netherlands | 0.0%** |
| Luxembourg | 0.0%** |
| Other Assets Less Liabilities | 7.6% |
| * | Holdings are classified by country of risk as determined by MSCI and Bloomberg. |
| ** | Country percentage was less than 0.1%. |
| 78 | Thornburg Taxable Fixed Income Funds Semi-Annual Report | See notes to financial statements. |
March 31, 2024 (Unaudited)
| THORNBURG ULTRA SHORT INCOME FUND | THORNBURG LIMITED TERM U.S. GOVERNMENT FUND | THORNBURG LIMITED TERM INCOME FUND | THORNBURG CORE PLUS BOND FUND | THORNBURG STRATEGIC INCOME FUND | |
| ASSETS | |||||
| Investments at cost | |||||
| Non-affiliated issuers | $ 237,612,407 | $ 159,702,462 | $ 6,235,380,719 | $ 63,895,832 | $ 7,809,215,325 |
| Non-controlled affiliated issuers | 25,767,151 | - | 407,546,114 | 107,148 | 470,383,516 |
| Investments at value | |||||
| Non-affiliated issuers | 237,846,726 | 150,548,930 | 5,982,197,001 | 64,736,948 | 7,716,821,549 |
| Non-controlled affiliated issuers | 25,767,151 | - | 407,546,114 | 107,148 | 470,383,516 |
| Cash | 4,299,873 | 5,143,800 | 97,173,919 | - | 120,963,187 |
| Foreign currency at value (a) | 147 | - | - | 4 | 4,828,876 |
| Unrealized appreciation on forward currency contracts | - | - | - | 452 | 659,122 |
| Receivable for investments sold | - | - | - | - | 180,988 |
| Receivable for fund shares sold | 762,254 | 57,685 | 17,204,776 | - | 29,068,039 |
| Receivable from investment advisor | - | - | - | 16,530 | - |
| Dividends receivable | - | - | - | - | 406 |
| Principal and interest receivable | 1,389,196 | 491,310 | 31,766,923 | 493,652 | 60,948,755 |
| Prepaid expenses and other assets | 32,693 | 59,878 | 160,433 | 109,492 | 283,613 |
| Total Assets | 270,098,040 | 156,301,603 | 6,536,049,166 | 65,464,226 | 8,404,138,051 |
| Liabilities | |||||
| Payable for investments purchased | 4,454,459 | - | 9,643,393 | 890,212 | 27,492,723 |
| Payable for fund shares redeemed | 712,402 | 313,472 | 14,634,982 | 137,980 | 16,299,008 |
| Payable to investment advisor and other affiliates | 9,652 | 86,235 | 2,512,427 | - | 3,487,773 |
| Deferred taxes payable | - | - | - | - | 28,033 |
| Accounts payable and accrued expenses | 36,817 | 100,589 | 1,617,703 | 19,038 | 339,592 |
| Dividends payable | 3,105 | 102,563 | 2,330,694 | 412 | 2,028,820 |
| Total Liabilities | 5,216,435 | 602,859 | 30,739,199 | 1,047,642 | 49,675,949 |
| Commitments and contingencies | |||||
| Unrealized depreciation on unfunded commmitments | - | - | - | - | (3,905) |
| Net Assets | $ 264,881,605 | $ 155,698,744 | $ 6,505,309,967 | $ 64,416,584 | $ 8,354,458,197 |
| NET ASSETS CONSIST OF | |||||
| Net capital paid in on shares of beneficial interest | $ 265,162,757 | $ 196,482,622 | $ 7,159,844,795 | $ 63,413,065 | $ 8,607,422,890 |
| Distributable earnings (accumulated loss) | (281,152) | (40,783,878) | (654,534,828) | 1,003,519 | (252,964,693) |
| Net Assets | $ 264,881,605 | $ 155,698,744 | $ 6,505,309,967 | $ 64,416,584 | $ 8,354,458,197 |
March 31, 2024 (Unaudited)
| THORNBURG ULTRA SHORT INCOME FUND | THORNBURG LIMITED TERM U.S. GOVERNMENT FUND | THORNBURG LIMITED TERM INCOME FUND | THORNBURG CORE PLUS BOND FUND | THORNBURG STRATEGIC INCOME FUND | |
| NET ASSET VALUE | |||||
| Class A Shares: | |||||
| Net assets applicable to shares outstanding | $ 26,911,179 | $ 39,898,711 | $ 497,853,901 | $ 144,754 | $ 299,297,326 |
| Shares outstanding | 2,203,813 | 3,382,412 | 38,853,131 | 13,834 | 26,313,107 |
| Net asset value and redemption price per share | $ 12.21 | $ 11.80 | $ 12.81 | $ 10.46 | $ 11.37 |
| Maximum offering price per share (net asset value, plus 2.25% of offering price) | $ 12.49 | $ 12.07 | $ 13.10 | $ 10.95 * | $ 11.91 * |
| Class C Shares: | |||||
| Net assets applicable to shares outstanding | - | 2,708,341 | 119,852,440 | 287,639 | 101,348,841 |
| Shares outstanding | - | 228,320 | 9,368,592 | 27,485 | 8,926,464 |
| Net asset value and redemption price per share** | - | 11.86 | 12.79 | 10.47 | 11.35 |
| Class C2 Shares: | |||||
| Net assets applicable to shares outstanding | - | 291,512 | 5,597,128 | - | - |
| Shares outstanding | - | 24,558 | 437,474 | - | - |
| Net asset value and redemption price per share** | - | 11.87 | 12.79 | - | - |
| Class I Shares: | |||||
| Net assets applicable to shares outstanding | 237,970,426 | 108,180,368 | 5,587,405,802 | 63,038,450 | 7,712,479,764 |
| Shares outstanding | 19,502,088 | 9,172,163 | 435,942,555 | 6,025,333 | 679,736,055 |
| Net asset value and redemption price per share | 12.20 | 11.79 | 12.82 | 10.46 | 11.35 |
| Class R3 Shares: | |||||
| Net assets applicable to shares outstanding | - | 2,401,780 | 38,700,896 | 106,799 | 904,737 |
| Shares outstanding | - | 203,382 | 3,018,194 | 10,209 | 79,634 |
| Net asset value and redemption price per share | - | 11.81 | 12.82 | 10.46 | 11.36 |
| Class R4 Shares: | |||||
| Net assets applicable to shares outstanding | - | 1,033,158 | 15,933,257 | 107,075 | 2,984,706 |
| Shares outstanding | - | 87,632 | 1,243,810 | 10,235 | 262,781 |
| Net asset value and redemption price per share | - | 11.79 | 12.81 | 10.46 | 11.36 |
| Class R5 Shares: | |||||
| Net assets applicable to shares outstanding | - | 1,184,874 | 69,938,284 | 107,061 | 65,826,917 |
| Shares outstanding | - | 100,379 | 5,458,375 | 10,234 | 5,799,732 |
| Net asset value and redemption price per share | - | 11.80 | 12.81 | 10.46 | 11.35 |
| Class R6 Shares: | |||||
| Net assets applicable to shares outstanding | - | - | 170,028,259 | 624,806 | 171,615,906 |
| Shares outstanding | - | - | 13,243,391 | 59,717 | 15,078,723 |
| Net asset value and redemption price per share | - | - | 12.84 | 10.46 | 11.38 |
| (a) | Cost of foreign currency is $140; $0; $0; $4; $4,850,807; respectively. |
| * | Net asset value, plus 4.50% of offering price. |
| ** | Redemption price per share is equal to net asset value less any applicable contingent deferred sales charge. |
Six Months Ended March 31, 2024 (Unaudited)
| THORNBURG ULTRA SHORT INCOME FUND | THORNBURG LIMITED TERM U.S. GOVERNMENT FUND | THORNBURG LIMITED TERM INCOME FUND | THORNBURG CORE PLUS BOND FUND† | THORNBURG STRATEGIC INCOME FUND | |
| INVESTMENT INCOME | |||||
| Dividend income | |||||
| Non-affiliated issuers | $ - | $ - | $ 246,925 | $ 850 | $ 323,155 |
| Non-controlled affiliated issuers | 584,275 | - | 5,907,036 | 63,137 | 16,766,652 |
| Interest income | 7,253,554 | 2,763,369 | 129,645,604 | 672,850 | 176,810,974 |
| Foreign withholding tax claims | - | - | - | - | 63,244 |
| Total Income | 7,837,829 | 2,763,369 | 135,799,565 | 736,837 | 193,964,025 |
| EXPENSES | |||||
| Investment management fees | 341,519 | 308,713 | 10,449,958 | 70,996 | 20,628,380 |
| Administration fees | 120,221 | 72,454 | 2,864,148 | 12,718 | 3,354,846 |
| Distribution and service fees | |||||
| Class A Shares | 27,279 | 53,118 | 642,868 | 163 | 363,796 |
| Class C Shares | - | 7,786 | 323,706 | 762 | 491,031 |
| Class C2 Shares | - | 1,084 | 19,110 | - | - |
| Class R3 Shares | - | 6,738 | 97,478 | 258 | 2,048 |
| Class R4 Shares | - | 1,226 | 22,625 | 129 | 3,554 |
| Transfer agent fees | |||||
| Class A Shares | 29,448 | 29,243 | 201,847 | 945 | 135,673 |
| Class C Shares | - | 4,939 | 49,218 | 362 | 31,914 |
| Class C2 Shares | - | 442 | 2,306 | - | - |
| Class I Shares | 125,093 | 42,816 | 2,361,417 | 3,325 | 2,228,451 |
| Class R3 Shares | - | 5,174 | 22,309 | 839 | 1,727 |
| Class R4 Shares | - | 1,463 | 35,359 | 362 | 8,356 |
| Class R5 Shares | - | 2,708 | 83,988 | 839 | 64,755 |
| Class R6 Shares | - | - | 20,844 | 658 | 20,842 |
| Registration and filing fees | |||||
| Class A Shares | 9,279 | 7,176 | 12,669 | 518 | 14,277 |
| Class C Shares | - | 7,096 | 7,632 | 682 | 11,736 |
| Class C2 Shares | - | 2,568 | 6,997 | - | - |
| Class I Shares | 14,741 | 10,686 | 48,430 | 1,109 | 143,837 |
| Class R3 Shares | - | 7,164 | 7,686 | 372 | 7,768 |
| Class R4 Shares | - | 7,344 | 7,613 | 372 | 7,782 |
| Class R5 Shares | - | 7,330 | 7,599 | 373 | 7,766 |
| Class R6 Shares | - | - | 7,996 | 373 | 8,408 |
| Custodian fees | 28,174 | 23,408 | 133,148 | 905 | 159,160 |
| Professional fees | 26,526 | 26,485 | 72,639 | 39,205 | 101,693 |
| Trustee and officer fees | 9,748 | 5,502 | 213,087 | 1,354 | 249,614 |
| Other expenses | 26,235 | 22,615 | 338,509 | 104,867 | 660,162 |
| Total Expenses | 758,263 | 665,278 | 18,061,186 | 242,486 | 28,707,576 |
| Less: | |||||
| Expenses reimbursed | (298,853) | (42,605) | (952,941) | (22,495) | (3,145,355) |
| Investment management fees waived | (22,309) | - | - | (146,244) | (1,642,848) |
| Net Expenses | 437,101 | 622,673 | 17,108,245 | 73,747 | 23,919,373 |
| Net Investment Income (Loss) | $ 7,400,728 | $ 2,140,696 | $ 118,691,320 | $ 663,090 | $ 170,044,652 |
| THORNBURG ULTRA SHORT INCOME FUND | THORNBURG LIMITED TERM U.S. GOVERNMENT FUND | THORNBURG LIMITED TERM INCOME FUND | THORNBURG CORE PLUS BOND FUND† | THORNBURG STRATEGIC INCOME FUND | |
| REALIZED AND UNREALIZED GAIN (LOSS) | |||||
| Net realized gain (loss) on: | |||||
| Non-affiliated issuers investments | $ 53,029 | $ (3,662,482) | $ (110,631,019) | $ 162,946 | $ (85,826,613) |
| Forward currency contracts | - | - | - | (1,486) | (1,019,828) |
| Foreign currency transactions | - | - | - | (94) | (135,823) |
| Net realized gain (loss) | 53,029 | (3,662,482) | (110,631,019) | 161,366 | (86,982,264) |
| Net change in unrealized appreciation (depreciation) on: | |||||
| Non-affiliated issuers investments* | 998,741 | 8,511,348 | 330,222,242 | 841,116 | 330,018,588 |
| Forward currency contracts | - | - | - | 452 | (111,166) |
| Foreign currency translations | 3 | - | - | 10 | (4,935) |
| Change in net unrealized appreciation (depreciation) | 998,744 | 8,511,348 | 330,222,242 | 841,578 | 329,902,487 |
| Net Realized and Unrealized Gain (Loss) | 1,051,773 | 4,848,866 | 219,591,223 | 1,002,944 | 242,920,223 |
| Change in Net Assets Resulting from Operations | $ 8,452,501 | $ 6,989,562 | $ 338,282,543 | $ 1,666,034 | $ 412,964,875 |
| * Net of change in deferred taxes | $ - | $ - | $ - | $ - | $ (3,442) |
| † | The Fund commenced operations on October 2, 2023. |
| THORNBURG ULTRA SHORT INCOME FUND | THORNBURG LIMITED TERM U.S. GOVERNMENT FUND | |||
| Six Months Ended March 31, 2024* | Year Ended September 30, 2023 | Six Months Ended March 31, 2024* | Year Ended September 30, 2023 | |
| INCREASE (DECREASE) IN NET ASSETS FROM | ||||
| OPERATIONS | ||||
| Net investment income (loss) | $ 7,400,728 | $ 11,567,185 | $ 2,140,696 | $ 4,156,957 |
| Net realized gain (loss) | 53,029 | 81,945 | (3,662,482) | (6,846,424) |
| Net change in unrealized appreciation (depreciation) | 998,744 | 955,945 | 8,511,348 | 5,340,615 |
| Net Increase (Decrease) in Net Assets Resulting from Operations | 8,452,501 | 12,605,075 | 6,989,562 | 2,651,148 |
| DIVIDENDS TO SHAREHOLDERS | ||||
| From distributable earnings | ||||
| Class A Shares | (715,096) | (1,413,188) | (542,937) | (1,074,414) |
| Class C Shares | - | - | (35,676) | (80,233) |
| Class C2 Shares | - | - | (3,856) | (13,629) |
| Class I Shares | (6,683,342) | (10,148,755) | (1,639,007) | (3,285,693) |
| Class R3 Shares | - | - | (34,066) | (68,173) |
| Class R4 Shares | - | - | (12,492) | (20,131) |
| Class R5 Shares | - | - | (19,325) | (38,667) |
| FUND SHARE TRANSACTIONS | ||||
| Class A Shares | (1,424,853) | (6,040,854) | (4,602,097) | (13,232,202) |
| Class C Shares | - | - | (689,351) | (2,484,963) |
| Class C2 Shares | - | - | (289,924) | 356,417 |
| Class I Shares | 2,007,235 | 88,353,098 | (14,434,424) | (35,246,726) |
| Class R3 Shares | - | - | (493,791) | (606,847) |
| Class R4 Shares | - | - | 75,682 | (201,923) |
| Class R5 Shares | - | - | (318,591) | (523,625) |
| Net Increase (Decrease) in Net Assets | 1,636,445 | 83,355,376 | (16,050,293) | (53,869,661) |
| NET ASSETS | ||||
| Beginning of Period | 263,245,160 | 179,889,784 | 171,749,037 | 225,618,698 |
| End of Period | $ 264,881,605 | $ 263,245,160 | $ 155,698,744 | $ 171,749,037 |
| * | Unaudited. |
| THORNBURG LIMITED TERM INCOME FUND | THORNBURG CORE PLUS BOND FUND | ||
| Six Months Ended March 31, 2024* | Year Ended September 30, 2023 | Period Ended March 31, 2024*, † | |
| INCREASE (DECREASE) IN NET ASSETS FROM | |||
| OPERATIONS | |||
| Net investment income (loss) | $ 118,691,320 | $ 230,700,976 | $ 663,090 |
| Net realized gain (loss) | (110,631,019) | (159,239,483) | 161,366 |
| Net change in unrealized appreciation (depreciation) | 330,222,242 | 180,031,652 | 841,578 |
| Net Increase (Decrease) in Net Assets Resulting from Operations | 338,282,543 | 251,493,145 | 1,666,034 |
| DIVIDENDS TO SHAREHOLDERS | |||
| From distributable earnings | |||
| Class A Shares | (8,797,222) | (16,933,118) | (2,885) |
| Class C Shares | (2,049,180) | (4,699,291) | (2,814) |
| Class C2 Shares | (86,611) | (201,735) | - |
| Class I Shares | (102,862,784) | (200,761,802) | (645,048) |
| Class R3 Shares | (622,500) | (1,202,278) | (2,162) |
| Class R4 Shares | (288,284) | (501,476) | (2,293) |
| Class R5 Shares | (1,349,176) | (2,746,692) | (2,422) |
| Class R6 Shares | (3,064,846) | (5,444,781) | (4,891) |
| FUND SHARE TRANSACTIONS | |||
| Class A Shares | (53,183,339) | (66,492,152) | 138,624 |
| Class C Shares | (25,273,813) | (81,423,823) | 281,067 |
| Class C2 Shares | (1,332,733) | (2,919,625) | - |
| Class I Shares | (368,684,047) | (1,136,009,720) | 62,071,273 |
| Class R3 Shares | (39,515) | (12,461,630) | 102,162 |
| Class R4 Shares | (3,434,636) | 786,251 | 102,426 |
| Class R5 Shares | (3,188,765) | (41,358,252) | 102,422 |
| Class R6 Shares | 7,124,431 | (23,831,523) | 615,091 |
| Net Increase (Decrease) in Net Assets | (228,850,477) | (1,344,708,502) | 64,416,584 |
| NET ASSETS | |||
| Beginning of Period | 6,734,160,444 | 8,078,868,946 | - |
| End of Period | $ 6,505,309,967 | $ 6,734,160,444 | $ 64,416,584 |
| * | Unaudited. |
| † | The Fund commenced operations on October 2, 2023. |
| THORNBURG STRATEGIC INCOME FUND | ||
| Six Months Ended March 31, 2024* | Year Ended September 30, 2023 | |
| INCREASE (DECREASE) IN NET ASSETS FROM | ||
| OPERATIONS | ||
| Net investment income (loss) | $ 170,044,652 | $ 261,668,783 |
| Net realized gain (loss) | (86,982,264) | (27,857,506) |
| Net change in unrealized appreciation (depreciation) | 329,902,487 | 9,528,122 |
| Net Increase (Decrease) in Net Assets Resulting from Operations | 412,964,875 | 243,339,399 |
| DIVIDENDS TO SHAREHOLDERS | ||
| From distributable earnings | ||
| Class A Shares | (6,421,613) | (11,128,378) |
| Class C Shares | (1,811,006) | (2,985,734) |
| Class I Shares | (168,096,943) | (239,667,614) |
| Class R3 Shares | (17,014) | (24,114) |
| Class R4 Shares | (58,970) | (96,895) |
| Class R5 Shares | (1,558,349) | (2,489,823) |
| Class R6 Shares | (3,659,662) | (5,679,657) |
| FUND SHARE TRANSACTIONS | ||
| Class A Shares | 18,314,229 | (50,739,155) |
| Class C Shares | 5,264,496 | 12,663,012 |
| Class I Shares | 1,072,410,809 | 2,266,443,833 |
| Class R3 Shares | 209,803 | 27,510 |
| Class R4 Shares | 90,266 | 770,776 |
| Class R5 Shares | 896,170 | 22,511,555 |
| Class R6 Shares | 28,926,412 | 28,836,792 |
| Net Increase (Decrease) in Net Assets | 1,357,453,503 | 2,261,781,507 |
| NET ASSETS | ||
| Beginning of Period | 6,997,004,694 | 4,735,223,187 |
| End of Period | $ 8,354,458,197 | $ 6,997,004,694 |
| * | Unaudited. |
March 31, 2024 (Unaudited)
March 31, 2024 (Unaudited)
| Class A | Class C | Class C2 | Class I | Class R3 | Class R4 | Class R5 | Class R6 | |
| Ultra Short Income Fund | X | X | ||||||
| Limited Term U.S. Government Fund | X | X | X | X | X | X | X | |
| Limited Term Income Fund | X | X | X | X | X | X | X | X |
| Core Plus Bond Fund | X | X | X | X | X | X | X | |
| Strategic Income Fund | X | X | X | X | X | X | X |
March 31, 2024 (Unaudited)
March 31, 2024 (Unaudited)
March 31, 2024 (Unaudited)
| ULTRA SHORT INCOME FUND | TOTAL | LEVEL 1 | LEVEL 2 | LEVEL 3 |
| Assets | ||||
| Investments in Securities | ||||
| U.S. Treasury Securities | $ 35,514,971 | $ 35,514,971 | $ — | $ — |
| U.S. Government Agencies | 28,099 | — | 28,099 | — |
| Mortgage Backed | 3,775,732 | — | 3,775,732 | — |
| Asset Backed Securities | 72,230,404 | — | 72,230,404 | — |
| Corporate Bonds | 126,272,668 | — | 126,272,668 | — |
| Long-Term Municipal Bonds | 24,852 | — | 24,852 | — |
| Short-Term Investments | 25,767,151 | 25,767,151 | — | — |
| Total Investments in Securities | $ 263,613,877 | $ 61,282,122 | $ 202,331,755 | $ — |
| Total Assets | $ 263,613,877 | $ 61,282,122 | $ 202,331,755 | $ — |
| LIMITED TERM U.S. GOVERNMENT FUND | TOTAL | LEVEL 1 | LEVEL 2 | LEVEL 3 |
| Assets | ||||
| Investments in Securities | ||||
| U.S. Treasury Securities | $ 26,603,357 | $ 26,603,357 | $ — | $ — |
| U.S. Government Agencies | 10,795,239 | — | 10,795,239 | — |
| Mortgage Backed | 104,958,048 | — | 104,958,048 | — |
| Corporate Bonds | 2,979,910 | — | 2,979,910 | — |
| Short-Term Investments | 5,212,376 | — | 5,212,376 | — |
| Total Investments in Securities | $ 150,548,930 | $ 26,603,357 | $ 123,945,573 | $ — |
| Total Assets | $ 150,548,930 | $ 26,603,357 | $ 123,945,573 | $— |
March 31, 2024 (Unaudited)
| LIMITED TERM INCOME FUND | TOTAL | LEVEL 1 | LEVEL 2 | LEVEL 3 |
| Assets | ||||
| Investments in Securities | ||||
| U.S. Treasury Securities | $ 1,036,929,333 | $ 1,036,929,333 | $ — | $ — |
| U.S. Government Agencies | 24,823,882 | — | 24,823,882 | — |
| Other Government | 9,811,171 | — | 9,811,171 | — |
| Mortgage Backed | 1,730,525,877 | — | 1,730,525,877 | — |
| Asset Backed Securities | 786,510,652 | — | 786,510,652 | — |
| Corporate Bonds | 2,349,649,106 | — | 2,349,649,106 | — |
| Long-Term Municipal Bonds | 16,530,752 | — | 16,530,752 | — |
| Preferred Stock | 27,416,228 | — | — | 27,416,228 |
| Short-Term Investments | 407,546,114 | 407,546,114 | — | — |
| Total Investments in Securities | $ 6,389,743,115 | $ 1,444,475,447 | $ 4,917,851,440 | $ 27,416,228 |
| Total Assets | $ 6,389,743,115 | $ 1,444,475,447 | $ 4,917,851,440 | $ 27,416,228(a) |
| (a) Level 3 investments at the beginning and/or end of the period in relation to net assets were not significant and accordingly, a reconciliation of Level 3 assets for the period ended March 31, 2024 is not presented. | ||||
| CORE PLUS BOND FUND | TOTAL | LEVEL 1 | LEVEL 2 | LEVEL 3 |
| Assets | ||||
| Investments in Securities | ||||
| U.S. Treasury Securities | $ 24,717,134 | $ 24,717,134 | $ — | $ — |
| Other Government | 164,270 | — | 164,270 | — |
| Mortgage Backed | 18,592,140 | — | 18,592,140 | — |
| Asset Backed Securities | 4,286,333 | — | 4,286,333 | — |
| Corporate Bonds | 16,776,090 | — | 16,776,090 | — |
| Long-Term Municipal Bonds | 106,605 | — | 106,605 | — |
| Preferred Stock | 94,376 | — | — | 94,376 |
| Short-Term Investments | 107,148 | 107,148 | — | — |
| Total Investments in Securities | $ 64,844,096 | $ 24,824,282 | $ 39,925,438 | $ 94,376 |
| Other Financial Instruments | ||||
| Forward Currency Contracts | $ 452 | $ — | $ 452 | $ — |
| Total Assets | $ 64,844,548 | $ 24,824,282 | $ 39,925,890 | $ 94,376(a) |
| (a) Level 3 investments at the beginning and/or end of the period in relation to net assets were not significant and accordingly, a reconciliation of Level 3 assets for the period ended March 31, 2024 is not presented. | ||||
March 31, 2024 (Unaudited)
| STRATEGIC INCOME FUND | TOTAL | LEVEL 1 | LEVEL 2 | LEVEL 3 |
| Assets | ||||
| Investments in Securities | ||||
| Common Stock | $ 417,702 | $ — | $ — | $ 417,702 |
| Preferred Stock | 12,386,850 | — | — | 12,386,850 |
| Asset Backed Securities | 931,347,710 | — | 929,022,947 | 2,324,763 |
| Corporate Bonds | 3,503,330,612 | — | 3,503,330,067 | 545 |
| Convertible Bonds | 13,592,931 | — | 13,592,931 | — |
| Long-Term Municipal Bonds | 5,588,040 | — | 5,588,040 | — |
| Other Government | 90,817,744 | — | 90,817,744 | — |
| U.S. Treasury Securities | 1,411,696,535 | 1,411,696,535 | — | — |
| U.S. Government Agencies | 9,398,819 | — | 9,398,819 | — |
| Mortgage Backed | 1,658,541,213 | — | 1,658,541,213 | — |
| Loan Participations | 79,703,393 | — | 79,703,393 | — |
| Short-Term Investments | 470,383,516 | 470,383,516 | — | — |
| Total Investments in Securities | $ 8,187,205,065 | $ 1,882,080,051 | $ 6,289,995,154 | $ 15,129,860 |
| Other Financial Instruments | ||||
| Forward Currency Contracts | $ 659,122 | $ — | $ 659,122 | $ — |
| Total Assets | $ 8,187,864,187 | $ 1,882,080,051 | $ 6,290,654,276 | $15,129,860(a) |
| (a) | Level 3 investments at the beginning and/or end of the period in relation to net assets were not significant and accordingly, a reconciliation of Level 3 assets for the period ended March 31, 2024 is not presented. |
| ULTRA SHORT INCOME FUND | LIMITED TERM U.S. GOVERNMENT FUND | LIMITED TERM INCOME FUND | CORE PLUS BOND FUND | STRATEGIC INCOME FUND | |||||
| DAILY NET ASSETS | FEE RATE | DAILY NET ASSETS | FEE RATE | DAILY NET ASSETS | FEE RATE | DAILY NET ASSETS | FEE RATE | DAILY NET ASSETS | FEE RATE |
| Up to $5 billion | 0.250% | Up to $1 billion | 0.375% | Up to $500 million | 0.500% | Up to $500 million | 0.490% | Up to $500 million | 0.750% |
| Next $5 billion | 0.225 | Next $1 billion | 0.325 | Next $500 million | 0.450 | Next $500 million | 0.460 | Next $500 million | 0.675 |
| Over $10 billion | 0.200 | Over $2 billion | 0.275 | Next $500 million | 0.400 | Next $500 million | 0.430 | Next $500 million | 0.625 |
| Next $500 million | 0.350 | Next $500 million | 0.400 | Next $500 million | 0.575 | ||||
| Over $2 billion | 0.275 | Over $2 billion | 0.370 | Over $2 billion | 0.500 | ||||
| Effective Management Fee | |
| Ultra Short Income Fund | 0.250% |
| Limited Term U.S. Government Fund | 0.375 |
| Limited Term Income Fund | 0.321 |
| Core Plus Bond Fund | 0.490 |
| Strategic Income Fund | 0.541 |
March 31, 2024 (Unaudited)
| Administrative Services Fee Schedule | |
| Daily Net Assets | Fee Rate |
| Up to $20 billion | 0.100% |
| $20 billion to $40 billion | 0.075 |
| $40 billion to $60 billion | 0.040 |
| Over $60 billion | 0.030 |
| Commissions | CDSC fees | |
| Ultra Short Income Fund | $ 619 | $ — |
| Limited Term U.S. Government Fund | 151 | — |
| Limited Term Income Fund | 4,282 | 1,490 |
| Strategic Income Fund | 17,133 | 7,827 |
March 31, 2024 (Unaudited)
| Class A | Class C | Class C2 | Class I | Class R3 | Class R4 | Class R5 | Class R6 | |
| Ultra Short Income Fund | 0.50% | —% | —% | 0.30% | —% | —% | —% | —% |
| Limited Term U.S. Government Fund | — | 1.24 | 1.24 | — | 0.99 | 0.99 | 0.67 | — |
| Limited Term Income Fund | — | — | 1.24 | 0.49 | 0.99 | 0.99 | 0.49 | 0.42 |
| Core Plus Bond Fund | 0.75 | 1.50 | — | 0.50 | 1.00 | 0.75 | 0.50 | 0.49 |
| Strategic Income Fund | 1.05 | — | — | 0.60 | 1.25 | 1.25 | 0.60 | 0.53 |
| Contractual: | Class A | Class C | Class C2 | Class I | Class R3 | Class R4 | Class R5 | Class R6 | Total |
| Ultra Short Income Fund | $ 50,814 | $ — | $ — | $ 248,039 | $ — | $ — | $ — | $ — | $ 298,853 |
| Limited Term U.S. Government Fund | — | 9,201 | 2,954 | — | 13,246 | 7,921 | 9,283 | — | 42,605 |
| Limited Term Income Fund | — | — | 4,655 | 804,446 | 18,851 | 15,070 | 70,647 | 39,272 | 952,941 |
| Core Plus Bond Fund | 1,552 | 1,054 | — | 15,598 | 1,257 | 780 | 1,257 | 997 | 22,495 |
| Strategic Income Fund | 40,649 | 13,709 | — | 3,929,645 | 9,069 | 11,086 | 87,233 | 116,464 | 4,207,855 |
| Voluntary: | Class A | Class C | Class C2 | Class I | Class R3 | Class R4 | Class R5 | Class R6 | Total |
| Ultra Short Income Fund | $ 2,229 | $ — | $ — | $ 20,080 | $ — | $ — | $ — | $ — | $ 22,309 |
| Core Plus Bond Fund | 660 | 772 | — | 142,185 | 522 | 522 | 522 | 1,061 | 146,244 |
| Strategic Income Fund | 22,168 | 7,476 | — | 534,019 | 62 | 216 | 4,948 | 11,459 | 580,348 |
| Percentage of Direct Investments | |
| Ultra Short Income Fund | 1.09% |
| Limited Term U.S. Government Fund | 18.08 |
| Limited Term Income Fund | 0.12 |
| Core Plus Bond Fund | 1.81 |
| Strategic Income Fund | 0.14 |
| ULTRA SHORT INCOME FUND | Market Value 9/30/23 | Purchases at Cost | Sales Proceeds | Realized Gain (Loss) | Change in Unrealized Appr./(Depr.) | Market Value 3/31/24 | Dividend Income |
| Thornburg Capital Mgmt. Fund | $ 18,968,697 | $ 140,201,657 | $ (133,403,203) | $- | $- | $ 25,767,151 | $ 584,275 |
| LIMITED TERM INCOME FUND | |||||||
| Thornburg Capital Mgmt. Fund | $122,751,672 | $1,259,822,622 | $ (975,028,180) | $- | $- | $407,546,114 | $ 5,907,036 |
| CORE PLUS BOND FUND | |||||||
| Thornburg Capital Mgmt. Fund | $ - | $ 30,512,513 | $ (30,405,365) | $- | $- | $ 107,148 | $ 63,137 |
March 31, 2024 (Unaudited)
| STRATEGIC INCOME FUND | Market Value 9/30/23 | Purchases at Cost | Sales Proceeds | Realized Gain (Loss) | Change in Unrealized Appr./(Depr.) | Market Value 3/31/24 | Dividend Income |
| Thornburg Capital Mgmt. Fund | $570,141,195 | $1,409,750,302 | $(1,509,507,981) | $- | $- | $470,383,516 | $16,766,652 |
| Cost | Unrealized Appreciation | Unrealized Depreciation | Net Unrealized Appreciation (Depreciation) | |
| Ultra Short Income Fund | $ 263,379,558 | $ 627,456 | $ (393,137) | $ 234,319 |
| Limited Term U.S. Government Fund | 159,702,462 | 1,205,162 | (10,358,694) | (9,153,532) |
| Limited Term Income Fund | 6,642,926,833 | 57,898,143 | (311,081,861) | (253,183,718) |
| Core Plus Bond Fund | 64,002,980 | 864,699 | (23,583) | 841,116 |
| Strategic Income Fund | 8,279,598,841 | 144,760,519 | (237,154,295) | (92,393,776) |
| Cumulative Capital Losses | ||
| Short-Term | Long-Term | |
| Ultra Short Income Fund | $ 491,499 | $ 143,617 |
| Limited Term U.S. Government Fund | 6,001,461 | 21,456,202 |
| Limited Term Income Fund | 118,812,794 | 168,477,437 |
| Strategic Income Fund | 22,479,214 | 43,210,307 |
March 31, 2024 (Unaudited)
| SIX MONTHS ENDED March 31, 2024 | YEAR ENDED September 30, 2023 | |||
| ULTRA SHORT INCOME FUND | SHARES | AMOUNT | SHARES | AMOUNT |
| Class A Shares | ||||
| Shares sold | 114,126 | $ 1,392,830 | 1,453,234 | $ 17,630,385 |
| Shares issued to shareholders in reinvestment of dividends | 58,306 | 711,447 | 115,522 | 1,403,778 |
| Shares repurchased | (289,441) | (3,529,130) | (2,064,019) | (25,075,017) |
| Net increase (decrease) | (117,009) | $ (1,424,853) | (495,263) | $ (6,040,854) |
| Class I Shares | ||||
| Shares sold | 6,970,516 | $ 84,904,977 | 20,384,068 | $ 247,111,472 |
| Shares issued to shareholders in reinvestment of dividends | 547,186 | 6,671,423 | 834,289 | 10,131,349 |
| Shares repurchased | (7,347,873) | (89,569,165) | (13,912,802) | (168,889,723) |
| Net increase (decrease) | 169,829 | $ 2,007,235 | 7,305,555 | $ 88,353,098 |
| SIX MONTHS ENDED March 31, 2024 | YEAR ENDED September 30, 2023 | |||
| LIMITED TERM U.S. GOVERNMENT FUND | SHARES | AMOUNT | SHARES | AMOUNT |
| Class A Shares | ||||
| Shares sold | 226,019 | $ 2,648,703 | 484,272 | $ 5,696,911 |
| Shares issued to shareholders in reinvestment of dividends | 44,420 | 519,984 | 87,114 | 1,024,639 |
| Shares repurchased | (663,380) | (7,770,784) | (1,694,530) | (19,953,752) |
| Net increase (decrease) | (392,941) | $ (4,602,097) | (1,123,144) | $ (13,232,202) |
| Class C Shares | ||||
| Shares sold | 23,795 | $ 280,246 | 38,665 | $ 452,840 |
| Shares issued to shareholders in reinvestment of dividends | 2,848 | 33,513 | 6,392 | 75,633 |
| Shares repurchased | (85,196) | (1,003,110) | (255,356) | (3,013,436) |
| Net increase (decrease) | (58,553) | $ (689,351) | (210,299) | $ (2,484,963) |
| Class C2 Shares | ||||
| Shares sold | - | $ - | 55,309 | $ 651,242 |
| Shares issued to shareholders in reinvestment of dividends | 329 | 3,856 | 1,151 | 13,629 |
| Shares repurchased | (25,627) | (293,780) | (26,208) | (308,454) |
| Net increase (decrease) | (25,298) | $ (289,924) | 30,252 | $ 356,417 |
| Class I Shares | ||||
| Shares sold | 1,142,689 | $ 13,491,094 | 1,955,400 | $ 23,052,895 |
| Shares issued to shareholders in reinvestment of dividends | 100,197 | 1,172,241 | 211,345 | 2,484,791 |
| Shares repurchased | (2,469,711) | (29,097,759) | (5,162,638) | (60,784,412) |
| Net increase (decrease) | (1,226,825) | $ (14,434,424) | (2,995,893) | $ (35,246,726) |
| Class R3 Shares | ||||
| Shares sold | 19,038 | $ 223,782 | 39,410 | $ 466,739 |
| Shares issued to shareholders in reinvestment of dividends | 2,837 | 33,263 | 5,733 | 67,500 |
| Shares repurchased | (64,056) | (750,836) | (97,420) | (1,141,086) |
| Net increase (decrease) | (42,181) | $ (493,791) | (52,277) | $ (606,847) |
March 31, 2024 (Unaudited)
| SIX MONTHS ENDED March 31, 2024 | YEAR ENDED September 30, 2023 | |||
| LIMITED TERM U.S. GOVERNMENT FUND | SHARES | AMOUNT | SHARES | AMOUNT |
| Class R4 Shares | ||||
| Shares sold | 10,562 | $ 123,529 | 17,318 | $ 204,243 |
| Shares issued to shareholders in reinvestment of dividends | 1,066 | 12,480 | 1,705 | 20,038 |
| Shares repurchased | (5,128) | (60,327) | (36,415) | (426,204) |
| Net increase (decrease) | 6,500 | $ 75,682 | (17,392) | $ (201,923) |
| Class R5 Shares | ||||
| Shares sold | 5,829 | $ 68,371 | 11,488 | $ 135,557 |
| Shares issued to shareholders in reinvestment of dividends | 1,630 | 19,086 | 3,166 | 37,252 |
| Shares repurchased | (34,282) | (406,048) | (58,727) | (696,434) |
| Net increase (decrease) | (26,823) | $ (318,591) | (44,073) | $ (523,625) |
| SIX MONTHS ENDED March 31, 2024 | YEAR ENDED September 30, 2023 | |||
| LIMITED TERM INCOME FUND | SHARES | AMOUNT | SHARES | AMOUNT |
| Class A Shares | ||||
| Shares sold | 2,467,164 | $ 31,183,906 | 7,767,621 | $ 97,211,011 |
| Shares issued to shareholders in reinvestment of dividends | 611,516 | 7,747,577 | 1,109,321 | 13,922,644 |
| Shares repurchased | (7,290,919) | (92,114,822) | (14,188,210) | (177,625,807) |
| Net increase (decrease) | (4,212,239) | $ (53,183,339) | (5,311,268) | $ (66,492,152) |
| Class C Shares | ||||
| Shares sold | 242,266 | $ 3,057,104 | 535,634 | $ 6,695,779 |
| Shares issued to shareholders in reinvestment of dividends | 145,446 | 1,838,550 | 333,115 | 4,173,355 |
| Shares repurchased | (2,395,294) | (30,169,467) | (7,384,523) | (92,292,957) |
| Net increase (decrease) | (2,007,582) | $ (25,273,813) | (6,515,774) | $ (81,423,823) |
| Class C2 Shares | ||||
| Shares sold | 26,331 | $ 335,449 | 13,644 | $ 172,557 |
| Shares issued to shareholders in reinvestment of dividends | 6,854 | 86,612 | 16,098 | 201,734 |
| Shares repurchased | (139,986) | (1,754,794) | (263,643) | (3,293,916) |
| Net increase (decrease) | (106,801) | $ (1,332,733) | (233,901) | $ (2,919,625) |
| Class I Shares | ||||
| Shares sold | 60,897,724 | $ 772,748,293 | 149,123,931 | $ 1,871,085,459 |
| Shares issued to shareholders in reinvestment of dividends | 7,257,480 | 91,958,028 | 14,369,488 | 180,390,754 |
| Shares repurchased | (97,742,734) | (1,233,390,368) | (254,623,845) | (3,187,485,933) |
| Net increase (decrease) | (29,587,530) | $ (368,684,047) | (91,130,426) | $ (1,136,009,720) |
| Class R3 Shares | ||||
| Shares sold | 614,569 | $ 7,757,704 | 1,022,834 | $ 12,778,746 |
| Shares issued to shareholders in reinvestment of dividends | 48,738 | 617,994 | 95,094 | 1,194,229 |
| Shares repurchased | (661,440) | (8,415,213) | (2,100,002) | (26,434,605) |
| Net increase (decrease) | 1,867 | $ (39,515) | (982,074) | $ (12,461,630) |
March 31, 2024 (Unaudited)
| SIX MONTHS ENDED March 31, 2024 | YEAR ENDED September 30, 2023 | |||
| LIMITED TERM INCOME FUND | SHARES | AMOUNT | SHARES | AMOUNT |
| Class R4 Shares | ||||
| Shares sold | 289,938 | $ 3,688,807 | 400,976 | $ 5,039,463 |
| Shares issued to shareholders in reinvestment of dividends | 4,674 | 59,109 | 10,075 | 126,436 |
| Shares repurchased | (566,754) | (7,182,552) | (349,159) | (4,379,648) |
| Net increase (decrease) | (272,142) | $ (3,434,636) | 61,892 | $ 786,251 |
| Class R5 Shares | ||||
| Shares sold | 1,287,074 | $ 16,174,269 | 1,748,755 | $ 21,951,346 |
| Shares issued to shareholders in reinvestment of dividends | 102,254 | 1,295,439 | 209,812 | 2,631,955 |
| Shares repurchased | (1,629,200) | (20,658,473) | (5,242,828) | (65,941,553) |
| Net increase (decrease) | (239,872) | $ (3,188,765) | (3,284,261) | $ (41,358,252) |
| Class R6 Shares | ||||
| Shares sold | 3,086,664 | $ 39,159,081 | 4,137,670 | $ 52,080,541 |
| Shares issued to shareholders in reinvestment of dividends | 226,722 | 2,878,799 | 407,058 | 5,118,693 |
| Shares repurchased | (2,746,138) | (34,913,449) | (6,413,880) | (81,030,757) |
| Net increase (decrease) | 567,248 | $ 7,124,431 | (1,869,152) | $ (23,831,523) |
| PERIOD ENDED March 31, 2024† | ||
| CORE PLUS BOND FUND | SHARES | AMOUNT |
| Class A Shares | ||
| Shares sold | 16,650 | $ 167,218 |
| Shares issued to shareholders in reinvestment of dividends | 278 | 2,883 |
| Shares repurchased | (3,094) | (31,477) |
| Net increase (decrease) | 13,834 | $ 138,624 |
| Class C Shares | ||
| Shares sold | 34,109 | $ 348,824 |
| Shares issued to shareholders in reinvestment of dividends | 259 | 2,691 |
| Shares repurchased | (6,883) | (70,448) |
| Net increase (decrease) | 27,485 | $ 281,067 |
| Class I Shares | ||
| Shares sold | 6,114,736 | $ 63,004,478 |
| Shares issued to shareholders in reinvestment of dividends | 61,706 | 643,858 |
| Shares repurchased | (151,109) | (1,577,063) |
| Net increase (decrease) | 6,025,333 | $ 62,071,273 |
| Class R3 Shares | ||
| Shares sold | 10,000 | $ 100,000 |
| Shares issued to shareholders in reinvestment of dividends | 209 | 2,162 |
| Net increase (decrease) | 10,209 | $ 102,162 |
March 31, 2024 (Unaudited)
| PERIOD ENDED March 31, 2024† | ||
| CORE PLUS BOND FUND | SHARES | AMOUNT |
| Class R4 Shares | ||
| Shares sold | 10,206 | $ 102,145 |
| Shares issued to shareholders in reinvestment of dividends | 221 | 2,292 |
| Shares repurchased | (192) | (2,011) |
| Net increase (decrease) | 10,235 | $ 102,426 |
| Class R5 Shares | ||
| Shares sold | 10,000 | $ 100,000 |
| Shares issued to shareholders in reinvestment of dividends | 234 | 2,422 |
| Net increase (decrease) | 10,234 | $ 102,422 |
| Class R6 Shares | ||
| Shares sold | 59,247 | $ 610,200 |
| Shares issued to shareholders in reinvestment of dividends | 470 | 4,891 |
| Net increase (decrease) | 59,717 | $ 615,091 |
| † The Fund commenced operations on October 2, 2023. | ||
| SIX MONTHS ENDED March 31, 2024 | YEAR ENDED September 30, 2023 | |||
| STRATEGIC INCOME FUND | SHARES | AMOUNT | SHARES | AMOUNT |
| Class A Shares | ||||
| Shares sold | 4,864,713 | $ 54,412,397 | 8,657,794 | $ 96,602,148 |
| Shares issued to shareholders in reinvestment of dividends | 539,241 | 6,075,794 | 934,483 | 10,441,785 |
| Shares repurchased | (3,750,864) | (42,173,962) | (14,202,566) | (157,783,088) |
| Net increase (decrease) | 1,653,090 | $ 18,314,229 | (4,610,289) | $ (50,739,155) |
| Class C Shares | ||||
| Shares sold | 1,384,649 | $ 15,542,279 | 3,206,423 | $ 35,705,220 |
| Shares issued to shareholders in reinvestment of dividends | 152,488 | 1,714,788 | 251,686 | 2,809,155 |
| Shares repurchased | (1,067,981) | (11,992,571) | (2,322,708) | (25,851,363) |
| Net increase (decrease) | 469,156 | $ 5,264,496 | 1,135,401 | $ 12,663,012 |
| Class I Shares | ||||
| Shares sold | 201,311,827 | $ 2,257,694,928 | 359,137,452 | $ 4,001,961,036 |
| Shares issued to shareholders in reinvestment of dividends | 14,019,625 | 157,611,872 | 20,114,084 | 224,360,437 |
| Shares repurchased | (120,110,968) | (1,342,895,991) | (176,222,506) | (1,959,877,640) |
| Net increase (decrease) | 95,220,484 | $ 1,072,410,809 | 203,029,030 | $ 2,266,443,833 |
| Class R3 Shares | ||||
| Shares sold | 22,676 | $ 253,312 | 9,122 | $ 102,123 |
| Shares issued to shareholders in reinvestment of dividends | 1,487 | 16,746 | 2,099 | 23,424 |
| Shares repurchased | (5,363) | (60,255) | (8,829) | (98,037) |
| Net increase (decrease) | 18,800 | $ 209,803 | 2,392 | $ 27,510 |
March 31, 2024 (Unaudited)
| SIX MONTHS ENDED March 31, 2024 | YEAR ENDED September 30, 2023 | |||
| STRATEGIC INCOME FUND | SHARES | AMOUNT | SHARES | AMOUNT |
| Class R4 Shares | ||||
| Shares sold | 60,404 | $ 682,825 | 87,654 | $ 981,829 |
| Shares issued to shareholders in reinvestment of dividends | 4,381 | 49,291 | 7,454 | 83,223 |
| Shares repurchased | (56,904) | (641,850) | (26,458) | (294,276) |
| Net increase (decrease) | 7,881 | $ 90,266 | 68,650 | $ 770,776 |
| Class R5 Shares | ||||
| Shares sold | 826,870 | $ 9,289,563 | 2,698,674 | $ 30,030,333 |
| Shares issued to shareholders in reinvestment of dividends | 137,453 | 1,545,602 | 220,858 | 2,464,408 |
| Shares repurchased | (883,330) | (9,938,995) | (895,507) | (9,983,186) |
| Net increase (decrease) | 80,993 | $ 896,170 | 2,024,025 | $ 22,511,555 |
| Class R6 Shares | ||||
| Shares sold | 4,108,240 | $ 46,337,157 | 4,613,451 | $ 51,669,559 |
| Shares issued to shareholders in reinvestment of dividends | 234,122 | 2,641,365 | 339,635 | 3,799,157 |
| Shares repurchased | (1,784,468) | (20,052,110) | (2,379,658) | (26,631,924) |
| Net increase (decrease) | 2,557,894 | $ 28,926,412 | 2,573,428 | $ 28,836,792 |
| Purchases | Sales | |
| Ultra Short Income Fund | $ 80,641,503 | $ 34,714,482 |
| Limited Term U.S. Government Fund | 35,530,989 | 53,687,253 |
| Limited Term Income Fund | 2,012,585,992 | 2,558,684,772 |
| Core Plus Bond Fund | 79,350,102 | 16,826,410 |
| Strategic Income Fund | 3,214,165,496 | 1,913,951,269 |
March 31, 2024 (Unaudited)
| Forward currency sell | |
| Core Plus Bond Fund | $ 73,608 |
| Strategic Income Fund | 97,233,895 |
| Type of Derivative(a) | Principal Risk | Counter Party | Asset Derivatives | Liability Derivatives | Net Amount | |
| Core Plus Bond Fund | Forward currency contracts | Foreign currency risk | SSB | $ 452 | $ — | $ 452 |
| Strategic Income Fund | Forward currency contracts | Foreign currency risk | SSB | 659,122 | — | 659,122 |
| (a) | Generally, the Statement of Assets and Liabilities location for forward currency contracts is Assets - Unrealized appreciation on forward currency contracts for asset derivatives and Liabilities - Unrealized depreciation on forward currency contracts for liabilities derivatives. |
| Net Realized | Net Change in Unrealized | |||
| Type of Derivative(a) | Principal Risk | Gain (Loss) | Appreciation (Depreciation) | |
| Core Plus Bond Fund | Forward currency contracts | Foreign currency risk | $ (1,486) | $ 452 |
| Strategic Income Fund | Forward currency contracts | Foreign currency risk | (1,019,828) | (111,166) |
| (a) | Generally, the Statement of Operations location for forward currency contracts is Net realized gain (loss) on: forward currency contracts and Net change in unrealized appreciation (depreciation) on: forward currency contracts. |
Ultra Short Income Fund
| PER SHARE PERFORMANCE (FOR A SHARE OUTSTANDING THROUGHOUT THE PERIOD) | ||||||||||
| UNLESS OTHERWISE NOTED, PERIODS ARE FISCAL YEARS ENDED SEPTEMBER 30, | Net Asset Value, Beginning of PERIOD | Net Investment Income (Loss)+ | Net Realized & Unrealized Gain (Loss) on Investments | Total from Investment Operations | Dividends from Net Investment Income | Dividends from Net Realized Gains | Dividends from Return of Capital | Total Dividends | Net Asset Value, End of PERIOD | |
| CLASS A SHARES(b) | ||||||||||
| 2024 (c) | $ 12.17 | 0.32 | 0.04 | 0.36 | (0.32) | — | — | (0.32) | $ 12.21 | |
| 2023 | $ 12.13 | 0.52 | 0.05 | 0.57 | (0.53) | — | — | (0.53) | $ 12.17 | |
| 2022 | $ 12.44 | 0.19 | (0.31) | (0.12) | (0.19) | — | — | (0.19) | $ 12.13 | |
| 2021 | $ 12.59 | 0.15 | (0.08) | 0.07 | (0.18) | (0.04) | — | (0.22) | $ 12.44 | |
| 2020 | $ 12.49 | 0.23 | 0.15 | 0.38 | (0.24) | (0.04) | — | (0.28) | $ 12.59 | |
| 2019 | $ 12.29 | 0.28 | 0.21 | 0.49 | (0.29) | — | — | (0.29) | $ 12.49 | |
| CLASS I SHARES | ||||||||||
| 2024 (c) | $ 12.16 | 0.33 | 0.04 | 0.37 | (0.33) | — | — | (0.33) | $ 12.20 | |
| 2023 | $ 12.12 | 0.55 | 0.04 | 0.59 | (0.55) | — | — | (0.55) | $ 12.16 | |
| 2022 | $ 12.43 | 0.21 | (0.31) | (0.10) | (0.21) | — | — | (0.21) | $ 12.12 | |
| 2021 | $ 12.58 | 0.18 | (0.08) | 0.10 | (0.21) | (0.04) | — | (0.25) | $ 12.43 | |
| 2020 | $ 12.48 | 0.25 | 0.16 | 0.41 | (0.27) | (0.04) | — | (0.31) | $ 12.58 | |
| 2019 | $ 12.28 | 0.31 | 0.20 | 0.51 | (0.31) | — | — | (0.31) | $ 12.48 | |
| (a) | Not annualized for periods less than one year. |
| (b) | Sales loads are not reflected in computing total return. |
| (c) | Unaudited Six Month Period Ended March 31. |
| (d) | Annualized. |
| + | Based on weighted average shares outstanding. |
Ultra Short Income Fund
| RATIOS TO AVERAGE NET ASSETS | Supplemental Data | ||||||
| UNLESS OTHERWISE NOTED, PERIODS ARE FISCAL YEARS ENDED SEPTEMBER 30, | Net Investment Income (Loss) (%) | Expenses, After Expense Reductions (%) | Expenses, Before Expense Reductions (%) | Total Return (%)(a) | Portfolio Turnover Rate (%)(a) | Net Assets at End of PERIOD (Thousands) | |
| CLASS A SHARES(b) | |||||||
| 2024 (c) | 5.24 (d) | 0.50 (d) | 0.89 (d) | 2.99 | 21.51 | $ 26,911 | |
| 2023 | 4.29 | 0.50 | 0.86 | 4.77 | 29.46 | $ 28,234 | |
| 2022 | 1.54 | 0.50 | 1.05 | (0.96) | 39.29 | $ 34,147 | |
| 2021 | 1.22 | 0.50 | 1.38 | 0.54 | 37.51 | $ 10,930 | |
| 2020 | 1.83 | 0.70 | 1.84 | 3.13 | 46.29 | $ 8,127 | |
| 2019 | 2.28 | 0.70 | 1.65 | 4.00 | 79.59 | $ 8,012 | |
| CLASS I SHARES | |||||||
| 2024 (c) | 5.44 (d) | 0.30 (d) | 0.52 (d) | 3.09 | 21.51 | $ 237,971 | |
| 2023 | 4.56 | 0.30 | 0.52 | 4.98 | 29.46 | $ 235,011 | |
| 2022 | 1.75 | 0.30 | 0.60 | (0.77) | 39.29 | $ 145,743 | |
| 2021 | 1.40 | 0.30 | 0.76 | 0.74 | 37.51 | $ 42,587 | |
| 2020 | 2.02 | 0.50 | 1.06 | 3.33 | 46.29 | $ 28,249 | |
| 2019 | 2.47 | 0.50 | 0.94 | 4.21 | 79.59 | $ 24,858 | |
Limited Term U.S. Government Fund
| PER SHARE PERFORMANCE (FOR A SHARE OUTSTANDING THROUGHOUT THE PERIOD) | ||||||||||
| UNLESS OTHERWISE NOTED, PERIODS ARE FISCAL YEARS ENDED SEPTEMBER 30, | Net Asset Value, Beginning of PERIOD | Net Investment Income (Loss)+ | Net Realized & Unrealized Gain (Loss) on Investments | Total from Investment Operations | Dividends from Net Investment Income | Dividends from Net Realized Gains | Dividends from Return of Capital | Total Dividends | Net Asset Value, End of PERIOD | |
| CLASS A SHARES(b) | ||||||||||
| 2024 (c) | $ 11.48 | 0.14 | 0.33 | 0.47 | (0.15) | — | — | (0.15) | $ 11.80 | |
| 2023 | $ 11.64 | 0.22 | (0.13) | 0.09 | (0.25) | — | — | (0.25) | $ 11.48 | |
| 2022 | $ 13.06 | 0.13 | (1.36) | (1.23) | (0.19) | — | — | (0.19) | $ 11.64 | |
| 2021 | $ 13.38 | 0.08 | (0.24) | (0.16) | (0.16) | — | — | (0.16) | $ 13.06 | |
| 2020 | $ 13.10 | 0.15 | 0.33 | 0.48 | (0.20) | — | — | (0.20) | $ 13.38 | |
| 2019 | $ 12.69 | 0.19 | 0.45 | 0.64 | (0.23) | — | — | (0.23) | $ 13.10 | |
| CLASS C SHARES | ||||||||||
| 2024 (c) | $ 11.54 | 0.12 | 0.33 | 0.45 | (0.13) | — | — | (0.13) | $ 11.86 | |
| 2023 | $ 11.71 | 0.19 | (0.14) | 0.05 | (0.22) | — | — | (0.22) | $ 11.54 | |
| 2022 | $ 13.13 | 0.09 | (1.36) | (1.27) | (0.15) | — | — | (0.15) | $ 11.71 | |
| 2021 | $ 13.46 | 0.03 | (0.25) | (0.22) | (0.11) | — | — | (0.11) | $ 13.13 | |
| 2020 | $ 13.17 | 0.11 | 0.35 | 0.46 | (0.17) | — | — | (0.17) | $ 13.46 | |
| 2019 | $ 12.77 | 0.15 | 0.43 | 0.58 | (0.18) | — | — | (0.18) | $ 13.17 | |
| CLASS C2 SHARES | ||||||||||
| 2024 (c) | $ 11.55 | 0.13 | 0.32 | 0.45 | (0.13) | — | — | (0.13) | $ 11.87 | |
| 2023 | $ 11.71 | 0.20 | (0.14) | 0.06 | (0.22) | — | — | (0.22) | $ 11.55 | |
| 2022 | $ 13.14 | 0.08 | (1.36) | (1.28) | (0.15) | — | — | (0.15) | $ 11.71 | |
| 2021 (e) | $ 13.46 | 0.04 | (0.25) | (0.21) | (0.11) | — | — | (0.11) | $ 13.14 | |
| CLASS I SHARES | ||||||||||
| 2024 (c) | $ 11.47 | 0.16 | 0.33 | 0.49 | (0.17) | — | — | (0.17) | $ 11.79 | |
| 2023 | $ 11.64 | 0.26 | (0.14) | 0.12 | (0.29) | — | — | (0.29) | $ 11.47 | |
| 2022 | $ 13.06 | 0.16 | (1.36) | (1.20) | (0.22) | — | — | (0.22) | $ 11.64 | |
| 2021 | $ 13.38 | 0.11 | (0.24) | (0.13) | (0.19) | — | — | (0.19) | $ 13.06 | |
| 2020 | $ 13.10 | 0.18 | 0.34 | 0.52 | (0.24) | — | — | (0.24) | $ 13.38 | |
| 2019 | $ 12.69 | 0.23 | 0.44 | 0.67 | (0.26) | — | — | (0.26) | $ 13.10 | |
| CLASS R3 SHARES | ||||||||||
| 2024 (c) | $ 11.49 | 0.14 | 0.33 | 0.47 | (0.15) | — | — | (0.15) | $ 11.81 | |
| 2023 | $ 11.65 | 0.22 | (0.13) | 0.09 | (0.25) | — | — | (0.25) | $ 11.49 | |
| 2022 | $ 13.06 | 0.11 | (1.34) | (1.23) | (0.18) | — | — | (0.18) | $ 11.65 | |
| 2021 | $ 13.39 | 0.06 | (0.25) | (0.19) | (0.14) | — | — | (0.14) | $ 13.06 | |
| 2020 | $ 13.10 | 0.13 | 0.35 | 0.48 | (0.19) | — | — | (0.19) | $ 13.39 | |
| 2019 | $ 12.70 | 0.18 | 0.44 | 0.62 | (0.22) | — | — | (0.22) | $ 13.10 | |
| CLASS R4 SHARES | ||||||||||
| 2024 (c) | $ 11.47 | 0.14 | 0.33 | 0.47 | (0.15) | — | — | (0.15) | $ 11.79 | |
| 2023 | $ 11.64 | 0.22 | (0.15) | 0.07 | (0.24) | — | — | (0.24) | $ 11.47 | |
| 2022 | $ 13.05 | 0.12 | (1.35) | (1.23) | (0.18) | — | — | (0.18) | $ 11.64 | |
| 2021 | $ 13.37 | 0.06 | (0.24) | (0.18) | (0.14) | — | — | (0.14) | $ 13.05 | |
| 2020 | $ 13.09 | 0.13 | 0.34 | 0.47 | (0.19) | — | — | (0.19) | $ 13.37 | |
| 2019 | $ 12.69 | 0.18 | 0.43 | 0.61 | (0.21) | — | — | (0.21) | $ 13.09 | |
| CLASS R5 SHARES | ||||||||||
| 2024 (c) | $ 11.48 | 0.16 | 0.33 | 0.49 | (0.17) | — | — | (0.17) | $ 11.80 | |
| 2023 | $ 11.65 | 0.25 | (0.14) | 0.11 | (0.28) | — | — | (0.28) | $ 11.48 | |
| 2022 | $ 13.07 | 0.16 | (1.36) | (1.20) | (0.22) | — | — | (0.22) | $ 11.65 | |
| 2021 | $ 13.39 | 0.11 | (0.25) | (0.14) | (0.18) | — | — | (0.18) | $ 13.07 | |
| 2020 | $ 13.11 | 0.17 | 0.34 | 0.51 | (0.23) | — | — | (0.23) | $ 13.39 | |
| 2019 | $ 12.70 | 0.23 | 0.44 | 0.67 | (0.26) | — | — | (0.26) | $ 13.11 | |
| (a) | Not annualized for periods less than one year. |
| (b) | Sales loads are not reflected in computing total return. |
| (c) | Unaudited Six Month Period Ended March 31. |
| (d) | Annualized. |
| (e) | Effective date of this class of shares was October 1, 2020. |
| + | Based on weighted average shares outstanding. |
| RATIOS TO AVERAGE NET ASSETS | Supplemental Data | ||||||
| UNLESS OTHERWISE NOTED, PERIODS ARE FISCAL YEARS ENDED SEPTEMBER 30, | Net Investment Income (Loss) (%) | Expenses, After Expense Reductions (%) | Expenses, Before Expense Reductions (%) | Total Return (%)(a) | Portfolio Turnover Rate (%)(a) | Net Assets at End of PERIOD (Thousands) | |
| CLASS A SHARES(b) | |||||||
| 2024 (c) | 2.38 (d) | 0.98 (d) | 0.98 (d) | 4.11 | 22.66 | $ 39,899 | |
| 2023 | 1.89 | 0.95 | 0.95 | 0.74 | 38.65 | $ 43,326 | |
| 2022 | 1.01 | 0.92 | 0.92 | (9.51) | 28.92 | $ 57,028 | |
| 2021 | 0.60 | 0.87 | 0.87 | (1.22) | 9.50 | $ 92,786 | |
| 2020 | 1.10 | 0.89 | 0.89 | 3.70 | 11.66 | $ 86,955 | |
| 2019 | 1.48 | 0.90 | 0.90 | 5.06 | 29.37 | $ 66,140 | |
| CLASS C SHARES | |||||||
| 2024 (c) | 2.11 (d) | 1.24 (d) | 1.83 (d) | 3.96 | 22.66 | $ 2,708 | |
| 2023 | 1.57 | 1.24 | 1.56 | 0.37 | 38.65 | $ 3,311 | |
| 2022 | 0.68 | 1.24 | 1.39 | (9.74) | 28.92 | $ 5,821 | |
| 2021 | 0.21 | 1.24 | 1.24 | (1.65) | 9.50 | $ 10,084 | |
| 2020 | 0.82 | 1.16 | 1.16 | 3.48 | 11.66 | $ 17,994 | |
| 2019 | 1.13 | 1.24 | 1.24 | 4.60 | 29.37 | $ 15,618 | |
| CLASS C2 SHARES | |||||||
| 2024 (c) | 2.13 (d) | 1.24 (d) | 3.01 (d) | 4.04 | 22.66 | $ 292 | |
| 2023 | 1.69 | 1.24 | 2.63 | 0.37 | 38.65 | $ 576 | |
| 2022 | 0.62 | 1.24 | 2.28 | (9.81) | 28.92 | $ 230 | |
| 2021 (e) | 0.28 | 1.24 | 3.37 | (1.58) | 9.50 | $ 680 | |
| CLASS I SHARES | |||||||
| 2024 (c) | 2.71 (d) | 0.65 (d) | 0.65 (d) | 4.28 | 22.66 | $ 108,180 | |
| 2023 | 2.18 | 0.65 | 0.65 | 0.96 | 38.65 | $ 119,323 | |
| 2022 | 1.31 | 0.62 | 0.62 | (9.24) | 28.92 | $ 155,928 | |
| 2021 | 0.85 | 0.61 | 0.61 | (0.96) | 9.50 | $ 219,833 | |
| 2020 | 1.36 | 0.60 | 0.60 | 4.00 | 11.66 | $ 243,793 | |
| 2019 | 1.76 | 0.62 | 0.62 | 5.35 | 29.37 | $ 145,273 | |
| CLASS R3 SHARES | |||||||
| 2024 (c) | 2.35 (d) | 0.99 (d) | 1.97 (d) | 4.10 | 22.66 | $ 2,402 | |
| 2023 | 1.86 | 0.99 | 1.75 | 0.70 | 38.65 | $ 2,821 | |
| 2022 | 0.89 | 0.99 | 1.52 | (9.50) | 28.92 | $ 3,471 | |
| 2021 | 0.46 | 0.99 | 1.31 | (1.41) | 9.50 | $ 7,601 | |
| 2020 | 1.02 | 0.99 | 1.29 | 3.67 | 11.66 | $ 9,222 | |
| 2019 | 1.39 | 0.99 | 1.43 | 4.88 | 29.37 | $ 9,181 | |
| CLASS R4 SHARES | |||||||
| 2024 (c) | 2.37 (d) | 0.99 (d) | 2.61 (d) | 4.10 | 22.66 | $ 1,033 | |
| 2023 | 1.85 | 0.99 | 2.91 | 0.61 | 38.65 | $ 931 | |
| 2022 | 0.92 | 0.99 | 2.30 | (9.51) | 28.92 | $ 1,146 | |
| 2021 | 0.47 | 0.99 | 1.63 | (1.34) | 9.50 | $ 2,011 | |
| 2020 | 1.01 | 0.99 | 1.60 | 3.60 | 11.66 | $ 2,779 | |
| 2019 | 1.38 | 0.99 | 1.78 | 4.88 | 29.37 | $ 2,293 | |
| CLASS R5 SHARES | |||||||
| 2024 (c) | 2.69 (d) | 0.67 (d) | 2.05 (d) | 4.27 | 22.66 | $ 1,185 | |
| 2023 | 2.16 | 0.67 | 2.01 | 0.94 | 38.65 | $ 1,461 | |
| 2022 | 1.30 | 0.67 | 1.64 | (9.27) | 28.92 | $ 1,995 | |
| 2021 | 0.80 | 0.67 | 1.56 | (1.02) | 9.50 | $ 2,198 | |
| 2020 | 1.27 | 0.67 | 2.12 | 3.93 | 11.66 | $ 2,307 | |
| 2019 | 1.80 | 0.67 | 2.04 | 5.29 | 29.37 | $ 897 | |
Limited Term Income Fund
| PER SHARE PERFORMANCE (FOR A SHARE OUTSTANDING THROUGHOUT THE PERIOD) | ||||||||||
| UNLESS OTHERWISE NOTED, PERIODS ARE FISCAL YEARS ENDED SEPTEMBER 30, | Net Asset Value, Beginning of PERIOD | Net Investment Income (Loss)+ | Net Realized & Unrealized Gain (Loss) on Investments | Total from Investment Operations | Dividends from Net Investment Income | Dividends from Net Realized Gains | Dividends from Return of Capital | Total Dividends | Net Asset Value, End of PERIOD | |
| CLASS A SHARES(b) | ||||||||||
| 2024 (c) | $ 12.39 | 0.22 | 0.42 | 0.64 | (0.22) | — | — | (0.22) | $ 12.81 | |
| 2023 | $ 12.38 | 0.36 | 0.02 | 0.38 | (0.37) | — | — | (0.37) | $ 12.39 | |
| 2022 | $ 13.83 | 0.21 | (1.43) | (1.22) | (0.23) | — | — | (0.23) | $ 12.38 | |
| 2021 | $ 14.14 | 0.16 | (0.11) | 0.05 | (0.19) | (0.17) | — | (0.36) | $ 13.83 | |
| 2020 | $ 13.61 | 0.27 | 0.64 | 0.91 | (0.28) | (0.10) | — | (0.38) | $ 14.14 | |
| 2019 | $ 13.16 | 0.33 | 0.45 | 0.78 | (0.33) | — | — | (0.33) | $ 13.61 | |
| CLASS C SHARES | ||||||||||
| 2024 (c) | $ 12.37 | 0.20 | 0.42 | 0.62 | (0.20) | — | — | (0.20) | $ 12.79 | |
| 2023 | $ 12.36 | 0.33 | 0.02 | 0.35 | (0.34) | — | — | (0.34) | $ 12.37 | |
| 2022 | $ 13.81 | 0.18 | (1.43) | (1.25) | (0.20) | — | — | (0.20) | $ 12.36 | |
| 2021 | $ 14.12 | 0.13 | (0.11) | 0.02 | (0.16) | (0.17) | — | (0.33) | $ 13.81 | |
| 2020 | $ 13.59 | 0.24 | 0.64 | 0.88 | (0.25) | (0.10) | — | (0.35) | $ 14.12 | |
| 2019 | $ 13.14 | 0.30 | 0.46 | 0.76 | (0.31) | — | — | (0.31) | $ 13.59 | |
| CLASS C2 SHARES | ||||||||||
| 2024 (c) | $ 12.37 | 0.19 | 0.42 | 0.61 | (0.19) | — | — | (0.19) | $ 12.79 | |
| 2023 | $ 12.36 | 0.30 | 0.02 | 0.32 | (0.31) | — | — | (0.31) | $ 12.37 | |
| 2022 | $ 13.81 | 0.15 | (1.43) | (1.28) | (0.17) | — | — | (0.17) | $ 12.36 | |
| 2021 (e) | $ 14.12 | 0.09 | (0.11) | (0.02) | (0.12) | (0.17) | — | (0.29) | $ 13.81 | |
| CLASS I SHARES | ||||||||||
| 2024 (c) | $ 12.39 | 0.23 | 0.43 | 0.66 | (0.23) | — | — | (0.23) | $ 12.82 | |
| 2023 | $ 12.38 | 0.40 | 0.02 | 0.42 | (0.41) | — | — | (0.41) | $ 12.39 | |
| 2022 | $ 13.84 | 0.25 | (1.44) | (1.19) | (0.27) | — | — | (0.27) | $ 12.38 | |
| 2021 | $ 14.15 | 0.20 | (0.11) | 0.09 | (0.23) | (0.17) | — | (0.40) | $ 13.84 | |
| 2020 | $ 13.62 | 0.30 | 0.65 | 0.95 | (0.32) | (0.10) | — | (0.42) | $ 14.15 | |
| 2019 | $ 13.16 | 0.37 | 0.47 | 0.84 | (0.38) | — | — | (0.38) | $ 13.62 | |
| CLASS R3 SHARES | ||||||||||
| 2024 (c) | $ 12.40 | 0.20 | 0.42 | 0.62 | (0.20) | — | — | (0.20) | $ 12.82 | |
| 2023 | $ 12.38 | 0.33 | 0.03 | 0.36 | (0.34) | — | — | (0.34) | $ 12.40 | |
| 2022 | $ 13.84 | 0.18 | (1.44) | (1.26) | (0.20) | — | — | (0.20) | $ 12.38 | |
| 2021 | $ 14.15 | 0.13 | (0.11) | 0.02 | (0.16) | (0.17) | — | (0.33) | $ 13.84 | |
| 2020 | $ 13.63 | 0.24 | 0.63 | 0.87 | (0.25) | (0.10) | — | (0.35) | $ 14.15 | |
| 2019 | $ 13.17 | 0.30 | 0.47 | 0.77 | (0.31) | — | — | (0.31) | $ 13.63 | |
| CLASS R4 SHARES | ||||||||||
| 2024 (c) | $ 12.38 | 0.20 | 0.43 | 0.63 | (0.20) | — | — | (0.20) | $ 12.81 | |
| 2023 | $ 12.37 | 0.34 | 0.01 | 0.35 | (0.34) | — | — | (0.34) | $ 12.38 | |
| 2022 | $ 13.83 | 0.20 | (1.46) | (1.26) | (0.20) | — | — | (0.20) | $ 12.37 | |
| 2021 | $ 14.14 | 0.13 | (0.11) | 0.02 | (0.16) | (0.17) | — | (0.33) | $ 13.83 | |
| 2020 | $ 13.61 | 0.24 | 0.64 | 0.88 | (0.25) | (0.10) | — | (0.35) | $ 14.14 | |
| 2019 | $ 13.16 | 0.30 | 0.46 | 0.76 | (0.31) | — | — | (0.31) | $ 13.61 | |
| CLASS R5 SHARES | ||||||||||
| 2024 (c) | $ 12.39 | 0.23 | 0.42 | 0.65 | (0.23) | — | — | (0.23) | $ 12.81 | |
| 2023 | $ 12.37 | 0.40 | 0.02 | 0.42 | (0.40) | — | — | (0.40) | $ 12.39 | |
| 2022 | $ 13.83 | 0.25 | (1.44) | (1.19) | (0.27) | — | — | (0.27) | $ 12.37 | |
| 2021 | $ 14.14 | 0.20 | (0.11) | 0.09 | (0.23) | (0.17) | — | (0.40) | $ 13.83 | |
| 2020 | $ 13.61 | 0.31 | 0.64 | 0.95 | (0.32) | (0.10) | — | (0.42) | $ 14.14 | |
| 2019 | $ 13.16 | 0.36 | 0.46 | 0.82 | (0.37) | — | — | (0.37) | $ 13.61 | |
| CLASS R6 SHARES | ||||||||||
| 2024 (c) | $ 12.41 | 0.24 | 0.43 | 0.67 | (0.24) | — | — | (0.24) | $ 12.84 | |
| 2023 | $ 12.40 | 0.41 | 0.01 | 0.42 | (0.41) | — | — | (0.41) | $ 12.41 | |
| 2022 | $ 13.86 | 0.26 | (1.44) | (1.18) | (0.28) | — | — | (0.28) | $ 12.40 | |
| 2021 | $ 14.17 | 0.21 | (0.11) | 0.10 | (0.24) | (0.17) | — | (0.41) | $ 13.86 | |
| 2020 | $ 13.64 | 0.32 | 0.64 | 0.96 | (0.33) | (0.10) | — | (0.43) | $ 14.17 | |
| 2019 | $ 13.19 | 0.38 | 0.46 | 0.84 | (0.39) | — | — | (0.39) | $ 13.64 | |
| (a) | Not annualized for periods less than one year. |
| (b) | Sales loads are not reflected in computing total return. |
| (c) | Unaudited Six Month Period Ended March 31. |
| (d) | Annualized. |
| (e) | Effective date of this class of shares was October 1, 2020. |
| (f) | The total return based on the NAV which reflects the adjustments in accordance with U.S. GAAP is (8.70)%. |
| (g) | The total return based on the NAV which reflects the adjustments in accordance with U.S. GAAP is 0.61%. |
| (h) | The total return based on the NAV which reflects the adjustments in accordance with U.S. GAAP is 6.47%. |
| + | Based on weighted average shares outstanding. |
Limited Term Income Fund
| RATIOS TO AVERAGE NET ASSETS | Supplemental Data | ||||||
| UNLESS OTHERWISE NOTED, PERIODS ARE FISCAL YEARS ENDED SEPTEMBER 30, | Net Investment Income (Loss) (%) | Expenses, After Expense Reductions (%) | Expenses, Before Expense Reductions (%) | Total Return (%)(a) | Portfolio Turnover Rate (%)(a) | Net Assets at End of PERIOD (Thousands) | |
| CLASS A SHARES(b) | |||||||
| 2024 (c) | 3.41 (d) | 0.77 (d) | 0.77 (d) | 5.17 | 32.51 | $ 497,854 | |
| 2023 | 2.90 | 0.78 | 0.78 | 3.06 | 37.65 | $ 533,551 | |
| 2022 | 1.58 | 0.77 | 0.77 | (8.89) | 46.77 | $ 598,675 | |
| 2021 | 1.17 | 0.77 | 0.77 | 0.33 | 33.37 | $ 818,846 | |
| 2020 | 1.94 | 0.77 | 0.77 | 6.78 | 53.84 | $ 768,798 | |
| 2019 | 2.44 | 0.81 | 0.81 | 6.03 | 43.22 | $ 645,383 | |
| CLASS C SHARES | |||||||
| 2024 (c) | 3.15 (d) | 1.02 (d) | 1.02 (d) | 5.04 | 32.51 | $ 119,852 | |
| 2023 | 2.64 | 1.01 | 1.01 | 2.83 | 37.65 | $ 140,716 | |
| 2022 | 1.33 | 0.99 | 0.99 | (9.11) | 46.77 | $ 221,057 | |
| 2021 | 0.94 | 0.99 | 0.99 | 0.11 | 33.37 | $ 360,840 | |
| 2020 | 1.72 | 1.00 | 1.00 | 6.55 | 53.84 | $ 412,659 | |
| 2019 | 2.24 | 1.02 | 1.02 | 5.82 | 43.22 | $ 356,205 | |
| CLASS C2 SHARES | |||||||
| 2024 (c) | 2.93 (d) | 1.24 (d) | 1.40 (d) | 4.92 | 32.51 | $ 5,597 | |
| 2023 | 2.43 | 1.24 | 1.44 | 2.59 | 37.65 | $ 6,733 | |
| 2022 | 1.10 | 1.24 | 1.30 | (9.33) | 46.77 | $ 9,615 | |
| 2021 (e) | 0.65 | 1.24 | 1.32 | (0.17) | 33.37 | $ 12,902 | |
| CLASS I SHARES | |||||||
| 2024 (c) | 3.68 (d) | 0.49 (d) | 0.52 (d) | 5.39 | 32.51 | $ 5,587,407 | |
| 2023 | 3.18 | 0.49 | 0.54 | 3.36 | 37.65 | $ 5,769,043 | |
| 2022 | 1.86 | 0.49 | 0.51 | (8.63) (f) | 46.77 | $ 6,890,513 | |
| 2021 | 1.44 | 0.49 | 0.50 | 0.53 (g) | 33.37 | $ 8,840,331 | |
| 2020 | 2.21 | 0.49 | 0.51 | 7.08 | 53.84 | $ 6,999,911 | |
| 2019 | 2.75 | 0.50 | 0.53 | 6.44 | 43.22 | $ 4,455,457 | |
| CLASS R3 SHARES | |||||||
| 2024 (c) | 3.18 (d) | 0.99 (d) | 1.09 (d) | 5.05 | 32.51 | $ 38,701 | |
| 2023 | 2.66 | 0.99 | 1.06 | 2.93 | 37.65 | $ 37,395 | |
| 2022 | 1.39 | 0.99 | 1.04 | (9.16) | 46.77 | $ 49,513 | |
| 2021 | 0.94 | 0.99 | 1.02 | 0.11 | 33.37 | $ 51,825 | |
| 2020 | 1.75 | 0.99 | 1.02 | 6.54 (h) | 53.84 | $ 61,041 | |
| 2019 | 2.27 | 0.99 | 1.06 | 5.84 | 43.22 | $ 64,335 | |
| CLASS R4 SHARES | |||||||
| 2024 (c) | 3.17 (d) | 0.99 (d) | 1.16 (d) | 5.13 | 32.51 | $ 15,933 | |
| 2023 | 2.71 | 0.99 | 1.15 | 2.84 | 37.65 | $ 18,774 | |
| 2022 | 1.51 | 0.99 | 1.24 | (9.16) | 46.77 | $ 17,988 | |
| 2021 | 0.94 | 0.99 | 1.19 | 0.11 | 33.37 | $ 10,777 | |
| 2020 | 1.74 | 0.99 | 1.32 | 6.55 | 53.84 | $ 6,413 | |
| 2019 | 2.27 | 0.99 | 1.23 | 5.84 | 43.22 | $ 8,073 | |
| CLASS R5 SHARES | |||||||
| 2024 (c) | 3.68 (d) | 0.49 (d) | 0.68 (d) | 5.31 | 32.51 | $ 69,938 | |
| 2023 | 3.15 | 0.49 | 0.74 | 3.44 | 37.65 | $ 70,594 | |
| 2022 | 1.88 | 0.49 | 0.71 | (8.71) | 46.77 | $ 111,149 | |
| 2021 | 1.44 | 0.49 | 0.69 | 0.61 | 33.37 | $ 134,974 | |
| 2020 | 2.24 | 0.49 | 0.64 | 7.08 | 53.84 | $ 149,322 | |
| 2019 | 2.70 | 0.56 | 0.74 | 6.31 | 43.22 | $ 106,753 | |
| CLASS R6 SHARES | |||||||
| 2024 (c) | 3.76 (d) | 0.42 (d) | 0.47 (d) | 5.42 | 32.51 | $ 170,028 | |
| 2023 | 3.25 | 0.42 | 0.46 | 3.43 | 37.65 | $ 157,354 | |
| 2022 | 2.00 | 0.42 | 0.45 | (8.62) | 46.77 | $ 180,359 | |
| 2021 | 1.51 | 0.42 | 0.43 | 0.68 | 33.37 | $ 127,763 | |
| 2020 | 2.31 | 0.42 | 0.46 | 7.15 | 53.84 | $ 98,639 | |
| 2019 | 2.82 | 0.43 | 0.49 | 6.43 | 43.22 | $ 60,440 | |
Core Plus Bond Fund
| PER SHARE PERFORMANCE (FOR A SHARE OUTSTANDING THROUGHOUT THE PERIOD) | ||||||||||
| UNLESS OTHERWISE NOTED, PERIODS ARE FISCAL YEARS ENDED SEPTEMBER 30, | Net Asset Value, Beginning of PERIOD | Net Investment Income (Loss)+ | Net Realized & Unrealized Gain (Loss) on Investments | Total from Investment Operations | Dividends from Net Investment Income | Dividends from Net Realized Gains | Dividends from Return of Capital | Total Dividends | Net Asset Value, End of PERIOD | |
| CLASS A SHARES(b)(c) | ||||||||||
| 2024 (d) | $ 10.00 | 0.23 | 0.46 | 0.69 | (0.23) | — | — | (0.23) | $ 10.46 | |
| CLASS C SHARES(b) | ||||||||||
| 2024 (d) | $ 10.00 | 0.19 | 0.47 | 0.66 | (0.19) | — | — | (0.19) | $ 10.47 | |
| CLASS I SHARES(b) | ||||||||||
| 2024 (d) | $ 10.00 | 0.23 | 0.47 | 0.70 | (0.24) | — | — | (0.24) | $ 10.46 | |
| CLASS R3 SHARES(b) | ||||||||||
| 2024 (d) | $ 10.00 | 0.21 | 0.46 | 0.67 | (0.21) | — | — | (0.21) | $ 10.46 | |
| CLASS R4 SHARES(b) | ||||||||||
| 2024 (d) | $ 10.00 | 0.23 | 0.46 | 0.69 | (0.23) | — | — | (0.23) | $ 10.46 | |
| CLASS R5 SHARES(b) | ||||||||||
| 2024 (d) | $ 10.00 | 0.24 | 0.46 | 0.70 | (0.24) | — | — | (0.24) | $ 10.46 | |
| CLASS R6 SHARES(b) | ||||||||||
| 2024 (d) | $ 10.00 | 0.24 | 0.46 | 0.70 | (0.24) | — | — | (0.24) | $ 10.46 | |
| (a) | Not annualized for periods less than one year. |
| (b) | The Fund commenced operations on October 2, 2023. |
| (c) | Sales loads are not reflected in computing total return. |
| (d) | Unaudited Six Month Period Ended March 31. |
| (e) | Annualized. |
| + | Based on weighted average shares outstanding. |
Core Plus Bond Fund
| RATIOS TO AVERAGE NET ASSETS | Supplemental Data | ||||||
| UNLESS OTHERWISE NOTED, PERIODS ARE FISCAL YEARS ENDED SEPTEMBER 30, | Net Investment Income (Loss) (%) | Expenses, After Expense Reductions (%) | Expenses, Before Expense Reductions (%) | Total Return (%)(a) | Portfolio Turnover Rate (%)(a) | Net Assets at End of PERIOD (Thousands) | |
| CLASS A SHARES(b)(c) | |||||||
| 2024 (d) | 4.43 (e) | 0.75 (e) | 4.14 (e) | 6.91 | 50.55 | $ 145 | |
| CLASS C SHARES(b) | |||||||
| 2024 (d) | 3.70 (e) | 1.50 (e) | 3.90 (e) | 6.62 | 50.55 | $ 288 | |
| CLASS I SHARES(b) | |||||||
| 2024 (d) | 4.58 (e) | 0.50 (e) | 1.62 (e) | 7.05 | 50.55 | $ 63,038 | |
| CLASS R3 SHARES(b) | |||||||
| 2024 (d) | 4.20 (e) | 1.00 (e) | 4.45 (e) | 6.78 | 50.55 | $ 107 | |
| CLASS R4 SHARES(b) | |||||||
| 2024 (d) | 4.45 (e) | 0.75 (e) | 3.28 (e) | 6.91 | 50.55 | $ 107 | |
| CLASS R5 SHARES(b) | |||||||
| 2024 (d) | 4.70 (e) | 0.50 (e) | 3.95 (e) | 7.05 | 50.55 | $ 107 | |
| CLASS R6 SHARES(b) | |||||||
| 2024 (d) | 4.86 (e) | 0.49 (e) | 2.53 (e) | 7.05 | 50.55 | $ 625 | |
Strategic Income Fund
| PER SHARE PERFORMANCE (FOR A SHARE OUTSTANDING THROUGHOUT THE PERIOD) | ||||||||||
| UNLESS OTHERWISE NOTED, PERIODS ARE FISCAL YEARS ENDED SEPTEMBER 30, | Net Asset Value, Beginning of PERIOD | Net Investment Income (Loss)+ | Net Realized & Unrealized Gain (Loss) on Investments | Total from Investment Operations | Dividends from Net Investment Income | Dividends from Net Realized Gains | Dividends from Return of Capital | Total Dividends | Net Asset Value, End of PERIOD | |
| CLASS A SHARES(c) | ||||||||||
| 2024 (d) | $ 11.02 | 0.23 | 0.37 | 0.60 | (0.25) | — | — | (0.25) | $ 11.37 | |
| 2023 | $ 10.99 | 0.45 | 0.03 | 0.48 | (0.45) | — | — | (0.45) | $ 11.02 | |
| 2022 | $ 12.41 | 0.36 | (1.38) | (1.02) | (0.37) | (0.03) | — | (0.40) | $ 10.99 | |
| 2021 | $ 12.24 | 0.43 | 0.21 | 0.64 | (0.47) | — | — | (0.47) | $ 12.41 | |
| 2020 | $ 11.92 | 0.40 | 0.31 | 0.71 | (0.39) | — | — | (0.39) | $ 12.24 | |
| 2019 | $ 11.65 | 0.42 | 0.26 | 0.68 | (0.41) | — | — | (0.41) | $ 11.92 | |
| CLASS C SHARES | ||||||||||
| 2024 (d) | $ 11.00 | 0.19 | 0.37 | 0.56 | (0.21) | — | — | (0.21) | $ 11.35 | |
| 2023 | $ 10.97 | 0.37 | 0.03 | 0.40 | (0.37) | — | — | (0.37) | $ 11.00 | |
| 2022 | $ 12.39 | 0.27 | (1.38) | (1.11) | (0.28) | (0.03) | — | (0.31) | $ 10.97 | |
| 2021 | $ 12.22 | 0.33 | 0.21 | 0.54 | (0.37) | — | — | (0.37) | $ 12.39 | |
| 2020 | $ 11.90 | 0.31 | 0.31 | 0.62 | (0.30) | — | — | (0.30) | $ 12.22 | |
| 2019 | $ 11.63 | 0.33 | 0.26 | 0.59 | (0.32) | — | — | (0.32) | $ 11.90 | |
| CLASS I SHARES | ||||||||||
| 2024 (d) | $ 11.00 | 0.25 | 0.37 | 0.62 | (0.27) | — | — | (0.27) | $ 11.35 | |
| 2023 | $ 10.96 | 0.49 | 0.04 | 0.53 | (0.49) | — | — | (0.49) | $ 11.00 | |
| 2022 | $ 12.38 | 0.40 | (1.38) | (0.98) | (0.41) | (0.03) | — | (0.44) | $ 10.96 | |
| 2021 | $ 12.20 | 0.47 | 0.22 | 0.69 | (0.51) | — | — | (0.51) | $ 12.38 | |
| 2020 | $ 11.89 | 0.44 | 0.30 | 0.74 | (0.43) | — | — | (0.43) | $ 12.20 | |
| 2019 | $ 11.62 | 0.45 | 0.27 | 0.72 | (0.45) | — | — | (0.45) | $ 11.89 | |
| CLASS R3 SHARES | ||||||||||
| 2024 (d) | $ 11.01 | 0.22 | 0.36 | 0.58 | (0.23) | — | — | (0.23) | $ 11.36 | |
| 2023 | $ 10.98 | 0.42 | 0.03 | 0.45 | (0.42) | — | — | (0.42) | $ 11.01 | |
| 2022 | $ 12.40 | 0.33 | (1.38) | (1.05) | (0.34) | (0.03) | — | (0.37) | $ 10.98 | |
| 2021 | $ 12.22 | 0.40 | 0.21 | 0.61 | (0.43) | — | — | (0.43) | $ 12.40 | |
| 2020 | $ 11.91 | 0.35 | 0.31 | 0.66 | (0.35) | — | — | (0.35) | $ 12.22 | |
| 2019 | $ 11.64 | 0.39 | 0.26 | 0.65 | (0.38) | — | — | (0.38) | $ 11.91 | |
| CLASS R4 SHARES | ||||||||||
| 2024 (d) | $ 11.01 | 0.22 | 0.36 | 0.58 | (0.23) | — | — | (0.23) | $ 11.36 | |
| 2023 | $ 10.97 | 0.42 | 0.04 | 0.46 | (0.42) | — | — | (0.42) | $ 11.01 | |
| 2022 | $ 12.39 | 0.32 | (1.37) | (1.05) | (0.34) | (0.03) | — | (0.37) | $ 10.97 | |
| 2021 | $ 12.22 | 0.40 | 0.20 | 0.60 | (0.43) | — | — | (0.43) | $ 12.39 | |
| 2020 | $ 11.90 | 0.36 | 0.31 | 0.67 | (0.35) | — | — | (0.35) | $ 12.22 | |
| 2019 | $ 11.63 | 0.39 | 0.26 | 0.65 | (0.38) | — | — | (0.38) | $ 11.90 | |
| CLASS R5 SHARES | ||||||||||
| 2024 (d) | $ 11.00 | 0.25 | 0.37 | 0.62 | (0.27) | — | — | (0.27) | $ 11.35 | |
| 2023 | $ 10.96 | 0.50 | 0.03 | 0.53 | (0.49) | — | — | (0.49) | $ 11.00 | |
| 2022 | $ 12.39 | 0.40 | (1.39) | (0.99) | (0.41) | (0.03) | — | (0.44) | $ 10.96 | |
| 2021 | $ 12.21 | 0.47 | 0.22 | 0.69 | (0.51) | — | — | (0.51) | $ 12.39 | |
| 2020 | $ 11.89 | 0.45 | 0.30 | 0.75 | (0.43) | — | — | (0.43) | $ 12.21 | |
| 2019 | $ 11.62 | 0.46 | 0.26 | 0.72 | (0.45) | — | — | (0.45) | $ 11.89 | |
| CLASS R6 SHARES | ||||||||||
| 2024 (d) | $ 11.03 | 0.26 | 0.36 | 0.62 | (0.27) | — | — | (0.27) | $ 11.38 | |
| 2023 | $ 10.99 | 0.50 | 0.04 | 0.54 | (0.50) | — | — | (0.50) | $ 11.03 | |
| 2022 | $ 12.42 | 0.41 | (1.39) | (0.98) | (0.42) | (0.03) | — | (0.45) | $ 10.99 | |
| 2021 | $ 12.24 | 0.48 | 0.22 | 0.70 | (0.52) | — | — | (0.52) | $ 12.42 | |
| 2020 | $ 11.93 | 0.45 | 0.30 | 0.75 | (0.44) | — | — | (0.44) | $ 12.24 | |
| 2019 | $ 11.65 | 0.47 | 0.27 | 0.74 | (0.46) | — | — | (0.46) | $ 11.93 | |
| (a) | Net investment income (loss) includes income from foreign withholding tax claims adjusted for IRS compliance fees and/or tax reclaim collection fees. Without these proceeds, the Net Investment Income (Loss) ratios for 2021 would have been: |
| Class A | Class C | Class I | Class R3 | Class R4 | Class R5 | Class R6 | |
| 2024 | 4.12% | 3.38% | 4.48% | 3.85% | 3.84% | 4.50% | 4.57% |
| 2021 | 3.48% | 2.71% | 3.81% | 3.19% | 3.21% | 3.84% | 3.89% |
| (b) | Not annualized for periods less than one year. |
| (c) | Sales loads are not reflected in computing total return. |
| (d) | Unaudited Six Month Period Ended March 31. |
| (e) | Annualized. |
| (f) | The total return based on the NAV which reflects adjustments in accordance with U.S. GAAP is 6.49% for 2019 and 6.46% for 2020. |
| + | Based on weighted average shares outstanding. |
Strategic Income Fund
| RATIOS TO AVERAGE NET ASSETS | Supplemental Data | ||||||
| UNLESS OTHERWISE NOTED, PERIODS ARE FISCAL YEARS ENDED SEPTEMBER 30, | Net Investment Income (Loss) (%)(a) | Expenses, After Expense Reductions (%) | Expenses, Before Expense Reductions (%) | Total Return (%)(b) | Portfolio Turnover Rate (%)(b) | Net Assets at End of PERIOD (Thousands) | |
| CLASS A SHARES(c) | |||||||
| 2024 (d) | 4.12 (e) | 0.97 (e) | 1.01 (e) | 5.47 | 27.87 | $ 299,297 | |
| 2023 | 4.00 | 1.02 | 1.07 | 4.39 | 22.34 | $ 271,826 | |
| 2022 | 3.03 | 0.99 | 1.06 | (8.37) | 27.19 | $ 321,614 | |
| 2021 | 3.48 | 0.95 | 1.05 | 5.30 | 28.55 | $ 376,252 | |
| 2020 | 3.35 | 0.96 | 1.13 | 6.07 | 58.91 | $ 249,520 | |
| 2019 | 3.55 | 0.99 | 1.16 | 5.92 | 31.55 | $ 215,441 | |
| CLASS C SHARES | |||||||
| 2024 (d) | 3.38 (e) | 1.71 (e) | 1.75 (e) | 5.10 | 27.87 | $ 101,349 | |
| 2023 | 3.31 | 1.72 | 1.77 | 3.69 | 22.34 | $ 93,062 | |
| 2022 | 2.29 | 1.72 | 1.79 | (9.08) | 27.19 | $ 80,326 | |
| 2021 | 2.71 | 1.73 | 1.83 | 4.49 | 28.55 | $ 100,385 | |
| 2020 | 2.57 | 1.70 | 1.88 | 5.30 | 58.91 | $ 103,302 | |
| 2019 | 2.80 | 1.75 | 1.92 | 5.15 | 31.55 | $ 118,982 | |
| CLASS I SHARES | |||||||
| 2024 (d) | 4.49 (e) | 0.60 (e) | 0.73 (e) | 5.68 | 27.87 | $ 7,712,479 | |
| 2023 | 4.44 | 0.60 | 0.77 | 4.90 | 22.34 | $ 6,427,625 | |
| 2022 | 3.45 | 0.60 | 0.77 | (8.07) | 27.19 | $ 4,180,742 | |
| 2021 | 3.81 | 0.60 | 0.81 | 5.74 | 28.55 | $ 3,255,002 | |
| 2020 | 3.73 | 0.60 | 0.88 | 6.39 | 58.91 | $ 1,758,843 | |
| 2019 | 3.89 | 0.63 | 0.91 | 6.35 | 31.55 | $ 1,141,046 | |
| CLASS R3 SHARES | |||||||
| 2024 (d) | 3.85 (e) | 1.25 (e) | 3.48 (e) | 5.33 | 27.87 | $ 905 | |
| 2023 | 3.78 | 1.25 | 4.49 | 4.15 | 22.34 | $ 670 | |
| 2022 | 2.77 | 1.25 | 3.96 | (8.64) | 27.19 | $ 641 | |
| 2021 | 3.20 | 1.25 | 3.16 | 5.06 | 28.55 | $ 837 | |
| 2020 | 2.96 | 1.25 | 2.53 | 5.70 | 58.91 | $ 1,105 | |
| 2019 | 3.30 | 1.25 | 2.59 | 5.71 | 31.55 | $ 1,661 | |
| CLASS R4 SHARES | |||||||
| 2024 (d) | 3.85 (e) | 1.25 (e) | 2.04 (e) | 5.33 | 27.87 | $ 2,985 | |
| 2023 | 3.81 | 1.25 | 2.10 | 4.24 | 22.34 | $ 2,806 | |
| 2022 | 2.76 | 1.25 | 2.44 | (8.65) | 27.19 | $ 2,044 | |
| 2021 | 3.21 | 1.25 | 2.28 | 4.98 | 28.55 | $ 2,139 | |
| 2020 | 3.06 | 1.25 | 2.70 | 5.79 | 58.91 | $ 1,633 | |
| 2019 | 3.28 | 1.25 | 2.51 | 5.71 | 31.55 | $ 1,279 | |
| CLASS R5 SHARES | |||||||
| 2024 (d) | 4.50 (e) | 0.60 (e) | 0.88 (e) | 5.68 | 27.87 | $ 65,827 | |
| 2023 | 4.46 | 0.60 | 0.88 | 4.90 | 22.34 | $ 62,908 | |
| 2022 | 3.38 | 0.60 | 0.96 | (8.14) | 27.19 | $ 40,507 | |
| 2021 | 3.84 | 0.60 | 0.92 | 5.74 | 28.55 | $ 64,449 | |
| 2020 | 3.78 | 0.60 | 1.00 | 6.48 | 58.91 | $ 43,715 | |
| 2019 | 3.94 | 0.59 | 1.18 | 6.35 | 31.55 | $ 11,180 | |
| CLASS R6 SHARES | |||||||
| 2024 (d) | 4.57 (e) | 0.53 (e) | 0.70 (e) | 5.70 | 27.87 | $ 171,616 | |
| 2023 | 4.52 | 0.53 | 0.70 | 4.97 | 22.34 | $ 138,108 | |
| 2022 | 3.53 | 0.53 | 0.72 | (8.05) | 27.19 | $ 109,349 | |
| 2021 | 3.89 | 0.53 | 0.75 | 5.81 | 28.55 | $ 77,415 | |
| 2020 | 3.77 | 0.53 | 0.88 | 6.55 (f) | 58.91 | $ 39,115 | |
| 2019 | 3.98 | 0.53 | 0.98 | 6.40 (f) | 31.55 | $ 21,630 | |
March 31, 2024 (Unaudited)
| (1) | transaction costs, including |
| (a) | sales charges (loads) on purchase payments, for Class A shares; |
| (b) | a deferred sales charge on redemptions of any part or all of a purchase of $1 million of Class A shares within 12 months of purchase; |
| (c) | a deferred sales charge on redemptions of Class C and Class C2 shares within 12 months of purchase; |
| (2) | ongoing costs, including management fees; distribution and/or service (12b-1) fees; and other Fund expenses. |
| Actual | Hypothetical * | |||||
| Ending Account Value 3/31/24 | Expenses Paid During Period 10/1/23-3/31/24 | Ending Account Value 3/31/24 | Expenses Paid During Period† 10/1/23-3/31/24 | Annualized Expense Ratio | ||
| ULTRA SHORT INCOME FUND | ||||||
| CLASS A SHARES | $1,029.88 | $2.54 | $1,022.50 | $2.53 | 0.50% | |
| CLASS I SHARES | $1,030.89 | $1.52 | $1,023.50 | $1.52 | 0.30% | |
| LIMITED TERM U.S. GOVERNMENT FUND | ||||||
| CLASS A SHARES | $1,041.06 | $5.00 | $1,020.10 | $4.95 | 0.98% | |
| CLASS C SHARES | $1,039.56 | $6.32 | $1,018.80 | $6.26 | 1.24% | |
| CLASS C2 SHARES | $1,040.41 | $6.33 | $1,018.80 | $6.26 | 1.24% | |
| CLASS I SHARES | $1,042.79 | $3.32 | $1,021.75 | $3.29 | 0.65% | |
| CLASS R3 SHARES | $1,040.97 | $5.05 | $1,020.05 | $5.00 | 0.99% | |
| CLASS R4 SHARES | $1,041.04 | $5.05 | $1,020.05 | $5.00 | 0.99% | |
| CLASS R5 SHARES | $1,042.67 | $3.42 | $1,021.65 | $3.39 | 0.67% | |
| LIMITED TERM INCOME FUND | ||||||
| CLASS A SHARES | $1,051.66 | $3.95 | $1,021.15 | $3.89 | 0.77% | |
| CLASS C SHARES | $1,050.38 | $5.23 | $1,019.90 | $5.15 | 1.02% | |
| CLASS C2 SHARES | $1,049.23 | $6.35 | $1,018.80 | $6.26 | 1.24% | |
| CLASS I SHARES | $1,053.92 | $2.52 | $1,022.55 | $2.48 | 0.49% | |
| CLASS R3 SHARES | $1,050.46 | $5.07 | $1,020.05 | $5.00 | 0.99% | |
| CLASS R4 SHARES | $1,051.32 | $5.08 | $1,020.05 | $5.00 | 0.99% | |
| CLASS R5 SHARES | $1,053.11 | $2.52 | $1,022.55 | $2.48 | 0.49% | |
| CLASS R6 SHARES | $1,054.24 | $2.16 | $1,022.90 | $2.12 | 0.42% | |
March 31, 2024 (Unaudited)
| Actual | Hypothetical * | |||||
| Ending Account Value 3/31/24 | Expenses Paid During Period 10/1/23-3/31/24 | Ending Account Value 3/31/24 | Expenses Paid During Period† 10/1/23-3/31/24 | Annualized Expense Ratio | ||
| CORE PLUS BOND FUND | ||||||
| CLASS A SHARES | $1,069.09 | $3.84 | $1,021.02 | $3.75 ‡ | 0.75% | |
| CLASS C SHARES | $1,066.21 | $7.66 | $1,017.31 | $7.48 ‡ | 1.50% | |
| CLASS I SHARES | $1,070.53 | $2.56 | $1,022.25 | $2.50 ‡ | 0.50% | |
| CLASS R3 SHARES | $1,067.83 | $5.11 | $1,019.78 | $4.99 ‡ | 1.00% | |
| CLASS R4 SHARES | $1,069.14 | $3.84 | $1,021.02 | $3.75 ‡ | 0.75% | |
| CLASS R5 SHARES | $1,070.45 | $2.56 | $1,022.25 | $2.50 ‡ | 0.50% | |
| CLASS R6 SHARES | $1,070.54 | $2.51 | $1,022.30 | $2.45 ‡ | 0.49% | |
| STRATEGIC INCOME FUND | ||||||
| CLASS A SHARES | $1,054.68 | $4.98 | $1,020.15 | $4.90 | 0.97% | |
| CLASS C SHARES | $1,050.96 | $8.77 | $1,016.45 | $8.62 | 1.71% | |
| CLASS I SHARES | $1,056.76 | $3.09 | $1,022.00 | $3.03 | 0.60% | |
| CLASS R3 SHARES | $1,053.32 | $6.42 | $1,018.75 | $6.31 | 1.25% | |
| CLASS R4 SHARES | $1,053.32 | $6.42 | $1,018.75 | $6.31 | 1.25% | |
| CLASS R5 SHARES | $1,056.76 | $3.09 | $1,022.00 | $3.03 | 0.60% | |
| CLASS R6 SHARES | $1,057.04 | $2.73 | $1,022.35 | $2.68 | 0.53% | |
| * | Hypothetical assumes a rate of return of 5% per year before expenses. |
| † | Expenses are equal to the annualized expense ratio for each class multiplied by the average account value over the period, multiplied by 183/366 to reflect the one-half year period. |
| ‡ | Expenses are equal to the annualized expense ratio for each class multiplied by the average account value over the period, multiplied by 181/366 to reflect the accrual period from 10/3/23 to 3/31/24. |
March 31, 2024 (Unaudited)
March 31, 2024 (Unaudited)
| Outstanding Shares | Shares Voted For | % of Voted Shares For | % of Outstanding Shares For | Shares Voted Withhold | % of Voted Shares Withhold | % of Outstanding Shares Withhold | |
| Ultra Short Income Fund | 21,130,449.28 | 16,022,617.81 | 99.41% | 75.83% | 94,509.26 | 0.59% | 0.45% |
| Limited Term U.S. Government Fund | 15,349,731.18 | 12,566,148.96 | 99.30% | 81.87% | 88,620.49 | 0.70% | 0.58% |
| Limited Term Income Fund | 554,954,364.23 | 447,221,385.22 | 99.25% | 80.59% | 3,361,394.32 | 0.75% | 0.61% |
| Strategic Income Fund | 613,022,341.85 | 477,365,145.51 | 99.18% | 77.87% | 3,924,064.17 | 0.82% | 0.64% |
March 31, 2024 (Unaudited)
| Outstanding Shares | Shares Voted For | % of Voted Shares For | % of Outstanding Shares For | Shares Voted Withhold | % of Voted Shares Withhold | % of Outstanding Shares Withhold | |
| Ultra Short Income Fund | 21,130,449.28 | 16,022,617.81 | 99.41% | 75.83% | 94,509.26 | 0.59% | 0.45% |
| Limited Term U.S. Government Fund | 15,349,731.18 | 12,555,955.96 | 99.22% | 81.80% | 98,813.49 | 0.78% | 0.64% |
| Limited Term Income Fund | 554,954,364.23 | 447,226,362.75 | 99.26% | 80.59% | 3,356,416.78 | 0.74% | 0.60% |
| Strategic Income Fund | 613,022,341.85 | 477,279,402.51 | 99.17% | 77.86% | 4,009,807.17 | 0.83% | 0.65% |
| Outstanding Shares | Shares Voted For | % of Voted Shares For | % of Outstanding Shares For | Shares Voted Withhold | % of Voted Shares Withhold | % of Outstanding Shares Withhold | |
| Ultra Short Income Fund | 21,130,449.28 | 16,044,468.81 | 99.55% | 75.93% | 72,658.26 | 0.45% | 0.34% |
| Limited Term U.S. Government Fund | 15,349,731.18 | 12,559,988.96 | 99.25% | 81.83% | 94,780.49 | 0.75% | 0.62% |
| Limited Term Income Fund | 554,954,364.23 | 446,827,413.61 | 99.17% | 80.52% | 3,755,365.92 | 0.83% | 0.68% |
| Strategic Income Fund | 613,022,341.85 | 476,864,940.17 | 99.08% | 77.79% | 4,424,269.51 | 0.92% | 0.72% |
| Outstanding Shares | Shares Voted For | % of Voted Shares For | % of Outstanding Shares For | Shares Voted Withhold | % of Voted Shares Withhold | % of Outstanding Shares Withhold | |
| Ultra Short Income Fund | 21,130,449.28 | 15,924,617.81 | 98.81% | 75.36% | 192,509.26 | 1.19% | 0.91% |
| Limited Term U.S. Government Fund | 15,349,731.18 | 12,530,603.96 | 99.02% | 81.63% | 124,165.49 | 0.98% | 0.81% |
| Limited Term Income Fund | 554,954,364.23 | 440,676,242.86 | 97.80% | 79.41% | 9,906,536.68 | 2.20% | 1.79% |
| Strategic Income Fund | 613,022,341.85 | 462,999,614.54 | 96.20% | 75.53% | 18,289,595.14 | 3.80% | 2.98% |
March 31, 2024 (Unaudited)
| NAME, AGE, YEAR ELECTED POSITION HELD WITH FUND | PRINCIPAL OCCUPATION(S) DURING PAST FIVE YEARS | OTHER DIRECTORSHIPS HELD BY TRUSTEE |
| INTERESTED TRUSTEES(1)(2) | ||
| Garrett Thornburg, 78 Trustee Since 1984, Chairman of Trustees(4) | Chairman and controlling shareholder of Thornburg Investment Management, Inc. (investment advisor); Chairman and controlling shareholder of Thornburg Securities Corporation (securities dealer); Chairman of the Thornburg Foundation (nonprofit). | None |
| Brian J. McMahon, 68 Trustee since 2001, Vice Chairman of Trustees, Member of Governance & Nominating Committee and Operations Risk Oversight Committee(5) | Vice Chairman, Chief Investment Strategist, Managing Director, and Portfolio Manager, and until 2019 Chief Investment Officer, and, until 2016, CEO and President, of Thornburg Investment Management, Inc.; Vice President of Thornburg Securities Corporation. | None |
| INDEPENDENT TRUSTEES(1)(2)(3) | ||
| Lisa Black, 64 Trustee since 2023(6), Member of Audit Committee and Operations Risk Oversight Committee | Until 2019, Senior Managing Director, Chief Investment Officer and Head, Taxable Fixed Income, Nuveen LLC, New York, NY; Managing Director, TIAA-CREF, New York, NY (1996-2012). | None |
| Sally Corning, 63 Trustee since 2012, Member of Audit Committee and Governance & Nominating Committee | Partner in Sun Mountain Capital, Santa Fe, NM (private equity firm with investment programs encompassing venture capital, mezzanine debt, and growth equity). | None |
| Susan H. Dubin, 75 Trustee since 2004, Member of Audit Committee and Operations Risk Oversight Committee | President of Dubin Investments, Ltd., Greenwich, CT (private investment fund); Director and officer of various charitable organizations. | None |
| David L. Gardner, 61 Trustee since 2015, Chair of Governance & Nominating Committee and Member of Operations Risk Oversight Committee | Until 2012, head of EMEA (Europe, Middle East and Africa) Sales for iShares of Blackrock, Inc., EMEA Executive Committee Member and EMEA Operating Committee Member at Blackrock, Inc. | None |
| Patrick J. Talamantes, 59 Trustee since 2019, Chair of Audit Committee | President of Talamantes Strategies, a management consulting firm, since 2018. Until 2017, President and Chief Executive Officer of The McClatchy Company, Sacramento, CA (news and media company). | None |
| Owen D. Van Essen, 69 Trustee since 2004, Lead Independent Trustee, Member of Governance & Nominating Committee and Operations Risk Oversight Committee | President of Dirks, Van Essen & April, Santa Fe, New Mexico (newspaper mergers and acquisitions). | None |
| James W. Weyhrauch, 65 Trustee since 1996, Chair of Operations Risk Oversight Committee, Member of Audit Committee | Real estate broker, Santa Fe Properties, Santa Fe, NM; General Partner, Investments of Genext LLC (a family investment partnership); until 2019, Vice Chairman of Nambé LLC, Santa Fe, NM (manufacturing and design company). | None |
March 31, 2024 (Unaudited)
| NAME, AGE, YEAR ELECTED POSITION HELD WITH FUND | PRINCIPAL OCCUPATION(S) DURING PAST FIVE YEARS | OTHER DIRECTORSHIPS HELD BY TRUSTEE |
| OFFICERS OF THE FUND (WHO ARE NOT TRUSTEES)(1) | ||
| Nimish Bhatt, 60 President since 2023, Chief Financial Officer 2019-2023, Treasurer 2016-2019, Secretary 2018-2019(7) | Chief Financial Officer and Treasurer of Thornburg Investment Management, Inc. and Thornburg Securities Corporation since 2016, and Secretary of Thornburg Securities Corporation since 2018; Senior Vice President (2004-2016), Chief Financial Officer (2011-2016), and Head of Fund Administration (2011- 2016) of Calamos Asset Management, Inc., Calamos Investments LLC, Calamos Advisors LLC, and Calamos Wealth Management; Director of Calamos Global Funds plc (2007-2016). | Not applicable |
| Geoffrey Black, 62 Secretary since 2024(6)(7) | Director of Fund Operations of Thornburg Investment Management, Inc. since 2024; Director, Transfer Agent Services at Russell Investments (2010-2024). | Not applicable |
| Randy Dry, 49 Vice President 2014-2024(6) | Managing Director, Chief Operating Officer since 2020, Chief Administrative Officer (2016-2020), and Director of Institutional Group (2014-2016) of Thornburg Investment Management, Inc. | Not applicable |
| Curtis Holloway, 56 Chief Financial Officer since 2023, Secretary 2024(6), Treasurer since 2019(7) | Director of Finance since 2021 and Director of Fund Administration since 2019 of Thornburg Investment Management, Inc.; Senior Vice President, Head of Fund Administration (2017-2019) and Vice President, Fund Administration (2010-2017) of Calamos Investments, and Chief Financial Officer (2017-2019) and Treasurer (2010-2019) of Calamos Funds. | Not applicable |
| Ben Kirby, 43 Vice President since 2014 | Co-Head of Investments since 2019, and Portfolio Manager and Managing Director since 2013, of Thornburg Investment Management, Inc. | Not applicable |
| Jeff Klingelhofer, 43 Vice President since 2016 | Co-Head of Investments since 2019, Portfolio Manager and Managing Director since 2015, Associate Portfolio Manager (2012-2015), of Thornburg Investment Management, Inc. | Not applicable |
| Ponn Lithiluxa, 52 Assistant Treasurer since 2020; Vice President 2017-2020 | Senior Manager & Vice President, Tax & Fund Administration of Thornburg Investment Management, Inc. since 2017; Senior Vice President, Citi Fund Services, Inc. (2014-2017); Vice President, Citi Fund Services, Inc. (2007-2014). | Not applicable |
| Christopher Luckham, 46 Assistant Treasurer since 2022 | Senior Manager, Fund Administration of Thornburg Investment Management, Inc. since 2010. | Not applicable |
| Natasha Rippel, 41 Secretary 2021-2024(6)(7) | Director of Fund Operations since 2021, Supervisor of Fund Operations (2017-2021), and Senior Associate of Fund Operations (2015-2017) of Thornburg Investment Management, Inc. | Not applicable |
| Stephen Velie, 55 Chief Compliance Officer since 2009 | Chief Compliance Officer of Thornburg Investment Trust and Thornburg Investment Management, Inc. | Not applicable |
| (1) | Each person’s address is 2300 North Ridgetop Road, Santa Fe, New Mexico 87506. |
| (2) | The Trust is organized as a Massachusetts business trust, and currently comprises a complex of 24 separate investment “Funds” or “series.” Thornburg Investment Management, Inc. is the investment advisor to, and manages, the 24 Funds of the Trust. Each Trustee oversees the 24 Funds of the Trust. |
| (3) | The Bylaws of the Trust currently require that each Independent Trustee shall retire by the end of the calendar year during which the Trustee reached the age of 75 years. Otherwise, each Trustee serves in office until the election and qualification of a successor or until the Trustee sooner dies, resigns, retires or is removed. |
| (4) | Mr. Thornburg is considered an “interested” Trustee under the Investment Company Act of 1940 because he is a director and controlling shareholder of Thornburg Investment Management, Inc. the investment advisor to the 24 Funds of the Trust, and is the sole director and controlling shareholder of Thornburg Securities Corporation, the distributor of shares of the Trust. |
| (5) | Mr. McMahon is considered an “interested” Trustee under the Investment Company Act of 1940 because he is a director and the chief investment strategist of Thornburg Investment Management, Inc. |
| (6) | Ms. Black served as an Advisory Trustee from April 1, 2023 through October 1, 2023 and was elected as an independent Trustee effective October 2, 2023. Mr. Dry concluded his service as a Vice President of the Trust effective April 15, 2024. Ms. Rippel concluded her service as Secretary of the Trust effective April 19, 2024.Mr. Holloway served as Secretary of the Trust from April 22, 2024 through May 15, 2024, when he was succeeded by Mr. Black, who was appointed as Secretary of the Trust effective May 15, 2024. |
| (7) | The Trust’s president, chief financial officer, secretary and treasurer each serves a one-year term or until the election and qualification of a successor; each other officer serves at the pleasure of the Trustees. |
| ■ | Thornburg Global Opportunities Fund |
| ■ | Thornburg International Equity Fund |
| ■ | Thornburg Better World International Fund |
| ■ | Thornburg International Growth Fund |
| ■ | Thornburg Developing World Fund |
| ■ | Thornburg Small/Mid Cap Core Fund |
| ■ | Thornburg Small/Mid Cap Growth Fund |
| ■ | Thornburg Investment Income Builder Fund |
| ■ | Thornburg Income Builder Opportunities Trust |
| ■ | Thornburg Summit Fund |
| ■ | Thornburg Ultra Short Income Fund |
| ■ | Thornburg Limited Term U.S. Government Fund |
| ■ | Thornburg Limited Term Income Fund |
| ■ | Thornburg Core Plus Bond Fund |
| ■ | Thornburg Strategic Income Fund |
| ■ | Thornburg Short Duration Municipal Fund |
| ■ | Thornburg Limited Term Municipal Fund |
| ■ | Thornburg Intermediate Municipal Fund |
| ■ | Thornburg Strategic Municipal Income Fund |
| ■ | Thornburg California Limited Term Municipal Fund |
| ■ | Thornburg New Mexico Intermediate Municipal Fund |
| ■ | Thornburg New York Intermediate Municipal Fund |


| 800.847.0200 | TH4625 |

| Thornburg Municipal Funds |
| Thornburg Short Duration Municipal Fund |
| Thornburg Limited Term Municipal Fund |
| Thornburg Intermediate Municipal Fund |
| Thornburg Strategic Municipal Income Fund |
| Thornburg California Limited Term Municipal Fund |
| Thornburg New Mexico Intermediate Municipal Fund |
| Thornburg New York Intermediate Municipal Fund |
| 4 | |
| 12 | |
| Schedule of Investments | |
| 19 | |
| 23 | |
| 37 | |
| 46 | |
| 52 | |
| 55 | |
| 57 | |
| 60 | |
| 64 | |
| 66 | |
| 70 | |
| 82 | |
| 96 | |
| 98 | |
| 101 | |
| 103 |
Fund Overview
| THORNBURG SHORT DURATION MUNICIPAL FUND | FINAL VALUE |
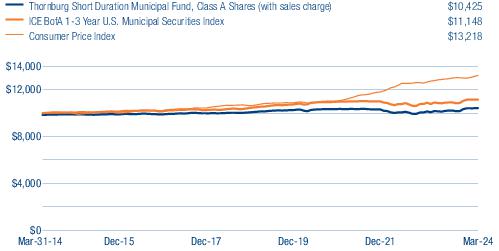
| THORNBURG SHORT DURATION MUNICIPAL FUND | 1-YR | 3-YR | 5-YR | 10-YR | SINCE INCEPTION |
| Class A Shares (Incep: 12/30/13) | |||||
| Without sales charge | 2.46% | 0.26% | 0.56% | 0.57% | 0.56% |
| With sales charge | 0.19% | -0.49% | 0.25% | 0.42% | 0.41% |
| Class I Shares (Incep: 12/30/13) | 2.75% | 0.49% | 0.78% | 0.77% | 0.76% |
| ICE BofA 1-3 Year U.S. Municipal Securities Index (Since 12/30/13) | 2.27% | 0.48% | 1.12% | 1.09% | 1.09% |
Fund Overview
| THORNBURG LIMITED TERM MUNICIPAL FUND | FINAL VALUE |
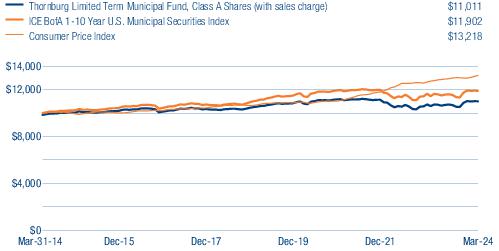
| THORNBURG LIMITED TERM MUNICIPAL FUND | 1-YR | 3-YR | 5-YR | 10-YR | SINCE INCEPTION |
| Class A Shares (Incep: 9/28/84) | |||||
| Without sales charge | 2.55% | -0.36% | 0.76% | 1.12% | 4.18% |
| With sales charge | 0.26% | -1.13% | 0.45% | 0.97% | 4.14% |
| Class C Shares (Incep: 9/1/94) | |||||
| Without sales charge | 2.36% | -0.59% | 0.50% | 0.88% | 2.70% |
| With sales charge | 1.86% | -0.59% | 0.50% | 0.88% | 2.70% |
| Class C2 Shares (Incep: 10/1/20) | |||||
| Without sales charge | 2.04% | -0.87% | - | - | -0.74% |
| With sales charge | 1.39% | -0.87% | - | - | -0.74% |
| Class I Shares (Incep: 7/5/96) | 2.87% | -0.11% | 1.01% | 1.40% | 3.23% |
| ICE BofA 1-10 Year U.S. Municipal Securities Index (Since 9/28/84) | 2.23% | - | 1.32% | 1.76% | - |
Fund Overview
| THORNBURG INTERMEDIATE MUNICIPAL FUND | FINAL VALUE |
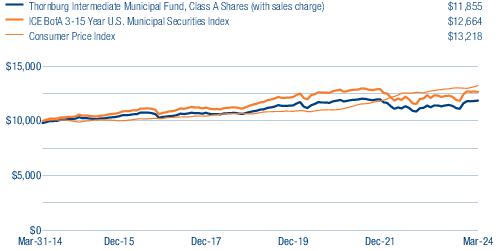
| THORNBURG INTERMEDIATE MUNICIPAL FUND | 1-YR | 3-YR | 5-YR | 10-YR | SINCE INCEPTION |
| Class A Shares (Incep: 7/22/91) | |||||
| Without sales charge | 3.87% | 0.05% | 1.44% | 1.92% | 4.10% |
| With sales charge | 1.79% | -0.61% | 1.03% | 1.72% | 4.03% |
| Class C Shares (Incep: 9/1/94) | |||||
| Without sales charge | 3.41% | -0.34% | 1.06% | 1.56% | 3.31% |
| With sales charge | 2.81% | -0.34% | 1.06% | 1.56% | 3.31% |
| Class C2 Shares (Incep: 10/1/20) | |||||
| Without sales charge | 3.49% | -0.31% | - | - | 0.04% |
| With sales charge | 2.84% | -0.31% | - | - | 0.04% |
| Class I Shares (Incep: 7/5/96) | 4.12% | 0.29% | 1.67% | 2.19% | 3.83% |
| ICE BofA 3-15 Year U.S. Municipal Securities Index (Since 7/22/91) | 2.59% | -0.16% | 1.59% | 2.39% | - |
Fund Overview
| THORNBURG STRATEGIC MUNICIPAL INCOME FUND | FINAL VALUE |
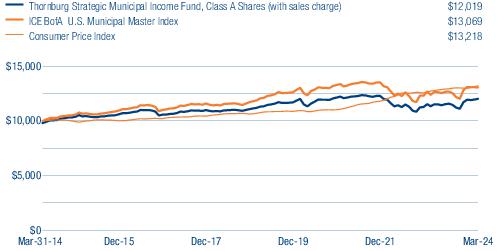
| THORNBURG STRATEGIC MUNICIPAL INCOME FUND | 1-YR | 3-YR | 5-YR | 10-YR | SINCE INCEPTION |
| Class A Shares (Incep: 4/1/09) | |||||
| Without sales charge | 4.35% | -0.32% | 1.23% | 2.06% | 4.20% |
| With sales charge | 2.23% | -0.98% | 0.82% | 1.86% | 4.06% |
| Class C Shares (Incep: 4/1/09) | |||||
| Without sales charge | 3.86% | -0.81% | 0.76% | 1.62% | 3.81% |
| With sales charge | 3.26% | -0.81% | 0.76% | 1.62% | 3.81% |
| Class I Shares (Incep: 4/1/09) | 4.58% | -0.12% | 1.45% | 2.31% | 4.47% |
| ICE BofA U.S. Municipal Master Index (Since 4/1/09) | 3.27% | -0.43% | 1.62% | 2.71% | 3.83% |
Fund Overview
| THORNBURG CALIFORNIA LIMITED TERM MUNICIPAL FUND | FINAL VALUE |
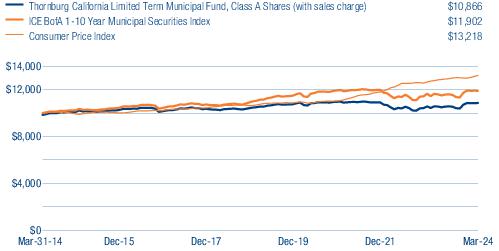
| THORNBURG CALIFORNIA LIMITED TERM MUNICIPAL FUND | 1-YR | 3-YR | 5-YR | 10-YR | SINCE INCEPTION |
| Class A Shares (Incep: 2/19/87) | |||||
| Without sales charge | 2.72% | -0.17% | 0.57% | 0.99% | 3.60% |
| With sales charge | 0.38% | -0.93% | 0.27% | 0.83% | 3.56% |
| Class C Shares (Incep: 9/1/94) | |||||
| Without sales charge | 2.51% | -0.42% | 0.31% | 0.73% | 2.58% |
| With sales charge | 2.01% | -0.42% | 0.31% | 0.73% | 2.58% |
| Class C2 Shares (Incep: 10/1/20) | |||||
| Without sales charge | 2.43% | -0.46% | - | - | -0.42% |
| With sales charge | 1.78% | -0.46% | - | - | -0.42% |
| Class I Shares (Incep: 4/1/97) | 3.05% | 0.08% | 0.84% | 1.27% | 3.02% |
| ICE BofA 1-10 Year U.S. Municipal Securities Index (Since 2/19/87) | 2.23% | - | 1.32% | 1.76% | - |
Fund Overview
| THORNBURG NEW MEXICO INTERMEDIATE MUNICIPAL FUND | FINAL VALUE |
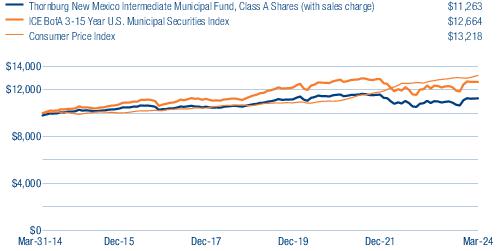
| THORNBURG NEW MEXICO INTERMEDIATE MUNICIPAL FUND | 1-YR | 3-YR | 5-YR | 10-YR | SINCE INCEPTION |
| Class A Shares (Incep: 6/18/91) | |||||
| Without sales charge | 2.21% | -0.64% | 0.70% | 1.40% | 3.63% |
| With sales charge | 0.21% | -1.30% | 0.30% | 1.20% | 3.57% |
| Class D Shares (Incep: 6/1/99) | 2.04% | -0.87% | 0.46% | 1.15% | 2.54% |
| Class I Shares (Incep: 2/1/07) | 2.62% | -0.30% | 1.04% | 1.73% | 2.67% |
| ICE BofA 3-15 Year U.S. Municipal Securities Index (Since 6/18/91) | 2.59% | -0.16% | 1.59% | 2.39% | - |
Fund Overview
| THORNBURG NEW YORK INTERMEDIATE MUNICIPAL FUND | FINAL VALUE |
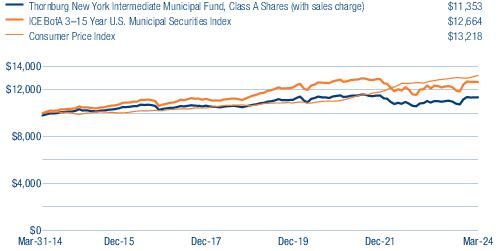
| THORNBURG NEW YORK INTERMEDIATE MUNICIPAL FUND | 1-YR | 3-YR | 5-YR | 10-YR | SINCE INCEPTION |
| Class A Shares (Incep: 9/5/97) | |||||
| Without sales charge | 2.96% | -0.16% | 0.91% | 1.48% | 3.13% |
| With sales charge | 0.94% | -0.82% | 0.50% | 1.28% | 3.05% |
| Class I Shares (Incep: 2/1/10) | 3.29% | 0.16% | 1.23% | 1.80% | 2.51% |
| ICE BofA 3-15 Year U.S. Municipal Securities Index (Since 9/5/97) | 2.59% | -0.16% | 1.59% | 2.39% | 4.21% |
Thornburg Short Duration Municipal Fund | March 31, 2024 (Unaudited)
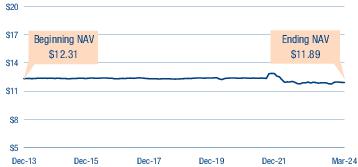
| KEY PORTFOLIO ATTRIBUTES | |
| Number of Bonds | 135 |
| Effective Duration | 1.4 Yrs |
| Average Maturity | 1.8 Yrs |
| Annualized Distribution Yield | 2.87% |
| SEC Yield | 2.82% |
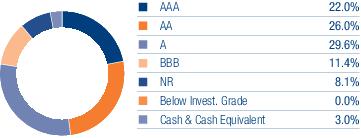
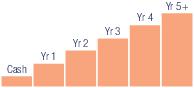
| 3% | 30% | 20% | 27% | 15% | 5% |
| THORNBURG SHORT DURATION MUNICIPAL FUND | NASDAQ SYMBOLS | CUSIPS |
| Class A | TLMAX | 885-216-788 |
| Class I | TLMIX | 885-216-770 |
Thornburg Limited Term Municipal Fund | March 31, 2024 (Unaudited)

| KEY PORTFOLIO ATTRIBUTES | |
| Number of Bonds | 834 |
| Effective Duration | 3.3 Yrs |
| Average Maturity | 4.6 Yrs |
| Annualized Distribution Yield | 2.78% |
| SEC Yield | 2.52% |
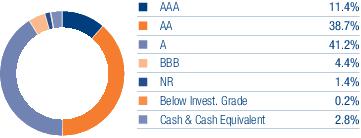
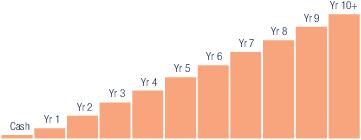
| 3% | 12% | 9% | 11% | 9% | 9% | 9% | 10% | 15% | 9% | 5% |
| THORNBURG LIMITED TERM MUNICIPAL FUND | NASDAQ SYMBOLS | CUSIPS |
| Class A | LTMFX | 885-215-459 |
| Class C | LTMCX | 885-215-442 |
| Class C2 | LTMQX | 885-216-556 |
| Class I | LTMIX | 885-215-434 |
Thornburg Intermediate Municipal Fund | March 31, 2024 (Unaudited)
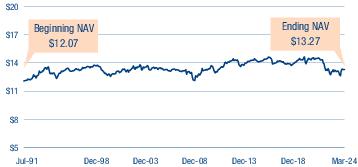
| KEY PORTFOLIO ATTRIBUTES | |
| Number of Bonds | 482 |
| Effective Duration | 5.1 Yrs |
| Average Maturity | 9.8 Yrs |
| Annualized Distribution Yield | 3.18% |
| SEC Yield | 2.89% |
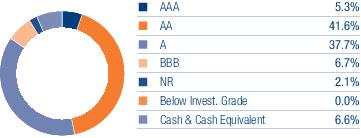
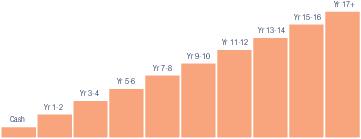
| 7% | 9% | 6% | 8% | 16% | 8% | 7% | 9% | 6% | 25% |
| THORNBURG INTERMEDIATE MUNICIPAL FUND | NASDAQ SYMBOLS | CUSIPS |
| Class A | THIMX | 885-215-202 |
| Class C | THMCX | 885-215-780 |
| Class C2 | THMQX | 885-216-374 |
| Class I | THMIX | 885-215-673 |
Thornburg Strategic Municipal Income Fund | March 31, 2024 (Unaudited)
| KEY PORTFOLIO ATTRIBUTES | |
| Number of Bonds | 260 |
| Effective Duration | 5.7 Yrs |
| Average Maturity | 11.6 Yrs |
| Annualized Distribution Yield | 3.33% |
| SEC Yield | 3.06% |
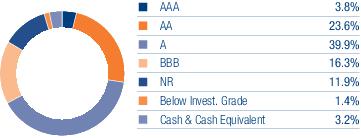
| THORNBURG STRATEGIC MUNICIPAL INCOME FUND | NASDAQ SYMBOLS | CUSIPS |
| Class A | TSSAX | 885-216-101 |
| Class C | TSSCX | 885-216-200 |
| Class I | TSSIX | 885-216-309 |
Thornburg California Limited Term Municipal Fund | March 31, 2024 (Unaudited)
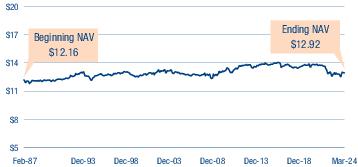
| KEY PORTFOLIO ATTRIBUTES | |
| Number of Bonds | 178 |
| Effective Duration | 3.3 Yrs |
| Average Maturity | 4.4 Yrs |
| Annualized Distribution Yield | 2.64% |
| SEC Yield | 2.54% |
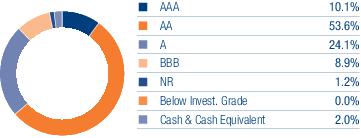
| 2% | 18% | 14% | 11% | 6% | 4% | 5% | 8% | 7% | 7% | 17% |
| THORNBURG CALIFORNIA LIMITED TERM MUNICIPAL FUND | NASDAQ SYMBOLS | CUSIPS |
| Class A | LTCAX | 885-215-426 |
| Class C | LTCCX | 885-215-418 |
| Class C2 | LTCQX | 885-216-515 |
| Class I | LTCIX | 885-215-392 |
Thornburg New Mexico Intermediate Municipal Fund | March 31, 2024 (Unaudited)
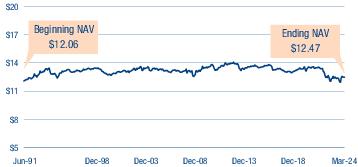
| KEY PORTFOLIO ATTRIBUTES | |
| Number of Bonds | 91 |
| Effective Duration | 3.9 Yrs |
| Average Maturity | 8.0 Yrs |
| Annualized Distribution Yield | 2.37% |
| SEC Yield | 2.25% |
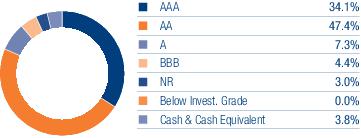
| 4% | 14% | 12% | 13% | 6% | 11% | 14% | 10% | 4% | 12% |
| THORNBURG NEW MEXICO INTERMEDIATE MUNICIPAL FUND | NASDAQ SYMBOLS | CUSIPS |
| Class A | THNMX | 885-215-301 |
| Class D | THNDX | 885-215-624 |
| Class I | THNIX | 885-215-285 |
Thornburg New York Intermediate Municipal Fund | March 31, 2024 (Unaudited)
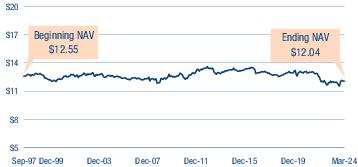
| KEY PORTFOLIO ATTRIBUTES | |
| Number of Bonds | 50 |
| Effective Duration | 4.2 Yrs |
| Average Maturity | 9.0 Yrs |
| Annualized Distribution Yield | 2.54% |
| SEC Yield | 2.49% |
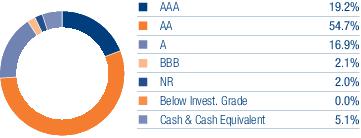
| 5% | 17% | 5% | 11% | 13% | 6% | 9% | 7% | 8% | 21% |
| THORNBURG NEW YORK INTERMEDIATE MUNICIPAL FUND | NASDAQ SYMBOLS | CUSIPS |
| Class A | THNYX | 885-215-665 |
| Class I | TNYIX | 885-216-705 |
Thornburg Short Duration Municipal Fund | March 31, 2024 (Unaudited)
| ISSUER-DESCRIPTION | Principal Amount | VALUE | |
| LONG-TERM MUNICIPAL BONDS — 95.4% | |||
| Alabama — 2.4% | |||
| Chatom (Powersouth Energy Cooperative Projects; Insured: AGM) IDB, 5.00% due 8/1/2025 | $ 425,000 | $ 433,479 | |
| a | Chatom (PowerSouth Energy Cooperative; SPA National Rural Utilities Cooperative Finance) IDB, Series A, 3.875% due 8/1/2037 (put 8/1/2024) | 1,500,000 | 1,567,691 |
| a | City of Mobile Alabama (Alabama Power Co.) IDB, Series C, 3.78% due 6/1/2034 (put 6/16/2026) | 1,000,000 | 1,000,467 |
| Arizona — 0.8% | |||
| Arizona (Banner Health Obligated Group) HFA, | |||
| Series B, | |||
| a | 3.89% (MUNIPSA + 0.25%) due 1/1/2046 (pre-refunded 11/4/2025) | 155,000 | 154,565 |
| a | 3.89% (MUNIPSA + 0.25%) due 1/1/2046 (put 11/4/2026) | 845,000 | 837,853 |
| California — 0.3% | |||
| California (PIH Health, Inc. Obligated Group) HFFA, Series A, 5.00% due 6/1/2027 | 365,000 | 380,096 | |
| Colorado — 2.4% | |||
| a | Adams County Housing Authority (647 Oat LLLP), 4.50% due 5/1/2042 (put 5/1/2026) | 1,000,000 | 1,006,840 |
| a | E-470 Public Highway Authority, Series B, 3.914% (SOFR + 0.35%) due 9/1/2039 (put 9/1/2024) | 2,000,000 | 1,992,866 |
| Florida — 6.4% | |||
| a | Broward County Housing Finance Authority (Pinnacle 441 Phase 2 LLC), 4.05% due 9/1/2056 (put 3/1/2026) | 500,000 | 501,925 |
| City of Orlando (Senior Tourist Development; Insured: AGM), Series A, 5.00% due 11/1/2025 | 1,000,000 | 1,025,403 | |
| County of Manatee (Public Utilities System Improvements), 5.00% due 10/1/2026 | 370,000 | 376,028 | |
| a | Florida Housing Finance Corp. (Collateralized: GNMA), Series B, 3.35% due 10/1/2027 (put 10/1/2026) | 1,000,000 | 994,695 |
| a | Florida Housing Finance Corp. (Hampton Point Preservation Ltd.), Series E, 5.00% due 5/1/2026 (put 5/1/2025) | 1,000,000 | 1,012,110 |
| a | Miami-Dade County Housing Finance Authority (Fairfield Miami Gardens LP), Series B, 4.05% due 9/1/2026 (put 9/1/2025) | 1,000,000 | 1,001,672 |
| a | Miami-Dade County Housing Finance Authority (Quail Roost Transit Village I Ltd.), 5.00% due 9/1/2026 (put 9/1/2025) | 1,000,000 | 1,019,555 |
| a | Miami-Dade County Housing Finance Authority (St. Mary Towers Apartments LLLP), 3.40% due 4/1/2041 (put 10/1/2026) | 1,000,000 | 992,985 |
| Orange County (AdventHealth Obligated Group) HFA, | |||
| Series C, | |||
| a | 5.00% due 11/15/2052 (pre-refunded 11/15/2026) | 55,000 | 57,754 |
| a | 5.00% due 11/15/2052 (put 11/15/2026) | 820,000 | 852,761 |
| Georgia — 5.9% | |||
| a | Bartow County Development Authority (Georgia Power Co.), 3.95% due 12/1/2032 (put 3/8/2028) | 1,300,000 | 1,328,921 |
| a | Development Authority of Burke County (Georgia Power Co.), Series REMK, 3.80% due 10/1/2032 (put 5/21/2026) | 1,000,000 | 1,005,565 |
| Main Street Natural Gas, Inc. (Guaranty: Citigroup, Inc.), Series A, 5.00% due 6/1/2024 | 550,000 | 550,449 | |
| Main Street Natural Gas, Inc. (Guaranty: Macquarie Group Ltd.), Series A, 5.00% due 5/15/2024 | 1,500,000 | 1,500,609 | |
| Private Colleges & Universities Authority (Corp. of Mercer University), 5.00% due 10/1/2024 - 10/1/2026 | 870,000 | 895,342 | |
| Savannah (International Paper Co.) EDA, Series B, 1.90% due 8/1/2024 | 2,000,000 | 1,987,738 | |
| Guam — 0.3% | |||
| Guam Waterworks Authority (Water & Wastewater System), 5.00% due 7/1/2024 | 350,000 | 351,094 | |
| Hawaii — 0.8% | |||
| a | City & County of Honolulu (Komohale Maunakea Venture LP), 5.00% due 6/1/2027 (put 6/1/2026) | 1,000,000 | 1,023,680 |
| Illinois — 8.2% | |||
| Chicago Park District GO, Series A, 5.00% due 1/1/2027 | 825,000 | 845,147 | |
| City of Chicago (Water System), 5.00% due 11/1/2027 | 560,000 | 579,719 | |
| Clinton Bond Fayette Etc Counties Community College District No. 501 Kaskaskia (Insured: AGM) GO, 5.00% due 12/1/2027 | 220,000 | 234,435 | |
| a | Illinois (Collateralized: GNMA, FNMA, FHLMC) HDA, Series G, 3.50% due 10/1/2054 (put 6/4/2024) | 2,000,000 | 1,999,500 |
| a | Illinois (Anchor Senior Living 2021 LP) HDA, Series A, 4.00% due 11/1/2042 (put 5/1/2025) | 2,000,000 | 1,997,596 |
| a | Illinois (South Shore IL Preservation LP) HDA, 4.00% due 6/1/2026 (put 6/1/2025) | 550,000 | 549,408 |
| Metropolitan Pier & Exposition Authority, Series A, 5.00% due 12/15/2028 | 440,000 | 466,080 | |
| Southern Illinois University (Insured: BAM), Series A, 5.00% due 4/1/2026 | 320,000 | 328,710 | |
| State of Illinois (State Facilities Improvements) GO, Series D, 5.00% due 11/1/2024 | 1,000,000 | 1,007,035 | |
| State of Illinois GO, Series B, 5.00% due 3/1/2025 - 9/1/2027 | 1,995,000 | 2,075,203 | |
| Indiana — 2.9% | |||
| City of Rockport (AEP Generating Co.; Guaranty: American Electric Power Co.), Series A, 3.125% due 7/1/2025 | 1,000,000 | 989,798 | |
| Warsaw Community Schools (Insured: State Intercept) GO, 5.00% due 7/15/2024 - 1/15/2025 | 1,510,000 | 1,519,232 | |
| Westfield-Washington Schools (Insured: State Intercept) GO, Series C, 6.00% due 7/15/2025 - 1/15/2026 | 1,010,000 | 1,049,872 | |
| Iowa — 2.5% | |||
| a | PEFA, Inc. (Guaranty: Goldman Sachs Group, Inc.), 5.00% due 9/1/2049 (put 9/1/2026) | 3,000,000 | 3,065,895 |
| Kansas — 1.1% | |||
| Kansas Independent College Finance Authority (Ottawa University), Series B, 7.30% due 5/1/2024 | 1,350,000 | 1,352,858 | |
| Kentucky — 4.2% | |||
| County of Boone (Duke Energy Kentucky, Inc.), Series A, 3.70% due 8/1/2027 | 1,000,000 | 991,758 |
| See notes to financial statements. | Thornburg Municipal Funds Semi-Annual Report | 19 |
Thornburg Short Duration Municipal Fund | March 31, 2024 (Unaudited)
| ISSUER-DESCRIPTION | Principal Amount | VALUE | |
| a | Kentucky (Republic Services, Inc.) EDFA, Series B, 3.80% due 4/1/2031 (put 6/3/2024) | $2,500,000 | $ 2,500,000 |
| a | Kentucky Public Energy Authority (Guaranty: Morgan Stanley Group), Series C-1, 4.00% due 12/1/2049 (put 6/1/2025) | 1,680,000 | 1,686,149 |
| Louisiana — 2.8% | |||
| a | Louisiana Offshore Terminal Authority (Loop LLC), Series A-R, 4.20% due 9/1/2033 (put 9/1/2028) | 1,000,000 | 1,020,830 |
| Plaquemines Port Harbor & Terminal District (International Marine Terminals Partnership; LOC Wells Fargo Bank NA), Series A, 4.00% due 3/15/2025 (put 3/15/2024) | 1,500,000 | 1,509,610 | |
| a | State of Louisiana Gasoline & Fuels Tax Revenue, Series A, 4.224% (SOFR + 0.50%) due 5/1/2043 (put 5/1/2026) | 975,000 | 958,194 |
| Massachusetts — 2.0% | |||
| a,b | Massachusetts (Mass General Brigham, Inc.) DFA, Series T-1, 4.24% (MUNIPSA + 0.60%) due 7/1/2049 (put 1/29/2026) | 2,500,000 | 2,489,493 |
| Michigan — 1.5% | |||
| a | Michigan Finance Authority (Bronson Health Care Group Obligated Group), Series B, 5.00% due 11/15/2044 (put 11/16/2026) | 1,730,000 | 1,778,310 |
| Minnesota — 0.8% | |||
| a | City of Mounds View Multifamily Housing Revenue (Sherman Forbes Project), Series A, 4.05% due 11/1/2026 (put 11/1/2024) | 1,000,000 | 999,054 |
| Mississippi — 1.0% | |||
| a | County of Jackson (Chevron Corp.) GO, 3.55% due 11/1/2024 (put 8/1/2024) | 1,240,000 | 1,240,128 |
| Montana — 0.8% | |||
| City of Forsyth (NorthWestern Corp.), 3.875% due 7/1/2028 | 1,000,000 | 1,013,927 | |
| Nebraska — 0.6% | |||
| Central Plains Energy Project (Guaranty: Royal Bank of Canada), 4.00% due 8/1/2024 | 250,000 | 249,731 | |
| Gretna Public Schools GO, Series B, 5.00% due 12/15/2027 | 500,000 | 514,006 | |
| Nevada — 1.6% | |||
| a | County of Clark (Nevada Power Co.), 3.75% due 1/1/2036 (put 3/31/2026) | 1,000,000 | 993,167 |
| a | Nevada Housing Division (Fairfield Woodcreek LLC), 5.00% due 12/1/2025 (put 12/1/2024) | 1,000,000 | 1,006,245 |
| New Jersey — 1.8% | |||
| City of Jersey (Municipal Utilities Authority Water Fund), Series B, 4.00% due 5/3/2024 | 1,000,000 | 1,000,430 | |
| Essex County Improvement Authority, 5.00% due 7/3/2024 | 500,000 | 501,840 | |
| New Jersey Transportation Trust Fund Authority (State Transportation System Improvements), Series A, 5.00% due 6/15/2024 | 150,000 | 150,358 | |
| Township of Springfield /Burlington County GO, 4.75% due 9/5/2024 | 600,000 | 603,362 | |
| New Mexico — 1.7% | |||
| a | City of Farmington (Public Service Co. of New Mexico), Series E, 1.15% due 6/1/2040 (put 6/1/2024) | 1,500,000 | 1,492,624 |
| City of Santa Fe Gasoline Tax GRT, 5.00% due 6/1/2025 | 380,000 | 387,171 | |
| New Mexico Municipal Energy Acquisition Authority (Guaranty: Royal Bank of Canada), Series A, 4.00% due 5/1/2024 | 250,000 | 249,923 | |
| New York — 3.0% | |||
| a | Metropolitan Transportation Authority (Green Bond), Series A, 5.00% due 11/15/2048 (put 11/15/2024) | 500,000 | 503,470 |
| a | New York City Housing Development Corp., Series F-2A, 3.40% due 11/1/2062 (put 12/22/2026) | 1,100,000 | 1,092,388 |
| a | Rockland County (Rockland Gardens Housing Partners LP) IDA, 4.65% due 5/1/2027 (put 5/1/2025) | 1,600,000 | 1,602,675 |
| a | Triborough Bridge & Tunnel Authority (Metropolitan Transportation Authority Payroll Mobility Tax Revenue), Series B2, 5.00% due 5/15/2050 (put 5/15/2026) | 500,000 | 515,484 |
| North Carolina — 0.5% | |||
| North Carolina Medical Care Commission (United Methodist Retirement Homes Inc Obligated Group), | |||
| Series 2024B-1, 4.25% due 10/1/2028 | 150,000 | 150,433 | |
| Series 2024B-2, 3.75% due 10/1/2028 | 500,000 | 492,143 | |
| Ohio — 2.3% | |||
| Akron, Bath & Copley Joint Township Hospital District (Summa Health System Obligated Group), 5.00% due 11/15/2027 | 735,000 | 760,704 | |
| a | County of Allen Hospital Facilities Revenue (Bon Secours Mercy Health, Inc.), Series B-1, 5.00% due 10/1/2049 (put 8/3/2027) | 2,000,000 | 2,087,990 |
| Oklahoma — 1.7% | |||
| Canadian County Educational Facilities Authority (Mustang Public Schools Project) ISD, 5.00% due 9/1/2027 | 1,000,000 | 1,039,641 | |
| Cushing Educational Facilities Authority (Payne County No. 67 Cushing) ISD, 5.00% due 9/1/2028 | 500,000 | 533,592 | |
| Muskogee Industrial Trust (Muskogee County No. 20) ISD, 5.00% due 9/1/2027 | 475,000 | 495,270 | |
| Oregon — 0.8% | |||
| State of Oregon Housing & Community Services Department (Susan Emmons LP), Series S-2, 4.35% due 6/1/2024 | 1,000,000 | 999,560 | |
| Pennsylvania — 5.3% | |||
| Allegheny County Hospital Development Authority (UPMC Obligated Group), Series A, 5.00% due 7/15/2025 | 1,500,000 | 1,528,420 | |
| a | Bethlehem Area School District Authority (State Aid Withholding), Series B, 3.914% (SOFR + 0.35%) due 7/1/2031 (put 11/1/2025) | 1,850,000 | 1,812,687 |
| a | Montgomery County (Constellation Energy Generation LLC) IDA, Series A, 4.10% due 4/1/2053 (put 4/3/2028) | 1,095,000 | 1,112,508 |
| Northeastern Pennsylvania Hospital & Education Authority (King’s College), 5.00% due 5/1/2024 - 5/1/2026 | 1,260,000 | 1,263,311 | |
| Pennsylvania (UPMC Obligated Group) EDFA, 5.00% due 3/15/2026 | 220,000 | 226,823 | |
| a | Pennsylvania Housing Finance Agency (Cambridge Community Partners LP), Series B, 5.00% due 11/1/2026 (put 11/1/2025) | 500,000 | 509,464 |
| Tennessee — 2.9% | |||
| Johnson City Health & Educational Facilities Board (Ballad Health Obligated Group), Series A, 5.00% due 7/1/2024 | 500,000 | 501,505 |
| 20 | Thornburg Municipal Funds Semi-Annual Report | See notes to financial statements. |
| ISSUER-DESCRIPTION | Principal Amount | VALUE | |
| a | Knox County Health Educational & Housing Facility Board (Gleason Partners LP), 3.95% due 12/1/2027 (put 12/1/2025) | $2,000,000 | $ 2,007,762 |
| a | Metropolitan Government Nashville & Davidson County Health & Educational Facilities Board (Northview Housing Development LP), Series B, 3.85% due 2/1/2045 (put 2/1/2025) | 1,000,000 | 997,197 |
| Texas — 13.7% | |||
| a | Boerne School District (Insured: PSF-GTD) ISD GO, 3.125% due 2/1/2053 (put 2/1/2027) | 995,000 | 997,379 |
| a | Capital Area Housing Finance Corp. (LDG Redwood LP), 3.65% due 1/1/2041 (put 1/1/2026) | 1,000,000 | 993,426 |
| City of Aubrey Jackson Ridge Public Improvement District (Insured: BAM)), 5.00% due 9/1/2024 - 9/1/2025 | 335,000 | 338,171 | |
| a | City of Dallas Housing Finance Corp. (Ash Creek Housing LLC), 5.00% due 7/1/2026 (put 12/1/2025) | 500,000 | 508,374 |
| City of Georgetown Utility System Revenue (Insured: BAM), 5.00% due 8/15/2024 - 8/15/2026 | 1,505,000 | 1,535,560 | |
| a | Denton (Insured: PSF-GTD) ISD GO, Series B, 2.00% due 8/1/2044 (pre-refunded 8/1/2024) | 135,000 | 134,274 |
| a | Dickinson (Insured: PSF-GTD) ISD GO, 3.50% due 8/1/2037 (put 8/1/2025) | 1,000,000 | 1,002,753 |
| a | Grand Parkway Transportation Corp., 5.00% due 10/1/2052 (put 4/1/2028) | 1,000,000 | 1,079,140 |
| Harris County Cultural Education Facilities Finance Corp. (Texas Medical Center), Series A, 5.00% due 5/15/2027 | 2,000,000 | 2,105,374 | |
| Lower Colorado River Authority (LCRA Transmission Services Corp.), Series A, 5.00% due 5/15/2024 | 750,000 | 751,315 | |
| a | North East (Insured: PSF-GTD) ISD GO, 3.60% due 8/1/2052 (put 8/1/2024) | 1,000,000 | 999,538 |
| a | Northside (Insured: PSF-GTD) ISD GO, Series B, 3.00% due 8/1/2053 (put 8/1/2026) | 1,000,000 | 994,490 |
| Texas Municipal Gas Acquisition & Supply Corp. III (Guaranty: Macquarie Group Ltd.), 5.00% due 12/15/2025 - 12/15/2026 | 1,125,000 | 1,148,018 | |
| a | Texas State Affordable Housing Corp. (AHFC-FC Norman Housing LP), 3.625% due 1/1/2045 (put 1/1/2027) | 1,000,000 | 992,297 |
| a | Texas State Affordable Housing Corp. (Eden Court Senior Housing LP), 5.00% due 4/1/2043 (put 4/1/2026) | 1,000,000 | 1,015,315 |
| Texas Transportation Commission (Central Texas Turnpike System), Series C, 5.00% due 8/15/2025 | 240,000 | 241,017 | |
| a | Travis County Housing Finance Corp. (Austin Gateway Apartments LP), 4.125% due 6/1/2045 (put 6/1/2027) | 2,000,000 | 2,007,276 |
| Virginia — 1.9% | |||
| a | Halifax County IDA, Series A, 1.65% due 12/1/2041 (put 5/31/2024) | 500,000 | 497,205 |
| a | Harrisonburg Redevelopment & Housing Authority (John Early Seniors Housing LP), 4.00% due 12/1/2027 (put 12/1/2025) | 910,000 | 908,268 |
| Virginia Small Business Financing Authority (National Senior Campuses, Inc. Obligated Group), Series A, 5.00% due 1/1/2025 - 1/1/2027 | 900,000 | 906,482 | |
| Washington — 2.0% | |||
| a | Washington State Housing Finance Commission (Ardea Twg LLLP), 5.00% due 12/1/2043 (put 2/1/2027) | 1,000,000 | 1,025,696 |
| Washington State Housing Finance Commission (Eastside Retirement Association Obligated Group), Series B-2, 4.00% due 7/1/2026 | 1,450,000 | 1,420,884 | |
| Wisconsin — 8.5% | |||
| c | City of Watertown, 4.00% due 10/1/2025 | 1,000,000 | 1,004,335 |
| County of Waushara GO, Series A, 4.50% due 6/1/2027 | 1,260,000 | 1,274,552 | |
| Peshtigo School District, 4.75% due 3/1/2027 | 1,000,000 | 1,012,522 | |
| a | Public Finance Authority (Duke Energy Progress LLC), Series A-1, 3.30% due 10/1/2046 (put 10/1/2026) | 2,000,000 | 1,989,786 |
| Public Finance Authority (National Senior Communities Obligated Group), 4.00% due 1/1/2025 | 605,000 | 600,016 | |
| Public Finance Authority (Renown Regional Medical Center), Series A, 5.00% due 6/1/2027 | 350,000 | 362,069 | |
| Public Finance Authority (United Methodist Retirement Homes, Inc. Obligated Group), Series A, 4.00% due 10/1/2025 - 10/1/2026 | 590,000 | 588,023 | |
| Racine USD, Series B, 4.125% due 4/1/2025 | 1,500,000 | 1,500,066 | |
| Village of Kimberly, 4.00% due 6/1/2024 | 1,115,000 | 1,115,153 | |
| a | Wisconsin Housing & EDA Housing Revenue, Series E, 3.875% due 11/1/2054 (put 5/1/2027) | 1,000,000 | 999,620 |
| Total Long-Term Municipal Bonds — 95.4% (Cost $117,415,857) | 117,530,362 | ||
| Short-Term Municipal Bonds — 3.7% | |||
| California — 0.7% | |||
| a | California Public Finance Authority (Sharp Healthcare Obligated Group; LOC Barclays Bank plc), Series C, 4.35% due 8/1/2052 (put 4/1/2024) | 860,000 | 860,000 |
| Florida — 0.9% | |||
| a | City of Gainesville Utilities System Revenue (SPA Barclays Bank plc), Series C-REMK, 4.50% due 10/1/2026 (put 4/1/2024) | 1,090,000 | 1,090,000 |
| Mississippi — 1.4% | |||
| a | Mississippi Business Finance Corp., Series A, 4.62% due 12/1/2030 (put 4/1/2024) | 800,000 | 800,000 |
| a | Mississippi Business Finance Corp. (Chevron USA, Inc.; Guaranty: Chevron Corp.), Series G, 4.62% due 12/1/2030 (put 4/1/2024) | 995,000 | 995,000 |
| New York — 0.7% | |||
| a | City of New York (SPA Barclays Bank plc) GO, Series B-5, 4.45% due 10/1/2046 (put 4/1/2024) | 500,000 | 500,000 |
| a | New York City Transitional Finance Authority Future Tax Secured Revenue (SPA JP Morgan Chase Bank NA), Series E-4, 4.55% due 2/1/2045 (put 4/1/2024) | 350,000 | 350,000 |
| Total Short-Term Municipal Bonds — 3.7% (Cost $4,595,000) | 4,595,000 | ||
| Total Investments — 99.1% (Cost $122,010,857) | $122,125,362 | ||
| Other Assets Less Liabilities — 0.9% | 1,128,265 | ||
| Net Assets — 100.0% | $123,253,627 |
| See notes to financial statements. | Thornburg Municipal Funds Semi-Annual Report | 21 |
Thornburg Short Duration Municipal Fund | March 31, 2024 (Unaudited)
| Footnote Legend | |
| a | Variable, floating, step, or fixed to floating rate securities are securities for which interest rate changes are based on changes in a designated base rate or on a predetermined schedule. The rates shown are those in effect on March 31, 2024. |
| b | Securities exempt from registration under Rule 144A of the Securities Act of 1933, as amended. These securities are restricted but liquid and may only be resold in the ordinary course of business in transactions exempt from registration, normally to qualified institutional buyers. As of March 31, 2024, the aggregate value of these securities in the Fund’s portfolio was $2,489,493, representing 2.02% of the Fund’s net assets. |
| c | When-issued security. |
To simplify the listings of securities, abbreviations are used per the table below:
| AGM | Insured by Assured Guaranty Municipal Corp. |
| BAM | Insured by Build America Mutual Insurance Co. |
| DFA | Development Finance Authority/Agency |
| EDA | Economic Development Authority |
| EDFA | Economic Development Financing Authority |
| FHLMC | Collateralized by Federal Home Loan Mortgage Corp. |
| FNMA | Collateralized by Federal National Mortgage Association |
| GNMA | Collateralized by Government National Mortgage Association |
| GO | General Obligation |
| GRT | Gross Receipts Tax |
| HDA | Housing Development Authority |
| HFA | Health Facilities Authority |
| HFFA | Health Facilities Financing Authority |
| IDA | Industrial Development Authority/Agency |
| IDB | Industrial Development Board |
| ISD | Independent School District |
| LOC | Letter of Credit |
| MUNIPSA | Securities Industry and Financial Markets Association (SIFMA) Municipal Swap Index |
| PSF-GTD | Guaranteed by Permanent School Fund |
| SOFR | Secured Overnight Financing Rate |
| SPA | Stand-by Purchase Agreement |
| USD | Unified School District |
| 22 | Thornburg Municipal Funds Semi-Annual Report | See notes to financial statements. |
Thornburg Limited Term Municipal Fund | March 31, 2024 (Unaudited)
| ISSUER-DESCRIPTION | Principal Amount | VALUE | |
| LONG-TERM MUNICIPAL BONDS — 96.2% | |||
| Alabama — 3.2% | |||
| Alabama Special Care Facilities Financing Authority-Birmingham (Children’s Hospital of Alabama Obligated Group), 5.00% due 6/1/2033 | $ 3,470,000 | $ 3,539,799 | |
| a | Black Belt Energy Gas District (Guaranty: Canadian Imperial Bank), Series E, 5.00% due 5/1/2053 (put 6/1/2028) | 1,750,000 | 1,820,679 |
| a | Black Belt Energy Gas District (Guaranty: Goldman Sachs Group, Inc.), Series F, 5.50% due 11/1/2053 (put 12/1/2028) | 4,825,000 | 5,112,565 |
| a | Black Belt Energy Gas District (Guaranty: Morgan Stanley Group), Series C-1, 5.25% due 2/1/2053 (put 6/1/2029) | 13,240,000 | 13,999,195 |
| Black Belt Energy Gas District (Guaranty: Royal Bank of Canada), | |||
| Series B, | |||
| 5.00% due 12/1/2030 | 1,750,000 | 1,863,419 | |
| a | 5.25% due 12/1/2053 (put 12/1/2030) | 4,000,000 | 4,323,112 |
| a | Series D1, 4.00% due 7/1/2052 (put 6/1/2027) | 14,500,000 | 14,698,186 |
| a | Chatom (PowerSouth Energy Cooperative; SPA National Rural Utilities Cooperative Finance) IDB, Series A, 3.875% due 8/1/2037 (put 8/1/2024) | 3,000,000 | 3,135,381 |
| City of Mobile Alabama (Alabama Power Co.) IDB, | |||
| a | Series A, 3.65% due 7/15/2034 (put 1/10/2025) | 5,000,000 | 4,997,465 |
| a | Series C, 3.78% due 6/1/2034 (put 6/16/2026) | 2,000,000 | 2,000,934 |
| a | Energy Southeast A Cooperative District (Guaranty: Morgan Stanley Group), Series B-1, 5.75% due 4/1/2054 (put 11/1/2031) | 7,000,000 | 7,804,405 |
| b | Marshall County Board of Education (Warrants; Insured: BAM), 5.00% due 3/1/2032 - 3/1/2033 | 815,000 | 930,314 |
| a | Selma (International Paper Co.) IDB, Series A, 2.00% due 11/1/2033 (put 10/1/2024) | 6,025,000 | 5,973,637 |
| a | Southeast Alabama Gas Supply District (Guaranty: Pacific Life Insurance Co.), Series A, 5.00% due 8/1/2054 (put 4/1/2032) | 1,925,000 | 2,068,312 |
| a | Southeast Energy Authority A Cooperative District (Guaranty: Goldman Sachs Groups, Inc.), Series B-1, 5.00% due 5/1/2053 (put 8/1/2028) | 5,000,000 | 5,184,640 |
| a | Southeast Energy Authority A Cooperative District (Guaranty: Morgan Stanley Group), Series A, 5.50% due 1/1/2053 (put 12/1/2029) | 3,500,000 | 3,760,999 |
| Troy University (Insured: BAM), Series A, 5.00% due 11/1/2028 | 1,000,000 | 1,016,292 | |
| Water Works Board of the City of Birmingham, 5.00% due 1/1/2029 | 2,230,000 | 2,405,425 | |
| Arizona — 1.6% | |||
| Arizona (Banner Health Obligated Group) HFA, | |||
| Series B, | |||
| a | 3.89% (MUNIPSA + 0.25%) due 1/1/2046 (pre-refunded 11/4/2025) | 630,000 | 628,233 |
| a | 3.89% (MUNIPSA + 0.25%) due 1/1/2046 (put 11/4/2026) | 3,370,000 | 3,341,497 |
| Arizona (Scottsdale Lincoln Hospitals) HFA, Series A, 5.00% due 12/1/2024 | 260,000 | 261,921 | |
| a | Arizona (TWG Glendale LP) IDA, 5.00% due 3/1/2045 (put 9/1/2026) | 1,100,000 | 1,129,890 |
| a | Chandler (Intel Corp.) IDA, 3.80% due 12/1/2035 (put 6/15/2028) | 7,500,000 | 7,509,930 |
| County of Pinal (Detention & Training Facilities), Series A, 5.00% due 8/1/2024 | 700,000 | 703,458 | |
| a | Maricopa County (Banner Health Obligated Group) IDA, Series A-3, 5.00% due 1/1/2053 (put 11/1/2030) | 18,960,000 | 20,924,104 |
| a | Maricopa County Pollution Control Corp. (Public Service Co. of New Mexico), Series A, 3.00% due 1/1/2038 (put 6/1/2024) | 1,555,000 | 1,550,716 |
| Northern Arizona University (Insured: BAM), Series B, 5.00% due 6/1/2030 | 525,000 | 586,257 | |
| Salt River Project Agricultural Improvement & Power District (Salt River Electric System), Series A, 5.00% due 1/1/2029 | 1,405,000 | 1,514,527 | |
| State of Arizona COP ETM, Series A, 5.00% due 10/1/2025 | 3,375,000 | 3,462,780 | |
| California — 3.4% | |||
| a | Bay Area Toll Authority (San Francisco Bay Area Toll Bridge), Series E, 4.05% (MUNIPSA + 0.41%) due 4/1/2056 (put 4/1/2028) | 4,000,000 | 3,873,348 |
| California (PIH Health, Inc. Obligated Group) HFFA, Series A, 5.00% due 6/1/2028 - 6/1/2030 | 2,950,000 | 3,200,126 | |
| a | California Community Choice Financing Authority (Guaranty: Deutsche Bank AG) (Green Bond), Series C, 5.25% due 1/1/2054 (put 10/1/2031) | 16,955,000 | 17,908,617 |
| a | California Community Choice Financing Authority (Guaranty: Goldman Sachs Group, Inc.) (Green Bond), Series A, 4.00% due 10/1/2052 (put 12/1/2027) | 1,000,000 | 1,003,199 |
| California Community Choice Financing Authority (Guaranty: Morgan Stanley Group) (Green Bond), | |||
| a | Series B-1, 4.00% due 2/1/2052 (put 8/1/2031) | 13,175,000 | 13,225,579 |
| a | Series E-1, 5.00% due 2/1/2054 (put 3/1/2031) | 14,980,000 | 16,015,448 |
| California Municipal Finance Authority (Biola University), 5.00% due 10/1/2024 - 10/1/2025 | 1,040,000 | 1,042,959 | |
| California Municipal Finance Authority (CHF-Davis II LLC; Insured: BAM) (Green Bond), 4.00% due 5/15/2032 | 600,000 | 625,228 | |
| California Municipal Finance Authority (CHF-Davis II LLC; Insured: BAM-TCRS), 5.00% due 5/15/2028 | 2,905,000 | 3,101,947 | |
| California Municipal Finance Authority (Congregational Homes, Inc. Obligated Group), Series B, 2.125% due 11/15/2026 | 615,000 | 600,026 | |
| California Statewide Communities Development Authority (CHF-Irvine LLC), Series A, 5.00% due 5/15/2027 | 500,000 | 521,791 | |
| California Statewide Communities Development Authority (CHF-Irvine LLC; Insured: BAM), 5.00% due 5/15/2030 | 2,000,000 | 2,206,428 | |
| a | California Statewide Communities Development Authority (Kaiser Foundation Hospitals), Series 2004-M-R, 5.00% due 4/1/2038 (put 11/1/2029) | 5,250,000 | 5,849,272 |
| Lammersville Joint (Insured: BAM) USD, 5.00% due 9/1/2029 - 9/1/2030 | 2,215,000 | 2,499,091 | |
| Long Beach Bond Finance Authority (Guaranty: Merrill Lynch & Co.), Series A, 5.00% due 11/15/2024 | 2,000,000 | 2,008,834 | |
| a | Los Angeles County Development Authority (2111 Firestone LP), Series E, 5.00% due 7/1/2043 (put 7/1/2026) | 2,450,000 | 2,509,150 |
| Los Angeles Housing Authority (Collateralized: FNMA), Series A, 3.75% due 4/1/2034 | 2,000,000 | 1,998,468 | |
| Los Angeles USD GO, Series A, 5.00% due 7/1/2024 | 1,500,000 | 1,506,655 | |
| Peralta Community College District GO, Series A, 5.00% due 8/1/2025 | 585,000 | 598,973 | |
| Santa Fe Springs CDC Successor Agency (Consolidated Redevelopment Project; Insured: Natl-Re), Series A, Zero Coupon due 9/1/2024 | 7,000,000 | 6,901,496 | |
| Temecula Valley Financing Authority (Insured: BAM) USD, 5.00% due 9/1/2027 | 2,220,000 | 2,248,820 |
| See notes to financial statements. | Thornburg Municipal Funds Semi-Annual Report | 23 |
Thornburg Limited Term Municipal Fund | March 31, 2024 (Unaudited)
| ISSUER-DESCRIPTION | Principal Amount | VALUE | |
| Colorado — 2.1% | |||
| a | Adams County Housing Authority (647 Oat LLLP), 4.50% due 5/1/2042 (put 5/1/2026) | $ 3,500,000 | $ 3,523,940 |
| a | Colorado (AdventHealth Obligated Group) HFA, Series B, 5.00% due 11/15/2049 (put 11/19/2026) | 7,000,000 | 7,286,916 |
| a | Colorado (Adventhealth Obligation Group) HFA, Series A-2, 5.00% due 11/15/2057 (put 11/15/2033) | 13,190,000 | 15,062,136 |
| a | Colorado (Adventist Health System/Sunbelt Obligated Group) HFA, Series C, 5.00% due 11/15/2036 (put 11/15/2026) | 1,410,000 | 1,467,596 |
| Colorado (CommonSpirit Health Obligated Group) HFA, | |||
| 5.00% due 11/1/2029 - 11/1/2032 | 4,550,000 | 5,078,030 | |
| a | Series B-2, 5.00% due 8/1/2049 (put 8/1/2026) | 5,475,000 | 5,639,896 |
| a | Colorado (Intermountain Healthcare Obligated Group) HFA, Series B, 5.00% due 5/15/2062 (put 8/17/2026) | 1,590,000 | 1,654,284 |
| County of El Paso (Judicial Complex; Insured: AGM) COP, 5.00% due 12/1/2025 - 12/1/2028 | 1,800,000 | 1,917,287 | |
| Denver Convention Center Hotel Authority, 5.00% due 12/1/2028 | 1,000,000 | 1,024,365 | |
| a | E-470 Public Highway Authority, Series B, 3.914% (SOFR + 0.35%) due 9/1/2039 (put 9/1/2024) | 2,000,000 | 1,992,866 |
| Interlocken Metropolitan District (Insured: AGM) GO, Series A-1, 5.00% due 12/1/2024 - 12/1/2026 | 2,375,000 | 2,421,031 | |
| Regional Transportation District (Denver Transit Partners LLC), Series A, 5.00% due 1/15/2030 - 7/15/2032 | 3,430,000 | 3,762,150 | |
| Sierra Ridge Metropolitan District No. 2 (Insured: AGM) GO, 4.00% due 12/1/2025 | 275,000 | 276,289 | |
| State of Colorado COP, Series A, 5.00% due 9/1/2028 | 1,215,000 | 1,314,187 | |
| a | University of Colorado Hospital Authority (University of Colorado Health Obligated Group), Series C, 5.00% due 11/15/2047 (put 11/15/2024) | 1,360,000 | 1,361,625 |
| Connecticut — 2.1% | |||
| City of Hartford (Various Public Improvements; Insured: AGM) GO, Series A, 5.00% due 7/1/2024 - 7/1/2025 | 1,820,000 | 1,843,584 | |
| City of New Haven (Insured: AGM) GO, Series B, 5.00% due 2/1/2028 - 2/1/2030 | 1,470,000 | 1,589,802 | |
| City of New Haven (Insured: BAM) GO, 5.00% due 8/1/2032 - 8/1/2033 | 1,100,000 | 1,261,144 | |
| State of Connecticut (Various Capital Projects) GO, Series B, 5.00% due 5/15/2027 | 16,615,000 | 17,257,087 | |
| State of Connecticut GO, | |||
| Series B, 4.00% due 6/15/2034 | 1,000,000 | 1,001,452 | |
| Series C, 5.00% due 6/15/2026 - 6/15/2028 | 10,705,000 | 11,388,551 | |
| Series E, 5.00% due 9/15/2028 | 2,560,000 | 2,800,627 | |
| Series F, 5.00% due 11/15/2031 | 2,500,000 | 2,574,998 | |
| State of Connecticut Special Tax Revenue (Transportation Infrastructure Purposes), Series A, 5.00% due 8/1/2026 - 8/1/2033 | 2,200,000 | 2,248,895 | |
| State of Connecticut Special Tax Revenue (Transportation Infrastructure Purposes; Insured: BAM-TCRS), Series A, 5.00% due 9/1/2031 | 11,600,000 | 12,125,909 | |
| Delaware — 0.2% | |||
| Delaware State (Beebe Medical Center, Inc.) HFA, 5.00% due 6/1/2031 | 1,200,000 | 1,266,959 | |
| Delaware Transportation Authority, 5.00% due 9/1/2029 | 2,665,000 | 2,965,007 | |
| District of Columbia — 0.2% | |||
| a | District of Columbia Housing Finance Agency (Benning Corridor Titleholder LLC), 4.00% due 9/1/2040 (put 9/1/2025) | 3,000,000 | 2,997,537 |
| a | District of Columbia Housing Finance Agency (ECD Edgewood Commons 5 LP), 5.00% due 6/1/2027 (put 6/1/2026) | 2,000,000 | 2,036,520 |
| Washington Metropolitan Area Transit Authority, 5.00% due 7/1/2028 | 1,000,000 | 1,063,402 | |
| Florida — 4.7% | |||
| a | Broward County Housing Finance Authority (Pinnacle 441 Phase 2 LLC), 4.05% due 9/1/2056 (put 3/1/2026) | 2,150,000 | 2,158,275 |
| Broward County School Board COP, | |||
| Series A, 5.00% due 7/1/2029 - 7/1/2030 | 4,345,000 | 4,493,698 | |
| Series B, 5.00% due 7/1/2029 | 1,005,000 | 1,026,132 | |
| City of Jacksonville, Series B, 5.00% due 10/1/2029 | 1,350,000 | 1,415,455 | |
| City of Orlando (Senior Tourist Development; Insured: AGM), Series A, 5.00% due 11/1/2025 | 1,675,000 | 1,717,550 | |
| County of Lee Airport Revenue, 5.00% due 10/1/2033 | 3,305,000 | 3,403,112 | |
| County of Miami-Dade (Miami International Airport), Series B, 5.00% due 10/1/2025 | 2,500,000 | 2,518,405 | |
| County of Miami-Dade (Transit System), 5.00% due 7/1/2025 | 3,700,000 | 3,769,371 | |
| County of Miami-Dade Aviation Revenue, Series A, 5.00% due 10/1/2032 | 500,000 | 560,707 | |
| County of Miami-Dade Water & Sewer System Revenue, Series A, 5.00% due 10/1/2031 | 1,200,000 | 1,223,569 | |
| Duval County Public Schools (Insured: AGM) COP, Series A, 5.00% due 7/1/2025 - 7/1/2033 | 11,390,000 | 12,220,346 | |
| Florida Development Finance Corp. (Mater Academy Miami-Dade Osceola County Facilities Obligated Group), Series A, 5.00% due 6/15/2025 - 6/15/2027 | 770,000 | 776,400 | |
| a | Florida Housing Finance Corp. (Collateralized: GNMA), Series B, 3.35% due 10/1/2027 (put 10/1/2026) | 1,250,000 | 1,243,369 |
| a | Florida Housing Finance Corp. (Hampton Point Preservation Ltd.), Series E, 5.00% due 5/1/2026 (put 5/1/2025) | 1,625,000 | 1,644,679 |
| Florida Insurance Assistance Interlocal Agency, Inc., Series A-1, 5.00% due 9/1/2027 - 9/1/2028 | 11,000,000 | 11,527,538 | |
| Hillsborough County School Board (Master Lease Program) COP, 5.00% due 7/1/2027 - 7/1/2028 | 5,200,000 | 5,533,096 | |
| JEA Electric System Revenue, Series III B, 5.00% due 10/1/2031 | 2,110,000 | 2,261,502 | |
| Manatee County School District (School Facilities Improvements; Insured: AGM), 5.00% due 10/1/2027 | 2,000,000 | 2,108,698 | |
| Miami-Dade County Expressway Authority (Toll System), Series B, 5.00% due 7/1/2024 - 7/1/2025 | 5,350,000 | 5,367,693 | |
| Miami-Dade County School Board (Educational Facilities Improvements) COP, | |||
| a | Series A, 5.00% due 5/1/2031 (pre-refunded 5/1/2024) | 2,425,000 | 2,427,728 |
| Series C, 5.00% due 5/1/2025 | 15,000,000 | 15,262,470 | |
| Orange County (AdventHealth Obligated Group) HFA, |
| 24 | Thornburg Municipal Funds Semi-Annual Report | See notes to financial statements. |
| ISSUER-DESCRIPTION | Principal Amount | VALUE | |
| Series C, | |||
| a | 5.00% due 11/15/2052 (pre-refunded 11/15/2026) | $ 210,000 | $ 220,515 |
| a | 5.00% due 11/15/2052 (put 11/15/2026) | 3,575,000 | 3,717,832 |
| Orange County School Board COP, Series C, 5.00% due 8/1/2033 | 2,000,000 | 2,099,880 | |
| Palm Beach County (Jupiter Medical Center Obligated Group) HFA, Series A, 5.00% due 11/1/2028 - 11/1/2031 | 675,000 | 710,495 | |
| Palm Beach County School Board (Educational Facilities) COP, Series B, 5.00% due 8/1/2024 | 3,595,000 | 3,612,763 | |
| Palm Beach County School District COP, Series D, 5.00% due 8/1/2027 - 8/1/2031 | 3,300,000 | 3,381,439 | |
| Pasco County School Board COP, Series A, 5.00% due 8/1/2032 | 750,000 | 872,471 | |
| a | Polk County Housing Finance Authority (Episcopal Catholic Apartments Owner LLLP), 4.15% due 12/1/2040 (put 6/1/2026) | 2,000,000 | 2,014,800 |
| School Board of Miami-Dade County COP, | |||
| Series B, 5.00% due 8/1/2026 | 10,665,000 | 11,120,108 | |
| Series C, 5.00% due 2/1/2033 | 5,220,000 | 5,395,188 | |
| State of Florida GO, | |||
| Series A, 4.00% due 7/1/2031 | 2,500,000 | 2,570,510 | |
| Series C, 4.00% due 6/1/2031 | 1,540,000 | 1,582,570 | |
| Town of Davie (Nova Southeastern University, Inc.), 5.00% due 4/1/2032 | 400,000 | 425,432 | |
| Volusia County Educational Facilities Authority (Embry-Riddle Aeronautical University, Inc.), Series B, 5.00% due 10/15/2024 - 10/15/2025 | 1,050,000 | 1,061,168 | |
| Volusia County School Board (University High School, River Springs Middle School) COP, Series B, 5.00% due 8/1/2024 | 1,000,000 | 1,004,941 | |
| Georgia — 6.7% | |||
| a | Bartow County Development Authority (Georgia Power Co.), 3.95% due 12/1/2032 (put 3/8/2028) | 3,000,000 | 3,066,741 |
| Development Authority of Burke County (Georgia Power Co.), | |||
| Series 1995, 2.20% due 10/1/2032 | 1,225,000 | 1,046,291 | |
| a | Series 2013, 3.375% due 11/1/2053 (put 3/12/2027) | 3,000,000 | 2,991,522 |
| a | Series REMK, 3.80% due 10/1/2032 (put 5/21/2026) | 2,100,000 | 2,111,687 |
| a | Development Authority of Monroe County (Georgia Power Co.), Series 1, 3.875% due 6/1/2042 (put 3/6/2026) | 2,000,000 | 2,011,836 |
| Gwinnett County School District GO, 4.00% due 2/1/2032 | 2,000,000 | 2,035,072 | |
| Main Street Natural Gas, Inc. (Guaranty: Citigroup, Inc.), | |||
| a | Series A, 4.00% due 9/1/2052 (put 12/1/2029) | 29,500,000 | 29,581,626 |
| a | Series B, 5.00% due 12/1/2052 (put 6/1/2029) | 755,000 | 793,412 |
| a | Series C, 4.00% due 5/1/2052 (put 12/1/2028) | 5,160,000 | 5,187,498 |
| a | Series D, 5.00% due 5/1/2054 (put 12/1/2030) | 47,520,000 | 50,319,878 |
| Main Street Natural Gas, Inc. (Guaranty: Macquarie Group Ltd.), Series A, 5.00% due 5/15/2028 | 2,350,000 | 2,419,482 | |
| Main Street Natural Gas, Inc. (Guaranty: Royal Bank of Canada), | |||
| Series A, | |||
| a | 4.00% due 7/1/2052 (put 9/1/2027) | 12,645,000 | 12,741,570 |
| a | 5.00% due 5/1/2054 (put 9/1/2031) | 3,500,000 | 3,747,345 |
| a | Series B, 5.00% due 7/1/2053 (put 3/1/2030) | 26,675,000 | 28,281,208 |
| a | Series C, 5.00% due 9/1/2053 (put 9/1/2030) | 1,500,000 | 1,595,438 |
| a | Series E-1, 5.00% due 12/1/2053 (put 6/1/2031) | 25,250,000 | 26,960,006 |
| Private Colleges & Universities Authority (Corp. of Mercer University), 5.00% due 10/1/2030 - 10/1/2032 | 350,000 | 396,639 | |
| State of Georgia GO, Series A, 4.00% due 2/1/2033 | 500,000 | 503,256 | |
| Guam — 0.2% | |||
| Government of Guam (Various Capital Projects), Series D, 5.00% due 11/15/2024 | 4,500,000 | 4,530,037 | |
| Guam Power Authority (Electric Power System), Series A, 5.00% due 10/1/2026 | 1,230,000 | 1,262,755 | |
| Idaho — 0.1% | |||
| Idaho Housing & Finance Association (Collateralized: GNMA, FNMA, FHLMC), Series A, 3.75% due 1/1/2033 | 1,630,000 | 1,618,422 | |
| Illinois — 9.9% | |||
| Chicago Park District GO, Series A, 5.00% due 1/1/2032 | 1,550,000 | 1,589,189 | |
| Chicago Waterworks Revenue, 5.00% due 11/1/2028 | 1,250,000 | 1,297,269 | |
| City of Chicago (Chicago O’Hare International Airport Customer Facility Charge Revenue; Insured: BAM), 5.00% due 1/1/2031 - 1/1/2033 | 5,400,000 | 6,072,074 | |
| City of Chicago (Chicago O’Hare International Airport), Series C, 5.00% due 1/1/2031 | 500,000 | 516,415 | |
| City of Chicago (Water System), | |||
| 5.00% due 11/1/2024 - 11/1/2027 | 9,250,000 | 9,488,288 | |
| Series A-1, 5.00% due 11/1/2024 | 4,000,000 | 4,024,284 | |
| a | City of Chicago Heights (Olympic Village LLC), 2.875% due 8/1/2027 (put 8/1/2025) | 11,299,000 | 11,097,437 |
| City of Chicago Wastewater Transmission Revenue, | |||
| Series B, 5.00% due 1/1/2033 | 2,710,000 | 2,833,609 | |
| Series C, 5.00% due 1/1/2025 - 1/1/2026 | 4,205,000 | 4,243,556 | |
| City of Chicago Wastewater Transmission Revenue, ETM, Series C, 5.00% due 1/1/2025 | 795,000 | 803,174 | |
| City of Joliet (Rock Run Crossing Project; Insured: BAM) GO, 5.00% due 12/15/2031 - 12/15/2032 | 2,030,000 | 2,307,958 | |
| Cook County (Capital Improvement Plan) GO, Series A, 5.00% due 11/15/2024 | 2,500,000 | 2,520,367 | |
| Cook County Community College District No. 508 (City Colleges of Chicago) GO, |
| See notes to financial statements. | Thornburg Municipal Funds Semi-Annual Report | 25 |
Thornburg Limited Term Municipal Fund | March 31, 2024 (Unaudited)
| ISSUER-DESCRIPTION | Principal Amount | VALUE | |
| 5.00% due 12/1/2024 | $ 1,000,000 | $ 1,000,418 | |
| 5.25% due 12/1/2025 - 12/1/2026 | 3,365,000 | 3,366,888 | |
| Cook County Community High School District No. 233 Homewood-Flossmoor GO, 4.00% due 12/1/2025 | 1,000,000 | 1,008,420 | |
| Cook County Sales Tax Revenue, 5.00% due 11/15/2028 | 2,250,000 | 2,406,382 | |
| Cook County School District No.170 (Insured: AGM) GO, Series D, 5.00% due 12/1/2024 | 1,190,000 | 1,201,637 | |
| DuPage Cook & Will Counties Community College District No. 502 GO, 5.00% due 6/1/2024 | 5,000,000 | 5,011,675 | |
| DuPage County Forest Preserve District GO, 5.00% due 11/1/2030 | 1,710,000 | 1,943,589 | |
| Greene Jersey & Macoupin Counties Community Unit School District No. 9 Southwest (Insured: BAM) GO, 5.00% due 12/1/2029 - 12/1/2033 | 985,000 | 1,083,325 | |
| a | Illinois (Collateralized: GNMA, FNMA, FHLMC) HDA, Series G, 3.50% due 10/1/2054 (put 6/4/2024) | 2,200,000 | 2,199,450 |
| a | Illinois (Anchor Senior Living 2021 LP) HDA, Series A, 4.00% due 11/1/2042 (put 5/1/2025) | 2,000,000 | 1,997,596 |
| Illinois (Collateralized: GNMA, FNMA, FHLMC) HDA, | |||
| Series K, | |||
| 4.60% due 4/1/2031 | 1,700,000 | 1,815,207 | |
| 4.65% due 10/1/2031 | 1,700,000 | 1,823,408 | |
| 4.70% due 4/1/2032 | 1,980,000 | 2,132,803 | |
| 4.75% due 10/1/2032 | 1,650,000 | 1,787,296 | |
| 4.80% due 4/1/2033 | 1,000,000 | 1,085,531 | |
| a | Illinois (South Shore HHDC LIHTC LLC) HDA, 5.00% due 2/1/2027 (put 2/1/2026) | 1,000,000 | 1,020,154 |
| a | Illinois (South Shore IL Preservation LP) HDA, 4.00% due 6/1/2026 (put 6/1/2025) | 1,750,000 | 1,748,117 |
| a | Illinois Finance Authority, Series REMK, 3.875% due 5/1/2040 (put 9/1/2028) | 2,500,000 | 2,508,665 |
| Illinois Finance Authority (Advocate Aurora Health Obligated Group), Series B, 4.00% due 5/1/2041 | 4,745,000 | 4,774,927 | |
| Illinois Finance Authority (Ascension Health Credit Group), Series C, 5.00% due 2/15/2033 | 1,500,000 | 1,573,269 | |
| Illinois Finance Authority (Carle Foundation Obligated Group), | |||
| Series A, 5.00% due 2/15/2027 | 3,000,000 | 3,088,806 | |
| a | Series B, 5.00% due 8/15/2053 (put 8/15/2031) | 10,330,000 | 11,415,528 |
| Illinois Finance Authority (NorthShore University HealthSystem Obligated Group), Series A, 5.00% due 8/15/2027 - 8/15/2028 | 3,500,000 | 3,756,266 | |
| Illinois Finance Authority (Northwestern Memorial Healthcare Obligated Group), Series A, 5.00% due 7/15/2032 | 800,000 | 917,474 | |
| Illinois Finance Authority (Rush Obligated Group), | |||
| Series A, 5.00% due 11/15/2024 - 11/15/2034 | 4,945,000 | 5,014,598 | |
| Series B, 5.00% due 11/15/2033 | 805,000 | 813,357 | |
| Illinois Finance Authority (University of Chicago Medical Center Obligated Group), | |||
| c | Series A, 5.00% due 8/15/2029 | 2,500,000 | 2,548,447 |
| a | Series B-1, 5.00% due 8/15/2052 (put 8/15/2025) | 10,000,000 | 10,139,780 |
| Illinois State Toll Highway Authority, | |||
| Series A, 5.00% due 12/1/2032 | 3,000,000 | 3,090,156 | |
| Series C, 5.00% due 1/1/2025 - 1/1/2029 | 3,500,000 | 3,541,435 | |
| Knox & Warren Counties Community Unit School District No. 205 Galesburg GO, Series B, 5.00% due 12/1/2030 | 1,875,000 | 1,990,667 | |
| Metropolitan Pier & Exposition Authority, Series A, 5.00% due 12/15/2027 - 12/15/2028 | 6,000,000 | 6,345,738 | |
| Metropolitan Water Reclamation District of Greater Chicago (Green Bond) GO, Series E, 5.00% due 12/1/2025 | 1,000,000 | 1,027,325 | |
| Metropolitan Water Reclamation District of Greater Chicago GO, Series A, 5.00% due 12/1/2030 - 12/1/2031 | 3,120,000 | 3,270,494 | |
| Monroe & St. Clair Counties Community Unit School District No. 5 (Insured: BAM) GO, 5.00% due 4/15/2026 | 600,000 | 618,925 | |
| Peoria Metropolitan Airport Authority GO, Series D, 5.00% due 12/1/2027 | 2,000,000 | 2,083,214 | |
| Rock Island Henry Mercer Etc Counties Community College District No. 503 (Black Hawk College; Insured: AGM) GO, 5.00% due 12/1/2024 | 3,415,000 | 3,443,809 | |
| Sales Tax Securitization Corp., Series A, 5.00% due 1/1/2028 - 1/1/2029 | 6,445,000 | 6,889,500 | |
| Sangamon County School District No. 186 Springfield (Insured: AGM) GO, Series B, 5.00% due 2/1/2030 | 1,570,000 | 1,741,906 | |
| Southern Illinois University (Insured: BAM), Series A, 5.00% due 4/1/2024 - 4/1/2032 | 4,910,000 | 5,299,892 | |
| State of Illinois (State Facilities Improvements) GO, Series D, 5.00% due 11/1/2024 | 3,650,000 | 3,675,678 | |
| State of Illinois GO, | |||
| 5.50% due 5/1/2024 - 5/1/2030 | 2,500,000 | 2,601,246 | |
| Series A, 5.00% due 10/1/2024 - 3/1/2032 | 9,525,000 | 10,532,934 | |
| Series B, | |||
| 4.00% due 11/1/2033 | 1,000,000 | 1,023,781 | |
| 5.00% due 3/1/2029 - 12/1/2032 | 2,500,000 | 2,791,232 | |
| Series D, 5.00% due 11/1/2027 - 11/1/2028 | 35,470,000 | 37,620,821 | |
| State of Illinois Sales Tax Revenue, | |||
| Series B, 5.00% due 6/15/2026 - 6/15/2029 | 20,000,000 | 21,256,035 | |
| Series C, 5.00% due 6/15/2024 - 6/15/2028 | 1,500,000 | 1,541,926 | |
| State of Illinois Sales Tax Revenue (Insured: BAM), Series A, 5.00% due 6/15/2031 | 200,000 | 216,780 | |
| State of Illinois Sales Tax Revenue (Insured: BAM-TCRS National), 6.00% due 6/15/2026 | 235,000 | 248,395 | |
| University of Illinois (University of Illinois Auxiliary Facilities System), Series A, 4.00% due 4/1/2032 | 11,465,000 | 11,572,725 | |
| Village of Tinley Park GO, 5.00% due 12/1/2024 | 450,000 | 450,388 | |
| Indiana — 1.8% | |||
| Avon Community School Building Corp. (Educational Facilities; Insured: State Intercept), 5.00% due 7/15/2027 | 1,345,000 | 1,424,983 |
| 26 | Thornburg Municipal Funds Semi-Annual Report | See notes to financial statements. |
| ISSUER-DESCRIPTION | Principal Amount | VALUE | |
| City of Indianapolis Department of Public Utilities Gas Utility Revenue, Series A, 5.00% due 8/15/2027 | $ 6,865,000 | $ 7,324,523 | |
| City of Rockport (AEP Generating Co.; Guaranty: American Electric Power Co.), Series A, 3.125% due 7/1/2025 | 3,000,000 | 2,969,394 | |
| Clark-Pleasant Community School Building Corp. (Insured: State Intercept), 5.00% due 7/15/2033 | 955,000 | 1,102,032 | |
| Indiana Finance Authority (CWA Authority, Inc. Wastewater System Project), Series A, 5.00% due 10/1/2024 | 500,000 | 503,713 | |
| Indiana Finance Authority (Department of Transportation), Series C, 5.00% due 6/1/2029 | 8,040,000 | 8,894,129 | |
| a | Indiana Finance Authority (Indiana University Health, Inc. Obligated Group), Series B-2, 5.00% due 10/1/2060 (put 7/1/2030) | 12,800,000 | 14,155,341 |
| a | Indiana Finance Authority (Republic Services, Inc.), Series B, 3.80% due 5/1/2028 (put 6/3/2024) | 2,000,000 | 2,000,000 |
| Mount Vernon of Hancock County Multi-School Building Corp. (Insured: State Intercept), 5.00% due 1/15/2031 | 500,000 | 565,379 | |
| Noblesville Redevelopment Authority, 5.00% due 1/15/2028 | 300,000 | 323,520 | |
| Warsaw Community Schools (Insured: State Intercept) GO, 5.00% due 1/15/2025 - 1/15/2026 | 4,990,000 | 5,090,805 | |
| Westfield-Washington Schools (Insured: State Intercept) GO, Series C, 6.00% due 7/15/2024 - 1/15/2025 | 2,550,000 | 2,585,686 | |
| Iowa — 2.2% | |||
| Clinton Community School District/IA Infrastructure Sales Services & Use Tax (Insured: AGM), 5.00% due 7/1/2032 - 7/1/2033 | 3,050,000 | 3,442,384 | |
| a | PEFA, Inc. (Guaranty: Goldman Sachs Group, Inc.), 5.00% due 9/1/2049 (put 9/1/2026) | 53,720,000 | 54,899,960 |
| Kansas — 0.9% | |||
| a | City of Burlington (Evergy Metro, Inc.), 4.30% due 3/1/2045 (put 6/1/2026) | 7,200,000 | 7,309,382 |
| a | Kansas (AdventHealth Obligated Group) DFA, Series B, 5.00% due 11/15/2054 (put 11/15/2031) | 5,220,000 | 5,874,729 |
| Kansas DFA, Series SRF, 5.00% due 5/1/2026 | 765,000 | 794,923 | |
| Kansas Independent College Finance Authority (Ottawa University), Series B, 7.30% due 5/1/2024 | 3,000,000 | 3,006,351 | |
| Unified Government of Wyandotte County/Kansas City (Utility Systems Improvement), Series A, 5.00% due 9/1/2024 | 600,000 | 603,785 | |
| Wyandotte County No. 500 (General Improvement) USD GO, Series A, 5.00% due 9/1/2025 - 9/1/2026 | 5,675,000 | 5,857,343 | |
| Kentucky — 2.8% | |||
| County of Boone (Duke Energy Kentucky, Inc.), Series A, 3.70% due 8/1/2027 | 5,000,000 | 4,958,790 | |
| a | County of Owen (American Water/Kentucky-American Water Co. Obligated Group), 3.875% due 6/1/2040 (put 9/1/2028) | 2,350,000 | 2,358,145 |
| a | Kentucky (Republic Services, Inc.) EDFA, Series B, 3.80% due 4/1/2031 (put 6/3/2024) | 3,000,000 | 3,000,000 |
| Kentucky Public Energy Authority (Guaranty: Morgan Stanley Group), | |||
| Series A-1, | |||
| a | 4.00% due 8/1/2052 (put 8/1/2030) | 18,690,000 | 18,669,759 |
| a | 5.25% due 4/1/2054 (put 2/1/2032) | 13,000,000 | 14,096,173 |
| a | Series C-1, 4.00% due 12/1/2049 (put 6/1/2025) | 3,270,000 | 3,281,968 |
| Kentucky State Property & Building Commission, Series A, 5.00% due 6/1/2030 - 6/1/2032 | 3,000,000 | 3,398,644 | |
| Louisville/Jefferson County Metropolitan Government (Norton Healthcare Obligated Group), | |||
| Series A, 5.00% due 10/1/2027 - 10/1/2033 | 7,575,000 | 7,825,550 | |
| a | Series C, 5.00% due 10/1/2047 (put 10/1/2026) | 8,500,000 | 8,726,176 |
| a | Series D, 5.00% due 10/1/2047 (put 10/1/2029) | 6,575,000 | 7,016,373 |
| Louisiana — 1.1% | |||
| City of Shreveport (Insured: AGM) GO, Series A, 5.00% due 3/1/2025 - 3/1/2032 | 5,300,000 | 5,748,277 | |
| City of Shreveport (Water & Sewer System; Insured: BAM), | |||
| Series A, 5.00% due 12/1/2024 | 4,490,000 | 4,528,533 | |
| Series C, 5.00% due 12/1/2026 | 510,000 | 531,272 | |
| a | Louisiana Offshore Terminal Authority (Loop LLC), Series A-R, 4.20% due 9/1/2033 (put 9/1/2028) | 2,000,000 | 2,041,660 |
| Louisiana Public Facilities Authority (Ochsner Clinic Foundation Obligated Group), | |||
| Series A, 5.00% due 5/15/2031 | 875,000 | 950,247 | |
| a | Series B, 5.00% due 5/15/2050 (put 5/15/2025) | 2,800,000 | 2,832,236 |
| Plaquemines Port Harbor & Terminal District (International Marine Terminals Partnership; LOC Wells Fargo Bank NA), | |||
| Series A, 4.00% due 3/15/2025 (put 3/15/2024) | 2,500,000 | 2,516,018 | |
| Series B, 4.00% due 3/15/2025 (put 3/15/2024) | 5,000,000 | 5,032,035 | |
| State of Louisiana (Garvee), 5.00% due 9/1/2025 | 1,200,000 | 1,228,751 | |
| a | State of Louisiana Gasoline & Fuels Tax Revenue, Series A, 4.224% (SOFR + 0.50%) due 5/1/2043 (put 5/1/2026) | 2,920,000 | 2,869,668 |
| State of Louisiana GO, 4.00% due 5/1/2031 | 1,500,000 | 1,516,173 | |
| Maryland — 0.2% | |||
| Maryland Health & Higher Educational Facilities Authority (UPMC Obligated Group), Series B, 5.00% due 4/15/2024 | 500,000 | 500,249 | |
| State of Maryland GO, | |||
| Series A, 4.00% due 8/1/2030 | 2,500,000 | 2,592,338 | |
| Series B, 5.00% due 8/1/2024 | 2,500,000 | 2,512,270 | |
| Massachusetts — 0.9% | |||
| Massachusetts (CareGroup Healthcare System) DFA, Series I, 5.00% due 7/1/2027 | 1,900,000 | 1,981,626 | |
| Massachusetts (Insured: BHAC-CR FGIC), 5.50% due 1/1/2029 | 5,000,000 | 5,654,640 | |
| a,c | Massachusetts (Mass General Brigham, Inc.) DFA, Series T-1, 4.24% (MUNIPSA + 0.60%) due 7/1/2049 (put 1/29/2026) | 3,750,000 | 3,734,238 |
| Massachusetts DFA, Series H, 5.00% due 7/1/2024 - 7/1/2025 | 4,740,000 | 4,778,284 | |
| Massachusetts DFA ETM, Series H-1, 5.00% due 7/1/2024 - 7/1/2025 | 5,525,000 | 5,582,988 | |
| Massachusetts School Building Authority, Series D, 4.75% due 8/15/2032 | 2,700,000 | 2,769,093 |
| See notes to financial statements. | Thornburg Municipal Funds Semi-Annual Report | 27 |
Thornburg Limited Term Municipal Fund | March 31, 2024 (Unaudited)
| ISSUER-DESCRIPTION | Principal Amount | VALUE | |
| Michigan — 0.6% | |||
| Michigan Finance Authority (BHSH System Obligated Group), Series A, 5.00% due 4/15/2029 - 4/15/2032 | $ 6,215,000 | $ 6,996,892 | |
| Michigan Finance Authority (Great Lakes Water Authority Water Supply System Revenue; Insured: AGM), Series D2, 5.00% due 7/1/2027 | 3,000,000 | 3,012,732 | |
| Michigan Finance Authority (Henry Ford Health System), 5.00% due 11/15/2027 | 1,000,000 | 1,036,428 | |
| Michigan Finance Authority (McLaren Health Care Corp. Obligated Group), Series A, 5.00% due 5/15/2032 | 1,000,000 | 1,013,816 | |
| Michigan Finance Authority (Trinity Health Corp. Obligated Group), Series A, 5.00% due 12/1/2034 | 295,000 | 313,588 | |
| Michigan State Building Authority, Series I, 5.00% due 10/15/2032 | 1,250,000 | 1,318,504 | |
| Wayne County Airport Authority (Insured: BAM-TCRS), Series A, 5.00% due 12/1/2032 | 800,000 | 939,518 | |
| Minnesota — 0.1% | |||
| Minnesota Higher Education Facilities Authority (University of St. Thomas), | |||
| a | Series B-1, 5.00% due 10/1/2053 (put 10/1/2027) | 1,000,000 | 1,043,733 |
| a | Series B-2, 5.00% due 10/1/2053 (put 10/1/2029) | 1,000,000 | 1,086,814 |
| Minnesota Housing Finance Agency (Collateralized: GNMA, FNMA, FHLMC), Series F, 1.90% due 1/1/2029 | 160,000 | 147,487 | |
| St. Paul Housing & Redevelopment Authority (HealthPartners), Series A, 5.00% due 7/1/2024 - 7/1/2025 | 850,000 | 856,473 | |
| Mississippi — 0.1% | |||
| Mississippi Development Bank (Jackson Public School District; Insured: BAM), 5.00% due 10/1/2024 - 10/1/2028 | 2,400,000 | 2,501,456 | |
| Missouri — 0.6% | |||
| a | Health & Educational Facilities Authority of the State of Missouri (BJC Healthcare Obligated Group), Series C, 5.00% due 5/1/2052 (put 5/1/2028) | 9,265,000 | 9,913,874 |
| Health & Educational Facilities Authority of the State of Missouri (SSM Health Care Obligated Group), Series A, 5.00% due 6/1/2031 - 6/1/2032 | 2,555,000 | 2,890,083 | |
| Poplar Bluff R-I School District (Insured: AGM) COP, 5.00% due 3/1/2031 - 3/1/2033 | 1,575,000 | 1,777,429 | |
| Montana — 0.2% | |||
| b | City of Forsyth (Avista Corp.), Series A, 3.875% due 10/1/2032 | 4,000,000 | 3,855,212 |
| City of Forsyth (NorthWestern Corp.), 3.875% due 7/1/2028 | 1,000,000 | 1,013,927 | |
| Montana Facility Finance Authority (Billings Clinic Obligated Group), Series A, 5.00% due 8/15/2031 | 1,000,000 | 1,101,758 | |
| Nebraska — 1.1% | |||
| a | Central Plains Energy Project (Guaranty: Bank of Montreal), Series A, 5.00% due 5/1/2054 (put 11/1/2029) | 11,500,000 | 12,181,559 |
| Central Plains Energy Project (Guaranty: Goldman Sachs Group, Inc.), | |||
| a | Series 1, 5.00% due 5/1/2053 (put 10/1/2029) | 7,825,000 | 8,184,019 |
| Series A, 5.00% due 9/1/2031 | 1,215,000 | 1,292,146 | |
| Douglas County Hospital Authority No. 3 (Nebraska Methodist Health System), 5.00% due 11/1/2024 - 11/1/2025 | 3,405,000 | 3,460,225 | |
| Gretna Public Schools GO, Series B, 5.00% due 12/15/2027 | 3,000,000 | 3,084,033 | |
| Nevada — 1.4% | |||
| Carson City (Carson Tahoe Regional Healthcare), Series A, 5.00% due 9/1/2027 | 360,000 | 373,658 | |
| City of Las Vegas GO, Series C, 5.00% due 9/1/2031 | 1,000,000 | 1,039,810 | |
| Clark County School District (Insured: AGM) GO, Series B, 5.00% due 6/15/2031 | 1,650,000 | 1,830,837 | |
| Clark County School District (Insured: BAM) GO, Series B, 5.00% due 6/15/2029 - 6/15/2031 | 4,400,000 | 4,911,007 | |
| Clark County School District GO, Series C, 4.00% due 6/15/2030 | 2,015,000 | 2,049,721 | |
| a | County of Clark (Nevada Power Co.), 3.75% due 1/1/2036 (put 3/31/2026) | 1,000,000 | 993,167 |
| County of Clark GO, | |||
| 4.00% due 11/1/2033 | 2,550,000 | 2,580,886 | |
| Series C, 4.00% due 7/1/2032 | 1,985,000 | 2,092,049 | |
| Las Vegas Valley Water District GO, Series A, 5.00% due 6/1/2026 | 13,630,000 | 13,899,792 | |
| Truckee Meadows Water Authority, 5.00% due 7/1/2033 (pre-refunded 7/1/2026) | 5,070,000 | 5,276,886 | |
| New Hampshire — 0.3% | |||
| New Hampshire Business Finance Authority (United Illuminating Co.), Series A, 4.50% due 10/1/2033 | 7,000,000 | 7,393,568 | |
| New Jersey — 5.0% | |||
| a | Camden County Improvement Authority, 5.00% due 3/1/2027 (put 3/1/2026) | 3,200,000 | 3,276,352 |
| City of Jersey (Municipal Utilities Authority Water Fund), Series B, 4.00% due 5/3/2024 | 5,375,000 | 5,377,311 | |
| Essex County Improvement Authority, 5.00% due 7/3/2024 | 3,500,000 | 3,512,880 | |
| New Jersey (New Jersey Transit Corp.) (State Aid Withholding) EDA, Series B, 5.00% due 11/1/2024 | 8,000,000 | 8,059,736 | |
| New Jersey (New Jersey Transit Corp.) EDA, Series A, 5.00% due 11/1/2029 - 11/1/2032 | 3,630,000 | 4,161,573 | |
| New Jersey (School Facilities Construction) EDA, | |||
| 5.00% due 6/15/2028 | 900,000 | 971,310 | |
| Series UU, 5.00% due 6/15/2028 (pre-refunded 6/15/2024) | 7,930,000 | 7,952,283 | |
| New Jersey (State of New Jersey Department of the Treasury) EDA, Series DDD, 5.00% due 6/15/2033 (pre-refunded 6/15/2027) | 1,500,000 | 1,594,497 | |
| New Jersey Health Care Facilities Financing Authority (Virtua Health Obligated Group), 5.00% due 7/1/2024 | 935,000 | 935,875 | |
| New Jersey Transportation Trust Fund Authority, | |||
| Series 2014-BB-2, 5.00% due 6/15/2030 | 1,200,000 | 1,342,342 | |
| Series A, 5.00% due 12/15/2032 - 6/15/2033 | 4,100,000 | 4,556,444 | |
| Series BB1, 5.00% due 6/15/2033 | 1,425,000 | 1,550,748 | |
| New Jersey Transportation Trust Fund Authority (Transportation System), Series D, 5.00% due 6/15/2032 | 6,380,000 | 6,452,821 | |
| New Jersey Transportation Trust Fund Authority (State Transportation System Improvements), |
| 28 | Thornburg Municipal Funds Semi-Annual Report | See notes to financial statements. |
| ISSUER-DESCRIPTION | Principal Amount | VALUE | |
| Series A, 5.00% due 6/15/2028 | $ 4,240,000 | $ 4,392,246 | |
| Series A-1, 5.00% due 6/15/2024 - 6/15/2027 | 34,285,000 | 35,416,462 | |
| New Jersey Transportation Trust Fund Authority (Transportation System), | |||
| Series A, 5.00% due 12/15/2025 - 6/15/2032 | 25,965,000 | 28,069,354 | |
| Series BB-1, 5.00% due 6/15/2031 | 2,500,000 | 2,728,167 | |
| State of New Jersey (COVID-19 GO Emergency Bonds) GO, Series A, 5.00% due 6/1/2024 - 6/1/2029 | 8,000,000 | 8,794,702 | |
| State of New Jersey GO, 5.00% due 6/1/2027 | 2,200,000 | 2,329,859 | |
| New Mexico — 2.4% | |||
| Albuquerque Bernalillo County Water Utility Authority (2005 NMFA Loan & Joint Water & Sewer System Improvements), Series A, 5.00% due 7/1/2026 | 2,000,000 | 2,006,964 | |
| Albuquerque Municipal School District No. 12 (State Aid Withholding) GO, Series 2017, 5.00% due 8/1/2026 | 550,000 | 573,773 | |
| City of Albuquerque (City Infrastructure Improvements) GO, Series A, 5.00% due 7/1/2026 | 870,000 | 907,221 | |
| City of Farmington (Public Service Co. of New Mexico), | |||
| a | Series A, 0.875% due 6/1/2040 (put 10/1/2026) | 1,000,000 | 921,041 |
| a | Series B, 3.00% due 6/1/2040 (put 6/1/2024) | 5,000,000 | 4,986,225 |
| a | Series C, 1.15% due 6/1/2040 (put 6/1/2024) | 6,000,000 | 5,965,860 |
| a | Series D, 3.90% due 6/1/2040 (put 6/1/2028) | 2,000,000 | 1,995,982 |
| City of Santa Fe (Public Facilities) GRT, 5.00% due 6/1/2029 | 950,000 | 952,365 | |
| County of Sandoval GO, 5.00% due 8/1/2027 | 210,000 | 223,904 | |
| County of Santa Fe (County Buildings & Facilities) GRT, Series A, 5.00% due 6/1/2025 | 1,250,000 | 1,274,936 | |
| Las Cruces School District No. 2 (State Aid Withholding) GO, 5.00% due 8/1/2027 | 1,000,000 | 1,066,210 | |
| New Mexico Finance Authority, Series A, 5.00% due 6/1/2024 | 550,000 | 551,388 | |
| New Mexico Finance Authority (Public Project Revolving Fund), | |||
| Series A, 5.00% due 6/15/2031 | 1,000,000 | 1,017,533 | |
| Series C, 5.00% due 6/1/2029 | 1,900,000 | 1,943,483 | |
| New Mexico Finance Authority (State of New Mexico Department of Transportation), Series A, 5.00% due 6/15/2026 | 1,500,000 | 1,560,672 | |
| New Mexico Hospital Equipment Loan Council (Presbyterian Healthcare Services Obligated Group), | |||
| Series A, 5.00% due 8/1/2032 | 1,000,000 | 1,103,525 | |
| a | Series B, 5.00% due 8/1/2049 (put 8/1/2025) | 3,650,000 | 3,707,681 |
| New Mexico Hospital Equipment Loan Council (San Juan Regional Medical Center, Inc.), 5.00% due 6/1/2030 - 6/1/2031 | 1,215,000 | 1,299,550 | |
| a | New Mexico Mortgage Finance Authority (JLG Central 217 LLLP), 0.53% due 11/1/2024 (put 5/1/2024) | 10,500,000 | 10,467,786 |
| a | New Mexico Mortgage Finance Authority (JLG NM ABQ 2023 LLLP), 5.00% due 2/1/2042 (put 9/1/2025) | 3,100,000 | 3,131,459 |
| a | New Mexico Mortgage Finance Authority (JLG SAF 2023 LLLP), 5.00% due 2/1/2042 (put 6/1/2025) | 4,050,000 | 4,068,164 |
| State of New Mexico Severance Tax Permanent Fund, Series A, 5.00% due 7/1/2025 | 11,705,000 | 11,943,946 | |
| Village of Los Ranchos de Albuquerque (Albuquerque Academy), 5.00% due 9/1/2029 - 9/1/2032 | 1,330,000 | 1,434,480 | |
| New York — 5.8% | |||
| City of New York (City Budget Financial Management) GO, Series J, 5.00% due 8/1/2024 | 4,000,000 | 4,021,720 | |
| City of New York GO, | |||
| Series A-1, 5.00% due 9/1/2033 | 1,300,000 | 1,508,032 | |
| Series C, 5.00% due 8/1/2025 - 8/1/2026 | 4,250,000 | 4,386,587 | |
| Series C-1, 5.00% due 8/1/2032 | 1,000,000 | 1,123,446 | |
| Series F-1, 5.00% due 8/1/2033 | 1,000,000 | 1,174,511 | |
| City of Yonkers (Insured: AGM) GO, Series A, 5.00% due 2/15/2029 | 850,000 | 937,039 | |
| Long Island Power Authority, 5.00% due 9/1/2033 | 400,000 | 439,582 | |
| Metropolitan Transportation Authority, | |||
| Series A-1, 5.00% due 11/15/2025 | 1,265,000 | 1,283,875 | |
| Series B, | |||
| 4.00% due 11/15/2026 | 1,660,000 | 1,691,394 | |
| 5.00% due 11/15/2028 | 1,230,000 | 1,286,137 | |
| Series C-1, | |||
| 5.00% due 11/15/2027 | 1,070,000 | 1,096,287 | |
| 5.25% due 11/15/2028 - 11/15/2029 | 16,100,000 | 16,568,873 | |
| Series D-1, 5.00% due 11/15/2028 - 11/15/2029 | 4,990,000 | 5,119,633 | |
| Series F, 5.00% due 11/15/2025 | 1,055,000 | 1,080,359 | |
| Metropolitan Transportation Authority (Green Bond), | |||
| a | Series A, 5.00% due 11/15/2048 (put 11/15/2024) | 710,000 | 714,927 |
| Series A2, 5.00% due 11/15/2027 | 3,450,000 | 3,602,373 | |
| Series B, 5.00% due 11/15/2025 - 11/15/2027 | 6,650,000 | 6,884,326 | |
| Series C-1, 5.00% due 11/15/2024 - 11/15/2026 | 6,840,000 | 7,026,479 | |
| a | Monroe County Industrial Development Corp. (Andrews Terrace Community Partners LP), Series B-2, 5.00% due 7/1/2028 (put 7/1/2027) | 4,000,000 | 4,154,932 |
| New York City Housing Development Corp., | |||
| a | Series D, 4.30% due 11/1/2063 (put 11/1/2028) | 2,250,000 | 2,271,292 |
| a | Series F-2A, 3.40% due 11/1/2062 (put 12/22/2026) | 2,500,000 | 2,482,700 |
| See notes to financial statements. | Thornburg Municipal Funds Semi-Annual Report | 29 |
Thornburg Limited Term Municipal Fund | March 31, 2024 (Unaudited)
| ISSUER-DESCRIPTION | Principal Amount | VALUE | |
| New York City Municipal Water Finance Authority (New York City Water & Sewer System), Series AA-2, 5.00% due 6/15/2029 | $ 4,495,000 | $ 4,871,052 | |
| New York City Transitional Finance Authority Future Tax Secured Revenue, | |||
| Series A, 5.00% due 11/1/2031 | 7,980,000 | 9,122,393 | |
| Series A1, 5.00% due 8/1/2031 - 8/1/2032 | 8,500,000 | 8,651,933 | |
| Series B, 5.00% due 11/1/2032 | 2,500,000 | 2,954,840 | |
| Series F5, 5.00% due 2/1/2029 | 3,500,000 | 3,867,199 | |
| New York State Dormitory Authority (Insured: AGM), Series A, 5.00% due 10/1/2032 | 400,000 | 439,619 | |
| New York State Dormitory Authority (Insured: BAM), Series A, 5.00% due 10/1/2032 | 3,500,000 | 3,999,037 | |
| New York State Dormitory Authority (School Districts Financing Program; Insured: AGM) (State Aid Withholding), Series A, 5.00% due 10/1/2024 | 2,000,000 | 2,013,984 | |
| New York State Dormitory Authority (State of New York Personal Income Tax Revenue), | |||
| Series A, 5.00% due 3/15/2030 | 7,250,000 | 8,157,228 | |
| Series A1, 5.00% due 3/15/2031 | 4,545,000 | 5,219,664 | |
| Series E, 5.00% due 3/15/2033 | 2,000,000 | 2,329,000 | |
| New York State Dormitory Authority (State of New York Sales Tax Revenue), | |||
| Series A, 5.00% due 3/15/2028 - 3/15/2033 | 3,670,000 | 3,828,313 | |
| Series E, 5.00% due 3/15/2029 | 4,135,000 | 4,530,500 | |
| New York State Energy Research & Development Authority (New York State Electric & Gas Corp.), Series C, 4.00% due 4/1/2034 | 1,700,000 | 1,738,847 | |
| New York State Urban Development Corp. (State of New York Personal Income Tax Revenue), | |||
| Series A-G, 5.00% due 3/15/2034 | 3,220,000 | 3,425,011 | |
| Series C-2, 5.00% due 3/15/2032 | 4,715,000 | 5,069,794 | |
| Oneida County Local Development Corp. (Utica College), 5.00% due 7/1/2025 - 7/1/2032 | 855,000 | 881,656 | |
| Triborough Bridge & Tunnel Authority, | |||
| Series A, 5.00% due 11/15/2033 | 750,000 | 766,869 | |
| Series B, 5.00% due 11/15/2031 | 4,170,000 | 4,459,148 | |
| Triborough Bridge & Tunnel Authority (Metropolitan Transportation Authority Payroll Mobility Tax Revenue) (Green Bond), | |||
| a | Series A2, 2.00% due 5/15/2045 (put 5/15/2024) | 1,000,000 | 996,793 |
| Series D, 5.00% due 11/15/2031 | 1,000,000 | 1,164,968 | |
| Series E, 5.00% due 11/15/2032 | 2,000,000 | 2,348,616 | |
| Westchester County Local Development Corp. (Miriam Osborn Memorial Home Association Obligated Group), 5.00% due 7/1/2024 - 7/1/2028 | 1,100,000 | 1,114,110 | |
| North Carolina — 1.3% | |||
| Charlotte-Mecklenburg Hospital Authority (Atrium Health Obligated Group), | |||
| Series D, | |||
| a | 3.625% due 1/15/2048 (put 6/15/2027) | 1,350,000 | 1,342,540 |
| a | 5.00% due 1/15/2049 (put 12/1/2031) | 7,000,000 | 7,879,410 |
| City of Charlotte (Equipment Acquisition & Public Facilities) ETM COP, Series C, 5.00% due 12/1/2025 | 2,290,000 | 2,349,000 | |
| a | Columbus County Industrial Facilities & Pollution Control Financing Authority (International Paper Co.), Series B, 2.00% due 11/1/2033 (put 10/1/2024) | 1,100,000 | 1,090,623 |
| County of Buncombe, 5.00% due 6/1/2031 | 1,000,000 | 1,025,311 | |
| County of Buncombe (Primary, Middle School & Community College Facilities), Series A, 5.00% due 6/1/2024 | 600,000 | 601,617 | |
| County of Dare (Educational Facility Capital Projects), Series A, 5.00% due 6/1/2024 | 700,000 | 700,792 | |
| North Carolina Housing Finance Agency, Series 51, 3.85% due 7/1/2032 | 1,500,000 | 1,510,972 | |
| North Carolina Turnpike Authority, 5.00% due 1/1/2026 - 1/1/2029 | 10,690,000 | 11,168,140 | |
| State of North Carolina, 5.00% due 3/1/2033 | 5,000,000 | 5,521,140 | |
| North Dakota — 0.1% | |||
| a | North Dakota Housing Finance Agency, Series B, 3.84% (MUNIPSA + 0.20%) due 1/1/2043 (put 7/1/2024) | 2,000,000 | 1,997,048 |
| Ohio — 1.9% | |||
| Akron, Bath & Copley Joint Township Hospital District (Summa Health System Obligated Group), 5.00% due 11/15/2028 - 11/15/2032 | 3,280,000 | 3,495,331 | |
| City of Cincinnati Water System Revenue, Series C, 4.00% due 12/1/2030 | 1,000,000 | 1,025,870 | |
| City of Columbus GO, Series A, 4.00% due 4/1/2031 | 600,000 | 619,511 | |
| a | Columbus-Franklin County Finance Authority (Dering Family Homes Owner LLC), 5.00% due 7/1/2045 (put 2/1/2027) | 2,000,000 | 2,067,258 |
| County of Allen Hospital Facilities Revenue (Bon Secours Mercy Health, Inc.), | |||
| a | Series B-1, 5.00% due 10/1/2049 (put 8/3/2027) | 2,665,000 | 2,782,247 |
| a | Series B-2, 5.00% due 10/1/2051 (put 6/4/2030) | 10,590,000 | 11,498,156 |
| County of Cuyahoga (Convention Hotel Project) COP, 5.00% due 12/1/2024 | 11,515,000 | 11,535,600 | |
| County of Cuyahoga (Musical Arts Association), 5.00% due 1/1/2030 - 1/1/2032 | 820,000 | 900,573 | |
| a | County of Franklin (Trinity Health Corp. Obligated Group), Series OH, 3.70% due 12/1/2046 (put 5/1/2024) | 2,000,000 | 1,995,440 |
| County of Franklin GO, 5.00% due 12/1/2030 | 2,500,000 | 2,584,098 | |
| County of Hamilton Sales Tax Revenue, Series A, 4.00% due 12/1/2031 | 1,100,000 | 1,119,292 | |
| Northeast Ohio Medical University (Insured: BAM), 5.00% due 12/1/2029 - 12/1/2032 | 875,000 | 981,908 | |
| a | Ohio Air Quality Development Authority (Duke Energy Corp.), Series B, 4.00% due 9/1/2030 (put 6/1/2027) | 4,315,000 | 4,353,671 |
| a | Ohio Air Quality Development Authority (Ohio Valley Electric Corp.), Series B, 1.375% due 2/1/2026 (put 11/1/2024) | 800,000 | 779,216 |
| State of Ohio (Cleveland Clinic Health System Obligated Group), Series A, 5.00% due 1/1/2026 - 1/1/2032 | 1,800,000 | 1,895,174 | |
| a | State of Ohio (Republic Services, Inc.), 3.80% due 11/1/2035 (put 6/3/2024) | 1,000,000 | 1,000,000 |
| 30 | Thornburg Municipal Funds Semi-Annual Report | See notes to financial statements. |
| ISSUER-DESCRIPTION | Principal Amount | VALUE | |
| State of Ohio Department of Administrative Services, Series A-2, 4.00% due 4/1/2032 | $ 1,000,000 | $ 1,011,992 | |
| Oklahoma — 3.5% | |||
| Canadian County Educational Facilities Authority (Mustang Public Schools Project) ISD, Series A, 5.00% due 9/1/2032 - 9/1/2033 | 11,000,000 | 12,743,057 | |
| Canadian County Educational Facilities Authority (Yukon Public Schools Project) ISD, 5.00% due 9/1/2027 - 9/1/2029 | 10,850,000 | 11,721,778 | |
| Cleveland County Educational Facilities Authority (Moore Public Schools) ISD, 4.00% due 6/1/2030 - 6/1/2031 | 9,240,000 | 9,941,801 | |
| Cleveland County Educational Facilities Authority (Norman Public Schools) ISD, | |||
| 5.00% due 6/1/2024 | 4,250,000 | 4,258,959 | |
| Series A, 5.00% due 6/1/2028 - 6/1/2033 | 15,850,000 | 17,841,283 | |
| Clinton Public Works Authority, 5.00% due 10/1/2029 - 10/1/2032 | 4,295,000 | 4,728,764 | |
| Cushing Educational Facilities Authority (Payne County No. 67 Cushing) ISD, 5.00% due 9/1/2032 | 14,000,000 | 15,715,448 | |
| Muskogee Industrial Trust (Muskogee County No. 20) ISD, 5.00% due 9/1/2026 | 475,000 | 487,620 | |
| Oklahoma County Finance Authority (Midwest City Public Service) ISD, 5.00% due 10/1/2025 - 10/1/2026 | 825,000 | 849,796 | |
| Rogers County Educational Facilities Authority (School District No. 2 Catoosa), 5.00% due 9/1/2029 - 9/1/2032 | 12,000,000 | 13,461,956 | |
| Oregon — 0.6% | |||
| a | Oregon Health & Science University (Oregon Health & Science University Obligated Group), Series B2, 5.00% due 7/1/2046 (put 2/1/2032) | 11,780,000 | 13,219,210 |
| Tri-County Metropolitan Transportation District of Oregon, Series A, 5.00% due 10/1/2028 | 2,845,000 | 3,071,493 | |
| Pennsylvania — 6.4% | |||
| Allegheny County Higher Education Building Authority (Duquesne University of the Holy Spirit), Series A, 5.00% due 3/1/2025 | 1,145,000 | 1,159,187 | |
| Allegheny County Hospital Development Authority (UPMC Obligated Group), Series A, 5.00% due 7/15/2031 | 2,520,000 | 2,755,839 | |
| Allegheny County Sanitary Authority (2015 Capital Project), 5.00% due 12/1/2024 | 2,000,000 | 2,020,744 | |
| Allegheny County Sanitary Authority (2015 Capital Project; Insured: BAM), 5.00% due 12/1/2025 | 1,000,000 | 1,030,293 | |
| Allegheny County Sanitary Authority (Insured: BAM), 5.00% due 12/1/2029 | 2,830,000 | 2,902,830 | |
| Bethlehem Area School District Authority (State Aid Withholding), | |||
| a | Series A, 3.914% (SOFR + 0.35%) due 1/1/2030 (put 11/1/2025) | 2,985,000 | 2,866,116 |
| a | Series C, 3.914% (SOFR + 0.35%) due 1/1/2032 (put 11/1/2025) | 2,985,000 | 2,933,297 |
| City of Philadelphia (Insured: AGM) GO, 5.00% due 8/1/2025 - 8/1/2027 | 28,685,000 | 29,821,877 | |
| City of Philadelphia (Pennsylvania Gas Works), | |||
| Series 13, 5.00% due 8/1/2024 - 8/1/2031 | 6,900,000 | 6,971,783 | |
| Series 14, 5.00% due 10/1/2024 - 10/1/2032 | 3,070,000 | 3,165,708 | |
| City of Philadelphia (Pennsylvania Gas Works; Insured: AGM), Series A, 5.00% due 8/1/2025 - 8/1/2032 | 2,210,000 | 2,423,733 | |
| City of Philadelphia Airport Revenue, Series A, 5.00% due 7/1/2030 | 750,000 | 840,830 | |
| City of Philadelphia GO, Series B, 5.00% due 8/1/2033 | 1,060,000 | 1,088,550 | |
| City of Philadelphia IDA, 5.00% due 5/1/2025 - 5/1/2028 | 2,490,000 | 2,595,070 | |
| City of Philadelphia Water & Wastewater Revenue, Series B, 5.00% due 7/1/2032 | 2,500,000 | 2,554,088 | |
| Commonwealth Financing Authority (Pennsylvania Department of Community & Economic Development; Insured: AGM), Series B-1, 5.00% due 6/1/2025 | 3,000,000 | 3,055,266 | |
| Commonwealth Financing Authority (Tobacco Master Settlement Paym; Insured: BAM-TCRS), 5.00% due 6/1/2031 | 10,000,000 | 10,847,470 | |
| Commonwealth of Pennsylvania (Capital Facilities) GO, Series D, 5.00% due 8/15/2024 - 8/15/2025 | 8,325,000 | 8,423,438 | |
| Commonwealth of Pennsylvania GO, | |||
| 5.00% due 7/15/2030 | 12,930,000 | 14,357,252 | |
| Series 1, 5.00% due 3/15/2025 | 12,005,000 | 12,192,722 | |
| County of Luzerne (Insured: AGM) GO, Series A, 5.00% due 11/15/2024 | 4,000,000 | 4,036,420 | |
| Geisinger Authority (Geisinger Health System Obligated group), | |||
| a | Series B, 5.00% due 4/1/2043 (put 2/15/2027) | 5,115,000 | 5,288,337 |
| a | Series C, 5.00% due 4/1/2043 (put 4/1/2030) | 3,475,000 | 3,770,201 |
| Hempfield Area School District (Insured: AGM) (State Aid Withholding) GO, Series B, 5.00% due 3/15/2027 | 1,410,000 | 1,486,693 | |
| Luzerne County (Insured: AGM) IDA GO, 5.00% due 12/15/2026 - 12/15/2027 | 1,500,000 | 1,537,040 | |
| a | Montgomery County (Constellation Energy Generation LLC) IDA, Series A, 4.10% due 4/1/2053 (put 4/3/2028) | 5,000,000 | 5,079,945 |
| Northeastern Pennsylvania Hospital & Education Authority (King’s College), 5.00% due 5/1/2027 - 5/1/2029 | 3,825,000 | 3,911,800 | |
| Pennsylvania (UPMC Obligated Group) EDFA, Series A, 5.00% due 10/15/2033 | 1,150,000 | 1,299,850 | |
| a | Pennsylvania (Waste Management Obligated Group; Guaranty: Waste Management, Inc.) EDFA, 0.95% due 12/1/2033 (put 12/1/2026) | 1,000,000 | 921,190 |
| Pennsylvania Turnpike Commission, Series A-1, 5.00% due 12/1/2033 | 1,000,000 | 1,016,925 | |
| Philadelphia Municipal Authority (Juvenile Justice Services Center), 5.00% due 4/1/2027 | 1,365,000 | 1,435,236 | |
| Pittsburgh Water & Sewer Authority (Insured: AGM), Series B, 5.00% due 9/1/2033 | 1,000,000 | 1,183,570 | |
| Plum Borough School District (Insured: BAM) (State Aid Withholding) GO, Series A, 5.00% due 9/15/2024 | 1,885,000 | 1,886,862 | |
| School District of Philadelphia (State Aid Withholding) GO, | |||
| Series A, 5.00% due 9/1/2025 - 9/1/2028 | 1,870,000 | 1,966,139 | |
| Series F, 5.00% due 9/1/2024 | 620,000 | 623,252 | |
| School District of Philadelphia (State Aid Withholding; Insured: BAM-TCRS) GO, Series F, 5.00% due 9/1/2025 | 500,000 | 511,134 | |
| Sports & Exhibition Authority of Pittsburgh & Allegheny County (Allegheny County Hotel Room Excise Tax Revenue; Insured: AGM), Series A, 5.00% due 2/1/2033 | 4,000,000 | 4,615,856 | |
| State Public School Building Authority (Insured: BAM), Series A, 4.00% due 10/1/2033 | 2,325,000 | 2,350,947 | |
| State Public School Building Authority (School District of Philadelphia; Insured: AGM) (State Aid Withholding), Series A, 5.00% due 6/1/2030 | 3,550,000 | 3,730,738 |
| See notes to financial statements. | Thornburg Municipal Funds Semi-Annual Report | 31 |
Thornburg Limited Term Municipal Fund | March 31, 2024 (Unaudited)
| ISSUER-DESCRIPTION | Principal Amount | VALUE | |
| University of Pittsburgh-of the Commonwealth System of Higher Education, Series A, 4.00% due 4/15/2026 | $ 6,000,000 | $ 6,107,838 | |
| South Carolina — 0.6% | |||
| Berkeley County School District (School Facility Equipment Acquisition), 5.00% due 12/1/2024 | 2,000,000 | 2,020,194 | |
| a | Patriots Energy Group Financing Agency (Guaranty: Sumitomo Mitsui Banking Corp.), Series A1, 5.25% due 10/1/2054 (put 8/1/2031) | 10,090,000 | 10,801,890 |
| SCAGO Educational Facilities Corp. (School District of Pickens County), 5.00% due 12/1/2025 - 12/1/2029 | 3,000,000 | 3,049,018 | |
| Tennessee — 2.4% | |||
| a | Knox County Health Educational & Housing Facility Board (Gleason Partners LP), 3.95% due 12/1/2027 (put 12/1/2025) | 1,500,000 | 1,505,821 |
| Knox County Health Educational & Housing Facility Board (Provident Group - UTK Properties LLC; Insured: BAM), Series A-1, 5.00% due 7/1/2031 - 7/1/2034 | 1,245,000 | 1,384,424 | |
| a | Metropolitan Government Nashville & Davidson County Health & Educational Facilities Board (Northview Housing Development LP), Series B, 3.85% due 2/1/2045 (put 2/1/2025) | 2,500,000 | 2,492,992 |
| a | Tennergy Corp. (Guaranty: Morgan Stanley Group), Series A, 4.00% due 12/1/2051 (put 9/1/2028) | 14,730,000 | 14,714,489 |
| a | Tennessee Energy Acquisition Corp. (Guaranty: Goldman Sachs Group, Inc.), Series A-1, 5.00% due 5/1/2053 (put 5/1/2028) | 1,000,000 | 1,035,962 |
| a | Tennessee Energy Acquisition Corp. (Tennessee Energy Acquisition Corp.; Guaranty: Goldman Sachs Group, Inc.), Series A, 5.00% due 5/1/2052 (put 11/1/2031) | 35,310,000 | 37,299,401 |
| Tennessee HDA, | |||
| Series 2A, | |||
| 3.80% due 1/1/2032 | 400,000 | 404,530 | |
| 3.875% due 1/1/2033 | 500,000 | 507,025 | |
| 3.90% due 7/1/2033 | 500,000 | 507,443 | |
| 3.95% due 1/1/2034 | 1,000,000 | 1,017,489 | |
| a | Williamson County (ECG Wood Duck LP) IDB, 5.00% due 5/1/2042 (put 5/1/2027) | 2,000,000 | 2,062,064 |
| Texas — 13.6% | |||
| Amarillo Junior College District GO, 5.00% due 2/15/2030 | 2,325,000 | 2,603,807 | |
| Arlington Higher Education Finance Corp. (KIPP Texas, Inc.) (Insured: PSF-GTD), 4.00% due 8/15/2031 | 1,000,000 | 1,021,641 | |
| Arlington Higher Education Finance Corp. (Riverwalk Education Foundation, Inc.) (Insured: PSF-GTD), 5.00% due 8/15/2026 | 365,000 | 378,863 | |
| a | Bexar County Housing Finance Corp. (Culebra Road Apartments LP), 4.05% due 3/1/2028 (put 3/1/2026) | 2,500,000 | 2,495,142 |
| a | Boerne School District (Insured: PSF-GTD) ISD GO, 3.125% due 2/1/2053 (put 2/1/2027) | 4,775,000 | 4,786,417 |
| Central Texas Turnpike System, Series C, 5.00% due 8/15/2031 | 2,800,000 | 2,811,010 | |
| City of Aubrey Jackson Ridge Public Improvement District (Insured: BAM)), 5.00% due 9/1/2026 - 9/1/2034 | 2,180,000 | 2,382,848 | |
| City of Austin Water & Wastewater System Revenue, | |||
| 5.00% due 11/15/2033 | 2,000,000 | 2,160,046 | |
| Series A, 5.00% due 11/15/2032 | 1,000,000 | 1,024,875 | |
| City of Beaumont (Waterworks & Sewer System Improvements; Insured: AGM), Series A, 5.00% due 9/1/2024 | 2,500,000 | 2,502,672 | |
| City of Conroe GO, Series B, 5.00% due 11/15/2030 | 1,750,000 | 1,916,742 | |
| City of Dallas (Public Improvements) GO, 5.00% due 2/15/2025 | 3,000,000 | 3,039,735 | |
| City of Dallas (Trinity River Corridor Infrastructure) GO, 5.00% due 2/15/2025 - 2/15/2026 | 17,935,000 | 17,953,157 | |
| a | City of Dallas Housing Finance Corp. (Ash Creek Housing LLC), 5.00% due 7/1/2026 (put 12/1/2025) | 1,500,000 | 1,525,124 |
| City of Georgetown Utility System Revenue (Insured: BAM), 5.00% due 8/15/2028 - 8/15/2029 | 1,300,000 | 1,421,613 | |
| City of Houston (Airport System), Series B, 5.00% due 7/1/2027 - 7/1/2028 | 2,975,000 | 3,216,671 | |
| City of Houston (Combined Utility System), Series C, 5.00% due 5/15/2024 | 7,250,000 | 7,260,498 | |
| City of Houston (Public Improvements) GO, Series A, 5.00% due 3/1/2027 | 2,875,000 | 3,036,782 | |
| City of Houston Combined Utility System Revenue, | |||
| Series B, | |||
| 4.00% due 11/15/2031 | 1,725,000 | 1,755,822 | |
| 5.00% due 11/15/2032 | 1,500,000 | 1,568,495 | |
| City of Houston GO, Series A, 5.00% due 3/1/2031 | 2,635,000 | 2,911,330 | |
| City of Hutto (Insured: AGM) GO, 5.00% due 8/1/2033 | 400,000 | 456,236 | |
| City of Irving GO, Series A, 5.00% due 9/15/2029 | 1,000,000 | 1,075,053 | |
| City of Lubbock Electric Light & Power System Revenue, 5.00% due 4/15/2025 | 725,000 | 736,021 | |
| City of Lubbock GO, Series A, 5.00% due 2/15/2026 - 2/15/2027 | 1,500,000 | 1,572,780 | |
| City of Mansfield GO, Series A, 5.00% due 2/15/2031 - 2/15/2033 | 1,500,000 | 1,723,765 | |
| City of McAllen (International Toll Bridge System; Insured: AGM), Series A, 5.00% due 3/1/2027 | 1,125,000 | 1,160,724 | |
| City of Port Arthur (CTFS Obligation; Insured: BAM) GO, 5.00% due 2/15/2033 | 1,025,000 | 1,199,655 | |
| City of San Antonio (Public Facilities Corp.), 5.00% due 9/15/2027 - 9/15/2032 | 4,155,000 | 4,670,905 | |
| City of San Antonio Electric & Gas Systems Revenue, 4.00% due 2/1/2032 | 4,100,000 | 4,162,045 | |
| Clear Creek (Insured: PSF-GTD) ISD GO, | |||
| a | 3.60% due 2/15/2035 (put 8/15/2025) | 1,500,000 | 1,506,578 |
| Series A, 4.00% due 2/15/2033 | 5,000,000 | 5,052,485 | |
| Clifton Higher Education Finance Corp. (Idea Public Schools; Insured: PSF-GTD), | |||
| 4.00% due 8/15/2028 | 2,000,000 | 2,046,362 | |
| Series T, 5.00% due 8/15/2026 | 400,000 | 414,440 | |
| Clifton Higher Education Finance Corp. (International Leadership of Texas, Inc.; Insured: PSF-GTD), Series A, 5.00% due 8/15/2033 | 1,150,000 | 1,344,863 |
| 32 | Thornburg Municipal Funds Semi-Annual Report | See notes to financial statements. |
| ISSUER-DESCRIPTION | Principal Amount | VALUE | |
| Clifton Higher Education Finance Corp. (YES Prep Public Schools, Inc.; Insured: PSF-GTD), 5.00% due 4/1/2027 - 4/1/2029 | $ 1,700,000 | $ 1,815,382 | |
| Conroe (Insured: PSF-GTD) ISD GO, Series A, 4.00% due 2/15/2033 | 1,050,000 | 1,071,498 | |
| Cotulla (Insured: PSF-GTD) ISD GO, 5.00% due 2/15/2030 - 2/15/2033 | 4,315,000 | 4,908,511 | |
| County of Bexar GO, 4.00% due 6/15/2033 | 2,750,000 | 2,794,440 | |
| County of Harris (Harris County Toll Road Revenue), | |||
| Series A, 5.00% due 8/15/2031 | 2,500,000 | 2,606,985 | |
| Series B, 5.00% due 8/15/2030 - 8/15/2033 | 5,370,000 | 5,511,017 | |
| County of La Salle (Insured: AGM) GO, 5.00% due 3/1/2028 | 4,110,000 | 4,344,759 | |
| Cypress-Fairbanks (Insured: PSF-GTD) ISD GO, 5.00% due 2/15/2028 | 2,955,000 | 2,997,750 | |
| Dallas County Utility & Reclamation District GO, 5.00% due 2/15/2026 | 1,000,000 | 1,024,051 | |
| a | Denton (Insured: PSF-GTD) ISD GO, Series B, 2.00% due 8/1/2044 (pre-refunded 8/1/2024) | 340,000 | 338,171 |
| a | Dickinson (Insured: PSF-GTD) ISD GO, 3.50% due 8/1/2037 (put 8/1/2025) | 1,000,000 | 1,002,753 |
| a | El Paso Housing Finance Corp. (Columbia Housing Partners LP), 4.50% due 3/1/2026 (put 3/1/2025) | 2,300,000 | 2,304,966 |
| Franklin (Insured: PSF-GTD) ISD GO, 4.00% due 2/15/2032 | 2,000,000 | 2,021,062 | |
| Frisco (Insured: PSF-GTD) ISD GO, 5.00% due 8/15/2033 | 1,465,000 | 1,619,278 | |
| a | Grand Parkway Transportation Corp., 5.00% due 10/1/2052 (put 4/1/2028) | 4,000,000 | 4,316,560 |
| Harris County Cultural Education Facilities Finance Corp. (Memorial Hermann Health System Obligated Group), | |||
| Series A, | |||
| 4.00% due 12/1/2031 | 825,000 | 827,819 | |
| 5.00% due 12/1/2024 - 12/1/2025 | 5,845,000 | 5,896,013 | |
| a | Series B, 5.00% due 6/1/2050 (put 12/1/2028) | 2,250,000 | 2,409,503 |
| a | Harris County Cultural Education Facilities Finance Corp. (Texas Children’s Hospital Obligated Group), Series B, 5.00% due 10/1/2051 (put 10/1/2031) | 2,125,000 | 2,405,657 |
| Hays Consolidated (Insured: PSF-GTD) ISD GO, 5.00% due 2/15/2033 | 1,250,000 | 1,455,906 | |
| a | Houston (Insured: PSF-GTD) ISD GO, Series C, 4.00% due 6/1/2039 (put 6/1/2025) | 3,000,000 | 3,017,898 |
| a | Houston Housing Finance Corp. (Summerdale Apartments LP), 5.00% due 8/1/2041 (put 8/1/2026) | 3,500,000 | 3,571,690 |
| a | Houston Housing Finance Corp. (Sunset Gardens Preservation LP), 4.00% due 10/1/2025 (put 10/1/2024) | 6,000,000 | 5,992,008 |
| Humble (Insured: PSF-GTD) ISD GO, | |||
| 4.00% due 2/15/2033 | 1,605,000 | 1,705,211 | |
| Series A, 4.00% due 2/15/2029 | 2,500,000 | 2,526,175 | |
| a | Jacksboro (Insured: PSF-GTD) ISD GO, 4.00% due 2/15/2048 (put 8/15/2028) | 2,500,000 | 2,621,722 |
| Keller (Insured: PSF-GTD) ISD GO, 5.00% due 8/15/2027 (pre-refunded 2/15/2025) | 5,795,000 | 5,866,696 | |
| Klein (Insured: PSF-GTD) ISD GO, 5.00% due 8/1/2034 | 2,220,000 | 2,330,751 | |
| a | Lakeside Place PFC (Brookside Gardens Apartments LLC), 4.15% due 11/1/2026 (put 11/1/2025) | 5,000,000 | 5,004,665 |
| Laredo Community College District (School Facilities Improvements) GO, 5.00% due 8/1/2024 | 715,000 | 718,491 | |
| Leander (Insured: PSF-GTD) ISD GO, Series A, 5.00% due 2/15/2029 | 1,940,000 | 2,143,636 | |
| Llano (Insured: PSF-GTD) ISD GO, 5.00% due 2/15/2032 | 1,200,000 | 1,246,418 | |
| Lower Colorado River Authority, Series D, 5.00% due 5/15/2026 - 5/15/2027 | 2,200,000 | 2,239,559 | |
| Lower Colorado River Authority (LCRA Transmission Services Corp.), | |||
| Series A, | |||
| 5.00% due 5/15/2031 - 5/15/2032 | 900,000 | 1,033,467 | |
| 5.25% due 5/15/2033 | 350,000 | 411,174 | |
| a | North East (Insured: PSF-GTD) ISD GO, 3.60% due 8/1/2052 (put 8/1/2024) | 5,000,000 | 4,997,690 |
| North Texas Tollway Authority (North Texas Tollway System), Series A, 5.00% due 1/1/2031 - 1/1/2032 | 2,750,000 | 2,787,803 | |
| Northside (Insured: PSF-GTD) ISD GO, | |||
| 4.00% due 6/15/2033 | 1,500,000 | 1,533,236 | |
| a | Series B, 3.00% due 8/1/2053 (put 8/1/2026) | 7,400,000 | 7,359,226 |
| Pecos Barstow Toyah (Insured: PSF-GTD) ISD GO, 5.00% due 2/15/2031 - 2/15/2033 | 5,500,000 | 5,949,156 | |
| Prosper (Insured: PSF-GTD) ISD GO, 5.00% due 2/15/2033 | 1,000,000 | 1,164,479 | |
| Round Rock (Educational Facilities Improvements; Insured: PSF-GTD) ISD GO, 5.00% due 8/1/2028 - 8/1/2029 (pre-refunded 8/1/2025) | 5,820,000 | 5,937,529 | |
| San Antonio (Insured: PSF-GTD) ISD GO, 5.00% due 8/15/2033 | 2,080,000 | 2,441,254 | |
| a | San Antonio Housing Trust Finance Corp. (Arbors at West Avenue LP), 1.45% due 3/1/2026 (put 3/1/2025) | 2,000,000 | 1,934,522 |
| a | San Antonio Housing Trust Public Facility Corp. (PV Country Club Village LP), 4.00% due 8/1/2026 (put 8/1/2025) | 1,000,000 | 999,946 |
| Southwest (Insured: PSF-GTD) ISD GO, 5.00% due 2/1/2032 - 2/1/2033 | 2,600,000 | 3,009,840 | |
| State of Texas GO, | |||
| 5.00% due 10/1/2027 | 1,875,000 | 1,877,147 | |
| Series A, 4.00% due 10/1/2032 - 10/1/2033 | 20,430,000 | 20,553,148 | |
| Tarrant County College District GO, 5.00% due 8/15/2032 | 2,500,000 | 2,931,752 | |
| Tarrant County Cultural Education Facilities Finance Corp. (Christus Health Obligated Group), | |||
| a | Series A, 5.00% due 7/1/2053 (put 7/1/2032) | 7,520,000 | 8,419,565 |
| Series B, 5.00% due 7/1/2032 | 2,695,000 | 2,923,229 | |
| Tarrant County Hospital District GO, 5.00% due 8/15/2025 - 8/15/2027 | 2,880,000 | 3,028,155 | |
| Texas Municipal Gas Acquisition & Supply Corp. III (Guaranty: Macquarie Group Ltd.), 5.00% due 12/15/2025 - 12/15/2032 | 69,065,000 | 73,378,302 |
| See notes to financial statements. | Thornburg Municipal Funds Semi-Annual Report | 33 |
Thornburg Limited Term Municipal Fund | March 31, 2024 (Unaudited)
| ISSUER-DESCRIPTION | Principal Amount | VALUE | |
| a | Texas Municipal Gas Acquisition & Supply Corp. IV (Guaranty: BP plc), Series B, 5.50% due 1/1/2054 (put 1/1/2034) | $ 1,000,000 | $ 1,116,639 |
| Texas Public Finance Authority (Texas Southern University; Insured: BAM), 5.00% due 5/1/2032 - 5/1/2033 | 1,700,000 | 1,891,449 | |
| a | Texas State Affordable Housing Corp. (FC Juniper Creek Housing LP), 3.75% due 7/1/2044 (put 7/1/2026) | 2,000,000 | 1,989,842 |
| Texas State Technical College (Insured: AGM), | |||
| Series A, | |||
| 5.00% due 8/1/2031 - 8/1/2032 | 4,250,000 | 4,895,222 | |
| 5.25% due 8/1/2033 | 2,300,000 | 2,715,697 | |
| Texas Woman’s University, Series A, 5.00% due 7/1/2031 - 7/1/2033 | 4,275,000 | 4,980,151 | |
| Utah — 0.1% | |||
| a | County of Utah (Intermountain Healthcare Obligated Group), Series B, 5.00% due 5/15/2060 (put 8/1/2026) | 1,740,000 | 1,801,177 |
| Utah Telecommunication Open Infrastructure Agency, | |||
| 5.00% due 6/1/2031 | 600,000 | 686,591 | |
| 5.25% due 6/1/2033 | 500,000 | 590,547 | |
| Virginia — 0.7% | |||
| a | Fairfax County Redevelopment & Housing Authority (Apah Tysons North Four LP), 5.00% due 1/1/2045 (put 1/1/2028) | 2,000,000 | 2,083,404 |
| a | Halifax County IDA, Series A, 1.65% due 12/1/2041 (put 5/31/2024) | 3,000,000 | 2,983,230 |
| a | Harrisonburg Redevelopment & Housing Authority, 4.00% due 12/1/2028 (put 12/1/2026) | 1,615,000 | 1,612,364 |
| Virginia Commonwealth Transportation Board, | |||
| 4.00% due 5/15/2032 | 1,000,000 | 1,032,531 | |
| 5.00% due 9/15/2028 | 3,945,000 | 4,245,301 | |
| Virginia Small Business Financing Authority (National Senior Campuses, Inc. Obligated Group), Series A, 5.00% due 1/1/2029 - 1/1/2033 | 4,400,000 | 4,624,690 | |
| a | Wise County (Virginia Electric & Power Co.) IDA, Series A, 1.20% due 11/1/2040 (put 5/31/2024) | 1,550,000 | 1,539,175 |
| Washington — 0.7% | |||
| City of Seattle GO, 4.00% due 12/1/2032 | 1,000,000 | 1,010,612 | |
| Clark County Public Utility District No. 1, 5.00% due 1/1/2028 | 500,000 | 537,918 | |
| Energy Northwest (Nine Canyon Wind Project Phase I-III), 5.00% due 7/1/2025 | 850,000 | 868,035 | |
| King County School District No. 414 (State Aid Withholding) GO, 4.00% due 12/1/2033 | 2,000,000 | 2,041,932 | |
| State of Washington COP, Series B, 5.00% due 7/1/2032 | 650,000 | 711,149 | |
| State of Washington GO, | |||
| Series 2021A, 5.00% due 6/1/2024 | 500,000 | 501,272 | |
| Series C, 5.00% due 2/1/2032 | 1,200,000 | 1,218,798 | |
| Series R, 5.00% due 7/1/2032 | 4,000,000 | 4,056,516 | |
| University of Washington, Series C, 4.00% due 12/1/2031 | 1,000,000 | 1,007,812 | |
| Washington Health Care Facilities Authority (CommonSpirit Health Obligated Group), Series A1, 5.00% due 8/1/2031 | 780,000 | 839,390 | |
| Washington Health Care Facilities Authority (Providence St. Joseph Health Obligated Group), Series B, 5.00% due 10/1/2031 | 2,500,000 | 2,639,880 | |
| a | Washington State Housing Finance Commission (Ardea Twg LLLP), 5.00% due 12/1/2043 (put 2/1/2027) | 1,000,000 | 1,025,696 |
| c | Washington State Housing Finance Commission (Seattle Academy of Arts & Sciences), 5.125% due 7/1/2033 | 735,000 | 802,575 |
| Wisconsin — 2.4% | |||
| City of Milwaukee (Insured: AGM) GO, | |||
| 5.00% due 4/1/2032 - 4/1/2033 | 4,845,000 | 5,555,922 | |
| Series N3, 5.00% due 4/1/2031 - 4/1/2032 | 6,550,000 | 7,379,101 | |
| County of Waushara GO, Series A, 4.50% due 6/1/2027 | 4,000,000 | 4,046,196 | |
| Peshtigo School District, 4.75% due 3/1/2027 | 10,500,000 | 10,631,481 | |
| a | Public Finance Authority (Duke Energy Progress LLC), Series A-1, 3.30% due 10/1/2046 (put 10/1/2026) | 11,920,000 | 11,859,125 |
| a | Public Finance Authority (Providence St. Joseph Health Obligated Group), Series C, 4.00% due 10/1/2041 (put 10/1/2030) | 4,000,000 | 4,026,572 |
| a | Public Finance Authority (St. John’s College), 3.00% due 10/1/2045 (put 10/1/2026) | 1,500,000 | 1,446,385 |
| Racine USD, Series B, 4.125% due 4/1/2025 | 1,500,000 | 1,500,066 | |
| Village of Kimberly, 4.00% due 6/1/2024 | 6,000,000 | 6,000,822 | |
| a | Wisconsin Health & Educational Facilities Authority (Advocate Aurora Health Obligated Group), Series B1, 5.00% due 8/15/2054 (put 7/1/2027) | 1,375,000 | 1,421,778 |
| a | Wisconsin Health & Educational Facilities Authority (Fort Healthcare, Inc. Obligated Group), Series B, 5.00% due 10/1/2054 (put 10/3/2034) | 2,320,000 | 2,627,486 |
| Wisconsin Housing EDA, | |||
| Series B, | |||
| a | 0.50% due 11/1/2050 (put 11/1/2024) | 1,500,000 | 1,461,144 |
| a | 3.75% due 5/1/2054 (put 11/1/2026) | 3,000,000 | 2,996,766 |
| WPPI Energy, Series A, 5.00% due 7/1/2027 - 7/1/2028 | 390,000 | 418,526 | |
| Total Long-Term Municipal Bonds — 96.2% (Cost $2,459,160,653) | 2,511,294,362 | ||
| Short-Term Municipal Bonds — 3.0% | |||
| Florida — 0.1% |
| 34 | Thornburg Municipal Funds Semi-Annual Report | See notes to financial statements. |
| ISSUER-DESCRIPTION | Principal Amount | VALUE | |
| City of Gainesville Utilities System Revenue (SPA Barclays Bank plc), | |||
| a | Series A-REMK, 4.60% due 10/1/2026 (put 4/1/2024) | $ 1,400,000 | $ 1,400,000 |
| a | Series B-REMK, 4.50% due 10/1/2042 (put 4/1/2024) | 500,000 | 500,000 |
| Illinois — 0.0% | |||
| a | Phoenix Realty Special Account-U LP (LOC Northern Trust Co.), 4.21% due 4/1/2025 (put 4/5/2024) | 1,000,000 | 1,000,000 |
| Indiana — 0.0% | |||
| a | Indiana Finance Authority (Franciscan Alliance, Inc. Obligated Group; LOC Barclays Bank plc), Series I, 4.45% due 11/1/2037 (put 4/1/2024) | 1,445,000 | 1,445,000 |
| Michigan — 0.1% | |||
| a | Grand Traverse County Hospital Finance Authority (Munson Healthcare Obligated Group; LOC PNC Bank NA), Series C, 4.42% due 7/1/2041 (put 4/1/2024) | 3,400,000 | 3,400,000 |
| New York — 1.3% | |||
| a | City of New York (SPA Barclays Bank plc) GO, Series B4, 4.45% due 10/1/2046 (put 4/1/2024) | 850,000 | 850,000 |
| a | City of New York (SPA JP Morgan Chase Bank NA) GO, Series 1, 4.55% due 3/1/2040 (put 4/1/2024) | 18,000,000 | 18,000,000 |
| a | Metropolitan Transportation Authority (LOC Barclays Bank plc), Series 2012G-1, 4.45% due 11/1/2032 (put 4/1/2024) | 1,475,000 | 1,475,000 |
| a | New York City Municipal Water Finance Authority (New York City Water & Sewer System; SPA Bank of America NA), 4.57% due 6/15/2033 (put 4/1/2024) | 500,000 | 500,000 |
| a | New York City Municipal Water Finance Authority (New York City Water & Sewer System; SPA JP Morgan Chase Bank NA), Series AA-1, 4.55% due 6/15/2050 (put 4/1/2024) | 800,000 | 800,000 |
| a | New York City Transitional Finance Authority Future Tax Secured Revenue (SPA Barclays Bank plc), Series B3, 4.45% due 11/1/2042 (put 4/1/2024) | 11,255,000 | 11,255,000 |
| Ohio — 0.3% | |||
| a | State of Ohio (University Hospitals Health System, Inc. Obligated Group; LOC PNC Bank NA), Series A, 4.42% due 1/15/2046 (put 4/1/2024) | 6,955,000 | 6,955,000 |
| Texas — 1.0% | |||
| a | Port of Port Arthur Navigation District (Motiva Enterprises LLC), 4.85% due 4/1/2040 (put 4/1/2024) | 27,400,000 | 27,400,000 |
| Utah — 0.2% | |||
| a | City of Murray (Intermountain Healthcare Obligated Group; SPA JP Morgan Chase Bank NA), Series B, 4.45% due 5/15/2037 (put 4/1/2024) | 4,530,000 | 4,530,000 |
| Total Short-Term Municipal Bonds — 3.0% (Cost $79,510,000) | 79,510,000 | ||
| Total Investments — 99.2% (Cost $2,538,670,653) | $2,590,804,362 | ||
| Other Assets Less Liabilities — 0.8% | 20,567,441 | ||
| Net Assets — 100.0% | $2,611,371,803 |
| Footnote Legend | |
| a | Variable, floating, step, or fixed to floating rate securities are securities for which interest rate changes are based on changes in a designated base rate or on a predetermined schedule. The rates shown are those in effect on March 31, 2024. |
| b | When-issued security. |
| c | Securities exempt from registration under Rule 144A of the Securities Act of 1933, as amended. These securities are restricted but liquid and may only be resold in the ordinary course of business in transactions exempt from registration, normally to qualified institutional buyers. As of March 31, 2024, the aggregate value of these securities in the Fund’s portfolio was $7,085,260, representing 0.27% of the Fund’s net assets. |
| See notes to financial statements. | Thornburg Municipal Funds Semi-Annual Report | 35 |
Thornburg Limited Term Municipal Fund | March 31, 2024 (Unaudited)
To simplify the listings of securities, abbreviations are used per the table below:
| AGM | Insured by Assured Guaranty Municipal Corp. |
| BAM | Insured by Build America Mutual Insurance Co. |
| BHAC-CR | Berkshire Hathaway Assurance Corp. Custodial Receipts |
| CDC | Community Development Commission |
| COP | Certificates of Participation |
| DFA | Development Finance Authority/Agency |
| EDA | Economic Development Authority |
| EDFA | Economic Development Financing Authority |
| ETM | Escrowed to Maturity |
| FGIC | Insured by Financial Guaranty Insurance Co. |
| FHLMC | Collateralized by Federal Home Loan Mortgage Corp. |
| FNMA | Collateralized by Federal National Mortgage Association |
| GNMA | Collateralized by Government National Mortgage Association |
| GO | General Obligation |
| GRT | Gross Receipts Tax |
| HDA | Housing Development Authority |
| HFA | Health Facilities Authority |
| HFFA | Health Facilities Financing Authority |
| IDA | Industrial Development Authority/Agency |
| IDB | Industrial Development Board |
| ISD | Independent School District |
| JEA | Jacksonville Electric Authority |
| LOC | Letter of Credit |
| MUNIPSA | Securities Industry and Financial Markets Association (SIFMA) Municipal Swap Index |
| Natl-Re | Insured by National Public Finance Guarantee Corp. |
| PSF-GTD | Guaranteed by Permanent School Fund |
| SOFR | Secured Overnight Financing Rate |
| SPA | Stand-by Purchase Agreement |
| TCRS | Transferable Custodial Receipts |
| USD | Unified School District |
| 36 | Thornburg Municipal Funds Semi-Annual Report | See notes to financial statements. |
Thornburg Intermediate Municipal Fund | March 31, 2024 (Unaudited)
| ISSUER-DESCRIPTION | Principal Amount | VALUE | |
| LONG-TERM MUNICIPAL BONDS — 92.2% | |||
| Alabama — 3.7% | |||
| a | Black Belt Energy Gas District (Guaranty: Morgan Stanley Group), Series C-1, 5.25% due 2/1/2053 (put 6/1/2029) | $ 4,000,000 | $ 4,229,364 |
| a | Black Belt Energy Gas District (Guaranty: Royal Bank of Canada), Series B, 5.25% due 12/1/2053 (put 12/1/2030) | 1,375,000 | 1,486,070 |
| a | Chatom (PowerSouth Energy Cooperative; SPA National Rural Utilities Cooperative Finance) IDB, Series A, 3.875% due 8/1/2037 (put 8/1/2024) | 1,750,000 | 1,828,972 |
| a | Southeast Alabama Gas Supply District (Guaranty: Morgan Stanley Group), 5.00% due 6/1/2049 (put 5/1/2032) | 4,750,000 | 5,088,504 |
| a | Southeast Alabama Gas Supply District (Guaranty: Pacific Life Insurance Co.), Series A, 5.00% due 8/1/2054 (put 4/1/2032) | 5,000,000 | 5,372,240 |
| a | Southeast Energy Authority A Cooperative District, Series B, 5.00% due 1/1/2054 (put 6/1/2030) | 5,000,000 | 5,304,155 |
| a | Southeast Energy Authority A Cooperative District (Guaranty: Morgan Stanley Group), Series A, 5.50% due 1/1/2053 (put 12/1/2029) | 6,000,000 | 6,447,426 |
| UAB Medicine Finance Authority (University Hospital), Series B, 5.00% due 9/1/2032 | 6,000,000 | 6,285,834 | |
| Alaska — 0.1% | |||
| State of Alaska International Airports System AMT, Series C, 5.00% due 10/1/2029 | 750,000 | 804,374 | |
| Arizona — 0.5% | |||
| Arizona (Scottsdale Lincoln Hospitals) HFA, Series A, 5.00% due 12/1/2031 | 2,500,000 | 2,521,210 | |
| Arizona Board of Regents (University of Arizona SPEED), 5.00% due 8/1/2029 | 1,000,000 | 1,004,986 | |
| Salt Verde Financial Corp. (Gas Supply Acquisition; Guaranty: Citigroup, Inc.), 5.25% due 12/1/2028 | 770,000 | 813,642 | |
| Yavapai County (Waste Management, Inc.) IDA AMT, 1.30% due 6/1/2027 | 750,000 | 662,657 | |
| Arkansas — 0.1% | |||
| County of Pulaski (Arkansas Children’s Hospital), 5.00% due 3/1/2042 - 3/1/2043 | 1,000,000 | 1,079,804 | |
| California — 4.0% | |||
| California (Adventist Health System/West) HFFA, Series A, 5.00% due 3/1/2026 | 2,815,000 | 2,815,318 | |
| California (Children’s Hospital Los Angeles) HFFA, Series A, 5.00% due 8/15/2032 - 8/15/2033 | 950,000 | 990,912 | |
| a | California Community Choice Financing Authority (Guaranty: Deutsche Bank AG) (Green Bond), Series C, 5.25% due 1/1/2054 (put 10/1/2031) | 3,250,000 | 3,432,793 |
| California Infrastructure & Economic Development Bank (King City Joint Union High School District), 5.75% due 8/15/2029 | 1,500,000 | 1,501,296 | |
| California Municipal Finance Authority (CHF-Davis II LLC; Insured: BAM) (Green Bond), 4.00% due 5/15/2041 | 500,000 | 492,756 | |
| a | California Municipal Finance Authority (Republic Services, Inc.) AMT, Series B, 4.00% due 7/1/2051 (put 7/15/2024) | 2,000,000 | 1,998,594 |
| California Pollution Control Financing Authority (Republic Services, Inc.) AMT, | |||
| a,b | 4.125% due 7/1/2043 (put 8/15/2024) | 1,000,000 | 1,000,340 |
| a,b | Series A-1, 4.00% due 11/1/2042 (put 4/15/2024) | 2,250,000 | 2,250,000 |
| a | California Pollution Control Financing Authority (Waste Management, Inc.) AMT, Series A, 2.50% due 11/1/2038 (put 5/1/2024) | 2,000,000 | 1,997,772 |
| City of Los Angeles Department of Airports AMT, | |||
| Series A, 4.75% due 5/15/2040 | 1,500,000 | 1,516,814 | |
| Series C, 5.00% due 5/15/2033 | 2,000,000 | 2,249,860 | |
| Series D, 5.00% due 5/15/2041 | 4,000,000 | 4,043,708 | |
| City of San Mateo (City of San Mateo Community Facilities District No. 2008-1) (Insured: BAM), 5.25% due 9/1/2040 | 5,000,000 | 5,488,850 | |
| Delano Financing Authority (City of Delano Police Station & Woollomes Avenue Bridge), Series A, 5.00% due 12/1/2025 | 1,340,000 | 1,341,269 | |
| Franklin-McKinley School District (Insured: Natl-Re) GO, 5.25% due 8/1/2027 | 1,000,000 | 1,070,470 | |
| Fresno (Educational Facilities & Improvements; Insured: Natl-Re) USD GO, Series A, 6.00% due 8/1/2026 | 500,000 | 516,496 | |
| M-S-R Energy Authority (Guaranty: Citigroup Global Markets), Series B, 6.125% due 11/1/2029 | 2,060,000 | 2,227,484 | |
| North City West School Facilities Financing Authority (Carmel Valley Schools; Insured: AGM), Series A, 5.00% due 9/1/2024 | 1,080,000 | 1,081,201 | |
| Oakland (County of Alameda Educational Facilities) USD GO, Series A, 5.00% due 8/1/2032 - 8/1/2034 (pre-refunded 8/1/2025) | 3,000,000 | 3,072,075 | |
| Colorado — 0.8% | |||
| City & County of Denver Airport System Revenue AMT, Series A, 5.00% due 11/15/2041 | 1,660,000 | 1,797,488 | |
| Colorado (CommonSpirit Health Obligated Group) HFA, | |||
| 5.00% due 11/1/2041 | 1,500,000 | 1,648,332 | |
| Series A-2, 5.00% due 8/1/2038 | 1,000,000 | 1,064,314 | |
| Colorado School of Mines (Insured: AGM) (Green Bond), Series A, 5.00% due 12/1/2039 - 12/1/2043 | 1,310,000 | 1,434,459 | |
| Denver City & County Housing Authority (Three Towers Rehabilitation; Insured: AGM) AMT, 5.20% due 11/1/2027 | 1,180,000 | 1,181,036 | |
| State of Colorado COP, Series A, 5.00% due 9/1/2032 | 350,000 | 379,676 | |
| Connecticut — 2.4% | |||
| City of Hartford (Various Public Improvements; Insured: AGM) GO, Series A, 5.00% due 7/1/2031 | 1,700,000 | 1,735,754 | |
| City of New Haven (Insured: BAM) GO, 5.25% due 8/1/2043 | 1,900,000 | 2,135,211 | |
| State of Connecticut (Various Capital Projects) GO, Series B, 5.00% due 5/15/2027 | 1,000,000 | 1,038,645 | |
| State of Connecticut GO, | |||
| Series A, 5.00% due 4/15/2033 - 4/15/2035 | 12,415,000 | 13,493,186 | |
| Series C, 5.00% due 6/15/2028 - 6/15/2029 | 1,890,000 | 2,058,704 | |
| Series E, 5.00% due 9/15/2033 | 2,650,000 | 2,904,988 | |
| District of Columbia — 0.9% | |||
| Metropolitan Washington Airports Authority (Dulles Toll Road Revenue; Insured: AGC), Series B, Zero Coupon due 10/1/2024 | 5,000,000 | 4,907,410 | |
| Washington Metropolitan Area Transit Authority, 5.00% due 7/1/2032 - 7/1/2037 | 3,325,000 | 3,497,241 | |
| Florida — 5.4% |
| See notes to financial statements. | Thornburg Municipal Funds Semi-Annual Report | 37 |
Thornburg Intermediate Municipal Fund | March 31, 2024 (Unaudited)
| ISSUER-DESCRIPTION | Principal Amount | VALUE | |
| Broward County School Board (Educational Facilities) COP, Series B, 5.00% due 7/1/2032 | $ 2,000,000 | $ 2,042,116 | |
| City of Lakeland (Electric Power System Smart Grid Project), 5.25% due 10/1/2036 | 2,770,000 | 3,379,868 | |
| City of Lakeland (Electric Power System Smart Grid Project; Insured: AGM), 5.25% due 10/1/2027 | 3,680,000 | 3,974,050 | |
| City of Orlando (Senior Tourist Development; Insured: AGM), Series A, 5.00% due 11/1/2036 - 11/1/2037 | 2,335,000 | 2,481,961 | |
| County of Broward (Airport System Improvements) AMT, 5.00% due 10/1/2037 | 1,000,000 | 1,040,608 | |
| County of Broward Airport System Revenue AMT, 5.00% due 10/1/2042 | 2,850,000 | 2,932,450 | |
| County of Broward Port Facilities Revenue AMT, | |||
| 5.00% due 9/1/2037 - 9/1/2041 | 2,050,000 | 2,195,848 | |
| Series B, 4.00% due 9/1/2039 | 1,500,000 | 1,454,442 | |
| County of Manatee (Public Utilities System Improvements), 5.00% due 10/1/2033 | 1,535,000 | 1,562,188 | |
| County of Miami-Dade, Series A, 5.00% due 4/1/2043 | 500,000 | 548,214 | |
| County of Miami-Dade (Miami International Airport), Series B, 5.00% due 10/1/2028 - 10/1/2031 | 5,335,000 | 5,380,335 | |
| County of Miami-Dade Aviation Revenue AMT, | |||
| Series A, 5.00% due 10/1/2032 - 10/1/2035 | 4,000,000 | 4,019,993 | |
| Series B, 5.00% due 10/1/2040 | 2,500,000 | 2,569,972 | |
| County of Miami-Dade Seaport Department AMT, Series A, 5.00% due 10/1/2041 - 10/1/2042 | 3,050,000 | 3,242,718 | |
| Miami-Dade County (Nicklaus Children’s Hospital) HFA, 5.00% due 8/1/2035 - 8/1/2037 | 3,405,000 | 3,576,989 | |
| Miami-Dade County Educational Facilities Authority (University of Miami; Insured: AMBAC), Series B, 5.25% due 4/1/2024 | 1,000,000 | 1,000,127 | |
| Orange County (Presbyterian Retirement Communities Inc Obligated Group) HFA, 5.00% due 8/1/2040 | 1,750,000 | 1,760,630 | |
| Orange County Convention Center (Tourist Development), Series A, 5.00% due 10/1/2031 | 2,000,000 | 2,093,388 | |
| Palm Beach County (Boca Raton Regional Hospital) HFA, 5.00% due 12/1/2025 (pre-refunded 12/1/2024) | 500,000 | 505,006 | |
| Palm Beach County (Jupiter Medical Center Obligated Group) HFA, Series A, 5.00% due 11/1/2040 - 11/1/2041 | 715,000 | 734,632 | |
| Palm Beach County Housing Finance Authority (Lake Worth Towers Preservation LP; Collateralized: FNMA), 4.85% due 6/1/2041 | 1,341,518 | 1,423,699 | |
| School Board of Miami-Dade County COP, Series A, 5.00% due 5/1/2030 | 3,250,000 | 3,309,689 | |
| School District of Manatee County (School Facilities Improvement; Insured: AGM), 5.00% due 10/1/2032 | 2,250,000 | 2,387,687 | |
| Georgia — 4.6% | |||
| Athens-Clarke County Unified Government Development Authority (UGAREF Bolton Commons LLC), 5.00% due 6/15/2024 - 6/15/2028 | 2,320,000 | 2,322,637 | |
| Georgia Housing & Finance Authority, Series B, 5.05% due 12/1/2043 | 1,470,000 | 1,573,020 | |
| a | Main Street Natural Gas, Inc. (Guaranty: Citigroup, Inc.), Series D, 5.00% due 5/1/2054 (put 12/1/2030) | 5,000,000 | 5,294,600 |
| Main Street Natural Gas, Inc. (Guaranty: Macquarie Group Ltd.), Series A, 5.00% due 5/15/2036 - 5/15/2038 | 11,760,000 | 12,539,227 | |
| Main Street Natural Gas, Inc. (Guaranty: Royal Bank of Canada), | |||
| a | Series A, 5.00% due 5/1/2054 (put 9/1/2031) | 7,840,000 | 8,394,053 |
| a | Series B, 5.00% due 7/1/2053 (put 3/1/2030) | 2,000,000 | 2,120,428 |
| a | Series E-1, 5.00% due 12/1/2053 (put 6/1/2031) | 8,000,000 | 8,541,784 |
| Municipal Electric Authority of Georgia, Series A, 5.00% due 1/1/2034 | 2,295,000 | 2,469,287 | |
| Savannah (International Paper Co.) EDA, Series B, 1.90% due 8/1/2024 | 2,000,000 | 1,987,738 | |
| Guam — 0.2% | |||
| Guam Power Authority (Electric Power System), Series A, 5.00% due 10/1/2024 | 1,350,000 | 1,355,019 | |
| Guam Waterworks Authority (Water & Wastewater System), 5.25% due 7/1/2024 | 1,000,000 | 1,002,836 | |
| Hawaii — 0.2% | |||
| State of Hawaii Airports System Revenue AMT, Series A, 5.00% due 7/1/2034 | 2,000,000 | 2,173,874 | |
| Idaho — 0.6% | |||
| Idaho Housing & Finance Association (Collateralized: GNMA, FNMA, FHLMC), | |||
| Series A, 4.45% due 1/1/2044 | 2,000,000 | 2,001,536 | |
| Series C, 4.65% due 7/1/2043 | 3,500,000 | 3,563,640 | |
| Illinois — 14.2% | |||
| Chicago Board of Education Dedicated Capital Improvement Tax, 5.50% due 4/1/2042 - 4/1/2043 | 2,375,000 | 2,639,199 | |
| Chicago O’Hare International Airport, Series C, 5.00% due 1/1/2038 | 2,920,000 | 3,008,047 | |
| Chicago O’Hare International Airport (2016 Airport Projects), Series C, 5.00% due 1/1/2030 | 765,000 | 790,084 | |
| Chicago O’Hare International Airport (2017 Airport Projects), Series B, 5.00% due 1/1/2034 - 1/1/2035 | 9,100,000 | 9,583,430 | |
| Chicago Park District (Capital Improvement Plan) GO, Series B, 5.00% due 1/1/2025 | 1,000,000 | 1,000,813 | |
| City of Chicago (Chicago O’Hare International Airport Customer Facility Charge Revenue; Insured: BAM), 5.25% due 1/1/2043 | 1,500,000 | 1,649,377 | |
| City of Chicago (Chicago O’Hare International Airport) AMT, Series A, 5.00% due 1/1/2028 | 1,475,000 | 1,485,139 | |
| City of Chicago (Midway International Airport) AMT, Series A, 5.00% due 1/1/2034 | 1,365,000 | 1,365,020 | |
| City of Chicago (Wastewater Transmission System), Series C, 5.00% due 1/1/2033 | 500,000 | 505,824 | |
| City of Chicago (Wastewater Transmission System; Insured: AGM-CR), Series B, 5.00% due 1/1/2034 | 1,375,000 | 1,443,223 | |
| City of Chicago (Water System), Series A-1, 5.00% due 11/1/2024 | 1,000,000 | 1,006,071 | |
| City of Chicago (Water System; Insured: AGM), Series 2017-2, 5.00% due 11/1/2036 - 11/1/2037 | 5,500,000 | 5,852,568 | |
| City of Chicago (Water System; Insured: BHAC-CR AMBAC), 5.75% due 11/1/2030 | 1,100,000 | 1,195,998 | |
| City of Chicago GO, | |||
| Series A, | |||
| 5.625% due 1/1/2031 | 1,585,000 | 1,658,019 |
| 38 | Thornburg Municipal Funds Semi-Annual Report | See notes to financial statements. |
| ISSUER-DESCRIPTION | Principal Amount | VALUE | |
| 6.00% due 1/1/2038 | $ 7,500,000 | $ 7,835,362 | |
| City of Chicago Wastewater Transmission Revenue, | |||
| Series C, | |||
| 5.00% due 1/1/2028 - 1/1/2029 | 3,880,000 | 3,916,022 | |
| 5.00% due 1/1/2028 - 1/1/2029 (pre-refunded 1/1/2025) | 3,985,000 | 4,029,428 | |
| City of Joliet (Rock Run Crossing Project; Insured: BAM) GO, 5.50% due 12/15/2042 | 2,750,000 | 3,093,846 | |
| Cook County Community College District No. 508 (City Colleges of Chicago; Insured: BAM) GO, 5.00% due 12/1/2043 | 1,650,000 | 1,783,670 | |
| County of Cook Sales Tax Revenue, | |||
| 5.00% due 11/15/2038 | 435,000 | 456,069 | |
| Series A, 5.00% due 11/15/2036 - 11/15/2038 | 3,160,000 | 3,457,773 | |
| Illinois (Collateralized: GNMA, FNMA, FHLMC) HDA, Series K, 5.25% due 10/1/2043 | 2,000,000 | 2,119,914 | |
| Illinois Finance Authority (Ascension Health Credit Group), | |||
| Series C, | |||
| 4.00% due 2/15/2033 | 800,000 | 819,658 | |
| 5.00% due 2/15/2041 | 1,000,000 | 1,026,368 | |
| Illinois Finance Authority (Carle Foundation Obligated Group), Series A, 5.00% due 8/15/2034 | 1,700,000 | 1,931,363 | |
| Illinois Finance Authority (Rush Obligated Group), Series A, 5.00% due 11/15/2033 | 1,000,000 | 1,012,107 | |
| Illinois Finance Authority (Silver Cross Hospital & Medical Centers), Series C, 5.00% due 8/15/2024 - 8/15/2035 | 2,500,000 | 2,523,421 | |
| Illinois State Toll Highway Authority (Move Illinois Program), Series A, 5.00% due 1/1/2037 | 5,550,000 | 5,691,048 | |
| Monroe & St. Clair Counties Community Unit School District No. 5 (Insured: BAM) GO, 5.00% due 4/15/2027 - 4/15/2031 | 6,285,000 | 6,487,186 | |
| Moultrie Shelby & Coles Counties Community Unit School District No. 300 (Insured: BAM) GO, 5.00% due 12/1/2042 - 12/1/2044 | 3,375,000 | 3,548,344 | |
| Regional Transportation Authority (Insured: AGM), Series A, 5.75% due 6/1/2034 | 1,100,000 | 1,352,298 | |
| Sales Tax Securitization Corp., | |||
| Series A, | |||
| 4.00% due 1/1/2038 | 2,000,000 | 2,024,104 | |
| 5.00% due 1/1/2029 - 1/1/2044 | 6,350,000 | 6,705,332 | |
| Sales Tax Securitization Corp. (Insured: BAM-TCRS), Series A, 5.00% due 1/1/2038 | 3,075,000 | 3,245,638 | |
| Southern Illinois University (Insured: BAM), Series A, 5.00% due 4/1/2037 - 4/1/2042 | 2,040,000 | 2,196,004 | |
| State of Illinois (Insured: AGM-CR) GO, 5.00% due 4/1/2036 | 500,000 | 500,653 | |
| State of Illinois GO, | |||
| 5.00% due 2/1/2039 | 670,000 | 670,103 | |
| 5.50% due 5/1/2039 | 1,500,000 | 1,649,872 | |
| Series A, 5.00% due 12/1/2034 - 5/1/2040 | 11,810,000 | 12,794,904 | |
| Series B, 5.25% due 5/1/2043 | 3,500,000 | 3,806,712 | |
| Series D, 5.00% due 11/1/2027 - 11/1/2028 | 4,250,000 | 4,507,940 | |
| State of Illinois Sales Tax Revenue, Series B, 5.00% due 6/15/2030 - 6/15/2031 | 9,280,000 | 10,015,876 | |
| State of Illinois Sales Tax Revenue (Insured: BAM-Natl-Re), Series B, 5.00% due 6/15/2032 | 2,885,000 | 3,112,537 | |
| Tazewell County School District (Insured: Natl-Re) GO Partial ETM, 9.00% due 12/1/2024 | 1,205,000 | 1,245,862 | |
| Will County School District No. 114 Manhattan (Insured: BAM) GO, | |||
| 5.25% due 1/1/2040 - 1/1/2041 | 1,000,000 | 1,129,460 | |
| 5.50% due 1/1/2043 | 2,000,000 | 2,275,066 | |
| Indiana — 3.4% | |||
| Brownsburg 1999 School Building Corp. (Brownsburg Community School Corp.; Insured: State Intercept), 5.00% due 1/15/2042 | 1,000,000 | 1,100,700 | |
| a | City of Mount Vernon (Southern Indiana Gas & Electric Co.) AMT, 4.25% due 9/1/2055 (put 9/1/2028) | 2,000,000 | 2,000,472 |
| City of Whiting (BP Products North America, Inc.; Guaranty: BP plc) AMT, | |||
| a | 5.00% due 11/1/2047 (put 11/1/2024) | 250,000 | 250,013 |
| a | Series A, 5.00% due 12/1/2044 (put 6/5/2026) | 900,000 | 913,376 |
| Indiana (Ascension Health Credit Group) HFFA, Series 2001-A-1, 5.00% due 11/15/2036 | 6,000,000 | 6,199,608 | |
| Indiana Finance Authority (CWA Authority, Inc.), Series A, 5.00% due 10/1/2035 | 500,000 | 579,839 | |
| Indiana Finance Authority (Ohio Valley Electric Corp.), Series A, 4.25% due 11/1/2030 | 8,000,000 | 7,991,296 | |
| Indiana Finance Authority (Reid Hospital & Health Care Services, Inc. Obligated Group; Insured: AGM), 5.00% due 1/1/2041 - 1/1/2042 | 2,000,000 | 2,153,961 | |
| a | Indiana Finance Authority (Republic Services, Inc.) AMT, Series A, 4.20% due 5/1/2034 (put 6/3/2024) | 1,900,000 | 1,900,000 |
| Indiana Finance Authority (Southern Indiana Gas & Electric Co.) AMT, | |||
| a | Series A, 4.00% due 3/1/2038 (put 8/1/2028) | 1,500,000 | 1,518,787 |
| a | Series B, 4.00% due 5/1/2043 (put 8/1/2028) | 2,500,000 | 2,524,092 |
| Indiana Municipal Power Agency, Series C, 5.00% due 1/1/2036 | 1,000,000 | 1,045,206 | |
| IPS Multi-School Building Corp. (Indianapolis Board of School Commissioners; Insured: State Intercept), 5.50% due 7/15/2042 | 1,000,000 | 1,141,471 | |
| Mount Vernon of Hancock County Multi-School Building Corp. (Insured: State Intercept), 5.50% due 1/15/2042 | 1,000,000 | 1,128,084 | |
| Noblesville Redevelopment Authority, 5.50% due 7/15/2041 | 1,000,000 | 1,139,424 | |
| Silver Creek School Building Corp. (Insured: State Intercept), 5.25% due 1/15/2042 | 2,000,000 | 2,246,876 | |
| Iowa — 1.3% | |||
| a | Iowa Finance Authority (Iowa Fertilizer Co. LLC; Guaranty: OCI NV), 5.00% due 12/1/2050 (put 12/1/2042) | 3,000,000 | 3,154,905 |
| See notes to financial statements. | Thornburg Municipal Funds Semi-Annual Report | 39 |
Thornburg Intermediate Municipal Fund | March 31, 2024 (Unaudited)
| ISSUER-DESCRIPTION | Principal Amount | VALUE | |
| Iowa Finance Authority (UnityPoint Health), Series C, 5.00% due 2/15/2030 - 2/15/2032 | $ 4,100,000 | $ 4,107,126 | |
| a | PEFA, Inc. (Guaranty: Goldman Sachs Group, Inc.), 5.00% due 9/1/2049 (put 9/1/2026) | 5,350,000 | 5,467,513 |
| Kentucky — 2.7% | |||
| a | County of Trimble (Louisville Gas & Electric Co.) AMT, Series A, 4.70% due 6/1/2054 (put 6/1/2027) | 1,250,000 | 1,256,593 |
| Kentucky (Baptist Healthcare System Obligated Group) EDFA, Series B, 5.00% due 8/15/2041 | 5,000,000 | 5,109,655 | |
| a | Kentucky (Republic Services, Inc.) EDFA AMT, Series A, 4.20% due 4/1/2031 (put 6/3/2024) | 2,000,000 | 2,000,000 |
| Kentucky Housing Corp. (Collateralized: GNMA, FNMA, FHLMC), Series A, 4.35% due 7/1/2044 | 1,500,000 | 1,468,855 | |
| Kentucky Public Energy Authority (Guaranty: Morgan Stanley Group), | |||
| Series A-1, | |||
| a | 4.00% due 8/1/2052 (put 8/1/2030) | 1,220,000 | 1,218,679 |
| a | 5.25% due 4/1/2054 (put 2/1/2032) | 10,000,000 | 10,843,210 |
| Kentucky State Property & Building Commission, | |||
| Series A, | |||
| 4.00% due 11/1/2035 | 1,000,000 | 1,029,545 | |
| 5.25% due 6/1/2039 | 3,000,000 | 3,401,712 | |
| Louisiana — 0.6% | |||
| Jefferson Sales Tax District (Insured: AGM), Series B, 5.00% due 12/1/2034 | 1,000,000 | 1,067,028 | |
| Louisiana Public Facilities Authority (Ochsner Clinic Foundation Obligated Group), Series A, 5.00% due 5/15/2035 - 5/15/2037 | 1,925,000 | 2,062,580 | |
| Parish of Lafourche (Roads, Highways & Bridges), 5.00% due 1/1/2025 | 2,620,000 | 2,647,733 | |
| Maine — 0.1% | |||
| Maine Health & Higher Educational Facilities Authority (Insured: AGM), Series A, 5.00% due 7/1/2041 - 7/1/2043 | 625,000 | 690,639 | |
| Massachusetts — 0.1% | |||
| Massachusetts Bay Transportation Authority Assessment Revenue (Transportation Capital Program), Series A, 5.25% due 7/1/2030 | 1,000,000 | 1,149,548 | |
| Michigan — 1.7% | |||
| Board of Governors of Wayne State University (Educational Facilities & Equipment), Series A, 5.00% due 11/15/2031 | 1,010,000 | 1,018,848 | |
| Detroit City School District (School Building & Site Improvement; Insured: AGM Q-SBLF) GO, Series A, 5.25% due 5/1/2026 | 3,150,000 | 3,274,957 | |
| Detroit City School District (School Building & Site; Insured: AGM Q-SBLF) GO, Series A, 5.25% due 5/1/2027 | 1,100,000 | 1,168,888 | |
| Kalamazoo Hospital Finance Authority (Bronson Healthcare), Series A, 5.25% due 5/15/2026 | 110,000 | 110,111 | |
| Michigan Finance Authority (BHSH System Obligated Group), Series A, 5.00% due 4/15/2036 | 2,000,000 | 2,265,750 | |
| Michigan Finance Authority (Government Loan Program), Series F, 5.00% due 4/1/2026 | 680,000 | 680,717 | |
| Michigan Finance Authority (Trinity Health Corp. Obligated Group), Series A, 4.00% due 12/1/2040 | 6,200,000 | 6,215,134 | |
| Michigan HDA, Series B, 2.95% due 12/1/2039 | 2,000,000 | 1,714,028 | |
| Wayne County Airport Authority (Insured: AGM) AMT, Series B, 5.50% due 12/1/2043 | 675,000 | 754,985 | |
| Minnesota — 0.2% | |||
| City of Coon Rapids (Mississippi View Housing Partners LP; Collateralized: FNMA), Series M, 5.60% due 12/1/2039 | 1,498,270 | 1,599,903 | |
| Mississippi — 1.0% | |||
| a | County of Warren (International Paper Co.), Series A, 1.375% due 5/1/2034 (put 6/16/2025) | 1,625,000 | 1,582,079 |
| Mississippi Development Bank (Jackson Public School District; Insured: BAM), 5.25% due 10/1/2037 - 10/1/2038 | 5,250,000 | 5,685,906 | |
| Mississippi Home Corp. (Collateralized: GNMA, FNMA, FHLMC), Series A, 4.375% due 12/1/2044 | 3,000,000 | 2,981,523 | |
| Montana — 0.2% | |||
| Montana Board of Housing, Series B, 4.80% due 12/1/2043 | 2,000,000 | 2,045,284 | |
| Nebraska — 0.4% | |||
| a | Central Plains Energy Project (Guaranty: Bank of Montreal), Series A, 5.00% due 5/1/2054 (put 11/1/2029) | 2,000,000 | 2,118,532 |
| Central Plains Energy Project (Guaranty: Goldman Sachs Group, Inc.), | |||
| a | Series 1, 5.00% due 5/1/2053 (put 10/1/2029) | 500,000 | 522,940 |
| Series A, 5.00% due 9/1/2031 | 1,000,000 | 1,063,495 | |
| Nevada — 0.4% | |||
| Carson City (Carson Tahoe Regional Healthcare), Series A, 5.00% due 9/1/2032 - 9/1/2037 | 1,730,000 | 1,787,296 | |
| a | County of Washoe (Sierra Pacific Power Co.) AMT, Series F, 4.125% due 3/1/2036 (put 10/1/2029) | 1,000,000 | 1,012,446 |
| a,b | State of Nevada Department of Business & Industry (DesertXpress Enterprises LLC) AMT, 4.00% due 1/1/2050 (put 1/30/2025) | 1,500,000 | 1,494,426 |
| New Jersey — 3.9% | |||
| New Jersey (New Jersey Transit Corp.) EDA, Series A, 5.25% due 11/1/2042 | 4,000,000 | 4,471,648 | |
| New Jersey (School Facilities Construction; Insured: AMBAC) EDA, Series N-1, 5.50% due 9/1/2026 | 3,000,000 | 3,154,995 | |
| New Jersey (School Facilities Construction; Insured: Natl-Re) EDA, Series N1, 5.50% due 9/1/2027 | 1,700,000 | 1,831,111 | |
| New Jersey (State of New Jersey Department of the Treasury) EDA, Series EEE, 5.00% due 6/15/2043 | 545,000 | 573,749 | |
| New Jersey Health Care Facilities Financing Authority (Virtua Health Obligated Group), 5.00% due 7/1/2027 - 7/1/2028 | 2,815,000 | 2,817,653 | |
| New Jersey Transportation Trust Fund Authority, | |||
| Series A, 5.00% due 12/15/2032 - 12/15/2035 | 5,300,000 | 5,746,452 | |
| Series AA, | |||
| 5.00% due 6/15/2035 - 6/15/2040 | 1,800,000 | 1,993,164 | |
| 5.25% due 6/15/2043 | 3,100,000 | 3,306,615 |
| 40 | Thornburg Municipal Funds Semi-Annual Report | See notes to financial statements. |
| ISSUER-DESCRIPTION | Principal Amount | VALUE | |
| Series BB-1, 5.00% due 6/15/2034 | $ 2,000,000 | $ 2,174,902 | |
| New Jersey Transportation Trust Fund Authority (State Transportation System Improvements), | |||
| Series A, 5.00% due 6/15/2031 | 1,000,000 | 1,032,772 | |
| Series A-1, 5.00% due 6/15/2024 | 1,000,000 | 1,001,850 | |
| New Jersey Transportation Trust Fund Authority (Transportation Program Bonds), | |||
| Series AA, 5.00% due 6/15/2038 | 3,500,000 | 3,765,321 | |
| Series CC, 5.00% due 6/15/2042 | 3,750,000 | 4,122,135 | |
| New Jersey Transportation Trust Fund Authority (Transportation System), Series A, 5.00% due 12/15/2034 - 12/15/2039 | 2,000,000 | 2,162,615 | |
| New Mexico — 0.9% | |||
| Albuquerque Municipal School District No. 12 (State Aid Withholding) GO, Series A, 5.00% due 8/1/2035 | 500,000 | 562,075 | |
| New Mexico Hospital Equipment Loan Council (Haverland Carter Lifestyle Obligated Group), | |||
| Series A, 5.00% due 7/1/2033 | 360,000 | 331,010 | |
| Series LA, 5.00% due 7/1/2032 | 575,000 | 533,112 | |
| New Mexico Hospital Equipment Loan Council (Presbyterian Healthcare Services Obligated Group), Series A, 5.00% due 8/1/2036 - 8/1/2037 | 1,955,000 | 2,123,571 | |
| New Mexico Institute of Mining & Technology (Campus Buildings Acquisition & Improvements; Insured: AGM), 4.00% due 12/1/2035 - 12/1/2040 | 1,910,000 | 1,967,526 | |
| New Mexico Mortgage Finance Authority (Collateralized: GNMA, FNMA, FHLMC), Series A Class I, 4.50% due 9/1/2044 | 3,000,000 | 3,004,227 | |
| Village of Los Ranchos de Albuquerque (Albuquerque Academy), 4.00% due 9/1/2040 | 825,000 | 791,474 | |
| New York — 7.2% | |||
| Build NYC Resource Corp. (Kipp NYC Public Charter Schools), 5.00% due 7/1/2042 | 2,300,000 | 2,385,673 | |
| City of Long Beach (Insured: BAM) GO, Series B, 5.25% due 7/15/2042 | 1,000,000 | 1,107,151 | |
| City of New York (City Budget Financial Management) GO, | |||
| Series G, 5.00% due 8/1/2027 | 4,530,000 | 4,535,327 | |
| Series J, 5.00% due 8/1/2030 - 8/1/2031 | 9,000,000 | 9,050,114 | |
| City of New York GO, | |||
| Series A, 5.00% due 8/1/2039 | 1,000,000 | 1,075,300 | |
| Series D-1, 5.25% due 5/1/2040 - 5/1/2041 | 2,500,000 | 2,812,956 | |
| Dutchess County Local Development Corp. (Tompkins Terrace Housing LP; Collateralized: FNMA), 5.00% due 10/1/2040 | 3,100,000 | 3,361,969 | |
| Metropolitan Transportation Authority, | |||
| Series D, 5.00% due 11/15/2030 - 11/15/2035 | 8,295,000 | 8,705,600 | |
| Series D-1, 5.00% due 11/15/2031 | 2,285,000 | 2,352,101 | |
| Metropolitan Transportation Authority (Green Bond), Series A1, 5.00% due 11/15/2035 - 11/15/2036 | 1,820,000 | 1,902,817 | |
| New York City Housing Development Corp., Series B, 5.05% due 11/1/2043 | 4,250,000 | 4,446,244 | |
| New York City Housing Development Corp. (CSA Preservation Partners LLC), Series A, 4.45% due 8/1/2043 | 1,500,000 | 1,501,212 | |
| New York City Transitional Finance Authority Future Tax Secured Revenue, | |||
| Series A, 5.00% due 11/1/2036 | 1,230,000 | 1,384,819 | |
| Series A2, 5.00% due 5/1/2039 | 1,000,000 | 1,084,821 | |
| Series A-3, 4.00% due 8/1/2042 | 2,500,000 | 2,457,802 | |
| New York State Dormitory Authority (Cornell University) (Green Bond), Series D, 5.00% due 7/1/2036 | 500,000 | 629,208 | |
| New York State Dormitory Authority (Insured: BAM), Series A, 5.00% due 10/1/2042 | 5,000,000 | 5,454,295 | |
| New York State Thruway Authority (State of New York Personal Income Tax Revenue), 5.00% due 3/15/2041 | 1,500,000 | 1,667,789 | |
| New York State Urban Development Corp. (State of New York Personal Income Tax Revenue), Series A, 5.00% due 3/15/2041 - 3/15/2042 | 4,300,000 | 4,675,925 | |
| Port Authority of New York & New Jersey AMT, | |||
| Series 186, 5.00% due 10/15/2037 | 3,000,000 | 3,021,888 | |
| Series 207, 5.00% due 9/15/2030 | 1,400,000 | 1,485,858 | |
| State of New York Mortgage Agency (Insured: SONYMA) AMT, | |||
| Series 248, 4.05% due 10/1/2031 | 2,035,000 | 1,960,456 | |
| Series 253, 4.70% due 10/1/2038 | 995,000 | 998,925 | |
| Triborough Bridge & Tunnel Authority, Series D, 5.00% due 11/15/2033 | 250,000 | 286,373 | |
| Triborough Bridge & Tunnel Authority (Metropolitan Transportation Authority Payroll Mobility Tax Revenue), Series A, 4.00% due 5/15/2040 | 1,500,000 | 1,537,590 | |
| Westchester County Local Development Corp. (Miriam Osborn Memorial Home Association Obligated Group), 5.00% due 7/1/2029 | 250,000 | 260,089 | |
| Yonkers (New Community School Project) (State Aid Withholding) IDA, 4.00% due 5/1/2041 | 250,000 | 256,524 | |
| North Carolina — 0.8% | |||
| Charlotte-Mecklenburg Hospital Authority (Carolinas HealthCare System), Series A, 5.00% due 1/15/2028 | 2,190,000 | 2,192,072 | |
| Greater Asheville Regional Airport Authority (Insured: AGM) AMT, 5.25% due 7/1/2042 - 7/1/2043 | 1,450,000 | 1,592,877 | |
| North Carolina Medical Care Commission (Plantation Village Obligated Group), Series A, 4.00% due 1/1/2041 | 1,020,000 | 860,030 | |
| North Carolina Medical Care Commission (Vidant Health), 5.00% due 6/1/2030 (pre-refunded 6/1/2025) | 3,000,000 | 3,055,017 | |
| Ohio — 2.2% | |||
| Cincinnati City School District (School Improvement Project) COP, 5.00% due 12/15/2031 (pre-refunded 12/15/2024) | 3,075,000 | 3,107,072 | |
| City of Cleveland (Various Municipal Capital Improvements) GO, 5.00% due 12/1/2024 | 1,000,000 | 1,001,112 | |
| City of Cleveland GO, 5.00% due 12/1/2026 | 15,000 | 15,017 | |
| Cleveland-Cuyahoga County Port Authority (County Administration Offices), 5.00% due 7/1/2025 | 1,780,000 | 1,816,047 | |
| County of Hamilton (Cincinnati Children’s Hospital Medical Center), 5.00% due 5/15/2028 - 5/15/2031 | 8,085,000 | 8,099,324 |
| See notes to financial statements. | Thornburg Municipal Funds Semi-Annual Report | 41 |
Thornburg Intermediate Municipal Fund | March 31, 2024 (Unaudited)
| ISSUER-DESCRIPTION | Principal Amount | VALUE | |
| Northeast Ohio Medical University (Insured: BAM), | |||
| 5.00% due 12/1/2038 - 12/1/2041 | $ 2,420,000 | $ 2,614,608 | |
| Series B, 4.00% due 12/1/2038 - 12/1/2042 | 1,860,000 | 1,791,597 | |
| Ohio Higher Educational Facility Commission (Ashtabula County Medical Center Obligated Group), 5.25% due 1/1/2037 | 840,000 | 893,605 | |
| Ohio Housing Finance Agency (Collateralized: GNMA, FNMA, FHLMC), Series B, 4.80% due 9/1/2043 | 995,000 | 1,013,873 | |
| Polaris Career Center COP, 5.00% due 11/1/2041 | 1,150,000 | 1,171,995 | |
| Oklahoma — 1.0% | |||
| Clinton Public Works Authority, 5.00% due 10/1/2039 | 3,335,000 | 3,613,990 | |
| Muskogee Industrial Trust (Muskogee County No. 20) ISD, 5.00% due 9/1/2025 | 850,000 | 861,106 | |
| Oklahoma County Finance Authority (Oklahoma County ISD No. 4 Choctaw-Nicoma Park), 4.00% due 9/1/2038 | 5,000,000 | 5,131,445 | |
| Oregon — 0.2% | |||
| a | County of Gilliam (Guaranty: Waste Management, Inc.) AMT, 3.95% due 7/1/2038 (put 5/1/2024) | 1,500,000 | 1,499,757 |
| Salem Hospital Facility Authority (Capital Manor, Inc. Obligated Group), 4.00% due 5/15/2040 | 500,000 | 434,773 | |
| Pennsylvania — 5.7% | |||
| City of Philadelphia (Pennsylvania Gas Works), | |||
| Series 13, 5.00% due 8/1/2032 - 8/1/2034 | 2,300,000 | 2,345,815 | |
| Series 14, 5.00% due 10/1/2034 | 500,000 | 520,724 | |
| City of Philadelphia (Philadelphia Gas Works), Series 15, 5.00% due 8/1/2042 | 2,500,000 | 2,583,390 | |
| City of Philadelphia Airport Revenue (Insured: AGM) AMT, 4.00% due 7/1/2038 - 7/1/2041 | 3,410,000 | 3,428,295 | |
| City of Philadelphia Airport Revenue AMT, | |||
| Series B, 5.00% due 7/1/2030 - 7/1/2037 | 3,175,000 | 3,286,605 | |
| Series C, 5.00% due 7/1/2032 | 1,380,000 | 1,481,271 | |
| City of Pittsburgh (Capital Projects) GO, 5.00% due 9/1/2035 - 9/1/2036 | 1,215,000 | 1,291,525 | |
| County of Luzerne (Insured: AGM) GO, Series A, 5.00% due 11/15/2029 | 3,000,000 | 3,061,626 | |
| Luzerne County (Insured: AGM) IDA GO, 5.00% due 12/15/2025 | 545,000 | 558,324 | |
| Monroeville Financing Authority (University of Pittsburgh Medical Center), 5.00% due 2/15/2026 | 3,490,000 | 3,592,704 | |
| a | Montgomery County (Constellation Energy Generation LLC) IDA AMT, Series C, 4.45% due 10/1/2034 (put 4/3/2028) | 1,000,000 | 1,005,482 |
| Pennsylvania (Pennsylvania Department of Transportation) EDFA AMT, 5.50% due 6/30/2043 | 6,000,000 | 6,651,450 | |
| Pennsylvania (Presbyterian Homes Obligated Group) EDFA, Series B-2, 5.00% due 7/1/2042 | 1,250,000 | 1,310,180 | |
| Pennsylvania (UPMC Obligated Group) EDFA, | |||
| Series A, | |||
| 4.00% due 10/15/2037 | 1,000,000 | 1,027,621 | |
| 5.00% due 2/15/2036 | 1,000,000 | 1,126,101 | |
| Pennsylvania Higher Educational Facilities Authority (University of Pennsylvania Health System Obligated Group), Series A, 4.00% due 8/15/2042 | 1,000,000 | 1,001,514 | |
| Pennsylvania Housing Finance Agency (Cambridge Community Partners LP; Collateralized: FNMA), Series A, 5.55% due 11/1/2042 | 1,100,000 | 1,259,078 | |
| Pennsylvania Housing Finance Agency AMT, 5.00% due 4/1/2027 | 1,500,000 | 1,549,066 | |
| Pennsylvania State Public School Building Authority (Philadelphia School District; Insured: AGM) (State Aid Withholding), Series B, 5.00% due 6/1/2027 | 5,000,000 | 5,283,470 | |
| Pennsylvania Turnpike Commission, Series 2, 5.00% due 12/1/2036 | 1,150,000 | 1,222,325 | |
| Philadelphia Municipal Authority (Juvenile Justice Services Center), 5.00% due 4/1/2032 - 4/1/2036 | 11,125,000 | 11,736,370 | |
| School District of Philadelphia (State Aid Withholding) GO, Series A, 4.00% due 9/1/2041 | 1,000,000 | 996,422 | |
| Rhode Island — 0.6% | |||
| Rhode Island Housing & Mortgage Finance Corp. (Collateralized: GNMA), Series 81-A, 5.25% due 10/1/2043 | 2,000,000 | 2,148,334 | |
| State of Rhode Island & Providence Plantations (Training School Project) COP, Series B, 5.00% due 10/1/2024 | 3,595,000 | 3,598,789 | |
| South Carolina — 2.6% | |||
| City of Myrtle Beach (Municipal Sports Complex), Series B, 5.00% due 6/1/2028 - 6/1/2030 | 2,000,000 | 2,004,229 | |
| a | Patriots Energy Group Financing Agency (Guaranty: Royal Bank of Canada), Series B-1, 5.25% due 2/1/2054 (put 3/1/2031) | 6,000,000 | 6,494,454 |
| a | Patriots Energy Group Financing Agency (Guaranty: Sumitomo Mitsui Banking Corp.), Series A1, 5.25% due 10/1/2054 (put 8/1/2031) | 9,500,000 | 10,170,263 |
| a | South Carolina Jobs-EDA (Guaranty: International Paper Co.) AMT, Series A, 4.00% due 4/1/2033 (put 4/1/2026) | 2,000,000 | 2,000,754 |
| South Carolina State Housing Finance & Development Authority, Series A, 4.50% due 7/1/2044 | 5,000,000 | 5,039,910 | |
| South Dakota — 0.4% | |||
| c | South Dakota (Collateralized: GNMA, FNMA, FHLMC) HDA, Series A, 4.45% due 11/1/2044 | 2,500,000 | 2,500,673 |
| South Dakota Health & Educational Facilities Authority (Sanford Health), 5.00% due 11/1/2028 - 11/1/2029 | 1,800,000 | 1,837,965 | |
| Tennessee — 3.0% | |||
| Knox County Health Educational & Housing Facility Board (Provident Group - UTK Properties LLC; Insured: BAM), Series A-1, 5.00% due 7/1/2043 - 7/1/2044 | 975,000 | 1,045,256 | |
| Memphis-Shelby County Airport Authority AMT, Series A, 5.00% due 7/1/2026 - 7/1/2033 | 2,320,000 | 2,482,972 | |
| Shelby County Health Educational & Housing Facilities Board (Methodist Le Bonheur Healthcare), Series A, 5.00% due 5/1/2031 - 5/1/2035 | 2,925,000 | 3,071,379 | |
| a | Tennergy Corp. (Guaranty: Morgan Stanley Group), Series A, 4.00% due 12/1/2051 (put 9/1/2028) | 2,000,000 | 1,997,894 |
| Tennessee (Collateralized: GNMA, FNMA, FHLMC) HDA, Series 3A, 5.20% due 7/1/2043 | 1,975,000 | 2,105,388 | |
| a | Tennessee Energy Acquisition Corp. (Guaranty: Goldman Sachs Group, Inc.), Series A-1, 5.00% due 5/1/2053 (put 5/1/2028) | 5,000,000 | 5,179,810 |
| a | Tennessee Energy Acquisition Corp. (Tennessee Energy Acquisition Corp.; Guaranty: Goldman Sachs Group, Inc.), Series A, 5.00% due 5/1/2052 (put 11/1/2031) | 11,785,000 | 12,448,979 |
| 42 | Thornburg Municipal Funds Semi-Annual Report | See notes to financial statements. |
| ISSUER-DESCRIPTION | Principal Amount | VALUE | |
| Tennessee HDA, Series 2A, 4.45% due 7/1/2043 | $ 1,000,000 | $ 1,000,217 | |
| Texas — 10.0% | |||
| Calallen (Insured: PSF-GTD) ISD GO, 5.00% due 2/15/2043 | 750,000 | 831,554 | |
| Celina (Insured: PSF-GTD) ISD GO, 5.00% due 2/15/2042 - 2/15/2043 | 1,250,000 | 1,395,607 | |
| City of Austin Airport System Revenue AMT, 5.00% due 11/15/2035 - 11/15/2042 | 5,740,000 | 6,222,470 | |
| City of Dallas (Public Improvements) GO, 5.00% due 2/15/2025 - 2/15/2034 | 9,720,000 | 9,855,786 | |
| City of Galveston (Galveston Island Convention Center; Insured: AGM), Series B, 5.00% due 9/1/2024 | 575,000 | 575,566 | |
| City of Houston Airport System Revenue AMT, | |||
| Series A, | |||
| 4.00% due 7/1/2041 | 1,310,000 | 1,306,225 | |
| 5.00% due 7/1/2033 - 7/1/2041 | 2,500,000 | 2,651,338 | |
| City of Houston Airport System Revenue AMT; (Insured: AGM), Series A, 5.25% due 7/1/2042 | 1,000,000 | 1,099,080 | |
| City of McAllen (International Toll Bridge Revenue; Insured: AGM), Series A, 5.00% due 3/1/2029 - 3/1/2032 | 4,730,000 | 4,885,790 | |
| City of McKinney Waterworks & Sewer System Revenue, 5.00% due 3/15/2041 - 3/15/2042 | 900,000 | 982,771 | |
| City of New Braunfels Utility System Revenue, 5.00% due 7/1/2042 | 1,750,000 | 1,939,649 | |
| City of Port Arthur (CTFS Obligation; Insured: BAM) GO, | |||
| 4.00% due 2/15/2040 - 2/15/2042 | 1,750,000 | 1,766,905 | |
| 5.00% due 2/15/2039 - 2/15/2043 | 2,350,000 | 2,617,108 | |
| City of San Antonio (Airport System Capital Improvements) AMT, 5.00% due 7/1/2024 - 7/1/2025 | 3,225,000 | 3,226,726 | |
| City of San Antonio (Public Facilities Corp.), 5.00% due 9/15/2040 | 2,000,000 | 2,235,646 | |
| City of San Antonio (Water System), Series A, 5.00% due 5/15/2037 | 500,000 | 533,287 | |
| a | City of San Antonio Electric & Gas Systems Revenue, Series A, 1.75% due 2/1/2033 (put 12/1/2024) | 3,995,000 | 3,920,138 |
| Clifton Higher Education Finance Corp. (International Leadership of Texas, Inc.; Insured: PSF-GTD), Series A, 4.00% due 8/15/2044 | 1,280,000 | 1,248,535 | |
| Corpus Christi (Insured: PSF-GTD) ISD GO, 4.00% due 8/15/2043 | 1,500,000 | 1,508,051 | |
| County of Bexar GO, 4.00% due 6/15/2036 | 1,000,000 | 1,005,608 | |
| Crosby (Insured: PSF-GTD) ISD GO, 4.00% due 2/15/2042 | 1,000,000 | 1,009,504 | |
| Greater Texas Cultural Education Facilities Finance Corp. (County of Fort Bend), Series A, 5.00% due 3/1/2034 | 1,185,000 | 1,349,346 | |
| Harris County Cultural Education Facilities Finance Corp. (Memorial Hermann Health System Obligated Group), | |||
| 5.00% due 7/1/2040 | 5,000,000 | 5,143,795 | |
| Series A, 5.00% due 12/1/2028 | 3,000,000 | 3,028,095 | |
| Hays Consolidated (Insured: PSF-GTD) ISD GO, 4.00% due 2/15/2043 | 1,000,000 | 1,006,105 | |
| Houston (Insured: PSF-GTD) ISD GO, Series A, 4.00% due 2/15/2041 | 4,900,000 | 4,818,733 | |
| Lower Colorado River Authority (LCRA Transmission Services Corp.), | |||
| 5.00% due 5/15/2039 | 750,000 | 784,682 | |
| Series A, | |||
| 5.00% due 5/15/2039 | 500,000 | 544,613 | |
| 5.25% due 5/15/2042 | 1,410,000 | 1,578,104 | |
| Matagorda County Navigation District No. 1 (AEP Texas, Inc.) AMT, 4.25% due 5/1/2030 | 2,000,000 | 2,041,692 | |
| a | Mission Economic Development Corp. (Republic Services, Inc.) AMT, 4.10% due 1/1/2026 (put 5/1/2024) | 3,750,000 | 3,750,000 |
| a | Mission Economic Development Corp. (Waste Management, Inc.; Guaranty: Waste Management Holdings) AMT, Series A, 4.25% due 6/1/2048 (put 6/3/2024) | 1,100,000 | 1,099,112 |
| Newark Higher Education Finance Corp. (Hughen Center, Inc.; Insured: PSF-GTD), Series A, 5.00% due 8/15/2042 | 600,000 | 652,428 | |
| North Texas Tollway Authority (North Texas Tollway System), Series A, 4.125% due 1/1/2040 | 1,500,000 | 1,549,200 | |
| Pecos Barstow Toyah (Insured: PSF-GTD) ISD GO, 5.00% due 2/15/2043 | 1,000,000 | 1,024,358 | |
| Tarrant County Cultural Education Facilities Finance Corp. (CHRISTUS Health Obligated Group), Series B, 5.00% due 7/1/2036 | 1,185,000 | 1,270,815 | |
| Tarrant County Cultural Education Facilities Finance Corp. (Methodist Hospitals of Dallas Obligated Group), 5.00% due 10/1/2040 | 3,520,000 | 3,864,823 | |
| a | Texas Municipal Gas Acquisition & Supply Corp. IV (Guaranty: BP plc), Series B, 5.50% due 1/1/2054 (put 1/1/2034) | 6,000,000 | 6,699,834 |
| Texas Public Finance Authority (Texas Southern University; Insured: BAM), 5.25% due 5/1/2040 | 500,000 | 543,979 | |
| Texas State Technical College (Insured: AGM), Series A, 5.50% due 8/1/2042 | 2,000,000 | 2,290,126 | |
| Texas Transportation Commission (Central Texas Turnpike System), Series C, 5.00% due 8/15/2034 | 3,350,000 | 3,363,226 | |
| Waco Educational Finance Corp. (Baylor University Issue), 4.00% due 3/1/2041 | 850,000 | 865,054 | |
| Utah — 0.2% | |||
| Utah Charter School Finance Authority (Summit Academy, Inc.), Series A, 5.00% due 4/15/2039 | 500,000 | 526,072 | |
| Utah Housing Corp. (Collateralized: GNMA, FNMA, FHLMC), Series C, 4.45% due 1/1/2044 | 1,350,000 | 1,351,812 | |
| Utah Telecommunication Open Infrastructure Agency, 5.50% due 6/1/2040 | 500,000 | 579,057 | |
| Virginia — 0.8% | |||
| Virginia HDA, Series D, 4.50% due 8/1/2043 | 2,000,000 | 2,022,364 | |
| Virginia Small Business Financing Authority (National Senior Campuses, Inc. Obligated Group), Series A, 5.00% due 1/1/2029 | 850,000 | 882,581 | |
| a | Wise County (Virginia Electric & Power Co.) IDA, Series A, 1.20% due 11/1/2040 (put 5/31/2024) | 5,155,000 | 5,118,997 |
| Washington — 0.6% | |||
| Clark County Public Utility District No. 1, 5.00% due 1/1/2040 - 1/1/2041 | 1,000,000 | 1,114,403 | |
| State of Washington GO, Series 2021A, 5.00% due 6/1/2040 | 2,225,000 | 2,434,942 |
| See notes to financial statements. | Thornburg Municipal Funds Semi-Annual Report | 43 |
Thornburg Intermediate Municipal Fund | March 31, 2024 (Unaudited)
| ISSUER-DESCRIPTION | Principal Amount | VALUE | |
| Washington State Housing Finance Commission (Eastside Retirement Association Obligated Group), Series A, 5.00% due 7/1/2043 | $ 1,000,000 | $ 1,007,403 | |
| b | Washington State Housing Finance Commission (Seattle Academy of Arts & Sciences), 5.875% due 7/1/2043 | 1,000,000 | 1,098,069 |
| Wisconsin — 2.3% | |||
| Public Finance Authority (National Senior Communities Obligated Group), 4.00% due 1/1/2028 - 1/1/2042 | 5,235,000 | 5,119,947 | |
| Public Finance Authority (Texas Biomedical Research Institute), Series A, 4.00% due 6/1/2040 - 6/1/2041 | 525,000 | 484,310 | |
| a | Public Finance Authority (Waste Management, Inc.; Guaranty: Waste Management Holdings) AMT, Series A-2, 4.10% due 10/1/2025 (put 5/1/2024) | 2,900,000 | 2,889,409 |
| Racine (Insured: AGM) USD GO, 5.00% due 4/1/2039 - 4/1/2042 | 3,850,000 | 4,226,439 | |
| Wisconsin Health & Educational Facilities Authority (Ascension Health), Series A, 5.00% due 11/15/2036 | 2,380,000 | 2,441,295 | |
| Wisconsin Housing (Collateralized: GNMA, FNMA, FHLMC) EDA, Series A, 4.85% due 9/1/2043 | 5,000,000 | 5,187,975 | |
| WPPI Energy, Series A, 5.00% due 7/1/2030 - 7/1/2036 | 2,280,000 | 2,471,425 | |
| Total Long-Term Municipal Bonds — 92.2% (Cost $882,728,712) | 907,123,213 | ||
| Short-Term Municipal Bonds — 6.7% | |||
| Colorado — 0.2% | |||
| a | Colorado Educational & Cultural Facilities Authority (Jewish Federation of South Palm Beach County, Inc.; LOC Bank Of America NA), Series A-12, 4.50% due 2/1/2038 (put 4/1/2024) | 1,500,000 | 1,500,000 |
| Florida — 0.2% | |||
| a | City of Gainesville Utilities System Revenue (SPA Barclays Bank plc), Series B-REMK, 4.50% due 10/1/2042 (put 4/1/2024) | 505,000 | 505,000 |
| a,b | JP Morgan Chase Putters/Drivers Trust (LOC JP Morgan Chase Bank NA), Series 5032, 4.55% due 12/15/2034 (put 4/1/2024) | 1,700,000 | 1,700,000 |
| Kentucky — 2.0% | |||
| County of Meade (Nucor Corp.) AMT, | |||
| a | Series A-1, 5.16% due 7/1/2060 - 8/1/2061 (put 4/1/2024) | 11,560,000 | 11,560,000 |
| a | Series A-2, 5.16% due 7/1/2060 (put 4/1/2024) | 7,950,000 | 7,950,000 |
| New York — 0.8% | |||
| a | City of New York (SPA Barclays Bank plc) GO, Series F-5, 4.45% due 6/1/2044 (put 4/1/2024) | 280,000 | 280,000 |
| New York City Transitional Finance Authority Future Tax Secured Revenue (SPA JP Morgan Chase Bank NA), | |||
| a | Series B4, 4.55% due 8/1/2042 (put 4/1/2024) | 500,000 | 500,000 |
| a | Series E-3, 4.55% due 2/1/2045 (put 4/1/2024) | 500,000 | 500,000 |
| a | Series E-4, 4.55% due 2/1/2045 (put 4/1/2024) | 7,000,000 | 7,000,000 |
| North Carolina — 0.4% | |||
| a | Charlotte-Mecklenburg Hospital Authority (Atrium Health Obligated Group; SPA JP Morgan Chase Bank NA), Series B, 4.45% due 1/15/2038 (put 4/1/2024) | 4,435,000 | 4,435,000 |
| Ohio — 0.4% | |||
| a | State of Ohio (University Hospitals Health System, Inc. Obligated Group; LOC PNC Bank NA), Series A, 4.42% due 1/15/2046 (put 4/1/2024) | 4,350,000 | 4,350,000 |
| Texas — 2.6% | |||
| a | Port of Port Arthur Navigation District (Motiva Enterprises LLC), 4.85% due 4/1/2040 (put 4/1/2024) | 25,450,000 | 25,450,000 |
| Utah — 0.1% | |||
| a | City of Murray (Intermountain Healthcare Obligated Group), Series C, 4.45% due 5/15/2036 (put 4/1/2024) | 840,000 | 840,000 |
| Total Short-Term Municipal Bonds — 6.7% (Cost $66,570,000) | 66,570,000 | ||
| Total Investments — 98.9% (Cost $949,298,712) | $973,693,213 | ||
| Other Assets Less Liabilities — 1.1% | 10,353,080 | ||
| Net Assets — 100.0% | $984,046,293 |
| Footnote Legend | |
| a | Variable, floating, step, or fixed to floating rate securities are securities for which interest rate changes are based on changes in a designated base rate or on a predetermined schedule. The rates shown are those in effect on March 31, 2024. |
| b | Securities exempt from registration under Rule 144A of the Securities Act of 1933, as amended. These securities are restricted but liquid and may only be resold in the ordinary course of business in transactions exempt from registration, normally to qualified institutional buyers. As of March 31, 2024, the aggregate value of these securities in the Fund’s portfolio was $7,542,835, representing 0.77% of the Fund’s net assets. |
| c | When-issued security. |
To simplify the listings of securities, abbreviations are used per the table below:
| AGC | Insured by Assured Guaranty Corp. |
| AGM | Insured by Assured Guaranty Municipal Corp. |
| AMBAC | Insured by American Municipal Bond Assurance Corp. |
| AMT | Alternative Minimum Tax |
| BAM | Insured by Build America Mutual Insurance Co. |
| BHAC-CR | Berkshire Hathaway Assurance Corp. Custodial Receipts |
| COP | Certificates of Participation |
| EDA | Economic Development Authority |
| 44 | Thornburg Municipal Funds Semi-Annual Report | See notes to financial statements. |
| EDFA | Economic Development Financing Authority |
| ETM | Escrowed to Maturity |
| FHLMC | Collateralized by Federal Home Loan Mortgage Corp. |
| FNMA | Collateralized by Federal National Mortgage Association |
| GNMA | Collateralized by Government National Mortgage Association |
| GO | General Obligation |
| HDA | Housing Development Authority |
| HFA | Health Facilities Authority |
| HFFA | Health Facilities Financing Authority |
| IDA | Industrial Development Authority/Agency |
| IDB | Industrial Development Board |
| ISD | Independent School District |
| LOC | Letter of Credit |
| Natl-Re | Insured by National Public Finance Guarantee Corp. |
| PSF-GTD | Guaranteed by Permanent School Fund |
| Q-SBLF | Insured by Qualified School Bond Loan Fund |
| SONYMA | State of New York Mortgage Agency |
| SPA | Stand-by Purchase Agreement |
| TCRS | Transferable Custodial Receipts |
| USD | Unified School District |
| See notes to financial statements. | Thornburg Municipal Funds Semi-Annual Report | 45 |
Thornburg Strategic Municipal Income Fund | March 31, 2024 (Unaudited)
| ISSUER-DESCRIPTION | Principal Amount | VALUE | |
| LONG-TERM MUNICIPAL BONDS — 95.6% | |||
| Alabama — 1.9% | |||
| Alabama Housing Finance Authority (TBG Southtown Senior LP; Collateralized: FNMA), Series 2023-04FN Class PT, 5.23% due 10/1/2041 | $1,500,000 | $ 1,662,887 | |
| a | Southeast Alabama Gas Supply District (Guaranty: Morgan Stanley Group), 5.00% due 6/1/2049 (put 5/1/2032) | 1,000,000 | 1,071,264 |
| a | Southeast Alabama Gas Supply District (Guaranty: Pacific Life Insurance Co.), Series A, 5.00% due 8/1/2054 (put 4/1/2032) | 1,000,000 | 1,074,448 |
| a | Southeast Energy Authority A Cooperative District, Series B, 5.00% due 1/1/2054 (put 6/1/2030) | 1,000,000 | 1,060,831 |
| a | Southeast Energy Authority A Cooperative District (Guaranty: Morgan Stanley Group), Series A, 5.50% due 1/1/2053 (put 12/1/2029) | 1,000,000 | 1,074,571 |
| Arizona — 4.3% | |||
| Arizona (Scottsdale Lincoln Hospitals) HFA, Series A, 5.00% due 12/1/2031 | 2,500,000 | 2,521,210 | |
| Chandler (Intel Corp.) IDA AMT, | |||
| a | 4.10% due 12/1/2037 (put 6/15/2028) | 850,000 | 854,109 |
| a | Series 2022-2, 5.00% due 9/1/2052 (put 9/1/2027) | 1,855,000 | 1,908,673 |
| City of Phoenix Civic Improvement Corp. (Phoenix Airport Revenue) AMT, Series B, 5.00% due 7/1/2044 | 1,000,000 | 1,044,644 | |
| a | Coconino County Pollution Control Corp. (Nevada Power Co.) AMT, Series A, 4.125% due 9/1/2032 (put 3/31/2026) | 1,000,000 | 993,348 |
| b | County of Pima (La Posada at Park Centre, Inc. Obligated Group) IDA, Series A, 5.75% due 11/15/2024 | 415,000 | 415,144 |
| County of Pima (TMC HealthCare Obligated Group) IDA, Series A, 4.00% due 4/1/2041 | 1,000,000 | 984,102 | |
| a | Maricopa County (Banner Health Obligated Group) IDA, Series A-3, 5.00% due 1/1/2053 (put 11/1/2030) | 1,000,000 | 1,103,592 |
| a | Maricopa County Pollution Control Corp. (Public Service Co. of New Mexico), Series A, 0.875% due 6/1/2043 (put 10/1/2026) | 3,000,000 | 2,763,123 |
| Yavapai County (Waste Management, Inc.) IDA AMT, 1.30% due 6/1/2027 | 1,000,000 | 883,542 | |
| California — 6.1% | |||
| Benicia (Benicia High School; Insured: AGM) USD GO, Series C, Zero Coupon due 8/1/2026 | 830,000 | 760,870 | |
| California (Children’s Hospital Los Angeles) HFFA, Series A, 5.00% due 8/15/2036 | 500,000 | 518,263 | |
| California (Community Program Developmental Disabilities; Insured: California Mtg Insurance) HFFA, Series A, 6.25% due 2/1/2026 | 820,000 | 821,721 | |
| a | California Community Choice Financing Authority (Guaranty: Deutsche Bank AG) (Green Bond), Series C, 5.25% due 1/1/2054 (put 10/1/2031) | 3,700,000 | 3,908,103 |
| a | California Community Choice Financing Authority (Guaranty: Morgan Stanley Group) (Green Bond), Series B-1, 4.00% due 2/1/2052 (put 8/1/2031) | 1,000,000 | 1,003,839 |
| California Educational Facilities Authority (University of Redlands), Series A, 5.00% due 10/1/2044 | 500,000 | 514,569 | |
| a,b | California Infrastructure & Economic Development Bank (DesertXpress Enterprises LLC) AMT, Series A, 3.95% due 1/1/2050 (put 1/30/2025) | 750,000 | 742,157 |
| California Municipal Finance Authority (Greenfield Commons Eah LP; Collateralized: FNMA) (Green Bond), Series A, 5.28% due 9/1/2046 | 1,400,000 | 1,521,317 | |
| b | California Pollution Control Financing Authority (Poseidon Resources (Channelside) LP Desalination Project) AMT, 5.00% due 11/21/2045 | 1,000,000 | 994,898 |
| a,b | California Pollution Control Financing Authority (Republic Services, Inc.) AMT, 4.125% due 7/1/2043 (put 8/15/2024) | 1,000,000 | 1,000,340 |
| b | California School Finance Authority, Series A, 5.00% due 10/1/2042 | 1,000,000 | 1,015,753 |
| California Statewide Communities Development Authority (Methodist Hospital of Southern California Obligated Group), 5.00% due 1/1/2030 | 175,000 | 183,979 | |
| Calipatria (Educational Facilities; Insured: BAM) USD GO, Series B, Zero Coupon due 8/1/2025 | 670,000 | 628,568 | |
| City of Long Beach Airport System Revenue (Insured: AGM) AMT, | |||
| Series C, | |||
| 5.00% due 6/1/2042 | 750,000 | 814,052 | |
| 5.25% due 6/1/2047 | 500,000 | 540,700 | |
| County of El Dorado (El Dorado Hills Development-Community Facilities), 5.00% due 9/1/2026 | 625,000 | 625,729 | |
| M-S-R Energy Authority (Guaranty: Citigroup Global Markets), Series A, 6.50% due 11/1/2039 | 1,245,000 | 1,608,196 | |
| Oakland (County of Alameda Educational Facilities) USD GO, Series A, 5.00% due 8/1/2035 (pre-refunded 8/1/2025) | 1,000,000 | 1,024,025 | |
| Union Elementary School District (Santa Clara County District Schools; Insured: Natl-Re) GO, Series D, Zero Coupon due 9/1/2027 | 905,000 | 826,609 | |
| Colorado — 3.0% | |||
| City & County of Denver Airport System Revenue AMT, Series A, 5.00% due 11/15/2036 - 11/15/2039 | 1,565,000 | 1,718,491 | |
| Colorado (CommonSpirit Health Obligated Group) HFA, 5.50% due 11/1/2047 | 1,000,000 | 1,112,457 | |
| Colorado (Sanford Obligated Group) HFA, Series A, 5.00% due 11/1/2039 - 11/1/2044 | 3,015,000 | 3,200,922 | |
| Public Authority for Colorado Energy (Natural Gas Purchase; Guaranty: Merrill Lynch & Co.), 6.50% due 11/15/2038 | 260,000 | 322,888 | |
| Regional Transportation District (Denver Transit Partners LLC), Series A, 5.00% due 7/15/2032 | 1,215,000 | 1,336,099 | |
| Village Metropolitan District GO, 5.00% due 12/1/2040 | 1,000,000 | 966,580 | |
| Wild Plum Metropolitan District GO, Series A, 5.00% due 12/1/2049 (pre-refunded 12/1/2024) | 595,000 | 618,637 | |
| Connecticut — 1.5% | |||
| Connecticut Housing Finance Authority, Series B, 4.65% due 11/15/2048 | 850,000 | 865,529 | |
| State of Connecticut GO, | |||
| Series A, 5.00% due 4/15/2035 | 2,000,000 | 2,174,028 | |
| Series E, 5.00% due 9/15/2033 | 1,350,000 | 1,479,900 | |
| Delaware — 0.7% | |||
| Delaware State (ACTS Retirement-Life Communities, Inc. Obligated Group) EDA, Series B, 5.25% due 11/15/2053 | 1,000,000 | 1,031,927 | |
| Delaware State (Beebe Medical Center, Inc.) HFA, 4.00% due 6/1/2035 | 1,080,000 | 1,066,231 | |
| District of Columbia — 1.0% | |||
| Metropolitan Washington Airports Authority (Dulles Toll Road; Insured: AGC), Series B, Zero Coupon due 10/1/2027 | 1,500,000 | 1,329,099 | |
| Metropolitan Washington Airports Authority Aviation Revenue AMT, Series A, 4.00% due 10/1/2041 | 1,750,000 | 1,722,751 |
| 46 | Thornburg Municipal Funds Semi-Annual Report | See notes to financial statements. |
| ISSUER-DESCRIPTION | Principal Amount | VALUE | |
| Florida — 5.9% | |||
| b | Capital Trust Agency, Inc. (Southeastern University Obligated Group), Series A, 6.25% due 5/1/2048 | $3,000,000 | $ 3,000,990 |
| b | Charlotte County (Town & Country Utilities Projects) IDA AMT, 5.00% due 10/1/2029 | 390,000 | 392,058 |
| City of Pompano Beach (John Knox Village of Florida, Inc. Obligated Group), | |||
| 4.00% due 9/1/2040 | 1,000,000 | 904,196 | |
| Series A, 4.00% due 9/1/2036 | 500,000 | 481,786 | |
| County of Broward Airport System Revenue AMT, 5.00% due 10/1/2042 | 2,000,000 | 2,057,860 | |
| a | County of Escambia (International Paper Co.), Series B, 2.00% due 11/1/2033 (put 10/1/2024) | 775,000 | 768,393 |
| County of Miami-Dade Aviation Revenue AMT, Series A, 5.00% due 10/1/2035 | 1,840,000 | 1,850,019 | |
| County of Miami-Dade Seaport Department AMT, Series A, 5.25% due 10/1/2052 | 500,000 | 526,194 | |
| Florida Development Finance Corp. (Mater Academy Miami-Dade Osceola County Facilities Obligated Group), Series A, 5.00% due 6/15/2056 | 1,000,000 | 979,951 | |
| Lee County (Cypress Cove at Healthpark Florida Obligated Group) IDA, Series B-1, 3.75% due 10/1/2027 | 1,000,000 | 937,282 | |
| Miami-Dade County School Board (District School Facilities & Infrastructure) COP, Series A, 5.00% due 8/1/2027 | 1,100,000 | 1,101,186 | |
| Orange County (Presbyterian Retirement Communities Inc Obligated Group) HFA, 5.00% due 8/1/2040 | 2,000,000 | 2,012,148 | |
| Orange County Convention Center (Tourist Development), Series A, 5.00% due 10/1/2031 | 1,000,000 | 1,046,694 | |
| Palm Beach County (Jupiter Medical Center Obligated Group) HFA, Series A, 5.00% due 11/1/2047 | 250,000 | 253,639 | |
| Palm Beach County (Lifespace Communities, Inc. Obligated Group) HFA, Series C, 7.625% due 5/15/2058 | 500,000 | 552,622 | |
| Volusia County Educational Facilities Authority (Embry-Riddle Aeronautical University, Inc.), Series B, 5.00% due 10/15/2030 | 1,500,000 | 1,519,128 | |
| Georgia — 3.6% | |||
| City of Atlanta (Airport Passenger Facility) (Green Bond) AMT, Series E, 5.00% due 7/1/2040 | 100,000 | 109,875 | |
| Main Street Natural Gas, Inc. (Guaranty: Citigroup, Inc.), | |||
| a | Series C, 4.00% due 5/1/2052 (put 12/1/2028) | 1,500,000 | 1,507,994 |
| a | Series D, 5.00% due 5/1/2054 (put 12/1/2030) | 1,000,000 | 1,058,920 |
| Main Street Natural Gas, Inc. (Guaranty: Macquarie Group Ltd.), Series A, 5.00% due 5/15/2036 | 3,700,000 | 3,967,184 | |
| Main Street Natural Gas, Inc. (Guaranty: Royal Bank of Canada), | |||
| a | Series A, 4.00% due 7/1/2052 (put 9/1/2027) | 1,250,000 | 1,259,546 |
| a | Series E-1, 5.00% due 12/1/2053 (put 6/1/2031) | 3,000,000 | 3,203,169 |
| Guam — 0.3% | |||
| Guam Waterworks Authority (Water & Wastewater System), | |||
| 5.00% due 7/1/2028 | 500,000 | 501,186 | |
| 5.25% due 7/1/2024 | 500,000 | 501,418 | |
| Hawaii — 0.7% | |||
| State of Hawaii Airports System Revenue AMT, Series A, 5.00% due 7/1/2033 | 2,000,000 | 2,174,858 | |
| Illinois — 13.2% | |||
| Chicago Board of Education Dedicated Capital Improvement Tax, | |||
| 5.50% due 4/1/2042 | 500,000 | 556,304 | |
| 5.75% due 4/1/2048 | 1,000,000 | 1,114,082 | |
| Chicago Board of Education GO, Series A, 6.00% due 12/1/2049 | 1,000,000 | 1,104,530 | |
| City of Chicago (Chicago O’Hare International Airport) AMT, Series A, 5.00% due 1/1/2028 - 1/1/2042 | 2,000,000 | 2,068,123 | |
| City of Chicago (Midway International Airport) AMT, Series A, 5.00% due 1/1/2026 - 1/1/2034 | 2,500,000 | 2,521,605 | |
| City of Chicago (Wastewater Transmission System), Series C, 5.00% due 1/1/2030 | 1,500,000 | 1,517,494 | |
| City of Chicago (Water System; Insured: AGM), Series 2017-2, 5.00% due 11/1/2037 | 1,500,000 | 1,593,058 | |
| City of Chicago GO, | |||
| Series A, | |||
| 5.00% due 1/1/2039 | 1,000,000 | 1,047,639 | |
| 5.625% due 1/1/2031 | 500,000 | 523,035 | |
| 6.00% due 1/1/2038 | 3,330,000 | 3,478,901 | |
| Illinois Finance Authority (Plymouth Place Obligated Group), Series A, 6.625% due 5/15/2052 | 1,000,000 | 1,022,222 | |
| Illinois Finance Authority (Silver Cross Hospital & Medical Centers), Series C, 5.00% due 8/15/2035 | 2,355,000 | 2,387,082 | |
| Illinois Finance Authority (Southern Illinois Healthcare), 5.00% due 3/1/2032 - 3/1/2034 | 700,000 | 723,064 | |
| Illinois Finance Authority (Washington & Jane Smith Community-Orland Park), 4.00% due 10/15/2024 - 10/15/2027 | 1,225,000 | 1,168,794 | |
| Illinois State Toll Highway Authority (Move Illinois Program), Series A, 5.00% due 1/1/2037 | 1,000,000 | 1,025,414 | |
| Illinois State University (Insured: AGM), Series A, 5.00% due 4/1/2025 - 4/1/2036 | 1,515,000 | 1,605,268 | |
| Metropolitan Pier & Exposition Authority, Series A, 5.00% due 6/15/2050 | 1,500,000 | 1,555,992 | |
| Sales Tax Securitization Corp., | |||
| Series A, | |||
| 4.00% due 1/1/2038 | 1,000,000 | 1,012,052 | |
| 5.00% due 1/1/2029 | 1,000,000 | 1,068,937 | |
| State of Illinois GO, | |||
| 5.00% due 2/1/2039 | 600,000 | 600,092 | |
| 5.50% due 5/1/2039 | 375,000 | 412,468 | |
| 5.75% due 5/1/2045 | 1,600,000 | 1,751,667 |
| See notes to financial statements. | Thornburg Municipal Funds Semi-Annual Report | 47 |
Thornburg Strategic Municipal Income Fund | March 31, 2024 (Unaudited)
| ISSUER-DESCRIPTION | Principal Amount | VALUE | |
| Series A, 5.50% due 3/1/2042 | $1,000,000 | $ 1,125,534 | |
| Series D, 5.00% due 11/1/2028 | 3,000,000 | 3,183,120 | |
| State of Illinois Sales Tax Revenue (Insured: BAM-Natl-Re), Series B, 5.00% due 6/15/2032 - 6/15/2035 | 4,500,000 | 4,850,545 | |
| State of Illinois Sales Tax Revenue (Insured: BAM-TCRS), Series B, 4.75% due 6/15/2043 | 2,005,000 | 2,091,646 | |
| Indiana — 1.5% | |||
| Indiana Finance Authority (Ohio Valley Electric Corp.), Series A, 4.25% due 11/1/2030 | 1,300,000 | 1,298,586 | |
| a | Indiana Finance Authority (Republic Services, Inc.) AMT, 4.20% due 12/1/2037 (put 6/3/2024) | 2,000,000 | 2,000,000 |
| a | Indiana Finance Authority (Southern Indiana Gas & Electric Co.) AMT, Series B, 4.00% due 5/1/2043 (put 8/1/2028) | 1,500,000 | 1,514,455 |
| Iowa — 1.5% | |||
| a | Iowa Finance Authority (Iowa Fertilizer Co. LLC; Guaranty: OCI NV), 5.00% due 12/1/2050 (put 12/1/2042) | 2,075,000 | 2,182,143 |
| Iowa Higher Education Loan Authority (Des Moines University Osteopathic Medical Center), 5.00% due 10/1/2047 | 750,000 | 766,228 | |
| a | PEFA, Inc. (Guaranty: Goldman Sachs Group, Inc.), 5.00% due 9/1/2049 (put 9/1/2026) | 1,650,000 | 1,686,242 |
| Kansas — 1.4% | |||
| a | Kansas (AdventHealth Obligated Group) DFA, Series B, 5.00% due 11/15/2054 (put 11/15/2031) | 1,500,000 | 1,688,140 |
| Kansas Independent College Finance Authority (Ottawa University), Series B, 7.30% due 5/1/2024 | 500,000 | 501,059 | |
| Unified Government of Wyandotte County/Kansas City (Utility System Improvement), Series A, 5.00% due 9/1/2031 - 9/1/2032 | 2,000,000 | 2,013,082 | |
| Kentucky — 4.0% | |||
| b | City of Henderson (Guaranty: Pratt Industries, Inc.) AMT, Series B, 4.45% due 1/1/2042 | 1,000,000 | 998,053 |
| Kentucky (Baptist Healthcare System Obligated Group) EDFA, Series B, 5.00% due 8/15/2041 | 1,500,000 | 1,532,897 | |
| Kentucky Public Energy Authority (Guaranty: Morgan Stanley Group), | |||
| Series A-1, | |||
| a | 4.00% due 8/1/2052 (put 8/1/2030) | 5,500,000 | 5,494,043 |
| a | 5.25% due 4/1/2054 (put 2/1/2032) | 4,000,000 | 4,337,284 |
| Louisiana — 1.4% | |||
| City of New Orleans (Water System Facilities Improvement), 5.00% due 12/1/2034 (pre-refunded 12/1/2024) | 400,000 | 403,925 | |
| Louisiana Public Facilities Authority (Ochsner Clinic Foundation Obligated Group), 5.00% due 5/15/2046 | 3,000,000 | 3,056,175 | |
| New Orleans Aviation Board (Louis Armstrong New Orleans International Airport CFC Revenue; Insured: AGM), 5.00% due 1/1/2029 | 700,000 | 749,240 | |
| Massachusetts — 0.3% | |||
| Massachusetts (Jordan Hospital & Milton Hospital) DFA, Series H-1, 5.00% due 7/1/2032 - 7/1/2033 | 555,000 | 568,509 | |
| Massachusetts Housing Finance Agency, Series C1, 5.20% due 12/1/2053 | 500,000 | 521,698 | |
| Michigan — 5.4% | |||
| City of Detroit GO, | |||
| 5.00% due 4/1/2024 | 400,000 | 400,021 | |
| Series A, 5.00% due 4/1/2032 | 300,000 | 328,508 | |
| Detroit City School District (School Building & Site; Insured: AGM Q-SBLF) GO, Series A, 5.25% due 5/1/2027 | 1,000,000 | 1,062,625 | |
| Gerald R Ford International Airport Authority AMT, 5.00% due 1/1/2041 | 1,200,000 | 1,292,419 | |
| Kalamazoo Hospital Finance Authority (Bronson Methodist Hospital), Series A, 5.25% due 5/15/2041 | 140,000 | 140,163 | |
| Michigan Finance Authority (BHSH System Obligated Group), Series A, 4.00% due 4/15/2042 | 1,000,000 | 1,000,908 | |
| Michigan Finance Authority (State Department of Human Services Office Buildings), Series F, 5.00% due 4/1/2031 | 1,000,000 | 1,001,094 | |
| Michigan Finance Authority (Trinity Health Corp. Obligated Group), | |||
| Series 2017-MI, 5.00% due 12/1/2027 | 165,000 | 173,702 | |
| Series A, 4.00% due 12/1/2040 | 1,000,000 | 1,002,441 | |
| Michigan HDA, | |||
| Series A, 4.90% due 12/1/2048 | 1,400,000 | 1,427,990 | |
| Series B, 2.95% due 12/1/2039 | 3,000,000 | 2,571,042 | |
| Michigan State Hospital Finance Authority (Ascension Health Credit Group), Series F-4, 5.00% due 11/15/2047 | 2,250,000 | 2,347,227 | |
| Wayne County Airport Authority (Detroit Metropolitan Wayne County Airport), Series B, 5.00% due 12/1/2031 - 12/1/2034 | 2,615,000 | 2,642,598 | |
| Wayne State University (Educational Facilities & Equipment), Series A, 5.00% due 11/15/2033 | 1,250,000 | 1,260,960 | |
| Minnesota — 0.3% | |||
| City of Coon Rapids (Mississippi View Housing Partners LP; Collateralized: FNMA), Series M, 5.60% due 12/1/2039 | 998,847 | 1,066,602 | |
| Nebraska — 1.1% | |||
| Central Plains Energy Project (Guaranty: Goldman Sachs Group, Inc.), Series A, 5.00% due 9/1/2031 | 1,500,000 | 1,595,242 | |
| Douglas County Hospital Authority No. 3 (Nebraska Methodist Health System), 5.00% due 11/1/2029 - 11/1/2030 | 1,750,000 | 1,790,362 | |
| Nevada — 1.4% | |||
| City of Las Vegas Special Improvement District No. 814 (Summerlin Village 21 & 24A), 4.00% due 6/1/2039 - 6/1/2044 | 1,025,000 | 909,780 | |
| a | County of Washoe (Sierra Pacific Power Co.) AMT, Series F, 4.125% due 3/1/2036 (put 10/1/2029) | 750,000 | 759,334 |
| a,b | State of Nevada Department of Business & Industry (Republic Services, Inc.) AMT, Series 2001-REMK, 4.50% due 12/1/2026 (put 6/3/2024) | 2,600,000 | 2,587,208 |
| New Hampshire — 0.5% | |||
| New Hampshire Business Finance Authority (Presbyterian Homes Obligated Group), Series A, 5.25% due 7/1/2048 | 400,000 | 418,326 | |
| a | New Hampshire Business Finance Authority (Waste Management, Inc.; Guaranty: Waste Management Holdings) AMT, Series A4, 2.15% due 8/1/2038 (put 7/1/2024) | 1,250,000 | 1,243,415 |
| 48 | Thornburg Municipal Funds Semi-Annual Report | See notes to financial statements. |
| ISSUER-DESCRIPTION | Principal Amount | VALUE | |
| New Jersey — 4.4% | |||
| Camden County Improvement Authority (KIPP Cooper Norcross Obligated Group), 6.00% due 6/15/2052 | $1,000,000 | $ 1,079,830 | |
| New Jersey (New Jersey Transit Corp.) EDA, Series A, 5.00% due 11/1/2033 | 500,000 | 551,901 | |
| New Jersey (School Facilities Construction; Insured: Natl-Re) EDA, Series N1, 5.50% due 9/1/2027 | 1,000,000 | 1,077,124 | |
| New Jersey Housing & Mortgage Finance Agency (Riverview Towers Preservation LLC), Series B, 5.25% due 12/20/2065 | 1,600,000 | 1,651,635 | |
| New Jersey Transportation Trust Fund Authority, Series A, 5.00% due 12/15/2035 | 2,000,000 | 2,168,010 | |
| New Jersey Transportation Trust Fund Authority (State Transportation System Improvements), Series A-1, 5.00% due 6/15/2027 | 3,000,000 | 3,108,894 | |
| New Jersey Transportation Trust Fund Authority (Transportation Program Bonds), Series AA, 5.00% due 6/15/2038 | 1,500,000 | 1,613,709 | |
| New Jersey Transportation Trust Fund Authority (Transportation System), Series A, 5.00% due 12/15/2034 | 700,000 | 754,758 | |
| South Jersey Transportation Authority, Series A, 5.25% due 11/1/2052 | 1,500,000 | 1,589,139 | |
| New Mexico — 1.8% | |||
| a | City of Farmington (Public Service Co. of New Mexico), Series D, 3.90% due 6/1/2040 (put 6/1/2028) | 750,000 | 748,493 |
| City of Santa Fe (El Castillo Retirement Residences Obligated Group), | |||
| 5.00% due 5/15/2034 | 1,465,000 | 1,395,584 | |
| Series A, 5.00% due 5/15/2049 | 1,450,000 | 1,294,451 | |
| New Mexico Hospital Equipment Loan Council (Haverland Carter Lifestyle Obligated Group), Series A, 5.00% due 7/1/2033 - 7/1/2034 | 1,070,000 | 978,764 | |
| a | New Mexico Hospital Equipment Loan Council (Presbyterian Healthcare Services Obligated Group), Series B, 5.00% due 8/1/2049 (put 8/1/2025) | 1,250,000 | 1,269,754 |
| New York — 2.6% | |||
| Build NYC Resource Corp. (Kipp NYC Public Charter Schools), 5.25% due 7/1/2052 | 1,000,000 | 1,028,310 | |
| City of New York (City Budget Financial Management) GO, Series J, 5.00% due 8/1/2031 | 1,500,000 | 1,508,357 | |
| Dutchess County Local Development Corp. (Tompkins Terrace Housing LP; Collateralized: FNMA), 5.00% due 10/1/2040 | 1,000,000 | 1,084,506 | |
| Metropolitan Transportation Authority (Green Bond), Series A1, 5.00% due 11/15/2030 | 1,045,000 | 1,083,559 | |
| New York Transportation Development Corp. (Delta Air Lines, Inc.) AMT, 6.00% due 4/1/2035 | 1,000,000 | 1,120,000 | |
| Port Authority of New York & New Jersey AMT, Series 186, 5.00% due 10/15/2037 | 500,000 | 503,648 | |
| State of New York Mortgage Agency (Insured: SONYMA) AMT, | |||
| Series 248, | |||
| 4.10% due 4/1/2032 | 770,000 | 741,332 | |
| 4.125% due 10/1/2032 | 210,000 | 202,042 | |
| 4.20% due 4/1/2033 | 845,000 | 816,080 | |
| North Carolina — 1.2% | |||
| Greater Asheville Regional Airport Authority (Insured: AGM) AMT, Series A, 5.25% due 7/1/2039 | 1,000,000 | 1,106,423 | |
| North Carolina Medical Care Commission (Vidant Health), 5.00% due 6/1/2029 (pre-refunded 6/1/2025) | 1,500,000 | 1,527,508 | |
| North Carolina Turnpike Authority, 5.00% due 1/1/2029 - 1/1/2030 | 1,000,000 | 1,065,562 | |
| Ohio — 1.6% | |||
| Akron, Bath & Copley Joint Township Hospital District (Summa Health System Obligated Group), 5.25% due 11/15/2030 | 1,420,000 | 1,468,462 | |
| Buckeye Tobacco Settlement Financing Authority, Series B-2, 5.00% due 6/1/2055 | 1,000,000 | 944,167 | |
| County of Hamilton (Life Enriching Communities Obligated Group), Series A, 5.50% due 1/1/2043 | 500,000 | 505,814 | |
| Northeast Ohio Medical University (Insured: BAM), 5.00% due 12/1/2043 | 775,000 | 822,652 | |
| a | Ohio Air Quality Development Authority (Ohio Valley Electric Corp.), Series B, 1.375% due 2/1/2026 (put 11/1/2024) | 200,000 | 194,804 |
| Ohio Higher Educational Facility Commission (Ashtabula County Medical Center Obligated Group), 5.25% due 1/1/2038 | 1,105,000 | 1,167,404 | |
| Oregon — 1.0% | |||
| a | County of Gilliam (Guaranty: Waste Management, Inc.) AMT, 3.95% due 7/1/2038 (put 5/1/2024) | 1,000,000 | 999,838 |
| a | Oregon Health & Science University (Oregon Health & Science University Obligated Group), Series B2, 5.00% due 7/1/2046 (put 2/1/2032) | 1,900,000 | 2,132,131 |
| Pennsylvania — 4.7% | |||
| City of Philadelphia (Pennsylvania Gas Works), Series 15, 5.00% due 8/1/2047 | 1,000,000 | 1,024,521 | |
| City of Philadelphia Airport Revenue AMT, Series B, 5.00% due 7/1/2042 | 1,000,000 | 1,020,853 | |
| City of Philadelphia IDA, 5.00% due 5/1/2024 | 1,000,000 | 1,000,823 | |
| City of Philadelphia Municipal Authority (Juvenile Justice Services Center), 5.00% due 4/1/2038 | 1,360,000 | 1,418,471 | |
| Commonwealth Financing Authority, 5.00% due 6/1/2029 | 1,000,000 | 1,073,950 | |
| County of Luzerne (Insured: AGM) GO, Series A, 5.00% due 11/15/2029 | 1,000,000 | 1,020,542 | |
| a | Montgomery County (Constellation Energy Generation LLC) IDA AMT, Series C, 4.45% due 10/1/2034 (put 4/3/2028) | 500,000 | 502,741 |
| Northeastern Pennsylvania Hospital & Education Authority (King’s College), 5.00% due 5/1/2030 - 5/1/2031 | 2,230,000 | 2,316,199 | |
| Pennsylvania (Pennsylvania Department of Transportation) EDFA AMT, 5.75% due 6/30/2048 | 1,000,000 | 1,109,828 | |
| Pennsylvania (Presbyterian Homes Obligated Group) EDFA, 4.00% due 7/1/2033 - 7/1/2046 | 2,800,000 | 2,702,772 | |
| a | Pennsylvania (Waste Management Obligated Group; Guaranty: Waste Management, Inc.) EDFA, 0.95% due 12/1/2033 (put 12/1/2026) | 1,500,000 | 1,381,785 |
| School District of Philadelphia (State Aid Withholding) GO, Series A, 5.00% due 9/1/2038 | 100,000 | 106,195 | |
| Rhode Island — 0.1% | |||
| Pawtucket Housing Authority, 5.50% due 9/1/2024 | 250,000 | 250,294 | |
| South Carolina — 2.5% | |||
| a | Patriots Energy Group Financing Agency (Guaranty: Royal Bank of Canada), Series B-1, 5.25% due 2/1/2054 (put 3/1/2031) | 1,350,000 | 1,461,252 |
| a | Patriots Energy Group Financing Agency (Guaranty: Sumitomo Mitsui Banking Corp.), Series A1, 5.25% due 10/1/2054 (put 8/1/2031) | 5,000,000 | 5,352,770 |
| a | South Carolina Jobs-EDA (Guaranty: International Paper Co.) AMT, Series A, 4.00% due 4/1/2033 (put 4/1/2026) | 1,000,000 | 1,000,377 |
| See notes to financial statements. | Thornburg Municipal Funds Semi-Annual Report | 49 |
Thornburg Strategic Municipal Income Fund | March 31, 2024 (Unaudited)
| ISSUER-DESCRIPTION | Principal Amount | VALUE | |
| Tennessee — 1.0% | |||
| Shelby County Health Educational & Housing Facility Board (Methodist Le Bonheur Healthcare), Series A, 5.00% due 5/1/2036 | $1,000,000 | $ 1,048,816 | |
| Tennessee Energy Acquisition Corp. (Gas Project; Guaranty: Goldman Sachs Group, Inc.), Series A, 5.25% due 9/1/2024 | 500,000 | 501,970 | |
| a | Tennessee Energy Acquisition Corp. (Tennessee Energy Acquisition Corp.; Guaranty: Goldman Sachs Group, Inc.), Series A, 5.00% due 5/1/2052 (put 11/1/2031) | 1,500,000 | 1,584,511 |
| Texas — 7.0% | |||
| City of Aubrey Jackson Ridge Public Improvement District (Insured: BAM)), 5.00% due 9/1/2045 | 1,000,000 | 1,056,589 | |
| City of Austin Airport System Revenue AMT, 5.00% due 11/15/2038 | 2,000,000 | 2,191,040 | |
| City of Dallas (Public Improvements) GO, 5.00% due 2/15/2031 | 1,930,000 | 1,957,613 | |
| City of Houston Airport System Revenue AMT, Series A, 4.00% due 7/1/2040 | 1,500,000 | 1,496,139 | |
| a | Denton (Insured: PSF-GTD) ISD GO, Series B, 2.00% due 8/1/2044 (pre-refunded 8/1/2024) | 65,000 | 64,651 |
| Greater Texas Cultural Education Facilities Finance Corp. (Fort County Bend), Series A, 4.00% due 3/1/2040 - 3/1/2041 | 2,000,000 | 2,024,699 | |
| Harris County Cultural Education Facilities Finance Corp. (Memorial Hermann Health System Obligated Group), Series A, 5.00% due 7/1/2052 | 1,500,000 | 1,597,305 | |
| Matagorda County Navigation District No. 1 (AEP Texas, Inc.) AMT, 4.25% due 5/1/2030 | 1,350,000 | 1,378,142 | |
| a | Mission Economic Development Corp. (Waste Management, Inc.; Guaranty: Waste Management Holdings) AMT, Series A, 4.25% due 6/1/2048 (put 6/3/2024) | 1,000,000 | 999,193 |
| Newark Higher Education Finance Corp. (Hughen Center, Inc.; Insured: PSF-GTD), Series A, 5.00% due 8/15/2052 | 500,000 | 527,244 | |
| Texas Municipal Gas Acquisition & Supply Corp. III (Guaranty: Macquarie Group Ltd.), 5.00% due 12/15/2029 | 1,435,000 | 1,512,137 | |
| a | Texas Municipal Gas Acquisition & Supply Corp. IV (Guaranty: BP plc), Series B, 5.50% due 1/1/2054 (put 1/1/2034) | 2,000,000 | 2,233,278 |
| Texas Private Activity Bond Surface Transportation Corp. (NTE Mobility Partners LLC) AMT, 5.50% due 12/31/2058 | 850,000 | 932,442 | |
| Texas State Technical College (Insured: AGM), Series A, 5.75% due 8/1/2047 | 545,000 | 622,867 | |
| Texas Transportation Commission (Central Texas Turnpike System), Series C, 5.00% due 8/15/2034 | 3,000,000 | 3,011,844 | |
| U. S. Virgin Islands — 0.2% | |||
| Matching Fund Special Purpose Securitization Corp., Series A, 5.00% due 10/1/2025 | 500,000 | 508,523 | |
| Utah — 0.7% | |||
| b | Utah Charter School Finance Authority (Freedom Academy Foundation), Series A, 5.00% due 6/15/2041 | 900,000 | 806,265 |
| Utah Charter School Finance Authority (Summit Academy, Inc.), Series A, 5.00% due 4/15/2039 - 4/15/2049 | 1,200,000 | 1,231,086 | |
| Virginia — 1.2% | |||
| Virginia Beach Development Authority (Westminster-Canterbury on Chesapeake Bay Obligated Group), Series A, 7.00% due 9/1/2053 | 1,000,000 | 1,121,854 | |
| Virginia HDA, | |||
| Series C, 4.70% due 7/1/2043 | 1,205,000 | 1,234,197 | |
| Series D, 4.70% due 8/1/2048 | 1,500,000 | 1,514,282 | |
| Washington — 1.2% | |||
| Washington Health Care Facilities Authority (CommonSpirit Health Obligated Group), Series A2, 5.00% due 8/1/2044 | 1,000,000 | 1,041,717 | |
| Washington State Housing Finance Commission (Eastside Retirement Association Obligated Group), | |||
| Series A, 5.00% due 7/1/2048 | 1,000,000 | 989,757 | |
| Series B-1, 4.75% due 7/1/2027 | 700,000 | 700,029 | |
| b | Washington State Housing Finance Commission (Seattle Academy of Arts & Sciences), 6.125% due 7/1/2053 | 900,000 | 989,020 |
| West Virginia — 0.5% | |||
| a | West Virginia (Kentucky Power Co.) EDA AMT, Series A, 4.70% due 4/1/2036 (put 6/17/2026) | 1,550,000 | 1,578,701 |
| Wisconsin — 2.9% | |||
| a | Public Finance Authority (Duke Energy Progress LLC) AMT, Series B, 4.00% due 10/1/2046 (put 10/1/2030) | 1,000,000 | 1,055,987 |
| Public Finance Authority (National Senior Communities Obligated Group), 4.00% due 1/1/2026 - 1/1/2032 | 2,270,000 | 2,234,599 | |
| Public Finance Authority (Texas Biomedical Research Institute), Series A, 4.00% due 6/1/2039 | 245,000 | 230,454 | |
| Public Finance Authority (United Methodist Retirement Homes, Inc. Obligated Group), Series A, 4.00% due 10/1/2035 - 10/1/2046 | 2,800,000 | 2,602,487 | |
| Wisconsin Health & Educational Facilities Authority (HOPE Christian Schools Obligated Group), 4.00% due 12/1/2051 | 1,700,000 | 1,227,896 | |
| Wisconsin Housing & EDA Housing Revenue, Series D, 4.85% due 11/1/2048 | 1,500,000 | 1,509,197 | |
| Total Long-Term Municipal Bonds — 95.6% (Cost $288,596,964) | 296,889,954 | ||
| Short-Term Municipal Bonds — 3.2% | |||
| New York — 2.6% | |||
| a | City of New York (SPA Barclays Bank plc) GO, Series B-5, 4.45% due 10/1/2046 (put 4/1/2024) | 290,000 | 290,000 |
| City of New York (SPA JP Morgan Chase Bank NA) GO, | |||
| a | Series 1, 4.55% due 3/1/2040 (put 4/1/2024) | 3,300,000 | 3,300,000 |
| a | Series F-6, 4.55% due 6/1/2044 (put 4/1/2024) | 650,000 | 650,000 |
| a | Metropolitan Transportation Authority (LOC Barclays Bank plc), Series 2012G-1, 4.45% due 11/1/2032 (put 4/1/2024) | 650,000 | 650,000 |
| a | New York City Transitional Finance Authority Future Tax Secured Revenue (SPA JP Morgan Chase Bank NA), Series B4, 4.55% due 8/1/2042 (put 4/1/2024) | 3,000,000 | 3,000,000 |
| Texas — 0.6% | |||
| a | Port of Port Arthur Navigation District (Motiva Enterprises LLC), 4.85% due 4/1/2040 (put 4/1/2024) | 1,875,000 | 1,875,000 |
| 50 | Thornburg Municipal Funds Semi-Annual Report | See notes to financial statements. |
| ISSUER-DESCRIPTION | Principal Amount | VALUE | |
| Total Short-Term Municipal Bonds — 3.2% (Cost $9,765,000) | 9,765,000 | ||
| Total Investments — 98.8% (Cost $298,361,964) | $306,654,954 | ||
| Other Assets Less Liabilities — 1.2% | 3,869,152 | ||
| Net Assets — 100.0% | $310,524,106 |
| Footnote Legend | |
| a | Variable, floating, step, or fixed to floating rate securities are securities for which interest rate changes are based on changes in a designated base rate or on a predetermined schedule. The rates shown are those in effect on March 31, 2024. |
| b | Securities exempt from registration under Rule 144A of the Securities Act of 1933, as amended. These securities are restricted but liquid and may only be resold in the ordinary course of business in transactions exempt from registration, normally to qualified institutional buyers. As of March 31, 2024, the aggregate value of these securities in the Fund’s portfolio was $12,941,886, representing 4.17% of the Fund’s net assets. |
To simplify the listings of securities, abbreviations are used per the table below:
| AGC | Insured by Assured Guaranty Corp. |
| AGM | Insured by Assured Guaranty Municipal Corp. |
| AMT | Alternative Minimum Tax |
| BAM | Insured by Build America Mutual Insurance Co. |
| COP | Certificates of Participation |
| DFA | Development Finance Authority/Agency |
| EDA | Economic Development Authority |
| EDFA | Economic Development Financing Authority |
| FNMA | Collateralized by Federal National Mortgage Association |
| GO | General Obligation |
| HDA | Housing Development Authority |
| HFA | Health Facilities Authority |
| HFFA | Health Facilities Financing Authority |
| IDA | Industrial Development Authority/Agency |
| ISD | Independent School District |
| LOC | Letter of Credit |
| Mtg | Mortgage |
| Natl-Re | Insured by National Public Finance Guarantee Corp. |
| PSF-GTD | Guaranteed by Permanent School Fund |
| Q-SBLF | Insured by Qualified School Bond Loan Fund |
| SONYMA | State of New York Mortgage Agency |
| SPA | Stand-by Purchase Agreement |
| TCRS | Transferable Custodial Receipts |
| USD | Unified School District |
| See notes to financial statements. | Thornburg Municipal Funds Semi-Annual Report | 51 |
Thornburg California Limited Term Municipal Fund | March 31, 2024 (Unaudited)
| ISSUER-DESCRIPTION | PRINCIPAL AMOUNT | VALUE | |
| LONG-TERM MUNICIPAL BONDS — 96.0% | |||
| Apple Valley Public Financing Authority (Insured: BAM), Series A, 4.00% due 6/1/2028 | $ 460,000 | $ 481,654 | |
| Bay Area Toll Authority (San Francisco Bay Area Toll Bridge), | |||
| a | Series A, 2.95% due 4/1/2047 (put 4/1/2026) | 5,465,000 | 5,387,862 |
| a | Series E, 4.05% (MUNIPSA + 0.41%) due 4/1/2056 (put 4/1/2028) | 1,000,000 | 968,337 |
| California (Cedars-Sinai Medical Center Obligated Group) HFFA, Series A, 5.00% due 8/15/2033 | 1,000,000 | 1,055,986 | |
| California (Children’s Hospital Los Angeles) HFFA, Series A, 5.00% due 8/15/2033 | 770,000 | 803,163 | |
| California (Episcopal Communities & Services for Seniors Obligated Group) HFFA, Series A, 3.85% due 11/15/2027 | 1,500,000 | 1,487,406 | |
| a | California (Kaiser Foundation Hospitals) HFFA, Series C, 5.00% due 6/1/2041 (put 11/1/2029) | 4,000,000 | 4,448,368 |
| California (Providence St. Joseph Health Obligated Group) HFFA, | |||
| a | Series B, 5.00% due 10/1/2039 (put 10/1/2027) | 300,000 | 313,001 |
| a | Series B-2, 4.00% due 10/1/2036 (put 10/1/2024) | 930,000 | 929,526 |
| California (St. Joseph Health System) HFFA, Series A, 5.00% due 7/1/2024 | 1,000,000 | 1,000,315 | |
| California (Stanford Health Care Obligated Group) HFFA, | |||
| Series A, | |||
| a | 3.00% due 8/15/2054 (put 8/15/2025) | 3,000,000 | 2,994,348 |
| 5.00% due 8/15/2033 | 1,500,000 | 1,823,518 | |
| a | California Community Choice Financing Authority (Guaranty: Deutsche Bank AG) (Green Bond), Series C, 5.25% due 1/1/2054 (put 10/1/2031) | 5,000,000 | 5,281,220 |
| a | California Community Choice Financing Authority (Guaranty: Goldman Sachs Group, Inc.), Series G, 5.25% due 11/1/2054 (put 4/1/2030) | 3,000,000 | 3,226,665 |
| California Community Choice Financing Authority (Guaranty: Goldman Sachs Group, Inc.) (Green Bond), | |||
| a | Series A, 4.00% due 10/1/2052 (put 12/1/2027) | 2,440,000 | 2,447,806 |
| a | Series A-1, 5.00% due 12/1/2053 (put 8/1/2029) | 500,000 | 527,560 |
| California Community Choice Financing Authority (Guaranty: Morgan Stanley Group) (Green Bond), | |||
| a | Series B-1, 4.00% due 2/1/2052 (put 8/1/2031) | 4,500,000 | 4,517,275 |
| a | Series E-1, 5.00% due 2/1/2054 (put 3/1/2031) | 7,000,000 | 7,483,854 |
| California Educational Facilities Authority (Art Center College of Design), Series A, 5.00% due 12/1/2033 | 375,000 | 415,355 | |
| a | California Housing Finance Agency, Series A-2, 3.60% due 8/1/2063 (put 8/1/2026) | 2,500,000 | 2,487,490 |
| a | California Housing Finance Agency (Del Sur Family Housing LP), Series V, 5.00% due 5/1/2054 (put 11/1/2026) | 3,500,000 | 3,604,517 |
| a,b | California Infrastructure & Economic Development Bank (DesertXpress Enterprises LLC) AMT, Series A, 3.95% due 1/1/2050 (put 1/30/2025) | 1,000,000 | 989,543 |
| a | California Infrastructure & Economic Development Bank (J Paul Getty Trust), Series B-2, 3.00% due 10/1/2047 (put 10/1/2026) | 1,195,000 | 1,191,282 |
| California Municipal Finance Authority (Aldersly; Insured: California Mtg Insurance), | |||
| Series B, | |||
| 3.75% due 11/15/2028 | 2,990,000 | 2,997,311 | |
| 4.00% due 11/15/2028 | 595,000 | 597,059 | |
| California Municipal Finance Authority (Ararat Home of Los Angeles, Inc.; Insured: California Mtg Insurance), 5.00% due 5/15/2033 - 5/15/2034 | 200,000 | 226,115 | |
| California Municipal Finance Authority (Biola University), 5.00% due 10/1/2027 | 430,000 | 442,540 | |
| California Municipal Finance Authority (CHF-Davis II LLC; Insured: BAM) (Green Bond), 5.00% due 5/15/2024 - 5/15/2031 | 2,695,000 | 2,865,908 | |
| California Municipal Finance Authority (CHF-Davis II LLC; Insured: BAM-TCRS), 5.00% due 5/15/2028 | 2,100,000 | 2,242,372 | |
| California Municipal Finance Authority (Congregational Homes, Inc. Obligated Group), Series B-1, 2.75% due 11/15/2027 | 520,000 | 509,750 | |
| California Municipal Finance Authority (Palomar Health Obligated Group; Insured: AGM) COP, Series A, 5.00% due 11/1/2027 - 11/1/2032 | 500,000 | 557,900 | |
| California Municipal Finance Authority (Republic Services, Inc.) AMT, | |||
| Series A, | |||
| a | 3.875% due 3/1/2054 (put 3/1/2034) | 2,000,000 | 1,996,152 |
| a | 4.375% due 9/1/2053 (put 9/1/2033) | 3,000,000 | 3,169,944 |
| a | Series B, 4.00% due 7/1/2051 (put 7/15/2024) | 3,000,000 | 2,997,891 |
| a | California Municipal Finance Authority (Waste Management of California, Inc.; Guaranty: Waste Management Holdings) AMT, 4.10% due 10/1/2045 (put 6/3/2024) | 3,000,000 | 2,995,974 |
| California Municipal Finance Authority (Waste Management, Inc.; Guaranty: Waste Management Holdings) AMT, | |||
| a | Series A, 4.125% due 10/1/2041 (put 10/1/2025) | 750,000 | 751,681 |
| a | Series B, 4.80% due 11/1/2041 (put 6/2/2025) | 1,000,000 | 1,006,019 |
| California Pollution Control Financing Authority (Guaranty: Waste Management, Inc.) AMT, Series A1, 3.375% due 7/1/2025 | 2,000,000 | 1,992,854 | |
| a,b | California Pollution Control Financing Authority (Republic Services, Inc.) AMT, 4.125% due 7/1/2043 (put 8/15/2024) | 3,000,000 | 3,001,020 |
| a | California Pollution Control Financing Authority (Waste Management, Inc.) AMT, Series A, 2.50% due 7/1/2031 (put 5/1/2024) | 1,125,000 | 1,121,048 |
| California State Public Works Board, Series C, 5.00% due 9/1/2033 | 1,500,000 | 1,805,580 | |
| California State Public Works Board (Correctional & Rehabilitation Facilities), Series A, 5.00% due 9/1/2024 | 3,580,000 | 3,605,701 | |
| a | California State University, Series B-3, 3.125% due 11/1/2051 (put 11/1/2026) | 4,200,000 | 4,188,521 |
| California Statewide Communities Development Authority (CHF-Irvine LLC), 5.00% due 5/15/2024 - 5/15/2027 | 1,500,000 | 1,514,194 | |
| California Statewide Communities Development Authority (CHF-Irvine LLC; Insured: BAM), 5.00% due 5/15/2032 | 2,420,000 | 2,705,860 | |
| a | California Statewide Communities Development Authority (Kaiser Foundation Hospitals), Series 2004-M-R, 5.00% due 4/1/2038 (put 11/1/2029) | 2,815,000 | 3,136,324 |
| California Statewide Communities Development Authority (Methodist Hospital of Southern California Obligated Group), 5.00% due 1/1/2031 | 200,000 | 210,366 | |
| California Statewide Communities Development Authority (Odd Fellows Home of California; Insured: California Mtg Insurance), Series A, 5.00% due 4/1/2026 - 4/1/2033 | 2,345,000 | 2,622,974 | |
| California Statewide Communities Development Authority (Southern California Edison Co.), | |||
| 52 | Thornburg Municipal Funds Semi-Annual Report | See notes to financial statements. |
| ISSUER-DESCRIPTION | PRINCIPAL AMOUNT | VALUE | |
| Series A, 1.75% due 9/1/2029 | $2,500,000 | $ 2,202,265 | |
| Series D, 4.50% due 11/1/2033 | 3,500,000 | 3,866,012 | |
| Calipatria (Educational Facilities; Insured: BAM) USD GO, Series B, Zero Coupon due 8/1/2025 | 1,380,000 | 1,294,662 | |
| Chino Basin Regional Financing Authority, Series B, 4.00% due 11/1/2025 | 650,000 | 657,345 | |
| City of Chula Vista (Police Facility Project) COP, 5.00% due 10/1/2024 | 1,700,000 | 1,714,817 | |
| City of Chula Vista Redevelopment Successor Agency (Insured: AGM), 5.00% due 10/1/2032 | 1,070,000 | 1,123,785 | |
| City of Colton Redevelopment Successor Agency (Multiple Redevelopment Project Areas; Insured: BAM), 5.00% due 8/1/2025 | 950,000 | 969,121 | |
| City of Fresno (Fresno Airport Revenue; Insured: BAM) AMT, Series A, 5.00% due 7/1/2030 - 7/1/2033 | 3,255,000 | 3,656,221 | |
| City of Los Angeles, 5.00% due 6/27/2024 | 4,700,000 | 4,711,571 | |
| City of Los Angeles Department of Airports AMT, | |||
| Series B, 5.00% due 5/15/2030 - 5/15/2032 | 4,600,000 | 4,889,312 | |
| Series C, 5.00% due 5/15/2031 | 400,000 | 424,431 | |
| Series D, 5.00% due 5/15/2033 | 5,435,000 | 6,082,803 | |
| City of Menlo Park Community Development Successor Agency (Las Pulgas Community Development Project; Insured: AGM), 5.00% due 10/1/2025 | 600,000 | 613,907 | |
| City of Rialto Redevelopment Agency (Merged Project Area; Insured: BAM), Series A, 5.00% due 9/1/2024 | 500,000 | 503,147 | |
| a | City of San Jose (Allied 1510 Parkmoor LP), Series F-2, 5.00% due 6/1/2027 (put 6/1/2026) | 2,000,000 | 2,051,642 |
| City of San Mateo (San Mateo Community Facilities District No. 2008-1; Insured: BAM), 5.00% due 9/1/2027 - 9/1/2032 | 3,915,000 | 4,321,840 | |
| City of Stockton Redevelopment Successor Agency (Redevelopment of Midtown, North & South Stockton & Waterfront Areas; Insured: AGM), Series A, 5.00% due 9/1/2025 - 9/1/2027 | 2,155,000 | 2,224,594 | |
| City of Victorville Electric Revenue, Series A, 5.00% due 5/1/2028 - 5/1/2032 | 1,090,000 | 1,220,319 | |
| Commerce CDC Successor Agency (Multiple Redevelopment Project Areas; Insured: AGM), Series A, 5.00% due 8/1/2027 | 1,760,000 | 1,834,010 | |
| County of Sacramento CA Airport System Revenue AMT, Series C, 5.00% due 7/1/2027 | 1,925,000 | 2,021,048 | |
| Elk Grove Finance Authority (Poppy Ridge CFD No. 2003-1 & East Franklin CFD No. 2002-1), 5.00% due 9/1/2025 | 750,000 | 764,825 | |
| Fremont Union High School District GO, 5.00% due 8/1/2025 | 500,000 | 514,105 | |
| Guam Power Authority (Electric Power System), Series A, 5.00% due 10/1/2027 | 1,230,000 | 1,281,328 | |
| Guam Waterworks Authority (Water & Wastewater System), 5.00% due 7/1/2025 - 7/1/2027 | 1,735,000 | 1,787,897 | |
| Hacienda La Puente (Educational Facilities; Insured: AGM) USD COP, Series C, 5.00% due 6/1/2025 | 1,300,000 | 1,326,936 | |
| Indian Wells Redevelopment Successor Agency (Insured: Natl-Re), Series A, 5.00% due 9/1/2029 | 500,000 | 524,379 | |
| Indio Finance Authority (Insured: BAM), Series A, 5.00% due 11/1/2028 - 11/1/2032 | 1,815,000 | 2,078,670 | |
| Jurupa Public Financing Authority (Insured: AGM), 5.00% due 9/1/2030 - 9/1/2033 | 1,525,000 | 1,772,900 | |
| Lammersville Joint (Insured: BAM) USD, 5.00% due 9/1/2028 - 9/1/2032 | 4,055,000 | 4,640,855 | |
| Lodi Public Financing Authority (Lodi Electric System Revenue; Insured: AGM), 5.00% due 9/1/2031 | 1,405,000 | 1,529,587 | |
| a | Los Angeles County Development Authority (2111 Firestone LP), Series E, 5.00% due 7/1/2043 (put 7/1/2026) | 2,605,000 | 2,667,893 |
| a | Los Angeles County Development Authority (Century Wlava 2 LP), Series C, 3.75% due 12/1/2046 (put 12/1/2026) | 2,500,000 | 2,495,125 |
| a | Los Angeles County Development Authority (VA Building 402 LP), Series F, 3.375% due 1/1/2046 (put 7/1/2026) | 3,855,000 | 3,814,522 |
| Los Angeles County Metropolitan Transportation Authority Sales Tax Revenue, Series A, 4.00% due 7/1/2033 | 1,200,000 | 1,202,124 | |
| Los Angeles Department of Water & Power, Series A, 5.00% due 7/1/2033 - 7/1/2034 | 2,500,000 | 2,542,692 | |
| Los Angeles Housing Authority (Collateralized: FNMA), Series A, 3.75% due 4/1/2034 | 3,000,000 | 2,997,702 | |
| Los Angeles USD COP, Series A, 5.00% due 10/1/2033 | 3,000,000 | 3,610,908 | |
| Los Angeles USD GO, Series A, 5.00% due 7/1/2024 | 4,600,000 | 4,620,410 | |
| Milpitas Redevelopment Successor Agency (Redevelopment Project Area No. 1), 5.00% due 9/1/2025 | 2,300,000 | 2,362,114 | |
| Moreno Valley Public Financing Authority (Public Improvements), 5.00% due 11/1/2024 | 1,455,000 | 1,469,844 | |
| Municipal Improvement Corp. (Los Angeles), Series B, 4.00% due 11/1/2033 | 1,225,000 | 1,260,407 | |
| Norman Y Mineta San Jose International Airport SJC AMT, Series A, 5.00% due 3/1/2025 - 3/1/2028 | 2,575,000 | 2,633,803 | |
| a | Northern California Energy Authority (Commodity Supply Revenue; Guaranty: Goldman Sachs Group, Inc.), Series A, 4.00% due 7/1/2049 (put 7/1/2024) | 2,000,000 | 1,999,726 |
| a,c | Northern California Energy Authority (Guaranty: Paclife Life Insurance Co.), Series A-1, 5.00% due 12/1/2054 | 1,000,000 | 1,067,957 |
| Oakland (County of Alameda Educational Facilities) USD GO, Series A, 5.00% due 8/1/2025 | 1,300,000 | 1,330,361 | |
| Peralta Community College District GO, 5.00% due 8/1/2031 - 8/1/2033 | 2,065,000 | 2,455,728 | |
| Pittsburg Redevelopment Successor Agency (Insured: AGM), Series A, 5.00% due 9/1/2024 - 9/1/2029 | 3,735,000 | 3,808,045 | |
| Poway Redevelopment Successor Agency (Paguay Redevelopment Project), Series A, 5.00% due 6/15/2025 | 4,665,000 | 4,767,336 | |
| Rancho Cucamonga Redevelopment Project Successor Agency (Rancho Redevelopment Project Area; Insured: AGM), 5.00% due 9/1/2024 | 2,000,000 | 2,012,586 | |
| Rancho Santa Fe Community Services District Financing Authority, Series A, 5.00% due 9/1/2025 | 1,745,000 | 1,779,493 | |
| Richmond County Redevelopment Successor Agency (Joint Powers Financing Authority & Harbour Redevelopment Project; Insured: BAM), Series A, 5.00% due 9/1/2024 | 450,000 | 452,782 | |
| Riverside County Public Financing Authority (Capital Facilities Project) ETM, 5.00% due 11/1/2025 | 1,000,000 | 1,031,097 | |
| Riverside County Redevelopment Successor Agency (Insured: AGM), Series B, 5.00% due 10/1/2030 | 500,000 | 512,130 | |
| Riverside County Redevelopment Successor Agency (Insured: BAM), Series B, 5.00% due 10/1/2030 | 750,000 | 768,136 | |
| Rosemead CDC Successor Agency (Rosemead Merged Project Area; Insured: BAM), 5.00% due 10/1/2024 - 10/1/2026 | 1,770,000 | 1,818,921 | |
| Sacramento City Schools Joint Power Financing Authority (Sacramento City USD Educational Facility Sublease; Insured: BAM), Series A, 5.00% due 3/1/2025 | 2,175,000 | 2,176,233 | |
| a | Sacramento Municipal Utility District, Series B, 5.00% due 8/15/2049 (put 10/15/2025) | 1,255,000 | 1,271,202 |
| San Diego (Educational System Capital Projects) USD GO, Series R-3, 5.00% due 7/1/2024 | 3,000,000 | 3,002,199 | |
| San Diego County Regional Airport Authority, Series A, 5.00% due 7/1/2033 | 500,000 | 561,554 | |
| See notes to financial statements. | Thornburg Municipal Funds Semi-Annual Report | 53 |
Thornburg California Limited Term Municipal Fund | March 31, 2024 (Unaudited)
| ISSUER-DESCRIPTION | PRINCIPAL AMOUNT | VALUE | |
| San Diego County Regional Airport Authority AMT, | |||
| Series B, 5.00% due 7/1/2030 - 7/1/2033 | $5,380,000 | $ 5,995,819 | |
| Series C, 5.00% due 7/1/2031 - 7/1/2033 | 2,560,000 | 2,821,384 | |
| San Francisco City & County Airport Comm-San Francisco International Airport AMT, Series A, 5.00% due 5/1/2032 | 3,000,000 | 3,277,095 | |
| San Marcos Redevelopment Successor Agency, Series A, 5.00% due 10/1/2033 | 1,000,000 | 1,033,775 | |
| San Mateo County Transit District Sales Tax Revenue, Series A, 5.00% due 6/1/2029 | 1,000,000 | 1,023,462 | |
| Santa Clara County Financing Authority (Multiple Facilities Projects), Series P, 5.00% due 5/15/2025 | 6,755,000 | 6,885,979 | |
| Santa Margarita Water District (Talega Community Facilities), Series A, 5.00% due 9/1/2027 | 350,000 | 370,267 | |
| Semitropic Water Storage Improvement District (Irrigation Water System; Insured: AGM), Series A, 5.00% due 12/1/2025 | 1,110,000 | 1,144,116 | |
| State of California GO, 5.00% due 8/1/2027 - 8/1/2033 | 2,640,000 | 2,828,120 | |
| Stockton Public Financing Authority (Stockton Water Revenue; Insured: BAM) (Green Bond), Series A, 5.00% due 10/1/2024 - 10/1/2027 | 2,130,000 | 2,228,611 | |
| Torrance USD GO, 4.25% due 8/1/2033 | 1,320,000 | 1,370,639 | |
| Tulare Public Financing Authority (Insured: BAM), 5.00% due 4/1/2027 - 4/1/2028 | 1,055,000 | 1,091,652 | |
| Tustin (Community Facilities District No. 97-1) USD, Series A, 5.00% due 9/1/2031 | 450,000 | 458,042 | |
| Tustin (Community Facilities; Insured: BAM) USD, Series A, 5.00% due 9/1/2033 | 1,500,000 | 1,530,153 | |
| Vallejo City (Insured: BAM) USD GO, 5.00% due 8/1/2032 | 460,000 | 532,920 | |
| Ventura County Public Financing Authority (Office Building Purchase & Improvements), Series B, 5.00% due 11/1/2024 | 1,060,000 | 1,060,721 | |
| TOTAL LONG-TERM MUNICIPAL BONDS — 96.0% (Cost $258,002,460) | $261,877,228 | ||
| SHORT-TERM MUNICIPAL BONDS — 2.4% | |||
| Regents of the University of California Medical Center Pooled Revenue, | |||
| a | Series B-1-REMK, 4.35% due 5/15/2032 (put 4/1/2024) | 4,750,000 | 4,750,000 |
| a | Series B-2-REMK, 4.45% due 5/15/2032 (put 4/1/2024) | 1,845,000 | 1,845,000 |
| TOTAL SHORT-TERM MUNICIPAL BONDS — 2.4% (Cost $6,595,000) | $ 6,595,000 | ||
| Total Investments — 98.4% (Cost $264,597,460) | $268,472,228 | ||
| Other Assets Less Liabilities — 1.6% | 4,245,079 | ||
| Net Assets — 100.0% | $272,717,307 | ||
| Footnote Legend | |
| a | Variable, floating, step, or fixed to floating rate securities are securities for which interest rate changes are based on changes in a designated base rate or on a predetermined schedule. The rates shown are those in effect on March 31, 2024. |
| b | Securities exempt from registration under Rule 144A of the Securities Act of 1933, as amended. These securities are restricted but liquid and may only be resold in the ordinary course of business in transactions exempt from registration, normally to qualified institutional buyers. As of March 31, 2024, the aggregate value of these securities in the Fund’s portfolio was $3,990,563, representing 1.46% of the Fund’s net assets. |
| c | When-issued security. |
To simplify the listings of securities, abbreviations are used per the table below:
| AGM | Insured by Assured Guaranty Municipal Corp. |
| AMT | Alternative Minimum Tax |
| BAM | Insured by Build America Mutual Insurance Co. |
| CDC | Community Development Commission |
| COP | Certificates of Participation |
| ETM | Escrowed to Maturity |
| FNMA | Collateralized by Federal National Mortgage Association |
| GO | General Obligation |
| HFFA | Health Facilities Financing Authority |
| Mtg | Mortgage |
| MUNIPSA | Securities Industry and Financial Markets Association (SIFMA) Municipal Swap Index |
| Natl-Re | Insured by National Public Finance Guarantee Corp. |
| TCRS | Transferable Custodial Receipts |
| USD | Unified School District |
| VA | Veterans Affairs |
| 54 | Thornburg Municipal Funds Semi-Annual Report | See notes to financial statements. |
Thornburg New Mexico Intermediate Municipal Fund | March 31, 2024 (Unaudited)
| ISSUER-DESCRIPTION | PRINCIPAL AMOUNT | VALUE | |
| LONG-TERM MUNICIPAL BONDS — 95.2% | |||
| Albuquerque Bernalillo County Water Utility Authority (2007 NMFA Loan & Joint Water & Sewer System Improvements), 5.00% due 7/1/2031 - 7/1/2032 | $2,500,000 | $ 2,556,151 | |
| Albuquerque Municipal School District No. 12 (Bernalillo & Sandoval Counties School Facilities) (State Aid Withholding) GO, | |||
| 5.00% due 8/1/2034 | 1,260,000 | 1,374,656 | |
| Series 2017, 5.00% due 8/1/2031 | 1,000,000 | 1,046,420 | |
| Albuquerque Municipal School District No. 12 (State Aid Withholding) GO, | |||
| Series 2017, 5.00% due 8/1/2028 | 600,000 | 626,204 | |
| Series A, 5.00% due 8/1/2032 | 1,100,000 | 1,244,982 | |
| City of Albuquerque (City Infrastructure Improvements) GRT, Series A, 5.00% due 7/1/2033 - 7/1/2034 | 2,300,000 | 2,360,362 | |
| City of Albuquerque GO, Series A, 5.00% due 7/1/2025 | 500,000 | 510,816 | |
| City of Albuquerque GRT, | |||
| Series B, 5.00% due 7/1/2040 | 500,000 | 564,396 | |
| Series C, 4.00% due 7/1/2032 | 1,215,000 | 1,240,181 | |
| City of Albuquerque Refuse Removal & Disposal Revenue, 5.00% due 7/1/2030 | 40,000 | 45,320 | |
| City of Albuquerque Transportation Infrastructure GRT, 4.00% due 7/1/2031 | 800,000 | 832,678 | |
| a | City of Farmington (Public Service Co. of New Mexico), Series D, 3.90% due 6/1/2040 (put 6/1/2028) | 2,035,000 | 2,030,912 |
| City of Las Cruces (Joint Utility System), 4.00% due 6/1/2028 | 475,000 | 483,260 | |
| City of Roswell (Joint Water & Sewer Improvement; Insured: BAM), 5.00% due 6/1/2026 - 6/1/2036 | 2,050,000 | 2,133,653 | |
| City of Roswell GRT, 4.00% due 8/1/2030 | 200,000 | 205,838 | |
| City of Santa Fe (El Castillo Retirement Residences Obligated Group), 4.50% due 5/15/2027 | 2,680,000 | 2,604,453 | |
| City of Santa Fe (Public Facilities) GRT, Series A, 5.00% due 6/1/2034 - 6/1/2038 | 1,870,000 | 2,030,751 | |
| City of Santa Fe Gasoline Tax GRT, 5.00% due 6/1/2024 - 6/1/2028 | 875,000 | 913,890 | |
| County of Bernalillo (Government Services) GRT, | |||
| 5.25% due 4/1/2027 | 215,000 | 222,947 | |
| Series B, 5.70% due 4/1/2027 | 2,085,000 | 2,208,947 | |
| County of Bernalillo (Government Services; Insured: AMBAC) GRT, 5.25% due 10/1/2025 | 3,850,000 | 3,963,925 | |
| County of Bernalillo (Government Services; Insured: Natl-Re) GRT, Series B, 5.70% due 4/1/2027 | 565,000 | 598,588 | |
| County of McKinley (Insured: BAM) GRT, 4.00% due 6/1/2043 | 750,000 | 751,085 | |
| County of San Juan (County Capital Improvements) GRT, Series B, 5.00% due 6/15/2028 - 6/15/2030 | 2,645,000 | 2,652,847 | |
| County of Santa Fe (County Correctional System; Insured: AGM), 6.00% due 2/1/2027 | 595,000 | 620,506 | |
| County of Santa Fe GO, 4.25% due 7/1/2038 | 1,065,000 | 1,128,596 | |
| Guam Power Authority, Series A, 5.00% due 10/1/2042 | 1,750,000 | 1,843,627 | |
| Guam Power Authority (Electric Power System), Series A, 5.00% due 10/1/2024 | 500,000 | 501,859 | |
| Hobbs School District No. 16 (State Aid Withholding) GO, | |||
| 5.00% due 9/15/2028 - 9/15/2030 | 1,355,000 | 1,487,646 | |
| Series A, 5.00% due 9/15/2028 (pre-refunded 9/15/2024) | 1,000,000 | 1,006,542 | |
| Lea County Public School District No. 8 Eunice (State Aid Withholding) GO, 5.00% due 9/15/2032 - 9/15/2033 (pre-refunded 9/15/2029) | 2,185,000 | 2,442,955 | |
| New Mexico Educational Assistance Foundation AMT, Series 1A, 5.00% due 9/1/2029 | 2,600,000 | 2,809,903 | |
| New Mexico Finance Authority, Series D, 5.00% due 6/1/2040 | 845,000 | 914,916 | |
| New Mexico Finance Authority (Public Project Revolving Fund), | |||
| Series B, | |||
| 4.00% due 6/1/2029 - 6/1/2030 | 2,425,000 | 2,453,768 | |
| 5.00% due 6/1/2043 | 1,000,000 | 1,114,511 | |
| Series D, 4.00% due 6/1/2033 - 6/1/2034 | 5,245,000 | 5,352,556 | |
| New Mexico Finance Authority (State Highway Infrastructure), Series A, 5.00% due 6/15/2026 - 6/15/2027 | 2,415,000 | 2,422,222 | |
| New Mexico Finance Authority (State of New Mexico Department of Transportation), Series A, 5.00% due 6/15/2025 - 6/15/2026 | 1,230,000 | 1,275,801 | |
| New Mexico Hospital Equipment Loan Council (Haverland Carter Lifestyle Obligated Group), Series A, 5.00% due 7/1/2034 | 375,000 | 342,267 | |
| New Mexico Hospital Equipment Loan Council (Presbyterian Healthcare Services Obligated Group), | |||
| 5.00% due 8/1/2031 (pre-refunded 8/1/2025) | 600,000 | 611,898 | |
| Series A, | |||
| 4.00% due 8/1/2036 - 8/1/2037 | 3,965,000 | 4,022,821 | |
| 5.00% due 8/1/2039 | 1,440,000 | 1,544,030 | |
| New Mexico Institute of Mining & Technology (Campus Buildings Acquisition & Improvements; Insured: AGM), 4.00% due 12/1/2040 | 700,000 | 711,437 | |
| New Mexico Mortgage Finance Authority (Collateralized: GNMA, FNMA, FHLMC), | |||
| Series A Class I, 4.50% due 9/1/2044 | 220,000 | 220,310 | |
| Series A, 4.25% due 9/1/2043 | 995,000 | 966,730 | |
| Series B, 4.55% due 9/1/2043 | 1,485,000 | 1,544,694 | |
| Series C, | |||
| 2.85% due 7/1/2031 | 370,000 | 358,472 | |
| 4.55% due 9/1/2043 | 2,220,000 | 2,306,678 | |
| Series F, 2.85% due 7/1/2039 | 775,000 | 652,576 | |
| a | New Mexico Mortgage Finance Authority (JLG Central 217 LLLP), 0.53% due 11/1/2024 (put 5/1/2024) | 500,000 | 498,466 |
| a | New Mexico Mortgage Finance Authority (JLG SAF 2023 LLLP), 5.00% due 2/1/2042 (put 6/1/2025) | 1,000,000 | 1,004,485 |
| See notes to financial statements. | Thornburg Municipal Funds Semi-Annual Report | 55 |
Thornburg New Mexico Intermediate Municipal Fund | March 31, 2024 (Unaudited)
| ISSUER-DESCRIPTION | PRINCIPAL AMOUNT | VALUE | |
| New Mexico Municipal Energy Acquisition Authority (Guaranty: Royal Bank of Canada), | |||
| Series A, | |||
| 4.00% due 11/1/2024 | $1,500,000 | $ 1,497,662 | |
| a | 5.00% due 11/1/2039 (put 5/1/2025) | 1,000,000 | 1,014,104 |
| Regents of New Mexico State University (Campus Buildings Acquisition & Improvements), | |||
| Series A, | |||
| 4.50% due 6/1/2034 - 6/1/2036 | 4,500,000 | 4,661,593 | |
| 5.00% due 4/1/2032 - 4/1/2036 | 4,280,000 | 4,531,033 | |
| Rio Rancho Public School District No. 94 (State Aid Withholding) GO, Series A, 5.00% due 8/1/2026 | 1,085,000 | 1,131,897 | |
| Santa Fe Public School District (State Aid Withholding) GO, 5.00% due 8/1/2026 - 8/1/2033 | 2,650,000 | 2,981,300 | |
| State of New Mexico GO, 5.00% due 3/1/2025 | 2,040,000 | 2,073,701 | |
| State of New Mexico Severance Tax Permanent Fund, | |||
| 5.00% due 7/1/2028 | 465,000 | 506,254 | |
| Series A, 5.00% due 7/1/2025 - 7/1/2029 | 1,500,000 | 1,577,005 | |
| Town of Silver City (Insured: BAM) GRT, 5.00% due 6/1/2037 | 610,000 | 667,493 | |
| University of New Mexico, Series A, 4.00% due 6/1/2032 | 385,000 | 393,724 | |
| University of New Mexico (Insured: AGM), 4.375% due 6/1/2043 | 1,005,000 | 1,059,063 | |
| TOTAL LONG-TERM MUNICIPAL BONDS — 95.2% (Cost $94,355,114) | $ 95,458,363 | ||
| SHORT-TERM MUNICIPAL BONDS — 2.8% | |||
| a | New Mexico Hospital Equipment Loan Council (Presbyterian Healthcare Services Obligated Group; SPA JP Morgan Chase Bank NA), Series B, 4.40% due 8/1/2034 (put 4/1/2024) | 2,800,000 | 2,800,000 |
| TOTAL SHORT-TERM MUNICIPAL BONDS — 2.8% (Cost $2,800,000) | $ 2,800,000 | ||
| Total Investments — 98.0% (Cost $97,155,114) | $ 98,258,363 | ||
| Other Assets Less Liabilities — 2.0% | 1,986,134 | ||
| Net Assets — 100.0% | $100,244,497 | ||
| Footnote Legend | |
| a | Variable, floating, step, or fixed to floating rate securities are securities for which interest rate changes are based on changes in a designated base rate or on a predetermined schedule. The rates shown are those in effect on March 31, 2024. |
To simplify the listings of securities, abbreviations are used per the table below:
| AGM | Insured by Assured Guaranty Municipal Corp. |
| AMBAC | Insured by American Municipal Bond Assurance Corp. |
| AMT | Alternative Minimum Tax |
| BAM | Insured by Build America Mutual Insurance Co. |
| FHLMC | Collateralized by Federal Home Loan Mortgage Corp. |
| FNMA | Collateralized by Federal National Mortgage Association |
| GNMA | Collateralized by Government National Mortgage Association |
| GO | General Obligation |
| GRT | Gross Receipts Tax |
| Natl-Re | Insured by National Public Finance Guarantee Corp. |
| SPA | Stand-by Purchase Agreement |
| 56 | Thornburg Municipal Funds Semi-Annual Report | See notes to financial statements. |
Thornburg New York Intermediate Municipal Fund | March 31, 2024 (Unaudited)
| ISSUER-DESCRIPTION | PRINCIPAL AMOUNT | VALUE | |
| LONG-TERM MUNICIPAL BONDS — 93.8% | |||
| City of Long Beach (Insured: BAM) GO, Series B, 5.25% due 7/15/2042 | $ 500,000 | $ 553,575 | |
| City of New York (City Budget Financial Management) GO, Series G, 5.00% due 8/1/2030 | 1,000,000 | 1,001,225 | |
| City of New York GO, Series A, 5.00% due 8/1/2043 | 800,000 | 879,914 | |
| City of Yonkers (Insured: AGM) GO, Series C, 5.00% due 3/15/2025 | 350,000 | 355,545 | |
| Dutchess County Local Development Corp. (Tompkins Terrace Housing LP; Collateralized: FNMA), 5.00% due 10/1/2040 | 500,000 | 542,253 | |
| Guam Power Authority, Series A, 5.00% due 10/1/2042 | 250,000 | 263,375 | |
| Guam Power Authority (Electric Power System), Series A, 5.00% due 10/1/2024 | 250,000 | 250,930 | |
| Guam Waterworks Authority (Water & Wastewater System), 5.00% due 7/1/2028 | 500,000 | 501,186 | |
| Hudson Yards Infrastructure Corp. (Hudson Yards Subway Station), Series A, 5.00% due 2/15/2035 | 1,000,000 | 1,053,406 | |
| Long Island Power Authority (Electric System Capital Improvements; Insured: AGC), Series C, 5.25% due 9/1/2029 | 645,000 | 717,437 | |
| Metropolitan Transportation Authority, | |||
| Series A-1, 5.00% due 11/15/2040 | 205,000 | 207,233 | |
| Series D-1, 5.00% due 11/15/2031 | 1,000,000 | 1,029,366 | |
| Monroe County (Monroe Community College Association, Inc.; Insured: AGM) IDC, 5.00% due 1/15/2028 - 1/15/2029 | 550,000 | 550,442 | |
| Nassau County Sewer & Storm Water Finance Authority (Sewerage & Storm Water Resource Facilities), Series A, 5.00% due 10/1/2028 - 10/1/2031 | 1,400,000 | 1,411,984 | |
| New York City Housing Development Corp., Series G, 4.60% due 11/1/2043 | 250,000 | 252,072 | |
| New York City Housing Development Corp. (CSA Preservation Partners LLC), Series A, 4.45% due 8/1/2043 | 200,000 | 200,162 | |
| New York City Municipal Water Finance Authority (New York City Water & Sewer System), | |||
| Series AA-2, 4.00% due 6/15/2042 | 350,000 | 351,385 | |
| Series EE, 4.00% due 6/15/2042 | 250,000 | 251,509 | |
| New York City Transitional Finance Authority Future Tax Secured Revenue, | |||
| Series A, 5.00% due 11/1/2036 | 1,000,000 | 1,125,869 | |
| Series A1, 5.00% due 8/1/2038 | 1,000,000 | 1,065,669 | |
| Series C, 5.00% due 11/1/2026 | 500,000 | 500,499 | |
| New York State Dormitory Authority (Barnard College), | |||
| Series A, | |||
| 4.00% due 7/1/2024 | 200,000 | 200,154 | |
| 5.00% due 7/1/2041 | 250,000 | 265,546 | |
| New York State Dormitory Authority (Insured: AGM) (State Aid Withholding), Series H, 5.00% due 10/1/2024 | 155,000 | 155,148 | |
| New York State Dormitory Authority (School District Financing Program; Insured: AGM) (State Aid Withholding), Series A, 5.00% due 10/1/2028 | 200,000 | 201,412 | |
| New York State Dormitory Authority (State Aid Withholding), Series A, 5.00% due 10/1/2032 - 10/1/2033 | 450,000 | 477,309 | |
| New York State Dormitory Authority (State of New York Personal Income Tax Revenue), | |||
| Series A, 4.00% due 3/15/2040 - 3/15/2042 | 750,000 | 757,006 | |
| Series E, 4.00% due 3/15/2039 | 350,000 | 357,529 | |
| New York State Dormitory Authority (State of New York Sales Tax Revenue), Series A-1, 4.00% due 3/15/2043 | 500,000 | 505,198 | |
| New York State Energy Research & Development Authority (New York State Electric & Gas Corp.), Series C, 4.00% due 4/1/2034 | 550,000 | 562,568 | |
| New York State Housing Finance Agency (Insured: SONYMA), Series C-1, 4.50% due 11/1/2043 | 250,000 | 252,164 | |
| Oneida County Local Development Corp. (Utica College), 5.00% due 7/1/2024 | 290,000 | 290,185 | |
| Port Authority of New York & New Jersey AMT, | |||
| Series 186, 5.00% due 10/15/2037 | 500,000 | 503,648 | |
| Series 238, 5.00% due 7/15/2040 | 400,000 | 438,770 | |
| Sales Tax Asset Receivable Corp. (New York Local Government Assistance Corp.), Series A, 5.00% due 10/15/2029 - 10/15/2031 (pre-refunded 10/15/2024) | 1,250,000 | 1,260,299 | |
| Tompkins County Development Corp. (Ithaca College), 5.00% due 7/1/2027 - 7/1/2034 | 610,000 | 632,147 | |
| Triborough Bridge & Tunnel Authority, Series A, 5.00% due 11/15/2033 | 250,000 | 255,623 | |
| Triborough Bridge & Tunnel Authority (MTA Bridges & Tunnels), | |||
| Series A, | |||
| 5.00% due 11/15/2028 (pre-refunded 5/15/2024) | 1,000,000 | 1,001,740 | |
| 5.00% due 11/15/2029 | 1,000,000 | 1,002,233 | |
| Troy Capital Resource Corp. (Rensselaer Polytechnic Institute), Series A, 5.00% due 9/1/2033 | 645,000 | 712,902 | |
| Westchester County Local Development Corp. (Miriam Osborn Memorial Home Association Obligated Group), 5.00% due 7/1/2034 | 200,000 | 208,069 | |
| TOTAL LONG-TERM MUNICIPAL BONDS — 93.8% (Cost $22,772,461) | $23,104,686 | ||
| SHORT-TERM MUNICIPAL BONDS — 5.1% | |||
| a | Metropolitan Transportation Authority (LOC Barclays Bank plc), Series 2012G-1, 4.45% due 11/1/2032 (put 4/1/2024) | 250,000 | 250,000 |
| a | New York City Municipal Water Finance Authority (New York City Water & Sewer System; SPA JP Morgan Chase Bank NA), Series AA-2, 4.55% due 6/15/2050 (put 4/1/2024) | 1,000,000 | 1,000,000 |
| TOTAL SHORT-TERM MUNICIPAL BONDS — 5.1% (Cost $1,250,000) | $ 1,250,000 | ||
| Total Investments — 98.9% (Cost $24,022,461) | $24,354,686 | ||
| See notes to financial statements. | Thornburg Municipal Funds Semi-Annual Report | 57 |
Thornburg New York Intermediate Municipal Fund | March 31, 2024 (Unaudited)
| ISSUER-DESCRIPTION | PRINCIPAL AMOUNT | VALUE | |
| Other Assets Less Liabilities — 1.1% | 259,028 | ||
| Net Assets — 100.0% | $24,613,714 | ||
| Footnote Legend | |
| a | Variable, floating, step, or fixed to floating rate securities are securities for which interest rate changes are based on changes in a designated base rate or on a predetermined schedule. The rates shown are those in effect on March 31, 2024. |
To simplify the listings of securities, abbreviations are used per the table below:
| AGC | Insured by Assured Guaranty Corp. |
| AGM | Insured by Assured Guaranty Municipal Corp. |
| AMT | Alternative Minimum Tax |
| BAM | Insured by Build America Mutual Insurance Co. |
| FNMA | Collateralized by Federal National Mortgage Association |
| GO | General Obligation |
| IDC | Industrial Development Corp. |
| LOC | Letter of Credit |
| SONYMA | State of New York Mortgage Agency |
| SPA | Stand-by Purchase Agreement |
| 58 | Thornburg Municipal Funds Semi-Annual Report | See notes to financial statements. |
March 31, 2024 (Unaudited)
| THORNBURG SHORT DURATION MUNICIPAL FUND | THORNBURG LIMITED TERM MUNICIPAL FUND | THORNBURG INTERMEDIATE MUNICIPAL FUND | THORNBURG STRATEGIC MUNICIPAL INCOME FUND | |
| ASSETS | ||||
| Investment in securities, at cost | $ 122,010,857 | $ 2,538,670,653 | $ 949,298,712 | $ 298,361,964 |
| Investments at value | 122,125,362 | 2,590,804,362 | 973,693,213 | 306,654,954 |
| Cash | 40,061 | 164,647 | 242,943 | 32,485 |
| Receivable for investments sold | 760,000 | 1,030,000 | 595,000 | - |
| Receivable for fund shares sold | - | 2,854,782 | 1,993,028 | 745,784 |
| Principal and interest receivable | 1,545,986 | 31,781,796 | 12,215,416 | 4,118,719 |
| Prepaid expenses and other assets | 26,319 | 61,623 | 98,395 | 48,096 |
| Total Assets | 124,497,728 | 2,626,697,210 | 988,837,995 | 311,600,038 |
| Liabilities | ||||
| Payable for investments purchased | 1,003,890 | 7,574,797 | 2,500,000 | 10,178 |
| Payable for fund shares redeemed | 46,414 | 4,907,361 | 1,445,795 | 872,299 |
| Payable to investment advisor and other affiliates | 36,517 | 1,245,624 | 438,979 | 129,362 |
| Accounts payable and accrued expenses | 40,621 | 1,034,962 | 77,694 | 51,956 |
| Dividends payable | 116,659 | 562,663 | 329,234 | 12,137 |
| Total Liabilities | 1,244,101 | 15,325,407 | 4,791,702 | 1,075,932 |
| Net Assets | $ 123,253,627 | $ 2,611,371,803 | $ 984,046,293 | $ 310,524,106 |
| NET ASSETS CONSIST OF | ||||
| Net capital paid in on shares of beneficial interest | $ 130,653,187 | $ 2,819,460,810 | $ 999,443,757 | $ 326,265,874 |
| Accumulated loss | (7,399,560) | (208,089,007) | (15,397,464) | (15,741,768) |
| Net Assets | $ 123,253,627 | $ 2,611,371,803 | $ 984,046,293 | $ 310,524,106 |
March 31, 2024 (Unaudited)
| THORNBURG SHORT DURATION MUNICIPAL FUND | THORNBURG LIMITED TERM MUNICIPAL FUND | THORNBURG INTERMEDIATE MUNICIPAL FUND | THORNBURG STRATEGIC MUNICIPAL INCOME FUND | |
| NET ASSET VALUE | ||||
| Class A Shares: | ||||
| Net assets applicable to shares outstanding | $ 6,885,689 | $ 566,431,153 | $ 261,453,742 | $ 69,553,216 |
| Shares outstanding | 578,933 | 41,696,769 | 19,703,349 | 4,934,552 |
| Net asset value and redemption price per share | $ 11.89 | $ 13.58 | $ 13.27 | $ 14.10 |
| Maximum offering price per share (net asset value, plus 2.25% of offering price) | $ 12.16 | $ 13.89 | $ 13.54 * | $ 14.39 * |
| Class C Shares: | ||||
| Net assets applicable to shares outstanding | - | 49,025,363 | 14,790,233 | 4,975,031 |
| Shares outstanding | - | 3,602,432 | 1,113,306 | 352,559 |
| Net asset value and redemption price per share** | - | 13.61 | 13.28 | 14.11 |
| Class C2 Shares: | ||||
| Net assets applicable to shares outstanding | - | 2,951,233 | 1,559,363 | - |
| Shares outstanding | - | 216,807 | 117,370 | - |
| Net asset value and redemption price per share** | - | 13.61 | 13.29 | - |
| Class I Shares: | ||||
| Net assets applicable to shares outstanding | 116,367,938 | 1,992,964,054 | 706,242,955 | 235,995,859 |
| Shares outstanding | 9,786,646 | 146,694,214 | 53,292,066 | 16,728,125 |
| Net asset value and redemption price per share | 11.89 | 13.59 | 13.25 | 14.11 |
| * | Net asset value, plus 2.00% of offering price. |
| ** | Redemption price per share is equal to net asset value less any applicable contingent deferred sales charge. |
March 31, 2024 (Unaudited)
| THORNBURG CALIFORNIA LIMITED TERM MUNICIPAL FUND | THORNBURG NEW MEXICO INTERMEDIATE MUNICIPAL FUND | THORNBURG NEW YORK INTERMEDIATE MUNICIPAL FUND | |
| ASSETS | |||
| Investment in securities, at cost | $ 264,597,460 | $ 97,155,114 | $ 24,022,461 |
| Investments at value | 268,472,228 | 98,258,363 | 24,354,686 |
| Cash | 13,926 | 1,055,608 | 1,449 |
| Receivable for investments sold | 2,585,000 | - | - |
| Receivable for fund shares sold | 209,743 | 219,585 | 1,452 |
| Principal and interest receivable | 3,294,656 | 1,231,666 | 311,988 |
| Prepaid expenses and other assets | 17,875 | 12,563 | 8,506 |
| Total Assets | 274,593,428 | 100,777,785 | 24,678,081 |
| Liabilities | |||
| Payable for investments purchased | 1,063,930 | - | - |
| Payable for fund shares redeemed | 517,567 | 411,907 | 13,396 |
| Payable to investment advisor and other affiliates | 112,582 | 69,186 | 8,151 |
| Accounts payable and accrued expenses | 104,769 | 42,688 | 33,873 |
| Dividends payable | 77,273 | 9,507 | 8,947 |
| Total Liabilities | 1,876,121 | 533,288 | 64,367 |
| Net Assets | $ 272,717,307 | $ 100,244,497 | $ 24,613,714 |
| NET ASSETS CONSIST OF | |||
| Net capital paid in on shares of beneficial interest | $ 287,000,732 | $ 104,371,614 | $ 25,605,490 |
| Accumulated loss | (14,283,425) | (4,127,117) | (991,776) |
| Net Assets | $ 272,717,307 | $ 100,244,497 | $ 24,613,714 |
March 31, 2024 (Unaudited)
| THORNBURG CALIFORNIA LIMITED TERM MUNICIPAL FUND | THORNBURG NEW MEXICO INTERMEDIATE MUNICIPAL FUND | THORNBURG NEW YORK INTERMEDIATE MUNICIPAL FUND | |
| NET ASSET VALUE | |||
| Class A Shares: | |||
| Net assets applicable to shares outstanding | $ 61,432,236 | $ 40,855,239 | $ 12,819,259 |
| Shares outstanding | 4,753,463 | 3,275,536 | 1,064,773 |
| Net asset value and redemption price per share | $ 12.92 | $ 12.47 | $ 12.04 |
| Maximum offering price per share (net asset value, plus 2.00% of offering price) | $ 13.22 * | $ 12.72 | $ 12.29 |
| Class C Shares: | |||
| Net assets applicable to shares outstanding | 1,962,985 | - | - |
| Shares outstanding | 151,751 | - | - |
| Net asset value and redemption price per share** | 12.94 | - | - |
| Class C2 Shares: | |||
| Net assets applicable to shares outstanding | 442,036 | - | - |
| Shares outstanding | 34,177 | - | - |
| Net asset value and redemption price per share** | 12.93 | - | - |
| Class D Shares: | |||
| Net assets applicable to shares outstanding | - | 8,049,339 | - |
| Shares outstanding | - | 645,071 | - |
| Net asset value and redemption price per share | - | 12.48 | - |
| Class I Shares: | |||
| Net assets applicable to shares outstanding | 208,880,050 | 51,339,919 | 11,794,455 |
| Shares outstanding | 16,146,259 | 4,118,104 | 979,591 |
| Net asset value and redemption price per share | 12.94 | 12.47 | 12.04 |
| * | Net asset value, plus 2.25% of offering price. |
| ** | Redemption price per share is equal to net asset value less any applicable contingent deferred sales charge. |
Six Months Ended March 31, 2024 (Unaudited)
| THORNBURG SHORT DURATION MUNICIPAL FUND | THORNBURG LIMITED TERM MUNICIPAL FUND | THORNBURG INTERMEDIATE MUNICIPAL FUND | THORNBURG STRATEGIC MUNICIPAL INCOME FUND | |
| INVESTMENT INCOME | ||||
| Interest income | $ 2,418,522 | $ 50,440,746 | $ 19,147,127 | $ 6,622,850 |
| EXPENSES | ||||
| Investment management fees | 260,724 | 4,476,475 | 2,212,471 | 1,142,472 |
| Administration fees | 57,368 | 1,213,254 | 408,135 | 134,039 |
| Distribution and service fees | ||||
| Class A Shares | 10,198 | 736,830 | 329,085 | 83,125 |
| Class C Shares | - | 132,949 | 46,917 | 15,233 |
| Class C2 Shares | - | 10,294 | 5,814 | - |
| Transfer agent fees | ||||
| Class A Shares | 9,972 | 208,727 | 85,055 | 30,089 |
| Class C Shares | - | 21,139 | 7,496 | 3,610 |
| Class C2 Shares | - | 2,334 | 1,269 | - |
| Class I Shares | 24,338 | 755,416 | 192,467 | 108,619 |
| Registration and filing fees | ||||
| Class A Shares | 9,377 | 16,544 | 21,471 | 11,603 |
| Class C Shares | - | 8,780 | 8,100 | 8,243 |
| Class C2 Shares | - | 7,014 | 5,187 | - |
| Class I Shares | 9,601 | 27,069 | 30,309 | 12,336 |
| Custodian fees | 15,626 | 77,113 | 34,378 | 22,227 |
| Professional fees | 23,391 | 43,951 | 28,622 | 26,990 |
| Trustee and officer fees | 4,843 | 95,606 | 30,147 | 9,733 |
| Other expenses | 7,697 | 87,072 | 36,998 | 17,688 |
| Total Expenses | 433,135 | 7,920,567 | 3,483,921 | 1,626,007 |
| Less: | ||||
| Expenses reimbursed | (97,033) | (6,875) | (736,579) | (316,468) |
| Investment management fees waived | - | - | - | (320,126) |
| Net Expenses | 336,102 | 7,913,692 | 2,747,342 | 989,413 |
| Net Investment Income (Loss) | $ 2,082,420 | $ 42,527,054 | $ 16,399,785 | $ 5,633,437 |
| REALIZED AND UNREALIZED GAIN (LOSS) | ||||
| Net realized gain (loss) | (291,615) | (18,163,707) | (2,296,900) | (930,095) |
| Net change in unrealized appreciation (depreciation) | 1,883,794 | 104,459,624 | 39,299,715 | 16,480,272 |
| Net Realized and Unrealized Gain (Loss) | 1,592,179 | 86,295,917 | 37,002,815 | 15,550,177 |
| Change in Net Assets Resulting from Operations | $ 3,674,599 | $ 128,822,971 | $ 53,402,600 | $ 21,183,614 |
| THORNBURG CALIFORNIA LIMITED TERM MUNICIPAL FUND | THORNBURG NEW MEXICO INTERMEDIATE MUNICIPAL FUND | THORNBURG NEW YORK INTERMEDIATE MUNICIPAL FUND | |
| INVESTMENT INCOME | |||
| Interest income | $ 4,888,183 | $ 1,822,524 | $ 461,386 |
| EXPENSES | |||
| Investment management fees | 695,032 | 259,880 | 61,892 |
| Administration fees | 122,332 | 45,743 | 10,893 |
| Distribution and service fees | |||
| Class A Shares | 80,466 | 54,318 | 16,196 |
| Class C Shares | 6,380 | - | - |
| Class C2 Shares | 1,113 | - | - |
| Class D Shares | - | 20,750 | - |
| Transfer agent fees | |||
| Class A Shares | 18,479 | 19,382 | 10,188 |
| Class C Shares | 3,736 | - | - |
| Class C2 Shares | 322 | - | - |
| Class D Shares | - | 4,294 | - |
| Class I Shares | 79,049 | 11,384 | 6,305 |
| Registration and filing fees | |||
| Class A Shares | 4,425 | 4,285 | 4,335 |
| Class C Shares | 2,874 | - | - |
| Class C2 Shares | 2,272 | - | - |
| Class D Shares | - | 2,991 | - |
| Class I Shares | 5,700 | 3,498 | 3,836 |
| Custodian fees | 19,934 | 14,059 | 10,729 |
| Professional fees | 24,520 | 23,235 | 22,811 |
| Trustee and officer fees | 9,631 | 3,571 | 840 |
| Other expenses | 14,046 | 8,300 | 5,086 |
| Total Expenses | 1,090,311 | 475,690 | 153,111 |
| Less: | |||
| Expenses reimbursed | (239,236) | (34,269) | (31,075) |
| Investment management fees waived | (81,808) | - | (18,370) |
| Net Expenses | 769,267 | 441,421 | 103,666 |
| Net Investment Income (Loss) | $ 4,118,916 | $ 1,381,103 | $ 357,720 |
| REALIZED AND UNREALIZED GAIN (LOSS) | |||
| Net realized gain (loss) | (638,897) | (672,450) | 18,155 |
| Net change in unrealized appreciation (depreciation) | 8,812,478 | 4,630,158 | 888,911 |
| Net Realized and Unrealized Gain (Loss) | 8,173,581 | 3,957,708 | 907,066 |
| Change in Net Assets Resulting from Operations | $ 12,292,497 | $ 5,338,811 | $ 1,264,786 |
| THORNBURG SHORT DURATION MUNICIPAL FUND | THORNBURG LIMITED TERM MUNICIPAL FUND | |||
| Six Months Ended March 31, 2024* | Year Ended September 30, 2023 | Six Months Ended March 31, 2024* | Year Ended September 30, 2023 | |
| INCREASE (DECREASE) IN NET ASSETS FROM | ||||
| OPERATIONS | ||||
| Net investment income (loss) | $ 2,082,420 | $ 4,314,666 | $ 42,527,054 | $ 88,174,231 |
| Net realized gain (loss) | (291,615) | (1,499,341) | (18,163,707) | (65,366,632) |
| Net change in unrealized appreciation (depreciation) | 1,883,794 | 1,661,186 | 104,459,624 | 62,076,109 |
| Net Increase (Decrease) in Net Assets Resulting from Operations | 3,674,599 | 4,476,511 | 128,822,971 | 84,883,708 |
| DIVIDENDS TO SHAREHOLDERS | ||||
| From distributable earnings | ||||
| Class A Shares | (152,703) | (374,436) | (8,593,487) | (16,547,402) |
| Class C Shares | - | - | (698,054) | (1,596,072) |
| Class C2 Shares | - | - | (38,418) | (81,757) |
| Class I Shares | (1,929,717) | (3,940,027) | (33,387,304) | (69,956,736) |
| FUND SHARE TRANSACTIONS | ||||
| Class A Shares | (6,853,805) | (6,545,486) | (63,014,013) | (142,496,782) |
| Class C Shares | - | - | (12,309,006) | (31,507,397) |
| Class C2 Shares | - | - | (667,556) | (1,181,993) |
| Class I Shares | (15,793,106) | (18,282,140) | (376,822,044) | (856,389,436) |
| Net Increase (Decrease) in Net Assets | (21,054,732) | (24,665,578) | (366,706,911) | (1,034,873,867) |
| NET ASSETS | ||||
| Beginning of Period | 144,308,359 | 168,973,937 | 2,978,078,714 | 4,012,952,581 |
| End of Period | $ 123,253,627 | $ 144,308,359 | $ 2,611,371,803 | $ 2,978,078,714 |
| * | Unaudited. |
| THORNBURG INTERMEDIATE MUNICIPAL FUND | THORNBURG STRATEGIC MUNICIPAL INCOME FUND | |||
| Six Months Ended March 31, 2024* | Year Ended September 30, 2023 | Six Months Ended March 31, 2024* | Year Ended September 30, 2023 | |
| INCREASE (DECREASE) IN NET ASSETS FROM | ||||
| OPERATIONS | ||||
| Net investment income (loss) | $ 16,399,785 | $ 28,744,462 | $ 5,633,437 | $ 10,058,287 |
| Net realized gain (loss) | (2,296,900) | (12,731,956) | (930,095) | (10,961,557) |
| Net change in unrealized appreciation (depreciation) | 39,299,715 | 6,007,875 | 16,480,272 | 8,710,314 |
| Net Increase (Decrease) in Net Assets Resulting from Operations | 53,402,600 | 22,020,381 | 21,183,614 | 7,807,044 |
| DIVIDENDS TO SHAREHOLDERS | ||||
| From distributable earnings | ||||
| Class A Shares | (4,452,356) | (8,456,757) | (1,176,653) | (1,982,075) |
| Class C Shares | (235,531) | (512,526) | (77,618) | (164,395) |
| Class C2 Shares | (26,901) | (40,311) | - | - |
| Class I Shares | (11,703,931) | (19,698,247) | (4,374,119) | (7,913,674) |
| FUND SHARE TRANSACTIONS | ||||
| Class A Shares | (12,738,231) | (7,187,354) | 5,309,784 | 5,667,489 |
| Class C Shares | (2,185,168) | (5,698,642) | (295,932) | (3,326,832) |
| Class C2 Shares | (13,467) | 1,826 | - | - |
| Class I Shares | 97,526,154 | 32,482,766 | (3,535,567) | (7,458,735) |
| Net Increase (Decrease) in Net Assets | 119,573,169 | 12,911,136 | 17,033,509 | (7,371,178) |
| NET ASSETS | ||||
| Beginning of Period | 864,473,124 | 851,561,988 | 293,490,597 | 300,861,775 |
| End of Period | $ 984,046,293 | $ 864,473,124 | $ 310,524,106 | $ 293,490,597 |
| * | Unaudited. |
| THORNBURG CALIFORNIA LIMITED TERM MUNICIPAL FUND | THORNBURG NEW MEXICO INTERMEDIATE MUNICIPAL FUND | |||
| Six Months Ended March 31, 2024* | Year Ended September 30, 2023 | Six Months Ended March 31, 2024* | Year Ended September 30, 2023 | |
| INCREASE (DECREASE) IN NET ASSETS FROM | ||||
| OPERATIONS | ||||
| Net investment income (loss) | $ 4,118,916 | $ 7,786,453 | $ 1,381,103 | $ 2,377,948 |
| Net realized gain (loss) | (638,897) | (6,411,427) | (672,450) | (2,676,994) |
| Net change in unrealized appreciation (depreciation) | 8,812,478 | 6,686,800 | 4,630,158 | 2,278,602 |
| Net Increase (Decrease) in Net Assets Resulting from Operations | 12,292,497 | 8,061,826 | 5,338,811 | 1,979,556 |
| DIVIDENDS TO SHAREHOLDERS | ||||
| From distributable earnings | ||||
| Class A Shares | (895,438) | (1,638,746) | (549,311) | (972,353) |
| Class C Shares | (31,812) | (85,110) | - | - |
| Class C2 Shares | (4,295) | (2,826) | - | - |
| Class D Shares | - | - | (94,687) | (164,159) |
| Class I Shares | (3,189,283) | (6,049,751) | (743,698) | (1,247,241) |
| FUND SHARE TRANSACTIONS | ||||
| Class A Shares | (7,799,577) | (11,698,219) | (7,516,530) | (6,615,029) |
| Class C Shares | (1,013,935) | (3,111,724) | - | - |
| Class C2 Shares | 292,287 | 12,376 | - | - |
| Class D Shares | - | - | (1,157,182) | (1,477,519) |
| Class I Shares | (2,265,515) | (72,022,974) | (3,059,180) | (4,924,956) |
| Net Increase (Decrease) in Net Assets | (2,615,071) | (86,535,148) | (7,781,777) | (13,421,701) |
| NET ASSETS | ||||
| Beginning of Period | 275,332,378 | 361,867,526 | 108,026,274 | 121,447,975 |
| End of Period | $ 272,717,307 | $ 275,332,378 | $ 100,244,497 | $ 108,026,274 |
| * | Unaudited. |
| THORNBURG NEW YORK INTERMEDIATE MUNICIPAL FUND | ||
| Six Months Ended March 31, 2024* | Year Ended September 30, 2023 | |
| INCREASE (DECREASE) IN NET ASSETS FROM | ||
| OPERATIONS | ||
| Net investment income (loss) | $ 357,720 | $ 677,913 |
| Net realized gain (loss) | 18,155 | (342,396) |
| Net change in unrealized appreciation (depreciation) | 888,911 | 212,562 |
| Net Increase (Decrease) in Net Assets Resulting from Operations | 1,264,786 | 548,079 |
| DIVIDENDS TO SHAREHOLDERS | ||
| From distributable earnings | ||
| Class A Shares | (177,488) | (335,662) |
| Class I Shares | (180,232) | (342,326) |
| FUND SHARE TRANSACTIONS | ||
| Class A Shares | (756,477) | (2,041,154) |
| Class I Shares | (745,964) | (2,455,088) |
| Net Increase (Decrease) in Net Assets | (595,375) | (4,626,151) |
| NET ASSETS | ||
| Beginning of Period | 25,209,089 | 29,835,240 |
| End of Period | $ 24,613,714 | $ 25,209,089 |
| * | Unaudited. |
March 31, 2024 (Unaudited)
March 31, 2024 (Unaudited)
| Class A | Class C | Class C2 | Class D | Class I | |
| Short Duration Municipal Fund | X | X | |||
| Limited Term Municipal Fund | X | X | X | X | |
| Intermediate Municipal Fund | X | X | X | X | |
| Strategic Municipal Income Fund | X | X | X | ||
| Limited Term California Fund | X | X | X | X | |
| Intermediate New Mexico Fund | X | X | X | ||
| Intermediate New York Fund | X | X |
March 31, 2024 (Unaudited)
March 31, 2024 (Unaudited)
| SHORT DURATION MUNICIPAL FUND | TOTAL | LEVEL 1 | LEVEL 2 | LEVEL 3 |
| Assets | ||||
| Investments in Securities | ||||
| Long-Term Municipal Bonds | $ 117,530,362 | $ — | $ 117,530,362 | $ — |
| Short-Term Municipal Bonds | 4,595,000 | — | 4,595,000 | — |
| Total Investments in Securities | $ 122,125,362 | $ — | $ 122,125,362 | $ — |
| Total Assets | $ 122,125,362 | $ — | $ 122,125,362 | $ — |
| LIMITED TERM MUNICIPAL FUND | TOTAL | LEVEL 1 | LEVEL 2 | LEVEL 3 |
| Assets | ||||
| Investments in Securities | ||||
| Long-Term Municipal Bonds | $ 2,511,294,362 | $ — | $ 2,511,294,362 | $ — |
| Short-Term Municipal Bonds | 79,510,000 | — | 79,510,000 | — |
| Total Investments in Securities | $ 2,590,804,362 | $ — | $ 2,590,804,362 | $ — |
| Total Assets | $ 2,590,804,362 | $ — | $ 2,590,804,362 | $ — |
| INTERMEDIATE MUNICIPAL FUND | TOTAL | LEVEL 1 | LEVEL 2 | LEVEL 3 |
| Assets | ||||
| Investments in Securities | ||||
| Long-Term Municipal Bonds | $ 907,123,213 | $ — | $ 907,123,213 | $ — |
| Short-Term Municipal Bonds | 66,570,000 | — | 66,570,000 | — |
| Total Investments in Securities | $ 973,693,213 | $ — | $ 973,693,213 | $ — |
| Total Assets | $ 973,693,213 | $ — | $ 973,693,213 | $— |
March 31, 2024 (Unaudited)
| STRATEGIC MUNICIPAL INCOME FUND | TOTAL | LEVEL 1 | LEVEL 2 | LEVEL 3 |
| Assets | ||||
| Investments in Securities | ||||
| Long-Term Municipal Bonds | $ 296,889,954 | $ — | $ 296,889,954 | $ — |
| Short-Term Municipal Bonds | 9,765,000 | — | 9,765,000 | — |
| Total Investments in Securities | $ 306,654,954 | $ — | $ 306,654,954 | $ — |
| Total Assets | $ 306,654,954 | $ — | $ 306,654,954 | $ — |
| LIMITED TERM CALIFORNIA FUND | TOTAL | LEVEL 1 | LEVEL 2 | LEVEL 3 |
| Assets | ||||
| Investments in Securities | ||||
| Long-Term Municipal Bonds | $ 261,877,228 | $ — | $ 261,877,228 | $ — |
| Short-Term Municipal Bonds | 6,595,000 | — | 6,595,000 | — |
| Total Investments in Securities | $ 268,472,228 | $ — | $ 268,472,228 | $ — |
| Total Assets | $ 268,472,228 | $ — | $ 268,472,228 | $ — |
| INTERMEDIATE NEW MEXICO FUND | TOTAL | LEVEL 1 | LEVEL 2 | LEVEL 3 |
| Assets | ||||
| Investments in Securities | ||||
| Long-Term Municipal Bonds | $ 95,458,363 | $ — | $ 95,458,363 | $ — |
| Short-Term Municipal Bonds | 2,800,000 | — | 2,800,000 | — |
| Total Investments in Securities | $ 98,258,363 | $ — | $ 98,258,363 | $ — |
| Total Assets | $ 98,258,363 | $ — | $ 98,258,363 | $ — |
| INTERMEDIATE NEW YORK FUND | TOTAL | LEVEL 1 | LEVEL 2 | LEVEL 3 |
| Assets | ||||
| Investments in Securities | ||||
| Long-Term Municipal Bonds | $ 23,104,686 | $ — | $ 23,104,686 | $ — |
| Short-Term Municipal Bonds | 1,250,000 | — | 1,250,000 | — |
| Total Investments in Securities | $ 24,354,686 | $ — | $ 24,354,686 | $ — |
| Total Assets | $ 24,354,686 | $ — | $ 24,354,686 | $— |
| SHORT DURATION MUNICIPAL FUND | LIMITED TERM MUNICIPAL FUND, LIMITED TERM CALIFORNIA FUND | INTERMEDIATE MUNICIPAL FUND, INTERMEDIATE NEW MEXICO FUND, INTERMEDIATE NEW YORK FUND | STRATEGIC MUNICIPAL INCOME FUND | ||||
| DAILY NET ASSETS | FEE RATE | DAILY NET ASSETS | FEE RATE | DAILY NET ASSETS | FEE RATE | DAILY NET ASSETS | FEE RATE |
| Up to $1 billion | 0.400% | Up to $500 million | 0.500% | Up to $500 million | 0.500% | Up to $500 million | 0.750% |
| Next $500 million | 0.300 | Next $500 million | 0.400 | Next $500 million | 0.450 | Next $500 million | 0.675 |
| Next $500 million | 0.250 | Next $500 million | 0.300 | Next $500 million | 0.400 | Next $500 million | 0.625 |
| Over $2 billion | 0.225 | Next $500 million | 0.250 | Next $500 million | 0.350 | Next $500 million | 0.575 |
| Over $2 billion | 0.225 | Over $2 billion | 0.275 | Over $2 billion | 0.500 | ||
March 31, 2024 (Unaudited)
| Effective Management Fee | |
| Short Duration Municipal Fund | 0.400% |
| Limited Term Municipal Fund | 0.325 |
| Intermediate Municipal Fund | 0.477 |
| Strategic Municipal Income Fund | 0.750 |
| Limited Term California Fund | 0.500 |
| Intermediate New Mexico Fund | 0.500 |
| Intermediate New York Fund | 0.500 |
| Administrative Services Fee Schedule | |
| Daily Net Assets | Fee Rate |
| Up to $20 billion | 0.100% |
| $20 billion to $40 billion | 0.075 |
| $40 billion to $60 billion | 0.040 |
| Over $60 billion | 0.030 |
| Commissions | CDSC fees | |
| Limited Term Municipal Fund | $ 792 | $ 677 |
| Intermediate Municipal Fund | 294 | 3,970 |
| Strategic Municipal Income Fund | 400 | 7 |
| Limited Term California Fund | — | 38 |
| Intermediate New Mexico Fund | (10) | — |
March 31, 2024 (Unaudited)
| Class A | Class C | Class C2 | Class D | Class I | |
| Short Duration Municipal Fund | 0.70% | —% | —% | —% | 0.50% |
| Limited Term Municipal Fund | — | — | 1.24 | — | — |
| Intermediate Municipal Fund | 0.72 | 1.09 | 1.09 | — | 0.48 |
| Strategic Municipal Income Fund | 0.81 | 1.28 | — | — | 0.59 |
| Limited Term California Fund | 0.74 | 1.02 | 1.02 | — | 0.49 |
| Intermediate New Mexico Fund | 0.99 | — | — | 1.24 | 0.67 |
| Intermediate New York Fund | 0.99 | — | — | — | 0.67 |
| Contractual: | Class A | Class C | Class C2 | Class D | Class I | Total |
| Short Duration Municipal Fund | $ 22,722 | $ — | $ — | $ — | $ 74,311 | $ 97,033 |
| Limited Term Municipal Fund | — | — | 6,875 | — | — | 6,875 |
| Intermediate Municipal Fund | 224,742 | 21,023 | 7,522 | — | 483,292 | 736,579 |
| Strategic Municipal Income Fund | 131,143 | 15,582 | — | — | 398,237 | 544,962 |
| Limited Term California Fund | 51,482 | 7,351 | 2,951 | — | 177,452 | 239,236 |
| Intermediate New Mexico Fund | 11,165 | — | — | 4,922 | 18,182 | 34,269 |
| Intermediate New York Fund | 15,745 | — | — | — | 15,330 | 31,075 |
| Voluntary: | Class A | Class C | Class C2 | Class D | Class I | Total |
| Strategic Municipal Income Fund | $ 20,024 | $ 1,525 | $ — | $ — | $ 70,083 | $ 91,632 |
| Limited Term California Fund | 18,960 | 750 | 101 | — | 61,997 | 81,808 |
| Intermediate New York Fund | 9,620 | — | — | — | 8,750 | 18,370 |
| Percentage of Direct Investments | |
| Short Duration Municipal Fund | 79.09% |
| Limited Term Municipal Fund | 6.36 |
| Intermediate Municipal Fund | 0.24 |
| Strategic Municipal Income Fund | 9.10 |
| Limited Term California Fund | — |
| Intermediate New Mexico Fund | 20.21 |
| Intermediate New York Fund | — |
March 31, 2024 (Unaudited)
| Purchases | Sales | Realized gains/(losses) | |
| Short Duration Municipal Fund | $ 3,271,810 | $ 14,029,689 | $ (173,961) |
| Limited Term Municipal Fund | 40,343,420 | 35,092,059 | (853,803) |
| Intermediate Municipal Fund | 35,559,414 | 1,705,365 | — |
| Strategic Municipal Income Fund | 1,640,749 | 10,406,783 | (70,880) |
| Limited Term California Fund | 4,822,158 | 13,255,736 | (115,788) |
| Intermediate New Mexico Fund | 513,483 | 11,918,143 | (659,877) |
| Intermediate New York Fund | 256,742 | — | — |
| Cost | Unrealized Appreciation | Unrealized Depreciation | Net Unrealized Appreciation (Depreciation) | |
| Short Duration Municipal Fund | $ 122,010,857 | $ 482,362 | $ (367,857) | $ 114,505 |
| Limited Term Municipal Fund | 2,538,670,653 | 55,677,074 | (3,543,365) | 52,133,709 |
| Intermediate Municipal Fund | 949,298,712 | 25,101,889 | (707,388) | 24,394,501 |
| Strategic Municipal Income Fund | 298,361,964 | 8,975,889 | (682,899) | 8,292,990 |
| Limited Term California Fund | 264,597,460 | 4,476,628 | (601,860) | 3,874,768 |
| Intermediate New Mexico Fund | 97,155,114 | 1,330,676 | (227,427) | 1,103,249 |
| Intermediate New York Fund | 24,022,461 | 361,572 | (29,347) | 332,225 |
| Cumulative Capital Losses | ||
| Short-Term | Long-Term | |
| Short Duration Municipal Fund | $ 3,947,201 | $ 3,275,445 |
| Limited Term Municipal Fund | 118,299,539 | 122,061,930 |
| Intermediate Municipal Fund | 17,165,976 | 20,086,313 |
| Strategic Municipal Income Fund | 11,135,633 | 11,816,023 |
| Limited Term California Fund | 7,102,984 | 10,423,994 |
| Intermediate New Mexico Fund | 743,719 | 3,795,743 |
| Intermediate New York Fund | 564,813 | 768,060 |
March 31, 2024 (Unaudited)
| SIX MONTHS ENDED March 31, 2024 | YEAR ENDED September 30, 2023 | |||
| SHORT DURATION MUNICIPAL FUND | SHARES | AMOUNT | SHARES | AMOUNT |
| Class A Shares | ||||
| Shares sold | 75,307 | $ 887,916 | 770,467 | $ 9,099,088 |
| Shares issued to shareholders in reinvestment of dividends | 12,221 | 145,290 | 30,366 | 360,159 |
| Shares repurchased | (664,033) | (7,887,011) | (1,348,494) | (16,004,733) |
| Net increase (decrease) | (576,505) | $ (6,853,805) | (547,661) | $ (6,545,486) |
| Class I Shares | ||||
| Shares sold | 117,514 | $ 1,392,890 | 5,612,475 | $ 66,530,697 |
| Shares issued to shareholders in reinvestment of dividends | 97,189 | 1,155,759 | 240,300 | 2,849,344 |
| Shares repurchased | (1,550,863) | (18,341,755) | (7,389,911) | (87,662,181) |
| Net increase (decrease) | (1,336,160) | $ (15,793,106) | (1,537,136) | $ (18,282,140) |
| SIX MONTHS ENDED March 31, 2024 | YEAR ENDED September 30, 2023 | |||
| LIMITED TERM MUNICIPAL FUND | SHARES | AMOUNT | SHARES | AMOUNT |
| Class A Shares | ||||
| Shares sold | 1,398,555 | $ 18,813,640 | 6,556,278 | $ 88,290,088 |
| Shares issued to shareholders in reinvestment of dividends | 578,193 | 7,822,677 | 1,121,568 | 15,086,727 |
| Shares repurchased | (6,644,720) | (89,650,330) | (18,280,941) | (245,873,597) |
| Net increase (decrease) | (4,667,972) | $ (63,014,013) | (10,603,095) | $ (142,496,782) |
| Class C Shares | ||||
| Shares sold | 92,239 | $ 1,254,758 | 371,585 | $ 5,009,348 |
| Shares issued to shareholders in reinvestment of dividends | 49,410 | 669,391 | 113,301 | 1,526,706 |
| Shares repurchased | (1,055,104) | (14,233,155) | (2,822,351) | (38,043,451) |
| Net increase (decrease) | (913,455) | $ (12,309,006) | (2,337,465) | $ (31,507,397) |
| Class C2 Shares | ||||
| Shares sold | 20,458 | $ 277,719 | 40,364 | $ 540,715 |
| Shares issued to shareholders in reinvestment of dividends | 2,836 | 38,418 | 6,067 | 81,756 |
| Shares repurchased | (72,622) | (983,693) | (133,724) | (1,804,464) |
| Net increase (decrease) | (49,328) | $ (667,556) | (87,293) | $ (1,181,993) |
| Class I Shares | ||||
| Shares sold | 17,977,632 | $ 242,731,677 | 63,184,332 | $ 850,921,981 |
| Shares issued to shareholders in reinvestment of dividends | 2,233,977 | 30,223,185 | 4,723,244 | 63,533,966 |
| Shares repurchased | (48,204,982) | (649,776,906) | (131,709,944) | (1,770,845,383) |
| Net increase (decrease) | (27,993,373) | $ (376,822,044) | (63,802,368) | $ (856,389,436) |
| SIX MONTHS ENDED March 31, 2024 | YEAR ENDED September 30, 2023 | |||
| INTERMEDIATE MUNICIPAL FUND | SHARES | AMOUNT | SHARES | AMOUNT |
| Class A Shares | ||||
| Shares sold | 1,642,750 | $ 21,542,365 | 5,073,658 | $ 66,223,527 |
| Shares issued to shareholders in reinvestment of dividends | 308,649 | 4,057,349 | 589,411 | 7,682,624 |
| Shares repurchased | (2,925,805) | (38,337,945) | (6,218,714) | (81,093,505) |
| Net increase (decrease) | (974,406) | $ (12,738,231) | (555,645) | $ (7,187,354) |
March 31, 2024 (Unaudited)
| SIX MONTHS ENDED March 31, 2024 | YEAR ENDED September 30, 2023 | |||
| INTERMEDIATE MUNICIPAL FUND | SHARES | AMOUNT | SHARES | AMOUNT |
| Class C Shares | ||||
| Shares sold | 53,421 | $ 700,248 | 291,664 | $ 3,802,556 |
| Shares issued to shareholders in reinvestment of dividends | 16,332 | 214,886 | 34,603 | 451,628 |
| Shares repurchased | (237,195) | (3,100,302) | (762,674) | (9,952,826) |
| Net increase (decrease) | (167,442) | $ (2,185,168) | (436,407) | $ (5,698,642) |
| Class C2 Shares | ||||
| Shares sold | 46,037 | $ 603,417 | 41,998 | $ 551,057 |
| Shares issued to shareholders in reinvestment of dividends | 2,040 | 26,902 | 3,098 | 40,438 |
| Shares repurchased | (48,620) | (643,786) | (45,707) | (589,669) |
| Net increase (decrease) | (543) | $ (13,467) | (611) | $ 1,826 |
| Class I Shares | ||||
| Shares sold | 15,343,359 | $ 201,656,807 | 23,818,200 | $ 310,040,322 |
| Shares issued to shareholders in reinvestment of dividends | 714,530 | 9,392,023 | 1,202,918 | 15,662,375 |
| Shares repurchased | (8,724,904) | (113,522,676) | (22,496,384) | (293,219,931) |
| Net increase (decrease) | 7,332,985 | $ 97,526,154 | 2,524,734 | $ 32,482,766 |
| SIX MONTHS ENDED March 31, 2024 | YEAR ENDED September 30, 2023 | |||
| STRATEGIC MUNICIPAL INCOME FUND | SHARES | AMOUNT | SHARES | AMOUNT |
| Class A Shares | ||||
| Shares sold | 706,285 | $ 9,750,107 | 1,778,612 | $ 24,523,113 |
| Shares issued to shareholders in reinvestment of dividends | 82,759 | 1,151,639 | 140,576 | 1,937,301 |
| Shares repurchased | (404,689) | (5,591,962) | (1,513,130) | (20,792,925) |
| Net increase (decrease) | 384,355 | $ 5,309,784 | 406,058 | $ 5,667,489 |
| Class C Shares | ||||
| Shares sold | 83,684 | $ 1,160,944 | 68,747 | $ 942,034 |
| Shares issued to shareholders in reinvestment of dividends | 5,244 | 72,986 | 11,464 | 158,006 |
| Shares repurchased | (109,354) | (1,529,862) | (320,725) | (4,426,872) |
| Net increase (decrease) | (20,426) | $ (295,932) | (240,514) | $ (3,326,832) |
| Class I Shares | ||||
| Shares sold | 3,828,082 | $ 52,915,844 | 9,311,440 | $ 128,025,135 |
| Shares issued to shareholders in reinvestment of dividends | 313,813 | 4,367,705 | 572,986 | 7,901,463 |
| Shares repurchased | (4,400,233) | (60,819,116) | (10,444,002) | (143,385,333) |
| Net increase (decrease) | (258,338) | $ (3,535,567) | (559,576) | $ (7,458,735) |
| SIX MONTHS ENDED March 31, 2024 | YEAR ENDED September 30, 2023 | |||
| LIMITED TERM CALIFORNIA FUND | SHARES | AMOUNT | SHARES | AMOUNT |
| Class A Shares | ||||
| Shares sold | 226,966 | $ 2,889,814 | 432,078 | $ 5,528,145 |
| Shares issued to shareholders in reinvestment of dividends | 60,491 | 777,672 | 111,835 | 1,428,549 |
| Shares repurchased | (891,195) | (11,467,063) | (1,457,276) | (18,654,913) |
| Net increase (decrease) | (603,738) | $ (7,799,577) | (913,363) | $ (11,698,219) |
March 31, 2024 (Unaudited)
| SIX MONTHS ENDED March 31, 2024 | YEAR ENDED September 30, 2023 | |||
| LIMITED TERM CALIFORNIA FUND | SHARES | AMOUNT | SHARES | AMOUNT |
| Class C Shares | ||||
| Shares sold | 1,115 | $ 14,404 | 12,919 | $ 164,839 |
| Shares issued to shareholders in reinvestment of dividends | 1,903 | 24,481 | 5,392 | 68,954 |
| Shares repurchased | (81,645) | (1,052,820) | (261,563) | (3,345,517) |
| Net increase (decrease) | (78,627) | $ (1,013,935) | (243,252) | $ (3,111,724) |
| Class C2 Shares | ||||
| Shares sold | 22,658 | $ 288,324 | 789 | $ 9,993 |
| Shares issued to shareholders in reinvestment of dividends | 333 | 4,295 | 221 | 2,825 |
| Shares repurchased | (26) | (332) | (34) | (442) |
| Net increase (decrease) | 22,965 | $ 292,287 | 976 | $ 12,376 |
| Class I Shares | ||||
| Shares sold | 4,690,822 | $ 59,837,731 | 6,688,914 | $ 85,430,741 |
| Shares issued to shareholders in reinvestment of dividends | 220,809 | 2,843,500 | 416,213 | 5,322,522 |
| Shares repurchased | (5,062,604) | (64,946,746) | (12,736,859) | (162,776,237) |
| Net increase (decrease) | (150,973) | $ (2,265,515) | (5,631,732) | $ (72,022,974) |
| SIX MONTHS ENDED March 31, 2024 | YEAR ENDED September 30, 2023 | |||
| INTERMEDIATE NEW MEXICO FUND | SHARES | AMOUNT | SHARES | AMOUNT |
| Class A Shares | ||||
| Shares sold | 45,251 | $ 564,771 | 131,430 | $ 1,630,549 |
| Shares issued to shareholders in reinvestment of dividends | 40,467 | 500,710 | 72,302 | 890,105 |
| Shares repurchased | (697,561) | (8,582,011) | (743,503) | (9,135,683) |
| Net increase (decrease) | (611,843) | $ (7,516,530) | (539,771) | $ (6,615,029) |
| Class D Shares | ||||
| Shares sold | 98 | $ 1,200 | 4,130 | $ 51,433 |
| Shares issued to shareholders in reinvestment of dividends | 6,450 | 79,840 | 11,529 | 142,000 |
| Shares repurchased | (101,221) | (1,238,222) | (135,532) | (1,670,952) |
| Net increase (decrease) | (94,673) | $ (1,157,182) | (119,873) | $ (1,477,519) |
| Class I Shares | ||||
| Shares sold | 270,304 | $ 3,351,294 | 357,813 | $ 4,431,166 |
| Shares issued to shareholders in reinvestment of dividends | 56,252 | 696,039 | 94,857 | 1,167,329 |
| Shares repurchased | (575,452) | (7,106,513) | (855,053) | (10,523,451) |
| Net increase (decrease) | (248,896) | $ (3,059,180) | (402,383) | $ (4,924,956) |
| SIX MONTHS ENDED March 31, 2024 | YEAR ENDED September 30, 2023 | |||
| INTERMEDIATE NEW YORK FUND | SHARES | AMOUNT | SHARES | AMOUNT |
| Class A Shares | ||||
| Shares sold | 7,567 | $ 88,797 | 55,967 | $ 661,805 |
| Shares issued to shareholders in reinvestment of dividends | 12,805 | 153,123 | 24,387 | 289,441 |
| Shares repurchased | (84,084) | (998,397) | (252,591) | (2,992,400) |
| Net increase (decrease) | (63,712) | $ (756,477) | (172,237) | $ (2,041,154) |
March 31, 2024 (Unaudited)
| SIX MONTHS ENDED March 31, 2024 | YEAR ENDED September 30, 2023 | |||
| INTERMEDIATE NEW YORK FUND | SHARES | AMOUNT | SHARES | AMOUNT |
| Class I Shares | ||||
| Shares sold | 155,977 | $ 1,858,177 | 375,693 | $ 4,462,151 |
| Shares issued to shareholders in reinvestment of dividends | 12,720 | 152,091 | 23,831 | 282,778 |
| Shares repurchased | (232,821) | (2,756,232) | (609,238) | (7,200,017) |
| Net increase (decrease) | (64,124) | $ (745,964) | (209,714) | $ (2,455,088) |
| Purchases | Sales | |
| Short Duration Municipal Fund | $ 30,114,616 | $ 44,713,870 |
| Limited Term Municipal Fund | 563,488,652 | 948,623,188 |
| Intermediate Municipal Fund | 198,217,490 | 139,046,011 |
| Strategic Municipal Income Fund | 39,721,473 | 43,354,345 |
| Limited Term California Fund | 64,648,468 | 68,064,883 |
| Intermediate New Mexico Fund | 6,620,903 | 19,874,695 |
| Intermediate New York Fund | 854,868 | 3,440,120 |
Short Duration Municipal Fund
| PER SHARE PERFORMANCE (FOR A SHARE OUTSTANDING THROUGHOUT THE PERIOD) | ||||||||||
| UNLESS OTHERWISE NOTED, PERIODS ARE FISCAL YEARS ENDED SEPTEMBER 30, | Net Asset Value, Beginning of PERIOD | Net Investment Income (Loss)+ | Net Realized & Unrealized Gain (Loss) on Investments | Total from Investment Operations | Dividends from Net Investment Income | Dividends from Net Realized Gains | Dividends from Return of Capital | Total Dividends | Net Asset Value, End of PERIOD | |
| CLASS A SHARES(b) | ||||||||||
| 2024 (c) | $ 11.76 | 0.18 | 0.13 | 0.31 | (0.18) | — | — | (0.18) | $ 11.89 | |
| 2023 | $ 11.77 | 0.27 | — | 0.27 | (0.28) | — | — | (0.28) | $ 11.76 | |
| 2022 | $ 12.33 | 0.09 | (0.57) | (0.48) | (0.08) | — | — | (0.08) | $ 11.77 | |
| 2021 | $ 12.37 | 0.03 | (0.04) | (0.01) | (0.03) | — | — | (0.03) | $ 12.33 | |
| 2020 | $ 12.36 | 0.13 | 0.01 | 0.14 | (0.13) | — | — | (0.13) | $ 12.37 | |
| 2019 | $ 12.27 | 0.16 | 0.09 | 0.25 | (0.16) | — | — | (0.16) | $ 12.36 | |
| CLASS I SHARES | ||||||||||
| 2024 (c) | $ 11.75 | 0.19 | 0.14 | 0.33 | (0.19) | — | — | (0.19) | $ 11.89 | |
| 2023 | $ 11.76 | 0.30 | (0.01) | 0.29 | (0.30) | — | — | (0.30) | $ 11.75 | |
| 2022 | $ 12.33 | 0.11 | (0.57) | (0.46) | (0.11) | — | — | (0.11) | $ 11.76 | |
| 2021 | $ 12.36 | 0.06 | (0.03) | 0.03 | (0.06) | — | — | (0.06) | $ 12.33 | |
| 2020 | $ 12.36 | 0.16 | (0.01) | 0.15 | (0.15) | — | — | (0.15) | $ 12.36 | |
| 2019 | $ 12.27 | 0.18 | 0.09 | 0.27 | (0.18) | — | — | (0.18) | $ 12.36 | |
| (a) | Not annualized for periods less than one year. |
| (b) | Sales loads are not reflected in computing total return. |
| (c) | Unaudited Six Month Period Ended March 31. |
| (d) | Annualized. |
| + | Based on weighted average shares outstanding. |
Short Duration Municipal Fund
| RATIOS TO AVERAGE NET ASSETS | Supplemental Data | ||||||
| UNLESS OTHERWISE NOTED, PERIODS ARE FISCAL YEARS ENDED SEPTEMBER 30, | Net Investment Income (Loss) (%) | Expenses, After Expense Reductions (%) | Expenses, Before Expense Reductions (%) | Total Return (%)(a) | Portfolio Turnover Rate (%)(a) | Net Assets at End of PERIOD (Thousands) | |
| CLASS A SHARES(b) | |||||||
| 2024 (c) | 2.99 (d) | 0.70 (d) | 1.15 (d) | 2.64 | 26.14 | $ 6,886 | |
| 2023 | 2.29 | 0.70 | 1.06 | 2.29 | 56.32 | $ 13,585 | |
| 2022 | 0.71 | 0.70 | 1.10 | (3.88) | 89.01 | $ 20,045 | |
| 2021 | 0.27 | 0.70 | 0.98 | (0.05) | 34.71 | $ 16,332 | |
| 2020 | 1.04 | 0.70 | 1.03 | 1.14 | 38.44 | $ 24,581 | |
| 2019 | 1.26 | 0.70 | 0.99 | 2.02 | 33.60 | $ 16,899 | |
| CLASS I SHARES | |||||||
| 2024 (c) | 3.21 (d) | 0.50 (d) | 0.62 (d) | 2.83 | 26.14 | $ 116,368 | |
| 2023 | 2.52 | 0.50 | 0.60 | 2.50 | 56.32 | $ 130,723 | |
| 2022 | 0.88 | 0.50 | 0.58 | (3.77) | 89.01 | $ 148,929 | |
| 2021 | 0.46 | 0.50 | 0.65 | 0.23 | 34.71 | $ 179,245 | |
| 2020 | 1.28 | 0.50 | 0.65 | 1.26 | 38.44 | $ 132,539 | |
| 2019 | 1.47 | 0.50 | 0.64 | 2.22 | 33.60 | $ 224,343 | |
Limited Term Municipal Fund
| PER SHARE PERFORMANCE (FOR A SHARE OUTSTANDING THROUGHOUT THE PERIOD) | ||||||||||
| UNLESS OTHERWISE NOTED, PERIODS ARE FISCAL YEARS ENDED SEPTEMBER 30, | Net Asset Value, Beginning of PERIOD | Net Investment Income (Loss)+ | Net Realized & Unrealized Gain (Loss) on Investments | Total from Investment Operations | Dividends from Net Investment Income | Dividends from Net Realized Gains | Dividends from Return of Capital | Total Dividends | Net Asset Value, End of PERIOD | |
| CLASS A SHARES(b) | ||||||||||
| 2024 (c) | $ 13.19 | 0.20 | 0.39 | 0.59 | (0.20) | — | — | (0.20) | $ 13.58 | |
| 2023 | $ 13.26 | 0.32 | (0.06) | 0.26 | (0.33) | — | — | (0.33) | $ 13.19 | |
| 2022 | $ 14.51 | 0.21 | (1.25) | (1.04) | (0.21) | — | — | (0.21) | $ 13.26 | |
| 2021 | $ 14.64 | 0.19 | (0.13) | 0.06 | (0.19) | — | — | (0.19) | $ 14.51 | |
| 2020 | $ 14.46 | 0.24 | 0.18 | 0.42 | (0.24) | — | — | (0.24) | $ 14.64 | |
| 2019 | $ 14.10 | 0.26 | 0.36 | 0.62 | (0.26) | — | — | (0.26) | $ 14.46 | |
| CLASS C SHARES | ||||||||||
| 2024 (c) | $ 13.21 | 0.18 | 0.40 | 0.58 | (0.18) | — | — | (0.18) | $ 13.61 | |
| 2023 | $ 13.28 | 0.29 | (0.07) | 0.22 | (0.29) | — | — | (0.29) | $ 13.21 | |
| 2022 | $ 14.53 | 0.17 | (1.24) | (1.07) | (0.18) | — | — | (0.18) | $ 13.28 | |
| 2021 | $ 14.66 | 0.15 | (0.13) | 0.02 | (0.15) | — | — | (0.15) | $ 14.53 | |
| 2020 | $ 14.48 | 0.20 | 0.18 | 0.38 | (0.20) | — | — | (0.20) | $ 14.66 | |
| 2019 | $ 14.12 | 0.22 | 0.36 | 0.58 | (0.22) | — | — | (0.22) | $ 14.48 | |
| CLASS C2 SHARES | ||||||||||
| 2024 (c) | $ 13.21 | 0.16 | 0.40 | 0.56 | (0.16) | — | — | (0.16) | $ 13.61 | |
| 2023 | $ 13.28 | 0.26 | (0.07) | 0.19 | (0.26) | — | — | (0.26) | $ 13.21 | |
| 2022 | $ 14.54 | 0.14 | (1.26) | (1.12) | (0.14) | — | — | (0.14) | $ 13.28 | |
| 2021 (e) | $ 14.66 | 0.10 | (0.12) | (0.02) | (0.10) | — | — | (0.10) | $ 14.54 | |
| CLASS I SHARES | ||||||||||
| 2024 (c) | $ 13.19 | 0.21 | 0.40 | 0.61 | (0.21) | — | — | (0.21) | $ 13.59 | |
| 2023 | $ 13.26 | 0.35 | (0.06) | 0.29 | (0.36) | — | — | (0.36) | $ 13.19 | |
| 2022 | $ 14.51 | 0.24 | (1.25) | (1.01) | (0.24) | — | — | (0.24) | $ 13.26 | |
| 2021 | $ 14.64 | 0.22 | (0.13) | 0.09 | (0.22) | — | — | (0.22) | $ 14.51 | |
| 2020 | $ 14.46 | 0.27 | 0.18 | 0.45 | (0.27) | — | — | (0.27) | $ 14.64 | |
| 2019 | $ 14.10 | 0.29 | 0.36 | 0.65 | (0.29) | — | — | (0.29) | $ 14.46 | |
| (a) | Not annualized for periods less than one year. |
| (b) | Sales loads are not reflected in computing total return. |
| (c) | Unaudited Six Month Period Ended March 31. |
| (d) | Annualized. |
| (e) | Effective date of this class of shares was October 1, 2020. |
| + | Based on weighted average shares outstanding. |
Limited Term Municipal Fund
| RATIOS TO AVERAGE NET ASSETS | Supplemental Data | ||||||
| UNLESS OTHERWISE NOTED, PERIODS ARE FISCAL YEARS ENDED SEPTEMBER 30, | Net Investment Income (Loss) (%) | Expenses, After Expense Reductions (%) | Expenses, Before Expense Reductions (%) | Total Return (%)(a) | Portfolio Turnover Rate (%)(a) | Net Assets at End of PERIOD (Thousands) | |
| CLASS A SHARES(b) | |||||||
| 2024 (c) | 2.90 (d) | 0.76 (d) | 0.76 (d) | 4.46 | 21.33 | $ 566,431 | |
| 2023 | 2.40 | 0.74 | 0.74 | 1.91 | 37.26 | $ 611,338 | |
| 2022 | 1.51 | 0.71 | 0.71 | (7.20) | 37.69 | $ 755,222 | |
| 2021 | 1.28 | 0.69 | 0.69 | 0.39 | 22.29 | $ 978,221 | |
| 2020 | 1.63 | 0.69 | 0.69 | 2.91 | 20.62 | $ 942,857 | |
| 2019 | 1.80 | 0.69 | 0.69 | 4.41 | 21.22 | $ 915,684 | |
| CLASS C SHARES | |||||||
| 2024 (c) | 2.61 (d) | 1.05 (d) | 1.05 (d) | 4.39 | 21.33 | $ 49,025 | |
| 2023 | 2.15 | 0.98 | 0.98 | 1.66 | 37.26 | $ 59,652 | |
| 2022 | 1.23 | 0.97 | 0.97 | (7.43) | 37.69 | $ 91,018 | |
| 2021 | 1.00 | 0.97 | 0.97 | 0.11 | 22.29 | $ 146,806 | |
| 2020 | 1.39 | 0.94 | 0.94 | 2.65 | 20.62 | $ 231,226 | |
| 2019 | 1.56 | 0.94 | 0.94 | 4.16 | 21.22 | $ 325,144 | |
| CLASS C2 SHARES | |||||||
| 2024 (c) | 2.41 (d) | 1.24 (d) | 1.67 (d) | 4.29 | 21.33 | $ 2,951 | |
| 2023 | 1.89 | 1.24 | 1.67 | 1.39 | 37.26 | $ 3,516 | |
| 2022 | 0.99 | 1.24 | 1.48 | (7.74) | 37.69 | $ 4,695 | |
| 2021 (e) | 0.69 | 1.24 | 1.72 | (0.11) | 22.29 | $ 5,477 | |
| CLASS I SHARES | |||||||
| 2024 (c) | 3.15 (d) | 0.51 (d) | 0.51 (d) | 4.67 | 21.33 | $ 1,992,965 | |
| 2023 | 2.62 | 0.51 | 0.51 | 2.14 | 37.26 | $ 2,303,573 | |
| 2022 | 1.72 | 0.48 | 0.48 | (6.99) | 37.69 | $ 3,162,018 | |
| 2021 | 1.50 | 0.46 | 0.46 | 0.61 | 22.29 | $ 4,502,575 | |
| 2020 | 1.87 | 0.46 | 0.46 | 3.15 | 20.62 | $ 4,566,389 | |
| 2019 | 2.04 | 0.45 | 0.45 | 4.67 | 21.22 | $ 4,893,865 | |
Intermediate Municipal Fund
| PER SHARE PERFORMANCE (FOR A SHARE OUTSTANDING THROUGHOUT THE PERIOD) | ||||||||||
| UNLESS OTHERWISE NOTED, PERIODS ARE FISCAL YEARS ENDED SEPTEMBER 30, | Net Asset Value, Beginning of PERIOD | Net Investment Income (Loss)+ | Net Realized & Unrealized Gain (Loss) on Investments | Total from Investment Operations | Dividends from Net Investment Income | Dividends from Net Realized Gains | Dividends from Return of Capital | Total Dividends | Net Asset Value, End of PERIOD | |
| CLASS A SHARES(b) | ||||||||||
| 2024 (c) | $ 12.72 | 0.22 | 0.55 | 0.77 | (0.22) | — | — | (0.22) | $ 13.27 | |
| 2023 | $ 12.82 | 0.40 | (0.10) | 0.30 | (0.40) | — | — | (0.40) | $ 12.72 | |
| 2022 | $ 14.35 | 0.32 | (1.52) | (1.20) | (0.33) | — | — | (0.33) | $ 12.82 | |
| 2021 | $ 14.37 | 0.33 | (0.02) | 0.31 | (0.33) | — | — | (0.33) | $ 14.35 | |
| 2020 | $ 14.33 | 0.35 | 0.04 | 0.39 | (0.35) | — | — | (0.35) | $ 14.37 | |
| 2019 | $ 13.80 | 0.34 | 0.53 | 0.87 | (0.34) | — | — | (0.34) | $ 14.33 | |
| CLASS C SHARES | ||||||||||
| 2024 (c) | $ 12.73 | 0.20 | 0.55 | 0.75 | (0.20) | — | — | (0.20) | $ 13.28 | |
| 2023 | $ 12.83 | 0.35 | (0.10) | 0.25 | (0.35) | — | — | (0.35) | $ 12.73 | |
| 2022 | $ 14.37 | 0.27 | (1.54) | (1.27) | (0.27) | — | — | (0.27) | $ 12.83 | |
| 2021 | $ 14.39 | 0.27 | (0.01) | 0.26 | (0.28) | — | — | (0.28) | $ 14.37 | |
| 2020 | $ 14.35 | 0.30 | 0.04 | 0.34 | (0.30) | — | — | (0.30) | $ 14.39 | |
| 2019 | $ 13.82 | 0.29 | 0.53 | 0.82 | (0.29) | — | — | (0.29) | $ 14.35 | |
| CLASS C2 SHARES | ||||||||||
| 2024 (c) | $ 12.73 | 0.20 | 0.56 | 0.76 | (0.20) | — | — | (0.20) | $ 13.29 | |
| 2023 | $ 12.83 | 0.35 | (0.10) | 0.25 | (0.35) | — | — | (0.35) | $ 12.73 | |
| 2022 | $ 14.37 | 0.27 | (1.54) | (1.27) | (0.27) | — | — | (0.27) | $ 12.83 | |
| 2021 (e) | $ 14.39 | 0.27 | (0.02) | 0.25 | (0.27) | — | — | (0.27) | $ 14.37 | |
| CLASS I SHARES | ||||||||||
| 2024 (c) | $ 12.70 | 0.24 | 0.55 | 0.79 | (0.24) | — | — | (0.24) | $ 13.25 | |
| 2023 | $ 12.80 | 0.43 | (0.10) | 0.33 | (0.43) | — | — | (0.43) | $ 12.70 | |
| 2022 | $ 14.34 | 0.36 | (1.54) | (1.18) | (0.36) | — | — | (0.36) | $ 12.80 | |
| 2021 | $ 14.35 | 0.36 | (0.01) | 0.35 | (0.36) | — | — | (0.36) | $ 14.34 | |
| 2020 | $ 14.31 | 0.38 | 0.04 | 0.42 | (0.38) | — | — | (0.38) | $ 14.35 | |
| 2019 | $ 13.78 | 0.38 | 0.53 | 0.91 | (0.38) | — | — | (0.38) | $ 14.31 | |
| (a) | Not annualized for periods less than one year. |
| (b) | Sales loads are not reflected in computing total return. |
| (c) | Unaudited Six Month Period Ended March 31. |
| (d) | Annualized. |
| (e) | Effective date of this class of shares was October 1, 2020. |
| + | Based on weighted average shares outstanding. |
Intermediate Municipal Fund
| RATIOS TO AVERAGE NET ASSETS | Supplemental Data | ||||||
| UNLESS OTHERWISE NOTED, PERIODS ARE FISCAL YEARS ENDED SEPTEMBER 30, | Net Investment Income (Loss) (%) | Expenses, After Expense Reductions (%) | Expenses, Before Expense Reductions (%) | Total Return (%)(a) | Portfolio Turnover Rate (%)(a) | Net Assets at End of PERIOD (Thousands) | |
| CLASS A SHARES(b) | |||||||
| 2024 (c) | 3.38 (d) | 0.75 (d) | 0.92 (d) | 6.10 | 16.18 | $ 261,454 | |
| 2023 | 3.06 | 0.77 | 0.92 | 2.31 | 39.98 | $ 262,957 | |
| 2022 | 2.37 | 0.77 | 0.91 | (8.50) | 19.48 | $ 272,111 | |
| 2021 | 2.26 | 0.77 | 0.91 | 2.16 | 10.20 | $ 328,170 | |
| 2020 | 2.45 | 0.81 | 0.90 | 2.76 | 17.84 | $ 326,770 | |
| 2019 | 2.44 | 0.89 | 0.89 | 6.39 | 15.88 | $ 313,967 | |
| CLASS C SHARES | |||||||
| 2024 (c) | 3.01 (d) | 1.12 (d) | 1.39 (d) | 5.90 | 16.18 | $ 14,790 | |
| 2023 | 2.68 | 1.14 | 1.36 | 1.93 | 39.98 | $ 16,306 | |
| 2022 | 1.98 | 1.14 | 1.33 | (8.89) | 19.48 | $ 22,032 | |
| 2021 | 1.89 | 1.14 | 1.30 | 1.78 | 10.20 | $ 34,344 | |
| 2020 | 2.08 | 1.18 | 1.28 | 2.38 | 17.84 | $ 52,996 | |
| 2019 | 2.08 | 1.24 | 1.26 | 6.02 | 15.88 | $ 76,994 | |
| CLASS C2 SHARES | |||||||
| 2024 (c) | 3.00 (d) | 1.12 (d) | 1.96 (d) | 5.98 | 16.18 | $ 1,559 | |
| 2023 | 2.70 | 1.14 | 2.48 | 1.93 | 39.98 | $ 1,501 | |
| 2022 | 2.00 | 1.14 | 2.07 | (8.89) | 19.48 | $ 1,521 | |
| 2021 (e) | 1.85 | 1.14 | 2.62 | 1.76 | 10.20 | $ 1,860 | |
| CLASS I SHARES | |||||||
| 2024 (c) | 3.61 (d) | 0.51 (d) | 0.66 (d) | 6.23 | 16.18 | $ 706,243 | |
| 2023 | 3.30 | 0.53 | 0.67 | 2.55 | 39.98 | $ 583,709 | |
| 2022 | 2.60 | 0.53 | 0.67 | (8.36) | 19.48 | $ 555,898 | |
| 2021 | 2.50 | 0.53 | 0.67 | 2.47 | 10.20 | $ 666,356 | |
| 2020 | 2.69 | 0.56 | 0.65 | 3.01 | 17.84 | $ 668,185 | |
| 2019 | 2.67 | 0.65 | 0.65 | 6.66 | 15.88 | $ 730,144 | |
Strategic Municipal Income Fund
| PER SHARE PERFORMANCE (FOR A SHARE OUTSTANDING THROUGHOUT THE PERIOD) | ||||||||||
| UNLESS OTHERWISE NOTED, PERIODS ARE FISCAL YEARS ENDED SEPTEMBER 30, | Net Asset Value, Beginning of PERIOD | Net Investment Income (Loss)+ | Net Realized & Unrealized Gain (Loss) on Investments | Total from Investment Operations | Dividends from Net Investment Income | Dividends from Net Realized Gains | Dividends from Return of Capital | Total Dividends | Net Asset Value, End of PERIOD | |
| CLASS A SHARES(b) | ||||||||||
| 2024 (c) | $ 13.39 | 0.25 | 0.71 | 0.96 | (0.25) | — | — | (0.25) | $ 14.10 | |
| 2023 | $ 13.48 | 0.44 | (0.09) | 0.35 | (0.44) | — | — | (0.44) | $ 13.39 | |
| 2022 | $ 15.43 | 0.31 | (1.95) | (1.64) | (0.31) | — | — | (0.31) | $ 13.48 | |
| 2021 | $ 15.33 | 0.30 | 0.10 | 0.40 | (0.30) | — | — | (0.30) | $ 15.43 | |
| 2020 | $ 15.32 | 0.38 | 0.01 | 0.39 | (0.38) | — | — | (0.38) | $ 15.33 | |
| 2019 | $ 14.82 | 0.39 | 0.50 | 0.89 | (0.39) | — | — | (0.39) | $ 15.32 | |
| CLASS C SHARES | ||||||||||
| 2024 (c) | $ 13.40 | 0.21 | 0.71 | 0.92 | (0.21) | — | — | (0.21) | $ 14.11 | |
| 2023 | $ 13.49 | 0.37 | (0.09) | 0.28 | (0.37) | — | — | (0.37) | $ 13.40 | |
| 2022 | $ 15.45 | 0.24 | (1.96) | (1.72) | (0.24) | — | — | (0.24) | $ 13.49 | |
| 2021 | $ 15.34 | 0.23 | 0.11 | 0.34 | (0.23) | — | — | (0.23) | $ 15.45 | |
| 2020 | $ 15.34 | 0.30 | — (e) | 0.30 | (0.30) | — | — | (0.30) | $ 15.34 | |
| 2019 | $ 14.84 | 0.32 | 0.50 | 0.82 | (0.32) | — | — | (0.32) | $ 15.34 | |
| CLASS I SHARES | ||||||||||
| 2024 (c) | $ 13.40 | 0.26 | 0.71 | 0.97 | (0.26) | — | — | (0.26) | $ 14.11 | |
| 2023 | $ 13.49 | 0.47 | (0.09) | 0.38 | (0.47) | — | — | (0.47) | $ 13.40 | |
| 2022 | $ 15.45 | 0.34 | (1.96) | (1.62) | (0.34) | — | — | (0.34) | $ 13.49 | |
| 2021 | $ 15.34 | 0.34 | 0.11 | 0.45 | (0.34) | — | — | (0.34) | $ 15.45 | |
| 2020 | $ 15.33 | 0.41 | 0.01 | 0.42 | (0.41) | — | — | (0.41) | $ 15.34 | |
| 2019 | $ 14.84 | 0.42 | 0.49 | 0.91 | (0.42) | — | — | (0.42) | $ 15.33 | |
| (a) | Not annualized for periods less than one year. |
| (b) | Sales loads are not reflected in computing total return. |
| (c) | Unaudited Six Month Period Ended March 31. |
| (d) | Annualized. |
| (e) | Net realized and unrealized gain (loss) on investments was less than $0.01 per share. |
| + | Based on weighted average shares outstanding. |
Strategic Municipal Income Fund
| RATIOS TO AVERAGE NET ASSETS | Supplemental Data | ||||||
| UNLESS OTHERWISE NOTED, PERIODS ARE FISCAL YEARS ENDED SEPTEMBER 30, | Net Investment Income (Loss) (%) | Expenses, After Expense Reductions (%) | Expenses, Before Expense Reductions (%) | Total Return (%)(a) | Portfolio Turnover Rate (%)(a) | Net Assets at End of PERIOD (Thousands) | |
| CLASS A SHARES(b) | |||||||
| 2024 (c) | 3.54 (d) | 0.81 (d) | 1.26 (d) | 7.17 | 13.59 | $ 69,553 | |
| 2023 | 3.15 | 0.81 | 1.27 | 2.51 | 48.80 | $ 60,908 | |
| 2022 | 2.12 | 0.81 | 1.27 | (10.73) | 46.24 | $ 55,859 | |
| 2021 | 1.96 | 0.81 | 1.26 | 2.65 | 10.43 | $ 65,220 | |
| 2020 | 2.47 | 0.87 | 1.26 | 2.56 | 32.45 | $ 61,537 | |
| 2019 | 2.59 | 1.00 | 1.26 | 6.08 | 20.04 | $ 56,124 | |
| CLASS C SHARES | |||||||
| 2024 (c) | 3.06 (d) | 1.28 (d) | 1.95 (d) | 6.92 | 13.59 | $ 4,975 | |
| 2023 | 2.65 | 1.28 | 1.92 | 2.03 | 48.80 | $ 4,998 | |
| 2022 | 1.64 | 1.28 | 1.77 | (11.20) | 46.24 | $ 8,278 | |
| 2021 | 1.50 | 1.28 | 1.71 | 2.24 | 10.43 | $ 11,753 | |
| 2020 | 2.00 | 1.35 | 1.65 | 2.02 | 32.45 | $ 15,591 | |
| 2019 | 2.13 | 1.47 | 1.65 | 5.58 | 20.04 | $ 20,085 | |
| CLASS I SHARES | |||||||
| 2024 (c) | 3.76 (d) | 0.59 (d) | 0.99 (d) | 7.28 | 13.59 | $ 235,996 | |
| 2023 | 3.37 | 0.59 | 1.01 | 2.74 | 48.80 | $ 227,585 | |
| 2022 | 2.33 | 0.59 | 0.99 | (10.59) | 46.24 | $ 236,725 | |
| 2021 | 2.17 | 0.59 | 0.97 | 2.94 | 10.43 | $ 298,871 | |
| 2020 | 2.68 | 0.65 | 0.99 | 2.79 | 32.45 | $ 225,486 | |
| 2019 | 2.81 | 0.78 | 0.98 | 6.24 | 20.04 | $ 219,535 | |
Limited Term California Fund
| PER SHARE PERFORMANCE (FOR A SHARE OUTSTANDING THROUGHOUT THE PERIOD) | ||||||||||
| UNLESS OTHERWISE NOTED, PERIODS ARE FISCAL YEARS ENDED SEPTEMBER 30, | Net Asset Value, Beginning of PERIOD | Net Investment Income (Loss)+ | Net Realized & Unrealized Gain (Loss) on Investments | Total from Investment Operations | Dividends from Net Investment Income | Dividends from Net Realized Gains | Dividends from Return of Capital | Total Dividends | Net Asset Value, End of PERIOD | |
| CLASS A SHARES(b) | ||||||||||
| 2024 (c) | $ 12.56 | 0.18 | 0.36 | 0.54 | (0.18) | — | — | (0.18) | $ 12.92 | |
| 2023 | $ 12.61 | 0.29 | (0.05) | 0.24 | (0.29) | — | — | (0.29) | $ 12.56 | |
| 2022 | $ 13.66 | 0.17 | (1.04) | (0.87) | (0.18) | — | — | (0.18) | $ 12.61 | |
| 2021 | $ 13.80 | 0.15 | (0.14) | 0.01 | (0.15) | — | — | (0.15) | $ 13.66 | |
| 2020 | $ 13.72 | 0.18 | 0.08 | 0.26 | (0.18) | — | — | (0.18) | $ 13.80 | |
| 2019 | $ 13.45 | 0.22 | 0.27 | 0.49 | (0.22) | — | — | (0.22) | $ 13.72 | |
| CLASS C SHARES | ||||||||||
| 2024 (c) | $ 12.58 | 0.16 | 0.36 | 0.52 | (0.16) | — | — | (0.16) | $ 12.94 | |
| 2023 | $ 12.62 | 0.25 | (0.04) | 0.21 | (0.25) | — | — | (0.25) | $ 12.58 | |
| 2022 | $ 13.67 | 0.13 | (1.04) | (0.91) | (0.14) | — | — | (0.14) | $ 12.62 | |
| 2021 | $ 13.81 | 0.11 | (0.14) | (0.03) | (0.11) | — | — | (0.11) | $ 13.67 | |
| 2020 | $ 13.73 | 0.15 | 0.07 | 0.22 | (0.14) | — | — | (0.14) | $ 13.81 | |
| 2019 | $ 13.46 | 0.18 | 0.27 | 0.45 | (0.18) | — | — | (0.18) | $ 13.73 | |
| CLASS C2 SHARES | ||||||||||
| 2024 (c) | $ 12.57 | 0.16 | 0.36 | 0.52 | (0.16) | — | — | (0.16) | $ 12.93 | |
| 2023 | $ 12.61 | 0.26 | (0.05) | 0.21 | (0.25) | — | — | (0.25) | $ 12.57 | |
| 2022 | $ 13.67 | 0.14 | (1.06) | (0.92) | (0.14) | — | — | (0.14) | $ 12.61 | |
| 2021 (f) | $ 13.81 | 0.11 | (0.13) | (0.02) | (0.12) | — | — | (0.12) | $ 13.67 | |
| CLASS I SHARES | ||||||||||
| 2024 (c) | $ 12.58 | 0.19 | 0.36 | 0.55 | (0.19) | — | — | (0.19) | $ 12.94 | |
| 2023 | $ 12.62 | 0.32 | (0.04) | 0.28 | (0.32) | — | — | (0.32) | $ 12.58 | |
| 2022 | $ 13.67 | 0.21 | (1.05) | (0.84) | (0.21) | — | — | (0.21) | $ 12.62 | |
| 2021 | $ 13.82 | 0.19 | (0.15) | 0.04 | (0.19) | — | — | (0.19) | $ 13.67 | |
| 2020 | $ 13.73 | 0.21 | 0.10 | 0.31 | (0.22) | — | — | (0.22) | $ 13.82 | |
| 2019 | $ 13.46 | 0.25 | 0.27 | 0.52 | (0.25) | — | — | (0.25) | $ 13.73 | |
| (a) | Not annualized for periods less than one year. |
| (b) | Sales loads are not reflected in computing total return. |
| (c) | Unaudited Six Month Period Ended March 31. |
| (d) | Annualized. |
| (e) | Due to the size of net assets and fixed expenses, ratios may appear disproportionate. |
| (f) | Effective date of this class of shares was October 1, 2020. |
| + | Based on weighted average shares outstanding. |
Limited Term California Fund
| RATIOS TO AVERAGE NET ASSETS | Supplemental Data | ||||||
| UNLESS OTHERWISE NOTED, PERIODS ARE FISCAL YEARS ENDED SEPTEMBER 30, | Net Investment Income (Loss) (%) | Expenses, After Expense Reductions (%) | Expenses, Before Expense Reductions (%) | Total Return (%)(a) | Portfolio Turnover Rate (%)(a) | Net Assets at End of PERIOD (Thousands) | |
| CLASS A SHARES(b) | |||||||
| 2024 (c) | 2.78 (d) | 0.74 (d) | 0.96 (d) | 4.30 | 24.97 | $ 61,432 | |
| 2023 | 2.26 | 0.74 | 0.96 | 1.89 | 45.63 | $ 67,312 | |
| 2022 | 1.32 | 0.74 | 0.95 | (6.44) | 41.92 | $ 79,046 | |
| 2021 | 1.11 | 0.74 | 0.92 | 0.10 | 16.22 | $ 101,949 | |
| 2020 | 1.33 | 0.80 | 0.92 | 1.93 | 25.88 | $ 109,102 | |
| 2019 | 1.58 | 0.93 | 0.93 | 3.63 | 17.86 | $ 113,635 | |
| CLASS C SHARES | |||||||
| 2024 (c) | 2.49 (d) | 1.02 (d) | 1.65 (d) | 4.15 | 24.97 | $ 1,963 | |
| 2023 | 1.95 | 1.02 | 1.42 | 1.69 | 45.63 | $ 2,897 | |
| 2022 | 1.02 | 1.02 | 1.31 | (6.70) | 41.92 | $ 5,976 | |
| 2021 | 0.82 | 1.02 | 1.27 | (0.19) | 16.22 | $ 9,623 | |
| 2020 | 1.06 | 1.09 | 1.20 | 1.64 | 25.88 | $ 17,573 | |
| 2019 | 1.31 | 1.21 | 1.21 | 3.34 | 17.86 | $ 28,083 | |
| CLASS C2 SHARES | |||||||
| 2024 (c) | 2.51 (d) | 1.02 (d) | 2.80 (d)(e) | 4.16 | 24.97 | $ 442 | |
| 2023 | 2.00 | 1.02 | 8.02 (e) | 1.69 | 45.63 | $ 141 | |
| 2022 | 1.05 | 1.02 | 4.46 (e) | (6.78) | 41.92 | $ 129 | |
| 2021 (f) | 0.84 | 1.02 | 6.50 (e) | (0.18) | 16.22 | $ 149 | |
| CLASS I SHARES | |||||||
| 2024 (c) | 3.03 (d) | 0.49 (d) | 0.72 (d) | 4.43 | 24.97 | $ 208,880 | |
| 2023 | 2.50 | 0.49 | 0.71 | 2.23 | 45.63 | $ 204,982 | |
| 2022 | 1.56 | 0.49 | 0.71 | (6.20) | 41.92 | $ 276,717 | |
| 2021 | 1.35 | 0.49 | 0.70 | 0.27 | 16.22 | $ 366,861 | |
| 2020 | 1.56 | 0.54 | 0.69 | 2.25 | 25.88 | $ 449,964 | |
| 2019 | 1.84 | 0.67 | 0.68 | 3.90 | 17.86 | $ 350,962 | |
Intermediate New Mexico Fund
| PER SHARE PERFORMANCE (FOR A SHARE OUTSTANDING THROUGHOUT THE PERIOD) | ||||||||||
| UNLESS OTHERWISE NOTED, PERIODS ARE FISCAL YEARS ENDED SEPTEMBER 30, | Net Asset Value, Beginning of PERIOD | Net Investment Income (Loss)+ | Net Realized & Unrealized Gain (Loss) on Investments | Total from Investment Operations | Dividends from Net Investment Income | Dividends from Net Realized Gains | Dividends from Return of Capital | Total Dividends | Net Asset Value, End of PERIOD | |
| CLASS A SHARES(b) | ||||||||||
| 2024 (c) | $ 12.01 | 0.16 | 0.46 | 0.62 | (0.16) | — | — | (0.16) | $ 12.47 | |
| 2023 | $ 12.08 | 0.24 | (0.07) | 0.17 | (0.24) | — | — | (0.24) | $ 12.01 | |
| 2022 | $ 13.40 | 0.19 | (1.32) | (1.13) | (0.19) | — | — | (0.19) | $ 12.08 | |
| 2021 | $ 13.48 | 0.20 | (0.09) | 0.11 | (0.19) | — | — | (0.19) | $ 13.40 | |
| 2020 | $ 13.35 | 0.24 | 0.14 | 0.38 | (0.25) | — | — | (0.25) | $ 13.48 | |
| 2019 | $ 13.00 | 0.31 | 0.35 | 0.66 | (0.31) | — | — | (0.31) | $ 13.35 | |
| CLASS D SHARES | ||||||||||
| 2024 (c) | $ 12.02 | 0.14 | 0.46 | 0.60 | (0.14) | — | — | (0.14) | $ 12.48 | |
| 2023 | $ 12.08 | 0.20 | (0.05) | 0.15 | (0.21) | — | — | (0.21) | $ 12.02 | |
| 2022 | $ 13.41 | 0.16 | (1.33) | (1.17) | (0.16) | — | — | (0.16) | $ 12.08 | |
| 2021 | $ 13.49 | 0.16 | (0.08) | 0.08 | (0.16) | — | — | (0.16) | $ 13.41 | |
| 2020 | $ 13.36 | 0.21 | 0.13 | 0.34 | (0.21) | — | — | (0.21) | $ 13.49 | |
| 2019 | $ 13.01 | 0.28 | 0.35 | 0.63 | (0.28) | — | — | (0.28) | $ 13.36 | |
| CLASS I SHARES | ||||||||||
| 2024 (c) | $ 12.01 | 0.18 | 0.46 | 0.64 | (0.18) | — | — | (0.18) | $ 12.47 | |
| 2023 | $ 12.07 | 0.27 | (0.05) | 0.22 | (0.28) | — | — | (0.28) | $ 12.01 | |
| 2022 | $ 13.40 | 0.23 | (1.33) | (1.10) | (0.23) | — | — | (0.23) | $ 12.07 | |
| 2021 | $ 13.47 | 0.24 | (0.07) | 0.17 | (0.24) | — | — | (0.24) | $ 13.40 | |
| 2020 | $ 13.34 | 0.29 | 0.13 | 0.42 | (0.29) | — | — | (0.29) | $ 13.47 | |
| 2019 | $ 13.00 | 0.35 | 0.34 | 0.69 | (0.35) | — | — | (0.35) | $ 13.34 | |
| (a) | Not annualized for periods less than one year. |
| (b) | Sales loads are not reflected in computing total return. |
| (c) | Unaudited Six Month Period Ended March 31. |
| (d) | Annualized. |
| + | Based on weighted average shares outstanding. |
Intermediate New Mexico Fund
| RATIOS TO AVERAGE NET ASSETS | Supplemental Data | ||||||
| UNLESS OTHERWISE NOTED, PERIODS ARE FISCAL YEARS ENDED SEPTEMBER 30, | Net Investment Income (Loss) (%) | Expenses, After Expense Reductions (%) | Expenses, Before Expense Reductions (%) | Total Return (%)(a) | Portfolio Turnover Rate (%)(a) | Net Assets at End of PERIOD (Thousands) | |
| CLASS A SHARES(b) | |||||||
| 2024 (c) | 2.52 (d) | 0.99 (d) | 1.04 (d) | 5.15 | 6.55 | $ 40,855 | |
| 2023 | 1.91 | 0.99 | 1.02 | 1.35 | 48.90 | $ 46,699 | |
| 2022 | 1.50 | 0.99 | 1.01 | (8.49) | 8.83 | $ 53,476 | |
| 2021 | 1.46 | 0.98 | 0.98 | 0.85 | 7.43 | $ 70,051 | |
| 2020 | 1.83 | 0.98 | 0.98 | 2.84 | 22.92 | $ 80,463 | |
| 2019 | 2.37 | 0.97 | 0.97 | 5.15 | 17.26 | $ 84,782 | |
| CLASS D SHARES | |||||||
| 2024 (c) | 2.27 (d) | 1.24 (d) | 1.36 (d) | 5.01 | 6.55 | $ 8,049 | |
| 2023 | 1.65 | 1.24 | 1.34 | 1.18 | 48.90 | $ 8,891 | |
| 2022 | 1.25 | 1.24 | 1.29 | (8.78) | 8.83 | $ 10,388 | |
| 2021 | 1.20 | 1.24 | 1.29 | 0.59 | 7.43 | $ 12,917 | |
| 2020 | 1.57 | 1.24 | 1.26 | 2.58 | 22.92 | $ 14,475 | |
| 2019 | 2.10 | 1.24 | 1.25 | 4.87 | 17.26 | $ 15,888 | |
| CLASS I SHARES | |||||||
| 2024 (c) | 2.84 (d) | 0.67 (d) | 0.74 (d) | 5.31 | 6.55 | $ 51,340 | |
| 2023 | 2.23 | 0.67 | 0.74 | 1.76 | 48.90 | $ 52,436 | |
| 2022 | 1.82 | 0.67 | 0.73 | (8.27) | 8.83 | $ 57,584 | |
| 2021 | 1.77 | 0.67 | 0.71 | 1.24 | 7.43 | $ 66,312 | |
| 2020 | 2.13 | 0.67 | 0.71 | 3.16 | 22.92 | $ 65,715 | |
| 2019 | 2.66 | 0.67 | 0.69 | 5.39 | 17.26 | $ 62,162 | |
Intermediate New York Fund
| PER SHARE PERFORMANCE (FOR A SHARE OUTSTANDING THROUGHOUT THE PERIOD) | ||||||||||
| UNLESS OTHERWISE NOTED, PERIODS ARE FISCAL YEARS ENDED SEPTEMBER 30, | Net Asset Value, Beginning of PERIOD | Net Investment Income (Loss)+ | Net Realized & Unrealized Gain (Loss) on Investments | Total from Investment Operations | Dividends from Net Investment Income | Dividends from Net Realized Gains | Dividends from Return of Capital | Total Dividends | Net Asset Value, End of PERIOD | |
| CLASS A SHARES(b) | ||||||||||
| 2024 (c) | $ 11.60 | 0.16 | 0.44 | 0.60 | (0.16) | — | — | (0.16) | $ 12.04 | |
| 2023 | $ 11.68 | 0.28 | (0.08) | 0.20 | (0.28) | — | — | (0.28) | $ 11.60 | |
| 2022 | $ 12.88 | 0.25 | (1.20) | (0.95) | (0.25) | — | — | (0.25) | $ 11.68 | |
| 2021 | $ 12.96 | 0.23 | (0.07) | 0.16 | (0.24) | — | — | (0.24) | $ 12.88 | |
| 2020 | $ 12.95 | 0.26 | 0.01 | 0.27 | (0.26) | — | — | (0.26) | $ 12.96 | |
| 2019 | $ 12.61 | 0.30 | 0.34 | 0.64 | (0.30) | — | — | (0.30) | $ 12.95 | |
| CLASS I SHARES | ||||||||||
| 2024 (c) | $ 11.61 | 0.18 | 0.43 | 0.61 | (0.18) | — | — | (0.18) | $ 12.04 | |
| 2023 | $ 11.68 | 0.31 | (0.06) | 0.25 | (0.32) | — | — | (0.32) | $ 11.61 | |
| 2022 | $ 12.88 | 0.28 | (1.19) | (0.91) | (0.29) | — | — | (0.29) | $ 11.68 | |
| 2021 | $ 12.96 | 0.27 | (0.07) | 0.20 | (0.28) | — | — | (0.28) | $ 12.88 | |
| 2020 | $ 12.95 | 0.30 | 0.01 | 0.31 | (0.30) | — | — | (0.30) | $ 12.96 | |
| 2019 | $ 12.61 | 0.34 | 0.34 | 0.68 | (0.34) | — | — | (0.34) | $ 12.95 | |
| (a) | Not annualized for periods less than one year. |
| (b) | Sales loads are not reflected in computing total return. |
| (c) | Unaudited Six Month Period Ended March 31. |
| (d) | Annualized. |
| (e) | The total return based on the NAV which reflects the adjustments in accordance with U.S. GAAP is 5.22%. |
| (f) | The total return based on the NAV which reflects the adjustments in accordance with U.S. GAAP is 1.66%. |
| + | Based on weighted average shares outstanding. |
Intermediate New York Fund
| RATIOS TO AVERAGE NET ASSETS | Supplemental Data | ||||||
| UNLESS OTHERWISE NOTED, PERIODS ARE FISCAL YEARS ENDED SEPTEMBER 30, | Net Investment Income (Loss) (%) | Expenses, After Expense Reductions (%) | Expenses, Before Expense Reductions (%) | Total Return (%)(a) | Portfolio Turnover Rate (%)(a) | Net Assets at End of PERIOD (Thousands) | |
| CLASS A SHARES(b) | |||||||
| 2024 (c) | 2.74 (d) | 0.99 (d) | 1.38 (d) | 5.13 (e) | 3.60 | $ 12,820 | |
| 2023 | 2.33 | 0.99 | 1.33 | 1.75 (f) | 42.70 | $ 13,096 | |
| 2022 | 1.98 | 0.99 | 1.22 | (7.48) | 6.02 | $ 15,193 | |
| 2021 | 1.77 | 0.99 | 1.14 | 1.20 | 11.29 | $ 23,885 | |
| 2020 | 2.01 | 0.99 | 1.14 | 2.10 | 18.61 | $ 27,120 | |
| 2019 | 2.38 | 0.99 | 1.12 | 5.16 | 17.75 | $ 26,416 | |
| CLASS I SHARES | |||||||
| 2024 (c) | 3.05 (d) | 0.67 (d) | 1.08 (d) | 5.30 | 3.60 | $ 11,794 | |
| 2023 | 2.64 | 0.67 | 1.11 | 2.07 | 42.70 | $ 12,113 | |
| 2022 | 2.30 | 0.67 | 0.98 | (7.18) | 6.02 | $ 14,642 | |
| 2021 | 2.09 | 0.67 | 0.93 | 1.52 | 11.29 | $ 20,454 | |
| 2020 | 2.33 | 0.67 | 0.91 | 2.43 | 18.61 | $ 21,197 | |
| 2019 | 2.69 | 0.67 | 0.88 | 5.50 | 17.75 | $ 24,550 | |
March 31, 2024 (Unaudited)
| (1) | transaction costs, including |
| (a) | sales charges (loads) on purchase payments, for Class A shares; |
| (b) | a deferred sales charge on redemptions of any part or all of a purchase of $1 million of Class A shares within 12 months of purchase; |
| (c) | a deferred sales charge on redemptions of Class C and Class C2 shares within 12 months of purchase; |
| (2) | ongoing costs, including management fees; distribution and/or service (12b-1) fees; and other Fund expenses. |
| Actual | Hypothetical * | |||||
| Ending Account Value 3/31/24 | Expenses Paid During Period 10/1/23-3/31/24 | Ending Account Value 3/31/24 | Expenses Paid During Period† 10/1/23-3/31/24 | Annualized Expense Ratio | ||
| SHORT DURATION MUNICIPAL FUND | ||||||
| CLASS A SHARES | $1,026.36 | $3.55 | $1,021.50 | $3.54 | 0.70% | |
| CLASS I SHARES | $1,028.27 | $2.54 | $1,022.50 | $2.53 | 0.50% | |
| LIMITED TERM MUNICIPAL FUND | ||||||
| CLASS A SHARES | $1,044.64 | $3.88 | $1,021.20 | $3.84 | 0.76% | |
| CLASS C SHARES | $1,043.87 | $5.37 | $1,019.75 | $5.30 | 1.05% | |
| CLASS C2 SHARES | $1,042.86 | $6.33 | $1,018.80 | $6.26 | 1.24% | |
| CLASS I SHARES | $1,046.72 | $2.61 | $1,022.45 | $2.58 | 0.51% | |
| INTERMEDIATE MUNICIPAL FUND | ||||||
| CLASS A SHARES | $1,060.95 | $3.86 | $1,021.25 | $3.79 | 0.75% | |
| CLASS C SHARES | $1,058.96 | $5.77 | $1,019.40 | $5.65 | 1.12% | |
| CLASS C2 SHARES | $1,059.76 | $5.77 | $1,019.40 | $5.65 | 1.12% | |
| CLASS I SHARES | $1,062.28 | $2.63 | $1,022.45 | $2.58 | 0.51% | |
| STRATEGIC MUNICIPAL INCOME FUND | ||||||
| CLASS A SHARES | $1,071.72 | $4.20 | $1,020.95 | $4.09 | 0.81% | |
| CLASS C SHARES | $1,069.16 | $6.62 | $1,018.60 | $6.46 | 1.28% | |
| CLASS I SHARES | $1,072.84 | $3.06 | $1,022.05 | $2.98 | 0.59% | |
March 31, 2024 (Unaudited)
| Actual | Hypothetical * | |||||
| Ending Account Value 3/31/24 | Expenses Paid During Period 10/1/23-3/31/24 | Ending Account Value 3/31/24 | Expenses Paid During Period† 10/1/23-3/31/24 | Annualized Expense Ratio | ||
| LIMITED TERM CALIFORNIA FUND | ||||||
| CLASS A SHARES | $1,043.03 | $3.78 | $1,021.30 | $3.74 | 0.74% | |
| CLASS C SHARES | $1,041.52 | $5.21 | $1,019.90 | $5.15 | 1.02% | |
| CLASS C2 SHARES | $1,041.55 | $5.21 | $1,019.90 | $5.15 | 1.02% | |
| CLASS I SHARES | $1,044.28 | $2.50 | $1,022.55 | $2.48 | 0.49% | |
| INTERMEDIATE NEW MEXICO FUND | ||||||
| CLASS A SHARES | $1,051.47 | $5.08 | $1,020.05 | $5.00 | 0.99% | |
| CLASS D SHARES | $1,050.13 | $6.36 | $1,018.80 | $6.26 | 1.24% | |
| CLASS I SHARES | $1,053.14 | $3.44 | $1,021.65 | $3.39 | 0.67% | |
| INTERMEDIATE NEW YORK FUND | ||||||
| CLASS A SHARES | $1,051.28 | $5.08 | $1,020.05 | $5.00 | 0.99% | |
| CLASS I SHARES | $1,052.95 | $3.44 | $1,021.65 | $3.39 | 0.67% | |
| * | Hypothetical assumes a rate of return of 5% per year before expenses. |
| † | Expenses are equal to the annualized expense ratio for each class multiplied by the average account value over the period, multiplied by 183/366 to reflect the one-half year period. |
March 31, 2024 (Unaudited)
| Outstanding Shares | Shares Voted For | % of Voted Shares For | % of Outstanding Shares For | Shares Voted Withhold | % of Voted Shares Withhold | % of Outstanding Shares Withhold | |
| Short Duration Municipal Fund | 12,514,778.29 | 9,313,647.35 | 99.37% | 74.42% | 59,426.00 | 0.63% | 0.47% |
| Limited Term Municipal Fund | 232,755,543.67 | 194,751,686.68 | 98.75% | 83.67% | 2,469,951.59 | 1.25% | 1.06% |
| Intermediate Municipal Fund | 68,896,911.20 | 56,634,067.77 | 98.51% | 82.20% | 859,165.86 | 1.49% | 1.25% |
| Strategic Municipal Income Fund | 22,361,120.53 | 18,261,075.16 | 99.62% | 81.66% | 69,255.51 | 0.38% | 0.31% |
| Limited Term California Fund | 23,126,358.14 | 20,253,292.54 | 99.65% | 87.58% | 70,823.37 | 0.35% | 0.31% |
| Intermediate New Mexico Fund | 9,106,612.32 | 7,265,015.00 | 97.35% | 79.78% | 197,659.00 | 2.65% | 2.17% |
| Intermediate New York Fund | 2,206,124.78 | 1,714,358.71 | 99.79% | 77.71% | 3,653.09 | 0.21% | 0.17% |
March 31, 2024 (Unaudited)
| Outstanding Shares | Shares Voted For | % of Voted Shares For | % of Outstanding Shares For | Shares Voted Withhold | % of Voted Shares Withhold | % of Outstanding Shares Withhold | |
| Short Duration Municipal Fund | 12,514,778.29 | 9,313,647.35 | 99.37% | 74.42% | 59,426.00 | 0.63% | 0.47% |
| Limited Term Municipal Fund | 232,755,543.67 | 194,493,486.68 | 98.62% | 83.56% | 2,728,151.59 | 1.38% | 1.17% |
| Intermediate Municipal Fund | 68,896,911.20 | 56,466,131.77 | 98.21% | 81.96% | 1,027,101.86 | 1.79% | 1.49% |
| Strategic Municipal Income Fund | 22,361,120.53 | 18,261,075.16 | 99.62% | 81.66% | 69,255.51 | 0.38% | 0.31% |
| Limited Term California Fund | 23,126,358.14 | 20,253,292.54 | 99.65% | 87.58% | 70,823.37 | 0.35% | 0.31% |
| Intermediate New Mexico Fund | 9,106,612.32 | 7,265,015.00 | 97.35% | 79.78% | 197,659.00 | 2.65% | 2.17% |
| Intermediate New York Fund | 2,206,124.78 | 1,714,358.71 | 99.79% | 77.71% | 3,653.09 | 0.21% | 0.17% |
| Outstanding Shares | Shares Voted For | % of Voted Shares For | % of Outstanding Shares For | Shares Voted Withhold | % of Voted Shares Withhold | % of Outstanding Shares Withhold | |
| Short Duration Municipal Fund | 12,514,778.29 | 9,313,647.35 | 99.37% | 74.42% | 59,426.00 | 0.63% | 0.47% |
| Limited Term Municipal Fund | 232,755,543.67 | 194,059,314.12 | 98.40% | 83.37% | 3,162,324.14 | 1.60% | 1.36% |
| Intermediate Municipal Fund | 68,896,911.20 | 56,540,757.77 | 98.34% | 82.07% | 952,475.86 | 1.66% | 1.38% |
| Strategic Municipal Income Fund | 22,361,120.53 | 18,213,262.16 | 99.36% | 81.45% | 117,068.51 | 0.64% | 0.52% |
| Limited Term California Fund | 23,126,358.14 | 20,213,240.54 | 99.45% | 87.40% | 110,875.37 | 0.55% | 0.48% |
| Intermediate New Mexico Fund | 9,106,612.32 | 7,261,749.00 | 97.31% | 79.74% | 200,925.00 | 2.69% | 2.21% |
| Intermediate New York Fund | 2,206,124.78 | 1,715,070.80 | 99.83% | 77.74% | 2,941.00 | 0.17% | 0.13% |
| Outstanding Shares | Shares Voted For | % of Voted Shares For | % of Outstanding Shares For | Shares Voted Withhold | % of Voted Shares Withhold | % of Outstanding Shares Withhold | |
| Short Duration Municipal Fund | 12,514,778.29 | 9,292,736.03 | 99.14% | 74.25% | 80,337.33 | 0.86% | 0.64% |
| Limited Term Municipal Fund | 232,755,543.67 | 193,802,095.72 | 98.27% | 83.26% | 3,419,542.55 | 1.73% | 1.47% |
| Intermediate Municipal Fund | 68,896,911.20 | 53,627,656.43 | 93.28% | 77.84% | 3,865,577.20 | 6.72% | 5.61% |
| Strategic Municipal Income Fund | 22,361,120.53 | 18,211,797.88 | 99.35% | 81.44% | 118,532.80 | 0.65% | 0.53% |
| Limited Term California Fund | 23,126,358.14 | 19,896,234.11 | 97.89% | 86.03% | 427,881.80 | 2.11% | 1.85% |
| Intermediate New Mexico Fund | 9,106,612.32 | 7,347,483.00 | 98.46% | 80.68% | 115,191.00 | 1.54% | 1.26% |
| Intermediate New York Fund | 2,206,124.78 | 1,715,070.80 | 99.83% | 77.74% | 2,941.00 | 0.17% | 0.13% |
March 31, 2024 (Unaudited)
March 31, 2024 (Unaudited)
| NAME, AGE, YEAR ELECTED POSITION HELD WITH FUND | PRINCIPAL OCCUPATION(S) DURING PAST FIVE YEARS | OTHER DIRECTORSHIPS HELD BY TRUSTEE |
| INTERESTED TRUSTEES(1)(2) | ||
| Garrett Thornburg, 78 Trustee Since 1984, Chairman of Trustees(4) | Chairman and controlling shareholder of Thornburg Investment Management, Inc. (investment advisor); Chairman and controlling shareholder of Thornburg Securities Corporation (securities dealer); Chairman of the Thornburg Foundation (nonprofit). | None |
| Brian J. McMahon, 68 Trustee since 2001, Vice Chairman of Trustees, Member of Governance & Nominating Committee and Operations Risk Oversight Committee(5) | Vice Chairman, Chief Investment Strategist, Managing Director, and Portfolio Manager, and until 2019 Chief Investment Officer, and, until 2016, CEO and President, of Thornburg Investment Management, Inc.; Vice President of Thornburg Securities Corporation. | None |
| INDEPENDENT TRUSTEES(1)(2)(3) | ||
| Lisa Black, 64 Trustee since 2023(6), Member of Audit Committee and Operations Risk Oversight Committee | Until 2019, Senior Managing Director, Chief Investment Officer and Head, Taxable Fixed Income, Nuveen LLC, New York, NY; Managing Director, TIAA-CREF, New York, NY (1996-2012). | None |
| Sally Corning, 63 Trustee since 2012, Member of Audit Committee and Governance & Nominating Committee | Partner in Sun Mountain Capital, Santa Fe, NM (private equity firm with investment programs encompassing venture capital, mezzanine debt, and growth equity). | None |
| Susan H. Dubin, 75 Trustee since 2004, Member of Audit Committee and Operations Risk Oversight Committee | President of Dubin Investments, Ltd., Greenwich, CT (private investment fund); Director and officer of various charitable organizations. | None |
| David L. Gardner, 61 Trustee since 2015, Chair of Governance & Nominating Committee and Member of Operations Risk Oversight Committee | Until 2012, head of EMEA (Europe, Middle East and Africa) Sales for iShares of Blackrock, Inc., EMEA Executive Committee Member and EMEA Operating Committee Member at Blackrock, Inc. | None |
| Patrick J. Talamantes, 59 Trustee since 2019, Chair of Audit Committee | President of Talamantes Strategies, a management consulting firm, since 2018. Until 2017, President and Chief Executive Officer of The McClatchy Company, Sacramento, CA (news and media company). | None |
| Owen D. Van Essen, 69 Trustee since 2004, Lead Independent Trustee, Member of Governance & Nominating Committee and Operations Risk Oversight Committee | President of Dirks, Van Essen & April, Santa Fe, New Mexico (newspaper mergers and acquisitions). | None |
| James W. Weyhrauch, 65 Trustee since 1996, Chair of Operations Risk Oversight Committee, Member of Audit Committee | Real estate broker, Santa Fe Properties, Santa Fe, NM; General Partner, Investments of Genext LLC (a family investment partnership); until 2019, Vice Chairman of Nambé LLC, Santa Fe, NM (manufacturing and design company). | None |
March 31, 2024 (Unaudited)
| NAME, AGE, YEAR ELECTED POSITION HELD WITH FUND | PRINCIPAL OCCUPATION(S) DURING PAST FIVE YEARS | OTHER DIRECTORSHIPS HELD BY TRUSTEE |
| OFFICERS OF THE FUND (WHO ARE NOT TRUSTEES)(1) | ||
| Nimish Bhatt, 60 President since 2023, Chief Financial Officer 2019-2023, Treasurer 2016-2019, Secretary 2018-2019(7) | Chief Financial Officer and Treasurer of Thornburg Investment Management, Inc. and Thornburg Securities Corporation since 2016, and Secretary of Thornburg Securities Corporation since 2018; Senior Vice President (2004-2016), Chief Financial Officer (2011-2016), and Head of Fund Administration (2011- 2016) of Calamos Asset Management, Inc., Calamos Investments LLC, Calamos Advisors LLC, and Calamos Wealth Management; Director of Calamos Global Funds plc (2007-2016). | Not applicable |
| Geoffrey Black, 62 Secretary since 2024(6)(7) | Director of Fund Operations of Thornburg Investment Management, Inc. since 2024; Director, Transfer Agent Services at Russell Investments (2010-2024). | Not applicable |
| Randy Dry, 49 Vice President 2014-2024(6) | Managing Director, Chief Operating Officer since 2020, Chief Administrative Officer (2016-2020), and Director of Institutional Group (2014-2016) of Thornburg Investment Management, Inc. | Not applicable |
| Curtis Holloway, 56 Chief Financial Officer since 2023, Secretary 2024(6), Treasurer since 2019(7) | Director of Finance since 2021 and Director of Fund Administration since 2019 of Thornburg Investment Management, Inc.; Senior Vice President, Head of Fund Administration (2017-2019) and Vice President, Fund Administration (2010-2017) of Calamos Investments, and Chief Financial Officer (2017-2019) and Treasurer (2010-2019) of Calamos Funds. | Not applicable |
| Ben Kirby, 43 Vice President since 2014 | Co-Head of Investments since 2019, and Portfolio Manager and Managing Director since 2013, of Thornburg Investment Management, Inc. | Not applicable |
| Jeff Klingelhofer, 43 Vice President since 2016 | Co-Head of Investments since 2019, Portfolio Manager and Managing Director since 2015, Associate Portfolio Manager (2012-2015), of Thornburg Investment Management, Inc. | Not applicable |
| Ponn Lithiluxa, 52 Assistant Treasurer since 2020; Vice President 2017-2020 | Senior Manager & Vice President, Tax & Fund Administration of Thornburg Investment Management, Inc. since 2017; Senior Vice President, Citi Fund Services, Inc. (2014-2017); Vice President, Citi Fund Services, Inc. (2007-2014). | Not applicable |
| Christopher Luckham, 46 Assistant Treasurer since 2022 | Senior Manager, Fund Administration of Thornburg Investment Management, Inc. since 2010. | Not applicable |
| Natasha Rippel, 41 Secretary 2021-2024(6)(7) | Director of Fund Operations since 2021, Supervisor of Fund Operations (2017-2021), and Senior Associate of Fund Operations (2015-2017) of Thornburg Investment Management, Inc. | Not applicable |
| Stephen Velie, 55 Chief Compliance Officer since 2009 | Chief Compliance Officer of Thornburg Investment Trust and Thornburg Investment Management, Inc. | Not applicable |
| (1) | Each person’s address is 2300 North Ridgetop Road, Santa Fe, New Mexico 87506. |
| (2) | The Trust is organized as a Massachusetts business trust, and currently comprises a complex of 24 separate investment “Funds” or “series.” Thornburg Investment Management, Inc. is the investment advisor to, and manages, the 24 Funds of the Trust. Each Trustee oversees the 24 Funds of the Trust. |
| (3) | The Bylaws of the Trust currently require that each Independent Trustee shall retire by the end of the calendar year during which the Trustee reached the age of 75 years. Otherwise, each Trustee serves in office until the election and qualification of a successor or until the Trustee sooner dies, resigns, retires or is removed. |
| (4) | Mr. Thornburg is considered an “interested” Trustee under the Investment Company Act of 1940 because he is a director and controlling shareholder of Thornburg Investment Management, Inc. the investment advisor to the 24 Funds of the Trust, and is the sole director and controlling shareholder of Thornburg Securities Corporation, the distributor of shares of the Trust. |
| (5) | Mr. McMahon is considered an “interested” Trustee under the Investment Company Act of 1940 because he is a director and the chief investment strategist of Thornburg Investment Management, Inc. |
| (6) | Ms. Black served as an Advisory Trustee from April 1, 2023 through October 1, 2023 and was elected as an independent Trustee effective October 2, 2023. Mr. Dry concluded his service as a Vice President of the Trust effective April 15, 2024. Ms. Rippel concluded her service as Secretary of the Trust effective April 19, 2024.Mr. Holloway served as Secretary of the Trust from April 22, 2024 through May 15, 2024, when he was succeeded by Mr. Black, who was appointed as Secretary of the Trust effective May 15, 2024. |
| (7) | The Trust’s president, chief financial officer, secretary and treasurer each serves a one-year term or until the election and qualification of a successor; each other officer serves at the pleasure of the Trustees. |
| ■ | Thornburg Global Opportunities Fund |
| ■ | Thornburg International Equity Fund |
| ■ | Thornburg Better World International Fund |
| ■ | Thornburg International Growth Fund |
| ■ | Thornburg Developing World Fund |
| ■ | Thornburg Small/Mid Cap Core Fund |
| ■ | Thornburg Small/Mid Cap Growth Fund |
| ■ | Thornburg Investment Income Builder Fund |
| ■ | Thornburg Income Builder Opportunities Trust |
| ■ | Thornburg Summit Fund |
| ■ | Thornburg Ultra Short Income Fund |
| ■ | Thornburg Limited Term U.S. Government Fund |
| ■ | Thornburg Limited Term Income Fund |
| ■ | Thornburg Core Plus Bond Fund |
| ■ | Thornburg Strategic Income Fund |
| ■ | Thornburg Short Duration Municipal Fund |
| ■ | Thornburg Limited Term Municipal Fund |
| ■ | Thornburg Intermediate Municipal Fund |
| ■ | Thornburg Strategic Municipal Income Fund |
| ■ | Thornburg California Limited Term Municipal Fund |
| ■ | Thornburg New Mexico Intermediate Municipal Fund |
| ■ | Thornburg New York Intermediate Municipal Fund |


| 800.847.0200 | TH4626 |

| THORNBURG CAPITAL MANAGEMENT FUND |
| 4 | |
| 4 | |
| 5 | |
| 9 | |
| 10 | |
| 11 | |
| 12 | |
| 16 | |
| 18 | |
| 19 | |
| 21 | |
| 23 |
| SHARE CLASS | NASDAQ SYMBOL | CUSIP |
| Class I | N/A | 885-216-739 |
Fund Overview
| • | The Fund generated positive total returns and outpaced its benchmark, the FTSE 1-Month Treasury Bill Local Currency Index (the “Index”), during the six-month period ended March 31, 2024. |
| • | Over the reporting period, the Fund accomplished its goal of "safety of capital" by providing a share price of $10.00 that has not fluctuated since the Fund’s inception. |
| • | As of March 31, 2024, throughout the life of the strategy, the Fund has never suffered a default on any cash equivalent investment. |
| 1-YR | 3-YR | 5-YR | SINCE INCEPTION | |
| Class I Shares (Incep: 7/31/15) | 5.62% | 2.93% | 2.23% | 1.79% |
| FTSE 1-Month Treasury Bill Local Currency Index (Since 7/31/15) | 5.40% | 2.65% | 2.00% | 1.55% |
| Annualized Distribution Yield | 5.48% |
| SEC Yield | 5.69% |
| FINAL VALUE |
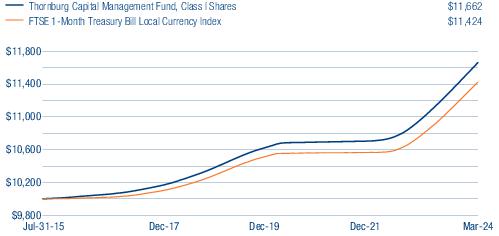
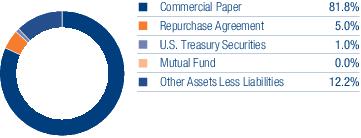
Thornburg Capital Management Fund | March 31, 2024 (Unaudited)
| ISSUER-DESCRIPTION | Shares/Principal Amount | VALUE | |
| U.S. Treasury Securities — 1.0% | |||
| U.S. Treasury Bills, 5.859% due 4/23/2024 | $15,675,000 | $ 15,624,708 | |
| Total U.S. Treasury Securities (Cost $15,624,708) | 15,624,708 | ||
| Commercial Paper — 81.8% | |||
| American Electric Power Co., Inc., | |||
| a | 5.535% due 4/5/2024 | 4,500,000 | 4,497,275 |
| a | 5.593% due 4/9/2024 | 7,500,000 | 7,490,833 |
| a | 5.602% due 4/19/2024 | 13,478,000 | 13,440,936 |
| American Honda Finance Corp., | |||
| 5.545% due 4/4/2024 | 33,000,000 | 32,985,013 | |
| 5.58% due 4/16/2024 | 125,000 | 124,715 | |
| 5.619% due 4/16/2024 | 1,000,000 | 997,700 | |
| a | AutoZone, Inc., 5.482% due 4/2/2024 | 4,000,000 | 3,999,400 |
| Avangrid, Inc., | |||
| a | 5.556% due 4/4/2024 | 32,000,000 | 31,985,440 |
| a | 5.559% due 4/4/2024 | 2,000,000 | 1,999,090 |
| a | 5.611% due 4/18/2024 | 1,000,000 | 997,398 |
| a | 5.59% due 4/22/2024 | 1,000,000 | 996,798 |
| a,b | Bell Telephone Co. of Canada or Bell Canada, 5.60% due 4/16/2024 | 250,000 | 249,427 |
| Brown-Forman Corp., | |||
| a | 5.527% due 4/22/2024 | 1,165,000 | 1,161,310 |
| a | 5.539% due 4/23/2024 | 30,000,000 | 29,900,267 |
| a | 5.539% due 4/25/2024 | 1,000,000 | 996,373 |
| Canadian National Railway Co., | |||
| a,b | 5.486% due 4/3/2024 | 3,000,000 | 2,999,102 |
| a,b | 5.497% due 4/3/2024 | 1,500,000 | 1,499,550 |
| a,b | 5.509% due 4/3/2024 | 10,000,000 | 9,996,994 |
| a,b | 5.502% due 4/9/2024 | 1,000,000 | 998,798 |
| a,b | 5.508% due 4/9/2024 | 11,000,000 | 10,986,776 |
| a,b | 5.531% due 4/12/2024 | 3,000,000 | 2,995,013 |
| a,b | 5.488% due 4/15/2024 | 6,000,000 | 5,987,423 |
| Canadian Pacific Railway Co., | |||
| a,b | 5.593% due 4/3/2024 | 6,000,000 | 5,998,167 |
| a,b | 5.584% due 4/8/2024 | 13,000,000 | 12,986,123 |
| a,b | 5.594% due 4/10/2024 | 3,000,000 | 2,995,875 |
| a,b | 5.594% due 4/11/2024 | 1,000,000 | 998,472 |
| a | CenterPoint Energy Resources Corp., 5.579% due 4/22/2024 | 25,000,000 | 24,920,083 |
| a | CenterPoint Energy, Inc., 5.551% due 4/10/2024 | 10,000,000 | 9,986,375 |
| Consolidated Edison Co. of New York, Inc., | |||
| a | 5.532% due 4/2/2024 | 624,000 | 623,906 |
| a | 5.543% due 4/2/2024 | 3,000,000 | 2,999,546 |
| a | 5.565% due 4/2/2024 | 876,000 | 875,867 |
| a | 5.563% due 4/3/2024 | 5,000,000 | 4,998,481 |
| a | 5.538% due 4/9/2024 | 26,000,000 | 25,968,511 |
| CVS Health Corp., | |||
| a | 5.545% due 4/1/2024 | 2,700,000 | 2,700,000 |
| a | 5.535% due 4/5/2024 | 850,000 | 849,485 |
| a | 5.543% due 4/5/2024 | 29,000,000 | 28,982,407 |
| a | 5.545% due 4/5/2024 | 250,000 | 249,848 |
| a,b | Diageo Capital plc, 5.481% due 4/1/2024 | 35,000,000 | 35,000,000 |
| Dominion Energy South Carolina, Inc., | |||
| 5.66% due 4/15/2024 | 569,000 | 567,770 | |
| 5.661% due 4/15/2024 | 7,500,000 | 7,483,783 | |
| 5.662% due 4/15/2024 | 5,000,000 | 4,989,189 | |
| Dover Corp., | |||
| a | 5.531% due 4/1/2024 | 26,000,000 | 26,000,000 |
| a | 5.534% due 4/1/2024 | 5,000,000 | 5,000,000 |
| a | 5.536% due 4/1/2024 | 1,000,000 | 1,000,000 |
| a | 5.547% due 4/1/2024 | 1,000,000 | 1,000,000 |
| a | 5.588% due 4/2/2024 | 2,000,000 | 1,999,694 |
| See notes to financial statements. | Semi-Annual Report | 5 |
Thornburg Capital Management Fund | March 31, 2024 (Unaudited)
| ISSUER-DESCRIPTION | Shares/Principal Amount | VALUE | |
| Duke Energy Corp., | |||
| a | 5.537% due 4/1/2024 | $ 3,300,000 | $ 3,300,000 |
| a | 5.537% due 4/2/2024 | 16,000,000 | 15,997,578 |
| a | 5.56% due 4/8/2024 | 11,000,000 | 10,988,300 |
| a | 5.575% due 4/16/2024 | 500,000 | 498,858 |
| a | 5.559% due 4/22/2024 | 2,000,000 | 1,993,630 |
| a | 5.493% due 4/4/2024 | 2,000,000 | 1,999,098 |
| Elevance Health, Inc., | |||
| a | 5.501% due 4/1/2024 | 1,000,000 | 1,000,000 |
| a | 5.529% due 4/1/2024 | 31,000,000 | 31,000,000 |
| a | 5.531% due 4/1/2024 | 1,000,000 | 1,000,000 |
| Enbridge U.S., Inc., | |||
| a | 5.549% due 4/1/2024 | 3,000,000 | 3,000,000 |
| a | 5.55% due 4/1/2024 | 25,000,000 | 25,000,000 |
| a | 5.56% due 4/1/2024 | 3,000,000 | 3,000,000 |
| a | 5.562% due 4/1/2024 | 1,000,000 | 1,000,000 |
| a | 5.588% due 4/1/2024 | 1,000,000 | 1,000,000 |
| a | 5.572% due 4/15/2024 | 250,000 | 249,467 |
| Entergy Corp., | |||
| a | 5.598% due 4/15/2024 | 19,720,000 | 19,677,821 |
| a | 5.545% due 4/18/2024 | 450,000 | 448,842 |
| Eversource Energy, | |||
| a | 5.689% due 4/1/2024 | 1,000,000 | 1,000,000 |
| a | 5.805% due 4/8/2024 | 3,000,000 | 2,996,675 |
| a | 5.754% due 4/9/2024 | 5,000,000 | 4,993,722 |
| a | 5.731% due 4/22/2024 | 500,000 | 498,358 |
| Experian Finance plc, | |||
| a,b | 5.52% due 4/5/2024 | 1,200,000 | 1,199,276 |
| a,b | 5.522% due 4/11/2024 | 7,900,000 | 7,888,084 |
| General Mills, Inc., | |||
| a | 5.491% due 4/8/2024 | 15,000,000 | 14,984,250 |
| a | 5.536% due 4/8/2024 | 19,000,000 | 18,979,865 |
| a | Hewlett Packard Enterprise Co., 5.542% due 4/3/2024 | 5,000,000 | 4,998,483 |
| HP, Inc., | |||
| a | 5.533% due 4/4/2024 | 27,000,000 | 26,987,760 |
| a | 5.575% due 4/11/2024 | 2,000,000 | 1,996,956 |
| Intercontinental Exchange, Inc., | |||
| a | 5.561% due 4/1/2024 | 13,000,000 | 13,000,000 |
| a | 5.615% due 4/1/2024 | 7,000,000 | 7,000,000 |
| a | 5.578% due 4/2/2024 | 1,000,000 | 999,848 |
| a | 5.601% due 4/24/2024 | 13,000,000 | 12,954,319 |
| a | J M Smucker Co., 5.504% due 4/1/2024 | 18,946,000 | 18,946,000 |
| a | Johnson Controls International plc, 5.53% due 4/2/2024 | 32,000,000 | 31,995,156 |
| Keurig Dr Pepper, Inc., | |||
| a | 5.532% due 4/2/2024 | 22,000,000 | 21,996,669 |
| a | 5.568% due 4/4/2024 | 10,000,000 | 9,995,433 |
| a | 5.599% due 4/4/2024 | 700,000 | 699,678 |
| McCormick & Co., Inc., | |||
| a | 5.497% due 4/3/2024 | 17,800,000 | 17,794,650 |
| a | 5.492% due 4/16/2024 | 17,000,000 | 16,961,750 |
| a,b | Medtronic Global Holdings SCA, 5.515% due 4/18/2024 | 2,500,000 | 2,493,601 |
| Mitsubishi HC Finance America LLC, | |||
| 5.547% due 4/1/2024 | 1,000,000 | 1,000,000 | |
| 5.563% due 4/8/2024 | 10,000,000 | 9,989,364 | |
| 5.568% due 4/8/2024 | 4,000,000 | 3,995,738 | |
| 5.569% due 4/8/2024 | 20,000,000 | 19,978,728 | |
| Mohawk Industries, Inc., | |||
| a | 5.587% due 4/1/2024 | 17,000,000 | 17,000,000 |
| a | 5.594% due 4/17/2024 | 1,000,000 | 997,556 |
| a | 5.561% due 4/26/2024 | 15,000,000 | 14,943,125 |
| a | NextEra Energy Capital Holdings, Inc., 5.59% due 4/5/2024 | 1,500,000 | 1,499,083 |
| 6 | Semi-Annual Report | See notes to financial statements. |
| ISSUER-DESCRIPTION | Shares/Principal Amount | VALUE | |
| Oglethorpe Power Corp., | |||
| a | 5.639% due 4/2/2024 | $ 250,000 | $ 249,961 |
| a | 5.602% due 4/5/2024 | 4,000,000 | 3,997,556 |
| a | 5.644% due 4/8/2024 | 250,000 | 249,730 |
| a | 5.652% due 4/11/2024 | 505,000 | 504,222 |
| a | 5.653% due 4/11/2024 | 952,000 | 950,532 |
| a | 5.703% due 4/15/2024 | 1,000,000 | 997,822 |
| a | 5.651% due 4/18/2024 | 18,100,000 | 18,052,563 |
| ONE Gas, Inc., | |||
| a | 5.618% due 4/2/2024 | 7,700,000 | 7,698,817 |
| a | 5.572% due 4/3/2024 | 2,000,000 | 1,999,390 |
| a | 5.673% due 4/9/2024 | 6,900,000 | 6,891,459 |
| a | 5.599% due 4/17/2024 | 5,000,000 | 4,987,778 |
| a | 5.601% due 4/19/2024 | 3,000,000 | 2,991,750 |
| a | 5.607% due 4/19/2024 | 1,100,000 | 1,096,970 |
| a | 5.633% due 4/24/2024 | 1,745,000 | 1,738,835 |
| Penske Truck Leasing Co. LP, | |||
| 5.584% due 4/1/2024 | 680,000 | 680,000 | |
| 5.59% due 4/1/2024 | 19,000,000 | 19,000,000 | |
| 5.602% due 4/12/2024 | 1,000,000 | 998,319 | |
| 5.599% due 4/16/2024 | 2,650,000 | 2,643,927 | |
| 5.60% due 4/16/2024 | 12,000,000 | 11,972,500 | |
| Peoples Gas Light & Coke Co., 5.532% due 4/3/2024 | 33,000,000 | 32,990,008 | |
| Ryder System, Inc., | |||
| 5.645% due 4/8/2024 | 12,054,000 | 12,040,992 | |
| 5.672% due 4/18/2024 | 17,000,000 | 16,955,285 | |
| a | Sempra, 5.597% due 4/2/2024 | 2,000,000 | 1,999,694 |
| Sherwin-Williams Co., | |||
| a | 5.495% due 4/1/2024 | 8,000,000 | 8,000,000 |
| a | 5.514% due 4/9/2024 | 8,000,000 | 7,990,364 |
| a | 5.542% due 4/9/2024 | 1,000,000 | 998,789 |
| a | 5.543% due 4/9/2024 | 3,000,000 | 2,996,367 |
| a | 5.537% due 4/10/2024 | 250,000 | 249,659 |
| a | Southern California Edison Co., 5.619% due 4/11/2024 | 2,000,000 | 1,996,928 |
| Spire, Inc., | |||
| a | 5.471% due 4/3/2024 | 251,000 | 250,925 |
| a | 5.598% due 4/8/2024 | 1,000,000 | 998,931 |
| a | 5.57% due 4/9/2024 | 32,000,000 | 31,961,102 |
| Tyco Electronics Group SA, | |||
| a,b | 5.50% due 4/1/2024 | 2,500,000 | 2,500,000 |
| a,b | 5.53% due 4/1/2024 | 18,000,000 | 18,000,000 |
| a | Union Pacific Corp., 5.478% due 4/23/2024 | 36,135,000 | 36,016,196 |
| a | Verizon Communications, Inc., 5.547% due 4/16/2024 | 32,000,000 | 31,927,333 |
| a | Waste Management, Inc., 5.472% due 4/3/2024 | 23,000,000 | 22,993,113 |
| WEC Energy Group, Inc., | |||
| a | 5.537% due 4/1/2024 | 7,000,000 | 7,000,000 |
| a | 5.553% due 4/3/2024 | 2,000,000 | 1,999,392 |
| a | 5.592% due 4/9/2024 | 8,000,000 | 7,990,222 |
| a | 5.603% due 4/9/2024 | 18,000,000 | 17,977,960 |
| a | 5.626% due 4/11/2024 | 272,000 | 271,582 |
| a | Western Union Co., 5.582% due 4/2/2024 | 34,000,000 | 33,994,806 |
| a | Whirlpool Corp., 5.684% due 4/3/2024 | 33,000,000 | 32,989,733 |
| Total Commercial Paper (Cost $1,229,168,446) | 1,229,168,446 | ||
| Repurchase Agreement — 5.0% | |||
| Bank of New York Tri-Party Repurchase Agreement, 5.42% dated 3/28/2024 due 4/1/2024, repurchase price $75,045,167 collateralized by 10 corporate debt securities, having an average coupon of 4.54%, a minimum credit rating of BBB-, maturity dates from 3/1/2028 to 7/1/2051, and having an aggregate market value of $80,484,850 at 3/31/2024 | 75,000,000 | 75,000,000 | |
| Total Repurchase Agreements (Cost $75,000,000) | 75,000,000 | ||
| Mutual Fund — 0.0% | |||
| c | State Street Institutional Treasury Money Market Fund Premier Class, 5.24% | 56,187 | 56,187 |
| See notes to financial statements. | Semi-Annual Report | 7 |
Thornburg Capital Management Fund | March 31, 2024 (Unaudited)
| ISSUER-DESCRIPTION | Shares/Principal Amount | VALUE | |
| Total Mutual Fund (Cost $56,187) | 56,187 | ||
| Total Investments — 87.8% (Cost $1,319,849,341) | $1,319,849,341 | ||
| Other Assets Less Liabilities — 12.2% | 182,616,169 | ||
| Net Assets — 100.0% | $1,502,465,510 |
| Footnote Legend | |
| a | Securities exempt from registration under Rule 144A of the Securities Act of 1933, as amended. These securities are restricted but liquid and may only be resold in the ordinary course of business in transactions exempt from registration, normally to qualified institutional buyers. As of March 31, 2024, the aggregate value of these securities in the Fund’s portfolio was $1,049,775,415, representing 69.87% of the Fund’s net assets. |
| b | Yankee bond denominated in U.S. dollars and is issued in the U.S. by foreign banks and corporations. |
| c | Rate represents the money market fund annualized seven-day yield at March 31, 2024. |
| 8 | Semi-Annual Report | See notes to financial statements. |
Thornburg Capital Management Fund | March 31, 2024 (Unaudited)
| ASSETS | |
| Investment in securities, at cost | $ 1,319,849,341 |
| Investments at value | 1,319,849,341 |
| Cash | 182,434,374 |
| Dividends receivable | 83 |
| Principal and interest receivable | 917,503 |
| Prepaid expenses and other assets | 5,548 |
| Total Assets | 1,503,206,849 |
| Liabilities | |
| Payable for investments purchased | 699,678 |
| Accounts payable and accrued expenses | 41,661 |
| Total Liabilities | 741,339 |
| Net Assets | $ 1,502,465,510 |
| NET ASSETS CONSIST OF | |
| Net capital paid in on shares of beneficial interest | $ 1,502,454,909 |
| Distributable earnings | 10,601 |
| Net Assets | $ 1,502,465,510 |
| NET ASSET VALUE | |
| Class I Shares: | |
| Net assets applicable to shares outstanding | $ 1,502,465,510 |
| Shares outstanding | 150,247,860 |
| Net asset value and redemption price per share | $ 10.00 |
Thornburg Capital Management Fund | Six Months Ended March 31, 2024 (Unaudited)
| INVESTMENT INCOME | |
| Interest income | $ 45,117,199 |
| Dividend income | 36,802 |
| Total Income | 45,154,001 |
| EXPENSES | |
| Transfer agent fees | 955 |
| Custodian fees | 32,907 |
| Professional fees | 15,223 |
| Other expenses | 8,735 |
| Total Expenses | 57,820 |
| Net Investment Income (Loss) | $ 45,096,181 |
| REALIZED AND UNREALIZED GAIN (LOSS) | |
| Net realized gain (loss) | 15,196 |
| Net Realized and Unrealized Gain (Loss) | 15,196 |
| Change in Net Assets Resulting from Operations | $ 45,111,377 |
Thornburg Capital Management Fund
| Six Months Ended March 31, 2024* | Year Ended September 30, 2023 | |
| INCREASE (DECREASE) IN NET ASSETS FROM | ||
| OPERATIONS | ||
| Net investment income | $ 45,096,181 | $ 70,926,529 |
| Net realized gain (loss) | 15,196 | 42,197 |
| Net Increase (Decrease) in Net Assets Resulting from Operations | 45,111,377 | 70,968,726 |
| DIVIDENDS TO SHAREHOLDERS | ||
| From distributable earnings | ||
| Class I Shares | (45,139,088) | (71,182,725) |
| FUND SHARE TRANSACTIONS | ||
| Class I Shares | (227,893,519) | 201,697,890 |
| Net Increase (Decrease) in Net Assets | (227,921,230) | 201,483,891 |
| NET ASSETS | ||
| Beginning of Period | 1,730,386,740 | 1,528,902,849 |
| End of Period | $ 1,502,465,510 | $ 1,730,386,740 |
| * | Unaudited. |
Thornburg Capital Management Fund | March 31, 2024 (Unaudited)
Thornburg Capital Management Fund | March 31, 2024 (Unaudited)
| TOTAL | LEVEL 1 | LEVEL 2 | LEVEL 3 | |
| Assets | ||||
| Investments in Securities | ||||
| U.S. Treasury Securities | $ 15,624,708 | $ — | $ 15,624,708 | $ — |
| Commercial Paper | 1,229,168,446 | — | 1,229,168,446 | — |
| Repurchase Agreement | 75,000,000 | — | 75,000,000 | — |
| Mutual Fund | 56,187 | 56,187 | — | — |
| Total Investments in Securities | $ 1,319,849,341 | $ 56,187 | $ 1,319,793,154 | $ — |
| Total Assets | $ 1,319,849,341 | $ 56,187 | $ 1,319,793,154 | $— |
| Cost of investments for tax purposes | $ 1,319,849,341 |
| Net unrealized appreciation (depreciation) on investments (tax basis) | $ - |
| SIX MONTHS ENDED March 31, 2024 | YEAR ENDED September 30, 2023 | |||
| SHARES | AMOUNT | SHARES | AMOUNT | |
| Class I Shares | ||||
| Shares sold | 463,911,623 | $ 4,639,116,229 | 882,916,619 | $ 8,829,166,189 |
| Shares issued to shareholders in reinvestment of dividends | 4,513,909 | 45,139,089 | 7,118,272 | 71,182,724 |
| Shares repurchased | (491,214,884) | (4,912,148,837) | (869,865,102) | (8,698,651,023) |
| Net increase (decrease) | (22,789,352) | $ (227,893,519) | 20,169,789 | $ 201,697,890 |
| Per Share Performance (For a Share Outstanding throughout the Period) | ||||||||
| UNLESS OTHERWISE NOTED, PERIODS ARE FISCAL YEARS ENDED SEPTEMBER 30, | Net Asset Value, Beginning of Period | Net Investment Income (Loss)+ | Net Realized & Unrealized Gain (Loss) on Investments | Total from Investment Operations | Dividends from Net Investment Income | Dividends from Net Realized Gains | Total Dividends | Net Asset Value, End of Period |
| Class I(b) | ||||||||
| 2024 (c) | $ 10.00 | 0.28 | — (d) | 0.28 | (0.28) | — | (0.28) | $ 10.00 |
| 2023 | $ 10.00 | 0.49 | — (d) | 0.49 | (0.49) | — | (0.49) | $ 10.00 |
| 2022 | $ 10.00 | 0.10 | — (d) | 0.10 | (0.10) | — | (0.10) | $ 10.00 |
| 2021 | $ 10.00 | 0.01 | — (d) | 0.01 | (0.01) | — | (0.01) | $ 10.00 |
| 2020 | $ 10.00 | 0.10 | 0.01 | 0.11 | (0.11) | — | (0.11) | $ 10.00 |
| 2019 | $ 10.00 | 0.24 | — | 0.24 | (0.24) | — | (0.24) | $ 10.00 |
| (a) | Not annualized for periods less than one year. |
| (b) | Sales loads are not reflected in computing total return. |
| (c) | Unaudited Six Month Period Ended March 31. |
| (d) | Net realized and unrealized gain (loss) on investments was less than $0.01 per share. |
| (e) | Annualized. |
| (f) | Portfolio turnover rate equals zero due to no long term investment transactions in the period. |
| + | Based on weighted average shares outstanding. |
| Ratios to Average Net Assets | Supplemental Data | ||||||
| UNLESS OTHERWISE NOTED, PERIODS ARE FISCAL YEARS ENDED SEPTEMBER 30, | Net Investment Income (Loss) (%) | Expenses, After Expense Reductions (%) | Expenses, Before Expense Reductions (%) | Total Return (%)(a) | Portfolio Turnover Rate (%)(a) | Net Assets at End of Period (Thousands) | |
| Class I(b) | |||||||
| 2024 (c) | 5.56 (e) | 0.01 (e) | 0.01 (e) | 2.83 | — (f) | $ 1,502,466 | |
| 2023 | 4.88 | 0.01 | 0.01 | 4.99 | — (f) | $ 1,730,387 | |
| 2022 | 0.96 | 0.01 | 0.01 | 0.96 | — (f) | $ 1,528,903 | |
| 2021 | 0.12 | 0.01 | 0.01 | 0.12 | — (f) | $ 2,060,113 | |
| 2020 | 1.00 | 0.01 | 0.01 | 1.08 | — (f) | $ 1,661,288 | |
| 2019 | 2.44 | 0.02 | 0.02 | 2.48 | — (f) | $ 1,552,677 | |
Thornburg Capital Management Fund | March 31, 2024 (Unaudited)
| BEGINNING ACCOUNT VALUE 10/1/23 | ENDING ACCOUNT VALUE 3/31/24 | EXPENSES PAID DURING PERIOD† 10/1/23—3/31/24 | |
| CLASS I SHARES | |||
| Actual | $1,000.00 | $1,028.25 | $0.05 |
| Hypothetical* | $1,000.00 | $1,024.95 | $0.05 |
| † | Expenses are equal to the annualized expense ratio for each class (I: 0.01%) multiplied by the average account value over the period, multiplied by 183/366 to reflect the one-half year period. |
| * | Hypothetical assumes a rate of return of 5% per year before expenses. |
Thornburg Capital Management Fund | March 31, 2024 (Unaudited)
| NAME, AGE, YEAR ELECTED POSITION HELD WITH FUND | PRINCIPAL OCCUPATION(S) DURING PAST FIVE YEARS | OTHER DIRECTORSHIPS HELD BY TRUSTEE |
| INTERESTED TRUSTEES(1)(2) | ||
| Garrett Thornburg, 78 Trustee Since 1984, Chairman of Trustees(4) | Chairman and controlling shareholder of Thornburg Investment Management, Inc. (investment advisor); Chairman and controlling shareholder of Thornburg Securities Corporation (securities dealer); Chairman of the Thornburg Foundation (nonprofit). | None |
| Brian J. McMahon, 68 Trustee since 2001, Vice Chairman of Trustees, Member of Governance & Nominating Committee and Operations Risk Oversight Committee(5) | Vice Chairman, Chief Investment Strategist, Managing Director, and Portfolio Manager, and until 2019 Chief Investment Officer, and, until 2016, CEO and President, of Thornburg Investment Management, Inc.; Vice President of Thornburg Securities Corporation. | None |
| INDEPENDENT TRUSTEES(1)(2)(3) | ||
| Lisa Black, 64 Trustee since 2023(6), Member of Audit Committee and Operations Risk Oversight Committee | Until 2019, Senior Managing Director, Chief Investment Officer and Head, Taxable Fixed Income, Nuveen LLC, New York, NY; Managing Director, TIAA-CREF, New York, NY (1996-2012). | None |
| Sally Corning, 63 Trustee since 2012, Member of Audit Committee and Governance & Nominating Committee | Partner in Sun Mountain Capital, Santa Fe, NM (private equity firm with investment programs encompassing venture capital, mezzanine debt, and growth equity). | None |
| Susan H. Dubin, 75 Trustee since 2004, Member of Audit Committee and Operations Risk Oversight Committee | President of Dubin Investments, Ltd., Greenwich, CT (private investment fund); Director and officer of various charitable organizations. | None |
| David L. Gardner, 61 Trustee since 2015, Chair of Governance & Nominating Committee and Member of Operations Risk Oversight Committee | Until 2012, head of EMEA (Europe, Middle East and Africa) Sales for iShares of Blackrock, Inc., EMEA Executive Committee Member and EMEA Operating Committee Member at Blackrock, Inc. | None |
| Patrick J. Talamantes, 59 Trustee since 2019, Chair of Audit Committee | President of Talamantes Strategies, a management consulting firm, since 2018. Until 2017, President and Chief Executive Officer of The McClatchy Company, Sacramento, CA (news and media company). | None |
| Owen D. Van Essen, 69 Trustee since 2004, Lead Independent Trustee, Member of Governance & Nominating Committee and Operations Risk Oversight Committee | President of Dirks, Van Essen & April, Santa Fe, New Mexico (newspaper mergers and acquisitions). | None |
| James W. Weyhrauch, 65 Trustee since 1996, Chair of Operations Risk Oversight Committee, Member of Audit Committee | Real estate broker, Santa Fe Properties, Santa Fe, NM; General Partner, Investments of Genext LLC (a family investment partnership); until 2019, Vice Chairman of Nambé LLC, Santa Fe, NM (manufacturing and design company). | None |
Thornburg Capital Management Fund | March 31, 2024 (Unaudited)
| NAME, AGE, YEAR ELECTED POSITION HELD WITH FUND | PRINCIPAL OCCUPATION(S) DURING PAST FIVE YEARS | OTHER DIRECTORSHIPS HELD BY TRUSTEE |
| OFFICERS OF THE FUND (WHO ARE NOT TRUSTEES)(1) | ||
| Nimish Bhatt, 60 President since 2023, Chief Financial Officer 2019-2023, Treasurer 2016-2019, Secretary 2018-2019(7) | Chief Financial Officer and Treasurer of Thornburg Investment Management, Inc. and Thornburg Securities Corporation since 2016, and Secretary of Thornburg Securities Corporation since 2018; Senior Vice President (2004-2016), Chief Financial Officer (2011-2016), and Head of Fund Administration (2011- 2016) of Calamos Asset Management, Inc., Calamos Investments LLC, Calamos Advisors LLC, and Calamos Wealth Management; Director of Calamos Global Funds plc (2007-2016). | Not applicable |
| Geoffrey Black, 62 Secretary since 2024(6)(7) | Director of Fund Operations of Thornburg Investment Management, Inc. since 2024; Director, Transfer Agent Services at Russell Investments (2010-2024). | Not applicable |
| Randy Dry, 49 Vice President 2014-2024(6) | Managing Director, Chief Operating Officer since 2020, Chief Administrative Officer (2016-2020), and Director of Institutional Group (2014-2016) of Thornburg Investment Management, Inc. | Not applicable |
| Curtis Holloway, 56 Chief Financial Officer since 2023, Secretary 2024(6), Treasurer since 2019(7) | Director of Finance since 2021 and Director of Fund Administration since 2019 of Thornburg Investment Management, Inc.; Senior Vice President, Head of Fund Administration (2017-2019) and Vice President, Fund Administration (2010-2017) of Calamos Investments, and Chief Financial Officer (2017-2019) and Treasurer (2010-2019) of Calamos Funds. | Not applicable |
| Ben Kirby, 43 Vice President since 2014 | Co-Head of Investments since 2019, and Portfolio Manager and Managing Director since 2013, of Thornburg Investment Management, Inc. | Not applicable |
| Jeff Klingelhofer, 43 Vice President since 2016 | Co-Head of Investments since 2019, Portfolio Manager and Managing Director since 2015, Associate Portfolio Manager (2012-2015), of Thornburg Investment Management, Inc. | Not applicable |
| Ponn Lithiluxa, 52 Assistant Treasurer since 2020; Vice President 2017-2020 | Senior Manager & Vice President, Tax & Fund Administration of Thornburg Investment Management, Inc. since 2017; Senior Vice President, Citi Fund Services, Inc. (2014-2017); Vice President, Citi Fund Services, Inc. (2007-2014). | Not applicable |
| Christopher Luckham, 46 Assistant Treasurer since 2022 | Senior Manager, Fund Administration of Thornburg Investment Management, Inc. since 2010. | Not applicable |
| Natasha Rippel, 41 Secretary 2021-2024(6)(7) | Director of Fund Operations since 2021, Supervisor of Fund Operations (2017-2021), and Senior Associate of Fund Operations (2015-2017) of Thornburg Investment Management, Inc. | Not applicable |
| Stephen Velie, 55 Chief Compliance Officer since 2009 | Chief Compliance Officer of Thornburg Investment Trust and Thornburg Investment Management, Inc. | Not applicable |
| (1) | Each person’s address is 2300 North Ridgetop Road, Santa Fe, New Mexico 87506. |
| (2) | The Trust is organized as a Massachusetts business trust, and currently comprises a complex of 24 separate investment “Funds” or “series.” Thornburg Investment Management, Inc. is the investment advisor to, and manages, the 24 Funds of the Trust. Each Trustee oversees the 24 Funds of the Trust. |
| (3) | The Bylaws of the Trust currently require that each Independent Trustee shall retire by the end of the calendar year during which the Trustee reached the age of 75 years. Otherwise, each Trustee serves in office until the election and qualification of a successor or until the Trustee sooner dies, resigns, retires or is removed. |
| (4) | Mr. Thornburg is considered an “interested” Trustee under the Investment Company Act of 1940 because he is a director and controlling shareholder of Thornburg Investment Management, Inc. the investment advisor to the 24 Funds of the Trust, and is the sole director and controlling shareholder of Thornburg Securities Corporation, the distributor of shares of the Trust. |
| (5) | Mr. McMahon is considered an “interested” Trustee under the Investment Company Act of 1940 because he is a director and the chief investment strategist of Thornburg Investment Management, Inc. |
| (6) | Ms. Black served as an Advisory Trustee from April 1, 2023 through October 1, 2023 and was elected as an independent Trustee effective October 2, 2023. Mr. Dry concluded his service as a Vice President of the Trust effective April 15, 2024. Ms. Rippel concluded her service as Secretary of the Trust effective April 19, 2024.Mr. Holloway served as Secretary of the Trust from April 22, 2024 through May 15, 2024, when he was succeeded by Mr. Black, who was appointed as Secretary of the Trust effective May 15, 2024. |
| (7) | The Trust’s president, chief financial officer, secretary and treasurer each serves a one-year term or until the election and qualification of a successor; each other officer serves at the pleasure of the Trustees. |
March 31, 2024 (Unaudited)
| Outstanding Shares | Shares Voted For | % of Voted Shares For | % of Outstanding Shares For | Shares Voted Withhold | % of Voted Shares Withhold | % of Outstanding Shares Withhold |
| 141,844,415.03 | 141,844,415.03 | 100.00% | 100.00% | 0.00 | 0.00% | 0.00% |
| Outstanding Shares | Shares Voted For | % of Voted Shares For | % of Outstanding Shares For | Shares Voted Withhold | % of Voted Shares Withhold | % of Outstanding Shares Withhold |
| 141,844,415.03 | 141,844,415.03 | 100.00% | 100.00% | 0.00 | 0.00% | 0.00% |
| Outstanding Shares | Shares Voted For | % of Voted Shares For | % of Outstanding Shares For | Shares Voted Withhold | % of Voted Shares Withhold | % of Outstanding Shares Withhold |
| 141,844,415.03 | 141,844,415.03 | 100.00% | 100.00% | 0.00 | 0.00% | 0.00% |
March 31, 2024 (Unaudited)
| Outstanding Shares | Shares Voted For | % of Voted Shares For | % of Outstanding Shares For | Shares Voted Withhold | % of Voted Shares Withhold | % of Outstanding Shares Withhold |
| 141,844,415.03 | 141,844,415.03 | 100.00% | 100.00% | 0.00 | 0.00% | 0.00% |
| ■ | Thornburg Global Opportunities Fund |
| ■ | Thornburg International Equity Fund |
| ■ | Thornburg Better World International Fund |
| ■ | Thornburg International Growth Fund |
| ■ | Thornburg Developing World Fund |
| ■ | Thornburg Small/Mid Cap Core Fund |
| ■ | Thornburg Small/Mid Cap Growth Fund |
| ■ | Thornburg Investment Income Builder Fund |
| ■ | Thornburg Income Builder Opportunities Trust |
| ■ | Thornburg Summit Fund |
| ■ | Thornburg Ultra Short Income Fund |
| ■ | Thornburg Limited Term U.S. Government Fund |
| ■ | Thornburg Limited Term Income Fund |
| ■ | Thornburg Core Plus Bond Fund |
| ■ | Thornburg Strategic Income Fund |
| ■ | Thornburg Short Duration Municipal Fund |
| ■ | Thornburg Limited Term Municipal Fund |
| ■ | Thornburg Intermediate Municipal Fund |
| ■ | Thornburg Strategic Municipal Income Fund |
| ■ | Thornburg California Limited Term Municipal Fund |
| ■ | Thornburg New Mexico Intermediate Municipal Fund |
| ■ | Thornburg New York Intermediate Municipal Fund |


| 800.847.0200 | TH3478 |

| Thornburg Managed Account Funds |
| Thornburg Emerging Markets Managed Account Fund |
| Thornburg Municipal Managed Account Fund |
| 4 | |
| 7 | |
| Schedule of Investments | |
| 9 | |
| 11 | |
| 13 | |
| 14 | |
| 15 | |
| 16 | |
| 22 | |
| 26 | |
| 27 | |
| 30 | |
| 32 |
Fund Overview
| THORNBURG EMERGING MARKETS MANAGED ACCOUNT FUND | FINAL VALUE |
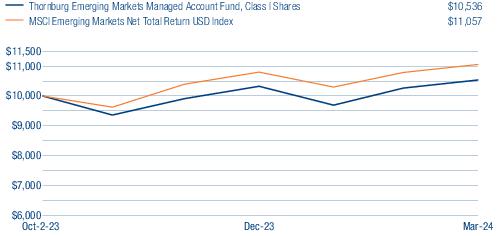
| THORNBURG EMERGING MARKETS MANAGED ACCOUNT FUND | SINCE INCEPTION |
| Class I Shares (Incep: 10/2/23) | 5.36% |
| MSCI Emerging Markets Net Total Return USD Index (Since 10/2/23) | 10.57% |
Fund Overview
| THORNBURG MUNICIPAL MANAGED ACCOUNT FUND | FINAL VALUE |
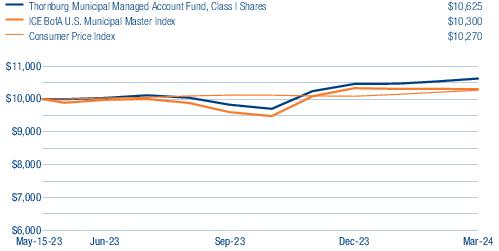
| THORNBURG MUNICIPAL MANAGED ACCOUNT FUND | SINCE INCEPTION |
| Class I Shares (Incep: 5/15/23) | 6.25% |
| ICE BofA U.S. Municipal Master Index (Since 5/15/23) | 3.00% |
Thornburg Emerging Markets Managed Account Fund | March 31, 2024 (Unaudited)
| TOP TEN EQUITY HOLDINGS | |
| Samsung Electronics Co. Ltd. | 14.2% |
| SK Hynix, Inc. | 9.8% |
| Chailease Holding Co. Ltd. | 5.7% |
| Lotes Co. Ltd. | 4.6% |
| SCB X PCL | 4.6% |
| Saudi Tadawul Group Holding Co. | 4.5% |
| Raia Drogasil SA | 3.8% |
| Kia Corp. | 3.7% |
| MediaTek, Inc. | 3.5% |
| Salik Co. PJSC | 3.4% |
| SECTOR EXPOSURE | |
| Information Technology | 34.7% |
| Financials | 14.8% |
| Consumer Staples | 11.6% |
| Consumer Discretionary | 9.0% |
| Health Care | 8.2% |
| Industrials | 6.4% |
| Communication Services | 3.0% |
| Energy | 2.8% |
| Real Estate | 2.7% |
| Other Assets Less Liabilities | 6.8% |
| TOP TEN INDUSTRY GROUPS | |
| Technology Hardware & Equipment | 18.8% |
| Semiconductors & Semiconductor Equipment | 15.9% |
| Financial Services | 10.2% |
| Automobiles & Components | 6.9% |
| Consumer Staples Distribution & Retail | 6.3% |
| Health Care Equipment & Services | 5.2% |
| Banks | 4.6% |
| Transportation | 3.4% |
| Food, Beverage & Tobacco | 3.3% |
| Telecommunication Services | 3.0% |
| THORNBURG EMERGING MARKETS MANAGED ACCOUNT FUND | NASDAQ SYMBOLS | CUSIPS |
| Class I | THMGX | 885-216-341 |
Thornburg Municipal Managed Account Fund | March 31, 2024 (Unaudited)
| KEY PORTFOLIO ATTRIBUTES | |
| Number of Bonds | 57 |
| Effective Duration | 5.4 Yrs |
| Average Maturity | 12.3 Yrs |
| Annualized Distribution Yield | 4.19% |
| SEC Yield | 4.11% |
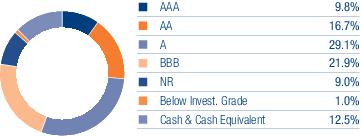
| THORNBURG MUNICIPAL MANAGED ACCOUNT FUND | NASDAQ SYMBOLS | CUSIPS |
| Class I | THMMX | 885-216-333 |
Thornburg Emerging Markets Managed Account Fund | March 31, 2024 (Unaudited)
| Issuer-Description | SHARES | VALUE | |
| Common Stock — 93.2% | |||
| Automobiles & Components — 6.9% | |||
| Automobile Components — 3.2% | |||
| Zhejiang Shuanghuan Driveline Co. Ltd. Class A, | 14,000 | $ 44,707 | |
| Automobiles — 3.7% | |||
| Kia Corp. | 626 | 52,080 | |
| 96,787 | |||
| Banks — 4.6% | |||
| Banks — 4.6% | |||
| SCB X PCL | 20,800 | 64,987 | |
| 64,987 | |||
| Capital Goods — 3.0% | |||
| Machinery — 3.0% | |||
| Shenzhen Inovance Technology Co. Ltd. Class A | 5,100 | 42,501 | |
| 42,501 | |||
| Consumer Discretionary Distribution & Retail — 2.1% | |||
| Specialty Retail — 2.1% | |||
| K Car Co. Ltd. | 2,915 | 29,599 | |
| 29,599 | |||
| Consumer Staples Distribution & Retail — 6.3% | |||
| Consumer Staples Distribution & Retail — 6.3% | |||
| BIM Birlesik Magazalar AS | 3,271 | 35,563 | |
| Raia Drogasil SA | 9,900 | 54,026 | |
| 89,589 | |||
| Energy — 2.8% | |||
| Energy Equipment & Services — 2.8% | |||
| ADNOC Drilling Co. PJSC | 36,766 | 39,747 | |
| 39,747 | |||
| Financial Services — 10.2% | |||
| Capital Markets — 4.5% | |||
| Saudi Tadawul Group Holding Co. | 881 | 64,081 | |
| Financial Services — 5.7% | |||
| Chailease Holding Co. Ltd. | 15,000 | 80,382 | |
| 144,463 | |||
| Food, Beverage & Tobacco — 3.3% | |||
| Beverages — 3.3% | |||
| Kweichow Moutai Co. Ltd. Class A | 200 | 47,088 | |
| 47,088 | |||
| Health Care Equipment & Services — 5.2% | |||
| Health Care Providers & Services — 5.2% | |||
| Aier Eye Hospital Group Co. Ltd. Class A | 20,100 | 35,765 | |
| a | Oncoclinicas do Brasil Servicos Medicos SA | 21,700 | 38,291 |
| 74,056 | |||
| Household & Personal Products — 2.0% | |||
| Personal Care Products — 2.0% | |||
| Proya Cosmetics Co. Ltd. Class A | 2,200 | 28,400 | |
| 28,400 | |||
| Pharmaceuticals, Biotechnology & Life Sciences — 3.0% | |||
| Biotechnology — 3.0% | |||
| Imeik Technology Development Co. Ltd. Class A | 900 | 42,139 | |
| 42,139 | |||
| Real Estate Management & Development — 2.7% |
| See notes to financial statements. | Thornburg Managed Account Funds Semi-Annual Report | 9 |
Thornburg Emerging Markets Managed Account Fund | March 31, 2024 (Unaudited)
| Issuer-Description | SHARES | VALUE | |
| Real Estate Management & Development — 2.7% | |||
| Aldar Properties PJSC | 25,468 | $ 38,283 | |
| 38,283 | |||
| Semiconductors & Semiconductor Equipment — 15.9% | |||
| Semiconductors & Semiconductor Equipment — 15.9% | |||
| Alchip Technologies Ltd. | 368 | 36,393 | |
| MediaTek, Inc. | 1,364 | 49,439 | |
| SK Hynix, Inc. | 1,053 | 139,383 | |
| 225,215 | |||
| Technology Hardware & Equipment — 18.8% | |||
| Electronic Equipment, Instruments & Components — 4.6% | |||
| Lotes Co. Ltd. | 1,505 | 65,131 | |
| Technology Hardware, Storage & Peripherals — 14.2% | |||
| Samsung Electronics Co. Ltd. | 3,350 | 201,062 | |
| 266,193 | |||
| Telecommunication Services — 3.0% | |||
| Diversified Telecommunication Services — 3.0% | |||
| a | Converge Information & Communications Technology Solutions, Inc. | 241,800 | 42,865 |
| 42,865 | |||
| Transportation — 3.4% | |||
| Transportation Infrastructure — 3.4% | |||
| Salik Co. PJSC | 47,836 | 48,328 | |
| 48,328 | |||
| Total Common Stock (Cost $1,221,657) | 1,320,240 | ||
| Short-Term Investments — 1.8% | |||
| b | Thornburg Capital Management Fund | 2,548 | 25,482 |
| Total Short-Term Investments (Cost $25,482) | 25,482 | ||
| Total Investments — 95.0% (Cost $1,247,139) | $1,345,722 | ||
| Other Assets Less Liabilities — 5.0% | 70,248 | ||
| Net Assets — 100.0% | $1,415,970 |
| Footnote Legend | |
| a | Non-income producing. |
| b | Investment in Affiliates. |
| COUNTRY EXPOSURE * (percent of equity holdings) | |
| South Korea | 32.0% |
| China | 18.2% |
| Taiwan | 17.5% |
| United Arab Emirates | 9.6% |
| Brazil | 7.0% |
| Thailand | 4.9% |
| Saudi Arabia | 4.9% |
| Philippines | 3.2% |
| Turkey | 2.7% |
| * | Holdings are classified by country of risk as determined by MSCI and Bloomberg. |
| 10 | Thornburg Managed Account Funds Semi-Annual Report | See notes to financial statements. |
Thornburg Municipal Managed Account Fund | March 31, 2024 (Unaudited)
| ISSUER-DESCRIPTION | Principal Amount | VALUE | |
| LONG-TERM MUNICIPAL BONDS — 86.2% | |||
| Alabama — 12.4% | |||
| a | Black Belt Energy Gas District (Guaranty: Goldman Sachs Group, Inc.), Series D-1, 5.50% due 6/1/2049 (put 2/1/2029) | $150,000 | $ 159,366 |
| Black Belt Energy Gas District (Guaranty: Royal Bank of Canada), Series B, 5.00% due 12/1/2030 | 250,000 | 266,203 | |
| a | Chatom (PowerSouth Energy Cooperative; SPA National Rural Utilities Cooperative Finance) IDB, Series A, 3.875% due 8/1/2037 (put 8/1/2024) | 250,000 | 261,282 |
| a | Southeast Alabama Gas Supply District (Guaranty: Morgan Stanley Group), 5.00% due 6/1/2049 (put 5/1/2032) | 250,000 | 267,816 |
| a | Southeast Alabama Gas Supply District (Guaranty: Pacific Life Insurance Co.), Series A, 5.00% due 8/1/2054 (put 4/1/2032) | 250,000 | 268,612 |
| Arizona — 1.5% | |||
| a | Chandler (Intel Corp.) IDA AMT, 4.10% due 12/1/2037 (put 6/15/2028) | 150,000 | 150,725 |
| California — 6.9% | |||
| a | California Community Choice Financing Authority (Guaranty: Morgan Stanley Group), Series A-1, 5.00% due 5/1/2054 (put 4/1/2032) | 250,000 | 268,938 |
| California Municipal Finance Authority (Greenfield Commons Eah LP; Collateralized: FNMA) (Green Bond), Series A, 5.28% due 9/1/2046 | 150,000 | 162,998 | |
| a,b | California Pollution Control Financing Authority (Republic Services, Inc.) AMT, Series A-1, 4.00% due 11/1/2042 (put 4/15/2024) | 250,000 | 250,000 |
| Connecticut — 1.6% | |||
| Connecticut Housing Finance Authority, Series B, 4.65% due 11/15/2048 | 150,000 | 152,740 | |
| Florida — 5.6% | |||
| b | Capital Trust Agency, Inc. (Southeastern University Obligated Group), Series A, 6.25% due 5/1/2048 | 100,000 | 100,033 |
| County of Broward Airport System Revenue AMT, 5.00% due 10/1/2042 | 150,000 | 154,340 | |
| County of Miami-Dade Aviation Revenue AMT, Series A, 5.00% due 10/1/2035 | 150,000 | 150,817 | |
| Florida Development Finance Corp. (Mater Academy Miami-Dade Osceola County Facilities Obligated Group), Series A, 5.00% due 6/15/2042 | 150,000 | 151,146 | |
| Georgia — 4.8% | |||
| a | Bartow County Development Authority (Georgia Power Co.), 3.95% due 12/1/2032 (put 3/8/2028) | 100,000 | 102,225 |
| Main Street Natural Gas, Inc. (Guaranty: Royal Bank of Canada), | |||
| a | Series A, 5.00% due 5/1/2054 (put 9/1/2031) | 200,000 | 214,134 |
| a | Series B, 5.00% due 7/1/2053 (put 3/1/2030) | 150,000 | 159,032 |
| Illinois — 3.1% | |||
| City of Chicago (Chicago O’Hare International Airport) AMT, Series A, 5.00% due 1/1/2028 | 150,000 | 151,031 | |
| State of Illinois GO, Series B, 4.00% due 11/1/2038 | 150,000 | 150,769 | |
| Indiana — 1.0% | |||
| a | Indiana Finance Authority (Republic Services, Inc.) AMT, Series A, 4.20% due 5/1/2034 (put 6/3/2024) | 100,000 | 100,000 |
| Iowa — 1.6% | |||
| a | Iowa Finance Authority (Iowa Fertilizer Co. LLC; Guaranty: OCI NV), 5.00% due 12/1/2050 (put 12/1/2042) | 150,000 | 157,745 |
| Kansas — 1.5% | |||
| Kansas Independent College Finance Authority (Ottawa University), Series B, 7.30% due 5/1/2024 | 150,000 | 150,318 | |
| Kentucky — 4.6% | |||
| a | County of Owen (American Water/Kentucky-American Water Co. Obligated Group), 3.875% due 6/1/2040 (put 9/1/2028) | 150,000 | 150,520 |
| Kentucky Housing Corp. (Collateralized: GNMA, FNMA, FHLMC), Series A, 4.35% due 7/1/2044 | 150,000 | 146,886 | |
| Louisville/Jefferson County Metropolitan Government (Norton Healthcare Obligated Group), Series A, 5.00% due 10/1/2033 | 150,000 | 155,202 | |
| Michigan — 2.8% | |||
| City of Detroit GO, Series C, 6.00% due 5/1/2043 | 250,000 | 280,659 | |
| Nevada — 2.6% | |||
| a | County of Washoe (Sierra Pacific Power Co.) AMT, Series F, 4.125% due 3/1/2036 (put 10/1/2029) | 250,000 | 253,111 |
| New Hampshire — 1.9% | |||
| New Hampshire Business Finance Authority (Presbyterian Homes Obligated Group), Series A, 5.25% due 7/1/2048 | 175,000 | 183,017 | |
| New Jersey — 1.8% | |||
| New Jersey Housing & Mortgage Finance Agency (Riverview Towers Preservation LLC), Series B, 5.25% due 12/20/2065 | 175,000 | 180,648 | |
| New Mexico — 5.4% | |||
| a | City of Farmington (Public Service Co. of New Mexico), Series D, 3.90% due 6/1/2040 (put 6/1/2028) | 250,000 | 249,498 |
| New Mexico Educational Assistance Foundation AMT, Series 1A, 5.00% due 9/1/2029 | 150,000 | 162,110 | |
| New Mexico Hospital Equipment Loan Council (Haverland Carter Lifestyle Obligated Group), Series A, 5.00% due 7/1/2049 | 150,000 | 123,378 | |
| North Carolina — 1.5% | |||
| North Carolina Medical Care Commission (United Methodist Retirement Homes Inc Obligated Group), Series 2024B-1, 4.25% due 10/1/2028 | 150,000 | 150,433 | |
| Pennsylvania — 1.5% | |||
| Northeastern Pennsylvania Hospital & Education Authority (King’s College), 5.00% due 5/1/2031 | 145,000 | 151,059 | |
| South Dakota — 1.6% | |||
| South Dakota Health & Educational Facilities Authority (Monument Health Obligated Group), 5.00% due 9/1/2040 | 150,000 | 155,532 | |
| Tennessee — 3.7% | |||
| Knox County Health Educational & Housing Facility Board (Provident Group - UTK Properties LLC; Insured: BAM), Series A-1, 5.00% due 7/1/2044 | 200,000 | 213,766 |
| See notes to financial statements. | Thornburg Managed Account Funds Semi-Annual Report | 11 |
Thornburg Municipal Managed Account Fund | March 31, 2024 (Unaudited)
| ISSUER-DESCRIPTION | Principal Amount | VALUE | |
| Tennessee HDA, Series 2A, 4.70% due 7/1/2053 | $150,000 | $ 148,636 | |
| Texas — 7.8% | |||
| Clifton Higher Education Finance Corp. (YES Prep Public Schools, Inc.; Insured: PSF-GTD), 4.25% due 4/1/2048 | 150,000 | 146,859 | |
| Matagorda County Navigation District No. 1 (AEP Texas, Inc.) AMT, 4.25% due 5/1/2030 | 150,000 | 153,127 | |
| a | Mission Economic Development Corp. (Waste Management, Inc.; Guaranty: Waste Management Holdings) AMT, Series A, 4.25% due 6/1/2048 (put 6/3/2024) | 150,000 | 149,879 |
| Texas Private Activity Bond Surface Transportation Corp. (NTE Mobility Partners LLC) AMT, 5.50% due 12/31/2058 | 150,000 | 164,549 | |
| Texas Transportation Commission (Central Texas Turnpike System), Series C, 5.00% due 8/15/2034 | 150,000 | 150,592 | |
| Utah — 2.6% | |||
| b | Utah Charter School Finance Authority (Freedom Academy Foundation), Series A, 5.00% due 6/15/2041 | 120,000 | 107,502 |
| Utah Charter School Finance Authority (Summit Academy, Inc.), Series A, 5.00% due 4/15/2049 | 150,000 | 153,099 | |
| Virginia — 2.1% | |||
| Virginia HDA, Series D, 4.70% due 8/1/2048 | 200,000 | 201,904 | |
| Washington — 2.7% | |||
| Washington State Housing Finance Commission (Eastside Retirement Association Obligated Group), Series B-1, 4.75% due 7/1/2027 | 155,000 | 155,007 | |
| b | Washington State Housing Finance Commission (Seattle Academy of Arts & Sciences), 6.125% due 7/1/2053 | 100,000 | 109,891 |
| West Virginia — 2.6% | |||
| a | West Virginia (Kentucky Power Co.) EDA AMT, Series A, 4.70% due 4/1/2036 (put 6/17/2026) | 250,000 | 254,629 |
| Wisconsin — 1.0% | |||
| a | Public Finance Authority (Waste Management, Inc.; Guaranty: Waste Management Holdings) AMT, Series A-2, 4.10% due 10/1/2025 (put 5/1/2024) | 100,000 | 99,635 |
| Total Long-Term Municipal Bonds — 86.2% (Cost $8,315,005) | 8,501,398 | ||
| Short-Term Municipal Bonds — 11.2% | |||
| Kentucky — 1.5% | |||
| a | County of Meade (Nucor Corp.) AMT, Series A-1, 5.16% due 8/1/2061 (put 4/1/2024) | 150,000 | 150,000 |
| New York — 5.9% | |||
| a | City of New York (SPA Barclays Bank plc) GO, Series F-5, 4.45% due 6/1/2044 (put 4/1/2024) | 195,000 | 195,000 |
| a | New York City Municipal Water Finance Authority (New York City Water & Sewer System; SPA JP Morgan Chase Bank NA), Series AA-1, 4.55% due 6/15/2050 (put 4/1/2024) | 185,000 | 185,000 |
| a | New York City Transitional Finance Authority Future Tax Secured Revenue (SPA JP Morgan Chase Bank NA), Series E-4, 4.55% due 2/1/2045 (put 4/1/2024) | 195,000 | 195,000 |
| North Carolina — 2.0% | |||
| a | Charlotte-Mecklenburg Hospital Authority (Atrium Health Obligated Group; SPA JP Morgan Chase Bank NA), Series B, 4.45% due 1/15/2038 (put 4/1/2024) | 195,000 | 195,000 |
| Texas — 1.8% | |||
| a | Port of Port Arthur Navigation District (Motiva Enterprises LLC), 4.85% due 4/1/2040 (put 4/1/2024) | 180,000 | 180,000 |
| Total Short-Term Municipal Bonds — 11.2% (Cost $1,100,000) | 1,100,000 | ||
| Total Investments — 97.4% (Cost $9,415,005) | $9,601,398 | ||
| Other Assets Less Liabilities — 2.6% | 256,281 | ||
| Net Assets — 100.0% | $9,857,679 |
| Footnote Legend | |
| a | Variable, floating, step, or fixed to floating rate securities are securities for which interest rate changes are based on changes in a designated base rate or on a predetermined schedule. The rates shown are those in effect on March 31, 2024. |
| b | Securities exempt from registration under Rule 144A of the Securities Act of 1933, as amended. These securities are restricted but liquid and may only be resold in the ordinary course of business in transactions exempt from registration, normally to qualified institutional buyers. As of March 31, 2024, the aggregate value of these securities in the Fund’s portfolio was $567,426, representing 5.76% of the Fund’s net assets. |
To simplify the listings of securities, abbreviations are used per the table below:
| AMT | Alternative Minimum Tax |
| BAM | Insured by Build America Mutual Insurance Co. |
| EDA | Economic Development Authority |
| FHLMC | Collateralized by Federal Home Loan Mortgage Corp. |
| FNMA | Collateralized by Federal National Mortgage Association |
| GNMA | Collateralized by Government National Mortgage Association |
| GO | General Obligation |
| HDA | Housing Development Authority |
| IDA | Industrial Development Authority/Agency |
| IDB | Industrial Development Board |
| PSF-GTD | Guaranteed by Permanent School Fund |
| SPA | Stand-by Purchase Agreement |
| 12 | Thornburg Managed Account Funds Semi-Annual Report | See notes to financial statements. |
March 31, 2024 (Unaudited)
| THORNBURG EMERGING MARKETS MANAGED ACCOUNT FUND | THORNBURG MUNICIPAL MANAGED ACCOUNT FUND | |
| ASSETS | ||
| Investments at cost | ||
| Non-affiliated issuers | $ 1,221,657 | $ 9,415,005 |
| Non-controlled affiliated issuers | 25,482 | - |
| Investments at value | ||
| Non-affiliated issuers | 1,320,240 | 9,601,398 |
| Non-controlled affiliated issuers | 25,482 | - |
| Cash | - | 122,387 |
| Receivable for investments sold | 18,600 | - |
| Receivable from investment advisor | 12,434 | 13,668 |
| Dividends receivable | 6,729 | - |
| Principal and interest receivable | - | 109,927 |
| Prepaid expenses and other assets | 55,679 | 33,779 |
| Total Assets | 1,439,164 | 9,881,159 |
| Liabilities | ||
| Payable for investments purchased | 29 | - |
| Deferred taxes payable | 956 | - |
| Accounts payable and accrued expenses | 22,209 | 23,480 |
| Total Liabilities | 23,194 | 23,480 |
| Net Assets | $ 1,415,970 | $ 9,857,679 |
| NET ASSETS CONSIST OF | ||
| Net capital paid in on shares of beneficial interest | $ 1,325,953 | $ 9,694,699 |
| Distributable earnings | 90,017 | 162,980 |
| Net Assets | $ 1,415,970 | $ 9,857,679 |
| NET ASSET VALUE | ||
| Class I Shares: | ||
| Net assets applicable to shares outstanding | $ 1,415,970 | $ 9,857,679 |
| Shares outstanding | 135,170 | 962,963 |
| Net asset value and redemption price per share | $ 10.48 | $ 10.24 |
Six Months Ended March 31, 2024 (Unaudited)
| THORNBURG EMERGING MARKETS MANAGED ACCOUNT FUND(a) | THORNBURG MUNICIPAL MANAGED ACCOUNT FUND | |
| INVESTMENT INCOME | ||
| Dividend income | ||
| Non-affiliated issuers | $ 12,606 | $ - |
| Non-controlled affiliated issuers | 3,229 | - |
| Dividend taxes withheld | (2,136) | - |
| Interest income | - | 155,705 |
| Total Income | 13,699 | 155,705 |
| EXPENSES | ||
| Transfer agent fees | ||
| Class I Shares | 1,042 | 1,202 |
| Registration and filing fees | ||
| Class I Shares | 509 | 4,472 |
| Custodian fees | 905 | 11,916 |
| Professional fees | 24,345 | 23,415 |
| Trustee and officer fees | 362 | 549 |
| Other expenses | 32,288 | 31,273 |
| Total Expenses | 59,451 | 72,827 |
| Less: | ||
| Expenses reimbursed | (59,451) | (72,827) |
| Net Expenses | - | - |
| Net Investment Income (Loss) | $ 13,699 | $ 155,705 |
| REALIZED AND UNREALIZED GAIN (LOSS) | ||
| Net realized gain (loss) on: | ||
| Non-affiliated issuers investments | (15,074) | (12,362) |
| Foreign currency transactions | 906 | - |
| Net realized gain (loss) | (14,168) | (12,362) |
| Net change in unrealized appreciation (depreciation) on: | ||
| Non-affiliated issuers investments* | 97,627 | 351,591 |
| Foreign currency translations | (57) | - |
| Change in net unrealized appreciation (depreciation) | 97,570 | 351,591 |
| Net Realized and Unrealized Gain (Loss) | 83,402 | 339,229 |
| Change in Net Assets Resulting from Operations | $ 97,101 | $ 494,934 |
| * Net of change in deferred taxes | $ (956) | $ - |
| (a) | The Fund commenced operations on October 2, 2023. |
| THORNBURG EMERGING MARKETS MANAGED ACCOUNT FUND | THORNBURG MUNICIPAL MANAGED ACCOUNT FUND | ||
| Period Ended March 31, 2024*, (a) | Six Months Ended March 31, 2024* | Period Ended September 30, 2023(b) | |
| INCREASE (DECREASE) IN NET ASSETS FROM | |||
| OPERATIONS | |||
| Net investment income (loss) | $ 13,699 | $ 155,705 | $ 80,674 |
| Net realized gain (loss) | (14,168) | (12,362) | (10,731) |
| Net change in unrealized appreciation (depreciation) | 97,570 | 351,591 | (165,198) |
| Net Increase (Decrease) in Net Assets Resulting from Operations | 97,101 | 494,934 | (95,255) |
| DIVIDENDS TO SHAREHOLDERS | |||
| From distributable earnings | |||
| Class I Shares | (7,084) | (156,043) | (80,656) |
| FUND SHARE TRANSACTIONS | |||
| Class I Shares | 1,325,953 | 4,226,043 | 5,468,656 |
| Net Increase (Decrease) in Net Assets | 1,415,970 | 4,564,934 | 5,292,745 |
| NET ASSETS | |||
| Beginning of Period | - | 5,292,745 | - |
| End of Period | $ 1,415,970 | $ 9,857,679 | $ 5,292,745 |
| * | Unaudited. |
| (a) | The Fund commenced operations on October 2, 2023. |
| (b) | The Fund commenced operations on May 15, 2023. |
March 31, 2024 (Unaudited)
March 31, 2024 (Unaudited)
March 31, 2024 (Unaudited)
March 31, 2024 (Unaudited)
| EMERGING MARKETS MANAGED ACCOUNT FUND | TOTAL | LEVEL 1 | LEVEL 2 | LEVEL 3 |
| Assets | ||||
| Investments in Securities | ||||
| Common Stock | $ 1,320,240 | $ 1,320,240 | $ — | $ — |
| Short-Term Investments | 25,482 | 25,482 | — | — |
| Total Investments in Securities | $ 1,345,722 | $ 1,345,722 | $ — | $ — |
| Total Assets | $ 1,345,722 | $ 1,345,722 | $ — | $ — |
| MUNICIPAL MANAGED ACCOUNT FUND | TOTAL | LEVEL 1 | LEVEL 2 | LEVEL 3 |
| Assets | ||||
| Investments in Securities | ||||
| Long-Term Municipal Bonds | $ 8,501,398 | $ — | $ 8,501,398 | $ — |
| Short-Term Municipal Bonds | 1,100,000 | — | 1,100,000 | — |
| Total Investments in Securities | $ 9,601,398 | $ — | $ 9,601,398 | $ — |
| Total Assets | $ 9,601,398 | $ — | $ 9,601,398 | $— |
March 31, 2024 (Unaudited)
| EMERGING MARKETS MANAGED ACCOUNT FUND | Market Value 9/30/23 | Purchases at Cost | Sales Proceeds | Realized Gain (Loss) | Change in Unrealized Appr./(Depr.) | Market Value 3/31/24 | Dividend Income |
| Thornburg Capital Mgmt. Fund | $- | $1,642,522 | $(1,617,040) | $- | $- | $25,482 | $3,229 |
| Cost | Unrealized Appreciation | Unrealized Depreciation | Net Unrealized Appreciation (Depreciation) | |
| Emerging Markets Managed Account Fund | $ 1,247,139 | $ 145,161 | $ (46,578) | $ 98,583 |
| Municipal Managed Account Fund | 9,415,005 | 193,212 | (6,819) | 186,393 |
March 31, 2024 (Unaudited)
| PERIOD ENDED March 31, 2024† | ||
| EMERGING MARKETS MANAGED ACCOUNT FUND | SHARES | AMOUNT |
| Class I Shares | ||
| Shares sold | 135,423 | $ 1,328,375 |
| Shares issued to shareholders in reinvestment of dividends | 724 | 7,084 |
| Shares repurchased | (977) | (9,506) |
| Net increase (decrease) | 135,170 | $ 1,325,953 |
| † The Fund commenced operations on October 2, 2023. | ||
| SIX MONTHS ENDED March 31, 2024 | PERIOD ENDED September 30, 2023* | |||
| MUNICIPAL MANAGED ACCOUNT FUND | SHARES | AMOUNT | SHARES | AMOUNT |
| Class I Shares | ||||
| Shares sold | 400,465 | $ 4,070,000 | 538,878 | $ 5,388,000 |
| Shares issued to shareholders in reinvestment of dividends | 15,478 | 156,043 | 8,142 | 80,656 |
| Net increase (decrease) | 415,943 | $ 4,226,043 | 547,020 | $ 5,468,656 |
| * The Fund commenced operations on May 15, 2023. | ||||
| Purchases | Sales | |
| Emerging Markets Managed Account Fund | $ 1,692,238 | $ 455,506 |
| Municipal Managed Account Fund | 3,434,759 | 377,588 |
Emerging Markets Managed Account Fund
| PER SHARE PERFORMANCE (FOR A SHARE OUTSTANDING THROUGHOUT THE PERIOD) | ||||||||||
| UNLESS OTHERWISE NOTED, PERIODS ARE FISCAL YEARS ENDED SEPTEMBER 30, | Net Asset Value, Beginning of PERIOD | Net Investment Income (Loss)+ | Net Realized & Unrealized Gain (Loss) on Investments | Total from Investment Operations | Dividends from Net Investment Income | Dividends from Net Realized Gains | Dividends from Return of Capital | Total Dividends | Net Asset Value, End of PERIOD | |
| CLASS I SHARES | ||||||||||
| 2024 (b)(c) | $ 10.00 | 0.10 | 0.43 | 0.53 | (0.05) | — | — | (0.05) | $ 10.48 | |
| (a) | Not annualized for periods less than one year. |
| (b) | The Fund commenced operations on October 2, 2023. |
| (c) | Unaudited Six Month Period Ended March 31. |
| (d) | Annualized. |
| (e) | Due to the size of net assets and fixed expenses, ratios may appear disproportionate. |
| + | Based on weighted average shares outstanding. |
| RATIOS TO AVERAGE NET ASSETS | Supplemental Data | ||||||
| UNLESS OTHERWISE NOTED, PERIODS ARE FISCAL YEARS ENDED SEPTEMBER 30, | Net Investment Income (Loss) (%) | Expenses, After Expense Reductions (%) | Expenses, Before Expense Reductions (%) | Total Return (%)(a) | Portfolio Turnover Rate (%)(a) | Net Assets at End of PERIOD (Thousands) | |
| CLASS I SHARES | |||||||
| 2024 (b)(c) | 2.14 (d) | — (d) | 9.30 (d)(e) | 5.36 | 36.56 | $ 1,416 | |
Municipal Managed Account Fund
| PER SHARE PERFORMANCE (FOR A SHARE OUTSTANDING THROUGHOUT THE PERIOD) | ||||||||||
| UNLESS OTHERWISE NOTED, PERIODS ARE FISCAL YEARS ENDED SEPTEMBER 30, | Net Asset Value, Beginning of PERIOD | Net Investment Income (Loss)+ | Net Realized & Unrealized Gain (Loss) on Investments | Total from Investment Operations | Dividends from Net Investment Income | Dividends from Net Realized Gains | Dividends from Return of Capital | Total Dividends | Net Asset Value, End of PERIOD | |
| CLASS I SHARES | ||||||||||
| 2024 (b) | $ 9.68 | 0.22 | 0.56 | 0.78 | (0.22) | — | — | (0.22) | $ 10.24 | |
| 2023 (d) | $ 10.00 | 0.15 | (0.32) | (0.17) | (0.15) | — | — | (0.15) | $ 9.68 | |
| (a) | Not annualized for periods less than one year. |
| (b) | Unaudited Six Month Period Ended March 31. |
| (c) | Annualized. |
| (d) | The Fund commenced operations on May 15, 2023. |
| + | Based on weighted average shares outstanding. |
Municipal Managed Account Fund
| RATIOS TO AVERAGE NET ASSETS | Supplemental Data | ||||||
| UNLESS OTHERWISE NOTED, PERIODS ARE FISCAL YEARS ENDED SEPTEMBER 30, | Net Investment Income (Loss) (%) | Expenses, After Expense Reductions (%) | Expenses, Before Expense Reductions (%) | Total Return (%)(a) | Portfolio Turnover Rate (%)(a) | Net Assets at End of PERIOD (Thousands) | |
| CLASS I SHARES | |||||||
| 2024 (b) | 4.35 (c) | — (c) | 2.04 (c) | 8.13 | 6.03 | $ 9,858 | |
| 2023 (d) | 4.00 (c) | — (c) | 3.65 (c) | (1.74) | 39.98 | $ 5,293 | |
March 31, 2024 (Unaudited)
| Actual | Hypothetical * | |||||
| Ending Account Value 3/31/24 | Expenses Paid During Period 10/1/23-3/31/24 | Ending Account Value 3/31/24 | Expenses Paid During Period† 10/1/23-3/31/24 | Annualized Expense Ratio | ||
| EMERGING MARKETS MANAGED ACCOUNT FUND | ||||||
| CLASS I SHARES | $1,053.59 | $0.00 | $1,024.73 | $0.00 ‡ | 0.00% | |
| MUNICIPAL MANAGED ACCOUNT FUND | ||||||
| CLASS I SHARES | $1,081.32 | $0.00 | $1,025.00 | $0.00 | 0.00% | |
| * | Hypothetical assumes a rate of return of 5% per year before expenses. |
| † | Expenses are equal to the annualized expense ratio for each class (I: 0.00%) multiplied by the average account value over the period, multiplied by 183/366 to reflect the one-half year period. |
| ‡ | Expenses are equal to the annualized expense ratio for the class (I: 0.00%) multiplied by the average account value over the period, multiplied by 181/366 to reflect the accrual period from 10/3/23 to 3/31/24. |
March 31, 2024 (Unaudited)
March 31, 2024 (Unaudited)
| Outstanding Shares | Shares Voted For | % of Voted Shares For | % of Outstanding Shares For | Shares Voted Withhold | % of Voted Shares Withhold | % of Outstanding Shares Withhold |
| 543,318.95 | 504,199.98 | 100.00% | 92.80% | 0.00 | 0.00% | 0.00% |
| Outstanding Shares | Shares Voted For | % of Voted Shares For | % of Outstanding Shares For | Shares Voted Withhold | % of Voted Shares Withhold | % of Outstanding Shares Withhold |
| 543,318.95 | 504,199.98 | 100.00% | 92.80% | 0.00 | 0.00% | 0.00% |
| Outstanding Shares | Shares Voted For | % of Voted Shares For | % of Outstanding Shares For | Shares Voted Withhold | % of Voted Shares Withhold | % of Outstanding Shares Withhold |
| 543,318.95 | 504,199.98 | 100.00% | 92.80% | 0.00 | 0.00% | 0.00% |
March 31, 2024 (Unaudited)
| Outstanding Shares | Shares Voted For | % of Voted Shares For | % of Outstanding Shares For | Shares Voted Withhold | % of Voted Shares Withhold | % of Outstanding Shares Withhold |
| 543,318.95 | 504,199.98 | 100.00% | 92.80% | 0.00 | 0.00% | 0.00% |
March 31, 2024 (Unaudited)
| NAME, AGE, YEAR ELECTED POSITION HELD WITH FUND | PRINCIPAL OCCUPATION(S) DURING PAST FIVE YEARS | OTHER DIRECTORSHIPS HELD BY TRUSTEE |
| INTERESTED TRUSTEES(1)(2) | ||
| Garrett Thornburg, 78 Trustee Since 1984, Chairman of Trustees(4) | Chairman and controlling shareholder of Thornburg Investment Management, Inc. (investment advisor); Chairman and controlling shareholder of Thornburg Securities Corporation (securities dealer); Chairman of the Thornburg Foundation (nonprofit). | None |
| Brian J. McMahon, 68 Trustee since 2001, Vice Chairman of Trustees, Member of Governance & Nominating Committee and Operations Risk Oversight Committee(5) | Vice Chairman, Chief Investment Strategist, Managing Director, and Portfolio Manager, and until 2019 Chief Investment Officer, and, until 2016, CEO and President, of Thornburg Investment Management, Inc.; Vice President of Thornburg Securities Corporation. | None |
| INDEPENDENT TRUSTEES(1)(2)(3) | ||
| Lisa Black, 64 Trustee since 2023(6), Member of Audit Committee and Operations Risk Oversight Committee | Until 2019, Senior Managing Director, Chief Investment Officer and Head, Taxable Fixed Income, Nuveen LLC, New York, NY; Managing Director, TIAA-CREF, New York, NY (1996-2012). | None |
| Sally Corning, 63 Trustee since 2012, Member of Audit Committee and Governance & Nominating Committee | Partner in Sun Mountain Capital, Santa Fe, NM (private equity firm with investment programs encompassing venture capital, mezzanine debt, and growth equity). | None |
| Susan H. Dubin, 75 Trustee since 2004, Member of Audit Committee and Operations Risk Oversight Committee | President of Dubin Investments, Ltd., Greenwich, CT (private investment fund); Director and officer of various charitable organizations. | None |
| David L. Gardner, 61 Trustee since 2015, Chair of Governance & Nominating Committee and Member of Operations Risk Oversight Committee | Until 2012, head of EMEA (Europe, Middle East and Africa) Sales for iShares of Blackrock, Inc., EMEA Executive Committee Member and EMEA Operating Committee Member at Blackrock, Inc. | None |
| Patrick J. Talamantes, 59 Trustee since 2019, Chair of Audit Committee | President of Talamantes Strategies, a management consulting firm, since 2018. Until 2017, President and Chief Executive Officer of The McClatchy Company, Sacramento, CA (news and media company). | None |
| Owen D. Van Essen, 69 Trustee since 2004, Lead Independent Trustee, Member of Governance & Nominating Committee and Operations Risk Oversight Committee | President of Dirks, Van Essen & April, Santa Fe, New Mexico (newspaper mergers and acquisitions). | None |
| James W. Weyhrauch, 65 Trustee since 1996, Chair of Operations Risk Oversight Committee, Member of Audit Committee | Real estate broker, Santa Fe Properties, Santa Fe, NM; General Partner, Investments of Genext LLC (a family investment partnership); until 2019, Vice Chairman of Nambé LLC, Santa Fe, NM (manufacturing and design company). | None |
March 31, 2024 (Unaudited)
| NAME, AGE, YEAR ELECTED POSITION HELD WITH FUND | PRINCIPAL OCCUPATION(S) DURING PAST FIVE YEARS | OTHER DIRECTORSHIPS HELD BY TRUSTEE |
| OFFICERS OF THE FUND (WHO ARE NOT TRUSTEES)(1) | ||
| Nimish Bhatt, 60 President since 2023, Chief Financial Officer 2019-2023, Treasurer 2016-2019, Secretary 2018-2019(7) | Chief Financial Officer and Treasurer of Thornburg Investment Management, Inc. and Thornburg Securities Corporation since 2016, and Secretary of Thornburg Securities Corporation since 2018; Senior Vice President (2004-2016), Chief Financial Officer (2011-2016), and Head of Fund Administration (2011- 2016) of Calamos Asset Management, Inc., Calamos Investments LLC, Calamos Advisors LLC, and Calamos Wealth Management; Director of Calamos Global Funds plc (2007-2016). | Not applicable |
| Geoffrey Black, 62 Secretary since 2024(6)(7) | Director of Fund Operations of Thornburg Investment Management, Inc. since 2024; Director, Transfer Agent Services at Russell Investments (2010-2024). | Not applicable |
| Randy Dry, 49 Vice President 2014-2024(6) | Managing Director, Chief Operating Officer since 2020, Chief Administrative Officer (2016-2020), and Director of Institutional Group (2014-2016) of Thornburg Investment Management, Inc. | Not applicable |
| Curtis Holloway, 56 Chief Financial Officer since 2023, Secretary 2024(6), Treasurer since 2019(7) | Director of Finance since 2021 and Director of Fund Administration since 2019 of Thornburg Investment Management, Inc.; Senior Vice President, Head of Fund Administration (2017-2019) and Vice President, Fund Administration (2010-2017) of Calamos Investments, and Chief Financial Officer (2017-2019) and Treasurer (2010-2019) of Calamos Funds. | Not applicable |
| Ben Kirby, 43 Vice President since 2014 | Co-Head of Investments since 2019, and Portfolio Manager and Managing Director since 2013, of Thornburg Investment Management, Inc. | Not applicable |
| Jeff Klingelhofer, 43 Vice President since 2016 | Co-Head of Investments since 2019, Portfolio Manager and Managing Director since 2015, Associate Portfolio Manager (2012-2015), of Thornburg Investment Management, Inc. | Not applicable |
| Ponn Lithiluxa, 52 Assistant Treasurer since 2020; Vice President 2017-2020 | Senior Manager & Vice President, Tax & Fund Administration of Thornburg Investment Management, Inc. since 2017; Senior Vice President, Citi Fund Services, Inc. (2014-2017); Vice President, Citi Fund Services, Inc. (2007-2014). | Not applicable |
| Christopher Luckham, 46 Assistant Treasurer since 2022 | Senior Manager, Fund Administration of Thornburg Investment Management, Inc. since 2010. | Not applicable |
| Natasha Rippel, 41 Secretary 2021-2024(6)(7) | Director of Fund Operations since 2021, Supervisor of Fund Operations (2017-2021), and Senior Associate of Fund Operations (2015-2017) of Thornburg Investment Management, Inc. | Not applicable |
| Stephen Velie, 55 Chief Compliance Officer since 2009 | Chief Compliance Officer of Thornburg Investment Trust and Thornburg Investment Management, Inc. | Not applicable |
| (1) | Each person’s address is 2300 North Ridgetop Road, Santa Fe, New Mexico 87506. |
| (2) | The Trust is organized as a Massachusetts business trust, and currently comprises a complex of 24 separate investment “Funds” or “series.” Thornburg Investment Management, Inc. is the investment advisor to, and manages, the 24 Funds of the Trust. Each Trustee oversees the 24 Funds of the Trust. |
| (3) | The Bylaws of the Trust currently require that each Independent Trustee shall retire by the end of the calendar year during which the Trustee reached the age of 75 years. Otherwise, each Trustee serves in office until the election and qualification of a successor or until the Trustee sooner dies, resigns, retires or is removed. |
| (4) | Mr. Thornburg is considered an “interested” Trustee under the Investment Company Act of 1940 because he is a director and controlling shareholder of Thornburg Investment Management, Inc. the investment advisor to the 24 Funds of the Trust, and is the sole director and controlling shareholder of Thornburg Securities Corporation, the distributor of shares of the Trust. |
| (5) | Mr. McMahon is considered an “interested” Trustee under the Investment Company Act of 1940 because he is a director and the chief investment strategist of Thornburg Investment Management, Inc. |
| (6) | Ms. Black served as an Advisory Trustee from April 1, 2023 through October 1, 2023 and was elected as an independent Trustee effective October 2, 2023. Mr. Dry concluded his service as a Vice President of the Trust effective April 15, 2024. Ms. Rippel concluded her service as Secretary of the Trust effective April 19, 2024.Mr. Holloway served as Secretary of the Trust from April 22, 2024 through May 15, 2024, when he was succeeded by Mr. Black, who was appointed as Secretary of the Trust effective May 15, 2024. |
| (7) | The Trust’s president, chief financial officer, secretary and treasurer each serves a one-year term or until the election and qualification of a successor; each other officer serves at the pleasure of the Trustees. |
| ■ | Thornburg Global Opportunities Fund |
| ■ | Thornburg International Equity Fund |
| ■ | Thornburg Better World International Fund |
| ■ | Thornburg International Growth Fund |
| ■ | Thornburg Developing World Fund |
| ■ | Thornburg Small/Mid Cap Core Fund |
| ■ | Thornburg Small/Mid Cap Growth Fund |
| ■ | Thornburg Investment Income Builder Fund |
| ■ | Thornburg Income Builder Opportunities Trust |
| ■ | Thornburg Summit Fund |
| ■ | Thornburg Ultra Short Income Fund |
| ■ | Thornburg Limited Term U.S. Government Fund |
| ■ | Thornburg Limited Term Income Fund |
| ■ | Thornburg Core Plus Bond Fund |
| ■ | Thornburg Strategic Income Fund |
| ■ | Thornburg Short Duration Municipal Fund |
| ■ | Thornburg Limited Term Municipal Fund |
| ■ | Thornburg Intermediate Municipal Fund |
| ■ | Thornburg Strategic Municipal Income Fund |
| ■ | Thornburg California Limited Term Municipal Fund |
| ■ | Thornburg New Mexico Intermediate Municipal Fund |
| ■ | Thornburg New York Intermediate Municipal Fund |


| 800.847.0200 | TH6341 |
Item 2. Code of Ethics
Not applicable.
Item 3. Audit Committee Financial Expert
Not applicable.
Item 4. Principal Accountant Fees and Services
Not applicable.
Item 5. Audit Committee of Listed Registrants
Not applicable.
Item 6. Schedule of Investments
Filed as part of the reports to shareholders filed under item 1 of this Form.
Item 7. Disclosure of Proxy Voting Policies and Procedures for Closed-End Management Investment Companies
Not applicable.
Item 8. Portfolio Managers of Closed-End Management Investment Companies
Not applicable.
Item 9. Purchases of Equity Securities by Closed-End Management Investment Companies and Affiliated Purchasers.
Not applicable.
Item 10. Submission of Matters to a Vote of Security Holders
The authority to consider candidates recommended by the shareholders in accordance with the Trust’s Procedures for Shareholder Communications is committed to the Governance and Nominating Committee.
Item 11. Controls and Procedures
(a) The principal executive officer and the principal financial officer have concluded that Thornburg Investment Trust’s disclosure controls and procedures provide reasonable assurance that material information relating to Thornburg Investment Trust is made known to them by the appropriate persons, based on their evaluation of these controls and procedures as of a date within 90 days prior to the filing date of this report.
(b) There was no change in Thornburg Investment Trust’s internal control over financial reporting that occurred during the registrant’s second fiscal quarter of the period covered by this report (that is, the registrant’s second fiscal quarter) that has materially affected, or is reasonably likely to materially affect, the registrant’s internal control over financial reporting.
Item 12. Disclosure of Securities Lending Activities for Closed-End Management Investment Companies
Not applicable.
Item 13. Exhibits
| (a) (1) | Not Applicable |
| (a) (2) |
| (a) (3) | Not Applicable |
| (b) |
SIGNATURES
Pursuant to the requirements of the Securities Exchange Act of 1934 and the Investment Company Act of 1940, the registrant has duly caused this report to be signed on its behalf by the undersigned, thereunto duly authorized.
Thornburg Investment Trust, in respect of the following Thornburg Funds: Global Opportunities Fund, International Equity Fund, Better World International Fund, International Growth Fund, Developing World Fund, Small/Mid Cap Core Fund, Small/Mid Cap Growth Fund, Investment Income Builder Fund, Summit Fund, Ultra Short Income Fund, Limited Term U.S. Government Fund, Limited Term Income Fund, Core Plus Bond Fund, Strategic Income Fund, Short Duration Municipal Fund, Limited Term Municipal Fund, Intermediate Municipal Fund, Strategic Municipal Income Fund, California Limited Term Municipal Fund, New Mexico Intermediate Municipal Fund, New York Intermediate Municipal Fund, Capital Management Fund, Emerging Markets Managed Account Fund, and Municipal Managed Account Fund.
| By: | /s/ Nimish Bhatt | |
| Nimish Bhatt | ||
| President and principal executive officer | ||
| Date: | May 15, 2024 | |
Pursuant to the requirements of the Securities Exchange Act of 1934 and the Investment Company Act of 1940, this report has been signed below by the following persons on behalf of the registrant and in the capacities and on the dates indicated.
| By: | /s/ Nimish Bhatt | |
| Nimish Bhatt | ||
| President and principal executive officer | ||
| Date: | May 15, 2024 | |
| By: | /s/ Curtis Holloway | |
| Curtis Holloway | ||
| Treasurer and principal financial officer | ||
| Date: | May 15, 2024 | |