UNITED STATES
SECURITIES AND EXCHANGE COMMISSION
Washington, D.C. 20549
FORM N-CSR
CERTIFIED SHAREHOLDER REPORT OF REGISTERED MANAGEMENT INVESTMENT
COMPANIES
Investment Company Act file number 811-05201
Thornburg Investment Trust
(Exact name of registrant as specified in charter)
c/o Thornburg Investment Management, Inc.
2300 North Ridgetop Road, Santa Fe, New Mexico 87506
(Address of principal executive offices) (Zip code)
Garrett Thornburg, 2300 North Ridgetop Road, Santa Fe, New Mexico 87506
(Name and address of agent for service)
Registrant’s telephone number, including area code: 505-984-0200
Date of fiscal year end: September 30
Date of reporting period: March 31, 2023
Item 1. Reports to Stockholders
The following Semi-annual reports are attached hereto, in order:
Thornburg Global Opportunities
Thornburg International Equity Fund
Thornburg Better World International Fund
Thornburg International Growth Fund
Thornburg Developing World Fund
Thornburg Small/Mid Cap Core Fund
Thornburg Small/Mid Cap Growth Fund
Thornburg Investment Income Builder Fund
Thornburg Summit Fund
Thornburg Limited Term U.S. Government Fund
Thornburg Limited Term Income Fund
Thornburg Ultra Short Income Fund
Thornburg Strategic Income Fund
Thornburg Short Duration Municipal Fund
Thornburg Limited Term Municipal Fund
Thornburg California Limited Term Municipal Fund
Thornburg New Mexico Intermediate Municipal Fund
Thornburg New York Intermediate Municipal Fund
Thornburg Intermediate Municipal Fund
Thornburg Strategic Municipal Income Fund
Thornburg Capital Management Fund

| EQUITY FUNDS |
| Global Equity |
| Thornburg Global Opportunities Fund |
| International Equity |
| Thornburg International Equity Fund |
| Thornburg Better World International Fund |
| Thornburg International Growth Fund |
| Thornburg Developing World Fund |
| U.S. Equity |
| Thornburg Small/Mid Cap Core Fund |
| Thornburg Small/Mid Cap Growth Fund |
| Multi Asset |
| Thornburg Investment Income Builder Fund |
| Thornburg Summit Fund |
At Thornburg, we believe unconstrained investing leads to better outcomes for our clients. Our investment solutions are highly active, high conviction, and benchmark agnostic. When it comes to finding economic opportunity for clients, it’s more than what we do.
It’s how we do it. Active As bottom-up, fundamental, active managers, we look beyond conventional benchmarks. Long Term We take a long-term view in how we manage our firm and our portfolios. Benchmark Agnostic Investment strategies should have the flexibility to pursue solutions for clients, not stay within the conventional confines of benchmarks. Flexible Perspective Our approach to portfolio construction is guided by our convictions rather than convention. High Conviction We focus our attention and capital on thoroughly researched, well-understood positions. The best form of risk management is to know what you own, and why. Repeatable & Robust Our long-term outperformance of benchmarks verifies that our process works and outperforms conventional thinking. Independent We are independently owned and far from the herd of other investment managers. Investment Driven All members of the investment team are resources for all of our strategies. Collaborative Our team collaborates on opportunities across geography, sector, or asset class.2 semi-annual report
| 4 | |
| 11 | |
| 22 | |
| 24 | |
| Schedule of Investments | |
| 35 | |
| 38 | |
| 42 | |
| 46 | |
| 50 | |
| 54 | |
| 57 | |
| 60 | |
| 71 | |
| 80 | |
| 84 | |
| 88 | |
| 93 | |
| 116 | |
| 134 | |
| 136 | |
| 137 |
March 31, 2023 (Unaudited)
 | |
| Jason Brady, cfa Portfolio Manager CEO, President, and Managing Director |
March 31, 2023 (Unaudited)
March 31, 2023 (Unaudited)
| • | The trailing 5-year weighted average revenue growth rate of firms included in the Index was +3.1%/year through December 31, 2022. The annualized average revenue growth rate was +6.8% through the most recently reported trailing 12-month period, which ended December 31, 2022 for most of these firms. |
| • | The trailing 5-year weighted average revenue growth rate of the equity holdings in the Fund was +10.5%/year through December 31, 2022. The weighted average revenue growth rate of these firms was +17.1% through the most recently reported trailing 12-month period, which ended December 31, 2022 for many of these firms. |
March 31, 2023 (Unaudited)
March 31, 2023 (Unaudited)

 |  |
| Brian McMahon Portfolio Manager Chief Investment Strategist and Managing Director | Miguel Oleaga Portfolio Manager and Managing Director |
March 31, 2023 (Unaudited)
March 31, 2023 (Unaudited)
March 31, 2023 (Unaudited)
March 31, 2023 (Unaudited)
 | |
| Brian McMahon Portfolio Manager Chief Investment Strategist and Managing Director | Jason Brady, cfa Portfolio Manager CEO, President, and Managing Director |
 |  |
| Ben Kirby, cfa Portfolio Manager Head of Investments and Managing Director | Matt Burdett Portfolio Manager and Managing Director |
Fund Overview
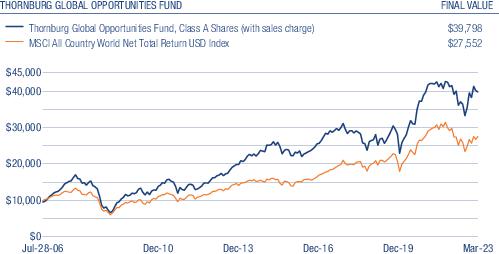
| THORNBURG GLOBAL OPPORTUNITIES FUND | 1-YR | 3-YR | 5-YR | 10-YR | SINCE INCEPTION |
| Class A Shares (Incep: 7/28/06) | |||||
| Without sales charge | -4.17% | 20.23% | 7.03% | 9.05% | 8.94% |
| With sales charge | -8.47% | 18.40% | 6.04% | 8.55% | 8.64% |
| Class C Shares (Incep: 7/28/06) | |||||
| Without sales charge | -4.93% | 19.32% | 6.22% | 8.23% | 8.10% |
| With sales charge | -5.86% | 19.32% | 6.22% | 8.23% | 8.10% |
| Class I Shares (Incep: 7/28/06) | -3.90% | 20.59% | 7.34% | 9.42% | 9.37% |
| Class R3 Shares (Incep: 2/1/08) | -4.37% | 19.98% | 6.80% | 8.86% | 6.56% |
| Class R4 Shares (Incep: 2/1/08) | -4.29% | 20.09% | 6.91% | 8.96% | 6.66% |
| Class R5 Shares (Incep: 2/1/08) | -3.90% | 20.59% | 7.34% | 9.41% | 7.11% |
| Class R6 Shares (Incep: 4/10/17) | -3.75% | 20.74% | 7.49% | - | 7.46% |
| MSCI All Country World Net Total Return USD Index (Since 7/28/06) | -7.44% | 15.36% | 6.93% | 8.06% | 6.27% |
Fund Overview
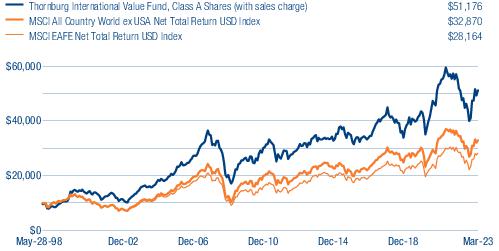
| THORNBURG INTERNATIONAL EQUITY FUND | FINAL VALUE |
| THORNBURG INTERNATIONAL EQUITY FUND | 1-YR | 3-YR | 5-YR | 10-YR | SINCE INCEPTION |
| Class A Shares (Incep: 5/28/98) | |||||
| Without sales charge | 0.54% | 13.48% | 4.39% | 5.17% | 6.99% |
| With sales charge | -3.97% | 11.76% | 3.43% | 4.69% | 6.79% |
| Class C Shares (Incep: 5/28/98) | |||||
| Without sales charge | -0.20% | 12.69% | 3.64% | 4.41% | 6.17% |
| With sales charge | -1.18% | 12.69% | 3.64% | 4.41% | 6.17% |
| Class I Shares (Incep: 3/30/01) | 0.82% | 13.85% | 4.71% | 5.54% | 6.83% |
| Class R3 Shares (Incep: 7/1/03) | 0.37% | 13.29% | 4.20% | 4.99% | 7.40% |
| Class R4 Shares (Incep: 2/1/07) | 0.56% | 13.51% | 4.40% | 5.19% | 3.94% |
| Class R5 Shares (Incep: 2/1/05) | 0.85% | 13.81% | 4.68% | 5.48% | 6.23% |
| Class R6 Shares (Incep: 5/1/12) | 1.06% | 14.05% | 4.89% | 5.70% | 5.89% |
| MSCI All Country World ex USA Net Total Return USD Index (Since 5/28/98) | -5.07% | 11.80% | 2.47% | 4.17% | 4.50% |
| MSCI EAFE Net Total Return USD Index (Since 5/28/98) | -1.38% | 12.99% | 3.52% | 5.00% | 4.26% |
Fund Overview
| THORNBURG BETTER WORLD INTERNATIONAL FUND | FINAL VALUE |
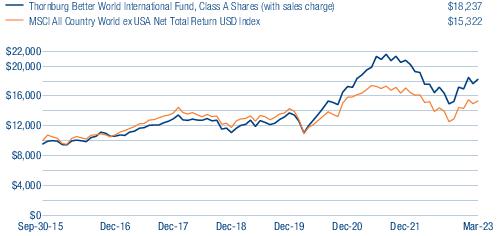
| THORNBURG BETTER WORLD INTERNATIONAL FUND | 1-YR | 3-YR | 5-YR | 10-YR | SINCE INCEPTION |
| Class A Shares (Incep: 10/1/15) | |||||
| Without sales charge | -4.76% | 18.23% | 7.47% | - | 9.00% |
| With sales charge | -9.03% | 16.42% | 6.49% | - | 8.34% |
| Class C Shares (Incep: 10/1/15) | |||||
| Without sales charge | -5.46% | 17.38% | 6.77% | - | 8.33% |
| With sales charge | -6.40% | 17.38% | 6.77% | - | 8.33% |
| Class I Shares (Incep: 10/1/15) | -4.23% | 18.93% | 8.15% | - | 9.75% |
| MSCI All Country World ex USA Net Total Return USD Index (Since 9/30/15) | -5.07% | 11.80% | 2.47% | - | 5.85% |
Fund Overview
| THORNBURG INTERNATIONAL GROWTH FUND | FINAL VALUE |
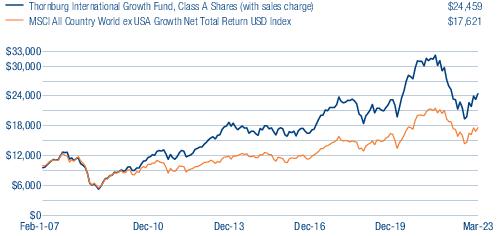
| THORNBURG INTERNATIONAL GROWTH FUND | 1-YR | 3-YR | 5-YR | 10-YR | SINCE INCEPTION |
| Class A Shares (Incep: 2/1/07) | |||||
| Without sales charge | -3.31% | 7.32% | 1.57% | 4.88% | 5.99% |
| With sales charge | -7.65% | 5.68% | 0.64% | 4.40% | 5.69% |
| Class C Shares (Incep: 2/1/07) | |||||
| Without sales charge | -4.16% | 6.43% | 0.75% | 4.06% | 5.21% |
| With sales charge | -5.12% | 6.43% | 0.75% | 4.06% | 5.21% |
| Class I Shares (Incep: 2/1/07) | -2.92% | 7.67% | 1.89% | 5.26% | 6.46% |
| Class R3 Shares (Incep: 2/1/08) | -3.44% | 7.12% | 1.38% | 4.72% | 5.08% |
| Class R4 Shares (Incep: 2/1/08) | -3.33% | 7.24% | 1.48% | 4.83% | 5.18% |
| Class R5 Shares (Incep: 2/1/08) | -2.93% | 7.67% | 1.90% | 5.25% | 5.61% |
| Class R6 Shares (Incep: 2/1/13) | -2.85% | 7.78% | 1.99% | 5.36% | 5.82% |
| MSCI All Country World ex USA Growth Net Total Return USD Index (Since 2/1/07) | -6.35% | 9.49% | 3.36% | 5.08% | 3.57% |
Fund Overview
| THORNBURG DEVELOPING WORLD FUND | FINAL VALUE |
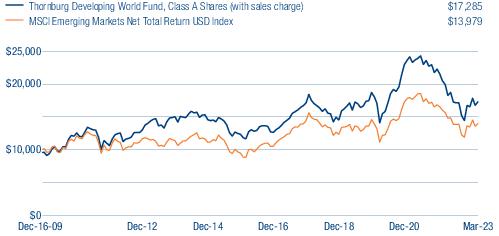
| THORNBURG DEVELOPING WORLD FUND | 1-YR | 3-YR | 5-YR | 10-YR | SINCE INCEPTION |
| Class A Shares (Incep: 12/16/09) | |||||
| Without sales charge | -13.30% | 7.08% | 0.33% | 1.88% | 4.56% |
| With sales charge | -17.20% | 5.44% | -0.59% | 1.42% | 4.20% |
| Class C Shares (Incep: 12/16/09) | |||||
| Without sales charge | -14.01% | 6.23% | -0.45% | 1.10% | 3.79% |
| With sales charge | -14.86% | 6.23% | -0.45% | 1.10% | 3.79% |
| Class I Shares (Incep: 12/16/09) | -13.00% | 7.45% | 0.70% | 2.28% | 5.03% |
| Class R5 Shares (Incep: 2/1/13) | -13.00% | 7.46% | 0.70% | 2.28% | 2.61% |
| Class R6 Shares (Incep: 2/1/13) | -12.88% | 7.58% | 0.80% | 2.38% | 2.72% |
| MSCI Emerging Markets Net Total Return USD Index (Since 12/16/09) | -10.70% | 7.83% | -0.91% | 2.00% | 2.55% |
Fund Overview
| THORNBURG SMALL/MID CAP CORE FUND | FINAL VALUE |
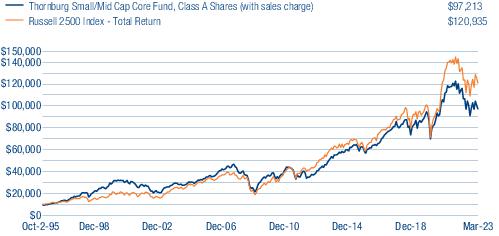
| THORNBURG SMALL/MID CAP CORE FUND | 1-YR | 3-YR | 5-YR | 10-YR | SINCE INCEPTION |
| Class A Shares (Incep: 10/2/95) | |||||
| Without sales charge | -16.24% | 11.70% | 4.01% | 8.58% | 8.80% |
| With sales charge | -20.01% | 10.00% | 3.06% | 8.08% | 8.62% |
| Class C Shares (Incep: 10/2/95) | |||||
| Without sales charge | -17.05% | 10.73% | 3.12% | 7.71% | 7.95% |
| With sales charge | -17.88% | 10.73% | 3.12% | 7.71% | 7.95% |
| Class I Shares (Incep: 11/2/98) | -15.88% | 12.12% | 4.38% | 8.99% | 7.12% |
| Class R3 Shares (Incep: 7/1/03) | -16.18% | 11.72% | 4.01% | 8.60% | 7.04% |
| Class R4 Shares (Incep: 2/1/07) | -16.10% | 11.83% | 4.11% | 8.70% | 5.33% |
| Class R5 Shares (Incep: 2/1/05) | -15.87% | 12.13% | 4.38% | 8.99% | 7.07% |
| Russell 2500 Index - Total Return (Since 10/2/95) | -10.39% | 19.42% | 6.65% | 9.07% | 9.49% |
Fund Overview
| THORNBURG SMALL/MID CAP GROWTH FUND | FINAL VALUE |
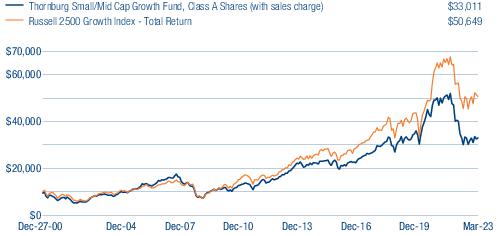
| THORNBURG SMALL/MID CAP GROWTH FUND | 1-YR | 3-YR | 5-YR | 10-YR | SINCE INCEPTION |
| Class A Shares (Incep: 12/27/00) | |||||
| Without sales charge | -17.68% | 2.89% | 2.40% | 6.66% | 5.73% |
| With sales charge | -21.37% | 1.32% | 1.46% | 6.17% | 5.51% |
| Class C Shares (Incep: 12/27/00) | |||||
| Without sales charge | -18.40% | 2.04% | 1.56% | 5.81% | 4.89% |
| With sales charge | -19.21% | 2.04% | 1.56% | 5.81% | 4.89% |
| Class I Shares (Incep: 11/3/03) | -17.26% | 3.30% | 2.78% | 7.07% | 7.59% |
| Class R3 Shares (Incep: 7/1/03) | -17.68% | 2.78% | 2.27% | 6.53% | 7.60% |
| Class R4 Shares (Incep: 2/1/07) | -17.60% | 2.87% | 2.37% | 6.64% | 4.86% |
| Class R5 Shares (Incep: 10/3/05) | -17.28% | 3.29% | 2.79% | 7.07% | 6.71% |
| Russell 2500 Growth Index - Total Return (Since 12/27/00) | -10.35% | 14.75% | 6.82% | 10.05% | 7.56% |
Fund Overview
| THORNBURG INVESTMENT INCOME BUILDER FUND | FINAL VALUE |
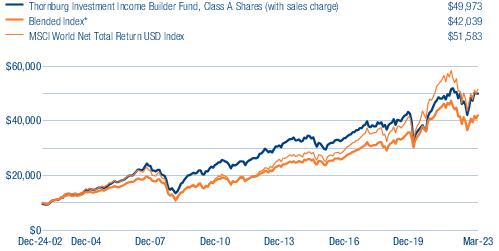
| THORNBURG INVESTMENT INCOME BUILDER FUND | 1-YR | 3-YR | 5-YR | 10-YR | SINCE INCEPTION |
| Class A Shares (Incep: 12/24/02) | |||||
| Without sales charge | -1.21% | 15.95% | 5.82% | 5.68% | 8.51% |
| With sales charge | -5.64% | 14.18% | 4.85% | 5.19% | 8.26% |
| Class C Shares (Incep: 12/24/02) | |||||
| Without sales charge | -1.96% | 15.09% | 5.03% | 4.90% | 7.81% |
| With sales charge | -2.90% | 15.09% | 5.03% | 4.90% | 7.81% |
| Class I Shares (Incep: 11/3/03) | -0.96% | 16.23% | 6.09% | 5.98% | 8.04% |
| Class R3 Shares (Incep: 2/1/05) | -1.58% | 15.51% | 5.44% | 5.32% | 6.68% |
| Class R4 Shares (Incep: 2/1/08) | -1.51% | 15.64% | 5.54% | 5.42% | 5.32% |
| Class R5 Shares (Incep: 2/1/07) | -1.07% | 16.11% | 5.97% | 5.86% | 5.99% |
| Class R6 Shares (Incep: 4/10/17) | -0.86% | 16.34% | 6.18% | - | 6.64% |
| MSCI World Net Total Return USD Index (Since 12/24/02) | -7.02% | 16.40% | 8.01% | 8.85% | 8.43% |
Fund Overview
| THORNBURG SUMMIT FUND | FINAL VALUE |
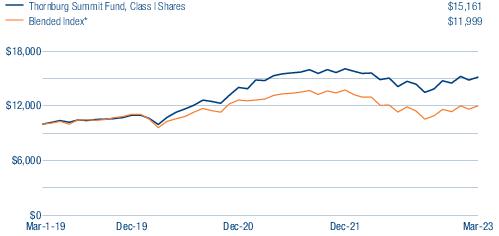
| THORNBURG SUMMIT FUND | 1-YR | 3-YR | 5-YR | 10-YR | SINCE INCEPTION |
| Class A Shares (Incep: 1/26/22) | |||||
| Without sales charge | -3.09% | - | - | - | -2.01% |
| With sales charge | -7.45% | - | - | - | -5.78% |
| Class I Shares (Incep: 3/1/19) | -2.87% | 15.04% | - | - | 10.73% |
| Blended Index* (Since 3/1/19) | -7.50% | 7.69% | - | - | 4.57% |
Thornburg Investment Income Builder Fund | March 31, 2023 (Unaudited)
| RUSSELL 1000 INDEX | RUSSELL 2000 INDEX | |
| Financials | 34% | 39% |
| Real Estate | 31% | 29% |
| Consumer Discretionary | 13% | 8% |
| Energy | 6% | 9% |
| Materials | 5% | 3% |
| Consumer Staples | 3% | 3% |
| Health Care | 2% | 0% |
| Information Technology | 2% | 1% |
| Communication Services | 2% | 1% |
| Industrials | 1% | 6% |
| Utilities | 1% | 1% |
Thornburg Global Opportunities Fund | March 31, 2023 (Unaudited)
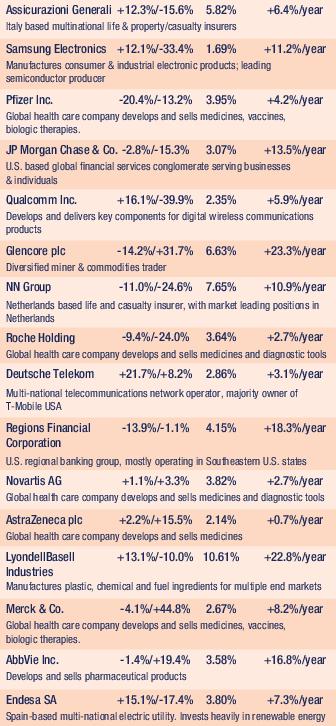
| TOP TEN EQUITY HOLDINGS | |
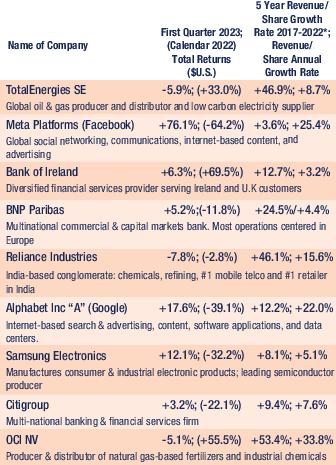
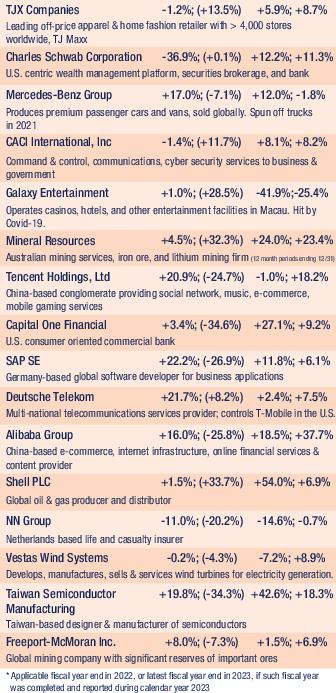
| TotalEnergies SE | 5.2% |
| Meta Platforms, Inc. Class A | 4.7% |
| Bank of Ireland Group plc | 4.6% |
| BNP Paribas SA | 4.3% |
| Reliance Industries Ltd. | 3.9% |
| Alphabet, Inc. Class A | 3.8% |
| Samsung Electronics Co. Ltd. | 3.8% |
| Citigroup, Inc. | 3.8% |
| OCI NV | 3.6% |
| TJX Companies, Inc. | 3.3% |
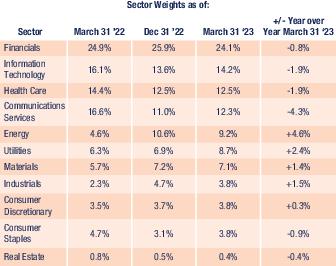
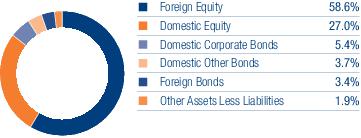
| SECTOR EXPOSURE | |
| Financials | 21.0% |
| Consumer Discretionary | 15.6% |
| Communication Services | 14.9% |
| Energy | 11.8% |
| Information Technology | 10.9% |
| Materials | 10.3% |
| Industrials | 7.7% |
| Health Care | 4.2% |
| Consumer Staples | 1.9% |
| Other Assets Less Liabilities | 1.7% |
| TOP TEN INDUSTRY GROUPS | |
| Banks | 12.6% |
| Energy | 11.8% |
| Media & Entertainment | 11.4% |
| Materials | 10.3% |
| Consumer Discretionary Distribution & Retail | 6.3% |
| Financial Services | 5.9% |
| Consumer Services | 5.1% |
| Capital Goods | 4.7% |
| Semiconductors & Semiconductor Equipment | 4.4% |
| Pharmaceuticals, Biotechnology & Life Sciences | 4.2% |
| THORNBURG GLOBAL OPPORTUNITIES FUND | NASDAQ SYMBOLS | CUSIPS |
| Class A | THOAX | 885-215-343 |
| Class C | THOCX | 885-215-335 |
| Class I | THOIX | 885-215-327 |
| Class R3 | THORX | 885-215-145 |
| Class R4 | THOVX | 885-215-137 |
| Class R5 | THOFX | 885-215-129 |
| Class R6 | THOGX | 885-216-655 |
Thornburg International Equity Fund | March 31, 2023 (Unaudited)
| TOP TEN EQUITY HOLDINGS | |
| TotalEnergies SE | 4.0% |
| Alibaba Group Holding Ltd. | 3.7% |
| Kweichow Moutai Co. Ltd. Class A | 3.6% |
| Tencent Holdings Ltd. | 3.4% |
| ABB Ltd. | 3.2% |
| Canadian Pacific Railway Ltd. | 3.1% |
| L’Oreal SA | 3.1% |
| Galaxy Entertainment Group Ltd. | 3.0% |
| Seven & i Holdings Co. Ltd. | 2.8% |
| Roche Holding AG | 2.8% |
| SECTOR EXPOSURE | |
| Industrials | 17.1% |
| Financials | 13.3% |
| Consumer Discretionary | 13.1% |
| Consumer Staples | 11.4% |
| Communication Services | 8.6% |
| Utilities | 8.3% |
| Information Technology | 7.4% |
| Health Care | 6.7% |
| Materials | 6.3% |
| Energy | 5.1% |
| Other Assets Less Liabilities | 2.7% |
| TOP TEN INDUSTRY GROUPS | |
| Capital Goods | 12.4% |
| Utilities | 8.3% |
| Materials | 6.3% |
| Banks | 6.2% |
| Consumer Services | 5.5% |
| Pharmaceuticals, Biotechnology & Life Sciences | 5.4% |
| Media & Entertainment | 5.3% |
| Energy | 5.1% |
| Household & Personal Products | 4.2% |
| Consumer Durables & Apparel | 3.9% |
| THORNBURG INTERNATIONAL EQUITY FUND | NASDAQ SYMBOLS | CUSIPS |
| Class A | TGVAX | 885-215-657 |
| Class C | THGCX | 885-215-640 |
| Class I | TGVIX | 885-215-566 |
| Class R3 | TGVRX | 885-215-525 |
| Class R4 | THVRX | 885-215-269 |
| Class R5 | TIVRX | 885-215-368 |
| Class R6 | TGIRX | 885-216-804 |
Thornburg Better World International Fund | March 31, 2023 (Unaudited)
| TOP TEN EQUITY HOLDINGS | |
| Tencent Holdings Ltd. | 3.7% |
| L’Oreal SA | 3.0% |
| SAP SE | 2.9% |
| Canadian Pacific Railway Ltd. | 2.9% |
| Seven & i Holdings Co. Ltd. | 2.9% |
| ABB Ltd. | 2.7% |
| Meituan Class B | 2.7% |
| NVIDIA Corp. | 2.5% |
| Hitachi Ltd. | 2.5% |
| Alibaba Group Holding Ltd. Sponsored ADR | 2.5% |
| SECTOR EXPOSURE | |
| Industrials | 17.1% |
| Health Care | 15.1% |
| Information Technology | 13.0% |
| Consumer Staples | 12.8% |
| Communication Services | 9.1% |
| Financials | 9.0% |
| Consumer Discretionary | 8.9% |
| Materials | 4.1% |
| Utilities | 2.5% |
| Other Assets Less Liabilities | 8.4% |
| TOP TEN INDUSTRY GROUPS | |
| Pharmaceuticals, Biotechnology & Life Sciences | 11.3% |
| Capital Goods | 9.0% |
| Consumer Staples Distribution & Retail | 7.0% |
| Software & Services | 6.3% |
| Banks | 5.6% |
| Media & Entertainment | 5.3% |
| Commercial & Professional Services | 5.2% |
| Household & Personal Products | 4.8% |
| Materials | 4.1% |
| Consumer Services | 4.1% |
| THORNBURG BETTER WORLD INTERNATIONAL FUND | NASDAQ SYMBOLS | CUSIPS |
| Class A | TBWAX | 885-216-721 |
| Class C | TBWCX | 885-216-713 |
| Class I | TBWIX | 885-216-697 |
Thornburg International Growth Fund | March 31, 2023 (Unaudited)

| TOP TEN EQUITY HOLDINGS | |
| Nestle SA | 5.3% |
| Taiwan Semiconductor Manufacturing Co. Ltd. | 5.2% |
| AstraZeneca plc | 5.1% |
| ASML Holding NV | 4.7% |
| LVMH Moet Hennessy Louis Vuitton SE | 3.9% |
| Keyence Corp. | 3.4% |
| Novo Nordisk AS Sponsored ADR | 3.1% |
| Tencent Holdings Ltd. | 3.0% |
| Diageo plc | 2.9% |
| Lonza Group AG | 2.8% |
| SECTOR EXPOSURE | |
| Information Technology | 18.2% |
| Health Care | 16.2% |
| Consumer Discretionary | 16.1% |
| Consumer Staples | 14.9% |
| Financials | 12.2% |
| Communication Services | 8.1% |
| Industrials | 6.6% |
| Materials | 4.6% |
| Energy | 1.6% |
| Other Assets Less Liabilities | 1.5% |
| TOP TEN INDUSTRY GROUPS | |
| Pharmaceuticals, Biotechnology & Life Sciences | 15.4% |
| Semiconductors & Semiconductor Equipment | 12.0% |
| Food, Beverage & Tobacco | 10.4% |
| Financial Services | 7.3% |
| Consumer Discretionary Distribution & Retail | 6.5% |
| Media & Entertainment | 6.5% |
| Materials | 4.6% |
| Consumer Durables & Apparel | 3.9% |
| Capital Goods | 3.7% |
| Consumer Services | 3.7% |
| THORNBURG INTERNATIONAL GROWTH FUND | NASDAQ SYMBOLS | CUSIPS |
| Class A | TIGAX | 885-215-319 |
| Class C | TIGCX | 885-215-293 |
| Class I | TINGX | 885-215-244 |
| Class R3 | TIGVX | 885-215-178 |
| Class R4 | TINVX | 885-215-160 |
| Class R5 | TINFX | 885-215-152 |
| Class R6 | THGIX | 885-216-820 |
Thornburg Developing World Fund | March 31, 2023 (Unaudited)
| TOP TEN EQUITY HOLDINGS | |
| Taiwan Semiconductor Manufacturing Co. Ltd. | 7.1% |
| Tencent Holdings Ltd. | 5.4% |
| Yum China Holdings, Inc. | 4.2% |
| AIA Group Ltd. | 3.8% |
| Alibaba Group Holding Ltd. | 3.4% |
| Samsung Electronics Co. Ltd. | 3.4% |
| Naspers Ltd. Class N | 2.8% |
| HDFC Bank Ltd. | 2.7% |
| Americana Restaurants International plc | 2.7% |
| Hon Hai Precision Industry Co. Ltd. | 2.6% |
| SECTOR EXPOSURE | |
| Financials | 24.9% |
| Consumer Discretionary | 22.4% |
| Information Technology | 16.6% |
| Consumer Staples | 8.5% |
| Communication Services | 6.7% |
| Industrials | 5.4% |
| Materials | 4.1% |
| Utilities | 3.7% |
| Energy | 2.5% |
| Health Care | 1.4% |
| Other Assets Less Liabilities | 3.8% |
| TOP TEN INDUSTRY GROUPS | |
| Banks | 14.3% |
| Consumer Discretionary Distribution & Retail | 11.4% |
| Consumer Services | 9.2% |
| Semiconductors & Semiconductor Equipment | 8.1% |
| Financial Services | 6.8% |
| Consumer Staples Distribution & Retail | 6.3% |
| Technology Hardware & Equipment | 6.0% |
| Media & Entertainment | 5.4% |
| Materials | 4.1% |
| Transportation | 3.9% |
| THORNBURG DEVELOPING WORLD FUND | NASDAQ SYMBOLS | CUSIPS |
| Class A | THDAX | 885-216-408 |
| Class C | THDCX | 885-216-507 |
| Class I | THDIX | 885-216-606 |
| Class R5 | THDRX | 885-216-846 |
| Class R6 | TDWRX | 885-216-838 |
Thornburg Small/Mid Cap Core Fund | March 31, 2023 (Unaudited)
| TOP TEN EQUITY HOLDINGS | |
| Casella Waste Systems, Inc. Class A | 3.6% |
| AES Corp. | 3.4% |
| Clean Harbors, Inc. | 3.4% |
| Agilysys, Inc. | 3.1% |
| BJ’s Wholesale Club Holdings, Inc. | 3.0% |
| Deckers Outdoor Corp. | 2.9% |
| Sensient Technologies Corp. | 2.8% |
| LPL Financial Holdings, Inc. | 2.7% |
| Teledyne Technologies, Inc. | 2.7% |
| TechnipFMC plc | 2.6% |
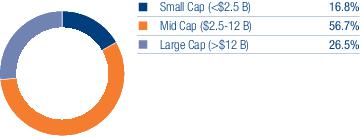
| SECTOR EXPOSURE | |
| Industrials | 20.4% |
| Information Technology | 15.6% |
| Health Care | 11.0% |
| Financials | 9.8% |
| Energy | 8.7% |
| Consumer Discretionary | 7.9% |
| Materials | 7.9% |
| Consumer Staples | 7.3% |
| Real Estate | 3.7% |
| Utilities | 3.4% |
| Communication Services | 3.2% |
| Other Assets Less Liabilities | 1.1% |
| TOP TEN INDUSTRY GROUPS | |
| Capital Goods | 11.4% |
| Commercial & Professional Services | 9.0% |
| Energy | 8.7% |
| Software & Services | 8.2% |
| Materials | 7.9% |
| Health Care Equipment & Services | 7.1% |
| Financial Services | 6.2% |
| Technology Hardware & Equipment | 4.8% |
| Food, Beverage & Tobacco | 4.3% |
| Consumer Durables & Apparel | 4.0% |
| THORNBURG SMALL/MID CAP CORE FUND | NASDAQ SYMBOLS | CUSIPS |
| Class A | TVAFX | 885-215-731 |
| Class C | TVCFX | 885-215-715 |
| Class I | TVIFX | 885-215-632 |
| Class R3 | TVRFX | 885-215-533 |
| Class R4 | TVIRX | 885-215-277 |
| Class R5 | TVRRX | 885-215-376 |
Thornburg Small/Mid Cap Growth Fund | March 31, 2023 (Unaudited)
| TOP TEN EQUITY HOLDINGS | |
| Casella Waste Systems, Inc. Class A | 3.9% |
| Bentley Systems, Inc. Class B | 3.7% |
| Shockwave Medical, Inc. | 3.4% |
| Teledyne Technologies, Inc. | 3.2% |
| TechnipFMC plc | 3.1% |
| WillScot Mobile Mini Holdings Corp. | 2.9% |
| Calix, Inc. | 2.9% |
| Liberty Media Corp-Liberty Formula One Class C | 2.8% |
| Chart Industries, Inc. | 2.8% |
| On Holding AG Class A | 2.6% |
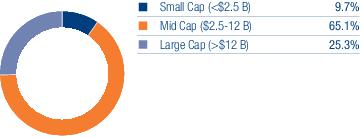
| SECTOR EXPOSURE | |
| Information Technology | 23.2% |
| Health Care | 21.0% |
| Industrials | 20.7% |
| Consumer Discretionary | 11.4% |
| Consumer Staples | 8.0% |
| Financials | 5.4% |
| Energy | 5.3% |
| Communication Services | 2.8% |
| Materials | 1.6% |
| Other Assets Less Liabilities | 0.6% |
| TOP TEN INDUSTRY GROUPS | |
| Software & Services | 11.2% |
| Pharmaceuticals, Biotechnology & Life Sciences | 10.9% |
| Health Care Equipment & Services | 10.1% |
| Capital Goods | 9.5% |
| Commercial & Professional Services | 8.3% |
| Food, Beverage & Tobacco | 6.7% |
| Technology Hardware & Equipment | 6.1% |
| Semiconductors & Semiconductor Equipment | 5.9% |
| Energy | 5.3% |
| Consumer Durables & Apparel | 4.4% |
| THORNBURG SMALL/MID CAP GROWTH FUND | NASDAQ SYMBOLS | CUSIPS |
| Class A | THCGX | 885-215-582 |
| Class C | TCGCX | 885-215-574 |
| Class I | THIGX | 885-215-475 |
| Class R3 | THCRX | 885-215-517 |
| Class R4 | TCGRX | 885-215-251 |
| Class R5 | THGRX | 885-215-350 |
Thornburg Investment Income Builder Fund | March 31, 2023 (Unaudited)
| TOP TEN LONG HOLDINGS | |
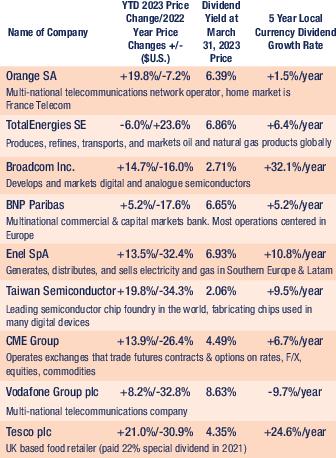
| Orange SA | 5.1% |
| TotalEnergies SE | 4.7% |
| Broadcom, Inc. | 3.6% |
| BNP Paribas SA | 3.5% |
| Enel SpA | 3.3% |
| Taiwan Semiconductor Manufacturing Co. Ltd. | 2.9% |
| CME Group, Inc. | 2.8% |
| Vodafone Group plc | 2.6% |
| Tesco plc | 2.6% |
| Assicurazioni Generali SpA | 2.6% |
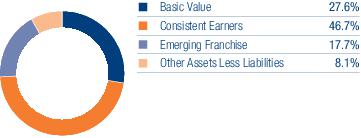
| SECTOR EXPOSURE (percent of equity holdings) | |
| Financials | 24.5% |
| Information Technology | 14.3% |
| Health Care | 12.6% |
| Communication Services | 12.3% |
| Energy | 9.2% |
| Utilities | 8.7% |
| Materials | 6.5% |
| Consumer Discretionary | 3.9% |
| Industrials | 3.8% |
| Consumer Staples | 3.8% |
| Real Estate | 0.4% |
Thornburg Investment Income Builder Fund | March 31, 2023 (Unaudited)
| QUARTERLY DIVIDEND HISTORY, CLASS A | |||||
| YEAR | Q1 | Q2 | Q3 | Q4 | TOTAL |
| 2003 | 9.2¢ | 11.2¢ | 12.4¢ | 17.5¢ | 50.3¢ |
| 2004 | 10.2¢ | 12.5¢ | 15.0¢ | 21.8¢ | 59.5¢ |
| 2005 | 11.0¢ | 13.6¢ | 17.4¢ | 29.0¢ | 71.0¢ |
| 2006 | 12.5¢ | 16.0¢ | 19.2¢ | 33.0¢ | 80.7¢ |
| 2007 | 14.2¢ | 18.5¢ | 21.5¢ | 36.8¢ | 91.0¢ |
| 2008 | 17.9¢ | 21.8¢ | 26.0¢ | 36.8¢ | 102.5¢ |
| 2009 | 18.0¢ | 24.2¢ | 28.0¢ | 34.5¢ | 104.7¢ |
| 2010 | 19.8¢ | 25.0¢ | 32.0¢ | 36.0¢ | 112.8¢ |
| 2011 | 21.0¢ | 26.0¢ | 32.0¢ | 37.5¢ | 116.5¢ |
| 2012 | 21.5¢ | 26.0¢ | 28.5¢ | 36.0¢ | 112.0¢ |
| 2013 | 21.5¢ | 25.3¢ | 25.0¢ | 24.5¢ | 96.3¢ |
| 2014 | 22.5¢ | 24.0¢ | 27.0¢ | 26.0¢ | 99.5¢ |
| 2015 | 16.5¢ | 20.0¢ | 20.0¢ | 25.3¢ | 81.8¢ |
| 2016 | 17.0¢ | 18.5¢ | 19.5¢ | 21.5¢ | 76.5¢ |
| 2017 | 17.0¢ | 20.0¢ | 26.0¢ | 29.5¢ | 92.5¢ |
| 2018 | 18.0¢ | 20.0¢ | 24.0¢ | 28.0¢ | 90.0¢ |
| 2019 | 19.0¢ | 21.5¢ | 25.0¢ | 30.0¢ | 95.5¢ |
| 2020 | 19.0¢ | 19.0¢ | 21.0¢ | 29.0¢ | 88.0¢ |
| 2021 | 22.5¢ | 27.5¢ | 31.0¢ | 43.5¢ | 124.5¢ |
| 2022 | 20.0¢ | 25.0¢ | 29.0¢ | 38.8¢ | 112.8¢ |
| 2023 | 21.0¢ | ||||
| As of 3/31/2023 | |
| Pharmaceuticals, Biotechnology & Life Sciences | 12.4% |
| Telecommunication Services | 12.3% |
| Semiconductors & Semiconductor Equipment | 10.1% |
| Banks | 9.6% |
| Energy | 9.2% |
| Utilities | 8.7% |
| Financial Services | 7.8% |
| Insurance | 7.1% |
| Materials | 6.5% |
| Technology Hardware & Equipment | 4.1% |
| As of 12/31/2022 | |
| Pharmaceuticals, Biotechnology & Life Sciences | 12.6% |
| Telecommunication Services | 11.1% |
| Energy | 10.7% |
| Banks | 10.4% |
| Semiconductors & Semiconductor Equipment | 9.6% |
| Diversified Financials | 8.6% |
| Insurance | 7.4% |
| Utilities | 7.0% |
| Materials | 6.4% |
| Technology Hardware & Equipment | 4.1% |
| As of 9/30/2022 | |
| Pharmaceuticals, Biotechnology & Life Sciences | 12.5% |
| Telecommunication Services | 10.8% |
| Energy | 10.6% |
| Semiconductors & Semiconductor Equipment | 10.2% |
| Banks | 9.9% |
| Diversified Financials | 9.6% |
| Insurance | 8.1% |
| Materials | 6.6% |
| Utilities | 5.7% |
| Technology Hardware & Equipment | 4.1% |
| As of 6/30/2022 | |
| Pharmaceuticals, Biotechnology & Life Sciences | 13.9% |
| Telecommunication Services | 12.1% |
| Semiconductors & Semiconductor Equipment | 10.3% |
| Diversified Financials | 9.8% |
| Banks | 9.4% |
| Insurance | 8.0% |
| Energy | 7.8% |
| Utilities | 7.3% |
| Materials | 5.9% |
| Technology Hardware & Equipment | 4.1% |
| THORNBURG INVESTMENT INCOME BUILDER FUND | NASDAQ SYMBOLS | CUSIPS |
| Class A | TIBAX | 885-215-558 |
| Class C | TIBCX | 885-215-541 |
| Class I | TIBIX | 885-215-467 |
| Class R3 | TIBRX | 885-215-384 |
| Class R4 | TIBGX | 885-215-186 |
| Class R5 | TIBMX | 885-215-236 |
| Class R6 | TIBOX | 885-216-663 |
Thornburg Summit Fund | March 31, 2023 (Unaudited)
| SECTOR EXPOSURE (percent of equity holdings) | |
| Information Technology | 21.0% |
| Financials | 17.1% |
| Health Care | 12.5% |
| Communication Services | 11.7% |
| Consumer Discretionary | 9.6% |
| Exchange Traded Funds | 7.3% |
| Energy | 5.9% |
| Materials | 5.4% |
| Consumer Staples | 4.8% |
| Industrials | 4.7% |
| TOP TEN LONG HOLDINGS | |
| Microsoft Corp. | 2.1% |
| Roche Holding AG | 1.9% |
| Apple, Inc. | 1.6% |
| Visa, Inc. Class A | 1.5% |
| ASML Holding NV | 1.4% |
| Alphabet, Inc. Class A | 1.4% |
| Nintendo Co. Ltd. | 1.3% |
| Nestle SA | 1.2% |
| Deutsche Telekom AG | 1.2% |
| SAP SE | 1.2% |
| THORNBURG SUMMIT FUND | NASDAQ SYMBOLS | CUSIPS |
| Class A | TSAMX | 885-216-358 |
| Class I | TSUMX | 885-216-580 |
Thornburg Global Opportunities Fund | March 31, 2023 (Unaudited)
| Issuer-Description | SHARES | VALUE | |
| Common Stock — 98.3% | |||
| Automobiles & Components — 3.0% | |||
| Automobiles — 3.0% | |||
| Mercedes-Benz Group AG | 400,248 | $ 30,723,398 | |
| 30,723,398 | |||
| Banks — 12.6% | |||
| Banks — 12.6% | |||
| Bank of Ireland Group plc | 4,681,887 | 47,342,666 | |
| BNP Paribas SA | 734,002 | 43,948,545 | |
| Citigroup, Inc. | 819,908 | 38,445,486 | |
| 129,736,697 | |||
| Capital Goods — 4.7% | |||
| Aerospace & Defense — 0.8% | |||
| L3Harris Technologies, Inc. | 43,120 | 8,461,869 | |
| Electrical Equipment — 2.4% | |||
| Vestas Wind Systems AS | 845,636 | 24,497,451 | |
| Machinery — 1.5% | |||
| Techtronic Industries Co. Ltd. | 1,424,254 | 15,394,839 | |
| 48,354,159 | |||
| Commercial & Professional Services — 3.0% | |||
| Professional Services — 3.0% | |||
| a | CACI International, Inc. Class A | 103,000 | 30,516,840 |
| 30,516,840 | |||
| Consumer Discretionary Distribution & Retail — 6.3% | |||
| Broadline Retail — 3.0% | |||
| a | Alibaba Group Holding Ltd. Sponsored ADR | 271,331 | 27,724,601 |
| JD.com, Inc. Class A | 155,539 | 3,408,032 | |
| Specialty Retail — 3.3% | |||
| TJX Companies, Inc. | 434,961 | 34,083,544 | |
| 65,216,177 | |||
| Consumer Durables & Apparel — 1.2% | |||
| Household Durables — 1.2% | |||
| Barratt Developments plc | 2,105,444 | 12,116,284 | |
| 12,116,284 | |||
| Consumer Services — 5.1% | |||
| Hotels, Restaurants & Leisure — 5.1% | |||
| a | Booking Holdings, Inc. | 8,261 | 21,911,559 |
| a | Galaxy Entertainment Group Ltd. | 4,537,928 | 30,320,682 |
| a,b | Meituan Class B | 37,302 | 681,899 |
| 52,914,140 | |||
| Consumer Staples Distribution & Retail — 1.9% | |||
| Consumer Staples Distribution & Retail — 1.9% | |||
| Tesco plc | 6,007,355 | 19,690,147 | |
| 19,690,147 | |||
| Energy — 11.8% | |||
| Oil, Gas & Consumable Fuels — 11.8% | |||
| Reliance Industries Ltd. | 1,401,727 | 39,757,315 | |
| Shell plc | 954,694 | 27,426,833 | |
| TotalEnergies SE | 913,210 | 53,836,848 | |
| 121,020,996 | |||
| Financial Services — 5.9% | |||
| Capital Markets — 3.0% | |||
| Charles Schwab Corp. | 589,967 | 30,902,472 | |
| Consumer Finance — 2.9% |
| See notes to financial statements. | Thornburg Equity Funds Semi-Annual Report | 35 |
Thornburg Global Opportunities Fund | March 31, 2023 (Unaudited)
| Issuer-Description | SHARES | VALUE | |
| Capital One Financial Corp. | 305,088 | $ 29,337,262 | |
| 60,239,734 | |||
| Insurance — 2.5% | |||
| Insurance — 2.5% | |||
| NN Group NV | 698,279 | 25,338,706 | |
| 25,338,706 | |||
| Materials — 10.3% | |||
| Chemicals — 3.6% | |||
| OCI NV | 1,095,849 | 37,150,889 | |
| Metals & Mining — 6.7% | |||
| First Quantum Minerals Ltd. | 675,042 | 15,518,724 | |
| Freeport-McMoRan, Inc. | 586,699 | 24,001,856 | |
| Mineral Resources Ltd. | 549,665 | 29,610,669 | |
| 106,282,138 | |||
| Media & Entertainment — 11.4% | |||
| Interactive Media & Services — 11.4% | |||
| a | Alphabet, Inc. Class A | 377,440 | 39,151,851 |
| a | Meta Platforms, Inc. Class A | 229,258 | 48,588,941 |
| Tencent Holdings Ltd. | 601,313 | 29,552,804 | |
| 117,293,596 | |||
| Pharmaceuticals, Biotechnology & Life Sciences — 4.2% | |||
| Pharmaceuticals — 4.2% | |||
| Pfizer, Inc. | 571,041 | 23,298,473 | |
| Roche Holding AG | 68,837 | 19,632,783 | |
| 42,931,256 | |||
| Semiconductors & Semiconductor Equipment — 4.4% | |||
| Semiconductors & Semiconductor Equipment — 4.4% | |||
| a | Qorvo, Inc. | 204,746 | 20,796,051 |
| Taiwan Semiconductor Manufacturing Co. Ltd. | 1,373,114 | 24,037,105 | |
| 44,833,156 | |||
| Software & Services — 2.7% | |||
| Software — 2.7% | |||
| SAP SE | 225,215 | 28,347,149 | |
| 28,347,149 | |||
| Technology Hardware & Equipment — 3.8% | |||
| Technology Hardware, Storage & Peripherals — 3.8% | |||
| Samsung Electronics Co. Ltd. | 789,839 | 38,829,125 | |
| 38,829,125 | |||
| Telecommunication Services — 3.5% | |||
| Diversified Telecommunication Services — 3.5% | |||
| a | Converge Information and Communications Technology Solutions, Inc. | 33,263,215 | 7,831,678 |
| Deutsche Telekom AG | 1,146,154 | 27,781,137 | |
| 35,612,815 | |||
| Total Common Stock (Cost $735,472,107) | 1,009,996,513 | ||
| Short-Term Investments — 2.0% | |||
| c | Thornburg Capital Management Fund | 1,995,679 | 19,956,792 |
| Total Short-Term Investments (Cost $19,956,792) | 19,956,792 | ||
| Total Investments — 100.3% (Cost $755,428,899) | $1,029,953,305 | ||
| Liabilities Net of Other Assets — (0.3)% | (2,703,660) | ||
| Net Assets — 100.0% | $1,027,249,645 |
| 36 | Thornburg Equity Funds Semi-Annual Report | See notes to financial statements. |
| Outstanding Forward Currency Contracts To Buy Or Sell At March 31, 2023 | |||||||
| Contract Description | Contract Party* | Buy/Sell | Contract Amount | Contract Value Date | Value USD | Unrealized Appreciation | Unrealized Depreciation |
| Great Britain Pound | SSB | Sell | 17,887,800 | 4/17/2023 | 22,072,328 | $ — | $ (185,352) |
| Euro | SSB | Sell | 55,786,000 | 5/22/2023 | 60,663,621 | — | (732,108) |
| Euro | BBH | Sell | 55,786,000 | 5/22/2023 | 60,663,622 | — | (729,375) |
| Total | — | $ (1,646,835) | |||||
| Net unrealized appreciation (depreciation) | $ (1,646,835) | ||||||
| * | Counterparties include State Street Bank and Trust Company (“SSB”) and Brown Brothers Harriman & Co. (“BBH”). |
| Footnote Legend | |
| a | Non-income producing. |
| b | Securities exempt from registration under Rule 144A of the Securities Act of 1933, as amended. These securities are restricted but liquid and may only be resold in the ordinary course of business in transactions exempt from registration, normally to qualified institutional buyers. As of March 31, 2023, the aggregate value of these securities in the Fund’s portfolio was $681,899, representing 0.07% of the Fund’s net assets. |
| c | Investment in Affiliates. |
To simplify the listings of securities, abbreviations are used per the table below:
| ADR | American Depositary Receipt |
| COUNTRY EXPOSURE * (percent of equity holdings) | |
| United States | 36.6% |
| France | 9.7% |
| Netherlands | 8.9% |
| Germany | 8.6% |
| China | 6.1% |
| Ireland | 4.7% |
| India | 3.9% |
| South Korea | 3.8% |
| United Kingdom | 3.2% |
| Macao | 3.0% |
| Australia | 2.9% |
| Denmark | 2.4% |
| Taiwan | 2.4% |
| Zambia | 1.5% |
| Hong Kong | 1.5% |
| Philippines | 0.8% |
| * | Holdings are classified by country of risk as determined by MSCI and Bloomberg. |
| See notes to financial statements. | Thornburg Equity Funds Semi-Annual Report | 37 |
Thornburg International Equity Fund | March 31, 2023 (Unaudited)
| Issuer-Description | SHARES | VALUE | |
| Common Stock — 97.3% | |||
| Banks — 6.2% | |||
| Banks — 6.2% | |||
| BNP Paribas Emissions- und Handelsgesellschaft mbH | 4,929,917 | $ 58,437,184 | |
| BNP Paribas SA | 214,355 | 12,834,557 | |
| China Merchants Bank Co. Ltd. Class A | 13,127,193 | 65,465,472 | |
| United Overseas Bank Ltd. | 857,361 | 19,172,726 | |
| 155,909,939 | |||
| Capital Goods — 12.4% | |||
| Aerospace & Defense — 2.5% | |||
| Safran SA | 419,529 | 62,122,854 | |
| Construction & Engineering — 2.3% | |||
| Ferrovial SA | 1,988,714 | 58,426,632 | |
| Electrical Equipment — 5.8% | |||
| ABB Ltd. | 2,357,979 | 80,845,730 | |
| Schneider Electric SE | 399,041 | 66,506,545 | |
| Industrial Conglomerates — 1.8% | |||
| Hitachi Ltd. | 846,548 | 46,237,365 | |
| 314,139,126 | |||
| Commercial & Professional Services — 1.6% | |||
| Professional Services — 1.6% | |||
| Recruit Holdings Co. Ltd. | 1,514,469 | 41,632,927 | |
| 41,632,927 | |||
| Consumer Discretionary Distribution & Retail — 3.7% | |||
| Broadline Retail — 3.7% | |||
| a | Alibaba Group Holding Ltd. | 7,280,310 | 93,114,960 |
| 93,114,960 | |||
| Consumer Durables & Apparel — 3.9% | |||
| Household Durables — 2.6% | |||
| Sony Group Corp. | 736,804 | 66,507,972 | |
| Textiles, Apparel & Luxury Goods — 1.3% | |||
| LVMH Moet Hennessy Louis Vuitton SE | 35,373 | 32,392,885 | |
| 98,900,857 | |||
| Consumer Services — 5.5% | |||
| Hotels, Restaurants & Leisure — 5.5% | |||
| Galaxy Entertainment Group Ltd. | 11,258,672 | 75,226,098 | |
| a,b | Meituan Class B | 3,430,209 | 62,705,893 |
| 137,931,991 | |||
| Consumer Staples Distribution & Retail — 3.6% | |||
| Consumer Staples Distribution & Retail — 3.6% | |||
| Alimentation Couche-Tard, Inc. | 374,804 | 18,844,197 | |
| Seven & i Holdings Co. Ltd. | 1,586,610 | 71,398,944 | |
| 90,243,141 | |||
| Energy — 5.1% | |||
| Oil, Gas & Consumable Fuels — 5.1% | |||
| Shell plc | 965,617 | 27,740,634 | |
| TotalEnergies SE | 1,710,813 | 100,858,267 | |
| 128,598,901 | |||
| Financial Services — 3.9% | |||
| Capital Markets — 2.9% | |||
| B3 SA - Brasil Bolsa Balcao | 7,410,300 | 15,132,162 | |
| Hong Kong Exchanges & Clearing Ltd. | 1,299,960 | 57,662,654 | |
| Financial Services — 1.0% | |||
| a,b | Adyen NV | 8,669 | 13,718,712 |
| Fidelity National Information Services, Inc. | 201,133 | 10,927,556 |
| 38 | Thornburg Equity Funds Semi-Annual Report | See notes to financial statements. |
| Issuer-Description | SHARES | VALUE | |
| 97,441,084 | |||
| Food, Beverage & Tobacco — 3.6% | |||
| Beverages — 3.6% | |||
| Kweichow Moutai Co. Ltd. Class A | 339,320 | $ 89,868,434 | |
| 89,868,434 | |||
| Health Care Equipment & Services — 1.3% | |||
| Health Care Equipment & Supplies — 1.3% | |||
| Alcon, Inc. | 113,162 | 7,982,447 | |
| Olympus Corp. | 1,486,973 | 25,965,332 | |
| 33,947,779 | |||
| Household & Personal Products — 4.2% | |||
| Personal Care Products — 4.2% | |||
| L’Oreal SA | 174,441 | 77,800,787 | |
| Shiseido Co. Ltd. | 594,439 | 27,672,585 | |
| 105,473,372 | |||
| Insurance — 3.2% | |||
| Insurance — 3.2% | |||
| Assicurazioni Generali SpA | 1,879,745 | 37,469,160 | |
| NN Group NV | 1,172,956 | 42,563,484 | |
| 80,032,644 | |||
| Materials — 6.3% | |||
| Chemicals — 5.6% | |||
| Air Liquide SA | 308,195 | 51,539,414 | |
| Akzo Nobel NV | 344,414 | 26,885,750 | |
| Linde plc | 178,867 | 62,869,320 | |
| Metals & Mining — 0.7% | |||
| Norsk Hydro ASA | 2,314,783 | 17,200,913 | |
| 158,495,397 | |||
| Media & Entertainment — 5.3% | |||
| Entertainment — 1.9% | |||
| Nintendo Co. Ltd. | 1,229,797 | 47,524,673 | |
| Interactive Media & Services — 3.4% | |||
| Tencent Holdings Ltd. | 1,739,369 | 85,484,982 | |
| 133,009,655 | |||
| Pharmaceuticals, Biotechnology & Life Sciences — 5.4% | |||
| Pharmaceuticals — 5.4% | |||
| AstraZeneca plc | 475,543 | 65,890,227 | |
| Roche Holding AG | 249,910 | 71,276,042 | |
| 137,166,269 | |||
| Semiconductors & Semiconductor Equipment — 3.4% | |||
| Semiconductors & Semiconductor Equipment — 3.4% | |||
| NVIDIA Corp. | 107,189 | 29,773,889 | |
| Taiwan Semiconductor Manufacturing Co. Ltd. Sponsored ADR | 608,526 | 56,605,088 | |
| 86,378,977 | |||
| Software & Services — 1.2% | |||
| Software — 1.2% | |||
| Constellation Software, Inc. | 16,210 | 30,475,880 | |
| a | Lumine Group, Inc. | 48,636 | 529,364 |
| 31,005,244 | |||
| Technology Hardware & Equipment — 2.8% | |||
| Electronic Equipment, Instruments & Components — 2.8% | |||
| Keyence Corp. | 145,428 | 70,591,863 | |
| 70,591,863 | |||
| Telecommunication Services — 3.3% |
| See notes to financial statements. | Thornburg Equity Funds Semi-Annual Report | 39 |
Thornburg International Equity Fund | March 31, 2023 (Unaudited)
| Issuer-Description | SHARES | VALUE | |
| Diversified Telecommunication Services — 2.0% | |||
| Orange SA | 4,241,403 | $ 50,377,022 | |
| Wireless Telecommunication Services — 1.3% | |||
| Vodafone Group plc | 29,064,854 | 32,017,964 | |
| 82,394,986 | |||
| Transportation — 3.1% | |||
| Ground Transportation — 3.1% | |||
| Canadian Pacific Railway Ltd. | 1,016,066 | 78,176,118 | |
| 78,176,118 | |||
| Utilities — 8.3% | |||
| Electric Utilities — 5.7% | |||
| Endesa SA | 2,030,396 | 44,039,285 | |
| Enel SpA | 8,556,297 | 52,214,639 | |
| Iberdrola SA | 3,798,970 | 47,318,000 | |
| Multi-Utilities — 2.6% | |||
| E.ON SE | 5,236,572 | 65,309,210 | |
| 208,881,134 | |||
| Total Common Stock (Cost $2,112,359,701) | 2,453,334,798 | ||
| Short-Term Investments — 5.3% | |||
| c | Thornburg Capital Management Fund | 13,336,564 | 133,365,643 |
| Total Short-Term Investments (Cost $133,365,643) | 133,365,643 | ||
| Total Investments — 102.6% (Cost $2,245,725,344) | $2,586,700,441 | ||
| Liabilities Net of Other Assets — (2.6)% | (64,901,837) | ||
| Net Assets — 100.0% | $2,521,798,604 |
| Footnote Legend | |
| a | Non-income producing. |
| b | Securities exempt from registration under Rule 144A of the Securities Act of 1933, as amended. These securities are restricted but liquid and may only be resold in the ordinary course of business in transactions exempt from registration, normally to qualified institutional buyers. As of March 31, 2023, the aggregate value of these securities in the Fund’s portfolio was $76,424,605, representing 3.03% of the Fund’s net assets. |
| c | Investment in Affiliates. |
To simplify the listings of securities, abbreviations are used per the table below:
| ADR | American Depositary Receipt |
| 40 | Thornburg Equity Funds Semi-Annual Report | See notes to financial statements. |
| COUNTRY EXPOSURE * (percent of equity holdings) | |
| Japan | 16.2% |
| China | 16.2% |
| France | 15.8% |
| United States | 9.8% |
| Netherlands | 6.9% |
| Spain | 6.1% |
| Canada | 5.2% |
| United Kingdom | 4.0% |
| Italy | 3.7% |
| Switzerland | 3.6% |
| Macao | 3.1% |
| Germany | 2.7% |
| Hong Kong | 2.3% |
| Taiwan | 2.3% |
| Singapore | 0.8% |
| Norway | 0.7% |
| Brazil | 0.6% |
| * | Holdings are classified by country of risk as determined by MSCI and Bloomberg. |
| See notes to financial statements. | Thornburg Equity Funds Semi-Annual Report | 41 |
Thornburg Better World International Fund | March 31, 2023 (Unaudited)
| Issuer-Description | SHARES | VALUE | |
| Common Stock — 91.6% | |||
| Banks — 5.6% | |||
| Banks — 5.6% | |||
| Bank of Montreal | 13,471 | $ 1,199,881 | |
| BNP Paribas SA | 163,925 | 9,815,048 | |
| National Australia Bank Ltd. | 298,700 | 5,534,743 | |
| United Overseas Bank Ltd. | 546,200 | 12,214,391 | |
| 28,764,063 | |||
| Capital Goods — 9.0% | |||
| Electrical Equipment — 5.0% | |||
| ABB Ltd. | 403,888 | 13,847,715 | |
| Schneider Electric SE | 71,445 | 11,907,448 | |
| Industrial Conglomerates — 2.5% | |||
| Hitachi Ltd. | 235,000 | 12,835,398 | |
| Trading Companies & Distributors — 1.5% | |||
| Ashtead Group plc | 121,697 | 7,443,214 | |
| 46,033,775 | |||
| Commercial & Professional Services — 5.2% | |||
| Commercial Services & Supplies — 3.7% | |||
| Daiei Kankyo Co. Ltd. | 285,200 | 3,761,139 | |
| Tetra Tech, Inc. | 35,362 | 5,195,031 | |
| Waste Connections, Inc. | 72,460 | 10,077,012 | |
| Professional Services — 1.5% | |||
| Recruit Holdings Co. Ltd. | 265,200 | 7,290,379 | |
| 26,323,561 | |||
| Consumer Discretionary Distribution & Retail — 2.5% | |||
| Broadline Retail — 2.5% | |||
| a | Alibaba Group Holding Ltd. Sponsored ADR | 125,066 | 12,779,244 |
| 12,779,244 | |||
| Consumer Durables & Apparel — 2.3% | |||
| Household Durables — 1.8% | |||
| Sony Group Corp. | 103,183 | 9,313,864 | |
| Textiles, Apparel & Luxury Goods — 0.5% | |||
| LVMH Moet Hennessy Louis Vuitton SE | 1,418 | 1,298,536 | |
| a | On Holding AG Class A | 41,878 | 1,299,474 |
| 11,911,874 | |||
| Consumer Services — 4.1% | |||
| Hotels, Restaurants & Leisure — 4.1% | |||
| McDonald’s Corp. | 26,300 | 7,353,743 | |
| a,b | Meituan Class B | 743,577 | 13,592,950 |
| 20,946,693 | |||
| Consumer Staples Distribution & Retail — 7.0% | |||
| Consumer Staples Distribution & Retail — 7.0% | |||
| Alimentation Couche-Tard, Inc. | 214,996 | 10,809,455 | |
| Costco Wholesale Corp. | 20,982 | 10,425,326 | |
| Seven & i Holdings Co. Ltd. | 325,700 | 14,656,807 | |
| 35,891,588 | |||
| Financial Services — 3.4% | |||
| Capital Markets — 1.1% | |||
| B3 SA - Brasil Bolsa Balcao | 2,786,907 | 5,690,988 | |
| Financial Services — 2.3% | |||
| a,b | Adyen NV | 3,399 | 5,378,925 |
| Fidelity National Information Services, Inc. | 113,838 | 6,184,818 | |
| 17,254,731 | |||
| Food, Beverage & Tobacco — 1.0% |
| 42 | Thornburg Equity Funds Semi-Annual Report | See notes to financial statements. |
| Issuer-Description | SHARES | VALUE | |
| Food Products — 1.0% | |||
| Nestle SA | 41,840 | $ 5,096,985 | |
| 5,096,985 | |||
| Health Care Equipment & Services — 3.8% | |||
| Health Care Equipment & Supplies — 3.8% | |||
| Alcon, Inc. | 130,648 | 9,238,675 | |
| a | Inspire Medical Systems, Inc. | 22,478 | 5,261,425 |
| Olympus Corp. | 276,500 | 4,828,208 | |
| 19,328,308 | |||
| Household & Personal Products — 4.8% | |||
| Personal Care Products — 4.8% | |||
| L’Oreal SA | 34,511 | 15,391,926 | |
| Shiseido Co. Ltd. | 199,000 | 9,263,935 | |
| 24,655,861 | |||
| Materials — 4.1% | |||
| Chemicals — 2.5% | |||
| Air Liquide SA | 17,157 | 2,869,163 | |
| Linde plc | 19,709 | 6,927,446 | |
| OCI NV | 87,812 | 2,976,956 | |
| Metals & Mining — 1.6% | |||
| Norsk Hydro ASA | 1,131,022 | 8,404,507 | |
| 21,178,072 | |||
| Media & Entertainment — 5.3% | |||
| Entertainment — 1.6% | |||
| Nintendo Co. Ltd. | 210,300 | 8,126,901 | |
| Interactive Media & Services — 3.7% | |||
| Tencent Holdings Ltd. | 390,500 | 19,191,952 | |
| 27,318,853 | |||
| Pharmaceuticals, Biotechnology & Life Sciences — 11.3% | |||
| Biotechnology — 1.6% | |||
| a,b | Innovent Biologics, Inc. | 1,810,500 | 8,106,992 |
| Life Sciences Tools & Services — 3.4% | |||
| Lonza Group AG | 14,665 | 8,773,835 | |
| a,b | Wuxi Biologics Cayman, Inc. | 1,403,000 | 8,686,200 |
| Pharmaceuticals — 6.3% | |||
| Novartis AG | 112,415 | 10,291,142 | |
| Novo Nordisk A/S Class B | 77,082 | 12,183,924 | |
| Roche Holding AG | 33,651 | 9,597,495 | |
| 57,639,588 | |||
| Semiconductors & Semiconductor Equipment — 3.8% | |||
| Semiconductors & Semiconductor Equipment — 3.8% | |||
| NVIDIA Corp. | 46,756 | 12,987,414 | |
| Taiwan Semiconductor Manufacturing Co. Ltd. | 374,000 | 6,547,073 | |
| 19,534,487 | |||
| Software & Services — 6.3% | |||
| Information Technology Services — 1.2% | |||
| Nomura Research Institute Ltd. | 255,700 | 5,902,621 | |
| Software — 5.1% | |||
| Constellation Software, Inc. | 5,937 | 11,161,955 | |
| a | Lumine Group, Inc. | 17,813 | 193,880 |
| SAP SE | 117,578 | 14,799,197 | |
| 32,057,653 | |||
| Technology Hardware & Equipment — 2.9% | |||
| Electronic Equipment, Instruments & Components — 2.9% | |||
| Halma plc | 139,951 | 3,848,223 | |
| Keyence Corp. | 22,500 | 10,921,672 |
| See notes to financial statements. | Thornburg Equity Funds Semi-Annual Report | 43 |
Thornburg Better World International Fund | March 31, 2023 (Unaudited)
| Issuer-Description | SHARES | VALUE | |
| 14,769,895 | |||
| Telecommunication Services — 3.8% | |||
| Diversified Telecommunication Services — 1.6% | |||
| Orange SA | 690,644 | $ 8,203,085 | |
| Wireless Telecommunication Services — 2.2% | |||
| Vodafone Group plc Sponsored ADR | 990,978 | 10,940,397 | |
| 19,143,482 | |||
| Transportation — 2.9% | |||
| Ground Transportation — 2.9% | |||
| Canadian Pacific Railway Ltd. | 191,457 | 14,730,702 | |
| 14,730,702 | |||
| Utilities — 2.5% | |||
| Electric Utilities — 2.5% | |||
| Enel SpA | 1,052,065 | 6,420,206 | |
| Iberdrola SA | 505,414 | 6,295,175 | |
| 12,715,381 | |||
| Total Common Stock (Cost $459,208,014) | 468,074,796 | ||
| Exchange-Traded Funds — 0.3% | |||
| KraneShares Global Carbon Strategy ETF | 44,878 | 1,779,413 | |
| Total Exchange-Traded Funds (Cost $1,622,730) | 1,779,413 | ||
| Short-Term Investments — 7.8% | |||
| c | Thornburg Capital Management Fund | 3,998,073 | 39,980,730 |
| Total Short-Term Investments (Cost $39,980,730) | 39,980,730 | ||
| Total Investments — 99.7% (Cost $500,811,474) | $509,834,939 | ||
| Other Assets Less Liabilities — 0.3% | 1,333,974 | ||
| Net Assets — 100.0% | $511,168,913 |
| Footnote Legend | |
| a | Non-income producing. |
| b | Securities exempt from registration under Rule 144A of the Securities Act of 1933, as amended. These securities are restricted but liquid and may only be resold in the ordinary course of business in transactions exempt from registration, normally to qualified institutional buyers. As of March 31, 2023, the aggregate value of these securities in the Fund’s portfolio was $35,765,067, representing 7.00% of the Fund’s net assets. |
| c | Investment in Affiliates. |
To simplify the listings of securities, abbreviations are used per the table below:
| ADR | American Depositary Receipt |
| 44 | Thornburg Equity Funds Semi-Annual Report | See notes to financial statements. |
| COUNTRY EXPOSURE * (percent of equity holdings) | |
| United States | 19.7% |
| Japan | 18.5% |
| China | 13.3% |
| Switzerland | 9.2% |
| Canada | 8.1% |
| France | 8.0% |
| United Kingdom | 4.7% |
| Germany | 3.2% |
| Singapore | 2.6% |
| Denmark | 2.6% |
| Norway | 1.8% |
| Netherlands | 1.8% |
| Taiwan | 1.4% |
| Italy | 1.4% |
| Spain | 1.3% |
| Brazil | 1.2% |
| Australia | 1.2% |
| * | Holdings are classified by country of risk as determined by MSCI and Bloomberg. |
| See notes to financial statements. | Thornburg Equity Funds Semi-Annual Report | 45 |
Thornburg International Growth Fund | March 31, 2023 (Unaudited)
| Issuer-Description | SHARES | VALUE | |
| Common Stock — 98.5% | |||
| Automobiles & Components — 2.0% | |||
| Automobiles — 2.0% | |||
| Ferrari NV | 70,058 | $ 18,981,515 | |
| 18,981,515 | |||
| Banks — 2.9% | |||
| Banks — 2.9% | |||
| HDFC Bank Ltd. | 52,098 | 1,019,994 | |
| HDFC Bank Ltd. ADR | 395,126 | 26,343,051 | |
| 27,363,045 | |||
| Capital Goods — 3.7% | |||
| Machinery — 1.8% | |||
| Kone OYJ Class B | 340,794 | 17,740,370 | |
| Trading Companies & Distributors — 1.9% | |||
| Ashtead Group plc | 214,562 | 13,123,010 | |
| Diploma plc | 135,139 | 4,684,477 | |
| 35,547,857 | |||
| Commercial & Professional Services — 2.0% | |||
| Professional Services — 2.0% | |||
| Nihon M&A Center Holdings, Inc. | 722,800 | 5,356,695 | |
| Wolters Kluwer NV | 112,832 | 14,237,318 | |
| 19,594,013 | |||
| Consumer Discretionary Distribution & Retail — 6.5% | |||
| Broadline Retail — 6.0% | |||
| B&M European Value Retail SA | 1,515,866 | 9,015,131 | |
| JD.com, Inc. Class A | 566,616 | 12,415,184 | |
| a | MercadoLibre, Inc. | 15,679 | 20,665,863 |
| Prosus NV | 195,489 | 15,251,841 | |
| Specialty Retail — 0.5% | |||
| China Meidong Auto Holdings Ltd. | 2,197,000 | 4,741,102 | |
| 62,089,121 | |||
| Consumer Durables & Apparel — 3.9% | |||
| Textiles, Apparel & Luxury Goods — 3.9% | |||
| LVMH Moet Hennessy Louis Vuitton SE | 41,167 | 37,698,751 | |
| 37,698,751 | |||
| Consumer Services — 3.7% | |||
| Hotels, Restaurants & Leisure — 3.7% | |||
| a | Booking Holdings, Inc. | 9,180 | 24,349,124 |
| a,b | Meituan Class B | 595,690 | 10,889,503 |
| 35,238,627 | |||
| Consumer Staples Distribution & Retail — 0.8% | |||
| Consumer Staples Distribution & Retail — 0.8% | |||
| Raia Drogasil SA | 1,678,852 | 8,098,715 | |
| 8,098,715 | |||
| Energy — 1.6% | |||
| Oil, Gas & Consumable Fuels — 1.6% | |||
| TotalEnergies SE | 266,927 | 15,736,258 | |
| 15,736,258 | |||
| Financial Services — 7.3% | |||
| Capital Markets — 1.4% | |||
| Deutsche Boerse AG | 71,187 | 13,853,952 | |
| Financial Services — 5.9% | |||
| a,b | Adyen NV | 9,403 | 14,880,268 |
| Mastercard, Inc. Class A | 61,549 | 22,367,522 |
| 46 | Thornburg Equity Funds Semi-Annual Report | See notes to financial statements. |
| Issuer-Description | SHARES | VALUE | |
| Visa, Inc. Class A | 83,915 | $ 18,919,476 | |
| 70,021,218 | |||
| Food, Beverage & Tobacco — 10.4% | |||
| Beverages — 5.1% | |||
| Diageo plc | 620,737 | 27,673,870 | |
| Kweichow Moutai Co. Ltd. Class A | 78,767 | 20,861,331 | |
| Food Products — 5.3% | |||
| Nestle SA | 421,558 | 51,354,560 | |
| 99,889,761 | |||
| Health Care Equipment & Services — 0.8% | |||
| Health Care Equipment & Supplies — 0.8% | |||
| Carl Zeiss Meditec AG Class BR | 54,085 | 7,507,863 | |
| 7,507,863 | |||
| Household & Personal Products — 3.7% | |||
| Personal Care Products — 3.7% | |||
| Beiersdorf AG | 86,342 | 11,231,865 | |
| L’Oreal SA | 53,513 | 23,866,829 | |
| 35,098,694 | |||
| Insurance — 2.0% | |||
| Insurance — 2.0% | |||
| Aon plc Class A | 62,017 | 19,553,340 | |
| 19,553,340 | |||
| Materials — 4.6% | |||
| Chemicals — 2.0% | |||
| Air Liquide SA | 112,295 | 18,779,080 | |
| Containers & Packaging — 1.1% | |||
| SIG Group AG | 411,837 | 10,586,815 | |
| Metals & Mining — 1.5% | |||
| Teck Resources Ltd. Class B | 395,572 | 14,444,305 | |
| 43,810,200 | |||
| Media & Entertainment — 6.5% | |||
| Entertainment — 2.3% | |||
| Activision Blizzard, Inc. | 221,274 | 18,938,842 | |
| a | Sea Ltd. ADR | 36,062 | 3,121,166 |
| Interactive Media & Services — 4.2% | |||
| carsales.com Ltd. | 301,600 | 4,461,509 | |
| Hemnet Group AB | 391,104 | 6,579,320 | |
| Tencent Holdings Ltd. | 585,800 | 28,790,384 | |
| 61,891,221 | |||
| Pharmaceuticals, Biotechnology & Life Sciences — 15.4% | |||
| Biotechnology — 2.4% | |||
| CSL Ltd. | 120,292 | 23,181,972 | |
| Life Sciences Tools & Services — 4.8% | |||
| a | ICON plc ADR | 89,724 | 19,164,149 |
| Lonza Group AG | 44,406 | 26,567,402 | |
| Pharmaceuticals — 8.2% | |||
| AstraZeneca plc | 354,946 | 49,180,563 | |
| Novo Nordisk AS Sponsored ADR | 185,997 | 29,599,562 | |
| 147,693,648 | |||
| Semiconductors & Semiconductor Equipment — 12.0% | |||
| Semiconductors & Semiconductor Equipment — 12.0% | |||
| ASML Holding NV | 67,169 | 45,542,552 | |
| BE Semiconductor Industries NV | 122,958 | 10,681,170 | |
| SK Hynix, Inc. | 132,600 | 9,024,358 | |
| Taiwan Semiconductor Manufacturing Co. Ltd. | 2,826,000 | 49,470,662 |
| See notes to financial statements. | Thornburg Equity Funds Semi-Annual Report | 47 |
Thornburg International Growth Fund | March 31, 2023 (Unaudited)
| Issuer-Description | SHARES | VALUE | |
| 114,718,742 | |||
| Software & Services — 2.8% | |||
| Information Technology Services — 2.8% | |||
| a | Globant SA | 56,829 | $ 9,320,524 |
| Nomura Research Institute Ltd. | 739,400 | 17,068,432 | |
| 26,388,956 | |||
| Technology Hardware & Equipment — 3.4% | |||
| Electronic Equipment, Instruments & Components — 3.4% | |||
| Keyence Corp. | 66,500 | 32,279,608 | |
| 32,279,608 | |||
| Telecommunication Services — 1.6% | |||
| Diversified Telecommunication Services — 1.6% | |||
| b | Cellnex Telecom SA | 386,085 | 14,973,039 |
| 14,973,039 | |||
| Transportation — 0.9% | |||
| Air Freight & Logistics — 0.9% | |||
| DSV AS | 45,546 | 8,795,122 | |
| 8,795,122 | |||
| Total Common Stock (Cost $706,327,075) | 942,969,314 | ||
| Short-Term Investments — 1.5% | |||
| c | Thornburg Capital Management Fund | 1,467,424 | 14,674,244 |
| Total Short-Term Investments (Cost $14,674,244) | 14,674,244 | ||
| Total Investments — 100.0% (Cost $721,001,319) | $957,643,558 | ||
| Liabilities Net of Other Assets — (0.0)% | (420,201) | ||
| Net Assets — 100.0% | $957,223,357 |
| Footnote Legend | |
| a | Non-income producing. |
| b | Securities exempt from registration under Rule 144A of the Securities Act of 1933, as amended. These securities are restricted but liquid and may only be resold in the ordinary course of business in transactions exempt from registration, normally to qualified institutional buyers. As of March 31, 2023, the aggregate value of these securities in the Fund’s portfolio was $40,742,810, representing 4.26% of the Fund’s net assets. |
| c | Investment in Affiliates. |
To simplify the listings of securities, abbreviations are used per the table below:
| ADR | American Depositary Receipt |
| 48 | Thornburg Equity Funds Semi-Annual Report | See notes to financial statements. |
| COUNTRY EXPOSURE * (percent of equity holdings) | |
| United States | 22.0% |
| United Kingdom | 11.0% |
| France | 10.2% |
| China | 9.9% |
| Netherlands | 9.0% |
| Japan | 5.8% |
| Taiwan | 5.2% |
| Denmark | 4.1% |
| Switzerland | 3.9% |
| Germany | 3.5% |
| Brazil | 3.0% |
| India | 2.9% |
| Italy | 2.0% |
| Finland | 1.9% |
| Spain | 1.6% |
| Canada | 1.5% |
| South Korea | 1.0% |
| Sweden | 0.7% |
| Australia | 0.5% |
| Singapore | 0.3% |
| * | Holdings are classified by country of risk as determined by MSCI and Bloomberg. |
| See notes to financial statements. | Thornburg Equity Funds Semi-Annual Report | 49 |
Thornburg Developing World Fund | March 31, 2023 (Unaudited)
| Issuer-Description | SHARES | VALUE | |
| Common Stock — 95.5% | |||
| Automobiles & Components — 1.8% | |||
| Automobiles — 1.8% | |||
| a,b | Tata Motors Ltd. Sponsored ADR | 771,916 | $ 19,762,252 |
| 19,762,252 | |||
| Banks — 14.3% | |||
| Banks — 14.3% | |||
| Bank Rakyat Indonesia Persero Tbk PT | 88,345,967 | 27,868,647 | |
| China Construction Bank Corp. Class H | 33,052,307 | 21,431,642 | |
| Grupo Financiero Banorte SAB de CV Class O | 1,665,293 | 14,020,991 | |
| HDFC Bank Ltd. | 1,513,259 | 29,627,156 | |
| c | Postal Savings Bank of China Co. Ltd. Class H | 44,489,669 | 26,410,764 |
| Saudi National Bank | 1,674,424 | 20,452,444 | |
| SCB X PCL | 5,162,125 | 15,473,543 | |
| 155,285,187 | |||
| Capital Goods — 1.5% | |||
| Machinery — 1.5% | |||
| Shenzhen Inovance Technology Co. Ltd. Class A | 1,574,698 | 16,109,384 | |
| 16,109,384 | |||
| Consumer Discretionary Distribution & Retail — 11.4% | |||
| Broadline Retail — 9.1% | |||
| b | Alibaba Group Holding Ltd. | 2,876,722 | 36,793,193 |
| JD.com, Inc. Class A | 558,677 | 12,241,232 | |
| b | MercadoLibre, Inc. | 14,572 | 19,206,770 |
| Naspers Ltd. Class N | 166,997 | 30,885,394 | |
| Specialty Retail — 2.3% | |||
| China Tourism Group Duty Free Corp. Ltd. Class A, | 682,298 | 18,193,687 | |
| K Car Co. Ltd. | 705,055 | 6,894,304 | |
| 124,214,580 | |||
| Consumer Services — 9.2% | |||
| Hotels, Restaurants & Leisure — 9.2% | |||
| b | Americana Restaurants International plc | 27,508,100 | 29,606,182 |
| b,c | Meituan Class B | 1,342,468 | 24,540,970 |
| Yum China Holdings, Inc. | 732,889 | 46,083,900 | |
| 100,231,052 | |||
| Consumer Staples Distribution & Retail — 6.3% | |||
| Consumer Staples Distribution & Retail — 6.3% | |||
| b,c | Dino Polska SA | 265,087 | 24,018,424 |
| Raia Drogasil SA | 2,144,347 | 10,344,244 | |
| Sendas Distribuidora S/A | 4,202,784 | 12,885,845 | |
| Wal-Mart de Mexico SAB de CV | 5,243,807 | 20,951,948 | |
| 68,200,461 | |||
| Energy — 2.5% | |||
| Oil, Gas & Consumable Fuels — 2.5% | |||
| b | Adnoc Gas plc | 4,000,000 | 3,267,529 |
| PTT Exploration & Production PCL | 1,900,249 | 8,363,429 | |
| Reliance Industries Ltd. | 561,126 | 15,915,270 | |
| 27,546,228 | |||
| Financial Services — 6.8% | |||
| Capital Markets — 2.7% | |||
| East Money Information Co. Ltd. Class A | 5,256,940 | 15,322,877 | |
| Saudi Tadawul Group Holding Co. | 357,944 | 13,769,644 | |
| Consumer Finance — 1.6% | |||
| SBI Cards & Payment Services Ltd. | 1,932,895 | 17,333,905 | |
| Financial Services — 2.5% | |||
| Chailease Holding Co. Ltd. | 3,704,940 | 27,196,127 |
| 50 | Thornburg Equity Funds Semi-Annual Report | See notes to financial statements. |
| Issuer-Description | SHARES | VALUE | |
| 73,622,553 | |||
| Food, Beverage & Tobacco — 2.2% | |||
| Beverages — 2.2% | |||
| Varun Beverages Ltd. | 1,440,239 | $ 24,258,824 | |
| 24,258,824 | |||
| Health Care Equipment & Services — 0.9% | |||
| Health Care Providers & Services — 0.9% | |||
| b | Max Healthcare Institute Ltd. | 1,827,533 | 9,727,793 |
| 9,727,793 | |||
| Insurance — 3.8% | |||
| Insurance — 3.8% | |||
| AIA Group Ltd. | 3,914,092 | 41,210,678 | |
| 41,210,678 | |||
| Materials — 4.1% | |||
| Chemicals — 0.8% | |||
| Fertiglobe plc | 8,099,548 | 8,821,836 | |
| Construction Materials — 1.0% | |||
| Beijing Oriental Yuhong Waterproof Technology Co. Ltd. Class A | 2,131,887 | 10,386,661 | |
| Metals & Mining — 2.3% | |||
| Cia Brasileira de Aluminio | 4,475,728 | 6,693,569 | |
| First Quantum Minerals Ltd. | 785,313 | 18,053,773 | |
| 43,955,839 | |||
| Media & Entertainment — 5.4% | |||
| Interactive Media & Services — 5.4% | |||
| Tencent Holdings Ltd. | 1,183,109 | 58,146,403 | |
| 58,146,403 | |||
| Pharmaceuticals, Biotechnology & Life Sciences — 0.5% | |||
| Pharmaceuticals — 0.5% | |||
| b,c | Gland Pharma Ltd. | 369,264 | 5,656,963 |
| 5,656,963 | |||
| Semiconductors & Semiconductor Equipment — 8.1% | |||
| Semiconductors & Semiconductor Equipment — 8.1% | |||
| Micron Technology, Inc. | 188,810 | 11,392,795 | |
| Taiwan Semiconductor Manufacturing Co. Ltd. | 4,381,267 | 76,696,455 | |
| 88,089,250 | |||
| Software & Services — 2.5% | |||
| Information Technology Services — 2.5% | |||
| b | EPAM Systems, Inc. | 21,474 | 6,420,726 |
| b | Globant SA | 41,345 | 6,780,994 |
| Infosys Ltd. Sponsored ADR | 768,982 | 13,411,046 | |
| 26,612,766 | |||
| Technology Hardware & Equipment — 6.0% | |||
| Electronic Equipment, Instruments & Components — 2.6% | |||
| Hon Hai Precision Industry Co. Ltd. | 8,430,754 | 28,797,058 | |
| Technology Hardware, Storage & Peripherals — 3.4% | |||
| Samsung Electronics Co. Ltd. | 743,724 | 36,562,074 | |
| 65,359,132 | |||
| Telecommunication Services — 1.3% | |||
| Diversified Telecommunication Services — 1.3% | |||
| b | Converge Information and Communications Technology Solutions, Inc. | 58,574,534 | 13,791,116 |
| 13,791,116 | |||
| Transportation — 3.9% | |||
| Ground Transportation — 1.2% | |||
| Localiza Rent a Car SA | 1,301,282 | 13,710,002 |
| See notes to financial statements. | Thornburg Equity Funds Semi-Annual Report | 51 |
Thornburg Developing World Fund | March 31, 2023 (Unaudited)
| Issuer-Description | SHARES | VALUE | |
| Transportation Infrastructure — 2.7% | |||
| Grupo Aeroportuario del Pacifico SAB de CV Class B | 892,514 | $ 17,410,957 | |
| b | Salik Co. PJSC | 14,638,825 | 11,519,729 |
| 42,640,688 | |||
| Utilities — 3.0% | |||
| Electric Utilities — 1.4% | |||
| Enel Chile SA | 264,943,260 | 14,452,238 | |
| Independent Power and Renewable Electricity Producers — 1.6% | |||
| China Longyuan Power Group Corp. Ltd. Class H | 15,363,487 | 17,555,699 | |
| 32,007,937 | |||
| Total Common Stock (Cost $932,533,161) | 1,036,429,086 | ||
| Preferred Stock — 0.7% | |||
| Utilities — 0.7% | |||
| Electric Utilities — 0.7% | |||
| Centrais Eletricas Brasileiras SA Class B, 4.45% | 1,067,482 | 7,641,044 | |
| 7,641,044 | |||
| Total Preferred Stock (Cost $10,582,235) | 7,641,044 | ||
| Rights — 0.0% | |||
| Transportation — 0.0% | |||
| Ground Transportation — 0.0% | |||
| b | Localiza Rent a Car SA | 5,822 | 15,082 |
| 15,082 | |||
| Total Rights (Cost $0) | 15,082 | ||
| Short-Term Investments — 3.5% | |||
| d | Thornburg Capital Management Fund | 3,837,065 | 38,370,652 |
| Total Short-Term Investments (Cost $38,370,652) | 38,370,652 | ||
| Total Investments — 99.7% (Cost $981,486,048) | $1,082,455,864 | ||
| Other Assets Less Liabilities — 0.3% | 3,181,028 | ||
| Net Assets — 100.0% | $1,085,636,892 |
| Footnote Legend | |
| a | Security currently fair valued by the Valuation and Pricing Committee. |
| b | Non-income producing. |
| c | Securities exempt from registration under Rule 144A of the Securities Act of 1933, as amended. These securities are restricted but liquid and may only be resold in the ordinary course of business in transactions exempt from registration, normally to qualified institutional buyers. As of March 31, 2023, the aggregate value of these securities in the Fund’s portfolio was $80,627,121, representing 7.43% of the Fund’s net assets. |
| d | Investment in Affiliates. |
To simplify the listings of securities, abbreviations are used per the table below:
| ADR | American Depositary Receipt |
| 52 | Thornburg Equity Funds Semi-Annual Report | See notes to financial statements. |
| COUNTRY EXPOSURE * (percent of equity holdings) | |
| China | 29.0% |
| India | 13.0% |
| Taiwan | 12.7% |
| Brazil | 6.7% |
| United Arab Emirates | 5.1% |
| Mexico | 5.0% |
| South Korea | 4.2% |
| Hong Kong | 3.9% |
| Saudi Arabia | 3.3% |
| South Africa | 3.0% |
| Indonesia | 2.7% |
| United States | 2.4% |
| Poland | 2.3% |
| Thailand | 2.3% |
| Zambia | 1.7% |
| Chile | 1.4% |
| Philippines | 1.3% |
| * | Holdings are classified by country of risk as determined by MSCI and Bloomberg. |
| See notes to financial statements. | Thornburg Equity Funds Semi-Annual Report | 53 |
Thornburg Small/Mid Cap Core Fund | March 31, 2023 (Unaudited)
| Issuer-Description | SHARES | VALUE | |
| Common Stock — 98.9% | |||
| Automobiles & Components — 1.1% | |||
| Automobile Components — 1.1% | |||
| a | Gentherm, Inc. | 94,866 | $ 5,731,804 |
| 5,731,804 | |||
| Banks — 1.0% | |||
| Banks — 1.0% | |||
| Pinnacle Financial Partners, Inc. | 94,829 | 5,230,768 | |
| 5,230,768 | |||
| Capital Goods — 11.4% | |||
| Building Products — 2.5% | |||
| a | Builders FirstSource, Inc. | 145,514 | 12,918,733 |
| Construction & Engineering — 2.4% | |||
| AECOM | 139,033 | 11,723,263 | |
| a | MYR Group, Inc. | 7,972 | 1,004,552 |
| Machinery — 4.3% | |||
| a | Chart Industries, Inc. | 78,036 | 9,785,714 |
| ITT, Inc. | 147,336 | 12,715,097 | |
| Trading Companies & Distributors — 2.2% | |||
| Applied Industrial Technologies, Inc. | 82,356 | 11,705,258 | |
| 59,852,617 | |||
| Commercial & Professional Services — 9.0% | |||
| Commercial Services & Supplies — 6.9% | |||
| a | Casella Waste Systems, Inc. Class A | 227,100 | 18,772,086 |
| a | Clean Harbors, Inc. | 124,485 | 17,746,582 |
| Professional Services — 2.1% | |||
| Booz Allen Hamilton Holding Corp. Class A | 116,424 | 10,791,340 | |
| 47,310,008 | |||
| Consumer Discretionary Distribution & Retail — 2.8% | |||
| Broadline Retail — 1.1% | |||
| a | Ollie’s Bargain Outlet Holdings, Inc. | 105,276 | 6,099,691 |
| Distributors — 1.7% | |||
| Pool Corp. | 25,779 | 8,827,761 | |
| 14,927,452 | |||
| Consumer Durables & Apparel — 4.0% | |||
| Leisure Products — 1.1% | |||
| a | YETI Holdings, Inc. | 139,152 | 5,566,080 |
| Textiles, Apparel & Luxury Goods — 2.9% | |||
| a | Deckers Outdoor Corp. | 34,245 | 15,394,840 |
| 20,960,920 | |||
| Consumer Staples Distribution & Retail — 3.0% | |||
| Consumer Staples Distribution & Retail — 3.0% | |||
| a | BJ’s Wholesale Club Holdings, Inc. | 205,693 | 15,647,066 |
| 15,647,066 | |||
| Energy — 8.7% | |||
| Energy Equipment & Services — 4.4% | |||
| Liberty Energy, Inc. Class A | 740,357 | 9,483,973 | |
| a | TechnipFMC plc | 989,186 | 13,502,389 |
| Oil, Gas & Consumable Fuels — 4.3% | |||
| Chesapeake Energy Corp. | 147,881 | 11,244,871 | |
| Matador Resources Co. | 240,694 | 11,469,069 | |
| 45,700,302 | |||
| Equity Real Estate Investment Trusts (REITs) — 3.7% | |||
| Residential REITs — 1.7% |
| 54 | Thornburg Equity Funds Semi-Annual Report | See notes to financial statements. |
| Issuer-Description | SHARES | VALUE | |
| Independence Realty Trust, Inc. | 561,772 | $ 9,005,205 | |
| Retail REITs — 2.0% | |||
| Kite Realty Group Trust | 509,101 | 10,650,393 | |
| 19,655,598 | |||
| Financial Services — 6.2% | |||
| Capital Markets — 2.7% | |||
| LPL Financial Holdings, Inc. | 71,560 | 14,483,744 | |
| Financial Services — 3.5% | |||
| a | Repay Holdings Corp. Class A | 1,380,555 | 9,070,247 |
| Walker & Dunlop, Inc. | 120,943 | 9,212,228 | |
| 32,766,219 | |||
| Food, Beverage & Tobacco — 4.3% | |||
| Food Products — 4.3% | |||
| Lamb Weston Holdings, Inc. | 109,767 | 11,472,847 | |
| a | SunOpta, Inc. | 1,435,953 | 11,056,838 |
| 22,529,685 | |||
| Health Care Equipment & Services — 7.1% | |||
| Health Care Equipment & Supplies — 4.1% | |||
| CONMED Corp. | 83,627 | 8,685,500 | |
| a | Envista Holdings Corp. | 317,410 | 12,975,721 |
| Health Care Providers & Services — 3.0% | |||
| a | Acadia Healthcare Co., Inc. | 124,616 | 9,003,506 |
| a | PetIQ, Inc. Class A | 598,921 | 6,851,656 |
| 37,516,383 | |||
| Insurance — 2.6% | |||
| Insurance — 2.6% | |||
| Assurant, Inc. | 112,303 | 13,484,221 | |
| 13,484,221 | |||
| Materials — 7.9% | |||
| Chemicals — 4.4% | |||
| Element Solutions, Inc. | 435,446 | 8,408,462 | |
| Sensient Technologies Corp. | 193,481 | 14,812,906 | |
| Containers & Packaging — 2.4% | |||
| Crown Holdings, Inc. | 150,339 | 12,434,539 | |
| Metals & Mining — 1.1% | |||
| First Quantum Minerals Ltd. | 244,990 | 5,632,141 | |
| 41,288,048 | |||
| Media & Entertainment — 1.0% | |||
| Media — 1.0% | |||
| a | WideOpenWest, Inc. | 510,180 | 5,423,213 |
| 5,423,213 | |||
| Pharmaceuticals, Biotechnology & Life Sciences — 3.9% | |||
| Biotechnology — 1.5% | |||
| a | BioMarin Pharmaceutical, Inc. | 82,777 | 8,049,235 |
| Life Sciences Tools & Services — 2.4% | |||
| a | Avantor, Inc. | 580,411 | 12,269,889 |
| 20,319,124 | |||
| Semiconductors & Semiconductor Equipment — 2.6% | |||
| Semiconductors & Semiconductor Equipment — 2.6% | |||
| Entegris, Inc. | 88,831 | 7,285,030 | |
| a | MaxLinear, Inc. | 177,969 | 6,266,289 |
| 13,551,319 | |||
| Software & Services — 8.2% | |||
| Software — 8.2% | |||
| a | Agilysys, Inc. | 199,761 | 16,482,280 |
| See notes to financial statements. | Thornburg Equity Funds Semi-Annual Report | 55 |
Thornburg Small/Mid Cap Core Fund | March 31, 2023 (Unaudited)
| Issuer-Description | SHARES | VALUE | |
| a | Aspen Technology, Inc. | 57,883 | $ 13,247,682 |
| a | CCC Intelligent Solutions Holdings, Inc. | 748,115 | 6,710,592 |
| a | Instructure Holdings, Inc. | 248,751 | 6,442,651 |
| 42,883,205 | |||
| Technology Hardware & Equipment — 4.8% | |||
| Communications Equipment — 2.1% | |||
| a | Harmonic, Inc. | 743,092 | 10,841,712 |
| Electronic Equipment, Instruments & Components — 2.7% | |||
| a | Teledyne Technologies, Inc. | 32,137 | 14,376,808 |
| 25,218,520 | |||
| Telecommunication Services — 2.2% | |||
| Diversified Telecommunication Services — 2.2% | |||
| a | Radius Global Infrastructure, Inc. Class A | 770,645 | 11,305,362 |
| 11,305,362 | |||
| Utilities — 3.4% | |||
| Independent Power and Renewable Electricity Producers — 3.4% | |||
| AES Corp. | 752,470 | 18,119,478 | |
| 18,119,478 | |||
| Total Common Stock (Cost $502,802,166) | 519,421,312 | ||
| Short-Term Investments — 1.5% | |||
| b | Thornburg Capital Management Fund | 788,484 | 7,884,843 |
| Total Short-Term Investments (Cost $7,884,843) | 7,884,843 | ||
| Total Investments — 100.4% (Cost $510,687,009) | $527,306,155 | ||
| Liabilities Net of Other Assets — (0.4)% | (1,939,721) | ||
| Net Assets — 100.0% | $525,366,434 |
| Footnote Legend | |
| a | Non-income producing. |
| b | Investment in Affiliates. |
| 56 | Thornburg Equity Funds Semi-Annual Report | See notes to financial statements. |
Thornburg Small/Mid Cap Growth Fund | March 31, 2023 (Unaudited)
| Issuer-Description | SHARES | VALUE | |
| Common Stock — 99.4% | |||
| Automobiles & Components — 2.8% | |||
| Automobile Components — 2.8% | |||
| a | Fox Factory Holding Corp. | 49,471 | $ 6,004,295 |
| a | Gentherm, Inc. | 30,000 | 1,812,600 |
| 7,816,895 | |||
| Capital Goods — 9.5% | |||
| Building Products — 2.1% | |||
| Zurn Elkay Water Solutions Corp. | 272,609 | 5,822,928 | |
| Construction & Engineering — 3.1% | |||
| a | MYR Group, Inc. | 4,252 | 535,795 |
| a | WillScot Mobile Mini Holdings Corp. | 171,299 | 8,030,497 |
| Machinery — 2.8% | |||
| a | Chart Industries, Inc. | 60,893 | 7,635,982 |
| Trading Companies & Distributors — 1.5% | |||
| Applied Industrial Technologies, Inc. | 29,651 | 4,214,297 | |
| 26,239,499 | |||
| Commercial & Professional Services — 8.3% | |||
| Commercial Services & Supplies — 6.0% | |||
| a | Casella Waste Systems, Inc. Class A | 130,905 | 10,820,608 |
| Tetra Tech, Inc. | 39,277 | 5,770,184 | |
| Professional Services — 2.3% | |||
| Booz Allen Hamilton Holding Corp. Class A | 69,886 | 6,477,733 | |
| 23,068,525 | |||
| Consumer Discretionary Distribution & Retail — 3.7% | |||
| Distributors — 2.0% | |||
| Pool Corp. | 16,392 | 5,613,276 | |
| Specialty Retail — 1.7% | |||
| a | Floor & Decor Holdings, Inc. Class A | 46,512 | 4,568,409 |
| 10,181,685 | |||
| Consumer Durables & Apparel — 4.4% | |||
| Leisure Products — 1.8% | |||
| a | YETI Holdings, Inc. | 123,017 | 4,920,680 |
| Textiles, Apparel & Luxury Goods — 2.6% | |||
| a | On Holding AG Class A | 235,018 | 7,292,609 |
| 12,213,289 | |||
| Consumer Services — 0.5% | |||
| Hotels, Restaurants & Leisure — 0.5% | |||
| Churchill Downs, Inc. | 5,382 | 1,383,443 | |
| 1,383,443 | |||
| Consumer Staples Distribution & Retail — 1.3% | |||
| Consumer Staples Distribution & Retail — 1.3% | |||
| a | Grocery Outlet Holding Corp. | 127,512 | 3,603,489 |
| 3,603,489 | |||
| Energy — 5.3% | |||
| Energy Equipment & Services — 5.3% | |||
| Cactus, Inc. Class A | 144,840 | 5,971,753 | |
| a | TechnipFMC plc | 637,784 | 8,705,752 |
| 14,677,505 | |||
| Financial Services — 3.0% | |||
| Capital Markets — 0.5% | |||
| Tradeweb Markets, Inc. Class A | 17,582 | 1,389,330 | |
| Financial Services — 2.5% | |||
| a | Shift4 Payments, Inc. Class A | 91,899 | 6,965,944 |
| See notes to financial statements. | Thornburg Equity Funds Semi-Annual Report | 57 |
Thornburg Small/Mid Cap Growth Fund | March 31, 2023 (Unaudited)
| Issuer-Description | SHARES | VALUE | |
| 8,355,274 | |||
| Food, Beverage & Tobacco — 6.7% | |||
| Beverages — 1.8% | |||
| a | Celsius Holdings, Inc. | 55,148 | $ 5,125,455 |
| Food Products — 4.9% | |||
| a | Freshpet, Inc. | 104,273 | 6,901,830 |
| a | Sovos Brands, Inc. | 398,918 | 6,653,952 |
| 18,681,237 | |||
| Health Care Equipment & Services — 10.1% | |||
| Health Care Equipment & Supplies — 8.5% | |||
| a | AtriCure, Inc. | 119,569 | 4,956,135 |
| a | Heska Corp. | 67,541 | 6,593,353 |
| a | Inspire Medical Systems, Inc. | 11,018 | 2,578,983 |
| a | Shockwave Medical, Inc. | 43,957 | 9,531,196 |
| Health Care Providers & Services — 1.6% | |||
| a | Option Care Health, Inc. | 137,465 | 4,367,263 |
| 28,026,930 | |||
| Insurance — 2.4% | |||
| Insurance — 2.4% | |||
| a | Ryan Specialty Holdings, Inc. | 163,024 | 6,560,086 |
| 6,560,086 | |||
| Materials — 1.6% | |||
| Chemicals — 1.6% | |||
| a | Livent Corp. | 209,304 | 4,546,083 |
| 4,546,083 | |||
| Media & Entertainment — 2.8% | |||
| Entertainment — 2.8% | |||
| a | Liberty Media Corp-Liberty Formula One Class C | 104,681 | 7,833,279 |
| 7,833,279 | |||
| Pharmaceuticals, Biotechnology & Life Sciences — 10.9% | |||
| Biotechnology — 6.2% | |||
| a | BioMarin Pharmaceutical, Inc. | 57,546 | 5,595,773 |
| a | Cytokinetics, Inc. | 90,394 | 3,180,965 |
| a | IVERIC bio, Inc. | 291,337 | 7,088,229 |
| a | Prothena Corp. plc | 29,643 | 1,436,796 |
| Life Sciences Tools & Services — 4.7% | |||
| a | Avantor, Inc. | 323,512 | 6,839,044 |
| a | Repligen Corp. | 36,041 | 6,067,863 |
| 30,208,670 | |||
| Semiconductors & Semiconductor Equipment — 5.9% | |||
| Semiconductors & Semiconductor Equipment — 5.9% | |||
| a | Ambarella, Inc. | 60,063 | 4,650,077 |
| Entegris, Inc. | 80,279 | 6,583,681 | |
| Monolithic Power Systems, Inc. | 9,998 | 5,004,399 | |
| 16,238,157 | |||
| Software & Services — 11.2% | |||
| Software — 11.2% | |||
| a | Agilysys, Inc. | 73,118 | 6,032,966 |
| Bentley Systems, Inc. Class B | 238,878 | 10,269,365 | |
| a | CCC Intelligent Solutions Holdings, Inc. | 552,975 | 4,960,186 |
| a | Kinaxis, Inc. | 33,691 | 4,625,751 |
| a | Paycom Software, Inc. | 16,828 | 5,115,880 |
| 31,004,148 | |||
| Technology Hardware & Equipment — 6.1% |
| 58 | Thornburg Equity Funds Semi-Annual Report | See notes to financial statements. |
| Issuer-Description | SHARES | VALUE | |
| Communications Equipment — 2.9% | |||
| a | Calix, Inc. | 148,559 | $ 7,961,277 |
| Electronic Equipment, Instruments & Components — 3.2% | |||
| a | Teledyne Technologies, Inc. | 20,173 | 9,024,593 |
| 16,985,870 | |||
| Transportation — 2.9% | |||
| Air Freight & Logistics — 1.3% | |||
| a | GXO Logistics, Inc. | 68,780 | 3,470,639 |
| Ground Transportation — 1.6% | |||
| a | Saia, Inc. | 16,633 | 4,525,506 |
| 7,996,145 | |||
| Total Common Stock (Cost $272,518,939) | 275,620,209 | ||
| Short-Term Investments — 0.7% | |||
| b | Thornburg Capital Management Fund | 210,022 | 2,100,219 |
| Total Short-Term Investments (Cost $2,100,219) | 2,100,219 | ||
| Total Investments — 100.1% (Cost $274,619,158) | $277,720,428 | ||
| Liabilities Net of Other Assets — (0.1)% | (324,027) | ||
| Net Assets — 100.0% | $277,396,401 |
| Footnote Legend | |
| a | Non-income producing. |
| b | Investment in Affiliates. |
| See notes to financial statements. | Thornburg Equity Funds Semi-Annual Report | 59 |
Thornburg Investment Income Builder Fund | March 31, 2023 (Unaudited)
| Issuer-Description | SHARES/ PRINCIPAL AMOUNT | VALUE | |
| Common Stock — 85.3% | |||
| Automobiles & Components — 2.0% | |||
| Automobiles — 2.0% | |||
| Mercedes-Benz Group AG | 1,479,700 | $ 113,583,108 | |
| Stellantis NV | 5,773,800 | 104,795,568 | |
| 218,378,676 | |||
| Banks — 8.1% | |||
| Banks — 8.1% | |||
| BNP Paribas SA | 6,511,500 | 389,877,620 | |
| Citigroup, Inc. | 993,199 | 46,571,101 | |
| JPMorgan Chase & Co. | 1,903,466 | 248,040,654 | |
| Regions Financial Corp. | 11,232,655 | 208,478,077 | |
| 892,967,452 | |||
| Capital Goods — 2.1% | |||
| Aerospace & Defense — 1.1% | |||
| BAE Systems plc | 10,030,100 | 121,578,320 | |
| Electrical Equipment — 0.6% | |||
| ABB Ltd. | 1,928,600 | 66,124,031 | |
| Industrial Conglomerates — 0.4% | |||
| Siemens AG | 244,200 | 39,529,253 | |
| 227,231,604 | |||
| Consumer Discretionary Distribution & Retail — 1.3% | |||
| Specialty Retail — 1.3% | |||
| Home Depot, Inc. | 505,482 | 149,177,848 | |
| 149,177,848 | |||
| Consumer Staples Distribution & Retail — 2.6% | |||
| Consumer Staples Distribution & Retail — 2.6% | |||
| Tesco plc | 87,652,330 | 287,295,705 | |
| 287,295,705 | |||
| Energy — 7.7% | |||
| Oil, Gas & Consumable Fuels — 7.7% | |||
| Enbridge, Inc. | 3,309,521 | 126,185,436 | |
| a | LUKOIL PJSC | 314,000 | 226,080 |
| a,b,c | Malamute Energy, Inc. | 12,439 | 12,439 |
| Petroleo Brasileiro SA Sponsored ADR | 6,346,016 | 66,188,947 | |
| Shell plc | 4,878,000 | 138,913,927 | |
| TotalEnergies SE | 8,807,100 | 519,208,614 | |
| 850,735,443 | |||
| Equity Real Estate Investment Trusts (REITs) — 0.4% | |||
| Residential REITs — 0.4% | |||
| Elme Communities | 2,354,592 | 42,053,013 | |
| 42,053,013 | |||
| Financial Services — 6.7% | |||
| Capital Markets — 4.6% | |||
| CME Group, Inc. | 1,606,027 | 307,586,291 | |
| MidCap Financial Investment Corp. | 2,937,783 | 33,490,726 | |
| b | SLR Investment Corp. | 4,307,900 | 64,790,816 |
| UBS Group AG | 4,785,272 | 100,888,461 | |
| Financial Services — 1.2% | |||
| Equitable Holdings, Inc. | 5,173,952 | 131,366,641 | |
| Mortgage Real Estate Investment Trusts — 0.9% | |||
| b | Chimera Investment Corp. | 17,117,311 | 96,541,634 |
| 734,664,569 | |||
| Food, Beverage & Tobacco — 0.6% |
| 60 | Thornburg Equity Funds Semi-Annual Report | See notes to financial statements. |
| Issuer-Description | SHARES/ PRINCIPAL AMOUNT | VALUE | |
| Food Products — 0.6% | |||
| Nestle SA | 559,000 | $ 68,097,863 | |
| 68,097,863 | |||
| Health Care Equipment & Services — 0.1% | |||
| Health Care Equipment & Supplies — 0.1% | |||
| Medtronic plc | 198,225 | 15,980,900 | |
| 15,980,900 | |||
| Insurance — 6.1% | |||
| Insurance — 6.1% | |||
| Assicurazioni Generali SpA | 14,347,847 | 285,997,185 | |
| AXA SA | 2,995,500 | 91,497,366 | |
| Legal & General Group plc | 22,020,000 | 64,894,453 | |
| NN Group NV | 6,304,220 | 228,763,541 | |
| 671,152,545 | |||
| Materials — 5.5% | |||
| Chemicals — 2.4% | |||
| LyondellBasell Industries NV Class A | 1,867,909 | 175,377,976 | |
| OCI NV | 2,608,000 | 88,415,025 | |
| Metals & Mining — 3.1% | |||
| BHP Group Ltd. | 3,605,700 | 113,835,187 | |
| Glencore plc | 40,061,200 | 229,602,849 | |
| a | MMC Norilsk Nickel PJSC | 351,400 | 2,073,260 |
| 609,304,297 | |||
| Pharmaceuticals, Biotechnology & Life Sciences — 10.7% | |||
| Biotechnology — 1.4% | |||
| AbbVie, Inc. | 977,267 | 155,747,042 | |
| Pharmaceuticals — 9.3% | |||
| AstraZeneca plc | 1,263,300 | 175,040,161 | |
| Merck & Co., Inc. | 1,468,094 | 156,190,520 | |
| Novartis AG | 2,176,808 | 199,278,035 | |
| Pfizer, Inc. | 6,382,021 | 260,386,457 | |
| Roche Holding AG | 800,100 | 228,193,994 | |
| 1,174,836,209 | |||
| Semiconductors & Semiconductor Equipment — 8.6% | |||
| Semiconductors & Semiconductor Equipment — 8.6% | |||
| Broadcom, Inc. | 621,258 | 398,561,857 | |
| QUALCOMM, Inc. | 1,857,277 | 236,951,400 | |
| Taiwan Semiconductor Manufacturing Co. Ltd. | 17,965,000 | 314,487,068 | |
| ��� 950,000,325 | |||
| Software & Services — 0.1% | |||
| Information Technology Services — 0.1% | |||
| HCL Technologies Ltd. | 1,264,800 | 16,705,225 | |
| 16,705,225 | |||
| Technology Hardware & Equipment — 3.5% | |||
| Communications Equipment — 1.0% | |||
| Cisco Systems, Inc. | 2,053,251 | 107,333,696 | |
| Technology Hardware, Storage & Peripherals — 2.5% | |||
| Samsung Electronics Co. Ltd. | 5,604,000 | 275,497,177 | |
| 382,830,873 | |||
| Telecommunication Services — 10.5% | |||
| Diversified Telecommunication Services — 7.9% | |||
| Deutsche Telekom AG | 8,863,500 | 214,838,588 | |
| Koninklijke KPN NV | 26,201,000 | 92,519,180 | |
| Orange SA | 47,345,780 | 562,346,796 | |
| Wireless Telecommunication Services — 2.6% |
| See notes to financial statements. | Thornburg Equity Funds Semi-Annual Report | 61 |
Thornburg Investment Income Builder Fund | March 31, 2023 (Unaudited)
| Issuer-Description | SHARES/ PRINCIPAL AMOUNT | VALUE | |
| Vodafone Group plc | 263,842,924 | $ 290,650,466 | |
| 1,160,355,030 | |||
| Transportation — 1.2% | |||
| Air Freight & Logistics — 1.2% | |||
| Deutsche Post AG | 2,770,100 | 129,449,821 | |
| 129,449,821 | |||
| Utilities — 7.5% | |||
| Electric Utilities — 5.7% | |||
| Endesa SA | 7,157,383 | 155,243,622 | |
| Enel SpA | 59,905,671 | 365,573,213 | |
| Energias de Portugal SA | 20,615,600 | 112,145,802 | |
| Multi-Utilities — 1.8% | |||
| E.ON SE | 6,212,000 | 77,474,504 | |
| Engie SA | 7,288,372 | 115,196,374 | |
| 825,633,515 | |||
| Total Common Stock (Cost $7,654,603,722) | 9,406,850,913 | ||
| Preferred Stock — 0.3% | |||
| Banks — 0.1% | |||
| Banks — 0.1% | |||
| d,e,f | First Horizon Bank 5.66% (LIBOR 3 Month + 0.85%), 5/2/2023 | 12,000 | 10,020,000 |
| 10,020,000 | |||
| Energy — 0.2% | |||
| Oil, Gas & Consumable Fuels — 0.2% | |||
| e | Crestwood Equity Partners LP 9.25%, 12/31/2049 | 2,166,596 | 20,149,343 |
| 20,149,343 | |||
| Financial Services — 0.0% | |||
| Capital Markets — 0.0% | |||
| e,f | Morgan Stanley Series A, 5.492% (LIBOR 3 Month + 0.70%), 5/1/2023 | 120,000 | 2,487,600 |
| 2,487,600 | |||
| Total Preferred Stock (Cost $34,858,652) | 32,656,943 | ||
| Asset Backed Securities — 2.1% | |||
| Auto Receivables — 1.2% | |||
| American Credit Acceptance Receivables Trust, | |||
| d | Series 2019-3 Class F, 5.42% due 5/12/2026 | $ 6,850,000 | 6,800,418 |
| d | Series 2019-4 Class F, 5.37% due 9/14/2026 | 5,000,000 | 4,944,180 |
| d | Series 2020-1 Class F, 4.75% due 11/13/2026 | 5,460,000 | 5,366,389 |
| Carvana Auto Receivables Trust, | |||
| d | Series 2019-4A Class R, due 10/15/2026 | 32,000 | 9,079,549 |
| d | Series 2021-P1 Class R, due 12/10/2027 | 24,000 | 3,666,714 |
| d | Series 2021-P2 Class R, due 5/10/2028 | 8,000 | 2,473,303 |
| d | Series 2021-P4 Class R, due 9/11/2028 | 17,500 | 7,298,998 |
| d | Series 2022-P1 Class R, due 1/10/2029 | 24,000 | 8,354,354 |
| CPS Auto Receivables Trust, | |||
| d | Series 2019-A Class E, 5.81% due 3/16/2026 | 1,000,000 | 998,371 |
| d | Series 2020-A Class E, 4.09% due 12/15/2025 | 2,000,000 | 1,960,579 |
| d | Series 2020-C Class F, 6.67% due 11/15/2027 | 3,000,000 | 2,883,497 |
| d | CPS Auto Securitization Trust, Series 2021-1A Class A, 7.86% due 6/16/2026 | 14,000,000 | 13,601,294 |
| d | Credit Suisse ABS Trust Series 2020-AT1 Class CERT, due 6/15/2026 | 40,000 | 567,203 |
| d | DT Auto Owner Trust, Series 2020-1A Class E, 3.48% due 2/16/2027 | 4,500,000 | 4,353,453 |
| d | FHF Trust, Series 2022-2A Class A, 6.14% due 12/15/2027 | 6,541,760 | 6,473,405 |
| Flagship Credit Auto Trust, | |||
| d | Series 2018-4 Class R, due 3/16/2026 | 53,000 | 2,575,495 |
| d | Series 2019-1 Class R, due 6/15/2026 | 6,000 | 178,477 |
| d | Series 2019-2 Class R, due 12/15/2026 | 33,000 | 1,665,876 |
| 62 | Thornburg Equity Funds Semi-Annual Report | See notes to financial statements. |
| Issuer-Description | SHARES/ PRINCIPAL AMOUNT | VALUE | |
| d | Series 2019-3 Class R, due 12/15/2026 | $ 60,000 | $ 4,653,698 |
| d | Series 2019-4 Class R, due 3/15/2027 | 42,000 | 3,788,084 |
| d | Foursight Capital Automobile Receivables Trust, Series 2020-1 Class F, 4.62% due 6/15/2027 | 3,180,000 | 3,133,044 |
| JPMorgan Chase Bank NA - CACLN, | |||
| d | Series 2020 -1 Class R, 33.784% due 1/25/2028 | 1,816,919 | 1,899,825 |
| d | Series 2020-2 Class R, 31.355% due 2/25/2028 | 1,170,563 | 1,201,310 |
| d | Series 2021-1 Class R, 28.348% due 9/25/2028 | 3,718,175 | 3,878,135 |
| d | Santander Consumer Auto Receivables Trust Series 2020-AA Class R, due 1/16/2029 | 45,588 | 6,316,770 |
| d | United Auto Credit Securitization Trust Series 2022-1 Class R, due 11/10/2028 | 37,000 | 7,540,686 |
| d | Veros Automobile Receivables Trust, Series 2020-1 Class D, 5.64% due 2/16/2027 | 5,000,000 | 4,990,842 |
| d | Westlake Automobile Receivables Trust, Series 2019-3A Class F, 4.72% due 4/15/2026 | 8,000,000 | 7,929,338 |
| 128,573,287 | |||
| Other Asset Backed — 0.9% | |||
| d | Amur Equipment Finance Receivables VIII LLC, Series 2020-1A Class E, 7.00% due 1/20/2027 | 5,536,362 | 5,491,341 |
| d | Aqua Finance Trust, Series 2020-AA Class D, 7.15% due 7/17/2046 | 8,200,000 | 7,309,408 |
| CFG Investments Ltd., | |||
| d | Series 2021-1 Class C, 7.48% due 5/20/2032 | 2,340,000 | 2,245,215 |
| d | Series 2021-1 Class D, 9.07% due 5/20/2032 | 800,000 | 753,970 |
| Consumer Loan Underlying Bond Certificate Issuer Trust I, | |||
| d | Series 2019-HP1 Class C, 4.70% due 12/15/2026 | 2,554,358 | 2,547,175 |
| d,f | Series 2019-HP1 Class CERT, due 12/15/2026 | 400,000 | 4,699,303 |
| d | Consumer Loan Underlying Bond CLUB Credit Trust, Series 2020-P1 Class C, 4.61% due 3/15/2028 | 1,141,807 | 1,134,997 |
| d | Consumer Loan Underlying Bond Credit Trust, Series 2019-P1 Class C, 4.66% due 7/15/2026 | 1,182,618 | 1,181,313 |
| d | FAT Brands Fazoli’s Native I LLC, Series 2021-1 Class A2, 6.00% due 7/25/2051 | 14,187,000 | 12,597,134 |
| a,d | Goldman Home Improvement Trust Issuer Trust Series 2021-GRN2 Class R, due 6/20/2051 | 42,000 | 3,244,086 |
| d | LendingPoint Asset Securitization Trust, Series 2020-REV1 Class C, 7.699% due 10/15/2028 | 25,750,000 | 25,071,346 |
| d | LP LMS Asset Securitization Trust, Series 2021-2A Class A, 1.75% due 1/15/2029 | 2,102,057 | 2,043,355 |
| Marlette Funding Trust, | |||
| d | Series 2019-1A Class C, 4.42% due 4/16/2029 | 544,958 | 543,982 |
| d | Series 2021-1A Class R, due 6/16/2031 | 9,550 | 679,239 |
| d | Series 2021-2A Class R, due 9/15/2031 | 26,000 | 2,533,569 |
| d | Series 2021-3A Class R, due 12/15/2031 | 9,910 | 1,381,508 |
| Mosaic Solar Loan Trust, | |||
| d | Series 2020-2A Class R, due 8/20/2046 | 4,449,258 | 1,851,216 |
| a,d | Series 2021-1A Class R, due 12/20/2046 | 7,314,479 | 2,412,578 |
| a,d | Series 2021-2A Class R, due 4/22/2047 | 10,000,000 | 1,901,756 |
| d,f | Oportun Funding LLC Series 2022-1 Class CERT, due 6/15/2029 | 11,604 | 3,509,142 |
| Prosper Pass-Thru Trust II, | |||
| d | Series 2019-ST1 Class CERT, due 7/15/2025 | 38,500,000 | 896,511 |
| d | Series 2019-ST2 Class R1, due 11/15/2025 | 17,477,134 | 2,063,700 |
| d | Series 2019-ST2 Class R2, due 11/15/2025 | 8,738,067 | 1,031,791 |
| Upstart Pass-Through Trust, | |||
| d | Series 2020-ST6 Class A, 3.00% due 1/20/2027 | 2,301,503 | 2,198,148 |
| d | Series 2021-ST4 Class CERT, due 7/20/2027 | 1,375,000 | 412,880 |
| d | Series 2021-ST8 Class CERT, due 10/20/2029 | 4,150,000 | 1,031,188 |
| d | Series 2021-ST9 Class CERT, due 11/20/2029 | 1,415,000 | 380,082 |
| d | Upstart Structured Pass-Through Trust, Series 2022-4A Class A, 7.01% due 11/15/2030 | 7,359,522 | 7,356,671 |
| 98,502,604 | |||
| Student Loan — 0.0% | |||
| d | SoFi Professional Loan Program Trust Series 2021-B Class R1, due 2/15/2047 | 23,000 | 794,633 |
| 794,633 | |||
| Total Asset Backed Securities (Cost $237,791,948) | 227,870,524 | ||
| Corporate Bonds — 8.7% | |||
| Automobiles & Components — 0.0% | |||
| Construction & Engineering — 0.0% | |||
| d,g | IHS Netherlands Holdco BV, 8.00% due 9/18/2027 | 6,445,000 | 5,711,752 |
| 5,711,752 | |||
| Banks — 0.1% |
| See notes to financial statements. | Thornburg Equity Funds Semi-Annual Report | 63 |
Thornburg Investment Income Builder Fund | March 31, 2023 (Unaudited)
| Issuer-Description | SHARES/ PRINCIPAL AMOUNT | VALUE | |
| Banks — 0.1% | |||
| KeyBank NA, 5.00% due 1/26/2033 | $ 6,250,000 | $ 5,803,625 | |
| 5,803,625 | |||
| Capital Goods — 0.2% | |||
| Aerospace & Defense — 0.2% | |||
| d | BWX Technologies, Inc., 4.125% due 6/30/2028 | 6,500,000 | 5,877,820 |
| TransDigm, Inc., | |||
| d | 6.25% due 3/15/2026 | 10,000,000 | 10,007,900 |
| d | 6.75% due 8/15/2028 | 6,345,000 | 6,408,450 |
| 22,294,170 | |||
| Commercial & Professional Services — 0.5% | |||
| Commercial Services & Supplies — 0.5% | |||
| d | ACCO Brands Corp., 4.25% due 3/15/2029 | 7,500,000 | 6,476,550 |
| g | Cimpress plc, 7.00% due 6/15/2026 | 27,804,000 | 22,598,257 |
| CoreCivic, Inc., 8.25% due 4/15/2026 | 20,726,000 | 20,968,494 | |
| 50,043,301 | |||
| Consumer Services — 0.3% | |||
| Hotels, Restaurants & Leisure — 0.3% | |||
| Marriott International, Inc., | |||
| 4.50% due 10/1/2034 | 4,497,000 | 4,047,885 | |
| Series- II, 2.75% due 10/15/2033 | 2,500,000 | 2,023,475 | |
| d | Nathan’s Famous, Inc., 6.625% due 11/1/2025 | 3,300,000 | 3,273,006 |
| d | SeaWorld Parks & Entertainment, Inc., 8.75% due 5/1/2025 | 24,785,000 | 25,453,947 |
| 34,798,313 | |||
| Consumer Staples Distribution & Retail — 0.0% | |||
| Consumer Staples Distribution & Retail — 0.0% | |||
| d | KeHE Distributors LLC/KeHE Finance Corp., 8.625% due 10/15/2026 | 5,168,000 | 5,138,646 |
| 5,138,646 | |||
| Energy — 2.2% | |||
| Energy Equipment & Services — 0.0% | |||
| d,g | Odebrecht Offshore Drilling Finance Ltd., 7.72% due 12/1/2026 PIK | 20,400,953 | 4,216,469 |
| d,e,g | Odebrecht Oil & Gas Finance Ltd. (Guaranty: Odebrecht Oleo e Gas SA), Zero coupon due 5/1/2023 | 2,337,727 | 4,769 |
| c,d,g,h | Schahin II Finance Co. SPV Ltd., 5.875% due 9/25/2023 | 11,396,735 | 56,984 |
| Oil, Gas & Consumable Fuels — 2.2% | |||
| d | Citgo Holding, Inc., 9.25% due 8/1/2024 | 14,196,000 | 14,228,935 |
| d | CITGO Petroleum Corp., 7.00% due 6/15/2025 | 8,000,000 | 7,911,600 |
| f | Energy Transfer LP, 7.831% (LIBOR 3 Month + 3.02%) due 11/1/2066 | 13,820,000 | 10,048,522 |
| f | Enterprise TE Partners LP, Series 1, 7.74% (LIBOR 3 Month + 2.78%) due 6/1/2067 | 7,000,000 | 6,028,540 |
| Kinder Morgan Energy Partners LP, | |||
| 5.00% due 3/1/2043 | 10,000,000 | 8,800,100 | |
| 5.80% due 3/15/2035 | 10,000,000 | 10,164,500 | |
| Kinder Morgan, Inc., | |||
| 5.30% due 12/1/2034 | 23,630,000 | 23,201,115 | |
| 5.55% due 6/1/2045 | 5,000,000 | 4,741,900 | |
| ONEOK Partners LP, 4.90% due 3/15/2025 | 9,544,000 | 9,485,877 | |
| Petroleos Mexicanos, | |||
| g | 5.95% due 1/28/2031 | 7,820,000 | 5,983,473 |
| g | 6.50% due 6/2/2041 | 5,648,000 | 3,782,183 |
| g | 6.70% due 2/16/2032 | 3,000,000 | 2,389,770 |
| Petroleos Mexicanos (EUR), 3.75% due 2/21/2024 | 2,000,000 | 2,136,465 | |
| e | Summit Midstream Partners LP, Series A, 12.296% (LIBOR 3 Month + 7.43%) due 5/1/2023 | 16,097,000 | 12,015,928 |
| Transcontinental Gas Pipe Line Co. LLC, 7.85% due 2/1/2026 | 32,700,000 | 35,025,951 | |
| Williams Cos., Inc., | |||
| 4.55% due 6/24/2024 | 69,318,000 | 68,815,444 | |
| 5.75% due 6/24/2044 | 14,198,000 | 13,883,798 | |
| 242,922,323 | |||
| Equity Real Estate Investment Trusts (REITs) — 0.2% |
| 64 | Thornburg Equity Funds Semi-Annual Report | See notes to financial statements. |
| Issuer-Description | SHARES/ PRINCIPAL AMOUNT | VALUE | |
| Diversified REITs — 0.2% | |||
| Trust Fibra Uno, | |||
| d,g | 4.869% due 1/15/2030 | $ 1,843,000 | $ 1,550,203 |
| d,g | 5.25% due 1/30/2026 | 11,637,000 | 11,097,276 |
| Vornado Realty LP, 2.15% due 6/1/2026 | 8,186,500 | 6,570,730 | |
| Real Estate Management & Development — 0.0% | |||
| d | Cushman & Wakefield US Borrower LLC, 6.75% due 5/15/2028 | 3,000,000 | 2,698,500 |
| 21,916,709 | |||
| Financial Services — 0.6% | |||
| Capital Markets — 0.3% | |||
| d | Compass Group Diversified Holdings LLC, 5.25% due 4/15/2029 | 6,272,000 | 5,548,337 |
| d | LPL Holdings, Inc., 4.00% due 3/15/2029 | 1,000,000 | 899,850 |
| d | Owl Rock Core Income Corp., 7.75% due 9/16/2027 | 2,500,000 | 2,468,750 |
| d | StoneX Group, Inc., 8.625% due 6/15/2025 | 17,784,000 | 17,908,310 |
| Financial Services — 0.3% | |||
| Antares Holdings LP, | |||
| d | 3.75% due 7/15/2027 | 3,000,000 | 2,484,630 |
| d | 6.00% due 8/15/2023 | 18,000,000 | 17,891,280 |
| d | 8.50% due 5/18/2025 | 11,500,000 | 11,720,800 |
| d | United Wholesale Mortgage LLC, 5.50% due 11/15/2025 | 5,000,000 | 4,735,150 |
| 63,657,107 | |||
| Food, Beverage & Tobacco — 0.7% | |||
| Beverages — 0.1% | |||
| d,g | Central American Bottling Corp./CBC Bottling Holdco SL/Beliv Holdco SL, 5.25% due 4/27/2029 | 10,443,000 | 9,672,933 |
| Food Products — 0.1% | |||
| d | Darling Ingredients, Inc., 6.00% due 6/15/2030 | 4,050,000 | 4,036,271 |
| d | Post Holdings, Inc., 5.50% due 12/15/2029 | 10,000,000 | 9,467,200 |
| Tobacco — 0.5% | |||
| d,g | Imperial Brands Finance plc, 6.125% due 7/27/2027 | 5,000,000 | 5,123,600 |
| d,g | JT International Financial Services BV, 6.875% due 10/24/2032 | 5,000,000 | 5,518,100 |
| d | Vector Group Ltd., 10.50% due 11/1/2026 | 44,464,000 | 44,729,005 |
| 78,547,109 | |||
| Health Care Equipment & Services — 0.1% | |||
| Health Care Providers & Services — 0.1% | |||
| Tenet Healthcare Corp., 4.875% due 1/1/2026 | 7,184,000 | 7,042,763 | |
| 7,042,763 | |||
| Household & Personal Products — 0.1% | |||
| Household Durables — 0.1% | |||
| Newell Brands, Inc., | |||
| 4.70% due 4/1/2026 | 3,700,000 | 3,562,175 | |
| 6.625% due 9/15/2029 | 6,300,000 | 6,349,833 | |
| 9,912,008 | |||
| Insurance — 0.7% | |||
| Insurance — 0.7% | |||
| f | Enstar Finance LLC, 5.75% (5-Yr. CMT + 5.468%) due 9/1/2040 | 1,632,000 | 1,346,808 |
| g | Enstar Group Ltd., 3.10% due 9/1/2031 | 8,354,000 | 6,460,148 |
| Fidelity National Financial, Inc., 3.40% due 6/15/2030 | 10,000,000 | 8,762,600 | |
| d | MetLife, Inc., 9.25% due 4/8/2068 | 12,000,000 | 14,157,360 |
| d,f,g | QBE Insurance Group Ltd., 7.50% (USSW10 + 6.03%) due 11/24/2043 | 40,000,000 | 39,901,200 |
| Stewart Information Services Corp., 3.60% due 11/15/2031 | 6,216,000 | 4,891,309 | |
| 75,519,425 | |||
| Materials — 0.4% | |||
| Chemicals — 0.2% | |||
| Celanese U.S. Holdings LLC, 6.165% due 7/15/2027 | 10,000,000 | 10,109,600 | |
| d,g | Nufarm Australia Ltd./Nufarm Americas, Inc., 5.00% due 1/27/2030 | 3,000,000 | 2,643,060 |
| See notes to financial statements. | Thornburg Equity Funds Semi-Annual Report | 65 |
Thornburg Investment Income Builder Fund | March 31, 2023 (Unaudited)
| Issuer-Description | SHARES/ PRINCIPAL AMOUNT | VALUE | |
| OCP SA, | |||
| d,g | 3.75% due 6/23/2031 | $ 2,000,000 | $ 1,644,400 |
| d,g | 4.50% due 10/22/2025 | 5,000,000 | 4,856,450 |
| Containers & Packaging — 0.1% | |||
| d | Matthews International Corp., Class C, 5.25% due 12/1/2025 | 14,969,000 | 14,334,614 |
| d | Silgan Holdings, Inc., 1.40% due 4/1/2026 | 2,500,000 | 2,248,350 |
| Metals & Mining — 0.1% | |||
| d | Cleveland-Cliffs, Inc., 6.75% due 3/15/2026 | 5,000,000 | 5,087,050 |
| d | Compass Minerals International, Inc., 6.75% due 12/1/2027 | 3,000,000 | 2,868,720 |
| 43,792,244 | |||
| Media & Entertainment — 0.2% | |||
| Media — 0.2% | |||
| d | CCO Holdings LLC/CCO Holdings Capital Corp., 4.75% due 2/1/2032 | 8,000,000 | 6,732,880 |
| Sirius XM Radio, Inc., | |||
| d | 3.125% due 9/1/2026 | 5,000,000 | 4,509,700 |
| d | 5.00% due 8/1/2027 | 7,500,000 | 6,971,025 |
| d,g | Telenet Finance Luxembourg Notes Sarl, 5.50% due 3/1/2028 | 10,000,000 | 9,256,200 |
| 27,469,805 | |||
| Semiconductors & Semiconductor Equipment — 0.1% | |||
| Semiconductors & Semiconductor Equipment — 0.1% | |||
| d | Qorvo, Inc., 3.375% due 4/1/2031 | 9,800,000 | 8,119,104 |
| 8,119,104 | |||
| Software & Services — 0.5% | |||
| Information Technology Services — 0.1% | |||
| d | Science Applications International Corp., 4.875% due 4/1/2028 | 5,000,000 | 4,675,850 |
| Internet Software & Services — 0.2% | |||
| d | Arches Buyer, Inc., 4.25% due 6/1/2028 | 6,500,000 | 5,430,750 |
| d | Cogent Communications Group, Inc., 7.00% due 6/15/2027 | 10,000,000 | 9,918,400 |
| d,g | Prosus NV, 3.061% due 7/13/2031 | 11,800,000 | 9,296,748 |
| Software — 0.2% | |||
| d | Fair Isaac Corp., 4.00% due 6/15/2028 | 7,000,000 | 6,494,600 |
| d | GoTo Group, Inc., 5.50% due 9/1/2027 | 5,655,000 | 2,916,057 |
| d | MSCI, Inc., 3.625% due 9/1/2030 | 3,000,000 | 2,607,000 |
| d | Open Text Holdings, Inc., 4.125% due 2/15/2030 | 10,000,000 | 8,579,400 |
| 49,918,805 | |||
| Technology Hardware & Equipment — 0.1% | |||
| Electronic Equipment, Instruments & Components — 0.0% | |||
| Vontier Corp., | |||
| 2.40% due 4/1/2028 | 4,375,000 | 3,678,456 | |
| 2.95% due 4/1/2031 | 1,457,000 | 1,159,670 | |
| Office Electronics — 0.0% | |||
| CDW LLC/CDW Finance Corp., 4.25% due 4/1/2028 | 5,000,000 | 4,671,750 | |
| Technology Hardware, Storage & Peripherals — 0.1% | |||
| d,g | Lenovo Group Ltd., 5.831% due 1/27/2028 | 5,000,000 | 5,043,900 |
| 14,553,776 | |||
| Telecommunication Services — 1.5% | |||
| Diversified Telecommunication Services — 1.2% | |||
| g | Deutsche Telekom International Finance BV (Guaranty: Deutsche Telekom AG), 8.75% due 6/15/2030 | 26,150,000 | 31,955,561 |
| g | Telefonica Emisiones SA (Guaranty: Telefonica SA), 7.045% due 6/20/2036 | 85,390,000 | 93,990,481 |
| Wireless Telecommunication Services — 0.3% | |||
| Digicel International Finance Ltd./Digicel international Holdings Ltd., | |||
| d,g | 8.00% due 12/31/2026 | 10,003,281 | 2,108,992 |
| d,g | 8.75% due 5/25/2024 | 36,785,955 | 33,428,847 |
| 161,483,881 | |||
| Transportation — 0.1% | |||
| Passenger Airlines — 0.1% |
| 66 | Thornburg Equity Funds Semi-Annual Report | See notes to financial statements. |
| Issuer-Description | SHARES/ PRINCIPAL AMOUNT | VALUE | |
| American Airlines Pass Through Trust, | |||
| Series 2016-3 Class B, 3.75% due 4/15/2027 | $ 10,293,831 | $ 9,511,293 | |
| Series 2019-1 Class B, 3.85% due 8/15/2029 | 7,249,397 | 6,490,386 | |
| US Airways Pass-Through Trust, Series 2010-1 Class A, 6.25% due 10/22/2024 | 772,707 | 772,135 | |
| 16,773,814 | |||
| Utilities — 0.1% | |||
| Electric Utilities — 0.1% | |||
| d,g | AES Andres BV, 5.70% due 5/4/2028 | 2,000,000 | 1,760,260 |
| g | Comision Federal de Electricidad, 5.00% due 9/29/2036 | 10,472,000 | 8,877,638 |
| 10,637,898 | |||
| Total Corporate Bonds (Cost $931,178,031) | 956,056,578 | ||
| Other Government — 0.1% | |||
| d,g | Finance Department Government of Sharjah, 6.50% due 11/23/2032 | 4,786,000 | 4,879,183 |
| d,g | Nigeria Government International Bond, 7.625% due 11/28/2047 | 6,000,000 | 3,847,080 |
| Total Other Government (Cost $8,308,870) | 8,726,263 | ||
| Mortgage Backed — 1.5% | |||
| d,f | Angel Oak Mortgage Trust, Whole Loan Securities Trust CMO, Series 2022-6 Class A3, 4.30% due 7/25/2067 | 4,784,299 | 4,264,543 |
| d,f | Barclays Mortgage Loan Trust, Whole Loan Securities Trust CMO, Series 2022-INV1 Class A3, 4.53% due 2/25/2062 | 16,344,597 | 15,167,311 |
| f | Bear Stearns ARM Trust, Whole Loan Securities Trust CMO, Series 2003-6 Class 2B1, 4.047% due 8/25/2033 | 25,241 | 24,330 |
| Chase Home Lending Mortgage Trust, Whole Loan Securities Trust CMO, | |||
| d,f | Series 2019-1 Class B4, 3.898% due 3/25/2050 | 1,034,096 | 814,268 |
| d,f | Series 2019-1 Class B5, 3.898% due 3/25/2050 | 483,096 | 314,694 |
| d,f | Series 2019-1 Class B6, 3.898% due 3/25/2050 | 745,503 | 329,151 |
| d,f | Chase Mortgage Finance Corp., Whole Loan Securities Trust CMO, Series 2016-SH2 Class M4, 3.75% due 12/25/2045 | 774,964 | 699,440 |
| CIM Trust, Whole Loan Securities Trust CMO, | |||
| d,f,i | Series 2020-J1 Class AIO1, 0.447% due 7/25/2050 | 60,562,477 | 959,098 |
| d,f,i | Series 2020-J1 Class AIO2, 0.50% due 7/25/2050 | 54,016,784 | 1,055,650 |
| d,f,i | Series 2020-J1 Class AIOS, 0.20% due 6/25/2050 | 73,438,951 | 504,085 |
| d,f | Series 2020-J1 Class B4, 3.447% due 7/25/2050 | 1,365,074 | 1,093,405 |
| d,f | Series 2020-J1 Class B5, 3.447% due 7/25/2050 | 683,009 | 450,914 |
| d,f | Series 2020-J1 Class B6, 3.447% due 7/25/2050 | 1,287,301 | 431,221 |
| d,f,i | Series 2020-J2 Class AX1, 0.258% due 1/25/2051 | 109,366,507 | 1,099,625 |
| d,f,i | Series 2020-J2 Class AXS, 0.21% due 1/25/2051 | 116,370,965 | 1,097,483 |
| d,f | Series 2020-J2 Class B4, 2.758% due 1/25/2051 | 491,000 | 202,991 |
| d,f | Series 2020-J2 Class B5, 2.758% due 1/25/2051 | 164,000 | 66,084 |
| d,f | Series 2020-J2 Class B6, 2.758% due 1/25/2051 | 651,975 | 148,071 |
| Citigroup Mortgage Loan Trust, Whole Loan Securities Trust CMO, | |||
| f | Series 2004-HYB2 Class B1, 4.31% due 3/25/2034 | 183,878 | 164,428 |
| d,f | Series 2020-EXP1 Class B1, 4.467% due 5/25/2060 | 2,150,000 | 1,726,965 |
| d,f | Series 2020-EXP1 Class B2, 4.467% due 5/25/2060 | 1,450,000 | 1,087,549 |
| d,f | Series 2020-EXP1 Class B3, 4.467% due 5/25/2060 | 725,000 | 495,314 |
| d,i | Series 2020-EXP1 Class XS, due 5/25/2060 | 38,592,602 | 175,403 |
| d,f | Series 2020-EXP2 Class B5, 3.668% due 8/25/2050 | 585,000 | 280,383 |
| d,f | Series 2020-EXP2 Class B6, 3.668% due 8/25/2050 | 1,400,000 | 517,351 |
| d,f | Series 2021-J1 Class B4, 2.611% due 4/25/2051 | 379,000 | 127,966 |
| d,f | Series 2021-J1 Class B5, 2.611% due 4/25/2051 | 615,000 | 172,249 |
| d,f | Series 2021-J1 Class B6, 2.611% due 4/25/2051 | 460,000 | 106,431 |
| d,f | Series 2021-J3 Class B4, 2.858% due 9/25/2051 | 1,033,000 | 358,439 |
| d,f | Series 2021-J3 Class B6, 2.858% due 9/25/2051 | 590,000 | 159,166 |
| CSMC Trust, Whole Loan Securities Trust CMO, | |||
| d,f | Series 2020-AFC1 Class M1, 2.841% due 2/25/2050 | 3,808,500 | 2,879,050 |
| d,f,i | Series 2021-AFC1 Class AIOS, 0.25% due 3/25/2056 | 88,348,955 | 762,098 |
| d,f | Series 2021-AFC1 Class B3, 4.345% due 3/25/2056 | 215,000 | 150,939 |
| d,f,i | Series 2021-AFC1 Class XS, 3.314% due 3/25/2056 | 88,348,955 | 11,675,374 |
| d,f | Series 2022-NQM5 Class A3, 5.169% due 5/25/2067 | 4,001,970 | 3,740,530 |
| Flagstar Mortgage Trust, Whole Loan Securities Trust CMO, | |||
| d,f,i | Series 2020-2 Class AX1, 0.669% due 8/25/2050 | 113,587,573 | 2,714,107 |
| d,f,i | Series 2020-2 Class AX2, 0.50% due 8/25/2050 | 19,468,319 | 376,087 |
| d,f | Series 2020-2 Class B4, 3.669% due 8/25/2050 | 844,253 | 684,166 |
| See notes to financial statements. | Thornburg Equity Funds Semi-Annual Report | 67 |
Thornburg Investment Income Builder Fund | March 31, 2023 (Unaudited)
| Issuer-Description | SHARES/ PRINCIPAL AMOUNT | VALUE | |
| d,f | Series 2020-2 Class B5, 3.669% due 8/25/2050 | $ 2,532,760 | $ 2,031,232 |
| d,f | Series 2020-2 Class B6C, 3.669% due 8/25/2050 | 3,377,014 | 1,500,750 |
| d,f,i | Series 2021-13INV Class AX1, 0.187% due 12/30/2051 | 175,837,918 | 1,328,579 |
| d,f,i | Series 2021-13INV Class AX17, 0.18% due 12/30/2051 | 14,577,237 | 125,504 |
| d,f,i | Series 2021-13INV Class AX4, 0.50% due 12/30/2051 | 13,301,729 | 340,861 |
| d,f | Series 2021-13INV Class B4, 3.367% due 12/30/2051 | 2,434,289 | 1,505,518 |
| d,f | Series 2021-13INV Class B5, 3.367% due 12/30/2051 | 477,121 | 311,580 |
| d,f | Series 2021-13INV Class B6C, 3.222% due 12/30/2051 | 4,186,977 | 2,135,172 |
| d,f | Galton Funding Mortgage Trust, Whole Loan Securities Trust CMO, Series 2020-H1 Class B1, 3.386% due 1/25/2060 | 4,379,900 | 2,767,296 |
| GS Mortgage-Backed Securities Trust, Whole Loan Securities Trust CMO, | |||
| d,f,i | Series 2020-INV1 Class A11X, 3.418% due 10/25/2050 | 1,512,465 | 232,630 |
| d,f,i | Series 2020-INV1 Class A12X, 2.93% due 10/25/2050 | 18,109,137 | 2,387,456 |
| d,f,i | Series 2020-INV1 Class AIOS, 0.19% due 10/25/2050 | 95,452,868 | 686,793 |
| d,f,i | Series 2020-INV1 Class AX1, 0.005% due 10/25/2050 | 65,476,982 | 655 |
| d,f,i | Series 2020-INV1 Class AX2, 0.43% due 10/25/2050 | 3,263,739 | 39,471 |
| d,f,i | Series 2020-INV1 Class AX4, 0.928% due 10/25/2050 | 3,513,694 | 92,187 |
| d,f | Series 2020-INV1 Class B4, 3.857% due 10/25/2050 | 1,906,485 | 1,490,834 |
| d,f | Series 2020-INV1 Class B5, 3.857% due 10/25/2050 | 1,906,886 | 1,324,040 |
| d,f | Series 2020-INV1 Class B6, 3.857% due 10/25/2050 | 4,403,621 | 2,340,878 |
| d,f,i | Series 2020-INV1 Class BX, 0.357% due 10/25/2050 | 21,763,122 | 254,498 |
| JPMorgan Mortgage Trust, Whole Loan Securities Trust CMO, | |||
| d,f | Series 2016-5 Class B5, 5.934% due 12/25/2046 | 1,999,979 | 1,274,343 |
| d,f,i | Series 2020-3 Class AX1, 0.147% due 8/25/2050 | 15,531,545 | 57,249 |
| d,f,i | Series 2020-4 Class A11X, 0.633% (5.25% - LIBOR 1 Month) due 11/25/2050 | 2,971,522 | 218,802 |
| d,f,i | Series 2020-4 Class A3X, 0.50% due 11/25/2050 | 13,470,898 | 247,234 |
| d,f,i | Series 2020-4 Class AX1, 0.099% due 11/25/2050 | 49,756,642 | 135,049 |
| d,f,i | Series 2020-4 Class AX3, 3.50% due 11/25/2050 | 1,376,640 | 178,026 |
| d,f,i | Series 2020-4 Class AX4, 0.55% due 11/25/2050 | 3,177,052 | 64,108 |
| d,f | Series 2020-4 Class B4, 3.649% due 11/25/2050 | 1,962,754 | 1,536,089 |
| d,f | Series 2020-4 Class B5, 3.649% due 11/25/2050 | 906,031 | 650,386 |
| d,f | Series 2020-4 Class B6, 3.536% due 11/25/2050 | 1,603,555 | 566,822 |
| d,f | Series 2020-7 Class B4, 3.521% due 1/25/2051 | 2,396,849 | 1,939,912 |
| d,f | Series 2020-7 Class B5, 3.521% due 1/25/2051 | 1,679,682 | 941,013 |
| d,f | Series 2020-7 Class B6, 3.521% due 1/25/2051 | 2,289,984 | 731,190 |
| d,f | Series 2021-11 Class B5, 3.028% due 1/25/2052 | 3,750,041 | 2,004,133 |
| d,f | Series 2021-11 Class B6, 2.756% due 1/25/2052 | 4,366,430 | 1,697,123 |
| d,f | Series 2022-2 Class B4, 3.133% due 8/25/2052 | 3,288,384 | 1,930,238 |
| d,f | Series 2022-2 Class B5, 3.133% due 8/25/2052 | 1,746,649 | 852,353 |
| d,f | Series 2022-2 Class B6, 2.692% due 8/25/2052 | 1,830,000 | 429,248 |
| d,f | Series 2022-3 Class B4, 3.115% due 8/25/2052 | 2,698,641 | 1,564,850 |
| d,f | Series 2022-3 Class B5, 3.115% due 8/25/2052 | 1,717,584 | 630,900 |
| d,f | Series 2022-3 Class B6, 2.238% due 8/25/2052 | 1,471,070 | 345,136 |
| Mello Mortgage Capital Acceptance, Whole Loan Securities Trust CMO, | |||
| d,f,i | Series 2021-INV2 Class AX1, 0.127% due 8/25/2051 | 105,087,176 | 486,491 |
| d,f,i | Series 2021-INV2 Class AX4, 0.70% due 8/25/2051 | 7,200,385 | 267,450 |
| d,f | Series 2021-INV2 Class B5, 3.327% due 8/25/2051 | 318,556 | 187,929 |
| d,f | Series 2021-INV2 Class B6, 2.994% due 8/25/2051 | 1,537,778 | 623,846 |
| d,f,i | Series 2021-INV3 Class AX1, 0.167% due 10/25/2051 | 126,834,003 | 831,473 |
| d,f,i | Series 2021-INV3 Class AX4, 0.55% due 10/25/2051 | 10,271,768 | 280,028 |
| d,f | Series 2021-INV3 Class B5, 3.217% due 10/25/2051 | 445,554 | 260,341 |
| d,f | Series 2021-INV3 Class B6, 2.983% due 10/25/2051 | 1,940,858 | 802,466 |
| f | Merrill Lynch Mortgage Investors Trust, Whole Loan Securities Trust CMO, Series 2004-A4 Class M1, 3.533% due 8/25/2034 | 1,024,577 | 933,337 |
| New Residential Mortgage Loan Trust, Whole Loan Securities Trust CMO, | |||
| d,f,i | Series 2021-INV1 Class AX1, 0.753% due 6/25/2051 | 103,000,568 | 3,826,502 |
| d,f | Series 2021-INV1 Class B5, 3.253% due 6/25/2051 | 1,104,053 | 703,268 |
| d,f | Series 2021-INV1 Class B6, 1.454% due 6/25/2051 | 1,980,331 | 876,781 |
| d,f | Onslow Bay Mortgage Loan Trust, Whole Loan Securities Trust CMO, Series 2021-NQM4 Class A1, 1.957% due 10/25/2061 | 20,256,844 | 16,491,481 |
| d,f | PRPM LLC, Whole Loan Securities Trust CMO, Series 2022-NQM1 Class A1, 5.50% due 8/25/2067 | 9,666,481 | 9,437,134 |
| d,f | Residential Mortgage Loan Trust, Whole Loan Securities Trust CMO, Series 2019-3 Class B1, 3.81% due 9/25/2059 | 1,500,000 | 1,281,242 |
| d,f | Saluda Grade Alternative Mortgage Trust, Whole Loan Securities Trust CMO, Series 2020-FIG1 Class C, due 9/25/2050 | 20,353,758 | 5,097,538 |
| d,f | Sequoia Mortgage Trust, Whole Loan Securities Trust CMO, Series 2017-7 Class B3, 3.724% due 10/25/2047 | 2,119,607 | 1,845,837 |
| 68 | Thornburg Equity Funds Semi-Annual Report | See notes to financial statements. |
| Issuer-Description | SHARES/ PRINCIPAL AMOUNT | VALUE | |
| SG Residential Mortgage Trust, Whole Loan Securities Trust CMO, | |||
| d,f,i | Series 2019-3 Class AIOS, 0.375% due 9/25/2059 | $ 58,077,418 | $ 283,278 |
| d,f | Series 2019-3 Class B2, 5.663% due 9/25/2059 | 7,910,000 | 6,201,510 |
| d,f | Series 2019-3 Class B3, 5.936% due 9/25/2059 | 3,366,214 | 2,350,691 |
| a,d,f | Series 2019-3 Class C, due 9/25/2059 | 950 | 950 |
| d | Series 2019-3 Class XS1, due 9/25/2059 | 57,479,319 | 2,069 |
| d | Series 2019-3 Class XS2, due 9/25/2059 | 57,479,319 | 2,147,249 |
| d,f | Starwood Mortgage Residential Trust, Whole Loan Securities Trust CMO, Series 2019-INV1 Class B1, 3.657% due 9/27/2049 | 10,000,000 | 8,572,961 |
| Wells Fargo Mortgage Backed Securities Trust, Whole Loan Securities Trust CMO, | |||
| d,f,i | Series 2020-3 Class AIO1, 0.182% due 6/25/2050 | 174,863,930 | 1,201,053 |
| d,f | Series 2020-3 Class B5, 3.182% due 6/25/2050 | 1,046,000 | 509,877 |
| d,f | Series 2020-3 Class B6, 3.182% due 6/25/2050 | 1,912,755 | 595,272 |
| d,f,i | Series 2021-INV1 Class AIO2, 0.50% due 8/25/2051 | 189,123,544 | 4,707,966 |
| d,f | Series 2021-INV1 Class B4, 3.317% due 8/25/2051 | 3,401,822 | 2,157,375 |
| d,f | Series 2021-INV1 Class B5, 3.317% due 8/25/2051 | 2,624,263 | 1,520,260 |
| d,f | Series 2021-INV1 Class B6, 3.317% due 8/25/2051 | 2,024,060 | 706,456 |
| Total Mortgage Backed (Cost $187,780,972) | 171,156,608 | ||
| Loan Participations — 0.1% | |||
| Semiconductors & Semiconductor Equipment — 0.1% | |||
| Information Technology Services — 0.1% | |||
| j | Xperi Corporation, 8.34% (LIBOR 1 Month + 3.50%) due 6/8/2028 | 8,755,331 | 8,631,269 |
| 8,631,269 | |||
| Software & Services — 0.0% | |||
| Software — 0.0% | |||
| j | GoTo Group, Inc., 9.59% (LIBOR 1 Month + 4.75%) due 8/31/2027 | 2,984,772 | 1,688,873 |
| 1,688,873 | |||
| Total Loan Participations (Cost $10,778,174) | 10,320,142 | ||
| Short-Term Investments — 2.0% | |||
| b | Thornburg Capital Management Fund | 22,177,799 | 221,777,990 |
| Total Short-Term Investments (Cost $221,777,990) | 221,777,990 | ||
| Total Investments — 100.1% (Cost $9,287,078,359) | $11,035,415,961 | ||
| Liabilities Net of Other Assets — (0.1)% | (8,750,795) | ||
| Net Assets — 100.0% | $11,026,665,166 |
| Outstanding Forward Currency Contracts To Buy Or Sell At March 31, 2023 | |||||||
| Contract Description | Contract Party* | Buy/Sell | Contract Amount | Contract Value Date | Value USD | Unrealized Appreciation | Unrealized Depreciation |
| Great Britain Pound | SSB | Sell | 775,403,700 | 4/17/2023 | 956,795,390 | $ — | $ (8,034,684) |
| Swiss Franc | SSB | Sell | 33,185,300 | 4/26/2023 | 36,355,970 | — | (43,793) |
| Euro | SSB | Sell | 668,800,700 | 5/22/2023 | 727,276,962 | — | (8,777,013) |
| Euro | BBH | Sell | 668,800,700 | 5/22/2023 | 727,276,962 | — | (8,744,242) |
| Total | — | $ (25,599,732) | |||||
| Net unrealized appreciation (depreciation) | $ (25,599,732) | ||||||
| * | Counterparties include State Street Bank and Trust Company (“SSB”) and Brown Brothers Harriman & Co. (“BBH”). |
| See notes to financial statements. | Thornburg Equity Funds Semi-Annual Report | 69 |
Thornburg Investment Income Builder Fund | March 31, 2023 (Unaudited)
| Footnote Legend | |
| a | Security currently fair valued by the Valuation and Pricing Committee. |
| b | Investment in Affiliates. |
| c | Non-income producing. |
| d | Securities exempt from registration under Rule 144A of the Securities Act of 1933, as amended. These securities are restricted but liquid and may only be resold in the ordinary course of business in transactions exempt from registration, normally to qualified institutional buyers. As of March 31, 2023, the aggregate value of these securities in the Fund’s portfolio was $884,559,240, representing 8.02% of the Fund’s net assets. |
| e | Securities are perpetual and, thus, do not have a predetermined maturity date. The date shown, if applicable, reflects the next call date. |
| f | Variable, floating, step, or fixed to floating rate securities are securities for which interest rate changes are based on changes in a designated base rate or on a predetermined schedule. The rates shown are those in effect on March 31, 2023. |
| g | Yankee bond denominated in U.S. dollars and is issued in the U.S. by foreign banks and corporations. |
| h | Bond in default. |
| i | Interest only. |
| j | The stated coupon rate represents the greater of the LIBOR or the LIBOR floor rate plus a spread at March 31, 2023. |
To simplify the listings of securities, abbreviations are used per the table below:
| ABS | Asset Backed Securities |
| ADR | American Depositary Receipt |
| ARM | Adjustable Rate Mortgage |
| CMO | Collateralized Mortgage Obligation |
| CMT | Constant Maturity Rate |
| EUR | Denominated in Euro |
| LIBOR | London Interbank Offered Rates |
| PIK | Payment-in-kind |
| SPV | Special Purpose Vehicle |
| USSW10 | USD 10 Year Swap Rate |
| COUNTRY EXPOSURE * (percent of net assets) | |
| United States | 38.7% |
| France | 15.2% |
| United Kingdom | 8.6% |
| Italy | 5.9% |
| Germany | 5.5% |
| Netherlands | 5.0% |
| Australia | 3.5% |
| Switzerland | 3.3% |
| Taiwan | 2.9% |
| South Korea | 2.5% |
| Spain | 2.3% |
| Canada | 1.5% |
| Portugal | 1.0% |
| Brazil | 0.6% |
| Mexico | 0.3% |
| Jamaica | 0.3% |
| Ireland | 0.2% |
| India | 0.2% |
| China | 0.1% |
| Guatemala | 0.1% |
| Nigeria | 0.1% |
| Belgium | 0.1% |
| Morocco | 0.1% |
| Japan | 0.1% |
| United Arab Emirates | 0.0%** |
| Russian Federation | 0.0%** |
| Dominican Republic | 0.0%** |
| Other Assets Less Liabilities | 1.9% |
| * | Holdings are classified by country of risk as determined by MSCI and Bloomberg. |
| ** | Country percentage was less than 0.1%. |
| 70 | Thornburg Equity Funds Semi-Annual Report | See notes to financial statements. |
Thornburg Summit Fund | March 31, 2023 (Unaudited)
| Issuer-Description | SHARES/ PRINCIPAL AMOUNT/ NOTIONAL AMOUNT | VALUE | |
| Common Stock — 50.6% | |||
| Automobiles & Components — 0.4% | |||
| Automobiles — 0.4% | |||
| Mercedes-Benz Group AG | 3,499 | $ 268,586 | |
| 268,586 | |||
| Banks — 1.8% | |||
| Banks — 1.8% | |||
| BNP Paribas SA | 9,984 | 597,794 | |
| JPMorgan Chase & Co. | 5,242 | 683,085 | |
| 1,280,879 | |||
| Capital Goods — 2.1% | |||
| Aerospace & Defense — 1.0% | |||
| L3Harris Technologies, Inc. | 3,725 | 730,994 | |
| Building Products — 0.4% | |||
| a | Builders FirstSource, Inc. | 3,327 | 295,371 |
| Machinery — 0.7% | |||
| Otis Worldwide Corp. | 6,060 | 511,464 | |
| 1,537,829 | |||
| Consumer Discretionary Distribution & Retail — 3.2% | |||
| Broadline Retail — 2.2% | |||
| a | Alibaba Group Holding Ltd. | 56,900 | 727,749 |
| a | Amazon.com, Inc. | 6,458 | 667,047 |
| a | MercadoLibre, Inc. | 154 | 202,981 |
| Specialty Retail — 1.0% | |||
| Home Depot, Inc. | 2,406 | 710,059 | |
| 2,307,836 | |||
| Consumer Services — 1.7% | |||
| Diversified Consumer Services — 0.8% | |||
| Service Corp. International | 8,401 | 577,821 | |
| Hotels, Restaurants & Leisure — 0.9% | |||
| a | Airbnb, Inc. Class A | 1,425 | 177,270 |
| Yum China Holdings, Inc. | 7,450 | 468,454 | |
| 1,223,545 | |||
| Consumer Staples Distribution & Retail — 1.4% | |||
| Consumer Staples Distribution & Retail — 1.4% | |||
| Costco Wholesale Corp. | 727 | 361,225 | |
| Raia Drogasil SA | 59,680 | 287,894 | |
| Sendas Distribuidora S/A | 114,200 | 350,140 | |
| 999,259 | |||
| Energy — 3.2% | |||
| Oil, Gas & Consumable Fuels — 3.2% | |||
| Chesapeake Energy Corp. | 9,283 | 705,879 | |
| Enbridge, Inc. | 19,676 | 750,207 | |
| Shell plc | 11,376 | 323,962 | |
| TotalEnergies SE | 9,462 | 557,817 | |
| ���2,337,865 | |||
| Financial Services — 5.9% | |||
| Capital Markets — 1.8% | |||
| Charles Schwab Corp. | 8,152 | 427,002 | |
| CME Group, Inc. | 2,781 | 532,617 | |
| Hong Kong Exchanges & Clearing Ltd. | 7,400 | 328,243 | |
| Consumer Finance — 1.2% | |||
| Capital One Financial Corp. | 6,493 | 624,367 | |
| SBI Cards & Payment Services Ltd. | 26,865 | 240,921 |
| See notes to financial statements. | Thornburg Equity Funds Semi-Annual Report | 71 |
Thornburg Summit Fund | March 31, 2023 (Unaudited)
| Issuer-Description | SHARES/ PRINCIPAL AMOUNT/ NOTIONAL AMOUNT | VALUE | |
| Financial Services — 2.9% | |||
| a,b | Adyen NV | 128 | $ 202,560 |
| Mastercard, Inc. Class A | 2,202 | 800,229 | |
| Visa, Inc. Class A | 4,860 | 1,095,736 | |
| 4,251,675 | |||
| Food, Beverage & Tobacco — 1.2% | |||
| Food Products — 1.2% | |||
| Nestle SA | 7,166 | 872,968 | |
| 872,968 | |||
| Health Care Equipment & Services — 0.9% | |||
| Health Care Equipment & Supplies — 0.9% | |||
| Medtronic plc | 8,377 | 675,354 | |
| 675,354 | |||
| Insurance — 1.6% | |||
| Insurance — 1.6% | |||
| AIA Group Ltd. | 46,800 | 492,748 | |
| NN Group NV | 19,431 | 705,100 | |
| 1,197,848 | |||
| Materials — 3.0% | |||
| Chemicals — 2.1% | |||
| Akzo Nobel NV | 4,672 | 364,707 | |
| Linde plc | 2,142 | 761,353 | |
| LyondellBasell Industries NV Class A | 3,870 | 363,354 | |
| Metals & Mining — 0.9% | |||
| Glencore plc | 76,743 | 439,837 | |
| Teck Resources Ltd. Class B | 5,923 | 216,190 | |
| 2,145,441 | |||
| Media & Entertainment — 3.3% | |||
| Entertainment — 1.9% | |||
| Nintendo Co. Ltd. | 25,000 | 966,108 | |
| a | Sea Ltd. ADR | 4,391 | 380,041 |
| Interactive Media & Services — 1.4% | |||
| a | Alphabet, Inc. Class A | 9,819 | 1,018,525 |
| 2,364,674 | |||
| Pharmaceuticals, Biotechnology & Life Sciences — 5.9% | |||
| Biotechnology — 1.1% | |||
| a | BioMarin Pharmaceutical, Inc. | 8,036 | 781,421 |
| Life Sciences Tools & Services — 0.7% | |||
| Thermo Fisher Scientific, Inc. | 866 | 499,136 | |
| Pharmaceuticals — 4.1% | |||
| AstraZeneca plc | 3,658 | 506,845 | |
| Merck & Co., Inc. | 6,974 | 741,964 | |
| Novo Nordisk A/S Class B | 2,443 | 386,151 | |
| Roche Holding AG | 4,680 | 1,334,768 | |
| 4,250,285 | |||
| Semiconductors & Semiconductor Equipment — 3.9% | |||
| Semiconductors & Semiconductor Equipment — 3.9% | |||
| ASML Holding NV | 1,516 | 1,027,893 | |
| Broadcom, Inc. | 984 | 631,275 | |
| NVIDIA Corp. | 1,564 | 434,432 | |
| Taiwan Semiconductor Manufacturing Co. Ltd. | 41,000 | 717,727 | |
| 2,811,327 | |||
| Software & Services — 4.8% | |||
| Information Technology Services — 1.1% |
| 72 | Thornburg Equity Funds Semi-Annual Report | See notes to financial statements. |
| Issuer-Description | SHARES/ PRINCIPAL AMOUNT/ NOTIONAL AMOUNT | VALUE | |
| HCL Technologies Ltd. | 26,881 | $ 355,039 | |
| Nomura Research Institute Ltd. | 18,900 | 436,291 | |
| Software — 3.7% | |||
| Microsoft Corp. | 5,153 | 1,485,610 | |
| SAP SE | 6,591 | 829,590 | |
| a | ServiceNow, Inc. | 755 | 350,863 |
| 3,457,393 | |||
| Technology Hardware & Equipment — 2.8% | |||
| Communications Equipment — 0.6% | |||
| a | Calix, Inc. | 8,444 | 452,514 |
| Electronic Equipment, Instruments & Components — 0.6% | |||
| Keyence Corp. | 853 | 414,053 | |
| Technology Hardware, Storage & Peripherals — 1.6% | |||
| Apple, Inc. | 7,002 | 1,154,630 | |
| 2,021,197 | |||
| Telecommunication Services — 3.1% | |||
| Diversified Telecommunication Services — 2.0% | |||
| Deutsche Telekom AG | 36,005 | 872,710 | |
| Orange SA | 51,242 | 608,624 | |
| Wireless Telecommunication Services — 1.1% | |||
| KDDI Corp. | 25,500 | 786,078 | |
| 2,267,412 | |||
| Transportation — 0.4% | |||
| Ground Transportation — 0.4% | |||
| Canadian Pacific Railway Ltd. | 3,950 | 303,913 | |
| 303,913 | |||
| Total Common Stock (Cost $32,859,164) | 36,575,286 | ||
| Asset Backed Securities — 7.1% | |||
| Auto Receivables — 2.3% | |||
| b | ACC Auto Trust, Series 2022-A Class A, 4.58% due 7/15/2026 | $ 256,747 | 252,450 |
| CarMax Auto Owner Trust, Series 2021-1 Class A3, 0.34% due 12/15/2025 | 389,896 | 376,359 | |
| b | CPS Auto Receivables Trust, Series 2022-A Class A, 0.98% due 4/16/2029 | 107,374 | 106,082 |
| b | Exeter Automobile Receivables Trust, Series 2019-3A Class D, 3.11% due 8/15/2025 | 224,765 | 222,003 |
| Harley-Davidson Motorcycle Trust, Series 2021-B Class A3, 0.56% due 11/16/2026 | 490,010 | 472,602 | |
| Nissan Auto Receivables Owner Trust, Series 2019-C Class A3, 1.93% due 7/15/2024 | 98,191 | 98,091 | |
| Santander Drive Auto Receivables Trust, Series 2020-3 Class C, 1.12% due 1/15/2026 | 123,670 | 123,132 | |
| 1,650,719 | |||
| Credit Card — 0.6% | |||
| b | Mission Lane Credit Card Master Trust, Series 2021-A Class A, 1.59% due 9/15/2026 | 450,000 | 437,071 |
| 437,071 | |||
| Other Asset Backed — 3.9% | |||
| b | Amur Equipment Finance Receivables IX LLC, Series 2021-1A Class F, 6.09% due 2/20/2029 | 600,000 | 549,482 |
| b | Aqua Finance Trust, Series 2019-A Class B, 3.47% due 7/16/2040 | 189,700 | 173,331 |
| b | Consumer Loan Underlying Bond Credit Trust, Series 2019-P1 Class C, 4.66% due 7/15/2026 | 157,682 | 157,508 |
| b | Dell Equipment Finance Trust, Series 2020-2 Class A3, 0.57% due 10/23/2023 | 74,722 | 74,533 |
| b,c | ECAF I Ltd., Series 2015-1A Class A2, 4.947% due 6/15/2040 | 168,145 | 111,195 |
| b | Foundation Finance Trust, Series 2019-1A Class A, 3.86% due 11/15/2034 | 27,123 | 26,601 |
| b | FREED ABS Trust, Series 2022-3FP Class A, 4.50% due 8/20/2029 | 93,875 | 93,724 |
| b,d | Goldman Home Improvement Trust Issuer Trust Series 2021-GRN2 Class R, due 6/20/2051 | 2,000 | 154,480 |
| b | LendingPoint Pass-Through Trust, Series 2022-ST1 Class A, 2.50% due 3/15/2028 | 147,642 | 141,111 |
| Marlette Funding Trust, | |||
| b | Series 2021-1A Class R, due 6/16/2031 | 1,200 | 85,349 |
| b | Series 2021-2A Class R, due 9/15/2031 | 1,150 | 112,062 |
| b | Series 2022-1A Class A, 1.36% due 4/15/2032 | 226,893 | 224,431 |
| b,d | Mosaic Solar Loan Trust Series 2021-2A Class R, due 4/22/2047 | 1,150,000 | 218,702 |
| See notes to financial statements. | Thornburg Equity Funds Semi-Annual Report | 73 |
Thornburg Summit Fund | March 31, 2023 (Unaudited)
| Issuer-Description | SHARES/ PRINCIPAL AMOUNT/ NOTIONAL AMOUNT | VALUE | |
| b | New Residential Advance Receivables Trust Advance Receivables Backed, Series 2020-T1 Class DT1, 3.011% due 8/15/2053 | $ 250,000 | $ 244,765 |
| b,e | SBA Tower Trust, Series 2014-2A Class C, 3.869% due 10/15/2049 | 30,000 | 29,134 |
| b | Sierra Timeshare Receivables Funding LLC, Series 2019-1A Class A, 3.20% due 1/20/2036 | 14,705 | 14,018 |
| b | SPS Servicer Advance Receivables Trust, Series 2020-T2 Class A, 1.83% due 11/15/2055 | 100,000 | 92,295 |
| Upstart Pass-Through Trust, | |||
| b | Series 2021-ST4 Class CERT, due 7/20/2027 | 500,000 | 150,138 |
| b | Series 2021-ST7 Class A, 1.85% due 9/20/2029 | 163,274 | 160,259 |
| Verizon Owner Trust, Series 2020-A Class A1A, 1.85% due 7/22/2024 | 22,762 | 22,716 | |
| 2,835,834 | |||
| Student Loan — 0.3% | |||
| b,e | Navient Private Education Loan Trust, Series 2015-AA Class A2B, 5.884% (LIBOR 1 Month + 1.20%) due 12/15/2028 | 51,976 | 51,893 |
| b | SMB Private Education Loan Trust, Series 2020-B Class A1A, 1.29% due 7/15/2053 | 137,929 | 120,162 |
| 172,055 | |||
| Total Asset Backed Securities (Cost $5,819,296) | 5,095,679 | ||
| Corporate Bonds — 11.3% | |||
| Automobiles & Components — 0.6% | |||
| Automobiles — 0.4% | |||
| b | Hyundai Capital America, 0.875% due 6/14/2024 | 300,000 | 284,361 |
| Construction & Engineering — 0.2% | |||
| b,c | IHS Netherlands Holdco BV, 8.00% due 9/18/2027 | 200,000 | 177,246 |
| 461,607 | |||
| Capital Goods — 0.9% | |||
| Aerospace & Defense — 0.6% | |||
| b | TransDigm, Inc., 6.75% due 8/15/2028 | 400,000 | 404,000 |
| Machinery — 0.3% | |||
| b | Regal Rexnord Corp., 6.05% due 2/15/2026 | 250,000 | 251,710 |
| 655,710 | |||
| Commercial Services — 0.3% | |||
| Food Products — 0.3% | |||
| b | Darling Global Finance BV (EUR), 3.625% due 5/15/2026 | 200,000 | 210,473 |
| 210,473 | |||
| Energy — 0.7% | |||
| Oil, Gas & Consumable Fuels — 0.7% | |||
| c | Ecopetrol SA, 8.875% due 1/13/2033 | 250,000 | 253,077 |
| Petroleos Mexicanos, | |||
| c | 5.95% due 1/28/2031 | 120,000 | 91,818 |
| c | 6.50% due 6/2/2041 | 200,000 | 133,930 |
| 478,825 | |||
| Equity Real Estate Investment Trusts (REITs) — 0.4% | |||
| Diversified REITs — 0.4% | |||
| Extra Space Storage LP, 5.70% due 4/1/2028 | 250,000 | 251,708 | |
| Service Properties Trust, 4.95% due 2/15/2027 | 40,000 | 33,689 | |
| 285,397 | |||
| Financial Services — 0.5% | |||
| Capital Markets — 0.5% | |||
| b | Compass Group Diversified Holdings LLC, 5.00% due 1/15/2032 | 250,000 | 200,745 |
| Owl Rock Technology Finance Corp., | |||
| 2.50% due 1/15/2027 | 168,000 | 140,215 | |
| b | 4.75% due 12/15/2025 | 11,000 | 9,904 |
| 350,864 | |||
| Food, Beverage & Tobacco — 0.4% | |||
| Tobacco — 0.4% | |||
| b | Vector Group Ltd., 10.50% due 11/1/2026 | 251,000 | 252,496 |
| 74 | Thornburg Equity Funds Semi-Annual Report | See notes to financial statements. |
| Issuer-Description | SHARES/ PRINCIPAL AMOUNT/ NOTIONAL AMOUNT | VALUE | |
| 252,496 | |||
| Health Care Equipment & Services — 0.7% | |||
| Health Care Providers & Services — 0.7% | |||
| Tenet Healthcare Corp., 4.625% due 7/15/2024 | $ 500,000 | $ 493,240 | |
| 493,240 | |||
| Insurance — 0.6% | |||
| Insurance — 0.6% | |||
| c | Pentair Finance Sarl, 5.90% due 7/15/2032 | 400,000 | 413,940 |
| 413,940 | |||
| Materials — 0.9% | |||
| Metals & Mining — 0.9% | |||
| b | Compass Minerals International, Inc., 6.75% due 12/1/2027 | 500,000 | 478,120 |
| b,c | POSCO, 5.625% due 1/17/2026 | 200,000 | 202,464 |
| 680,584 | |||
| Media & Entertainment — 0.8% | |||
| Media — 0.8% | |||
| b | CCO Holdings LLC/CCO Holdings Capital Corp.,4.25% due 2/1/2031 - 1/15/2034 | 750,000 | 603,392 |
| 603,392 | |||
| Pharmaceuticals, Biotechnology & Life Sciences — 0.1% | |||
| Life Sciences Tools & Services — 0.1% | |||
| b | Avantor Funding, Inc. (EUR), 2.625% due 11/1/2025 | 100,000 | 104,301 |
| 104,301 | |||
| Semiconductors & Semiconductor Equipment — 0.8% | |||
| Semiconductors & Semiconductor Equipment — 0.8% | |||
| Intel Corp., 4.875% due 2/10/2026 | 200,000 | 202,604 | |
| b | Qorvo, Inc., 3.375% due 4/1/2031 | 200,000 | 165,696 |
| b,c | SK Hynix, Inc., 6.25% due 1/17/2026 | 200,000 | 201,978 |
| 570,278 | |||
| Software & Services — 1.0% | |||
| Internet Software & Services — 0.3% | |||
| b | Prosus NV (EUR), 1.288% due 7/13/2029 | 285,000 | 235,796 |
| Software — 0.7% | |||
| b | GoTo Group, Inc., 5.50% due 9/1/2027 | 239,000 | 123,243 |
| b | Open Text Holdings, Inc., 4.125% due 2/15/2030 | 400,000 | 343,176 |
| 702,215 | |||
| Technology Hardware & Equipment — 1.5% | |||
| Electronic Equipment, Instruments & Components — 0.4% | |||
| Arrow Electronics, Inc., 6.125% due 3/1/2026 | 300,000 | 300,615 | |
| Office Electronics — 0.3% | |||
| CDW LLC/CDW Finance Corp., 3.25% due 2/15/2029 | 250,000 | 219,833 | |
| Technology Hardware, Storage & Peripherals — 0.8% | |||
| Dell International LLC/EMC Corp., 4.90% due 10/1/2026 | 250,000 | 248,632 | |
| b,c | Lenovo Group Ltd., 5.831% due 1/27/2028 | 300,000 | 302,634 |
| 1,071,714 | |||
| Telecommunication Services — 0.3% | |||
| Diversified Telecommunication Services — 0.3% | |||
| AT&T, Inc., 5.539% due 2/20/2026 | 250,000 | 250,643 | |
| 250,643 | |||
| Utilities — 0.8% | |||
| Electric Utilities — 0.8% | |||
| American Electric Power Co., Inc., 5.625% due 3/1/2033 | 300,000 | 310,923 | |
| System Energy Resources, Inc., 6.00% due 4/15/2028 | 260,000 | 266,523 |
| See notes to financial statements. | Thornburg Equity Funds Semi-Annual Report | 75 |
Thornburg Summit Fund | March 31, 2023 (Unaudited)
| Issuer-Description | SHARES/ PRINCIPAL AMOUNT/ NOTIONAL AMOUNT | VALUE | |
| 577,446 | |||
| Total Corporate Bonds (Cost $8,103,764) | 8,163,125 | ||
| U.S. Treasury Securities — 13.5% | |||
| United States Treasury Inflationary Indexed Bonds, 0.125%, 2/15/2052 | $ 537,215 | $ 372,211 | |
| United States Treasury Notes, | |||
| 0.125%, 5/31/2023 | 1,000,000 | 992,578 | |
| 0.875%, 9/30/2026 | 1,000,000 | 905,859 | |
| 1.125%, 2/15/2031 | 1,200,000 | 1,010,438 | |
| 2.25%, 11/15/2024 | 550,000 | 532,662 | |
| 3.50%, 2/15/2033 - 2/15/2039 | 1,900,000 | 1,885,390 | |
| 4.125%, 11/15/2032 | 550,000 | 578,016 | |
| United States Treasury Notes Inflationary Index, | |||
| 0.125%, 7/15/2024 - 1/15/2031 | 3,513,282 | 3,289,086 | |
| 1.125%, 1/15/2033 | 220,900 | 220,270 | |
| Total U.S. Treasury Securities (Cost $9,545,108) | 9,786,510 | ||
| Mortgage Backed — 5.0% | |||
| b,e | Arroyo Mortgage Trust, Whole Loan Securities Trust CMO, Series 2019-1 Class A1, 3.805% due 1/25/2049 | 37,660 | 35,845 |
| Citigroup Mortgage Loan Trust, Whole Loan Securities Trust CMO, | |||
| b,e | Series 2021-J1 Class B4, 2.611% due 4/25/2051 | 100,000 | 33,764 |
| b,e | Series 2021-J1 Class B5, 2.611% due 4/25/2051 | 100,000 | 28,008 |
| b,e | Series 2021-J1 Class B6, 2.611% due 4/25/2051 | 99,907 | 23,116 |
| COMM Mortgage Trust, CMBS, Series 2015-LC23 Class ASB, 3.598% due 10/10/2048 | 304,020 | 296,279 | |
| b,e | Ellington Financial Mortgage Trust, Whole Loan Securities Trust CMO, Series 2022-1 Class A1, 2.206% due 1/25/2067 | 266,861 | 222,423 |
| Federal Home Loan Mtg Corp., Pool SE9046, 3.00% due 12/1/2051 | 269,118 | 238,604 | |
| Federal Home Loan Mtg Corp., Seasoned Credit Risk Transfer, Whole Loan Securities Trust CMO, Series 2019-1 Class MA, 3.50% due 7/25/2058 | 48,920 | 46,760 | |
| Federal Home Loan Mtg Corp., UMBS Collateral, | |||
| Pool SD1669, 2.50% due 1/1/2052 | 289,179 | 249,238 | |
| Pool SD8205 2.50% due 4/1/2052 | 500,218 | 430,911 | |
| Federal Home Loan Mtg Corp., Whole Loan Securities Trust CMO, Series 2017-SC02 Class 1A, 3.00% due 5/25/2047 | 71,276 | 63,413 | |
| Federal National Mtg Assoc., UMBS Collateral, Pool MA4579, 3.00% due 4/1/2052 | 237,073 | 212,586 | |
| b,e | Flagstar Mortgage Trust, Whole Loan Securities Trust CMO, Series 2019-2 Class B3, 4.03% due 12/25/2049 | 116,312 | 98,170 |
| b,e | GCAT Trust, Whole Loan Securities Trust CMO, Series 2021-CM2 Class A1, 2.352% due 8/25/2066 | 243,771 | 220,647 |
| Imperial Fund Mortgage Trust, Whole Loan Securities Trust CMO, | |||
| b,e | Series 2021-NQM2 Class A1, 1.073% due 9/25/2056 | 228,382 | 182,863 |
| b,e | Series 2021-NQM3 Class A1, 1.595% due 11/25/2056 | 347,343 | 292,029 |
| JPMorgan Chase Commercial Mortgage Securities Trust, CMBS, Series 2013-LC11 Class A5, 2.96% due 4/15/2046 | 123,831 | 123,292 | |
| b,e | Metlife Securitization Trust, Whole Loan Securities Trust CMO, Series 2019-1A Class A1A, 3.75% due 4/25/2058 | 50,660 | 49,092 |
| b,e | MFRA Trust, Whole Loan Securities Trust CMO, Series 2022-CHM1 Class A1, 3.875% due 9/25/2056 | 302,378 | 284,510 |
| b,e | New Residential Mortgage Loan Trust, Whole Loan Securities Trust CMO, Series 2022-NQM3 Class A1, 3.90% due 4/25/2062 | 381,972 | 345,566 |
| b,e | TIAA Bank Mortgage Loan Trust, Whole Loan Securities Trust CMO, Series 2018-2 Class B3, 3.692% due 7/25/2048 | 161,735 | 136,301 |
| Total Mortgage Backed (Cost $3,904,742) | 3,613,417 | ||
| Exchange-Traded Funds — 4.0% | |||
| Invesco DB Agriculture Fund | 19,822 | 404,963 | |
| Invesco DB Base Metals Fund | 34,412 | 695,122 | |
| a | SPDR Gold Shares Fund | 5,318 | 974,364 |
| a | United States Oil Fund LP | 12,067 | 801,732 |
| Total Exchange-Traded Funds (Cost $2,372,814) | 2,876,181 | ||
| Call Options Purchased — 0.2% | |||
| a | SPDR Gold Shares Fund Expiration Date: 9/15/2023 Contract Amount: 12,740 Exercise Price: USD 180.00 Contract Party: JPMorgan Chase Bank, N.A. | USD 2,334,223 | 150,593 |
| 76 | Thornburg Equity Funds Semi-Annual Report | See notes to financial statements. |
| Issuer-Description | SHARES/ PRINCIPAL AMOUNT/ NOTIONAL AMOUNT | VALUE | |
| Total Call Options Purchased (Premiums paid $86,377) | 150,593 | ||
| Total Long-Term Investments — 91.7% (Cost $62,691,265) | 66,260,791 | ||
| Short-Term Investments — 8.5% | |||
| f | Thornburg Capital Management Fund | 616,094 | $ 6,160,938 |
| Total Short-Term Investments (Cost $6,160,938) | 6,160,938 | ||
| Total Investments — 100.2% (Cost $68,852,203) | $72,421,729 | ||
| Liabilities Net of Other Assets — (0.2)% | (163,314) | ||
| Net Assets — 100.0% | $72,258,415 |
| Outstanding Forward Currency Contracts To Buy Or Sell At March 31, 2023 | |||||||
| Contract Description | Contract Party* | Buy/Sell | Contract Amount | Contract Value Date | Value USD | Unrealized Appreciation | Unrealized Depreciation |
| Euro | SSB | Buy | 1,093,820 | 4/28/2023 | 1,187,840 | $ — | $ (7,717) |
| Japanese Yen | MSC | Buy | 246,842,000 | 4/28/2023 | 1,865,535 | — | (51,984) |
| Total | — | $ (59,701) | |||||
| Net unrealized appreciation (depreciation) | $ (59,701) | ||||||
| * | Counterparties include State Street Bank and Trust Company (“SSB”) and Morgan Stanely & Co. Inc. ("MSC"). |
| Footnote Legend | |
| a | Non-income producing. |
| b | Securities exempt from registration under Rule 144A of the Securities Act of 1933, as amended. These securities are restricted but liquid and may only be resold in the ordinary course of business in transactions exempt from registration, normally to qualified institutional buyers. As of March 31, 2023, the aggregate value of these securities in the Fund’s portfolio was $10,709,408, representing 14.82% of the Fund’s net assets. |
| c | Yankee bond denominated in U.S. dollars and is issued in the U.S. by foreign banks and corporations. |
| d | Security currently fair valued by the Valuation and Pricing Committee. |
| e | Variable, floating, step, or fixed to floating rate securities are securities for which interest rate changes are based on changes in a designated base rate or on a predetermined schedule. The rates shown are those in effect on March 31, 2023. |
| f | Investment in Affiliates. |
To simplify the listings of securities, abbreviations are used per the table below:
| ABS | Asset Backed Securities |
| ADR | American Depositary Receipt |
| CMBS | Commercial Mortgage-Backed Securities |
| CMO | Collateralized Mortgage Obligation |
| EUR | Denominated in Euro |
| LIBOR | London Interbank Offered Rates |
| Mtg | Mortgage |
| UMBS | Uniform Mortgage Backed Securities |
| USD | United States Dollar |
| See notes to financial statements. | Thornburg Equity Funds Semi-Annual Report | 77 |
Thornburg Summit Fund | March 31, 2023 (Unaudited)
| COUNTRY EXPOSURE * (percent of net assets) | |
| United States | 66.6% |
| Netherlands | 3.6% |
| Japan | 3.6% |
| Germany | 2.7% |
| France | 2.4% |
| China | 2.4% |
| Canada | 2.2% |
| Brazil | 1.2% |
| Hong Kong | 1.1% |
| Taiwan | 1.0% |
| India | 0.8% |
| United Kingdom | 0.7% |
| Australia | 0.6% |
| South Korea | 0.6% |
| Denmark | 0.5% |
| Singapore | 0.5% |
| Colombia | 0.4% |
| Mexico | 0.3% |
| Nigeria | 0.3% |
| Cayman Islands | 0.2% |
| Other Assets Less Liabilities | 8.3% |
| * | Holdings are classified by country of risk as determined by MSCI and Bloomberg. |
| 78 | Thornburg Equity Funds Semi-Annual Report | See notes to financial statements. |
March 31, 2023 (Unaudited)
| THORNBURG GLOBAL OPPORTUNITIES FUND | THORNBURG INTERNATIONAL EQUITY FUND | THORNBURG BETTER WORLD INTERNATIONAL FUND | THORNBURG INTERNATIONAL GROWTH FUND | THORNBURG DEVELOPING WORLD FUND | |
| ASSETS | |||||
| Investments at cost | |||||
| Non-affiliated issuers | $ 735,472,107 | $ 2,112,359,701 | $ 460,830,744 | $ 706,327,075 | $ 943,115,396 |
| Non-controlled affiliated issuers | 19,956,792 | 133,365,643 | 39,980,730 | 14,674,244 | 38,370,652 |
| Investments at value | |||||
| Non-affiliated issuers | 1,009,996,513 | 2,453,334,798 | 469,854,209 | 942,969,314 | 1,044,085,212 |
| Non-controlled affiliated issuers | 19,956,792 | 133,365,643 | 39,980,730 | 14,674,244 | 38,370,652 |
| Foreign currency at value (a) | 642 | 1,982 | 1,028 | 114,604 | 142,099 |
| Receivable for investments sold | - | - | 1,215,187 | 1,173,625 | 541,721 |
| Receivable for fund shares sold | 1,284,903 | 1,536,762 | 1,597,784 | 432,431 | 1,552,771 |
| Dividends receivable | 1,262,552 | 5,182,802 | 870,382 | 1,407,551 | 3,033,951 |
| Tax reclaims receivable | 1,045,501 | 6,914,004 | 679,443 | 1,587,315 | 305,961 |
| Prepaid expenses and other assets | 130,565 | 90,772 | 93,774 | 95,577 | 85,869 |
| Total Assets | 1,033,677,468 | 2,600,426,763 | 514,292,537 | 962,454,661 | 1,088,118,236 |
| Liabilities | |||||
| Unrealized depreciation on forward currency contracts | 1,646,835 | - | - | - | - |
| Payable for investments purchased | 85,656 | 16,530,912 | 1,563,339 | 1,532,600 | 150,378 |
| Payable for fund shares redeemed | 751,925 | 2,595,080 | 1,090,558 | 2,182,293 | 810,086 |
| Payable to investment advisor and other affiliates | 918,961 | 1,772,161 | 283,023 | 708,637 | 952,009 |
| IRS compliance fees for foreign withholding tax claims payable | - | 56,067,400 | - | - | - |
| Deferred taxes payable | 2,661,300 | - | - | - | - |
| Accounts payable and accrued expenses | 363,146 | 1,662,606 | 186,704 | 807,774 | 568,871 |
| Total Liabilities | 6,427,823 | 78,628,159 | 3,123,624 | 5,231,304 | 2,481,344 |
| Net Assets | $ 1,027,249,645 | $ 2,521,798,604 | $ 511,168,913 | $ 957,223,357 | $ 1,085,636,892 |
| NET ASSETS CONSIST OF | |||||
| Net capital paid in on shares of beneficial interest | $ 728,518,604 | $ 2,156,098,859 | $ 550,470,677 | $ 741,542,828 | $ 1,135,273,623 |
| Distributable earnings (accumulated loss) | 298,731,041 | 365,699,745 | (39,301,764) | 215,680,529 | (49,636,731) |
| Net Assets | $ 1,027,249,645 | $ 2,521,798,604 | $ 511,168,913 | $ 957,223,357 | $ 1,085,636,892 |
March 31, 2023 (Unaudited)
| THORNBURG GLOBAL OPPORTUNITIES FUND | THORNBURG INTERNATIONAL EQUITY FUND | THORNBURG BETTER WORLD INTERNATIONAL FUND | THORNBURG INTERNATIONAL GROWTH FUND | THORNBURG DEVELOPING WORLD FUND | |
| NET ASSET VALUE | |||||
| Class A Shares: | |||||
| Net assets applicable to shares outstanding | $ 271,894,935 | $ 401,518,357 | $ 41,854,972 | $ 96,544,065 | $ 96,486,120 |
| Shares outstanding | 8,489,793 | 17,522,026 | 2,550,818 | 4,209,475 | 4,663,183 |
| Net asset value and redemption price per share | $ 32.03 | $ 22.92 | $ 16.41 | $ 22.93 | $ 20.69 |
| Maximum offering price per share (net asset value, plus 4.50% of offering price) | $ 33.54 | $ 24.00 | $ 17.18 | $ 24.01 | $ 21.66 |
| Class C Shares: | |||||
| Net assets applicable to shares outstanding | 59,295,767 | 15,650,691 | 5,542,246 | 10,937,044 | 15,411,529 |
| Shares outstanding | 1,952,352 | 795,226 | 347,543 | 533,055 | 793,578 |
| Net asset value and redemption price per share* | 30.37 | 19.68 | 15.95 | 20.52 | 19.42 |
| Class I Shares: | |||||
| Net assets applicable to shares outstanding | 612,675,264 | 1,487,473,171 | 463,771,695 | 730,284,232 | 906,468,555 |
| Shares outstanding | 19,053,082 | 62,349,554 | 27,439,906 | 30,658,507 | 42,749,174 |
| Net asset value and redemption price per share | 32.16 | 23.86 | 16.90 | 23.82 | 21.20 |
| Class R3 Shares: | |||||
| Net assets applicable to shares outstanding | 3,047,643 | 120,282,145 | - | 4,826,627 | - |
| Shares outstanding | 96,356 | 5,256,999 | - | 214,090 | - |
| Net asset value and redemption price per share | 31.63 | 22.88 | - | 22.54 | - |
| Class R4 Shares: | |||||
| Net assets applicable to shares outstanding | 5,212,286 | 94,256,837 | - | 7,682,725 | - |
| Shares outstanding | 164,066 | 4,158,796 | - | 338,248 | - |
| Net asset value and redemption price per share | 31.77 | 22.66 | - | 22.71 | - |
| Class R5 Shares: | |||||
| Net assets applicable to shares outstanding | 17,941,602 | 105,432,005 | - | 25,296,267 | 3,582,851 |
| Shares outstanding | 557,077 | 4,423,829 | - | 1,058,876 | 169,536 |
| Net asset value and redemption price per share | 32.21 | 23.83 | - | 23.89 | 21.13 |
| Class R6 Shares: | |||||
| Net assets applicable to shares outstanding | 57,182,148 | 297,185,398 | - | 81,652,397 | 63,687,837 |
| Shares outstanding | 1,771,372 | 12,528,893 | - | 3,401,766 | 2,997,651 |
| Net asset value and redemption price per share | 32.28 | 23.72 | - | 24.00 | 21.25 |
| (a) | Cost of foreign currency is $626; $1,975; $1,018; $114,457; $137,339 respectively. |
| * | Redemption price per share is equal to net asset value less any applicable contingent deferred sales charge. |
March 31, 2023 (Unaudited)
| THORNBURG SMALL/MID CAP CORE FUND | THORNBURG SMALL/MID CAP GROWTH FUND | THORNBURG INVESTMENT INCOME BUILDER FUND | THORNBURG SUMMIT FUND | |
| ASSETS | ||||
| Investments at cost | ||||
| Non-affiliated issuers | $ 502,802,166 | $ 272,518,939 | $ 8,826,372,355 | $ 62,691,265 |
| Non-controlled affiliated issuers | 7,884,843 | 2,100,219 | 460,706,004 | 6,160,938 |
| Investments at value | ||||
| Non-affiliated issuers | 519,421,312 | 275,620,209 | 10,652,293,082 | 66,260,791 |
| Non-controlled affiliated issuers | 7,884,843 | 2,100,219 | 383,122,879 | 6,160,938 |
| Cash | - | - | - | 1,237 |
| Foreign currency at value (a) | - | - | 15,107 | 72 |
| Receivable for investments sold | - | 3,798,345 | 11,444,183 | 984,579 |
| Receivable for fund shares sold | 82,716 | 18,783 | 8,357,630 | 122,022 |
| Dividends receivable | 177,734 | 21,982 | 28,650,956 | 84,738 |
| Tax reclaims receivable | - | - | 53,770,381 | 43,770 |
| Principal and interest receivable | - | - | 22,384,155 | 136,573 |
| Prepaid expenses and other assets | 69,035 | 65,558 | 232,256 | 32,507 |
| Total Assets | 527,635,640 | 281,625,096 | 11,160,270,629 | 73,827,227 |
| Liabilities | ||||
| Unrealized depreciation on forward currency contracts | - | - | 25,599,732 | 59,701 |
| Payable for investments purchased | 1,036,059 | 3,337,384 | 22,751,722 | 1,455,821 |
| Payable for fund shares redeemed | 221,307 | 320,315 | 6,023,969 | - |
| Payable to investment advisor and other affiliates | 576,809 | 318,373 | 9,185,617 | 16,327 |
| IRS compliance fees for foreign withholding tax claims payable | - | - | 49,825,445 | - |
| Accounts payable and accrued expenses | 435,031 | 252,623 | 2,718,328 | 36,963 |
| Dividends payable | - | - | 17,500,650 | - |
| Total Liabilities | 2,269,206 | 4,228,695 | 133,605,463 | 1,568,812 |
| Net Assets | $ 525,366,434 | $ 277,396,401 | $ 11,026,665,166 | $ 72,258,415 |
| NET ASSETS CONSIST OF | ||||
| Net capital paid in on shares of beneficial interest | $ 564,706,555 | $ 391,516,217 | $ 9,821,632,304 | $ 70,354,077 |
| Distributable earnings (accumulated loss) | (39,340,121) | (114,119,816) | 1,205,032,862 | 1,904,338 |
| Net Assets | $ 525,366,434 | $ 277,396,401 | $ 11,026,665,166 | $ 72,258,415 |
March 31, 2023 (Unaudited)
| THORNBURG SMALL/MID CAP CORE FUND | THORNBURG SMALL/MID CAP GROWTH FUND | THORNBURG INVESTMENT INCOME BUILDER FUND | THORNBURG SUMMIT FUND | |
| NET ASSET VALUE | ||||
| Class A Shares: | ||||
| Net assets applicable to shares outstanding | $ 292,253,726 | $ 137,523,184 | $ 3,886,826,464 | $ 3,658,058 |
| Shares outstanding | 4,940,547 | 5,944,676 | 175,403,112 | ��319,616 |
| Net asset value and redemption price per share | $ 59.15 | $ 23.13 | $ 22.16 | $ 11.45 |
| Maximum offering price per share (net asset value, plus 4.50% of offering price) | $ 61.94 | $ 24.22 | $ 23.20 | $ 11.99 |
| Class C Shares: | ||||
| Net assets applicable to shares outstanding | 6,356,319 | 4,629,180 | 568,667,672 | - |
| Shares outstanding | 126,319 | 275,411 | 25,696,871 | - |
| Net asset value and redemption price per share* | 50.32 | 16.81 | 22.13 | - |
| Class I Shares: | ||||
| Net assets applicable to shares outstanding | 204,493,130 | 111,861,370 | 6,337,292,451 | 68,600,357 |
| Shares outstanding | 3,306,985 | 4,195,994 | 283,855,597 | 5,991,612 |
| Net asset value and redemption price per share | 61.84 | 26.66 | 22.33 | 11.45 |
| Class R3 Shares: | ||||
| Net assets applicable to shares outstanding | 13,407,499 | 14,035,591 | 21,026,928 | - |
| Shares outstanding | 228,063 | 619,156 | 949,259 | - |
| Net asset value and redemption price per share | 58.79 | 22.67 | 22.15 | - |
| Class R4 Shares: | ||||
| Net assets applicable to shares outstanding | 2,771,797 | 1,259,274 | 11,967,104 | - |
| Shares outstanding | 46,402 | 54,238 | 539,484 | - |
| Net asset value and redemption price per share | 59.73 | 23.22 | 22.18 | - |
| Class R5 Shares: | ||||
| Net assets applicable to shares outstanding | 6,083,963 | 8,087,802 | 22,497,707 | - |
| Shares outstanding | 98,564 | 303,909 | 1,008,403 | - |
| Net asset value and redemption price per share | 61.73 | 26.61 | 22.31 | - |
| Class R6 Shares: | ||||
| Net assets applicable to shares outstanding | - | - | 178,386,840 | - |
| Shares outstanding | - | - | 8,015,091 | - |
| Net asset value and redemption price per share | - | - | 22.26 | - |
| (a) | Cost of foreign currency is $0; $0; $14,639; $71 respectively. |
| * | Redemption price per share is equal to net asset value less any applicable contingent deferred sales charge. |
Six Months Ended March 31, 2023 (Unaudited)
| THORNBURG GLOBAL OPPORTUNITIES FUND | THORNBURG INTERNATIONAL EQUITY FUND | THORNBURG BETTER WORLD INTERNATIONAL FUND | THORNBURG INTERNATIONAL GROWTH FUND | THORNBURG DEVELOPING WORLD FUND | |
| INVESTMENT INCOME | |||||
| Dividend income | |||||
| Non-affiliated issuers | $ 12,306,728 | $ 21,916,789 | $ 3,227,240 | $ 7,021,684 | $ 7,511,892 |
| Non-controlled affiliated issuers | 943,557 | 2,972,542 | 619,933 | 527,361 | 626,956 |
| Non-cash dividend | - | 7,653,995 | 1,189,723 | - | 2,826,566 |
| Dividend taxes withheld | (238,697) | (1,305,104) | (377,988) | (387,369) | (639,677) |
| Interest income | 8,777 | 74,480 | 4,618 | 9,371 | - |
| Foreign withholding tax claims | 255,371 | 1,875,445 | 92,276 | 213,552 | - |
| Adjusted for: IRS compliance fees for foreign withholding tax claims | - | (4,885,153) | - | - | - |
| Total Income | 13,275,736 | 28,302,994 | 4,755,802 | 7,384,599 | 10,325,737 |
| EXPENSES | |||||
| Investment management fees | 4,154,884 | 9,247,899 | 2,177,022 | 4,022,005 | 4,741,705 |
| Administration fees | 433,641 | 1,051,146 | 197,978 | 418,997 | 443,305 |
| Distribution and service fees | |||||
| Class A Shares | 326,840 | 476,485 | 48,136 | 114,886 | 116,527 |
| Class C Shares | 329,020 | 76,949 | 24,992 | 55,404 | 83,318 |
| Class R3 Shares | 7,335 | 286,213 | - | 11,311 | - |
| Class R4 Shares | 6,595 | 107,917 | - | 9,109 | - |
| Transfer agent fees | |||||
| Class A Shares | 112,729 | 143,170 | 26,725 | 55,520 | 65,354 |
| Class C Shares | 36,038 | 5,820 | 2,555 | 8,268 | 11,450 |
| Class I Shares | 202,605 | 633,135 | 206,053 | 321,670 | 347,544 |
| Class R3 Shares | 4,860 | 158,590 | - | 9,527 | - |
| Class R4 Shares | 14,981 | 120,874 | - | 21,732 | �� - |
| Class R5 Shares | 14,530 | 167,560 | - | 40,014 | 4,498 |
| Class R6 Shares | 3,180 | 10,900 | - | 5,638 | 9,178 |
| Registration and filing fees | |||||
| Class A Shares | 12,753 | 12,149 | 13,438 | 7,954 | 8,274 |
| Class C Shares | 7,107 | 6,260 | 11,769 | 6,811 | 8,099 |
| Class I Shares | 13,545 | 17,707 | 26,191 | 9,937 | 27,321 |
| Class R3 Shares | 6,896 | 6,503 | - | 6,930 | - |
| Class R4 Shares | 6,896 | 6,802 | - | 6,932 | - |
| Class R5 Shares | 6,928 | 6,810 | - | 6,979 | 7,474 |
| Class R6 Shares | 7,036 | 7,047 | - | 6,865 | 7,530 |
| Custodian fees | 98,269 | 304,303 | 94,927 | 142,193 | 515,459 |
| Professional fees | 40,444 | 59,694 | 52,750 | 45,115 | 36,555 |
| Trustee and officer fees | 30,551 | 73,945 | 13,704 | 32,823 | 30,728 |
| Other expenses | 36,532 | 131,068 | 26,004 | 51,197 | 49,955 |
| Total Expenses | 5,914,195 | 13,118,946 | 2,922,244 | 5,417,817 | 6,514,274 |
| Less: | |||||
| Expenses reimbursed | (146,725) | (459,561) | (420,334) | (421,451) | (364,829) |
| Investment management fees waived | (203,907) | (1,521,113) | (353,155) | (87,687) | (691,935) |
| Net Expenses | 5,563,563 | 11,138,272 | 2,148,755 | 4,908,679 | 5,457,510 |
| Net Investment Income (Loss) | $ 7,712,173 | $ 17,164,722 | $ 2,607,047 | $ 2,475,920 | $ 4,868,227 |
| THORNBURG GLOBAL OPPORTUNITIES FUND | THORNBURG INTERNATIONAL EQUITY FUND | THORNBURG BETTER WORLD INTERNATIONAL FUND | THORNBURG INTERNATIONAL GROWTH FUND | THORNBURG DEVELOPING WORLD FUND | |
| REALIZED AND UNREALIZED GAIN (LOSS) | |||||
| Net realized gain (loss) on: | |||||
| Non-affiliated issuer investments* | $ 34,782,845 | $ 42,483,542 | $ (79,782) | $ 21,649,512 | $ (37,584,394) |
| Forward currency contracts | (3,092,251) | - | - | - | - |
| Foreign currency transactions | (92,324) | 256,243 | (75,678) | 70,739 | (141,813) |
| Net realized gain (loss) | 31,598,270 | 42,739,785 | (155,460) | 21,720,251 | (37,726,207) |
| Net change in unrealized appreciation (depreciation) on: | |||||
| Non-affiliated issuers investments** | 134,222,733 | 511,342,958 | 83,415,739 | 198,268,730 | 158,030,617 |
| Forward currency contracts | (7,282,152) | - | - | - | - |
| Foreign currency translations | 108,040 | 543,198 | 61,428 | 159,838 | 117,762 |
| Change in net unrealized appreciation (depreciation) | 127,048,621 | 511,886,156 | 83,477,167 | 198,428,568 | 158,148,379 |
| Net Realized and Unrealized Gain (Loss) | 158,646,891 | 554,625,941 | 83,321,707 | 220,148,819 | 120,422,172 |
| Change in Net Assets Resulting from Operations | $ 166,359,064 | $ 571,790,663 | $ 85,928,754 | $ 222,624,739 | $ 125,290,399 |
| * Net of foreign capital gain taxes | $ 368,317 | $ - | $ - | $ - | $ - |
| ** Net of change in deferred taxes | $ 585,893 | $ - | $ - | $ - | $ 184,783 |
Six Months Ended March 31, 2023 (Unaudited)
| THORNBURG SMALL/MID CAP CORE FUND | THORNBURG SMALL/MID CAP GROWTH FUND | THORNBURG INVESTMENT INCOME BUILDER FUND | THORNBURG SUMMIT FUND | |
| INVESTMENT INCOME | ||||
| Dividend income | ||||
| Non-affiliated issuers | $ 3,069,656 | $ 260,032 | $ 167,204,547 | $ 425,829 |
| Non-controlled affiliated issuers | 138,674 | 58,800 | 18,369,111 | 98,591 |
| Dividend taxes withheld | - | - | (5,403,999) | (30,556) |
| Interest income | - | - | 51,472,999 | 485,357 |
| Foreign withholding tax claims | - | - | 9,792,258 | 12,341 |
| Adjusted for: IRS compliance fees for foreign withholding tax claims | - | - | (11,976,528) | - |
| Total Income | 3,208,330 | 318,832 | 229,458,388 | 991,562 |
| EXPENSES | ||||
| Investment management fees | 2,391,342 | 1,245,174 | 36,487,416 | 245,494 |
| Administration fees | 243,698 | 126,231 | 4,629,898 | 29,025 |
| Distribution and service fees | ||||
| Class A Shares | 381,074 | 178,088 | 4,662,826 | 2,483 |
| Class C Shares | 35,754 | 25,499 | 2,940,311 | - |
| Class R3 Shares | 35,053 | 35,024 | 52,460 | - |
| Class R4 Shares | 3,691 | 1,461 | 14,216 | - |
| Transfer agent fees | ||||
| Class A Shares | 173,065 | 102,387 | 1,192,445 | 908 |
| Class C Shares | 9,090 | 8,268 | 158,460 | - |
| Class I Shares | 98,715 | 43,462 | 2,082,733 | 17,243 |
| Class R3 Shares | 21,648 | 24,039 | 22,642 | - |
| Class R4 Shares | 5,606 | 2,272 | 14,802 | - |
| Class R5 Shares | 18,080 | 16,235 | 37,054 | - |
| Class R6 Shares | - | - | 8,450 | - |
| Registration and filing fees | ||||
| Class A Shares | 13,359 | 12,727 | 27,417 | 7,534 |
| Class C Shares | 8,622 | 7,704 | 12,175 | - |
| Class I Shares | 8,211 | 8,777 | 43,177 | 9,029 |
| Class R3 Shares | 6,819 | 6,638 | 7,280 | - |
| Class R4 Shares | 7,274 | 7,139 | 7,033 | - |
| Class R5 Shares | 7,275 | 8,534 | 7,329 | - |
| Class R6 Shares | - | - | 7,551 | - |
| Custodian fees | 26,729 | 22,427 | 463,670 | 37,633 |
| Professional fees | 36,613 | 28,070 | 222,501 | 33,388 |
| Trustee and officer fees | 19,261 | 11,543 | 310,912 | 2,004 |
| Other expenses | 10,007 | 22,166 | 368,792 | 14,510 |
| Total Expenses | 3,560,986 | 1,943,865 | 53,781,550 | 399,251 |
| Less: | ||||
| Expenses reimbursed | (239,301) | (173,357) | (57,324) | (62,128) |
| Investment management fees waived | - | - | - | (108,787) |
| Net Expenses | 3,321,685 | 1,770,508 | 53,724,226 | 228,336 |
| Net Investment Income (Loss) | $ (113,355) | $ (1,451,676) | $ 175,734,162 | $ 763,226 |
| THORNBURG SMALL/MID CAP CORE FUND | THORNBURG SMALL/MID CAP GROWTH FUND | THORNBURG INVESTMENT INCOME BUILDER FUND | THORNBURG SUMMIT FUND | |
| REALIZED AND UNREALIZED GAIN (LOSS) | ||||
| Net realized gain (loss) on: | ||||
| Non-affiliated issuer investments* | $ (27,146,582) | $ (21,275,074) | $ (7,280,468) | $ (103,238) |
| Non-controlled affiliated issuers | - | - | (2,152,707) | - |
| Forward currency contracts | - | - | (58,881,461) | 91,949 |
| Foreign currency transactions | (301) | 572 | 1,034,027 | (6,763) |
| Net realized gain (loss) | (27,146,883) | (21,274,502) | (67,280,609) | (18,052) |
| Net change in unrealized appreciation (depreciation) on: | ||||
| Non-affiliated issuers investments** | 64,696,731 | 48,386,129 | 1,715,063,689 | 6,506,130 |
| Non-controlled affiliated issuers | - | - | 21,353,872 | - |
| Forward currency contracts | - | - | (128,732,363) | 113,394 |
| Foreign currency translations | - | - | 4,000,729 | 3,156 |
| Change in net unrealized appreciation (depreciation) | 64,696,731 | 48,386,129 | 1,611,685,927 | 6,622,680 |
| Net Realized and Unrealized Gain (Loss) | 37,549,848 | 27,111,627 | 1,544,405,318 | 6,604,628 |
| Change in Net Assets Resulting from Operations | $ 37,436,493 | $ 25,659,951 | $ 1,720,139,480 | $ 7,367,854 |
| * Net of foreign capital gain taxes | $ - | $ - | $ - | $ - |
| ** Net of change in deferred taxes | $ - | $ - | $ - | $ 17 |
| THORNBURG GLOBAL OPPORTUNITIES FUND | THORNBURG INTERNATIONAL EQUITY FUND | |||
| Six Months Ended March 31, 2023* | Year Ended September 30, 2022 | Six Months Ended March 31, 2023* | Year Ended September 30, 2022 | |
| INCREASE (DECREASE) IN NET ASSETS FROM | ||||
| OPERATIONS | ||||
| Net investment income (loss) | $ 7,712,173 | $ 9,655,415 | $ 17,164,722 | $ 45,024,621 |
| Net realized gain (loss) | 31,598,270 | 40,008,544 | 42,739,785 | (31,319,415) |
| Net change in unrealized appreciation (depreciation) | 127,048,621 | (245,776,411) | 511,886,156 | (861,255,347) |
| Net Increase (Decrease) in Net Assets Resulting from Operations | 166,359,064 | (196,112,452) | 571,790,663 | (847,550,141) |
| DIVIDENDS TO SHAREHOLDERS | ||||
| From distributable earnings | ||||
| Class A Shares | (9,456,995) | (35,940,962) | (6,396,784) | (71,630,114) |
| Class C Shares | (1,959,214) | (13,819,339) | (180,196) | (3,618,672) |
| Class I Shares | (22,157,893) | (79,676,826) | (27,585,467) | (255,342,551) |
| Class R3 Shares | (100,396) | (482,303) | (1,851,400) | (19,948,636) |
| Class R4 Shares | (189,199) | (784,298) | (1,536,366) | (13,551,778) |
| Class R5 Shares | (660,146) | (2,624,395) | (2,007,059) | (20,223,366) |
| Class R6 Shares | (2,165,798) | (7,791,346) | (6,118,423) | (44,109,955) |
| FUND SHARE TRANSACTIONS | ||||
| Class A Shares | 17,798,687 | 29,863,763 | (23,832,335) | 7,250,330 |
| Class C Shares | (14,680,467) | (17,418,699) | (1,836,919) | (3,502,879) |
| Class I Shares | 92,604,072 | 30,696,403 | (76,466,730) | 15,624,909 |
| Class R3 Shares | (3,796) | (10,925) | (6,219,903) | 3,097,926 |
| Class R4 Shares | (84,912) | 296,505 | 5,765,914 | 5,287,546 |
| Class R5 Shares | 91,053 | 1,038,704 | (3,019,469) | (16,546,986) |
| Class R6 Shares | 2,641,153 | 9,155,545 | (7,510,209) | 48,306,156 |
| Net Increase (Decrease) in Net Assets | 228,035,213 | (283,610,625) | 412,995,317 | (1,216,458,211) |
| NET ASSETS | ||||
| Beginning of Period | 799,214,432 | 1,082,825,057 | 2,108,803,287 | 3,325,261,498 |
| End of Period | $ 1,027,249,645 | $ 799,214,432 | $ 2,521,798,604 | $ 2,108,803,287 |
| * | Unaudited. |
| THORNBURG BETTER WORLD INTERNATIONAL FUND | THORNBURG INTERNATIONAL GROWTH FUND | |||
| Six Months Ended March 31, 2023* | Year Ended September 30, 2022 | Six Months Ended March 31, 2023* | Year Ended September 30, 2022 | |
| INCREASE (DECREASE) IN NET ASSETS FROM | ||||
| OPERATIONS | ||||
| Net investment income (loss) | $ 2,607,047 | $ 3,393,785 | $ 2,475,920 | $ 6,137,633 |
| Net realized gain (loss) | (155,460) | (42,878,412) | 21,720,251 | (30,287,813) |
| Net change in unrealized appreciation (depreciation) | 83,477,167 | (99,167,998) | 198,428,568 | (561,023,660) |
| Net Increase (Decrease) in Net Assets Resulting from Operations | 85,928,754 | (138,652,625) | 222,624,739 | (585,173,840) |
| DIVIDENDS TO SHAREHOLDERS | ||||
| From distributable earnings | ||||
| Class A Shares | (110,786) | (5,765,352) | (255,104) | (10,325,457) |
| Class C Shares | - | (780,125) | - | (1,922,046) |
| Class I Shares | (3,365,207) | (42,774,823) | (5,140,255) | (99,259,528) |
| Class R3 Shares | - | - | (7,298) | (497,684) |
| Class R4 Shares | - | - | (24,867) | (657,230) |
| Class R5 Shares | - | - | (170,516) | (2,277,399) |
| Class R6 Shares | - | - | (626,086) | (6,805,277) |
| FUND SHARE TRANSACTIONS | ||||
| Class A Shares | 1,559,598 | 11,651,032 | (10,656,409) | (6,281,463) |
| Class C Shares | 216,000 | 1,343,528 | (2,542,710) | (7,027,788) |
| Class I Shares | 43,104,357 | 210,904,868 | (162,208,597) | (290,734,058) |
| Class R3 Shares | - | - | (534,819) | (259,124) |
| Class R4 Shares | - | - | (629,826) | 1,098,706 |
| Class R5 Shares | - | - | (1,201,431) | (924,557) |
| Class R6 Shares | - | - | (2,092,364) | 3,330,404 |
| Net Increase (Decrease) in Net Assets | 127,332,716 | 35,926,503 | 36,534,457 | (1,007,716,341) |
| NET ASSETS | ||||
| Beginning of Period | 383,836,197 | 347,909,694 | 920,688,900 | 1,928,405,241 |
| End of Period | $ 511,168,913 | $ 383,836,197 | $ 957,223,357 | $ 920,688,900 |
| * | Unaudited. |
| THORNBURG DEVELOPING WORLD FUND | THORNBURG SMALL/MID CAP CORE FUND | |||
| Six Months Ended March 31, 2023* | Year Ended September 30, 2022 | Six Months Ended March 31, 2023* | Year Ended September 30, 2022 | |
| INCREASE (DECREASE) IN NET ASSETS FROM | �� | |||
| OPERATIONS | ||||
| Net investment income (loss) | $ 4,868,227 | $ 21,627,644 | $ (113,355) | $ (1,630,048) |
| Net realized gain (loss) | (37,726,207) | (65,584,058) | (27,146,883) | (19,690,191) |
| Net change in unrealized appreciation (depreciation) | 158,148,379 | (377,472,251) | 64,696,731 | (143,639,039) |
| Net Increase (Decrease) in Net Assets Resulting from Operations | 125,290,399 | (421,428,665) | 37,436,493 | (164,959,278) |
| DIVIDENDS TO SHAREHOLDERS | ||||
| From distributable earnings | ||||
| Class A Shares | (1,251,706) | - | (136,460) | (122,071,650) |
| Class C Shares | (41,004) | - | - | (4,832,240) |
| Class I Shares | (13,972,476) | - | (1,088,874) | (87,917,194) |
| Class R3 Shares | - | - | (15,650) | (6,082,568) |
| Class R4 Shares | - | - | (6,736) | (1,155,007) |
| Class R5 Shares | (57,870) | - | (29,855) | (3,628,978) |
| Class R6 Shares | (1,105,768) | - | - | - |
| FUND SHARE TRANSACTIONS | ||||
| Class A Shares | (1,961,576) | 1,023,278 | (21,368,103) | 51,894,406 |
| Class C Shares | (3,712,208) | (13,423,005) | (1,615,027) | (2,381,118) |
| Class I Shares | 44,257,221 | 186,186,571 | (16,537,054) | 26,723,681 |
| Class R3 Shares | - | - | (927,036) | 175,122 |
| Class R4 Shares | - | - | (255,098) | 473,412 |
| Class R5 Shares | 812,603 | (537,878) | (438,522) | (2,667,211) |
| Class R6 Shares | 2,718,242 | 2,994,134 | - | - |
| Net Increase (Decrease) in Net Assets | 150,975,857 | (245,185,565) | (4,981,922) | (316,428,623) |
| NET ASSETS | ||||
| Beginning of Period | 934,661,035 | 1,179,846,600 | 530,348,356 | 846,776,979 |
| End of Period | $ 1,085,636,892 | $ 934,661,035 | $ 525,366,434 | $ 530,348,356 |
| * | Unaudited. |
| THORNBURG SMALL/MID CAP GROWTH FUND | THORNBURG INVESTMENT INCOME BUILDER FUND | |||
| Six Months Ended March 31, 2023* | Year Ended September 30, 2022 | Six Months Ended March 31, 2023* | Year Ended September 30, 2022 | |
| INCREASE (DECREASE) IN NET ASSETS FROM | ||||
| OPERATIONS | ||||
| Net investment income (loss) | $ (1,451,676) | $ (4,731,095) | $ 175,734,162 | $ 572,565,616 |
| Net realized gain (loss) | (21,274,502) | (91,058,919) | (67,280,609) | 558,281,672 |
| Net change in unrealized appreciation (depreciation) | 48,386,129 | (125,609,457) | 1,611,685,927 | (2,378,483,248) |
| Net Increase (Decrease) in Net Assets Resulting from Operations | 25,659,951 | (221,399,471) | 1,720,139,480 | (1,247,635,960) |
| DIVIDENDS TO SHAREHOLDERS | ||||
| From distributable earnings | ||||
| Class A Shares | - | (116,662,505) | (102,758,825) | (201,637,382) |
| Class C Shares | - | (9,000,446) | (14,108,832) | (34,382,021) |
| Class I Shares | - | (96,903,886) | (169,249,231) | (322,622,375) |
| Class R3 Shares | - | (9,133,414) | (541,227) | (1,161,653) |
| Class R4 Shares | - | (677,509) | (298,227) | (614,910) |
| Class R5 Shares | - | (6,929,696) | (866,396) | (1,874,171) |
| Class R6 Shares | - | - | (4,609,939) | (7,073,144) |
| FUND SHARE TRANSACTIONS | ||||
| Class A Shares | (22,675,679) | 33,337,901 | 29,603,491 | 122,948,703 |
| Class C Shares | (1,403,827) | (3,334,612) | (85,787,398) | (242,851,475) |
| Class I Shares | (11,961,946) | 24,438,534 | 323,233,500 | 372,237,215 |
| Class R3 Shares | (1,301,528) | 6,084,629 | (1,802,234) | (1,166,777) |
| Class R4 Shares | 44,668 | 427,757 | 212,545 | (534,461) |
| Class R5 Shares | (1,990,819) | 541,093 | (11,444,906) | (4,004,205) |
| Class R6 Shares | - | - | 23,583,335 | 44,998,660 |
| Net Increase (Decrease) in Net Assets | (13,629,180) | (399,211,625) | 1,705,305,136 | (1,525,373,956) |
| NET ASSETS | ||||
| Beginning of Period | 291,025,581 | 690,237,206 | 9,321,360,030 | 10,846,733,986 |
| End of Period | $ 277,396,401 | $ 291,025,581 | $ 11,026,665,166 | $ 9,321,360,030 |
| * | Unaudited. |
| THORNBURG SUMMIT FUND | ||
| Six Months Ended March 31, 2023* | Year Ended September 30, 2022 | |
| INCREASE (DECREASE) IN NET ASSETS FROM | ||
| OPERATIONS | ||
| Net investment income (loss) | $ 763,226 | $ 1,571,118 |
| Net realized gain (loss) | (18,052) | (1,543,670) |
| Net change in unrealized appreciation (depreciation) | 6,622,680 | (9,351,210) |
| Net Increase (Decrease) in Net Assets Resulting from Operations | 7,367,854 | (9,323,762) |
| DIVIDENDS TO SHAREHOLDERS | ||
| From distributable earnings | ||
| Class A Shares† | (24,333) | (6,137) |
| Class I Shares | (783,732) | (10,896,644) |
| FUND SHARE TRANSACTIONS | ||
| Class A Shares† | 3,000,861 | 565,061 |
| Class I Shares | 6,154,950 | 13,738,449 |
| Net Increase (Decrease) in Net Assets | 15,715,600 | (5,923,033) |
| NET ASSETS | ||
| Beginning of Period | 56,542,815 | 62,465,848 |
| End of Period | $ 72,258,415 | $ 56,542,815 |
| * | Unaudited. |
| † | Effective date of this class of shares was January 26, 2022. |
March 31, 2023 (Unaudited)
March 31, 2023 (Unaudited)
| Class A | Class C | Class I | Class R3 | Class R4 | Class R5 | Class R6 | |
| Global Opportunities Fund | X | X | X | X | X | X | X |
| International Equity Fund | X | X | X | X | X | X | X |
| Better World International Fund | X | X | X | ||||
| International Growth Fund | X | X | X | X | X | X | X |
| Developing World Fund | X | X | X | X | X | ||
| Small/Mid Cap Core Fund | X | X | X | X | X | X | |
| Small/Mid Cap Growth Fund | X | X | X | X | X | X | |
| Income Builder Fund | X | X | X | X | X | X | X |
| Summit Fund | X | X |
March 31, 2023 (Unaudited)
March 31, 2023 (Unaudited)
March 31, 2023 (Unaudited)
March 31, 2023 (Unaudited)
| GLOBAL OPPORTUNITIES FUND | TOTAL | LEVEL 1 | LEVEL 2 | LEVEL 3 |
| Assets | ||||
| Investments in Securities | ||||
| Common Stock | $ 1,009,996,513 | $ 1,009,996,513 | $ — | $ — |
| Short-Term Investments | 19,956,792 | 19,956,792 | — | — |
| Total Investments in Securities | $ 1,029,953,305 | $ 1,029,953,305 | $ — | $ — |
| Total Assets | $ 1,029,953,305 | $ 1,029,953,305 | $ — | $ — |
| Liabilities | ||||
| Other Financial Instruments | ||||
| Forward Currency Contracts | $ (1,646,835) | $ — | $ (1,646,835) | $ — |
| Total Other Financial Instruments | $ (1,646,835) | $ — | $ (1,646,835) | $ — |
| Total Liabilities | $ (1,646,835) | $ — | $ (1,646,835) | $ — |
| INTERNATIONAL EQUITY FUND | TOTAL | LEVEL 1 | LEVEL 2 | LEVEL 3 |
| Assets | ||||
| Investments in Securities | ||||
| Common Stock | $ 2,453,334,798 | $ 2,453,334,798 | $ — | $ — |
| Short-Term Investments | 133,365,643 | 133,365,643 | — | — |
| Total Investments in Securities | $ 2,586,700,441 | $ 2,586,700,441 | $ — | $ — |
| Total Assets | $ 2,586,700,441 | $ 2,586,700,441 | $ — | $— |
March 31, 2023 (Unaudited)
| BETTER WORLD INTERNATIONAL FUND | TOTAL | LEVEL 1 | LEVEL 2 | LEVEL 3 |
| Assets | ||||
| Investments in Securities | ||||
| Common Stock | $ 468,074,796 | $ 468,074,796 | $ — | $ — |
| Exchange-Traded Funds | 1,779,413 | 1,779,413 | — | — |
| Short-Term Investments | 39,980,730 | 39,980,730 | — | — |
| Total Investments in Securities | $ 509,834,939 | $ 509,834,939 | $ — | $ — |
| Total Assets | $ 509,834,939 | $ 509,834,939 | $ — | $ — |
| INTERNATIONAL GROWTH FUND | TOTAL | LEVEL 1 | LEVEL 2 | LEVEL 3 |
| Assets | ||||
| Investments in Securities | ||||
| Common Stock | $ 942,969,314 | $ 942,969,314 | $ — | $ — |
| Short-Term Investments | 14,674,244 | 14,674,244 | — | — |
| Total Investments in Securities | $ 957,643,558 | $ 957,643,558 | $ — | $ — |
| Total Assets | $ 957,643,558 | $ 957,643,558 | $ — | $ — |
| DEVELOPING WORLD FUND | TOTAL | LEVEL 1 | LEVEL 2 | LEVEL 3 |
| Assets | ||||
| Investments in Securities | ||||
| Common Stock | $ 1,036,429,086 | $ 1,016,666,834 | $ 19,762,252 | $ — |
| Preferred Stock | 7,641,044 | 7,641,044 | — | — |
| Rights | 15,082 | 15,082 | — | — |
| Short-Term Investments | 38,370,652 | 38,370,652 | — | — |
| Total Investments in Securities | $ 1,082,455,864 | $ 1,062,693,612 | $ 19,762,252 | $ — |
| Total Assets | $ 1,082,455,864 | $ 1,062,693,612 | $ 19,762,252 | $ — |
| SMALL/MID CAP CORE FUND | TOTAL | LEVEL 1 | LEVEL 2 | LEVEL 3 |
| Assets | ||||
| Investments in Securities | ||||
| Common Stock | $ 519,421,312 | $ 519,421,312 | $ — | $ — |
| Short-Term Investments | 7,884,843 | 7,884,843 | — | — |
| Total Investments in Securities | $ 527,306,155 | $ 527,306,155 | $ — | $ — |
| Total Assets | $ 527,306,155 | $ 527,306,155 | $ — | $ — |
| SMALL/MID CAP GROWTH FUND | TOTAL | LEVEL 1 | LEVEL 2 | LEVEL 3 |
| Assets | ||||
| Investments in Securities | ||||
| Common Stock | $ 275,620,209 | $ 275,620,209 | $ — | $ — |
| Short-Term Investments | 2,100,219 | 2,100,219 | — | — |
| Total Investments in Securities | $ 277,720,428 | $ 277,720,428 | $ — | $ — |
| Total Assets | $ 277,720,428 | $ 277,720,428 | $ — | $— |
March 31, 2023 (Unaudited)
| INCOME BUILDER FUND | TOTAL | LEVEL 1 | LEVEL 2 | LEVEL 3 |
| Assets | ||||
| Investments in Securities | ||||
| Common Stock | $ 9,406,850,913 | $ 9,404,539,134 | $ — | $ 2,311,779 |
| Preferred Stock | 32,656,943 | 22,636,943 | 10,020,000 | — |
| Asset Backed Securities | 227,870,524 | — | 220,312,104 | 7,558,420 |
| Corporate Bonds | 956,056,578 | — | 956,056,578 | — |
| Other Government | 8,726,263 | — | 8,726,263 | — |
| Mortgage Backed | 171,156,608 | — | 171,155,658 | 950 |
| Loan Participations | 10,320,142 | — | 10,320,142 | — |
| Short-Term Investments | 221,777,990 | 221,777,990 | — | — |
| Total Investments in Securities | $ 11,035,415,961 | $ 9,648,954,067 | $ 1,376,590,745 | $ 9,871,149(a) |
| Total Assets | $ 11,035,415,961 | $ 9,648,954,067 | $ 1,376,590,745 | $ 9,871,149 |
| Liabilities | ||||
| Other Financial Instruments | ||||
| Forward Currency Contracts | $ (25,599,732) | $ — | $ (25,599,732) | $ — |
| Total Other Financial Instruments | $ (25,599,732) | $ — | $ (25,599,732) | $ — |
| Total Liabilities | $ (25,599,732) | $ — | $ (25,599,732) | $— |
| (a) | Level 3 investments at the beginning and/or end of the period in relation to net assets were not significant and accordingly, a reconciliation of Level 3 assets for the period ended March 31, 2023 is not presented. |
| SUMMIT FUND | TOTAL | LEVEL 1 | LEVEL 2 | LEVEL 3 |
| Assets | ||||
| Investments in Securities | ||||
| Common Stock | $ 36,575,286 | $ 36,575,286 | $ — | $ — |
| Asset Backed Securities | 5,095,679 | — | 4,722,497 | 373,182 |
| Corporate Bonds | 8,163,125 | — | 8,163,125 | — |
| U.S. Treasury Securities | 9,786,510 | 9,786,510 | — | — |
| Mortgage Backed | 3,613,417 | — | 3,613,417 | — |
| Exchange-Traded Funds | 2,876,181 | 2,876,181 | — | — |
| Purchased Options | 150,593 | — | 150,593 | — |
| Short-Term Investments | 6,160,938 | 6,160,938 | — | — |
| Total Investments in Securities | $ 72,421,729 | $ 55,398,915 | $ 16,649,632 | $ 373,182(a) |
| Total Assets | $ 72,421,729 | $ 55,398,915 | $ 16,649,632 | $ 373,182 |
| Liabilities | ||||
| Other Financial Instruments | ||||
| Forward Currency Contracts | $ (59,701) | $ — | $ (59,701) | $ — |
| Total Other Financial Instruments | $ (59,701) | $ — | $ (59,701) | $ — |
| Total Liabilities | $ (59,701) | $ — | $ (59,701) | $— |
| (a) | Level 3 investments at the beginning and/or end of the period in relation to net assets were not significant and accordingly, a reconciliation of Level 3 assets for the period ended March 31, 2023 is not presented. |
March 31, 2023 (Unaudited)
| GLOBAL OPPORTUNITIES FUND, INTERNATIONAL EQUITY FUND, INTERNATIONAL GROWTH FUND, SMALL/MID CAP CORE FUND, SMALL/MID CAP GROWTH FUND, INCOME BUILDER FUND | BETTER WORLD INTERNATIONAL FUND, DEVELOPING WORLD FUND | SUMMIT FUND | |||
| DAILY NET ASSETS | FEE RATE | DAILY NET ASSETS | FEE RATE | DAILY NET ASSETS | FEE RATE |
| Up to $500 million | 0.875% | Up to $500 million | 0.975% | Up to $500 million | 0.750% |
| Next $500 million | 0.825 | Next $500 million | 0.925 | Next $500 million | 0.700 |
| Next $500 million | 0.775 | Next $500 million | 0.875 | Next $500 million | 0.650 |
| Next $500 million | 0.725 | Next $500 million | 0.825 | Next $500 million | 0.625 |
| Over $2 billion | 0.675 | Over $2 billion | 0.775 | Over $2 billion | 0.600 |
| Effective Management Fee | |
| Global Opportunities Fund | 0.850% |
| International Equity Fund | 0.780 |
| Better World International Fund | 0.975 |
| International Growth Fund | 0.851 |
| Developing World Fund | 0.949 |
| Small/Mid Cap Core Fund | 0.870 |
| Small/Mid Cap Growth Fund | 0.875 |
| Income Builder Fund | 0.699 |
| Summit Fund | 0.750 |
| Administrative Services Fee Schedule | |
| Daily Net Assets | Fee Rate |
| Up to $20 billion | 0.100% |
| $20 billion to $40 billion | 0.075 |
| $40 billion to $60 billion | 0.040 |
| Over $60 billion | 0.030 |
March 31, 2023 (Unaudited)
| Commissions | CDSC fees | |
| Global Opportunities Fund | $ 2,641 | $ (127) |
| International Equity Fund | 1,073 | 21 |
| Better World International Fund | 1,320 | 56 |
| International Growth Fund | 839 | (100) |
| Developing World Fund | 1,515 | 221 |
| Small/Mid Cap Core Fund | 3,100 | 42 |
| Small/Mid Cap Growth Fund | 789 | 471 |
| Income Builder Fund | 126,787 | 16,767 |
| Summit Fund | 1,644 | — |
| Class A | Class C | Class I | Class R3 | Class R4 | Class R5 | Class R6 | |
| Global Opportunities Fund | —% | —% | 0.99% | 1.50% | 1.40% | 0.99% | 0.85% |
| International Equity Fund | — | — | 0.90 | 1.36 | 1.16 | 0.90 | 0.70 |
| Better World International Fund | — | 2.19 | 0.90 | — | — | — | — |
| International Growth Fund | — | — | 0.99 | 1.50 | 1.40 | 0.99 | 0.89 |
| Developing World Fund | — | 2.33 | 1.04 | — | — | 1.04 | 0.94 |
| Small/Mid Cap Core Fund | — | — | 0.95 | 1.31 | 1.21 | 0.95 | — |
| Small/Mid Cap Growth Fund | — | 2.34 | 0.95 | 1.46 | 1.36 | 0.95 | — |
| Income Builder Fund | — | — | — | 1.50 | 1.40 | 0.99 | 0.80 |
| Summit Fund | 0.94 | — | 0.99 | — | — | — | — |
March 31, 2023 (Unaudited)
| Contractual: | Class A | Class C | Class I | Class R3 | Class R4 | Class R5 | Class R6 | Total |
| Global Opportunities Fund | $ — | $ — | $ 68,277 | $ 10,850 | $ 16,320 | $ 16,987 | $ 34,291 | $ 146,725 |
| International Equity Fund | — | — | — | 125,013 | 73,537 | 119,192 | 141,819 | 459,561 |
| Better World International Fund | — | 9,392 | 410,942 | — | — | — | — | 420,334 |
| International Growth Fund | — | — | 291,428 | 15,967 | 22,423 | 45,655 | 45,978 | 421,451 |
| Developing World Fund | — | — | 309,978 | — | — | 11,773 | 43,078 | 364,829 |
| Small/Mid Cap Core Fund | — | — | 152,741 | 41,274 | 13,357 | 26,679 | — | 234,051 |
| Small/Mid Cap Growth Fund | — | 7,865 | 93,505 | 35,084 | 8,909 | 27,994 | — | 173,357 |
| Income Builder Fund | — | — | — | 10,328 | 2,734 | 16,563 | 27,699 | 57,324 |
| Summit Fund | 7,724 | — | 54,404 | — | — | — | — | 62,128 |
| Voluntary: | Class A | Class C | Class I | Class R3 | Class R4 | Class R5 | Class R6 | Total |
| Global Opportunities Fund | $ 54,025 | $ 12,046 | $ 121,306 | $ 604 | $ 1,067 | $ 3,579 | $ 11,280 | $ 203,907 |
| International Equity Fund | 242,321 | 9,518 | 896,743 | 72,630 | 57,101 | 63,488 | 179,312 | 1,521,113 |
| Better World International Fund | 28,922 | 3,865 | 320,368 | — | — | — | — | 353,155 |
| International Growth Fund | 8,795 | 1,002 | 67,018 | 439 | 706 | 2,306 | 7,421 | 87,687 |
| Developing World Fund | 62,097 | 10,074 | 577,300 | — | — | 2,279 | 40,185 | 691,935 |
| Small/Mid Cap Core Fund | — | 5,250 | — | — | — | — | — | 5,250 |
| Summit Fund | 5,031 | — | 103,756 | — | — | — | — | 108,787 |
| Percentage of Direct Investments | |
| Global Opportunities Fund | 5.43% |
| International Equity Fund | 1.68 |
| Better World International Fund | 8.13 |
| International Growth Fund | 3.44 |
| Developing World Fund | 3.29 |
| Small/Mid Cap Core Fund | 6.72 |
| Small/Mid Cap Growth Fund | 7.22 |
| Income Builder Fund | 1.61 |
| Summit Fund | 55.67 |
| Purchases | Sales | Realized gains/(losses) | |
| Small/Mid Cap Core Fund | $ 2,204,134 | $ 2,708,396 | $ 346,567 |
| Small/Mid Cap Growth Fund | 2,708,396 | 2,204,134 | (1,030,556) |
| GLOBAL OPPORTUNITIES FUND | Market Value 9/30/22 | Purchases at Cost | Sales Proceeds | Realized Gain (Loss) | Change in Unrealized Appr./(Depr.) | Market Value 3/31/23 | Dividend Income |
| Thornburg Capital Mgmt. Fund | $ 67,253,606 | $151,944,759 | $(199,241,573) | $ - | $ - | $ 19,956,792 | $ 943,557 |
March 31, 2023 (Unaudited)
| INTERNATIONAL EQUITY FUND | Market Value 9/30/22 | Purchases at Cost | Sales Proceeds | Realized Gain (Loss) | Change in Unrealized Appr./(Depr.) | Market Value 3/31/23 | Dividend Income |
| Thornburg Capital Mgmt. Fund | $201,533,193 | $379,265,405 | $(447,432,955) | $ - | $ - | $133,365,643 | $ 2,972,542 |
| BETTER WORLD INTERNATIONAL FUND | |||||||
| Thornburg Capital Mgmt. Fund | $ 21,444,036 | $125,199,868 | $(106,663,174) | $ - | $ - | $ 39,980,730 | $ 619,933 |
| INTERNATIONAL GROWTH FUND | |||||||
| Thornburg Capital Mgmt. Fund | $ 45,852,069 | $158,515,976 | $(189,693,801) | $ - | $ - | $ 14,674,244 | $ 527,361 |
| DEVELOPING WORLD FUND | |||||||
| Thornburg Capital Mgmt. Fund | $ 37,261,633 | $196,575,716 | $(195,466,697) | $ - | $ - | $ 38,370,652 | $ 626,956 |
| SMALL/MID CAP CORE FUND | |||||||
| Thornburg Capital Mgmt. Fund | $ 3,867,931 | $ 54,140,442 | $ (50,123,530) | $ - | $ - | $ 7,884,843 | $ 138,674 |
| SMALL/MID CAP GROWTH FUND | |||||||
| Thornburg Capital Mgmt. Fund | $ 4,533,328 | $ 40,589,920 | $ (43,023,029) | $ - | $ - | $ 2,100,219 | $ 58,800 |
| INCOME BUILDER FUND | |||||||
| Chimera Investment Corp | $ 90,396,363 | $ - | $ (1,338,406) | $(2,152,707) | $ 9,636,384 | $ 96,541,634 | $ 7,919,963 |
| Malamute Energy, Inc. | 12,439 | - | - | - | - | 12,439 | - |
| SLR Investment Corp | 53,073,328 | - | - | - | 11,717,488 | 64,790,816 | 3,532,487 |
| Thornburg Capital Mgmt. Fund | 519,970,522 | 575,453,926 | (873,646,458) | - | - | 221,777,990 | 6,916,661 |
| Total | $663,452,652 | $575,453,926 | $(874,984,864) | $(2,152,707) | $21,353,872 | $383,122,879 | $18,369,111 |
| SUMMIT FUND | |||||||
| Thornburg Capital Mgmt. Fund | $ 1,326,366 | $ 21,426,189 | $ (16,591,617) | $ - | $ - | $ 6,160,938 | $ 98,591 |
March 31, 2023 (Unaudited)
| Cost | Unrealized Appreciation | Unrealized Depreciation | Net Unrealized Appreciation (Depreciation) | |
| Global Opportunities Fund | $ 755,428,899 | $ 290,267,422 | $ (15,743,016) | $ 274,524,406 |
| International Equity Fund | 2,245,725,344 | 420,745,910 | (79,770,813) | 340,975,097 |
| Better World International Fund | 500,811,474 | 36,217,849 | (27,194,384) | 9,023,465 |
| International Growth Fund | 721,001,319 | 262,768,424 | (26,126,185) | 236,642,239 |
| Developing World Fund | 981,486,048 | 202,657,501 | (101,687,685) | 100,969,816 |
| Small/Mid Cap Core Fund | 510,687,009 | 75,932,211 | (59,313,065) | 16,619,146 |
| Small/Mid Cap Growth Fund | 274,619,158 | 34,675,076 | (31,573,806) | 3,101,270 |
| Income Builder Fund | 9,287,078,359 | 2,407,170,321 | (658,832,719) | 1,748,337,602 |
| Summit Fund | 68,852,203 | 5,703,436 | (2,133,910) | 3,569,526 |
| Deferred Tax Basis | ||
| Late-Year Ordinary Losses | Capital Losses | |
| Better World International Fund | $ — | $ 46,756,909 |
| International Growth Fund | 352,915 | 32,981,508 |
| Small/Mid Cap Core Fund | 587,843 | 25,633,462 |
| Small/Mid Cap Growth Fund | 3,114,180 | — |
| Cumulative Capital Losses | ||
| Short-Term | Long-Term | |
| International Equity Fund | $ 30,511,660 | $ — |
| Developing World Fund | 115,291,488 | — |
| Small/Mid Cap Growth Fund | 37,655,259 | 50,463,381 |
| Income Builder Fund | 239,747,614 | — |
| Summit Fund | 1,011,960 | 291,143 |
March 31, 2023 (Unaudited)
| SIX MONTHS ENDED March 31, 2023 | YEAR ENDED September 30, 2022 | |||
| GLOBAL OPPORTUNITIES FUND | SHARES | AMOUNT | SHARES | AMOUNT |
| Class A Shares | ||||
| Shares sold | 1,136,683 | $ 34,815,427 | 974,446 | $ 32,677,548 |
| Shares issued to shareholders in reinvestment of dividends | 286,501 | 8,832,745 | 932,299 | 33,290,506 |
| Shares repurchased | (822,022) | (25,849,485) | (1,066,676) | (36,104,291) |
| Net increase (decrease) | 601,162 | $ 17,798,687 | 840,069 | $ 29,863,763 |
| Class C Shares | ||||
| Shares sold | 44,973 | $ 1,310,560 | 91,768 | $ 2,937,754 |
| Shares issued to shareholders in reinvestment of dividends | 66,415 | 1,933,568 | 402,531 | 13,579,745 |
| Shares repurchased | (600,236) | (17,924,595) | (1,061,887) | (33,936,198) |
| Net increase (decrease) | (488,848) | $ (14,680,467) | (567,588) | $ (17,418,699) |
| Class I Shares | ||||
| Shares sold | 4,956,631 | $ 151,457,275 | 3,320,142 | $ 113,814,310 |
| Shares issued to shareholders in reinvestment of dividends | 667,251 | 20,667,164 | 2,086,899 | 74,888,020 |
| Shares repurchased | (2,560,378) | (79,520,367) | (4,751,990) | (158,005,927) |
| Net increase (decrease) | 3,063,504 | $ 92,604,072 | 655,051 | $ 30,696,403 |
| Class R3 Shares | ||||
| Shares sold | 6,719 | $ 207,425 | 16,133 | $ 526,960 |
| Shares issued to shareholders in reinvestment of dividends | 3,300 | 100,393 | 13,696 | 482,287 |
| Shares repurchased | (10,087) | (311,614) | (30,694) | (1,020,172) |
| Net increase (decrease) | (68) | $ (3,796) | (865) | $ (10,925) |
| Class R4 Shares | ||||
| Shares sold | 12,300 | $ 373,589 | 21,583 | $ 717,640 |
| Shares issued to shareholders in reinvestment of dividends | 4,888 | 149,433 | 17,674 | 625,825 |
| Shares repurchased | (19,261) | (607,934) | (31,449) | (1,046,960) |
| Net increase (decrease) | (2,073) | $ (84,912) | 7,808 | $ 296,505 |
| Class R5 Shares | ||||
| Shares sold | 80,353 | $ 2,553,265 | 138,723 | $ 4,670,479 |
| Shares issued to shareholders in reinvestment of dividends | 18,221 | 565,110 | 63,528 | 2,282,290 |
| Shares repurchased | (96,521) | (3,027,322) | (170,169) | (5,914,065) |
| Net increase (decrease) | 2,053 | $ 91,053 | 32,082 | $ 1,038,704 |
March 31, 2023 (Unaudited)
| SIX MONTHS ENDED March 31, 2023 | YEAR ENDED September 30, 2022 | |||
| GLOBAL OPPORTUNITIES FUND | SHARES | AMOUNT | SHARES | AMOUNT |
| Class R6 Shares | ||||
| Shares sold | 38,532 | $ 1,223,798 | 101,369 | $ 3,757,080 |
| Shares issued to shareholders in reinvestment of dividends | 65,982 | 2,052,294 | 210,743 | 7,594,896 |
| Shares repurchased | (20,595) | (634,939) | (64,288) | (2,196,431) |
| Net increase (decrease) | 83,919 | $ 2,641,153 | 247,824 | $ 9,155,545 |
| SIX MONTHS ENDED March 31, 2023 | YEAR ENDED September 30, 2022 | |||
| INTERNATIONAL EQUITY FUND | SHARES | AMOUNT | SHARES | AMOUNT |
| Class A Shares | ||||
| Shares sold | 496,389 | $ 10,628,248 | 2,041,060 | $ 52,169,489 |
| Shares issued to shareholders in reinvestment of dividends | 272,209 | 5,792,603 | 2,401,673 | 64,165,504 |
| Shares repurchased | (1,915,992) | (40,253,186) | (4,666,655) | (109,084,663) |
| Net increase (decrease) | (1,147,394) | $ (23,832,335) | (223,922) | $ 7,250,330 |
| Class C Shares | ||||
| Shares sold | 25,878 | $ 455,627 | 67,920 | $ 1,516,672 |
| Shares issued to shareholders in reinvestment of dividends | 9,319 | 170,731 | 147,243 | 3,385,937 |
| Shares repurchased | (135,391) | (2,463,277) | (398,808) | (8,405,488) |
| Net increase (decrease) | (100,194) | $ (1,836,919) | (183,645) | $ (3,502,879) |
| Class I Shares | ||||
| Shares sold | 5,280,472 | $ 119,407,432 | 12,619,730 | $ 312,476,672 |
| Shares issued to shareholders in reinvestment of dividends | 1,155,316 | 25,578,700 | 8,538,732 | 237,811,796 |
| Shares repurchased | (10,201,569) | (221,452,862) | (22,012,027) | (534,663,559) |
| Net increase (decrease) | (3,765,781) | $ (76,466,730) | (853,565) | $ 15,624,909 |
| Class R3 Shares | ||||
| Shares sold | 373,555 | $ 7,974,099 | 912,200 | $ 20,606,533 |
| Shares issued to shareholders in reinvestment of dividends | 86,320 | 1,835,165 | 740,732 | 19,783,311 |
| Shares repurchased | (749,658) | (16,029,167) | (1,592,391) | (37,291,918) |
| Net increase (decrease) | (289,783) | $ (6,219,903) | 60,541 | $ 3,097,926 |
| Class R4 Shares | ||||
| Shares sold | 817,407 | $ 17,034,587 | 1,113,079 | $ 25,625,006 |
| Shares issued to shareholders in reinvestment of dividends | 60,137 | 1,265,884 | 420,162 | 11,128,522 |
| Shares repurchased | (592,301) | (12,534,557) | (1,327,502) | (31,465,982) |
| Net increase (decrease) | 285,243 | $ 5,765,914 | 205,739 | $ 5,287,546 |
| Class R5 Shares | ||||
| Shares sold | 378,252 | $ 8,502,553 | 767,101 | $ 18,825,543 |
| Shares issued to shareholders in reinvestment of dividends | 87,952 | 1,945,490 | 717,832 | 19,976,446 |
| Shares repurchased | (603,881) | (13,467,512) | (2,284,897) | (55,348,975) |
| Net increase (decrease) | (137,677) | $ (3,019,469) | (799,964) | $ (16,546,986) |
March 31, 2023 (Unaudited)
| SIX MONTHS ENDED March 31, 2023 | YEAR ENDED September 30, 2022 | |||
| INTERNATIONAL EQUITY FUND | SHARES | AMOUNT | SHARES | AMOUNT |
| Class R6 Shares | ||||
| Shares sold | 1,117,472 | $ 24,946,819 | 2,573,099 | $ 61,671,850 |
| Shares issued to shareholders in reinvestment of dividends | 243,087 | 5,347,922 | 1,437,278 | 39,828,164 |
| Shares repurchased | (1,719,221) | (37,804,950) | (2,268,264) | (53,193,858) |
| Net increase (decrease) | (358,662) | $ (7,510,209) | 1,742,113 | $ 48,306,156 |
| SIX MONTHS ENDED March 31, 2023 | YEAR ENDED September 30, 2022 | |||
| BETTER WORLD INTERNATIONAL FUND | SHARES | AMOUNT | SHARES | AMOUNT |
| Class A Shares | ||||
| Shares sold | 438,205 | $ 6,765,222 | 1,582,515 | $ 28,147,344 |
| Shares issued to shareholders in reinvestment of dividends | 7,172 | 109,299 | 294,897 | 5,729,841 |
| Shares repurchased | (345,784) | (5,314,923) | (1,303,757) | (22,226,153) |
| Net increase (decrease) | 99,593 | $ 1,559,598 | 573,655 | $ 11,651,032 |
| Class C Shares | ||||
| Shares sold | 49,270 | $ 752,375 | 109,442 | $ 1,929,300 |
| Shares issued to shareholders in reinvestment of dividends | - | - | 41,038 | 780,125 |
| Shares repurchased | (36,732) | (536,375) | (80,971) | (1,365,897) |
| Net increase (decrease) | 12,538 | $ 216,000 | 69,509 | $ 1,343,528 |
| Class I Shares | ||||
| Shares sold | 6,912,240 | $ 110,559,830 | 19,799,712 | $ 351,052,279 |
| Shares issued to shareholders in reinvestment of dividends | 207,000 | 3,245,758 | 2,124,211 | 42,507,949 |
| Shares repurchased | (4,547,910) | (70,701,231) | (10,767,532) | (182,655,360) |
| Net increase (decrease) | 2,571,330 | $ 43,104,357 | 11,156,391 | $ 210,904,868 |
| SIX MONTHS ENDED March 31, 2023 | YEAR ENDED September 30, 2022 | |||
| INTERNATIONAL GROWTH FUND | SHARES | AMOUNT | SHARES | AMOUNT |
| Class A Shares | ||||
| Shares sold | 270,018 | $ 5,624,810 | 962,327 | $ 24,783,568 |
| Shares issued to shareholders in reinvestment of dividends | 11,150 | 232,369 | 318,951 | 9,348,439 |
| Shares repurchased | (799,888) | (16,513,588) | (1,660,999) | (40,413,470) |
| Net increase (decrease) | (518,720) | $ (10,656,409) | (379,721) | $ (6,281,463) |
| Class C Shares | ||||
| Shares sold | 4,267 | $ 75,791 | 37,981 | $ 909,671 |
| Shares issued to shareholders in reinvestment of dividends | - | - | 68,485 | 1,812,795 |
| Shares repurchased | (141,221) | (2,618,501) | (447,856) | (9,750,254) |
| Net increase (decrease) | (136,954) | $ (2,542,710) | (341,390) | $ (7,027,788) |
| Class I Shares | ||||
| Shares sold | 2,796,371 | $ 60,362,953 | 10,967,456 | $ 282,718,001 |
| Shares issued to shareholders in reinvestment of dividends | 221,806 | 4,795,444 | 2,988,849 | 90,890,906 |
| Shares repurchased | (10,554,696) | (227,366,994) | (26,337,373) | (664,342,965) |
| Net increase (decrease) | (7,536,519) | $ (162,208,597) | (12,381,068) | $ (290,734,058) |
March 31, 2023 (Unaudited)
| SIX MONTHS ENDED March 31, 2023 | YEAR ENDED September 30, 2022 | |||
| INTERNATIONAL GROWTH FUND | SHARES | AMOUNT | SHARES | AMOUNT |
| Class R3 Shares | ||||
| Shares sold | 19,677 | $ 408,067 | 38,455 | $ 901,733 |
| Shares issued to shareholders in reinvestment of dividends | 351 | 7,201 | 17,128 | 493,619 |
| Shares repurchased | (48,375) | (950,087) | (69,584) | (1,654,476) |
| Net increase (decrease) | (28,347) | $ (534,819) | (14,001) | $ (259,124) |
| Class R4 Shares | ||||
| Shares sold | 23,720 | $ 493,202 | 117,683 | $ 2,910,598 |
| Shares issued to shareholders in reinvestment of dividends | 545 | 11,257 | 11,821 | 343,404 |
| Shares repurchased | (55,419) | (1,134,285) | (89,929) | (2,155,296) |
| Net increase (decrease) | (31,154) | $ (629,826) | 39,575 | $ 1,098,706 |
| Class R5 Shares | ||||
| Shares sold | 69,961 | $ 1,550,285 | 210,329 | $ 5,124,797 |
| Shares issued to shareholders in reinvestment of dividends | 7,816 | 169,448 | 74,090 | 2,260,498 |
| Shares repurchased | (134,834) | (2,921,164) | (327,159) | (8,309,852) |
| Net increase (decrease) | (57,057) | $ (1,201,431) | (42,740) | $ (924,557) |
| Class R6 Shares | ||||
| Shares sold | 105,980 | $ 2,330,457 | 235,553 | $ 6,055,870 |
| Shares issued to shareholders in reinvestment of dividends | 25,612 | 557,839 | 210,948 | 6,463,441 |
| Shares repurchased | (225,640) | (4,980,660) | (371,500) | (9,188,907) |
| Net increase (decrease) | (94,048) | $ (2,092,364) | 75,001 | $ 3,330,404 |
| SIX MONTHS ENDED March 31, 2023 | YEAR ENDED September 30, 2022 | |||
| DEVELOPING WORLD FUND | SHARES | AMOUNT | SHARES | AMOUNT |
| Class A Shares | ||||
| Shares sold | 441,014 | $ 8,823,703 | 1,354,097 | $ 32,648,557 |
| Shares issued to shareholders in reinvestment of dividends | 60,652 | 1,196,665 | - | - |
| Shares repurchased | (606,660) | (11,981,944) | (1,352,523) | (31,625,279) |
| Net increase (decrease) | (104,994) | $ (1,961,576) | 1,574 | $ 1,023,278 |
| Class C Shares | ||||
| Shares sold | 39,120 | $ 715,539 | 115,696 | $ 2,715,472 |
| Shares issued to shareholders in reinvestment of dividends | 2,206 | 40,950 | - | - |
| Shares repurchased | (239,660) | (4,468,697) | (702,621) | (16,138,477) |
| Net increase (decrease) | (198,334) | $ (3,712,208) | (586,925) | $ (13,423,005) |
| Class I Shares | ||||
| Shares sold | 9,738,434 | $ 202,430,900 | 19,508,504 | $ 457,205,551 |
| Shares issued to shareholders in reinvestment of dividends | 680,314 | 13,735,542 | - | - |
| Shares repurchased | (8,497,207) | (171,909,221) | (11,471,300) | (271,018,980) |
| Net increase (decrease) | 1,921,541 | $ 44,257,221 | 8,037,204 | $ 186,186,571 |
March 31, 2023 (Unaudited)
| SIX MONTHS ENDED March 31, 2023 | YEAR ENDED September 30, 2022 | |||
| DEVELOPING WORLD FUND | SHARES | AMOUNT | SHARES | AMOUNT |
| Class R5 Shares | ||||
| Shares sold | 54,664 | $ 1,057,377 | 25,218 | $ 621,172 |
| Shares issued to shareholders in reinvestment of dividends | 2,871 | 57,789 | - | - |
| Shares repurchased | (15,351) | (302,563) | (45,654) | (1,159,050) |
| Net increase (decrease) | 42,184 | $ 812,603 | (20,436) | $ (537,878) |
| Class R6 Shares | ||||
| Shares sold | 270,845 | $ 5,594,901 | 456,652 | $ 11,372,017 |
| Shares issued to shareholders in reinvestment of dividends | 50,092 | 1,013,358 | - | - |
| Shares repurchased | (190,022) | (3,890,017) | (350,216) | (8,377,883) |
| Net increase (decrease) | 130,915 | $ 2,718,242 | 106,436 | $ 2,994,134 |
| SIX MONTHS ENDED March 31, 2023 | YEAR ENDED September 30, 2022 | |||
| SMALL/MID CAP CORE FUND | SHARES | AMOUNT | SHARES | AMOUNT |
| Class A Shares | ||||
| Shares sold | 44,494 | $ 2,661,944 | 217,480 | $ 15,364,294 |
| Shares issued to shareholders in reinvestment of dividends | 2,209 | 130,588 | 1,546,880 | 116,587,733 |
| Shares repurchased | (404,758) | (24,160,635) | (1,122,476) | (80,057,621) |
| Net increase (decrease) | (358,055) | $ (21,368,103) | 641,884 | $ 51,894,406 |
| Class C Shares | ||||
| Shares sold | 2,348 | $ 121,077 | 3,664 | $ 220,812 |
| Shares issued to shareholders in reinvestment of dividends | - | - | 74,225 | 4,803,824 |
| Shares repurchased | (34,120) | (1,736,104) | (118,480) | (7,405,754) |
| Net increase (decrease) | (31,772) | $ (1,615,027) | (40,591) | $ (2,381,118) |
| Class I Shares | ||||
| Shares sold | 52,725 | $ 3,323,150 | 171,464 | $ 13,046,450 |
| Shares issued to shareholders in reinvestment of dividends | 16,489 | 1,017,848 | 1,089,536 | 85,936,055 |
| Shares repurchased | (334,753) | (20,878,052) | (978,338) | (72,258,824) |
| Net increase (decrease) | (265,539) | $ (16,537,054) | 282,662 | $ 26,723,681 |
| Class R3 Shares | ||||
| Shares sold | 14,177 | $ 838,155 | 24,799 | $ 1,702,857 |
| Shares issued to shareholders in reinvestment of dividends | 266 | 15,650 | 81,262 | 6,082,567 |
| Shares repurchased | (29,991) | (1,780,841) | (105,446) | (7,610,302) |
| Net increase (decrease) | (15,548) | $ (927,036) | 615 | $ 175,122 |
| Class R4 Shares | ||||
| Shares sold | 3,167 | $ 190,863 | 11,684 | $ 827,543 |
| Shares issued to shareholders in reinvestment of dividends | 107 | 6,387 | 14,252 | 1,084,494 |
| Shares repurchased | (7,256) | (452,348) | (20,168) | (1,438,625) |
| Net increase (decrease) | (3,982) | $ (255,098) | 5,768 | $ 473,412 |
March 31, 2023 (Unaudited)
| SIX MONTHS ENDED March 31, 2023 | YEAR ENDED September 30, 2022 | |||
| SMALL/MID CAP CORE FUND | SHARES | AMOUNT | SHARES | AMOUNT |
| Class R5 Shares | ||||
| Shares sold | 5,819 | $ 362,762 | 11,303 | $ 807,519 |
| Shares issued to shareholders in reinvestment of dividends | 485 | 29,855 | 46,107 | 3,628,979 |
| Shares repurchased | (13,189) | (831,139) | (97,834) | (7,103,709) |
| Net increase (decrease) | (6,885) | $ (438,522) | (40,424) | $ (2,667,211) |
| SIX MONTHS ENDED March 31, 2023 | YEAR ENDED September 30, 2022 | |||
| SMALL/MID CAP GROWTH FUND | SHARES | AMOUNT | SHARES | AMOUNT |
| Class A Shares | ||||
| Shares sold | 92,010 | $ 2,041,349 | 479,005 | $ 15,626,745 |
| Shares issued to shareholders in reinvestment of dividends | - | - | 3,054,719 | 110,183,728 |
| Shares repurchased | (1,113,489) | (24,717,028) | (3,145,771) | (92,472,572) |
| Net increase (decrease) | (1,021,479) | $ (22,675,679) | 387,953 | $ 33,337,901 |
| Class C Shares | ||||
| Shares sold | 3,501 | $ 57,207 | 33,600 | $ 727,603 |
| Shares issued to shareholders in reinvestment of dividends | - | - | 334,608 | 8,877,148 |
| Shares repurchased | (90,226) | (1,461,034) | (555,269) | (12,939,363) |
| Net increase (decrease) | (86,725) | $ (1,403,827) | (187,061) | $ (3,334,612) |
| Class I Shares | ||||
| Shares sold | 87,869 | $ 2,214,940 | 850,566 | $ 47,437,538 |
| Shares issued to shareholders in reinvestment of dividends | - | - | 2,318,105 | 95,714,556 |
| Shares repurchased | (554,063) | (14,176,886) | (3,340,551) | (118,713,560) |
| Net increase (decrease) | (466,194) | $ (11,961,946) | (171,880) | $ 24,438,534 |
| Class R3 Shares | ||||
| Shares sold | 36,092 | $ 791,821 | 78,566 | $ 2,122,092 |
| Shares issued to shareholders in reinvestment of dividends | - | - | 257,207 | 9,092,273 |
| Shares repurchased | (97,193) | (2,093,349) | (181,644) | (5,129,736) |
| Net increase (decrease) | (61,101) | $ (1,301,528) | 154,129 | $ 6,084,629 |
| Class R4 Shares | ||||
| Shares sold | 3,837 | $ 86,871 | 11,058 | $ 326,875 |
| Shares issued to shareholders in reinvestment of dividends | - | - | 13,941 | 504,087 |
| Shares repurchased | (1,812) | (42,203) | (12,824) | (403,205) |
| Net increase (decrease) | 2,025 | $ 44,668 | 12,175 | $ 427,757 |
| Class R5 Shares | ||||
| Shares sold | 21,646 | $ 554,103 | 46,825 | $ 1,617,763 |
| Shares issued to shareholders in reinvestment of dividends | - | - | 159,882 | 6,590,335 |
| Shares repurchased | (97,799) | (2,544,922) | (231,439) | (7,667,005) |
| Net increase (decrease) | (76,153) | $ (1,990,819) | (24,732) | $ 541,093 |
March 31, 2023 (Unaudited)
| SIX MONTHS ENDED March 31, 2023 | YEAR ENDED September 30, 2022 | |||
| INCOME BUILDER FUND | SHARES | AMOUNT | SHARES | AMOUNT |
| Class A Shares | ||||
| Shares sold | 10,129,331 | $ 217,355,981 | 20,452,673 | $ 471,778,955 |
| Shares issued to shareholders in reinvestment of dividends | 4,492,659 | 96,066,174 | 8,182,741 | 184,957,591 |
| Shares repurchased | (13,273,033) | (283,818,664) | (23,393,696) | (533,787,843) |
| Net increase (decrease) | 1,348,957 | $ 29,603,491 | 5,241,718 | $ 122,948,703 |
| Class C Shares | ||||
| Shares sold | 1,369,239 | $ 29,445,747 | 3,169,422 | $ 73,205,279 |
| Shares issued to shareholders in reinvestment of dividends | 652,414 | 13,931,305 | 1,480,354 | 33,671,970 |
| Shares repurchased | (6,043,440) | (129,164,450) | (15,161,446) | (349,728,724) |
| Net increase (decrease) | (4,021,787) | $ (85,787,398) | (10,511,670) | $ (242,851,475) |
| Class I Shares | ||||
| Shares sold | 31,704,387 | $ 691,008,295 | 43,401,332 | $ 1,001,318,903 |
| Shares issued to shareholders in reinvestment of dividends | 7,317,043 | 157,629,324 | 13,008,019 | 295,975,824 |
| Shares repurchased | (24,472,848) | (525,404,119) | (40,351,846) | (925,057,512) |
| Net increase (decrease) | 14,548,582 | $ 323,233,500 | 16,057,505 | $ 372,237,215 |
| Class R3 Shares | ||||
| Shares sold | 40,997 | $ 890,132 | 109,253 | $ 2,539,813 |
| Shares issued to shareholders in reinvestment of dividends | 25,246 | 539,591 | 50,372 | 1,139,554 |
| Shares repurchased | (149,959) | (3,231,957) | (214,599) | (4,846,144) |
| Net increase (decrease) | (83,716) | $ (1,802,234) | (54,974) | $ (1,166,777) |
| Class R4 Shares | ||||
| Shares sold | 35,020 | $ 752,608 | 74,259 | $ 1,699,300 |
| Shares issued to shareholders in reinvestment of dividends | 12,256 | 262,320 | 23,766 | 538,409 |
| Shares repurchased | (37,057) | (802,383) | (123,516) | (2,772,170) |
| Net increase (decrease) | 10,219 | $ 212,545 | (25,491) | $ (534,461) |
| Class R5 Shares | ||||
| Shares sold | 116,537 | $ 2,518,742 | 319,714 | $ 7,363,065 |
| Shares issued to shareholders in reinvestment of dividends | 29,352 | 631,933 | 58,724 | 1,342,082 |
| Shares repurchased | (652,980) | (14,595,581) | (539,290) | (12,709,352) |
| Net increase (decrease) | (507,091) | $ (11,444,906) | (160,852) | $ (4,004,205) |
| Class R6 Shares | ||||
| Shares sold | 1,055,150 | $ 22,934,416 | 2,015,040 | $ 45,266,210 |
| Shares issued to shareholders in reinvestment of dividends | 199,271 | 4,278,881 | 282,496 | 6,359,945 |
| Shares repurchased | (167,612) | (3,629,962) | (286,739) | (6,627,495) |
| Net increase (decrease) | 1,086,809 | $ 23,583,335 | 2,010,797 | $ 44,998,660 |
March 31, 2023 (Unaudited)
| SIX MONTHS ENDED March 31, 2023 | YEAR ENDED September 30, 2022 | |||
| SUMMIT FUND | SHARES | AMOUNT | SHARES | AMOUNT |
| Class A Shares† | ||||
| Shares sold | 293,971 | $ 3,261,075 | 55,966 | $ 640,846 |
| Shares issued to shareholders in reinvestment of dividends | 2,189 | 24,333 | 561 | 6,137 |
| Shares repurchased | (25,688) | (284,547) | (7,383) | (81,922) |
| Net increase (decrease) | 270,472 | $ 3,000,861 | 49,144 | $ 565,061 |
| Class I Shares | ||||
| Shares sold | 816,967 | $ 9,050,449 | 932,567 | $ 11,328,129 |
| Shares issued to shareholders in reinvestment of dividends | 63,028 | 700,567 | 858,759 | 10,674,300 |
| Shares repurchased | (323,082) | (3,596,066) | (740,432) | (8,263,980) |
| Net increase (decrease) | 556,913 | $ 6,154,950 | 1,050,894 | $ 13,738,449 |
| † Effective date of this class of shares was January 26, 2022. | ||||
| Purchases | Sales | |
| Global Opportunities Fund | $ 247,248,617 | $ 119,537,815 |
| International Equity Fund | 568,706,037 | 629,575,139 |
| Better World International Fund | 219,702,241 | 192,447,038 |
| International Growth Fund | 156,352,411 | 302,244,929 |
| Developing World Fund | 180,059,793 | 136,025,407 |
| Small/Mid Cap Core Fund | 74,730,078 | 122,878,339 |
| Small/Mid Cap Growth Fund | 54,350,281 | 93,810,194 |
| Income Builder Fund | 1,118,061,787 | 671,316,792 |
| Summit Fund | 34,855,602 | 30,367,996 |
March 31, 2023 (Unaudited)
March 31, 2023 (Unaudited)
| Type of Derivative(a) | Counter Party | Asset Derivatives | Liability Derivatives | Net Amount | |
| Global Opportunities Fund | Forward currency contracts | SSB | $ — | $ (917,460) | $ (917,460) |
| Forward currency contracts | BBH | — | (729,375) | (729,375) | |
| $ — | $ (1,646,835) | $ (1,646,835) | |||
| Income Builder Fund | Forward currency contracts | SSB | — | (16,855,490) | (16,855,490) |
| Forward currency contracts | BBH | — | (8,744,242) | (8,744,242) | |
| $ — | $ (25,599,732) | $ (25,599,732) | |||
| Summit Fund | Forward currency contracts | SSB | — | (7,717) | (7,717) |
| Forward currency contracts | MSC | — | (51,984) | (51,984) | |
| $ — | $ (59,701) | $ (59,701) |
| (a) | Generally, the Statement of Assets and Liabilities location for forward currency contracts is Assets - Unrealized appreciation on forward currency contracts for asset derivatives and Liabilities - Unrealized depreciation on forward currency contracts for liabilities derivatives. |
| Net Realized | Net Change in Unrealized | ||||
| Type of Derivative(a) | Gain (Loss) | Appreciation (Depreciation) | |||
| Global Opportunities Fund | Forward currency contracts | $ (3,092,251) | $ (7,282,152) | ||
| Income Builder Fund | Forward currency contracts | (58,881,461) | (128,732,363) | ||
| Summit Fund | Forward currency contracts | 91,949 | 113,394 |
| (a) | Generally, the Statement of Operations location for forward currency contracts is Net realized gain (loss) on: forward currency contracts and Net change in unrealized appreciation (depreciation) on: forward currency contracts. |
Global Opportunities Fund
| PER SHARE PERFORMANCE (FOR A SHARE OUTSTANDING THROUGHOUT THE PERIOD) | |||||||||
| UNLESS OTHERWISE NOTED, PERIODS ARE FISCAL YEARS ENDED SEPTEMBER 30, | Net Asset Value, Beginning of PERIOD | Net Investment Income (Loss)+ | Net Realized & Unrealized Gain (Loss) on Investments | Total from Investment Operations | Dividends from Net Investment Income | Dividends from Net Realized Gains | Dividends from Return of Capital | Total Dividends | Net Asset Value, End of PERIOD |
| CLASS A SHARES(c) | |||||||||
| 2023 (d) | $ 27.76 | 0.22 | 5.20 | 5.42 | (0.36) | (0.79) | — | (1.15) | $ 32.03 |
| 2022 | $ 39.32 | 0.28 | (6.80) | (6.52) | (0.49) | (4.55) | — | (5.04) | $ 27.76 |
| 2021 | $ 31.69 | 0.53 | 9.40 | 9.93 | — (f) | (2.30) | — | (2.30) | $ 39.32 |
| 2020 | $ 27.56 | 0.08 | 4.47 | 4.55 | (0.14) | (0.28) | — | (0.42) | $ 31.69 |
| 2019 | $ 29.93 | 0.20 | (2.02) | (1.82) | (0.55) | — | — | (0.55) | $ 27.56 |
| 2018 | $ 30.98 | 0.44 | (1.42) | (0.98) | (0.07) | — | — | (0.07) | $ 29.93 |
| CLASS C SHARES | |||||||||
| 2023 (d) | $ 26.21 | 0.10 | 4.91 | 5.01 | (0.06) | (0.79) | — | (0.85) | $ 30.37 |
| 2022 | $ 37.36 | — (g) | (6.41) | (6.41) | (0.19) | (4.55) | — | (4.74) | $ 26.21 |
| 2021 | $ 30.44 | 0.22 | 9.00 | 9.22 | — | (2.30) | — | (2.30) | $ 37.36 |
| 2020 | $ 26.55 | (0.14) | 4.31 | 4.17 | — | (0.28) | — | (0.28) | $ 30.44 |
| 2019 | $ 28.70 | (0.01) | (1.89) | (1.90) | (0.25) | — | — | (0.25) | $ 26.55 |
| 2018 | $ 29.88 | 0.23 | (1.39) | (1.16) | (0.02) | — | — | (0.02) | $ 28.70 |
| CLASS I SHARES | |||||||||
| 2023 (d) | $ 27.91 | 0.27 | 5.22 | 5.49 | (0.45) | (0.79) | — | (1.24) | $ 32.16 |
| 2022 | $ 39.49 | 0.39 | (6.83) | (6.44) | (0.59) | (4.55) | — | (5.14) | $ 27.91 |
| 2021 | $ 31.81 | 0.64 | 9.43 | 10.07 | (0.09) | (2.30) | — | (2.39) | $ 39.49 |
| 2020 | $ 27.67 | 0.15 | 4.50 | 4.65 | (0.23) | (0.28) | — | (0.51) | $ 31.81 |
| 2019 | $ 30.07 | 0.29 | (2.04) | (1.75) | (0.65) | — | — | (0.65) | $ 27.67 |
| 2018 | $ 31.06 | 0.56 | (1.45) | (0.89) | (0.10) | — | — | (0.10) | $ 30.07 |
| CLASS R3 SHARES | |||||||||
| 2023 (d) | $ 27.37 | 0.19 | 5.13 | 5.32 | (0.27) | (0.79) | — | (1.06) | $ 31.63 |
| 2022 | $ 38.81 | 0.20 | (6.69) | (6.49) | (0.40) | (4.55) | — | (4.95) | $ 27.37 |
| 2021 | $ 31.38 | 0.42 | 9.31 | 9.73 | — | (2.30) | — | (2.30) | $ 38.81 |
| 2020 | $ 27.28 | 0.01 | 4.42 | 4.43 | (0.05) | (0.28) | — | (0.33) | $ 31.38 |
| 2019 | $ 29.57 | 0.15 | (1.98) | (1.83) | (0.46) | — | — | (0.46) | $ 27.28 |
| 2018 | $ 30.66 | 0.38 | (1.41) | (1.03) | (0.06) | — | — | (0.06) | $ 29.57 |
| CLASS R4 SHARES | |||||||||
| 2023 (d) | $ 27.53 | 0.20 | 5.15 | 5.35 | (0.32) | (0.79) | — | (1.11) | $ 31.77 |
| 2022 | $ 39.01 | 0.24 | (6.73) | (6.49) | (0.44) | (4.55) | — | (4.99) | $ 27.53 |
| 2021 | $ 31.50 | 0.49 | 9.32 | 9.81 | — | (2.30) | — | (2.30) | $ 39.01 |
| 2020 | $ 27.32 | 0.03 | 4.43 | 4.46 | — | (0.28) | — | (0.28) | $ 31.50 |
| 2019 | $ 29.62 | 0.19 | (2.00) | (1.81) | (0.49) | — | — | (0.49) | $ 27.32 |
| 2018 | $ 30.69 | 0.46 | (1.47) | (1.01) | (0.06) | — | — | (0.06) | $ 29.62 |
| CLASS R5 SHARES | |||||||||
| 2023 (d) | $ 27.95 | 0.27 | 5.23 | 5.50 | (0.45) | (0.79) | — | (1.24) | $ 32.21 |
| 2022 | $ 39.53 | 0.38 | (6.83) | (6.45) | (0.58) | (4.55) | — | (5.13) | $ 27.95 |
| 2021 | $ 31.84 | 0.61 | 9.47 | 10.08 | (0.09) | (2.30) | — | (2.39) | $ 39.53 |
| 2020 | $ 27.70 | 0.15 | 4.50 | 4.65 | (0.23) | (0.28) | — | (0.51) | $ 31.84 |
| 2019 | $ 30.10 | 0.28 | (2.02) | (1.74) | (0.66) | — | — | (0.66) | $ 27.70 |
| 2018 | $ 31.10 | 0.57 | (1.47) | (0.90) | (0.10) | — | — | (0.10) | $ 30.10 |
| CLASS R6 SHARES | |||||||||
| 2023 (d) | $ 28.03 | 0.29 | 5.24 | 5.53 | (0.49) | (0.79) | — | (1.28) | $ 32.28 |
| 2022 | $ 39.64 | 0.44 | (6.86) | (6.42) | (0.64) | (4.55) | — | (5.19) | $ 28.03 |
| 2021 | $ 31.93 | 0.70 | 9.44 | 10.14 | (0.13) | (2.30) | — | (2.43) | $ 39.64 |
| 2020 | $ 27.77 | 0.21 | 4.50 | 4.71 | (0.27) | (0.28) | — | (0.55) | $ 31.93 |
| 2019 | $ 30.20 | 0.32 | (2.05) | (1.73) | (0.70) | — | — | (0.70) | $ 27.77 |
| 2018 | $ 31.16 | 0.90 | (1.75) | (0.85) | (0.11) | — | — | (0.11) | $ 30.20 |
| (a) | Net investment income (loss) includes income from foreign withholding tax claims adjusted for IRS compliance fees and/or tax reclaim collection fees. Without these proceeds, the Net Investment Income (Loss) ratios for 2023 would have been: Class A, 1.38%; Class C, 0.65%; Class I, 1.67%; Class R3, 1.17%; Class R4, 1.27%; Class R5, 1.69%; Class R6, 1.81%, 2022 would have been: Class A, 0.79%; Class C, (0.04)%; Class I, 1.10%; Class R3, 0.56%; Class R4, 0.67%; Class R5, 1.08%; Class R6, 1.24% and 2021 would have been: Class A, 1.36%; Class C, 0.57%; Class I, 1.64%; Class R3, 1.10%; Class R4, 1.27%; Class R5, 1.60%; Class R6, 1.80%. |
| (b) | Not annualized for periods less than one year. |
| (c) | Sales loads are not reflected in computing total return. |
| (d) | Unaudited Six Month Period Ended March 31. |
| (e) | Annualized. |
| (f) | Dividends From Net Investment Income was less than 0.01. |
| (g) | Net investment income (loss) was less than $0.01 per share. |
| + | Based on weighted average shares outstanding. |
Global Opportunities Fund
| RATIOS TO AVERAGE NET ASSETS | Supplemental Data | ||||||
| UNLESS OTHERWISE NOTED, PERIODS ARE FISCAL YEARS ENDED SEPTEMBER 30, | Net Investment Income (Loss) (%)(a) | Expenses, After Expense Reductions (%) | Expenses, Before Expense Reductions (%) | Total Return (%)(b) | Portfolio Turnover Rate (%)(b) | Net Assets at End of PERIOD (Thousands) | |
| CLASS A SHARES(c) | |||||||
| 2023 (d) | 1.43 (e) | 1.28 (e) | 1.33 (e) | 19.69 | 12.89 | $ 271,895 | |
| 2022 | 0.83 | 1.29 | 1.35 | (19.31) | 26.92 | $ 218,968 | |
| 2021 | 1.42 | 1.27 | 1.31 | 32.82 | 25.48 | $ 277,126 | |
| 2020 | 0.27 | 1.28 | 1.32 | 16.59 | 35.63 | $ 215,473 | |
| 2019 | 0.73 | 1.31 | 1.33 | (5.78) | 29.12 | $ 236,560 | |
| 2018 | 1.40 | 1.28 | 1.28 | (3.16) | 41.99 | $ 367,449 | |
| CLASS C SHARES | |||||||
| 2023 (d) | 0.70 (e) | 2.07 (e) | 2.11 (e) | 19.23 | 12.89 | $ 59,296 | |
| 2022 | — (g) | 2.06 | 2.11 | (19.94) | 26.92 | $ 63,994 | |
| 2021 | 0.63 | 2.04 | 2.08 | 31.77 | 25.48 | $ 112,420 | |
| 2020 | (0.49) | 2.02 | 2.06 | 15.78 | 35.63 | $ 116,705 | |
| 2019 | (0.02) | 2.07 | 2.09 | (6.49) | 29.12 | $ 151,469 | |
| 2018 | 0.78 | 2.03 | 2.03 | (3.90) | 41.99 | $ 253,907 | |
| CLASS I SHARES | |||||||
| 2023 (d) | 1.72 (e) | 0.99 (e) | 1.06 (e) | 19.86 | 12.89 | $ 612,675 | |
| 2022 | 1.14 | 0.99 | 1.06 | (19.06) | 26.92 | $ 446,228 | |
| 2021 | 1.69 | 0.99 | 1.06 | 33.17 | 25.48 | $ 605,581 | |
| 2020 | 0.50 | 0.99 | 1.08 | 16.91 | 35.63 | $ 523,175 | |
| 2019 | 1.05 | 0.99 | 1.06 | (5.46) | 29.12 | $ 762,697 | |
| 2018 | 1.79 | 0.97 | 0.97 | (2.88) | 41.99 | $ 1,200,267 | |
| CLASS R3 SHARES | |||||||
| 2023 (d) | 1.22 (e) | 1.50 (e) | 2.28 (e) | 19.60 | 12.89 | $ 3,048 | |
| 2022 | 0.61 | 1.50 | 2.40 | (19.47) | 26.92 | $ 2,639 | |
| 2021 | 1.15 | 1.50 | 2.07 | 32.48 | 25.48 | $ 3,776 | |
| 2020 | 0.03 | 1.50 | 2.00 | 16.32 | 35.63 | $ 3,633 | |
| 2019 | 0.55 | 1.50 | 2.20 | (5.95) | 29.12 | $ 4,317 | |
| 2018 | 1.22 | 1.50 | 1.92 | (3.38) | 41.99 | $ 7,577 | |
| CLASS R4 SHARES | |||||||
| 2023 (d) | 1.32 (e) | 1.40 (e) | 2.06 (e) | 19.60 | 12.89 | $ 5,212 | |
| 2022 | 0.72 | 1.40 | 2.09 | (19.37) | 26.92 | $ 4,573 | |
| 2021 | 1.32 | 1.40 | 1.83 | 32.62 | 25.48 | $ 6,177 | |
| 2020 | 0.09 | 1.40 | 1.62 | 16.41 | 35.63 | $ 5,093 | |
| 2019 | 0.71 | 1.40 | 1.86 | (5.84) | 29.12 | $ 9,254 | |
| 2018 | 1.49 | 1.40 | 1.61 | (3.29) | 41.99 | $ 20,786 | |
| CLASS R5 SHARES | |||||||
| 2023 (d) | 1.74 (e) | 0.99 (e) | 1.23 (e) | 19.86 | 12.89 | $ 17,942 | |
| 2022 | 1.12 | 0.99 | 1.38 | (19.06) | 26.92 | $ 15,512 | |
| 2021 | 1.64 | 0.99 | 1.36 | 33.18 | 25.48 | $ 20,673 | |
| 2020 | 0.53 | 0.99 | 1.28 | 16.89 | 35.63 | $ 32,817 | |
| 2019 | 1.04 | 0.99 | 1.27 | (5.45) | 29.12 | $ 42,354 | |
| 2018 | 1.82 | 0.99 | 1.16 | (2.92) | 41.99 | $ 70,084 | |
| CLASS R6 SHARES | |||||||
| 2023 (d) | 1.86 (e) | 0.85 (e) | 1.02 (e) | 19.94 | 12.89 | $ 57,182 | |
| 2022 | 1.28 | 0.85 | 1.03 | (18.95) | 26.92 | $ 47,300 | |
| 2021 | 1.85 | 0.85 | 1.00 | 33.32 | 25.48 | $ 57,072 | |
| 2020 | 0.70 | 0.85 | 1.03 | 17.08 | 35.63 | $ 43,911 | |
| 2019 | 1.17 | 0.85 | 1.00 | (5.34) | 29.12 | $ 45,699 | |
| 2018 | 2.93 | 0.85 | 0.98 | (2.75) | 41.99 | $ 51,836 | |
International Equity Fund
| PER SHARE PERFORMANCE (FOR A SHARE OUTSTANDING THROUGHOUT THE PERIOD) | |||||||||
| UNLESS OTHERWISE NOTED, PERIODS ARE FISCAL YEARS ENDED SEPTEMBER 30, | Net Asset Value, Beginning of PERIOD | Net Investment Income (Loss)+ | Net Realized & Unrealized Gain (Loss) on Investments | Total from Investment Operations | Dividends from Net Investment Income | Dividends from Net Realized Gains | Dividends from Return of Capital | Total Dividends | Net Asset Value, End of PERIOD |
| CLASS A SHARES(d) | |||||||||
| 2023 (e) | $ 18.19 | 0.13 | 4.96 | 5.09 | (0.36) | — | — | (0.36) | $ 22.92 |
| 2022 | $ 28.75 | 0.29 | (7.15) | (6.86) | (0.27) | (3.43) | — | (3.70) | $ 18.19 |
| 2021 | $ 24.78 | 0.31 | 4.49 | 4.80 | (0.06) | (0.77) | — | (0.83) | $ 28.75 |
| 2020 | $ 22.91 | 0.07 | 3.29 | 3.36 | (0.21) | (1.28) | — | (1.49) | $ 24.78 |
| 2019 | $ 22.69 | 0.19 | 0.31 | 0.50 | (0.28) | — | — | (0.28) | $ 22.91 |
| 2018 | $ 27.63 | 0.19 | (1.10) | (0.91) | — | (4.03) | — | (4.03) | $ 22.69 |
| CLASS C SHARES | |||||||||
| 2023 (e) | $ 15.61 | 0.04 | 4.24 | 4.28 | (0.21) | — | — | (0.21) | $ 19.68 |
| 2022 | $ 25.20 | 0.11 | (6.13) | (6.02) | (0.14) | (3.43) | — | (3.57) | $ 15.61 |
| 2021 | $ 21.91 | 0.06 | 4.00 | 4.06 | — | (0.77) | — | (0.77) | $ 25.20 |
| 2020 | $ 20.33 | (0.08) | 2.94 | 2.86 | — | (1.28) | — | (1.28) | $ 21.91 |
| 2019 | $ 20.01 | — (g) | 0.32 | 0.32 | — | — | — | — | $ 20.33 |
| 2018 | $ 25.00 | 0.02 | (0.98) | (0.96) | — | (4.03) | — | (4.03) | $ 20.01 |
| CLASS I SHARES | |||||||||
| 2023 (e) | $ 18.98 | 0.17 | 5.15 | 5.32 | (0.44) | — | — | (0.44) | $ 23.86 |
| 2022 | $ 29.88 | 0.41 | (7.47) | (7.06) | (0.41) | (3.43) | — | (3.84) | $ 18.98 |
| 2021 | $ 25.70 | 0.39 | 4.68 | 5.07 | (0.12) | (0.77) | — | (0.89) | $ 29.88 |
| 2020 | $ 23.69 | 0.15 | 3.42 | 3.57 | (0.28) | (1.28) | — | (1.56) | $ 25.70 |
| 2019 | $ 23.47 | 0.25 | 0.32 | 0.57 | (0.35) | — | — | (0.35) | $ 23.69 |
| 2018 | $ 28.37 | 0.29 | (1.15) | (0.86) | (0.01) | (4.03) | — | (4.04) | $ 23.47 |
| CLASS R3 SHARES | |||||||||
| 2023 (e) | $ 18.17 | 0.11 | 4.94 | 5.05 | (0.34) | — | — | (0.34) | $ 22.88 |
| 2022 | $ 28.75 | 0.27 | (7.16) | (6.89) | (0.26) | (3.43) | — | (3.69) | $ 18.17 |
| 2021 | $ 24.77 | 0.23 | 4.52 | 4.75 | — | (0.77) | — | (0.77) | $ 28.75 |
| 2020 | $ 22.89 | 0.03 | 3.29 | 3.32 | (0.16) | (1.28) | — | (1.44) | $ 24.77 |
| 2019 | $ 22.65 | 0.15 | 0.31 | 0.46 | (0.22) | — | — | (0.22) | $ 22.89 |
| 2018 | $ 27.63 | 0.14 | (1.09) | (0.95) | — | (4.03) | — | (4.03) | $ 22.65 |
| CLASS R4 SHARES | |||||||||
| 2023 (e) | $ 18.03 | 0.13 | 4.89 | 5.02 | (0.39) | — | — | (0.39) | $ 22.66 |
| 2022 | $ 28.56 | 0.32 | (7.10) | (6.78) | (0.32) | (3.43) | — | (3.75) | $ 18.03 |
| 2021 | $ 24.60 | 0.28 | 4.49 | 4.77 | (0.04) | (0.77) | — | (0.81) | $ 28.56 |
| 2020 | $ 22.74 | 0.07 | 3.27 | 3.34 | (0.20) | (1.28) | — | (1.48) | $ 24.60 |
| 2019 | $ 22.52 | 0.19 | 0.30 | 0.49 | (0.27) | — | — | (0.27) | $ 22.74 |
| 2018 | $ 27.45 | 0.20 | (1.10) | (0.90) | — | (4.03) | — | (4.03) | $ 22.52 |
| CLASS R5 SHARES | |||||||||
| 2023 (e) | $ 18.96 | 0.17 | 5.14 | 5.31 | (0.44) | — | — | (0.44) | $ 23.83 |
| 2022 | $ 29.84 | 0.39 | (7.44) | (7.05) | (0.40) | (3.43) | — | (3.83) | $ 18.96 |
| 2021 | $ 25.66 | 0.38 | 4.67 | 5.05 | (0.10) | (0.77) | — | (0.87) | $ 29.84 |
| 2020 | $ 23.67 | 0.13 | 3.42 | 3.55 | (0.28) | (1.28) | — | (1.56) | $ 25.66 |
| 2019 | $ 23.44 | 0.25 | 0.32 | 0.57 | (0.34) | — | — | (0.34) | $ 23.67 |
| 2018 | $ 28.35 | 0.27 | (1.15) | (0.88) | — (h) | (4.03) | — | (4.03) | $ 23.44 |
| CLASS R6 SHARES | |||||||||
| 2023 (e) | $ 18.89 | 0.19 | 5.13 | 5.32 | (0.49) | — | — | (0.49) | $ 23.72 |
| 2022 | $ 29.75 | 0.45 | (7.43) | (6.98) | (0.45) | (3.43) | — | (3.88) | $ 18.89 |
| 2021 | $ 25.59 | 0.44 | 4.65 | 5.09 | (0.16) | (0.77) | — | (0.93) | $ 29.75 |
| 2020 | $ 23.61 | 0.18 | 3.41 | 3.59 | (0.33) | (1.28) | — | (1.61) | $ 25.59 |
| 2019 | $ 23.40 | 0.31 | 0.29 | 0.60 | (0.39) | — | — | (0.39) | $ 23.61 |
| 2018 | $ 28.27 | 0.33 | (1.15) | (0.82) | (0.02) | (4.03) | — | (4.05) | $ 23.40 |
| (a) | Net investment income (loss) includes income from foreign withholding tax claims adjusted for IRS compliance fees and/or tax reclaim collection fees. Without these proceeds, the Net Investment Income (Loss) ratios for 2023 would have been: Class A, 1.52%; Class C, 0.67%; Class I, 1.75%; Class R3, 1.29%; Class R4, 1.54%; Class R5, 1.75%; Class R6, 1.95%, 2022 would have been: Class A, 1.20%; Class C, 0.52%; Class I, 1.61%; Class R3, 1.11%; Class R4, 1.32%; Class R5, 1.53%; Class R6, 1.80% and 2021 would have been: Class A, 0.99%; Class C, 0.16%; Class I, 1.23%; Class R3, 0.71%; Class R4, 0.90%; Class R5, 1.18%; Class R6, 1.40%. |
| (b) | Net expenses include tax reclaim collection fees that are excluded from the expense limitation agreement. If such expenses and fees had not occurred, the Expenses After Expense Reductions ratios for 2021 would have been: Class A, 1.25%; Class C, 1.96%; Class I, 0.94%; Class R3, 1.45%; Class R4, 1.25%; Class R5, 0.99%; Class R6, 0.79%. |
| (c) | Not annualized for periods less than one year. |
| (d) | Sales loads are not reflected in computing total return. |
| (e) | Unaudited Six Month Period Ended March 31. |
| (f) | Annualized. |
| (g) | Net investment income (loss) was less than $(0.01) per share. |
| (h) | Dividends from net investment income per share were less than $(0.01). |
| + | Based on weighted average shares outstanding. |
International Equity Fund
| RATIOS TO AVERAGE NET ASSETS | Supplemental Data | ||||||
| UNLESS OTHERWISE NOTED, PERIODS ARE FISCAL YEARS ENDED SEPTEMBER 30, | Net Investment Income (Loss) (%)(a) | Expenses, After Expense Reductions (%)(b) | Expenses, Before Expense Reductions (%) | Total Return (%)(c) | Portfolio Turnover Rate (%)(c) | Net Assets at End of PERIOD (Thousands) | |
| CLASS A SHARES(d) | |||||||
| 2023 (e) | 1.27 (f) | 1.12 (f) | 1.25 (f) | 28.07 | 25.08 | $ 401,518 | |
| 2022 | 1.25 | 1.30 | 1.38 | (27.88) | 48.88 | $ 339,638 | |
| 2021 | 1.07 | 1.58 | 1.58 | 19.66 | 42.85 | $ 543,262 | |
| 2020 | 0.31 | 1.25 | 1.26 | 15.33 | 79.05 | $ 825,677 | |
| 2019 | 0.86 | 1.26 | 1.26 | 2.47 | 71.09 | $ 655,807 | |
| 2018 | 0.77 | 1.27 | 1.27 | (4.13) | 44.41 | $ 782,371 | |
| CLASS C SHARES | |||||||
| 2023 (e) | 0.43 (f) | 1.95 (f) | 2.07 (f) | 27.55 | 25.08 | $ 15,651 | |
| 2022 | 0.56 | 1.96 | 2.05 | (28.38) | 48.88 | $ 13,978 | |
| 2021 | 0.24 | 2.26 | 2.26 | 18.83 | 42.85 | $ 27,189 | |
| 2020 | (0.40) | 1.93 | 1.94 | 14.69 | 79.05 | $ 44,594 | |
| 2019 | (0.02) | 2.09 | 2.09 | 1.60 | 71.09 | $ 81,401 | |
| 2018 | 0.07 | 2.02 | 2.02 | (4.86) | 44.41 | $ 159,789 | |
| CLASS I SHARES | |||||||
| 2023 (e) | 1.50 (f) | 0.88 (f) | 1.01 (f) | 28.25 | 25.08 | $ 1,487,474 | |
| 2022 | 1.66 | 0.90 | 1.00 | (27.64) | 48.88 | $ 1,254,672 | |
| 2021 | 1.32 | 1.24 | 1.24 | 20.05 | 42.85 | $ 2,000,723 | |
| 2020 | 0.64 | 0.92 | 0.93 | 15.74 | 79.05 | $ 1,713,358 | |
| 2019 | 1.11 | 0.97 | 0.97 | 2.76 | 71.09 | $ 1,694,780 | |
| 2018 | 1.15 | 0.91 | 0.91 | (3.81) | 44.41 | $ 2,462,564 | |
| CLASS R3 SHARES | |||||||
| 2023 (e) | 1.04 (f) | 1.36 (f) | 1.71 (f) | 27.93 | 25.08 | $ 120,282 | |
| 2022 | 1.16 | 1.40 | 1.70 | (27.97) | 48.88 | $ 100,783 | |
| 2021 | 0.80 | 1.75 | 1.91 | 19.46 | 42.85 | $ 157,724 | |
| 2020 | 0.12 | 1.45 | 1.58 | 15.11 | 79.05 | $ 152,764 | |
| 2019 | 0.67 | 1.45 | 1.65 | 2.25 | 71.09 | $ 164,437 | |
| 2018 | 0.59 | 1.45 | 1.64 | (4.29) | 44.41 | $ 213,007 | |
| CLASS R4 SHARES | |||||||
| 2023 (e) | 1.28 (f) | 1.16 (f) | 1.46 (f) | 28.00 | 25.08 | $ 94,257 | |
| 2022 | 1.37 | 1.19 | 1.50 | (27.81) | 48.88 | $ 69,822 | |
| 2021 | 0.99 | 1.55 | 1.70 | 19.69 | 42.85 | $ 104,735 | |
| 2020 | 0.30 | 1.25 | 1.32 | 15.35 | 79.05 | $ 102,266 | |
| 2019 | 0.88 | 1.25 | 1.44 | 2.45 | 71.09 | $ 125,363 | |
| 2018 | 0.81 | 1.25 | 1.47 | (4.11) | 44.41 | $ 164,663 | |
| CLASS R5 SHARES | |||||||
| 2023 (e) | 1.50 (f) | 0.90 (f) | 1.27 (f) | 28.18 | 25.08 | $ 105,432 | |
| 2022 | 1.57 | 0.94 | 1.28 | (27.60) | 48.88 | $ 86,468 | |
| 2021 | 1.26 | 1.29 | 1.46 | 19.97 | 42.85 | $ 160,007 | |
| 2020 | 0.55 | 0.99 | 1.02 | 15.64 | 79.05 | $ 133,705 | |
| 2019 | 1.10 | 0.99 | 1.12 | 2.74 | 71.09 | $ 153,366 | |
| 2018 | 1.06 | 0.99 | 1.17 | (3.87) | 44.41 | $ 229,485 | |
| CLASS R6 SHARES | |||||||
| 2023 (e) | 1.69 (f) | 0.70 (f) | 0.93 (f) | 28.35 | 25.08 | $ 297,185 | |
| 2022 | 1.85 | 0.73 | 0.92 | (27.47) | 48.88 | $ 243,442 | |
| 2021 | 1.49 | 1.09 | 1.18 | 20.21 | 42.85 | $ 331,621 | |
| 2020 | 0.78 | 0.79 | 0.90 | 15.90 | 79.05 | $ 250,391 | |
| 2019 | 1.37 | 0.79 | 0.88 | 2.95 | 71.09 | $ 219,441 | |
| 2018 | 1.33 | 0.79 | 0.83 | (3.68) | 44.41 | $ 457,006 | |
Better World International Fund
| PER SHARE PERFORMANCE (FOR A SHARE OUTSTANDING THROUGHOUT THE PERIOD) | |||||||||
| UNLESS OTHERWISE NOTED, PERIODS ARE FISCAL YEARS ENDED SEPTEMBER 30, | Net Asset Value, Beginning of PERIOD | Net Investment Income (Loss)+ | Net Realized & Unrealized Gain (Loss) on Investments | Total from Investment Operations | Dividends from Net Investment Income | Dividends from Net Realized Gains | Dividends from Return of Capital | Total Dividends | Net Asset Value, End of PERIOD |
| CLASS A SHARES(c) | |||||||||
| 2023 (d) | $ 13.48 | 0.05 | 2.92 | 2.97 | (0.04) | — | — | (0.04) | $ 16.41 |
| 2022 | $ 21.46 | 0.06 | (5.18) | (5.12) | — | (2.86) | — | (2.86) | $ 13.48 |
| 2021 | $ 15.66 | 0.01 | 5.79 | 5.80 | — | — | — | — | $ 21.46 |
| 2020 | $ 12.85 | — (f) | 2.90 | 2.90 | (0.09) | — | — | (0.09) | $ 15.66 |
| 2019 | $ 14.51 | 0.12 | (0.66) | (0.54) | (0.15) | (0.97) | — | (1.12) | $ 12.85 |
| 2018 | $ 14.13 | 0.09 | 0.66 | 0.75 | — | (0.37) | — | (0.37) | $ 14.51 |
| CLASS C SHARES | |||||||||
| 2023 (d) | $ 13.11 | (0.01) | 2.85 | 2.84 | — | — | — | — | $ 15.95 |
| 2022 | $ 21.08 | (0.07) | (5.04) | (5.11) | — | (2.86) | — | (2.86) | $ 13.11 |
| 2021 | $ 15.51 | (0.15) | 5.72 | 5.57 | — | — | — | — | $ 21.08 |
| 2020 | $ 12.72 | (0.08) | 2.88 | 2.80 | (0.01) | — | — | (0.01) | $ 15.51 |
| 2019 | $ 14.32 | 0.03 | (0.62) | (0.59) | (0.04) | (0.97) | — | (1.01) | $ 12.72 |
| 2018 | $ 14.02 | — (f) | 0.67 | 0.67 | — | (0.37) | — | (0.37) | $ 14.32 |
| CLASS I SHARES | |||||||||
| 2023 (d) | $ 13.93 | 0.10 | 3.01 | 3.11 | (0.14) | — | — | (0.14) | $ 16.90 |
| 2022 | $ 22.03 | 0.15 | (5.34) | (5.19) | (0.05) | (2.86) | — | (2.91) | $ 13.93 |
| 2021 | $ 16.06 | 0.11 | 5.93 | 6.04 | (0.07) | — | — | (0.07) | $ 22.03 |
| 2020 | $ 13.16 | 0.10 | 2.99 | 3.09 | (0.19) | — | — | (0.19) | $ 16.06 |
| 2019 | $ 14.83 | 0.20 | (0.67) | (0.47) | (0.23) | (0.97) | — | (1.20) | $ 13.16 |
| 2018 | $ 14.33 | 0.18 | 0.69 | 0.87 | — | (0.37) | — | (0.37) | $ 14.83 |
| (a) | Net investment income (loss) includes income from foreign withholding tax claims adjusted for IRS compliance fees and/or tax reclaim collection fees. Without these proceeds, the Net Investment Income (Loss) ratios for 2023 would have been: Class A, 0.61%; Class C, (0.11)%; Class I, 1.19%, 2022 would have been: Class A, 0.32%; Class C, (0.43)%; Class I, 0.88% and 2021 would have been: Class A, 0.04%; Class C, (0.78)%; Class I, 0.51%. |
| (b) | Not annualized for periods less than one year. |
| (c) | Sales loads are not reflected in computing total return. |
| (d) | Unaudited Six Month Period Ended March 31. |
| (e) | Annualized. |
| (f) | Net investment income (loss) was less than $0.01 per share. |
| + | Based on weighted average shares outstanding. |
Better World International Fund
| RATIOS TO AVERAGE NET ASSETS | Supplemental Data | ||||||
| UNLESS OTHERWISE NOTED, PERIODS ARE FISCAL YEARS ENDED SEPTEMBER 30, | Net Investment Income (Loss) (%)(a) | Expenses, After Expense Reductions (%) | Expenses, Before Expense Reductions (%) | Total Return (%)(b) | Portfolio Turnover Rate (%)(b) | Net Assets at End of PERIOD (Thousands) | |
| CLASS A SHARES(c) | |||||||
| 2023 (d) | 0.65 (e) | 1.46 (e) | 1.61 (e) | 22.02 | 46.10 | $ 41,855 | |
| 2022 | 0.34 | 1.47 | 1.58 | (27.93) | 140.89 | $ 33,050 | |
| 2021 | 0.05 | 1.57 | 1.57 | 37.04 | 119.96 | $ 40,287 | |
| 2020 | (0.02) | 1.83 | 1.94 | 22.65 | 42.87 | $ 11,859 | |
| 2019 | 0.91 | 1.82 | 2.10 | (3.19) | 62.33 | $ 9,378 | |
| 2018 | 0.64 | 1.82 | 2.12 | 5.37 | 111.99 | $ 8,537 | |
| CLASS C SHARES | |||||||
| 2023 (d) | (0.07) (e) | 2.19 (e) | 2.72 (e) | 21.59 | 46.10 | $ 5,542 | |
| 2022 | (0.42) | 2.24 | 2.50 | (28.44) | 140.89 | $ 4,391 | |
| 2021 | (0.77) | 2.38 | 2.85 | 35.91 | 119.96 | $ 5,597 | |
| 2020 | (0.56) | 2.38 | 3.31 | 22.02 | 42.87 | $ 2,159 | |
| 2019 | 0.25 | 2.38 | 3.48 | (3.75) | 62.33 | $ 1,687 | |
| 2018 | (0.03) | 2.38 | 3.09 | 4.82 | 111.99 | $ 2,292 | |
| CLASS I SHARES | |||||||
| 2023 (d) | 1.23 (e) | 0.90 (e) | 1.26 (e) | 22.38 | 46.10 | $ 463,772 | |
| 2022 | 0.89 | 0.96 | 1.25 | (27.54) | 140.89 | $ 346,395 | |
| 2021 | 0.53 | 1.09 | 1.21 | 37.72 | 119.96 | $ 302,026 | |
| 2020 | 0.74 | 1.09 | 1.33 | 23.62 | 42.87 | $ 83,208 | |
| 2019 | 1.57 | 1.09 | 1.44 | (2.54) | 62.33 | $ 59,833 | |
| 2018 | 1.20 | 1.09 | 1.35 | 6.15 | 111.99 | $ 55,989 | |
International Growth Fund
| PER SHARE PERFORMANCE (FOR A SHARE OUTSTANDING THROUGHOUT THE PERIOD) | |||||||||
| UNLESS OTHERWISE NOTED, PERIODS ARE FISCAL YEARS ENDED SEPTEMBER 30, | Net Asset Value, Beginning of PERIOD | Net Investment Income (Loss)+ | Net Realized & Unrealized Gain (Loss) on Investments | Total from Investment Operations | Dividends from Net Investment Income | Dividends from Net Realized Gains | Dividends from Return of Capital | Total Dividends | Net Asset Value, End of PERIOD |
| CLASS A SHARES(d) | |||||||||
| 2023 (e) | $ 18.22 | 0.02 | 4.75 | 4.77 | (0.06) | — | — | (0.06) | $ 22.93 |
| 2022 | $ 30.27 | 0.03 | (10.09) | (10.06) | — | (1.99) | — | (1.99) | $ 18.22 |
| 2021 | $ 28.37 | (0.09) | 2.37 | 2.28 | — | (0.38) | — | (0.38) | $ 30.27 |
| 2020 | $ 21.46 | (0.08) | 7.10 | 7.02 | — (g) | (0.11) | — | (0.11) | $ 28.37 |
| 2019 | $ 23.78 | — (h) | (1.55) | (1.55) | (0.02) | (0.75) | — | (0.77) | $ 21.46 |
| 2018 | $ 23.85 | 0.02 | 0.72 | 0.74 | (0.05) | (0.76) | — | (0.81) | $ 23.78 |
| CLASS C SHARES | |||||||||
| 2023 (e) | $ 16.33 | (0.06) | 4.25 | 4.19 | — | — | — | — | $ 20.52 |
| 2022 | $ 27.55 | (0.17) | (9.06) | (9.23) | — | (1.99) | — | (1.99) | $ 16.33 |
| 2021 | $ 26.06 | (0.31) | 2.18 | 1.87 | — | (0.38) | — | (0.38) | $ 27.55 |
| 2020 | $ 19.87 | (0.25) | 6.55 | 6.30 | — | (0.11) | — | (0.11) | $ 26.06 |
| 2019 | $ 22.21 | (0.15) | (1.44) | (1.59) | — | (0.75) | — | (0.75) | $ 19.87 |
| 2018 | $ 22.50 | (0.15) | 0.67 | 0.52 | (0.05) | (0.76) | — | (0.81) | $ 22.21 |
| CLASS I SHARES | |||||||||
| 2023 (e) | $ 18.97 | 0.06 | 4.94 | 5.00 | (0.15) | — | — | (0.15) | $ 23.82 |
| 2022 | $ 31.32 | 0.12 | (10.48) | (10.36) | — | (1.99) | — | (1.99) | $ 18.97 |
| 2021 | $ 29.27 | (0.01) | 2.44 | 2.43 | — | (0.38) | — | (0.38) | $ 31.32 |
| 2020 | $ 22.13 | (0.01) | 7.33 | 7.32 | (0.07) | (0.11) | — | (0.18) | $ 29.27 |
| 2019 | $ 24.51 | 0.07 | (1.60) | (1.53) | (0.10) | (0.75) | — | (0.85) | $ 22.13 |
| 2018 | $ 24.48 | 0.12 | 0.72 | 0.84 | (0.05) | (0.76) | — | (0.81) | $ 24.51 |
| CLASS R3 SHARES | |||||||||
| 2023 (e) | $ 17.90 | 0.01 | 4.66 | 4.67 | (0.03) | — | — | (0.03) | $ 22.54 |
| 2022 | $ 29.80 | — (h) | (9.91) | (9.91) | — | (1.99) | — | (1.99) | $ 17.90 |
| 2021 | $ 28.01 | (0.16) | 2.33 | 2.17 | — | (0.38) | — | (0.38) | $ 29.80 |
| 2020 | $ 21.23 | (0.13) | 7.02 | 6.89 | — | (0.11) | — | (0.11) | $ 28.01 |
| 2019 | $ 23.54 | (0.04) | (1.52) | (1.56) | — | (0.75) | — | (0.75) | $ 21.23 |
| 2018 | $ 23.66 | (0.02) | 0.71 | 0.69 | (0.05) | (0.76) | — | (0.81) | $ 23.54 |
| CLASS R4 SHARES | |||||||||
| 2023 (e) | $ 18.06 | 0.02 | 4.70 | 4.72 | (0.07) | — | — | (0.07) | $ 22.71 |
| 2022 | $ 30.02 | 0.03 | (10.00) | (9.97) | — | (1.99) | — | (1.99) | $ 18.06 |
| 2021 | $ 28.18 | (0.13) | 2.35 | 2.22 | — | (0.38) | — | (0.38) | $ 30.02 |
| 2020 | $ 21.34 | (0.03) | 6.98 | 6.95 | — | (0.11) | — | (0.11) | $ 28.18 |
| 2019 | $ 23.63 | (0.02) | (1.52) | (1.54) | — | (0.75) | — | (0.75) | $ 21.34 |
| 2018 | $ 23.73 | (0.01) | 0.72 | 0.71 | (0.05) | (0.76) | — | (0.81) | $ 23.63 |
| CLASS R5 SHARES | |||||||||
| 2023 (e) | $ 19.03 | 0.07 | 4.95 | 5.02 | (0.16) | — | — | (0.16) | $ 23.89 |
| 2022 | $ 31.41 | 0.12 | (10.51) | (10.39) | — | (1.99) | — | (1.99) | $ 19.03 |
| 2021 | $ 29.35 | (0.01) | 2.45 | 2.44 | — | (0.38) | — | (0.38) | $ 31.41 |
| 2020 | $ 22.19 | (0.03) | 7.37 | 7.34 | (0.07) | (0.11) | — | (0.18) | $ 29.35 |
| 2019 | $ 24.58 | 0.07 | (1.61) | (1.54) | (0.10) | (0.75) | — | (0.85) | $ 22.19 |
| 2018 | $ 24.54 | 0.10 | 0.75 | 0.85 | (0.05) | (0.76) | — | (0.81) | $ 24.58 |
| CLASS R6 SHARES | |||||||||
| 2023 (e) | $ 19.13 | 0.08 | 4.97 | 5.05 | (0.18) | — | — | (0.18) | $ 24.00 |
| 2022 | $ 31.54 | 0.15 | (10.57) | (10.42) | — | (1.99) | — | (1.99) | $ 19.13 |
| 2021 | $ 29.44 | 0.02 | 2.46 | 2.48 | — | (0.38) | — | (0.38) | $ 31.54 |
| 2020 | $ 22.26 | 0.02 | 7.37 | 7.39 | (0.10) | (0.11) | — | (0.21) | $ 29.44 |
| 2019 | $ 24.65 | 0.10 | (1.61) | (1.51) | (0.13) | (0.75) | — | (0.88) | $ 22.26 |
| 2018 | $ 24.59 | 0.21 | 0.66 | 0.87 | (0.05) | (0.76) | — | (0.81) | $ 24.65 |
| (a) | Net investment income (loss) includes income from foreign withholding tax claims adjusted for IRS compliance fees and/or tax reclaim collection fees. Without these proceeds, the Net Investment Income (Loss) ratios for 2023 would have been: Class A, 0.17%; Class C, (0.74)%; Class I, 0.52%; Class R3, 0.03%; Class R4, 0.15%; Class R5, 0.57%; Class R6, 0.66%, 2022 would have been: Class A, 0.08%; Class C, (0.83)%; Class I, 0.42%; Class R3, (0.06)%; Class R4, 0.07%; Class R5, 0.44%; Class R6, 0.56% and 2021 would have been: Class A, (0.37)%; Class C, (1.18)%; Class I, (0.10)%; Class R3, (0.60)%; Class R4, (0.51)%; Class R5, (0.11)%; Class R6, (0.02)%. |
| (b) | Net expenses include tax reclaim collection fees that are excluded from the expense limitation agreement. If such expenses and fees had not occurred, the Expenses After Expense Reductions ratios for 2021 would have been: Class A, 1.26%; Class C, 2.07%; Class I, 0.99%; Class R3, 1.50%; Class R4, 1.40%; Class R5, 0.99%; Class R6, 0.89%. |
| (c) | Not annualized for periods less than one year. |
| (d) | Sales loads are not reflected in computing total return. |
| (e) | Unaudited Six Month Period Ended March 31. |
| (f) | Annualized. |
| (g) | Dividends from net investment income per share were less than $(0.01). |
| (h) | Net investment income (loss) was less than $0.01 per share. |
| + | Based on weighted average shares outstanding. |
International Growth Fund
| RATIOS TO AVERAGE NET ASSETS | Supplemental Data | ||||||
| UNLESS OTHERWISE NOTED, PERIODS ARE FISCAL YEARS ENDED SEPTEMBER 30, | Net Investment Income (Loss) (%)(a) | Expenses, After Expense Reductions (%)(b) | Expenses, Before Expense Reductions (%) | Total Return (%)(c) | Portfolio Turnover Rate (%)(c) | Net Assets at End of PERIOD (Thousands) | |
| CLASS A SHARES(d) | |||||||
| 2023 (e) | 0.22 (f) | 1.37 (f) | 1.39 (f) | 26.25 | 17.08 | $ 96,544 | |
| 2022 | 0.13 | 1.36 | 1.36 | (35.72) | 63.54 | $ 86,145 | |
| 2021 | (0.29) | 1.27 | 1.27 | 8.07 | 34.41 | $ 154,613 | |
| 2020 | (0.35) | 1.31 | 1.31 | 32.88 | 35.88 | $ 139,429 | |
| 2019 | 0.02 | 1.32 | 1.32 | (6.36) | 25.83 | $ 107,196 | |
| 2018 | 0.09 | 1.32 | 1.32 | 3.28 | 33.28 | $ 127,863 | |
| CLASS C SHARES | |||||||
| 2023 (e) | (0.69) (f) | 2.25 (f) | 2.27 (f) | 25.66 | 17.08 | $ 10,937 | |
| 2022 | (0.78) | 2.22 | 2.23 | (36.27) | 63.54 | $ 10,939 | |
| 2021 | (1.10) | 2.07 | 2.07 | 7.21 | 34.41 | $ 27,864 | |
| 2020 | (1.13) | 2.07 | 2.07 | 31.87 | 35.88 | $ 42,164 | |
| 2019 | (0.78) | 2.08 | 2.08 | (7.04) | 25.83 | $ 47,980 | |
| 2018 | (0.65) | 2.08 | 2.08 | 2.47 | 33.28 | $ 77,262 | |
| CLASS I SHARES | |||||||
| 2023 (e) | 0.57 (f) | 0.99 (f) | 1.09 (f) | 26.45 | 17.08 | $ 730,284 | |
| 2022 | 0.47 | 0.99 | 1.06 | (35.47) | 63.54 | $ 724,495 | |
| 2021 | (0.02) | 1.00 | 1.00 | 8.34 | 34.41 | $ 1,584,102 | |
| 2020 | (0.03) | 0.99 | 1.02 | 33.31 | 35.88 | $ 1,454,322 | |
| 2019 | 0.34 | 0.99 | 1.03 | (6.02) | 25.83 | $ 1,203,538 | |
| 2018 | 0.47 | 0.99 | 0.99 | 3.61 | 33.28 | $ 1,470,211 | |
| CLASS R3 SHARES | |||||||
| 2023 (e) | 0.08 (f) | 1.50 (f) | 2.23 (f) | 26.13 | 17.08 | $ 4,827 | |
| 2022 | (0.01) | 1.50 | 2.29 | (35.79) | 63.54 | $ 4,340 | |
| 2021 | (0.52) | 1.51 | 1.89 | 7.78 | 34.41 | $ 7,643 | |
| 2020 | (0.56) | 1.50 | 2.03 | 32.61 | 35.88 | $ 6,424 | |
| 2019 | (0.17) | 1.50 | 2.02 | (6.50) | 25.83 | $ 6,274 | |
| 2018 | (0.10) | 1.50 | 1.98 | 3.08 | 33.28 | $ 8,426 | |
| CLASS R4 SHARES | |||||||
| 2023 (e) | 0.19 (f) | 1.40 (f) | 2.03 (f) | 26.17 | 17.08 | $ 7,683 | |
| 2022 | 0.12 | 1.40 | 2.00 | (35.72) | 63.54 | $ 6,670 | |
| 2021 | (0.42) | 1.41 | 1.63 | 7.91 | 34.41 | $ 9,903 | |
| 2020 | (0.44) | 1.40 | 1.45 | 32.73 | 35.88 | $ 8,436 | |
| 2019 | (0.09) | 1.40 | 1.91 | (6.39) | 25.83 | $ 7,515 | |
| 2018 | (0.02) | 1.40 | 1.88 | 3.16 | 33.28 | $ 12,644 | |
| CLASS R5 SHARES | |||||||
| 2023 (e) | 0.61 (f) | 0.99 (f) | 1.40 (f) | 26.45 | 17.08 | $ 25,296 | |
| 2022 | 0.49 | 0.99 | 1.45 | (35.46) | 63.54 | $ 21,233 | |
| 2021 | (0.02) | 1.00 | 1.27 | 8.35 | 34.41 | $ 36,396 | |
| 2020 | (0.03) | 0.99 | 1.31 | 33.31 | 35.88 | $ 34,152 | |
| 2019 | 0.32 | 0.99 | 1.29 | (6.05) | 25.83 | $ 28,729 | |
| 2018 | 0.40 | 0.99 | 1.25 | 3.64 | 33.28 | $ 38,052 | |
| CLASS R6 SHARES | |||||||
| 2023 (e) | 0.71 (f) | 0.89 (f) | 1.03 (f) | 26.50 | 17.08 | $ 81,652 | |
| 2022 | 0.61 | 0.89 | 1.01 | (35.41) | 63.54 | $ 66,867 | |
| 2021 | 0.06 | 0.90 | 0.96 | 8.46 | 34.41 | $ 107,884 | |
| 2020 | 0.07 | 0.89 | 0.99 | 33.42 | 35.88 | $ 61,130 | |
| 2019 | 0.47 | 0.89 | 0.99 | (5.91) | 25.83 | $ 44,923 | |
| 2018 | 0.82 | 0.89 | 0.99 | 3.72 | 33.28 | $ 51,091 | |
Developing World Fund
| PER SHARE PERFORMANCE (FOR A SHARE OUTSTANDING THROUGHOUT THE PERIOD) | |||||||||
| UNLESS OTHERWISE NOTED, PERIODS ARE FISCAL YEARS ENDED SEPTEMBER 30, | Net Asset Value, Beginning of PERIOD | Net Investment Income (Loss)+ | Net Realized & Unrealized Gain (Loss) on Investments | Total from Investment Operations | Dividends from Net Investment Income | Dividends from Net Realized Gains | Dividends from Return of Capital | Total Dividends | Net Asset Value, End of PERIOD |
| CLASS A SHARES(d) | |||||||||
| 2023 (e) | $ 18.43 | 0.06 | 2.47 | 2.53 | (0.27) | — | — | (0.27) | $ 20.69 |
| 2022 | $ 27.58 | 0.39 | (9.54) | (9.15) | — | — | — | — | $ 18.43 |
| 2021 | $ 22.92 | — (g) | 4.66 | 4.66 | — | — | — | — | $ 27.58 |
| 2020 | $ 20.43 | 0.03 | 2.69 | 2.72 | (0.23) | — | — | (0.23) | $ 22.92 |
| 2019 | $ 19.13 | 0.23 | 1.22 | 1.45 | (0.15) | — | — | (0.15) | $ 20.43 |
| 2018 | $ 19.86 | 0.11 | (0.84) | (0.73) | — | — | — | — | $ 19.13 |
| CLASS C SHARES | |||||||||
| 2023 (e) | $ 17.18 | (0.02) | 2.31 | 2.29 | (0.05) | — | — | (0.05) | $ 19.42 |
| 2022 | $ 25.93 | 0.14 | (8.89) | (8.75) | — | — | — | — | $ 17.18 |
| 2021 | $ 21.71 | (0.21) | 4.43 | 4.22 | — | — | — | — | $ 25.93 |
| 2020 | $ 19.35 | (0.13) | 2.54 | 2.41 | (0.05) | — | — | (0.05) | $ 21.71 |
| 2019 | $ 18.10 | 0.06 | 1.19 | 1.25 | — | — | — | — | $ 19.35 |
| 2018 | $ 18.93 | (0.05) | (0.78) | (0.83) | — | — | — | — | $ 18.10 |
| CLASS I SHARES | |||||||||
| 2023 (e) | $ 18.93 | 0.10 | 2.53 | 2.63 | (0.36) | — | — | (0.36) | $ 21.20 |
| 2022 | $ 28.22 | 0.50 | (9.79) | (9.29) | — | — | — | — | $ 18.93 |
| 2021 | $ 23.40 | 0.10 | 4.76 | 4.86 | (0.04) | — | — | (0.04) | $ 28.22 |
| 2020 | $ 20.86 | 0.11 | 2.74 | 2.85 | (0.31) | — | — | (0.31) | $ 23.40 |
| 2019 | $ 19.55 | 0.31 | 1.24 | 1.55 | (0.24) | — | — | (0.24) | $ 20.86 |
| 2018 | $ 20.21 | 0.19 | (0.85) | (0.66) | — | — | — | — | $ 19.55 |
| CLASS R5 SHARES | |||||||||
| 2023 (e) | $ 18.87 | 0.11 | 2.51 | 2.62 | (0.36) | — | — | (0.36) | $ 21.13 |
| 2022 | $ 28.12 | 0.48 | (9.73) | (9.25) | — | — | — | — | $ 18.87 |
| 2021 | $ 23.33 | 0.10 | 4.73 | 4.83 | (0.04) | — | — | (0.04) | $ 28.12 |
| 2020 | $ 20.79 | 0.10 | 2.75 | 2.85 | (0.31) | — | — | (0.31) | $ 23.33 |
| 2019 | $ 19.48 | 0.27 | 1.28 | 1.55 | (0.24) | — | — | (0.24) | $ 20.79 |
| 2018 | $ 20.14 | 0.19 | (0.85) | (0.66) | — | — | — | — | $ 19.48 |
| CLASS R6 SHARES | |||||||||
| 2023 (e) | $ 18.98 | 0.12 | 2.53 | 2.65 | (0.38) | — | — | (0.38) | $ 21.25 |
| 2022 | $ 28.26 | 0.52 | (9.80) | (9.28) | — | — | — | — | $ 18.98 |
| 2021 | $ 23.43 | 0.12 | 4.78 | 4.90 | (0.07) | — | — | (0.07) | $ 28.26 |
| 2020 | $ 20.88 | 0.13 | 2.75 | 2.88 | (0.33) | — | — | (0.33) | $ 23.43 |
| 2019 | $ 19.57 | 0.33 | 1.24 | 1.57 | (0.26) | — | — | (0.26) | $ 20.88 |
| 2018 | $ 20.21 | 0.24 | (0.88) | (0.64) | — | — | — | — | $ 19.57 |
| (a) | Net investment income (loss) includes income from foreign withholding tax claims adjusted for IRS compliance fees and/or tax reclaim collection fees. Without these proceeds, the Net Investment Income (Loss) ratios for 2023 would have been: Class A, 0.63%; Class C, (0.18)%; Class I, 1.02%; Class R5, 1.05%; Class R6, 1.14%, 2022 would have been: Class A, 1.63%; Class C, 0.61%; Class I, 2.06%; Class R5, 1.94%; Class R6, 2.14% and 2021 would have been: Class A, (0.02)%; Class C, (0.82)%; Class I, 0.33%; Class R5, 0.34%; Class R6, 0.42%. |
| (b) | Net expenses include tax reclaim collection fees that are excluded from the expense limitation agreement. If such expenses and fees had not occurred, the Expenses After Expense Reductions ratios for 2021 would have been: Class A, 1.43%; Class C, 2.19%; Class I, 1.09%; Class R5, 1.09%; Class R6, 0.99%. |
| (c) | Not annualized for periods less than one year. |
| (d) | Sales loads are not reflected in computing total return. |
| (e) | Unaudited Six Month Period Ended March 31. |
| (f) | Annualized. |
| (g) | Net investment income (loss) was less than $0.01 per share. |
| (h) | The total return based on the NAV which reflects adjustments in accordance with U.S. GAAP is 12.47% for 2020 and 19.44% for 2021. |
| + | Based on weighted average shares outstanding. |
Developing World Fund
| RATIOS TO AVERAGE NET ASSETS | Supplemental Data | ||||||
| UNLESS OTHERWISE NOTED, PERIODS ARE FISCAL YEARS ENDED SEPTEMBER 30, | Net Investment Income (Loss) (%)(a) | Expenses, After Expense Reductions (%)(b) | Expenses, Before Expense Reductions (%) | Total Return (%)(c) | Portfolio Turnover Rate (%)(c) | Net Assets at End of PERIOD (Thousands) | |
| CLASS A SHARES(d) | |||||||
| 2023 (e) | 0.63 (f) | 1.44 (f) | 1.57 (f) | 13.85 | 14.18 | $ 96,486 | |
| 2022 | 1.63 | 1.44 | 1.54 | (33.18) | 68.24 | $ 87,897 | |
| 2021 | (0.01) | 1.43 | 1.43 | 20.33 | 61.50 | $ 131,471 | |
| 2020 | 0.13 | 1.45 | 1.48 | 13.31 | 56.55 | $ 101,723 | |
| 2019 | 1.18 | 1.47 | 1.50 | 7.74 | 43.52 | $ 96,935 | |
| 2018 | 0.55 | 1.46 | 1.48 | (3.68) | 58.28 | $ 112,082 | |
| CLASS C SHARES | |||||||
| 2023 (e) | (0.18) (f) | 2.27 (f) | 2.40 (f) | 13.37 | 14.18 | $ 15,412 | |
| 2022 | 0.62 | 2.26 | 2.36 | (33.74) | 68.24 | $ 17,044 | |
| 2021 | (0.81) | 2.19 | 2.19 | 19.49 (h) | 61.50 | $ 40,933 | |
| 2020 | (0.64) | 2.20 | 2.23 | 12.42 (h) | 56.55 | $ 48,977 | |
| 2019 | 0.30 | 2.23 | 2.26 | 6.91 | 43.52 | $ 63,203 | |
| 2018 | (0.23) | 2.23 | 2.25 | (4.38) | 58.28 | $ 80,728 | |
| CLASS I SHARES | |||||||
| 2023 (e) | 1.02 (f) | 1.04 (f) | 1.25 (f) | 13.98 | 14.18 | $ 906,468 | |
| 2022 | 2.07 | 1.06 | 1.23 | (32.92) | 68.24 | $ 772,911 | |
| 2021 | 0.34 | 1.09 | 1.15 | 20.78 | 61.50 | $ 925,280 | |
| 2020 | 0.50 | 1.09 | 1.18 | 13.68 | 56.55 | $ 668,427 | |
| 2019 | 1.53 | 1.09 | 1.19 | 8.14 | 43.52 | $ 590,196 | |
| 2018 | 0.93 | 1.08 | 1.16 | (3.27) | 58.28 | $ 634,501 | |
| CLASS R5 SHARES | |||||||
| 2023 (e) | 1.05 (f) | 1.04 (f) | 1.89 (f) | 13.97 | 14.18 | $ 3,583 | |
| 2022 | 1.94 | 1.06 | 2.15 | (32.89) | 68.24 | $ 2,403 | |
| 2021 | 0.35 | 1.09 | 1.70 | 20.72 | 61.50 | $ 4,157 | |
| 2020 | 0.49 | 1.09 | 1.89 | 13.73 | 56.55 | $ 2,735 | |
| 2019 | 1.38 | 1.09 | 2.07 | 8.16 | 43.52 | $ 2,430 | |
| 2018 | 0.90 | 1.09 | 1.71 | (3.28) | 58.28 | $ 3,340 | |
| CLASS R6 SHARES | |||||||
| 2023 (e) | 1.14 (f) | 0.94 (f) | 1.22 (f) | 14.07 | 14.18 | $ 63,688 | |
| 2022 | 2.14 | 0.96 | 1.20 | (32.84) | 68.24 | $ 54,406 | |
| 2021 | 0.43 | 0.99 | 1.11 | 20.90 | 61.50 | $ 78,006 | |
| 2020 | 0.60 | 0.99 | 1.15 | 13.82 | 56.55 | $ 62,993 | |
| 2019 | 1.65 | 0.99 | 1.14 | 8.25 | 43.52 | $ 56,658 | |
| 2018 | 1.16 | 0.99 | 1.14 | (3.17) | 58.28 | $ 56,258 | |
Small/Mid Cap Core Fund
| PER SHARE PERFORMANCE (FOR A SHARE OUTSTANDING THROUGHOUT THE PERIOD) | |||||||||
| UNLESS OTHERWISE NOTED, PERIODS ARE FISCAL YEARS ENDED SEPTEMBER 30, | Net Asset Value, Beginning of PERIOD | Net Investment Income (Loss)+ | Net Realized & Unrealized Gain (Loss) on Investments | Total from Investment Operations | Dividends from Net Investment Income | Dividends from Net Realized Gains | Dividends from Return of Capital | Total Dividends | Net Asset Value, End of PERIOD |
| CLASS A SHARES(d) | |||||||||
| 2023 (e) | $ 55.35 | (0.06) | 3.89 | 3.83 | (0.03) | — | — | (0.03) | $ 59.15 |
| 2022 | $ 97.60 | (0.27) | (15.33) | (15.60) | (0.30) | (26.35) | — | (26.65) | $ 55.35 |
| 2021 | $ 74.81 | (0.05) | 22.84 | 22.79 | — | — | — | — | $ 97.60 |
| 2020 | $ 71.81 | 0.07 | 3.11 | 3.18 | (0.18) | — | — | (0.18) | $ 74.81 |
| 2019 | $ 72.46 | 0.24 | (0.60) | (0.36) | (0.29) | — | — | (0.29) | $ 71.81 |
| 2018 | $ 65.26 | 0.39 | 7.17 | 7.56 | (0.36) | — | — | (0.36) | $ 72.46 |
| CLASS C SHARES | |||||||||
| 2023 (e) | $ 47.29 | (0.30) | 3.33 | 3.03 | — | — | — | — | $ 50.32 |
| 2022 | $ 87.40 | (0.81) | (12.95) | (13.76) | — | (26.35) | — | (26.35) | $ 47.29 |
| 2021 | $ 67.54 | (0.71) | 20.57 | 19.86 | — | — | — | — | $ 87.40 |
| 2020 | $ 65.19 | (0.45) | 2.80 | 2.35 | — | — | — | — | $ 67.54 |
| 2019 | $ 66.03 | (0.31) | (0.53) | (0.84) | — | — | — | — | $ 65.19 |
| 2018 | $ 59.87 | (0.11) | 6.52 | 6.41 | (0.25) | — | — | (0.25) | $ 66.03 |
| CLASS I SHARES | |||||||||
| 2023 (e) | $ 58.01 | 0.07 | 4.08 | 4.15 | (0.32) | — | — | (0.32) | $ 61.84 |
| 2022 | $ 100.99 | 0.01 | (16.09) | (16.08) | (0.55) | (26.35) | — | (26.90) | $ 58.01 |
| 2021 | $ 77.16 | 0.25 | 23.58 | 23.83 | — | — | — | — | $ 100.99 |
| 2020 | $ 74.04 | 0.33 | 3.22 | 3.55 | (0.43) | — | — | (0.43) | $ 77.16 |
| 2019 | $ 74.70 | 0.49 | (0.65) | (0.16) | (0.50) | — | — | (0.50) | $ 74.04 |
| 2018 | $ 67.10 | 0.64 | 7.38 | 8.02 | (0.42) | — | — | (0.42) | $ 74.70 |
| CLASS R3 SHARES | |||||||||
| 2023 (e) | $ 55.03 | (0.04) | 3.87 | 3.83 | (0.07) | — | — | (0.07) | $ 58.79 |
| 2022 | $ 97.10 | (0.25) | (15.21) | (15.46) | (0.26) | (26.35) | — | (26.61) | $ 55.03 |
| 2021 | $ 74.46 | (0.08) | 22.72 | 22.64 | — | — | — | — | $ 97.10 |
| 2020 | $ 71.44 | 0.06 | 3.10 | 3.16 | (0.14) | — | — | (0.14) | $ 74.46 |
| 2019 | $ 72.02 | 0.23 | (0.59) | (0.36) | (0.22) | — | — | (0.22) | $ 71.44 |
| 2018 | $ 64.88 | 0.39 | 7.11 | 7.50 | (0.36) | — | — | (0.36) | $ 72.02 |
| CLASS R4 SHARES | |||||||||
| 2023 (e) | $ 55.96 | (0.01) | 3.92 | 3.91 | (0.14) | — | — | (0.14) | $ 59.73 |
| 2022 | $ 98.30 | (0.16) | (15.50) | (15.66) | (0.33) | (26.35) | — | (26.68) | $ 55.96 |
| 2021 | $ 75.30 | 0.01 | 22.99 | 23.00 | — | — | — | — | $ 98.30 |
| 2020 | $ 72.25 | 0.12 | 3.14 | 3.26 | (0.21) | — | — | (0.21) | $ 75.30 |
| 2019 | $ 72.83 | 0.30 | (0.60) | (0.30) | (0.28) | — | — | (0.28) | $ 72.25 |
| 2018 | $ 65.55 | 0.47 | 7.19 | 7.66 | (0.38) | — | — | (0.38) | $ 72.83 |
| CLASS R5 SHARES | |||||||||
| 2023 (e) | $ 57.90 | 0.07 | 4.07 | 4.14 | (0.31) | — | — | (0.31) | $ 61.73 |
| 2022 | $ 100.84 | — (h) | (16.04) | (16.04) | (0.55) | (26.35) | — | (26.90) | $ 57.90 |
| 2021 | $ 77.05 | 0.26 | 23.53 | 23.79 | — | — | — | — | $ 100.84 |
| 2020 | $ 73.93 | 0.33 | 3.22 | 3.55 | (0.43) | — | — | (0.43) | $ 77.05 |
| 2019 | $ 74.60 | 0.49 | (0.66) | (0.17) | (0.50) | — | — | (0.50) | $ 73.93 |
| 2018 | $ 67.01 | 0.63 | 7.38 | 8.01 | (0.42) | — | — | (0.42) | $ 74.60 |
| (a) | Net investment income (loss) includes income from foreign withholding tax claims adjusted for IRS compliance fees and/or tax reclaim collection fees. Without these proceeds, the Net Investment Income (Loss) ratios for 2021 would have been: Class A, (0.15)%; Class C, (0.95)%; Class I, 0.17%; Class R3, (0.17)%; Class R4, (0.09)%; Class R5, 0.18%. |
| (b) | Net expenses include tax reclaim collection fees that are excluded from the expense limitation agreement. If such expenses and fees had not occurred, the Expenses After Expense Reductions ratios for 2021 would have been: Class A, 1.16%; Class C, 1.98%; Class I, 0.84%; Class R3, 1.20%; Class R4, 1.10%; Class R5, 0.84%. |
| (c) | Not annualized for periods less than one year. |
| (d) | Sales loads are not reflected in computing total return. |
| (e) | Unaudited Six Month Period Ended March 31. |
| (f) | Annualized. |
| (g) | The Fund modified its strategy in December 2020 and due to the change, the Fund experienced a higher portfolio turnover from higher purchases and sales. |
| (h) | Net investment income (loss) was less than $0.01 per share. |
| + | Based on weighted average shares outstanding. |
Small/Mid Cap Core Fund
| RATIOS TO AVERAGE NET ASSETS | Supplemental Data | ||||||
| UNLESS OTHERWISE NOTED, PERIODS ARE FISCAL YEARS ENDED SEPTEMBER 30, | Net Investment Income (Loss) (%)(a) | Expenses, After Expense Reductions (%)(b) | Expenses, Before Expense Reductions (%) | Total Return (%)(c) | Portfolio Turnover Rate (%)(c) | Net Assets at End of PERIOD (Thousands) | |
| CLASS A SHARES(d) | |||||||
| 2023 (e) | (0.20) (f) | 1.37 (f) | 1.37 (f) | 6.93 | 13.66 | $ 292,254 | |
| 2022 | (0.38) | 1.31 | 1.37 | (23.16) | 46.19 | $ 293,290 | |
| 2021 | (0.06) | 1.18 | 1.33 | 30.46 | 135.80 (g) | $ 454,488 | |
| 2020 | 0.10 | 1.33 | 1.34 | 4.42 | 20.39 | $ 388,895 | |
| 2019 | 0.35 | 1.33 | 1.33 | (0.42) | 24.94 | $ 425,218 | |
| 2018 | 0.56 | 1.33 | 1.33 | 11.62 | 57.33 | $ 473,740 | |
| CLASS C SHARES | |||||||
| 2023 (e) | (1.17) (f) | 2.34 (f) | 2.49 (f) | 6.41 | 13.66 | $ 6,356 | |
| 2022 | (1.31) | 2.22 | 2.34 | (23.86) | 46.19 | $ 7,476 | |
| 2021 | (0.86) | 2.00 | 2.15 | 29.40 | 135.80 (g) | $ 17,364 | |
| 2020 | (0.69) | 2.12 | 2.12 | 3.59 | 20.39 | $ 22,951 | |
| 2019 | (0.50) | 2.19 | 2.19 | (1.26) | 24.94 | $ 35,934 | |
| 2018 | (0.17) | 2.11 | 2.11 | 10.73 | 57.33 | $ 52,023 | |
| CLASS I SHARES | |||||||
| 2023 (e) | 0.22 (f) | 0.95 (f) | 1.09 (f) | 7.15 | 13.66 | $ 204,493 | |
| 2022 | 0.02 | 0.91 | 1.09 | (22.84) | 46.19 | $ 207,251 | |
| 2021 | 0.26 | 0.86 | 1.08 | 30.88 | 135.80 (g) | $ 332,235 | |
| 2020 | 0.44 | 0.99 | 1.09 | 4.77 | 20.39 | $ 287,746 | |
| 2019 | 0.70 | 0.99 | 1.07 | (0.07) | 24.94 | $ 360,070 | |
| 2018 | 0.90 | 0.99 | 1.06 | 12.00 | 57.33 | $ 422,302 | |
| CLASS R3 SHARES | |||||||
| 2023 (e) | (0.14) (f) | 1.31 (f) | 1.90 (f) | 6.95 | 13.66 | $ 13,407 | |
| 2022 | (0.35) | 1.27 | 1.87 | (23.11) | 46.19 | $ 13,406 | |
| 2021 | (0.08) | 1.22 | 1.81 | 30.41 | 135.80 (g) | $ 23,594 | |
| 2020 | 0.09 | 1.35 | 1.73 | 4.40 | 20.39 | $ 24,939 | |
| 2019 | 0.34 | 1.35 | 1.79 | (0.43) | 24.94 | $ 29,601 | |
| 2018 | 0.57 | 1.35 | 1.78 | 11.60 | 57.33 | $ 39,211 | |
| CLASS R4 SHARES | |||||||
| 2023 (e) | (0.04) (f) | 1.21 (f) | 2.11 (f) | 6.98 | 13.66 | $ 2,772 | |
| 2022 | (0.23) | 1.17 | 2.04 | (23.03) | 46.19 | $ 2,819 | |
| 2021 | 0.01 | 1.12 | 1.78 | 30.54 | 135.80 (g) | $ 4,386 | |
| 2020 | 0.17 | 1.25 | 1.74 | 4.50 | 20.39 | $ 4,548 | |
| 2019 | 0.44 | 1.25 | 1.75 | (0.33) | 24.94 | $ 6,434 | |
| 2018 | 0.68 | 1.25 | 1.77 | 11.72 | 57.33 | $ 7,868 | |
| CLASS R5 SHARES | |||||||
| 2023 (e) | 0.22 (f) | 0.95 (f) | 1.81 (f) | 7.15 | 13.66 | $ 6,084 | |
| 2022 | — (h) | 0.90 | 1.64 | (22.83) | 46.19 | $ 6,106 | |
| 2021 | 0.27 | 0.86 | 1.48 | 30.88 | 135.80 (g) | $ 14,710 | |
| 2020 | 0.45 | 0.99 | 1.43 | 4.76 | 20.39 | $ 14,156 | |
| 2019 | 0.70 | 0.99 | 1.43 | (0.07) | 24.94 | $ 18,119 | |
| 2018 | 0.89 | 0.99 | 1.38 | 12.00 | 57.33 | $ 19,085 | |
Small/Mid Cap Growth Fund
| PER SHARE PERFORMANCE (FOR A SHARE OUTSTANDING THROUGHOUT THE PERIOD) | |||||||||
| UNLESS OTHERWISE NOTED, PERIODS ARE FISCAL YEARS ENDED SEPTEMBER 30, | Net Asset Value, Beginning of PERIOD | Net Investment Income (Loss)+ | Net Realized & Unrealized Gain (Loss) on Investments | Total from Investment Operations | Dividends from Net Investment Income | Dividends from Net Realized Gains | Dividends from Return of Capital | Total Dividends | Net Asset Value, End of PERIOD |
| CLASS A SHARES(b) | |||||||||
| 2023 (c) | $ 21.17 | (0.13) | 2.09 | 1.96 | — | — | — | — | $ 23.13 |
| 2022 | $ 51.77 | (0.35) | (12.37) | (12.72) | — | (17.88) | — | (17.88) | $ 21.17 |
| 2021 | $ 48.17 | (0.51) | 7.33 | 6.82 | — | (3.22) | — | (3.22) | $ 51.77 |
| 2020 | $ 39.37 | (0.30) | 12.72 | 12.42 | — | (3.62) | — | (3.62) | $ 48.17 |
| 2019 | $ 40.43 | (0.17) | (0.89) | (1.06) | — | — | — | — | $ 39.37 |
| 2018 | $ 32.46 | (0.21) | 8.18 | 7.97 | — | — | — | — | $ 40.43 |
| CLASS C SHARES | |||||||||
| 2023 (c) | $ 15.45 | (0.17) | 1.53 | 1.36 | — | — | — | — | $ 16.81 |
| 2022 | $ 42.67 | (0.48) | (8.86) | (9.34) | — | (17.88) | — | (17.88) | $ 15.45 |
| 2021 | $ 40.53 | (0.75) | 6.11 | 5.36 | — | (3.22) | — | (3.22) | $ 42.67 |
| 2020 | $ 33.91 | (0.51) | 10.75 | 10.24 | — | (3.62) | — | (3.62) | $ 40.53 |
| 2019 | $ 35.11 | (0.42) | (0.78) | (1.20) | — | — | — | — | $ 33.91 |
| 2018 | $ 28.43 | (0.42) | 7.10 | 6.68 | — | — | — | — | $ 35.11 |
| CLASS I SHARES | |||||||||
| 2023 (c) | $ 24.34 | (0.09) | 2.41 | 2.32 | — | — | — | — | $ 26.66 |
| 2022 | $ 56.75 | (0.26) | (14.27) | (14.53) | — | (17.88) | — | (17.88) | $ 24.34 |
| 2021 | $ 52.36 | (0.38) | 7.99 | 7.61 | — | (3.22) | — | (3.22) | $ 56.75 |
| 2020 | $ 42.35 | (0.17) | 13.80 | 13.63 | — | (3.62) | — | (3.62) | $ 52.36 |
| 2019 | $ 43.33 | (0.03) | (0.95) | (0.98) | — | — | — | — | $ 42.35 |
| 2018 | $ 34.67 | (0.08) | 8.74 | 8.66 | — | — | — | — | $ 43.33 |
| CLASS R3 SHARES | |||||||||
| 2023 (c) | $ 20.75 | (0.13) | 2.05 | 1.92 | — | — | — | — | $ 22.67 |
| 2022 | $ 51.09 | (0.36) | (12.10) | (12.46) | — | (17.88) | — | (17.88) | $ 20.75 |
| 2021 | $ 47.67 | (0.60) | 7.24 | 6.64 | — | (3.22) | — | (3.22) | $ 51.09 |
| 2020 | $ 39.05 | (0.36) | 12.60 | 12.24 | — | (3.62) | — | (3.62) | $ 47.67 |
| 2019 | $ 40.16 | (0.23) | (0.88) | (1.11) | — | — | — | — | $ 39.05 |
| 2018 | $ 32.30 | (0.26) | 8.12 | 7.86 | — | — | — | — | $ 40.16 |
| CLASS R4 SHARES | |||||||||
| 2023 (c) | $ 21.24 | (0.13) | 2.11 | 1.98 | — | — | — | — | $ 23.22 |
| 2022 | $ 51.86 | (0.34) | (12.40) | (12.74) | — | (17.88) | — | (17.88) | $ 21.24 |
| 2021 | $ 48.30 | (0.55) | 7.33 | 6.78 | — | (3.22) | — | (3.22) | $ 51.86 |
| 2020 | $ 39.49 | (0.32) | 12.75 | 12.43 | — | (3.62) | — | (3.62) | $ 48.30 |
| 2019 | $ 40.56 | (0.19) | (0.88) | (1.07) | — | — | — | — | $ 39.49 |
| 2018 | $ 32.59 | (0.23) | 8.20 | 7.97 | — | — | — | — | $ 40.56 |
| CLASS R5 SHARES | |||||||||
| 2023 (c) | $ 24.30 | (0.09) | 2.40 | 2.31 | — | — | — | — | $ 26.61 |
| 2022 | $ 56.68 | (0.26) | (14.24) | (14.50) | — | (17.88) | — | (17.88) | $ 24.30 |
| 2021 | $ 52.30 | (0.38) | 7.98 | 7.60 | — | (3.22) | — | (3.22) | $ 56.68 |
| 2020 | $ 42.31 | (0.16) | 13.77 | 13.61 | — | (3.62) | — | (3.62) | $ 52.30 |
| 2019 | $ 43.29 | (0.04) | (0.94) | (0.98) | — | — | — | — | $ 42.31 |
| 2018 | $ 34.64 | (0.08) | 8.73 | 8.65 | — | — | — | — | $ 43.29 |
| (a) | Not annualized for periods less than one year. |
| (b) | Sales loads are not reflected in computing total return. |
| (c) | Unaudited Six Month Period Ended March 31. |
| (d) | Annualized. |
| (e) | The Fund modified its strategy in December 2020 and due to the change, the Fund experienced a higher portfolio turnover from higher purchases and sales. |
| + | Based on weighted average shares outstanding. |
Small/Mid Cap Growth Fund
| RATIOS TO AVERAGE NET ASSETS | Supplemental Data | ||||||
| UNLESS OTHERWISE NOTED, PERIODS ARE FISCAL YEARS ENDED SEPTEMBER 30, | Net Investment Income (Loss) (%) | Expenses, After Expense Reductions (%) | Expenses, Before Expense Reductions (%) | Total Return (%)(a) | Portfolio Turnover Rate (%)(a) | Net Assets at End of PERIOD (Thousands) | |
| CLASS A SHARES(b) | |||||||
| 2023 (c) | (1.21) (d) | 1.43 (d) | 1.43 (d) | 9.31 | 19.04 | $ 137,523 | |
| 2022 | (1.20) | 1.33 | 1.40 | (38.84) | 57.56 | $ 147,493 | |
| 2021 | (0.99) | 1.16 | 1.31 | 14.69 | 161.43 (e) | $ 340,545 | |
| 2020 | (0.72) | 1.33 | 1.33 | 34.37 | 43.82 | $ 326,035 | |
| 2019 | (0.44) | 1.35 | 1.35 | (2.62) | 40.69 | $ 259,799 | |
| 2018 | (0.57) | 1.34 | 1.34 | 24.55 | 54.98 | $ 296,429 | |
| CLASS C SHARES | |||||||
| 2023 (c) | (2.12) (d) | 2.34 (d) | 2.65 (d) | 8.80 | 19.04 | $ 4,629 | |
| 2022 | (2.09) | 2.21 | 2.40 | (39.39) | 57.56 | $ 5,596 | |
| 2021 | (1.76) | 1.94 | 2.09 | 13.80 | 161.43 (e) | $ 23,433 | |
| 2020 | (1.47) | 2.09 | 2.09 | 33.38 | 43.82 | $ 36,917 | |
| 2019 | (1.27) | 2.18 | 2.18 | (3.42) | 40.69 | $ 36,841 | |
| 2018 | (1.33) | 2.14 | 2.14 | 23.50 | 54.98 | $ 53,903 | |
| CLASS I SHARES | |||||||
| 2023 (c) | (0.73) (d) | 0.95 (d) | 1.12 (d) | 9.53 | 19.04 | $ 111,861 | |
| 2022 | (0.76) | 0.90 | 1.10 | (38.54) | 57.56 | $ 113,478 | |
| 2021 | (0.67) | 0.84 | 1.04 | 15.04 | 161.43 (e) | $ 274,357 | |
| 2020 | (0.37) | 0.99 | 1.06 | 34.84 | 43.82 | $ 277,991 | |
| 2019 | (0.08) | 0.99 | 1.05 | (2.26) | 40.69 | $ 254,721 | |
| 2018 | (0.20) | 0.99 | 1.05 | 24.98 | 54.98 | $ 286,152 | |
| CLASS R3 SHARES | |||||||
| 2023 (c) | (1.24) (d) | 1.46 (d) | 1.96 (d) | 9.25 | 19.04 | $ 14,036 | |
| 2022 | (1.27) | 1.41 | 1.92 | (38.84) | 57.56 | $ 14,115 | |
| 2021 | (1.17) | 1.35 | 1.79 | 14.45 | 161.43 (e) | $ 26,881 | |
| 2020 | (0.88) | 1.50 | 1.71 | 34.17 | 43.82 | $ 33,505 | |
| 2019 | (0.60) | 1.50 | 1.80 | (2.76) | 40.69 | $ 30,084 | |
| 2018 | (0.72) | 1.50 | 1.80 | 24.33 | 54.98 | $ 40,963 | |
| CLASS R4 SHARES | |||||||
| 2023 (c) | (1.14) (d) | 1.36 (d) | 2.88 (d) | 9.32 | 19.04 | $ 1,259 | |
| 2022 | (1.18) | 1.31 | 2.97 | (38.79) | 57.56 | $ 1,109 | |
| 2021 | (1.07) | 1.25 | 2.17 | 14.56 | 161.43 (e) | $ 2,076 | |
| 2020 | (0.78) | 1.40 | 2.00 | 34.28 | 43.82 | $ 2,771 | |
| 2019 | (0.50) | 1.40 | 1.91 | (2.64) | 40.69 | $ 4,183 | |
| 2018 | (0.62) | 1.40 | 1.97 | 24.46 | 54.98 | $ 4,484 | |
| CLASS R5 SHARES | |||||||
| 2023 (c) | (0.73) (d) | 0.95 (d) | 1.58 (d) | 9.51 | 19.04 | $ 8,088 | |
| 2022 | (0.77) | 0.90 | 1.52 | (38.53) | 57.56 | $ 9,235 | |
| 2021 | (0.67) | 0.84 | 1.31 | 15.04 | 161.43 (e) | $ 22,945 | |
| 2020 | (0.37) | 0.99 | 1.26 | 34.83 | 43.82 | $ 22,691 | |
| 2019 | (0.09) | 0.99 | 1.39 | (2.26) | 40.69 | $ 19,984 | |
| 2018 | (0.21) | 0.99 | 1.33 | 24.97 | 54.98 | $ 31,433 | |
Income Builder Fund
| PER SHARE PERFORMANCE (FOR A SHARE OUTSTANDING THROUGHOUT THE PERIOD) | |||||||||
| UNLESS OTHERWISE NOTED, PERIODS ARE FISCAL YEARS ENDED SEPTEMBER 30, | Net Asset Value, Beginning of PERIOD | Net Investment Income (Loss)+ | Net Realized & Unrealized Gain (Loss) on Investments | Total from Investment Operations | Dividends from Net Investment Income | Dividends from Net Realized Gains | Dividends from Return of Capital | Total Dividends | Net Asset Value, End of PERIOD |
| CLASS A SHARES(d) | |||||||||
| 2023 (e) | $ 19.22 | 0.35 | 3.18 | 3.53 | (0.59) | — | — | (0.59) | $ 22.16 |
| 2022 | $ 22.96 | 1.18 | (3.75) | (2.57) | (1.17) | — | — | (1.17) | $ 19.22 |
| 2021 | $ 18.70 | 1.19 | 4.19 | 5.38 | (1.12) | — | — | (1.12) | $ 22.96 |
| 2020 | $ 21.72 | 0.86 | (2.98) | (2.12) | (0.90) | — | — | (0.90) | $ 18.70 |
| 2019 | $ 21.80 | 0.93 | (0.07) | 0.86 | (0.94) | — | — | (0.94) | $ 21.72 |
| 2018 | $ 21.50 | 0.92 | 0.30 | 1.22 | (0.92) | — | — | (0.92) | $ 21.80 |
| CLASS C SHARES | |||||||||
| 2023 (e) | $ 19.19 | 0.27 | 3.18 | 3.45 | (0.51) | — | — | (0.51) | $ 22.13 |
| 2022 | $ 22.93 | 0.98 | (3.72) | (2.74) | (1.00) | — | — | (1.00) | $ 19.19 |
| 2021 | $ 18.68 | 1.00 | 4.19 | 5.19 | (0.94) | — | — | (0.94) | $ 22.93 |
| 2020 | $ 21.69 | 0.69 | (2.95) | (2.26) | (0.75) | — | — | (0.75) | $ 18.68 |
| 2019 | $ 21.78 | 0.76 | (0.06) | 0.70 | (0.79) | — | — | (0.79) | $ 21.69 |
| 2018 | $ 21.48 | 0.76 | 0.30 | 1.06 | (0.76) | — | — | (0.76) | $ 21.78 |
| CLASS I SHARES | |||||||||
| 2023 (e) | $ 19.36 | 0.38 | 3.21 | 3.59 | (0.62) | — | — | (0.62) | $ 22.33 |
| 2022 | $ 23.13 | 1.25 | (3.78) | (2.53) | (1.24) | — | — | (1.24) | $ 19.36 |
| 2021 | $ 18.84 | 1.25 | 4.22 | 5.47 | (1.18) | — | — | (1.18) | $ 23.13 |
| 2020 | $ 21.88 | 0.89 | (2.98) | (2.09) | (0.95) | — | — | (0.95) | $ 18.84 |
| 2019 | $ 21.96 | 0.99 | (0.07) | 0.92 | (1.00) | — | — | (1.00) | $ 21.88 |
| 2018 | $ 21.65 | 1.00 | 0.29 | 1.29 | (0.98) | — | — | (0.98) | $ 21.96 |
| CLASS R3 SHARES | |||||||||
| 2023 (e) | $ 19.21 | 0.31 | 3.18 | 3.49 | (0.55) | — | — | (0.55) | $ 22.15 |
| 2022 | $ 22.95 | 1.09 | (3.74) | (2.65) | (1.09) | — | — | (1.09) | $ 19.21 |
| 2021 | $ 18.70 | 1.10 | 4.18 | 5.28 | (1.03) | — | — | (1.03) | $ 22.95 |
| 2020 | $ 21.71 | 0.78 | (2.96) | (2.18) | (0.83) | — | — | (0.83) | $ 18.70 |
| 2019 | $ 21.80 | 0.84 | (0.07) | 0.77 | (0.86) | — | — | (0.86) | $ 21.71 |
| 2018 | $ 21.49 | 0.83 | 0.32 | 1.15 | (0.84) | — | — | (0.84) | $ 21.80 |
| CLASS R4 SHARES | |||||||||
| 2023 (e) | $ 19.24 | 0.32 | 3.18 | 3.50 | (0.56) | — | — | (0.56) | $ 22.18 |
| 2022 | $ 22.98 | 1.12 | (3.75) | (2.63) | (1.11) | — | — | (1.11) | $ 19.24 |
| 2021 | $ 18.72 | 1.12 | 4.20 | 5.32 | (1.06) | — | — | (1.06) | $ 22.98 |
| 2020 | $ 21.74 | 0.77 | (2.94) | (2.17) | (0.85) | — | — | (0.85) | $ 18.72 |
| 2019 | $ 21.83 | 0.86 | (0.07) | 0.79 | (0.88) | — | — | (0.88) | $ 21.74 |
| 2018 | $ 21.52 | 0.85 | 0.33 | 1.18 | (0.87) | — | — | (0.87) | $ 21.83 |
| CLASS R5 SHARES | |||||||||
| 2023 (e) | $ 19.35 | 0.35 | 3.22 | 3.57 | (0.61) | — | — | (0.61) | $ 22.31 |
| 2022 | $ 23.11 | 1.21 | (3.76) | (2.55) | (1.21) | — | — | (1.21) | $ 19.35 |
| 2021 | $ 18.83 | 1.22 | 4.21 | 5.43 | (1.15) | — | — | (1.15) | $ 23.11 |
| 2020 | $ 21.86 | 0.90 | (3.00) | (2.10) | (0.93) | — | — | (0.93) | $ 18.83 |
| 2019 | $ 21.95 | 0.97 | (0.09) | 0.88 | (0.97) | — | — | (0.97) | $ 21.86 |
| 2018 | $ 21.64 | 0.94 | 0.33 | 1.27 | (0.96) | — | — | (0.96) | $ 21.95 |
| CLASS R6 SHARES | |||||||||
| 2023 (e) | $ 19.30 | 0.39 | 3.20 | 3.59 | (0.63) | — | — | (0.63) | $ 22.26 |
| 2022 | $ 23.06 | 1.27 | (3.78) | (2.51) | (1.25) | — | — | (1.25) | $ 19.30 |
| 2021 | $ 18.78 | 1.27 | 4.20 | 5.47 | (1.19) | — | — | (1.19) | $ 23.06 |
| 2020 | $ 21.81 | 0.92 | (2.98) | (2.06) | (0.97) | — | — | (0.97) | $ 18.78 |
| 2019 | $ 21.89 | 1.01 | (0.08) | 0.93 | (1.01) | — | — | (1.01) | $ 21.81 |
| 2018 | $ 21.58 | 1.16 | 0.14 | 1.30 | (0.99) | — | — | (0.99) | $ 21.89 |
| (a) | Net investment income (loss) includes income from foreign withholding tax claims adjusted for IRS compliance fees and/or tax reclaim collection fees. Without these proceeds, the Net Investment Income (Loss) ratios for 2023 would have been: Class A, 3.31%; Class C, 2.54%; Class I, 3.55%; Class R3, 2.92%; Class R4, 3.04%; Class R5, 3.27%; Class R6, 3.67%, 2022 would have been: Class A, 4.71%; Class C, 3.83%; Class I, 4.96%; Class R3, 4.32%; Class R4, 4.44%; Class R5, 4.79%; Class R6, 5.14% and 2021 would have been: Class A, 5.07%; Class C, 4.25%; Class I, 5.28%; Class R3, 4.68%; Class R4, 4.77%; Class R5, 5.18%; Class R6, 5.40%. |
| (b) | Net expenses include tax reclaim collection fees that are excluded from the expense limitation agreement. If such expenses and fees had not occurred, the Expenses After Expense Reductions ratios for 2021 would have been: Class A, 1.13%; Class C, 1.90%; Class I, 0.89%; Class R3, 1.50%; Class R4, 1.40%; Class R5, 0.99%; Class R6, 0.80%. |
| (c) | Not annualized for periods less than one year. |
| (d) | Sales loads are not reflected in computing total return. |
| (e) | Unaudited Six Month Period Ended March 31. |
| (f) | Annualized. |
| (g) | The total return based on the NAV which reflects the adjustments in accordance with U.S. GAAP is 28.55%. |
| (h) | The total return based on the NAV which reflects the adjustments in accordance with U.S. GAAP is 29.02%. |
| + | Based on weighted average shares outstanding. |
Income Builder Fund
| RATIOS TO AVERAGE NET ASSETS | Supplemental Data | ||||||
| UNLESS OTHERWISE NOTED, PERIODS ARE FISCAL YEARS ENDED SEPTEMBER 30, | Net Investment Income (Loss) (%)(a) | Expenses, After Expense Reductions (%)(b) | Expenses, Before Expense Reductions (%) | Total Return (%)(c) | Portfolio Turnover Rate (%)(c) | Net Assets at End of PERIOD (Thousands) | |
| CLASS A SHARES(d) | |||||||
| 2023 (e) | 3.27 (f) | 1.13 (f) | 1.13 (f) | 18.49 | 6.62 | $ 3,886,826 | |
| 2022 | 5.14 | 1.14 | 1.14 | (11.81) | 25.31 | $ 3,344,513 | |
| 2021 | 5.32 | 1.26 | 1.26 | 28.90 | 18.99 | $ 3,876,333 | |
| 2020 | 4.27 | 1.15 | 1.15 | (9.78) | 47.60 | $ 2,912,063 | |
| 2019 | 4.42 | 1.13 | 1.13 | 4.13 | 43.69 | $ 3,458,385 | |
| 2018 | 4.25 | 1.15 | 1.15 | 5.79 | 41.17 | $ 3,378,149 | |
| CLASS C SHARES | |||||||
| 2023 (e) | 2.50 (f) | 1.87 (f) | 1.87 (f) | 18.10 | 6.62 | $ 568,668 | |
| 2022 | 4.26 | 1.89 | 1.89 | (12.52) | 25.31 | $ 570,348 | |
| 2021 | 4.49 | 2.03 | 2.03 | 27.93 | 18.99 | $ 922,523 | |
| 2020 | 3.40 | 1.88 | 1.88 | (10.44) | 47.60 | $ 1,452,643 | |
| 2019 | 3.60 | 1.87 | 1.87 | 3.35 | 43.69 | $ 2,658,581 | |
| 2018 | 3.51 | 1.90 | 1.90 | 5.01 | 41.17 | $ 3,591,856 | |
| CLASS I SHARES | |||||||
| 2023 (e) | 3.51 (f) | 0.89 (f) | 0.89 (f) | 18.68 | 6.62 | $ 6,337,292 | |
| 2022 | 5.40 | 0.89 | 0.89 | (11.61) | 25.31 | $ 5,213,452 | |
| 2021 | 5.54 | 1.02 | 1.02 | 29.18 | 18.99 | $ 5,858,020 | |
| 2020 | 4.40 | 0.91 | 0.91 | (9.55) | 47.60 | $ 5,094,055 | |
| 2019 | 4.67 | 0.88 | 0.88 | 4.39 | 43.69 | $ 7,810,067 | |
| 2018 | 4.58 | 0.86 | 0.86 | 6.12 | 41.17 | $ 7,806,245 | |
| CLASS R3 SHARES | |||||||
| 2023 (e) | 2.88 (f) | 1.50 (f) | 1.60 (f) | 18.29 | 6.62 | $ 21,027 | |
| 2022 | 4.76 | 1.50 | 1.63 | (12.15) | 25.31 | $ 19,842 | |
| 2021 | 4.93 | 1.63 | 1.71 | 28.39 | 18.99 | $ 24,971 | |
| 2020 | 3.86 | 1.49 | 1.49 | (10.06) | 47.60 | $ 24,343 | |
| 2019 | 3.97 | 1.50 | 1.58 | 3.72 | 43.69 | $ 36,155 | |
| 2018 | 3.84 | 1.50 | 1.61 | 5.47 | 41.17 | $ 46,901 | |
| CLASS R4 SHARES | |||||||
| 2023 (e) | 3.00 (f) | 1.40 (f) | 1.45 (f) | 18.32 | 6.62 | $ 11,967 | |
| 2022 | 4.87 | 1.40 | 1.50 | (12.08) | 25.31 | $ 10,181 | |
| 2021 | 5.02 | 1.53 | 1.59 | 28.60 (g) | 18.99 | $ 12,751 | |
| 2020 | 3.79 | 1.40 | 1.51 | (10.01) | 47.60 | $ 13,044 | |
| 2019 | 4.09 | 1.40 | 1.50 | 3.79 | 43.69 | $ 25,221 | |
| 2018 | 3.91 | 1.40 | 1.56 | 5.58 | 41.17 | $ 31,132 | |
| CLASS R5 SHARES | |||||||
| 2023 (e) | 3.26 (f) | 0.99 (f) | 1.10 (f) | 18.57 | 6.62 | $ 22,498 | |
| 2022 | 5.21 | 0.99 | 1.12 | (11.71) | 25.31 | $ 29,318 | |
| 2021 | 5.43 | 1.12 | 1.22 | 29.07 (h) | 18.99 | $ 38,749 | |
| 2020 | 4.44 | 0.99 | 1.05 | (9.58) | 47.60 | $ 45,308 | |
| 2019 | 4.55 | 0.99 | 1.08 | 4.20 | 43.69 | $ 59,890 | |
| 2018 | 4.30 | 0.99 | 1.12 | 5.99 | 41.17 | $ 59,545 | |
| CLASS R6 SHARES | |||||||
| 2023 (e) | 3.62 (f) | 0.80 (f) | 0.83 (f) | 18.72 | 6.62 | $ 178,387 | |
| 2022 | 5.55 | 0.80 | 0.85 | (11.54) | 25.31 | $ 133,706 | |
| 2021 | 5.66 | 0.93 | 0.97 | 29.32 | 18.99 | $ 113,387 | |
| 2020 | 4.58 | 0.80 | 0.84 | (9.44) | 47.60 | $ 86,889 | |
| 2019 | 4.76 | 0.80 | 0.82 | 4.47 | 43.69 | $ 157,924 | |
| 2018 | 5.39 | 0.80 | 0.82 | 6.20 | 41.17 | $ 156,750 | |
Summit Fund
| PER SHARE PERFORMANCE (FOR A SHARE OUTSTANDING THROUGHOUT THE PERIOD) | |||||||||
| UNLESS OTHERWISE NOTED, PERIODS ARE FISCAL YEARS ENDED SEPTEMBER 30, | Net Asset Value, Beginning of PERIOD | Net Investment Income (Loss)+ | Net Realized & Unrealized Gain (Loss) on Investments | Total from Investment Operations | Dividends from Net Investment Income | Dividends from Net Realized Gains | Dividends from Return of Capital | Total Dividends | Net Asset Value, End of PERIOD |
| CLASS A SHARES(e) | |||||||||
| 2023 (f) | $ 10.31 | 0.13 | 1.13 | 1.26 | (0.12) | — | — | (0.12) | $ 11.45 |
| 2022 † | $ 12.06 | 0.18 | (1.74) | (1.56) | (0.19) | — | — | (0.19) | $ 10.31 |
| CLASS I SHARES | |||||||||
| 2023 (f) | $ 10.31 | 0.13 | 1.14 | 1.27 | (0.13) | — | — | (0.13) | $ 11.45 |
| 2022 | $ 14.25 | 0.28 | (1.81) | (1.53) | (0.24) | (2.17) | — | (2.41) | $ 10.31 |
| 2021 | $ 12.18 | 0.16 | 2.71 | 2.87 | (0.22) | (0.58) | — | (0.80) | $ 14.25 |
| 2020 | $ 10.47 | 0.09 | 1.80 | 1.89 | (0.13) | (0.05) | — | (0.18) | $ 12.18 |
| 2019 (i) | $ 10.00 | 0.11 | 0.43 | 0.54 | (0.07) | — | — | (0.07) | $ 10.47 |
| (a) | Net investment income (loss) includes income from foreign withholding tax claims adjusted for IRS compliance fees and/or tax reclaim collection fees. Without these proceeds, the Net Investment Income (Loss) ratios for 2023 would have been: Class A, 2.34%; Class I, 2.29%. |
| (b) | The Fund incurs certain expenses and fees in connection with investments in short positions. If such expenses and fees had not occurred, the Expenses After Expense Reductions ratios for 2021, 2020 and 2019 would have been 0.99%, 0.99% and 0.99% respectively. |
| (c) | The Fund incurs certain expenses and fees in connection with investments in short positions. If such expenses and fees had not occurred, the Expenses Before Expense Reductions ratios for 2021, 2020 and 2019 would have been 1.19%, 1.31% and 1.71% respectively. |
| (d) | Not annualized for periods less than one year. |
| (e) | Sales loads are not reflected in computing total return. |
| (f) | Unaudited Six Month Period Ended March 31. |
| (g) | Annualized. |
| (h) | Due to the size of net assets and fixed expenses, ratios may appear disproportionate. |
| (i) | Fund commenced operations on March 1, 2019. |
| + | Based on weighted average shares outstanding. |
| † | Effective date of this class of shares was January 26, 2022. |
Summit Fund
| RATIOS TO AVERAGE NET ASSETS | Supplemental Data | ||||||
| UNLESS OTHERWISE NOTED, PERIODS ARE FISCAL YEARS ENDED SEPTEMBER 30, | Net Investment Income (Loss) (%)(a) | Expenses, After Expense Reductions (%)(b) | Expenses, Before Expense Reductions (%)(c) | Total Return (%)(d) | Portfolio Turnover Rate (%)(d) | Net Assets at End of PERIOD (Thousands) | |
| CLASS A SHARES(e) | |||||||
| 2023 (f) | 2.39 (g) | 0.94 (g) | 2.22 (g) | 12.27 | 50.68 | $ 3,658 | |
| 2022 † | 2.40 (g) | 0.99 (g) | 9.32 (g)(h) | (13.02) | 128.69 | $ 507 | |
| CLASS I SHARES | |||||||
| 2023 (f) | 2.33 (g) | 0.69 (g) | 1.19 (g) | 12.40 | 50.68 | $ 68,600 | |
| 2022 | 2.38 | 0.88 | 1.22 | (13.36) | 128.69 | $ 56,036 | |
| 2021 | 1.20 | 1.01 | 1.21 | 24.63 | 155.26 | $ 62,466 | |
| 2020 | 0.81 | 1.09 | 1.41 | 18.45 | 139.88 | $ 45,886 | |
| 2019 (i) | 1.78 (g) | 1.72 (g) | 2.44 (g) | 5.45 | 53.38 | $ 35,489 | |
March 31, 2023 (Unaudited)
| (1) | transaction costs, including |
| (a) | sales charges (loads) on purchase payments, for Class A shares; |
| (b) | a deferred sales charge on redemptions of any part or all of a purchase of $1 million of Class A shares within 12 months of purchase; |
| (c) | a deferred sales charge on redemptions of Class C shares within 12 months of purchase; |
| (2) | ongoing costs, including management fees; distribution and/or service (12b-1) fees; and other Fund expenses. |
| Actual | Hypothetical * | |||||
| Ending Account Value 3/31/23 | Expenses Paid During Period 10/1/22-3/31/23 | Ending Account Value 3/31/23 | Expenses Paid During Period† 10/1/22-3/31/23 | Annualized Expense Ratio | ||
| GLOBAL OPPORTUNITIES FUND | ||||||
| CLASS A SHARES | $1,196.85 | $ 7.01 | $1,018.55 | $ 6.44 | 1.28% | |
| CLASS C SHARES | $1,192.25 | $11.31 | $1,014.61 | $10.40 | 2.07% | |
| CLASS I SHARES | $1,198.62 | $ 5.43 | $1,020.00 | $ 4.99 | 0.99% | |
| CLASS R3 SHARES | $1,196.02 | $ 8.21 | $1,017.45 | $ 7.54 | 1.50% | |
| CLASS R4 SHARES | $1,195.99 | $ 7.66 | $1,017.95 | $ 7.04 | 1.40% | |
| CLASS R5 SHARES | $1,198.63 | $ 5.43 | $1,020.00 | $ 4.99 | 0.99% | |
| CLASS R6 SHARES | $1,199.39 | $ 4.66 | $1,020.69 | $ 4.28 | 0.85% | |
| INTERNATIONAL EQUITY FUND | ||||||
| CLASS A SHARES | $1,280.70 | $ 6.37 | $1,019.35 | $ 5.64 | 1.12% | |
| CLASS C SHARES | $1,275.51 | $11.06 | $1,015.21 | $ 9.80 | 1.95% | |
| CLASS I SHARES | $1,282.45 | $ 5.01 | $1,020.54 | $ 4.43 | 0.88% | |
| CLASS R3 SHARES | $1,279.28 | $ 7.73 | $1,018.15 | $ 6.84 | 1.36% | |
| CLASS R4 SHARES | $1,280.00 | $ 6.59 | $1,019.15 | $ 5.84 | 1.16% | |
| CLASS R5 SHARES | $1,281.83 | $ 5.12 | $1,020.44 | $ 4.53 | 0.90% | |
| CLASS R6 SHARES | $1,283.50 | $ 3.99 | $1,021.44 | $ 3.53 | 0.70% | |
| BETTER WORLD INTERNATIONAL FUND | ||||||
| CLASS A SHARES | $1,220.17 | $ 8.08 | $1,017.65 | $ 7.34 | 1.46% | |
| CLASS C SHARES | $1,215.86 | $12.10 | $1,014.01 | $11.00 | 2.19% | |
| CLASS I SHARES | $1,223.75 | $ 4.99 | $1,020.44 | $ 4.53 | 0.90% | |
March 31, 2023 (Unaudited)
| Actual | Hypothetical * | |||||
| Ending Account Value 3/31/23 | Expenses Paid During Period 10/1/22-3/31/23 | Ending Account Value 3/31/23 | Expenses Paid During Period† 10/1/22-3/31/23 | Annualized Expense Ratio | ||
| INTERNATIONAL GROWTH FUND | ||||||
| CLASS A SHARES | $1,262.54 | $ 7.73 | $1,018.10 | $ 6.89 | 1.37% | |
| CLASS C SHARES | $1,256.58 | $12.66 | $1,013.71 | $11.30 | 2.25% | |
| CLASS I SHARES | $1,264.54 | $ 5.59 | $1,020.00 | $ 4.99 | 0.99% | |
| CLASS R3 SHARES | $1,261.27 | $ 8.46 | $1,017.45 | $ 7.54 | 1.50% | |
| CLASS R4 SHARES | $1,261.66 | $ 7.89 | $1,017.95 | $ 7.04 | 1.40% | |
| CLASS R5 SHARES | $1,264.50 | $ 5.59 | $1,020.00 | $ 4.99 | 0.99% | |
| CLASS R6 SHARES | $1,264.99 | $ 5.03 | $1,020.49 | $ 4.48 | 0.89% | |
| DEVELOPING WORLD FUND | ||||||
| CLASS A SHARES | $1,138.45 | $ 7.68 | $1,017.75 | $ 7.24 | 1.44% | |
| CLASS C SHARES | $1,133.73 | $12.08 | $1,013.61 | $11.40 | 2.27% | |
| CLASS I SHARES | $1,139.81 | $ 5.55 | $1,019.75 | $ 5.24 | 1.04% | |
| CLASS R5 SHARES | $1,139.71 | $ 5.55 | $1,019.75 | $ 5.24 | 1.04% | |
| CLASS R6 SHARES | $1,140.68 | $ 5.02 | $1,020.24 | $ 4.73 | 0.94% | |
| SMALL/MID CAP CORE FUND | ||||||
| CLASS A SHARES | $1,069.31 | $ 7.07 | $1,018.10 | $ 6.89 | 1.37% | |
| CLASS C SHARES | $1,064.07 | $12.04 | $1,013.26 | $11.75 | 2.34% | |
| CLASS I SHARES | $1,071.48 | $ 4.91 | $1,020.19 | $ 4.78 | 0.95% | |
| CLASS R3 SHARES | $1,069.52 | $ 6.76 | $1,018.40 | $ 6.59 | 1.31% | |
| CLASS R4 SHARES | $1,069.82 | $ 6.24 | $1,018.90 | $ 6.09 | 1.21% | |
| CLASS R5 SHARES | $1,071.45 | $ 4.91 | $1,020.19 | $ 4.78 | 0.95% | |
| SMALL/MID CAP GROWTH FUND | ||||||
| CLASS A SHARES | $1,093.05 | $ 7.46 | $1,017.80 | $ 7.19 | 1.43% | |
| CLASS C SHARES | $1,088.02 | $12.18 | $1,013.26 | $11.75 | 2.34% | |
| CLASS I SHARES | $1,095.31 | $ 4.96 | $1,020.19 | $ 4.78 | 0.95% | |
| CLASS R3 SHARES | $1,092.53 | $ 7.62 | $1,017.65 | $ 7.34 | 1.46% | |
| CLASS R4 SHARES | $1,093.22 | $ 7.10 | $1,018.15 | $ 6.84 | 1.36% | |
| CLASS R5 SHARES | $1,095.06 | $ 4.96 | $1,020.19 | $ 4.78 | 0.95% | |
| INCOME BUILDER FUND | ||||||
| CLASS A SHARES | $1,184.93 | $ 6.16 | $1,019.30 | $ 5.69 | 1.13% | |
| CLASS C SHARES | $1,180.96 | $10.17 | $1,015.61 | $ 9.40 | 1.87% | |
| CLASS I SHARES | $1,186.77 | $ 4.85 | $1,020.49 | $ 4.48 | 0.89% | |
| CLASS R3 SHARES | $1,182.91 | $ 8.16 | $1,017.45 | $ 7.54 | 1.50% | |
| CLASS R4 SHARES | $1,183.23 | $ 7.62 | $1,017.95 | $ 7.04 | 1.40% | |
| CLASS R5 SHARES | $1,185.73 | $ 5.39 | $1,020.00 | $ 4.99 | 0.99% | |
| CLASS R6 SHARES | $1,187.23 | $ 4.36 | $1,020.94 | $ 4.03 | 0.80% | |
| SUMMIT FUND | ||||||
| CLASS A SHARES | $1,122.65 | $ 4.97 | $1,020.24 | $ 4.73 | 0.94% | |
| CLASS I SHARES | $1,123.99 | $ 3.65 | $1,021.49 | $ 3.48 | 0.69% | |
| * | Hypothetical assumes a rate of return of 5% per year before expenses. |
| † | Expenses are equal to the annualized expense ratio for each class multiplied by the average account value over the period, multiplied by 182/365 to reflect the one-half year period. |
March 31, 2023 (Unaudited)
| ■ | Thornburg Global Opportunities Fund |
| ■ | Thornburg International Equity Fund |
| ■ | Thornburg Better World International Fund |
| ■ | Thornburg International Growth Fund |
| ■ | Thornburg Developing World Fund |
| ■ | Thornburg Small/Mid Cap Core Fund |
| ■ | Thornburg Small/Mid Cap Growth Fund |
| ■ | Thornburg Investment Income Builder Fund |
| ■ | Thornburg Income Builder Opportunities Trust |
| ■ | Thornburg Summit Fund |
| ■ | Thornburg Limited Term U.S. Government Fund |
| ■ | Thornburg Limited Term Income Fund |
| ■ | Thornburg Ultra Short Income Fund |
| ■ | Thornburg Strategic Income Fund |
| ■ | Thornburg Short Duration Municipal Fund |
| ■ | Thornburg Limited Term Municipal Fund |
| ■ | Thornburg California Limited Term Municipal Fund |
| ■ | Thornburg New Mexico Intermediate Municipal Fund |
| ■ | Thornburg New York Intermediate Municipal Fund |
| ■ | Thornburg Intermediate Municipal Fund |
| ■ | Thornburg Strategic Municipal Income Fund |


| 800.847.0200 | TH4624 |

| Thornburg Taxable Fixed Income Funds |
| Thornburg Limited Term U.S. Government Fund |
| Thornburg Limited Term Income Fund |
| Thornburg Ultra Short Income Fund |
| Thornburg Strategic Income Fund |

At Thornburg, we believe unconstrained investing leads to better outcomes for our clients. Our investment solutions are highly active, high conviction, and benchmark agnostic. When it comes to finding economic opportunity for clients, it’s more than what we do.
It’s how we do it. Active As bottom-up, fundamental, active managers, we look beyond conventional benchmarks. Long Term We take a long-term view in how we manage our firm and our portfolios. Benchmark Agnostic Investment strategies should have the flexibility to pursue solutions for clients, not stay within the conventional confines of benchmarks. Flexible Perspective Our approach to portfolio construction is guided by our convictions rather than convention. High Conviction We focus our attention and capital on thoroughly researched, well-understood positions. The best form of risk management is to know what you own, and why. Repeatable & Robust Our long-term outperformance of benchmarks verifies that our process works and outperforms conventional thinking. Independent We are independently owned and far from the herd of other investment managers. Investment Driven All members of the investment team are resources for all of our strategies. Collaborative Our team collaborates on opportunities across geography, sector, or asset class.
2 Semi-Annual Report
| 4 | |
| 5 | |
| 10 | |
| Schedule of Investments | |
| 14 | |
| 18 | |
| 37 | |
| 46 | |
| 74 | |
| 76 | |
| 78 | |
| 80 | |
| 94 | |
| 102 | |
| 104 | |
| 105 |
March 31, 2023 (Unaudited)
 | |
| Jason Brady, cfa Portfolio Manager CEO, President, and Managing Director |
Fund Overview
| THORNBURG LIMITED TERM U.S. GOVERNMENT FUND | FINAL VALUE |
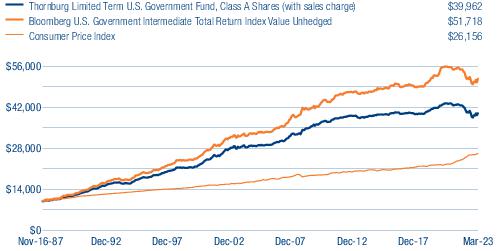
| THORNBURG LIMITED TERM U.S. GOVERNMENT FUND | 1-YR | 3-YR | 5-YR | 10-YR | SINCE INCEPTION |
| Class A Shares (Incep: 11/16/87) | |||||
| Without sales charge | -2.51% | -2.06% | 0.11% | 0.23% | 4.04% |
| With sales charge | -4.73% | -2.55% | -0.20% | 0.08% | 3.99% |
| Class C Shares (Incep: 9/1/94) | |||||
| Without sales charge | -2.85% | -2.38% | -0.21% | -0.08% | 2.91% |
| With sales charge | -3.33% | -2.38% | -0.21% | -0.08% | 2.91% |
| Class C2 Shares (Incep: 10/1/20) | |||||
| Without sales charge | -2.85% | - | - | - | -3.49% |
| With sales charge | -3.47% | - | - | - | -3.49% |
| Class I Shares (Incep: 7/5/96) | -2.22% | -1.78% | 0.39% | 0.54% | 3.36% |
| Class R3 Shares (Incep: 7/1/03) | -2.47% | -2.12% | 0.03% | 0.17% | 1.69% |
| Class R4 Shares (Incep: 2/1/14) | -2.55% | -2.15% | 0.01% | - | 0.26% |
| Class R5 Shares (Incep: 5/1/12) | -2.24% | -1.83% | 0.33% | 0.49% | 0.57% |
| Bloomberg U.S. Government Intermediate Total Return Index Value Unhedged ( Since 11/16/87) | -1.52% | -2.30% | 1.06% | 0.90% | 4.76% |
Fund Overview
| THORNBURG LIMITED TERM INCOME FUND | FINAL VALUE |
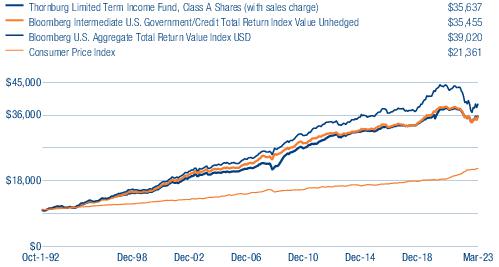
| THORNBURG LIMITED TERM INCOME FUND | 1-YR | 3-YR | 5-YR | 10-YR | SINCE INCEPTION |
| Class A Shares (Incep: 10/1/92) | |||||
| Without sales charge | -1.16% | 0.52% | 1.54% | 1.55% | 4.31% |
| With sales charge | -3.37% | 0.03% | 1.23% | 1.39% | 4.26% |
| Class C Shares (Incep: 9/1/94) | |||||
| Without sales charge | -1.38% | 0.33% | 1.31% | 1.32% | 3.97% |
| With sales charge | -1.86% | 0.33% | 1.31% | 1.32% | 3.97% |
| Class C2 Shares (Incep: 10/1/20) | |||||
| Without sales charge | -1.61% | - | - | - | -2.57% |
| With sales charge | -2.24% | - | - | - | -2.57% |
| Class I Shares (Incep: 7/5/96) | -0.86% | 0.84% | 1.83% | 1.88% | 4.44% |
| Class R3 Shares (Incep: 7/1/03) | -1.36% | 0.31% | 1.33% | 1.39% | 2.98% |
| Class R4 Shares (Incep: 2/1/14) | -1.36% | 0.34% | 1.33% | - | 1.49% |
| Class R5 Shares (Incep: 5/1/12) | -0.86% | 0.84% | 1.81% | 1.80% | 2.13% |
| Class R6 Shares (Incep: 4/10/17) | -0.79% | 0.91% | 1.90% | - | 1.89% |
| Bloomberg Intermediate U.S. Government/Credit Total Return Index Value Unhedged (Since 10/1/92) | -1.66% | -1.28% | 1.40% | 1.32% | 4.24% |
| Bloomberg U.S. Aggregate Bond Total Return Index Value USD (Since 10/1/92) | -4.78% | -2.77% | 0.91% | 1.36% | 4.57% |
Fund Overview
| THORNBURG ULTRA SHORT INCOME FUND | FINAL VALUE |
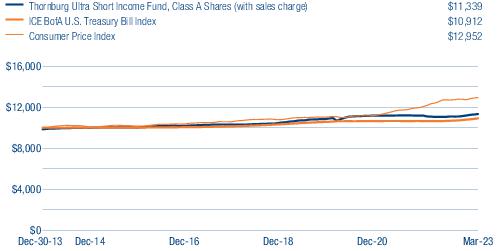
| THORNBURG ULTRA SHORT INCOME FUND | 1-YR | 3-YR | 5-YR | 10-YR | SINCE INCEPTION |
| Class A Shares (Incep: 12/30/13) | |||||
| Without sales charge | 2.35% | 2.06% | 1.93% | - | 1.54% |
| With sales charge | 0.06% | 1.53% | 1.62% | - | 1.37% |
| Class I Shares (Incep: 12/30/13) | 2.56% | 2.23% | 2.12% | - | 1.73% |
| ICE BofA U.S. Treasury Bill Index (Since 12/30/13) | 2.50% | 0.86% | 1.43% | - | 0.95% |
Fund Overview
| THORNBURG STRATEGIC INCOME FUND | FINAL VALUE |
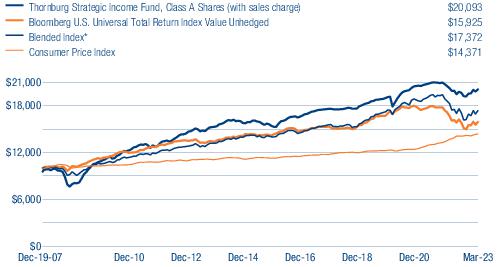
| THORNBURG STRATEGIC INCOME FUND | 1-YR | 3-YR | 5-YR | 10-YR | SINCE INCEPTION |
| Class A Shares (Incep: 12/19/07) | |||||
| Without sales charge | -0.75% | 3.94% | 2.77% | 3.04% | 4.99% |
| With sales charge | -5.18% | 2.35% | 1.83% | 2.56% | 4.67% |
| Class C Shares (Incep: 12/19/07) | |||||
| Without sales charge | -1.38% | 3.20% | 2.03% | 2.35% | 4.33% |
| With sales charge | -2.34% | 3.20% | 2.03% | 2.35% | 4.33% |
| Class I Shares (Incep: 12/19/07) | -0.29% | 4.35% | 3.16% | 3.41% | 5.35% |
| Class R3 Shares (Incep: 5/1/12) | -1.01% | 3.65% | 2.49% | 2.88% | 3.53% |
| Class R4 Shares (Incep: 2/1/14) | -1.01% | 3.68% | 2.51% | - | 2.81% |
| Class R5 Shares (Incep: 5/1/12) | -0.37% | 4.32% | 3.16% | 3.39% | 4.02% |
| Class R6 Shares (Incep: 4/10/17) | -0.29% | 4.39% | 3.22% | - | 3.43% |
| Bloomberg U.S. Universal Total Return Index Value Unhedged (Since 12/19/07) | -4.61% | -2.02% | 1.05% | 1.62% | 3.09% |
Thornburg Limited Term U.S. Government Fund | March 31, 2023 (Unaudited)
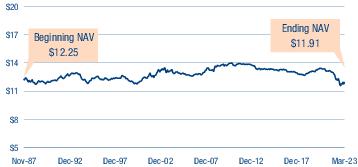
| KEY PORTFOLIO ATTRIBUTES | |
| Number of Bonds | 177 |
| Effective Duration | 3.5 Yrs |
| Average Maturity | 4.6 Yrs |
| Annualized Distribution Yield | 2.78% |
| SEC Yield | 3.16% |
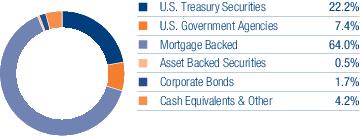
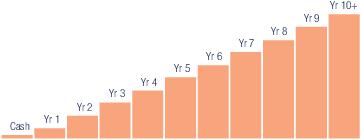
| 5% | 10% | 11% | 9% | 17% | 12% | 2% | 3% | 9% | 6% | 16% |
| THORNBURG LIMITED TERM U.S. GOVERNMENT FUND | NASDAQ SYMBOLS | CUSIPS |
| Class A | LTUSX | 885-215-103 |
| Class C | LTUCX | 885-215-830 |
| Class C2 | LTUQX | 885-216-465 |
| Class I | LTUIX | 885-215-699 |
| Class R3 | LTURX | 885-215-491 |
| Class R4 | LTUGX | 885-216-747 |
| Class R5 | LTGRX | 885-216-861 |
Thornburg Limited Term Income Fund | March 31, 2023 (Unaudited)
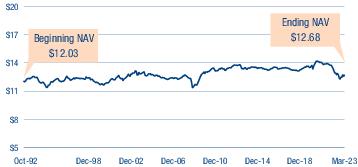
| KEY PORTFOLIO ATTRIBUTES | |
| Number of Bonds | 771 |
| Effective Duration | 3.4 Yrs |
| Average Maturity | 4.4 Yrs |
| Annualized Distribution Yield | 3.19% |
| SEC Yield | 4.27% |
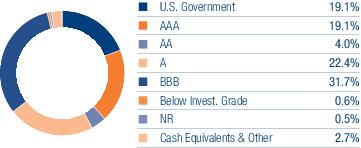
| 3% | 14% | 13% | 10% | 14% | 10% | 8% | 4% | 7% | 5% | 13% |
| THORNBURG LIMITED TERM INCOME FUND | NASDAQ SYMBOLS | CUSIPS |
| Class A | THIFX | 885-215-509 |
| Class C | THICX | 885-215-764 |
| Class C2 | THIQX | 885-216-424 |
| Class I | THIIX | 885-215-681 |
| Class R3 | THIRX | 885-215-483 |
| Class R4 | THRIX | 885-216-762 |
| Class R5 | THRRX | 885-216-853 |
| Class R6 | THRLX | 885-216-671 |
Thornburg Ultra Short Income Fund | March 31, 2023 (Unaudited)
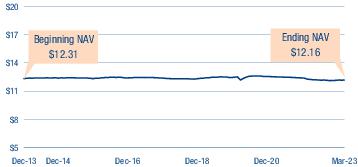
| KEY PORTFOLIO ATTRIBUTES | |
| Number of Bonds | 328 |
| Effective Duration | 0.5 Yrs |
| Average Maturity | 0.6 Yrs |
| Annualized Distribution Yield | 4.24% |
| SEC Yield | 4.14% |
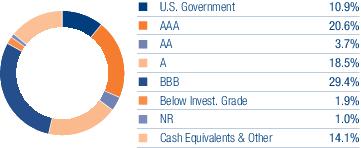
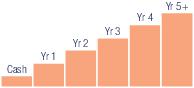
| 14% | 65% | 17% | 3% | 1% | 0% |
| THORNBURG ULTRA SHORT INCOME FUND | NASDAQ SYMBOLS | CUSIPS |
| Class A | TLDAX | 885-216-812 |
| Class I | TLDIX | 885-216-796 |
Thornburg Strategic Income Fund | March 31, 2023 (Unaudited)
| PORTFOLIO COMPOSITION | |
| Corporate/Convertible Bonds | 50.7% |
| Asset Backed Securities | 15.4% |
| Bank Loans | 0.9% |
| Common & Preferred Stock | 0.4% |
| U.S. Treasury Securities | 5.4% |
| U.S. Government Agencies | 0.1% |
| Other Fixed Income | 16.2% |
| Other Assets Less Liabilities | 10.9% |
| Annualized Distribution Yield | 3.67% |
| SEC Yield | 4.20% |
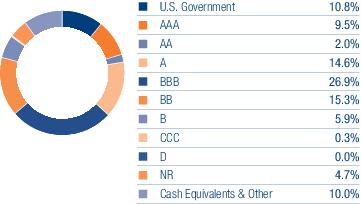
| TOP TEN INDUSTRY GROUPS | |
| Financial Services | 6.5% |
| Utilities | 5.9% |
| Insurance | 4.3% |
| Software & Services | 4.2% |
| Materials | 3.9% |
| Energy | 3.7% |
| Equity Real Estate Investment Trusts (REITs) | 2.3% |
| Food, Beverage & Tobacco | 2.2% |
| Technology Hardware & Equipment | 2.0% |
| Media & Entertainment | 2.0% |
| THORNBURG STRATEGIC INCOME FUND | NASDAQ SYMBOLS | CUSIPS |
| Class A | TSIAX | 885-215-228 |
| Class C | TSICX | 885-215-210 |
| Class I | TSIIX | 885-215-194 |
| Class R3 | TSIRX | 885-216-887 |
| Class R4 | TSRIX | 885-216-754 |
| Class R5 | TSRRX | 885-216-879 |
| Class R6 | TSRSX | 885-216-648 |
Thornburg Limited Term U.S. Government Fund | March 31, 2023 (Unaudited)
| Issuer-Description | PRINCIPAL AMOUNT | VALUE | |
| U.S. Treasury Securities — 22.2% | |||
| United States Treasury Bill, | |||
| 4.439% due 5/23/2023 | $ 1,100,000 | $ 1,092,989 | |
| 4.687% due 7/20/2023 | 5,000,000 | 4,930,513 | |
| United States Treasury Notes, | |||
| 0.125% due 12/15/2023 | 5,800,000 | 5,617,844 | |
| 2.25% due 12/31/2023 | 3,100,000 | 3,043,813 | |
| 3.50% due 2/15/2033 | 3,700,000 | 3,706,359 | |
| 4.375% due 10/31/2024 | 4,600,000 | 4,605,211 | |
| United States Treasury Notes Inflationary Index, | |||
| 0.125% due 4/15/2027 - 7/15/2031 | 20,668,910 | 19,177,260 | |
| 0.25% due 1/15/2025 | 393,987 | 384,552 | |
| 0.50% due 4/15/2024 - 1/15/2028 | 796,286 | 776,218 | |
| 0.625% due 1/15/2024 | 390,961 | 387,694 | |
| 0.75% due 7/15/2028 | 517,720 | 507,684 | |
| Total U.S. Treasury Securities (Cost $43,952,811) | 44,230,137 | ||
| U.S. Government Agencies — 7.4% | |||
| a | Durrah MSN 35603 (Guaranty: Export-Import Bank of the United States), 1.684% due 1/22/2025 | 260,112 | 252,119 |
| HNA Group LLC (Guaranty: Export-Import Bank of the United States), 2.291% due 6/30/2027 | 1,177,826 | 1,137,369 | |
| a | MSN 41079 and 41084 Ltd. (Guaranty: Export-Import Bank of the United States), 1.717% due 7/13/2024 | 215,784 | 209,694 |
| Petroleos Mexicanos (Guaranty: Export-Import Bank of the United States), | |||
| a | 2.29% due 2/15/2024 | 52,500 | 50,387 |
| a | 2.46% due 12/15/2025 | 750,000 | 698,183 |
| a,b | 5.142% (LIBOR 3 Month + 0.35%) due 4/15/2025 | 787,500 | 753,929 |
| Reliance Industries Ltd. (Guaranty: Export-Import Bank of the United States), | |||
| a | 2.06% due 1/15/2026 | 1,050,000 | 1,006,089 |
| a | 2.512% due 1/15/2026 | 1,582,500 | 1,516,810 |
| Small Business Administration Participation Certificates, | |||
| Series 2005-20H Class 1, 5.11% due 8/1/2025 | 26,068 | 25,444 | |
| Series 2007-20D Class 1, 5.32% due 4/1/2027 | 71,006 | 69,895 | |
| Series 2007-20F Class 1, 5.71% due 6/1/2027 | 43,609 | 43,194 | |
| Series 2007-20I Class 1, 5.56% due 9/1/2027 | 150,291 | 148,801 | |
| Series 2007-20K Class 1, 5.51% due 11/1/2027 | 115,380 | 114,043 | |
| Series 2008-20G Class 1, 5.87% due 7/1/2028 | 240,208 | 240,070 | |
| Series 2011-20G Class 1, 3.74% due 7/1/2031 | 411,179 | 394,956 | |
| Series 2011-20K Class 1, 2.87% due 11/1/2031 | 720,620 | 676,592 | |
| Series 2014-20H Class 1, 2.88% due 8/1/2034 | 450,253 | 422,040 | |
| Series 2015-20B Class 1, 2.46% due 2/1/2035 | 409,700 | 376,991 | |
| Series 2015-20G Class 1, 2.88% due 7/1/2035 | 833,249 | 781,181 | |
| Series 2015-20I Class 1, 2.82% due 9/1/2035 | 849,133 | 792,686 | |
| Series 2017-20I Class 1, 2.59% due 9/1/2037 | 1,839,712 | 1,693,961 | |
| Series 2017-20K Class 1, 2.79% due 11/1/2037 | 913,035 | 850,861 | |
| Thirax 1 LLC (Guaranty: Export-Import Bank of the United States), 0.968% due 1/14/2033 | 1,264,625 | 1,090,740 | |
| Ulani MSN 35940 LLC (Guaranty: Export-Import Bank of the United States), 2.227% due 5/16/2025 | 937,500 | 859,969 | |
| a,b | Washington Aircraft 2 Co DAC (Guaranty: Export-Import Bank of the United States), 5.564% (LIBOR 3 Month + 0.43%) due 6/26/2024 | 465,145 | 462,629 |
| Total U.S. Government Agencies (Cost $15,660,585) | 14,668,633 | ||
| Mortgage Backed — 64.0% | |||
| b,c | Federal Agricultural Mortgage Corp. Mtg Trust, Whole Loan Securities Trust CMO, Seies 2021-1 Class A, 2.18% due 1/25/2051 | 4,367,196 | 3,540,257 |
| Federal Home Loan Mtg Corp., | |||
| 3.00% due 4/1/2052 | 1,659,952 | 1,488,436 | |
| Pool D98887, 3.50% due 1/1/2032 | 224,134 | 218,777 | |
| Pool E09025, 2.50% due 3/1/2028 | 42,657 | 41,119 | |
| Pool G13804, 5.00% due 3/1/2025 | 24,425 | 24,250 | |
| Pool G15227, 3.50% due 12/1/2029 | 703,331 | 689,253 | |
| Pool G16710, 3.00% due 11/1/2030 | 1,103,858 | 1,066,078 | |
| Pool J11371, 4.50% due 12/1/2024 | 23,889 | 23,643 | |
| Pool J21208, 2.50% due 11/1/2027 | 796,021 | 762,883 | |
| Pool J37586, 3.50% due 9/1/2032 | 170,108 | 166,151 | |
| Pool RE6097, 2.00% due 5/1/2051 | 2,167,839 | 1,741,923 | |
| Pool RE6119, 2.50% due 12/1/2051 | 1,893,211 | 1,590,324 |
| 14 | Thornburg Taxable Fixed Income Funds Semi-Annual Report | See notes to financial statements. |
| Issuer-Description | PRINCIPAL AMOUNT | VALUE | |
| Pool SE9046, 3.00% due 12/1/2051 | $ 2,242,647 | $ 1,988,370 | |
| Pool T61943, 3.50% due 8/1/2045 | 108,955 | 101,249 | |
| Pool T65457, 3.00% due 1/1/2048 | 430,505 | 386,342 | |
| Federal Home Loan Mtg Corp., CMO REMIC, | |||
| Series 3704 Class DC, 4.00% due 11/15/2036 | 35,713 | 35,476 | |
| Series 3922 Class PQ, 2.00% due 4/15/2041 | 92,888 | 89,083 | |
| Series 4050 Class MV, 3.50% due 8/15/2023 | 154,305 | 153,696 | |
| b | Series 4105 Class FG, 5.084% (LIBOR 1 Month + 0.40%) due 9/15/2042 | 523,169 | 512,663 |
| Series 4120 Class TC, 1.50% due 10/15/2027 | 427,564 | 404,223 | |
| Series 4120 Class UE, 2.00% due 10/15/2027 | 483,964 | 462,180 | |
| Federal Home Loan Mtg Corp., Multifamily Structured Pass Through Certificates, CMBS, | |||
| b | Series K035 Class A2, 3.458% due 8/25/2023 | 4,788,735 | 4,751,718 |
| Series K037 Class A1, 2.592% due 4/25/2023 | 1,868 | 1,868 | |
| Series K042 Class A1, 2.267% due 6/25/2024 | 737,465 | 721,364 | |
| Series K043 Class A2, 3.062% due 12/25/2024 | 1,357,000 | 1,322,335 | |
| b | Series K047 Class A2, 3.329% due 5/25/2025 | 1,250,000 | 1,219,198 |
| Series K055 Class A1, 2.263% due 4/25/2025 | 43,422 | 42,177 | |
| b | Series K061 Class A2, 3.347% due 11/25/2026 | 290,000 | 280,879 |
| b | Series K069 Class A2, 3.187% due 9/25/2027 | 180,000 | 172,456 |
| Series K071 Class A2, 3.286% due 11/25/2027 | 2,000,000 | 1,920,756 | |
| Series K072 Class A2, 3.444% due 12/25/2027 | 120,000 | 115,965 | |
| Series K073 Class A2, 3.35% due 1/25/2028 | 3,000,000 | 2,886,971 | |
| Series K095 Class A2, 2.785% due 6/25/2029 | 577,000 | 532,472 | |
| Series K729 Class A2, 3.136% due 10/25/2024 | 3,500,000 | 3,420,497 | |
| b | Series K730 Class A2, 3.59% due 1/25/2025 | 182,616 | 179,078 |
| Series KHG1 Class A3, 3.341% due 12/25/2027 | 300,000 | 288,943 | |
| Federal Home Loan Mtg Corp., Seasoned Credit Risk Transfer, Whole Loan Securities Trust CMO, | |||
| b | Series 2017-3 Class HA, 3.25% due 7/25/2056 | 969,257 | 919,059 |
| b | Series 2017-4 Class HT, 3.25% due 6/25/2057 | 2,763,893 | 2,543,360 |
| Series 2017-4 Class MT, 3.50% due 6/25/2057 | 618,303 | 577,800 | |
| b | Series 2018-1 Class HA, 3.00% due 5/25/2057 | 1,245,022 | 1,167,264 |
| b | Series 2018-2 Class HA, 3.00% due 11/25/2057 | 698,525 | 658,866 |
| Series 2018-3 Class HA, 3.00% due 8/25/2057 | 930,765 | 875,128 | |
| b | Series 2018-3 Class MA, 3.50% due 8/25/2057 | 1,046,961 | 1,005,524 |
| Series 2018-4 Class HA, 3.00% due 3/25/2058 | 1,151,682 | 1,080,826 | |
| Series 2018-4 Class MA, 3.50% due 3/25/2058 | 802,880 | 770,272 | |
| Series 2019-1 Class MA, 3.50% due 7/25/2058 | 2,242,190 | 2,143,166 | |
| Series 2019-2 Class MA, 3.50% due 8/25/2058 | 1,975,735 | 1,884,985 | |
| Series 2019-3 Class MA, 3.50% due 10/25/2058 | 795,976 | 761,337 | |
| Series 2019-4 Class MA, 3.00% due 2/25/2059 | 1,175,254 | 1,102,629 | |
| Series 2020-1 Class MA, 2.50% due 8/25/2059 | 1,770,092 | 1,633,166 | |
| Series 2020-2 Class A1C, 2.00% due 9/25/2030 | 2,097,103 | 1,896,076 | |
| Series 2020-2 Class A1D, 1.75% due 9/25/2030 | 2,097,103 | 1,878,088 | |
| Series 2020-2 Class MA, 2.00% due 11/25/2059 | 1,728,782 | 1,565,769 | |
| Series 2020-3 Class MA, 2.00% due 5/25/2060 | 563,835 | 509,092 | |
| Series 2020-3 Class MT, 2.00% due 5/25/2060 | 672,876 | 566,306 | |
| Series 2022-1 Class MTU, 3.25% due 11/25/2061 | 1,076,943 | 968,835 | |
| Federal Home Loan Mtg Corp., UMBS Collateral, | |||
| Pool RA6808 3.00% due 2/1/2052 | 2,295,223 | 2,062,599 | |
| Pool RC1280, 3.00% due 3/1/2035 | 525,782 | 500,564 | |
| Pool RC1826, 2.00% due 2/1/2036 | 1,460,897 | 1,323,670 | |
| Pool RD5043, 2.00% due 12/1/2030 | 2,153,970 | 1,994,738 | |
| Pool SB8010, 2.50% due 10/1/2034 | 612,861 | 571,318 | |
| Pool SB8030, 2.00% due 12/1/2034 | 915,577 | 829,756 | |
| Pool SD1669, 2.50% due 1/1/2052 | 2,434,167 | 2,097,959 | |
| Pool ZS4730, 3.50% due 8/1/2047 | 833,781 | 785,139 | |
| Pool ZS7299, 3.00% due 10/1/2030 | 566,695 | 546,789 | |
| Federal Home Loan Mtg Corp., Whole Loan Securities Trust CMO, | |||
| Series 2015-SC02 Class 2A, 3.50% due 9/25/2045 | 202,507 | 185,207 | |
| Series 2016-SC01 Class 1A, 3.00% due 7/25/2046 | 807,042 | 715,525 | |
| Series 2016-SC01 Class 2A, 3.50% due 7/25/2046 | 257,042 | 235,065 | |
| Series 2016-SC02 Class 2A, 3.50% due 10/25/2046 | 169,460 | 154,496 | |
| Series 2017-SC01 Class 1A, 3.00% due 12/25/2046 | 1,469,140 | 1,301,533 |
| See notes to financial statements. | Thornburg Taxable Fixed Income Funds Semi-Annual Report | 15 |
Thornburg Limited Term U.S. Government Fund | March 31, 2023 (Unaudited)
| Issuer-Description | PRINCIPAL AMOUNT | VALUE | |
| Series 2017-SC01 Class 2A, 3.50% due 12/25/2046 | $ 505,929 | $ 458,608 | |
| Series 2017-SC02 Class 1A, 3.00% due 5/25/2047 | 321,218 | 285,779 | |
| Series 2017-SC02 Class 2A, 3.50% due 5/25/2047 | 161,393 | 145,392 | |
| Federal National Mtg Assoc., | |||
| b | Pool 895572, 4.07% (LIBOR 12 Month + 1.82%) due 6/1/2036 | 66,755 | 67,771 |
| Pool BF0130, 3.50% due 8/1/2056 | 346,468 | 327,264 | |
| Pool BF0144, 3.50% due 10/1/2056 | 494,468 | 467,061 | |
| Pool BM6983, 3.00% due 3/1/2052 | 1,968,738 | 1,760,799 | |
| Federal National Mtg Assoc., CMBS, | |||
| b | Series 2015-SB5 Class A10, 3.15% due 9/25/2035 | 298,328 | 290,363 |
| b | Series 2018-SB47 Class A5H, 5.369% (LIBOR 1 Month + 0.70%) due 1/25/2038 | 407,674 | 403,700 |
| Federal National Mtg Assoc., CMO REMIC, | |||
| b | Series 2009-17 Class AH, 0.574% due 3/25/2039 | 196,458 | 161,438 |
| Series 2011-70 Class CA, 3.00% due 8/25/2026 | 719,254 | 697,898 | |
| b | Series 2013-81 Class FW, 5.145% (LIBOR 1 Month + 0.30%) due 1/25/2043 | 911,000 | 891,858 |
| b | Series 2013-92 Class FA, 5.395% (LIBOR 1 Month + 0.55%) due 9/25/2043 | 635,864 | 624,332 |
| Federal National Mtg Assoc., UMBS Collateral, | |||
| Pool AE0704, 4.00% due 1/1/2026 | 305,151 | 300,063 | |
| Pool AJ1752, 3.50% due 9/1/2026 | 361,258 | 352,548 | |
| Pool AK6768, 3.00% due 3/1/2027 | 477,883 | 462,151 | |
| Pool AL6582, 3.50% due 4/1/2030 | 446,988 | 437,630 | |
| Pool AL7801, 2.50% due 11/1/2030 | 1,658,136 | 1,567,920 | |
| Pool AL9445, 3.00% due 7/1/2031 | 12,841 | 12,390 | |
| Pool AL9821, 2.50% due 1/1/2032 | 1,972,466 | 1,857,821 | |
| Pool AS9749, 4.00% due 6/1/2047 | 321,592 | 312,435 | |
| Pool AU2669, 2.50% due 10/1/2028 | 516,537 | 497,438 | |
| Pool AZ3778, 3.00% due 4/1/2030 | 1,070,122 | 1,033,013 | |
| Pool BM4153, 3.00% due 6/1/2033 | 1,267,331 | 1,213,723 | |
| Pool BM4864, 3.50% due 5/1/2033 | 826,155 | 808,012 | |
| Pool BP9589, 2.50% due 8/1/2035 | 1,856,800 | 1,727,020 | |
| Pool CA0942, 2.50% due 12/1/2032 | 830,222 | 774,525 | |
| Pool CA4102, 3.50% due 8/1/2029 | 683,862 | 665,807 | |
| Pool CA5271, 2.50% due 3/1/2035 | 1,113,169 | 1,037,734 | |
| Pool CA5282, 3.00% due 3/1/2035 | 2,412,636 | 2,296,893 | |
| Pool CA6862, 2.00% due 9/1/2035 | 1,365,869 | 1,238,827 | |
| Pool CA7470, 2.00% due 10/1/2035 | 2,420,830 | 2,195,664 | |
| Pool CA7535, 1.50% due 10/1/2030 | 2,521,974 | 2,301,586 | |
| Pool CA7891, 1.50% due 11/1/2035 | 1,406,020 | 1,246,197 | |
| Pool FM1523, 2.50% due 8/1/2029 | 668,929 | 635,917 | |
| Pool FM2831, 2.50% due 5/1/2032 | 1,465,461 | 1,380,284 | |
| Pool FM3494, 2.50% due 4/1/2048 | 1,191,727 | 1,049,080 | |
| Pool FM5458, 1.50% due 12/1/2035 | 1,335,590 | 1,179,515 | |
| Pool FS0898, 3.00% due 2/1/2052 | 5,102,662 | 4,578,113 | |
| Pool FS0916, 3.00% due 3/1/2052 | 2,797,667 | 2,509,358 | |
| Pool MA2353, 3.00% due 8/1/2035 | 669,726 | 632,747 | |
| Pool MA3465, 4.00% due 9/1/2038 | 374,329 | 370,898 | |
| Pool MA3557, 4.00% due 1/1/2029 | 494,671 | 489,731 | |
| Pool MA3681, 3.00% due 6/1/2034 | 344,128 | 327,619 | |
| Pool MA3826, 3.00% due 11/1/2029 | 744,143 | 710,822 | |
| Pool MA3896, 2.50% due 1/1/2035 | 100,968 | 94,126 | |
| Pool MA3953, 2.50% due 3/1/2030 | 416,644 | 394,148 | |
| Pool MA4148, 2.00% due 10/1/2030 | 513,435 | 475,448 | |
| Pool MA4390, 2.00% due 7/1/2031 | 3,608,674 | 3,339,445 | |
| Pool MA4579, 3.00% due 4/1/2052 | 2,370,732 | 2,125,860 | |
| Pool MA4598, 2.50% due 5/1/2052 | 1,200,373 | 1,034,142 | |
| Government National Mtg Assoc., | |||
| b | Pool 751392, 5.00% due 2/20/2061 | 170,597 | 169,486 |
| b | Pool 894205, 2.625% (H15T1Y + 1.50%) due 8/20/2039 | 182,428 | 177,286 |
| b | Pool MA0100, 2.875% (H15T1Y + 1.50%) due 5/20/2042 | 173,534 | 172,625 |
| Pool MA0907, 2.00% due 4/20/2028 | 517,901 | 489,371 | |
| Government National Mtg Assoc., CMBS, Series 2022-147 Class B, 2.20% due 10/16/2063 | 1,250,000 | 998,927 | |
| Government National Mtg Assoc., CMO, | |||
| Series 2016-32 Class LJ, 2.50% due 12/20/2040 | 141,497 | 140,329 |
| 16 | Thornburg Taxable Fixed Income Funds Semi-Annual Report | See notes to financial statements. |
| Issuer-Description | PRINCIPAL AMOUNT | VALUE | |
| Series 2016-H04 Class HA, 2.25% due 7/20/2065 | $ 1,774,589 | $ 1,711,809 | |
| Series 2017-186 Class VA, 3.00% due 2/20/2031 | 1,956,497 | 1,904,139 | |
| Total Mortgage Backed (Cost $137,127,794) | 127,167,844 | ||
| Asset Backed Securities — 0.5% | |||
| Other Asset Backed — 0.5% | |||
| Federal National Mtg Assoc., Grantor Trust, Series 2017-T1 Class A, 2.898% due 6/25/2027 | 993,304 | 935,983 | |
| 935,983 | |||
| Total Asset Backed Securities (Cost $993,304) | 935,983 | ||
| Corporate Bonds — 1.7% | |||
| Utilities — 1.7% | |||
| Electric Utilities — 1.7% | |||
| c | Caledonia Generating LLC, 1.95% due 2/28/2034 | 3,901,598 | 3,368,815 |
| 3,368,815 | |||
| Total Corporate Bonds (Cost $3,784,134) | 3,368,815 | ||
| Short-Term Investments — 4.2% | |||
| Federal Home Loan Mortgage Corp. Discount Notes, due 4/3/2023 | 2,437,000 | 2,437,000 | |
| United States Treasury Bill | |||
| 3.955% due 4/20/2023 | 1,000,000 | 997,947 | |
| 3.96% due 4/18/2023 | 1,000,000 | 998,161 | |
| 4.486% due 4/13/2023 | 1,000,000 | 998,528 | |
| 4.667% due 4/6/2023 | 1,000,000 | 999,361 | |
| 4.671% due 4/4/2023 | 1,000,000 | 999,617 | |
| United States Treasury Notes, 0.25% due 4/15/2023 | 1,000,000 | 998,312 | |
| Total Short-Term Investments (Cost $8,428,398) | 8,428,926 | ||
| Total Investments — 100.0% (Cost $209,947,026) | $198,800,338 | ||
| Other Assets Less Liabilities — 0.0% | 148 | ||
| Net Assets — 100.0% | $198,800,486 |
| Footnote Legend | |
| a | Yankee bond denominated in U.S. dollars and is issued in the U.S. by foreign banks and corporations. |
| b | Variable, floating, step, or fixed to floating rate securities are securities for which interest rate changes are based on changes in a designated base rate or on a predetermined schedule. The rates shown are those in effect on March 31, 2023. |
| c | Securities exempt from registration under Rule 144A of the Securities Act of 1933, as amended. These securities are restricted but liquid and may only be resold in the ordinary course of business in transactions exempt from registration, normally to qualified institutional buyers. As of March 31, 2023, the aggregate value of these securities in the Fund’s portfolio was $6,909,072, representing 3.48% of the Fund’s net assets. |
To simplify the listings of securities, abbreviations are used per the table below:
| CMBS | Commercial Mortgage-Backed Securities |
| CMO | Collateralized Mortgage Obligation |
| DAC | Designated Activity Company |
| H15T1Y | US Treasury Yield Curve Rate T-Note Constant Maturity 1 Year |
| LIBOR | London Interbank Offered Rates |
| Mtg | Mortgage |
| REMIC | Real Estate Mortgage Investment Conduit |
| UMBS | Uniform Mortgage Backed Securities |
| See notes to financial statements. | Thornburg Taxable Fixed Income Funds Semi-Annual Report | 17 |
Thornburg Limited Term Income Fund | March 31, 2023 (Unaudited)
| Issuer-Description | SHARES/PRINCIPAL AMOUNT | VALUE | |
| U.S. Treasury Securities — 10.6% | |||
| United States Treasury Notes, | |||
| 0.125% due 1/15/2024 | $ 50,000,000 | $ 48,230,469 | |
| 2.50% due 2/28/2026 | 52,700,000 | 50,773,156 | |
| 2.875% due 5/15/2032 | 110,098,000 | 104,782,331 | |
| 4.375% due 10/31/2024 | 19,520,000 | 19,542,112 | |
| United States Treasury Notes Inflationary Index, | |||
| 0.125% due 4/15/2027 - 7/15/2031 | 325,158,204 | 304,038,833 | |
| 0.25% due 1/15/2025 | 21,181,872 | 20,674,576 | |
| 0.50% due 4/15/2024 - 1/15/2028 | 28,767,010 | 28,042,053 | |
| 0.625% due 1/15/2024 - 7/15/2032 | 124,984,767 | 119,906,867 | |
| 0.75% due 7/15/2028 | 87,156,606 | 85,467,138 | |
| Total U.S. Treasury Securities (Cost $765,702,515) | 781,457,535 | ||
| U.S. Government Agencies — 0.4% | |||
| ALEX Alpha LLC (Guaranty: Export-Import Bank of the United States), 1.617% due 8/15/2024 | 652,173 | 635,366 | |
| Petroleos Mexicanos (Guaranty: Export-Import Bank of the United States), | |||
| a,b | 5.142% (LIBOR 3 Month + 0.35%) due 4/15/2025 | 2,331,000 | 2,231,629 |
| b | 6.50% due 1/23/2029 | 10,007,000 | 8,601,817 |
| Reliance Industries Ltd. (Guaranty: Export-Import Bank of the United States), | |||
| b | 2.06% due 1/15/2026 | 450,000 | 431,181 |
| b | 2.512% due 1/15/2026 | 1,950,000 | 1,869,055 |
| Santa Rosa Leasing LLC (Guaranty: Export-Import Bank of the United States), 1.693% due 8/15/2024 | 499,178 | 489,629 | |
| Small Business Administration Participation Certificates, | |||
| Series 2008-20D Class 1, 5.37% due 4/1/2028 | 306,676 | 303,358 | |
| Series 2009-20E Class 1, 4.43% due 5/1/2029 | 174,987 | 170,163 | |
| Series 2009-20K Class 1, 4.09% due 11/1/2029 | 1,347,063 | 1,300,295 | |
| Series 2011-20E Class 1, 3.79% due 5/1/2031 | 1,703,390 | 1,637,819 | |
| Series 2011-20F Class 1, 3.67% due 6/1/2031 | 316,217 | 303,190 | |
| Series 2011-20G Class 1, 3.74% due 7/1/2031 | 1,644,716 | 1,579,825 | |
| Series 2011-20I Class 1, 2.85% due 9/1/2031 | 3,103,583 | 2,909,106 | |
| Series 2011-20K Class 1, 2.87% due 11/1/2031 | 2,805,014 | 2,633,636 | |
| Series 2012-20D Class 1, 2.67% due 4/1/2032 | 2,356,282 | 2,200,405 | |
| Series 2012-20J Class 1, 2.18% due 10/1/2032 | 2,091,998 | 1,926,241 | |
| Series 2012-20K Class 1, 2.09% due 11/1/2032 | 1,410,574 | 1,299,008 | |
| Total U.S. Government Agencies (Cost $33,455,664) | 30,521,723 | ||
| Other Government — 0.2% | |||
| b,c | Bermuda Government International Bond, 2.375% due 8/20/2030 | 6,800,000 | 5,811,688 |
| Carpintero Finance Ltd. (Guaranty: Export Credits Guarantee Department), | |||
| b,c | 2.004% due 9/18/2024 | 1,964,873 | 1,909,660 |
| b,c | 2.581% due 11/11/2024 | 2,160,383 | 2,115,061 |
| b,c | Finance Department Government of Sharjah, 6.50% due 11/23/2032 | 3,828,000 | 3,902,531 |
| b,c | Khadrawy Ltd. (Guaranty: Export Credits Guarantee Department), 2.471% due 3/31/2025 | 1,336,977 | 1,301,494 |
| b | Sharjah Sukuk Program Ltd., 4.226% due 3/14/2028 | 2,000,000 | 1,902,860 |
| Total Other Government (Cost $18,188,581) | 16,943,294 | ||
| Mortgage Backed — 20.8% | |||
| a,c | Angel Oak Mortgage Trust LLC, Whole Loan Securities Trust CMO, Series 2020-2 Class A3, 5.00% due 1/26/2065 | 5,194,550 | 4,940,487 |
| Angel Oak Mortgage Trust, Whole Loan Securities Trust CMO, | |||
| a,c | Series 2023-1 Class A1, 4.75% due 9/26/2067 | 14,804,935 | 14,406,365 |
| a,c | Series 2023-2 Class A1, 4.65% due 10/25/2067 | 12,967,892 | 12,430,151 |
| Arroyo Mortgage Trust, Whole Loan Securities Trust CMO, | |||
| a,c | Series 2019-1 Class A1, 3.805% due 1/25/2049 | 4,632,157 | 4,408,989 |
| a,c | Series 2019-1 Class A3, 4.208% due 1/25/2049 | 2,423,997 | 2,281,082 |
| a,c | Series 2019-2 Class A1, 3.347% due 4/25/2049 | 2,030,163 | 1,908,944 |
| a,c | Series 2019-3 Class A1, 2.962% due 10/25/2048 | 4,752,252 | 4,346,777 |
| c | Series 2020-1 Class A2, 2.927% due 3/25/2055 | 6,518,000 | 5,469,477 |
| c | Series 2020-1 Class A3, 3.328% due 3/25/2055 | 4,500,000 | 3,663,932 |
| c | Series 2020-1 Class M1, 4.277% due 3/25/2055 | 3,189,000 | 2,572,649 |
| 18 | Thornburg Taxable Fixed Income Funds Semi-Annual Report | See notes to financial statements. |
| Issuer-Description | SHARES/PRINCIPAL AMOUNT | VALUE | |
| a,c | Series 2021-1R Class A1, 1.175% due 10/25/2048 | $ 9,714,097 | $ 7,860,306 |
| c | Series 2022-1 Class M1, 3.65% due 12/25/2056 | 7,338,000 | 4,754,138 |
| c | Bravo Residential Funding Trust, Whole Loan Securities Trust CMO, Series 2019-1 Class A1C, 3.50% due 3/25/2058 | 829,138 | 809,314 |
| a,c | Bunker Hill Loan Depositary Trust, Whole Loan Securities Trust CMO, Series 2020-1 Class A3, 3.253% due 2/25/2055 | 3,285,000 | 2,962,105 |
| Chase Mortgage Finance Corp., Whole Loan Securities Trust CMO, | |||
| a,c | Series 2016-SH1 Class M3, 3.75% due 4/25/2045 | 2,030,478 | 1,817,665 |
| a,c | Series 2016-SH2 Class M3, 3.75% due 12/25/2045 | 2,473,236 | 2,234,634 |
| CHNGE Mortgage Trust, Whole Loan Securities Trust CMO, | |||
| a,c | Series 2022-1 Class A1, 3.007% due 1/25/2067 | 15,652,070 | 13,992,741 |
| a,c | Series 2022-2 Class M1, 4.609% due 3/25/2067 | 14,163,000 | 11,824,907 |
| a,c | Series 2023-1 Class A1, 7.065% due 3/25/2058 | 9,644,739 | 9,612,133 |
| a,c | CIM Trust, Whole Loan Securities Trust CMO, Series 2018-INV1 Class A4, 4.00% due 8/25/2048 | 802,397 | 744,928 |
| Citigroup Mortgage Loan Trust, Whole Loan Securities Trust CMO, | |||
| a | Series 2004-HYB2 Class B1, 4.31% due 3/25/2034 | 51,026 | 45,629 |
| a,c | Series 2014-A Class A, 4.00% due 1/25/2035 | 543,602 | 515,747 |
| a,c | Series 2014-J1 Class B4, 3.637% due 6/25/2044 | 1,489,969 | 1,274,769 |
| a,c | Series 2019-E Class A1, 6.228% due 11/25/2070 | 6,534,476 | 6,521,324 |
| a,c | Series 2021-J2 Class A7A, 2.50% due 7/25/2051 | 24,001,866 | 20,769,885 |
| CSMC Trust, Whole Loan Securities Trust CMO, | |||
| a,c | Series 2013-HYB1 Class B3, 5.907% due 4/25/2043 | 260,882 | 258,397 |
| a,c | Series 2021-AFC1 Class-A1, 0.83% due 3/25/2056 | 9,395,506 | 7,301,781 |
| a,c | Series 2021-NQM3 Class A1, 1.015% due 4/25/2066 | 12,174,476 | 9,880,527 |
| a,c | Series 2021-NQM8 Class-A1, 1.841% due 10/25/2066 | 16,540,429 | 13,772,786 |
| a,c | Series 2022-ATH2 Class A1, 4.547% due 5/25/2067 | 12,585,174 | 12,293,194 |
| a,c | Deephaven Residential Mortgage Trust, Whole Loan Securities Trust CMO, Series 2021-1 Class A1, 0.715% due 5/25/2065 | 3,727,800 | 3,366,044 |
| Ellington Financial Mortgage Trust, Whole Loan Securities Trust CMO, | |||
| a,c | Series 2019-2 Class A1, 2.739% due 11/25/2059 | 3,694,966 | 3,439,130 |
| a,c | Series 2021-2 Class A1, 0.931% due 6/25/2066 | 11,075,062 | 9,092,574 |
| a,c | Series 2022-1 Class A1, 2.206% due 1/25/2067 | 19,302,914 | 16,088,581 |
| Federal Home Loan Mtg Corp., | |||
| Pool D98887, 3.50% due 1/1/2032 | 750,287 | 732,354 | |
| Pool G16710, 3.00% due 11/1/2030 | 299,410 | 289,163 | |
| Pool RE6097, 2.00% due 5/1/2051 | 27,418,825 | 22,031,840 | |
| Pool SE9046, 3.00% due 12/1/2051 | 24,099,636 | 21,367,160 | |
| Federal Home Loan Mtg Corp., CMO REMIC, | |||
| Series 3195 Class PD, 6.50% due 7/15/2036 | 214,334 | 223,943 | |
| Series 3919 Class VB, 4.00% due 8/15/2024 | 62,970 | 62,439 | |
| Series 3922 Class PQ, 2.00% due 4/15/2041 | 139,331 | 133,624 | |
| Series 4050 Class MV, 3.50% due 8/15/2023 | 176,298 | 175,603 | |
| Series 4120 Class TC, 1.50% due 10/15/2027 | 555,196 | 524,887 | |
| Federal Home Loan Mtg Corp., Multifamily Structured Pass Through Certificates, CMBS, Series K071 Class A2, 3.286% due 11/25/2027 | 4,420,000 | 4,244,870 | |
| Federal Home Loan Mtg Corp., Seasoned Credit Risk Transfer, Whole Loan Securities Trust CMO, | |||
| a | Series 2017-1 Class HA, 3.00% due 1/25/2056 | 4,609,760 | 4,344,539 |
| a | Series 2017-3 Class HA, 3.25% due 7/25/2056 | 8,088,647 | 7,669,731 |
| a | Series 2017-4 Class HT, 3.25% due 6/25/2057 | 7,408,884 | 6,817,724 |
| a | Series 2018-1 Class HA, 3.00% due 5/25/2057 | 4,948,964 | 4,639,874 |
| a | Series 2018-2 Class HA, 3.00% due 11/25/2057 | 11,176,393 | 10,541,850 |
| Series 2018-3 Class HA, 3.00% due 8/25/2057 | 13,403,014 | 12,601,846 | |
| a | Series 2018-3 Class MA, 3.50% due 8/25/2057 | 8,861,073 | 8,510,372 |
| Series 2018-4 Class HA, 3.00% due 3/25/2058 | 11,326,540 | 10,629,694 | |
| Series 2019-1 Class MA, 3.50% due 7/25/2058 | 22,589,048 | 21,591,419 | |
| Series 2019-2 Class MA, 3.50% due 8/25/2058 | 23,666,930 | 22,579,844 | |
| Series 2019-3 Class MA, 3.50% due 10/25/2058 | 11,235,996 | 10,747,032 | |
| Series 2019-4 Class MA, 3.00% due 2/25/2059 | 18,132,119 | 17,011,650 | |
| Series 2020-1 Class MA, 2.50% due 8/25/2059 | 3,042,043 | 2,806,725 | |
| Series 2020-2 Class A1C, 2.00% due 9/25/2030 | 24,439,695 | 22,096,923 | |
| Series 2020-2 Class A1D, 1.75% due 9/25/2030 | 32,858,607 | 29,426,963 | |
| Series 2020-2 Class MA, 2.00% due 11/25/2059 | 22,840,881 | 20,687,130 | |
| Series 2020-3 Class MA, 2.00% due 5/25/2060 | 12,973,845 | 11,714,212 | |
| Series 2020-3 Class MT, 2.00% due 5/25/2060 | 3,895,955 | 3,278,910 | |
| Federal Home Loan Mtg Corp., UMBS Collateral, | |||
| Pool RA6808 3.00% due 2/1/2052 | 12,683,404 | 11,397,924 | |
| Pool SD1374, 3.00% due 3/1/2052 | 14,763,204 | 13,239,911 |
| See notes to financial statements. | Thornburg Taxable Fixed Income Funds Semi-Annual Report | 19 |
Thornburg Limited Term Income Fund | March 31, 2023 (Unaudited)
| Issuer-Description | SHARES/PRINCIPAL AMOUNT | VALUE | |
| Pool SD1588, 5.00% due 9/1/2052 | $ 9,725,659 | $ 9,805,607 | |
| Pool SD1626, 5.00% due 10/1/2052 | 14,688,791 | 14,833,475 | |
| Pool SD1669, 2.50% due 1/1/2052 | 26,858,214 | 23,148,553 | |
| Pool SD8205 2.50% due 4/1/2052 | 26,025,628 | 22,419,656 | |
| Pool SD8219, 2.50% due 6/1/2052 | 25,172,759 | 21,718,448 | |
| Federal Home Loan Mtg Corp., UMBS Collateral , Pool RA7373, 3.00% due 5/1/2052 | 5,872,215 | 5,267,530 | |
| Federal Home Loan Mtg Corp., Whole Loan Securities Trust CMO, | |||
| Series 2016-SC01 Class 2A, 3.50% due 7/25/2046 | 985,329 | 901,084 | |
| Series 2017-SC01 Class 1A, 3.00% due 12/25/2046 | 8,872,379 | 7,860,174 | |
| Series 2017-SC02 Class 2A, 3.50% due 5/25/2047 | 615,311 | 554,308 | |
| Federal National Mtg Assoc., Pool BM7067, 2.50% due 6/1/2051 | 3,547,522 | 2,994,281 | |
| Federal National Mtg Assoc., CMO REMIC, | |||
| Series 2007-42 Class PA, 5.50% due 4/25/2037 | 3,923 | 3,906 | |
| a | Series 2009-17 Class AH, 0.574% due 3/25/2039 | 327,431 | 269,064 |
| Series 2012-129 Class LA, 3.50% due 12/25/2042 | 1,302,241 | 1,229,213 | |
| a | Series 2013-81 Class FW, 5.145% (LIBOR 1 Month + 0.30%) due 1/25/2043 | 3,310,088 | 3,240,539 |
| Federal National Mtg Assoc., UMBS Collateral, | |||
| Pool AE0704, 4.00% due 1/1/2026 | 793,691 | 780,457 | |
| Pool AS9749, 4.00% due 6/1/2047 | 9,234 | 8,971 | |
| Pool BM4324, 3.50% due 7/1/2033 | 2,651,001 | 2,586,900 | |
| Pool BP9550, 2.50% due 7/1/2035 | 8,803 | 8,188 | |
| Pool BP9589, 2.50% due 8/1/2035 | 749,783 | 697,378 | |
| Pool BW8669, 5.00% due 9/1/2052 | 9,100,130 | 9,087,471 | |
| Pool CB1810, 3.00% due 10/1/2051 | 14,218,416 | 12,751,171 | |
| Pool CB3880, 5.00% due 6/1/2052 | 5,704,093 | 5,750,986 | |
| Pool FS0898, 3.00% due 2/1/2052 | 33,227,606 | 29,811,841 | |
| Pool MA3465, 4.00% due 9/1/2038 | 3,356,982 | 3,326,216 | |
| Pool MA3953, 2.50% due 3/1/2030 | 2,799,845 | 2,648,672 | |
| Pool MA4390, 2.00% due 7/1/2031 | 1,335,209 | 1,235,595 | |
| Pool MA4493 2.50% due 12/1/2051 | 20,584,218 | 17,760,107 | |
| Pool MA4579, 3.00% due 4/1/2052 | 29,586,734 | 26,530,735 | |
| Pool MA4599, 3.00% due 5/1/2052 | 17,831,549 | 15,986,275 | |
| a,c | Flagstar Mortgage Trust, Whole Loan Securities Trust CMO, Series 2017-1 Class 2A2, 3.00% due 3/25/2047 | 1,624,222 | 1,460,762 |
| GCAT Trust, Whole Loan Securities Trust CMO, | |||
| a,c | Series 2019-NQM3 Class A1, 2.686% due 11/25/2059 | 4,305,864 | 4,007,714 |
| a,c | Series 2021-CM1 Class A, 1.469% due 4/25/2065 | 11,030,529 | 10,368,728 |
| a,c | Series 2021-CM2 Class A1, 2.352% due 8/25/2066 | 22,589,124 | 20,446,293 |
| a,c | Series 2021-NQM4 Class A1, 1.093% due 8/25/2066 | 13,486,442 | 10,463,009 |
| Government National Mtg Assoc., CMO, Series 2016-32 Class LJ, 2.50% due 12/20/2040 | 557,242 | 552,641 | |
| GS Mortgage-Backed Securities Corp. Trust, Whole Loan Securities Trust CMO, | |||
| a,c | Series 2020-PJ2 Class B3, 3.571% due 7/25/2050 | 5,161,995 | 4,252,251 |
| a | Series 2023-CCM1 Class A1, 6.65% due 8/25/2053 | 14,895,696 | 15,101,482 |
| a,c | Homeward Opportunities Fund Trust, Whole Loan Securities Trust CMO, Series 2022-1 A Class A1, 5.082% due 7/25/2067 | 5,704,048 | 5,662,844 |
| Imperial Fund Mortgage Trust, Whole Loan Securities Trust CMO, | |||
| a,c | Series 2021-NQM3 Class A1, 1.595% due 11/25/2056 | 17,019,811 | 14,309,444 |
| a,c | Series 2021-NQM4 Class A1, 2.091% due 1/25/2057 | 22,473,554 | 18,944,505 |
| a,c | Series 2022- NQM1 Class A1, 2.493% due 2/25/2067 | 39,293,361 | 34,081,990 |
| a,c | Series 2022-NQM2 Class A1, 3.638% due 3/25/2067 | 23,125,940 | 21,204,010 |
| a,c | Series 2022-NQM4 Class A, 4.767% due 6/25/2067 | 28,834,332 | 28,423,671 |
| JPMorgan Mortgage Trust, Whole Loan Securities Trust CMO, | |||
| a,c | Series 2014-IVR3 Class B4, 3.792% due 9/25/2044 | 1,940,616 | 1,861,966 |
| a,c | Series 2018-3 Class B2, 3.711% due 9/25/2048 | 2,462,432 | 2,202,849 |
| a,c | Series 2018-6 Class B2, 3.893% due 12/25/2048 | 1,006,594 | 894,993 |
| a,c | Series 2019-5 Class B3, 4.482% due 11/25/2049 | 7,989,314 | 7,282,824 |
| a,c | Series 2019-HYB1 Class B3, 4.483% due 10/25/2049 | 5,585,706 | 5,101,641 |
| a,c | Series 2019-INV2 Class B3A, 3.749% due 2/25/2050 | 9,251,369 | 7,558,551 |
| a,c | Series 2021-LTV2 Class A1, 2.52% due 5/25/2052 | 37,525,014 | 30,157,508 |
| a,c | Series 2022- LTV1 Class A1, 3.25% due 7/25/2052 | 13,673,266 | 11,463,918 |
| a,c | Series 2022-2 Class A6A, 2.50% due 8/25/2052 | 33,280,431 | 29,954,204 |
| a,c | Series 2022-DSC1 Class A1, 4.75% due 1/25/2063 | 9,442,731 | 9,069,861 |
| a | Merrill Lynch Mortgage Investors Trust, Whole Loan Securities Trust CMO, Series 2004-A4 Class M1, 3.533% due 8/25/2034 | 139,209 | 126,812 |
| a,c | Metlife Securitization Trust, Whole Loan Securities Trust CMO, Series 2019-1A Class A1A, 3.75% due 4/25/2058 | 1,329,825 | 1,288,657 |
| 20 | Thornburg Taxable Fixed Income Funds Semi-Annual Report | See notes to financial statements. |
| Issuer-Description | SHARES/PRINCIPAL AMOUNT | VALUE | |
| MFA Trust, Whole Loan Securities Trust CMO, | |||
| a,c | Series 2020-NQM3 Class A1, 1.014% due 1/26/2065 | $ 3,436,082 | $ 3,051,099 |
| a,c | Series 2021-AEI1 Class A4, 2.50% due 8/25/2051 | 16,782,518 | 14,502,785 |
| a,c | Series 2021-INV1 Class A1, 0.852% due 1/25/2056 | 4,603,124 | 4,082,334 |
| a,c | Series 2021-INV2 Class A1, 1.906% due 11/25/2056 | 24,669,304 | 20,567,635 |
| a,c | Series 2022-INV1 Class A3, 4.25% due 4/25/2066 | 4,995,000 | 3,923,857 |
| a,c | Series 2022-NQM1 Class A3, 4.20% due 12/25/2066 | 13,129,000 | 10,746,185 |
| a,c | MFRA Trust, Whole Loan Securities Trust CMO, Series 2022-CHM1 Class A1, 3.875% due 9/25/2056 | 20,278,226 | 19,079,919 |
| a,c | Mill City Mortgage Loan Trust, Whole Loan Securities Trust CMO, Series 2023-NQM1 Class A1, 6.05% due 10/25/2067 | 14,702,697 | 14,554,686 |
| Morgan Stanley Bank of America Merrill Lynch Trust, CMBS, Series 2015-C22 Class A4, 3.306% due 4/15/2048 | 1,100,000 | 1,048,638 | |
| New Residential Mortgage Loan Trust, Whole Loan Securities Trust CMO, | |||
| a,c | Series 2017-2A Class A3, 4.00% due 3/25/2057 | 3,141,911 | 2,965,529 |
| a,c | Series 2017-3A Class A1, 4.00% due 4/25/2057 | 3,837,457 | 3,665,158 |
| a,c | Series 2017-4A Class A1, 4.00% due 5/25/2057 | 4,165,414 | 3,866,247 |
| a,c | Series 2017-5A Class A1, 6.345% (LIBOR 1 Month + 1.50%) due 6/25/2057 | 305,968 | 298,178 |
| a,c | Series 2017-6A Class A1, 4.00% due 8/27/2057 | 1,870,173 | 1,751,550 |
| a,c | Series 2018-1A Class A1A, 4.00% due 12/25/2057 | 2,248,648 | 2,128,655 |
| a,c | Series 2018-2A Class A1, 4.50% due 2/25/2058 | 3,998,996 | 3,833,919 |
| a,c | Series 2018-RPL1 Class A1, 3.50% due 12/25/2057 | 2,287,082 | 2,154,091 |
| a,c | Series 2022-NQM3 Class A1, 3.90% due 4/25/2062 | 41,708,435 | 37,733,248 |
| a,c | OBX Trust, Whole Loan Securities Trust CMO, Series 2021-NQM2 Class A1, 1.101% due 5/25/2061 | 18,863,624 | 14,475,226 |
| a,c | Onslow Bay Mortgage Loan Trust, Whole Loan Securities Trust CMO, Series 2021-NQM4 Class A1, 1.957% due 10/25/2061 | 48,004,158 | 39,081,097 |
| PRKCM Trust, Whole Loan Securities Trust CMO, | |||
| a,c | Series 2021-AFC1 Class A1, 1.51% due 8/25/2056 | 31,185,572 | 24,505,654 |
| a,c | Series 2021-AFC2 Class A1, 2.071% due 11/25/2056 | 17,400,517 | 14,374,152 |
| a,c | PRPM Trust, Whole Loan Securities Trust CMO, Series 2022-INV1 Class A1, 4.40% due 4/25/2067 | 33,536,837 | 32,381,320 |
| RAMP Trust, Whole Loan Securities Trust CMO, Series 2003-SL1 Class A31, 7.125% due 4/25/2031 | 313,411 | 313,411 | |
| a,c | Rate Mortgage Trust, Whole Loan Securities Trust CMO, Series 2022-J1 Class A9, 2.50% due 1/25/2052 | 51,672,047 | 44,583,382 |
| a,c | RCKT Mortgage Trust, Whole Loan Securities Trust CMO, Series 2020-1 Class B3, 3.47% due 2/25/2050 | 3,116,952 | 2,655,823 |
| Seasoned Loans Structured Transaction Trust, Whole Loan Securities Trust CMO, | |||
| Series 2019-2 Class A1C, 2.75% due 9/25/2029 | 16,196,849 | 14,976,012 | |
| Series 2019-3 Class A1C, 2.75% due 11/25/2029 | 2,732,227 | 2,539,917 | |
| Sequoia Mortgage Trust, Whole Loan Securities Trust CMO, | |||
| a | Series 2013-6 Class B4, 3.515% due 5/25/2043 | 716,584 | 500,235 |
| a | Series 2013-7 Class B4, 3.502% due 6/25/2043 | 489,808 | 378,342 |
| SG Residential Mortgage Trust, Whole Loan Securities Trust CMO, | |||
| a,c | Series 2019-3 Class A1, 2.703% due 9/25/2059 | 460,897 | 445,480 |
| a,c | Series 2019-3 Class A3, 3.082% due 9/25/2059 | 800,926 | 772,825 |
| a,c | Series 2020-2 Class A1, 1.381% due 5/25/2065 | 10,700,587 | 9,638,395 |
| a,c | Series 2020-2 Class A2, 1.587% due 5/25/2065 | 2,079,118 | 1,845,597 |
| a,c | Series 2020-2 Class A3, 1.895% due 5/25/2065 | 709,833 | 627,289 |
| a,c | Series 2021-2 Class A1, 1.737% due 12/25/2061 | 15,618,575 | 12,763,378 |
| a,c | Shellpoint Asset Funding Trust, Whole Loan Securities Trust CMO, Series 2013-1 Class A1, 3.75% due 7/25/2043 | 906,069 | 846,310 |
| a,c | Starwood Mortgage Residential Trust, Whole Loan Securities Trust CMO, Series 2021-5 Class A1, 1.92% due 9/25/2066 | 43,628,640 | 35,522,370 |
| a | Structured Asset Securities Corp., Mortgage Pass-Through Certificates, Whole Loan Securities Trust CMO, Series 2003-9A Class 2A2, 5.501% due 3/25/2033 | 305,714 | 289,558 |
| Towd Point Mortgage Trust, Whole Loan Securities Trust CMO, | |||
| a,c | Series 2016-5 Class A1, 2.50% due 10/25/2056 | 850,320 | 833,514 |
| a,c | Series 2017-1 Class A1, 2.75% due 10/25/2056 | 391,093 | 383,567 |
| a,c | Series 2018-1 Class A1, 3.00% due 1/25/2058 | 335,037 | 324,693 |
| a,c | Series 2018-2 Class A1, 3.25% due 3/25/2058 | 14,438,018 | 13,834,984 |
| a,c | Series 2018-6 Class A1A, 3.75% due 3/25/2058 | 8,731,094 | 8,489,632 |
| a,c | TRK Trust, Whole Loan Securities Trust CMO, Series 2022-INV2 Class A1, 4.35% due 6/25/2057 | 25,262,723 | 24,135,637 |
| Verus Securitization Trust, Whole Loan Securities Trust CMO, | |||
| a,c | Series 2020-1 Class M1, 3.021% due 1/25/2060 | 5,000,000 | 4,110,894 |
| a,c | Series 2020-2 Class M1, 5.36% due 5/25/2060 | 3,275,000 | 3,094,955 |
| a,c | Series 2021-R1 Class A1, 0.82% due 10/25/2063 | 7,087,379 | 6,472,593 |
| a,c | Vista Point Securitization Trust, Whole Loan Securities Trust CMO, Series 2020-2 Class A1, 1.475% due 4/25/2065 | 4,831,356 | 4,407,517 |
| a,c | WinWater Mortgage Loan Trust, Whole Loan Securities Trust CMO, Series 2015-3 Class B4, 3.844% due 3/20/2045 | 1,131,600 | 1,032,300 |
| Total Mortgage Backed (Cost $1,680,323,171) | 1,529,831,949 | ||
| Asset Backed Securities — 16.6% |
| See notes to financial statements. | Thornburg Taxable Fixed Income Funds Semi-Annual Report | 21 |
Thornburg Limited Term Income Fund | March 31, 2023 (Unaudited)
| Issuer-Description | SHARES/PRINCIPAL AMOUNT | VALUE | |
| Auto Receivables — 1.5% | |||
| ACC Auto Trust, | |||
| c | Series 2021-A Class A, 1.08% due 4/15/2027 | $ 2,189,981 | $ 2,172,799 |
| c | Series 2022-A Class A, 4.58% due 7/15/2026 | 7,422,544 | 7,298,324 |
| c | ACC Trust, Series 2022-1 Class A, 1.19% due 9/20/2024 | 2,496,743 | 2,476,785 |
| c | ACM Auto Trust, Series 2023-1A Class A, 6.61% due 1/22/2030 | 4,628,393 | 4,630,167 |
| American Credit Acceptance Receivables Trust, | |||
| c | Series 2020-2 Class C, 3.88% due 4/13/2026 | 4,414,311 | 4,386,680 |
| c | Series 2020-2 Class D, 5.65% due 5/13/2026 | 4,250,000 | 4,238,048 |
| Arivo Acceptance Auto Loan Receivables Trust, | |||
| c | Series 2019-1 Class B, 3.37% due 6/15/2025 | 2,350,959 | 2,333,502 |
| c | Series 2021-1A Class A, 1.19% due 1/15/2027 | 2,482,297 | 2,406,499 |
| c | Avid Automobile Receivables Trust, Series 2023-1 Class A, 6.63% due 7/15/2026 | 8,746,634 | 8,783,513 |
| c | Carvana Auto Receivables Trust, Series 2019-1A Class D, 3.88% due 10/15/2024 | 246,545 | 246,416 |
| c | Credito Real USA Auto Receivables Trust, Series 2021-1A Class A, 1.35% due 2/16/2027 | 2,261,566 | 2,222,089 |
| c | DT Auto Owner Trust, Series 2019-4A Class D, 2.85% due 7/15/2025 | 5,970,300 | 5,884,233 |
| c | Exeter Automobile Receivables Trust, Series 2019-3A Class D, 3.11% due 8/15/2025 | 1,057,717 | 1,044,723 |
| FHF Trust, | |||
| c | Series 2021-1A Class A, 1.27% due 3/15/2027 | 8,245,106 | 7,867,178 |
| c | Series 2021-2A Class A, 0.83% due 12/15/2026 | 6,613,212 | 6,301,453 |
| c | Flagship Credit Auto Trust, Series 2019-2 Class D, 3.53% due 5/15/2025 | 3,500,000 | 3,441,704 |
| Lendbuzz Securitization Trust, | |||
| c | Series 2021-1A Class A, 1.46% due 6/15/2026 | 13,127,203 | 12,535,394 |
| c | Series 2022-1A Class A, 4.22% due 5/17/2027 | 9,865,678 | 9,542,662 |
| c | Octane Receivables Trust, Series 2020-1A Class A, 1.71% due 2/20/2025 | 1,409,852 | 1,399,189 |
| b,c | Oscar US Funding Trust IX LLC, Series 2018-2A Class A4, 3.63% due 9/10/2025 | 151,571 | 151,254 |
| b,c | Oscar US Funding XII LLC, Series 2021-1A Class A3, 0.70% due 4/10/2025 | 15,933,600 | 15,575,214 |
| c | Tricolor Auto Securitization Trust, Series 2023-1A Class A, 6.48% due 8/17/2026 | 5,942,022 | 5,941,980 |
| c | Veros Auto Receivables Trust, Series 2021-1 Class A, 0.92% due 10/15/2026 | 1,893,340 | 1,870,126 |
| 112,749,932 | |||
| Credit Card — 1.3% | |||
| c | Avant Credit Card Master Trust, Series 2021-1A Class A, 1.37% due 4/15/2027 | 11,900,000 | 11,072,430 |
| c | Continental Credit Card ABS LLC, Series 2019-1A Class A, 3.83% due 8/15/2026 | 4,590,056 | 4,568,817 |
| c | Continental Finance Credit Card ABS Master Trust, Series 2020-1A Class A, 2.24% due 12/15/2028 | 17,500,000 | 16,690,829 |
| Mercury Financial Credit Card Master Trust, | |||
| c | Series 2022-1A Class A, 2.50% due 9/21/2026 | 32,350,000 | 30,357,926 |
| c | Series 2023-1A Class A, 8.04% due 9/20/2027 | 14,600,000 | 14,605,189 |
| c | Mission Lane Credit Card Master Trust, Series 2021-A Class A, 1.59% due 9/15/2026 | 21,455,000 | 20,838,540 |
| 98,133,731 | |||
| Other Asset Backed — 10.7% | |||
| c | Affirm Asset Securitization Trust, Series 2020-Z1 Class A, 3.46% due 10/15/2024 | 808,195 | 804,446 |
| c | AFG ABS I LLC, Series 2023-1 Class A2, 6.30% due 9/16/2030 | 10,000,000 | 10,064,798 |
| c | Amur Equipment Finance Receivables X LLC, Series 2022-1A Class A2, 1.64% due 10/20/2027 | 26,595,858 | 25,458,475 |
| Aqua Finance Trust, | |||
| c | Series 2020-AA Class A, 1.90% due 7/17/2046 | 20,312,554 | 18,723,547 |
| c | Series 2020-AA Class C, 3.97% due 7/17/2046 | 6,300,000 | 5,304,807 |
| c | Series 2021-A Class A, 1.54% due 7/17/2046 | 12,829,791 | 11,577,540 |
| a,b,c | Arbor Realty Commercial Real Estate Notes Ltd., Series 2022-FL1 Class A, 6.008% (SOFR30A + 1.45%) due 1/15/2037 | 37,350,000 | 36,680,796 |
| c | Bankers Healthcare Group Securitization Trust, Series 2020-A Class A, 2.56% due 9/17/2031 | 1,611,008 | 1,578,729 |
| BHG Securitization Trust, | |||
| c | Series 2021-B Class A, 0.90% due 10/17/2034 | 7,533,558 | 7,151,895 |
| c | Series 2022-A Class A, 1.71% due 2/20/2035 | 23,676,167 | 22,634,627 |
| c | BRE Grand Islander Timeshare Issuer LLC, Series 2017-1A Class A, 2.94% due 5/25/2029 | 1,005,440 | 967,842 |
| c | CFG Investments Ltd., Series 2021-1 Class A, 4.70% due 5/20/2032 | 6,000,000 | 5,814,580 |
| c | CFMT Issuer Trust, Series 2021-GRN1 Class A, 1.10% due 3/20/2041 | 4,965,621 | 4,581,512 |
| c | CP EF Asset Securitization I LLC, Series 2022-1A Class A, 5.96% due 4/15/2030 | 10,853,657 | 10,735,940 |
| c | Crossroads Asset Trust, Series 2021-A Class A2, 0.82% due 3/20/2024 | 62,137 | 62,011 |
| Dext ABS LLC, | |||
| c | Series 2020-1 Class A, 1.46% due 2/16/2027 | 3,547,117 | 3,518,869 |
| c | Series 2021-1 Class A, 1.12% due 2/15/2028 | 8,897,018 | 8,549,071 |
| c | Diamond Infrastructure Funding LLC, Series 2021-1A Class A, 1.76% due 4/15/2049 | 36,000,000 | 30,809,466 |
| c | Diamond Issuer, Series 2021-1A Class A, 2.305% due 11/20/2051 | 27,894,000 | 24,073,521 |
| 22 | Thornburg Taxable Fixed Income Funds Semi-Annual Report | See notes to financial statements. |
| Issuer-Description | SHARES/PRINCIPAL AMOUNT | VALUE | |
| c | Diamond Resorts Owner Trust, Series 2019-1A Class A, 2.89% due 2/20/2032 | $ 4,325,232 | $ 4,166,872 |
| b,c | ECAF I Ltd., Series 2015-1A Class A2, 4.947% due 6/15/2040 | 3,362,895 | 2,223,896 |
| Entergy New Orleans Storm Recovery Funding I LLC, Series 2015-1 Class A, 2.67% due 6/1/2027 | 2,851,725 | 2,782,127 | |
| c | ExteNet LLC, Series 2019-1A Class A2, 3.204% due 7/26/2049 | 9,855,000 | 9,375,889 |
| Federal National Mtg Assoc., Grantor Trust, Series 2017-T1 Class A, 2.898% due 6/25/2027 | 17,879,467 | 16,847,695 | |
| Foundation Finance Trust, | |||
| c | Series 2019-1A Class A, 3.86% due 11/15/2034 | 4,129,477 | 4,049,978 |
| c | Series 2020-1A Class A, 3.54% due 7/16/2040 | 5,166,833 | 4,996,947 |
| c | Series 2020-1A Class B, 4.62% due 7/16/2040 | 3,000,000 | 2,827,480 |
| c | Series 2021-1A Class A, 1.27% due 5/15/2041 | 16,578,954 | 14,999,659 |
| c | Series 2021-2A Class A, 2.19% due 1/15/2042 | 11,838,730 | 11,070,331 |
| FREED ABS Trust, | |||
| c | Series 2019-2 Class C, 4.86% due 11/18/2026 | 1,719,825 | 1,718,532 |
| c | Series 2022-3FP Class A, 4.50% due 8/20/2029 | 2,140,354 | 2,136,905 |
| Goldman Home Improvement Trust Issuer Trust, | |||
| c | Series 2021-GRN2 Class A, 1.15% due 6/25/2051 | 14,265,031 | 13,132,452 |
| c | Series 2022-GRN1 Class A, 4.50% due 6/25/2052 | 7,319,980 | 7,162,379 |
| c | Goodgreen Trust, Series 2021-1A Class A, 2.66% due 10/15/2056 | 18,250,196 | 15,410,490 |
| GoodLeap Sustainable Home Solutions Trust, | |||
| c | Series 2021-3CS Class A, 2.10% due 5/20/2048 | 15,936,288 | 12,517,823 |
| c | Series 2021-4GS Class A, 1.93% due 7/20/2048 | 10,585,537 | 8,287,805 |
| a,b,c | Greystone Commercial Real Estate Notes Ltd., Series 2021-FL3 Class A, 5.962% (TSFR1M + 1.13%) due 7/15/2039 | 13,382,000 | 13,051,977 |
| HERO Funding Trust, | |||
| c | Series 2015-1A Class A, 3.84% due 9/21/2040 | 2,490,535 | 2,383,178 |
| c | Series 2017-2A Class A1, 3.28% due 9/20/2048 | 492,206 | 454,429 |
| Hilton Grand Vacations Trust, | |||
| c | Series 2019-AA Class A, 2.34% due 7/25/2033 | 4,006,547 | 3,786,734 |
| c | Series 2020-AA Class A, 2.74% due 2/25/2039 | 813,158 | 770,042 |
| c | HIN Timeshare Trust, Series 2020-A Class A, 1.39% due 10/9/2039 | 3,840,079 | 3,510,622 |
| c | InStar Leasing III LLC, Series 2021-1A Class A, 2.30% due 2/15/2054 | 8,979,408 | 7,526,795 |
| LendingPoint Asset Securitization Trust, | |||
| c | Series 2012-B Class A, 4.77% due 10/15/2029 | 5,671,672 | 5,574,435 |
| c | Series 2020-REV1 Class A, 2.731% due 10/15/2028 | 23,887,926 | 23,679,287 |
| c | Series 2021-B Class A, 1.11% due 2/15/2029 | 834,890 | 832,654 |
| LendingPoint Pass-Through Trust, | |||
| c | Series 2022-ST1 Class A, 2.50% due 3/15/2028 | 5,207,838 | 4,977,450 |
| c | Series 2022-ST3 Class A, 4.00% due 5/15/2028 | 6,418,864 | 6,199,070 |
| c | LL ABS Trust, Series 2021-1A Class A, 1.07% due 5/15/2029 | 5,847,901 | 5,579,891 |
| c | Loanpal Solar Loan Ltd., Series 2021-1GS Class A, 2.29% due 1/20/2048 | 16,791,876 | 12,277,994 |
| c | Marlette Funding Trust, Series 2022-3A Class A, 5.18% due 11/15/2032 | 4,683,190 | 4,636,963 |
| Mosaic Solar Loan Trust, | |||
| c | Series 2019-1A Class A, 4.37% due 12/21/2043 | 1,173,289 | 1,088,903 |
| c | Series 2021 Class A, 2.10% due 4/20/2046 | 3,814,848 | 3,313,335 |
| c | New Residential Advance Receivables Trust Advance Receivables Backed, Series 2020-T1 Class AT1, 1.426% due 8/15/2053 | 65,590,000 | 64,175,598 |
| NRZ Advance Receivables Trust, | |||
| c | Series 2020-T2 Class AT2, 1.475% due 9/15/2053 | 49,400,000 | 48,199,452 |
| c | Series 2020-T2 Class BT2, 1.724% due 9/15/2053 | 3,000,000 | 2,919,873 |
| Oportun Funding LLC, | |||
| c | Series 2019-A Class B, 3.87% due 8/8/2025 | 4,183,218 | 4,084,202 |
| c | Series 2022-1 Class A, 3.25% due 6/15/2029 | 9,827,869 | 9,697,476 |
| c | Oportun Issuance Trust, Series 2022-A Class A, 5.05% due 6/9/2031 | 22,026,000 | 21,485,349 |
| Pagaya AI Debt Selection Trust, | |||
| c | Series 2021-1 Class A, 1.18% due 11/15/2027 | 4,417,819 | 4,375,398 |
| c | Series 2021-3 Class A, 1.15% due 5/15/2029 | 7,396,961 | 7,272,571 |
| c | Series 2021-HG1 Class A, 1.22% due 1/16/2029 | 6,614,980 | 6,290,371 |
| Pagaya AI Debt Trust, | |||
| c | Series 2022-1 Class A, 2.03% due 10/15/2029 | 16,745,566 | 16,197,321 |
| c | Series 2022-2 Class A, 4.97% due 1/15/2030 | 9,920,109 | 9,770,219 |
| c | Series 2023-1 Class A, 7.556% due 7/15/2030 | 7,250,000 | 7,270,432 |
| Pawnee Equipment Receivables LLC, | |||
| c | Series 2020-1 Class A, 1.37% due 11/17/2025 | 903,132 | 896,968 |
| c | Series 2021-1 Class A2, 1.10% due 7/15/2027 | 5,420,897 | 5,210,859 |
| c | Post Road Equipment Finance, Series 2022-1A Class A1, 3.76% due 8/16/2027 | 9,030,280 | 8,917,777 |
| See notes to financial statements. | Thornburg Taxable Fixed Income Funds Semi-Annual Report | 23 |
Thornburg Limited Term Income Fund | March 31, 2023 (Unaudited)
| Issuer-Description | SHARES/PRINCIPAL AMOUNT | VALUE | |
| a,c | SBA Tower Trust, Series 2014-2A Class C, 3.869% due 10/15/2049 | $ 4,610,000 | $ 4,476,885 |
| c | SCF Equipment Leasing LLC, Series 2019-2A Class C, 3.11% due 6/21/2027 | 3,000,000 | 2,872,094 |
| c | Service Experts Issuer LLC, Series 2021-1A Class A, 2.67% due 2/2/2032 | 17,042,148 | 15,925,917 |
| c | Sierra Timeshare Receivables Funding LLC, Series 2019-1A Class A, 3.20% due 1/20/2036 | 720,546 | 686,904 |
| c | SpringCastle America Funding LLC, Series 2020-AA Class A, 1.97% due 9/25/2037 | 26,465,700 | 24,598,624 |
| c | SPS Servicer Advance Receivables Trust, Series 2020-T2 Class A, 1.83% due 11/15/2055 | 6,000,000 | 5,537,728 |
| c | Stack Infrastructure Issuer LLC, Series 2021-1A Class A2, 1.877% due 3/26/2046 | 7,500,000 | 6,722,921 |
| c | Theorem Funding Trust, Series 2021-1A Class A, 1.21% due 12/15/2027 | 3,279,637 | 3,239,578 |
| Upstart Pass-Through Trust, | |||
| c | Series 2020-ST2 Class A, 3.50% due 3/20/2028 | 361,783 | 352,757 |
| c | Series 2020-ST3 Class A, 3.35% due 4/20/2028 | 1,754,937 | 1,710,033 |
| c | Series 2021-ST4 Class A, 2.00% due 7/20/2027 | 1,931,083 | 1,807,428 |
| c | Series 2021-ST5 Class A, 2.00% due 7/20/2027 | 2,517,152 | 2,364,914 |
| c | Series 2021-ST6 Class A, 1.85% due 8/20/2027 | 3,320,695 | 3,092,287 |
| c | Series 2021-ST8 Class A, 1.75% due 10/20/2029 | 5,026,315 | 4,648,857 |
| Upstart Securitization Trust, | |||
| c | Series 2021-2 Class A, 0.91% due 6/20/2031 | 967,580 | 957,477 |
| c | Series 2021-4 Class A, 0.84% due 9/20/2031 | 2,625,945 | 2,564,413 |
| c | Series 2023-1 Class A, 6.59% due 2/20/2033 | 4,225,000 | 4,209,996 |
| Upstart Structured Pass-Through Trust, | |||
| c | Series 2022-1A Class A, 3.40% due 4/15/2030 | 19,244,410 | 18,438,984 |
| c | Series 2022-4A Class A, 7.01% due 11/15/2030 | 7,212,332 | 7,209,538 |
| 790,624,692 | |||
| Student Loan — 3.1% | |||
| College Ave Student Loans LLC, | |||
| a,c | Series 2021-A Class A1, 5.945% (LIBOR 1 Month + 1.10%) due 7/25/2051 | 8,747,245 | 8,506,523 |
| c | Series 2021-A Class A2, 1.60% due 7/25/2051 | 2,022,818 | 1,753,692 |
| a,c | Series 2021-C Class A1, 5.745% (LIBOR 1 Month + 0.90%) due 7/26/2055 | 14,314,022 | 13,599,374 |
| Commonbond Student Loan Trust, | |||
| c | Series 18-CGS Class A1, 3.87% due 2/25/2046 | 1,770,405 | 1,692,339 |
| c | Series 2020-1 Class A, 1.69% due 10/25/2051 | 12,725,890 | 11,486,658 |
| c | Series 2021-AGS Class A, 1.20% due 3/25/2052 | 9,746,871 | 8,199,364 |
| c | Series 2021-BGS Class A, 1.17% due 9/25/2051 | 11,288,805 | 9,290,956 |
| Navient Private Education Loan Trust, | |||
| a,c | Series 2015-AA Class A2B, 5.884% (LIBOR 1 Month + 1.20%) due 12/15/2028 | 279,869 | 279,422 |
| c | Series 2017-A Class A2A, 2.88% due 12/16/2058 | 926,997 | 910,651 |
| Navient Private Education Refi Loan Trust, | |||
| a,c | Series 2019-D Class A2B, 5.734% (LIBOR 1 Month + 1.05%) due 12/15/2059 | 8,975,551 | 8,787,283 |
| c | Series 2021-A Class A, 0.84% due 5/15/2069 | 3,292,939 | 2,877,475 |
| c | Series 2022-BA Class A, 4.16% due 10/15/2070 | 22,494,838 | 21,564,551 |
| Navient Student Loan Trust, | |||
| a | Series 2014-1 Class A3, 5.355% (LIBOR 1 Month + 0.51%) due 6/25/2031 | 4,792,752 | 4,626,705 |
| a,c | Series 2019-BA Class A2B, 5.664% (LIBOR 1 Month + 0.98%) due 12/15/2059 | 1,375,483 | 1,363,410 |
| a,c | Nelnet Private Education Loan Trust, Series 2016-A Class A1A, 6.595% (LIBOR 1 Month + 1.75%) due 12/26/2040 | 28,524 | 28,517 |
| Nelnet Student Loan Trust, | |||
| a,c | Series 2013-1A Class A, 5.445% (LIBOR 1 Month + 0.60%) due 6/25/2041 | 2,878,708 | 2,734,244 |
| a,c | Series 2015-2A Class A2, 5.445% (LIBOR 1 Month + 0.60%) due 9/25/2042 | 21,914,435 | 21,055,444 |
| a,c | Series 2015-3A Class A2, 5.445% (LIBOR 1 Month + 0.60%) due 2/27/2051 | 1,325,093 | 1,306,110 |
| a,c | Series 2021-CA Class AFL, 5.501% (LIBOR 1 Month + 0.74%) due 4/20/2062 | 12,551,878 | 12,238,549 |
| a,c | Series 2021-DA Class AFL, 5.451% (LIBOR 1 Month + 0.69%) due 4/20/2062 | 18,045,723 | 17,521,374 |
| a,c | Pennsylvania Higher Education Assistance Agency, Student Loan Trust, Series 2012-1A Class A1, 5.395% (LIBOR 1 Month + 0.55%) due 5/25/2057 | 673,687 | 650,535 |
| a,b,c | Prodigy Finance DAC, Series 2021-1A Class A, 6.095% (LIBOR 1 Month + 1.25%) due 7/25/2051 | 2,654,359 | 2,550,631 |
| SLM Student Loan Trust, | |||
| a | Series 2011-2 Class A2, 6.045% (LIBOR 1 Month + 1.20%) due 10/25/2034 | 9,189,072 | 9,182,951 |
| a | Series 2013-6 Class A3, 5.495% (LIBOR 1 Month + 0.65%) due 6/26/2028 | 24,742,978 | 23,993,983 |
| SMB Private Education Loan Trust, | |||
| a,c | Series 2015-A Class A3, 6.184% (LIBOR 1 Month + 1.50%) due 2/17/2032 | 1,088,611 | 1,087,411 |
| a,c | Series 2017-B Class A2B, 5.434% (LIBOR 1 Month + 0.75%) due 10/15/2035 | 921,883 | 902,571 |
| a,c | Series 2021-D Class A1B, 5.284% (LIBOR 1 Month + 0.60%) due 3/17/2053 | 7,692,900 | 7,460,399 |
| a,c | Series 2021-E Class A1B, 5.314% (LIBOR 1 Month + 0.63%) due 2/15/2051 | 23,274,726 | 22,548,690 |
| 24 | Thornburg Taxable Fixed Income Funds Semi-Annual Report | See notes to financial statements. |
| Issuer-Description | SHARES/PRINCIPAL AMOUNT | VALUE | |
| c | SoFi Professional Loan Program LLC, Series 2017-E Class A2B, 2.72% due 11/26/2040 | $ 186,846 | $ 185,881 |
| a,c | Towd Point Asset Trust, Series 2021-SL1 Class A2, 5.461% (LIBOR 1 Month + 0.70%) due 11/20/2061 | 6,465,168 | 6,352,545 |
| 224,738,238 | |||
| Total Asset Backed Securities (Cost $1,293,611,293) | 1,226,246,593 | ||
| Corporate Bonds — 47.8% | |||
| Automobiles & Components — 1.0% | |||
| Automobile Components — 0.1% | |||
| b | Aptiv plc/Aptiv Corp., 2.396% due 2/18/2025 | 5,434,000 | 5,173,440 |
| Automobiles — 0.9% | |||
| a,c | Daimler Truck Finance North America LLC, 5.569% (SOFR+ 0.75%) due 12/13/2024 | 10,414,000 | 10,265,080 |
| Hyundai Capital America, | |||
| c | 0.875% due 6/14/2024 | 8,710,000 | 8,255,948 |
| c | 1.00% due 9/17/2024 | 8,872,000 | 8,318,121 |
| c | 1.80% due 10/15/2025 - 1/10/2028 | 9,765,000 | 8,669,432 |
| c | 2.375% due 10/15/2027 | 3,500,000 | 3,091,620 |
| c | 3.00% due 2/10/2027 | 2,105,000 | 1,928,959 |
| b,c | Hyundai Capital Services, Inc., 1.25% due 2/8/2026 | 2,970,000 | 2,659,872 |
| b,c | Kia Corp., 2.375% due 2/14/2025 | 9,800,000 | 9,308,432 |
| Mercedes-Benz Finance North America LLC, | |||
| c | 2.125% due 3/10/2025 | 13,600,000 | 12,903,408 |
| c | 3.70% due 5/4/2023 | 4,725,000 | 4,717,723 |
| 75,292,035 | |||
| Banks — 0.9% | |||
| Banks — 0.9% | |||
| FNB Corp., 5.15% due 8/25/2025 | 5,748,000 | 5,346,157 | |
| KeyBank NA, 5.00% due 1/26/2033 | 9,100,000 | 8,450,078 | |
| a,b,c | NBK SPC Ltd., 1.625% (SOFR + 1.05%) due 9/15/2027 | 13,033,000 | 11,594,417 |
| Santander Holdings USA, Inc., | |||
| 3.244% due 10/5/2026 | 6,823,000 | 6,173,314 | |
| 3.45% due 6/2/2025 | 4,453,000 | 4,186,132 | |
| 4.40% due 7/13/2027 | 4,940,000 | 4,663,162 | |
| Sumitomo Mitsui Trust Bank Ltd., | |||
| b,c | 0.80% due 9/12/2023 | 14,760,000 | 14,451,664 |
| b,c | 0.85% due 3/25/2024 | 6,550,000 | 6,270,315 |
| Synchrony Bank, 5.40% due 8/22/2025 | 7,250,000 | 6,798,108 | |
| 67,933,347 | |||
| Capital Goods — 0.7% | |||
| Aerospace & Defense — 0.3% | |||
| Boeing Co., 2.196% due 2/4/2026 | 6,256,000 | 5,803,128 | |
| Teledyne Technologies, Inc., | |||
| 2.25% due 4/1/2028 | 14,013,000 | 12,531,125 | |
| 2.75% due 4/1/2031 | 4,501,000 | 3,842,864 | |
| Industrial Conglomerates — 0.0% | |||
| Trane Technologies Co. LLC, 6.391% due 11/15/2027 | 3,000,000 | 3,138,270 | |
| Machinery — 0.4% | |||
| Flowserve Corp., 3.50% due 10/1/2030 | 5,914,000 | 5,131,873 | |
| b | nVent Finance Sarl, 4.55% due 4/15/2028 | 7,023,000 | 6,701,557 |
| Regal Rexnord Corp., | |||
| c | 6.05% due 2/15/2026 | 4,906,000 | 4,939,557 |
| c | 6.30% due 2/15/2030 | 5,891,000 | 5,918,158 |
| Westinghouse Air Brake Technologies Corp., 4.40% due 3/15/2024 | 3,853,000 | 3,801,640 | |
| 51,808,172 | |||
| Commercial & Professional Services — 0.4% | |||
| Commercial Services & Supplies — 0.4% | |||
| Avery Dennison Corp., 5.75% due 3/15/2033 | 17,120,000 | 17,801,547 | |
| Quanta Services, Inc., 0.95% due 10/1/2024 | 10,296,000 | 9,601,947 | |
| 27,403,494 |
| See notes to financial statements. | Thornburg Taxable Fixed Income Funds Semi-Annual Report | 25 |
Thornburg Limited Term Income Fund | March 31, 2023 (Unaudited)
| Issuer-Description | SHARES/PRINCIPAL AMOUNT | VALUE | |
| Consumer Discretionary Distribution & Retail — 0.1% | |||
| Specialty Retail — 0.1% | |||
| Advance Auto Parts, Inc., | |||
| 1.75% due 10/1/2027 | $ 4,763,000 | $ 4,114,279 | |
| 3.90% due 4/15/2030 | 6,584,000 | 5,990,716 | |
| 10,104,995 | |||
| Consumer Durables & Apparel — 0.0% | |||
| Household Durables — 0.0% | |||
| b,c | Panasonic Holdings Corp., 2.679% due 7/19/2024 | 2,000,000 | 1,934,020 |
| 1,934,020 | |||
| Consumer Staples Distribution & Retail — 0.2% | |||
| Consumer Staples Distribution & Retail — 0.2% | |||
| c | 7-Eleven, Inc., 0.80% due 2/10/2024 | 13,945,000 | 13,362,378 |
| 13,362,378 | |||
| Energy — 2.0% | |||
| Energy Equipment & Services — 0.0% | |||
| b,c,d,e | Schahin II Finance Co. SPV Ltd., 5.875% due 9/25/2023 | 3,997,362 | 19,987 |
| Oil, Gas & Consumable Fuels — 2.0% | |||
| Buckeye Partners LP, 4.15% due 7/1/2023 | 7,000,000 | 6,957,230 | |
| c | Colorado Interstate Gas Co. LLC/Colorado Interstate Issuing Corp., 4.15% due 8/15/2026 | 9,092,000 | 8,808,330 |
| c | El Paso Natural Gas Co. LLC, 3.50% due 2/15/2032 | 4,068,000 | 3,504,460 |
| c | Florida Gas Transmission Co. LLC, 2.30% due 10/1/2031 | 10,778,000 | 8,788,489 |
| Galaxy Pipeline Assets Bidco Ltd., | |||
| b,c | 1.75% due 9/30/2027 | 30,294,445 | 28,225,940 |
| b,c | 2.16% due 3/31/2034 | 8,906,484 | 7,682,911 |
| b,c,d,e | Gazprom PJSC via Gaz Finance plc, 3.50% due 7/14/2031 | 32,475,000 | 20,869,734 |
| Gray Oak Pipeline LLC, | |||
| c | 2.00% due 9/15/2023 | 17,190,000 | 16,897,770 |
| c | 3.45% due 10/15/2027 | 12,955,000 | 11,697,847 |
| Kinder Morgan, Inc., 5.20% due 6/1/2033 | 7,878,000 | 7,824,587 | |
| c | Midwest Connector Capital Co. LLC, 4.625% due 4/1/2029 | 16,535,000 | 15,447,989 |
| b,c | TMS Issuer Sarl, 5.78% due 8/23/2032 | 10,700,000 | 11,132,708 |
| 147,857,982 | |||
| Equity Real Estate Investment Trusts (REITs) — 2.3% | |||
| Diversified REITs — 2.1% | |||
| American Tower Corp., | |||
| 1.45% due 9/15/2026 | 4,969,000 | 4,415,503 | |
| 1.50% due 1/31/2028 | 15,000,000 | 12,768,450 | |
| 2.40% due 3/15/2025 | 12,850,000 | 12,189,638 | |
| 3.65% due 3/15/2027 | 6,380,000 | 6,056,279 | |
| Crown Castle, Inc., | |||
| 1.05% due 7/15/2026 | 6,222,000 | 5,483,760 | |
| 5.00% due 1/11/2028 | 7,301,000 | 7,355,757 | |
| Digital Realty Trust LP, | |||
| 4.45% due 7/15/2028 | 4,880,000 | 4,593,593 | |
| 5.55% due 1/15/2028 | 13,400,000 | 13,386,466 | |
| Extra Space Storage LP, | |||
| 3.90% due 4/1/2029 | 4,920,000 | 4,539,832 | |
| 5.70% due 4/1/2028 | 3,245,000 | 3,267,163 | |
| Realty Income Corp., 5.05% due 1/13/2026 | 6,146,000 | 6,111,644 | |
| SBA Tower Trust, | |||
| c | 1.631% due 5/15/2051 | 26,000,000 | 22,769,567 |
| c | 1.84% due 4/15/2027 | 8,140,000 | 7,097,930 |
| c | 2.836% due 1/15/2050 | 12,661,000 | 11,993,442 |
| c | 6.599% due 1/15/2028 | 7,950,000 | 8,390,388 |
| Service Properties Trust, | |||
| 4.35% due 10/1/2024 | 10,161,000 | 9,728,040 | |
| 4.65% due 3/15/2024 | 4,233,000 | 4,127,175 | |
| 5.25% due 2/15/2026 | 4,020,000 | 3,522,646 |
| 26 | Thornburg Taxable Fixed Income Funds Semi-Annual Report | See notes to financial statements. |
| Issuer-Description | SHARES/PRINCIPAL AMOUNT | VALUE | |
| Vornado Realty LP, | |||
| 2.15% due 6/1/2026 | $ 7,000,000 | $ 5,618,410 | |
| 3.40% due 6/1/2031 | 2,916,000 | 2,017,814 | |
| Mortgage Real Estate Investment Trusts — 0.2% | |||
| Sun Communities Operating LP, 2.30% due 11/1/2028 | 13,878,000 | 11,824,611 | |
| 167,258,108 | |||
| Financial Services — 9.1% | |||
| Banks — 0.2% | |||
| a,b,c | DNB Bank ASA, 5.896% (SOFRINDX + 1.95%) due 10/9/2026 | 7,500,000 | 7,556,925 |
| b,c | Sumitomo Mitsui Trust Bank Ltd., 5.65% due 3/9/2026 | 3,800,000 | 3,860,420 |
| Capital Markets — 2.1% | |||
| Blackstone Private Credit Fund, 2.625% due 12/15/2026 | 8,137,000 | 6,841,183 | |
| Hercules Capital, Inc., | |||
| 2.625% due 9/16/2026 | 14,120,000 | 11,902,595 | |
| 3.375% due 1/20/2027 | 7,458,000 | 6,391,804 | |
| b,c | LSEGA Financing plc, 1.375% due 4/6/2026 | 9,720,000 | 8,688,125 |
| Main Street Capital Corp., 3.00% due 7/14/2026 | 8,163,000 | 7,147,115 | |
| Owl Rock Capital Corp., 2.875% due 6/11/2028 | 22,599,000 | 18,334,569 | |
| Owl Rock Capital Corp. III, 3.125% due 4/13/2027 | 16,243,000 | 13,944,778 | |
| Owl Rock Core Income Corp., | |||
| 3.125% due 9/23/2026 | 19,056,000 | 16,252,672 | |
| 4.70% due 2/8/2027 | 4,870,000 | 4,421,911 | |
| 5.50% due 3/21/2025 | 6,810,000 | 6,626,130 | |
| Owl Rock Technology Finance Corp., | |||
| 2.50% due 1/15/2027 | 10,556,000 | 8,810,143 | |
| c | 3.75% due 6/17/2026 | 12,276,000 | 10,800,057 |
| c | 4.75% due 12/15/2025 | 17,883,000 | 16,101,674 |
| Sixth Street Specialty Lending, Inc., | |||
| 2.50% due 8/1/2026 | 2,591,000 | 2,277,411 | |
| 3.875% due 11/1/2024 | 14,960,000 | 14,262,415 | |
| Consumer Finance — 0.3% | |||
| a | PNC Financial Services Group, Inc., 5.068% (SOFR + 1.93%) due 1/24/2034 | 2,374,000 | 2,343,803 |
| a | U.S. Bancorp, 4.653% (SOFR + 1.23%) due 2/1/2029 | 7,881,000 | 7,684,605 |
| Wells Fargo & Co., | |||
| a | 3.908% (SOFR + 1.32%) due 4/25/2026 | 8,792,000 | 8,524,899 |
| a | 4.808% (SOFR + 1.98%) due 7/25/2028 | 3,448,000 | 3,405,831 |
| Financial Services — 6.1% | |||
| Antares Holdings LP, | |||
| c | 2.75% due 1/15/2027 | 7,360,000 | 5,996,634 |
| c | 3.75% due 7/15/2027 | 8,520,000 | 7,056,349 |
| c | 3.95% due 7/15/2026 | 14,391,000 | 12,411,230 |
| c | 6.00% due 8/15/2023 | 10,075,000 | 10,014,147 |
| b | Banco Santander SA, 5.147% due 8/18/2025 | 10,000,000 | 9,833,800 |
| Bank of America Corp., | |||
| a | 0.976% (SOFR + 0.69%) due 4/22/2025 | 9,525,000 | 9,074,944 |
| a | 1.197% (SOFR + 1.01%) due 10/24/2026 | 3,035,000 | 2,726,887 |
| a | 1.734% (SOFR + 0.96%) due 7/22/2027 | 3,632,000 | 3,251,185 |
| a | 3.841% (SOFR + 1.11%) due 4/25/2025 | 7,305,000 | 7,169,346 |
| a | 4.948% (SOFR + 2.04%) due 7/22/2028 | 6,007,000 | 5,975,523 |
| a | 5.272% (BSBY3M + 0.43%) due 5/28/2024 | 5,093,000 | 5,086,430 |
| a,b | Barclays plc, 6.252% (LIBOR 3 Month + 1.38%) due 5/16/2024 | 17,500,000 | 17,451,875 |
| BNP Paribas SA, | |||
| a,b,c | 1.323% (SOFR + 1.00%) due 1/13/2027 | 7,000,000 | 6,189,400 |
| a,b,c | 2.159% (SOFR + 1.22%) due 9/15/2029 | 3,650,000 | 3,051,510 |
| a,b,c | 2.219% (SOFR + 2.07%) due 6/9/2026 | 4,800,000 | 4,413,120 |
| a | Charles Schwab Corp., 5.834% (SOFRINDX + 1.05%) due 3/3/2027 | 33,148,000 | 31,638,109 |
| Citigroup, Inc., | |||
| a | 1.462% (SOFR + 0.77%) due 6/9/2027 | 7,328,000 | 6,511,221 |
| a | 3.07% (SOFR + 1.28%) due 2/24/2028 | 9,000 | 8,373 |
| a | 3.106% (SOFR + 2.84%) due 4/8/2026 | 4,265,000 | 4,078,065 |
| 3.40% due 5/1/2026 | 2,425,000 | 2,314,735 |
| See notes to financial statements. | Thornburg Taxable Fixed Income Funds Semi-Annual Report | 27 |
Thornburg Limited Term Income Fund | March 31, 2023 (Unaudited)
| Issuer-Description | SHARES/PRINCIPAL AMOUNT | VALUE | |
| a | 4.412% (SOFR + 3.91%) due 3/31/2031 | $ 7,315,000 | $ 6,958,833 |
| a | 5.339% (SOFR + 0.67%) due 5/1/2025 | 5,753,000 | 5,687,646 |
| Deutsche Bank AG, | |||
| b | 0.898% due 5/28/2024 | 10,952,000 | 10,286,885 |
| a,b | 2.552% (SOFR + 1.32%) due 1/7/2028 | 4,940,000 | 4,207,991 |
| Goldman Sachs Group, Inc., | |||
| a | 1.757% (SOFR + 0.73%) due 1/24/2025 | 3,991,000 | 3,868,835 |
| a | 5.064% (SOFR + 0.50%) due 7/16/2024 | 14,450,000 | 14,355,930 |
| a | 5.305% (SOFR + 0.50%) due 9/10/2024 | 6,506,000 | 6,447,836 |
| a | 5.324% (SOFR + 0.70%) due 1/24/2025 | 6,322,000 | 6,243,923 |
| a | 5.625% (SOFR + 0.82%) due 9/10/2027 | 10,881,000 | 10,491,569 |
| HSBC Holdings plc, | |||
| a,b | 1.589% (SOFR + 1.29%) due 5/24/2027 | 6,100,000 | 5,377,333 |
| a,b | 1.645% (SOFR + 1.54%) due 4/18/2026 | 3,025,000 | 2,764,003 |
| a,b | 2.013% (SOFR + 1.73%) due 9/22/2028 | 9,550,000 | 8,182,822 |
| a,b | 2.099% (SOFR + 1.93%) due 6/4/2026 | 6,800,000 | 6,248,384 |
| a,b | 2.206% (SOFR + 1.29%) due 8/17/2029 | 3,500,000 | 2,942,800 |
| a,b | 2.251% (SOFR + 1.10%) due 11/22/2027 | 3,430,000 | 3,037,437 |
| a,b | 4.18% (SOFR + 1.51%) due 12/9/2025 | 5,400,000 | 5,242,104 |
| a,b | 5.21% (SOFR + 2.61%) due 8/11/2028 | 2,330,000 | 2,310,614 |
| a,b | 5.322% (SOFR + 0.58%) due 11/22/2024 | 1,585,000 | 1,551,271 |
| JPMorgan Chase & Co., | |||
| a | 1.04% (TSFR3M + 0.70%) due 2/4/2027 | 4,690,000 | 4,185,919 |
| a | 1.045% (SOFR + 0.80%) due 11/19/2026 | 5,982,000 | 5,348,506 |
| a | 3.54% (LIBOR 3 Month + 1.38%) due 5/1/2028 | 3,040,000 | 2,876,114 |
| a | 4.323% (SOFR + 1.56%) due 4/26/2028 | 3,906,000 | 3,815,498 |
| a | 5.506% (SOFR + 0.89%) due 4/22/2027 | 3,096,000 | 3,039,188 |
| a | 5.679% (SOFR + 0.92%) due 2/24/2026 | 10,418,000 | 10,339,344 |
| a,b | Lloyds Banking Group plc, 3.87% (H15T1Y + 3.50%) due 7/9/2025 | 3,500,000 | 3,402,385 |
| Mitsubishi UFJ Financial Group, Inc., | |||
| a,b | 0.953% (H15T1Y + 0.55%) due 7/19/2025 | 14,075,000 | 13,253,864 |
| a,b | 1.538% (H15T1Y + 0.75%) due 7/20/2027 | 4,800,000 | 4,244,688 |
| a,b | 1.64% (H15T1Y + 0.67%) due 10/13/2027 | 6,750,000 | 5,934,128 |
| a,b | 2.309% (H15T1Y + 0.95%) due 7/20/2032 | 2,750,000 | 2,203,438 |
| a,b | 4.788% (H15T1Y + 1.70%) due 7/18/2025 | 4,550,000 | 4,503,636 |
| a,b | 5.017% (H15T1Y + 1.95%) due 7/20/2028 | 1,250,000 | 1,240,338 |
| a,b | 5.354% (H15T1Y + 1.90%) due 9/13/2028 | 5,000,000 | 5,015,450 |
| Mizuho Financial Group, Inc., | |||
| a,b | 3.922% (LIBOR 3 Month + 1.00%) due 9/11/2024 | 10,850,000 | 10,755,605 |
| a,b | 5.588% (LIBOR 3 Month + 0.63%) due 5/25/2024 | 12,978,000 | 12,957,365 |
| Morgan Stanley, | |||
| a | 0.791% (SOFR + 0.51%) due 1/22/2025 | 11,785,000 | 11,337,641 |
| a | 1.164% (SOFR + 0.56%) due 10/21/2025 | 9,635,000 | 8,999,379 |
| a,b | NatWest Group plc, 1.642% (H15T1Y + 0.90%) due 6/14/2027 | 3,000,000 | 2,643,900 |
| Societe Generale SA, | |||
| a,b,c | 1.792% (H15T1Y + 1.00%) due 6/9/2027 | 4,933,000 | 4,284,458 |
| b,c | 2.625% due 1/22/2025 | 4,000,000 | 3,745,480 |
| b,c | 3.875% due 3/28/2024 | 8,000,000 | 7,806,880 |
| b,c | 4.25% due 9/14/2023 | 9,000,000 | 8,956,350 |
| a,b,c | 5.668% (SOFR + 1.05%) due 1/21/2026 | 6,400,000 | 6,244,544 |
| b | Sumitomo Mitsui Financial Group, Inc., 1.402% due 9/17/2026 | 11,650,000 | 10,186,877 |
| a,b,c | UBS AG, 5.159% (SOFR + 0.45%) due 8/9/2024 | 2,800,000 | 2,782,472 |
| UBS Group AG, | |||
| a,b,c | 1.494% (H15T1Y + 0.85%) due 8/10/2027 | 7,121,000 | 6,131,608 |
| a,b,c | 4.49% (H15T1Y + 1.60%) due 8/5/2025 | 9,800,000 | 9,565,192 |
| a,b,c | 4.751% (H15T1Y + 1.75%) due 5/12/2028 | 7,800,000 | 7,448,922 |
| Western Union Co., 2.85% due 1/10/2025 | 7,256,000 | 6,925,634 | |
| Insurance — 0.4% | |||
| c | Five Corners Funding Trust III, 5.791% due 2/15/2033 | 5,900,000 | 6,054,639 |
| c | Global Atlantic Fin Co., 4.40% due 10/15/2029 | 27,285,000 | 24,347,224 |
| 667,214,830 | |||
| Food, Beverage & Tobacco — 1.0% |
| 28 | Thornburg Taxable Fixed Income Funds Semi-Annual Report | See notes to financial statements. |
| Issuer-Description | SHARES/PRINCIPAL AMOUNT | VALUE | |
| Beverages — 0.6% | |||
| b,c | Becle SAB de CV, 2.50% due 10/14/2031 | $ 28,038,000 | $ 22,650,498 |
| Constellation Brands, Inc., 5.00% due 2/2/2026 | 2,750,000 | 2,752,255 | |
| Huntington Ingalls Industries, Inc., 2.043% due 8/16/2028 | 17,717,000 | 15,171,953 | |
| Food Products — 0.1% | |||
| a | General Mills, Inc., 5.84% (LIBOR 3 Month + 1.01%) due 10/17/2023 | 2,475,000 | 2,479,133 |
| Ingredion, Inc., 2.90% due 6/1/2030 | 9,725,000 | 8,543,510 | |
| Tobacco — 0.3% | |||
| BAT Capital Corp., | |||
| 2.726% due 3/25/2031 | 2,950,000 | 2,393,306 | |
| 3.557% due 8/15/2027 | 5,838,000 | 5,429,107 | |
| BAT International Finance plc, | |||
| b | 1.668% due 3/25/2026 | 4,764,000 | 4,338,765 |
| b | 4.448% due 3/16/2028 | 3,000,000 | 2,852,550 |
| b,c | JT International Financial Services BV, 6.875% due 10/24/2032 | 5,350,000 | 5,904,367 |
| 72,515,444 | |||
| Health Care Equipment & Services — 0.8% | |||
| Health Care Equipment & Supplies — 0.2% | |||
| b,c | Olympus Corp., 2.143% due 12/8/2026 | 14,061,000 | 12,690,755 |
| Health Care Providers & Services — 0.6% | |||
| Centene Corp., 3.00% due 10/15/2030 | 9,314,000 | 7,838,942 | |
| c | Highmark, Inc., 1.45% due 5/10/2026 | 20,542,000 | 18,535,457 |
| Humana, Inc., 5.70% due 3/13/2026 | 11,996,000 | 12,062,458 | |
| Laboratory Corp. of America Holdings, 1.55% due 6/1/2026 | 8,355,000 | 7,468,117 | |
| 58,595,729 | |||
| Household & Personal Products — 0.0% | |||
| Household Products — 0.0% | |||
| b,c | Kimberly-Clark de Mexico SAB de CV, 3.80% due 4/8/2024 | 3,900,000 | 3,824,379 |
| 3,824,379 | |||
| Industrials — 0.1% | |||
| Transportation Infrastructure — 0.1% | |||
| c | Penske Truck Leasing Co. LP/PTL Finance Corp., 5.55% due 5/1/2028 | 9,819,000 | 9,804,861 |
| 9,804,861 | |||
| Insurance — 7.7% | |||
| Insurance — 7.7% | |||
| c | American National Group, Inc., 6.144% due 6/13/2032 | 25,662,000 | 24,801,553 |
| Arthur J Gallagher & Co., 5.50% due 3/2/2033 | 8,212,000 | 8,376,158 | |
| b,c | Ascot Group Ltd., 4.25% due 12/15/2030 | 12,308,000 | 9,687,011 |
| c | Belrose Funding Trust, 2.33% due 8/15/2030 | 9,685,000 | 7,466,070 |
| Brighthouse Financial Global Funding, | |||
| c | 1.55% due 5/24/2026 | 7,538,000 | 6,774,024 |
| c | 2.00% due 6/28/2028 | 10,733,000 | 9,175,534 |
| a,c | 5.326% (SOFR + 0.76%) due 4/12/2024 | 7,247,000 | 7,153,586 |
| Brighthouse Financial, Inc., 5.625% due 5/15/2030 | 10,707,000 | 10,301,205 | |
| CNO Global Funding, | |||
| c | 1.65% due 1/6/2025 | 5,359,000 | 5,037,460 |
| c | 1.75% due 10/7/2026 | 9,414,000 | 8,424,683 |
| b,c | DaVinciRe Holdings Ltd., 4.75% due 5/1/2025 | 10,260,000 | 10,099,123 |
| Enstar Group Ltd., | |||
| b | 3.10% due 9/1/2031 | 10,106,000 | 7,814,970 |
| b | 4.95% due 6/1/2029 | 16,116,000 | 15,076,679 |
| Equitable Financial Life Global Funding, | |||
| c | 1.00% due 1/9/2026 | 8,665,000 | 7,801,966 |
| c | 1.40% due 7/7/2025 - 8/27/2027 | 16,048,000 | 14,541,929 |
| c | 1.80% due 3/8/2028 | 6,800,000 | 5,776,532 |
| F&G Global Funding, | |||
| c | 1.75% due 6/30/2026 | 16,912,000 | 15,128,799 |
| c | 2.00% due 9/20/2028 | 17,963,000 | 15,194,004 |
| c | 2.30% due 4/11/2027 | 16,833,000 | 14,991,806 |
| See notes to financial statements. | Thornburg Taxable Fixed Income Funds Semi-Annual Report | 29 |
Thornburg Limited Term Income Fund | March 31, 2023 (Unaudited)
| Issuer-Description | SHARES/PRINCIPAL AMOUNT | VALUE | |
| Fairfax Financial Holdings Ltd., | |||
| b | 3.375% due 3/3/2031 | $ 5,261,000 | $ 4,414,979 |
| b | 4.625% due 4/29/2030 | 11,984,000 | 11,298,156 |
| b,c | 5.625% due 8/16/2032 | 15,746,000 | 15,489,655 |
| b,c | Fidelis Insurance Holdings Ltd., 4.875% due 6/30/2030 | 17,531,000 | 17,546,603 |
| Fidelity National Financial, Inc., 3.40% due 6/15/2030 | 14,931,000 | 13,083,438 | |
| First American Financial Corp., | |||
| 2.40% due 8/15/2031 | 2,261,000 | 1,750,285 | |
| 4.00% due 5/15/2030 | 4,316,000 | 3,889,320 | |
| GA Global Funding Trust, | |||
| c | 1.625% due 1/15/2026 | 1,940,000 | 1,749,550 |
| c | 2.25% due 1/6/2027 | 9,479,000 | 8,474,416 |
| c | 3.85% due 4/11/2025 | 11,960,000 | 11,573,214 |
| a,c | 5.308% (SOFR + 0.50%) due 9/13/2024 | 6,888,000 | 6,744,730 |
| Globe Life, Inc., 4.80% due 6/15/2032 | 3,410,000 | 3,280,011 | |
| c | Guardian Life Global Funding, 5.55% due 10/28/2027 | 9,750,000 | 10,121,670 |
| Horace Mann Educators Corp., 4.50% due 12/1/2025 | 6,533,000 | 6,348,181 | |
| Jackson National Life Global Funding, | |||
| c | 3.25% due 1/30/2024 | 5,000,000 | 4,921,150 |
| c | 5.50% due 1/9/2026 | 12,660,000 | 12,700,512 |
| Mercury General Corp., 4.40% due 3/15/2027 | 2,901,000 | 2,792,416 | |
| Metropolitan Life Global Funding I, | |||
| c | 3.30% due 3/21/2029 | 4,000,000 | 3,704,640 |
| a,c | 4.855% (SOFR + 0.32%) due 1/7/2024 | 14,683,000 | 14,608,117 |
| a,c | Nationwide Mutual Insurance Co., 7.156% (LIBOR 3 Month + 2.29%) due 12/15/2024 | 16,096,000 | 16,006,828 |
| New York Life Global Funding, | |||
| c | 4.55% due 1/28/2033 | 4,892,000 | 4,838,971 |
| a,c | 5.282% (SOFR + 0.48%) due 6/9/2026 | 22,760,000 | 22,120,216 |
| Pacific Life Global Funding II, | |||
| a,c | 5.406% (SOFR + 0.62%) due 6/4/2026 | 13,475,000 | 13,027,091 |
| a,c | 5.65% (SOFRINDX + 0.80%) due 3/30/2025 | 653,000 | 646,685 |
| c | Protective Life Corp., 3.40% due 1/15/2030 | 16,787,000 | 14,846,758 |
| Protective Life Global Funding, | |||
| c | 1.618% due 4/15/2026 | 14,716,000 | 13,300,762 |
| c | 3.218% due 3/28/2025 | 4,000,000 | 3,851,000 |
| Reliance Standard Life Global Funding II, | |||
| c | 1.512% due 9/28/2026 | 10,762,000 | 9,498,326 |
| c | 2.75% due 5/7/2025 | 13,490,000 | 12,775,704 |
| c | 3.85% due 9/19/2023 | 5,950,000 | 5,893,475 |
| c | 5.243% due 2/2/2026 | 3,922,000 | 3,893,016 |
| c | RGA Global Funding, 2.70% due 1/18/2029 | 11,803,000 | 10,311,219 |
| c | Sammons Financial Group, Inc., 4.45% due 5/12/2027 | 7,950,000 | 7,504,084 |
| c | Security Benefit Global Funding, 1.25% due 5/17/2024 | 37,488,000 | 35,555,868 |
| Stewart Information Services Corp., 3.60% due 11/15/2031 | 22,401,000 | 17,627,123 | |
| Willis North America, Inc., 4.65% due 6/15/2027 | 14,331,000 | 14,119,618 | |
| 563,930,879 | |||
| Materials — 1.8% | |||
| Chemicals — 0.5% | |||
| b,c | LG Chem Ltd., 4.375% due 7/14/2025 | 5,000,000 | 4,911,450 |
| b,c | OCP SA, 5.625% due 4/25/2024 | 8,555,000 | 8,517,101 |
| Phosagro OAO Via Phosagro Bond Funding DAC, | |||
| b,c,d,e | 3.05% due 1/23/2025 | 2,525,000 | 1,581,685 |
| b,c,d,e | 3.949% due 4/24/2023 | 29,098,000 | 26,121,857 |
| Construction Materials — 0.3% | |||
| Martin Marietta Materials, Inc., 0.65% due 7/15/2023 | 14,635,000 | 14,412,255 | |
| Vulcan Materials Co., 5.80% due 3/1/2026 | 4,595,000 | 4,639,342 | |
| Containers & Packaging — 0.5% | |||
| b,c | CCL Industries, Inc., 3.05% due 6/1/2030 | 9,810,000 | 8,341,051 |
| c | Graphic Packaging International LLC, 1.512% due 4/15/2026 | 6,873,000 | 6,118,826 |
| c | Silgan Holdings, Inc., 1.40% due 4/1/2026 | 14,004,000 | 12,594,357 |
| Sonoco Products Co., 1.80% due 2/1/2025 | 11,725,000 | 11,005,437 |
| 30 | Thornburg Taxable Fixed Income Funds Semi-Annual Report | See notes to financial statements. |
| Issuer-Description | SHARES/PRINCIPAL AMOUNT | VALUE | |
| Metals & Mining — 0.5% | |||
| b | AngloGold Ashanti Holdings plc, 3.375% due 11/1/2028 | $ 23,500,000 | $ 20,851,315 |
| b,c,d,e | Metalloinvest Finance DAC, 3.375% due 10/22/2028 | 12,700,000 | 7,141,845 |
| b,c | Newcrest Finance Pty Ltd., 3.25% due 5/13/2030 | 2,961,000 | 2,597,448 |
| b,c | POSCO, 5.625% due 1/17/2026 | 4,700,000 | 4,757,904 |
| 133,591,873 | |||
| Media & Entertainment — 0.3% | |||
| Hotels, Restaurants & Leisure — 0.1% | |||
| Warnermedia Holdings, Inc., 6.412% due 3/15/2026 | 10,000,000 | 10,048,500 | |
| Media — 0.2% | |||
| Warnermedia Holdings, Inc., | |||
| c | 3.428% due 3/15/2024 | 4,090,000 | 3,997,893 |
| c | 3.528% due 3/15/2024 | 10,415,000 | 10,182,329 |
| 24,228,722 | |||
| Pharmaceuticals, Biotechnology & Life Sciences — 1.1% | |||
| Biotechnology — 0.4% | |||
| Amgen, Inc., | |||
| 5.25% due 3/2/2033 | 4,699,000 | 4,826,014 | |
| 5.507% due 3/2/2026 | 7,240,000 | 7,274,535 | |
| Bio-Rad Laboratories, Inc., 3.30% due 3/15/2027 | 5,820,000 | 5,497,106 | |
| Illumina, Inc., 5.80% due 12/12/2025 | 5,600,000 | 5,681,592 | |
| b | Royalty Pharma plc, 1.75% due 9/2/2027 | 7,532,000 | 6,528,738 |
| Pharmaceuticals — 0.7% | |||
| a,b | AstraZeneca plc, 5.542% (LIBOR 3 Month + 0.67%) due 8/17/2023 | 10,524,000 | 10,513,371 |
| c | Bayer US Finance II LLC, 4.25% due 12/15/2025 | 2,500,000 | 2,447,650 |
| Cigna Group, 5.685% due 3/15/2026 | 11,172,000 | 11,238,697 | |
| CVS Health Corp., 5.125% due 2/21/2030 | 19,470,000 | 19,715,906 | |
| Viatris, Inc., 2.30% due 6/22/2027 | 4,935,000 | 4,335,644 | |
| 78,059,253 | |||
| Semiconductors & Semiconductor Equipment — 1.9% | |||
| Semiconductors & Semiconductor Equipment — 1.9% | |||
| Broadcom Corp./Broadcom Cayman Finance Ltd., | |||
| b | 3.50% due 1/15/2028 | 12,245,000 | 11,481,157 |
| b | 3.875% due 1/15/2027 | 1,712,000 | 1,655,350 |
| Broadcom, Inc., | |||
| c | 3.187% due 11/15/2036 | 6,583,000 | 4,989,453 |
| c | 4.00% due 4/15/2029 | 2,060,000 | 1,929,005 |
| 4.15% due 11/15/2030 | 2,980,000 | 2,762,371 | |
| 4.75% due 4/15/2029 | 3,575,000 | 3,524,056 | |
| Microchip Technology, Inc., | |||
| 0.972% due 2/15/2024 | 18,694,000 | 17,946,053 | |
| 4.25% due 9/1/2025 | 10,634,000 | 10,460,134 | |
| Micron Technology, Inc., | |||
| 4.663% due 2/15/2030 | 4,150,000 | 3,983,668 | |
| 5.327% due 2/6/2029 | 7,690,000 | 7,720,298 | |
| 6.75% due 11/1/2029 | 9,900,000 | 10,532,709 | |
| Qorvo, Inc., | |||
| c | 1.75% due 12/15/2024 | 9,528,000 | 8,885,622 |
| c | 3.375% due 4/1/2031 | 14,210,000 | 11,772,701 |
| 4.375% due 10/15/2029 | 930,000 | 857,451 | |
| b,c | Renesas Electronics Corp., 1.543% due 11/26/2024 | 17,721,000 | 16,547,338 |
| SK Hynix, Inc., | |||
| b,c | 1.00% due 1/19/2024 | 6,800,000 | 6,551,256 |
| b,c | 1.50% due 1/19/2026 | 10,200,000 | 9,064,434 |
| b,c | 2.375% due 1/19/2031 | 6,588,000 | 4,935,071 |
| b,c | 6.25% due 1/17/2026 | 3,000,000 | 3,029,670 |
| Skyworks Solutions, Inc., 1.80% due 6/1/2026 | 3,574,000 | 3,220,710 | |
| 141,848,507 | |||
| Software & Services — 2.9% |
| See notes to financial statements. | Thornburg Taxable Fixed Income Funds Semi-Annual Report | 31 |
Thornburg Limited Term Income Fund | March 31, 2023 (Unaudited)
| Issuer-Description | SHARES/PRINCIPAL AMOUNT | VALUE | |
| Information Technology Services — 1.3% | |||
| Block Financial LLC, 2.50% due 7/15/2028 | $ 10,392,000 | $ 8,956,137 | |
| DXC Technology Co., 2.375% due 9/15/2028 | 26,644,000 | 22,605,569 | |
| b | Genpact Luxembourg Sarl, 3.375% due 12/1/2024 | 4,350,000 | 4,194,488 |
| b | Genpact Luxembourg Sarl/Genpact USA, Inc., 1.75% due 4/10/2026 | 9,063,000 | 8,286,482 |
| Global Payments, Inc., | |||
| 1.50% due 11/15/2024 | 5,624,000 | 5,296,852 | |
| 2.15% due 1/15/2027 | 3,516,000 | 3,115,035 | |
| 4.00% due 6/1/2023 | 1,335,000 | 1,328,632 | |
| Kyndryl Holdings, Inc., | |||
| 2.05% due 10/15/2026 | 10,562,000 | 9,231,505 | |
| 2.70% due 10/15/2028 | 22,750,000 | 19,100,445 | |
| Leidos, Inc., 2.30% due 2/15/2031 | 8,489,000 | 6,901,048 | |
| c | Wipro IT Services LLC, 1.50% due 6/23/2026 | 10,647,000 | 9,592,734 |
| Internet Software & Services — 0.5% | |||
| eBay, Inc., 5.90% due 11/22/2025 | 14,800,000 | 15,199,896 | |
| Prosus NV, | |||
| b,c | 3.061% due 7/13/2031 | 2,816,000 | 2,218,614 |
| b,c | 3.257% due 1/19/2027 | 6,400,000 | 5,819,264 |
| b,c | 4.193% due 1/19/2032 | 13,254,000 | 11,264,707 |
| b,c | Tencent Holdings Ltd., 2.39% due 6/3/2030 | 5,000,000 | 4,237,250 |
| Software — 1.1% | |||
| Fidelity National Information Services, Inc., | |||
| 1.15% due 3/1/2026 | 4,111,000 | 3,671,328 | |
| 4.70% due 7/15/2027 | 7,167,000 | 7,062,935 | |
| c | Infor, Inc., 1.75% due 7/15/2025 | 12,382,000 | 11,288,793 |
| c | MSCI, Inc., 3.625% due 9/1/2030 | 10,700,000 | 9,298,300 |
| b,c | Open Text Corp., 6.90% due 12/1/2027 | 9,723,000 | 10,024,510 |
| Oracle Corp., | |||
| 1.65% due 3/25/2026 | 15,136,000 | 13,906,503 | |
| 2.30% due 3/25/2028 | 3,982,000 | 3,563,532 | |
| VMware, Inc., | |||
| 1.00% due 8/15/2024 | 3,304,000 | 3,114,714 | |
| 4.50% due 5/15/2025 | 15,043,000 | 14,865,944 | |
| 214,145,217 | |||
| Technology Hardware & Equipment — 2.4% | |||
| Communications Equipment — 0.4% | |||
| Motorola Solutions, Inc., | |||
| 2.30% due 11/15/2030 | 1,582,000 | 1,285,343 | |
| 5.60% due 6/1/2032 | 24,026,000 | 24,164,390 | |
| Electronic Equipment, Instruments & Components — 1.1% | |||
| b | Allegion plc, 3.50% due 10/1/2029 | 3,059,000 | 2,767,722 |
| Arrow Electronics, Inc., 6.125% due 3/1/2026 | 4,556,000 | 4,565,340 | |
| Avnet, Inc., 6.25% due 3/15/2028 | 9,844,000 | 10,002,292 | |
| Flex Ltd., | |||
| b | 4.875% due 5/12/2030 | 9,507,000 | 9,246,698 |
| b | 6.00% due 1/15/2028 | 2,375,000 | 2,421,787 |
| TD SYNNEX Corp., 1.75% due 8/9/2026 | 28,691,000 | 24,992,156 | |
| Trimble, Inc., 4.75% due 12/1/2024 | 17,000,000 | 16,844,960 | |
| Vontier Corp., | |||
| 1.80% due 4/1/2026 | 5,272,000 | 4,677,371 | |
| 2.40% due 4/1/2028 | 5,266,000 | 4,427,600 | |
| Office Electronics — 0.2% | |||
| CDW LLC/CDW Finance Corp., 3.25% due 2/15/2029 | 16,381,000 | 14,404,305 | |
| Technology Hardware, Storage & Peripherals — 0.7% | |||
| Dell International LLC/EMC Corp., 4.90% due 10/1/2026 | 14,874,000 | 14,792,639 | |
| HP, Inc., | |||
| 1.45% due 6/17/2026 | 5,334,000 | 4,800,387 | |
| 4.75% due 1/15/2028 | 14,002,000 | 13,842,797 |
| 32 | Thornburg Taxable Fixed Income Funds Semi-Annual Report | See notes to financial statements. |
| Issuer-Description | SHARES/PRINCIPAL AMOUNT | VALUE | |
| Lenovo Group Ltd., | |||
| b,c | 5.831% due 1/27/2028 | $ 10,065,000 | $ 10,153,371 |
| b | 5.875% due 4/24/2025 | 10,600,000 | 10,688,192 |
| 174,077,350 | |||
| Telecommunication Services — 1.1% | |||
| Diversified Telecommunication Services — 1.0% | |||
| AT&T, Inc., | |||
| 2.55% due 12/1/2033 | 1,016,000 | 817,281 | |
| 5.539% due 2/20/2026 | 31,242,000 | 31,322,292 | |
| NBN Co. Ltd., | |||
| b,c | 1.45% due 5/5/2026 | 29,450,000 | 26,697,308 |
| b,c | 1.625% due 1/8/2027 | 9,800,000 | 8,764,826 |
| b,c | NTT Finance Corp., 4.239% due 7/25/2025 | 2,800,000 | 2,761,024 |
| Wireless Telecommunication Services — 0.1% | |||
| T-Mobile USA, Inc., | |||
| 2.25% due 2/15/2026 | 4,275,000 | 3,984,044 | |
| 2.625% due 4/15/2026 | 4,847,000 | 4,536,598 | |
| 78,883,373 | |||
| Transportation — 0.3% | |||
| Air Freight & Logistics — 0.3% | |||
| Ryder System, Inc., 5.65% due 3/1/2028 | 11,759,000 | 11,900,226 | |
| c | TTX Co., 4.15% due 1/15/2024 | 6,000,000 | 5,919,840 |
| Diversified Consumer Services — 0.0% | |||
| University of Chicago, Series 12-B, 3.065% due 10/1/2024 | 360,000 | 349,765 | |
| Passenger Airlines — 0.0% | |||
| US Airways Pass-Through Trust, Series 2010-1 Class A, 6.25% due 10/22/2024 | 1,935,116 | 1,933,683 | |
| 20,103,514 | |||
| Utilities — 9.7% | |||
| Electric Utilities — 8.2% | |||
| AEP Texas, Inc., Series I, 2.10% due 7/1/2030 | 12,187,000 | 10,108,873 | |
| c | Alexander Funding Trust, 1.841% due 11/15/2023 | 38,072,000 | 36,912,708 |
| Allegion U.S. Holding Co., Inc., 5.411% due 7/1/2032 | 15,759,000 | 15,807,223 | |
| Alliant Energy Finance LLC, | |||
| c | 1.40% due 3/15/2026 | 5,240,000 | 4,639,758 |
| c | 3.75% due 6/15/2023 | 9,673,000 | 9,624,442 |
| Ameren Corp., | |||
| 1.75% due 3/15/2028 | 9,990,000 | 8,687,903 | |
| 3.50% due 1/15/2031 | 5,200,000 | 4,721,236 | |
| American Electric Power Co., Inc., | |||
| 2.031% due 3/15/2024 | 3,898,000 | 3,780,124 | |
| 2.30% due 3/1/2030 | 14,211,000 | 11,987,973 | |
| 5.625% due 3/1/2033 | 7,170,000 | 7,431,060 | |
| Series M, 0.75% due 11/1/2023 | 9,667,000 | 9,439,439 | |
| Appalachian Power Co., | |||
| 3.40% due 6/1/2025 | 3,000,000 | 2,906,130 | |
| Series BB, 4.50% due 8/1/2032 | 6,337,000 | 6,085,358 | |
| Avangrid, Inc., | |||
| 3.15% due 12/1/2024 | 8,870,000 | 8,597,425 | |
| 3.20% due 4/15/2025 | 9,395,000 | 9,008,208 | |
| Black Hills Corp., | |||
| 1.037% due 8/23/2024 | 22,410,000 | 21,125,459 | |
| 2.50% due 6/15/2030 | 5,490,000 | 4,586,511 | |
| 5.95% due 3/15/2028 | 3,846,000 | 3,979,572 | |
| c | Caledonia Generating LLC, 1.95% due 2/28/2034 | 18,678,253 | 16,127,644 |
| CenterPoint Energy Houston Electric LLC, 4.95% due 4/1/2033 | 4,922,000 | 5,027,380 | |
| a | CenterPoint Energy, Inc., 5.373% (SOFRINDX + 0.65%) due 5/13/2024 | 2,289,000 | 2,267,186 |
| Comision Federal de Electricidad, | |||
| b,c | 3.348% due 2/9/2031 | 8,740,000 | 6,930,907 |
| b,c | 4.688% due 5/15/2029 | 6,125,000 | 5,480,344 |
| b | 5.00% due 9/29/2036 | 18,849,600 | 15,979,748 |
| See notes to financial statements. | Thornburg Taxable Fixed Income Funds Semi-Annual Report | 33 |
Thornburg Limited Term Income Fund | March 31, 2023 (Unaudited)
| Issuer-Description | SHARES/PRINCIPAL AMOUNT | VALUE | |
| Consolidated Edison, Inc., Series A, 0.65% due 12/1/2023 | $ 12,309,000 | $ 11,945,515 | |
| Dominion Energy, Inc., | |||
| 5.375% due 11/15/2032 | 19,385,000 | 19,896,182 | |
| Series B, 3.60% due 3/15/2027 | 25,576,000 | 24,593,626 | |
| Duke Energy Corp., 4.50% due 8/15/2032 | 14,790,000 | 14,292,612 | |
| Duke Energy Ohio, Inc., 5.25% due 4/1/2033 | 2,411,000 | 2,481,715 | |
| Enel Finance International NV, | |||
| b,c | 1.375% due 7/12/2026 | 12,250,000 | 10,915,362 |
| b,c | 1.875% due 7/12/2028 | 20,585,000 | 17,365,918 |
| b,c | 2.25% due 7/12/2031 | 5,957,000 | 4,651,345 |
| b,c | 5.00% due 6/15/2032 | 3,073,000 | 2,879,862 |
| b,c | 7.50% due 10/14/2032 | 4,000,000 | 4,460,440 |
| Entergy Louisiana LLC, 0.62% due 11/17/2023 | 3,963,000 | 3,843,674 | |
| Entergy Mississippi LLC, 3.25% due 12/1/2027 | 4,727,000 | 4,386,845 | |
| Entergy Texas, Inc., | |||
| 1.50% due 9/1/2026 | 8,640,000 | 7,638,019 | |
| 3.45% due 12/1/2027 | 9,000,000 | 8,397,000 | |
| c | Evergy Missouri West, Inc., 5.15% due 12/15/2027 | 9,711,000 | 9,800,827 |
| Eversource Energy, 5.45% due 3/1/2028 | 3,859,000 | 3,998,850 | |
| Georgia Power Co., 4.70% due 5/15/2032 | 20,681,000 | 20,502,523 | |
| ITC Holdings Corp., | |||
| c | 2.95% due 5/14/2030 | 14,800,000 | 13,039,836 |
| c | 4.95% due 9/22/2027 | 9,703,000 | 9,755,202 |
| c | Jersey Central Power & Light Co., 4.30% due 1/15/2026 | 9,414,000 | 9,243,701 |
| Kentucky Utilities Co., Series KENT, 5.45% due 4/15/2033 | 4,920,000 | 5,107,009 | |
| c | Liberty Utilities Finance GP 1, 2.05% due 9/15/2030 | 15,653,000 | 12,383,088 |
| Louisville Gas & Electric Co., Series LOU, 5.45% due 4/15/2033 | 4,771,000 | 4,941,229 | |
| c | Metropolitan Edison Co., 5.20% due 4/1/2028 | 1,475,000 | 1,489,898 |
| c | Midland Cogeneration Venture LP, 6.00% due 3/15/2025 | 555,577 | 566,466 |
| a | Mississippi Power Co., Series A, 5.149% (SOFR + 0.30%) due 6/28/2024 | 6,780,000 | 6,707,793 |
| c | Monongahela Power Co., 3.55% due 5/15/2027 | 3,300,000 | 3,137,937 |
| NextEra Energy Capital Holdings, Inc., 6.051% due 3/1/2025 | 4,701,000 | 4,783,456 | |
| Northern States Power Co., 3.30% due 6/15/2024 | 2,500,000 | 2,448,925 | |
| OGE Energy Corp., 0.703% due 5/26/2023 | 6,063,000 | 6,019,831 | |
| Oklahoma Gas & Electric Co., 5.40% due 1/15/2033 | 9,192,000 | 9,514,823 | |
| Pacific Gas & Electric Co., 3.25% due 2/16/2024 | 20,160,000 | 19,753,574 | |
| c | Pennsylvania Electric Co., 5.15% due 3/30/2026 | 980,000 | 984,273 |
| Public Service Co. of Oklahoma, Series J, 2.20% due 8/15/2031 | 5,905,000 | 4,846,233 | |
| Puget Energy, Inc., | |||
| 2.379% due 6/15/2028 | 8,825,000 | 7,774,119 | |
| 4.10% due 6/15/2030 | 4,742,000 | 4,387,251 | |
| San Diego Gas & Electric Co., Series NN, 3.60% due 9/1/2023 | 4,212,000 | 4,195,236 | |
| Southern California Edison Co., | |||
| a | 5.141% (SOFRINDX + 0.64%) due 4/3/2023 | 19,476,000 | 19,476,000 |
| Series C, 4.20% due 6/1/2025 | 5,722,000 | 5,641,091 | |
| Southern Co., 5.70% due 10/15/2032 | 2,828,000 | 2,973,840 | |
| Transelec SA, | |||
| b,c | 4.25% due 1/14/2025 | 5,200,000 | 5,042,284 |
| b,c | 4.625% due 7/26/2023 | 2,880,000 | 2,880,000 |
| Virginia Electric & Power Co., 5.00% due 4/1/2033 | 2,170,000 | 2,184,604 | |
| c | Vistra Operations Co. LLC, 4.875% due 5/13/2024 | 25,918,000 | 25,622,016 |
| WEC Energy Group, Inc., 2.20% due 12/15/2028 | 11,412,000 | 9,946,471 | |
| Gas Utilities — 1.5% | |||
| c | Brooklyn Union Gas Co., 4.632% due 8/5/2027 | 9,700,000 | 9,478,452 |
| c | KeySpan Gas East Corp., 5.994% due 3/6/2033 | 14,757,000 | 15,225,830 |
| NiSource, Inc., | |||
| 0.95% due 8/15/2025 | 11,850,000 | 10,820,472 | |
| 5.25% due 3/30/2028 | 3,444,000 | 3,504,718 | |
| Northwest Natural Gas Co., 5.75% due 3/15/2033 | 7,311,000 | 7,506,569 | |
| Southern Co. Gas Capital Corp., 5.15% due 9/15/2032 | 12,206,000 | 12,317,441 | |
| Southwest Gas Corp., | |||
| 2.20% due 6/15/2030 | 5,120,000 | 4,224,256 | |
| 4.05% due 3/15/2032 | 13,150,000 | 12,123,906 |
| 34 | Thornburg Taxable Fixed Income Funds Semi-Annual Report | See notes to financial statements. |
| Issuer-Description | SHARES/PRINCIPAL AMOUNT | VALUE | |
| 5.45% due 3/23/2028 | $ 3,462,000 | $ 3,494,127 | |
| 5.80% due 12/1/2027 | 4,828,000 | 4,987,662 | |
| a | Spire Missouri, Inc., 5.281% (SOFR + 0.50%) due 12/2/2024 | 24,347,000 | 24,038,280 |
| 715,860,825 | |||
| Total Corporate Bonds (Cost $3,759,035,458) | 3,519,639,287 | ||
| Long-Term Municipal Bonds — 0.2% | |||
| Los Angeles Community College District GO, 1.806% due 8/1/2030 | 12,115,000 | 10,277,130 | |
| New Jersey Transportation Trust Fund Authority, | |||
| Series B, | |||
| 2.551% due 6/15/2023 | 1,170,000 | 1,163,777 | |
| 2.631% due 6/15/2024 | 860,000 | 833,618 | |
| Total Long-Term Municipal Bonds (Cost $12,818,026) | 12,274,525 | ||
| Preferred Stock — 0.4% | |||
| Financial Services — 0.4% | |||
| Capital Markets — 0.4% | |||
| a,f | Gabelli Dividend & Income Trust, Series J, 1.70% due 3/26/2028 | 1,162 | 26,362,875 |
| 26,362,875 | |||
| Total Preferred Stock (Cost $29,019,196) | 26,362,875 | ||
| Short-Term Investments — 1.6% | |||
| g | Thornburg Capital Management Fund | 11,756,001 | 117,560,015 |
| Total Short-Term Investments (Cost $117,560,015) | 117,560,015 | ||
| Total Investments — 98.6% (Cost $7,709,713,919) | $7,260,837,796 | ||
| Other Assets Less Liabilities — 1.4% | 105,967,870 | ||
| Net Assets — 100.0% | $7,366,805,666 |
| Footnote Legend | |
| a | Variable, floating, step, or fixed to floating rate securities are securities for which interest rate changes are based on changes in a designated base rate or on a predetermined schedule. The rates shown are those in effect on March 31, 2023. |
| b | Yankee bond denominated in U.S. dollars and is issued in the U.S. by foreign banks and corporations. |
| c | Securities exempt from registration under Rule 144A of the Securities Act of 1933, as amended. These securities are restricted but liquid and may only be resold in the ordinary course of business in transactions exempt from registration, normally to qualified institutional buyers. As of March 31, 2023, the aggregate value of these securities in the Fund’s portfolio was $3,668,763,521, representing 49.80% of the Fund’s net assets. |
| d | Bond in default. |
| e | Non-income producing. |
| f | Security currently fair valued by the Valuation and Pricing Committee. |
| g | Investment in Affiliates. |
| See notes to financial statements. | Thornburg Taxable Fixed Income Funds Semi-Annual Report | 35 |
Thornburg Limited Term Income Fund | March 31, 2023 (Unaudited)
To simplify the listings of securities, abbreviations are used per the table below:
| ABS | Asset Backed Securities |
| BSBY3M | Bloomberg Short Term Bank Yield 3 Month |
| CMBS | Commercial Mortgage-Backed Securities |
| CMO | Collateralized Mortgage Obligation |
| DAC | Designated Activity Company |
| GO | General Obligation |
| H15T1Y | US Treasury Yield Curve Rate T-Note Constant Maturity 1 Year |
| LIBOR | London Interbank Offered Rates |
| Mtg | Mortgage |
| REMIC | Real Estate Mortgage Investment Conduit |
| SOFR | Secured Overnight Financing Rate |
| SOFR30A | Secured Overnight Financing Rate 30-Day Average |
| SOFRINDX | Secured Overnight Financing Rate Index |
| SPV | Special Purpose Vehicle |
| TSFR1M | Term SOFR 1 Month |
| TSFR3M | Term SOFR 3 Month |
| UMBS | Uniform Mortgage Backed Securities |
| 36 | Thornburg Taxable Fixed Income Funds Semi-Annual Report | See notes to financial statements. |
Thornburg Ultra Short Income Fund | March 31, 2023 (Unaudited)
| Issuer-Description | SHARES/PRINCIPAL AMOUNT | VALUE | |
| U.S. Treasury Securities — 10.8% | |||
| United States Treasury Bill, due 8/17/2023 | $3,000,000 | $ 2,946,818 | |
| United States Treasury Notes, | |||
| 0.125% due 8/31/2023 - 12/15/2023 | 6,750,000 | 6,585,469 | |
| 1.25% due 7/31/2023 | 2,000,000 | 1,976,484 | |
| 1.375% due 8/31/2023 | 3,000,000 | 2,958,867 | |
| 1.625% due 5/31/2023 - 10/31/2023 | 6,510,000 | 6,452,138 | |
| 2.25% due 1/31/2024 | 3,280,000 | 3,212,991 | |
| 2.75% due 4/30/2023 | 1,000,000 | 998,281 | |
| United States Treasury Notes Inflationary Index, 0.625% due 1/15/2024 | 1,858,668 | 1,843,138 | |
| Total U.S. Treasury Securities (Cost $26,996,402) | 26,974,186 | ||
| U.S. Government Agencies — 0.0% | |||
| a,b | Petroleos Mexicanos (Guaranty: Export-Import Bank of the United States), 5.142% (LIBOR 3 Month + 0.35%) due 4/15/2025 | 22,500 | 21,541 |
| Small Business Administration Participation Certificates, | |||
| Series 2005-20K Class 1, 5.36% due 11/1/2025 | 5,036 | 4,936 | |
| Series 2009-20E Class 1, 4.43% due 5/1/2029 | 17,499 | 17,016 | |
| Total U.S. Government Agencies (Cost $45,156) | 43,493 | ||
| Mortgage Backed — 3.5% | |||
| Arroyo Mortgage Trust, Whole Loan Securities Trust CMO, | |||
| a,c | Series 2019-1 Class A1, 3.805% due 1/25/2049 | 21,520 | 20,483 |
| a,c | Series 2019-3 Class A1, 2.962% due 10/25/2048 | 20,843 | 19,065 |
| c | Bravo Residential Funding Trust, Whole Loan Securities Trust CMO, Series 2019-1 Class A1C, 3.50% due 3/25/2058 | 9,369 | 9,145 |
| a,c | COLT Mortgage Pass-Through Certificates, Whole Loan Securities Trust CMO, Series 2021-1R Class A1, 0.857% due 5/25/2065 | 254,264 | 215,060 |
| a,c | CSMC Trust, CMBS, Series 2021-BPNY Class A, 8.399% (LIBOR 1 Month + 3.71%) due 8/15/2023 | 300,000 | 285,838 |
| a,c | CSMC Trust, Whole Loan Securities Trust CMO, Series 2020-NQM1 Class A1, 1.208% due 5/25/2065 | 101,239 | 91,480 |
| Federal Home Loan Mtg Corp., Multifamily Structured Pass Through Certificates, CMBS, | |||
| a | Series K032 Class A2, 3.31% due 5/25/2023 | 877,141 | 873,134 |
| a | Series K034 Class A2, 3.531% due 7/25/2023 | 1,314,390 | 1,305,573 |
| a | Series K035 Class A2, 3.458% due 8/25/2023 | 1,355,302 | 1,344,826 |
| Series K723 Class A2, 2.454% due 8/25/2023 | 1,803,130 | 1,786,262 | |
| a | Federal Home Loan Mtg Corp., REMIC, Series 3877 Class FA, 5.034% (LIBOR 1 Month + 0.35%) due 11/15/2040 | 3,234 | 3,234 |
| Federal Home Loan Mtg Corp., Seasoned Credit Risk Transfer, Whole Loan Securities Trust CMO, | |||
| a | Series 2017-3 Class HA, 3.25% due 7/25/2056 | 29,078 | 27,572 |
| a | Series 2018-1 Class HA, 3.00% due 5/25/2057 | 20,750 | 19,454 |
| a | Series 2018-2 Class HA, 3.00% due 11/25/2057 | 79,831 | 75,299 |
| Federal National Mtg Assoc., UMBS Collateral, Pool MA3557, 4.00% due 1/1/2029 | 33,080 | 32,750 | |
| a,c | Flagstar Mortgage Trust, Whole Loan Securities Trust CMO, Series 2017-1 Class 2A2, 3.00% due 3/25/2047 | 12,591 | 11,324 |
| GCAT Trust, Whole Loan Securities Trust CMO, | |||
| a,c | Series 2021-CM1 Class A, 1.469% due 4/25/2065 | 260,780 | 245,134 |
| a,c | Series 2021-CM2 Class A1, 2.352% due 8/25/2066 | 153,961 | 139,356 |
| a,c | Metlife Securitization Trust, Whole Loan Securities Trust CMO, Series 2019-1A Class A1A, 3.75% due 4/25/2058 | 75,990 | 73,638 |
| a,c | MFRA Trust, Whole Loan Securities Trust CMO, Series 2022-CHM1 Class A1, 3.875% due 9/25/2056 | 566,959 | 533,455 |
| a,c | New Residential Mortgage Loan Trust, Whole Loan Securities Trust CMO, Series 2017-5A Class A1, 6.345% (LIBOR 1 Month + 1.50%) due 6/25/2057 | 16,104 | 15,694 |
| a,c | Residential Mortgage Loan Trust, Whole Loan Securities Trust CMO, Series 2020-2 Class A1, 1.654% due 5/25/2060 | 469,840 | 455,630 |
| a,c | SG Residential Mortgage Trust, Whole Loan Securities Trust CMO, Series 2019-3 Class A1, 2.703% due 9/25/2059 | 3,668 | 3,545 |
| Towd Point Mortgage Trust, Whole Loan Securities Trust CMO, | |||
| a,c | Series 2016-5 Class A1, 2.50% due 10/25/2056 | 5,707 | 5,594 |
| a,c | Series 2018-2 Class A1, 3.25% due 3/25/2058 | 26,168 | 25,075 |
| a,c | Series 2018-6 Class A1A, 3.75% due 3/25/2058 | 918,206 | 892,812 |
| a,c | Verus Securitization Trust, Whole Loan Securities Trust CMO, Series 2019-INV3 Class A1B, 3.192% due 11/25/2059 | 306,849 | 297,313 |
| WFRBS Commercial Mortgage Trust, CMBS, | |||
| Series 2013-C14 Class ASB, 2.977% due 6/15/2046 | 1 | 1 | |
| Series 2013-C17 Class ASB, 3.558% due 12/15/2046 | 66,011 | 65,687 | |
| Total Mortgage Backed (Cost $9,066,720) | 8,873,433 | ||
| Asset Backed Securities — 29.7% | |||
| Auto Receivables — 14.0% |
| See notes to financial statements. | Thornburg Taxable Fixed Income Funds Semi-Annual Report | 37 |
Thornburg Ultra Short Income Fund | March 31, 2023 (Unaudited)
| Issuer-Description | SHARES/PRINCIPAL AMOUNT | VALUE | |
| ACC Auto Trust, | |||
| c | Series 2021-A Class A, 1.08% due 4/15/2027 | $ 20,317 | $ 20,158 |
| c | Series 2022-A Class A, 4.58% due 7/15/2026 | 302,447 | 297,386 |
| c | ACC Trust, Series 2022-1 Class A, 1.19% due 9/20/2024 | 167,033 | 165,697 |
| ACM Auto Trust, | |||
| c | Series 2022-1A Class B, 4.47% due 4/20/2029 | 401,835 | 400,816 |
| c | Series 2023-1A Class A, 6.61% due 1/22/2030 | 1,262,289 | 1,262,773 |
| American Credit Acceptance Receivables Trust, | |||
| c | Series 2019-4 Class D, 2.97% due 12/12/2025 | 654,288 | 648,983 |
| c | Series 2022-3 Class A, 4.12% due 2/13/2026 | 466,853 | 464,548 |
| c | Arivo Acceptance Auto Loan Receivables Trust, Series 2021-1A Class A, 1.19% due 1/15/2027 | 661,880 | 641,669 |
| Capital One Prime Auto Receivables Trust, Series 2020-1 Class A3, 1.60% due 11/15/2024 | 434,656 | 431,653 | |
| CarMax Auto Owner Trust, | |||
| Series 2020-1 Class A3, 1.70% due 11/15/2024 | 183,174 | 182,534 | |
| Series 2020-4 Class A3, 0.50% due 8/15/2025 | 1,190,317 | 1,158,408 | |
| Series 2022-1 Class A2 0.91% due 2/18/2025 | 919,483 | 911,099 | |
| Carvana Auto Receivables Trust, | |||
| Series 2021-N2 Class A1, 0.32% due 3/10/2028 | 24,996 | 24,702 | |
| Series 2021-N3 Class A1, 0.35% due 6/12/2028 | 417,384 | 406,878 | |
| Series 2021-N4 Class A1, 0.83% due 9/11/2028 | 339,166 | 329,002 | |
| Series 2021-P4 Class A2, 0.82% due 4/10/2025 | 382,122 | 378,986 | |
| c | Series 2022-N1 Class A1, 2.31% due 12/11/2028 | 669,557 | 652,580 |
| CPS Auto Receivables Trust, | |||
| c | Series 2022-A Class A, 0.98% due 4/16/2029 | 281,857 | 278,465 |
| c | Series 2023-A Class A, 5.54% due 3/16/2026 | 1,784,608 | 1,788,062 |
| c | Credito Real USA Auto Receivables Trust, Series 2021-1A Class A, 1.35% due 2/16/2027 | 87,170 | 85,648 |
| DT Auto Owner Trust, | |||
| c | Series 2019-2A Class D, 3.48% due 2/18/2025 | 337,965 | 336,628 |
| c | Series 2021-4A Class A, 0.56% due 9/15/2025 | 146,085 | 144,621 |
| c | Series 2022-1A Class A, 1.58% due 4/15/2026 | 1,051,075 | 1,035,041 |
| Exeter Automobile Receivables Trust, | |||
| c | Series 2019-3A Class D, 3.11% due 8/15/2025 | 784,042 | 774,410 |
| c | Series 2019-4A Class D, 2.58% due 9/15/2025 | 916,042 | 898,639 |
| Series 2021-1A Class C, 0.74% due 1/15/2026 | 575,523 | 565,851 | |
| Series 2021-2A Class B, 0.57% due 9/15/2025 | 106,448 | 106,291 | |
| FHF Trust, | |||
| c | Series 2021-1A Class A, 1.27% due 3/15/2027 | 41,516 | 39,613 |
| c | Series 2021-2A Class A, 0.83% due 12/15/2026 | 85,168 | 81,153 |
| c | Series 2022-2A Class A, 6.14% due 12/15/2027 | 1,234,294 | 1,221,397 |
| First Investors Auto Owner Trust, | |||
| c | Series 2020-1A Class C, 2.55% due 2/17/2026 | 342,346 | 340,806 |
| Series 2021-1A Class A, | |||
| c | 0.45% due 3/16/2026 | 27,488 | 27,285 |
| c | 0.48% due 3/15/2027 | 1,560,921 | 1,513,590 |
| Flagship Credit Auto Trust, | |||
| c | Series 2020-4 Class B, 1.00% due 10/15/2025 | 1,195,662 | 1,184,969 |
| c | Series 2021-1 Class B, 0.31% due 6/16/2025 | 91,862 | 91,718 |
| GLS Auto Receivables Issuer Trust, | |||
| c | Series 2021-4A Class A, 0.84% due 7/15/2025 | 731,960 | 723,569 |
| c | Series 2022-2A Class A2, 3.55% due 1/15/2026 | 561,153 | 555,164 |
| GM Financial Consumer Automobile Receivables Trust, | |||
| Series 2020-1 Class A3, 1.84% due 9/16/2024 | 153,104 | 152,678 | |
| Series 2022-1 Class A2 0.76% due 2/18/2025 | 751,111 | 742,674 | |
| Honda Auto Receivables Owner Trust, Series 2020-3 Class A3, 0.37% due 10/18/2024 | 268,853 | 263,964 | |
| Hyundai Auto Receivables Trust, Series 2020-A Class A4, 1.72% due 6/15/2026 | 2,100,000 | 2,037,091 | |
| Lendbuzz Securitization Trust, | |||
| c | Series 2021-1A Class A, 1.46% due 6/15/2026 | 217,683 | 207,869 |
| c | Series 2022-1A Class A, 4.22% due 5/17/2027 | 829,049 | 801,904 |
| c | Series 2023-1A Class A1, 5.383% due 3/15/2024 | 817,140 | 816,912 |
| Nissan Auto Receivables Owner Trust, Series 2019-B Class A4, 2.54% due 12/15/2025 | 151,012 | 150,271 | |
| c | Octane Receivables Trust, Series 2020-1A Class A, 1.71% due 2/20/2025 | 235,671 | 233,888 |
| b,c | Oscar US Funding Trust IX LLC, Series 2018-2A Class A4, 3.63% due 9/10/2025 | 379,336 | 378,544 |
| b,c | Oscar US Funding XIV LLC, Series 2022-1A Class A2, 1.60% due 3/10/2025 | 1,473,830 | 1,449,945 |
| 38 | Thornburg Taxable Fixed Income Funds Semi-Annual Report | See notes to financial statements. |
| Issuer-Description | SHARES/PRINCIPAL AMOUNT | VALUE | |
| Santander Consumer Auto Receivables Trust, | |||
| c | Series 2020-AA Class B, 2.26% due 12/15/2025 | $ 1,151 | $ 1,149 |
| c | Series 2020-AA Class C, 3.71% due 2/17/2026 | 1,940,000 | 1,929,679 |
| c | Series 2020-BA Class A4 0.54% due 4/15/2025 | 429,803 | 428,412 |
| Santander Drive Auto Receivables Trust, Series 2019-1 Class D, 3.65% due 4/15/2025 | 2,937 | 2,935 | |
| c | Tesla Auto Lease Trust, Series 2021-A Class A2, 0.36% due 3/20/2025 | 28,942 | 28,854 |
| Toyota Auto Receivables Owner Trust, Series 2020-D Class A3, 0.35% due 1/15/2025 | 564,140 | 554,798 | |
| c | United Auto Credit Securitization Trust, Series 2022-2 Class A, 4.39% due 4/10/2025 | 540,723 | 538,366 |
| Veros Auto Receivables Trust, | |||
| c | Series 2021-1 Class A, 0.92% due 10/15/2026 | 152,689 | 150,817 |
| c | Series 2022-1 Class A, 3.47% due 12/15/2025 | 300,523 | 296,293 |
| Westlake Automobile Receivables Trust, | |||
| c | Series 2019-2A Class D, 3.20% due 11/15/2024 | 160,294 | 160,124 |
| c | Series 2019-3A Class D, 2.72% due 11/15/2024 | 1,150,697 | 1,144,935 |
| World Omni Auto Receivables Trust, | |||
| Series 2019-C Class A3, 1.96% due 12/16/2024 | 99,976 | 99,538 | |
| Series 2020-C Class A3, 0.48% due 11/17/2025 | 1,421,552 | 1,383,075 | |
| Series 2022-A Class A2, 1.15% due 4/15/2025 | 866,121 | 856,886 | |
| 34,982,393 | |||
| Credit Card — 1.6% | |||
| c | Continental Credit Card ABS LLC, Series 2019-1A Class A, 3.83% due 8/15/2026 | 289,373 | 288,034 |
| c | Mercury Financial Credit Card Master Trust, Series 2023-1A Class A, 8.04% due 9/20/2027 | 700,000 | 700,249 |
| c | Mission Lane Credit Card Master Trust, Series 2021-A Class A, 1.59% due 9/15/2026 | 1,209,000 | 1,174,262 |
| c | Perimeter Master Note Business Trust, Series 2019-2A Class C, 7.06% due 5/15/2024 | 500,000 | 491,082 |
| Synchrony Credit Card Master Note Trust, Series 2018-2 Class A, 3.47% due 5/15/2026 | 1,350,000 | 1,347,030 | |
| 4,000,657 | |||
| Other Asset Backed — 11.7% | |||
| c | ACHV ABS Trust, Series 2023-1PL Class A, 6.42% due 3/18/2030 | 1,171,368 | 1,170,847 |
| Affirm Asset Securitization Trust, | |||
| c | Series 2020-Z1 Class A, 3.46% due 10/15/2024 | 524,815 | 522,381 |
| c | Series 2020-Z2 Class A, 1.90% due 1/15/2025 | 28,753 | 28,250 |
| c | Series 2021-Z2 Class A, 1.17% due 11/16/2026 | 593,162 | 570,755 |
| c | AFG ABS I LLC, Series 2023-1 Class A1, 5.462% due 2/15/2024 | 2,000,000 | 1,998,994 |
| c | Amur Equipment Finance Receivables XI LLC, Series 2022-2A Class A1, 3.994% due 9/20/2023 | 39,674 | 39,644 |
| Aqua Finance Trust, | |||
| c | Series 2017-A Class A, 3.72% due 11/15/2035 | 335,617 | 331,689 |
| c | Series 2020-AA Class A, 1.90% due 7/17/2046 | 1,121,464 | 1,033,734 |
| c | Bankers Healthcare Group Securitization Trust, Series 2020-A Class A, 2.56% due 9/17/2031 | 29,291 | 28,704 |
| c | BHG Securitization Trust, Series 2021-B Class A, 0.90% due 10/17/2034 | 95,361 | 90,530 |
| c | BRE Grand Islander Timeshare Issuer LLC, Series 2017-1A Class A, 2.94% due 5/25/2029 | 48,701 | 46,880 |
| c | Conn’s Receivables Funding LLC, Series 2022-A Class A, 5.87% due 12/15/2026 | 1,175,580 | 1,175,394 |
| c | Consumer Loan Underlying Bond CLUB Credit Trust, Series 2019-P2 Class C, 4.41% due 10/15/2026 | 314,216 | 313,317 |
| c | Consumer Loan Underlying Bond Credit Trust, Series 2019-P1 Class C, 4.66% due 7/15/2026 | 357,624 | 357,229 |
| c | Crossroads Asset Trust, Series 2022-A Class A, 6.35% due 4/21/2031 | 1,676,804 | 1,687,924 |
| Dell Equipment Finance Trust, | |||
| c | Series 2021-2 Class A3, 0.53% due 12/22/2026 | 1,500,000 | 1,454,959 |
| c | Series 2022-1 Class A2, 2.11% due 8/23/2027 | 315,505 | 312,688 |
| Dext ABS LLC, | |||
| c | Series 2020-1 Class A, 1.46% due 2/16/2027 | 21,862 | 21,688 |
| c | Series 2021-1 Class A, 1.12% due 2/15/2028 | 56,669 | 54,453 |
| c | Diamond Resorts Owner Trust, Series 2019-1A Class A, 2.89% due 2/20/2032 | 37,126 | 35,767 |
| c | DLL LLC, Series 2019-DA1 Class A4, 2.92% due 4/20/2027 | 22,019 | 21,996 |
| Foundation Finance Trust, | |||
| c | Series 2017-1A Class B, 4.14% due 7/15/2033 | 1,103,602 | 1,085,086 |
| c | Series 2019-1A Class A, 3.86% due 11/15/2034 | 699,773 | 686,302 |
| c | Series 2020-1A Class A, 3.54% due 7/16/2040 | 274,491 | 265,466 |
| c | FREED ABS Trust, Series 2022-2CP Class A, 3.03% due 5/18/2029 | 65,340 | 65,107 |
| a,b,c | Greystone Commercial Real Estate Notes Ltd., Series 2021-FL3 Class A, 5.962% (TSFR1M + 1.13%) due 7/15/2039 | 100,000 | 97,534 |
| c | Hilton Grand Vacations Trust, Series 2019-AA Class A, 2.34% due 7/25/2033 | 46,229 | 43,693 |
| John Deere Owner Trust, Series 2021-B Class A2, 0.25% due 6/17/2024 | 105,082 | 104,920 | |
| c | Kubota Credit Owner Trust, Series 2021-2A Class A2, 0.26% due 6/17/2024 | 283,459 | 281,720 |
| c | LendingClub Receivables Trust, Series 2020-6A Class A, 2.75% due 11/15/2047 | 689 | 687 |
| See notes to financial statements. | Thornburg Taxable Fixed Income Funds Semi-Annual Report | 39 |
Thornburg Ultra Short Income Fund | March 31, 2023 (Unaudited)
| Issuer-Description | SHARES/PRINCIPAL AMOUNT | VALUE | |
| LendingPoint Asset Securitization Trust, | |||
| c | Series 2012-B Class A, 4.77% due 10/15/2029 | $ 126,493 | $ 124,324 |
| c | Series 2020-REV1 Class A, 2.731% due 10/15/2028 | 71,307 | 70,684 |
| c | Series 2021-B Class A, 1.11% due 2/15/2029 | 9,063 | 9,038 |
| c | Series 2022-A Class A, 1.68% due 6/15/2029 | 90,822 | 90,367 |
| c | Series 2022-C Class A, 6.56% due 2/15/2030 | 852,878 | 851,379 |
| LendingPoint Pass-Through Trust, | |||
| c | Series 2022-ST1 Class A, 2.50% due 3/15/2028 | 246,071 | 235,185 |
| c | Series 2022-ST2 Class A, 3.25% due 4/15/2028 | 228,375 | 219,501 |
| c | Series 2022-ST3 Class A, 4.00% due 5/15/2028 | 288,209 | 278,340 |
| c | LL ABS Trust, Series 2021-1A Class A, 1.07% due 5/15/2029 | 303,429 | 289,523 |
| c | LP LMS Asset Securitization Trust, Series 2021-2A Class A, 1.75% due 1/15/2029 | 80,287 | 78,045 |
| Mariner Finance Issuance Trust, | |||
| c | Series 2019-AA Class A, 2.96% due 7/20/2032 | 237,924 | 234,385 |
| c | Series 2019-AA Class B, 3.51% due 7/20/2032 | 490,000 | 475,301 |
| Marlette Funding Trust, | |||
| c | Series 2019-1A Class C, 4.42% due 4/16/2029 | 49,662 | 49,573 |
| c | Series 2019-4A Class C, 3.76% due 12/17/2029 | 545,899 | 540,327 |
| c | Series 2021-1A Class B, 1.00% due 6/16/2031 | 184,369 | 183,095 |
| c | Series 2021-3 Class A, 0.65% due 12/15/2031 | 51,501 | 51,151 |
| c | Series 2022-1A Class A, 1.36% due 4/15/2032 | 394,077 | 389,801 |
| c | Series 2022-3A Class A, 5.18% due 11/15/2032 | 334,514 | 331,212 |
| c | MMAF Equipment Finance LLC, Series 2017-AA Class A5, 2.68% due 7/16/2027 | 382,545 | 381,849 |
| c | Mosaic Solar Loan Trust, Series 2018-1A Class C, Zero coupon due 6/22/2043 | 179,168 | 165,630 |
| c | New Residential Advance Receivables Trust Advance Receivables Backed, Series 2020-T1 Class AT1, 1.426% due 8/15/2053 | 535,000 | 523,463 |
| c | NRZ Advance Receivables Trust, Series 2020-T2 Class AT2, 1.475% due 9/15/2053 | 750,000 | 731,773 |
| c | Oportun Funding LLC, Series 2022-1 Class A, 3.25% due 6/15/2029 | 262,197 | 258,718 |
| Pagaya AI Debt Selection Trust, | |||
| c | Series 2021-1 Class A, 1.18% due 11/15/2027 | 187,388 | 185,589 |
| c | Series 2021-3 Class A, 1.15% due 5/15/2029 | 137,212 | 134,904 |
| Pagaya AI Debt Trust, | |||
| c | Series 2022-1 Class A, 2.03% due 10/15/2029 | 124,105 | 120,042 |
| c | Series 2023-1 Class A, 7.556% due 7/15/2030 | 500,000 | 501,409 |
| c | Pawnee Equipment Receivables LLC, Series 2020-1 Class A, 1.37% due 11/17/2025 | 36,690 | 36,439 |
| c | Post Road Equipment Finance, Series 2022-1A Class A1, 3.76% due 8/16/2027 | 128,291 | 126,693 |
| Prosper Marketplace Issuance Trust, | |||
| c | Series 2019-2A Class C, 5.05% due 9/15/2025 | 417,913 | 417,867 |
| c | Series 2019-4A Class C, 4.95% due 2/17/2026 | 229,576 | 229,170 |
| c | Prosper Pass-Thru Trust II, Series 2019-ST2 Class A 3.75% due 11/15/2025 | 206,858 | 205,398 |
| PSNH Funding LLC 3, Series 2018-1 Class A1, 3.094% due 2/1/2026 | 13,707 | 13,537 | |
| a,c | SBA Tower Trust, Series 2014-2A Class C, 3.869% due 10/15/2049 | 548,000 | 532,176 |
| c | SoFi Consumer Loan Program Trust, Series 2021-1 Class A, 0.49% due 9/25/2030 | 198,650 | 195,012 |
| c | SpringCastle America Funding LLC, Series 2020-AA Class A, 1.97% due 9/25/2037 | 339,700 | 315,735 |
| c | SPS Servicer Advance Receivables Trust, Series 2020-T2 Class A, 1.83% due 11/15/2055 | 450,000 | ��� 415,330 |
| Theorem Funding Trust, | |||
| c | Series 2021-1A Class A, 1.21% due 12/15/2027 | 196,901 | 194,496 |
| c | Series 2022-3A Class A, 7.60% due 4/15/2029 | 814,814 | 821,140 |
| c | Transportation Finance Equipment Trust, Series 2019-1 Class A4, 1.88% due 3/25/2024 | 227,175 | 226,256 |
| Upstart Pass-Through Trust, | |||
| c | Series 2020-ST1 Class A, 3.75% due 2/20/2028 | 46,193 | 45,274 |
| c | Series 2020-ST2 Class A, 3.50% due 3/20/2028 | 78,724 | 76,760 |
| c | Series 2020-ST3 Class A, 3.35% due 4/20/2028 | 30,128 | 29,357 |
| c | Series 2020-ST6 Class A, 3.00% due 1/20/2027 | 1,015,996 | 970,370 |
| c | Series 2021-ST4 Class A, 2.00% due 7/20/2027 | 415,287 | 388,694 |
| c | Series 2021-ST8 Class A, 1.75% due 10/20/2029 | 384,033 | 355,194 |
| Upstart Securitization Trust, | |||
| c | Series 2020-2 Class A, 2.309% due 11/20/2030 | 335,699 | 328,210 |
| c | Series 2021-2 Class A, 0.91% due 6/20/2031 | 14,735 | 14,581 |
| c | Series 2021-4 Class A, 0.84% due 9/20/2031 | 405,066 | 395,574 |
| c | Series 2023-1 Class A, 6.59% due 2/20/2033 | 300,000 | 298,935 |
| Verizon Owner Trust, | |||
| Series 2020-A Class A1A, 1.85% due 7/22/2024 | 159,754 | 159,430 | |
| Series 2020-B Class A, 0.47% due 2/20/2025 | 1,060,797 | 1,048,685 |
| 40 | Thornburg Taxable Fixed Income Funds Semi-Annual Report | See notes to financial statements. |
| Issuer-Description | SHARES/PRINCIPAL AMOUNT | VALUE | |
| 29,273,259 | |||
| Student Loan — 2.4% | |||
| Laurel Road Prime Student Loan Trust, | |||
| c | Series 2017-C Class A2B, 2.81% due 11/25/2042 | $ 689,551 | $ 677,470 |
| c | Series 2019-A Class A2FX, 2.73% due 10/25/2048 | 355,498 | 346,496 |
| a | National Collegiate Student Loan Trust, Series 2006-4 Class A4, 5.155% (LIBOR 1 Month + 0.31%) due 5/25/2032 | 312,518 | 293,619 |
| Navient Private Education Loan Trust, | |||
| c | Series 2017-A Class A2A, 2.88% due 12/16/2058 | 583,072 | 572,791 |
| a,c | Series 2017-A Class A2B, 5.584% (LIBOR 1 Month + 0.90%) due 12/16/2058 | 20,616 | 20,515 |
| a,c | Series 2018-BA Class A2B, 5.404% (LIBOR 1 Month + 0.72%) due 12/15/2059 | 55,610 | 54,511 |
| c | Navient Private Education Refi Loan Trust, Series 2018-CA Class A2, 3.52% due 6/16/2042 | 619,765 | 609,398 |
| a,c | Navient Student Loan Trust, Series 2019-BA Class A2B, 5.664% (LIBOR 1 Month + 0.98%) due 12/15/2059 | 343,871 | 340,853 |
| a,c | Nelnet Private Education Loan Trust, Series 2016-A Class A1A, 6.595% (LIBOR 1 Month + 1.75%) due 12/26/2040 | 239 | 239 |
| Nelnet Student Loan Trust, | |||
| a,c | Series 2012-2A Class A, 5.645% (LIBOR 1 Month + 0.80%) due 12/26/2033 | 72,864 | 70,605 |
| a,c | Series 2015-3A Class A2, 5.445% (LIBOR 1 Month + 0.60%) due 2/27/2051 | 26,370 | 25,992 |
| a,c | Series 2021-DA Class AFL, 5.451% (LIBOR 1 Month + 0.69%) due 4/20/2062 | 158,142 | 153,547 |
| a,c | Pennsylvania Higher Education Assistance Agency, Student Loan Trust, Series 2012-1A Class A1, 5.395% (LIBOR 1 Month + 0.55%) due 5/25/2057 | 12,249 | 11,828 |
| a,b,c | Prodigy Finance DAC, Series 2021-1A Class A, 6.095% (LIBOR 1 Month + 1.25%) due 7/25/2051 | 94,798 | 91,094 |
| SLM Student Loan Trust, | |||
| a | Series 2013-4 Class A, 5.395% (LIBOR 1 Month + 0.55%) due 6/25/2043 | 23,612 | 22,818 |
| a | Series 2013-6 Class A3, 5.495% (LIBOR 1 Month + 0.65%) due 6/26/2028 | 146,009 | 141,590 |
| SMB Private Education Loan Trust, | |||
| a,c | Series 2015-C Class A3, 6.634% (LIBOR 1 Month + 1.95%) due 8/16/2032 | 148,891 | 148,911 |
| a,c | Series 2016-A Class A2B, 6.184% (LIBOR 1 Month + 1.50%) due 5/15/2031 | 274,288 | 273,184 |
| a,c | Series 2016-B Class A2B, 6.134% (LIBOR 1 Month + 1.45%) due 2/17/2032 | 311,479 | 309,211 |
| a,c | Series 2017-A Class A2B, 5.584% (LIBOR 1 Month + 0.90%) due 9/15/2034 | 265,190 | 260,490 |
| a,c | Series 2017-B Class A2B, 5.434% (LIBOR 1 Month + 0.75%) due 10/15/2035 | 512,157 | 501,428 |
| a,c | Series 2018-B Class A2B, 5.404% (LIBOR 1 Month + 0.72%) due 1/15/2037 | 624,325 | 613,348 |
| a,c | Series 2018-C Class A2B, 5.434% (LIBOR 1 Month + 0.75%) due 11/15/2035 | 149,373 | 147,409 |
| a,c | SoFi Professional Loan Program LLC, Series 2017-A Class A1, 5.545% (LIBOR 1 Month + 0.70%) due 3/26/2040 | 4,659 | 4,641 |
| Towd Point Asset Trust, | |||
| a,c | Series 2018-SL1 Class A, 5.445% (LIBOR 1 Month + 0.60%) due 1/25/2046 | 86,175 | 85,675 |
| a,c | Series 2021-SL1 Class A2, 5.461% (LIBOR 1 Month + 0.70%) due 11/20/2061 | 155,204 | 152,500 |
| 5,930,163 | |||
| Total Asset Backed Securities (Cost $74,554,044) | 74,186,472 | ||
| Corporate Bonds — 43.8% | |||
| Automobiles & Components — 1.4% | |||
| Automobiles — 1.4% | |||
| c | Hyundai Capital America, 0.80% due 1/8/2024 | 1,259,000 | 1,214,305 |
| Mercedes-Benz Finance North America LLC, | |||
| c | 3.70% due 5/4/2023 | 1,250,000 | 1,248,075 |
| c | 5.50% due 11/27/2024 | 1,000,000 | 1,009,370 |
| 3,471,750 | |||
| Banks — 0.3% | |||
| Banks — 0.3% | |||
| HSBC USA, Inc., 3.75% due 5/24/2024 | 750,000 | 732,698 | |
| 732,698 | |||
| Capital Goods — 1.3% | |||
| Aerospace & Defense — 0.4% | |||
| Boeing Co., 4.508% due 5/1/2023 | 1,000,000 | 998,980 | |
| Industrial Conglomerates — 0.5% | |||
| Lennox International, Inc., 3.00% due 11/15/2023 | 1,425,000 | 1,400,490 | |
| Machinery — 0.4% | |||
| a | Caterpillar Financial Services Corp., 4.983% (SOFR + 0.25%) due 5/17/2024 | 950,000 | 945,088 |
| 3,344,558 |
| See notes to financial statements. | Thornburg Taxable Fixed Income Funds Semi-Annual Report | 41 |
Thornburg Ultra Short Income Fund | March 31, 2023 (Unaudited)
| Issuer-Description | SHARES/PRINCIPAL AMOUNT | VALUE | |
| Commercial & Professional Services — 2.3% | |||
| Automobiles — 1.2% | |||
| Daimler Truck Finance North America LLC, | |||
| a,c | 5.422% (SOFR + 0.60%) due 12/14/2023 | $2,100,000 | $ 2,091,411 |
| a,c | 5.526% (SOFR + 1.00%) due 4/5/2024 | 945,000 | 941,173 |
| Commercial Services & Supplies — 1.1% | |||
| Quanta Services, Inc., 0.95% due 10/1/2024 | 1,550,000 | 1,445,514 | |
| Waste Management, Inc., 2.40% due 5/15/2023 | 1,250,000 | 1,245,488 | |
| 5,723,586 | |||
| Consumer Discretionary Distribution & Retail — 1.0% | |||
| Broadline Retail — 0.4% | |||
| Dollar General Corp., 4.25% due 9/20/2024 | 1,000,000 | 988,900 | |
| Specialty Retail — 0.6% | |||
| Advance Auto Parts, Inc., 5.90% due 3/9/2026 | 750,000 | 765,893 | |
| Lowe’s Cos., Inc., 4.40% due 9/8/2025 | 800,000 | 794,936 | |
| 2,549,729 | |||
| Consumer Services — 0.4% | |||
| Hotels, Restaurants & Leisure — 0.4% | |||
| Hyatt Hotels Corp., 1.30% due 10/1/2023 | 125,000 | 122,176 | |
| a | Starbucks Corp., 5.144% (SOFRINDX + 0.42%) due 2/14/2024 | 949,000 | 943,733 |
| 1,065,909 | |||
| Energy — 2.3% | |||
| Oil, Gas & Consumable Fuels — 2.3% | |||
| Buckeye Partners LP, 4.15% due 7/1/2023 | 1,250,000 | 1,242,362 | |
| Energy Transfer L.P. / Regency Energy Finance Corp., 4.50% due 11/1/2023 | 1,500,000 | 1,488,465 | |
| c | Gray Oak Pipeline LLC, 2.00% due 9/15/2023 | 1,350,000 | 1,327,050 |
| b | Petroleos Mexicanos, 4.625% due 9/21/2023 | 1,000,000 | 989,870 |
| Williams Cos., Inc., 4.30% due 3/4/2024 | 750,000 | 742,440 | |
| 5,790,187 | |||
| Equity Real Estate Investment Trusts (REITs) — 0.6% | |||
| Diversified REITs — 0.6% | |||
| American Tower Corp., 2.40% due 3/15/2025 | 1,000,000 | 948,610 | |
| c | SBA Tower Trust, 2.836% due 1/15/2050 | 500,000 | 473,637 |
| 1,422,247 | |||
| Financial Services — 4.3% | |||
| Capital Markets — 1.3% | |||
| Ares Capital Corp., 4.20% due 6/10/2024 | 1,250,000 | 1,210,188 | |
| Sixth Street Specialty Lending, Inc., 3.875% due 11/1/2024 | 2,000,000 | 1,906,740 | |
| Financial Services — 3.0% | |||
| c | Antares Holdings LP, 6.00% due 8/15/2023 | 1,279,000 | 1,271,275 |
| a | Citigroup, Inc., 0.776% (SOFR + 0.69%) due 10/30/2024 | 1,250,000 | 1,214,975 |
| a,b | Deutsche Bank AG, Series E, 5.206% (SOFR + 0.50%) due 11/8/2023 | 150,000 | 148,000 |
| a | Goldman Sachs Group, Inc., 5.108% (SOFR + 0.49%) due 10/21/2024 | 1,000,000 | 988,530 |
| a,b | HSBC Holdings plc, 3.95% (LIBOR 3 Month + 0.99%) due 5/18/2024 | 1,000,000 | 996,360 |
| a,b | Mizuho Financial Group, Inc., 5.588% (LIBOR 3 Month + 0.63%) due 5/25/2024 | 1,675,000 | 1,672,337 |
| a | Morgan Stanley, 5.108% (SOFR + 0.46%) due 1/25/2024 | 1,250,000 | 1,246,075 |
| 10,654,480 | |||
| Food, Beverage & Tobacco — 1.8% | |||
| Beverages — 0.5% | |||
| Constellation Brands, Inc., 5.00% due 2/2/2026 | 700,000 | 700,574 | |
| b | Diageo Capital plc, 2.625% due 4/29/2023 | 442,000 | 440,966 |
| Food Products — 1.3% | |||
| b,c | Barry Callebaut Services NV, 5.50% due 6/15/2023 | 2,000,000 | 1,996,300 |
| b,c | Danone SA, 2.589% due 11/2/2023 | 1,350,000 | 1,327,779 |
| 4,465,619 | |||
| Health Care Equipment & Services — 1.7% |
| 42 | Thornburg Taxable Fixed Income Funds Semi-Annual Report | See notes to financial statements. |
| Issuer-Description | SHARES/PRINCIPAL AMOUNT | VALUE | |
| Health Care Equipment & Supplies — 0.8% | |||
| Baxter International, Inc., | |||
| a | 5.038% (SOFRINDX + 0.26%) due 12/1/2023 | $1,000,000 | $ 989,920 |
| a | 5.207% (SOFRINDX + 0.44%) due 11/29/2024 | 1,000,000 | 982,740 |
| Health Care Providers & Services — 0.9% | |||
| Humana, Inc., | |||
| 0.65% due 8/3/2023 | 1,509,000 | 1,487,723 | |
| 5.70% due 3/13/2026 | 750,000 | 754,155 | |
| 4,214,538 | |||
| Insurance — 5.0% | |||
| Insurance — 5.0% | |||
| a,c | Equitable Financial Life Global Funding, 4.928% (SOFR + 0.39%) due 4/6/2023 | 1,522,000 | 1,521,132 |
| c | Fairfax U.S., Inc., 4.875% due 8/13/2024 | 850,000 | 836,842 |
| Loews Corp., 2.625% due 5/15/2023 | 1,121,000 | 1,115,552 | |
| a,c | Metropolitan Life Global Funding I, 4.855% (SOFR + 0.32%) due 1/7/2024 | 1,037,000 | 1,031,711 |
| a,c | Pacific Life Global Funding II, 5.65% (SOFRINDX + 0.80%) due 3/30/2025 | 235,000 | 232,728 |
| c | Principal Life Global Funding II, 0.50% due 1/8/2024 | 1,500,000 | 1,445,265 |
| c | Protective Life Global Funding, 1.082% due 6/9/2023 | 2,225,000 | 2,208,090 |
| Reliance Standard Life Global Funding II, | |||
| c | 3.85% due 9/19/2023 | 601,000 | 595,291 |
| c | 5.243% due 2/2/2026 | 850,000 | 843,718 |
| c | Security Benefit Global Funding, 1.25% due 5/17/2024 | 1,400,000 | 1,327,844 |
| Willis North America, Inc., 3.60% due 5/15/2024 | 1,500,000 | 1,462,110 | |
| 12,620,283 | |||
| Materials — 1.8% | |||
| Chemicals — 0.7% | |||
| Celanese US Holdings LLC, 5.90% due 7/5/2024 | 1,500,000 | 1,500,705 | |
| b,c,d | Phosagro OAO Via Phosagro Bond Funding DAC, 3.949% due 4/24/2023 | 260,000 | 233,407 |
| Construction Materials — 0.3% | |||
| Vulcan Materials Co., 5.80% due 3/1/2026 | 751,000 | 758,247 | |
| Containers & Packaging — 0.8% | |||
| Ball Corp., 4.00% due 11/15/2023 | 2,053,000 | 2,030,910 | |
| 4,523,269 | |||
| Media & Entertainment — 0.6% | |||
| Hotels, Restaurants & Leisure — 0.6% | |||
| Warnermedia Holdings, Inc., 6.412% due 3/15/2026 | 1,500,000 | 1,507,275 | |
| 1,507,275 | |||
| Pharmaceuticals, Biotechnology & Life Sciences — 3.7% | |||
| Biotechnology — 0.1% | |||
| Amgen, Inc., 5.507% due 3/2/2026 | 250,000 | 251,193 | |
| Life Sciences Tools & Services — 0.9% | |||
| Thermo Fisher Scientific, Inc., | |||
| a | 4.937% (SOFRINDX + 0.35%) due 4/18/2023 | 1,050,000 | 1,050,567 |
| a | 4.977% (SOFRINDX + 0.39%) due 10/18/2023 | 1,300,000 | 1,296,178 |
| Pharmaceuticals — 2.7% | |||
| a,b | AstraZeneca plc, 5.542% (LIBOR 3 Month + 0.67%) due 8/17/2023 | 240,000 | 239,758 |
| c | Bayer Corp., 6.136% due 8/28/2023 | 500,000 | 487,790 |
| a,c | Bayer US Finance II LLC, 5.876% (LIBOR 3 Month + 1.01%) due 12/15/2023 | 1,500,000 | 1,499,895 |
| Cigna Group, | |||
| a | 5.682% (LIBOR 3 Month + 0.89%) due 7/15/2023 | 747,000 | 746,574 |
| 5.685% due 3/15/2026 | 500,000 | 502,985 | |
| McKesson Corp., 5.25% due 2/15/2026 | 686,000 | 688,305 | |
| Mylan, Inc., 4.20% due 11/29/2023 | 1,673,000 | 1,655,132 | |
| a,c | Roche Holdings, Inc., 5.137% (SOFR + 0.33%) due 9/11/2023 | 850,000 | 848,504 |
| 9,266,881 | |||
| Semiconductors & Semiconductor Equipment — 1.4% |
| See notes to financial statements. | Thornburg Taxable Fixed Income Funds Semi-Annual Report | 43 |
Thornburg Ultra Short Income Fund | March 31, 2023 (Unaudited)
| Issuer-Description | SHARES/PRINCIPAL AMOUNT | VALUE | |
| Semiconductors & Semiconductor Equipment — 1.4% | |||
| c | Qorvo, Inc., 1.75% due 12/15/2024 | $1,250,000 | $ 1,165,725 |
| b,c | SK Hynix, Inc., 1.00% due 1/19/2024 | 700,000 | 674,394 |
| Skyworks Solutions, Inc., 0.90% due 6/1/2023 | 1,600,000 | 1,588,256 | |
| 3,428,375 | |||
| Software & Services — 0.7% | |||
| Information Technology Services — 0.7% | |||
| b | Genpact Luxembourg Sarl, 3.375% due 12/1/2024 | 1,000,000 | 964,250 |
| Global Payments, Inc., 3.75% TOTAL SYSTEM SERVICES IN SR UNSECURED 06/23 3.75 due 6/1/2023 | 776,000 | 773,400 | |
| 1,737,650 | |||
| Technology Hardware & Equipment — 0.8% | |||
| Electronic Equipment, Instruments & Components — 0.3% | |||
| Arrow Electronics, Inc., 6.125% due 3/1/2026 | 750,000 | 751,538 | |
| Technology Hardware, Storage & Peripherals — 0.5% | |||
| Hewlett Packard Enterprise Co., 5.90% due 10/1/2024 | 1,250,000 | 1,265,737 | |
| 2,017,275 | |||
| Telecommunication Services — 2.0% | |||
| Diversified Telecommunication Services — 1.3% | |||
| AT&T, Inc., | |||
| a | 5.488% (SOFRINDX + 0.64%) due 3/25/2024 | 750,000 | 747,683 |
| c | 6.126% due 3/19/2024 | 1,000,000 | 944,108 |
| b | British Telecommunications plc, 4.50% due 12/4/2023 | 1,075,000 | 1,067,916 |
| b,c | NTT Finance Corp., 4.142% due 7/26/2024 | 500,000 | 495,725 |
| Wireless Telecommunication Services — 0.7% | |||
| Sprint LLC, 7.875% due 9/15/2023 | 1,250,000 | 1,260,175 | |
| T-Mobile USA, Inc., 2.25% due 2/15/2026 | 500,000 | 465,970 | |
| 4,981,577 | |||
| Transportation — 0.3% | |||
| Air Freight & Logistics — 0.3% | |||
| Ryder System, Inc., 3.875% due 12/1/2023 | 750,000 | 739,860 | |
| 739,860 | |||
| Utilities — 10.1% | |||
| Electric Utilities — 9.6% | |||
| c | Alexander Funding Trust, 1.841% due 11/15/2023 | 431,000 | 417,876 |
| c | Alliant Energy Finance LLC, 3.75% due 6/15/2023 | 1,188,000 | 1,182,036 |
| b,c | Ausgrid Finance Pty Ltd., 3.85% due 5/1/2023 | 1,600,000 | 1,597,680 |
| Cleveland Electric Illuminating Co., 5.50% due 8/15/2024 | 1,000,000 | 1,006,260 | |
| a | Dominion Energy, Inc., Series D, 5.396% (LIBOR 3 Month + 0.53%) due 9/15/2023 | 225,000 | 224,348 |
| a | DTE Energy Co., 4.22% due 11/1/2024 | 907,000 | 897,613 |
| a | Duke Energy Corp., 5.055% (SOFR + 0.25%) due 6/10/2023 | 1,385,000 | 1,382,521 |
| a | Eversource Energy, Series T, 4.978% (SOFRINDX + 0.25%) due 8/15/2023 | 1,500,000 | 1,493,460 |
| b,c | Israel Electric Corp. Ltd., 6.875% due 6/21/2023 | 1,500,000 | 1,500,570 |
| a | Mississippi Power Co., Series A, 5.149% (SOFR + 0.30%) due 6/28/2024 | 750,000 | 742,012 |
| a | National Rural Utilities Cooperative Finance Corp., 5.103% (SOFR + 0.40%) due 8/7/2023 | 250,000 | 249,098 |
| NextEra Energy Capital Holdings, Inc., | |||
| 4.255% due 9/1/2024 | 750,000 | 742,852 | |
| a | 5.092% (SOFRINDX + 0.40%) due 11/3/2023 | 1,113,000 | 1,107,813 |
| a | 5.85% (SOFRINDX + 1.02%) due 3/21/2024 | 375,000 | 374,250 |
| c | Niagara Mohawk Power Corp., 3.508% due 10/1/2024 | 750,000 | 724,223 |
| OGE Energy Corp., 0.703% due 5/26/2023 | 725,000 | 719,838 | |
| Pacific Gas & Electric Co., 4.25% due 8/1/2023 | 1,550,000 | 1,540,684 | |
| Public Service Enterprise Group, Inc., 0.841% due 11/8/2023 | 1,390,000 | 1,350,844 | |
| San Diego Gas & Electric Co., Series NN, 3.60% due 9/1/2023 | 1,500,000 | 1,494,030 | |
| Southern California Edison Co., | |||
| Series C, 4.20% due 6/1/2025 | 230,000 | 226,748 | |
| Series D, 3.40% due 6/1/2023 | 1,400,000 | 1,394,442 | |
| Series J, 0.70% due 8/1/2023 | 1,000,000 | 985,090 | |
| a | Southern Co., Series 2021, 5.086% (SOFRINDX + 0.37%) due 5/10/2023 | 1,300,000 | 1,297,075 |
| 44 | Thornburg Taxable Fixed Income Funds Semi-Annual Report | See notes to financial statements. |
| Issuer-Description | SHARES/PRINCIPAL AMOUNT | VALUE | |
| Vistra Operations Co. LLC, | |||
| c | 3.55% due 7/15/2024 | $ 500,000 | $ 482,975 |
| c | 4.875% due 5/13/2024 | 1,000,000 | 988,580 |
| Gas Utilities — 0.5% | |||
| Entergy New Orleans LLC, 3.90% due 7/1/2023 | 1,250,000 | 1,243,800 | |
| 25,366,718 | |||
| Total Corporate Bonds (Cost $109,801,953) | 109,624,464 | ||
| Long-Term Municipal Bonds — 0.0% | |||
| New Jersey Transportation Trust Fund Authority, | |||
| Series B, | |||
| 2.551% due 6/15/2023 | 30,000 | 29,840 | |
| 2.631% due 6/15/2024 | 25,000 | 24,233 | |
| Total Long-Term Municipal Bonds (Cost $55,000) | 54,073 | ||
| Short-Term Investments — 9.6% | |||
| e | Thornburg Capital Management Fund | 2,398,125 | 23,981,255 |
| Total Short-Term Investments (Cost $23,981,256) | 23,981,255 | ||
| Total Investments — 97.4% (Cost $244,500,531) | $243,737,376 | ||
| Other Assets Less Liabilities — 2.6% | 6,460,677 | ||
| Net Assets — 100.0% | $250,198,053 |
| Footnote Legend | |
| a | Variable, floating, step, or fixed to floating rate securities are securities for which interest rate changes are based on changes in a designated base rate or on a predetermined schedule. The rates shown are those in effect on March 31, 2023. |
| b | Yankee bond denominated in U.S. dollars and is issued in the U.S. by foreign banks and corporations. |
| c | Securities exempt from registration under Rule 144A of the Securities Act of 1933, as amended. These securities are restricted but liquid and may only be resold in the ordinary course of business in transactions exempt from registration, normally to qualified institutional buyers. As of March 31, 2023, the aggregate value of these securities in the Fund’s portfolio was $99,841,654, representing 39.91% of the Fund’s net assets. |
| d | Bond in default. |
| e | Investment in Affiliates. |
To simplify the listings of securities, abbreviations are used per the table below:
| ABS | Asset Backed Securities |
| CMBS | Commercial Mortgage-Backed Securities |
| CMO | Collateralized Mortgage Obligation |
| DAC | Designated Activity Company |
| LIBOR | London Interbank Offered Rates |
| Mtg | Mortgage |
| REMIC | Real Estate Mortgage Investment Conduit |
| SOFR | Secured Overnight Financing Rate |
| SOFRINDX | Secured Overnight Financing Rate Index |
| TSFR1M | Term SOFR 1 Month |
| UMBS | Uniform Mortgage Backed Securities |
| See notes to financial statements. | Thornburg Taxable Fixed Income Funds Semi-Annual Report | 45 |
Thornburg Strategic Income Fund | March 31, 2023 (Unaudited)
| Issuer-Description | SHARES/ PRINCIPAL AMOUNT | VALUE | |
| Common Stock — 0.0% | |||
| Energy — 0.0% | |||
| Oil, Gas & Consumable Fuels — 0.0% | |||
| a,b | Malamute Energy, Inc. | 847 | $ 847 |
| 847 | |||
| Total Common Stock (Cost $0) | 847 | ||
| Preferred Stock — 0.4% | |||
| Banks — 0.1% | |||
| Banks — 0.1% | |||
| c,d | AgriBank FCB 6.875% (LIBOR 3 Month + 4.23%), 1/1/2024 | 40,000 | 4,037,600 |
| 4,037,600 | |||
| Energy — 0.1% | |||
| Oil, Gas & Consumable Fuels — 0.1% | |||
| c | Crestwood Equity Partners LP 9.25%, 12/31/2049 | 653,920 | 6,081,456 |
| 6,081,456 | |||
| Financial Services — 0.2% | |||
| Capital Markets — 0.2% | |||
| a,d | Gabelli Dividend & Income Trust Series J, 1.70%, 3/26/2028 | 522 | 11,842,875 |
| 11,842,875 | |||
| Total Preferred Stock (Cost $22,352,447) | 21,961,931 | ||
| Asset Backed Securities — 15.4% | |||
| Auto Receivables — 3.5% | |||
| ACC Auto Trust, | |||
| e | Series 2021-A Class A, 1.08% due 4/15/2027 | $ 793,078 | 786,856 |
| e | Series 2022-A Class A, 4.58% due 7/15/2026 | 3,469,160 | 3,411,102 |
| ACC Trust, | |||
| e | Series 2019-2 Class C, 5.24% due 10/21/2024 | 313,486 | 312,959 |
| e | Series 2022-1 Class A, 1.19% due 9/20/2024 | 956,845 | 949,196 |
| ACM Auto Trust, | |||
| e | Series 2022-1A Class B, 4.47% due 4/20/2029 | 1,607,340 | 1,603,263 |
| e | Series 2023-1A Class A, 6.61% due 1/22/2030 | 4,628,393 | 4,630,167 |
| e | American Credit Acceptance Receivables Trust, Series 2019-2 Class F, 5.81% due 6/12/2026 | 2,550,000 | 2,546,261 |
| Arivo Acceptance Auto Loan Receivables Trust, | |||
| e | Series 2019-1 Class B, 3.37% due 6/15/2025 | 1,325,604 | 1,315,761 |
| e | Series 2021-1A Class A, 1.19% due 1/15/2027 | 1,016,153 | 985,124 |
| e | Series 2021-1A Class C, 3.77% due 3/15/2027 | 900,000 | 841,808 |
| e | Series 2021-1A Class D, 5.83% due 1/18/2028 | 850,000 | 764,793 |
| e | Avid Automobile Receivables Trust, Series 2023-1 Class A, 6.63% due 7/15/2026 | 8,746,634 | 8,783,513 |
| Carvana Auto Receivables Trust, | |||
| e | Series 2019-4A Class R, due 10/15/2026 | 8,000 | 2,269,887 |
| e | Series 2020-P1 Class R, due 9/8/2027 | 20,000 | 2,591,104 |
| Series 2021-N3 Class A1, 0.35% due 6/12/2028 | 267,292 | 260,564 | |
| e | Series 2021-N4 Class R, due 9/12/2028 | 11,650 | 2,580,417 |
| e | Series 2021-P1 Class R, due 12/10/2027 | 23,500 | 3,590,324 |
| e | Series 2021-P2 Class R, due 5/10/2028 | 7,500 | 2,318,721 |
| e | Series 2021-P3 Class R, due 9/11/2028 | 9,000 | 3,598,615 |
| e | Series 2021-P4 Class R, due 9/11/2028 | 8,250 | 3,440,956 |
| e | Series 2022-N1 Class E, 6.01% due 12/11/2028 | 6,000,000 | 5,071,257 |
| e | Series 2022-P1 Class R, due 1/10/2029 | 24,000 | 8,354,354 |
| e | Series 2022-P1 Class XS, due 1/10/2029 | 551,233,355 | 2,175,277 |
| e | CIG Auto Receivables Trust, Series 2019-1A Class D, 4.85% due 5/15/2026 | 1,897,597 | 1,859,055 |
| CPS Auto Receivables Trust, | |||
| e | Series 2018-C Class E, 6.07% due 9/15/2025 | 1,423,120 | 1,423,049 |
| e | Series 2020-A Class F, 6.93% due 3/15/2027 | 3,500,000 | 3,454,677 |
| 46 | Thornburg Taxable Fixed Income Funds Semi-Annual Report | See notes to financial statements. |
| Issuer-Description | SHARES/ PRINCIPAL AMOUNT | VALUE | |
| e | Series 2020-B Class D, 4.75% due 4/15/2026 | $ 932,456 | $ 927,307 |
| e | Series 2020-C Class F, 6.67% due 11/15/2027 | 1,000,000 | 961,166 |
| e | CPS Auto Securitization Trust, Series 2021-1A Class A, 7.86% due 6/16/2026 | 10,000,000 | 9,715,210 |
| e | Credit Suisse ABS Trust Series 2020-AT1 Class CERT, due 6/15/2026 | 10,000 | 141,801 |
| e | Credito Real USA Auto Receivables Trust, Series 2021-1A Class A, 1.35% due 2/16/2027 | 2,276,094 | 2,236,363 |
| e | Exeter Automobile Receivables Trust, Series 2019-3A Class D, 3.11% due 8/15/2025 | 7,685,627 | 7,591,206 |
| FHF Trust, | |||
| e | Series 2021-2A Class A, 0.83% due 12/15/2026 | 2,370,904 | 2,259,136 |
| e | Series 2022-2A Class A, 6.14% due 12/15/2027 | 6,541,760 | 6,473,405 |
| First Investors Auto Owner Trust, | |||
| e | Series 2019-1A Class E, 4.53% due 6/16/2025 | 3,640,000 | 3,632,889 |
| e | Series 2020-1A Class C, 2.55% due 2/17/2026 | 1,311,184 | 1,305,285 |
| e | Series 2022-1A Class E, 5.41% due 6/15/2029 | 5,000,000 | 4,687,676 |
| Flagship Credit Auto Trust, | |||
| e | Series 2018-4 Class R, due 3/16/2026 | 13,000 | 631,725 |
| e | Series 2019-1 Class E, 5.06% due 6/15/2026 | 2,500,000 | 2,456,372 |
| e | Series 2019-1 Class R, due 6/15/2026 | 24,000 | 713,907 |
| e | Series 2019-2 Class R, due 12/15/2026 | 33,000 | 1,665,876 |
| e | Series 2019-3 Class R, due 12/15/2026 | 31,000 | 2,404,411 |
| e | Series 2019-4 Class R, due 3/15/2027 | 8,000 | 721,540 |
| e | Series 2022-1 Class E, 5.37% due 6/15/2029 | 6,120,000 | 5,259,093 |
| Foursight Capital Automobile Receivables Trust, | |||
| e | Series 2019-1 Class F, 5.57% due 11/16/2026 | 500,000 | 499,350 |
| e | Series 2020-1 Class E, 3.49% due 4/15/2026 | 1,100,000 | 1,082,948 |
| e | Series 2021-1 Class F, 4.06% due 8/15/2028 | 3,130,000 | 2,865,964 |
| e | GLS Auto Receivables Issuer Trust, Series 2020-2A Class C, 4.57% due 4/15/2026 | 2,025,000 | 2,001,447 |
| JPMorgan Chase Bank NA - CACLN, | |||
| e | Series 2020 -1 Class R, 33.784% due 1/25/2028 | 1,816,919 | 1,899,825 |
| e | Series 2020-2 Class R, 31.355% due 2/25/2028 | 8,603,640 | 8,829,632 |
| e | Series 2021-1 Class R, 28.348% due 9/25/2028 | 3,293,647 | 3,435,343 |
| e | Series 2021-2 Class G, 8.482% due 12/26/2028 | 3,950,000 | 3,332,562 |
| Lendbuzz Securitization Trust, | |||
| e | Series 2021-1A Class A, 1.46% due 6/15/2026 | 3,501,849 | 3,343,977 |
| e | Series 2022-1A Class A, 4.22% due 5/17/2027 | 15,370,561 | 14,867,307 |
| e | Series 2023-1A Class A1, 5.383% due 3/15/2024 | 6,537,123 | 6,535,297 |
| e | Octane Receivables Trust, Series 2020-1A Class A, 1.71% due 2/20/2025 | 250,270 | 248,377 |
| e | Prestige Auto Receivables Trust, Series 2018-1A Class E, 5.03% due 1/15/2026 | 2,625,000 | 2,612,459 |
| Santander Consumer Auto Receivables Trust, | |||
| e | Series 2020-AA Class R, due 1/16/2029 | 25,000 | 3,464,053 |
| e | Series 2021-AA Class F, 5.79% due 8/15/2028 | 3,000,000 | 2,802,311 |
| e | Series 2021-AA Class R, due 8/15/2028 | 28,500 | 1,569,032 |
| e | Skopos Auto Receivables Trust, Series 2019-1A Class D, 5.24% due 4/15/2025 | 2,100,830 | 2,088,143 |
| e | Tricolor Auto Securitization Trust, Series 2023-1A Class A, 6.48% due 8/17/2026 | 5,942,022 | 5,941,980 |
| United Auto Credit Securitization Trust, | |||
| e | Series 2021-1 Class F, 4.30% due 9/10/2027 | 6,125,000 | 5,811,033 |
| e | Series 2022-1 Class R, due 11/10/2028 | 37,000 | 7,540,686 |
| e | Veros Auto Receivables Trust, Series 2021-1 Class A, 0.92% due 10/15/2026 | 610,755 | 603,267 |
| e | Veros Automobile Receivables Trust, Series 2020-1 Class D, 5.64% due 2/16/2027 | 7,000,000 | 6,987,178 |
| 212,065,599 | |||
| Credit Card — 1.1% | |||
| e | Avant Credit Card Master Trust, Series 2021-1A Class A, 1.37% due 4/15/2027 | 3,000,000 | 2,791,369 |
| Continental Credit Card ABS LLC, | |||
| e | Series 2019-1A Class A, 3.83% due 8/15/2026 | 2,105,439 | 2,095,696 |
| e | Series 2019-1A Class C, 6.16% due 8/15/2026 | 6,440,000 | 6,281,874 |
| Continental Finance Credit Card ABS Master Trust, | |||
| e | Series 2020-1A Class A, 2.24% due 12/15/2028 | 3,000,000 | 2,861,285 |
| e | Series 2020-1A Class B, 3.66% due 12/15/2028 | 3,700,000 | 3,430,736 |
| e | Genesis Private Label Amortizing Trust, Series 2020-1 Class D, 6.63% due 7/20/2030 | 1,321,072 | 1,312,994 |
| Mercury Financial Credit Card Master Trust, | |||
| e | Series 2022-1A Class A, 2.50% due 9/21/2026 | 12,500,000 | 11,730,265 |
| e | Series 2023-1A Class A, 8.04% due 9/20/2027 | 14,600,000 | 14,605,189 |
| e | Mission Lane Credit Card Master Trust, Series 2021-A Class A, 1.59% due 9/15/2026 | 13,599,000 | 13,208,264 |
| See notes to financial statements. | Thornburg Taxable Fixed Income Funds Semi-Annual Report | 47 |
Thornburg Strategic Income Fund | March 31, 2023 (Unaudited)
| Issuer-Description | SHARES/ PRINCIPAL AMOUNT | VALUE | |
| Perimeter Master Note Business Trust, | |||
| e | Series 2019-2A Class A, 4.23% due 5/15/2024 | $ 1,922,409 | $ 1,883,662 |
| e | Series 2019-2A Class B, 5.21% due 5/15/2024 | 6,500,000 | 6,357,405 |
| e | Series 2019-2A Class C, 7.06% due 5/15/2024 | 1,463,000 | 1,436,906 |
| 67,995,645 | |||
| Other Asset Backed — 9.2% | |||
| d,e | 321 Henderson Receivables I LLC, Series 2006-3A Class A1, 4.884% (LIBOR 1 Month + 0.20%) due 9/15/2041 | 647,573 | 629,771 |
| e | ACHV ABS Trust, Series 2023-1PL Class A, 6.42% due 3/18/2030 | 2,792,771 | 2,791,528 |
| e | Affirm Asset Securitization Trust, Series 2021-Z2 Class A, 1.17% due 11/16/2026 | 1,075,105 | 1,034,494 |
| AFG ABS I LLC, | |||
| e | Series 2023-1 Class A1, 5.462% due 2/15/2024 | 8,000,000 | 7,995,974 |
| e | Series 2023-1 Class A2, 6.30% due 9/16/2030 | 10,000,000 | 10,064,798 |
| e | Amur Equipment Finance Receivables IX LLC, Series 2021-1A Class F, 6.09% due 2/20/2029 | 8,152,000 | 7,465,623 |
| Amur Equipment Finance Receivables VIII LLC, | |||
| e | Series 2020-1A Class E, 7.00% due 1/20/2027 | 2,237,613 | 2,219,417 |
| e | Series 2020-1A Class F, 7.00% due 12/20/2027 | 6,301,302 | 6,180,076 |
| Aqua Finance Trust, | |||
| e | Series 2019-A Class D, 6.07% due 7/16/2040 | 17,926,591 | 16,240,544 |
| e | Series 2020-AA Class A, 1.90% due 7/17/2046 | 4,163,771 | 3,838,049 |
| e | Series 2020-AA Class D, 7.15% due 7/17/2046 | 2,550,000 | 2,273,048 |
| e | Series 2021-A Class A, 1.54% due 7/17/2046 | 6,288,996 | 5,675,159 |
| d,e,f | Arbor Realty Commercial Real Estate Notes Ltd., Series 2022-FL1 Class A, 6.008% (SOFR30A + 1.45%) due 1/15/2037 | 20,000,000 | 19,641,658 |
| e | Arm Master Trust LLC Agricultural Loan Backed Notes, Series 2021-T1 Class A, 2.43% due 11/15/2027 | 12,550,000 | 11,711,660 |
| BHG Securitization Trust, | |||
| e | Series 2021-A Class C, 3.69% due 11/17/2033 | 2,200,000 | 1,749,276 |
| e | Series 2021-B Class A, 0.90% due 10/17/2034 | 2,860,845 | 2,715,910 |
| e | Series 2022-A Class A, 1.71% due 2/20/2035 | 12,110,571 | 11,577,814 |
| d,e,f | Blackbird Capital Aircraft Lease Securitization Ltd., Series 2016-1A Class A, 4.213% due 12/16/2041 | 4,437,959 | 3,972,018 |
| CFG Investments Ltd., | |||
| e | Series 2021-1 Class A, 4.70% due 5/20/2032 | 7,275,000 | 7,050,178 |
| e | Series 2021-1 Class C, 7.48% due 5/20/2032 | 1,560,000 | 1,496,810 |
| e | Series 2021-1 Class D, 9.07% due 5/20/2032 | 515,000 | 485,368 |
| e | CFMT Issuer Trust, Series 2021-GRN1 Class A, 1.10% due 3/20/2041 | 1,027,370 | 947,899 |
| e | Conn’s Receivables Funding LLC, Series 2022-A Class A, 5.87% due 12/15/2026 | 470,232 | 470,158 |
| d,e | Consumer Lending Receivables Trust Clrt Series 2019-A Class CERT, due 4/15/2026 | 310,000 | 2,306,329 |
| Consumer Loan Underlying Bond Certificate Issuer Trust I, | |||
| e | Series 2019-HP1 Class C, 4.70% due 12/15/2026 | 1,906,237 | 1,900,877 |
| d,e | Series 2019-HP1 Class CERT, due 12/15/2026 | 100,000 | 1,174,826 |
| e | Consumer Loan Underlying Bond CLUB Credit Trust, Series 2019-P2 Class C, 4.41% due 10/15/2026 | 235,662 | 234,988 |
| e | Consumer Loan Underlying Bond Credit Trust, Series 2019-P1 Class C, 4.66% due 7/15/2026 | 2,283,557 | 2,281,036 |
| e | CP EF Asset Securitization I LLC, Series 2022-1A Class A, 5.96% due 4/15/2030 | 10,781,300 | 10,664,367 |
| e | Crossroads Asset Trust, Series 2022-A Class A, 6.35% due 4/21/2031 | 9,264,342 | 9,325,779 |
| Dext ABS LLC, | |||
| e | Series 2020-1 Class A, 1.46% due 2/16/2027 | 546,551 | 542,199 |
| e | Series 2021-1 Class A, 1.12% due 2/15/2028 | 3,513,472 | 3,376,066 |
| e | Diamond Infrastructure Funding LLC, Series 2021-1A Class A, 1.76% due 4/15/2049 | 15,300,000 | 13,094,023 |
| e | Diamond Issuer, Series 2021-1A Class A, 2.305% due 11/20/2051 | 10,983,000 | 9,478,722 |
| e | Diamond Resorts Owner Trust, Series 2019-1A Class A, 2.89% due 2/20/2032 | 1,206,610 | 1,162,432 |
| e,f | ECAF I Ltd., Series 2015-1A Class B1, 5.802% due 6/15/2040 | 4,600,060 | 1,144,716 |
| e | ExteNet LLC, Series 2019-1A Class A2, 3.204% due 7/26/2049 | 5,000,000 | 4,756,920 |
| e | FAT Brands Fazoli’s Native I LLC, Series 2021-1 Class A2, 6.00% due 7/25/2051 | 11,313,000 | 10,045,209 |
| Foundation Finance Trust, | |||
| e | Series 2019-1A Class A, 3.86% due 11/15/2034 | 1,734,516 | 1,701,124 |
| e | Series 2019-1A Class C, 5.66% due 11/15/2034 | 575,000 | 556,418 |
| e | Series 2020-1A Class A, 3.54% due 7/16/2040 | 2,927,903 | 2,831,633 |
| e | Series 2020-1A Class C, 5.75% due 7/16/2040 | 4,025,000 | 3,674,175 |
| e | Series 2021-1A Class A, 1.27% due 5/15/2041 | 1,834,868 | 1,660,081 |
| e | Series 2021-1A Class D, 4.96% due 5/15/2041 | 2,345,000 | 2,087,944 |
| e | Series 2021-2A Class A, 2.19% due 1/15/2042 | 1,892,179 | 1,769,366 |
| e | Series 2021-2A Class D, 5.73% due 1/15/2042 | 3,750,000 | 3,403,414 |
| e | FREED ABS Trust, Series 2019-2 Class C, 4.86% due 11/18/2026 | 1,181,992 | 1,181,104 |
| 48 | Thornburg Taxable Fixed Income Funds Semi-Annual Report | See notes to financial statements. |
| Issuer-Description | SHARES/ PRINCIPAL AMOUNT | VALUE | |
| Goldman Home Improvement Trust Issuer Trust, | |||
| e | Series 2021-GRN2 Class A, 1.15% due 6/25/2051 | $ 7,592,033 | $ 6,989,260 |
| a,e | Series 2021-GRN2 Class R, due 6/20/2051 | 41,500 | 3,205,466 |
| e | Series 2022-GRN1 Class A, 4.50% due 6/25/2052 | 3,659,990 | 3,581,190 |
| e | Goodgreen Trust, Series 2021-1A Class A, 2.66% due 10/15/2056 | 10,418,419 | 8,797,327 |
| GoodLeap Sustainable Home Solutions Trust, | |||
| e | Series 2021-3CS Class C, 3.50% due 5/20/2048 | 4,388,280 | 3,071,940 |
| e | Series 2021-4GS Class A, 1.93% due 7/20/2048 | 4,055,761 | 3,175,404 |
| d,e,f | Greystone Commercial Real Estate Notes Ltd., Series 2021-FL3 Class A, 5.962% (TSFR1M + 1.13%) due 7/15/2039 | 14,000,000 | 13,654,736 |
| e | HERO Funding Trust, Series 2017-2A Class A1, 3.28% due 9/20/2048 | 984,411 | 908,858 |
| e | Hilton Grand Vacations Trust, Series 2019-AA Class A, 2.34% due 7/25/2033 | 1,186,554 | 1,121,456 |
| InStar Leasing III LLC, | |||
| e | Series 2021-1A Class A, 2.30% due 2/15/2054 | 4,453,786 | 3,733,290 |
| e | Series 2021-1A Class C, 5.29% due 2/15/2054 | 6,112,752 | 3,809,111 |
| e | LendingClub Receivables Trust, Series 2020-6A Class A, 2.75% due 11/15/2047 | 35,118 | 35,047 |
| LendingPoint Asset Securitization Trust, | |||
| e | Series 2012-B Class A, 4.77% due 10/15/2029 | 2,818,173 | 2,769,857 |
| e | Series 2020-REV1 Class A, 2.731% due 10/15/2028 | 3,089,980 | 3,062,992 |
| e | Series 2020-REV1 Class C, 7.699% due 10/15/2028 | 4,000,000 | 3,894,578 |
| e | Series 2021-A Class D, 5.73% due 12/15/2028 | 9,000,000 | 8,428,235 |
| e | Series 2021-B Class D, 6.12% due 2/15/2029 | 5,000,000 | 4,597,698 |
| e | Series 2022-A Class E, 7.02% due 6/15/2029 | 6,000,000 | 5,168,593 |
| e | Series 2022-C Class A, 6.56% due 2/15/2030 | 5,458,421 | 5,448,826 |
| e | LendingPoint Pass-Through Trust, Series 2022-ST3 Class A, 4.00% due 5/15/2028 | 788,782 | 761,773 |
| LL ABS Trust, | |||
| e | Series 2020-1A Class C, 6.54% due 1/17/2028 | 5,182,434 | 5,080,435 |
| e | Series 2021-1A Class A, 1.07% due 5/15/2029 | 1,655,066 | 1,579,214 |
| Loanpal Solar Loan Ltd., | |||
| a,e,g | Series 2021-1GS Class R, due 1/20/2048 | 13,252,480 | 11,517,558 |
| e | Series 2021-2GS Class C, 3.50% due 3/20/2048 | 3,189,301 | 1,991,633 |
| LP LMS Asset Securitization Trust, | |||
| e | Series 2021-2A Class A, 1.75% due 1/15/2029 | 3,664,002 | 3,561,681 |
| e | Series 2021-2A Class D, 6.61% due 1/15/2029 | 2,947,000 | 2,548,491 |
| Marlette Funding Trust, | |||
| e | Series 2018-1A Class CERT, due 3/15/2028 | 58,592 | 583,238 |
| e | Series 2019-1A Class C, 4.42% due 4/16/2029 | 460,217 | 459,392 |
| e | Series 2019-4A Class C, 3.76% due 12/17/2029 | 2,183,598 | 2,161,306 |
| e | Series 2021-1A Class R, due 6/16/2031 | 9,520 | 677,105 |
| e | Series 2021-2A Class R, due 9/15/2031 | 16,347 | 1,592,933 |
| e | Series 2021-3A Class R, due 12/15/2031 | 23,182 | 3,231,696 |
| e | Series 2022-3A Class A, 5.18% due 11/15/2032 | 5,017,704 | 4,968,175 |
| Mosaic Solar Loan Trust, | |||
| e | Series 2020-2A Class D, 5.42% due 8/20/2046 | 966,521 | 885,111 |
| e | Series 2020-2A Class R, due 8/20/2046 | 1,120,937 | 466,392 |
| a,e | Series 2021-1A Class R, due 12/20/2046 | 7,400,552 | 2,440,968 |
| a,e | Series 2021-2A Class R, due 4/22/2047 | 9,930,000 | 1,888,443 |
| a,e | Series 2021-3A Class R, due 6/20/2052 | 12,320,000 | 3,041,838 |
| e | Netcredit Combined Receivables LLC, Series 2023-A Class A, 7.78% due 12/20/2027 | 10,000,000 | 9,984,710 |
| New Residential Advance Receivables Trust Advance Receivables Backed, | |||
| e | Series 2020-T1 Class AT1, 1.426% due 8/15/2053 | 8,500,000 | 8,316,703 |
| e | Series 2020-T1 Class BT1, 1.823% due 8/15/2053 | 3,000,000 | 2,934,488 |
| e | Series 2020-T1 Class CT1, 2.269% due 8/15/2053 | 3,400,000 | 3,327,710 |
| e | Series 2020-T1 Class DT1, 3.011% due 8/15/2053 | 6,575,000 | 6,437,331 |
| NRZ Advance Receivables Trust, | |||
| e | Series 2020-T2 Class AT2, 1.475% due 9/15/2053 | 18,705,000 | 18,250,420 |
| e | Series 2020-T2 Class CT2, 2.17% due 9/15/2053 | 3,000,000 | 2,921,993 |
| e | Series 2020-T2 Class DT2, 2.863% due 9/15/2053 | 5,550,000 | 5,402,720 |
| Oportun Funding LLC, | |||
| e | Series 2022-1 Class A, 3.25% due 6/15/2029 | 4,339,814 | 4,282,234 |
| d,e | Series 2022-1 Class CERT, due 6/15/2029 | 11,000 | 3,326,487 |
| e | Oportun Issuance Trust, Series 2022-A Class A, 5.05% due 6/9/2031 | 10,588,000 | 10,328,107 |
| See notes to financial statements. | Thornburg Taxable Fixed Income Funds Semi-Annual Report | 49 |
Thornburg Strategic Income Fund | March 31, 2023 (Unaudited)
| Issuer-Description | SHARES/ PRINCIPAL AMOUNT | VALUE | |
| Pagaya AI Debt Selection Trust, | |||
| e | Series 2021-1 Class A, 1.18% due 11/15/2027 | $ 1,249,255 | $ 1,237,259 |
| e | Series 2021-3 Class A, 1.15% due 5/15/2029 | 2,494,759 | 2,452,807 |
| e | Series 2021-HG1 Class A, 1.22% due 1/16/2029 | 2,601,892 | 2,474,213 |
| Pagaya AI Debt Trust, | |||
| e | Series 2022-1 Class A, 2.03% due 10/15/2029 | 8,658,514 | 8,375,037 |
| e | Series 2022-2 Class A, 4.97% due 1/15/2030 | 4,636,750 | 4,566,690 |
| e | Series 2023-1 Class A, 7.556% due 7/15/2030 | 7,250,000 | 7,270,432 |
| e | Pawnee Equipment Receivables LLC, Series 2020-1 Class A, 1.37% due 11/17/2025 | 225,783 | 224,242 |
| e | Post Road Equipment Finance, Series 2022-1A Class A1, 3.76% due 8/16/2027 | 4,492,935 | 4,436,961 |
| Prosper Marketplace Issuance Trust, | |||
| d,e | Series 2019-2A Class CERT, due 9/15/2025 | 16,385 | 538,942 |
| d,e | Series 2019-3A Class CERT, due 7/15/2025 | 101,327,127 | 406,828 |
| e | Series 2019-4A Class C, 4.95% due 2/17/2026 | 1,494,648 | 1,492,004 |
| Prosper Pass-Thru Trust II, | |||
| e | Series 2019-ST1 Class CERT, due 7/15/2025 | 13,363,728 | 311,188 |
| e | Series 2019-ST2 Class A 3.75% due 11/15/2025 | 310,287 | 308,097 |
| e | Series 2019-ST2 Class R1, due 11/15/2025 | 6,385,267 | 753,972 |
| e | Series 2019-ST2 Class R2, due 11/15/2025 | 3,193,133 | 377,045 |
| d,e | SBA Tower Trust, Series 2014-2A Class C, 3.869% due 10/15/2049 | 4,607,000 | 4,473,972 |
| e | SCF Equipment Leasing LLC, Series 2019-2A Class C, 3.11% due 6/21/2027 | 7,300,000 | 6,988,761 |
| e | Service Experts Issuer LLC, Series 2021-1A Class A, 2.67% due 2/2/2032 | 6,997,392 | 6,539,075 |
| e,h | Sierra Timeshare Receivables Funding LLC, Series 2023-1A Class D, 9.89% due 1/20/2040 | 4,000,000 | 4,008,432 |
| e | SolarCity LMC Series I LLC, Series 2013-1 Class A, 4.80% due 11/20/2038 | 1,130,477 | 1,102,005 |
| e | SpringCastle America Funding LLC, Series 2020-AA Class A, 1.97% due 9/25/2037 | 4,117,573 | 3,827,090 |
| e | SPS Servicer Advance Receivables Trust, Series 2020-T2 Class A, 1.83% due 11/15/2055 | 3,300,000 | 3,045,751 |
| e | Stack Infrastructure Issuer LLC, Series 2021-1A Class A2, 1.877% due 3/26/2046 | 7,500,000 | 6,722,921 |
| Theorem Funding Trust, | |||
| e | Series 2021-1A Class A, 1.21% due 12/15/2027 | 1,472,031 | 1,454,051 |
| e | Series 2022-3A Class A, 7.60% due 4/15/2029 | 7,333,329 | 7,390,262 |
| Upstart Pass-Through Trust, | |||
| e | Series 2020-ST1 Class A, 3.75% due 2/20/2028 | 725,898 | 711,456 |
| e | Series 2020-ST2 Class A, 3.50% due 3/20/2028 | 687,387 | 670,237 |
| e | Series 2020-ST3 Class A, 3.35% due 4/20/2028 | 903,830 | 880,704 |
| e | Series 2020-ST5 Class A, 3.00% due 12/20/2026 | 3,977,965 | 3,808,903 |
| e | Series 2021-ST1 Class A, 2.75% due 2/20/2027 | 2,545,004 | 2,429,608 |
| e | Series 2021-ST2 Class A, 2.50% due 4/20/2027 | 2,842,375 | 2,695,120 |
| e | Series 2021-ST4 Class A, 2.00% due 7/20/2027 | 2,491,720 | 2,332,165 |
| e | Series 2021-ST5 Class A, 2.00% due 7/20/2027 | 2,517,152 | 2,364,914 |
| e | Series 2021-ST6 Class A, 1.85% due 8/20/2027 | 2,101,634 | 1,957,077 |
| e | Series 2021-ST8 Class A, 1.75% due 10/20/2029 | 824,541 | 762,621 |
| e | Series 2021-ST8 Class CERT, due 10/20/2029 | 5,400,000 | 1,341,787 |
| e | Series 2021-ST9 Class CERT, due 11/20/2029 | 1,414,000 | 379,813 |
| Upstart Securitization Trust, | |||
| e,g | Series 2018-2 Class CERT, due 12/22/2025 | 84,500 | 2,129,962 |
| e | Series 2021-2 Class A, 0.91% due 6/20/2031 | 392,926 | 388,823 |
| e | Series 2021-3 Class CERT, due 7/20/2031 | 7,165 | 561,706 |
| e | Series 2021-4 Class A, 0.84% due 9/20/2031 | 1,620,264 | 1,582,298 |
| e | Series 2021-4 Class CERT, due 9/20/2031 | 4,706 | 496,634 |
| e | Series 2023-1 Class A, 6.59% due 2/20/2033 | 4,225,000 | 4,209,996 |
| Upstart Structured Pass-Through Trust, | |||
| e | Series 2022-1A Class A, 3.40% due 4/15/2030 | 9,320,842 | 8,930,741 |
| e | Series 2022-4A Class A, 7.01% due 11/15/2030 | 7,359,522 | 7,356,671 |
| 555,754,400 | |||
| Student Loan — 1.6% | |||
| College Ave Student Loans LLC, | |||
| d,e | Series 2021-A Class A1, 5.945% (LIBOR 1 Month + 1.10%) due 7/25/2051 | 3,034,227 | 2,950,726 |
| e | Series 2021-A Class A2, 1.60% due 7/25/2051 | 288,974 | 250,528 |
| d,e | Series 2021-C Class A1, 5.745% (LIBOR 1 Month + 0.90%) due 7/26/2055 | 5,817,019 | 5,526,596 |
| e | Series 2021-C Class R, due 7/26/2055 | 38,750 | 8,439,521 |
| Commonbond Student Loan Trust, | |||
| e | Series 18-CGS Class A1, 3.87% due 2/25/2046 | 482,838 | 461,547 |
| 50 | Thornburg Taxable Fixed Income Funds Semi-Annual Report | See notes to financial statements. |
| Issuer-Description | SHARES/ PRINCIPAL AMOUNT | VALUE | |
| e | Series 2020-1 Class A, 1.69% due 10/25/2051 | $ 1,817,984 | $ 1,640,951 |
| e | Series 2021-BGS Class A, 1.17% due 9/25/2051 | 2,866,998 | 2,359,608 |
| National Collegiate Student Loan Trust, | |||
| d | Series 2004-2 Class B, 5.385% (LIBOR 1 Month + 0.54%) due 12/26/2033 | 14,609,738 | 13,943,768 |
| d | Series 2006-1 Class A5, 5.195% (LIBOR 1 Month + 0.35%) due 3/25/2033 | 13,529,040 | 12,543,453 |
| d | Series 2006-4 Class A4, 5.155% (LIBOR 1 Month + 0.31%) due 5/25/2032 | 4,837,445 | 4,544,917 |
| d | Series 2007-2 Class A4, 5.135% (LIBOR 1 Month + 0.29%) due 1/25/2033 | 2,469,380 | 2,252,094 |
| d,e | Navient Private Education Refi Loan Trust, Series 2019-D Class A2B, 5.734% (LIBOR 1 Month + 1.05%) due 12/15/2059 | 3,739,813 | 3,661,368 |
| d,e | Nelnet Private Education Loan Trust, Series 2016-A Class A1A, 6.595% (LIBOR 1 Month + 1.75%) due 12/26/2040 | 7,158 | 7,156 |
| Nelnet Student Loan Trust, | |||
| d,e | Series 2015-2A Class A2, 5.445% (LIBOR 1 Month + 0.60%) due 9/25/2042 | 1,988,993 | 1,911,029 |
| d,e | Series 2021-CA Class AFL, 5.501% (LIBOR 1 Month + 0.74%) due 4/20/2062 | 3,558,522 | 3,469,692 |
| d,e | Series 2021-DA Class AFL, 5.451% (LIBOR 1 Month + 0.69%) due 4/20/2062 | 4,217,112 | 4,094,576 |
| d,e,f | Prodigy Finance DAC, Series 2021-1A Class A, 6.095% (LIBOR 1 Month + 1.25%) due 7/25/2051 | 947,985 | 910,940 |
| SLM Student Loan Trust, | |||
| d | Series 2008-2 Class A3, 5.568% (LIBOR 3 Month + 0.75%) due 4/25/2023 | 616,361 | 586,062 |
| d | Series 2008-5 Class A4, 6.518% (LIBOR 3 Month + 1.70%) due 7/25/2023 | 765,061 | 760,983 |
| d | Series 2011-2 Class A2, 6.045% (LIBOR 1 Month + 1.20%) due 10/25/2034 | 3,441,084 | 3,438,792 |
| d | Series 2012-1 Class A3, 5.795% (LIBOR 1 Month + 0.95%) due 9/25/2028 | 1,686,699 | 1,604,761 |
| d | Series 2013-6 Class A3, 5.495% (LIBOR 1 Month + 0.65%) due 6/26/2028 | 1,797,039 | 1,742,641 |
| SMB Private Education Loan Trust, | |||
| e | Series 2021-A Class R, due 1/15/2053 | 2,742 | 6,656,725 |
| d,e | Series 2021-D Class A1B, 5.284% (LIBOR 1 Month + 0.60%) due 3/17/2053 | 2,814,476 | 2,729,414 |
| e | Series 2022-A Class D, 4.75% due 11/16/2054 | 6,000,000 | 5,617,394 |
| e | SoFi Professional Loan Program Trust Series 2021-B Class R1, due 2/15/2047 | 90,000 | 3,109,434 |
| d,e | Towd Point Asset Trust, Series 2021-SL1 Class A2, 5.461% (LIBOR 1 Month + 0.70%) due 11/20/2061 | 2,793,668 | 2,745,002 |
| 97,959,678 | |||
| Total Asset Backed Securities (Cost $984,081,618) | 933,775,322 | ||
| Corporate Bonds — 50.4% | |||
| Automobiles & Components — 0.9% | |||
| Automobile Components — 0.2% | |||
| e | LKQ European Holdings BV (EUR), 4.125% due 4/1/2028 | 6,600,000 | 6,939,962 |
| e | Real Hero Merger Sub 2, Inc., 6.25% due 2/1/2029 | 4,616,000 | 3,423,687 |
| Automobiles — 0.5% | |||
| d,e | Daimler Truck Finance North America LLC, 5.569% (SOFR+ 0.75%) due 12/13/2024 | 4,099,000 | 4,040,384 |
| Hyundai Capital America, | |||
| e | 0.875% due 6/14/2024 | 2,950,000 | 2,796,217 |
| e | 1.00% due 9/17/2024 | 7,143,000 | 6,697,063 |
| e | 1.80% due 10/15/2025 - 1/10/2028 | 1,933,000 | 1,737,081 |
| e | 2.375% due 10/15/2027 | 1,345,000 | 1,188,065 |
| e | 3.00% due 2/10/2027 | 2,750,000 | 2,520,018 |
| e | 5.50% due 3/30/2026 | 3,000,000 | 3,005,400 |
| e,f | Hyundai Capital Services, Inc., 1.25% due 2/8/2026 | 830,000 | 743,331 |
| e | Mercedes-Benz Finance North America LLC, 2.125% due 3/10/2025 | 7,500,000 | 7,115,850 |
| Construction & Engineering — 0.2% | |||
| e,f | IHS Netherlands Holdco BV, 8.00% due 9/18/2027 | 15,475,000 | 13,714,409 |
| 53,921,467 | |||
| Banks — 0.5% | |||
| Banks — 0.5% | |||
| d,e,f | Bank Leumi Le-Israel BM, 7.129% (5-Yr. CMT + 346.6%) due 7/18/2033 | 6,000,000 | 5,822,640 |
| FNB Corp., 5.15% due 8/25/2025 | 3,170,000 | 2,948,385 | |
| KeyBank NA, 5.00% due 1/26/2033 | 9,100,000 | 8,450,078 | |
| e,f | Macquarie Bank Ltd., 3.624% due 6/3/2030 | 2,800,000 | 2,385,544 |
| d,e,f | NBK SPC Ltd., 1.625% (SOFR + 1.05%) due 9/15/2027 | 5,177,000 | 4,605,563 |
| Santander Holdings USA, Inc., | |||
| 3.244% due 10/5/2026 | 1,815,000 | 1,642,176 | |
| 3.45% due 6/2/2025 | 1,185,000 | 1,113,983 | |
| Synchrony Bank, 5.40% due 8/22/2025 | 6,660,000 | 6,244,882 | |
| 33,213,251 |
| See notes to financial statements. | Thornburg Taxable Fixed Income Funds Semi-Annual Report | 51 |
Thornburg Strategic Income Fund | March 31, 2023 (Unaudited)
| Issuer-Description | SHARES/ PRINCIPAL AMOUNT | VALUE | |
| Capital Goods — 1.7% | |||
| Aerospace & Defense — 1.0% | |||
| Boeing Co., 2.196% due 2/4/2026 | $ 2,832,000 | $ 2,626,992 | |
| e | BWX Technologies, Inc.,4.125% due 6/30/2028 - 4/15/2029 | 15,461,000 | 13,813,872 |
| Spirit AeroSystems, Inc., | |||
| e | 7.50% due 4/15/2025 | 6,676,000 | 6,678,804 |
| e | 9.375% due 11/30/2029 | 2,490,000 | 2,717,984 |
| Teledyne Technologies, Inc., | |||
| 2.25% due 4/1/2028 | 4,423,000 | 3,955,268 | |
| 2.75% due 4/1/2031 | 2,217,000 | 1,892,830 | |
| TransDigm, Inc., | |||
| e | 6.25% due 3/15/2026 | 12,244,000 | 12,253,673 |
| e | 6.75% due 8/15/2028 | 11,165,000 | 11,276,650 |
| e | 8.00% due 12/15/2025 | 5,600,000 | 5,710,600 |
| Industrial Conglomerates — 0.2% | |||
| Lennox International, Inc., 3.00% due 11/15/2023 | 12,343,000 | 12,130,700 | |
| Machinery — 0.5% | |||
| e,f | ATS Corp., 4.125% due 12/15/2028 | 9,620,000 | 8,554,873 |
| Flowserve Corp., 3.50% due 10/1/2030 | 4,053,000 | 3,516,991 | |
| nVent Finance Sarl, | |||
| f | 2.75% due 11/15/2031 | 4,097,000 | 3,361,261 |
| f | 4.55% due 4/15/2028 | 3,000,000 | 2,862,690 |
| Regal Rexnord Corp., | |||
| e | 6.05% due 2/15/2026 | 4,350,000 | 4,379,754 |
| e | 6.30% due 2/15/2030 | 6,000,000 | 6,027,660 |
| Westinghouse Air Brake Technologies Corp., 4.40% due 3/15/2024 | 3,854,000 | 3,802,626 | |
| 105,563,228 | |||
| Commercial & Professional Services — 1.2% | |||
| Commercial Services & Supplies — 0.9% | |||
| e | ACCO Brands Corp., 4.25% due 3/15/2029 | 16,611,000 | 14,344,263 |
| Avery Dennison Corp., 5.75% due 3/15/2033 | 17,120,000 | 17,801,547 | |
| f | Cimpress plc, 7.00% due 6/15/2026 | 12,141,000 | 9,867,841 |
| e | Clean Harbors, Inc., 6.375% due 2/1/2031 | 1,000,000 | 1,020,360 |
| CoreCivic, Inc., 8.25% due 4/15/2026 | 5,250,000 | 5,311,425 | |
| Quanta Services, Inc., 0.95% due 10/1/2024 | 10,069,000 | 9,390,249 | |
| Professional Services — 0.3% | |||
| Gartner, Inc., | |||
| e | 3.625% due 6/15/2029 | 7,155,000 | 6,391,061 |
| e | 4.50% due 7/1/2028 | 3,749,000 | 3,558,176 |
| Verisk Analytics, Inc., 5.75% due 4/1/2033 | 6,750,000 | 7,087,297 | |
| 74,772,219 | |||
| Commercial Services — 0.3% | |||
| Food Products — 0.2% | |||
| e | Darling Global Finance BV (EUR), 3.625% due 5/15/2026 | 9,700,000 | 10,207,952 |
| Hotels, Restaurants & Leisure — 0.1% | |||
| Marriott International, Inc., Series GG, 3.50% due 10/15/2032 | 8,825,000 | 7,735,024 | |
| 17,942,976 | |||
| Consumer Discretionary Distribution & Retail — 0.3% | |||
| Broadline Retail — 0.1% | |||
| MercadoLibre, Inc., 3.125% due 1/14/2031 | 9,465,000 | 7,451,416 | |
| Specialty Retail — 0.2% | |||
| Advance Auto Parts, Inc., | |||
| 1.75% due 10/1/2027 | 1,792,000 | 1,547,930 | |
| 3.90% due 4/15/2030 | 2,996,000 | 2,726,030 | |
| 5.90% due 3/9/2026 | 5,850,000 | 5,973,961 | |
| 17,699,337 | |||
| Consumer Durables & Apparel — 0.4% |
| 52 | Thornburg Taxable Fixed Income Funds Semi-Annual Report | See notes to financial statements. |
| Issuer-Description | SHARES/ PRINCIPAL AMOUNT | VALUE | |
| Household Durables — 0.2% | |||
| e | CD&R Smokey Buyer, Inc., 6.75% due 7/15/2025 | $ 13,833,000 | $ 11,866,639 |
| Leisure Products — 0.2% | |||
| e | Vista Outdoor, Inc., 4.50% due 3/15/2029 | 16,065,000 | 12,955,780 |
| 24,822,419 | |||
| Consumer Services — 1.0% | |||
| Hotels, Restaurants & Leisure — 1.0% | |||
| Hyatt Hotels Corp., | |||
| 1.80% due 10/1/2024 | 6,520,000 | 6,162,965 | |
| 6.00% due 4/23/2030 | 4,475,000 | 4,542,125 | |
| Marriott International, Inc., Series- II, 2.75% due 10/15/2033 | 2,359,000 | 1,909,351 | |
| e | Nathan’s Famous, Inc., 6.625% due 11/1/2025 | 11,131,000 | 11,039,948 |
| e | Papa John’s International, Inc., 3.875% due 9/15/2029 | 12,568,000 | 10,806,343 |
| e | SeaWorld Parks & Entertainment, Inc., 8.75% due 5/1/2025 | 15,990,000 | 16,421,570 |
| e | TKC Holdings, Inc., 6.875% due 5/15/2028 | 8,650,000 | 7,349,300 |
| 58,231,602 | |||
| Consumer Staples Distribution & Retail — 0.4% | |||
| Consumer Staples Distribution & Retail — 0.4% | |||
| e | 7-Eleven, Inc., 0.80% due 2/10/2024 | 5,236,000 | 5,017,240 |
| Albertsons Cos., Inc./Safeway, Inc./New Albertsons LP/Albertsons LLC, | |||
| e | 5.875% due 2/15/2028 | 13,948,000 | 13,861,522 |
| e | 6.50% due 2/15/2028 | 4,725,000 | 4,763,698 |
| e | KeHE Distributors LLC/KeHE Finance Corp., 8.625% due 10/15/2026 | 3,567,000 | 3,546,740 |
| 27,189,200 | |||
| Energy — 3.6% | |||
| Energy Equipment & Services — 0.3% | |||
| e | Enviva Partners LP/Enviva Partners Finance Corp., 6.50% due 1/15/2026 | 17,644,000 | 16,062,568 |
| e,f | Odebrecht Offshore Drilling Finance Ltd., 7.72% due 12/1/2026 PIK | 2,660,787 | 549,932 |
| c,e,f | Odebrecht Oil & Gas Finance Ltd. (Guaranty: Odebrecht Oleo e Gas SA), Zero coupon due 5/1/2023 | 304,899 | 622 |
| b,e,f,i | Schahin II Finance Co. SPV Ltd., 5.875% due 9/25/2023 | 10,461,182 | 52,306 |
| Oil, Gas & Consumable Fuels — 3.3% | |||
| Buckeye Partners LP, 4.15% due 7/1/2023 | 4,945,000 | 4,914,786 | |
| e | Chesapeake Energy Corp., 5.50% due 2/1/2026 | 8,550,000 | 8,411,148 |
| e | Citgo Holding, Inc., 9.25% due 8/1/2024 | 15,777,000 | 15,813,603 |
| e | CITGO Petroleum Corp., 7.00% due 6/15/2025 | 5,000,000 | 4,944,750 |
| e | Colorado Interstate Gas Co. LLC/Colorado Interstate Issuing Corp., 4.15% due 8/15/2026 | 725,000 | 702,380 |
| Delek Logistics Partners LP/Delek Logistics Finance Corp., 6.75% due 5/15/2025 | 10,848,000 | 10,642,539 | |
| f | Ecopetrol SA, 8.875% due 1/13/2033 | 19,451,000 | 19,690,442 |
| e | El Paso Natural Gas Co. LLC, 3.50% due 2/15/2032 | 1,989,000 | 1,713,464 |
| d | Energy Transfer LP, 7.831% (LIBOR 3 Month + 3.02%) due 11/1/2066 | 1,200,000 | 872,520 |
| e | Florida Gas Transmission Co. LLC, 2.30% due 10/1/2031 | 3,985,000 | 3,249,409 |
| Galaxy Pipeline Assets Bidco Ltd., | |||
| e,f | 1.75% due 9/30/2027 | 7,512,526 | 6,999,571 |
| e,f | 2.16% due 3/31/2034 | 3,867,756 | 3,336,404 |
| e,f | 2.625% due 3/31/2036 | 6,630,000 | 5,443,561 |
| b,e,f,i | Gazprom PJSC via Gaz Finance plc, 3.50% due 7/14/2031 | 16,000,000 | 10,282,240 |
| Gray Oak Pipeline LLC, | |||
| e | 2.00% due 9/15/2023 | 7,848,000 | 7,714,584 |
| e | 3.45% due 10/15/2027 | 6,730,000 | 6,076,921 |
| e | Gulfstream Natural Gas System LLC, 4.60% due 9/15/2025 | 5,000,000 | 4,885,500 |
| Kinder Morgan, Inc., 5.20% due 6/1/2033 | 3,846,000 | 3,819,924 | |
| e | Midwest Connector Capital Co. LLC, 4.625% due 4/1/2029 | 5,487,000 | 5,126,285 |
| MPLX LP, 4.95% due 9/1/2032 | 4,675,000 | 4,579,817 | |
| Parkland Corp., | |||
| e,f | 4.50% due 10/1/2029 | 1,825,000 | 1,621,896 |
| e,f | 5.875% due 7/15/2027 | 3,726,000 | 3,613,810 |
| Petroleos Mexicanos, | |||
| f | 5.95% due 1/28/2031 | 6,562,000 | 5,020,914 |
| f | 6.84% due 1/23/2030 | 4,450,000 | 3,686,647 |
| f | 8.75% due 6/2/2029 | 6,500,000 | 6,052,345 |
| See notes to financial statements. | Thornburg Taxable Fixed Income Funds Semi-Annual Report | 53 |
Thornburg Strategic Income Fund | March 31, 2023 (Unaudited)
| Issuer-Description | SHARES/ PRINCIPAL AMOUNT | VALUE | |
| Petroleos Mexicanos (EUR), 3.75% due 2/21/2024 | $ 4,466,000 | $ 4,770,726 | |
| e,f | Petrorio Luxembourg Trading Sarl, 6.125% due 6/9/2026 | 800,000 | 750,672 |
| e | Summit Midstream Holdings LLC/Summit Midstream Finance Corp., 8.50% due 10/15/2026 | 848,000 | 814,580 |
| c | Summit Midstream Partners LP, Series A, 12.296% (LIBOR 3 Month + 7.43%) due 5/1/2023 | 2,114,000 | 1,578,037 |
| Sunoco LP/Sunoco Finance Corp., | |||
| 4.50% due 4/30/2030 | 2,500,000 | 2,260,250 | |
| 5.875% due 3/15/2028 | 10,000,000 | 9,755,500 | |
| 6.00% due 4/15/2027 | 3,000,000 | 2,972,940 | |
| Tennessee Gas Pipeline Co. LLC, 7.00% due 3/15/2027 | 2,251,000 | 2,399,498 | |
| e,f | TMS Issuer Sarl, 5.78% due 8/23/2032 | 10,700,000 | 11,132,708 |
| e,f | Var Energi ASA, 7.50% due 1/15/2028 | 5,000,000 | 5,255,450 |
| Williams Cos., Inc., 4.30% due 3/4/2024 | 11,067,000 | 10,955,445 | |
| 218,526,694 | |||
| Equity Real Estate Investment Trusts (REITs) — 2.1% | |||
| Diversified REITs — 1.8% | |||
| American Tower Corp., | |||
| 1.45% due 9/15/2026 | 1,842,000 | 1,636,820 | |
| 3.65% due 3/15/2027 | 2,830,000 | 2,686,406 | |
| Crown Castle, Inc., | |||
| 1.05% due 7/15/2026 | 2,636,000 | 2,323,239 | |
| 5.00% due 1/11/2028 | 7,100,000 | 7,153,250 | |
| Digital Realty Trust LP, | |||
| 4.45% due 7/15/2028 | 4,800,000 | 4,518,288 | |
| 5.55% due 1/15/2028 | 11,912,000 | 11,899,969 | |
| Extra Space Storage LP, 5.70% due 4/1/2028 | 3,257,000 | 3,279,245 | |
| Iron Mountain, Inc., | |||
| e | 4.875% due 9/15/2029 | 2,000,000 | 1,800,000 |
| e | 5.00% due 7/15/2028 | 2,880,000 | 2,679,523 |
| e | 5.25% due 7/15/2030 | 6,085,000 | 5,495,363 |
| Retail Opportunity Investments Partnership LP (Guaranty: Retail Opportunity Investments Corp.), 5.00% due 12/15/2023 | 1,500,000 | 1,478,700 | |
| SBA Tower Trust, | |||
| e | 1.631% due 5/15/2051 | 13,500,000 | 11,822,660 |
| e | 1.84% due 4/15/2027 | 3,400,000 | 2,964,737 |
| e | 6.599% due 1/15/2028 | 15,000,000 | 15,830,920 |
| Service Properties Trust, | |||
| 4.35% due 10/1/2024 | 2,295,000 | 2,197,210 | |
| 4.65% due 3/15/2024 | 900,000 | 877,500 | |
| 4.95% due 2/15/2027 | 2,850,000 | 2,400,356 | |
| 5.25% due 2/15/2026 | 700,000 | 613,396 | |
| Sun Communities Operating LP, 5.70% due 1/15/2033 | 6,095,000 | 6,093,903 | |
| e,f | Trust Fibra Uno, 5.25% due 1/30/2026 | 12,784,000 | 12,191,078 |
| Vornado Realty LP, | |||
| 2.15% due 6/1/2026 | 9,336,500 | 7,493,755 | |
| 3.40% due 6/1/2031 | 957,000 | 662,225 | |
| Mortgage Real Estate Investment Trusts — 0.1% | |||
| Sun Communities Operating LP, 2.30% due 11/1/2028 | 5,153,000 | 4,390,562 | |
| Real Estate Management & Development — 0.2% | |||
| e | Cushman & Wakefield US Borrower LLC, 6.75% due 5/15/2028 | 13,774,000 | 12,389,713 |
| 124,878,818 | |||
| Financial Services — 6.3% | |||
| Banks — 0.2% | |||
| d,e,f | DNB Bank ASA, 5.896% (SOFRINDX + 1.95%) due 10/9/2026 | 6,900,000 | 6,952,371 |
| e,f | Sumitomo Mitsui Trust Bank Ltd., 5.65% due 3/9/2026 | 5,800,000 | 5,892,220 |
| Capital Markets — 1.7% | |||
| e,f | B3 SA - Brasil Bolsa Balcao, 4.125% due 9/20/2031 | 8,827,000 | 7,309,197 |
| Blackstone Private Credit Fund, 2.625% due 12/15/2026 | 2,995,000 | 2,518,046 | |
| d | Citigroup Global Markets Holdings, Inc., 6.40% due 1/29/2035 | 4,108,000 | 2,721,152 |
| Compass Group Diversified Holdings LLC, | |||
| e | 5.00% due 1/15/2032 | 800,000 | 642,384 |
| e | 5.25% due 4/15/2029 | 9,633,000 | 8,521,544 |
| e | GTP Acquisition Partners I LLC, Series 2015-2 Class A, 3.482% due 6/15/2050 | 2,000,000 | 1,908,100 |
| 54 | Thornburg Taxable Fixed Income Funds Semi-Annual Report | See notes to financial statements. |
| Issuer-Description | SHARES/ PRINCIPAL AMOUNT | VALUE | |
| Hercules Capital, Inc., | |||
| 2.625% due 9/16/2026 | $ 5,218,000 | $ 4,398,565 | |
| 3.375% due 1/20/2027 | 4,157,000 | 3,562,715 | |
| LPL Holdings, Inc., | |||
| e | 4.00% due 3/15/2029 | 16,905,000 | 15,211,964 |
| e | 4.625% due 11/15/2027 | 3,515,000 | 3,321,499 |
| Main Street Capital Corp., 3.00% due 7/14/2026 | 2,258,000 | 1,976,992 | |
| Owl Rock Capital Corp., 2.875% due 6/11/2028 | 8,172,000 | 6,629,944 | |
| Owl Rock Capital Corp. III, 3.125% due 4/13/2027 | 6,070,000 | 5,211,156 | |
| Owl Rock Core Income Corp., | |||
| 3.125% due 9/23/2026 | 7,087,000 | 6,044,431 | |
| 4.70% due 2/8/2027 | 1,910,000 | 1,734,261 | |
| 5.50% due 3/21/2025 | 2,690,000 | 2,617,370 | |
| e | 7.75% due 9/16/2027 | 2,030,000 | 2,004,625 |
| Owl Rock Technology Finance Corp., | |||
| 2.50% due 1/15/2027 | 3,547,000 | 2,960,362 | |
| e | 3.75% due 6/17/2026 | 3,540,000 | 3,114,386 |
| e | 4.75% due 12/15/2025 | 6,409,000 | 5,770,600 |
| Sixth Street Specialty Lending, Inc., | |||
| 2.50% due 8/1/2026 | 609,000 | 535,293 | |
| 3.875% due 11/1/2024 | 4,054,000 | 3,864,962 | |
| e | StoneX Group, Inc., 8.625% due 6/15/2025 | 13,286,000 | 13,378,869 |
| Consumer Finance — 0.5% | |||
| e | FirstCash, Inc., 5.625% due 1/1/2030 | 17,215,000 | 15,877,222 |
| d | PNC Financial Services Group, Inc., 5.068% (SOFR + 1.93%) due 1/24/2034 | 2,274,000 | 2,245,075 |
| d | U.S. Bancorp, 4.653% (SOFR + 1.23%) due 2/1/2029 | 7,808,000 | 7,613,425 |
| d | Wells Fargo & Co., 4.808% (SOFR + 1.98%) due 7/25/2028 | 3,350,000 | 3,309,029 |
| Financial Services — 3.6% | |||
| Antares Holdings LP, | |||
| e | 2.75% due 1/15/2027 | 1,630,000 | 1,328,059 |
| e | 3.75% due 7/15/2027 | 6,480,000 | 5,366,801 |
| e | 3.95% due 7/15/2026 | 9,451,000 | 8,150,826 |
| e | 6.00% due 8/15/2023 | 4,400,000 | 4,373,424 |
| e | 8.50% due 5/18/2025 | 2,750,000 | 2,802,800 |
| f | Banco Santander SA, 5.147% due 8/18/2025 | 9,500,000 | 9,342,110 |
| Bank of America Corp., | |||
| d | 0.976% (SOFR + 0.69%) due 4/22/2025 | 9,500,000 | 9,051,125 |
| d | 1.734% (SOFR + 0.96%) due 7/22/2027 | 1,290,000 | 1,154,744 |
| d | 3.841% (SOFR + 1.11%) due 4/25/2025 | 2,535,000 | 2,487,925 |
| d | 4.948% (SOFR + 2.04%) due 7/22/2028 | 4,900,000 | 4,874,324 |
| d | 5.272% (BSBY3M + 0.43%) due 5/28/2024 | 1,707,000 | 1,704,798 |
| d,f | Barclays plc, 6.252% (LIBOR 3 Month + 1.38%) due 5/16/2024 | 2,500,000 | 2,493,125 |
| BNP Paribas SA, | |||
| d,e,f | 2.159% (SOFR + 1.22%) due 9/15/2029 | 1,350,000 | 1,128,641 |
| e,f | 3.375% due 1/9/2025 | 5,000,000 | 4,798,050 |
| d | Charles Schwab Corp., 5.834% (SOFRINDX + 1.05%) due 3/3/2027 | 20,000,000 | 19,089,000 |
| Citigroup, Inc., | |||
| d | 1.462% (SOFR + 0.77%) due 6/9/2027 | 5,881,000 | 5,225,504 |
| d | 3.07% (SOFR + 1.28%) due 2/24/2028 | 3,071,000 | 2,856,890 |
| d | 5.339% (SOFR + 0.67%) due 5/1/2025 | 3,971,000 | 3,925,889 |
| Deutsche Bank AG, | |||
| f | 0.898% due 5/28/2024 | 3,667,000 | 3,444,303 |
| d,f | 2.552% (SOFR + 1.32%) due 1/7/2028 | 4,760,000 | 4,054,663 |
| Goldman Sachs Group, Inc., | |||
| d | 1.757% (SOFR + 0.73%) due 1/24/2025 | 2,692,000 | 2,609,598 |
| 3.00% due 3/15/2024 | 3,052,000 | 2,984,459 | |
| d | 5.064% (SOFR + 0.50%) due 7/16/2024 | 5,092,000 | 5,058,851 |
| d | 5.305% (SOFR + 0.50%) due 9/10/2024 | 3,687,000 | 3,654,038 |
| d | 5.324% (SOFR + 0.70%) due 1/24/2025 | 2,610,000 | 2,577,766 |
| d | 5.625% (SOFR + 0.82%) due 9/10/2027 | 3,687,000 | 3,555,042 |
| HSBC Holdings plc, | |||
| d,f | 1.589% (SOFR + 1.29%) due 5/24/2027 | 3,500,000 | 3,085,355 |
| d,f | 1.645% (SOFR + 1.54%) due 4/18/2026 | 3,750,000 | 3,426,450 |
| See notes to financial statements. | Thornburg Taxable Fixed Income Funds Semi-Annual Report | 55 |
Thornburg Strategic Income Fund | March 31, 2023 (Unaudited)
| Issuer-Description | SHARES/ PRINCIPAL AMOUNT | VALUE | |
| d,f | 2.206% (SOFR + 1.29%) due 8/17/2029 | $ 3,500,000 | $ 2,942,800 |
| d,f | 2.251% (SOFR + 1.10%) due 11/22/2027 | 1,350,000 | 1,195,493 |
| d,f | 4.18% (SOFR + 1.51%) due 12/9/2025 | 2,600,000 | 2,523,976 |
| d,f | 5.21% (SOFR + 2.61%) due 8/11/2028 | 2,329,000 | 2,309,623 |
| d,f | 5.322% (SOFR + 0.58%) due 11/22/2024 | 715,000 | 699,785 |
| JPMorgan Chase & Co., | |||
| d | 1.04% (TSFR3M + 0.70%) due 2/4/2027 | 1,896,000 | 1,692,218 |
| d | 3.54% (LIBOR 3 Month + 1.38%) due 5/1/2028 | 3,880,000 | 3,670,829 |
| d | 4.323% (SOFR + 1.56%) due 4/26/2028 | 2,434,000 | 2,377,604 |
| d | 5.506% (SOFR + 0.89%) due 4/22/2027 | 1,251,000 | 1,228,044 |
| d | 5.679% (SOFR + 0.92%) due 2/24/2026 | 7,590,000 | 7,532,695 |
| Mitsubishi UFJ Financial Group, Inc., | |||
| d,f | 2.309% (H15T1Y + 0.95%) due 7/20/2032 | 7,000,000 | 5,608,750 |
| d,f | 3.837% (H15T1Y + 1.13%) due 4/17/2026 | 9,714,000 | 9,396,741 |
| d,f | 5.017% (H15T1Y + 1.95%) due 7/20/2028 | 1,750,000 | 1,736,472 |
| d,f | 5.475% (H15T1Y + 1.53%) due 2/22/2031 | 2,000,000 | 2,015,780 |
| d,f | Mizuho Financial Group, Inc., 5.588% (LIBOR 3 Month + 0.63%) due 5/25/2024 | 11,070,000 | 11,052,399 |
| d | Morgan Stanley, 4.679% (SOFR + 1.67%) due 7/17/2026 | 1,560,000 | 1,539,127 |
| d,f | NatWest Group plc, 1.642% (H15T1Y + 0.90%) due 6/14/2027 | 2,000,000 | 1,762,600 |
| Societe Generale SA, | |||
| d,e,f | 1.792% (H15T1Y + 1.00%) due 6/9/2027 | 1,667,000 | 1,447,840 |
| e,f | 2.625% due 1/22/2025 | 3,000,000 | 2,809,110 |
| e,f | 3.875% due 3/28/2024 | 2,000,000 | 1,951,720 |
| e,f | 4.25% due 9/14/2023 | 3,000,000 | 2,985,450 |
| d,e,f | 5.668% (SOFR + 1.05%) due 1/21/2026 | 2,600,000 | 2,536,846 |
| UBS Group AG, | |||
| d,e,f | 1.494% (H15T1Y + 0.85%) due 8/10/2027 | 2,679,000 | 2,306,780 |
| d,e,f | 4.49% (H15T1Y + 1.60%) due 8/5/2025 | 5,200,000 | 5,075,408 |
| d,e,f | 4.751% (H15T1Y + 1.75%) due 5/12/2028 | 3,600,000 | 3,437,964 |
| e | United Wholesale Mortgage LLC, 5.50% due 11/15/2025 | 12,301,000 | 11,649,416 |
| Western Union Co., 2.85% due 1/10/2025 | 2,338,000 | 2,231,551 | |
| Insurance — 0.3% | |||
| e | Five Corners Funding Trust III, 5.791% due 2/15/2033 | 8,760,000 | 8,989,599 |
| e | Global Atlantic Fin Co., 4.40% due 10/15/2029 | 7,275,000 | 6,491,701 |
| 383,650,640 | |||
| Food, Beverage & Tobacco — 2.2% | |||
| Beverages — 0.6% | |||
| e,f | Becle SAB de CV, 2.50% due 10/14/2031 | 10,661,000 | 8,612,489 |
| e,f | Central American Bottling Corp./CBC Bottling Holdco SL/Beliv Holdco SL, 5.25% due 4/27/2029 | 16,417,000 | 15,206,410 |
| Constellation Brands, Inc., 5.00% due 2/2/2026 | 2,763,000 | 2,765,266 | |
| Huntington Ingalls Industries, Inc., 2.043% due 8/16/2028 | 6,445,000 | 5,519,176 | |
| Keurig Dr Pepper, Inc., 3.95% due 4/15/2029 | 6,036,000 | 5,787,256 | |
| Food Products — 0.8% | |||
| e,f | Barry Callebaut Services NV,5.50% due 6/15/2023 | 21,702,000 | 21,661,852 |
| Darling Ingredients, Inc., | |||
| e | 5.25% due 4/15/2027 | 3,700,000 | 3,625,334 |
| e | 6.00% due 6/15/2030 | 1,000,000 | 996,610 |
| d | General Mills, Inc., 5.84% (LIBOR 3 Month + 1.01%) due 10/17/2023 | 2,530,000 | 2,534,225 |
| Post Holdings, Inc., | |||
| e | 4.625% due 4/15/2030 | 8,247,000 | 7,392,858 |
| e | 5.625% due 1/15/2028 | 8,445,000 | 8,273,735 |
| Tobacco — 0.8% | |||
| Altria Group, Inc., 2.45% due 2/4/2032 | 9,890,000 | 7,785,408 | |
| BAT Capital Corp., | |||
| 2.726% due 3/25/2031 | 7,615,000 | 6,177,973 | |
| 7.75% due 10/19/2032 | 4,862,000 | 5,392,153 | |
| e,f | Imperial Brands Finance plc, 6.125% due 7/27/2027 | 5,000,000 | 5,123,600 |
| e,f | JT International Financial Services BV, 6.875% due 10/24/2032 | 8,000,000 | 8,828,960 |
| e | Vector Group Ltd., 10.50% due 11/1/2026 | 14,927,000 | 15,015,965 |
| 130,699,270 | |||
| Health Care Equipment & Services — 1.7% |
| 56 | Thornburg Taxable Fixed Income Funds Semi-Annual Report | See notes to financial statements. |
| Issuer-Description | SHARES/ PRINCIPAL AMOUNT | VALUE | |
| Health Care Equipment & Supplies — 0.2% | |||
| e | Hologic, Inc., 3.25% due 2/15/2029 | $ 9,957,000 | $ 8,862,626 |
| e,f | Olympus Corp., 2.143% due 12/8/2026 | 5,510,000 | 4,973,051 |
| Health Care Providers & Services — 1.5% | |||
| Centene Corp., | |||
| 2.625% due 8/1/2031 | 3,950,000 | 3,202,028 | |
| 3.375% due 2/15/2030 | 6,697,000 | 5,865,099 | |
| 4.625% due 12/15/2029 | 5,775,000 | 5,433,120 | |
| Charles River Laboratories International, Inc., | |||
| e | 3.75% due 3/15/2029 | 4,567,000 | 4,062,757 |
| e | 4.25% due 5/1/2028 | 4,480,000 | 4,192,698 |
| e | Highmark, Inc., 1.45% due 5/10/2026 | 8,000,000 | 7,218,560 |
| Humana, Inc., 5.70% due 3/13/2026 | 11,996,000 | 12,062,458 | |
| IQVIA, Inc. (EUR), | |||
| e | 2.25% due 3/15/2029 | 9,460,000 | 8,735,853 |
| e | 2.875% due 6/15/2028 | 5,000,000 | 4,865,771 |
| Tenet Healthcare Corp., | |||
| 4.25% due 6/1/2029 | 4,123,000 | 3,725,419 | |
| 4.375% due 1/15/2030 | 8,675,000 | 7,788,068 | |
| 4.625% due 7/15/2024 | 3,656,000 | 3,606,571 | |
| 4.875% due 1/1/2026 | 2,826,000 | 2,770,441 | |
| e | 6.125% due 6/15/2030 | 4,500,000 | 4,445,280 |
| Universal Health Services, Inc., | |||
| 1.65% due 9/1/2026 | 6,179,000 | 5,398,901 | |
| 2.65% due 10/15/2030 | 4,646,000 | 3,724,419 | |
| 100,933,120 | |||
| Household & Personal Products — 1.3% | |||
| Household Durables — 0.2% | |||
| Newell Brands, Inc., | |||
| 4.70% due 4/1/2026 | 2,129,000 | 2,049,695 | |
| 6.625% due 9/15/2029 | 9,300,000 | 9,373,563 | |
| Household Products — 0.9% | |||
| e | Energizer Holdings, Inc., 4.75% due 6/15/2028 | 7,268,000 | 6,582,555 |
| e | Kronos Acquisition Holdings, Inc./KIK Custom Products, Inc., 5.00% due 12/31/2026 | 4,585,000 | 4,199,035 |
| Prestige Brands, Inc., | |||
| e | 3.75% due 4/1/2031 | 6,386,000 | 5,490,875 |
| e | 5.125% due 1/15/2028 | 12,321,000 | 11,963,198 |
| Scotts Miracle-Gro Co., 4.375% due 2/1/2032 | 13,166,000 | 10,578,881 | |
| Spectrum Brands, Inc., | |||
| e | 3.875% due 3/15/2031 | 9,098,000 | 7,528,322 |
| e | 5.50% due 7/15/2030 | 5,705,000 | 5,063,872 |
| Spectrum Brands, Inc. (EUR), 4.00% due 10/1/2026 | 2,900,000 | 2,947,981 | |
| e | Spectrum Brands, Inc.(EUR), 4.00% due 10/1/2026 | 2,000,000 | 2,033,090 |
| Personal Care Products — 0.2% | |||
| e | Edgewell Personal Care Co., 5.50% due 6/1/2028 | 9,892,000 | 9,472,282 |
| Scotts Miracle-Gro Co., 5.25% due 12/15/2026 | 2,000,000 | 1,914,660 | |
| 79,198,009 | |||
| Industrials — 0.2% | |||
| Transportation Infrastructure — 0.2% | |||
| e | Penske Truck Leasing Co. LP/PTL Finance Corp., 5.55% due 5/1/2028 | 9,940,000 | 9,925,686 |
| 9,925,686 | |||
| Insurance — 4.3% | |||
| Insurance — 4.3% | |||
| e | American National Group, Inc., 6.144% due 6/13/2032 | 12,684,000 | 12,258,706 |
| Arthur J Gallagher & Co., 5.50% due 3/2/2033 | 8,212,000 | 8,376,158 | |
| e,f | Ascot Group Ltd., 4.25% due 12/15/2030 | 6,889,000 | 5,421,987 |
| Brighthouse Financial Global Funding, | |||
| e | 1.55% due 5/24/2026 | 2,089,000 | 1,877,280 |
| e | 2.00% due 6/28/2028 | 4,823,000 | 4,123,134 |
| d,e | 5.326% (SOFR + 0.76%) due 4/12/2024 | 2,307,000 | 2,277,263 |
| See notes to financial statements. | Thornburg Taxable Fixed Income Funds Semi-Annual Report | 57 |
Thornburg Strategic Income Fund | March 31, 2023 (Unaudited)
| Issuer-Description | SHARES/ PRINCIPAL AMOUNT | VALUE | |
| Brighthouse Financial, Inc., 5.625% due 5/15/2030 | $ 6,750,000 | $ 6,494,175 | |
| e,f | DaVinciRe Holdings Ltd., 4.75% due 5/1/2025 | 4,790,000 | 4,714,893 |
| d | Enstar Finance LLC, 5.75% (5-Yr. CMT + 5.468%) due 9/1/2040 | 3,304,000 | 2,726,626 |
| Enstar Group Ltd., | |||
| f | 3.10% due 9/1/2031 | 7,975,000 | 6,167,068 |
| f | 4.95% due 6/1/2029 | 4,726,000 | 4,421,220 |
| Equitable Financial Life Global Funding, | |||
| e | 1.00% due 1/9/2026 | 3,000,000 | 2,701,200 |
| e | 1.40% due 8/27/2027 | 4,620,000 | 3,956,938 |
| e | 1.80% due 3/8/2028 | 4,074,000 | 3,460,822 |
| e | F&G Annuities & Life, Inc., 7.40% due 1/13/2028 | 11,590,000 | 11,670,087 |
| F&G Global Funding, | |||
| e | 1.75% due 6/30/2026 | 7,973,000 | 7,132,327 |
| e | 2.00% due 9/20/2028 | 6,641,000 | 5,617,290 |
| e | 2.30% due 4/11/2027 | 6,017,000 | 5,358,861 |
| Fairfax Financial Holdings Ltd., | |||
| f | 3.375% due 3/3/2031 | 1,520,000 | 1,275,569 |
| f | 4.625% due 4/29/2030 | 4,673,000 | 4,405,564 |
| f | 4.85% due 4/17/2028 | 1,105,000 | 1,082,701 |
| e,f | 5.625% due 8/16/2032 | 10,603,000 | 10,430,383 |
| e | Fairfax U.S., Inc., 4.875% due 8/13/2024 | 1,187,000 | 1,168,625 |
| e,f | Fidelis Insurance Holdings Ltd., 4.875% due 6/30/2030 | 4,409,000 | 4,412,924 |
| Fidelity National Financial, Inc., 3.40% due 6/15/2030 | 5,137,000 | 4,501,348 | |
| First American Financial Corp., | |||
| 2.40% due 8/15/2031 | 2,261,000 | 1,750,285 | |
| 4.00% due 5/15/2030 | 1,457,000 | 1,312,961 | |
| GA Global Funding Trust, | |||
| e | 1.625% due 1/15/2026 | 610,000 | 550,116 |
| e | 2.25% due 1/6/2027 | 2,971,000 | 2,656,133 |
| e | 3.85% due 4/11/2025 | 5,860,000 | 5,670,488 |
| d,e | 5.308% (SOFR + 0.50%) due 9/13/2024 | 5,322,000 | 5,211,302 |
| Globe Life, Inc., 4.80% due 6/15/2032 | 3,038,000 | 2,922,191 | |
| e | Guardian Life Global Funding, 5.55% due 10/28/2027 | 4,545,000 | 4,718,255 |
| e,f | Intact Financial Corp., 5.459% due 9/22/2032 | 5,922,000 | 5,957,354 |
| Jackson Financial, Inc., 5.17% due 6/8/2027 | 2,788,000 | 2,779,525 | |
| e | Jackson National Life Global Funding, 5.50% due 1/9/2026 | 17,000,000 | 17,054,400 |
| Mercury General Corp., 4.40% due 3/15/2027 | 6,808,000 | 6,553,177 | |
| d,e | Nationwide Mutual Insurance Co., 7.156% (LIBOR 3 Month + 2.29%) due 12/15/2024 | 6,178,000 | 6,143,774 |
| e | New York Life Global Funding, 4.55% due 1/28/2033 | 4,400,000 | 4,352,304 |
| d,e | Pacific Life Global Funding II, 5.406% (SOFR + 0.62%) due 6/4/2026 | 4,533,000 | 4,382,323 |
| f | Pentair Finance Sarl, 5.90% due 7/15/2032 | 9,193,000 | 9,513,376 |
| e | Principal Life Global Funding II, 0.50% due 1/8/2024 | 9,485,000 | 9,138,892 |
| e | Protective Life Corp., 3.40% due 1/15/2030 | 4,902,000 | 4,335,427 |
| Reliance Standard Life Global Funding II, | |||
| e | 1.512% due 9/28/2026 | 4,000,000 | 3,530,320 |
| e | 2.75% due 5/7/2025 | 2,900,000 | 2,746,445 |
| e | 3.85% due 9/19/2023 | 3,000,000 | 2,971,500 |
| e | 5.243% due 2/2/2026 | 9,630,000 | 9,558,834 |
| e | RGA Global Funding, 2.70% due 1/18/2029 | 4,687,000 | 4,094,610 |
| e | Sammons Financial Group, Inc., 4.45% due 5/12/2027 | 2,000,000 | 1,887,820 |
| e | Security Benefit Global Funding, 1.25% due 5/17/2024 | 2,404,000 | 2,280,098 |
| Stewart Information Services Corp., 3.60% due 11/15/2031 | 14,735,000 | 11,594,824 | |
| 259,699,883 | |||
| Materials — 3.9% | |||
| Chemicals — 1.2% | |||
| Celanese U.S. Holdings LLC, 6.05% due 3/15/2025 | 9,084,000 | 9,136,596 | |
| International Flavors & Fragrances, Inc. (EUR), 1.80% due 9/25/2026 | 13,400,000 | 13,198,233 | |
| e,f | NOVA Chemicals Corp., 5.25% due 6/1/2027 | 9,300,000 | 8,477,601 |
| e,f | Nufarm Australia Ltd./Nufarm Americas, Inc., 5.00% due 1/27/2030 | 12,383,000 | 10,909,671 |
| 58 | Thornburg Taxable Fixed Income Funds Semi-Annual Report | See notes to financial statements. |
| Issuer-Description | SHARES/ PRINCIPAL AMOUNT | VALUE | |
| OCP SA, | |||
| e,f | 3.75% due 6/23/2031 | $ 7,800,000 | $ 6,413,160 |
| e,f | 4.50% due 10/22/2025 | 4,800,000 | 4,662,192 |
| e,f | 5.625% due 4/25/2024 | 4,710,000 | 4,689,135 |
| Phosagro OAO Via Phosagro Bond Funding DAC, | |||
| b,e,f,i | 3.05% due 1/23/2025 | 933,000 | 584,440 |
| b,e,f,i | 3.949% due 4/24/2023 | 11,250,000 | 10,099,350 |
| e,f | SPCM SA, 3.125% due 3/15/2027 | 8,405,000 | 7,397,409 |
| Construction Materials — 0.1% | |||
| Vulcan Materials Co., 5.80% due 3/1/2026 | 4,595,000 | 4,639,342 | |
| Containers & Packaging — 1.5% | |||
| e,f | Ardagh Metal Packaging Finance USA LLC/Ardagh Metal Packaging Finance plc, 3.25% due 9/1/2028 | 16,310,000 | 14,087,110 |
| Ball Corp., | |||
| 2.875% due 8/15/2030 | 14,300,000 | 11,990,979 | |
| 3.125% due 9/15/2031 | 5,414,000 | 4,481,601 | |
| e | Graphic Packaging International LLC,3.50% due 3/15/2028 - 3/1/2029 | 8,150,000 | 7,437,877 |
| e | Matthews International Corp., Class C, 5.25% due 12/1/2025 | 15,091,000 | 14,451,443 |
| Sealed Air Corp., | |||
| e | 1.573% due 10/15/2026 | 13,352,000 | 11,688,074 |
| e | 4.00% due 12/1/2027 | 8,460,000 | 7,896,395 |
| e | Silgan Holdings, Inc., 1.40% due 4/1/2026 | 20,082,000 | 18,060,546 |
| Metals & Mining — 1.1% | |||
| f | AngloGold Ashanti Holdings plc, 3.375% due 11/1/2028 | 15,715,000 | 13,943,762 |
| e | Cleveland-Cliffs, Inc., 6.75% due 3/15/2026 | 16,150,000 | 16,431,171 |
| Compass Minerals International, Inc., | |||
| e | 4.875% due 7/15/2024 | 8,730,000 | 8,353,039 |
| e | 6.75% due 12/1/2027 | 11,123,000 | 10,636,258 |
| b,e,f,i | Metalloinvest Finance DAC, 3.375% due 10/22/2028 | 7,500,000 | 4,217,625 |
| e,f | POSCO, 5.625% due 1/17/2026 | 4,650,000 | 4,707,288 |
| Stillwater Mining Co., | |||
| e | 4.00% due 11/16/2026 | 9,328,000 | 8,342,870 |
| e | 4.50% due 11/16/2029 | 3,050,000 | 2,508,106 |
| 239,441,273 | |||
| Media & Entertainment — 1.6% | |||
| Hotels, Restaurants & Leisure — 0.5% | |||
| Warnermedia Holdings, Inc., 6.412% due 3/15/2026 | 13,000,000 | 13,063,050 | |
| e | WMG Acquisition Corp. (EUR), 2.25% due 8/15/2031 | 19,018,000 | 16,429,684 |
| Media — 1.1% | |||
| CCO Holdings LLC/CCO Holdings Capital Corp., | |||
| e | 4.25% due 2/1/2031 - 1/15/2034 | 11,548,000 | 9,238,936 |
| e | 4.75% due 3/1/2030 - 2/1/2032 | 9,273,000 | 8,013,658 |
| e | Directv Financing LLC/Directv Financing Co.-Obligor, Inc., 5.875% due 8/15/2027 | 3,880,000 | 3,514,388 |
| e | News Corp., 5.125% due 2/15/2032 | 4,980,000 | 4,664,766 |
| e | Sirius XM Radio, Inc., 5.00% due 8/1/2027 | 21,775,000 | 20,239,209 |
| e,f | Telenet Finance Luxembourg Notes Sarl, 5.50% due 3/1/2028 | 14,200,000 | 13,143,804 |
| Warnermedia Holdings, Inc., | |||
| e | 3.428% due 3/15/2024 | 1,800,000 | 1,759,464 |
| e | 3.528% due 3/15/2024 | 4,585,000 | 4,482,571 |
| 94,549,530 | |||
| Pharmaceuticals, Biotechnology & Life Sciences — 1.6% | |||
| Biotechnology — 0.4% | |||
| Amgen, Inc., | |||
| 5.25% due 3/2/2033 | 5,000,000 | 5,135,150 | |
| 5.507% due 3/2/2026 | 6,800,000 | 6,832,436 | |
| Bio-Rad Laboratories, Inc., 3.30% due 3/15/2027 | 2,505,000 | 2,366,022 | |
| Illumina, Inc., 5.80% due 12/12/2025 | 5,579,000 | 5,660,286 | |
| f | Royalty Pharma plc, 1.75% due 9/2/2027 | 4,086,000 | 3,541,745 |
| Life Sciences Tools & Services — 0.4% | |||
| e | Avantor Funding, Inc. (EUR), 2.625% due 11/1/2025 | 11,000,000 | 11,473,076 |
| d | Thermo Fisher Scientific, Inc., 4.977% (SOFRINDX + 0.39%) due 10/18/2023 | 10,892,000 | 10,859,978 |
| See notes to financial statements. | Thornburg Taxable Fixed Income Funds Semi-Annual Report | 59 |
Thornburg Strategic Income Fund | March 31, 2023 (Unaudited)
| Issuer-Description | SHARES/ PRINCIPAL AMOUNT | VALUE | |
| Pharmaceuticals — 0.8% | |||
| a,b,i | Atlas U.S. Royalty LLC Participation Rights, Zero coupon due 3/15/2027 | $ 5,450,000 | $ 545 |
| e | Bayer Corp., 6.136% due 8/28/2023 | 9,000,000 | 8,780,225 |
| Bayer US Finance II LLC, | |||
| e | 4.25% due 12/15/2025 | 2,500,000 | 2,447,650 |
| d,e | 5.876% (LIBOR 3 Month + 1.01%) due 12/15/2023 | 4,096,000 | 4,095,713 |
| Cigna Group, 5.685% due 3/15/2026 | 16,515,000 | 16,613,595 | |
| CVS Health Corp., 5.125% due 2/21/2030 | 18,957,000 | 19,196,427 | |
| 97,002,848 | |||
| Semiconductors & Semiconductor Equipment — 1.4% | |||
| Semiconductors & Semiconductor Equipment — 1.4% | |||
| Broadcom Corp./Broadcom Cayman Finance Ltd., | |||
| f | 3.50% due 1/15/2028 | 1,628,000 | 1,526,445 |
| f | 3.875% due 1/15/2027 | 4,975,000 | 4,810,377 |
| Broadcom, Inc., | |||
| e | 3.187% due 11/15/2036 | 4,861,000 | 3,684,298 |
| e | 4.00% due 4/15/2029 | 940,000 | 880,226 |
| 4.75% due 4/15/2029 | 476,000 | 469,217 | |
| Microchip Technology, Inc., | |||
| 0.972% due 2/15/2024 | 5,137,000 | 4,931,469 | |
| 4.25% due 9/1/2025 | 11,300,000 | 11,115,245 | |
| Micron Technology, Inc., | |||
| 4.663% due 2/15/2030 | 1,186,000 | 1,138,465 | |
| 5.327% due 2/6/2029 | 2,031,000 | 2,039,002 | |
| 6.75% due 11/1/2029 | 9,820,000 | 10,447,596 | |
| Qorvo, Inc., | |||
| e | 1.75% due 12/15/2024 | 8,500,000 | 7,926,930 |
| e | 3.375% due 4/1/2031 | 12,907,000 | 10,693,191 |
| 4.375% due 10/15/2029 | 1,452,000 | 1,338,730 | |
| e,f | Renesas Electronics Corp., 1.543% due 11/26/2024 | 6,990,000 | 6,527,052 |
| SK Hynix, Inc., | |||
| e,f | 1.00% due 1/19/2024 | 2,800,000 | 2,697,576 |
| e,f | 1.50% due 1/19/2026 | 4,400,000 | 3,910,148 |
| e,f | 2.375% due 1/19/2031 | 2,812,000 | 2,106,469 |
| e,f | 6.25% due 1/17/2026 | 6,800,000 | 6,867,252 |
| Skyworks Solutions, Inc., 1.80% due 6/1/2026 | 1,160,000 | 1,045,334 | |
| 84,155,022 | |||
| Software & Services — 4.0% | |||
| Information Technology Services — 1.2% | |||
| Block Financial LLC, 2.50% due 7/15/2028 | 3,605,000 | 3,106,897 | |
| DXC Technology Co., 2.375% due 9/15/2028 | 11,657,000 | 9,890,148 | |
| f | Genpact Luxembourg Sarl, 3.375% due 12/1/2024 | 8,939,000 | 8,619,431 |
| f | Genpact Luxembourg Sarl/Genpact USA, Inc., 1.75% due 4/10/2026 | 2,762,000 | 2,525,352 |
| Global Payments, Inc., | |||
| 1.50% due 11/15/2024 | 2,230,000 | 2,100,281 | |
| 2.15% due 1/15/2027 | 1,394,000 | 1,235,028 | |
| 5.30% due 8/15/2029 | 4,441,000 | 4,392,060 | |
| Kyndryl Holdings, Inc., | |||
| 2.05% due 10/15/2026 | 3,968,000 | 3,468,151 | |
| 2.70% due 10/15/2028 | 8,296,000 | 6,965,156 | |
| Leidos, Inc., 2.30% due 2/15/2031 | 2,220,000 | 1,804,727 | |
| Sabre GLBL, Inc., | |||
| e | 7.375% due 9/1/2025 | 3,586,000 | 3,203,051 |
| e | 9.25% due 4/15/2025 | 2,267,000 | 2,134,562 |
| e | 11.25% due 12/15/2027 | 5,100,000 | 4,740,654 |
| e | Science Applications International Corp., 4.875% due 4/1/2028 | 15,749,000 | 14,727,992 |
| e | Wipro IT Services LLC, 1.50% due 6/23/2026 | 3,953,000 | 3,561,574 |
| Internet Software & Services — 1.0% | |||
| e | Arches Buyer, Inc., 4.25% due 6/1/2028 | 19,319,000 | 16,141,025 |
| e | Cogent Communications Group, Inc., 7.00% due 6/15/2027 | 9,567,000 | 9,488,933 |
| eBay, Inc., 5.90% due 11/22/2025 | 14,755,000 | 15,153,680 |
| 60 | Thornburg Taxable Fixed Income Funds Semi-Annual Report | See notes to financial statements. |
| Issuer-Description | SHARES/ PRINCIPAL AMOUNT | VALUE | |
| Prosus NV, | |||
| e,f | 3.061% due 7/13/2031 | $ 656,000 | $ 516,836 |
| e,f | 4.193% due 1/19/2032 | 11,494,000 | 9,768,866 |
| Prosus NV (EUR), | |||
| e | 1.288% due 7/13/2029 | 8,715,000 | 7,210,391 |
| e | 2.031% due 8/3/2032 | 3,000,000 | 2,330,579 |
| Professional Services — 0.2% | |||
| e | Korn Ferry, 4.625% due 12/15/2027 | 15,003,000 | 14,200,490 |
| Software — 1.6% | |||
| e | Fair Isaac Corp., 4.00% due 6/15/2028 | 16,087,000 | 14,925,519 |
| Fidelity National Information Services, Inc., | |||
| 1.15% due 3/1/2026 | 2,000,000 | 1,786,100 | |
| 4.70% due 7/15/2027 | 12,167,000 | 11,990,335 | |
| e | GoTo Group, Inc., 5.50% due 9/1/2027 | 6,873,000 | 3,544,131 |
| e | Infor, Inc., 1.75% due 7/15/2025 | 2,250,000 | 2,051,348 |
| MSCI, Inc., | |||
| e | 3.875% due 2/15/2031 | 9,973,000 | 8,877,266 |
| e | 4.00% due 11/15/2029 | 6,289,000 | 5,739,593 |
| Open Text Corp., | |||
| e,f | 3.875% due 2/15/2028 | 7,761,000 | 6,930,030 |
| e,f | 6.90% due 12/1/2027 | 9,150,000 | 9,433,741 |
| e | Open Text Holdings, Inc.,4.125% due 2/15/2030 - 12/1/2031 | 12,327,000 | 10,323,505 |
| Oracle Corp., | |||
| 1.65% due 3/25/2026 | 4,565,000 | 4,194,185 | |
| 2.30% due 3/25/2028 | 2,257,000 | 2,019,812 | |
| 6.15% due 11/9/2029 | 6,753,000 | 7,194,106 | |
| VMware, Inc., | |||
| 1.00% due 8/15/2024 | 1,180,000 | 1,112,398 | |
| 4.50% due 5/15/2025 | 4,040,000 | 3,992,449 | |
| 241,400,382 | |||
| Technology Hardware & Equipment — 2.0% | |||
| Communications Equipment — 0.2% | |||
| Motorola Solutions, Inc., | |||
| 2.30% due 11/15/2030 | 337,000 | 273,806 | |
| 5.60% due 6/1/2032 | 13,595,000 | 13,673,307 | |
| Electronic Equipment, Instruments & Components — 1.1% | |||
| f | Allegion plc, 3.50% due 10/1/2029 | 1,723,000 | 1,558,936 |
| Arrow Electronics, Inc., 6.125% due 3/1/2026 | 8,844,000 | 8,862,130 | |
| Avnet, Inc., 6.25% due 3/15/2028 | 14,700,000 | 14,936,376 | |
| Flex Ltd., | |||
| f | 4.875% due 5/12/2030 | 4,671,000 | 4,543,108 |
| f | 6.00% due 1/15/2028 | 4,486,000 | 4,574,374 |
| e,f | Sensata Technologies BV, 5.875% due 9/1/2030 | 2,375,000 | 2,352,509 |
| TD SYNNEX Corp., 1.75% due 8/9/2026 | 10,183,000 | 8,870,208 | |
| Trimble, Inc., 4.75% due 12/1/2024 | 6,525,000 | 6,465,492 | |
| Vontier Corp., | |||
| 1.80% due 4/1/2026 | 1,533,000 | 1,360,093 | |
| 2.40% due 4/1/2028 | 5,241,000 | 4,406,580 | |
| 2.95% due 4/1/2031 | 6,127,000 | 4,876,663 | |
| Office Electronics — 0.2% | |||
| CDW LLC/CDW Finance Corp., | |||
| 3.25% due 2/15/2029 | 5,238,000 | 4,605,931 | |
| 4.25% due 4/1/2028 | 8,103,000 | 7,571,038 | |
| Technology Hardware, Storage & Peripherals — 0.5% | |||
| Dell International LLC/EMC Corp., 4.90% due 10/1/2026 | 5,123,000 | 5,094,977 | |
| HP, Inc., 4.75% due 1/15/2028 | 11,941,000 | 11,805,231 | |
| Lenovo Group Ltd., | |||
| e,f | 5.831% due 1/27/2028 | 3,885,000 | 3,919,110 |
| f | 5.875% due 4/24/2025 | 10,993,000 | 11,084,462 |
| 120,834,331 |
| See notes to financial statements. | Thornburg Taxable Fixed Income Funds Semi-Annual Report | 61 |
Thornburg Strategic Income Fund | March 31, 2023 (Unaudited)
| Issuer-Description | SHARES/ PRINCIPAL AMOUNT | VALUE | |
| Telecommunication Services — 1.4% | |||
| Diversified Telecommunication Services — 0.9% | |||
| AT&T, Inc., | |||
| 5.539% due 2/20/2026 | $ 22,242,000 | $ 22,299,162 | |
| e | 6.126% due 3/19/2024 | 9,000,000 | 8,496,975 |
| f | British Telecommunications plc, 4.50% due 12/4/2023 | 8,483,000 | 8,427,097 |
| Videotron Ltd., | |||
| e,f | 5.125% due 4/15/2027 | 7,150,000 | 6,900,537 |
| e,f | 5.375% due 6/15/2024 | 6,000,000 | 6,015,180 |
| e,f | Virgin Media Secured Finance plc, 5.50% due 5/15/2029 | 1,800,000 | 1,672,992 |
| Wireless Telecommunication Services — 0.5% | |||
| Digicel International Finance Ltd./Digicel international Holdings Ltd., | |||
| e,f | 8.00% due 12/31/2026 | 1,111,755 | 234,391 |
| e,f | 8.75% due 5/25/2024 | 4,866,916 | 4,423,242 |
| e,f | SK Telecom Co. Ltd., 3.75% due 4/16/2023 | 3,000,000 | 2,998,680 |
| T-Mobile USA, Inc., | |||
| 2.25% due 2/15/2026 | 2,232,000 | 2,080,090 | |
| 2.625% due 4/15/2026 | 2,708,000 | 2,534,580 | |
| 3.375% due 4/15/2029 | 10,090,000 | 9,198,448 | |
| 5.375% due 4/15/2027 | 2,965,000 | 2,979,024 | |
| Vmed O2 UK Financing I plc, | |||
| e,f | 4.25% due 1/31/2031 | 7,818,000 | 6,649,131 |
| e,f | 4.75% due 7/15/2031 | 1,500,000 | 1,285,455 |
| 86,194,984 | |||
| Transportation — 0.2% | |||
| Air Freight & Logistics — 0.2% | |||
| Ryder System, Inc., | |||
| 3.875% due 12/1/2023 | 3,753,000 | 3,702,259 | |
| 5.65% due 3/1/2028 | 7,244,000 | 7,331,001 | |
| Passenger Airlines — 0.0% | |||
| American Airlines Pass Through Trust, Series 2016-3 Class B, 3.75% due 4/15/2027 | 725,507 | 670,354 | |
| e | British Airways Pass Through Trust, Series 2020-1 Class A, 4.25% due 5/15/2034 | 988,860 | 920,025 |
| US Airways Pass-Through Trust, | |||
| Series 2010-1 Class A, 6.25% due 10/22/2024 | 515,138 | 514,757 | |
| Series 2012-1 Class A, 5.90% due 4/1/2026 | 791,848 | 785,775 | |
| 13,924,171 | |||
| Utilities — 5.9% | |||
| Electric Utilities — 4.6% | |||
| AEP Texas, Inc., Series I, 2.10% due 7/1/2030 | 3,800,000 | 3,152,024 | |
| e,f | AES Andres BV, 5.70% due 5/4/2028 | 14,177,000 | 12,477,603 |
| e | Alexander Funding Trust, 1.841% due 11/15/2023 | 18,263,000 | 17,706,892 |
| Allegion U.S. Holding Co., Inc., 5.411% due 7/1/2032 | 7,922,000 | 7,946,241 | |
| e | Alliant Energy Finance LLC, 1.40% due 3/15/2026 | 1,500,000 | 1,328,175 |
| American Electric Power Co., Inc., | |||
| 2.031% due 3/15/2024 | 3,302,000 | 3,202,147 | |
| 5.625% due 3/1/2033 | 7,171,000 | 7,432,096 | |
| Appalachian Power Co., | |||
| Series AA, 2.70% due 4/1/2031 | 4,705,000 | 3,995,956 | |
| Series BB, 4.50% due 8/1/2032 | 3,327,000 | 3,194,885 | |
| e,f | Ausgrid Finance Pty Ltd., 3.85% due 5/1/2023 | 8,600,000 | 8,587,530 |
| Black Hills Corp., | |||
| 1.037% due 8/23/2024 | 8,226,000 | 7,754,486 | |
| 2.50% due 6/15/2030 | 1,000,000 | 835,430 | |
| 5.95% due 3/15/2028 | 7,750,000 | 8,019,157 | |
| e | Boston Gas Co., 3.757% due 3/16/2032 | 6,140,000 | 5,544,543 |
| CenterPoint Energy Houston Electric LLC, 4.95% due 4/1/2033 | 5,000,000 | 5,107,050 | |
| d | CenterPoint Energy, Inc., 5.373% (SOFRINDX + 0.65%) due 5/13/2024 | 2,500,000 | 2,476,175 |
| Comision Federal de Electricidad, | |||
| e,f | 3.348% due 2/9/2031 | 3,020,000 | 2,394,890 |
| e,f | 4.688% due 5/15/2029 | 5,000,000 | 4,473,750 |
| f | 5.00% due 9/29/2036 | 7,031,200 | 5,960,700 |
| 62 | Thornburg Taxable Fixed Income Funds Semi-Annual Report | See notes to financial statements. |
| Issuer-Description | SHARES/ PRINCIPAL AMOUNT | VALUE | |
| Dominion Energy, Inc., 5.375% due 11/15/2032 | $ 5,000,000 | $ 5,131,850 | |
| Duke Energy Ohio, Inc., 5.25% due 4/1/2033 | 2,411,000 | 2,481,715 | |
| Enel Finance International NV, | |||
| e,f | 1.375% due 7/12/2026 | 2,750,000 | 2,450,387 |
| e,f | 1.875% due 7/12/2028 | 16,900,000 | 14,257,178 |
| e,f | 2.25% due 7/12/2031 | 3,843,000 | 3,000,691 |
| e,f | 5.00% due 6/15/2032 | 1,927,000 | 1,805,888 |
| e,f | 7.50% due 10/14/2032 | 2,400,000 | 2,676,264 |
| Entergy Texas, Inc., | |||
| 1.50% due 9/1/2026 | 5,866,000 | 5,185,720 | |
| 3.45% due 12/1/2027 | 3,000,000 | 2,799,000 | |
| e | Evergy Missouri West, Inc., 3.75% due 3/15/2032 | 4,100,000 | 3,680,816 |
| Eversource Energy, 5.45% due 3/1/2028 | 5,761,000 | 5,969,779 | |
| d | Florida Power & Light Co., 4.966% (SOFRINDX + 0.25%) due 5/10/2023 | 2,120,000 | 2,120,191 |
| Georgia Power Co., 4.70% due 5/15/2032 | 12,308,000 | 12,201,782 | |
| e | Metropolitan Edison Co., 5.20% due 4/1/2028 | 1,475,000 | 1,489,897 |
| e | Mid-Atlantic Interstate Transmission LLC, 4.10% due 5/15/2028 | 945,000 | 911,708 |
| e | Midland Cogeneration Venture LP, 6.00% due 3/15/2025 | 102,694 | 104,707 |
| e | Monongahela Power Co., 3.55% due 5/15/2027 | 3,305,000 | 3,142,691 |
| NextEra Energy Capital Holdings, Inc., | |||
| d | 5.092% (SOFRINDX + 0.40%) due 11/3/2023 | 2,500,000 | 2,488,350 |
| 6.051% due 3/1/2025 | 4,700,000 | 4,782,438 | |
| Niagara Mohawk Power Corp., | |||
| e | 3.508% due 10/1/2024 | 2,236,000 | 2,159,149 |
| e | 4.278% due 12/15/2028 | 10,186,000 | 9,616,195 |
| Oklahoma Gas & Electric Co., 5.40% due 1/15/2033 | 9,317,000 | 9,644,213 | |
| Pacific Gas & Electric Co., | |||
| 3.25% due 2/16/2024 | 8,680,000 | 8,505,011 | |
| 3.75% due 2/15/2024 | 9,367,000 | 9,196,708 | |
| e | Pennsylvania Electric Co., 5.15% due 3/30/2026 | 980,000 | 984,273 |
| Puget Energy, Inc., | |||
| 2.379% due 6/15/2028 | 2,980,000 | 2,625,142 | |
| 4.10% due 6/15/2030 | 1,950,000 | 1,804,120 | |
| 4.224% due 3/15/2032 | 3,655,000 | 3,352,805 | |
| Southern California Edison Co., Series J, 0.70% due 8/1/2023 | 8,857,000 | 8,724,942 | |
| Southern Co., | |||
| 3.25% due 7/1/2026 | 6,725,000 | 6,415,717 | |
| 5.113% due 8/1/2027 | 6,096,000 | 6,113,008 | |
| 5.70% due 10/15/2032 | 1,001,000 | 1,052,622 | |
| System Energy Resources, Inc., 6.00% due 4/15/2028 | 2,212,000 | 2,267,499 | |
| e | Toledo Edison Co., 2.65% due 5/1/2028 | 3,933,000 | 3,485,700 |
| Transelec SA, | |||
| e,f | 4.25% due 1/14/2025 | 200,000 | 193,934 |
| e,f | 4.625% due 7/26/2023 | 2,409,000 | 2,409,000 |
| Virginia Electric & Power Co., 5.00% due 4/1/2033 | 770,000 | 775,182 | |
| e | Vistra Operations Co. LLC, 4.875% due 5/13/2024 | 12,188,000 | 12,048,813 |
| Gas Utilities — 1.3% | |||
| e | Brooklyn Union Gas Co., 4.632% due 8/5/2027 | 5,142,000 | 5,024,557 |
| e,f | ENN Clean Energy International Investment Ltd., 3.375% due 5/12/2026 | 9,524,000 | 8,545,599 |
| e | KeySpan Gas East Corp., 5.994% due 3/6/2033 | 14,587,000 | 15,050,429 |
| NiSource, Inc., 5.25% due 3/30/2028 | 3,444,000 | 3,504,718 | |
| Northwest Natural Gas Co., 5.75% due 3/15/2033 | 7,310,000 | 7,505,542 | |
| Southern Co. Gas Capital Corp., 5.15% due 9/15/2032 | 6,950,000 | 7,013,454 | |
| Southwest Gas Corp., | |||
| 2.20% due 6/15/2030 | 5,095,000 | 4,203,630 | |
| 4.05% due 3/15/2032 | 5,870,000 | 5,411,964 | |
| 5.45% due 3/23/2028 | 3,465,000 | 3,497,155 | |
| 5.80% due 12/1/2027 | 4,610,000 | 4,762,453 | |
| d | Spire Missouri, Inc., 5.281% (SOFR + 0.50%) due 12/2/2024 | 12,345,000 | 12,188,465 |
| 356,352,781 | |||
| Total Corporate Bonds (Cost $3,212,778,408) | 3,054,723,141 |
| See notes to financial statements. | Thornburg Taxable Fixed Income Funds Semi-Annual Report | 63 |
Thornburg Strategic Income Fund | March 31, 2023 (Unaudited)
| Issuer-Description | SHARES/ PRINCIPAL AMOUNT | VALUE | |
| Convertible Bonds — 0.3% | |||
| Equity Real Estate Investment Trusts (REITs) — 0.2% | |||
| Diversified REITs — 0.2% | |||
| e | Radius Global Infrastructure, Inc., 2.50% due 9/15/2026 | $ 11,200,000 | $ 10,928,848 |
| 10,928,848 | |||
| Media & Entertainment — 0.1% | |||
| Media — 0.1% | |||
| Comcast Holdings Corp. (Guaranty: Comcast Corp.), 2.00% due 10/15/2029 | 15,486,000 | 8,362,440 | |
| 8,362,440 | |||
| Total Convertible Bonds (Cost $20,458,364) | 19,291,288 | ||
| Long-Term Municipal Bonds — 0.1% | |||
| California Health Facilities Financing Authority, 7.875% due 2/1/2026 | 1,255,000 | 1,257,569 | |
| City of Detroit GO, | |||
| Series B, | |||
| 2.017% due 4/1/2023 | 275,000 | 275,000 | |
| 2.189% due 4/1/2024 | 275,000 | 264,464 | |
| 2.511% due 4/1/2025 | 465,000 | 428,203 | |
| New Jersey Transportation Trust Fund Authority, | |||
| Series B, | |||
| 2.551% due 6/15/2023 | 2,115,000 | 2,103,750 | |
| 2.631% due 6/15/2024 | 1,565,000 | 1,516,991 | |
| New York Transportation Development Corp., 4.248% due 9/1/2035 | 2,870,000 | 2,805,790 | |
| West Contra Costa USD GO, 2.612% due 8/1/2032 | 980,000 | 838,074 | |
| Total Long-Term Municipal Bonds (Cost $9,829,116) | 9,489,841 | ||
| Other Government — 0.7% | |||
| Finance Department Government of Sharjah, | |||
| e,f | 3.625% due 3/10/2033 | 14,382,000 | 11,702,633 |
| e,f | 6.50% due 11/23/2032 | 4,786,000 | 4,879,184 |
| Indonesia Treasury Bond (IDR), | |||
| Series FR75, 7.50% due 5/15/2038 | 36,895,000,000 | 2,571,860 | |
| Series FR79, 8.375% due 4/15/2039 | 44,919,000,000 | 3,371,449 | |
| Series FR83, 7.50% due 4/15/2040 | 44,090,000,000 | 3,072,642 | |
| Nigeria Government International Bond, | |||
| e,f | 7.625% due 11/28/2047 | 10,000,000 | 6,411,800 |
| e,f | 8.25% due 9/28/2051 | 4,300,000 | 2,857,737 |
| f | Panama Government International Bond, 6.40% due 2/14/2035 | 5,000,000 | 5,212,350 |
| Total Other Government (Cost $41,784,126) | 40,079,655 | ||
| U.S. Treasury Securities — 5.4% | |||
| United States Treasury Inflation Indexed Bonds, | |||
| 0.625%, 2/15/2043 | 26,018,200 | 21,906,011 | |
| 0.75%, 2/15/2045 | 7,874,868 | 6,687,919 | |
| United States Treasury Notes, | |||
| 0.125%, 7/31/2023 | 25,000,000 | 24,622,070 | |
| 0.625%, 5/15/2030 | 11,841,000 | 9,692,969 | |
| 1.125%, 8/31/2028 - 5/15/2040 | 75,000,000 | 62,674,219 | |
| 1.25%, 6/30/2028 | 50,000,000 | 44,382,813 | |
| 1.375%, 11/15/2040 | 9,700,000 | 6,674,813 | |
| 2.75%, 8/15/2032 | 14,311,000 | 13,467,993 | |
| 2.875%, 5/15/2032 | 14,051,000 | 13,372,600 | |
| 3.50%, 2/15/2033 | 31,634,000 | 31,688,371 | |
| United States Treasury Notes Inflationary Index, | |||
| 0.125%, 4/15/2025 - 7/15/2030 | 66,011,115 | 62,548,171 | |
| 0.625%, 7/15/2032 | 28,243,922 | 26,980,100 | |
| Total U.S. Treasury Securities (Cost $317,792,224) | 324,698,049 |
| 64 | Thornburg Taxable Fixed Income Funds Semi-Annual Report | See notes to financial statements. |
| Issuer-Description | SHARES/ PRINCIPAL AMOUNT | VALUE | |
| U.S. Government Agencies — 0.1% | |||
| c,d,e | Farm Credit Bank of Texas, Series 4, 5.70% (5-Yr. CMT + 5.415%), 9/15/2025 | $ 9,580,000 | $ 8,717,800 |
| Total U.S. Government Agencies (Cost $9,835,116) | 8,717,800 | ||
| Mortgage Backed — 15.4% | |||
| d,e | Ajax Mortgage Loan Trust, Whole Loan Securities Trust CMO, Series 2019-G Class A, 3.00% due 9/25/2059 | 841,008 | 829,609 |
| Angel Oak Mortgage Trust, Whole Loan Securities Trust CMO, | |||
| d,e | Series 2022-1 Class B1, 4.025% due 12/25/2066 | 4,575,000 | 2,821,122 |
| d,e | Series 2022-6 Class A3, 4.30% due 7/25/2067 | 4,784,299 | 4,264,543 |
| d,e | Series 2023-1 Class A1, 4.75% due 9/26/2067 | 14,804,935 | 14,406,365 |
| d,e | Series 2023-2 Class A1, 4.65% due 10/25/2067 | 14,962,953 | 14,342,482 |
| Arroyo Mortgage Trust, Whole Loan Securities Trust CMO, | |||
| d,e | Series 2019-1 Class A1, 3.805% due 1/25/2049 | 860,796 | 819,324 |
| d,e | Series 2019-3 Class A1, 2.962% due 10/25/2048 | 1,681,005 | 1,537,577 |
| d,e | Series 2021-1R Class A1, 1.175% due 10/25/2048 | 3,413,061 | 2,761,729 |
| d,e | Barclays Mortgage Loan Trust, Whole Loan Securities Trust CMO, Series 2022-INV1 Class A3, 4.53% due 2/25/2062 | 16,344,597 | 15,167,311 |
| d | Bear Stearns ARM Trust, Whole Loan Securities Trust CMO, Series 2003-6 Class 2B1, 4.047% due 8/25/2033 | 25,241 | 24,330 |
| e | Bravo Residential Funding Trust, Whole Loan Securities Trust CMO, Series 2019-1 Class A1C, 3.50% due 3/25/2058 | 1,031,504 | 1,006,841 |
| d,e | Cascade MH Asset Trust, Whole Loan Securities Trust CMO, Series 2021-MH1 Class B3, 7.58% due 2/25/2046 | 1,936,119 | 1,521,264 |
| Chase Home Lending Mortgage Trust, Whole Loan Securities Trust CMO, | |||
| d,e | Series 2019-1 Class B4, 3.898% due 3/25/2050 | 721,987 | 568,507 |
| d,e | Series 2019-1 Class B5, 3.898% due 3/25/2050 | 371,984 | 242,315 |
| d,e | Series 2019-1 Class B6, 3.898% due 3/25/2050 | 521,093 | 230,071 |
| d,e | Chase Mortgage Finance Corp., Whole Loan Securities Trust CMO, Series 2016-SH2 Class M4, 3.75% due 12/25/2045 | 2,634,879 | 2,378,098 |
| CHNGE Mortgage Trust, Whole Loan Securities Trust CMO, | |||
| d,e | Series 2022-1 Class A1, 3.007% due 1/25/2067 | 3,972,607 | 3,551,457 |
| Series 2022-2 Class B2, | |||
| d,e | 4.534% due 1/25/2067 | 4,700,000 | 3,423,284 |
| d,e | 4.628% due 3/25/2067 | 7,015,000 | 5,123,922 |
| d,e | Series 2023-1 Class A1, 7.065% due 3/25/2058 | 14,467,109 | 14,418,200 |
| CIM Trust, Whole Loan Securities Trust CMO, | |||
| d,e | Series 2018-INV1 Class A4, 4.00% due 8/25/2048 | 180,314 | 167,400 |
| d,e,g | Series 2020-J1 Class AIO1, 0.447% due 7/25/2050 | 15,140,729 | 239,776 |
| d,e,g | Series 2020-J1 Class AIO2, 0.50% due 7/25/2050 | 13,504,196 | 263,912 |
| d,e,g | Series 2020-J1 Class AIOS, 0.20% due 6/25/2050 | 18,359,683 | 126,021 |
| d,e | Series 2020-J1 Class B4, 3.447% due 7/25/2050 | 341,504 | 273,540 |
| d,e | Series 2020-J1 Class B5, 3.447% due 7/25/2050 | 170,752 | 112,729 |
| d,e | Series 2020-J1 Class B6, 3.447% due 7/25/2050 | 322,311 | 107,968 |
| d,e,g | Series 2020-J2 Class AX1, 0.258% due 1/25/2051 | 109,366,507 | 1,099,626 |
| d,e,g | Series 2020-J2 Class AXS, 0.21% due 1/25/2051 | 116,370,626 | 1,097,480 |
| d,e | Series 2020-J2 Class B4, 2.758% due 1/25/2051 | 491,000 | 202,991 |
| d,e | Series 2020-J2 Class B5, 2.758% due 1/25/2051 | 164,000 | 66,084 |
| d,e | Series 2020-J2 Class B6, 2.758% due 1/25/2051 | 651,500 | 147,963 |
| Citigroup Mortgage Loan Trust, Whole Loan Securities Trust CMO, | |||
| d | Series 2004-HYB2 Class B1, 4.31% due 3/25/2034 | 22,985 | 20,553 |
| d,e | Series 2014-A Class A, 4.00% due 1/25/2035 | 418,573 | 397,125 |
| d,e | Series 2019-E Class A1, 6.228% due 11/25/2070 | 18,550,677 | 18,513,342 |
| d,e | Series 2020-EXP1 Class B1, 4.467% due 5/25/2060 | 1,180,900 | 948,546 |
| d,e | Series 2020-EXP1 Class B2, 4.467% due 5/25/2060 | 770,600 | 577,976 |
| d,e | Series 2020-EXP1 Class B3, 4.467% due 5/25/2060 | 386,242 | 263,878 |
| e,g | Series 2020-EXP1 Class XS, due 5/25/2060 | 21,143,897 | 96,099 |
| d,e | Series 2020-EXP2 Class B5, 3.668% due 8/25/2050 | 153,000 | 73,331 |
| d,e | Series 2020-EXP2 Class B6, 3.668% due 8/25/2050 | 372,000 | 137,468 |
| d,e | Series 2021-J1 Class B4, 2.611% due 4/25/2051 | 375,000 | 126,615 |
| d,e | Series 2021-J1 Class B5, 2.611% due 4/25/2051 | 616,000 | 172,529 |
| d,e | Series 2021-J1 Class B6, 2.611% due 4/25/2051 | 454,249 | 105,100 |
| d,e | Series 2021-J2 Class B4, 2.769% due 7/25/2051 | 2,281,541 | 925,491 |
| d,e | Series 2021-J2 Class B5, 2.769% due 7/25/2051 | 623,000 | 244,628 |
| d,e | Series 2021-J2 Class B6, 2.769% due 7/25/2051 | 1,247,350 | 280,335 |
| d,e | Series 2021-J3 Class B4, 2.858% due 9/25/2051 | 1,032,000 | 358,092 |
| d,e | Series 2021-J3 Class B5, 2.858% due 9/25/2051 | 173,000 | 59,718 |
| d,e | Series 2021-J3 Class B6, 2.858% due 9/25/2051 | 590,214 | 159,224 |
| See notes to financial statements. | Thornburg Taxable Fixed Income Funds Semi-Annual Report | 65 |
Thornburg Strategic Income Fund | March 31, 2023 (Unaudited)
| Issuer-Description | SHARES/ PRINCIPAL AMOUNT | VALUE | |
| d,e,g | Series 2022-INV1 Class A5IX, 0.30% due 11/27/2051 | $ 211,920,641 | $ 2,796,272 |
| d,e | Series 2022-INV1 Class B4, 3.30% due 11/27/2051 | 1,346,631 | 825,714 |
| d,e | Series 2022-INV1 Class B6, 3.30% due 11/27/2051 | 3,394,875 | 1,075,406 |
| d,e | Series 2022-J1 Class B4, 2.907% due 2/25/2052 | 700,598 | 246,908 |
| d,e | Series 2022-J1 Class B5, 2.907% due 2/25/2052 | 527,000 | 155,935 |
| d,e | Series 2022-J1 Class B6, 2.907% due 2/25/2052 | 1,404,735 | 308,770 |
| d,e | CSMC Trust, CMBS, Series 2021-BPNY Class A, 8.399% (LIBOR 1 Month + 3.71%) due 8/15/2023 | 13,600,000 | 12,957,985 |
| CSMC Trust, Whole Loan Securities Trust CMO, | |||
| d,e | Series 2013-HYB1 Class B3, 5.907% due 4/25/2043 | 228,158 | 225,984 |
| d,e | Series 2019-AFC1, 5.234% due 7/25/2049 | 2,366,448 | 1,813,949 |
| d,e | Series 2019-RP10 Class A1, 3.005% due 12/26/2059 | 12,901,589 | 12,910,062 |
| d,e,g | Series 2021-AFC1 Class AIOS, 0.25% due 3/25/2056 | 55,350,028 | 477,449 |
| d,e | Series 2021-AFC1 Class B3, 4.345% due 3/25/2056 | 146,228 | 102,659 |
| d,e,g | Series 2021-AFC1 Class XS, 3.314% due 3/25/2056 | 55,350,028 | 7,314,543 |
| d,e | Series 2021-NQM3 Class A1, 1.015% due 4/25/2066 | 2,766,926 | 2,245,574 |
| d,e | Series 2021-NQM3 Class B2, 4.128% due 4/25/2066 | 2,650,000 | 1,512,827 |
| d,e | Series 2021-NQM8 Class B2, 4.197% due 10/25/2066 | 3,478,650 | 2,236,480 |
| d,e | Series 2022-ATH2 Class A1, 4.547% due 5/25/2067 | 6,099,171 | 5,957,669 |
| d,e | Series 2022-NQM5 Class A3, 5.169% due 5/25/2067 | 4,001,970 | 3,740,530 |
| d,e | Deephaven Residential Mortgage Trust, Whole Loan Securities Trust CMO, Series 2021-1 Class A1, 0.715% due 5/25/2065 | 860,262 | 776,779 |
| Ellington Financial Mortgage Trust, Whole Loan Securities Trust CMO, | |||
| d,e | Series 2019-2 Class A1, 2.739% due 11/25/2059 | 1,080,974 | 1,006,129 |
| d,e | Series 2021-2 Class A1, 0.931% due 6/25/2066 | 3,076,406 | 2,525,715 |
| d,e | Series 2022-1 Class B2, 3.88% due 1/25/2067 | 6,901,000 | 3,838,702 |
| Federal Home Loan Mtg Corp., Pool RE6097, 2.00% due 5/1/2051 | 13,007,033 | 10,451,537 | |
| d,g | Federal Home Loan Mtg Corp., Multifamily Structured Pass Through Certificates, CMBS, Series KIR1 Class X, 1.036% due 3/25/2026 | 33,375,934 | 867,967 |
| Federal Home Loan Mtg Corp., Seasoned Credit Risk Transfer, Whole Loan Securities Trust CMO, | |||
| Series 2020-2 Class A1C, 2.00% due 9/25/2030 | 6,590,895 | 5,959,096 | |
| Series 2020-2 Class MA, 2.00% due 11/25/2059 | 3,143,241 | 2,846,853 | |
| Federal Home Loan Mtg Corp., UMBS Collateral, | |||
| Pool SD1374, 3.00% due 3/1/2052 | 8,453,595 | 7,581,338 | |
| Pool SD1588, 5.00% due 9/1/2052 | 5,873,325 | 5,921,606 | |
| Pool SD1626, 5.00% due 10/1/2052 | 8,408,087 | 8,490,906 | |
| Pool SD8205 2.50% due 4/1/2052 | 20,547,950 | 17,700,936 | |
| Pool SD8206, 3.00% due 4/1/2052 | 18,487,431 | 16,577,202 | |
| Pool SD8212, 2.50% due 5/1/2052 | 20,507,315 | 17,666,291 | |
| Pool SD8219, 2.50% due 6/1/2052 | 11,761,868 | 10,147,855 | |
| Federal Home Loan Mtg Corp., UMBS Collateral , Pool RA7373, 3.00% due 5/1/2052 | 3,364,380 | 3,017,937 | |
| Federal Home Loan Mtg Corp., Whole Loan Securities Trust CMO, | |||
| d,e | Series 2017-SC01 Class M1, 3.647% due 12/25/2046 | 359,654 | 343,774 |
| d,e | Series 2017-SC02 Class M1, 3.863% due 5/25/2047 | 166,550 | 161,591 |
| Federal National Mtg Assoc., Pool BM6899, 2.50% due 1/1/2052 | 11,130,552 | 9,349,824 | |
| Federal National Mtg Assoc., CMO REMIC, Series 1994-37 Class L, 6.50% due 3/25/2024 | 81 | 81 | |
| Federal National Mtg Assoc., UMBS Collateral, | |||
| Pool BV2784, 2.50% due 2/1/2052 | 4,257,466 | 3,669,017 | |
| Pool BW8669, 5.00% due 9/1/2052 | 5,210,477 | 5,203,229 | |
| Pool CB1810, 3.00% due 10/1/2051 | 8,141,642 | 7,301,479 | |
| Pool CB3880, 5.00% due 6/1/2052 | 3,267,120 | 3,293,979 | |
| Pool FS2239, 2.50% due 7/1/2052 | 24,120,412 | 20,819,723 | |
| Pool MA4493 2.50% due 12/1/2051 | 15,885,925 | 13,706,411 | |
| Pool MA4512, 2.50% due 1/1/2052 | 44,393,949 | 38,248,479 | |
| Pool MA4578, 2.50% due 4/1/2052 | 11,896,248 | 10,248,825 | |
| Pool MA4598, 2.50% due 5/1/2052 | 15,840,118 | 13,646,538 | |
| Pool MA4599, 3.00% due 5/1/2052 | 23,363,164 | 20,945,458 | |
| Pool MA4623, 2.50% due 6/1/2052 | 46,003,748 | 39,694,206 | |
| Pool MA4730, 3.00% due 9/1/2052 | 22,270,144 | 19,960,561 | |
| First Republic Mortgage Trust, Whole Loan Securities Trust CMO, | |||
| d,e,g | Series 2020-1 Class A2IO, 1.244% due 4/25/2050 | 125,047,981 | 2,371,685 |
| d,e | Series 2020-1 Class B3, 2.884% due 4/25/2050 | 1,414,180 | 1,154,066 |
| d,e | Series 2020-1 Class B4, 2.884% due 4/25/2050 | 1,325,000 | 832,821 |
| d,e | Series 2020-1 Class B5, 2.884% due 4/25/2050 | 470,000 | 283,171 |
| d,e | Series 2020-1 Class B6, 2.884% due 4/25/2050 | 755,000 | 336,452 |
| 66 | Thornburg Taxable Fixed Income Funds Semi-Annual Report | See notes to financial statements. |
| Issuer-Description | SHARES/ PRINCIPAL AMOUNT | VALUE | |
| Flagstar Mortgage Trust, Whole Loan Securities Trust CMO, | |||
| d,e | Series 2017-1 Class 2A2, 3.00% due 3/25/2047 | $ 251,817 | $ 226,475 |
| d,e | Series 2018-3INV Class B4, 4.469% due 5/25/2048 | 5,347,729 | 4,684,050 |
| d,e | Series 2019-2 Class B3, 4.03% due 12/25/2049 | 3,622,424 | 3,057,412 |
| d,e,g | Series 2020-2 Class AX1, 0.669% due 8/25/2050 | 27,852,049 | 665,508 |
| d,e,g | Series 2020-2 Class AX2, 0.50% due 8/25/2050 | 4,773,095 | 92,206 |
| d,e | Series 2020-2 Class B4, 3.669% due 8/25/2050 | 207,743 | 168,351 |
| d,e | Series 2020-2 Class B5, 3.669% due 8/25/2050 | 620,384 | 497,538 |
| d,e | Series 2020-2 Class B6C, 3.669% due 8/25/2050 | 829,217 | 368,505 |
| d,e,g | Series 2021-13INV Class AX1, 0.187% due 12/30/2051 | 175,516,809 | 1,326,152 |
| d,e,g | Series 2021-13INV Class AX17, 0.18% due 12/30/2051 | 14,510,409 | 124,929 |
| d,e,g | Series 2021-13INV Class AX4, 0.50% due 12/30/2051 | 13,271,360 | 340,083 |
| d,e | Series 2021-13INV Class B4, 3.367% due 12/30/2051 | 2,601,817 | 1,609,128 |
| d,e | Series 2021-13INV Class B5, 3.367% due 12/30/2051 | 474,311 | 309,746 |
| d,e | Series 2021-13INV Class B6C, 3.222% due 12/30/2051 | 4,134,220 | 2,108,268 |
| d,e | FREMF Mortgage Trust, CMBS, Series 2016-KF24 Class B, 9.669% (LIBOR 1 Month + 5.00%) due 10/25/2026 | 313,311 | 295,580 |
| GCAT Trust, Whole Loan Securities Trust CMO, | |||
| d,e | Series 2019-NQM3 Class A1, 2.686% due 11/25/2059 | 780,578 | 726,529 |
| d,e | Series 2021-CM1 Class A, 1.469% due 4/25/2065 | 3,951,215 | 3,714,153 |
| d,e | Series 2021-CM2 Class A1, 2.352% due 8/25/2066 | 8,724,444 | 7,896,832 |
| d,e | Series 2021-NQM4 Class A1, 1.093% due 8/25/2066 | 4,164,725 | 3,231,064 |
| d,e | Series 2023-NQM1, 2.316% due 1/25/2066 | 6,112,000 | 3,737,535 |
| d | GS Mortgage-Backed Securities Corp. Trust, Whole Loan Securities Trust CMO, Series 2023-CCM1 Class A1, 6.65% due 8/25/2053 | 14,895,696 | 15,101,482 |
| GS Mortgage-Backed Securities Trust, Whole Loan Securities Trust CMO, | |||
| d,e,g | Series 2020-INV1 Class A11X, 3.418% due 10/25/2050 | 1,008,310 | 155,087 |
| d,e,g | Series 2020-INV1 Class A12X, 2.93% due 10/25/2050 | 12,073,002 | 1,591,670 |
| d,e,g | Series 2020-INV1 Class AIOS, 0.19% due 10/25/2050 | 63,635,486 | 457,864 |
| d,e,g | Series 2020-INV1 Class AX1, 0.005% due 10/25/2050 | 43,651,322 | 437 |
| d,e,g | Series 2020-INV1 Class AX2, 0.43% due 10/25/2050 | 2,175,826 | 26,314 |
| d,e,g | Series 2020-INV1 Class AX4, 0.928% due 10/25/2050 | 2,342,251 | 61,453 |
| d,e | Series 2020-INV1 Class B4, 3.857% due 10/25/2050 | 1,271,305 | 994,136 |
| d,e | Series 2020-INV1 Class B5, 3.857% due 10/25/2050 | 1,271,572 | 882,912 |
| d,e | Series 2020-INV1 Class B6, 3.857% due 10/25/2050 | 2,936,315 | 1,560,887 |
| d,e,g | Series 2020-INV1 Class BX, 0.357% due 10/25/2050 | 14,508,118 | 169,658 |
| d,e,g | Series 2020-PJ3 Class A11X, 3.50% due 10/25/2050 | 2,685,005 | 351,605 |
| d,e | Homeward Opportunities Fund I Trust, Whole Loan Securities Trust CMO, Series 2020-2 Class B3, 5.486% due 5/25/2065 | 14,305,000 | 11,874,699 |
| d,e | Homeward Opportunities Fund Trust, Whole Loan Securities Trust CMO, Series 2022-1 A Class A1, 5.082% due 7/25/2067 | 5,704,048 | 5,662,844 |
| Imperial Fund Mortgage Trust, Whole Loan Securities Trust CMO, | |||
| d,e | Series 2021-NQM3 Class B2, 4.15% due 11/25/2056 | 5,408,000 | 3,139,026 |
| d,e | Series 2021-NQM4 Class A1, 2.091% due 1/25/2057 | 4,512,762 | 3,804,117 |
| d,e | Series 2021-NQM4 Class B2, 4.10% due 1/25/2057 | 2,500,000 | 1,476,501 |
| d,e | Series 2022- NQM1 Class A1, 2.493% due 2/25/2067 | 17,820,118 | 15,456,685 |
| d,e | Series 2022-NQM2 Class B2, 4.20% due 3/25/2067 | 15,600,000 | 9,581,854 |
| d,e | Series 2022-NQM4 Class A, 4.767% due 6/25/2067 | 14,046,613 | 13,846,560 |
| d,e | Series 2022-NQM4 Class A3, 5.04% due 6/25/2067 | 4,254,668 | 3,973,927 |
| d,e | Series 2022-NQM6 Class A1, 6.819% due 10/25/2067 | 9,613,221 | 9,666,486 |
| JPMorgan Mortgage Trust, Whole Loan Securities Trust CMO, | |||
| d,e | Series 2015-4 Class B4, 3.548% due 6/25/2045 | 830,166 | 554,184 |
| d,e | Series 2016-5 Class B4, 5.934% due 12/25/2046 | 1,630,300 | 1,569,060 |
| d,e | Series 2016-5 Class B5, 5.934% due 12/25/2046 | 1,235,587 | 787,289 |
| d,e | Series 2017-5 Class B6, 3.30% due 10/26/2048 | 3,020,511 | 1,952,427 |
| d,e | Series 2019-8 Class B4, 4.166% due 3/25/2050 | 3,382,159 | 2,761,729 |
| d,e,g | Series 2020-3 Class AX1, 0.147% due 8/25/2050 | 10,181,791 | 37,530 |
| d,e,g | Series 2020-4 Class A11X, 0.633% (5.25% - LIBOR 1 Month) due 11/25/2050 | 1,981,014 | 145,868 |
| d,e,g | Series 2020-4 Class A3X, 0.50% due 11/25/2050 | 8,980,598 | 164,823 |
| d,e,g | Series 2020-4 Class AX1, 0.099% due 11/25/2050 | 33,171,095 | 90,033 |
| d,e,g | Series 2020-4 Class AX3, 3.50% due 11/25/2050 | 917,705 | 118,677 |
| d,e,g | Series 2020-4 Class AX4, 0.55% due 11/25/2050 | 2,118,035 | 42,739 |
| d,e | Series 2020-4 Class B4, 3.649% due 11/25/2050 | 1,309,130 | 1,024,551 |
| d,e | Series 2020-4 Class B5, 3.649% due 11/25/2050 | 603,707 | 433,365 |
| d,e | Series 2020-4 Class B6, 3.536% due 11/25/2050 | 1,069,000 | 377,868 |
| d,e | Series 2020-7 Class B4, 3.521% due 1/25/2051 | 620,916 | 502,544 |
| d,e | Series 2020-7 Class B5, 3.521% due 1/25/2051 | 433,131 | 242,654 |
| See notes to financial statements. | Thornburg Taxable Fixed Income Funds Semi-Annual Report | 67 |
Thornburg Strategic Income Fund | March 31, 2023 (Unaudited)
| Issuer-Description | SHARES/ PRINCIPAL AMOUNT | VALUE | |
| d,e | Series 2020-7 Class B6, 3.521% due 1/25/2051 | $ 588,627 | $ 187,948 |
| d,e | Series 2020-LTV1 Class B3A, 3.783% due 6/25/2050 | 2,743,648 | 2,285,341 |
| d,e | Series 2021-11 Class B5, 3.028% due 1/25/2052 | 2,356,340 | 1,259,298 |
| d,e | Series 2021-11 Class B6, 2.756% due 1/25/2052 | 2,747,935 | 1,068,054 |
| d,e | Series 2021-LTV2 Class A1, 2.52% due 5/25/2052 | 14,517,298 | 11,667,031 |
| d,e | Series 2022- LTV1 Class A1, 3.25% due 7/25/2052 | 18,294,467 | 15,338,419 |
| d,e | Series 2022-2 Class B4, 3.133% due 8/25/2052 | 3,289,360 | 1,930,811 |
| d,e | Series 2022-2 Class B5, 3.133% due 8/25/2052 | 1,749,576 | 853,781 |
| d,e | Series 2022-2 Class B6, 2.692% due 8/25/2052 | 1,841,056 | 431,841 |
| d,e | Series 2022-3 Class B4, 3.115% due 8/25/2052 | 2,699,619 | 1,565,418 |
| d,e | Series 2022-3 Class B5, 3.115% due 8/25/2052 | 1,717,584 | 630,900 |
| d,e | Series 2022-3 Class B6, 2.238% due 8/25/2052 | 1,471,813 | 345,310 |
| d,e | Series 2022-DSC1 Class A1, 4.75% due 1/25/2063 | 9,441,746 | 9,068,915 |
| d,e | Series 2023-1 Class A2, 5.50% due 6/25/2053 | 7,567,355 | 7,458,290 |
| d,e | JPMorgan Wealth Management, Whole Loan Securities Trust CMO, Series 2021-CL1 Class M1, 5.86% (SOFR30A + 1.30%) due 3/25/2051 | 4,478,502 | 3,964,697 |
| d,e | Legacy Mortgage Asset Trust, Whole Loan Securities Trust CMO, Series 2019-GS7 Class A1, 6.25% due 11/25/2059 | 2,202,689 | 2,199,453 |
| Mello Mortgage Capital Acceptance, Whole Loan Securities Trust CMO, | |||
| d,e,g | Series 2021-INV2 Class AX1, 0.127% due 8/25/2051 | 105,087,176 | 486,491 |
| d,e,g | Series 2021-INV2 Class AX4, 0.70% due 8/25/2051 | 7,200,385 | 267,450 |
| d,e | Series 2021-INV2 Class B5, 3.327% due 8/25/2051 | 319,525 | 188,500 |
| d,e | Series 2021-INV2 Class B6, 2.994% due 8/25/2051 | 1,536,806 | 623,451 |
| d,e,g | Series 2021-INV3 Class AX1, 0.167% due 10/25/2051 | 125,840,768 | 824,962 |
| d,e,g | Series 2021-INV3 Class AX4, 0.55% due 10/25/2051 | 10,236,040 | 279,054 |
| d,e | Series 2021-INV3 Class B5, 3.217% due 10/25/2051 | 442,649 | 258,644 |
| d,e | Series 2021-INV3 Class B6, 2.983% due 10/25/2051 | 1,939,882 | 802,063 |
| d | Merrill Lynch Mortgage Investors Trust, Whole Loan Securities Trust CMO, Series 2004-A4 Class M1, 3.533% due 8/25/2034 | 55,684 | 50,725 |
| d,e | Metlife Securitization Trust, Whole Loan Securities Trust CMO, Series 2019-1A Class A1A, 3.75% due 4/25/2058 | 506,600 | 490,917 |
| MFA Trust, Whole Loan Securities Trust CMO, | |||
| d,e | Series 2020-NQM3 Class M1, 2.654% due 1/26/2065 | 800,000 | 617,444 |
| d,e | Series 2021-INV1 Class A1, 0.852% due 1/25/2056 | 5,510,518 | 4,887,067 |
| d,e | Series 2021-INV2 Class A1, 1.906% due 11/25/2056 | 9,662,289 | 8,055,778 |
| d,e | Series 2022-INV1 Class A3, 4.25% due 4/25/2066 | 4,950,000 | 3,888,507 |
| d,e | Series 2022-NQM3 Class A1, 5.57% due 9/25/2067 | 9,537,515 | 9,569,431 |
| d,e | MFRA Trust, Whole Loan Securities Trust CMO, Series 2022-CHM1 Class A1, 3.875% due 9/25/2056 | 8,693,368 | 8,179,648 |
| d,e | Mill City Mortgage Loan Trust, Whole Loan Securities Trust CMO, Series 2023-NQM1 Class A1, 6.05% due 10/25/2067 | 19,902,127 | 19,701,775 |
| New Residential Mortgage Loan Trust, Whole Loan Securities Trust CMO, | |||
| d,e | Series 2017-3A Class A1, 4.00% due 4/25/2057 | 965,398 | 922,052 |
| d,e | Series 2017-4A Class A1, 4.00% due 5/25/2057 | 793,412 | 736,428 |
| d,e | Series 2017-5A Class A1, 6.345% (LIBOR 1 Month + 1.50%) due 6/25/2057 | 483,108 | 470,807 |
| d,e | Series 2017-6A Class A1, 4.00% due 8/27/2057 | 431,578 | 404,204 |
| d,e | Series 2018-1A Class A1A, 4.00% due 12/25/2057 | 803,089 | 760,234 |
| d,e,g | Series 2021-INV1 Class AX1, 0.753% due 6/25/2051 | 106,007,797 | 3,938,221 |
| d,e | Series 2021-INV1 Class B5, 3.253% due 6/25/2051 | 1,204,246 | 767,090 |
| d,e | Series 2021-INV1 Class B6, 1.454% due 6/25/2051 | 2,118,001 | 937,734 |
| d,e | Series 2022-NQM3 Class A1, 3.90% due 4/25/2062 | 19,481,507 | 17,624,745 |
| d,e | OBX Trust, Whole Loan Securities Trust CMO, Series 2021-NQM2 Class A1, 1.101% due 5/25/2061 | 6,287,875 | 4,825,075 |
| d,e | Onslow Bay Mortgage Loan Trust, Whole Loan Securities Trust CMO, Series 2021-NQM4 Class A1, 1.957% due 10/25/2061 | 16,820,532 | 13,693,915 |
| PRKCM Trust, Whole Loan Securities Trust CMO, | |||
| d,e | Series 2021-AFC1 Class A1, 1.51% due 8/25/2056 | 4,810,114 | 3,779,792 |
| d,e | Series 2021-AFC1 Class B2, 3.95% due 8/25/2056 | 2,729,000 | 1,531,794 |
| d,e | PRPM LLC, Whole Loan Securities Trust CMO, Series 2022-NQM1 Class A1, 5.50% due 8/25/2067 | 9,666,481 | 9,437,134 |
| PRPM Trust, Whole Loan Securities Trust CMO, | |||
| d,e | Series 2022-INV1 Class A1, 4.40% due 4/25/2067 | 28,745,860 | 27,755,417 |
| d,e | Series 2022-INV1 Class A3, 4.448% due 4/25/2067 | 9,657,817 | 8,795,166 |
| d,e | Rate Mortgage Trust, Whole Loan Securities Trust CMO, Series 2022-J1 Class A9, 2.50% due 1/25/2052 | 13,477,678 | 11,628,733 |
| d,e | Saluda Grade Alternative Mortgage Trust, Whole Loan Securities Trust CMO, Series 2020-FIG1 Class C, due 9/25/2050 | 5,428,595 | 1,359,575 |
| Sequoia Mortgage Trust, Whole Loan Securities Trust CMO, | |||
| d,e | Series 2015-4 Class B4, 3.132% due 11/25/2030 | 1,686,000 | 1,488,073 |
| d,e | Series 2016-3 Class B3, 3.613% due 11/25/2046 | 2,698,747 | 2,063,544 |
| d,e | Series 2017-7 Class B3, 3.724% due 10/25/2047 | 1,360,787 | 1,185,028 |
| d,e | Series 2018-7 Class B4, 4.254% due 9/25/2048 | 1,802,000 | 1,332,352 |
| 68 | Thornburg Taxable Fixed Income Funds Semi-Annual Report | See notes to financial statements. |
| Issuer-Description | SHARES/ PRINCIPAL AMOUNT | VALUE | |
| SG Residential Mortgage Trust, Whole Loan Securities Trust CMO, | |||
| d,e | Series 2019-3 Class A1, 2.703% due 9/25/2059 | $ 146,705 | $ 141,797 |
| d,e,g | Series 2019-3 Class AIOS, 0.375% due 9/25/2059 | 14,519,388 | 70,820 |
| d,e | Series 2019-3 Class B2, 5.663% due 9/25/2059 | 1,978,000 | 1,550,769 |
| d,e | Series 2019-3 Class B3, 5.936% due 9/25/2059 | 842,000 | 587,985 |
| e | Series 2019-3 Class XS1, due 9/25/2059 | 14,369,863 | 517 |
| e | Series 2019-3 Class XS2, due 9/25/2059 | 14,369,408 | 536,797 |
| d,e | Series 2020-2 Class A3, 1.895% due 5/25/2065 | 1,315,543 | 1,162,562 |
| d,e | Series 2021-2 Class A1, 1.737% due 12/25/2061 | 6,753,979 | 5,519,298 |
| d,e | Series 2022-1 Class B2, 3.982% due 3/27/2062 | 4,204,000 | 2,306,860 |
| d,e | Shellpoint Co-Originator Trust, Whole Loan Securities Trust CMO, Series 2016-1 Class B4, 3.558% due 11/25/2046 | 2,750,486 | 2,154,054 |
| d,e | Starwood Mortgage Residential Trust, Whole Loan Securities Trust CMO, Series 2021-5 Class A1, 1.92% due 9/25/2066 | 16,839,124 | 13,710,388 |
| TIAA Bank Mortgage Loan Trust, Whole Loan Securities Trust CMO, | |||
| d,e | Series 2018-2 Class B3, 3.692% due 7/25/2048 | 2,551,044 | 2,149,866 |
| d,e | Series 2018-2 Class B4, 3.692% due 7/25/2048 | 2,040,000 | 1,256,051 |
| Towd Point Mortgage Trust, Whole Loan Securities Trust CMO, | |||
| d,e | Series 2017-1 Class A1, 2.75% due 10/25/2056 | 229,523 | 225,106 |
| d,e | Series 2018-2 Class A1, 3.25% due 3/25/2058 | 1,831,738 | 1,755,231 |
| d,e | TRK Trust, Whole Loan Securities Trust CMO, Series 2022-INV2 Class A1, 4.35% due 6/25/2057 | 12,119,811 | 11,579,091 |
| d,e | Vista Point Securitization Trust, Whole Loan Securities Trust CMO, Series 2020-2 Class A2, 1.986% due 4/25/2065 | 1,230,973 | 1,106,277 |
| Wells Fargo Commercial Mortgage Trust, CMBS, Series 2016-C34 Class A2, 2.603% due 6/15/2049 | 1,257,056 | 1,230,546 | |
| Wells Fargo Mortgage Backed Securities Trust, Whole Loan Securities Trust CMO, | |||
| d,e,g | Series 2021-INV1 Class AIO2, 0.50% due 8/25/2051 | 94,768,089 | 2,359,119 |
| d,e | Series 2021-INV1 Class B4, 3.317% due 8/25/2051 | 1,667,865 | 1,057,730 |
| d,e | Series 2021-INV1 Class B5, 3.317% due 8/25/2051 | 1,338,374 | 775,333 |
| d,e | Series 2021-INV1 Class B6, 3.317% due 8/25/2051 | 1,031,830 | 360,139 |
| Total Mortgage Backed (Cost $993,364,974) | 932,939,278 | ||
| Loan Participations — 0.9% | |||
| Consumer Durables & Apparel — 0.1% | |||
| Textiles, Apparel & Luxury Goods — 0.1% | |||
| j | Hanesbrands, Inc., 8.557% (SOFR + 3.75%) due 3/8/2030 | 5,000,000 | 4,975,000 |
| 4,975,000 | |||
| Consumer Services — 0.1% | |||
| Hotels, Restaurants & Leisure — 0.1% | |||
| j | TKC Holdings, Inc., 10.34% (LIBOR 1 Month + 5.50%) due 5/15/2028 | 4,570,590 | 3,846,929 |
| 3,846,929 | |||
| Household & Personal Products — 0.1% | |||
| Household Products — 0.1% | |||
| j | Energizer Holdings, Inc., 7.116% (SOFR + 2.25%) due 12/22/2027 | 4,930,942 | 4,881,632 |
| 4,881,632 | |||
| Media & Entertainment — 0.3% | |||
| Media — 0.3% | |||
| j | ABG Intermediate Holdings 2 LLC, 8.407% (SOFR + 3.50%) due 12/21/2028 | 9,240,175 | 9,086,141 |
| j | DirecTV Financing LLC, 9.84% (LIBOR 1 Month + 5.00%) due 8/2/2027 | 8,996,000 | 8,639,219 |
| 17,725,360 | |||
| Semiconductors & Semiconductor Equipment — 0.1% | |||
| Information Technology Services — 0.1% | |||
| j | Xperi Corporation, 8.352% (LIBOR 1 Month + 3.50%) due 6/8/2028 | 10,028,209 | 9,886,109 |
| 9,886,109 | |||
| Software & Services — 0.2% | |||
| Internet Software & Services — 0.1% | |||
| j | Titan AcquisitionCo New Zealand Ltd., 9.159% (LIBOR 3 Month + 4.00%) due 10/18/2028 | 7,385,400 | 7,173,070 |
| Software — 0.1% | |||
| j | GoTo Group, Inc., 9.59% (LIBOR 1 Month + 4.75%) due 8/31/2027 | 6,692,488 | 3,786,810 |
| 10,959,880 |
| See notes to financial statements. | Thornburg Taxable Fixed Income Funds Semi-Annual Report | 69 |
Thornburg Strategic Income Fund | March 31, 2023 (Unaudited)
| Issuer-Description | SHARES/ PRINCIPAL AMOUNT | VALUE | |
| Total Loan Participations (Cost $54,645,008) | 52,274,910 | ||
| Short-Term Investments — 8.7% | |||
| k | Thornburg Capital Management Fund | 52,633,057 | $ 526,330,566 |
| Total Short-Term Investments (Cost $526,330,566) | 526,330,566 | ||
| Total Investments — 97.8% (Cost $6,193,251,967) | $5,924,282,628 | ||
| Other Assets Less Liabilities — 2.2% | 131,366,728 | ||
| Net Assets — 100.0% | $6,055,649,356 |
| Outstanding Forward Currency Contracts To Buy Or Sell At March 31, 2023 | |||||||
| Contract Description | Contract Party* | Buy/Sell | Contract Amount | Contract Value Date | Value USD | Unrealized Appreciation | Unrealized Depreciation |
| Euro | SSB | Sell | 78,509,100 | 9/25/2023 | 85,904,429 | $ — | $ (568,885) |
| Net unrealized appreciation (depreciation) | $ (568,885) | ||||||
| * | Counterparty includes State Street Bank and Trust Company ("SSB"). |
| 70 | Thornburg Taxable Fixed Income Funds Semi-Annual Report | See notes to financial statements. |
| Footnote Legend | |
| a | Security currently fair valued by the Valuation and Pricing Committee. |
| b | Non-income producing. |
| c | Securities are perpetual and, thus, do not have a predetermined maturity date. The date shown, if applicable, reflects the next call date. |
| d | Variable, floating, step, or fixed to floating rate securities are securities for which interest rate changes are based on changes in a designated base rate or on a predetermined schedule. The rates shown are those in effect on March 31, 2023. |
| e | Securities exempt from registration under Rule 144A of the Securities Act of 1933, as amended. These securities are restricted but liquid and may only be resold in the ordinary course of business in transactions exempt from registration, normally to qualified institutional buyers. As of March 31, 2023, the aggregate value of these securities in the Fund’s portfolio was $3,234,426,104, representing 53.41% of the Fund’s net assets. |
| f | Yankee bond denominated in U.S. dollars and is issued in the U.S. by foreign banks and corporations. |
| g | Interest only. |
| h | When-issued security. |
| i | Bond in default. |
| j | The stated coupon rate represents the greater of the LIBOR or the LIBOR floor rate plus a spread at March 31, 2023. |
| k | Investment in Affiliates. |
To simplify the listings of securities, abbreviations are used per the table below:
| ABS | Asset Backed Securities |
| ARM | Adjustable Rate Mortgage |
| BSBY3M | Bloomberg Short Term Bank Yield 3 Month |
| CMBS | Commercial Mortgage-Backed Securities |
| CMO | Collateralized Mortgage Obligation |
| CMT | Constant Maturity Rate |
| DAC | Designated Activity Company |
| EUR | Denominated in Euro |
| FCB | Farm Credit Bank |
| GO | General Obligation |
| H15T1Y | US Treasury Yield Curve Rate T-Note Constant Maturity 1 Year |
| IDR | Denominated in Indonesian Rupiah |
| LIBOR | London Interbank Offered Rates |
| Mtg | Mortgage |
| PIK | Payment-in-kind |
| REMIC | Real Estate Mortgage Investment Conduit |
| SOFR | Secured Overnight Financing Rate |
| SOFR30A | Secured Overnight Financing Rate 30-Day Average |
| SOFRINDX | Secured Overnight Financing Rate Index |
| SPV | Special Purpose Vehicle |
| TSFR1M | Term SOFR 1 Month |
| TSFR3M | Term SOFR 3 Month |
| UMBS | Uniform Mortgage Backed Securities |
| USD | Unified School District |
| See notes to financial statements. | Thornburg Taxable Fixed Income Funds Semi-Annual Report | 71 |
Thornburg Strategic Income Fund | March 31, 2023 (Unaudited)
| COUNTRY EXPOSURE * (percent of net assets) | |
| United States | 75.5% |
| Canada | 1.9% |
| United Kingdom | 1.0% |
| Japan | 0.9% |
| Mexico | 0.9% |
| China | 0.7% |
| Cayman Islands | 0.6% |
| Australia | 0.6% |
| Belgium | 0.6% |
| Germany | 0.6% |
| United Arab Emirates | 0.5% |
| Russian Federation | 0.4% |
| France | 0.4% |
| Italy | 0.4% |
| South Korea | 0.4% |
| Nigeria | 0.4% |
| Colombia | 0.3% |
| Brazil | 0.3% |
| Morocco | 0.3% |
| Guatemala | 0.2% |
| Bermuda | 0.2% |
| Dominican Republic | 0.2% |
| Norway | 0.2% |
| Saudi Arabia | 0.2% |
| South Africa | 0.2% |
| Switzerland | 0.2% |
| Ireland | 0.2% |
| Spain | 0.1% |
| Indonesia | 0.1% |
| New Zealand | 0.1% |
| Israel | 0.1% |
| Panama | 0.1% |
| Jamaica | 0.1% |
| Kuwait | 0.1% |
| India | 0.1% |
| Chile | 0.0%** |
| Other Assets Less Liabilities | 10.9% |
| * | Holdings are classified by country of risk as determined by MSCI and Bloomberg. |
| ** | Country percentage was less than 0.1%. |
| 72 | Thornburg Taxable Fixed Income Funds Semi-Annual Report | See notes to financial statements. |
March 31, 2023 (Unaudited)
| THORNBURG LIMITED TERM U.S. GOVERNMENT FUND | THORNBURG LIMITED TERM INCOME FUND | THORNBURG ULTRA SHORT INCOME FUND | THORNBURG STRATEGIC INCOME FUND | |
| ASSETS | ||||
| Investments at cost | ||||
| Non-affiliated issuers | $ 209,947,026 | $ 7,592,153,904 | $ 220,519,276 | $ 5,666,921,401 |
| Non-controlled affiliated issuers | - | 117,560,015 | 23,981,255 | 526,330,566 |
| Investments at value | ||||
| Non-affiliated issuers | 198,800,338 | 7,143,277,781 | 219,756,121 | 5,397,952,062 |
| Non-controlled affiliated issuers | - | 117,560,015 | 23,981,255 | 526,330,566 |
| Cash | 895 | 80,276,135 | 4,068,708 | 58,911,243 |
| Foreign currency at value (a) | - | 7,295 | 148 | 9,330 |
| Receivable for investments sold | - | 4,078,594 | - | 1,628,282 |
| Receivable for fund shares sold | 265,017 | 10,598,665 | 2,129,284 | 48,823,764 |
| Receivable from investment advisor | - | - | 5,436 | - |
| Dividends receivable | - | 430,214 | 87,893 | 2,207,319 |
| Principal and interest receivable | 529,069 | 37,842,803 | 1,112,005 | 42,415,050 |
| Prepaid expenses and other assets | 65,820 | 227,541 | 41,540 | 313,623 |
| Total Assets | 199,661,139 | 7,394,299,043 | 251,182,390 | 6,078,591,239 |
| Liabilities | ||||
| Unrealized depreciation on forward currency contracts | - | - | - | 568,885 |
| Payable for investments purchased | - | 4,352,893 | 87,893 | 7,459,838 |
| Payable for fund shares redeemed | 549,435 | 16,402,231 | 867,561 | 10,824,138 |
| Payable to investment advisor and other affiliates | 103,989 | 2,589,544 | - | 2,209,416 |
| Deferred taxes payable | - | - | - | 23,819 |
| Accounts payable and accrued expenses | 105,949 | 1,739,615 | 26,966 | 358,430 |
| Dividends payable | 101,280 | 2,409,094 | 1,917 | 1,497,357 |
| Total Liabilities | 860,653 | 27,493,377 | 984,337 | 22,941,883 |
| Net Assets | $ 198,800,486 | $ 7,366,805,666 | $ 250,198,053 | $ 6,055,649,356 |
| NET ASSETS CONSIST OF | ||||
| Net capital paid in on shares of beneficial interest | $ 237,528,071 | $ 8,076,770,482 | $ 251,650,741 | $ 6,386,949,476 |
| Accumulated loss | (38,727,585) | (709,964,816) | (1,452,688) | (331,300,120) |
| Net Assets | $ 198,800,486 | $ 7,366,805,666 | $ 250,198,053 | $ 6,055,649,356 |
March 31, 2023 (Unaudited)
| THORNBURG LIMITED TERM U.S. GOVERNMENT FUND | THORNBURG LIMITED TERM INCOME FUND | THORNBURG ULTRA SHORT INCOME FUND | THORNBURG STRATEGIC INCOME FUND | |
| NET ASSET VALUE | ||||
| Class A Shares: | ||||
| Net assets applicable to shares outstanding | $ 50,527,574 | $ 584,155,741 | $ 30,658,449 | $ 275,961,455 |
| Shares outstanding | 4,241,749 | 46,055,754 | 2,521,311 | 24,481,204 |
| Net asset value and redemption price per share | $ 11.91 | $ 12.68 | $ 12.16 | $ 11.27 |
| Maximum offering price per share (net asset value, plus 2.25% of offering price) | $ 12.18 | $ 12.97 | $ 12.44 | $ 11.80 * |
| Class C Shares: | ||||
| Net assets applicable to shares outstanding | 4,518,289 | 174,778,216 | - | 90,919,747 |
| Shares outstanding | 377,182 | 13,802,119 | - | 8,077,032 |
| Net asset value and redemption price per share** | 11.98 | 12.66 | - | 11.26 |
| Class C2 Shares: | ||||
| Net assets applicable to shares outstanding | 792,998 | 8,136,523 | - | - |
| Shares outstanding | 66,176 | 642,480 | - | - |
| Net asset value and redemption price per share** | 11.98 | 12.66 | - | - |
| Class I Shares: | ||||
| Net assets applicable to shares outstanding | 137,185,666 | 6,290,234,092 | 219,539,604 | 5,496,980,533 |
| Shares outstanding | 11,518,118 | 495,808,639 | 18,067,627 | 488,833,310 |
| Net asset value and redemption price per share | 11.91 | 12.69 | 12.15 | 11.25 |
| Class R3 Shares: | ||||
| Net assets applicable to shares outstanding | 3,293,931 | 43,889,864 | - | 606,623 |
| Shares outstanding | 276,208 | 3,457,992 | - | 53,866 |
| Net asset value and redemption price per share | 11.93 | 12.69 | - | 11.26 |
| Class R4 Shares: | ||||
| Net assets applicable to shares outstanding | 907,202 | 18,302,823 | - | 2,699,097 |
| Shares outstanding | 76,199 | 1,443,582 | - | 239,741 |
| Net asset value and redemption price per share | 11.91 | 12.68 | - | 11.26 |
| Class R5 Shares: | ||||
| Net assets applicable to shares outstanding | 1,574,826 | 83,076,559 | - | 57,811,386 |
| Shares outstanding | 132,118 | 6,550,426 | - | 5,139,252 |
| Net asset value and redemption price per share | 11.92 | 12.68 | - | 11.25 |
| Class R6 Shares: | ||||
| Net assets applicable to shares outstanding | - | 164,231,848 | - | 130,670,515 |
| Shares outstanding | - | 12,922,708 | - | 11,584,833 |
| Net asset value and redemption price per share | - | 12.71 | - | 11.28 |
| (a) | Cost of foreign currency is $0; $7,019; $140; $9,369 respectively. |
| * | Net asset value, plus 4.50% of offering price. |
| ** | Redemption price per share is equal to net asset value less any applicable contingent deferred sales charge. |
Six Months Ended March 31, 2023 (Unaudited)
| THORNBURG LIMITED TERM U.S. GOVERNMENT FUND | THORNBURG LIMITED TERM INCOME FUND | THORNBURG ULTRA SHORT INCOME FUND | THORNBURG STRATEGIC INCOME FUND | |
| INVESTMENT INCOME | ||||
| Dividend income | ||||
| Non-affiliated issuers | $ - | $ 370,388 | $ - | $ 556,601 |
| Non-controlled affiliated issuers | - | 4,248,803 | 717,070 | 11,388,138 |
| Interest income | 2,668,754 | 122,152,736 | 4,830,315 | 116,988,459 |
| Total Income | 2,668,754 | 126,771,927 | 5,547,385 | 128,933,198 |
| EXPENSES | ||||
| Investment management fees | 397,556 | 11,898,573 | 317,630 | 14,776,136 |
| Administration fees | 94,050 | 3,355,645 | 112,656 | 2,344,084 |
| Distribution and service fees | ||||
| Class A Shares | 67,800 | 742,543 | 35,933 | 344,685 |
| Class C Shares | 12,458 | 483,964 | - | 423,845 |
| Class C2 Shares | 2,045 | 28,041 | - | - |
| Class R3 Shares | 8,308 | 121,652 | - | 1,552 |
| Class R4 Shares | 1,274 | 22,371 | - | 2,849 |
| Transfer agent fees | ||||
| Class A Shares | 29,061 | 309,992 | 23,768 | 208,223 |
| Class C Shares | 3,814 | 67,913 | - | 28,655 |
| Class C2 Shares | 620 | 3,480 | - | - |
| Class I Shares | 65,308 | 3,414,260 | 82,075 | 2,229,816 |
| Class R3 Shares | 3,683 | 21,434 | - | 1,169 |
| Class R4 Shares | 2,362 | 29,971 | - | 6,119 |
| Class R5 Shares | 2,932 | 152,015 | - | 52,620 |
| Class R6 Shares | - | 17,260 | - | 8,352 |
| Registration and filing fees | ||||
| Class A Shares | 7,916 | 12,504 | 10,848 | 16,408 |
| Class C Shares | 7,343 | 8,971 | - | 10,232 |
| Class C2 Shares | 3,047 | 10,145 | - | - |
| Class I Shares | 7,786 | 56,815 | 16,930 | 79,563 |
| Class R3 Shares | 6,389 | 7,029 | - | 6,586 |
| Class R4 Shares | 6,799 | 7,185 | - | 7,239 |
| Class R5 Shares | 6,145 | 6,518 | - | 6,592 |
| Class R6 Shares | - | 7,887 | - | 8,042 |
| Custodian fees | 34,165 | 235,538 | 39,148 | 174,250 |
| Professional fees | 24,783 | 78,486 | 23,239 | 75,971 |
| Trustee and officer fees | 6,903 | 242,267 | 8,442 | 161,809 |
| Other expenses | 18,409 | 361,139 | 9,385 | 218,879 |
| Total Expenses | 820,956 | 21,703,598 | 680,054 | 21,193,676 |
| Less: | ||||
| Expenses reimbursed | (36,864) | (1,648,429) | (246,847) | (2,853,661) |
| Investment management fees waived | - | - | (16,117) | (1,446,768) |
| Net Expenses | 784,092 | 20,055,169 | 417,090 | 16,893,247 |
| Net Investment Income (Loss) | $ 1,884,662 | $ 106,716,758 | $ 5,130,295 | $ 112,039,951 |
| THORNBURG LIMITED TERM U.S. GOVERNMENT FUND | THORNBURG LIMITED TERM INCOME FUND | THORNBURG ULTRA SHORT INCOME FUND | THORNBURG STRATEGIC INCOME FUND | |
| REALIZED AND UNREALIZED GAIN (LOSS) | ||||
| Net realized gain (loss) on: | ||||
| Non-affiliated issuer investments | $ (6,802,400) | $ (130,662,660) | $ 5,660 | $ (20,989,435) |
| Forward currency contracts | - | - | - | (4,903,023) |
| Foreign currency transactions | - | - | - | (18,200) |
| Net realized gain (loss) | (6,802,400) | (130,662,660) | 5,660 | (25,910,658) |
| Net change in unrealized appreciation (depreciation) on: | ||||
| Non-affiliated issuers investments* | 11,858,807 | 314,561,430 | 957,206 | 162,229,132 |
| Forward currency contracts | - | - | - | (767,013) |
| Foreign currency translations | - | 335 | 10 | 65,367 |
| Change in net unrealized appreciation (depreciation) | 11,858,807 | 314,561,765 | 957,216 | 161,527,486 |
| Net Realized and Unrealized Gain (Loss) | 5,056,407 | 183,899,105 | 962,876 | 135,616,828 |
| Change in Net Assets Resulting from Operations | $ 6,941,069 | $ 290,615,863 | $ 6,093,171 | $ 247,656,779 |
| * Net of change in deferred taxes | $ - | $ - | $ - | $ (16,916) |
| THORNBURG LIMITED TERM U.S. GOVERNMENT FUND | THORNBURG LIMITED TERM INCOME FUND | |||
| Six Months Ended March 31, 2023* | Year Ended September 30, 2022 | Six Months Ended March 31, 2023* | Year Ended September 30, 2022 | |
| INCREASE (DECREASE) IN NET ASSETS FROM | ||||
| OPERATIONS | ||||
| Net investment income (loss) | $ 1,884,662 | $ 3,351,500 | $ 106,716,758 | $ 173,410,217 |
| Net realized gain (loss) | (6,802,400) | (3,914,810) | (130,662,660) | (112,711,590) |
| Net change in unrealized appreciation (depreciation) | 11,858,807 | (25,443,104) | 314,561,765 | (918,159,951) |
| Net Increase (Decrease) in Net Assets Resulting from Operations | 6,941,069 | (26,006,414) | 290,615,863 | (857,461,324) |
| DIVIDENDS TO SHAREHOLDERS | ||||
| From distributable earnings | ||||
| Class A Shares | (488,670) | (1,077,301) | (7,726,025) | (12,209,248) |
| Class C Shares | (36,974) | (89,707) | (2,292,647) | (4,274,325) |
| Class C2 Shares | (4,988) | (5,977) | (92,305) | (138,924) |
| Class I Shares | (1,525,794) | (3,332,395) | (93,034,005) | (162,307,895) |
| Class R3 Shares | (29,102) | (73,375) | (580,557) | (840,905) |
| Class R4 Shares | (8,852) | (23,597) | (215,197) | (192,235) |
| Class R5 Shares | (17,985) | (37,478) | (1,371,096) | (2,585,649) |
| Class R6 Shares | - | - | (2,570,107) | (3,874,795) |
| FUND SHARE TRANSACTIONS | ||||
| Class A Shares | (7,756,498) | (27,886,841) | (28,869,081) | (142,969,791) |
| Class C Shares | (1,419,491) | (3,412,668) | (50,934,375) | (108,485,863) |
| Class C2 Shares | 546,871 | (393,489) | (1,691,376) | (2,056,363) |
| Class I Shares | (22,041,011) | (43,028,059) | (755,071,911) | (1,058,145,415) |
| Class R3 Shares | (251,811) | (3,567,935) | (6,886,380) | 3,797,881 |
| Class R4 Shares | (260,258) | (677,402) | (128,796) | 8,552,330 |
| Class R5 Shares | (464,718) | 38,259 | (30,619,439) | (9,631,811) |
| Class R6 Shares | - | - | (20,595,846) | 73,435,426 |
| Net Increase (Decrease) in Net Assets | (26,818,212) | (109,574,379) | (712,063,280) | (2,279,388,906) |
| NET ASSETS | ||||
| Beginning of Period | 225,618,698 | 335,193,077 | 8,078,868,946 | 10,358,257,852 |
| End of Period | $ 198,800,486 | $ 225,618,698 | $ 7,366,805,666 | $ 8,078,868,946 |
| * | Unaudited. |
| THORNBURG ULTRA SHORT INCOME FUND | THORNBURG STRATEGIC INCOME FUND | |||
| Six Months Ended March 31, 2023* | Year Ended September 30, 2022 | Six Months Ended March 31, 2023* | Year Ended September 30, 2022 | |
| INCREASE (DECREASE) IN NET ASSETS FROM | ||||
| OPERATIONS | ||||
| Net investment income (loss) | $ 5,130,295 | $ 1,768,496 | $ 112,039,951 | $ 146,720,630 |
| Net realized gain (loss) | 5,660 | (408,939) | (25,910,658) | (32,329,695) |
| Net change in unrealized appreciation (depreciation) | 957,216 | (1,856,585) | 161,527,486 | (489,494,142) |
| Net Increase (Decrease) in Net Assets Resulting from Operations | 6,093,171 | (497,028) | 247,656,779 | (375,103,207) |
| DIVIDENDS TO SHAREHOLDERS | ||||
| From distributable earnings | ||||
| Class A Shares | (695,666) | (283,888) | (5,383,229) | (12,129,707) |
| Class C Shares | - | - | (1,366,240) | (2,428,639) |
| Class I Shares | (4,471,846) | (1,662,348) | (102,894,875) | (139,146,370) |
| Class R3 Shares | - | - | (11,361) | (23,381) |
| Class R4 Shares | - | - | (42,167) | (67,012) |
| Class R5 Shares | - | - | (1,107,384) | (2,091,728) |
| Class R6 Shares | - | - | (2,578,448) | (4,010,518) |
| FUND SHARE TRANSACTIONS | ||||
| Class A Shares | (3,601,239) | 23,598,176 | (52,769,048) | (11,367,670) |
| Class C Shares | - | - | 8,399,021 | (9,033,972) |
| Class I Shares | 72,983,849 | 105,217,615 | 1,195,615,845 | 1,386,260,132 |
| Class R3 Shares | - | - | (50,556) | (105,090) |
| Class R4 Shares | - | - | 599,581 | 166,961 |
| Class R5 Shares | - | - | 16,018,767 | (17,150,444) |
| Class R6 Shares | - | - | 18,339,484 | 44,974,373 |
| Net Increase (Decrease) in Net Assets | 70,308,269 | 126,372,527 | 1,320,426,169 | 858,743,728 |
| NET ASSETS | ||||
| Beginning of Period | 179,889,784 | 53,517,257 | 4,735,223,187 | 3,876,479,459 |
| End of Period | $ 250,198,053 | $ 179,889,784 | $ 6,055,649,356 | $ 4,735,223,187 |
| * | Unaudited. |
March 31, 2023 (Unaudited)
March 31, 2023 (Unaudited)
| Class A | Class C | Class C2 | Class I | Class R3 | Class R4 | Class R5 | Class R6 | |
| Limited Term U.S. Government Fund | X | X | X | X | X | X | X | |
| Limited Term Income Fund | X | X | X | X | X | X | X | X |
| Ultra Short Income Fund | X | X | ||||||
| Strategic Income Fund | X | X | X | X | X | X | X |
March 31, 2023 (Unaudited)
March 31, 2023 (Unaudited)
March 31, 2023 (Unaudited)
| LIMITED TERM U.S. GOVERNMENT FUND | TOTAL | LEVEL 1 | LEVEL 2 | LEVEL 3 |
| Assets | ||||
| Investments in Securities | ||||
| Asset Backed Securities | $ 935,983 | $ — | $ 935,983 | $ — |
| Corporate Bonds | 3,368,815 | — | 3,368,815 | — |
| U.S. Treasury Securities | 38,206,635 | 38,206,635 | — | — |
| U.S. Government Agencies | 14,668,633 | — | 14,668,633 | — |
| Mortgage Backed | 127,167,844 | — | 127,167,844 | — |
| Short-Term Investments | ||||
| U.S. Government Agencies | 2,437,000 | — | 2,437,000 | — |
| U.S. Treasury Securities | 12,015,428 | 6,023,502 | 5,991,926 | — |
| Total Investments in Securities | $ 198,800,338 | $ 44,230,137 | $ 154,570,201 | $ — |
| Total Assets | $ 198,800,338 | $ 44,230,137 | $ 154,570,201 | $ — |
| LIMITED TERM INCOME FUND | TOTAL | LEVEL 1 | LEVEL 2 | LEVEL 3 |
| Assets | ||||
| Investments in Securities | ||||
| Preferred Stock | $ 26,362,875 | $ — | $ — | $ 26,362,875 |
| Asset Backed Securities | 1,226,246,593 | — | 1,226,246,593 | — |
| Corporate Bonds | 3,519,639,287 | — | 3,519,639,287 | — |
| Long-Term Municipal Bonds | 12,274,525 | — | 12,274,525 | — |
| Other Government | 16,943,294 | — | 16,943,294 | — |
| U.S. Treasury Securities | 781,457,535 | 781,457,535 | — | — |
| U.S. Government Agencies | 30,521,723 | — | 30,521,723 | — |
| Mortgage Backed | 1,529,831,949 | — | 1,529,831,949 | — |
| Short-Term Investments | 117,560,015 | 117,560,015 | — | — |
| Total Investments in Securities | $ 7,260,837,796 | $ 899,017,550 | $ 6,335,457,371 | $ 26,362,875 |
| Total Assets | $ 7,260,837,796 | $ 899,017,550 | $ 6,335,457,371 | $26,362,875(a) |
| (a) | Level 3 investments at the beginning and/or end of the period in relation to net assets were not significant and accordingly, a reconciliation of Level 3 assets for the period ended March 31, 2023 is not presented. |
March 31, 2023 (Unaudited)
| ULTRA SHORT INCOME FUND | TOTAL | LEVEL 1 | LEVEL 2 | LEVEL 3 |
| Assets | ||||
| Investments in Securities | ||||
| Asset Backed Securities | $ 74,186,472 | $ — | $ 74,186,472 | $ — |
| Corporate Bonds | 109,624,464 | — | 109,624,464 | — |
| Long-Term Municipal Bonds | 54,073 | — | 54,073 | — |
| U.S. Treasury Securities | 26,974,186 | 26,974,186 | — | — |
| U.S. Government Agencies | 43,493 | — | 43,493 | — |
| Mortgage Backed | 8,873,433 | — | 8,873,433 | — |
| Short-Term Investments | ||||
| Mutual Fund | 23,981,255 | 23,981,255 | — | — |
| Total Investments in Securities | $ 243,737,376 | $ 50,955,441 | $ 192,781,935 | $ — |
| Total Assets | $ 243,737,376 | $ 50,955,441 | $ 192,781,935 | $ — |
| STRATEGIC INCOME FUND | TOTAL | LEVEL 1 | LEVEL 2 | LEVEL 3 |
| Assets | ||||
| Investments in Securities | ||||
| Common Stock | $ 847 | $ — | $ — | $ 847 |
| Preferred Stock | 21,961,931 | 6,081,456 | 4,037,600 | 11,842,875 |
| Asset Backed Securities | 933,775,322 | — | 911,681,049 | 22,094,273 |
| Corporate Bonds | 3,054,723,141 | — | 3,054,722,596 | 545 |
| Convertible Bonds | 19,291,288 | — | 19,291,288 | — |
| Long-Term Municipal Bonds | 9,489,841 | — | 9,489,841 | — |
| Other Government | 40,079,655 | — | 40,079,655 | — |
| U.S. Treasury Securities | 300,075,979 | 300,075,979 | — | — |
| U.S. Government Agencies | 8,717,800 | — | 8,717,800 | — |
| Mortgage Backed | 932,939,278 | — | 932,939,278 | — |
| Loan Participations | 52,274,910 | — | 52,274,910 | — |
| Short-Term Investments | 550,952,636 | 550,952,636 | — | — |
| Total Investments in Securities | $ 5,924,282,628 | $ 857,110,071 | $ 5,033,234,017 | $ 33,938,540 |
| Total Assets | $ 5,924,282,628 | $ 857,110,071 | $ 5,033,234,017 | $ 33,938,540 |
| Liabilities | ||||
| Other Financial Instruments | ||||
| Forward Currency Contracts | $ (568,885) | $ — | $ (568,885) | $ — |
| Total Other Financial Instruments | $ (568,885) | $ — | $ (568,885) | $ — |
| Total Liabilities | $ (568,885) | $ — | $ (568,885) | $— |
| STRATEGIC INCOME FUND | COMMON STOCK | PREFERRED STOCK | ASSET BACKED SECURITIES | CORPORATE BONDS | TOTAL (e) |
| Beginning Balance 9/30/2022 | $ 847 | $ 10,286,816 | $ 41,039,192 | $ 745 | $ 51,327,600 |
| Accrued Discounts (Premiums) | – | – | (3,042,968) | – | (3,042,968) |
| Net Realized Gain (Loss)(a) | – | – | (43,518) | (2,000,000) | (2,043,518) |
| Gross Purchases | – | 2,532,250 | – | – | 2,532,250 |
| Gross Sales | – | – | (53,104) | – | (53,104) |
| Net Change in Unrealized Appreciation (Depreciation)(b)(c) | – | (976,191) | 3,479,686 | 1,999,800 | 4,503,295 |
| Transfers into Level 3(d) | – | – | – | – | – |
| Transfers out of Level 3(d) | – | – | (19,285,015) | – | (19,285,015) |
| Ending Balance 3/31/2023 | $ 847 | $ 11,842,875 | $ 22,094,273 | $ 545 | $ 33,938,540 |
March 31, 2023 (Unaudited)
| (a) | Amount of net realized gain (loss) from investments recognized in income is included in the Fund’s Statement of Operations for the six months ended March 31, 2023. |
| (b) | Amount of net change in unrealized appreciation (depreciation) on investments recognized in income is included in the Fund’s Statement of Operations for the six months ended March 31, 2023. |
| (c) | The net change in unrealized appreciation (depreciation) attributable to securities owned at March 31, 2023, which were valued using significant unobservable inputs, was $2,503,495. This is included within net change in unrealized appreciation (depreciation) on investments in the Fund’s Statement of Operations for the six months ended March 31, 2023. |
| (d) | Transfers into or out of Level 3 were out of or into Level 2, and were due to changes in other significant observable inputs available during the six months ended March 31, 2023. Transfers into or out of Level 3 are based on the beginning market value of the period in which they occurred. |
| (e) | Level 3 investments represent 0.56% of total net assets at the six months ended March 31, 2023. Significant fluctuations of the unobservable inputs applied to portfolio securities characterized as Level 3 investments could be expected to increase or decrease the fair value of these portfolio securities. |
| LIMITED TERM U.S. GOVERNMENT FUND | LIMITED TERM INCOME FUND | ULTRA SHORT INCOME FUND | STRATEGIC INCOME FUND | ||||
| DAILY NET ASSETS | FEE RATE | DAILY NET ASSETS | FEE RATE | DAILY NET ASSETS | FEE RATE | DAILY NET ASSETS | FEE RATE |
| Up to $1 billion | 0.375% | Up to $500 million | 0.500% | Up to $5 billion | 0.250% | Up to $500 million | 0.750% |
| Next $1 billion | 0.325 | Next $500 million | 0.450 | Next $5 billion | 0.225 | Next $500 million | 0.675 |
| Over $2 billion | 0.275 | Next $500 million | 0.400 | Over $10 billion | 0.200 | Next $500 million | 0.625 |
| Next $500 million | 0.350 | Next $500 million | 0.575 | ||||
| Over $2 billion | 0.275 | Over $2 billion | 0.500 | ||||
| Effective Management Fee | |
| Limited Term U.S. Government Fund | 0.375% |
| Limited Term Income Fund | 0.315 |
| Ultra Short Income Fund | 0.250 |
| Strategic Income Fund | 0.559 |
| Administrative Services Fee Schedule | |
| Daily Net Assets | Fee Rate |
| Up to $20 billion | 0.100% |
| $20 billion to $40 billion | 0.075 |
| $40 billion to $60 billion | 0.040 |
| Over $60 billion | 0.030 |
March 31, 2023 (Unaudited)
| Commissions | CDSC fees | |
| Limited Term U.S. Government Fund | $ 281 | $ 155 |
| Limited Term Income Fund | 3,272 | 1,602 |
| Ultra Short Income Fund | 699 | — |
| Strategic Income Fund | 12,177 | 8,600 |
| Class A | Class C | Class C2 | Class I | Class R3 | Class R4 | Class R5 | Class R6 | |
| Limited Term U.S. Government Fund | —% | 1.24% | 1.24% | —% | 0.99% | 0.99% | 0.67% | —% |
| Limited Term Income Fund | — | — | 1.24 | 0.49 | 0.99 | 0.99 | 0.49 | 0.42 |
| Ultra Short Income Fund | 0.50 | — | — | 0.30 | — | — | — | — |
| Strategic Income Fund | 1.05 | — | — | 0.60 | 1.25 | 1.25 | 0.60 | 0.53 |
| Contractual: | Class A | Class C | Class C2 | Class I | Class R3 | Class R4 | Class R5 | Class R6 | Total |
| Limited Term U.S. Government Fund | $ — | $ 2,200 | $ 3,537 | $ — | $ 10,964 | $ 8,154 | $ 7,962 | $ — | $ 32,817 |
| Limited Term Income Fund | — | — | 6,619 | 1,458,933 | 13,259 | 9,275 | 128,527 | 31,816 | 1,648,429 |
| Ultra Short Income Fund | 51,203 | — | — | 195,644 | — | — | — | — | 246,847 |
| Strategic Income Fund | 55,627 | 17,073 | — | 3,657,246 | 7,474 | 9,482 | 74,287 | 92,061 | 3,913,250 |
| Voluntary: | Class A | Class C | Class C2 | Class I | Class R3 | Class R4 | Class R5 | Class R6 | Total |
| Limited Term U.S. Government Fund | $ — | $ 4,047 | $ — | $ — | $ — | $ — | $ — | $ — | $ 4,047 |
| Ultra Short Income Fund | 2,023 | — | — | 14,094 | — | — | — | — | 16,117 |
| Strategic Income Fund | 18,040 | 5,894 | — | 350,784 | 39 | 174 | 3,770 | 8,478 | 387,179 |
March 31, 2023 (Unaudited)
| Percentage of Direct Investments | |
| Limited Term U.S. Government Fund | 14.36% |
| Limited Term Income Fund | 0.11 |
| Ultra Short Income Fund | 1.58 |
| Strategic Income Fund | 0.20 |
| LIMITED TERM INCOME FUND | Market Value 9/30/22 | Purchases at Cost | Sales Proceeds | Realized Gain (Loss) | Change in Unrealized Appr./(Depr.) | Market Value 3/31/23 | Dividend Income |
| Thornburg Capital Mgmt. Fund | $118,768,589 | $1,131,454,653 | $(1,132,663,227) | $- | $- | $117,560,015 | $ 4,248,803 |
| ULTRA SHORT INCOME FUND | |||||||
| Thornburg Capital Mgmt. Fund | $ 23,148,493 | $ 173,258,713 | $ (172,425,951) | $- | $- | $ 23,981,255 | $ 717,070 |
| STRATEGIC INCOME FUND | |||||||
| Thornburg Capital Mgmt. Fund | $465,780,083 | $1,318,434,688 | $(1,257,884,205) | $- | $- | $526,330,566 | $11,388,138 |
| Cost | Unrealized Appreciation | Unrealized Depreciation | Net Unrealized Appreciation (Depreciation) | |
| Limited Term U.S. Government Fund | $ 209,947,026 | $ 1,008,723 | $ (12,155,411) | $ (11,146,688) |
| Limited Term Income Fund | 7,709,713,919 | 38,677,359 | (487,553,482) | (448,876,123) |
| Ultra Short Income Fund | 244,500,531 | 330,704 | (1,093,859) | (763,155) |
| Strategic Income Fund | 6,193,251,967 | 80,450,410 | (349,419,749) | (268,969,339) |
March 31, 2023 (Unaudited)
| Cumulative Capital Losses | ||
| Short-Term | Long-Term | |
| Limited Term U.S. Government Fund | $ 4,856,828 | $ 15,605,681 |
| Limited Term Income Fund | 90,321,161 | 37,600,970 |
| Ultra Short Income Fund | 638,904 | 19,241 |
| Strategic Income Fund | 18,717,647 | 18,125,899 |
| SIX MONTHS ENDED March 31, 2023 | YEAR ENDED September 30, 2022 | |||
| LIMITED TERM U.S. GOVERNMENT FUND | SHARES | AMOUNT | SHARES | AMOUNT |
| Class A Shares | ||||
| Shares sold | 356,727 | $ 4,202,968 | 439,668 | $ 5,516,825 |
| Shares issued to shareholders in reinvestment of dividends | 39,496 | 465,528 | 79,599 | 989,124 |
| Shares repurchased | (1,052,971) | (12,424,994) | (2,726,703) | (34,392,790) |
| Net increase (decrease) | (656,748) | $ (7,756,498) | (2,207,436) | $ (27,886,841) |
| Class C Shares | ||||
| Shares sold | 35,337 | $ 413,562 | 81,326 | $ 1,021,762 |
| Shares issued to shareholders in reinvestment of dividends | 2,928 | 34,704 | 6,821 | 85,080 |
| Shares repurchased | (158,255) | (1,867,757) | (358,755) | (4,519,510) |
| Net increase (decrease) | (119,990) | $ (1,419,491) | (270,608) | $ (3,412,668) |
| Class C2 Shares | ||||
| Shares sold | 47,328 | $ 556,008 | 11,803 | $ 153,582 |
| Shares issued to shareholders in reinvestment of dividends | 419 | 4,988 | 476 | 5,972 |
| Shares repurchased | (1,175) | (14,125) | (44,406) | (553,043) |
| Net increase (decrease) | 46,572 | $ 546,871 | (32,127) | $ (393,489) |
| Class I Shares | ||||
| Shares sold | 531,229 | $ 6,240,209 | 1,985,296 | $ 25,069,718 |
| Shares issued to shareholders in reinvestment of dividends | 99,844 | 1,176,157 | 211,124 | 2,621,823 |
| Shares repurchased | (2,507,836) | (29,457,377) | (5,638,164) | (70,719,600) |
| Net increase (decrease) | (1,876,763) | $ (22,041,011) | (3,441,744) | $ (43,028,059) |
March 31, 2023 (Unaudited)
| SIX MONTHS ENDED March 31, 2023 | YEAR ENDED September 30, 2022 | |||
| LIMITED TERM U.S. GOVERNMENT FUND | SHARES | AMOUNT | SHARES | AMOUNT |
| Class R3 Shares | ||||
| Shares sold | 23,763 | $ 281,890 | 51,864 | $ 652,234 |
| Shares issued to shareholders in reinvestment of dividends | 2,441 | 28,815 | 5,705 | 71,072 |
| Shares repurchased | (47,836) | (562,516) | (341,529) | (4,291,241) |
| Net increase (decrease) | (21,632) | $ (251,811) | (283,960) | $ (3,567,935) |
| Class R4 Shares | ||||
| Shares sold | 7,961 | $ 93,698 | 14,871 | $ 186,632 |
| Shares issued to shareholders in reinvestment of dividends | 743 | 8,753 | 1,896 | 23,544 |
| Shares repurchased | (31,029) | (362,709) | (72,332) | (887,578) |
| Net increase (decrease) | (22,325) | $ (260,258) | (55,565) | $ (677,402) |
| Class R5 Shares | ||||
| Shares sold | 7,597 | $ 89,712 | 29,321 | $ 364,596 |
| Shares issued to shareholders in reinvestment of dividends | 1,407 | 16,592 | 2,380 | 29,481 |
| Shares repurchased | (48,161) | (571,022) | (28,658) | (355,818) |
| Net increase (decrease) | (39,157) | $ (464,718) | 3,043 | $ 38,259 |
| SIX MONTHS ENDED March 31, 2023 | YEAR ENDED September 30, 2022 | |||
| LIMITED TERM INCOME FUND | SHARES | AMOUNT | SHARES | AMOUNT |
| Class A Shares | ||||
| Shares sold | 5,444,621 | $ 67,928,396 | 10,541,439 | $ 140,150,366 |
| Shares issued to shareholders in reinvestment of dividends | 508,682 | 6,371,451 | 817,718 | 10,693,958 |
| Shares repurchased | (8,274,187) | (103,168,928) | (22,180,526) | (293,814,115) |
| Net increase (decrease) | (2,320,884) | $ (28,869,081) | (10,821,369) | $ �� (142,969,791) |
| Class C Shares | ||||
| Shares sold | 331,750 | $ 4,137,818 | 950,042 | $ 12,643,799 |
| Shares issued to shareholders in reinvestment of dividends | 161,998 | 2,025,010 | 289,804 | 3,782,337 |
| Shares repurchased | (4,583,577) | (57,097,203) | (9,476,803) | (124,911,999) |
| Net increase (decrease) | (4,089,829) | $ (50,934,375) | (8,236,957) | $ (108,485,863) |
| Class C2 Shares | ||||
| Shares sold | 3,170 | $ 40,088 | 80,061 | $ 1,062,877 |
| Shares issued to shareholders in reinvestment of dividends | 7,382 | 92,306 | 10,679 | 138,920 |
| Shares repurchased | (146,248) | (1,823,770) | (246,744) | (3,258,160) |
| Net increase (decrease) | (135,696) | $ (1,691,376) | (156,004) | $ (2,056,363) |
| Class I Shares | ||||
| Shares sold | 92,356,541 | $ 1,156,676,703 | 220,666,997 | $ 2,925,215,365 |
| Shares issued to shareholders in reinvestment of dividends | 6,657,067 | 83,418,603 | 11,080,794 | 144,940,625 |
| Shares repurchased | (159,865,480) | (1,995,167,217) | (314,030,159) | (4,128,301,405) |
| Net increase (decrease) | (60,851,872) | $ (755,071,911) | (82,282,368) | $ (1,058,145,415) |
March 31, 2023 (Unaudited)
| SIX MONTHS ENDED March 31, 2023 | YEAR ENDED September 30, 2022 | |||
| LIMITED TERM INCOME FUND | SHARES | AMOUNT | SHARES | AMOUNT |
| Class R3 Shares | ||||
| Shares sold | 764,367 | $ 9,526,427 | 2,265,150 | $ 30,239,348 |
| Shares issued to shareholders in reinvestment of dividends | 45,956 | 575,977 | 64,069 | 834,682 |
| Shares repurchased | (1,350,732) | (16,988,784) | (2,074,866) | (27,276,149) |
| Net increase (decrease) | (540,409) | $ (6,886,380) | 254,353 | $ 3,797,881 |
| Class R4 Shares | ||||
| Shares sold | 173,219 | $ 2,169,649 | 1,013,644 | $ 12,974,366 |
| Shares issued to shareholders in reinvestment of dividends | 4,516 | 56,581 | 5,897 | 76,820 |
| Shares repurchased | (188,213) | (2,355,026) | (344,863) | (4,498,856) |
| Net increase (decrease) | (10,478) | $ (128,796) | 674,678 | $ 8,552,330 |
| Class R5 Shares | ||||
| Shares sold | 946,679 | $ 11,863,940 | 6,131,927 | $ 82,049,887 |
| Shares issued to shareholders in reinvestment of dividends | 105,375 | 1,318,849 | 188,604 | 2,462,116 |
| Shares repurchased | (3,484,136) | (43,802,228) | (7,096,207) | (94,143,814) |
| Net increase (decrease) | (2,432,082) | $ (30,619,439) | (775,676) | $ (9,631,811) |
| Class R6 Shares | ||||
| Shares sold | 1,675,256 | $ 21,021,711 | 12,325,073 | $ 165,456,777 |
| Shares issued to shareholders in reinvestment of dividends | 193,180 | 2,424,543 | 281,783 | 3,678,103 |
| Shares repurchased | (3,491,023) | (44,042,100) | (7,278,342) | (95,699,454) |
| Net increase (decrease) | (1,622,587) | $ (20,595,846) | 5,328,514 | $ 73,435,426 |
| SIX MONTHS ENDED March 31, 2023 | YEAR ENDED September 30, 2022 | |||
| ULTRA SHORT INCOME FUND | SHARES | AMOUNT | SHARES | AMOUNT |
| Class A Shares | ||||
| Shares sold | 1,238,755 | $ 15,022,081 | 2,494,229 | $ 30,419,140 |
| Shares issued to shareholders in reinvestment of dividends | 57,037 | 692,308 | 23,169 | 282,740 |
| Shares repurchased | (1,590,566) | (19,315,628) | (580,148) | (7,103,704) |
| Net increase (decrease) | (294,774) | $ (3,601,239) | 1,937,250 | $ 23,598,176 |
| Class I Shares | ||||
| Shares sold | 14,534,245 | $ 176,020,530 | 12,647,567 | $ 154,631,056 |
| Shares issued to shareholders in reinvestment of dividends | 368,065 | 4,464,291 | 135,441 | 1,651,088 |
| Shares repurchased | (8,861,387) | (107,500,972) | (4,182,562) | (51,064,529) |
| Net increase (decrease) | 6,040,923 | $ 72,983,849 | 8,600,446 | $ 105,217,615 |
| SIX MONTHS ENDED March 31, 2023 | YEAR ENDED September 30, 2022 | |||
| STRATEGIC INCOME FUND | SHARES | AMOUNT | SHARES | AMOUNT |
| Class A Shares | ||||
| Shares sold | 5,551,844 | $ 61,790,597 | 10,115,056 | $ 119,485,988 |
| Shares issued to shareholders in reinvestment of dividends | 450,754 | 5,024,414 | 945,131 | 11,115,435 |
| Shares repurchased | (10,791,700) | (119,584,059) | (12,099,708) | (141,969,093) |
| Net increase (decrease) | (4,789,102) | $ (52,769,048) | (1,039,521) | $ (11,367,670) |
March 31, 2023 (Unaudited)
| SIX MONTHS ENDED March 31, 2023 | YEAR ENDED September 30, 2022 | |||
| STRATEGIC INCOME FUND | SHARES | AMOUNT | SHARES | AMOUNT |
| Class C Shares | ||||
| Shares sold | 2,022,388 | $ 22,451,768 | 1,857,127 | $ 21,894,946 |
| Shares issued to shareholders in reinvestment of dividends | 114,993 | 1,280,970 | 195,252 | 2,294,880 |
| Shares repurchased | (1,382,256) | (15,333,717) | (2,831,455) | (33,223,798) |
| Net increase (decrease) | 755,125 | $ 8,399,021 | (779,076) | $ (9,033,972) |
| Class I Shares | ||||
| Shares sold | 201,398,699 | $ 2,237,113,293 | 238,941,841 | $ 2,788,013,156 |
| Shares issued to shareholders in reinvestment of dividends | 8,657,341 | 96,384,768 | 11,042,043 | 128,768,898 |
| Shares repurchased | (102,709,271) | (1,137,882,216) | (131,451,156) | (1,530,521,922) |
| Net increase (decrease) | 107,346,769 | $ 1,195,615,845 | 118,532,728 | $ 1,386,260,132 |
| Class R3 Shares | ||||
| Shares sold | 1,739 | $ 19,394 | 3,768 | $ 44,038 |
| Shares issued to shareholders in reinvestment of dividends | 980 | 10,915 | 1,941 | 22,789 |
| Shares repurchased | (7,295) | (80,865) | (14,779) | (171,917) |
| Net increase (decrease) | (4,576) | $ (50,556) | (9,070) | $ (105,090) |
| Class R4 Shares | ||||
| Shares sold | 57,390 | $ 642,604 | 80,230 | $ 956,587 |
| Shares issued to shareholders in reinvestment of dividends | 3,344 | 37,266 | 5,139 | 60,387 |
| Shares repurchased | (7,243) | (80,289) | (71,761) | (850,013) |
| Net increase (decrease) | 53,491 | $ 599,581 | 13,608 | $ 166,961 |
| Class R5 Shares | ||||
| Shares sold | 1,843,562 | $ 20,454,095 | 1,459,940 | $ 16,964,830 |
| Shares issued to shareholders in reinvestment of dividends | 98,271 | 1,094,495 | 175,916 | 2,072,320 |
| Shares repurchased | (497,295) | (5,529,823) | (3,144,440) | (36,187,594) |
| Net increase (decrease) | 1,444,538 | $ 16,018,767 | (1,508,584) | $ (17,150,444) |
| Class R6 Shares | ||||
| Shares sold | 2,691,508 | $ 30,103,820 | 5,402,932 | $ 64,663,323 |
| Shares issued to shareholders in reinvestment of dividends | 149,347 | 1,667,044 | 249,143 | 2,924,729 |
| Shares repurchased | (1,203,423) | (13,431,380) | (1,939,475) | (22,613,679) |
| Net increase (decrease) | 1,637,432 | $ 18,339,484 | 3,712,600 | $ 44,974,373 |
| Purchases | Sales | |
| Limited Term U.S. Government Fund | $ 55,438,238 | $ 81,605,040 |
| Limited Term Income Fund | 1,687,270,833 | 2,229,521,345 |
| Ultra Short Income Fund | 109,365,413 | 19,377,767 |
| Strategic Income Fund | 1,794,564,775 | 659,496,897 |
March 31, 2023 (Unaudited)
| Type of Derivative | Counter Party | Asset Derivatives | Liability Derivatives | Net Amount | |
| Strategic Income Fund | Forward currency contracts | SSB | $ — | $ (568,885) | $ (568,885) |
| Net Realized | Net Change in Unrealized | ||||
| Type of Derivative | Gain (Loss) | Appreciation (Depreciation) | |||
| Strategic Income Fund | Forward currency contracts | $ (4,903,023) | $ (767,013) |
Limited Term U.S. Government Fund
| PER SHARE PERFORMANCE (FOR A SHARE OUTSTANDING THROUGHOUT THE PERIOD) | |||||||||
| UNLESS OTHERWISE NOTED, PERIODS ARE FISCAL YEARS ENDED SEPTEMBER 30, | Net Asset Value, Beginning of PERIOD | Net Investment Income (Loss)+ | Net Realized & Unrealized Gain (Loss) on Investments | Total from Investment Operations | Dividends from Net Investment Income | Dividends from Net Realized Gains | Dividends from Return of Capital | Total Dividends | Net Asset Value, End of PERIOD |
| CLASS A SHARES(b) | |||||||||
| 2023 (c) | $ 11.64 | 0.09 | 0.29 | 0.38 | (0.11) | — | — | (0.11) | $ 11.91 |
| 2022 | $ 13.06 | 0.13 | (1.36) | (1.23) | (0.19) | — | — | (0.19) | $ 11.64 |
| 2021 | $ 13.38 | 0.08 | (0.24) | (0.16) | (0.16) | — | — | (0.16) | $ 13.06 |
| 2020 | $ 13.10 | 0.15 | 0.33 | 0.48 | (0.20) | — | — | (0.20) | $ 13.38 |
| 2019 | $ 12.69 | 0.19 | 0.45 | 0.64 | (0.23) | — | — | (0.23) | $ 13.10 |
| 2018 | $ 13.01 | 0.18 | (0.28) | (0.10) | (0.22) | — | — | (0.22) | $ 12.69 |
| CLASS C SHARES | |||||||||
| 2023 (c) | $ 11.71 | 0.08 | 0.28 | 0.36 | (0.09) | — | — | (0.09) | $ 11.98 |
| 2022 | $ 13.13 | 0.09 | (1.36) | (1.27) | (0.15) | — | — | (0.15) | $ 11.71 |
| 2021 | $ 13.46 | 0.03 | (0.25) | (0.22) | (0.11) | — | — | (0.11) | $ 13.13 |
| 2020 | $ 13.17 | 0.11 | 0.35 | 0.46 | (0.17) | — | — | (0.17) | $ 13.46 |
| 2019 | $ 12.77 | 0.15 | 0.43 | 0.58 | (0.18) | — | — | (0.18) | $ 13.17 |
| 2018 | $ 13.09 | 0.14 | (0.28) | (0.14) | (0.18) | — | — | (0.18) | $ 12.77 |
| CLASS C2 SHARES | |||||||||
| 2023 (c) | $ 11.71 | 0.08 | 0.28 | 0.36 | (0.09) | — | — | (0.09) | $ 11.98 |
| 2022 | $ 13.14 | 0.08 | (1.36) | (1.28) | (0.15) | — | — | (0.15) | $ 11.71 |
| 2021 (e) | $ 13.46 | 0.04 | (0.25) | (0.21) | (0.11) | — | — | (0.11) | $ 13.14 |
| CLASS I SHARES | |||||||||
| 2023 (c) | $ 11.64 | 0.11 | 0.28 | 0.39 | (0.12) | — | — | (0.12) | $ 11.91 |
| 2022 | $ 13.06 | 0.16 | (1.36) | (1.20) | (0.22) | — | — | (0.22) | $ 11.64 |
| 2021 | $ 13.38 | 0.11 | (0.24) | (0.13) | (0.19) | — | — | (0.19) | $ 13.06 |
| 2020 | $ 13.10 | 0.18 | 0.34 | 0.52 | (0.24) | — | — | (0.24) | $ 13.38 |
| 2019 | $ 12.69 | 0.23 | 0.44 | 0.67 | (0.26) | — | — | (0.26) | $ 13.10 |
| 2018 | $ 13.01 | 0.22 | (0.28) | (0.06) | (0.26) | — | — | (0.26) | $ 12.69 |
| CLASS R3 SHARES | |||||||||
| 2023 (c) | $ 11.65 | 0.09 | 0.29 | 0.38 | (0.10) | — | — | (0.10) | $ 11.93 |
| 2022 | $ 13.06 | 0.11 | (1.34) | (1.23) | (0.18) | — | — | (0.18) | $ 11.65 |
| 2021 | $ 13.39 | 0.06 | (0.25) | (0.19) | (0.14) | — | — | (0.14) | $ 13.06 |
| 2020 | $ 13.10 | 0.13 | 0.35 | 0.48 | (0.19) | — | — | (0.19) | $ 13.39 |
| 2019 | $ 12.70 | 0.18 | 0.44 | 0.62 | (0.22) | — | — | (0.22) | $ 13.10 |
| 2018 | $ 13.02 | 0.17 | (0.28) | (0.11) | (0.21) | — | — | (0.21) | $ 12.70 |
| CLASS R4 SHARES | |||||||||
| 2023 (c) | $ 11.64 | 0.09 | 0.28 | 0.37 | (0.10) | — | — | (0.10) | $ 11.91 |
| 2022 | $ 13.05 | 0.12 | (1.35) | (1.23) | (0.18) | — | — | (0.18) | $ 11.64 |
| 2021 | $ 13.37 | 0.06 | (0.24) | (0.18) | (0.14) | — | — | (0.14) | $ 13.05 |
| 2020 | $ 13.09 | 0.13 | 0.34 | 0.47 | (0.19) | — | — | (0.19) | $ 13.37 |
| 2019 | $ 12.69 | 0.18 | 0.43 | 0.61 | (0.21) | — | — | (0.21) | $ 13.09 |
| 2018 | $ 13.01 | 0.17 | (0.28) | (0.11) | (0.21) | — | — | (0.21) | $ 12.69 |
| CLASS R5 SHARES | |||||||||
| 2023 (c) | $ 11.65 | 0.11 | 0.28 | 0.39 | (0.12) | — | — | (0.12) | $ 11.92 |
| 2022 | $ 13.07 | 0.16 | (1.36) | (1.20) | (0.22) | — | — | (0.22) | $ 11.65 |
| 2021 | $ 13.39 | 0.11 | (0.25) | (0.14) | (0.18) | — | — | (0.18) | $ 13.07 |
| 2020 | $ 13.11 | 0.17 | 0.34 | 0.51 | (0.23) | — | — | (0.23) | $ 13.39 |
| 2019 | $ 12.70 | 0.23 | 0.44 | 0.67 | (0.26) | — | — | (0.26) | $ 13.11 |
| 2018 | $ 13.02 | 0.21 | (0.28) | (0.07) | (0.25) | — | — | (0.25) | $ 12.70 |
| (a) | Not annualized for periods less than one year. |
| (b) | Sales loads are not reflected in computing total return. |
| (c) | Unaudited Six Month Period Ended March 31. |
| (d) | Annualized. |
| (e) | Effective date of this class of shares was October 1, 2020. |
| + | Based on weighted average shares outstanding. |
| RATIOS TO AVERAGE NET ASSETS | Supplemental Data | ||||||
| UNLESS OTHERWISE NOTED, PERIODS ARE FISCAL YEARS ENDED SEPTEMBER 30, | Net Investment Income (Loss) (%) | Expenses, After Expense Reductions (%) | Expenses, Before Expense Reductions (%) | Total Return (%)(a) | Portfolio Turnover Rate (%)(a) | Net Assets at End of PERIOD (Thousands) | |
| CLASS A SHARES(b) | |||||||
| 2023 (c) | 1.59 (d) | 0.93 (d) | 0.93 (d) | 3.25 | 28.05 | $ 50,528 | |
| 2022 | 1.01 | 0.92 | 0.92 | (9.51) | 28.92 | $ 57,028 | |
| 2021 | 0.60 | 0.87 | 0.87 | (1.22) | 9.50 | $ 92,786 | |
| 2020 | 1.10 | 0.89 | 0.89 | 3.70 | 11.66 | $ 86,955 | |
| 2019 | 1.48 | 0.90 | 0.90 | 5.06 | 29.37 | $ 66,140 | |
| 2018 | 1.42 | 0.91 | 0.91 | (0.77) | 5.93 | $ 69,634 | |
| CLASS C SHARES | |||||||
| 2023 (c) | 1.27 (d) | 1.24 (d) | 1.49 (d) | 3.07 | 28.05 | $ 4,518 | |
| 2022 | 0.68 | 1.24 | 1.39 | (9.74) | 28.92 | $ 5,821 | |
| 2021 | 0.21 | 1.24 | 1.24 | (1.65) | 9.50 | $ 10,084 | |
| 2020 | 0.82 | 1.16 | 1.16 | 3.48 | 11.66 | $ 17,994 | |
| 2019 | 1.13 | 1.24 | 1.24 | 4.60 | 29.37 | $ 15,618 | |
| 2018 | 1.10 | 1.23 | 1.23 | (1.08) | 5.93 | $ 19,686 | |
| CLASS C2 SHARES | |||||||
| 2023 (c) | 1.37 (d) | 1.24 (d) | 2.36 (d) | 3.08 | 28.05 | $ 793 | |
| 2022 | 0.62 | 1.24 | 2.28 | (9.81) | 28.92 | $ 230 | |
| 2021 (e) | 0.28 | 1.24 | 3.37 | (1.58) | 9.50 | $ 680 | |
| CLASS I SHARES | |||||||
| 2023 (c) | 1.87 (d) | 0.64 (d) | 0.64 (d) | 3.39 | 28.05 | $ 137,185 | |
| 2022 | 1.31 | 0.62 | 0.62 | (9.24) | 28.92 | $ 155,928 | |
| 2021 | 0.85 | 0.61 | 0.61 | (0.96) | 9.50 | $ 219,833 | |
| 2020 | 1.36 | 0.60 | 0.60 | 4.00 | 11.66 | $ 243,793 | |
| 2019 | 1.76 | 0.62 | 0.62 | 5.35 | 29.37 | $ 145,273 | |
| 2018 | 1.73 | 0.60 | 0.60 | (0.47) | 5.93 | $ 131,898 | |
| CLASS R3 SHARES | |||||||
| 2023 (c) | 1.54 (d) | 0.99 (d) | 1.65 (d) | 3.30 | 28.05 | $ 3,294 | |
| 2022 | 0.89 | 0.99 | 1.52 | (9.50) | 28.92 | $ 3,471 | |
| 2021 | 0.46 | 0.99 | 1.31 | (1.41) | 9.50 | $ 7,601 | |
| 2020 | 1.02 | 0.99 | 1.29 | 3.67 | 11.66 | $ 9,222 | |
| 2019 | 1.39 | 0.99 | 1.43 | 4.88 | 29.37 | $ 9,181 | |
| 2018 | 1.34 | 0.99 | 1.45 | (0.85) | 5.93 | $ 9,036 | |
| CLASS R4 SHARES | |||||||
| 2023 (c) | 1.52 (d) | 0.99 (d) | 2.59 (d) | 3.22 | 28.05 | $ 907 | |
| 2022 | 0.92 | 0.99 | 2.30 | (9.51) | 28.92 | $ 1,146 | |
| 2021 | 0.47 | 0.99 | 1.63 | (1.34) | 9.50 | $ 2,011 | |
| 2020 | 1.01 | 0.99 | 1.60 | 3.60 | 11.66 | $ 2,779 | |
| 2019 | 1.38 | 0.99 | 1.78 | 4.88 | 29.37 | $ 2,293 | |
| 2018 | 1.35 | 0.99 | 1.75 | (0.85) | 5.93 | $ 2,509 | |
| CLASS R5 SHARES | |||||||
| 2023 (c) | 1.84 (d) | 0.67 (d) | 1.58 (d) | 3.38 | 28.05 | $ 1,575 | |
| 2022 | 1.30 | 0.67 | 1.64 | (9.27) | 28.92 | $ 1,995 | |
| 2021 | 0.80 | 0.67 | 1.56 | (1.02) | 9.50 | $ 2,198 | |
| 2020 | 1.27 | 0.67 | 2.12 | 3.93 | 11.66 | $ 2,307 | |
| 2019 | 1.80 | 0.67 | 2.04 | 5.29 | 29.37 | $ 897 | |
| 2018 | 1.60 | 0.65 | 1.94 | (0.52) | 5.93 | $ 661 | |
Limited Term Income Fund
| PER SHARE PERFORMANCE (FOR A SHARE OUTSTANDING THROUGHOUT THE PERIOD) | |||||||||
| UNLESS OTHERWISE NOTED, PERIODS ARE FISCAL YEARS ENDED SEPTEMBER 30, | Net Asset Value, Beginning of PERIOD | Net Investment Income (Loss)+ | Net Realized & Unrealized Gain (Loss) on Investments | Total from Investment Operations | Dividends from Net Investment Income | Dividends from Net Realized Gains | Dividends from Return of Capital | Total Dividends | Net Asset Value, End of PERIOD |
| CLASS A SHARES(b) | |||||||||
| 2023 (c) | $ 12.38 | 0.16 | 0.30 | 0.46 | (0.16) | — | — | (0.16) | $ 12.68 |
| 2022 | $ 13.83 | 0.21 | (1.43) | (1.22) | (0.23) | — | — | (0.23) | $ 12.38 |
| 2021 | $ 14.14 | 0.16 | (0.11) | 0.05 | (0.19) | (0.17) | — | (0.36) | $ 13.83 |
| 2020 | $ 13.61 | 0.27 | 0.64 | 0.91 | (0.28) | (0.10) | — | (0.38) | $ 14.14 |
| 2019 | $ 13.16 | 0.33 | 0.45 | 0.78 | (0.33) | — | — | (0.33) | $ 13.61 |
| 2018 | $ 13.44 | 0.28 | (0.27) | 0.01 | (0.29) | — | — | (0.29) | $ 13.16 |
| CLASS C SHARES | |||||||||
| 2023 (c) | $ 12.36 | 0.15 | 0.30 | 0.45 | (0.15) | — | — | (0.15) | $ 12.66 |
| 2022 | $ 13.81 | 0.18 | (1.43) | (1.25) | (0.20) | — | — | (0.20) | $ 12.36 |
| 2021 | $ 14.12 | 0.13 | (0.11) | 0.02 | (0.16) | (0.17) | — | (0.33) | $ 13.81 |
| 2020 | $ 13.59 | 0.24 | 0.64 | 0.88 | (0.25) | (0.10) | — | (0.35) | $ 14.12 |
| 2019 | $ 13.14 | 0.30 | 0.46 | 0.76 | (0.31) | — | — | (0.31) | $ 13.59 |
| 2018 | $ 13.42 | 0.25 | (0.27) | (0.02) | (0.26) | — | — | (0.26) | $ 13.14 |
| CLASS C2 SHARES | |||||||||
| 2023 (c) | $ 12.36 | 0.13 | 0.30 | 0.43 | (0.13) | — | — | (0.13) | $ 12.66 |
| 2022 | $ 13.81 | 0.15 | (1.43) | (1.28) | (0.17) | — | — | (0.17) | $ 12.36 |
| 2021 (e) | $ 14.12 | 0.09 | (0.11) | (0.02) | (0.12) | (0.17) | — | (0.29) | $ 13.81 |
| CLASS I SHARES | |||||||||
| 2023 (c) | $ 12.38 | 0.18 | 0.31 | 0.49 | (0.18) | — | — | (0.18) | $ 12.69 |
| 2022 | $ 13.84 | 0.25 | (1.44) | (1.19) | (0.27) | — | — | (0.27) | $ 12.38 |
| 2021 | $ 14.15 | 0.20 | (0.11) | 0.09 | (0.23) | (0.17) | — | (0.40) | $ 13.84 |
| 2020 | $ 13.62 | 0.30 | 0.65 | 0.95 | (0.32) | (0.10) | — | (0.42) | $ 14.15 |
| 2019 | $ 13.16 | 0.37 | 0.47 | 0.84 | (0.38) | — | — | (0.38) | $ 13.62 |
| 2018 | $ 13.44 | 0.33 | (0.28) | 0.05 | (0.33) | — | — | (0.33) | $ 13.16 |
| CLASS R3 SHARES | |||||||||
| 2023 (c) | $ 12.38 | 0.15 | 0.31 | 0.46 | (0.15) | — | — | (0.15) | $ 12.69 |
| 2022 | $ 13.84 | 0.18 | (1.44) | (1.26) | (0.20) | — | — | (0.20) | $ 12.38 |
| 2021 | $ 14.15 | 0.13 | (0.11) | 0.02 | (0.16) | (0.17) | — | (0.33) | $ 13.84 |
| 2020 | $ 13.63 | 0.24 | 0.63 | 0.87 | (0.25) | (0.10) | — | (0.35) | $ 14.15 |
| 2019 | $ 13.17 | 0.30 | 0.47 | 0.77 | (0.31) | — | — | (0.31) | $ 13.63 |
| 2018 | $ 13.45 | 0.26 | (0.27) | (0.01) | (0.27) | — | — | (0.27) | $ 13.17 |
| CLASS R4 SHARES | |||||||||
| 2023 (c) | $ 12.37 | 0.15 | 0.31 | 0.46 | (0.15) | — | — | (0.15) | $ 12.68 |
| 2022 | $ 13.83 | 0.20 | (1.46) | (1.26) | (0.20) | — | — | (0.20) | $ 12.37 |
| 2021 | $ 14.14 | 0.13 | (0.11) | 0.02 | (0.16) | (0.17) | — | (0.33) | $ 13.83 |
| 2020 | $ 13.61 | 0.24 | 0.64 | 0.88 | (0.25) | (0.10) | — | (0.35) | $ 14.14 |
| 2019 | $ 13.16 | 0.30 | 0.46 | 0.76 | (0.31) | — | — | (0.31) | $ 13.61 |
| 2018 | $ 13.43 | 0.26 | (0.26) | — (i) | (0.27) | — | — | (0.27) | $ 13.16 |
| CLASS R5 SHARES | |||||||||
| 2023 (c) | $ 12.37 | 0.18 | 0.31 | 0.49 | (0.18) | — | — | (0.18) | $ 12.68 |
| 2022 | $ 13.83 | 0.25 | (1.44) | (1.19) | (0.27) | — | — | (0.27) | $ 12.37 |
| 2021 | $ 14.14 | 0.20 | (0.11) | 0.09 | (0.23) | (0.17) | — | (0.40) | $ 13.83 |
| 2020 | $ 13.61 | 0.31 | 0.64 | 0.95 | (0.32) | (0.10) | — | (0.42) | $ 14.14 |
| 2019 | $ 13.16 | 0.36 | 0.46 | 0.82 | (0.37) | — | — | (0.37) | $ 13.61 |
| 2018 | $ 13.44 | 0.31 | (0.28) | 0.03 | (0.31) | — | — | (0.31) | $ 13.16 |
| CLASS R6 SHARES | |||||||||
| 2023 (c) | $ 12.40 | 0.18 | 0.32 | 0.50 | (0.19) | — | — | (0.19) | $ 12.71 |
| 2022 | $ 13.86 | 0.26 | (1.44) | (1.18) | (0.28) | — | — | (0.28) | $ 12.40 |
| 2021 | $ 14.17 | 0.21 | (0.11) | 0.10 | (0.24) | (0.17) | — | (0.41) | $ 13.86 |
| 2020 | $ 13.64 | 0.32 | 0.64 | 0.96 | (0.33) | (0.10) | — | (0.43) | $ 14.17 |
| 2019 | $ 13.19 | 0.38 | 0.46 | 0.84 | (0.39) | — | — | (0.39) | $ 13.64 |
| 2018 | $ 13.46 | 0.35 | (0.28) | 0.07 | (0.34) | — | — | (0.34) | $ 13.19 |
| (a) | Not annualized for periods less than one year. |
| (b) | Sales loads are not reflected in computing total return. |
| (c) | Unaudited Six Month Period Ended March 31. |
| (d) | Annualized. |
| (e) | Effective date of this class of shares was October 1, 2020. |
| (f) | The total return based on the NAV which reflects the adjustments in accordance with U.S. GAAP is (8.70)%. |
| (g) | The total return based on the NAV which reflects the adjustments in accordance with U.S. GAAP is 0.61%. |
| (h) | The total return based on the NAV which reflects the adjustments in accordance with U.S. GAAP is 6.47%. |
| (i) | Total from investment operations was less than $0.01 per share. |
| + | Based on weighted average shares outstanding. |
Limited Term Income Fund
| RATIOS TO AVERAGE NET ASSETS | Supplemental Data | ||||||
| UNLESS OTHERWISE NOTED, PERIODS ARE FISCAL YEARS ENDED SEPTEMBER 30, | Net Investment Income (Loss) (%) | Expenses, After Expense Reductions (%) | Expenses, Before Expense Reductions (%) | Total Return (%)(a) | Portfolio Turnover Rate (%)(a) | Net Assets at End of PERIOD (Thousands) | |
| CLASS A SHARES(b) | |||||||
| 2023 (c) | 2.57 (d) | 0.79 (d) | 0.79 (d) | 3.76 | 22.90 | $ 584,156 | |
| 2022 | 1.58 | 0.77 | 0.77 | (8.89) | 46.77 | $ 598,675 | |
| 2021 | 1.17 | 0.77 | 0.77 | 0.33 | 33.37 | $ 818,846 | |
| 2020 | 1.94 | 0.77 | 0.77 | 6.78 | 53.84 | $ 768,798 | |
| 2019 | 2.44 | 0.81 | 0.81 | 6.03 | 43.22 | $ 645,383 | |
| 2018 | 2.12 | 0.84 | 0.84 | 0.09 | 33.62 | $ 680,473 | |
| CLASS C SHARES | |||||||
| 2023 (c) | 2.34 (d) | 1.01 (d) | 1.01 (d) | 3.65 | 22.90 | $ 174,778 | |
| 2022 | 1.33 | 0.99 | 0.99 | (9.11) | 46.77 | $ 221,057 | |
| 2021 | 0.94 | 0.99 | 0.99 | 0.11 | 33.37 | $ 360,840 | |
| 2020 | 1.72 | 1.00 | 1.00 | 6.55 | 53.84 | $ 412,659 | |
| 2019 | 2.24 | 1.02 | 1.02 | 5.82 | 43.22 | $ 356,205 | |
| 2018 | 1.91 | 1.05 | 1.05 | (0.13) | 33.62 | $ 439,305 | |
| CLASS C2 SHARES | |||||||
| 2023 (c) | 2.11 (d) | 1.24 (d) | 1.39 (d) | 3.53 | 22.90 | $ 8,137 | |
| 2022 | 1.10 | 1.24 | 1.30 | (9.33) | 46.77 | $ 9,615 | |
| 2021 (e) | 0.65 | 1.24 | 1.32 | (0.17) | 33.37 | $ 12,902 | |
| CLASS I SHARES | |||||||
| 2023 (c) | 2.86 (d) | 0.49 (d) | 0.54 (d) | 3.99 | 22.90 | $ 6,290,233 | |
| 2022 | 1.86 | 0.49 | 0.51 | (8.63) (f) | 46.77 | $ 6,890,513 | |
| 2021 | 1.44 | 0.49 | 0.50 | 0.53 (g) | 33.37 | $ 8,840,331 | |
| 2020 | 2.21 | 0.49 | 0.51 | 7.08 | 53.84 | $ 6,999,911 | |
| 2019 | 2.75 | 0.50 | 0.53 | 6.44 | 43.22 | $ 4,455,457 | |
| 2018 | 2.46 | 0.51 | 0.51 | 0.41 | 33.62 | $ 3,685,859 | |
| CLASS R3 SHARES | |||||||
| 2023 (c) | 2.36 (d) | 0.99 (d) | 1.04 (d) | 3.74 | 22.90 | $ 43,890 | |
| 2022 | 1.39 | 0.99 | 1.04 | (9.16) | 46.77 | $ 49,513 | |
| 2021 | 0.94 | 0.99 | 1.02 | 0.11 | 33.37 | $ 51,825 | |
| 2020 | 1.75 | 0.99 | 1.02 | 6.54 (h) | 53.84 | $ 61,041 | |
| 2019 | 2.27 | 0.99 | 1.06 | 5.84 | 43.22 | $ 64,335 | |
| 2018 | 1.98 | 0.99 | 1.09 | (0.06) | 33.62 | $ 88,298 | |
| CLASS R4 SHARES | |||||||
| 2023 (c) | 2.37 (d) | 0.99 (d) | 1.09 (d) | 3.74 | 22.90 | $ 18,303 | |
| 2022 | 1.51 | 0.99 | 1.24 | (9.16) | 46.77 | $ 17,988 | |
| 2021 | 0.94 | 0.99 | 1.19 | 0.11 | 33.37 | $ 10,777 | |
| 2020 | 1.74 | 0.99 | 1.32 | 6.55 | 53.84 | $ 6,413 | |
| 2019 | 2.27 | 0.99 | 1.23 | 5.84 | 43.22 | $ 8,073 | |
| 2018 | 1.98 | 0.99 | 1.45 | 0.01 | 33.62 | $ 7,962 | |
| CLASS R5 SHARES | |||||||
| 2023 (c) | 2.85 (d) | 0.49 (d) | 0.76 (d) | 4.00 | 22.90 | $ 83,077 | |
| 2022 | 1.88 | 0.49 | 0.71 | (8.71) | 46.77 | $ 111,149 | |
| 2021 | 1.44 | 0.49 | 0.69 | 0.61 | 33.37 | $ 134,974 | |
| 2020 | 2.24 | 0.49 | 0.64 | 7.08 | 53.84 | $ 149,322 | |
| 2019 | 2.70 | 0.56 | 0.74 | 6.31 | 43.22 | $ 106,753 | |
| 2018 | 2.31 | 0.67 | 0.69 | 0.26 | 33.62 | $ 113,333 | |
| CLASS R6 SHARES | |||||||
| 2023 (c) | 2.93 (d) | 0.42 (d) | 0.46 (d) | 4.03 | 22.90 | $ 164,232 | |
| 2022 | 2.00 | 0.42 | 0.45 | (8.62) | 46.77 | $ 180,359 | |
| 2021 | 1.51 | 0.42 | 0.43 | 0.68 | 33.37 | $ 127,763 | |
| 2020 | 2.31 | 0.42 | 0.46 | 7.15 | 53.84 | $ 98,639 | |
| 2019 | 2.82 | 0.43 | 0.49 | 6.43 | 43.22 | $ 60,440 | |
| 2018 | 2.62 | 0.45 | 0.57 | 0.56 | 33.62 | $ 29,568 | |
Ultra Short Income Fund
| PER SHARE PERFORMANCE (FOR A SHARE OUTSTANDING THROUGHOUT THE PERIOD) | |||||||||
| UNLESS OTHERWISE NOTED, PERIODS ARE FISCAL YEARS ENDED SEPTEMBER 30, | Net Asset Value, Beginning of PERIOD | Net Investment Income (Loss)+ | Net Realized & Unrealized Gain (Loss) on Investments | Total from Investment Operations | Dividends from Net Investment Income | Dividends from Net Realized Gains | Dividends from Return of Capital | Total Dividends | Net Asset Value, End of PERIOD |
| CLASS A SHARES(b) | |||||||||
| 2023 (c) | $ 12.13 | 0.23 | 0.03 | 0.26 | (0.23) | — | — | (0.23) | $ 12.16 |
| 2022 | $ 12.44 | 0.19 | (0.31) | (0.12) | (0.19) | — | — | (0.19) | $ 12.13 |
| 2021 | $ 12.59 | 0.15 | (0.08) | 0.07 | (0.18) | (0.04) | — | (0.22) | $ 12.44 |
| 2020 | $ 12.49 | 0.23 | 0.15 | 0.38 | (0.24) | (0.04) | — | (0.28) | $ 12.59 |
| 2019 | $ 12.29 | 0.28 | 0.21 | 0.49 | (0.29) | — | — | (0.29) | $ 12.49 |
| 2018 | $ 12.42 | 0.22 | (0.13) | 0.09 | (0.22) | — | — | (0.22) | $ 12.29 |
| CLASS I SHARES | |||||||||
| 2023 (c) | $ 12.12 | 0.25 | 0.03 | 0.28 | (0.25) | — | — | (0.25) | $ 12.15 |
| 2022 | $ 12.43 | 0.21 | (0.31) | (0.10) | (0.21) | — | — | (0.21) | $ 12.12 |
| 2021 | $ 12.58 | 0.18 | (0.08) | 0.10 | (0.21) | (0.04) | — | (0.25) | $ 12.43 |
| 2020 | $ 12.48 | 0.25 | 0.16 | 0.41 | (0.27) | (0.04) | — | (0.31) | $ 12.58 |
| 2019 | $ 12.28 | 0.31 | 0.20 | 0.51 | (0.31) | — | — | (0.31) | $ 12.48 |
| 2018 | $ 12.41 | 0.24 | (0.12) | 0.12 | (0.25) | — | — | (0.25) | $ 12.28 |
| (a) | Not annualized for periods less than one year. |
| (b) | Sales loads are not reflected in computing total return. |
| (c) | Unaudited Six Month Period Ended March 31. |
| (d) | Annualized. |
| + | Based on weighted average shares outstanding. |
Ultra Short Income Fund
| RATIOS TO AVERAGE NET ASSETS | Supplemental Data | ||||||
| UNLESS OTHERWISE NOTED, PERIODS ARE FISCAL YEARS ENDED SEPTEMBER 30, | Net Investment Income (Loss) (%) | Expenses, After Expense Reductions (%) | Expenses, Before Expense Reductions (%) | Total Return (%)(a) | Portfolio Turnover Rate (%)(a) | Net Assets at End of PERIOD (Thousands) | |
| CLASS A SHARES(b) | |||||||
| 2023 (c) | 3.84 (d) | 0.50 (d) | 0.80 (d) | 2.20 | 13.11 | $ 30,658 | |
| 2022 | 1.54 | 0.50 | 1.05 | (0.96) | 39.29 | $ 34,147 | |
| 2021 | 1.22 | 0.50 | 1.38 | 0.54 | 37.51 | $ 10,930 | |
| 2020 | 1.83 | 0.70 | 1.84 | 3.13 | 46.29 | $ 8,127 | |
| 2019 | 2.28 | 0.70 | 1.65 | 4.00 | 79.59 | $ 8,012 | |
| 2018 | 1.75 | 0.70 | 1.82 | 0.75 | 20.93 | $ 7,140 | |
| CLASS I SHARES | |||||||
| 2023 (c) | 4.07 (d) | 0.30 (d) | 0.49 (d) | 2.30 | 13.11 | $ 219,540 | |
| 2022 | 1.75 | 0.30 | 0.60 | (0.77) | 39.29 | $ 145,743 | |
| 2021 | 1.40 | 0.30 | 0.76 | 0.74 | 37.51 | $ 42,587 | |
| 2020 | 2.02 | 0.50 | 1.06 | 3.33 | 46.29 | $ 28,249 | |
| 2019 | 2.47 | 0.50 | 0.94 | 4.21 | 79.59 | $ 24,858 | |
| 2018 | 1.96 | 0.50 | 1.09 | 0.95 | 20.93 | $ 22,748 | |
Strategic Income Fund
| PER SHARE PERFORMANCE (FOR A SHARE OUTSTANDING THROUGHOUT THE PERIOD) | |||||||||
| UNLESS OTHERWISE NOTED, PERIODS ARE FISCAL YEARS ENDED SEPTEMBER 30, | Net Asset Value, Beginning of PERIOD | Net Investment Income (Loss)+ | Net Realized & Unrealized Gain (Loss) on Investments | Total from Investment Operations | Dividends from Net Investment Income | Dividends from Net Realized Gains | Dividends from Return of Capital | Total Dividends | Net Asset Value, End of PERIOD |
| CLASS A SHARES(c) | |||||||||
| 2023 (d) | $ 10.99 | 0.21 | 0.29 | 0.50 | (0.22) | — | — | (0.22) | $ 11.27 |
| 2022 | $ 12.41 | 0.36 | (1.38) | (1.02) | (0.37) | (0.03) | — | (0.40) | $ 10.99 |
| 2021 | $ 12.24 | 0.43 | 0.21 | 0.64 | (0.47) | — | — | (0.47) | $ 12.41 |
| 2020 | $ 11.92 | 0.40 | 0.31 | 0.71 | (0.39) | — | — | (0.39) | $ 12.24 |
| 2019 | $ 11.65 | 0.42 | 0.26 | 0.68 | (0.41) | — | — | (0.41) | $ 11.92 |
| 2018 | $ 11.82 | 0.40 | (0.24) | 0.16 | (0.33) | — | — | (0.33) | $ 11.65 |
| CLASS C SHARES | |||||||||
| 2023 (d) | $ 10.97 | 0.18 | 0.29 | 0.47 | (0.18) | — | — | (0.18) | $ 11.26 |
| 2022 | $ 12.39 | 0.27 | (1.38) | (1.11) | (0.28) | (0.03) | — | (0.31) | $ 10.97 |
| 2021 | $ 12.22 | 0.33 | 0.21 | 0.54 | (0.37) | — | — | (0.37) | $ 12.39 |
| 2020 | $ 11.90 | 0.31 | 0.31 | 0.62 | (0.30) | — | — | (0.30) | $ 12.22 |
| 2019 | $ 11.63 | 0.33 | 0.26 | 0.59 | (0.32) | — | — | (0.32) | $ 11.90 |
| 2018 | $ 11.81 | 0.32 | (0.25) | 0.07 | (0.25) | — | — | (0.25) | $ 11.63 |
| CLASS I SHARES | |||||||||
| 2023 (d) | $ 10.96 | 0.24 | 0.29 | 0.53 | (0.24) | — | — | (0.24) | $ 11.25 |
| 2022 | $ 12.38 | 0.40 | (1.38) | (0.98) | (0.41) | (0.03) | — | (0.44) | $ 10.96 |
| 2021 | $ 12.20 | 0.47 | 0.22 | 0.69 | (0.51) | — | — | (0.51) | $ 12.38 |
| 2020 | $ 11.89 | 0.44 | 0.30 | 0.74 | (0.43) | — | — | (0.43) | $ 12.20 |
| 2019 | $ 11.62 | 0.45 | 0.27 | 0.72 | (0.45) | — | — | (0.45) | $ 11.89 |
| 2018 | $ 11.80 | 0.45 | (0.25) | 0.20 | (0.38) | — | — | (0.38) | $ 11.62 |
| CLASS R3 SHARES | |||||||||
| 2023 (d) | $ 10.98 | 0.20 | 0.28 | 0.48 | (0.20) | — | — | (0.20) | $ 11.26 |
| 2022 | $ 12.40 | 0.33 | (1.38) | (1.05) | (0.34) | (0.03) | — | (0.37) | $ 10.98 |
| 2021 | $ 12.22 | 0.40 | 0.21 | 0.61 | (0.43) | — | — | (0.43) | $ 12.40 |
| 2020 | $ 11.91 | 0.35 | 0.31 | 0.66 | (0.35) | — | — | (0.35) | $ 12.22 |
| 2019 | $ 11.64 | 0.39 | 0.26 | 0.65 | (0.38) | — | — | (0.38) | $ 11.91 |
| 2018 | $ 11.82 | 0.38 | (0.25) | 0.13 | (0.31) | — | — | (0.31) | $ 11.64 |
| CLASS R4 SHARES | |||||||||
| 2023 (d) | $ 10.97 | 0.20 | 0.29 | 0.49 | (0.20) | — | — | (0.20) | $ 11.26 |
| 2022 | $ 12.39 | 0.32 | (1.37) | (1.05) | (0.34) | (0.03) | — | (0.37) | $ 10.97 |
| 2021 | $ 12.22 | 0.40 | 0.20 | 0.60 | (0.43) | — | — | (0.43) | $ 12.39 |
| 2020 | $ 11.90 | 0.36 | 0.31 | 0.67 | (0.35) | — | — | (0.35) | $ 12.22 |
| 2019 | $ 11.63 | 0.39 | 0.26 | 0.65 | (0.38) | — | — | (0.38) | $ 11.90 |
| 2018 | $ 11.82 | 0.38 | (0.25) | 0.13 | (0.32) | — | — | (0.32) | $ 11.63 |
| CLASS R5 SHARES | |||||||||
| 2023 (d) | $ 10.96 | 0.24 | 0.29 | 0.53 | (0.24) | — | — | (0.24) | $ 11.25 |
| 2022 | $ 12.39 | 0.40 | (1.39) | (0.99) | (0.41) | (0.03) | — | (0.44) | $ 10.96 |
| 2021 | $ 12.21 | 0.47 | 0.22 | 0.69 | (0.51) | — | — | (0.51) | $ 12.39 |
| 2020 | $ 11.89 | 0.45 | 0.30 | 0.75 | (0.43) | — | — | (0.43) | $ 12.21 |
| 2019 | $ 11.62 | 0.46 | 0.26 | 0.72 | (0.45) | — | — | (0.45) | $ 11.89 |
| 2018 | $ 11.80 | 0.45 | (0.25) | 0.20 | (0.38) | — | — | (0.38) | $ 11.62 |
| CLASS R6 SHARES | |||||||||
| 2023 (d) | $ 10.99 | 0.24 | 0.29 | 0.53 | (0.24) | — | — | (0.24) | $ 11.28 |
| 2022 | $ 12.42 | 0.41 | (1.39) | (0.98) | (0.42) | (0.03) | — | (0.45) | $ 10.99 |
| 2021 | $ 12.24 | 0.48 | 0.22 | 0.70 | (0.52) | — | — | (0.52) | $ 12.42 |
| 2020 | $ 11.93 | 0.45 | 0.30 | 0.75 | (0.44) | — | — | (0.44) | $ 12.24 |
| 2019 | $ 11.65 | 0.47 | 0.27 | 0.74 | (0.46) | — | — | (0.46) | $ 11.93 |
| 2018 | $ 11.85 | 0.45 | (0.26) | 0.19 | (0.39) | — | — | (0.39) | $ 11.65 |
| (a) | Net investment income (loss) includes income from foreign withholding tax claims adjusted for IRS compliance fees and/or tax reclaim collection fees. Without these proceeds, the Net Investment Income (Loss) ratios for 2021 would have been: Class A, 3.48%; Class C, 2.71%; Class I, 3.81%; Class R3, 3.19%; Class R4, 3.21%; Class R5, 3.84%; Class R6, 3.89%. |
| (b) | Not annualized for periods less than one year. |
| (c) | Sales loads are not reflected in computing total return. |
| (d) | Unaudited Six Month Period Ended March 31. |
| (e) | Annualized. |
| (f) | The total return based on the NAV which reflects adjustments in accordance with U.S. GAAP is 6.49% for 2019 and 6.46% for 2020. |
| + | Based on weighted average shares outstanding. |
Strategic Income Fund
| RATIOS TO AVERAGE NET ASSETS | Supplemental Data | ||||||
| UNLESS OTHERWISE NOTED, PERIODS ARE FISCAL YEARS ENDED SEPTEMBER 30, | Net Investment Income (Loss) (%)(a) | Expenses, After Expense Reductions (%) | Expenses, Before Expense Reductions (%) | Total Return (%)(b) | Portfolio Turnover Rate (%)(b) | Net Assets at End of PERIOD (Thousands) | |
| CLASS A SHARES(c) | |||||||
| 2023 (d) | 3.82 (e) | 1.03 (e) | 1.08 (e) | 4.57 | 14.02 | $ 275,961 | |
| 2022 | 3.03 | 0.99 | 1.06 | (8.37) | 27.19 | $ 321,614 | |
| 2021 | 3.48 | 0.95 | 1.05 | 5.30 | 28.55 | $ 376,252 | |
| 2020 | 3.35 | 0.96 | 1.13 | 6.07 | 58.91 | $ 249,520 | |
| 2019 | 3.55 | 0.99 | 1.16 | 5.92 | 31.55 | $ 215,441 | |
| 2018 | 3.41 | 1.09 | 1.21 | 1.39 | 29.90 | $ 198,320 | |
| CLASS C SHARES | |||||||
| 2023 (d) | 3.16 (e) | 1.71 (e) | 1.76 (e) | 4.30 | 14.02 | $ 90,920 | |
| 2022 | 2.29 | 1.72 | 1.79 | (9.08) | 27.19 | $ 80,326 | |
| 2021 | 2.71 | 1.73 | 1.83 | 4.49 | 28.55 | $ 100,385 | |
| 2020 | 2.57 | 1.70 | 1.88 | 5.30 | 58.91 | $ 103,302 | |
| 2019 | 2.80 | 1.75 | 1.92 | 5.15 | 31.55 | $ 118,982 | |
| 2018 | 2.70 | 1.80 | 1.96 | 0.59 | 29.90 | $ 150,364 | |
| CLASS I SHARES | |||||||
| 2023 (d) | 4.28 (e) | 0.60 (e) | 0.77 (e) | 4.87 | 14.02 | $ 5,496,980 | |
| 2022 | 3.45 | 0.60 | 0.77 | (8.07) | 27.19 | $ 4,180,742 | |
| 2021 | 3.81 | 0.60 | 0.81 | 5.74 | 28.55 | $ 3,255,002 | |
| 2020 | 3.73 | 0.60 | 0.88 | 6.39 | 58.91 | $ 1,758,843 | |
| 2019 | 3.89 | 0.63 | 0.91 | 6.35 | 31.55 | $ 1,141,046 | |
| 2018 | 3.81 | 0.69 | 0.91 | 1.71 | 29.90 | $ 762,239 | |
| CLASS R3 SHARES | |||||||
| 2023 (d) | 3.61 (e) | 1.25 (e) | 3.67 (e) | 4.44 | 14.02 | $ 607 | |
| 2022 | 2.77 | 1.25 | 3.96 | (8.64) | 27.19 | $ 641 | |
| 2021 | 3.20 | 1.25 | 3.16 | 5.06 | 28.55 | $ 837 | |
| 2020 | 2.96 | 1.25 | 2.53 | 5.70 | 58.91 | $ 1,105 | |
| 2019 | 3.30 | 1.25 | 2.59 | 5.71 | 31.55 | $ 1,661 | |
| 2018 | 3.24 | 1.25 | 2.46 | 1.16 | 29.90 | $ 1,968 | |
| CLASS R4 SHARES | |||||||
| 2023 (d) | 3.66 (e) | 1.25 (e) | 2.10 (e) | 4.54 | 14.02 | $ 2,699 | |
| 2022 | 2.76 | 1.25 | 2.44 | (8.65) | 27.19 | $ 2,044 | |
| 2021 | 3.21 | 1.25 | 2.28 | 4.98 | 28.55 | $ 2,139 | |
| 2020 | 3.06 | 1.25 | 2.70 | 5.79 | 58.91 | $ 1,633 | |
| 2019 | 3.28 | 1.25 | 2.51 | 5.71 | 31.55 | $ 1,279 | |
| 2018 | 3.25 | 1.25 | 2.14 | 1.08 | 29.90 | $ 2,182 | |
| CLASS R5 SHARES | |||||||
| 2023 (d) | 4.31 (e) | 0.60 (e) | 0.91 (e) | 4.87 | 14.02 | $ 57,811 | |
| 2022 | 3.38 | 0.60 | 0.96 | (8.14) | 27.19 | $ 40,507 | |
| 2021 | 3.84 | 0.60 | 0.92 | 5.74 | 28.55 | $ 64,449 | |
| 2020 | 3.78 | 0.60 | 1.00 | 6.48 | 58.91 | $ 43,715 | |
| 2019 | 3.94 | 0.59 | 1.18 | 6.35 | 31.55 | $ 11,180 | |
| 2018 | 3.82 | 0.69 | 1.20 | 1.71 | 29.90 | $ 7,406 | |
| CLASS R6 SHARES | |||||||
| 2023 (d) | 4.36 (e) | 0.53 (e) | 0.70 (e) | 4.90 | 14.02 | $ 130,671 | |
| 2022 | 3.53 | 0.53 | 0.72 | (8.05) | 27.19 | $ 109,349 | |
| 2021 | 3.89 | 0.53 | 0.75 | 5.81 | 28.55 | $ 77,415 | |
| 2020 | 3.77 | 0.53 | 0.88 | 6.55 (f) | 58.91 | $ 39,115 | |
| 2019 | 3.98 | 0.53 | 0.98 | 6.40 (f) | 31.55 | $ 21,630 | |
| 2018 | 3.91 | 0.65 | 1.13 | 1.66 | 29.90 | $ 9,679 | |
March 31, 2023 (Unaudited)
| (1) | transaction costs, including |
| (a) | sales charges (loads) on purchase payments, for Class A shares; |
| (b) | a deferred sales charge on redemptions of any part or all of a purchase of $1 million of Class A shares within 12 months of purchase; |
| (c) | a deferred sales charge on redemptions of Class C and Class C2 shares within 12 months of purchase; |
| (2) | ongoing costs, including management fees; distribution and/or service (12b-1) fees; and other Fund expenses. |
| Actual | Hypothetical * | |||||
| Ending Account Value 3/31/23 | Expenses Paid During Period 10/1/22-3/31/23 | Ending Account Value 3/31/23 | Expenses Paid During Period† 10/1/22-3/31/23 | Annualized Expense Ratio | ||
| LIMITED TERM U.S. GOVERNMENT FUND | ||||||
| CLASS A SHARES | $1,032.46 | $4.71 | $1,020.29 | $4.68 | 0.93% | |
| CLASS C SHARES | $1,030.73 | $6.28 | $1,018.75 | $6.24 | 1.24% | |
| CLASS C2 SHARES | $1,030.77 | $6.28 | $1,018.75 | $6.24 | 1.24% | |
| CLASS I SHARES | $1,033.93 | $3.25 | $1,021.74 | $3.23 | 0.64% | |
| CLASS R3 SHARES | $1,033.00 | $5.02 | $1,020.00 | $4.99 | 0.99% | |
| CLASS R4 SHARES | $1,032.15 | $5.02 | $1,020.00 | $4.99 | 0.99% | |
| CLASS R5 SHARES | $1,033.78 | $3.40 | $1,021.59 | $3.38 | 0.67% | |
| LIMITED TERM INCOME FUND | ||||||
| CLASS A SHARES | $1,037.59 | $4.01 | $1,020.99 | $3.98 | 0.79% | |
| CLASS C SHARES | $1,036.49 | $5.13 | $1,019.90 | $5.09 | 1.01% | |
| CLASS C2 SHARES | $1,035.29 | $6.29 | $1,018.75 | $6.24 | 1.24% | |
| CLASS I SHARES | $1,039.94 | $2.49 | $1,022.49 | $2.47 | 0.49% | |
| CLASS R3 SHARES | $1,037.35 | $5.03 | $1,020.00 | $4.99 | 0.99% | |
| CLASS R4 SHARES | $1,037.38 | $5.03 | $1,020.00 | $4.99 | 0.99% | |
| CLASS R5 SHARES | $1,039.96 | $2.49 | $1,022.49 | $2.47 | 0.49% | |
| CLASS R6 SHARES | $1,040.26 | $2.14 | $1,022.84 | $2.12 | 0.42% | |
| ULTRA SHORT INCOME FUND | ||||||
| CLASS A SHARES | $1,021.99 | $2.52 | $1,022.44 | $2.52 | 0.50% | |
| CLASS I SHARES | $1,023.01 | $1.51 | $1,023.44 | $1.51 | 0.30% | |
March 31, 2023 (Unaudited)
| Actual | Hypothetical * | |||||
| Ending Account Value 3/31/23 | Expenses Paid During Period 10/1/22-3/31/23 | Ending Account Value 3/31/23 | Expenses Paid During Period† 10/1/22-3/31/23 | Annualized Expense Ratio | ||
| STRATEGIC INCOME FUND | ||||||
| CLASS A SHARES | $1,045.67 | $5.25 | $1,019.80 | $5.19 | 1.03% | |
| CLASS C SHARES | $1,043.00 | $8.71 | $1,016.40 | $8.60 | 1.71% | |
| CLASS I SHARES | $1,048.74 | $3.06 | $1,021.94 | $3.02 | 0.60% | |
| CLASS R3 SHARES | $1,044.40 | $6.37 | $1,018.70 | $6.29 | 1.25% | |
| CLASS R4 SHARES | $1,045.35 | $6.37 | $1,018.70 | $6.29 | 1.25% | |
| CLASS R5 SHARES | $1,048.74 | $3.06 | $1,021.94 | $3.02 | 0.60% | |
| CLASS R6 SHARES | $1,049.03 | $2.71 | $1,022.29 | $2.67 | 0.53% | |
| * | Hypothetical assumes a rate of return of 5% per year before expenses. |
| † | Expenses are equal to the annualized expense ratio for each class multiplied by the average account value over the period, multiplied by 182/365 to reflect the one-half year period. |
March 31, 2023 (Unaudited)
| ■ | Thornburg Global Opportunities Fund |
| ■ | Thornburg International Equity Fund |
| ■ | Thornburg Better World International Fund |
| ■ | Thornburg International Growth Fund |
| ■ | Thornburg Developing World Fund |
| ■ | Thornburg Small/Mid Cap Core Fund |
| ■ | Thornburg Small/Mid Cap Growth Fund |
| ■ | Thornburg Investment Income Builder Fund |
| ■ | Thornburg Income Builder Opportunities Trust |
| ■ | Thornburg Summit Fund |
| ■ | Thornburg Limited Term U.S. Government Fund |
| ■ | Thornburg Limited Term Income Fund |
| ■ | Thornburg Ultra Short Income Fund |
| ■ | Thornburg Strategic Income Fund |
| ■ | Thornburg Short Duration Municipal Fund |
| ■ | Thornburg Limited Term Municipal Fund |
| ■ | Thornburg California Limited Term Municipal Fund |
| ■ | Thornburg New Mexico Intermediate Municipal Fund |
| ■ | Thornburg New York Intermediate Municipal Fund |
| ■ | Thornburg Intermediate Municipal Fund |
| ■ | Thornburg Strategic Municipal Income Fund |


| 800.847.0200 | TH4625 |

| Thornburg Municipal Funds |
| Thornburg Short Duration Municipal Fund |
| Thornburg Limited Term Municipal Fund |
| Thornburg California Limited Term Municipal Fund |
| Thornburg New Mexico Intermediate Municipal Fund |
| Thornburg New York Intermediate Municipal Fund |
| Thornburg Intermediate Municipal Fund |
| Thornburg Strategic Municipal Income Fund |

At Thornburg, we believe unconstrained investing leads to better outcomes for our clients. Our investment solutions are highly active, high conviction, and benchmark agnostic. When it comes to finding economic opportunity for clients, it’s more than what we do.
It’s how we do it. Active As bottom-up, fundamental, active managers, we look beyond conventional benchmarks. Long Term We take a long-term view in how we manage our firm and our portfolios. Benchmark Agnostic Investment strategies should have the flexibility to pursue solutions for clients, not stay within the conventional confines of benchmarks. Flexible Perspective Our approach to portfolio construction is guided by our convictions rather than convention. High Conviction We focus our attention and capital on thoroughly researched, well-understood positions. The best form of risk management is to know what you own, and why. Repeatable & Robust Our long-term outperformance of benchmarks verifies that our process works and outperforms conventional thinking. Independent We are independently owned and far from the herd of other investment managers. Investment Driven All members of the investment team are resources for all of our strategies. Collaborative Our team collaborates on opportunities across geography, sector, or asset class. 2 Semi-Annual Report
| 4 | |
| 5 | |
| 13 | |
| Schedule of Investments | |
| 20 | |
| 24 | |
| 39 | |
| 43 | |
| 45 | |
| 46 | |
| 54 | |
| 60 | |
| 64 | |
| 66 | |
| 70 | |
| 82 | |
| 96 | |
| 98 | |
| 99 |
March 31, 2023 (Unaudited)
 | |
| Jason Brady, cfa Portfolio Manager CEO, President, and Managing Director |
Fund Overview
| THORNBURG SHORT DURATION MUNICIPAL FUND | FINAL VALUE |
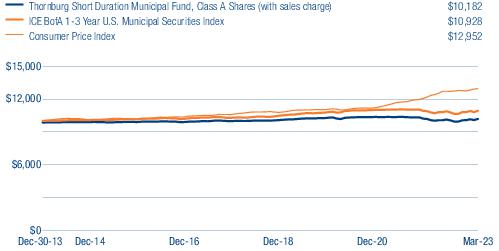
| THORNBURG SHORT DURATION MUNICIPAL FUND | 1-YR | 3-YR | 5-YR | SINCE INCEPTION |
| Class A Shares (Incep: 12/30/13) | ||||
| Without sales charge | 1.12% | -0.09% | 0.38% | 0.36% |
| With sales charge | -1.18% | -0.61% | 0.07% | 0.19% |
| Class I Shares (Incep: 12/30/13) | 1.24% | 0.08% | 0.56% | 0.55% |
| ICE BofA 1-3 Year U.S. Municipal Securities Index (Since 12/30/13) | 1.42% | 0.55% | 1.17% | 0.96% |
Fund Overview
| THORNBURG LIMITED TERM MUNICIPAL FUND | FINAL VALUE |
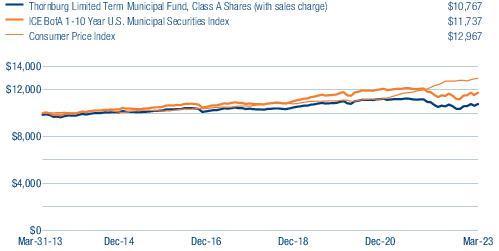
| THORNBURG LIMITED TERM MUNICIPAL FUND | 1-YR | 3-YR | 5-YR | 10-YR | SINCE INCEPTION |
| Class A Shares (Incep: 9/28/84) | |||||
| Without sales charge | 0.71% | -0.21% | 0.86% | 0.89% | 4.22% |
| With sales charge | -1.57% | -0.71% | 0.55% | 0.74% | 4.18% |
| Class C Shares (Incep: 9/1/94) | |||||
| Without sales charge | 0.40% | -0.49% | 0.59% | 0.64% | 2.71% |
| With sales charge | -0.10% | -0.49% | 0.59% | 0.64% | 2.71% |
| Class C2 Shares (Incep: 10/1/20) | |||||
| Without sales charge | 0.21% | - | - | - | -1.83% |
| With sales charge | -0.43% | - | - | - | -1.83% |
| Class I Shares (Incep: 7/5/96) | 0.94% | -0.01% | 1.08% | 1.17% | 3.24% |
| ICE BofA 1-10 Year U.S. Municipal Securities Index (Since 9/28/84) | 1.62% | 0.64% | 1.75% | 1.61% | - |
Fund Overview
| THORNBURG CALIFORNIA LIMITED TERM MUNICIPAL FUND | FINAL VALUE |
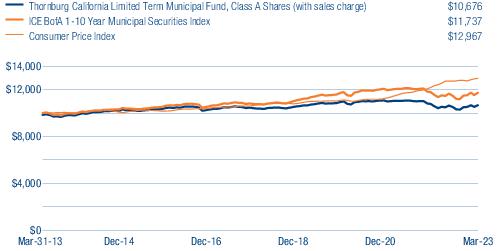
| THORNBURG CALIFORNIA LIMITED TERM MUNICIPAL FUND | 1-YR | 3-YR | 5-YR | 10-YR | SINCE INCEPTION |
| Class A Shares (Incep: 2/19/87) | |||||
| Without sales charge | 0.92% | -0.34% | 0.56% | 0.81% | 3.62% |
| With sales charge | -1.35% | -0.85% | 0.25% | 0.66% | 3.58% |
| Class C Shares (Incep: 9/1/94) | |||||
| Without sales charge | 0.64% | -0.62% | 0.27% | 0.53% | 2.58% |
| With sales charge | 0.14% | -0.62% | 0.27% | 0.53% | 2.58% |
| Class C2 Shares (Incep: 10/1/20) | |||||
| Without sales charge | 0.63% | - | - | - | -1.53% |
| With sales charge | -0.02% | - | - | - | -1.53% |
| Class I Shares (Incep: 4/1/97) | 1.17% | -0.09% | 0.80% | 1.09% | 3.02% |
| ICE BofA 1-10 Year U.S. Municipal Securities Index (Since 2/19/87) | 1.62% | 0.64% | 1.75% | 1.61% | - |
Fund Overview
| THORNBURG NEW MEXICO INTERMEDIATE MUNICIPAL FUND | FINAL VALUE |
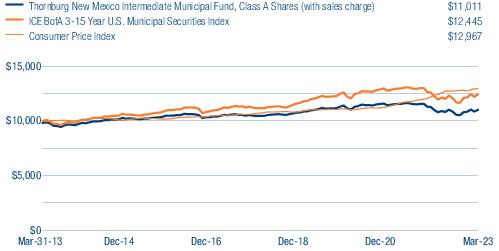
| THORNBURG NEW MEXICO INTERMEDIATE MUNICIPAL FUND | 1-YR | 3-YR | 5-YR | 10-YR | SINCE INCEPTION |
| Class A Shares (Incep: 6/18/91) | |||||
| Without sales charge | 0.19% | -0.39% | 1.01% | 1.17% | 3.68% |
| With sales charge | -1.82% | -1.05% | 0.60% | 0.97% | 3.61% |
| Class D Shares (Incep: 6/1/99) | -0.14% | -0.64% | 0.73% | 0.91% | 2.56% |
| Class I Shares (Incep: 2/1/07) | 0.43% | -0.07% | 1.32% | 1.48% | 2.68% |
| ICE BofA 3-15 Year U.S. Municipal Securities Index (Since 6/18/91) | 1.61% | 0.70% | 2.16% | 2.21% | - |
Fund Overview
| THORNBURG NEW YORK INTERMEDIATE MUNICIPAL FUND | FINAL VALUE |
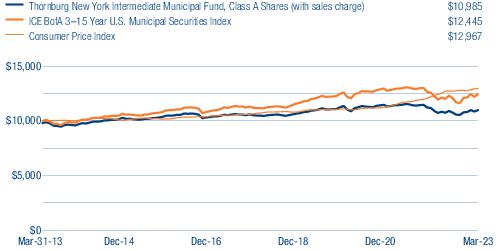
| THORNBURG NEW YORK INTERMEDIATE MUNICIPAL FUND | 1-YR | 3-YR | 5-YR | 10-YR | SINCE INCEPTION |
| Class A Shares (Incep: 9/5/97) | |||||
| Without sales charge | 0.71% | -0.15% | 0.94% | 1.15% | 3.13% |
| With sales charge | -1.31% | -0.82% | 0.54% | 0.94% | 3.05% |
| Class I Shares (Incep: 2/1/10) | 0.95% | 0.17% | 1.27% | 1.47% | 2.45% |
| ICE BofA 3-15 Year U.S. Municipal Securities Index (Since 9/5/97) | 1.61% | 0.70% | 2.16% | 2.21% | 4.27% |
Fund Overview
| THORNBURG INTERMEDIATE MUNICIPAL FUND | FINAL VALUE |
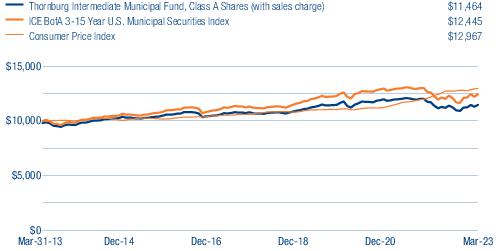
| THORNBURG INTERMEDIATE MUNICIPAL FUND | 1-YR | 3-YR | 5-YR | 10-YR | SINCE INCEPTION |
| Class A Shares (Incep: 7/22/91) | |||||
| Without sales charge | 0.68% | 0.33% | 1.43% | 1.58% | 4.11% |
| With sales charge | -1.36% | -0.35% | 1.02% | 1.38% | 4.04% |
| Class C Shares (Incep: 9/1/94) | |||||
| Without sales charge | 0.31% | -0.04% | 1.06% | 1.23% | 3.31% |
| With sales charge | -0.27% | -0.04% | 1.06% | 1.23% | 3.31% |
| Class C2 Shares (Incep: 10/1/20) | |||||
| Without sales charge | 0.32% | - | - | - | -1.30% |
| With sales charge | -0.32% | - | - | - | -1.30% |
| Class I Shares (Incep: 7/5/96) | 0.85% | 0.57% | 1.67% | 1.86% | 3.82% |
| ICE BofA 3-15 Year U.S. Municipal Securities Index (Since 7/22/91) | 1.61% | 0.70% | 2.16% | 2.21% | - |
Fund Overview
| THORNBURG STRATEGIC MUNICIPAL INCOME FUND | FINAL VALUE |
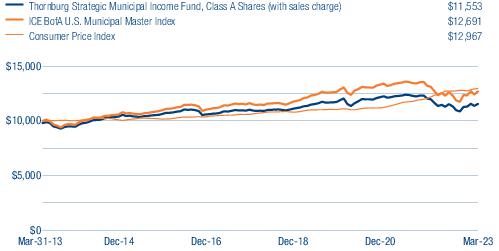
| THORNBURG STRATEGIC MUNICIPAL INCOME FUND | 1-YR | 3-YR | 5-YR | 10-YR | SINCE INCEPTION |
| Class A Shares (Incep: 4/1/09) | |||||
| Without sales charge | -0.76% | 0.04% | 1.11% | 1.66% | 4.19% |
| With sales charge | -2.78% | -0.65% | 0.71% | 1.45% | 4.04% |
| Class C Shares (Incep: 4/1/09) | |||||
| Without sales charge | -1.30% | -0.46% | 0.64% | 1.24% | 3.81% |
| With sales charge | -1.87% | -0.46% | 0.64% | 1.24% | 3.81% |
| Class I Shares (Incep: 4/1/09) | -0.54% | 0.26% | 1.33% | 1.91% | 4.47% |
| ICE BofA U.S. Municipal Master Index (Since 4/1/09) | -0.29% | 0.32% | 2.00% | 2.41% | 3.87% |
Thornburg Short Duration Municipal Fund | March 31, 2023 (Unaudited)
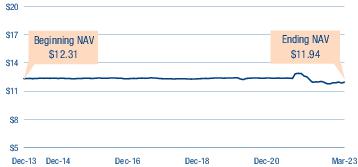
| KEY PORTFOLIO ATTRIBUTES | |
| Number of Bonds | 165 |
| Effective Duration | 1.4 Yrs |
| Average Maturity | 1.7 Yrs |
| Annualized Distribution Yield | 2.26% |
| SEC Yield | 2.52% |
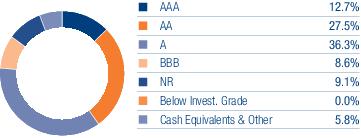
| 6% | 39% | 15% | 18% | 14% | 9% | 1% |
| THORNBURG SHORT DURATION MUNICIPAL FUND | NASDAQ SYMBOLS | CUSIPS |
| Class A | TLMAX | 885-216-788 |
| Class I | TLMIX | 885-216-770 |
Thornburg Limited Term Municipal Fund | March 31, 2023 (Unaudited)
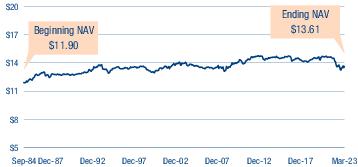
| KEY PORTFOLIO ATTRIBUTES | |
| Number of Bonds | 1,128 |
| Effective Duration | 2.9 Yrs |
| Average Maturity | 3.5 Yrs |
| Annualized Distribution Yield | 2.23% |
| SEC Yield | 2.31% |
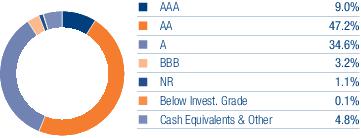

| 5% | 18% | 19% | 11% | 10% | 9% | 7% | 5% | 5% | 6% | 6% |
| THORNBURG LIMITED TERM MUNICIPAL FUND | NASDAQ SYMBOLS | CUSIPS |
| Class A | LTMFX | 885-215-459 |
| Class C | LTMCX | 885-215-442 |
| Class C2 | LTMQX | 885-216-556 |
| Class I | LTMIX | 885-215-434 |
Thornburg California Limited Term Municipal Fund | March 31, 2023 (Unaudited)
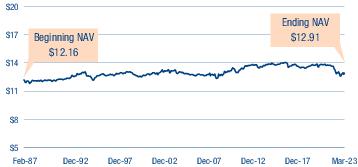
| KEY PORTFOLIO ATTRIBUTES | |
| Number of Bonds | 220 |
| Effective Duration | 2.5 Yrs |
| Average Maturity | 3.2 Yrs |
| Annualized Distribution Yield | 2.07% |
| SEC Yield | 2.29% |
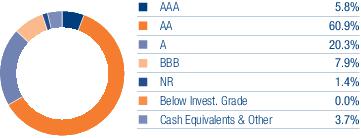
| 4% | 23% | 20% | 11% | 9% | 8% | 6% | 4% | 4% | 5% | 7% |
| THORNBURG CALIFORNIA LIMITED TERM MUNICIPAL FUND | NASDAQ SYMBOLS | CUSIPS |
| Class A | LTCAX | 885-215-426 |
| Class C | LTCCX | 885-215-418 |
| Class C2 | LTCQX | 885-216-515 |
| Class I | LTCIX | 885-215-392 |
Thornburg New Mexico Intermediate Municipal Fund | March 31, 2023 (Unaudited)
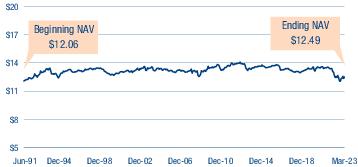
| KEY PORTFOLIO ATTRIBUTES | |
| Number of Bonds | 123 |
| Effective Duration | 4.2 Yrs |
| Average Maturity | 7.3 Yrs |
| Annualized Distribution Yield | 1.66% |
| SEC Yield | 2.07% |
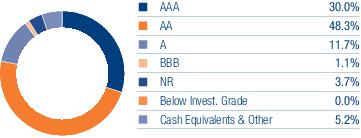
| 5% | 6% | 3% | 10% | 9% | 9% | 4% | 6% | 3% | 6% | 39% |
| THORNBURG NEW MEXICO INTERMEDIATE MUNICIPAL FUND | NASDAQ SYMBOLS | CUSIPS |
| Class A | THNMX | 885-215-301 |
| Class D | THNDX | 885-215-624 |
| Class I | THNIX | 885-215-285 |
Thornburg New York Intermediate Municipal Fund | March 31, 2023 (Unaudited)
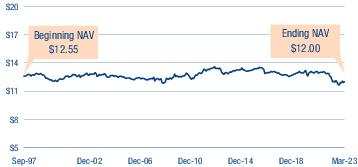
| KEY PORTFOLIO ATTRIBUTES | |
| Number of Bonds | 41 |
| Effective Duration | 3.8 Yrs |
| Average Maturity | 7.6 Yrs |
| Annualized Distribution Yield | 2.10% |
| SEC Yield | 2.18% |
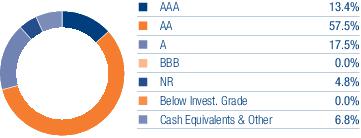
| 7% | 15% | 9% | 0% | 0% | 1% | 5% | 7% | 4% | 12% | 40% |
| THORNBURG NEW YORK INTERMEDIATE MUNICIPAL FUND | NASDAQ SYMBOLS | CUSIPS |
| Class A | THNYX | 885-215-665 |
| Class I | TNYIX | 885-216-705 |
Thornburg Intermediate Municipal Fund | March 31, 2023 (Unaudited)
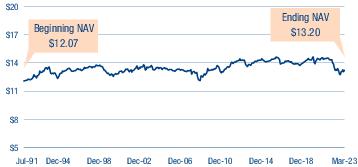
| KEY PORTFOLIO ATTRIBUTES | |
| Number of Bonds | 474 |
| Effective Duration | 4.7 Yrs |
| Average Maturity | 9.0 Yrs |
| Annualized Distribution Yield | 2.79% |
| SEC Yield | 2.60% |
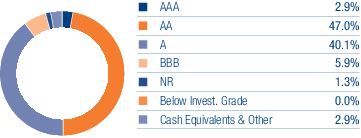
| 3% | 9% | 6% | 3% | 2% | 6% | 5% | 5% | 5% | 7% | 48% |
| THORNBURG INTERMEDIATE MUNICIPAL FUND | NASDAQ SYMBOLS | CUSIPS |
| Class A | THIMX | 885-215-202 |
| Class C | THMCX | 885-215-780 |
| Class C2 | THMQX | 885-216-374 |
| Class I | THMIX | 885-215-673 |
Thornburg Strategic Municipal Income Fund | March 31, 2023 (Unaudited)
| KEY PORTFOLIO ATTRIBUTES | |
| Number of Bonds | 269 |
| Effective Duration | 5.5 Yrs |
| Average Maturity | 10.4 Yrs |
| Annualized Distribution Yield | 2.99% |
| SEC Yield | 2.94% |
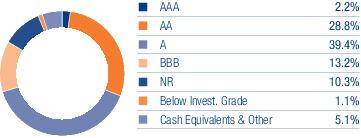
| THORNBURG STRATEGIC MUNICIPAL INCOME FUND | NASDAQ SYMBOLS | CUSIPS |
| Class A | TSSAX | 885-216-101 |
| Class C | TSSCX | 885-216-200 |
| Class I | TSSIX | 885-216-309 |
Thornburg Short Duration Municipal Fund | March 31, 2023 (Unaudited)
| ISSUER-DESCRIPTION | Principal Amount | VALUE | |
| LONG-TERM MUNICIPAL BONDS — 93.3% | |||
| Alabama — 1.9% | |||
| a | Black Belt Energy Gas District (Guaranty: Morgan Stanley Group), Series A-1, 4.00% due 12/1/2049 (put 12/1/2025) | $1,230,000 | $ 1,225,839 |
| Chatom (Powersouth Energy Co-operative Projects; Insured: AGM) IDB, 5.00% due 8/1/2025 | 425,000 | 446,410 | |
| a | Chatom (PowerSouth Energy Cooperative; SPA National Rural Utilities Cooperative Finance) IDB, Series A, 3.25% due 8/1/2037 (put 8/1/2023) | 1,500,000 | 1,533,294 |
| Arizona — 1.2% | |||
| a | Arizona (Banner Health Obligated Group) HFA, Series B, 4.22% (MUNIPSA + 0.25%) due 1/1/2046 (put 11/4/2026) | 1,000,000 | 997,708 |
| Northern Arizona University, 5.00% due 8/1/2024 | 1,115,000 | 1,122,409 | |
| California — 5.8% | |||
| California (PIH Health, Inc. Obligated Group) HFFA, Series A, 5.00% due 6/1/2027 | 365,000 | 397,686 | |
| California Municipal Finance Authority (CHF-Davis II LLC; Insured: BAM) (Green Bond), 5.00% due 5/15/2025 - 5/15/2026 | 650,000 | 687,625 | |
| a,b | California Pollution Control Financing Authority (Republic Services, Inc. Project), Series B, 2.95% due 8/1/2024 (put 5/1/2023) | 1,750,000 | 1,750,000 |
| City of Los Angeles, 4.00% due 6/29/2023 | 1,500,000 | 1,504,514 | |
| County of Riverside, | |||
| 5.00% due 6/30/2023 | 1,500,000 | 1,508,008 | |
| Series A, 3.70% due 10/19/2023 | 1,750,000 | 1,759,408 | |
| Rancho Santa Fe Community Services District Financing Authority, Series A, 5.00% due 9/1/2025 | 1,745,000 | 1,819,656 | |
| a | Sacramento Municipal Utility District, Series A, 5.00% due 8/15/2049 (put 10/17/2023) | 600,000 | 600,740 |
| Colorado — 2.7% | |||
| Colorado (Adventhealth Obligation Group) HFA, | |||
| Series C, | |||
| a | 5.00% due 11/15/2036 (pre-refunded 11/15/2023) | 265,000 | 268,697 |
| a | 5.00% due 11/15/2036 (put 11/15/2023) | 735,000 | 744,868 |
| Colorado (Northern Colorado Medical Center) HFA ETM, 5.00% due 5/15/2025 | 565,000 | 590,914 | |
| a | E-470 Public Highway Authority, Series B, 3.579% (SOFR + 0.35%) due 9/1/2039 (put 9/1/2024) | 2,000,000 | 2,001,986 |
| Interlocken Metropolitan District (Insured: AGM) GO, Series A-1, 5.00% due 12/1/2023 | 750,000 | 760,563 | |
| Sierra Ridge Metropolitan District No 2 (Insured: AGM) GO, 4.00% due 12/1/2025 | 275,000 | 282,478 | |
| Connecticut — 0.7% | |||
| City of New Haven (Insured: AGM) GO, Series B, 5.00% due 2/1/2026 - 2/1/2027 | 1,150,000 | 1,218,465 | |
| District of Columbia — 1.2% | |||
| a | District of Columbia Housing Finance Agency (Benning Corridor Titleholder LLC), 4.00% due 9/1/2040 (put 9/1/2025) | 2,000,000 | 2,032,552 |
| Florida — 3.3% | |||
| City of Orlando (Senior Tourist Development; Insured: AGM), Series A, 5.00% due 11/1/2025 | 1,000,000 | 1,046,727 | |
| a | County of Escambia (International Paper Co.), Series B, 2.00% due 11/1/2033 (put 10/1/2024) | 775,000 | 756,635 |
| County of Miami-Dade Aviation Revenue, Series A, 5.00% due 10/1/2025 | 1,000,000 | 1,054,928 | |
| Florida Development Finance Corp. (Mater Academy Miami-Dade Osceola County Facilities Obligated Group), Series A, 5.00% due 6/15/2025 - 6/15/2027 | 770,000 | 796,586 | |
| a,c | Miami-Dade County Housing Finance Authority (Quail Roost Transit Village I Ltd.), 5.00% due 9/1/2026 (put 9/1/2025) | 1,000,000 | 1,037,139 |
| Orange County (AdventHealth Obligated Group) HFA, | |||
| Series C, | |||
| a | 5.00% due 11/15/2052 (pre-refunded 11/15/2026) | 55,000 | 60,106 |
| a | 5.00% due 11/15/2052 (put 11/15/2026) | 820,000 | 883,642 |
| Georgia — 7.4% | |||
| a | Bartow County Development Authority (Georgia Power Co.), 3.95% due 12/1/2032 (put 3/8/2028) | 1,300,000 | 1,323,618 |
| a | Development Authority of Burke County (Georigia Power Company), 2.925% due 11/1/2048 (put 3/12/2024) | 500,000 | 497,030 |
| Main Street Natural Gas, Inc. (Guaranty: Citigroup Global Markets), | |||
| Series A, 5.00% due 6/1/2024 | 550,000 | 555,624 | |
| Series C, 4.00% due 12/1/2023 | 750,000 | 749,450 | |
| Main Street Natural Gas, Inc. (Guaranty: Macquarie Group Ltd.), Series A, 5.00% due 5/15/2023 | 2,450,000 | 2,452,139 | |
| Main Street Natural Gas, Inc. (Guaranty: Royal Bank of Canada), | |||
| a | Series A, 4.00% due 4/1/2048 (put 9/1/2023) | 1,700,000 | 1,701,607 |
| a | Series C, 4.00% due 8/1/2048 (put 12/1/2023) | 1,650,000 | 1,652,767 |
| Municipal Electric Authority of Georgia, Series A, 4.00% due 11/1/2025 | 600,000 | 614,495 | |
| Private Colleges & Universities Authority (Corp. of Mercer University), 5.00% due 10/1/2023 - 10/1/2026 | 1,170,000 | 1,216,532 | |
| Savannah (International Paper Co.) EDA, Series B, 1.90% due 8/1/2024 | 2,000,000 | 1,954,904 | |
| Illinois — 7.8% | |||
| City of Chicago (Water System), 5.00% due 11/1/2024 | 1,000,000 | 1,027,792 | |
| a | City of Chicago Heights (Olympic Village LLC), 2.875% due 8/1/2027 (put 8/1/2025) | 1,500,000 | 1,499,514 |
| Clinton Bond Fayette Etc Counties Community College District No 501 Kaskaskia (Insured: AGM) GO, 5.00% due 12/1/2027 | 220,000 | 240,129 | |
| Cook County (Capital Improvement Plan) GO, Series A, 5.00% due 11/15/2024 | 1,000,000 | 1,031,672 | |
| Cook County Community College District No. 508 (City Colleges of Chicago) GO, 5.00% due 12/1/2023 | 500,000 | 501,768 |
| 20 | Thornburg Municipal Funds Semi-Annual Report | See notes to financial statements. |
| ISSUER-DESCRIPTION | Principal Amount | VALUE | |
| a | Illinois (Anchor Senior Living 2021 L.P.) HDA, Series A, 4.00% due 11/1/2042 (put 5/1/2025) | $2,000,000 | $ 2,019,920 |
| Illinois Finance Authority (NorthShore University HealthSystem Obligated Group), Series A, 5.00% due 8/15/2027 | 500,000 | 551,163 | |
| Illinois Finance Authority (Washington & Jane Smith Community-Orland Park), 4.00% due 10/15/2023 - 10/15/2024 | 420,000 | 415,665 | |
| Metropolitan Water Reclamation District of Greater Chicago GO, Series A, 5.00% due 12/1/2025 | 585,000 | 622,145 | |
| Southern Illinois University (Insured: BAM), Series A, 5.00% due 4/1/2023 - 4/1/2026 | 1,630,000 | 1,665,309 | |
| State of Illinois (State Facilities Improvements) GO, Series D, 5.00% due 11/1/2024 | 1,000,000 | 1,030,334 | |
| State of Illinois GO, | |||
| Series A, 5.00% due 3/1/2024 | 800,000 | 813,973 | |
| Series B, 5.00% due 3/1/2025 - 9/1/2027 | 1,995,000 | 2,129,217 | |
| Indiana — 0.6% | |||
| City of Rockport (AEP Generating Co.; Guaranty: American Electric Power Co.), Series A, 3.125% due 7/1/2025 | 1,000,000 | 994,999 | |
| Iowa — 2.1% | |||
| a | PEFA, Inc. (Guaranty: Goldman Sachs Group, Inc.), 5.00% due 9/1/2049 (put 9/1/2026) | 3,600,000 | 3,670,643 |
| Kansas — 2.6% | |||
| Chisholm Creek Utility Authority (Insured: AMBAC), 5.25% due 9/1/2023 | 1,165,000 | 1,174,926 | |
| Kansas Independent College Finance Authority (Ottawa University), Series C, 5.75% due 5/1/2023 | 3,000,000 | 3,002,079 | |
| Unified Government of Wyandotte County/Kansas City (School Improvement Project; Insured: AGM) USD GO, Series A, 5.00% due 9/1/2031 (pre-refunded 9/1/2027) | 350,000 | 389,804 | |
| Kentucky — 0.8% | |||
| County of Boone (Duke Energy Kentucky, Inc.), Series A, 3.70% due 8/1/2027 | 1,000,000 | 1,008,022 | |
| a | Kentucky Public Energy Authority (Guaranty: Morgan Stanley Group), Series C-1, 4.00% due 12/1/2049 (put 6/1/2025) | 450,000 | 448,315 |
| Louisiana — 2.8% | |||
| City of Shreveport Water & Sewer Revenue (Insured: BAM), Series C, 5.00% due 12/1/2023 | 860,000 | 872,135 | |
| a | Louisiana Offshore Terminal Authority (Loop LLC), 1.65% due 9/1/2027 (put 12/1/2023) | 1,500,000 | 1,482,590 |
| a | Plaquemines Port Harbor & Terminal District (International Marine Terminals Partnership; LOC Wells Fargo Bank N.A.), Series A, 4.00% due 3/15/2025 (put 3/15/2024) | 1,500,000 | 1,507,545 |
| a | State of Louisiana Gasoline & Fuels Tax Revenue, Series A, 3.874% (SOFR + 0.50%) due 5/1/2043 (put 5/1/2026) | 985,000 | 951,846 |
| Maryland — 0.3% | |||
| Maryland Health & Higher Educational Facilities Authority (UPMC Obligated Group), Series B, 5.00% due 4/15/2024 | 500,000 | 510,783 | |
| Massachusetts — 1.4% | |||
| a,b | Massachusetts (Mass General Brigham, Inc.) DFA, Series T-1, 4.57% (MUNIPSA + 0.60%) due 7/1/2049 (put 1/29/2026) | 2,500,000 | 2,495,660 |
| Michigan — 1.1% | |||
| a | Michigan Finance Authority (Bronson Health Care Group Obligated Group), Series B, 5.00% due 11/15/2044 (put 11/16/2026) | 1,730,000 | 1,817,092 |
| Minnesota — 0.5% | |||
| a | Minnesota Housing Finance Agency (Residential Single Family Development; Collateralized: GNMA, FNMA, FHLMC), Series H, 4.52% (MUNIPSA + 0.55%) due 7/1/2041 (put 12/12/2023) | 825,000 | 825,337 |
| Mississippi — 0.9% | |||
| a | County of Jackson GO, 2.75% due 11/1/2024 (put 8/1/2023) | 1,500,000 | 1,500,688 |
| Nebraska — 1.0% | |||
| a | Central Plains Energy Project (Guaranty: Goldman Sachs Group, Inc.), 5.00% due 3/1/2050 (put 1/1/2024) | 1,000,000 | 1,005,407 |
| Central Plains Energy Project (Guaranty: Royal Bank of Canada), 4.00% due 8/1/2024 | 250,000 | 252,173 | |
| Gretna Public Schools GO, Series B, 5.00% due 12/15/2027 | 500,000 | 532,203 | |
| Nevada — 1.2% | |||
| a | County of Clark (Nevada Power Co.), 3.75% due 1/1/2036 (put 3/31/2026) | 1,000,000 | 1,013,672 |
| a | Nevada Housing Division (Fairfield Woodcreek LLC), 5.00% due 12/1/2025 (put 12/1/2024) | 1,000,000 | 1,034,712 |
| New Jersey — 3.3% | |||
| City of Newark GO, Series D, 4.00% due 9/29/2023 | 2,000,000 | 2,011,746 | |
| New Jersey (School Facilities Construction) EDA, Series NN, 5.00% due 3/1/2024 | 1,000,000 | 1,001,227 | |
| New Jersey (State of New Jersey Department of the Treasury) EDA, Series BBB, 5.50% due 6/15/2029 (pre-refunded 12/15/2026) | 1,000,000 | 1,114,116 | |
| New Jersey Transportation Trust Fund Authority (State Transportation System Improvements), Series A, 5.00% due 6/15/2024 | 850,000 | 871,650 | |
| Southeast Monmouth Municipal Utilities Authority (Water Revenue Project Notes), 4.00% due 9/29/2023 | 700,000 | 702,290 | |
| New Mexico — 3.0% | |||
| City of Farmington (Public Service Co. of New Mexico), | |||
| a,d | Series C, 1.15% due 6/1/2040 (put 6/1/2024) | 1,500,000 | 1,461,825 |
| a | Series E, 1.15% due 6/1/2040 (put 6/1/2024) | 1,500,000 | 1,461,825 |
| New Mexico Municipal Energy Acquisition Authority (Guaranty: Royal Bank of Canada), Series A, 4.00% due 11/1/2023 - 5/1/2024 | 1,400,000 | 1,402,716 | |
| Santa Fe Public School District (State Aid Withholding) GO, 3.00% due 8/1/2023 | 900,000 | 899,732 | |
| New York — 8.4% | |||
| City of Plattsburgh GO, Series B, 4.75% due 11/17/2023 | 1,680,000 | 1,693,085 | |
| County of Nassau (Insured: BAM) GO, Series B, 5.00% due 4/1/2034 (pre-refunded 4/1/2024) | 500,000 | 511,668 |
| See notes to financial statements. | Thornburg Municipal Funds Semi-Annual Report | 21 |
Thornburg Short Duration Municipal Fund | March 31, 2023 (Unaudited)
| ISSUER-DESCRIPTION | Principal Amount | VALUE | |
| Manchester-Shortsville Central School District (State Aid Withholding) GO, 4.00% due 8/17/2023 | $2,200,000 | $ 2,205,150 | |
| Metropolitan Transportation Authority, Series A, 5.00% due 11/15/2023 | 2,065,000 | 2,069,219 | |
| a | New York City Housing Development Corp., Series F, 3.40% due 11/1/2062 (put 12/22/2026) | 1,100,000 | 1,100,645 |
| New York State Dormitory Authority (Barnard College), Series A, 4.00% due 7/1/2024 - 7/1/2025 | 350,000 | 353,712 | |
| a | New York State Energy Research & Development Authority (New York State Electric & Gas Corp.), Series C, 2.625% due 4/1/2034 (put 7/3/2023) | 2,000,000 | 1,995,604 |
| New York State Housing Finance Agency (Green Bond), Series I, 2.70% due 11/1/2023 | 2,125,000 | 2,123,470 | |
| Oneida County Local Development Corp. (Utica College), 5.00% due 7/1/2023 - 7/1/2025 | 1,100,000 | 1,107,809 | |
| Town of Oyster Bay (Insured: BAM) GO, 4.00% due 11/1/2024 | 925,000 | 946,512 | |
| Westchester County Local Development Corp. (Miriam Osborn Memorial Home Association Obligated Group), 5.00% due 7/1/2023 | 425,000 | 426,400 | |
| North Carolina — 1.3% | |||
| North Carolina Medical Care Commission (Vidant Health), 5.00% due 6/1/2029 (pre-refunded 6/1/2025) | 205,000 | 215,771 | |
| North Carolina Turnpike Authority ETM, Series B, 5.00% due 2/1/2024 | 2,000,000 | 2,035,136 | |
| North Dakota — 1.1% | |||
| a | North Dakota Housing Finance Agency, Series B, 4.17% (MUNIPSA + 0.20%) due 1/1/2043 (put 7/1/2024) | 2,000,000 | 1,980,096 |
| Ohio — 2.6% | |||
| Akron, Bath and Copley Joint Township Hospital District (Summa Health System Obligated Group), 5.00% due 11/15/2027 | 735,000 | 782,251 | |
| a | County of Allen Hospital Facilities Revenue (Bon Secours Mercy Health, Inc.), Series B-1, 5.00% due 10/1/2049 (put 8/3/2027) | 2,000,000 | 2,191,366 |
| Union/Clermont County Township GO, 3.00% due 8/30/2023 | 1,500,000 | 1,498,101 | |
| Oklahoma — 1.1% | |||
| Muskogee Industrial Trust (Muskogee County ISD No. 20), 5.00% due 9/1/2023 | 200,000 | 200,797 | |
| Rogers County Educational Facilities Authority (School District No 2 Catoosa), 5.00% due 9/1/2026 | 1,500,000 | 1,606,791 | |
| Pennsylvania — 4.3% | |||
| Allegheny County Hospital Development Authority (UPMC Obligated Group), Series A, 5.00% due 7/15/2025 | 1,500,000 | 1,571,242 | |
| a | Bethlehem Area School District Authority (State Aid Withholding), Series B, 3.586% (SOFR + 0.35%) due 7/1/2031 (put 11/1/2025) | 1,930,000 | 1,885,367 |
| Hempfield Area School District (Insured: AGM) (State Aid Withholding) GO, | |||
| Series B, 5.00% due 3/15/2027 | 1,410,000 | 1,521,680 | |
| Series C, 5.00% due 3/15/2027 | 290,000 | 312,970 | |
| a,c | Montgomery County (Constellation Energy Generation LLC) IDA, Series A, 4.10% due 4/1/2053 (put 4/3/2028) | 1,000,000 | 1,019,626 |
| Philadelphia Gas Works Co. (Insured: AGM), Series A, 5.00% due 8/1/2025 | 460,000 | 482,909 | |
| School District of Philadelphia (State Aid Withholding) GO, Series F, 5.00% due 9/1/2024 | 620,000 | 636,459 | |
| South Carolina — 0.9% | |||
| a | Patriots Energy Group Financing Agency (Guaranty: Royal Bank of Canada), Series A, 4.00% due 10/1/2048 (put 2/1/2024) | 1,500,000 | 1,502,305 |
| South Dakota — 0.2% | |||
| South Dakota Health & Educational Facilities Authority (Monument Health Obligated Group), Series A, 5.00% due 9/1/2023 | 335,000 | 337,517 | |
| Tennessee — 3.0% | |||
| Health Educational and Housing Facility Board of the City of Memphis (Memphis Towers TC L.P.), 3.40% due 12/1/2023 | 1,000,000 | 1,001,186 | |
| a | Knox County Health Educational & Housing Facility Board (Gleason Partners L.P.), 3.95% due 12/1/2027 (put 12/1/2025) | 2,000,000 | 2,045,952 |
| Tennessee Energy Acquisition Corp. (The Gas Project; Guaranty: Goldman Sachs Group, Inc.), Series A, 5.25% due 9/1/2023 | 2,115,000 | 2,124,116 | |
| Texas — 11.0% | |||
| Arlington Higher Education Finance Corp (Riverwalk Education Foundation, Inc.) (Insured: PSF-GTD), 5.00% due 8/15/2026 | 365,000 | 390,521 | |
| a | Boerne School District (Insured: PSF-GTD) ISD GO, 2.80% due 12/1/2051 (put 12/1/2023) | 1,800,000 | 1,802,048 |
| City of Houston Airport System Revenue, Series B, 5.00% due 7/1/2023 | 150,000 | 150,766 | |
| City of Lubbock Electric Light & Power System Revenue, 5.00% due 4/15/2025 - 4/15/2027 | 2,050,000 | 2,179,157 | |
| Dallas County Utility & Reclamation District GO, 5.00% due 2/15/2026 | 1,000,000 | 1,061,695 | |
| Dallas Fort Worth International Airport, 5.00% due 11/1/2023 | 1,000,000 | 1,012,755 | |
| a | Denton (Insured: PSF-GTD) ISD GO, Series B, 2.00% due 8/1/2044 (pre-refunded 8/1/2024) | 135,000 | 133,945 |
| a | Fort Bend (Insured: PSF-GTD) ISD GO, Series B, 3.00% due 8/1/2052 (put 8/1/2023) | 2,000,000 | 2,002,380 |
| Harris County Cultural Education Facilities Finance Corp. (Texas Medical Center), Series A, 5.00% due 5/15/2027 | 2,000,000 | 2,164,612 | |
| a | Houston (Insured: PSF-GTD) ISD GO, Series C, 4.00% due 6/1/2039 (put 6/1/2025) | 1,000,000 | 1,031,349 |
| Lower Colorado River Authority (LCRA Transmission Services Corp.), Series A, 5.00% due 5/15/2024 | 750,000 | 767,725 | |
| a | North East (Insured: PSF-GTD) ISD GO, Series C, 2.05% due 8/1/2046 (put 8/1/2023) | 1,000,000 | 996,612 |
| a | Prosper (Insured: PSF-GTD) ISD GO, Series B, 2.00% due 2/15/2050 (put 8/15/2023) | 750,000 | 748,189 |
| a | San Antonio Housing Trust Public Facility Corp. (PV Country Club Village LP), 4.00% due 8/1/2026 (put 8/1/2025) | 1,000,000 | 1,032,413 |
| Texas Municipal Gas Acquisition & Supply Corp. III (Guaranty: Macquarie Group Ltd.), 5.00% due 12/15/2025 - 12/15/2026 | 1,125,000 | 1,151,217 | |
| Texas Transportation Commission (Central Texas Turnpike System), Series C, 5.00% due 8/15/2025 | 240,000 | 245,158 | |
| a | Travis County Housing Finance Corp. (Austin Gateway Apartments L.P.), 4.125% due 6/1/2045 (put 6/1/2027) | 2,000,000 | 2,060,502 |
| Utah — 0.6% | |||
| a | County of Utah (Intermountain Healthcare Obligated Group), Series B, 5.00% due 5/15/2060 (put 8/1/2024) | 1,000,000 | 1,027,612 |
| Virginia — 0.8% | |||
| a | Halifax County IDA, Series A, 1.65% due 12/1/2041 (put 5/31/2024) | 500,000 | 487,385 |
| Virginia Small Business Financing Authority (National Senior Campuses, Inc. Obligated Group), Series A, 5.00% due 1/1/2024 - 1/1/2025 | 900,000 | 912,248 |
| 22 | Thornburg Municipal Funds Semi-Annual Report | See notes to financial statements. |
| ISSUER-DESCRIPTION | Principal Amount | VALUE | |
| Washington — 0.9% | |||
| King County Housing Authority, 2.00% due 6/1/2023 | $ 790,000 | $ 788,589 | |
| State of Washington GO, Series 2021A, 5.00% due 6/1/2024 | 500,000 | 513,880 | |
| University of Washington, 5.00% due 4/1/2023 | 300,000 | 300,000 | |
| Wisconsin — 3.5% | |||
| County of Waushara GO, Series A, 4.50% due 6/1/2027 | 1,260,000 | 1,310,384 | |
| Public Finance Authority, 4.00% due 1/1/2027 | 870,000 | 866,590 | |
| a | Public Finance Authority (Duke Energy Progress LLC), Series A-1, 3.30% due 10/1/2046 (put 10/1/2026) | 2,000,000 | 2,051,968 |
| Public Finance Authority (Renown Regional Medical Center), Series A, 5.00% due 6/1/2027 | 350,000 | 375,308 | |
| Pulaski Community School District, 4.00% due 7/12/2023 | 1,500,000 | 1,500,433 | |
| Total Long-Term Municipal Bonds — 93.3% (Cost $161,100,546) | 161,124,461 | ||
| Short-Term Municipal Bonds — 6.9% | |||
| Louisiana — 1.7% | |||
| a | Parish of St James Los Angeles (Nucor Steel Louisiana, LLC; Guaranty: Nucor Corp.), Series B-1, 4.40% due 11/1/2040 (put 4/10/2023) | 3,000,000 | 3,000,000 |
| Ohio — 1.2% | |||
| a | Ohio Higher Educational Facility Commission (Cleveland Clinic Health System Obligated Group; SPA U.S. Bank N.A.), Series B3, 3.80% due 1/1/2039 (put 4/3/2023) | 2,100,000 | 2,100,000 |
| Oregon — 0.9% | |||
| a | Oregon State Facilities Authority (Peacehealth Obligated Group; LOC U.S. Bank N.A.), Series A, 3.80% due 8/1/2034 (put 4/3/2023) | 1,600,000 | 1,600,000 |
| Texas — 3.1% | |||
| Port of Port Arthur Navigation District (Motiva Enterprises, LLC), | |||
| a | 4.40% due 4/1/2040 (put 4/3/2023) | 3,300,000 | 3,300,000 |
| a | Series D, 4.40% due 11/1/2040 (put 4/10/2023) | 2,000,000 | 2,000,000 |
| Total Short-Term Municipal Bonds — 6.9% (Cost $12,000,000) | 12,000,000 | ||
| Total Investments — 100.2% (Cost $173,100,546) | $173,124,461 | ||
| Liabilities Net of Other Assets — (0.2)% | (343,719) | ||
| Net Assets — 100.0% | $172,780,742 |
| Footnote Legend | |
| a | Variable, floating, step, or fixed to floating rate securities are securities for which interest rate changes are based on changes in a designated base rate or on a predetermined schedule. The rates shown are those in effect on March 31, 2023. |
| b | Securities exempt from registration under Rule 144A of the Securities Act of 1933, as amended. These securities are restricted but liquid and may only be resold in the ordinary course of business in transactions exempt from registration, normally to qualified institutional buyers. As of March 31, 2023, the aggregate value of these securities in the Fund’s portfolio was $4,245,660, representing 2.46% of the Fund’s net assets. |
| c | When-issued security. |
| d | Segregated as collateral for a when-issued security. |
To simplify the listings of securities, abbreviations are used per the table below:
| AGM | Insured by Assured Guaranty Municipal Corp. |
| AMBAC | Insured by American Municipal Bond Assurance Corp. |
| BAM | Insured by Build America Mutual Insurance Co. |
| DFA | Development Finance Authority/Agency |
| EDA | Economic Development Authority |
| ETM | Escrowed to Maturity |
| FHLMC | Collateralized by Federal Home Loan Mortgage Corp. |
| FNMA | Collateralized by Federal National Mortgage Association |
| GNMA | Collateralized by Government National Mortgage Association |
| GO | General Obligation |
| HDA | Housing Development Authority |
| HFA | Health Facilities Authority |
| HFFA | Health Facilities Financing Authority |
| IDA | Industrial Development Authority/Agency |
| IDB | Industrial Development Board |
| ISD | Independent School District |
| LOC | Letter of Credit |
| MUNIPSA | Securities Industry and Financial Markets Association (SIFMA) Municipal Swap Index |
| PSF-GTD | Guaranteed by Permanent School Fund |
| SOFR | Secured Overnight Financing Rate |
| SPA | Stand-by Purchase Agreement |
| USD | Unified School District |
| See notes to financial statements. | Thornburg Municipal Funds Semi-Annual Report | 23 |
Thornburg Limited Term Municipal Fund | March 31, 2023 (Unaudited)
| ISSUER-DESCRIPTION | Principal Amount | VALUE | |
| LONG-TERM MUNICIPAL BONDS — 94.2% | |||
| Alabama — 1.7% | |||
| Alabama Public School and College Authority, Series A, 5.00% due 11/1/2025 | $ 1,000,000 | $ 1,062,445 | |
| Alabama Public School and College Authority (Education System Capital Improvements), Series B, 5.00% due 6/1/2023 | 735,000 | 737,689 | |
| a | Black Belt Energy Gas District (Guaranty: Goldman Sachs Group, Inc.), Series F, 5.50% due 11/1/2053 (put 12/1/2028) | 4,825,000 | 5,096,604 |
| a | Black Belt Energy Gas District (Guaranty: Morgan Stanley Group), Series A-1, 4.00% due 12/1/2049 (put 12/1/2025) | 4,500,000 | 4,484,777 |
| Black Belt Energy Gas District (Guaranty: Royal Bank of Canada), Series D1, 4.00% due 6/1/2023 - 6/1/2026 | 1,370,000 | 1,371,418 | |
| Chatom (Powersouth Energy Co-operative Projects; Insured: AGM) IDB, 5.00% due 8/1/2026 - 8/1/2030 | 1,435,000 | 1,583,344 | |
| a | Chatom (PowerSouth Energy Cooperative; SPA National Rural Utilities Cooperative Finance) IDB, Series A, 3.25% due 8/1/2037 (put 8/1/2023) | 3,000,000 | 3,066,588 |
| a | Lower Alabama Gas District (Guaranty: Goldman Sachs Group, Inc.), 4.00% due 12/1/2050 (put 12/1/2025) | 17,175,000 | 16,994,491 |
| a | Selma (International Paper Co.) IDB, Series A, 2.00% due 11/1/2033 (put 10/1/2024) | 6,025,000 | 5,866,759 |
| a | Southeast Alabama Gas Supply District (Guaranty: Morgan Stanley Group), Series A, 4.00% due 6/1/2049 (put 6/1/2024) | 1,000,000 | 1,002,315 |
| Southeast Energy Authority A Cooperative District (Guaranty: Morgan Stanley Group), | |||
| a | Series A, 5.50% due 1/1/2053 (put 12/1/2029) | 3,500,000 | 3,749,088 |
| a | Series B, 4.00% due 12/1/2051 (put 12/1/2031) | 6,780,000 | 6,611,103 |
| Troy University (Insured: BAM), Series A, 5.00% due 11/1/2028 | 1,000,000 | 1,040,758 | |
| UAB Medicine Finance Authority (University Hospital), Series B, 5.00% due 9/1/2025 - 9/1/2027 | 3,975,000 | 4,230,051 | |
| Water Works Board of the City of Birmingham, 5.00% due 1/1/2029 | 2,230,000 | 2,485,672 | |
| Arizona — 1.2% | |||
| a | Arizona (Banner Health Obligated Group) HFA, Series B, 4.22% (MUNIPSA + 0.25%) due 1/1/2046 (put 11/4/2026) | 4,000,000 | 3,990,832 |
| Arizona (Scottsdale Lincoln Hospitals) HFA, Series A, 5.00% due 12/1/2024 | 1,760,000 | 1,818,237 | |
| Arizona Board of Regents (Arizona State University) COP, Series A, 5.00% due 9/1/2023 | 5,580,000 | 5,626,699 | |
| Arizona Board of Regents (University of Arizona), 5.00% due 8/1/2023 - 8/1/2024 | 1,350,000 | 1,371,359 | |
| Arizona Board of Regents (University of Arizona) COP, Series C, 5.00% due 6/1/2028 | 780,000 | 867,440 | |
| City of Phoenix Civic Improvement Corp., Series A, 5.00% due 7/1/2023 - 7/1/2025 | 7,330,000 | 7,596,207 | |
| County of Pinal (Detention and Training Facilities), Series A, 5.00% due 8/1/2023 - 8/1/2025 | 3,300,000 | 3,407,943 | |
| County of Pinal (Hunt Highway (Phases III-V), Ironwood Drive, Public Safety Radio & Court Buildings), 5.00% due 8/1/2025 | 3,000,000 | 3,089,439 | |
| a | Maricopa County Pollution Control Corp (Public Service Co. of New Mexico), Series A, 3.00% due 1/1/2038 (put 6/1/2024) | 1,555,000 | 1,543,134 |
| Maricopa County Pollution Control Corp. (Public Service Co. of New Mexico), | |||
| a | Series A, 0.875% due 6/1/2043 (put 10/1/2026) | 3,000,000 | 2,741,331 |
| a | Series B, 0.875% due 6/1/2043 (put 10/1/2026) | 1,700,000 | 1,553,421 |
| Northern Arizona University (Insured: BAM), Series B, 5.00% due 6/1/2030 | 525,000 | 605,573 | |
| Northern Arizona University COP, 5.00% due 9/1/2023 | 3,325,000 | 3,329,994 | |
| Salt River Project Agricultural Improvement and Power District (Salt River Electric System), Series A, 5.00% due 1/1/2029 | 1,405,000 | 1,579,969 | |
| State of Arizona COP ETM, Series A, 5.00% due 10/1/2025 | 3,375,000 | 3,579,775 | |
| California — 3.4% | |||
| Alameda County Joint Powers Authority (Alameda County Medical Center Highland Hospital), Series A, 5.00% due 12/1/2023 | 3,200,000 | 3,252,410 | |
| a | Bay Area Toll Authority (San Francisco Bay Area Toll Bridge), Series E, 4.38% (MUNIPSA + 0.41%) due 4/1/2056 (put 4/1/2028) | 1,500,000 | 1,482,287 |
| California (PIH Health, Inc. Obligated Group) HFFA, Series A, 5.00% due 6/1/2028 - 6/1/2030 | 2,950,000 | 3,347,580 | |
| a | California Community Choice Financing Authority (Guaranty: Deutsche A.G.) (Green Bond), Series C, 5.25% due 1/1/2054 (put 10/1/2031) | 7,955,000 | 8,131,903 |
| a | California Community Choice Financing Authority (Guaranty: Goldman Sachs Group, Inc.) (Green Bond), Series A, 4.00% due 10/1/2052 (put 12/1/2027) | 1,000,000 | 1,007,772 |
| a | California Infrastructure & Economic Development Bank (J Paul Getty Trust), Series B-2, 3.00% due 10/1/2047 (put 10/1/2026) | 3,000,000 | 3,038,844 |
| California Municipal Finance Authority (CHF-Davis II LLC; Insured: BAM) (Green Bond), 5.00% due 5/15/2029 - 5/15/2031 | 1,195,000 | 1,384,412 | |
| a,b | California Pollution Control Financing Authority (Republic Services, Inc. Project), Series B, 2.95% due 8/1/2024 (put 5/1/2023) | 2,000,000 | 2,000,000 |
| California Statewide Communities Development Authority (CHF-Irvine LLC; Insured: BAM), 5.00% due 5/15/2030 | 2,000,000 | 2,291,726 | |
| a | California Statewide Communities Development Authority (Kaiser Foundation Hospitals), Series 2004-M-R, 5.00% due 4/1/2038 (put 11/1/2029) | 5,250,000 | 6,078,366 |
| California Statewide Communities Development Authority (Southern California Edison Co.) (Green Bond), Series A, 1.75% due 9/1/2029 | 2,000,000 | 1,837,644 | |
| Castaic Lake Water Agency (Water System Improvement; Insured: AMBAC) COP, Zero Coupon due 8/1/2023 | 10,125,000 | 10,044,445 | |
| City of Los Angeles, 4.00% due 6/29/2023 | 7,500,000 | 7,522,567 | |
| City of Modesto Wastewater Revenue, Series B, 5.00% due 11/1/2027 - 11/1/2029 | 3,500,000 | 4,002,923 | |
| County of Los Angeles, 4.00% due 6/30/2023 | 2,000,000 | 2,006,020 | |
| County of Riverside, 5.00% due 6/30/2023 | 2,550,000 | 2,563,614 | |
| Lammersville USD (Insured: BAM), 5.00% due 9/1/2029 - 9/1/2030 | 2,215,000 | 2,561,880 | |
| Los Angeles (Educational Facilities and Information Technology Infrastructure) USD GO, | |||
| Series B, 5.00% due 7/1/2023 | 11,950,000 | 12,019,991 | |
| Series D, 5.00% due 7/1/2024 | 10,640,000 | 10,970,872 | |
| Los Angeles County Redevelopment Refunding Authority Successor Agency (Bunker Hill Project), Series C, 5.00% due 6/1/2023 - 12/1/2024 | 17,250,000 | 17,698,625 | |
| Los Angeles USD GO, Series A, 5.00% due 7/1/2024 | 1,500,000 | 1,546,597 | |
| Needles (Insured: Natl-Re) USD GO, Series B, Zero Coupon due 8/1/2023 | 1,005,000 | 994,605 | |
| North City West School Facilities Financing Authority (Carmel Valley Educational Facilities; Insured: AGM), Series A, 5.00% due 9/1/2023 | 4,545,000 | 4,552,163 | |
| Santa Fe Springs CDC Successor Agency (Consolidated Redevelopment Project; Insured: Natl-Re), Series A, Zero Coupon due 9/1/2024 | 7,000,000 | 6,732,278 |
| 24 | Thornburg Municipal Funds Semi-Annual Report | See notes to financial statements. |
| ISSUER-DESCRIPTION | Principal Amount | VALUE | |
| Colorado — 1.3% | |||
| City & County of Denver (Buell Theatre Property) COP, Series A, 5.00% due 12/1/2023 | $ 1,720,000 | $ 1,746,137 | |
| City & County of Denver School District No. 1 (Eastbridge Elementary and Conservatory Green K-8 Schools) COP, Series C, 5.00% due 12/15/2023 | 1,180,000 | 1,197,243 | |
| Colorado (Adventhealth Obligation Group) HFA, | |||
| Series C, | |||
| a | 5.00% due 11/15/2036 (pre-refunded 11/15/2023) | 265,000 | 268,697 |
| a | 5.00% due 11/15/2036 (put 11/15/2023) | 735,000 | 744,868 |
| a | Colorado (Adventist Health System/Sunbelt Obligated Group) HFA, Series C, 5.00% due 11/15/2036 (put 11/15/2026) | 1,150,000 | 1,246,181 |
| Colorado (CommonSpirit Health Obligated Group) HFA, 5.00% due 11/1/2029 - 11/1/2032 | 4,550,000 | 5,074,413 | |
| a | Colorado (Intermountain Healthcare Obligated Group) HFA, Series B, 5.00% due 5/15/2062 (put 8/17/2026) | 1,415,000 | 1,523,959 |
| Colorado (Northern Colorado Medical Center) HFA ETM, 5.00% due 5/15/2026 | 740,000 | 787,589 | |
| Colorado Higher Education COP, 4.00% due 9/1/2032 | 1,000,000 | 1,088,054 | |
| County of El Paso (Judicial Complex; Insured: AGM) COP, 5.00% due 12/1/2024 - 12/1/2028 | 2,200,000 | 2,401,581 | |
| County of El Paso (Pikes Peak Regional Development Center) COP, 5.00% due 12/1/2023 | 1,330,000 | 1,350,211 | |
| Crystal Valley Metropolitan District No 2 (Insured: AGM) GO, Series A, 5.00% due 12/1/2025 - 12/1/2030 | 1,810,000 | 2,009,810 | |
| a | E-470 Public Highway Authority, Series B, 3.579% (SOFR + 0.35%) due 9/1/2039 (put 9/1/2024) | 2,000,000 | 2,001,986 |
| El Paso County Falcon School District No. 49 COP, 5.00% due 12/15/2023 - 12/15/2024 | 1,600,000 | 1,637,475 | |
| Interlocken Metropolitan District (Insured: AGM) GO, Series A-1, 5.00% due 12/1/2024 - 12/1/2026 | 2,375,000 | 2,505,559 | |
| Regional Transportation District (Denver Transit Partners LLC), Series A, 5.00% due 7/15/2024 - 7/15/2032 | 3,175,000 | 3,444,133 | |
| Regional Transportation District (North Metro Rail Line) COP, Series A, 5.00% due 6/1/2024 (pre-refunded 6/1/2023) | 4,000,000 | 4,013,860 | |
| Regional Transportation District (North Metro Rail Line) COP ETM, Series A, 5.00% due 6/1/2023 | 4,000,000 | 4,007,488 | |
| Sierra Ridge Metropolitan District No 2 (Insured: AGM) GO, 4.00% due 12/1/2030 - 12/1/2032 | 675,000 | 720,362 | |
| State of Colorado COP, Series A, 5.00% due 9/1/2024 - 9/1/2028 | 4,610,000 | 4,956,586 | |
| a | University of Colorado Hospital Authority (University of Colorado Health Obligated Group), Series C, 5.00% due 11/15/2047 (put 11/15/2024) | 1,210,000 | 1,240,554 |
| Connecticut — 2.5% | |||
| City of Hartford (Various Public Improvements; Insured: AGM) GO, Series A, 5.00% due 7/1/2024 - 7/1/2025 | 1,820,000 | 1,896,654 | |
| City of New Haven (Insured: AGM) GO, Series B, 5.00% due 2/1/2028 - 2/1/2030 | 1,470,000 | 1,616,501 | |
| State of Connecticut (Educational Facilities) GO, | |||
| Series B, 5.00% due 6/15/2024 - 6/15/2025 | 30,400,000 | 31,542,541 | |
| Series E, 5.00% due 9/1/2023 | 5,550,000 | 5,602,692 | |
| State of Connecticut (Various Capital Projects) GO, | |||
| Series B, 5.00% due 5/15/2027 | 16,615,000 | 17,944,217 | |
| Series E, 5.00% due 8/15/2024 | 1,845,000 | 1,860,688 | |
| State of Connecticut GO, | |||
| Series B, 5.00% due 2/15/2024 | 7,000,000 | 7,141,141 | |
| Series C, 5.00% due 6/15/2023 - 6/15/2028 | 11,540,000 | 12,686,257 | |
| Series E, 5.00% due 9/15/2028 | 2,560,000 | 2,910,935 | |
| State of Connecticut Special Tax Revenue, Series D, 5.00% due 11/1/2032 | 500,000 | 598,755 | |
| State of Connecticut Special Tax Revenue (Transportation Infrastructure Purposes), Series A, 5.00% due 8/1/2026 | 1,200,000 | 1,270,750 | |
| University of Connecticut, Series A, 5.00% due 5/1/2032 | 1,000,000 | 1,208,343 | |
| Delaware — 0.1% | |||
| Delaware State (Beebe Medical Center, Inc.) HFA, 5.00% due 6/1/2031 | 1,200,000 | 1,308,031 | |
| Delaware Transportation Authority, 5.00% due 9/1/2029 | 2,665,000 | 3,074,987 | |
| District of Columbia — 0.2% | |||
| a | District of Columbia Housing Finance Agency (Benning Corridor Titleholder LLC), 4.00% due 9/1/2040 (put 9/1/2025) | 1,000,000 | 1,016,276 |
| Washington Metropolitan Area Transit Authority, 5.00% due 7/1/2023 - 7/1/2028 | 4,750,000 | 4,994,184 | |
| Florida — 5.3% | |||
| Alachua County School Board (Educational Facilities) COP, 5.00% due 7/1/2023 | 2,250,000 | 2,262,161 | |
| Broward County School Board (Educational Facilities) COP, | |||
| Series A, 5.00% due 7/1/2023 - 7/1/2027 | 14,300,000 | 14,795,625 | |
| Series B, 5.00% due 7/1/2023 - 7/1/2025 | 9,000,000 | 9,313,604 | |
| Series C, 5.00% due 7/1/2025 - 7/1/2026 | 12,830,000 | 13,666,592 | |
| Central Florida Expressway Authority, 5.00% due 7/1/2026 | 575,000 | 620,597 | |
| City of Cape Coral (Water and Sewer System Improvements), 5.00% due 10/1/2024 - 10/1/2026 | 5,100,000 | 5,429,640 | |
| City of Jacksonville, | |||
| Series B, 5.00% due 10/1/2029 | 1,350,000 | 1,465,101 | |
| Series C, 5.00% due 10/1/2023 | 1,105,000 | 1,117,493 | |
| City of Lakeland (Lakeland Regional Health Systems), 5.00% due 11/15/2026 - 11/15/2028 | 1,990,000 | 2,138,740 | |
| City of Miami (Stormwater Management Utility System), 5.00% due 9/1/2026 - 9/1/2028 | 2,675,000 | 2,941,644 | |
| City of Orlando (Senior Tourist Development; Insured: AGM), Series A, 5.00% due 11/1/2024 - 11/1/2027 | 4,575,000 | 4,793,938 | |
| County of Manatee (Public Utilities Improvements), 5.00% due 10/1/2024 - 10/1/2025 | 970,000 | 1,009,341 | |
| County of Polk (Water and Wastewater Utility Systems), 5.00% due 10/1/2023 | 1,420,000 | 1,422,330 |
| See notes to financial statements. | Thornburg Municipal Funds Semi-Annual Report | 25 |
Thornburg Limited Term Municipal Fund | March 31, 2023 (Unaudited)
| ISSUER-DESCRIPTION | Principal Amount | VALUE | |
| Duval County Public Schools (Insured: AGM) COP, Series A, 5.00% due 7/1/2031 - 7/1/2033 | $ 4,450,000 | $ 5,156,192 | |
| Florida State Board of Governors (Florida State University Student Health Fee Revenue), Series A, 5.00% due 7/1/2030 | 1,010,000 | 1,187,461 | |
| Hillsborough County School Board (Master Lease Program) COP, | |||
| 5.00% due 7/1/2027 - 7/1/2028 | 5,200,000 | 5,744,911 | |
| Series B, 5.00% due 7/1/2028 | 4,835,000 | 5,289,524 | |
| JEA Electric System, | |||
| Series A, 5.00% due 10/1/2024 (pre-refunded 10/1/2023) | 1,200,000 | 1,213,194 | |
| Series III B, 5.00% due 10/1/2032 | 2,110,000 | 2,308,011 | |
| JEA Electric System ETM, Series A, 5.00% due 10/1/2023 | 1,395,000 | 1,411,203 | |
| Lee County School Board (School Facilities Improvements) COP, 5.00% due 8/1/2023 - 8/1/2024 | 3,000,000 | 3,067,073 | |
| Manatee County School District (School Facilities Improvements; Insured: AGM), 5.00% due 10/1/2025 - 10/1/2027 | 2,900,000 | 3,128,917 | |
| Marion County School Board (Insured: BAM) COP, Series B, 5.00% due 6/1/2024 | 3,065,000 | 3,147,396 | |
| Miami-Dade County (Miami International Airport), Series B, 5.00% due 10/1/2025 | 2,500,000 | 2,583,415 | |
| Miami-Dade County (Transit System), 5.00% due 7/1/2023 - 7/1/2025 | 10,265,000 | 10,586,249 | |
| Miami-Dade County Aviation Revenue, Series A, 5.00% due 10/1/2032 | 500,000 | 577,124 | |
| Miami-Dade County Expressway Authority (Toll System), Series B, 5.00% due 7/1/2024 - 7/1/2025 | 4,000,000 | 4,088,678 | |
| Miami-Dade County School Board (Educational Facilities Improvements) COP, | |||
| Series A, | |||
| 5.00% due 5/1/2023 - 5/1/2024 | 12,130,000 | 12,312,082 | |
| a | 5.00% due 5/1/2031 (pre-refunded 5/1/2024) | 2,550,000 | 2,612,763 |
| Series C, 5.00% due 5/1/2025 | 15,000,000 | 15,648,255 | |
| Orange County (AdventHealth Obligated Group) HFA, | |||
| Series C, | |||
| a | 5.00% due 11/15/2052 (pre-refunded 11/15/2026) | 210,000 | 229,496 |
| a | 5.00% due 11/15/2052 (put 11/15/2026) | 3,290,000 | 3,545,343 |
| Orange County School Board (Educational Facilities) COP, Series D, 5.00% due 8/1/2024 - 8/1/2025 | 2,635,000 | 2,744,214 | |
| Palm Beach County (Jupiter Medical Center Obligated Group) HFA, Series A, 5.00% due 11/1/2028 - 11/1/2031 | 675,000 | 726,966 | |
| Palm Beach County School Board (Educational Facilities) COP, Series B, 5.00% due 8/1/2023 - 8/1/2024 | 9,095,000 | 9,267,009 | |
| Palm Beach County School District COP, Series C, 5.00% due 8/1/2023 - 8/1/2026 | 7,000,000 | 7,262,169 | |
| Pasco County School Board COP, Series A, 5.00% due 8/1/2032 | 750,000 | 892,285 | |
| Reedy Creek Improvement District (Buena Vista Drive Corridor Improvements) GO, Series A, 5.00% due 6/1/2023 | 1,940,000 | 1,946,064 | |
| Reedy Creek Improvement District (Walt Disney World Resort Complex Utility Systems), Series 1, 5.00% due 10/1/2023 | 750,000 | 758,402 | |
| Reedy Creek Improvement District (Walt Disney World Resort Complex Utility Systems) GO, Series A, 5.00% due 6/1/2023 - 6/1/2025 | 3,710,000 | 3,824,022 | |
| State of Florida GO, | |||
| Series A, 4.00% due 7/1/2031 | 2,500,000 | 2,616,643 | |
| Series C, 4.00% due 6/1/2031 | 1,540,000 | 1,610,435 | |
| Sunshine State Governmental Financing Commission (Miami-Dade County Program), Series B-1, 5.00% due 9/1/2024 (pre-refunded 9/1/2023) | 1,725,000 | 1,740,629 | |
| Sunshine State Governmental Financing Commission (Miami-Dade County Program) ETM, Series B-1, 5.00% due 9/1/2023 | 2,100,000 | 2,119,093 | |
| Town of Davie (Nova Southeastern University, Inc.), 5.00% due 4/1/2032 | 400,000 | 431,175 | |
| Volusia County Educational Facilities Authority (Embry-Riddle Aeronautical University, Inc.), Series B, 5.00% due 10/15/2023 - 10/15/2025 | 1,750,000 | 1,799,096 | |
| Volusia County School Board (University High School, River Springs Middle School) COP, Series B, 5.00% due 8/1/2024 | 1,000,000 | 1,031,921 | |
| Wildwood Utility Dependent District (Insured: BAM), 5.00% due 10/1/2032 | 200,000 | 228,244 | |
| Georgia — 4.1% | |||
| Athens-Clarke County Unified Government Development Authority (UGAREF Central Precinct LLC), 5.00% due 6/15/2023 | 470,000 | 472,026 | |
| a | Bartow County Development Authority (Georgia Power Co.), 3.95% due 12/1/2032 (put 3/8/2028) | 3,000,000 | 3,054,504 |
| City of Atlanta (Airport Passenger Facility), | |||
| Series A, 5.00% due 1/1/2024 - 1/1/2025 | 3,850,000 | 3,917,029 | |
| Series B, 5.00% due 1/1/2025 | 1,645,000 | 1,673,166 | |
| City of Atlanta (Atlantic Station Project), 5.00% due 12/1/2023 - 12/1/2024 | 2,190,000 | 2,240,682 | |
| City of Atlanta (Water & Wastewater System), 5.00% due 11/1/2023 - 11/1/2025 | 3,130,000 | 3,232,267 | |
| Development Authority of Burke County (Georgia Power Co.), Series 5, 2.20% due 10/1/2032 | 1,225,000 | 1,044,147 | |
| a | Development Authority of Monroe County (Georgia Power Co.), Series 1, 3.875% due 6/1/2042 (put 3/6/2026) | 2,000,000 | 2,025,970 |
| Georgia State Road & Tollway Authority (GARVEE), 5.00% due 6/1/2032 | 1,000,000 | 1,167,535 | |
| Main Street Natural Gas, Inc. (Guaranty: Citigroup Global Markets), | |||
| a | Series A, 5.00% due 6/1/2053 (put 6/1/2030) | 18,500,000 | 19,269,119 |
| a | Series C, 4.00% due 5/1/2052 (put 12/1/2028) | 35,700,000 | 35,123,124 |
| Main Street Natural Gas, Inc. (Guaranty: Macquarie Group Ltd.), Series A, 5.00% due 5/15/2023 - 5/15/2028 | 7,765,000 | 7,923,272 | |
| Main Street Natural Gas, Inc. (Guaranty: Royal Bank of Canada), | |||
| a | Series A, 4.00% due 7/1/2052 (put 9/1/2027) | 42,805,000 | 42,993,770 |
| a | Series B, 5.00% due 7/1/2053 (put 3/1/2030) | 7,750,000 | 8,190,037 |
| Municipal Electric Authority of Georgia, Series A, 5.00% due 1/1/2024 - 1/1/2030 | 5,420,000 | 5,853,264 | |
| Private Colleges & Universities Authority (Corp. of Mercer University), 5.00% due 10/1/2030 - 10/1/2032 | 350,000 | 401,000 | |
| Savannah (International Paper Co.) EDA, Series B, 1.90% due 8/1/2024 | 2,000,000 | 1,954,904 |
| 26 | Thornburg Municipal Funds Semi-Annual Report | See notes to financial statements. |
| ISSUER-DESCRIPTION | Principal Amount | VALUE | |
| Guam — 0.3% | |||
| Government of Guam (Various Capital Projects), Series D, 5.00% due 11/15/2024 | $ 4,500,000 | $ 4,558,676 | |
| Guam Government Waterworks Authority (Water & Wastewater System Improvements), 5.25% due 7/1/2023 | 645,000 | 646,808 | |
| Guam Power Authority (Electric Power System), Series A, 5.00% due 10/1/2023 - 10/1/2026 | 4,330,000 | 4,427,175 | |
| Hawaii — 0.1% | |||
| County of Hawaii (Capital Improvements) GO, | |||
| Series C, 5.00% due 9/1/2026 | 1,500,000 | 1,609,885 | |
| Series E, 5.00% due 9/1/2026 | 500,000 | 536,629 | |
| Idaho — 0.1% | |||
| Idaho (Trinity Health Credit Group) HFA, Series D, 5.00% due 12/1/2023 - 12/1/2024 | 3,000,000 | 3,058,857 | |
| Illinois — 9.2% | |||
| Chicago Midway International Airport, Series B, 5.00% due 1/1/2024 | 17,060,000 | 17,099,267 | |
| Chicago O’Hare International Airport (2016 Airport Projects), Series C, 5.00% due 1/1/2027 | 1,750,000 | 1,863,963 | |
| Chicago Park District (Capital Improvement Plan) GO, | |||
| Series A, 5.00% due 1/1/2025 | 610,000 | 630,331 | |
| Series B, 5.00% due 1/1/2024 | 1,340,000 | 1,358,783 | |
| Series D, 5.00% due 1/1/2024 | 1,760,000 | 1,784,670 | |
| Chicago Park District GO, Series A, 5.00% due 1/1/2024 - 1/1/2032 | 1,405,000 | 1,462,423 | |
| Chicago Park District GO ETM, | |||
| Series A, 5.00% due 1/1/2024 | 1,150,000 | 1,170,452 | |
| Series D, 5.00% due 1/1/2024 | 1,060,000 | 1,078,847 | |
| City of Chicago (Wastewater Transmission System), Series C, 5.00% due 1/1/2024 - 1/1/2025 | 10,750,000 | 10,986,286 | |
| City of Chicago (Water System), | |||
| 5.00% due 11/1/2024 | 2,000,000 | 2,055,584 | |
| Series 2017-2, 5.00% due 11/1/2023 - 11/1/2024 | 1,650,000 | 1,683,981 | |
| Series A, 5.00% due 11/1/2027 | 6,250,000 | 6,628,681 | |
| Series A-1, 5.00% due 11/1/2024 | 4,000,000 | 4,109,876 | |
| City of Chicago (Water System; Insured: AGM), Series 2017-2, 5.00% due 11/1/2028 | 2,000,000 | 2,160,228 | |
| a | City of Chicago Heights (Olympic Village LLC), 2.875% due 8/1/2027 (put 8/1/2025) | 14,799,000 | 14,794,205 |
| City of Chicago Wastewater Transmission Revenue, | |||
| Series B, 5.00% due 1/1/2033 | 2,710,000 | 2,917,919 | |
| Series C, 5.00% due 1/1/2026 | 500,000 | 516,768 | |
| City of Joliet (Rock Run Crossing Project; Insured: BAM) GO, 5.00% due 12/15/2031 - 12/15/2032 | 2,030,000 | 2,370,658 | |
| Clinton Bond Fayette Etc Counties Community College District No 501 Kaskaskia (Insured: AGM) GO, 5.00% due 12/1/2031 - 12/1/2032 | 1,125,000 | 1,294,883 | |
| Cook County (Capital Improvement Plan) GO, Series A, 5.00% due 11/15/2024 | 1,500,000 | 1,547,508 | |
| Cook County Community College District No. 508 (City Colleges of Chicago) GO, | |||
| 5.00% due 12/1/2023 - 12/1/2024 | 4,425,000 | 4,440,732 | |
| 5.25% due 12/1/2025 - 12/1/2026 | 3,365,000 | 3,382,979 | |
| Cook County Community High School District No 233 Homewood-Flossmoor GO, 4.00% due 12/1/2025 - 12/1/2029 | 2,950,000 | 3,188,674 | |
| Cook County Sales Tax Revenue, 5.00% due 11/15/2028 | 2,250,000 | 2,460,307 | |
| Cook County School District No.170 (Insured: AGM) GO, Series D, 5.00% due 12/1/2024 | 1,190,000 | 1,222,959 | |
| DuPage Cook & Will Counties Community College District No 502 GO, 5.00% due 6/1/2024 | 5,000,000 | 5,128,695 | |
| DuPage County Forest Preserve District GO, 5.00% due 11/1/2023 - 11/1/2030 | 8,340,000 | 8,849,278 | |
| a | Illinois (Anchor Senior Living 2021 L.P.) HDA, Series A, 4.00% due 11/1/2042 (put 5/1/2025) | 2,000,000 | 2,019,920 |
| Illinois Finance Authority (Advocate Health Care), 5.00% due 8/1/2023 - 8/1/2024 | 1,365,000 | 1,392,053 | |
| Illinois Finance Authority (Ascension Health Credit Group), Series C, 5.00% due 2/15/2033 | 1,500,000 | 1,626,009 | |
| Illinois Finance Authority (Carle Foundation Obligated Group), | |||
| Series A, 5.00% due 2/15/2027 | 3,000,000 | 3,183,567 | |
| a | Series B, 5.00% due 8/15/2053 (put 8/15/2031) | 15,130,000 | 17,572,148 |
| Illinois Finance Authority (NorthShore University HealthSystem Obligated Group), Series A, 5.00% due 8/15/2025 - 8/15/2028 | 3,800,000 | 4,221,620 | |
| Illinois Finance Authority (Northwestern Memorial Healthcare Obligated Group), Series A, 5.00% due 7/15/2032 | 800,000 | 936,894 | |
| Illinois Finance Authority (Rush Obligated Group), Series B, 5.00% due 11/15/2033 | 805,000 | 834,011 | |
| Illinois Finance Authority (Rush University Medical Center), Series A, 5.00% due 11/15/2024 - 11/15/2029 | 5,170,000 | 5,374,521 | |
| b | Illinois Finance Authority (University of Chicago Medical Center Obligated Group), Series A, 5.00% due 8/15/2029 | 2,500,000 | 2,609,865 |
| Illinois State Toll Highway Authority, | |||
| Series A, 5.00% due 12/1/2032 | 3,000,000 | 3,179,355 | |
| Series C, 5.00% due 1/1/2025 | 2,000,000 | 2,083,928 | |
| Series D, 5.00% due 1/1/2024 | 6,500,000 | 6,613,808 | |
| Kane McHenry Cook & DeKalb Counties Unit School District No. 300 GO, 5.00% due 1/1/2024 | 7,150,000 | 7,245,424 | |
| Knox & Warren Counties Community Unit School District No 205 Galesburg GO, Series B, 5.00% due 12/1/2025 - 12/1/2030 | 9,275,000 | 10,096,778 | |
| McHenry County Conservation District GO, 5.00% due 2/1/2025 | 2,000,000 | 2,084,160 | |
| Metropolitan Water Reclamation District of Greater Chicago (Green Bond) GO, Series E, 5.00% due 12/1/2025 | 1,000,000 | 1,063,496 | |
| Metropolitan Water Reclamation District of Greater Chicago GO, Series A, 5.00% due 12/1/2031 | 1,500,000 | 1,635,666 |
| See notes to financial statements. | Thornburg Municipal Funds Semi-Annual Report | 27 |
Thornburg Limited Term Municipal Fund | March 31, 2023 (Unaudited)
| ISSUER-DESCRIPTION | Principal Amount | VALUE | |
| Monroe & St Clair Counties Community Unit School District No. 5 (Insured: BAM) GO, 5.00% due 4/15/2024 - 4/15/2026 | $ 1,650,000 | $ 1,717,330 | |
| Peoria Metropolitan Airport Authority GO, Series D, 5.00% due 12/1/2027 | 1,000,000 | 1,082,565 | |
| Rock Island Henry Mercer Etc Counties Community College District No. 503 (Black Hawk College; Insured: AGM) GO, 5.00% due 12/1/2023 - 12/1/2024 | 7,570,000 | 7,753,457 | |
| Rock Island Henry Mercer Etc Counties Community College District No. 503 (Black Hawk College; Insured: BAM) GO, 5.00% due 12/1/2033 | 1,000,000 | 1,185,738 | |
| Sales Tax Securitization Corp., Series A, 5.00% due 1/1/2028 - 1/1/2029 | 6,445,000 | 7,083,420 | |
| Sangamon County School District No 186 Springfield (Insured: AGM) GO, | |||
| 4.00% due 2/1/2030 - 2/1/2032 | 3,500,000 | 3,707,773 | |
| Series B, 5.00% due 2/1/2030 | 1,570,000 | 1,744,907 | |
| Southern Illinois University (Insured: BAM), Series A, 5.00% due 4/1/2027 - 4/1/2032 | 3,310,000 | 3,644,526 | |
| State of Illinois (State Facilities Improvements) GO, Series D, 5.00% due 11/1/2024 | 3,650,000 | 3,760,719 | |
| State of Illinois GO, | |||
| 5.50% due 5/1/2024 - 5/1/2030 | 2,350,000 | 2,504,637 | |
| Series A, 5.00% due 10/1/2024 - 3/1/2032 | 9,525,000 | 10,601,726 | |
| Series B, 5.00% due 3/1/2029 - 12/1/2032 | 2,500,000 | 2,812,209 | |
| Series D, 5.00% due 11/1/2023 - 11/1/2028 | 38,960,000 | 41,978,019 | |
| State of Illinois Sales Tax Revenue, | |||
| Series B, 5.00% due 6/15/2026 - 6/15/2029 | 20,000,000 | 21,622,995 | |
| Series C, 5.00% due 6/15/2024 - 6/15/2028 | 1,500,000 | 1,568,788 | |
| State of Illinois Sales Tax Revenue (Insured: BAM-Natl-Re), 6.00% due 6/15/2026 | 235,000 | 251,995 | |
| University of Illinois (University of Illinois Auxiliary Facilities System), Series A, 4.00% due 4/1/2032 | 11,465,000 | 11,750,983 | |
| Village of Tinley Park GO, 5.00% due 12/1/2024 | 870,000 | 881,708 | |
| Will & Kendall Counties Plainfield Community Consolidated School District 202 (Capital Improvements; Insured: BAM) GO, Series A, 5.00% due 1/1/2024 - 1/1/2025 | 13,075,000 | 13,504,394 | |
| Will County Community Unit School District No 201-U Crete-Monee (Insured: BAM) GO, Series U-A, 5.00% due 1/1/2028 | 350,000 | 378,070 | |
| Indiana — 0.9% | |||
| Avon Community School Building Corp. (Educational Facilities; Insured: State Intercept), 5.00% due 7/15/2023 - 7/15/2027 | 3,530,000 | 3,758,296 | |
| City of Rockport (AEP Generating Co.; Guaranty: American Electric Power Co.), Series A, 3.125% due 7/1/2025 | 3,000,000 | 2,984,997 | |
| Clark-Pleasant Community School Building Corp. (Insured: State Intercept), 5.00% due 7/15/2033 | 955,000 | 1,133,094 | |
| Columbus Multi School Building Corp. (Bartholomew Consolidated School Corp.; Insured: State Intercept), 4.00% due 1/15/2024 | 570,000 | 575,109 | |
| Hamilton Southeastern Consolidated School Building Corp. (Educational Facilities; Insured: State Intercept), Series D, 5.00% due 7/15/2023 - 1/15/2024 | 1,095,000 | 1,107,766 | |
| Indiana Finance Authority (CWA Authority, Inc. Wastewater System Project), Series A, 5.00% due 10/1/2023 - 10/1/2024 | 1,500,000 | 1,524,714 | |
| Indiana Finance Authority (CWA Authority, Inc.), Series 1, 5.00% due 10/1/2032 | 1,275,000 | 1,523,554 | |
| Indiana Finance Authority (Department of Transportation), Series C, 5.00% due 6/1/2029 | 8,040,000 | 9,229,526 | |
| a | Indiana Finance Authority (Republic Services, Inc.), Series B, 3.65% due 5/1/2028 (put 6/1/2023) | 2,500,000 | 2,500,000 |
| Indiana Municipal Power Agency (Power Supply System), Series A, 5.00% due 1/1/2026 - 1/1/2028 | 4,235,000 | 4,599,386 | |
| Mount Vernon of Hancock County Multi-School Building Corp. (Insured: State Intercept), 5.00% due 1/15/2031 | 500,000 | 580,371 | |
| Noblesville Redevelopment Authority, 5.00% due 1/15/2028 | 300,000 | 333,537 | |
| Iowa — 1.6% | |||
| Iowa Finance Authority (Genesis Health System), 5.00% due 7/1/2024 (pre-refunded 7/1/2023) | 2,350,000 | 2,362,309 | |
| Iowa Finance Authority (Genesis Health System) ETM, 5.00% due 7/1/2023 | 2,000,000 | 2,011,260 | |
| a | PEFA, Inc. (Guaranty: Goldman Sachs Group, Inc.), 5.00% due 9/1/2049 (put 9/1/2026) | 49,000,000 | 49,961,527 |
| Kansas — 0.7% | |||
| a | Kansas (AdventHealth Obligated Group) DFA, Series B, 5.00% due 11/15/2054 (put 11/15/2031) | 8,220,000 | 9,460,324 |
| Kansas DFA, Series SRF, 5.00% due 5/1/2026 | 765,000 | 824,697 | |
| Seward County No. 480 USD GO, | |||
| Series B, | |||
| 5.00% due 9/1/2024 - 9/1/2026 | 4,020,000 | 4,230,821 | |
| 5.00% due 9/1/2027 (pre-refunded 9/1/2025) | 2,100,000 | 2,217,885 | |
| Unified Government of Wyandotte County/Kansas City (Utility Systems Improvement), Series A, 5.00% due 9/1/2023 - 9/1/2024 | 1,600,000 | 1,623,863 | |
| Wyandotte County No. 500 (General Improvement) USD GO, Series A, 5.00% due 9/1/2025 - 9/1/2026 | 5,675,000 | 6,066,227 | |
| Kentucky — 3.9% | |||
| County of Boone (Duke Energy Kentucky, Inc.), Series A, 3.70% due 8/1/2027 | 5,000,000 | 5,040,110 | |
| Kentucky Economic (Norton Healthcare, Inc.; Insured: Natl-Re) DFA, Series B, Zero Coupon due 10/1/2023 | 4,195,000 | 4,134,223 | |
| Kentucky Public Energy Authority (Guaranty: Morgan Stanley Group), | |||
| a | Series A, 4.00% due 4/1/2048 (put 4/1/2024) | 77,915,000 | 77,924,973 |
| a | Series A-1, 4.00% due 8/1/2052 (put 8/1/2030) | 10,910,000 | 10,646,960 |
| a | Series C, 4.00% due 2/1/2050 (put 2/1/2028) | 14,730,000 | 14,531,852 |
| Kentucky State Property & Building Commission, Series A, 5.00% due 6/1/2030 - 6/1/2032 | 3,000,000 | 3,485,500 | |
| Kentucky State Property & Building Commission (Insured: AGM), Series A, 5.00% due 11/1/2029 | 750,000 | 859,819 | |
| Louisville/Jefferson County Metropolitan Government (Norton Healthcare Obligated Group), | �� |
| 28 | Thornburg Municipal Funds Semi-Annual Report | See notes to financial statements. |
| ISSUER-DESCRIPTION | Principal Amount | VALUE | |
| 5.00% due 10/1/2026 - 10/1/2032 | $ 4,640,000 | $ 4,947,726 | |
| Series A, 5.00% due 10/1/2027 | 2,775,000 | 2,799,831 | |
| a | Series D, 5.00% due 10/1/2047 (put 10/1/2029) | 3,950,000 | 4,373,831 |
| Turnpike Authority of Kentucky (Revitalization Projects), Series B, 5.00% due 7/1/2025 - 7/1/2026 | 5,615,000 | 5,949,152 | |
| Louisiana — 1.9% | |||
| City of Shreveport (Insured: AGM) GO, Series A, 5.00% due 3/1/2024 - 3/1/2032 | 5,800,000 | 6,360,851 | |
| City of Shreveport (Water and Sewer System; Insured: BAM), | |||
| Series A, 5.00% due 12/1/2023 - 12/1/2024 | 8,735,000 | 8,911,141 | |
| Series C, 5.00% due 12/1/2024 - 12/1/2026 | 2,420,000 | 2,542,397 | |
| East Baton Rouge Sewerage Commission (Wastewater System Improvements), Series B, 5.00% due 2/1/2024 - 2/1/2025 | 1,700,000 | 1,749,485 | |
| Louisiana Energy & Power Authority (LEPA Unit No. 1 Power; Insured: AGM), Series A, 5.00% due 6/1/2023 | 750,000 | 752,173 | |
| Louisiana Local Govt Environmental Facilities & Community Development Authority (Louisiana Community & Technical College System; Insured: BAM), 5.00% due 10/1/2025 - 10/1/2027 | 9,600,000 | 10,394,651 | |
| Louisiana Offshore Terminal Authority (Loop LLC), | |||
| a | 1.65% due 9/1/2033 - 9/1/2034 (put 12/1/2023) | 10,000,000 | 9,883,930 |
| a,c | 1.65% due 9/1/2027 (put 12/1/2023) | 6,150,000 | 6,078,617 |
| Louisiana Public Facilities Authority (Hurricane Recovery Program), 5.00% due 6/1/2023 | 5,000,000 | 5,017,225 | |
| Louisiana Public Facilities Authority (Ochsner Clinic Foundation Obligated Group), | |||
| Series A, 5.00% due 5/15/2031 | 875,000 | 984,788 | |
| a | Series B, 5.00% due 5/15/2050 (put 5/15/2025) | 2,800,000 | 2,909,122 |
| Plaquemines Port Harbor & Terminal District (International Marine Terminals Partnership; LOC Wells Fargo Bank N.A.), | |||
| a | Series A, 4.00% due 3/15/2025 (put 3/15/2024) | 2,500,000 | 2,512,575 |
| a | Series B, 4.00% due 3/15/2025 (put 3/15/2024) | 5,000,000 | 5,147,605 |
| State of Louisiana, 5.00% due 9/1/2032 | 1,000,000 | 1,175,206 | |
| a | State of Louisiana Gasoline & Fuels Tax Revenue, Series A, 3.874% (SOFR + 0.50%) due 5/1/2043 (put 5/1/2026) | 2,950,000 | 2,850,706 |
| Maine — 0.0% | |||
| Maine Governmental Facilities Authority (Augusta & Machias Courthouses), Series A, 5.00% due 10/1/2023 | 1,445,000 | 1,461,792 | |
| Maryland — 0.8% | |||
| County of Montgomery GO, Series C, 5.00% due 10/1/2025 | 1,000,000 | 1,062,457 | |
| County of Prince George’s GO, Series A, 5.00% due 9/15/2026 | 6,110,000 | 6,658,654 | |
| Maryland Health & Higher Educational Facilities Authority (UPMC Obligated Group), Series B, 5.00% due 4/15/2025 - 4/15/2029 | 6,755,000 | 7,371,211 | |
| Maryland Stadium Authority Built to Learn Revenue, Series A, 5.00% due 6/1/2023 - 6/1/2032 | 3,340,000 | 3,844,849 | |
| State of Maryland GO, Series B, 5.00% due 8/1/2024 | 9,455,000 | 9,758,921 | |
| Massachusetts — 1.1% | |||
| Massachusetts (CareGroup Healthcare System) DFA, Series I, 5.00% due 7/1/2024 - 7/1/2027 | 7,870,000 | 8,212,262 | |
| Massachusetts (Insured: BHAC-CR FGIC), 5.50% due 1/1/2029 | 8,300,000 | 9,484,053 | |
| a,b | Massachusetts (Mass General Brigham, Inc.) DFA, Series T-1, 4.57% (MUNIPSA + 0.60%) due 7/1/2049 (put 1/29/2026) | 3,750,000 | 3,743,490 |
| Massachusetts (Mount Auburn Hospital Health Records System) DFA, Series H-1, 5.00% due 7/1/2023 - 7/1/2025 | 14,165,000 | 14,510,465 | |
| Massachusetts (Simmons University) DFA, Series J, 5.25% due 10/1/2023 | 595,000 | 599,292 | |
| Michigan — 2.1% | |||
| Board of Governors of Wayne State University (Educational Facilities and Equipment), Series A, 5.00% due 11/15/2023 - 11/15/2025 | 1,445,000 | 1,484,757 | |
| Michigan Finance Authority (Beaumont Health Credit Group), 5.00% due 8/1/2025 (pre-refunded 8/1/2024) | 8,000,000 | 8,250,368 | |
| Michigan Finance Authority (Beaumont Health Credit Group) ETM, 5.00% due 8/1/2023 - 8/1/2024 | 10,800,000 | 11,033,869 | |
| Michigan Finance Authority (BHSH System Obligated Group), Series A, 5.00% due 4/15/2028 - 4/15/2032 | 7,000,000 | 8,080,477 | |
| a | Michigan Finance Authority (Bronson Health Care Group Obligated Group), Series B, 5.00% due 11/15/2044 (put 11/16/2026) | 7,000,000 | 7,352,394 |
| Michigan Finance Authority (Henry Ford Health System), 5.00% due 11/15/2027 | 1,500,000 | 1,605,122 | |
| Michigan Finance Authority (McLaren Health Care Corp. Obligated Group), Series A, 5.00% due 2/15/2029 - 5/15/2032 | 2,000,000 | 2,140,080 | |
| Michigan Finance Authority (Trinity Health Credit Group), | |||
| 5.00% due 12/1/2023 - 12/1/2024 | 3,500,000 | 3,574,830 | |
| Series A, 5.00% due 12/1/2024 - 12/1/2028 | 6,000,000 | 6,427,239 | |
| Michigan State Building Authority, Series I, 5.00% due 10/15/2032 | 1,250,000 | 1,362,071 | |
| Michigan State Building Authority (Higher Education Facilities Program), Series I-A, 5.00% due 10/15/2023 | 7,715,000 | 7,816,005 | |
| Royal Oak Hospital Finance Authority (William Beaumont Hospital), Series D, 5.00% due 9/1/2024 (pre-refunded 3/1/2024) | 2,000,000 | 2,042,030 | |
| Royal Oak Hospital Finance Authority (William Beaumont Hospital) ETM, Series D, 5.00% due 9/1/2023 | 1,240,000 | 1,251,009 | |
| School District of the City of Dearborn (Insured: Q-SBLF) GO, 4.00% due 5/1/2023 | 625,000 | 625,504 | |
| Wayne County Airport Authority (Insured: BAM), Series A, 5.00% due 12/1/2032 | 800,000 | 950,378 | |
| Wayne State University, Series A, 5.00% due 11/15/2025 - 11/15/2026 | 8,775,000 | 9,265,198 | |
| Minnesota — 0.3% | |||
| Minnesota Higher Education Facilities Authority, 5.00% due 10/1/2029 | 300,000 | 340,973 | |
| Minnesota Housing Finance Agency (Collateralized: GNMA, FNMA, FHLMC), | |||
| Series F, | |||
| 1.90% due 1/1/2029 | 160,000 | 152,253 |
| See notes to financial statements. | Thornburg Municipal Funds Semi-Annual Report | 29 |
Thornburg Limited Term Municipal Fund | March 31, 2023 (Unaudited)
| ISSUER-DESCRIPTION | Principal Amount | VALUE | |
| 1.95% due 7/1/2029 | $ 375,000 | $ 355,677 | |
| a | Minnesota Housing Finance Agency (Residential Single Family Development; Collateralized: GNMA, FNMA, FHLMC), Series H, 4.52% (MUNIPSA + 0.55%) due 7/1/2041 (put 12/12/2023) | 6,195,000 | 6,197,528 |
| Minnesota Municipal Gas Agency (Guaranty: Royal Bank of Canada), Series A, 4.00% due 6/1/2025 | 700,000 | 710,376 | |
| St. Paul Housing and Redevelopment Authority (HealthPartners), Series A, 5.00% due 7/1/2023 - 7/1/2025 | 1,850,000 | 1,880,270 | |
| Mississippi — 0.2% | |||
| Biloxi Public School District (Insured: BAM), 5.00% due 4/1/2025 | 1,350,000 | 1,403,066 | |
| a | County of Warren, Series A, 1.375% due 5/1/2034 (put 6/16/2025) | 1,625,000 | 1,523,572 |
| Mississippi Development Bank (Jackson Public School District; Insured: BAM), 5.00% due 10/1/2024 - 10/1/2028 | 2,400,000 | 2,563,113 | |
| Missouri — 0.5% | |||
| City of Kansas City GO, Series A, 5.00% due 2/1/2030 - 2/1/2031 | 1,750,000 | 2,051,649 | |
| a | Health & Educational Facilities Authority of the State of Missouri (BJC Healthcare Obligated Group), Series C, 5.00% due 5/1/2052 (put 5/1/2028) | 9,265,000 | 10,209,585 |
| Health & Educational Facilities Authority of the State of Missouri (SSM Health Care Obligated Group), Series A, 5.00% due 6/1/2030 - 6/1/2032 | 3,875,000 | 4,490,335 | |
| Montana — 0.0% | |||
| Montana Facility Finance Authority (Billings Clinic Obligated Group), Series A, 5.00% due 8/15/2031 | 1,000,000 | 1,174,320 | |
| Nebraska — 0.6% | |||
| a | Central Plains Energy Project (Guaranty: Goldman Sachs & Co.), Series 1, 5.00% due 5/1/2053 (put 10/1/2029) | 6,575,000 | 6,833,450 |
| Central Plains Energy Project (Guaranty: Goldman Sachs Group, Inc.), | |||
| a | 5.00% due 3/1/2050 (put 1/1/2024) | 3,000,000 | 3,016,221 |
| Series A, 5.00% due 9/1/2031 | 1,215,000 | 1,306,781 | |
| Douglas County Hospital Authority No. 3 (Nebraska Methodist Health System), 5.00% due 11/1/2023 - 11/1/2025 | 5,310,000 | 5,475,457 | |
| Gretna Public Schools GO, Series B, 5.00% due 12/15/2027 | 3,000,000 | 3,193,221 | |
| a | Nebraska Public Power District, Series A, 0.60% due 1/1/2051 (put 7/1/2023) | 1,720,000 | 1,709,737 |
| Nevada — 2.8% | |||
| Carson City (Carson Tahoe Regional Healthcare), Series A, 5.00% due 9/1/2023 - 9/1/2027 | 1,705,000 | 1,767,445 | |
| Clark County School District (Insured: AGM) GO, Series B, 5.00% due 6/15/2031 | 1,650,000 | 1,886,605 | |
| Clark County School District (Insured: BAM) GO, Series B, 5.00% due 6/15/2029 - 6/15/2031 | 4,400,000 | 5,069,930 | |
| Clark County School District GO, | |||
| Series A, 5.00% due 6/15/2023 | 4,000,000 | 4,017,456 | |
| Series C, 4.00% due 6/15/2030 | 2,015,000 | 2,073,757 | |
| a | County of Clark (Nevada Power Co.), 3.75% due 1/1/2036 (put 3/31/2026) | 1,000,000 | 1,013,672 |
| County of Washoe GO, 5.00% due 7/1/2024 | 1,470,000 | 1,511,626 | |
| Las Vegas Convention and Visitors Authority, Series C, 5.00% due 7/1/2023 - 7/1/2026 | 1,800,000 | 1,875,644 | |
| Las Vegas Valley Water District GO, | |||
| Series A, 5.00% due 6/1/2023 - 6/1/2030 | 56,355,000 | 58,282,881 | |
| Series B, 5.00% due 12/1/2025 | 20,000,000 | 21,096,220 | |
| New Jersey — 4.6% | |||
| City of Jersey City (Qualified General Improvement; Insured: BAM) (State Aid Withholding) GO, Series A, 5.00% due 8/1/2023 | 2,455,000 | 2,471,885 | |
| City of Newark GO, Series D, 4.00% due 9/29/2023 | 7,500,000 | 7,544,047 | |
| Essex County Improvement Authority (County Correctional Facilities & Gibraltar Facilities; Insured: Natl-Re) GO, 5.50% due 10/1/2024 | 5,000,000 | 5,214,000 | |
| New Jersey (Middlesex Water Co) EDA, Series A, 5.00% due 10/1/2023 | 1,500,000 | 1,516,497 | |
| New Jersey (New Jersey Transit Corp.) EDA, Series A, 5.00% due 11/1/2031 - 11/1/2032 | 3,590,000 | 4,115,272 | |
| New Jersey (New Jersey Transit Corporation) (State Aid Withholding) EDA, Series B, 5.00% due 11/1/2024 | 8,000,000 | 8,237,024 | |
| New Jersey (New Jersey Transit Corporation) EDA, | |||
| Series A, 5.00% due 11/1/2029 | 40,000 | 44,815 | |
| Series B, 5.00% due 11/1/2023 | 2,500,000 | 2,526,838 | |
| New Jersey (School Facilities Construction) EDA, | |||
| 5.00% due 6/15/2028 - 6/15/2029 | 5,930,000 | 6,545,066 | |
| Series- II, 5.00% due 3/1/2025 | 775,000 | 775,860 | |
| Series NN, 5.00% due 3/1/2024 | 3,600,000 | 3,604,417 | |
| Series UU, 5.00% due 6/15/2028 (pre-refunded 6/15/2024) | 7,930,000 | 8,152,318 | |
| New Jersey (State of New Jersey Department of the Treasury) EDA, Series DDD, 5.00% due 6/15/2033 (pre-refunded 6/15/2027) | 1,500,000 | 1,666,043 | |
| New Jersey Educational Facilities Authority (Ramapo College of New Jersey; Insured: AGM), Series A, 5.00% due 7/1/2032 | 600,000 | 714,796 | |
| New Jersey Health Care Facilities Financing Authority, 5.00% due 7/1/2024 (pre-refunded 1/1/2024) | 65,000 | 66,108 | |
| New Jersey Health Care Facilities Financing Authority (Virtua Health Obligated Group), 5.00% due 7/1/2024 | 935,000 | 950,079 | |
| New Jersey Health Care Facilities Financing Authority (Virtua Health Obligated Group) HFFA, 5.00% due 7/1/2023 | 535,000 | 537,727 | |
| New Jersey Transportation Trust Fund Authority, | |||
| Series A, 5.00% due 12/15/2032 - 6/15/2033 | 4,100,000 | 4,569,906 | |
| Series B, 5.00% due 6/15/2030 | 1,200,000 | 1,354,664 | |
| New Jersey Transportation Trust Fund Authority (Transportation System), Series D, 5.00% due 6/15/2032 | 6,380,000 | 6,573,671 | |
| New Jersey Transportation Trust Fund Authority (State Transportation System Improvements), | |||
| 5.00% due 6/15/2023 - 6/15/2024 | 6,000,000 | 6,088,224 |
| 30 | Thornburg Municipal Funds Semi-Annual Report | See notes to financial statements. |
| ISSUER-DESCRIPTION | Principal Amount | VALUE | |
| Series A, 5.00% due 6/15/2028 | $ 4,240,000 | $ 4,503,991 | |
| Series A-1, 5.00% due 6/15/2025 - 6/15/2027 | 30,485,000 | 32,328,752 | |
| New Jersey Transportation Trust Fund Authority (State Transportation System Improvements; Insured: AMBAC), Series B, 5.25% due 12/15/2023 | 3,545,000 | 3,597,200 | |
| New Jersey Transportation Trust Fund Authority (Transportation System), | |||
| Series A, 5.00% due 12/15/2025 - 6/15/2032 | 25,965,000 | 28,504,673 | |
| Series BB-1, 5.00% due 6/15/2031 | 2,500,000 | 2,752,678 | |
| State of New Jersey (COVID-19 GO Emergency Bonds) GO, | |||
| Series A, | |||
| 4.00% due 6/1/2023 | 1,000,000 | 1,002,106 | |
| 5.00% due 6/1/2024 - 6/1/2029 | 10,215,000 | 11,427,122 | |
| State of New Jersey GO, 5.00% due 6/1/2027 | 2,200,000 | 2,426,763 | |
| New Mexico — 1.2% | |||
| City of Albuquerque (City Infrastructure Improvements) GO, Series A, 5.00% due 7/1/2023 | 1,360,000 | 1,367,608 | |
| City of Farmington (Public Service Co. of New Mexico), | |||
| a | Series A, 0.875% due 6/1/2040 (put 10/1/2026) | 3,000,000 | 2,766,309 |
| a | Series B, 3.00% due 6/1/2040 (put 6/1/2024) | 5,000,000 | 4,976,855 |
| a | Series C, 1.15% due 6/1/2040 (put 6/1/2024) | 4,500,000 | 4,385,475 |
| a | Series D, 1.10% due 6/1/2040 (put 6/1/2023) | 230,000 | 229,129 |
| Lea County Public School District No 8 Eunice (State Aid Withholding) GO, | |||
| 4.00% due 9/15/2027 | 1,000,000 | 1,043,107 | |
| 5.00% due 9/15/2026 | 650,000 | 698,764 | |
| New Mexico Hospital Equipment Loan Council (Presbyterian Healthcare Services Obligated Group), | |||
| 5.00% due 8/1/2031 (pre-refunded 8/1/2025) | 500,000 | 525,044 | |
| Series A, 5.00% due 8/1/2032 | 1,000,000 | 1,115,420 | |
| a | Series B, 5.00% due 8/1/2049 (put 8/1/2025) | 3,650,000 | 3,820,962 |
| New Mexico Hospital Equipment Loan Council (Presbyterian Healthcare Services Obligated Group) ETM, 5.00% due 8/1/2024 - 8/1/2025 | 1,780,000 | 1,843,924 | |
| a | New Mexico Mortgage Finance Authority (JLG Central 217 LLLP), 0.53% due 11/1/2024 (put 5/1/2024) | 10,500,000 | 10,232,271 |
| a | New Mexico Municipal Energy Acquisition Authority (Guaranty: Royal Bank of Canada), Series A, 5.00% due 11/1/2039 (put 5/1/2025) | 1,000,000 | 1,026,616 |
| Santa Fe Public School District (State Aid Withholding) GO, 5.00% due 8/1/2029 - 8/1/2032 | 5,175,000 | 6,017,681 | |
| Santa Fe Public School District GO, 4.00% due 8/1/2024 | 1,250,000 | 1,269,874 | |
| State of New Mexico Severance Tax Permanent Fund, Series A, 5.00% due 7/1/2025 | 1,250,000 | 1,315,616 | |
| New York — 6.3% | |||
| City of New York (City Budget Financial Management) GO, | |||
| Series G, 5.00% due 8/1/2023 | 9,520,000 | 9,595,170 | |
| Series J, 5.00% due 8/1/2023 - 8/1/2024 | 33,130,000 | 33,897,169 | |
| City of New York GO, | |||
| Series B-1, 5.00% due 8/1/2032 | 2,000,000 | 2,429,474 | |
| Series C, 5.00% due 8/1/2025 - 8/1/2026 | 4,250,000 | 4,547,773 | |
| Series C-1, 5.00% due 8/1/2032 | 1,000,000 | 1,172,621 | |
| City of Plattsburgh GO, Series B, 4.75% due 11/17/2023 | 7,000,000 | 7,054,523 | |
| City of Yonkers (Insured: AGM) GO, Series A, 5.00% due 2/15/2029 | 850,000 | 968,717 | |
| County of Suffolk (Insured: BAM) GO, Series D, 5.00% due 10/15/2025 | 750,000 | 794,352 | |
| Manchester-Shortsville Central School District (State Aid Withholding) GO, 4.00% due 8/17/2023 | 6,000,000 | 6,014,046 | |
| Metropolitan Transportation Authority, | |||
| Series A-1, 5.00% due 11/15/2025 | 1,265,000 | 1,313,390 | |
| Series B, | |||
| 4.00% due 11/15/2026 | 1,660,000 | 1,707,413 | |
| 5.00% due 11/15/2028 | 1,230,000 | 1,300,552 | |
| Series C-1, | |||
| 5.00% due 11/15/2027 | 1,070,000 | 1,117,215 | |
| 5.25% due 11/15/2028 - 11/15/2029 | 16,100,000 | 16,943,330 | |
| Series D-1, 5.00% due 11/15/2028 - 11/15/2029 | 4,990,000 | 5,216,745 | |
| Series F, 5.00% due 11/15/2025 | 1,055,000 | 1,104,373 | |
| Metropolitan Transportation Authority (Green Bond), | |||
| Series A2, 5.00% due 11/15/2027 | 3,450,000 | 3,654,295 | |
| Series B, 5.00% due 11/15/2025 - 11/15/2027 | 6,650,000 | 7,015,847 | |
| Series C-1, 5.00% due 11/15/2024 - 11/15/2026 | 6,840,000 | 7,175,709 | |
| a | New York City Housing Development Corp., Series F, 3.40% due 11/1/2062 (put 12/22/2026) | 2,500,000 | 2,501,465 |
| New York City Transitional Finance Authority Future Tax Secured Revenue, | |||
| Series A, 5.00% due 11/1/2031 - 11/1/2032 | 8,980,000 | 10,597,891 | |
| Series A1, 5.00% due 8/1/2031 - 8/1/2032 | 8,500,000 | 9,022,436 | |
| Series B, 5.00% due 11/1/2032 | 2,500,000 | 3,050,105 | |
| Series C-1, 5.00% due 5/1/2032 | 1,000,000 | 1,182,052 |
| See notes to financial statements. | Thornburg Municipal Funds Semi-Annual Report | 31 |
Thornburg Limited Term Municipal Fund | March 31, 2023 (Unaudited)
| ISSUER-DESCRIPTION | Principal Amount | VALUE | |
| Series D, 5.00% due 11/1/2025 | $ 1,000,000 | $ 1,066,486 | |
| Series F-1, 5.00% due 11/1/2024 | 1,000,000 | 1,039,937 | |
| Series F5, 5.00% due 2/1/2029 | 3,500,000 | 4,014,906 | |
| New York City Trust for Cultural Resources (Lincoln Center for the Performing Arts, Inc.), Series A, 5.00% due 12/1/2026 | 2,500,000 | 2,701,028 | |
| New York State Authority (State of New York Personal Income Tax Revenue), | |||
| Series A, 5.00% due 3/15/2030 | 6,500,000 | 7,604,955 | |
| Series A1, 5.00% due 3/15/2030 | 5,000,000 | 5,849,270 | |
| New York State Dormitory Authority (Insured: BAM), Series A, 5.00% due 10/1/2032 | 3,500,000 | 4,123,042 | |
| New York State Dormitory Authority (School Districts Financing Program; Insured: AGC) (State Aid Withholding), Series B, 5.25% due 10/1/2023 | 140,000 | 140,264 | |
| New York State Dormitory Authority (School Districts Financing Program; Insured: AGM) (State Aid Withholding), Series A, 5.00% due 10/1/2023 - 10/1/2024 | 4,500,000 | 4,597,762 | |
| New York State Dormitory Authority (State of New York Personal Income Tax Revenue), | |||
| Series A1, 5.00% due 3/15/2031 | 4,545,000 | 5,410,891 | |
| Series E, 5.00% due 3/15/2033 | 2,000,000 | 2,404,212 | |
| New York State Dormitory Authority (State of New York Sales Tax Revenue), | |||
| Series A, 5.00% due 3/15/2033 | 500,000 | 541,942 | |
| Series E, 5.00% due 3/15/2029 | 4,135,000 | 4,694,958 | |
| a | New York State Energy Research & Development Authority (New York State Electric & Gas Corp.), Series C, 2.625% due 4/1/2034 (put 7/3/2023) | 12,225,000 | 12,198,129 |
| New York State Thruway Authority (Governor Thomas E. Dewey Thruway), Series K, 5.00% due 1/1/2024 - 1/1/2025 | 3,000,000 | 3,101,677 | |
| New York State Urban Development Corp. (State of New York Personal Income Tax Revenue), Series C-2, 5.00% due 3/15/2032 | 4,715,000 | 5,228,034 | |
| State of New York Mortgage Agency, | |||
| Series 223, | |||
| 1.85% due 4/1/2026 | 400,000 | 385,589 | |
| 1.90% due 10/1/2026 | 815,000 | 781,286 | |
| 1.95% due 4/1/2027 | 1,000,000 | 953,486 | |
| 2.00% due 10/1/2027 | 775,000 | 734,378 | |
| 2.05% due 4/1/2028 | 450,000 | 423,790 | |
| 2.25% due 4/1/2030 | 1,320,000 | 1,211,856 | |
| 2.30% due 10/1/2030 | 1,110,000 | 1,013,979 | |
| Triborough Bridge & Tunnel Authority (Metropolitan Transportation Authority Payroll Mobility Tax Revenue) (Green Bond), | |||
| a | Series A2, 2.00% due 5/15/2045 (put 5/15/2024) | 2,535,000 | 2,520,576 |
| Series D, 5.00% due 11/15/2029 - 11/15/2031 | 3,000,000 | 3,543,171 | |
| Series E, 5.00% due 11/15/2032 | 2,000,000 | 2,443,518 | |
| Westchester County Local Development Corp. (Miriam Osborn Memorial Home Association Obligated Group), 5.00% due 7/1/2024 - 7/1/2028 | 1,100,000 | 1,150,580 | |
| North Carolina — 1.2% | |||
| Charlotte-Mecklenburg Hospital Authority (Atrium Health Obligated Group), | |||
| a | Series B, 1.95% due 1/15/2048 (put 11/1/2029) | 1,000,000 | 961,113 |
| a | Series D, 5.00% due 1/15/2049 (put 12/1/2031) | 7,000,000 | 8,218,154 |
| Charlotte-Mecklenburg Hospital Authority (Carolinas HealthCare System), Series A, 5.00% due 1/15/2024 | 2,855,000 | 2,859,745 | |
| City of Charlotte (Equipment Acquisition & Public Facilities) ETM COP, Series C, 5.00% due 12/1/2023 - 12/1/2025 | 4,435,000 | 4,604,107 | |
| a | Columbus County Industrial Facilities & Pollution Control Financing Authority (International Paper Co.), Series B, 2.00% due 11/1/2033 (put 10/1/2024) | 1,100,000 | 1,074,120 |
| County of Buncombe (Primary, Middle School & Community College Facilities), Series A, 5.00% due 6/1/2023 - 6/1/2024 | 1,350,000 | 1,370,156 | |
| County of Dare (Educational Facility Capital Projects), Series A, 5.00% due 6/1/2024 | 700,000 | 702,611 | |
| County of Randolph, | |||
| Series B, 5.00% due 10/1/2023 | 550,000 | 556,477 | |
| Series C, 5.00% due 10/1/2023 | 400,000 | 404,711 | |
| North Carolina Turnpike Authority, 5.00% due 1/1/2024 - 1/1/2029 | 12,765,000 | 13,536,290 | |
| State of North Carolina, 5.00% due 3/1/2033 | 5,000,000 | 5,684,800 | |
| Ohio — 3.1% | |||
| Akron, Bath and Copley Joint Township Hospital District (Summa Health System Obligated Group), 5.00% due 11/15/2028 - 11/15/2032 | 2,605,000 | 2,827,116 | |
| Cincinnati City School District Board of Education (Educational Facilities; Insured: Natl-Re) GO, 5.25% due 12/1/2023 | 2,690,000 | 2,734,428 | |
| City of Cleveland (Municipal Street System Improvements) GO, Series A, 5.00% due 12/1/2026 | 3,610,000 | 3,846,365 | |
| City of Cleveland (Parks & Recreation Facilities), Series A3, 5.00% due 10/1/2023 | 630,000 | 637,115 | |
| City of Cleveland (Public Facilities Improvements), Series B1, 5.00% due 10/1/2025 - 10/1/2028 | 2,855,000 | 3,137,416 | |
| City of Cleveland (Public Facilities), Series A-1, 5.00% due 10/1/2023 | 1,155,000 | 1,168,045 | |
| City of Toledo (Water System Improvements), 5.00% due 11/15/2023 (pre-refunded 5/15/2023) | 1,750,000 | 1,754,344 | |
| County of Allen Hospital Facilities Revenue (Bon Secours Mercy Health, Inc.), | |||
| a | Series B-1, 5.00% due 10/1/2049 (put 8/3/2027) | 1,000,000 | 1,095,683 |
| a | Series B-2, 5.00% due 10/1/2051 (put 6/4/2030) | 10,565,000 | 12,022,674 |
| County of Cuyahoga (Convention Hotel Project) COP, 5.00% due 12/1/2023 - 12/1/2024 | 17,160,000 | 17,522,898 | |
| County of Cuyahoga (Musical Arts Association), 5.00% due 1/1/2030 - 1/1/2032 | 820,000 | 927,505 | |
| County of Scioto (Southern Ohio Medical Center), 5.00% due 2/15/2025 | 1,695,000 | 1,754,762 |
| 32 | Thornburg Municipal Funds Semi-Annual Report | See notes to financial statements. |
| ISSUER-DESCRIPTION | Principal Amount | VALUE | |
| Franklin County Convention Facilities Authority (Greater Columbus Convention Center) ETM, 5.00% due 12/1/2024 | $ 1,000,000 | $ 1,036,350 | |
| Northeast Ohio Medical University (Insured: BAM), 5.00% due 12/1/2029 - 12/1/2032 | 1,175,000 | 1,327,520 | |
| a | Ohio Air Quality Development Authority (Duke Energy Corp.), Series B, 4.00% due 9/1/2030 (put 6/1/2027) | 4,000,000 | 4,031,824 |
| Ohio Turnpike & Infrastructure Commission, Series A, 5.00% due 2/15/2027 - 2/15/2028 | 14,555,000 | 16,210,484 | |
| Ohio Water Development Authority, Series A, 5.00% due 12/1/2030 | 1,000,000 | 1,081,613 | |
| State of Ohio (Cleveland Clinic Health System Obligated Group), Series A, 5.00% due 1/1/2026 - 1/1/2032 | 1,800,000 | 1,946,201 | |
| State of Ohio GO, Series V, 5.00% due 5/1/2023 - 5/1/2028 | 24,310,000 | 26,120,361 | |
| Union/Clermont County Township GO, 3.00% due 8/30/2023 | 4,000,000 | 3,994,936 | |
| Youngstown City School District (Educational Facilities) (State Aid Withholding) GO, 4.00% due 12/1/2023 | 1,700,000 | 1,701,532 | |
| Oklahoma — 2.0% | |||
| Canadian County Educational Facilities Authority (Mustang Public Schools Project) ISD, 5.00% due 9/1/2027 | 1,000,000 | 1,069,845 | |
| Cleveland County Educational Facilities Authority (Moore Public Schools) ISD, | |||
| 4.00% due 6/1/2030 - 6/1/2031 | 9,240,000 | 10,022,933 | |
| 5.00% due 6/1/2023 | 5,355,000 | 5,372,297 | |
| Cleveland County Educational Facilities Authority (Norman Public Schools) ISD, 5.00% due 6/1/2024 | 4,250,000 | 4,354,801 | |
| Clinton Public Works Authority, 5.00% due 10/1/2029 - 10/1/2032 | 4,295,000 | 4,878,984 | |
| Cushing Educational Facilities Authority (Payne County No 67 Cushing) ISD, 5.00% due 9/1/2032 | 14,000,000 | 16,124,584 | |
| Muskogee Industrial Trust (Muskogee County No. 20) ISD, 5.00% due 9/1/2024 - 9/1/2027 | 4,025,000 | 4,168,979 | |
| Oklahoma (INTEGRIS Health) DFA, Series A, 5.00% due 8/15/2023 - 8/15/2025 | 3,725,000 | 3,811,719 | |
| Oklahoma County Finance Authority (Midwest City Public Service) ISD, 5.00% due 10/1/2023 - 10/1/2026 | 2,490,000 | 2,574,956 | |
| Pontotoc County Educational Facilities Authority (ADA Public Schools Project), 4.00% due 9/1/2026 - 9/1/2032 | 1,800,000 | 1,888,598 | |
| Rogers County Educational Facilities Authority (School District No 2 Catoosa), 5.00% due 9/1/2029 - 9/1/2032 | 12,000,000 | 13,742,502 | |
| Oregon — 0.8% | |||
| Hillsboro School District No. 1J (School Capital Improvements) (State Aid Withholding) GO, 5.00% due 6/15/2025 - 6/15/2027 | 9,130,000 | 9,865,071 | |
| a | Oregon Health & Science University (Oregon Health & Science University Obligated Group), Series B-2, 5.00% due 7/1/2046 (put 2/1/2032) | 11,780,000 | 13,837,118 |
| Tri-County Metropolitan Transportation District of Oregon, Series A, 5.00% due 10/1/2028 | 2,845,000 | 3,179,794 | |
| Pennsylvania — 8.3% | |||
| Allegheny County Higher Education Building Authority (Duquesne University of the Holy Spirit), Series A, 5.00% due 3/1/2024 - 3/1/2025 | 1,645,000 | 1,698,199 | |
| Allegheny County Hospital Development Authority (UPMC Obligated Group), Series A, 5.00% due 7/15/2025 - 7/15/2031 | 3,670,000 | 3,996,944 | |
| Allegheny County Sanitary Authority (2015 Capital Project), 5.00% due 12/1/2023 - 12/1/2024 | 19,150,000 | 19,548,199 | |
| Allegheny County Sanitary Authority (2015 Capital Project; Insured: BAM), 5.00% due 12/1/2025 | 1,000,000 | 1,065,477 | |
| Allegheny County Sanitary Authority (Insured: BAM), 5.00% due 12/1/2029 | 2,830,000 | 3,018,911 | |
| Bethlehem Area School District Authority (State Aid Withholding), | |||
| a | Series A, 3.586% (SOFR + 0.35%) due 1/1/2030 (put 11/1/2025) | 2,990,000 | 2,829,030 |
| a | Series C, 3.586% (SOFR + 0.35%) due 1/1/2032 (put 11/1/2025) | 2,990,000 | 2,893,973 |
| City of Philadelphia (Insured: AGM) GO, 5.00% due 8/1/2025 - 8/1/2027 | 28,685,000 | 30,654,690 | |
| City of Philadelphia (Pennsylvania Gas Works), | |||
| Series 13, 5.00% due 8/1/2023 - 8/1/2025 | 9,700,000 | 9,908,553 | |
| Series 14, 5.00% due 10/1/2023 - 10/1/2031 | 2,200,000 | 2,298,494 | |
| City of Philadelphia (Pennsylvania Gas Works; Insured: AGM), Series A, 5.00% due 8/1/2030 - 8/1/2032 | 1,750,000 | 2,010,852 | |
| City of Philadelphia Airport Revenue, Series A, 5.00% due 7/1/2030 | 750,000 | 865,013 | |
| City of Philadelphia GO, Series A, 5.00% due 8/1/2025 | 10,710,000 | 11,254,357 | |
| City of Philadelphia IDA, 5.00% due 5/1/2024 - 5/1/2028 | 2,975,000 | 3,186,994 | |
| City of Philadelphia Water & Wastewater Revenue, | |||
| 5.00% due 10/1/2026 | 2,070,000 | 2,240,725 | |
| Series B, 5.00% due 7/1/2032 | 2,500,000 | 2,629,262 | |
| Commonwealth Financing Authority (Tobacco Master Settlement), 5.00% due 6/1/2023 | 930,000 | 932,477 | |
| Commonwealth of Pennsylvania (Capital Facilities) GO, Series D, 5.00% due 8/15/2023 - 8/15/2025 | 39,450,000 | 40,677,215 | |
| Commonwealth of Pennsylvania GO, 5.00% due 7/15/2030 | 12,930,000 | 14,925,901 | |
| County of Luzerne (Insured: AGM) GO, Series A, 5.00% due 11/15/2023 - 11/15/2024 | 6,600,000 | 6,766,403 | |
| Geisinger Authority (Geisinger Health System Obligated group), | |||
| a | Series B, 5.00% due 4/1/2043 (put 2/15/2027) | 11,205,000 | 11,967,803 |
| a | Series C, 5.00% due 4/1/2043 (put 4/1/2030) | 3,475,000 | 3,855,082 |
| Lancaster County Solid Waste Management Authority (Harrisburg Resource Recovery Facility), Series A, 5.25% due 12/15/2024 (pre-refunded 12/15/2023) | 4,770,000 | 4,850,627 | |
| Lancaster County Solid Waste Management Authority (Harrisburg Resource Recovery Facility) ETM, Series A, 5.00% due 12/15/2023 | 2,680,000 | 2,722,331 | |
| Luzerne County (Insured: AGM) IDA GO, 5.00% due 12/15/2023 - 12/15/2027 | 4,045,000 | 4,221,304 | |
| Monroeville Finance Authority (UPMC Obligated Group), Series B, 5.00% due 2/15/2030 - 2/15/2031 | 2,500,000 | 2,845,117 | |
| a,d | Montgomery County (Constellation Energy Generation LLC) IDA, Series A, 4.10% due 4/1/2053 (put 4/3/2028) | 5,000,000 | 5,098,130 |
| Montgomery County Higher Education and Health Authority (Thomas Jefferson University Obligated Group), 5.00% due 9/1/2027 - 9/1/2033 | 3,475,000 | 3,835,377 | |
| Pennsylvania (UPMC Obligated Group) EDFA, | |||
| 5.00% due 3/15/2026 | 220,000 | 233,664 | |
| Series A, 5.00% due 11/15/2026 | 2,310,000 | 2,485,675 |
| See notes to financial statements. | Thornburg Municipal Funds Semi-Annual Report | 33 |
Thornburg Limited Term Municipal Fund | March 31, 2023 (Unaudited)
| ISSUER-DESCRIPTION | Principal Amount | VALUE | |
| Series A-1, 5.00% due 4/15/2024 - 4/15/2030 | $10,095,000 | $ 11,043,868 | |
| a | Pennsylvania (Waste Management Obligated Group; Guaranty: Waste Management, Inc.) EDFA, 0.95% due 12/1/2033 (put 12/1/2026) | 20,000,000 | 18,434,540 |
| Pennsylvania Higher Educational Facilities Authority (University of Pennsylvania Health System), Series A, 5.00% due 8/15/2027 | 1,000,000 | 1,104,623 | |
| Pennsylvania Housing Finance Agency, Series 137, 5.00% due 10/1/2029 | 365,000 | 408,684 | |
| Pennsylvania Turnpike Commission, | |||
| Series A-1, 5.00% due 12/1/2025 - 12/1/2027 | 4,000,000 | 4,347,528 | |
| Series B, 5.00% due 12/1/2032 | 500,000 | 586,215 | |
| Philadelphia Municipal Authority (Juvenile Justice Services Center), 5.00% due 4/1/2023 - 4/1/2027 | 6,125,000 | 6,389,814 | |
| Pittsburgh Water and Sewer Authority, | |||
| Series A, 5.00% due 9/1/2024 | 7,365,000 | 7,410,788 | |
| Series B, 5.00% due 9/1/2024 (pre-refunded 9/1/2023) | 2,395,000 | 2,415,990 | |
| Pittsburgh Water and Sewer Authority (Insured: AGM), Series B, 5.00% due 9/1/2033 | 1,000,000 | 1,207,837 | |
| Pittsburgh Water and Sewer Authority ETM, Series B, 5.00% due 9/1/2023 | 2,520,000 | 2,540,646 | |
| Plum Borough School District (Insured: BAM) (State Aid Withholding) GO, | |||
| Series A, 5.00% due 9/15/2023 - 9/15/2024 | 3,380,000 | 3,409,160 | |
| Series B, 5.00% due 9/15/2023 | 470,000 | 474,035 | |
| School District of Philadelphia (State Aid Withholding) GO, Series A, 5.00% due 9/1/2023 - 9/1/2028 | 2,400,000 | 2,528,798 | |
| School District of Philadelphia (State Aid Withholding; Insured: BAM) GO, Series F, 5.00% due 9/1/2025 | 500,000 | 525,658 | |
| Southeastern Pennsylvania Transportation Authority, 5.00% due 6/1/2025 - 6/1/2028 | 5,900,000 | 6,372,253 | |
| Sports & Exhibition Authority of Pittsburgh and Allegheny County (Allegheny County Hotel Room Excise Tax Revenue; Insured: AGM), | |||
| Series A, | |||
| 4.00% due 2/1/2024 | 1,800,000 | 1,814,861 | |
| 5.00% due 2/1/2033 | 4,000,000 | 4,611,700 | |
| State Public School Building Authority (Insured: BAM), Series A, 4.00% due 10/1/2033 | 2,325,000 | 2,374,583 | |
| State Public School Building Authority (School District of Philadelphia; Insured: AGM) (State Aid Withholding), Series A, 5.00% due 6/1/2030 | 3,550,000 | 3,840,724 | |
| Rhode Island — 0.3% | |||
| Rhode Island Clean Water Finance Agency (Public Drinking Water Supply or Treatment Facilities), Series B, 5.00% due 10/1/2023 | 2,380,000 | 2,408,177 | |
| Rhode Island Health and Educational Building Corp. (University of Rhode Island Auxiliary Enterprise), Series C, 5.00% due 9/15/2023 | 1,400,000 | 1,412,471 | |
| Rhode Island Health and Educational Building Corp. (University of Rhode Island), Series B, 5.00% due 9/15/2025 | 500,000 | 525,602 | |
| Rhode Island Housing and Mortgage Finance Corp, Series 76-A, 5.00% due 10/1/2029 | 180,000 | 198,520 | |
| State of Rhode Island and Providence Plantations (Information Technology) COP, Series C, 5.00% due 11/1/2024 | 3,010,000 | 3,108,268 | |
| State of Rhode Island and Providence Plantations (Kent County Courthouse) COP, Series A, 5.00% due 10/1/2023 | 1,500,000 | 1,515,024 | |
| State of Rhode Island and Providence Plantations (Training School) COP, Series B, 5.00% due 10/1/2023 | 1,705,000 | 1,722,077 | |
| South Carolina — 0.5% | |||
| Beaufort-Jasper Water & Sewer Authority (Waterworks & Sewer System), Series B, 5.00% due 3/1/2024 - 3/1/2025 | 2,000,000 | 2,072,209 | |
| Berkeley County School District (School Facility Equipment Acquisition), 5.00% due 12/1/2024 | 2,000,000 | 2,072,118 | |
| City of Charleston Public Facilities Corp. (City of Charleston Project), Series A, 5.00% due 9/1/2023 - 9/1/2025 | 1,275,000 | 1,330,448 | |
| County of Charleston (South Aviation Avenue Construction), 5.00% due 12/1/2023 | 2,460,000 | 2,496,910 | |
| a | Patriots Energy Group Financing Agency (Guaranty: Royal Bank of Canada), Series A, 4.00% due 10/1/2048 (put 2/1/2024) | 6,755,000 | 6,765,383 |
| SCAGO Educational Facilities Corp. (School District of Pickens County), 5.00% due 12/1/2023 - 12/1/2025 | 3,010,000 | 3,098,131 | |
| South Dakota — 0.1% | |||
| South Dakota Building Authority, Series B, 5.00% due 6/1/2024 (pre-refunded 6/1/2023) | 1,000,000 | 1,003,677 | |
| South Dakota Health & Educational Facilities Authority (Monument Health Obligated Group), 5.00% due 9/1/2028 | 1,500,000 | 1,625,345 | |
| South Dakota Health & Educational Facilities Authority (Sanford Health), 5.00% due 11/1/2024 - 11/1/2025 | 1,405,000 | 1,469,321 | |
| Tennessee — 0.8% | |||
| Health Educational and Housing Facility Board of the City of Memphis (Memphis Towers TC L.P.), 3.40% due 12/1/2023 | 1,750,000 | 1,752,076 | |
| a | Knox County Health Educational & Housing Facility Board (Gleason Partners L.P.), 3.95% due 12/1/2027 (put 12/1/2025) | 1,500,000 | 1,534,464 |
| Shelby County Health Educational & Housing Facilities Board (Methodist Le Bonheur Obligated Group), Series A, 5.00% due 5/1/2029 | 1,990,000 | 2,141,771 | |
| a | Tennessee Energy Acquisition Corp. (The Tennessee Energy Acquisition Corp.; Guaranty: Goldman Sachs Group, Inc.), Series A, 5.00% due 5/1/2052 (put 11/1/2031) | 23,000,000 | 24,034,494 |
| Texas — 12.9% | |||
| Amarillo Junior College District GO, 5.00% due 2/15/2030 | 2,325,000 | 2,686,944 | |
| Arlington Higher Education Finance Corp (Riverwalk Education Foundation, Inc.) (Insured: PSF-GTD), 5.00% due 8/15/2029 - 8/15/2032 | 1,130,000 | 1,291,694 | |
| Bexar County Hospital District (University Health System) GO, 5.00% due 2/15/2026 | 1,000,000 | 1,069,220 | |
| a | Boerne School District (Insured: PSF-GTD) ISD GO, 2.80% due 12/1/2051 (put 12/1/2023) | 4,000,000 | 4,004,552 |
| City of Beaumont (Waterworks & Sewer System Improvements; Insured: AGM), Series A, 5.00% due 9/1/2023 - 9/1/2024 | 7,500,000 | 7,566,367 | |
| City of Brownsville (Water, Wastewater & Electric Utilities Systems), Series A, 5.00% due 9/1/2023 | 2,380,000 | 2,400,301 | |
| City of Dallas (Public Improvements) GO, 5.00% due 2/15/2025 | 3,000,000 | 3,131,406 | |
| City of Dallas (Trinity River Corridor Infrastructure) GO, | |||
| 5.00% due 2/15/2024 - 2/15/2026 | 20,640,000 | 21,055,736 | |
| Series A, 5.00% due 2/15/2024 | 10,235,000 | 10,252,195 | |
| City of Houston (Airport System), |
| 34 | Thornburg Municipal Funds Semi-Annual Report | See notes to financial statements. |
| ISSUER-DESCRIPTION | Principal Amount | VALUE | |
| Series B, 5.00% due 7/1/2025 - 7/1/2028 | $ 9,105,000 | $ 9,865,807 | |
| Series D, 5.00% due 7/1/2027 | 3,355,000 | 3,695,814 | |
| City of Houston (Combined Utility System), | |||
| Series C, 5.00% due 5/15/2023 - 5/15/2024 | 11,695,000 | 11,889,922 | |
| Series D, 5.00% due 11/15/2023 - 11/15/2024 | 10,000,000 | 10,254,230 | |
| City of Houston (Public Improvements) GO, Series A, 5.00% due 3/1/2025 - 3/1/2028 | 42,700,000 | 45,256,122 | |
| City of Houston GO, Series A, 5.00% due 3/1/2031 | 2,635,000 | 2,986,090 | |
| City of Irving GO, Series A, 5.00% due 9/15/2029 | 1,000,000 | 1,109,845 | |
| City of Laredo (Sports Venues; Insured: AGM) ETM, 5.00% due 3/15/2024 | 300,000 | 305,309 | |
| City of Lubbock (Waterworks System) GO, 5.00% due 2/15/2024 - 2/15/2025 | 22,360,000 | 23,100,200 | |
| City of Lubbock GO, Series A, 5.00% due 2/15/2026 - 2/15/2027 | 1,500,000 | 1,622,455 | |
| City of Mansfield GO, Series A, 5.00% due 2/15/2031 - 2/15/2033 | 1,500,000 | 1,772,303 | |
| City of McAllen (International Toll Bridge System; Insured: AGM), Series A, 5.00% due 3/1/2024 - 3/1/2027 | 3,015,000 | 3,133,710 | |
| City of San Antonio (Public Facilities Corp.), 5.00% due 9/15/2027 - 9/15/2032 | 4,155,000 | 4,760,884 | |
| City of San Antonio (San Antonio Water System), Series A, 5.00% due 5/15/2023 | 425,000 | 426,125 | |
| City of San Antonio Electric & Gas Systems Revenue, | |||
| 5.25% due 2/1/2025 | 1,000,000 | 1,047,073 | |
| a | Series A, 1.75% due 2/1/2033 (put 12/1/2024) | 6,995,000 | 6,887,494 |
| City of San Antonio Electric & Gas Systems Revenue (CPS Energy), 5.25% due 2/1/2024 | 7,000,000 | 7,147,952 | |
| Clifton Higher Education Finance Corp. (Idea Public Schools), 5.00% due 8/15/2023 | 295,000 | 296,597 | |
| Clifton Higher Education Finance Corp. (Idea Public Schools; Insured: PSF-GTD), | |||
| 4.00% due 8/15/2028 | 2,000,000 | 2,102,748 | |
| Series T, 5.00% due 8/15/2026 - 8/15/2030 | 835,000 | 929,942 | |
| Cotulla ISD (Insured PSF-GTD) GO, 5.00% due 2/15/2032 | 1,115,000 | 1,321,779 | |
| Cotulla ISD (Insured: PSF-GTD) GO, 5.00% due 2/15/2029 - 2/15/2033 | 3,910,000 | 4,583,941 | |
| County of Bexar GO, 4.00% due 6/15/2033 | 2,750,000 | 2,850,045 | |
| County of Harris (Tax Road) GO, Series A, 5.00% due 10/1/2026 - 10/1/2028 | 7,885,000 | 8,742,615 | |
| County of Harris (Texas Permanent Improvement) GO, Series A, 5.00% due 10/1/2026 - 10/1/2027 | 9,815,000 | 10,869,998 | |
| County of Hays GO, 5.00% due 2/15/2024 - 2/15/2025 | 1,800,000 | 1,848,479 | |
| County of La Salle (Insured: AGM) GO, 5.00% due 3/1/2024 - 3/1/2028 | 17,100,000 | 18,205,908 | |
| Dallas County Utility & Reclamation District GO, 5.00% due 2/15/2024 - 2/15/2025 | 3,870,000 | 4,001,032 | |
| Dallas Fort Worth International Airport, Series A, 5.00% due 11/1/2027 | 1,000,000 | 1,111,668 | |
| a | Denton (Insured: PSF-GTD) ISD GO, Series B, 2.00% due 8/1/2044 (pre-refunded 8/1/2024) | 340,000 | 337,343 |
| a | El Paso Housing Finance Corp. (Columbia Housing Partners L.P.), 4.50% due 3/1/2026 (put 3/1/2025) | 2,000,000 | 2,056,108 |
| a | Fort Bend (Insured: PSF-GTD) ISD GO, Series B, 3.00% due 8/1/2052 (put 8/1/2023) | 7,000,000 | 7,008,330 |
| Gulf Coast Waste Disposal Authority (Bayport Area Wastewater Treatment System; Insured: AGM), 5.00% due 10/1/2023 - 10/1/2025 | 1,850,000 | 1,929,455 | |
| Harris County Cultural Education Facilities Finance Corp. (Memorial Hermann Health System Obligated Group), | |||
| Series A, 5.00% due 12/1/2023 - 12/1/2025 | 6,245,000 | 6,488,339 | |
| a | Series B, 5.00% due 6/1/2050 (put 12/1/2028) | 2,250,000 | 2,530,575 |
| a | Series C-3, 5.00% due 6/1/2032 (put 12/1/2026) | 1,300,000 | 1,418,794 |
| Harris County Cultural Education Facilities Finance Corp. (TECO Project), 5.00% due 11/15/2023 - 11/15/2027 | 4,800,000 | 5,113,691 | |
| a | Harris County Cultural Education Facilities Finance Corp. (Texas Children’s Hospital Obligated Group), Series B, 5.00% due 10/1/2051 (put 10/1/2031) | 2,125,000 | 2,534,139 |
| Harris County-Houston Sports Authority (Insured: AGM), Series A, 5.00% due 11/15/2023 - 11/15/2024 | 17,905,000 | 18,268,867 | |
| Houston (Insured: PSF-GTD) ISD GO, | |||
| a | Series B, 3.00% due 6/1/2036 (put 6/1/2024) | 1,500,000 | 1,507,274 |
| a | Series C, 4.00% due 6/1/2039 (put 6/1/2025) | 3,000,000 | 3,094,047 |
| a | Houston Housing Finance Corp (Sunset Gardens Preservation LP), 4.00% due 10/1/2025 (put 10/1/2024) | 6,000,000 | 6,101,508 |
| Laredo Community College District (School Facilities Improvements) GO, 5.00% due 8/1/2023 - 8/1/2024 | 1,325,000 | 1,352,175 | |
| Lower Colorado River Authority, | |||
| 5.00% due 5/15/2024 | 725,000 | 743,991 | |
| Series D, 5.00% due 5/15/2026 - 5/15/2027 | 2,200,000 | 2,304,974 | |
| Lower Colorado River Authority (LCRA Transmission Services Corp.), | |||
| 5.00% due 5/15/2032 | 575,000 | 677,169 | |
| Series A, | |||
| 5.00% due 5/15/2031 - 5/15/2032 | 900,000 | 1,064,173 | |
| 5.25% due 5/15/2033 | 350,000 | 422,026 | |
| Lubbock Electric Light & Power System Revenue, 5.00% due 4/15/2032 | 1,000,000 | 1,135,504 | |
| Metropolitan Transit Authority of Harris County, | |||
| 5.00% due 11/1/2023 - 11/1/2028 | 16,400,000 | 17,741,772 | |
| Series D, 5.00% due 11/1/2023 - 11/1/2027 | 5,605,000 | 5,928,292 |
| See notes to financial statements. | Thornburg Municipal Funds Semi-Annual Report | 35 |
Thornburg Limited Term Municipal Fund | March 31, 2023 (Unaudited)
| ISSUER-DESCRIPTION | Principal Amount | VALUE | |
| North East (Insured: PSF-GTD) ISD GO, | |||
| a | 2.20% due 8/1/2049 (put 8/1/2024) | $ 3,000,000 | $ 2,987,304 |
| a | Series C, 2.05% due 8/1/2046 (put 8/1/2023) | 4,200,000 | 4,185,770 |
| Prosper (Insured: PSF-GTD) ISD GO, 5.00% due 2/15/2033 | 1,000,000 | 1,201,544 | |
| Round Rock (Educational Facilities Improvements) ISD GO, 5.00% due 8/1/2027 | 1,100,000 | 1,218,845 | |
| Round Rock (Educational Facilities Improvements; Insured: PSF-GTD) ISD GO, | |||
| 5.00% due 8/1/2026 | 1,575,000 | 1,667,059 | |
| 5.00% due 8/1/2028 - 8/1/2029 (pre-refunded 8/1/2025) | 5,820,000 | 6,152,701 | |
| San Antonio (Insured: PSF-GTD) ISD GO, 5.00% due 8/15/2033 | 2,080,000 | 2,526,160 | |
| a | San Antonio Housing Trust Finance Corp. (Arbors at West Avenue L.P.), 1.45% due 3/1/2026 (put 3/1/2025) | 3,500,000 | 3,411,971 |
| a | San Antonio Housing Trust Public Facility Corp. (PV Country Club Village LP), 4.00% due 8/1/2026 (put 8/1/2025) | 3,000,000 | 3,097,239 |
| Stephen F Austin State University, 5.00% due 10/15/2024 | 1,445,000 | 1,492,095 | |
| Tarrant County College District GO, 5.00% due 8/15/2032 | 2,500,000 | 3,047,782 | |
| Tarrant County Cultural Education Facilities Finance Corp. (Christus Health Obligated Group), | |||
| a | Series A, 5.00% due 7/1/2053 (put 7/1/2032) | 2,520,000 | 2,887,192 |
| Series B, 5.00% due 7/1/2032 | 1,975,000 | 2,172,571 | |
| Tarrant County Hospital District GO, 5.00% due 8/15/2025 - 8/15/2027 | 2,880,000 | 3,129,867 | |
| Tarrant Regional Water District, Series A, 5.00% due 3/1/2027 | 2,000,000 | 2,135,812 | |
| Texas Municipal Gas Acquisition & Supply Corp. III (Guaranty: Macquarie Group Ltd.), 5.00% due 12/15/2023 - 12/15/2032 | 51,400,000 | 53,836,913 | |
| Texas State Technical College (Insured: AGM), | |||
| Series A, | |||
| 5.00% due 8/1/2031 - 8/1/2032 | 4,250,000 | 4,976,863 | |
| 5.25% due 8/1/2033 | 2,300,000 | 2,746,784 | |
| Texas Transportation Commission (Central Texas Turnpike System), Series C, 5.00% due 8/15/2023 - 8/15/2024 | 1,730,000 | 1,755,285 | |
| Texas Transportation Commission State Highway Fund, Series A, 5.00% due 4/1/2024 | 1,650,000 | 1,691,745 | |
| Texas Woman’s University, Series A, 5.00% due 7/1/2031 - 7/1/2033 | 4,275,000 | 5,033,542 | |
| Walnut Creek Special Utility District (Water System Improvements; Insured: BAM), 5.00% due 1/10/2024 | 750,000 | 762,630 | |
| Utah — 0.1% | |||
| Utah Telecommunication Open Infrastructure Agency, | |||
| 5.00% due 6/1/2031 | 600,000 | 696,131 | |
| 5.25% due 6/1/2033 | 500,000 | 594,769 | |
| Utah Transit Authority (Integrated Mass Transit System), Series A, 5.00% due 6/15/2023 - 6/15/2025 | 2,835,000 | 2,925,251 | |
| Virginia — 1.2% | |||
| County of Fairfax (State Aid Withholding) GO, Series A, 4.50% due 10/1/2027 | 4,975,000 | 5,454,451 | |
| a | Halifax County IDA, Series A, 1.65% due 12/1/2041 (put 5/31/2024) | 3,000,000 | 2,924,310 |
| a | Roanoke (Carilion Clinic Obligated Group) EDA, 5.00% due 7/1/2053 (put 7/1/2030) | 12,960,000 | 14,698,947 |
| Virginia Commonwealth Transportation Board, 5.00% due 9/15/2028 | 3,945,000 | 4,380,445 | |
| Virginia Small Business Financing Authority (National Senior Campuses, Inc. Obligated Group), Series A, 5.00% due 1/1/2027 - 1/1/2033 | 5,685,000 | 6,036,279 | |
| a | Wise County (Virginia Electric and Power Co.) IDA, Series A, 1.20% due 11/1/2040 (put 5/31/2024) | 6,655,000 | 6,440,703 |
| Washington — 1.7% | |||
| Clark County Public Utility District No. 1, 5.00% due 1/1/2028 | 500,000 | 559,594 | |
| Energy Northwest (Nine Canyon Wind Project Phase I-III), 5.00% due 7/1/2023 - 7/1/2025 | 1,850,000 | 1,898,200 | |
| Marysville School District No. 25 (Snohomish County Educational Facilities) (State Aid Withholding) GO, 5.00% due 12/1/2023 | 1,700,000 | 1,706,066 | |
| Skagit County Public Hospital District No. 1 (Skagit Regional Health) ETM, Series A, 5.00% due 12/1/2023 | 750,000 | 760,967 | |
| State of Washington (Capital Projects) GO, Series R-G, 5.00% due 7/1/2025 | 10,475,000 | 10,920,083 | |
| State of Washington (State and Local Agency Real and Personal Property Projects) COP, Series A, 5.00% due 7/1/2024 - 7/1/2027 | 17,775,000 | 19,003,177 | |
| State of Washington (Various Purposes) GO, Series C, 5.00% due 2/1/2029 | 8,515,000 | 9,759,655 | |
| State of Washington GO, | |||
| Series 2021A, 5.00% due 6/1/2025 - 6/1/2030 | 4,900,000 | 5,447,912 | |
| Series C, 5.00% due 2/1/2032 | 1,200,000 | 1,256,447 | |
| Series R, 5.00% due 7/1/2032 | 4,000,000 | 4,179,668 | |
| Washington Health Care Facilities Authority (Providence St Joseph Health Obligated Group), Series B, 5.00% due 10/1/2031 | 2,500,000 | 2,713,875 | |
| Wisconsin — 2.2% | |||
| City of Milwaukee (Insured: AGM) GO, Series N3, 5.00% due 4/1/2031 - 4/1/2032 | 6,550,000 | 7,540,478 | |
| County of Waushara GO, Series A, 4.50% due 6/1/2027 | 4,000,000 | 4,159,948 | |
| a | Public Finance Authority (Duke Energy Progress LLC), Series A-1, 3.30% due 10/1/2046 (put 10/1/2026) | 11,500,000 | 11,798,816 |
| Public Finance Authority (Moses H Cone Memorial Hospital Obligated Group), Series A, 5.00% due 10/1/2033 | 8,000,000 | 9,520,576 | |
| Public Finance Authority (National Senior Communities Obligated Group), 4.00% due 1/1/2024 - 1/1/2032 | 6,645,000 | 6,609,114 | |
| a | Public Finance Authority (Providence St. Joseph Health Obligated Group), Series C, 4.00% due 10/1/2041 (put 10/1/2030) | 4,000,000 | 4,180,436 |
| Pulaski Community School District, 4.00% due 7/12/2023 | 8,500,000 | 8,502,453 | |
| a | Wisconsin Health & Educational Facilities Authority (Advocate Aurora Health Obligated Group), Series B-4, 5.00% due 8/15/2054 (put 1/29/2025) | 12,415,000 | 12,920,328 |
| Wisconsin Health & Educational Facilities Authority (Ascension Health Alliance System), Series A, 5.00% due 11/15/2026 | 2,000,000 | 2,144,892 |
| 36 | Thornburg Municipal Funds Semi-Annual Report | See notes to financial statements. |
| ISSUER-DESCRIPTION | Principal Amount | VALUE | |
| Wisconsin Health & Educational Facilities Authority (Marquette University), 5.00% due 10/1/2023 | $ 235,000 | $ 237,426 | |
| Wisconsin Housing (Collateralized: FNMA) EDA, | |||
| Series C, | |||
| 1.65% due 9/1/2026 | 1,615,000 | 1,543,108 | |
| 1.95% due 3/1/2029 | 1,695,000 | 1,583,015 | |
| Wisconsin Housing EDA, | |||
| Series B, | |||
| a | 0.40% due 5/1/2045 (put 11/1/2023) | 950,000 | 936,112 |
| a | 0.50% due 11/1/2050 (put 11/1/2024) | 1,500,000 | 1,433,949 |
| WPPI Energy, Series A, 5.00% due 7/1/2024 - 7/1/2028 | 1,325,000 | 1,407,530 | |
| Total Long-Term Municipal Bonds — 94.2% (Cost $3,230,882,014) | 3,259,632,013 | ||
| Short-Term Municipal Bonds — 4.1% | |||
| California — 0.3% | |||
| a,b | Deutsche Bank Spears/Lifers Trust (LOC Deutsche Bank A.G.), Series DBE-8087 4.42% due 10/1/2058 (put 4/10/2023) | 9,480,000 | 9,480,000 |
| Florida — 0.7% | |||
| City of Gainesville Utilities System Revenue (SPA Barclays Bank plc), | |||
| a | Series B, 3.70% due 10/1/2042 (put 4/3/2023) | 6,500,000 | 6,500,000 |
| a | Series C-REMK 05/20/20 3.70% due 10/1/2026 (put 4/3/2023) | 2,090,000 | 2,090,000 |
| a | JEA Water & Sewer System Revenue (SPA U.S. Bank N.A.), Series A-1 3.80% due 10/1/2038 (put 4/3/2023) | 8,590,000 | 8,590,000 |
| a,b | JPMorgan Chase Putters/Drivers Trust (LOC JP Morgan Chase Bank N.A.), Series 5032, 3.75% due 12/15/2034 (put 4/3/2023) | 8,335,000 | 8,335,000 |
| Idaho — 0.0% | |||
| a | Idaho (St. Luke’s Health System Ltd. Obligated Group; LOC U.S. Bank N.A.) HFA, Series C, 3.80% due 3/1/2048 (put 4/3/2023) | 625,000 | 625,000 |
| Illinois — 0.1% | |||
| a | Phoenix Realty Special Account-U LP (LOC Northern Trust Company), 4.29% due 4/1/2025 (put 4/10/2023) | 1,575,000 | 1,575,000 |
| Indiana — 0.2% | |||
| a | Indiana Municipal Power Agency (LOC U.S. Bank N.A.), Series B, 3.80% due 1/1/2042 (put 4/3/2023) | 5,300,000 | 5,300,000 |
| Louisiana — 1.1% | |||
| a | Parish of St James Los Angeles (Nucor Steel Louisiana, LLC; Guaranty: Nucor Corp.), Series B-1, 4.40% due 11/1/2040 (put 4/10/2023) | 37,545,000 | 37,545,000 |
| Missouri — 0.0% | |||
| a | Health & Educational Facilities Authority of the State of Missouri (St. Louis University; LOC Barclays Bank plc), Series B-1, 3.70% due 10/1/2035 (put 4/3/2023) | 630,000 | 630,000 |
| New York — 0.8% | |||
| a | City of New York (LOC Mizuho Bank Ltd.) GO, Series G6, 3.66% due 4/1/2042 (put 4/3/2023) | 1,600,000 | 1,600,000 |
| a | New York City Municipal Water Finance Authority (New York City Water & Sewer System; SPA State Street B&T Co.), 3.75% due 6/15/2043 (put 4/3/2023) | 7,265,000 | 7,265,000 |
| a | New York State Housing Finance Agency (LOC Landesbank Hessen-Thuringen), Series A, 3.66% due 11/1/2046 (put 4/3/2023) | 20,000,000 | 20,000,000 |
| Ohio — 0.2% | |||
| a | Ohio Higher Educational Facility Commission (Cleveland Clinic Health System Obligated Group; SPA U.S. Bank N.A.), Series B3, 3.80% due 1/1/2039 (put 4/3/2023) | 4,800,000 | 4,800,000 |
| Oregon — 0.0% | |||
| a | Oregon State Facilities Authority (Peacehealth Obligated Group; LOC U.S. Bank N.A.), Series A, 3.80% due 8/1/2034 (put 4/3/2023) | 1,300,000 | 1,300,000 |
| Texas — 0.3% | |||
| a | Port of Port Arthur Navigation District (Motiva Enterprises, LLC), 4.40% due 4/1/2040 (put 4/3/2023) | 10,900,000 | 10,900,000 |
| Virginia — 0.1% | |||
| a | Virginia College Building Authority (University Of Richmond; SPA U.S. Bank N.A.), 3.80% due 11/1/2036 (put 4/3/2023) | 3,500,000 | 3,500,000 |
| Wisconsin — 0.3% | |||
| a,b | Deutsche Bank Spears/Lifers Trust (Guaranty: Deutsche Bank A.G.), Series DBE-8094, 4.42% due 4/1/2049 (put 4/10/2023) | 10,000,000 | 10,000,000 |
| Total Short-Term Municipal Bonds — 4.1% (Cost $140,035,000) | 140,035,000 | ||
| Total Investments — 98.3% (Cost $3,370,917,014) | $3,399,667,013 | ||
| Other Assets Less Liabilities — 1.7% | 59,452,259 | ||
| Net Assets — 100.0% | $3,459,119,272 |
| Footnote Legend | |
| a | Variable, floating, step, or fixed to floating rate securities are securities for which interest rate changes are based on changes in a designated base rate or on a predetermined schedule. The rates shown are those in effect on March 31, 2023. |
| See notes to financial statements. | Thornburg Municipal Funds Semi-Annual Report | 37 |
Thornburg Limited Term Municipal Fund | March 31, 2023 (Unaudited)
| b | Securities exempt from registration under Rule 144A of the Securities Act of 1933, as amended. These securities are restricted but liquid and may only be resold in the ordinary course of business in transactions exempt from registration, normally to qualified institutional buyers. As of March 31, 2023, the aggregate value of these securities in the Fund’s portfolio was $36,168,355, representing 1.05% of the Fund’s net assets. |
| c | Segregated as collateral for a when-issued security. |
| d | When-issued security. |
To simplify the listings of securities, abbreviations are used per the table below:
| AGC | Insured by Assured Guaranty Corp. |
| AGM | Insured by Assured Guaranty Municipal Corp. |
| AMBAC | Insured by American Municipal Bond Assurance Corp. |
| BAM | Insured by Build America Mutual Insurance Co. |
| BHAC-CR | Berkshire Hathaway Assurance Corp. Custodial Receipts |
| CDC | Community Development Commission |
| COP | Certificates of Participation |
| DFA | Development Finance Authority/Agency |
| EDA | Economic Development Authority |
| EDFA | Economic Development Financing Authority |
| ETM | Escrowed to Maturity |
| FGIC | Insured by Financial Guaranty Insurance Co. |
| FHLMC | Collateralized by Federal Home Loan Mortgage Corp. |
| FNMA | Collateralized by Federal National Mortgage Association |
| GNMA | Collateralized by Government National Mortgage Association |
| GO | General Obligation |
| HDA | Housing Development Authority |
| HFA | Health Facilities Authority |
| HFFA | Health Facilities Financing Authority |
| IDA | Industrial Development Authority/Agency |
| IDB | Industrial Development Board |
| ISD | Independent School District |
| JEA | Jacksonville Electric Authority |
| LOC | Letter of Credit |
| MUNIPSA | Securities Industry and Financial Markets Association (SIFMA) Municipal Swap Index |
| Natl-Re | Insured by National Public Finance Guarantee Corp. |
| PSF-GTD | Guaranteed by Permanent School Fund |
| Q-SBLF | Insured by Qualified School Bond Loan Fund |
| SOFR | Secured Overnight Financing Rate |
| SPA | Stand-by Purchase Agreement |
| USD | Unified School District |
| 38 | Thornburg Municipal Funds Semi-Annual Report | See notes to financial statements. |
Thornburg California Limited Term Municipal Fund | March 31, 2023 (Unaudited)
| ISSUER-DESCRIPTION | PRINCIPAL AMOUNT | VALUE | |
| LONG-TERM MUNICIPAL BONDS — 93.8% | |||
| Alameda County Joint Powers Authority (Alameda County Medical Center Highland Hospital), Series A, 5.00% due 12/1/2024 | $2,500,000 | $ 2,541,200 | |
| Apple Valley Public Financing Authority (Insured: BAM), Series A, 4.00% due 6/1/2028 | 460,000 | 492,568 | |
| Bay Area Toll Authority (San Francisco Bay Area Toll Bridge), | |||
| a | Series A, 2.95% due 4/1/2047 (put 4/1/2026) | 4,600,000 | 4,665,628 |
| a | Series E, 4.38% (MUNIPSA + 0.41%) due 4/1/2056 (put 4/1/2028) | 3,500,000 | 3,458,668 |
| a | Series G, 2.00% due 4/1/2053 (put 4/1/2024) | 1,500,000 | 1,493,080 |
| Brentwood Infrastructure Financing Authority (Residential Single Family Development; Insured: AGM), Series A, 5.00% due 9/2/2023 | 2,685,000 | 2,706,491 | |
| California (Children’s Hospital Los Angeles Obligated Group) HFFA, Series A, 5.00% due 8/15/2030 | 2,640,000 | 2,831,286 | |
| California (Kaiser Permanente) HFFA, Series A-1, 5.00% due 11/1/2027 | 3,000,000 | 3,348,123 | |
| a | California (Providence St. Joseph Health Obligated Group) HFFA, Series B, 5.00% due 10/1/2039 (put 10/1/2027) | 300,000 | 324,445 |
| California (St. Joseph Health System) HFFA, Series A, 5.00% due 7/1/2024 | 1,000,000 | 1,003,785 | |
| California (Stanford Health Care Obligated Group) HFFA, | |||
| Series A, | |||
| a | 3.00% due 8/15/2054 (put 8/15/2025) | 3,000,000 | 2,991,222 |
| 5.00% due 11/15/2030 | 1,500,000 | 1,682,737 | |
| a | California Community Choice Financing Authority (Guaranty: Deutsche A.G.) (Green Bond), Series C, 5.25% due 1/1/2054 (put 10/1/2031) | 3,000,000 | 3,066,714 |
| California Community Choice Financing Authority (Guaranty: Goldman Sachs Group, Inc.) (Green Bond), | |||
| a | Series A, 4.00% due 10/1/2052 (put 12/1/2027) | 2,440,000 | 2,458,964 |
| a | Series A-1, 5.00% due 12/1/2053 (put 8/1/2029) | 500,000 | 522,814 |
| California Community Choice Financing Authority (Guaranty: Morgan Stanley Group) (Green Bond), | |||
| a | Series A-1, 4.00% due 5/1/2053 (put 8/1/2028) | 5,000,000 | 4,986,050 |
| Series B-1, | |||
| a | 4.00% due 2/1/2052 (put 8/1/2031) | 4,500,000 | 4,442,013 |
| a | 5.00% due 7/1/2053 (put 8/1/2029) | 2,000,000 | 2,097,236 |
| a,b | California Infrastructure & Economic Development Bank (DesertXpress Enterprises LLC) AMT, Series A, 3.65% due 1/1/2050 (put 1/31/2024) | 1,000,000 | 1,000,046 |
| a | California Infrastructure & Economic Development Bank (J Paul Getty Trust), Series B-2, 3.00% due 10/1/2047 (put 10/1/2026) | 4,065,000 | 4,117,634 |
| California Infrastructure & Economic Development Bank (The Scripps Research Institute), Series A, 5.00% due 7/1/2026 - 7/1/2027 | 450,000 | 486,888 | |
| California Municipal Finance Authority (Biola University Residential Hall and Parking Structure) ETM, 5.00% due 10/1/2023 | 125,000 | 126,508 | |
| California Municipal Finance Authority (Biola University), 5.00% due 10/1/2023 - 10/1/2027 | 2,240,000 | 2,317,470 | |
| California Municipal Finance Authority (Biola University, Inc.), 5.00% due 10/1/2030 | 1,000,000 | 1,064,934 | |
| California Municipal Finance Authority (CHF-Davis II LLC; Insured: BAM), 5.00% due 5/15/2028 | 5,005,000 | 5,453,468 | |
| California Municipal Finance Authority (CHF-Davis II LLC; Insured: BAM) (Green Bond), | |||
| 4.00% due 5/15/2032 | 600,000 | 653,149 | |
| 5.00% due 5/15/2024 - 5/15/2028 | 1,150,000 | 1,238,505 | |
| California Municipal Finance Authority (Congregational Homes, Inc. Obligated Group), | |||
| 2.75% due 11/15/2027 | 520,000 | 473,201 | |
| Series B-2, 2.125% due 11/15/2026 | 615,000 | 570,090 | |
| California Municipal Finance Authority (Palomar Health Obligated Group; Insured: AGM) COP, Series A, 5.00% due 11/1/2027 - 11/1/2032 | 500,000 | 555,965 | |
| a | California Municipal Finance Authority (Republic Services, Inc.) AMT, Series B, 3.60% due 7/1/2051 (put 7/17/2023) | 3,250,000 | 3,227,169 |
| a | California Municipal Finance Authority (Waste Management of California, Inc.; Guaranty: Waste Management Holdings) AMT, 3.95% due 10/1/2045 (put 6/1/2023) | 2,000,000 | 1,999,212 |
| a | California Municipal Finance Authority (Waste Management, Inc.; Guaranty: Waste Management Holdings) AMT, Series A, 4.125% due 10/1/2041 (put 10/1/2025) | 750,000 | 757,762 |
| California Pollution Control Financing Authority (Guaranty: Waste Management, Inc.) AMT, Series A1, 3.375% due 7/1/2025 | 2,000,000 | 1,995,512 | |
| a,b | California Pollution Control Financing Authority (Republic Services, Inc.) AMT, Series A, 3.50% due 8/1/2023 (put 5/1/2023) | 3,000,000 | 3,000,000 |
| a | California Pollution Control Financing Authority (Waste Management, Inc.) AMT, Series A, 2.50% due 7/1/2031 (put 5/1/2024) | 1,125,000 | 1,109,185 |
| California State Public Works Board (Correctional and Rehabilitation Facilities), Series A, 5.00% due 9/1/2023 - 9/1/2024 | 7,180,000 | 7,339,387 | |
| California State Public Works Board (Judicial Council Projects), Series A, 5.00% due 3/1/2024 | 1,000,000 | 1,001,811 | |
| California State Public Works Board (Laboratory Facility and San Diego Courthouse), Series I, 5.00% due 11/1/2023 - 11/1/2024 | 7,000,000 | 7,098,258 | |
| California Statewide Communities Development Authority (CHF-Irvine LLC), | |||
| 5.00% due 5/15/2024 - 5/15/2027 | 2,000,000 | 2,033,867 | |
| Series A, 5.00% due 5/15/2027 | 500,000 | 523,443 | |
| California Statewide Communities Development Authority (CHF-Irvine LLC; Insured: BAM), 5.00% due 5/15/2032 | 2,420,000 | 2,810,143 | |
| California Statewide Communities Development Authority (Cottage Health System), 5.00% due 11/1/2025 (pre-refunded 11/1/2024) | 135,000 | 140,251 | |
| California Statewide Communities Development Authority (Cottage Health System) ETM, 5.00% due 11/1/2023 - 11/1/2024 | 350,000 | 359,333 | |
| a | California Statewide Communities Development Authority (Kaiser Foundation Hospitals), Series 2004-M-R, 5.00% due 4/1/2038 (put 11/1/2029) | 2,800,000 | 3,241,795 |
| California Statewide Communities Development Authority (Methodist Hospital of Southern California Obligated Group), 5.00% due 1/1/2024 - 1/1/2031 | 835,000 | 867,780 | |
| a | California Statewide Communities Development Authority (Southern California Edison Co.), Series D, 2.625% due 11/1/2033 (put 12/1/2023) | 4,895,000 | 4,890,776 |
| Calipatria (Educational Facilities; Insured: ACA) USD GO, Series B, Zero Coupon due 8/1/2025 | 2,145,000 | 1,926,695 | |
| Chino Basin Regional Financing Authority, Series B, 4.00% due 11/1/2025 | 370,000 | 384,594 | |
| Chino Basin Regional Financing Authority (Subordinate-Inland Empire), Series A, 5.00% due 6/1/2028 | 425,000 | 480,688 | |
| City of Antioch Public Financing Authority (Municipal Facilities Project), 5.00% due 5/1/2024 | 900,000 | 924,251 | |
| See notes to financial statements. | Thornburg Municipal Funds Semi-Annual Report | 39 |
Thornburg California Limited Term Municipal Fund | March 31, 2023 (Unaudited)
| ISSUER-DESCRIPTION | PRINCIPAL AMOUNT | VALUE | |
| City of Chula Vista (Police Facility Project) COP, 5.00% due 10/1/2024 | $1,700,000 | $ 1,764,059 | |
| City of Chula Vista Financing Authority (Infrastructure, Facilities and Equipment), 5.00% due 5/1/2026 - 5/1/2027 | 3,500,000 | 3,811,284 | |
| City of Chula Vista Redevelopment Successor Agency (Insured: AGM), 5.00% due 10/1/2032 | 1,070,000 | 1,157,736 | |
| City of Colton Redevelopment Successor Agency (Multiple Redevelopment Project Areas; Insured: BAM), 5.00% due 8/1/2023 - 8/1/2025 | 1,875,000 | 1,930,070 | |
| City of Los Angeles, 4.00% due 6/29/2023 | 5,000,000 | 5,015,045 | |
| City of Los Angeles Department of Airports AMT, | |||
| Series B, 5.00% due 5/15/2030 - 5/15/2032 | 4,600,000 | 5,014,993 | |
| Series C, 5.00% due 5/15/2031 | 400,000 | 430,783 | |
| Series D, 5.00% due 5/15/2029 | 4,000,000 | 4,473,800 | |
| City of Manteca (Water Supply System), 5.00% due 7/1/2023 | 650,000 | 651,162 | |
| City of Menlo Park Community Development Successor Agency (Las Pulgas Community Development Project; Insured: AGM), 5.00% due 10/1/2025 | 600,000 | 633,813 | |
| City of Palmdale Community Redevelopment Successor Agency (Merged Redevelopment Project Areas), Series A, 5.00% due 9/1/2025 - 9/1/2026 | 1,000,000 | 1,070,356 | |
| City of Rialto Redevelopment Agency (Merged Project Area; Insured: BAM), Series A, 5.00% due 9/1/2023 - 9/1/2024 | 1,050,000 | 1,070,061 | |
| City of San Diego Redevelopment Successor Agency (Multiple Redevelopment Project Areas), Series A, 5.00% due 9/1/2026 | 1,500,000 | 1,590,640 | |
| City of San Jose Financing Authority (Civic Center Project), Series A, 5.00% due 6/1/2024 (pre-refunded 6/1/2023) | 750,000 | 752,693 | |
| City of San Jose Financing Authority (Civic Center Project) ETM, Series A, 5.00% due 6/1/2023 | 1,000,000 | 1,003,251 | |
| City of San Mateo (San Mateo Community Facilities District No 2008-1; Insured: BAM), 5.00% due 9/1/2027 - 9/1/2032 | 3,915,000 | 4,388,240 | |
| City of Santee CDC Successor Agency (Redevelopment and Low and Moderate Income Housing; Insured: BAM), Series A, 5.00% due 8/1/2025 | 550,000 | 578,255 | |
| City of Stockton Redevelopment Successor Agency (Redevelopment of Midtown, North and South Stockton and Waterfront Areas; Insured: AGM), Series A, 5.00% due 9/1/2026 - 9/1/2027 | 2,000,000 | 2,162,387 | |
| City of Victorville Electric Revenue, Series A, 5.00% due 5/1/2028 - 5/1/2032 | 1,090,000 | 1,253,458 | |
| Commerce CDC Successor Agency (Multiple Redevelopment Project Areas; Insured: AGM), Series A, 5.00% due 8/1/2027 - 8/1/2030 | 3,315,000 | 3,572,474 | |
| County of Riverside, | |||
| 5.00% due 6/30/2023 | 4,000,000 | 4,021,356 | |
| Series A, 3.70% due 10/19/2023 | 1,000,000 | 1,005,376 | |
| County of Sacramento CA Airport System Revenue AMT, Series C, 5.00% due 7/1/2027 | 1,925,000 | 2,085,776 | |
| County of San Joaquin CA (Insured: AGM) COP, 5.00% due 11/15/2027 | 300,000 | 329,738 | |
| Desert Hot Springs Public Financing Authority (Desert Hot Springs), Series A, 4.00% due 3/1/2032 | 235,000 | 256,629 | |
| Dinuba (CAP APPREC; Insured: AGM) USD GO, Zero Coupon due 8/1/2030 | 460,000 | 362,649 | |
| Downey Public Financing Authority (Public Capital Improvements), 5.00% due 12/1/2025 - 12/1/2027 | 1,445,000 | 1,581,364 | |
| Elk Grove Finance Authority (Poppy Ridge CFD No. 2003-1 and East Franklin CFD No. 2002-1), 5.00% due 9/1/2025 | 750,000 | 782,087 | |
| Emeryville Redevelopment Successor Agency (Emeryville and Shellmound Park Projects; Insured: AGM), Series A, 5.00% due 9/1/2023 - 9/1/2024 | 6,320,000 | 6,462,198 | |
| Guam Power Authority (Electric Power System), Series A, 5.00% due 10/1/2027 | 1,230,000 | 1,301,988 | |
| Guam Waterworks Authority (Water and Wastewater System), 5.00% due 7/1/2023 - 7/1/2027 | 2,085,000 | 2,136,443 | |
| Hacienda La Puente (Educational Facilities; Insured: AGM) USD COP, Series C, 5.00% due 6/1/2024 - 6/1/2025 | 2,180,000 | 2,261,410 | |
| Indian Wells Redevelopment Agency Successor Agency (Insured: Natl-Re), Series A, 5.00% due 9/1/2029 | 500,000 | 542,727 | |
| Indio Finance Authority (Insured: BAM), Series A, 5.00% due 11/1/2028 - 11/1/2032 | 1,815,000 | 2,090,748 | |
| La Quinta Redevelopment Successor Agency (Redevelopment Project Areas No. 1 and 2) ETM, Series A, 5.00% due 9/1/2023 | 1,500,000 | 1,512,270 | |
| Lammersville Joint USD (Insured: BAM), 5.00% due 9/1/2028 - 9/1/2032 | 4,055,000 | 4,759,558 | |
| Lodi Public Financing Authority (Lodi Electric System Revenue; Insured: AGM), 5.00% due 9/1/2031 | 1,405,000 | 1,600,894 | |
| Long Beach Bond Finance Authority (Guaranty: Merrill Lynch & Co), Series A, 5.00% due 11/15/2024 | 5,000,000 | 5,085,420 | |
| Long Beach Community College District (Insured: Natl-Re) GO, Series D, Zero Coupon due 5/1/2023 | 1,000,000 | 998,096 | |
| Los Angeles (Educational Facilities and Information Technology Infrastructure) USD GO, | |||
| Series B, 5.00% due 7/1/2023 | 3,000,000 | 3,017,571 | |
| Series D, 5.00% due 7/1/2024 | 3,000,000 | 3,093,291 | |
| a | Los Angeles County Development Authority (VA Building 402 L.P.), Series F, 3.375% due 1/1/2046 (put 7/1/2026) | 3,250,000 | 3,289,663 |
| Los Angeles County Redevelopment Refunding Authority Successor Agency (Bunker Hill Project), Series C, 5.00% due 6/1/2023 - 6/1/2024 | 1,500,000 | 1,517,549 | |
| Los Angeles County Sanitation Districts Financing Authority (Green Bond), Series A, 5.00% due 10/1/2032 | 625,000 | 777,947 | |
| Los Angeles Department of Water & Power Water System Revenue, Series A, 5.00% due 7/1/2027 | 1,565,000 | 1,748,816 | |
| Los Angeles USD GO, Series A, 5.00% due 7/1/2024 | 4,600,000 | 4,742,899 | |
| Lynwood (Insured: AGM) USD GO, 5.00% due 8/1/2023 | 1,000,000 | 1,007,409 | |
| Manteca Community Facilities District No. 1989-2 (Educational Facilities; Insured: AGM) USD, Series F, 5.00% due 9/1/2023 | 500,000 | 503,977 | |
| Milpitas Redevelopment Successor Agency (Redevelopment Project Area No. 1), 5.00% due 9/1/2025 | 2,300,000 | 2,437,328 | |
| Moreno Valley Public Financing Authority (Public Improvements), 5.00% due 11/1/2024 | 1,455,000 | 1,512,951 | |
| Murrieta Valley Public Financing Authority (Educational Facilities; Insured: BAM) USD GO, 5.00% due 9/1/2023 | 1,080,000 | 1,089,010 | |
| a | Northern California Energy Authority (Commodity Supply Revenue; Guaranty: Goldman Sachs Group, Inc.), Series A, 4.00% due 7/1/2049 (put 7/1/2024) | 7,000,000 | 7,034,510 |
| Oakland (County of Alameda Educational Facilities) USD GO, Series A, 5.00% due 8/1/2023 - 8/1/2025 | 2,000,000 | 2,069,811 | |
| Peralta Community College District GO, | |||
| 5.00% due 8/1/2031 - 8/1/2033 | 2,065,000 | 2,522,161 | |
| Series A, 5.00% due 8/1/2025 | 585,000 | 619,129 | |
| Pittsburg Redevelopment Successor Agency (Insured: AGM), Series A, 5.00% due 9/1/2024 | 2,200,000 | 2,268,266 | |
| Pomona Public Financing Authority (Facilities Improvements; Insured: AGM), Series BC, 4.00% due 6/1/2024 - 6/1/2026 | 725,000 | 741,878 | |
| Poway Redevelopment Successor Agency (Paguay Redevelopment Project), Series A, 5.00% due 6/15/2025 | 4,665,000 | 4,898,824 | |
| 40 | Thornburg Municipal Funds Semi-Annual Report | See notes to financial statements. |
| ISSUER-DESCRIPTION | PRINCIPAL AMOUNT | VALUE | |
| Rancho Cucamonga Redevelopment Project Successor Agency (Rancho Redevelopment Project Area; Insured: AGM), 5.00% due 9/1/2023 - 9/1/2024 | $3,000,000 | $ 3,069,871 | |
| Richmond County Redevelopment Successor Agency (Joint Powers Financing Authority & Harbour Redevelopment Project; Insured: BAM), Series A, 5.00% due 9/1/2023 - 9/1/2024 | 850,000 | 867,315 | |
| Riverside County Public Financing Authority (Capital Facilities Project) ETM, 5.00% due 11/1/2025 | 1,000,000 | 1,061,698 | |
| Riverside County Redevelopment Successor Agency (Insured: BAM), Series B, 5.00% due 10/1/2030 | 750,000 | 793,154 | |
| Riverside Financing Authority (Educational Facilities; Insured: BAM) USD, 5.00% due 9/1/2024 - 9/1/2025 | 1,030,000 | 1,066,168 | |
| Riverside Redevelopment Successor Agency (Multiple Redevelopment Project Areas), Series A, 5.00% due 9/1/2023 - 9/1/2024 | 2,985,000 | 3,044,232 | |
| Rosemead CDC Successor Agency (Rosemead Merged Project Area; Insured: BAM), 5.00% due 10/1/2023 - 10/1/2026 | 2,220,000 | 2,327,018 | |
| Sacramento City Schools Joint Power Financing Authority (Sacramento City USD Educational Facility Sublease; Insured: BAM), Series A, 5.00% due 3/1/2024 - 3/1/2025 | 2,940,000 | 2,995,772 | |
| Sacramento County Sanitation Districts Financing Authority (Sacramento Regional County Sanitation District), | |||
| 5.00% due 12/1/2032 | 575,000 | 711,429 | |
| Series A, 5.00% due 12/1/2031 | 1,250,000 | 1,523,111 | |
| Salinas Valley Solid Waste Authority (Insured: AGM) AMT ETM, Series A, 5.00% due 8/1/2023 | 1,530,000 | 1,539,313 | |
| San Diego (Educational System Capital Projects) USD GO, Series R-3, 5.00% due 7/1/2023 - 7/1/2024 | 8,000,000 | 8,087,780 | |
| San Diego County Regional Airport Authority, Series A, 5.00% due 7/1/2030 - 7/1/2033 | 830,000 | 962,632 | |
| San Diego County Regional Airport Authority AMT, Series C, 5.00% due 7/1/2031 - 7/1/2033 | 2,560,000 | 2,892,420 | |
| San Francisco City & County Airport Comm-San Francisco International Airport AMT, Series A, 5.00% due 5/1/2032 | 3,000,000 | 3,452,169 | |
| San Francisco City & County Airports Commission (San Francisco International Airport), Series A, 5.00% due 5/1/2026 | 5,000,000 | 5,365,295 | |
| San Francisco City & County Airports Commission (San Francisco International Airport) AMT, Series H, 5.00% due 5/1/2028 | 500,000 | 547,321 | |
| San Mateo County Joint Powers Financing Authority (Maple Street Correctional Center), 5.00% due 6/15/2023 | 585,000 | 587,566 | |
| Santa Clara County Financing Authority (Multiple Facilities Projects), Series P, 5.00% due 5/15/2025 | 6,755,000 | 7,123,168 | |
| Santa Margarita Water District (Talega Community Facilities), Series A, 5.00% due 9/1/2026 - 9/1/2027 | 1,050,000 | 1,131,709 | |
| Semitropic Water Storage Improvement District (Irrigation Water System; Insured: AGM), Series A, 5.00% due 12/1/2023 - 12/1/2027 | 2,840,000 | 3,013,570 | |
| Stockton Public Financing Authority (Stockton Water Revenue; Green Bond; Insured: BAM), Series A, 5.00% due 10/1/2023 - 10/1/2027 | 2,630,000 | 2,813,651 | |
| Temecula Valley Financing Authority (Educational Facilities; Insured: BAM) USD, 5.00% due 9/1/2023 - 9/1/2025 | 900,000 | 923,922 | |
| Temecula Valley Financing Authority (Insured: BAM) USD, 5.00% due 9/1/2027 | 2,220,000 | 2,312,965 | |
| Trustees of the California State University (Educational Facilities Improvements), Series A, 5.00% due 11/1/2026 | 1,000,000 | 1,079,627 | |
| Tulare Public Financing Authority (Insured: BAM), 5.00% due 4/1/2023 - 4/1/2028 | 1,410,000 | 1,486,504 | |
| a | University of California, Series AK, 5.00% due 5/15/2048 (put 5/15/2023) | 1,250,000 | 1,252,816 |
| Vallejo City (Insured: BAM) USD GO, 5.00% due 8/1/2032 | 460,000 | 545,492 | |
| Ventura County Public Financing Authority (Office Building Purchase and Improvements), Series B, 5.00% due 11/1/2023 - 11/1/2024 | 1,560,000 | 1,582,380 | |
| Vista Redevelopment Successor Agency (Vista Redevelopment Project; Insured: AGM), Series B1, 5.00% due 9/1/2023 | 400,000 | 403,440 | |
| West Contra Costa (Insured: Natl-Re) USD GO, Series D, Zero Coupon due 8/1/2028 | 160,000 | 137,284 | |
| TOTAL LONG-TERM MUNICIPAL BONDS — 93.8% (Cost $298,965,164) | $300,377,863 | ||
| SHORT-TERM MUNICIPAL BONDS — 3.6% | |||
| a | California Public Finance Authority (Sharp Healthcare Obligated Group; LOC Barclays Bank plc), Series C, 3.45% due 8/1/2052 (put 4/3/2023) | 600,000 | 600,000 |
| Regents of the University of California Medical Center Pooled Revenue, | |||
| a | Series B-1, 3.55% due 5/15/2032 (put 4/3/2023) | 2,055,000 | 2,055,000 |
| a | Series B2, 3.55% due 5/15/2032 (put 4/3/2023) | 2,900,000 | 2,900,000 |
| a | Series K, 3.55% due 5/15/2047 (put 4/3/2023) | 5,950,000 | 5,950,000 |
| TOTAL SHORT-TERM MUNICIPAL BONDS — 3.6% (Cost $11,505,000) | $ 11,505,000 | ||
| Total Investments — 97.4% (Cost $310,470,164) | $311,882,863 | ||
| Other Assets Less Liabilities — 2.6% | 8,355,668 | ||
| Net Assets — 100.0% | $320,238,531 | ||
| Footnote Legend | |
| a | Variable, floating, step, or fixed to floating rate securities are securities for which interest rate changes are based on changes in a designated base rate or on a predetermined schedule. The rates shown are those in effect on March 31, 2023. |
| b | Securities exempt from registration under Rule 144A of the Securities Act of 1933, as amended. These securities are restricted but liquid and may only be resold in the ordinary course of business in transactions exempt from registration, normally to qualified institutional buyers. As of March 31, 2023, the aggregate value of these securities in the Fund’s portfolio was $4,000,046, representing 1.25% of the Fund’s net assets. |
| See notes to financial statements. | Thornburg Municipal Funds Semi-Annual Report | 41 |
Thornburg California Limited Term Municipal Fund | March 31, 2023 (Unaudited)
To simplify the listings of securities, abbreviations are used per the table below:
| ACA | Insured by American Capital Access |
| AGM | Insured by Assured Guaranty Municipal Corp. |
| AMT | Alternative Minimum Tax |
| BAM | Insured by Build America Mutual Insurance Co. |
| CDC | Community Development Commission |
| COP | Certificates of Participation |
| ETM | Escrowed to Maturity |
| GO | General Obligation |
| HFFA | Health Facilities Financing Authority |
| LOC | Letter of Credit |
| MUNIPSA | Securities Industry and Financial Markets Association (SIFMA) Municipal Swap Index |
| Natl-Re | Insured by National Public Finance Guarantee Corp. |
| USD | Unified School District |
| VA | Veterans Affairs |
| 42 | Thornburg Municipal Funds Semi-Annual Report | See notes to financial statements. |
Thornburg New Mexico Intermediate Municipal Fund | March 31, 2023 (Unaudited)
| ISSUER-DESCRIPTION | PRINCIPAL AMOUNT | VALUE | |
| LONG-TERM MUNICIPAL BONDS — 93.7% | |||
| Albuquerque Bernalillo County Water Utility Authority, 5.00% due 7/1/2023 | $ 40,000 | $ 40,226 | |
| Albuquerque Bernalillo County Water Utility Authority (2005 NMFA Loan and Joint Water and Sewer System Improvements), Series A, 5.00% due 7/1/2026 | 2,000,000 | 2,060,362 | |
| Albuquerque Bernalillo County Water Utility Authority (2007 NMFA Loan and Joint Water and Sewer System Improvements), 5.00% due 7/1/2031 - 7/1/2032 | 1,500,000 | 1,585,507 | |
| Albuquerque Municipal School District No. 12 (Bernalillo and Sandoval Counties School Facilities) (State Aid Withholding) GO, | |||
| 5.00% due 8/1/2034 | 1,260,000 | 1,414,298 | |
| Series 2017, 5.00% due 8/1/2031 | 1,000,000 | 1,080,083 | |
| Series A, 4.00% due 8/1/2029 | 1,300,000 | 1,305,026 | |
| Albuquerque Municipal School District No. 12 (State Aid Withholding) GO, | |||
| Series A, | |||
| 4.00% due 8/1/2031 | 300,000 | 324,012 | |
| 5.00% due 8/1/2035 | 500,000 | 575,479 | |
| Bernalillo County (Government Services) GRT, | |||
| 5.25% due 4/1/2027 | 260,000 | 277,555 | |
| Series B, 5.70% due 4/1/2027 | 2,555,000 | 2,781,659 | |
| Bernalillo County (Government Services; Insured: AMBAC) GRT, 5.25% due 10/1/2023 - 10/1/2025 | 5,125,000 | 5,405,483 | |
| Bernalillo County (Government Services; Insured: Natl-Re) GRT, Series B, 5.70% due 4/1/2027 | 695,000 | 755,561 | |
| Bernalillo Municipal School District No. 1 (State Aid Withholding) GO, 4.00% due 8/1/2023 - 8/1/2026 | 340,000 | 345,520 | |
| Carlsbad Municipal School District (Educational Facilities) (State Aid Withholding) ETM GO, 5.00% due 8/1/2023 | 1,650,000 | 1,659,992 | |
| City of Albuquerque (City Infrastructure Improvements) GO, Series A, 5.00% due 7/1/2026 | 870,000 | 939,276 | |
| City of Albuquerque (City Infrastructure Improvements) GRT, | |||
| Series A, | |||
| 4.00% due 7/1/2035 | 2,070,000 | 2,168,741 | |
| 5.00% due 7/1/2025 - 7/1/2034 | 2,500,000 | 2,639,050 | |
| City of Albuquerque (I-25/Paseo del Norte Interchange) GRT, 5.00% due 7/1/2025 - 7/1/2027 (pre-refunded 7/1/2023) | 1,095,000 | 1,100,068 | |
| City of Albuquerque GO, Series B, 5.00% due 7/1/2023 | 2,000,000 | 2,011,190 | |
| City of Albuquerque Refuse Removal & Disposal Revenue, 5.00% due 7/1/2030 - 7/1/2038 | 1,325,000 | 1,478,753 | |
| City of Albuquerque Transportation Infrastructure GRT, 4.00% due 7/1/2031 | 800,000 | 846,516 | |
| City of Las Cruces (Joint Utility System), | |||
| 4.00% due 6/1/2028 | 475,000 | 496,426 | |
| Series A, 4.00% due 6/1/2023 - 6/1/2025 | 1,445,000 | 1,470,771 | |
| City of Roswell (Joint Water and Sewer Improvement; Insured: BAM), 5.00% due 6/1/2026 - 6/1/2036 | 2,050,000 | 2,188,039 | |
| City of Roswell GRT, 4.00% due 8/1/2029 | 260,000 | 275,651 | |
| City of Santa Fe (El Castillo Retirement Residences), 4.50% due 5/15/2027 | 3,275,000 | 3,170,727 | |
| City of Santa Fe (Public Facilities) GRT, | |||
| 5.00% due 6/1/2028 - 6/1/2029 | 1,880,000 | 1,934,273 | |
| Series A, 5.00% due 6/1/2034 - 6/1/2038 | 1,870,000 | 2,064,009 | |
| City of Santa Fe Gasoline Tax GRT, 5.00% due 6/1/2024 - 6/1/2028 | 1,555,000 | 1,667,368 | |
| County of McKinley (Insured: BAM) GRT, 4.00% due 6/1/2043 | 750,000 | 733,616 | |
| County of San Juan (County Capital Improvements) GRT, Series B, 5.00% due 6/15/2028 - 6/15/2030 | 2,645,000 | 2,713,253 | |
| County of Sandoval GO, 5.00% due 8/1/2025 - 8/1/2029 | 2,015,000 | 2,184,046 | |
| County of Santa Fe (County Buildings & Facilities) GRT, Series A, 5.00% due 6/1/2025 - 6/1/2027 | 2,190,000 | 2,304,919 | |
| County of Santa Fe (County Correctional System; Insured: AGM), 6.00% due 2/1/2027 | 775,000 | 832,412 | |
| County of Santa Fe GO, 5.00% due 7/1/2024 | 825,000 | 850,541 | |
| Guam Waterworks Authority (Water and Wastewater System), 5.00% due 7/1/2035 - 7/1/2037 | 2,200,000 | 2,262,403 | |
| a | Hobbs School District No 16 (State Aid Withholding) GO, 5.00% due 9/15/2028 - 9/15/2029 | 1,110,000 | 1,246,422 |
| Las Cruces School District No. 2 (State Aid Withholding) GO, 5.00% due 8/1/2025 - 8/1/2028 | 3,800,000 | 4,130,221 | |
| New Mexico Educational Assistance Foundation AMT, Series 1A, 5.00% due 9/1/2029 | 2,750,000 | 3,093,040 | |
| New Mexico Finance Authority, | |||
| Series A, 5.00% due 6/1/2024 | 550,000 | 565,351 | |
| Series B, 5.00% due 6/1/2032 - 6/1/2033 | 4,125,000 | 4,727,726 | |
| Series D, 5.00% due 6/15/2029 - 6/1/2038 | 2,145,000 | 2,378,251 | |
| New Mexico Finance Authority (State Highway Infrastructure), Series A, 5.00% due 6/15/2026 - 6/15/2027 | 2,415,000 | 2,484,869 | |
| New Mexico Finance Authority (The Public Project Revolving Fund Program), Series A, 5.00% due 6/15/2031 | 1,000,000 | 1,057,573 | |
| New Mexico Hospital Equipment Loan Council (Haverland Carter Lifestyle Obligated Group), | |||
| Series A, 5.00% due 7/1/2033 - 7/1/2034 | 735,000 | 669,301 | |
| Series LA, 5.00% due 7/1/2032 | 575,000 | 530,127 | |
| New Mexico Hospital Equipment Loan Council (Presbyterian Healthcare Services Obligated Group), | |||
| 5.00% due 8/1/2031 (pre-refunded 8/1/2025) | 600,000 | 630,052 | |
| Series A, 5.00% due 8/1/2031 - 8/1/2039 | 3,590,000 | 3,846,724 | |
| New Mexico Hospital Equipment Loan Council (San Juan Regional Medical Center, Inc.), 5.00% due 6/1/2030 - 6/1/2031 | 1,215,000 | 1,327,440 | |
| See notes to financial statements. | Thornburg Municipal Funds Semi-Annual Report | 43 |
Thornburg New Mexico Intermediate Municipal Fund | March 31, 2023 (Unaudited)
| ISSUER-DESCRIPTION | PRINCIPAL AMOUNT | VALUE | |
| New Mexico Institute of Mining and Technology (Campus Buildings Acquisition & Improvements; Insured: AGM), 4.00% due 12/1/2035 - 12/1/2040 | $2,610,000 | $ 2,642,945 | |
| New Mexico Mortgage Finance Authority (Collateralized: GNMA, FNMA, FHLMC), | |||
| Series A, 4.25% due 9/1/2043 | 1,000,000 | 977,459 | |
| Series C, 2.85% due 7/1/2031 | 370,000 | 370,782 | |
| Series F, | |||
| 2.60% due 7/1/2034 | 475,000 | 461,369 | |
| 2.85% due 7/1/2039 | 1,240,000 | 1,217,748 | |
| b | New Mexico Mortgage Finance Authority (JLG Central 217 LLLP), 0.53% due 11/1/2024 (put 5/1/2024) | 500,000 | 487,251 |
| New Mexico Municipal Energy Acquisition Authority (Guaranty: Royal Bank of Canada), Series A, 4.00% due 11/1/2024 | 1,500,000 | 1,507,710 | |
| Regents of New Mexico State University (Campus Buildings Acquisition & Improvements), Series A, 5.00% due 4/1/2032 - 4/1/2036 | 5,935,000 | 6,403,323 | |
| Regents of New Mexico State University (Campus Buildings Acquisition & Improvements; Insured: BAM), Series A, 5.00% due 4/1/2030 | 1,440,000 | 1,587,341 | |
| Regents of the University of New Mexico (Campus Buildings Acquisition & Improvements), Series A, 4.50% due 6/1/2034 - 6/1/2036 | 4,500,000 | 4,702,954 | |
| Rio Rancho Public School District No. 94 (State Aid Withholding) GO, Series A, 5.00% due 8/1/2026 | 1,085,000 | 1,168,261 | |
| Santa Fe Public School District (State Aid Withholding) GO, 5.00% due 8/1/2034 | 350,000 | 405,521 | |
| State of New Mexico Severance Tax Permanent Fund, 5.00% due 7/1/2028 | 465,000 | 525,008 | |
| State of New Mexico Severance Tax Permanent Fund (Educational Facilities), Series A, 5.00% due 7/1/2025 | 2,040,000 | 2,147,186 | |
| Town of Silver City (Insured: BAM) GRT, 5.00% due 6/1/2037 | 610,000 | 662,680 | |
| University of New Mexico (Insured: AGM), 4.375% due 6/1/2043 | 1,005,000 | 1,034,105 | |
| Village of Los Ranchos de Albuquerque (Albuquerque Academy), | |||
| 4.00% due 9/1/2040 | 825,000 | 821,611 | |
| 5.00% due 9/1/2029 - 9/1/2032 | 1,330,000 | 1,491,689 | |
| TOTAL LONG-TERM MUNICIPAL BONDS — 93.7% (Cost $112,294,920) | $111,244,851 | ||
| SHORT-TERM MUNICIPAL BONDS — 5.1% | |||
| b | New Mexico Hospital Equipment Loan Council (Presbyterian Healthcare Services Obligated Group; SPA JP Morgan Chase Bank N.A.), Series B, 3.65% due 8/1/2034 (put 4/3/2023) | 3,900,000 | 3,900,000 |
| b | New Mexico Mortgage Finance Authority (Villas De San Ignacio L.P; LOC Freddie Mac), Series A, 3.85% due 11/1/2043 (put 4/10/2023) | 200,000 | 200,000 |
| University of New Mexico (SPA U.S. Bank N.A.), | |||
| b | Series B, 3.90% due 6/1/2026 (put 4/10/2023) | 1,360,000 | 1,360,000 |
| b | Series C, 3.90% due 6/1/2030 (put 4/10/2023) | 550,000 | 550,000 |
| TOTAL SHORT-TERM MUNICIPAL BONDS — 5.1% (Cost $6,010,000) | $ 6,010,000 | ||
| Total Investments — 98.8% (Cost $118,304,920) | $117,254,851 | ||
| Other Assets Less Liabilities — 1.2% | 1,435,497 | ||
| Net Assets — 100.0% | $118,690,348 | ||
| Footnote Legend | |
| a | When-issued security. |
| b | Variable, floating, step, or fixed to floating rate securities are securities for which interest rate changes are based on changes in a designated base rate or on a predetermined schedule. The rates shown are those in effect on March 31, 2023. |
To simplify the listings of securities, abbreviations are used per the table below:
| AGM | Insured by Assured Guaranty Municipal Corp. |
| AMBAC | Insured by American Municipal Bond Assurance Corp. |
| AMT | Alternative Minimum Tax |
| BAM | Insured by Build America Mutual Insurance Co. |
| ETM | Escrowed to Maturity |
| FHLMC | Collateralized by Federal Home Loan Mortgage Corp. |
| FNMA | Collateralized by Federal National Mortgage Association |
| GNMA | Collateralized by Government National Mortgage Association |
| GO | General Obligation |
| GRT | Gross Receipts Tax |
| LOC | Letter of Credit |
| Natl-Re | Insured by National Public Finance Guarantee Corp. |
| SPA | Stand-by Purchase Agreement |
| 44 | Thornburg Municipal Funds Semi-Annual Report | See notes to financial statements. |
Thornburg New York Intermediate Municipal Fund | March 31, 2023 (Unaudited)
| ISSUER-DESCRIPTION | PRINCIPAL AMOUNT | VALUE | |
| LONG-TERM MUNICIPAL BONDS — 88.3% | |||
| City of Long Beach (Insured: BAM) GO, Series B, 5.25% due 7/15/2042 | $ 500,000 | $ 540,274 | |
| City of New York (City Budget Financial Management) GO, Series G, 5.00% due 8/1/2030 | 1,000,000 | 1,020,937 | |
| City of New York GO, Series F1, 5.00% due 4/1/2037 | 940,000 | 1,019,965 | |
| Erie County Fiscal Stability Authority, Series D, 5.00% due 9/1/2034 | 850,000 | 944,868 | |
| Guam Waterworks Authority (Water and Wastewater System), 5.00% due 7/1/2028 - 7/1/2036 | 1,500,000 | 1,529,304 | |
| Hudson Yards Infrastructure Corp. (Hudson Yards Subway Station), Series A, 5.00% due 2/15/2035 | 1,000,000 | 1,080,996 | |
| Long Island Power Authority (Electric System Capital Improvements; Insured: AGC), Series C, 5.25% due 9/1/2029 | 645,000 | 740,799 | |
| Manchester-Shortsville Central School District (State Aid Withholding) GO, 4.00% due 8/17/2023 | 300,000 | 300,702 | |
| Metropolitan Transportation Authority, Series D-1, 5.00% due 11/15/2031 | 1,000,000 | 1,043,705 | |
| Monroe County (Monroe Community College Association, Inc.; Insured: AGM) IDC, 5.00% due 1/15/2028 - 1/15/2029 | 550,000 | 556,355 | |
| Nassau County Sewer & Storm Water Finance Authority (Sewerage and Storm Water Resource Facilities), Series A, 5.00% due 10/1/2028 - 10/1/2031 | 1,400,000 | 1,455,008 | |
| New York City Transitional Finance Authority Future Tax Secured Revenue, | |||
| Series A, 5.00% due 11/1/2036 | 1,000,000 | 1,131,073 | |
| Series A1, 5.00% due 8/1/2038 | 1,000,000 | 1,082,901 | |
| New York State Dormitory Authority, Series A, 5.00% due 2/15/2032 | 1,000,000 | 1,095,675 | |
| New York State Dormitory Authority (Barnard College), Series A, 5.00% due 7/1/2041 | 250,000 | 267,065 | |
| New York State Dormitory Authority (Insured: AGM) (State Aid Withholding), Series H, 5.00% due 10/1/2024 | 155,000 | 155,261 | |
| New York State Dormitory Authority (Northwell Health Obligated Group), Series A, 5.00% due 5/1/2033 | 100,000 | 111,974 | |
| New York State Dormitory Authority (School District Financing Program) (State Aid Withholding), Series C, 5.00% due 10/1/2023 | 575,000 | 581,060 | |
| New York State Dormitory Authority (School District Financing Program; Insured: AGM) (State Aid Withholding), Series A, 5.00% due 10/1/2028 | 200,000 | 207,117 | |
| New York State Housing Finance Agency (Green Bond), Series I, 2.70% due 11/1/2023 | 1,000,000 | 999,280 | |
| Oneida County Local Development Corp. (Utica College), 5.00% due 7/1/2032 | 500,000 | 533,751 | |
| Port Authority of New York & New Jersey AMT, | |||
| 5.00% due 11/1/2039 | 200,000 | 213,996 | |
| Series 186, 5.00% due 10/15/2037 | 500,000 | 507,633 | |
| Sales Tax Asset Receivable Corp. (New York Local Government Assistance Corp.), Series A, 5.00% due 10/15/2029 - 10/15/2031 (pre-refunded 10/15/2024) | 1,250,000 | 1,296,834 | |
| State of New York Mortgage Agency, Series 223, 2.65% due 10/1/2034 | 450,000 | 396,450 | |
| Tompkins County Development Corp. (Ithaca College Project), 5.00% due 7/1/2034 - 7/1/2037 | 820,000 | 870,615 | |
| Triborough Bridge & Tunnel Authority (MTA Bridges and Tunnels), | |||
| Series A, | |||
| 5.00% due 11/15/2028 (pre-refunded 5/15/2024) | 1,000,000 | 1,026,703 | |
| 5.00% due 11/15/2029 | 1,000,000 | 1,027,707 | |
| Troy Capital Resource Corp. (Rensselaer Polytechnic Institute), Series A, 5.00% due 9/1/2033 - 9/1/2038 | 895,000 | 982,944 | |
| West Seneca Central School District (Facilities Improvements; Insured: BAM) (State Aid Withholding) GO, 5.00% due 11/15/2023 | 1,300,000 | 1,317,828 | |
| Westchester County Local Development Corp. (Miriam Osborn Memorial Home Association Obligated Group), 5.00% due 7/1/2029 - 7/1/2034 | 450,000 | 475,853 | |
| TOTAL LONG-TERM MUNICIPAL BONDS — 88.3% (Cost $24,446,449) | $24,514,633 | ||
| SHORT-TERM MUNICIPAL BONDS — 6.3% | |||
| a | Metropolitan Transportation Authority (LOC Barclays Bank plc), Series E-1, 3.65% due 11/15/2050 (put 4/3/2023) | 1,050,000 | 1,050,000 |
| a | New York City Municipal Water Finance Authority, Series DD, 4.15% due 6/15/2033 (put 4/3/2023) | 700,000 | 700,000 |
| TOTAL SHORT-TERM MUNICIPAL BONDS — 6.3% (Cost $1,750,000) | $ 1,750,000 | ||
| Total Investments — 94.6% (Cost $26,196,449) | $26,264,633 | ||
| Other Assets Less Liabilities — 5.4% | 1,497,655 | ||
| Net Assets — 100.0% | $27,762,288 | ||
| Footnote Legend | |
| a | Variable, floating, step, or fixed to floating rate securities are securities for which interest rate changes are based on changes in a designated base rate or on a predetermined schedule. The rates shown are those in effect on March 31, 2023. |
To simplify the listings of securities, abbreviations are used per the table below:
| AGC | Insured by Assured Guaranty Corp. |
| AGM | Insured by Assured Guaranty Municipal Corp. |
| AMT | Alternative Minimum Tax |
| BAM | Insured by Build America Mutual Insurance Co. |
| GO | General Obligation |
| IDC | Industrial Development Corp. |
| LOC | Letter of Credit |
| See notes to financial statements. | Thornburg Municipal Funds Semi-Annual Report | 45 |
Thornburg Intermediate Municipal Fund | March 31, 2023 (Unaudited)
| ISSUER-DESCRIPTION | Principal Amount | VALUE | |
| LONG-TERM MUNICIPAL BONDS — 95.5% | |||
| Alabama — 2.0% | |||
| Alabama Public School and College Authority (Educational Facilities), Series B, 5.00% due 6/1/2026 (pre-refunded 6/1/2023) | $ 4,380,000 | $ 4,394,506 | |
| Southeast Energy Authority A Cooperative District (Guaranty: Morgan Stanley Group), | |||
| a | Series A, 5.50% due 1/1/2053 (put 12/1/2029) | 6,000,000 | 6,427,008 |
| a | Series B, 4.00% due 12/1/2051 (put 12/1/2031) | 1,220,000 | 1,189,609 |
| UAB Medicine Finance Authority (University Hospital), Series B, 5.00% due 9/1/2032 | 6,000,000 | 6,385,038 | |
| Alaska — 0.1% | |||
| State of Alaska International Airports System AMT, Series C, 5.00% due 10/1/2029 | 750,000 | 827,523 | |
| Arizona — 1.0% | |||
| b | Arizona (Scottsdale Lincoln Hospitals) HFA, Series A, 5.00% due 12/1/2031 | 2,500,000 | 2,587,375 |
| Arizona Board of Regents (University of Arizona SPEED), 5.00% due 8/1/2029 | 1,000,000 | 1,029,423 | |
| Salt River Project Agricultural Improvement and Power District (Salt River Electric System), Series A, 5.00% due 1/1/2036 - 1/1/2037 | 3,000,000 | 3,302,302 | |
| Salt Verde Financial Corp. (Gas Supply Acquisition; Guaranty: Citigroup Global Markets), 5.25% due 12/1/2028 | 770,000 | 817,345 | |
| Yavapai County (Waste Management, Inc.) AMT IDA, 1.30% due 6/1/2027 | 1,750,000 | 1,549,035 | |
| Arkansas — 0.4% | |||
| Board of Trustees of the University of Arkansas (Fayetteville Campus), Series A, 5.00% due 11/1/2031 - 11/1/2034 (pre-refunded 11/1/2024) | 3,655,000 | 3,780,677 | |
| California — 6.0% | |||
| Alameda County Joint Powers Authority (Alameda County Medical Center Highland Hospital), Series A, 5.25% due 12/1/2027 - 12/1/2029 | 3,650,000 | 3,717,289 | |
| California (Adventist Health System/West) HFFA, Series A, 5.00% due 3/1/2026 | 2,815,000 | 2,817,083 | |
| California (Children’s Hospital Los Angeles) HFFA, Series A, 5.00% due 8/15/2032 - 8/15/2033 | 950,000 | 1,013,988 | |
| California Infrastructure and Economic Development Bank (King City Joint Union High School District), 5.75% due 8/15/2029 | 1,500,000 | 1,501,753 | |
| California Municipal Finance Authority (CHF-Davis II LLC; Insured: BAM) (Green Bond), 4.00% due 5/15/2041 | 500,000 | 507,458 | |
| a | California Municipal Finance Authority (Waste Management of California, Inc.; Guaranty: Waste Management Holdings) AMT, 3.95% due 10/1/2045 (put 6/1/2023) | 2,000,000 | 1,999,212 |
| California Pollution Control Financing Authority (Republic Services, Inc.) AMT, | |||
| a,c | Series A, 3.50% due 8/1/2023 (put 5/1/2023) | 4,000,000 | 4,000,000 |
| a,c | Series A2, 3.45% due 11/1/2042 (put 4/17/2023) | 10,000,000 | 10,000,000 |
| a | California Pollution Control Financing Authority (Waste Management, Inc.) AMT, Series A, 2.50% due 11/1/2038 (put 5/1/2024) | 2,000,000 | 1,971,064 |
| City of Los Angeles Department of Airports AMT, | |||
| Series C, 5.00% due 5/15/2033 | 2,000,000 | 2,260,658 | |
| Series D, 5.00% due 5/15/2041 | 4,000,000 | 4,050,660 | |
| City of San Mateo (City of San Mateo Community Facilities District No 2008-1) (Insured: BAM), 5.25% due 9/1/2040 | 5,000,000 | 5,486,190 | |
| Delano Financing Authority (City of Delano Police Station and Woollomes Avenue Bridge), Series A, 5.00% due 12/1/2025 | 1,965,000 | 1,967,814 | |
| Franklin-McKinley School District (Insured: Natl-Re) GO, 5.25% due 8/1/2027 | 1,000,000 | 1,120,656 | |
| Fresno (Educational Facilities and Improvements; Insured: Natl-Re) USD GO, Series A, 6.00% due 8/1/2026 | 810,000 | 855,452 | |
| Jurupa Public Financing Authority (Eastvale Community Services; Insured: AGM), Series A, 5.50% due 9/1/2025 - 9/1/2027 | 2,530,000 | 2,557,898 | |
| M-S-R Energy Authority (Guaranty: Citigroup Global Markets), Series B, 6.125% due 11/1/2029 | 2,225,000 | 2,472,883 | |
| North City West School Facilities Financing Authority (Carmel Valley Schools; Insured: AGM), Series A, 5.00% due 9/1/2024 | 1,080,000 | 1,081,711 | |
| Oakland (County of Alameda Educational Facilities) USD GO, Series A, 5.00% due 8/1/2032 - 8/1/2034 (pre-refunded 8/1/2025) | 3,000,000 | 3,178,292 | |
| Redwood City Redevelopment Successor Agency (Redevelopment Area A-2; Insured: AMBAC), Series 2A, Zero Coupon due 7/15/2023 | 2,065,000 | 2,047,852 | |
| Saratoga Union School District (Insured: Natl-Re) USD GO, Series B, Zero Coupon due 9/1/2023 | 900,000 | 891,047 | |
| Colorado — 1.3% | |||
| Colorado (CommonSpirit Health Obligated Group) HFA, 5.00% due 11/1/2041 | 1,500,000 | 1,578,570 | |
| Colorado School of Mines (Insured: AGM) (Green Bond), Series A, 5.00% due 12/1/2039 - 12/1/2043 | 1,310,000 | 1,445,572 | |
| Denver City & County Housing Authority (Three Towers Rehabilitation; Insured: AGM) AMT, 5.20% due 11/1/2027 | 1,335,000 | 1,336,419 | |
| Regional Transportation District (North Metro Rail Line) COP, Series A, 5.00% due 6/1/2028 (pre-refunded 6/1/2023) | 1,650,000 | 1,655,717 | |
| State of Colorado COP, Series A, 5.00% due 9/1/2029 - 9/1/2032 | 5,205,000 | 5,814,524 | |
| Connecticut — 2.4% | |||
| City of Hartford (Various Public Improvements; Insured: AGM) GO, Series A, 5.00% due 7/1/2031 | 1,700,000 | 1,790,578 | |
| State of Connecticut (Various Capital Projects) GO, Series B, 5.00% due 5/15/2027 | 1,000,000 | 1,080,001 | |
| State of Connecticut GO, | |||
| Series A, 5.00% due 4/15/2033 - 4/15/2035 | 12,415,000 | 13,880,267 | |
| Series C, 5.00% due 6/15/2028 - 6/15/2029 | 1,890,000 | 2,137,617 | |
| Series E, 5.00% due 9/15/2033 | 2,650,000 | 2,986,648 | |
| District of Columbia — 1.6% | |||
| Metropolitan Washington Airports Authority (Dulles Toll Road Revenue; Insured: AGC), Series B, Zero Coupon due 10/1/2023 - 10/1/2024 | 9,890,000 | 9,614,068 | |
| Washington Convention & Sports Authority, Series A, 5.00% due 10/1/2028 | 1,105,000 | 1,219,483 | |
| Washington Metropolitan Area Transit Authority, 5.00% due 7/1/2032 - 7/1/2037 | 3,325,000 | 3,590,084 | |
| Florida — 6.0% | |||
| City of Lakeland (Electric Power System Smart Grid Project), 5.25% due 10/1/2036 | 2,770,000 | 3,469,638 |
| 46 | Thornburg Municipal Funds Semi-Annual Report | See notes to financial statements. |
| ISSUER-DESCRIPTION | Principal Amount | VALUE | |
| City of Lakeland (Electric Power System Smart Grid Project; Insured: AGM), 5.25% due 10/1/2027 | $ 3,680,000 | $ 4,121,964 | |
| City of Orlando (Senior Tourist Development; Insured: AGM), Series A, 5.00% due 11/1/2032 - 11/1/2037 | 3,430,000 | 3,617,374 | |
| County of Broward (Airport System Improvements) AMT, 5.00% due 10/1/2034 - 10/1/2035 | 3,500,000 | 3,707,568 | |
| County of Broward Port Facilities Revenue AMT, 5.00% due 9/1/2037 - 9/1/2041 | 2,050,000 | 2,167,510 | |
| County of Manatee (Public Utilities System Improvements), 5.00% due 10/1/2026 - 10/1/2033 | 6,080,000 | 6,373,809 | |
| County of Miami-Dade (Miami International Airport), Series B, 5.00% due 10/1/2028 - 10/1/2031 | 5,335,000 | 5,506,258 | |
| County of Miami-Dade Aviation Revenue AMT, Series B, 5.00% due 10/1/2040 | 2,500,000 | 2,571,027 | |
| County of Miami-Dade Seaport Department AMT, Series A, 5.00% due 10/1/2041 - 10/1/2042 | 3,050,000 | 3,234,689 | |
| Miami-Dade County (Nicklaus Children’s Hospital) HFA, 5.00% due 8/1/2035 - 8/1/2037 | 2,905,000 | 3,064,541 | |
| Miami-Dade County Educational Facilities Authority (University of Miami; Insured: AMBAC), Series B, 5.25% due 4/1/2024 | 1,000,000 | 1,022,889 | |
| Orange County (Presbyterian Retirement Communities Inc Obligated Group) HFA, 5.00% due 8/1/2040 | 1,000,000 | 1,000,917 | |
| Orange County Convention Center (Tourist Development), Series A, 5.00% due 10/1/2031 | 2,000,000 | 2,162,948 | |
| Palm Beach County (Boca Raton Regional Hospital) HFA, 5.00% due 12/1/2025 (pre-refunded 12/1/2024) | 500,000 | 519,469 | |
| Palm Beach County (Jupiter Medical Center Obligated Group) HFA, Series A, 5.00% due 11/1/2040 - 11/1/2041 | 715,000 | 726,833 | |
| Palm Beach County School District COP, Series C, 5.00% due 8/1/2028 | 595,000 | 670,116 | |
| School Board of Miami-Dade County COP, Series A, 5.00% due 5/1/2030 | 3,250,000 | 3,397,859 | |
| School District of Broward County (Educational Facilities and Equipment) COP, Series B, 5.00% due 7/1/2032 | 2,000,000 | 2,103,586 | |
| b | School District of Manatee County (School Facilities Improvement; Insured: AGM), 5.00% due 10/1/2032 | 2,250,000 | 2,441,353 |
| Sunshine State Governmental Finance Commission (Miami-Dade County Program), Series B-1, 5.00% due 9/1/2028 (pre-refunded 9/1/2023) | 3,500,000 | 3,531,710 | |
| Georgia — 2.2% | |||
| Athens-Clarke County Unified Government Development Authority (UGAREF Bolton Commons LLC), 5.00% due 6/15/2024 - 6/15/2028 | 2,320,000 | 2,330,382 | |
| Main Street Natural Gas, Inc. (Guaranty: Macquarie Group Ltd.), Series A, 5.00% due 5/15/2035 - 5/15/2038 | 11,170,000 | 11,560,704 | |
| a | Main Street Natural Gas, Inc. (Guaranty: Royal Bank of Canada), Series A, 4.00% due 7/1/2052 (put 9/1/2027) | 2,000,000 | 2,008,820 |
| Municipal Electric Authority of Georgia, Series A, 5.00% due 1/1/2034 - 1/1/2038 | 4,370,000 | 4,684,176 | |
| Guam — 0.1% | |||
| Guam Waterworks Authority (Water and Wastewater System), 5.25% due 7/1/2024 | 1,000,000 | 1,002,889 | |
| Hawaii — 0.3% | |||
| State of Hawaii Airports System Revenue AMT, Series A, 5.00% due 7/1/2034 | 2,000,000 | 2,196,830 | |
| Illinois — 16.1% | |||
| Chicago Board of Education Dedicated Capital Improvement Tax, 5.50% due 4/1/2042 - 4/1/2043 | 2,375,000 | 2,558,392 | |
| Chicago O’Hare International Airport (2016 Airport Projects), Series C, 5.00% due 1/1/2029 - 1/1/2030 | 1,765,000 | 1,877,972 | |
| Chicago O’Hare International Airport (2017 Airport Projects), Series B, 5.00% due 1/1/2034 - 1/1/2035 | 9,100,000 | 9,775,120 | |
| Chicago Park District (Capital Improvement Plan) GO, | |||
| Series B, 5.00% due 1/1/2025 | 1,000,000 | 1,014,096 | |
| Series D, 5.00% due 1/1/2028 | 3,450,000 | 3,499,180 | |
| Chicago Park District GO, | |||
| Series A, | |||
| 5.00% due 1/1/2027 - 1/1/2029 | 1,355,000 | 1,374,317 | |
| 5.00% due 1/1/2027 - 1/1/2029 (pre-refunded 1/1/2024) | 2,585,000 | 2,623,217 | |
| Series B, | |||
| 5.00% due 1/1/2030 | 1,215,000 | 1,232,441 | |
| 5.00% due 1/1/2030 (pre-refunded 1/1/2024) | 2,285,000 | 2,318,781 | |
| City of Chicago (Midway Airport), | |||
| Series B, | |||
| 5.00% due 1/1/2032 - 1/1/2033 | 9,805,000 | 9,961,165 | |
| 5.25% due 1/1/2034 | 4,700,000 | 4,708,291 | |
| City of Chicago (Midway Airport) AMT, Series A, 5.00% due 1/1/2034 | 1,365,000 | 1,381,508 | |
| City of Chicago (Wastewater Transmission System), Series C, 5.00% due 1/1/2028 - 1/1/2033 | 8,365,000 | 8,651,156 | |
| City of Chicago (Wastewater Transmission System; Insured: AGM-CR), Series B, 5.00% due 1/1/2034 | 1,375,000 | 1,500,870 | |
| City of Chicago (Water System), | |||
| 5.00% due 11/1/2042 | 6,500,000 | 6,500,962 | |
| Series A-1, 5.00% due 11/1/2024 | 1,000,000 | 1,027,469 | |
| City of Chicago (Water System; Insured: AGM), Series 2017-2, 5.00% due 11/1/2036 - 11/1/2037 | 5,500,000 | 5,792,039 | |
| City of Chicago (Water System; Insured: BHAC-CR AMBAC), 5.75% due 11/1/2030 | 1,230,000 | 1,392,028 | |
| City of Chicago GO, | |||
| Series A, | |||
| 5.625% due 1/1/2031 | 1,585,000 | 1,678,647 | |
| 6.00% due 1/1/2038 | 7,500,000 | 7,980,525 | |
| City of Joliet (Rock Run Crossing Project; Insured: BAM) GO, 5.50% due 12/15/2042 | 2,750,000 | 3,114,576 | |
| County of Cook Sales Tax Revenue, | |||
| 5.00% due 11/15/2038 | 435,000 | 457,885 | |
| Series A, 5.00% due 11/15/2036 - 11/15/2038 | 2,160,000 | 2,350,946 |
| See notes to financial statements. | Thornburg Municipal Funds Semi-Annual Report | 47 |
Thornburg Intermediate Municipal Fund | March 31, 2023 (Unaudited)
| ISSUER-DESCRIPTION | Principal Amount | VALUE | |
| Illinois Finance Authority (Ascension Health Credit Group), | |||
| Series C, | |||
| 4.00% due 2/15/2033 | $ 800,000 | $ 828,358 | |
| 5.00% due 2/15/2041 | 1,000,000 | 1,039,286 | |
| Illinois Finance Authority (Carle Foundation Obligated Group), Series A, 5.00% due 8/15/2034 | 1,700,000 | 1,929,381 | |
| Illinois Finance Authority (Rush University Medical Center), Series A, 5.00% due 11/15/2033 | 1,000,000 | 1,038,724 | |
| Illinois Finance Authority (Silver Cross Hospital and Medical Centers), Series C, 5.00% due 8/15/2024 | 1,000,000 | 1,024,483 | |
| Illinois Toll Highway Authority (Move Illinois Program), Series A, 5.00% due 1/1/2037 | 5,550,000 | 5,781,030 | |
| Knox & Warren Counties Community Unit School District No. 205 Galesburg GO, Series B, 5.00% due 12/1/2031 | 780,000 | 853,497 | |
| Monroe and St. Clair Counties (Community Unit School District No. 5; Insured: BAM) GO, 5.00% due 4/15/2027 - 4/15/2031 | 6,285,000 | 6,661,860 | |
| Regional Transportation Authority (Insured: AGM), Series A, 5.75% due 6/1/2034 | 1,100,000 | 1,348,861 | |
| Sales Tax Securitization Corp., | |||
| Series A, | |||
| 4.00% due 1/1/2038 | 2,000,000 | 1,978,062 | |
| 5.00% due 1/1/2029 - 1/1/2040 | 3,500,000 | 3,764,512 | |
| Sales Tax Securitization Corp. (Insured: BAM-TCRS), Series B, 5.00% due 1/1/2038 | 3,075,000 | 3,249,199 | |
| Southern Illinois University (Insured: BAM), Series A, 5.00% due 4/1/2037 - 4/1/2042 | 2,040,000 | 2,166,274 | |
| State of Illinois GO, | |||
| Series A, 5.00% due 12/1/2034 - 5/1/2040 | 10,810,000 | 11,611,765 | |
| Series D, 5.00% due 11/1/2027 - 11/1/2028 | 4,250,000 | 4,606,689 | |
| State of Illinois Sales Tax Revenue, Series B, 5.00% due 6/15/2030 - 6/15/2031 | 9,280,000 | 10,071,506 | |
| State of Illinois Sales Tax Revenue (Insured: BAM-Natl-Re), Series B, 5.00% due 6/15/2032 | 2,885,000 | 3,128,107 | |
| Tazewell County School District (Insured: Natl-Re) GO Partial ETM, 9.00% due 12/1/2024 | 1,205,000 | 1,324,193 | |
| Will County School District No. 114 Manhattan (Insured: BAM) GO, | |||
| 5.25% due 1/1/2040 - 1/1/2041 | 1,000,000 | 1,127,885 | |
| 5.50% due 1/1/2043 | 2,000,000 | 2,274,574 | |
| Indiana — 3.0% | |||
| Brownsburg 1999 School Building Corp (Brownsburg Community School Corp.; Insured: State Intercept), 5.00% due 1/15/2042 | 1,000,000 | 1,104,343 | |
| a | City of Whiting (BP Products North America, Inc.; Guaranty : BP plc) AMT, 5.00% due 11/1/2047 (put 11/1/2024) | 250,000 | 254,657 |
| Indiana (Ascension Health Credit Group) HFFA, Series A-1, 5.00% due 11/15/2034 - 11/15/2036 | 8,325,000 | 8,735,958 | |
| Indiana Bond Bank (Hendricks Regional Health Financing Program; Insured: AMBAC), Series A, 5.25% due 4/1/2023 | 2,000,000 | 2,000,000 | |
| Indiana Finance Authority (CWA Authority, Inc.), Series A, 5.00% due 10/1/2035 | 500,000 | 586,995 | |
| Indiana Finance Authority (Ohio Valley Electric Corp.), Series A, 4.25% due 11/1/2030 | 8,000,000 | 7,990,032 | |
| Indiana Finance Authority (Reid Hospital & Health Care Services, Inc. Obligated Group; Insured: AGM), 5.00% due 1/1/2041 - 1/1/2042 | 2,000,000 | 2,196,989 | |
| Indiana Municipal Power Agency, Series C, 5.00% due 1/1/2036 | 1,000,000 | 1,060,456 | |
| IPS Multi-School Building Corp. (Indianapolis Board of School Commissioners; Insured: State Intercept), 5.50% due 7/15/2042 | 1,000,000 | 1,126,509 | |
| Mount Vernon of Hancock County Multi-School Building Corp. (Insured: State Intercept), 5.50% due 1/15/2042 | 1,000,000 | 1,131,571 | |
| Noblesville Redevelopment Authority, 5.50% due 7/15/2041 | 1,000,000 | ��1,130,177 | |
| Iowa — 1.1% | |||
| Iowa Finance Authority (UnityPoint Health), Series C, 5.00% due 2/15/2030 - 2/15/2032 | 4,100,000 | 4,174,247 | |
| a | PEFA, Inc. (Guaranty: Goldman Sachs Group, Inc.), 5.00% due 9/1/2049 (put 9/1/2026) | 5,350,000 | 5,454,983 |
| Kentucky — 2.2% | |||
| Kentucky (Baptist Healthcare System Obligated Group) EDFA, Series B, 5.00% due 8/15/2041 | 5,000,000 | 5,170,495 | |
| Kentucky Public Energy Authority (Guaranty: Morgan Stanley Group), | |||
| a | Series A, 4.00% due 4/1/2048 (put 4/1/2024) | 6,500,000 | 6,500,832 |
| a | Series C, 4.00% due 2/1/2050 (put 2/1/2028) | 2,000,000 | 1,973,096 |
| Kentucky State Property & Building Commission, | |||
| Series A, | |||
| 4.00% due 11/1/2035 | 1,000,000 | 1,024,526 | |
| 5.25% due 6/1/2039 | 3,000,000 | 3,367,749 | |
| Louisville/Jefferson County Metropolitan Government (Norton Suburban Hospital and Kosair Children’s Hospital), Series A, 5.25% due 10/1/2026 | 2,320,000 | 2,343,460 | |
| Louisiana — 2.2% | |||
| East Baton Rouge Sewerage Commission, Series B, 5.00% due 2/1/2030 - 2/1/2032 (pre-refunded 2/1/2025) | 6,825,000 | 7,107,652 | |
| Jefferson Sales Tax District (Insured: AGM), Series B, 5.00% due 12/1/2034 | 1,000,000 | 1,082,955 | |
| Louisiana Energy and Power Authority (LEPA Unit No. 1; Insured: AGM), Series A, 5.25% due 6/1/2029 - 6/1/2031 (pre-refunded 6/1/2023) | 6,100,000 | 6,122,845 | |
| Louisiana Public Facilities Authority (Ochsner Clinic Foundation Obligated Group), Series A, 5.00% due 5/15/2035 - 5/15/2037 | 1,925,000 | 2,086,853 | |
| Parish of Lafourche (Roads, Highways and Bridges), 5.00% due 1/1/2024 - 1/1/2025 | 3,685,000 | 3,795,873 | |
| Massachusetts — 1.6% | |||
| Massachusetts (CareGroup Healthcare System) DFA, Series I, 5.00% due 7/1/2036 | 1,750,000 | 1,849,841 | |
| Massachusetts (Insured: BHAC-CR FGIC), 5.50% due 1/1/2029 | 8,370,000 | 9,564,039 | |
| Massachusetts (Simmons College) DFA, Series J, 5.50% due 10/1/2025 - 10/1/2028 | 1,790,000 | 1,805,534 | |
| Massachusetts Bay Transportation Authority Assessment Revenue (Transportation Capital Program), Series A, 5.25% due 7/1/2030 | 1,000,000 | 1,194,457 |
| 48 | Thornburg Municipal Funds Semi-Annual Report | See notes to financial statements. |
| ISSUER-DESCRIPTION | Principal Amount | VALUE | |
| Michigan — 2.2% | |||
| Board of Governors of Wayne State University (Educational Facilities and Equipment), Series A, 5.00% due 11/15/2031 | $ 1,010,000 | $ 1,043,658 | |
| County of Genesee (Water Supply System; Insured: BAM) GO, | |||
| 5.00% due 11/1/2024 - 11/1/2030 | 3,360,000 | 3,365,398 | |
| 5.125% due 11/1/2032 | 750,000 | 751,295 | |
| 5.25% due 11/1/2026 - 11/1/2028 | 2,920,000 | 2,925,210 | |
| Detroit City School District (School Building & Site Improvement; Insured: AGM Q-SBLF) GO, Series A, 5.25% due 5/1/2026 | 3,150,000 | 3,406,067 | |
| b | Detroit City School District (School Building & Site; Insured: AGM Q-SBLF) GO, Series A, 5.25% due 5/1/2027 | 1,100,000 | 1,219,459 |
| Kalamazoo Hospital Finance Authority (Bronson Healthcare), Series A, 5.25% due 5/15/2026 | 145,000 | 145,174 | |
| Michigan Finance Authority (BHSH System Obligated Group), Series A, 5.00% due 4/15/2036 | 2,000,000 | 2,268,116 | |
| Michigan Finance Authority (Government Loan Program), Series F, 5.00% due 4/1/2026 | 1,000,000 | 1,001,661 | |
| Michigan State Housing Development Authority, Series B, 2.95% due 12/1/2039 | 5,000,000 | 4,287,820 | |
| Minnesota — 0.1% | |||
| Minnesota Higher Education Facilities Authority, (University of St. Thomas), 5.00% due 10/1/2034 - 10/1/2035 | 600,000 | 662,760 | |
| Mississippi — 0.7% | |||
| Mississippi Development Bank (Jackson Public School District; Insured: BAM), 5.25% due 10/1/2037 - 10/1/2038 | 5,250,000 | 5,687,201 | |
| Mississippi Development Bank (Vicksburg Warren School District; Insured: BAM), 5.50% due 3/1/2038 | 700,000 | 784,674 | |
| Nebraska — 0.1% | |||
| Central Plains Energy Project (Guaranty: Goldman Sachs Group, Inc.), Series A, 5.00% due 9/1/2031 | 1,000,000 | 1,075,540 | |
| Nevada — 0.1% | |||
| Carson City (Carson Tahoe Regional Healthcare), Series A, 5.00% due 9/1/2032 | 730,000 | 770,439 | |
| New Hampshire — 0.2% | |||
| New Hampshire Municipal Bond Bank (Insured: State Intercept), Series C, 5.00% due 8/15/2026 (pre-refunded 8/15/2023) | 1,860,000 | 1,875,207 | |
| New Jersey — 4.9% | |||
| Essex County Improvement Authority (County Correctional Facilities & Gibraltar Facilities; Insured: Natl-Re) GO, 5.50% due 10/1/2024 | 2,500,000 | 2,607,000 | |
| New Jersey (New Jersey Transit Corp.) EDA, Series A, 5.25% due 11/1/2042 | 4,000,000 | 4,377,560 | |
| New Jersey (School Facilities Construction) EDA, | |||
| 5.00% due 6/15/2035 - 6/15/2038 | 4,515,000 | 4,897,134 | |
| Series NN, 5.00% due 3/1/2026 | 2,000,000 | 2,001,726 | |
| New Jersey (School Facilities Construction; Insured: AMBAC) EDA, Series N-1, 5.50% due 9/1/2026 | 3,000,000 | 3,245,814 | |
| New Jersey (School Facilities Construction; Insured: Natl-Re) EDA, Series N-1, 5.50% due 9/1/2027 | 1,700,000 | 1,879,812 | |
| New Jersey Health Care Facilities Financing Authority, 5.00% due 7/1/2027 - 7/1/2028 (pre-refunded 1/1/2024) | 185,000 | 188,152 | |
| New Jersey Health Care Facilities Financing Authority (Virtua Health Obligated Group), 5.00% due 7/1/2027 - 7/1/2028 | 2,815,000 | 2,861,102 | |
| New Jersey Transportation Trust Fund Authority, | |||
| Series A, 5.00% due 12/15/2032 - 12/15/2035 | 5,300,000 | 5,710,074 | |
| Series AA, | |||
| 5.00% due 6/15/2035 - 6/15/2040 | 1,800,000 | 1,958,835 | |
| 5.25% due 6/15/2043 | 1,600,000 | 1,695,010 | |
| Series BB-1 5.00% due 6/15/2034 | 2,000,000 | 2,172,784 | |
| New Jersey Transportation Trust Fund Authority (State Transportation System Improvements), | |||
| 5.00% due 6/15/2023 - 6/15/2024 | 2,500,000 | 2,531,457 | |
| Series A, 5.00% due 6/15/2031 | 1,000,000 | 1,058,735 | |
| New Jersey Transportation Trust Fund Authority (Transportation Program Bonds), | |||
| Series AA, 5.00% due 6/15/2038 | 3,500,000 | 3,719,320 | |
| Series CC, 5.00% due 6/15/2042 | 3,750,000 | 4,033,541 | |
| New Jersey Transportation Trust Fund Authority (Transportation System), Series A, 5.00% due 12/15/2034 | 500,000 | 541,703 | |
| New Mexico — 0.2% | |||
| New Mexico Hospital Equipment Loan Council (Presbyterian Healthcare Services Obligated Group), Series A, 5.00% due 8/1/2036 - 8/1/2037 | 1,955,000 | 2,096,250 | |
| New York — 6.8% | |||
| Build NYC Resource Corp. (Kipp NYC Public Charter Schools), 5.00% due 7/1/2042 | 2,300,000 | 2,401,386 | |
| City of Long Beach (Insured: BAM) GO, Series B, 5.25% due 7/15/2042 | 1,000,000 | 1,080,549 | |
| City of New York (City Budget Financial Management) GO, | |||
| Series G, 5.00% due 8/1/2027 | 4,530,000 | 4,623,739 | |
| Series J, 5.00% due 8/1/2030 - 8/1/2031 | 9,000,000 | 9,307,467 | |
| City of New York GO, | |||
| Series A, 5.00% due 8/1/2039 | 1,000,000 | 1,096,031 | |
| Series D, 5.25% due 5/1/2040 - 5/1/2041 | 2,500,000 | 2,848,774 | |
| Erie County (City of Buffalo School District) (State Aid Withholding) IDA, Series A, 5.00% due 5/1/2027 | 5,000,000 | 5,009,215 | |
| Metropolitan Transportation Authority, | |||
| Series D, 5.00% due 11/15/2030 - 11/15/2035 | 8,295,000 | 8,785,180 | |
| Series D-1, 5.00% due 11/15/2031 | 2,285,000 | 2,384,866 | |
| Metropolitan Transportation Authority (Green Bond), |
| See notes to financial statements. | Thornburg Municipal Funds Semi-Annual Report | 49 |
Thornburg Intermediate Municipal Fund | March 31, 2023 (Unaudited)
| ISSUER-DESCRIPTION | Principal Amount | VALUE | |
| Series A1, 5.00% due 11/15/2035 - 11/15/2036 | $ 1,820,000 | $ 1,890,778 | |
| Series A2, 5.00% due 11/15/2025 | 600,000 | 628,079 | |
| New York City Transitional Finance Authority Future Tax Secured Revenue, | |||
| Series A2, 5.00% due 5/1/2039 | 1,000,000 | 1,090,582 | |
| Series A-3 4.00% due 8/1/2042 | 2,500,000 | 2,512,265 | |
| Series F1, 5.00% due 2/1/2037 | 200,000 | 229,215 | |
| New York State Dormitory Authority (Cornell University) (Green Bond), Series D, 5.00% due 7/1/2036 | 500,000 | 613,962 | |
| New York State Dormitory Authority (Insured: BAM), Series A, 5.00% due 10/1/2042 | 5,000,000 | 5,506,980 | |
| New York State Dormitory Authority (State Aid Withholding), Series A, 5.00% due 10/1/2033 | 100,000 | 109,469 | |
| New York State Dormitory Authority (State of New York Sales Tax Revenue), Series A, 5.00% due 3/15/2033 | 500,000 | 541,942 | |
| New York State Thruway Authority, Series N, 5.00% due 1/1/2035 | 250,000 | 282,727 | |
| New York State Thruway Authority (State of New York Personal Income Tax Revenue), 5.00% due 3/15/2041 | 1,500,000 | 1,689,525 | |
| New York State Urban Development Corp. (State of New York Personal Income Tax Revenue), Series A, 5.00% due 3/15/2042 | 2,500,000 | 2,800,955 | |
| Port Authority of New York & New Jersey AMT, | |||
| Series 186, 5.00% due 10/15/2037 | 3,000,000 | 3,045,795 | |
| Series 223, 5.00% due 7/15/2033 | 750,000 | 843,208 | |
| State of New York Mortgage Agency (Insured: SONYMA) AMT, Series 248, 4.05% due 10/1/2031 | 2,035,000 | 2,020,667 | |
| Triborough Bridge & Tunnel Authority, Series D, 5.00% due 11/15/2033 | 250,000 | 292,761 | |
| Western Nassau County Water Authority (Green Bond), Series A, 4.00% due 4/1/2040 - 4/1/2041 | 475,000 | 484,722 | |
| Yonkers (New Community School Project) (State Aid Withholding) IDA, 4.00% due 5/1/2041 | 250,000 | 250,529 | |
| North Carolina — 0.7% | |||
| Charlotte-Mecklenburg Hospital Authority (Carolinas HealthCare System), Series A, 5.00% due 1/15/2028 | 2,190,000 | 2,193,738 | |
| North Carolina Medical Care Commission (Plantation Village Obligated Group), Series A, 4.00% due 1/1/2041 | 1,020,000 | 839,199 | |
| North Carolina Medical Care Commission (Vidant Health), 5.00% due 6/1/2030 (pre-refunded 6/1/2025) | 3,000,000 | 3,158,619 | |
| Ohio — 3.7% | |||
| Cincinnati City School District (School Improvement Project) COP, 5.00% due 12/15/2031 (pre-refunded 12/15/2024) | 3,075,000 | 3,197,782 | |
| City of Cleveland (Bridges and Roadways), Series A-2, 5.00% due 10/1/2028 - 10/1/2029 (pre-refunded 10/1/2023) | 2,520,000 | 2,547,798 | |
| City of Cleveland (Public Facilities Improvements), Series A-1, 5.00% due 11/15/2027 - 11/15/2030 (pre-refunded 11/15/2023) | 5,185,000 | 5,256,626 | |
| City of Cleveland (Various Municipal Capital Improvements) GO, 5.00% due 12/1/2024 | 1,000,000 | 1,001,696 | |
| City of Cleveland GO, 5.00% due 12/1/2026 | 15,000 | 15,026 | |
| City of Cleveland Income Tax Revenue, Series A, 5.00% due 10/1/2033 - 10/1/2035 | 1,450,000 | 1,600,138 | |
| Cleveland-Cuyahoga County Port Authority (County Administration Offices), 5.00% due 7/1/2025 | 1,780,000 | 1,871,818 | |
| County of Cuyahoga (Musical Arts Association), 5.00% due 1/1/2033 - 1/1/2039 | 2,350,000 | 2,567,444 | |
| County of Hamilton (Cincinnati Children’s Hospital Medical Center), 5.00% due 5/15/2028 - 5/15/2031 | 8,085,000 | 8,254,694 | |
| Greene County Vocational School District (School Facilities Construction and Improvement) GO, 5.00% due 12/1/2030 - 12/1/2033 | 2,580,000 | 2,887,843 | |
| Northeast Ohio Medical University (Insured: BAM), | |||
| 5.00% due 12/1/2038 - 12/1/2041 | 2,420,000 | 2,637,364 | |
| Series B, 4.00% due 12/1/2042 | 1,310,000 | 1,249,960 | |
| Ohio Higher Educational Facility Commission (Ashtabula County Medical Center Obligated Group), 5.25% due 1/1/2037 | 840,000 | 901,664 | |
| Oklahoma — 0.9% | |||
| Clinton Public Works Authority, 5.00% due 10/1/2039 | 3,335,000 | 3,623,274 | |
| Oklahoma County Finance Authority (Oklahoma County ISD No 4 Choctaw-Nicoma Park), 4.00% due 9/1/2038 | 5,000,000 | 4,911,305 | |
| Oregon — 0.3% | |||
| a | County of Gilliam (Guaranty: Waste Management, Inc.) AMT, 3.00% due 7/1/2038 (put 5/1/2023) | 3,000,000 | 2,999,238 |
| Pennsylvania — 8.9% | |||
| Allegheny County Hospital Development Authority (University of Pittsburgh Medical Center), Series A, 5.00% due 7/15/2034 | 1,150,000 | 1,262,372 | |
| City of Philadelphia (Pennsylvania Gas Works), | |||
| Series 13, 5.00% due 8/1/2032 - 8/1/2034 | 2,300,000 | 2,405,801 | |
| Series 14, 5.00% due 10/1/2034 | 500,000 | 531,885 | |
| City of Philadelphia (Philadelphia Gas Works), Series 15, 5.00% due 8/1/2036 - 8/1/2042 | 7,985,000 | 8,398,082 | |
| City of Philadelphia (Water and Wastewater System), Series A, 5.00% due 10/1/2029 | 1,100,000 | 1,190,258 | |
| City of Philadelphia Airport Revenue (Insured: AGM) AMT, 4.00% due 7/1/2038 - 7/1/2041 | 3,410,000 | 3,297,607 | |
| City of Philadelphia Airport Revenue AMT, | |||
| Series B, 5.00% due 7/1/2030 - 7/1/2037 | 3,175,000 | 3,339,067 | |
| Series C, 5.00% due 7/1/2032 | 1,380,000 | 1,510,577 | |
| City of Pittsburgh (Capital Projects) GO, 5.00% due 9/1/2035 - 9/1/2036 | 1,215,000 | 1,315,600 | |
| County of Luzerne (Insured: AGM) GO, Series A, 5.00% due 11/15/2029 | 3,000,000 | 3,162,915 | |
| Lancaster County Hospital Authority (Penn State Health Obligated Group), 5.00% due 11/1/2041 | 2,000,000 | 2,093,754 | |
| Lancaster County Solid Waste Management Authority (Acquisition of Susquehanna Resource Management Facility), Series A, 5.25% due 12/15/2030 (pre-refunded 12/15/2023) | 3,000,000 | 3,050,709 | |
| Monroeville Financing Authority (University of Pittsburgh Medical Center), 5.00% due 2/15/2026 | 3,490,000 | 3,700,307 | |
| a,d | Montgomery County (Constellation Energy Generation LLC) IDA AMT, Series C, 4.45% due 10/1/2034 (put 4/3/2028) | 1,000,000 | 1,004,364 |
| 50 | Thornburg Municipal Funds Semi-Annual Report | See notes to financial statements. |
| ISSUER-DESCRIPTION | Principal Amount | VALUE | |
| Pennsylvania (Pennsylvania Department of Transportation) EDFA AMT, 5.50% due 6/30/2043 | $ 6,000,000 | $ 6,457,614 | |
| Pennsylvania (UPMC Obligated Group) EDFA, Series A, 5.00% due 2/15/2036 | 1,000,000 | 1,105,641 | |
| Pennsylvania State Public School Building Authority (Philadelphia School District; Insured: AGM) (State Aid Withholding), Series B, 5.00% due 6/1/2027 | 5,000,000 | 5,476,515 | |
| Pennsylvania Turnpike Commission (Highway Improvements), Series A-1, 5.00% due 12/1/2035 - 12/1/2036 | 1,750,000 | 1,887,426 | |
| Philadelphia Authority for Industrial Development (Thomas Jefferson University), Series A, 5.00% due 9/1/2032 - 9/1/2034 | 5,000,000 | 5,342,341 | |
| Philadelphia Municipal Authority (Juvenile Justice Services Center), 5.00% due 4/1/2032 - 4/1/2036 | 11,125,000 | 11,989,952 | |
| Pittsburgh Water & Sewer Authority (Water and Sewer System; Insured: AGM), | |||
| Series A, 5.00% due 9/1/2030 - 9/1/2031 | 8,740,000 | 8,796,878 | |
| Series B, 5.00% due 9/1/2031 (pre-refunded 9/1/2023) | 3,665,000 | 3,697,120 | |
| School District of Philadelphia (State Aid Witholding) GO, Series A, 4.00% due 9/1/2041 | 1,000,000 | 964,025 | |
| Rhode Island — 0.4% | |||
| State of Rhode Island and Providence Plantations (Training School Project) COP, Series B, 5.00% due 10/1/2024 | 3,595,000 | 3,631,241 | |
| South Carolina — 0.7% | |||
| City of Myrtle Beach (Municipal Sports Complex), Series B, 5.00% due 6/1/2028 - 6/1/2030 | 2,000,000 | 2,050,595 | |
| County of Richland (International Paper Co.) ETM AMT, Series A, 3.875% due 4/1/2023 | 2,000,000 | 2,000,000 | |
| a | South Carolina Jobs-EDA (Guaranty: International Paper Co.) AMT, Series A, 4.00% due 4/1/2033 (put 4/1/2026) | 2,000,000 | 2,006,158 |
| South Dakota — 0.2% | |||
| South Dakota Health and Educational Facilities Authority (Sanford Health), 5.00% due 11/1/2028 - 11/1/2029 | 1,800,000 | 1,895,127 | |
| Tennessee — 1.8% | |||
| Memphis-Shelby County Airport Authority AMT, Series A, 5.00% due 7/1/2026 - 7/1/2033 | 2,320,000 | 2,521,631 | |
| Metropolitan Government of Nashville and Davidson County (Green Projects), Series B, 5.00% due 7/1/2033 - 7/1/2036 | 3,000,000 | 3,285,411 | |
| Shelby County Health Educational & Housing Facilities Board (Methodist Le Bonheur Healthcare), Series A, 5.00% due 5/1/2027 - 5/1/2035 | 3,560,000 | 3,787,616 | |
| Tennessee Energy Acquisition Corp. (The Gas Project; Guaranty: Goldman Sachs Group, Inc.), Series A, 5.25% due 9/1/2023 | 7,000,000 | 7,030,170 | |
| Texas — 9.3% | |||
| City of Austin Airport System Revenue AMT, 5.00% due 11/15/2035 - 11/15/2038 | 2,500,000 | 2,753,521 | |
| City of Dallas (Public Improvements) GO, 5.00% due 2/15/2025 - 2/15/2034 | 9,720,000 | 10,156,545 | |
| City of Dallas (Trinity River Corridor Infrastructure) GO, 5.00% due 2/15/2028 | 1,000,000 | 1,020,355 | |
| City of Galveston (Galveston Island Convention Center; Insured: AGM), Series B, 5.00% due 9/1/2024 | 1,115,000 | 1,116,594 | |
| City of Houston (Public Improvements) GO, Series A, 5.00% due 3/1/2027 | 1,175,000 | 1,259,479 | |
| City of Houston Airport System Revenue AMT, | |||
| Series A, | |||
| 4.00% due 7/1/2041 | 1,310,000 | 1,277,177 | |
| 5.00% due 7/1/2033 - 7/1/2041 | 2,500,000 | 2,676,109 | |
| City of McAllen (International Toll Bridge Revenue; Insured: AGM), Series A, 5.00% due 3/1/2028 - 3/1/2032 | 6,120,000 | 6,489,232 | |
| City of McKinney Waterworks & Sewer System Revenue, 5.00% due 3/15/2041 - 3/15/2042 | 900,000 | 1,002,535 | |
| City of New Braunfels Utility System Revenue, 5.00% due 7/1/2042 | 1,750,000 | 1,965,843 | |
| City of San Antonio (Airport System Capital Improvements) AMT, 5.00% due 7/1/2024 - 7/1/2025 | 3,225,000 | 3,229,202 | |
| City of San Antonio (Public Facilities Corp.), 5.00% due 9/15/2040 | 2,000,000 | 2,228,680 | |
| City of San Antonio (Water System), Series A, 5.00% due 5/15/2033 - 5/15/2037 | 3,575,000 | 3,861,398 | |
| County of Bexar GO, 4.00% due 6/15/2036 | 1,000,000 | 1,007,534 | |
| Dallas Area Rapid Transit, Series A, 5.00% due 12/1/2035 - 12/1/2036 (pre-refunded 12/1/2025) | 7,200,000 | 7,664,681 | |
| Greater Texas Cultural Education Facilities Finance Corp. (County of Fort Bend), Series A, 5.00% due 3/1/2034 | 1,185,000 | 1,363,580 | |
| Harris County Cultural Education Facilities Finance Corp. (Memorial Hermann Health System), | |||
| 5.00% due 7/1/2040 | 5,000,000 | 5,175,430 | |
| Series A, 5.00% due 12/1/2028 | 3,000,000 | 3,123,546 | |
| Harris County Cultural Education Facilities Finance Corp. (TECO Project), 5.00% due 11/15/2033 | 1,250,000 | 1,365,365 | |
| Harris County Cultural Education Facilities Finance Corp. (Texas Medical Center), Series A, 5.00% due 5/15/2029 | 2,100,000 | 2,344,629 | |
| Lower Colorado River Authority (LCRA Transmission Services Corp.), | |||
| 5.00% due 5/15/2039 | 500,000 | 544,894 | |
| Series A, 5.25% due 5/15/2042 | 1,410,000 | 1,574,359 | |
| Metropolitan Transit Authority of Harris County, 5.00% due 11/1/2029 - 11/1/2030 | 4,130,000 | 4,689,591 | |
| Newark Higher Education Finance Corp. (Hughen Center, Inc.; Insured: PSF-GTD), Series A, 5.00% due 8/15/2042 | 600,000 | 658,006 | |
| North Texas Tollway Authority (NTTA System), Series A, 5.00% due 1/1/2037 | 1,750,000 | 1,853,484 | |
| Stephen F Austin State University (Financing System), Series A, 5.00% due 10/15/2030 - 10/15/2033 | 1,265,000 | 1,411,643 | |
| Tarrant County Cultural Education Facilities Finance Corp. (CHRISTUS Health Obligated Group), Series B, 5.00% due 7/1/2036 | 1,185,000 | 1,267,057 | |
| Tarrant County Cultural Education Facilities Finance Corp. (Methodist Hospitals of Dallas Obligated Group), 5.00% due 10/1/2040 | 3,520,000 | 3,846,783 | |
| Texas Municipal Gas Acquisition & Supply Corp. III (Guaranty: Macquarie Group Ltd.), 5.00% due 12/15/2029 | 1,000,000 | 1,041,286 | |
| Texas State Technical College (Insured: AGM), Series A, 5.50% due 8/1/2042 | 2,000,000 | 2,296,252 | |
| Texas Transportation Commission (Central Texas Turnpike System), Series C, 5.00% due 8/15/2024 - 8/15/2034 | 5,250,000 | 5,364,322 | |
| Utah — 0.1% | |||
| Utah Telecommunication Open Infrastructure Agency, 5.50% due 6/1/2040 | 500,000 | 574,864 |
| See notes to financial statements. | Thornburg Municipal Funds Semi-Annual Report | 51 |
Thornburg Intermediate Municipal Fund | March 31, 2023 (Unaudited)
| ISSUER-DESCRIPTION | Principal Amount | VALUE | |
| Virginia — 0.4% | |||
| a | Virginia Small Business Financing Authority (Pure Salmon Virginia LLC) AMT, 3.50% due 11/1/2052 (put 11/1/2023) | $ 4,000,000 | $ 4,005,916 |
| Washington — 2.3% | |||
| Clark County Public Utility District No. 1, 5.00% due 1/1/2040 - 1/1/2041 | 1,000,000 | 1,121,194 | |
| King County Public Hospital District No. 2 (EvergreenHealth Medical Center) GO, 5.00% due 12/1/2028 - 12/1/2030 (pre-refunded 12/1/2024) | 4,545,000 | 4,723,732 | |
| State of Washington (Acquisition and Improvements of Real and Personal Property) COP, Series A, 5.00% due 7/1/2030 | 4,415,000 | 4,871,511 | |
| State of Washington (Various Purposes) GO, Series C, 5.00% due 2/1/2036 - 2/1/2037 | 7,425,000 | 8,286,056 | |
| State of Washington GO, Series 2021A, 5.00% due 6/1/2040 | 2,225,000 | 2,479,200 | |
| Wisconsin — 0.9% | |||
| Public Finance Authority, Series A, 4.00% due 10/1/2035 - 10/1/2041 | 1,225,000 | 1,071,339 | |
| d | Racine (Insured: AGM) USD GO, 5.00% due 4/1/2039 - 4/1/2042 | 3,850,000 | 4,188,626 |
| WPPI Energy, Series A, 5.00% due 7/1/2029 - 7/1/2036 | 2,980,000 | 3,315,807 | |
| Total Long-Term Municipal Bonds — 95.5% (Cost $864,292,518) | 879,019,559 | ||
| Short-Term Municipal Bonds — 1.3% | |||
| Colorado — 0.0% | |||
| a | City & County of Denver (SPA JP Morgan Chase Bank N.A.) COP, Series A2, 3.70% due 12/1/2029 (put 4/3/2023) | 275,000 | 275,000 |
| Minnesota — 0.4% | |||
| City of Minneapolis /St. Paul Housing & Redevelopment Authority (Allina Health Obligated Group; LOC JP Morgan Chase Bank N.A.), | |||
| a | Series B-1, 3.60% due 11/15/2035 (put 4/3/2023) | 600,000 | 600,000 |
| a | Series B-2, 3.65% due 11/15/2035 (put 4/3/2023) | 3,000,000 | 3,000,000 |
| Missouri — 0.1% | |||
| a | Missouri Development Finance Board (Nelson Gallery Foundation; SPA Northern Trust Co.), Series A, 3.80% due 12/1/2033 (put 4/3/2023) | 500,000 | 500,000 |
| Oregon — 0.3% | |||
| a | Oregon State Facilities Authority (Peacehealth Obligated Group; LOC U.S. Bank N.A.), Series A, 3.80% due 8/1/2034 (put 4/3/2023) | 2,800,000 | 2,800,000 |
| Texas — 0.5% | |||
| a | Port of Port Arthur Navigation District (Motiva Enterprises, LLC), 4.40% due 4/1/2040 (put 4/3/2023) | 4,700,000 | 4,700,000 |
| Virginia — 0.0% | |||
| a | Virginia College Building Authority (University Of Richmond; SPA U.S. Bank N.A.), 3.80% due 11/1/2036 (put 4/3/2023) | 300,000 | 300,000 |
| Total Short-Term Municipal Bonds — 1.3% (Cost $12,175,000) | 12,175,000 | ||
| Total Investments — 96.8% (Cost $876,467,518) | $891,194,559 | ||
| Other Assets Less Liabilities — 3.2% | 29,806,673 | ||
| Net Assets — 100.0% | $921,001,232 |
| Footnote Legend | |
| a | Variable, floating, step, or fixed to floating rate securities are securities for which interest rate changes are based on changes in a designated base rate or on a predetermined schedule. The rates shown are those in effect on March 31, 2023. |
| b | Segregated as collateral for a when-issued security. |
| c | Securities exempt from registration under Rule 144A of the Securities Act of 1933, as amended. These securities are restricted but liquid and may only be resold in the ordinary course of business in transactions exempt from registration, normally to qualified institutional buyers. As of March 31, 2023, the aggregate value of these securities in the Fund’s portfolio was $14,000,000, representing 1.52% of the Fund’s net assets. |
| d | When-issued security. |
To simplify the listings of securities, abbreviations are used per the table below:
| AGC | Insured by Assured Guaranty Corp. |
| AGM | Insured by Assured Guaranty Municipal Corp. |
| AMBAC | Insured by American Municipal Bond Assurance Corp. |
| AMT | Alternative Minimum Tax |
| BAM | Insured by Build America Mutual Insurance Co. |
| BHAC-CR | Berkshire Hathaway Assurance Corp. Custodial Receipts |
| COP | Certificates of Participation |
| DFA | Development Finance Authority/Agency |
| EDA | Economic Development Authority |
| EDFA | Economic Development Financing Authority |
| ETM | Escrowed to Maturity |
| FGIC | Insured by Financial Guaranty Insurance Co. |
| GO | General Obligation |
| HFA | Health Facilities Authority |
| HFFA | Health Facilities Financing Authority |
| IDA | Industrial Development Authority/Agency |
| ISD | Independent School District |
| LOC | Letter of Credit |
| Natl-Re | Insured by National Public Finance Guarantee Corp. |
| PSF-GTD | Guaranteed by Permanent School Fund |
| Q-SBLF | Insured by Qualified School Bond Loan Fund |
| SONYMA | State of New York Mortgage Agency |
| SPA | Stand-by Purchase Agreement |
| TCRS | Transferable Custodial Receipts |
| 52 | Thornburg Municipal Funds Semi-Annual Report | See notes to financial statements. |
| USD | Unified School District |
| See notes to financial statements. | Thornburg Municipal Funds Semi-Annual Report | 53 |
Thornburg Strategic Municipal Income Fund | March 31, 2023 (Unaudited)
| ISSUER-DESCRIPTION | Principal Amount | VALUE | |
| LONG-TERM MUNICIPAL BONDS — 93.7% | |||
| Alabama — 0.3% | |||
| a | Southeast Energy Authority A Cooperative District (Guaranty: Morgan Stanley Group), Series A, 5.50% due 1/1/2053 (put 12/1/2029) | $1,000,000 | $ 1,071,168 |
| Arizona — 2.4% | |||
| Arizona (Scottsdale Lincoln Hospitals) HFA, Series A, 5.00% due 12/1/2031 | 2,500,000 | 2,587,375 | |
| a | Chandler (Intel Corp.) IDA AMT, Series 2, 5.00% due 9/1/2052 (put 9/1/2027) | 1,110,000 | 1,164,856 |
| City of Phoenix Civic Improvement Corp. (Phoenix Airport Revenue) AMT, Series B, 5.00% due 7/1/2044 | 1,000,000 | 1,047,872 | |
| a | Coconino County Pollution Control Corp. (Nevada Power Co.) AMT, Series A, 4.125% due 9/1/2032 (put 3/31/2026) | 1,000,000 | 1,010,768 |
| b | Pima County (La Posada at Park Centre, Inc. Obligated Group) IDA, Series A, 5.75% due 11/15/2023 - 11/15/2024 | 600,000 | 600,572 |
| Pima County (TMC HealthCare Obligated Group) IDA, Series A, 4.00% due 4/1/2041 | 1,000,000 | 976,187 | |
| Arkansas — 0.3% | |||
| University of Arkansas Board of Trustees (Fayetteville Campus), Series A, 5.00% due 11/1/2036 (pre-refunded 11/1/2024) | 1,000,000 | 1,034,385 | |
| California — 5.6% | |||
| Benicia (Benicia High School; Insured: AGM) USD GO, Series C, Zero Coupon due 8/1/2026 | 830,000 | 749,656 | |
| California (Children’s Hospital Los Angeles) HFFA, Series A, 5.00% due 8/15/2036 | 500,000 | 523,474 | |
| California (Community Program Developmental Disabilities; Insured: California Mtg Insurance) HFFA, Series A, 6.25% due 2/1/2026 | 820,000 | 822,133 | |
| a | California Community Choice Financing Authority (Guaranty: Deutsche A.G.) (Green Bond), Series C, 5.25% due 1/1/2054 (put 10/1/2031) | 2,000,000 | 2,044,476 |
| California Educational Facilities Authority (University of Redlands), Series A, 5.00% due 10/1/2044 | 500,000 | 510,528 | |
| a,b | California Infrastructure & Economic Development Bank (DesertXpress Enterprises LLC) AMT, Series A, 3.65% due 1/1/2050 (put 1/31/2024) | 1,000,000 | 1,000,046 |
| b | California Pollution Control Financing Authority (Poseidon Resources (Channelside) LP Desalination Project) AMT, 5.00% due 11/21/2045 | 1,000,000 | 1,000,772 |
| a,b | California Pollution Control Financing Authority (Republic Services, Inc.) AMT, Series A2, 3.45% due 11/1/2042 (put 4/17/2023) | 2,000,000 | 2,000,000 |
| b | California School Finance Authority, Series A, 5.00% due 10/1/2042 | 1,000,000 | 1,040,943 |
| Calipatria (Educational Facilities; Insured: ACA) USD GO, Series B, Zero Coupon due 8/1/2025 | 1,040,000 | 934,155 | |
| City of Long Beach CA Airport System Revenue (Insured: AGM) AMT, | |||
| Series C, | |||
| 5.00% due 6/1/2042 | 750,000 | 826,932 | |
| 5.25% due 6/1/2047 | 500,000 | 554,196 | |
| County of El Dorado (El Dorado Hills Development-Community Facilities), 5.00% due 9/1/2026 | 625,000 | 625,971 | |
| Daly City Housing (Franciscan Country Club Mobile Home Park Acquisition) DFA, Series A, 5.25% due 12/15/2023 | 330,000 | 330,479 | |
| M-S-R Energy Authority (Guaranty: Citigroup Global Markets), Series A, 6.50% due 11/1/2039 | 1,245,000 | 1,493,350 | |
| Oakland (County of Alameda Educational Facilities) USD GO, Series A, 5.00% due 8/1/2035 (pre-refunded 8/1/2025) | 1,000,000 | 1,059,475 | |
| San Francisco City & County Redevelopment Financing Authority (Redevelopment Project; Insured: Natl-Re), Series D, Zero Coupon due 8/1/2023 | 1,025,000 | 1,015,762 | |
| Union Elementary School District (Santa Clara County District Schools; Insured: Natl-Re) GO, Series D, Zero Coupon due 9/1/2027 | 905,000 | 815,325 | |
| Colorado — 3.5% | |||
| City & County of Denver Airport System Revenue AMT, Series A, 5.00% due 11/15/2036 - 11/15/2039 | 1,565,000 | 1,719,224 | |
| Colorado (CommonSpirit Health Obligated Group) HFA, 5.50% due 11/1/2047 | 1,000,000 | 1,067,582 | |
| Colorado (Sanford Obligated Group) HFA, Series A, 5.00% due 11/1/2039 - 11/1/2044 | 3,015,000 | 3,169,870 | |
| Denver Convention Center Hotel Authority, 5.00% due 12/1/2028 | 1,000,000 | 1,046,084 | |
| Public Authority for Colorado Energy (Natural Gas Purchase; Guaranty: Merrill Lynch & Co), 6.50% due 11/15/2038 | 260,000 | 310,581 | |
| Regional Transportation District (Denver Transit Partners LLC), Series A, 5.00% due 7/15/2032 | 1,215,000 | 1,333,377 | |
| Regional Transportation District (FasTracks Transportation System) COP, Series A, 5.00% due 6/1/2044 (pre-refunded 6/1/2023) | 565,000 | 566,958 | |
| Village Metropolitan District GO, 5.00% due 12/1/2040 | 1,000,000 | 938,912 | |
| Wild Plum Metropolitan District GO, Series A, 5.00% due 12/1/2049 (pre-refunded 12/1/2024) | 595,000 | 618,331 | |
| Connecticut — 1.9% | |||
| State of Connecticut GO, | |||
| Series A, 5.00% due 4/15/2035 | 2,000,000 | 2,219,706 | |
| Series E, 5.00% due 9/15/2033 | 1,350,000 | 1,521,500 | |
| University of Connecticut (Insured: AGM), Series A, 5.00% due 4/15/2028 | 1,975,000 | 2,220,858 | |
| Delaware — 0.4% | |||
| Delaware State (Beebe Medical Center, Inc.) HFA, 4.00% due 6/1/2035 | 1,080,000 | 1,081,286 | |
| District of Columbia — 1.3% | |||
| Metropolitan Washington Airports Authority (Dulles Toll Road; Insured: AGC), Series B, Zero Coupon due 10/1/2027 | 1,500,000 | 1,320,484 | |
| Metropolitan Washington Airports Authority Aviation Revenue AMT, Series A, 4.00% due 10/1/2040 - 10/1/2041 | 2,750,000 | 2,682,024 | |
| Florida — 3.8% | |||
| b | Charlotte County (Town & Country Utilities Projects) IDA AMT, 5.00% due 10/1/2029 | 445,000 | 450,579 |
| City of Pompano Beach (John Knox Village of Florida Inc Obligated Group), Series A, 4.00% due 9/1/2036 | 500,000 | 435,223 | |
| City of Pompano Beach (John Knox Village of Florida, Inc. Obligated Group), 4.00% due 9/1/2040 | 1,000,000 | 817,742 | |
| County of Broward (Airport System Improvements) AMT, 5.00% due 10/1/2037 | 1,000,000 | 1,045,874 | |
| County of Miami-Dade Seaport Department AMT, Series A, 5.25% due 10/1/2052 | 500,000 | 526,021 | |
| Florida Development Finance Corp. (Mater Academy Miami-Dade Osceola County Facilities Obligated Group), Series A, 5.00% due 6/15/2056 | 1,000,000 | 934,651 | |
| Lee County (Cypress Cove at Healthpark Florida Obligated Group) IDA, Series B-1, 3.75% due 10/1/2027 | 1,000,000 | 927,392 |
| 54 | Thornburg Municipal Funds Semi-Annual Report | See notes to financial statements. |
| ISSUER-DESCRIPTION | Principal Amount | VALUE | |
| Miami-Dade County Expressway Authority (Toll System Five-Year Work Program), Series A, 5.00% due 7/1/2024 | $ 625,000 | $ 638,818 | |
| Miami-Dade County School Board (District School Facilities and Infrastructure) COP, Series A, 5.00% due 8/1/2027 | 1,100,000 | 1,101,654 | |
| Orange County (Presbyterian Retirement Communities Inc Obligated Group) HFA, 5.00% due 8/1/2040 | 2,000,000 | 2,001,834 | |
| Orange County Convention Center (Tourist Development), Series A, 5.00% due 10/1/2031 | 1,000,000 | 1,081,474 | |
| Palm Beach County (Jupiter Medical Center Obligated Group) HFA, Series A, 5.00% due 11/1/2047 | 250,000 | 250,444 | |
| Volusia County Educational Facilities Authority (Embry-Riddle Aeronautical University, Inc.), Series B, 5.00% due 10/15/2030 | 1,500,000 | 1,565,447 | |
| Georgia — 3.5% | |||
| Main Street Natural Gas, Inc. (Guaranty: Citigroup Global Markets), | |||
| Series C, | |||
| 4.00% due 12/1/2027 - 12/1/2028 | 1,700,000 | 1,671,385 | |
| a | 4.00% due 5/1/2052 (put 12/1/2028) | 1,500,000 | 1,475,761 |
| Main Street Natural Gas, Inc. (Guaranty: Citigroup, Inc.), Series A, 4.00% due 12/1/2023 | 1,000,000 | 999,281 | |
| Main Street Natural Gas, Inc. (Guaranty: Macquarie Group Ltd.), Series A, 5.00% due 5/15/2037 | 2,640,000 | 2,720,034 | |
| Main Street Natural Gas, Inc. (Guaranty: Merrill Lynch & Co), Series A, 5.50% due 9/15/2023 | 350,000 | 352,093 | |
| Main Street Natural Gas, Inc. (Guaranty: Royal Bank of Canada), | |||
| a | Series A, 4.00% due 7/1/2052 (put 9/1/2027) | 1,250,000 | 1,255,513 |
| a | Series B, 5.00% due 7/1/2053 (put 3/1/2030) | 1,000,000 | 1,056,779 |
| Municipal Electric Authority of Georgia, Series A, 5.00% due 1/1/2039 | 1,225,000 | 1,278,631 | |
| Guam — 0.7% | |||
| Guam Waterworks Authority (Water and Wastewater System), | |||
| 5.00% due 7/1/2028 | 500,000 | 501,197 | |
| 5.25% due 7/1/2024 | 500,000 | 501,445 | |
| Territory of Guam, Series F, 5.00% due 1/1/2030 - 1/1/2031 | 1,000,000 | 1,070,803 | |
| Hawaii — 0.7% | |||
| State of Hawaii Airports System Revenue AMT, Series A, 5.00% due 7/1/2033 | 2,000,000 | 2,218,760 | |
| Illinois — 15.9% | |||
| Chicago Board of Education Dedicated Capital Improvement Tax, | |||
| 5.50% due 4/1/2042 | 500,000 | 539,542 | |
| 5.75% due 4/1/2048 | 1,000,000 | 1,087,162 | |
| Chicago Midway International Airport AMT, Series A, 5.00% due 1/1/2026 | 1,000,000 | 1,046,768 | |
| Chicago O’Hare International Airport AMT, Series A, 5.00% due 1/1/2042 | 1,000,000 | 1,055,494 | |
| Chicago Park District GO, | |||
| Series A, | |||
| 5.00% due 1/1/2027 - 1/1/2035 | 1,510,000 | 1,564,533 | |
| 5.00% due 1/1/2035 (pre-refunded 1/1/2024) | 1,315,000 | 1,334,441 | |
| City of Chicago (Chicago O’Hare International Airport), Series C, 5.00% due 1/1/2031 | 500,000 | 531,201 | |
| City of Chicago (Midway Airport) AMT, Series A, 5.00% due 1/1/2034 | 1,500,000 | 1,518,141 | |
| City of Chicago (Wastewater Transmission System), Series C, 5.00% due 1/1/2030 | 1,500,000 | 1,551,923 | |
| City of Chicago (Water System Improvements), 5.00% due 11/1/2029 | 200,000 | 200,259 | |
| City of Chicago (Water System), 5.00% due 11/1/2042 | 1,500,000 | 1,500,222 | |
| City of Chicago (Water System; Insured: AGM), Series 2017-2, 5.00% due 11/1/2037 | 1,500,000 | 1,573,099 | |
| City of Chicago GO, | |||
| Series A, | |||
| 5.00% due 1/1/2039 | 1,000,000 | 1,026,212 | |
| 5.625% due 1/1/2031 | 500,000 | 529,542 | |
| 6.00% due 1/1/2038 | 3,330,000 | 3,543,353 | |
| Illinois Finance Authority (Advocate Health Care Network), 5.00% due 8/1/2029 (pre-refunded 8/1/2024) | 2,195,000 | 2,256,392 | |
| Illinois Finance Authority (Plymouth Place Obligated Group), Series A, 6.625% due 5/15/2052 | 1,000,000 | 1,010,539 | |
| Illinois Finance Authority (Silver Cross Hospital & Medical Centers), Series C, 5.00% due 8/15/2035 | 2,355,000 | 2,441,431 | |
| Illinois Finance Authority (Southern Illinois Healthcare), 5.00% due 3/1/2032 - 3/1/2034 | 700,000 | 748,183 | |
| Illinois State University (Insured: AGM), Series A, 5.00% due 4/1/2023 - 4/1/2036 | 1,615,000 | 1,729,962 | |
| Illinois Toll Highway Authority (Move Illinois Program), Series A, 5.00% due 1/1/2037 | 1,000,000 | 1,041,627 | |
| Kane, Cook, & DuPage Counties School District No. 46 GO, | |||
| Series A, 5.00% due 1/1/2031 | 2,255,000 | 2,294,740 | |
| Series D, 5.00% due 1/1/2028 | 1,000,000 | 1,017,227 | |
| Metropolitan Pier & Exposition Authority, Series A, 5.00% due 6/15/2050 | 1,500,000 | 1,519,829 | |
| Metropolitan Water Reclamation District of Greater Chicago (Various Capital Improvement Projects) GO, Series C, 5.25% due 12/1/2032 | 40,000 | 49,624 | |
| Sales Tax Securitization Corp., | |||
| Series A, | |||
| 4.00% due 1/1/2038 | 1,000,000 | 989,031 | |
| 5.00% due 1/1/2029 | 1,000,000 | 1,097,915 |
| See notes to financial statements. | Thornburg Municipal Funds Semi-Annual Report | 55 |
Thornburg Strategic Municipal Income Fund | March 31, 2023 (Unaudited)
| ISSUER-DESCRIPTION | Principal Amount | VALUE | |
| State of Illinois GO, | |||
| c | 5.00% due 2/1/2039 | $ 600,000 | $ 603,996 |
| 5.50% due 5/1/2039 | 375,000 | 409,083 | |
| 5.75% due 5/1/2045 | 1,600,000 | 1,744,107 | |
| Series A, 5.50% due 3/1/2042 | 1,000,000 | 1,098,774 | |
| Series D, 5.00% due 11/1/2028 | 3,000,000 | 3,251,670 | |
| State of Illinois Sales Tax Revenue (Insured: BAM-Natl-Re), Series B, 5.00% due 6/15/2032 - 6/15/2035 | 4,500,000 | 4,845,499 | |
| State of Illinois Sales Tax Revenue (Insured: BAM-TCRS), Series B, 4.75% due 6/15/2043 | 2,005,000 | 2,069,354 | |
| Will County School District No. 114 Manhattan (Insured: Natl-Re) ETM GO, Series C, Zero Coupon due 12/1/2023 | 115,000 | 112,913 | |
| Will County School District No. 114 Manhattan (Insured: Natl-Re) GO, Series C, Zero Coupon due 12/1/2023 | 455,000 | 445,839 | |
| Indiana — 0.4% | |||
| Indiana Finance Authority (Ohio Valley Electric Corp.), Series A, 4.25% due 11/1/2030 | 1,250,000 | 1,248,443 | |
| Iowa — 2.3% | |||
| a | Iowa Finance Authority (Iowa Fertilizer Co LLC; Guaranty: OCI NV), 5.00% due 12/1/2050 (put 12/1/2042) | 1,650,000 | 1,646,528 |
| Iowa Higher Education Loan Authority (Des Moines University Osteopathic Medical Center), 5.00% due 10/1/2047 | 750,000 | 766,497 | |
| a | PEFA, Inc. (Guaranty: Goldman Sachs Group, Inc.), 5.00% due 9/1/2049 (put 9/1/2026) | 4,650,000 | 4,741,247 |
| Kansas — 1.8% | |||
| a | Kansas (AdventHealth Obligated Group) DFA, Series B, 5.00% due 11/15/2054 (put 11/15/2031) | 1,500,000 | 1,726,337 |
| Kansas Independent College Finance Authority (Ottawa University), Series C, 5.75% due 5/1/2023 | 1,800,000 | 1,801,247 | |
| Unified Government of Wyandotte County/Kansas City (Utility System Improvement), Series A, 5.00% due 9/1/2031 - 9/1/2032 | 2,000,000 | 2,056,805 | |
| Kentucky — 4.0% | |||
| b | City of Henderson (Guaranty: Pratt Industries, Inc.) AMT, Series B, 4.45% due 1/1/2042 | 1,000,000 | 922,426 |
| Kentucky (Baptist Healthcare System Obligated Group) EDFA, Series B, 5.00% due 8/15/2041 | 1,500,000 | 1,551,148 | |
| Kentucky Higher Education Student Loan Corp. AMT, Series A-1, 5.00% due 6/1/2029 | 500,000 | 542,706 | |
| Kentucky Public Energy Authority (Guaranty: Morgan Stanley Group), | |||
| a | Series A, 4.00% due 4/1/2048 (put 4/1/2024) | 4,000,000 | 4,000,512 |
| a | Series C, 4.00% due 2/1/2050 (put 2/1/2028) | 5,500,000 | 5,426,014 |
| Louisiana — 2.0% | |||
| City of New Orleans (Water System Facilities Improvement), 5.00% due 12/1/2034 (pre-refunded 12/1/2024) | 400,000 | 415,028 | |
| Louisiana Energy and Power Authority (Louisiana Energy & Power Authority Unit No. 1; Insured: AGM), Series A, 5.25% due 6/1/2038 (pre-refunded 6/1/2023) | 2,000,000 | 2,007,490 | |
| Louisiana Public Facilities Authority (Ochsner Clinic Foundation Obligated Group), 5.00% due 5/15/2046 | 3,000,000 | 3,051,339 | |
| New Orleans Aviation Board (Louis Armstrong New Orleans International Airport CFC Revenue; Insured: AGM), 5.00% due 1/1/2029 | 700,000 | 769,052 | |
| Massachusetts — 0.2% | |||
| Massachusetts (Jordan Hospital and Milton Hospital) DFA, Series H-1, 5.00% due 7/1/2032 - 7/1/2033 | 555,000 | 580,813 | |
| Michigan — 5.2% | |||
| Board of Governors of Wayne State University (Educational Facilities and Equipment), Series A, 5.00% due 11/15/2033 | 1,250,000 | 1,291,750 | |
| City of Detroit GO, | |||
| 5.00% due 4/1/2023 - 4/1/2024 | 900,000 | 905,317 | |
| Series A, 5.00% due 4/1/2032 | 300,000 | 317,742 | |
| County of Genesee (Water Supply System; Insured: BAM) GO, 5.375% due 11/1/2038 | 1,000,000 | 1,001,959 | |
| Detroit City School District (School Building & Site; Insured: AGM Q-SBLF) GO, Series A, 5.25% due 5/1/2027 | 1,000,000 | 1,108,599 | |
| Detroit Downtown Development Authority (Catalyst Development Project; Insured: AGM), Series A, 5.00% due 7/1/2024 | 850,000 | 866,510 | |
| Gerald R Ford International Airport Authority AMT, 5.00% due 1/1/2041 | 1,845,000 | 2,022,207 | |
| Kalamazoo Hospital Finance Authority (Bronson Methodist Hospital), Series A, 5.25% due 5/15/2041 | 140,000 | 140,060 | |
| Livonia Public School District (School Building & Site; Insured: AGM) GO, Series I, 5.00% due 5/1/2036 (pre-refunded 5/1/2023) | 225,000 | 225,372 | |
| Michigan Finance Authority (BHSH System Obligated Group), Series A, 4.00% due 4/15/2042 | 1,000,000 | 977,341 | |
| Michigan Finance Authority (State Department of Human Services Office Buildings), Series F, 5.00% due 4/1/2031 | 1,000,000 | 1,001,700 | |
| Michigan Finance Authority (Trinity Health Corp. Obligated Group), 5.00% due 12/1/2027 | 165,000 | 180,454 | |
| Michigan State Hospital Finance Authority (Ascension Health Credit Group), Series F-4, 5.00% due 11/15/2047 | 2,250,000 | 2,357,977 | |
| a | Michigan Strategic Fund (Graphic Packaging International LLC) (Green Bond) AMT, 4.00% due 10/1/2061 (put 10/1/2026) | 1,000,000 | 991,056 |
| Wayne County Airport Authority (Detroit Metropolitan Wayne County Airport), Series B, 5.00% due 12/1/2031 - 12/1/2034 | 2,615,000 | 2,717,537 | |
| Minnesota — 0.3% | |||
| Minnesota Housing Finance Agency (Collateralized: GNMA, FNMA, FHLMC), Series F, 2.55% due 7/1/2039 | 1,065,000 | 977,898 | |
| Nebraska — 1.5% | |||
| a | Central Plains Energy Project (Guaranty: Goldman Sachs & Co.), Series 1, 5.00% due 5/1/2053 (put 10/1/2029) | 1,000,000 | 1,039,308 |
| Central Plains Energy Project (Guaranty: Goldman Sachs Group, Inc.), Series A, 5.00% due 9/1/2031 | 1,500,000 | 1,613,310 | |
| Douglas County Health Facilities (Nebraska Methodist Health System), 5.00% due 11/1/2029 - 11/1/2030 | 1,750,000 | 1,842,018 | |
| Nevada — 1.0% | |||
| Carson City (Carson Tahoe Regional Healthcare), Series A, 5.00% due 9/1/2037 | 1,000,000 | 1,025,071 |
| 56 | Thornburg Municipal Funds Semi-Annual Report | See notes to financial statements. |
| ISSUER-DESCRIPTION | Principal Amount | VALUE | |
| City of Las Vegas Special Improvement District No. 814 (Summerlin Vlg 21 & 24A), 4.00% due 6/1/2039 - 6/1/2044 | $1,050,000 | $ 917,039 | |
| a,b | State of Nevada Department of Business & Industry (Republic Services, Inc.) AMT, Series 2001, 3.75% due 12/1/2026 (put 6/1/2023) | 1,300,000 | 1,291,618 |
| New Hampshire — 0.4% | |||
| a | New Hampshire Business Finance Authority (Waste Management, Inc.; Guaranty: Waste Management Holdings) AMT, Series A4, 2.15% due 8/1/2038 (put 7/1/2024) | 1,250,000 | 1,219,865 |
| New Jersey — 5.1% | |||
| Camden County Improvement Authority (KIPP Cooper Norcross Obligated Group), 6.00% due 6/15/2052 | 1,000,000 | 1,050,151 | |
| New Jersey (New Jersey Transit Corp.) EDA, Series A, 5.00% due 11/1/2033 | 500,000 | 551,108 | |
| New Jersey (School Facilities Construction) EDA, | |||
| 5.00% due 6/15/2035 - 6/15/2038 | 1,250,000 | 1,350,457 | |
| Series NN, 5.00% due 3/1/2026 | 1,000,000 | 1,000,863 | |
| New Jersey (School Facilities Construction; Insured: Natl-Re) EDA, Series N-1, 5.50% due 9/1/2027 | 1,000,000 | 1,105,772 | |
| New Jersey Transportation Trust Fund Authority, Series A, 5.00% due 12/15/2035 | 2,000,000 | 2,152,606 | |
| New Jersey Transportation Trust Fund Authority (State Transportation System Improvements), Series A-1, 5.00% due 6/15/2027 | 3,000,000 | 3,182,217 | |
| New Jersey Transportation Trust Fund Authority (Transportation Program Bonds), Series AA, 5.00% due 6/15/2038 | 1,500,000 | 1,593,994 | |
| New Jersey Transportation Trust Fund Authority (Transportation System), Series A, 5.00% due 12/15/2034 - 12/15/2039 | 2,200,000 | 2,357,133 | |
| South Jersey Transportation Authority, Series A, 5.25% due 11/1/2052 | 1,500,000 | 1,588,973 | |
| New Mexico — 1.6% | |||
| City of Santa Fe (El Castillo Retirement Residences Obligated Group), | |||
| 5.00% due 5/15/2034 | 1,465,000 | 1,392,852 | |
| Series A, 5.00% due 5/15/2049 | 1,450,000 | 1,219,028 | |
| New Mexico Hospital Equipment Loan Council (Haverland Carter Lifestyle Obligated Group), Series A, 5.00% due 7/1/2034 | 375,000 | 340,111 | |
| a | New Mexico Hospital Equipment Loan Council (Presbyterian Healthcare Services Obligated Group), Series B, 5.00% due 8/1/2049 (put 8/1/2025) | 1,250,000 | 1,308,549 |
| New Mexico Mortgage Finance Authority (Collateralized: GNMA, FNMA, FHLMC), Series F, 2.85% due 7/1/2039 | 775,000 | 761,092 | |
| New York — 4.0% | |||
| Build NYC Resource Corp. (Kipp NYC Public Charter Schools), 5.25% due 7/1/2052 | 1,000,000 | 1,034,268 | |
| City of New York (City Budget Financial Management) GO, | |||
| Series G, 5.00% due 8/1/2023 | 3,000,000 | 3,023,688 | |
| Series J, 5.00% due 8/1/2031 | 1,500,000 | 1,551,259 | |
| Metropolitan Transportation Authority (Green Bond), Series A1, 5.00% due 11/15/2030 | 1,045,000 | 1,098,776 | |
| New York City Transitional Finance Authority Future Tax Secured Revenue, Series A, 5.00% due 11/1/2036 | 1,230,000 | 1,391,220 | |
| a | New York State Energy Research & Development Authority (New York State Electric & Gas Corp.), Series C, 2.625% due 4/1/2034 (put 7/3/2023) | 1,000,000 | 997,802 |
| Port Authority of New York & New Jersey AMT, Series 186, 5.00% due 10/15/2037 | 500,000 | 507,633 | |
| State of New York Mortgage Agency (Insured: SONYMA) AMT, | |||
| Series 248, | |||
| 4.10% due 4/1/2032 | 770,000 | 763,314 | |
| 4.125% due 10/1/2032 | 210,000 | 208,006 | |
| 4.20% due 4/1/2033 | 845,000 | 838,663 | |
| a | Triborough Bridge & Tunnel Authority (Metropolitan Transportation Authority Payroll Mobility Tax Revenue) (Green Bond), Series A2, 2.00% due 5/15/2045 (put 5/15/2024) | 1,000,000 | 994,310 |
| North Carolina — 1.5% | |||
| a | Charlotte-Mecklenburg Hospital Authority (Atrium Health Obligated Group), Series B, 1.95% due 1/15/2048 (put 11/1/2029) | 1,000,000 | 961,113 |
| Greater Asheville Regional Airport Authority (Insured: AGM) AMT, Series A, 5.25% due 7/1/2039 | 1,000,000 | 1,106,775 | |
| North Carolina Medical Care Commission (Vidant Health), 5.00% due 6/1/2029 (pre-refunded 6/1/2025) | 1,500,000 | 1,578,814 | |
| North Carolina Turnpike Authority, 5.00% due 1/1/2029 - 1/1/2030 | 1,000,000 | 1,090,894 | |
| Ohio — 1.6% | |||
| Akron, Bath and Copley Joint Township Hospital District (Summa Health System Obligated Group), 5.25% due 11/15/2030 | 1,420,000 | 1,501,124 | |
| Northeast Ohio Medical University (Insured: BAM), | |||
| 5.00% due 12/1/2043 | 775,000 | 836,974 | |
| Series B, 4.00% due 12/1/2038 | 550,000 | 538,112 | |
| a | Ohio Air Quality Development Authority (Ohio Valley Electric Corp.), Series B, 1.375% due 2/1/2026 (put 11/1/2024) | 1,000,000 | 950,511 |
| Ohio Higher Educational Facility Commission (Ashtabula County Medical Center Obligated Group), 5.25% due 1/1/2038 | 1,105,000 | 1,177,238 | |
| Oregon — 1.6% | |||
| a | County of Gilliam (Guaranty: Waste Management, Inc.) AMT, 3.00% due 7/1/2038 (put 5/1/2023) | 2,000,000 | 1,999,492 |
| a | Oregon Health & Science University (Oregon Health & Science University Obligated Group), Series B-2, 5.00% due 7/1/2046 (put 2/1/2032) | 1,900,000 | 2,231,793 |
| Salem Hospital Facility Authority (Capital Manor, Inc. Obligated Group), 4.00% due 5/15/2040 | 500,000 | 418,631 | |
| Yamhill County Hospital Authority (Friendsview Manor Obligated Group), Series B-3, 1.75% due 11/15/2026 | 340,000 | 316,548 | |
| Pennsylvania — 4.4% | |||
| City of Philadelphia Airport Revenue AMT, Series B, 5.00% due 7/1/2042 | 1,000,000 | 1,022,760 | |
| City of Philadelphia IDA, 5.00% due 5/1/2024 | 1,000,000 | 1,022,692 | |
| Coatesville Area School District (Insured: AGM) (State Aid Withholding) GO, 5.00% due 8/1/2025 | 500,000 | 527,135 | |
| Commonwealth Financing Authority, 5.00% due 6/1/2029 | 1,000,000 | 1,098,723 |
| See notes to financial statements. | Thornburg Municipal Funds Semi-Annual Report | 57 |
Thornburg Strategic Municipal Income Fund | March 31, 2023 (Unaudited)
| ISSUER-DESCRIPTION | Principal Amount | VALUE | |
| County of Luzerne (Insured: AGM) GO, Series A, 5.00% due 11/15/2029 | $1,000,000 | $ 1,054,305 | |
| a,d | Montgomery County (Constellation Energy Generation LLC) IDA AMT, Series C, 4.45% due 10/1/2034 (put 4/3/2028) | 500,000 | 502,182 |
| Pennsylvania (Pennsylvania Department of Transportation) EDFA AMT, 5.75% due 6/30/2048 | 1,000,000 | 1,081,036 | |
| Pennsylvania (Presbyterian Homes Obligated Group) EDFA, 4.00% due 7/1/2033 - 7/1/2041 | 2,800,000 | 2,546,736 | |
| Pennsylvania (UPMC Obligated Group) EDFA, Series A, 4.00% due 10/15/2037 | 1,000,000 | 996,824 | |
| Pennsylvania Turnpike Commission (Highway Improvements), Series A-1, 5.00% due 12/1/2037 | 750,000 | 801,430 | |
| Philadelphia (Thomas Jefferson University) IDA, Series A, 5.00% due 9/1/2035 | 1,500,000 | 1,580,437 | |
| Philadelphia Municipal Authority (Juvenile Justice Services Center), 5.00% due 4/1/2038 | 1,360,000 | 1,424,406 | |
| School District of Philadelphia (State Aid Witholding) GO, Series A, 5.00% due 9/1/2038 | 100,000 | 105,957 | |
| Rhode Island — 0.1% | |||
| Pawtucket Housing Authority, 5.50% due 9/1/2024 | 250,000 | 252,890 | |
| South Carolina — 0.6% | |||
| a | Patriots Energy Group Financing Agency (Guaranty: Royal Bank of Canada), Series A, 4.00% due 10/1/2048 (put 2/1/2024) | 1,000,000 | 1,001,537 |
| a | South Carolina Jobs-EDA (Guaranty: International Paper Co.) AMT, Series A, 4.00% due 4/1/2033 (put 4/1/2026) | 1,000,000 | 1,003,079 |
| Tennessee — 0.5% | |||
| Shelby County Health, Educational and Housing Facility (Methodist Le Bonheur Healthcare), Series A, 5.00% due 5/1/2036 | 1,000,000 | 1,044,782 | |
| Tennessee Energy Acquisition Corp. (The Gas Project; Guaranty: Goldman Sachs Group, Inc.), Series A, 5.25% due 9/1/2024 | 500,000 | 507,725 | |
| Texas — 7.4% | |||
| City of Austin Airport System Revenue AMT, 5.00% due 11/15/2038 | 2,000,000 | 2,177,758 | |
| City of Dallas (Public Improvements) GO, 5.00% due 2/15/2031 | 1,930,000 | 2,017,504 | |
| City of Houston (Combined Utility System), Series D, 5.00% due 11/15/2028 | 2,500,000 | 2,598,463 | |
| City of Houston (Public Improvements) GO, Series A, 5.00% due 3/1/2032 | 2,500,000 | 2,679,383 | |
| City of Houston Airport System Revenue AMT, Series A, 4.00% due 7/1/2040 | 1,500,000 | 1,466,316 | |
| a | Denton (Insured: PSF-GTD) ISD GO, Series B, 2.00% due 8/1/2044 (pre-refunded 8/1/2024) | 65,000 | 64,492 |
| Greater Texas Cultural Education Facilities Finance Corp. (Fort County Bend), Series A, 4.00% due 3/1/2040 - 3/1/2041 | 2,000,000 | 1,997,114 | |
| Harris County Cultural Education Facilities Finance Corp. (Memorial Hermann Health System Obligated Group), Series A, 5.00% due 7/1/2052 | 1,500,000 | 1,563,630 | |
| Newark Higher Education Finance Corp. (Abilene Christian University), Series A, 4.00% due 4/1/2057 | 1,000,000 | 891,545 | |
| Newark Higher Education Finance Corp. (Hughen Center, Inc.; Insured: PSF-GTD), Series A, 5.00% due 8/15/2052 | 500,000 | 536,552 | |
| North Texas Tollway Authority (NTTA System), Series A, 5.00% due 1/1/2034 | 750,000 | 905,883 | |
| Texas Municipal Gas Acquisition & Supply Corp. III (Guaranty: Macquarie Group Ltd.), 5.00% due 12/15/2029 | 1,435,000 | 1,494,245 | |
| Texas State Technical College (Insured: AGM), Series A, 5.75% due 8/1/2047 | 545,000 | 632,089 | |
| Texas Transportation Commission (Central Texas Turnpike System), Series C, 5.00% due 8/15/2034 | 3,000,000 | 3,066,219 | |
| Waco Educational Finance Corp. (Baylor University Issue), 4.00% due 3/1/2041 | 850,000 | 871,013 | |
| U. S. Virgin Islands — 0.2% | |||
| Matching Fund Special Purpose Securitization Corp., Series A, 5.00% due 10/1/2025 | 500,000 | 510,551 | |
| Utah — 0.6% | |||
| Utah Charter School Finance Authority (Summit Academy, Inc.), Series A, 5.00% due 4/15/2039 | 700,000 | 729,413 | |
| Utah Transit Authority (Integrated Mass Transit System), Series A, 5.00% due 6/15/2033 (pre-refunded 6/15/2025) | 1,000,000 | 1,055,158 | |
| Virginia — 1.4% | |||
| Henrico County (Westminster-Canterbury Corp. Obligated Group) EDA, Series A, 5.00% due 10/1/2052 | 1,000,000 | 1,041,616 | |
| a | Roanoke (Carilion Clinic Obligated Group) EDA, 5.00% due 7/1/2053 (put 7/1/2030) | 1,000,000 | 1,134,178 |
| Virginia Small Business Financing Authority (National Senior Campuses, Inc. Obligated Group), Series A, 5.00% due 1/1/2034 | 1,000,000 | 1,065,366 | |
| a | Virginia Small Business Financing Authority (Pure Salmon Virginia LLC) AMT, 3.50% due 11/1/2052 (put 11/1/2023) | 1,000,000 | 1,001,479 |
| Washington — 1.1% | |||
| Washington Higher Education Facilities Authority (Seattle Pacific University), Series A, 5.00% due 10/1/2038 - 10/1/2040 | 3,340,000 | 3,424,378 | |
| Wisconsin — 2.6% | |||
| a | Public Finance Authority (Duke Energy Progress, LLC) AMT, Series B, 4.00% due 10/1/2046 (put 10/1/2030) | 1,000,000 | 1,072,665 |
| Public Finance Authority (National Senior Community Obligated Group), 4.00% due 1/1/2042 - 1/1/2047 | 2,375,000 | 2,120,289 | |
| a | Public Finance Authority (St. John’s College), 3.00% due 10/1/2045 (put 10/1/2026) | 1,500,000 | 1,459,155 |
| Public Finance Authority (Texas Biomedical Research Institute), Series A, 4.00% due 6/1/2039 - 6/1/2041 | 770,000 | 708,277 | |
| Public Finance Authority (United Methodist Retirement Homes, Inc. Obligated Group), Series A, 4.00% due 10/1/2025 - 10/1/2046 | 2,165,000 | 1,826,398 | |
| Wisconsin Health & Educational Facilities Authority (HOPE Christian Schools Obligated Group), 4.00% due 12/1/2056 | 750,000 | 516,933 | |
| Wisconsin Housing (Collateralized: FNMA) EDA, Series C, 2.75% due 9/1/2039 | 305,000 | 280,560 | |
| Total Long-Term Municipal Bonds — 93.7% (Cost $289,205,429) | 290,756,557 | ||
| Short-Term Municipal Bonds — 5.2% | |||
| Florida — 1.4% | |||
| a | JEA Water & Sewer System Revenue (SPA U.S. Bank N.A.), Series A-1 3.80% due 10/1/2038 (put 4/3/2023) | 4,200,000 | 4,200,000 |
| Mississippi — 1.1% | |||
| a | Mississippi Business Finance Corp. (Chevron U.S.A., Inc.; Guaranty: Chevron Corp.), Series A, 3.70% due 11/1/2035 (put 4/3/2023) | 3,500,000 | 3,500,000 |
| 58 | Thornburg Municipal Funds Semi-Annual Report | See notes to financial statements. |
| ISSUER-DESCRIPTION | Principal Amount | VALUE | |
| New York — 0.2% | |||
| a | New York City Municipal Water Finance Authority (New York City Water & Sewer System; SPA U.S. Bank N.A.), 3.75% due 6/15/2043 (put 4/3/2023) | $ 600,000 | $ 600,000 |
| North Carolina — 0.3% | |||
| a | Charlotte-Mecklenburg Hospital Authority (Atrium Health Obligated Group; SPA JP Morgan Chase Bank N.A.), Series C, 3.65% due 1/15/2037 (put 4/3/2023) | 1,020,000 | 1,020,000 |
| Texas — 2.0% | |||
| Port of Port Arthur Navigation District (Motiva Enterprises, LLC), | |||
| a | 4.40% due 4/1/2040 (put 4/3/2023) | 3,200,000 | 3,200,000 |
| a | Series D, 4.40% due 11/1/2040 (put 4/10/2023) | 1,480,000 | 1,480,000 |
| a | Series E, 4.42% due 11/1/2040 (put 4/10/2023) | 1,500,000 | 1,500,000 |
| Utah — 0.2% | |||
| a | City of Murray (Intermountain Healthcare Obligated Group; SPA Barclays Bank plc), Series C, 3.65% due 5/15/2037 (put 4/3/2023) | 600,000 | 600,000 |
| Total Short-Term Municipal Bonds — 5.2% (Cost $16,100,000) | 16,100,000 | ||
| Total Investments — 98.9% (Cost $305,305,429) | $306,856,557 | ||
| Other Assets Less Liabilities — 1.1% | 3,423,885 | ||
| Net Assets — 100.0% | $310,280,442 |
| Footnote Legend | |
| a | Variable, floating, step, or fixed to floating rate securities are securities for which interest rate changes are based on changes in a designated base rate or on a predetermined schedule. The rates shown are those in effect on March 31, 2023. |
| b | Securities exempt from registration under Rule 144A of the Securities Act of 1933, as amended. These securities are restricted but liquid and may only be resold in the ordinary course of business in transactions exempt from registration, normally to qualified institutional buyers. As of March 31, 2023, the aggregate value of these securities in the Fund’s portfolio was $8,306,956, representing 2.68% of the Fund’s net assets. |
| c | Segregated as collateral for a when-issued security. |
| d | When-issued security. |
To simplify the listings of securities, abbreviations are used per the table below:
| ACA | Insured by American Capital Access |
| AGC | Insured by Assured Guaranty Corp. |
| AGM | Insured by Assured Guaranty Municipal Corp. |
| AMT | Alternative Minimum Tax |
| BAM | Insured by Build America Mutual Insurance Co. |
| COP | Certificates of Participation |
| DFA | Development Finance Authority/Agency |
| EDA | Economic Development Authority |
| EDFA | Economic Development Financing Authority |
| ETM | Escrowed to Maturity |
| FHLMC | Collateralized by Federal Home Loan Mortgage Corp. |
| FNMA | Collateralized by Federal National Mortgage Association |
| GNMA | Collateralized by Government National Mortgage Association |
| GO | General Obligation |
| HFA | Health Facilities Authority |
| HFFA | Health Facilities Financing Authority |
| IDA | Industrial Development Authority/Agency |
| ISD | Independent School District |
| JEA | Jacksonville Electric Authority |
| Mtg | Mortgage |
| Natl-Re | Insured by National Public Finance Guarantee Corp. |
| PSF-GTD | Guaranteed by Permanent School Fund |
| Q-SBLF | Insured by Qualified School Bond Loan Fund |
| SONYMA | State of New York Mortgage Agency |
| SPA | Stand-by Purchase Agreement |
| TCRS | Transferable Custodial Receipts |
| USD | Unified School District |
| See notes to financial statements. | Thornburg Municipal Funds Semi-Annual Report | 59 |
March 31, 2023 (Unaudited)
| THORNBURG SHORT DURATION MUNICIPAL FUND | THORNBURG LIMITED TERM MUNICIPAL FUND | THORNBURG CALIFORNIA LIMITED TERM MUNICIPAL FUND | THORNBURG NEW MEXICO INTERMEDIATE MUNICIPAL FUND | |
| ASSETS | ||||
| Investment in securities, at cost | $ 173,100,546 | $ 3,370,917,014 | $ 310,470,164 | $ 118,304,920 |
| Investments at value | 173,124,461 | 3,399,667,013 | 311,882,863 | 117,254,851 |
| Cash | 213,914 | 241,921 | 228,342 | 1,387,973 |
| Receivable for investments sold | 5,000 | 30,575,083 | 4,605,000 | - |
| Receivable for fund shares sold | - | 3,368,706 | 363,800 | 18,870 |
| Principal and interest receivable | 1,957,394 | 41,090,771 | 3,854,065 | 1,498,455 |
| Prepaid expenses and other assets | 34,968 | 121,598 | 23,641 | 15,703 |
| Total Assets | 175,335,737 | 3,475,065,092 | 320,957,711 | 120,175,852 |
| Liabilities | ||||
| Payable for investments purchased | 2,289,738 | 5,814,646 | - | 1,243,912 |
| Payable for fund shares redeemed | 33,079 | 6,767,129 | 379,210 | 102,645 |
| Payable to investment advisor and other affiliates | 56,149 | 1,482,678 | 120,213 | 79,781 |
| Accounts payable and accrued expenses | 43,494 | 1,275,389 | 144,911 | 53,435 |
| Dividends payable | 132,535 | 605,978 | 74,846 | 5,731 |
| Total Liabilities | 2,554,995 | 15,945,820 | 719,180 | 1,485,504 |
| Net Assets | $ 172,780,742 | $ 3,459,119,272 | $ 320,238,531 | $ 118,690,348 |
| NET ASSETS CONSIST OF | ||||
| Net capital paid in on shares of beneficial interest | $ 179,456,476 | $ 3,654,224,497 | $ 334,822,790 | $ 122,445,131 |
| Accumulated loss | (6,675,734) | (195,105,225) | (14,584,259) | (3,754,783) |
| Net Assets | $ 172,780,742 | $ 3,459,119,272 | $ 320,238,531 | $ 118,690,348 |
| NET ASSET VALUE | ||||
| Class A Shares: | ||||
| Net assets applicable to shares outstanding | $ 14,708,428 | $ 692,684,061 | $ 72,864,912 | $ 51,519,459 |
| Shares outstanding | 1,232,338 | 50,901,125 | 5,645,654 | 4,126,276 |
| Net asset value and redemption price per share | $ 11.94 | $ 13.61 | $ 12.91 | $ 12.49 |
| Maximum offering price per share (net asset value, plus 2.25% of offering price) | $ 12.21 | $ 13.92 | $ 13.21 | $ 12.74 * |
| Class C Shares: | ||||
| Net assets applicable to shares outstanding | - | 74,061,346 | 4,275,041 | - |
| Shares outstanding | - | 5,432,534 | 330,968 | - |
| Net asset value and redemption price per share** | - | 13.63 | 12.92 | - |
| Class C2 Shares: | ||||
| Net assets applicable to shares outstanding | - | 4,268,620 | 143,494 | - |
| Shares outstanding | - | 313,049 | 11,110 | - |
| Net asset value and redemption price per share** | - | 13.64 | 12.92 | - |
| Class D Shares: | ||||
| Net assets applicable to shares outstanding | - | - | - | 10,184,254 |
| Shares outstanding | - | - | - | 815,298 |
| Net asset value and redemption price per share | - | - | - | 12.49 |
March 31, 2023 (Unaudited)
| THORNBURG SHORT DURATION MUNICIPAL FUND | THORNBURG LIMITED TERM MUNICIPAL FUND | THORNBURG CALIFORNIA LIMITED TERM MUNICIPAL FUND | THORNBURG NEW MEXICO INTERMEDIATE MUNICIPAL FUND | |
| Class I Shares: | ||||
| Net assets applicable to shares outstanding | $ 158,072,314 | $ 2,688,105,245 | $ 242,955,084 | $ 56,986,635 |
| Shares outstanding | 13,249,974 | 197,511,883 | 18,805,162 | 4,566,182 |
| Net asset value and redemption price per share | 11.93 | 13.61 | 12.92 | 12.48 |
| * | Net asset value, plus 2.00% of offering price. |
| ** | Redemption price per share is equal to net asset value less any applicable contingent deferred sales charge. |
March 31, 2023 (Unaudited)
| THORNBURG NEW YORK INTERMEDIATE MUNICIPAL FUND | THORNBURG INTERMEDIATE MUNICIPAL FUND | THORNBURG STRATEGIC MUNICIPAL INCOME FUND | |
| ASSETS | |||
| Investment in securities, at cost | $ 26,196,449 | $ 876,467,518 | $ 305,305,429 |
| Investments at value | 26,264,633 | 891,194,559 | 306,856,557 |
| Cash | 130,641 | 278,167 | 108,398 |
| Receivable for investments sold | 1,000,000 | 20,545,000 | - |
| Receivable for fund shares sold | 51,762 | 4,281,631 | 672,849 |
| Principal and interest receivable | 391,884 | 12,156,393 | 4,005,723 |
| Prepaid expenses and other assets | 11,191 | 109,030 | 60,418 |
| Total Assets | 27,850,111 | 928,564,780 | 311,703,945 |
| Liabilities | |||
| Payable for investments purchased | - | 5,109,113 | 500,000 |
| Payable for fund shares redeemed | 29,650 | 1,463,798 | 712,436 |
| Payable to investment advisor and other affiliates | 8,989 | 440,250 | 118,233 |
| Accounts payable and accrued expenses | 40,231 | 195,535 | 80,226 |
| Dividends payable | 8,953 | 354,852 | 12,608 |
| Total Liabilities | 87,823 | 7,563,548 | 1,423,503 |
| Net Assets | $ 27,762,288 | $ 921,001,232 | $ 310,280,442 |
| NET ASSETS CONSIST OF | |||
| Net capital paid in on shares of beneficial interest | $ 28,794,438 | $ 940,317,468 | $ 328,487,407 |
| Accumulated loss | (1,032,150) | (19,316,236) | (18,206,965) |
| Net Assets | $ 27,762,288 | $ 921,001,232 | $ 310,280,442 |
| NET ASSET VALUE | |||
| Class A Shares: | |||
| Net assets applicable to shares outstanding | $ 14,676,465 | $ 282,497,631 | $ 64,412,230 |
| Shares outstanding | 1,223,068 | 21,399,904 | 4,608,589 |
| Net asset value and redemption price per share | $ 12.00 | $ 13.20 | $ 13.98 |
| Maximum offering price per share (net asset value, plus 2.00% of offering price) | $ 12.24 | $ 13.47 | $ 14.27 |
| Class C Shares: | |||
| Net assets applicable to shares outstanding | - | 19,605,693 | 5,926,902 |
| Shares outstanding | - | 1,483,432 | 423,602 |
| Net asset value and redemption price per share** | - | 13.22 | 13.99 |
| Class C2 Shares: | |||
| Net assets applicable to shares outstanding | - | 1,579,964 | - |
| Shares outstanding | - | 119,526 | - |
| Net asset value and redemption price per share** | - | 13.22 | - |
March 31, 2023 (Unaudited)
| THORNBURG NEW YORK INTERMEDIATE MUNICIPAL FUND | THORNBURG INTERMEDIATE MUNICIPAL FUND | THORNBURG STRATEGIC MUNICIPAL INCOME FUND | |
| Class I Shares: | |||
| Net assets applicable to shares outstanding | $ 13,085,823 | $ 617,317,944 | $ 239,941,310 |
| Shares outstanding | 1,090,429 | 46,824,179 | 17,151,743 |
| Net asset value and redemption price per share | 12.00 | 13.18 | 13.99 |
| ** | Redemption price per share is equal to net asset value less any applicable contingent deferred sales charge. |
Six Months Ended March 31, 2023 (Unaudited)
| THORNBURG SHORT DURATION MUNICIPAL FUND | THORNBURG LIMITED TERM MUNICIPAL FUND | THORNBURG CALIFORNIA LIMITED TERM MUNICIPAL FUND | THORNBURG NEW MEXICO INTERMEDIATE MUNICIPAL FUND | |
| INVESTMENT INCOME | ||||
| Interest income | $ 2,544,187 | $ 54,674,587 | $ 4,767,833 | $ 1,582,714 |
| EXPENSES | ||||
| Investment management fees | 373,428 | 5,460,021 | 838,208 | 296,739 |
| Administration fees | 82,787 | 1,612,190 | 148,721 | 52,643 |
| Distribution and service fees | ||||
| Class A Shares | 18,063 | 896,892 | 94,111 | 64,864 |
| Class C Shares | - | 202,648 | 12,328 | - |
| Class C2 Shares | - | 14,899 | 456 | - |
| Class D Shares | - | - | - | 25,580 |
| Transfer agent fees | ||||
| Class A Shares | 12,364 | 245,416 | 20,446 | 18,298 |
| Class C Shares | - | 21,258 | 2,438 | - |
| Class C2 Shares | - | 2,524 | 636 | - |
| Class D Shares | - | - | - | 3,371 |
| Class I Shares | 10,444 | 1,362,340 | 98,530 | 12,583 |
| Registration and filing fees | ||||
| Class A Shares | 10,043 | 20,480 | 4,539 | 4,076 |
| Class C Shares | - | 5,567 | 2,635 | - |
| Class C2 Shares | - | 9,571 | 2,779 | - |
| Class D Shares | - | - | - | 2,611 |
| Class I Shares | 14,457 | 29,503 | 5,222 | 3,118 |
| Custodian fees | 24,556 | 158,504 | 34,228 | 21,100 |
| Professional fees | 22,883 | 48,361 | 24,314 | 22,545 |
| Trustee and officer fees | 5,598 | 128,688 | 12,069 | 4,013 |
| Other expenses | 6,708 | 119,422 | 13,358 | 6,219 |
| Total Expenses | 581,331 | 10,338,284 | 1,315,018 | 537,760 |
| Less: | ||||
| Expenses reimbursed | (96,483) | (8,066) | (285,288) | (27,943) |
| Investment management fees waived | - | - | (100,735) | - |
| Net Expenses | 484,848 | 10,330,218 | 928,995 | 509,817 |
| Net Investment Income (Loss) | $ 2,059,339 | $ 44,344,369 | $ 3,838,838 | $ 1,072,897 |
| REALIZED AND UNREALIZED GAIN (LOSS) | ||||
| Net realized gain (loss) | (976,290) | (47,342,290) | (4,880,981) | (836,190) |
| Net change in unrealized appreciation (depreciation) | 3,454,390 | 143,152,023 | 13,037,209 | 4,755,442 |
| Net Realized and Unrealized Gain (Loss) | 2,478,100 | 95,809,733 | 8,156,228 | 3,919,252 |
| Change in Net Assets Resulting from Operations | $ 4,537,439 | $ 140,154,102 | $ 11,995,066 | $ 4,992,149 |
| THORNBURG NEW YORK INTERMEDIATE MUNICIPAL FUND | THORNBURG INTERMEDIATE MUNICIPAL FUND | THORNBURG STRATEGIC MUNICIPAL INCOME FUND | |
| INVESTMENT INCOME | |||
| Interest income | $ 449,128 | $ 16,634,172 | $ 5,768,903 |
| EXPENSES | |||
| Investment management fees | 69,517 | 2,131,453 | 1,124,723 |
| Administration fees | 12,334 | 395,507 | 133,009 |
| Distribution and service fees | |||
| Class A Shares | 18,447 | 345,470 | 76,326 |
| Class C Shares | - | 61,278 | 20,875 |
| Class C2 Shares | - | 4,687 | - |
| Transfer agent fees | |||
| Class A Shares | 7,996 | 77,700 | 27,536 |
| Class C Shares | - | 7,724 | 4,155 |
| Class C2 Shares | - | 1,467 | - |
| Class I Shares | 7,521 | 198,325 | 126,291 |
| Registration and filing fees | |||
| Class A Shares | 3,982 | 16,757 | 9,382 |
| Class C Shares | - | 8,300 | 7,570 |
| Class C2 Shares | - | 6,631 | - |
| Class I Shares | 4,020 | 22,784 | 11,238 |
| Custodian fees | 15,431 | 47,897 | 31,706 |
| Professional fees | 21,887 | 27,822 | 25,494 |
| Trustee and officer fees | 1,007 | 28,388 | 10,102 |
| Other expenses | 3,864 | 28,418 | 11,096 |
| Total Expenses | 166,006 | 3,410,608 | 1,619,503 |
| Less: | |||
| Expenses reimbursed | (30,891) | (648,700) | (325,298) |
| Investment management fees waived | (18,349) | - | (318,250) |
| Net Expenses | 116,766 | 2,761,908 | 975,955 |
| Net Investment Income (Loss) | $ 332,362 | $ 13,872,264 | $ 4,792,948 |
| REALIZED AND UNREALIZED GAIN (LOSS) | |||
| Net realized gain (loss) | (99,209) | (9,235,428) | (7,613,836) |
| Net change in unrealized appreciation (depreciation) | 837,432 | 35,640,130 | 18,448,724 |
| Net Realized and Unrealized Gain (Loss) | 738,223 | 26,404,702 | 10,834,888 |
| Change in Net Assets Resulting from Operations | $ 1,070,585 | $ 40,276,966 | $ 15,627,836 |
| THORNBURG SHORT DURATION MUNICIPAL FUND | THORNBURG LIMITED TERM MUNICIPAL FUND | |||
| Six Months Ended March 31, 2023* | Year Ended September 30, 2022 | Six Months Ended March 31, 2023* | Year Ended September 30, 2022 | |
| INCREASE (DECREASE) IN NET ASSETS FROM | ||||
| OPERATIONS | ||||
| Net investment income (loss) | $ 2,059,339 | $ 1,494,141 | $ 44,344,369 | $ 81,855,713 |
| Net realized gain (loss) | (976,290) | (3,498,912) | (47,342,290) | (134,960,930) |
| Net change in unrealized appreciation (depreciation) | 3,454,390 | (4,388,542) | 143,152,023 | (304,697,072) |
| Net Increase (Decrease) in Net Assets Resulting from Operations | 4,537,439 | (6,393,313) | 140,154,102 | (357,802,289) |
| DIVIDENDS TO SHAREHOLDERS | ||||
| From distributable earnings | ||||
| Class A Shares | (178,650) | (112,895) | (8,170,404) | (13,360,683) |
| Class C Shares | - | - | (822,339) | (1,485,783) |
| Class C2 Shares | - | - | (40,536) | (53,216) |
| Class I Shares | (1,880,736) | (1,381,252) | (35,329,592) | (67,125,973) |
| FUND SHARE TRANSACTIONS | ||||
| Class A Shares | (5,634,270) | 4,479,162 | (81,471,390) | (144,311,223) |
| Class C Shares | - | - | (19,126,164) | (45,234,960) |
| Class C2 Shares | - | - | (553,586) | (293,602) |
| Class I Shares | 6,963,022 | (23,194,614) | (548,473,400) | (990,458,748) |
| Net Increase (Decrease) in Net Assets | 3,806,805 | (26,602,912) | (553,833,309) | (1,620,126,477) |
| NET ASSETS | ||||
| Beginning of Period | 168,973,937 | 195,576,849 | 4,012,952,581 | 5,633,079,058 |
| End of Period | $ 172,780,742 | $ 168,973,937 | $ 3,459,119,272 | $ 4,012,952,581 |
| * | Unaudited. |
| THORNBURG CALIFORNIA LIMITED TERM MUNICIPAL FUND | THORNBURG NEW MEXICO INTERMEDIATE MUNICIPAL FUND | |||
| Six Months Ended March 31, 2023* | Year Ended September 30, 2022 | Six Months Ended March 31, 2023* | Year Ended September 30, 2022 | |
| INCREASE (DECREASE) IN NET ASSETS FROM | ||||
| OPERATIONS | ||||
| Net investment income (loss) | $ 3,838,838 | $ 6,448,964 | $ 1,072,897 | $ 2,202,141 |
| Net realized gain (loss) | (4,880,981) | (6,550,583) | (836,190) | (577,678) |
| Net change in unrealized appreciation (depreciation) | 13,037,209 | (26,787,872) | 4,755,442 | (13,363,891) |
| Net Increase (Decrease) in Net Assets Resulting from Operations | 11,995,066 | (26,889,491) | 4,992,149 | (11,739,428) |
| DIVIDENDS TO SHAREHOLDERS | ||||
| From distributable earnings | ||||
| Class A Shares | (795,022) | (1,196,853) | (434,931) | (911,306) |
| Class C Shares | (44,876) | (80,015) | - | - |
| Class C2 Shares | (1,294) | (1,787) | - | - |
| Class D Shares | - | - | (72,984) | (146,529) |
| Class I Shares | (2,997,646) | (5,172,330) | (564,982) | (1,137,193) |
| FUND SHARE TRANSACTIONS | ||||
| Class A Shares | (7,994,332) | (15,733,474) | (3,670,390) | (10,340,532) |
| Class C Shares | (1,825,311) | (3,035,388) | - | - |
| Class C2 Shares | 11,084 | (6,688) | - | - |
| Class D Shares | - | - | (543,240) | (1,313,907) |
| Class I Shares | (39,976,664) | (64,598,345) | (2,463,249) | (2,243,160) |
| Net Increase (Decrease) in Net Assets | (41,628,995) | (116,714,371) | (2,757,627) | (27,832,055) |
| NET ASSETS | ||||
| Beginning of Period | 361,867,526 | 478,581,897 | 121,447,975 | 149,280,030 |
| End of Period | $ 320,238,531 | $ 361,867,526 | $ 118,690,348 | $ 121,447,975 |
| * | Unaudited. |
| THORNBURG NEW YORK INTERMEDIATE MUNICIPAL FUND | THORNBURG INTERMEDIATE MUNICIPAL FUND | |||
| Six Months Ended March 31, 2023* | Year Ended September 30, 2022 | Six Months Ended March 31, 2023* | Year Ended September 30, 2022 | |
| INCREASE (DECREASE) IN NET ASSETS FROM | ||||
| OPERATIONS | ||||
| Net investment income (loss) | $ 332,362 | $ 777,003 | $ 13,872,264 | $ 23,492,905 |
| Net realized gain (loss) | (99,209) | (504,497) | (9,235,428) | (14,517,395) |
| Net change in unrealized appreciation (depreciation) | 837,432 | (3,062,592) | 35,640,130 | (90,410,124) |
| Net Increase (Decrease) in Net Assets Resulting from Operations | 1,070,585 | (2,790,086) | 40,276,966 | (81,434,614) |
| DIVIDENDS TO SHAREHOLDERS | ||||
| From distributable earnings | ||||
| Class A Shares | (165,630) | (386,248) | (4,105,267) | (7,123,328) |
| Class C Shares | - | - | (264,996) | (575,688) |
| Class C2 Shares | - | - | (18,855) | (34,430) |
| Class I Shares | (166,807) | (390,755) | (9,510,199) | (15,786,512) |
| FUND SHARE TRANSACTIONS | ||||
| Class A Shares | (915,300) | (6,758,106) | 2,260,826 | (22,336,360) |
| Class C Shares | - | - | (3,031,162) | (9,114,503) |
| Class C2 Shares | - | - | 23,316 | (149,000) |
| Class I Shares | (1,895,800) | (4,178,192) | 43,808,615 | (42,613,169) |
| Net Increase (Decrease) in Net Assets | (2,072,952) | (14,503,387) | 69,439,244 | (179,167,604) |
| NET ASSETS | ||||
| Beginning of Period | 29,835,240 | 44,338,627 | 851,561,988 | 1,030,729,592 |
| End of Period | $ 27,762,288 | $ 29,835,240 | $ 921,001,232 | $ 851,561,988 |
| * | Unaudited. |
| THORNBURG STRATEGIC MUNICIPAL INCOME FUND | ||
| Six Months Ended March 31, 2023* | Year Ended September 30, 2022 | |
| INCREASE (DECREASE) IN NET ASSETS FROM | ||
| OPERATIONS | ||
| Net investment income (loss) | $ 4,792,948 | $ 7,973,037 |
| Net realized gain (loss) | (7,613,836) | (10,503,946) |
| Net change in unrealized appreciation (depreciation) | 18,448,724 | (36,267,654) |
| Net Increase (Decrease) in Net Assets Resulting from Operations | 15,627,836 | (38,798,563) |
| DIVIDENDS TO SHAREHOLDERS | ||
| From distributable earnings | ||
| Class A Shares | (929,172) | (1,335,667) |
| Class C Shares | (88,704) | (177,079) |
| Class I Shares | (3,773,033) | (6,466,334) |
| FUND SHARE TRANSACTIONS | ||
| Class A Shares | 6,431,075 | (983,259) |
| Class C Shares | (2,624,148) | (2,031,617) |
| Class I Shares | (5,225,187) | (25,189,694) |
| Net Increase (Decrease) in Net Assets | 9,418,667 | (74,982,213) |
| NET ASSETS | ||
| Beginning of Period | 300,861,775 | 375,843,988 |
| End of Period | $ 310,280,442 | $ 300,861,775 |
| * | Unaudited. |
March 31, 2023 (Unaudited)
March 31, 2023 (Unaudited)
| Class A | Class C | Class C2 | Class D | Class I | |
| Short Duration Municipal Fund | X | X | |||
| Limited Term Municipal Fund | X | X | X | X | |
| Limited Term California Fund | X | X | X | X | |
| Intermediate New Mexico Fund | X | X | X | ||
| Intermediate New York Fund | X | X | |||
| Intermediate Municipal Fund | X | X | X | X | |
| Strategic Municipal Income Fund | X | X | X |
March 31, 2023 (Unaudited)
March 31, 2023 (Unaudited)
| SHORT DURATION MUNICIPAL FUND | TOTAL | LEVEL 1 | LEVEL 2 | LEVEL 3 |
| Assets | ||||
| Investments in Securities | ||||
| Long-Term Municipal Bonds | $ 161,124,461 | $ — | $ 161,124,461 | $ — |
| Short-Term Municipal Bonds | 12,000,000 | — | 12,000,000 | — |
| Total Investments in Securities | $ 173,124,461 | $ — | $ 173,124,461 | $ — |
| Total Assets | $ 173,124,461 | $ — | $ 173,124,461 | $ — |
| LIMITED TERM MUNICIPAL FUND | TOTAL | LEVEL 1 | LEVEL 2 | LEVEL 3 |
| Assets | ||||
| Investments in Securities | ||||
| Long-Term Municipal Bonds | $ 3,259,632,013 | $ — | $ 3,259,632,013 | $ — |
| Short-Term Municipal Bonds | 140,035,000 | — | 140,035,000 | — |
| Total Investments in Securities | $ 3,399,667,013 | $ — | $ 3,399,667,013 | $ — |
| Total Assets | $ 3,399,667,013 | $ — | $ 3,399,667,013 | $ — |
| LIMITED TERM CALIFORNIA FUND | TOTAL | LEVEL 1 | LEVEL 2 | LEVEL 3 |
| Assets | ||||
| Investments in Securities | ||||
| Long-Term Municipal Bonds | $ 300,377,863 | $ — | $ 300,377,863 | $ — |
| Short-Term Municipal Bonds | 11,505,000 | — | 11,505,000 | — |
| Total Investments in Securities | $ 311,882,863 | $ — | $ 311,882,863 | $ — |
| Total Assets | $ 311,882,863 | $ — | $ 311,882,863 | $— |
March 31, 2023 (Unaudited)
| INTERMEDIATE NEW MEXICO FUND | TOTAL | LEVEL 1 | LEVEL 2 | LEVEL 3 |
| Assets | ||||
| Investments in Securities | ||||
| Long-Term Municipal Bonds | $ 111,244,851 | $ — | $ 111,244,851 | $ — |
| Short-Term Municipal Bonds | 6,010,000 | — | 6,010,000 | — |
| Total Investments in Securities | $ 117,254,851 | $ — | $ 117,254,851 | $ — |
| Total Assets | $ 117,254,851 | $ — | $ 117,254,851 | $ — |
| INTERMEDIATE NEW YORK FUND | TOTAL | LEVEL 1 | LEVEL 2 | LEVEL 3 |
| Assets | ||||
| Investments in Securities | ||||
| Long-Term Municipal Bonds | $ 24,514,633 | $ — | $ 24,514,633 | $ — |
| Short-Term Municipal Bonds | 1,750,000 | — | 1,750,000 | — |
| Total Investments in Securities | $ 26,264,633 | $ — | $ 26,264,633 | $ — |
| Total Assets | $ 26,264,633 | $ — | $ 26,264,633 | $ — |
| INTERMEDIATE MUNICIPAL FUND | TOTAL | LEVEL 1 | LEVEL 2 | LEVEL 3 |
| Assets | ||||
| Investments in Securities | ||||
| Long-Term Municipal Bonds | $ 879,019,559 | $ — | $ 879,019,559 | $ — |
| Short-Term Municipal Bonds | 12,175,000 | — | 12,175,000 | — |
| Total Investments in Securities | $ 891,194,559 | $ — | $ 891,194,559 | $ — |
| Total Assets | $ 891,194,559 | $ — | $ 891,194,559 | $ — |
| STRATEGIC MUNICIPAL INCOME FUND | TOTAL | LEVEL 1 | LEVEL 2 | LEVEL 3 |
| Assets | ||||
| Investments in Securities | ||||
| Long-Term Municipal Bonds | $ 290,756,557 | $ — | $ 290,756,557 | $ — |
| Short-Term Municipal Bonds | 16,100,000 | — | 16,100,000 | — |
| Total Investments in Securities | $ 306,856,557 | $ — | $ 306,856,557 | $ — |
| Total Assets | $ 306,856,557 | $ — | $ 306,856,557 | $— |
| SHORT DURATION MUNICIPAL FUND | LIMITED TERM MUNICIPAL FUND, LIMITED TERM CALIFORNIA FUND | INTERMEDIATE NEW MEXICO FUND, INTERMEDIATE NEW YORK FUND, INTERMEDIATE MUNICIPAL FUND | STRATEGIC MUNICIPAL INCOME FUND | ||||
| DAILY NET ASSETS | FEE RATE | DAILY NET ASSETS | FEE RATE | DAILY NET ASSETS | FEE RATE | DAILY NET ASSETS | FEE RATE |
| Up to $1 billion | 0.400% | Up to $500 million | 0.500% | Up to $500 million | 0.500% | Up to $500 million | 0.750% |
| Next $500 million | 0.300 | Next $500 million | 0.400 | Next $500 million | 0.450 | Next $500 million | 0.675 |
| Next $500 million | 0.250 | Next $500 million | 0.300 | Next $500 million | 0.400 | Next $500 million | 0.625 |
| Over $2 billion | 0.225 | Next $500 million | 0.250 | Next $500 million | 0.350 | Next $500 million | 0.575 |
| Over $2 billion | 0.225 | Over $2 billion | 0.275 | Over $2 billion | 0.500 | ||
March 31, 2023 (Unaudited)
| Effective Management Fee | |
| Short Duration Municipal Fund | 0.400% |
| Limited Term Municipal Fund | 0.300 |
| Limited Term California Fund | 0.500 |
| Intermediate New Mexico Fund | 0.500 |
| Intermediate New York Fund | 0.500 |
| Intermediate Municipal Fund | 0.478 |
| Strategic Municipal Income Fund | 0.750 |
| Administrative Services Fee Schedule | |
| Daily Net Assets | Fee Rate |
| Up to $20 billion | 0.100% |
| $20 billion to $40 billion | 0.075 |
| $40 billion to $60 billion | 0.040 |
| Over $60 billion | 0.030 |
| Commissions | CDSC fees | |
| Limited Term Municipal Fund | $ 3,092 | $ 2,692 |
| Limited Term California Fund | 1 | — |
| Intermediate New York Fund | (80) | — |
| Intermediate Municipal Fund | 215 | 1,101 |
| Strategic Municipal Income Fund | 1,603 | 340 |
March 31, 2023 (Unaudited)
| Class A | Class C | Class C2 | Class D | Class I | |
| Short Duration Municipal Fund | 0.70% | —% | —% | —% | 0.50% |
| Limited Term Municipal Fund | — | — | 1.24 | — | — |
| Limited Term California Fund | 0.74 | 1.02 | 1.02 | — | 0.49 |
| Intermediate New Mexico Fund | 0.99 | — | — | 1.24 | 0.67 |
| Intermediate New York Fund | 0.99 | — | — | — | 0.67 |
| Intermediate Municipal Fund | 0.77 | 1.14 | 1.14 | — | 0.53 |
| Strategic Municipal Income Fund | 0.81 | 1.28 | — | — | 0.59 |
| Contractual: | Class A | Class C | Class C2 | Class D | Class I | Total |
| Short Duration Municipal Fund | $ 27,069 | $ — | $ — | $ — | $ 69,414 | $ 96,483 |
| Limited Term Municipal Fund | — | — | 8,066 | — | — | 8,066 |
| Limited Term California Fund | 58,297 | 6,676 | 3,559 | — | 216,756 | 285,288 |
| Intermediate New Mexico Fund | 6,666 | — | — | 2,887 | 18,390 | 27,943 |
| Intermediate New York Fund | 13,568 | — | — | — | 17,323 | 30,891 |
| Intermediate Municipal Fund | 201,143 | 21,829 | 8,885 | — | 416,843 | 648,700 |
| Strategic Municipal Income Fund | 118,807 | 17,219 | — | — | 414,217 | 550,243 |
| Voluntary: | Class A | Class C | Class C2 | Class D | Class I | Total |
| Limited Term California Fund | $ 23,189 | $ 1,359 | $ 45 | $ — | $ 76,142 | $ 100,735 |
| Intermediate New York Fund | 9,737 | — | — | — | 8,612 | 18,349 |
| Strategic Municipal Income Fund | 19,501 | 1,831 | — | — | 71,973 | 93,305 |
| Percentage of Direct Investments | |
| Short Duration Municipal Fund | 67.80% |
| Limited Term Municipal Fund | 4.58 |
| Limited Term California Fund | — |
| Intermediate New Mexico Fund | 16.64 |
| Intermediate New York Fund | — |
| Intermediate Municipal Fund | 0.20 |
| Strategic Municipal Income Fund | 8.73 |
March 31, 2023 (Unaudited)
| Purchases | Sales | Realized gains/(losses) | |
| Short Duration Municipal Fund | $ 20,684,571 | $ 28,934,409 | $ (696,664) |
| Limited Term Municipal Fund | 66,138,214 | 68,835,964 | �� (717,356) |
| Limited Term California Fund | 8,054,488 | 25,181,091 | (1,127,085) |
| Intermediate New Mexico Fund | 5,767,547 | 3,470,187 | (194,083) |
| Intermediate New York Fund | 1,080,229 | 549,151 | (42,337) |
| Intermediate Municipal Fund | 64,658,675 | 14,427,555 | (951,469) |
| Strategic Municipal Income Fund | 5,438,917 | 30,424,284 | (2,749,971) |
| Cost | Unrealized Appreciation | Unrealized Depreciation | Net Unrealized Appreciation (Depreciation) | |
| Short Duration Municipal Fund | $ 173,100,546 | $ 706,772 | $ (682,857) | $ 23,915 |
| Limited Term Municipal Fund | 3,370,917,014 | 42,851,364 | (14,101,365) | 28,749,999 |
| Limited Term California Fund | 310,470,164 | 3,019,066 | (1,606,367) | 1,412,699 |
| Intermediate New Mexico Fund | 118,304,920 | 851,978 | (1,902,047) | (1,050,069) |
| Intermediate New York Fund | 26,196,449 | 302,000 | (233,816) | 68,184 |
| Intermediate Municipal Fund | 876,467,518 | 17,365,996 | (2,638,955) | 14,727,041 |
| Strategic Municipal Income Fund | 305,305,429 | 5,376,663 | (3,825,535) | 1,551,128 |
| Cumulative Capital Losses | ||
| Short-Term | Long-Term | |
| Short Duration Municipal Fund | $ 3,641,028 | $ 2,082,277 |
| Limited Term Municipal Fund | 101,282,956 | 73,185,223 |
| Limited Term California Fund | 5,742,682 | 5,375,665 |
| Intermediate New Mexico Fund | 684,474 | 1,177,996 |
| Intermediate New York Fund | 558,562 | 431,917 |
| Intermediate Municipal Fund | 14,378,401 | 10,141,932 |
| Strategic Municipal Income Fund | 9,328,438 | 2,830,452 |
March 31, 2023 (Unaudited)
| SIX MONTHS ENDED March 31, 2023 | YEAR ENDED September 30, 2022 | |||
| SHORT DURATION MUNICIPAL FUND | SHARES | AMOUNT | SHARES | AMOUNT |
| Class A Shares | ||||
| Shares sold | 612,487 | $ 7,224,038 | 975,910 | $ 11,645,880 |
| Shares issued to shareholders in reinvestment of dividends | 14,373 | 170,644 | 9,210 | 110,214 |
| Shares repurchased | (1,097,621) | (13,028,952) | (606,198) | (7,276,932) |
| Net increase (decrease) | (470,761) | $ (5,634,270) | 378,922 | $ 4,479,162 |
| Class I Shares | ||||
| Shares sold | 5,493,745 | $ 65,122,930 | 2,429,963 | $ 29,269,579 |
| Shares issued to shareholders in reinvestment of dividends | 136,653 | 1,621,807 | 115,191 | 1,381,236 |
| Shares repurchased | (5,040,366) | (59,781,715) | (4,427,949) | (53,845,429) |
| Net increase (decrease) | 590,032 | $ 6,963,022 | (1,882,795) | $ (23,194,614) |
| SIX MONTHS ENDED March 31, 2023 | YEAR ENDED September 30, 2022 | |||
| LIMITED TERM MUNICIPAL FUND | SHARES | AMOUNT | SHARES | AMOUNT |
| Class A Shares | ||||
| Shares sold | 5,227,218 | $ 70,373,463 | 5,797,108 | $ 81,289,680 |
| Shares issued to shareholders in reinvestment of dividends | 552,357 | 7,447,397 | 875,385 | 12,136,291 |
| Shares repurchased | (11,846,286) | (159,292,250) | (17,127,910) | (237,737,194) |
| Net increase (decrease) | (6,066,711) | $ (81,471,390) | (10,455,417) | $ (144,311,223) |
| Class C Shares | ||||
| Shares sold | 310,820 | $ 4,190,380 | 563,525 | $ 7,949,052 |
| Shares issued to shareholders in reinvestment of dividends | 58,280 | 786,956 | 102,454 | 1,423,360 |
| Shares repurchased | (1,789,918) | (24,103,500) | (3,913,035) | (54,607,372) |
| Net increase (decrease) | (1,420,818) | $ (19,126,164) | (3,247,056) | $ (45,234,960) |
| Class C2 Shares | ||||
| Shares sold | 39,091 | $ 523,505 | 53,307 | $ 765,370 |
| Shares issued to shareholders in reinvestment of dividends | 3,001 | 40,536 | 3,845 | 53,211 |
| Shares repurchased | (82,471) | (1,117,627) | (80,465) | (1,112,183) |
| Net increase (decrease) | (40,379) | $ (553,586) | (23,313) | $ (293,602) |
| Class I Shares | ||||
| Shares sold | 48,826,019 | $ 657,471,975 | 94,507,639 | $ 1,312,091,500 |
| Shares issued to shareholders in reinvestment of dividends | 2,393,719 | 32,267,304 | 4,500,680 | 62,501,234 |
| Shares repurchased | (92,197,810) | (1,238,212,679) | (170,819,676) | (2,365,051,482) |
| Net increase (decrease) | (40,978,072) | $ (548,473,400) | (71,811,357) | $ (990,458,748) |
| SIX MONTHS ENDED March 31, 2023 | YEAR ENDED September 30, 2022 | |||
| LIMITED TERM CALIFORNIA FUND | SHARES | AMOUNT | SHARES | AMOUNT |
| Class A Shares | ||||
| Shares sold | 303,862 | $ 3,889,194 | 472,185 | $ 6,236,465 |
| Shares issued to shareholders in reinvestment of dividends | 54,089 | 692,130 | 79,155 | 1,037,091 |
| Shares repurchased | (982,861) | (12,575,656) | (1,745,136) | (23,007,030) |
| Net increase (decrease) | (624,910) | $ (7,994,332) | (1,193,796) | $ (15,733,474) |
March 31, 2023 (Unaudited)
| SIX MONTHS ENDED March 31, 2023 | YEAR ENDED September 30, 2022 | |||
| LIMITED TERM CALIFORNIA FUND | SHARES | AMOUNT | SHARES | AMOUNT |
| Class C Shares | ||||
| Shares sold | 11,678 | $ 148,924 | 63,476 | $ 850,420 |
| Shares issued to shareholders in reinvestment of dividends | 2,880 | 36,865 | 5,128 | 67,292 |
| Shares repurchased | (157,220) | (2,011,100) | (298,997) | (3,953,100) |
| Net increase (decrease) | (142,662) | $ (1,825,311) | (230,393) | $ (3,035,388) |
| Class C2 Shares | ||||
| Shares sold | 789 | $ 9,994 | 16,391 | $ 213,745 |
| Shares issued to shareholders in reinvestment of dividends | 101 | 1,294 | 137 | 1,781 |
| Shares repurchased | (16) | (204) | (17,170) | (222,214) |
| Net increase (decrease) | 874 | $ 11,084 | (642) | $ (6,688) |
| Class I Shares | ||||
| Shares sold | 5,349,362 | $ 68,264,931 | 13,576,399 | $ 177,388,306 |
| Shares issued to shareholders in reinvestment of dividends | 204,033 | 2,613,509 | 330,827 | 4,341,694 |
| Shares repurchased | (8,677,197) | (110,855,104) | (18,811,651) | (246,328,345) |
| Net increase (decrease) | (3,123,802) | $ (39,976,664) | (4,904,425) | $ (64,598,345) |
| SIX MONTHS ENDED March 31, 2023 | YEAR ENDED September 30, 2022 | |||
| INTERMEDIATE NEW MEXICO FUND | SHARES | AMOUNT | SHARES | AMOUNT |
| Class A Shares | ||||
| Shares sold | 58,461 | $ 724,909 | 79,250 | $ 1,025,276 |
| Shares issued to shareholders in reinvestment of dividends | 32,231 | 397,882 | 64,939 | 829,879 |
| Shares repurchased | (391,566) | (4,793,181) | (943,150) | (12,195,687) |
| Net increase (decrease) | (300,874) | $ (3,670,390) | (798,961) | $ (10,340,532) |
| Class D Shares | ||||
| Shares sold | 100 | $ 1,233 | 24,057 | $ 319,190 |
| Shares issued to shareholders in reinvestment of dividends | 5,167 | 63,802 | 10,163 | 129,833 |
| Shares repurchased | (49,586) | (608,275) | (137,795) | (1,762,930) |
| Net increase (decrease) | (44,319) | $ (543,240) | (103,575) | $ (1,313,907) |
| Class I Shares | ||||
| Shares sold | 248,826 | $ 3,084,836 | 418,154 | $ 5,424,025 |
| Shares issued to shareholders in reinvestment of dividends | 42,870 | 528,926 | 83,165 | 1,061,908 |
| Shares repurchased | (494,897) | (6,077,011) | (681,266) | (8,729,093) |
| Net increase (decrease) | (203,201) | $ (2,463,249) | (179,947) | $ (2,243,160) |
| SIX MONTHS ENDED March 31, 2023 | YEAR ENDED September 30, 2022 | |||
| INTERMEDIATE NEW YORK FUND | SHARES | AMOUNT | SHARES | AMOUNT |
| Class A Shares | ||||
| Shares sold | 55,541 | $ 656,737 | 60,466 | $ 754,981 |
| Shares issued to shareholders in reinvestment of dividends | 11,973 | 142,272 | 27,034 | 332,386 |
| Shares repurchased | (145,168) | (1,714,309) | (641,631) | (7,845,473) |
| Net increase (decrease) | (77,654) | $ (915,300) | (554,131) | $ (6,758,106) |
March 31, 2023 (Unaudited)
| SIX MONTHS ENDED March 31, 2023 | YEAR ENDED September 30, 2022 | |||
| INTERMEDIATE NEW YORK FUND | SHARES | AMOUNT | SHARES | AMOUNT |
| Class I Shares | ||||
| Shares sold | 280,191 | $ 3,326,187 | 432,284 | $ 5,255,005 |
| Shares issued to shareholders in reinvestment of dividends | 11,446 | 135,917 | 26,531 | 326,107 |
| Shares repurchased | (454,637) | (5,357,904) | (793,699) | (9,759,304) |
| Net increase (decrease) | (163,000) | $ (1,895,800) | (334,884) | $ (4,178,192) |
| SIX MONTHS ENDED March 31, 2023 | YEAR ENDED September 30, 2022 | |||
| INTERMEDIATE MUNICIPAL FUND | SHARES | AMOUNT | SHARES | AMOUNT |
| Class A Shares | ||||
| Shares sold | 3,983,069 | $ 51,969,601 | 2,771,579 | $ 37,472,279 |
| Shares issued to shareholders in reinvestment of dividends | 284,665 | 3,715,325 | 477,930 | 6,487,897 |
| Shares repurchased | (4,101,230) | (53,424,100) | (4,878,348) | (66,296,536) |
| Net increase (decrease) | 166,504 | $ 2,260,826 | (1,628,839) | $ (22,336,360) |
| Class C Shares | ||||
| Shares sold | 206,750 | $ 2,700,508 | 210,096 | $ 2,891,699 |
| Shares issued to shareholders in reinvestment of dividends | 17,740 | 231,760 | 36,564 | 497,930 |
| Shares repurchased | (458,213) | (5,963,430) | (919,240) | (12,504,132) |
| Net increase (decrease) | (233,723) | $ (3,031,162) | (672,580) | $ (9,114,503) |
| Class C2 Shares | ||||
| Shares sold | 41,998 | $ 551,058 | 17,957 | $ 243,106 |
| Shares issued to shareholders in reinvestment of dividends | 1,443 | 18,855 | 2,533 | 34,418 |
| Shares repurchased | (42,439) | (546,597) | (31,386) | (426,524) |
| Net increase (decrease) | 1,002 | $ 23,316 | (10,896) | $ (149,000) |
| Class I Shares | ||||
| Shares sold | 17,782,236 | $ 231,274,600 | 22,442,021 | $ 300,224,364 |
| Shares issued to shareholders in reinvestment of dividends | 581,212 | 7,578,330 | 962,305 | 13,065,184 |
| Shares repurchased | (14,973,616) | (195,044,315) | (26,450,592) | (355,902,717) |
| Net increase (decrease) | 3,389,832 | $ 43,808,615 | (3,046,266) | $ (42,613,169) |
| SIX MONTHS ENDED March 31, 2023 | YEAR ENDED September 30, 2022 | |||
| STRATEGIC MUNICIPAL INCOME FUND | SHARES | AMOUNT | SHARES | AMOUNT |
| Class A Shares | ||||
| Shares sold | 1,510,206 | $ 20,804,633 | 903,718 | $ 13,143,587 |
| Shares issued to shareholders in reinvestment of dividends | 65,760 | 907,200 | 90,311 | 1,306,251 |
| Shares repurchased | (1,111,516) | (15,280,758) | (1,076,456) | (15,433,097) |
| Net increase (decrease) | 464,450 | $ 6,431,075 | (82,427) | $ (983,259) |
| Class C Shares | ||||
| Shares sold | 65,083 | $ 891,244 | 225,997 | $ 3,341,511 |
| Shares issued to shareholders in reinvestment of dividends | 6,278 | 86,512 | 12,014 | 173,935 |
| Shares repurchased | (261,258) | (3,601,904) | (385,315) | (5,547,063) |
| Net increase (decrease) | (189,897) | $ (2,624,148) | (147,304) | $ (2,031,617) |
March 31, 2023 (Unaudited)
| SIX MONTHS ENDED March 31, 2023 | YEAR ENDED September 30, 2022 | |||
| STRATEGIC MUNICIPAL INCOME FUND | SHARES | AMOUNT | SHARES | AMOUNT |
| Class I Shares | ||||
| Shares sold | 6,705,374 | $ 91,969,675 | 13,498,846 | $ 193,988,220 |
| Shares issued to shareholders in reinvestment of dividends | 272,934 | 3,766,661 | 445,270 | 6,452,588 |
| Shares repurchased | (7,372,604) | (100,961,523) | (15,748,721) | (225,630,502) |
| Net increase (decrease) | (394,296) | $ (5,225,187) | (1,804,605) | $ (25,189,694) |
| Purchases | Sales | |
| Short Duration Municipal Fund | $ 42,097,650 | $ 51,557,322 |
| Limited Term Municipal Fund | 511,658,434 | 1,156,132,390 |
| Limited Term California Fund | 44,109,960 | 93,376,853 |
| Intermediate New Mexico Fund | 8,490,913 | 18,155,614 |
| Intermediate New York Fund | 2,269,028 | 4,894,600 |
| Intermediate Municipal Fund | 196,303,313 | 147,382,844 |
| Strategic Municipal Income Fund | 63,863,866 | 72,773,626 |
Short Duration Municipal Fund
| PER SHARE PERFORMANCE (FOR A SHARE OUTSTANDING THROUGHOUT THE PERIOD) | |||||||||
| UNLESS OTHERWISE NOTED, PERIODS ARE FISCAL YEARS ENDED SEPTEMBER 30, | Net Asset Value, Beginning of PERIOD | Net Investment Income (Loss)+ | Net Realized & Unrealized Gain (Loss) on Investments | Total from Investment Operations | Dividends from Net Investment Income | Dividends from Net Realized Gains | Dividends from Return of Capital | Total Dividends | Net Asset Value, End of PERIOD |
| CLASS A SHARES(b) | |||||||||
| 2023 (c) | $ 11.77 | 0.12 | 0.17 | 0.29 | (0.12) | — | — | (0.12) | $ 11.94 |
| 2022 | $ 12.33 | 0.09 | (0.57) | (0.48) | (0.08) | — | — | (0.08) | $ 11.77 |
| 2021 | $ 12.37 | 0.03 | (0.04) | (0.01) | (0.03) | — | — | (0.03) | $ 12.33 |
| 2020 | $ 12.36 | 0.13 | 0.01 | 0.14 | (0.13) | — | — | (0.13) | $ 12.37 |
| 2019 | $ 12.27 | 0.16 | 0.09 | 0.25 | (0.16) | — | — | (0.16) | $ 12.36 |
| 2018 | $ 12.38 | 0.11 | (0.11) | — (e) | (0.11) | — | — | (0.11) | $ 12.27 |
| CLASS I SHARES | |||||||||
| 2023 (c) | $ 11.76 | 0.13 | 0.17 | 0.30 | (0.13) | — | — | (0.13) | $ 11.93 |
| 2022 | $ 12.33 | 0.11 | (0.57) | (0.46) | (0.11) | — | — | (0.11) | $ 11.76 |
| 2021 | $ 12.36 | 0.06 | (0.03) | 0.03 | (0.06) | — | — | (0.06) | $ 12.33 |
| 2020 | $ 12.36 | 0.16 | (0.01) | 0.15 | (0.15) | — | — | (0.15) | $ 12.36 |
| 2019 | $ 12.27 | 0.18 | 0.09 | 0.27 | (0.18) | — | — | (0.18) | $ 12.36 |
| 2018 | $ 12.37 | 0.14 | (0.10) | 0.04 | (0.14) | — | — | (0.14) | $ 12.27 |
| (a) | Not annualized for periods less than one year. |
| (b) | Sales loads are not reflected in computing total return. |
| (c) | Unaudited Six Month Period Ended March 31. |
| (d) | Annualized. |
| (e) | Total from investment operations was less than $0.01 per share. |
| + | Based on weighted average shares outstanding. |
Short Duration Municipal Fund
| RATIOS TO AVERAGE NET ASSETS | Supplemental Data | ||||||
| UNLESS OTHERWISE NOTED, PERIODS ARE FISCAL YEARS ENDED SEPTEMBER 30, | Net Investment Income (Loss) (%) | Expenses, After Expense Reductions (%) | Expenses, Before Expense Reductions (%) | Total Return (%)(a) | Portfolio Turnover Rate (%)(a) | Net Assets at End of PERIOD (Thousands) | |
| CLASS A SHARES(b) | |||||||
| 2023 (c) | 1.98 (d) | 0.70 (d) | 1.00 (d) | 2.47 | 28.47 | $ 14,708 | |
| 2022 | 0.71 | 0.70 | 1.10 | (3.88) | 89.01 | $ 20,045 | |
| 2021 | 0.27 | 0.70 | 0.98 | (0.05) | 34.71 | $ 16,332 | |
| 2020 | 1.04 | 0.70 | 1.03 | 1.14 | 38.44 | $ 24,581 | |
| 2019 | 1.26 | 0.70 | 0.99 | 2.02 | 33.60 | $ 16,899 | |
| 2018 | 0.92 | 0.70 | 1.06 | 0.02 | 35.36 | $ 19,497 | |
| CLASS I SHARES | |||||||
| 2023 (c) | 2.23 (d) | 0.50 (d) | 0.58 (d) | 2.57 | 28.47 | $ 158,073 | |
| 2022 | 0.88 | 0.50 | 0.58 | (3.77) | 89.01 | $ 148,929 | |
| 2021 | 0.46 | 0.50 | 0.65 | 0.23 | 34.71 | $ 179,245 | |
| 2020 | 1.28 | 0.50 | 0.65 | 1.26 | 38.44 | $ 132,539 | |
| 2019 | 1.47 | 0.50 | 0.64 | 2.22 | 33.60 | $ 224,343 | |
| 2018 | 1.12 | 0.50 | 0.64 | 0.30 | 35.36 | $ 162,259 | |
Limited Term Municipal Fund
| PER SHARE PERFORMANCE (FOR A SHARE OUTSTANDING THROUGHOUT THE PERIOD) | |||||||||
| UNLESS OTHERWISE NOTED, PERIODS ARE FISCAL YEARS ENDED SEPTEMBER 30, | Net Asset Value, Beginning of PERIOD | Net Investment Income (Loss)+ | Net Realized & Unrealized Gain (Loss) on Investments | Total from Investment Operations | Dividends from Net Investment Income | Dividends from Net Realized Gains | Dividends from Return of Capital | Total Dividends | Net Asset Value, End of PERIOD |
| CLASS A SHARES(b) | |||||||||
| 2023 (c) | $ 13.26 | 0.15 | 0.35 | 0.50 | (0.15) | — | — | (0.15) | $ 13.61 |
| 2022 | $ 14.51 | 0.21 | (1.25) | (1.04) | (0.21) | — | — | (0.21) | $ 13.26 |
| 2021 | $ 14.64 | 0.19 | (0.13) | 0.06 | (0.19) | — | — | (0.19) | $ 14.51 |
| 2020 | $ 14.46 | 0.24 | 0.18 | 0.42 | (0.24) | — | — | (0.24) | $ 14.64 |
| 2019 | $ 14.10 | 0.26 | 0.36 | 0.62 | (0.26) | — | — | (0.26) | $ 14.46 |
| 2018 | $ 14.43 | 0.24 | (0.33) | (0.09) | (0.24) | — | — | (0.24) | $ 14.10 |
| CLASS C SHARES | |||||||||
| 2023 (c) | $ 13.28 | 0.14 | 0.35 | 0.49 | (0.14) | — | — | (0.14) | $ 13.63 |
| 2022 | $ 14.53 | 0.17 | (1.24) | (1.07) | (0.18) | — | — | (0.18) | $ 13.28 |
| 2021 | $ 14.66 | 0.15 | (0.13) | 0.02 | (0.15) | — | — | (0.15) | $ 14.53 |
| 2020 | $ 14.48 | 0.20 | 0.18 | 0.38 | (0.20) | — | — | (0.20) | $ 14.66 |
| 2019 | $ 14.12 | 0.22 | 0.36 | 0.58 | (0.22) | — | — | (0.22) | $ 14.48 |
| 2018 | $ 14.46 | 0.20 | (0.34) | (0.14) | (0.20) | — | — | (0.20) | $ 14.12 |
| CLASS C2 SHARES | |||||||||
| 2023 (c) | $ 13.28 | 0.12 | 0.36 | 0.48 | (0.12) | — | — | (0.12) | $ 13.64 |
| 2022 | $ 14.54 | 0.14 | (1.26) | (1.12) | (0.14) | — | — | (0.14) | $ 13.28 |
| 2021 (e) | $ 14.66 | 0.10 | (0.12) | (0.02) | (0.10) | — | — | (0.10) | $ 14.54 |
| CLASS I SHARES | |||||||||
| 2023 (c) | $ 13.26 | 0.17 | 0.35 | 0.52 | (0.17) | — | — | (0.17) | $ 13.61 |
| 2022 | $ 14.51 | 0.24 | (1.25) | (1.01) | (0.24) | — | — | (0.24) | $ 13.26 |
| 2021 | $ 14.64 | 0.22 | (0.13) | 0.09 | (0.22) | — | — | (0.22) | $ 14.51 |
| 2020 | $ 14.46 | 0.27 | 0.18 | 0.45 | (0.27) | — | — | (0.27) | $ 14.64 |
| 2019 | $ 14.10 | 0.29 | 0.36 | 0.65 | (0.29) | — | — | (0.29) | $ 14.46 |
| 2018 | $ 14.43 | 0.28 | (0.33) | (0.05) | (0.28) | — | — | (0.28) | $ 14.10 |
| (a) | Not annualized for periods less than one year. |
| (b) | Sales loads are not reflected in computing total return. |
| (c) | Unaudited Six Month Period Ended March 31. |
| (d) | Annualized. |
| (e) | Effective date of this class of shares was October 1, 2020. |
| + | Based on weighted average shares outstanding. |
Limited Term Municipal Fund
| RATIOS TO AVERAGE NET ASSETS | Supplemental Data | ||||||
| UNLESS OTHERWISE NOTED, PERIODS ARE FISCAL YEARS ENDED SEPTEMBER 30, | Net Investment Income (Loss) (%) | Expenses, After Expense Reductions (%) | Expenses, Before Expense Reductions (%) | Total Return (%)(a) | Portfolio Turnover Rate (%)(a) | Net Assets at End of PERIOD (Thousands) | |
| CLASS A SHARES(b) | |||||||
| 2023 (c) | 2.28 (d) | 0.74 (d) | 0.74 (d) | 3.81 | 14.90 | $ 692,684 | |
| 2022 | 1.51 | 0.71 | 0.71 | (7.20) | 37.69 | $ 755,222 | |
| 2021 | 1.28 | 0.69 | 0.69 | 0.39 | 22.29 | $ 978,221 | |
| 2020 | 1.63 | 0.69 | 0.69 | 2.91 | 20.62 | $ 942,857 | |
| 2019 | 1.80 | 0.69 | 0.69 | 4.41 | 21.22 | $ 915,684 | |
| 2018 | 1.67 | 0.71 | 0.71 | (0.64) | 16.29 | $ 1,037,769 | |
| CLASS C SHARES | |||||||
| 2023 (c) | 2.03 (d) | 0.98 (d) | 0.98 (d) | 3.68 | 14.90 | $ 74,061 | |
| 2022 | 1.23 | 0.97 | 0.97 | (7.43) | 37.69 | $ 91,018 | |
| 2021 | 1.00 | 0.97 | 0.97 | 0.11 | 22.29 | $ 146,806 | |
| 2020 | 1.39 | 0.94 | 0.94 | 2.65 | 20.62 | $ 231,226 | |
| 2019 | 1.56 | 0.94 | 0.94 | 4.16 | 21.22 | $ 325,144 | |
| 2018 | 1.43 | 0.95 | 0.95 | (0.94) | 16.29 | $ 450,402 | |
| CLASS C2 SHARES | |||||||
| 2023 (c) | 1.77 (d) | 1.24 (d) | 1.59 (d) | 3.62 | 14.90 | $ 4,269 | |
| 2022 | 0.99 | 1.24 | 1.48 | (7.74) | 37.69 | $ 4,695 | |
| 2021 (e) | 0.69 | 1.24 | 1.72 | (0.11) | 22.29 | $ 5,477 | |
| CLASS I SHARES | |||||||
| 2023 (c) | 2.49 (d) | 0.51 (d) | 0.51 (d) | 3.93 | 14.90 | $ 2,688,105 | |
| 2022 | 1.72 | 0.48 | 0.48 | (6.99) | 37.69 | $ 3,162,018 | |
| 2021 | 1.50 | 0.46 | 0.46 | 0.61 | 22.29 | $ 4,502,575 | |
| 2020 | 1.87 | 0.46 | 0.46 | 3.15 | 20.62 | $ 4,566,389 | |
| 2019 | 2.04 | 0.45 | 0.45 | 4.67 | 21.22 | $ 4,893,865 | |
| 2018 | 1.95 | 0.43 | 0.43 | (0.36) | 16.29 | $ 5,089,760 | |
Limited Term California Fund
| PER SHARE PERFORMANCE (FOR A SHARE OUTSTANDING THROUGHOUT THE PERIOD) | |||||||||
| UNLESS OTHERWISE NOTED, PERIODS ARE FISCAL YEARS ENDED SEPTEMBER 30, | Net Asset Value, Beginning of PERIOD | Net Investment Income (Loss)+ | Net Realized & Unrealized Gain (Loss) on Investments | Total from Investment Operations | Dividends from Net Investment Income | Dividends from Net Realized Gains | Dividends from Return of Capital | Total Dividends | Net Asset Value, End of PERIOD |
| CLASS A SHARES(b) | |||||||||
| 2023 (c) | $ 12.61 | 0.13 | 0.31 | 0.44 | (0.14) | — | — | (0.14) | $ 12.91 |
| 2022 | $ 13.66 | 0.17 | (1.04) | (0.87) | (0.18) | — | — | (0.18) | $ 12.61 |
| 2021 | $ 13.80 | 0.15 | (0.14) | 0.01 | (0.15) | — | — | (0.15) | $ 13.66 |
| 2020 | $ 13.72 | 0.18 | 0.08 | 0.26 | (0.18) | — | — | (0.18) | $ 13.80 |
| 2019 | $ 13.45 | 0.22 | 0.27 | 0.49 | (0.22) | — | — | (0.22) | $ 13.72 |
| 2018 | $ 13.78 | 0.20 | (0.33) | (0.13) | (0.20) | — | — | (0.20) | $ 13.45 |
| CLASS C SHARES | |||||||||
| 2023 (c) | $ 12.62 | 0.12 | 0.30 | 0.42 | (0.12) | — | — | (0.12) | $ 12.92 |
| 2022 | $ 13.67 | 0.13 | (1.04) | (0.91) | (0.14) | — | — | (0.14) | $ 12.62 |
| 2021 | $ 13.81 | 0.11 | (0.14) | (0.03) | (0.11) | — | — | (0.11) | $ 13.67 |
| 2020 | $ 13.73 | 0.15 | 0.07 | 0.22 | (0.14) | — | — | (0.14) | $ 13.81 |
| 2019 | $ 13.46 | 0.18 | 0.27 | 0.45 | (0.18) | — | — | (0.18) | $ 13.73 |
| 2018 | $ 13.79 | 0.17 | (0.33) | (0.16) | (0.17) | — | — | (0.17) | $ 13.46 |
| CLASS C2 SHARES | |||||||||
| 2023 (c) | $ 12.61 | 0.12 | 0.31 | 0.43 | (0.12) | — | — | (0.12) | $ 12.92 |
| 2022 | $ 13.67 | 0.14 | (1.06) | (0.92) | (0.14) | — | — | (0.14) | $ 12.61 |
| 2021 (f) | $ 13.81 | 0.11 | (0.13) | (0.02) | (0.12) | — | — | (0.12) | $ 13.67 |
| CLASS I SHARES | |||||||||
| 2023 (c) | $ 12.62 | 0.15 | 0.30 | 0.45 | (0.15) | — | — | (0.15) | $ 12.92 |
| 2022 | $ 13.67 | 0.21 | (1.05) | (0.84) | (0.21) | — | — | (0.21) | $ 12.62 |
| 2021 | $ 13.82 | 0.19 | (0.15) | 0.04 | (0.19) | — | — | (0.19) | $ 13.67 |
| 2020 | $ 13.73 | 0.21 | 0.10 | 0.31 | (0.22) | — | — | (0.22) | $ 13.82 |
| 2019 | $ 13.46 | 0.25 | 0.27 | 0.52 | (0.25) | — | — | (0.25) | $ 13.73 |
| 2018 | $ 13.79 | 0.24 | (0.33) | (0.09) | (0.24) | — | — | (0.24) | $ 13.46 |
| (a) | Not annualized for periods less than one year. |
| (b) | Sales loads are not reflected in computing total return. |
| (c) | Unaudited Six Month Period Ended March 31. |
| (d) | Annualized. |
| (e) | Due to the size of net assets and fixed expenses, ratios may appear disproportionate. |
| (f) | Effective date of this class of shares was October 1, 2020. |
| + | Based on weighted average shares outstanding. |
Limited Term California Fund
| RATIOS TO AVERAGE NET ASSETS | Supplemental Data | ||||||
| UNLESS OTHERWISE NOTED, PERIODS ARE FISCAL YEARS ENDED SEPTEMBER 30, | Net Investment Income (Loss) (%) | Expenses, After Expense Reductions (%) | Expenses, Before Expense Reductions (%) | Total Return (%)(a) | Portfolio Turnover Rate (%)(a) | Net Assets at End of PERIOD (Thousands) | |
| CLASS A SHARES(b) | |||||||
| 2023 (c) | 2.11 (d) | 0.74 (d) | 0.96 (d) | 3.46 | 14.00 | $ 72,865 | |
| 2022 | 1.32 | 0.74 | 0.95 | (6.44) | 41.92 | $ 79,046 | |
| 2021 | 1.11 | 0.74 | 0.92 | 0.10 | 16.22 | $ 101,949 | |
| 2020 | 1.33 | 0.80 | 0.92 | 1.93 | 25.88 | $ 109,102 | |
| 2019 | 1.58 | 0.93 | 0.93 | 3.63 | 17.86 | $ 113,635 | |
| 2018 | 1.50 | 0.92 | 0.92 | (0.92) | 25.20 | $ 127,346 | |
| CLASS C SHARES | |||||||
| 2023 (c) | 1.82 (d) | 1.02 (d) | 1.35 (d) | 3.32 | 14.00 | $ 4,275 | |
| 2022 | 1.02 | 1.02 | 1.31 | (6.70) | 41.92 | $ 5,976 | |
| 2021 | 0.82 | 1.02 | 1.27 | (0.19) | 16.22 | $ 9,623 | |
| 2020 | 1.06 | 1.09 | 1.20 | 1.64 | 25.88 | $ 17,573 | |
| 2019 | 1.31 | 1.21 | 1.21 | 3.34 | 17.86 | $ 28,083 | |
| 2018 | 1.23 | 1.19 | 1.19 | (1.18) | 25.20 | $ 40,608 | |
| CLASS C2 SHARES | |||||||
| 2023 (c) | 1.85 (d) | 1.02 (d) | 6.15 (e) | 3.40 | 14.00 | $ 144 | |
| 2022 | 1.05 | 1.02 | 4.46 (e) | (6.78) | 41.92 | $ 129 | |
| 2021 (f) | 0.84 | 1.02 | 6.50 (e) | (0.18) | 16.22 | $ 149 | |
| CLASS I SHARES | |||||||
| 2023 (c) | 2.35 (d) | 0.49 (d) | 0.72 (d) | 3.59 | 14.00 | $ 242,955 | |
| 2022 | 1.56 | 0.49 | 0.71 | (6.20) | 41.92 | $ 276,717 | |
| 2021 | 1.35 | 0.49 | 0.70 | 0.27 | 16.22 | $ 366,861 | |
| 2020 | 1.56 | 0.54 | 0.69 | 2.25 | 25.88 | $ 449,964 | |
| 2019 | 1.84 | 0.67 | 0.68 | 3.90 | 17.86 | $ 350,962 | |
| 2018 | 1.76 | 0.66 | 0.67 | (0.65) | 25.20 | $ 368,824 | |
Intermediate New Mexico Fund
| PER SHARE PERFORMANCE (FOR A SHARE OUTSTANDING THROUGHOUT THE PERIOD) | |||||||||
| UNLESS OTHERWISE NOTED, PERIODS ARE FISCAL YEARS ENDED SEPTEMBER 30, | Net Asset Value, Beginning of PERIOD | Net Investment Income (Loss)+ | Net Realized & Unrealized Gain (Loss) on Investments | Total from Investment Operations | Dividends from Net Investment Income | Dividends from Net Realized Gains | Dividends from Return of Capital | Total Dividends | Net Asset Value, End of PERIOD |
| CLASS A SHARES(b) | |||||||||
| 2023 (c) | $ 12.08 | 0.10 | 0.41 | 0.51 | (0.10) | — | — | (0.10) | $ 12.49 |
| 2022 | $ 13.40 | 0.19 | (1.32) | (1.13) | (0.19) | — | — | (0.19) | $ 12.08 |
| 2021 | $ 13.48 | 0.20 | (0.09) | 0.11 | (0.19) | — | — | (0.19) | $ 13.40 |
| 2020 | $ 13.35 | 0.24 | 0.14 | 0.38 | (0.25) | — | — | (0.25) | $ 13.48 |
| 2019 | $ 13.00 | 0.31 | 0.35 | 0.66 | (0.31) | — | — | (0.31) | $ 13.35 |
| 2018 | $ 13.30 | 0.33 | (0.30) | 0.03 | (0.33) | — | — | (0.33) | $ 13.00 |
| CLASS D SHARES | |||||||||
| 2023 (c) | $ 12.08 | 0.09 | 0.41 | 0.50 | (0.09) | — | — | (0.09) | $ 12.49 |
| 2022 | $ 13.41 | 0.16 | (1.33) | (1.17) | (0.16) | — | — | (0.16) | $ 12.08 |
| 2021 | $ 13.49 | 0.16 | (0.08) | 0.08 | (0.16) | — | — | (0.16) | $ 13.41 |
| 2020 | $ 13.36 | 0.21 | 0.13 | 0.34 | (0.21) | — | — | (0.21) | $ 13.49 |
| 2019 | $ 13.01 | 0.28 | 0.35 | 0.63 | (0.28) | — | — | (0.28) | $ 13.36 |
| 2018 | $ 13.31 | 0.30 | (0.30) | — | (0.30) | — | — | (0.30) | $ 13.01 |
| CLASS I SHARES | |||||||||
| 2023 (c) | $ 12.07 | 0.12 | 0.41 | 0.53 | (0.12) | — | — | (0.12) | $ 12.48 |
| 2022 | $ 13.40 | 0.23 | (1.33) | (1.10) | (0.23) | — | — | (0.23) | $ 12.07 |
| 2021 | $ 13.47 | 0.24 | (0.07) | 0.17 | (0.24) | — | — | (0.24) | $ 13.40 |
| 2020 | $ 13.34 | 0.29 | 0.13 | 0.42 | (0.29) | — | — | (0.29) | $ 13.47 |
| 2019 | $ 13.00 | 0.35 | 0.34 | 0.69 | (0.35) | — | — | (0.35) | $ 13.34 |
| 2018 | $ 13.29 | 0.37 | (0.29) | 0.08 | (0.37) | — | — | (0.37) | $ 13.00 |
| (a) | Not annualized for periods less than one year. |
| (b) | Sales loads are not reflected in computing total return. |
| (c) | Unaudited Six Month Period Ended March 31. |
| (d) | Annualized. |
| + | Based on weighted average shares outstanding. |
Intermediate New Mexico Fund
| RATIOS TO AVERAGE NET ASSETS | Supplemental Data | ||||||
| UNLESS OTHERWISE NOTED, PERIODS ARE FISCAL YEARS ENDED SEPTEMBER 30, | Net Investment Income (Loss) (%) | Expenses, After Expense Reductions (%) | Expenses, Before Expense Reductions (%) | Total Return (%)(a) | Portfolio Turnover Rate (%)(a) | Net Assets at End of PERIOD (Thousands) | |
| CLASS A SHARES(b) | |||||||
| 2023 (c) | 1.68 (d) | 0.99 (d) | 1.02 (d) | 4.26 | 7.67 | $ 51,519 | |
| 2022 | 1.50 | 0.99 | 1.01 | (8.49) | 8.83 | $ 53,476 | |
| 2021 | 1.46 | 0.98 | 0.98 | 0.85 | 7.43 | $ 70,051 | |
| 2020 | 1.83 | 0.98 | 0.98 | 2.84 | 22.92 | $ 80,463 | |
| 2019 | 2.37 | 0.97 | 0.97 | 5.15 | 17.26 | $ 84,782 | |
| 2018 | 2.51 | 0.97 | 0.97 | 0.24 | 7.77 | $ 94,686 | |
| CLASS D SHARES | |||||||
| 2023 (c) | 1.43 (d) | 1.24 (d) | 1.30 (d) | 4.13 | 7.67 | $ 10,184 | |
| 2022 | 1.25 | 1.24 | 1.29 | (8.78) | 8.83 | $ 10,388 | |
| 2021 | 1.20 | 1.24 | 1.29 | 0.59 | 7.43 | $ 12,917 | |
| 2020 | 1.57 | 1.24 | 1.26 | 2.58 | 22.92 | $ 14,475 | |
| 2019 | 2.10 | 1.24 | 1.25 | 4.87 | 17.26 | $ 15,888 | |
| 2018 | 2.26 | 1.23 | 1.23 | (0.02) | 7.77 | $ 18,436 | |
| CLASS I SHARES | |||||||
| 2023 (c) | 2.00 (d) | 0.67 (d) | 0.74 (d) | 4.43 | 7.67 | $ 56,987 | |
| 2022 | 1.82 | 0.67 | 0.73 | (8.27) | 8.83 | $ 57,584 | |
| 2021 | 1.77 | 0.67 | 0.71 | 1.24 | 7.43 | $ 66,312 | |
| 2020 | 2.13 | 0.67 | 0.71 | 3.16 | 22.92 | $ 65,715 | |
| 2019 | 2.66 | 0.67 | 0.69 | 5.39 | 17.26 | $ 62,162 | |
| 2018 | 2.82 | 0.67 | 0.68 | 0.62 | 7.77 | $ 53,675 | |
Intermediate New York Fund
| PER SHARE PERFORMANCE (FOR A SHARE OUTSTANDING THROUGHOUT THE PERIOD) | |||||||||
| UNLESS OTHERWISE NOTED, PERIODS ARE FISCAL YEARS ENDED SEPTEMBER 30, | Net Asset Value, Beginning of PERIOD | Net Investment Income (Loss)+ | Net Realized & Unrealized Gain (Loss) on Investments | Total from Investment Operations | Dividends from Net Investment Income | Dividends from Net Realized Gains | Dividends from Return of Capital | Total Dividends | Net Asset Value, End of PERIOD |
| CLASS A SHARES(b) | |||||||||
| 2023 (c) | $ 11.68 | 0.13 | 0.32 | 0.45 | (0.13) | — | — | (0.13) | $ 12.00 |
| 2022 | $ 12.88 | 0.25 | (1.20) | (0.95) | (0.25) | — | — | (0.25) | $ 11.68 |
| 2021 | $ 12.96 | 0.23 | (0.07) | 0.16 | (0.24) | — | — | (0.24) | $ 12.88 |
| 2020 | $ 12.95 | 0.26 | 0.01 | 0.27 | (0.26) | — | — | (0.26) | $ 12.96 |
| 2019 | $ 12.61 | 0.30 | 0.34 | 0.64 | (0.30) | — | — | (0.30) | $ 12.95 |
| 2018 | $ 13.00 | 0.30 | (0.39) | (0.09) | (0.30) | — | — | (0.30) | $ 12.61 |
| CLASS I SHARES | |||||||||
| 2023 (c) | $ 11.68 | 0.15 | 0.32 | 0.47 | (0.15) | — | — | (0.15) | $ 12.00 |
| 2022 | $ 12.88 | 0.28 | (1.19) | (0.91) | (0.29) | — | — | (0.29) | $ 11.68 |
| 2021 | $ 12.96 | 0.27 | (0.07) | 0.20 | (0.28) | — | — | (0.28) | $ 12.88 |
| 2020 | $ 12.95 | 0.30 | 0.01 | 0.31 | (0.30) | — | — | (0.30) | $ 12.96 |
| 2019 | $ 12.61 | 0.34 | 0.34 | 0.68 | (0.34) | — | — | (0.34) | $ 12.95 |
| 2018 | $ 13.00 | 0.34 | (0.39) | (0.05) | (0.34) | — | — | (0.34) | $ 12.61 |
| (a) | Not annualized for periods less than one year. |
| (b) | Sales loads are not reflected in computing total return. |
| (c) | Unaudited Six Month Period Ended March 31. |
| (d) | Annualized. |
| + | Based on weighted average shares outstanding. |
Intermediate New York Fund
| RATIOS TO AVERAGE NET ASSETS | Supplemental Data | ||||||
| UNLESS OTHERWISE NOTED, PERIODS ARE FISCAL YEARS ENDED SEPTEMBER 30, | Net Investment Income (Loss) (%) | Expenses, After Expense Reductions (%) | Expenses, Before Expense Reductions (%) | Total Return (%)(a) | Portfolio Turnover Rate (%)(a) | Net Assets at End of PERIOD (Thousands) | |
| CLASS A SHARES(b) | |||||||
| 2023 (c) | 2.24 (d) | 0.99 (d) | 1.31 (d) | 3.89 | 8.80 | $ 14,676 | |
| 2022 | 1.98 | 0.99 | 1.22 | (7.48) | 6.02 | $ 15,193 | |
| 2021 | 1.77 | 0.99 | 1.14 | 1.20 | 11.29 | $ 23,885 | |
| 2020 | 2.01 | 0.99 | 1.14 | 2.10 | 18.61 | $ 27,120 | |
| 2019 | 2.38 | 0.99 | 1.12 | 5.16 | 17.75 | $ 26,416 | |
| 2018 | 2.36 | 0.99 | 1.08 | (0.68) | 15.88 | $ 33,778 | |
| CLASS I SHARES | |||||||
| 2023 (c) | 2.56 (d) | 0.67 (d) | 1.07 (d) | 4.06 | 8.80 | $ 13,086 | |
| 2022 | 2.30 | 0.67 | 0.98 | (7.18) | 6.02 | $ 14,642 | |
| 2021 | 2.09 | 0.67 | 0.93 | 1.52 | 11.29 | $ 20,454 | |
| 2020 | 2.33 | 0.67 | 0.91 | 2.43 | 18.61 | $ 21,197 | |
| 2019 | 2.69 | 0.67 | 0.88 | 5.50 | 17.75 | $ 24,550 | |
| 2018 | 2.68 | 0.67 | 0.82 | (0.36) | 15.88 | $ 24,010 | |
Intermediate Municipal Fund
| PER SHARE PERFORMANCE (FOR A SHARE OUTSTANDING THROUGHOUT THE PERIOD) | |||||||||
| UNLESS OTHERWISE NOTED, PERIODS ARE FISCAL YEARS ENDED SEPTEMBER 30, | Net Asset Value, Beginning of PERIOD | Net Investment Income (Loss)+ | Net Realized & Unrealized Gain (Loss) on Investments | Total from Investment Operations | Dividends from Net Investment Income | Dividends from Net Realized Gains | Dividends from Return of Capital | Total Dividends | Net Asset Value, End of PERIOD |
| CLASS A SHARES(b) | |||||||||
| 2023 (c) | $ 12.82 | 0.19 | 0.38 | 0.57 | (0.19) | — | — | (0.19) | $ 13.20 |
| 2022 | $ 14.35 | 0.32 | (1.52) | (1.20) | (0.33) | — | — | (0.33) | $ 12.82 |
| 2021 | $ 14.37 | 0.33 | (0.02) | 0.31 | (0.33) | — | — | (0.33) | $ 14.35 |
| 2020 | $ 14.33 | 0.35 | 0.04 | 0.39 | (0.35) | — | — | (0.35) | $ 14.37 |
| 2019 | $ 13.80 | 0.34 | 0.53 | 0.87 | (0.34) | — | — | (0.34) | $ 14.33 |
| 2018 | $ 14.15 | 0.32 | (0.35) | (0.03) | (0.32) | — | — | (0.32) | $ 13.80 |
| CLASS C SHARES | |||||||||
| 2023 (c) | $ 12.83 | 0.17 | 0.39 | 0.56 | (0.17) | — | — | (0.17) | $ 13.22 |
| 2022 | $ 14.37 | 0.27 | (1.54) | (1.27) | (0.27) | — | — | (0.27) | $ 12.83 |
| 2021 | $ 14.39 | 0.27 | (0.01) | 0.26 | (0.28) | — | — | (0.28) | $ 14.37 |
| 2020 | $ 14.35 | 0.30 | 0.04 | 0.34 | (0.30) | — | — | (0.30) | $ 14.39 |
| 2019 | $ 13.82 | 0.29 | 0.53 | 0.82 | (0.29) | — | — | (0.29) | $ 14.35 |
| 2018 | $ 14.17 | 0.27 | (0.35) | (0.08) | (0.27) | — | — | (0.27) | $ 13.82 |
| CLASS C2 SHARES | |||||||||
| 2023 (c) | $ 12.83 | 0.17 | 0.39 | 0.56 | (0.17) | — | — | (0.17) | $ 13.22 |
| 2022 | $ 14.37 | 0.27 | (1.54) | (1.27) | (0.27) | — | — | (0.27) | $ 12.83 |
| 2021 (e) | $ 14.39 | 0.27 | (0.02) | 0.25 | (0.27) | — | — | (0.27) | $ 14.37 |
| CLASS I SHARES | |||||||||
| 2023 (c) | $ 12.80 | 0.21 | 0.38 | 0.59 | (0.21) | — | — | (0.21) | $ 13.18 |
| 2022 | $ 14.34 | 0.36 | (1.54) | (1.18) | (0.36) | — | — | (0.36) | $ 12.80 |
| 2021 | $ 14.35 | 0.36 | (0.01) | 0.35 | (0.36) | — | — | (0.36) | $ 14.34 |
| 2020 | $ 14.31 | 0.38 | 0.04 | 0.42 | (0.38) | — | — | (0.38) | $ 14.35 |
| 2019 | $ 13.78 | 0.38 | 0.53 | 0.91 | (0.38) | — | — | (0.38) | $ 14.31 |
| 2018 | $ 14.13 | 0.36 | (0.35) | 0.01 | (0.36) | — | — | (0.36) | $ 13.78 |
| (a) | Not annualized for periods less than one year. |
| (b) | Sales loads are not reflected in computing total return. |
| (c) | Unaudited Six Month Period Ended March 31. |
| (d) | Annualized. |
| (e) | Effective date of this class of shares was October 1, 2020. |
| + | Based on weighted average shares outstanding. |
Intermediate Municipal Fund
| RATIOS TO AVERAGE NET ASSETS | Supplemental Data | ||||||
| UNLESS OTHERWISE NOTED, PERIODS ARE FISCAL YEARS ENDED SEPTEMBER 30, | Net Investment Income (Loss) (%) | Expenses, After Expense Reductions (%) | Expenses, Before Expense Reductions (%) | Total Return (%)(a) | Portfolio Turnover Rate (%)(a) | Net Assets at End of PERIOD (Thousands) | |
| CLASS A SHARES(b) | |||||||
| 2023 (c) | 2.96 (d) | 0.77 (d) | 0.92 (d) | 4.50 | 17.84 | $ 282,498 | |
| 2022 | 2.37 | 0.77 | 0.91 | (8.50) | 19.48 | $ 272,111 | |
| 2021 | 2.26 | 0.77 | 0.91 | 2.16 | 10.20 | $ 328,170 | |
| 2020 | 2.45 | 0.81 | 0.90 | 2.76 | 17.84 | $ 326,770 | |
| 2019 | 2.44 | 0.89 | 0.89 | 6.39 | 15.88 | $ 313,967 | |
| 2018 | 2.29 | 0.89 | 0.89 | (0.21) | 20.68 | $ 324,199 | |
| CLASS C SHARES | |||||||
| 2023 (c) | 2.59 (d) | 1.14 (d) | 1.35 (d) | 4.38 | 17.84 | $ 19,606 | |
| 2022 | 1.98 | 1.14 | 1.33 | (8.89) | 19.48 | $ 22,032 | |
| 2021 | 1.89 | 1.14 | 1.30 | 1.78 | 10.20 | $ 34,344 | |
| 2020 | 2.08 | 1.18 | 1.28 | 2.38 | 17.84 | $ 52,996 | |
| 2019 | 2.08 | 1.24 | 1.26 | 6.02 | 15.88 | $ 76,994 | |
| 2018 | 1.94 | 1.24 | 1.26 | (0.55) | 20.68 | $ 104,093 | |
| CLASS C2 SHARES | |||||||
| 2023 (c) | 2.61 (d) | 1.14 (d) | 2.37 (d) | 4.38 | 17.84 | $ 1,580 | |
| 2022 | 2.00 | 1.14 | 2.07 | (8.89) | 19.48 | $ 1,521 | |
| 2021 (e) | 1.85 | 1.14 | 2.62 | 1.76 | 10.20 | $ 1,860 | |
| CLASS I SHARES | |||||||
| 2023 (c) | 3.20 (d) | 0.53 (d) | 0.67 (d) | 4.63 | 17.84 | $ 617,317 | |
| 2022 | 2.60 | 0.53 | 0.67 | (8.36) | 19.48 | $ 555,898 | |
| 2021 | 2.50 | 0.53 | 0.67 | 2.47 | 10.20 | $ 666,356 | |
| 2020 | 2.69 | 0.56 | 0.65 | 3.01 | 17.84 | $ 668,185 | |
| 2019 | 2.67 | 0.65 | 0.65 | 6.66 | 15.88 | $ 730,144 | |
| 2018 | 2.55 | 0.63 | 0.63 | 0.05 | 20.68 | $ 905,641 | |
Strategic Municipal Income Fund
| PER SHARE PERFORMANCE (FOR A SHARE OUTSTANDING THROUGHOUT THE PERIOD) | |||||||||
| UNLESS OTHERWISE NOTED, PERIODS ARE FISCAL YEARS ENDED SEPTEMBER 30, | Net Asset Value, Beginning of PERIOD | Net Investment Income (Loss)+ | Net Realized & Unrealized Gain (Loss) on Investments | Total from Investment Operations | Dividends from Net Investment Income | Dividends from Net Realized Gains | Dividends from Return of Capital | Total Dividends | Net Asset Value, End of PERIOD |
| CLASS A SHARES(b) | |||||||||
| 2023 (c) | $ 13.48 | 0.21 | 0.50 | 0.71 | (0.21) | — | — | (0.21) | $ 13.98 |
| 2022 | $ 15.43 | 0.31 | (1.95) | (1.64) | (0.31) | — | — | (0.31) | $ 13.48 |
| 2021 | $ 15.33 | 0.30 | 0.10 | 0.40 | (0.30) | — | — | (0.30) | $ 15.43 |
| 2020 | $ 15.32 | 0.38 | 0.01 | 0.39 | (0.38) | — | — | (0.38) | $ 15.33 |
| 2019 | $ 14.82 | 0.39 | 0.50 | 0.89 | (0.39) | — | — | (0.39) | $ 15.32 |
| 2018 | $ 15.14 | 0.37 | (0.32) | 0.05 | (0.37) | — | — | (0.37) | $ 14.82 |
| CLASS C SHARES | |||||||||
| 2023 (c) | $ 13.49 | 0.18 | 0.50 | 0.68 | (0.18) | — | — | (0.18) | $ 13.99 |
| 2022 | $ 15.45 | 0.24 | (1.96) | (1.72) | (0.24) | — | — | (0.24) | $ 13.49 |
| 2021 | $ 15.34 | 0.23 | 0.11 | 0.34 | (0.23) | — | — | (0.23) | $ 15.45 |
| 2020 | $ 15.34 | 0.30 | — (e) | 0.30 | (0.30) | — | — | (0.30) | $ 15.34 |
| 2019 | $ 14.84 | 0.32 | 0.50 | 0.82 | (0.32) | — | — | (0.32) | $ 15.34 |
| 2018 | $ 15.16 | 0.30 | (0.32) | (0.02) | (0.30) | — | — | (0.30) | $ 14.84 |
| CLASS I SHARES | |||||||||
| 2023 (c) | $ 13.49 | 0.22 | 0.50 | 0.72 | (0.22) | — | — | (0.22) | $ 13.99 |
| 2022 | $ 15.45 | 0.34 | (1.96) | (1.62) | (0.34) | — | — | (0.34) | $ 13.49 |
| 2021 | $ 15.34 | 0.34 | 0.11 | 0.45 | (0.34) | — | — | (0.34) | $ 15.45 |
| 2020 | $ 15.33 | 0.41 | 0.01 | 0.42 | (0.41) | — | — | (0.41) | $ 15.34 |
| 2019 | $ 14.84 | 0.42 | 0.49 | 0.91 | (0.42) | — | — | (0.42) | $ 15.33 |
| 2018 | $ 15.16 | 0.41 | (0.32) | 0.09 | (0.41) | — | — | (0.41) | $ 14.84 |
| (a) | Not annualized for periods less than one year. |
| (b) | Sales loads are not reflected in computing total return. |
| (c) | Unaudited Six Month Period Ended March 31. |
| (d) | Annualized. |
| (e) | Net realized and unrealized gain (loss) on investments was less than $0.01 per share. |
| + | Based on weighted average shares outstanding. |
Strategic Municipal Income Fund
| RATIOS TO AVERAGE NET ASSETS | Supplemental Data | ||||||
| UNLESS OTHERWISE NOTED, PERIODS ARE FISCAL YEARS ENDED SEPTEMBER 30, | Net Investment Income (Loss) (%) | Expenses, After Expense Reductions (%) | Expenses, Before Expense Reductions (%) | Total Return (%)(a) | Portfolio Turnover Rate (%)(a) | Net Assets at End of PERIOD (Thousands) | |
| CLASS A SHARES(b) | |||||||
| 2023 (c) | 3.04 (d) | 0.81 (d) | 1.26 (d) | 5.29 | 22.73 | $ 64,412 | |
| 2022 | 2.12 | 0.81 | 1.27 | (10.73) | 46.24 | $ 55,859 | |
| 2021 | 1.96 | 0.81 | 1.26 | 2.65 | 10.43 | $ 65,220 | |
| 2020 | 2.47 | 0.87 | 1.26 | 2.56 | 32.45 | $ 61,537 | |
| 2019 | 2.59 | 1.00 | 1.26 | 6.08 | 20.04 | $ 56,124 | |
| 2018 | 2.49 | 1.00 | 1.28 | 0.36 | 21.06 | $ 53,693 | |
| CLASS C SHARES | |||||||
| 2023 (c) | 2.55 (d) | 1.28 (d) | 1.83 (d) | 5.04 | 22.73 | $ 5,927 | |
| 2022 | 1.64 | 1.28 | 1.77 | (11.20) | 46.24 | $ 8,278 | |
| 2021 | 1.50 | 1.28 | 1.71 | 2.24 | 10.43 | $ 11,753 | |
| 2020 | 2.00 | 1.35 | 1.65 | 2.02 | 32.45 | $ 15,591 | |
| 2019 | 2.13 | 1.47 | 1.65 | 5.58 | 20.04 | $ 20,085 | |
| 2018 | 2.01 | 1.48 | 1.64 | (0.12) | 21.06 | $ 24,951 | |
| CLASS I SHARES | |||||||
| 2023 (c) | 3.26 (d) | 0.59 (d) | 1.01 (d) | 5.40 | 22.73 | $ 239,941 | |
| 2022 | 2.33 | 0.59 | 0.99 | (10.59) | 46.24 | $ 236,725 | |
| 2021 | 2.17 | 0.59 | 0.97 | 2.94 | 10.43 | $ 298,871 | |
| 2020 | 2.68 | 0.65 | 0.99 | 2.79 | 32.45 | $ 225,486 | |
| 2019 | 2.81 | 0.78 | 0.98 | 6.24 | 20.04 | $ 219,535 | |
| 2018 | 2.72 | 0.78 | 0.96 | 0.59 | 21.06 | $ 185,555 | |
March 31, 2023 (Unaudited)
| (1) | transaction costs, including |
| (a) | sales charges (loads) on purchase payments, for Class A shares; |
| (b) | a deferred sales charge on redemptions of any part or all of a purchase of $1 million of Class A shares within 12 months of purchase; |
| (c) | a deferred sales charge on redemptions of Class C and Class C2 shares within 12 months of purchase; |
| (2) | ongoing costs, including management fees; distribution and/or service (12b-1) fees; and other Fund expenses. |
| Actual | Hypothetical * | |||||
| Ending Account Value 3/31/23 | Expenses Paid During Period 10/1/22-3/31/23 | Ending Account Value 3/31/23 | Expenses Paid During Period† 10/1/22-3/31/23 | Annualized Expense Ratio | ||
| SHORT DURATION MUNICIPAL FUND | ||||||
| CLASS A SHARES | $1,024.69 | $3.53 | $1,021.44 | $3.53 | 0.70% | |
| CLASS I SHARES | $1,025.74 | $2.53 | $1,022.44 | $2.52 | 0.50% | |
| LIMITED TERM MUNICIPAL FUND | ||||||
| CLASS A SHARES | $1,038.12 | $3.76 | $1,021.24 | $3.73 | 0.74% | |
| CLASS C SHARES | $1,036.83 | $4.98 | $1,020.04 | $4.94 | 0.98% | |
| CLASS C2 SHARES | $1,036.24 | $6.30 | $1,018.75 | $6.24 | 1.24% | |
| CLASS I SHARES | $1,039.28 | $2.59 | $1,022.39 | $2.57 | 0.51% | |
| LIMITED TERM CALIFORNIA FUND | ||||||
| CLASS A SHARES | $1,034.64 | $3.75 | $1,021.24 | $3.73 | 0.74% | |
| CLASS C SHARES | $1,033.18 | $5.17 | $1,019.85 | $5.14 | 1.02% | |
| CLASS C2 SHARES | $1,034.01 | $5.17 | $1,019.85 | $5.14 | 1.02% | |
| CLASS I SHARES | $1,035.90 | $2.49 | $1,022.49 | $2.47 | 0.49% | |
| INTERMEDIATE NEW MEXICO FUND | ||||||
| CLASS A SHARES | $1,042.61 | $5.04 | $1,020.00 | $4.99 | 0.99% | |
| CLASS D SHARES | $1,041.31 | $6.31 | $1,018.75 | $6.24 | 1.24% | |
| CLASS I SHARES | $1,044.30 | $3.41 | $1,021.59 | $3.38 | 0.67% | |
| INTERMEDIATE NEW YORK FUND | ||||||
| CLASS A SHARES | $1,038.94 | $5.03 | $1,020.00 | $4.99 | 0.99% | |
| CLASS I SHARES | $1,040.59 | $3.41 | $1,021.59 | $3.38 | 0.67% | |
March 31, 2023 (Unaudited)
| Actual | Hypothetical * | |||||
| Ending Account Value 3/31/23 | Expenses Paid During Period 10/1/22-3/31/23 | Ending Account Value 3/31/23 | Expenses Paid During Period† 10/1/22-3/31/23 | Annualized Expense Ratio | ||
| INTERMEDIATE MUNICIPAL FUND | ||||||
| CLASS A SHARES | $1,044.97 | $3.93 | $1,021.09 | $3.88 | 0.77% | |
| CLASS C SHARES | $1,043.81 | $5.81 | $1,019.25 | $5.74 | 1.14% | |
| CLASS C2 SHARES | $1,043.83 | $5.81 | $1,019.25 | $5.74 | 1.14% | |
| CLASS I SHARES | $1,046.26 | $2.70 | $1,022.29 | $2.67 | 0.53% | |
| STRATEGIC MUNICIPAL INCOME FUND | ||||||
| CLASS A SHARES | $1,052.89 | $4.15 | $1,020.89 | $4.08 | 0.81% | |
| CLASS C SHARES | $1,050.40 | $6.54 | $1,018.55 | $6.44 | 1.28% | |
| CLASS I SHARES | $1,054.01 | $3.02 | $1,021.99 | $2.97 | 0.59% | |
| * | Hypothetical assumes a rate of return of 5% per year before expenses. |
| † | Expenses are equal to the annualized expense ratio for each class multiplied by the average account value over the period, multiplied by 182/365 to reflect the one-half year period. |
March 31, 2023 (Unaudited)
| ■ | Thornburg Global Opportunities Fund |
| ■ | Thornburg International Equity Fund |
| ■ | Thornburg Better World International Fund |
| ■ | Thornburg International Growth Fund |
| ■ | Thornburg Developing World Fund |
| ■ | Thornburg Small/Mid Cap Core Fund |
| ■ | Thornburg Small/Mid Cap Growth Fund |
| ■ | Thornburg Investment Income Builder Fund |
| ■ | Thornburg Income Builder Opportunities Trust |
| ■ | Thornburg Summit Fund |
| ■ | Thornburg Limited Term U.S. Government Fund |
| ■ | Thornburg Limited Term Income Fund |
| ■ | Thornburg Ultra Short Income Fund |
| ■ | Thornburg Strategic Income Fund |
| ■ | Thornburg Short Duration Municipal Fund |
| ■ | Thornburg Limited Term Municipal Fund |
| ■ | Thornburg California Limited Term Municipal Fund |
| ■ | Thornburg New Mexico Intermediate Municipal Fund |
| ■ | Thornburg New York Intermediate Municipal Fund |
| ■ | Thornburg Intermediate Municipal Fund |
| ■ | Thornburg Strategic Municipal Income Fund |


| 800.847.0200 | TH4626 |

| THORNBURG CAPITAL MANAGEMENT FUND |

At Thornburg, we believe unconstrained investing leads to better outcomes for our clients. Our investment solutions are highly active, high conviction, and benchmark agnostic. When it comes to finding economic opportunity for clients, it’s more than what we do.
It’s how we do it. Active As bottom-up, fundamental, active managers, we look beyond conventional benchmarks. Long Term We take a long-term view in how we manage our firm and our portfolios. Benchmark Agnostic Investment strategies should have the flexibility to pursue solutions for clients, not stay within the conventional confines of benchmarks. Flexible Perspective Our approach to portfolio construction is guided by our convictions rather than convention. High Conviction We focus our attention and capital on thoroughly researched, well-understood positions. The best form of risk management is to know what you own, and why. Repeatable & Robust Our long-term outperformance of benchmarks verifies that our process works and outperforms conventional thinking. Independent We are independently owned and far from the herd of other investment managers. Investment Driven All members of the investment team are resources for all of our strategies. Collaborative Our team collaborates on opportunities across geography, sector, or asset class.
2 Semi-Annual Report
| 4 | |
| 5 | |
| 5 | |
| 6 | |
| 9 | |
| 10 | |
| 11 | |
| 12 | |
| 16 | |
| 18 | |
| 19 | |
| 20 |
| SHARE CLASS | NASDAQ SYMBOL | CUSIP |
| Class I | N/A | 885-216-739 |
Thornburg Capital Management Fund | March 31, 2023 (Unaudited)
 | |
| Jason Brady, cfa Portfolio Manager CEO, President, and Managing Director |
Fund Overview
| • | The Fund generated positive total returns and outpaced its benchmark, the FTSE 1-Month Treasury Bill Local Currency Index (the “Index), during the trailing 6-month reporting period ended March 31, 2023. |
| • | Over the reporting period, the Fund accomplished its goal of "safety of capital" by maintaining a share price of $10.00 that has not fluctuated since the Fund’s inception. |
| • | A rising interest rate environment on the front end of the yield curve provided a backdrop to deliver robust yields during the period. |
| • | As of March 31, 2023, the Fund has matched or outperformed its benchmark for all standard time periods since inception and has never suffered a default on any cash equivalent investment. |
| 1-YR | 3-YR | 5-YR | SINCE INCEPTION | |
| Class I Shares (Incep: 7/31/15) | 3.07% | 1.15% | 1.57% | 1.30% |
| FTSE 1-Month Treasury Bill Local Currency Index (Since 7/31/15) | 2.57% | 0.89% | 1.35% | 1.06% |
| Annualized Distribution Yield | 4.94% |
| SEC Yield | 5.20% |
| FINAL VALUE |
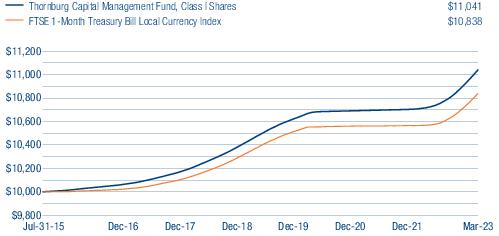
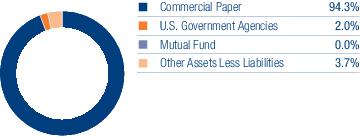
Thornburg Capital Management Fund | March 31, 2023 (Unaudited)
| ISSUER-DESCRIPTION | Shares/Principal Amount | VALUE | |
| U.S. Government Agencies — 2.0% | |||
| Federal Home Loan Bank Discount Notes, | |||
| 3.439% due 4/12/2023 | $ 400,000 | $ 399,550 | |
| 3.906% due 4/20/2023 | 100,000 | 99,787 | |
| 3.828% due 4/18/2023 | 1,500,000 | 1,497,185 | |
| 4.023% due 4/24/2023 | 1,300,000 | 1,296,586 | |
| Tennessee Valley Authority Discount Notes, 3.439% due 4/12/2023 | 19,770,000 | 19,747,733 | |
| Total U.S. Government Agencies (Cost $23,040,841) | ��� | 23,040,841 | |
| Commercial Paper — 94.3% | |||
| a | Alabama Power Co., 5.13% due 4/11/2023 | 20,000,000 | 19,971,945 |
| Ameren Corp., 4.987% due 4/3/2023 | 12,000,000 | 11,996,733 | |
| Ameren Illinois Co., | |||
| 5.285% due 4/10/2023 | 6,000,000 | 5,992,200 | |
| 5.447% due 4/24/2023 | 2,000,000 | 1,993,164 | |
| American Honda Finance Corp., | |||
| 5.632% due 4/18/2023 | 12,000,000 | 11,968,663 | |
| 5.312% due 4/21/2023 | 2,000,000 | 1,994,200 | |
| a | Amphenol Corp., 4.869% due 4/3/2023 | 20,000,000 | 19,994,667 |
| Arizona Public Service Co., | |||
| 5.072% due 4/3/2023 | 20,000,000 | 19,994,445 | |
| 5.07% due 4/4/2023 | 20,000,000 | 19,997,222 | |
| AutoZone, Inc., | |||
| a | 5.177% due 4/4/2023 | 4,000,000 | 3,998,300 |
| a | 5.026% due 4/11/2023 | 16,000,000 | 15,978,000 |
| Avangrid, Inc., | |||
| a | 5.084% due 4/4/2023 | 1,000,000 | 999,583 |
| a | 5.188% due 4/5/2023 | 17,000,000 | 16,990,367 |
| a | 5.285% due 4/13/2023 | 2,000,000 | 1,996,533 |
| Baltimore Gas & Electric Co., 5.267% due 4/12/2023 | 18,000,000 | 17,971,510 | |
| a,b | Bell Canada, 4.937% due 4/5/2023 | 12,000,000 | 11,993,533 |
| a | Berkshire Hathaway Energy Co., 5.237% due 4/19/2023 | 20,000,000 | 19,948,500 |
| a | Brown-Forman Corp., 5.139% due 4/24/2023 | 15,000,000 | 14,951,604 |
| Canadian National Railway Co., | |||
| a,b | 4.762% due 4/5/2023 | 5,418,000 | 5,415,183 |
| a,b | 4.782% due 4/5/2023 | 13,000,000 | 12,993,211 |
| a,b | 4.847% due 4/13/2023 | 1,000,000 | 998,410 |
| a | Cargill, Inc., 4.833% due 4/10/2023 | 20,000,000 | 19,976,200 |
| Caterpillar Financial Services Corp., 4.885% due 4/28/2023 | 19,000,000 | 18,931,600 | |
| CenterPoint Energy, Inc., | |||
| a | 5.072% due 4/3/2023 | 15,000,000 | 14,995,833 |
| a | 5.07% due 4/4/2023 | 15,000,000 | 14,997,917 |
| a | 5.339% due 4/20/2023 | 5,000,000 | 4,986,146 |
| Cintas Corp. No. 2, | |||
| a | 5.072% due 4/3/2023 | 12,000,000 | 11,996,667 |
| a | 5.07% due 4/4/2023 | 12,000,000 | 11,998,333 |
| a | 4.982% due 4/5/2023 | 8,000,000 | 7,995,644 |
| Clorox Co., | |||
| a | 5.159% due 4/5/2023 | 750,000 | 749,577 |
| a | 5.127% due 4/10/2023 | 1,877,000 | 1,874,630 |
| Commonwealth Edison Co., | |||
| a | 5.125% due 4/3/2023 | 20,000,000 | 19,994,389 |
| a | 5.019% due 4/4/2023 | 20,000,000 | 19,997,250 |
| a | Consolidated Edison Co. of New York, Inc., 5.345% due 4/24/2023 | 10,000,000 | 9,966,458 |
| Dollar General Corp., | |||
| a | 4.985% due 4/3/2023 | 5,000,000 | 4,998,639 |
| a | 4.986% due 4/3/2023 | 12,000,000 | 11,996,733 |
| a | 5.232% due 4/10/2023 | 700,000 | 699,099 |
| a | 5.084% due 4/17/2023 | 3,000,000 | 2,993,333 |
| Dominion Energy South Carolina, Inc., | |||
| 5.083% due 4/3/2023 | 1,000,000 | 999,722 | |
| 5.084% due 4/3/2023 | 1,000,000 | 999,722 |
| 6 | Semi-Annual Report | See notes to financial statements. |
| ISSUER-DESCRIPTION | Shares/Principal Amount | VALUE | |
| 5.429% due 4/4/2023 | $ 1,000,000 | $ 999,555 | |
| 5.333% due 4/10/2023 | 17,000,000 | 16,977,688 | |
| a | Dover Corp., 5.177% due 4/4/2023 | 20,000,000 | 19,991,500 |
| Duke Energy Corp., | |||
| a | 5.146% due 4/4/2023 | 2,000,000 | 1,999,155 |
| a | 5.505% due 4/3/2023 | 18,000,000 | 17,994,580 |
| Electricite de France SA, | |||
| a,b | 5.375% due 4/5/2023 | 18,000,000 | 17,989,420 |
| a,b | 5.332% due 4/11/2023 | 2,000,000 | 1,997,083 |
| Emerson Electric Co., | |||
| a | 4.782% due 4/3/2023 | 2,500,000 | 2,499,347 |
| a | 4.886% due 4/12/2023 | 14,000,000 | 13,979,467 |
| Entergy Corp., | |||
| a | 5.173% due 4/3/2023 | 2,000,000 | 1,999,433 |
| a | 4.937% due 4/4/2023 | 12,000,000 | 11,995,150 |
| a | 5.291% due 4/10/2023 | 6,000,000 | 5,992,200 |
| Evergy Metro, Inc., | |||
| a | 5.176% due 4/4/2023 | 6,000,000 | 5,997,450 |
| a | 5.188% due 4/20/2023 | 2,000,000 | 1,994,617 |
| a | 5.191% due 4/20/2023 | 10,000,000 | 9,973,083 |
| Evergy Missouri West, Inc., | |||
| a | 5.145% due 4/4/2023 | 1,000,000 | 999,578 |
| a | 5.338% due 4/4/2023 | 1,000,000 | 999,563 |
| Exelon Corp., | |||
| a | 5.021% due 4/3/2023 | 10,000,000 | 9,997,250 |
| a | 5.019% due 4/4/2023 | 20,000,000 | 19,997,250 |
| a | General Mills, Inc., 5.574% due 4/10/2023 | 1,000,000 | 998,630 |
| a | GlaxoSmithKline LLC, 4.935% due 4/26/2023 | 20,000,000 | 19,932,639 |
| Hitachi America Capital Ltd., | |||
| a | 5.178% due 4/6/2023 | 2,000,000 | 1,998,583 |
| a | 5.231% due 4/6/2023 | 18,000,000 | 17,987,125 |
| a | HP, Inc., 5.345% due 4/24/2023 | 20,000,000 | 19,932,917 |
| McCormick & Co., Inc., | |||
| a | 5.294% due 4/25/2023 | 2,000,000 | 1,993,067 |
| a | 5.316% due 4/28/2023 | 18,000,000 | 17,929,530 |
| Mercedes-Benz Finance North America LLC, | |||
| a | 5.079% due 4/10/2023 | 2,000,000 | 1,997,500 |
| a | 5.394% due 4/17/2023 | 10,000,000 | 9,976,444 |
| Mondelez International, Inc., | |||
| a | 5.387% due 4/3/2023 | 2,000,000 | 1,999,411 |
| a | 5.07% due 4/12/2023 | 10,000,000 | 9,984,783 |
| a | 5.14% due 4/12/2023 | 3,000,000 | 2,995,371 |
| NSTAR Electric Co., 4.799% due 4/5/2023 | 20,000,000 | 19,989,489 | |
| a | Oglethorpe Power Corp., 5.806% due 4/18/2023 | 18,000,000 | 17,951,550 |
| ONE Gas, Inc., | |||
| a | 5.43% due 4/3/2023 | 12,000,000 | 11,996,433 |
| a | 5.798% due 4/10/2023 | 8,000,000 | 7,988,600 |
| a | Oracle Corp., 5.11% due 4/13/2023 | 18,000,000 | 17,969,880 |
| a | PECO Energy Co., 5.074% due 4/6/2023 | 20,000,000 | 19,986,111 |
| Peoples Gas Light & Coke Co., 5.082% due 4/3/2023 | 20,000,000 | 19,994,433 | |
| Philip Morris International, Inc., | |||
| a | 5.084% due 4/17/2023 | 2,000,000 | 1,995,556 |
| a | 5.118% due 4/17/2023 | 16,000,000 | 15,964,231 |
| a | 5.17% due 4/17/2023 | 2,268,000 | 2,262,879 |
| PPG Industries, Inc., 5.60% due 4/13/2023 | 18,000,000 | 17,967,000 | |
| a | Public Service Co. of Colorado, 5.139% due 4/10/2023 | 14,000,000 | 13,982,325 |
| a,b | Reckitt Benckiser Treasury Services plc, 5.602% due 4/19/2023 | 18,000,000 | 17,950,500 |
| Ryder System, Inc., 5.447% due 4/26/2023 | 20,000,000 | 19,925,695 | |
| a | Sempra Energy, 5.091% due 4/5/2023 | 20,000,000 | 19,994,422 |
| a | Southern California Gas Co., 4.803% due 4/11/2023 | 1,981,000 | 1,978,397 |
| a | Southern Co. Gas Capital Corp., 5.704% due 4/21/2023 | 2,000,000 | 1,993,778 |
| a | Spire, Inc., 5.186% due 4/4/2023 | 17,000,000 | 16,992,775 |
| a | Stanley Black & Decker, Inc., 5.806% due 4/19/2023 | 17,000,000 | 16,951,550 |
| See notes to financial statements. | Semi-Annual Report | 7 |
Thornburg Capital Management Fund | March 31, 2023 (Unaudited)
| ISSUER-DESCRIPTION | Shares/Principal Amount | VALUE | |
| a,b | TotalEnergies Capital Canada Ltd., 4.896% due 4/11/2023 | $20,000,000 | $ 19,973,222 |
| Tyson Foods, Inc., | |||
| a | 5.487% due 4/4/2023 | 10,000,000 | 9,995,500 |
| a | 5.136% due 4/6/2023 | 3,000,000 | 2,997,896 |
| Union Electric Co., 5.397% due 4/27/2023 | 20,000,000 | 19,923,445 | |
| a | Walt Disney Co., 4.98% due 4/14/2023 | 7,500,000 | 7,486,729 |
| a | Waste Management, Inc., 5.19% due 4/10/2023 | 17,000,000 | 16,978,325 |
| WEC Energy Group, Inc., | |||
| a | 5.286% due 4/10/2023 | 18,000,000 | 17,976,600 |
| a | 5.29% due 4/19/2023 | 2,000,000 | 1,994,800 |
| Wisconsin Gas Co., | |||
| 4.97% due 4/3/2023 | 5,000,000 | 4,998,639 | |
| 5.022% due 4/4/2023 | 15,000,000 | 14,993,813 | |
| Wisconsin Power & Light Co., 5.074% due 4/3/2023 | 20,000,000 | 19,994,445 | |
| Total Commercial Paper (Cost $1,092,534,252) | 1,092,534,252 | ||
| Mutual Fund — 0.0% | |||
| c | State Street Institutional Treasury Money Market Fund Premier Class, 4.53% | 284,816 | 284,816 |
| Total Mutual Fund (Cost $284,816) | 284,816 | ||
| Total Investments — 96.3% (Cost $1,115,859,909) | $1,115,859,909 | ||
| Other Assets Less Liabilities — 3.7% | 42,515,475 | ||
| Net Assets — 100.0% | $1,158,375,384 |
| Footnote Legend | |
| a | Securities exempt from registration under Rule 144A of the Securities Act of 1933, as amended. These securities are restricted but liquid and may only be resold in the ordinary course of business in transactions exempt from registration, normally to qualified institutional buyers. As of March 31, 2023, the aggregate value of these securities in the Fund’s portfolio was $823,930,869, representing 71.13% of the Fund’s net assets. |
| b | Yankee bond denominated in U.S. dollars and is issued in the U.S. by foreign banks and corporations. |
| c | Rate represents the money market fund annualized seven-day yield at March 31, 2023. |
| 8 | Semi-Annual Report | See notes to financial statements. |
Thornburg Capital Management Fund | March 31, 2023 (Unaudited)
| ASSETS | |
| Investment in securities, at cost | $ 1,115,859,909 |
| Investments at value | 1,115,859,909 |
| Cash | 149,076,825 |
| Dividends receivable | 3,814 |
| Principal and interest receivable | 499,670 |
| Prepaid expenses and other assets | 6,433 |
| Total Assets | 1,265,446,651 |
| Liabilities | |
| Payable for investments purchased | 106,982,394 |
| Accounts payable and accrued expenses | 88,873 |
| Total Liabilities | 107,071,267 |
| Net Assets | $ 1,158,375,384 |
| NET ASSETS CONSIST OF | |
| Net capital paid in on shares of beneficial interest | $ 1,158,335,550 |
| Distributable earnings | 39,834 |
| Net Assets | $ 1,158,375,384 |
| NET ASSET VALUE | |
| Class I Shares: | |
| Net assets applicable to shares outstanding | $ 1,158,375,384 |
| Shares outstanding | 115,835,925 |
| Net asset value and redemption price per share | $ 10.00 |
Thornburg Capital Management Fund | Six Months Ended March 31, 2023 (Unaudited)
| INVESTMENT INCOME | |
| Interest income | $ 29,310,157 |
| Dividend income | 43,931 |
| Total Income | 29,354,088 |
| EXPENSES | |
| Transfer agent fees | 2,360 |
| Custodian fees | 51,111 |
| Professional fees | 14,635 |
| Officer fees | 6,427 |
| Other expenses | 10,298 |
| Total Expenses | 84,831 |
| Net Investment Income (Loss) | $ 29,269,257 |
| REALIZED AND UNREALIZED GAIN (LOSS) | |
| Net realized gain (loss) | 17,687 |
| Net Realized and Unrealized Gain (Loss) | 17,687 |
| Change in Net Assets Resulting from Operations | $ 29,286,944 |
Thornburg Capital Management Fund
| Six Months Ended March 31, 2023* | Year Ended September 30, 2022 | |
| INCREASE (DECREASE) IN NET ASSETS FROM | ||
| OPERATIONS | ||
| Net investment income | $ 29,269,257 | $ 16,891,756 |
| Net realized gain (loss) on investments | 17,687 | 9,153 |
| Net Increase (Decrease) in Net Assets Resulting from Operations | 29,286,944 | 16,900,909 |
| DIVIDENDS TO SHAREHOLDERS | ||
| From distributable earnings | ||
| Class I Shares | (29,499,421) | (16,654,159) |
| FUND SHARE TRANSACTIONS | ||
| Class I Shares | (370,314,988) | (531,456,557) |
| Net Increase (Decrease) in Net Assets | (370,527,465) | (531,209,807) |
| NET ASSETS | ||
| Beginning of Period | 1,528,902,849 | 2,060,112,656 |
| End of Period | $ 1,158,375,384 | $ 1,528,902,849 |
| * | Unaudited. |
Thornburg Capital Management Fund | March 31, 2023 (Unaudited)
Thornburg Capital Management Fund | March 31, 2023 (Unaudited)
| TOTAL | LEVEL 1 | LEVEL 2 | LEVEL 3 | |
| Assets | ||||
| Investments in Securities | ||||
| Commercial Paper | $ 1,092,534,252 | $ — | $ 1,092,534,252 | $ — |
| Mutual Fund | 284,816 | 284,816 | — | — |
| U.S. Government Agencies | 23,040,841 | — | 23,040,841 | — |
| Total Investments in Securities | $ 1,115,859,909 | $ 284,816 | $ 1,115,575,093 | $ — |
| Total Assets | $ 1,115,859,909 | $ 284,816 | $ 1,115,575,093 | $— |
| Cost of investments for tax purposes | $ 1,115,859,909 |
| Net unrealized appreciation (depreciation) on investments (tax basis) | $ - |
| SIX MONTHS ENDED March 31, 2023 | YEAR ENDED September 30, 2022 | |||
| SHARES | AMOUNT | SHARES | AMOUNT | |
| Class I Shares | ||||
| Shares sold | 437,454,815 | $ 4,374,548,137 | 1,043,716,043 | $ 10,437,160,430 |
| Shares issued to shareholders in reinvestment of dividends | 2,949,942 | 29,499,420 | 1,665,416 | 16,654,160 |
| Shares repurchased | (477,436,255) | (4,774,362,545) | (1,098,527,115) | (10,985,271,147) |
| Net decrease | (37,031,498) | $ (370,314,988) | (53,145,656) | $ (531,456,557) |
| Per Share Performance (For a Share Outstanding throughout the Period) | ||||||||
| UNLESS OTHERWISE NOTED, PERIODS ARE FISCAL YEARS ENDED SEPTEMBER 30, | Net Asset Value, Beginning of Period | Net Investment Income (Loss)+ | Net Realized & Unrealized Gain (Loss) on Investments | Total from Investment Operations | Dividends from Net Investment Income | Dividends from Net Realized Gains | Total Dividends | Net Asset Value, End of Period |
| Class I(b) | ||||||||
| 2023 (c) | $ 10.00 | 0.22 | — (d) | 0.22 | (0.22) | — | (0.22) | $ 10.00 |
| 2022 | $ 10.00 | 0.10 | — (d) | 0.10 | (0.10) | — | (0.10) | $ 10.00 |
| 2021 | $ 10.00 | 0.01 | — (d) | 0.01 | (0.01) | — | (0.01) | $ 10.00 |
| 2020 | $ 10.00 | 0.10 | 0.01 | 0.11 | (0.11) | — | (0.11) | $ 10.00 |
| 2019 | $ 10.00 | 0.24 | — | 0.24 | (0.24) | — | (0.24) | $ 10.00 |
| 2018 | $ 10.00 | 0.18 | — | 0.18 | (0.18) | — | (0.18) | $ 10.00 |
| (a) | Not annualized for periods less than one year. |
| (b) | Sales loads are not reflected in computing total return. |
| (c) | Unaudited Six Month Period Ended March 31. |
| (d) | Net realized and unrealized gain (loss) on investments was less than $0.01 per share. |
| (e) | Annualized. |
| (f) | Portfolio turnover rate equals zero due to no long term investment transactions in the period. |
| + | Based on weighted average shares outstanding. |
| Ratios to Average Net Assets | Supplemental Data | ||||||
| UNLESS OTHERWISE NOTED, PERIODS ARE FISCAL YEARS ENDED SEPTEMBER 30, | Net Investment Income (Loss) (%) | Expenses, After Expense Reductions (%) | Expenses, Before Expense Reductions (%) | Total Return (%)(a) | Portfolio Turnover Rate (%)(a) | Net Assets at End of Period (Thousands) | |
| Class I(b) | |||||||
| 2023 (c) | 4.32 (e) | 0.01 (e) | 0.01 (e) | 2.21 | — (f) | $ 1,158,375 | |
| 2022 | 0.96 | 0.01 | 0.01 | 0.96 | — (f) | $ 1,528,903 | |
| 2021 | 0.12 | 0.01 | 0.01 | 0.12 | — (f) | $ 2,060,113 | |
| 2020 | 1.00 | 0.01 | 0.01 | 1.08 | — (f) | $ 1,661,288 | |
| 2019 | 2.44 | 0.02 | 0.02 | 2.48 | — (f) | $ 1,552,677 | |
| 2018 | 1.76 | 0.02 | 0.02 | 1.76 | — (f) | $ 1,325,525 | |
Thornburg Capital Management Fund | March 31, 2023 (Unaudited)
| BEGINNING ACCOUNT VALUE 10/1/22 | ENDING ACCOUNT VALUE 3/31/23 | EXPENSES PAID DURING PERIOD† 10/1/22—3/31/23 | |
| CLASS I SHARES | |||
| Actual | $1,000.00 | $1,022.07 | $0.05 |
| Hypothetical* | $1,000.00 | $1,024.88 | $0.05 |
| † | Expenses are equal to the annualized expense ratio for each class (I: 0.01%) multiplied by the average account value over the period, multiplied by 182/365 to reflect the one-half year period. |
| * | Hypothetical assumes a rate of return of 5% per year before expenses. |
March 31, 2023 (Unaudited)
| ■ | Thornburg Global Opportunities Fund |
| ■ | Thornburg International Equity Fund |
| ■ | Thornburg Better World International Fund |
| ■ | Thornburg International Growth Fund |
| ■ | Thornburg Developing World Fund |
| ■ | Thornburg Small/Mid Cap Core Fund |
| ■ | Thornburg Small/Mid Cap Growth Fund |
| ■ | Thornburg Investment Income Builder Fund |
| ■ | Thornburg Income Builder Opportunities Trust |
| ■ | Thornburg Summit Fund |
| ■ | Thornburg Limited Term U.S. Government Fund |
| ■ | Thornburg Limited Term Income Fund |
| ■ | Thornburg Ultra Short Income Fund |
| ■ | Thornburg Strategic Income Fund |
| ■ | Thornburg Short Duration Municipal Fund |
| ■ | Thornburg Limited Term Municipal Fund |
| ■ | Thornburg California Limited Term Municipal Fund |
| ■ | Thornburg New Mexico Intermediate Municipal Fund |
| ■ | Thornburg New York Intermediate Municipal Fund |
| ■ | Thornburg Intermediate Municipal Fund |
| ■ | Thornburg Strategic Municipal Income Fund |


| 800.847.0200 | TH3478 |
Item 2. Code of Ethics
Not applicable.
Item 3. Audit Committee Financial Expert
Not applicable.
Item 4. Principal Accountant Fees and Services
Not applicable.
Item 5. Audit Committee of Listed Registrants
Not applicable.
Item 6. Schedule of Investments
Filed as part of the reports to shareholders filed under item 1 of this Form.
Item 7. Disclosure of Proxy Voting Policies and Procedures for Closed-End Management Investment Companies
Not applicable.
Item 8. Portfolio Managers of Closed-End Management Investment Companies
Not applicable.
Item 9. Purchases of Equity Securities by Closed-End Management Investment Companies and Affiliated Purchasers.
Not applicable.
Item 10. Submission of Matters to a Vote of Security Holders
The authority to consider candidates recommended by the shareholders in accordance with the Trust’s Procedures for Shareholder Communications is committed to the Governance and Nominating Committee.
Item 11. Controls and Procedures
(a) The principal executive officer and the principal financial officer have concluded that Thornburg Investment Trust’s disclosure controls and procedures provide reasonable assurance that material information relating to Thornburg Investment Trust is made known to them by the appropriate persons, based on their evaluation of these controls and procedures as of a date within 90 days prior to the filing date of this report.
(b) There was no change in Thornburg Investment Trust’s internal control over financial reporting that occurred during the registrant’s second fiscal quarter of the period covered by this report (that is, the registrant’s second fiscal quarter) that has materially affected, or is reasonably likely to materially affect, the registrant’s internal control over financial reporting.
Item 12. Disclosure of Securities Lending Activities for Closed-End Management Investment Companies
Not applicable.
Item 13. Exhibits
| (a) (1) | Not Applicable |
| (a) (2) |
| (a) (3) | Not Applicable |
| (b) |
SIGNATURES
Pursuant to the requirements of the Securities Exchange Act of 1934 and the Investment Company Act of 1940, the registrant has duly caused this report to be signed on its behalf by the undersigned, thereunto duly authorized.
Thornburg Investment Trust, in respect of the following Thornburg Funds: Global Opportunities Fund, International Equity Fund, Better World International Fund, International Growth Fund, Developing World Fund, Small/Mid Cap Core Fund, Small/Mid Cap Growth Fund, Investment Income Builder Fund, Summit Fund, Limited Term U.S. Government Fund, Limited Term Income Fund, Ultra Short Income Fund, Strategic Income Fund, Short Duration Municipal Fund, Limited Term Municipal Fund, California Limited Term Municipal Fund, New Mexico Intermediate Municipal Fund, New York Intermediate Municipal Fund, Intermediate Municipal Fund, Strategic Municipal Income Fund, and Capital Management Fund.
| By: | /s/ Jason H. Brady | |
| Jason H. Brady | ||
| President and principal executive officer | ||
| Date: | May 15, 2023 | |
Pursuant to the requirements of the Securities Exchange Act of 1934 and the Investment Company Act of 1940, this report has been signed below by the following persons on behalf of the registrant and in the capacities and on the dates indicated.
| By: | /s/ Jason H. Brady | |
| Jason H. Brady | ||
| President and principal executive officer | ||
| Date: | May 15, 2023 | |
| By: | /s/ Nimish Bhatt | |
| Nimish Bhatt | ||
| Principal financial officer | ||
| Date: | May 15, 2023 | |