UNITED STATES
SECURITIES AND EXCHANGE COMMISSION
Washington, D.C. 20549
FORM N-CSR
CERTIFIED SHAREHOLDER REPORT OF REGISTERED MANAGEMENT
INVESTMENT COMPANIES
| | |
| Investment Company Act file number: | | 811-05206 |
| |
| Exact name of registrant as specified in charter: | | Jennison Natural |
| | | Resources Fund, Inc. |
| |
| Address of principal executive offices: | | Gateway Center 3, |
| | | 100 Mulberry Street, |
| | | Newark, New Jersey 07102 |
| |
| Name and address of agent for service: | | William V. Healey |
| | | Gateway Center 3, |
| | | 100 Mulberry Street, |
| | | Newark, New Jersey 07102 |
| |
| Registrant’s telephone number, including area code: | | 973-802-2991 |
| |
| Date of fiscal year end: | | 5/31/2004 |
| |
| Date of reporting period: | | 5/31/2004 |
Item 1 – Reports to Stockholders – [ INSERT REPORT ]

Jennison Natural Resources Fund, Inc.
| | |
| MAY 31, 2004 | | ANNUAL REPORT |

FUND TYPE
Sector stock
OBJECTIVE
Long-term growth of capital
This report is not authorized for distribution to prospective investors unless preceded or accompanied by a current prospectus.
The views expressed in this report and information about the Fund’s portfolio holdings are for the period covered by this report and are subject to change thereafter.
JennisonDryden is a registered trademark of The Prudential Insurance Company of America.

Dear Shareholder, July 16, 2004
The U.S. stock market slowed in 2004 following a particularly strong performance in 2003. Although the recovery in corporate profitability that began in 2003 has continued, the stock market in 2004 has been dominated by a sense of uncertainty.
As always, we believe you are best served by a diversified asset allocation strategy developed in consultation with a financial professional who knows you and understands your reasons for investing, the time you have to reach your goals, and the amount of risk you are comfortable assuming. JennisonDryden’s sector funds can add a particular emphasis to your portfolio, such as increased exposure to economic sectors that are growing rapidly. Your financial professional can help you determine whether sector investing is right for you and choose the appropriate funds to implement your strategy.
Whether you are investing for your retirement, your children’s education, or some other purpose, JennisonDryden mutual funds offer the experience, resources, and professional discipline of three leading asset managers that can make a difference for you. JennisonDryden equity funds are advised by Jennison Associates LLC and/or Quantitative Management Associates LLC (QMA). Prudential Investment Management, Inc. (PIM) advises the JennisonDryden fixed income and money market funds. Jennison Associates, QMA, and PIM are Registered Investment Advisors and Prudential Financial companies.
Thank you for your confidence in JennisonDryden mutual funds.
Sincerely,

Judy A. Rice, President
Jennison Natural Resources Fund, Inc.
| | |
| Jennison Natural Resources Fund, Inc. | | 1 |
Your Fund’s Performance
Fund objective
The investment objective of the Jennison Natural Resources Fund, Inc. (the Fund) is long-term growth of capital. There can be no assurance that the Fund will achieve its investment objective.
Performance data quoted represents past performance. Past performance does not guarantee future results. The investment return and principal value of an investment will fluctuate so that an investor’s shares, when redeemed, may be worth more or less than their original cost. Current performance may be lower or higher than the past performance data quoted. An investor may obtain performance data current to the most recent month-end by visiting our website at www.jennisondryden.com or by calling (800) 225-1852.
| | | | | | | | | | | | |
| Cumulative Total Returns1 as of 5/31/04 | | | | | | | | | | | | |
| | | One Year | | | Five Years | | | Ten Years | | | Since Inception2 | |
Class A | | 26.24 | % | | 131.03 | % | | 211.65 | % | | 280.27 | % |
Class B | | 25.28 | | | 122.40 | | | 189.12 | | | 286.18 | |
Class C | | 25.28 | | | 122.40 | | | N/A | | | 184.95 | |
Class Z | | 26.49 | | | 134.16 | | | N/A | | | 121.01 | |
MSCI World ND Index3 | | 23.50 | | | –5.95 | | | 94.38 | | | *** | |
S&P 500 Index4 | | 18.32 | | | –7.38 | | | 192.51 | | | **** | |
Lipper Natural Resources Funds Avg.5 | | 25.09 | | | 72.12 | | | 187.91 | | | ***** | |
| | | | | | | | | | | | | |
| | | | | | | | | | | | |
| Average Annual Total Returns1 as of 6/30/04 | | | | | | | | | | | | |
| | | One Year | | | Five Years | | | Ten Years | | | Since Inception2 | |
Class A | | 29.74 | % | | 16.29 | % | | 12.37 | % | | 9.73 | % |
Class B | | 31.18 | | | 16.62 | | | 12.16 | | | 8.79 | |
Class C | | 35.18 | | | 16.73 | | | N/A | | | 11.82 | |
Class Z | | 37.62 | | | 17.93 | | | N/A | | | 11.60 | |
MSCI World ND Index3 | | 24.00 | | | –1.70 | | | 7.13 | | | *** | |
S&P 500 Index4 | | 19.10 | | | –2.20 | | | 11.82 | | | **** | |
Lipper Natural Resources Funds Avg.5 | | 34.70 | | | 10.87 | | | 11.67 | | | ***** | |
1Source: Prudential Investments LLC and Lipper Inc. The cumulative total returns do not take into account applicable sales charges. If reflected, the applicable sales charges would reduce the cumulative total returns performance quoted. The average annual total returns do take into account applicable sales charges. Without the distribution and service (12b-1) fee waiver of 0.05% for Class A shares, the returns would have been lower. Through March 14, 2004, the Fund charged a maximum front-end sales charge of 5% for Class A shares and a 12b-1 fee of up to 0.30% annually. Effective March 15, 2004, Class A shares are subject to a maximum front-end sales charge of 5.50% and a 12b-1 fee of up to 0.30% annually. Investors who purchase Class A shares in an amount of $1 million or more do not pay a front-end sales charge, but are subject to a contingent deferred sales charge (CDSC) of 1% for shares sold within 12 months of purchase. Class B shares are subject to a
| | |
| 2 | | Visit our website at www.jennisondryden.com |
declining CDSC for the first six years after purchase and a 12b-1 fee of 1% annually. Approximately seven years after purchase, Class B shares will automatically convert to Class A shares on a quarterly basis. Through February 1, 2004, Class C shares were subject to a front-end sales charge of 1%, a CDSC of 1% for shares redeemed within 18 months of purchase, and a 12b-1 fee of 1% annually. Class C shares purchased on or after February 2, 2004 are not subject to a front-end sales charge, the CDSC of 1% for Class C shares purchased on or after that date will apply for redemptions within 12 months from the date of purchase, and the annual 12b-1 fee will remain 1%. Class Z shares are not subject to a sales charge or 12b-1 fee. The returns in the tables do not reflect the deduction of taxes that a shareholder would pay on Fund distributions or following the redemption of Fund shares.
2Inception dates: Class A, 1/22/90; Class B, 9/28/87; Class C, 8/1/94; and Class Z, 9/16/96.
3The Morgan Stanley Capital International (MSCI) World Net Dividends (ND) Index is a free float-adjusted, market- capitalization index that is designed to measure global developed market equity performance. The MSCI World ND Index consists of approximately 23 developed market indexes in Australia, Canada, Europe, the Far East, New Zealand, and the United States.
4The Standard & Poor’s 500 Composite Stock Price Index (S&P 500 Index) is an unmanaged index of 500 stocks of large U.S. public companies. It gives a broad look at how stock prices have performed in the United States.
5The Lipper Natural Resources Funds Average (Lipper Average) represents returns based on the average return of all funds in the Lipper Natural Resources Funds category for the periods noted. Funds in the Lipper Average invest primarily in natural resources stocks. Investors cannot invest directly in an index. The returns for the MSCI World ND Index, S&P 500 Index, and Lipper Average would be lower if they included the effects of sales charges, operating expenses of a mutual fund, or taxes. Returns for the Lipper Average reflect the deduction of operating expenses, but not sales charges or taxes.
*** MSCI World ND Index Closest Month-End to Inception cumulative total returns as of 5/31/04 are 141.59% for Class A, 179.49% for Class B, 91.37% for Class C, and 46.79% for Class Z. MSCI World ND Index Closest Month-End to Inception average annual total returns as of 6/30/04 are 6.46% for Class A, 6.46% for Class B, 6.99% for Class C, and 5.36% for Class Z.
**** S&P 500 Index Closest Month-End to Inception cumulative total returns as of 5/31/04 are 364.67% for Class A, 415.30% for Class B, 190.32% for Class C, and 83.19% for Class Z. S&P 500 Index Closest Month-End to Inception average annual total returns as of 6/30/04 are 11.39% for Class A, 10.41% for Class B, 11.56% for Class C, and 8.39% for Class Z.
***** Lipper Average Closest Month-End to Inception cumulative total returns as of 5/31/04 are 222.16% for Class A, 242.97% for Class B, 181.00% for Class C, and 88.62% for Class Z. Lipper Average Closest Month-End to Inception average annual total returns as of 6/30/04 are 8.68% for Class A, 7.60% for Class B, 11.51% for Class C, and 9.31% for Class Z.
| | | |
| Five Largest Holdings expressed as a percentage of net assets as of 5/31/04 | | | |
BJ Services Co., Energy Equipment & Services | | 4.8 | % |
Smith International, Inc., Energy Equipment & Services | | 4.2 | |
Total SA, Oil & Gas | | 3.7 | |
OPTI Canada, Inc., Energy Equipment & Services | | 3.5 | |
Weatherford International Ltd., Energy Equipment & Services | | 3.3 | |
Holdings are subject to change.
| | |
| Jennison Natural Resources Fund, Inc. | | 3 |
Your Fund’s Performance (continued)
| | | |
| Five Largest Industries expressed as a percentage of net assets as of 5/31/04 | | | |
Oil & Gas | | 33.8 | % |
Energy Equipment & Services | | 26.8 | |
Metals & Mining | | 24.3 | |
Industrial Conglomerates | | 5.6 | |
Capital Markets | | 1.5 | |
| Industry | weightings are subject to change. |
| | |
| 4 | | Visit our website at www.jennisondryden.com |
Investment Adviser’s Report
Jennison Associates LLC
Overview
For the fiscal year ended May 31, 2004, the Fund outperformed the broader global market as measured by the MSCI World ND Index, the U.S. market as measured by the S&P 500 Index, and the Lipper Natural Resources Funds Average.
During the reporting period, natural resources markets were influenced primarily by two factors. One was the continued and unexpected strength in the price of oil. Oil prices began the Fund’s fiscal year at $25 per barrel and finished the fiscal year at $40. The other factor was the effect of the booming Chinese economy. During the first six months of the Fund’s fiscal year, demand for most base (nonprecious) metals surged as the Chinese economy expanded at near double-digit rates. However, since January 2004, investors have become worried that attempts by the Chinese government to slow its economy would result in a “hard landing.” The Chinese economy has been growing at an extremely rapid pace over the past five years, and surging inflows of foreign capital, an undervalued currency, and rapid money growth have pushed Chinese expansion to potentially dangerous levels. A significant slowing of the Chinese economy would likely have a negative impact on the global natural resources markets.
Our materials and energy stocks drove the Fund’s performance for the reporting period. The materials holdings, which primarily include metals and mining companies, benefited from strong industrial and precious metal prices. The strong oil and natural gas prices benefited our energy holdings, specifically our exploration and production stocks. Although drilling activity has continued to grow in many regions of the world, some of our energy equipment and services companies created a minor drag on performance, mainly due to volatility and high share prices at the beginning of the reporting period. However, our fundamental thesis, that increased drilling activity will be needed to raise supply to meet increased demand levels, is unchanged, and our outlook for these stocks remains positive.
Oil and natural gas prices rose
Oil and natural gas prices increased throughout the fiscal year. The demand for oil was much higher than original forecasts. While much attention has been focused on oil demand from the booming Chinese economy, oil demand has come in much stronger than expected from almost all economies, including the United States. In addition, concerns regarding global oil supply have emerged over the last year. Major integrated oil companies reported declining production figures and/or restated reserves. Also, the health and size of Saudi Arabian oil reserves were called into question. Although Saudi Arabia announced its intention to increase output and bring new production resources on-line, it is unclear if these will be sufficient to meet
| | |
| Jennison Natural Resources Fund, Inc. | | 5 |
demand. Finally, terrorist attacks on oil targets in Iraq and Saudi Arabia have prodded fears of unpredictable supply disruptions. Together, these factors pushed oil prices to new highs, which benefited our oil and gas holdings. Total Societe Anonyme (SA) was the Fund’s top performer in this sector.
Rising natural gas prices also helped the performance of our oil and gas holdings. Domestic demand for natural gas has steadily increased, while supplies are limited, pushing prices higher. As a result, natural gas producers Western Gas Resources and Evergreen Resources were key contributors to the Fund’s performance during the fiscal year.
Our oil and gas drilling services holdings were very volatile over the fiscal year and produced mixed results for the Fund. Lone Star Technologies and Weatherford International delivered disappointing stock performance during the fiscal year. We believe that this was primarily due to their very high share prices at the beginning of the reporting period, which led many investors to take their profits, and not to fundamental industry or company weakness. Smith International was one of our top performers during the reporting period. Since November 2003, however, the entire sector has shown tremendous price appreciation, and we maintain our belief that these oil services stocks will continue to be market leaders, as they offer a broad line of products that enhance drilling productivity.
China and base metal prices
Base metal prices increased steadily throughout 2003 and early 2004, as the demand for base metals, particularly copper, grew ahead of available supplies. Although improved global economic growth helped base metal demand, it was the surging Chinese demand that really pushed up metal prices in the second half of 2003. China’s rapid economic growth, coupled with its large population, has made China a major force in global metal markets. Even though Chinese consumption per capita is well below the world average, China already consumes one-fifth of the world’s copper supply. However, investor uncertainty increased enormously as the government took steps early in 2004 to slow the economy.
Our metals holdings were not immune when base metal prices were hard hit by fears of slowing Chinese imports. However, since these pullbacks occurred late in the fiscal year, the impact on the Fund’s performance was mitigated. Three of our holdings with substantial metals exposure—Phelps Dodge Corp, Freeport-McMoRan Copper & Gold, and Companhia Vale do Rio Doce—were the top contributors to the Fund’s performance. As of this writing, base metal prices have rebounded, and we think that
| | |
| 6 | | Visit our website at www.jennisondryden.com |
China’s demand for industrial metals remains strong. We maintain our bullish stance on industrial metals stocks, especially copper.
The price of gold remained volatile
Gold prices were volatile during the fiscal year as they were buffeted by the opposing effects of strengthening demand and a strengthening U.S. dollar. We sold some positions during the year in order to realize profits, and closely monitored our exposure to South Africa due to political risk. We have selectively added to our gold exploration positions since many of these companies are making excellent discoveries and are attractively valued. IAMGOLD was the leading contributor to performance from this sector. While we anticipate periodic pullbacks in the gold markets, we are not tempted to alter our long-term bullish perspective on precious metals.
Portfolio outlook
We continue to be bullish on natural gas as we are experiencing the higher natural gas prices that we expected. We are positioned to benefit from the increased drilling that we believe will be needed to balance demand with inadequate supply. In addition, we believe that oil prices will remain higher than most expectations. We also remain positive on industrial metals, particularly copper, since we believe that demand, especially from China, will continue to be strong. Although we anticipate periodic pullbacks in both the gold and silver markets, we maintain a long-term bullish perspective on precious metals.
The Portfolio of Investments following this report shows the size of the Fund’s positions at period-end.
| | |
| Jennison Natural Resources Fund, Inc. | | 7 |
Comments on Largest Holdings
Holdings expressed as a percentage of the Fund’s net assets as of 5/31/04.
| 4.8% | BJ Services Co./Energy Equipment & Services |
BJ Services provides pressure pumping and cementing services, which are very sensitive to increases in drilling activity. BJ’s annual sales have risen rapidly since 1999.
| 4.2% | Smith International, Inc./Energy Equipment & Services |
Smith International makes premium drill bits, drilling fluids and related products, and offers drilling-related services. The market for these products varies with the overall amount of drilling activity. Its annual sales have risen rapidly since 1999.
Total is France’s largest oil company. It is an integrated oil company that trades and transports crude oil and finished products in more than 100 countries, and operates a chain of service stations primarily in Europe and Africa.
| 3.5% | OPTI Canada, Inc./Energy Equipment & Services |
OPTI Canada develops integrated bitumen and heavy oil projects. The company is engaged in a 50-50 joint venture with Nexen Inc. to develop the Long Lake Project in the Athabasca oil sands region of Alberta.
| 3.3% | Weatherford International Ltd./Energy Equipment & Services |
Weatherford provides oil and gas drilling services such as well installation and equipment rental, conducting operations in approximately 100 countries, with several hundred service and sales locations in oil and natural gas-producing regions of the world. Weatherford is focused on new and growing areas of the business where there is little competition.
Holdings are subject to change.
| | |
| 8 | | Visit our website at www.jennisondryden.com |
Financial Statements
| | |
| MAY 31, 2004 | | ANNUAL REPORT |
Jennison Natural Resources Fund, Inc.
Portfolio of Investments
as of May 31, 2004
| | | | | |
| Shares | | Description | | Value (Note 1) |
| | | | | | |
LONG-TERM INVESTMENTS 94.5% | | | |
COMMON STOCKS 93.8% | | | |
| |
Capital Markets 1.5% | | | |
| 50,000 | | Globaly Corp. | | $ | 1,501,923 |
| 47,000 | | Kobayashi Yoko Co., Ltd. | | | 901,515 |
| 127,000 | | Nihon Unicom Corp. | | | 1,447,817 |
| | | | |
|
|
| | | | | | 3,851,255 |
| |
Chemicals 0.2% | | | |
| 119,100 | | Hokko Chemical Industry Co., Ltd. | | | 394,396 |
| |
Construction Materials 1.1% | | | |
| 2,152,000 | | Anhui Conch Cement Co., Ltd. | | | 2,761,134 |
| |
Energy Equipment & Services 26.8% | | | |
| 286,800 | | BJ Services Co.(a)(d) | | | 12,014,052 |
| 51,000 | | Cooper Cameron Corp.(a)(d) | | | 2,364,870 |
| 96,800 | | ENSCO International, Inc. | | | 2,578,752 |
| 62,388 | | FMC Technologies, Inc.(a) | | | 1,682,604 |
| 48,800 | | Grant Prideco, Inc.(a)(d) | | | 756,888 |
| 75,400 | | Grey Wolf, Inc.(a)(d) | | | 275,210 |
| 23,500 | | Hydril Co.(a) | | | 675,860 |
| 101,100 | | Maverick Tube Corp.(a) | | | 2,325,300 |
| 97,800 | | Nabors Industries Ltd.(a)(d) | | | 4,048,920 |
| 151,100 | | National-Oilwell, Inc.(a) | | | 4,182,448 |
| 137,100 | | Oil States International, Inc.(a) | | | 1,946,820 |
| 151,300 | | OPTI Canada, Inc. (Class “C” Stock)(a)(g)
(cost $2,534,149; Purchased 4/15/04-4/27/04) | | | 2,139,887 |
| 474,118 | | OPTI Canada, Inc. (Class “C” Stock)(a)(g)
(cost $6,627,984; Purchased 6/30/03-4/4/04) | | | 6,705,612 |
| 65,000 | | Rowan Cos., Inc.(a)(d) | | | 1,428,700 |
| 210,400 | | Smith International, Inc.(a)(d) | | | 10,505,272 |
| 182,200 | | Transocean, Inc.(a)(d) | | | 4,870,206 |
| 43,300 | | W-H Energy Services, Inc.(a) | | | 800,184 |
| 198,200 | | Weatherford International Ltd.(a)(d) | | | 8,227,282 |
| | | | |
|
|
| | | | | | 67,528,867 |
| |
Food Products 0.3% | | | |
| 79,200 | | Cresud S.A.C.I.F.y A. (ADR)(a)(d) | | | 814,968 |
| |
Industrial Conglomerates 5.6% | | | |
| 126,900 | | Companhia Vale do Rio Doce (ADR)(d) | | | 6,433,830 |
| 111,300 | | Phelps Dodge Corp.(a) | | | 7,557,270 |
| | | | |
|
|
| | | | | | 13,991,100 |
See Notes to Financial Statements.
| | |
| 10 | | Visit our website at www.jennisondryden.com |
| | | | | |
| Shares | | Description | | Value (Note 1) |
| | | | | | |
| |
Metals & Mining 24.3% | | | |
| 64,700 | | Alcoa, Inc. | | $ | 2,025,110 |
| 129,100 | | Alumina Ltd. (ADR)(d) | | | 1,968,775 |
| 543,600 | | Alumina Ltd. | | | 2,075,335 |
| 47,900 | | Anglo American Platinum Corp., Ltd. | | | 1,760,720 |
| 57,671 | | AngloGold Ashanti Ltd. (ADR)(d) | | | 2,019,633 |
| 141,950 | | Aquarius Platinum Ltd. | | | 683,745 |
| 96,800 | | Arizona Star Resource Corp.(a) | | | 312,121 |
| 580,400 | | AXMIN, Inc.(a) | | | 318,995 |
| 120,700 | | Cameco Corp. | | | 6,315,389 |
| 60,411 | | Canico Resource Corp.(a) | | | 587,907 |
| 27,600 | | Century Aluminum Co.(a) | | | 639,492 |
| 72,100 | | Coeur d’Alene Mines Corp.(a)(d) | | | 338,149 |
| 260,700 | | CONSOL Energy, Inc.(d) | | | 8,042,595 |
| 667,600 | | Crystallex International Corp.(a)(d) | | | 1,535,480 |
| 248,600 | | Durban Roodepoort Deep Ltd. (ADR)(a)(d) | | | 728,398 |
| 10,540 | | European Goldfields Ltd.(a) | | | 27,034 |
| 102,300 | | First Quantum Minerals Ltd.(a) | | | 1,161,989 |
| 57,200 | | FNX Mining Co., Inc.(a)(g)
(cost $189,466; Purchased 7/23/03) | | | 270,365 |
| 147,900 | | Freeport-McMoRan Copper & Gold, Inc. (Class B)(d) | | | 4,973,877 |
| 105,400 | | Gabriel Resources Ltd.(a) | | | 144,436 |
| 36,300 | | Gold Reserve, Inc.(a) | | | 127,686 |
| 56,400 | | Golden Star Resources Ltd.(a)(d) | | | 280,308 |
| 147,373 | | Harmony Gold Mining Co., Ltd. | | | 1,758,749 |
| 568,280 | | IAMGOLD Corp.(a)(d) | | | 3,205,099 |
| 30,700 | | Impala Platinum Holdings Ltd. | | | 2,238,296 |
| 131,000 | | Ivanhoe Mines Ltd.(a)(d) | | | 869,840 |
| 151,042 | | Kinross Gold Corp.(a) | | | 934,189 |
| 38,000 | | Korea Zinc Co., Ltd.(a) | | | 618,138 |
| 1,760,200 | | Lihir Gold Ltd.(a) | | | 1,218,397 |
| 89,500 | | Massey Energy Co.(d) | | | 2,203,490 |
| 73,100 | | Meridian Gold, Inc.(a) | | | 946,025 |
| 61,100 | | Miramar Mining Corp.(a)(d) | | | 83,096 |
| 86,400 | | Miramar Mining Corp. (Canadian Dollar)(a) | | | 117,133 |
| 190,500 | | Nelson Resources Ltd.(a) | | | 206,610 |
| 96,400 | | Nevsun Resources Ltd.(a) | | | 274,096 |
| 131,200 | | Newcrest Mining Ltd.(a) | | | 1,184,348 |
| 280,000 | | Orezone Resources, Inc.(a) | | | 246,226 |
| 351,500 | | Oxus Gold PLC(a) | | | 341,563 |
| 23,845 | | Pan American Silver Corp.(a) | | | 323,968 |
| 280,300 | | Platinum Group Metals Ltd.(a) | | | 203,354 |
| 29,800 | | Randgold Resources Ltd. (ADR)(a) | | | 542,062 |
| 330,000 | | SouthernEra Resources Ltd.(a) | | | 967,316 |
See Notes to Financial Statements.
| | |
| Jennison Natural Resources Fund, Inc. | | 11 |
Portfolio of Investments
as of May 31, 2004 Cont’d.
| | | | | |
| Shares | | Description | | Value (Note 1) |
| | | | | | |
| 107,200 | | Stornoway Diamond Corp.(a)(d) | | $ | 180,683 |
| | | USD Palladium Linked Bank Note, zero coupon, 7/13/07 | | | |
| 2,000 | | (cost $2,000,001; Purchased 6/30/03)(f) | | | 2,613,080 |
| 332,200 | | Wheaton River Minerals Ltd.(a)(d) | | | 964,028 |
| 499,700 | | WMC Resources Ltd. | | | 1,647,427 |
| 68,000 | | WMC Resources Ltd. (ADR) | | | 907,120 |
| | | | |
|
|
| | | | | | 61,131,872 |
| |
Oil & Gas 33.8% | | | |
| 77,012 | | Apache Corp. | | | 3,108,204 |
| 18,900 | | Brigham Exploration Co.(a) | | | 161,047 |
| 56,200 | | Cheniere Energy, Inc.(a) | | | 848,620 |
| 157,000 | | Denbury Resources, Inc.(a) | | | 2,888,800 |
| 116,000 | | Encore Acquisition Co.(a) | | | 3,259,600 |
| 171,300 | | Endeavour International Corp.(a)(d) | | | 647,514 |
| 62,900 | | Eni S.p.A. (ADR)(d) | | | 6,386,237 |
| 166,800 | | Evergreen Resources, Inc.(a)(d) | | | 6,313,380 |
| 190,600 | | Genoil, Inc.(a) | | | 21,650 |
| 130,300 | | Houston Exploration Co. (The)(a)(d) | | | 6,157,978 |
| 66,920 | | KCS Energy, Inc.(a) | | | 837,169 |
| 8,600 | | Lukoil (ADR)(a) | | | 946,000 |
| 29,300 | | McMoRan Exploration Co.(a)(d) | | | 419,576 |
| 173,300 | | Nexen, Inc. (Canadian Dollar) | | | 6,108,825 |
| 25,100 | | Noble Energy, Inc. | | | 1,138,034 |
| 113,000 | | Petroleo Brasileiro SA (ADR)(d) | | | 2,949,300 |
| 85,786 | | Pioneer Natural Resources Co. | | | 2,655,077 |
| 67,900 | | Quicksilver Resources, Inc.(a)(d) | | | 3,314,878 |
| 13,500 | | Sibneft (ADR)(a)(d) | | | 349,920 |
| 33,000 | | St. Mary Land & Exploration Co. | | | 1,072,830 |
| 52,500 | | Suncor Energy, Inc. | | | 1,241,625 |
| 160,300 | | Suncor Energy, Inc. (Canadian Dollar) | | | 3,770,797 |
| 21,900 | | Surgutneftegaz (ADR)(a)(d) | | | 686,565 |
| 89,100 | | Swift Energy Co.(a)(d) | | | 1,799,820 |
| 50,060 | | Total SA | | | 9,395,802 |
| 131,300 | | Trident Resources Corp.(a)(e)(f)
(cost $1,400,693; Purchased 12/04/03) | | | 1,347,061 |
| 33,000 | | Valero Energy Corp.(d) | | | 2,181,630 |
| 143,800 | | Western Gas Resources, Inc. | | | 7,952,140 |
| 129,300 | | Western Oil Sands, Inc. (Class A)(a) | | | 2,880,492 |
| 34,000 | | Westport Resources Corp.(a) | | | 1,176,400 |
| 70,895 | | XTO Energy, Inc. | | | 1,790,099 |
| 40,910 | | YUKOS (ADR)(a)(d) | | | 1,260,028 |
| | | | |
|
|
| | | | | | 85,067,098 |
| |
Real Estate 0.2% | | | |
| 72,400 | | IRSA Inversiones y Representaciones S.A. (GDR)(a)(d) | | | 542,276 |
| | | | |
|
|
| | | Total common stocks
(cost $176,963,667) | | | 236,082,966 |
| | | | |
|
|
See Notes to Financial Statements.
| | |
| 12 | | Visit our website at www.jennisondryden.com |
| | | | | | |
Principal
Amount (000) | | Description | | Value (Note 1) | |
| | | | | | | |
| |
CONVERTIBLE BONDS | | | | |
| |
Industrial Conglomerates | | | | |
| | | JCI Ltd. 11.50%, 7/15/05 | | | | |
| 9 | | (cost $1,346) | | $ | 16 | |
| | |
Shares
| | | | | |
PREFERRED STOCKS 0.4% | | | | |
| |
Oil & Gas 0.4% | | | | |
| | | Surgutneftegaz (ADR)(a)(d) | | | | |
| 24,000 | | (cost $740,765) | | | 1,020,000 | |
STAPLE UNIT 0.3% | | | | |
| |
Paper & Forest Products 0.3% | | | | |
| | | TimberWest Forest Ltd.(b) | | | | |
| 83,100 | | (cost $625,209) | | | 806,276 | |
|
WARRANT(a) | |
| |
Metals & Mining | | | | |
| | | Pan American Silver Corp. Expiring 2/20/08 @ CAD$12 | | | | |
| 11,922 | | (cost $33,484) | | | 87,366 | |
| | | | |
|
|
|
| | | Total long-term investments
(cost $178,364,471) | | | 237,996,624 | |
| | | | |
|
|
|
SHORT-TERM INVESTMENTS 29.6% | | | | |
| |
Mutual Fund | | | | |
| | | Dryden Core Investment Fund - Taxable Money Market Series(c) | | | | |
| 74,367,011 | | (cost $74,367,011; Note 3) | | | 74,367,011 | |
| | | | |
|
|
|
| | | Total Investments 124.1%
(cost $252,731,482; Note 5) | | | 312,363,635 | |
| | | Liabilities in excess of other assets (24.1%) | | | (60,705,131 | ) |
| | | | |
|
|
|
| | | Net Assets 100% | | $ | 251,658,504 | |
| | | | |
|
|
|
See Notes to Financial Statements.
| | |
| Jennison Natural Resources Fund, Inc. | | 13 |
| (a) | Non-income producing security. |
| (b) | A Stapled Unit consists of 1 common share, 100 preferred shares, and 1 subordinate note receipt. |
| (c) | Represents security, or a portion thereof, purchased with cash collateral received for securities on loan. |
| (d) | Securities, or portion thereof, on loan, see Note 4. |
| (e) | Indicates a fair valued security. The aggregate value, $1,347,061, is approximately 0.5% of net assets. |
| (f) | Indicates illiquid securities. The aggregate cost of such securities is $3,400,694. The aggregate value of $3,960,141 is approximately 1.6% of net assets. |
| (g) | Indicates securities restricted to resale. The aggregate cost of such securities was $9,351,599. The aggregate value of $9,115,864 is approximately 3.6% of net assets. |
ADR—American Depositary Receipt.
GDR—Global Depositary Receipt.
The classification of portfolio holdings by country and liabilities in excess of other assets shown as a percentage of net assets as of May 31, 2004 was as follows:
| | | |
†United States | | 99.4 | % |
Canada | | 12.8 | |
France | | 3.7 | |
Australia | | 2.7 | |
South Africa | | 2.3 | |
Japan | | 1.7 | |
Hong Kong | | 1.1 | |
South Korea | | 0.3 | |
United Kingdom | | 0.1 | |
| | |
|
|
| | | 124.1 | |
Liabilities in excess of other assets | | (24.1 | ) |
| | |
|
|
| | | 100.0 | % |
| | |
|
|
| | † | A portion of the holdings represent ADR’s. |
See Notes to Financial Statements.
| | |
| 14 | | Visit our website at www.jennisondryden.com |
Financial Statements
| | |
| MAY 31, 2004 | | ANNUAL REPORT |
Jennison Natural Resources Fund, Inc.
Statement of Assets and Liabilities
as of May 31, 2004
| | | | |
Assets | | | | |
Investments, at value, including securities on loan of $57,352,696 (cost $252,731,482) | | $ | 312,363,635 | |
Foreign currency, at value (cost $265,313) | | | 270,500 | |
Receivable for Fund shares sold | | | 2,331,235 | |
Dividends and interest receivable | | | 193,974 | |
Tax reclaim receivable | | | 14,452 | |
Prepaid expenses | | | 2,099 | |
| | |
|
|
|
Total assets | | | 315,175,895 | |
| | |
|
|
|
| |
Liabilities | | | | |
Payable to broker for collateral for securities on loan (Note 4) | | | 61,007,821 | |
Payable for investments purchased | | | 1,804,541 | |
Payable for Fund shares reacquired | | | 338,539 | |
Management fee payable | | | 153,827 | |
Accrued expenses and other liabilities | | | 118,228 | |
Distribution fee payable | | | 93,875 | |
Payable to custodian | | | 560 | |
| | |
|
|
|
Total liabilities | | | 63,517,391 | |
| | |
|
|
|
| |
Net Assets | | $ | 251,658,504 | |
| | |
|
|
|
| | | | | |
Net assets were comprised of: | | | | |
Common stock, at par | | $ | 111,649 | |
Paid-in capital in excess of par | | | 197,547,619 | |
| | |
|
|
|
| | | | 197,659,268 | |
Accumulated net investment loss | | | (5,880,232 | ) |
Accumulated net realized gain on investments and foreign currency transactions | | | 243,918 | |
Net unrealized appreciation on investments and foreign currencies | | | 59,635,550 | |
| | |
|
|
|
Net assets May 31, 2004 | | $ | 251,658,504 | |
| | |
|
|
|
See Notes to Financial Statements
| | |
| 16 | | Visit our website at www.jennisondryden.com |
| | | |
Class A | | | |
Net asset value and redemption price per share | | | |
($121,699,800 ÷ 5,217,519 shares of common stock issued and outstanding) | | $ | 23.33 |
Maximum sales charge (5.50% of offering price) | | | 1.36 |
| | |
|
|
Maximum offering price to public | | $ | 24.69 |
| | |
|
|
| |
Class B | | | |
Net asset value, offering price and redemption price per share | | | |
($52,684,005 ÷ 2,509,624 shares of common stock issued and outstanding) | | $ | 20.99 |
| | |
|
|
| |
Class C | | | |
Net asset value, offering price and redemption price per share | | | |
($32,611,888 ÷ 1,553,448 shares of common stock issued and outstanding) | | $ | 20.99 |
| | |
|
|
| |
Class Z | | | |
Net asset value, offering price and redemption price per share | | | |
($44,662,811 ÷ 1,884,260 shares of common stock issued and outstanding) | | $ | 23.70 |
| | |
|
|
See Notes to Financial Statements
| | |
| Jennison Natural Resources Fund, Inc. | | 17 |
Statement of Operations
Year Ended May 31, 2004
| | | | |
Net Investment Loss | | | | |
Income | | | | |
Dividends (net of foreign withholding taxes of $149,013) | | $ | 1,702,893 | |
Income from securities loaned, net | | | 169,066 | |
| | |
|
|
|
Total income | | | 1,871,959 | |
| | |
|
|
|
| |
Expenses | | | | |
Management fee | | | 1,237,039 | |
Distribution fee—Class A | | | 204,280 | |
Distribution fee—Class B | | | 409,848 | |
Distribution fee—Class C | | | 163,472 | |
Transfer agent’s fees and expenses | | | 233,000 | |
Custodian’s fees and expenses | | | 205,000 | |
Reports to shareholders | | | 91,000 | |
Registration fees | | | 69,000 | |
Legal fees and expenses | | | 36,000 | |
Audit fee | | | 17,000 | |
Directors’ fees | | | 10,000 | |
Miscellaneous | | | 10,437 | |
| | |
|
|
|
Total expenses | | | 2,686,076 | |
| | |
|
|
|
Net investment loss | | | (814,117 | ) |
| | |
|
|
|
| |
Realized And Unrealized Gain On Investments | | | | |
Net realized gain on: | | | | |
Investment transactions | | | 2,302,835 | |
Foreign currency transactions | | | 26,006 | |
| | |
|
|
|
| | | | 2,328,841 | |
| | |
|
|
|
Net change in unrealized appreciation on: | | | | |
Investments | | | 29,081,996 | |
Foreign currencies | | | 36 | |
| | |
|
|
|
| | | | 29,082,032 | |
| | |
|
|
|
Net gain on investments | | | 31,410,873 | |
| | |
|
|
|
Net Increase In Net Assets Resulting From Operations | | $ | 30,596,756 | |
| | |
|
|
|
See Notes to Financial Statements
| | |
| 18 | | Visit our website at www.jennisondryden.com |
Statement of Changes in Net Assets
| | | | | | | | |
| | | Year Ended May 31,
| |
| | | 2004 | | | 2003 | |
Increase (Decrease) In Net Assets | | | | | | | | |
Operations | | | | | | | | |
Net investment loss | | $ | (814,117 | ) | | $ | (747,062 | ) |
Net realized gain on investment transactions | | | 2,328,841 | | | | 4,978,029 | |
Net change in unrealized appreciation (depreciation) on investments | | | 29,082,032 | | | | (4,797,442 | ) |
| | |
|
|
| |
|
|
|
Net increase (decrease) in net assets resulting from operations | | | 30,596,756 | | | | (566,475 | ) |
| | |
|
|
| |
|
|
|
Dividends and distributions (Note 1) | | | | | | | | |
Dividends from net investment income | | | | | | | | |
Class A | | | (1,292,357 | ) | | | (1,011,751 | ) |
Class B | | | (487,666 | ) | | | (573,481 | ) |
Class C | | | (155,138 | ) | | | (90,805 | ) |
Class Z | | | (422,727 | ) | | | (246,269 | ) |
| | |
|
|
| |
|
|
|
| | | | (2,357,888 | ) | | | (1,922,306 | ) |
| | |
|
|
| |
|
|
|
Distributions from net realized gains | | | | | | | | |
Class A | | | (395,328 | ) | | | (2,328,277 | ) |
Class B | | | (242,411 | ) | | | (1,908,871 | ) |
Class C | | | (77,117 | ) | | | (302,250 | ) |
Class Z | | | (114,617 | ) | | | (515,782 | ) |
| | |
|
|
| |
|
|
|
| | | | (829,473 | ) | | | (5,055,180 | ) |
| | |
|
|
| |
|
|
|
| | |
Fund share transactions (net of share conversions) (Note 6) | | | | | | | | |
Net proceeds from shares sold | | | 153,454,334 | | | | 45,044,753 | |
Net asset value of shares issued in reinvestment of dividends and distributions | | | 2,809,565 | | | | 6,184,558 | |
Cost of shares reacquired | | | (46,322,268 | ) | | | (36,640,339 | ) |
| | |
|
|
| |
|
|
|
Net increase in net assets from Fund share transactions | | | 109,941,631 | | | | 14,588,972 | |
| | |
|
|
| |
|
|
|
Total increase | | | 137,351,026 | | | | 7,045,011 | |
| | |
Net Assets | | | | | | | | |
Beginning of year | | | 114,307,478 | | | | 107,262,467 | |
| | |
|
|
| |
|
|
|
End of year | | $ | 251,658,504 | | | $ | 114,307,478 | |
| | |
|
|
| |
|
|
|
See Notes to Financial Statements
| | |
| Jennison Natural Resources Fund, Inc. | | 19 |
Notes to Financial Statements
Jennison Natural Resources Fund, Inc. (the “Fund”), is registered under the Investment Company Act of 1940 as a non-diversified, open-end management investment company. The Fund’s investment objective is long-term growth of capital which it seeks to achieve by investing primarily in equity securities of foreign and domestic companies that own, explore, mine, process or otherwise develop, or provide goods and services with respect to, natural resources and in asset-based securities the terms of which are related to the market value of an underlying asset such as a natural resource.
Note 1. Accounting Policies
The following is a summary of significant accounting policies followed by the Fund in the preparation of its financial statements.
Securities Valuation: Securities listed on a securities exchange are valued at the last sale price on such exchange on the day of valuation or, if there was no sale on such day, at the mean between the last reported bid and asked prices, or at the last bid price on such day in the absence of an asked price. Securities that are actively traded via Nasdaq are valued at the official closing price as provided by Nasdaq. Securities that are actively traded in the over-the-counter market, including listed securities for which the primary market is believed by Prudential Investments LLC (“PI” or “Manager”) in consultation with the subadvisor, to be over-the-counter are valued at market value using prices provided, by an independent pricing agent or principal market maker. Securities for which reliable market quotations are not readily available, or whose values have been affected by events occurring after the close of the security’s foreign market and before the Fund’s normal pricing time, are valued at fair value in accordance with Board of Director’s approved fair valuation procedures.
Investments in mutual funds are valued at their net asset value as of the close of the New York Stock Exchange on the date of valuation.
Short-term securities which mature in 60 days or less are valued at amortized cost, which approximates market value. The amortized cost method includes valuing a security at its cost on the date of purchase and thereafter assuming a constant amortization to maturity of the difference between the principal amount due at maturity and cost. Short-term securities which mature in more than 60 days are valued at current market quotation.
The Fund may hold up to 15% of its net assets in illiquid securities including repurchase agreements which have a maturity of longer than seven days, certain
| | |
| 20 | | Visit our website at www.jennisondryden.com |
securities with legal or contractual restrictions on resale (restricted securities, sometimes referred to as Private Placements) and securities that are not readily marketable. Restricted securities are valued pursuant to the valuation procedures noted above.
Foreign Currency Translation: The books and records of the Fund are maintained in U.S. dollars. Foreign currency amounts are translated into U.S. dollars on the following basis:
(i) market value of investment securities, other assets and liabilities at the current rates of exchange.
(ii) purchases and sales of investment securities, income and expenses at the rate of exchange prevailing on the respective dates of such transactions.
Although the net assets of the Fund are presented at the foreign exchange rates and market values at the close of the period, the Fund does not isolate that portion of the results of operations arising as a result of changes in the foreign exchange rates from the fluctuations arising from changes in the market prices of long-term portfolio securities held at the end of the period. Similarly, the Fund does not isolate the effect of changes in foreign exchange rates from the fluctuations arising from changes in the market prices of long-term portfolio securities sold during the period. Accordingly, realized foreign currency gains or losses are included in the reported net realized gain or loss on investment transactions.
Net realized gains or losses on foreign currency transactions represent net foreign exchange gains or losses from the holding of foreign currencies, currency gains or losses realized between the trade date and settlement date on securities transactions, and the difference between the amounts of dividends, interest and foreign withholding taxes recorded on the Fund’s books and the U.S. dollar equivalent amounts actually received or paid. Net unrealized currency gains or losses from valuing foreign currency denominated assets and liabilities (other than investments) at period end exchange rates are reflected as a component of net unrealized appreciation (depreciation) on investment and foreign currencies.
Foreign security and currency transactions may involve certain considerations and risks not typically associated with those of domestic origin as a result of, among other factors, the possibility of political and economic instability, or the level of governmental supervision and regulation of foreign securities markets.
Securities Lending: The Fund may lend its portfolio securities to broker-dealers. The loans are secured by collateral at least equal at all times to the market value of the securities loaned. Loans are subject to termination at the option of the borrower or the
| | |
| Jennison Natural Resources Fund, Inc. | | 21 |
Notes to Financial Statements
Cont’d
Fund. Upon termination of the loan, the borrower will return to the lender securities identical to the loaned securities. Should the borrower of the securities fail financially, the Fund has the right to repurchase the securities using the collateral in the open market. The Fund recognizes income, net of any rebate and securities lending agent fees, for lending its securities in the form of fees or interest on the investment of any cash received as collateral. The Fund also continues to receive interest and dividends or amounts equivalent thereto, on the securities loaned and recognizes any unrealized gain or loss in the market price of the securities loaned that may occur during the term of the loan.
Securities Transactions and Net Investment Income: Securities transactions are recorded on the trade date. Realized gains or losses on sales of securities are calculated on the identified cost basis. Dividend income is recorded on the ex-dividend date and interest income is recorded on the accrual basis. Expenses are recorded on the accrual basis.
Net investment income or loss, (other than distribution fees, which are charged directly to the respective class) and unrealized and realized gains or losses are allocated daily to each class of shares based upon the relative proportion of net assets of each class at the beginning of the day.
Dividends and Distributions: The Fund expects to pay dividends of net investment income and distributions of net realized capital and currency gains, if any, annually. Dividends and distributions to shareholders, which are determined in accordance with federal income tax regulations and which may differ from generally accepted accounting principles, are recorded on the ex-dividend date.
Taxes: It is the Fund’s policy to continue to meet the requirements of the Internal Revenue Code applicable to regulated investment companies and to distribute all of its taxable net investment income and capital gains, if any, to shareholders. Therefore, no federal income tax provision is required.
Withholding taxes on foreign dividends have been provided for in accordance with the Fund’s understanding of the applicable country’s tax rules and rates.
Estimates: The preparation of the financial statements requires management to make estimates and assumptions that affect the reported amounts and disclosures in the financial statements. Actual results could differ from those estimates.
| | |
| 22 | | Visit our website at www.jennisondryden.com |
Note 2. Agreements
The Fund has a management agreement with PI. Pursuant to a subadvisory agreement between PI and Jennison, Jennison furnishes investment advisory services in connection with the management of the Fund. Under the subadvisory agreement, Jennison, subject to the supervision of PI, is responsible for managing the assets of the Fund in accordance with its investment objective and policies. PI pays for the services of Jennison, the compensation of officers of the Fund, occupancy and certain clerical and bookkeeping costs of the Fund. The Fund bears all other costs and expenses.
Effective June 1, 2004 the management fee paid to PI is computed daily and payable monthly at an annual rate of 0.75 of 1% of average daily net assets up to $1 billion and 0.70 of 1% of average daily net assets in excess of $1 billion. Prior to June 1, 2004 the management fee was 0.75 of 1% of average daily net assets.
The Fund has a distribution agreement with Prudential Investment Management Services LLC (“PIMS”), which acts as the distributor of the Class A, Class B, Class C and Class Z shares of the Fund. The Fund compensates PIMS for distributing and servicing the Fund’s Class A, Class B and Class C shares, pursuant to plans of distribution (the ‘Class A, B and C Plans’), regardless of expenses actually incurred. The distribution fees are accrued daily and payable monthly. No distribution or service fees are paid to PIMS as distributor of the Class Z shares of the Fund.
Pursuant to the Class A, B and C Plans, the Fund compensates PIMS for distribution-related activities at an annual rate of up to .30 of 1%, 1% and 1% of the average daily net assets of the Class A, B and Class C shares, respectively. For the year ended May 31, 2004, PIMS contractually agreed to limit such fees to .25% of 1% of the average daily net assets of the Class A shares.
PIMS has advised the Fund that it received approximately $928,200 and $84,500 in front-end sales charges resulting from sales of Class A and Class C shares, respectively, during the year ended May 31, 2004. From these fees, PIMS paid such sales charges to affiliated broker-dealers, which in turn paid commissions to salespersons and incurred other distribution costs.
PIMS has advised the Fund that for the year ended May 31, 2004, it received approximately $61,800 and $11,500 in contingent deferred sales charges imposed upon certain redemptions by Class B and Class C shareholders, respectively.
PI, PIMS and Jennison are indirect, wholly-owned subsidiaries of Prudential Financial, Inc. (“Prudential”).
| | |
| Jennison Natural Resources Fund, Inc. | | 23 |
Notes to Financial Statements
Cont’d
The Fund, along with other affiliated registered investment companies (the “Funds”), is a party to a syndicated credit agreement (“SCA”) with a group of banks. For the year ended May 31, 2004, the SCA provides for a commitment of $800 million and allows the Funds to increase the commitment to $1 billion, if necessary. Interest on any borrowings under the SCA will be at market rates. The Funds pay a commitment fee of .08 of 1% of the unused portion of the SCA. The commitment fee is accrued and paid quarterly and is allocated to the Funds pro rata, based on net assets. The purpose of the SCA is to serve as an alternative source of funding for capital share redemptions. The expiration date of the SCA was April 30, 2004. Effective May 1, 2004, the commitment was reduced to $500 million. All other terms and conditions remain the same. The expiration of the renewed SCA will be October 29, 2004. The Fund did not borrow any amounts pursuant to the SCA during the year ended May 31, 2004.
Note 3. Other Transactions With Affiliates
Prudential Mutual Fund Services LLC (“PMFS”), an affiliate of PI, and an indirect, wholly-owned subsidiary of Prudential, serves as the Fund’s transfer agent. During the year ended May 31, 2004, the Fund incurred fees of approximately $188,200 for the services of PMFS. As of May 31, 2004, approximately $21,000 of such fees were due to PMFS. Transfer agent fees and expenses in the Statement of Operations include certain out-of-pocket expenses paid to nonaffiliates, where applicable.
The Fund pays networking fees to affiliated and unaffiliated broker/dealers. These networking fees are payments made to broker/dealers that clear mutual fund transactions through a national clearing system. The Fund incurred approximately $25,200 in total networking fees, of which the amount relating to the services of Wachovia Securities, LLC (“Wachovia”) and Prudential Securities, Inc. (“PSI”), affiliates of PI, was approximately $3,200 for the year ended May 31, 2004. Effective July 1, 2003 Prudential and Wachovia Corp. formed a joint venture (“Wachovia Securities, LLC”) whereby Prudential and Wachovia Corp. combined their brokerage businesses with Prudential holding a minority interest. Prior to July 1, 2003, PSI was an indirect, wholly-owned subsidiary of Prudential. As of May 31, 2004 approximately $2,500 of such fees were due to Wachovia. These amounts are included in transfer agent’s fees and expenses in the Statement of Operations.
| | |
| 24 | | Visit our website at www.jennisondryden.com |
PSI was the securities lending agent for the Fund. Effective July 1, 2003, Prudential Investment Management, Inc. (“PIM”), an indirect, wholly-owned subsidiary of Prudential, became the Fund’s securities lending agent. For the year ended May 31, 2004, PSI and PIM have been compensated approximately $9,600 and $46,800 for these services, respectively.
The Fund invests in the Taxable Money Market Series (the “Series”), a portfolio of Dryden Core Investment Fund, formerly known as the Prudential Core Investment Fund, pursuant to an exemptive order received from the Securities and Exchange Commission. The Series is a money market mutual fund registered under the Investment Company Act of 1940, as amended, and managed by PI. During the year ended May 31, 2004, the Fund earned income by investing its excess cash and collateral received from securities lending of approximately $92,000 and $169,000 respectively.
Note 4. Portfolio Securities
Purchases and sales of investment securities, other than short-term investments, for the year ended May 31, 2004 were $104,993,226 and $10,070,621, respectively.
As of May 31, 2004, the Fund had securities on loan with an aggregate market value of $57,352,696. The Fund received $61,007,821 in cash as collateral for securities on loan which was used to purchase highly liquid short-term investments in accordance with the Fund’s securities lending procedures.
Note 5. Distributions and Tax Information
Distributions to shareholders, which are determined in accordance with federal income tax regulations and may differ from generally accepted accounting principles, are recorded on the ex-dividend date. In order to present undistributed net investment income (loss) and accumulated net realized gains (losses) on the Statement of Assets and Liabilities that more closely represent their tax character, certain adjustments have been made to paid-in-capital in excess of par, undistributed net investment income (loss) and accumulated gains (losses) on investments. For the year ended May 31, 2004, the adjustments were to decrease accumulated net investment loss by $738,232 and decrease accumulated net realized gains due to differences in the treatment for book and tax purposes of certain transactions involving foreign securities and currencies. Net investment loss, net realized gains and net assets were not affected by this change.
| | |
| Jennison Natural Resources Fund, Inc. | | 25 |
Notes to Financial Statements
Cont’d
For the year ended May 31, 2004, the tax character of distributions paid by the fund was $2,357,888 from ordinary income and $829,473 from long-term capital gains. For the year ended May 31, 2003, the tax character of distributions paid by the Fund was $2,796,192 from ordinary income and $4,181,294 from long-term capital gains.
As of May 31, 2004 the Fund had undistributed ordinary income of $1,053,714 and $226,059 of long-term capital gains on tax basis.
The fund defers approximately $2,824,000 of loss due to the depreciation of certain passive foreign investment companies from November 1, 2003 through May 31, 2004. These losses offsetting net investment income will arise for tax purposes on June 1, 2004.
The United States federal income tax basis of the Fund’s investments and the net unrealized appreciation as of May 31, 2004 were as follows:
| | | | | | | | | | |
Tax Basis
| | Appreciation
| | Depreciation
| | Net Unrealized
Appreciation
| | Other Cost
Basis
Adjustments
| | Total Net
Unrealized
Appreciation
|
| $256,823,182 | | $61,127,224 | | $(5,586,771) | | $55,540,453 | | $3,397 | | $55,543,850 |
The differences between book basis and tax basis of investments are primarily attributable to deferred losses on wash sales and mark to market on passive foreign investment companies. The other cost basis adjustments are primarily attributable to appreciation of foreign currency and mark to market of receivables and payables.
Note 6. Capital
The Fund offers Class A, Class B, Class C and Class Z shares. Class A shares are sold with a front-end sales charge of up to 5.50%. Prior to March 15, 2004, Class A shares were sold with a front-end sales charge of 5%. Effective on March 15, 2004, all investors who purchase Class A shares in an amount of $1 million or more and sell these shares within 12 months of purchase are subject to a contingent deferred sales charge (CDSC) of 1%, including investors who purchase their shares through broker-dealers affiliated with Prudential. Class B shares are sold with a contingent deferred sales charge which declines from 5% to zero depending upon the period of time the shares are held. Through February 1, 2004, Class C shares were sold with a front-end sales charge of 1% and a contingent deferred sales charge of 1% during the first 18 months. Class C shares purchased on or after February 2, 2004 are not subject to a front-end sales charge and the contingent deferred sales charge (CDSC) for Class C shares is 12 months from the date of purchase. Class B shares automatically convert
| | |
| 26 | | Visit our website at www.jennisondryden.com |
to Class A shares on a quarterly basis approximately seven years after purchase. A special exchange privilege is also available for shareholders who qualify to purchase Class A shares at net asset value. Class Z shares are not subject to any sales or redemption charge and are offered exclusively for sale to a limited group of investors.
There are 500 million shares of $.01 par value common stock authorized divided into four classes, designated Class A, Class B, Class C and Class Z common stock, each of which consists of 125 million authorized shares.
Transactions in shares of common stock were as follows:
| | | | | | | |
Class A
| | Shares
| | | Amount
| |
Year ended May 31, 2004: | | | | | | | |
Shares sold | | 2,823,725 | | | $ | 64,273,813 | |
Shares issued in reinvestment of dividends and distributions | | 71,767 | | | | 1,471,938 | |
Shares reacquired | | (1,029,711 | ) | | | (22,197,333 | ) |
| | |
|
| |
|
|
|
Net increase (decrease) in shares outstanding before conversion | | 1,865,781 | | | | 43,548,418 | |
Shares issued upon conversion from Class B | | 408,917 | | | | 8,729,867 | |
| | |
|
| |
|
|
|
Net increase (decrease) in shares outstanding | | 2,274,698 | | | $ | 52,278,285 | |
| | |
|
| |
|
|
|
Year ended May 31, 2003: | | | | | | | |
Shares sold | | 1,079,712 | | | $ | 18,669,013 | |
Shares issued in reinvestment of dividends and distributions | | 186,981 | | | | 2,978,614 | |
Shares reacquired | | (1,019,020 | ) | | | (17,462,534 | ) |
| | |
|
| |
|
|
|
Net increase (decrease) in shares outstanding before conversion | | 247,673 | | | | 4,185,093 | |
Shares issued upon conversion from Class B | | 212,020 | | | | 3,697,968 | |
| | |
|
| |
|
|
|
Net increase (decrease) in shares outstanding | | 459,693 | | | $ | 7,883,061 | |
| | |
|
| |
|
|
|
Class B
| | | | | | |
Year ended May 31, 2004: | | | | | | | |
Shares sold | | 1,217,278 | | | $ | 24,803,626 | |
Shares issued in reinvestment of dividends and distributions | | 34,160 | | | | 632,976 | |
Shares reacquired | | (406,856 | ) | | | (7,906,850 | ) |
| | |
|
| |
|
|
|
Net increase (decrease) in shares outstanding before conversion | | 844,582 | | | | 17,529,752 | |
Shares issued upon conversion to Class A | | (453,572 | ) | | | (8,729,867 | ) |
| | |
|
| |
|
|
|
Net increase (decrease) in shares outstanding | | 391,010 | | | $ | 8,799,885 | |
| | |
|
| |
|
|
|
Year ended May 31, 2003: | | | | | | | |
Shares sold | | 689,856 | | | $ | 10,865,100 | |
Shares issued in reinvestment of dividends and distributions | | 145,931 | | | | 2,105,784 | |
Shares reacquired | | (615,494 | ) | | | (9,621,616 | ) |
| | |
|
| |
|
|
|
Net increase (decrease) in shares outstanding before conversion | | 220,293 | | | | 3,349,268 | |
Shares issued upon conversion to Class A | | (234,093 | ) | | | (3,697,968 | ) |
| | |
|
| |
|
|
|
Net increase (decrease) in shares outstanding | | (13,800 | ) | | $ | (348,700 | ) |
| | |
|
| |
|
|
|
| | |
| Jennison Natural Resources Fund, Inc. | | 27 |
Notes to Financial Statements
Cont’d
| | | | | | | |
Class C
| | | | | | |
Year ended May 31, 2004: | | | | | | | |
Shares sold | | 1,229,575 | | | $ | 25,221,290 | |
Shares issued in reinvestment of dividends and distributions | | 10,526 | | | | 195,053 | |
Shares reacquired | | (141,886 | ) | | | (2,816,670 | ) |
| | |
|
| |
|
|
|
Net increase (decrease) in shares outstanding | | 1,098,215 | | | $ | 22,599,673 | |
| | |
|
| |
|
|
|
Year ended May 31, 2003: | | | | | | | |
Shares sold | | 262,349 | | | $ | 4,188,424 | |
Shares issued in reinvestment of dividends and distributions | | 23,502 | | | | 339,126 | |
Shares reacquired | | (111,987 | ) | | | (1,743,580 | ) |
| | |
|
| |
|
|
|
Net increase (decrease) in shares outstanding | | 173,864 | | | $ | 2,783,970 | |
| | |
|
| |
|
|
|
Class Z
| | | | | | |
Year ended May 31, 2004: | | | | | | | |
Shares sold | | 1,715,600 | | | $ | 39,155,605 | |
Shares issued in reinvestment of dividends and distributions | | 24,476 | | | | 509,598 | |
Shares reacquired | | (614,093 | ) | | | (13,401,415 | ) |
| | |
|
| |
|
|
|
Net increase (decrease) in shares outstanding | | 1,125,983 | | | $ | 26,263,788 | |
| | |
|
| |
|
|
|
Year ended May 31, 2003: | | | | | | | |
Shares sold | | 643,743 | | | $ | 11,322,216 | |
Shares issued in reinvestment of dividends and distributions | | 47,093 | | | | 761,034 | |
Shares reacquired | | (445,036 | ) | | | (7,812,609 | ) |
| | |
|
| |
|
|
|
Net increase (decrease) in shares outstanding | | 245,800 | | | $ | 4,270,641 | |
| | |
|
| |
|
|
|
| | |
| 28 | | Visit our website at www.jennisondryden.com |
Financial Highlights
| | |
| May 31, 2004 | | ANNUAL REPORT |
Jennison Natural Resources Fund, Inc.
Financial Highlights
| | | | |
| | | Class A
| |
| | | Year Ended
May 31, 2004 | |
Per Share Operating Performance(a): | | | | |
Net Asset Value, Beginning Of Year | | $ | 18.94 | |
| | |
|
|
|
Income (loss) from investment operations: | | | | |
Net investment income (loss) | | | (.06 | ) |
Net realized and unrealized gain (loss) on investment and foreign currency transactions | | | 4.96 | |
| | |
|
|
|
Total from investment operations | | | 4.90 | |
| | |
|
|
|
Less dividends and distributions | | | | |
Dividends from net investment income | | | (.39 | ) |
Distributions from net realized gains on investments | | | (.12 | ) |
| | |
|
|
|
Total dividends and distributions | | | (.51 | ) |
| | |
|
|
|
Net asset value, end of year | | $ | 23.33 | |
| | |
|
|
|
Total Return(b): | | | 26.24 | % |
Ratios/Supplemental Data: | | | | |
Net assets, end of year (000) | | $ | 121,700 | |
Average net assets (000) | | $ | 81,712 | |
Ratios to average net assets: | | | | |
Expenses, including distribution and service (12b-1) fees(c) | | | 1.41 | % |
Expenses, excluding distribution and service (12b-1) fees | | | 1.16 | % |
Net investment income (loss) | | | (.27 | )% |
Class A, B, C and Z shares: | | | | |
Portfolio turnover | | | 6 | % |
| (a) | Calculations are made based on average month-end shares outstanding during the year. |
| (b) | Total return does not consider the effects of sales loads. Total return is calculated assuming a purchase of shares on the first day and a sale on the last day of each year reported and includes reinvestment of dividends and distributions. |
| (c) | During each period covered above, the distributor of the Fund contractually agreed to limit its distribution and service (12b-1) fees to .25 of 1% of the average net assets of Class A shares. |
See Notes to Financial Statements.
| | |
| 30 | | Visit our website at www.jennisondryden.com |
| | | | | | | | | | | | | | |
| Class A | |
| Year Ended May 31, | |
| 2003 | | | 2002 | | | 2001 | | | 2000 | |
| | | | | | | | | | | | | | | |
| $ | 20.64 | | | $ | 19.05 | | | $ | 15.55 | | | $ | 11.33 | |
|
|
| |
|
|
| |
|
|
| |
|
|
|
| | | | | | | | | | | | | | | |
| | (.09 | ) | | | (.04 | ) | | | .13 | | | | (.04 | ) |
| | (.27 | ) | | | 1.78 | | | | 3.37 | | | | 4.26 | |
|
|
| |
|
|
| |
|
|
| |
|
|
|
| | (.36 | ) | | | 1.74 | | | | 3.50 | | | | 4.22 | |
|
|
| |
|
|
| |
|
|
| |
|
|
|
| | | | | | | | | | | | | | | |
| | (.41 | ) | | | (.15 | ) | | | — | | | | — | |
| | (.93 | ) | | | — | | | | — | | | | — | |
|
|
| |
|
|
| |
|
|
| |
|
|
|
| | (1.34 | ) | | | (.15 | ) | | | — | | | | — | |
|
|
| |
|
|
| |
|
|
| |
|
|
|
| $ | 18.94 | | | $ | 20.64 | | | $ | 19.05 | | | $ | 15.55 | |
|
|
| |
|
|
| |
|
|
| |
|
|
|
| | (.53 | )% | | | 9.43 | % | | | 22.51 | % | | | 37.25 | % |
| | | | | | | | | | | | | | | |
| $ | 55,747 | | | $ | 51,254 | | | $ | 41,934 | | | $ | 28,971 | |
| $ | 46,251 | | | $ | 37,737 | | | $ | 33,769 | | | $ | 26,574 | |
| | | | | | | | | | | | | | | |
| | 1.64 | % | | | 1.71 | % | | | 1.57 | % | | | 1.53 | % |
| | 1.39 | % | | | 1.46 | % | | | 1.32 | % | | | 1.28 | % |
| | (.51 | )% | | | (.23 | )% | | | .78 | % | | | (.27 | )% |
| | | | | | | | | | | | | | | |
| | 25 | % | | | 28 | % | | | 26 | % | | | 22 | % |
See Notes to Financial Statements.
| | |
| Jennison Natural Resources Fund, Inc. | | 31 |
Financial Highlights
Cont’d
| | | | |
| | | Class B
| |
| | | Year Ended
May 31, 2004 | |
Per Share Operating Performance(a): | | | | |
Net Asset Value, Beginning Of Year | | $ | 17.09 | |
| | |
|
|
|
Income (loss) from investment operations: | | | | |
Net investment loss | | | (.20 | ) |
Net realized and unrealized gain (loss) on investment and foreign currency transactions | | | 4.46 | |
| | |
|
|
|
Total from investment operations | | | 4.26 | |
| | |
|
|
|
Less dividends and distributions | | | | |
Dividends from net investment income | | | (.24 | ) |
Distributions from net realized gains on investments | | | (.12 | ) |
| | |
|
|
|
Total dividends and distributions | | | (.36 | ) |
| | |
|
|
|
Net asset value, end of year | | $ | 20.99 | |
| | |
|
|
|
Total Return(b): | | | 25.28 | % |
Ratios/Supplemental Data: | | | | |
Net assets, end of year (000) | | $ | 52,684 | |
Average net assets (000) | | $ | 40,985 | |
Ratios to average net assets: | | | | |
Expenses, including distribution and service (12b-1) fees | | | 2.16 | % |
Expenses, excluding distribution and service (12b-1) fees | | | 1.16 | % |
Net investment loss | | | (1.03 | )% |
| (a) | Calculations are made based on average month-end shares outstanding during the year. |
| (b) | Total return does not consider the effects of sales loads. Total return is calculated assuming a purchase of shares on the first day and a sale on the last day of each year reported and includes reinvestment of dividends and distributions. |
See Notes to Financial Statements.
| | |
| 32 | | Visit our website at www.jennisondryden.com |
| | | | | | | | | | | | | | |
| Class B | |
| Year Ended May 31, | |
| 2003 | | | 2002 | | | 2001 | | | 2000 | |
| | | | | | | | | | | | | | | |
| $ | 18.76 | | | $ | 17.33 | | | $ | 14.24 | | | $ | 10.46 | |
|
|
| |
|
|
| |
|
|
| |
|
|
|
| | | | | | | | | | | | | | | |
| | (.20 | ) | | | (.14 | ) | | | (.02 | ) | | | (.13 | ) |
| | (.26 | ) | | | 1.61 | | | | 3.11 | | | | 3.91 | |
|
|
| |
|
|
| |
|
|
| |
|
|
|
| | (.46 | ) | | | 1.47 | | | | 3.09 | | | | 3.78 | |
|
|
| |
|
|
| |
|
|
| |
|
|
|
| | | | | | | | | | | | | | | |
| | (.28 | ) | | | (.04 | ) | | | — | | | | — | |
| | (.93 | ) | | | — | | | | — | | | | — | |
|
|
| |
|
|
| |
|
|
| |
|
|
|
| | (1.21 | ) | | | (.04 | ) | | | — | | | | — | |
|
|
| |
|
|
| |
|
|
| |
|
|
|
| $ | 17.09 | | | $ | 18.76 | | | $ | 17.33 | | | $ | 14.24 | |
|
|
| |
|
|
| |
|
|
| |
|
|
|
| | (1.31 | )% | | | 8.57 | % | | | 21.70 | % | | | 36.14 | % |
| | | | | | | | | | | | | | | |
| $ | 36,197 | | | $ | 40,002 | | | $ | 42,288 | | | $ | 46,230 | |
| $ | 33,154 | | | $ | 32,040 | | | $ | 39,793 | | | $ | 45,728 | |
| | | | | | | | | | | | | | | |
| | 2.39 | % | | | 2.46 | % | | | 2.32 | % | | | 2.28 | % |
| | 1.39 | % | | | 1.46 | % | | | 1.32 | % | | | 1.28 | % |
| | (1.27 | )% | | | (.95 | )% | | | (.16 | )% | | | (1.04 | )% |
See Notes to Financial Statements.
| | |
| Jennison Natural Resources Fund, Inc. | | 33 |
Financial Highlights
Cont’d
| | | | |
| | | Class C
| |
| | | Year Ended
May 31, 2004 | |
Per Share Operating Performance(a): | | | | |
Net Asset Value, Beginning Of Year | | $ | 17.09 | |
| | |
|
|
|
Income (loss) from investment operations: | | | | |
Net investment income (loss) | | | (.20 | ) |
Net realized and unrealized gain (loss) on investment and foreign currency transactions | | | 4.46 | |
| | |
|
|
|
Total from investment operations | | | 4.26 | |
| | |
|
|
|
Less dividends and distributions | | | | |
Dividends from net investment income | | | (.24 | ) |
Distributions from net realized gains on investments | | | (.12 | ) |
| | |
|
|
|
Total dividends and distributions | | | (.36 | ) |
| | |
|
|
|
Net asset value, end of year | | $ | 20.99 | |
| | |
|
|
|
Total Return(b): | | | 25.28 | % |
Ratios/Supplemental Data: | | | | |
Net assets, end of year (000) | | $ | 32,612 | |
Average net assets (000) | | $ | 16,347 | |
Ratios to average net assets: | | | | |
Expenses, including distribution and service (12b-1) fees | | | 2.16 | % |
Expenses, excluding distribution and service (12b-1) fees | | | 1.16 | % |
Net investment income (loss) | | | (1.00 | )% |
| (a) | Calculations are made based on average month-end shares outstanding during the year. |
| (b) | Total return does not consider the effects of sales loads. Total return is calculated assuming a purchase of shares on the first day and a sale on the last day of each year reported and includes reinvestment of dividends and distributions. |
See Notes to Financial Statements.
| | |
| 34 | | Visit our website at www.jennisondryden.com |
| | | | | | | | | | | | | | |
| Class C | |
| Year Ended May 31, | |
| 2003 | | | 2002 | | | 2001 | | | 2000 | |
| | | | | | | | | | | | | | | |
| $ | 18.76 | | | $ | 17.33 | | | $ | 14.24 | | | $ | 10.46 | |
|
|
| |
|
|
| |
|
|
| |
|
|
|
| | | | | | | | | | | | | | | |
| | (.19 | ) | | | (.14 | ) | | | .01 | | | | (.13 | ) |
| | (.27 | ) | | | 1.61 | | | | 3.08 | | | | 3.91 | |
|
|
| |
|
|
| |
|
|
| |
|
|
|
| | (.46 | ) | | | 1.47 | | | | 3.09 | | | | 3.78 | |
|
|
| |
|
|
| |
|
|
| |
|
|
|
| | | | | | | | | | | | | | | |
| | (.28 | ) | | | (.04 | ) | | | — | | | | — | |
| | (.93 | ) | | | — | | | | — | | | | — | |
|
|
| |
|
|
| |
|
|
| |
|
|
|
| | (1.21 | ) | | | (.04 | ) | | | — | | | | — | |
|
|
| |
|
|
| |
|
|
| |
|
|
|
| $ | 17.09 | | | $ | 18.76 | | | $ | 17.33 | | | $ | 14.24 | |
|
|
| |
|
|
| |
|
|
| |
|
|
|
| | (1.31 | )% | | | 8.57 | % | | | 21.70 | % | | | 36.14 | % |
| | | | | | | | | | | | | | | |
| $ | 7,778 | | | $ | 5,278 | | | $ | 4,277 | | | $ | 2,078 | |
| $ | 5,585 | | | $ | 3,771 | | | $ | 2,923 | | | $ | 1,851 | |
| | | | | | | | | | | | | | | |
| | 2.39 | % | | | 2.46 | % | | | 2.32 | % | | | 2.28 | % |
| | 1.39 | % | | | 1.46 | % | | | 1.32 | % | | | 1.28 | % |
| | (1.23 | )% | | | (.93 | )% | | | .05 | % | | | (1.04 | )% |
See Notes to Financial Statements.
| | |
| Jennison Natural Resources Fund, Inc. | | 35 |
Financial Highlights
Cont’d
| | | | |
| | | Class Z
| |
| | | Year Ended
May 31, 2004 | |
Per Share Operating Performance(a): | | | | |
Net Asset Value, Beginning Of Year | | $ | 19.24 | |
| | |
|
|
|
Income (loss) from investment operations: | | | | |
Net investment income (loss) | | | — | (c) |
Net realized and unrealized gain (loss) on investment and foreign currency transactions | | | 5.02 | |
| | |
|
|
|
Total from investment operations | | | 5.02 | |
| | |
|
|
|
Less dividends and distributions | | | | |
Dividends from net investment income | | | (.44 | ) |
Distributions from net realized gains on investments | | | (.12 | ) |
| | |
|
|
|
Total dividends and distributions | | | (.56 | ) |
| | |
|
|
|
Net asset value, end of year | | $ | 23.70 | |
| | |
|
|
|
Total Return(b): | | | 26.49 | % |
Ratios/Supplemental Data: | | | | |
Net assets, end of year (000) | | $ | 44,663 | |
Average net assets (000) | | $ | 25,894 | |
Ratios to average net assets: | | | | |
Expenses, including distribution and service (12b-1) fees | | | 1.16 | % |
Expenses, excluding distribution and service (12b-1) fees | | | 1.16 | % |
Net investment income (loss) | | | (.02 | )% |
| (a) | Calculations are made based on average month-end shares outstanding during the year. |
| (b) | Total return is calculated assuming a purchase of shares on the first day and a sale on the last day of each year reported and includes reinvestment of dividends and distributions. |
| (c) | Less than $.005 per share. |
See Notes to Financial Statements.
| | |
| 36 | | Visit our website at www.jennisondryden.com |
| | | | | | | | | | | | | | |
| Class Z | |
| Year Ended May 31, | |
| 2003 | | | 2002 | | | 2001 | | | 2000 | |
| | | | | | | | | | | | | | | |
| $ | 20.93 | | | $ | 19.32 | | | $ | 15.71 | | | $ | 11.42 | |
|
|
| |
|
|
| |
|
|
| |
|
|
|
| | | | | | | | | | | | | | | |
| | (.04 | ) | | | — | (c) | | | .20 | | | | — | (c) |
| | (.27 | ) | | | 1.80 | | | | 3.41 | | | | 4.29 | |
|
|
| |
|
|
| |
|
|
| |
|
|
|
| | (.31 | ) | | | 1.80 | | | | 3.61 | | | | 4.29 | |
|
|
| |
|
|
| |
|
|
| |
|
|
|
| | | | | | | | | | | | | | | |
| | (.45 | ) | | | (.19 | ) | | | — | | | | — | |
| | (.93 | ) | | | — | | | | — | | | | — | |
|
|
| |
|
|
| |
|
|
| |
|
|
|
| | (1.38 | ) | | | (.19 | ) | | | — | | | | — | |
|
|
| |
|
|
| |
|
|
| |
|
|
|
| $ | 19.24 | | | $ | 20.93 | | | $ | 19.32 | | | $ | 15.71 | |
|
|
| |
|
|
| |
|
|
| |
|
|
|
| | (.24 | )% | | | 9.69 | % | | | 22.98 | % | | | 37.57 | % |
| | | | | | | | | | | | | | | |
| $ | 14,586 | | | $ | 10,728 | | | $ | 8,319 | | | $ | 3,467 | |
| $ | 10,707 | | | $ | 6,272 | | | $ | 5,053 | | | $ | 2,552 | |
| | | | | | | | | | | | | | | |
| | 1.39 | % | | | 1.46 | % | | | 1.32 | % | | | 1.28 | % |
| | 1.39 | % | | | 1.46 | % | | | 1.32 | % | | | 1.28 | % |
| | (.22 | )% | | | (.01 | )% | | | 1.22 | % | | | 0 | % |
See Notes to Financial Statements.
| | |
| Jennison Natural Resources Fund, Inc. | | 37 |
Report of Independent Registered Public Accounting Firm
The Board of Directors and Shareholders of
Jennison Natural Resources Fund, Inc.:
We have audited the accompanying statement of assets and liabilities of the Jennison Natural Resources Fund, Inc. including the portfolio of investments, as of May 31, 2004, and the related statement of operations, the statement of changes in net assets, and the financial highlights for the year then ended. These financial statements and financial highlights are the responsibility of the Fund’s management. Our responsibility is to express an opinion on these financial statements and financial highlights based on our audit. The statement of changes in net assets for the year ending May 31, 2003 and the financial highlights for all years presented prior to the year ended May 31, 2004, were audited by other auditors, whose report dated, July 16, 2003, expressed an unqualified opinion thereon.
We conducted our audit in accordance with the standards of the Public Company Accounting Oversight Board (United States). Those standards require that we plan and perform the audit to obtain reasonable assurance about whether the financial statements and financial highlights are free of material misstatement. An audit includes examining, on a test basis, evidence supporting the amounts and disclosures in the financial statements. Our procedures included confirmation of securities owned as of May 31, 2004, by correspondence with the custodian and brokers. As to securities purchased or sold but not yet received or delivered, we performed other appropriate auditing procedures. An audit also includes assessing the accounting principles used and significant estimates made by management, as well as evaluating the overall financial statement presentation. We believe that our audit provides a reasonable basis for our opinion.
In our opinion, the financial statements and financial highlights referred to above present fairly, in all material respects, the financial position of the Jennison Natural Resources Fund, Inc. as of May 31, 2004 and the results of its operations, the changes in its net assets, and the financial highlights for the year then ended, in conformity with U.S. generally accepted accounting principles.
New York, New York
July 22, 2004
| | |
| 38 | | Visit our website at www.jennisondryden.com |
Tax Information
(Unaudited)
We are required by the Internal Revenue Code to advise you within 60 days of the Fund’s fiscal year end (May 31, 2004) as to the federal tax status of dividends paid by the Fund during its fiscal year ended May 31, 2004.
During the fiscal year ended May 31, 2004, the Fund paid distributions of $0.51 per Class A share, $0.36 per Class B share, $0.36 per Class C share and $0.56 per Class Z share. Of these amounts, $0.39, $0.24, $0.24 and $0.44 per Class A, B, C, and Z shares, respectively represent dividends paid from net investment income which are taxable as ordinary income (35%) and $0.1193 per Class A, B, C and Z shares represent distributions from long-term capital gains. Further, we wish to advise you that 27.88% of the ordinary income dividends paid in the fiscal year ended May 31, 2004, qualify for the corporate dividends received deduction available to corporate taxpayers.
For the purpose of preparing your annual federal income tax return, however, you should report the amounts as reflected on the appropriate Form 1099-DIV or substitute 1099-DIV.
| | |
| Jennison Natural Resources Fund, Inc. | | 39 |
Management of the Fund
(Unaudited)
Information pertaining to the Directors of the Fund is set forth below. Directors who are not deemed to be “interested persons” of the Fund, as defined in the 1940 Act are referred to as “Independent Directors.” Directors who are deemed to be “interested persons” of the Fund are referred to as “Interested Directors.” “Fund Complex”† consists of the Fund and any other investment companies managed by PI.
Independent Directors(2)
David E.A. Carson (69), Director since 2003(3) Oversees 90 portfolios in Fund complex
Principal occupations (last 5 years): Director (January 2000 to May 2000), Chairman (January 1999 to December 1999), Chairman and Chief Executive Officer (January 1998 to December 1998) and President, Chairman and Chief Executive Officer (1983-1997) of People’s Bank.
Other Directorships held:(4) Director of United Illuminating and UIL Holdings (utility company), since 1993.
Robert E. La Blanc (70), Director since 2003(3) Oversees 98 portfolios in Fund complex
Principal occupations (last 5 years): President (since 1981) of Robert E. La Blanc Associates, Inc. (telecommunications); formerly General Partner at Salomon Brothers and Vice-Chairman of Continental Telecom; Trustee of Manhattan College.
Other Directorships held:(4), Chartered Semiconductor Manufacturing, Ltd. (since 1998); Titan Corporation (electronics) (since 1995), Computer Associates International, Inc. (software company) (since 2002); FiberNet Telecom Group, Inc. (telecom company) (since 2003); Director (since April 1999) of the High Yield Plus Fund, Inc.
Douglas H. McCorkindale (64), Director since 2000(3) Oversees 91 portfolios in Fund complex
Principal occupations (last 5 years): Chairman (since February 2001), Chief Executive Officer (since June 2000) and President (since September 1997) of Gannett Co. Inc. (publishing and media); formerly Vice Chairman (March 1984-May 2000) of Gannett Co., Inc.
Other Directorships held:(4) Director of Gannett Co. Inc., Director of Continental Airlines, Inc. (since May 1993); Director of Lockheed Martin Corp. (aerospace and defense) (since May 2001); Director of The High Yield Plus Fund, Inc. (since 1996).
Richard A. Redeker (60), Director since 2000(3) Oversees 92 portfolios in Fund complex
Principal occupations (last 5 years): Management Consultant; formerly employee of Prudential Investments (October 1996-December 1998); Director of Invesmart, Inc. (since 2001) and Director of Penn Tank Lines, Inc. (since 1999).
Other Directorships held:(4) None.
| | |
| 40 | | Visit our website at www.jennisondryden.com |
Robin B. Smith (64), Director since 1996(3) Oversees 97 portfolios in Fund complex
Principal occupations (last 5 years): Chairman of the Board (since January 2003) of Publishers Clearing House (direct marketing); formerly Chairman and Chief Executive Officer (August 1996-January 2003) of Publishers Clearing House.
Other Directorships held:(4) Director of BellSouth Corporation (since 1992).
Stephen Stoneburn (60), Director since 2003(3) Oversees 95 portfolios in Fund complex
Principal occupations (last 5 years): President and Chief Executive Officer (since June 1996) of Quadrant Media Corp. (a publishing company); formerly President (June 1995-June 1996) of Argus Integrated Media, Inc.; Senior Vice President and Managing Director (January 1993-1995) of Cowles Business Media and Senior Vice President of Fairchild Publications, Inc. (1975-1989).
Other Directorships held:(4) None
Clay T. Whitehead (65), Director since 1999(3) Oversees 96 portfolios in Fund complex
Principal occupations (last 5 years): President (since 1983) of National Exchange Inc. (new business development firm).
Other Directorships held:(4) Director (since 2000) of the High Yield Plus Fund, Inc.
Interested Directors(1)
Judy A. Rice (56), President since 2003 and Director since 2000(3) Oversees 95 portfolios in Fund complex
Principal occupations (last 5 years): President, Chief Executive Officer, Chief Operating Officer and Officer-in-Charge (since 2003) of PI; Director, Officer-in-Charge, President, Chief Executive Officer and Chief Operating Officer (since May 2003) of American Skandia Advisory Services, Inc. and American Skandia Investment Services, Inc.; Director, Officer-in-Charge, President, Chief Executive Officer (since May 2003) of American Skandia Fund Services, Inc.; Vice President (since February 1999) of Prudential Investment Management Services LLC; President, Chief Executive Officer and Officer-in-Charge (since April 2003) of Prudential Mutual Fund Services LLC; formerly various positions to Senior Vice President (1992-1999) of Prudential Securities; and various positions to Managing Director (1975-1992) of Salomon Smith Barney; Member of Board of Governors of the Money Management Institute.
Other Directorships held:(4) None
Robert F. Gunia (57), Vice President(3) since 1987 and Director since 1996(3) Oversees 175 portfolios in Fund complex
Principal occupations (last 5 years): Chief Administrative Officer (since June 1999) of PI; Executive Vice President and Treasurer (since January 1996) of PI; President (since April 1999) of Prudential Investment Management Services LLC (PIMS); Corporate Vice President (since September 1997) of The Prudential Insurance Company of America (Prudential); Director, Executive Vice President and Chief Administrative Officer (since May 2003) of American Skandia Investment Services, Inc., American Skandia Advisory Services, Inc. and American Skandia Fund Services, Inc.; President (since April 1999) of Prudential Investment Management Services LLC; Executive Vice President (since March 1999) and Treasurer (since May 2000) of Prudential Mutual Fund Services LLC; formerly Senior Vice President (March 1987-May 1999) of Prudential Securities.
Other Directorships held:(4) Vice President and Director (since May 1989) and Treasurer (since 1999) of The Asia Pacific Fund, Inc.
| | |
| Jennison Natural Resources Fund, Inc. | | 41 |
Information pertaining to the Officers of the Fund who are not also Directors is set forth below.
Officers(2)
William V. Healey (50) Chief Legal Officer and Secretary since 2004(3)
Principal occupations (last 5 years): Vice President and Associate General Counsel (since 1998) of Prudential; Executive Vice President and Chief Legal Officer (since February 1999) of Prudential Investments LLC; Senior Vice President, Chief Legal Officer and Secretary (since December 1998) of Prudential Investment Management Services LLC; Executive Vice President and Chief Legal Officer (since February 1999) of Prudential Mutual Fund Services LLC; Vice President and Secretary (since October 1998) of Prudential Investment Management, Inc.; Executive Vice President and Chief Legal Officer (since May 2003) of American Skandia Investment Services, Inc., American Skandia Fund Services, Inc. and American Skandia Advisory Services, Inc.; Director (June 1999-June 2002 and June 2003-present) of ICI Mutual Insurance Company; prior to August 1998, Associate General Counsel of the Dreyfus Corporation (Dreyfus), a subsidiary of Mellon Bank, N.A. (Mellon Bank), and an officer and/or director of various affiliates of Mellon Bank and Dreyfus. Assistant Secretary (since June 2004) of the Asia Pacific Fund, Inc.
Lee D. Augsburger (45) Chief Compliance Officer since 2004(3)
Principal occupations (last 5 years): Vice President and Chief Compliance Officer (since May 2003) of Pl; Vice President and Chief Compliance Officer (since October 2000) of Prudential Investment Management, Inc.; formerly Vice President and Chief Legal Officer—Annuities (August 1999-October 2000) of Prudential Insurance Company of America; Vice President and Corporate Counsel (November 1997-August 1999) of Prudential Insurance Company of America.
Maryanne Ryan (39), Anti-Money Laundering Compliance Officer since 2002(3)
Principal occupations (last 5 years): Vice President, Prudential (since November 1998); First Vice President, Prudential Securities (March 1997-May 1998); Anti-Money Laundering Compliance Officer (since 2003) of American Skandia Investment Services, Inc., American Skandia Advisory Services, Inc. and American Skandia Marketing, Inc.
Grace C. Torres (44), Treasurer and Principal Financial and Accounting Officer since 1997(3)
Principal occupations (last 5 years): Senior Vice President (since January 2000) of PI; Senior Vice President and Assistant Treasurer (since May 2003) of American Skandia Investment Services, Inc. and American Skandia Advisory Services, Inc.; formerly First Vice President (December 1996-January 2000) of PI and First Vice President (March 1993-1999) of Prudential Securities.
Lori E. Bostrom (41) Assistant Secretary since 2004(3)
Principal occupations (last 5 years): Vice President and Corporate Counsel (since October 2002) of Prudential; Vice President and Assistant Secretary (since May 2003) of American Skandia Investment Services, Inc.; formerly Senior Counsel of The Guardian Life Insurance Company of America (February 1996-October 2002)
| (1) | “Interested” Director, as defined in the 1940 Act, by reason of employment with the Manager (Prudential Investments LLC or PI), the Subadviser (Jennison Associates LLC or Jennison) or the Distributor (Prudential Investment Management Services LLC or PIMS). |
| (2) | Unless otherwise noted, the address of the Directors and Officers is c/o: Prudential Investments LLC, Gateway Center Three, 100 Mulberry Street, Newark, NJ 07102. |
| | |
| 42 | | Visit our website at www.jennisondryden.com |
| (3) | There is no set term of office for Directors and Officers. The Independent Directors have adopted a retirement policy, which calls for the retirement of Directors on December 31 of the year in which they reach the age of 75. The table shows the individuals length of service as Director and/or Officer. |
| (4) | This includes only directorships of companies requested to register, or file reports with the SEC under the Securities and Exchange Act of 1934 (that is, “public companies”) or other investment companies registered under the 1940 Act. |
| † | The Fund Complex consists of all investment companies managed by PI. The Funds for which PI serves as manager include JennisonDryden Mutual Funds, Strategic Partners Mutual Funds, Strategic Partners Mutual Funds, Inc., The Prudential Variable Contract Accounts 2, 10, 11, The Target Portfolio Trust, The Prudential Series Fund, Inc., American Skandia Trust, and Prudential’s Gibraltar Fund. |
Additional information about the Fund’s Directors is included in the Fund’s Statement of Additional Information which is available without charge, upon request, by calling (800) 521-7466 or (732) 482-7555 (Calling from outside the U.S.)
| | |
| Jennison Natural Resources Fund, Inc. | | 43 |
Growth of a $10,000 Investment
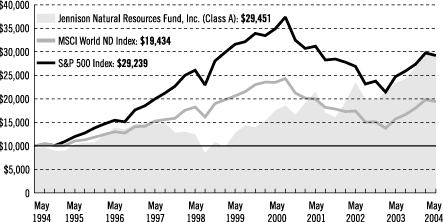
| | | | | | | | | | | | |
| Average Annual Total Returns (With Sales Charges) as of 5/31/04 | |
| | | One Year | | | Five Years | | | Ten Years | | | Since Inception | |
Class A | | 19.29 | % | | 16.90 | % | | 11.41 | % | | 9.32 | % |
Class B | | 20.28 | | | 17.23 | | | 11.20 | | | 8.44 | |
Class C | | 24.28 | | | 17.34 | | | N/A | | | 11.24 | |
Class Z | | 26.49 | | | 18.55 | | | N/A | | | 10.84 | |
| | | | | | | | | | | | | |
| Average Annual Total Returns (Without Sales Charges) as of 5/31/04 | |
| | | One Year | | | Five Years | | | Ten Years | | | Since Inception | |
Class A | | 26.24 | % | | 18.23 | % | | 12.04 | % | | 9.75 | % |
Class B | | 25.28 | | | 17.34 | | | 11.20 | | | 8.44 | |
Class C | | 25.28 | | | 17.34 | | | N/A | | | 11.24 | |
Class Z | | 26.49 | | | 18.55 | | | N/A | | | 10.84 | |
Performance data quoted represents past performance. Past performance does not guarantee future results. The investment return and principal value of an investment will fluctuate so that an investor’s shares, when redeemed, may be worth more or less than their original cost. Current performance may be lower or higher than the past performance data quoted. An investor may obtain performance data current to the most recent month-end by visiting our website at www.jennisondryden.com or by calling (800) 225-1825.
Source: Prudential Investments LLC and Lipper Inc. Inception dates: Class A, 1/22/90; Class B, 9/28/87; Class C, 8/1/94; and Class Z, 9/16/96.
The graph compares a $10,000 investment in the Jennison Natural Resources Fund, Inc. (Class A shares) with a similar investment in the Morgan Stanley Capital International World Net Dividends Index (MSCI World ND Index)
| | |
| | | Visit our website at www.jennisondryden.com |
and the Standard & Poor’s 500 Composite Stock Price Index (S&P 500 Index) by portraying the initial account values at the beginning of the 10-year period for Class A shares (May 31, 1994) and the account values at the end of the current fiscal year (May 31, 2004) as measured on a quarterly basis. For purposes of the graph, and unless otherwise indicated, it has been assumed that (a) the maximum applicable front-end sales charge was deducted from the initial $10,000 investment in Class A shares; (b) all recurring fees (including management fees) were deducted; and (c) all dividends and distributions were reinvested. The line graph provides information for Class A shares only. As indicated in the tables provided earlier, performance for Class B, C, and Z shares will vary due to the differing charges and expenses applicable to each share class (as indicated in the following paragraphs). Without a distribution and service (12b-1) fee waiver of 0.05% for Class A shares through May 31, 2004, the returns shown in the graph and for Class A shares in the tables would have been lower.
MSCI World ND Index is a free float-adjusted, market-capitalization index that is designed to measure global developed market equity performance. The MSCI World ND Index consists of approximately 23 developed market indexes in Australia, Canada, Europe, the Far East, New Zealand, and the United States. The S&P 500 Index is an unmanaged index of 500 stocks of large U.S. public companies. It gives a broad look at how stock prices have performed in the United States. The Indexes’ total returns include the reinvestment of all dividends, but do not include the effects of sales charges, operating expenses of a mutual fund, or taxes. The returns for the Indexes would be lower if they included the effects of sales charges, operating expenses, or taxes. The securities that comprise the Indexes may differ substantially from the securities in the Fund. These are not the only indexes that may be used to characterize performance of sector stock funds. Other indexes may portray different comparative performance. Investors cannot invest directly in an index.
Through March 14, 2004, the Fund charged a maximum front-end sales charge of 5% for Class A shares and a 12b-1 fee of up to 0.30% annually. Effective March 15, 2004, Class A shares are subject to a maximum front-end sales charge of 5.50%, a 12b-1 fee of up to 0.30% annually, and all investors who purchase Class A shares in an amount of $1 million or more and sell these shares within 12 months of purchase are subject to a contingent deferred sales charge (CDSC) of 1%. Class B shares are subject to a declining CDSC of 5%, 4%, 3%, 2%, 1%, and 1% respectively for the first six years after purchase and a 12b-1 fee of 1% annually. Approximately seven years after purchase, Class B shares will automatically convert to Class A shares on a quarterly basis. Until February 2, 2004, Class C shares were subject to a front-end sales charge of 1%, a CDSC of 1% for shares redeemed within 18 months of purchase, and a 12b-1 fee of 1% annually. Class C shares purchased on or after February 2, 2004 are not subject to a front-end sales charge, but charge a CDSC of 1% for Class C shares sold within 12 months from the date of purchase, and an annual 12b-1 fee of 1%. The returns in the graph and tables reflect the share class expense structure in effect at the close of the fiscal period. The returns in the graph and the tables do not reflect the deduction of taxes that a shareholder would pay on Fund distributions or following the redemption of Fund shares.
| | |
| Jennison Natural Resources Fund, Inc. | | |
| | | | |
| n MAIL | | n TELEPHONE | | n WEBSITE |
Gateway Center Three
100 Mulberry Street
Newark, NJ 07102 | | (800) 225-1852 | | www.jennisondryden.com |
|
| PROXY VOTING |
| The Board of Directors of the Fund has delegated to the Fund’s investment adviser the responsibility for voting any proxies and maintaining proxy recordkeeping with respect to the Fund. A description of these proxy voting policies and procedures is available without charge, upon request, by calling (800) 225-1852 or by visiting the SEC’s website at http://www.sec.gov. |
|
| DIRECTORS |
David E.A. Carson•Robert F. Gunia•Robert E. La Blanc•Douglas H. McCorkindale•
Richard A. Redeker• Judy A. Rice•Robin B. Smith•Stephen D. Stoneburn•
Clay T. Whitehead |
|
| OFFICERS |
Judy A. Rice, President•Robert F. Gunia, Vice President•Grace C. Torres, Treasurer and Principal Financial and Accounting Officer•William V. Healey, Chief Legal Officer•
Maryanne Ryan, Anti-Money Laundering Compliance Officer•Lee D. Augsburger, Chief Compliance Officer |
| | | | |
| MANAGER | | Prudential Investments LLC | | Gateway Center Three
100 Mulberry Street
Newark, NJ 07102 |
|
| INVESTMENT ADVISER | | Jennison Associates LLC | | 466 Lexington Avenue
New York, NY 10017 |
|
| DISTRIBUTOR | | Prudential Investment
Management Services LLC | | Gateway Center Three
14th Floor
100 Mulberry Street
Newark, NJ 07102 |
|
| CUSTODIAN | | State Street Bank
and Trust Company | | One Heritage Drive
North Quincy, MA 02171 |
‘
|
| TRANSFER AGENT | | Prudential Mutual Fund
Services LLC | | PO Box 8098
Philadelphia, PA 19101 |
|
| INDEPENDENT REGISTERED PUBLIC ACCOUNTING FIRM | | KPMG LLP | | 757 Third Avenue
New York, NY 10017 |
|
| FUND COUNSEL | | Sullivan & Cromwell LLP | | 125 Broad Street
New York, NY 10004 |
| | | | | | | | | | | | |
| Jennison Natural Resources Fund, Inc. | | | | |
| | | Share Class | | A | | B | | C | | Z | | |
| | | NASDAQ | | PGNAX | | PRGNX | | PNRCX | | PNRZX | | |
| | | CUSIP | | 476293105 | | 476293204 | | 476293303 | | 476293402 | | |
| | | | | | | | | | | | | |
|
An investor should consider the investment objectives, risks, and charges and expenses of the Fund carefully before investing. The prospectus for the Fund contains this and other information about the Fund. An investor may obtain a prospectus by visiting our website at www.jennisondryden.com or by calling (800) 225-1852. The prospectus should be read carefully before investing. |
|
| Quantitative Management Associates and Prudential Fixed Income are business units of Prudential Investment Management, Inc. (PIM), and Jennison Associates LLC is a subsidiary of PIM. Jennison Associates LLC and PIM are registered investment advisers. PIM is a subsidiary of Prudential Financial, Inc. |
|
| |
E-DELIVERY To receive your mutual fund documents on-line, go to www.icsdelivery.com/prudential/funds and enroll. Instead of receiving printed documents by mail, you will receive notification via e-mail when new materials are available. You can cancel your enrollment or change your e-mail address at any time by clicking on the change/cancel enrollment option at the icsdelivery website address. |
Mutual Funds:
| | | | |
| ARE NOT INSURED BY THE FDIC OR ANY FEDERAL GOVERNMENT AGENCY | | MAY LOSE VALUE | | ARE NOT A DEPOSIT OF OR GUARANTEED BY ANY BANK OR ANY BANK AFFILIATE |
| | | | | | | | | | | | | | |
| | | Jennison Natural Resources Fund, Inc. | | | | | | | | |
| | | Share Class | | A | | B | | C | | Z | | | | |
| | | NASDAQ | | PGNAX | | PRGNX | | PNRCX | | PNRZX | | | | |
| | | CUSIP | | 476293105 | | 476293204 | | 476293303 | | 476293402 | | | | |
| | | | | | | | | | | | | | | |
MF135E IFS-A094194 Ed. 07/2004
Item 2 – Code of Ethics — See Exhibit (a)
As of the end of the period covered by this report, the registrant has adopted a code of ethics (the “Section 406 Standards for Investment Companies – Ethical Standards for Principal Executive and Financial Officers”) that applies to the registrant’s Principal Executive Officer and Principal Financial Officer; the registrant’s Principal Financial Officer also serves as the Principal Accounting Officer.
The registrant hereby undertakes to provide any person, without charge, upon request, a copy of the code of ethics. To request a copy of the code of ethics, contact the registrant 973-802-6469, and ask for a copy of the Section 406 Standards for Investment Companies - Ethical Standards for Principal Executive and Financial Officers.
Item 3 – Audit Committee Financial Expert –
The registrant’s Board has determined that Mr. David Carson, member of the Board’s Audit Committee is an “audit committee financial expert,” and that he is “independent,” for purposes of this Item.
Item 4 – Principal Accountant Fees and Services –
(a) Audit Fees
For the fiscal year ended May 31, 2004, KPMG LLP, the Registrant’s principal accountant, billed the Registrant $16,700 for professional services rendered for the audit of the Registrant’s annual financial statements or services that are normally provided in connection with statutory and regulatory filings. KPMG did not serve as the Registrant’s principal accountant during fiscal year ended May 31, 2003, so no information for that fiscal year is provided.
(b) Audit-Related Fees
None.
(c) Tax Fees
None.
(d) All Other Fees
None.
(e) (1) Audit Committee Pre-Approval Policies and Procedures
THE PRUDENTIAL MUTUAL FUNDS
AUDIT COMMITTEE POLICY
on
Pre-Approval of Services Provided by the Independent Accountants
The Audit Committee of each Prudential Mutual Fund is charged with the responsibility to monitor the independence of the Fund’s independent accountants. As part of this responsibility, the Audit Committee must pre-approve any independent accounting firm’s engagement to render audit and/or permissible non-audit services, as required by law. In evaluating a proposed engagement of the independent accountants, the Audit Committee will assess the effect that the engagement might reasonably be expected to have on the accountant’s independence. The Committee’s evaluation will be based on:
| | • | a review of the nature of the professional services expected to be provided, |
| | • | a review of the safeguards put into place by the accounting firm to safeguard independence, and |
| | • | periodic meetings with the accounting firm. |
Policy for Audit and Non-Audit Services Provided to the Funds
On an annual basis, the scope of audits for each Fund, audit fees and expenses, and audit-related and non-audit services (and fees proposed in respect thereof) proposed to be performed by the Fund’s independent accountants will be presented by the Treasurer and the independent accountants to the Audit Committee for review and, as appropriate, approval prior to the initiation of such services. Such presentation shall be accompanied by confirmation by both the Treasurer and the independent accountants that the proposed services will not adversely affect the independence of the independent accountants. Proposed services shall be described in sufficient detail to enable the Audit Committee to assess the appropriateness of such services and fees, and the compatibility of the provision of such services with the auditor’s independence. The Committee shall receive periodic reports on the progress of the audit and other services which are approved by the Committee or by the Committee Chair pursuant to authority delegated in this Policy.
The categories of services enumerated under “Audit Services”, “Audit-related Services”, and “Tax Services” are intended to provide guidance to the Treasurer and the independent accountants as to those categories of services which the Committee believes are generally consistent with the independence of the independent accountants and which the Committee (or the Committee Chair) would expect upon the presentation of specific proposals to pre-approve. The enumerated categories are not intended as an exclusive list of audit, audit-related or tax services which the Committee (or the Committee Chair) would consider for pre-approval.
Audit Services
The following categories of audit services are considered to be consistent with the role of the Fund’s independent accountants:
| | • | Annual Fund financial statement audits |
| | • | Seed audits (related to new product filings, as required) |
| | • | SEC and regulatory filings and consents |
Audit-related Services
The following categories of audit-related services are considered to be consistent with the role of the Fund’s independent accountants:
| | • | Accounting consultations |
| | • | Fund merger support services |
| | • | Agreed Upon Procedure Reports |
| | • | Other Internal Control Reports |
Individual audit-related services that fall within one of these categories and are not presented to the Audit Committee as part of the annual pre-approval process will be subject to pre-approval by the Committee Chair (or any other Committee member on whom this responsibility has been delegated) so long as the estimated fee for those services does not exceed $50,000.
Tax Services
The following categories of tax services are considered to be consistent with the role of the Fund’s independent accountants:
| | • | Tax compliance services related to the filing or amendment of the following: |
| | • | Federal, state and local income tax compliance; and, |
| | • | Sales and use tax compliance |
| | • | Timely RIC qualification reviews |
| | • | Tax distribution analysis and planning |
| | • | Tax authority examination services |
| | • | Tax appeals support services |
| | • | Accounting methods studies |
| | • | Fund merger support services |
| | • | Tax consulting services and related projects |
Individual tax services that fall within one of these categories and are not presented to the Audit Committee as part of the annual pre-approval process will be subject to pre-approval by the Committee Chair (or any other Committee member on whom this responsibility has been delegated) so long as the estimated fee for those services does not exceed $50,000.
Other Non-audit Services
Certain non-audit services that the independent accountants are legally permitted to render will be subject to pre-approval by the Committee or by one or more Committee members to whom the Committee has delegated this authority and who will report to the full Committee any pre-approval decisions made pursuant to this Policy. Non-audit services presented for pre-approval
pursuant to this paragraph will be accompanied by a confirmation from both the Treasurer and the independent accountants that the proposed services will not adversely affect the independence of the independent accountants.
Proscribed Services
The Fund’s independent accountants will not render services in the following categories of non-audit services:
| | • | Bookkeeping or other services related to the accounting records or financial statements of the Fund |
| | • | Financial information systems design and implementation |
| | • | Appraisal or valuation services, fairness opinions, or contribution-in-kind reports |
| | • | Internal audit outsourcing services |
| | • | Management functions or human resources |
| | • | Broker or dealer, investment adviser, or investment banking services |
| | • | Legal services and expert services unrelated to the audit |
| | • | Any other service that the Public Company Accounting Oversight Board determines, by regulation, is impermissible. |
Pre-approval of Non-Audit Services Provided to Other Entities Within the Prudential Fund Complex
Certain non-audit services provided to Prudential Investments LLC or any of its affiliates that also provide ongoing services to the Prudential Mutual Funds will be subject to pre-approval by the Audit Committee. The only non-audit services provided to these entities that will require pre-approval are those related directly to the operations and financial reporting of the Funds. Individual projects that are not presented to the Audit Committee as part of the annual pre-approval process, will be subject to pre-approval by the Committee Chair (or any other Committee member on whom this responsibility has been delegated) so long as the estimated fee for those services does not exceed $50,000. Services presented for pre-approval pursuant to this paragraph will be accompanied by a confirmation from both the Treasurer and the independent accountants that the proposed services will not adversely affect the independence of the independent accountants.
Although the Audit Committee will not pre-approve all services provided to Prudential Investments LLC and its affiliates, the Committee will receive an annual report from the Fund’s independent accounting firm showing the aggregate fees for all services provided to Prudential Investments and its affiliates.
(e)-(2) Percentage of services referred to in 4(b)- (4)(d) that were approved by the audit committee – Not applicable.
| (f) | Percentage of hours expended attributable to work performed by other than full time employees of principal accountant if greater than 50%. |
Not applicable.
(g) Non-Audit Fees
Not applicable to Registrant and to the registrant’s investment adviser and any entity controlling, controlled by, or under common control with the investment adviser that provides ongoing services to the registrant.
(h) Principal Accountants Independence
Not applicable as KPMG has not provided non-audit services to the registrant’s investment adviser and any entity controlling, controlled by, or under common control with the investment adviser that provides ongoing services to the registrant that were not pre-approved pursuant to Rule 2-01(c)(7)(ii) of Regulation S-X.
| Item | 5 – Audit Committee of Listed Registrants – Not applicable. |
Item 6 – Schedule of Investments – The schedule is included as part of the report to shareholders filed under Item 1 of this Form.
Item 7 – Disclosure of Proxy Voting Policies and Procedures for Closed-End Management Investment Companies – Not applicable.
Item 8 – Purchases of Equity Securities by Closed-End Management Investment Company and Affiliated Purchasers – Not applicable.
Item 9 – Submission of Matters to a Vote of Security Holders: None.
Item 10 – Controls and Procedures
| | (a) | It is the conclusion of the registrant’s principal executive officer and principal financial officer that the effectiveness of the registrant’s current disclosure controls and procedures (such disclosure controls and procedures having been evaluated within 90 days of the date of this filing) provide reasonable assurance that the information required to be disclosed by the registrant has been recorded, processed, summarized and reported within the time period specified in the Commission’s rules and forms and that the information required to be disclosed by the registrant has been accumulated and communicated to the registrant’s principal executive officer and principal financial officer in order to allow timely decisions regarding required disclosure. |
| | (b) | There have been no significant changes in the registrant’s internal controls or in other factors that could significantly affect these controls subsequent to the date of their evaluation, including any corrective actions with regard to significant deficiencies and material weaknesses. |
Item 11 – Exhibits
(a) Code of Ethics – Attached hereto
(b) Certifications pursuant to Section 302 and 906 of the Sarbanes-Oxley Act – Attached hereto
SIGNATURES
Pursuant to the requirements of the Securities Exchange Act of 1934 and the Investment Company Act of 1940, the registrant has duly caused this report to be signed on its behalf by the undersigned, thereunto duly authorized.
| | |
(Registrant) Jennison Natural Resources Fund, Inc. |
| |
By (Signature and Title)* | | /s/ William V. Healey
|
| | | William V. Healey Chief Legal Officer |
Date July 30, 2004 |
Pursuant to the requirements of the Securities Exchange Act of 1934 and the Investment Company Act of 1940, this report has been signed below by the following persons on behalf of the registrant and in the capacities and on the dates indicated.
| | |
By (Signature and Title)* | | /s/ Judy A. Rice
|
| | | Judy A. Rice |
| | | President and Principal Executive Officer |
|
Date July 30, 2004 |
| |
By (Signature and Title)* | | /s/ Grace C. Torres
|
| | | Grace C. Torres |
| | | Treasurer and Principal Financial Officer |
|
Date July 30, 2004 |
| * | Print the name and title of each signing officer under his or her signature. |