UNITED STATES
SECURITIES AND EXCHANGE COMMISSION
Washington, D.C. 20549
FORM N-CSR
CERTIFIED SHAREHOLDER REPORT OF REGISTERED
MANAGEMENT INVESTMENT COMPANIES
| | |
| Investment Company Act file number: | | 811-05206 |
| |
| Exact name of registrant as specified in charter: | | Jennison Natural Resources Fund, Inc. |
| |
| Address of principal executive offices: | | Gateway Center 3, 100 Mulberry Street, Newark, New Jersey 07102 |
| |
| Name and address of agent for service: | | Deborah A. Docs Gateway Center 3, 100 Mulberry Street, Newark, New Jersey 07102 |
| |
| Registrant’s telephone number, including area code: | | 973-367-7521 |
| |
| Date of fiscal year end: | | 5/31/2005 |
| |
| Date of reporting period: | | 5/31/2005 |
Item 1 – Reports to Stockholders – [INSERT REPORT]

Jennison Natural Resources Fund, Inc.
| | |
| MAY 31, 2005 | | ANNUAL REPORT |

FUND TYPE
Sector stock
OBJECTIVE
Long-term growth of capital
This report is not authorized for distribution to prospective investors unless preceded or accompanied by a current prospectus.
The views expressed in this report and information about the Fund’s portfolio holdings are for the period covered by this report and are subject to change thereafter.
JennisonDryden is a registered trademark of The Prudential Insurance Company of America.

Dear Shareholder,
July 15, 2005
We hope that you find the annual report for the Jennison Natural Resources Fund informative and useful. As a JennisonDryden Mutual Fund shareholder, you may be thinking about where you can find additional growth opportunities. You could invest in last year’s top-performing asset class and hope that history repeats itself or you could stay in cash while waiting for the “right moment” to invest.
We believe it is wise to take advantage of developing domestic and global investment opportunities through a diversified portfolio of stock and bond mutual funds. A diversified asset allocation offers two advantages. It helps you manage downside risk by not being overly exposed to any particular asset class, plus it gives you a better opportunity to have at least some of your assets in the right place at the right time. Your financial professional can help you create a diversified investment plan that may include mutual funds that cover all the basic asset classes and is reflective of your personal investor profile and tolerance for risk.
JennisonDryden Mutual Funds give you a wide range of choices that can help you make progress toward your financial goals. Our funds offer the experience, resources, and professional discipline of three leading asset managers. They are recognized and respected in the institutional market and by discerning investors for excellence in their respective strategies. JennisonDryden equity funds are advised by Jennison Associates LLC and/or Quantitative Management Associates LLC (QMA). Prudential Investment Management, Inc. (PIM) advises the JennisonDryden fixed income and money market funds. Jennison Associates, QMA, and PIM are registered investment advisers and Prudential Financial companies.
Thank you for choosing JennisonDryden Mutual Funds.
Sincerely,

Judy A. Rice, President
Jennison Natural Resources Fund, Inc.
| | |
| Jennison Natural Resources Fund, Inc. | | 1 |
Your Fund’s Performance
Fund objective
The investment objective of the Jennison Natural Resources Fund, Inc. (the Fund) is long-term growth of capital. There can be no assurance that the Fund will achieve its investment objective.
Performance data quoted represent past performance. Past performance does not guarantee future results. The investment return and principal value of an investment will fluctuate, so that an investor’s shares, when redeemed, may be worth more or less than their original cost. Current performance may be lower or higher than the past performance data quoted. An investor may obtain performance data current to the most recent month-end by visiting our website at www.jennisondryden.com or by calling (800) 225-1852. The maximum initial sales charge is 5.50% (Class A shares).
| | | | | | | | | | | |
| Cumulative Total Returns1 as of 5/31/05 | | | | | | | | | |
| | | One Year | | | Five Years | | | Ten Years | | | Since Inception2 |
Class A | | 33.24 | % | | 124.28 | % | | 279.54 | % | | 406.65% |
Class B | | 32.30 | | | 116.14 | | | 252.14 | | | 410.93 (410.36) |
Class C | | 32.30 | | | 116.14 | | | 252.14 | | | 276.99 |
Class Z | | 33.64 | | | 127.47 | | | N/A | | | 195.37 |
MSCI World ND Index3 | | 11.43 | | | –7.75 | | | 96.21 | | | *** |
S&P 500 Index4 | | 8.23 | | | –9.26 | | | 163.47 | | | **** |
Lipper Natural Resources Funds Avg.5 | | 35.20 | | | 83.60 | | | 260.58 | | | ***** |
| | | | | | | | | | | | |
| | | | | | | | | | | |
| Average Annual Total Returns1 as of 6/30/05 | | | | | | | | | | | |
| | | One Year | | | Five Years | | | Ten Years | | | Since Inception2 |
Class A | | 29.39 | % | | 18.91 | % | | 14.62 | % | | 11.31% |
Class B | | 30.94 | | | 19.27 | | | 14.41 | | | 10.17 (10.16) |
Class C | | 34.94 | | | 19.37 | | | 14.41 | | | 13.84 |
Class Z | | 37.32 | | | 20.58 | | | N/A | | | 14.26 |
MSCI World ND Index3 | | 10.05 | | | –2.08 | | | 7.07 | | | *** |
S&P 500 Index4 | | 6.32 | | | –2.37 | | | 9.94 | | | **** |
Lipper Natural Resources Funds Avg.5 | | 36.91 | | | 13.90 | | | 14.25 | | | ***** |
The cumulative total returns do not reflect the deduction of applicable sales charges. If reflected, the applicable sales charges would reduce the cumulative total returns performance quoted. Class A shares are subject to a maximum front-end sales charge of 5.50%. Under certain circumstances, Class A shares may be subject to a contingent deferred sales charge (CDSC) of 1%. Class B and Class C shares are subject to a maximum CDSC of 5% and 1% respectively. Class Z shares are not subject to a sales charge.
| | |
| 2 | | Visit our website at www.jennisondryden.com |
1Source: Prudential Investments LLC and Lipper Inc. The average annual total returns take into account applicable sales charges. During certain periods shown, fee waivers and/or expense reimbursements were in effect. Without such fee waivers and expense reimbursements, the returns for the share classes would have been lower, as reflected in parentheses. Class A, Class B, and Class C shares are subject to an annual distribution and service (12b-1) fee of up to 0.30%, 1.00%, and 1.00% respectively. Approximately seven years after purchase, Class B shares will automatically convert to Class A shares on a quarterly basis. Class Z shares are not subject to a 12b-1 fee. The returns in the tables do not reflect the deduction of taxes that a shareholder would pay on Fund distributions or following the redemption of Fund shares.
2Inception dates: Class A, 1/22/90; Class B, 9/28/87; Class C, 8/1/94; and Class Z, 9/16/96.
3The Morgan Stanley Capital International (MSCI) World Net Dividends (ND) Index is a free float-adjusted, market-capitalization index that is designed to measure global developed market equity performance. The MSCI World ND Index consists of approximately 23 developed market indexes in Australia, Canada, Europe, the Far East, New Zealand, and the United States.
4The Standard & Poor’s 500 Composite Stock Price Index (S&P 500 Index) is an unmanaged index of 500 stocks of large U.S. public companies. It gives a broad look at how stock prices have performed in the United States.
5The Lipper Natural Resources Funds Average (Lipper Average) represents returns based on the average return of all funds in the Lipper Natural Resources Funds category for the periods noted. Funds in the Lipper Average invest primarily in natural resources stocks.
The returns for the MSCI World ND Index and S&P 500 Index would be lower if they included the effects of sales charges, operating expenses of a mutual fund, or taxes that may be paid by an investor. Returns for the Lipper Average reflect the deduction of operating expenses, but not sales charges or taxes. Returns for the Lipper Average would be lower if it included the effects of sales charges or taxes.
*** MSCI World ND Index Closest Month-End to Inception cumulative total returns as of 5/31/05 are 169.21% for Class A, 211.45% for Class B, 113.25% for Class C, and 63.57% for Class Z. MSCI World ND Index Closest Month-End to Inception average annual total returns as of 6/30/05 are 6.69% for Class A, 6.66% for Class B, 7.27% for Class C, and 5.89% for Class Z.
**** S&P 500 Index Closest Month-End to Inception cumulative total returns as of 5/31/05 are 402.91% for Class A, 457.71% for Class B, 214.22% for Class C, and 98.27% for Class Z. S&P 500 Index Closest Month-End to Inception average annual total returns as of 6/30/05 are 11.06% for Class A, 10.18% for Class B, 11.07% for Class C, and 8.15% for Class Z.
***** Lipper Average Closest Month-End to Inception cumulative total returns as of 5/31/05 are 345.50% for Class A, 376.69% for Class B, 293.60% for Class C, and 161.51% for Class Z. Lipper Average Closest Month-End to Inception average annual total returns as of 6/30/05 are 10.55% for Class A, 9.30% for Class B, 13.90% for Class C, and 12.42% for Class Z.
| | | |
| Five Largest Holdings expressed as a percentage of net assets as of 5/31/05 | | | |
OPTI Canada, Inc., Energy Equipment & Services | | 5.0 | % |
National-Oilwell Varco, Inc., Energy Equipment & Services | | 4.4 | |
Suncor Energy, Inc., Oil, Gas & Consumable Fuels | | 4.3 | |
GlobalSantaFe Corp., Energy Equipment & Services | | 4.2 | |
BJ Services Co., Energy Equipment & Services | | 4.1 | |
Holdings reflect only long-term investments and are subject to change.
| | |
| Jennison Natural Resources Fund, Inc. | | 3 |
Your Fund’s Performance (continued)
| | | |
| Five Largest Industries expressed as a percentage of net assets as of 5/31/05 | | | |
Energy Equipment & Services | | 37.4 | % |
Oil, Gas & Consumable Fuels | | 36.5 | |
Metals & Mining | | 20.2 | |
Chemicals | | 2.3 | |
Household Durables | | 0.5 | |
Industry weightings reflect only long-term investments and are subject to change.
| | |
| 4 | | Visit our website at www.jennisondryden.com |
Investment Adviser’s Report
Jennison Associates LLC
Performance overview
The Fund’s return for its fiscal year ended May 31, 2005, was very strong, significantly outperforming the broader global market, as measured by the MSCI World ND Index, and the U.S. market, as measured by the S&P 500 Index. It performed approximately in line with its peers, as measured by the Lipper Natural Resources Funds Average. Throughout the period, the prices of oil, copper, iron ore, and gold—commodities to which the Fund is exposed—moved higher as surging demand outstripped geologically constrained supplies. Although natural gas prices in the United States were slightly lower at the end of the fiscal year than at its beginning, unabated demand and strained supplies kept them at historically high levels.
The strong global demand for natural resources has significantly outstripped the supply of oil, natural gas, and key industrial metals. The size of geologic reserves is the most obvious limit to supply, but, in addition, production costs often rise when a reserve becomes significantly depleted. As the productive capacities for the commodities on which the Fund has focused have neared their respective peaks, supplies have become strained and prices higher. While new discoveries and technological advances may help ease these constraints, we do not believe that they will lead to lower prices. The most easily exploited producing areas for oil, natural gas, and metals (particularly copper) have largely been tapped; developing new sources or extending the life of existing ones will be more costly, which would likely keep commodity prices high.
However, not all companies in the natural resources sector will benefit equally from these positive dynamics. Some may not benefit at all. The Fund’s successful performance this reporting period was the result of using disciplined research to identify the companies we believe are most likely to gain.
Exploration and production holdings drove performance
Among oil and natural gas exploration and production (E&P) companies, we sought firms with clear potential for attractive production growth. By “attractive,” we mean companies that can increase production while their per-barrel operating costs rise less rapidly than the price of the commodity. Consequently, we generally avoided the major integrated oil and gas producers, which are most exposed to declining production. Instead, we emphasized E&P companies that are successfully exploiting unconventional sources of oil or gas and currently benefiting from historically high oil and/or natural gas prices. We expect this to drive acceleration in their revenue growth. They included OPTI Canada and Suncor Energy (see Comments on Largest Holdings), which produce oil from tar sands in the Athabasca region of Alberta, Canada, and Southwestern Energy and Quicksilver Resources, which produce natural
| | |
| Jennison Natural Resources Fund, Inc. | | 5 |
Investment Adviser’s Report (continued)
gas from major shale formations. Both tar sands and shale are plentiful sources of energy whose use in the past was deterred by relatively high production and transportation costs. As the price of oil and gas rose and production technology improved, these resources became much more attractive. Each of these companies was a key contributor to the Fund’s performance.
Drilling services benefited from increased activity
We have relatively little exposure to the major integrated oil and gas producers because they are exposed to declining production. Nonetheless, they profited from sustained high oil and natural gas prices, and many had substantial cash flows. Because of the high oil and gas prices, they allocated substantial amounts of this cash to new drilling activity to replace their depleting reserves. This benefited drilling service companies, which provide equipment such as drill bits and pressure pumps, or services such as contract drilling. Many of our holdings in this area, including National Oilwell Varco, Smith International, and BJ Services (see Comments on Largest Holdings for all three), were significant contributors to the Fund’s performance.
Demand for industrial metals was strong
China’s appetite for copper and iron ore placed additional strains on already limited supplies, driving prices for these metals higher. Since many of the easily exploited sources of these metals have long been tapped, our investments focused on the producers with the largest and most productive reserves. We selected companies that can benefit from rising prices and maintain relatively flat cost structures. Phelps Dodge, one of the world’s largest copper producers, was an important contributor to the Fund’s return. It has extensive reserves and continues to employ new technologies to increase the productive capacity of its properties and reduce its cost of production. Brazilian iron ore producer Companhia Vale do Rio Doce is benefiting from higher ore prices and also added to the Fund’s return. It was able to secure major price increases from its customers, and is one of the few companies in the industry with enough reserves to bring new mines into production in the coming years. We believe this will add to its value over time.
Gold prices remained volatile
Our investments in gold producers, including Placer Dome, Newmont Mining, DRDGOLD, and Gold Fields, were the principal detractors from the Fund’s performance. Although gold prices ended higher in the reporting period, they were volatile throughout the period because of fluctuations in the U.S. dollar’s value. Lack of a clear gold price direction led investors to question these companies’ earnings prospects and hurt their share prices. However, we expect the bull market in gold to
resume some time in 2005. We believe that increased currency fluctuations, rising
| | |
| 6 | | Visit our website at www.jennisondryden.com |
demand for gold brought about by the introduction of gold-backed exchange-traded funds (ETFs), and declining mine supply make a very bullish picture for gold. Many of our gold holdings are making discoveries that we expect will enable them to raise production. We think their stocks are attractively priced for their potential earnings growth.
Portfolio outlook
We would not be surprised if there are periods of volatile commodity prices from time to time, especially when investors become overly focused on short-term supply and demand data. We, however, will remain focused on the long-term dynamics of the natural resources markets. We believe that supply and demand imbalances for oil, natural gas, gold, copper, iron ore, and other metals will continue, and we think that the prices for these commodities will remain higher than most investors expect. We will continue to invest in the companies that we think are best positioned to benefit from rising commodity prices.
The Portfolio of Investments following this report shows the size of the Fund’s positions at period-end.
| | |
| Jennison Natural Resources Fund, Inc. | | 7 |
Comments on Largest Holdings
Holdings expressed as a percentage of the Fund’s net assets as of 5/31/05.
| 5.0% | OPTI Canada, Inc./Energy Equipment & Services |
OPTI Canada develops integrated bitumen and heavy oil projects. It is engaged in a joint venture with Nexen to develop the Long Lake Project in the Athabasca oil sands region of Alberta. We believe that this project is on target to deliver as much as 58,500 barrels/day of synthetic crude oil by 2007. Given our expectation that the price of oil will remain high, this production potential should increase the company’s long-term earnings growth.
| 4.4% | National-Oilwell Varco Inc./Energy Equipment & Services |
On March 11, 2005, National-Oilwell and Varco International merged to create National-Oilwell Varco. The combined company is a leading manufacturer of equipment for land rigs and drilling systems, offshore rig drilling systems, and other oil field goods. We believe that the company will benefit from the increased global drilling activity that is driven by shortfalls in the supply of oil and natural gas.
| 4.3% | Suncor Energy, Inc./Oil, Gas & Consumable Fuels |
Suncor Energy is primarily engaged in the production of oil from its large Athabasca tar sands reserves in Canada. Suncor’s huge proven reserve base should allow it to increase production with virtually no exploration risk in an environment of rising oil prices. We believe Suncor will continue to benefit from supply and demand imbalances.
| 4.2% | GlobalSantaFe Corp./Energy Equipment & Services |
GlobalSantaFe is one of the world’s largest international drilling contractors, providing offshore and land-based drilling services to the oil and natural gas industry. It is a dominant firm in the business of providing fully manned mobile drilling rigs. It is particularly well positioned in two of the fastest-growing offshore drilling markets, West Africa and the North Sea, where its services are commanding growing day rates.
| 4.1% | BJ Services Co./Energy Equipment & Services |
BJ Services is a global oil services company specializing in pressure pumping. It is particularly active in the North American natural gas market. We believe that the company should continue to benefit from an imbalance between supply and demand for oil and natural gas.
Holdings are subject to change.
| | |
| 8 | | Visit our website at www.jennisondryden.com |
Fees and Expenses (Unaudited)
As a shareholder of the Fund, you incur two types of costs: (1) transaction costs, including sales charges (loads) on purchase payments and redemptions, as applicable, and (2) ongoing costs, including management fees, distribution and/or service (12b-1) fees, and other Fund expenses, as applicable. This example is intended to help you understand your ongoing costs (in dollars) of investing in the Fund and to compare these costs with the ongoing costs of investing in other mutual funds.
The example is based on an investment of $1,000 invested on December 1, 2004, at the beginning of the period, and held through the six-month period ended May 31, 2005.
The Fund may charge additional fees to holders of certain accounts that are not included in the expenses shown in the table on the following page. These fees apply to Individual Retirement Accounts (IRAs), Section 403(b) accounts, and Section 529 plan accounts. As of the close of the six-month period covered by the table, IRA fees included a setup fee of $5, a maintenance fee of up to $36 annually ($18 for the six-month period), and a termination fee of $10. Section 403(b) accounts and Section 529 plan accounts are each charged an annual $25 fiduciary maintenance fee ($12.50 for the six-month period). Some of the fees vary in amount, or are waived, based on your total account balance or the number of JennisonDryden or Strategic Partners funds, including the Fund, that you own. You should consider the additional fees that were charged to your Fund account over the six-month period when you estimate the total ongoing expenses paid over the period and the impact of these fees on your ending account value, as these additional expenses are not reflected in the information provided in the expense table. Additional fees have the effect of reducing investment returns.
Actual Expenses
The first line for each share class in the table on the following page provides information about actual account values and actual expenses. You may use the information on this line, together with the amount you invested, to estimate the expenses that you paid over the period. Simply divide your account value by $1,000 (for example, an $8,600 account value ÷ $1,000 = 8.6), then multiply the result by the number on the first line under the heading “Expenses Paid During the Six-Month Period” to estimate the expenses you paid on your account during this period.
Hypothetical Example for Comparison Purposes
The second line for each share class in the table on the following page provides information about hypothetical account values and hypothetical expenses based on the Fund’s actual expense ratio and an assumed rate of return of 5% per year before
| | |
| Jennison Natural Resources Fund, Inc. | | 9 |
Fees and Expenses (continued)
expenses, which is not the Fund’s actual return. The hypothetical account values and expenses may not be used to estimate the actual ending account balance or expenses you paid for the period. You may use this information to compare the ongoing costs of investing in the Fund and other funds. To do so, compare this 5% hypothetical example with the 5% hypothetical examples that appear in the shareholder reports of the other funds.
Please note that the expenses shown in the table are meant to highlight your ongoing costs only, and do not reflect any transactional costs such as sales charges (loads). Therefore the second line for each share class in the table is useful in comparing ongoing costs only, and will not help you determine the relative total costs of owning different funds. In addition, if these transactional costs were included, your costs would have been higher.
| | | | | | | | | | | | | | |
Jennison Natural Resources Fund, Inc. | | Beginning Account
Value
December 1, 2004 | | Ending Account
Value May 31, 2005 | | Annualized
Expense Ratio
Based on the
Six-Month Period | | | Expenses Paid
During the
Six-Month Period* |
| | | | | | | | | | | | | | | |
| Class A | | Actual | | $ | 1,000.00 | | $ | 1,044.38 | | 1.23 | % | | $ | 6.27 |
| | | Hypothetical | | $ | 1,000.00 | | $ | 1,018.80 | | 1.23 | % | | $ | 6.19 |
| | | | | | | | | | | | | | | |
| Class B | | Actual | | $ | 1,000.00 | | $ | 1,040.69 | | 1.98 | % | | $ | 10.07 |
| | | Hypothetical | | $ | 1,000.00 | | $ | 1,015.06 | | 1.98 | % | | $ | 9.95 |
| | | | | | | | | | | | | | | |
| Class C | | Actual | | $ | 1,000.00 | | $ | 1,040.69 | | 1.98 | % | | $ | 10.07 |
| | | Hypothetical | | $ | 1,000.00 | | $ | 1,015.06 | | 1.98 | % | | $ | 9.95 |
| | | | | | | | | | | | | | | |
| Class Z | | Actual | | $ | 1,000.00 | | $ | 1,046.12 | | 0.98 | % | | $ | 5.00 |
| | | Hypothetical | | $ | 1,000.00 | | $ | 1,020.04 | | 0.98 | % | | $ | 4.94 |
| | | | | | | | | | | | | | | |
* Fund expenses for each share class are equal to the annualized expense ratio for each share class (provided in the table) multiplied by the average account value over the period, multiplied by the 182 days in the six-month period ended May 31, 2005, and divided by the 365 days in the Fund’s fiscal year ended May 31, 2005 (to reflect the six-month period).
| | |
| 10 | | Visit our website at www.jennisondryden.com |
Portfolio of Investments
as of May 31, 2005
| | | | | |
| Shares | | Description | | Value (Note 1) |
| | | | | | |
LONG-TERM INVESTMENTS 97.9% | | | |
COMMON STOCKS 96.6% | | | |
| |
Chemicals 2.3% | | | |
| 39,000 | | Hokko Chemical Industry Co., Ltd. (Japan) | | $ | 143,418 |
| 347,300 | | Huntsman Corp.(a)(d) | | | 6,685,525 |
| 400,100 | | Lyondell Chemical Co. | | | 9,498,374 |
| | | | |
|
|
| | | | | | 16,327,317 |
| |
Construction Materials 0.4% | | | |
| 3,130,000 | | Anhui Conch Cement Co., Ltd. (Hong Kong) | | | 2,763,972 |
| |
Electrical Equipment 0.3% | | | |
| 400,800 | | Evergreen Solar, Inc.(a)(d) | | | 2,024,040 |
| |
Energy Equipment & Services 37.4% | | | |
| 570,600 | | BJ Services Co. | | | 28,729,710 |
| 102,600 | | CARBO Ceramics, Inc.(d) | | | 7,350,264 |
| 190,800 | | Cooper Cameron Corp.(a)(d) | | | 11,278,188 |
| 386,100 | | ENSCO International, Inc. | | | 12,857,130 |
| 816,900 | | GlobalSantaFe Corp. | | | 29,931,216 |
| 326,100 | | Halliburton Co. | | | 13,937,514 |
| 118,200 | | Hydril Co.(a)(d) | | | 6,135,762 |
| 692,500 | | National-Oilwell Varco, Inc.(a) | | | 31,162,500 |
| 1,690,418 | | OPTI Canada, Inc. (Class “C” Stock) (Canada)(a)(d) | | | 34,274,329 |
| 61,100 | | OPTI Canada, Inc. (Class “C” Stock) (Canada) 144A(a)(i) | | | 1,238,843 |
| 412,900 | | Patterson-UTI Energy, Inc. | | | 10,937,721 |
| 351,200 | | Pioneer Drilling Co.(a) | | | 4,913,288 |
| 471,000 | | Smith International, Inc. | | | 27,675,960 |
| 325,400 | | Technip SA (France) (ADR)(d) | | | 14,385,934 |
| 182,200 | | Transocean, Inc.(a)(d) | | | 9,075,382 |
| 394,100 | | Weatherford International Ltd.(a) | | | 20,717,837 |
| | | | |
|
|
| | | | | | 264,601,578 |
| |
Household Durables 0.5% | | | |
| 179,000 | | Blount International, Inc.(a) | | | 3,161,140 |
| |
Machinery 0.3% | | | |
| 62,800 | | Railpower Technologies Corp. (Canada)(a)(d) | | | 255,090 |
| 442,700 | | Railpower Technologies Corp. (Canada) 144A(a)(i) | | | 2,000,168 |
| | | | |
|
|
| | | | | | 2,255,258 |
See Notes to Financial Statements.
| | |
| Jennison Natural Resources Fund, Inc. | | 11 |
Portfolio of Investments
as of May 31, 2005 Cont’d.
| | | | | |
| Shares | | Description | | Value (Note 1) |
| | | | | | |
| |
Metals & Mining 19.9% | | | |
| 842,700 | | Aflease Gold & Uranium Resources Ltd. (South Africa) (ADR)(a)(d) | | $ | 5,140,470 |
| 1,060,000 | | Alumina Ltd. (Australia) | | | 4,391,295 |
| 52,400 | | Aluminum Corp. of China (China) (ADR)(d) | | | 2,672,400 |
| 120,400 | | Aquarius Platinum Ltd. (Australia) | | | 577,601 |
| 608,000 | | AXMIN, Inc. (Canada)(a) | | | 213,129 |
| 371,711 | | Canico Resource Corp. (Canada)(a) | | | 3,997,848 |
| 380,700 | | Companhia Vale do Rio Doce (Brazil) (ADR) | | | 11,051,721 |
| 1,580,500 | | Crystallex International Corp.(a)(d) | | | 5,531,750 |
| 241,500 | | First Quantum Minerals Ltd. (Canada) | | | 4,009,608 |
| 174,700 | | FNX Mining Co., Inc. (Canada)(a) | | | 1,629,818 |
| 14,200 | | FNX Mining Co., Inc. (Canada) 144A(a)(i) | | | 78,288 |
| 147,900 | | Freeport-McMoRan Copper & Gold, Inc. (Class “B” Stock)(d) | | | 5,220,870 |
| 190,200 | | Gabriel Resources Ltd. (Canada)(a) | | | 218,203 |
| 723,500 | | Gold Fields Ltd. (South Africa) (ADR)(d) | | | 7,951,265 |
| 166,900 | | Gold Reserve, Inc. (Canada)(a) | | | 487,988 |
| 1,086,873 | | Harmony Gold Mining Ltd. (South Africa) (ADR)(d) | | | 8,314,579 |
| 470,200 | | Impala Platinum Holdings Ltd. (South Africa) (ADR)(d) | | | 9,930,389 |
| 30,700 | | Impala Platinum Holdings Ltd. (South Africa) | | | 2,569,771 |
| 559,900 | | Meridian Gold, Inc.(a)(d) | | | 9,249,548 |
| 414,700 | | Nevsun Resources Ltd. (Canada)(a) | | | 783,014 |
| 587,300 | | Newcrest Mining Ltd. (Australia) | | | 5,879,174 |
| 227,400 | | Newmont Mining Corp. | | | 8,468,376 |
| 243,900 | | Northern Dynasty Minerals Ltd.(a) | | | 956,088 |
| 280,000 | | Orezone Resources, Inc. (Canada)(a) | | | 334,608 |
| 69,745 | | Pan American Silver Corp. (Canada)(a) | | | 994,055 |
| 808,800 | | Peru Copper, Inc. (Canada)(a) | | | 902,103 |
| 234,700 | | Phelps Dodge Corp. | | | 20,512,780 |
| 627,700 | | Placer Dome, Inc.(d) | | | 8,486,504 |
| 269,600 | | Platinum Group Metals Ltd. (Canada)(a) | | | 176,125 |
| 88,100 | | Southern Peru Copper Corp.(d) | | | 4,093,126 |
| 523,800 | | SouthernEra Diamonds, Inc. (Canada)(a) | | | 164,835 |
| 593,900 | | Western Silver Corp.(a)(d) | | | 5,653,928 |
| | | | |
|
|
| | | | | | 140,641,257 |
| |
Oil, Gas & Consumable Fuels 35.5% | | | |
| 1,200,000 | | BPI Industries, Inc. (Canada) (cost $1,377,540; Purchased 12/31/04)(a)(f)(g) | | | 2,088,910 |
| 362,100 | | Cameco Corp. (Canada) | | | 14,902,873 |
| 123,400 | | Cheniere Energy, Inc.(a)(d) | | | 3,615,620 |
| 415,300 | | Compton Petroleum Corp. (Canada)(a) | | | 3,553,475 |
| 193,200 | | Duvernay Oil Corp. (Canada)(a) | | | 4,325,143 |
See Notes to Financial Statements.
| | |
| 12 | | Visit our website at www.jennisondryden.com |
| | | | | |
| Shares | | Description | | Value (Note 1) |
| | | | | | |
| 116,000 | | Encore Acquisition Co.(a)(d) | | $ | 4,326,800 |
| 710,400 | | Endeavour International Corp.(a)(d) | | | 2,337,216 |
| 77,500 | | Eni S.p.A. (Italy) (ADR) | | | 9,941,700 |
| 300,400 | | EOG Resources, Inc. | | | 14,986,956 |
| 237,600 | | Frontline Ltd.(d) | | | 10,323,720 |
| 985,900 | | Gasco Energy, Inc.(a)(d) | | | 3,115,444 |
| 205,100 | | Goodrich Petroleum Corp.(a) | | | 3,632,321 |
| 134,500 | | Houston Exploration Co. (The)(a)(d) | | | 6,855,465 |
| 144,000 | | McMoRan Exploration Co.(a)(d) | | | 2,665,440 |
| 1,260,500 | | Nelson Resources Ltd. (Canada)(a) | | | 1,807,600 |
| 346,600 | | Nexen, Inc. | | | 9,011,600 |
| 580,100 | | OMI Corp.(d) | | | 11,219,134 |
| 113,000 | | Petroleo Brasileiro SA (Brazil) (ADR)(d) | | | 5,333,600 |
| 225,600 | | Quicksilver Resources, Inc.(a)(d) | | | 11,776,320 |
| 447,900 | | Range Resources Corp. | | | 10,346,490 |
| 525,800 | | Sasol Ltd. (South Africa) (ADR)(d) | | | 13,039,840 |
| 337,800 | | Southwestern Energy Co.(a) | | | 23,578,440 |
| 766,900 | | Suncor Energy, Inc. | | | 30,208,191 |
| 256,900 | | Teekay Shipping Corp.(d) | | | 10,913,112 |
| 184,394 | | Trident Resources Corp.
(cost $2,058,960; Purchased 12/04/03-8/25/04)(a)(f)(g) | | | 7,345,204 |
| 2,402,500 | | UTS Energy Corp. (Canada)(a)(d) | | | 3,789,795 |
| 896,000 | | Warren Resources, Inc.(a) | | | 7,920,640 |
| 377,300 | | Western Gas Resources, Inc. | | | 12,100,011 |
| 387,900 | | Western Oil Sands, Inc. (Class “A” Stock) (Canada)(a) | | | 5,973,635 |
| | | | |
|
|
| | | | | | 251,034,695 |
| | | | |
|
|
| | | Total common stocks
(cost $563,876,028) | | | 682,809,257 |
| | | | |
|
|
| | |
Principal
Amount (000)
| | | | |
CONVERTIBLE BOND | | | |
| |
Conv-Industrial | | | |
| 9 | | JCI Ltd. (South Africa) 11.00%, 7/15/05(a)(h)
(cost $1,346) | | | 14 |
See Notes to Financial Statements.
| | |
| Jennison Natural Resources Fund, Inc. | | 13 |
Portfolio of Investments
as of May 31, 2005 Cont’d.
| | | | | | |
| Shares | | Description | | Value (Note 1) | |
| | | | | | | |
PREFERRED STOCKS 0.9% | | | | |
| |
Oil, Gas & Consumable Fuels 0.9% | | | | |
| 129,200 | | Surgutneftegaz (Russia) (ADR)
(cost $6,336,568) | | $ | 6,731,320 | |
LINKED NOTE 0.3% | | | | |
| |
Metals & Mining 0.3% | | | | |
| 10,876 | | USD Palladium Linked Bank Note, zero coupon, 7/13/07 (cost $2,000,001; Purchased 6/30/03-1/05/05)(a)(f)(g) 1.00%, 7/13/07
(cost $2,000,001) | | | 1,937,450 | |
| | |
Units
| | | | | |
WARRANTS(a) 0.1% | | | | |
| |
Metals & Mining | | | | |
| 11,922 | | Pan American Silver Corp. (Canada) Expiring 2/20/08 @ CAD$12 | | | 65,632 | |
| 404,400 | | Peru Copper, Inc. (Canada) Expiring 3/18/06 @ CAD$2 | | | 48,327 | |
| | | | |
|
|
|
| | | | | | 113,959 | |
| |
Oil, Gas & Consumable Fuels 0.1% | | | | |
| 600,000 | | BPI Industries, Inc. (Canada) Expiring 12/31/06
(Cost $132,099; Purchased 12/31/04)(f)(g) | | | 308,497 | |
| | | | |
|
|
|
| | | Total warrants(a)
(cost $196,926) | | | 422,456 | |
| | | | |
|
|
|
| | | Total long-term investments
(cost $572,410,869) | | | 691,900,497 | |
| | | | |
|
|
|
SHORT-TERM INVESTMENTS 26.1% | | | | |
| |
Mutual Fund 26.1% | | | | |
| 184,508,419 | | Dryden Core Investment Fund-Taxable Money Market Series(b)(c)
(cost $184,508,419) | | | 184,508,419 | |
| | | | |
|
|
|
| | | Total Investments(e) 124.0%
(cost $756,919,288) | | | 876,408,916 | |
| | | Liabilities in excess of other assets (24.0%) | | | (169,344,028 | ) |
| | | | |
|
|
|
| | | Net Assets 100% | | $ | 707,064,888 | |
| | | | |
|
|
|
See Notes to Financial Statements.
| | |
| 14 | | Visit our website at www.jennisondryden.com |
| (a) | Non-income producing security. |
| (b) | Represents security, or a portion thereof, purchased with cash collateral received for securities on loan. |
| (c) | Prudential Investments LLC, the manager of the Fund also serves as manager of the Dryden Core Investment Fund -Taxable Money Market Series. |
| (d) | Securities, or a portion thereof, on loan with an aggregate market value of $167,428,659; cash collateral of $177,036,756 (included with liabilities) was received with which the Fund purchased highly liquid short-term investments. |
| (e) | As of May 31, 2005, 9 securities representing $25,435,521 and 2.9% of the total market value were fair valued in accordance with the Policies adopted by the Board of Directors. |
| (f) | Indicates illiquid securities. The aggregate cost of such securities is $5,568,600. The aggregate value of $11,680,061 is approximately 1.65% of net assets. |
| (g) | Indicates securities restricted to resale. The aggregate cost of such securities was $5,568,600. The aggregate value of $11,680,061 is approximately 1.65% of net assets. Indicates a variable rate security. The interest rate shown reflects the rate in effect at May 31, 2005. |
| (h) | Indicates a variable rate security. The interest rate shown reflects the rate in effect at May 31, 2005. |
| (i) | Securities were purchased pursuant to Rule 144A under the Securities Act of 1933 and may not be resold subject to that rule except to qualified institutional buyers. Unless otherwise noted 144A securities are deemed to be liquid. |
ADR—American Depository Receipt
The industry classification of long-term portfolio holdings, short-term investments and liabilities in excess of other assets shown as a percentage of net assets as of May 31, 2005 was as follows:
| | | |
†United States | | 93.8 | % |
Canada | | 23.4 | |
South Africa | | 2.5 | |
Bermuda | | 1.5 | |
Australia | | 1.5 | |
Russia | | 1.0 | |
Hong Kong | | 0.3 | |
| | |
|
|
| | | 124.0 | |
Liabilities in excess of other assets | | (24.0 | ) |
| | |
|
|
| | | 100.0 | % |
| | |
|
|
| † | A portion of the holdings represent ADR's. |
See Notes to Financial Statements.
| | |
| Jennison Natural Resources Fund, Inc. | | 15 |
Statement of Assets and Liabilities
as of May 31, 2005
| | | | |
Assets | | | | |
Investments, at value, including securities on loan of $167,428,659: | | | | |
Unaffiliated investments (cost $572,410,869) | | $ | 691,900,497 | |
Affiliated investments (cost $184,508,419) | | | 184,508,419 | |
Foreign currency, at value (cost $3,321,153) | | | 3,279,095 | |
Cash | | | 58 | |
Receivable for Fund shares sold | | | 5,260,748 | |
Receivable for investments sold | | | 1,597,879 | |
Dividends and interest receivable | | | 871,712 | |
Prepaid expenses | | | 5,952 | |
| | |
|
|
|
Total assets | | | 887,424,360 | |
| | |
|
|
|
| |
Liabilities | | | | |
Payable to broker for collateral for securities on loan (Note 4) | | | 177,036,756 | |
Payable for Fund shares reacquired | | | 2,049,239 | |
Management fee payable | | | 436,743 | |
Distribution fee payable | | | 288,744 | |
Transfer agent fee payable | | | 242,466 | |
Payable for investments purchased | | | 175,028 | |
Accrued expenses and other liabilities | | | 78,900 | |
Withholding tax payable | | | 50,064 | |
Deferred directors’ fees | | | 1,532 | |
| | |
|
|
|
Total liabilities | | | 180,359,472 | |
| | |
|
|
|
| |
Net Assets | | $ | 707,064,888 | |
| | |
|
|
|
| | | | | |
Net assets were comprised of: | | | | |
Common stock, at par | | $ | 242,876 | |
Paid-in capital in excess of par | | | 560,526,938 | |
| | |
|
|
|
| | | | 560,769,814 | |
Accumulated net investment loss | | | (2,763,952 | ) |
Accumulated net realized gain on investments and foreign currency transactions | | | 29,601,620 | |
Net unrealized appreciation on investments and foreign currencies | | | 119,457,406 | |
| | |
|
|
|
Net assets May 31, 2005 | | $ | 707,064,888 | |
| | |
|
|
|
See Notes to Financial Statements.
| | |
| 16 | | Visit our website at www.jennisondryden.com |
| | | |
Class A | | | |
Net asset value and redemption price per share
($327,161,650 ÷ 10,774,483 shares of common stock issued and outstanding) | | $ | 30.36 |
Maximum sales charge (5.50% of offering price) | | | 1.77 |
| | |
|
|
Maximum offering price to public | | $ | 32.13 |
| | |
|
|
| |
Class B | | | |
Net asset value, offering price and redemption price per share
($132,157,317 ÷ 4,870,880 shares of common stock issued and outstanding) | | $ | 27.13 |
| | |
|
|
| |
Class C | | | |
Net asset value, offering price and redemption price per share
($138,176,443 ÷ 5,092,543 shares of common stock issued and outstanding) | | $ | 27.13 |
| | |
|
|
| |
Class Z | | | |
Net asset value, offering price and redemption price per share
($109,569,478 ÷ 3,549,731 shares of common stock issued and outstanding) | | $ | 30.87 |
| | |
|
|
See Notes to Financial Statements.
| | |
| Jennison Natural Resources Fund, Inc. | | 17 |
Statement of Operations
Year Ended May 31, 2005
| | | | |
Net Investment Income | | | | |
Income | | | | |
Unaffiliated dividend income (net of foreign withholding taxes of $244,480) | | $ | 6,795,753 | |
Affiliated income from securities loaned, net | | | 444,071 | |
Affiliated dividend income | | | 362,943 | |
Interest | | | 2,039 | |
| | |
|
|
|
Total income | | | 7,604,806 | |
| | |
|
|
|
| |
Expenses | | | | |
Management fee | | | 3,528,169 | |
Distribution fee—Class A | | | 539,047 | |
Distribution fee—Class B | | | 915,884 | |
Distribution fee—Class C | | | 793,519 | |
Transfer agent’s fees and expenses (including affiliated expenses of $507,786) | | | 513,000 | |
Custodian’s fees and expenses | | | 259,000 | |
Registration fees | | | 122,000 | |
Reports to shareholders | | | 74,000 | |
Legal fees and expenses | | | 26,000 | |
Audit fee | | | 18,000 | |
Directors’ fees | | | 14,000 | |
Miscellaneous | | | 24,627 | |
| | |
|
|
|
Total expenses | | | 6,827,246 | |
| | |
|
|
|
Net investment income | | | 777,560 | |
| | |
|
|
|
| |
Realized And Unrealized Gain (Loss) On Investments And Foreign Currencies | | | | |
Net realized gain (loss) on: | | | | |
Investment transactions | | | 43,008,645 | |
Foreign currency transactions | | | (235,873 | ) |
| | |
|
|
|
| | | | 42,772,772 | |
| | |
|
|
|
Net change in unrealized appreciation (depreciation) on: | | | | |
Investments | | | 59,857,475 | |
Foreign currencies | | | (35,619 | ) |
| | |
|
|
|
| | | | 59,821,856 | |
| | |
|
|
|
Net gain on investments and foreign currencies | | | 102,594,628 | |
| | |
|
|
|
Net Increase In Net Assets Resulting From Operations | | $ | 103,372,188 | |
| | |
|
|
|
See Notes to Financial Statements.
| | |
| 18 | | Visit our website at www.jennisondryden.com |
Statement of Changes in Net Assets
| | | | | | | | |
| | | Year Ended May 31,
| |
| | | 2005 | | | 2004 | |
Increase (Decrease) In Net Assets | | | | | | | | |
Operations | | | | | | | | |
Net investment gain (loss) | | $ | 777,560 | | | $ | (814,117 | ) |
Net realized gain on investment and foreign currency transactions | | | 42,772,772 | | | | 2,328,841 | |
Net change in unrealized appreciation on investments | | | 59,821,856 | | | | 29,082,032 | |
| | |
|
|
| |
|
|
|
Net increase in net assets resulting from operations | | | 103,372,188 | | | | 30,596,756 | |
| | |
|
|
| |
|
|
|
Dividends and distributions (Note 1) | | | | | | | | |
Dividends from net investment income | | | | | | | | |
Class A | | | (553,474 | ) | | | (1,292,357 | ) |
Class B | | | — | | | | (487,666 | ) |
Class C | | | — | | | | (155,138 | ) |
Class Z | | | (436,104 | ) | | | (422,727 | ) |
| | |
|
|
| |
|
|
|
| | | | (989,578 | ) | | | (2,357,888 | ) |
| | |
|
|
| |
|
|
|
| | |
Distributions from net realized gains | | | | | | | | |
Class A | | | (4,380,660 | ) | | | (395,328 | ) |
Class B | | | (2,173,876 | ) | | | (242,411 | ) |
Class C | | | (1,766,520 | ) | | | (77,117 | ) |
Class Z | | | (1,765,716 | ) | | | (114,617 | ) |
| | |
|
|
| |
|
|
|
| | | | (10,086,772 | ) | | | (829,473 | ) |
| | |
|
|
| |
|
|
|
| | |
Fund share transactions (Net of share conversions) (Note 6) | | | | | | | | |
Net proceeds from shares sold | | | 496,396,307 | | | | 153,454,334 | |
Net asset value of shares issued in reinvestment of dividends and distributions | | | 9,550,178 | | | | 2,809,565 | |
Cost of shares reacquired | | | (142,835,939 | ) | | | (46,322,268 | ) |
| | |
|
|
| |
|
|
|
Net increase in net assets from Fund share transactions | | | 363,110,546 | | | | 109,941,631 | |
| | |
|
|
| |
|
|
|
Total increase | | | 455,406,384 | | | | 137,351,026 | |
| | |
Net Assets | | | | | | | | |
Beginning of year | | | 251,658,504 | | | | 114,307,478 | |
| | |
|
|
| |
|
|
|
End of year | | $ | 707,064,888 | | | $ | 251,658,504 | |
| | |
|
|
| |
|
|
|
See Notes to Financial Statements.
| | |
| Jennison Natural Resources Fund, Inc. | | 19 |
Notes to Financial Statements
Jennison Natural Resources Fund, Inc. (the “Fund”), is registered under the Investment Company Act of 1940 as a non-diversified, open-end management investment company. The Fund’s investment objective is long-term growth of capital which it seeks to achieve by investing primarily in equity securities of foreign and domestic companies that own, explore, mine, process or otherwise develop, or provide goods and services with respect to, natural resources and in asset-based securities the terms of which are related to the market value of an underlying asset such as a natural resource.
Note 1. Accounting Policies
The following is a summary of significant accounting policies followed by the Fund in the preparation of its financial statements.
Securities Valuation: Securities listed on a securities exchange (other than options on securities and indices) are valued at the last sale price on such exchange on the day of valuation or, if there was no sale on such day, at the mean between the last reported bid and asked prices, or at the last bid price on such day in the absence of an asked price. Securities traded via Nasdaq are valued at the Nasdaq official closing price (NOCP) on the day of valuation, or if there was no NOCP, at the last sale price. Securities that are actively traded in the over-the-counter market, including listed securities for which the primary market is believed by Prudential Investments LLC (“PI or Manager”), in consultation with the subadvisers; to be over-the-counter, are valued at market value using prices provided by an independent pricing agent or principal market maker.
Corporate bonds (other than convertible debt securities) and U.S. government securities that are actively traded in the over-the-counter market, including listed securities for which the primary market is believed by an Adviser in consultation with the Manager to be over-the-counter, are valued by an independent pricing agent or more than one principal market maker (if available, otherwise by a principal market maker or a primary market dealer). Convertible debt securities that are actively traded in the over-the-counter market, including listed securities for which the primary market is believed by an Adviser in consultation with the Manager to be over-the-counter, are valued by an independent pricing agent or at the mean between the last reported bid and asked prices (or at the last bid price in the absence of an asked price) provided by more than one principal market maker (if available, otherwise by a principal market maker or a primary market dealer).
| | |
| 20 | | Visit our website at www.jennisondryden.com |
Securities for which market quotations are not readily available, or whose values have been effected by events occurring after the close of the security’s foreign market and before the fund’s normal pricing time, are valued at fair value in accordance with the Board of Directors’ approved fair valuation procedures. Using fair value to price securities may result in a value that is different from a security’s most recent closing price and from the price used by other mutual funds to calculate their net asset values.
Investments in mutual funds are valued at their net asset value as of the close of the New York Stock Exchange on the date of valuation.
Short-term securities which mature in sixty days or less are valued at amortized cost, which approximates market value. The amortized cost method includes valuing a security at its cost on the date of purchase and thereafter assuming a constant amortization to maturity of the difference between the principal amount due at maturity and cost. Short-term securities which mature in more than sixty days are valued at current market quotation.
The Fund may hold up to 15% of its net assets in illiquid securities including repurchase agreements which have a maturity of longer than seven days, certain securities with legal or contractual restrictions on resale (restricted securities, sometimes referred to as Private Placements) and securities that are not readily marketable. Restricted securities are valued pursuant to the valuation procedures noted above.
Foreign Currency Translation: The books and records of the Fund are maintained in U.S. dollars. Foreign currency amounts are translated into U.S. dollars on the following basis:
(i) market value of investment securities, other assets and liabilities at the current rates of exchange.
(ii) purchases and sales of investment securities, income and expenses at the rate of exchange prevailing on the respective dates of such transactions.
Although the net assets of the Fund are presented at the foreign exchange rates and market values at the close of the period, the Fund does not isolate that portion of the results of operations arising as a result of changes in the foreign exchange rates from the fluctuations arising from changes in the market prices of long-term portfolio securities held at the end of the period. Similarly, the Fund does not isolate the effect of changes in foreign exchange rates from the fluctuations arising from changes in the market prices of long-term portfolio securities sold during the period. Accordingly,
| | |
| Jennison Natural Resources Fund, Inc. | | 21 |
Notes to Financial Statements
Cont’d
realized foreign currency gains or losses are included in the reported net realized gain or loss on investment transactions.
Net realized gains or losses on foreign currency transactions represent net foreign exchange gains or losses from the holding of foreign currencies, currency gains or losses realized between the trade date and settlement date on securities transactions, and the difference between the amounts of dividends, interest and foreign withholding taxes recorded on the Fund’s books and the U.S. dollar equivalent amounts actually received or paid. Net unrealized currency gains or losses from valuing foreign currency denominated assets and liabilities (other than investments) at period end exchange rates are reflected as a component of net unrealized appreciation (depreciation) on investment and foreign currencies.
Foreign security and currency transactions may involve certain considerations and risks not typically associated with those of domestic origin as a result of, among other factors, the possibility of political and economic instability, or the level of governmental supervision and regulation of foreign securities markets.
Securities Lending: The Fund may lend its portfolio securities to broker-dealers. The loans are secured by collateral at least equal at all times to the market value of the securities loaned. Loans are subject to termination at the option of the borrower or the Fund. Upon termination of the loan, the borrower will return to the lender securities identical to the loaned securities. Should the borrower of the securities fail financially, the Fund has the right to repurchase the securities using the collateral in the open market. The Fund recognizes income, net of any rebate and securities lending agent fees, for lending its securities in the form of fees or interest on the investment of any cash received as collateral. The Fund also continues to receive interest and dividends or amounts equivalent thereto, on the securities loaned and recognizes any unrealized gain or loss in the market price of the securities loaned that may occur during the term of the loan.
Securities Transactions and Net Investment Income: Securities transactions are recorded on the trade date. Realized gains or losses on sales of securities are calculated on the identified cost basis. Dividend income is recorded on the ex-dividend date and interest income is recorded on the accrual basis. Expenses are recorded on the accrual basis.
| | |
| 22 | | Visit our website at www.jennisondryden.com |
Net investment income or loss, (other than distribution fees, which are charged directly to the respective class) and unrealized and realized gains or losses are allocated daily to each class of shares based upon the relative proportion of net assets of each class at the beginning of the day.
Dividends and Distributions: The Fund expects to pay dividends of net investment income and distributions of net realized capital and currency gains, if any, annually. Dividends and distributions to shareholders, which are determined in accordance with federal income tax regulations and which may differ from generally accepted accounting principles, are recorded on the ex-dividend date.
Taxes: It is the Fund’s policy to continue to meet the requirements of the Internal Revenue Code applicable to regulated investment companies and to distribute all of its taxable net investment income and capital gains, if any, to shareholders. Therefore, no federal income tax provision is required.
Withholding taxes on foreign dividends have been provided for in accordance with the Fund’s understanding of the applicable country’s tax rules and rates.
Estimates: The preparation of the financial statements requires management to make estimates and assumptions that affect the reported amounts and disclosures in the financial statements. Actual results could differ from those estimates.
Note 2. Agreements
The Fund has a management agreement with PI. Pursuant to a subadvisory agreement between PI and Jennison Associates LLC (“Jennison”), Jennison furnishes investment advisory services in connection with the management of the Fund. Under the subadvisory agreement, Jennison, subject to the supervision of PI, is responsible for managing the assets of the Fund in accordance with its investment objective and policies. PI pays for the services of Jennison, the compensation of officers of the Fund, occupancy and certain clerical and bookkeeping costs of the Fund. The Fund bears all other costs and expenses.
The management fee paid to PI is computed daily and payable monthly at an annual rate of 0.75 of 1% of average daily net assets up to $1 billion and 0.70 of 1% of average daily net assets in excess of $1 billion. The effective management fee rate was 0.75 of 1% for the year ended May 31, 2005.
The Fund has a distribution agreement with Prudential Investment Management Services LLC (“PIMS”), which acts as the distributor of the Class A, Class B, Class C
| | |
| Jennison Natural Resources Fund, Inc. | | 23 |
Notes to Financial Statements
Cont’d
and Class Z shares of the Fund. The Fund compensates PIMS for distributing and servicing the Fund’s Class A, Class B and Class C shares, pursuant to plans of distribution (the ‘Class A, B and C Plans’), regardless of expenses actually incurred. The distribution fees are accrued daily and payable monthly. No distribution or service fees are paid to PIMS as distributor of the Class Z shares of the Fund.
Pursuant to the Class A, B and C Plans, the Fund compensates PIMS for distribution-related activities at an annual rate of up to .30 of 1%, 1% and 1% of the average daily net assets of the Class A, B and Class C shares, respectively. For the year ended May 31, 2005, PIMS contractually agreed to limit such fees to .25 of 1% of the average daily net assets of the Class A shares.
PIMS has advised the Fund that it received approximately $4,260,500 in front-end sales charges resulting from sales of Class A shares, during the year ended May 31, 2005. From these fees, PIMS paid such sales charges to affiliated broker-dealers, which in turn paid commissions to salespersons and incurred other distribution costs.
PIMS has advised the Fund that for the year ended May 31, 2005, it received approximately $25,700, $164,300 and $62,700 in contingent deferred sales charges imposed upon certain redemptions by Class A, Class B and Class C shareholders, respectively.
PI, PIMS and Jennison are indirect, wholly-owned subsidiaries of Prudential Financial, Inc. (“Prudential”).
The Fund, along with other affiliated registered investment companies (the “Funds”), is a party to a syndicated credit agreement (“SCA”) with two banks. For the period May 1, 2004 through October 29, 2004, the SCA provided for a commitment of $500 million. Interest on any borrowings under the SCA would be incurred at market rates. The Funds paid a commitment fee of .08 of 1% of the unused portion of the SCA. The commitment fee is accrued daily and paid quarterly and is allocated to the Funds pro-rata based on net assets. The purpose of the SCA is to serve as an alternative source of funding for capital share redemptions. The expiration date of the SCA was October 29, 2004. Effective October 29, 2004, the Funds entered into a revised credit agreement with two banks. The commitment under the revised credit agreement continues to be $500 million. The Funds pay a commitment fee of .075 of 1% of the unused portion of the revised credit agreement. The expiration of the revised SCA is
| | |
| 24 | | Visit our website at www.jennisondryden.com |
October 28, 2005. The Fund did not borrow any amounts pursuant to the SCA during the year ended May 31, 2005.
Note 3. Other Transactions with Affiliates
Prudential Mutual Fund Services LLC (“PMFS”), an affiliate of PI, and an indirect, wholly-owned subsidiary of Prudential, serves as the Fund’s transfer agent. The transfer agent fees and expenses in the Statement of Operations include certain out-of-pocket expenses paid to nonaffiliates, where applicable.
The Fund pays networking fees to affiliated and unaffiliated broker/dealers. These networking fees are payments made to broker/dealers that clear mutual fund transactions through a national clearing system. For the year ended May 31, 2005, the Fund incurred approximately $167,300 in total networking fees. These amounts are included in transfer agent’s fees and expenses in the Statement of Operations.
PIM is the securities lending agent for the Fund. For the year ended May 31, 2005, PIM has been compensated by the Fund in the amount of approximately $163,200 for these services.
The Fund invests in the Taxable Money Market Series (the “Series”), a portfolio of Dryden Core Investment Fund, pursuant to an exemptive order received from the Securities and Exchange Commission. The Series is a money market mutual fund registered under the Investment Company Act of 1940, as amended, and managed by PI.
Note 4. Portfolio Securities
Purchases and sales of investment securities, other than short-term investments, for the year ended May 31, 2005 were $489,416,292 and $138,015,142, respectively.
As of May 31, 2005, the Fund had securities on loan with an aggregate market value of $167,428,659. The Fund received $177,036,756 in cash as collateral for securities on loan which was used to purchase highly liquid short-term investments in accordance with the Fund’s securities lending procedures.
Note 5. Tax Information
Distributions to shareholders, which are determined in accordance with federal income tax regulations and may differ from generally accepted accounting principles,
| | |
| Jennison Natural Resources Fund, Inc. | | 25 |
Notes to Financial Statements
Cont’d
are recorded on the ex-dividend date. In order to present undistributed net investment income (loss) and accumulated net realized gains (loss) on the Statement of Assets and Liabilities that more closely represent their tax character, certain adjustments have been made to paid-in-capital in excess of par, undistributed net investment income (loss) and accumulated gains (loss) on investments. For the year ended May 31, 2005, the adjustments were to decrease accumulated net investment loss and accumulated net realized gains by $3,328,298 due to differences in the treatment for book and tax purposes of certain transactions involving foreign securities and currencies. Net investment loss, net realized gains and net assets were not affected by this change.
For the year ended May 31, 2005, the tax character of distributions paid by the Fund was $1,068,509 from ordinary income and $10,007,841 from long-term capital gains. For the year ended May 31, 2004, the tax character of distributions paid by the Fund was $2,357,888 from ordinary income and $829,473 from long-term capital gains.
As of May 31, 2005, the Fund had undistributed ordinary income of $6,102,458 and $26,156,843 long-term capital gains on a tax basis.
The Fund defers approximately $14,316 of loss due to the depreciation of certain passive foreign investment companies from November 1, 2004 through May 31, 2005. These losses offsetting net investment income will arise for tax purposes on June 1, 2005.
The United States federal income tax basis of the Fund’s investments and the net unrealized appreciation as of May 31, 2005 were as follows:
| | | | | | | | | | |
Tax Basis
| | Appreciation
| | Depreciation
| | Net Unrealized
Appreciation
| | Other Cost
Basis
Adjustments
| | Total Net
Unrealized
Appreciation
|
| $762,156,822 | | $135,574,262 | | $21,322,168 | | $114,252,094 | | $(32,222) | | $114,219,872 |
The differences between book basis and tax basis of investments are primarily attributable to deferred losses on wash sales and mark to market on passive foreign investment companies.
The other cost basis adjustments are primarily attributable to depreciation of foreign currency and mark to market of receivables and payables.
| | |
| 26 | | Visit our website at www.jennisondryden.com |
In addition, the Fund elected to treat post-October currency losses of approximately $168,300 incurred in the seven months ended May 31, 2005 as having incurred in the next fiscal year.
Note 6. Capital
The Fund offers Class A, Class B, Class C and Class Z shares. Class A shares are sold with a front-end sales charge of up to 5.50%. All investors who purchase Class A shares in an amount of $1 million or more and sell these shares within 12 months of purchase are subject to a contingent deferred sales charge (CDSC) of 1%, including investors who purchase their shares through broker-dealers affiliated with Prudential. Class B shares are sold with a contingent deferred sales charge which declines from 5% to zero depending upon the period of time the shares are held. Class C shares are sold with a contingent deferred sales charge of 1% during the first 12 months. Class B shares automatically convert to Class A shares on a quarterly basis approximately seven years after purchase. A special exchange privilege is also available for shareholders who qualify to purchase Class A shares at net asset value. Class Z shares are not subject to any sales or redemption charge and are offered exclusively for sale to a limited group of investors.
There are 500 million shares of $.01 par value common stock authorized divided into four classes, designated Class A, Class B, Class C and Class Z common stock, each of which consists of 125 million authorized shares.
Transactions in shares of common stock were as follows:
| | | | | | | |
Class A
| | Shares
| | | Amount
| |
Year ended May 31, 2005: | | | | | | | |
Shares sold | | 7,537,558 | | | $ | 218,488,059 | |
Shares issued in reinvestment of dividends and distributions | | 145,652 | | | | 4,219,529 | |
Shares reacquired | | (2,406,778 | ) | | | (68,994,645 | ) |
| | |
|
| |
|
|
|
Net increase (decrease) in shares outstanding before conversion | | 5,276,432 | | | | 153,712,943 | |
Shares issued upon conversion from Class B | | 280,532 | | | | 7,582,384 | |
| | |
|
| |
|
|
|
Net increase (decrease) in shares outstanding | | 5,556,964 | | | $ | 161,295,327 | |
| | |
|
| |
|
|
|
Year ended May 31, 2004: | | | | | | | |
Shares sold | | 2,823,725 | | | $ | 64,273,813 | |
Shares issued in reinvestment of dividends and distributions | | 71,767 | | | | 1,471,938 | |
Shares reacquired | | (1,029,711 | ) | | | (22,197,333 | ) |
| | |
|
| |
|
|
|
Net increase (decrease) in shares outstanding before conversion | | 1,865,781 | | | | 43,548,418 | |
Shares issued upon conversion from Class B | | 408,917 | | | | 8,729,867 | |
| | |
|
| |
|
|
|
Net increase (decrease) in shares outstanding | | 2,274,698 | | | $ | 52,278,285 | |
| | |
|
| |
|
|
|
| | |
| Jennison Natural Resources Fund, Inc. | | 27 |
Notes to Financial Statements
Cont’d
| | | | | | | |
Class B
| | Shares
| | | Amount
| |
Year ended May 31, 2005: | | | | | | | |
Shares sold | | 3,203,639 | | | $ | 82,108,683 | |
Shares issued in reinvestment of dividends and distributions | | 75,014 | | | | 1,949,628 | |
Shares reacquired | | (604,886 | ) | | | (15,553,683 | ) |
| | |
|
| |
|
|
|
Net increase (decrease) in shares outstanding before conversion | | 2,673,767 | | | | 68,504,628 | |
Shares issued upon conversion into Class A | | (312,511 | ) | | | (7,582,384 | ) |
| | |
|
| |
|
|
|
Net increase (decrease) in shares outstanding | | 2,361,256 | | | $ | 60,922,244 | |
| | |
|
| |
|
|
|
Year ended May 31, 2004: | | | | | | | |
Shares sold | | 1,217,278 | | | $ | 24,803,626 | |
Shares issued in reinvestment of dividends and distributions | | 34,160 | | | | 632,976 | |
Shares reacquired | | (406,856 | ) | | | (7,906,850 | ) |
| | |
|
| |
|
|
|
Net increase (decrease) in shares outstanding before conversion | | 844,582 | | | | 17,529,752 | |
Shares issued upon conversion into Class A | | (453,572 | ) | | | (8,729,867 | ) |
| | |
|
| |
|
|
|
Net increase (decrease) in shares outstanding | | 391,010 | | | $ | 8,799,885 | |
| | |
|
| |
|
|
|
Class C
| | | | | | |
Year ended May 31, 2005: | | | | | | | |
Shares sold | | 4,015,128 | | | $ | 104,823,634 | |
Shares issued in reinvestment of dividends and distributions | | 52,875 | | | | 1,374,216 | |
Shares reacquired | | (528,908 | ) | | | (13,767,500 | ) |
| | |
|
| |
|
|
|
Net increase (decrease) in shares outstanding | | 3,539,095 | | | $ | 92,430,350 | |
| | |
|
| |
|
|
|
Year ended May 31, 2004: | | | | | | | |
Shares sold | | 1,229,575 | | | $ | 25,221,290 | |
Shares issued in reinvestment of dividends and distributions | | 10,526 | | | | 195,053 | |
Shares reacquired | | (141,886 | ) | | | (2,816,670 | ) |
| | |
|
| |
|
|
|
Net increase (decrease) in shares outstanding | | 1,098,215 | | | $ | 22,599,673 | |
| | |
|
| |
|
|
|
Class Z
| | | | | | |
Year ended May 31, 2005: | | | | | | | |
Shares sold | | 3,127,633 | | | $ | 90,975,931 | |
Shares issued in reinvestment of dividends and distributions | | 68,236 | | | | 2,006,805 | |
Shares reacquired | | (1,530,398 | ) | | | (44,520,111 | ) |
| | |
|
| |
|
|
|
Net increase (decrease) in shares outstanding | | 1,665,471 | | | $ | 48,462,625 | |
| | |
|
| |
|
|
|
Year ended May 31, 2004: | | | | | | | |
Shares sold | | 1,715,600 | | | $ | 39,155,605 | |
Shares issued in reinvestment of distributions | | 24,476 | | | | 509,598 | |
Shares reacquired | | (614,093 | ) | | | (13,401,415 | ) |
| | |
|
| |
|
|
|
Net increase (decrease) in shares outstanding | | 1,125,983 | | | $ | 26,263,788 | |
| | |
|
| |
|
|
|
| | |
| 28 | | Visit our website at www.jennisondryden.com |
Financial Highlights
| | |
| MAY 31, 2005 | | ANNUAL REPORT |
Jennison Natural Resources Fund, Inc.
Financial Highlights
| | | | |
| | | Class A
| |
| | | Year Ended May 31, 2005 | |
Per Share Operating Performance(a): | | | | |
Net Asset Value, Beginning Of Year | | $ | 23.33 | |
| | |
|
|
|
Income (loss) from investment operations: | | | | |
Net investment income (loss) | | | .11 | |
Net realized and unrealized gain (loss) on investment and foreign currency transactions | | | 7.61 | |
| | |
|
|
|
Total from investment operations | | | 7.72 | |
| | |
|
|
|
Less dividends and distributions | | | | |
Dividends from net investment income | | | (.08 | ) |
Distributions from net realized gains on investments | | | (.61 | ) |
| | |
|
|
|
Total dividends and distributions | | | (.69 | ) |
| | |
|
|
|
Net asset value, end of year | | $ | 30.36 | |
| | |
|
|
|
Total Return(b): | | | 33.24 | % |
Ratios/Supplemental Data: | | | | |
Net assets, end of year (000) | | $ | 327,162 | |
Average net assets (000) | | $ | 215,619 | |
Ratios to average net assets: | | | | |
Expenses, including distribution and service (12b-1) fees(c) | | | 1.22 | % |
Expenses, excluding distribution and service (12b-1) fees | | | .97 | % |
Net investment income (loss) | | | .39 | % |
Class A, B, C and Z shares: | | | | |
Portfolio turnover | | | 30 | % |
| (a) | Calculations are made based on average daily shares outstanding during the year. |
| (b) | Total return does not consider the effects of sales loads. Total return is calculated assuming a purchase of shares on the first day and a sale on the last day of each year reported and includes reinvestment of dividends and distributions. |
| (c) | The distributor of the Fund contractually agreed to limit its distribution and service (12b-1) fees to .25 of 1% of the average net assets of Class A shares. |
See Notes to Financial Statements.
| | |
| 30 | | Visit our website at www.jennisondryden.com |
| | | | | | | | | | | | | | |
| Class A | |
| Year Ended May 31, | |
| 2004 | | | 2003 | | | 2002 | | | 2001 | |
| | | | | | | | | | | | | | | |
| $ | 18.94 | | | $ | 20.64 | | | $ | 19.05 | | | $ | 15.55 | |
|
|
| |
|
|
| |
|
|
| |
|
|
|
| | | | | | | | | | | | | | | |
| | (.06 | ) | | | (.09 | ) | | | (.04 | ) | | | .13 | |
| | 4.96 | | | | (.27 | ) | | | 1.78 | | | | 3.37 | |
|
|
| |
|
|
| |
|
|
| |
|
|
|
| | 4.90 | | | | (.36 | ) | | | 1.74 | | | | 3.50 | |
|
|
| |
|
|
| |
|
|
| |
|
|
|
| | | | | | | | | | | | | | | |
| | (.39 | ) | | | (.41 | ) | | | (.15 | ) | | | — | |
| | (.12 | ) | | | (.93 | ) | | | — | | | | — | |
|
|
| |
|
|
| |
|
|
| |
|
|
|
| | (.51 | ) | | | (1.34 | ) | | | (.15 | ) | | | — | |
|
|
| |
|
|
| |
|
|
| |
|
|
|
| $ | 23.33 | | | $ | 18.94 | | | $ | 20.64 | | | $ | 19.05 | |
|
|
| |
|
|
| |
|
|
| |
|
|
|
| | 26.24 | % | | | (.53 | )% | | | 9.43 | % | | | 22.51 | % |
| | | | | | | | | | | | | | | |
| $ | 121,700 | | | $ | 55,747 | | | $ | 51,254 | | | $ | 41,934 | |
| $ | 81,712 | | | $ | 46,251 | | | $ | 37,737 | | | $ | 33,769 | |
| | | | | | | | | | | | | | | |
| | 1.41 | % | | | 1.64 | % | | | 1.71 | % | | | 1.57 | % |
| | 1.16 | % | | | 1.39 | % | | | 1.46 | % | | | 1.32 | % |
| | (.27 | )% | | | (.51 | )% | | | (.23 | )% | | | .78 | % |
| | | | | | | | | | | | | | | |
| | 6 | % | | | 25 | % | | | 28 | % | | | 26 | % |
See Notes to Financial Statements.
| | |
| Jennison Natural Resources Fund, Inc. | | 31 |
Financial Highlights
Cont’d
| | | | |
| | | Class B
| |
| | | Year Ended
May 31, 2005 | |
Per Share Operating Performance(a): | | | | |
Net Asset Value, Beginning Of Year | | $ | 20.99 | |
| | |
|
|
|
Income (loss) from investment operations: | | | | |
Net investment loss | | | (.09 | ) |
Net realized and unrealized gain (loss) on investment and foreign currency transactions | | | 6.84 | |
| | |
|
|
|
Total from investment operations | | | 6.75 | |
| | |
|
|
|
Less dividends and distributions | | | | |
Dividends from net investment income | | | — | |
Distributions from net realized gains on investments | | | (.61 | ) |
| | |
|
|
|
Total dividends and distributions | | | (.61 | ) |
| | |
|
|
|
Net asset value, end of year | | $ | 27.13 | |
| | |
|
|
|
Total Return(b): | | | 32.30 | % |
Ratios/Supplemental Data: | | | | |
Net assets, end of year (000) | | $ | 132,157 | |
Average net assets (000) | | $ | 91,588 | |
Ratios to average net assets: | | | | |
Expenses, including distribution and service (12b-1) fees | | | 1.97 | % |
Expenses, excluding distribution and service (12b-1) fees | | | .97 | % |
Net investment loss | | | (.36 | )% |
| (a) | Calculations are made based on average daily shares outstanding during the year. |
| (b) | Total return does not consider the effects of sales loads. Total return is calculated assuming a purchase of shares on the first day and a sale on the last day of each year reported and includes reinvestment of dividends and distributions. |
See Notes to Financial Statements.
| | |
| 32 | | Visit our website at www.jennisondryden.com |
| | | | | | | | | | | | | | |
| Class B | |
| Year Ended May 31, | |
| 2004 | | | 2003 | | | 2002 | | | 2001 | |
| | | | | | | | | | | | | | | |
| $ | 17.09 | | | $ | 18.76 | | | $ | 17.33 | | | $ | 14.24 | |
|
|
| |
|
|
| |
|
|
| |
|
|
|
| | | | | | | | | | | | | | | |
| | (.20 | ) | | | (.20 | ) | | | (.14 | ) | | | (.02 | ) |
| | 4.46 | | | | (.26 | ) | | | 1.61 | | | | 3.11 | |
|
|
| |
|
|
| |
|
|
| |
|
|
|
| | 4.26 | | | | (.46 | ) | | | 1.47 | | | | 3.09 | |
|
|
| |
|
|
| |
|
|
| |
|
|
|
| | | | | | | | | | | | | | | |
| | (.24 | ) | | | (.28 | ) | | | (.04 | ) | | | — | |
| | (.12 | ) | | | (.93 | ) | | | — | | | | — | |
|
|
| |
|
|
| |
|
|
| |
|
|
|
| | (.36 | ) | | | (1.21 | ) | | | (.04 | ) | | | — | |
|
|
| |
|
|
| |
|
|
| |
|
|
|
| $ | 20.99 | | | $ | 17.09 | | | $ | 18.76 | | | $ | 17.33 | |
|
|
| |
|
|
| |
|
|
| |
|
|
|
| | 25.28 | % | | | (1.31 | )% | | | 8.57 | % | | | 21.70 | % |
| | | | | | | | | | | | | | | |
| $ | 52,684 | | | $ | 36,197 | | | $ | 40,002 | | | $ | 42,288 | |
| $ | 40,985 | | | $ | 33,154 | | | $ | 32,040 | | | $ | 39,793 | |
| | | | | | | | | | | | | | | |
| | 2.16 | % | | | 2.39 | % | | | 2.46 | % | | | 2.32 | % |
| | 1.16 | % | | | 1.39 | % | | | 1.46 | % | | | 1.32 | % |
| | (1.03 | )% | | | (1.27 | )% | | | (.95 | )% | | | (.16 | )% |
See Notes to Financial Statements.
| | |
| Jennison Natural Resources Fund, Inc. | | 33 |
Financial Highlights
Cont’d
| | | | |
| | | Class C
| |
| | | Year Ended May 31, 2005 | |
Per Share Operating Performance(a): | | | | |
Net Asset Value, Beginning Of Year | | $ | 20.99 | |
| | |
|
|
|
Income (loss) from investment operations: | | | | |
Net investment income (loss) | | | (.09 | ) |
Net realized and unrealized gain (loss) on investment and foreign currency transactions | | | 6.84 | |
| | |
|
|
|
Total from investment operations | | | 6.75 | |
| | |
|
|
|
Less dividends and distributions | | | | |
Dividends from net investment income | | | — | |
Distributions from net realized gains on investments | | | (.61 | ) |
| | |
|
|
|
Total dividends and distributions | | | (.61 | ) |
| | |
|
|
|
Net asset value, end of year | | $ | 27.13 | |
| | |
|
|
|
Total Return(b): | | | 32.30 | % |
Ratios/Supplemental Data: | | | | |
Net assets, end of year (000) | | $ | 138,176 | |
Average net assets (000) | | $ | 79,352 | |
Ratios to average net assets: | | | | |
Expenses, including distribution and service (12b-1) fees | | | 1.97 | % |
Expenses, excluding distribution and service (12b-1) fees | | | .97 | % |
Net investment income (loss) | | | (.37 | )% |
| (a) | Calculations are made based on average daily shares outstanding during the year. |
| (b) | Total return does not consider the effects of sales loads. Total return is calculated assuming a purchase of shares on the first day and a sale on the last day of each year reported and includes reinvestment of dividends and distributions. |
See Notes to Financial Statements.
| | |
| 34 | | Visit our website at www.jennisondryden.com |
| | | | | | | | | | | | | | |
| Class C | |
| Year Ended May 31, | |
| 2004 | | | 2003 | | | 2002 | | | 2001 | |
| | | | | | | | | | | | | | | |
| $ | 17.09 | | | $ | 18.76 | | | $ | 17.33 | | | $ | 14.24 | |
|
|
| |
|
|
| |
|
|
| |
|
|
|
| | | | | | | | | | | | | | | |
| | (.20 | ) | | | (.19 | ) | | | (.14 | ) | | | .01 | |
| | 4.46 | | | | (.27 | ) | | | 1.61 | | | | 3.08 | |
|
|
| |
|
|
| |
|
|
| |
|
|
|
| | 4.26 | | | | (.46 | ) | | | 1.47 | | | | 3.09 | |
|
|
| |
|
|
| |
|
|
| |
|
|
|
| | | | | | | | | | | | | | | |
| | (.24 | ) | | | (.28 | ) | | | (.04 | ) | | | — | |
| | (.12 | ) | | | (.93 | ) | | | — | | | | — | |
|
|
| |
|
|
| |
|
|
| |
|
|
|
| | (.36 | ) | | | (1.21 | ) | | | (.04 | ) | | | — | |
|
|
| |
|
|
| |
|
|
| |
|
|
|
| $ | 20.99 | | | $ | 17.09 | | | $ | 18.76 | | | $ | 17.33 | |
|
|
| |
|
|
| |
|
|
| |
|
|
|
| | 25.28 | % | | | (1.31 | )% | | | 8.57 | % | | | 21.70 | % |
| | | | | | | | | | | | | | | |
| $ | 32,612 | | | $ | 7,778 | | | $ | 5,278 | | | $ | 4,277 | |
| $ | 16,347 | | | $ | 5,585 | | | $ | 3,771 | | | $ | 2,923 | |
| | | | | | | | | | | | | | | |
| | 2.16 | % | | | 2.39 | % | | | 2.46 | % | | | 2.32 | % |
| | 1.16 | % | | | 1.39 | % | | | 1.46 | % | | | 1.32 | % |
| | (1.00 | )% | | | (1.23 | )% | | | (.93 | )% | | | .05 | % |
See Notes to Financial Statements.
| | |
| Jennison Natural Resources Fund, Inc. | | 35 |
Financial Highlights
Cont’d
| | | | |
| | | Class Z
| |
| | | Year Ended May 31, 2005 | |
Per Share Operating Performance(a): | | | | |
Net Asset Value, Beginning Of Year | | $ | 23.70 | |
| | |
|
|
|
Income (loss) from investment operations: | | | | |
Net investment income (loss) | | | .19 | |
Net realized and unrealized gain (loss) on investment and foreign currency transactions | | | 7.74 | |
| | |
|
|
|
Total from investment operations | | | 7.93 | |
| | �� |
|
|
|
Less dividends and distributions | | | | |
Dividends from net investment income | | | (.15 | ) |
Distributions from net realized gains on investments | | | (.61 | ) |
| | |
|
|
|
Total dividends and distributions | | | (.76 | ) |
| | |
|
|
|
Net asset value, end of year | | $ | 30.87 | |
| | |
|
|
|
Total Return(b): | | | 33.64 | % |
Ratios/Supplemental Data: | | | | |
Net assets, end of year (000) | | $ | 109,569 | |
Average net assets (000) | | $ | 83,864 | |
Ratios to average net assets: | | | | |
Expenses, including distribution and service (12b-1) fees | | | .97 | % |
Expenses, excluding distribution and service (12b-1) fees | | | .97 | % |
Net investment income (loss) | | | .65 | % |
| (a) | Calculations are made based on average daily shares outstanding during the year. |
| (b) | Total return is calculated assuming a purchase of shares on the first day and a sale on the last day of each year reported and includes reinvestment of dividends and distributions. |
| (c) | Less than $.005 per share. |
See Notes to Financial Statements.
| | |
| 36 | | Visit our website at www.jennisondryden.com |
| | | | | | | | | | | | | | |
| Class Z | |
| Year Ended May 31, | |
| 2004 | | | 2003 | | | 2002 | | | 2001 | |
| | | | | | | | | | | | | | | |
| $ | 19.24 | | | $ | 20.93 | | | $ | 19.32 | | | $ | 15.71 | |
|
|
| |
|
|
| |
|
|
| |
|
|
|
| | | | | | | | | | | | | | | |
| | — | (c) | | | (.04 | ) | | | — | (c) | | | .20 | |
| | 5.02 | | | | (.27 | ) | | | 1.80 | | | | 3.41 | |
|
|
| |
|
|
| |
|
|
| |
|
|
|
| | 5.02 | | | | (.31 | ) | | | 1.80 | | | | 3.61 | |
|
|
| |
|
|
| |
|
|
| |
|
|
|
| | | | | | | | | | | | | | | |
| | (.44 | ) | | | (.45 | ) | | | (.19 | ) | | | — | |
| | (.12 | ) | | | (.93 | ) | | | — | | | | — | |
|
|
| |
|
|
| |
|
|
| |
|
|
|
| | (.56 | ) | | | (1.38 | ) | | | (.19 | ) | | | — | |
|
|
| |
|
|
| |
|
|
| |
|
|
|
| $ | 23.70 | | | $ | 19.24 | | | $ | 20.93 | | | $ | 19.32 | |
|
|
| |
|
|
| |
|
|
| |
|
|
|
| | 26.49 | % | | | (.24 | )% | | | 9.69 | % | | | 22.98 | % |
| | | | | | | | | | | | | | | |
| $ | 44,663 | | | $ | 14,586 | | | $ | 10,728 | | | $ | 8,319 | |
| $ | 25,894 | | | $ | 10,707 | | | $ | 6,272 | | | $ | 5,053 | |
| | | | | | | | | | | | | | | |
| | 1.16 | % | | | 1.39 | % | | | 1.46 | % | | | 1.32 | % |
| | 1.16 | % | | | 1.39 | % | | | 1.46 | % | | | 1.32 | % |
| | (.02 | )% | | | (.22 | )% | | | (.01 | )% | | | 1.22 | % |
See Notes to Financial Statements.
| | |
| Jennison Natural Resources Fund, Inc. | | 37 |
Report of Independent Registered Public Accounting Firm
The Board of Directors and Shareholders of
Jennison Natural Resources Fund, Inc.:
We have audited the accompanying statement of assets and liabilities of the Jennison Natural Resources Fund, Inc., including the portfolio of investments, as of May 31, 2005, and the related statement of operations for the year then ended, and the statement of changes in net assets, and the financial highlights for each of the years in the two-year period then ended. These financial statements and financial highlights are the responsibility of the Fund’s management. Our responsibility is to express an opinion on these financial statements and financial highlights based on our audits. The financial highlights for the years presented prior to the year ended May 31, 2004, were audited by another independent registered public accounting firm, whose report dated, July 16, 2003, expressed an unqualified opinion thereon.
We conducted our audits in accordance with the standards of the Public Company Accounting Oversight Board (United States). Those standards require that we plan and perform the audit to obtain reasonable assurance about whether the financial statements and financial highlights are free of material misstatement. An audit includes examining, on a test basis, evidence supporting the amounts and disclosures in the financial statements. Our procedures included confirmation of securities owned as of May 31, 2005, by correspondence with the custodian and brokers or by other appropriate auditing procedures where replies from brokers were not received. An audit also includes assessing the accounting principles used and significant estimates made by management, as well as evaluating the overall financial statement presentation. We believe that our audits provide a reasonable basis for our opinion.
In our opinion, the financial statements and financial highlights referred to above present fairly, in all material respects, the financial position of the Jennison Natural Resources Fund, Inc. as of May 31, 2005, and the results of its operations for the year then ended, and the changes in its net assets, and the financial highlights for each of the years in the two-year period then ended, in conformity with U.S. generally accepted accounting principles.
New York, New York
July 25, 2005
| | |
| 38 | | Visit our website at www.jennisondryden.com |
Tax Information
(Unaudited)
As required by the Internal Revenue Code, we wish to advise you as to the federal status of dividends paid by the Fund during its fiscal year ended May 31, 2005.
During the fiscal year ended May 31, 2005, the Fund paid dividends taxable as ordinary income of $0.08 and $0.15 to Class A and Class Z shares respectively. The Fund also paid long-term capital gains of $0.61 per share to Class A, B, C and Z shares. Further, we wish to advise you that 28.59% of ordinary income dividends paid during the fiscal year ended May 31, 2005 qualified for the corporate dividends received deduction available to corporate taxpayers.
For the fiscal year ended May 31, 2005, the Fund designated 100% as qualified dividend income for the reduced tax rate under the Jobs and Growth Tax Relief Reconciliation Act of 2003.
For the purpose of preparing your annual federal income tax return, however, you should report the amounts as reflected on the appropriate Form 1099-DIV or substitute 1099-DIV.
| | |
| Jennison Natural Resources Fund, Inc. | | 39 |
Management of the Fund
(Unaudited)
Information pertaining to the Directors of the Fund is set forth below. Directors who are not deemed to be “interested persons” of the Fund, as defined in the 1940 Act are referred to as “Independent Directors.” Directors who are deemed to be “interested persons” of the Fund are referred to as “Interested Directors.” “Fund Complex”† consists of the Fund and any other investment companies managed by PI.
Independent Directors(2)
Linda W. Bynoe (53), Director since 2005(3) Oversees 92 portfolios in Fund complex
Principal occupations (last 5 years): President and Chief Executive Officer (since March 1995) of Telemat Ltd.; formerly Vice President at Morgan Stanley & Co.
Other Directorships held:(4) Director of Dynegy Inc. (since September 2002) and Simon Property Group, Inc. (since May 2003).
David E.A. Carson (70), Director since 2003(3) Oversees 92 portfolios in Fund complex
Principal occupations (last 5 years): Director (January 2000 to May 2000), Chairman (January 1999 to December 1999), Chairman and Chief Executive Officer (January 1998 to December 1998) and President, Chairman and Chief Executive Officer (1983-1997) of People’s Bank.
Other Directorships held:(4) None
Robert E. La Blanc (71), Director since 2003(3) Oversees 92 portfolios in Fund complex
Principal occupations (last 5 years): President (since 1981) of Robert E. La Blanc Associates, Inc. (telecommunications); formerly General Partner at Salomon Brothers and Vice-Chairman of Continental Telecom; Trustee of Manhattan College.
Other Directorships held:(4) Director of Chartered Semiconductor Manufacturing, Ltd. (since 1998); Titan Corporation (electronics) (since 1995), Computer Associates International, Inc. (software company) (since 2002); FiberNet Telecom Group, Inc. (telecom company) (since 2003); Director (since April 1999) of the High Yield Plus Fund, Inc.
Douglas H. McCorkindale (66), Director since 2000(3) Oversees 92 portfolios in Fund complex
Principal occupations (last 5 years): Chairman (since February 2001) of Gannett Co. Inc. (publishing and media); formerly Chief Executive Officer (June 2000-July 2005), President (September 1997-July 2005) and Vice Chairman (March 1984-May 2000) of Gannett Co., Inc.
Other Directorships held:(4) Director of Gannett Co. Inc., Director of Continental Airlines, Inc. (since May 1993); Director of Lockheed Martin Corp. (aerospace and defense) (since May 2001); Director of The High Yield Plus Fund, Inc. (since 1996).
Richard A. Redeker (61), Director since 2000(3) Oversees 91 portfolios in Fund complex
Principal occupations (last 5 years): Management Consultant; Director of Invesmart, Inc. (since 2001) and Director of Penn Tank Lines, Inc. (since 1999).
Other Directorships held:(4) None.
| | |
| 40 | | Visit our website at www.jennisondryden.com |
Robin B. Smith (65), Director since 1996(3) Oversees 91 portfolios in Fund complex
Principal occupations (last 5 years): Chairman of the Board (since January 2003) of Publishers Clearing House (direct marketing); formerly Chairman and Chief Executive Officer (August 1996-January 2003) of Publishers Clearing House.
Other Directorships held:(4) Director of BellSouth Corporation (since 1992).
Stephen G. Stoneburn (62), Director since 2003(3) Oversees 91 portfolios in Fund complex
Principal occupations (last 5 years): President and Chief Executive Officer (since June 1996) of Quadrant Media Corp. (a publishing company); formerly President (June 1995-June 1996) of Argus Integrated Media, Inc.; Senior Vice President and Managing Director (January 1993-1995) of Cowles Business Media and Senior Vice President of Fairchild Publications, Inc. (1975-1989).
Other Directorships held:(4) None
Clay T. Whitehead (66), Director since 1999(3) Oversees 92 portfolios in Fund complex
Principal occupations (last 5 years): President (since 1983) of National Exchange Inc. (new business development firm).
Other Directorships held:(4) Director (since 2000) of the High Yield Plus Fund, Inc.
Interested Directors(1)
Judy A. Rice (57), President since 2003 and Director since 2000(3) Oversees 92 portfolios in Fund complex
Principal occupations (last 5 years): President, Chief Executive Officer, Chief Operating Officer and Officer-in-Charge (since 2003) of PI; Director, Officer-in-Charge, President, Chief Executive Officer and Chief Operating Officer (since May 2003) of American Skandia Advisory Services, Inc. and American Skandia Investment Services, Inc.; Director, Officer-in-Charge, President, Chief Executive Officer (since May 2003) of American Skandia Fund Services, Inc.; Vice President (since February 1999) of Prudential Investment Management Services LLC; President, Chief Executive Officer and Officer-in-Charge (since April 2003) of Prudential Mutual Fund Services LLC; formerly various positions to Senior Vice President (1992-1999) of Prudential Securities; and various positions to Managing Director (1975-1992) of Salomon Smith Barney; Member of Board of Governors of the Money Management Institute.
Other Directorships held:(4) None
Robert F. Gunia (58), Vice President(3) since 1987 and Director since 1996(3) Oversees 167 portfolios in Fund complex
Principal occupations (last 5 years): Chief Administrative Officer (since June 1999) of PI; Executive Vice President and Treasurer (since December 1996) of PI; President (since April 1999) of Prudential Investment Management Services LLC (PIMS); Corporate Vice President (since September 1997) of The Prudential Insurance Company of America (Prudential); Director, Executive Vice President and Chief Administrative Officer (since May 2003) of American Skandia Investment Services, Inc., American Skandia Advisory Services, Inc. and American Skandia Fund Services, Inc.; Executive Vice President (since March 1999) of Prudential Mutual Fund Services LLC; formerly Senior Vice President (March 1987-May 1999) of Prudential Securities.
Other Directorships held:(4) Vice President and Director (since May 1989) and Treasurer (since 1999) of The Asia Pacific Fund, Inc.
| | |
| Jennison Natural Resources Fund, Inc. | | 41 |
Information pertaining to the Officers of the Fund who are not also Directors is set forth below.
Officers(2)
Deborah A. Docs (47), Secretary since 2005(3)
Principal occupations (last 5 years): Vice President and Corporate Counsel (since January 2001) of Prudential; Vice President and Assistant Secretary (since December 1996) of PI; Vice President and Assistant Secretary (since May 2003) of American Skandia Investment Services, Inc.
Lee D. Augsburger (46), Chief Compliance Officer since 2004(3)
Principal occupations (last 5 years): Vice President and Chief Compliance Officer (since May 2003) of Pl; Vice President and Chief Compliance Officer (since October 2000) of Prudential Investment Management, Inc.; formerly Vice President and Chief Legal Officer—Annuities (August 1999-October 2000) of Prudential Insurance Company of America; Vice President and Corporate Counsel (November 1997-August 1999) of Prudential Insurance Company of America.
Maryanne Ryan (40), Anti-Money Laundering Compliance Officer since 2002(3)
Principal occupations (last 5 years): Vice President, Prudential (since November 1998); First Vice President, Prudential Securities (March 1997-May 1998); Anti-Money Laundering Compliance Officer (since 2003) of American Skandia Investment Services, Inc., American Skandia Advisory Services, Inc. and American Skandia Marketing, Inc.
Grace C. Torres (46), Treasurer and Principal Financial and Accounting Officer since 1997(3)
Principal occupations (last 5 years): Senior Vice President (since January 2000) of PI; Senior Vice President and Assistant Treasurer (since May 2003) of American Skandia Investment Services, Inc. and American Skandia Advisory Services, Inc.; formerly First Vice President (December 1996-January 2000) of PI and First Vice President (March 1993-1999) of Prudential Securities.
Jonathan D. Shain (46), Assistant Secretary since 2005(3)
Vice President and Corporate Counsel (since August 1998) of Prudential; Vice President and Assistant Secretary (since May 2003) of American Skandia Investment Services, Inc. and American Skandia Fund Services, Inc.
| | |
| 42 | | Visit our website at www.jennisondryden.com |
| (1) | “Interested” Director, as defined in the 1940 Act, by reason of employment with the Manager (Prudential Investments LLC or PI), the Subadviser (Jennison Associates LLC or Jennison) or the Distributor (Prudential Investment Management Services LLC or PIMS). |
| (2) | Unless otherwise noted, the address of the Directors and Officers is c/o: Prudential Investments LLC, Gateway Center Three, 100 Mulberry Street, Newark, NJ 07102. |
| (3) | There is no set term of office for Directors and Officers. The Independent Directors have adopted a retirement policy, which calls for the retirement of Directors on December 31 of the year in which they reach the age of 75. The table shows the individuals length of service as Director and/or Officer. |
| (4) | This includes only directorships of companies requested to register, or file reports with the SEC under the Securities and Exchange Act of 1934 (that is, “public companies”) or other investment companies registered under the 1940 Act. |
| † | The Fund Complex consists of all investment companies managed by PI. The Funds for which PI serves as manager include JennisonDryden Mutual Funds, Strategic Partners Mutual Funds, Strategic Partners Mutual Funds, Inc., The Prudential Variable Contract Accounts 2, 10, 11, The Target Portfolio Trust, The Prudential Series Fund, Inc., American Skandia Trust, and Prudential’s Gibraltar Fund. |
Additional information about the Fund’s Directors is included in the Fund’s Statement of Additional Information which is available without charge, upon request, by calling (800) 521-7466 or (732) 482-7555 (Calling from outside the U.S.)
| | |
| Jennison Natural Resources Fund, Inc. | | 43 |
Renewal of Advisory Agreements
The Board of Directors (the “Board”) of Jennison Natural Resources Fund, Inc. (the “Fund”) oversees the management of the Fund, and, as required by law, determines annually whether to renew the Fund’s management agreement with Prudential Investments LLC (“PI”) and the Fund’s subadvisory agreement with Jennison Associates LLC (“Jennison”). In considering the renewal of the agreements, the Board, including a majority of the Independent Directors, met on May 24, 2005 and June 23, 2005 and approved the renewal of the agreements through July 31, 2006, after concluding that renewal of the agreements was in the best interests of the Fund and its shareholders.
In advance of the meeting, the Board received materials relating to the agreements, and had the opportunity to ask questions and request further information in connection with their consideration. In approving the agreements, the Board, including the Independent Directors advised by independent legal counsel, considered the factors they deemed relevant, including the nature, quality and extent of services provided, the performance of the Fund, the profitability of “PI and its affiliates, expenses and fees, and the potential for economies of scale that may be shared with the Fund and its shareholders. In their deliberations, the Directors did not identify any single factor that was dispositive and each Director attributed different weights to the various factors. In connection with their deliberations, the Board considered information provided by PI throughout the year at regular Board meetings, presentations from portfolio managers and other information, as well as information furnished at or in advance of the meetings on May 24, 2005 and June 23, 2005.
The Directors determined that the overall arrangements between the Fund and PI, which serves as the Fund’s investment manager pursuant to a management agreement, and between PI and Jennison , which serves as the Fund’s subadviser pursuant to the terms of a subadvisory agreement with PI, are fair and reasonable in light of the services performed, fees charged and such other matters as the Directors considered relevant in the exercise of their business judgment.
The material factors and conclusions that formed the basis for the Directors’ reaching their determinations to approve the continuance of the agreements are separately discussed below.
Nature, quality and extent of services
The Board received and considered information regarding the nature and extent of services provided to the Fund by PI and Jennison. The Board considered the services provided by PI, including but not limited to the oversight of the subadvisers for the Fund, as well as the provision of fund accounting, recordkeeping, compliance, and other services to the Fund. With respect to PI’s oversight of the subadviser, the Board noted that PI’s Strategic Investment Research Group (“SIRG”), a business unit of PI, is
responsible for monitoring and reporting to PI’s senior management on the performance and operations of the subadviser. The Board also considered that PI pays the salaries of all of the officers and non-independent Directors of the Fund. The Board also considered the investment subadvisory services provided by Jennison, as well as adherence to the Fund’s investment restrictions and compliance with applicable Fund policies and procedures.
The Board reviewed the qualifications, backgrounds and responsibilities of PI’s senior management responsible for the oversight of the Fund and Jennison, and also reviewed the qualifications, backgrounds and responsibilities of Jennison’s portfolio managers who are responsible for the day-to-day management of the Fund’s portfolio. The Board was provided with information pertaining to PI’s and Jennison’s organizational structure, senior management, investment operations, and other relevant information pertaining to both PI and Jennison. The Board also noted that it received favorable compliance reports from the Fund’s Chief Compliance Officer (CCO) as to both PI and Jennison. The Board noted that Jennison is affiliated with PI.
The Board concluded that it was satisfied with the nature, extent and quality of the investment management services provided by PI and the subadvisory services provided to the Fund by Jennison, and that there was a reasonable basis on which to conclude that the Fund benefits from the services provided by PI and Jennison under the management and subadvisory agreements.
Performance of Jennison Natural Resources Fund
The Board received and considered information about the Fund’s historical performance, noting that the Fund had achieved performance that was in the third quartile over a one-year time period, performance that was in the first quartile over a three-year period, and performance that was in the second quartile over a five-year period in relation to the group of comparable funds in a peer universe (the “Peer Universe”). The Board noted that the Fund outperformed in comparison to its benchmark index over three-year and five-year periods, and that the Fund’s performance was above the median performance of the other mutual funds included in the Peer Universe over the same three-year and five-year time periods.
The Board further noted that earlier in the year, the long-standing portfolio manager of the Fund had resigned and a new portfolio manager had assumed responsibility for managing the Fund. The Board concluded that it was reasonable to approve the continuance of the management and subadvisory agreements, but to monitor the ongoing performance of the Fund’s new portfolio manager.
The Board determined that the Fund’s performance was satisfactory.
The funds included in the Peer Universe are objectively determined solely by Lipper Inc., independent provider of investment company data. The benchmark index is established by Frank Russell Company.
Fees and Expenses
The Board considered the management fee for the Fund as compared to the advisory fee charged by PI to other funds and accounts and the fee charged by other advisers to comparable mutual funds provided by Lipper Inc.
The Fund’s contractual and actual management fee of 0.750% ranked in the third and fourth quartile, respectively, in its Lipper 15(c) Peer Group. The contractual fee rate was only 3 basis points higher than the median fee of 0.72% for all of the mutual funds included in the Peer Group. The contractual management fee is computed based on hypothetical common levels of Fund net assets, while the actual management fee represents the fee rate actually paid by Fund shareholders and includes any fee waivers or reimbursements. The Board concluded that the management and subadvisory fees are reasonable.
Costs of Services and Profits Realized by PI
The Board was provided with information on the profitability of PI and its affiliates in serving as the Fund’s investment manager. The Board discussed with PI the methodology utilized in assembling the information regarding profitability and considered its reasonableness. The Board recognized that it is difficult to make comparisons of profitability from fund management contracts because comparative information is not generally publicly available and is affected by numerous factors, including the structure of the particular adviser, the types of funds it manages, its business mix, numerous assumptions regarding allocations and the adviser’s capital structure and cost of capital. The Board did not separately consider the profitability of the subadviser, an affiliate of PI, as its profitability was reflected in the profitability report for PI. Taking these factors into account, the Board concluded that the profitability of PI and its affiliates in relation to the services rendered was not unreasonable.
Economies of Scale
The Board noted that the management fee schedule for the Fund includes breakpoints, which have the effect of decreasing the fee rate as assets increase, but at the current level of assets the Fund does not realize the effect of those rate reductions. The Board received and discussed information concerning whether PI realizes economies of scale as the Fund’s assets grow beyond current levels. The Board took note that the Fund’s fee structure would result in benefits to Fund shareholders when (and if) assets reach the levels at which the fee rate is reduced. These benefits will accrue whether or not PI is then realizing any economies of scale.
Other Benefits to PI and Jennison
The Board considered potential ancillary benefits that might be received by PI and Jennison and their affiliates as a result of their relationship with the Fund. The Board
concluded that potential benefits to be derived by PI included brokerage commissions received by affiliates of PI and transfer agency fees received by the Fund’s transfer agent (which is affiliated with PI), as well as reputational or other intangible benefits resulting from PI’s association with the Fund. The Board concluded that the potential benefits to be derived by Jennison included the ability to use soft dollar credits and brokerage commissions received by affiliates of Jennison, as well as the potential benefits consistent with those generally resulting from an increase in assets under management, specifically, potential access to additional research resources and reputational benefits. The Board concluded that the benefits derived by PI and Jennison were consistent with the types of benefits generally derived by investment managers and subadvisers to mutual funds.
Growth of a $10,000 Investment
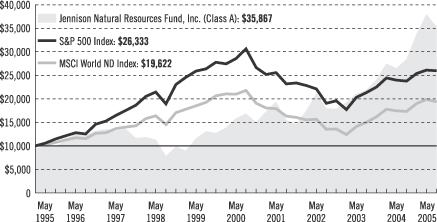
| | | | | | | | | | | | |
| Average Annual Total Returns (With Sales Charges) as of 5/31/05 | |
| | | One Year | | | Five Years | | | Ten Years | | | Since Inception | |
Class A | | 25.91 | % | | 16.21 | % | | 13.62 | % | | 10.74 | % |
Class B | | 27.30 | | | 16.56 | | | 13.42 | | | 9.67 | |
Class C | | 31.30 | | | 16.67 | | | 13.42 | | | 13.03 | |
Class Z | | 33.64 | | | 17.87 | | | N/A | | | 13.25 | |
| | | | | | | | | | | | | |
| Average Annual Total Returns (Without Sales Charges) as of 5/31/05 | |
| | | One Year | | | Five Years | | | Ten Years | | | Since Inception | |
Class A | | 33.24 | % | | 17.53 | % | | 14.27 | % | | 11.14 | % |
Class B | | 32.30 | | | 16.67 | | | 13.42 | | | 9.67 | |
Class C | | 32.30 | | | 16.67 | | | 13.42 | | | 13.03 | |
Class Z | | 33.64 | | | 17.87 | | | N/A | | | 13.25 | |
Performance data quoted represent past performance. Past performance does not guarantee future results. The investment return and principal value of an investment will fluctuate, so that an investor’s shares, when redeemed, may be worth more or less than their original cost. Current performance may be lower or higher than the past performance data quoted. An investor may obtain performance data current to the most recent month-end by visiting our website at www.jennisondryden.com or by calling (800) 225-1852.
| | |
| | | Visit our website at www.jennisondryden.com |
Source: Prudential Investments LLC and Lipper Inc.
Inception dates: Class A, 1/22/90; Class B, 9/28/87; Class C, 8/1/94; and Class Z, 9/16/96.
The graph compares a $10,000 investment in the Jennison Natural Resources Fund, Inc. (Class A shares) with a similar investment in the Morgan Stanley Capital International World Net Dividends Index (MSCI World ND Index) and the Standard & Poor’s 500 Composite Stock Price Index (S&P 500 Index) by portraying the initial account values at the beginning of the 10-year period for Class A shares (May 31, 1995) and the account values at the end of the current fiscal year (May 31, 2005) as measured on a quarterly basis. For purposes of the graph, and unless otherwise indicated, it has been assumed that (a) the maximum applicable front-end sales charge was deducted from the initial $10,000 investment in Class A shares; (b) all recurring fees (including management fees) were deducted; and (c) all dividends and distributions were reinvested. The line graph provides information for Class A shares only. As indicated in the tables provided earlier, performance for Class B, C, and Z shares will vary due to the differing charges and expenses applicable to each share class (as indicated in the following paragraphs). Without a distribution and service (12b-1) fee waiver of 0.05% for Class A shares through May 31, 2005, the returns shown in the graph and for Class A shares in the tables would have been lower.
MSCI World ND Index is a free float-adjusted, market-capitalization index that is designed to measure global developed market equity performance. The MSCI World ND Index consists of approximately 23 developed market indexes in Australia, Canada, Europe, the Far East, New Zealand, and the United States. The S&P 500 Index is an unmanaged index of 500 stocks of large U.S. public companies. It gives a broad look at how stock prices have performed in the United States. The Indexes’ total returns include the reinvestment of all dividends, but do not include the effects of sales charges, operating expenses of a mutual fund, or taxes. The returns for the Indexes would be lower if they included the effects of sales charges, operating expenses, or taxes. The securities that comprise the Indexes may differ substantially from the securities in the Fund. These are not the only indexes that may be used to characterize performance of sector stock funds. Other indexes may portray different comparative performance. Investors cannot invest directly in an index.
Class A shares are subject to a maximum front-end sales charge of 5.50%, a 12b-1 fee of up to 0.30% annually, and all investors who purchase Class A shares in an amount of $1 million or more and sell these shares within 12 months of purchase are not subject to an initial sales charge but are subject to a contingent deferred sales charge (CDSC) of 1%. Class B shares are subject to a declining CDSC of 5%, 4%, 3%, 2%, 1%, and 1% respectively for the first six years after purchase and a 12b-1 fee of 1% annually. Approximately seven years after purchase, Class B shares will automatically convert to Class A shares on a quarterly basis. Class C shares are subject to a CDSC of 1% for shares sold within 12 months from the date of purchase and an annual 12b-1 fee of 1%. The returns in the graph and tables reflect the share class expense structure in effect at the close of the fiscal period. The returns in the graph and the tables do not reflect the deduction of taxes that a shareholder would pay on Fund distributions or following the redemption of Fund shares.
| | |
| Jennison Natural Resources Fund, Inc. | | |
| | | | |
| n MAIL | | n TELEPHONE | | n WEBSITE |
Gateway Center Three
100 Mulberry Street
Newark, NJ 07102 | | (800) 225-1852 | | www.jennisondryden.com |
|
| PROXY VOTING |
| The Board of Directors for the Fund has delegated to the Fund’s investment adviser the responsibility for voting any proxies and maintaining proxy recordkeeping with respect to the Fund. A description of these proxy voting policies and procedures is available without charge, upon request, by calling (800) 225-1852 or by visiting the Securities and Exchange Commission’s (the Commission) website at http://www.sec.gov. Information regarding how the Fund voted proxies relating to portfolio securities during the most recent 12-month period ended June 30, 2004, is available on the Fund’s website at http://www.prudential.com and on the Commission’s website at http://www.sec.gov. |
|
| DIRECTORS |
| Linda W. Bynoe • David E.A. Carson • Robert F. Gunia • Robert E. La Blanc • Douglas H. McCorkindale • Richard A. Redeker • Judy A. Rice • Robin B. Smith • Stephen G. Stoneburn • Clay T. Whitehead |
|
| OFFICERS |
Judy A. Rice, President • Robert F. Gunia, Vice President • Grace C. Torres, Treasurer and Principal Financial and Accounting Officer • Deborah A. Docs, Secretary • Jonathan D. Shain, Assistant Secretary • Maryanne Ryan, Anti-Money Laundering Compliance Officer •
Lee D. Augsburger, Chief Compliance Officer |
| | | | |
| MANAGER | | Prudential Investments LLC | | Gateway Center Three
100 Mulberry Street
Newark, NJ 07102 |
|
| INVESTMENT ADVISER | | Jennison Associates LLC | | 466 Lexington Avenue
New York, NY 10017 |
|
| DISTRIBUTOR | | Prudential Investment
Management Services LLC | | Gateway Center Three
100 Mulberry Street
Newark, NJ 07102 |
|
CUSTODIAN Through June 26, 2005: Effective June 27, 2005: | | State Street Bank
And Trust Company
The Bank of New York | |
One Heritage Drive
North Quincy, MA 02171
One Wall Street
New York, NY 10286 |
|
| TRANSFER AGENT | | Prudential Mutual Fund
Services LLC | | PO Box 8098
Philadelphia, PA 19176 |
|
| INDEPENDENT REGISTERED PUBLIC ACCOUNTING FIRM | | KPMG LLP | | 345 Park Avenue
New York, NY 10154 |
|
| FUND COUNSEL | | Sullivan & Cromwell LLP | | 125 Broad Street
New York, NY 10004 |
| | | | | | | | | | | | |
| Jennison Natural Resources Fund, Inc. | | | | |
| | | Share Class | | A | | B | | C | | Z | | |
| | | NASDAQ | | PGNAX | | PRGNX | | PNRCX | | PNRZX | | |
| | | CUSIP | | 476293105 | | 476293204 | | 476293303 | | 476293402 | | |
| | | | | | | | | | | | | |
|
| An investor should consider the investment objectives, risks, charges, and expenses of the Fund carefully before investing. The prospectus for the Fund contains this and other information about the Fund. An investor may obtain a prospectus by visiting our website at www.jennisondryden.com or by calling (800) 225-1852. The prospectus should be read carefully before investing. |
|
| Prudential Fixed Income is a business unit of Prudential Investment Management, Inc. (PIM). Quantitative Management Associates LLC, Jennison Associates LLC, and PIM are registered investment advisers and Prudential Financial companies. |
|
| E-DELIVERY |
| To receive your mutual fund documents on-line, go to www.icsdelivery.com/prudential/funds and enroll. Instead of receiving printed documents by mail, you will receive notification via e-mail when new materials are available. You can cancel your enrollment or change your e-mail address at any time by clicking on the change/cancel enrollment option at the icsdelivery website address. |
|
| SHAREHOLDER COMMUNICATIONS WITH DIRECTORS |
| Shareholders of the Fund can communicate directly with the Board of Directors by writing to the Chair of the Board, Jennison Natural Resources Fund, Inc., PO Box 13964, Philadelphia, PA 19176. Shareholders can communicate directly with an individual Director by writing to that Director at Jennison Natural Resources Fund, Inc., PO Box 13964, Philadelphia, PA 19176. Such communications to the Board or individual Directors are not screened before being delivered to the addressee. |
|
| AVAILABILITY OF PORTFOLIO SCHEDULE |
| The Fund files its complete schedule of portfolio holdings with the Securities and Exchange Commission (the Commission) for the first and third quarters of each fiscal year on Form N-Q. The Fund’s Forms N-Q are available on the Commission’s website at http://www.sec.gov. The Fund’s Forms N-Q may also be reviewed and copied at the Commission’s Public Reference Room in Washington, D.C. Information on the operation and location of the Public Reference Room may be obtained by calling (800) SEC-0330 (732-0330). The Fund will provide a full list of its portfolio holdings as of the end of each month on its website at www.jennisondryden.com approximately 30 days after the end of each month. |
Mutual Funds:
| | | | |
| ARE NOT INSURED BY THE FDIC OR ANY FEDERAL GOVERNMENT AGENCY | | MAY LOSE VALUE | | ARE NOT A DEPOSIT OF OR GUARANTEED BY ANY BANK OR ANY BANK AFFILIATE |

| | | | | | | | | | | | |
| | | Jennison Natural Resources Fund, Inc. | | | | | | |
| | | Share Class | | A | | B | | C | | Z | | |
| | | NASDAQ | | PGNAX | | PRGNX | | PNRCX | | PNRZX | | |
| | | CUSIP | | 476293105 | | 476293204 | | 476293303 | | 476293402 | | |
| | | | | | | | | | | | | |
MF135E IFS-A106499 Ed. 06/2005
Item 2 – Code of Ethics – – See Exhibit (a)
As of the end of the period covered by this report, the registrant has adopted a code of ethics (the “Section 406 Standards for Investment Companies – Ethical Standards for Principal Executive and Financial Officers”) that applies to the registrant’s Principal Executive Officer and Principal Financial Officer; the registrant’s Principal Financial Officer also serves as the Principal Accounting Officer.
The registrant hereby undertakes to provide any person, without charge, upon request, a copy of the code of ethics. To request a copy of the code of ethics, contact the registrant 973-367-7521, and ask for a copy of the Section 406 Standards for Investment Companies - Ethical Standards for Principal Executive and Financial Officers.
Item 3 – Audit Committee Financial Expert –
The registrant’s Board has determined that Mr. David Carson, member of the Board’s Audit Committee is an “audit committee financial expert,” and that he is “independent,” for purposes of this Item.
Item 4 – Principal Accountant Fees and Services –
For the fiscal years ended May 31, 2005 and May 31, 2004, KPMG LLP (“KPMG”), the Registrant’s principal accountant, billed the Registrant $16,700 and $16,700, respectively, for professional services rendered for the audit of the Registrant’s annual financial statements or services that are normally provided in connection with statutory and regulatory filings.
None.
None.
None.
| (e) | (1) Audit Committee Pre-Approval Policies and Procedures |
THE PRUDENTIAL MUTUAL FUNDS
AUDIT COMMITTEE POLICY
on
Pre-Approval of Services Provided by the Independent Accountants
The Audit Committee of each Prudential Mutual Fund is charged with the responsibility to monitor the independence of the Fund’s independent accountants. As part of this responsibility, the Audit Committee must pre-approve any independent accounting firm’s engagement to render audit and/or permissible non-audit services, as required by law. In evaluating a proposed engagement of the independent accountants, the Audit Committee will assess the effect that the engagement might reasonably be expected to have on the accountant’s independence. The Committee’s evaluation will be based on:
| | • | | a review of the nature of the professional services expected to be provided, |
| | • | | a review of the safeguards put into place by the accounting firm to safeguard independence, and |
| | • | | periodic meetings with the accounting firm. |
Policy for Audit and Non-Audit Services Provided to the Funds
On an annual basis, the scope of audits for each Fund, audit fees and expenses, and audit-related and non-audit services (and fees proposed in respect thereof) proposed to be performed by the Fund’s independent accountants will be presented by the Treasurer and the independent accountants to the Audit Committee for review and, as appropriate, approval prior to the initiation of such services. Such presentation shall be accompanied by confirmation by both the Treasurer and the independent accountants that the proposed services will not adversely affect the independence of the independent accountants. Proposed services shall be described in sufficient detail to enable the Audit Committee to assess the appropriateness of such services and fees, and the compatibility of the provision of such services with the auditor’s independence. The Committee shall receive periodic reports on the progress of the audit and other services which are approved by the Committee or by the Committee Chair pursuant to authority delegated in this Policy.
The categories of services enumerated under “Audit Services”, “Audit-related Services”, and “Tax Services” are intended to provide guidance to the Treasurer and the independent accountants as to those categories of services which the Committee believes are generally consistent with the independence of the independent accountants and which the Committee (or the Committee Chair) would expect upon the presentation of specific proposals to pre-approve. The enumerated categories are not intended as an exclusive list of audit, audit-related or tax services which the Committee (or the Committee Chair) would consider for pre-approval.
Audit Services
The following categories of audit services are considered to be consistent with the role of the Fund’s independent accountants:
| | • | | Annual Fund financial statement audits |
| | • | | Seed audits (related to new product filings, as required) |
| | • | | SEC and regulatory filings and consents |
Audit-related Services
The following categories of audit-related services are considered to be consistent with the role of the Fund’s independent accountants:
| | • | | Accounting consultations |
| | • | | Fund merger support services |
| | • | | Agreed Upon Procedure Reports |
| | • | | Other Internal Control Reports |
Individual audit-related services that fall within one of these categories and are not presented to the Audit Committee as part of the annual pre-approval process will be subject to pre-approval by the Committee Chair (or any other Committee member on whom this responsibility has been delegated) so long as the estimated fee for those services does not exceed $50,000.
Tax Services
The following categories of tax services are considered to be consistent with the role of the Fund’s independent accountants:
| | • | | Tax compliance services related to the filing or amendment of the following: |
| | • | | Federal, state and local income tax compliance; and, |
| | • | | Sales and use tax compliance |
| | • | | Timely RIC qualification reviews |
| | • | | Tax distribution analysis and planning |
| | • | | Tax authority examination services |
| | • | | Tax appeals support services |
| | • | | Accounting methods studies |
| | • | | Fund merger support services |
| | • | | Tax consulting services and related projects |
Individual tax services that fall within one of these categories and are not presented to the Audit Committee as part of the annual pre-approval process will be subject to pre-approval by the Committee Chair (or any other Committee member on whom this responsibility has been delegated) so long as the estimated fee for those services does not exceed $50,000.
Other Non-audit Services
Certain non-audit services that the independent accountants are legally permitted to render will be subject to pre-approval by the Committee or by one or more Committee members to whom the Committee has delegated this authority and who will report to the full Committee any pre-approval decisions made pursuant to this Policy. Non-audit services presented for pre-approval pursuant to this paragraph will be accompanied by a confirmation from both the Treasurer and the independent accountants that the proposed services will not adversely affect the independence of the independent accountants.
Proscribed Services
The Fund’s independent accountants will not render services in the following categories of non-audit services:
| | • | | Bookkeeping or other services related to the accounting records or financial statements of the Fund |
| | • | | Financial information systems design and implementation |
| | • | | Appraisal or valuation services, fairness opinions, or contribution-in-kind reports |
| | • | | Internal audit outsourcing services |
| | • | | Management functions or human resources |
| | • | | Broker or dealer, investment adviser, or investment banking services |
| | • | | Legal services and expert services unrelated to the audit |
| | • | | Any other service that the Public Company Accounting Oversight Board determines, by regulation, is impermissible. |
Pre-approval of Non-Audit Services Provided to Other Entities Within the Prudential Fund Complex
Certain non-audit services provided to Prudential Investments LLC or any of its affiliates that also provide ongoing services to the Prudential Mutual Funds will be subject to pre-approval by the Audit Committee. The only non-audit services provided to these entities that will require pre-approval are those related directly to the operations and financial reporting of the Funds. Individual projects that are not presented to the Audit Committee as part of the annual pre-approval process, will be subject to pre-approval by the Committee Chair (or any other Committee member on whom this responsibility has been delegated) so long as the estimated fee for those services does not exceed $50,000. Services presented for pre-approval pursuant to this paragraph will be accompanied by a confirmation from both the Treasurer and the independent accountants that the proposed services will not adversely affect the independence of the independent accountants.
Although the Audit Committee will not pre-approve all services provided to Prudential Investments LLC and its affiliates, the Committee will receive an annual report from the Fund’s independent accounting firm showing the aggregate fees for all services provided to Prudential Investments and its affiliates.
| (e) | (2) Percentage of services referred to in 4(b)- (4)(d) that were approved by the audit committee – |
Not applicable.
| (f) | Percentage of hours expended attributable to work performed by other than full time employees of principal accountant if greater than 50%. |
Not applicable.
Not applicable to Registrant for the fiscal years 2005 and 2004. The aggregate non-audit fees billed by KPMG for services rendered to the registrant’s investment adviser and any entity controlling, controlled by, or under common control with the investment adviser that provides ongoing services to the registrant for the fiscal year 2005 was $33,500. There were no non-audit fees billed by KPMG for services rendered to the registrant’s investment adviser and any entity controlling, controlled by, or under common control with the investment adviser that provides ongoing services to the registrant for the fiscal year 2004.
| (h) | Principal Accountants Independence |
Not applicable as KPMG has not provided non-audit services to the registrant’s investment adviser and any entity controlling, controlled by, or under common control with the investment adviser that provides ongoing services to the registrant that were not pre-approved pursuant to Rule 2-01(c)(7)(ii) of Regulation S-X.
Item 5 – Audit Committee of Listed Registrants – Not applicable.
Item 6 – Schedule of Investments – The schedule is included as part of the report to shareholders filed under Item 1 of this Form.
Item 7 – Disclosure of Proxy Voting Policies and Procedures for Closed-End Management Investment Companies – Not applicable.
Item 8 – Portfolio Managers of Closed-End Management Investment Companies – Not applicable.
Item 9 – Purchases of Equity Securities by Closed-End Management Investment Company and Affiliated Purchasers – Not applicable.
Item 10 – Submission of Matters to a Vote of Security Holders – Not applicable.
Item 11 – Controls and Procedures
| | (a) | It is the conclusion of the registrant’s principal executive officer and principal financial officer that the effectiveness of the registrant’s current disclosure controls and procedures (such disclosure controls and procedures having been evaluated within 90 days of the date of this filing) provide reasonable assurance that the information required to be disclosed by the registrant has been recorded, processed, summarized and reported within the time period specified in the Commission’s rules and forms and that the information required to be disclosed by the registrant has been accumulated and communicated to the registrant’s principal executive officer and principal financial officer in order to allow timely decisions regarding required disclosure. |
| | (b) | There has been no significant change in the registrant’s internal control over financial reporting that occurred during the registrant’s most recent fiscal half-year if the period covered by this report that has materially affected, or is likely to materially affect, the registrant’s internal control over financial reporting. |
Item 12 – Exhibits
| | (a) | (1) Code of Ethics – Attached hereto as Exhibit EX-99.CODE-ETH |
| | (2) | Certifications pursuant to Section 302 of the Sarbanes-Oxley Act – Attached hereto as Exhibit EX-99.CERT. |
| | (3) | Any written solicitation to purchase securities under Rule 23c-1. – Not applicable. |
| | (b) | Certifications pursuant to Section 906 of the Sarbanes-Oxley Act – Attached hereto as Exhibit EX-99.906CERT. |
SIGNATURES
Pursuant to the requirements of the Securities Exchange Act of 1934 and the Investment Company Act of 1940, the registrant has duly caused this report to be signed on its behalf by the undersigned, thereunto duly authorized.
| | |
| (Registrant) Jennison Natural Resources Fund, Inc. |
| |
| By (Signature and Title)* | | /s/ DEBORAH A. DOCS |
| | | Deborah A. Docs |
| | | Secretary |
Date July 25, 2005
Pursuant to the requirements of the Securities Exchange Act of 1934 and the Investment Company Act of 1940, this report has been signed below by the following persons on behalf of the registrant and in the capacities and on the dates indicated.
| | |
| |
| By (Signature and Title)* | | /s/ JUDY A. RICE |
| | | Judy A. Rice |
| | | President and Principal Executive Officer |
Date July 25, 2005
| | |
| |
| By (Signature and Title)* | | /s/ GRACE C. TORRES |
| | | Grace C. Torres |
| | | Treasurer and Principal Financial Officer |
Date July 25, 2005
| * | Print the name and title of each signing officer under his or her signature. |