UNITED STATES
SECURITIES AND EXCHANGE COMMISSION
Washington, D.C. 20549
FORM N-CSR
CERTIFIED SHAREHOLDER REPORT OF REGISTERED
MANAGEMENT INVESTMENT COMPANIES
| | |
Investment Company Act file number | | 811-05206 |
Jennison Natural Resources Fund, Inc.
|
| (Exact name of registrant as specified in charter) |
| | |
Gateway Center 3, 100 Mulberry Street, Newark, New Jersey | | 07102 |
| (Address of principal executive offices) | | (Zip code) |
Deborah A. Docs
Gateway Center 3,
100 Mulberry Street,
Newark, New Jersey 07102
|
| (Name and address of agent for service) |
Registrant’s telephone number, including area code: 800-225-1852
Date of fiscal year end: 5/31/2008
Date of reporting period: 5/31/2008
Item 1 – Reports to Stockholders


| | |
| MAY 31, 2008 | | ANNUAL REPORT |
Jennison Natural Resources Fund, Inc.
FUND TYPE
Sector stock
OBJECTIVE
Long-term growth of capital
This report is not authorized for distribution to prospective investors unless preceded or accompanied by a current prospectus.
The views expressed in this report and information about the Fund’s portfolio holdings are for the period covered by this report and are subject to change thereafter.
JennisonDryden, Jennison, Prudential Financial and the Rock Prudential logo are registered service marks of The Prudential Insurance Company of America, Newark, NJ, and its affiliates.

July 15, 2008
Dear Shareholder:
We hope you find the annual report for the Jennison Natural Resources Fund informative and useful. As a JennisonDryden mutual fund shareholder, you may be thinking about where you can find additional growth opportunities. You could invest in last year’s top-performing asset class and hope that history repeats itself or you could stay in cash while waiting for the “right moment” to invest.
Instead, we believe it is better to take advantage of developing domestic and global investment opportunities through a diversified portfolio of stock and bond mutual funds. A diversified asset allocation offers two potential advantages. It helps you manage downside risk by not being overly exposed to any particular asset class, plus it gives you a better opportunity to have at least some of your assets in the right place at the right time. Your financial professional can help you create a diversified investment plan that may include mutual funds covering all the basic asset classes and that reflects your personal investor profile and tolerance for risk. Keep in mind that diversification and asset allocation do not assure against loss in declining markets.
JennisonDryden Mutual Funds gives you a wide range of choices that can help you make progress toward your financial goals. Our funds offer the experience, resources, and professional discipline of four leading asset managers. They are recognized and respected in the institutional market and by discerning investors for excellence in their respective strategies. JennisonDryden equity funds are advised by Jennison Associates LLC, Quantitative Management Associates LLC (QMA), or PREI® (Prudential Real Estate Investors). Prudential Investment Management, Inc. (PIM) advises the JennisonDryden fixed income and money market funds. Jennison Associates, QMA, and PIM are registered investment advisers and Prudential Financial companies. PREI is a registered investment adviser and a unit of PIM.
Thank you for choosing JennisonDryden Mutual Funds.
Sincerely,

Judy A. Rice, President
Jennison Natural Resources Fund, Inc.
| | |
| Jennison Natural Resources Fund, Inc. | | 1 |
Your Fund’s Performance
Fund objective
The investment objective of the Jennison Natural Resources Fund, Inc. is long-term growth of capital. There can be no assurance that the Fund will achieve its investment objective.
Performance data quoted represent past performance. Past performance does not guarantee future results. The investment return and principal value of an investment will fluctuate, so that an investor’s shares, when redeemed, may be worth more or less than their original cost. Current performance may be lower or higher than the past performance data quoted. An investor may obtain performance data as of the most recent month-end by visiting our website at www.jennisondryden.com or by calling (800) 225-1852. The maximum initial sales charge is 5.50% (Class A shares). Gross operating expenses: Class A, 1.17%; Class B, 1.87%; Class C, 1.87%; Class R, 1.62%; Class Z, 0.87%. Net operating expenses: Class A, 1.14%; Class B, 1.85%; Class C, 1.85%; Class R, 1.35%; Class Z, 0.85%, after contractual reductions.1
| | | | | | | | | | | |
| Cumulative Total Returns as of 5/31/08 |
| | | One Year | | | Five Years | | | Ten Years | | | Since Inception2 |
Class A | | 38.15 | % | | 391.42 | % | | 820.99 | % | | — |
Class B | | 37.14 | | | 373.44 | | | 754.28 | | | — |
Class C | | 37.14 | | | 373.44 | | | 754.28 | | | — |
Class R | | 37.82 | | | N/A | | | N/A | | | 73.61% (8/22/06) |
Class Z | | 38.53 | | | 397.53 | | | 844.57 | | | — |
Lipper Natural Resources Index3 | | 31.88 | | | 313.49 | | | 388.10 | | | *** |
MSCI World ND Index4 | | –3.68 | | | 94.71 | | | 67.75 | | | **** |
S&P 500 Index5 | | –6.70 | | | 59.36 | | | 50.98 | | | ***** |
Lipper Global Natural Resources Funds Avg.6 | | 30.78 | | | 314.43 | | | 476.45 | | | ****** |
| | |
| 2 | | Visit our website at www.jennisondryden.com |
| | | | | | | | | | | |
| Average Annual Total Returns7 as of 6/30/08 |
| | | One Year | | | Five Years | | | Ten Years | | | Since Inception2 |
Class A | | 35.91 | % | | 37.90 | % | | 25.41 | % | | — |
Class B | | 37.80 | | | 38.37 | | | 25.19 | | | — |
Class C | | 41.80 | | | 38.42 | | | 25.19 | | | — |
Class R | | 43.54 | | | N/A | | | N/A | | | 38.15% (8/22/06) |
Class Z | | 44.25 | | | 39.82 | | | 26.45 | | | — |
Lipper Natural Resources Index3 | | 37.15 | | | 34.68 | | | 18.22 | | | *** |
MSCI World ND Index4 | | –10.68 | | | 11.99 | | | 4.19 | | | **** |
S&P 500 Index5 | | –13.11 | | | 7.58 | | | 2.88 | | | ***** |
Lipper Global Natural Resources Funds Avg.6 | | 30.37 | | | 33.15 | | | 19.53 | | | ****** |
The cumulative total returns do not reflect the deduction of applicable sales charges. If reflected, the applicable sales charges would reduce the cumulative total returns performance quoted. Class A shares are subject to a maximum front-end sales charge of 5.50%. Under certain circumstances, Class A shares may be subject to a contingent deferred sales charge (CDSC) of 1%. Class B and Class C shares are subject to a maximum CDSC of 5% and 1%, respectively. Class R and Class Z shares are not subject to a sales charge.
Source: Prudential Investments LLC and Lipper Inc. Performance figures may reflect fee waivers and/or expense reimbursements. In the absence of such fee waivers and/or expense reimbursements, total returns would be lower.
1For the period through September 30, 2007, the distributor of the Fund has contractually agreed to limit distribution and (12b-1) fees to 0.25% of the average daily net assets for Class A shares. However, effective October 1, 2007 such waiver has been terminated. Class R shares distribution and (12b-1) fees will continue to be limited to 0.50% of the average daily net assets to September 30, 2009. Through September 30, 2008 the manager of the Fund has contractually agreed to waive 0.05% of the management fee rate on average daily net assets over $2 billion. Effective October 1, 2008 through September 30, 2009, the manager of the Fund has contractually agreed to waive 0.05% of the management fee rate on average daily net assets over $4 billion.
2Inception date returns are provided for any share class with less than 10 calendar years of returns.
3The Lipper Natural Resources Index is an unmanaged index which tracks the performance of the 30 largest natural resources mutual funds.
4The Morgan Stanley Capital International (MSCI) World Net Dividends (ND) Index is a free float-adjusted, market-capitalization index that is designed to measure global developed market equity performance. The MSCI World ND Index consists of approximately 23 developed market indexes in Australia, Canada, Europe, the Far East, New Zealand, and the United States.
5The Standard & Poor’s 500 Composite Stock Price Index (S&P 500 Index) is an unmanaged index of 500 stocks of large U.S. public companies. It gives a broad look at how stock prices have performed in the United States.
6The Lipper Global Natural Resources Funds Average (Lipper Average) is based on the average return of all mutual funds in the Lipper Natural Resources Fund category and does not include the effect of any sales charges or taxes payable by investors.
7The average annual total returns take into account applicable sales charges. Class A, Class B, Class C, and Class R shares are subject to an annual distribution and service (12b-1) fee of up to 0.30%, 1.00%, 1.00%, and 0.75%, respectively. Approximately seven years after purchase, Class B shares will automatically convert to Class A
| | |
| Jennison Natural Resources Fund, Inc. | | 3 |
Your Fund’s Performance (continued)
shares on a quarterly basis. Class Z shares are not subject to a 12b-1 fee. The returns in the tables do not reflect the deduction of taxes that a shareholder would pay on Fund distributions or following the redemption of Fund shares.
***Lipper Natural Resources Index Closest Month-End to Inception cumulative total return as of 5/31/08 is 67.04% for Class R. Lipper Natural Resources Index Closest Month-End to Inception average annual total return as of 6/30/08 is 35.89% for Class R.
****MSCI World ND Index Closest Month-End to Inception cumulative total return as of 5/31/08 is 16.20% for Class R. MSCI World ND Index Closest Month-End to Inception average annual total return as of 6/30/08 is 3.72% for Class R.
*****S&P 500 Index Closest Month-End to Inception cumulative total return as of 5/31/08 is 11.06% for Class R. S&P 500 Index Closest Month-End to Inception average annual total return as of 6/30/08 is 0.93% for Class R.
******Lipper Average Closest Month-End to Inception cumulative total return as of 5/31/08 is 66.10% for Class R. Lipper Average Closest Month-End to Inception average annual total return as of 6/30/08 is 33.54% for Class R.
Investors cannot invest directly in an index. The returns for the MSCI World ND Index and S&P 500 Index would be lower if they included the effects of sales charges, operating expenses of a mutual fund, or taxes that may be paid by an investor. Returns for the Lipper Index reflect the deduction of operating expenses, but not sales charges or taxes. Returns for the Lipper Index would be lower if it included the effects of sales charges or taxes.
| | | |
| Five Largest Holdings expressed as a percentage of net assets as of 5/31/08 | | | |
Southwestern Energy Co., Oil & Gas Exploration & Production | | 2.5 | % |
Freeport-McMoRan Copper & Gold, Inc., Diversified Metals & Mining | | 2.5 | |
MMX Mineracao E Metalicos SA, Steel | | 2.5 | |
Suncor Energy, Inc., Integrated Oil & Gas | | 2.2 | |
Tenaris SA, Oil & Gas Equipment & Services | | 2.1 | |
Holdings reflect only long-term investments and are subject to change.
| | | |
| Five Largest Industries expressed as a percentage of net assets as of 5/31/08 | | | |
Oil & Gas Exploration & Production | | 27.7 | % |
Oil & Gas Equipment & Services | | 14.2 | |
Integrated Oil & Gas | | 10.7 | |
Gold | | 9.7 | |
Diversified Metals & Mining | | 8.7 | |
Industry weightings reflect only long-term investments and are subject to change.
| | |
| 4 | | Visit our website at www.jennisondryden.com |
Strategy and Performance Overview
How did the Fund perform?
The Jennison Natural Resources Fund’s Class A shares returned 38.15% for the year ended May 31, 2008. This return solidly outperformed the 31.88% advance of the benchmark Lipper Natural Resources Index (the Index), and the 6.70% decline of the style neutral S&P 500 Index. It also exceeded the 30.78% gain of the Lipper Global Natural Resources Funds Average.
What is distinct about the Fund’s investment strategy?
Jennison’s Natural Resources strategy seeks capital appreciation by investing in the stocks of companies that own, explore, mine, process, or otherwise develop natural resource commodities. The manager believes that the investment opportunities of natural resources include, but are not limited to: oil and natural gas exploration and production companies, oilfield service equipment manufacturers, contract drillers (onshore and offshore), seismic equipment manufacturers and producers. Also included are the following types of energy companies: integrated oil and gas producers, independent refiners, and pipeline operators. On the metals side, investment opportunities include miners of gold, silver, copper, iron ore, zinc, nickel, and aluminum, as well as coal and steel producers, ethanol, sugar, agricultural producers and marketers, and electric power generators and marketers.
The strategy is managed using a contrarian/value investment style that combines a top-down analysis of the relevant commodities’ supply/demand fundamentals with bottom-up stock selection. Jennison’s proprietary fundamental research drives this process and is critical to successful stock selection. The management team initially examines the relative strengths of commodity groups, attempting to determine if a commodity has favorable supply/demand characteristics. The team then seeks to identify stocks from energy/mining sub-sectors with attractive attributes such as: valuations versus peers, organic reserves and production growth, and competitive unit cost structures. The team is especially interested in companies with the ability to show increasing proven and probable reserves and strong organic production growth from natural resource reserve bases whose potential may currently be underappreciated by the marketplace.
What was the market environment like during the fiscal year?
A volatile investment environment characterized the Fund’s fiscal year. Financial markets continued to experience the effects of the ongoing credit crisis, which was originally triggered by the securitization of subprime mortgage loans. During the fourth quarter of the fiscal year, more financial institutions reported considerable write-offs, resulting in substantial losses, management changes, and new strategies for raising capital. Subsequently, the equity markets weakened over the past twelve
| | |
| Jennison Natural Resources Fund, Inc. | | 5 |
Strategy and Performance Overview (continued)
months, with many broad market indexes showing declines. The S&P 500 Index posted a loss of 6.70% for the reporting period. While the energy and materials sectors struggled with volatility, they handily outperformed broad equity market returns, achieving strong gains of 24% and 13%, respectively.
Disruptions in supply and demand balances have sent commodity prices for food, energy, and metals to new cycle highs, fueling inflationary concerns. Crude oil prices continued to soar during the first five months of 2008, hitting highs in late May of $135 per barrel. Higher oil prices bolstered the stock prices of many energy companies.
The U.S. dollar continued its downward trend. But in the precious metals sector, the declining dollar proved to be a positive catalyst for gold prices due to high investment demand for the metal, in conjunction with concerns that the U.S. economy was likely to enter into a recession. After briefly reaching an intraday high of $1,000 per ounce in March, gold prices moderated toward the end of the fiscal period. Nevertheless, the manager of the Fund believes that long-term demand for gold will most likely continue to outstrip supply. Prices of metals used in construction and industry such as copper, iron ore, and aluminum rose, spurred by strong global demand. Geopolitical risk also led to increased prices for energy and precious metals.
What added to or detracted from the Fund’s performance?
As global supply and demand imbalances intensify, available supplies remain tight, as do supplies of precious and industrial metals. Accordingly, the Fund’s holdings in metals and mining companies significantly drove the Fund’s strong performance. Three of the top five contributors to the Fund’s return were in these industries. The manager maintains the position that the emerging economies, especially China, will continue to push demand and prices higher in these key sectors. Since many of the easily exploited sources have long been tapped, the Fund’s investment focus is on producers with the largest and most productive reserves.
Companies that made the most significant contribution to the Fund’s performance include MMX Mineracao E Metalicos, Cleveland-Cliffs Inc., and Freeport-McMoRan Copper and Gold. Please refer to the Comments on Largest Holdings section for MMX and Freeport.
Shares of Cleveland-Cliffs appreciated around 143% during the period as demand for iron-ore and metallurgical coal increased. Cleveland-Cliffs is North America’s largest producer of iron ore pellets, the main raw material in steelmaking, with a 28% market share. Ongoing demand and the company’s market strength reinforce the manager’s confidence in this established supplier.
| | |
| 6 | | Visit our website at www.jennisondryden.com |
One company in this area that detracted from performance was the Canadian gold miner Crystallex International Corp. Shares fell approximately 80% during the reporting period. This decline was largely due to the Venezuelan government’s denial of the company’s permit to continue exploration at the Las Cristinas gold deposit, which contains probable reserves of 14 million ounces. Crystallex has responded to the Venezuelan Environmental Ministry’s Director General asking for clarification. The manager will continue to carefully monitor future developments.
Oil and gas producers also bolstered the Fund’s returns. The price for oil has remained historically high, since the most accessible production areas have been largely exhausted, making it costlier to both develop new production and to extend the capacity of existing reserves. While the manager continues to view the long-term supply and demand imbalances for oil as secular, or long-term, caution is suggested since corrections are likely, as investors focus on near-term economic data regarding supply and demand. The manager believes the costs of incremental production in the face of robust demand will keep prices high, and that volatility tends to increase when supply is limited.
The most significant contributors to performance in this area were Petroleo Brasilerio S/A (Petrobras), Southwestern Energy, Hess Corp., Range Resources, and Suncor Energy. Please refer to the Comments on Largest Holdings section for Southwestern and Suncor.
Brazilian oil and gas company Petrobras saw its stock price increase around 166% during the period, primarily due to the announcement that its Tupi Sul discovery in the Santos Basin may hold five to eight billion barrels of crude oil and natural gas reserves. The manager believes that the Tupi field and further exploration of the Santos Basin could provide additional upside to the stock price. Global integrated energy company Hess Corp. also benefited from this announcement. Hess’ block, not far from Tupi, is thought to be part of the same geological structure.
Range Resources is a company engaged in the exploration, development and acquisition of oil and gas properties, primarily in the southwestern, Appalachian and Gulf Coast regions of the United States. During the Fund’s fiscal year, the company announced initial success at its Marcellus Shale field in Appalachia, and increased its holdings in the Barnett Shale field of North Texas. The manager also likes Range Resources because it has a multi-year inventory of drilling opportunities, a well-balanced portfolio of assets, and a lower cost of operations.
| | |
| Jennison Natural Resources Fund, Inc. | | 7 |
Strategy and Performance Overview (continued)
Within the energy sector, there were a few detractors. The most notable was Cheniere Energy, which develops, constructs, owns, and operates liquefied natural gas (LNG) receiving terminals and natural gas pipelines. Cheniere’s stock price dropped due to concerns about the availability of liquefied natural gas for the U.S. market and the effect it may have on the company’s ability to generate free cash flow (operating cash flow minus capital expenditures). The manager finds it encouraging that Cheniere has opened the Sabine Pass LNG terminal in Louisiana.
Did anything else materially affect the Fund’s performance?
The Fund continued to limit exposure to the major integrated oil and gas producers most exposed to declining production and difficult reserve growth. Instead, the Fund sought exploration and production companies that are growing production and reserves by successfully exploiting unconventional sources of oil or gas, and offering leverage to historically high oil and/or natural gas prices.
As a result of its bottom-up stock selection approach to portfolio construction based on extensive fundamental research, the Fund took profits in some stocks during the reporting period and used the proceeds to either add to existing positions or to purchase new ones.
An example of a successful reduction in holdings was in oilfield services equipment provider National Oil Well Varco. At one point it was the Fund’s second largest holding, but after the stock’s significant price appreciation the manager decided to cut back the position and take profits. The manager still believes the company is exposed to solid long-term trends as evidenced by the growth in its backlog of business. Since the reduction, the Fund has been adding shares back to its position.
Shares of Gammon Gold declined. The company suffered from production and cost issues during the second quarter, due to low gold recovery and output. Senior management hires were cited as an effort to strengthen the team. Although the manager remains positive on long-term gold fundamentals and believes the new management team will eventually recover some value, the Fund exited the position rather than waiting for a turnaround.
| | |
| 8 | | Visit our website at www.jennisondryden.com |
Comments on Largest Holdings
Holdings expressed as a percentage of the Fund’s net assets as of 5/31/08.
| 2.5% | Southwestern Energy Co., Oil & Gas Exploration & Production |
Southwestern Energy Company is a U.S. producer of natural gas. The company’s share price gained more than 80% during the Fund’s fiscal year. The manager believes that Southwestern’s strong, low-cost growth should continue over the next several years, as it efficiently develops its Fayetteville Shale field in Arkansas.
| 2.5% | Freeport-McMoRan Copper & Gold, Inc., Diversified Metals & Mining |
Arizona-based Freeport-McMoRan focuses on copper, gold, and molybdenum mining. The company’s stock price posted a gain of almost 50% during the period on strong copper and gold prices. While the U.S. demand for copper has slowed, global demand for copper has remained high, especially in China. In addition supply disruptions from Chile, the world’s largest copper-producing nation, have helped keep the copper market tight. The manager believes the company’s asset quality and pipeline of development projects should allow it to sustain growth and generate free cash flow (operating cash flow minus capital expenditures) even at lower commodity prices.
| 2.5% | MMX Mineracao E Metalicos SA, Steel |
MMX Mineracao e Metalicos SA is a Brazilian iron ore miner. Its shares rose approximately 143% during the reporting period. The company owns iron ore mines and processing plants that produce goods like pig iron, hot briquetted iron (HBI) and steel. The company also negotiated a deal to sell one of its iron ore projects to Anglo-American at a substantial valuation. The manager believes Mineracao will continue to meet the need for high-quality mineral products through its low production costs and its strong management.
| 2.2% | Suncor Energy, Inc., Integrated Oil & Gas |
Suncor Energy is primarily engaged in the production of oil from their large reserve position in the Canadian Athabasca tar sands. The Fund originally purchased shares of Suncor in April 2003, because Suncor’s huge proven reserve base should allow it to increase reserves and production while constraining the rise in per-barrel operating costs. Suncor’s shares appreciated around 57% during the reporting period because of tightening oil supply and rising demand. Suncor’s operational strengths also contributed to its outperformance.
| 2.1% | Tenaris SA, Oil & Gas Equipment & Services |
Tenaris S.A. manufactures and supplies tubular products and services that are used in the drilling, completion, and production of oil and gas products. It is the largest supplier of high-quality oil tubular goods, and has an exposure to many long-term projects. The manager does not believe any short-term drop in commodity prices will significantly affect Tenaris’ earnings. Also, the manager believes that the continued expansion of offshore drilling should drive future growth for this company.
| | |
| Jennison Natural Resources Fund, Inc. | | 9 |
Fees and Expenses (Unaudited)
As a shareholder of the Fund, you incur two types of costs: (1) transaction costs, including sales charges (loads) on purchase payments and redemptions, as applicable, and (2) ongoing costs, including management fees, distribution and/or service (12b-1) fees, and other Fund expenses, as applicable. This example is intended to help you understand your ongoing costs (in dollars) of investing in the Fund and to compare these costs with the ongoing costs of investing in other mutual funds.
The example is based on an investment of $1,000 invested on December 1, 2007, at the beginning of the period, and held through the six-month period ended May 31, 2008. The example is for illustrative purposes only; you should consult the Prospectus for information on initial and subsequent minimum investment requirements.
The Fund’s transfer agent may charge additional fees to holders of certain accounts that are not included in the expenses shown in the table on the following page. These fees apply to individual retirement accounts (IRAs) and Section 403(b) accounts. As of the close of the six-month period covered by the table, IRA fees included an annual maintenance fee of $15 per account (subject to a maximum annual maintenance fee of $25 for all accounts held by the same shareholder). Section 403(b) accounts are charged an annual $25 fiduciary maintenance fee. Some of the fees may vary in amount, or may be waived, based on your total account balance or the number of JennisonDryden funds, including the Fund, that you own. You should consider the additional fees that were charged to your Fund account over the six-month period when you estimate the total ongoing expenses paid over the period and the impact of these fees on your ending account value, as these additional expenses are not reflected in the information provided in the expense table. Additional fees have the effect of reducing investment returns.
Actual Expenses
The first line for each share class in the table on the following page provides information about actual account values and actual expenses. You may use the information on this line, together with the amount you invested, to estimate the expenses that you paid over the period. Simply divide your account value by $1,000 (for example, an $8,600 account value ÷ $1,000 = 8.6), then multiply the result by the number on the first line under the heading “Expenses Paid During the Six-Month Period” to estimate the expenses you paid on your account during this period.
Hypothetical Example for Comparison Purposes
The second line for each share class in the table on the following page provides information about hypothetical account values and hypothetical expenses based on
| | |
| 10 | | Visit our website at www.jennisondryden.com |
the Fund’s actual expense ratio and an assumed rate of return of 5% per year before expenses, which is not the Fund’s actual return. The hypothetical account values and expenses may not be used to estimate the actual ending account balance or expenses you paid for the period. You may use this information to compare the ongoing costs of investing in the Fund and other funds. To do so, compare this 5% hypothetical example with the 5% hypothetical examples that appear in the shareholder reports of the other funds.
Please note that the expenses shown in the table are meant to highlight your ongoing costs only and do not reflect any transactional costs such as sales charges (loads). Therefore, the second line for each share class in the table is useful in comparing ongoing costs only and will not help you determine the relative total costs of owning different funds. In addition, if these transactional costs were included, your costs would have been higher.
| | | | | | | | | | | | | | |
Jennison Natural Resources Fund, Inc. | | Beginning Account
Value
December 1, 2007 | | Ending Account
Value
May 31, 2008 | | Annualized
Expense Ratio
Based on the
Six-Month Period | | | Expenses Paid
During the
Six-Month Period* |
| | | | | | | | | | | | | | |
| Class A | | Actual | | $ | 1,000.00 | | $ | 1,205.90 | | 1.16 | % | | $ | 6.40 |
| | | Hypothetical | | $ | 1,000.00 | | $ | 1,019.20 | | 1.16 | % | | $ | 5.86 |
| | | | | | | | | | | | | | |
| Class B | | Actual | | $ | 1,000.00 | | $ | 1,201.60 | | 1.86 | % | | $ | 10.24 |
| | | Hypothetical | | $ | 1,000.00 | | $ | 1,015.70 | | 1.86 | % | | $ | 9.37 |
| | | | | | | | | | | | | | |
| Class C | | Actual | | $ | 1,000.00 | | $ | 1,201.60 | | 1.86 | % | | $ | 10.24 |
| | | Hypothetical | | $ | 1,000.00 | | $ | 1,015.70 | | 1.86 | % | | $ | 9.37 |
| | | | | | | | | | | | | | |
| Class R | | Actual | | $ | 1,000.00 | | $ | 1,204.30 | | 1.36 | % | | $ | 7.49 |
| | | Hypothetical | | $ | 1,000.00 | | $ | 1,018.20 | | 1.36 | % | | $ | 6.86 |
| | | | | | | | | | | | | | |
| Class Z | | Actual | | $ | 1,000.00 | | $ | 1,207.70 | | 0.86 | % | | $ | 4.75 |
| | | Hypothetical | | $ | 1,000.00 | | $ | 1,020.70 | | 0.86 | % | | $ | 4.34 |
| | | | | | | | | | | | | | |
* Fund expenses (net of fee waivers or subsidies, if any) for each share class are equal to the annualized expense ratio for each share class (provided in the table), multiplied by the average account value over the period, multiplied by the 183 days in the six-month period ended May 31, 2008, and divided by the 366 days in the Fund’s fiscal year ended May 31, 2008 (to reflect the six-month period). Expenses presented in the table include the expenses of any underlying portfolios in which the Fund may invest.
| | |
| Jennison Natural Resources Fund, Inc. | | 11 |
Portfolio of Investments
as of May 31, 2008
| | | | | |
| Shares | | Description | | Value (Note 1) |
| | | | | |
LONG-TERM INVESTMENTS 94.6% | | | |
COMMON STOCKS 93.2% | | | |
| |
Agricultural Products 0.1% | | | |
| 2,346,200 | | Agrenco Ltd. 144A (Brazil)(a)(f)(h) | | $ | 6,332,504 |
| |
Aluminum 1.3% | | | |
| 733,900 | | Century Aluminum Co.(a)(b) | | | 53,574,700 |
| |
Coal & Consumable Fuels 2.6% | | | |
| 1,044,600 | | Cameco Corp. (Canada) | | | 42,557,778 |
| 678,200 | | CONSOL Energy, Inc. | | | 66,165,192 |
| | | | | |
| | | | | 108,722,970 |
| |
Diversified Metals & Mining 8.7% | | | |
| 1,236,900 | | African Rainbow Minerals Ltd. (South Africa) | | | 48,679,494 |
| 1,508,300 | | Cia Vale Do Rio Doce (Brazil)(ADR)(b) | | | 60,000,174 |
| 583,900 | | First Quantum Minerals Ltd. (Canada) | | | 45,861,067 |
| 1,267,700 | | First Uranium Corp. (South Africa)(a) | | | 8,216,574 |
| 600,000 | | First Uranium Corp. 144A (South Africa)(a)(f)(h) | | | 3,888,889 |
| 698,900 | | FNX Mining Co., Inc. (Canada)(a) | | | 16,424,431 |
| 14,200 | | FNX Mining Co., Inc. 144A (Canada)(a)(f)(h) | | | 333,706 |
| 924,499 | | Freeport-McMoRan Copper & Gold, Inc. (Class B)(b) | | | 106,973,779 |
| 1,398,700 | | Northern Dynasty Minerals Ltd.(a)(b) | | | 13,707,260 |
| 178,000 | | Southern Copper Corp.(b) | | | 19,620,940 |
| 2,053,900 | | Sterlite Industries India Ltd. (India)(ADR)(a) | | | 45,473,346 |
| | | | | |
| | | | | 369,179,660 |
| |
Gas Utilities 1.1% | | | |
| 676,800 | | Equitable Resources, Inc. | | | 47,531,664 |
| |
Gold 9.7% | | | |
| 731,800 | | Agnico-Eagle Mines Ltd.(b) | | | 51,730,942 |
| 8,000,000 | | Archipelago Resources PLC (United Kingdom)(a) | | | 3,961,808 |
| 6,303,400 | | AXMIN, Inc. (Canada)(a) | | | 3,108,561 |
| 885,046 | | Barrick Gold Corp. | | | 35,658,503 |
| 982,800 | | Centerra Gold, Inc. (Canada)(a) | | | 8,753,804 |
| 3,653,600 | | Crystallex International Corp.(a)(b) | | | 2,959,416 |
| 1,807,300 | | Crystallex International Corp. (Canada)(a) | | | 1,455,153 |
| 4,306,800 | | Eldorado Gold Corp. (Canada)(a) | | | 34,893,056 |
| 4,519,100 | | European Goldfields Ltd. (Canada)(a) | | | 22,741,043 |
| 2,837,400 | | Gabriel Resources Ltd. (Canada)(a) | | | 8,538,472 |
| 216,800 | | Gold Reserve, Inc.(a) | | | 436,393 |
See Notes to Financial Statements.
| | |
| Jennison Natural Resources Fund, Inc. | | 13 |
Portfolio of Investments
as of May 31, 2008 continued
| | | | | |
| Shares | | Description | | Value (Note 1) |
| | | | | |
COMMON STOCKS (Continued) | | | |
| |
Gold (cont’d.) | | | |
| 993,800 | | Gold Reserve, Inc.(a)(b) | | $ | 2,007,476 |
| 1,325,336 | | Goldcorp, Inc. | | | 53,198,987 |
| 792,400 | | Highland Gold Mining Ltd. (United Kingdom)(a) | | | 2,754,768 |
| 2,480,800 | | Kinross Gold Corp. | | | 49,541,576 |
| 1,092,300 | | Lihir Gold Ltd. (Papua New Guinea)(ADR)(a)(b) | | | 31,447,317 |
| 3,817,384 | | Lihir Gold Ltd. 144A (Papua New Guinea)(a)(h) | | | 10,873,035 |
| 1,734,700 | | Nevsun Resources Ltd. (Canada)(a) | | | 3,299,701 |
| 1,031,927 | | Newcrest Mining Ltd. (Australia) | | | 31,404,416 |
| 439,890 | | Newcrest Mining Ltd. 144A (Australia)(h) | | | 13,387,079 |
| 474,800 | | Newmont Mining Corp.(b) | | | 22,567,244 |
| 2,250,600 | | Orezone Resources, Inc. (Canada)(a) | | | 3,374,994 |
| 176,300 | | Seabridge Gold, Inc.(a)(b) | | | 4,084,871 |
| 3,312,300 | | Semafo, Inc. (Canada)(a) | | | 4,567,080 |
| 4,783,700 | | Semafo, Inc. 144A (Canada)(a)(f)(h) | | | 6,595,883 |
| | | | | |
| | | | | 413,341,578 |
| |
Independent Power Producers & Energy Traders 0.8% | | | |
| 834,000 | | NRG Energy, Inc.(a)(b) | | | 34,686,060 |
| |
Integrated Oil & Gas 10.7% | | | |
| 466,100 | | Hess Corp.(b) | | | 57,241,741 |
| 661,900 | | Murphy Oil Corp. | | | 61,325,035 |
| 849,200 | | OAO Gazprom (Russia)(ADR) | | | 51,291,680 |
| 677,300 | | Occidental Petroleum Corp. | | | 62,264,189 |
| 998,400 | | Petroleo Brasileiro SA (Brazil)(ADR)(b) | | | 70,387,200 |
| 904,900 | | Sasol Ltd. (South Africa)(ADR)(b) | | | 56,918,210 |
| 1,387,800 | | Suncor Energy, Inc.(b) | | | 94,856,130 |
| | | | | |
| | | | | 454,284,185 |
| |
Oil & Gas Drilling 3.6% | | | |
| 328,900 | | Nabors Industries Ltd.(a)(b) | | | 13,826,956 |
| 835,300 | | Noble Corp.(b) | | | 52,740,842 |
| 442,256 | | Transocean, Inc.(b) | | | 66,422,429 |
| 2,488,400 | | Vantage Energy Services, Inc.(a) | | | 20,653,720 |
| | | | | |
| | | | | 153,643,947 |
| |
Oil & Gas Equipment & Services 14.2% | | | |
| 1,253,100 | | Cameron International Corp.(a)(b) | | | 66,702,513 |
| 554,400 | | Exterran Holdings Inc.(a)(b) | | | 40,759,488 |
| 424,200 | | FMC Technologies, Inc.(a)(b) | | | 30,478,770 |
See Notes to Financial Statements.
| | |
| 14 | | Visit our website at www.jennisondryden.com |
| | | | | |
| Shares | | Description | | Value (Note 1) |
| | | | | |
COMMON STOCKS (Continued) | | | |
| |
Oil & Gas Equipment & Services (cont’d.) | | | |
| 1,339,700 | | Halliburton Co. | | $ | 65,082,626 |
| 2,660,250 | | Integra Group Holdings (Russia) (GDR)(a) | | | 36,578,438 |
| 611,100 | | National Oilwell Varco, Inc.(a) | | | 50,916,852 |
| 1,360,500 | | Petroleum Geo-Services ASA (Norway)(ADR)(b) | | | 40,338,825 |
| 618,000 | | Schlumberger Ltd. | | | 62,498,340 |
| 217,600 | | SEACOR Holdings, Inc.(a)(b) | | | 19,362,048 |
| 502,600 | | Smith International, Inc.(b) | | | 39,665,192 |
| 722,700 | | Superior Energy Services, Inc.(a)(b) | | | 38,801,763 |
| 1,479,900 | | Tenaris SA (Luxembourg)(ADR)(b) | | | 90,717,870 |
| 253,200 | | W-H Energy Services, Inc.(a)(b) | | | 21,656,196 |
| | | | | |
| | | | | 603,558,921 |
| |
Oil & Gas Exploration & Production 26.3% | | | |
| 662,500 | | Anadarko Petroleum Corp.(b) | | | 49,667,625 |
| 708,500 | | Bill Barrett Corp.(a)(b) | | | 38,138,555 |
| 3,600,000 | | BPI Energy Holdings, Inc.(a) | | | 1,044,000 |
| 874,100 | | Cabot Oil & Gas Corp. | | | 52,664,525 |
| 825,000 | | Cairn Energy PLC (United Kingdom)(a) | | | 55,008,716 |
| 588,600 | | CNX Gas Corp.(a)(b) | | | 24,479,874 |
| 939,800 | | Concho Resources, Inc.(a) | | | 29,979,620 |
| 1,778,700 | | Denbury Resources, Inc.(a) | | | 60,529,161 |
| 550,600 | | Devon Energy Corp. | | | 63,836,564 |
| 698,600 | | Newfield Exploration Co.(a) | | | 44,179,464 |
| 672,600 | | Nexen, Inc. | | | 25,874,922 |
| —(i) | | OGX Petroleo e Gas Participacoes SA (Brazil) (Private)
(cost $9; purchased 12/11/07)(a)(f)(g) | | | 9 |
| 4,067,412 | | Oil Search Ltd. (Papua New Guinea) | | | 23,870,154 |
| 2,317,636 | | OPTI Canada, Inc. (Canada)(a) | | | 52,482,699 |
| 1,205,300 | | Petrohawk Energy Corp.(a)(b) | | | 35,411,714 |
| 694,600 | | Pioneer Natural Resources Co. | | | 49,865,334 |
| 1,063,000 | | Quicksilver Resources, Inc.(a)(b) | | | 38,725,090 |
| 1,045,750 | | Range Resources Corp. | | | 68,768,520 |
| 553,800 | | SandRidge Energy, Inc.(a) | | | 30,459,000 |
| 2,431,400 | | Southwestern Energy Co.(a) | | | 107,808,276 |
| 2,674,700 | | Talisman Energy, Inc. | | | 62,213,522 |
| 551,694 | | Trident Resources Corp. (Canada) (Private)
(cost $17,670,540; purchased 12/4/03 - 1/5/06)(a)(f)(g) | | | 5,552,476 |
| 708,600 | | Ultra Petroleum Corp.(a)(b) | | | 61,626,942 |
| 4,810,000 | | UTS Energy Corp. (Canada)(a) | | | 27,109,501 |
See Notes to Financial Statements.
| | |
| Jennison Natural Resources Fund, Inc. | | 15 |
Portfolio of Investments
as of May 31, 2008 continued
| | | | | |
| Shares | | Description | | Value (Note 1) |
| | | | | |
COMMON STOCKS (Continued) | | | |
| |
Oil & Gas Exploration & Production (cont’d.) | | | |
| 1,010,797 | | Woodside Petroleum Ltd. (Australia) | | $ | 62,798,024 |
| 736,050 | | XTO Energy, Inc. | | | 46,827,501 |
| | | | | |
| | | | | 1,118,921,788 |
| |
Oil & Gas Refining & Marketing 1.9% | | | |
| 304,100 | | Reliance Industries Ltd. 144A (India)(GDR)(f)(h) | | | 34,431,966 |
| 887,200 | | Valero Energy Corp. | | | 45,105,248 |
| | | | | |
| | | | | 79,537,214 |
| |
Oil & Gas Storage & Transportation 1.6% | | | |
| 1,699,100 | | Cheniere Energy, Inc.(a)(b) | | | 8,325,590 |
| 1,615,800 | | Williams Cos., Inc. | | | 61,465,032 |
| | | | | |
| | | | | 69,790,622 |
| |
Packaged Foods 0.8% | | | |
| 2,719,400 | | Cosan Ltd. (Class A)(a)(b) | | | 32,034,532 |
| |
Precious Metals & Minerals 4.6% | | | |
| 673,200 | | Apex Silver Mines Ltd.(a)(b) | | | 4,577,760 |
| 768,500 | | Cia de Minas Buenaventura SA (Peru)(ADR) | | | 50,567,300 |
| 2,766,300 | | Coeur d’Alene Mines Corp.(a)(b) | | | 8,658,519 |
| 1,371,100 | | Greystar Resources Ltd. (Canada)(a) | | | 6,651,270 |
| 1,551,800 | | Hecla Mining Co.(a)(b) | | | 13,997,236 |
| 245,600 | | Impala Platnum Holdings Ltd. (South Africa) | | | 10,490,187 |
| 950,400 | | Impala Platinum Holdings Ltd. (South Africa)(ADR) | | | 39,916,800 |
| 953,800 | | Pan American Silver Corp.(a) | | | 31,618,470 |
| 95,067 | | Pan American Silver Corp. (Canada)(a) | | | 3,150,721 |
| 523,100 | | Platmin Ltd. 144A (South Africa)(a)(f)(h) | | | 3,853,756 |
| 1,445,300 | | Silver Wheaton Corp.(a)(b) | | | 20,956,850 |
| | | | | |
| | | | | 194,438,869 |
| |
Steel 5.2% | | | |
| 729,800 | | Cleveland-Cliffs, Inc.(b) | | | 77,869,660 |
| 3,134,000 | | MMX Mineracao E Metalicos SA (Brazil)(a) | | | 105,918,217 |
| 469,900 | | Nucor Corp. | | | 35,148,520 |
| | | | | |
| | | | | 218,936,397 |
| | | | | |
| | Total common stocks
(cost $2,307,468,576) | | | 3,958,515,611 |
| | | | | |
See Notes to Financial Statements.
| | |
| 16 | | Visit our website at www.jennisondryden.com |
| | | | | | |
Principal
Amount (000) | | Description | | Value (Note 1) | |
| | | | | | |
CORPORATE BOND 0.7% | | | | |
| |
Oil & Gas Exploration & Production | | | | |
| | Trident Subordinated Unsecured Note (Canada) (Private)
9.89%, due 8/12/12 | | | | |
| CAD 29,000 | | (cost $27,641,921; purchased 8/20/07 - 5/27/08)(f)(g) | | $ | 27,910,933 | |
| | |
| Units | | | | | |
WARRANTS(a) | | | | |
| | |
Gold | | | | | | |
| | Crystallex International Corp. (Canada) (Private) expiring 8/11/09 | | | | |
| 903,650 | | (cost $0; purchased 2/8/08)(f)(g) | | | 27,775 | |
| |
Oil & Gas Exploration & Production | | | | |
| | Trident Resources Corp. (Canada) (Private) expiring 1/1/15 | | | | |
| 2,628,029 | | (cost $0; purchased 8/20/07)(f)(g) | | | 264 | |
| | | | | | |
| | Total warrants
(cost $0) | | | 28,039 | |
| | | | | | |
| | |
| Shares | | | | | |
PREFERRED STOCKS & WARRANTS 0.7% | | | | |
| |
Oil & Gas Exploration & Production | | | | |
| | OGX Petroleo e Gas Participacoes SA (Brazil) (Class A) (Private) | | | | |
| 201,488 | | (cost $25,126,364; purchased 12/17/07)(a)(f)(g) | | | 28,053,782 | |
| | Trident Resources Corp. (Canada) (Class B) (Private)
7.00% expiring 3/10/13 @ $12.50 | | | | |
| 80,000 | | (cost $5,000,000; purchased 7/7/06)(a)(f)(g) | | | 1,000,000 | |
| | | | | | |
| | Total preferred stocks & warrants
(cost $30,126,364) | | | 29,053,782 | |
| | | | | | |
| | Total long-term investments
(cost $2,365,236,861) | | | 4,015,508,365 | |
| | | | | | |
SHORT-TERM INVESTMENT 23.5% | | | | |
| |
Affiliated Money Market Mutual Fund | | | | |
| | Dryden Core Investment Fund - Taxable Money Market Series | | | | |
| 998,987,727 | | (cost $998,987,727; includes $768,728,759 of cash collateral received for securities on loan) (Note 3)(c)(d) | | | 998,987,727 | |
| | | | | | |
| | Total Investments(e) 118.1%
(cost $3,364,224,588; Note 5) | | | 5,014,496,092 | |
| | Liabilities in excess of other assets (18.1%) | | | (766,953,472 | ) |
| | | | | | |
| | Net Assets 100.0% | | $ | 4,247,542,620 | |
| | | | | | |
See Notes to Financial Statements.
| | |
| Jennison Natural Resources Fund, Inc. | | 17 |
Portfolio of Investments
as of May 31, 2008 continued
The following abbreviations are used in portfolio descriptions:
ADR—American Depositary Receipt.
GDR—Global Depositary Receipt.
CAD—Canadian Dollar.
| (a) | Non-income producing security. |
| (b) | All or a portion of security is on loan. The aggregate market value of such securities is $751,096,724; cash collateral of $768,728,759 (included in liabilities) was received with which the Fund purchased highly liquid short-term investments. |
| (c) | Prudential Investments LLC, the manager of the Fund, also serves as manager of the Dryden Core Investment Fund-Taxable Money Market Series. |
| (d) | Represents security, or a portion thereof, purchased with cash collateral received for securities on loan. |
| (e) | As of May 31, 2008, seven securities representing $62,545,239 and 1.5% of the net assets were fair valued in accordance with the policies adopted by the Board of Directors. |
| (f) | Indicates a security that has been deemed illiquid. |
| (g) | Indicates securities restricted to resale. The aggregate cost of such securities was $75,438,834. The aggregate value of $62,545,239 is approximately 1.5% of net assets. |
| (h) | Securities were purchased pursuant to Rule 144A under the Securities Act of 1933 and may not be resold subject to that rule except to qualified institutional buyers. Unless otherwise noted, 144A securities are deemed to be liquid. |
The geographic concentration of portfolio holdings and liabilities in excess of other assets shown as a percentage of net assets as of May 31, 2008 were as follows:
| | | |
United States (including 18.1% of collateral received for securities on loan) | | 87.0 | % |
Canada | | 7.7 | |
Brazil | | 6.4 | |
South Africa | | 4.0 | |
Australia | | 2.5 | |
Luxembourg | | 2.1 | |
India | | 1.9 | |
Papua New Guinea | | 1.6 | |
United Kingdom | | 1.5 | |
Peru | | 1.2 | |
Russia | | 1.2 | |
Norway | | 1.0 | |
| | | |
| | 118.1 | |
Liabilities in excess of other assets | | (18.1 | ) |
| | | |
| | 100.0 | % |
| | | |
See Notes to Financial Statements.
| | |
| 18 | | Visit our website at www.jennisondryden.com |
Financial Statements
| | |
| MAY 31, 2008 | | ANNUAL REPORT |
Jennison Natural Resources Fund, Inc.
Statement of Assets and Liabilities
as of May 31, 2008
| | | | |
Assets | | | | |
Investments, at value, including securities on loan of $751,096,724: | | | | |
Unaffiliated Investments (cost $2,365,236,861) | | $ | 4,015,508,365 | |
Affiliated Investments (cost $998,987,727) | | | 998,987,727 | |
Cash | | | 119,323 | |
Receivable for Fund shares sold | | | 23,013,374 | |
Dividends and interest receivable | | | 2,746,747 | |
Foreign tax reclaim receivable | | | 38,666 | |
Prepaid expenses | | | 8,592 | |
| | | | |
Total assets | | | 5,040,422,794 | |
| | | | |
| |
Liabilities | | | | |
Payable to broker for collateral for securities on loan (Note 4) | | | 768,728,759 | |
Payable for Fund shares reacquired | | | 14,409,406 | |
Payable for investments purchased | | | 4,768,500 | |
Management fee payable | | | 2,399,892 | |
Distribution fee payable | | | 1,695,999 | |
Accrued expenses | | | 528,539 | |
Transfer agent fee payable | | | 347,455 | |
Deferred directors’ fees | | | 1,624 | |
| | | | |
Total liabilities | | | 792,880,174 | |
| | | | |
| |
Net Assets | | $ | 4,247,542,620 | |
| | | | |
| | | | | |
Net assets were comprised of: | | | | |
Common stock, at par | | $ | 653,959 | |
Paid-in capital in excess of par | | | 2,635,884,951 | |
| | | | |
| | | 2,636,538,910 | |
Distribution in excess of net investment income | | | (106,262,204 | ) |
Accumulated net realized gain on investments and foreign currency transactions | | | 66,994,398 | |
Net unrealized appreciation on investments and foreign currencies | | | 1,650,271,516 | |
| | | | |
Net assets May 31, 2008 | | $ | 4,247,542,620 | |
| | | | |
See Notes to Financial Statements.
| | |
| 20 | | Visit our website at www.jennisondryden.com |
| | | |
Class A | | | |
Net asset value and redemption price per share
($2,090,493,238 ÷ 30,609,943 shares of common stock issued and outstanding) | | $ | 68.29 |
Maximum sales charge (5.50% of offering price) | | | 3.97 |
| | | |
Maximum offering price to public | | $ | 72.26 |
| | | |
| |
Class B | | | |
Net asset value, offering price and redemption price per share
($436,506,199 ÷ 7,448,499 shares of common stock issued and outstanding) | | $ | 58.60 |
| | | |
| |
Class C | | | |
Net asset value, offering price and redemption price per share
($985,867,370 ÷ 16,821,792 shares of common stock issued and outstanding) | | $ | 58.61 |
| | | |
| |
Class R | | | |
Net asset value, offering price and redemption price per share
($15,327,989 ÷ 224,474 shares of common stock issued and outstanding) | | $ | 68.28 |
| | | |
| |
Class Z | | | |
Net asset value, offering price and redemption price per share
($719,347,824 ÷ 10,291,162 shares of common stock issued and outstanding) | | $ | 69.90 |
| | | |
See Notes to Financial Statements.
| | |
| Jennison Natural Resources Fund, Inc. | | 21 |
Statement of Operations
Year Ended May 31, 2008
| | | | |
Net Investment Loss | | | | |
Income | | | | |
Unaffiliated dividends (net of foreign withholding taxes of $548,765) | | $ | 17,873,307 | |
Affiliated dividend income | | | 5,603,048 | |
Affiliated income from securities loaned, net | | | 3,208,540 | |
Interest | | | 2,621,322 | |
| | | | |
Total income | | | 29,306,217 | |
| | | | |
| |
Expenses | | | | |
Management fee | | | 21,568,625 | |
Distribution fee—Class A | | | 4,280,069 | |
Distribution fee—Class B | | | 3,606,626 | |
Distribution fee—Class C | | | 7,248,778 | |
Distribution fee—Class R | | | 33,649 | |
Transfer agent’s fee and expenses (including affiliated expense of $1,324,600) (Note 3) | | | 3,303,000 | |
Custodian’s fees and expenses | | | 569,000 | |
Reports to shareholders | | | 360,000 | |
Registration fees | | | 270,000 | |
Legal fees and expenses | | | 65,000 | |
Directors’ fees | | | 64,000 | |
Insurance | | | 48,000 | |
Audit fee | | | 21,000 | |
Miscellaneous | | | 45,914 | |
| | | | |
Total expenses | | | 41,483,661 | |
| | | | |
Net investment loss | | | (12,177,444 | ) |
| | | | |
| |
Realized And Unrealized Gain (Loss) On Investments And Foreign Currencies | | | | |
Net realized gain (loss) on: | | | | |
Investment transactions | | | 151,509,961 | |
Foreign currency transactions | | | (595,252 | ) |
| | | | |
| | | 150,914,709 | |
| | | | |
Net change in unrealized appreciation (depreciation) on: | | | | |
Investments | | | 884,458,155 | |
Foreign currencies | | | (17 | ) |
| | | | |
| | | 884,458,138 | |
| | | | |
Net gain on investments and foreign currencies | | | 1,035,372,847 | |
| | | | |
Net Increase In Net Assets Resulting From Operations | | $ | 1,023,195,403 | |
| | | | |
See Notes to Financial Statements.
| | |
| 22 | | Visit our website at www.jennisondryden.com |
Statement of Changes in Net Assets
| | | | | | | | |
| | | Year Ended May 31, | |
| | | 2008 | | | 2007 | |
Increase (Decrease) In Net Assets | | | | | | | | |
Operations | | | | | | | | |
Net investment loss | | $ | (12,177,444 | ) | | $ | (5,778,916 | ) |
Net realized gain (loss) on investment and foreign currency transactions | | | 150,914,709 | | | | 217,167,338 | |
Net change in unrealized appreciation (depreciation) on investments and foreign currencies | | | 884,458,138 | | | | 225,380,787 | |
| | | | | | | | |
Net increase in net assets resulting from operations | | | 1,023,195,403 | | | | 436,769,209 | |
| | | | | | | | |
Dividends and Distributions (Note 1) | | | | | | | | |
Dividends from net investment income | | | | | | | | |
Class A | | | (57,445,684 | ) | | | (7,037,113 | ) |
Class B | | | (14,286,691 | ) | | | (685,338 | ) |
Class C | | | (28,309,937 | ) | | | (1,095,771 | ) |
Class R | | | (217,772 | ) | | | (43 | ) |
Class Z | | | (19,616,981 | ) | | | (2,974,505 | ) |
| | | | | | | | |
| | | (119,877,065 | ) | | | (11,792,770 | ) |
| | | | | | | | |
Distributions from net realized gains | | | | | | | | |
Class A | | | (62,490,439 | ) | | | (86,614,442 | ) |
Class B | | | (17,848,604 | ) | | | (31,263,755 | ) |
Class C | | | (35,367,012 | ) | | | (49,986,880 | ) |
Class R | | | (239,287 | ) | | | (737 | ) |
Class Z | | | (20,313,414 | ) | | | (29,034,324 | ) |
| | | | | | | | |
| | | (136,258,756 | ) | | | (196,900,138 | ) |
| | | | | | | | |
| | |
Fund share transactions (Net of share conversions) (Note 6) | | | | | | | | |
Net proceeds from shares sold | | | 1,669,733,304 | | | | 726,159,782 | |
Net asset value of shares issued in reinvestment of dividends and distributions | | | 208,778,584 | | | | 171,275,762 | |
Cost of shares reacquired | | | (722,832,041 | ) | | | (566,371,914 | ) |
| | | | | | | | |
Net increase in net assets from Fund share transactions | | | 1,155,679,847 | | | | 331,063,630 | |
| | | | | | | | |
Total increase | | | 1,922,739,429 | | | | 559,139,931 | |
| | |
Net Assets | | | | | | | | |
Beginning of year | | | 2,324,803,191 | | | | 1,765,663,260 | |
| | | | | | | | |
End of year | | $ | 4,247,542,620 | | | $ | 2,324,803,191 | |
| | | | | | | | |
See Notes to Financial Statements.
| | |
| Jennison Natural Resources Fund, Inc. | | 23 |
Notes to Financial Statements
Jennison Natural Resources Fund, Inc. (the “Fund”), is registered under the Investment Company Act of 1940 as a non-diversified, open-end management investment company. The Fund’s investment objective is long-term growth of capital which it seeks to achieve by investing primarily in equity securities of foreign and domestic companies that own, explore, mine, process or otherwise develop, or provide goods and services with respect to, natural resources and in asset-based securities the terms of which are related to the market value of an underlying asset such as a natural resource.
Note 1. Accounting Policies
The following is a summary of significant accounting policies followed by the Fund in the preparation of its financial statements.
Securities Valuation: Securities listed on a securities exchange (other than options on securities and indices) are valued at the last sale price on such exchange on the day of valuation or, if there was no sale on such day, at the mean between the last reported bid and asked prices, or at the last bid price on such day in the absence of an asked price. Securities traded via Nasdaq are valued at the Nasdaq official closing price (“NOCP”) on the day of valuation, or if there was no NOCP, at the last sale price. Securities that are actively traded in the over-the-counter market, including listed securities for which the primary market is believed by Prudential Investments LLC (“PI” or “Manager”), in consultation with the subadvisers; to be over-the-counter, are valued at market value using prices provided by an independent pricing agent or principal market maker.
Corporate bonds (other than convertible debt securities) and U.S. government securities that are actively traded in the over-the-counter market, including listed securities for which the primary market is believed by an Adviser in consultation with the Manager to be over-the-counter, are valued by an independent pricing agent or more than one principal market maker (if available, otherwise by a principal market maker or a primary market dealer). Convertible debt securities that are actively traded in the over-the-counter market, including listed securities for which the primary market is believed by an Adviser in consultation with the Manager to be over-the-counter, are valued by an independent pricing agent or at the mean between the last reported bid and asked prices (or at the last bid price in the absence of an asked price) provided by more than one principal market maker (if available, otherwise by a principal market maker or a primary market dealer).
| | |
| 24 | | Visit our website at www.jennisondryden.com |
Securities for which reliable market quotations are not readily available, or whose values have been effected by events occurring after the close of the security’s foreign market and before the fund’s normal pricing time, are valued at fair value in accordance with the Board of Directors’ approved fair valuation procedures. When determining the fair valuation of securities some of the factors influencing the valuation include, the nature of any restrictions on disposition of the securities; assessment of the general liquidity of the securities; the issuer’s financial condition and the markets in which it does business; the cost of the investment; the size of the holding and the capitalization of issuer; the prices of any recent transactions or bids/offers for such securities or any comparable securities; any available analyst media or other reports or information deemed reliable by the investment adviser regarding the issuer or the markets or industry in which it operates. Using fair value to price securities may result in a value that is different from a security’s most recent closing price and from the price used by other mutual funds to calculate their net asset values.
Investments in mutual funds are valued at their net asset value as of the close of the New York Stock Exchange on the date of valuation.
Short-term debt securities which mature in sixty days or less are valued at amortized cost, which approximates market value. The amortized cost method includes valuing a security at its cost on the date of purchase and thereafter assuming a constant amortization to maturity of the difference between the principal amount due at maturity and cost. Short-term debt securities which mature in more than sixty days are valued at current market quotation.
The Fund may hold up to 15% of its net assets in illiquid securities including repurchase agreements which have a maturity of longer than seven days, certain securities with legal or contractual restrictions on resale (restricted securities, sometimes referred to as Private Placements) and securities that are not readily marketable. Restricted securities are valued pursuant to the valuation procedures noted above.
Foreign Currency Translation: The books and records of the Fund are maintained in U.S. dollars. Foreign currency amounts are translated into U.S. dollars on the following basis:
(i) market value of investment securities, other assets and liabilities at the current rates of exchange.
(ii) purchases and sales of investment securities, income and expenses at the rate of exchange prevailing on the respective dates of such transactions.
| | |
| Jennison Natural Resources Fund, Inc. | | 25 |
Notes to Financial Statements
continued
Although the net assets of the Fund are presented at the foreign exchange rates and market values at the close of the period, the Fund does not isolate that portion of the results of operations arising as a result of changes in the foreign exchange rates from the fluctuations arising from changes in the market prices of long-term portfolio securities held at the end of the period. Similarly, the Fund does not isolate the effect of changes in foreign exchange rates from the fluctuations arising from changes in the market prices of long-term portfolio securities sold during the period. Accordingly, realized foreign currency gains or losses are included in the reported net realized gain or loss on investment transactions.
Net realized gains or losses on foreign currency transactions represent net foreign exchange gains or losses from the holding of foreign currencies, currency gains or losses realized between the trade date and settlement date on securities transactions, and the difference between the amounts of dividends, interest and foreign withholding taxes recorded on the Fund’s books and the U.S. dollar equivalent amounts actually received or paid. Net unrealized currency gains or losses from valuing foreign currency denominated assets and liabilities (other than investments) at period end exchange rates are reflected as a component of net unrealized appreciation (depreciation) on investment and foreign currencies.
Foreign security and currency transactions may involve certain considerations and risks not typically associated with those of domestic origin as a result of, among other factors, the possibility of political and economic instability, or the level of governmental supervision and regulation of foreign securities markets.
Securities Lending: The Fund may lend its portfolio securities to broker-dealers. The loans are secured by collateral at least equal at all times to the market value of the securities loaned. Loans are subject to termination at the option of the borrower or the Fund. Upon termination of the loan, the borrower will return to the Fund securities identical to the loaned securities. Should the borrower of the securities fail financially, the Fund has the right to repurchase the securities using the collateral in the open market. The Fund recognizes income, net of any rebate and securities lending agent fees, for lending its securities in the form of fees or interest on the investment of any cash received as collateral. The Fund also continues to receive interest and dividends or amounts equivalent thereto, on the securities loaned and recognizes any unrealized gain or loss in the market price of the securities loaned that may occur during the term of the loan.
| | |
| 26 | | Visit our website at www.jennisondryden.com |
Total Return Swap: Total return swap agreements are contracts in which one party agrees to make periodic payments based on the change in market value of the underlying assets, which may include a specified security, basket of securities or securities indices during the specified period, in return for periodic payments based on a fixed or variable interest rate or the total return from other underlying assets. Total return swap agreements may be used to obtain exposure to a security or market without owning or taking physical custody of such security or market. Generally, the Fund will enter into total return swaps on a net basis (i.e., the two payment streams are netted out with the Fund receiving or paying, as the case may be, only the net amount of the two payments). The net amount of the excess, if any, of the Fund’s obligations over its entitlements with respect to each total return swap will be accrued on a daily basis, and an amount of cash or liquid instruments having an aggregate net asset value at least equal to the accrued excess will be segregated by the Fund. If the total return swap transaction is entered into on other than a net basis, the full amount of the Fund’s obligations will be accrued on a daily basis, and the full amount of the Fund’s obligations will be segregated by the Fund in an amount equal to or greater than the market value of the liabilities under the total return swap agreement or the amount it would have cost the Fund initially to make an equivalent direct investment, plus or minus any amount the Fund is obligated to pay or is to receive under the total return swap agreement.
Securities Transactions and Net Investment Income: Securities transactions are recorded on the trade date. Realized gains or losses on sales of securities are calculated on the identified cost basis. Dividend income is recorded on the ex-dividend date and interest income is recorded on the accrual basis. Expenses are recorded on the accrual basis.
Net investment income or loss, (other than distribution fees, which are charged directly to the respective class) and unrealized and realized gains or losses are allocated daily to each class of shares based upon the relative proportion of net assets of each class at the beginning of the day.
Dividends and Distributions: The Fund expects to pay dividends of net investment income and distributions of net realized capital and currency gains, if any, at least annually. Dividends and distributions to shareholders, which are determined in accordance with federal income tax regulations and which may differ from generally accepted accounting principles, are recorded on the ex-dividend date.
Taxes: It is the Fund’s policy to continue to meet the requirements of the Internal Revenue Code applicable to regulated investment companies and to distribute all of its taxable net investment income and capital gains, if any, to shareholders. Therefore,
| | |
| Jennison Natural Resources Fund, Inc. | | 27 |
Notes to Financial Statements
continued
no federal income tax provision is required. Withholding taxes on foreign dividends have been provided for in accordance with the Fund’s understanding of the applicable country’s tax rules and rates.
Estimates: The preparation of the financial statements requires management to make estimates and assumptions that affect the reported amounts and disclosures in the financial statements. Actual results could differ from those estimates.
Note 2. Agreements
The Fund has a management agreement with PI. Pursuant to a subadvisory agreement between PI and Jennison Associates LLC (“Jennison”), Jennison furnishes investment advisory services in connection with the management of the Fund. Under the subadvisory agreement, Jennison, subject to the supervision of PI, is responsible for managing the assets of the Fund in accordance with its investment objective and policies. PI pays for the services of Jennison, the compensation of officers of the Fund, occupancy and certain clerical and bookkeeping costs of the Fund. The Fund bears all other costs and expenses.
Pursuant to the management agreement between the Fund and PI, the management fee paid to PI is computed daily and payable monthly at an annual rate of .75 of 1% of average daily net assets up to $1 billion and .70 of 1% of average daily net assets in excess of $1 billion.
Through September 30, 2008, PI has contractually agreed to waive 0.05 of 1% of the management fee rate on average daily net assets over $2 billion that would otherwise be applicable under the terms of the management agreement. Effective October 1, 2008 through September 30, 2009, PI has contractually agreed to waive 0.05 of 1% of the management fee rate on average daily net assets over $4 billion that would otherwise be applicable under the terms of the management agreement. The effective management fee rate was .70 of 1% for the year ended May 31, 2008.
The Fund has a distribution agreement with Prudential Investment Management Services LLC (“PIMS”), which acts as the distributor of the Class A, Class B, Class C, Class R and Class Z shares of the Fund. The Fund compensates PIMS for distributing and servicing the Fund’s Class A, Class B, Class C and Class R shares, pursuant to plans of distribution (the “Class A, B, C and R Plans”), regardless of expenses actually incurred by PIMS. The distribution fees are accrued daily and payable monthly. No distribution or service fees are paid to PIMS as distributor of the Class Z shares of the Fund.
| | |
| 28 | | Visit our website at www.jennisondryden.com |
Pursuant to the Class A, B, C and R Plans, the Fund compensates PIMS for distribution related activities at an annual rate of up to .30 of 1%, 1%, 1% and .75 of 1% of the average daily net assets of the Class A, B, C and Class R shares, respectively. For the period through September 30, 2007, PIMS had contractually agreed to limit such fees to .25 of 1% of the average daily net assets of the Class A shares. However, effective October 1, 2007 such waiver has been terminated. The effective distribution fee rate for Class A was .29 of 1% for the year ended May 31, 2008. Class R fees continue to be limited to 0.50 of 1% of the average daily net assets to September 30, 2009.
PIMS has advised the Fund that it received approximately $10,235,600 in front-end sales charges resulting from sales of Class A shares, during the year ended May 31, 2008. From these fees, PIMS paid such sales charges to affiliated broker-dealers, which in turn paid commissions to salespersons and incurred other distribution costs.
PIMS has advised the Fund that for the year ended May 31, 2008, it received approximately $46,900, $710,200 and $214,300 in contingent deferred sales charges imposed upon redemptions by certain Class A, Class B and Class C shareholders, respectively.
PI, PIMS and Jennison are indirect, wholly-owned subsidiaries of Prudential Financial, Inc. (“Prudential”).
The Fund along with other affiliated registered investment companies (the “Funds”), is a party to a Syndicated Credit Agreement (“SCA”) with two banks. The SCA provides for a commitment of $500 million. Interest on any borrowings under the SCA is incurred at contracted market rates and a commitment fee for the unused amount is accrued daily and paid quarterly. The Funds pay a commitment fee of .06 of 1% of the unused portion of the SCA. The expiration date of the SCA is October 24, 2008. The purpose of the SCA is to provide an alternative source of temporary funding for capital share redemptions.
The Fund did not borrow any amounts pursuant to the SCA during the year ended May 31, 2008.
Note 3. Other Transactions with Affiliates
Prudential Mutual Fund Services LLC (“PMFS”), an affiliate of PI, and an indirect, wholly-owned subsidiary of Prudential, serves as the Fund’s transfer agent. Transfer
| | |
| Jennison Natural Resources Fund, Inc. | | 29 |
Notes to Financial Statements
continued
agent’s fees and expenses in the Statement of Operations include certain out-of-pocket expenses paid to non-affiliates, where applicable.
The Fund pays networking fees to affiliated and unaffiliated broker/dealers, including fees relating to the service of Wachovia Securities, LLC, (“Wachovia”) and First Clearing, LLC (“First Clearing”), affiliates of PI. These networking fees are payments made to broker/dealers that clear mutual fund transactions through a national clearing system. For the year ended May 31, 2008, the Fund incurred approximately $1,745,400 in total networking fees, of which $253,100 was paid to Wachovia Securities and First Clearing. These amounts are included in transfer agent’s fees and expenses in the Statement of Operations.
Prudential Investment Management, Inc. (“PIM”), an indirect, wholly-owned subsidiary of Prudential, is the Fund’s security lending agent. For the year ended May 31, 2008, PIM has been compensated approximately $1,375,100 for these services.
The Fund invests in the Taxable Money Market Series (the “Portfolio”), a portfolio of Dryden Core Investment Fund, pursuant to an exemptive order received from the Securities and Exchange Commission. The Portfolio is a money market mutual fund registered under the Investment Company Act of 1940, as amended, and managed by PI.
Note 4. Portfolio Securities
Purchases and sales of investment securities, other than short-term investments, for the year ended May 31, 2008 were $1,363,468,413 and $619,247,903, respectively.
As of May 31, 2008, the Fund had securities on loan with an aggregate market value of $751,096,724. The Fund received $768,728,759 in cash as collateral for securities on loan which was used to purchase highly liquid short-term investments in accordance with the Fund’s securities lending procedures.
Note 5. Distributions and Tax Information
Distributions to shareholders, which are determined in accordance with federal income tax regulations and may differ from generally accepted accounting principles, are recorded on the ex-dividend date. In order to present distribution in excess of net
| | |
| 30 | | Visit our website at www.jennisondryden.com |
investment income and accumulated net realized gain on investments and foreign currency transactions on the Statement of Assets and Liabilities that more closely represent their tax character, certain adjustments have been made to distribution in excess of net investment income and accumulated gain on investments and foreign currency transactions. For the year ended May 31, 2008, the adjustments were to decrease distribution in excess of net investment income and to decrease accumulated net realized gain on investments and foreign currency transactions by $41,014,477 due to differences in the treatment for book and tax purposes of certain transactions involving Passive Foreign Investment Companies and foreign currencies. Net investment loss, net realized gains and net assets were not affected by this change.
For the year ended May 31, 2008, the tax character of distributions paid by the Fund were $168,411,424 from ordinary income and $87,724,397 from long-term capital gains. For the year ended May 31, 2007, the tax character of distributions paid by the Fund were $78,007,653 from ordinary income and $130,685,255 from long-term capital gains.
As of May 31, 2008, the accumulated undistributed earnings on a tax basis were $48,556,329 from ordinary income and $50,755,148 from long-term capital gains.
The United States federal income tax basis of the Fund’s investments and the net unrealized appreciation as of May 31, 2008 were as follows:
| | | | | | | | | | |
Tax Basis
of Investments | | Appreciation | | Depreciation | | Net Unrealized
Appreciation | | Other Cost
Basis
Adjustment | | Total Net
Unrealized
Appreciation |
| $3,502,262,612 | | $1,626,789,786 | | $(114,556,306) | | $1,512,233,480 | | $12 | | $1,512,233,492 |
The differences between book basis and tax basis of investments are primarily attributable to deferred losses on wash sales and mark-to-market on open investments in Passive Foreign Investment Companies. Other cost basis adjustment is attributable to unrealized appreciation of foreign currencies.
In addition, the Fund elected to treat post-october currency losses of approximately $539,600 incurred in the seven months ended May 31, 2008 as having incurred in the next fiscal year.
Management has analyzed the Fund’s tax positions taken on federal income tax returns for all open tax years and has concluded that as of May 31, 2008, no provisions for income tax would be required in the Fund’s financial statements. The Fund’s federal and state income and federal excise tax returns for tax years for which the applicable statuses of limitations have not expired are subject to examination by the Internal Revenue Service and state departments of revenue.
| | |
| Jennison Natural Resources Fund, Inc. | | 31 |
Notes to Financial Statements
continued
Note 6. Capital
The Fund offers Class A, Class B, Class C, Class R and Class Z shares. Class A shares are sold with a front-end sales charge of up to 5.50%. All investors who purchase Class A shares in an amount of $1 million or more and sell these shares within 12 months of purchase are subject to a contingent deferred sales charge (CDSC) of 1%, including investors who purchase their shares through broker-dealers affiliated with Prudential. Class B shares are sold with a contingent deferred sales charge which declines from 5% to zero depending upon the period of time the shares are held. Class C shares are sold with a contingent deferred sales charge of 1% during the first 12 months. Class B shares automatically convert to Class A shares on a quarterly basis approximately seven years after purchase. A special exchange privilege is also available for shareholders who qualify to purchase Class A shares at net asset value. Class R and Class Z shares are not subject to any sales or redemption charge and are offered exclusively for sale to a limited group of investors.
There are 500 million shares of $.01 par value common stock authorized divided into five classes, designated Class A, Class B, Class C, Class R and Class Z common stock, each of which consists of 100 million authorized shares.
Transactions in shares of common stock were as follows:
| | | | | | | |
Class A | | Shares | | | Amount | |
Year ended May 31, 2008: | | | | | | | |
Shares sold | | 14,854,403 | | | $ | 895,176,340 | |
Shares issued in reinvestment of dividends and distributions | | 1,885,140 | | | | 106,717,427 | |
Shares reacquired | | (6,851,754 | ) | | | (407,109,970 | ) |
| | | | | | | |
Net increase (decrease) in shares outstanding before conversion | | 9,887,789 | | | | 594,783,797 | |
Shares issued upon conversion from Class B | | 293,726 | | | | 16,908,576 | |
| | | | | | | |
Net increase (decrease) in shares outstanding | | 10,181,515 | | | $ | 611,692,373 | |
| | | | | | | |
Year ended May 31, 2007: | | | | | | | |
Shares sold | | 7,753,176 | | | $ | 365,442,259 | |
Shares issued in reinvestment of dividends and distributions | | 1,812,945 | | | | 83,939,344 | |
Shares reacquired | | (6,386,011 | ) | | | (291,809,106 | ) |
| | | | | | | |
Net increase (decrease) in shares outstanding before conversion | | 3,180,110 | | | | 157,572,497 | |
Shares issued upon conversion from Class B | | 311,206 | | | | 14,136,738 | |
| | | | | | | |
Net increase (decrease) in shares outstanding | | 3,491,316 | | | $ | 171,709,235 | |
| | | | | | | |
| | |
| 32 | | Visit our website at www.jennisondryden.com |
| | | | | | | |
Class B | | Shares | | | Amount | |
Year ended May 31, 2008: | | | | | | | |
Shares sold | | 1,749,925 | | | $ | 90,765,803 | |
Shares issued in reinvestment of dividends and distributions | | 583,181 | | | | 28,429,233 | |
Shares reacquired | | (1,277,580 | ) | | | (65,191,605 | ) |
| | | | | | | |
Net increase (decrease) in shares outstanding before conversion | | 1,055,526 | | | | 54,003,431 | |
Shares reacquired upon conversion into Class A | | (339,787 | ) | | | (16,908,576 | ) |
| | | | | | | |
Net increase (decrease) in shares outstanding | | 715,739 | | | $ | 37,094,855 | |
| | | | | | | |
Year ended May 31, 2007: | | | | | | | |
Shares sold | | 1,315,594 | | | $ | 54,194,495 | |
Shares issued in reinvestment of dividends and distributions | | 702,350 | | | | 28,417,094 | |
Shares reacquired | | (1,287,599 | ) | | | (51,826,796 | ) |
| | | | | | | |
Net increase (decrease) in shares outstanding before conversion | | 730,345 | | | | 30,784,793 | |
Shares reacquired upon conversion into Class A | | (354,424 | ) | | | (14,136,738 | ) |
| | | | | | | |
Net increase (decrease) in shares outstanding | | 375,921 | | | $ | 16,648,055 | |
| | | | | | | |
Class C | | | | | | |
Year ended May 31, 2008: | | | | | | | |
Shares sold | | 6,734,719 | | | $ | 349,581,730 | |
Shares issued in reinvestment of dividends and distributions | | 888,499 | | | | 43,314,332 | |
Shares reacquired | | (2,530,695 | ) | | | (129,565,968 | ) |
| | | | | | | |
Net increase (decrease) in shares outstanding | | 5,092,523 | | | $ | 263,330,094 | |
| | | | | | | |
Year ended May 31, 2007: | | | | | | | |
Shares sold | | 3,989,026 | | | $ | 164,175,593 | |
Shares issued in reinvestment of dividends and distributions | | 878,938 | | | | 35,561,812 | |
Shares reacquired | | (2,660,960 | ) | | | (106,575,883 | ) |
| | | | | | | |
Net increase (decrease) in shares outstanding | | 2,207,004 | | | $ | 93,161,522 | |
| | | | | | | |
Class R | | | | | | |
Year ended May 31, 2008: | | | | | | | |
Shares sold | | 247,215 | | | $ | 15,053,063 | |
Shares issued in reinvestment of dividends and distributions | | 7,964 | | | | 451,237 | |
Shares reacquired | | (78,232 | ) | | | (4,753,385 | ) |
| | | | | | | |
Net increase (decrease) in shares outstanding | | 176,947 | | | $ | 10,750,915 | |
| | | | | | | |
August 22, 2006(a) through May 31, 2007: | | | | | | | |
Shares sold | | 52,753 | | | $ | 2,523,700 | |
Shares issued in reinvestment of dividends and distributions | | 10 | | | | 496 | |
Shares reacquired | | (5,236 | ) | | | (244,250 | ) |
| | | | | | | |
Net increase (decrease) in shares outstanding | | 47,527 | | | $ | 2,279,946 | |
| | | | | | | |
| | |
| Jennison Natural Resources Fund, Inc. | | 33 |
Notes to Financial Statements
continued
| | | | | | | |
Class Z | | Shares | | | Amount | |
Year ended May 31, 2008: | | | | | | | |
Shares sold | | 5,220,045 | | | $ | 319,156,368 | |
Shares issued in reinvestment of dividends and distributions | | 516,273 | | | | 29,866,355 | |
Shares reacquired | | (1,918,168 | ) | | | (116,211,113 | ) |
| | | | | | | |
Net increase (decrease) in shares outstanding | | 3,818,150 | | | $ | 232,811,610 | |
| | | | | | | |
Year ended May 31, 2007: | | | | | | | |
Shares sold | | 2,932,460 | | | $ | 139,823,735 | |
Shares issued in reinvestment of dividends and distributions | | 494,852 | | | | 23,357,016 | |
Shares reacquired | | (2,458,480 | ) | | | (115,915,879 | ) |
| | | | | | | |
Net increase (decrease) in shares outstanding | | 968,832 | | | $ | 47,264,872 | |
| | | | | | | |
| (a) | Commencement of investment operations. |
Note 7. New Accounting Pronouncements
On September 20, 2006, the Financial Accounting Standards Board (“FASB”) released Statement of Financial Accounting Standards No. 157 “Fair Value Measurements” (“FAS 157”). FAS 157 establishes an authoritative definition of fair value, sets out a framework for measuring fair value, and requires additional disclosures about fair-value measurements. The application of FAS 157 is required for fiscal years beginning after November 15, 2007 and interim periods within those fiscal years. At this time, management is evaluating the implications of FAS 157 and its impact, if any, on the financial statements has not yet been determined.
In addition, in March 2008, the FASB released Statement of Financial Accounting Standards No. 161, Disclosures about Derivative Instruments and Hedging Activities (“FAS 161”). FAS 161 requires qualitative disclosures about objectives and strategies for using derivatives, quantitative disclosures about fair value amounts of and gains and losses on derivative instruments, and disclosures about credit-risk-related contingent features in derivative agreements. The application of FAS 161 is required for fiscal years beginning after November 15, 2008 and interim periods within those fiscal years. At this time, management is evaluating the implications of FAS 161 and its impact on the financial statements has not yet been determined.
| | |
| 34 | | Visit our website at www.jennisondryden.com |
Financial Highlights
| | |
| MAY 31, 2008 | | ANNUAL REPORT |
Jennison Natural Resources Fund, Inc.
Financial Highlights
| | | | |
| | | Class A | |
| | | Year Ended
May 31, 2008(a) | |
Per Share Operating Performance: | | | | |
Net Asset Value, Beginning Of Year | | $ | 53.87 | |
| | | | |
Income (loss) from investment operations: | | | | |
Net investment income (loss) | | | (.12 | ) |
Net realized and unrealized gain on investment and foreign currency transactions | | | 19.61 | |
| | | | |
Total from investment operations | | | 19.49 | |
| | | | |
Less Dividends and Distributions: | | | | |
Dividends from net investment income | | | (2.43 | ) |
Distributions from net realized gains on investments | | | (2.64 | ) |
| | | | |
Total dividends and distributions | | | (5.07 | ) |
| | | | |
Net asset value, end of year | | $ | 68.29 | |
| | | | |
Total Return(b): | | | 38.15 | % |
Ratios/Supplemental Data: | | | | |
Net assets, end of year (000) | | $ | 2,090,493 | |
Average net assets (000) | | $ | 1,491,943 | |
Ratios to average net assets(c): | | | | |
Expenses, including distribution and service (12b-1) fees(d) | | | 1.14 | %(e) |
Expenses, excluding distribution and service (12b-1) fees | | | .85 | %(e) |
Net investment income (loss) | | | (.20 | )%(e) |
For Class A, B, C, R and Z shares: | | | | |
Portfolio turnover | | | 21 | % |
| (a) | Calculated based upon average daily shares outstanding during the year. |
| (b) | Total return does not consider the effects of sales loads. Total return is calculated assuming a purchase of a share on the first day and a sale on the last day of each year reported, and includes reinvestment of dividends and distributions. Total returns may reflect adjustments to conform to generally accepted accounting principles. |
| (c) | Does not include the expenses of the underlying fund in which the Fund invests. |
| (d) | The distributor of the Fund has contractually agreed to limit its distribution and service (12b-1) fees to .25 of 1% of the average daily net assets of the Class A shares until September 30, 2007. |
| (e) | Through September 30, 2008, the manager of the Fund has contractually agreed to waive 0.05 of 1% of the management fee rate on average daily net assets over $2 billion. Effective October 1, 2008 through September 30, 2009, the manager of the Fund has contractually agreed to waive 0.05 of 1% of the management fee rate on average daily net assets over $4 billion. |
See Notes to Financial Statements.
| | |
| 36 | | Visit our website at www.jennisondryden.com |
| | | | | | | | | | | | | | |
| Class A | |
| Year Ended May 31, | |
| 2007(a) | | | 2006(a) | | | 2005 | | | 2004 | |
| | | | | | | | | | | | | | |
| $ | 48.25 | | | $ | 30.36 | | | $ | 23.33 | | | $ | 18.94 | |
| | | | | | | | | | | | | | | |
| | | | | | | | | | | | | | |
| | (.03 | ) | | | .15 | | | | .11 | | | | (.06 | ) |
| | 11.21 | | | | 20.28 | | | | 7.61 | | | | 4.96 | |
| | | | | | | | | | | | | | | |
| | 11.18 | | | | 20.43 | | | | 7.72 | | | | 4.90 | |
| | | | | | | | | | | | | | | |
| | | | | | | | | | | | | | |
| | (.42 | ) | | | (.30 | ) | | | (.08 | ) | | | (.39 | ) |
| | (5.14 | ) | | | (2.24 | ) | | | (.61 | ) | | | (.12 | ) |
| | | | | | | | | | | | | | | |
| | (5.56 | ) | | | (2.54 | ) | | | (.69 | ) | | | (.51 | ) |
| | | | | | | | | | | | | | | |
| $ | 53.87 | | | $ | 48.25 | | | $ | 30.36 | | | $ | 23.33 | |
| | | | | | | | | | | | | | | |
| | 25.03 | % | | | 69.16 | % | | | 33.24 | % | | | 26.24 | % |
| | | | | | | | | | | | | | |
| $ | 1,100,431 | | | $ | 817,299 | | | $ | 327,162 | | | $ | 121,700 | |
| $ | 847,853 | | | $ | 566,901 | | | $ | 215,619 | | | $ | 81,712 | |
| | | | | | | | | | | | | | |
| | 1.19 | % | | | 1.14 | % | | | 1.22 | % | | | 1.41 | % |
| | .94 | % | | | .89 | % | | | .97 | % | | | 1.16 | % |
| | (.07 | )% | | | .36 | % | | | .39 | % | | | (.27 | )% |
| | | | | | | | | | | | | | |
| | 46 | % | | | 34 | % | | | 30 | % | | | 6 | % |
See Notes to Financial Statements.
| | |
| Jennison Natural Resources Fund, Inc. | | 37 |
Financial Highlights
continued
| | | | |
| | | Class B | |
| | | Year Ended
May 31, 2008(a) | |
Per Share Operating Performance: | | | | |
Net Asset Value, Beginning Of Year | | $ | 46.90 | |
| | | | |
Income (loss) from investment operations: | | | | |
Net investment loss | | | (.44 | ) |
Net realized and unrealized gain on investment and foreign currency transactions | | | 16.90 | |
| | | | |
Total from investment operations | | | 16.46 | |
| | | | |
Less Dividends and Distributions: | | | | |
Dividends from net investment income | | | (2.12 | ) |
Distributions from net realized gains on investments | | | (2.64 | ) |
| | | | |
Total dividends and distributions | | | (4.76 | ) |
| | | | |
Net asset value, end of year | | $ | 58.60 | |
| | | | |
Total Return(b): | | | 37.14 | % |
Ratios/Supplemental Data: | | | | |
Net assets, end of year (000) | | $ | 436,506 | |
Average net assets (000) | | $ | 360,663 | |
Ratios to average net assets(c): | | | | |
Expenses, including distribution and service (12b-1) fees | | | 1.85 | %(d) |
Expenses, excluding distribution and service (12b-1) fees | | | .85 | %(d) |
Net investment loss | | | (.86 | )%(d) |
| (a) | Calculated based upon average daily shares outstanding during the year. |
| (b) | Total return does not consider the effects of sales loads. Total return is calculated assuming a purchase of a share on the first day and a sale on the last day of each year reported, and includes reinvestment of dividends and distributions. Total returns may reflect adjustments to conform to generally accepted accounting principles. |
| (c) | Does not include the expenses of the underlying fund in which the Fund invests. |
| (d) | Through September 30, 2008, the manager of the Fund has contractually agreed to waive 0.05 of 1% of the management fee rate on average daily net assets over $2 billion. Effective October 1, 2008 through September 30, 2009, the manager of the Fund has contractually agreed to waive 0.05 of 1% of the management fee rate on average daily net assets over $4 billion. |
See Notes to Financial Statements.
| | |
| 38 | | Visit our website at www.jennisondryden.com |
| | | | | | | | | | | | | | |
| Class B | |
| Year Ended May 31, | |
| 2007(a) | | | 2006(a) | | | 2005 | | | 2004 | |
| | | | | | | | | | | | | | |
| $ | 42.70 | | | $ | 27.13 | | | $ | 20.99 | | | $ | 17.09 | |
| | | | | | | | | | | | | | | |
| | | | | | | | | | | | | | |
| | (.34 | ) | | | (.15 | ) | | | (.09 | ) | | | (.20 | ) |
| | 9.79 | | | | 18.05 | | | | 6.84 | | | | 4.46 | |
| | | | | | | | | | | | | | | |
| | 9.45 | | | | 17.90 | | | | 6.75 | | | | 4.26 | |
| | | | | | | | | | | | | | | |
| | | | | | | | | | | | | | |
| | (.11 | ) | | | (.09 | ) | | | — | | | | (.24 | ) |
| | (5.14 | ) | | | (2.24 | ) | | | (.61 | ) | | | (.12 | ) |
| | | | | | | | | | | | | | | |
| | (5.25 | ) | | | (2.33 | ) | | | (.61 | ) | | | (.36 | ) |
| | | | | | | | | | | | | | | |
| $ | 46.90 | | | $ | 42.70 | | | $ | 27.13 | | | $ | 20.99 | |
| | | | | | | | | | | | | | | |
| | 24.10 | % | | | 67.84 | % | | | 32.30 | % | | | 25.28 | % |
| | | | | | | | | | | | | | |
| $ | 315,782 | | | $ | 271,419 | | | $ | 132,157 | | | $ | 52,684 | |
| $ | 265,189 | | | $ | 206,935 | | | $ | 91,588 | | | $ | 40,985 | |
| | | | | | | | | | | | | | |
| | 1.94 | % | | | 1.89 | % | | | 1.97 | % | | | 2.16 | % |
| | .94 | % | | | .89 | % | | | .97 | % | | | 1.16 | % |
| | (.82 | )% | | | (.40 | )% | | | (.36 | )% | | | (1.03 | )% |
See Notes to Financial Statements.
| | |
| Jennison Natural Resources Fund, Inc. | | 39 |
Financial Highlights
continued
| | | | |
| | | Class C | |
| | | Year Ended
May 31, 2008(a) | |
Per Share Operating Performance: | | | | |
Net Asset Value, Beginning Of Year | | $ | 46.90 | |
| | | | |
Income (loss) from investment operations: | | | | |
Net investment loss | | | (.46 | ) |
Net realized and unrealized gain on investment and foreign currency transactions | | | 16.93 | |
| | | | |
Total from investment operations | | | 16.47 | |
| | | | |
Less Dividends and Distributions: | | | | |
Dividends from net investment income | | | (2.12 | ) |
Distributions from net realized gains on investments | | | (2.64 | ) |
| | | | |
Total dividends and distributions | | | (4.76 | ) |
| | | | |
Net asset value, end of year | | $ | 58.61 | |
| | | | |
Total Return(b): | | | 37.14 | % |
Ratios/Supplemental Data: | | | | |
Net assets, end of year (000) | | $ | 985,867 | |
Average net assets (000) | | $ | 724,878 | |
Ratios to average net assets(c): | | | | |
Expenses, including distribution and service (12b-1) fees | | | 1.85 | %(d) |
Expenses, excluding distribution and service (12b-1) fees | | | .85 | %(d) |
Net investment loss | | | (.90 | )%(d) |
| (a) | Calculated based upon average daily shares outstanding during the year. |
| (b) | Total return does not consider the effects of sales loads. Total return is calculated assuming a purchase of a share on the first day and a sale on the last day of each year reported, and includes reinvestment of dividends and distributions. Total returns may reflect adjustments to conform to generally accepted accounting principles. |
| (c) | Does not include the expenses of the underlying fund in which the Fund invests. |
| (d) | Through September 30, 2008, the manager of the Fund has contractually agreed to waive 0.05 of 1% of the management fee rate on average daily net assets over $2 billion. Effective October 1, 2008 through September 30, 2009, the manager of the Fund has contractually agreed to waive 0.05 of 1% of the management fee rate on average daily net assets over $4 billion. |
See Notes to Financial Statements.
| | |
| 40 | | Visit our website at www.jennisondryden.com |
| | | | | | | | | | | | | | |
| Class C | |
| Year Ended May 31, | |
| 2007(a) | | | 2006(a) | | | 2005 | | | 2004 | |
| | | | | | | | | | | | | | |
| $ | 42.70 | | | $ | 27.13 | | | $ | 20.99 | | | $ | 17.09 | |
| | | | | | | | | | | | | | | |
| | | | | | | | | | | | | | |
| | (.34 | ) | | | (.15 | ) | | | (.09 | ) | | | (.20 | ) |
| | 9.79 | | | | 18.05 | | | | 6.84 | | | | 4.46 | |
| | | | | | | | | | | | | | | |
| | 9.45 | | | | 17.90 | | | | 6.75 | | | | 4.26 | |
| | | | | | | | | | | | | | | |
| | | | | | | | | | | | | | |
| | (.11 | ) | | | (.09 | ) | | | — | | | | (.24 | ) |
| | (5.14 | ) | | | (2.24 | ) | | | (.61 | ) | | | (.12 | ) |
| | | | | | | | | | | | | | | |
| | (5.25 | ) | | | (2.33 | ) | | | (.61 | ) | | | (.36 | ) |
| | | | | | | | | | | | | | | |
| $ | 46.90 | | | $ | 42.70 | | | $ | 27.13 | | | $ | 20.99 | |
| | | | | | | | | | | | | | | |
| | 24.10 | % | | | 67.84 | % | | | 32.30 | % | | | 25.28 | % |
| | | | | | | | | | | | | | |
| $ | 550,097 | | | $ | 406,571 | | | $ | 138,176 | | | $ | 32,612 | |
| $ | 428,643 | | | $ | 261,145 | | | $ | 79,352 | | | $ | 16,347 | |
| | | | | | | | | | | | | | |
| | 1.94 | % | | | 1.89 | % | | | 1.97 | % | | | 2.16 | % |
| | .94 | % | | | .89 | % | | | .97 | % | | | 1.16 | % |
| | (.82 | )% | | | (.40 | )% | | | (.37 | )% | | | (1.00 | )% |
See Notes to Financial Statements.
| | |
| Jennison Natural Resources Fund, Inc. | | 41 |
Financial Highlights
continued
| | | | | | | | |
| | | Class R | |
| | | Year
Ended
May 31, 2008(b) | | | August 22, 2006(a)
through
May 31, 2007(b) | |
Per Share Operating Performance: | | | | | | | | |
Net Asset Value, Beginning Of Period | | $ | 53.96 | | | $ | 47.85 | |
| | | | | | | | |
Income (loss) from investment operations: | | | | | | | | |
Net investment loss | | | (.37 | ) | | | (.08 | ) |
Net realized and unrealized gain on investment and foreign currency transactions | | | 19.74 | | | | 11.63 | |
| | | | | | | | |
Total from investment operations | | | 19.37 | | | | 11.55 | |
| | | | | | | | |
Less Dividends and Distributions: | | | | | | | | |
Dividends from net investment income | | | (2.41 | ) | | | (.30 | ) |
Distributions from net realized gains on investments | | | (2.64 | ) | | | (5.14 | ) |
| | | | | | | | |
Total dividends and distributions | | | (5.05 | ) | | | (5.44 | ) |
| | | | | | | | |
Net asset value, end of period | | $ | 68.28 | | | $ | 53.96 | |
| | | | | | | | |
Total Return(c): | | | 37.82 | % | | | 25.98 | % |
Ratios/Supplemental Data: | | | | | | | | |
Net assets, end of period (000) | | $ | 15,328 | | | $ | 2,565 | |
Average net assets (000) | | $ | 6,730 | | | $ | 626 | |
Ratios to average net assets(d): | | | | | | | | |
Expenses, including distribution and service (12b-1) fees(e) | | | 1.35 | %(f) | | | 1.44 | %(g) |
Expenses, excluding distribution and service (12b-1) fees | | | .85 | %(f) | | | .94 | %(g) |
Net investment loss | | | (.62 | )%(f) | | | (.24 | )%(g) |
| (a) | Inception date of Class R shares. |
| (b) | Calculated based upon average daily shares outstanding during the period. |
| (c) | Total return is calculated assuming a purchase of a share on the first day and a sale on the last day of each period reported, and includes reinvestment of dividends and distributions. Total returns may reflect adjustments to conform to generally accepted accounting principles. Total returns for periods less than one full year are not annualized. |
| (d) | Does not include the expenses of the underlying fund in which the Fund invests. |
| (e) | The distributor of the Fund has contractually agreed to September 30, 2009 to limit its distribution and service (12b-1) fees to .50 of 1% of the average daily net assets of the Class R shares. |
| (f) | Through September 30, 2008, the manager of the Fund has contractually agreed to waive 0.05 of 1% of the management fee rate on average daily net assets over $2 billion. Effective October 1, 2008 through September 30, 2009, the manager of the Fund has contractually agreed to waive 0.05 of 1% of the management fee rate on average daily net assets over $4 billion. |
See Notes to Financial Statements.
| | |
| 42 | | Visit our website at www.jennisondryden.com |
This Page Intentionally Left Blank
Financial Highlights
continued
| | | | |
| | | Class Z | |
| | | Year Ended
May 31, 2008(a) | |
Per Share Operating Performance: | | | | |
Net Asset Value, Beginning Of Year | | $ | 54.99 | |
| | | | |
Income (loss) from investment operations: | | | | |
Net investment income | | | .05 | |
Net realized and unrealized gain on investment and foreign currency transactions | | | 20.05 | |
| | | | |
Total from investment operations | | | 20.10 | |
| | | | |
Less Dividends and Distributions: | | | | |
Dividends from net investment income | | | (2.55 | ) |
Distributions from net realized gains on investments | | | (2.64 | ) |
| | | | |
Total dividends and distributions | | | (5.19 | ) |
| | | | |
Net asset value, end of year | | $ | 69.90 | |
| | | | |
Total Return(b): | | | 38.53 | % |
Ratios/Supplemental Data: | | | | |
Net assets, end of year (000) | | $ | 719,348 | |
Average net assets (000) | | $ | 503,262 | |
Ratios to average net assets(d): | | | | |
Expenses, including distribution and service (12b-1) fees | | | .85 | %(e) |
Expenses, excluding distribution and service (12b-1) fees | | | .85 | %(e) |
Net investment income (loss) | | | .08 | %(e) |
| (a) | Calculated based upon average daily shares outstanding during the year. |
| (b) | Total return is calculated assuming a purchase of a share on the first day and a sale on the last day of each year reported, and includes reinvestment of dividends and distributions. Total returns may reflect adjustments to conform to generally accepted accounting principles. |
| (c) | Less than $.005 per share. |
| (d) | Does not include the expenses of the underlying fund in which the Fund invests. |
| (e) | Through September 30, 2008, the manager of the Fund has contractually agreed to waive 0.05 of 1% of the management fee rate on average daily net assets over $2 billion. Effective October 1, 2008 through September 30, 2009, the manager of the Fund has contractually agreed to waive 0.05 of 1% of the management fee rate on average daily net assets over $4 billion. |
See Notes to Financial Statements.
| | |
| 44 | | Visit our website at www.jennisondryden.com |
| | | | | | | | | | | | | | |
| Class Z | |
| Year Ended May 31, | |
| 2007(a) | | | 2006(a) | | | 2005 | | | 2004 | |
| | | | | | | | | | | | | | |
| $ | 49.12 | | | $ | 30.87 | | | $ | 23.70 | | | $ | 19.24 | |
| | | | | | | | | | | | | | | |
| | | | | | | | | | | | | | |
| | .08 | | | | .26 | | | | .19 | | | | — | (c) |
| | 11.46 | | | | 20.60 | | | | 7.74 | | | | 5.02 | |
| | | | | | | | | | | | | | | |
| | 11.54 | | | | 20.86 | | | | 7.93 | | | | 5.02 | |
| | | | | | | | | | | | | | | |
| | | | | | | | | | | | | | |
| | (.53 | ) | | | (.37 | ) | | | (.15 | ) | | | (.44 | ) |
| | (5.14 | ) | | | (2.24 | ) | | | (.61 | ) | | | (.12 | ) |
| | | | | | | | | | | | | | | |
| | (5.67 | ) | | | (2.61 | ) | | | (.76 | ) | | | (.56 | ) |
| | | | | | | | | | | | | | | |
| $ | 54.99 | | | $ | 49.12 | | | $ | 30.87 | | | $ | 23.70 | |
| | | | | | | | | | | | | | | |
| | 25.39 | % | | | 69.44 | % | | | 33.64 | % | | | 26.49 | % |
| | | | | | | | | | | | | | |
| $ | 355,928 | | | $ | 270,375 | | | $ | 109,569 | | | $ | 44,663 | |
| $ | 283,266 | | | $ | 179,109 | | | $ | 83,864 | | | $ | 25,894 | |
| | | | | | | | | | | | | | |
| | .94 | % | | | .89 | % | | | .97 | % | | | 1.16 | % |
| | .94 | % | | | .89 | % | | | .97 | % | | | 1.16 | % |
| | .18 | % | | | .60 | % | | | .65 | % | | | (.02 | )% |
See Notes to Financial Statements.
| | |
| Jennison Natural Resources Fund, Inc. | | 45 |
Report of Independent Registered Public Accounting Firm
The Board of Directors and Shareholders of
Jennison Natural Resources Fund, Inc.:
We have audited the accompanying statement of assets and liabilities of the Jennison Natural Resources Fund, Inc. (hereafter referred to as the “Fund”), including the portfolio of investments, as of May 31, 2008, and the related statement of operations for the year then ended, the statement of changes in net assets for each of the years in the two-year period then ended and the financial highlights for each of the years in the five-year period then ended. These financial statements and financial highlights are the responsibility of the Fund’s management. Our responsibility is to express an opinion on these financial statements and financial highlights based on our audits.
We conducted our audits in accordance with the standards of the Public Company Accounting Oversight Board (United States). Those standards require that we plan and perform the audit to obtain reasonable assurance about whether the financial statements and financial highlights are free of material misstatement. An audit includes examining, on a test basis, evidence supporting the amounts and disclosures in the financial statements. Our procedures included confirmation of securities owned as of May 31, 2008, by correspondence with the custodian and brokers or by other appropriate audit procedures when replies from brokers were not received. An audit also includes assessing the accounting principles used and significant estimates made by management, as well as evaluating the overall financial statement presentation. We believe that our audits provide a reasonable basis for our opinion.
In our opinion, the financial statements and financial highlights referred to above present fairly, in all material respects, the financial position of the Fund as of May 31, 2008, and the results of its operations for the year then ended, the changes in its net assets for each of the years in the two-year period then ended and the financial highlights for each of the years in the five-year period then ended, in conformity with U.S. generally accepted accounting principles.

New York, New York
July 25, 2008
| | |
| 46 | | Visit our website at www.jennisondryden.com |
Tax Information
(Unaudited)
As required by the Internal Revenue Code, we wish to advise you as to the federal status of dividends and distributions paid by the Fund during its fiscal year ended May 31, 2008.
During the fiscal year ended May 31, 2008, the Fund paid dividends and distributions as follows:
| | | | | | | | | | | | | | | |
| | | Class |
| | | A | | B | | C | | R | | Z |
Ordinary Income | | $ | 3.371 | | $ | 3.057 | | $ | 3.057 | | $ | 3.346 | | $ | 3.493 |
Long-Term Capital Gains | | | 1.701 | | | 1.701 | | | 1.701 | | | 1.701 | | | 1.701 |
| | | | | | | | | | | | | | | |
| | $ | 5.072 | | $ | 4.758 | | $ | 4.758 | | $ | 5.047 | | $ | 5.194 |
| | | | | | | | | | | | | | | |
Further, we wish to advise you that 5.43% of ordinary income dividends paid during the fiscal year ended May 31, 2008 qualified for the corporate dividends received deduction available to corporate taxpayers.
For the fiscal year ended May 31, 2008, the Fund designated 28.43% as qualified dividend income for the reduced tax rate under the Jobs and Growth Tax Relief Reconciliation Act of 2003.
For the fiscal year ended May 31, 2008, the Fund designated 68.05% of the ordinary income dividends as short-term capital gain dividends under The American Jobs Creation Act of 2004.
Interest-related dividends and short-term capital gain dividends do not include any distributions paid by a Fund with respect to Fund tax years beginning after December 31, 2007. Consequently, this provision expires with respect such distributions paid after the Fund’s fiscal year ended May 31, 2008.
In January 2009, you will be advised on IRS Form 1099 DIV or Substitute 1099 DIV as to federal tax status of the dividends and distributions received by you in calendar year 2008.
| | |
| Jennison Natural Resources Fund, Inc. | | 47 |
Management of the Fund
(Unaudited)
Information about Fund Directors/Trustees (referred to herein as “Board Members”) and Fund Officers is set forth below. Board Members who are not deemed to be “interested persons,” as defined in the 1940 Act, are referred to as “Independent Board Members.” Board Members who are deemed to be “interested persons” are referred to as “Interested Board Members.” The Board Members are responsible for the overall supervision of the operations of the Fund and perform the various duties imposed on the directors or trustees of investment companies by the 1940 Act.
| | | | |
| Independent Board Members |
Name, Address, Age Position(s)
Portfolios Overseen (1) | | Principal Occupation(s) During Past Five
Years | | Other Directorships Held |
Kevin J. Bannon (56) Board Member Portfolios Overseen: 61 | | Managing Director (since April 2008) of Highmount Capital LLC (registered investment adviser); formerly Executive Vice President and Chief Investment Officer (January 2003-August 2007) of Bank of New York Company; President (May 2003-May 2007) of BNY Hamilton Family of Mutual Funds. | | None. |
Linda W. Bynoe (56) Board Member Portfolios Overseen: 61 | | President and Chief Executive Officer (since March 1995) of Telemat Ltd. (management consulting); formerly Vice President at Morgan Stanley & Co. (broker-dealer). | | Director of Simon Property Group, Inc. (real estate investment trust) (since May 2003); Anixter International (communication products distributor) (since January 2006); Director of Northern Trust Corporation (banking) (since April 2006). |
David E.A. Carson (73) Board Member Portfolios Overseen: 63 | | Director (since May 2008) of Liberty Bank; Director (since October 2007) of ICI Mutual Insurance Company. | | Formerly President, Chairman and Chief Executive Officer of People’s Bank (1987-2000). |
Michael S. Hyland, CFA
(62) Board Member Portfolios Overseen: 61 | | Independent Consultant (since February 2005); formerly Senior Managing Director (July 2001-February 2005) of Bear Stearns & Co, Inc. | | None. |
Robert E. La Blanc (74) Board Member Portfolios Overseen: 62 | | President (since 1981) of Robert E. La Blanc Associates, Inc. (telecommunications). | | Director of CA, Inc. (since 2002) (software company); FiberNet Telecom Group, Inc. (since 2003) (telecom company). |
Douglas H. McCorkindale
(69) Board Member Portfolios Overseen: 61 | | Formerly Chairman (February 2001-June 2006), Chief Executive Officer (June 2000-July 2005), President (September 1997-July 2005) and Vice Chairman (March 1984-May 2000) of Gannett Co. Inc. (publishing and media). | | Director of Continental Airlines, Inc. (since May 1993); Director of Lockheed Martin Corp. (aerospace and defense) (since May 2001). |
| | |
| 48 | | Visit our website at www.jennisondryden.com |
| | | | |
Stephen P. Munn (66) Board Member Portfolios Overseen: 61 | | Lead Director (since 2007) and formerly Chairman (1993-2007) of Carlisle Companies Incorporated (manufacturer of industrial products). | | None. |
Richard A. Redeker (64) Board Member & Portfolios Overseen: 62 | | Retired Mutual Fund Executive (36 years); Management Consultant; Director of Penn Tank Lines, Inc. (since 1999). | | None. |
Robin B. Smith (68) Board Member Independent Chair Portfolios Overseen: 62 | | Chairman of the Board (since January 2003) of Publishers Clearing House (direct marketing); formerly Chairman and Chief Executive Officer (August 1996-January 2003) of Publishers Clearing House. | | Formerly Director of BellSouth Corporation (telecommunications) (1992-2006). |
Stephen G. Stoneburn (65) Board Member Portfolios Overseen: 62 | | President and Chief Executive Officer (since June 1996) of Quadrant Media Corp. (publishing company); formerly President (June 1995-June 1996) of Argus Integrated Media, Inc.; Senior Vice President and Managing Director (January 1993-1995) of Cowles Business Media; Senior Vice President of Fairchild Publications, Inc. (1975-1989). | | None. |
| | | | |
| Interested Board Members | | | | |
Judy A. Rice (60) Board Member & President Portfolios Overseen: 61 | | President, Chief Executive Officer, Chief Operating Officer and Officer-In-Charge (since February 2003) of Prudential Investments LLC; President, Chief Executive Officer and Officer-In-Charge (since April 2003) of Prudential Mutual Fund Services LLC; formerly Vice President (February 1999-April 2006) of Prudential Investment Management Services LLC; formerly President, Chief Executive Officer, Chief Operating Officer and Officer-In-Charge (May 2003-June 2005) and Director (May 2003-March 2006) and Executive Vice President (June 2005-March 2006) of AST Investment Services, Inc.; Member of Board of Governors of the Investment Company Institute. | | None. |
| | |
| Jennison Natural Resources Fund, Inc. | | 49 |
| | | | |
Robert F. Gunia (61) Board Member & Vice
President Portfolios Overseen: 147 | | Chief Administrative Officer (since September 1999) and Executive Vice President (since December 1996) of Prudential Investments LLC; President (since April 1999) of Prudential Investment Management Services LLC; Executive Vice President (since March 1999) and Treasurer (since May 2000) of Prudential Mutual Fund Services LLC; Chief Administrative Officer, Executive Vice President and Director (since May 2003) of AST Investment Services, Inc. | | Director (since May 1989) of The Asia Pacific Fund, Inc. and Vice President (since January 2007) of The Greater China Fund, Inc. |
1 The year that each Board Member joined the Fund’s Board is as follows: Kevin J. Bannon, 2008; Linda W. Bynoe, 2005; David E.A. Carson, 2003; Michael S. Hyland, 2008; Robert E. La Blanc, 2003; Douglas H. McCorkindale, 2000; Stephen P. Munn, 2008; Richard A. Redeker, 2000; Robin B. Smith, 1996; Stephen G. Stoneburn, 2003; Judy A. Rice, Board Member since 2000 and President since 2003; Robert F. Gunia, Board Member since 1996 and Vice President since 1999.
| | |
| Fund Officers (a)(1) | | |
Name, Address and Age
Position with Fund | | Principal Occupation(s) During Past Five Years |
Kathryn L. Quirk (55) Chief Legal Officer | | Vice President and Corporate Counsel (since September 2004) of Prudential; Executive Vice President, Chief Legal Officer and Secretary (since July 2005) of PI and Prudential Mutual Fund Services LLC; Vice President and Corporate Counsel (since June 2005) and Secretary (since February 2006) of AST Investment Services, Inc.; formerly Senior Vice President and Assistant Secretary (November 2004-August 2005) of PI; formerly Assistant Secretary (June 2005-February 2006) of AST Investment Services, Inc.; formerly Managing Director, General Counsel, Chief Compliance Officer, Chief Risk Officer and Corporate Secretary (1997-2002) of Zurich Scudder Investments, Inc. |
Deborah A. Docs (50) Secretary | | Vice President and Corporate Counsel (since January 2001) of Prudential; Vice President (since December 1996) and Assistant Secretary (since March 1999) of PI; formerly Vice President and Assistant Secretary (May 2003-June 2005) of AST Investment Services, Inc. |
Jonathan D. Shain (49) Assistant Secretary | | Vice President and Corporate Counsel (since August 1998) of Prudential; Vice President and Assistant Secretary (since May 2001) of PI; Vice President and Assistant Secretary (since February 2001) of PMFS; formerly Vice President and Assistant Secretary (May 2003-June 2005) of AST Investment Services, Inc. |
Claudia DiGiacomo (33) Assistant Secretary | | Vice President and Corporate Counsel (since January 2005) of Prudential; Vice President and Assistant Secretary of PI (since December 2005); Associate at Sidley Austin Brown & Wood LLP (1999-2004). |
John P. Schwartz (37) Assistant Secretary | | Vice President and Corporate Counsel (since April 2005) of Prudential; Vice President and Assistant Secretary of PI (since December 2005); Associate at Sidley Austin Brown & Wood LLP (1997-2005). |
| | |
| 50 | | Visit our website at www.jennisondryden.com |
| | |
Andrew R. French (45) Assistant Secretary | | Director and Corporate Counsel (since May 2006) of Prudential; Vice President and Assistant Secretary (since January 2007) of PI; Vice President and Assistant Secretary (since January 2007) of PMFS; formerly Senior Legal Analyst of Prudential Mutual Fund Law Department (1997-2006). |
Timothy J. Knierim (49) Chief Compliance Officer | | Chief Compliance Officer of Prudential Investment Management, Inc. (since July 2007); formerly Chief Risk Officer of PIM and PI (2002-2007) and formerly Chief Ethics Officer of PIM and PI (2006-2007). |
Valerie M. Simpson (50) Deputy Chief Compliance Officer | | Chief Compliance Officer (since April 2007) of PI and AST Investment Services, Inc.; formerly Vice President-Financial Reporting (June 1999-March 2006) for Prudential Life and Annuities Finance. |
Theresa C. Thompson (46) Deputy Chief Compliance Officer | | Vice President, Mutual Fund Compliance, PI (since April 2004); and Director, Compliance, PI (2001-2004). |
Noreen M. Fierro (43) Anti-Money Laundering Compliance Officer | | Vice President, Corporate Compliance (since May 2006) of Prudential; formerly Corporate Vice President, Associate General Counsel (April 2002-May 2005) of UBS Financial Services, Inc., in their Money Laundering Prevention Group; Senior Manager (May 2005-May 2006) of Deloitte Financial Advisory Services, LLP, in their Forensic and Dispute Services, Anti-Money Laundering Group. |
Grace C. Torres (49) Treasurer and Principal Financial and Accounting Officer | | Assistant Treasurer (since March 1999) and Senior Vice President (since September 1999) of PI; Assistant Treasurer (since May 2003) and Vice President (since June 2005) of AST Investment Services, Inc.; Senior Vice President and Assistant Treasurer (since May 2003) of Prudential Annuities Advisory Services, Inc.; formerly Senior Vice President (May 2003-June 2005) of AST Investment Services, Inc. |
M. Sadiq Peshimam (44) Assistant Treasurer | | Vice President (since 2005) and Director (2000-2005) within Prudential Mutual Fund Administration. |
Peter Parrella (49) Assistant Treasurer | | Vice President (since 2007) and Director (2004-2007) within Prudential Mutual Fund Administration; formerly Tax Manager at SSB Citi Fund Management LLC (1997-2004). |
(a) | Excludes interested Board Members who also serves as President or Vice President. |
1 | The year each individual became an officer of the Fund is as follows: |
Kathryn L. Quirk, 2005; Deborah A. Docs, 2005; Jonathan D. Shain, 2005; Claudia DiGiacomo, 2005; John P. Schwartz, 2006; Andrew R. French, 2006; Timothy J. Knierim, 2007; Valerie M. Simpson, 2007; Theresa C. Thompson, 2008; Noreen M. Fierro, 2006; Grace C. Torres, 1997; M. Sadiq Peshimam, 2006; Peter Parrella, 2007.
| | |
| Jennison Natural Resources Fund, Inc. | | 51 |
Explanatory Notes
¡ Board Members are deemed to be “Interested,” as defined in the 1940 Act, by reason of their affiliation with Prudential Investments LLC and/or an affiliate of Prudential Investments LLC.
¡ Unless otherwise noted, the address of all Board Members and Officers is c/o Prudential Investments LLC, Gateway Center Three, 100 Mulberry Street, Newark, New Jersey 07102.
¡ There is no set term of office for Board Members or Officers. The Board Members have adopted a retirement policy, which calls for the retirement of Board Members on December 31st of the year in which they reach the age of 75.
¡ “Other Directorships Held” includes only directorships of companies required to register or file reports with the SEC under the Securities Exchange Act of 1934 (that is, “public companies”) or other investment companies registered under the 1940 Act.
¡ “Portfolios Overseen” includes all investment companies managed by Prudential Investments LLC. The investment companies for which PI serves as manager include the JennisonDryden Funds, Strategic Partners Funds, The Prudential Variable Contract Accounts, The Target Portfolio Trust, The Prudential Series Fund, The High Yield Income Fund, Inc., The High Yield Plus Fund, Inc., Nicholas-Applegate Fund, Inc., Prudential’s Gibraltar Fund, Inc. and The Advanced Series Trust.
| | |
| 52 | | Visit our website at www.jennisondryden.com |
Growth of a $10,000 Investment
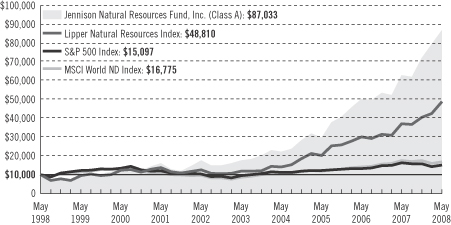
| | | | | | | | | | | |
| Average Annual Total Returns (With Sales Charges) as of 5/31/08 | | | |
| | | One Year | | | Five Years | | | Ten Years | | | Since Inception |
Class A | | 30.55 | % | | 35.95 | % | | 24.16 | % | | — |
Class B | | 32.14 | | | 36.42 | | | 23.93 | | | — |
Class C | | 36.14 | | | 36.48 | | | 23.93 | | | — |
Class R | | 37.82 | | | N/A | | | N/A | | | 36.41% (8/22/06) |
Class Z | | 38.53 | | | 37.84 | | | 25.18 | | | — |
| | | | | | | | | | | |
| Average Annual Total Returns (Without Sales Charges) as of 5/31/08 | | | |
| | | One Year | | | Five Years | | | Ten Years | | | Since Inception |
Class A | | 38.15 | % | | 37.50 | % | | 24.86 | % | | — |
Class B | | 37.14 | | | 36.48 | | | 23.93 | | | — |
Class C | | 37.14 | | | 36.48 | | | 23.93 | | | — |
Class R | | 37.82 | | | N/A | | | N/A | | | 36.41% (8/22/06) |
Class Z | | 38.53 | | | 37.84 | | | 25.18 | | | — |
Performance data quoted represent past performance. Past performance does not guarantee future results. The investment return and principal value of an investment will fluctuate, so that an investor’s shares, when redeemed, may be worth more or less than their original cost. Current performance may be lower or higher than the past performance data quoted. An investor may obtain performance data current to the most recent month-end by visiting our website at www.jennisondryden.com or by calling (800) 225-1852. The maximum initial sales charge is 5.50% (Class A shares).
Gross operating expenses: Class A, 1.17%; Class B, 1.87%; Class C, 1.87%; Class R, 1.62%; Class Z, 0.87%. Net operating expenses apply to: Class A, 1.14%; Class B, 1.85%; Class C, 1.85%; Class R, 1.35%; Class Z, 0.85%, after contractual reductions.*
| | |
| | Visit our website at www.jennisondryden.com |
Source: Prudential Investments LLC and Lipper Inc.
Inception date returns are provided for any share class with less than 10 calendar years of returns.
The graph compares a $10,000 investment in the Jennison Natural Resources Fund, Inc. (Class A shares) with a similar investment in the Lipper Natural Resources Index, Morgan Stanley Capital International World Net Dividends Index (MSCI World ND Index) and the Standard & Poor’s 500 Composite Stock Price Index (S&P 500 Index) by portraying the initial account values at the beginning of the 10-year period for Class A shares (May 31, 1998) and the account values at the end of the current fiscal year (May 31, 2008) as measured on a quarterly basis. For purposes of the graph, and unless otherwise indicated, it has been assumed that (a) the maximum applicable front-end sales charge was deducted from the initial $10,000 investment in Class A shares; (b) all recurring fees (including management fees) were deducted; and (c) all dividends and distributions were reinvested. The line graph provides information for Class A shares only. As indicated in the tables provided earlier, performance for Class B, C, R, and Z shares will vary due to the differing charges and expenses applicable to each share class (as indicated in the following paragraphs). Without a distribution and service (12b-1) fee waiver of 0.05% for Class A shares which expired September 30, 2007, the returns shown in the graph and for Class A shares in the tables would have been lower.
The Lipper Natural Resources Index is an unmanaged index which tracks the performance of the 30 largest natural resources mutual funds. MSCI World ND Index is a free float-adjusted, market-capitalization index that is designed to measure global developed market equity performance. The MSCI World ND Index consists of approximately 23 developed market indexes in Australia, Canada, Europe, the Far East, New Zealand, and the United States. The S&P 500 Index is an unmanaged index of 500 stocks of large U.S. public companies. It gives a broad look at how stock prices have performed in the United States. The Indexes’ total returns include the reinvestment of all dividends, but do not include the effects of sales charges, operating expenses of a mutual fund, or taxes that may be paid by an investor. The returns for the Indexes would be lower if they included the effects of sales charges, operating expenses, or taxes. The securities that comprise the Indexes may differ substantially from the securities in the Fund. These are not the only indexes that may be used to characterize performance of sector stock funds. Other indexes may portray different comparative performance. Investors cannot invest directly in an index.
Class A shares are subject to a maximum front-end sales charge of 5.50%, a 12b-1 fee of up to 0.30% annually, and all investors who purchase Class A shares in an amount of $1 million or more and sell these shares within 12 months of purchase are not subject to an initial sales charge but are subject to a contingent deferred sales charge (CDSC) of 1%. Class B shares are subject to a declining CDSC of 5%, 4%, 3%, 2%, 1%, and 1%, respectively for the first six years after purchase and a 12b-1 fee of 1% annually. Approximately seven years after purchase, Class B shares will automatically convert to Class A shares on a quarterly basis. Class C shares are subject to a CDSC of 1% for shares sold within 12 months from the date of purchase and an annual 12b-1 fee of 1%. Class R shares are not subject to a sales charge, but are subject to a 12b-1 fee of up to 0.75% annually. Class Z shares are not subject to a sales charge or 12b-1 fees. The returns in the graph and tables reflect the share class expense structure in effect at the close of the fiscal period. The returns in the graph and the tables do not reflect the deduction of taxes that a shareholder would pay on Fund distributions or following the redemption of Fund shares.
*For the period through September 30, 2007, the distributor of the Fund has contractually agreed to limit distribution and (12b-1) fees to 0.25% of the average daily net assets for Class A shares. However, effective October 1, 2007 such waiver has been terminated. Class R shares distribution and (12b-1) fees will continue to be limited to 0.50% of the average daily net assets to September 30, 2009. Through September 30, 2008 the manager of the Fund has contractually agreed to waive 0.05% of the management fee rate on average daily net assets over $2 billion. Effective October 1, 2008 through September 30, 2009, the manager of the Fund has contractually agreed to waive 0.05% of the management fee rate on average daily net assets over $4 billion.
| | |
| Jennison Natural Resources Fund, Inc. | | |
| | | | |
| n MAIL | | n TELEPHONE | | n WEBSITE |
Gateway Center Three
100 Mulberry Street
Newark, NJ 07102 | | (800) 225-1852
| | www.jennisondryden.com |
|
| PROXY VOTING |
| The Board of Directors of the Fund has delegated to the Fund’s investment subadviser the responsibility for voting any proxies and maintaining proxy recordkeeping with respect to the Fund. A description of these proxy voting policies and procedures is available without charge, upon request, by calling (800) 225-1852 or by visiting the Securities and Exchange Commission’s website at www.sec.gov. Information regarding how the Fund voted proxies relating to portfolio securities during the most recent 12-month period ended June 30 is available on the Fund’s website and on the Commission’s website. |
|
| DIRECTORS |
| Kevin J. Bannon • Linda W. Bynoe • David E.A. Carson • Robert F. Gunia • Michael S. Hyland • Robert E. La Blanc • Douglas H. McCorkindale • Stephen P. Munn • Richard A. Redeker • Judy A. Rice • Robin B. Smith • Stephen G. Stoneburn |
|
| OFFICERS |
| Judy A. Rice, President • Robert F. Gunia, Vice President • Grace C. Torres, Treasurer and Principal Financial and Accounting Officer • Kathryn L. Quirk, Chief Legal Officer • Deborah A. Docs, Secretary • Timothy J. Knierim, Chief Compliance Officer • Valerie M. Simpson, Deputy Chief Compliance Officer • Theresa C. Thompson, Deputy Chief Compliance Officer • Noreen M. Fierro, Anti-Money Laundering Compliance Officer • Jonathan D. Shain, Assistant Secretary • Claudia DiGiacomo, Assistant Secretary • John P. Schwartz, Assistant Secretary • Andrew R. French, Assistant Secretary • M. Sadiq Peshimam, Assistant Treasurer • Peter Parrella, Assistant Treasurer |
| | | | |
| MANAGER | | Prudential Investments LLC | | Gateway Center Three
100 Mulberry Street Newark, NJ 07102 |
|
| INVESTMENT SUBADVISER | | Jennison Associates LLC | | 466 Lexington Avenue
New York, NY 10017 |
|
| DISTRIBUTOR | | Prudential Investment
Management Services LLC | | Gateway Center Three
100 Mulberry Street Newark, NJ 07102 |
|
| CUSTODIAN | | The Bank of New York | | One Wall Street
New York, NY 10286 |
|
| TRANSFER AGENT | | Prudential Mutual Fund
Services LLC | | PO Box 9658
Providence, RI 02940 |
|
| INDEPENDENT REGISTERED PUBLIC ACCOUNTING FIRM | | KPMG LLP | | 345 Park Avenue
New York, NY 10154 |
|
| FUND COUNSEL | | Sullivan & Cromwell LLP | | 125 Broad Street
New York, NY 10004 |
|
| An investor should consider the investment objectives, risks, charges, and expenses of the Fund carefully before investing. The prospectus for the Fund contains this and other information about the Fund. An investor may obtain a prospectus by visiting our website at www.jennisondryden.com or by calling (800) 225-1852. The prospectus should be read carefully before investing. |
|
| E-DELIVERY |
| To receive your mutual fund documents on-line, go to www.icsdelivery.com/prudential/funds and enroll. Instead of receiving printed documents by mail, you will receive notification via e-mail when new materials are available. You can cancel your enrollment or change your e-mail address at any time by clicking on the change/cancel enrollment option at the icsdelivery website address. |
|
| SHAREHOLDER COMMUNICATIONS WITH DIRECTORS |
| Shareholders can communicate directly with the Board of Directors by writing to the Chair of the Board, Jennison Natural Resources Fund, Inc., Prudential Investments, Attn: Board of Directors, 100 Mulberry Street, Gateway Center Three, Newark, NJ 07102. Shareholders can communicate directly with an individual Director by writing to the same address. Communications are not screened before being delivered to the addressee. |
|
| AVAILABILITY OF PORTFOLIO SCHEDULE |
| The Fund files its complete schedule of portfolio holdings with the Securities and Exchange Commission for the first and third quarters of each fiscal year on Form N-Q. The Fund’s Forms N-Q are available on the Commission’s website at www.sec.gov. The Fund’s Forms N-Q may also be reviewed and copied at the Commission’s Public Reference Room in Washington, D.C. Information on the operation and location of the Public Reference Room may be obtained by calling (800) SEC-0330 (732-0330). The Fund’s schedule of portfolio holdings is also available on the Fund’s website as of the end of each fiscal quarter. |
|
| The Fund’s Statement of Additional Information contains additional information about the Fund’s Directors and is available without charge, upon request, by calling (800) 225-1852. |
Mutual Funds:
| | | | |
ARE NOT INSURED BY THE FDIC OR ANY
FEDERAL GOVERNMENT AGENCY | | MAY LOSE VALUE | | ARE NOT A DEPOSIT OF OR GUARANTEED
BY ANY BANK OR ANY BANK AFFILIATE |

| | | | | | | | | | | | | | |
| | | Jennison Natural Resources Fund, Inc. | | |
| | | Share Class | | A | | B | | C | | R | | Z | | |
| | NASDAQ | | PGNAX | | PRGNX | | PNRCX | | JNRRX | | PNRZX | | |
| | CUSIP | | 476293105 | | 476293204 | | 476293303 | | 476293501 | | 476293402 | | |
| | | | | | | | | | | | | | |
MF135E IFS-A151457 Ed. 7/2008

Item 2 – Code of Ethics — See Exhibit (a)
As of the end of the period covered by this report, the registrant has adopted a code of ethics (the “Section 406 Standards for Investment Companies – Ethical Standards for Principal Executive and Financial Officers”) that applies to the registrant’s Principal Executive Officer and Principal Financial Officer; the registrant’s Principal Financial Officer also serves as the Principal Accounting Officer.
The registrant hereby undertakes to provide any person, without charge, upon request, a copy of the code of ethics. To request a copy of the code of ethics, contact the registrant 800-225-1852, and ask for a copy of the Section 406 Standards for Investment Companies - Ethical Standards for Principal Executive and Financial Officers.
Item 3 – Audit Committee Financial Expert –
The registrant’s Board has determined that Mr. David E. A. Carson, member of the Board’s Audit Committee is an “audit committee financial expert,” and that he is “independent,” for purposes of this Item.
Item 4 – Principal Accountant Fees and Services –
(a) Audit Fees
For the fiscal years ended May 31, 2008 and May 31, 2007 KPMG LLP (“KPMG”), the Registrant’s principal accountant, billed the Registrant $20,869 and $29,859, respectively, for professional services rendered for the audit of the Registrant’s annual financial statements or services that are normally provided in connection with statutory and regulatory filings.
(b) Audit-Related Fees
None.
(c) Tax Fees
None.
(d) All Other Fees
None.
(e) (1) Audit Committee Pre-Approval Policies and Procedures
THE PRUDENTIAL MUTUAL FUNDS
AUDIT COMMITTEE POLICY
on
Pre-Approval of Services Provided by the Independent Accountants
The Audit Committee of each Prudential Mutual Fund is charged with the responsibility to monitor the independence of the Fund’s independent accountants. As part of this responsibility, the Audit Committee must pre-approve any independent accounting firm’s engagement to render audit and/or permissible non-audit services, as required by law. In evaluating a proposed engagement of the independent accountants, the Audit Committee will assess the effect that the engagement might reasonably be expected to have on the accountant’s independence. The Committee’s evaluation will be based on:
| | • | | a review of the nature of the professional services expected to be provided, |
| | • | | a review of the safeguards put into place by the accounting firm to safeguard independence, and |
| | • | | periodic meetings with the accounting firm. |
Policy for Audit and Non-Audit Services Provided to the Funds
On an annual basis, the scope of audits for each Fund, audit fees and expenses, and audit-related and non-audit services (and fees proposed in respect thereof) proposed to be performed by the Fund’s independent accountants will be presented by the Treasurer and the independent accountants to the Audit Committee for review and, as appropriate, approval prior to the initiation of such services. Such presentation shall be accompanied by confirmation by both the Treasurer and the independent accountants that the proposed services will not adversely affect the independence of the independent accountants. Proposed services shall be described in sufficient detail to enable the Audit Committee to assess the appropriateness of such services and fees, and the compatibility of the provision of such services with the auditor’s independence. The Committee shall receive periodic reports on the progress of the audit and other services which are approved by the Committee or by the Committee Chair pursuant to authority delegated in this Policy.
The categories of services enumerated under “Audit Services”, “Audit-related Services”, and “Tax Services” are intended to provide guidance to the Treasurer and the independent accountants as to those categories of services which the Committee believes are generally consistent with the independence of the independent accountants and which the Committee (or the Committee Chair) would expect upon the presentation of specific proposals to pre-approve. The enumerated categories are not intended as an exclusive list of audit, audit-related or tax services, which the Committee (or the Committee Chair) would consider for pre-approval.
Audit Services
The following categories of audit services are considered to be consistent with the role of the Fund’s independent accountants:
| | • | | Annual Fund financial statement audits |
| | • | | Seed audits (related to new product filings, as required) |
| | • | | SEC and regulatory filings and consents |
Audit-related Services
The following categories of audit-related services are considered to be consistent with the role of the Fund’s independent accountants:
| | • | | Accounting consultations |
| | • | | Fund merger support services |
| | • | | Agreed Upon Procedure Reports |
| | • | | Other Internal Control Reports |
Individual audit-related services that fall within one of these categories and are not presented to the Audit Committee as part of the annual pre-approval process will be subject to pre-approval by the Committee Chair (or any other Committee member on whom this responsibility has been delegated) so long as the estimated fee for those services does not exceed $50,000.
Tax Services
The following categories of tax services are considered to be consistent with the role of the Fund’s independent accountants:
| | • | | Tax compliance services related to the filing or amendment of the following: |
| | • | | Federal, state and local income tax compliance; and, |
| | • | | Sales and use tax compliance |
| | • | | Timely RIC qualification reviews |
| | • | | Tax distribution analysis and planning |
| | • | | Tax authority examination services |
| | • | | Tax appeals support services |
| | • | | Accounting methods studies |
| | • | | Fund merger support services |
| | • | | Tax consulting services and related projects |
Individual tax services that fall within one of these categories and are not presented to the Audit Committee as part of the annual pre-approval process will be subject to pre-approval by the Committee Chair (or any other Committee member on whom this responsibility has been delegated) so long as the estimated fee for those services does not exceed $50,000.
Other Non-audit Services
Certain non-audit services that the independent accountants are legally permitted to render will be subject to pre-approval by the Committee or by one or more Committee members to whom the Committee has delegated this authority and who will report to the full Committee any pre-approval decisions made pursuant to this Policy. Non-audit services presented for pre-approval pursuant to this paragraph will be accompanied by a confirmation from both the Treasurer and the independent accountants that the proposed services will not adversely affect the independence of the independent accountants.
Proscribed Services
The Fund’s independent accountants will not render services in the following categories of non-audit services:
| | • | | Bookkeeping or other services related to the accounting records or financial statements of the Fund |
| | • | | Financial information systems design and implementation |
| | • | | Appraisal or valuation services, fairness opinions, or contribution-in-kind reports |
| | • | | Internal audit outsourcing services |
| | • | | Management functions or human resources |
| | • | | Broker or dealer, investment adviser, or investment banking services |
| | • | | Legal services and expert services unrelated to the audit |
| | • | | Any other service that the Public Company Accounting Oversight Board determines, by regulation, is impermissible. |
Pre-approval of Non-Audit Services Provided to Other Entities Within the Prudential Fund Complex
Certain non-audit services provided to Prudential Investments LLC or any of its affiliates that also provide ongoing services to the Prudential Mutual Funds will be subject to pre-approval by the Audit Committee. The only non-audit services provided to these entities that will require pre-approval are those related directly to the operations and financial reporting of the Funds. Individual projects that are not presented to the Audit Committee as part of the annual pre-approval process will be subject to pre-approval by the Committee Chair (or any other Committee member on whom this responsibility has been delegated) so long as the estimated fee for those services does not exceed $50,000. Services presented for pre-approval pursuant to this paragraph will be accompanied by a confirmation from both the Treasurer and the independent accountants that the proposed services will not adversely affect the independence of the independent accountants.
Although the Audit Committee will not pre-approve all services provided to Prudential Investments LLC and its affiliates, the Committee will receive an annual report from the Fund’s independent accounting firm showing the aggregate fees for all services provided to Prudential Investments and its affiliates.
(e) (2) Percentage of services referred to in 4(b) – 4(d) that were approved by the audit committee –
Not applicable.
(f) Percentage of hours expended attributable to work performed by other than full time employees of principal accountant if greater than 50%.
The percentage of hours expended on the principal accountant’s engagement to audit the registrant’s financial statements for the most recent fiscal year that were attributed to work performed by persons other than the principal accountant’s full-time, permanent employees was 0%.
(g) Non-Audit Fees
Not applicable to Registrant for the fiscal years 2008 and 2007. The aggregate non-audit fees billed by KPMG for services rendered to the registrant’s investment adviser and any entity controlling, controlled by, or under common control with the investment adviser that provides ongoing services to the registrant for the fiscal years 2008 and 2007 was $26,200 and $317,300, respectively.
(h) Principal Accountant’s Independence
Not applicable as KPMG has not provided non-audit services to the registrant’s investment adviser and any entity controlling, controlled by, or under common control with the investment adviser that provides ongoing services to the registrant that were not pre-approved pursuant to Rule 2-01(c)(7)(ii) of Regulation S-X.
Item 5 – Audit Committee of Listed Registrants – Not applicable.
Item 6 – Schedule of Investments – The schedule is included as part of the report to shareholders filed under Item 1 of this Form.
Item 7 – Disclosure of Proxy Voting Policies and Procedures for Closed-End Management Investment Companies – Not applicable.
Item 8 – Portfolio Managers of Closed-End Management Investment Companies – Not applicable.
Item 9 – Purchases of Equity Securities by Closed-End Management Investment Company and Affiliated Purchasers – Not applicable.
Item 10 – Submission of Matters to a Vote of Security Holders – Not applicable.
Item 11 – Controls and Procedures
| | (a) | It is the conclusion of the registrant’s principal executive officer and principal financial officer that the effectiveness of the registrant’s current disclosure controls and procedures (such disclosure controls and procedures having been evaluated within 90 days of the date of this filing) provide reasonable assurance that the information required to be disclosed by the registrant has been recorded, processed, summarized and reported within the time period specified in the Commission’s rules and forms and that the information required to be disclosed by the registrant has been accumulated and communicated to the registrant’s principal executive officer and principal financial officer in order to allow timely decisions regarding required disclosure. |
| | (b) | There has been no significant change in the registrant’s internal control over financial reporting that occurred during the registrant’s most recent fiscal quarter of the period covered by this report that has materially affected, or is likely to materially affect, the registrant’s internal control over financial reporting. |
Item 12 – Exhibits
| | |
| (a) | | (1) Code of Ethics – Attached hereto as Exhibit EX-99.CODE-ETH |
| |
| | (2) Certifications pursuant to Section 302 of the Sarbanes-Oxley Act – Attached hereto as Exhibit EX-99.CERT. (3) Any written solicitation to purchase securities under Rule 23c-1. – Not applicable. |
| |
| (b) | | Certifications pursuant to Section 906 of the Sarbanes-Oxley Act – Attached hereto as Exhibit EX-99.906CERT. |
SIGNATURES
Pursuant to the requirements of the Securities Exchange Act of 1934 and the Investment Company Act of 1940, the registrant has duly caused this report to be signed on its behalf by the undersigned, thereunto duly authorized.
| | | | | | | | |
| (Registrant) Jennison Natural Resources Fund, Inc. | | | | |
| | | |
| By (Signature and Title)* | | /s/ Deborah A. Docs | | | | |
| | Deborah A. Docs | | | | | | |
| | Secretary | | | | | | |
| Date July 24, 2008 | | | | | | |
Pursuant to the requirements of the Securities Exchange Act of 1934 and the Investment Company Act of 1940, this report has been signed below by the following persons on behalf of the registrant and in the capacities and on the dates indicated.
| | | | | | | | |
| By (Signature and Title)* | | /s/ Judy A. Rice | | | | |
| | Judy A. Rice | | | | | | |
| | President and Principal Executive Officer | | | | |
| | | |
| Date July 24, 2008 | | | | | | |
| | | |
| By (Signature and Title)* | | /s/ Grace C. Torres | | | | |
| | Grace C. Torres | | | | | | |
| | Treasurer and Principal Financial Officer | | | | |
| | | |
| Date July 24, 2008 | | | | | | |
* | Print the name and title of each signing officer under his or her signature. |