UNITED STATES
SECURITIES AND EXCHANGE COMMISSION
Washington, D.C. 20549
FORM N-CSR
CERTIFIED SHAREHOLDER REPORT OF REGISTERED
MANAGEMENT INVESTMENT COMPANIES
| | |
| Investment Company Act file number: | | 811-05206 |
| |
| Exact name of registrant as specified in charter: | | Prudential Jennison Natural Resources Fund, Inc. |
| |
| Address of principal executive offices: | | Gateway Center 3, 100 Mulberry Street, Newark, New Jersey 07102 |
| |
| Name and address of agent for service: | | Deborah A. Docs Gateway Center 3, 100 Mulberry Street, Newark, New Jersey 07102 |
| |
| Registrant’s telephone number, including area code: | | 800-225-1852 |
| |
| Date of fiscal year end: | | 10/31/2010 |
| |
| Date of reporting period: | | 10/31/2010 |
Item 1 – Reports to Stockholders

| | |
ANNUAL REPORT | | OCTOBER 31, 2010 |
Prudential Jennison Natural Resources Fund, Inc.
| | | | |
Fund Type Sector stock Objective Long-term growth of capital | | | | This report is not authorized for distribution to prospective investors unless preceded or accompanied by a current prospectus. The views expressed in this report and information about the Fund’s portfolio holdings are for the period covered by this report and are subject to change thereafter. Prudential Investments, Prudential, Jennison, the Prudential logo and the Rock symbol are service marks of Prudential Financial, Inc. and its related entities, registered in many jurisdictions worldwide. |
| | |

| | To enroll in e-delivery, go to www.prudentialfunds.com/edelivery |
December 15, 2010
Dear Shareholder:
We hope you find the annual report for the Prudential Jennison Natural Resources Fund, Inc. informative and useful. Because of ongoing market volatility, we understand that this is a difficult time to be an investor. While it is impossible to predict what the future holds, we continue to believe a prudent response to uncertainty is to maintain a diversified portfolio, including stock and bond mutual funds consistent with your tolerance for risk, time horizon, and financial goals.
A diversified asset allocation offers two potential advantages: It limits your exposure to any particular asset class; plus it provides a better opportunity to invest some of your assets in the right place at the right time. Your financial professional can help you create a diversified investment plan that may include mutual funds covering all the basic asset classes and that reflects your personal investor profile and risk tolerance. Keep in mind that diversification and asset allocation strategies do not assure a profit or protect against loss in declining markets.
Prudential Investments® provides a wide range of mutual funds to choose from that can help you make progress toward your financial goals. Our funds offer the experience, resources, and professional discipline of Prudential Financial’s affiliated asset managers. Most of Prudential Investments’ equity funds are advised by Jennison Associates LLC, Quantitative Management Associates LLC (QMA), or Prudential Real Estate Investors. Prudential Investment Management, Inc. (PIM) advises the Prudential Investments fixed income and money market funds through its Prudential Fixed Income unit. Jennison Associates, QMA, and PIM are registered investment advisers and Prudential Financial companies. Prudential Real Estate Investors is a unit of PIM.
Thank you for choosing the Prudential Investments family of mutual funds.
Sincerely,

Judy A. Rice, President
Prudential Jennison Natural Resources Fund, Inc.
| | | | |
| Prudential Jennison Natural Resources Fund, Inc. | | | 1 | |
Your Fund’s Performance
Performance data quoted represent past performance. Past performance does not guarantee future results. The investment return and principal value of an investment will fluctuate, so that an investor’s shares, when redeemed, may be worth more or less than their original cost. Current performance may be lower or higher than the past performance data quoted. An investor may obtain performance data as of the most recent month-end by visiting our website at www.prudentialfunds.com or by calling (800) 225-1852. The maximum initial sales charge is 5.50% (Class A shares). Gross operating expenses: Class A, 1.20%; Class B, 1.90%; Class C, 1.90%; Class R, 1.65%; Class Z, 0.90%. Net operating expenses: Class A, 1.20%; Class B, 1.90%; Class C, 1.90%; Class R, 1.40%; Class Z, 0.90%, after contractual reduction for Class R through 2/29/2012.
| | | | | | | | | | | | | | | | |
Cumulative Total Returns (Without Sales Charges) as of 10/31/10 | |
| | | One Year | | | Five Years | | | Ten Years | | | Since Inception | |
Class A | | | 24.42 | % | | | 81.15 | % | | | 452.83 | % | | | — | |
Class B | | | 23.55 | | | | 74.76 | | | | 413.51 | | | | — | |
Class C | | | 23.54 | | | | 74.80 | | | | 413.63 | | | | — | |
Class R | | | 24.15 | | | | N/A | | | | N/A | | | | 38.58% (8/22/06) | |
Class Z | | | 24.80 | | | | 83.73 | | | | 467.93 | | | | — | |
Lipper Global Natural Resources Index | | | 13.86 | | | | 37.92 | | | | 249.29 | | | | — | |
MSCI World ND Index | | | 12.74 | | | | 13.39 | | | | 14.12 | | | | — | |
S&P 500 Index | | | 16.54 | | | | 8.99 | | | | –0.14 | | | | — | |
Lipper Global Natural Resources Funds Avg. | | | 10.59 | | | | 38.65 | | | | 276.75 | | | | — | |
| | | | | | | | | | | | | | | | |
Average Annual Total Returns (With Sales Charges) as of 9/30/10 | |
| | | One Year | | | Five Years | | | Ten Years | | | Since Inception | |
Class A | | | 10.20 | % | | | 8.53 | % | | | 16.15 | % | | | — | |
Class B | | | 10.78 | | | | 8.83 | | | | 15.94 | | | | — | |
Class C | | | 14.81 | | | | 8.98 | | | | 15.94 | | | | — | |
Class R | | | 16.38 | | | | N/A | | | | N/A | | | | 7.03% (8/22/06) | |
Class Z | | | 16.96 | | | | 10.07 | | | | 17.12 | | | | — | |
Lipper Global Natural Resources Index | | | 7.03 | | | | 4.06 | | | | 11.92 | | | | — | |
MSCI World ND Index | | | 6.76 | | | | 1.30 | | | | 0.79 | | | | — | |
S&P 500 Index | | | 10.18 | | | | 0.64 | | | | –0.43 | | | | — | |
Lipper Global Natural Resources Funds Avg. | | | 3.38 | | | | 3.86 | | | | 12.11 | | | | — | |
| | |
| 2 | | Visit our website at www.prudentialfunds.com |
| | | | | | | | | | | | | | | | |
Average Annual Total Returns (With Sales Charges) as of 10/31/10 | | | | | |
| | | One Year | | | Five Years | | | Ten Years | | | Since Inception | |
Class A | | | 17.58 | % | | | 11.35 | % | | | 17.98 | % | | | — | |
Class B | | | 18.55 | | | | 11.68 | | | | 17.78 | | | | — | |
Class C | | | 22.54 | | | | 11.82 | | | | 17.78 | | | | — | |
Class R | | | 24.15 | | | | N/A | | | | N/A | | | | 8.09% (8/22/06) | |
Class Z | | | 24.80 | | | | 12.94 | | | | 18.97 | | | | — | |
| | | | | | | | | | | | | | | | |
Average Annual Total Returns (Without Sales Charges) as of 10/31/10 | |
| | | One Year | | | Five Years | | | Ten Years | | | Since Inception | |
Class A | | | 24.42 | % | | | 12.62 | % | | | 18.65 | % | | | — | |
Class B | | | 23.55 | | | | 11.81 | | | | 17.78 | | | | — | |
Class C | | | 23.54 | | | | 11.82 | | | | 17.78 | | | | — | |
Class R | | | 24.15 | | | | N/A | | | | N/A | | | | 8.09% (8/22/06) | |
Class Z | | | 24.80 | | | | 12.94 | | | | 18.97 | | | | — | |
Growth of a $10,000 Investment
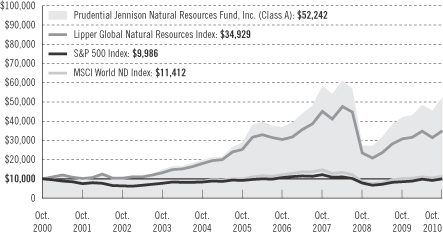
The graph compares a $10,000 investment in the Prudential Jennison Natural Resources Fund, Inc. (Class A shares) with a similar investment in the Lipper Global Natural Resources Index, Morgan Stanley Capital International World Net Dividends Index (MSCI World ND Index), and the Standard & Poor’s 500 Composite Stock Price Index (S&P 500 Index) by portraying the initial account values at the beginning of the 10-year period for Class A shares (October 31, 2000) and the account values at the end of the current fiscal year (October 31, 2010) as measured on a quarterly basis. For purposes of the graph, and unless otherwise indicated, it has been assumed that (a) the maximum applicable front-end sales charge was deducted from the initial $10,000 investment in Class A shares; (b) all recurring fees (including management fees) were deducted; and (c) all
| | | | |
| Prudential Jennison Natural Resources Fund, Inc. | | | 3 | |
Your Fund’s Performance (continued)
dividends and distributions were reinvested. The line graph provides information for Class A shares only. As indicated in the tables provided earlier, performance for Class B, Class C, Class R, and Class Z shares will vary due to the differing charges and expenses applicable to each share class (as indicated in the following paragraphs). Without a distribution and service (12b-1) fee waiver of 0.05% for Class A shares which expired September 30, 2007, the returns shown in the graph and for Class A shares in the tables would have been lower.
Source: Prudential Investments LLC and Lipper Inc. Performance figures may reflect fee waivers and/or expense reimbursements. In the absence of such fee waivers and/or expense reimbursements, total returns would be lower.
Inception returns are provided for any share class with less than 10 calendar years of returns.
The average annual total returns take into account applicable sales charges. Class A shares are subject to a maximum front-end sales charge of 5.50%, a 12b-1 fee of up to 0.30% annually, and all investors who purchase Class A shares in an amount of $1 million or more and sell these shares within 12 months of purchase are not subject to an initial sales charge but are subject to a contingent deferred sales charge (CDSC) of 1%. Class B shares are subject to a declining CDSC of 5%, 4%, 3%, 2%, 1%, and 1%, respectively for the first six years after purchase and a 12b-1 fee of 1% annually. Approximately seven years after purchase, Class B shares will automatically convert to Class A shares on a quarterly basis. Class C shares are subject to a CDSC of 1% for shares sold within 12 months from the date of purchase and an annual 12b-1 fee of 1%. Class R shares are not subject to a sales charge, but are subject to a 12b-1 fee of up to 0.75% annually. Class Z shares are not subject to a sales charge or 12b-1 fees. The returns in the graph and tables reflect the share class expense structure in effect at the close of the fiscal period. The returns in the graph and the tables do not reflect the deduction of taxes that a shareholder would pay on Fund distributions or following the redemption of Fund shares.
For the period through February 29, 2012, the distributor of the Fund has contractually agreed to limit distribution and service (12b-1) fees to 0.50% of the average daily net assets for Class R shares. Through September 30, 2008, the manager of the Fund has contractually agreed to waive 0.05% of the management fee rate on average daily net assets over $2 billion. Effective October 1, 2008 through February 29, 2012, the manager of the Fund has contractually agreed to waive 0.05% of the management fee rate on average daily net assets over $4 billion.
Benchmark Definitions
Lipper Global Natural Resources Index
The Lipper Global Natural Resources Index is an unmanaged index which tracks the performance of the 10 largest global natural resources mutual funds. Lipper Global Natural Resources Index Closest Month-End to Inception cumulative total return as of 10/31/10 is 14.28% for Class R. Lipper Global Natural Resources Index Closest Month-End to Inception average annual total return as of 9/30/10 is 2.17% for Class R.
Morgan Stanley Capital International (MSCI) World Net Dividends (ND) Index
The Morgan Stanley Capital International (MSCI) World Net Dividends (ND) Index is a free float-adjusted, market-capitalization index that is designed to measure global developed market equity performance. The MSCI World ND Index consists of approximately 23 developed market indexes in Australia, Canada, Europe, the Far East, New Zealand, and the United States. MSCI World ND Index Closest Month-End to Inception cumulative total return as of 10/31/10 is –1.95% for Class R. MSCI World ND Index Closest Month-End to Inception average annual total return as of 9/30/10 is –1.37% for Class R.
| | |
| 4 | | Visit our website at www.prudentialfunds.com |
Standard & Poor’s 500 Composite Stock Price Index
The Standard & Poor’s 500 Composite Stock Price Index (S&P 500 Index) is an unmanaged index of 500 stocks of large U.S. public companies. It gives a broad look at how stock prices have performed in the United States. S&P 500 Index Closest Month-End to Inception cumulative total return as of 10/31/10 is –0.77% for Class R. S&P 500 Index Closest Month-End to Inception average annual total return as of 9/30/10 is –1.10% for Class R.
Lipper Global Natural Resources Funds Average
The Lipper Global Natural Resources Funds Average (Lipper Average) is based on the average return of all mutual funds in the Lipper Natural Resources Fund category and does not include the effect of any sales charges or taxes payable by investors. Lipper Average Closest Month-End to Inception cumulative total return as of 10/31/10 is 12.31% for Class R. Lipper Average Closest Month-End to Inception average annual total return as of 9/30/10 is 1.41% for Class R.
Investors cannot invest directly in an index or average. The returns for the Lipper Global Natural Resources Index, MSCI World ND Index, and S&P 500 Index would be lower if they included the effects of sales charges, operating expenses of a mutual fund, or taxes that may be paid by an investor. Returns for the Lipper Average reflect the deduction of operating expenses, but not sales charges or taxes. Returns for the Lipper Average would be lower if it included the effects of sales charges or taxes.
| | | | |
Five Largest Holdings expressed as a percentage of net assets as of 10/31/10 | | | | |
Pacific Rubiales Energy Corp., Oil, Gas & Consumable Fuels | | | 2.7 | % |
Freeport-McMoRan Copper & Gold, Inc., Metals & Mining | | | 2.3 | |
OGX Petroleo e Gas Participacoes SA, Oil, Gas & Consumable Fuels | | | 2.2 | |
Schlumberger Ltd., Energy Equipment & Services | | | 2.2 | |
Cameron International Corp., Energy Equipment & Services | | | 2.1 | |
Holdings reflect only long-term investments and are subject to change.
| | | | |
| Five Largest Industries expressed as a percentage of net assets as of 10/31/10 | | | |
Oil, Gas & Consumable Fuels | | | 44.9 | % |
Metals & Mining | | | 34.8 | |
Energy Equipment & Services | | | 16.6 | |
Transportation Infrastructure | | | 0.6 | |
Chemicals | | | 0.5 | |
Industry weightings reflect only long-term investments and are subject to change.
| | | | |
| Prudential Jennison Natural Resources Fund, Inc. | | | 5 | |
Strategy and Performance Overview
How did the Fund perform?
For the 12-month period ending October 31, 2010, the Prudential Jennison Natural Resources Fund Class A shares gained 24.42%, widely exceeding the 13.86% return of the benchmark Lipper Global Natural Resources Index (the Index). The Fund also outperformed the 10.59% return of the Lipper Global Natural Resources Funds Average.
How is the Fund managed?
Jennison’s Natural Resources strategy seeks capital appreciation by investing in the stocks of companies that own, explore, mine, process or otherwise develop natural resource commodities. Jennison believes the investment opportunities of natural resources include, but are not limited to: oil and natural gas exploration and production companies, oilfield service equipment manufacturers, contract drillers (onshore and offshore), seismic equipment manufacturers and producers, integrated oil and gas producers, independent refiners, pipeline operators, and on the metals side, miners of gold, silver, copper, iron ore, zinc, nickel, and aluminum as well as coal and steel producers, ethanol, sugar, agricultural producers and marketers, and electric power generators and marketers.
What was the market environment like for stocks during the period?
U.S. equity market strength at the beginning and end of the fiscal year, aided by continued, albeit slow, economic growth, more than offset declines during the period’s middle months, when expansion appeared to be losing steam. In late 2009, distressed sale prices, low interest rates, increased mortgage credit, and tax credits stimulated housing activity. Manufacturing activity increased, and corporate profits improved largely due to workforce and inventory reductions.
Clouds began to gather on the horizon in early 2010, however, as the pace of improvement decelerated. Markets grappled with the effects of reduced stimulus, persistently subpar job growth, and flagging confidence indicators. In Europe, a sovereign debt crisis in several European Union member states weakened the euro and prompted the European Central Bank to intervene. Attempts in China to cool the domestic property market likewise raised fears that global growth might slow more than anticipated.
Domestic markets saw additional volatility linked to turns in Washington policy debates. In March, an overhaul in the US health care system was enacted. In July, the President signed sweeping financial regulatory legislation that expands federal banking and securities regulation, subjecting a wider range of financial companies to government oversight.
| | |
| 6 | | Visit our website at www.prudentialfunds.com |
At the end of the period, housing activity, consumer spending, retail sales, and personal income were rising, as was consumer confidence. However, business production measures were mixed, overall job growth remained anemic, and credit expansion continued to be weak. Given the overall uncertainty, businesses prolonged their pause in investing and hiring.
Which holdings made the largest positive contribution to the Fund’s return?
Shares of Pacific Rubiales Energy, a Canada-based developer of heavy crude oil and natural gas in Colombia and Peru, appreciated following the announcement of positive drilling results from two wells in the northwest region of the Quifa Block in Columbia, confirming the significant prospective resources of the block. Jennison believes further exploration of the Quifa Block, the completion of the Rubiales pipeline, and continued exploration of the Rubiales field should provide future opportunities to support Jennison’s investment decision.
Semafo, a gold mining company with operations in West Africa, significantly contributed to the Fund’s performance. Shares increased as expectations for its Mana mine in Burkina Faso drove the company’s valuation higher. Jennison likes Semafo and believes the ultimate growth potential from the Mana mine is currently underappreciated.
Shares of Brazil-based OGX Petroleo e Gas Participacoes rose on the news that the company made a substantial gas shale discovery in the Parnaiba basin. Shares also benefited from the anticipated sale of a portion of its reserves and the potential of a higher valuation. OGX is Brazil’s largest independent exploration and production company and holds significant onshore and offshore territory. Exploration momentum remains strong as the company expects to drill 24 wells by the end of 2011.
Which holdings detracted most from the Fund’s return?
Among the key detractors from performance were natural gas producers Southwestern Energy, Petrohawk Energy, and Range Resources. The decline likely reflects concerns that continued weak natural gas prices could impede earnings growth. While investors are focused on weak gas prices, Jennison remains comfortable with the Fund’s positions, and thinks production growth for these holdings should continue to outpace other exploration and production companies and does not believe production and reserve growth potential is properly reflected in the stock price.
Were there significant changes to the Portfolio?
During the reporting period there were no significant changes to the portfolio. Rather, the Fund added or exited individual positions based on company fundamentals and the stock’s risk-reward characteristics.
| | | | |
| Prudential Jennison Natural Resources Fund, Inc. | | | 7 | |
Comments on the Fund’s Five Largest Holdings
| 2.7% | Pacific Rubiales Energy Corp., Oil, Gas & Consumable Fuels |
Pacific Rubiales Energy is discussed in the positive contributors to performance section.
| 2.3% | Freeport-McMoRan Copper & Gold, Inc., Metals & Mining |
Freeport-McMoRan operates large, long-lived, geographically diverse copper and gold mines with significant proven and probable reserves. Jennison believes strong long-term supply/demand imbalances for copper and gold should boost prices both for these commodities and ultimately Freeport’s shares. Jennison has confidence in Freeport’s strong management team, which has demonstrated operational excellence.
| 2.2% | OGX Petroleo e Gas Participacoes SA, Oil, Gas & Consumable Fuels |
This company is discussed in the positive contributors to performance section.
| 2.2% | Schlumberger Ltd., Energy Equipment & Services |
Schlumberger supplies technology, integrated project management and information services to customers in the oil and gas industry. Jennison likes the company for its global footprint and what is, in Jennison’s opinion, superb execution on a broad service offering. Additionally, Schlumberger recently completed its acquisition of Smith International, which should boost earnings per share (EPS) in 2011 and provide ample cost savings opportunities.
| 2.1% | Cameron International Corp., Energy Equipment and Services |
Cameron International provides flow equipment, products and systems to companies in the oil and gas industry. Cameron is the leading provider of subsea equipment, an area Jennison expects will experience significant growth as the most easily-exploited producing areas have largely been tapped.
| | |
| 8 | | Visit our website at www.prudentialfunds.com |
Fees and Expenses (Unaudited)
As a shareholder of the Fund, you incur two types of costs: (1) transaction costs, including sales charges (loads) on purchase payments and redemptions, as applicable, and (2) ongoing costs, including management fees, distribution and/or service (12b-1) fees, and other Fund expenses, as applicable. This example is intended to help you understand your ongoing costs (in dollars) of investing in the Fund and to compare these costs with the ongoing costs of investing in other mutual funds.
The example is based on an investment of $1,000 invested on May 1, 2010, at the beginning of the period, and held through the six-month period ended October 31, 2010. The example is for illustrative purposes only; you should consult the Prospectus for information on initial and subsequent minimum investment requirements.
The Fund’s transfer agent may charge additional fees to holders of certain accounts that are not included in the expenses shown in the table on the following page. These fees apply to individual retirement accounts (IRAs) and Section 403(b) accounts. As of the close of the six-month period covered by the table, IRA fees included an annual maintenance fee of $15 per account (subject to a maximum annual maintenance fee of $25 for all accounts held by the same shareholder). Section 403(b) accounts are charged an annual $25 fiduciary maintenance fee. Some of the fees may vary in amount, or may be waived, based on your total account balance or the number of Prudential Investments funds, including the Fund, that you own. You should consider the additional fees that were charged to your Fund account over the six-month period when you estimate the total ongoing expenses paid over the period and the impact of these fees on your ending account value, as these additional expenses are not reflected in the information provided in the expense table. Additional fees have the effect of reducing investment returns.
Actual Expenses
The first line for each share class in the table on the following page provides information about actual account values and actual expenses. You may use the information on this line, together with the amount you invested, to estimate the expenses that you paid over the period. Simply divide your account value by $1,000 (for example, an $8,600 account value ÷ $1,000 = 8.6), then multiply the result by the number on the first line under the heading “Expenses Paid During the Six-Month Period” to estimate the expenses you paid on your account during this period.
Hypothetical Example for Comparison Purposes
The second line for each share class in the table on the following page provides information about hypothetical account values and hypothetical expenses based on the Fund’s actual expense ratio and an assumed rate of return of 5% per year before
| | | | |
| Prudential Jennison Natural Resources Fund, Inc. | | | 9 | |
Fees and Expenses (continued)
expenses, which is not the Fund’s actual return. The hypothetical account values and expenses may not be used to estimate the actual ending account balance or expenses you paid for the period. You may use this information to compare the ongoing costs of investing in the Fund and other funds. To do so, compare this 5% hypothetical example with the 5% hypothetical examples that appear in the shareholder reports of the other funds.
Please note that the expenses shown in the table are meant to highlight your ongoing costs only and do not reflect any transactional costs such as sales charges (loads). Therefore, the second line for each share class in the table is useful in comparing ongoing costs only and will not help you determine the relative total costs of owning different funds. In addition, if these transactional costs were included, your costs would have been higher.
| | | | | | | | | | | | | | | | | | |
Prudential Jennison Natural Resources Fund, Inc. | | Beginning Account
Value
May 1, 2010 | | | Ending Account
Value
October 31, 2010 | | | Annualized
Expense Ratio
Based on the
Six-Month Period | | | Expenses Paid
During the
Six-Month Period* | |
| | | | | | | | | | | | | | | | | | |
| | | | | | | | | | | | | | | | | | |
| Class A | | Actual | | $ | 1,000.00 | | | $ | 1,081.20 | | | | 1.24 | % | | $ | 6.50 | |
| | | Hypothetical | | $ | 1,000.00 | | | $ | 1,018.95 | | | | 1.24 | % | | $ | 6.31 | |
| | | | | | | | | | | | | | | | | | |
| Class B | | Actual | | $ | 1,000.00 | | | $ | 1,077.40 | | | | 1.94 | % | | $ | 10.16 | |
| | | Hypothetical | | $ | 1,000.00 | | | $ | 1,015.43 | | | | 1.94 | % | | $ | 9.86 | |
| | | | | | | | | | | | | | | | | | |
| Class C | | Actual | | $ | 1,000.00 | | | $ | 1,077.60 | | | | 1.94 | % | | $ | 10.16 | |
| | | Hypothetical | | $ | 1,000.00 | | | $ | 1,015.43 | | | | 1.94 | % | | $ | 9.86 | |
| | | | | | | | | | | | | | | | | | |
| Class R | | Actual | | $ | 1,000.00 | | | $ | 1,080.10 | | | | 1.44 | % | | $ | 7.55 | |
| | | Hypothetical | | $ | 1,000.00 | | | $ | 1,017.95 | | | | 1.44 | % | | $ | 7.32 | |
| | | | | | | | | | | | | | | | | | |
| Class Z | | Actual | | $ | 1,000.00 | | | $ | 1,082.70 | | | | 0.94 | % | | $ | 4.93 | |
| | | Hypothetical | | $ | 1,000.00 | | | $ | 1,020.47 | | | | 0.94 | % | | $ | 4.79 | |
* Fund expenses (net of fee waivers or subsidies, if any) for each share class are equal to the annualized expense ratio for each share class (provided in the table), multiplied by the average account value over the period, multiplied by the 184 days in the six-month period ended October 31, 2010, and divided by the 365 days in the Fund’s fiscal year ended October 31, 2010 (to reflect the six-month period). Expenses presented in the table include the expenses of any underlying portfolios in which the Fund may invest.
| | |
| 10 | | Visit our website at www.prudentialfunds.com |
Portfolio of Investments
as of October 31, 2010
| | | | | | |
| Shares | | Description | | Value (Note 1) | |
| | | | | | |
LONG-TERM INVESTMENTS 97.9% | | | | |
COMMON STOCKS 97.9% | | | | |
| |
Chemicals 0.5% | | | | |
| 168,294 | | Potash Corp. of Saskatchewan, Inc. | | $ | 24,417,777 | |
| |
Energy Equipment & Services 16.6% | | | | |
| 126,302 | | Baker Hughes, Inc. | | | 5,851,572 | |
| 2,226,698 | | Cameron International Corp.(a) | | | 97,418,038 | |
| 781,981 | | Complete Production Services, Inc.(a)(b) | | | 18,321,815 | |
| 708,200 | | Dresser-Rand Group, Inc.(a) | | | 24,234,604 | |
| 1,144,581 | | Dril-Quip, Inc.(a) | | | 79,090,547 | |
| 755,561 | | FMC Technologies, Inc.(a)(b) | | | 54,475,948 | |
| 2,819,350 | | Halliburton Co. | | | 89,824,491 | |
| 841,044 | | Helmerich & Payne, Inc.(b) | | | 35,979,862 | |
| 3,037,450 | | Integra Group Holdings, GDR(a) | | | 9,567,967 | |
| 1,082,424 | | Key Energy Services, Inc.(a)(b) | | | 10,661,876 | |
| 240,510 | | Lufkin Industries, Inc. | | | 11,748,914 | |
| 232,434 | | Nabors Industries Ltd.(a) | | | 4,857,871 | |
| 1,759,379 | | National Oilwell Varco, Inc. | | | 94,584,215 | |
| 1,217,361 | | Noble Corp.(b) | | | 42,035,475 | |
| 71,900 | | OSX Brasil SA (Brazil), 144A(a)(c) | | | 23,046,227 | |
| 617,955 | | Patterson-UTI Energy, Inc. | | | 11,994,507 | |
| 1,487,816 | | Schlumberger Ltd. | | | 103,983,460 | |
| 1,139,211 | | Tenaris SA (Luxembourg), ADR(b) | | | 47,197,512 | |
| 31,520 | | Transocean Ltd.(a) | | | 1,997,107 | |
| 335,861 | | Weatherford International Ltd.(a) | | | 5,645,823 | |
| | | | | | |
| | | | | 772,517,831 | |
| |
Food Products 0.1% | | | | |
| 2,183,300 | | Agrenco Ltd. (Brazil), 144A(a)(c) | | | 2,041,025 | |
| |
Independent Power Producers & Energy Traders 0.1% | | | | |
| 265,673 | | NRG Energy, Inc.(a)(b) | | | 5,289,550 | |
| |
Metals & Mining 34.8% | | | | |
| 1,236,900 | | African Rainbow Minerals Ltd. (South Africa) | | | 31,555,517 | |
| 656,985 | | Agnico-Eagle Mines Ltd.(b) | | | 50,975,466 | |
| 1,458,149 | | Alcoa, Inc.(b) | | | 19,145,496 | |
| 1,552,829 | | Anatolia Minerals Development Ltd.(a) | | | 11,479,881 | |
| 8,000,000 | | Archipelago Resources PLC (United Kingdom)(a) | | | 5,287,784 | |
| 6,303,400 | | AXMIN, Inc. (Canada)(a) | | | 865,257 | |
| 114,494 | | Barrick Gold Corp. | | | 5,506,017 | |
See Notes to Financial Statements.
| | | | |
| Prudential Jennison Natural Resources Fund, Inc. | | | 11 | |
Portfolio of Investments
as of October 31, 2010 continued
| | | | | | |
| Shares | | Description | | Value (Note 1) | |
| | | | | | |
COMMON STOCKS (Continued) | | | | |
| |
Metals & Mining (cont’d) | | | | |
| 637,824 | | BHP Billiton Ltd. (Australia), ADR(b) | | $ | 52,677,884 | |
| 1,679,974 | | Century Aluminum Co.(a)(b) | | | 22,713,249 | |
| 1,339,832 | | Cia de Minas Buenaventura SA (Peru), ADR | | | 71,064,689 | |
| 1,269,790 | | Cliffs Natural Resources, Inc. | | | 82,790,308 | |
| 668,728 | | Detour Gold Corp. (Canada)(a) | | | 19,532,706 | |
| 4,584,779 | | Eldorado Gold Corp. (Canada) | | | 77,634,213 | |
| 3,047,376 | | European Goldfields Ltd. (Canada)(a) | | | 41,173,489 | |
| 912,041 | | First Quantum Minerals Ltd. (Canada) | | | 79,865,067 | |
| 600,000 | | First Uranium Corp. (South Africa), 144A(a)(b)(c) | | | 464,751 | |
| 1,267,700 | | First Uranium Corp. (South Africa)(a)(b)(c) | | | 981,942 | |
| 1,142,926 | | Freeport-McMoRan Copper & Gold, Inc. | | | 108,212,234 | |
| 1,796,500 | | Fronteer Gold, Inc.(a)(b) | | | 14,264,210 | |
| 2,610,301 | | Gabriel Resources Ltd. (Canada)(a) | | | 16,149,622 | |
| 216,800 | | Gold Reserve, Inc.(a) | | | 299,724 | |
| 993,800 | | Gold Reserve, Inc.(a) | | | 1,371,444 | |
| 1,210,175 | | Goldcorp, Inc. | | | 53,961,703 | |
| 4,578,959 | | Hecla Mining Co.(a)(b) | | | 31,549,028 | |
| 792,400 | | Highland Gold Mining Ltd. (United Kingdom)(a) | | | 2,018,837 | |
| 586,195 | | Impala Platinum Holdings Ltd. (South Africa) | | | 16,569,109 | |
| 950,400 | | Impala Platinum Holdings Ltd. (South Africa), ADR | | | 26,991,360 | |
| 3,443,739 | | Kinross Gold Corp.(b) | | | 61,815,115 | |
| 4,685,810 | | MMX Mineracao E Metalicos SA (Brazil)(a) | | | 37,700,336 | |
| 4,052,100 | | Nevsun Resources Ltd. (Canada)(a)(b) | | | 23,083,343 | |
| 233,339 | | Newcrest Mining Ltd. (Australia), 144A | | | 9,133,519 | |
| 1,470,921 | | Newcrest Mining Ltd. (Australia) | | | 57,575,820 | |
| 831,598 | | Newmont Mining Corp. | | | 50,619,370 | |
| 1,398,700 | | Northern Dynasty Minerals Ltd.(a)(b) | | | 12,616,274 | |
| 131,267 | | Nucor Corp.(b) | | | 5,017,025 | |
| 95,067 | | Pan American Silver Corp. (Canada) | | | 3,041,510 | |
| 1,454,164 | | Pan American Silver Corp. | | | 46,416,915 | |
| 523,100 | | Platmin Ltd. (South Africa), 144A(a) | | | 564,183 | |
| 620,397 | | Quadra FNX Mining Ltd. (Canada)(a)(b) | | | 8,759,405 | |
| 708,771 | | Randgold Resources Ltd. (Jersey Islands), ADR | | | 66,567,772 | |
| 10,522 | | Rio Tinto PLC (United Kingdom) | | | 680,470 | |
| 816,624 | | Rio Tinto PLC (United Kingdom), ADR(b) | | | 53,178,555 | |
| 504,300 | | Seabridge Gold, Inc.(a)(b) | | | 13,782,519 | |
| 1,566,360 | | SEMAFO, Inc. (Canada)(a)(c) | | | 18,798,163 | |
| 4,783,700 | | SEMAFO, Inc. (Canada), 144A(a)(c) | | | 57,410,028 | |
| 1,828,808 | | Silver Wheaton Corp.(a)(b) | | | 52,578,230 | |
| 719,983 | | Southern Copper Corp.(b) | | | 30,815,272 | |
See Notes to Financial Statements.
| | |
| 12 | | Visit our website at www.prudentialfunds.com |
| | | | | | |
| Shares | | Description | | Value (Note 1) | |
| | | | | | |
COMMON STOCKS (Continued) | | | | |
| |
Metals & Mining (cont’d) | | | | |
| 3,091,041 | | Sterlite Industries India Ltd. (India), ADR(b) | | $ | 47,818,404 | |
| 238,651 | | Tahoe Resources, Inc.(a)(c) | | | 2,339,945 | |
| 506,600 | | Tahoe Resources, Inc., 144A(a)(c) | | | 4,967,154 | |
| 2,393,392 | | Vale SA (Brazil), ADR(b) | | | 76,923,619 | |
| 1,452,900 | | Western Areas NL (Australia)(b) | | | 8,368,321 | |
| 1,476,538 | | Xstrata PLC (Switzerland) | | | 28,616,086 | |
| | | | | | |
| | | | | 1,624,288,340 | |
| |
Oil, Gas & Consumable Fuels 44.9% | | | | |
| 361,200 | | Advantage Oil & Gas Ltd. (Canada)(a)(c) | | | 2,238,243 | |
| 983,300 | | Advantage Oil & Gas Ltd. (Canada), Reg. D(a)(c) | | | 6,093,201 | |
| 1,607,568 | | Alpha Natural Resources, Inc.(a) | | | 72,613,847 | |
| 1,228,480 | | Anadarko Petroleum Corp. | | | 75,637,514 | |
| 839,149 | | Apache Corp.(b) | | | 84,770,832 | |
| 485,657 | | Atlas Energy, Inc.(a)(b) | | | 14,142,332 | |
| 3,191,200 | | Bankers Petroleum Ltd. (Canada)(a) | | | 22,371,880 | |
| 4,140,783 | | BG Group PLC (United Kingdom) | | | 80,648,663 | |
| 1,282,103 | | Cabot Oil & Gas Corp. | | | 37,155,345 | |
| 6,685,455 | | Cairn Energy PLC (United Kingdom)(a) | | | 41,339,525 | |
| 1,737,714 | | Cameco Corp. (Canada) | | | 53,755,149 | |
| 1,785,625 | | Canadian Natural Resources Ltd. | | | 65,121,744 | |
| 731,977 | | Carrizo Oil & Gas, Inc.(a) | | | 17,289,297 | |
| 243,998 | | Cimarex Energy Co. | | | 18,726,846 | |
| 1,336,800 | | Cobalt International Energy, Inc.(a)(b) | | | 12,365,400 | |
| 1,298,492 | | Concho Resources, Inc.(a)(b) | | | 89,167,446 | |
| 2,236,325 | | Denbury Resources, Inc.(a)(b) | | | 38,062,251 | |
| 650,283 | | EOG Resources, Inc. | | | 62,245,089 | |
| 1,030,539 | | EQT Corp.(b) | | | 38,583,380 | |
| 115,266 | | Exxon Mobil Corp. | | | 7,661,731 | |
| 20,910,417 | | Far East Energy Corp.(a) | | | 11,607,372 | |
| 239,100 | | Forest Oil Corp.(a)(b) | | | 7,347,543 | |
| 10,642 | | HRT Participacoes em Petroleo SA (Brazil)(a) | | | 7,147,659 | |
| 15,900 | | HRT Participacoes em Petroleo SA (Brazil), 144A(a) | | | 10,679,174 | |
| 6,430,000 | | Linc Energy Ltd. (Australia), 144A(b)(c) | | | 12,219,066 | |
| 752,400 | | MEG Energy Corp. (Canada), 144A(a)(c) | | | 27,546,442 | |
| 700,800 | | Murphy Oil Corp. | | | 45,664,128 | |
| 1,137,300 | | Newfield Exploration Co.(a) | | | 67,805,826 | |
| 308,240 | | Niko Resources Ltd. (Canada) | | | 29,406,561 | |
| 1,098,698 | | Noble Energy, Inc. | | | 89,521,913 | |
| 967,257 | | Occidental Petroleum Corp. | | | 76,055,418 | |
See Notes to Financial Statements.
| | | | |
| Prudential Jennison Natural Resources Fund, Inc. | | | 13 | |
Portfolio of Investments
as of October 31, 2010 continued
| | | | | | |
| Shares | | Description | | Value (Note 1) | |
| | | | | | |
COMMON STOCKS (Continued) | | | | |
| |
Oil, Gas & Consumable Fuels (cont’d) | | | | |
| 7,963,525 | | OGX Petroleo e Gas Participacoes SA (Brazil)(a) | | $ | 104,116,427 | |
| 4,201,797 | | Oil Search Ltd. (Papua New Guinea) | | | 26,259,173 | |
| 1,460,236 | | OPTI Canada, Inc. (Canada)(a)(b) | | | 1,002,221 | |
| 4,003,850 | | Pacific Rubiales Energy Corp. (Canada)(a) | | | 127,625,418 | |
| 2,119,967 | | Petrohawk Energy Corp.(a)(b) | | | 36,060,639 | |
| 1,307,660 | | Petroleo Brasileiro SA (Brazil), ADR | | | 44,617,359 | |
| 1,304,666 | | Range Resources Corp.(b) | | | 48,781,462 | |
| 872,148 | | Reliance Industries Ltd. (India), GDR, 144A(c) | | | 43,424,249 | |
| 917,540 | | Rosetta Resources, Inc.(a)(b) | | | 21,938,381 | |
| 1,923,400 | | SandRidge Energy, Inc.(a)(b) | | | 10,520,998 | |
| 2,383,999 | | Southwestern Energy Co.(a) | | | 80,698,366 | |
| 1,143,783 | | Suncor Energy, Inc. | | | 36,612,494 | |
| 41,922 | | Sunoco, Inc. | | | 1,570,817 | |
| 2,913,413 | | Talisman Energy, Inc. | | | 52,849,312 | |
| | Trident Resources Corp., Private Placement | | | | |
| 111,959 | | (original cost $45,141,529; purchased 6/30/10)(a)(c)(d) | | | 52,778,857 | |
| 1,323,663 | | Ultra Petroleum Corp.(a)(b) | | | 54,468,732 | |
| 562,144 | | Whiting Petroleum Corp.(a) | | | 56,461,743 | |
| 1,055,816 | | Woodside Petroleum, Ltd. (Australia) | | | 44,988,633 | |
| 33,790,800 | | Zodiac Exploration, Inc. (Canada)(a) | | | 25,842,557 | |
| | | | | | |
| | | | | 2,095,608,655 | |
| |
Semiconductors & Semiconductor Equipment 0.3% | | | | |
| 1,354,115 | | Yingli Green Energy Holding Co. Ltd. (China), ADR(a)(b) | | | 15,788,981 | |
| |
Transportation Infrastructure 0.6% | | | | |
| 4,807,594 | | LLX Logistica SA (Brazil)(a) | | | 26,352,277 | |
| | | | | | |
| | TOTAL COMMON STOCKS
(cost $3,211,128,947) | | | 4,566,304,436 | |
| | | | | | |
| | |
| Units | | | | | |
RIGHT | | | | | | |
| |
Oil, Gas & Consumable Fuels | | | | |
| 41,616 | | Trident Resources Corp., Private Placement
(original cost $0; purchased 06/30/10)(a)(c)(d) | | | — | |
| | | | | | |
See Notes to Financial Statements.
| | |
| 14 | | Visit our website at www.prudentialfunds.com |
| | | | | | |
| Units | | Description | | Value (Note 1) | |
| | | | | | |
WARRANTS | | | | | | |
| |
Metals & Mining | | | | |
| 903,650 | | Crystallex International Corp. (Canada), Private Placement, expiring 11/04/14
(original cost $0; purchased 10/30/09)(a)(c)(d) | | $ | — | |
| | | | | | |
| |
Oil, Gas & Consumable Fuels | | | | |
| 13,500,000 | | Zodiac Exploration, Inc. (Canada), Private Placement, expiring 02/10/12
(original cost $0; purchased 08/08/08)(a)(c)(d) | | | — | |
| | | | | | |
| | TOTAL WARRANTS
(cost $0) | | | — | |
| | | | | | |
| | TOTAL LONG-TERM INVESTMENTS
(cost $3,211,128,947) | | | 4,566,304,436 | |
| | | | | | |
| | |
| Shares | | | | | |
SHORT-TERM INVESTMENT 11.8% | | | | |
| |
Affiliated Money Market Mutual Fund | | | | |
| 549,389,199 | | Prudential Investment Portfolios 2 - Prudential Core Taxable Money Market Fund (cost $549,389,199; includes $405,190,369 of cash collateral received for securities on loan)(Note 3)(e)(f) | | | 549,389,199 | |
| | | | | | |
| | TOTAL INVESTMENTS(g) 109.7%
(cost $3,760,518,146; Note 5) | | | 5,115,693,635 | |
| | Liabilities in excess of other assets (9.7%) | | | (452,541,307 | ) |
| | | | | | |
| | NET ASSETS 100.0% | | $ | 4,663,152,328 | |
| | | | | | |
The following abbreviations are used in the portfolio descriptions:
144A—Security was purchased pursuant to Rule 144A under the Securities Act of 1933 and may not be resold subject to that rule except to qualified institutional buyers. Unless otherwise noted, 144A securities are deemed to be liquid.
ADR—American Depositary Receipt
GDR—Global Depositary Receipt
| (a) | Non-income producing security. |
| (b) | All or a portion of security is on loan. The aggregate market value of such securities, including those sold and pending settlement, is $396,634,802; cash collateral of $405,190,369 (included in liabilities) was received with which the Fund purchased highly liquid short-term investments. |
| (c) | Indicates a security that has been deemed illiquid. |
See Notes to Financial Statements.
| | | | |
| Prudential Jennison Natural Resources Fund, Inc. | | | 15 | |
Portfolio of Investments
as of October 31, 2010 continued
| (d) | Indicates a restricted security, the aggregate original cost of such securities is $45,141,529. The aggregate value of $52,778,857 is approximately 1.1% of net assets. |
| (e) | Prudential Investments LLC, the manager of the Fund, also serves as manager of the Prudential Investment Portfolios 2-Prudential Core Taxable Money Market Fund. |
| (f) | Represents security, or a portion thereof, purchased with cash collateral received for securities on loan. |
| (g) | As of October 31, 2010, 5 securities representing $54,819,882 and 1.2% of the net assets were fair valued in accordance with the policies adopted by the Board of Directors. |
Various inputs are used in determining the value of the Fund’s investments. These inputs are summarized in the three broad levels listed below.
Level 1—quoted prices in active markets for identical securities, generally for stocks and mutual funds with daily NAVs
Level 2—other significant observable inputs (including quoted prices for similar securities, interest rates, prepayment speeds, credit risk, etc., and amortized cost), generally for foreign stocks priced through vendor modeling tools and debt securities
Level 3—significant unobservable inputs (including the Fund’s own assumptions in determining the fair value of investments)
The following is a summary of the inputs used as of October 31, 2010 in valuing the Fund’s assets carried at fair value:
| | | | | | | | | | | | |
| | | Level 1 | | | Level 2 | | | Level 3 | |
Investments in Securities | | | | | | | | | | | | |
Common Stocks | | $ | 4,511,484,554 | | | $ | — | | | $ | 54,819,882 | |
Right | | | — | | | | — | | | | — | |
Warrants | | | — | | | | — | | | | — | |
Affiliated Money Market Mutual Fund | | | 549,389,199 | | | | — | | | | — | |
| | | | | | | | | | | | |
Total | | $ | 5,060,873,753 | | | $ | — | | | $ | 54,819,882 | |
| | | | | | | | | | | | |
See Notes to Financial Statements.
| | |
| 16 | | Visit our website at www.prudentialfunds.com |
The following is a reconciliation of assets in which significant unobservable inputs (Level 3) were used in determining fair value:
| | | | |
| | | Common
Stocks | |
Balance as of 10/31/09 | | $ | 8,839,234 | |
Realized gain (loss) | | | (17,670,540 | ) |
Change in unrealized appreciation (depreciation)* | | | 23,536,674 | |
Purchases | | | 45,141,529 | |
Sales | | | (6,340,763 | ) |
Accrued discount/premium | | | — | |
Transfers into Level 3 | | | 1,313,748 | |
Transfers out Level 3 | | | — | |
| | | | |
Balance as of 10/31/10 | | $ | 54,819,882 | |
| | | | |
| * | Of which, $8,364,605 was included in Net Assets relating to securities held at the reporting period end. |
It is the Fund’s policy to recognize transfers in and transfers out at the fair value as of the beginning of period. Fair value of Level 3 Common Stocks of $1,313,748 was transferred into Level 3 at 10/31/2010 as a result of a suspended exchange-traded security being fair valued in accordance with the Board of Directors’ approved fair valuation procedures.
The industry classification of portfolio holdings and liabilities in excess of other assets shown as a percentage of net assets as of October 31, 2010 were as follows:
| | | | |
United States (including 8.7% of collateral received for securities on loan) | | | 71.8 | % |
Canada | | | 13.8 | |
Brazil | | | 7.1 | |
Australia | | | 4.0 | |
United Kingdom | | | 3.9 | |
India | | | 2.0 | |
South Africa | | | 1.7 | |
Peru | | | 1.5 | |
Jersey Islands | | | 1.4 | |
Luxembourg | | | 1.0 | |
Switzerland | | | 0.6 | |
Papua New Guinea | | | 0.6 | |
China | | | 0.3 | |
| | | | |
| | | 109.7 | |
Liabilities in excess of other assets | | | (9.7 | ) |
| | | | |
| | | 100.0 | % |
| | | | |
See Notes to Financial Statements.
| | | | |
| Prudential Jennison Natural Resources Fund, Inc. | | | 17 | |
Portfolio of Investments
as of October 31, 2010 continued
The Fund invested in derivative instruments during the reporting period. The primary type of risk associated with these derivative instruments is equity risk. The effect of such derivative instruments on the Fund’s financial position and financial performance as reflected in the Statement of Assets and Liabilities and Statement of Operations is presented in the summary below.
At October 31, 2010 the Fund held derivatives not accounted for as hedging instruments. These equity contracts have a fair value at October 31, 2010 of $0 and are presented in the Statement of Assets and Liabilities as such.
The effects of derivative instruments on the Statement of Operations for the year ended October 31, 2010 are as follows:
| | | | |
Amount of Realized Gain or (Loss) on Derivatives Recognized in Income | |
Derivatives not designated as hedging
instruments, carried at fair value | | Right | |
Equity contracts | | $ | 15,181 | |
| | | | |
|
Change in Unrealized Appreciation or (Depreciation) on Derivatives Recognized in Income | |
Derivatives not designated as hedging
instruments, carried at fair value | | Warrants | |
Equity contracts | | $ | — | |
| | | | |
See Notes to Financial Statements.
| | |
| 18 | | Visit our website at www.prudentialfunds.com |
Financial Statements
| | |
| OCTOBER 31, 2010 | | ANNUAL REPORT |
Prudential Jennison Natural Resources Fund, Inc.
Statement of Assets and Liabilities
as of October 31, 2010
| | | | |
Assets | | | | |
Investments at value, including securities on loan of $396,634,802 | | | | |
Unaffiliated investments (cost $3,211,128,947) | | $ | 4,566,304,436 | |
Affiliated investments (cost $549,389,199) | | | 549,389,199 | |
Cash | | | 2,134 | |
Foreign currency, at value (cost $38) | | | 39 | |
Receivable for Fund shares sold | | | 18,316,069 | |
Dividends receivable | | | 1,196,715 | |
Prepaid expenses | | | 74,448 | |
| | | | |
Total assets | | | 5,135,283,040 | |
| | | | |
| |
Liabilities | | | | |
Payable to broker for collateral for securities on loan (Note 4) | | | 405,190,369 | |
Payable for investments purchased | | | 50,281,965 | |
Payable for Fund shares reacquired | | | 10,721,202 | |
Management fee payable | | | 2,727,563 | |
Distribution fee payable | | | 1,584,698 | |
Accrued expenses | | | 1,456,308 | |
Affiliated transfer agent fee payable | | | 166,870 | |
Deferred directors’ fees | | | 1,737 | |
| | | | |
Total liabilities | | | 472,130,712 | |
| | | | |
| |
Net assets | | $ | 4,663,152,328 | |
| | | | |
| | | | | |
Net assets were comprised of: | | | | |
Common stock, at par | | $ | 962,298 | |
Paid-in capital in excess of par | | | 3,942,002,363 | |
| | | | |
| | | 3,942,964,661 | |
Distribution in excess of net investment income | | | (142,700,386 | ) |
Accumulated net realized loss on investment and foreign currency transactions | | | (492,223,568 | ) |
Net unrealized appreciation on investments and foreign currencies | | | 1,355,111,621 | |
| | | | |
Net assets, October 31, 2010 | | $ | 4,663,152,328 | |
| | | | |
See Notes to Financial Statements.
| | |
| 20 | | Visit our website at www.prudentialfunds.com |
| | | | |
Class A | | | | |
Net asset value and redemption price per share
($2,165,179,945 ÷ 42,895,722 shares of common stock issued and outstanding) | | $ | 50.48 | |
Maximum sales charge (5.50% of offering price) | | | 2.94 | |
| | | | |
Maximum offering price to public | | $ | 53.42 | |
| | | | |
| |
Class B | | | | |
Net asset value, offering price and redemption price per share
($280,296,454 ÷ 6,557,174 shares of common stock issued and outstanding) | | $ | 42.75 | |
| | | | |
| |
Class C | | | | |
Net asset value, offering price and redemption price per share
($953,596,886 ÷ 22,304,972 shares of common stock issued and outstanding) | | $ | 42.75 | |
| | | | |
| |
Class R | | | | |
Net asset value, offering price and redemption price per share
($51,423,650 ÷ 1,022,980 shares of common stock issued and outstanding) | | $ | 50.27 | |
| | | | |
| |
Class Z | | | | |
Net asset value, offering price and redemption price per share
($1,212,655,393 ÷ 23,448,953 shares of common stock issued and outstanding) | | $ | 51.71 | |
| | | | |
See Notes to Financial Statements.
| | | | |
| Prudential Jennison Natural Resources Fund, Inc. | | | 21 | |
Statement of Operations
Year Ended October 31, 2010
| | | | |
Net Investment Loss | | | | |
Income | | | | |
Unaffiliated dividend income (net of foreign withholding taxes of $613,782) | | $ | 26,411,262 | |
Affiliated income from securities loaned, net | | | 1,149,043 | |
Affiliated dividend income | | | 297,083 | |
Unaffiliated interest income | | | 49,492 | |
| | | | |
Total income | | | 27,906,880 | |
| | | | |
| |
Expenses | | | | |
Management fee | | | 27,551,018 | |
Distribution fee—Class A | | | 5,546,830 | |
Distribution fee—Class B | | | 2,599,042 | |
Distribution fee—Class C | | | 8,190,872 | |
Distribution fee—Class R | | | 202,103 | |
Transfer agent’s fees and expenses (including affiliated expense of $1,092,100) (Note 3) | | | 5,099,000 | |
Custodian’s fees and expenses | | | 774,000 | |
Reports to shareholders | | | 639,000 | |
Registration fees | | | 276,000 | |
Directors’ fees | | | 115,000 | |
Legal fees and expenses | | | 108,000 | |
Insurance | | | 70,000 | |
Audit fee | | | 22,000 | |
Miscellaneous | | | 53,904 | |
| | | | |
Total expenses | | | 51,246,769 | |
| | | | |
Net investment loss | | | (23,339,889 | ) |
| | | | |
| |
Realized And Unrealized Gain (Loss) On Investment And Foreign Currencies Transactions | | | | |
Net realized loss on: | | | | |
Investment transactions | | | (35,949,185 | ) |
Foreign currency transactions | | | (1,718,233 | ) |
| | | | |
| | | (37,667,418 | ) |
| | | | |
Net change in unrealized appreciation (depreciation) on: | | | | |
Investments | | | 879,831,885 | |
Foreign currencies | | | (54,941 | ) |
| | | | |
| | | 879,776,944 | |
| | | | |
Net gain on investment and foreign currencies transactions | | | 842,109,526 | |
| | | | |
Net Increase In Net Assets Resulting From Operations | | $ | 818,769,637 | |
| | | | |
See Notes to Financial Statements.
| | |
| 22 | | Visit our website at www.prudentialfunds.com |
Statement of Changes in Net Assets
| | | | | | | | | | | | |
| | | Year Ended
October 31,
2010 | | | Five Months
Ended
October 31,
2009 | | | Year Ended
May 31,
2009 | |
Increase (Decrease) In Net Assets | | | | | | | | | | | | |
Operations | | | | | | | | | | | | |
Net investment loss | | $ | (23,339,889 | ) | | $ | (3,197,605 | ) | | $ | (7,560,265 | ) |
Net realized loss on investment and foreign currency transactions | | | (37,667,418 | ) | | | (50,135,811 | ) | | | (313,151,067 | ) |
Net change in unrealized appreciation (depreciation) on investments and foreign currencies | | | 879,776,944 | | | | 273,790,005 | | | | (1,448,726,844 | ) |
| | | | | | | | | | | | |
Net increase (decrease) in net assets resulting from operations | | | 818,769,637 | | | | 220,456,589 | | | | (1,769,438,176 | ) |
| | | | | | | | | | | | |
| | | |
Dividends and Distributions (Note 1) | | | | | | | | | | | | |
Dividends from net investment income | | | | | | | | | | | | |
Class A | | | (28,821,268 | ) | | | — | | | | (14,577,961 | ) |
Class B | | | (5,186,007 | ) | | | — | | | | (1,324,211 | ) |
Class C | | | (14,824,396 | ) | | | — | | | | (2,979,912 | ) |
Class R | | | (542,653 | ) | | | — | | | | (168,354 | ) |
Class Z | | | (11,918,242 | ) | | | — | | | | (6,889,323 | ) |
| | | | | | | | | | | | |
| | | (61,292,566 | ) | | | — | | | | (25,939,761 | ) |
| | | | | | | | | | | | |
Distributions from net realized gains | | | | | | | | | | | | |
Class A | | | — | | | | — | | | | (23,866,599 | ) |
Class B | | | — | | | | — | | | | (5,615,782 | ) |
Class C | | | — | | | | — | | | | (12,627,217 | ) |
Class R | | | — | | | | — | | | | (278,583 | ) |
Class Z | | | — | | | | — | | | | (8,436,181 | ) |
| | | | | | | | | | | | |
| | | — | | | | — | | | | (50,824,362 | ) |
| | | | | | | | | | | | |
| | | |
Fund share transactions (Net of share conversions)(Note 6) | | | | | | | | | | | | |
Net proceeds from shares sold | | | 1,803,070,829 | | | | 733,064,082 | | | | 1,212,380,600 | |
Net asset value of shares issued in reinvestment of dividends and distributions | | | 51,247,329 | | | | — | | | | 63,999,841 | |
Cost of shares reacquired | | | (1,070,051,549 | ) | | | (354,567,783 | ) | | | (1,155,282,866 | ) |
| | | | | | | | | | | | |
Net increase in net assets from Fund share transactions | | | 784,266,609 | | | | 378,496,299 | | | | 121,097,575 | |
| | | | | | | | | | | | |
| | | |
Capital Contributions (Note 6) | | | | | | | | | | | | |
Proceeds from regulatory settlement | | | 17,864 | | | | — | | | | — | |
| | | | | | | | | | | | |
Total increase (decrease) | | | 1,541,761,544 | | | | 598,952,888 | | | | (1,725,104,724 | ) |
| | | |
Net Assets: | | | | | | | | | | | | |
Beginning of period | | | 3,121,390,784 | | | | 2,522,437,896 | | | | 4,247,542,620 | |
| | | | | | | | | | | | |
End of period | | $ | 4,663,152,328 | | | $ | 3,121,390,784 | | | $ | 2,522,437,896 | |
| | | | | | | | | | | | |
See Notes to Financial Statements.
| | | | |
| Prudential Jennison Natural Resources Fund, Inc. | | | 23 | |
Notes to Financial Statements
Prudential Jennison Natural Resources Fund, Inc. (the “Fund”), is registered under the Investment Company Act of 1940, as amended, as a non-diversified, open-end management investment company. The Fund’s investment objective is long-term growth of capital which it seeks to achieve by investing primarily in equity securities of foreign and domestic companies that own, explore, mine, process or otherwise develop, or provide goods and services with respect to, natural resources and in asset-based securities the terms of which are related to the market value of an underlying asset such as a natural resource.
Note 1. Accounting Policies
The following is a summary of significant accounting policies followed by the Fund in the preparation of its financial statements.
Securities Valuation: Securities listed on a securities exchange (other than options on securities and indices) are valued at the last sale price on such exchange on the day of valuation or, if there was no sale on such day, at the mean between the last reported bid and asked prices, or at the last bid price on such day in the absence of an asked price. Securities traded via NASDAQ are valued at the NASDAQ official closing price (“NOCP”) on the day of valuation, or if there was no NOCP, at the last sale price. Securities that are actively traded in the over-the-counter market, including listed securities for which the primary market is believed by Prudential Investments LLC (“PI” or “Manager”), in consultation with the subadvisers; to be over-the-counter, are valued at market value using prices provided by an independent pricing agent or principal market maker.
Corporate bonds (other than convertible debt securities) and U.S. government securities that are actively traded in the over-the-counter market, including listed securities for which the primary market is believed by an Adviser in consultation with the Manager to be over-the-counter, are valued by an independent pricing agent or more than one principal market maker (if available, otherwise by a principal market maker or a primary market dealer). Convertible debt securities that are actively traded in the over-the-counter market, including listed securities for which the primary market is believed by an Adviser in consultation with the Manager to be over-the-counter, are valued by an independent pricing agent or at the mean between the last reported bid and asked prices (or at the last bid price in the absence of an asked price) provided by more than one principal market maker (if available, otherwise by a principal market maker or a primary market dealer).
| | |
| 24 | | Visit our website at www.prudentialfunds.com |
Securities for which reliable market quotations are not readily available, or whose values have been effected by events occurring after the close of the security’s foreign market and before the fund’s normal pricing time, are valued at fair value in accordance with the Board of Directors’ approved fair valuation procedures. When determining the fair valuation of securities some of the factors influencing the valuation include, the nature of any restrictions on disposition of the securities; assessment of the general liquidity of the securities; the issuer’s financial condition and the markets in which it does business; the cost of the investment; the size of the holding and the capitalization of issuer; the prices of any recent transactions or bids/offers for such securities or any comparable securities; any available analyst media or other reports or information deemed reliable by the investment adviser regarding the issuer or the markets or industry in which it operates. Using fair value to price securities may result in a value that is different from a security’s most recent closing price and from the price used by other mutual funds to calculate their net asset values.
Investments in open end, non exchange-traded mutual funds are valued at their net asset value as of the close of the New York Stock Exchange on the date of valuation.
Short-term debt securities of sufficient credit quality which mature in sixty days or less are valued at amortized cost, which approximates fair value. The amortized cost method includes valuing a security at its cost on the date of purchase and thereafter assuming a constant amortization to maturity of the difference between the principal amount due at maturity and cost. Short-term debt securities which mature in more than sixty days are valued at fair value.
The Fund may hold up to 15% of its net assets in illiquid securities including repurchase agreements which have a maturity of longer than seven days, certain securities with legal or contractual restrictions on resale (restricted securities, sometimes referred to as Private Placements) and securities that are not readily marketable. Restricted securities are valued pursuant to the valuation procedures noted above.
Foreign Currency Translation: The books and records of the Fund are maintained in U.S. dollars. Foreign currency amounts are translated into U.S. dollars on the following basis:
(i) market value of investment securities, other assets and liabilities at the current rates of exchange.
(ii) purchases and sales of investment securities, income and expenses at the rate of exchange prevailing on the respective dates of such transactions.
| | | | |
| Prudential Jennison Natural Resources Fund, Inc. | | | 25 | |
Notes to Financial Statements
continued
Although the net assets of the Fund are presented at the foreign exchange rates and market values at the close of the period, the Fund does not isolate that portion of the results of operations arising as a result of changes in the foreign exchange rates from the fluctuations arising from changes in the market prices of long-term portfolio securities held at the end of the period. Similarly, the Fund does not isolate the effect of changes in foreign exchange rates from the fluctuations arising from changes in the market prices of long-term portfolio securities sold during the period. Accordingly, realized foreign currency gains or losses are included in the reported net realized gain or loss on investment transactions.
Net realized gains or losses on foreign currency transactions represent net foreign exchange gains or losses from the holding of foreign currencies, currency gains or losses realized between the trade date and settlement date on securities transactions, and the difference between the amounts of dividends, interest and foreign withholding taxes recorded on the Fund’s books and the U.S. dollar equivalent amounts actually received or paid. Net unrealized currency gains or losses from valuing foreign currency denominated assets and liabilities (other than investments) at period end exchange rates are reflected as a component of net unrealized appreciation (depreciation) on investment and foreign currencies.
Foreign security and currency transactions may involve certain considerations and risks not typically associated with those of domestic origin as a result of, among other factors, the possibility of political and economic instability, or the level of governmental supervision and regulation of foreign securities markets.
Warrants and Rights: The Fund may hold warrants and rights acquired either through a direct purchase, including as part of private placement, or pursuant to corporate actions. Warrants and rights entitle the holder to buy a proportionate amount of common stock at a specific price and time through the expiration dates. Such warrants and rights are held as long positions by the Fund until exercised, sold or expired. Warrants and rights are valued at fair value in accordance with the Board of Directors’ approved fair valuation procedures.
Securities Lending: The Fund may lend its portfolio securities to broker-dealers. The loans are secured by collateral at least equal at all times to the market value of the securities loaned. Loans are subject to termination at the option of the borrower or the Fund. Upon termination of the loan, the borrower will return to the Fund securities identical to the loaned securities. Should the borrower of the securities fail financially,
| | |
| 26 | | Visit our website at www.prudentialfunds.com |
the Fund has the right to repurchase the securities using the collateral in the open market. The Fund recognizes income, net of any rebate and securities lending agent fees, for lending its securities in the form of fees or interest on the investment of any cash received as collateral. The Fund also continues to receive interest and dividends or amounts equivalent thereto, on the securities loaned and recognizes any unrealized gain or loss in the market price of the securities loaned that may occur during the term of the loan.
Securities Transactions and Net Investment Income: Securities transactions are recorded on the trade date. Realized gains or losses on sales of securities are calculated on the identified cost basis. Dividend income is recorded on the ex-dividend date and interest income is recorded on the accrual basis. Expenses are recorded on the accrual basis.
Net investment income or loss, (other than distribution fees, which are charged directly to the respective class) and unrealized and realized gains or losses are allocated daily to each class of shares based upon the relative proportion of net assets of each class at the beginning of the day.
Dividends and Distributions: The Fund expects to pay dividends from net investment income and distributions from net realized capital and currency gains, if any, annually. Dividends and distributions to shareholders, which are determined in accordance with federal income tax regulations and which may differ from generally accepted accounting principles, are recorded on the ex-dividend date.
Taxes: It is the Fund’s policy to continue to meet the requirements of the Internal Revenue Code applicable to regulated investment companies and to distribute all of its taxable net investment income and capital gains, if any, to shareholders. Therefore, no federal income tax provision is required. Withholding taxes on foreign dividends have been provided for in accordance with the Fund’s understanding of the applicable country’s tax rules and rates.
Estimates: The preparation of the financial statements requires management to make estimates and assumptions that affect the reported amounts and disclosures in the financial statements. Actual results could differ from those estimates.
Note 2. Agreements
The Fund has a management agreement with PI. Pursuant to a subadvisory agreement between PI and Jennison Associates LLC (“Jennison”), Jennison furnishes investment advisory services in connection with the management of the Fund. Under the
| | | | |
| Prudential Jennison Natural Resources Fund, Inc. | | | 27 | |
Notes to Financial Statements
continued
subadvisory agreement, Jennison, subject to the supervision of PI, is responsible for managing the assets of the Fund in accordance with its investment objective and policies. PI pays for the services of Jennison, the compensation of officers of the Fund, occupancy and certain clerical and bookkeeping costs of the Fund. The Fund bears all other costs and expenses.
Pursuant to the management agreement between the Fund and PI, the management fee paid to PI is computed daily and payable monthly at an annual rate of .75% of the Fund’s average daily net assets up to $1 billion and .70% of average daily net assets in excess of $1 billion.
Effective October 1, 2008 through February 29, 2012, PI has contractually agreed to waive .05% of the management fee rate on the Fund’s average daily net assets over $4 billion that would otherwise be applicable under the terms of the management agreement. The effective management fee rate was .71% of the Fund’s average daily net assets for the year ended October 31, 2010.
The Fund has a distribution agreement with Prudential Investment Management Services LLC (“PIMS”), which acts as the distributor of the Class A, Class B, Class C, Class R and Class Z shares of the Fund. The Fund compensates PIMS for distributing and servicing the Fund’s Class A, Class B, Class C and Class R shares, pursuant to plans of distribution (the “Class A, B, C and R Plans”), regardless of expenses actually incurred by PIMS. The distribution fees are accrued daily and payable monthly. No distribution or service fees are paid to PIMS as distributor of the Class Z shares of the Fund.
Pursuant to the Class A, B, C and R Plans, the Fund compensates PIMS for distribution related activities at an annual rate of up to .30%, 1%, 1% and .75% of the average daily net assets of the Class A, B, C and Class R shares, respectively. PIMS had contractually agreed to limit such fees to .50% of the average daily net assets of the Class R shares through February 29, 2012.
PIMS has advised the Fund that it received $4,902,925 in front-end sales charges resulting from sales of Class A shares, during the year ended October 31, 2010. From these fees, PIMS paid such sales charges to affiliated broker-dealers, which in turn paid commissions to salespersons and incurred other distribution costs.
| | |
| 28 | | Visit our website at www.prudentialfunds.com |
PIMS has advised the Fund that for the year ended October 31, 2010, it received $10,528, $544,399 and $224,488 in contingent deferred sales charges imposed upon redemptions by certain Class A, Class B and Class C shareholders, respectively.
PI, PIMS and Jennison are indirect, wholly-owned subsidiaries of Prudential Financial, Inc. (“Prudential”).
Note 3. Other Transactions with Affiliates
Prudential Mutual Fund Services LLC (“PMFS”), an affiliate of PI, and an indirect, wholly-owned subsidiary of Prudential, serves as the Fund’s transfer agent. Transfer agent’s fees and expenses in the Statement of Operations include certain out-of-pocket expenses paid to non-affiliates, where applicable.
The Fund pays networking fees to affiliated and unaffiliated broker/dealers including fees relating to the services of Wells Fargo Advisors, LLC (“Wells Fargo”), an affiliate of PI through December 31, 2009. These networking fees are payments made to broker/dealers that clear mutual fund transactions through a national clearing system. For the year ended October 31, 2010, the Fund incurred approximately $3,495,100 in total networking fees, of which approximately $90,400 was paid to Wells Fargo through December 31, 2009. These amounts are included in transfer agent’s fees and expenses in the Statement of Operations.
Prudential Investment Management, Inc. (“PIM”), an indirect, wholly-owned subsidiary of Prudential, is the Fund’s security lending agent. For the year ended October 31, 2010, PIM has been compensated approximately $398,900 for these services.
The Fund invests in the Prudential Core Taxable Money Market Fund (the “Core Fund”), a portfolio of the Prudential Investment Portfolios 2 registered under the Investment Company Act of 1940, as amended, and managed by PI. Earnings from the Core Fund are disclosed on the Statement of Operations as affiliated dividend income.
Note 4. Portfolio Securities
Purchases and sales of investment securities, other than short-term investments, for the year ended October 31, 2010 were $1,496,584,689 and $796,908,824, respectively.
Note 5. Distributions and Tax Information
Distributions to shareholders, which are determined in accordance with federal income tax regulations and may differ from generally accepted accounting principles,
| | | | |
| Prudential Jennison Natural Resources Fund, Inc. | | | 29 | |
Notes to Financial Statements
continued
are recorded on the ex-dividend date. In order to present distribution in excess of net investment income, accumulated net realized loss on investment and foreign currency transactions and paid-in capital in excess of par on the Statement of Assets and Liabilities that more closely represent their tax character, certain adjustments have been made to distribution in excess of net investment income and accumulated net realized loss on investment and foreign currency transactions. For the fiscal year ended October 31, 2010, the adjustments were to decrease distribution in excess of net investment income and to increase accumulated net realized loss on investment and foreign currency transactions by $9,864,111 due to differences in the treatment for book and tax purposes of certain transactions involving Passive Foreign Investment Companies and foreign securities and currencies. Net investment loss, net realized loss and net assets were not affected by this change.
For the fiscal year ended October 31, 2010, the tax character of distributions paid by the Fund was $61,292,566 from ordinary income. For the five-month period ended October 31, 2009, the Fund did not pay distribution from ordinary income or long-term capital gains. For the fiscal year ended May 31, 2009, the tax character of distributions paid by the Fund were $36,439,509 from ordinary income and $40,324,614 from long-term capital gains.
As of October 31, 2010, the accumulated undistributed earnings on a tax basis was $56,221,688 from ordinary income.
For federal income tax purposes, the Fund had a capital loss carryforward as of October 31, 2010 of approximately $438,964,000, of which $124,253,000 expires in 2016, $264,952,000 expires in 2017 and $49,759,000 expires in 2018. Accordingly, no capital gains distribution is expected to be paid to shareholders until net gains have been realized in excess of such carryforwards. It is uncertain if the Fund will be able to realize the full benefit of the remaining carryforwards prior to the expiration date.
The United States federal income tax basis of the Fund’s investments and the net unrealized appreciation as of October 31, 2010 were as follows:
| | | | | | | | | | |
Tax Basis | | Appreciation | | Depreciation | | Net Unrealized
Appreciation | | Other Cost
Basis
Adjustments | | Total Net
Unrealized
Appreciation |
| $4,012,697,945 | | $1,270,261,598 | | $(167,265,908) | | $1,102,995,690 | | $(63,868) | | $1,102,931,822 |
| | |
| 30 | | Visit our website at www.prudentialfunds.com |
The differences between book basis and tax basis of investments are primarily attributable to deferred losses on wash sales and mark-to-market on open investments in Passive Foreign Investment Companies. Other cost basis adjustments are attributable to net unrealized appreciation (depreciation) of foreign currencies and the mark-to-market of receivables and payables.
Management has analyzed the Fund’s tax positions taken on federal income tax returns for all open tax years and has concluded that as of October 31, 2010, no provisions for income tax would be required in the Fund’s financial statements. The Fund’s federal and state income and federal excise tax returns for tax years for which the applicable statuses of limitations have not expired are subject to examination by the Internal Revenue Service and state departments of revenue.
Note 6. Capital
The Fund offers Class A, Class B, Class C, Class R and Class Z shares. Class A shares are sold with a front-end sales charge of up to 5.50%. All investors who purchase Class A shares in an amount of $1 million or more and sell these shares within 12 months of purchase are subject to a contingent deferred sales charge (CDSC) of 1%, including investors who purchase their shares through broker-dealers affiliated with Prudential. Class B shares are sold with a contingent deferred sales charge which declines from 5% to zero depending upon the period of time the shares are held. Class C shares are sold with a contingent deferred sales charge of 1% during the first 12 months. Class B shares automatically convert to Class A shares on a quarterly basis approximately seven years after purchase. A special exchange privilege is also available for shareholders who qualify to purchase Class A shares at net asset value
There are 500 million shares of common stock authorized with $.01 par value per share, divided into six classes, designated Class A, Class B, Class C, Class Q, Class R and Class Z common stock. Class A shares consist of 150 million authorized shares, Class B shares consist of 35 million authorized shares, Class C and Class Z shares each consist of 90 million authorized shares, Class Q shares consist of 85 million authorized shares and Class R shares consist of 50 million authorized shares. Class Q will commence on December 27, 2010. Class Q, Class R and Class Z shares are not subject to any sales or redemption charge and are offered exclusively for sale to a limited group of investors. As of October 31, 2010, 57 shares of Class R were owned by Prudential.
For the year ended October 31, 2010, the Fund received $17,864 related to an affiliate’s settlement of regulatory proceedings involving allegations of improper trading. This amount is presented in the Fund’s Statement of Changes in net assets. The Fund was not involved in the proceedings or the calculation of the payment.
| | | | |
| Prudential Jennison Natural Resources Fund, Inc. | | | 31 | |
Notes to Financial Statements
continued
Transactions in shares of common stock were as follows:
| | | | | | | | |
Class A | | Shares | | | Amount | |
Year ended October 31, 2010: | | | | | | | | |
Shares sold | | | 17,713,955 | | | $ | 798,950,753 | |
Shares issued in reinvestment of dividends | | | 589,987 | | | | 25,971,196 | |
Shares reacquired | | | (12,747,299 | ) | | | (565,749,143 | ) |
| | | | | | | | |
Net increase (decrease) in shares outstanding before conversion | | | 5,556,643 | | | | 259,172,806 | |
Shares issued upon conversion from Class B | | | 129,953 | | | | 5,785,920 | |
| | | | | | | | |
Net increase (decrease) in shares outstanding | | | 5,686,596 | | | $ | 264,958,726 | |
| | | | | | | | |
Five months ended October 31, 2009: | | | | | | | | |
Shares sold | | | 9,510,215 | | | $ | 375,898,059 | |
Shares reacquired | | | (5,543,100 | ) | | | (212,400,454 | ) |
| | | | | | | | |
Net increase (decrease) in shares outstanding before conversion | | | 3,967,115 | | | | 163,497,605 | |
Shares issued upon conversion from Class B | | | 123,593 | | | | 4,912,972 | |
| | | | | | | | |
Net increase (decrease) in shares outstanding | | | 4,090,708 | | | $ | 168,410,577 | |
| | | | | | | | |
Year ended May 31, 2009: | | | | | | | | |
Shares sold | | | 16,455,086 | | | $ | 630,121,121 | |
Shares issued in reinvestment of dividends and distributions | | | 1,602,631 | | | | 34,248,669 | |
Shares reacquired | | | (15,876,136 | ) | | | (622,518,576 | ) |
| | | | | | | | |
Net increase (decrease) in shares outstanding before conversion | | | 2,181,581 | | | | 41,851,214 | |
Shares issued upon conversion from Class B | | | 326,894 | | | | 14,818,288 | |
| | | | | | | | |
Net increase (decrease) in shares outstanding | | | 2,508,475 | | | $ | 56,669,502 | |
| | | | | | | | |
Class B | | | | | | |
Year ended October 31, 2010: | | | | | | | | |
Shares sold | | | 1,024,344 | | | $ | 39,451,414 | |
Shares issued in reinvestment of dividends | | | 123,126 | | | | 4,620,477 | |
Shares reacquired | | | (1,273,841 | ) | | | (48,171,816 | ) |
| | | | | | | | |
Net increase (decrease) in shares outstanding before conversion | | | (126,371 | ) | | | (4,099,925 | ) |
Shares reacquired upon conversion into Class A | | | (152,889 | ) | | | (5,785,920 | ) |
| | | | | | | | |
Net increase (decrease) in shares outstanding | | | (279,260 | ) | | $ | (9,885,845 | ) |
| | | | | | | | |
Five months ended October 31, 2009: | | | | | | | | |
Shares sold | | | 752,985 | | | $ | 25,202,815 | |
Shares reacquired | | | (561,129 | ) | | | (18,537,064 | ) |
| | | | | | | | |
Net increase (decrease) in shares outstanding before conversion | | | 191,856 | | | | 6,665,751 | |
Shares reacquired upon conversion into Class A | | | (144,212 | ) | | | (4,912,972 | ) |
| | | | | | | | |
Net increase (decrease) in shares outstanding | | | 47,644 | | | $ | 1,752,779 | |
| | | | | | | | |
| | |
| 32 | | Visit our website at www.prudentialfunds.com |
| | | | | | | | |
Class B | | Shares | | | Amount | |
Year ended May 31, 2009: | | | | | | | | |
Shares sold | | | 1,447,736 | | | $ | 48,244,549 | |
Shares issued in reinvestment of dividends and distributions | | | 333,106 | | | | 6,128,832 | |
Shares reacquired | | | (2,059,780 | ) | | | (68,790,192 | ) |
| | | | | | | | |
Net increase (decrease) in shares outstanding before conversion | | | (278,938 | ) | | | (14,416,811 | ) |
Shares issued upon conversion from Class B | | | (380,771 | ) | | | (14,818,288 | ) |
| | | | | | | | |
Net increase (decrease) in shares outstanding | | | (659,709 | ) | | $ | (29,235,099 | ) |
| | | | | | | | |
Class C | | | | | | |
Year ended October 31, 2010: | | | | | | | | |
Shares sold | | | 6,784,356 | | | $ | 260,862,553 | |
Shares issued in reinvestment of dividends | | | 295,023 | | | | 11,072,370 | |
Shares reacquired | | | (3,885,937 | ) | | | (146,648,923 | ) |
| | | | | | | | |
Net increase (decrease) in shares outstanding | | | 3,193,442 | | | $ | 125,286,000 | |
| | | | | | | | |
Five months ended October 31, 2009: | | | | | | | | |
Shares sold | | | 3,766,920 | | | $ | 127,528,621 | |
Shares reacquired | | | (1,476,693 | ) | | | (49,030,138 | ) |
| | | | | | | | |
Net increase (decrease) in shares outstanding | | | 2,290,227 | | | $ | 78,498,483 | |
| | | | | | | | |
Year ended May 31, 2009: | | | | | | | | |
Shares sold | | | 6,195,211 | | | $ | 200,966,716 | |
Shares issued in reinvestment of dividends and distributions | | | 601,799 | | | | 11,073,050 | |
Shares reacquired | | | (6,797,499 | ) | | | (224,053,651 | ) |
| | | | | | | | |
Net increase (decrease) in shares outstanding | | | (489 | ) | | $ | (12,013,885 | ) |
| | | | | | | | |
Class R | | | | | | | | |
Year ended October 31, 2010: | | | | | | | | |
Shares sold | | | 793,486 | | | $ | 35,842,178 | |
Shares issued in reinvestment of dividends | | | 11,954 | | | | 525,131 | |
Shares reacquired | | | (476,158 | ) | | | (21,452,783 | ) |
| | | | | | | | |
Net increase (decrease) in shares outstanding | | | 329,282 | | | $ | 14,914,526 | |
| | | | | | | | |
Five months ended October 31, 2009: | | | | | | | | |
Shares sold | | | 341,928 | | | $ | 13,647,240 | |
Shares reacquired | | | (173,986 | ) | | | (6,728,157 | ) |
| | | | | | | | |
Net increase (decrease) in shares outstanding | | | 167,942 | | | $ | 6,919,083 | |
| | | | | | | | |
Year ended May 31, 2009: | | | | | | | | |
Shares sold | | | 500,380 | | | $ | 18,863,100 | |
Shares issued in reinvestment of dividends and distributions | | | 20,902 | | | | 446,464 | |
Shares reacquired | | | (220,000 | ) | | | (8,266,069 | ) |
| | | | | | | | |
Net increase (decrease) in shares outstanding | | | 301,282 | | | $ | 11,043,495 | |
| | | | | | | | |
| | | | |
| Prudential Jennison Natural Resources Fund, Inc. | | | 33 | |
Notes to Financial Statements
continued
| | | | | | | | |
Class Z | | Shares | | | Amount | |
Year ended October 31, 2010: | | | | | | | | |
Shares sold | | | 14,402,038 | | | $ | 667,963,931 | |
Shares issued in reinvestment of dividends | | | 201,382 | | | | 9,058,155 | |
Shares reacquired | | | (6,361,610 | ) | | | (288,028,884 | ) |
| | | | | | | | |
Net increase (decrease) in shares outstanding | | | 8,241,810 | | | $ | 388,993,202 | |
| | | | | | | | |
Five months ended October 31, 2009: | | | | | | | | |
Shares sold | | | 4,818,768 | | | $ | 190,787,347 | |
Shares reacquired | | | (1,718,490 | ) | | | (67,871,970 | ) |
| | | | | | | | |
Net increase (decrease) in shares outstanding | | | 3,100,278 | | | $ | 122,915,377 | |
| | | | | | | | |
Year ended May 31, 2009: | | | | | | | | |
Shares sold | | | 7,455,066 | | | $ | 314,185,114 | |
Shares issued in reinvestment of dividends and distributions | | | 555,944 | | | | 12,102,826 | |
Shares reacquired | | | (6,195,307 | ) | | | (231,654,378 | ) |
| | | | | | | | |
Net increase (decrease) in shares outstanding | | | 1,815,703 | | | $ | 94,633,562 | |
| | | | | | | | |
Note 7. Borrowing
The Fund, along with other affiliated registered investment companies (the “Funds”), is a party to a Syndicated Credit Agreement (“SCA”) with two banks. The SCA provides for a commitment of $500 million. Interest on any borrowings under the SCA would be incurred at contracted market rates and a commitment fee for the unused amount is accrued daily and paid quarterly. The Funds pay an annualized commitment fee of .15% of the unused portion of the SCA. The expiration date of the SCA has been extended from October 20, 2010 through December 17, 2010 under the same terms. Effective December 17, 2010 the Fund, along with the Funds entered into a new Syndicated Credit Agreement (“New SCA”) with a group of banks. The New SCA provides for a commitment of $750 million. The Funds will pay an annualized commitment fee of .10% of the unused portion of the New SCA. The expiration date of the New SCA is December 16, 2011. Interest on any borrowings under the New SCA will be incurred at contracted market rates and a commitment fee for the unused amount is accrued daily and paid quarterly. The purpose of the SCA is to provide an alternative source of temporary funding for capital share redemptions.
The Fund did not borrow any amounts pursuant to the SCA during the year ended October 31, 2010.
| | |
| 34 | | Visit our website at www.prudentialfunds.com |
Note 8. Notice of Dividends to Shareholders
The Fund declared an ordinary income dividend on November 26, 2010 to shareholders of record on November 29, 2010. The ex-dividend date was November 30, 2010. The per share amounts declared were as follows:
| | | | |
| | | | | Ordinary
Income |
| Class A | | | | $0.56691 |
| Class B | | | | $0.56691 |
| Class C | | | | $0.56691 |
| Class R | | | | $0.56691 |
| Class Z | | | | $0.56691 |
Note 9. New Accounting Pronouncement
In January 2010, the Financial Accounting Standards Board issued Accounting Standards Update (“ASU”) No. 2010-06 “Improving Disclosures about Fair Value Measurements”. ASU 2010-06 will require reporting entities to make new disclosures about purchases, sales, issuances, and settlements in the roll forward of activity in Level 3 fair value measurements. The new and revised disclosures are effective for interim and annual reporting periods beginning after December 15, 2010. At this time, management is evaluating the implications of ASU No. 2010-06 and its impact on the financial statements has not been determined.
Note 10. Subsequent Event
Class Q shares are scheduled to commence operations on December 27, 2010. These shares will be available only to limited groups of investors.
| | | | |
| Prudential Jennison Natural Resources Fund, Inc. | | | 35 | |
Financial Highlights
| | | | | | | | | | | | | | | | | | | | | | | | |
| Class A Shares | |
| | | Year Ended
October 31, | | | Five Months
Ended
October 31, | | | Year Ended May 31, | |
Per Share Operating
Performance: | | 2010(b) | | | 2009(a)(b) | | | 2009(b) | | | 2008(b) | | | 2007(b) | | | 2006(b) | |
| Net Asset Value, Beginning Of Period | | | $41.27 | | | | $38.08 | | | | $68.29 | | | | $53.87 | | | | $48.25 | | | | $30.36 | |
| Income (loss) from investment operations: | | | | | | | | | | | | | | | | | | | | | | | | |
| Net investment income (loss) | | | (.21 | ) | | | (.02 | ) | | | (.06 | ) | | | (.12 | ) | | | (.03 | ) | | | .15 | |
| Net realized and unrealized gain (loss) on investment and foreign currency transactions | | | 10.18 | | | | 3.21 | | | | (28.75 | ) | | | 19.61 | | | | 11.21 | | | | 20.28 | |
| Total from investment operations | | | 9.97 | | | | 3.19 | | | | (28.81 | ) | | | 19.49 | | | | 11.18 | | | | 20.43 | |
| Less Dividends and Distributions: | | | | | | | | | | | | | | | | | | | | | | | | |
| Dividends from net investment income | | | (.76 | ) | | | - | | | | (.53 | ) | | | (2.43 | ) | | | (.42 | ) | | | (.30 | ) |
| Distributions from net realized gains | | | - | | | | - | | | | (.87 | ) | | | (2.64 | ) | | | (5.14 | ) | | | (2.24 | ) |
| Total dividends and distributions | | | (.76 | ) | | | - | | | | (1.40 | ) | | | (5.07 | ) | | | (5.56 | ) | | | (2.54 | ) |
| Capital contributions: | | | - | (i) | | | - | | | | - | | | | - | | | | - | | | | - | |
| Net asset value, end of period | | | $50.48 | | | | $41.27 | | | | $38.08 | | | | $68.29 | | | | $53.87 | | | | $48.25 | |
| Total Return(c): | | | 24.42% | | | | 8.38% | | | | (40.56)% | | | | 38.15% | | | | 25.03% | | | | 69.16% | |
| |
| Ratios/Supplemental Data: | | | | | | | | | | | | | | | | |
| Net assets, end of period (000) | | | $2,165,180 | | | | $1,535,793 | | | | $1,261,030 | | | | $2,090,493 | | | | $1,100,431 | | | | $817,299 | |
| Average net assets (000) | | | $1,849,392 | | | | $1,372,157 | | | | $1,168,562 | | | | $1,491,943 | | | | $847,853 | | | | $566,901 | |
| Ratios to average net assets(d): | | | | | | | | | | | | | | | | | | | | | | | | |
| Expenses, including distribution and service (12b-1) fees | | | 1.20% | (e) | | | 1.21% | (e)(g) | | | 1.23% | (e) | | | 1.14% | (e)(f) | | | 1.19% | (f) | | | 1.14% | (f) |
| Expenses, excluding distribution and service (12b-1) fees | | | .90% | (e) | | | .91% | (e)(g) | | | .93% | (e) | | | .85% | (e) | | | .94% | | | | .89% | |
| Net investment income (loss) | | | (.47)% | (e) | | | (.12)% | (e)(g) | | | (.15)% | (e) | | | (.20)% | (e) | | | (.07)% | | | | .36% | |
| For Class A, B, C, R and Z shares: | | | | | | | | | | | | | | | | | | | | | | | | |
| Portfolio turnover rate | | | 21% | | | | 9% | (h) | | | 51% | | | | 21% | | | | 46% | | | | 34% | |
(a) The Fund changed its fiscal year end from May 31 to October 31, effective October 31, 2009.
(b) Calculated based on average shares outstanding during the period.
(c) Total return does not consider the effects of sales loads. Total return is calculated assuming a purchase of a share on the first day and a sale on the last day of each period reported, and includes reinvestment of dividends and distributions. Total return may reflect adjustments to conform to generally accepted accounting principles. Total returns for periods less than one full year are not annualized.
(d) Does not include expenses of the underlying portfolio in which the Fund invests.
(e) Through September 30, 2008, the manager of the Fund contractually agreed to waive .05% of the management fee rate on average daily net assets over $2 billion. Effective October 1, 2008, the manager of the Fund has contractually agreed to waive .05% of the management fee rate on average daily net assets over $4 billion.
(f) The distributor of the Fund contractually agreed to limit its distribution and service (12b-1) fees to .25% of the average daily net assets of the Class A shares until September 30, 2007.
(g) Annualized.
(h) Not annualized.
(i) Less than $.005.
See Notes to Financial Statements.
| | |
| 36 | | Visit our website at www.prudentialfunds.com |
| | | | | | | | | | | | | | | | | | | | | | | | |
| Class B Shares | | | | | | | | | | | | |
| | | Year Ended
October 31, | | | Five Months
Ended
October 31, | | | Year Ended May 31, | |
| Per Share Operating Performance: | | 2010(b) | | | 2009(a)(b) | | | 2009(b) | | | 2008(b) | | | 2007(b) | | | 2006(b) | |
| Net Asset Value, Beginning Of Period | | | $35.30 | | | | $32.66 | | | | $58.60 | | | | $46.90 | | | | $42.70 | | | | $27.13 | |
| Income (loss) from investment operations: | | | | | | | | | | | | | | | | | | | | | | | | |
| Net investment loss | | | (.45 | ) | | | (.11 | ) | | | (.28 | ) | | | (.44 | ) | | | (.34 | ) | | | (.15 | ) |
| Net realized and unrealized gain (loss) on investment and foreign currency transactions | | | 8.66 | | | | 2.75 | | | | (24.58 | ) | | | 16.90 | | | | 9.79 | | | | 18.05 | |
| Total from investment operations | | | 8.21 | | | | 2.64 | | | | (24.86 | ) | | | 16.46 | | | | 9.45 | | | | 17.90 | |
| Less Dividends and Distributions: | | | | | | | | | | | | | | | | | | | | | | | | |
| Dividends from net investment income | | | (.76 | ) | | | - | | | | (.21 | ) | | | (2.12 | ) | | | (.11 | ) | | | (.09 | ) |
| Distributions from net realized gains | | | - | | | | - | | | | (.87 | ) | | | (2.64 | ) | | | (5.14 | ) | | | (2.24 | ) |
| Total dividends and distributions | | | (.76 | ) | | | - | | | | (1.08 | ) | | | (4.76 | ) | | | (5.25 | ) | | | (2.33 | ) |
| Capital contributions: | | | - | (g) | | | - | | | | - | | | | - | | | | - | | | | - | |
| Net asset value, end of period | | | $42.75 | | | | $35.30 | | | | $32.66 | | | | $58.60 | | | | $46.90 | | | | $42.70 | |
| Total Return(c): | | | 23.55% | | | | 8.08% | | | | (40.99)% | | | | 37.14% | | | | 24.10% | | | | 67.84% | |
| |
| Ratios/Supplemental Data: | | | | | | | | | | | | | | | | | | |
| Net assets, end of period (000) | | | $280,296 | | | | $241,335 | | | | $221,738 | | | | $436,506 | | | | $315,782 | | | | $271,419 | |
| Average net assets (000) | | | $259,961 | | | | $227,342 | | | | $229,217 | | | | $360,663 | | | | $265,189 | | | | $206,935 | |
| Ratios to average net assets(d): | | | | | | | | | | | | | | | | | | | | | | | | |
| Expenses, including distribution and service (12b-1) fees | | | 1.90% | (e) | | | 1.91% | (e)(f) | | | 1.93% | (e) | | | 1.85% | (e) | | | 1.94% | | | | 1.89% | |
| Expenses, excluding distribution and service (12b-1) fees | | | .90% | (e) | | | .91% | (e)(f) | | | .93% | (e) | | | .85% | (e) | | | .94% | | | | .89% | |
| Net investment loss | | | (1.17)% | (e) | | | (.81)% | (e)(f) | | | (.84)% | (e) | | | (.86)% | (e) | | | (.82)% | | | | (.40)% | |
(a) The Fund changed its fiscal year end from May 31 to October 31, effective October 31, 2009.
(b) Calculated based on average shares outstanding during the period.
(c) Total return does not consider the effects of sales loads. Total return is calculated assuming a purchase of a share on the first day and a sale on the last day of each period reported, and includes reinvestment of dividends and distributions. Total return may reflect adjustments to conform to generally accepted accounting principles. Total returns for periods less than one full year are not annualized.
(d) Does not include expenses of the underlying portfolio in which the Fund invests.
(e) Through September 30, 2008, the manager of the Fund contractually agreed to waive .05% of the management fee rate on average daily net assets over $2 billion. Effective October��1, 2008, the manager of the Fund has contractually agreed to waive .05% of the management fee rate on average daily net assets over $4 billion.
(f) Annualized.
(g) Less than $.005.
See Notes to Financial Statements.
| | | | |
| Prudential Jennison Natural Resources Fund, Inc. | | | 37 | |
Financial Highlights
continued
| | | | | | | | | | | | | | | | | | | | | | | | |
| Class C Shares | | | | | | | | | | | | | | | | | | |
| | | Year Ended
October 31, | | | Five Months
Ended
October 31, | | | Year Ended May 31, | |
| Per Share Operating Performance: | | 2010(b) | | | 2009(a)(b) | | | 2009(b) | | | 2008(b) | | | 2007(b) | | | 2006(b) | |
| Net Asset Value, Beginning Of Period | | | $35.31 | | | | $32.67 | | | | $58.61 | | | | $46.90 | | | | $42.70 | | | | $27.13 | |
| Income (loss) from investment operations: | | | | | | | | | | | | | | | | | | | | | | | | |
| Net investment loss | | | (.45 | ) | | | (.12 | ) | | | (.28 | ) | | | (.46 | ) | | | (.34 | ) | | | (.15 | ) |
| Net realized and unrealized gain (loss) on investment and foreign currency transactions | | | 8.65 | | | | 2.76 | | | | (24.58 | ) | | | 16.93 | | | | 9.79 | | | | 18.05 | |
| Total from investment operations | | | 8.20 | | | | 2.64 | | | | (24.86 | ) | | | 16.47 | | | | 9.45 | | | | 17.90 | |
| Less Dividends and Distributions: | | | | | | | | | | | | | | | | | | | | | | | | |
| Dividends from net investment income | | | (.76 | ) | | | - | | | | (.21 | ) | | | (2.12 | ) | | | (.11 | ) | | | (.09 | ) |
| Distributions from net realized gains | | | - | | | | - | | | | (.87 | ) | | | (2.64 | ) | | | (5.14 | ) | | | (2.24 | ) |
| Total dividends and distributions | | | (.76 | ) | | | - | | | | (1.08 | ) | | | (4.76 | ) | | | (5.25 | ) | | | (2.33 | ) |
| Capital contributions: | | | - | (g) | | | - | | | | - | | | | - | | | | - | | | | - | |
| Net asset value, end of period | | | $42.75 | | | | $35.31 | | | | $32.67 | | | | $58.61 | | | | $46.90 | | | | $42.70 | |
| Total Return(c): | | | 23.51% | | | | 8.08% | | | | (40.99)% | | | | 37.14% | | | | 24.10% | | | | 67.84% | |
| |
| Ratios/Supplemental Data: | | | | | | | | | | | | | | | | | | |
| Net assets, end of period (000) | | | $953,597 | | | | $674,791 | | | | $549,558 | | | | $985,867 | | | | $550,097 | | | | $406,571 | |
| Average net assets (000) | | | $819,275 | | | | $600,514 | | | | $533,680 | | | | $724,878 | | | | $428,643 | | | | $261,145 | |
| Ratios to average net assets(d): | | | | | | | | | | | | | | | | | | | | | | | | |
| Expenses, including distribution and service (12b-1) fees | | | 1.90% | (e) | | | 1.91% | (e)(f) | | | 1.93% | (e) | | | 1.85% | (e) | | | 1.94% | | | | 1.89% | |
| Expenses, excluding distribution and service (12b-1) fees | | | .90% | (e) | | | .91% | (e)(f) | | | .93% | (e) | | | .85% | (e) | | | .94% | | | | .89% | |
| Net investment loss | | | (1.17)% | (e) | | | (.82)% | (e)(f) | | | (.85)% | (e) | | | (.90)% | (e) | | | (.82)% | | | | (.40)% | |
(a) The Fund changed its fiscal year end from May 31 to October 31, effective October 31, 2009.
(b) Calculated based on average shares outstanding during the period.
(c) Total return does not consider the effects of sales loads. Total return is calculated assuming a purchase of a share on the first day and a sale on the last day of each period reported, and includes reinvestment of dividends and distributions. Total return may reflect adjustments to conform to generally accepted accounting principles. Total returns for periods less than one full year are not annualized.
(d) Does not include expenses of the underlying portfolio in which the Fund invests.
(e) Through September 30, 2008, the manager of the Fund contractually agreed to waive .05% of the management fee rate on average daily net assets over $2 billion. Effective October 1, 2008, the manager of the Fund has contractually agreed to waive .05% of the management fee rate on average daily net assets over $4 billion.
(f) Annualized.
(g) Less than $.005.
See Notes to Financial Statements.
| | |
| 38 | | Visit our website at www.prudentialfunds.com |
| | | | | | | | | | | | | | | | | | | | |
| Class R Shares | |
| | | Year Ended
October 31 | | | Five Months
Ended
October 31, | | | Year Ended May 31, | | | August 22,
2006(b)
through
May 31, | |
| Per Share Operating Performance: | | 2010(c) | | | 2009(a)(c) | | | 2009(c) | | | 2008(c) | | | 2007(c) | |
| Net Asset Value, Beginning Of Period | | | $41.19 | | | | $38.02 | | | | $68.28 | | | | $53.96 | | | | $47.85 | |
| Income (loss) from investment operations: | | | | | | | | | | | | | | | | | | | | |
| Net investment loss | | | (.31 | ) | | | (.05 | ) | | | (.13 | ) | | | (.37 | ) | | | (.08 | ) |
| Net realized and unrealized gain (loss) on investment and foreign currency transactions | | | 10.15 | | | | 3.22 | | | | (28.73 | ) | | | 19.74 | | | | 11.63 | |
| Total from investment operations | | | 9.84 | | | | 3.17 | | | | (28.86 | ) | | | 19.37 | | | | 11.55 | |
| Less Dividends and Distributions: | | | | | | | | | | | | | | | | | | | | |
| Dividends from net investment income | | | (.76 | ) | | | - | | | | (.53 | ) | | | (2.41 | ) | | | (.30 | ) |
| Distributions from net realized gains | | | - | | | | - | | | | (.87 | ) | | | (2.64 | ) | | | (5.14 | ) |
| Total dividends and distributions | | | (.76 | ) | | | - | | | | (1.40 | ) | | | (5.05 | ) | | | (5.44 | ) |
| Capital contributions: | | | - | (i) | | | - | | | | - | | | | - | | | | - | |
| Net asset value, end of period | | | $50.27 | | | | $41.19 | | | | $38.02 | | | | $68.28 | | | | $53.96 | |
| Total Return(d): | | | 24.15% | | | | 8.34% | | | | (40.66)% | | | | 37.82% | | | | 25.98% | |
| |
| Ratios/Supplemental Data: | | | | | | | | | | | | | | | |
| Net assets, end of period (000) | | | $51,424 | | | | $28,573 | | | | $19,990 | | | | $15,328 | | | | $2,565 | |
| Average net assets (000) | | | $40,431 | | | | $23,555 | | | | $12,599 | | | | $6,730 | | | | $626 | |
| Ratios to average net assets(e): | | | | | | | | | | | | | | | | | | | | |
| Expenses, including distribution and service (12b-1) fees(f) | | | 1.40% | (g) | | | 1.41% | (g)(h) | | | 1.43% | (g) | | | 1.35% | (g) | | | 1.44% | (h) |
| Expenses, excluding distribution and service (12b-1) fees | | | .90% | (g) | | | .91% | (g)(h) | | | .93% | (g) | | | .85% | (g) | | | .94% | (h) |
| Net investment loss | | | (.68)% | (g) | | | (.33)% | (g)(h) | | | (.37)% | (g) | | | (.62)% | (g) | | | (.24)% | (h) |
(a) The Fund changed its fiscal year end from May 31 to October 31, effective October 31, 2009.
(b) Inception date of Class R shares.
(c) Calculated based on average shares outstanding during the period.
(d) Total return is calculated assuming a purchase of a share on the first day and a sale on the last day of each period reported, and includes reinvestment of dividends and distributions. Total returns may reflect adjustments to conform to generally accepted accounting principles. Total returns for periods less than one full year are not annualized.
(e) Does not include expenses of the underlying portfolio in which the Fund invests.
(f) The distributor of the Fund has contractually agreed to limit its distribution and service (12b-1) fees to .50% of the average daily net assets of the Class R shares.
(g) Through September 30, 2008, the manager of the Fund contractually agreed to waive .05% of the management fee rate on average daily net assets over $2 billion. Effective October 1, 2008, the manager of the Fund has contractually agreed to waive .05% of the management fee rate on average daily net assets over $4 billion.
(h) Annualized.
(i) Less than $.005.
See Notes to Financial Statements.
| | | | |
| Prudential Jennison Natural Resources Fund, Inc. | | | 39 | |
Financial Highlights
continued
| | | | | | | | | | | | | | | | | | | | | | | | |
| Class Z Shares | | | | | | | | | | | | | | | | | | |
| | | Year Ended
October 31, | | | Five Months
Ended
October 31, | | | Year Ended May 31, | |
| Per Share Operating Performance: | | 2010(b) | | | 2009(a)(b) | | | 2009(b) | | | 2008(b) | | | 2007(b) | | | 2006(b) | |
| Net Asset Value, Beginning Of Period | | | $42.14 | | | | $38.83 | | | | $69.90 | | | | $54.99 | | | | $49.12 | | | | $30.87 | |
| Income (loss) from investment operations: | | | | | | | | | | | | | | | | | | | | | | | | |
| Net investment income (loss) | | | (.08 | ) | | | .03 | | | | .06 | | | | .05 | | | | .08 | | | | .26 | |
| Net realized and unrealized gain (loss) on investment and foreign currency transactions | | | 10.41 | | | | 3.28 | | | | (29.55 | ) | | | 20.05 | | | | 11.46 | | | | 20.60 | |
| Total from investment operations | | | 10.33 | | | | 3.31 | | | | (29.49 | ) | | | 20.10 | | | | 11.54 | | | | 20.86 | |
| Less Dividends and Distributions: | | | | | | | | | | | | | | | | | | | | | | | | |
| Dividends from net investment income | | | (.76 | ) | | | - | | | | (.71 | ) | | | (2.55 | ) | | | (.53 | ) | | | (.37 | ) |
| Distributions from net realized gains | | | - | | | | - | | | | (.87 | ) | | | (2.64 | ) | | | (5.14 | ) | | | (2.24 | ) |
| Total dividends and distributions | | | (.76 | ) | | | - | | | | (1.58 | ) | | | (5.19 | ) | | | (5.67 | ) | | | (2.61 | ) |
| Capital contributions: | | | - | (g) | | | - | | | | - | | | | - | | | | - | | | | - | |
| Net asset value, end of period | | | $51.71 | | | | $42.14 | | | | $38.83 | | | | $69.90 | | | | $54.99 | | | | $49.12 | |
| Total Return(c): | | | 24.77% | | | | 8.52% | | | | (40.40)% | | | | 38.53% | | | | 25.39% | | | | 69.44% | |
| |
| Ratios/Supplemental Data: | | | | | | | | | | | | | | | | | | |
| Net assets, end of period (000) | | | $1,212,655 | | | | $640,899 | | | | $470,122 | | | | $719,348 | | | | $355,928 | | | | $270,375 | |
| Average net assets (000) | | | $896,356 | | | | $552,361 | | | | $433,493 | | | | $503,262 | | | | $283,266 | | | | $179,109 | |
| Ratios to average net assets(d): | | | | | | | | | | | | | | | | | | | | | | | | |
| Expenses, including distribution and service (12b-1) fees | | | .90% | (e) | | | .91% | (e)(f) | | | .93% | (e) | | | .85% | (e) | | | .94% | | | | .89% | |
| Expenses, excluding distribution and service (12b-1) fees | | | .90% | (e) | | | .91% | (e)(f) | | | .93% | (e) | | | .85% | (e) | | | .94% | | | | .89% | |
| Net investment income (loss) | | | (.18)% | (e) | | | .17% | (e)(f) | | | .15% | (e) | | | .08% | (e) | | | .18% | | | | .60% | |
(a) The Fund changed its fiscal year end from May 31 to October 31, effective October 31, 2009.
(b) Calculated based on average shares outstanding during the period.
(c) Total return is calculated assuming a purchase of a share on the first day and a sale on the last day of each period reported, and includes reinvestment of dividends and distributions. Total return may reflect adjustments to conform to generally accepted accounting principles. Total returns for periods less than one full year are not annualized.
(d) Does not include expenses of the underlying portfolio in which the Fund invests.
(e) Through September 30, 2008, the manager of the Fund contractually agreed to waive .05% of the management fee rate on average daily net assets over $2 billion. Effective October 1, 2008, the manager of the Fund has contractually agreed to waive .05% of the management fee rate on average daily net assets over $4 billion.
(f) Annualized.
(g) Less than $.005.
See Notes to Financial Statements.
| | |
| 40 | | Visit our website at www.prudentialfunds.com |
Report of Independent Registered Public
Accounting Firm
The Board of Directors and Shareholders
Prudential Jennison Natural Resources Fund, Inc.:
We have audited the accompanying statement of assets and liabilities of Prudential Jennison Natural Resources Fund, Inc. (formerly Jennison Natural Resources Fund, Inc) (hereafter referred to as the “Fund”), including the portfolio of investments, as of October 31, 2010, and the related statement of operations for the year then ended, the statement of changes in net assets for the year then ended, the five-month period ended October 31, 2009 and the year ended May 31, 2009, and the financial highlights for the year then ended, the five-month period ended October 31, 2009 and for each of the years in the four-year period ended May 31, 2009. These financial statements and financial highlights are the responsibility of the Fund’s management. Our responsibility is to express an opinion on these financial statements and financial highlights based on our audits.
We conducted our audits in accordance with the standards of the Public Company Accounting Oversight Board (United States). Those standards require that we plan and perform the audit to obtain reasonable assurance about whether the financial statements and financial highlights are free of material misstatement. An audit includes examining, on a test basis, evidence supporting the amounts and disclosures in the financial statements. Our procedures included confirmation of securities owned as of October 31, 2010, by correspondence with the custodian, transfer agent and brokers or by other appropriate auditing procedures when replies from brokers were not received. An audit also includes assessing the accounting principles used and significant estimates made by management, as well as evaluating the overall financial statement presentation. We believe that our audits provide a reasonable basis for our opinion.
In our opinion, the financial statements and financial highlights referred to above present fairly, in all material respects, the financial position of the Fund as of October 31, 2010, and the results of its operations for the year then ended, the changes in its net assets for the year then ended, the five-month period ended October 31, 2009, the year ended May 31, 2009 and the financial highlights for the year then ended, the five-month period ended October 31, 2009 and for each of the years in the four-year period ended May 31, 2009, in conformity with U.S. generally accepted accounting principles.
New York, New York
December 20, 2010
| | | | |
| Prudential Jennison Natural Resources Fund, Inc. | | | 41 | |
Federal Income Tax Information
(Unaudited)
We are required by the Internal Revenue Code of 1986, as amended (“the Code”), to advise you within 60 days of the Fund’s fiscal year end (October 31, 2010) as to the federal income tax status of dividends paid during such fiscal year. We are advising you that during its fiscal year ended October 31, 2010, the Fund paid ordinary income dividends of $0.76 per share for Class A, Class B, Class C, Class R and Class Z, which are taxable as such.
For the fiscal year ended October 31, 2010, the Fund designates the maximum amount allowable under Section 854 of the Internal Revenue Code but not less than the following percentages of the ordinary income distributions paid as: 1) qualified dividend income (QDI); and 2) eligible for corporate dividends received deduction (DRD).
| | | | | | | | |
| | | QDI | | | DRD | |
Prudential Jennison Natural Resources Fund | | | 69.18 | % | | | 11.87 | % |
In January 2011, you will be advised on IRS Form 1099 DIV or substitute 1099 DIV as to the federal tax status of the distributions received by you in calendar year 2010.
| | |
| 42 | | Visit our website at www.prudentialfunds.com |
MANAGEMENT OF THE FUND
(Unaudited)
Information about Fund Directors/Trustees (referred to herein as “Board Members”) and Fund Officers is set forth below. Board Members who are not deemed to be “interested persons,” as defined in the 1940 Act, are referred to as “Independent Board Members.” Board Members who are deemed to be “interested persons” are referred to as “Interested Board Members.” The Board Members are responsible for the overall supervision of the operations of the Fund and perform the various duties imposed on the directors or trustees of investment companies by the 1940 Act.
| | | | |
Independent Board Members (1) |
Name, Address, Age Position(s) Portfolios Overseen | | Principal Occupation(s) During Past Five Years | | Other Directorships Held |
Kevin J. Bannon (58) Board Member Portfolios Overseen: 58 | | Managing Director (since April 2008) and Chief Investment Officer (since October 2008) of Highmount Capital LLC (registered investment adviser); formerly Executive Vice President and Chief Investment Officer (April 1993-August 2007) of Bank of New York Company; President (May 2003-May 2007) of BNY Hamilton Family of Mutual Funds. | | Director of Urstadt Biddle Properties (since September 2008). |
Linda W. Bynoe (58) Board Member Portfolios Overseen: 58 | | President and Chief Executive Officer (since March 1995) and formerly Chief Operating Officer (December 1989- February 1995) of Telemat Ltd. (management consulting); formerly Vice President (January 1985-June 1989) at Morgan Stanley & Co (broker-dealer). | | Director of Simon Property Group, Inc. (retail real estate) (since May 2003); Anixter International, Inc. (communication products distributor) (since January 2006); Director of Northern Trust Corporation (financial services) (since April 2006); Trustee of Equity Residential (residential real estate) (since December 2009); formerly Director of Dynegy Inc. (power generation) (September 2002-May 2006), CitiStreet Funds, Inc. (mutual funds) (May 1993-February 2005), AM-CH, Inc. (restaurant holding company) (November 2004-February 2005). |
Michael S. Hyland, CFA (65) Board Member Portfolios Overseen: 58 | | Independent Consultant (since February 2005); formerly Senior Managing Director (July 2001-February 2005) of Bear Stearns & Co, Inc.; Global Partner, INVESCO (1999-2001); Managing Director and President of Salomon Brothers Asset Management (1989-1999). | | None. |
Prudential Jennison Natural Resources Fund, Inc.
| | | | |
Douglas H. McCorkindale (71) Board Member Portfolios Overseen: 58 | | Formerly Chairman (February 2001-June 2006), Chief Executive Officer (June 2000-July 2005), President (September 1997-July 2005) and Vice Chairman (March 1984-May 2000) of Gannett Co. Inc. (publishing and media). | | Director of Continental Airlines, Inc. (since May 1993); Director of Lockheed Martin Corp. (aerospace and defense) (since May 2001). |
Stephen P. Munn (68) Board Member Portfolios Overseen: 58 | | Lead Director (since 2007) and formerly Chairman (1993-2007) of Carlisle Companies Incorporated (manufacturer of industrial products). | | Lead Director (since 2007) of Carlisle Companies Incorporated (manufacturer of industrial products). |
Richard A. Redeker (67) Board Member Portfolios Overseen: 58 | | Retired Mutual Fund Senior Executive (42 years); Management Consultant; Independent Directors Council (organization of 2,800 Independent Mutual Fund Directors)-Executive Committee, Chair of Policy Steering Committee, Governing Council. | | None. |
Robin B. Smith (71) Board Member & Independent Chair Portfolios Overseen: 58 | | Chairman of the Board (since January 2003) of Publishers Clearing House (direct marketing); formerly Chairman and Chief Executive Officer (August 1996-January 2003) of Publishers Clearing House. | | Formerly Director of BellSouth Corporation (telecommunications) (1992-2006). |
Stephen G. Stoneburn (67) Board Member Portfolios Overseen: 58 | | President and Chief Executive Officer (since June 1996) of Quadrant Media Corp. (publishing company); formerly President (June 1995-June 1996) of Argus Integrated Media, Inc.; Senior Vice President and Managing Director (January 1993-1995) of Cowles Business Media; Senior Vice President of Fairchild Publications, Inc (1975-1989). | | None. |
Visit our website at www.prudentialfunds.com
| | | | |
Interested Board Members (1) |
Name, Address, Age Position(s) Portfolios Overseen | | Principal Occupation(s) During Past Five Years | | Other Directorships Held |
Judy A. Rice (62) Board Member & President Portfolios Overseen: 58 | | President, Chief Executive Officer, Chief Operating Officer and Officer-In-Charge (since February 2003) of Prudential Investments LLC; President, Chief Executive Officer and Officer-In-Charge (since April 2003) of Prudential Mutual Fund Services LLC; Executive Vice President (since December 2008) of Prudential Investment Management Services LLC; Member of the Board of Directors of Jennison Associates LLC (since November 2010); formerly Vice President (February 1999-April 2006) of Prudential Investment Management Services LLC; formerly President, Chief Executive Officer, Chief Operating Officer and Officer-In-Charge (May 2003-June 2005) and Director (May 2003-March 2006) and Executive Vice President (June 2005-March 2006) of AST Investment Services, Inc.; Member of Board of Governors of the Investment Company Institute. | | None. |
Scott E. Benjamin (37) Board Member & Vice President Portfolios Overseen: 58 | | Executive Vice President (since June 2009) of Prudential Investments LLC and Prudential Investment Management Services LLC; Executive Vice President (since September 2009) of AST Investment Services, Inc.; Senior Vice President of Product Development and Marketing, Prudential Investments (since February 2006); Vice President of Product Development and Product Management, Prudential Investments (2003-2006). | | None. |
| (1) | The year that each individual joined the Fund's Board is as follows: |
Kevin J. Bannon, 2008; Linda W. Bynoe, 2005; Michael S. Hyland, 2008; Douglas H. McCorkindale, 2003; Stephen P. Munn, 2008; Richard A. Redeker, 1995; Robin B. Smith, 2003; Stephen G. Stoneburn, 2003; Judy A. Rice, Board Member since 2000 and President since 2003; Scott E. Benjamin, Board Member since 2010 and Vice President since 2009. Prudential Jennison Natural Resources Fund, Inc.
Prudential Jennison Natural Resources Fund, Inc.
| | |
Fund Officers (a)(1) | | |
Name, Address and Age Position with Fund | | Principal Occupation(s) During Past Five Years |
Kathryn L. Quirk (58) Chief Legal Officer | | Vice President and Corporate Counsel (since September 2004) of Prudential; Executive Vice President, Chief Legal Officer and Secretary (since July 2005) of PI and Prudential Mutual Fund Services LLC; Vice President and Corporate Counsel (since June 2005) and Secretary (since February 2006) of AST Investment Services, Inc.; formerly Senior Vice President and Assistant Secretary (November 2004-August 2005) of PI; formerly Assistant Secretary (June 2005-February 2006) of AST Investment Services, Inc.; formerly Managing Director, General Counsel, Chief Compliance Officer, Chief Risk Officer and Corporate Secretary (1997-2002) of Zurich Scudder Investments, Inc. |
Deborah A. Docs (52) Secretary | | Vice President and Corporate Counsel (since January 2001) of Prudential; Vice President (since December 1996) and Assistant Secretary (since March 1999) of PI; formerly Vice President and Assistant Secretary (May 2003-June 2005) of AST Investment Services, Inc. |
Jonathan D. Shain (52) Assistant Secretary | | Vice President and Corporate Counsel (since August 1998) of Prudential; Vice President and Assistant Secretary (since May 2001) of PI; Vice President and Assistant Secretary (since February 2001) of PMFS; formerly Vice President and Assistant Secretary (May 2003-June 2005) of AST Investment Services, Inc. |
Claudia DiGiacomo (36) Assistant Secretary | | Vice President and Corporate Counsel (since January 2005) of Prudential; Vice President and Assistant Secretary of PI (since December 2005); Associate at Sidley Austin Brown & Wood LLP (1999-2004). |
John P. Schwartz (39) Assistant Secretary | | Vice President and Corporate Counsel (since April 2005) of Prudential; Vice President and Assistant Secretary of PI (since December 2005); Associate at Sidley Austin Brown & Wood LLP (1997-2005). |
Andrew R. French (48) Assistant Secretary | | Vice President and Corporate Counsel (since February 2010) of Prudential; formerly Director and Corporate Counsel (2006-2010) of Prudential; Vice President and Assistant Secretary (since January 2007) of PI; Vice President and Assistant Secretary (since January 2007) of PMFS; formerly Senior Legal Analyst of Prudential Mutual Fund Law Department (1997-2006). |
Timothy J. Knierim (51) Chief Compliance Officer | | Chief Compliance Officer of Prudential Investment Management, Inc. (since July 2007); formerly Chief Risk Officer of PIM and PI (2002-2007) and formerly Chief Ethics Officer of PIM and PI (2006-2007). |
Valerie M. Simpson (52) Deputy Chief Compliance Officer | | Chief Compliance Officer (since April 2007) of PI and AST Investment Services, Inc.; formerly Vice President-Financial Reporting (June 1999-March 2006) for Prudential Life and Annuities Finance. |
Theresa C. Thompson (48) Deputy Chief Compliance Officer | | Vice President, Compliance, PI (since April 2004); and Director, Compliance, PI (2001-2004). |
Visit our website at www.prudentialfunds.com
| | |
Noreen M. Fierro (46) Anti-Money Laundering Compliance Officer | | Vice President, Corporate Compliance (since May 2006) of Prudential; formerly Corporate Vice President, Associate General Counsel (April 2002-May 2005) of UBS Financial Services, Inc., in their Money Laundering Prevention Group; Senior Manager (May 2005-May 2006) of Deloitte Financial Advisory Services, LLP, in their Forensic and Dispute Services, Anti-Money Laundering Group. |
Grace C. Torres (51) Treasurer and Principal Financial and Accounting Officer | | Assistant Treasurer (since March 1999) and Senior Vice President (since September 1999) of PI; Assistant Treasurer (since May 2003) and Vice President (since June 2005) of AST Investment Services, Inc.; Senior Vice President and Assistant Treasurer (since May 2003) of Prudential Annuities Advisory Services, Inc.; formerly Senior Vice President (May 2003-June 2005) of AST Investment Services, Inc. |
M. Sadiq Peshimam (46) Assistant Treasurer | | Vice President (since 2005) of Prudential Investments LLC. |
Peter Parrella (52) Assistant Treasurer | | Vice President (since 2007) and Director (2004-2007) within Prudential Mutual Fund Administration; formerly Tax Manager at SSB Citi Fund Management LLC (1997-2004). |
(a) Excludes Ms. Rice and Mr. Benjamin, interested Board Members who also serve as President and Vice President, respectively.
(1) The year that each individual became an Officer of the Fund is as follows:
Kathryn L. Quirk, 2005; Deborah A. Docs, 1996; Jonathan D. Shain, 2004; Claudia DiGiacomo, 2005; John P. Schwartz, 2006; Andrew R. French, 2006; Timothy J. Kneirim, 2007; Valerie M. Simpson, 2007; Theresa C. Thompson, 2008; Noreen M. Fierro, 2006; Grace C. Torres, 1995; Peter Parrella, 2007; M. Sadiq Peshimam, 2006.
Explanatory Notes to Tables:
| | n | Board Members are deemed to be “Interested,” as defined in the 1940 Act, by reason of their affiliation with Prudential Investments LLC and/or an affiliate of Prudential Investments LLC. |
| | n | Unless otherwise noted, the address of all Board Members and Officers is c/o Prudential Investments LLC, Gateway Center Three, 100 Mulberry Street, Newark, New Jersey 07102-4077. |
| | n | There is no set term of office for Board Members or Officers. The Board Members have adopted a retirement policy, which calls for the retirement of Board Members on December 31 of the year in which they reach the age of 75. |
| | n | Other Directorships Held” includes only directorships of companies required to register or file reports with the Commission under the Securities Exchange Act of 1934, as amended (the “Exchange Act”) (that is, “public companies”) or other investment companies registered under the 1940 Act. |
| | n | Portfolios Overseen” includes all investment companies managed by Prudential Investments LLC. The investment companies for which PI serves as manager include the Prudential Investments Mutual Funds, The Prudential Variable Contract Accounts, Target Mutual Funds, The Prudential Series Fund, Prudential’s Gibraltar Fund, Inc. and the Advanced Series Trust. |
Prudential Jennison Natural Resources Fund, Inc.
Approval of Advisory Agreements
The Fund’s Board of Directors
The Board of Directors (the “Board”) of Prudential Jennison Natural Resources Fund, Inc.(the “Fund”) consists of 10 individuals, eight of whom are not “interested persons” of the Fund, as defined in the Investment Company Act of 1940, as amended (the “1940 Act”) (the “Independent Directors”). The Board is responsible for the oversight of the Fund and its operations, and performs the various duties imposed on the directors of investment companies by the 1940 Act. The Independent Directors have retained independent legal counsel to assist them in connection with their duties. The Chair of the Board is an Independent Director. The Board has established three standing committees: the Audit Committee, the Nominating and Governance Committee, and the Investment Committee. Each committee is chaired by, and composed of, Independent Directors.
Annual Approval of the Fund’s Advisory Agreements
As required under the 1940 Act, the Board determines annually whether to renew the Fund’s management agreement with Prudential Investments LLC (“PI”) and the Fund’s subadvisory agreement with Jennison Associates LLC (“Jennison”). In considering the renewal of the agreements, the Board, including all of the Independent Directors, met on June 21-23, 2010 and approved the renewal of the agreements through July 31, 2011, after concluding that the renewal of the agreements was in the best interests of the Fund and its shareholders.
In advance of the meetings, the Board requested and received materials relating to the agreements, and had the opportunity to ask questions and request further information in connection with its consideration. Among other things, the Board considered comparative fee information from PI and Jennison. Also, the Board considered comparisons with other mutual funds in relevant Peer Universes and Peer Groups. The mutual funds included in each Peer Universe or Peer Group were objectively determined by Lipper Inc. (“Lipper”), an independent provider of mutual fund data. The comparisons placed the Fund in various quartiles over the one-, three-, five-, and 10-year periods ending December 31, 2009, with the first quartile being the best 25% of the mutual funds (for performance, the best performing mutual funds and, for expenses, the lowest cost mutual funds).
In approving the agreements, the Board, including the Independent Directors advised by independent legal counsel, considered the factors it deemed relevant, including the nature, quality and extent of services provided by PI and the subadviser, the performance of the Fund, the profitability of PI and its affiliates, expenses and fees, and the potential for economies of scale that may be shared with the Fund and its shareholders as the Fund’s assets grow. In their deliberations, the Directors did not
Prudential Jennison Natural Resources Fund, Inc.
Approval of Advisory Agreements (continued)
identify any single factor which alone was responsible for the Board’s decision to approve the agreements with respect to the Fund. In connection with its deliberations, the Board considered information provided by PI throughout the year at regular Board meetings, presentations from portfolio managers and other information, as well as information furnished at or in advance of the meetings on June 21-23, 2010.
The Directors determined that the overall arrangements between the Fund and PI, which serves as the Fund’s investment manager pursuant to a management agreement, and between PI and Jennison, which serves as the Fund’s subadviser pursuant to the terms of a subadvisory agreement with PI, are in the interest of the Fund and its shareholders in light of the services performed, fees charged and such other matters as the Directors considered relevant in the exercise of their business judgment.
The material factors and conclusions that formed the basis for the Directors’ reaching their determinations to approve the continuance of the agreements are separately discussed below.
Nature, Quality, and Extent of Services
The Board received and considered information regarding the nature, quality and extent of services provided to the Fund by PI and Jennison. The Board considered the services provided by PI, including but not limited to the oversight of the subadviser for the Fund, as well as the provision of fund recordkeeping, compliance, and other services to the Fund. With respect to PI’s oversight of the subadviser, the Board noted that PI’s Strategic Investment Research Group (“SIRG”), which is a business unit of PI, is responsible for monitoring and reporting to PI’s senior management on the performance and operations of the subadviser. The Board also considered that PI pays the salaries of all of the officers and non-independent Directors of the Fund. The Board also considered the investment subadvisory services provided by Jennison, as well as adherence to the Fund’s investment restrictions and compliance with applicable Fund policies and procedures. The Board considered PI’s evaluation of the subadviser, as well as PI’s recommendation, based on its review of the subadviser, to renew the subadvisory agreement.
The Board reviewed the qualifications, backgrounds and responsibilities of PI’s senior management responsible for the oversight of the Fund and Jennison, and also reviewed the qualifications, backgrounds and responsibilities of Jennison’s portfolio managers who are responsible for the day-to-day management of the Fund’s portfolio. The Board was provided with information pertaining to PI’s and Jennison’s organizational structure, senior management, investment operations, and other relevant information pertaining to both PI and Jennison. The Board also noted that it received favorable
Visit our website at www.prudentialfunds.com
compliance reports from the Fund’s Chief Compliance Officer (“CCO”) as to both PI and Jennison. The Board noted that Jennison is affiliated with PI.
The Board concluded that it was satisfied with the nature, extent and quality of the investment management services provided by PI and the subadvisory services provided to the Fund by Jennison, and that there was a reasonable basis on which to conclude that the Fund benefits from the services provided by PI and Jennison under the management and subadvisory agreements.
Performance of the Fund
The Board received and considered information about the Fund’s historical performance. The Board considered that the Fund’s gross performance in relation to its Peer Universe (the Lipper Global Natural Resources Fund Performance Universe) was in the first quartile over the one-, three-, five-, and 10-year periods. The Board also noted that the Fund outperformed its benchmark index over all periods. The Board concluded that, in light of the Fund’s competitive performance, it would be in the interest of the Fund and its shareholders for the Fund to renew the agreements.
Fees and Expenses
The Board considered that the Fund’s actual management fee (which reflects any subsidies, expense caps or waivers) and total expenses both ranked in the Expense Group’s second quartile. The Board concluded that the management fees and total expenses were reasonable in light of the services provided.
Costs of Services and Profits Realized by PI
The Board was provided with information on the profitability of PI and its affiliates in serving as the Fund’s investment manager. The Board discussed with PI the methodology utilized in assembling the information regarding profitability and considered its reasonableness. The Board recognized that it is difficult to make comparisons of profitability from fund management contracts because comparative information is not generally publicly available and is affected by numerous factors, including the structure of the particular adviser, the types of funds it manages, its business mix, numerous assumptions regarding allocations and the adviser’s capital structure and cost of capital. The Board did not separately consider the profitability of the subadviser, an affiliate of PI, as its profitability was reflected in the profitability report for PI. Taking these factors into account, the Board concluded that the profitability of PI and its affiliates in relation to the services rendered was not unreasonable.
Economies of Scale
The Board noted that the management fee schedule for the Fund includes breakpoints, which have the effect of decreasing the fee rate as assets increase, and
Prudential Jennison Natural Resources Fund, Inc.
Approval of Advisory Agreements (continued)
that at its current level of assets the Fund’s effective fee rate reflected some of those rate reductions. The Board received and discussed information concerning whether PI realizes economies of scale as the Fund’s assets grow beyond current levels. The Board took note that the Fund’s fee structure currently results in benefits to Fund shareholders whether or not PI realizes any economies of scale.
Other Benefits to PI and Jennison
The Board considered potential ancillary benefits that might be received by PI and Jennison and their affiliates as a result of their relationship with the Fund. The Board concluded that potential benefits to be derived by PI included brokerage commissions received by affiliates of PI, transfer agency fees received by the Fund’s transfer agent (which is affiliated with PI), benefits to the reputation as well as other intangible benefits resulting from PI’s association with the Fund. The Board concluded that the potential benefits to be derived by Jennison included its ability to use soft dollar credits, brokerage commissions received by affiliates of Jennison, as well as the potential benefits consistent with those generally resulting from an increase in assets under management, specifically, potential access to additional research resources and benefits to the reputation. The Board concluded that the benefits derived by PI and Jennison were consistent with the types of benefits generally derived by investment managers and subadvisers to mutual funds.
After full consideration of these factors, the Board concluded that approval of the agreements was in the best interest of the Fund and its shareholders.
Visit our website at www.prudentialfunds.com
| | | | |
| n MAIL | | n TELEPHONE | | n WEBSITE |
Gateway Center Three
100 Mulberry Street
Newark, NJ 07102 | | (800) 225-1852
| | www.prudentialfunds.com |
|
| PROXY VOTING |
| The Board of Directors of the Fund has delegated to the Fund’s investment subadviser the responsibility for voting any proxies and maintaining proxy recordkeeping with respect to the Fund. A description of these proxy voting policies and procedures is available without charge, upon request, by calling (800) 225-1852 or by visiting the Securities and Exchange Commission’s website at www.sec.gov. Information regarding how the Fund voted proxies relating to portfolio securities during the most recent 12-month period ended June 30 is available on the Fund’s website and on the Commission’s website. |
|
| DIRECTORS |
| Kevin J. Bannon • Scott E. Benjamin • Linda W. Bynoe • Michael S. Hyland • Douglas H. McCorkindale • Stephen P. Munn • Richard A. Redeker • Judy A. Rice • Robin B. Smith • Stephen G. Stoneburn |
|
| OFFICERS |
| Judy A. Rice, President • Scott E. Benjamin, Vice President • Grace C. Torres, Treasurer and Principal Financial and Accounting Officer • Kathryn L. Quirk, Chief Legal Officer • Deborah A. Docs, Secretary • Timothy J. Knierim, Chief Compliance Officer • Valerie M. Simpson, Deputy Chief Compliance Officer • Theresa C. Thompson, Deputy Chief Compliance Officer • Noreen M. Fierro, Anti-Money Laundering Compliance Officer • Jonathan D. Shain, Assistant Secretary • Claudia DiGiacomo, Assistant Secretary • John P. Schwartz, Assistant Secretary • Andrew R. French, Assistant Secretary • M. Sadiq Peshimam, Assistant Treasurer • Peter Parrella, Assistant Treasurer |
| | | | |
| MANAGER | | Prudential Investments LLC | | Gateway Center Three
100 Mulberry Street Newark, NJ 07102 |
|
| INVESTMENT SUBADVISER | | Jennison Associates LLC | | 466 Lexington Avenue
New York, NY 10017 |
|
| DISTRIBUTOR | | Prudential Investment
Management Services LLC | | Gateway Center Three
100 Mulberry Street Newark, NJ 07102 |
|
| CUSTODIAN | | The Bank of New York Mellon | | One Wall Street
New York, NY 10286 |
|
| TRANSFER AGENT | | Prudential Mutual Fund
Services LLC | | PO Box 9658
Providence, RI 02940 |
|
| INDEPENDENT REGISTERED PUBLIC ACCOUNTING FIRM | | KPMG LLP | | 345 Park Avenue
New York, NY 10154 |
|
| FUND COUNSEL | | Sullivan & Cromwell LLP | | 125 Broad Street
New York, NY 10004 |
|
| An investor should consider the investment objectives, risks, charges, and expenses of the Fund carefully before investing. The prospectus for the Fund contains this and other information about the Fund. An investor may obtain a prospectus by visiting our website at www.prudentialfunds.com or by calling (800) 225-1852. The prospectus should be read carefully before investing. |
|
| E-DELIVERY |
| To receive your mutual fund documents online, go to www.prudentialfunds.com/edelivery and enroll. Instead of receiving printed documents by mail, you will receive notification via e-mail when new materials are available. You can cancel your enrollment or change your e-mail address at any time by visiting the website address above. |
|
| SHAREHOLDER COMMUNICATIONS WITH DIRECTORS |
| Shareholders can communicate directly with the Board of Directors by writing to the Chair of the Board, Prudential Jennison Natural Resources Fund, Inc., Prudential Investments, Attn: Board of Directors, 100 Mulberry Street, Gateway Center Three, Newark, NJ 07102. Shareholders can communicate directly with an individual Director by writing to the same address. Communications are not screened before being delivered to the addressee. |
|
| AVAILABILITY OF PORTFOLIO SCHEDULE |
| The Fund files its complete schedule of portfolio holdings with the Securities and Exchange Commission for the first and third quarters of each fiscal year on Form N-Q. The Fund’s Forms N-Q are available on the Commission’s website at www.sec.gov. The Fund’s Forms N-Q may also be reviewed and copied at the Commission’s Public Reference Room in Washington, D.C. Information on the operation and location of the Public Reference Room may be obtained by calling (202) 551-8090. The Fund’s schedule of portfolio holdings is also available on the Fund’s website as of the end of each fiscal quarter. |
|
| The Fund’s Statement of Additional Information contains additional information about the Fund’s Directors and is available without charge, upon request, by calling (800) 225-1852. |
Mutual Funds:
| | | | |
ARE NOT INSURED BY THE FDIC OR ANY
FEDERAL GOVERNMENT AGENCY | | MAY LOSE VALUE | | ARE NOT A DEPOSIT OF OR GUARANTEED
BY ANY BANK OR ANY BANK AFFILIATE |

| | | | | | | | | | | | | | |
| | | Prudential Jennison Natural Resources Fund, Inc. | | |
| | | Share Class | | A | | B | | C | | R | | Z | | |
| | NASDAQ | | PGNAX | | PRGNX | | PNRCX | | JNRRX | | PNRZX | | |
| | CUSIP | | 74441K107 | | 74441K206 | | 74441K305 | | 74441K404 | | 74441K503 | | |
| | | | | | | | | | | | | | |
MF135E 0192566-00001-00
Item 2 – Code of Ethics – See Exhibit (a)
As of the end of the period covered by this report, the registrant has adopted a code of ethics (the “Section 406 Standards for Investment Companies – Ethical Standards for Principal Executive and Financial Officers”) that applies to the registrant’s Principal Executive Officer and Principal Financial Officer; the registrant’s Principal Financial Officer also serves as the Principal Accounting Officer.
The registrant hereby undertakes to provide any person, without charge, upon request, a copy of the code of ethics. To request a copy of the code of ethics, contact the registrant 800-225-1852, and ask for a copy of the Section 406 Standards for Investment Companies – Ethical Standards for Principal Executive and Financial Officers.
Item 3 – Audit Committee Financial Expert –
The registrant’s Board has determined that Mr. Stephen P. Munn, member of the Board’s Audit Committee is an “audit committee financial expert,” and that he is “independent,” for purposes of this Item.
Item 4 – Principal Accountant Fees and Services –
(a) Audit Fees
For the fiscal years ended October 31, 2010 and for the fiscal period June 1, 2009 through October 31, 2009 and the fiscal year ended May 31, 2009, KPMG LLP (“KPMG”), the Registrant’s principal accountant, billed the Registrant $22,000, 15,000 and $20,869, respectively, for professional services rendered for the audit of the Registrant’s annual financial statements or services that are normally provided in connection with statutory and regulatory filings.
(b) Audit-Related Fees
Not applicable for the fiscal year ended October 31, 2010 and fiscal period June 1, 2009 through October 31, 2009. During the fiscal year ended May 31, 2009, KPMG, the Registrant’s principal accountant, billed the Registrant $1,558 for professional services rendered in connection with agreed upon procedures performed related to a custody conversion.
(c) Tax Fees
None.
(d) All Other Fees
None.
(e) (1) Audit Committee Pre-Approval Policies and Procedures
THE PRUDENTIAL MUTUAL FUNDS
AUDIT COMMITTEE POLICY
on
Pre-Approval of Services Provided by the Independent Accountants
The Audit Committee of each Prudential Mutual Fund is charged with the responsibility to monitor the independence of the Fund’s independent accountants. As part of this responsibility, the Audit Committee must pre-approve any independent accounting firm’s engagement to render audit and/or permissible non-audit services, as required by law. In evaluating a proposed engagement of the independent accountants, the Audit Committee will assess the effect that the engagement might reasonably be expected to have on the accountant’s independence. The Committee’s evaluation will be based on:
| | • | | a review of the nature of the professional services expected to be provided, |
| | • | | a review of the safeguards put into place by the accounting firm to safeguard independence, and |
| | • | | periodic meetings with the accounting firm. |
Policy for Audit and Non-Audit Services Provided to the Funds
On an annual basis, the scope of audits for each Fund, audit fees and expenses, and audit-related and non-audit services (and fees proposed in respect thereof) proposed to be performed by the Fund’s independent accountants will be presented by the Treasurer and the independent accountants to the Audit Committee for review and, as appropriate, approval prior to the initiation of such services. Such presentation shall be accompanied by confirmation by both the Treasurer and the independent accountants that the proposed services will not adversely affect the independence of the independent accountants. Proposed services shall be described in sufficient detail to enable the Audit Committee to assess the appropriateness of such services and fees, and the compatibility of the provision of such services with the auditor’s independence. The Committee shall receive periodic reports on the progress of the audit and other services which are approved by the Committee or by the Committee Chair pursuant to authority delegated in this Policy.
The categories of services enumerated under “Audit Services”, “Audit-related Services”, and “Tax Services” are intended to provide guidance to the Treasurer and the independent accountants as to those categories of services which the Committee believes are generally consistent with the independence of the independent accountants and which the Committee (or the Committee Chair) would expect upon the presentation of specific proposals to pre-approve. The enumerated categories are not intended as an exclusive list of audit, audit-related or tax services, which the Committee (or the Committee Chair) would consider for pre-approval.
Audit Services
The following categories of audit services are considered to be consistent with the role of the Fund’s independent accountants:
| | • | | Annual Fund financial statement audits |
| | • | | Seed audits (related to new product filings, as required) |
| | • | | SEC and regulatory filings and consents |
Audit-related Services
The following categories of audit-related services are considered to be consistent with the role of the Fund’s independent accountants:
| | • | | Accounting consultations |
| | • | | Fund merger support services |
| | • | | Agreed Upon Procedure Reports |
| | • | | Other Internal Control Reports |
Individual audit-related services that fall within one of these categories and are not presented to the Audit Committee as part of the annual pre-approval process will be subject to pre-approval by the Committee Chair (or any other Committee member on whom this responsibility has been delegated) so long as the estimated fee for those services does not exceed $50,000.
Tax Services
The following categories of tax services are considered to be consistent with the role of the Fund’s independent accountants:
| | • | | Tax compliance services related to the filing or amendment of the following: |
| | • | | Federal, state and local income tax compliance; and, |
| | • | | Sales and use tax compliance |
| | • | | Timely RIC qualification reviews |
| | • | | Tax distribution analysis and planning |
| | • | | Tax authority examination services |
| | • | | Tax appeals support services |
| | • | | Accounting methods studies |
| | • | | Fund merger support services |
| | • | | Tax consulting services and related projects |
Individual tax services that fall within one of these categories and are not presented to the Audit Committee as part of the annual pre-approval process will be subject to pre-approval by the Committee Chair (or any other Committee member on whom this responsibility has been delegated) so long as the estimated fee for those services does not exceed $50,000.
Other Non-audit Services
Certain non-audit services that the independent accountants are legally permitted to render will be subject to pre-approval by the Committee or by one or more Committee members to whom the Committee has delegated this authority and who will report to the full Committee any pre-approval decisions made pursuant to this Policy. Non-audit services presented for pre-approval pursuant to this paragraph will be accompanied by a confirmation from both the Treasurer and the independent accountants that the proposed services will not adversely affect the independence of the independent accountants.
Proscribed Services
The Fund’s independent accountants will not render services in the following categories of non-audit services:
| | • | | Bookkeeping or other services related to the accounting records or financial statements of the Fund |
| | • | | Financial information systems design and implementation |
| | • | | Appraisal or valuation services, fairness opinions, or contribution-in-kind reports |
| | • | | Internal audit outsourcing services |
| | • | | Management functions or human resources |
| | • | | Broker or dealer, investment adviser, or investment banking services |
| | • | | Legal services and expert services unrelated to the audit |
| | • | | Any other service that the Public Company Accounting Oversight Board determines, by regulation, is impermissible. |
Pre-approval of Non-Audit Services Provided to Other Entities Within the Prudential Fund Complex
Certain non-audit services provided to Prudential Investments LLC or any of its affiliates that also provide ongoing services to the Prudential Mutual Funds will be subject to pre-approval by the Audit Committee. The only non-audit services provided to these entities that will require pre-approval are those related directly to the operations and financial reporting of the Funds. Individual projects that are not presented to the Audit Committee as part of the annual pre-approval process will be subject to pre-approval by the Committee Chair (or any other Committee member on whom this responsibility has been delegated) so long as the estimated fee for those services does not exceed $50,000. Services presented for pre-approval pursuant to this paragraph will be accompanied by a confirmation from both the Treasurer and the independent accountants that the proposed services will not adversely affect the independence of the independent accountants.
Although the Audit Committee will not pre-approve all services provided to Prudential Investments LLC and its affiliates, the Committee will receive an annual report from the Fund’s independent accounting firm showing the aggregate fees for all services provided to Prudential Investments and its affiliates.
(e) (2) Percentage of services referred to in 4(b) – 4(d) that were approved by the audit committee –
One hundred percent of the services described in Item 4(b) was approved by the audit committee.
(f) Percentage of hours expended attributable to work performed by other than full time employees of principal accountant if greater than 50%.
The percentage of hours expended on the principal accountant’s engagement to audit the registrant’s financial statements for the most recent fiscal year that were attributed to work performed by persons other than the principal accountant’s full-time, permanent employees was 0%.
(g) Non-Audit Fees
Not applicable to Registrant for the fiscal years 2010 and 2009. The aggregate non-audit fees billed by KPMG for services rendered to the registrant’s investment adviser and any entity controlling, controlled by, or under common control with the investment adviser that provides ongoing services to the registrant for the fiscal years 2010 and 2009 was $0 and $0, respectively.
(h) Principal Accountant’s Independence
Not applicable as KPMG has not provided non-audit services to the registrant’s investment adviser and any entity controlling, controlled by, or under common control with the investment adviser that provides ongoing services to the registrant that were not pre-approved pursuant to Rule 2-01(c)(7)(ii) of Regulation S-X.
Item 5 – Audit Committee of Listed Registrants – Not applicable.
Item 6 – Schedule of Investments – The schedule is included as part of the report to shareholders filed under Item 1 of this Form.
Item 7 – Disclosure of Proxy Voting Policies and Procedures for Closed-End Management Investment Companies – Not applicable.
Item 8 – Portfolio Managers of Closed-End Management Investment Companies – Not applicable.
Item 9 – Purchases of Equity Securities by Closed-End Management Investment Company and Affiliated Purchasers – Not applicable.
Item 10 – Submission of Matters to a Vote of Security Holders – Not applicable.
Item 11 – Controls and Procedures
| | (a) | It is the conclusion of the registrant’s principal executive officer and principal financial officer that the effectiveness of the registrant’s current disclosure controls and procedures (such disclosure controls and procedures having been evaluated within 90 days of the date of this filing) provide reasonable assurance that the information required to be disclosed by the registrant has been recorded, processed, summarized and reported within the time period specified in the Commission’s rules and forms and that the information required to be disclosed by the registrant has been accumulated and communicated to the registrant’s principal executive officer and principal financial officer in order to allow timely decisions regarding required disclosure. |
| | (b) | There has been no significant change in the registrant’s internal control over financial reporting that occurred during the registrant’s most recent fiscal quarter of the period covered by this report that has materially affected, or is likely to materially affect, the registrant’s internal control over financial reporting. |
Item 12 – Exhibits
| | | | |
| (a) | | (1) | | Code of Ethics – Attached hereto as Exhibit EX-99.CODE-ETH |
| | |
| | (2) | | Certifications pursuant to Section 302 of the Sarbanes-Oxley Act – Attached hereto as Exhibit EX-99.CERT. |
| | |
| | (3) | | Any written solicitation to purchase securities under Rule 23c-1. – Not applicable. |
| |
| (b) | | Certifications pursuant to Section 906 of the Sarbanes-Oxley Act – Attached hereto as Exhibit EX-99.906CERT. |
SIGNATURES
Pursuant to the requirements of the Securities Exchange Act of 1934 and the Investment Company Act of 1940, the registrant has duly caused this report to be signed on its behalf by the undersigned, thereunto duly authorized.
| | |
| Registrant: | | Prudential Jennison Natural Resources Fund, Inc. |
| | |
| By: | | /S/ DEBORAH A. DOCS |
| | Deborah A. Docs |
| | Secretary |
| |
| Date: | | December 21, 2010 |
Pursuant to the requirements of the Securities Exchange Act of 1934 and the Investment Company Act of 1940, this report has been signed below by the following persons on behalf of the registrant and in the capacities and on the dates indicated.
| | |
| By: | | /S/ JUDY A. RICE |
| | Judy A. Rice |
| | President and Principal Executive Officer |
| |
| Date: | | December 21, 2010 |
| |
| By: | | /S/ GRACE C. TORRES |
| | Grace C. Torres |
| | Treasurer and Principal Financial Officer |
| |
| Date: | | December 21, 2010 |