UNITED STATES
SECURITIES AND EXCHANGE COMMISSION
Washington, D.C. 20549
FORM N-CSR
CERTIFIED SHAREHOLDER REPORT OF REGISTERED
MANAGEMENT INVESTMENT COMPANIES
| | |
| Investment Company Act file number: | | 811-05206 |
| |
| Exact name of registrant as specified in charter: | | Prudential Jennison Natural Resources Fund, Inc. |
| |
| Address of principal executive offices: | | Gateway Center 3, |
| | 100 Mulberry Street, |
| | Newark, New Jersey 07102 |
| |
| Name and address of agent for service: | | Deborah A. Docs |
| | Gateway Center 3, |
| | 100 Mulberry Street, |
| | Newark, New Jersey 07102 |
| |
| Registrant’s telephone number, including area code: | | 800-225-1852 |
| |
| Date of fiscal year end: | | 10/31/2013 |
| |
| Date of reporting period: | | 10/31/2013 |
Item 1 – Reports to Stockholders

PRUDENTIAL INVESTMENTS»MUTUAL FUNDS
PRUDENTIAL JENNISON NATURAL RESOURCES FUND, INC.
ANNUAL REPORT · OCTOBER 31, 2013
Fund Type
Sector Stock
Objective
Long-term growth of capital
This report is not authorized for distribution to prospective investors unless preceded or accompanied by a current prospectus.
The views expressed in this report and information about the Fund’s portfolio holdings are for the period covered by this report and are subject to change thereafter.
Mutual funds are distributed by Prudential Investment Management Services LLC (PIMS). Jennison Associates is a registered investment adviser. Both are Prudential Financial companies. © 2013 Prudential Financial, Inc. and its related entities. Prudential Investments, Prudential, Jennison Associates, Jennison, the Prudential logo, Bring Your Challenges, and the Rock symbol are service marks of Prudential Financial, Inc. and its related entities, registered in many jurisdictions worldwide.

December 16, 2013
Dear Shareholder:
We hope you find the annual report for the Prudential Jennison Natural Resources Fund, Inc., informative and useful. The report covers performance for the 12-month period that ended October 31, 2013.
We recognize that ongoing market volatility may make it a difficult time to be an investor. We continue to believe a prudent response to uncertainty is to maintain a diversified portfolio of funds consistent with your tolerance for risk, time horizon, and financial goals.
Your financial advisor can help you create a diversified investment plan that may include funds covering all the basic asset classes and that reflects your personal investor profile and risk tolerance. Keep in mind, however, that diversification and asset allocation strategies do not assure a profit or protect against loss in declining markets.
Prudential Investments® is dedicated to helping you solve your toughest investment challenges—whether it’s capital growth, reliable income, or protection from market volatility and other risks. We offer the expertise of Prudential Financial’s affiliated asset managers* that strive to be leaders in a broad range of funds to help you stay on course to the future you envision. They also manage money for major corporations and pension funds around the world, which means you benefit from the same expertise, innovation, and attention to risk demanded by today’s most sophisticated investors.
Thank you for choosing the Prudential Investments family of funds.
Sincerely,

Stuart S. Parker, President
Prudential Jennison Natural Resources Fund, Inc.
*Most of Prudential Investments’ equity funds are advised by Jennison Associates LLC, Quantitative Management Associates LLC (QMA), or Prudential Real Estate Investors. Prudential Investments’ fixed income and money market funds are advised by Prudential Investment Management, Inc. (PIM) through its Prudential Fixed Income unit. Jennison Associates, QMA, and PIM are registered investment advisers and Prudential Financial companies. Prudential Real Estate Investors is a unit of PIM.
| | | | |
| Prudential Jennison Natural Resources Fund, Inc. | | | 1 | |
Your Fund’s Performance (Unaudited)
Performance data quoted represent past performance. Past performance does not guarantee future results. The investment return and principal value of an investment will fluctuate, so that an investor’s shares, when redeemed, may be worth more or less than their original cost. Current performance may be lower or higher than the past performance data quoted. An investor may obtain performance data as of the most recent month-end by visiting our website at www.prudentialfunds.com or by calling (800) 225-1852.
| | | | | | | | | | | | | | |
Cumulative Total Returns (Without Sales Charges) as of 10/31/13 | | | |
| | | One Year | | | Five Years | | | Ten Years | | | Since Inception |
Class A | | | 14.88 | % | | | 95.97 | % | | | 264.05 | % | | — |
Class B | | | 14.08 | | | | 89.21 | | | | 238.94 | | | — |
Class C | | | 14.07 | | | | 89.25 | | | | 239.01 | | | — |
Class Q | | | 15.37 | | | | N/A | | | | N/A | | | –6.68% (12/27/10) |
Class R | | | 14.67 | | | | 94.07 | | | | N/A | | | 41.84 (8/22/06) |
Class Z | | | 15.24 | | | | 98.91 | | | | 274.78 | | | — |
Lipper Global Natural Resources Index | | | 15.09 | | | | 62.10 | | | | 188.03 | | | — |
S&P 500 Index | | | 27.16 | | | | 102.55 | | | | 105.21 | | | — |
MSCI World ND Index | | | 25.77 | | | | 87.01 | | | | 103.74 | | | — |
Lipper Global Natural Resources Funds Avg. | | | 15.22 | | | | 55.06 | | | | 210.78 | | | — |
| | | | | | | | | | | | | | |
Average Annual Total Returns (With Sales Charges) as of 9/30/13 | | | |
| | | One Year | | | Five Years | | | Ten Years | | | Since Inception |
Class A | | | 0.61 | % | | | 3.84 | % | | | 13.50 | % | | — |
Class B | | | 0.74 | | | | 4.12 | | | | 13.32 | | | — |
Class C | | | 4.74 | | | | 4.29 | | | | 13.32 | | | — |
Class Q | | | 6.95 | | | | N/A | | | | N/A | | | –3.89% (12/27/10) |
Class R | | | 6.28 | | | | 4.82 | | | | N/A | | | 4.45 (8/22/06) |
Class Z | | | 6.80 | | | | 5.34 | | | | 14.46 | | | — |
Lipper Global Natural Resources Index | | | 9.36 | | | | 2.12 | | | | 11.25 | | | — |
S&P 500 Index | | | 19.34 | | | | 10.01 | | | | 7.56 | | | — |
MSCI World ND Index | | | 20.21 | | | | 7.84 | | | | 7.58 | | | — |
Lipper Global Natural Resources Funds Avg. | | | 8.57 | | | | 1.15 | | | | 11.97 | | | — |
| | |
| 2 | | Visit our website at www.prudentialfunds.com |
| | | | | | | | | | | | | | |
Average Annual Total Returns (With Sales Charges) as of 10/31/13 | | | |
| | | One Year | | | Five Years | | | Ten Years | | | Since Inception |
Class A | | | 8.56 | % | | | 13.12 | % | | | 13.15 | % | | — |
Class B | | | 9.08 | | | | 13.48 | | | | 12.98 | | | — |
Class C | | | 13.07 | | | | 13.61 | | | | 12.99 | | | — |
Class Q | | | 15.37 | | | | N/A | | | | N/A | | | –2.40% (12/27/10) |
Class R | | | 14.67 | | | | 14.18 | | | | N/A | | | 4.98 (8/22/06) |
Class Z | | | 15.24 | | | | 14.74 | | | | 14.12 | | | — |
| | | | | | | | | | | | | | |
Average Annual Total Returns (Without Sales Charges) as of 10/31/13 |
| | | One Year | | | Five Years | | | Ten Years | | | Since Inception |
Class A | | | 14.88 | % | | | 14.40 | % | | | 13.79 | % | | — |
Class B | | | 14.08 | | | | 13.60 | | | | 12.98 | | | — |
Class C | | | 14.07 | | | | 13.61 | | | | 12.99 | | | — |
Class Q | | | 15.37 | | | | N/A | | | | N/A | | | –2.40% (12/27/10) |
Class R | | | 14.67 | | | | 14.18 | | | | N/A | | | 4.98 (8/22/06) |
Class Z | | | 15.24 | | | | 14.74 | | | | 14.12 | | | — |
Growth of a $10,000 Investment
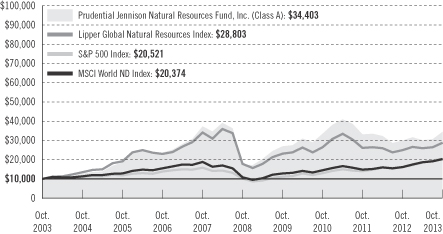
The graph compares a $10,000 investment in the Prudential Jennison Natural Resources Fund, Inc. (Class A shares) with a similar investment in the Lipper Global Natural Resources Index, Morgan Stanley Capital International World Net Dividends Index (MSCI World ND Index), and the Standard & Poor’s 500 Composite Stock Price Index (S&P 500 Index) by portraying the initial account values at the beginning of the 10-year period for Class A shares (October 31, 2003) and the account values at the end of the current fiscal year (October 31, 2013) as measured on a quarterly basis. For purposes of the graph, and unless otherwise indicated, it has been
| | | | |
| Prudential Jennison Natural Resources Fund, Inc. | | | 3 | |
Your Fund’s Performance (continued)
assumed that (a) the maximum applicable front-end sales charge was deducted from the initial $10,000 investment in Class A shares; (b) all recurring fees (including management fees) were deducted; and (c) all dividends and distributions were reinvested. The line graph provides information for Class A shares only. As indicated in the tables provided earlier, performance for Class B, Class C, Class Q, Class R, and Class Z shares will vary due to the differing charges and expenses applicable to each share class (as indicated in the following paragraphs). Without waiver of fees and/or expense reimbursement, if any, the returns would have been lower.
Total returns and the ending account values in the graph include changes in share price and reinvestment of dividends and capital gains distributions in a hypothetical investment for the periods shown. The Fund’s total returns do not reflect the deduction of income taxes on an individual’s investment. Taxes may reduce your actual investment returns on income or gains paid by the Fund or any gains you may realize if you sell your shares.
Source: Prudential Investments LLC and Lipper Inc.
Inception returns are provided for any share class with less than 10 calendar years of returns.
The average annual total returns take into account applicable sales charges, which are described for each share class in the table below.
| | | | | | | | | | | | |
| | Class A | | Class B | | Class C | | Class Q | | Class R | | Class Z |
Maximum initial sales charge | | 5.50% of
the public
offering
price | | None | | None | | None | | None | | None |
Contingent Deferred Sales Charge (CDSC) (as a percentage of the lower of original purchase price or sale proceeds) | | 1% on sales
of $1 million
or more
made within
12 months of
purchase | | 5% (Yr. 1)
4% (Yr. 2)
3% (Yr. 3)
2% (Yr. 4)
1% (Yr. 5)
1% (Yr. 6)
0% (Yr. 7) | | 1% on sales
made within
12 months
of purchase | | None | | None | | None |
Annual distribution and service (12b-1) fees (shown as a percentage of average daily net assets) | | .30% | | 1% | | 1% | | None | | .75%
(.50%
currently) | | None |
Benchmark Definitions
Lipper Global Natural Resources Index
The Lipper Global Natural Resources Index is an unmanaged index which tracks the performance of the 10 largest global natural resources mutual funds. Lipper Global Natural Resources Index Closest Month-End to
| | |
| 4 | | Visit our website at www.prudentialfunds.com |
Inception cumulative total returns as of 10/31/13 are –2.84% for Class Q and 24.76% for Class R. Lipper Global Natural Resources Index Closest Month-End to Inception average annual total returns as of 9/30/13 are –2.35% for Class Q and 2.64% for Class R.
S&P 500 Index
The S&P 500 Index is an unmanaged index of 500 stocks of large U.S. public companies. It gives a broad look at how stock prices have performed in the United States. S&P 500 Index Closest Month-End to Inception cumulative total returns as of 10/31/13 are 48.36% for Class Q and 57.08% for Class R. S&P 500 Index Closest Month-End to Inception average annual total returns as of 9/30/13 are 13.56% for Class Q and 5.91% for Class R.
Morgan Stanley Capital International (MSCI) World Net Dividends (ND) Index
The Morgan Stanley Capital International (MSCI) World Net Dividends (ND) Index is a free-float-adjusted, market-capitalization index that is designed to measure global developed-market equity performance. The MSCI World ND Index consists of approximately 23 developed-market indexes in Australia, Canada, Europe, the Far East, New Zealand, and the United States. The MSCI World ND Index is unmanaged and the total return includes the reinvestment of all dividends. MSCI World ND Index Closest Month-End to Inception cumulative total returns as of 10/31/13 are 33.35% for Class Q and 37.34% for Class R. MSCI World ND Index Closest Month-End to Inception average annual total returns as of 9/30/13 are 9.49% for Class Q and 4.02% for Class R.
Lipper Global Natural Resources Funds Average
The Lipper Global Natural Resources Funds Average (Lipper Average) is based on the average return of all mutual funds in the Lipper Natural Resources Funds category and does not include the effect of any sales charges or taxes payable by investors. Lipper Average Closest Month-End to Inception cumulative total returns as of 10/31/13 are –3.63% for Class Q and 27.99% for Class R. Lipper Average Closest Month-End to Inception average annual total returns as of 9/30/13 are –3.40% for Class Q and 2.84% for Class R.
Investors cannot invest directly in an index or average. The returns for the Indexes would be lower if they included the effects of sales charges, operating expenses of a mutual fund, or taxes that may be paid by an investor. Returns for the Lipper Index and the Lipper Average reflect the deduction of operating expenses, but not sales charges or taxes. Returns for the Lipper Index and the Lipper Average would be lower if they included the effects of sales charges or taxes.
| | | | |
Five Largest Holdings expressed as a percentage of net assets as of 10/31/13 | | | | |
Noble Energy, Inc., Oil, Gas & Consumable Fuels | | | 4.1 | % |
Schlumberger Ltd., Energy Equipment & Services | | | 3.7 | % |
Dril-Quip, Inc., Energy Equipment & Services | | | 3.6 | % |
EOG Resources, Inc., Oil, Gas & Consumable Fuels | | | 3.5 | % |
Halliburton Co., Energy Equipment & Services | | | 3.4 | % |
Holdings reflect only long-term investments and are subject to change.
| | | | |
Five Largest Industries expressed as a percentage of net assets as of 10/31/13 | | | | |
Oil, Gas & Consumable Fuels | | | 57.6 | % |
Energy Equipment & Services | | | 24.2 | % |
Metals & Mining | | | 14.0 | % |
Construction Materials | | | 0.4 | % |
Food Products | | | 0.3 | % |
Industry weightings reflect only long-term investments and are subject to change.
| | | | |
| Prudential Jennison Natural Resources Fund, Inc. | | | 5 | |
Strategy and Performance Overview
How did the Fund perform?
For the 12 months ended October 31, 2013, the Prudential Jennison Natural Resources Fund’s Class A shares returned 14.88%, underperforming the 15.09% return for the Lipper Global Natural Resources Index and the 15.22% return of the Lipper Global Natural Resources Funds Average. The Fund underperformed the 27.16% return of the S&P 500 Index.
What was the market environment like for stocks and natural resources during the period?
| | • | | The U.S. equity market advanced strongly in the 12 months ended October 31, 2013, reflecting a more optimistic economic outlook. Housing and employment indicators improved, consumer confidence rose, and strength in corporate profits continued. |
| | • | | Conditions in Europe appeared to stabilize, relieving earlier worries of sustained deterioration. |
| | • | | In China, economic growth slowed but to levels sufficiently expansionary to give investors conviction that global GDP, although moderating, remained solid. |
| | • | | Concerns that the Federal Reserve would begin scaling back its quantitative easing program took a toll in early summer. However, the market soon refocused on individual company fundamentals and showed renewed appreciation for companies with strong growth. |
| | • | | The past year has been volatile for natural resource commodity markets. Global crude oil prices continued to be supported for much of the year by non-U.S. supply disruptions across the Middle East and Africa. Seasonal factors, such as North Sea downtime, helped to keep prices high. In September and October, some of these outages began to recover, along with North Sea production, and oil prices corrected from their August highs. Basic metals prices over the year were largely driven by macroeconomic signals—often ambiguous—from China. |
| | • | | Gold prices posted the largest decline since the mid-1970s, as demand for gold-based ETFs collapsed in the face of a robust U.S. dollar and strong equity market performance. Buyers of the physical commodity failed to take up the slack. With inflation still subdued and concerns about prospects for rising interest rates, investors found precious metals less attractive as defensive assets. |
| | |
| 6 | | Visit our website at www.prudentialfunds.com |
Which holdings made the largest positive contribution to the Fund’s return?
Energy companies dominated the period’s largest positive contributors, led by some of the Fund’s highest conviction holdings.
| | • | | Global independent oil & gas company Noble Energy enjoyed solid execution and improving production during the Fund’s reporting period. |
| | • | | Halliburton benefited from improving margins in North America and healthy performance in the Eastern Hemisphere. Investors also appeared to like its share buyback. |
| | • | | Dril-Quip’s solid performance was driven by strong Eastern Hemisphere revenue growth—specifically Asia Pacific—and continued improvements in operating margins. |
Please see “Comments on Largest Holdings” below for additional information on Noble Energy, Halliburton, and Dril-Qip.
Which holdings detracted most from the Fund’s return?
Metals and mining companies were prominent among the leading detractors for the year.
| | • | | Eldorado Gold declined with the price of gold bullion that finished the Fund’s fiscal year lower. Additionally it operates in challenging environments in Greece, Turkey, and China and has experienced slippage in some of the projects in its pipeline. Jennison continues to like the company’s geographic diversity and the quality of its assets. |
| | • | | Shares of London-based gold exploration and mining company Randgold Resources also fell along with the price of gold. Heightened sensitivity to rising political tensions in Africa also weighed on share price performance. While Jennison continues to monitor these developments, it expects Randgold will continue to be successful in managing its operations through challenging environments as it has in the past. |
| | • | | Silver Wheaton was another holding that lost ground, in part because of declining precious metal prices, but also because of a delay late in the period to the development of the Pascua-Lama mine, from which it has rights to silver production. Jennison continues to like the company’s business model of purchasing silver by-product from non-silver mines at a fixed unit cost. In these instances, Jennison believes, because Silver Wheaton doesn’t actually own the mine, the operational risk is with the mine operator. |
| | | | |
| Prudential Jennison Natural Resources Fund, Inc. | | | 7 | |
Strategy and Performance Overview (continued)
Were there significant changes to the Portfolio?
Over the reporting period, Jennison significantly increased the Fund’s position in oil and gas exploration and production companies and scaled back exposure to precious metals. U.S. domestic exploration and production companies have benefited from higher price realizations as domestic oil prices (West Texas Intermediate crude) have strengthened with pipelines coming on line. The Fund reduced its overall gold allocation by eliminating companies that seemed to us to be most susceptible to margin compression resulting from rising input costs and falling bullion prices.
The Fund added or exited individual positions based on company fundamentals and the stock’s risk-reward characteristics. Significant new positions established included Phillips 66, Glencore Xstrata, Pioneer Natural Resources, and Gulfport Energy. Positions in other securities, including HollyFrontier, Royal Dutch Shell, and Compania de Minas Buenaventura, were eliminated.
| | |
| 8 | | Visit our website at www.prudentialfunds.com |
Comments on Largest Holdings
| 4.1% | Noble Energy, Oil, Gas and Consumable Fuels |
Jennison continues to view Noble Energy as a multiyear growth story with high visibility and upside exploration potential and likes its balanced portfolio of assets, prudent cost management, and efficient use of capital.
| 3.7% | Schlumberger, Energy Equipment and Services |
Schlumberger continues to develop new products and technologies that have helped the company hold and even expand on its dominant market share in what Jennison considers important secular growth markets. Schlumberger remains well positioned to generate strong earnings growth and, importantly relative to its peers, robust free cash over the next several years in our opinion.
| 3.6% | Dril-Quip, Energy Equipment and Services |
Dril-Quip designs, manufactures, sells, and services engineered offshore drilling and production equipment for use in deepwater, harsh environment, and severe service applications. With persistent order backlog expansion, robust cash flow, and good growth visibility, Jennison continues to like the company as a way to play what Jennison expects will be sustained growth in deep-water exploration and production, from the Gulf of Mexico in particular.
| 3.5% | EOG Resources, Oil, Gas and Consumable Fuels |
With strong, positive outlooks for its Eagle Ford, Bakken, and Permian Basin plays, EOG management and Jennison remain confident EOG has the visibility to anchor a multiyear growth plan through at least 2017 with improving cost control. Given the depth of its portfolio, the health of its balance sheet, and the stepped-up cash flow, Jennison believes that EOG has the potential to command a premium and outperform irrespective of oil and gas prices.
| 3.4% | Halliburton, Energy Equipment and Services |
Jennison sees Halliburton as attractively valued and believes the company’s current programs focused on cost cutting and efficiency gains could amplify expected North American and international growth in the months ahead.
| | | | |
| Prudential Jennison Natural Resources Fund, Inc. | | | 9 | |
Fees and Expenses (Unaudited)
As a shareholder of the Fund, you incur two types of costs: (1) transaction costs, including sales charges (loads) on purchase payments and redemptions, as applicable, and (2) ongoing costs, including management fees, distribution, and/or service (12b-1) fees, and other Fund expenses, as applicable. This example is intended to help you understand your ongoing costs (in dollars) of investing in the Fund and to compare these costs with the ongoing costs of investing in other mutual funds.
The example is based on an investment of $1,000 invested on May 1, 2013, at the beginning of the period, and held through the six-month period ended October 31, 2013. The example is for illustrative purposes only; you should consult the Prospectus for information on initial and subsequent minimum investment requirements.
Actual Expenses
The first line for each share class in the table on the following page provides information about actual account values and actual expenses. You may use the information on this line, together with the amount you invested, to estimate the expenses that you paid over the period. Simply divide your account value by $1,000 (for example, an $8,600 account value ÷ $1,000 = 8.6), then multiply the result by the number on the first line under the heading “Expenses Paid During the Six-Month Period” to estimate the expenses you paid on your account during this period.
Hypothetical Example for Comparison Purposes
The second line for each share class in the table on the following page provides information about hypothetical account values and hypothetical expenses based on the Fund’s actual expense ratio and an assumed rate of return of 5% per year before expenses, which is not the Fund’s actual return. The hypothetical account values and expenses may not be used to estimate the actual ending account balance or expenses you paid for the period. You may use this information to compare the ongoing costs of investing in the Fund and other funds. To do so, compare this 5% hypothetical example with the 5% hypothetical examples that appear in the shareholder reports of the other funds.
The Fund’s transfer agent may charge additional fees to holders of certain accounts that are not included in the expenses shown in the table on the following page. These fees apply to individual retirement accounts (IRAs) and Section 403(b) accounts. As of the close of the six-month period covered by the table, IRA fees included an annual maintenance fee of $15 per account (subject to a maximum annual maintenance fee of $25 for all accounts held by the same shareholder). Section 403(b) accounts are charged an annual $25 fiduciary maintenance fee. Some of the fees may vary in amount, or may be waived, based on your total account balance or the number of
| | |
| 10 | | Visit our website at www.prudentialfunds.com |
Prudential Investments funds, including the Fund, that you own. You should consider the additional fees that were charged to your Fund account over the six-month period when you estimate the total ongoing expenses paid over the period and the impact of these fees on your ending account value, as these additional expenses are not reflected in the information provided in the expense table. Additional fees have the effect of reducing investment returns.
Please note that the expenses shown in the table are meant to highlight your ongoing costs only and do not reflect any transactional costs such as sales charges (loads). Therefore, the second line for each share class in the table is useful in comparing ongoing costs only and will not help you determine the relative total costs of owning different funds. In addition, if these transactional costs were included, your costs would have been higher.
| | | | | | | | | | | | | | | | | | |
Prudential
Jennison Natural Resources Fund, Inc. | | Beginning Account
Value
May 1, 2013 | | | Ending Account
Value
October 31, 2013 | | | Annualized
Expense Ratio
Based on the
Six-Month Period | | | Expenses Paid
During the
Six-Month Period* | |
| | | | | | | | | | | | | | | | | | |
| Class A | | Actual | | $ | 1,000.00 | | | $ | 1,146.00 | | | | 1.14 | % | | $ | 6.17 | |
| | | Hypothetical | | $ | 1,000.00 | | | $ | 1,019.46 | | | | 1.14 | % | | $ | 5.80 | |
| | | | | | | | | | | | | | | | | | |
| Class B | | Actual | | $ | 1,000.00 | | | $ | 1,142.30 | | | | 1.84 | % | | $ | 9.94 | |
| | | Hypothetical | | $ | 1,000.00 | | | $ | 1,015.93 | | | | 1.84 | % | | $ | 9.35 | |
| | | | | | | | | | | | | | | | | | |
| Class C | | Actual | | $ | 1,000.00 | | | $ | 1,141.90 | | | | 1.84 | % | | $ | 9.93 | |
| | | Hypothetical | | $ | 1,000.00 | | | $ | 1,015.93 | | | | 1.84 | % | | $ | 9.35 | |
| | | | | | | | | | | | | | | | | | |
| Class Q | | Actual | | $ | 1,000.00 | | | $ | 1,148.50 | | | | 0.73 | % | | $ | 3.95 | |
| | | Hypothetical | | $ | 1,000.00 | | | $ | 1,021.53 | | | | 0.73 | % | | $ | 3.72 | |
| | | | | | | | | | | | | | | | | | |
| Class R | | Actual | | $ | 1,000.00 | | | $ | 1,145.10 | | | | 1.34 | % | | $ | 7.25 | |
| | | Hypothetical | | $ | 1,000.00 | | | $ | 1,018.45 | | | | 1.34 | % | | $ | 6.82 | |
| | | | | | | | | | | | | | | | | | |
| Class Z | | Actual | | $ | 1,000.00 | | | $ | 1,147.90 | | | | 0.84 | % | | $ | 4.55 | |
| | | Hypothetical | | $ | 1,000.00 | | | $ | 1,020.97 | | | | 0.84 | % | | $ | 4.28 | |
*Fund expenses (net of fee waivers or subsidies, if any) for each share class are equal to the annualized expense ratio for each share class (provided in the table), multiplied by the average account value over the period, multiplied by the 184 days in the six-month period ended October 31, 2013, and divided by 365 days. Expenses presented in the table include the expenses of any underlying portfolios in which the Fund may invest.
| | | | |
| Prudential Jennison Natural Resources Fund, Inc. | | | 11 | |
Fees and Expenses (continued)
The Fund’s annual expense ratios for the year ended October 31, 2013 are as follows:
| | | | |
Class | | Gross Operating Expenses | | Net Operating Expenses |
A | | 1.17% | | 1.17% |
B | | 1.87% | | 1.87% |
C | | 1.87% | | 1.87% |
Q | | .74% | | .74% |
R | | 1.62% | | 1.37% |
Z | | .87% | | .87% |
Net operating expenses shown above reflect any fee waivers and/or expense reimbursements. Additional information on Fund expenses and any fee waivers and/or expense reimbursements can be found in the “Financial Highlights” tables in this report and in the Notes to the Financial Statements in this report.
| | |
| 12 | | Visit our website at www.prudentialfunds.com |
Portfolio of Investments
as of October 31, 2013
| | | | | | |
| Shares | | Description | | Value (Note 1) | |
LONG-TERM INVESTMENTS 96.5% | | | | |
COMMON STOCKS 95.9% | | | | |
| |
Construction Materials 0.4% | | | | |
| 8,018 | | Holcim Ltd. (Switzerland) | | $ | 596,375 | |
| 14,634,551 | | PT Semen Indonesia Persero Tbk (Indonesia) | | | 18,619,446 | |
| 118,430 | | Taiheiyo Cement Corp. (Japan) | | | 502,287 | |
| | | | | | |
| | | | | 19,718,108 | |
| |
Energy Equipment & Services 24.2% | | | | |
| 13,241 | | Baker Hughes, Inc. | | | 769,170 | |
| 2,062,476 | | Cameron International Corp.* | | | 113,147,433 | |
| 328,852 | | Core Laboratories NV | | | 61,567,671 | |
| 638,586 | | Dresser-Rand Group, Inc.* | | | 38,806,871 | |
| 1,325,146 | | Dril-Quip, Inc.* | | | 155,598,643 | |
| 614,827 | | Ensco PLC (Class A Stock) | | | 35,444,777 | |
| 1,060,087 | | FMC Technologies, Inc.*(a) | | | 53,587,398 | |
| 2,773,980 | | Halliburton Co. | | | 147,104,159 | |
| 728,776 | | Helmerich & Payne, Inc. | | | 56,516,579 | |
| 1,318,451 | | National Oilwell Varco, Inc. | | | 107,031,852 | |
| 7,953 | | Noble Corp. | | | 299,828 | |
| 1,433,538 | | Patterson-UTI Energy, Inc. | | | 34,777,632 | |
| 1,677,963 | | Rowan Cos. PLC (Class A Stock)* | | | 60,540,905 | |
| 1,726,500 | | Schlumberger Ltd. | | | 161,807,580 | |
| 1,114,627 | | Superior Energy Services, Inc.* | | | 29,905,443 | |
| 5,296 | | Technip SA (France) | | | 554,698 | |
| 7,142 | | Tenaris SA (Luxembourg), ADR | | | 334,317 | |
| 42,598 | | Weatherford International Ltd.* | | | 700,311 | |
| | | | | | |
| | | | | 1,058,495,267 | |
| |
Food Products 0.3% | | | | |
| 1,446,270 | | Adecoagro SA (Argentina)*(a) | | | 11,570,160 | |
| |
Metals & Mining 13.4% | | | | |
| 1,303,662 | | African Rainbow Minerals Ltd. (South Africa) | | | 24,959,689 | |
| 9,196 | | Agnico-Eagle Mines Ltd. (Canada) | | | 271,558 | |
| 2,345,854 | | Alamos Gold, Inc. (Canada) | | | 37,370,772 | |
| 77,526 | | Alcoa, Inc.(a) | | | 718,666 | |
| 46,738 | | ArcelorMittal SA (Luxembourg), ADR(a) | | | 736,591 | |
| 666,158 | | AXMIN, Inc. (Canada)* | | | 31,945 | |
| 7,711,525 | | B2Gold Corp. (Canada)*(a) | | | 19,081,892 | |
| 936,766 | | BHP Billiton Ltd. (Australia), ADR(a) | | | 66,219,989 | |
| 1,725,811 | | Constellium NV (Netherlands) (Class A Stock)* | | | 31,875,729 | |
See Notes to Financial Statements.
| | | | |
| Prudential Jennison Natural Resources Fund, Inc. | | | 13 | |
Portfolio of Investments
as of October 31, 2013 continued
| | | | | | |
| Shares | | Description | | Value (Note 1) | |
COMMON STOCKS (Continued) | | | | |
| |
Metals & Mining (cont’d.) | | | | |
| 4,773,076 | | Eldorado Gold Corp. (Canada) | | $ | 32,182,155 | |
| 2,481,395 | | First Quantum Minerals Ltd. (Canada) | | | 47,074,275 | |
| 600,000 | | First Uranium Corp. (South Africa), 144A(b) | | | 8,632 | |
| 905,962 | | Freeport-McMoRan Copper & Gold, Inc. | | | 33,303,163 | |
| 9,194,565 | | Glencore Xstrata PLC (Switzerland) | | | 50,039,238 | |
| 13,509 | | Goldcorp, Inc. (Canada) | | | 343,534 | |
| 3,485,076 | | Guyana Goldfields, Inc. (Canada), 144A*(b) | | | 8,155,743 | |
| 1,951,939 | | Ivanhoe Mines Ltd. (Canada)*(a) | | | 4,886,166 | |
| 2,082,400 | | Ivanhoe Mines Ltd. (Canada) (Class A Stock), 144A*(b) | | | 5,172,796 | |
| 3,013,826 | | Kinross Gold Corp. (Canada)(a) | | | 15,280,098 | |
| 17,928 | | Newmont Mining Corp. | | | 488,717 | |
| 1,850,769 | | Northern Dynasty Minerals Ltd. (Canada)*(a) | | | 2,498,538 | |
| 13,344 | | Nucor Corp. | | | 690,819 | |
| 5,674,802 | | Platinum Group Metals Ltd. (Canada)* | | | 6,526,022 | |
| 523,100 | | Platmin Ltd. (South Africa), Private Placement
(original cost $4,469,143; purchased 11/27/07)*(b)(c) | | | 48,335 | |
| 547,376 | | Randgold Resources Ltd. (United Kingdom), ADR | | | 40,451,086 | |
| 685,179 | | Reliance Steel & Aluminum Co. | | | 50,216,769 | |
| 11,307 | | Rio Tinto PLC (United Kingdom) | | | 572,141 | |
| 882,722 | | Rio Tinto PLC (United Kingdom), ADR(a) | | | 44,754,005 | |
| 1,129,691 | | Silver Wheaton Corp. (Canada) | | | 25,610,095 | |
| 553,943 | | Southern Copper Corp.(a) | | | 15,482,707 | |
| 495,713 | | Tahoe Resources, Inc.* | | | 9,518,222 | |
| 506,600 | | Tahoe Resources, Inc. (Canada), 144A*(b) | | | 9,727,264 | |
| | | | | | |
| | | | | 584,297,351 | |
| |
Oil, Gas & Consumable Fuels 57.6% | | | | |
| 1,878,099 | | Africa Oil Corp. (Canada)*(a)(b) | | | 16,679,803 | |
| 205,152 | | Africa Oil Corp., Reg. D (Canada), Private Placement
(original cost $1,604,367; purchased 12/06/12)*(c) | | | 1,821,999 | |
| 1,344,008 | | Anadarko Petroleum Corp. | | | 128,070,522 | |
| 377,261 | | Antero Resources Corp.* | | | 21,311,474 | |
| 7,446 | | Apache Corp. | | | 661,205 | |
| 222,702 | | Athlon Energy, Inc.* | | | 7,326,896 | |
| 6,018,658 | | Bankers Petroleum Ltd. (Canada)* | | | 23,089,850 | |
| 1,227,372 | | Bonanza Creek Energy, Inc.*(a) | | | 62,031,381 | |
| 16,513 | | Cabot Oil & Gas Corp. | | | 583,239 | |
| 1,576,267 | | Cheniere Energy, Inc.* | | | 62,735,427 | |
| 24,692 | | Chesapeake Energy Corp.(a) | | | 690,388 | |
| 699,131 | | Cimarex Energy Co. | | | 73,653,451 | |
See Notes to Financial Statements.
| | | | | | |
| Shares | | Description | | Value (Note 1) | |
COMMON STOCKS (Continued) | | | | |
| |
Oil, Gas & Consumable Fuels (cont’d.) | | | | |
| 2,143,082 | | Cobalt International Energy, Inc.* | | $ | 49,740,933 | |
| 1,182,839 | | Concho Resources, Inc.* | | | 130,833,822 | |
| 1,857,169 | | CONSOL Energy, Inc. | | | 67,786,669 | |
| 6,627 | | Continental Resources, Inc.*(a) | | | 754,815 | |
| 15,111 | | Crescent Point Energy Corp. (Canada) | | | 586,817 | |
| 4,319,333 | | Denbury Resources, Inc.* | | | 82,024,134 | |
| 631,964 | | Devon Energy Corp. | | | 39,952,764 | |
| 8,140 | | Energen Corp. | | | 637,525 | |
| 772,475 | | Energy XXI Ltd.(a) | | | 22,448,124 | |
| 864,733 | | EOG Resources, Inc. | | | 154,268,367 | |
| 7,414 | | EQT Corp. | | | 634,713 | |
| 822,237 | | Gulfport Energy Corp.*(a) | | | 48,257,090 | |
| 376,139 | | Hess Corp. | | | 30,542,487 | |
| 6,521 | | HollyFrontier Corp. | | | 300,357 | |
| 4,515,339 | | Kodiak Oil & Gas Corp.*(a) | | | 58,563,947 | |
| 1,771,770 | | Kosmos Energy Ltd. * | | | 18,887,068 | |
| 1,796,786 | | Laredo Petroleum Holdings, Inc.* | | | 57,083,891 | |
| 2,714,259 | | Marathon Oil Corp. | | | 95,704,772 | |
| 746,840 | | Marathon Petroleum Corp. | | | 53,518,554 | |
| 345,256 | | MEG Energy Corp. (Canada)* | | | 11,049,914 | |
| 752,400 | | MEG Energy Corp. (Canada), 144A*(b) | | | 24,080,552 | |
| 9,168 | | Murphy Oil Corp. | | | 553,014 | |
| 1,640,171 | | Newfield Exploration Co.* | | | 49,943,207 | |
| 2,404,807 | | Noble Energy, Inc. | | | 180,192,189 | |
| 661,899 | | Occidental Petroleum Corp. | | | 63,595,256 | |
| 3,498,521 | | Oil Search Ltd. (Australia) | | | 28,126,703 | |
| 1,538,526 | | Pacific Rubiales Energy Corp. (Colombia) | | | 31,828,519 | |
| 1,004,503 | | PDC Energy, Inc.*(a) | | | 68,115,348 | |
| 904,243 | | Phillips 66 | | | 58,260,376 | |
| 249,637 | | Pioneer Natural Resources Co. | | | 51,120,665 | |
| 2,467,907 | | QGEP Participacoes SA (Brazil) | | | 11,952,857 | |
| 979,655 | | Range Resources Corp. | | | 74,169,680 | |
| 1,283,537 | | Rosetta Resources, Inc.* | | | 76,935,208 | |
| 6,609 | | Royal Dutch Shell PLC (Netherlands), ADR | | | 440,556 | |
| 1,630,681 | | Sanchez Energy Corp.*(a) | | | 46,490,715 | |
| 280,734 | | SM Energy Co. | | | 24,875,840 | |
| 2,014,024 | | Southwestern Energy Co.* | | | 74,961,973 | |
| 2,905,002 | | Suncor Energy, Inc. (Canada) | | | 105,596,823 | |
| 2,800,756 | | Talisman Energy, Inc. (Canada) | | | 34,953,435 | |
| 2,546,178 | | Tullow Oil PLC (United Kingdom) | | | 38,486,358 | |
See Notes to Financial Statements.
| | | | |
| Prudential Jennison Natural Resources Fund, Inc. | | | 15 | |
Portfolio of Investments
as of October 31, 2013 continued
| | | | | | |
| Shares | | Description | | Value (Note 1) | |
COMMON STOCKS (Continued) | | | | |
| |
Oil, Gas & Consumable Fuels (cont’d.) | | | | |
| 1,540,540 | | Whiting Petroleum Corp.* | | $ | 103,046,721 | |
| 1,150,293 | | Williams Cos., Inc. (The) | | | 41,076,963 | |
| 15,257 | | Woodside Petroleum Ltd. (Australia) | | | 559,322 | |
| 9,569,891 | | Zodiac Exploration, Inc. (Canada)* | | | 550,706 | |
| 19,575,000 | | Zodiac Exploration, Inc., Reg D (Canada)*(b) | | | 1,126,457 | |
| | | | | | |
| | | | | 2,513,271,841 | |
| | | | | | |
| | TOTAL COMMON STOCKS
(cost $2,792,880,685) | | | 4,187,352,727 | |
| | | | | | |
CONVERTIBLE PREFERRED STOCKS 0.6% | | | | |
| |
Metals & Mining | | | | |
| 18,340 | | Manabi SA (Class A Preferred) (Brazil), Private Placement
(original cost $22,988,745; purchased 05/25/11), 144A*(b)(c) | | | 18,631,940 | |
| 7,336 | | Manabi SA (Class B Preferred) (Brazil), Private Placement
(original cost $9,262,957; purchased 08/21/12), 144A*(b)(c) | | | 7,766,657 | |
| | | | | | |
| | TOTAL CONVERTIBLE PREFERRED STOCKS
(cost $32,251,702) | | | 26,398,597 | |
| | | | | | |
| | |
| Units | | | | | |
RIGHTS* | | | | | | |
| |
Oil, Gas & Consumable Fuels | | | | |
| 41,616 | | Trident Resources Corp. CVR (Canada), Private Placement, expiring 06/30/15 (original cost $0; purchased 06/30/10)(b)(c) | | | — | |
| | | | | | |
WARRANTS* | | | | | | |
| |
Metals & Mining | | | | |
| 903,650 | | Crystallex International Corp. (Canada),
Private Placement, expiring 11/04/14
(original cost $0; purchased 10/30/09)(b)(c) | | | — | |
| | | | | | |
| | TOTAL LONG-TERM INVESTMENTS
(cost $2,825,132,387) | | | 4,213,751,324 | |
| | | | | | |
See Notes to Financial Statements.
| | | | | | |
| Shares | | Description | | Value (Note 1) | |
SHORT-TERM INVESTMENT 7.4% | | | | |
| |
AFFILIATED MONEY MARKET MUTUAL FUND | | | | |
| 321,712,796 | | Prudential Investment Portfolios 2 - Prudential Core Taxable Money Market Fund (cost $321,712,796; includes $167,518,587 of cash collateral for securities on loan) (Note 3)(d)(e) | | $ | 321,712,796 | |
| | | | | | |
| | TOTAL INVESTMENTS 103.9%
(cost $3,146,845,183; Note 5) | | | 4,535,464,120 | |
| | Liabilities in excess of other assets (3.9)% | | | (172,028,377 | ) |
| | | | | | |
| | NET ASSETS 100.0% | | $ | 4,363,435,743 | |
| | | | | | |
The following abbreviations are used in the Portfolio descriptions:
144A—Security was purchased pursuant to Rule 144A under the Securities Act of 1933 and may not be resold subject to that rule except to qualified institutional buyers. Unless otherwise noted, 144A securities are deemed to be liquid.
ADR—American Depositary Receipt
CVR—Contingent Value Rights
Reg D—Security was purchased pursuant to Regulation D under the Securities Act of 1933, providing exemption from the registration requirements. Unless otherwise noted, Regulation D securities are deemed to be liquid.
| * | Non-income producing security. |
| (a) | All or a portion of security is on loan. The aggregate market value of such securities, including those sold and pending settlement, is $160,201,401; cash collateral of $167,518,587 (included with liabilities) was received with which the Fund purchased highly liquid short-term investments. |
| (b) | Indicates a security or securities that have been deemed illiquid. |
| (c) | Indicates a restricted security; the aggregate cost of the restricted securities is $38,325,212. The aggregate value of $28,268,931 is approximately 0.6% of net assets. |
| (d) | Represents security, or a portion thereof, purchased with cash collateral received for securities on loan. |
| (e) | Prudential Investments LLC, the manager of the Fund, also serves as manager of the Prudential Investment Portfolios 2 - Prudential Core Taxable Money Market Fund. |
Various inputs are used in determining the value of the Fund’s investments. These inputs are summarized in the three broad levels listed below.
Level 1—quoted prices generally in active markets for identical securities.
Level 2—other significant observable inputs including, but not limited to, quoted prices for similar securities, interest rates and yield curves, prepayment speeds, foreign currency exchange rates, and amortized cost.
Level 3—significant unobservable inputs for securities valued in accordance with Board approved fair valuation procedures.
See Notes to Financial Statements.
| | | | |
| Prudential Jennison Natural Resources Fund, Inc. | | | 17 | |
Portfolio of Investments
as of October 31, 2013 (continued)
The following is a summary of the inputs used as of October 31, 2013 in valuing such portfolio securities:
| | | | | | | | | | | | |
| | | Level 1 | | | Level 2 | | | Level 3 | |
Investments in Securities | | | | | | | | | | | | |
Common Stocks | | $ | 3,949,123,124 | | | $ | 238,181,268 | | | $ | 48,335 | |
Convertible Preferred Stocks | | | — | | | | — | | | | 26,398,597 | |
Rights | | | — | | | | — | | | | — | |
Warrants | | | — | | | | — | | | | — | |
Affiliated Money Market Mutual Fund | | | 321,712,796 | | | | — | | | | — | |
| | | | | | | | | | | | |
Total | | $ | 4,270,835,920 | | | $ | 238,181,268 | | | $ | 26,446,932 | |
| | | | | | | | | | | | |
The following is a reconciliation of assets in which significant unobservable inputs (Level 3) were used in determining fair value:
| | | | | | | | |
| | | Common
Stocks | | | Convertible
Preferred Stock | |
Balance as of 10/31/12 | | $ | 37,791,737 | | | $ | 32,201,665 | |
Realized gain (loss) | | | (43,798,021 | ) | | | — | |
Change in unrealized appreciation (depreciation)* | | | 7,398,127 | | | | (5,803,068 | ) |
Purchases | | | — | | | | — | |
Sales | | | (1,343,508 | ) | | | — | |
Accrued discount/premium | | | — | | | | — | |
Transfers into Level 3 | | | — | | | | — | |
Transfers out of Level 3 | | | — | | | | — | |
| | | | | | | | |
Balance as of 10/31/13 | | $ | 48,335 | | | $ | 26,398,597 | |
| | | | | | | | |
| * | Of which, $(5,797,873) was included in Net Assets relating to securities held at the reporting period end. |
Fair value of Level 2 investments at October 31, 2012 was $0. An amount of $77,048,978 was transferred from Level 1 into Level 2 at October 31, 2013 as a result of using other significant observable inputs such as quoted prices of similar securities for non-registered securities and an amount of $157,308,425 was transferred from Level 1 into Level 2 as a result of fair valuing certain foreign investments using third party vendor modeling tools. Such fair values are used to reflect the impact of market movements between the time at which the Portfolio values its securities and the earlier closing of foreign markets. It is the Portfolio’s policy to recognize transfers in and transfers out at the fair value as of the beginning of the period.
See Notes to Financial Statements.
Included in the table above, under Level 3 securities, are common and convertible preferred stocks, equity rights and warrants, that were fair valued using the last traded price or the original cost adjusted for daily changes in indices deemed directly or indirectly correlated to the security. For equity rights received through a bankruptcy distribution, the fair value is determined to be the residual value of the original bonds and other factors impacting the values of securities being issued pursuant to the reorganization. For the common stocks, convertible preferred stocks and rights, the securities were private placement and therefore, the prices were a significant unobservable input. For certain warrants received in a private placement offering, the Manager has determined the fair value using the Black Scholes method with adjustment for volatility factor which is deemed to be a significant unobservable input.
The country allocation of portfolio holdings and liabilities in excess of other assets shown as percentage of net assets as of October 31, 2013 was as follows:
| | | | |
United States (including 3.8% of collateral received for securities on loan) | | | 81.7 | % |
Canada | | | 10.2 | |
United Kingdom | | | 2.8 | |
Australia | | | 2.2 | |
Netherlands | | | 2.1 | |
Switzerland | | | 1.1 | |
Bermuda | | | 0.9 | |
Brazil | | | 0.9 | |
Colombia | | | 0.7 | % |
South Africa | | | 0.6 | |
Indonesia | | | 0.4 | |
Luxembourg | | | 0.3 | |
| | | | |
| | | 103.9 | |
Liabilities in excess of other assets | | | (3.9 | ) |
| | | | |
| | | 100.0 | % |
| | | | |
The Fund invested in derivative instruments during the reporting period. The primary type of risk associated with these derivative instruments is equity risk. The effect of such derivative instruments on the Fund’s financial position and financial performance as reflected in the Statement of Assets and Liabilities and Statement of Operations is presented in the summary below.
At October 31, 2013, the Fund held derivatives not accounted for as hedging instruments. These equity contracts have a fair value at October 31, 2013 of $0 and are presented in the Statement of Assets and Liabilities as such.
For the year ended October 31, 2013, the Fund did not have any realized gain or (loss) or change in unrealized appreciation or (depreciation) on derivatives recognized in income on the Statement of Operations.
See Notes to Financial Statements.
| | | | |
| Prudential Jennison Natural Resources Fund, Inc. | | | 19 | |
Statement of Assets & Liabilities
as of October 31, 2013
| | | | |
Assets | | | | |
Investments at value, including securities on loan of $160,201,401: | | | | |
Unaffiliated investments (cost $2,825,132,387) | | $ | 4,213,751,324 | |
Affiliated investments (cost $321,712,796) | | | 321,712,796 | |
Receivable for Fund shares sold | | | 11,409,633 | |
Dividends receivable | | | 809,106 | |
Tax reclaim receivable | | | 157,747 | |
Receivable for investments sold | | | 87,524 | |
Prepaid expenses | | | 45,129 | |
| | | | |
Total assets | | | 4,547,973,259 | |
| | | | |
| |
Liabilities | | | | |
Payable to broker for collateral for securities on loan | | | 167,518,587 | |
Payable for Fund shares reacquired | | | 11,281,548 | |
Management fee payable | | | 2,620,058 | |
Accrued expenses | | | 1,926,960 | |
Distribution fee payable | | | 1,085,935 | |
Affiliated transfer agent fee payable | | | 104,428 | |
| | | | |
Total liabilities | | | 184,537,516 | |
| | | | |
| |
Net Assets | | $ | 4,363,435,743 | |
| | | | |
| | | | | |
Net assets were comprised of: | | | | |
Common stock, at par | | $ | 867,068 | |
Paid-in capital in excess of par | | | 3,762,307,021 | |
| | | | |
| | | 3,763,174,089 | |
Accumulated net investment loss | | | (20,550,251 | ) |
Accumulated net realized loss on investment and foreign currency transactions | | | (767,806,248 | ) |
Net unrealized appreciation on investments and foreign currencies | | | 1,388,618,153 | |
| | | | |
Net assets, October 31, 2013 | | $ | 4,363,435,743 | |
| | | | |
See Notes to Financial Statements.
| | | | |
Class A | | | | |
Net asset value and redemption price per share
($1,642,228,573 ÷ 31,941,929 shares of common stock issued and outstanding) | | $ | 51.41 | |
Maximum sales charge (5.50% of offering price) | | | 2.99 | |
| | | | |
Maximum offering price to public | | $ | 54.40 | |
| | | | |
| |
Class B | | | | |
Net asset value, offering price and redemption price per share
($123,836,604 ÷ 2,910,434 shares of common stock issued and outstanding) | | $ | 42.55 | |
| | | | |
| |
Class C | | | | |
Net asset value, offering price and redemption price per share
($629,108,151 ÷ 14,780,880 shares of common stock issued and outstanding) | | $ | 42.56 | |
| | | | |
| |
Class Q | | | | |
Net asset value, offering price and redemption price per share
($180,803,443 ÷ 3,387,600 shares of common stock issued and outstanding) | | $ | 53.37 | |
| | | | |
| |
Class R | | | | |
Net asset value, offering price and redemption price per share
($80,001,268 ÷ 1,571,715 shares of common stock issued and outstanding) | | $ | 50.90 | |
| | | | |
| |
Class Z | | | | |
Net asset value, offering price and redemption price per share
($1,707,457,704 ÷ 32,114,193 shares of common stock issued and outstanding) | | $ | 53.17 | |
| | | | |
See Notes to Financial Statements.
| | | | |
| Prudential Jennison Natural Resources Fund, Inc. | | | 21 | |
Statement of Operations
Year Ended October 31, 2013
| | | | |
Net Investment Loss | | | | |
Income | | | | |
Unaffiliated dividend income (net of foreign withholding taxes of $1,709,190) | | $ | 48,456,903 | |
Affiliated income from securities loaned, net | | | 777,925 | |
Affiliated dividend income | | | 236,913 | |
| | | | |
Total income | | | 49,471,741 | |
| | | | |
| |
Expenses | | | | |
Management fee | | | 30,562,801 | |
Distribution fee—Class A | | | 4,964,176 | |
Distribution fee—Class B | | | 1,349,953 | |
Distribution fee—Class C | | | 6,568,249 | |
Distribution fee—Class R | | | 374,513 | |
Transfer agent’s fees and expenses (including affiliated expense of $667,200) (Note 3) | | | 5,530,000 | |
Custodian’s fees and expenses | | | 670,000 | |
Shareholders’ reports | | | 265,000 | |
Registration fees | | | 90,000 | |
Directors’ fees | | | 88,000 | |
Insurance | | | 79,000 | |
Legal fees and expenses | | | 55,000 | |
Audit fee | | | 29,000 | |
Miscellaneous | | | 42,558 | |
| | | | |
Total expenses | | | 50,668,250 | |
| | | | |
Net investment loss | | | (1,196,509 | ) |
| | | | |
| |
Realized and Unrealized Gain (Loss) on Investment and Foreign Currency Transactions | | | | |
Net realized loss on: | | | | |
Investment transactions | | | (19,716,146 | ) |
Foreign currency transactions | | | (1,102,648 | ) |
| | | | |
| | | (20,818,794 | ) |
| | | | |
Net change in unrealized appreciation (depreciation) on: | | | | |
Investments | | | 605,657,533 | |
Foreign currencies | | | 1,795 | |
| | | | |
| | | 605,659,328 | |
| | | | |
Net gain on investment and foreign currency transactions | | | 584,840,534 | |
| | | | |
Net Increase In Net Assets Resulting From Operations | | $ | 583,644,025 | |
| | | | |
See Notes to Financial Statements.
Statement of Changes in Net Assets
| | | | | | | | |
| | | Year Ended October 31, | |
| | | 2013 | | | 2012 | |
Increase (Decrease) in Net Assets | | | | | | | | |
Operations | | | | | | | | |
Net investment loss | | $ | (1,196,509 | ) | | $ | (3,831,685 | ) |
Net realized loss on investment and foreign currency transactions | | | (20,818,794 | ) | | | (250,842,509 | ) |
Net change in unrealized appreciation (depreciation) on investments and foreign currencies | | | 605,659,328 | | | | (264,017,643 | ) |
| | | | | | | | |
Net increase (decrease) in net assets resulting from operations | | | 583,644,025 | | | | (518,691,837 | ) |
| | | | | | | | |
| | |
Fund share transactions (Net of share conversions) (Note 6) | | | | | | | | |
Net proceeds from shares sold | | | 980,943,532 | | | | 1,404,893,393 | |
Cost of shares reacquired | | | (1,785,686,934 | ) | | | (1,737,161,629 | ) |
| | | | | | | | |
Net decrease in net assets from Fund share transactions | | | (804,743,402 | ) | | | (332,268,236 | ) |
| | | | | | | | |
Total decrease | | | (221,099,377 | ) | | | (850,960,073 | ) |
| | |
Net Assets: | | | | | | | | |
Beginning of year | | | 4,584,535,120 | | | | 5,435,495,193 | |
| | | | | | | | |
End of year | | $ | 4,363,435,743 | | | $ | 4,584,535,120 | |
| | | | | | | | |
See Notes to Financial Statements.
| | | | |
| Prudential Jennison Natural Resources Fund, Inc. | | | 23 | |
Notes to Financial Statements
Prudential Jennison Natural Resources Fund, Inc. (the “Fund”) is a non-diversified open-end management investment company, registered under the Investment Company Act of 1940, as amended (“1940 Act”). The Fund’s investment objective is long-term growth of capital.
Note 1. Accounting Policies
The following accounting policies conform to U.S. generally accepted accounting principles. The Fund consistently follows such policies in the preparation of its financial statements.
Security Valuation: The Fund holds securities and other assets that are fair valued at the close of each day the New York Stock Exchange (“NYSE”) is open for trading. Fair value is the price that would be received to sell an asset or paid to transfer a liability in an orderly transaction between market participants on the measurement date. The Board of Directors (the “Board”) has adopted Valuation Procedures for security valuation under which fair valuation responsibilities have been delegated to Prudential Investments LLC (“PI” or “Manager”). Under the current Valuation Procedures, the established Valuation Committee is responsible for supervising the valuation of portfolio securities and other assets. The Valuation Procedures permit the Fund to utilize independent pricing vendor services, quotations from market makers, and alternative valuation methods when market quotations are either not readily available or not representative of fair value. A record of the Valuation Committee’s actions is subject to the Board’s review, approval, and ratification at its next regularly-scheduled quarterly meeting.
Various inputs determine how the Fund’s investments are valued, all of which are categorized according to the three broad levels (Level 1, 2, or 3) detailed in the table following the Portfolio of Investments.
Common stocks, exchange-traded funds, and derivative instruments that are traded on a national securities exchange are valued at the last sale price as of the close of trading on the applicable exchange. Securities traded via NASDAQ are valued at the NASDAQ official closing price. To the extent these securities are valued at the last sale price or NASDAQ official closing price; they are classified as Level 1 in the fair value hierarchy.
In the event that no sale or official closing price on valuation date exists, these securities are generally valued at the mean between the last reported bid and asked prices, or at the last bid price in the absence of an asked price. These securities are classified as Level 2 in the fair value hierarchy, as the inputs are observable and considered to be significant to the valuation.
Common stocks traded on foreign securities exchanges are valued using pricing vendor services that provide model prices derived using adjustment factors based on information such as local closing price, relevant general and sector indices, currency fluctuations, depositary receipts, and futures, as applicable. Securities valued using such model prices are classified as Level 2 in the fair value hierarchy, as the adjustment factors are observable and considered to be significant to the valuation.
Investments in open-end, non-exchange-traded mutual funds are valued at their net asset values as of the close of the NYSE on the date of valuation. These securities are classified as Level 1 in the fair value hierarchy since they may be purchased or sold at their net asset values on the date of valuation.
Fixed income securities traded in the over-the-counter market are generally valued at prices provided by approved independent pricing vendors. The pricing vendors provide these prices after evaluating observable inputs including, but not limited to yield curves, yield spreads, credit ratings, deal terms, tranche level attributes, default rates, cash flows, prepayment speeds, broker/dealer quotations, and reported trades. Securities valued using such vendor prices are classified as Level 2 in the fair value hierarchy.
Over-the-counter derivative instruments are generally valued using pricing vendor services, which derive the valuation based on inputs such as underlying asset prices, indices, spreads, interest rates, and exchange rates. These instruments are categorized as Level 2 in the fair value hierarchy.
Securities and other assets that cannot be priced according to the methods described above are valued based on pricing methodologies approved by the Board of Directors. In the event that significant unobservable inputs are used when determining such valuations, the securities will be classified as Level 3 in the fair value hierarchy.
When determining the fair value of securities, some of the factors influencing the valuation include: the nature of any restrictions on disposition of the securities; assessment of the general liquidity of the securities; the issuer’s financial condition and the markets in which it does business; the cost of the investment; the size of the holding and the capitalization of the issuer; the prices of any recent transactions or
| | | | |
| Prudential Jennison Natural Resources Fund, Inc. | | | 25 | |
Notes to Financial Statements
continued
bids/offers for such securities or any comparable securities; any available analyst media or other reports or information deemed reliable by the investment adviser regarding the issuer or the markets or industry in which it operates. Using fair value to price securities may result in a value that is different from a security’s most recent closing price and from the price used by other mutual funds to calculate their net asset values.
Restricted and Illiquid Securities: Subject to guidelines adopted by the Board, the Fund may invest up to 15% of its net assets in illiquid securities. Illiquid securities are those that, because of the absence of a readily available market or due to legal or contractual restrictions on resale (restricted securities, sometimes referred to as Private Placements) cannot be resold within seven days in the ordinary course of business at approximately the amount at which the Fund has valued the investment. Therefore, the Fund may find it difficult to sell illiquid securities at the time considered most advantageous by its Subadviser and may incur expenses that would not be incurred in the sale of securities that were freely marketable. Certain securities that would otherwise be considered illiquid because of legal restrictions on resale to the general public may be traded among qualified institutional buyers under Rule 144A of the Securities Act of 1933. These Rule 144A securities, as well as commercial paper that is sold in private placements under Section 4(2) of the Securities Act, may be deemed liquid by the Fund’s Subadviser under the guidelines adopted by the Directors of the Fund. However, the liquidity of the Fund’s investments in Rule 144A securities could be impaired if trading does not develop or declines.
Foreign Currency Translation: The books and records of the Fund are maintained in U.S. dollars. Foreign currency amounts are translated into U.S. dollars on the following basis:
(i) market value of investment securities, other assets and liabilities at the current rates of exchange.
(ii) purchases and sales of investment securities, income and expenses at the rates of exchange prevailing on the respective dates of such transactions.
Although the net assets of the Fund are presented at the foreign exchange rates and market values at the close of the period, the Fund does not isolate that portion of the results of operations arising as a result of changes in the foreign exchange rates from the fluctuations arising from changes in the market prices of long-term portfolio
securities held at the end of the period. Similarly, the Fund does not isolate the effect of changes in foreign exchange rates from the fluctuations arising from changes in the market prices of long-term portfolio securities sold during the period. Accordingly, these realized foreign currency gains or losses are included in the reported net realized gains or losses on investment transactions.
Net realized gains or losses on foreign currency transactions represent net foreign exchange gains or losses from holdings of foreign currencies, currency gains or losses realized between the trade and settlement date on security transactions, and the difference between the amounts of dividends, interest and foreign withholding taxes recorded on the Fund’s books and the U.S. dollar equivalent amounts actually received or paid. Net unrealized currency gains or losses from valuing foreign currency denominated assets and liabilities (other than investments) at period end exchange rates are reflected as a component of net unrealized appreciation (depreciation) on foreign currencies.
Foreign security and currency transactions may involve certain considerations and risks not typically associated with those of domestic origin as a result of, among other factors, the possibility of political and economic instability, or the level of governmental supervision and regulation of foreign securities markets.
Warrants and Rights: The Fund holds warrants and rights acquired either through a direct purchase, including as part of private placement, or pursuant to corporate actions. Warrants and rights entitle the holder to buy a proportionate amount of common stock at a specific price and time through the expiration dates. Such warrants and rights are held as long positions by the Fund until exercised, sold or expired. Warrants and rights are valued at fair value in accordance with the Board of Directors’ approved fair valuation procedures.
Securities Lending: The Fund may lend its portfolio securities to banks and broker-dealers. The loans are secured by collateral at least equal to the market value of the securities loaned. Collateral pledged by each borrower is invested in a highly liquid short-term money market fund and is marked to market daily, based on the previous day’s market value, such that the value of the collateral exceeds the value of the loaned securities. Loans are subject to termination at the option of the borrower or the Fund. Upon termination of the loan, the borrower will return to the Fund securities identical to the loaned securities.
Should the borrower of the securities fail financially, the Fund has the right to repurchase the securities using the collateral in the open market. The Fund recognizes income, net of any rebate and securities lending agent fees, for lending its securities,
| | | | |
| Prudential Jennison Natural Resources Fund, Inc. | | | 27 | |
Notes to Financial Statements
continued
and any interest on the investment of cash received as collateral. The Fund also continues to receive interest and dividends or amounts equivalent thereto, on the securities loaned and recognizes any unrealized gain or loss in the market price of the securities loaned that may occur during the term of the loan.
Securities Transactions and Net Investment Income: Securities transactions are recorded on the trade date. Realized gains or losses from investment and currency transactions are calculated on the identified cost basis. Dividend income is recorded on the ex-dividend date. Interest income, including amortization of premium and accretion of discount on debt securities, as required, is recorded on the accrual basis. Expenses are recorded on the accrual basis, which may require the use of certain estimates by management, that may differ from actual.
Net investment income or loss (other than distribution fees, which are charged directly to the respective class) and unrealized and realized gains or losses are allocated daily to each class of shares based upon the relative proportion of adjusted net assets of each class at the beginning of the day.
Dividends and Distributions: The Fund expects to pay dividends from net investment income and distributions from net realized capital and currency gains, if any, annually. Dividends and distributions to shareholders, which are determined in accordance with federal income tax regulations and which may differ from generally accepted accounting principles, are recorded on the ex-dividend date. Permanent book/tax differences relating to income and gains are reclassified amongst undistributed net investment income, accumulated net realized gain or loss and paid-in capital in excess of par, as appropriate.
Taxes: For federal income tax purposes, the Fund is treated as a separate tax-paying entity. It is the Fund’s policy to continue to meet the requirements of the Internal Revenue Code applicable to regulated investment companies and to distribute all of its taxable net investment income and capital gains, if any, to its shareholders. Therefore, no federal income tax provision is required. Withholding taxes on foreign dividends are recorded, net of reclaimable amounts, at the time the related income is earned.
Estimates: The preparation of the financial statements requires management to make estimates and assumptions that affect the reported amounts and disclosures in the financial statements. Actual results could differ from those amounts.
Note 2. Agreements
The Fund has a management agreement with PI. Pursuant to a subadvisory agreement between PI and Jennison Associates LLC (“Jennison”), Jennison furnishes investment advisory services in connection with the management of the Fund. Under the subadvisory agreement, Jennison, subject to the supervision of PI, is responsible for managing the assets of the Fund in accordance with its investment objective and policies. PI pays for the services of Jennison, the compensation of officers of the Fund, occupancy and certain clerical and bookkeeping costs of the Fund. The Fund bears all other costs and expenses.
Pursuant to the management agreement between the Fund and PI, the management fee paid to PI is computed daily and payable monthly at an annual rate of .75% of the Fund’s average daily net assets up to $1 billion and .70% of average daily net assets in excess of $1 billion. The effective management fee rate was .71% of the Fund’s average daily net assets for the year ended October 31, 2013.
The Fund has a distribution agreement with Prudential Investment Management Services LLC (“PIMS”), which acts as the distributor of the Class A, Class B, Class C, Class Q, Class R and Class Z shares of the Fund. The Fund compensates PIMS for distributing and servicing the Fund’s Class A, Class B, Class C and Class R shares, pursuant to plans of distribution (the “Class A, B, C and R Plans”), regardless of expenses actually incurred by PIMS. The distribution fees are accrued daily and payable monthly. No distribution or service fees are paid to PIMS as distributor of the Class Q and Class Z shares of the Fund.
Pursuant to the Class A, B, C and R Plans, the Fund compensates PIMS for distribution-related activities at an annual rate of up to ..30%, 1%, 1% and .75% of the average daily net assets of the Class A, B, C and Class R shares, respectively. PIMS has contractually agreed to limit such fees to .50% of the average daily net assets of the Class R shares through February 28, 2015.
PIMS has advised the Fund that it received $978,402 in front-end sales charges resulting from sales of Class A shares, during the year ended October 31, 2013. From these fees, PIMS paid such sales charges to affiliated broker/dealers, which in turn paid commissions to salespersons and incurred other distribution costs.
PIMS has advised the Fund that for the year ended October 31, 2013, it received $2,652, $326,976 and $49,186 in contingent deferred sales charges imposed upon redemptions by certain Class A, Class B and Class C shareholders, respectively.
| | | | |
| Prudential Jennison Natural Resources Fund, Inc. | | | 29 | |
Notes to Financial Statements
continued
PI, PIMS and Jennison are indirect, wholly-owned subsidiaries of Prudential Financial, Inc. (“Prudential”).
Note 3. Other Transactions with Affiliates
Prudential Mutual Fund Services LLC (“PMFS”), an affiliate of PI, and an indirect, wholly-owned subsidiary of Prudential, serves as the Fund’s transfer agent. Transfer agent’s fees and expenses in the Statement of Operations include certain out-of-pocket expenses paid to non-affiliates, where applicable.
Prudential Investment Management, Inc. (“PIM”), an indirect, wholly-owned subsidiary of Prudential, is the Fund’s security lending agent. For the year ended October 31, 2013, PIM has been compensated approximately $232,400 for these services.
The Fund invests in the Prudential Core Taxable Money Market Fund (the “Core Fund”), a portfolio of the Prudential Investment Portfolios 2, registered under the 1940 Act, and managed by PI. Earnings from the Core Fund are disclosed on the Statement of Operations as affiliated dividend income.
Note 4. Portfolio Securities
Purchases and sales of portfolio securities, other than short-term investments, for the year ended October 31, 2013 were $853,080,045 and $1,691,386,177, respectively.
Note 5. Tax Information
Distributions to shareholders, which are determined in accordance with federal income tax regulations, which may differ from generally accepted accounting principles, are recorded on the ex-dividend date. In order to present accumulated net investment loss, accumulated net realized loss on investment and foreign currency transactions and paid-in capital in excess of par on the Statement of Assets and Liabilities that more closely represent their tax character, certain adjustments have been made to accumulated net investment loss, accumulated net realized loss on investment and foreign currency transactions and paid-in capital in excess of par. For the year ended October 31, 2013, the adjustments were to decrease accumulated net investment loss by $27,962,262, increase accumulated net realized loss on
investment and foreign currency transactions by $15,187,239 and decrease paid-in capital in excess of par by $12,775,023 due to differences in the treatment for book and tax purposes of certain transactions involving investments in passive foreign investment companies, foreign securities and currencies, net operating loss and other book to tax differences. Net investment loss, net realized gain (loss) on investment and foreign currency transactions and net assets were not affected by this change.
For the years ended October 31, 2013 and October 31, 2012, there were no distributions paid by the Fund.
As of October 31, 2013, the Fund did not have any distributable earnings on a tax basis.
The United States federal income tax basis of the Fund’s investments and the net unrealized appreciation as of October 31, 2013 were as follows:
| | | | | | | | | | |
Tax Basis | | Appreciation | | Depreciation | | Net
Unrealized
Appreciation | | Other Cost
Basis
Adjustments | | Total Net
Unrealized
Appreciation |
| $3,201,607,108 | | $1,547,827,165 | | $(213,970,153) | | $1,333,857,012 | | $(784) | | $1,333,856,228 |
The difference between book basis and tax basis of investments was primarily attributable to deferred losses on wash sales, investments in passive foreign investment companies and other cost basis differences between financial and tax accounting. The other cost basis adjustments are primarily attributable to net unrealized appreciation (depreciation) of foreign currency transactions and mark-to-market of receivables and payables.
Under the Regulated Investment Company Modernization Act of 2010 (the “Act”), the Fund is permitted to carryforward capital losses incurred in the fiscal year ended October 31, 2012 and October 31, 2013 (“post-enactment losses”) for an unlimited period. Post-enactment losses are required to be utilized before the utilization of losses incurred prior to the effective date of the Act. As a result of this ordering rule, capital loss carryforwards related to taxable years ending before October 31, 2012 (“pre-enactment losses”) may have an increased likelihood to expire unused. Additionally, post-enactment capital losses that are carried forward will retain their character as either short-term or long-term capital losses rather than being considered all short-term as under previous law. No capital gains distributions are expected to be paid to shareholders until net gains have been realized in excess of such losses. As of October 31, 2013, the pre and post-enactment losses were approximately:
| | | | |
Post-Enactment Losses: | | $ | 320,735,000 | |
| | | | |
Pre-Enactment Losses: | | | | |
Expiring 2016 | | $ | 93,457,000 | |
Expiring 2017 | | | 264,952,000 | |
Expiring 2018 | | | 49,759,000 | |
| | | | |
| | $ | 408,168,000 | |
| | | | |
| | | | |
| Prudential Jennison Natural Resources Fund, Inc. | | | 31 | |
Notes to Financial Statements
continued
The Fund elected to treat certain late-year ordinary income losses of approximately $4,692,000 as having been incurred in the following fiscal year (October 31, 2014).
Management has analyzed the Fund’s tax positions taken on federal income tax returns for all open tax years and has concluded that no provision for income tax is required in the Fund’s financial statements for the current reporting period. The Fund’s federal and state income and federal excise tax returns for tax years for which the applicable statutes of limitations have not expired are subject to examination by the Internal Revenue Service and state departments of revenue.
Note 6. Capital
The Fund offers Class A, Class B, Class C, Class Q, Class R and Class Z shares. Class A shares are sold with a front-end sales charge of up to 5.50%. All investors who purchase Class A shares in an amount of $1 million or more and sell these shares within 12 months of purchase are subject to a contingent deferred sales charge (CDSC) of 1%. The Class A CDSC is waived for certain purchases by retirement and/or benefit plans. Class B shares are sold with a CDSC which declines from 5% to zero depending upon the period of time the shares are held. Class B shares automatically convert to Class A shares on a quarterly basis approximately seven years after purchase. Class C shares are sold with a CDSC of 1% on shares redeemed within 12 months after purchase. Class Q, Class R and Class Z shares are not subject to any sales or redemption charges and are offered exclusively for sale to a limited group of investors. A special exchange privilege is also available for shareholders who qualify to purchase Class A shares at net asset value. Under certain circumstances, an exchange may be made from specified share classes of the Fund to one or more other share classes of the Fund as presented in the table of transactions in shares of capital stock.
There are 500 million shares of common stock authorized with $.01 par value per share, divided into six classes, designated Class A, Class B, Class C, Class Q, Class R and Class Z common stock. Class A shares consist of 150 million authorized shares, Class B shares consist of 35 million authorized shares, Class C and Class Z shares each consist of 90 million authorized shares, Class Q shares consist of 85 million authorized shares and Class R shares consist of 50 million authorized shares. Class Q, Class R and Class Z shares are not subject to any sales or redemption charge and are offered exclusively for sale to a limited group of investors. As of October 31, 2013, 17 shares of Class Q were owned by Prudential.
Transactions in shares of common stock were as follows:
| | | | | | | | |
Class A | | Shares | | | Amount | |
Year ended October 31, 2013: | | | | | | | | |
Shares sold | | | 6,124,898 | | | $ | 284,693,610 | |
Shares reacquired | | | (15,532,690 | ) | | | (714,685,312 | ) |
| | | | | | | | |
Net increase (decrease) in shares outstanding before conversion | | | (9,407,792 | ) | | | (429,991,702 | ) |
Shares issued upon conversion from Class B, Class C and Class Z | | | 985,383 | | | | 45,500,759 | |
Shares reacquired upon conversion into Class Z | | | (338,469 | ) | | | (15,881,352 | ) |
| | | | | | | | |
Net increase (decrease) in shares outstanding | | | (8,760,878 | ) | | $ | (400,372,295 | ) |
| | | | | | | | |
Year ended October 31, 2012: | | | | | | | | |
Shares sold | | | 9,887,326 | | | $ | 459,429,906 | |
Shares reacquired | | | (15,125,296 | ) | | | (699,183,947 | ) |
| | | | | | | | |
Net increase (decrease) in shares outstanding before conversion | | | (5,237,970 | ) | | | (239,754,041 | ) |
Shares issued upon conversion from Class B and Class Z | | | 944,963 | | | | 44,972,884 | |
Shares reacquired upon conversion into Class Z | | | (897,438 | ) | | | (44,874,708 | ) |
| | | | | | | | |
Net increase (decrease) in shares outstanding | | | (5,190,445 | ) | | $ | (239,655,865 | ) |
| | | | | | | | |
Class B | | | | | | |
Year ended October 31, 2013: | | | | | | | | |
Shares sold | | | 198,783 | | | $ | 7,642,012 | |
Shares reacquired | | | (858,037 | ) | | | (32,742,312 | ) |
| | | | | | | | |
Net increase (decrease) in shares outstanding before conversion | | | (659,254 | ) | | | (25,100,300 | ) |
Shares reacquired upon conversion into Class A | | | (665,719 | ) | | | (25,484,836 | ) |
| | | | | | | | |
Net increase (decrease) in shares outstanding | | | (1,324,973 | ) | | $ | (50,585,136 | ) |
| | | | | | | | |
Year ended October 31, 2012: | | | | | | | | |
Shares sold | | | 347,518 | | | $ | 13,633,137 | |
Shares reacquired | | | (961,440 | ) | | | (37,098,309 | ) |
| | | | | | | | |
Net increase (decrease) in shares outstanding before conversion | | | (613,922 | ) | | | (23,465,172 | ) |
Shares reacquired upon conversion into Class A | | | (970,375 | ) | | | (38,791,121 | ) |
| | | | | | | | |
Net increase (decrease) in shares outstanding | | | (1,584,297 | ) | | $ | (62,256,293 | ) |
| | | | | | | | |
Class C | | | | | | |
Year ended October 31, 2013: | | | | | | | | |
Shares sold | | | 1,228,808 | | | $ | 47,264,971 | |
Shares reacquired | | | (6,226,429 | ) | | | (237,287,830 | ) |
| | | | | | | | |
Net increase (decrease) in shares outstanding before conversion | | | (4,997,621 | ) | | | (190,022,859 | ) |
Shares reacquired upon conversion into Class A and Class Z | | | (268,703 | ) | | | (10,251,485 | ) |
| | | | | | | | |
Net increase (decrease) in shares outstanding | | | (5,266,324 | ) | | $ | (200,274,344 | ) |
| | | | | | | | |
Year ended October 31, 2012: | | | | | | | | |
Shares sold | | | 1,881,020 | | | $ | 73,971,595 | |
Shares reacquired | | | (6,083,141 | ) | | | (234,214,567 | ) |
| | | | | | | | |
Net increase (decrease) in shares outstanding before conversion | | | (4,202,121 | ) | | | (160,242,972 | ) |
Shares reacquired upon conversion into Class Z | | | (195,611 | ) | | | (7,643,070 | ) |
| | | | | | | | |
Net increase (decrease) in shares outstanding | | | (4,397,732 | ) | | $ | (167,886,042 | ) |
| | | | | | | | |
| | | | |
| Prudential Jennison Natural Resources Fund, Inc. | | | 33 | |
Notes to Financial Statements
continued
| | | | | | | | |
Class Q | | Shares | | | Amount | |
Year ended October 31, 2013: | | | | | | | | |
Shares sold | | | 1,315,309 | | | $ | 62,371,800 | |
Shares reacquired | | | (881,654 | ) | | | (42,158,775 | ) |
| | | | | | | | |
Net increase (decrease) in shares outstanding | | | 433,655 | | | $ | 20,213,025 | |
| | | | | | | | |
Year ended October 31, 2012: | | | | | | | | |
Shares sold | | | 1,885,156 | | | $ | 90,581,950 | |
Shares reacquired | | | (462,382 | ) | | | (22,263,443 | ) |
| | | | | | | | |
Net increase (decrease) in shares outstanding | | | 1,422,774 | | | $ | 68,318,507 | |
| | | | | | | | |
Class R | | | | | | |
Year ended October 31, 2013: | | | | | | | | |
Shares sold | | | 709,270 | | | $ | 32,458,212 | |
Shares reacquired | | | (809,780 | ) | | | (36,950,390 | ) |
| | | | | | | | |
Net increase (decrease) in shares outstanding | | | (100,510 | ) | | $ | (4,492,178 | ) |
| | | | | | | | |
Year ended October 31, 2012: | | | | | | | | |
Shares sold | | | 927,720 | | | $ | 42,608,364 | |
Shares reacquired | | | (761,502 | ) | | | (35,021,610 | ) |
| | | | | | | | |
Net increase (decrease) in shares outstanding | | | 166,218 | | | $ | 7,586,754 | |
| | | | | | | | |
Class Z | | | | | | |
Year ended October 31, 2013: | | | | | | | | |
Shares sold | | | 11,458,913 | | | $ | 546,512,927 | |
Shares reacquired | | | (15,145,400 | ) | | | (721,862,315 | ) |
| | | | | | | | |
Net increase (decrease) in shares outstanding before conversion | | | (3,686,487 | ) | | | (175,349,388 | ) |
Shares issued upon conversion from Class A and Class C | | | 541,084 | | | | 25,987,929 | |
Shares reacquired upon conversion into Class A | | | (416,009 | ) | | | (19,871,015 | ) |
| | | | | | | | |
Net increase (decrease) in shares outstanding | | | (3,561,412 | ) | | $ | (169,232,474 | ) |
| | | | | | | | |
Year ended October 31, 2012: | | | | | | | | |
Shares sold | | | 15,281,133 | | | $ | 724,668,441 | |
Shares reacquired | | | (14,981,061 | ) | | | (709,379,753 | ) |
| | | | | | | | |
Net increase (decrease) in shares outstanding before conversion | | | 300,072 | | | | 15,288,688 | |
Shares issued upon conversion from Class A and Class C | | | 1,031,497 | | | | 52,517,778 | |
Shares reacquired upon conversion into Class A | | | (129,336 | ) | | | (6,181,763 | ) |
| | | | | | | | |
Net increase (decrease) in shares outstanding | | | 1,202,233 | | | $ | 61,624,703 | |
| | | | | | | | |
Note 7. Borrowing
The Fund, along with other affiliated registered investment companies (the “Funds”), is a party to a Syndicated Credit Agreement (“SCA”) with a group of banks. The purpose of the SCA is to provide an alternative source of temporary funding for capital share redemptions. The SCA provides for a commitment of $900 million for the period November 15, 2012 through November 4, 2013. The Funds pay an annualized commitment fee of 0.08% on the unused portion of the SCA. Prior to November 15, 2012, the Funds had another SCA with substantially similar terms. Interest on any borrowings under the SCA is paid at contracted market rates. The commitment fee for the unused amount is accrued daily and paid quarterly.
Subsequent to the fiscal year end, the SCA has been renewed effective November 5, 2013 at substantially similar terms through November 4, 2014.
The Fund did not utilize the SCA during the year ended October 31, 2013.
Note 8. New Accounting Pronouncement
In January 2013, the Financial Accounting Standards Board (“FASB”) issued Accounting Standards Update (“ASU”) No. 2013-01 “Clarifying the Scope of Disclosures about Offsetting Assets and Liabilities” which replaced ASU No. 2011-11 “Disclosures about Offsetting Assets and Liabilities”. The updates create new disclosure requirements requiring entities to disclose both gross and net information for derivatives and other financial instruments that are either offset in the Statement of Assets and Liabilities or subject to an enforceable master netting arrangement or similar agreement. The disclosure requirements are effective for annual reporting periods beginning on or after January 1, 2013 and interim periods within those annual periods. Management is currently evaluating the application of ASU No. 2013-01 and its impact, if any, on the Fund’s financial statements.
| | | | |
| Prudential Jennison Natural Resources Fund, Inc. | | | 35 | |
Financial Highlights
| | | | | | | | | | | | | | | | | | | | | | | | | | | | |
| Class A Shares | |
| | | Year Ended October 31, | | | | | Five Months
Ended
October 31, | | | | | Year Ended
May 31, | |
| | | 2013 | | | 2012 | | | 2011 | | | 2010 | | | | | 2009(a) | | | | | 2009 | |
| Per Share Operating Performance(b): | | | | | | | | | | | | | | | | | | | | | |
| Net Asset Value, Beginning Of Period | | | $44.75 | | | | $49.50 | | | | $50.48 | | | | $41.27 | | | | | | $38.08 | | | | | | $68.29 | |
| Income (loss) from investment operations: | | | | | | | | | | | | | | | | | | | | | |
| Net investment loss | | | (.01 | ) | | | (.02 | ) | | | (.19 | ) | | | (.21 | ) | | | | | (.02 | ) | | | | | (.06 | ) |
| Net realized and unrealized gain (loss) on investment and foreign currency transactions | | | 6.67 | | | | (4.73 | ) | | | (.22 | ) | | | 10.18 | | | | | | 3.21 | | | | | | (28.75 | ) |
| Total from investment operations | | | 6.66 | | | | (4.75 | ) | | | (.41 | ) | | | 9.97 | | | | | | 3.19 | | | | | | (28.81 | ) |
| Less Dividends and Distributions: | | | | | | | | | | | | | | | | | | | | | |
| Dividends from net investment income | | | - | | | | - | | | | (.57 | ) | | | (.76 | ) | | | | | - | | | | | | (.53 | ) |
| Distributions from net realized gains | | | - | | | | - | | | | - | | | | - | | | | | | - | | | | | | (.87 | ) |
| Total dividends and distributions | | | - | | | | - | | | | (.57 | ) | | | (.76 | ) | | | | | - | | | | | | (1.40 | ) |
| Capital Contributions(e): | | | - | | | | - | | | | - | | | | - | (h) | | | | | - | | | | | | - | |
| Net asset value, end of period | | | $51.41 | | | | $44.75 | | | | $49.50 | | | | $50.48 | | | | | | $41.27 | | | | | | $38.08 | |
| Total Return(c): | | | 14.88% | | | | (9.60)% | | | | (.88)% | | | | 24.42% | | | | | | 8.38% | | | | | | (40.56)% | |
| | | | | | | | | | | | | | | | | | | | | | | | | | | | |
| Ratios/Supplemental Data: | |
| Net assets, end of period (000) | | | $1,642,229 | | | | $1,821,585 | | | | $2,271,696 | | | | $2,165,180 | | | | | | $1,535,793 | | | | | | $1,261,030 | |
| Average net assets (000) | | | $1,654,831 | | | | $2,016,026 | | | | $2,669,299 | | | | $1,849,392 | | | | | | $1,372,157 | | | | | | $1,168,562 | |
| Ratios to average net assets(d)(i): | | | | | | | | | | | | | | | | | | | | | |
| Expenses after waivers and/or expense reimbursement | | | 1.17% | | | | 1.19% | | | | 1.16% | | | | 1.20% | | | | | | 1.21% | (f) | | | | | 1.23% | |
| Expenses before waivers and/or expense reimbursement | | | 1.17% | | | | 1.19% | | | | 1.18% | | | | 1.20% | | | | | | 1.21% | (f) | | | | | 1.24% | |
| Net investment loss | | | (.02)% | | | | (.04)% | | | | (.35)% | | | | (.47)% | | | | | | (.12)% | (f) | | | | | (.15)% | |
| Portfolio turnover rate | | | 21% | | | | 27% | | | | 34% | | | | 21% | | | | | | 9% | (g) | | | | | 51% | |
(a) The Fund changed its fiscal year end from May 31 to October 31, effective October 31, 2009.
(b) Calculated based on average shares outstanding during the period.
(c) Total return does not consider the effects of sales loads. Total return is calculated assuming a purchase of a share on the first day and a sale on the last day of each period reported, and includes reinvestment of dividends and distributions. Total returns may reflect adjustments to conform to generally accepted accounting principles. Total returns for periods less than one full year are not annualized.
(d) Does not include expenses of the underlying portfolio in which the Fund invests.
(e) The Fund received payments related to a former affiliate’s settlement of regulatory proceedings involving allegations of improper trading in Fund shares during the fiscal year ended October 31, 2010. The Fund was not involved in the proceedings or in the calculation of the amount of settlement.
(f) Annualized.
(g) Not annualized.
(h) Less than $.005.
(i) Through September 30, 2008, the manager of the Fund contractually agreed to waive .05% of the management fee rate on average daily net assets over $2 billion. Effective October 1, 2008 through February 29, 2012, the manager of the Fund has contractually agreed to waive .05% of the management fee rate on average daily net assets over $4 billion.
See Notes to Financial Statements.
| | | | | | | | | | | | | | | | | | | | | | | | | | | | |
| Class B Shares | |
| | | Year Ended October 31, | | | | | Five Months
Ended
October 31, | | | | | Year Ended
May 31, | |
| | | 2013 | | | 2012 | | | 2011 | | | 2010 | | | | | 2009(a) | | | | | 2009 | |
| Per Share Operating Performance(b): | | | | | | | | | | | | | | | | | | | | | |
| Net Asset Value, Beginning Of Period | | | $37.30 | | | | $41.55 | | | | $42.75 | | | | $35.30 | | | | | | $32.66 | | | | | | $58.60 | |
| Income (loss) from investment operations: | | | | | | | | | | | | | | | | | | | | | |
| Net investment loss | | | (.27 | ) | | | (.29 | ) | | | (.49 | ) | | | (.45 | ) | | | | | (.11 | ) | | | | | (.28 | ) |
| Net realized and unrealized gain (loss) on investment and foreign currency transactions | | | 5.52 | | | | (3.96 | ) | | | (.14 | ) | | | 8.66 | | | | | | 2.75 | | | | | | (24.58 | ) |
| Total from investment operations | | | 5.25 | | | | (4.25 | ) | | | (.63 | ) | | | 8.21 | | | | | | 2.64 | | | | | | (24.86 | ) |
| Less Dividends and Distributions: | | | | | | | | | | | | | | | | | | | | | |
| Dividends from net investment income | | | - | | | | - | | | | (.57 | ) | | | (.76 | ) | | | | | - | | | | | | (.21 | ) |
| Distributions from net realized gains | | | - | | | | - | | | | - | | | | - | | | | | | - | | | | | | (.87 | ) |
| Total dividends and distributions | | | - | | | | - | | | | (.57 | ) | | | (.76 | ) | | | | | - | | | | | | (1.08 | ) |
| Capital Contributions(e): | | | - | | | | - | | | | - | | | | - | (g) | | | | | - | | | | | | - | |
| Net asset value, end of period | | | $42.55 | | | | $37.30 | | | | $41.55 | | | | $42.75 | | | | | | $35.30 | | | | | | $32.66 | |
| Total Return(c): | | | 14.08% | | | | (10.23)% | | | | (1.56)% | | | | 23.55% | | | | | | 8.08% | | | | | | (40.99)% | |
| | | | | | | | | | | | | | | | | | | | | | | | | | | | |
| Ratios/Supplemental Data: | |
| Net assets, end of period (000) | | | $123,837 | | | | $157,970 | | | | $241,789 | | | | $280,296 | | | | | | $241,335 | | | | | | $221,738 | |
| Average net assets (000) | | | $135,005 | | | | $195,871 | | | | $296,198 | | | | $259,961 | | | | | | $227,342 | | | | | | $229,217 | |
| Ratios to average net assets(d)(i): | | | | | | | | | | | | | | | | | | | | | |
| Expenses after waivers and/or expense reimbursement | | | 1.87% | | | | 1.89% | | | | 1.86% | | | | 1.90% | | | | | | 1.91% | (f) | | | | | 1.93% | |
| Expenses before waivers and/or expense reimbursement | | | 1.87% | | | | 1.89% | | | | 1.88% | | | | 1.90% | | | | | | 1.91% | (f) | | | | | 1.94% | |
| Net investment loss | | | (.71)% | | | | (.74)% | | | | (1.05)% | | | | (1.17)% | | | | | | (.81)% | (f) | | | | | (.84)% | |
| Portfolio turnover rate | | | 21% | | | | 27% | | | | 34% | | | | 21% | | | | | | 9% | (h) | | | | | 51% | |
(a) The Fund changed its fiscal year end from May 31 to October 31, effective October 31, 2009.
(b) Calculated based on average shares outstanding during the period.
(c) Total return does not consider the effects of sales loads. Total return is calculated assuming a purchase of a share on the first day and a sale on the last day of each period reported, and includes reinvestment of dividends and distributions. Total returns may reflect adjustments to conform to generally accepted accounting principles. Total returns for periods less than one full year are not annualized.
(d) Does not include expenses of the underlying portfolio in which the Fund invests.
(e) The Fund received payments related to a former affiliate’s settlement of regulatory proceedings involving allegations of improper trading in Fund shares during the fiscal year ended October 31, 2010. The Fund was not involved in the proceedings or in the calculation of the amount of settlement.
(f) Annualized.
(g) Less than $.005.
(h) Not annualized.
(i) Through September 30, 2008, the manager of the Fund contractually agreed to waive .05% of the management fee rate on average daily net assets over $2 billion. Effective October 1, 2008 through February 29, 2012, the manager of the Fund has contractually agreed to waive .05% of the management fee rate on average daily net assets over $4 billion.
See Notes to Financial Statements.
| | | | |
| Prudential Jennison Natural Resources Fund, Inc. | | | 37 | |
Financial Highlights
continued
| | | | | | | | | | | | | | | | | | | | | | | | | | | | |
| Class C Shares | |
| | | Year Ended October 31, | | | | | Five Months
Ended
October 31, | | | | | Year Ended
May 31, | |
| | | 2013 | | | 2012 | | | 2011 | | | 2010 | | | | | 2009(a) | | | | | 2009 | |
| Per Share Operating Performance(b): | | | | | | | | | | | | | | | | | | | | | |
| Net Asset Value, Beginning Of Period | | | $37.31 | | | | $41.56 | | | | $42.75 | | | | $35.31 | | | | | | $32.67 | | | | | | $58.61 | |
| Income (loss) from investment operations: | | | | | | | | | | | | | | | | | | | | | |
| Net investment loss | | | (.28 | ) | | | (.29 | ) | | | (.48 | ) | | | (.45 | ) | | | | | (.12 | ) | | | | | (.28 | ) |
| Net realized and unrealized gain (loss) on investment and foreign currency transactions | | | 5.53 | | | | (3.96 | ) | | | (.14 | ) | | | 8.65 | | | | | | 2.76 | | | | | | (24.58 | ) |
| Total from investment operations | | | 5.25 | | | | (4.25 | ) | | | (.62 | ) | | | 8.20 | | | | | | 2.64 | | | | | | (24.86 | ) |
| Less Dividends and Distributions: | | | | | | | | | | | | | | | | | | | | | |
| Dividends from net investment income | | | - | | | | - | | | | (.57 | ) | | | (.76 | ) | | | | | - | | | | | | (.21 | ) |
| Distributions from net realized gains | | | - | | | | - | | | | - | | | | - | | | | | | - | | | | | | (.87 | ) |
| Total dividends and distributions | | | - | | | | - | | | | (.57 | ) | | | (.76 | ) | | | | | - | | | | | | (1.08 | ) |
| Capital Contributions(e): | | | - | | | | - | | | | - | | | | - | (g) | | | | | - | | | | | | - | |
| Net asset value, end of period | | | $42.56 | | | | $37.31 | | | | $41.56 | | | | $42.75 | | | | | | $35.31 | | | | | | $32.67 | |
| Total Return(c): | | | 14.07% | | | | (10.23)% | | | | (1.54)% | | | | 23.51% | | | | | | 8.08% | | | | | | (40.99)% | |
| | | | | | | | | | | | | | | | | | | | | | | | | | | | |
| Ratios/Supplemental Data: | |
| Net assets, end of period (000) | | | $629,108 | | | | $747,931 | | | | $1,015,836 | | | | $953,597 | | | | | | $674,791 | | | | | | $549,558 | |
| Average net assets (000) | | | $656,867 | | | | $871,352 | | | | $1,146,777 | | | | $819,275 | | | | | | $600,514 | | | | | | $533,680 | |
| Ratios to average net assets(d)(i): | | | | | | | | | | | | | | | | | | | | | |
| Expenses after waivers and/or expense reimbursement | | | 1.87% | | | | 1.89% | | | | 1.86% | | | | 1.90% | | | | | | 1.91% | (f) | | | | | 1.93% | |
| Expenses before waivers and/or expense reimbursement | | | 1.87% | | | | 1.89% | | | | 1.88% | | | | 1.90% | | | | | | 1.91% | (f) | | | | | 1.94% | |
| Net investment loss | | | (.72)% | | | | (.74)% | | | | (1.04)% | | | | (1.17)% | | | | | | (.82)% | (f) | | | | | (.85)% | |
| Portfolio turnover rate | | | 21% | | | | 27% | | | | 34% | | | | 21% | | | | | | 9% | (h) | | | | | 51% | |
(a) The Fund changed its fiscal year end from May 31 to October 31, effective October 31, 2009.
(b) Calculated based on average shares outstanding during the period.
(c) Total return does not consider the effects of sales loads. Total return is calculated assuming a purchase of a share on the first day and a sale on the last day of each period reported and includes reinvestment of dividends and distributions. Total returns may reflect adjustments to conform to generally accepted accounting principles. Total returns for periods less than one full year are not annualized.
(d) Does not include expenses of the underlying portfolio in which the Fund invests.
(e) The Fund received payments related to a former affiliate’s settlement of regulatory proceedings involving allegations of improper trading in Fund shares during the fiscal year ended October 31, 2010. The Fund was not involved in the proceedings or in the calculation of the amount of settlement.
(f) Annualized.
(g) Less than $.005.
(h) Not annualized.
(i) Through September 30, 2008, the manager of the Fund contractually agreed to waive .05% of the management fee rate on average daily net assets over $2 billion. Effective October 1, 2008 through February 29, 2012, the manager of the Fund has contractually agreed to waive .05% of the management fee rate on average daily net assets over $4 billion.
See Notes to Financial Statements.
| | | | | | | | | | | | | | |
| Class Q Shares | | | |
| | | Year Ended October 31, | | | | | December 27,
2010(a) through
October 31, | |
| | | 2013 | | | 2012 | | | | | 2011 | |
| Per Share Operating Performance(b): | | | | | | | | | | | | | | |
| Net Asset Value, Beginning Of Period | | | $46.26 | | | | $50.93 | | | | | | $57.19 | |
| Income (loss) from investment operations: | | | | | | | | | | | | | | |
| Net investment income | | | .19 | | | | .20 | | | | | | .04 | |
| Net realized and unrealized gain (loss) on investment and foreign currency transactions | | | 6.92 | | | | (4.87 | ) | | | | | (6.30 | ) |
| Total from investment operations | | | 7.11 | | | | (4.67 | ) | | | | | (6.26 | ) |
| Net asset value, end of period | | | $53.37 | | | | $46.26 | | | | | | $50.93 | |
| Total Return(c): | | | 15.37% | | | | (9.17)% | | | | | | (10.95)% | |
| | | | | | | | | | | | | | |
| Ratios/Supplemental Data: | | | |
| Net assets, end of period (000) | | | $180,803 | | | | $136,641 | | | | | | $77,986 | |
| Average net assets (000) | | | $153,964 | | | | $105,382 | | | | | | $30,408 | |
| Ratios to average net assets(d)(g): | | | | | | | | | | | | | | |
| Expenses after waivers and/or expense reimbursement | | | .74% | | | | .75% | | | | | | .74% | (e) |
| Expenses before waivers and/or expense reimbursement | | | .74% | | | | .75% | | | | | | .76% | (e) |
| Net investment income | | | .39% | | | | .42% | | | | | | .09% | (e) |
| Portfolio turnover rate | | | 21% | | | | 27% | | | | | | 34% | (f) |
(a) Commencement of offering.
(b) Calculated based on average shares outstanding during the period.
(c) Total return is calculated assuming a purchase of a share on the first day and a sale on the last day of each period reported, and includes reinvestment of dividends and distributions. Total returns may reflect adjustments to conform to generally accepted accounting principles. Total returns for periods less than one full year are not annualized.
(d) Does not include expenses of the underlying portfolio in which the Fund invests.
(e) Annualized.
(f) Not annualized.
(g) Through February 29, 2012, the manager of the Fund has contractually agreed to waive .05% of the management fee rate on average daily net assets over $4 billion.
See Notes to Financial Statements.
| | | | |
| Prudential Jennison Natural Resources Fund, Inc. | | | 39 | |
Financial Highlights
continued
| | | | | | | | | | | | | | | | | | | | | | | | | | | | |
| Class R Shares | |
| | | Year Ended October 31, | | | | | Five Months
Ended
October 31, | | | | | Year Ended
May 31, | |
| | | 2013 | | | 2012 | | | 2011 | | | 2010 | | | | | 2009(a) | | | | | 2009 | |
| Per Share Operating Performance(b): | | | | | | | | | | | | | | | | | | | | | |
| Net Asset Value, Beginning Of Period | | | $44.39 | | | | $49.20 | | | | $50.27 | | | | $41.19 | | | | | | $38.02 | | | | | | $68.28 | |
| Income (loss) from investment operations: | | | | | | | | | | | | | | | | | | | | | |
| Net investment loss | | | (.11 | ) | | | (.10 | ) | | | (.29 | ) | | | (.31 | ) | | | | | (.05 | ) | | | | | (.13 | ) |
| Net realized and unrealized gain (loss) on investment and foreign currency transactions | | | 6.62 | | | | (4.71 | ) | | | (.21 | ) | | | 10.15 | | | | | | 3.22 | | | | | | (28.73 | ) |
| Total from investment operations | | | 6.51 | | | | (4.81 | ) | | | (.50 | ) | | | 9.84 | | | | | | 3.17 | | | | | | (28.86 | ) |
| Less Dividends and Distributions: | | | | | | | | | | | | | | | | | | | | | |
| Dividends from net investment income | | | - | | | | - | | | | (.57 | ) | | | (.76 | ) | | | | | - | | | | | | (.53 | ) |
| Distributions from net realized gains | | | - | | | | - | | | | - | | | | - | | | | | | - | | | | | | (.87 | ) |
| Total dividends and distributions | | | - | | | | - | | | | (.57 | ) | | | (.76 | ) | | | | | - | | | | | | (1.40 | ) |
| Capital Contributions(f): | | | - | | | | - | | | | - | | | | - | (h) | | | | | - | | | | | | - | |
| Net asset value, end of period | | | $50.90 | | | | $44.39 | | | | $49.20 | | | | $50.27 | | | | | | $41.19 | | | | | | $38.02 | |
| Total Return(c): | | | 14.67% | | | | (9.78)% | | | | (1.07)% | | | | 24.15% | | | | | | 8.34% | | | | | | (40.66)% | |
| | | | | | | | | | | | | | | | | | | | | | | | | | | | |
| Ratios/Supplemental Data: | |
| Net assets, end of period (000) | | | $80,001 | | | | $74,238 | | | | $74,092 | | | | $51,424 | | | | | | $28,573 | | | | | | $19,990 | |
| Average net assets (000) | | | $74,909 | | | | $74,335 | | | | $73,359 | | | | $40,431 | | | | | | $23,555 | | | | | | $12,599 | |
| Ratios to average net assets(d)(e)(j): | | | | | | | | | | | | | | | | | | | | | |
| Expenses after waivers and/or expense reimbursement | | | 1.37% | | | | 1.39% | | | | 1.36% | | | | 1.40% | | | | | | 1.41% | (g) | | | | | 1.43% | |
| Expenses before waivers and/or expense reimbursement | | | 1.62% | | | | 1.64% | | | | 1.63% | | | | 1.65% | | | | | | 1.66% | (g) | | | | | 1.69% | |
| Net investment loss | | | (.23)% | | | | (.22)% | | | | (.54)% | | | | (.68)% | | | | | | (.33)% | (g) | | | | | (.37)% | |
| Portfolio turnover rate | | | 21% | | | | 27% | | | | 34% | | | | 21% | | | | | | 9% | (i) | | | | | 51% | |
(a) The Fund changed its fiscal year end from May 31 to October 31, effective October 31, 2009.
(b) Calculated based on average shares outstanding during the period.
(c) Total return is calculated assuming a purchase of a share on the first day and a sale on the last day of each period reported, and includes reinvestment of dividends and distributions. Total returns may reflect adjustments to conform to generally accepted accounting principles. Total returns for periods less than one full year are not annualized.
(d) Does not include expenses of the underlying portfolio in which the Fund invests.
(e) The distributor of the Fund has contractually agreed to limit its distribution and service (12b-1) fees to .50% of the average daily net assets of the Class R shares.
(f) The Fund received payments related to a former affiliate’s settlement of regulatory proceedings involving allegations of improper trading in Fund shares during the fiscal year ended October 31, 2010. The Fund was not involved in the proceedings or in the calculation of the amount of settlement.
(g) Annualized.
(h) Less than $.005.
(i) Not annualized.
(j) Through September 30, 2008, the manager of the Fund contractually agreed to waive .05% of the management fee rate on average daily net assets over $2 billion. Effective October 1, 2008 through February 29, 2012, the manager of the Fund has contractually agreed to waive .05% of the management fee rate on average daily net assets over $4 billion.
See Notes to Financial Statements.
| | | | | | | | | | | | | | | | | | | | | | | | | | | | |
| Class Z Shares | |
| | | Year Ended October 31, | | | | | Five Months
Ended
October 31, | | | | | Year Ended
May 31, | |
| | | 2013 | | | 2012 | | | 2011 | | | 2010 | | | | | 2009(a) | | | | | 2009 | |
| Per Share Operating Performance(b): | | | | | | | | | | | | | | | | | | | | | |
| Net Asset Value, Beginning Of Period | | | $46.14 | | | | $50.88 | | | | $51.71 | | | | $42.14 | | | | | | $38.83 | | | | | | $69.90 | |
| Income (loss) from investment operations: | | | | | | | | | | | | | | | | | | | | | |
| Net investment income (loss) | | | .13 | | | | .13 | | | | (.02 | ) | | | (.08 | ) | | | | | .03 | | | | | | .06 | |
| Net realized and unrealized gain (loss) on investment and foreign currency transactions | | | 6.90 | | | | (4.87 | ) | | | (.24 | ) | | | 10.41 | | | | | | 3.28 | | | | | | (29.55 | ) |
| Total from investment operations | | | 7.03 | | | | (4.74 | ) | | | (.26 | ) | | | 10.33 | | | | | | 3.31 | | | | | | (29.49 | ) |
| Less Dividends and Distributions: | | | | | | | | | | | | | | | | | | | | | |
| Dividends from net investment income | | | - | | | | - | | | | (.57 | ) | | | (.76 | ) | | | | | - | | | | | | (.71 | ) |
| Distributions from net realized gains | | | - | | | | - | | | | - | | | | - | | | | | | - | | | | | | (.87 | ) |
| Total dividends and distributions | | | - | | | | - | | | | (.57 | ) | | | (.76 | ) | | | | | - | | | | | | (1.58 | ) |
| Capital Contributions(e): | | | - | | | | - | | | | - | | | | - | (g) | | | | | - | | | | | | - | |
| Net asset value, end of period | | | $53.17 | | | | $46.14 | | | | $50.88 | | | | $51.71 | | | | | | $42.14 | | | | | | $38.83 | |
| Total Return(c): | | | 15.24% | | | | (9.32)% | | | | (.57)% | | | | 24.77% | | | | | | 8.52% | | | | | | (40.40)% | |
| | | | | | | | | | | | | | | | | | | | | | | | | | | | |
| Ratios/Supplemental Data: | |
| Net assets, end of period (000) | | | $1,707,458 | | | | $1,646,171 | | | | $1,754,096 | | | | $1,212,655 | | | | | | $640,899 | | | | | | $470,122 | |
| Average net assets (000) | | | $1,619,393 | | | | $1,663,079 | | | | $1,759,452 | | | | $896,356 | | | | | | $552,361 | | | | | | $433,493 | |
| Ratios to average net assets(d)(i): | | | | | | | | | | | | | | | | | | | | | |
| Expenses after waivers and/or expense reimbursement | | | .87% | | | | .89% | | | | .86% | | | | .90% | | | | | | .91% | (f) | | | | | .93% | |
| Expenses before waivers and/or expense reimbursement | | | .87% | | | | .89% | | | | .88% | | | | .90% | | | | | | .91% | (f) | | | | | .94% | |
| Net investment income (loss) | | | .27% | | | | .27% | | | | (.04)% | | | | (.18)% | | | | | | .17% | (f) | | | | | .15% | |
| Portfolio turnover rate | | | 21% | | | | 27% | | | | 34% | | | | 21% | | | | | | 9% | (h) | | | | | 51% | |
(a) The Fund changed its fiscal year end from May 31 to October 31, effective October 31, 2009.
(b) Calculated based on average shares outstanding during the period.
(c) Total return is calculated assuming a purchase of a share on the first day and a sale on the last day of each period reported, and includes reinvestment of dividends and distributions. Total returns may reflect adjustments to conform to generally accepted accounting principles. Total returns for periods less than one full year are not annualized.
(d) Does not include expenses of the underlying portfolio in which the Fund invests.
(e) The Fund received payments related to a former affiliate’s settlement of regulatory proceedings involving allegations of improper trading in Fund shares during the fiscal year ended October 31, 2010. The Fund was not involved in the proceedings or in the calculation of the amount of settlement.
(f) Annualized.
(g) Less than $.005.
(h) Not annualized.
(i) Through September 30, 2008, the manager of the Fund contractually agreed to waive .05% of the management fee rate on average daily net assets over $2 billion. Effective October 1, 2008 through February 29, 2012, the manager of the Fund has contractually agreed to waive .05% of the management fee rate on average daily net assets over $4 billion.
See Notes to Financial Statements.
| | | | |
| Prudential Jennison Natural Resources Fund, Inc. | | | 41 | |
Report of Independent Registered Public
Accounting Firm
The Board of Directors and Shareholders
Prudential Jennison Natural Resources Fund, Inc.:
We have audited the accompanying statement of assets and liabilities of Prudential Jennison Natural Resources Fund, Inc. (hereafter referred to as the “Fund”), including the portfolio of investments, as of October 31, 2013, and the related statement of operations for the year then ended, the statements of changes in net assets for each of the years in the two-year period then ended, and the financial highlights for each of the years in the five-year period then ended. These financial statements and financial highlights are the responsibility of the Fund’s management. Our responsibility is to express an opinion on these financial statements and financial highlights based on our audits.
We conducted our audits in accordance with the standards of the Public Company Accounting Oversight Board (United States). Those standards require that we plan and perform the audit to obtain reasonable assurance about whether the financial statements and financial highlights are free of material misstatement. An audit includes examining, on a test basis, evidence supporting the amounts and disclosures in the financial statements. Our procedures included confirmation of securities owned as of October 31, 2013, by correspondence with the custodian, transfer agent and brokers or by other appropriate auditing procedures when replies from brokers were not received. An audit also includes assessing the accounting principles used and significant estimates made by management, as well as evaluating the overall financial statement presentation. We believe that our audits provide a reasonable basis for our opinion.
In our opinion, the financial statements and financial highlights referred to above present fairly, in all material respects, the financial position of the Fund as of October 31, 2013, and the results of its operations for the year then ended, the changes in its net assets for each of the years in the two-year period then ended and the financial highlights for each of the years in the five-year period then ended, in conformity with U.S. generally accepted accounting principles.

New York, New York
December 20, 2013
INFORMATION ABOUT BOARD MEMBERS AND OFFICERS
(Unaudited)
Information about Board Members and Officers of the Fund is set forth below. Board Members who are not deemed to be “interested persons” of the Fund, as defined in the 1940 Act, are referred to as “Independent Board Members.” Board Members who are deemed to be “interested persons” of the Fund are referred to as “Interested Board Members.” The Board Members are responsible for the overall supervision of the operations of the Fund and perform the various duties imposed on the directors of investment companies by the 1940 Act. The Board in turn elects the Officers, who are responsible for administering the day-to-day operations of the Fund.
| | | | |
| Independent Board Members(1) |
Name, Address, Age Position(s) Portfolios Overseen | | Principal Occupation(s) During Past Five Years | | Other Directorships Held |
Ellen S. Alberding (55) Board Member Portfolios Overseen: 64 | | President and Board Member, The Joyce Foundation (charitable foundation) (since 2002); Vice Chair, City Colleges of Chicago (community college system) (since 2011); Trustee, Skills for America’s Future (national initiative to connect employers to community colleges) (since 2011); Trustee, National Park Foundation (charitable foundation for national park system) (since 2009); Trustee, Economic Club of Chicago (since 2009). | | None. |
Kevin J. Bannon (61) Board Member Portfolios Overseen: 64 | | Managing Director (since April 2008) and Chief Investment Officer (since October 2008) of Highmount Capital LLC (registered investment adviser); formerly Executive Vice President and Chief Investment Officer (April 1993-August 2007) of Bank of New York Company; President (May 2003-May 2007) of BNY Hamilton Family of Mutual Funds. | | Director of Urstadt Biddle Properties (since September 2008). |
Linda W. Bynoe (61) Board Member Portfolios Overseen: 64 | | President and Chief Executive Officer (since March 1995) and formerly Chief Operating Officer (December 1989-February 1995) of Telemat Ltd. (management consulting); formerly Vice President (January 1985-June 1989) at Morgan Stanley & Co (broker-dealer). | | Director of Simon Property Group, Inc. (retail real estate) (May 2003-May 2012); Director of Anixter International, Inc. (communication products distributor) (since January 2006); Director of Northern Trust Corporation (financial services) (since April 2006); Trustee of Equity Residential (residential real estate) (since December 2009). |
Prudential Jennison Natural Resources Fund, Inc.
| | | | |
| Independent Board Members(1) |
Name, Address, Age Position(s) Portfolios Overseen | | Principal Occupation(s) During Past Five Years | | Other Directorships Held |
Keith F. Hartstein (57) Board Member Portfolios Overseen: 64 | | Formerly President and Chief Executive Officer (2005-2012), Senior Vice President (2004-2005), Senior Vice President of Sales and Marketing (1997-2004), and various executive management positions (1990-1997), John Hancock Funds, LLC (asset management); Chairman, Investment Company Institute’s Sales Force Marketing Committee (2003-2008). | | None. |
Michael S. Hyland, CFA (68) Board Member Portfolios Overseen: 64 | | Independent Consultant (since February 2005); formerly Senior Managing Director (July 2001-February 2005) of Bear Stearns & Co, Inc.; Global Partner, INVESCO (1999-2001); Managing Director and President of Salomon Brothers Asset Management (1989-1999). | | None. |
Douglas H. McCorkindale (74) Board Member Portfolios Overseen: 64 | | Formerly Chairman (February 2001-June 2006), Chief Executive Officer (June 2000-July 2005), President (September 1997-July 2005) and Vice Chairman (March 1984-May 2000) of Gannett Co. Inc. (publishing and media). | | Director of Lockheed Martin Corp. (aerospace and defense) (since May 2001). |
Stephen P. Munn (71) Board Member Portfolios Overseen: 64 | | Lead Director (since 2007) and formerly Chairman (1993-2007) of Carlisle Companies Incorporated (manufacturer of industrial products). | | Lead Director (since 2007) of Carlisle Companies Incorporated (manufacturer of industrial products). |
James E. Quinn (61) Board Member Portfolios Overseen: 64 | | Formerly President (2003-2012) and Director (2003-2008), and Vice Chairman and Director (1998-2003), Tiffany & Company (jewelry retailing); Director, Mutual of America Capital Management Corporation (asset management) (since 1996); Director, Hofstra University (since 2008); Vice Chairman, Museum of the City of New York (since 1984). | | Director of Deckers Outdoor Corporation (footwear manufacturer) (since 2011). |
Richard A. Redeker (70) Board Member & Independent Chair Portfolios Overseen: 64 | | Retired Mutual Fund Senior Executive (44 years); Management Consultant; Independent Directors Council (organization of 2,800 Independent Mutual Fund Directors)-Executive Committee, Chair of Policy Steering Committee, Governing Council. | | None. |
Visit our website at www.prudentialfunds.com
| | | | |
| Independent Board Members(1) |
Name, Address, Age Position(s) Portfolios Overseen | | Principal Occupation(s) During Past Five Years | | Other Directorships Held |
Robin B. Smith (74) Board Member Portfolios Overseen: 64 | | Chairman of the Board (since January 2003) of Publishers Clearing House (direct marketing); Member of the Board of Directors of ADLPartner (marketing) (since December 2010); formerly Chairman and Chief Executive Officer (August 1996-January 2003) of Publishers Clearing House. | | Formerly Director of BellSouth Corporation (telecommunications) (1992-2006). |
Stephen G. Stoneburn (70) Board Member Portfolios Overseen: 64 | | Chairman, (since July 2011), President and Chief Executive Officer (since June 1996) of Quadrant Media Corp. (publishing company); formerly President (June 1995-June 1996) of Argus Integrated Media, Inc.; Senior Vice President and Managing Director (January 1993-1995) of Cowles Business Media; Senior Vice President of Fairchild Publications, Inc. (1975-1989). | | None. |
| | | | |
| Interested Board Members(1) |
Name, Address, Age Position(s) Portfolios Overseen | | Principal Occupation(s) During Past Five Years | | Other Directorships Held |
Stuart S. Parker (51) Board Member & President Portfolios Overseen: 59 | | President of Prudential Investments LLC (since January 2012); Executive Vice President of Prudential Investment Management Services LLC (since December 2012); Executive Vice President of Jennison Associates LLC and Head of Retail Distribution of Prudential Investments LLC (June 2005 - December 2011). | | None. |
Scott E. Benjamin (40) Board Member & Vice President Portfolios Overseen: 64 | | Executive Vice President (since June 2009) of Prudential Investments LLC; Executive Vice President (June 2009-June 2012) and Vice President (since June 2012) of Prudential Investment Management Services LLC; Executive Vice President (since September 2009) of AST Investment Services, Inc.; Senior Vice President of Product Development and Marketing, Prudential Investments (since February 2006); Vice President of Product Development and Product Management, Prudential Investments (2003-2006). | | None. |
Prudential Jennison Natural Resources Fund, Inc.
| (1) | The year that each Board Member joined the Fund’s Board is as follows: |
Ellen S. Alberding, 2013; Kevin J. Bannon, 2008; Linda W. Bynoe, 2005; Keith F. Hartstein, 2013; Michael S. Hyland, 2008; Douglas H. McCorkindale, 2000; Stephen P. Munn, 2008; James E. Quinn, 2013; Richard A. Redeker, 2000; Robin B. Smith, 1996; Stephen G. Stoneburn, 2003; Stuart S. Parker, Board Member and President since 2012; Scott E. Benjamin, Board Member since 2010 and Vice President since 2009.
| | | | |
| Fund Officers(a) |
Name, Address and Age Position with Fund | | Principal Occupation(s) During Past Five Years | | Length of Service as Fund Officer |
Raymond A. O’Hara (58) Chief Legal Officer | | Vice President and Corporate Counsel (since July 2010) of Prudential Insurance Company of America (Prudential); Vice President (March 2011-Present) of Pruco Life Insurance Company and Pruco Life Insurance Company of New Jersey; Vice President and Corporate Counsel (March 2011-Present) of Prudential Annuities Life Assurance Corporation; Chief Legal Officer of Prudential Investments LLC (since June 2012); Chief Legal Officer of Prudential Mutual Fund Services LLC (since June 2012) and Corporate Counsel of AST Investment Services, Inc. (since June 2012); formerly Assistant Vice President and Corporate Counsel (September 2008-July 2010) of The Hartford Financial Services Group, Inc.; formerly Associate (September 1980-December 1987) and Partner (January 1988–August 2008) of Blazzard & Hasenauer, P.C. (formerly, Blazzard, Grodd & Hasenauer, P.C.). | | Since 2012 |
Deborah A. Docs (55) Secretary | | Vice President and Corporate Counsel (since January 2001) of Prudential; Vice President (since December 1996) and Assistant Secretary (since March 1999) of Prudential Investments LLC; formerly Vice President and Assistant Secretary (May 2003-June 2005) of AST Investment Services, Inc. | | Since 2004 |
Jonathan D. Shain (55) Assistant Secretary | | Vice President and Corporate Counsel (since August 1998) of Prudential; Vice President and Assistant Secretary (since May 2001) of Prudential Investments LLC; Vice President and Assistant Secretary (since February 2001) of Prudential Mutual Fund Services LLC; formerly Vice President and Assistant Secretary (May 2003-June 2005) of AST Investment Services, Inc. | | Since 2005 |
Claudia DiGiacomo (39) Assistant Secretary | | Vice President and Corporate Counsel (since January 2005) of Prudential; Vice President and Assistant Secretary of Prudential Investments LLC (since December 2005); Associate at Sidley Austin Brown & Wood LLP (1999-2004). | | Since 2005 |
Andrew R. French (51) Assistant Secretary | | Vice President and Corporate Counsel (since February 2010) of Prudential; formerly Director and Corporate Counsel (2006-2010) of Prudential; Vice President and Assistant Secretary (since January 2007) of Prudential Investments LLC; Vice President and Assistant Secretary (since January 2007) of Prudential Mutual Fund Services LLC. | | Since 2006 |
Visit our website at www.prudentialfunds.com
| | | | |
| Fund Officers(a) |
Name, Address and Age Position with Fund | | Principal Occupation(s) During Past Five Years | | Length of Service as Fund Officer |
Amanda S. Ryan (35) Assistant Secretary | | Director and Corporate Counsel (since March 2012) of Prudential; Director and Assistant Secretary (since June 2012) of Prudential Investments LLC; Associate at Ropes & Gray LLP (2008-2012). | | Since 2012 |
Bruce Karpati (43) Chief Compliance Officer | | Chief Compliance Officer of the Prudential Investments Funds, Target Funds, Advanced Series Trust, the Prudential Series Fund and Prudential’s Gibraltar Fund, Inc. (May 2013 - Present); formerly National Chief (May 2012 - May 2013) and Co-Chief (January 2010 - May 2012) of the Asset Management Unit, Division of Enforcement, of the U.S. Securities and Exchange Commission; Assistant Regional Director (January 2005 - January 2010) of the U.S. Securities and Exchange Commission. | | Since 2013 |
Theresa C. Thompson (51) Deputy Chief Compliance Officer | | Vice President, Compliance, Prudential Investments LLC (since April 2004); and Director, Compliance, Prudential Investments LLC (2001-2004). | | Since 2008 |
Richard W. Kinville (45) Anti-Money Laundering Compliance Officer | | Vice President, Corporate Compliance, Anti-Money Laundering Unit (since January 2005) of Prudential; committee member of the American Council of Life Insurers Anti-Money Laundering and Critical Infrastructure Committee (since January 2007); formerly Investigator and Supervisor in the Special Investigations Unit for the New York Central Mutual Fire Insurance Company (August 1994-January 1999); Investigator in AXA Financial’s Internal Audit Department and Manager in AXA’s Anti-Money Laundering Office (January 1999-January 2005); first chair of the American Council of Life Insurers Anti-Money Laundering and Critical Infrastructure Committee (June 2007-December 2009). | | Since 2011 |
Grace C. Torres (54) Treasurer and Principal Financial and Accounting Officer | | Assistant Treasurer (since March 1999) and Senior Vice President (since September 1999) of Prudential Investments LLC; Assistant Treasurer (since May 2003) and Vice President (since June 2005) of AST Investment Services, Inc.; Senior Vice President and Assistant Treasurer (since May 2003) of Prudential Annuities Advisory Services, Inc.; formerly Senior Vice President (May 2003-June 2005) of AST Investment Services, Inc. | | Since 1998 |
M. Sadiq Peshimam (49) Assistant Treasurer | | Vice President (since 2005) of Prudential Investments LLC. | | Since 2006 |
Peter Parrella (55) Assistant Treasurer | | Vice President (since 2007) and Director (2004-2007) within Prudential Mutual Fund Administration; formerly Tax Manager at SSB Citi Fund Management LLC (1997-2004). | | Since 2007 |
| (a) | Excludes Mr. Parker and Mr. Benjamin, interested Board Members who also serve as President and Vice President, respectively. |
Prudential Jennison Natural Resources Fund, Inc.
Explanatory Notes to Tables:
| • | | Board Members are deemed to be “Interested,” as defined in the 1940 Act, by reason of their affiliation with Prudential Investments LLC and/or an affiliate of Prudential Investments LLC. |
| • | | Unless otherwise noted, the address of all Board Members and Officers is c/o Prudential Investments LLC, Gateway Center Three, 100 Mulberry Street, Newark, New Jersey 07102-4077. |
| • | | There is no set term of office for Board Members or Officers. The Board Members have adopted a retirement policy, which calls for the retirement of Board Members on December 31 of the year in which they reach the age of 75. |
| • | | “Other Directorships Held” includes only directorships of companies required to register or file reports with the SEC under the 1934 Act (that is, “public companies”) or other investment companies registered under the 1940 Act. |
| • | | “Portfolios Overseen” includes all investment companies managed by Prudential Investments LLC. The investment companies for which Prudential Investments LLC serves as manager include the Prudential Investments Mutual Funds, The Prudential Variable Contract Accounts, Target Mutual Funds, Prudential Short Duration High Yield Fund, Inc., Prudential Global Short Duration High Yield Fund, Inc., The Prudential Series Fund, Prudential’s Gibraltar Fund, Inc. and the Advanced Series Trust. |
Visit our website at www.prudentialfunds.com
Approval of Advisory Agreements
The Fund’s Board of Directors
The Board of Directors (the “Board”) of Prudential Jennison Natural Resources Fund, Inc. (the “Fund”) consists of ten individuals, eight of whom are not “interested persons” of the Fund, as defined in the Investment Company Act of 1940, as amended (the “1940 Act”) (the “Independent Directors”).1 The Board is responsible for the oversight of the Fund and its operations, and performs the various duties imposed on the directors of investment companies by the 1940 Act. The Independent Directors have retained independent legal counsel to assist them in connection with their duties. The Chair of the Board is an Independent Director. The Board has established three standing committees: the Audit Committee, the Nominating and Governance Committee, and the Investment Committee. Each committee is chaired by, and composed of, Independent Directors.
Annual Approval of the Fund’s Advisory Agreements
As required under the 1940 Act, the Board determines annually whether to renew the Fund’s management agreement with Prudential Investments LLC (“PI”) and the Fund’s subadvisory agreement with Jennison Associates LLC (“Jennison”). In considering the renewal of the agreements, the Board, including all of the Independent Directors, met on June 4-6, 2013 and approved the renewal of the agreements through July 31, 2014, after concluding that the renewal of the agreements was in the best interests of the Fund and its shareholders.
In advance of the meetings, the Board requested and received materials relating to the agreements, and had the opportunity to ask questions and request further information in connection with its consideration. Among other things, the Board considered comparative fee information from PI and Jennison. Also, the Board considered comparisons with other mutual funds in relevant Peer Universes and Peer Groups, as is further discussed below.
In approving the agreements, the Board, including the Independent Directors advised by independent legal counsel, considered the factors it deemed relevant, including the nature, quality and extent of services provided by PI and the subadviser, the performance of the Fund, the profitability of PI and its affiliates, expenses and fees, and the potential for economies of scale that may be shared with the Fund and its shareholders as the Fund’s assets grow. In their deliberations, the Directors did not identify any single factor which alone was responsible for the Board’s decision to approve the agreements with respect to the Fund. In connection with its deliberations, the Board considered information provided by PI throughout the year at regular Board meetings, presentations from portfolio managers and other information, as well as information furnished at or in advance of the meetings on June 4-6, 2013.
| 1 | Ms. Alberding and Messrs. Hartstein and Quinn were elected to the Board as of September 1, 2013. |
Prudential Jennison Natural Resources Fund, Inc.
Approval of Advisory Agreements (continued)
The Directors determined that the overall arrangements between the Fund and PI, which serves as the Fund’s investment manager pursuant to a management agreement, and between PI and Jennison, which serves as the Fund’s subadviser pursuant to the terms of a subadvisory agreement with PI, are in the best interests of the Fund and its shareholders in light of the services performed, fees charged and such other matters as the Directors considered relevant in the exercise of their business judgment.
The material factors and conclusions that formed the basis for the Directors’ reaching their determinations to approve the continuance of the agreements are separately discussed below.
Nature, Quality, and Extent of Services
The Board received and considered information regarding the nature, quality and extent of services provided to the Fund by PI and Jennison. The Board considered the services provided by PI, including but not limited to the oversight of the subadviser for the Fund, as well as the provision of fund recordkeeping, compliance, and other services to the Fund. With respect to PI’s oversight of the subadviser, the Board noted that PI’s Strategic Investment Research Group (“SIRG”), which is a business unit of PI, is responsible for monitoring and reporting to PI’s senior management on the performance and operations of the subadviser. The Board also considered that PI pays the salaries of all of the officers and non-independent Directors of the Fund. The Board also considered the investment subadvisory services provided by Jennison, as well as adherence to the Fund’s investment restrictions and compliance with applicable Fund policies and procedures. The Board considered PI’s evaluation of the subadviser, as well as PI’s recommendation, based on its review of the subadviser, to renew the subadvisory agreement.
The Board considered the qualifications, backgrounds and responsibilities of PI’s senior management responsible for the oversight of the Fund and Jennison, and also considered the qualifications, backgrounds and responsibilities of Jennison’s portfolio managers who are responsible for the day-to-day management of the Fund’s portfolio. The Board was provided with information pertaining to PI’s and Jennison’s organizational structure, senior management, investment operations, and other relevant information pertaining to both PI and Jennison. The Board also noted that it received favorable compliance reports from the Fund’s Chief Compliance Officer (“CCO”) as to both PI and Jennison. The Board noted that Jennison is affiliated with PI.
The Board concluded that it was satisfied with the nature, extent and quality of the investment management services provided by PI and the subadvisory services
Visit our website at www.prudentialfunds.com
provided to the Fund by Jennison, and that there was a reasonable basis on which to conclude that the Fund benefits from the services provided by PI and Jennison under the management and subadvisory agreements.
Costs of Services and Profits Realized by PI
The Board was provided with information on the profitability of PI and its affiliates in serving as the Fund’s investment manager. The Board discussed with PI the methodology utilized in assembling the information regarding profitability and considered its reasonableness. The Board recognized that it is difficult to make comparisons of profitability from fund management contracts because comparative information is not generally publicly available and is affected by numerous factors, including the structure of the particular adviser, the types of funds it manages, its business mix, numerous assumptions regarding allocations and the adviser’s capital structure and cost of capital. The Board separately considered information regarding the profitability of the subadviser, an affiliate of PI. Taking these factors into account, the Board concluded that the profitability of PI and its affiliates in relation to the services rendered was not unreasonable.
Economies of Scale
The Board noted that the management fee schedule for the Fund includes breakpoints, which have the effect of decreasing the fee rate as assets increase, and that at its current level of assets the Fund’s effective fee rate reflected some of those rate reductions. The Board received and discussed information concerning whether PI realizes economies of scale as the Fund’s assets grow beyond current levels. The Board took note that the Fund’s fee structure currently results in benefits to Fund shareholders whether or not PI realizes any economies of scale. The Board recognized the inherent limitations of any analysis of economies of scale, stemming largely from the Board’s understanding that most of PI’s costs are not specific to individual funds, but rather are incurred across a variety of products and services.
Other Benefits to PI and Jennison
The Board considered potential ancillary benefits that might be received by PI and Jennison and their affiliates as a result of their relationship with the Fund. The Board concluded that potential benefits to be derived by PI included fees received by affiliates of PI for serving as the Fund’s securities lending agent, transfer agency fees received by the Fund’s transfer agent (which is affiliated with PI), benefits to its reputation as well as other intangible benefits resulting from PI’s association with the Fund. The Board concluded that the potential benefits to be derived by Jennison included its ability to use soft dollar credits, as well as the potential benefits consistent with those generally resulting from an increase in assets under management,
Prudential Jennison Natural Resources Fund, Inc.
Approval of Advisory Agreements (continued)
specifically, potential access to additional research resources and benefits to its reputation. The Board concluded that the benefits derived by PI and Jennison were consistent with the types of benefits generally derived by investment managers and subadvisers to mutual funds.
Performance of the Fund / Fees and Expenses
The Board considered certain additional specific factors and made related conclusions relating to the historical performance of the Fund for the one-, three-, five- and ten-year periods ended December 31, 2012.
The Board also considered the Fund’s actual management fee, as well as the Fund’s net total expense ratio, for the fiscal year ended October 31, 2012. The Board considered the management fee for the Fund as compared to the management fee charged by PI to other funds and the fee charged by other advisers to comparable mutual funds in a Peer Group. The actual management fee represents the fee rate actually paid by Fund shareholders and includes any fee waivers or reimbursements. The net total expense ratio for the Fund represents the actual expense ratio incurred by Fund shareholders.
The mutual funds included in the Peer Universe (the Lipper Global Natural Resources Funds Performance Universe) and the Peer Group were objectively determined by Lipper Inc. (“Lipper”), an independent provider of mutual fund data. The comparisons placed the Fund in various quartiles, with the first quartile being the best 25% of the mutual funds (for performance, the best performing mutual funds and, for expenses, the lowest cost mutual funds).
The section below summarizes key factors considered by the Board and the Board’s conclusions regarding the Fund’s performance, fees and overall expenses. The table sets forth gross performance comparisons (which do not reflect the impact on performance of fund expenses, or any subsidies, expense caps or waivers that may be applicable) with the Peer Universe, actual management fees with the Peer Group (which reflect the impact of any subsidies or fee waivers), and net total expenses with the Peer Group, each of which were key factors considered by the Board.
| | | | | | | | |
| Performance | | 1 Year | | 3 Years | | 5 Years | | 10 Years |
| | | 3rd Quartile | | 3rd Quartile | | 2nd Quartile | | 1st Quartile |
| Actual Management Fees: 1st Quartile |
| Net Total Expenses: 1st Quartile |
| | • | | The Board noted that the Fund outperformed its benchmark index over the three-, five- and ten-year periods, although it underperformed over the one-year period. |
Visit our website at www.prudentialfunds.com
| | • | | The Board concluded that, in light of the Fund’s strong performance over longer time periods, it would be in the best interests of the Fund and its shareholders to renew the agreements. |
| | • | | The Board concluded that the management fees (including subadvisory fees) and total expenses were reasonable in light of the services provided. |
* * *
After full consideration of these factors, the Board concluded that approval of the agreements was in the best interests of the Fund and its shareholders.
Prudential Jennison Natural Resources Fund, Inc.
| | | | |
| n MAIL | | n TELEPHONE | | n WEBSITE |
Gateway Center Three
100 Mulberry Street
Newark, NJ 07102 | | (800) 225-1852
| | www.prudentialfunds.com |
|
| PROXY VOTING |
| The Board of Directors of the Fund has delegated to the Fund’s investment subadviser the responsibility for voting any proxies and maintaining proxy recordkeeping with respect to the Fund. A description of these proxy voting policies and procedures is available without charge, upon request, by calling (800) 225-1852 or by visiting the Securities and Exchange Commission’s website at www.sec.gov. Information regarding how the Fund voted proxies relating to portfolio securities during the most recent 12-month period ended June 30 is available on the Fund’s website and on the Securities and Exchange Commission’s website. |
|
| DIRECTORS |
| Ellen S. Alberding • Kevin J. Bannon • Scott E. Benjamin • Linda W. Bynoe • Keith F. Hartstein • Michael S. Hyland • Douglas H. McCorkindale • Stephen P. Munn • Stuart S. Parker • James E. Quinn • Richard A. Redeker • Robin B. Smith • Stephen G. Stoneburn |
|
| OFFICERS |
| Stuart S. Parker, President • Scott E. Benjamin, Vice President • Grace C. Torres, Treasurer and Principal Financial and Accounting Officer • Raymond A. O’Hara, Chief Legal Officer • Deborah A. Docs, Secretary • Bruce Karpati, Chief Compliance Officer • Theresa C. Thompson, Deputy Chief Compliance Officer • Richard W. Kinville, Anti-Money Laundering Compliance Officer • Jonathan D. Shain, Assistant Secretary • Claudia DiGiacomo, Assistant Secretary • Amanda S. Ryan, Assistant Secretary • Andrew R. French, Assistant Secretary • M. Sadiq Peshimam, Assistant Treasurer • Peter Parrella, Assistant Treasurer |
| | | | |
| MANAGER | | Prudential Investments LLC | | Gateway Center Three
100 Mulberry Street Newark, NJ 07102 |
|
| INVESTMENT SUBADVISER | | Jennison Associates LLC | | 466 Lexington Avenue
New York, NY 10017 |
|
| DISTRIBUTOR | | Prudential Investment
Management Services LLC | | Gateway Center Three
100 Mulberry Street Newark, NJ 07102 |
|
| CUSTODIAN | | The Bank of New York Mellon | | One Wall Street
New York, NY 10286 |
|
| TRANSFER AGENT | | Prudential Mutual Fund
Services LLC | | PO Box 9658
Providence, RI 02940 |
|
| INDEPENDENT REGISTERED PUBLIC ACCOUNTING FIRM | | KPMG LLP | | 345 Park Avenue
New York, NY 10154 |
|
| FUND COUNSEL | | Willkie Farr & Gallagher LLP | | 787 Seventh Avenue
New York, NY 10019 |
|
| An investor should consider the investment objectives, risks, charges, and expenses of the Fund carefully before investing. The prospectus and summary prospectus contain this and other information about the Fund. An investor may obtain a prospectus and summary prospectus by visiting our website at www.prudentialfunds.com or by calling (800) 225-1852. The prospectus and summary prospectus should be read carefully before investing. |
|
| E-DELIVERY |
| To receive your mutual fund documents online, go to www.prudentialfunds.com/edelivery and enroll. Instead of receiving printed documents by mail, you will receive notification via email when new materials are available. You can cancel your enrollment or change your email address at any time by visiting the website address above. |
|
| SHAREHOLDER COMMUNICATIONS WITH DIRECTORS |
| Shareholders can communicate directly with the Board of Directors by writing to the Chair of the Board, Prudential Jennison Natural Resources Fund, Inc., Prudential Investments, Attn: Board of Directors, 100 Mulberry Street, Gateway Center Three, Newark, NJ 07102. Shareholders can communicate directly with an individual Director by writing to the same address. Communications are not screened before being delivered to the addressee. |
|
| AVAILABILITY OF PORTFOLIO SCHEDULE |
| The Fund files its complete schedule of portfolio holdings with the Securities and Exchange Commission for the first and third quarters of each fiscal year on Form N-Q. The Fund’s Forms N-Q are available on the Commission’s website at www.sec.gov. The Fund’s Forms N-Q may also be reviewed and copied at the Commission’s Public Reference Room in Washington, D.C. Information on the operation and location of the Public Reference Room may be obtained by calling 1-800-SEC-0330. The Fund’s schedule of portfolio holdings is also available on the Fund’s website as of the end of each month. |
|
| The Fund’s Statement of Additional Information contains additional information about the Fund’s Directors and is available without charge, upon request, by calling (800) 225-1852. |
Mutual Funds:
| | | | |
ARE NOT INSURED BY THE FDIC OR ANY
FEDERAL GOVERNMENT AGENCY | | MAY LOSE VALUE | | ARE NOT A DEPOSIT OF OR GUARANTEED
BY ANY BANK OR ANY BANK AFFILIATE |

PRUDENTIAL JENNISON NATURAL RESOURCES FUND, INC.
| | | | | | | | | | | | | | |
| | | SHARE CLASS | | A | | B | | C | | Q | | R | | Z |
| | NASDAQ | | PGNAX | | PRGNX | | PNRCX | | PJNQX | | JNRRX | | PNRZX |
| | CUSIP | | 74441K107 | | 74441K206 | | 74441K305 | | 74441K602 | | 74441K404 | | 74441K503 |
MF135E 0255229-00001-00
Item 2 – Code of Ethics — See Exhibit (a)
As of the end of the period covered by this report, the registrant has adopted a code of ethics (the “Section 406 Standards for Investment Companies – Ethical Standards for Principal Executive and Financial Officers”) that applies to the registrant’s Principal Executive Officer and Principal Financial Officer; the registrant’s Principal Financial Officer also serves as the Principal Accounting Officer.
The registrant hereby undertakes to provide any person, without charge, upon request, a copy of the code of ethics. To request a copy of the code of ethics, contact the registrant 800-225-1852, and ask for a copy of the Section 406 Standards for Investment Companies - Ethical Standards for Principal Executive and Financial Officers.
Item 3 – Audit Committee Financial Expert –
The registrant’s Board has determined that Mr. Stephen P. Munn, member of the Board’s Audit Committee is an “audit committee financial expert,” and that he is “independent,” for purposes of this Item.
Item 4 – Principal Accountant Fees and Services –
(a) Audit Fees
For the fiscal years ended October 31, 2013 and October 31, 2012, KPMG LLP (“KPMG”), the Registrant’s principal accountant, billed the Registrant $32,500 and $28,500 respectively, for professional services rendered for the audit of the Registrant’s annual financial statements or services that are normally provided in connection with statutory and regulatory filings.
(b) Audit-Related Fees
None.
(c) Tax Fees
Not applicable for the fiscal year ended October 31, 2013. During the fiscal year ended October 31, 2012, KPMG billed the Registrant $3,429 for professional services rendered in connection with agreed upon procedures performed related to the receipt of payments pursuant to certain fair fund settlement orders and an analysis in connection with federal and state tax return preparation.
(d) All Other Fees
None.
(e) (1) Audit Committee Pre-Approval Policies and Procedures
THE PRUDENTIAL MUTUAL FUNDS
AUDIT COMMITTEE POLICY
on
Pre-Approval of Services Provided by the Independent Accountants
The Audit Committee of each Prudential Mutual Fund is charged with the responsibility to monitor the independence of the Fund’s independent accountants. As part of this responsibility, the Audit Committee must pre-approve any independent accounting firm’s engagement to render audit and/or permissible non-audit services, as required by law. In evaluating a proposed engagement of the independent accountants, the Audit Committee will assess the effect that the engagement might reasonably be expected to have on the accountant’s independence. The Committee’s evaluation will be based on:
| | • | | a review of the nature of the professional services expected to be provided, |
| | • | | a review of the safeguards put into place by the accounting firm to safeguard independence, and |
| | • | | periodic meetings with the accounting firm. |
Policy for Audit and Non-Audit Services Provided to the Funds
On an annual basis, the scope of audits for each Fund, audit fees and expenses, and audit-related and non-audit services (and fees proposed in respect thereof) proposed to be performed by the Fund’s independent accountants will be presented by the Treasurer and the independent accountants to the Audit Committee for review and, as appropriate, approval prior to the initiation of such services. Such presentation shall be accompanied by confirmation by both the Treasurer and the independent accountants that the proposed services will not adversely affect the independence of the independent accountants. Proposed services shall be described in sufficient detail to enable the Audit Committee to assess the appropriateness of such services and fees, and the compatibility of the provision of such services with the auditor’s independence. The Committee shall receive periodic reports on the progress of the audit and other services which are approved by the Committee or by the Committee Chair pursuant to authority delegated in this Policy.
The categories of services enumerated under “Audit Services”, “Audit-related Services”, and “Tax Services” are intended to provide guidance to the Treasurer and the independent accountants as to those categories of services which the Committee believes are generally consistent with the independence of the independent accountants and which the Committee (or the Committee Chair) would expect upon the presentation of specific proposals to pre-approve. The enumerated categories are not intended as an exclusive list of audit, audit-related or tax services, which the Committee (or the Committee Chair) would consider for pre-approval.
Audit Services
The following categories of audit services are considered to be consistent with the role of the Fund’s independent accountants:
| | • | | Annual Fund financial statement audits |
| | • | | Seed audits (related to new product filings, as required) |
| | • | | SEC and regulatory filings and consents |
Audit-related Services
The following categories of audit-related services are considered to be consistent with the role of the Fund’s independent accountants:
| | • | | Accounting consultations |
| | • | | Fund merger support services |
| | • | | Agreed Upon Procedure Reports |
| | • | | Other Internal Control Reports |
Individual audit-related services that fall within one of these categories and are not presented to the Audit Committee as part of the annual pre-approval process will be subject to pre-approval by the Committee Chair (or any other Committee member on whom this responsibility has been delegated) so long as the estimated fee for those services does not exceed $50,000.
Tax Services
The following categories of tax services are considered to be consistent with the role of the Fund’s independent accountants:
| | • | | Tax compliance services related to the filing or amendment of the following: |
| | • | | Federal, state and local income tax compliance; and, |
| | • | | Sales and use tax compliance |
| | • | | Timely RIC qualification reviews |
| | • | | Tax distribution analysis and planning |
| | • | | Tax authority examination services |
| | • | | Tax appeals support services |
| | • | | Accounting methods studies |
| | • | | Fund merger support services |
| | • | | Tax consulting services and related projects |
Individual tax services that fall within one of these categories and are not presented to the Audit Committee as part of the annual pre-approval process will be subject to pre-approval by the Committee Chair (or any other Committee member on whom this responsibility has been delegated) so long as the estimated fee for those services does not exceed $50,000.
Other Non-audit Services
Certain non-audit services that the independent accountants are legally permitted to render will be subject to pre-approval by the Committee or by one or more Committee members to whom the Committee has delegated this authority and who will report to the full Committee any pre-approval decisions made pursuant to this Policy. Non-audit services presented for pre-approval pursuant to this paragraph will be accompanied by a confirmation from both the Treasurer and the independent accountants that the proposed services will not adversely affect the independence of the independent accountants.
Proscribed Services
The Fund’s independent accountants will not render services in the following categories of non-audit services:
| | • | | Bookkeeping or other services related to the accounting records or financial statements of the Fund |
| | • | | Financial information systems design and implementation |
| | • | | Appraisal or valuation services, fairness opinions, or contribution-in-kind reports |
| | • | | Internal audit outsourcing services |
| | • | | Management functions or human resources |
| | • | | Broker or dealer, investment adviser, or investment banking services |
| | • | | Legal services and expert services unrelated to the audit |
| | • | | Any other service that the Public Company Accounting Oversight Board determines, by regulation, is impermissible. |
Pre-approval of Non-Audit Services Provided to Other Entities Within the Prudential Fund Complex
Certain non-audit services provided to Prudential Investments LLC or any of its affiliates that also provide ongoing services to the Prudential Mutual Funds will be subject to pre-approval by the Audit Committee. The only non-audit services provided to these entities that will require pre-approval are those related directly to the operations and financial reporting of the Funds. Individual projects that are not presented to the Audit Committee as part of the annual pre-approval process will be subject to pre-approval by the Committee Chair (or any other Committee member on whom this responsibility has been delegated) so long as the estimated fee for those services does not exceed $50,000. Services presented for pre-approval pursuant to this paragraph will be accompanied by a confirmation from both the Treasurer and the independent accountants that the proposed services will not adversely affect the independence of the independent accountants.
Although the Audit Committee will not pre-approve all services provided to Prudential Investments LLC and its affiliates, the Committee will receive an annual report from the Fund’s independent accounting firm showing the aggregate fees for all services provided to Prudential Investments and its affiliates.
(e) (2) Percentage of services referred to in 4(b) – 4(d) that were approved by the audit committee –
One hundred percent of the services described in Item 4(c) was approved by the audit committee.
(f) Percentage of hours expended attributable to work performed by other than full time employees of principal accountant if greater than 50%.
The percentage of hours expended on the principal accountant’s engagement to audit the registrant’s financial statements for the most recent fiscal year that were attributed to work performed by persons other than the principal accountant’s full-time, permanent employees was 0%.
(g) Non-Audit Fees
Not applicable to Registrant for the fiscal years 2013 and 2012. The aggregate non-audit fees billed by KPMG for services rendered to the registrant’s investment adviser and any entity controlling, controlled by, or under common control with the investment adviser that provides ongoing services to the registrant for the fiscal years 2013 and 2012 was $0 and $0, respectively.
(h) Principal Accountant’s Independence
Not applicable as KPMG has not provided non-audit services to the registrant’s investment adviser and any entity controlling, controlled by, or under common control with the investment adviser that provides ongoing services to the registrant that were not pre-approved pursuant to Rule 2-01(c)(7)(ii) of Regulation S-X.
Item 5 – Audit Committee of Listed Registrants – Not applicable.
Item 6 – Schedule of Investments – The schedule is included as part of the report to shareholders filed under Item 1 of this Form.
Item 7 – Disclosure of Proxy Voting Policies and Procedures for Closed-End Management Investment Companies – Not applicable.
Item 8 – Portfolio Managers of Closed-End Management Investment Companies – Not applicable.
| Item 9 – | Purchases of Equity Securities by Closed-End Management Investment Company and Affiliated Purchasers – Not applicable. |
Item 10 – Submission of Matters to a Vote of Security Holders – Not applicable.
Item 11 – Controls and Procedures
| | (a) | It is the conclusion of the registrant’s principal executive officer and principal financial officer that the effectiveness of the registrant’s current disclosure controls and procedures (such disclosure controls and procedures having been evaluated within 90 days of the date of this filing) provide reasonable assurance that the information required to be disclosed by the registrant has been recorded, processed, summarized and reported within the time period specified in the Commission’s rules and forms and that the information required to be disclosed by the registrant has been accumulated and communicated to the registrant’s principal executive officer and principal financial officer in order to allow timely decisions regarding required disclosure. |
| | (b) | There has been no significant change in the registrant’s internal control over financial reporting that occurred during the registrant’s most recent fiscal quarter of the period covered by this report that has materially affected, or is likely to materially affect, the registrant’s internal control over financial reporting. |
Item 12 – Exhibits
| | | | |
| | (a) | | (1) Code of Ethics – Attached hereto as Exhibit EX-99.CODE-ETH |
| | |
| | | | (2) Certifications pursuant to Section 302 of the Sarbanes-Oxley Act – Attached hereto as Exhibit EX-99.CERT. |
| | |
| | | | (3) Any written solicitation to purchase securities under Rule 23c-1. – Not applicable. |
| | |
| | (b) | | Certifications pursuant to Section 906 of the Sarbanes-Oxley Act – Attached hereto as Exhibit EX-99.906CERT. |
SIGNATURES
Pursuant to the requirements of the Securities Exchange Act of 1934 and the Investment Company Act of 1940, the registrant has duly caused this report to be signed on its behalf by the undersigned, thereunto duly authorized.
| | |
| Registrant: | | Prudential Jennison Natural Resources Fund, Inc. |
| |
| By: | | /s/ Deborah A. Docs |
| | Deborah A. Docs |
| | Secretary |
| |
| Date: | | December 19, 2013 |
Pursuant to the requirements of the Securities Exchange Act of 1934 and the Investment Company Act of 1940, this report has been signed below by the following persons on behalf of the registrant and in the capacities and on the dates indicated.
| | |
| By: | | /s/ Stuart S. Parker |
| | Stuart S. Parker |
| | President and Principal Executive Officer |
| |
| Date: | | December 19, 2013 |
| |
| By: | | /s/ Grace C. Torres |
| | Grace C. Torres |
| | Treasurer and Principal Financial Officer |
| |
| Date: | | December 19, 2013 |