UNITED STATES
SECURITIES AND EXCHANGE COMMISSION
WASHINGTON, D.C. 20549
FORM N-CSR
CERTIFIED SHAREHOLDER REPORT OF REGISTERED
MANAGEMENT INVESTMENT COMPANIES
Investment Company Act file number 811-5225
Oppenheimer Quest for Value Funds
(Exact name of registrant as specified in charter)
6803 South Tucson Way, Centennial, Colorado 80112-3924
(Address of principal executive offices) (Zip code)
Arthur S. Gabinet
OFI Global Asset Management, Inc.
Two World Financial Center, New York, New York 10281-1008
(Name and address of agent for service)
Registrant’s telephone number, including area code: (303) 768-3200
Date of fiscal year end: October 31
Date of reporting period: 4/30/2014
Item 1. Reports to Stockholders.
Table of Contents
Class A Shares
AVERAGE ANNUAL TOTAL RETURNS AT 4/30/14
| | | | | | | | | | | | | | | | |
| | | 6-Month | | | 1-Year | | | 5-Year | | | 10-Year | |
Class A Shares of the Fund without Sales Charge | | | 1.91% | | | | 8.84% | | | | 12.21% | | | | 3.87% | |
Class A Shares of the Fund with Sales Charge | | | -3.95 | | | | 2.58 | | | | 10.89 | | | | 3.26 | |
S&P 500 Index | | | 8.36 | | | | 20.44 | | | | 19.14 | | | | 7.67 | |
Russell 1000 Index | | | 8.25 | | | | 20.81 | | | | 19.52 | | | | 8.05 | |
MSCI All Country World Index (ex-U.S.) | | | 2.91 | | | | 9.76 | | | | 12.90 | | | | 7.61 | |
Barclays U.S. Aggregate Bond Index | | | 1.74 | | | | -0.26 | | | | 4.88 | | | | 4.83 | |
Barclays Multiverse Index (ex-U.S.) | | | 2.26 | | | | 1.89 | | | | 5.52 | | | | 5.14 | |
Reference Index | | | 4.27 | | | | 9.73 | | | | 12.16 | | | | 7.43 | |
Performance data quoted represents past performance, which does not guarantee future results. The investment return and principal value of an investment in the Fund will fluctuate so that an investor’s shares, when redeemed, may be worth more or less than their original cost. Fund returns include changes in share price, reinvested distributions, and a 5.75% maximum applicable sales charge except where “without sales charge” is indicated. Current performance may be lower or higher than the performance quoted. Returns do not consider capital gains or income taxes on an individual’s investment. Returns for periods of less than one year are cumulative and not annualized. For performance data current to the most recent month-end, visit oppenheimerfunds.com or call 1.800.CALL OPP (225.5677).
2 OPPENHEIMER GLOBAL ALLOCATION FUND
Fund Performance Discussion
The Fund’s Class A shares (without sales charge) produced a return of 1.91% during the reporting period. The Fund underperformed its Reference Index (the “Index”), a customized weighted index currently comprised of 30% of the Russell 1000 Index, 30% of the MSCI All Country World Index (ex-U.S.), 20% of the Barclays U.S. Aggregate Bond Index, and 20% of the Barclays Multiverse Index (ex-U.S.), which returned 4.27%. The largest detractor was security selection within the portfolio’s underlying investment strategies. Return shaping or hedging strategies, which are primarily used to provide a degree of downside protection in periods of extreme market volatility, also detracted from relative performance. However, like insurance, we expect these strategies to have an associated cost. This was partially offset by asset allocation decisions, which were a slight positive to relative performance.
MARKET OVERVIEW
Markets were volatile this reporting period against the backdrop of a complex market environment. Through December 2013, improvement in the U.S. labor market, consumer spending and retail sales pointed toward a slow but persistent economic recovery. Interest rates climbed higher at a measured rate as investors anticipated that a gradual unwinding of quantitative easing – the so-called tapering – would have a benign impact on interest rates and economic growth. This attitude was bolstered by the Federal Reserve’s (the “Fed’s”) decision in mid-September to delay the onset of tapering. The marketplace interpreted this as a sign that the Fed’s approach to tapering would not be aggressive. Encouraged by this perception, investors showed an aggressive appetite for risk, bidding up equity prices to new highs. Prices for fixed income securities and hard assets commonly used to hedge against a weak economy (e.g., gold) came
under pressure. Emerging market currencies pegged to the U.S. dollar lost ground as well, with emerging markets remaining under pressure due to concerns that the benefits of low developed market interest rates were largely behind them.
The Fed announced its decision to begin tapering in December, affirming its commitment to wean the U.S. economy off easy money. The move persuaded investors that after years of interest rates near all-time lows, the Fed may finally be headed down the path to interest-rate normalization. Prices for bonds and hard assets rose, while equity-market volatility increased as investors considered the potential impact of higher domestic interest rates. The high valuations of stocks, a dip in U.S. retail sales data and a slight uptick in U.S. unemployment in February also colored the market’s mood. So, too, did the less-robust pace of economic
3 OPPENHEIMER GLOBAL ALLOCATION FUND
growth in China and escalating civil unrest in Ukraine. Towards the end of the reporting period, estimates of first quarter 2014 U.S. Gross Domestic Product indicated a slowdown in growth, but the market pushed forward recognizing the difficult winter.
FUND REVIEW
With respect to asset allocation, the portfolio had a modest overweight to equity focused strategies and credit centric fixed income strategies this reporting period. In particular, we currently have a tilt to growth equities and are light on duration in comparison to the blended benchmark. The Fund currently also runs no exposure in international government debt. We are also generally underweight U.S. Treasury securities and investment-grade fixed income. Given natural impediments to Treasury bond price response from such low yields, we favor sourcing downside protection from our return shaping (hedging) strategies. We also favor income alternatives like event-linked bonds that act as an effective diversifier because of their floating rate structure and lack of correlation with traditional financial assets.
The Fund’s asset allocation positioning benefited from its lack of exposure to international (emerging and developed market) sovereign debt. In our view, despite the rise in credit spreads last summer, emerging and developed market sovereign bonds do not offer a sufficient yield cushion in the context of deteriorating trade and fiscal conditions. There may be additional currency
depreciation required to restore balance to some of these markets. Additionally, a less accommodative Fed may be positive for the U.S. dollar, leading to a headwind for foreign currency denominated bonds. This allocation decision added value as international debt markets underperformed the Index.
Some of the Fund’s asset allocation decisions detracted from relative performance. Our cash allocation, which serves to collateralize our upside hedges detracted. However, our tactical upside positioning, often implemented in our return shaping overlays, helped offset some of this (see return shaping section).
During the period, the security selection component of the Fund’s investment process detracted from relative performance. Stock selection within our domestic equity strategies detracted from relative performance. This was partially offset by the international developed market growth strategy, and emerging market equity strategy, which added positive excess returns to the Fund. The international developed market growth strategy outperformed the MSCI All Country World Index (ex-U.S.) by roughly 4.3%, and the emerging market equity strategy outperformed the MSCI Emerging Markets Index by roughly 1.8%.
We currently use derivatives to cheaply mitigate downside risk and efficiently access market upside, techniques we call “return shaping.” Because the Fund’s return shaping
4 OPPENHEIMER GLOBAL ALLOCATION FUND
strategies are designed to improve the overall risk profile of the Fund by dampening volatility, we expect them to come with a cost, like any insurance policy. Although we maintained hedges against many of our downside risk exposures in a rallying market, we financed some of the protection via upside capture strategies, which are intended to capture gains from sustained market appreciation. Our upside capture strategies benefited as equity markets rallied during the period. Specifically, our S&P 500 Index and Euro Stoxx 50 call options were accretive to returns and offset some of the downside hedging cost.
A significant portion of our downside protection strategy entailed owning and selling Chicago Board Options Exchange Market Volatility Index (the “CBOE VIX Index”) futures contracts to protect against market volatility.1 We managed this position by owning near-dated futures and selling longer-dated futures. This strategy, which provides relatively cheap downside protection, detracted from performance. Again, under normal circumstances we expect return shaping strategies to cost money and commensurately enhance returns or partially protect principal in environments of extreme market volatility.
1. The CBOE VIX Index is a measure of market expectations of
near-term volatility conveyed by S&P 500 stock index option prices.
STRATEGY & OUTLOOK
Overall, we remain cautious and are slightly overweight equities in the portfolio relative to the Reference Index, but with defensive hedges built in for downside protection and upside in case of a continued rally. Volatility within the Reference Index is very low, so the carrying cost of hedges is fairly modest. Much of this is due to measures taken by central bankers, which have significantly lifted global equity markets back at least to fair value territory. We believe current zero short-term rates will be left largely unchanged for some time given the Fed’s more dovish stance, and we will continue to see reductions in large scale asset purchases in the U.S. Given this accommodative monetary environment, contained inflation, and positive global growth, we believe equities remain somewhat attractive versus bonds although much less so than at this time last year. Among fixed-income investments, we currently favor floating rate securities and higher yielding corporate bonds, as the corporate sector globally has gone to great lengths to term out debt, improve balance sheet quality, and bolster profit margins. We are currently maintaining very limited exposure to U.S. Treasuries with a view toward eventual rate and borrowing cost increases. Any normalization in monetary policy, such as increased reduction in the pace of asset purchases, could have adverse effects on the Treasury market. At period end, we remain focused on establishing downside protection via derivative strategies, which we have been
5 OPPENHEIMER GLOBAL ALLOCATION FUND
able to purchase at lower costs due to low volatility.
At the end of the day, reduced Fed “intervention” is inevitable. In this environment, we expect correlation among assets to continue to decline as investors focus more on company fundamentals rather than macro events. This may enhance the opportunity for our security selection teams to add value. At the same time, less Fed activity
| | |
 | | 
Mark Hamilton Portfolio Manager |
in terms of providing market support only enhances the importance of seeking cost-efficient hedges in the event of a downturn. Finally, it is worth noting that most asset classes have returned to at least normal valuation levels as investors gradually returned to the market. Of course, this implies fewer opportunities, but that is one of the advantages of the Fund’s wide ranging mandate.
| | |
 | | 
Benjamin Rockmuller, CFA Portfolio Manager |
6 OPPENHEIMER GLOBAL ALLOCATION FUND
Top Holdings and Allocations
TOP TEN COMMON STOCK HOLDINGS
| | | | |
Walt Disney Co. (The) | | | 1.0 | % |
Apple, Inc. | | | 0.9 | |
Telefonaktiebolaget LM Ericsson, Cl. B | | | 0.8 | |
SAP AG | | | 0.7 | |
LVMH Moet Hennessy Louis Vuitton SA | | | 0.7 | |
Citigroup, Inc. | | | 0.6 | |
UBS AG | | | 0.6 | |
Microsoft Corp. | | | 0.6 | |
Prudential plc | | | 0.6 | |
Gilead Sciences, Inc. | | | 0.6 | |
Portfolio holdings and allocations are subject to change. Percentages are as of April 30, 2014, and are based on net assets. For more current Fund holdings, please visit oppenheimerfunds.com.
TOP TEN COMMON STOCK INDUSTRIES
| | | | |
Pharmaceuticals | | | 3.8 | % |
Internet Software & Services | | | 3.7 | |
Commercial Banks | | | 3.6 | |
Software | | | 3.6 | |
Oil, Gas & Consumable Fuels | | | 3.0 | |
Capital Markets | | | 2.8 | |
Media | | | 2.6 | |
Biotechnology | | | 2.5 | |
Insurance | | | 2.5 | |
Textiles, Apparel & Luxury Goods | | | 2.5 | |
Portfolio holdings and allocations are subject to change. Percentages are as of April 30, 2014, and are based on net assets.
PORTFOLIO ALLOCATION
| | | | |
Common Stocks | | | 72.0 | % |
Investment Companies Oppenheimer Master Loan Fund, LLC | | | 10.2 | |
Oppenheimer Master Event-Linked Bond Fund, LLC | | | 7.5 | |
Oppenheimer Institutional Money Market Fund | | | 1.0 | |
Non-Convertible Corporate Bonds and Notes | | | 7.5 | |
Corporate Loans | | | 1.0 | |
Exchange-Traded Options Purchased | | | 0.6 | |
Preferred Stocks | | | 0.1 | |
Over-the-Counter Options Purchased | | | 0.1 | |
Rights, Warrants and Certificates | | | — | * |
* Represents a value of less than 0.005%.
Portfolio holdings and allocations are subject to change. Percentages are as of April 30, 2014, and are based on the total market value of investments.
7 OPPENHEIMER GLOBAL ALLOCATION FUND
TOP TEN GEOGRAPHICAL HOLDINGS
| | | | |
United States | | | 64.7 | % |
United Kingdom | | | 4.6 | |
Germany | | | 3.5 | |
Switzerland | | | 3.4 | |
France | | | 3.3 | |
Japan | | | 2.8 | |
Brazil | | | 2.0 | |
India | | | 1.7 | |
Netherlands | | | 1.6 | |
Spain | | | 1.5 | |
Portfolio holdings and allocation are subject to change. Percentages are as of April 30, 2014, and are based on total market value of investments.
REGIONAL ALLOCATION
| | | | |
U.S./Canada | | | 65.8 | % |
Europe | | | 21.9 | |
Asia | | | 7.4 | |
Latin America | | | 3.4 | |
Emerging Europe | | | 0.8 | |
Middle East/Africa | | | 0.7 | |
Portfolio holdings and allocations are subject to change. Percentages are as of April 30, 2014, and are based on the total market value of investments.
8 OPPENHEIMER GLOBAL ALLOCATION FUND
Share Class Performance
AVERAGE ANNUAL TOTAL RETURNS WITHOUT SALES CHARGE AS OF 4/30/14
| | | | | | | | | | | | | | | | | | | | |
| | | Inception Date | | | 6-Month | | | 1-Year | | | 5-Year | | | 10-Year | |
Class A (QVGIX) | | | 11/1/91 | | | | 1.91% | | | | 8.84% | | | | 12.21% | | | | 3.87% | |
Class B (QGRBX) | | | 9/1/93 | | | | 1.50% | | | | 7.90% | | | | 11.27% | | | | 3.40% | |
Class C (QGRCX) | | | 9/1/93 | | | | 1.54% | | | | 8.08% | | | | 11.41% | | | | 3.13% | |
Class I (QGRIX) | | | 2/28/12 | | | | 2.09% | | | | 9.31% | | | | 9.00% * | | | | N/A | |
Class N (QGRNX) | | | 3/1/01 | | | | 1.71% | | | | 8.54% | | | | 11.93% | | | | 3.60% | |
Class Y (QGRYX) | | | 5/1/00 | | | | 2.02% | | | | 9.23% | | | | 12.62% | | | | 4.24% | |
AVERAGE ANNUAL TOTAL RETURNS WITH SALES CHARGE AS OF 4/30/14
| | | | | | | | | | | | | | | | | | | | |
| | | Inception Date | | | 6-Month | | | 1-Year | | | 5-Year | | | 10-Year | |
| Class A (QVGIX) | | | 11/1/91 | | | | -3.95% | | | | 2.58% | | | | 10.89% | | | | 3.26% | |
| Class B (QGRBX) | | | 9/1/93 | | | | -3.50% | | | | 2.90% | | | | 11.00% | | | | 3.40% | |
| Class C (QGRCX) | | | 9/1/93 | | | | 0.54% | | | | 7.08% | | | | 11.41% | | | | 3.13% | |
| Class I (QGRIX) | | | 2/28/12 | | | | 2.09% | | | | 9.31% | | | | 9.00% * | | | | N/A | |
| Class N (QGRNX) | | | 3/1/01 | | | | 0.71% | | | | 7.54% | | | | 11.93% | | | | 3.60% | |
| Class Y (QGRYX) | | | 5/1/00 | | | | 2.02% | | | | 9.23% | | | | 12.62% | | | | 4.24% | |
* Shows performance since inception.
Performance data quoted represents past performance, which does not guarantee future results. The investment return and principal value of an investment in the Fund will fluctuate so that an investor’s shares, when redeemed, may be worth more or less than their original cost. Current performance may be lower or higher than the performance quoted. Returns do not consider capital gains or income taxes on an individual’s investment. For performance data current to the most recent month-end, visit oppenheimerfunds.com or call 1.800.CALL OPP (225.5677). Fund returns include changes in share price, reinvested distributions, and the applicable sales charge: for Class A shares, the current maximum initial sales charge of 5.75%; for Class B shares, the contingent deferred sales charge of 5% (1-year) and 2% (5-year); and for Class C and N shares, the contingent deferred sales charge of 1% for the 1-year period. There is no sales charge for Class I and Y shares. Because Class B shares convert to Class A shares 72 months after purchase, the 10-year return for Class B shares uses Class A performance for the period after conversion. Returns for periods of less than one year are cumulative and not annualized.
The Fund’s performance is compared to the performance of the S&P 500 Index, the Russell 1000 Index, the MSCI All Country World Index (ex-U.S.), the Barclays U.S. Aggregate Bond Index, the Barclays Multiverse Index (ex-U.S.) and the Fund’s Reference Index. The S&P 500 Index is a capitalization-weighted index of 500 stocks intended to be a representative sample of leading companies in leading industries within the U.S. economy. The Russell 1000 Index
9 OPPENHEIMER GLOBAL ALLOCATION FUND
measures the performance of the large-cap segment of the U.S. equity universe. The MSCI All Country World Index (ex U.S.) is designed to measure global developed and emerging equity market performance excluding the United States. The Barclays U.S. Aggregate Bond Index is an index of U.S dollar-denominated, investment-grade U.S. corporate government and mortgage-backed securities. The Barclays Multiverse Index (ex-U.S.) provides a broad-based measure of the global fixed-income bond market. The Fund’s Reference Index is a customized weighted index currently comprised of 30% of the Russell 1000 Index, 30% of the MSCI All Country World Index (ex-U.S.), 20% of the Barclays U.S. Aggregate Bond Index, and 20% of the Barclays Multiverse Index (ex-U.S.). The Indices are unmanaged and cannot be purchased directly by investors. While index comparisons may be useful to provide a benchmark for the Fund’s performance, it must be noted that the Fund’s investments are not limited to the investments comprising the Index. Index performance includes reinvestment of income, but does not reflect transaction costs, fees, expenses or taxes. Index performance is shown for illustrative purposes only as a benchmark for the Fund’s performance, and does not predict or depict performance of the Fund. The Fund’s performance reflects the effects of the Fund’s business and operating expenses.
The Fund’s investment strategy and focus can change over time. The mention of specific fund holdings does not constitute a recommendation by OppenheimerFunds, Inc. or its affiliates.
Before investing in any of the Oppenheimer funds, investors should carefully consider a fund’s investment objectives, risks, charges and expenses. Fund prospectuses and summary prospectuses contain this and other information about the funds, and may be obtained by asking your financial advisor, visiting oppenheimerfunds.com, or calling 1.800.CALL OPP (225.5677). Read prospectuses and summary prospectuses carefully before investing.
Shares of Oppenheimer funds are not deposits or obligations of any bank, are not guaranteed by any bank, are not insured by the FDIC or any other agency, and involve investment risks, including the possible loss of the principal amount invested.
10 OPPENHEIMER GLOBAL ALLOCATION FUND
Fund Expenses
Fund Expenses. As a shareholder of the Fund, you incur two types of costs: (1) transaction costs, which may include sales charges (loads) on purchase payments, contingent deferred sales charges on redemptions; and (2) ongoing costs, including management fees; distribution and service fees; and other Fund expenses. These examples are intended to help you understand your ongoing costs (in dollars) of investing in the Fund and to compare these costs with the ongoing costs of investing in other mutual funds.
The examples are based on an investment of $1,000.00 invested at the beginning of the period and held for the entire
6-month period ended April 30, 2014.
Actual Expenses. The first section of the table provides information about actual account values and actual expenses. You may use the information in this section for the class of shares you hold, together with the amount you invested, to estimate the expense that you paid over the period. Simply divide your account value by $1,000.00 (for example, an $8,600.00 account value divided by $1,000.00 = 8.60), then multiply the result by the number in the first section under the heading entitled “Expenses Paid During Period” to estimate the expenses you paid on your account during this period.
Hypothetical Example for Comparison Purposes. The second section of the table provides information about hypothetical account values and hypothetical expenses based on the Fund’s actual expense ratio for each class of shares, and an assumed rate of return of 5% per year for each class before expenses, which is not the actual return. The hypothetical account values and expenses may not be used to estimate the actual ending account balance or expenses you paid for the period. You may use this information to compare the ongoing costs of investing in the Fund and other funds. To do so, compare this 5% hypothetical example for the class of shares you hold with the 5% hypothetical examples that appear in the shareholder reports of the other funds.
Please note that the expenses shown in the table are meant to highlight your ongoing costs only and do not reflect any transactional costs, such as front-end or contingent deferred sales charges (loads). Therefore, the “hypothetical” section of the table is useful in comparing ongoing costs only, and will not help you determine the relative total costs of owning different funds. In addition, if these transactional costs were included, your costs would have been higher.
11 OPPENHEIMER GLOBAL ALLOCATION FUND
| | | | | | | | | | | | | | |
| Actual | | Beginning
Account Value
November 1, 2013 | | | Ending Account Value
April 30, 2014 | | | Expenses
Paid During
6 Months Ended
April 30, 2014 | | | |
Class A | | $ | 1,000.00 | | | $ | 1,019.10 | | | $ | 6.53 | | | |
Class B | | | 1,000.00 | | | | 1,015.00 | | | | 10.55 | | | |
Class C | | | 1,000.00 | | | | 1,015.40 | | | | 10.19 | | | |
Class I | | | 1,000.00 | | | | 1,020.90 | | | | 4.22 | | | |
Class N | | | 1,000.00 | | | | 1,017.10 | | | | 7.78 | | | |
Class Y | | | 1,000.00 | | | | 1,020.20 | | | | 4.92 | | | |
| | | | |
Hypothetical (5% return before expenses) | | | | | | | | | | | | | | |
Class A | | | 1,000.00 | | | | 1,018.35 | | | | 6.53 | | | |
Class B | | | 1,000.00 | | | | 1,014.38 | | | | 10.54 | | | |
Class C | | | 1,000.00 | | | | 1,014.73 | | | | 10.19 | | | |
Class I | | | 1,000.00 | | | | 1,020.63 | | | | 4.22 | | | |
Class N | | | 1,000.00 | | | | 1,017.11 | | | | 7.78 | | | |
Class Y | | | 1,000.00 | | | | 1,019.93 | | | | 4.92 | | | |
Expenses are equal to the Fund’s annualized expense ratio for that class, multiplied by the average account value over the period, multiplied by 181/365 (to reflect the one-half year period). Those annualized expense ratios, excluding indirect expenses from affiliated funds, based on the 6-month period ended April 30, 2014 are as follows:
| | | | | | |
| Class | | Expense Ratios | | | |
Class A | | | 1.30 | % | | |
Class B | | | 2.10 | | | |
Class C | | | 2.03 | | | |
Class I | | | 0.84 | | | |
Class N | | | 1.55 | | | |
Class Y | | | 0.98 | | | |
The expense ratios reflect voluntary and/or contractual waivers and/or reimbursements of expenses by the Fund’s Manager and Transfer Agent. Some of these undertakings may be modified or terminated at any time, as indicated in the Fund’s prospectus. The “Consolidated Financial Highlights” tables in the Fund’s consolidated financial statements, included in this report, also show the gross expense ratios, without such waivers or reimbursements and reduction to custodian expenses, if applicable.
12 OPPENHEIMER GLOBAL ALLOCATION FUND
| | |
| |
CONSOLIDATED STATEMENTOF INVESTMENTS April 30, 2014 Unaudited | | |
| | | | | | | | |
| | | Shares | | | Value | |
| |
Common Stocks—70.8% | |
| |
Consumer Discretionary—10.6% | |
| |
Auto Components—0.4% | |
| |
Delphi Automotive plc | | | 27,320 | | | $ | 1,826,069 | |
| |
Dorman Products, Inc.1 | | | 18,320 | | | | 1,054,316 | |
| |
Gentherm, Inc.1 | | | 19,970 | | | | 725,909 | |
| |
Johnson Controls, Inc. | | | 46,260 | | | | 2,088,176 | |
| |
Magna International, Inc. | | | 7,650 | | | | 749,624 | |
| | | | | | | | |
| | | | | | | 6,444,094 | |
|
| |
Automobiles—0.8% | | | | | | | | |
| |
Astra International Tbk PT | | | 3,276,500 | | | | 2,105,245 | |
| |
Bayerische Motoren Werke (BMW) AG | | | 14,193 | | | | 1,777,146 | |
| |
Bayerische Motoren Werke (BMW) AG, Preference | | | 88,159 | | | | 8,682,242 | |
| |
Daimler AG, Sponsored ADR | | | 14,710 | | | | 1,361,337 | |
| | | | | | | | |
| | | | | | | 13,925,970 | |
|
| |
Diversified Consumer Services—0.5% | | | | | | | | |
| |
Apollo Education Group, Inc.1 | | | 30,990 | | | | 894,371 | |
| |
Benesse Holdings, Inc. | | | 31,200 | | | | 1,185,591 | |
| |
Dignity plc | | | 63,038 | | | | 1,525,349 | |
| |
Estacio Participacoes SA | | | 166,800 | | | | 1,786,381 | |
| |
Grand Canyon Education, Inc.1 | | | 12,980 | | | | 559,698 | |
| |
Kroton Educacional SA | | | 42,759 | | | | 915,874 | |
| |
LifeLock, Inc.1 | | | 42,370 | | | | 665,209 | |
| |
New Oriental Education & Technology Group, Inc., Sponsored ADR | | | 55,910 | | | | 1,353,022 | |
| | | | | | | | |
| | | | | | | 8,885,495 | |
|
| |
Hotels, Restaurants & Leisure—1.5% | | | | | | | | |
| |
Buffalo Wild Wings, Inc.1 | | | 15,470 | | | | 2,260,476 | |
| |
Carnival Corp. | | | 54,870 | | | | 2,156,940 | |
| |
Chipotle Mexican Grill, Inc.1 | | | 2,250 | | | | 1,121,625 | |
| |
Chuy’s Holdings, Inc.1 | | | 25,090 | | | | 901,985 | |
| |
Domino’s Pizza Group plc | | | 180,150 | | | | 1,565,400 | |
| |
Fiesta Restaurant Group, Inc.1 | | | 30,070 | | | | 1,100,863 | |
| |
Genting Bhd | | | 520,000 | | | | 1,560,830 | |
| |
Gtech Spa | | | 46,753 | | | | 1,373,360 | |
| |
Home Inns & Hotels Management, Inc., ADR1 | | | 19,680 | | | | 559,306 | |
| |
Jollibee Foods Corp. | | | 243,130 | | | | 938,232 | |
| |
McDonald’s Corp. | | | 43,730 | | | | 4,433,347 | |
| |
MGM Resorts International1 | | | 56,750 | | | | 1,431,803 | |
| |
Red Robin Gourmet Burgers, Inc.1 | | | 19,790 | | | | 1,345,324 | |
| |
Revel Entertainment, Inc.1 | | | 5,092 | | | | — | |
| |
Royal Caribbean Cruises Ltd. | | | 30,460 | | | | 1,618,340 | |
| |
William Hill plc | | | 334,469 | | | | 2,007,838 | |
| |
Wynn Resorts Ltd. | | | 8,990 | | | | 1,832,971 | |
| | | | | | | | |
| | | | | | | 26,208,640 | |
|
| |
Household Durables—0.4% | | | | | | | | |
| |
Cyrela Brazil Realty SA Empreendimentos e Participacoes | | | 67,400 | | | | 408,677 | |
| |
Harman International Industries, Inc. | | | 30,190 | | | | 3,309,126 | |
| |
La-Z-Boy, Inc. | | | 32,460 | | | | 786,506 | |
| |
Newell Rubbermaid, Inc. | | | 29,890 | | | | 899,988 | |
13 OPPENHEIMER GLOBAL ALLOCATION FUND
| | |
| |
CONSOLIDATED STATEMENTOF INVESTMENTS Unaudited / Continued | | |
| | | | | | | | |
| | | Shares | | | Value | |
| |
Household Durables (Continued) | |
| |
SEB SA | | | 18,250 | | | $ | 1,688,282 | |
| | | | | | | | |
| | | | 7,092,579 | |
|
| |
Internet & Catalog Retail—0.4% | | | | | | | | |
| |
Amazon.com, Inc.1 | | | 2,426 | | | | 737,819 | |
| |
B2W Cia Digital1 | | | 31,117 | | | | 345,814 | |
| |
Coupons.com, Inc.1 | | | 5,140 | | | | 86,455 | |
| |
Ctrip.com International Ltd., ADR1 | | | 40,720 | | | | 1,903,253 | |
| |
Priceline.com, Inc. (The)1 | | | 490 | | | | 567,298 | |
| |
RetailMeNot, Inc.1 | | | 18,090 | | | | 539,263 | |
| |
TripAdvisor, Inc.1 | | | 14,100 | | | | 1,138,434 | |
| |
Yoox SpA1 | | | 47,773 | | | | 1,720,979 | |
| |
zulily, Inc., Cl. A1 | | | 6,710 | | | | 285,309 | |
| | | | | | | | |
| | | | 7,324,624 | |
|
| |
Media—2.6% | | | | | | | | |
| |
British Sky Broadcasting Group plc | | | 115,802 | | | | 1,723,865 | |
| |
Cinemark Holdings, Inc. | | | 25,850 | | | | 765,677 | |
| |
Comcast Corp., Cl. A | | | 25,470 | | | | 1,318,327 | |
| |
Grupo Televisa SAB, Sponsored ADR | | | 174,873 | | | | 5,737,583 | |
| |
Liberty Global plc, Cl. A1 | | | 6,979 | | | | 277,904 | |
| |
Liberty Global plc, Series C1 | | | 17,401 | | | | 668,721 | |
| |
Lions Gate Entertainment Corp. | | | 35,910 | | | | 952,692 | |
| |
MDC Partners, Inc., Cl. A | | | 45,160 | | | | 1,102,807 | |
| |
Naspers Ltd., Cl. N | | | 3,822 | | | | 361,838 | |
| |
SES SA | | | 56,200 | | | | 2,117,137 | |
| |
Time Warner, Inc. | | | 34,030 | | | | 2,261,634 | |
| |
Twenty-First Century Fox, Inc., Cl. A2 | | | 57,350 | | | | 1,836,347 | |
| |
Twenty-First Century Fox, Inc., Cl. B | | | 69,520 | | | | 2,177,366 | |
| |
Viacom, Inc., Cl. B | | | 21,610 | | | | 1,836,418 | |
| |
Walt Disney Co. (The) | | | 220,206 | | | | 17,471,144 | |
| |
World Wrestling Entertainment, Inc., Cl. A | | | 21,560 | | | | 420,420 | |
| |
Zee Entertainment Enterprises Ltd. | | | 976,856 | | | | 4,251,772 | |
| | | | | | | | |
| | | | 45,281,652 | |
|
| |
Multiline Retail—0.2% | | | | | | | | |
| |
Dollarama, Inc. | | | 22,545 | | | | 1,875,099 | |
| |
Lojas Americanas SA, Preference | | | 244,490 | | | | 1,851,973 | |
| |
Shinsegae Co. Ltd. | | | 3,481 | | | | 754,460 | |
| | | | | | | | |
| | | | 4,481,532 | |
|
| |
Specialty Retail—1.3% | | | | | | | | |
| |
Gap, Inc. (The) | | | 20,420 | | | | 802,506 | |
| |
Home Depot, Inc. (The) | | | 20,490 | | | | 1,629,160 | |
| |
Industria de Diseno Textil SA (Inditex) | | | 62,630 | | | | 9,420,138 | |
| |
Lithia Motors, Inc., Cl. A | | | 14,130 | | | | 1,049,576 | |
| |
Lowe’s Cos., Inc. | | | 14,530 | | | | 667,072 | |
| |
Tiffany & Co. | | | 103,503 | | | | 9,055,478 | |
| |
TJX Cos., Inc. (The) | | | 21,426 | | | | 1,246,565 | |
| | | | | | | | |
| | | | 23,870,495 | |
14 OPPENHEIMER GLOBAL ALLOCATION FUND
| | | | | | | | |
| | | Shares | | | Value | |
| |
Textiles, Apparel & Luxury Goods—2.5% | |
| |
Brunello Cucinelli SpA | | | 11,590 | | | $ | 334,259 | |
| |
Burberry Group plc | | | 77,567 | | | | 1,950,778 | |
| |
Cie Financiere Richemont SA | | | 35,021 | | | | 3,565,901 | |
| |
G-III Apparel Group Ltd.1 | | | 9,770 | | | | 701,193 | |
| |
Kering | | | 40,230 | | | | 8,906,046 | |
| |
lululemon athletica, Inc.1 | | | 44,630 | | | | 2,049,856 | |
| |
Luxottica Group SpA | | | 17,827 | | | | 1,024,303 | |
| |
LVMH Moet Hennessy Louis Vuitton SA | | | 59,220 | | | | 11,656,990 | |
| |
Nike, Inc., Cl. B | | | 32,572 | | | | 2,376,127 | |
| |
Prada SpA | | | 517,800 | | | | 4,149,057 | |
| |
Salvatore Ferragamo SpA | | | 6,405 | | | | 203,509 | |
| |
Swatch Group AG (The) | | | 2,663 | | | | 1,714,509 | |
| |
Tod’s SpA | | | 23,344 | | | | 3,280,250 | |
| |
VF Corp. | | | 24,380 | | | | 1,489,374 | |
| | | | | | | | |
| | | | 43,402,152 | |
|
| |
Consumer Staples—5.9% | | | | | | | | |
| |
Beverages—2.0% | | | | | | | | |
| |
AMBEV SA, ADR | | | 483,000 | | | | 3,501,750 | |
| |
Anadolu Efes Biracilik Ve Malt Sanayii AS | | | 73,650 | | | | 881,067 | |
| |
Boston Beer Co., Inc. (The), Cl. A1 | | | 1,490 | | | | 366,600 | |
| |
Brown-Forman Corp., Cl. B | | | 47,670 | | | | 4,276,952 | |
| |
C&C Group plc | | | 18,520 | | | | 110,284 | |
| |
Carlsberg AS, Cl. B | | | 28,446 | | | | 2,851,755 | |
| |
Coca-Cola Enterprises, Inc. | | | 65,100 | | | | 2,958,144 | |
| |
Diageo plc | | | 99,865 | | | | 3,061,778 | |
| |
Fomento Economico Mexicano SAB de CV, Sponsored ADR | | | 43,546 | | | | 3,952,670 | |
| |
Fomento Economico Mexicano SAB de CV, UBD | | | 200,050 | | | | 1,817,504 | |
| |
Heineken NV | | | 32,962 | | | | 2,288,001 | |
| |
Nigerian Breweries plc | | | 611,085 | | | | 570,574 | |
| |
PepsiCo, Inc. | | | 19,360 | | | | 1,662,830 | |
| |
Pernod-Ricard SA | | | 30,940 | | | | 3,714,923 | |
| |
SABMiller plc | | | 41,520 | | | | 2,265,102 | |
| |
Tsingtao Brewery Co. Ltd., Cl. H | | | 70,000 | | | | 508,484 | |
| | | | | | | | |
| | | | 34,788,418 | |
|
| |
Food & Staples Retailing—1.0% | | | | | | | | |
| |
Almacenes Exito SA | | | 43,892 | | | | 668,610 | |
| |
Almacenes Exito SA, GDR3 | | | 57,600 | | | | 868,107 | |
| |
BIM Birlesik Magazalar AS | | | 31,202 | | | | 720,596 | |
| |
Cencosud SA | | | 420,359 | | | | 1,400,564 | |
| |
Costco Wholesale Corp. | | | 13,685 | | | | 1,583,081 | |
| |
CP ALL PCL | | | 2,240,300 | | | | 2,911,289 | |
| |
CVS Caremark Corp. | | | 71,510 | | | | 5,200,207 | |
| |
InRetail Peru Corp.1,3 | | | 18,800 | | | | 282,367 | |
| |
Magnit | | | 12,756 | | | | 2,536,054 | |
| |
Walgreen Co. | | | 27,600 | | | | 1,874,040 | |
| |
Whole Foods Market, Inc. | | | 6,800 | | | | 337,960 | |
| | | | | | | | |
| | | | 18,382,875 | |
|
| |
Food Products—1.8% | | | | | | | | |
| |
Aryzta AG1 | | | 34,114 | | | | 3,150,906 | |
15 OPPENHEIMER GLOBAL ALLOCATION FUND
| | |
| |
CONSOLIDATED STATEMENTOF INVESTMENTS Unaudited / Continued | | |
| | | | | | | | |
| | | Shares | | | Value | |
| |
Food Products (Continued) | | | | | | | | |
| |
Barry Callebaut AG1 | | | 1,636 | | | $ | 2,224,384 | |
| |
Boulder Brands, Inc.1 | | | 66,950 | | | | 988,182 | |
| |
ConAgra Foods, Inc. | | | 35,840 | | | | 1,093,478 | |
| |
DANONE SA | | | 21,470 | | | | 1,586,612 | |
| |
Hershey Co. (The) | | | 29,360 | | | | 2,825,606 | |
| |
J&J Snack Foods Corp. | | | 7,222 | | | | 675,979 | |
| |
Kraft Foods Group, Inc. | | | 26,480 | | | | 1,505,653 | |
| |
Nestle SA | | | 64,291 | | | | 4,971,984 | |
| |
Tingyi Cayman Islands Holding Corp. | | | 738,000 | | | | 2,048,952 | |
| |
Ulker Biskuvi Sanayi AS | | | 47,551 | | | | 363,192 | |
| |
Unilever plc | | | 211,574 | | | | 9,473,622 | |
| |
Want Want China Holdings Ltd. | | | 1,220,000 | �� | | | 1,907,538 | |
| | | | | | | | |
| | | | | | | 32,816,088 | |
|
| |
Household Products—0.7% | | | | | | | | |
| |
Colgate-Palmolive Co. | | | 121,810 | | | | 8,197,813 | |
| |
Hindustan Unilever Ltd. | | | 26,093 | | | | 246,497 | |
| |
Reckitt Benckiser Group plc | | | 22,037 | | | | 1,781,858 | |
| |
Reckitt Benckiser Group plc, Sponsored ADR | | | 79,660 | | | | 1,302,441 | |
| |
Unilever Indonesia Tbk PT | | | 121,000 | | | | 307,176 | |
| | | | | | | | |
| | | | | | | 11,835,785 | |
|
| |
Personal Products—0.2% | | | | | | | | |
| |
Colgate-Palmolive India Ltd. | | | 34,752 | | | | 831,517 | |
| |
L’Oreal SA | | | 2,760 | | | | 475,105 | |
| |
Marico Ltd. | | | 120,272 | | | | 411,293 | |
| |
Natura Cosmeticos SA | | | 89,500 | | | | 1,532,910 | |
| | | | | | | | |
| | | | | | | 3,250,825 | |
|
| |
Tobacco—0.2% | | | | | | | | |
| |
Lorillard, Inc. | | | 32,740 | | | | 1,945,411 | |
| |
Swedish Match AB1 | | | 32,061 | | | | 1,101,398 | |
| | | | | | | | |
| | | | | | | 3,046,809 | |
|
| |
Energy—4.6% | | | | | | | | |
| |
Energy Equipment & Services—1.6% | | | | | | | | |
| |
C&J Energy Services, Inc.1 | | | 37,800 | | | | 1,136,268 | |
| |
China Oilfield Services Ltd., Cl. H | | | 246,000 | | | | 585,272 | |
| |
Dril-Quip, Inc.1 | | | 7,190 | | | | 813,333 | |
| |
Eurasia Drilling Co. Ltd., GDR | | | 18,190 | | | | 448,075 | |
| |
Halliburton Co. | | | 41,670 | | | | 2,628,127 | |
| |
Hunting plc | | | 14,380 | | | | 206,144 | |
| |
Matrix Service Co.1 | | | 12,650 | | | | 391,770 | |
| |
National Oilwell Varco, Inc. | | | 19,630 | | | | 1,541,544 | |
| |
Oceaneering International, Inc. | | | 9,050 | | | | 663,184 | |
| |
Saipem SpA | | | 53,447 | | | | 1,433,772 | |
| |
Schlumberger Ltd. | | | 32,448 | | | | 3,295,094 | |
| |
Schoeller-Bleckmann Oilfield Equipment AG | | | 11,677 | | | | 1,487,926 | |
| |
Technip SA | | | 83,850 | | | | 9,444,920 | |
| |
Tenaris SA, ADR | | | 47,420 | | | | 2,088,851 | |
16 OPPENHEIMER GLOBAL ALLOCATION FUND
| | | | | | | | |
| | | Shares | | | Value | |
| |
Energy Equipment & Services (Continued) | |
| |
Transocean Ltd. | | | 67,270 | | | $ | 2,897,319 | |
| | | | | | | | |
| | | | 29,061,599 | |
|
| |
Oil, Gas & Consumable Fuels—3.0% | | | | | | | | |
| |
Anadarko Petroleum Corp. | | | 26,300 | | | | 2,604,226 | |
| |
Antero Resources Corp.1 | | | 9,970 | | | | 654,730 | |
| |
Athlon Energy, Inc.1 | | | 29,120 | | | | 1,176,739 | |
| |
BP plc, Sponsored ADR | | | 43,780 | | | | 2,216,144 | |
| |
Cabot Oil & Gas Corp. | | | 18,280 | | | | 718,038 | |
| |
Chevron Corp. | | | 13,222 | | | | 1,659,625 | |
| |
Cimarex Energy Co. | | | 5,140 | | | | 612,277 | |
| |
CNOOC Ltd. | | | 742,000 | | | | 1,220,047 | |
| |
ConocoPhillips | | | 39,990 | | | | 2,971,657 | |
| |
Diamondback Energy, Inc.1 | | | 25,260 | | | | 1,817,204 | |
| |
Enbridge, Inc. | | | 42,880 | | | | 2,070,675 | |
| |
EOG Resources, Inc. | | | 49,030 | | | | 4,804,940 | |
| |
Gazprom OAO, Sponsored ADR | | | 139,110 | | | | 1,009,364 | |
| |
Genel Energy plc1 | | | 34,960 | | | | 572,770 | |
| |
Koninklijke Vopak NV | | | 27,644 | | | | 1,379,096 | |
| |
Matador Resources Co.1 | | | 27,410 | | | | 787,215 | |
| |
Noble Energy, Inc. | | | 25,520 | | | | 1,831,826 | |
| |
NovaTek OAO, Sponsored GDR | | | 28,000 | | | | 2,913,659 | |
| |
Oasis Petroleum, Inc.1 | | | 16,810 | | | | 781,833 | |
| |
Occidental Petroleum Corp. | | | 45,500 | | | | 4,356,625 | |
| |
Petroleo Brasileiro SA, Cl. A, Sponsored ADR | | | 197,400 | | | | 2,921,520 | |
| |
Phillips 66 | | | 19,620 | | | | 1,632,776 | |
| |
Pioneer Natural Resources Co. | | | 4,900 | | | | 947,023 | |
| |
Repsol SA | | | 118,829 | | | | 3,207,317 | |
| |
Suncor Energy, Inc. | | | 129,590 | | | | 5,002,174 | |
| |
Tullow Oil plc | | | 155,430 | | | | 2,315,249 | |
| | | | | | | | |
| | | | 52,184,749 | |
|
| |
Financials—11.3% | | | | | | | | |
| |
Capital Markets—2.8% | | | | | | | | |
| |
Ameriprise Financial, Inc. | | | 25,650 | | | | 2,863,309 | |
| |
Artisan Partners Asset Management, Inc., Cl. A | | | 16,450 | | | | 955,251 | |
| |
BinckBank NV | | | 5,683 | | | | 64,267 | |
| |
Charles Schwab Corp. (The) | | | 149,600 | | | | 3,971,880 | |
| |
Credit Suisse Group AG1 | | | 138,271 | | | | 4,383,831 | |
| |
Deutsche Bank AG | | | 138,920 | | | | 6,123,770 | |
| |
Evercore Partners, Inc., Cl. A | | | 20,860 | | | | 1,114,550 | |
| |
Financial Engines, Inc. | | | 15,310 | | | | 677,467 | |
| |
Goldman Sachs Group, Inc. (The) | | | 51,810 | | | | 8,280,274 | |
| |
ICAP plc | | | 347,263 | | | | 2,433,832 | |
| |
Invesco Ltd. | | | 80,750 | | | | 2,843,208 | |
| |
Morgan Stanley | | | 105,720 | | | | 3,269,920 | |
| |
Northern Trust Corp. | | | 20,670 | | | | 1,245,368 | |
| |
Tullett Prebon plc | | | 157,630 | | | | 847,653 | |
| |
UBS AG1 | | | 523,314 | | | | 10,952,834 | |
| | | | | | | | |
| | | | 50,027,414 | |
17 OPPENHEIMER GLOBAL ALLOCATION FUND
| | |
| |
CONSOLIDATED STATEMENTOF INVESTMENTS Unaudited / Continued | | |
| | | | | | | | |
| | | Shares | | | Value | |
| |
Commercial Banks—3.6% | |
| |
Banco Bilbao Vizcaya Argentaria SA | | | 482,549 | | | $ | 5,942,516 | |
| |
Banco Bradesco SA, ADR | | | 75,760 | | | | 1,126,551 | |
| |
Banco Davivienda SA, Preference | | | 55,678 | | | | 792,946 | |
| |
Bancolombia SA, Preference | | | 7,619 | | | | 107,799 | |
| |
Bancolombia SA, Sponsored ADR | | | 12,490 | | | | 711,056 | |
| |
Bank of America Corp. | | | 73,850 | | | | 1,118,089 | |
| |
Bank of the Ozarks, Inc. | | | 16,330 | | | | 978,167 | |
| |
CIT Group, Inc. | | | 28,820 | | | | 1,240,701 | |
| |
Citigroup, Inc. | | | 232,230 | | | | 11,126,139 | |
| |
Commercial International Bank Egypt SAE | | | 136,564 | | | | 726,082 | |
| |
First Financial Holdings, Inc. | | | 11,370 | | | | 653,434 | |
| |
Grupo Financiero Banorte SAB de CV, Cl. O | | | 143,999 | | | | 956,379 | |
| |
Grupo Financiero Inbursa SAB de CV, Cl. O | | | 313,127 | | | | 802,040 | |
| |
Guaranty Trust Bank plc | | | 2,866,834 | | | | 467,902 | |
| |
Home BancShares, Inc. | | | 20,800 | | | | 659,568 | |
| |
ICICI Bank Ltd., Sponsored ADR | | | 195,470 | | | | 8,340,705 | |
| |
Itau Unibanco Holding SA, Preference, ADR | | | 253,774 | | | | 4,151,743 | |
| |
JPMorgan Chase & Co. | | | 47,172 | | | | 2,640,688 | |
| |
KeyCorp | | | 73,150 | | | | 997,766 | |
| |
PNC Financial Services Group, Inc. | | | 22,220 | | | | 1,867,369 | |
| |
Signature Bank1 | | | 19,110 | | | | 2,270,650 | |
| |
Societe Generale SA | | | 57,940 | | | | 3,607,888 | |
| |
Square 1 Financial, Inc., Cl. A1 | | | 3,340 | | | | 62,959 | |
| |
Sumitomo Mitsui Financial Group, Inc. | | | 88,000 | | | | 3,471,307 | |
| |
Turkiye Garanti Bankasi AS | | | 272,477 | | | | 997,934 | |
| |
U.S. Bancorp | | | 48,100 | | | | 1,961,518 | |
| |
Wells Fargo & Co. | | | 76,404 | | | | 3,792,695 | |
| |
Western Alliance Bancorp1 | | | 58,200 | | | | 1,342,674 | |
| |
Zenith Bank plc | | | 3,525,007 | | | | 498,087 | |
| | | | | | | | |
| | | | 63,413,352 | |
|
| |
Consumer Finance—0.4% | | | | | | | | |
| |
American Express Co. | | | 21,406 | | | | 1,871,526 | |
| |
Capital One Financial Corp. | | | 36,920 | | | | 2,728,388 | |
| |
Discover Financial Services | | | 37,930 | | | | 2,120,287 | |
| |
SLM Corp. | | | 40,720 | | | | 1,048,540 | |
| | | | | | | | |
| | | | 7,768,741 | |
|
| |
Diversified Financial Services—1.2% | | | | | | | | |
| |
BM&FBovespa SA | | | 1,133,000 | | | | 5,792,667 | |
| |
CME Group, Inc. | | | 14,670 | | | | 1,032,621 | |
| |
Grupo de Inversiones Suramericana SA | | | 12,219 | | | | 238,377 | |
| |
Haci Omer Sabanci Holding AS | | | 394,688 | | | | 1,667,706 | |
| |
Hong Kong Exchanges & Clearing Ltd. | | | 61,245 | | | | 1,103,839 | |
| |
Marico Kaya Enterprises Ltd.1 | | | 2,405 | | | | 152 | |
| |
McGraw Hill Financial, Inc. | | | 116,130 | | | | 8,585,491 | |
| |
Moscow Exchange (The) | | | 1,322,277 | | | | 1,959,382 | |
| | | | | | | | |
| | | | 20,380,235 | |
|
| |
Insurance—2.5% | | | | | | | | |
| |
Aflac, Inc. | | | 24,960 | | | | 1,565,491 | |
| |
AIA Group Ltd. | | | 379,200 | | | | 1,839,214 | |
18 OPPENHEIMER GLOBAL ALLOCATION FUND
| | | | | | | | |
| | | Shares | | | Value | |
| |
Insurance (Continued) | |
| |
Allianz SE | | | 42,566 | | | $ | 7,376,431 | |
| |
Allstate Corp. (The) | | | 32,650 | | | | 1,859,417 | |
| |
American International Group, Inc. | | | 49,400 | | | | 2,624,622 | |
| |
Aon plc | | | 57,430 | | | | 4,874,658 | |
| |
China Life Insurance Co. Ltd., Cl. H | | | 2,000 | | | | 5,194 | |
| |
Dai-ichi Life Insurance Co. Ltd. (The) | | | 305,400 | | | | 4,223,228 | |
| |
Fidelity National Financial, Inc., Cl. A | | | 87,700 | | | | 2,822,186 | |
| |
Marsh & McLennan Cos., Inc. | | | 41,320 | | | | 2,037,489 | |
| |
MetLife, Inc. | | | 45,830 | | | | 2,399,201 | |
| |
Old Mutual plc | | | 304,254 | | | | 1,030,231 | |
| |
Prudential plc | | | 430,282 | | | | 9,897,143 | |
| |
Sul America SA | | | 100,060 | | | | 733,706 | |
| |
Sun Life Financial, Inc. | | | 18,350 | | | | 620,964 | |
| | | | | | | | |
| | | | 43,909,175 | |
|
| |
Real Estate Investment Trusts (REITs)—0.2% | | | | | | | | |
| |
American Tower Corp. | | | 18,730 | | | | 1,564,330 | |
| |
Public Storage | | | 10,240 | | | | 1,797,222 | |
| | | | | | | | |
| | | | 3,361,552 | |
|
| |
Real Estate Management & Development—0.4% | | | | | | | | |
| |
DLF Ltd. | | | 1,220,788 | | | | 2,830,603 | |
| |
Hang Lung Group Ltd. | | | 129,500 | | | | 703,050 | |
| |
Hang Lung Properties Ltd. | | | 684,570 | | | | 2,045,411 | |
| |
Multiplan Empreendimentos Imobiliarios SA | | | 3,300 | | | | 72,934 | |
| |
SM Prime Holdings, Inc. | | | 2,819,103 | | | | 1,032,250 | |
| |
Soho China Ltd. | | | 926,500 | | | | 734,905 | |
| |
Wallace Theater Holdings, Inc.1,4 | | | 430 | | | | 3,324 | |
| | | | | | | | |
| | | | 7,422,477 | |
|
| |
Thrifts & Mortgage Finance—0.2% | | | | | | | | |
| |
Housing Development Finance Corp. Ltd. | | | 230,967 | | | | 3,451,860 | |
|
| |
Health Care—10.2% | | | | | | | | |
| |
Biotechnology—2.5% | | | | | | | | |
| |
Amgen, Inc. | | | 40,140 | | | | 4,485,645 | |
| |
Biogen Idec, Inc.1 | | | 24,280 | | | | 6,971,274 | |
| |
Celgene Corp.1 | | | 11,963 | | | | 1,758,681 | |
| |
Celldex Therapeutics, Inc.1 | | | 124,160 | | | | 1,862,400 | |
| |
Cepheid, Inc.1 | | | 22,910 | | | | 996,127 | |
| |
Circassia Pharmaceuticals plc1 | | | 249,310 | | | | 1,302,752 | |
| |
Clovis Oncology, Inc.1 | | | 25,380 | | | | 1,372,297 | |
| |
CSL Ltd. | | | 30,100 | | | | 1,919,295 | |
| |
Cubist Pharmaceuticals, Inc.1 | | | 17,870 | | | | 1,251,972 | |
| |
Gilead Sciences, Inc.1 | | | 125,780 | | | | 9,872,472 | |
| |
Grifols SA | | | 57,848 | | | | 3,101,127 | |
| |
InterMune, Inc.1 | | | 20,330 | | | | 652,186 | |
| |
Medivation, Inc.1 | | | 20,320 | | | | 1,223,467 | |
| |
NPS Pharmaceuticals, Inc.1 | | | 27,970 | | | | 744,561 | |
| |
Theravance, Inc.1 | | | 85,550 | | | | 2,303,006 | |
19 OPPENHEIMER GLOBAL ALLOCATION FUND
| | | | |
CONSOLIDATED STATEMENTOF INVESTMENTS Unaudited / Continued | | |
| | | | | | | | |
| | | Shares | | | Value | |
| |
Biotechnology (Continued) | |
| |
Vertex Pharmaceuticals, Inc.1 | | | 72,360 | | | $ | 4,898,772 | |
| | | | | | | | |
| | | | 44,716,034 | |
| | | | | | | | |
| |
Health Care Equipment & Supplies—1.4% | | | | | | | | |
| |
Baxter International, Inc. | | | 25,530 | | | | 1,858,329 | |
| |
Cantel Medical Corp. | | | 15,520 | | | | 514,643 | |
| |
Cardiovascular Systems, Inc.1 | | | 17,130 | | | | 492,487 | |
| |
DexCom, Inc.1 | | | 46,061 | | | | 1,494,219 | |
| |
DiaSorin SpA | | | 34,844 | | | | 1,438,975 | |
| |
Essilor International SA | | | 15,680 | | | | 1,677,893 | |
| |
Globus Medical, Inc., Cl. A1 | | | 58,800 | | | | 1,435,896 | |
| |
Insulet Corp.1 | | | 37,200 | | | | 1,399,836 | |
| |
Mindray Medical International Ltd., ADR | | | 17,790 | | | | 588,137 | |
| |
Novadaq Technologies, Inc.1 | | | 15,810 | | | | 247,426 | |
| |
Shandong Weigao Group Medical Polymer Co. Ltd., Cl. H | | | 650,000 | | | | 657,279 | |
| |
Sonova Holding AG1 | | | 13,572 | | | | 1,963,072 | |
| |
Spectranetics Corp.1 | | | 43,160 | | | | 917,582 | |
| |
St. Jude Medical, Inc. | | | 41,440 | | | | 2,630,197 | |
| |
West Pharmaceutical Services, Inc. | | | 21,920 | | | | 950,890 | |
| |
William Demant Holding1 | | | 15,136 | | | | 1,359,100 | |
| |
Zeltiq Aesthetics, Inc.1 | | | 35,920 | | | | 656,977 | |
| |
Zimmer Holdings, Inc. | | | 42,880 | | | | 4,150,784 | |
| | | | | | | | |
| | | | 24,433,722 | |
| | | | | | | | |
| |
Health Care Providers & Services—1.8% | | | | | | | | |
| |
Acadia Healthcare Co., Inc.1 | | | 32,800 | | | | 1,378,256 | |
| |
Aetna, Inc. | | | 83,930 | | | | 5,996,799 | |
| |
Apollo Hospitals Enterprise Ltd. | | | 43,579 | | | | 646,023 | |
| |
Bangkok Dusit Medical Services PCL, Cl. F | | | 25,000 | | | | 11,433 | |
| |
Cardinal Health, Inc. | | | 87,030 | | | | 6,049,455 | |
| |
Centene Corp.1 | | | 18,320 | | | | 1,216,448 | |
| |
Diagnosticos da America SA | | | 102,900 | | | | 610,086 | |
| |
ExamWorks Group, Inc.1 | | | 39,690 | | | | 1,460,592 | |
| |
HCA Holdings, Inc.1 | | | 13,980 | | | | 726,960 | |
| |
MWI Veterinary Supply, Inc.1 | | | 8,810 | | | | 1,379,998 | |
| |
Sinopharm Group Co. Ltd., Cl. H4 | | | 347,400 | | | | 909,735 | |
| |
Sonic Healthcare Ltd. | | | 118,200 | | | | 1,949,095 | |
| |
Team Health Holdings, Inc.1 | | | 33,430 | | | | 1,620,686 | |
| |
UnitedHealth Group, Inc. | | | 22,860 | | | | 1,715,414 | |
| |
WellPoint, Inc. | | | 66,640 | | | | 6,709,315 | |
| | | | | | | | |
| | | | 32,380,295 | |
| | | | | | | | |
| |
Health Care Technology—0.1% | | | | | | | | |
| |
Cerner Corp.1 | | | 17,890 | | | | 917,757 | |
| |
CompuGroup Medical AG | | | 21,881 | | | | 583,169 | |
| | | | | | | | |
| | | | 1,500,926 | |
| | | | | | | | |
| |
Life Sciences Tools & Services—0.6% | | | | | | | | |
| |
Agilent Technologies, Inc. | | | 36,920 | | | | 1,995,157 | |
| |
Fluidigm Corp.1 | | | 16,850 | | | | 632,886 | |
| |
ICON plc1 | | | 37,220 | | | | 1,443,019 | |
20 OPPENHEIMER GLOBAL ALLOCATION FUND
| | | | | | | | |
| | | Shares | | | Value | |
| |
Life Sciences Tools & Services (Continued) | |
| |
Thermo Fisher Scientific, Inc. | | | 55,710 | | | $ | 6,350,940 | |
| | | | | | | | |
| | | | 10,422,002 | |
| | | | | | | | |
| |
Pharmaceuticals—3.8% | | | | | | | | |
| |
AbbVie, Inc. | | | 51,050 | | | | 2,658,684 | |
| |
Actavis plc1 | | | 8,040 | | | | 1,642,813 | |
| |
Akorn, Inc.1 | | | 50,430 | | | | 1,271,845 | |
| |
Allergan, Inc. | | | 55,320 | | | | 9,174,269 | |
| |
Bayer AG | | | 47,371 | | | | 6,574,106 | |
| |
Bristol-Myers Squibb Co. | | | 89,487 | | | | 4,482,404 | |
| |
Cipla Ltd. | | | 111,107 | | | | 730,467 | |
| |
Galenica AG | | | 1,444 | | | | 1,470,740 | |
| |
Jazz Pharmaceuticals plc1 | | | 4,760 | | | | 642,124 | |
| |
Johnson & Johnson | | | 25,097 | | | | 2,542,075 | |
| |
Merck & Co., Inc. | | | 52,330 | | | | 3,064,445 | |
| |
Novo Nordisk AS, Cl. B | | | 42,648 | | | | 1,935,002 | |
| |
Pacira Pharmaceuticals, Inc.1 | | | 13,850 | | | | 948,586 | |
| |
Perrigo Co. PLC | | | 20,340 | | | | 2,946,452 | |
| |
Pfizer, Inc. | | | 160,684 | | | | 5,026,196 | |
| |
Roche Holding AG | | | 30,180 | | | | 8,872,569 | |
| |
Roche Holding AG, Sponsored ADR | | | 72,860 | | | | 2,670,319 | |
| |
Sanofi, ADR | | | 58,340 | | | | 3,138,692 | |
| |
Shire plc | | | 76,260 | | | | 4,360,194 | |
| |
Teva Pharmaceutical Industries Ltd., Sponsored ADR | | | 26,150 | | | | 1,277,689 | |
| |
Valeant Pharmaceuticals International, Inc.1 | | | 6,603 | | | | 882,887 | |
| | | | | | | | |
| | | | 66,312,558 | |
| | | | | | | | |
| |
Industrials—10.1% | | | | | | | | |
| |
Aerospace & Defense—2.0% | | | | | | | | |
| |
Airbus Group NV | | | 139,280 | | | | 9,590,222 | |
| |
B/E Aerospace, Inc.1 | | | 11,230 | | | | 985,657 | |
| |
Curtiss-Wright Corp. | | | 11,510 | | | | 735,949 | |
| |
Embraer SA | | | 197,700 | | | | 1,709,454 | |
| |
Embraer SA, ADR | | | 147,440 | | | | 5,071,936 | |
| |
General Dynamics Corp. | | | 6,800 | | | | 744,260 | |
| |
HEICO Corp. | | | 27,080 | | | | 1,498,066 | |
| |
Hexcel Corp.1 | | | 54,090 | | | | 2,255,012 | |
| |
Lockheed Martin Corp. | | | 9,400 | | | | 1,542,916 | |
| |
Precision Castparts Corp. | | | 11,320 | | | | 2,864,979 | |
| |
Rolls-Royce Holdings plc1 | | | 99,470 | | | | 1,767,050 | |
| |
United Technologies Corp. | | | 51,670 | | | | 6,114,111 | |
| | | | | | | | |
| | | | 34,879,612 | |
| | | | | | | | |
| |
Air Freight & Couriers—0.3% | | | | | | | | |
| |
Royal Mail plc1 | | | 117,780 | | | | 1,055,083 | |
| |
United Parcel Service, Inc., Cl. B | | | 48,220 | | | | 4,749,670 | |
| | | | | | | | |
| | | | 5,804,753 | |
| | | | | | | | |
| |
Airlines—0.2% | |
| |
Delta Air Lines, Inc. | | | 106,200 | | | | 3,911,346 | |
21 OPPENHEIMER GLOBAL ALLOCATION FUND
| | | | |
| |
CONSOLIDATED STATEMENTOF INVESTMENTS Unaudited / Continued | | |
| | | | | | | | |
| | | Shares | | | Value | |
| |
Building Products—0.6% | |
| |
A.O. Smith Corp. | | | 23,020 | | | $ | 1,076,415 | |
| |
Allegion plc | | | 39,860 | | | | 1,967,091 | |
| |
Assa Abloy AB, Cl. B1 | | | 121,111 | | | | 6,442,865 | |
| |
Fortune Brands Home & Security, Inc. | | | 35,010 | | | | 1,395,149 | |
| |
Nortek, Inc.1 | | | 5,864 | | | | 481,786 | |
| | | | | | | | |
| | | | 11,363,306 | |
| | | | | | | | |
| |
Commercial Services & Supplies—0.7% | | | | | | | | |
| |
Aggreko plc | | | 62,489 | | | | 1,666,881 | |
| |
Edenred | | | 44,970 | | | | 1,517,509 | |
| |
Mobile Mini, Inc. | | | 57,980 | | | | 2,561,557 | |
| |
Prosegur Compania de Seguridad SA | | | 289,135 | | | | 1,941,547 | |
| |
Tyco International Ltd. | | | 62,030 | | | | 2,537,027 | |
| |
Waste Management, Inc. | | | 29,280 | | | | 1,301,496 | |
| | | | | | | | |
| | | | 11,526,017 | |
| | | | | | | | |
| |
Construction & Engineering—0.5% | | | | | | | | |
| |
Chicago Bridge & Iron Co. NV | | | 12,440 | | | | 996,071 | |
| |
FLSmidth & Co. AS | | | 40,899 | | | | 2,191,073 | |
| |
Koninklijke Boskalis Westminster NV | | | 41,111 | | | | 2,330,358 | |
| |
Leighton Holdings Ltd. | | | 72,400 | | | | 1,285,429 | |
| |
Trevi Finanziaria Industriale SpA | | | 129,332 | | | | 1,489,826 | |
| | | | | | | | |
| | | | 8,292,757 | |
| | | | | | | | |
| |
Electrical Equipment—1.4% | | | | | | | | |
| |
ABB Ltd.1 | | | 63,765 | | | | 1,536,504 | |
| |
ABB Ltd., Sponsored ADR1 | | | 24,910 | | | | 595,847 | |
| |
AMETEK, Inc. | | | 17,270 | | | | 910,474 | |
| |
Eaton Corp. plc | | | 40,760 | | | | 2,960,806 | |
| |
Emerson Electric Co. | | | 61,570 | | | | 4,197,843 | |
| |
Generac Holdings, Inc. | | | 27,030 | | | | 1,591,526 | |
| |
Legrand SA | | | 32,160 | | | | 2,077,873 | |
| |
Nidec Corp. | | | 111,400 | | | | 6,337,143 | |
| |
Prysmian SpA | | | 78,491 | | | | 2,045,093 | |
| |
Schneider Electric SA | | | 19,220 | | | | 1,806,376 | |
| |
Schneider Electric SA, ADR1 | | | 42,920 | | | | 804,321 | |
| | | | | | | | |
| | | | 24,863,806 | |
| | | | | | | | |
| |
Industrial Conglomerates—1.0% | | | | | | | | |
| |
3M Co. | | | 40,070 | | | | 5,573,336 | |
| |
General Electric Co.2 | | | 85,210 | | | | 2,291,297 | |
| |
Jardine Strategic Holdings Ltd. | | | 31,512 | | | | 1,125,368 | |
| |
Seibu Holdings, Inc. | | | 69,700 | | | | 1,274,896 | |
| |
Siemens AG | | | 43,464 | | | | 5,730,043 | |
| |
Siemens AG, Sponsored ADR | | | 6,930 | | | | 913,582 | |
| |
SM Investments Corp. | | | 80,573 | | | | 1,313,604 | |
| | | | | | | | |
| | | | 18,222,126 | |
| | | | | | | | |
| |
Machinery—1.9% | | | | | | | | |
| |
Aalberts Industries NV | | | 103,165 | | | | 3,441,829 | |
| |
Atlas Copco AB, Cl. A | | | 60,877 | | | | 1,771,845 | |
| |
Caterpillar, Inc. | | | 45,070 | | | | 4,750,378 | |
22 OPPENHEIMER GLOBAL ALLOCATION FUND
| | | | | | | | |
| | | Shares | | | Value | |
| |
Machinery (Continued) | |
| |
FANUC Corp. | | | 21,100 | | | $ | 3,796,971 | |
| |
Flowserve Corp. | | | 20,050 | | | | 1,464,652 | |
| |
Middleby Corp. (The)1 | | | 10,440 | | | | 2,635,891 | |
| |
Pall Corp. | | | 10,420 | | | | 876,843 | |
| |
Parker Hannifin Corp. | | | 42,140 | | | | 5,346,723 | |
| |
Pentair Ltd. | | | 37,140 | | | | 2,759,131 | |
| |
Proto Labs, Inc.1 | | | 18,740 | | | | 1,134,520 | |
| |
Timken Co. | | | 11,050 | | | | 697,034 | |
| |
Wabtec Corp. | | | 23,520 | | | | 1,753,416 | |
| |
Weir Group plc (The) | | | 49,526 | | | | 2,253,925 | |
| | | | | | | | |
| | | | 32,683,158 | |
| | | | | | | | |
| |
Professional Services—0.6% | | | | | | | | |
| |
Experian plc | | | 95,346 | | | | 1,832,421 | |
| |
Huron Consulting Group, Inc.1 | | | 18,890 | | | | 1,344,968 | |
| |
Intertek Group plc | | | 37,560 | | | | 1,846,469 | |
| |
Korn/Ferry International1 | | | 23,570 | | | | 684,708 | |
| |
On Assignment, Inc.1 | | | 75,090 | | | | 2,628,150 | |
| |
Paylocity Holding Corp.1 | | | 2,820 | | | | 53,326 | |
| |
SGS SA | | | 691 | | | | 1,726,956 | |
| |
WageWorks, Inc.1 | | | 15,770 | | | | 668,175 | |
| | | | | | | | |
| | | | 10,785,173 | |
| | | | | | | | |
| |
Road & Rail—0.2% | | | | | | | | |
| |
CSX Corp. | | | 46,840 | | | | 1,321,825 | |
| |
Genesee & Wyoming, Inc., Cl. A1 | | | 13,670 | | | | 1,353,467 | |
| |
Localiza Rent a Car SA | | | 2,700 | | | | 40,323 | |
| |
Union Pacific Corp. | | | 8,020 | | | | 1,527,248 | |
| | | | | | | | |
| | | | 4,242,863 | |
| | | | | | | | |
| |
Trading Companies & Distributors—0.6% | | | | | | | | |
| |
Brenntag AG | | | 11,954 | | | | 2,163,013 | |
| |
Bunzl plc | | | 115,038 | | | | 3,273,126 | |
| |
H&E Equipment Services, Inc.1 | | | 75,550 | | | | 2,912,453 | |
| |
United Rentals, Inc.1 | | | 3,470 | | | | 325,590 | |
| |
Wolseley plc | | | 32,040 | | | | 1,855,484 | |
| | | | | | | | |
| | | | 10,529,666 | |
| | | | | | | | |
| |
Transportation Infrastructure—0.1% | | | | | | | | |
| |
Airports of Thailand PCL | | | 26,100 | | | | 157,278 | |
| |
DP World Ltd.5 | | | 17,946 | | | | 332,001 | |
| |
DP World Ltd.5 | | | 62,902 | | | | 1,180,287 | |
| |
Grupo Aeroportuario del Sureste SAB de CV, Cl. B | | | 5,898 | | | | 72,181 | |
| |
International Container Terminal Services, Inc. | | | 57,570 | | | | 139,688 | |
| | | | | | | | |
| | | | 1,881,435 | |
| | | | | | | | |
| |
Information Technology—14.0% | | | | | | | | |
| |
Communications Equipment—1.2% | | | | | | | | |
| |
Cisco Systems, Inc. | | | 152,640 | | | | 3,527,510 | |
| |
Juniper Networks, Inc.1 | | | 143,820 | | | | 3,550,916 | |
| |
QUALCOMM, Inc. | | | 15,220 | | | | 1,197,966 | |
23 OPPENHEIMER GLOBAL ALLOCATION FUND
| | | | |
| |
CONSOLIDATED STATEMENTOF INVESTMENTS Unaudited / Continued | | |
| | | | | | | | |
| | | Shares | | | Value | |
| |
Communications Equipment (Continued) | |
| |
Telefonaktiebolaget LM Ericsson, Cl. B | | | 1,110,418 | | | $ | 13,335,528 | |
| | | | | | | | |
| | | | 21,611,920 | |
| | | | | | | | |
| |
Electronic Equipment, Instruments, & Components—1.3% | | | | | | | | |
| |
Hoya Corp. | | | 84,900 | | | | 2,502,857 | |
| |
Keyence Corp. | | | 19,050 | | | | 7,338,475 | |
| |
Kyocera Corp. | | | 89,100 | | | | 4,188,872 | |
| |
Methode Electronics, Inc. | | | 34,390 | | | | 953,979 | |
| |
Murata Manufacturing Co. Ltd. | | | 69,800 | | | | 5,803,058 | |
| |
Omron Corp. | | | 19,100 | | | | 674,402 | |
| |
TE Connectivity Ltd. | | | 29,070 | | | | 1,714,549 | |
| | | | | | | | |
| | | | 23,176,192 | |
| | | | | | | | |
| |
Internet Software & Services—3.7% | | | | | | | | |
| |
Baidu, Inc., Sponsored ADR1 | | | 37,950 | | | | 5,838,607 | |
| |
Benefitfocus, Inc.1 | | | 6,650 | | | | 215,460 | |
| |
ChannelAdvisor Corp.1 | | | 32,990 | | | | 865,658 | |
| |
Cornerstone OnDemand, Inc.1 | | | 49,590 | | | | 1,822,928 | |
| |
CoStar Group, Inc.1 | | | 13,760 | | | | 2,213,846 | |
| |
Demandware, Inc.1 | | | 19,560 | | | | 970,763 | |
| |
eBay, Inc.1 | | | 161,850 | | | | 8,388,685 | |
| |
Envestnet, Inc.1 | | | 24,770 | | | | 912,774 | |
| |
Facebook, Inc., Cl. A1,2 | | | 157,740 | | | | 9,429,697 | |
| |
Google, Inc., Cl. A1 | | | 13,799 | | | | 7,380,809 | |
| |
Google, Inc., Cl. C1,2 | | | 13,549 | | | | 7,135,716 | |
| |
GrubHub, Inc.1 | | | 1,270 | | | | 39,307 | |
| |
LinkedIn Corp., Cl. A1 | | | 10,950 | | | | 1,680,497 | |
| |
MercadoLibre, Inc. | | | 11,640 | | | | 1,085,663 | |
| |
NAVER Corp. | | | 1,729 | | | | 1,245,030 | |
| |
Pandora Media, Inc.1 | | | 51,840 | | | | 1,214,093 | |
| |
Q2 Holdings, Inc.1 | | | 6,040 | | | | 74,171 | |
| |
Shutterstock, Inc.1 | | | 21,780 | | | | 1,579,268 | |
| |
SPS Commerce, Inc.1 | | | 12,160 | | | | 629,888 | |
| |
Telecity Group plc | | | 99,170 | | | | 1,202,718 | |
| |
Tencent Holdings Ltd. | | | 44,800 | | | | 2,819,077 | |
| |
United Internet AG | | | 41,187 | | | | 1,768,431 | |
| |
Web.com Group, Inc.1 | | | 54,270 | | | | 1,666,632 | |
| |
Yahoo Japan Corp. | | | 307,400 | | | | 1,346,714 | |
| |
Yandex NV, Cl. A1 | | | 98,620 | | | | 2,613,430 | |
| |
Yelp, Inc.1 | | | 12,680 | | | | 739,498 | |
| |
Youku Tudou, Inc., ADR1 | | | 22,730 | | | | 506,652 | |
| | | | | | | | |
| | | | 65,386,012 | |
| | | | | | | | |
| |
IT Services—0.9% | | | | | | | | |
| |
Acxiom Corp.1 | | | 24,890 | | | | 702,894 | |
| |
Alliance Data Systems Corp.1 | | | 380 | | | | 91,922 | |
| |
Amadeus IT Holding SA, Cl. A | | | 57,082 | | | | 2,376,699 | |
| |
FleetCor Technologies, Inc.1 | | | 7,070 | | | | 806,899 | |
| |
Infosys Ltd. | | | 53,279 | | | | 2,844,991 | |
| |
MasterCard, Inc., Cl. A | | | 56,770 | | | | 4,175,433 | |
| |
MAXIMUS, Inc. | | | 24,050 | | | | 1,023,808 | |
| |
Tata Consultancy Services Ltd. | | | 33,411 | | | | 1,213,659 | |
24 OPPENHEIMER GLOBAL ALLOCATION FUND
| | | | | | | | |
| | | Shares | | | Value | |
| |
IT Services (Continued) | |
| |
Visa, Inc., Cl. A | | | 15,808 | | | $ | 3,202,859 | |
| | | | | | | | |
| | | | 16,439,164 | |
| | | | | | | | |
| |
Semiconductors & Semiconductor Equipment—1.6% | | | | | | | | |
| |
Altera Corp. | | | 207,710 | | | | 6,754,729 | |
| |
ARM Holdings plc | | | 107,520 | | | | 1,624,165 | |
| |
Avago Technologies Ltd. | | | 8,560 | | | | 543,560 | |
| |
Broadcom Corp., Cl. A | | | 23,930 | | | | 737,283 | |
| |
Intel Corp. | | | 74,660 | | | | 1,992,676 | |
| |
Maxim Integrated Products, Inc. | | | 223,110 | | | | 7,237,688 | |
| |
Microchip Technology, Inc. | | | 11,570 | | | | 550,038 | |
| |
Monolithic Power Systems, Inc.1 | | | 48,180 | | | | 1,787,478 | |
| |
Taiwan Semiconductor Manufacturing Co. Ltd. | | | 656,000 | | | | 2,585,964 | |
| |
Texas Instruments, Inc. | | | 66,988 | | | | 3,044,605 | |
| |
Xilinx, Inc. | | | 42,310 | | | | 1,996,609 | |
| | | | | | | | |
| | | | 28,854,795 | |
| | | | | | | | |
| |
Software—3.6% | | | | | | | | |
| |
Adobe Systems, Inc.1 | | | 103,890 | | | | 6,408,974 | |
| |
Aspen Technology, Inc.1 | | | 54,470 | | | | 2,341,665 | |
| |
Autodesk, Inc.1 | | | 36,860 | | | | 1,770,017 | |
| |
Aveva Group plc | | | 31,500 | | | | 1,123,572 | |
| |
CA, Inc. | | | 35,400 | | | | 1,066,956 | |
| |
Citrix Systems, Inc.1 | | | 11,450 | | | | 679,100 | |
| |
Dassault Systemes SA | | | 13,590 | | | | 1,671,609 | |
| |
Gemalto NV | | | 18,642 | | | | 2,089,887 | |
| |
Guidewire Software, Inc.1 | | | 51,420 | | | | 1,941,619 | |
| |
Imperva, Inc.1 | | | 14,810 | | | | 338,853 | |
| |
Interactive Intelligence Group, Inc.1 | | | 22,900 | | | | 1,432,853 | |
| |
Intuit, Inc. | | | 80,180 | | | | 6,073,635 | |
| |
Microsoft Corp. | | | 251,721 | | | | 10,169,529 | |
| |
Oracle Corp. | | | 68,450 | | | | 2,798,236 | |
| |
Proofpoint, Inc.1 | | | 28,200 | | | | 717,408 | |
| |
Sage Group plc (The) | | | 192,419 | | | | 1,386,954 | |
| |
SAP AG | | | 150,195 | | | | 12,090,512 | |
| |
ServiceNow, Inc.1 | | | 18,320 | | | | 910,870 | |
| |
Splunk, Inc.1 | | | 11,890 | | | | 648,837 | |
| |
Synopsys, Inc.1 | | | 21,910 | | | | 824,254 | |
| |
Tableau Software, Inc., Cl. A1 | | | 19,290 | | | | 1,066,158 | |
| |
Temenos Group AG | | | 36,964 | | | | 1,324,877 | |
| |
Tyler Technologies, Inc.1 | | | 20,110 | | | | 1,641,982 | |
| |
Ultimate Software Group, Inc. (The)1 | | | 18,110 | | | | 2,166,499 | |
| |
Workday, Inc., Cl. A1 | | | 6,310 | | | | 461,072 | |
| | | | | | | | |
| | | | 63,145,928 | |
| | | | | | | | |
| |
Technology Hardware, Storage & Peripherals—1.7% | | | | | | | | |
| |
Apple, Inc.2 | | | 25,913 | | | | 15,291,002 | |
| |
EMC Corp.2 | | | 251,440 | | | | 6,487,152 | |
| |
Fusion-io, Inc.1 | | | 157,550 | | | | 1,359,656 | |
| |
NCR Corp.1 | | | 15,680 | | | | 478,397 | |
| |
SanDisk Corp. | | | 19,970 | | | | 1,696,851 | |
| |
Stratasys Ltd.1 | | | 12,950 | | | | 1,254,467 | |
25 OPPENHEIMER GLOBAL ALLOCATION FUND
| | |
| |
CONSOLIDATED STATEMENTOF INVESTMENTS Unaudited / Continued | | |
| | | | | | | | |
| | | Shares | | | Value | |
| |
Technology Hardware, Storage & Peripherals (Continued) | |
| |
Western Digital Corp. | | | 33,970 | | | $ | 2,993,776 | |
| | | | | | | | |
| | | | 29,561,301 | |
| | | | | | | | |
| |
Materials—2.5% | | | | | | | | |
| |
Chemicals—1.5% | | | | | | | | |
| |
Asian Paints Ltd. | | | 77,874 | | | | 652,658 | |
| |
Dow Chemical Co. (The) | | | 52,280 | | | | 2,608,772 | |
| |
Essentra plc | | | 205,412 | | | | 2,780,123 | |
| |
Linde AG | | | 21,507 | | | | 4,460,240 | |
| |
LyondellBasell Industries NV, Cl. A | | | 32,807 | | | | 3,034,647 | |
| |
Methanex Corp. | | | 33,680 | | | | 2,088,160 | |
| |
PolyOne Corp. | | | 42,350 | | | | 1,586,854 | |
| |
Potash Corp. of Saskatchewan, Inc. | | | 32,160 | | | | 1,162,906 | |
| |
PPG Industries, Inc. | | | 21,980 | | | | 4,255,768 | |
| |
Sika AG | | | 571 | | | | 2,314,513 | |
| |
Syngenta AG1 | | | 5,843 | | | | 2,320,057 | |
| | | | | | | | |
| | | | 27,264,698 | |
| | | | | | | | |
| |
Construction Materials—0.5% | | | | | | | | |
| |
Ambuja Cements Ltd. | | | 205,461 | | | | 679,697 | |
| |
Caesarstone Sdot-Yam Ltd. | | | 16,990 | | | | 886,538 | |
| |
Cementos Argos SA, Preference | | | 64,546 | | | | 353,298 | |
| |
Eagle Materials, Inc. | | | 15,990 | | | | 1,332,447 | |
| |
Indocement Tunggal Prakarsa Tbk PT | | | 302,000 | | | | 580,358 | |
| |
James Hardie Industries plc | | | 227,800 | | | | 2,915,401 | |
| |
Semen Indonesia (Persero) Tbk PT | | | 477,000 | | | | 619,764 | |
| |
Ultratech Cement Ltd. | | | 30,473 | | | | 1,029,467 | |
| | | | | | | | |
| | | | 8,396,970 | |
| | | | | | | | |
| |
Metals & Mining—0.4% | | | | | | | | |
| |
Alrosa AO | | | 1,810,382 | | | | 1,870,702 | |
| |
Carpenter Technology Corp. | | | 19,000 | | | | 1,193,200 | |
| |
Glencore Xstrata plc1 | | | 435,420 | | | | 2,350,174 | |
| |
Real Gold Mining Ltd.1 | | | 273,000 | | | | 352 | |
| |
Vale SA, Cl. B, Sponsored ADR | | | 138,340 | | | | 1,828,855 | |
| | | | | | | | |
| | | | 7,243,283 | |
| | | | | | | | |
| |
Paper & Forest Products—0.1% | | | | | | | | |
| |
Louisiana-Pacific Corp.1 | | | 68,630 | | | | 1,124,846 | |
| | | | | | | | |
| |
Telecommunication Services—1.2% | | | | | | | | |
| |
Diversified Telecommunication Services—0.7% | | | | | | | | |
| |
BT Group plc, Cl. A | | | 557,220 | | | | 3,484,913 | |
| |
Iliad SA | | | 3,870 | | | | 1,047,003 | |
| |
Inmarsat plc | | | 143,030 | | | | 1,761,236 | |
| |
Telefonica Brasil SA, ADR | | | 55,600 | | | | 1,178,720 | |
| |
Telefonica Brasil SA, Preference | | | 100 | | | | 2,101 | |
| |
Telefonica SA, Sponsored ADR | | | 32,010 | | | | 536,167 | |
| |
Verizon Communications, Inc. | | | 65,923 | | | | 3,080,582 | |
| |
Ziggo NV | | | 27,046 | | | | 1,174,279 | |
| | | | | | | | |
| | | | 12,265,001 | |
26 OPPENHEIMER GLOBAL ALLOCATION FUND
| | | | | | | | |
| | | Shares | | | Value | |
| |
Wireless Telecommunication Services—0.5% | |
| |
America Movil SAB de CV, Series L, ADR | | | 54,880 | | | $ | 1,101,990 | |
| |
KDDI Corp. | | | 113,500 | | | | 6,041,434 | |
| |
MTN Group Ltd. | | | 82,699 | | | | 1,658,856 | |
| | | | | | | | |
| | | | 8,802,280 | |
| | | | | | | | |
| |
Utilities—0.4% | | | | | | | | |
| |
Electric Utilities—0.3% | | | | | | | | |
| |
Edison International | | | 53,030 | | | | 2,999,377 | |
| |
Entergy Corp. | | | 15,460 | | | | 1,120,850 | |
| |
NextEra Energy, Inc. | | | 20,487 | | | | 2,045,627 | |
| | | | | | | | |
| | | | 6,165,854 | |
| | | | | | | | |
| |
Independent Power and Renewable Electricity Producers—0.1% | | | | | | | | |
| |
APR Energy plc | | | 82,430 | | | | 1,109,640 | |
| | | | | | | | |
| |
Multi-Utilities—0.0% | | | | | | | | |
| |
Sempra Energy | | | 9,140 | | | | 901,295 | |
| | | | | | | | |
Total Common Stocks (Cost $1,011,107,354) | | | | 1,252,219,921 | |
| | | | | | | | |
| | | | | | | | |
| |
Preferred Stocks—0.0% | | | | | | | | |
| |
Ally Financial, Inc., 7% Cum., Series G, Non-Vtg.3 | | | 656 | | | | 652,966 | |
| |
Zee Entertainment Enterprises Ltd., 6% Cum. Non-Cv. | | | INR 21,135,219 | | | | 269,819 | |
| | | | | | | | |
Total Preferred Stocks (Cost $778,848) | | | | 922,785 | |
| | |
| | | Units | | | | |
| |
Rights, Warrants and Certificates—0.0% | | | | | | | | |
| |
Genting Bhd Wts., Strike Price 7.96MYR, 12/18/181 (Cost $77,776) | | | 123,800 | | | | 109,564 | |
| | |
| | | Principal Amount | | | | |
| |
Non-Convertible Corporate Bonds and Notes—7.4% | | | | | | | | |
| |
Access Midstream Partners LP/ACMP Finance Corp., 6.125% Sr. Unsec. Nts., 7/15/22 | | | $ 335,000 | | | | 363,894 | |
| |
Actuant Corp., 5.625% Sr. Unsec. Nts., 6/15/22 | | | 340,000 | | | | 360,400 | |
| |
ADS Waste Holdings, Inc., 8.25% Sr. Unsec. Nts., 10/1/20 | | | 265,000 | | | | 288,519 | |
| |
AES Corp., 7.375% Sr. Unsec. Nts., 7/1/21 | | | 205,000 | | | | 235,750 | |
| |
Affinia Group, Inc., 7.75% Sr. Unsec. Nts., 5/1/21 | | | 510,000 | | | | 548,250 | |
| |
Affinion Group, Inc., 7.875% Sr. Unsec. Nts., 12/15/18 | | | 880,000 | | | | 827,200 | |
| |
Ahern Rentals, Inc., 9.50% Sec. Nts., 6/15/183 | | | 405,000 | | | | 452,587 | |
| |
Air Canada, 6.75% Sr. Sec. Nts., 10/1/193 | | | 320,000 | | | | 345,200 | |
| |
AK Steel Corp., 7.625% Sr. Unsec. Nts., 5/15/20 | | | 400,000 | | | | 403,000 | |
| |
Alcatel-Lucent USA, Inc., 6.75% Sr. Unsec. Nts., 11/15/203 | | | 360,000 | | | | 379,800 | |
| |
Alere, Inc., 6.50% Sr. Sub. Nts., 6/15/20 | | | 305,000 | | | | 321,775 | |
| |
Aleris International, Inc.: | | | | | | | | |
7.625% Sr. Unsec. Nts., 2/15/18 | | | 655,000 | | | | 672,194 | |
7.875% Sr. Unsec. Nts., 11/1/20 | | | 680,000 | | | | 688,500 | |
| |
Ally Financial, Inc., 7.50% Sr. Unsec. Nts., 9/15/20 | | | 275,000 | | | | 326,906 | |
| |
Altice Financing SA, 6.50% Sec. Nts., 1/15/223 | | | 210,000 | | | | 220,500 | |
| |
American Capital Ltd., 6.50% Sr. Unsec. Nts., 9/15/183 | | | 385,000 | | | | 410,987 | |
| |
American Seafoods Group LLC/American Seafoods Finance, Inc., 10.75% Sr. Sub. Nts., 5/15/163 | | | 320,000 | | | | 330,816 | |
| |
Amsted Industries, Inc., 5% Sr. Unsec. Nts., 3/15/223 | | | 360,000 | | | | 360,450 | |
| |
Anixter, Inc., 5.625% Sr. Unsec. Nts., 5/1/19 | | | 290,000 | | | | 311,025 | |
27 OPPENHEIMER GLOBAL ALLOCATION FUND
| | |
| |
CONSOLIDATED STATEMENTOF INVESTMENTS Unaudited / Continued | | |
| | | | | | | | |
| | | Principal Amount | | | Value | |
| |
Non-Convertible Corporate Bonds and Notes (Continued) | |
| |
Antero Resources Finance Corp., 6% Sr. Unsec. Nts., 12/1/20 | | | $ 335,000 | | | $ | 360,125 | |
| |
ARAMARK Corp., 5.75% Sr. Unsec. Nts., 3/15/20 | | | 680,000 | | | | 716,550 | |
| |
Arch Coal, Inc.: | | | | | | | | |
7.25% Sr. Unsec. Nts., 6/15/21 | | | 90,000 | | | | 67,725 | |
8.00% Sec. Nts., 1/15/193 | | | 225,000 | | | | 225,000 | |
| |
Ardagh Packaging Finance plc/Ardagh Holdings USA, Inc., 6.75% Sr. Unsec. Nts., 1/31/213 | | | 375,000 | | | | 391,875 | |
| |
Ardagh Packaging Finance plc/Ardagh MP Holdings USA, Inc., 7% Sr. Unsec. Nts., 11/15/203 | | | 126,176 | | | | 132,170 | |
| |
Athlon Holdings LP/Athlon Finance Corp., 6% Sr. Unsec. Nts., 5/1/223,6 | | | 135,000 | | | | 136,856 | |
| |
Atlantic Power Corp., 9% Sr. Unsec. Nts., 11/15/18 | | | 330,000 | | | | 349,800 | |
| |
Atlas Pipeline Partners LP/Atlas Pipeline Finance Corp.: | | | | | | | | |
5.875% Sr. Unsec. Nts., 8/1/23 | | | 320,000 | | | | 317,600 | |
6.625% Sr. Unsec. Nts., 10/1/20 | | | 340,000 | | | | 362,100 | |
| |
Avaya, Inc., 7% Sr. Sec. Nts., 4/1/193 | | | 365,000 | | | | 365,000 | |
| |
Axalta Coating Systems Dutch Holding BV, 7.375% Sr. Unsec. Nts., 5/1/213 | | | 495,000 | | | | 545,738 | |
| |
B/E Aerospace, Inc., 6.875% Sr. Unsec. Nts., 10/1/20 | | | 295,000 | | | | 323,762 | |
| |
BC Mountain LLC/BC Mountain Finance, Inc., 7% Sr. Unsec. Nts., 2/1/213 | | | 710,000 | | | | 694,025 | |
| |
Beazer Homes USA, Inc., 9.125% Sr. Unsec. Nts., 5/15/19 | | | 660,000 | | | | 712,800 | |
| |
Belden, Inc., 5.50% Sr. Sub. Nts., 9/1/223 | | | 325,000 | | | | 332,312 | |
| |
Bill Barrett Corp., 7.625% Sr. Unsec. Nts., 10/1/19 | | | 560,000 | | | | 607,600 | |
| |
BI-LO LLC/BI-LO Finance Corp., 8.625% Sr. Unsec. Nts., 9/15/183,7 | | | 355,000 | | | | 363,431 | |
| |
Biomet, Inc., 6.50% Sr. Unsec. Nts., 8/1/20 | | | 90,000 | | | | 98,887 | |
| |
Blackboard, Inc., 7.75% Sr. Unsec. Nts., 11/15/193 | | | 440,000 | | | | 465,300 | |
| |
BMC Software Finance, Inc., 8.125% Sr. Unsec. Nts., 7/15/213 | | | 405,000 | | | | 426,262 | |
| |
Bon-Ton Department Stores, Inc. (The), 8% Sec. Nts., 6/15/21 | | | 390,000 | | | | 373,425 | |
| |
Boyd Gaming Corp., 9.125% Sr. Unsec. Nts., 12/1/18 | | | 215,000 | | | | 231,662 | |
| |
Brand Energy & Infrastructure Services, Inc., 8.50% Sr. Unsec. Nts., 12/1/213 | | | 720,000 | | | | 765,000 | |
| |
BreitBurn Energy Partners LP/BreitBurn Finance Corp., 8.625% Sr. Unsec. Nts., 10/15/20 | | | 645,000 | | | | 706,275 | |
| |
Building Materials Corp. of America, 6.75% Sr. Nts., 5/1/213 | | | 225,000 | | | | 244,125 | |
| |
Bumble Bee Holdings, Inc., 9% Sr. Sec. Nts., 12/15/173 | | | 605,000 | | | | 654,912 | |
| |
Burger King Corp., 9.875% Sr. Unsec. Nts., 10/15/18 | | | 305,000 | | | | 331,687 | |
| |
Burlington Coat Factory Warehouse Corp., 10% Sr. Unsec. Nts., 2/15/19 | | | 120,000 | | | | 132,900 | |
| |
Burlington Holdings LLC/Burlington Holding Finance, Inc., 9% Sr. Unsec. Nts., 2/15/184,7 | | | 271,000 | | | | 278,116 | |
| |
Caesars Growth Properties Holdings LLC/Caesars Growth Properties Finance, Inc., 9.375% Sec. Nts., 5/1/223 | | | 365,000 | | | | 364,772 | |
| |
Calpine Corp.: | | | | | | | | |
7.50% Sr. Sec. Nts., 2/15/213 | | | 423,000 | | | | 463,185 | |
7.875% Sr. Sec. Nts., 1/15/233 | | | 171,000 | | | | 192,375 | |
| |
Cantor Commercial Real Estate Co. LP/CCRE Finance Corp., 7.75% Sr. Unsec. Nts., 2/15/183 | | | 465,000 | | | | 504,525 | |
| |
Capsugel SA, 7% Sr. Unsec. Nts., 5/15/193,7 | | | 365,000 | | | | 376,634 | |
| |
Cash America International, Inc., 5.75% Sr. Unsec. Nts., 5/15/18 | | | 355,000 | | | | 356,775 | |
| |
CBC Ammo LLC/CBC FinCo, Inc., 7.25% Sr. Unsec. Nts., 11/15/213 | | | 1,135,000 | | | | 1,159,119 | |
| |
CBS Outdoor Americas Capital LLC/CBS Outdoor Americas Capital Corp., 5.25% Sr. Unsec. Nts., 2/15/223 | | | 105,000 | | | | 107,887 | |
| |
CCO Holdings LLC/CCO Holdings Capital Corp., 5.75% Sr. Unsec. Nts., 9/1/23 | | | 375,000 | | | | 379,687 | |
28 OPPENHEIMER GLOBAL ALLOCATION FUND
| | | | | | | | |
| | | Principal Amount | | | Value | |
| |
Non-Convertible Corporate Bonds and Notes (Continued) | |
| |
Cenveo Corp., 8.875% Sec. Nts., 2/1/18 | | | $ 690,000 | | | $ | 716,737 | |
| |
Cequel Communications Holdings I LLC/Cequel Capital Corp., 6.375% Sr. Unsec. Nts., 9/15/203 | | | 1,375,000 | | | | 1,447,187 | |
| |
CEVA Group plc, 7% Sr. Sec. Nts., 3/1/213 | | | 725,000 | | | | 749,469 | |
| |
Chaparral Energy, Inc., 7.625% Sr. Unsec. Nts., 11/15/22 | | | 330,000 | | | | 353,100 | |
| |
Chesapeake Energy Corp., 5.75% Sr. Unsec. Nts., 3/15/23 | | | 360,000 | | | | 384,300 | |
| |
Chinos Intermediate Holdings A, Inc., 7.75% Sr. Unsec. Nts., 5/1/193,7 | | | 505,000 | | | | 523,937 | |
| |
Chiquita Brands International, Inc./Chiquita Brands LLC, 7.875% Sr. Sec. Nts., 2/1/21 | | | 377,000 | | | | 421,769 | |
| |
CHS/Community Health Systems, Inc., 7.125% Sr. Unsec. Nts., 7/15/20 | | | 270,000 | | | | 289,912 | |
| |
Churchill Downs, Inc., 5.375% Sr. Unsec. Nts., 12/15/213 | | | 270,000 | | | | 277,425 | |
| |
CIT Group, Inc.: | | | | | | | | |
4.25% Sr. Unsec. Nts., 8/15/17 | | | 145,000 | | | | 152,250 | |
5.00% Sr. Unsec. Nts., 8/15/22 | | | 425,000 | | | | 436,156 | |
| |
Claire’s Stores, Inc.: | | | | | | | | |
7.75% Sr. Unsec. Nts., 6/1/203 | | | 415,000 | | | | 285,312 | |
8.875% Sr. Unsec. Nts., 3/15/19 | | | 445,000 | | | | 373,800 | |
| |
Cleaver-Brooks, Inc., 8.75% Sr. Sec. Nts., 12/15/193 | | | 495,000 | | | | 550,687 | |
| |
Cloud Peak Energy Resources LLC/Cloud Peak Energy Finance Corp.: | | | | | | | | |
6.375% Sr. Unsec. Nts., 3/15/24 | | | 165,000 | | | | 172,425 | |
8.50% Sr. Unsec. Nts., 12/15/19 | | | 150,000 | | | | 162,187 | |
| |
CNH Industrial Capital LLC, 6.25% Sr. Unsec. Nts., 11/1/16 | | | 180,000 | | | | 198,000 | |
| |
Consolidated Container Co. LLC/Consolidated Container Capital, Inc., 10.125% Sr. Unsec. Nts., 7/15/203 | | | 160,000 | | | | 167,200 | |
| |
Constellium NV, 5.75% Sr. Unsec. Nts., 5/15/246 | | | 140,000 | | | | 140,000 | |
| |
Crestwood Midstream Partners LP/Crestwood Midstream Finance Corp.: | | | | | | | | |
6.00% Sr. Unsec. Nts., 12/15/20 | | | 140,000 | | | | 147,700 | |
6.125% Sr. Unsec. Nts., 3/1/223 | | | 350,000 | | | | 367,500 | |
| |
Crown Americas LLC/Crown Americas Capital Corp. IV, 4.50% Sr. Unsec. Nts., 1/15/23 | | | 150,000 | | | | 144,000 | |
| |
Cumulus Media Holdings, Inc., 7.75% Sr. Unsec. Nts., 5/1/19 | | | 410,000 | | | | 438,700 | |
| |
DaVita HealthCare Partners, Inc., 5.75% Sr. Unsec. Nts., 8/15/22 | | | 280,000 | | | | 297,500 | |
| |
Dean Foods Co., 9.75% Sr. Unsec. Nts., 12/15/18 | | | 400,000 | | | | 441,000 | |
| |
Denali Borrower LLC/Denali Finance Corp., 5.625% Sr. Sec. Nts., 10/15/203 | | | 440,000 | | | | 453,200 | |
| |
Denbury Resources, Inc., 4.625% Sr. Sub. Nts., 7/15/23 | | | 295,000 | | | | 282,094 | |
| |
DISH DBS Corp.: | | | | | | | | |
6.75% Sr. Unsec. Nts., 6/1/21 | | | 180,000 | | | | 203,850 | |
7.875% Sr. Unsec. Nts., 9/1/19 | | | 605,000 | | | | 719,194 | |
| |
DJO Finance LLC/DJO Finance Corp., 8.75% Sec. Nts., 3/15/18 | | | 330,000 | | | | 359,700 | |
| |
DreamWorks Animation SKG, Inc., 6.875% Sr. Unsec. Nts., 8/15/203 | | | 355,000 | | | | 386,950 | |
| |
Drill Rigs Holdings, Inc., 6.50% Sr. Sec. Nts., 10/1/173 | | | 335,000 | | | | 347,562 | |
| |
DuPont Fabros Technology LP, 5.875% Sr. Unsec. Nts., 9/15/21 | | | 445,000 | | | | 466,137 | |
| |
Dynegy, Inc., 5.875% Sr. Unsec. Nts., 6/1/23 | | | 95,000 | | | | 92,150 | |
| |
EarthLink Holdings Corp., 7.375% Sr. Sec. Nts., 6/1/20 | | | 695,000 | | | | 728,012 | |
| |
Eletson Holdings, 9.625% Sr. Sec. Nts., 1/15/223 | | | 295,000 | | | | 315,650 | |
| |
Entercom Radio LLC, 10.50% Sr. Unsec. Nts., 12/1/19 | | | 270,000 | | | | 313,200 | |
| |
EP Energy LLC/Everest Acquisition Finance, Inc., 7.75% Sr. Unsec. Nts., 9/1/22 | | | 630,000 | | | | 704,812 | |
| |
Equinix, Inc., 4.875% Sr. Unsec. Nts., 4/1/20 | | | 345,000 | | | | 353,625 | |
| |
Erickson, Inc., 8.25% Sec. Nts., 5/1/203 | | | 896,000 | | | | 936,320 | |
29 OPPENHEIMER GLOBAL ALLOCATION FUND
| | |
| |
CONSOLIDATED STATEMENTOF INVESTMENTS Unaudited / Continued | | |
| | | | | | | | |
| | | Principal Amount | | | Value | |
| |
Non-Convertible Corporate Bonds and Notes (Continued) | |
| |
EXCO Resources, Inc., 7.50% Sr. Unsec. Nts., 9/15/18 | | $ | 210,000 | | | $ | 214,725 | |
| |
Exopack Holdings SA, 7.875% Sr. Unsec. Nts., 11/1/194 | | | 395,000 | | | | 420,675 | |
| |
Exterran Partners LP/EXLP Finance Corp., 6% Sr. Unsec. Nts., 4/1/21 | | | 355,000 | | | | 356,775 | |
| |
FairPoint Communications, Inc., 8.75% Sr. Sec. Nts., 8/15/193 | | | 1,015,000 | | | | 1,103,812 | |
| |
Felcor Lodging LP, 6.75% Sr. Sec. Nts., 6/1/19 | | | 245,000 | | | | 263,375 | |
| |
Ferrellgas LP/Ferrellgas Finance Corp., 6.50% Sr. Unsec. Nts., 5/1/21 | | | 265,000 | | | | 279,575 | |
| |
FGI Operating Co. LLC/FGI Finance, Inc., 7.875% Sec. Nts., 5/1/20 | | | 765,000 | | | | 818,550 | |
| |
First Data Corp.: | | | | | | | | |
6.75% Sr. Sec. Nts., 11/1/203 | | | 550,000 | | | | 589,875 | |
8.25% Sec. Nts., 1/15/213 | | | 665,000 | | | | 719,862 | |
10.625% Sr. Unsec. Nts., 6/15/21 | | | 460,000 | | | | 523,825 | |
| |
First Data Holdings, Inc., 14.50% Sr. Unsec. Nts., 9/24/193,7 | | | 282,941 | | | | 274,099 | |
| |
Fly Leasing Ltd., 6.75% Sr. Unsec. Nts., 12/15/20 | | | 400,000 | | | | 420,500 | |
| |
FMG Resources August 2006 Pty Ltd., 6.875% Sr. Unsec. Nts., 4/1/223 | | | 215,000 | | | | 230,856 | |
| |
Forbes Energy Services Ltd., 9% Sr. Unsec. Nts., 6/15/19 | | | 210,000 | | | | 215,775 | |
| |
Ford Motor Co., 7.45% Sr. Unsec. Nts., 7/16/31 | | | 230,000 | | | | 300,639 | |
| |
Freescale Semiconductor, Inc.: | | | | | | | | |
6.00% Sr. Sec. Nts., 1/15/223 | | | 730,000 | | | | 764,675 | |
10.75% Sr. Unsec. Nts., 8/1/20 | | | 407,000 | | | | 470,085 | |
| |
Fresenius Medical Care US Finance II, Inc.: | | | | | | | | |
5.625% Sr. Unsec. Nts., 7/31/193 | | | 290,000 | | | | 316,825 | |
5.875% Sr. Unsec. Nts., 1/31/223 | | | 145,000 | | | | 155,150 | |
| |
Frontier Communications Corp.: | | | | | | | | |
7.125% Sr. Unsec. Nts., 1/15/23 | | | 425,000 | | | | 440,937 | |
7.625% Sr. Unsec. Nts., 4/15/24 | | | 355,000 | | | | 370,087 | |
| |
FTI Consulting, Inc., 6% Sr. Unsec. Nts., 11/15/22 | | | 650,000 | | | | 666,250 | |
| |
Gannett Co., Inc., 5.125% Sr. Unsec. Nts., 7/15/203 | | | 335,000 | | | | 348,400 | |
| |
GenCorp, Inc., 7.125% Sec. Nts., 3/15/21 | | | 1,010,000 | | | | 1,100,900 | |
| |
General Cable Corp., 6.50% Sr. Unsec. Nts., 10/1/223 | | | 495,000 | | | | 498,712 | |
| |
Genesis Energy LP/Genesis Energy Finance Corp., 5.75% Sr. Unsec. Nts., 2/15/21 | | | 350,000 | | | | 365,750 | |
| |
Gentiva Health Services, Inc., 11.50% Sr. Unsec. Nts., 9/1/18 | | | 390,000 | | | | 409,500 | |
| |
Goodyear Tire & Rubber Co., 8.25% Sr. Unsec. Nts., 8/15/20 | | | 890,000 | | | | 989,012 | |
| |
Gray Television, Inc., 7.50% Sr. Unsec. Nts., 10/1/20 | | | 675,000 | | | | 729,000 | |
| |
Greektown Holdings LLC/Greektown Mothership Corp., 8.875% Sr. Sec. Nts., 3/15/193 | | | 495,000 | | | | 512,325 | |
| |
Halcon Resources Corp., 8.875% Sr. Unsec. Nts., 5/15/21 | | | 675,000 | | | | 702,844 | |
| |
Harland Clarke Holdings Corp., 6.875% Sr. Sec. Nts., 3/1/203 | | | 365,000 | | | | 368,194 | |
| |
HCA, Inc., 7.50% Sr. Unsec. Nts., 2/15/22 | | | 550,000 | | | | 628,650 | |
| |
HD Supply, Inc., 7.50% Sr. Unsec. Nts., 7/15/20 | | | 860,000 | | | | 935,250 | |
| |
Hexion US Finance Corp., 6.625% Sr. Sec. Nts., 4/15/20 | | | 210,000 | | | | 219,187 | |
| |
Hexion US Finance Corp./Hexion Nova Scotia Finance ULC, 8.875% Sr. Sec. Nts., 2/1/18 | | | 195,000 | | | | 204,019 | |
| |
Hiland Partners LP/Hiland Partners Finance Corp., 7.25% Sr. Unsec. Nts., 10/1/203 | | | 335,000 | | | | 366,825 | |
| |
HOA Restaurant Group LLC/HOA Finance Corp., 11.25% Sec. Nts., 4/1/174 | | | 639,000 | | | | 680,535 | |
| |
Hockey Merger Sub 2, Inc., 7.875% Sr. Unsec. Nts., 10/1/213 | | | 440,000 | | | | 471,900 | |
| |
Hologic, Inc., 6.25% Sr. Unsec. Nts., 8/1/20 | | | 50,000 | | | | 53,125 | |
| |
Hornbeck Offshore Services, Inc., 5.875% Sr. Unsec. Nts., 4/1/20 | | | 560,000 | | | | 585,200 | |
| |
Hot Topic, Inc., 9.25% Sr. Sec. Nts., 6/15/213 | | | 790,000 | | | | 867,025 | |
30 OPPENHEIMER GLOBAL ALLOCATION FUND
| | | | | | | | |
| | | Principal Amount | | | Value | |
| |
Non-Convertible Corporate Bonds and Notes (Continued) | |
| |
Huntington Ingalls Industries, Inc., 7.125% Sr. Unsec. Unsub. Nts., 3/15/21 | | $ | 460,000 | | | $ | 509,450 | |
| |
IAC/InterActiveCorp, 4.75% Sr. Unsec. Nts., 12/15/22 | | | 275,000 | | | | 271,562 | |
| |
IASIS Healthcare LLC/IASIS Capital Corp., 8.375% Sr. Unsec. Nts., 5/15/19 | | | 665,000 | | | | 708,225 | |
| |
Icahn Enterprises LP/Icahn Enterprises Finance Corp., 5.875% Sr. Unsec. Nts., 2/1/223 | | | 545,000 | | | | 554,537 | |
| |
INEOS Group Holdings SA, 6.125% Sr. Unsec. Nts., 8/15/183 | | | 430,000 | | | | 447,200 | |
| |
Intelsat Jackson Holdings SA: | | | | | | | | |
5.50% Sr. Unsec. Nts., 8/1/233 | | | 235,000 | | | | 230,887 | |
7.25% Sr. Unsec. Nts., 10/15/20 | | | 400,000 | | | | 433,000 | |
| |
Intelsat Luxembourg SA, 7.75% Sr. Unsec. Nts., 6/1/21 | | | 655,000 | | | | 685,294 | |
| |
Interactive Data Corp., 5.875% Sr. Unsec. Nts., 4/15/193,6 | | | 365,000 | | | | 369,334 | |
| |
International Lease Finance Corp., 8.75% Sr. Unsec. Nts., 3/15/17 | | | 580,000 | | | | 676,787 | |
| |
iPayment, Inc., 10.25% Sr. Unsec. Nts., 5/15/18 | | | 1,185,000 | | | | 841,350 | |
| |
Isle of Capri Casinos, Inc., 7.75% Sr. Unsec. Nts., 3/15/19 | | | 320,000 | | | | 344,000 | |
| |
iStar Financial, Inc., 4.875% Sr. Unsec. Nts., 7/1/18 | | | 255,000 | | | | 263,925 | |
| |
Jaguar Land Rover Automotive plc, 5.625% Sr. Unsec. Nts., 2/1/233 | | | 285,000 | | | | 298,537 | |
| |
Jefferies Finance LLC/JFIN Co.-Issuer Corp.: | | | | | | | | |
6.875% Sr. Unsec. Nts., 4/15/223 | | | 345,000 | | | | 346,725 | |
7.375% Sr. Unsec. Nts., 4/1/203 | | | 420,000 | | | | 442,050 | |
| |
Jefferies LoanCore LLC/JLC Finance Corp., 6.875% Sr. Unsec. Nts., 6/1/203 | | | 350,000 | | | | 354,375 | |
| |
JLL/Delta Dutch Newco BV, 7.50% Sr. Unsec. Nts., 2/1/223 | | | 300,000 | | | | 308,625 | |
| |
JMC Steel Group, Inc., 8.25% Sr. Nts., 3/15/183 | | | 375,000 | | | | 380,625 | |
| |
Jones Energy Holdings LLC/Jones Energy Finance Corp., 6.75% Sr. Unsec. Nts., 4/1/223 | | | 165,000 | | | | 171,600 | |
| |
Jurassic Holdings III, Inc., 6.875% Sec. Nts., 2/15/213 | | | 365,000 | | | | 378,688 | |
| |
K Hovnanian Enterprises, Inc.: | | | | | | | | |
7.00% Sr. Unsec. Nts., 1/15/193 | | | 285,000 | | | | 292,303 | |
9.125% Sec. Nts., 11/15/203 | | | 370,000 | | | | 415,325 | |
| |
Kenan Advantage Group, Inc. (The), 8.375% Sr. Unsec. Nts., 12/15/184 | | | 510,000 | | | | 548,888 | |
| |
Kindred Healthcare, Inc.: | | | | | | | | |
6.375% Sr. Unsec. Nts., 4/15/223 | | | 330,000 | | | | 335,775 | |
8.25% Sr. Unsec. Nts., 6/1/19 | | | 535,000 | | | | 573,788 | |
| |
Kinetic Concepts, Inc./KCI USA, Inc., 10.50% Sec. Nts., 11/1/18 | | | 760,000 | | | | 872,100 | |
| |
Kodiak Oil & Gas Corp., 5.50% Sr. Unsec. Nts., 1/15/21 | | | 405,000 | | | | 419,175 | |
| |
Kratos Defense & Security Solutions, Inc., 10% Sr. Sec. Nts., 6/1/17 | | | 325,000 | | | | 342,672 | |
| |
Landry’s, Inc., 9.375% Sr. Nts., 5/1/203 | | | 595,000 | | | | 658,963 | |
| |
Laredo Petroleum, Inc., 5.625% Sr. Unsec. Nts., 1/15/223 | | | 135,000 | | | | 137,869 | |
| |
LBC Tank Terminals Holding Netherlands BV, 6.875% Sr. Unsec. Nts., 5/15/234 | | | 140,000 | | | | 149,100 | |
| �� |
Lear Corp., 4.75% Sr. Unsec. Nts., 1/15/233 | | | 490,000 | | | | 483,875 | |
| |
Level 3 Communications, Inc., 8.875% Sr. Unsec. Nts., 6/1/19 | | | 330,000 | | | | 363,825 | |
| |
Level 3 Financing, Inc., 9.375% Sr. Unsec. Nts., 4/1/19 | | | 180,000 | | | | 199,800 | |
| |
LifePoint Hospitals, Inc., 5.50% Sr. Unsec. Nts., 12/1/213 | | | 720,000 | | | | 750,600 | |
| |
Lightstream Resources Ltd., 8.625% Sr. Unsec. Nts., 2/1/203 | | | 355,000 | | | | 364,319 | |
| |
Linn Energy LLC/Linn Energy Finance Corp.: | | | | | | | | |
7.75% Sr. Unsec. Nts., 2/1/21 | | | 655,000 | | | | 704,125 | |
8.625% Sr. Unsec. Nts., 4/15/20 | | | 325,000 | | | | 352,219 | |
| |
Manitowoc Co., Inc. (The), 8.50% Sr. Unsec. Nts., 11/1/20 | | | 615,000 | | | | 693,413 | |
| |
McDermott International, Inc., 8% Sec. Nts., 5/1/213 | | | 370,000 | | | | 374,625 | |
| |
MCE Finance Ltd., 5% Sr. Unsec. Nts., 2/15/213 | | | 430,000 | | | | 431,075 | |
31 OPPENHEIMER GLOBAL ALLOCATION FUND
| | |
| |
CONSOLIDATED STATEMENTOF INVESTMENTS Unaudited / Continued | | |
| | | | | | | | |
| | | Principal Amount | | | Value | |
| |
Non-Convertible Corporate Bonds and Notes (Continued) | |
| |
MEG Energy Corp., 6.50% Sr. Unsec. Nts., 3/15/213 | | $ | 1,005,000 | | | $ | 1,062,788 | |
| |
Memorial Production Partners LP/Memorial Production Finance Corp., 7.625% Sr. Unsec. Nts., 5/1/21 | | | 370,000 | | | | 391,738 | |
| |
Meritor, Inc., 6.25% Sr. Unsec. Nts., 2/15/24 | | | 715,000 | | | | 716,788 | |
| |
MetroPCS Wireless, Inc., 6.625% Sr. Unsec. Nts., 11/15/20 | | | 1,020,000 | | | | 1,092,675 | |
| |
MGM Resorts International: | | | | | | | | |
6.625% Sr. Unsec. Nts., 12/15/21 | | | 405,000 | | | | 446,128 | |
6.75% Sr. Unsec. Nts., 10/1/20 | | | 390,000 | | | | 431,964 | |
| |
Michaels FinCo Holdings LLC/Michaels FinCo, Inc., 7.50% Sr. Unsec. Nts., 8/1/183,7 | | | 300,000 | | | | 310,500 | |
| |
Micron Technology, Inc., 5.875% Sr. Unsec. Nts., 2/15/223 | | | 135,000 | | | | 142,763 | |
| |
Midstates Petroleum Co., Inc./Midstates Petroleum Co. LLC, 9.25% Sr. Unsec. Nts., 6/1/21 | | | 345,000 | | | | 354,488 | |
| |
Milestone Aviation Group Ltd. (The), 8.625% Sr. Unsec. Nts., 12/15/173 | | | 395,000 | | | | 428,575 | |
| |
Miran Mid-Atlantic Trust, 10.06% Sec. Pass-Through Certificates, 10.06%, Series C, 12/30/28 | | | 370,232 | | | | 413,271 | |
| |
Momentive Performance Materials, Inc., 8.875% Sr. Sec. Nts., 10/15/20 | | | 350,000 | | | | 380,188 | |
| |
Monitronics International, Inc., 9.125% Sr. Unsec. Nts., 4/1/20 | | | 680,000 | | | | 726,750 | |
| |
MPH Acquisition Holdings LLC, 6.625% Sr. Unsec. Nts., 4/1/223 | | | 165,000 | | | | 171,188 | |
| |
MTR Gaming Group, Inc., 11.50% Sec. Nts., 8/1/19 | | | 326,575 | | | | 369,030 | |
| |
Murray Energy Corp., 8.625% Sr. Sec. Nts., 6/15/213 | | | 140,000 | | | | 152,600 | |
| |
National Financial Partners Corp., 9% Sr. Unsec. Nts., 7/15/213 | | | 390,000 | | | | 422,175 | |
| |
Nationstar Mortgage LLC/Nationstar Capital Corp.: | | | | | | | | |
6.50% Sr. Unsec. Nts., 8/1/18 | | | 120,000 | | | | 121,500 | |
7.875% Sr. Unsec. Nts., 10/1/20 | | | 200,000 | | | | 205,500 | |
10.875% Sr. Unsec. Nts., 4/1/15 | | | 460,000 | | | | 463,450 | |
| |
Navios Maritime Acquisition Corp./Navios Acquisition Finance US, Inc., 8.125% Sr. Sec. Nts., 11/15/213 | | | 365,000 | | | | 382,338 | |
| |
Navios Maritime Holdings, Inc./Navios Maritime Finance II US, Inc., 7.375% Sr. Nts., 1/15/223 | | | 395,000 | | | | 399,938 | |
| |
Navistar International Corp., 8.25% Sr. Unsec. Nts., 11/1/21 | | | 345,000 | | | | 352,331 | |
| |
Neiman Marcus Group Ltd., Inc.: | | | | | | | | |
8.00% Sr. Unsec. Nts., 10/15/213 | | | 190,000 | | | | 209,000 | |
8.75% Sr. Unsec. Nts., 10/15/213,7 | | | 630,000 | | | | 699,300 | |
| |
Nexstar Broadcasting, Inc., 6.875% Sr. Unsec. Nts., 11/15/20 | | | 445,000 | | | | 478,375 | |
| |
Nortek, Inc., 8.50% Sr. Unsec. Nts., 4/15/21 | | | 640,000 | | | | 708,800 | |
| |
North Atlantic Drilling Ltd., 6.25% Sr. Unsec. Nts., 2/1/193 | | | 385,000 | | | | 369,600 | |
| |
Novelis, Inc., 8.75% Sr. Unsec. Nts., 12/15/20 | | | 450,000 | | | | 504,000 | |
| |
NRG Energy, Inc.: | | | | | | | | |
6.25% Sr. Unsec. Nts., 7/15/22-5/1/243 | | | 935,000 | | | | 951,550 | |
6.625% Sr. Unsec. Nts., 3/15/23 | | | 135,000 | | | | 141,750 | |
| |
Numericable Group SA, 6% Sr. Sec. Nts., 5/15/223,6 | | | 700,000 | | | | 717,500 | |
| |
Oasis Petroleum, Inc., 6.875% Sr. Unsec. Nts., 1/15/23 | | | 180,000 | | | | 195,750 | |
| |
Offshore Group Investment Ltd., 7.50% Sr. Sec. Nts., 11/1/19 | | | 595,000 | | | | 621,775 | |
| |
Opal Acquisition, Inc., 8.875% Sr. Unsec. Nts., 12/15/213 | | | 145,000 | | | | 150,619 | |
| |
Pacific Drilling SA, 5.375% Sr. Sec. Nts., 6/1/203 | | | 375,000 | | | | 366,563 | |
| |
Parsley Energy LLC/Parsley Finance Corp., 7.50% Sr. Unsec. Nts., 2/15/223 | | | 355,000 | | | | 372,750 | |
| |
Party City Holdings, Inc., 8.875% Sr. Unsec. Nts., 8/1/20 | | | 460,000 | | | | 515,200 | |
| |
Penn Virginia Corp., 8.50% Sr. Unsec. Nts., 5/1/20 | | | 100,000 | | | | 111,500 | |
| |
PetroLogistics LP/PetroLogistics Finance Corp., 6.25% Sr. Unsec. Nts., 4/1/20 | | | 90,000 | | | | 92,363 | |
32 OPPENHEIMER GLOBAL ALLOCATION FUND
| | | | | | | | |
| | | Principal Amount | | | Value | |
| |
Non-Convertible Corporate Bonds and Notes (Continued) | |
| |
PF Chang’s China Bistro, Inc., 10.25% Sr. Unsec. Nts., 6/30/203 | | $ | 400,000 | | | $ | 418,000 | |
| |
Ply Gem Industries, Inc., 6.50% Sr. Unsec. Nts., 2/1/223 | | | 390,000 | | | | 391,463 | |
| |
PNK Finance Corp., 6.375% Sr. Unsec. Nts., 8/1/213 | | | 475,000 | | | | 501,125 | |
| |
Polymer Group, Inc., 7.75% Sr. Sec. Nts., 2/1/19 | | | 480,000 | | | | 517,200 | |
| |
PQ Corp., 8.75% Sec. Nts., 5/1/183 | | | 285,000 | | | | 311,363 | |
| |
Precision Drilling Corp., 6.625% Sr. Unsec. Nts., 11/15/20 | | | 330,000 | | | | 356,400 | |
| |
Prospect Medical Holdings, Inc., 8.375% Sr. Sec. Nts., 5/1/193 | | | 460,000 | | | | 502,550 | |
| |
Quiksilver, Inc./QS Wholesale, Inc.: | | | | | | | | |
7.875% Sr. Sec. Nts., 8/1/183 | | | 300,000 | | | | 327,000 | |
10.00% Sr. Unsec. Nts., 8/1/20 | | | 300,000 | | | | 342,000 | |
| |
R.R. Donnelley & Sons Co., 7.875% Sr. Unsec. Nts., 3/15/21 | | | 335,000 | | | | 385,250 | |
| |
Realogy Group LLC: | | | | | | | | |
7.625% Sr. Sec. Nts., 1/15/203 | | | 380,000 | | | | 425,600 | |
9.00% Sr. Sec. Nts., 1/15/203 | | | 245,000 | | | | 281,750 | |
| |
Regal Entertainment Group, 5.75% Sr. Unsec. Nts., 3/15/22 | | | 110,000 | | | | 113,575 | |
| |
Rentech Nitrogen Partners LP/Rentech Nitrogen Finance Corp., 6.50% Sec. Nts., 4/15/213 | | | 230,000 | | | | 227,700 | |
| |
Reynolds Group Issuer, Inc./Reynolds Group Issuer LLC/Reynolds Group Issuer Luxembourg SA: | | | | | | | | |
5.75% Sr. Sec. Nts., 10/15/20 | | | 350,000 | | | | 365,750 | |
9.00% Sr. Unsec. Nts., 4/15/19 | | | 395,000 | | | | 423,638 | |
| |
Rice Energy, Inc., 6.25% Sr. Unsec. Nts., 5/1/223 | | | 115,000 | | | | 115,288 | |
| |
Rosetta Resources, Inc., 5.625% Sr. Unsec. Nts., 5/1/21 | | | 355,000 | | | | 362,988 | |
| |
Sabre GLBL, Inc., 8.50% Sr. Sec. Nts., 5/15/193 | | | 630,000 | | | | 696,938 | |
| |
Salix Pharmaceuticals Ltd., 6% Sr. Unsec. Nts., 1/15/213 | | | 705,000 | | | | 757,875 | |
| |
Samson Investment Co., 10.75% Sr. Unsec. Nts., 2/15/203 | | | 975,000 | | | | 1,033,500 | |
| |
Sanchez Energy Corp., 7.75% Sr. Unsec. Nts., 6/15/213 | | | 350,000 | | | | 376,250 | |
| |
SandRidge Energy, Inc.: | | | | | | | | |
7.50% Sr. Unsec. Nts., 2/15/23 | | | 275,000 | | | | 292,875 | |
7.51% Sr. Unsec. Nts., 3/15/21 | | | 623,000 | | | | 665,053 | |
| |
SBA Telecommunications, Inc., 5.75% Sr. Unsec. Nts., 7/15/20 | | | 215,000 | | | | 226,825 | |
| |
Schaeffler Finance BV, 8.50% Sr. Sec. Nts., 2/15/194 | | | 420,000 | | | | 474,138 | |
| |
Sealed Air Corp., 6.50% Sr. Unsec. Nts., 12/1/203 | | | 360,000 | | | | 399,600 | |
| |
Select Medical Corp.: | | | | | | | | |
6.375% Sr. Unsec. Nts., 6/1/21 | | | 230,000 | | | | 238,050 | |
6.375% Sr. Unsec. Nts., 6/1/213 | | | 165,000 | | | | 170,775 | |
| |
ServiceMaster Co., 8% Sr. Unsec. Nts., 2/15/20 | | | 410,000 | | | | 444,338 | |
| |
Signode Industrial Group Lux SA/Signode Industrial Group US, Inc., 6.375% Sr. Unsec. Nts., 5/1/223 | | | 280,000 | | | | 283,500 | |
| |
Sinclair Television Group, Inc.: | | | | | | | | |
5.375% Sr. Unsec. Nts., 4/1/21 | | | 350,000 | | | | 350,000 | |
6.125% Sr. Unsec. Nts., 10/1/22 | | | 690,000 | | | | 708,113 | |
| |
SIWF Merger Sub, Inc., 6.25% Sr. Sec. Nts., 6/1/213 | | | 755,000 | | | | 787,088 | |
| |
SLM Corp., 7.25% Sr. Unsec. Nts., 1/25/22 | | | 400,000 | | | | 442,000 | |
| |
SM Energy Co., 6.50% Sr. Unsec. Nts., 1/1/23 | | | 330,000 | | | | 357,225 | |
| |
Speedy Cash Intermediate Holdings Corp., 10.75% Sec. Nts., 5/15/183 | | | 545,000 | | | | 543,638 | |
| |
Spencer Spirit Holdings, Inc., 9% Sr. Unsec. Nts., 5/1/184,7 | | | 365,000 | | | | 373,669 | |
| |
Spirit AeroSystems, Inc., 5.25% Sr. Unsec. Nts., 3/15/223 | | | 365,000 | | | | 370,931 | |
| |
SPL Logistics Escrow LLC/SPL Logistics Finance Corp., 8.875% Sr. Sec. Nts., 8/1/203 | | | 685,000 | | | | 765,488 | |
| |
Springleaf Finance Corp., 6.90% Sr. Unsec. Nts., 12/15/17 | | | 665,000 | | | | 732,331 | |
33 OPPENHEIMER GLOBAL ALLOCATION FUND
| | |
| |
CONSOLIDATED STATEMENTOF INVESTMENTS Unaudited / Continued | | |
| | | | | | | | |
| | | Principal Amount | | | Value | |
| |
Non-Convertible Corporate Bonds and Notes (Continued) | |
| |
Sprint Corp., 7.25% Sr. Unsec. Nts., 9/15/213 | | $ | 475,000 | | | $ | 519,531 | |
| |
Stackpole International Intermediate Co., 7.75% Sr. Sec. Nts., 10/15/213 | | | 360,000 | | | | 387,000 | |
| |
| Sugarhouse HSP Gaming Prop Mezz LP/Sugarhouse HSP Gaming Finance Corp., 6.375% Sr. Sec. Nts., 6/1/213 | | | 365,000 | | | | 359,525 | |
| |
Taylor Morrison Communities, Inc./Monarch Communities, Inc., 5.25% Sr. Unsec. Nts., 4/15/213 | | | 230,000 | | | | 233,450 | |
| |
Tenet Healthcare Corp., 6% Sr. Sec. Nts., 10/1/203 | | | 300,000 | | | | 315,563 | |
| |
Terex Corp., 6% Sr. Unsec. Nts., 5/15/21 | | | 630,000 | | | | 677,250 | |
| |
Tervita Corp., 8% Sr. Sec. Nts., 11/15/183 | | | 275,000 | | | | 279,125 | |
| |
Tesoro Logistics LP/Tesoro Logistics Finance Corp., 5.875% Sr. Unsec. Nts., 10/1/20 | | | 345,000 | | | | 363,113 | |
| |
Thompson Creek Metals Co., Inc., 7.375% Sr. Unsec. Nts., 6/1/18 | | | 390,000 | | | | 369,525 | |
| |
T-Mobile USA, Inc., 6.25% Sr. Unsec. Nts., 4/1/21 | | | 355,000 | | | | 379,406 | �� |
| |
TMX Finance LLC/TitleMax Finance Corp., 8.50% Sr. Sec. Nts., 9/15/183 | | | 430,000 | | | | 460,100 | |
| |
Tomkins LLC/Tomkins, Inc., 9% Sec. Nts., 10/1/18 | | | 406,000 | | | | 437,465 | |
| |
TransDigm, Inc., 7.75% Sr. Sub. Nts., 12/15/18 | | | 315,000 | | | | 337,050 | |
| |
Trinseo Materials Operating SCA/Trinseo Materials Finance, Inc., 8.75% Sr. Sec. Nts., 2/1/19 | | | 180,000 | | | | 192,150 | |
| |
Universal Hospital Services, Inc., 7.625% Sec. Nts., 8/15/20 | | | 350,000 | | | | 376,250 | |
| |
Univision Communications, Inc., 8.50% Sr. Unsec. Nts., 5/15/213 | | | 320,000 | | | | 353,600 | |
| |
UPCB Finance V Ltd., 7.25% Sr. Sec. Nts., 11/15/213 | | | 530,000 | | | | 586,975 | |
| |
UPCB Finance VI Ltd., 6.875% Sr. Sec. Nts., 1/15/223 | | | 675,000 | | | | 739,125 | |
| |
US Airways 2011-1 Class A Pass Through Trust, 7.125% Pass-Through Certificates, 10/22/23 | | | 507,796 | | | | 589,043 | |
| |
Valeant Pharmaceuticals International, Inc.: | | | | | | | | |
6.375% Sr. Unsec. Nts., 10/15/203 | | | 270,000 | | | | 291,600 | |
7.25% Sr. Unsec. Nts., 7/15/223 | | | 300,000 | | | | 328,500 | |
| |
Vector Group Ltd.: | | | | | | | | |
7.75% Sr. Sec. Nts., 2/15/213 | | | 65,000 | | | | 69,875 | |
7.75% Sr. Sec. Nts., 2/15/21 | | | 325,000 | | | | 349,375 | |
| |
ViaSat, Inc., 6.875% Sr. Unsec. Nts., 6/15/20 | | | 756,000 | | | | 813,645 | |
| |
Victor Technologies Group, Inc., 9% Sr. Sec. Nts., 12/15/17 | | | 531,000 | | | | 567,878 | |
| |
Viking Cruises Ltd., 8.50% Unsec. Nts., 10/15/223 | | | 220,000 | | | | 249,700 | |
| |
Visteon Corp., 6.75% Sr. Unsec. Nts., 4/15/19 | | | 725,000 | | | | 763,106 | |
| |
Walter Energy, Inc., 9.50% Sr. Sec. Nts., 10/15/193 | | | 420,000 | | | | 428,925 | |
| |
Walter Investment Management Corp., 7.875% Sr. Unsec. Nts., 12/15/213 | | | 580,000 | | | | 578,550 | |
| |
Wells Enterprises, Inc., 6.75% Sr. Sec. Nts., 2/1/203 | | | 283,000 | | | | 293,613 | |
| |
Western Express, Inc., 12.50% Sr. Sec. Nts., 4/15/154 | | | 535,000 | | | | 405,263 | |
| |
Wind Acquisition Finance SA, 7.25% Sr. Sec. Nts., 2/15/183 | | | 810,000 | | | | 856,575 | |
| |
Windstream Corp.: | | | | | | | | |
6.375% Sr. Unsec. Nts., 8/1/23 | | | 300,000 | | | | 293,250 | |
7.75% Sr. Unsec. Nts., 10/15/20-10/1/21 | | | 1,020,000 | | | | 1,107,575 | |
| |
Wise Metals Group LLC/Wise Alloys Finance Corp., 8.75% Sr. Sec. Nts., 12/15/183 | | | 215,000 | | | | 228,975 | |
| |
Xerium Technologies, Inc., 8.875% Sr. Unsec. Nts., 6/15/18 | | | 430,000 | | | | 461,444 | |
| | | | | | | | |
Total Non-Convertible Corporate Bonds and Notes (Cost $125,486,766) | | | | | | | 130,247,327 | |
| | | | | | | | |
| |
Corporate Loans—1.0% | | | | | | | | |
| |
Accellent, Inc., Sr. Sec. Credit Facilities 2nd Lien Term Loan, 7.50%, 3/11/228 | | | 320,000 | | | | 319,200 | |
34 OPPENHEIMER GLOBAL ALLOCATION FUND
| | | | | | | | |
| | | Principal Amount | | | Value | |
| |
Corporate Loans (Continued) | |
| |
Affinion Group, Inc., Sr. Sec. Credit Facilities 1st Lien Term Loan, Tranche B, 6.75%, 10/9/168 | | $ | 334,291 | | | $ | 335,545 | |
| |
Asurion LLC, Sr. Sec. Credit Facilities 2nd Lien Term Loan, 8.50%, 3/3/218 | | | 355,000 | | | | 364,023 | |
| |
BJ’s Wholesale Club, Inc., Sr. Sec. Credit Facilities 2nd Lien Term Loan, 8.50%, 3/26/208 | | | 420,000 | | | | 429,413 | |
| |
Blue Coat Systems, Inc., Sr. Sec. Credit Facilities 2nd Lien Term Loan, 9.50%, 6/26/208 | | | 200,000 | | | | 205,250 | |
| |
Brock Holdings III, Inc., Sr. Sec. Credit Facilities 2nd Lien Term Loan, 10.00%, 3/16/188 | | | 280,000 | | | | 283,558 | |
| |
| Caesars Entertainment Operating Co., Inc., Sr. Sec. Credit Facilities 1st Lien Term Loan, Tranche B6, 5.402%, 1/28/186,8 | | | 628,751 | | | | 587,784 | |
| |
| Caesars Entertainment Resort Properties LLC, Sr. Sec. Credit Facilities 1st Lien Term Loan, Tranche B, 7.00%, 10/11/208 | | | 738,150 | | | | 740,559 | |
| |
| Caesars Growth Properties Holdings LLC/Caesars Growth Properties Finance, Inc., Sr. Sec. Credit Facilities 1st Lien Term Loan, 6.25%, 4/9/216,8 | | | 245,000 | | | | 244,311 | |
| |
| Catalent Pharma Solutions, Inc., Sr. Sec. Credit Facilities 1st Lien Term Loan, 6.50%, 12/31/178 | | | 275,000 | | | | 277,062 | |
| |
| Cenveo Corp., Sr. Sec. Credit Facilities 1st Lien Term Loan, Tranche B, 6.25%, 2/13/178 | | | 467,286 | | | | 468,455 | |
| |
| Clear Channel Communications, Inc., Extended Sr. Sec. Credit Facilities 1st Lien Term Loan, Tranche D, 6.90%, 1/30/198 | | | 1,199,336 | | | | 1,191,240 | |
| |
| Clear Channel Communications, Inc., Sr. Sec. Credit Facilities 1st Lien Term Loan: | | | | | | | | |
| Tranche B, 3.80%, 1/29/16 | | | 11,336 | | | | 11,252 | |
| Tranche E, 7.65%, 7/30/19 | | | 209,337 | | | | 209,962 | |
| |
| CRC Health Corp., Sr. Sec. Credit Facilities 2nd Lien Term Loan, 9.00%, 9/28/218 | | | 555,000 | | | | 557,544 | |
| |
| Del Monte Pacific Ltd., Sr. Sec. Credit Facilities 2nd Lien Term Loan, 8.25%, 8/18/218 | | | 330,000 | | | | 327,319 | |
| |
| Deltek, Inc., Sr. Sec. Credit Facilities 2nd Lien Term Loan, 10.00%, 10/10/198 | | | 455,000 | | | | 464,100 | |
| |
| Dialysis Newco, Inc., Sr. Sec. Credit Facilities 2nd Lien Term Loan, 7.75%, 10/21/218 | | | 555,000 | | | | 556,388 | |
| |
| Fairpoint Communications, Inc., Sr. Sec. Credit Facilities 1st Lien Term Loan, Tranche B, 7.50%, 2/14/196,8 | | | 427,839 | | | | 442,502 | |
| |
Fieldwood Energy LLC, Sr. Sec. Credit Facilities 2nd Lien Term Loan, 8.375%, 9/30/208 | | | 854,152 | | | | 883,193 | |
| |
Fram Group Holdings, Sr. Sec. Credit Facilities 1st Lien Term Loan, 6.50%, 7/31/178 | | | 275,820 | | | | 276,050 | |
| |
GYP Holdings III Corp., Sr. Sec. Credit Facilities 2nd Lien Term Loan, 7.75%, 3/27/228 | | | 550,000 | | | | 556,875 | |
| |
iStar Financial, Inc., Sr. Sec. Credit Facilities 1st Lien Term Loan, 7.00%, 3/19/178 | | | 273,597 | | | | 287,961 | |
| |
Moxie Patriot LLC, Sr. Sec. Credit Facilities 1st Lien Term Loan, Tranche B1, 6.75%, 12/19/208 | | | 325,000 | | | | 333,734 | |
| |
Murray Energy Corp., Sr. Sec. Credit Facilities 2nd Lien Term Loan, 9.50%, 12/4/208 | | | 620,000 | | | | 689,362 | |
| |
NewPage Corp., Sr. Sec. Credit Facilities 1st Lien Term Loan, 9.50%, 2/5/218 | | | 710,000 | | | | 718,431 | |
| |
NTELOS, Inc., Sr. Sec. Credit Facilities 1st Lien Term Loan, Tranche B, 5.75%, 11/9/198 | | | 320,125 | | | | 320,525 | |
35 OPPENHEIMER GLOBAL ALLOCATION FUND
| | |
| |
CONSOLIDATED STATEMENTOF INVESTMENTS Unaudited / Continued | | |
| | | | | | | | | | | | | | | | | | | | | | | | | | |
| | | | | | | | | | | | | | | | | Principal Amount | | | Value | |
| |
Corporate Loans (Continued) | | | | | | | | | | | | | | | | | | | | | | | | | | |
| |
Clear Channel Communications, Inc., Sr. Sec. Credit Facilities 1st Lien Term Loan: (Continued) | | | | | | | | | |
| |
Nuveen Investments, Inc., Sr. Sec. Credit Facilities 2nd Lien Term Loan, 6.50%, 2/28/198 | | | $ | 705,000 | | | $ | 709,658 | |
| |
OneLink Communications/San Juan Cable LLC, Sr. Sec. Credit Facilities 2nd Lien Term Loan, 10.00%, 6/9/188 | | | | 620,000 | | | | 625,425 | |
| |
Quicksilver Resources, Inc., Sr. Sec. Credit Facilities 2nd Lien Term Loan, 7.00%, 6/21/198 | | | | 735,000 | | | | 735,000 | |
| |
Radnet Management, Inc., Sr. Sec. Credit Facilities 2nd Lien Term Loan, Tranche B, 8.00%, 3/5/218 | | | | 415,000 | | | | 413,444 | |
| |
Revel Entertainment, Inc., Sr. Sec. Credit Facilities 2nd Lien Exit Term Loan, 0.00%, 5/20/188,9 | | | | 326,143 | | | | 203,839 | |
| |
Rexam plc, Sr. Sec. Credit Facilities 2nd Lien Term Loan, 8.00%, 4/11/226,8 | | | | 440,000 | | | | 440,688 | |
| |
Road Infrastructure Investment LC, Sr. Sec. Credit Facilities 2nd Lien Term Loan, 7.75%, 9/21/218 | | | | 435,000 | | | | 433,912 | |
| |
Sabine Oil & Gas LLC, Sr. Sec. Credit Facilities 2nd Lien Term Loan, 8.75%, 12/31/188 | | | | 705,000 | | | | 714,694 | |
| |
Templar Energy, Sr. Sec. Credit Facilities 2nd Lien Term Loan, 8.00%, 11/25/208 | | | | 1,095,000 | | | | 1,090,894 | |
| |
TWCC Holding Corp., Sr. Sec. Credit Facilities 2nd Lien Term Loan, 7.00%, 6/26/208 | | | | 600,000 | | | | 598,250 | |
| | | | | | | | | | | | | | | | | | | | | | | | | | |
Total Corporate Loans (Cost $17,696,365) | | | | | | | | 18,047,402 | |
| | | | | | | | Exercise
Price | | | Expiration
Date | | | | | | Contracts | | | | |
| |
Exchange-Traded Options Purchased—0.6% | | | | | | | | | | | | | | | | | | | | | | | | | | |
| |
CBOE SPX Volatility Index Call1 | | | USD | | | | 18.000 | | | | 5/21/14 | | | | USD | | | | 20,000 | | | | 600,000 | |
| |
CBOE SPX Volatility Index Call1 | | | USD | | | | 15.000 | | | | 5/21/14 | | | | USD | | | | 25,000 | | | | 2,125,000 | |
| |
CBOE SPX Volatility Index Call1 | | | USD | | | | 16.000 | | | | 5/21/14 | | | | USD | | | | 20,000 | | | | 1,240,000 | |
| |
CBOE SPX Volatility Index Call1 | | | USD | | | | 25.000 | | | | 5/21/14 | | | | USD | | | | 5,000 | | | | 35,000 | |
| |
iShares China Large Cap Exchange Traded Fund Call1 | | | USD | | | | 38.000 | | | | 5/17/14 | | | | USD | | | | 10,000 | | | | 20,000 | |
| |
S&P 500 Index Call1 | | | USD | | | | 1,875.000 | | | | 5/17/14 | | | | USD | | | | 1,000 | | | | 2,200,000 | |
| |
S&P 500 Index Put1 | | | USD | | | | 1,815.000 | | | | 5/17/14 | | | | USD | | | | 1,500 | | | | 592,500 | |
| |
S&P 500 Index Call1 | | | USD | | | | 1,900.000 | | | | 5/17/14 | | | | USD | | | | 3,000 | | | | 2,490,000 | |
| |
United States Treasury Nts., 5 yr. Futures, 6/14/14 Call1 | | | USD | | | | 120.250 | | | | 5/23/14 | | | | USD | | | | 13,000 | | | | 1,117,194 | |
| | | | | | | | | | | | | | | | | | | | | | | | | | |
Total Exchange-Traded Options Purchased (Cost $22,697,853) | | | | | | | | | | | | | | | | | | | | | | | 10,419,694 | |
| | | | | | | |
| | | Counterparty | | | | | | | | | | | | | | | | | | |
| |
Over-the-Counter Option Purchased—0.1% | | | | | | | | | |
| |
SX5E Index Call1 (Cost $1,106,511) | | GSG | | | EUR | | | | 3200.000 | | | | 5/16/14 | | | | EUR | | | | 3,500 | | | | 973,786 | |
| | | | | | | |
| | | | | | | | | | | | | | | | | Shares | | | | |
| |
Investment Companies—18.4% | | | | | | | | | | | | | | | | | | | | | | | | | | |
| |
Oppenheimer Institutional Money Market Fund, Cl. E, 0.08%10,11 | | | | 16,858,823 | | | | 16,858,823 | |
| |
Oppenheimer Master Event-Linked Bond Fund, LLC1,10 | | | | 9,251,612 | | | | 130,504,730 | |
36 OPPENHEIMER GLOBAL ALLOCATION FUND
| | | | | | | | |
| | | Shares | | | | |
| |
Investment Companies (Continued) | |
| |
Oppenheimer Master Loan Fund, LLC1,10 | | | 12,415,260 | | | $ | 177,992,776 | |
| | | | | | | | |
Total Investment Companies (Cost $320,643,889) | | | | | | | 325,356,329 | |
| | | | | | | | |
| |
Total Investments, at Value (Cost $1,499,595,362) | | | 98.3% | | | | 1,738,296,808 | |
| |
Assets in Excess of Other Liabilities | | | 1.7 | | | | 29,180,720 | |
| | | | |
Net Assets | | | 100.0% | | | $ | 1,767,477,528 | |
| | | | |
Footnotes to Consolidated Statement of Investments
|
1. Non-income producing security. |
| 2. All or a portion of the security position is held in segregated accounts and pledged to cover margin requirements with respect to outstanding written options. The aggregate market value of such securities is $16,299,296. See Note 6 of the accompanying Consolidated Notes. |
| 3. Represents securities sold under Rule 144A, which are exempt from registration under the Securities Act of 1933, as amended. These securities have been determined to be liquid under guidelines established by the Board of Trustees. These securities amount to $60,696,605 or 3.43% of the Fund’s net assets as of April 30, 2014. |
| 4. Restricted security. The aggregate value of restricted securities as of April 30, 2014 was $4,243,443, which represents 0.24% of the Fund’s net assets. See Note 7 of the accompanying Consolidated Notes. Information concerning restricted securities is as follows: |
| | | | | | | | | | | | | | | | |
| | | | | | | | | | | | Unrealized | |
| | | Acquisition | | | | | | | | | Appreciation/ | |
| Security | | Dates | | | Cost | | | Value | | | (Depreciation) | |
| |
| Burlington Holdings LLC/Burlington Holding Finance, Inc., 9% Sr. Unsec. Nts., 2/15/18 | | | 4/12/13-10/21/13 | | | $ | 275,869 | | | $ | 278,116 | | | $ | 2,247 | |
Exopack Holdings SA, 7.875% Sr. Unsec. Nts., 11/1/19 | | | 10/24/13 | | | | 395,000 | | | | 420,675 | | | | 25,675 | |
HOA Restaurant Group LLC/HOA Finance Corp., 11.25% Sec. Nts., 4/1/17 | | | 6/7/11-2/15/12 | | | | 625,294 | | | | 680,535 | | | | 55,241 | |
Kenan Advantage Group, Inc. (The), 8.375% Sr. Unsec. Nts., 12/15/18 | | | 12/7/12-12/12/13 | | | | 520,399 | | | | 548,888 | | | | 28,489 | |
LBC Tank Terminals Holding Netherlands BV, 6.875% Sr. Unsec. Nts., 5/15/23 | | | 5/8/13 | | | | 140,000 | | | | 149,100 | | | | 9,100 | |
Schaeffler Finance BV, 8.50% Sr. Sec. Nts., 2/15/19 | | | 2/2/12-1/7/13 | | | | 432,128 | | | | 474,138 | | | | 42,010 | |
Sinopharm Group Co. Ltd., Cl. H | | | 6/15/12-4/26/13 | | | | 1,040,265 | | | | 909,735 | | | | (130,530) | |
Spencer Spirit Holdings, Inc., 9% Sr. Unsec. Nts., 5/1/18 | | | 4/25/13-4/26/13 | | | | 365,721 | | | | 373,669 | | | | 7,948 | |
Wallace Theater Holdings, Inc. | | | 3/28/13 | | | | 4 | | | | 3,324 | | | | 3,320 | |
Western Express, Inc., 12.50% Sr. Sec. Nts., 4/15/15 | | | 8/24/10-1/24/11 | | | | 528,918 | | | | 405,263 | | | | (123,655) | |
| | | | | | | | |
| | | | | | $ | 4,323,598 | | | $ | 4,243,443 | | | $ | (80,155) | |
| | | | | | | | |
|
5. The Fund holds securities which have been issued by the same entity and that trade on separate exchanges. |
6. All or a portion of the security position is when-issued or delayed delivery to be delivered and settled after April 30, 2014. See Note 1 of the accompanying Consolidated Notes. |
|
37 OPPENHEIMER GLOBAL ALLOCATION FUND
| | |
| |
CONSOLIDATED STATEMENTOF INVESTMENTS Unaudited / Continued | | |
Footnotes to Consolidated Statement of Investments (Continued)
|
| 7. Interest or dividend is paid-in-kind, when applicable. |
| 8. Represents the current interest rate for a variable or increasing rate security. |
| 9. This security is not accruing income because the issuer has missed an interest payment on it and/or is not anticipated to make future interest and or principal payments. The rate shown is the original contractual interest rate. See Note 1 of the accompanying Consolidated Notes. |
| 10. Is or was an affiliate, as defined in the Investment Company Act of 1940, at or during the period ended April 30, 2014, by virtue of the Fund owning at least 5% of the voting securities of the issuer or as a result of the Fund and the issuer having the same investment adviser. Transactions during the period in which the issuer was an affiliate are as follows: |
| | | | | | | | | | | | | | | | |
| | | Shares | | | Gross | | | Gross | | | Shares | |
| | | October 31, 2013 | | | Additions | | | Reductions | | | April 30, 2014 | |
| |
| Oppenheimer Institutional Money Market Fund, Cl. E | | | 1,392,718 | | | | 330,212,303 | | | | 314,746,198 | | | | 16,858,823 | |
| Oppenheimer Master Event-Linked Bond Fund, LLC | | | 9,251,612 | | | | — | | | | — | | | | 9,251,612 | |
| Oppenheimer Master Loan Fund, LLC | | | 12,766,071 | | | | — | | | | 350,811 | | | | 12,415,260 | |
| Oppenheimer Ultra Short Duration Fund, Cl. Y (formerly Oppenheimer Short Duration Fund, Cl. Y) | | | 4,513,213 | | | | 4,995,145 | | | | 9,508,358 | | | | — | |
| | | | |
| | | | | | | | | | | | Realized Gain | |
| | | | | | Value | | | Income | | | (Loss) | |
| |
| Oppenheimer Institutional Money Market Fund, Cl. E | | | $ | 16,858,823 | | | $ | 14,221 | | | $ | — | |
| Oppenheimer Master Event-Linked Bond Fund, LLC | | | | 130,504,730 | | | | 4,579,591 a | | | | 473,099 a | |
| Oppenheimer Master Loan Fund, LLC | | | | | | | 177,992,776 | | | | 5,146,203 b | | | | (524,732)b | |
| Oppenheimer Ultra Short Duration Fund, Cl. Y (formerly | | | | | | | | | | | | | | | | |
| Oppenheimer Short Duration Fund, Cl. Y) | | | | — | | | | 58,651 | | | | — | |
| | | | | | | | |
| | | | | | $ | 325,356,329 | | | $ | 9,798,666 | | | $ | (51,633) | |
| | | | | | | | |
|
a. Represents the amount allocated to the Fund from Oppenheimer Master Event-Linked Bond Fund, LLC. b. Represents the amount allocated to the Fund from Oppenheimer Master Loan Fund, LLC. |
| 11. Rate shown is the 7-day yield as of April 30, 2014. |
|
| | | | | | | | |
| Distribution of investments representing geographic holdings, as a percentage of total investments at value, is as follows: | |
| Geographic Holdings | | Value | | | Percent | |
| |
United States | | $ | 1,124,603,248 | | | | 64.7% | |
United Kingdom | | | 79,433,249 | | | | 4.6 | |
Germany | | | 60,550,133 | | | | 3.5 | |
Switzerland | | | 59,824,528 | | | | 3.4 | |
France | | | 57,656,679 | | | | 3.3 | |
Japan | | | 48,184,949 | | | | 2.8 | |
Brazil | | | 35,583,974 | | | | 2.0 | |
India | | | 28,935,179 | | | | 1.7 | |
Netherlands | | | 27,056,685 | | | | 1.6 | |
Spain | | | 26,525,511 | | | | 1.5 | |
Sweden | | | 22,651,636 | | | | 1.3 | |
China | | | 22,576,534 | | | | 1.3 | |
Italy | | | 19,349,958 | | | | 1.1 | |
Canada | | | 18,990,215 | | | | 1.1 | |
Mexico | | | 14,440,348 | | | | 0.8 | |
Russia | | | 13,350,666 | | | | 0.8 | |
Ireland | | | 10,283,397 | | | | 0.6 | |
Denmark | | | 8,336,931 | | | | 0.5 | |
Hong Kong | | | 6,816,881 | | | | 0.4 | |
Australia | | | 5,384,675 | | | | 0.3 | |
38 OPPENHEIMER GLOBAL ALLOCATION FUND
| | | | | | | | |
Turkey | | | 4,630,496 | | | | 0.3 | |
Luxembourg | | | 3,750,027 | | | | 0.2 | |
Colombia | | | 3,740,192 | | | | 0.2 | |
Indonesia | | | 3,612,543 | | | | 0.2 | |
Philippines | | | 3,423,774 | | | | 0.2 | |
Thailand | | | 3,080,000 | | | | 0.2 | |
Bermuda | | | 2,843,207 | | | | 0.2 | |
Taiwan | | | 2,585,964 | | | | 0.1 | |
Israel | | | 2,384,727 | | | | 0.1 | |
South Africa | | | 2,020,694 | | | | 0.1 | |
South Korea | | | 1,999,490 | | | | 0.1 | |
Jersey, Channel Islands | | | 1,832,421 | | | | 0.1 | |
Malaysia | | | 1,670,395 | | | | 0.1 | |
Nigeria | | | 1,536,563 | | | | 0.1 | |
United Arab Emirates | | | 1,512,288 | | | | 0.1 | |
Austria | | | 1,487,926 | | | | 0.1 | |
Chile | | | 1,400,563 | | | | 0.1 | |
Argentina | | | 1,085,663 | | | | 0.1 | |
Eurozone | | | 973,786 | | | | 0.1 | |
Egypt | | | 726,082 | | | | 0.0 | |
Greece | | | 663,212 | | | | 0.0 | |
Norway | | | 369,600 | | | | 0.0 | |
Peru | | | 282,367 | | | | 0.0 | |
Belgium | | | 149,100 | | | | 0.0 | |
Mongolia | | | 352 | | | | 0.0 | |
| | | | |
Total | | $ | 1,738,296,808 | | | | 100.0% | |
| | | | |
| | | | | | | | | | | | | | | | | | | | | | | | |
| |
Futures Contracts as of April 30, 2014 | |
| Description | | Exchange | | | Buy/Sell | | | Expiration
Date | | | Number of
Contracts | | | Value | | | Unrealized
Appreciation
(Depreciation) | |
| |
CBOE Volatility Index | | | CBE | | | | Sell | | | | 9/16/14 | | | | 2,000 | | | $ | 34,300,000 | | | $ | 397,060 | |
CBOE Volatility Index | | | CBE | | | | Buy | | | | 6/17/14 | | | | 3,000 | | | | 47,250,000 | | | | (1,510,608) | |
Russell 2000 Mini Index | | | NYF | | | | Sell | | | | 6/20/14 | | | | 1,035 | | | | 116,292,600 | | | | 7,816,010 | |
S&P 500 E-Mini Index | | | CME | | | | Sell | | | | 6/20/14 | | | | 1,000 | | | | 93,895,000 | | | | (1,222,120) | |
| | | | | | | | | | | | | | | | | | | | | | | | |
| | | | | | | | | | | | | | | | | | | | | | $ | 5,480,342 | |
| | | | | | | | | | | | | | | | | | | | | | | | |
| | | | | | | | | | | | | | | | | | | | | | | | | | | | |
| |
Exchange-Traded Options Written at April 30, 2014 | |
| Description | | | | | Exercise
Price | | | Expiration
Date | | | Number of
Contracts | | | Premiums
Received | | | Value | |
| |
CBOE SPX Volatility Index Call | | | USD | | | | 23.000 | | | | 5/21/14 | | | | USD | | | | (20,000) | | | $ | 719,198 | | | $ | (160,000) | |
| |
CBOE SPX Volatility Index Call | | | USD | | | | 20.000 | | | | 5/21/14 | | | | USD | | | | (50,000) | | | | 4,472,520 | | | | (1,000,000) | |
| |
S&P 500 Index Put | | | USD | | | | 1750.000 | | | | 5/17/14 | | | | USD | | | | (1,500) | | | | 1,720,441 | | | | (135,000) | |
| | | | | | | | | | | | | | | | | | | | | | | | |
Total Exchange-Traded Options Written | | | $ | 6,912,159 | | | $ | (1,295,000) | |
| | | | | | | | | | | | | | | | | | | | | | | | |
39 OPPENHEIMER GLOBAL ALLOCATION FUND
| | |
| |
CONSOLIDATED STATEMENTOF INVESTMENTS Unaudited / Continued | | |
| | |
| Glossary: | | |
Counterparty Abbreviations | | |
| GSG | | Goldman Sachs Group, Inc. (The) |
| | |
|
| Currency abbreviations indicate amounts reporting in currencies |
| EUR | | Euro |
| INR | | Indian Rupee |
| MYR | | Malaysian Ringgit |
| |
Exchange Abbreviations | | |
| CBE | | Chicago Board Options Exchange |
| CME | | Chicago Mercantile Exchange |
| NYF | | New York Futures Exchange |
See accompanying Notes to Consolidated Financial Statements.
40 OPPENHEIMER GLOBAL ALLOCATION FUND
| | |
| |
CONSOLIDATEDSTATEMENTOF ASSETS AND LIABILITIES April 30, 2014 Unaudited | | |
| | | | |
| |
Assets | | | | |
Investments, at value—see accompanying consolidated statement of investments: | | | | |
Unaffiliated companies (cost $1,178,951,473) | | $ | 1,412,940,479 | |
Affiliated companies (cost $320,643,889) | | | 325,356,329 | |
| | | | |
| | | 1,738,296,808 | |
| |
Cash | | | 14,928,567 | |
| |
Cash—foreign currencies (cost $160,999) | | | 158,947 | |
| |
Cash used for collateral on futures | | | 16,361,000 | |
| |
Receivables and other assets: | | | | |
Investments sold (including $1,023,156 sold on a when-issued or delayed delivery basis) | | | 7,139,022 | |
Interest and dividends | | | 5,080,675 | |
Shares of beneficial interest sold | | | 194,905 | |
Variation margin receivable | | | 150,000 | |
Other | | | 373,457 | |
| | | | |
Total assets | | | 1,782,683,381 | |
| |
Liabilities | | | | |
Options written, at value (premiums received $6,912,159) | | | 1,295,000 | |
| |
Payables and other liabilities: | | | | |
Investments purchased (including $3,058,369 purchased on a when-issued or delayed delivery basis) | | | 9,748,309 | |
Shares of beneficial interest redeemed | | | 1,818,942 | |
Variation margin payable | | | 1,060,550 | |
Trustees’ compensation | | | 789,941 | |
Distribution and service plan fees | | | 356,615 | |
Foreign capital gains tax | | | 54,181 | |
Other | | | 82,315 | |
| | | | |
Total liabilities | | | 15,205,853 | |
| |
Net Assets | | $ | 1,767,477,528 | |
| | | | |
| | | | |
| |
Composition of Net Assets | | | | |
Par value of shares of beneficial interest | | $ | 1,026,183 | |
| |
Additional paid-in capital | | | 2,278,055,543 | |
| |
Accumulated net investment income | | | 10,621,921 | |
| |
Accumulated net realized loss on investments and foreign currency transactions | | | (771,983,234) | |
| |
Net unrealized appreciation on investments and translation of assets and liabilities denominated in foreign currencies | | | 249,757,115 | |
| | | | |
Net Assets | | $ | 1,767,477,528 | |
| | | | |
41 OPPENHEIMER GLOBAL ALLOCATION FUND
| | |
| |
CONSOLIDATEDSTATEMENTOF ASSETS AND LIABILITIES Unaudited / Continued | | |
| | |
|
Net Asset Value Per Share | | |
Class A Shares: | | |
| Net asset value and redemption price per share (based on net assets of $1,339,643,728 and 77,278,281 shares of beneficial interest outstanding) | | $17.34 |
| Maximum offering price per share (net asset value plus sales charge of 5.75% of offering price) | | $18.40 |
|
Class B Shares: | | |
| Net asset value, redemption price (excludes applicable contingent deferred sales charge) and offering price per share (based on net assets of $68,978,331 and 4,106,385 shares of beneficial interest outstanding) | | $16.80 |
|
Class C Shares: | | |
| Net asset value, redemption price (excludes applicable contingent deferred sales charge) and offering price per share (based on net assets of $276,509,375 and 16,441,935 shares of beneficial interest outstanding) | | $16.82 |
|
Class I Shares: | | |
| Net asset value, redemption price and offering price per share (based on net assets of $878,390 and 50,736 shares of beneficial interest outstanding) | | $17.31 |
|
Class N Shares: | | |
| Net asset value, redemption price (excludes applicable contingent deferred sales charge) and offering price per share (based on net assets of $42,682,502 and 2,501,661 shares of beneficial interest outstanding) | | $17.06 |
|
Class Y Shares: | | |
| Net asset value, redemption price and offering price per share (based on net assets of $38,785,202 and 2,239,297 shares of beneficial interest outstanding) | | $17.32 |
See accompanying Notes to Consolidated Financial Statements.
42 OPPENHEIMER GLOBAL ALLOCATION FUND
| | |
| |
CONSOLIDATEDSTATEMENTOF OPERATIONS For the Six Months Ended April 30, 2014 Unaudited | | |
| | | | |
| |
Allocation of Income and Expenses from Master Funds1 | | | | |
Net investment income allocated from Oppenheimer Master Event-Linked Bond Fund, LLC: | | | | |
Interest | | $ | 4,578,336 | |
Dividends | | | 1,255 | |
Net expenses | | | (272,391) | |
| | | | |
Net investment income allocated from Oppenheimer Master Event-Linked Bond Fund, LLC | | | 4,307,200 | |
| |
Net investment income allocated from Oppenheimer Master Loan Fund, LLC: | | | | |
Interest | | | 4,684,160 | |
Dividends | | | 462,043 | |
Net expenses | | | (299,106) | |
| | | | |
Net investment income allocated from Oppenheimer Master Loan Fund, LLC | | | 4,847,097 | |
| | | | |
Total allocation of net investment income from master funds | | | 9,154,297 | |
| |
Investment Income | | | | |
Dividends: | | | | |
Unaffiliated companies (net of foreign withholding taxes of $507,761) | | | 8,693,620 | |
Affiliated companies | | | 72,872 | |
| |
Interest | | | 6,789,369 | |
| | | | |
Total investment income | | | 15,555,861 | |
|
| |
Expenses | | | | |
Management fees | | | 7,038,387 | |
| |
Distribution and service plan fees: | | | | |
Class A | | | 1,645,545 | |
Class B | | | 379,688 | |
Class C | | | 1,381,904 | |
Class N | | | 106,087 | |
| |
Transfer and shareholder servicing agent fees: | | | | |
Class A | | | 1,540,412 | |
Class B | | | 142,095 | |
Class C | | | 290,885 | |
Class I | | | 134 | |
Class N | | | 50,388 | |
Class Y | | | 31,572 | |
| |
Shareholder communications: | | | | |
Class A | | | 73,522 | |
Class B | | | 2,104 | |
Class C | | | 13,161 | |
Class I | | | 10 | |
Class N | | | 1,833 | |
Class Y | | | 119 | |
| |
Custodian fees and expenses | | | 66,960 | |
| |
Trustees’ compensation | | | 26,892 | |
| |
Other | | | 155,064 | |
| | | | |
Total expenses | | | 12,946,762 | |
1. The Fund invests in certain affiliated mutual funds that expect to be treated as partnerships for tax purposes. See Note 1 of the accompanying Consolidated Notes.
43 OPPENHEIMER GLOBAL ALLOCATION FUND
| | |
| |
CONSOLIDATEDSTATEMENTOF OPERATIONS Unaudited / Continued | | |
| | | | |
| |
Expenses (Continued) | | | | |
Less waivers and reimbursements of expenses | | $ | (688,451) | |
| | | | |
Net expenses | | | 12,258,311 | |
| |
Net Investment Income | | | 12,451,847 | |
| |
Realized and Unrealized Gain (Loss) | | | | |
Net realized gain (loss) on: | | | | |
Investments from unaffiliated companies (includes premiums on options exercised)/(net of foreign capital gains tax of $65,193) | | | 3,508,734 | |
Closing and expiration of option contracts written | | | 17,773,808 | |
Closing and expiration of futures contracts | | | 3,353,605 | |
Foreign currency transactions | | | (9,093) | |
Swap contracts | | | 2,469,564 | |
| |
Net realized gain (loss) allocated from: | | | | |
Oppenheimer Master Event-Linked Bond Fund, LLC | | | 473,099 | |
Oppenheimer Master Loan Fund, LLC | | | (524,732) | |
| | | | |
Net realized gain | | | 27,044,985 | |
| |
Net change in unrealized appreciation/depreciation on: | | | | |
Investments (net of foreign capital gains tax of $40,923) | | | (8,350,973) | |
Translation of assets and liabilities denominated in foreign currencies | | | (2,579,948) | |
Futures contracts | | | 3,689,986 | |
Option contracts written | | | 1,121,159 | |
Swap contracts | | | (1,493,798) | |
| |
Net change in unrealized appreciation/depreciation allocated from: | | | | |
Oppenheimer Master Event-Linked Bond Fund, LLC | | | (377,892) | |
Oppenheimer Master Loan Fund, LLC | | | 742,557 | |
| | | | |
Net change in unrealized appreciation/depreciation | | | (7,248,909) | |
| |
Net Increase in Net Assets Resulting from Operations | | $ | 32,247,923 | |
| | | | |
See accompanying Notes to Consolidated Financial Statements.
44 OPPENHEIMER GLOBAL ALLOCATION FUND
| | |
| |
CONSOLIDATEDSTATEMENTSOF CHANGES IN NET ASSETS | | |
| | | | | | | | |
| | | Six Months Ended
April 30, 2014
(Unaudited) | | | Year Ended
October 31, 2013 | |
| |
Operations | | | | | | | | |
Net investment income | | $ | 12,451,847 | | | $ | 34,625,240 | |
| |
Net realized gain | | | 27,044,985 | | | | 96,677,175 | |
| |
Net change in unrealized appreciation/depreciation | | | (7,248,909) | | | | 170,766,109 | |
| | | | | | | | |
Net increase in net assets resulting from operations | | | 32,247,923 | | | | 302,068,524 | |
|
| |
Dividends and/or Distributions to Shareholders | | | | | | | | |
Dividends from net investment income: | | | | | | | | |
Class A | | | (19,933,563) | | | | (14,740,309) | |
Class B | | | (988,141) | | | | (420,207) | |
Class C | | | (3,578,883) | | | | (1,470,325) | |
Class I | | | (13,810) | | | | (2,401) | |
Class N | | | (598,720) | | | | (391,600) | |
Class Y | | | (617,332) | | | | (496,821) | |
| | | | |
| | | (25,730,449) | | | | (17,521,663) | |
|
| |
Beneficial Interest Transactions | | | | | | | | |
Net increase (decrease) in net assets resulting from beneficial interest transactions: | | | | | | | | |
Class A | | | (35,072,361) | �� | | | (138,689,585) | |
Class B | | | (15,383,710) | | | | (32,624,127) | |
Class C | | | (5,561,988) | | | | (29,656,121) | |
Class I | | | 99,274 | | | | 717,984 | |
Class N | | | (1,152,260) | | | | (8,121,300) | |
Class Y | | | 1,373,383 | | | | (140,408) | |
| | | | | | | | |
| | | (55,697,662) | | | | (208,513,557) | |
| |
Net Assets | | | | | | | | |
Total increase (decrease) | | | (49,180,188) | | | | 76,033,304 | |
| |
Beginning of period | | | 1,816,657,716 | | | | 1,740,624,412 | |
| | | | | | | | |
| | |
End of period (including accumulated net investment income of $10,621,921 and $23,900,523, respectively) | | $ | 1,767,477,528 | | | $ | 1,816,657,716 | |
| | | | |
See accompanying Notes to Consolidated Financial Statements.
45 OPPENHEIMER GLOBAL ALLOCATION FUND
| | |
| |
| CONSOLIDATEDFINANCIAL HIGHLIGHTS | | |
| | | | | | | | | | | | | | | | | | | | | | | | |
| Class A | | Six Months
Ended
April 30, 2014
(Unaudited) | | | Year Ended
October 31,
2013 | | | Year Ended
October 31,
2012 | | | Year Ended
October 31,
2011 | | | Year Ended
October 29,
2010 1 | | | Year Ended
October 31,
2009 | |
| |
| Per Share Operating Data | | | | | | | | | | | | | | | | | | | | | | | | |
| Net asset value, beginning of period | | $ | 17.27 | | | $ | 14.70 | | | $ | 14.81 | | | $ | 15.08 | | | $ | 13.05 | | | $ | 10.69 | |
| |
| Income (loss) from investment operations: | | | | | | | | | | | | | | | | | | | | | | | | |
| Net investment income2 | | | 0.13 | | | | 0.34 | | | | 0.33 | | | | 0.36 | | | | 0.18 | | | | 0.16 | |
| Net realized and unrealized gain (loss) | | | 0.19 | | | | 2.41 | | | | (0.04) | | | | (0.41) | | | | 1.96 | | | | 2.36 | |
| | | | |
| Total from investment operations | | | 0.32 | | | | 2.75 | | | | 0.29 | | | | (0.05) | | | | 2.14 | | | | 2.52 | |
| |
| Dividends and/or distributions to shareholders: | | | | | | | | | | | | | | | | | | | | | | | | |
| Dividends from net investment income | | | (0.25) | | | | (0.18) | | | | (0.40) | | | | (0.22) | | | | (0.11) | | | | (0.16) | |
| |
| Net asset value, end of period | | $ | 17.34 | | | $ | 17.27 | | | $ | 14.70 | | | $ | 14.81 | | | $ | 15.08 | | | $ | 13.05 | |
| | | | |
|
| |
| Total Return, at Net Asset Value3 | | | 1.91% | | | | 18.81% | | | | 2.14% | | | | (0.37)% | | | | 16.44% | | | | 24.06% | |
| | | | | | | | | | | | | | | | | | | | | | | | |
| |
| Ratios/Supplemental Data | | | | | | | | | | | | | | | | | | | | | | | | |
| Net assets, end of period (in thousands) | | $ | 1,339,644 | | | $ | 1,369,331 | | | $ | 1,294,433 | | | $ | 1,473,322 | | | $ | 1,623,802 | | | $ | 1,584,420 | |
| |
| Average net assets (in thousands) | | $ | 1,359,385 | | | $ | 1,327,442 | | | $ | 1,358,002 | | | $ | 1,589,726 | | | $ | 1,619,840 | | | $ | 1,450,251 | |
| |
| Ratios to average net assets:4 | | | | | | | | | | | | | | | | | | | | | | | | |
| Net investment income | | | 1.54%5 | | | | 2.11%5 | | | | 2.29%5 | | | | 2.35%5 | | | | 1.29%5 | | | | 1.44% | |
| Total expenses | | | 1.37%5,6 | | | | 1.43%5,6 | | | | 1.46%5,6 | | | | 1.44%5,6 | | | | 1.37%5,6 | | | | 1.48% | |
| Expenses after payments, waivers and/or reimbursements and reduction to custodian expenses | | | 1.30%5 | | | | 1.35%5 | | | | 1.38%5 | | | | 1.36%5 | | | | 1.37%5 | | | | 1.42% | |
| |
Portfolio turnover rate | | | 41% | | | | 37% | | | | 59% | | | | 82% | | | | 204%7 | | | | 232%7 | |
46 OPPENHEIMER GLOBAL ALLOCATION FUND
1. October 29, 2010 represents the last business day of the Fund’s reporting period.
2. Per share amounts calculated based on the average shares outstanding during the period.
3. Assumes an initial investment on the business day before the first day of the fiscal period, with all dividends and distributions reinvested in additional shares on the reinvestment date, and redemption at the net asset value calculated on the last business day of the fiscal period. Sales charges are not reflected in the total returns. Total returns are not annualized for periods less than one full year. Returns do not reflect the deduction of taxes that a shareholder would pay on fund distributions or the redemption of fund shares.
4. Annualized for periods less than one full year.
5. Includes the Fund’s share of the allocated expenses and/or net investment income from the master funds.
6. Total expenses including indirect expenses from affiliated fund were as follows:
| | | | | | | | |
| | Six Months Ended April 30, 2014 | | | 1.38 | % | | |
| | Year Ended October 31, 2013 | | | 1.44 | % | | |
| | Year Ended October 31, 2012 | | | 1.46 | % | | |
| | Year Ended October 31, 2011 | | | 1.44 | % | | |
| | Year Ended October 29, 2010 | | | 1.37 | % | | |
7. The portfolio turnover rate excludes purchase and sale transactions of To Be Announced (TBA) mortgage-related securities as follows:
| | | | | | | | | | |
| | | Purchase Transactions | | | Sale Transactions | | | |
| | | |
Year Ended October 29, 2010 | | | $125,339,102 | | | | $124,699,026 | | | |
Year Ended October 31, 2009 | | | $878,270,714 | | | | $1,182,457,896 | | | |
See accompanying Notes to Consolidated Financial Statements.
47 OPPENHEIMER GLOBAL ALLOCATION FUND
| | |
| |
| CONSOLIDATEDFINANCIAL HIGHLIGHTS Continued | | |
| | | | | | | | | | | | | | | | | | | | | | | | |
| Class B | | Six Months
Ended
April 30,
2014
(Unaudited) | | | Year Ended
October 31,
2013 | | | Year Ended
October 31,
2012 | | | Year Ended
October 31,
2011 | | | Year Ended
October 29,
2010 1 | | | Year Ended
October 31,
2009 | |
| |
| Per Share Operating Data | | | | | | | | | | | | | | | | | | | | | | | | |
| Net asset value, beginning of period | | $ | 16.76 | | | $ | 14.30 | | | $ | 14.43 | | | $ | 14.73 | | | $ | 12.77 | | | $ | 10.47 | |
| |
| Income (loss) from investment operations: | | | | | | | | | | | | | | | | | | | | | | | | |
| Net investment income2 | | | 0.06 | | | | 0.19 | | | | 0.20 | | | | 0.23 | | | | 0.06 | | | | 0.08 | |
| Net realized and unrealized gain (loss) | | | 0.19 | | | | 2.34 | | | | (0.02) | | | | (0.41) | | | | 1.91 | | | | 2.32 | |
| | | | |
| Total from investment operations | | | 0.25 | | | | 2.53 | | | | 0.18 | | | | (0.18) | | | | 1.97 | | | | 2.40 | |
| |
| Dividends and/or distributions to shareholders: | | | | | | | | | | | | | | | | | | | | | | | | |
| Dividends from net investment income | | | (0.21) | | | | (0.07) | | | | (0.31) | | | | (0.12) | | | | (0.01) | | | | (0.10) | |
| |
| Net asset value, end of period | | $ | 16.80 | | | $ | 16.76 | | | $ | 14.30 | | | $ | 14.43 | | | $ | 14.73 | | | $ | 12.77 | |
| | | | |
|
| |
| Total Return, at Net Asset Value3 | | | 1.50% | | | | 17.72% | | | | 1.36% | | | | (1.25)% | | | | 15.45% | | | | 23.17% | |
| | | | | | | | | | | | | | | | | | | | | | | | |
| |
| Ratios/Supplemental Data | | | | | | | | | | | | | | | | | | | | | | | | |
| Net assets, end of period (in thousands) | | $ | 68,978 | | | $ | 84,161 | | | $ | 102,131 | | | $ | 145,291 | | | $ | 277,243 | | | $ | 353,853 | |
| |
| Average net assets (in thousands) | | $ | 76,797 | | | $ | 91,497 | | | $ | 119,580 | | | $ | 224,604 | | | $ | 309,274 | | | $ | 357,111 | |
| |
| Ratios to average net assets:4 | | | | | | | | | | | | | | | | | | | | | | | | |
| Net investment income | | | 0.72%5 | | | | 1.24%5 | | | | 1.46%5 | | | | 1.52%5 | | | | 0.46%5 | | | | 0.71% | |
| Total expenses | | | 2.26%5,6 | | | | 2.42%5,6 | | | | 2.41%5,6 | | | | 2.43%5,6 | | | | 2.33%5,6 | | | | 2.44% | |
| Expenses after payments, waivers and/or reimbursements and reduction to custodian expenses | | | 2.10%5 | | | | 2.22%5 | | | | 2.20%5 | | | | 2.21%5 | | | | 2.18%5 | | | | 2.20% | |
| |
Portfolio turnover rate | | | 41% | | | | 37% | | | | 59% | | | | 82% | | | | 204%7 | | | | 232%7 | |
1. October 29, 2010 represents the last business day of the Fund’s reporting period.
2. Per share amounts calculated based on the average shares outstanding during the period.
3. Assumes an initial investment on the business day before the first day of the fiscal period, with all dividends and distributions reinvested in additional shares on the reinvestment date, and redemption at the net asset value calculated on the last business day of the fiscal period. Sales charges are not reflected in the total returns. Total returns are not annualized for periods less than one full year. Returns do not reflect the deduction of taxes that a shareholder would pay on fund distributions or the redemption of fund shares.
4. Annualized for periods less than one full year.
5. Includes the Fund’s share of the allocated expenses and/or net investment income from the master funds.
6. Total expenses including indirect expenses from affiliated fund were as follows:
| | | | | | | | |
| | Six Months Ended April 30, 2014 | | | 2.27 | % | | |
| | Year Ended October 31, 2013 | | | 2.43 | % | | |
| | Year Ended October 31, 2012 | | | 2.41 | % | | |
| | Year Ended October 31, 2011 | | | 2.43 | % | | |
| | Year Ended October 29, 2010 | | | 2.33 | % | | |
7. The portfolio turnover rate excludes purchase and sale transactions of To Be Announced (TBA) mortgage-related securities as follows:
| | | | | | | | | | |
| | | Purchase Transactions | | | Sale Transactions | | | |
| | | |
Year Ended October 29, 2010 | | | $125,339,102 | | | | $124,699,026 | | | |
Year Ended October 31, 2009 | | | $878,270,714 | | | | $1,182,457,896 | | | |
See accompanying Notes to Consolidated Financial Statements.
48 OPPENHEIMER GLOBAL ALLOCATION FUND
| | | | | | | | | | | | | | | | | | | | | | | | |
| Class C | | Six Months
Ended
April 30,
2014
(Unaudited) | | | Year Ended
October 31,
2013 | | | Year Ended
October 31,
2012 | | | Year Ended
October 31,
2011 | | | Year Ended
October 29,
2010 1 | | | Year Ended
October 31,
2009 | |
| |
| Per Share Operating Data | | | | | | | | | | | | | | | | | | | | | | | | |
| Net asset value, beginning of period | | $ | 16.78 | | | $ | 14.31 | | | $ | 14.44 | | | $ | 14.73 | | | $ | 12.77 | | | $ | 10.47 | |
| |
| Income (loss) from investment operations: | | | | | | | | | | | | | | | | | | | | | | | | |
| Net investment income2 | | | 0.07 | | | | 0.22 | | | | 0.22 | | | | 0.25 | | | | 0.08 | | | | 0.08 | |
| Net realized and unrealized gain (loss) | | | 0.19 | | | | 2.33 | | | | (0.03) | | | | (0.40) | | | | 1.90 | | | | 2.32 | |
| | | | |
| Total from investment operations | | | 0.26 | | | | 2.55 | | | | 0.19 | | | | (0.15) | | | | 1.98 | | | | 2.40 | |
| |
| Dividends and/or distributions to shareholders: | | | | | | | | | | | | | | | | | | | | | | | | |
| Dividends from net investment income | | | (0.22) | | | | (0.08) | | | | (0.32) | | | | (0.14) | | | | (0.02) | | | | (0.10) | |
| |
| Net asset value, end of period | | $ | 16.82 | | | $ | 16.78 | | | $ | 14.31 | | | $ | 14.44 | | | $ | 14.73 | | | $ | 12.77 | |
| | | | |
|
| |
| Total Return, at Net Asset Value3 | | | 1.54% | | | | 17.90% | | | | 1.45% | | | | (1.08)% | | | | 15.55% | | | | 23.23% | |
| | | | | | | | | | | | | | | | | | | | | | | | |
| |
| Ratios/Supplemental Data | | | | | | | | | | | | | | | | | | | | | | | | |
| Net assets, end of period (in thousands) | | $ | 276,509 | | | $ | 281,444 | | | $ | 267,392 | | | $ | 313,963 | | | $ | 363,252 | | | $ | 366,167 | |
| |
| Average net assets (in thousands) | | $ | 279,936 | | | $ | 273,813 | | | $ | 284,820 | | | $ | 350,372 | | | $ | 366,311 | | | $ | 343,726 | |
| |
| Ratios to average net assets:4 | | | | | | | | | | | | | | | | | | | | | | | | |
| Net investment income | | | 0.81%5 | | | | 1.39%5 | | | | 1.58%5 | | | | 1.64%5 | | | | 0.57%5 | | | | 0.74% | |
| Total expenses | | | 2.10%5,6 | | | | 2.14%5,6 | | | | 2.17%5,6 | | | | 2.15%5,6 | | | | 2.08%5,6 | | | | 2.19% | |
| Expenses after payments, waivers and/or reimbursements and reduction to custodian expenses | | | 2.03%5 | | | | 2.06%5 | | | | 2.09%5 | | | | 2.07%5 | | | | 2.08%5 | | | | 2.14% | |
| |
Portfolio turnover rate | | | 41% | | | | 37% | | | | 59% | | | | 82% | | | | 204%7 | | | | 232%7 | |
1. October 29, 2010 represents the last business day of the Fund’s reporting period.
2. Per share amounts calculated based on the average shares outstanding during the period.
3. Assumes an initial investment on the business day before the first day of the fiscal period, with all dividends and distributions reinvested in additional shares on the reinvestment date, and redemption at the net asset value calculated on the last business day of the fiscal period. Sales charges are not reflected in the total returns. Total returns are not annualized for periods less than one full year. Returns do not reflect the deduction of taxes that a shareholder would pay on fund distributions or the redemption of fund shares.
4. Annualized for periods less than one full year.
5. Includes the Fund’s share of the allocated expenses and/or net investment income from the master funds.
6. Total expenses including indirect expenses from affiliated fund were as follows:
| | | | | | | | |
| | Six Months Ended April 30, 2014 | | | 2.11 | % | | |
| | Year Ended October 31, 2013 | | | 2.15 | % | | |
| | Year Ended October 31, 2012 | | | 2.17 | % | | |
| | Year Ended October 31, 2011 | | | 2.15 | % | | |
| | Year Ended October 29, 2010 | | | 2.08 | % | | |
7. The portfolio turnover rate excludes purchase and sale transactions of To Be Announced (TBA) mortgage-related securities as follows:
| | | | | | | | | | |
| | | Purchase Transactions | | | Sale Transactions | | | |
| | | |
Year Ended October 29, 2010 | | | $125,339,102 | | | | $124,699,026 | | | |
Year Ended October 31, 2009 | | | $878,270,714 | | | | $1,182,457,896 | | | |
See accompanying Notes to Consolidated Financial Statements.
49 OPPENHEIMER GLOBAL ALLOCATION FUND
| | |
| |
| CONSOLIDATEDFINANCIAL HIGHLIGHTS Continued | | |
| | | | | | | | | | | | |
| Class I | | Six Months
Ended
April 30,
2014
(Unaudited) | | | Year Ended
October 31,
2013 | | | Period Ended
October 31,
2012 1 | |
| |
Per Share Operating Data | | | | | | | | | | | | |
Net asset value, beginning of period | | $ | 17.25 | | | $ | 14.69 | | | $ | 14.98 | |
| |
Income (loss) from investment operations: | | | | | | | | | | | | |
Net investment income2 | | | 0.17 | | | | 0.34 | | | | 0.37 | |
Net realized and unrealized gain (loss) | | | 0.18 | | | | 2.48 | | | | (0.53) | |
| | | | |
Total from investment operations | | | 0.35 | | | | 2.82 | | | | (0.16) | |
| |
Dividends and/or distributions to shareholders: | | | | | | | | | | | | |
Dividends from net investment income | | | (0.29) | | | | (0.26) | | | | (0.13) | |
| |
Net asset value, end of period | | $ | 17.31 | | | $ | 17.25 | | | $ | 14.69 | |
| | | | |
|
| |
Total Return, at Net Asset Value3 | | | 2.09% | | | | 19.35% | | | | (1.04)% | |
| | | | | | | | | | | | |
| |
Ratios/Supplemental Data | | | | | | | | | | | | |
Net assets, end of period (in thousands) | | $ | 879 | | | $ | 775 | | | $ | 10 | |
| |
Average net assets (in thousands) | | $ | 901 | | | $ | 147 | | | $ | 10 | |
| |
Ratios to average net assets:4,5 | | | | | | | | | | | | |
Net investment income | | | 1.98% | | | | 2.01% | | | | 3.78% | |
Total expenses6 | | | 0.91% | | | | 0.92% | | | | 0.94% | |
Expenses after payments, waivers and/or reimbursements and reduction to custodian expenses | | | 0.84% | | | | 0.84% | | | | 0.89% | |
| |
Portfolio turnover rate | | | 41% | | | | 37% | | | | 59% | |
1. For the period from February 28, 2012 (inception of offering) to October 31, 2012.
2. Per share amounts calculated based on the average shares outstanding during the period.
3. Assumes an initial investment on the business day before the first day of the fiscal period, with all dividends and distributions reinvested in additional shares on the reinvestment date, and redemption at the net asset value calculated on the last business day of the fiscal period. Sales charges are not reflected in the total returns. Total returns are not annualized for periods less than one full year. Returns do not reflect the deduction of taxes that a shareholder would pay on fund distributions or the redemption of fund shares.
4. Annualized for periods less than one full year.
5. Includes the Fund’s share of the allocated expenses and/or net investment income from the master funds.
6. Total expenses including indirect expenses from affiliated fund were as follows:
| | | | | | | | |
| | Six Months Ended April 30, 2014 | | | 0.92 | % | | |
| | Year Ended October 31, 2013 | | | 0.93 | % | | |
| | Period Ended October 31, 2012 | | | 0.94 | % | | |
See accompanying Notes to Consolidated Financial Statements.
50 OPPENHEIMER GLOBAL ALLOCATION FUND
| | | | | | | | | | | | | | | | | | | | | | | | |
| Class N | | Six Months
Ended
April 30,
2014
(Unaudited) | | | Year Ended
October 31,
2013 | | | Year Ended
October 31,
2012 | | | Year Ended
October 31,
2011 | | | Year Ended
October 29,
2010 1 | | | Year Ended
October 31,
2009 | |
| |
| Per Share Operating Data | | | | | | | | | | | | | | | | | | | | | | | | |
| Net asset value, beginning of period | | $ | 17.01 | | | $ | 14.48 | | | $ | 14.60 | | | $ | 14.86 | | | $ | 12.87 | | | $ | 10.54 | |
| |
| Income (loss) from investment operations: | | | | | | | | | | | | | | | | | | | | | | | | |
| Net investment income2 | | | 0.11 | | | | 0.29 | | | | 0.29 | | | | 0.32 | | | | 0.14 | | | | 0.14 | |
| Net realized and unrealized gain (loss) | | | 0.18 | | | | 2.38 | | | | (0.04) | | | | (0.39) | | | | 1.93 | | | | 2.33 | |
| | | | |
| Total from investment operations | | | 0.29 | | | | 2.67 | | | | 0.25 | | | | (0.07) | | | | 2.07 | | | | 2.47 | |
| |
| Dividends and/or distributions to shareholders: | | | | | | | | | | | | | | | | | | | | | | | | |
| Dividends from net investment income | | | (0.24) | | | | (0.14) | | | | (0.37) | | | | (0.19) | | | | (0.08) | | | | (0.14) | |
| |
| Net asset value, end of period | | $ | 17.06 | | | $ | 17.01 | | | $ | 14.48 | | | $ | 14.60 | | | $ | 14.86 | | | $ | 12.87 | |
| | | | |
|
| |
| Total Return, at Net Asset Value3 | | | 1.71% | | | | 18.52% | | | | 1.86% | | | | (0.55)% | | | | 16.09% | | | | 23.89% | |
| | | | | | | | | | | | | | | | | | | | | | | | |
| |
| Ratios/Supplemental Data | | | | | | | | | | | | | | | | | | | | | | | | |
| Net assets, end of period (in thousands) | | $ | 42,683 | | | $ | 43,683 | | | $ | 44,700 | | | $ | 56,284 | | | $ | 69,338 | | | $ | 74,293 | |
| |
Average net assets (in thousands) | | $ | 43,211 | | | $ | 44,174 | | | $ | 50,331 | | | $ | 63,592 | | | $ | 71,783 | | | $ | 70,697 | |
| |
Ratios to average net assets:4 | | | | | | | | | | | | | | | | | | | | | | | | |
Net investment income | | | 1.29%5 | | | | 1.86%5 | | | | 2.05%5 | | | | 2.12%5 | | | | 1.03%5 | | | | 1.26% | |
Total expenses | | | 1.62%5,6 | | | | 1.68%5,6 | | | | 1.70%5,6 | | | | 1.67%5,6 | | | | 1.61%5,6 | | | | 1.69% | |
Expenses after payments, waivers and/or reimbursements and reduction to custodian expenses | | | 1.55%5 | | | | 1.60%5 | | | | 1.62%5 | | | | 1.59%5 | | | | 1.61%5 | | | | 1.62% | |
| |
Portfolio turnover rate | | | 41% | | | | 37% | | | | 59% | | | | 82% | | | | 204%7 | | | | 232%7 | |
1. October 29, 2010 represents the last business day of the Fund’s reporting period.
2. Per share amounts calculated based on the average shares outstanding during the period.
3. Assumes an initial investment on the business day before the first day of the fiscal period, with all dividends and distributions reinvested in additional shares on the reinvestment date, and redemption at the net asset value calculated on the last business day of the fiscal period. Sales charges are not reflected in the total returns. Total returns are not annualized for periods less than one full year. Returns do not reflect the deduction of taxes that a shareholder would pay on fund distributions or the redemption of fund shares.
4. Annualized for periods less than one full year.
5. Includes the Fund’s share of the allocated expenses and/or net investment income from the master funds.
6. Total expenses including indirect expenses from affiliated fund were as follows:
| | | | | | | | |
| | Six Months Ended April 30, 2014 | | | 1.63 | % | | |
| | Year Ended October 31, 2013 | | | 1.69 | % | | |
| | Year Ended October 31, 2012 | | | 1.70 | % | | |
| | Year Ended October 31, 2011 | | | 1.67 | % | | |
| | Year Ended October 29, 2010 | | | 1.61 | % | | |
7. The portfolio turnover rate excludes purchase and sale transactions of To Be Announced (TBA) mortgage-related securities as follows:
| | | | | | | | | | |
| | | Purchase Transactions | | | Sale Transactions | | | |
| | | |
Year Ended October 29, 2010 | | | $125,339,102 | | | | $124,699,026 | | | |
Year Ended October 31, 2009 | | | $878,270,714 | | | | $1,182,457,896 | | | |
See accompanying Notes to Consolidated Financial Statements.
51 OPPENHEIMER GLOBAL ALLOCATION FUND
| | |
| |
| CONSOLIDATEDFINANCIAL HIGHLIGHTS Continued | | |
| | | | | | | | | | | | | | | | | | | | | | | | |
| Class Y | | Six Months Ended April 30, 2014 (Unaudited) | | | Year Ended
October 31,
2013 | | | Year Ended
October 31,
2012 | | | Year Ended
October 31,
2011 | | | Year Ended
October 29,
2010 1 | | | Year Ended
October 31,
2009 | |
| |
| Per Share Operating Data | | | | | | | | | | | | | | | | | | | | | | | | |
| Net asset value, beginning of period | | $ | 17.26 | | | $ | 14.69 | | | $ | 14.80 | | | $ | 15.07 | | | $ | 13.05 | | | $ | 10.68 | |
| |
| Income (loss) from investment operations: | | | | | | | | | | | | | | | | | | | | | | | | |
| Net investment income2 | | | 0.16 | | | | 0.40 | | | | 0.38 | | | | 0.42 | | | | 0.23 | | | | 0.25 | |
| Net realized and unrealized gain (loss) | | | 0.18 | | | | 2.41 | | | | (0.03) | | | | (0.42) | | | | 1.95 | | | | 2.34 | |
| | | | |
| Total from investment operations | | | 0.34 | | | | 2.81 | | | | 0.35 | | | | 0.00 | | | | 2.18 | | | | 2.59 | |
| |
| Dividends and/or distributions to shareholders: | | | | | | | | | | | | | | | | | | | | | | | | |
| Dividends from net investment income | | | (0.28) | | | | (0.24) | | | | (0.46) | | | | (0.27) | | | | (0.16) | | | | (0.22) | |
| |
| Net asset value, end of period | | $ | 17.32 | | | $ | 17.26 | | | $ | 14.69 | | | $ | 14.80 | | | $ | 15.07 | | | $ | 13.05 | |
| | | | |
|
| |
| Total Return, at Net Asset Value3 | | | 2.02% | | | | 19.26% | | | | 2.53% | | | | (0.04)% | | | | 16.80% | | | | 24.83% | |
| |
| Ratios/Supplemental Data | | | | | | | | | | | | | | | | | | | | | | | | |
| Net assets, end of period (in thousands) | | $ | 38,785 | | | $ | 37,264 | | | $ | 31,958 | | | $ | 36,291 | | | $ | 35,843 | | | $ | 35,737 | |
| |
| Average net assets (in thousands) | | $ | 38,609 | | | $ | 33,958 | | | $ | 33,356 | | | $ | 38,475 | | | $ | 35,361 | | | $ | 42,026 | |
| |
| Ratios to average net assets:4 | | | | | | | | | | | | | | | | | | | | | | | | |
| Net investment income | | | 1.86%5 | | | | 2.47%5 | | | | 2.65%5 | | | | 2.70%5 | | | | 1.64%5 | | | | 2.25% | |
| Total expenses | | | 1.05%5,6 | | | | 1.06%5,6 | | | | 1.09%5,6 | | | | 1.11%5,6 | | | | 1.01%5,6 | | | | 1.00% | |
| Expenses after payments, waivers and/or reimbursements and reduction to custodian expenses | | | 0.98%5 | | | | 0.98%5 | | | | 1.01%5 | | | | 1.03%5 | | | | 1.01%5 | | | | 0.85% | |
| |
| Portfolio turnover rate | | | 41% | | | | 37% | | | | 59% | | | | 82% | | | | 204%7 | | | | 232%7 | |
1. October 29, 2010 represents the last business day of the Fund’s reporting period.
2. Per share amounts calculated based on the average shares outstanding during the period.
3. Assumes an initial investment on the business day before the first day of the fiscal period, with all dividends and distributions reinvested in additional shares on the reinvestment date, and redemption at the net asset value calculated on the last business day of the fiscal period. Sales charges are not reflected in the total returns. Total returns are not annualized for periods less than one full year. Returns do not reflect the deduction of taxes that a shareholder would pay on fund distributions or the redemption of fund shares.
4. Annualized for periods less than one full year.
5. Includes the Fund’s share of the allocated expenses and/or net investment income from the master funds.
6. Total expenses including indirect expenses from affiliated fund were as follows:
| | | | | | | | |
| | Six Months Ended April 30, 2014 | | | 1.06 | % | | |
| | Year Ended October 31, 2013 | | | 1.07 | % | | |
| | Year Ended October 31, 2012 | | | 1.09 | % | | |
| | Year Ended October 31, 2011 | | | 1.11 | % | | |
| | Year Ended October 29, 2010 | | | 1.01 | % | | |
7. The portfolio turnover rate excludes purchase and sale transactions of To Be Announced (TBA) mortgage-related securities as follows:
| | | | | | | | | | |
| | | Purchase Transactions | | | Sale Transactions | | | |
| | | |
Year Ended October 29, 2010 | | | $125,339,102 | | | | $124,699,026 | | | |
Year Ended October 31, 2009 | | | $878,270,714 | | | | $1,182,457,896 | | | |
See accompanying Notes to Consolidated Financial Statements.
52 OPPENHEIMER GLOBAL ALLOCATION FUND
| | |
| |
NOTES TO CONSOLIDATED FINANCIAL STATEMENTS April 30, 2014 Unaudited | | |
1. Significant Accounting Policies
Oppenheimer Global Allocation Fund (the “Fund”), a series of Oppenheimer Quest for Value Funds, is registered under the Investment Company Act of 1940, as amended, as a diversified open-end management investment company. The Fund’s investment objective is to seek total return. The Fund’s investment adviser is OFI Global Asset Management, Inc. (“OFI Global” or the “Manager”), a wholly-owned subsidiary of OppenheimerFunds, Inc. (“OFI” or the “Sub-Adviser”). The Manager has entered into a sub-advisory agreement with OFI.
The Fund offers Class A, Class C, Class I, Class N and Class Y shares, and previously offered Class B shares for new purchase through June 29, 2012. Subsequent to that date, no new purchases of Class B shares are permitted, however reinvestment of dividend and/or capital gain distributions and exchanges of Class B shares into and from other Oppenheimer funds will be allowed. Class A shares are sold at their offering price, which is normally net asset value plus a front-end sales charge. Class C and Class N shares are sold, and Class B shares were sold, without a front-end sales charge but may be subject to a contingent deferred sales charge (“CDSC”). Class N shares are sold only through retirement plans. Retirement plans that offer Class N shares may impose charges on those accounts. Class I and Class Y shares are sold to certain institutional investors or intermediaries without either a front-end sales charge or a CDSC, however, the intermediaries may impose charges on their accountholders who beneficially own Class I and Class Y shares. All classes of shares have identical rights and voting privileges with respect to the Fund in general and exclusive voting rights on matters that affect that class alone. Earnings, net assets and net asset value per share may differ due to each class having its own expenses, such as transfer and shareholder servicing agent fees and shareholder communications, directly attributable to that class. Class A, B, C and N shares have separate distribution and/or service plans under which they pay fees. Class I and Class Y shares do not pay such fees. Class B shares will automatically convert to Class A shares 72 months after the date of purchase.
The following is a summary of significant accounting policies consistently followed by the Fund.
Securities on a When-Issued or Delayed Delivery Basis. The Fund may purchase securities on a “when-issued” basis, and may purchase or sell securities on a “delayed delivery” basis. “When-issued” or “delayed delivery” refers to securities whose terms and indenture are available and for which a market exists, but which are not available for immediate delivery. Delivery and payment for securities that have been purchased by the Fund on a when-issued basis normally takes place within six months and possibly as long as two years or more after the trade date. During this period, such securities do not earn interest, are subject to market fluctuation and may increase or decrease in value prior to their delivery. The purchase of securities on a when-issued basis may increase the volatility of the Fund’s net asset value to the extent the Fund executes such transactions while remaining substantially fully invested. When the Fund engages in when-issued or delayed delivery transactions, it relies on the buyer or seller, as the case may be, to complete the transaction. Their failure to do so may cause the Fund to lose the opportunity to obtain or dispose of the security at a
53 OPPENHEIMER GLOBAL ALLOCATION FUND
| | |
| |
NOTES TO CONSOLIDATED FINANCIAL STATEMENTS Unaudited / Continued | | |
1. Significant Accounting Policies (Continued)
price and yield it considers advantageous. The Fund may also sell securities that it purchased on a when-issued basis or forward commitment prior to settlement of the original purchase.
As of April 30, 2014, the Fund had purchased securities issued on a when-issued or delayed delivery basis and sold securities issued on a delayed delivery basis as follows:
| | | | |
| | | When-Issued or
Delayed Delivery
Basis Transactions | |
Purchased securities | | | $3,058,369 | |
Sold securities | | | 1,023,156 | |
Credit Risk. The Fund invests in high-yield, non-investment-grade bonds, which may be subject to a greater degree of credit risk. Credit risk relates to the ability of the issuer to meet interest or principal payments or both as they become due. The Fund may acquire securities that have missed an interest payment, and is not obligated to dispose of securities whose issuers or underlying obligors subsequently miss an interest payment. Information concerning securities not accruing interest as of April 30, 2014 is as follows:
| | | | |
Cost | | $ | 315,293 | |
Market Value | | $ | 203,839 | |
Market value as % of Net Assets | | | 0.01% | |
Basis for Consolidation. The Fund has established a Cayman Islands exempted company, Oppenheimer Global Allocation Fund (Cayman) Ltd., which is wholly-owned and controlled by the Fund (the “Subsidiary”). The Fund and Subsidiary are both managed by the Manager. The Fund may invest up to 25% of its total assets in the Subsidiary. The Subsidiary invests primarily in commodity-linked derivatives (including commodity futures, financial futures, options and swap contracts) and certain fixed-income securities and other investments that may serve as margin or collateral for its derivatives positions. Investments in the Subsidiary are expected to provide the Fund with exposure to commodities markets within the limitations of the federal tax requirements that apply to the Fund. The Subsidiary is subject to the same investment restrictions and guidelines, and follows the same compliance policies and procedures, as the Fund.
The financial statements have been consolidated and include accounts of the Fund and the Subsidiary. Accordingly, all inter-company transactions and balances have been eliminated. At April 30, 2014, the Fund owned 2,921 shares of the subsidiary with a value of $14,778,007.
Investment in Oppenheimer Institutional Money Market Fund. The Fund is permitted to invest daily available cash balances in an affiliated money market fund. The Fund may invest the available cash in Class E shares of Oppenheimer Institutional Money Market Fund (“IMMF”) to seek current income while preserving liquidity. IMMF is a registered open-end management investment company, regulated as a money market fund under the Investment Company Act of 1940, as amended. The Manager is the investment adviser of IMMF, and the Sub-Adviser provides investment and related advisory services to IMMF. When applicable, the
54 OPPENHEIMER GLOBAL ALLOCATION FUND
1. Significant Accounting Policies (Continued)
Fund’s investment in IMMF is included in the Consolidated Statement of Investments. Shares of IMMF are valued at their net asset value per share. As a shareholder, the Fund is subject to its proportional share of IMMF’s Class E expenses, including its management fee. The Manager will waive fees and/or reimburse Fund expenses in an amount equal to the indirect management fees incurred through the Fund’s investment in IMMF.
Investment in Oppenheimer Master Funds. The Fund is permitted to invest in entities sponsored and/or advised by the Manager or an affiliate. Certain of these entities in which the Fund invests are mutual funds registered under the Investment Company Act of 1940 that expect to be treated as partnerships for tax purposes, specifically Oppenheimer Master Loan Fund, LLC and Oppenheimer Master Event-Linked Bond Fund, LLC (the “Master Funds”). Each Master Fund has its own investment risks, and those risks can affect the value of the Fund’s investments and therefore the value of the Fund’s shares. To the extent that the Fund invests more of its assets in one Master Fund than in another, the Fund will have greater exposure to the risks of that Master Fund.
The investment objective of Oppenheimer Master Loan Fund, LLC is to seek income. The investment objective of Oppenheimer Master Event-Linked Bond Fund, LLC is to seek total return. The Fund’s investments in the Master Funds are included in the Consolidated Statement of Investments. The Fund recognizes income and gain/(loss) on its investments in each Master Fund according to its allocated pro-rata share, based on its relative proportion of total outstanding Master Fund shares held, of the total net income earned and the net gain/(loss) realized on investments sold by the Master Funds. As a shareholder, the Fund is subject to its proportional share of the Master Funds’ expenses, including their management fee. The Manager will waive fees and/or reimburse Fund expenses in an amount equal to the indirect management fees incurred through the Fund’s investment in the Master Funds.
Foreign Currency Translation. The Fund’s accounting records are maintained in U.S. dollars. The values of securities denominated in foreign currencies and amounts related to the purchase and sale of foreign securities and foreign investment income are translated into U.S. dollars as of the close of the New York Stock Exchange (the “Exchange”), normally 4:00 P.M. Eastern time, on each day the Exchange is open for trading. Foreign exchange rates may be valued primarily using a reliable bank, dealer or service authorized by the Board of Trustees.
Reported net realized gains and losses from foreign currency transactions arise from sales of portfolio securities, sales and maturities of short-term securities, sales of foreign currencies, exchange rate fluctuations between the trade and settlement dates on securities transactions, and the difference between the amounts of dividends, interest, and foreign withholding taxes recorded on the Fund’s books and the U.S. dollar equivalent of the amounts actually received or paid. Net unrealized appreciation and depreciation on the translation of assets and liabilities denominated in foreign currencies arise from changes in the values of assets and liabilities, including investments in securities at fiscal period end, resulting from changes in exchange rates.
The effect of changes in foreign currency exchange rates on investments is separately identified from the fluctuations arising from changes in market values of securities held and
55 OPPENHEIMER GLOBAL ALLOCATION FUND
| | |
| |
NOTES TO CONSOLIDATED FINANCIAL STATEMENTS Unaudited / Continued | | |
1. Significant Accounting Policies (Continued)
reported with all other foreign currency gains and losses in the Fund’s Consolidated Statement of Operations.
Allocation of Income, Expenses, Gains and Losses. Income, expenses (other than those attributable to a specific class), gains and losses are allocated on a daily basis to each class of shares based upon the relative proportion of net assets represented by such class. Operating expenses directly attributable to a specific class are charged against the operations of that class.
Federal Taxes. The Fund intends to comply with provisions of the Internal Revenue Code applicable to regulated investment companies and to distribute substantially all of its investment company taxable income to shareholders. Therefore, no federal income or excise tax provision is required. The Fund files income tax returns in U.S. federal and applicable state jurisdictions. The statute of limitations on the Fund’s tax return filings generally remain open for the three preceding fiscal reporting period ends.
During the fiscal year ended October 31, 2013, the Fund utilized $97,135,826 of capital loss carryforward to offset capital gains realized in that fiscal year. Details of the fiscal year ended October 31, 2013 capital loss carryforwards are included in the table below. Capital loss carryforwards with no expiration, if any, must be utilized prior to those with expiration dates. Capital losses with no expiration will be carried forward to future years if not offset by gains.
| | | | |
| Expiring | | | |
2016 | | | $ 387,470,214 | |
2017 | | | 410,473,446 | |
| | | | |
Total | | | $ 797,943,660 | |
| | | | |
As of April 30, 2014, it is estimated that the capital loss carryforwards would be $770,898,675 expiring by 2017. The estimated capital loss carryforward represents the carryforward as of the end of the last fiscal year, increased or decreased by capital losses or gains realized in the first six months of the current fiscal year. During the six months ended April 30, 2014, it is estimated that the Fund will utilize $27,044,985 of capital loss carryforward to offset realized capital gains.
Net investment income (loss) and net realized gain (loss) may differ for financial statement and tax purposes. The character of dividends and distributions made during the fiscal year from net investment income or net realized gains may differ from their ultimate characterization for federal income tax purposes. Also, due to timing of dividends and distributions, the fiscal year in which amounts are distributed may differ from the fiscal year in which the income or net realized gain was recorded by the Fund.
The aggregate cost of securities and other investments and the composition of unrealized appreciation and depreciation of securities and other investments for federal income tax purposes as of April 30, 2014 are noted in the following table. The primary difference between book and tax appreciation or depreciation of securities and other investments, if
56 OPPENHEIMER GLOBAL ALLOCATION FUND
1. Significant Accounting Policies (Continued)
applicable, is attributable to the tax deferral of losses or tax realization of financial statement unrealized gain or loss.
| | | | |
Federal tax cost of securities | | $ | 1,506,326,721 | |
Federal tax cost of other investments | | | 279,506,098 | |
| | | | |
Total federal tax cost | | $ | 1,785,832,819 | |
| | | | |
Gross unrealized appreciation | | $ | 302,649,819 | |
Gross unrealized depreciation | | | (59,584,283) | |
| | | | |
Net unrealized appreciation | | $ | 243,065,536 | |
| | | | |
Certain foreign countries impose a tax on capital gains which is accrued by the Fund based on unrealized appreciation, if any, on affected securities. The tax is paid when the gain is realized.
Trustees’ Compensation. The Fund has adopted an unfunded retirement plan (the “Plan”) for the Fund’s independent trustees. Benefits are based on years of service and fees paid to each trustee during their period of service. The Plan was frozen with respect to adding new participants effective December 31, 2006 (the “Freeze Date”) and existing Plan Participants as of the Freeze Date will continue to receive accrued benefits under the Plan. Active independent trustees as of the Freeze Date have each elected a distribution method with respect to their benefits under the Plan. During the six months ended April 30, 2014, the Fund’s projected benefit obligations, payments to retired trustees and accumulated liability were as follows:
| | | | |
Projected Benefit Obligations Increased | | $ | 6,739 | |
Payments Made to Retired Trustees | | | 97,659 | |
Accumulated Liability as of April 30, 2014 | | | 579,217 | |
The Board of Trustees has adopted a compensation deferral plan for independent trustees that enables trustees to elect to defer receipt of all or a portion of the annual compensation they are entitled to receive from the Fund. For purposes of determining the amount owed to the Trustee under the plan, deferred amounts are treated as though equal dollar amounts had been invested in shares of the Fund or in other Oppenheimer funds selected by the Trustee. The Fund purchases shares of the funds selected for deferral by the Trustee in amounts equal to his or her deemed investment, resulting in a Fund asset equal to the deferred compensation liability. Such assets are included as a component of “Other” within the asset section of the Consolidated Statement of Assets and Liabilities. Deferral of trustees’ fees under the plan will not affect the net assets of the Fund, and will not materially affect the Fund’s assets, liabilities or net investment income per share. Amounts will be deferred until distributed in accordance with the compensation deferral plan.
57 OPPENHEIMER GLOBAL ALLOCATION FUND
| | |
| |
NOTES TO CONSOLIDATED FINANCIAL STATEMENTS Unaudited / Continued | | |
1. Significant Accounting Policies (Continued)
Dividends and Distributions to Shareholders. Dividends and distributions to shareholders, which are determined in accordance with income tax regulations and may differ from U.S. generally accepted accounting principles, are recorded on the ex-dividend date. Income distributions, if any, are declared and paid quarterly. Capital gain distributions, if any, are declared and paid annually.
Investment Income. Dividend income is recorded on the ex-dividend date or upon ex-dividend notification in the case of certain foreign dividends where the ex-dividend date may have passed. Non-cash dividends included in dividend income, if any, are recorded at the fair market value of the securities received. Interest income is recognized on an accrual basis. Discount and premium, which are included in interest income on the Consolidated Statement of Operations, are amortized or accreted daily.
Custodian Fees. “Custodian fees and expenses” in the Consolidated Statement of Operations may include interest expense incurred by the Fund on any cash overdrafts of its custodian account during the period. Such cash overdrafts may result from the effects of failed trades in portfolio securities and from cash outflows resulting from unanticipated shareholder redemption activity. The Fund pays interest to its custodian on such cash overdrafts, to the extent they are not offset by positive cash balances maintained by the Fund, at a rate equal to the Federal Funds Rate plus 0.50%. The “Reduction to custodian expenses” line item, if applicable, represents earnings on cash balances maintained by the Fund during the period. Such interest expense and other custodian fees may be paid with these earnings.
Security Transactions. Security transactions are recorded on the trade date. Realized gains and losses on securities sold are determined on the basis of identified cost.
Indemnifications. The Fund’s organizational documents provide current and former trustees and officers with a limited indemnification against liabilities arising in connection with the performance of their duties to the Fund. In the normal course of business, the Fund may also enter into contracts that provide general indemnifications. The Fund’s maximum exposure under these arrangements is unknown as this would be dependent on future claims that may be made against the Fund. The risk of material loss from such claims is considered remote.
Other. The preparation of financial statements in conformity with accounting principles generally accepted in the United States of America requires management to make estimates and assumptions that affect the reported amounts of assets and liabilities and disclosure of contingent assets and liabilities at the date of the financial statements and the reported amounts of increases and decreases in net assets from operations during the reporting period. Actual results could differ from those estimates.
58 OPPENHEIMER GLOBAL ALLOCATION FUND
2. Securities Valuation
The Fund calculates the net asset value of its shares as of the close of the New York Stock Exchange (the “Exchange”), normally 4:00 P.M. Eastern time, on each day the Exchange is open for trading.
The Fund’s Board has adopted procedures for the valuation of the Fund’s securities and has delegated the day-to-day responsibility for valuation determinations under those procedures to the Manager. The Manager has established a Valuation Committee which is responsible for determining a “fair valuation” for any security for which market quotations are not “readily available.” The Valuation Committee’s fair valuation determinations are subject to review, approval and ratification by the Fund’s Board at its next regularly scheduled meeting covering the calendar quarter in which the fair valuation was determined.
Valuation Methods and Inputs
Securities are valued using unadjusted quoted market prices, when available, as supplied primarily by third party pricing services or dealers.
The following methodologies are used to determine the market value or the fair value of the types of securities described below:
Securities traded on a registered U.S. securities exchange (including exchange-traded derivatives other than futures and futures options) are valued based on the last sale price of the security reported on the principal exchange on which it is traded, prior to the time when the Fund’s assets are valued. In the absence of a sale, the security is valued at the last sale price on the prior trading day, if it is within the spread of the current day’s closing “bid” and “asked” prices, and if not, at the current day’s closing bid price. A security of a foreign issuer traded on a foreign exchange, but not listed on a registered U.S. securities exchange, is valued based on the last sale price on the principal exchange on which the security is traded, as identified by the third party pricing service used by the Manager, prior to the time when the Fund’s assets are valued. If the last sale price is unavailable, the security is valued at the most recent official closing price on the principal exchange on which it is traded. If the last sales price or official closing price for a foreign security is not available, the security is valued at the mean between the bid and asked price per the exchange or, if not available from the exchange, obtained from two dealers. If bid and asked prices are not available from either the exchange or two dealers, the security is valued by using one of the following methodologies (listed in order of priority): (1) using a bid from the exchange, (2) the mean between the bid and asked price as provided by a single dealer, or (3) a bid from a single dealer.
Shares of a registered investment company that are not traded on an exchange are valued at that investment company’s net asset value per share.
Corporate and government debt securities (of U.S. or foreign issuers) and municipal debt securities, event-linked bonds, loans, mortgage-backed securities, collateralized mortgage obligations, and asset-backed securities are valued at the mean between the “bid” and “asked” prices utilizing evaluated prices obtained from third party pricing services or broker-dealers who may use matrix pricing methods to determine the evaluated prices.
Short-term money market type debt securities with a remaining maturity of sixty days or less are valued at cost adjusted by the amortization of discount or premium to maturity (amortized cost), which approximates market value. Short-term debt securities with a
59 OPPENHEIMER GLOBAL ALLOCATION FUND
| | |
| |
NOTES TO CONSOLIDATED FINANCIAL STATEMENTS Unaudited / Continued | | |
2. Securities Valuation (Continued)
remaining maturity in excess of sixty days are valued at the mean between the “bid” and “asked” prices utilizing evaluated prices obtained from third party pricing services or broker-dealers.
Futures contracts and futures options traded on a commodities or futures exchange will be valued at the final settlement price or official closing price on the principal exchange as reported by such principal exchange at its trading session ending at, or most recently prior to, the time when the Fund’s assets are valued.
A description of the standard inputs that may generally be considered by the third party pricing vendors in determining their evaluated prices is provided below.
| | |
| Security Type | | Standard inputs generally considered by third-party pricing vendors |
Corporate debt, government debt, municipal, mortgage-backed and asset-backed securities | | Reported trade data, broker-dealer price quotations, benchmark yields, issuer spreads on comparable securities, the credit quality, yield, maturity, and other appropriate factors. |
| Loans | | Information obtained from market participants regarding reported trade data and broker-dealer price quotations. |
| Event-linked bonds | | Information obtained from market participants regarding reported trade data and broker-dealer price quotations. |
If a market value or price cannot be determined for a security using the methodologies described above, or if, in the “good faith” opinion of the Manager, the market value or price obtained does not constitute a “readily available market quotation,” or a significant event has occurred that would materially affect the value of the security the security is fair valued either (i) by a standardized fair valuation methodology applicable to the security type or the significant event as previously approved by the Valuation Committee and the Fund’s Board or (ii) as determined in good faith by the Manager’s Valuation Committee. The Valuation Committee considers all relevant facts that are reasonably available, through either public information or information available to the Manager, when determining the fair value of a security. Fair value determinations by the Manager are subject to review, approval and ratification by the Fund’s Board at its next regularly scheduled meeting covering the calendar quarter in which the fair valuation was determined. Those fair valuation standardized methodologies include, but are not limited to, valuing securities at the last sale price or initially at cost and subsequently adjusting the value based on: changes in company specific fundamentals, changes in an appropriate securities index, or changes in the value of similar securities which may be further adjusted for any discounts related to security-specific resale restrictions. When possible, such methodologies use observable market inputs such as unadjusted quoted prices of similar securities, observable interest rates, currency rates and yield curves. The methodologies used for valuing securities are not necessarily an indication of the risks associated with investing in those securities nor can it be assured that the Fund can obtain the fair value assigned to a security if it were to sell the security.
To assess the continuing appropriateness of security valuations, the Manager, or its third party service provider who is subject to oversight by the Manager, regularly compares prior day prices, prices on comparable securities, and sale prices to the current day prices and
60 OPPENHEIMER GLOBAL ALLOCATION FUND
2. Securities Valuation (Continued)
challenges those prices exceeding certain tolerance levels with the third party pricing service or broker source. For those securities valued by fair valuations, whether through a standardized fair valuation methodology or a fair valuation determination, the Valuation Committee reviews and affirms the reasonableness of the valuations based on such methodologies and fair valuation determinations on a regular basis after considering all relevant information that is reasonably available.
Classifications
Each investment asset or liability of the Fund is assigned a level at measurement date based on the significance and source of the inputs to its valuation. Various data inputs are used in determining the value of each of the Fund’s investments as of the reporting period end. These data inputs are categorized in the following hierarchy under applicable financial accounting standards:
1) Level 1-unadjusted quoted prices in active markets for identical assets or liabilities (including securities actively traded on a securities exchange)
2) Level 2-inputs other than unadjusted quoted prices that are observable for the asset or liability (such as unadjusted quoted prices for similar assets and market corroborated inputs such as interest rates, prepayment speeds, credit risks, etc.)
3) Level 3-significant unobservable inputs (including the Manager’s own judgments about assumptions that market participants would use in pricing the asset or liability).
The inputs used for valuing securities are not necessarily an indication of the risks associated with investing in those securities.
The table below categorizes amounts that are included in the Fund’s Consolidated Statement of Assets and Liabilities as of April 30, 2014 based on valuation input level:
| | | | | | | | | | | | | | | | |
| | | Level 1—
Unadjusted
Quoted Prices | | | Level 2— Other Significant
Observable Inputs | | | Level 3—
Significant
Unobservable
Inputs | | | Value | |
Assets Table | |
Investments, at Value: | |
Common Stocks | | | | | | | | | | | | | | | | |
Consumer Discretionary | | $ | 100,063,208 | | | $ | 86,854,025 | | | $ | — | | | $ | 186,917,233 | |
Consumer Staples | | | 44,819,371 | | | | 59,301,429 | | | | — | | | | 104,120,800 | |
Energy | | | 55,022,737 | | | | 26,223,611 | | | | — | | | | 81,246,348 | |
Financials | | | 110,782,121 | | | | 88,949,209 | | | | 3,476 | | | | 199,734,806 | |
Health Care | | | 137,693,425 | | | | 42,072,112 | | | | — | | | | 179,765,537 | |
Industrials | | | 97,200,025 | | | | 81,785,993 | | | | — | | | | 178,986,018 | |
Information Technology | | | 175,617,261 | | | | 72,558,051 | | | | — | | | | 248,175,312 | |
Materials | | | 21,102,993 | | | | 22,926,804 | | | | — | | | | 44,029,797 | |
Telecommunication Services | | | 5,897,459 | | | | 15,169,822 | | | | — | | | | 21,067,281 | |
Utilities | | | 7,067,149 | | | | 1,109,640 | | | | — | | | | 8,176,789 | |
Preferred Stocks | | | 269,819 | | | | 652,966 | | | | — | | | | 922,785 | |
Rights, Warrants and Certificates | | | 109,564 | | | | — | | | | — | | | | 109,564 | |
Non-Convertible Corporate Bonds and Notes | | | — | | | | 130,247,327 | | | | — | | | | 130,247,327 | |
Corporate Loans | | | — | | | | 18,047,402 | | | | — | | | | 18,047,402 | |
61 OPPENHEIMER GLOBAL ALLOCATION FUND
| | |
| |
NOTES TO CONSOLIDATED FINANCIAL STATEMENTS Unaudited / Continued | | |
2. Securities Valuation (Continued)
| | | | | | | | | | | | | | | | |
| | | Level 1—
Unadjusted
Quoted Prices | | | Level 2— Other Significant
Observable Inputs | | | Level 3—
Significant
Unobservable
Inputs | | | Value | |
| |
Assets Table (Continued) | |
Investments, at Value: (Continued) | |
Exchange-Traded Options Purchased | | $ | 10,419,694 | | | $ | — | | | $ | — | | | $ | 11,393,480 | |
Over-the-Counter Options Purchased | | | — | | | | 973,786 | | | | — | | | | 11,393,480 | |
Investment Companies | | | 325,356,329 | | | | — | | | | — | | | | 325,356,329 | |
| | | | |
Total Investments, at Value | | | 1,091,421,155 | | | | 646,872,177 | | | | 3,476 | | | | 1,738,296,808 | |
Other Financial Instruments: | | | | | | | | | | | | | | | | |
Variation margin receivable | | | 150,000 | | | | — | | | | — | | | | 150,000 | |
| | | | |
Total Assets | | $ | 1,091,571,155 | | | $ | 646,872,177 | | | $ | 3,476 | | | $ | 1,738,446,808 | |
| | | | |
| | | | |
Liabilities Table | | | | | | | | | | | | | | | | |
Other Financial Instruments: | | | | | | | | | | | | | | | | |
Options written, at value | | $ | — | | | $ | (1,295,000 | ) | | $ | — | | | $ | (1,295,000) | |
Variation margin payable | | | (1,060,550 | ) | | | — | | | | — | | | | (1,060,550) | |
| | | | |
Total Liabilities | | $ | (1,060,550 | ) | | $ | (1,295,000 | ) | | $ | — | | | $ | (2,355,550) | |
| | | | |
Currency contracts and forwards, if any, are reported at their unrealized appreciation/ depreciation at measurement date, which represents the change in the contract’s value from trade date. Futures, if any, are reported at their variation margin at measurement date, which represents the amount due to/from the Fund at that date. All additional assets and liabilities included in the above table are reported at their market value at measurement date.
The table below shows the transfers between Level 1 and Level 2. The Fund’s policy is to recognize transfers in and transfers out as of the beginning of the reporting period.
| | | | | | | | |
| | | Transfers out of Level 1* | | | Transfers into Level 2* | |
Assets Table | | | | | | | | |
Investments, at Value: | | | | | | | | |
Common Stocks | | | | | | | | |
Consumer Staples | | | $ (735,264) | | | | $ 735,264 | |
Financials | | | (2,772,680) | | | | 2,772,680 | |
Materials | | | (365,289) | | | | 365,289 | |
| | | | |
Total Assets | | | $ (3,873,233) | | | | $ 3,873,233 | |
| | | | |
*Transferred from Level 1 to Level 2 due to the absence of a readily available unadjusted quoted market price.
3. Shares of Beneficial Interest
The Fund has authorized an unlimited number of $0.01 par value shares of beneficial interest of each class. Transactions in shares of beneficial interest were as follows:
62 OPPENHEIMER GLOBAL ALLOCATION FUND
3. Shares of Beneficial Interest (Continued)
| | | | | | | | | | | | | | | | |
| | | Six Months Ended April 30, 2014 | | | Year Ended October 31, 2013 | |
| | | Shares | | | Amount | | | Shares | | | Amount | |
Class A | | | | | | | | | | | | | | | | |
Sold | | | 2,869,490 | | | $ | 49,664,391 | | | | 5,284,040 | | | $ | 84,264,351 | |
Dividends and/or distributions reinvested | | | 1,079,654 | | | | 18,330,632 | | | | 856,406 | | | | 13,475,276 | |
Redeemed | | | (5,959,030 | ) | | | (103,067,384 | ) | | | (14,903,832 | ) | | | (236,429,212) | |
| | | | |
Net decrease | | | (2,009,886 | ) | | $ | (35,072,361 | ) | | | (8,763,386 | ) | | $ | (138,689,585) | |
| | | | |
| | | | | | | | | | | | | | | | | |
Class B | | | | | | | | | | | | | | | | |
Sold | | | 58,495 | | | $ | 982,201 | | | | 49,266 | | | $ | 780,124 | |
Dividends and/or distributions reinvested | | | 58,918 | | | | 971,566 | | | | 27,521 | | | | 412,759 | |
Redeemed | | | (1,031,914 | ) | | | (17,337,477 | ) | | | (2,199,862 | ) | | | (33,817,010) | |
| | | | |
Net decrease | | | (914,501 | ) | | $ | (15,383,710 | ) | | | (2,123,075 | ) | | $ | (32,624,127) | |
| | | | |
| | | | | | | | | | | | | | | | | |
Class C | | | | | | | | | | | | | | | | |
Sold | | | 735,793 | | | $ | 12,350,038 | | | | 1,277,126 | | | $ | 19,804,767 | |
Dividends and/or distributions reinvested | | | 192,392 | | | | 3,176,397 | | | | 86,185 | | | | 1,301,190 | |
Redeemed | | | (1,255,667 | ) | | | (21,088,423 | ) | | | (3,284,095 | ) | | | (50,762,078) | |
| | | | |
Net decrease | | | (327,482 | ) | | $ | (5,561,988 | ) | | | (1,920,784 | ) | | $ | (29,656,121) | |
| | | | |
| | | | | | | | | | | | | | | | | |
Class I | | | | | | | | | | | | | | | | |
Sold | | | 19,434 | | | $ | 335,998 | | | | 58,815 | | | $ | 956,098 | |
Dividends and/or distributions reinvested | | | 802 | | | | 13,614 | | | | 133 | | | | 2,230 | |
Redeemed | | | (14,427 | ) | | | (250,338 | ) | | | (14,689 | ) | | | (240,344) | |
| | | | |
Net increase | | | 5,809 | | | $ | 99,274 | | | | 44,259 | | | $ | 717,984 | |
| | | | |
| | | | | | | | | | | | | | | | | |
Class N | | | | | | | | | | | | | | | | |
Sold | | | 167,176 | | | $ | 2,848,504 | | | | 346,258 | | | $ | 5,427,902 | |
Dividends and/or distributions reinvested | | | 34,082 | | | | 569,850 | | | | 24,106 | | | | 371,919 | |
Redeemed | | | (268,322 | ) | | | (4,570,614 | ) | | | (888,780 | ) | | | (13,921,121) | |
| | | | |
Net decrease | | | (67,064 | ) | | $ | (1,152,260 | ) | | | (518,416 | ) | | $ | (8,121,300) | |
| | | | |
| | | | | | | | | | | | | | | | | |
Class Y | | | | | | | | | | | | | | | | |
Sold | | | 244,188 | | | $ | 4,220,247 | | | | 401,300 | | | $ | 6,467,550 | |
Dividends and/or distributions reinvested | | | 33,794 | | | | 573,695 | | | | 28,910 | | | | 456,453 | |
Redeemed | | | (198,033 | ) | | | (3,420,559 | ) | | | (446,374 | ) | | | (7,064,411) | |
| | | | |
Net increase (decrease) | | | 79,949 | | | $ | 1,373,383 | | | | (16,164 | ) | | $ | (140,408) | |
| | | | |
63 OPPENHEIMER GLOBAL ALLOCATION FUND
| | |
| |
NOTES TO CONSOLIDATED FINANCIAL STATEMENTS Unaudited / Continued | | |
4. Purchases and Sales of Securities
The aggregate cost of purchases and proceeds from sales of securities, other than short-term obligations and investments in IMMF, for the six months ended April 30, 2014 were as follows:
| | | | | | | | |
| | | Purchases | | | Sales | |
Investment securities | | $ | 708,450,103 | | | $ | 832,917,427 | |
5. Fees and Other Transactions with Affiliates
Management Fees. Under the investment advisory agreement, the Fund pays the Manager a management fee based on the daily net assets of the Fund at an annual rate as shown in the following table:
| | | | |
| Fee Schedule | | | |
Up to $1.0 billion | | | 0.80 | % |
Next $2.0 billion | | | 0.76 | |
Next $1.0 billion | | | 0.71 | |
Next $1.0 billion | | | 0.66 | |
Next $1.0 billion | | | 0.60 | |
Next $1.0 billion | | | 0.55 | |
Next $2.0 billion | | | 0.50 | |
Over $9.0 billion | | | 0.48 | |
Sub-Adviser Fees. The Manager has retained the Sub-Adviser to provide the day-to-day portfolio management of the Fund. Under the Sub-Advisory Agreement, the Manager pays the Sub-Adviser an annual fee in monthly installments, equal to a percentage of the investment management fee collected by the Manager from the Fund, which shall be calculated after any investment management fee waivers. The fee paid to the Sub-Adviser is paid by the Manager, not by the Fund.
Transfer Agent Fees. OFI Global (the “Transfer Agent”) serves as the transfer and shareholder servicing agent for the Fund. The Fund pays the Transfer Agent a fee based on annual net assets. Fees incurred by the Fund with respect to these services are detailed in the Statement of Operations.
Sub-Transfer Agent Fees. The Transfer Agent has retained Shareholder Services, Inc., a wholly-owned subsidiary of OFI (the “Sub-Transfer Agent”), to provide the day-to-day transfer agent and shareholder servicing of the Fund. Under the Sub-Transfer Agency Agreement, the Transfer Agent pays the Sub-Transfer Agent an annual fee in monthly installments, equal to a percentage of the transfer agent fee collected by the Transfer Agent from the Fund, which shall be calculated after any applicable fee waivers. The fee paid to the Sub-Transfer Agent is paid by the Transfer Agent, not by the Fund.
Distribution and Service Plan (12b-1) Fees. Under its General Distributor’s Agreement with the Fund, OppenheimerFunds Distributor, Inc. (the “Distributor”) acts as the Fund’s principal underwriter in the continuous public offering of the Fund’s classes of shares.
64 OPPENHEIMER GLOBAL ALLOCATION FUND
5. Fees and Other Transactions with Affiliates (Continued)
Distribution and Service Plan for Class A Shares. The Fund has adopted a Distribution and Service Plan (the “Plan”) for Class A shares. Under the Plan, the Fund pays a service fee to the Distributor at an annual rate of 0.25% of the daily net assets of Class A shares. The Distributor currently uses all of those fees to pay dealers, brokers, banks and other financial institutions periodically for providing personal services and maintenance of accounts of their customers that hold Class A shares. Under the Plan, the Fund may also pay an asset-based sales charge to the Distributor. However, the Fund’s Board has currently set the rate at zero. Fees incurred by the Fund under the Plan are detailed in the Consolidated Statement of Operations.
Distribution and Service Plans for Class B, Class C and Class N Shares. The Fund has adopted Distribution and Service Plans (the “Plans”) for Class B, Class C and Class N shares under Rule 12b-1 of the Investment Company Act of 1940 to compensate the Distributor for its services in connection with the distribution of those shares and servicing accounts. Under the Plans, the Fund pays the Distributor an annual asset-based sales charge of 0.75% on Class B and Class C shares daily net assets and 0.25% on Class N shares daily net assets. The Distributor also receives a service fee of 0.25% per year under each plan. If either the Class B, Class C or Class N plan is terminated by the Fund or by the shareholders of a class, the Board of Trustees and its independent trustees must determine whether the Distributor shall be entitled to payment from the Fund of all or a portion of the service fee and/or asset-based sales charge in respect to shares sold prior to the effective date of such termination. Fees incurred by the Fund under the Plans are detailed in the Consolidated Statement of Operations. The Distributor determines its uncompensated expenses under the Plans at calendar quarter ends. The Distributor’s aggregate uncompensated expenses under the Plans at March 31, 2014 were as follows:
| | | | |
Class B | | $ | 30,806,194 | |
Class C | | | 36,963,538 | |
Class N | | | 6,879,519 | |
Sales Charges. Front-end sales charges and contingent deferred sales charges (“CDSC”) do not represent expenses of the Fund. They are deducted from the proceeds of sales of Fund shares prior to investment or from redemption proceeds prior to remittance, as applicable. The sales charges retained by the Distributor from the sale of shares and the CDSC retained by the Distributor on the redemption of shares is shown in the following table for the period indicated.
| | | | | | | | | | | | | | | | | | | | |
| Six Months Ended | | Class A Front-End
Sales Charges
Retained by
Distributor | | | Class A
Contingent
Deferred Sales
Charges
Retained by
Distributor | | | Class B
Contingent
Deferred Sales
Charges
Retained by
Distributor | | | Class C
Contingent
Deferred Sales
Charges
Retained by
Distributor | | | Class N
Contingent
Deferred Sales
Charges
Retained by
Distributor | |
April 30, 2014 | | | $163,177 | | | | $36 | | | | $42,703 | | | | $7,450 | | | | $87 | |
65 OPPENHEIMER GLOBAL ALLOCATION FUND
| | |
| |
NOTES TO CONSOLIDATED FINANCIAL STATEMENTS Unaudited / Continued | | |
5. Fees and Other Transactions with Affiliates (Continued)
Waivers and Reimbursements of Expenses. The Manager has contractually agreed to waive the management fee it receives from the Fund in an amount equal to the management fee it receives from the Subsidiary. This undertaking will continue in effect for so long as the Fund invests in the Subsidiary and may not be terminated unless approved by the Fund’s Board of Trustees. During the six months ended April 30, 2014, the Manager waived $58,785.
The Manager will waive fees and/or reimburse Fund expenses in an amount equal to the indirect management fees incurred through the Fund’s investments in IMMF, Oppenheimer Ultra Short Duration Fund and Master Funds. During the six months ended April 30, 2014, the Manager waived fees and/or reimbursed the Fund $593,604 for management fees.
The Transfer Agent has contractually agreed to limit transfer and shareholder servicing agent fees for Classes B, C, N and Y shares to 0.35% of average annual net assets per class and for Class A shares to 0.30% of average annual net assets of the class.
During the six months ended April 30, 2014, the Transfer Agent waived transfer and shareholder servicing agent fees as follows:
Some of these undertakings may be modified or terminated at any time; some may not be modified or terminated until after one year from the date of the current prospectus, as indicated therein.
6. Risk Exposures and the Use of Derivative Instruments
The Fund’s investment objective not only permits the Fund to purchase investment securities, it also allows the Fund to enter into various types of derivatives contracts, including, but not limited to, futures contracts, forward currency exchange contracts, credit default swaps, interest rate swaps, total return swaps, variance swaps and purchased and written options. In doing so, the Fund will employ strategies in differing combinations to permit it to increase, decrease, or change the level or types of exposure to market risk factors. These instruments may allow the Fund to pursue its objectives more quickly and efficiently than if it were to make direct purchases or sales of securities capable of effecting a similar response to market factors. Such contracts may be entered into through a bilateral over-the-counter (“OTC”) transaction, or through a securities or futures exchange and cleared through a clearinghouse.
Market Risk Factors. In accordance with its investment objectives, the Fund may use derivatives to increase or decrease its exposure to one or more of the following market risk factors:
Commodity Risk. Commodity risk relates to the change in value of commodities or commodity indexes as they relate to increases or decreases in the commodities market. Commodities are physical assets that have tangible properties. Examples of these types of assets are crude oil, heating oil, metals, livestock, and agricultural products.
66 OPPENHEIMER GLOBAL ALLOCATION FUND
6. Risk Exposures and the Use of Derivative Instruments (Continued)
Credit Risk. Credit risk relates to the ability of the issuer to meet interest and principal payments, or both, as they come due. In general, lower-grade, higher-yield bonds are subject to credit risk to a greater extent than lower-yield, higher-quality bonds.
Equity Risk. Equity risk relates to the change in value of equity securities as they relate to increases or decreases in the general market.
Foreign Exchange Rate Risk. Foreign exchange rate risk relates to the change in the U.S. dollar value of a security held that is denominated in a foreign currency. The U.S. dollar value of a foreign currency denominated security will decrease as the dollar appreciates against the currency, while the U.S. dollar value will increase as the dollar depreciates against the currency.
Interest Rate Risk. Interest rate risk refers to the fluctuations in value of fixed-income securities resulting from the inverse relationship between price and yield. For example, an increase in general interest rates will tend to reduce the market value of already issued fixed-income investments, and a decline in general interest rates will tend to increase their value. In addition, debt securities with longer maturities, which tend to have higher yields, are subject to potentially greater fluctuations in value from changes in interest rates than obligations with shorter maturities.
Volatility Risk. Volatility risk refers to the magnitude of the movement, but not the direction of the movement, in a financial instrument’s price over a defined time period. Large increases or decreases in a financial instrument’s price over a relative time period typically indicate greater volatility risk, while small increases or decreases in its price typically indicate lower volatility risk.
Derivatives may have little or no initial cash investment relative to their market value exposure and therefore can produce significant gains or losses in excess of their cost due to unanticipated changes in the market risk factors and the overall market. This use of embedded leverage allows the Fund to increase its market value exposure relative to its net assets and can substantially increase the volatility of the Fund’s performance. In instances where the Fund is using derivatives to decrease, or hedge, exposures to market risk factors for securities held by the Fund, there are also risks that those derivatives may not perform as expected resulting in losses for the combined or hedged positions. Some derivatives have the potential for unlimited loss, regardless of the size of the Fund’s initial investment.
Additional associated risks from investing in derivatives also exist and potentially could have significant effects on the valuation of the derivative and the Fund. Typically, the associated risks are not the risks that the Fund is attempting to increase or decrease exposure to, per its investment objectives, but are the additional risks from investing in derivatives. Examples of these associated risks are liquidity risk, which is the risk that the Fund will not be able to sell the derivative in the open market in a timely manner, and counterparty credit risk, which is the risk that the counterparty will not fulfill its obligation to the Fund.
The Fund’s actual exposures to these market risk factors and associated risks during the period are discussed in further detail, by derivative type, below.
67 OPPENHEIMER GLOBAL ALLOCATION FUND
| | |
| |
NOTES TO CONSOLIDATED FINANCIAL STATEMENTS Unaudited / Continued | | |
6. Risk Exposures and the Use of Derivative Instruments (Continued)
Futures Contracts
A futures contract is a commitment to buy or sell a specific amount of a commodity, financial instrument or currency at a negotiated price on a stipulated future date. The Fund may buy and sell futures contracts and may also buy or write put or call options on these futures contracts. Futures contracts and options thereon are generally entered into on a regulated futures exchange and cleared through a clearinghouse associated with the exchange.
Upon entering into a futures contract, the Fund is required to deposit either cash or securities (initial margin) in an amount equal to a certain percentage of the contract value in an account registered in the futures commission merchant’s name. Subsequent payments (variation margin) are paid to or from the futures commission merchant each day equal to the daily changes in the contract value. Such payments are recorded as unrealized gains and losses. Should the Fund fail to make requested variation margin payments, the futures commission merchant can gain access to the initial margin to satisfy the Fund’s payment obligations.
Futures contracts are reported on a schedule following the Consolidated Statement of Investments. Securities held by a futures commission merchant to cover initial margin requirements on open futures contracts are noted in the Consolidated Statement of Investments. Cash held by a futures commission merchant to cover initial margin requirements on open futures contracts and the receivable and/or payable for the daily mark to market for the variation margin are noted in the Consolidated Statement of Assets and Liabilities. The net change in unrealized appreciation and depreciation is reported in the Consolidated Statement of Operations. Realized gains (losses) are reported in the Consolidated Statement of Operations at the closing or expiration of futures contracts.
The Fund has purchased futures contracts on various bonds and notes to increase exposure to interest rate risk.
The Fund has sold futures contracts on various bonds and notes to decrease exposure to interest rate risk.
The Fund has sold futures contracts on various equity indexes to decrease exposure to equity risk.
The Fund has purchased futures contracts, which have values that are linked to the price movement of the related volatility indexes, in order to increase exposure to volatility risk.
The Fund has sold futures contracts, which have values that are linked to the price movement of the related volatility indexes, in order to decrease exposure to volatility risk.
During the six months ended April 30, 2014, the Fund had an ending monthly average market value of $84,609,054 and $137,880,571 on futures contracts purchased and sold, respectively.
Additional associated risks of entering into futures contracts (and related options) include the possibility that there may be an illiquid market where the Fund is unable to liquidate the contract or enter into an offsetting position and, if used for hedging purposes, the risk that the price of the contract will correlate imperfectly with the prices of the Fund’s securities.
68 OPPENHEIMER GLOBAL ALLOCATION FUND
6. Risk Exposures and the Use of Derivative Instruments (Continued)
Option Activity
The Fund may buy and sell put and call options, or write put and call options. When an option is written, the Fund receives a premium and becomes obligated to sell or purchase the underlying security, currency or other underlying financial instrument at a fixed price, upon exercise of the option.
Options can be traded through an exchange or through a privately negotiated arrangement with a dealer in an OTC transaction. Options traded through an exchange are generally cleared through a clearinghouse (such as The Options Clearing Corporation). The difference between the premium received or paid, and market value of the option, is recorded as unrealized appreciation or depreciation. The net change in unrealized appreciation or depreciation is reported in the Consolidated Statement of Operations. When an option is exercised, the cost of the security purchased or the proceeds of the security sale are adjusted by the amount of premium received or paid. Upon the expiration or closing of the option transaction, a gain or loss is reported in the Consolidated Statement of Operations.
The Fund has purchased call options on treasury and/or euro futures to increase exposure to interest rate risk. A purchased call option becomes more valuable as the price of the underlying financial instrument appreciates relative to the strike price.
The Fund has purchased call options on individual equity securities and/or equity indexes to increase exposure to equity risk. A purchased call option becomes more valuable as the price of the underlying financial instrument appreciates relative to the strike price.
The Fund has purchased put options on individual equity securities and/or equity indexes to decrease exposure to equity risk. A purchased put option becomes more valuable as the price of the underlying financial instrument depreciates relative to the strike price.
The Fund has purchased call options on volatility indexes to increase exposure to volatility risk. A purchased call option becomes more valuable as the level of the underlying volatility index increases relative to the strike price.
During the six months ended April 30, 2014, the Fund had an ending monthly average market value of $84,609,054 and $137,880,571 on purchased call options and purchased put options, respectively.
Options written, if any, are reported in a schedule following the Consolidated Statement of Investments and as a liability in the Consolidated Statement of Assets and Liabilities. Securities held in collateral accounts to cover potential obligations with respect to outstanding written options are noted in the Consolidated Statement of Investments.
The risk in writing a call option is that the market price of the security increases and if the option is exercised, the Fund must either purchase the security at a higher price for delivery or, if the Fund owns the underlying security, give up the opportunity for profit. The risk in writing a put option is that the Fund may incur a loss if the market price of the security decreases and the option is exercised. The risk in buying an option is that the Fund pays a premium whether or not the option is exercised. The Fund also has the additional risk that there may be an illiquid market where the Fund is unable to close the contract.
The Fund has written put options on individual equity securities and/or equity indexes to increase exposure to equity risk. A written put option becomes more valuable as the price of the underlying financial instrument appreciates relative to the strike price.
69 OPPENHEIMER GLOBAL ALLOCATION FUND
| | |
| |
NOTES TO CONSOLIDATED FINANCIAL STATEMENTS Unaudited / Continued | | |
6. Risk Exposures and the Use of Derivative Instruments (Continued)
The Fund has written call options on individual equity securities and/or equity indexes to decrease exposure to equity risk. A written call option becomes more valuable as the price of the underlying financial instrument depreciates relative to the strike price.
The Fund has written call options on volatility indexes to decrease exposure to volatility risk. A written call option becomes more valuable as the level of the underlying volatility index decreases relative to the strike price.
During the six months ended April 30, 2014, the Fund had an ending monthly average market value of $14,790,426 and $3,687,759 on written call options and written put options, respectively.
Additional associated risks to the Fund include counterparty credit risk and liquidity risk.
Written option activity for the six months ended April 30, 2014 was as follows:
| | | | | | | | | | | | | | | | |
| | | Call Options | | | Put Options | |
| | | Number of
Contracts | | | Amount of
Premiums | | | Number of Contracts | | | Amount of
Premiums | |
Options outstanding as of October 31, 2013 | | | 115,000 | | | | $ 10,998,142 | | | | 4,000 | | | | $ 10,667,858 | |
Options written | | | 390,000 | | | | 16,594,706 | | | | 17,250 | | | | 15,072,596 | |
Options closed or expired | | | (225,000) | | | | (12,448,991) | | | | (11,000) | | | | (7,876,581) | |
Options exercised | | | (210,000) | | | | (9,952,139) | | | | (8,750) | | | | (16,143,432) | |
| | | | |
Options outstanding as of April 30, 2014 | | | 70,000 | | | | $ 5,191,718 | | | | 1,500 | | | | $ 1,720,441 | |
| | | | |
Swap Contracts
The Fund may enter into swap contract agreements with a counterparty to exchange a series of cash flows based on either specified reference rates, the price or volatility of asset or non-asset references, or the occurrence of a credit event, over a specified period. Swaps can be executed in a bi-lateral privately negotiated arrangement with a dealer in an OTC transaction (“OTC swaps”) or executed on a regulated market. Certain swaps, regardless of the venue of their execution, are required to be cleared through a clearinghouse (“cleared swaps”). Swap contracts may include interest rate, equity, debt, index, total return, credit default, currency, and volatility swaps.
Swap contracts are reported on a schedule following the Consolidated Statement of Investments. Daily changes in the value of cleared swaps are reported as variation margin receivable or payable on the Consolidated Statement of Assets and Liabilities. The values of OTC swap contracts are aggregated by positive and negative values and disclosed separately on the Consolidated Statement of Assets and Liabilities. The unrealized appreciation (depreciation) related to the change in the valuation of the notional amount of the swap is combined with the accrued interest due to (owed by) the Fund, if any, at termination or settlement. The net change in this amount during the period is included on the Consolidated Statement of Operations. The Fund also records any periodic payments received from (paid to) the counterparty, including at termination, under such contracts as realized gain (loss) on the Consolidated Statement of Operations.
70 OPPENHEIMER GLOBAL ALLOCATION FUND
6. Risk Exposures and the Use of Derivative Instruments (Continued)
Swap contract agreements are exposed to the market risk factor of the specific underlying reference rate or asset. Swap contracts are typically more attractively priced compared to similar investments in related cash securities because they isolate the risk to one market risk factor and eliminate the other market risk factors. Investments in cash securities (for instance bonds) have exposure to multiple risk factors (credit and interest rate risk). Because swaps have embedded leverage, they can expose the Fund to substantial risk in the isolated market risk factor.
Volatility Swap Contracts. A volatility swap is an agreement between counterparties to exchange periodic payments based on the measured volatility of a reference security, index, currency or other reference investment over a specified time frame. One cash flow is typically based on the realized volatility of the reference investment as measured by changes in its price or level over the specified time period while the other cash flow is based on a specified rate representing expected volatility for the reference investment at the time the swap is executed, or the measured volatility of a different reference investment over the specified time period. The appreciation or depreciation on a volatility swap will typically depend on the magnitude of the reference investment’s volatility, or size of the movements in its price, over the specified time period, rather than general directional increases or decreases in its price.
Volatility swaps are less standard in structure than other types of swaps and provide pure, or isolated, exposure to volatility risk of the specific underlying reference investment. Volatility swaps are typically used to speculate on future volatility levels, to trade the spread between realized and expected volatility, or to decrease the volatility exposure of investments held by the Fund.
Variance swaps are a type of volatility swap where counterparties agree to exchange periodic payments based on the measured variance (or the volatility squared) of a reference security, index, or other reference investment over a specified time period. At payment date, a net cash flow will be exchanged based on the difference between the realized variance of the reference investment over the specified time period and the specified rate representing expected variance for the reference investment at the time the swap is executed multiplied by the notional amount of the contract.
The Fund has entered into variance swaps to decrease exposure to the volatility risk of various reference investments. These types of volatility swaps require the Fund to make a payment if the measured price variance of the reference asset is less than the specified fixed rate. If the measured variance of the related reference investment increases over the period, the swaps will appreciate in value. Conversely, if the measured variance of the related reference investment decreases over the period, the swaps will depreciate in value.
For the six months ended April 30, 2014, the Fund had ending monthly average notional amounts of $5,903 on volatility swaps which receive measured volatility/variance.
Additional associated risks to the Fund include counterparty credit risk and liquidity risk.
Counterparty Credit Risk. Derivative positions are subject to the risk that the counterparty will not fulfill its obligation to the Fund. The Fund intends to enter into derivative transactions
71 OPPENHEIMER GLOBAL ALLOCATION FUND
| | |
| |
NOTES TO CONSOLIDATED FINANCIAL STATEMENTS Unaudited / Continued | | |
6. Risk Exposures and the Use of Derivative Instruments (Continued)
with counterparties that the Manager believes to be creditworthy at the time of the transaction.
The Fund’s risk of loss from counterparty credit risk on OTC derivatives is generally limited to the aggregate unrealized gain netted against any collateral held by the Fund. For OTC options purchased, the Fund bears the risk of loss of the amount of the premiums paid plus the positive change in market values net of any collateral held by the Fund should the counterparty fail to perform under the contracts. Options written by the Fund do not typically give rise to counterparty credit risk, as options written generally obligate the Fund and not the counterparty to perform.
To reduce counterparty risk with respect to OTC transactions, the Fund has entered into master netting arrangements, established within the Fund’s International Swap and Derivatives Association, Inc. (“ISDA”) master agreements, which allow the Fund to make (or to have an entitlement to receive) a single net payment in the event of default (close-out netting) for outstanding payables and receivables with respect to certain OTC positions in swaps, options, swaptions, and forward currency exchange contracts for each individual counterparty. In addition, the Fund may require that certain counterparties post cash and/or securities in collateral accounts to cover their net payment obligations for those derivative contracts subject to ISDA master agreements. If the counterparty fails to perform under these contracts and agreements, the cash and/or securities will be made available to the Fund.
As of April 30, 2014, the Fund has not required certain counterparties to post collateral.
ISDA master agreements include credit related contingent features which allow counterparties to OTC derivatives to terminate derivative contracts prior to maturity in the event that, for example, the Fund’s net assets decline by a stated percentage or the Fund fails to meet the terms of its ISDA master agreements, which would cause the Fund to accelerate payment of any net liability owed to the counterparty.
For financial reporting purposes, the Fund does not offset derivative assets and derivative liabilities that are subject to netting arrangements in the Consolidated Statement of Assets and Liabilities. Bankruptcy or insolvency laws of a particular jurisdiction may impose restrictions on or prohibitions against the right of offset in bankruptcy, insolvency or other events.
The Fund’s risk of loss from counterparty credit risk on exchange-traded derivatives cleared through a clearinghouse and for cleared swaps is generally considered lower than as compared to OTC derivatives. However, counterparty credit risk exists with respect to initial and variation margin deposited/paid by the Fund that is held in futures commission merchant, broker and/or clearinghouse accounts for such exchange-traded derivatives and for cleared swaps.
With respect to cleared swaps, such transactions will be submitted for clearing, and if cleared, will be held in accounts at futures commission merchants or brokers that are members of clearinghouses. While brokers, futures commission merchants and clearinghouses are required to segregate customer margin from their own assets, in the event that a broker, futures commission merchant or clearinghouse becomes insolvent or goes into bankruptcy and at that time there is a shortfall in the aggregate amount of margin held by the broker, futures commission merchant or clearinghouse for all its customers, U.S. bankruptcy laws will
72 OPPENHEIMER GLOBAL ALLOCATION FUND
6. Risk Exposures and the Use of Derivative Instruments (Continued)
typically allocate that shortfall on a pro-rata basis across all the broker’s, futures commission merchant’s or clearinghouse’s customers, potentially resulting in losses to the Fund.
There is the risk that a broker, futures commission merchant or clearinghouse will decline to clear a transaction on the Fund’s behalf, and the Fund may be required to pay a termination fee to the executing broker with whom the Fund initially enters into the transaction. Clearinghouses may also be permitted to terminate cleared swaps at any time. The Fund is also subject to the risk that the broker or futures commission merchant will improperly use the Fund’s assets deposited/paid as initial or variation margin to satisfy payment obligations of another customer. In the event of a default by another customer of the broker or futures commission merchant, the Fund might not receive its variation margin payments from the clearinghouse, due to the manner in which variation margin payments are aggregated for all customers of the broker/futures commission merchant.
Collateral and margin requirements differ by type of derivative. Margin requirements are established by the broker, futures commission merchant or clearinghouse for exchange-traded and cleared derivatives, including cleared swaps. Brokers, futures commission merchants and clearinghouses can ask for margin in excess of the regulatory minimum, or increase the margin amount, in certain circumstances.
Collateral terms are contract specific for OTC derivatives. For derivatives traded under an ISDA master agreement, the collateral requirements are typically calculated by netting the mark to market amount for each transaction under such agreement and comparing that amount to the value of any collateral currently pledged by the Fund or the counterparty.
For financial reporting purposes, cash collateral that has been pledged to cover obligations of the Fund, if any, is reported separately on the Consolidated Statement of Assets and Liabilities as cash pledged as collateral. Non-cash collateral pledged by the Fund, if any, is noted in the Consolidated Statement of Investments. Generally, the amount of collateral due from or to a party must exceed a minimum transfer amount threshold (e.g. $250,000) before a transfer has to be made. To the extent amounts due to the Fund from its counterparties are not fully collateralized, contractually or otherwise, the Fund bears the risk of loss from counterparty nonperformance.
The following table presents by counterparty the Fund’s OTC derivative assets net of the related collateral posted for the benefit of the Fund at April 30, 2014
| | | | | | | | | | | | | | | | | | | | |
| | | | | | Gross Amounts Not Offset in the Consolidated
Statement of Assets & Liabilities | | | | |
| Counterparty | | Gross Amount of Assets in the
Consolidated
Statement of
Assets &
Liabilities* | | | Financial
Instruments
Available for
Offset | | | Financial
Instruments
Collateral
Received** | | | Cash Collateral
Received** | | | Net Amount | |
Goldman Sachs Group, Inc. (The) | | $ | 973,786 | | | $ | — | | | $ | — | | | $ | — | | | $ | 973,786 | |
*OTC derivatives are reported gross on the Consolidated Statement of Assets and Liabilities. Exchange traded options and margin related to cleared swaps and futures are excluded from these reported amounts.
**Reported collateral posted for the benefit of the Fund within this table is limited to the net outstanding amount due from an individual counterparty. The collateral posted for the benefit of the Fund may exceed these amounts.
73 OPPENHEIMER GLOBAL ALLOCATION FUND
| | |
| |
NOTES TO CONSOLIDATED FINANCIAL STATEMENTS Unaudited / Continued | | |
6. Risk Exposures and the Use of Derivative Instruments (Continued)
The following table presents the valuations of derivative instruments by risk exposure as reported within the Consolidated Statement of Assets and Liabilities as of April 30, 2014:
| | | | | | | | | | | | |
| | | Asset Derivatives | | | Liability Derivatives | |
Derivatives Not Accounted for as Hedging Instruments | | Consolidated Statement of Assets and Liabilities Location | | Value | | | Consolidated Statement of Assets and Liabilities Location | | Value | |
| |
Volatility contracts | | Variation margin receivable | | $ | 150,000 | * | | Options written, at value | | $ | 1,160,000 | |
Equity contracts | | Investments, at value | | | 6,276,286 | ** | | Options written, at value | | | 135,000 | |
Interest rate contracts | | Investments, at value | | | 1,117,194 | ** | | | | | | |
Equity contracts | | | | | | | | Variation margin payable | | | 1,060,550 | * |
Volatility contracts | | Investments, at value | | | 4,000,000 | ** | | | | | | |
| | | | | | | | | | | | |
Total | | | | $ | 11,543,480 | | | | | $ | 2,355,550 | |
| | | | | | | | | | | | |
*Includes only the current day’s variation margin. Prior variation margin movements have been reflected in cash on the Consolidated Statement of Assets and Liabilities upon receipt or payment.
**Amounts relate to purchased option contracts and purchased swaption contracts.
The effective of derivative instruments on the Consolidated Statement of Operations is as follows:
| | | | | | | | | | | | | | | | | | | | | | | | |
Amount of Realized Gain or (Loss) Recognized on Derivatives | |
Derivatives Not Accounted for as Hedging Instruments | | Investments from unaffiliated
companies
(including
premiums on
options
exercised)* | | | Closing and
expiration of
option contracts written | | | Closing and
expiration of
futures
contracts | | | Foreign
currency
transactions | | | Swap
contracts | | | Total | |
| |
Equity contracts | | $ | (21,429,102) | | | $ | 7,876,581 | | | $ | (3,445,754) | | | $ | — | | | $ | — | | | $ | (16,998,275) | |
Interest rate contracts | | | 1,189,138 | | | | — | | | | 6,047,305 | | | | — | | | | — | | | | 7,236,443 | |
Volatility contracts | | | (25,597,334) | | | | 9,897,227 | | | | 752,054 | | | | — | | | | 2,469,564 | | | | (12,478,489) | |
| | | | |
Total | | $ | (45,837,298) | | | $ | 17,773,808 | | | $ | 3,353,605 | | | $ | — | | | $ | 2,469,564 | | | $ | (22,240,321) | |
| | | | |
*Includes purchased option contracts, purchased swaption contracts, written option contracts exercised and written swaption contracts exercised, if any.
| | | | | | | | | | | | | | | | | | | | |
Amount of Change in Unrealized Gain or (Loss) Recognized on Derivatives | |
Derivatives Not Accounted for as Hedging Instruments | | Investments* | | | Option
contracts
written | | | Futures
contracts | | | Swap contracts | | | Total | |
| |
Equity contracts | | $ | (1,149,872) | | | $ | 1,524,271 | | | $ | (1,226,961) | | | $ | — | | | $ | (852,562) | |
Interest rate contracts | | | (2,798,406) | | | | — | | | | — | | | | — | | | | (2,798,406) | |
Volatility contracts | | | 4,367,528 | | | | (403,112) | | | | 4,916,947 | | | | (1,493,798) | | | | 7,387,565 | |
| | | | |
Total | | $ | 419,250 | | | $ | 1,121,159 | | | $ | 3,689,986 | | | $ | (1,493,798) | | | $ | 3,736,597 | |
| | | | |
*Includes purchased option contracts and purchased swaption contracts, if any.
74 OPPENHEIMER GLOBAL ALLOCATION FUND
7. Restricted Securities
As of April 30, 2014, investments in securities included issues that are restricted. A restricted security may have a contractual restriction on its resale and is valued under methods approved by the Board of Trustees as reflecting fair value. Securities that are restricted are marked with an applicable footnote on the Consolidated Statement of Investments. Restricted securities are reported on a schedule following the Consolidated Statement of Investments.
8. Pending Litigation
Since 2009, seven class action lawsuits have been pending in the U.S. District Court for the District of Colorado against OppenheimerFunds, Inc. (“OFI”), OppenheimerFunds Distributor, Inc., the Fund’s principal underwriter and distributor (the “Distributor”), and certain funds (but not including the Fund) advised by OFI Global Asset Management, Inc. and distributed by the Distributor (the “Defendant Funds”). The lawsuits also name as defendants certain officers and current and former trustees of the respective Defendant Funds. The lawsuits raise claims under federal securities law and allege, among other things, that the disclosure documents of the respective Defendant Funds contained misrepresentations and omissions and that the respective Defendant Funds’ investment policies were not followed. The plaintiffs in these actions seek unspecified damages, equitable relief and awards of attorneys’ fees and litigation expenses. The Defendant Funds’ Boards of Trustees have also engaged counsel to represent the Funds and the present and former Independent Trustees named in those suits. On March 5, 2014, the parties in six of these lawsuits executed stipulations and agreements of settlement resolving those actions. The settlements are subject to a variety of contingencies, including approval by the court. The settlements do not resolve a seventh outstanding lawsuit relating to Oppenheimer Rochester California Municipal Fund.
Other class action and individual lawsuits have been filed since 2008 in various state and federal courts against OFI and certain of its affiliates by investors seeking to recover investments they allegedly lost as a result of the “Ponzi” scheme run by Bernard L. Madoff and his firm, Bernard L. Madoff Investment Securities, LLC (“BLMIS”). Plaintiffs in these suits allege that they suffered losses as a result of their investments in several funds managed by an affiliate of OFI and assert a variety of claims, including breach of fiduciary duty, fraud, negligent misrepresentation, unjust enrichment, and violation of federal and state securities laws and regulations, among others. They seek unspecified damages, equitable relief and awards of attorneys’ fees and litigation expenses. Neither the Distributor, nor any of the Oppenheimer mutual funds, their independent trustees or directors are named as defendants in these lawsuits. None of the Oppenheimer mutual funds invested in any funds or accounts managed by Madoff or BLMIS. On February 28, 2011, a stipulation of partial settlement of three groups of consolidated putative class action lawsuits relating to these matters was filed in the U.S. District Court for the Southern District of New York. On August 19, 2011, the court entered an order and final judgment approving the settlement as fair, reasonable and adequate. In September 2011, certain parties filed notices of appeal from the court’s order approving the settlement. The settlement does not resolve other outstanding lawsuits against OFI and its affiliates relating to BLMIS.
75 OPPENHEIMER GLOBAL ALLOCATION FUND
| | |
| |
NOTES TO CONSOLIDATED FINANCIAL STATEMENTS Unaudited / Continued | | |
| | |
8. Pending Litigation (Continued)
OFI believes the lawsuits and appeals described above are without legal merit and, with the exception of actions it has settled, is defending against them vigorously. While it is premature to render any opinion as to the outcome in these lawsuits, or whether any costs that the Defendant Funds may bear in defending the suits might not be reimbursed by insurance, OFI believes that these suits should not impair the ability of OFI or the Distributor to perform their respective duties to the Fund, and that the outcome of all of the suits together should not have any material effect on the operations of any of the Oppenheimer mutual funds.
76 OPPENHEIMER GLOBAL ALLOCATION FUND
| | |
| |
PORTFOLIO PROXY VOTING POLICIESAND PROCEDURES; UPDATES TO CONSOLIDATED STATEMENTS OF INVESTMENTS Unaudited | | |
| | |
The Fund has adopted Portfolio Proxy Voting Policies and Procedures under which the Fund votes proxies relating to securities (“portfolio proxies”) held by the Fund. A description of the Fund’s Portfolio Proxy Voting Policies and Procedures is available (i) without charge, upon request, by calling the Fund toll-free at 1.800.CALL OPP (225.5677), (ii) on the Fund’s website at oppenheimerfunds.com, and (iii) on the SEC’s website at www.sec.gov. In addition, the Fund is required to file Form N-PX, with its complete proxy voting record for the 12 months ended June 30th, no later than August 31st of each year. The Fund’s voting record is available (i) without charge, upon request, by calling the Fund toll-free at 1.800.CALL OPP (225.5677), and (ii) in the Form N-PX filing on the SEC’s website at www.sec.gov.
The Fund files its complete schedule of portfolio holdings with the SEC for the first quarter and the third quarter of each fiscal year on Form N-Q. The Fund’s Form N-Q filings are available on the SEC’s website at www.sec.gov. Those forms may be reviewed and copied at the SEC’s Public Reference Room in Washington, D.C. Information on the operation of the Public Reference Room may be obtained by calling 1-800-SEC-0330.
Householding—Delivery of Shareholder Documents
This is to inform you about OppenheimerFunds’ “householding” policy. If more than one member of your household maintains an account in a particular fund, OppenheimerFunds will mail only one copy of the fund’s prospectus (or, if available, the fund’s summary prospectus), annual and semiannual report and privacy policy. The consolidation of these mailings, called householding, benefits your fund through reduced mailing expense, and benefits you by reducing the volume of mail you receive from OppenheimerFunds. Householding does not affect the delivery of your account statements.
Please note that we will continue to household these mailings for as long as you remain an OppenheimerFunds shareholder, unless you request otherwise. If you prefer to receive multiple copies of these materials, please call us at 1.800.CALL-OPP (225-5677). You may also notify us in writing or via email. We will begin sending you individual copies of the prospectus (or, if available, the summary prospectus), reports and privacy policy within 30 days of receiving your request to stop householding.
77 OPPENHEIMER GLOBAL ALLOCATION FUND
| | |
| |
| OPPENHEIMER GLOBAL ALLOCATION FUND | | |
| | |
| Trustees and Officers | | Brian F. Wruble, Chairman of the Board of Trustees and Trustee |
| | David K. Downes, Trustee |
| | Matthew P. Fink, Trustee |
| | Edmund P. Giambastiani, Jr., Trustee |
| | Mary F. Miller, Trustee |
| | Joel W. Motley, Trustee |
| | Joanne Pace, Trustee |
| | Joseph M. Wikler, Trustee |
| | Peter I. Wold, Trustee |
| | William F. Glavin, Jr., Trustee, President and Principal Executive Officer |
| | Mark Hamilton, Vice President |
| | Benjamin H. Rockmuller, Vice President |
| | Arthur. S. Gabinet, Secretary and Chief Legal Officer |
| | Christina M. Nasta, Vice President and Chief Business Officer |
| | Mary Ann Picciotto, Chief Compliance Officer and Chief Anti-Money |
| | Laundering Officer |
| | Brian W. Wixted, Treasurer and Principal Financial & Accounting Officer |
| |
| Manager | | OFI Global Asset Management, Inc. |
| |
| Sub-Adviser | | OppenheimerFunds, Inc. |
| |
| Distributor | | OppenheimerFunds Distributor, Inc. |
| |
| Transfer and Shareholder Servicing Agent | | OFI Global Asset Management, Inc. |
| |
| Sub-Transfer Agent | | Shareholder Services, Inc. DBA OppenheimerFunds Services |
| |
| Independent Registered Public Accounting Firm | | KPMGLLP |
| |
| Legal Counsel | | Kramer Levin Naftalis & Frankel LLP |
| |
| | The consolidated financial statements included herein have been taken from the records of the Fund without examination of those records by the independent registered public accounting firm. |
© 2014 OppenheimerFunds, Inc. All rights reserved
78 OPPENHEIMER GLOBAL ALLOCATION FUND
As an Oppenheimer fund shareholder, you are entitled to know how we protect your personal information and how we limit its disclosure.
Information Sources
We obtain nonpublic personal information about our shareholders from the following sources:
| • | | Applications or other forms |
| • | | When you create a user ID and password for online account access |
| • | | When you enroll in eDocs Direct, our electronic document delivery service |
| • | | Your transactions with us, our affiliates or others |
| • | | A software program on our website, often referred to as a “cookie,” which indicates which parts of our site you’ve visited |
| • | | When you set up challenge questions to reset your password online |
If you visit oppenheimerfunds.com and do not log on to the secure account information areas, we do not obtain any personal information about you. When you do log on to a secure area, we do obtain your user ID and password to identify you. We also use this information to provide you with products and services you have requested, to inform you about products and services that you may be interested in and assist you in other ways.
We do not collect personal information through our website unless you willingly provide it to us, either directly by email or in those areas of the website that request information. In order to update your personal information (including your mailing address, email address and phone number) you must first log on and visit your user profile.
If you have set your browser to warn you before accepting cookies, you will receive the warning message with each cookie. You can refuse cookies by turning them off in your browser. However, doing so may limit your access to certain sections of our website.
We use cookies to help us improve and manage our website. For example, cookies help us recognize new versus repeat visitors to the site, track the pages visited, and enable some special features on the website. This data helps us provide a better service for our website visitors.
Protection of Information
We do not disclose any non-public personal information (such as names on a customer list) about current or former customers to anyone, except as permitted by law.
Disclosure of Information
We send your financial advisor (as designated by you) copies of confirmations, account statements and other documents reporting activity in your fund accounts. We may also use details about you and your investments to help us, our financial service affiliates, or firms that jointly market their financial products and services with ours, to better serve your investment needs or suggest financial services or educational material that may be of interest to you. If this requires us to provide you with an opportunity to “opt in” or “opt out” of such information sharing with a firm not affiliated with us, you will receive notification on how to do so, before any such sharing takes place.
Right of Refusal
We will not disclose your personal information to unaffiliated third parties (except as permitted by law), unless we first offer you a reasonable opportunity to refuse or “opt out” of such disclosure.
79 OPPENHEIMER GLOBAL ALLOCATION FUND
| | |
| |
| PRIVACY POLICY NOTICE Continued | | |
| | |
Internet Security and Encryption
In general, the email services provided by our website are encrypted and provide a secure and private means of communication with us. To protect your own privacy, confidential and/or personal information should only be communicated via email when you are advised that you are using a secure website.
As a security measure, we do not include personal or account information in non-secure emails, and we advise you not to send such information to us in non-secure emails. Instead, you may take advantage of the secure features of our website to encrypt your email correspondence. To do this, you will need to use a browser that supports Secure Sockets Layer (SSL) protocol.
We do not guarantee or warrant that any part of our website, including files available for download, are free of viruses or other harmful code. It is your responsibility to take appropriate precautions, such as use of an anti-virus software package, to protect your computer hardware and software.
| • | | All transactions, including redemptions, exchanges and purchases, are secured by SSL and 128-bit encryption. SSL is used to establish a secure connection between your PC and OppenheimerFunds’ server. It transmits information in an encrypted and scrambled format. |
| • | | Encryption is achieved through an electronic scrambling technology that uses a “key” to code and then decode the data. Encryption acts like the cable converter box you may have on your television set. It scrambles data with a secret code so that no one can make sense of it while it is being transmitted. When the data reaches its destination, the same software unscrambles the data. |
| • | | You can exit the secure area by either closing your browser, or for added security, you can use the Log Out button before you close your browser. |
Other Security Measures
We maintain physical, electronic and procedural safeguards to protect your personal account information. Our employees and agents have access to that information only so that they may offer you products or provide services, for example, when responding to your account questions.
How You Can Help
You can also do your part to keep your account information private and to prevent unauthorized transactions. If you obtain a user ID and password for your account, do not allow it to be used by anyone else. Also, take special precautions when accessing your account on a computer used by others.
Who We Are
This joint notice describes the privacy policies of the Oppenheimer funds, OppenheimerFunds, Inc., and each of its investment adviser subsidiaries, OppenheimerFunds Distributor, Inc. and OFI Global Trust Co. It applies to all Oppenheimer fund accounts you presently have, or may open in the future, using your Social Security number—whether or not you remain a shareholder of our funds. This notice was last updated November 2013. In the event it is updated or changed, we will post an updated notice on our website at oppenheimerfunds.com. If you have any questions about these privacy policies, write to us at P.O. Box 5270, Denver, CO 80217-5270, email us by clicking on the Contact Us section of our website at oppenheimerfunds.com or call us at 1.800.CALL OPP (225.5677).
80 OPPENHEIMER GLOBAL ALLOCATION FUND
|
|
| THIS PAGE INTENTIONALLY LEFT BLANK. |
|
|
81 OPPENHEIMER GLOBAL ALLOCATION FUND
|
|
| THIS PAGE INTENTIONALLY LEFT BLANK. |
|
|
82 OPPENHEIMER GLOBAL ALLOCATION FUND
|
|
| THIS PAGE INTENTIONALLY LEFT BLANK. |
|
|
83 OPPENHEIMER GLOBAL ALLOCATION FUND
|
|
| THIS PAGE INTENTIONALLY LEFT BLANK. |
|
|
84 OPPENHEIMER GLOBAL ALLOCATION FUND
|
|
| THIS PAGE INTENTIONALLY LEFT BLANK. |
|
|
85 OPPENHEIMER GLOBAL ALLOCATION FUND
|
|
| THIS PAGE INTENTIONALLY LEFT BLANK. |
|
|
86 OPPENHEIMER GLOBAL ALLOCATION FUND
|
|
| THIS PAGE INTENTIONALLY LEFT BLANK. |
|
|
87 OPPENHEIMER GLOBAL ALLOCATION FUND

Table of Contents
Class A Shares
AVERAGE ANNUAL TOTAL RETURNS AT 4/30/14
| | | | | | | | | | |
| | | Class A Shares of the Fund | | | | |
| | | Without Sales Charge | | With Sales Charge | | | | S&P 500 Index | | HFRI Fund Weighted
Composite Index |
6-Month | | 6.74% | | 0.60% | | | | 8.36% | | 2.86% |
1-Year | | 8.38 | | 2.15 | | | | 20.44 | | 5.63 |
5-Year | | 5.00 | | 3.76 | | | | 19.14 | | 7.15 |
10-Year | | 4.35 | | 3.73 | | | | 7.67 | | 5.58 |
Performance data quoted represents past performance, which does not guarantee future results. The investment return and principal value of an investment in the Fund will fluctuate so that an investor’s shares, when redeemed, may be worth more or less than their original cost. Fund returns include changes in share price, reinvested distributions, and a 5.75% maximum applicable sales charge except where “without sales charge” is indicated. Current performance may be lower or higher than the performance quoted. Returns do not consider capital gains or income taxes on an individual’s investment. Returns for periods of less than one year are cumulative and not annualized. For performance data current to the most recent month-end, visit oppenheimerfunds.com or call 1.800.CALL OPP (225.5677).
2 OPPENHEIMER FLEXIBLE STRATEGIES FUND
Fund Performance Discussion
The Fund’s Class A shares (without sales charge) generated a total return of 6.74% during the six month period ended 4/30/14, outperforming the HFRI Fund Weighted Composite Index, which returned 2.86%, by 388 basis points. The Fund’s Equity Hedge and Long/Short Credit strategies were the biggest contributors to performance, while the Global Macro strategy was a detractor. The Relative Value strategy had a negligible impact on performance during the period. In general, our long positions in the Equity Hedge strategy outperformed the broader equity markets, while our short positions rose only marginally. Both of these factors contributed to the outperformance. In the Global Macro strategy, our positions in interest rates and credit default swaps detracted from performance.
INVESTMENT STRATEGIES
In the Fund’s February 2014 prospectus, we defined the investment strategies used in the Fund to pursue our mandate of seeking strong risk-adjusted returns on a long-term basis in a variety of market conditions. We employ multiple alternative strategies utilizing securities from across capital structures and numerous asset classes. The Fund is organized into four distinct long/short strategies, described below, with varying allocations within and across strategies based on the portfolio manager’s view of the attractiveness of the strategies, as well as their risks to the Fund, at any given point in time.
| ¡ | Equity Hedge and Long/Short Credit. Security selection in these two strategies is based on fundamentally driven, bottom-up analysis of companies, industries and indices, combined with a top-down macroeconomic overlay. Simply put, we seek to profit from potential change that is not well understood by the markets. In our |
| | long positions, we seek attractive valuations with improving fundamentals relative to market expectations. In our short positions, we seek high valuations combined with deteriorating fundamentals relative to market expectations. The Equity Hedge strategy can include long and short positions in equities, equity-sensitive convertibles and derivatives including options, futures, swaps and structured notes. The Long/Short Credit strategy can include long and short positions in a variety of fixed-income securities including loans, asset-backed securities, event-linked bonds, credit-sensitive convertibles, high-grade, high-yield and distressed credit, sovereign debt and derivatives. |
| ¡ | Global Macro. Security selection is based on top-down analysis of macroeconomic variables and their expected impact on a broad range of securities and asset classes. We seek to identify long-term fundamental change |
3 OPPENHEIMER FLEXIBLE STRATEGIES FUND
| | that is not well understood by the markets and then implement a strategy that optimizes the potential for attractive risk-adjusted returns. This strategy can include long and short positions that provide exposure to interest rates, credit spreads, sovereign debt, currencies, commodities, volatility, equities and equity indices, and derivatives. |
| ¡ | Relative Value. Security selection is based on pairing long and short positions when we believe relative valuation discrepancies exist between specific securities and we expect those valuations to converge. Our views on relative valuation are based on fundamental analysis and can be implemented across multiple asset classes when opportunities arise. This strategy can include long and short positions in multiple asset classes including equities, fixed income, derivatives or other types of securities. |
The Fund’s long and short exposures within each of the strategies may change depending on the portfolio manager’s view of the opportunities available. The portfolio manager conducts fundamental evaluations of market, economic, industry and company specific factors that we believe are not reflected in pricing of the underlying securities and asset classes. In response to changing conditions and/or valuations, the portfolio manager may change the allocations.
In the second quarter of 2014, the Fund moved from the Morningstar Moderate
Allocation category to the Multi Alternative category. We believe the Multi Alternative category provides a more appropriate peer group against which to compare performance and is more reflective of the variety of alternative strategies which have been used in the Fund for some time. This change aligns the category with the preferred category we have been measuring the Fund against since the current manager took over the Fund.
MARKET OVERVIEW
The reporting period covers different market environments, as tailwinds during the first two months turned into headwinds during January before the markets started to stabilize later in the first quarter. Through December, improvement in the U.S. labor market, consumer spending and retail sales pointed toward slow but persistent economic recovery. Interest rates climbed higher at a measured pace as investors anticipated that a gradual unwinding of quantitative easing would have a benign impact on the yield curve and economic growth. Against this backdrop, investors showed an aggressive appetite for risk, bidding up equity prices to new highs. Prices for fixed income securities and hard assets commonly used to hedge against a weakening economy came under pressure.
The market environment changed in January as U.S. economic data started to soften, parts of the country were hit with unseasonably cold weather, volatility increased and the Fed
4 OPPENHEIMER FLEXIBLE STRATEGIES FUND
continued to execute its tapering strategy. Interest rates rallied sharply as equities fell, emerging market debt sold off, U.S. bonds climbed and alternatives (e.g., gold, commodities, real estate investment trusts (REITs)) started to outperform. Broadly speaking, investors were selling what had worked well in 2013 and shifting capital into asset classes that had lagged last year. As part of this move, the S&P 500 Index dropped 5.5% into early February before the markets began to stabilize. The relatively high valuation of the U.S. stock market, a slight uptick in unemployment and slowing economic growth in China weighed on investor sentiment. However, the market environment began to shift again in February as investors gained perspective on the unseasonably cold winter weather, China’s growth trajectory and Russia’s takeover of Crimea. Interest rates started to stabilize, bonds produced flat returns and the S&P 500 Index retraced some lost ground, eventually making a new high in early April. Several alternative asset classes continued to outperform as investors focused on diversifying risk, managing volatility and protecting the downside.
FUND REVIEW
The Equity Long/Short strategy was the strongest contributor to performance during the reporting period. Within the Equity Long strategy, the top contributors included AerCap Holdings NV, Actavis plc and Merck & Co., Inc.
AerCap is a global aircraft lessor based in the Netherlands. The company announced in mid-December that it would purchase the aircraft-leasing subsidiary of AIG at an attractive price. Investors concluded that the deal would likely add value quickly to this best-in-class lessor, sending its shares higher. In addition, investors became more positive on the outlook for the aircraft leasing market in 2014 on the back of strong demand, controlled supply and increasing air traffic. Growing investor confidence in AerCap’s ability to close the AIG acquisition successfully by the middle of this year also helped support the stock price.
Actavis (ACT), a specialty pharmaceutical company, announced the acquisition of Forest Labs, a branded drug company, for roughly $25 billion in February. The deal will strengthen ACT’s existing gastroenterology business, and expand its specialty brands business into new areas of cognitive neuroscience, cardiovascular, respiratory, cystic fibrosis, and infectious diseases. The deal should close mid-year and is expected to be immediately accretive in 2014, with more significant accretion expected in 2015-2016.
Merck, a pharmaceutical company, made progress with its anti-PD-1 pipeline drug, MK-3475, in the emerging field of immune-oncology. This drug could eventually be part of a significant breakthrough in cancer research and has the potential to revolutionize oncology. In January, the
5 OPPENHEIMER FLEXIBLE STRATEGIES FUND
company announced that it was initiating an early filing with the FDA in advanced melanoma, which is expected to be completed in the second quarter of 2014. The company also announced that it is evaluating strategic options for its animal health and consumer businesses, and expects to complete the portfolio review this year.
In our Equity Long strategy, Cinemark Holdings, Inc., Philip Morris International, Inc. and Brinker International, Inc. were among the biggest detractors.
Cinemark, a global movie theater operator, was negatively impacted by its exposure to Latin American currency markets. The company’s international presence, which constitutes roughly 30% of its admission and concession revenue, is skewed toward markets like Brazil. While we expect currency volatility to continue, we still like the longer-term growth opportunity in Latin America and are encouraged by Cinemark’s ability to use pricing in these markets as a partial offset in the near term. In addition, there is still significant green-field opportunity to expand Cinemark’s theatre footprint in Latin America. The U.S. box office, which drives the majority of the company’s profits, remains resilient and is growing at a double-digit pace. This strength could continue into 2015 when a heavy slate of highly anticipated films is expected to be released.
Philip Morris, a cigarette manufacturer, was negatively impacted by its exposure to
emerging market currencies during the reporting period. In 2013, the company suffered earnings per share (EPS) dilution from foreign exchange movements. Although we expect the stock to remain vulnerable to currency swings in the near-term, the longer-term opportunity in emerging markets should support the company’s growth trajectory in revenue and earnings. These markets have expanding adult populations with significant potential for increased penetration as well as for up-trading of tobacco products over time. Finally, we are optimistic about prospects for the company’s new reduced-risk products which should impact results in 2015 and beyond.
Brinker, a restaurant operator, was negatively impacted by severe weather over the last six months that curtailed traffic across a wide swath of retailers and restaurants. These conditions have masked the positive impact from some of Brinker’s initiatives to drive same-store sales and provide differentiation from their competitors in the fast casual and traditional dining arenas. With the headwind from adverse weather abating, the benefit from these positive changes should become more apparent to investors in 2014.
In our Equity Short strategy, the top contributors included Cliffs Natural Resources, Inc., Walter Energy, Inc. and ADT Corp.
6 OPPENHEIMER FLEXIBLE STRATEGIES FUND
Our short positions in Cliff Natural Resources, a leading North American iron ore company, and Walter Energy, a pure play metallurgical coal company, benefited from price declines to multi-year lows in both commodities. Lower demand for these inputs from the Chinese steel industry, high inventory levels, and continued oversupply from Australian exports have combined to put pressure on both of these high cost producers. We expect commodity price pressure to continue into the back half of 2014 given the lack of any meaningful production rationalization in the already oversupplied metallurgical coal and iron ore markets.
Our short position in ADT, an electronic home security provider, also contributed to performance during the reporting period. The company is facing increased competition from several large telecom and cable companies that have been promoting lower priced but comparable home monitoring services. This has resulted in market share loss for ADT along with rising costs to acquire new customers. We believe the company will continue to face challenges growing its subscriber base.
In our Equity Short strategy, the biggest detractors were Caterpillar, Inc., SanDisk Corp. and Air Lease Corp.
Our short position in Caterpillar (CAT), a construction and mining equipment
manufacturer, detracted from performance. Emerging signs of a recovery in the North American construction market, solid demand in Chinese construction, re-stocking of inventory at Caterpillar dealers, and growth in the oil & gas and power generation markets more than offset worsening mining equipment trends. We reduced our position in CAT during the reporting period.
Our short position in SanDisk, a data storage solutions provider, also hurt performance. The stock price climbed as the company managed through an inventory correction in the NAND memory market. Instead of suffering a cyclical drop in profitability, SanDisk has been able to manage its product mix in a way that has allowed the company to expand gross margins. While its operating performance has been impressive, we remain concerned that the company’s lack of leadership on the industry’s transition to 3D NAND will result in share loss and longer-term margin pressure.
Our short position in Air Lease, an aircraft lessor, detracted from performance as well. Although the company trades at a premium based on book value, Air Lease benefited from increased investor attention resulting from positive aircraft leasing trends. In addition, reduced concerns about the company’s Asian exposure and greater investor focus on its portfolio of newer aircraft helped propel the stock price.
7 OPPENHEIMER FLEXIBLE STRATEGIES FUND
The Long/Short Credit strategy also added to performance during the period. The top contributors included Oppenheimer Master Loan Fund, LLC, our residential mortgage backed securities (RMBS) and a bond backed by commercial jet aircraft.
Our position in Oppenheimer Master Loan Fund, LLC contributed to performance as bank loan portfolios benefited from strong flows into the asset class over the last six months. However, this trend has shown some signs of weakening as loan funds saw their first weekly outflow in April since June of 2013.
Our position in Structured Asset Securities Corp. Mortgage Loan Trust, Series 2007-GEL2 A2, non-agency RMBS, also added to results largely due to strong performance of the collateral. Both default rates and default severities have improved significantly over the last six months. In addition, the bond began receiving principal payments in January.
Our holding in Airspeed Ltd., Series 2007-1A G1, a bond backed by commercial jet aircraft, contributed to performance as well. Airspeed continues to benefit from favorable supply/demand conditions in the narrowbody aircraft market. The percentage of the narrowbody fleet in storage declined from 9.5% to 8.3% year over year through April. Market dynamics for the specific kinds of
aircraft that back this bond are even more favorable, with storage rates in the mid to low single digits for the primary aircraft types in Airspeed’s fleet.
The biggest detractors from performance in the Long/Short Credit strategy included our positions in Alpha Natural Resources, Lukoil and a non-agency RMBS.
Our short position in Alpha Natural Resources 3.25% Convertible Bond detracted from performance during the period. Despite downward pricing pressure on metallurgical coal, Alpha has been able to maintain access to the capital markets. The company used external funds to pay down a portion of its convertible bond, negatively impacting our short position. In addition, the supply of bonds available for shorting contracted in conjunction with Alpha’s successful financing activities, which forced us to close out the position.
Our holdings in Lukoil International Finance BV, 6.125% of 2020, a corporate bond issued by a Russian oil & gas company, also detracted from performance. This position was negatively impacted by the political turmoil between Russia and the Ukraine. In addition, Standard & Poor’s lowered its credit rating on Lukoil, citing the impact of economic sanctions on Russia and the risk to Lukoil from any potential default by Russia.
8 OPPENHEIMER FLEXIBLE STRATEGIES FUND
Our position in Ameriquest Mortgage Securities, Inc., Series 2004-R2 M1, non-agency RMBS, was also a marginal detractor from performance. The bond failed a delinquency test during the period, which pushed principal cash flows higher up the structure. The bond is performing very close to the test level, so if delinquency rates improve modestly, the principal cash flows will again be paid to the M1 part of the structure, benefitting our position.
The Global Macro strategy detracted from the Fund’s performance during the period. The biggest contributors to performance were our short positions in the Australian dollar, Turkish lira and Japanese yen, while the biggest detractors were our positions in certain credit default swaps (CDS) and the euro.
Our short Turkish lira, Australian dollar and Japanese yen positions all benefited performance during the reporting period. The Turkish lira declined as concerns about how the country would finance its large current account deficit in a higher global interest rate environment pressured the currency. Political turmoil within Turkey, including a corruption investigation reaching to the highest levels of government, further exacerbated the currency weakness. The Australian dollar weakened against the U.S. dollar as declining commodity prices reduced foreign investment into the mining sector and slowed the
Australian economy. Finally, the Japanese yen declined as the Bank of Japan implemented large scale purchases of government bonds that were funded by an expansion of the central bank’s balance sheet. This policy increased the supply of yen and pressured the exchange rate.
Our CDS positions in Italy and Austria both detracted from performance. In Italy, the government’s commitment to keep the deficit in line with European Union guidance, combined with improving (but still negative) real GDP growth and an accommodative European Central Bank (ECB), have caused Italian credit spreads to decline, hurting our position. Similarly, Austrian credit spreads tightened during the period as the European and Austrian economies continued their tepid recovery.
Our short position in the euro detracted from performance as that currency appreciated against the U.S. dollar. The ECB’s balance sheet is contracting as banks make early repayments of funds borrowed under the long-term refinancing operation (LTRO) facility. In contrast, the Fed’s balance sheet is still expanding, and the relative movements in these balance sheets helps to explain some of the strength of the euro versus the dollar. Additionally, investor disappointment with the strength of the U.S. economic recovery, combined with the continued stabilization of the Eurozone economy, has resulted in a stronger euro relative to the dollar.
9 OPPENHEIMER FLEXIBLE STRATEGIES FUND
STRATEGY & OUTLOOK
The market environment remains complex and we see numerous potential crosswinds. While U.S. equities look attractive versus bonds on a medium term basis, the multiple expansion they enjoyed in 2013 means they are no longer inexpensive. In fact, the price-to-earnings ratio for the S&P 500 Index based on next twelve months’ consensus earnings stands at a relatively high level versus history over the last four decades. Absent a new valuation bubble, we believe equity price gains this year will largely depend on earnings growth rather than multiple expansion. In addition, we believe that unusually low volatility in the market today belies the turmoil lurking beneath the surface. For example, both equities and interest rates sold off sharply in January before stabilizing later in the first quarter. Emerging market debt was under significant pressure (again) at the start of the year. Highly valued growth stocks, many of which performed well last year, started selling off sharply in March. We expect these rolling waves of asset repricings to continue as the market searches for the appropriate discount rate to apply to financial assets in a post quantitative easing (QE) world.
More broadly, we believe many structural weaknesses in the global economy have yet to be addressed, which makes the current
outlook more fragile than many investors believe. For example, Europe and Japan have come to the hard part of the recovery process—the part that requires meaningful structural reform. We are skeptical that Europe and Japan can muster the political will necessary to address the banking, overspending and deficit problems their economies face. The U.S. certainly cannot. Economic growth remains weak in Europe, and although spreads have tightened, the ECB is signaling that it may ease policy again in an effort to stimulate growth. The Bank of Japan continues to execute its massive QE program in an effort to accelerate growth, while China is deliberately slowing growth as it implements new priorities. This Chinese slowdown had a knock-on effect in emerging markets both last year and early this year, and threatens to do so again. The Chinese property market remains stressed, and we believe the issues in that country have grown bigger, not smaller, since the start of the year.
In summary, we believe investors face the prospect of higher volatility and lower expected returns over the next several years. Tail risks include potential shocks from Russia, China, Japan and a host of other countries. In the U.S., while we do not expect the Fed to raise short term rates any time soon, we believe that rates could still continue to normalize as the market pushes the 10-year Treasury yield higher over time. After six years of artificially repressed interest
10 OPPENHEIMER FLEXIBLE STRATEGIES FUND
rates and coordinated monetary stimulus around the world, no one knows what growth will look like with a normalized yield curve. We do know that stocks and bonds typically move in opposite directions, but they have moved together for some time now, creating a dislocation that has yet to be resolved. Against this backdrop, we continue to search for opportunities to generate strong risk-adjusted returns, control volatility and utilize the flexibility of multiple asset classes to hedge the key tail risks we see.
| | |
 | |  |
| | Michelle Borré, CFA Portfolio Manager |
11 OPPENHEIMER FLEXIBLE STRATEGIES FUND
Top Holdings and Allocations
TOP TEN COMMON STOCK HOLDINGS
| | |
Starwood Property Trust, Inc. | | 1.8% |
Actavis plc | | 1.8 |
Quanta Services, Inc. | | 1.8 |
Chevron Corp. | | 1.7 |
Apple, Inc. | | 1.6 |
Comcast Corp., Cl. A | | 1.5 |
LyondellBasell Industries NV, Cl. A | | 1.5 |
Merck & Co., Inc. | | 1.5 |
UnitedHealth Group, Inc. | | 1.4 |
Macy’s, Inc. | | 1.4 |
|
| Portfolio holdings and allocations are subject to change. Percentages are as of April 30, 2014, and are based on net assets. For more current Fund holdings, please visit oppenheimerfunds.com. |
| |
TOP TEN COMMON STOCK INDUSTRIES | | |
Oil, Gas & Consumable Fuels | | 6 .5% |
Pharmaceuticals | | 5.2 |
Real Estate Investment Trusts (REITs) | | 3.6 |
Communications Equipment | | 3.5 |
Commercial Banks | | 3.3 |
Chemicals | | 3.0 |
Media | | 2.9 |
Energy Equipment & Services | | 2.1 |
Health Care Providers & Services | | 1.9 |
Construction & Engineering | | 1.8 |
Portfolio holdings and allocations are subject to change. Percentages are as of April 30, 2014, and are based on net assets.
PORTFOLIO ALLOCATION
| | |
Common Stocks | | 52.1% |
Investment Companies
Oppenheimer Institutional
Money Market Fund
Oppenheimer Master Loan
Fund, LLC
SPDR Gold Trust Exchange
Traded Fund | | 6.9 14.4 2.0 |
Asset-Backed Securities | | 9.9 |
Mortgage-Backed Obligations Non-Agency | | 5.0 |
Preferred Stocks | | 3.7 |
| Non-Convertible Corporate Bonds and Notes | | 3.1 |
Corporate Loans | | 1.4 |
| Over-the-Counter Interest Rate Swaptions Purchased | | 0.7 |
Convertible Corporate Bonds and Notes | | 0.4 |
Structured Securities | | 0.3 |
Exchange-Traded Options Purchased | | 0.1 |
Over-the-Counter Options Purchased | | —* |
*Represents less than 0.005%.
Portfolio holdings and allocations are subject to change. Percentages are as of April 30, 2014, and are based on the total market value of investments. Short sales of securities, which accounted for 23.0% of the Fund’s net assets as of fiscal year end, are not reflected in the chart above. More information about these investments is included in the Consolidated Statement of Investments and the accompanying Notes to Consolidated Financial Statements.
12 OPPENHEIMER FLEXIBLE STRATEGIES FUND
Share Class Performance
AVERAGE ANNUAL TOTAL RETURNS WITHOUT SALES CHARGE AS OF 4/30/14
| | | | | | | | | | | | |
| | | Inception Date | | 6-Month | | 1-Year | | 5-Year | | 10-Year | | |
Class A (QVOPX) | | 1/3/89 | | 6.74% | | 8.38% | | 5.00% | | 4.35% | | |
Class B (QOPBX) | | 9/1/93 | | 6.30% | | 7.46% | | 4.07% | | 3.86% | | |
Class C (QOPCX) | | 9/1/93 | | 6.33% | | 7.55% | | 4.20% | | 3.56% | | |
Class I (QOPIX) | | 2/28/13 | | 6.90% | | 8.80% | | 8.70% * | | N/A | | |
Class N (QOPNX) | | 3/1/01 | | 6.59% | | 8.05% | | 4.67% | | 4.00% | | |
Class Y (QOPYX) | | 12/16/96 | | 6.83% | | 8.60% | | 5.29% | | 4.59% | | |
AVERAGE ANNUAL TOTAL RETURNS WITH SALES CHARGE AS OF 4/30/14
| | | | | | | | | | | | |
| | | Inception Date | | 6-Month | | 1-Year | | 5-Year | | 10-Year | | |
Class A (QVOPX) | | 1/3/89 | | 0.60% | | 2.15% | | 3.76% | | 3.73% | | |
Class B (QOPBX) | | 9/1/93 | | 1.30% | | 2.46% | | 3.73% | | 3.86% | | |
Class C (QOPCX) | | 9/1/93 | | 5.33% | | 6.55% | | 4.20% | | 3.56% | | |
Class I (QOPIX) | | 2/28/13 | | 6.90% | | 8.80% | | 8.70% * | | N/A | | |
Class N (QOPNX) | | 3/1/01 | | 5.59% | | 7.05% | | 4.67% | | 4.00% | | |
Class Y (QOPYX) | | 12/16/96 | | 6.83% | | 8.60% | | 5.29% | | 4.59% | | |
| * Shows performance since inception. |
Performance data quoted represents past performance, which does not guarantee future results. The investment return and principal value of an investment in the Fund will fluctuate so that an investor’s shares, when redeemed, may be worth more or less than their original cost. Current performance may be lower or higher than the performance quoted. Returns do not consider capital gains or income taxes on an individual’s investment. For performance data current to the most recent month-end, visit oppenheimerfunds.com or call 1.800.CALL OPP (225.5677). Fund returns include changes in share price, reinvested distributions, and the applicable sales charge: for Class A shares, the current maximum initial sales charge of 5.75%; for Class B shares, the contingent deferred sales charge of 5% (1-year) and 2% (5-year); and for Class C and N shares, the contingent deferred sales charge of 1% for the 1-year period. There is no sales charge for Class I and Y shares. Because Class B shares convert to Class A shares 72 months after purchase, the 10-year return for Class B shares uses Class A performance for the period after conversion. Returns for periods of less than one year are cumulative and not annualized.
The Fund’s performance is compared to the performance of the S&P 500 Index and the HFRI Fund Weighted Composite Index. The S&P 500 Index is a capitalization-weighted index of 500 stocks intended to be a representative sample of leading companies in leading industries within the U.S. economy. The HFRI Fund Weighted Composite Index is a global, equal-weighted index of over 2,000 single-manager funds that report to HFR Database. Constituent funds report monthly net of all fees performance in U.S. Dollars and have a minimum of $50 million under management or a twelve (12) month track record of active performance. The HFRI Fund Weighted Composite Index’s returns are calculated three times each month and are subject to periodic recalculation by Hedge Fund Research, Inc. As a result, the HFRI Fund Weighted Composite Index returns shown may differ from the same Index’s returns for the
13 OPPENHEIMER FLEXIBLE STRATEGIES FUND
same period published elsewhere. If subsequent recalculations cause the Index’s returns to change, the Fund does not expect to update the Index returns. The Indices are unmanaged and cannot be purchased directly by investors. While index comparisons may be useful to provide a benchmark for the Fund’s performance, it must be noted that the Fund’s investments are not limited to the investments comprising the Index. Index performance includes reinvestment of income, but does not reflect transaction costs, fees, expenses or taxes. Index performance is shown for illustrative purposes only as a benchmark for the Fund’s performance, and does not predict or depict performance of the Fund. The Fund’s performance reflects the effects of the Fund’s business and operating expenses.
The Fund’s investment strategy and focus can change over time. The mention of specific fund holdings does not constitute a recommendation by OppenheimerFunds, Inc. or its affiliates.
Before investing in any of the Oppenheimer funds, investors should carefully consider a fund’s investment objectives, risks, charges and expenses. Fund prospectuses and summary prospectuses contain this and other information about the funds, and may be obtained by asking your financial advisor, visiting oppenheimerfunds.com, or calling 1.800.CALL OPP (225.5677). Read prospectuses and summary prospectuses carefully before investing.
Shares of Oppenheimer funds are not deposits or obligations of any bank, are not guaranteed by any bank, are not insured by the FDIC or any other agency, and involve investment risks, including the possible loss of the principal amount invested.
14 OPPENHEIMER FLEXIBLE STRATEGIES FUND
Fund Expenses
Fund Expenses. As a shareholder of the Fund, you incur two types of costs: (1) transaction costs, which may include sales charges (loads) on purchase payments, contingent deferred sales charges on redemptions; and (2) ongoing costs, including management fees; distribution and service fees; and other Fund expenses. These examples are intended to help you understand your ongoing costs (in dollars) of investing in the Fund and to compare these costs with the ongoing costs of investing in other mutual funds.
The examples are based on an investment of $1,000.00 invested at the beginning of the period and held for the entire 6-month period ended April 30, 2014.
Actual Expenses. The first section of the table provides information about actual account values and actual expenses. You may use the information in this section for the class of shares you hold, together with the amount you invested, to estimate the expense that you paid over the period. Simply divide your account value by $1,000.00 (for example, an $8,600.00 account value divided by $1,000.00 = 8.60), then multiply the result by the number in the first section under the heading entitled “Expenses Paid During Period” to estimate the expenses you paid on your account during this period.
Hypothetical Example for Comparison Purposes. The second section of the table provides information about hypothetical account values and hypothetical expenses based on the Fund’s actual expense ratio for each class of shares, and an assumed rate of return of 5% per year for each class before expenses, which is not the actual return. The hypothetical account values and expenses may not be used to estimate the actual ending account balance or expenses you paid for the period. You may use this information to compare the ongoing costs of investing in the Fund and other funds. To do so, compare this 5% hypothetical example for the class of shares you hold with the 5% hypothetical examples that appear in the shareholder reports of the other funds.
Please note that the expenses shown in the table are meant to highlight your ongoing costs only and do not reflect any transactional costs, such as front-end or contingent deferred sales charges (loads). Therefore, the “hypothetical” section of the table is useful in comparing ongoing costs only, and will not help you determine the relative total costs of owning different funds. In addition, if these transactional costs were included, your costs would have been higher.
15 OPPENHEIMER FLEXIBLE STRATEGIES FUND
| | | | | | | | | | | | | | | | | | |
| Actual | | Beginning Account Value November 1, 2013 | | Ending Account Value April 30, 2014 | | Expenses Paid During 6 Months Ended April 30, 2014 |
Class A | | $ | 1,000.00 | | | | | $ | 1,067.40 | | | | | $ | 12.06 | | | |
Class B | | | 1,000.00 | | | | | | 1,063.00 | | | | | | 16.34 | | | |
Class C | | | 1,000.00 | | | | | | 1,063.30 | | | | | | 15.98 | | | |
Class I | | | 1,000.00 | | | | | | 1,069.00 | | | | | | 9.58 | | | |
Class N | | | 1,000.00 | | | | | | 1,065.90 | | | | | | 13.71 | | | |
Class Y | | | 1,000.00 | | | | | | 1,068.30 | | | | | | 11.29 | | | |
| | | | | | |
| Hypothetical | | | | | | | | | | | | | | | | | | |
(5% return before expenses) | | | | | | | | | | | | | | | | | | |
Class A | | | 1,000.00 | | | | | | 1,013.19 | | | | | | 11.75 | | | |
Class B | | | 1,000.00 | | | | | | 1,009.07 | | | | | | 15.91 | | | |
Class C | | | 1,000.00 | | | | | | 1,009.42 | | | | | | 15.56 | | | |
Class I | | | 1,000.00 | | | | | | 1,015.57 | | | | | | 9.34 | | | |
Class N | | | 1,000.00 | | | | | | 1,011.60 | | | | | | 13.35 | | | |
Class Y | | | 1,000.00 | | | | | | 1,013.93 | | | | | | 10.99 | | | |
Expenses are equal to the Fund’s annualized expense ratio for that class, multiplied by the average account value over the period, multiplied by 181/365 (to reflect the one-half year period). Those annualized expense ratios, excluding indirect expenses from affiliated funds, based on the 6-month period ended April 30, 2014 are as follows:
| | | | | | |
| Class | | Expense Ratios | | | |
Class A | | | 2.34 | % | | |
Class B | | | 3.17 | | | |
Class C | | | 3.10 | | | |
Class I | | | 1.86 | | | |
Class N | | | 2.66 | | | |
Class Y | | | 2.19 | | | |
The expense ratios reflect voluntary and/or contractual waivers and/or reimbursements of expenses by the Fund’s Manager and Transfer Agent. Some of these undertakings may be modified or terminated at any time, as indicated in the Fund’s prospectus. The “Consolidated Financial Highlights” tables in the Fund’s consolidated financial statements, included in this report, also show the gross expense ratios, without such waivers or reimbursements and reduction to custodian expenses, if applicable.
16 OPPENHEIMER FLEXIBLE STRATEGIES FUND
|
CONSOLIDATED STATEMENTOF INVESTMENTS April 30, 2014 Unaudited |
| | | | | | | | |
| | | Shares | | | Value | |
| |
Common Stocks—51.7% | | | | | | | | |
| |
Consumer Discretionary—5.4% | | | | | | | | |
| |
Hotels, Restaurants & Leisure—1.1% | | | | | | | | |
| |
Brinker International, Inc. | | | 75,000 | | | $ | 3,685,500 | |
| |
McDonald’s Corp. | | | 54,500 | | | | 5,525,210 | |
| | | | | | | | |
| | | | | | | 9,210,710 | |
| | | | | | | | |
| |
Media—2.9% | | | | | | | | |
| |
Cinemark Holdings, Inc.1 | | | 363,000 | | | | 10,752,060 | |
| |
Comcast Corp., Cl. A | | | 248,400 | | | | 12,857,184 | |
| | | | | | | | |
| | | | | | | 23,609,244 | |
| | | | | | | | |
| |
Multiline Retail—1.4% | | | | | | | | |
| |
Macy’s, Inc. | | | 207,300 | | | | 11,905,239 | |
| | | | | | | | |
| |
Consumer Staples—2.3% | | | | | | | | |
| |
Beverages—1.1% | | | | | | | | |
| |
Coca-Cola Co. (The)1 | | | 215,500 | | | | 8,790,245 | |
| | | | | | | | |
| |
Tobacco—1.2% | | | | | | | | |
| |
Altria Group, Inc. | | | 108,000 | | | | 4,331,880 | |
| |
Philip Morris International, Inc.1 | | | 69,500 | | | | 5,937,385 | |
| | | | | | | | |
| | | | | | | 10,269,265 | |
| | | | | | | | |
| |
Energy—8.6% | | | | | | | | |
| |
Energy Equipment & Services—2.1% | | | | | | | | |
| |
Baker Hughes, Inc. | | | 111,300 | | | | 7,779,870 | |
| |
Schlumberger Ltd. | | | 100,000 | | | | 10,155,000 | |
| | | | | | | | |
| | | | | | | 17,934,870 | |
| | | | | | | | |
| |
Oil, Gas & Consumable Fuels—6.5% | | | | | | | | |
| |
Apache Corp. | | | 17,800 | | | | 1,545,040 | |
| |
Chevron Corp. | | | 111,520 | | | | 13,997,990 | |
| |
ConocoPhillips | | | 106,000 | | | | 7,876,860 | |
| |
EOG Resources, Inc. | | | 110,000 | | | | 10,780,000 | |
| |
HollyFrontier Corp. | | | 106,820 | | | | 5,617,664 | |
| |
Kinder Morgan, Inc. | | | 100,000 | | | | 3,266,000 | |
| |
Noble Energy, Inc. | | | 90,000 | | | | 6,460,200 | |
| |
Valero Energy Corp. | | | 83,000 | | | | 4,745,110 | |
| | | | | | | | |
| | | | | | | 54,288,864 | |
| | | | | | | | |
| |
Financials—8.1% | | | | | | | | |
| |
Commercial Banks—3.3% | | | | | | | | |
| |
Bond Street Holdings, Inc., Cl. A2,3 | | | 375,000 | | | | 6,750,000 | |
| |
Bond Street Holdings, Inc., Cl. B2,3 | | | 120,000 | | | | 1,680,000 | |
| |
Citigroup, Inc. | | | 189,800 | | | | 9,093,318 | |
| |
JPMorgan Chase & Co. | | | 91,500 | | | | 5,122,170 | |
| |
M&T Bank Corp. | | | 39,640 | | | | 4,836,476 | |
| | | | | | | | |
| | | | | | | 27,481,964 | |
| | | | | | | | |
| |
Insurance—1.2% | | | | | | | | |
| |
ACE Ltd. | | | 96,570 | | | | 9,881,043 | |
17 OPPENHEIMER FLEXIBLE STRATEGIES FUND
|
CONSOLIDATED STATEMENTOF INVESTMENTS Unaudited / Continued |
| | | | | | | | |
| | | Shares | | | Value | |
| |
Real Estate Investment Trusts (REITs)—3.6% | | | | | | | | |
| |
American Assets Trust, Inc. | | | 60,788 | | | $ | 2,063,753 | |
| |
Blackstone Mortgage Trust, Inc., Cl. A | | | 251,870 | | | | 7,160,664 | |
| |
Macerich Co. (The) | | | 89,500 | | | | 5,809,445 | |
| |
Starwood Property Trust, Inc. | | | 634,000 | | | | 15,247,700 | |
| | | | | | | | |
| | | | | | | 30,281,562 | |
| | | | | | | | |
| |
Health Care—8.2% | | | | | | | | |
| |
Health Care Equipment & Supplies—1.1% | | | | | | | | |
| |
Baxter International, Inc. | | | 94,000 | | | | 6,842,260 | |
| |
Covidien plc | | | 38,000 | | | | 2,707,500 | |
| | | | | | | | |
| | | | | | | 9,549,760 | |
| | | | | | | | |
| |
Health Care Providers & Services—1.9% | | | | | | | | |
| |
HCA Holdings, Inc.2 | | | 20,000 | | | | 1,040,000 | |
| |
UnitedHealth Group, Inc. | | | 160,420 | | | | 12,037,917 | |
| |
Universal Health Services, Inc., Cl. B | | | 31,000 | | | | 2,535,490 | |
| | | | | | | | |
| | | | | | | 15,613,407 | |
| | | | | | | | |
| |
Pharmaceuticals—5.2% | | | | | | | | |
| |
Actavis plc2 | | | 74,000 | | | | 15,120,420 | |
| |
Merck & Co., Inc. | | | 208,000 | | | | 12,180,480 | |
| |
Novartis AG, ADR | | | 78,000 | | | | 6,781,320 | |
| |
Roche Holding AG | | | 32,500 | | | | 9,554,622 | |
| | | | | | | | |
| | | | | | | 43,636,842 | |
| | | | | | | | |
| |
Industrials—6.3% | | | | | | | | |
| |
Aerospace & Defense—1.6% | | | | | | | | |
| |
Honeywell International, Inc. | | | 102,000 | | | | 9,475,800 | |
| |
Northrop Grumman Corp. | | | 34,000 | | | | 4,131,340 | |
| | | | | | | | |
| | | | | | | 13,607,140 | |
| | | | | | | | |
| |
Commercial Services & Supplies—1.3% | | | | | | | | |
| |
Tyco International Ltd. | | | 255,000 | | | | 10,429,500 | |
| | | | | | | | |
| |
Construction & Engineering—1.8% | | | | | | | | |
| |
Quanta Services, Inc.2 | | | 425,000 | | | | 14,994,000 | |
| | | | | | | | |
| |
Electrical Equipment—0.1% | | | | | | | | |
| |
Hubbell, Inc., Cl. B | | | 9,500 | | | | 1,118,340 | |
| | | | | | | | |
| |
Trading Companies & Distributors—1.5% | | | | | | | | |
| |
AerCap Holdings NV2 | | | 140,901 | | | | 5,879,799 | |
| |
WESCO International, Inc.2 | | | 74,000 | | | | 6,495,720 | |
| | | | | | | | |
| | | | | | | 12,375,519 | |
| | | | | | | | |
| |
Information Technology—7.0% | | | | | | | | |
| |
Communications Equipment—3.5% | | | | | | | | |
| |
Cisco Systems, Inc. | | | 125,000 | | | | 2,888,750 | |
| |
Juniper Networks, Inc.2 | | | 345,790 | | | | 8,537,555 | |
| |
QUALCOMM, Inc. | | | 143,160 | | | | 11,268,123 | |
| |
Telefonaktiebolaget LM Ericsson, Cl. B | | | 520,000 | | | | 6,244,923 | |
| | | | | | | | |
| | | | | | | 28,939,351 | |
18 OPPENHEIMER FLEXIBLE STRATEGIES FUND
| | | | | | | | |
| | | Shares | | | Value | |
| |
Internet Software & Services—1.0% | | | | | | | | |
| |
Google, Inc., Cl. A2 | | | 7,750 | | | $ | 4,145,320 | |
| |
Google, Inc., Cl. C2 | | | 7,750 | | | | 4,081,615 | |
| | | | | | | | |
| | | | | | | 8,226,935 | |
| | | | | | | | |
| |
IT Services—0.1% | | | | | | | | |
| |
Accenture plc, Cl. A | | | 10,000 | | | | 802,200 | |
| | | | | | | | |
| |
Semiconductors & Semiconductor Equipment—0.8% | | | | | | | | |
| |
Xilinx, Inc. | | | 152,000 | | | | 7,172,880 | |
| | | | | | | | |
| |
Technology Hardware, Storage & Peripherals—1.6% | | | | | | | | |
| |
Apple, Inc.1 | | | 22,498 | | | | 13,275,845 | |
| | | | | | | | |
| |
Materials—3.0% | | | | | | | | |
| |
Chemicals—3.0% | | | | | | | | |
| |
Celanese Corp., Series A | | | 109,500 | | | | 6,726,585 | |
| |
LyondellBasell Industries NV, Cl. A | | | 136,900 | | | | 12,663,250 | |
| |
Methanex Corp. | | | 90,000 | | | | 5,580,000 | |
| | | | | | | | |
| | | | | | | 24,969,835 | |
| | | | | | | | |
| |
Telecommunication Services—1.1% | | | | | | | | |
| |
Diversified Telecommunication Services—1.1% | | | | | | | | |
| |
BCE, Inc. | | | 202,000 | | | | 8,997,080 | |
| | | | | | | | |
| |
Utilities—1.7% | | | | | | | | |
| |
Electric Utilities—1.7% | | | | | | | | |
| |
Cleco Corp. | | | 75,000 | | | | 3,941,250 | |
| |
Edison International | | | 75,000 | | | | 4,242,000 | |
| |
PPL Corp. | | | 174,050 | | | | 5,802,827 | |
| | | | | | | | |
| | | | | | | 13,986,077 | |
| | | | | | | | |
Total Common Stocks (Cost $339,932,302) | | | | | | | 431,347,717 | |
| | | | | | | | |
| |
Preferred Stocks—3.7% | | | | | | | | |
| |
M&T Bank Corp., 6.375% Cum., Series A, Non-Vtg. | | | 5,167 | | | | 5,091,097 | |
| |
M&T Bank Corp., 6.375% Cum., Series C, Non-Vtg. | | | 7,500 | | | | 7,417,950 | |
| |
PPL Corp. 8.75% Cv., Non-Vtg. | | | 185,000 | | | | 9,990,000 | |
| |
US Bancorp, 6% Non-Cum., Series G, Non-Vtg.4 | | | 300,000 | | | | 8,310,000 | |
| | | | | | | | |
Total Preferred Stocks (Cost $31,005,641) | | | | | | | 30,809,047 | |
| | |
| | | Principal Amount | | | | | |
| |
Asset-Backed Securities—9.8% | | | | | | | | |
| |
Airspeed Ltd.: | | | | | | | | |
Series 2007-1A, Cl. G1, 0.422%, 6/15/323,4 | | $ | 29,041,381 | | | | 24,688,789 | |
Series 2007-1A, Cl. G2, 0.432%, 6/15/323,4 | | | 7,885,883 | | | | 6,634,513 | |
| |
Blade Engine Securitization Ltd., Series 2006-1AW, Cl. A1, 0.452%, | | | | | | | | |
9/15/413,4 | | | 31,973,370 | | | | 23,150,300 | |
| |
New Century Home Equity Loan Trust, Series 2005-2, Cl. M3, 0.642%, | | | | | | | | |
6/25/354 | | | 5,500,000 | | | | 4,322,037 | |
| |
Park Place Securities, Inc., Series 2005-WCW3, Cl. M1, 0.632%, 8/25/354 | | | 5,000,000 | | | | 4,621,000 | |
| |
Saxon Asset Securities Trust, Series 2007-3, Cl. 2A4, 0.642%, 9/25/474 | | | 7,595,000 | | | | 4,192,888 | |
19 OPPENHEIMER FLEXIBLE STRATEGIES FUND
|
CONSOLIDATED STATEMENTOF INVESTMENTS Unaudited / Continued |
| | | | | | | | | | | | | | | | |
| | | | | | | | | Principal Amount | | | Value | |
| |
Asset-Backed Securities (Continued) | | | | | | | | | | | | | | | | |
| |
Structured Asset Securities Corp. Mortgage Loan Trust, Series 2007-GEL2,
Cl. A2, 0.472%, 5/25/374,5 | | | | | | | $ | 16,147,909 | | | $ | 14,521,620 | |
| | | | | | | | | | | | | | | | |
Total Asset-Backed Securities (Cost $73,374,831) | | | | | | | | | | | | | | | 82,131,147 | |
| | | | | | | | | | | | | | | | |
| |
Mortgage-Backed Obligations—4.9% | | | | | | | | | | | | | | | | |
| |
Ameriquest Mortgage Securities, Inc., Series 2004-R2, Cl. M1,
0.799%, 4/25/344 | | | | | | | | | | | 3,558,338 | | | | 2,931,035 | |
| |
Asset-Backed Funding Certificates Trust, Series 2005-HE2, Cl. M3,
0.932%, 6/25/354 | | | | | | | | 4,000,000 | | | | 3,378,220 | |
| |
Bear Stearns Asset Backed Securities I Trust, Series 2004-HE9, Cl. M2,
1.954%, 11/25/344 | | | | | | | | 8,055,247 | | | | 5,809,154 | |
| |
First NLC Trust, Series 2005-4, Cl. A4, 0.542%, 2/25/364 | | | | | | | | | | | 11,003,000 | | | | 8,037,570 | |
| |
Home Equity Asset Trust, Series 2005-5, Cl. M2, 0.662%, 11/25/354 | | | | | | | | | | | 1,888,088 | | | | 1,733,767 | |
| |
Home Equity Mortgage Loan Asset-Backed Trust, Series 2005-B, Cl. M3,
0.642%, 8/25/354 | | | | | | | | 1,298,061 | | | | 1,099,183 | |
| |
MASTR Adjustable Rate Mortgages Trust, Series 2004-13, Cl. 2A2,
2.641%, 4/21/344 | | | | | | | | 733,293 | | | | 748,670 | |
| |
RAMP Trust: | | | | | | | | | | | | | | | | |
Series 2005-RS6, Cl. M2, 0.662%, 6/25/354 | | | | | | | | | | | 944,044 | | | | 877,137 | |
Series 2006-NC3, Cl. A3, 0.422%, 3/25/364 | | | | | | | | | | | 16,698,000 | | | | 13,475,754 | |
| |
Structured Asset Securities Corp. Mortgage Loan Trust, Series 2007-GEL2,
Cl. A3, 0.602%, 5/25/374,5 | | | | | | | | 4,486,000 | | | | 3,224,245 | |
| | | | | | | | | | | | | | | | |
Total Mortgage-Backed Obligations (Cost $32,265,767) | | | | | | | | | | | | | | | 41,314,735 | |
| | | | | | | | | | | | | | | | |
| |
Non-Convertible Corporate Bonds and Notes—3.0% | | | | | | | | | | | | | | | | |
| |
Goldman Sachs Capital II, 4% Jr. Sub. Perpetual Bonds4,6 | | | | | | | | | | | 999,000 | | | | 774,225 | |
| |
Lukoil International Finance BV, 6.125% Sr. Unsec. Nts., 11/9/205 | | | | | | | | | | | 14,000,000 | | | | 14,105,000 | |
| |
Wachovia Capital Trust III, 5.57% Jr. Sub. Perpetual Bonds4,6 | | | | | | | | | | | 11,000,000 | | | | 10,642,500 | |
| | | | | | | | | | | | | | | | |
Total Non-Convertible Corporate Bonds and Notes (Cost $25,164,827) | | | | | | | | | | | | 25,521,725 | |
| | | | | | | | | | | | | | | | |
| |
Convertible Corporate Bond and Note—0.4% | | | | | | | | | | | | | | | | |
| |
SEACOR Holdings, Inc., 2.50% Cv. Sr. Unsec. Nts., 12/15/27 | | | | | | | | | | | | | | | | |
(Cost $3,000,000) | | | | | | | | | | | 3,000,000 | | | | 3,487,500 | |
| | | | | | | | | | | | | | | | |
| |
Corporate Loans—1.4% | | | | | | | | | | | | | | | | |
| |
Appvion, Inc., Sr. Sec. Credit Facilities 1st Lien Term Loan, | | | | | | | | | | | | | | | | |
5.75%, 6/28/194 | | | | | | | | | | | 6,947,500 | | | | 7,015,530 | |
| |
Dynegy, Inc., Sr. Sec. Credit Facilities 1st Lien Term Loan, Tranche | | | | | | | | | | | | | | | | |
B2, 4.00%, 4/23/204 | | | | | | | | | | | 4,962,500 | | | | 4,960,708 | |
| | | | | | | | | | | | | | | | |
Total Corporate Loans (Cost $11,820,546) | | | | | | | | | | | | | | | 11,976,238 | |
| | | | |
| | | | | | | | | Shares | | | | |
| |
Structured Security—0.3% | | | | | | | | | | | | | | | | |
| |
Africa Telecommunications Media & Technology Fund 1 LLC2,3 | | | | | | | | | | | | | | | | |
(Cost $10,000,000) | | | | | | | | | | | 9,542,930 | | | | 2,576,591 | |
| | | | |
| | | Exercise Price | | | Expiration
Date | | | Contracts | | | | |
| |
Exchange-Traded Options Purchased—0.1% | | | | | | | | | | | | | | | | |
| |
S&P 500 Index Call2 | | USD | 1,925.000 | | | | 5/17/14 | | | USD | 875 | | | | 157,500 | |
20 OPPENHEIMER FLEXIBLE STRATEGIES FUND
| | | | | | | | | | | | | | | | | | | | | | | | | | | | | | |
| | | | | | | | | Exercise | | | Expiration | | | | | | | | | | | | |
| | | | | | | | | Price | | | Date | | | | | | | | Contracts | | | Value | |
Exchange-Traded Options Purchased (Continued) | | | | | | | | | | | | | | | | | | | |
United States Treasury | | | | | | | | | | | | | | | | | | | | | | | | | | | | | | |
Nts., 10 yr. Futures, | | | | | | | | | | | | | | | | | | | | | | | | | | | | | | |
7/14/14 Call2 | | | | | | | | | | | USD 125.000 | | | | 6/20/14 | | | | | | | USD | | | 1,500 | | | $ | 468,750 | |
| | | | | | | | | | | | | | | | | | | | | | | | | | | | | | |
Total Exchange-Traded Options Purchased (Cost $1,434,111) | | | | | | | | | | | | | | | | | | 626,250 | |
| | | | | | | | |
| | | Counterparty | | | | | | Exercise Price | | | Expiration
Date | | | | | | | | Contracts | | | | |
Over-the-Counter Option Purchased—0.0% | | | | | | | | | | | | | | | | | | | |
JPY | | | | | | | | | | | | | | | | | | | | | | | | | | | | | | |
Currency | | | | | | | | | | | | | | | | | | | | | | | | | | | | | | |
Put2 (Cost | | | | | | | | | | | | | | | | | | | | | | | | | | | | | | |
$390,000) | | | JPM | | | | | | | | JPY 120.000 | | | | 5/27/14 | | | | | | | JPY | | | 6,000,000,000 | | | | — | |
| | | | | | | | |
| | | | | | Pay/Receive
Floating | | | Floating | | | Fixed | | | Expiration | | | | | Notional Amount | | | | |
| | | Counterparty | | | Rate | | | Rate | | | Rate | | | Date | | | | | (000’s) | | | | |
Over-the-Counter Interest Rate Swaptions Purchased—0.7% | |
Interest | | | | | | | | | | | | | | | | | | | | | | | | | | | | | | |
Rate Swap maturing | | | | | | | | | | | Six-Month | | | | | | | | | | | | | | | | | | | |
1/21/25 | | | | | | | | | | | JPY BBA | | | | | | | | | | | | | | | | | | | |
Put2 | | | GSG | | | | Receive | | | | LIBOR | | | | 2.000% | | | | 1/19/15 | | | JPY | | | 3,838,000 | | | | 9,608 | |
Interest | | | | | | | | | | | | | | | | | | | | | | | | | | | | | | |
Rate Swap maturing | | | | | | | | | | | Six-Month | | | | | | | | | | | | | | | | | | | |
1/25/26 | | | | | | | | | | | JPY BBA | | | | | | | | | | | | | | | | | | | |
Put2 | | | GSG | | | | Receive | | | | LIBOR | | | | 1.870 | | | | 1/21/16 | | | JPY | | | 5,406,000 | | | | 88,401 | |
Interest | | | | | | | | | | | | | | | | | | | | | | | | | | | | | | |
Rate Swap maturing | | | | | | | | | | | Three- | | | | | | | | | | | | | | | | | | | |
2/28/27 | | | | | | | | | | | Month USD | | | | | | | | | | | | | | | | | | | |
Put2 | | | JPM | | | | Receive | | | | BBA LIBOR | | | | 4.500 | | | | 2/24/17 | | | USD | | | 50,000 | | | | 1,275,132 | |
Interest | | | | | | | | | | | | | | | | | | | | | | | | | | | | | | |
Rate Swap maturing | | | | | | | | | | | Three- | | | | | | | | | | | | | | | | | | | |
4/13/26 | | | | | | | | | | | Month USD | | | | | | | | | | | | | | | | | | | |
Call2 | | | JPM | | | | Receive | | | | BBA LIBOR | | | | 3.410 | | | | 4/11/16 | | | USD | | | 33,000 | | | | 1,423,145 | |
Interest | | | | | | | | | | | | | | | | | | | | | | | | | | | | | | |
Rate Swap maturing | | | | | | | | | | | Three- | | | | | | | | | | | | | | | | | | | |
4/13/26 | | | | | | | | | | | Month USD | | | | | | | | | | | | | | | | | | | |
Call2 | | | JPM | | | | Receive | | | | BBA LIBOR | | | | 3.468 | | | | 4/11/16 | | | USD | | | 33,000 | | | | 1,343,458 | |
Interest | | | | | | | | | | | | | | | | | | | | | | | | | | | | | | |
Rate Swap maturing | | | | | | | | | | | Three- | | | | | | | | | | | | | | | | | | | |
4/27/26 | | | | | | | | | | | Month USD | | | | | | | | | | | | | | | | | | | |
Call2 | | | JPM | | | | Receive | | | | BBA LIBOR | | | | 3.373 | | | | 4/25/16 | | | USD | | | 30,000 | | | | 1,370,337 | |
| | | | | | | | | | | | | | | | | | | | | | | | | | | | | | |
Total Over-the-Counter Interest Rate Swaptions Purchased (Cost $8,098,189) | | | | | | | | | | | | | | | | | | 5,510,081 | |
| | | | | | | | |
| | | Shares | | | | |
Investment Companies—23.1% | | | | | | | | |
Oppenheimer Institutional Money Market Fund, Cl. E, 0.08%7,8 | | | 56,822,099 | | | | 56,822,099 | |
21 OPPENHEIMER FLEXIBLE STRATEGIES FUND
|
CONSOLIDATED STATEMENTOF INVESTMENTS Unaudited / Continued |
| | | | | | | | |
| | | Shares | | | Value | |
Investment Companies (Continued) | | | | | | | | |
Oppenheimer Master Loan Fund, LLC7 | | | 8,288,014 | | | $ | 118,822,044 | |
SPDR Gold Trust Exchange Traded Fund2 | | | 135,900 | | | | 16,881,498 | |
| | | | | | | | |
Total Investment Companies (Cost $191,715,081) | | | | | | | 192,525,641 | |
Total Investments, at Value (Cost $728,201,295) | | | 99.1% | | | | 827,826,672 | |
Assets in Excess of Other Liabilities | | | 0.9 | | | | 7,183,104 | |
| | | | |
Net Assets | | | 100.0% | | | $ | 835,009,776 | |
| | | | |
Footnotes to Consolidated Statement of Investments
1. All or portion of the security position is held in segregated accounts and pledged to cover margin requirements with respect to securities sold short. The aggregate market value of such securities is $26,205,988. See Note 1 of accompanying Consolidated Notes.
2. Non-income producing security.
3. Restricted security. The aggregate value of restricted securities as of April 30, 2014 was $65,480,193, which represents 7.84% of the Fund’s net assets. See Note 7 of the accompanying Consolidated Notes. Information concerning restricted securities is as follows:
| | | | | | | | | | | | | | | | |
| Security | | Acquisition
Dates | | | Cost | | | Value | | | Unrealized
Appreciation/
(Depreciation) | |
Africa Telecommunications | | | | | | | | | | | | | | | | |
Media & Technology Fund 1 LLC | | | 4/20/11 | | | $ | 10,000,000 | | | $ | 2,576,591 | | | $ | (7,423,409 | ) |
| | | | |
Airspeed Ltd., Series 2007-1A, | | | | | | | | | | | | | | | | |
Cl. G1, 0.422%, 6/15/32 | | | 1/9/13-7/10/13 | | | | 23,043,324 | | | | 24,688,789 | | | | 1,645,465 | |
| | | | |
Airspeed Ltd., Series 2007-1A, | | | | | | | | | | | | | | | | |
Cl. G2, 0.432%, 6/15/32 | | | 1/9/13-1/25/13 | | | | 6,430,837 | | | | 6,634,513 | | | | 203,676 | |
| | | | |
Blade Engine Securitization Ltd., | | | | | | | | | | | | | | | | |
Series 2006-1AW, Cl. A1, | | | | | | | | | | | | | | | | |
0.452%, 9/15/41 | | | 4/19/13-5/29/13 | | | | 24,157,207 | | | | 23,150,300 | | | | (1,006,907 | ) |
| | | | |
Bond Street Holdings, Inc., Cl. A | | | 11/4/09 | | | | 7,500,000 | | | | 6,750,000 | | | | (750,000 | ) |
| | | | |
Bond Street Holdings, Inc., Cl. B | | | 11/4/09 | | | | 2,400,000 | | | | 1,680,000 | | | | (720,000 | ) |
| | | | | | | | |
| | | | | | $ | 73,531,368 | | | $ | 65,480,193 | | | $ | (8,051,175 | ) |
| | | | | | | | |
4. Represents the current interest rate for a variable or increasing rate security.
5. Represents securities sold under Rule 144A, which are exempt from registration under the Securities Act of 1933, as amended. These securities have been determined to be liquid under guidelines established by the Board of Trustees. These securities amount to $31,850,865 or 3.81% of the Fund’s net assets as of April 30, 2014.
6. This bond has no contractual maturity date, is not redeemable and contractually pays an indefinite stream of interest. Rate reported represents the current interest rate for this variable rate security.
7. Is or was an affiliate, as defined in the Investment Company Act of 1940, at or during the period ended April 30, 2014, by virtue of the Fund owning at least 5% of the voting securities of the issuer or as a result of the Fund and the issuer having the same investment adviser. Transactions during the period in which the issuer was an affiliate are as follows:
| | | | | | | | | | | | | | | | |
| | | Shares
October 31, 2013 | | | Gross
Additions | | | Gross
Reductions | | | Shares
April 30, 2014 | |
Oppenheimer Institutional Money | | | | | | | | | | | | | | | | |
Market Fund, Cl. E | | | 341,351 | | | | 188,658,996 | | | | 132,178,248 | | | | 56,822,099 | |
Oppenheimer Master Loan Fund, LLC | | | 8,288,014 | | | | — | | | | — | | | | 8,288,014 | |
Oppenheimer Short Duration Fund, Cl. Y | | | 3,016,273 | | | | 902 | | | | 3,017,175 | | | | — | |
22 OPPENHEIMER FLEXIBLE STRATEGIES FUND
|
| Footnotes to Consolidated Statement of Investments (Continued) |
| | | | | | | | | | | | |
| | | Value | | | Income | | | Realized Loss | |
Oppenheimer Institutional Money Market Fund, Cl. E | | $ | 56,822,099 | | | $ | 15,906 | | | $ | — | |
Oppenheimer Master Loan Fund, LLC | | | 118,822,044 | | | | 3,379,688 | a | | | 340,729 | a |
Oppenheimer Short Duration Fund, Cl. Y | | | — | | | | 17,719 | | | | — | |
| | | | |
Total | | $ | 175,644,143 | | | $ | 3,413,313 | | | $ | 340,729 | |
| | | | |
|
| a. Represents the amount allocated to the Fund from Oppenheimer Master Loan Fund, LLC. |
| 8. Rate shown is the 7-day yield as of April 30, 2014. |
| | | | | | | | |
| | | Shares Sold
Short | | | Value | |
Securities Sold Short—(23.0)% | | | | | | | | |
Common Stock Securities Sold Short—(23.0)% | | | | | | | | |
ADT Corp. (The) | | | (91,000 | ) | | $ | (2,751,840 | ) |
Aeropostale, Inc. | | | (300 | ) | | | (1,491 | ) |
Aflac, Inc. | | | (139,000 | ) | | | (8,718,080 | ) |
Air Lease Corp., Cl. A | | | (176,000 | ) | | | (6,313,120 | ) |
Aircastle Ltd. | | | (165,000 | ) | | | (2,899,050 | ) |
Assurant, Inc. | | | (63,500 | ) | | | (4,280,535 | ) |
BHP Billiton Ltd., Sponsored ADR | | | (98,000 | ) | | | (6,912,920 | ) |
BJ’s Restaurants, Inc. | | | (165,700 | ) | | | (4,730,735 | ) |
Boeing Co. (The) | | | (50,000 | ) | | | (6,451,000 | ) |
Camden Property Trust | | | (60,000 | ) | | | (4,109,400 | ) |
Caterpillar, Inc. | | | (43,000 | ) | | | (4,532,200 | ) |
CBL & Associates Properties, Inc. | | | (361,000 | ) | | | (6,559,370 | ) |
Chesapeake Energy Corp. | | | (217,000 | ) | | | (6,238,750 | ) |
City National Corp. | | | (50,000 | ) | | | (3,628,500 | ) |
Cliffs Natural Resources, Inc. | | | (174,000 | ) | | | (3,083,280 | ) |
CME Group, Inc. | | | (58,000 | ) | | | (4,082,620 | ) |
Comerica, Inc. | | | (186,000 | ) | | | (8,972,640 | ) |
Commerce Bancshares, Inc. | | | (69,457 | ) | | | (3,019,990 | ) |
Daido Steel Co. Ltd. | | | (233,000 | ) | | | (1,137,207 | ) |
First Niagara Financial Group, Inc. | | | (400,000 | ) | | | (3,568,000 | ) |
FirstMerit Corp. | | | (155,000 | ) | | | (3,005,450 | ) |
FMC Technologies, Inc. | | | (51,000 | ) | | | (2,891,700 | ) |
Glimcher Realty Trust | | | (614,000 | ) | | | (6,256,660 | ) |
KCG Holdings, Inc., Cl. A | | | (200,000 | ) | | | (1,990,000 | ) |
Kohl’s Corp. | | | (94,000 | ) | | | (5,150,260 | ) |
Montpelier Re Holdings Ltd. | | | (120,000 | ) | | | (3,669,600 | ) |
NASDAQ OMX Group, Inc. (The) | | | (170,000 | ) | | | (6,273,000 | ) |
Nationstar Mortgage Holdings, Inc. | | | (100,000 | ) | | | (3,273,000 | ) |
Oracle Corp. | | | (113,000 | ) | | | (4,619,440 | ) |
Pennsylvania Real Estate Investment Trust | | | (430,000 | ) | | | (7,116,500 | ) |
Quicksilver Resources, Inc. | | | (598,734 | ) | | | (1,951,872 | ) |
Rio Tinto plc, Sponsored ADR | | | (55,000 | ) | | | (2,985,950 | ) |
Rosetta Resources, Inc. | | | (75,000 | ) | | | (3,550,500 | ) |
Rouse Properties, Inc. | | | (203,392 | ) | | | (3,414,952 | ) |
SanDisk Corp. | | | (126,500 | ) | | | (10,748,705 | ) |
SandRidge Energy, Inc. | | | (200,000 | ) | | | (1,372,000 | ) |
Southern Copper Corp. | | | (391,000 | ) | | | (11,784,740 | ) |
Transocean Ltd. | | | (207,000 | ) | | | (8,915,490 | ) |
United Technologies Corp. | | | (26,500 | ) | | | (3,135,745 | ) |
23 OPPENHEIMER FLEXIBLE STRATEGIES FUND
|
CONSOLIDATED STATEMENTOF INVESTMENTS Unaudited / Continued |
| | | | | | | | |
| | | Shares Sold
Short | | | Value | |
Common Stock Securities Sold Short Continued | | | | | | | | |
Walter Energy, Inc. | | | (266,000 | ) | | $ | (1,915,200 | ) |
Weingarten Realty Investors | | | (197,000 | ) | | | (6,146,400 | ) |
| | | | | | | | |
Total Securities Sold Short (Proceeds $ 172,355,994) | | | | | | $ | (192,157,892) | |
| | | | | | | | |
|
Forward Currency Exchange Contracts as of April 30, 2014 |
| | | | | | | | | | | | | | | | | | | | |
| Counterparty | | Settlement
Month(s) | | | Currency
Purchased
(000’s) | | | Currency Sold
(000’s) | | | Unrealized
Appreciation | | | Unrealized
Depreciation | |
BOA | | | 07/2014 | | | TRY | 15,000 | | | USD | 6,982 | | | $ | — | | | $ | 15,395 | |
BOA | | | 08/2014 | | | USD | 39,360 | | | JPY | 4,040,000 | | | | — | | | | 181,981 | |
DEU | | | 01/2015 | | | AUD | 5,000 | | | USD | 4,572 | | | | — | | | | 14,825 | |
DEU | | | 01/2015 | | | USD | 17,200 | | | AUD | 19,760 | | | | — | | | | 810,179 | |
JPM | | | 08/2014 | | | JPY | 2,020,000 | | | USD | 19,610 | | | | 160,667 | | | | — | |
MSCO | | | 07/2014 | | | USD | 13,614 | | | TRY | 30,000 | | | | — | | | | 318,731 | |
RBS | | | 07/2014 | | | EUR | 7,300 | | | USD | 10,054 | | | | 71,587 | | | | — | |
RBS | | | 07/2014 | | | USD | 20,135 | | | EUR | 14,600 | | | | — | | | | 116,602 | |
| | | | | | | | | | | | | | | | |
Total Unrealized Appreciation and Depreciation | | | | | | | $ | 232,254 | | | $ | 1,457,713 | |
| | | | | | | | | | | | | | | | |
| | | | | | | | | | | | | | | | | | | | | | | | |
Futures Contracts as of April 30, 2014 | |
| Description | | Exchange | | | Buy/Sell | | | Expiration
Date | | | Number of
Contracts | | | Value | | | Unrealized
Appreciation (Depreciation) | |
Euro BTP | | | EUX | | | | Sell | | | | 6/6/14 | | | | 43 | | | $ | 7,397,350 | | | $ | (261,310 | ) |
United States Treasury Nts., | | | | | | | | | | | | | | | | | | | | | | | | |
10 yr. | | | CBT | | | | Sell | | | | 6/19/14 | | | | 107 | | | | 13,313,141 | | | | 9,906 | |
| | | | | | | | | | | | | | | | | | | | | | | | |
| | | | | | | | | | | | | | | | | | | | | | $ | (251,404) | |
| | | | | | | | | | | | | | | | | | | | | | | | |
| | | | | | | | | | | | | | | | | | | | | | | | | | | | |
Over-the-Counter Credit Default Swaps at April 30, 2014 | | | | | | | | | |
| Reference Asset | | Counterparty | | | Buy/Sell
Protection | | | Fixed
Rate | | | Maturity
Date | | | Notional
Amount
(000’s) | | | Premiums
Received/(Paid) | | | Value | |
CDX.NA.IG.21 | | | JPM | | | | Sell | | | | 1.000 | | | | 6/20/18 USD | | | | 25,000 | | | $ | (118,806 | ) | | $ | 542,973 | |
Federal Republic of Germany | | | GSG | | | | Buy | | | | 0.250 | | | | 12/20/16 USD | | | | 50,000 | | | | (1,804,216 | ) | | | (222,345 | ) |
iTraxx Europe, Series 19, Version 1 | | | JPM | | | | Buy | | | | 1.000 | | | | 6/20/18 EUR | | | | 19,490 | | | | (332,086 | ) | | | (532,723 | ) |
Republic of Austria | | | GSG | | | | Buy | | | | 1.000 | | | | 12/20/16 USD | | | | 25,000 | | | | (874,393 | ) | | | (595,209 | ) |
Republic of France | | | GSG | | | | Buy | | | | 0.250 | | | | 12/20/16 USD | | | | 25,000 | | | | (1,910,232 | ) | | | (37,904 | ) |
Republic of Italy | | | BAC | | | | Buy | | | | 1.000 | | | | 9/20/18 USD | | | | 15,000 | | | | (1,316,379 | ) | | | 10,189 | |
Republic of Italy | | | GSG | | | | Buy | | | | 1.000 | | | | 9/20/18 USD | | | | 30,000 | | | | (2,689,419 | ) | | | 20,377 | |
| | | | | | | | | | | | | | | | | | | | | | | | |
Total of Over-the-Counter Credit Default Swaps | | | | | | | | | | | $ | (9,045,531) | | | $ | (814,642) | |
| | | | | | | | | | | | | | | | | | | | | | | | |
24 OPPENHEIMER FLEXIBLE STRATEGIES FUND
The table that follows shows the undiscounted maximum potential payment by the Fund related to selling credit protection in credit default swaps:
| | | | | | | | | | | | |
Type of Reference Asset on which the Fund Sold Protection | | Total Maximum
Potential Payments for
Selling Credit Protection
(Undiscounted) | | | Amount
Recoverable* | | | Reference
Asset Rating
Range** | |
Investment Grade Corporate Debt Indexes | | | $25,000,000 | | | | $— | | | | BBB+ | |
*The Fund has no amounts recoverable from related purchased protection. In addition, the Fund has no recourse provisions under the credit derivatives and holds no collateral which can offset or reduce potential payments under a triggering event.
** The period end reference asset security ratings, as rated by any rating organization, are included in the equivalent Standard & Poor’s rating category. The reference asset rating represents the likelihood of a potential credit event on the reference asset which would result in a related payment by the fund.
| | | | | | | | | | | | |
| Over-the-Counter Total Return Swaps at April 30, 2014 | | | | |
| | | | | | | | | | | | | | | | | | | | | | | | |
| Reference Asset | | Counterparty | | | Pay/Receive
Total
Return | | | Floating Rate | | | Maturity
Date | | | Notional Amount
(000’s) | | | Value | |
| Blackstone Group LP (The) | | | GSG | | | | Receive | | |
| Six-Month USD
BBA LIBOR plus
58 basis points |
| | | 10/17/14 | | | | USD 6,558 | | | | $ (330,319 | ) |
| | |
| Glossary: | | |
| Counterparty | | |
| Abbreviations | | |
| BAC | | Barclays Bank plc |
| BOA | | Bank of America NA |
| DEU | | Deutsche Bank AG |
| GSG | | Goldman Sachs Group, Inc. (The) |
| JPM | | JPMorgan Chase Bank NA |
| MSCO | | Morgan Stanley Capital Services, Inc. |
| RBS | | Royal Bank of Scotland plc (The) |
Currency abbreviations indicate amounts reporting in currencies |
| AUD | | Australian Dollar |
| EUR | | Euro |
| JPY | | Japanese Yen |
| TRY | | New Turkish Lira |
| USD | | U.S. Dollar |
Definitions | | |
| CDX.NA.IG.21 | | Markit CDX North American Investment Grade High Volatility |
| BBA LIBOR | | British Bankers’ Association London - Interbank Offered Rate |
| iTraxx Europe, Series 19, | | |
| Version 1 | | Credit Default Swap Trading Index for a Specific Basket of Securities |
Exchange Abbreviations | | |
| CBT | | Chicago Board of Trade |
| EUX | | European Stock Exchange |
See accompanying Notes to Consolidated Financial Statements.
25 OPPENHEIMER FLEXIBLE STRATEGIES FUND
CONSOLIDATEDSTATEMENTOF
ASSETS AND LIABILITIES April 30, 2014 Unaudited
| | | | |
| |
Assets | | | | |
Investments, at value—see accompanying consolidated statement of investments: | | | | |
Unaffiliated companies (cost $553,320,275) | | $ | 652,182,529 | |
Affiliated companies (cost $174,881,020) | | | 175,644,143 | |
| | | | |
| | | 827,826,672 | |
| |
Cash | | | 6,102,447 | |
| |
Cash used for collateral on futures | | | 460,204 | |
| |
Cash used for collateral on OTC derivatives | | | 706,627 | |
| |
Deposits with broker for securities sold short | | | 193,552,370 | |
| |
Unrealized appreciation on foreign currency exchange contracts | | | 232,254 | |
| |
Swaps, at value (premiums paid $4,124,604) | | | 573,539 | |
| |
Receivables and other assets: | | | | |
Investments sold | | | 8,872,610 | |
Interest and dividends | | | 1,405,696 | |
Shares of beneficial interest sold | | | 414,913 | |
Other | | | 170,597 | |
| | | | |
Total assets | | | 1,040,317,929 | |
|
| |
Liabilities | | | | |
Short positions, at value (proceeds $172,355,994)—see accompanying consolidated statement of investments | | | 192,157,892 | |
| |
Unrealized depreciation on foreign currency exchange contracts | | | 1,457,713 | |
| |
Swaps, at value (premiums paid $4,920,927) | | | 1,718,500 | |
| |
Payables and other liabilities: | | | | |
Investments purchased | | | 9,032,243 | |
Shares of beneficial interest redeemed | | | 412,986 | |
Trustees’ compensation | | | 261,984 | |
Distribution and service plan fees | | | 169,169 | |
Variation margin payable | | | 62,341 | |
Other | | | 35,325 | |
| | | | |
Total liabilities | | | 205,308,153 | |
|
| |
Net Assets | | $ | 835,009,776 | |
| | | | |
|
| |
Composition of Net Assets | | | | |
Par value of shares of beneficial interest | | $ | 325,894 | |
| |
Additional paid-in capital | | | 809,524,343 | |
| |
Accumulated net investment income | | | 15,652,464 | |
| |
Accumulated net realized loss on investments and foreign currency transactions | | | (58,645,799 | ) |
| |
| Net unrealized appreciation on investments and translation of assets and liabilities denominated in foreign currencies | | | 68,152,874 | |
| | | | |
Net Assets | | $ | 835,009,776 | |
| | | | |
26 OPPENHEIMER FLEXIBLE STRATEGIES FUND
| | | | |
|
| |
Net Asset Value Per Share | | | | |
| Class A Shares: | | | | |
Net asset value and redemption price per share (based on net assets of $658,720,362 and 25,212,155 shares of beneficial interest outstanding) | | | $26.13 | |
| Maximum offering price per share (net asset value plus sales charge of 5.75% of offering price) | | | $27.72 | |
| |
| |
| Class B Shares: | | | | |
Net asset value, redemption price (excludes applicable contingent deferred sales charge) and offering price per share (based on net assets of $30,615,052 and 1,304,210 shares of beneficial interest outstanding) | | | $23.47 | |
| |
| |
| Class C Shares: | | | | |
Net asset value, redemption price (excludes applicable contingent deferred sales charge) and offering price per share (based on net assets of $112,803,380 and 4,796,885 shares of beneficial interest outstanding) | | | $23.52 | |
| |
| |
| Class I Shares: | | | | |
Net asset value, redemption price and offering price per share (based on net assets of $11,027 and 411 shares of beneficial interest outstanding) | | | $26.82 | |
| |
| |
| Class N Shares: | | | | |
Net asset value, redemption price (excludes applicable contingent deferred sales charge) and offering price per share (based on net assets of $19,163,495 and 763,817 shares of beneficial interest outstanding) | | | $25.09 | |
| |
| |
| Class Y Shares: | | | | |
Net asset value, redemption price and offering price per share (based on net assets of $13,696,460 and 511,900 shares of beneficial interest outstanding) | | | $26.76 | |
See accompanying Notes to Consolidated Financial Statement
27 OPPENHEIMER FLEXIBLE STRATEGIES FUND
CONSOLIDATEDSTATEMENTOF
OPERATIONS For the Six Months Ended April 30, 2014 Unaudited
| | | | |
| |
Allocation of Income and Expenses from Master Fund1 | | | | |
Net investment income allocated from Oppenheimer Master Loan Fund, LLC: | | | | |
Interest | | $ | 3,079,645 | |
Dividends | | | 300,043 | |
Net expenses | | | (196,805 | ) |
| | | | |
Net investment income allocated from Oppenheimer Master Loan Fund, LLC | | | 3,182,883 | |
|
| |
Investment Income | | | | |
| |
Dividends: | | | | |
Unaffiliated companies (net of foreign withholding taxes of $158,597) | | | 10,033,907 | |
Affiliated companies | | | 33,625 | |
| |
Interest | | | 4,418,782 | |
| |
Total investment income | | | 14,486,314 | |
|
| |
Expenses | | | | |
Management fees | | | 3,671,486 | |
| |
Distribution and service plan fees: | | | | |
Class A | | | 803,233 | |
Class B | | | 162,089 | |
Class C | | | 562,217 | |
Class N | | | 49,816 | |
| |
Transfer and shareholder servicing agent fees: | | | | |
Class A | | | 737,013 | |
Class B | | | 63,583 | |
Class C | | | 128,329 | |
Class I | | | 2 | |
Class N | | | 29,230 | |
Class Y | | | 100,020 | |
| |
Shareholder communications: | | | | |
Class A | | | 40,740 | |
Class B | | | 5,183 | |
Class C | | | 7,235 | |
Class N | | | 1,218 | |
Class Y | | | 329 | |
| |
Financing expense from short sales | | | 2,409,124 | |
| |
Dividends on short sales | | | 1,954,364 | |
| |
Interest on short sales | | | 215,913 | |
| |
Trustees’ compensation | | | 16,506 | |
| |
Custodian fees and expenses | | | 6,292 | |
| |
Other | | | 89,272 | |
| | | | |
Total expenses | | | 11,053,194 | |
Less waivers and reimbursements of expenses | | | (819,870 | ) |
| | | | |
Net expenses | | | 10,233,324 | |
|
| |
Net Investment Income | | | 7,435,873 | |
1. The Fund invests in an affiliated mutual fund that expects to be treated as a partnership for tax purposes. See Note 1 of the accompanying Consolidated Notes.
28 OPPENHEIMER FLEXIBLE STRATEGIES FUND
| | | | |
| |
Realized and Unrealized Gain (Loss) | | | | |
Net realized gain (loss) on: | | | | |
Investments from unaffiliated companies | | $ | 34,063,494 | |
Closing and expiration of futures contracts | | | (1,672,694 | ) |
Foreign currency transactions | | | 1,840,192 | |
Short positions | | | (4,552,943 | ) |
Swap contracts | | | 2,581,692 | |
| |
Net realized loss allocated from: | | | | |
Oppenheimer Master Loan Fund, LLC | | | (340,729 | ) |
| | | | |
Net realized gain | | | 31,919,012 | |
| |
Net change in unrealized appreciation/depreciation on: | | | | |
Investments | | | 14,350,420 | |
Translation of assets and liabilities denominated in foreign currencies | | | (372,829 | ) |
Futures contracts | | | 1,018,881 | |
Short positions | | | 3,521,485 | |
Swap contracts | | | (3,543,488 | ) |
| |
Net change in unrealized appreciation/depreciation allocated from: | | | | |
Oppenheimer Master Loan Fund, LLC | | | 465,832 | |
| | | | |
Net change in unrealized appreciation/depreciation | | | 15,440,301 | |
|
| |
Net Increase in Net Assets Resulting from Operations | | $ | 54,795,186 | |
| | | | |
See accompanying Notes to Consolidated Financial Statements.
29 OPPENHEIMER FLEXIBLE STRATEGIES FUND
CONSOLIDATEDSTATEMENTSOF
CHANGES IN NET ASSETS
| | | | | | | | |
| | | Six Months Ended
April 30, 2014
(Unaudited) | | | Year Ended
October 31, 2013 | |
| |
Operations | | | | | | | | |
Net investment income | | $ | 7,435,873 | | | $ | 10,137,159 | |
| |
Net realized gain | | | 31,919,012 | | | | 26,621,764 | |
| |
Net change in unrealized appreciation/depreciation | | | 15,440,301 | | | | 5,982,485 | |
| | | | | | | | |
Net increase in net assets resulting from operations | | | 54,795,186 | | | | 42,741,408 | |
|
| |
Beneficial Interest Transactions | | | | | | | | |
Net increase (decrease) in net assets resulting from beneficial interest transactions: | | | | | | | | |
Class A | | | (53,215,153 | ) | | | (140,308,061 | ) |
Class B | | | (5,781,534 | ) | | | (14,031,285 | ) |
Class C | | | (7,163,029 | ) | | | (27,694,063 | ) |
Class I | | | — | | | | 10,000 | |
Class N | | | (2,545,453 | ) | | | (7,842,250 | ) |
Class Y | | | 1,688,612 | | | | (5,596,759 | ) |
| | | | | | | | |
| | | (67,016,557 | ) | | | (195,462,418 | ) |
|
| |
Net Assets | | | | | | | | |
Total decrease | | | (12,221,371 | ) | | | (152,721,010 | ) |
| |
Beginning of period | | | 847,231,147 | | | | 999,952,157 | |
| | | | | | | | |
| | |
| End of period (including accumulated net investment income of $15,652,464 and $8,216,591, respectively) | | $ | 835,009,776 | | | $ | 847,231,147 | |
| | | | |
See accompanying Notes to Consolidated Financial Statements.
30 OPPENHEIMER FLEXIBLE STRATEGIES FUND
| | | | |
| CONSOLIDATED FINANCIAL HIGHLIGHTS | | |
| | | | | | | | | | | | | | | | | | | | | | | | |
| Class A | | Six Months Ended April 30, 2014
(Unaudited) | | | Year Ended
October 31, 2013 | | | Year Ended October 31, 2012 | | | Year Ended October 31, 2011 | | | Year Ended October 29, 20101 | | | Year Ended October 31, 2009 | |
| |
Per Share Operating Data | | | | | | | | | | | | | | | | | | | | | | | | |
| Net asset value, beginning of period | | $ | 24.48 | | | $ | 23.35 | | | $ | 25.55 | | | $ | 26.01 | | | $ | 24.46 | | | $ | 23.15 | |
| |
| Income (loss) from investment operations: | | | | | | | | | | | | | | | | | | | | | | | | |
| Net investment income (loss)2 | | | 0.24 | | | | 0.30 | | | | 0.04 | | | | (0.17 | ) | | | (0.11 | ) | | | (0.03 | ) |
| Net realized and unrealized gain (loss) | | | 1.41 | | | | 0.83 | | | | (0.10 | ) | | | 0.22 | | | | 1.66 | | | | 2.19 | |
| | | | |
| Total from investment operations | | | 1.65 | | | | 1.13 | | | | (0.06 | ) | | | 0.05 | | | | 1.55 | | | | 2.16 | |
| |
| Dividends and/or distributions to shareholders: | | | | | | | | | | | | | | | | | | | | | | | | |
| Distributions from net realized gain | | | 0.00 | | | | 0.00 | | | | (2.13 | ) | | | (0.51 | ) | | | 0.00 | | | | (0.79 | ) |
| Tax return of capital distribution | | | 0.00 | | | | 0.00 | | | | (0.01 | ) | | | 0.00 | | | | 0.00 | | | | (0.06 | ) |
| | | | |
| Total dividends and/or distributions to shareholders | | | 0.00 | | | | 0.00 | | | | (2.14 | ) | | | (0.51 | ) | | | 0.00 | | | | (0.85 | ) |
| |
| Net asset value, end of period | | $ | 26.13 | | | $ | 24.48 | | | $ | 23.35 | | | $ | 25.55 | | | $ | 26.01 | | | $ | 24.46 | |
| | | | |
|
| |
Total Return, at Net Asset Value3 | | | 6.74% | | | | 4.84% | | | | 0.03% | | | | 0.14% | | | | 6.34% | | | | 9.94% | |
|
| |
Ratios/Supplemental Data | | | | | | | | | | | | | | | | | | | | | | | | |
| Net assets, end of period (in thousands) | | $ | 658,720 | | | $ | 668,235 | | | $ | 774,007 | | | $ | 1,024,109 | | | $ | 1,229,920 | | | $ | 1,340,846 | |
| |
| Average net assets (in thousands) | | $ | 670,369 | | | $ | 721,521 | | | $ | 870,856 | | | $ | 1,165,257 | | | $ | 1,297,058 | | | $ | 1,206,192 | |
| |
| Ratios to average net assets:4 | | | | | | | | | | | | | | | | | | | | | | | | |
| Net investment income (loss) | | | 1.90% | 5 | | | 1.25% | 5 | | | 0.19% | 5 | | | (0.65)% | | | | (0.44)% | | | | (0.13)% | |
| Total expenses6 | | | 2.51% | 5 | | | 2.04% | 5 | | | 1.85% | 5 | | | 1.57% | | | | 1.43% | | | | 1.48% | |
| Expenses after payments, waivers and/or reimbursements and reduction to custodian expenses | | | 2.34% | 5 | | | 1.97% | 5 | | | 1.78% | 5 | | | 1.52% | | | | 1.38% | | | | 1.43% | |
| |
| Portfolio turnover rate | | | 26% | | | | 76% | | | | 212% | | | | 181% | | | | 58% | | | | 117% | |
1. October 29, 2010 represents the last business day of the Fund’s reporting period.
2. Per share amounts calculated based on the average shares outstanding during the period.
3. Assumes an initial investment on the business day before the first day of the fiscal period, with all dividends and distributions reinvested in additional shares on the reinvestment date, and redemption at the net asset value calculated on the last business day of the fiscal period. Sales charges are not reflected in the total returns. Total returns are not annualized for periods less than one full year. Returns do not reflect the deduction of taxes that a shareholder would pay on fund distributions or the redemption of fund shares.
4. Annualized for periods less than one full year.
5. Includes the Fund’s share of the allocated expenses and/or net investment income from the master funds.
6. Total expenses including indirect expenses from affiliated fund were as follows:
| | | | | | |
| | Six Months Ended April 30, 2014 | | | 2.52 | % |
| | Year Ended October 31, 2013 | | | 2.06 | % |
| | Year Ended October 31, 2012 | | | 1.90 | % |
| | Year Ended October 31, 2011 | | | 1.62 | % |
| | Year Ended October 29, 2010 | | | 1.48 | % |
| | Year Ended October 31, 2009 | | | 1.53 | % |
See accompanying Notes to Consolidated Financial Statements.
31 OPPENHEIMER FLEXIBLE STRATEGIES FUND
| | | | |
| CONSOLIDATED FINANCIAL HIGHLIGHTS Continued | | |
| | | | | | | | | | | | | | | | | | | | | | | | |
| Class B | | Six Months Ended April 30, 2014
(Unaudited) | | | Year Ended
October 31, 2013 | | | Year Ended
October 31, 2012 | | | Year Ended
October 31,
2011 | | | Year Ended October 29,
20101 | | | Year Ended
October 31, 2009 | |
| |
Per Share Operating Data | | | | | | | | | | | | | | | | | | | | | | | | |
| Net asset value, beginning of period | | $ | 22.08 | | | $ | 21.25 | | | $ | 23.63 | | | $ | 24.32 | | | $ | 23.07 | | | $ | 22.08 | |
| |
| Income (loss) from investment operations: | | | | | | | | | | | | | | | | | | | | | | | | |
| Net investment income (loss)2 | | | 0.12 | | | | 0.08 | | | | (0.15 | ) | | | (0.38 | ) | | | (0.31 | ) | | | (0.23 | ) |
| Net realized and unrealized gain (loss) | | | 1.27 | | | | 0.75 | | | | (0.09 | ) | | | 0.20 | | | | 1.56 | | | | 2.07 | |
| | | | |
| Total from investment operations | | | 1.39 | | | | 0.83 | | | | (0.24 | ) | | | (0.18 | ) | | | 1.25 | | | | 1.84 | |
| |
| Dividends and/or distributions to shareholders: | | | | | | | | | | | | | | | | | | | | | | | | |
| Distributions from net realized gain | | | 0.00 | | | | 0.00 | | | | (2.13 | ) | | | (0.51 | ) | | | 0.00 | | | | (0.79 | ) |
| Tax return of capital distribution | | | 0.00 | | | | 0.00 | | | | (0.01 | ) | | | 0.00 | | | | 0.00 | | | | (0.06 | ) |
| | | | |
| Total dividends and/or distributions to shareholders | | | 0.00 | | | | 0.00 | | | | (2.14 | ) | | | (0.51 | ) | | | 0.00 | | | | (0.85 | ) |
| |
| Net asset value, end of period | | $ | 23.47 | | | $ | 22.08 | | | $ | 21.25 | | | $ | 23.63 | | | $ | 24.32 | | | $ | 23.07 | |
| | | | |
|
| |
Total Return, at Net Asset Value3 | | | 6.30% | | | | 3.91% | | | | (0.79)% | | | | (0.81)% | | | | 5.42% | | | | 8.93% | |
|
| |
Ratios/Supplemental Data | | | | | | | | | | | | | | | | | | | | | | | | |
| Net assets, end of period (in thousands) | | $ | 30,615 | | | $ | 34,346 | | | $ | 46,780 | | | $ | 68,426 | | | $ | 91,209 | | | $ | 107,366 | |
| |
| Average net assets (in thousands) | | $ | 32,830 | | | $ | 40,057 | | | $ | 56,004 | | | $ | 82,022 | | | $ | 98,421 | | | $ | 97,044 | |
| |
| Ratios to average net assets: 4 | | | | | | | | | | | | | | | | | | | | | | | | |
| Net investment income (loss) | | | 1.06% | 5 | | | 0.35% | 5 | | | (0.70)%5 | | | | (1.55)% | | | | (1.34)% | | | | (1.04)% | |
| Total expenses6 | | | 3.45% | 5 | | | 3.06% | 5 | | | 2.85% | 5 | | | 2.57% | | | | 2.43% | | | | 2.49% | |
| Expenses after payments, waivers and/or reimbursements and reduction to custodian expenses | | | 3.17% | 5 | | | 2.86% | 5 | | | 2.67% | 5 | | | 2.43% | | | | 2.29% | | | | 2.34% | |
| |
| Portfolio turnover rate | | | 26% | | | | 76% | | | | 212% | | | | 181% | | | | 58% | | | | 117% | |
1. October 29, 2010 represents the last business day of the Fund’s reporting period.
2. Per share amounts calculated based on the average shares outstanding during the period.
3. Assumes an initial investment on the business day before the first day of the fiscal period, with all dividends and distributions reinvested in additional shares on the reinvestment date, and redemption at the net asset value calculated on the last business day of the fiscal period. Sales charges are not reflected in the total returns. Total returns are not annualized for periods less than one full year. Returns do not reflect the deduction of taxes that a shareholder would pay on fund distributions or the redemption of fund shares.
4. Annualized for periods less than one full year.
5. Includes the Fund’s share of the allocated expenses and/or net investment income from the master funds.
6. Total expenses including indirect expenses from affiliated fund were as follows:
| | | | | | |
| | Six Months Ended April 30, 2014 | | | 3.46 | % |
| | Year Ended October 31, 2013 | | | 3.08 | % |
| | Year Ended October 31, 2012 | | | 2.90 | % |
| | Year Ended October 31, 2011 | | | 2.62 | % |
| | Year Ended October 29, 2010 | | | 2.48 | % |
| | Year Ended October 31, 2009 | | | 2.54 | % |
See accompanying Notes to Consolidated Financial Statements.
32 OPPENHEIMER FLEXIBLE STRATEGIES FUND
| | | | | | | | | | | | | | | | | | | | | | | | |
| Class C | | Six Months Ended April 30, 2014 (Unaudited) | | | Year Ended October 31, 2013 | | | Year Ended October 31, 2012 | | | Year Ended October 31, 2011 | | | Year Ended October 29, 20101 | | | Year Ended October 31, 2009 | |
| |
Per Share Operating Data | | | | | | | | | | | | | | | | | | | | | | | | |
| Net asset value, beginning of period | | $ | 22.12 | | | $ | 21.26 | | | $ | 23.62 | | | $ | 24.27 | | | $ | 22.99 | | | $ | 21.98 | |
| |
| Income (loss) from investment operations: | | | | | | | | | | | | | | | | | | | | | | | | |
| Net investment income (loss)2 | | | 0.13 | | | | 0.10 | | | | (0.12 | ) | | | (0.35 | ) | | | (0.28 | ) | | | (0.20 | ) |
| Net realized and unrealized gain (loss) | | | 1.27 | | | | 0.76 | | | | (0.10 | ) | | | 0.21 | | | | 1.56 | | | | 2.06 | |
| | | | |
| Total from investment operations | | | 1.40 | | | | 0.86 | | | | (0.22 | ) | | | (0.14 | ) | | | 1.28 | | | | 1.86 | |
| |
| Dividends and/or distributions to shareholders: | | | | | | | | | | | | | | | | | | | | | | | | |
| Distributions from net realized gain | | | 0.00 | | | | 0.00 | | | | (2.13 | ) | | | (0.51 | ) | | | 0.00 | | | | (0.79 | ) |
| Tax return of capital distribution | | | 0.00 | | | | 0.00 | | | | (0.01 | ) | | | 0.00 | | | | 0.00 | | | | (0.06 | ) |
| | | | |
| Total dividends and/or distributions to shareholders | | | 0.00 | | | | 0.00 | | | | (2.14 | ) | | | (0.51 | ) | | | 0.00 | | | | (0.85 | ) |
| |
| Net asset value, end of period | | $ | 23.52 | | | $ | 22.12 | | | $ | 21.26 | | | $ | 23.62 | | | $ | 24.27 | | | $ | 22.99 | |
| | | | |
|
| |
Total Return, at Net Asset Value3 | | | 6.33% | | | | 4.05% | | | | (0.71)% | | | | (0.64)% | | | | 5.57% | | | | 9.07% | |
|
| |
Ratios/Supplemental Data | | | | | | | | | | | | | | | | | | | | | | | | |
| Net assets, end of period (in thousands) | | $ | 112,803 | | | $ | 112,993 | | | $ | 135,750 | | | $ | 199,765 | | | $ | 247,138 | | | $ | 253,051 | |
| |
| Average net assets (in thousands) | | $ | 113,940 | | | $ | 122,514 | | | $ | 160,258 | | | $ | 233,997 | | | $ | 259,581 | | | $ | 194,014 | |
| |
| Ratios to average net assets:4 | | | | | | | | | | | | | | | | | | | | | | | | |
| Net investment income (loss) | | | 1.15% | 5 | | | 0.48% | 5 | | | (0.59)%5 | | | | (1.40)% | | | | (1.20)% | | | | (0.93)% | |
| Total expenses6 | | | 3.27% | 5 | | | 2.81% | 5 | | | 2.62% | 5 | | | 2.32% | | | | 2.18% | | | | 2.24% | |
| Expenses after payments, waivers and/or reimbursements and reduction to custodian expenses | | | 3.10% | 5 | | | 2.74% | 5 | | | 2.55% | 5 | | | 2.27% | | | | 2.13% | | | | 2.19% | |
| |
| Portfolio turnover rate | | | 26% | | | | 76% | | | | 212% | | | | 181% | | | | 58% | | | | 117% | |
1. October 29, 2010 represents the last business day of the Fund’s reporting period.
2. Per share amounts calculated based on the average shares outstanding during the period.
3. Assumes an initial investment on the business day before the first day of the fiscal period, with all dividends and distributions reinvested in additional shares on the reinvestment date, and redemption at the net asset value calculated on the last business day of the fiscal period. Sales charges are not reflected in the total returns. Total returns are not annualized for periods less than one full year. Returns do not reflect the deduction of taxes that a shareholder would pay on fund distributions or the redemption of fund shares.
4. Annualized for periods less than one full year.
5. Includes the Fund’s share of the allocated expenses and/or net investment income from the master funds.
6. Total expenses including indirect expenses from affiliated fund were as follows:
| | | | | | |
| | Six Months Ended April 30, 2014 | | | 3.28 | % |
| | Year Ended October 31, 2013 | | | 2.83 | % |
| | Year Ended October 31, 2012 | | | 2.67 | % |
| | Year Ended October 31, 2011 | | | 2.37 | % |
| | Year Ended October 29, 2010 | | | 2.23 | % |
| | Year Ended October 31, 2009 | | | 2.29 | % |
See accompanying Notes to Consolidated Financial Statements.
33 OPPENHEIMER FLEXIBLE STRATEGIES FUND
| | |
| CONSOLIDATED FINANCIAL HIGHLIGHTS Continued | | |
| | | | | | | | | | | | | | |
| Class I | | Six Months Ended April 30, 2014 (Unaudited) | | | Period Ended October 31, 20131 | | | | | | | |
| | | | | | | |
Per Share Operating Data | | | | | | | | | | | | | | |
| Net asset value, beginning of period | | $ | 25.09 | | | $ | 24.32 | | | | | | | |
| | | | | | | |
| Income (loss) from investment operations: | | | | | | | | | | | | | | |
| Net investment income2 | | | 0.31 | | | | 0.34 | | | | | | | |
| Net realized and unrealized gain | | | 1.42 | | | | 0.43 | | | | | | | |
| | | | | | | | | | |
| Total from investment operations | | | 1.73 | | | | 0.77 | | | | | | | |
| | | | | | | |
| Dividends and/or distributions to shareholders: | | | | | | | | | | | | | | |
| Distributions from net realized gain | | | 0.00 | | | | 0.00 | | | | | | | |
| Tax return of capital distribution | | | 0.00 | | | | 0.00 | | | | | | | |
| | | | | | | | | | |
| Total dividends and/or distributions to shareholders | | | 0.00 | | | | 0.00 | | | | | | | |
| | | | | | | |
Net asset value, end of period | | $ | 26.82 | | | $ | 25.09 | | | | | | | |
| | | | | | | | | | |
| | | |
| | | | | | | |
| Total Return, at Net Asset Value3 | | | 6.90 | % | | | 3.17 | % | | | | | | |
| | | |
| | | | | | | |
| Ratios/Supplemental Data | | | | | | | | | | | | | | |
| Net assets, end of period (in thousands) | | $ | 11 | | | $ | 10 | | | | | | | |
| | | | | | | |
| Average net assets (in thousands) | | $ | 11 | | | $ | 10 | | | | | | | |
| | | | | | | |
| Ratios to average net assets:4,5 | | | | | | | | | | | | | | |
| Net investment income | | | 2.37% | | | | 2.07% | | | | | | | |
| Total expenses6 | | | 2.03% | | | | 1.86% | | | | | | | |
| Expenses after payments, waivers and/or reimbursements and reduction to custodian expenses | | | 1.86% | | | | 1.79% | | | | | | | |
| | | | | | | |
| Portfolio turnover rate | | | 26% | | | | 76% | | | | | | | |
1. For the period from February 28, 2013 (inception of offering) to October 31, 2013.
2. Per share amounts calculated based on the average shares outstanding during the period.
3. Assumes an initial investment on the business day before the first day of the fiscal period, with all dividends and distributions reinvested in additional shares on the reinvestment date, and redemption at the net asset value calculated on the last business day of the fiscal period. Sales charges are not reflected in the total returns. Total returns are not annualized for periods less than one full year. Returns do not reflect the deduction of taxes that a shareholder would pay on fund distributions or the redemption of fund shares.
4. Annualized for periods less than one full year.
5. Includes the Fund’s share of the allocated expenses and/or net investment income from the master funds.
6. Total expenses including indirect expenses from affiliated fund were as follows:
| | | | | | |
| | Six Months Ended April 30, 2014 | | | 2.04 | % |
| | Period Ended October 31, 2013 | | | 1.88 | % |
See accompanying Notes to Consolidated Financial Statements.
34 OPPENHEIMER FLEXIBLE STRATEGIES FUND
| | | | | | | | | | | | | | | | | | | | | | | | |
| Class N | | Six Months
Ended April 30, 2014
(Unaudited) | | | Year Ended
October 31,
2013 | | | Year Ended
October 31,
2012 | | | Year Ended
October 31,
2011 | | | Year Ended
October 29,
20101 | | | Year Ended
October 31,
2009 | |
| |
Per Share Operating Data | | | | | | | | | | | | | | | | | | | | | | | | |
| Net asset value, beginning of period | | $ | 23.54 | | | $ | 22.53 | | | $ | 24.80 | | | $ | 25.34 | | | $ | 23.91 | | | $ | 22.72 | |
| |
| Income (loss) from investment operations: | | | | | | | | | | | | | | | | | | | | | | | | |
| Net investment income (loss)2 | | | 0.19 | | | | 0.21 | | | | (0.03 | ) | | | (0.24 | ) | | | (0.19 | ) | | | (0.12 | ) |
| Net realized and unrealized gain (loss) | | | 1.36 | | | | 0.80 | | | | (0.10 | ) | | | 0.21 | | | | 1.62 | | | | 2.16 | |
| | | | |
| Total from investment operations | | | 1.55 | | | | 1.01 | | | | (0.13 | ) | | | (0.03 | ) | | | 1.43 | | | | 2.04 | |
| |
| Dividends and/or distributions to shareholders: | | | | | | | | | | | | | | | | | | | | | | | | |
| Distributions from net realized gain | | | 0.00 | | | | 0.00 | | | | (2.13 | ) | | | (0.51 | ) | | | 0.00 | | | | (0.79 | ) |
| Tax return of capital distribution | | | 0.00 | | | | 0.00 | | | | (0.01 | ) | | | 0.00 | | | | 0.00 | | | | (0.06 | ) |
| | | | |
| Total dividends and/or distributions to shareholders | | | 0.00 | | | | 0.00 | | | | (2.14 | ) | | | (0.51 | ) | | | 0.00 | | | | (0.85 | ) |
| |
| Net asset value, end of period | | $ | 25.09 | | | $ | 23.54 | | | $ | 22.53 | | | $ | 24.80 | | | $ | 25.34 | | | $ | 23.91 | |
| | | | |
|
| |
Total Return, at Net Asset Value3 | | | 6.59% | | | | 4.48% | | | | (0.27)% | | | | (0.18)% | | | | 5.98% | | | | 9.58% | |
|
| |
Ratios/Supplemental Data | | | | | | | | | | | | | | | | | | | | | | | | |
| Net assets, end of period (in thousands) | | $ | 19,164 | | | $ | 20,410 | | | $ | 27,181 | | | $ | 39,916 | | | $ | 46,237 | | | $ | 36,363 | |
| |
| Average net assets (in thousands) | | $ | 20,226 | | | $ | 23,822 | | | $ | 33,095 | | | $ | 45,004 | | | $ | 43,184 | | | $ | 25,939 | |
| |
| Ratios to average net assets:4 | | | | | | | | | | | | | | | | | | | | | | | | |
| Net investment income (loss) | | | 1.58% | 5 | | | 0.92% | 5 | | | (0.14)% 5 | | | | (0.95)% | | | | (0.79)% | | | | (0.52)% | |
| Total expenses6 | | | 2.83% | 5 | | | 2.36% | 5 | | | 2.18% | 5 | | | 1.87% | | | | 1.77% | | | | 1.83% | |
| Expenses after payments, waivers and/or reimbursements and reduction to custodian expenses | | | 2.66% | 5 | | | 2.29% | 5 | | | 2.11% | 5 | | | 1.82% | | | | 1.71% | | | | 1.77% | |
| |
| Portfolio turnover rate | | | 26% | | | | 76% | | | | 212 % | | | | 181 % | | | | 58% | | | | 117 % | |
|
| 1. October 29, 2010 represents the last business day of the Fund’s reporting period. |
| 2. Per share amounts calculated based on the average shares outstanding during the period. |
| 3. Assumes an initial investment on the business day before the first day of the fiscal period, with all dividends and distributions reinvested in additional shares on the reinvestment date, and redemption at the net asset value calculated on the last business day of the fiscal period. Sales charges are not reflected in the total returns. Total returns are not annualized for periods less than one full year. Returns do not reflect the deduction of taxes that a shareholder would pay on fund distributions or the redemption of fund shares. |
| 4. Annualized for periods less than one full year. |
| 5. Includes the Fund’s share of the allocated expenses and/or net investment income from the master funds. |
| 6. Total expenses including indirect expenses from affiliated fund were as follows: |
| | | | | | |
| | Six Months Ended April 30, 2014 | | | 2.84 | % |
| | Year Ended October 31, 2013 | | | 2.38 | % |
| | Year Ended October 31, 2012 | | | 2.23 | % |
| | Year Ended October 31, 2011 | | | 1.92 | % |
| | Year Ended October 29, 2010 | | | 1.82 | % |
| | Year Ended October 31, 2009 | | | 1.88 | % |
See accompanying Notes to Consolidated Financial Statements.
35 OPPENHEIMER FLEXIBLE STRATEGIES FUND
| | |
| CONSOLIDATED FINANCIAL HIGHLIGHTS Continued | | |
| | |
| | | | | | | | | | | | | | | | | | | | | | | | |
| Class Y | | Six Months
Ended
April 30,
2014
(Unaudited) | | | Year Ended
October 31,
2013 | | | Year Ended
October 31,
2012 | | | Year Ended
October 31,
2011 | | | Year Ended
October 29,
20101 | | | Year Ended
October 31,
2009 | |
| |
Per Share Operating Data | | | | | | | | | | | | | | | | | | | | | | | | |
| Net asset value, beginning of period | | $ | 25.05 | | | $ | 23.84 | | | $ | 25.97 | | | $ | 26.35 | | | $ | 24.70 | | | $ | 23.30 | |
| |
| Income (loss) from investment operations: | | | | | | | | | | | | | | | | | | | | | | | | |
| Net investment income (loss)2 | | | 0.27 | | | | 0.38 | | | | 0.10 | | | | (0.09 | ) | | | (0.04 | ) | | | 0.02 | |
| Net realized and unrealized gain (loss) | | | 1.44 | | | | 0.83 | | | | (0.09 | ) | | | 0.22 | | | | 1.69 | | | | 2.23 | |
| | | | |
| Total from investment operations | | | 1.71 | | | | 1.21 | | | | 0.01 | | | | 0.13 | | | | 1.65 | | | | 2.25 | |
| |
| Dividends and/or distributions to shareholders: | | | | | | | | | | | | | | | | | | | | | | | | |
| Distributions from net realized gain | | | 0.00 | | | | 0.00 | | | | (2.13 | ) | | | (0.51 | ) | | | 0.00 | | | | (0.79 | ) |
| Tax return of capital distribution | | | 0.00 | | | | 0.00 | | | | (0.01 | ) | | | 0.00 | | | | 0.00 | | | | (0.06 | ) |
| | | | |
| Total dividends and/or distributions to shareholders | | | 0.00 | | | | 0.00 | | | | (2.14 | ) | | | (0.51 | ) | | | 0.00 | | | | (0.85 | ) |
| |
| Net asset value, end of period | | $ | 26.76 | | | $ | 25.05 | | | $ | 23.84 | | | $ | 25.97 | | | $ | 26.35 | | | $ | 24.70 | |
| | | | |
|
| |
Total Return, at Net Asset Value3 | | | 6.83% | | | | 5.08% | | | | 0.32% | | | | 0.45% | | | | 6.68% | | | | 10.27% | |
|
| |
Ratios/Supplemental Data | | | | | | | | | | | | | | | | | | | | | | | | |
| Net assets, end of period (in thousands) | | $ | 13,697 | | | $ | 11,237 | | | $ | 16,234 | | | $ | 53,803 | | | $ | 50,445 | | | $ | 37,726 | |
| |
| Average net assets (in thousands) | | $ | 12,308 | | | $ | 12,213 | | | $ | 28,561 | | | $ | 58,196 | | | $ | 50,667 | | | $ | 32,544 | |
| |
| Ratios to average net assets:4 | | | | | | | | | | | | | | | | | | | | | | | | |
| Net investment income (loss) | | | 2.07% | 5 | | | 1.52% | 5 | | | 0.41% | 5 | | | (0.34)% | | | | (0.14)% | | | | 0.10% | |
| Total expenses6 | | | 3.69% | 5 | | | 1.79% | 5 | | | 1.60% | 5 | | | 1.25% | | | | 1.11% | | | | 1.18% | |
| Expenses after payments, waivers and/or reimbursements and reduction to custodian expenses | | | 2.19% | 5 | | | 1.72% | 5 | | | 1.53% | 5 | | | 1.20% | | | | 1.06% | | | | 1.13% | |
| |
| Portfolio turnover rate | | | 26% | | | | 76% | | | | 212% | | | | 181% | | | | 58% | | | | 117% | |
|
| 1. October 29, 2010 represents the last business day of the Fund’s reporting period. |
| 2. Per share amounts calculated based on the average shares outstanding during the period. |
| 3. Assumes an initial investment on the business day before the first day of the fiscal period, with all dividends and distributions reinvested in additional shares on the reinvestment date, and redemption at the net asset value calculated on the last business day of the fiscal period. Sales charges are not reflected in the total returns. Total returns are not annualized for periods less than one full year. Returns do not reflect the deduction of taxes that a shareholder would pay on fund distributions or the redemption of fund shares. |
| 4. Annualized for periods less than one full year. |
| 5. Includes the Fund’s share of the allocated expenses and/or net investment income from the master funds. |
| 6. Total expenses including indirect expenses from affiliated fund were as follows: |
| | | | | | |
| | Six Months Ended April 30, 2014 | | | 3.70 | % |
| | Year Ended October 31, 2013 | | | 1.81 | % |
| | Year Ended October 31, 2012 | | | 1.65 | % |
| | Year Ended October 31, 2011 | | | 1.30 | % |
| | Year Ended October 29, 2010 | | | 1.16 | % |
| | Year Ended October 31, 2009 | | | 1.23 | % |
See accompanying Notes to Consolidated Financial Statements.
36 OPPENHEIMER FLEXIBLE STRATEGIES FUND
| | |
NOTES TO CONSOLIDATED FINANCIAL STATEMENTS April 30, 2014 Unaudited | | |
| | |
1. Significant Accounting Policies
Oppenheimer Flexible Strategies Fund (the “Fund”), a series of Oppenheimer Quest for Values Funds, is registered under the Investment Company Act of 1940, as amended, as a diversified open-end management investment company. The Fund’s investment objective is to seek total return. The Fund’s investment adviser is OFI Global Asset Management, Inc. (“OFI Global” or the “Manager”), a wholly-owned subsidiary of OppenheimerFunds, Inc. (“OFI” or the “Sub-Adviser”). The Manager has entered into a sub-advisory agreement with OFI.
The Fund offers Class A, Class C, Class I, Class N and Class Y shares, and previously offered Class B shares for new purchase through June 29, 2012. Subsequent to that date, no new purchases of Class B shares are permitted, however reinvestment of dividend and/or capital gain distributions and exchanges of Class B shares into and from other Oppenheimer funds will be allowed. Class A shares are sold at their offering price, which is normally net asset value plus a front-end sales charge. Class C and Class N shares are sold, and Class B shares were sold, without a front-end sales charge but may be subject to a contingent deferred sales charge (“CDSC”). Class N shares are sold only through retirement plans. Retirement plans that offer Class N shares may impose charges on those accounts. Class I and Class Y shares are sold to certain institutional investors or intermediaries without either a front-end sales charge or a CDSC, however, the intermediaries may impose charges on their accountholders who beneficially own Class I and Class Y shares. All classes of shares have identical rights and voting privileges with respect to the Fund in general and exclusive voting rights on matters that affect that class alone. Earnings, net assets and net asset value per share may differ due to each class having its own expenses, such as transfer and shareholder servicing agent fees and shareholder communications, directly attributable to that class. Class A, B, C and N shares have separate distribution and/or service plans under which they pay fees. Class I and Class Y shares do not pay such fees. Class B shares will automatically convert to Class A shares 72 months after the date of purchase.
The following is a summary of significant accounting policies consistently followed by the Fund.
Structured Securities. The Fund invests in structured securities whose market values, interest rates and/or redemption prices are linked to the performance of underlying foreign currencies, interest rate spreads, stock market indices, prices of individual securities, commodities or other financial instruments or the occurrence of other specific events. The structured securities are often leveraged, increasing the volatility of each note’s market value relative to the change in the underlying linked financial element or event. Fluctuations in value of these securities are recorded as unrealized gains and losses in the accompanying Consolidated Statement of Operations. The Fund records a realized gain or loss when a structured security is sold or matures.
Securities Sold Short. The Fund sells securities that it does not own, and it will therefore be obligated to purchase such securities at a future date. Upon entering into a short position, the Fund is required to segregate cash or securities at its custodian which are pledged for the benefit of the lending broker and/or to deposit and pledge cash directly at the lending broker,
37 OPPENHEIMER FLEXIBLE STRATEGIES FUND
| | |
NOTES TO CONSOLIDATED FINANCIAL STATEMENTS Unaudited / Continued | | |
| | |
| 1. Significant Accounting Policies (Continued) | | |
with a value equal to a certain percentage, exceeding 100%, of the value of the securities that it sold short. Cash that has been segregated and pledged for this purpose will be disclosed on the Consolidated Statement of Assets and Liabilities; securities that have been segregated and pledged for this purpose are disclosed as such in the Consolidated Statement of Investments. The aggregate market value of such cash and securities at period end is $219,758,358. The value of the open short position is recorded as a liability, and the Fund records an unrealized gain or loss to the extent of the difference between the proceeds received and the change in value of the open short position. The Fund records a realized gain or loss when the short position is closed out. By entering into short sales, the Fund bears the market risk of increases in value of the security sold short in excess of the proceeds received. Until the security is replaced, the Fund is required to pay the lender any dividend or interest earned. Dividend expense on short sales is treated as an expense in the Consolidated Statement of Operations.
Basis for Consolidation. The Fund has established a Cayman Islands exempted company, Oppenheimer Flexible Strategies Fund (Cayman) Ltd., which is wholly-owned and controlled by the Fund (the “Subsidiary”). The Fund and Subsidiary are both managed by the Manager. The Fund may invest up to 25% of its total assets in the Subsidiary. The Subsidiary invests primarily in commodity-linked derivatives (including commodity futures, financial futures, options and swap contracts) and certain fixed-income securities and other investments that may serve as margin or collateral for its derivatives positions. Investments in the Subsidiary are expected to provide the Fund with exposure to commodities markets within the limitations of the federal tax requirements that apply to the Fund. The Subsidiary is subject to the same investment restrictions and guidelines, and follows the same compliance policies and procedures, as the Fund.
The financial statements have been consolidated and include accounts of the Fund and the Subsidiary. Accordingly, all inter-company transactions and balances have been eliminated. At April 30, 2014, the Fund owned 7,500 shares with a market value of $22,978,106.
Investment in Oppenheimer Institutional Money Market Fund. The Fund is permitted to invest daily available cash balances in an affiliated money market fund. The Fund may invest the available cash in Class E shares of Oppenheimer Institutional Money Market Fund (“IMMF”) to seek current income while preserving liquidity. IMMF is a registered open-end management investment company, regulated as a money market fund under the Investment Company Act of 1940, as amended. The Manager is the investment adviser of IMMF, and the Sub-Adviser provides investment and related advisory services to IMMF. When applicable, the Fund’s investment in IMMF is included in the Consolidated Statement of Investments. Shares of IMMF are valued at their net asset value per share. As a shareholder, the Fund is subject to its proportional share of IMMF’s Class E expenses, including its management fee. The Manager will waive fees and/or reimburse Fund expenses in an amount equal to the indirect management fees incurred through the Fund’s investment in IMMF.
38 OPPENHEIMER FLEXIBLE STRATEGIES FUND
| | | | |
| | |
1. Significant Accounting Policies (Continued) | | |
Investment in Oppenheimer Master Fund. The Fund is permitted to invest in entities sponsored and/or advised by the Manager or an affiliate. Certain of these entities in which the Fund invests are mutual funds registered under the Investment Company Act of 1940 that expect to be treated as partnerships for tax purposes, specifically Oppenheimer Master Loan Fund, LLC (the “Master Fund”). The Master Fund has its own investment risks, and those risks can affect the value of the Fund’s investments and therefore the value of the Fund’s shares. To the extent that the Fund invests more of its assets in the Master Fund, the Fund will have greater exposure to the risks of the Master Fund.
The investment objective of the Master Fund is to seek income. The Fund’s investment in the Master Fund is included in the Consolidated Statement of Investments. The Fund recognizes income and gain/(loss) on its investment in the master fund according to its allocated pro-rata share, based on its relative proportion of total outstanding Master Fund shares held, of the total net income earned and the net gain/(loss) realized on investments sold by the Master Fund. As a shareholder, the Fund is subject to its proportional share of the Master Fund’s expenses, including its management fee. The Manager will waive fees and/or reimburse Fund expenses in an amount equal to the indirect management fees incurred through the Fund’s investment in the Master Fund.
Foreign Currency Translation. The Fund’s accounting records are maintained in U.S. dollars. The values of securities denominated in foreign currencies and amounts related to the purchase and sale of foreign securities and foreign investment income are translated into U.S. dollars as of the close of the New York Stock Exchange (the “Exchange”), normally 4:00 P.M. Eastern time, on each day the Exchange is open for trading. Foreign exchange rates may be valued primarily using a reliable bank, dealer or service authorized by the Board of Trustees.
Reported net realized gains and losses from foreign currency transactions arise from sales of portfolio securities, sales and maturities of short-term securities, sales of foreign currencies, exchange rate fluctuations between the trade and settlement dates on securities transactions, and the difference between the amounts of dividends, interest, and foreign withholding taxes recorded on the Fund’s books and the U.S. dollar equivalent of the amounts actually received or paid. Net unrealized appreciation and depreciation on the translation of assets and liabilities denominated in foreign currencies arise from changes in the values of assets and liabilities, including investments in securities at fiscal period end, resulting from changes in exchange rates.
The effect of changes in foreign currency exchange rates on investments is separately identified from the fluctuations arising from changes in market values of securities held and reported with all other foreign currency gains and losses in the Fund’s Consolidated Statement of Operations.
Allocation of Income, Expenses, Gains and Losses. Income, expenses (other than those attributable to a specific class), gains and losses are allocated on a daily basis to each class of shares based upon the relative proportion of net assets represented by such class. Operating expenses directly attributable to a specific class are charged against the operations of that class.
39 OPPENHEIMER FLEXIBLE STRATEGIES FUND
| | |
NOTES TO CONSOLIDATED FINANCIAL STATEMENTS Unaudited / Continued | | |
| | |
| 1. Significant Accounting Policies (Continued) | | |
Federal Taxes. The Fund intends to comply with provisions of the Internal Revenue Code applicable to regulated investment companies and to distribute substantially all of its investment company taxable income to shareholders. Therefore, no federal income or excise tax provision is required. The Fund files income tax returns in U.S. federal and applicable state jurisdictions. The statute of limitations on the Fund’s tax return filings generally remain open for the three preceding fiscal reporting period ends.
During the fiscal year ended October 31, 2013, the Fund utilized $36,560,232 of capital loss carryforward to offset capital gains realized in that fiscal year. Details of the fiscal year ended October 31, 2013 capital loss carryforwards are included in the table below. Capital loss carryforwards with no expiration, if any, must be utilized prior to those with expiration dates. Capital losses with no expiration will be carried forward to future years if not offset by gains.
| | | | |
| Expiring | | | |
No expiration | | $ | 88,770,852 | |
As of April 30, 2014, it is estimated that the capital loss carryforwards would be $56,851,840 which will not expire. The estimated capital loss carryforward represents the carryforward as of the end of the last fiscal year, increased or decreased by capital losses or gains realized in the first six months of the current fiscal year. During the six months ended April 30, 2014, it is estimated that the Fund will utilize $31,919,012 capital loss carryforward to offset realized capital gains.
Net investment income (loss) and net realized gain (loss) may differ for financial statement and tax purposes. The character of dividends and distributions made during the fiscal year from net investment income or net realized gains may differ from their ultimate characterization for federal income tax purposes. Also, due to timing of dividends and distributions, the fiscal year in which amounts are distributed may differ from the fiscal year in which the income or net realized gain was recorded by the Fund.
The aggregate cost of securities and other investments and the composition of unrealized appreciation and depreciation of securities and other investments for federal income tax purposes as of April 30, 2014 are noted in the following table. The primary difference between book and tax appreciation or depreciation of securities and other investments, if applicable, is attributable to the tax deferral of losses or tax realization of financial statement unrealized gain or loss.
| | | | |
Federal tax cost of securities | | $ | 728,377,175 | |
Federal tax cost of other investments | | | (183,769,551 | ) |
| | | | |
Total federal tax cost | | $ | 544,607,624 | |
| | | | |
Gross unrealized appreciation | | $ | 128,591,769 | |
Gross unrealized depreciation | | | (59,386,066 | ) |
| | | | |
Net unrealized appreciation | | $ | 69,205,703 | |
| | | | |
40 OPPENHEIMER FLEXIBLE STRATEGIES FUND
| | |
| | |
1. Significant Accounting Policies (Continued) | | |
Trustees’ Compensation. The Fund has adopted an unfunded retirement plan (the “Plan”) for the Fund’s independent trustees. Benefits are based on years of service and fees paid to each trustee during their period of service. The Plan was frozen with respect to adding new participants effective December 31, 2006 (the “Freeze Date”) and existing Plan Participants as of the Freeze Date will continue to receive accrued benefits under the Plan. Active independent trustees as of the Freeze Date have each elected a distribution method with respect to their benefits under the Plan. During the six months ended April 30, 2014, the Fund’s projected benefit obligations, payments to retired trustees and accumulated liability were as follows:
| | | | |
Projected Benefit Obligations Increased | | $ | 3,451 | |
Payments Made to Retired Trustees | | | 28,007 | |
Accumulated Liability as of April 30, 2014 | | | 166,986 | |
The Board of Trustees has adopted a compensation deferral plan for independent trustees that enables trustees to elect to defer receipt of all or a portion of the annual compensation they are entitled to receive from the Fund. For purposes of determining the amount owed to the Trustee under the plan, deferred amounts are treated as though equal dollar amounts had been invested in shares of the Fund or in other Oppenheimer funds selected by the Trustee. The Fund purchases shares of the funds selected for deferral by the Trustee in amounts equal to his or her deemed investment, resulting in a Fund asset equal to the deferred compensation liability. Such assets are included as a component of “Other” within the asset section of the Consolidated Statement of Assets and Liabilities. Deferral of trustees’ fees under the plan will not affect the net assets of the Fund, and will not materially affect the Fund’s assets, liabilities or net investment income per share. Amounts will be deferred until distributed in accordance with the compensation deferral plan.
Dividends and Distributions to Shareholders. Dividends and distributions to shareholders, which are determined in accordance with income tax regulations and may differ from U.S. generally accepted accounting principles, are recorded on the ex-dividend date. Income and capital gain distributions, if any, are declared and paid annually or at other times as deemed necessary by the Manager.
The tax character of distributions is determined as of the Fund’s fiscal year end. Therefore, a portion of the Fund’s distributions made to shareholders prior to the Fund’s fiscal year end may ultimately be categorized as a tax return of capital.
Investment Income. Dividend income is recorded on the ex-dividend date or upon ex-dividend notification in the case of certain foreign dividends where the ex-dividend date may have passed. Non-cash dividends included in dividend income, if any, are recorded at the fair market value of the securities received. Interest income is recognized on an accrual basis. Discount and premium, which are included in interest income on the Consolidated Statement of Operations, are amortized or accreted daily.
41 OPPENHEIMER FLEXIBLE STRATEGIES FUND
| | |
NOTES TO CONSOLIDATED FINANCIAL STATEMENTS Unaudited / Continued | | |
| | |
| 1. Significant Accounting Policies (Continued) | | |
Custodian Fees. “Custodian fees and expenses” in the Consolidated Statement of Operations may include interest expense incurred by the Fund on any cash overdrafts of its custodian account during the period. Such cash overdrafts may result from the effects of failed trades in portfolio securities and from cash outflows resulting from unanticipated shareholder redemption activity. The Fund pays interest to its custodian on such cash overdrafts, to the extent they are not offset by positive cash balances maintained by the Fund, at a rate equal to the Federal Funds Rate plus 0.50%. The “Reduction to custodian expenses” line item, if applicable, represents earnings on cash balances maintained by the Fund during the period. Such interest expense and other custodian fees may be paid with these earnings.
Security Transactions. Security transactions are recorded on the trade date. Realized gains and losses on securities sold are determined on the basis of identified cost.
Indemnifications. The Fund’s organizational documents provide current and former trustees and officers with a limited indemnification against liabilities arising in connection with the performance of their duties to the Fund. In the normal course of business, the Fund may also enter into contracts that provide general indemnifications. The Fund’s maximum exposure under these arrangements is unknown as this would be dependent on future claims that may be made against the Fund. The risk of material loss from such claims is considered remote.
Other. The preparation of financial statements in conformity with accounting principles generally accepted in the United States of America requires management to make estimates and assumptions that affect the reported amounts of assets and liabilities and disclosure of contingent assets and liabilities at the date of the financial statements and the reported amounts of increases and decreases in net assets from operations during the reporting period. Actual results could differ from those estimates.
2. Securities Valuation
The Fund calculates the net asset value of its shares as of the close of the New York Stock Exchange (the “Exchange”), normally 4:00 P.M. Eastern time, on each day the Exchange is open for trading.
The Fund’s Board has adopted procedures for the valuation of the Fund’s securities and has delegated the day-to-day responsibility for valuation determinations under those procedures to the Manager. The Manager has established a Valuation Committee which is responsible for determining a “fair valuation” for any security for which market quotations are not “readily available.” The Valuation Committee’s fair valuation determinations are subject to review, approval and ratification by the Fund’s Board at its next regularly scheduled meeting covering the calendar quarter in which the fair valuation was determined.
Valuation Methods and Inputs
Securities are valued using unadjusted quoted market prices, when available, as supplied primarily by third party pricing services or dealers.
42 OPPENHEIMER FLEXIBLE STRATEGIES FUND
| | |
| | |
| 2. Securities Valuation (Continued) | | |
The following methodologies are used to determine the market value or the fair value of the types of securities described below:
Securities traded on a registered U.S. securities exchange (including exchange-traded derivatives other than futures and futures options) are valued based on the last sale price of the security reported on the principal exchange on which it is traded, prior to the time when the Fund’s assets are valued. In the absence of a sale, the security is valued at the last sale price on the prior trading day, if it is within the spread of the current day’s closing “bid” and “asked” prices, and if not, at the current day’s closing bid price. A security of a foreign issuer traded on a foreign exchange, but not listed on a registered U.S. securities exchange, is valued based on the last sale price on the principal exchange on which the security is traded, as identified by the third party pricing service used by the Manager, prior to the time when the Fund’s assets are valued. If the last sale price is unavailable, the security is valued at the most recent official closing price on the principal exchange on which it is traded. If the last sales price or official closing price for a foreign security is not available, the security is valued at the mean between the bid and asked price per the exchange or, if not available from the exchange, obtained from two dealers. If bid and asked prices are not available from either the exchange or two dealers, the security is valued by using one of the following methodologies (listed in order of priority): (1) using a bid from the exchange, (2) the mean between the bid and asked price as provided by a single dealer, or (3) a bid from a single dealer.
Shares of a registered investment company that are not traded on an exchange are valued at that investment company’s net asset value per share.
Corporate and government debt securities (of U.S. or foreign issuers) and municipal debt securities, event-linked bonds, loans, mortgage-backed securities, collateralized mortgage obligations, and asset-backed securities are valued at the mean between the “bid” and “asked” prices utilizing evaluated prices obtained from third party pricing services or broker-dealers who may use matrix pricing methods to determine the evaluated prices.
Short-term money market type debt securities with a remaining maturity of sixty days or less are valued at cost adjusted by the amortization of discount or premium to maturity (amortized cost), which approximates market value. Short-term debt securities with a remaining maturity in excess of sixty days are valued at the mean between the “bid” and “asked” prices utilizing evaluated prices obtained from third party pricing services or broker-dealers.
Structured securities, swaps, swaptions, and other over-the-counter derivatives are valued utilizing evaluated prices obtained from third party pricing services or broker-dealers.
Forward foreign currency exchange contracts are valued utilizing current and forward currency rates obtained from third party pricing services. When the settlement date of a contract is an interim date for which a quotation is not available, interpolated values are derived using the nearest dated forward currency rate.
Futures contracts and futures options traded on a commodities or futures exchange will be valued at the final settlement price or official closing price on the principal exchange as reported by such principal exchange at its trading session ending at, or most recently prior to, the time when the Fund’s assets are valued.
43 OPPENHEIMER FLEXIBLE STRATEGIES FUND
| | |
NOTES TO CONSOLIDATED FINANCIAL STATEMENTS Unaudited / Continued | | |
| | |
| 2. Securities Valuation (Continued) | | |
A description of the standard inputs that may generally be considered by the third party pricing vendors in determining their evaluated prices is provided below.
| | |
| Security Type | | Standard inputs generally considered by third-party pricing vendors |
| Corporate debt, government debt, municipal, mortgage-backed and asset-backed securities | | Reported trade data, broker-dealer price quotations, benchmark yields, issuer spreads on comparable securities, the credit quality, yield, maturity, and other appropriate factors. |
| Loans | | Information obtained from market participants regarding reported trade data and broker-dealer price quotations. |
| Event-linked bonds | | Information obtained from market participants regarding reported trade data and broker-dealer price quotations. |
| Structured securities | | Relevant market information such as the price of underlying financial instruments, stock market indices, foreign currencies, interest rate spreads, commodities, or the occurrence of other specific events. |
| Swaps | | Relevant market information, including underlying reference assets such as credit spreads, credit event probabilities, index values, individual security values, forward interest rates, variable interest rates, volatility measures, and forward currency rates. |
If a market value or price cannot be determined for a security using the methodologies described above, or if, in the “good faith” opinion of the Manager, the market value or price obtained does not constitute a “readily available market quotation,” or a significant event has occurred that would materially affect the value of the security the security is fair valued either (i) by a standardized fair valuation methodology applicable to the security type or the significant event as previously approved by the Valuation Committee and the Fund’s Board or (ii) as determined in good faith by the Manager’s Valuation Committee. The Valuation Committee considers all relevant facts that are reasonably available, through either public information or information available to the Manager, when determining the fair value of a security. Fair value determinations by the Manager are subject to review, approval and ratification by the Fund’s Board at its next regularly scheduled meeting covering the calendar quarter in which the fair valuation was determined. Those fair valuation standardized methodologies include, but are not limited to, valuing securities at the last sale price or initially at cost and subsequently adjusting the value based on: changes in company specific fundamentals, changes in an appropriate securities index, or changes in the value of similar securities which may be further adjusted for any discounts related to security-specific resale restrictions. When possible, such methodologies use observable market inputs such as unadjusted quoted prices of similar securities, observable interest rates, currency rates and yield curves. The methodologies used for valuing securities are not necessarily an indication of the risks associated with investing in those securities nor can it be assured that the Fund can obtain the fair value assigned to a security if it were to sell the security.
To assess the continuing appropriateness of security valuations, the Manager, or its third party service provider who is subject to oversight by the Manager, regularly compares prior day prices, prices on comparable securities, and sale prices to the current day prices and challenges those prices exceeding certain tolerance levels with the third party pricing service or broker source. For those securities valued by fair valuations, whether through a
44 OPPENHEIMER FLEXIBLE STRATEGIES FUND
2. Securities Valuation (Continued)
standardized fair valuation methodology or a fair valuation determination, the Valuation Committee reviews and affirms the reasonableness of the valuations based on such methodologies and fair valuation determinations on a regular basis after considering all relevant information that is reasonably available.
Classifications
Each investment asset or liability of the Fund is assigned a level at measurement date based on the significance and source of the inputs to its valuation. Various data inputs are used in determining the value of each of the Fund’s investments as of the reporting period end. These data inputs are categorized in the following hierarchy under applicable financial accounting standards:
1) Level 1-unadjusted quoted prices in active markets for identical assets or liabilities (including securities actively traded on a securities exchange)
2) Level 2-inputs other than unadjusted quoted prices that are observable for the asset or liability (such as unadjusted quoted prices for similar assets and market corroborated inputs such as interest rates, prepayment speeds, credit risks, etc.)
3) Level 3-significant unobservable inputs (including the Manager’s own judgments about assumptions that market participants would use in pricing the asset or liability).
The inputs used for valuing securities are not necessarily an indication of the risks associated with investing in those securities.
The table below categorizes amounts that are included in the Fund’s Consolidated Statement of Assets and Liabilities as of April 30, 2014 based on valuation input level:
| | | | | | | | | | | | | | | | |
| | | Level 1—
Unadjusted
Quoted Prices | | | Level 2— Other Significant
Observable Inputs | | | Level 3—
Significant
Unobservable
Inputs | | | Value | |
| |
Assets Table | | | | | | | | | | | | | | | | |
Investments, at Value: | | | | | | | | | | | | | | | | |
Common Stocks | | | | | | | | | | | | | | | | |
Consumer Discretionary | | $ | 44,725,193 | | | $ | — | | | $ | — | | | $ | 44,725,193 | |
Consumer Staples | | | 19,059,510 | | | | — | | | | — | | | | 19,059,510 | |
Energy | | | 72,223,734 | | | | — | | | | — | | | | 72,223,734 | |
Financials | | | 59,214,569 | | | | 8,430,000 | | | | — | | | | 67,644,569 | |
Health Care | | | 59,245,387 | | | | 9,554,622 | | | | — | | | | 68,800,009 | |
Industrials | | | 52,524,499 | | | | — | | | | — | | | | 52,524,499 | |
Information Technology | | | 52,172,288 | | | | 6,244,923 | | | | — | | | | 58,417,211 | |
Materials | | | 24,969,835 | | | | — | | | | — | | | | 24,969,835 | |
Telecommunication Services | | | 8,997,080 | | | | — | | | | — | | | | 8,997,080 | |
Utilities | | | 13,986,077 | | | | — | | | | — | | | | 13,986,077 | |
Preferred Stocks | | | 12,509,047 | | | | 18,300,000 | | | | — | | | | 30,809,047 | |
Asset-Backed Securities | | | — | | | | 58,980,847 | | | | 23,150,300 | | | | 82,131,147 | |
Mortgage-Backed Obligations | | | — | | | | 41,314,735 | | | | — | | | | 41,314,735 | |
Non-Convertible Corporate Bonds and Notes | | | — | | | | 25,521,725 | | | | — | | | | 25,521,725 | |
Convertible Corporate Bond and Note | | | — | | | | 3,487,500 | | | | — | | | | 3,487,500 | |
Corporate Loans | | | — | | | | 11,976,238 | | | | — | | | | 11,976,238 | |
Structured Security | | | — | | | | — | | | | 2,576,591 | | | | 2,576,591 | |
45 OPPENHEIMER FLEXIBLE STRATEGIES FUND
NOTESTOCONSOLIDATED
FINANCIAL STATEMENTS Unaudited / Continued
2. Securities Valuation (Continued)
| | | | | | | | | | | | | | | | |
| | | Level 1—
Unadjusted
Quoted Prices | | | Level 2— Other Significant
Observable Inputs | | | Level 3—
Significant
Unobservable
Inputs | | | Value | |
| |
Investments, at Value: (Continued) | | | | | | | | | | | | | | | | |
Exchange-Traded Options Purchased | | $ | 626,250 | | | $ | — | | | $ | — | | | $ | 626,250 | |
Over-the-Counter Option Purchased | | | — | | | | — | | | | — | | | | — | |
Over-the-Counter Interest Rate | | | | | | | | | | | | | | | | |
Swaptions Purchased | | | — | | | | 5,510,081 | | | | — | | | | 5,510,081 | |
Investment Companies | | | 73,703,597 | | | | 118,822,044 | | | | — | | | | 192,525,641 | |
| | | | |
Total Investments, at Value | | | 493,957,066 | | | | 308,142,715 | | | | 25,726,891 | | | | 827,826,672 | |
Other Financial Instruments: | | | | | | | | | | | | | | | | |
Swaps, at value | | | — | | | | 573,539 | | | | — | | | | 573,539 | |
Foreign currency exchange contracts | | | — | | | | 232,254 | | | | — | | | | 232,254 | |
| | | | |
Total Assets | | $ | 493,957,066 | | | $ | 308,948,508 | | | $ | 25,726,891 | | | $ | 828,632,465 | |
| | | | |
| | | | |
Liabilities Table | | | | | | | | | | | | | | | | |
Other Financial Instruments: | | | | | | | | | | | | | | | | |
Common Stock Securities Sold Short | | $ | (191,020,685 | ) | | $ | (1,137,207 | ) | | $ | — | | | $ | (192,157,892 | ) |
Swaps, at value | | | — | | | | (1,718,500 | ) | | | — | | | | (1,718,500 | ) |
Variation margin payable | | | (62,341 | ) | | | — | | | | — | | | | (62,341 | ) |
Foreign currency exchange contracts | | | — | | | | (1,457,713 | ) | | | — | | | | (1,457,713 | ) |
| | | | |
Total Liabilities | | $ | (191,083,026 | ) | | $ | (4,313,420 | ) | | $ | — | | | $ | (195,396,446 | ) |
| | | | |
Currency contracts and forwards, if any, are reported at their unrealized appreciation/ depreciation at measurement date, which represents the change in the contract’s value from trade date. Futures, if any, are reported at their variation margin at measurement date, which represents the amount due to/from the Fund at that date. All additional assets and liabilities included in the above table are reported at their market value at measurement date.
The following is a reconciliation of assets in which significant unobservable inputs (level 3) were used in determining fair value:
| | | | | | | | | | | | | | | | | | | | |
| | | Value as of
October 31,
2013 | | | Realized
Gain
(Loss) | | | Change in
unrealized
appreciation/
depreciation | | | Accretion/
(amortization)
of premium/
discounta | | | Value as of
April 30, 2014 | |
| |
Assets Table | | | | | | | | | | | | | | | | | | | | |
Investments, at Value: | | | | | | | | | | | | | | | | | | | | |
Asset-Backed Securities | | $ | 23,012,297 | | | $ | 113,835 | | | $ | (249,906 | ) | | $ | 274,074 | | | $ | 23,150,300 | |
Structured Security | | | 2,576,591 | | | | — | | | | — | | | | — | | | | 2,576,591 | |
| | | | |
Total Assets | | $ | 25,588,888 | | | $ | 113,835 | | | $ | (249,906 | ) | | $ | 274,074 | | | $ | 25,726,891 | |
| | | | |
a. Included in net investment income.
The total change in unrealized appreciation/depreciation included in the Consolidated Statement of Operations attributable to Level 3 investments still held at April 30, 2014:
| | | | |
| | | Change in unrealized appreciation/depreciation | |
| |
Assets Table | | | | |
Investments, at Value: | | | | |
Asset-Backed Securities | | | $ (249,906) | |
46 OPPENHEIMER FLEXIBLE STRATEGIES FUND
| | | | |
|
| 2. Securities Valuation (Continued) | | |
The following table summarizes the valuation techniques and significant unobservable inputs used in determining fair value measurements for those investments classified as Level 3 as of April 30, 2014:
| | | | | | | | | | | | | | |
| | | Value as of April 30, 2014 | | | Valuation Technique | | Unobservable input | | Range of
Unobservable
Inputs | | Unobservable
Input Used | |
| |
Assets Table | | | | | | | | | | | | | | |
Investments, at Value: | | | | | | | | | | | | | | |
Asset-Backed Securities | | $ | 23,150,300 | | | Broker quotes | | N/A | | N/A | | | N/A (a) | |
Structured Security | | | 2,576,591 | | | Discount to offer price | | Discount rate Offer price | | N/A
N/A | |
$ | 40% (b)
0.45/share |
|
| | | | | | | | | | | | | | |
Total | | $ | 25,726,891 | | | | | | | | | | | |
| | | | | | | | | | | | | | |
(a) The Fund fair values certain asset-backed securities using broker-dealer price quotations provided on a daily basis. The Manager periodically reviews broker methodologies and inputs to confirm they are determined using unobservable inputs and have been appropriately classified. Such securities’ fair valuations could change significantly based on changes in unobservable inputs used by the broker.
(b) The Fund fair values certain structured securities at a discount to the last offer price to reflect the age of the offer, uncertainty of the sales price as compared to the offer price, and illiquidity. A significant decrease (increase) to the discount rate, or a significant increase (decrease) to the offer price, will result in a significant increase (decrease) to the fair value of the investment.
3. Shares of Beneficial Interest
The Fund has authorized an unlimited number of $0.01 par value shares of beneficial interest of each class. Transactions in shares of beneficial interest were as follows:
| | | | | | | | | | | | | | | | |
| | | Six Months Ended April 30, 2014 | | | Year Ended October 31, 20131 | |
| | | Shares | | | Amount | | | Shares | | | Amount | |
| |
Class A | | | | | | | | | | | | | | | | |
Sold | | | 926,450 | | | $ | 23,701,835 | | | | 1,628,620 | | | $ | 39,070,980 | |
Dividends and/or distributions reinvested | | | — | | | | — | | | | — | | | | — | |
Redeemed | | | (3,007,870 | ) | | | (76,916,988 | ) | | | (7,478,759 | ) | | | (179,379,041 | ) |
| | | | |
Net decrease | | | (2,081,420 | ) | | $ | (53,215,153 | ) | | | (5,850,139 | ) | | $ | (140,308,061 | ) |
| | | | |
| | | | |
| | | | | | | | | | | | | | | | | |
Class B | | | | | | | | | | | | | | | | |
Sold | | | 6,157 | | | $ | 141,052 | | | | 30,166 | | | $ | 657,593 | |
Dividends and/or distributions reinvested | | | — | | | | — | | | | — | | | | — | |
Redeemed | | | (257,542 | ) | | | (5,922,586 | ) | | | (676,245 | ) | | | (14,688,878 | ) |
| | | | |
Net decrease | | | (251,385 | ) | | $ | (5,781,534 | ) | | | (646,079 | ) | | $ | (14,031,285 | ) |
| | | | |
| | | | |
| | | | | | | | | | | | | | | | | |
Class C | | | | | | | | | | | | | | | | |
Sold | | | 243,127 | | | $ | 5,630,438 | | | | 458,878 | | | $ | 10,004,823 | |
Dividends and/or distributions reinvested | | | — | | | | — | | | | — | | | | — | |
Redeemed | | | (554,823 | ) | | | (12,793,467 | ) | | | (1,735,128 | ) | | | (37,698,886 | ) |
| | | | |
Net decrease | | | (311,696 | ) | | $ | (7,163,029 | ) | | | (1,276,250 | ) | | $ | (27,694,063 | ) |
| | | | |
47 OPPENHEIMER FLEXIBLE STRATEGIES FUND
|
NOTESTOCONSOLIDATED FINANCIAL STATEMENTS Unaudited / Continued |
|
| 3. Shares of Beneficial Interest (Continued) |
| | | | | | | | | | | | | | | | |
| | | Six Months Ended April 30, 2014 | | | Year Ended October 31, 20131 | |
| | | Shares | | | Amount | | | Shares | | | Amount | |
| |
Class I | | | | | | | | | | | | | | | | |
Sold | | | — | | | $ | — | | | | 411 | | | $ | 10,000 | |
Dividends and/or distributions reinvested | | | — | | | | — | | | | — | | | | — | |
Redeemed | | | — | | | | — | | | | — | | | | — | |
| | | | |
Net increase | | | — | | | $ | — | | | | 411 | | | $ | 10,000 | |
| | | | |
| | | | |
| | | | | | | | | | | | | | | | | |
Class N | | | | | | | | | | | | | | | | |
Sold | | | 54,600 | | | $ | 1,348,752 | | | | 127,722 | | | $ | 2,948,706 | |
Dividends and/or distributions reinvested | | | — | | | | — | | | | — | | | | — | |
Redeemed | | | (157,729 | ) | | | (3,894,205 | ) | | | (467,256 | ) | | | (10,790,956 | ) |
| | | | |
Net decrease | | | (103,129 | ) | | $ | (2,545,453 | ) | | | (339,534 | ) | | $ | (7,842,250 | ) |
| | | | |
| | | | |
| | | | | | | | | | | | | | | | | |
Class Y | | | | | | | | | | | | | | | | |
Sold | | | 156,578 | | | $ | 4,132,282 | | | | 196,189 | | | $ | 4,864,663 | |
Dividends and/or distributions reinvested | | | — | | | | — | | | | — | | | | — | |
Redeemed | | | (93,201 | ) | | | (2,443,670 | ) | | | (428,730 | ) | | | (10,461,422 | ) |
| | | | |
Net increase (decrease) | | | 63,377 | | | $ | 1,688,612 | | | | (232,541 | ) | | $ | (5,596,759 | ) |
| | | | |
1. For the year ended October 21, 2013 for Class A, Class B, Class C, Class N and Class Y shares, and for the period from February 28, 2013 (inception of offering) to October 31, 2013 for Class I shares.
4. Purchases and Sales of Securities
The aggregate cost of purchases and proceeds from sales of securities, other than short-term obligations and investments in IMMF, for the six months ended April 30, 2014 were as follows:
| | | | | | | | |
| | | Purchases | | | Sales | |
| |
Investment securities | | $ | 174,284,653 | | | $ | 280,195,368 | |
5. Fees and Other Transactions with Affiliates
Management Fees. Under the investment advisory agreement, the Fund pays the Manager a management fee based on the daily net assets of the Fund at an annual rate as shown in the following table:
| | | | |
| Fee Schedule | | | |
Up to $1.0 billion | | | 0.85 | % |
Next $500 million | | | 0.80 | |
Next $500 million | | | 0.75 | |
Next $500 million | | | 0.70 | |
Next $500 million | | | 0.65 | |
Next $500 million | | | 0.60 | |
Next $500 million | | | 0.55 | |
Over $4.0 billion | | | 0.50 | |
48 OPPENHEIMER FLEXIBLE STRATEGIES FUND
| | | | |
| | |
5. Fees and Other Transactions with Affiliates (Continued) | | |
Sub-Adviser Fees. The Manager has retained the Sub-Adviser to provide the day-to-day portfolio management of the Fund. Under the Sub-Advisory Agreement, the Manager pays the Sub-Adviser an annual fee in monthly installments, equal to a percentage of the investment management fee collected by the Manager from the Fund, which shall be calculated after any investment management fee waivers. The fee paid to the Sub-Adviser is paid by the Manager, not by the Fund.
Transfer Agent Fees. OFI Global (the “Transfer Agent”) serves as the transfer and shareholder servicing agent for the Fund. The Fund pays the Transfer Agent a fee based on annual net assets. Fees incurred by the Fund with respect to these services are detailed in the Statement of Operations.
Sub-Transfer Agent Fees. The Transfer Agent has retained Shareholder Services, Inc., a wholly-owned subsidiary of OFI (the “Sub-Transfer Agent”), to provide the day-to-day transfer agent and shareholder servicing of the Fund. Under the Sub-Transfer Agency Agreement, the Transfer Agent pays the Sub-Transfer Agent an annual fee in monthly installments, equal to a percentage of the transfer agent fee collected by the Transfer Agent from the Fund, which shall be calculated after any applicable fee waivers. The fee paid to the Sub-Transfer Agent is paid by the Transfer Agent, not by the Fund.
Distribution and Service Plan (12b-1) Fees. Under its General Distributor’s Agreement with the Fund, OppenheimerFunds Distributor, Inc. (the “Distributor”) acts as the Fund’s principal underwriter in the continuous public offering of the Fund’s classes of shares.
Distribution and Service Plan for Class A Shares. The Fund has adopted a Distribution and Service Plan (the “Plan”) for Class A shares. Under the Plan, the Fund pays a service fee to the Distributor at an annual rate of 0.25% of the daily net assets of Class A shares. The Distributor currently uses all of those fees to pay dealers, brokers, banks and other financial institutions periodically for providing personal services and maintenance of accounts of their customers that hold Class A shares. Under the Plan, the Fund may also pay an asset-based sales charge to the Distributor. However, the Fund’s Board has currently set the rate at zero. Fees incurred by the Fund under the Plan are detailed in the Consolidated Statement of Operations.
Distribution and Service Plans for Class B, Class C and Class N Shares. The Fund has adopted Distribution and Service Plans (the “Plans”) for Class B, Class C and Class N shares under Rule 12b-1 of the Investment Company Act of 1940 to compensate the Distributor for its services in connection with the distribution of those shares and servicing accounts. Under the Plans, the Fund pays the Distributor an annual asset-based sales charge of 0.75% on Class B and Class C shares daily net assets and 0.25% on Class N shares daily net assets. The Distributor also receives a service fee of 0.25% per year under each plan. If either the Class B, Class C or Class N plan is terminated by the Fund or by the shareholders of a class, the Board of Trustees and its independent trustees must determine whether the
49 OPPENHEIMER FLEXIBLE STRATEGIES FUND
| | |
NOTES TO CONSOLIDATED FINANCIAL STATEMENTS Unaudited / Continued | | |
| | |
| 5. Fees and Other Transactions with Affiliates (Continued) | | |
Distributor shall be entitled to payment from the Fund of all or a portion of the service fee and/or asset-based sales charge in respect to shares sold prior to the effective date of such termination. Fees incurred by the Fund under the Plans are detailed in the Consolidated Statement of Operations. The Distributor determines its uncompensated expenses under the Plans at calendar quarter ends. The Distributor’s aggregate uncompensated expenses under the Plans at March 31, 2014 were as follows:
| | | | |
Class C | | $ | 12,446,258 | |
Class N | | | 1,114,120 | |
Sales Charges. Front-end sales charges and contingent deferred sales charges (“CDSC”) do not represent expenses of the Fund. They are deducted from the proceeds of sales of Fund shares prior to investment or from redemption proceeds prior to remittance, as applicable. The sales charges retained by the Distributor from the sale of shares and the CDSC retained by the Distributor on the redemption of shares is shown in the following table for the period indicated.
| | | | | | | | | | | | | | | | | | | | |
| Six Months Ended | | Class A
Front-End
Sales Charges
Retained by
Distributor | | | Class A
Contingent
Deferred Sales
Charges
Retained by
Distributor | | | Class B
Contingent
Deferred Sales
Charges
Retained by
Distributor | | | Class C
Contingent
Deferred Sales
Charges
Retained by
Distributor | | | Class N
Contingent
Deferred Sales
Charges
Retained by
Distributor | |
April 30, 2014 | | | $67,514 | | | | $362 | | | | $26,008 | | | | $1,541 | | | | $51 | |
Waivers and Reimbursements of Expenses. The Manager has contractually agreed to waive the management fee it receives from the Fund in an amount equal to the management fee it receives from the Subsidiary. This undertaking will continue in effect for so long as the Fund invests in the Subsidiary and may not be terminated unless approved by the Fund’s Board of Trustees. During the six months ended April 30, 2014, the Manager waived $89,505.
The Manager will waive fees and/or reimburse Fund expenses in an amount equal to the indirect management fees incurred through the Fund’s investments in underlying funds managed by the Manager or its affiliates. During the six months ended April 30, 2014, the Manager waived fees and/or reimbursed the Fund $210,807 for management fees.
The Manager, upon discussion with the Board, has voluntarily agreed to reduce its management fee by 0.10% of the Fund’s daily net assets until the Fund’s trailing one-year total performance is out of the 5th quintile of the Fund’s Morningstar peer group as measured at the end of each calendar quarter. After that, the Manager will voluntarily reduce its management fee by 0.05% of the Fund’s daily net assets until the Fund’s trailing one-year performance is out of the 4th quintile of the Fund’s Morningstar peer group as measured at the end of each calendar quarter. During the six months ended April 30, 2014, the Manager reimbursed the Fund $421,403.
50 OPPENHEIMER FLEXIBLE STRATEGIES FUND
| | | | |
| | |
5. Fees and Other Transactions with Affiliates (Continued) | | |
The Transfer Agent has contractually agreed to limit transfer and shareholder servicing agent fees for Classes B, C, N and Y shares to 0.35% of average annual net assets per class and for Class A shares to 0.30% of average annual net assets of the class.
During the six months ended April 30, 2014, the Transfer Agent waived transfer and shareholder servicing agent fees as follows:
| | | | |
Class B | | $ | 16,879 | |
Class Y | | | 81,276 | |
Some of these undertakings may be modified or terminated at any time; some may not be modified or terminated until after one year from the date of the current prospectus, as indicated therein.
6. Risk Exposures and the Use of Derivative Instruments
The Fund’s investment objective not only permits the Fund to purchase investment securities, it also allows the Fund to enter into various types of derivatives contracts, including, but not limited to, futures contracts, forward currency exchange contracts, credit default swaps, interest rate swaps, total return swaps, variance swaps and purchased and written options. In doing so, the Fund will employ strategies in differing combinations to permit it to increase, decrease, or change the level or types of exposure to market risk factors. These instruments may allow the Fund to pursue its objectives more quickly and efficiently than if it were to make direct purchases or sales of securities capable of effecting a similar response to market factors. Such contracts may be entered into through a bilateral over-the-counter (“OTC”) transaction, or through a securities or futures exchange and cleared through a clearinghouse.
Market Risk Factors. In accordance with its investment objectives, the Fund may use derivatives to increase or decrease its exposure to one or more of the following market risk factors:
Commodity Risk. Commodity risk relates to the change in value of commodities or commodity indexes as they relate to increases or decreases in the commodities market. Commodities are physical assets that have tangible properties. Examples of these types of assets are crude oil, heating oil, metals, livestock, and agricultural products.
Credit Risk. Credit risk relates to the ability of the issuer to meet interest and principal payments, or both, as they come due. In general, lower-grade, higher-yield bonds are subject to credit risk to a greater extent than lower-yield, higher-quality bonds.
Equity Risk. Equity risk relates to the change in value of equity securities as they relate to increases or decreases in the general market.
Foreign Exchange Rate Risk. Foreign exchange rate risk relates to the change in the U.S. dollar value of a security held that is denominated in a foreign currency. The U.S. dollar value of a foreign currency denominated security will decrease as the dollar appreciates against the currency, while the U.S. dollar value will increase as the dollar depreciates against the currency.
51 OPPENHEIMER FLEXIBLE STRATEGIES FUND
| | |
NOTES TO CONSOLIDATED FINANCIAL STATEMENTS Unaudited / Continued | | |
| | |
6. Risk Exposures and the Use of Derivative Instruments (Continued) | | |
Interest Rate Risk. Interest rate risk refers to the fluctuations in value of fixed-income securities resulting from the inverse relationship between price and yield. For example, an increase in general interest rates will tend to reduce the market value of already issued fixed-income investments, and a decline in general interest rates will tend to increase their value. In addition, debt securities with longer maturities, which tend to have higher yields, are subject to potentially greater fluctuations in value from changes in interest rates than obligations with shorter maturities.
Volatility Risk. Volatility risk refers to the magnitude of the movement, but not the direction of the movement, in a financial instrument’s price over a defined time period. Large increases or decreases in a financial instrument’s price over a relative time period typically indicate greater volatility risk, while small increases or decreases in its price typically indicate lower volatility risk.
Derivatives may have little or no initial cash investment relative to their market value exposure and therefore can produce significant gains or losses in excess of their cost due to unanticipated changes in the market risk factors and the overall market. This use of embedded leverage allows the Fund to increase its market value exposure relative to its net assets and can substantially increase the volatility of the Fund’s performance. In instances where the Fund is using derivatives to decrease, or hedge, exposures to market risk factors for securities held by the Fund, there are also risks that those derivatives may not perform as expected resulting in losses for the combined or hedged positions. Some derivatives have the potential for unlimited loss, regardless of the size of the Fund’s initial investment.
Additional associated risks from investing in derivatives also exist and potentially could have significant effects on the valuation of the derivative and the Fund. Typically, the associated risks are not the risks that the Fund is attempting to increase or decrease exposure to, per its investment objectives, but are the additional risks from investing in derivatives. Examples of these associated risks are liquidity risk, which is the risk that the Fund will not be able to sell the derivative in the open market in a timely manner, and counterparty credit risk, which is the risk that the counterparty will not fulfill its obligation to the Fund.
The Fund’s actual exposures to these market risk factors and associated risks during the period are discussed in further detail, by derivative type, below.
Forward Currency Exchange Contracts
The Fund may enter into forward currency exchange contracts (“forward contracts”) for the purchase or sale of a foreign currency at a negotiated rate at a future date. Such contracts are traded in the OTC inter-bank currency dealer market.
Forward contracts are reported on a schedule following the Consolidated Statement of Investments. The unrealized appreciation (depreciation) is reported in the Consolidated Statement of Assets and Liabilities as a receivable (or payable) and in the Consolidated Statement of Operations within the change in unrealized appreciation (depreciation). At contract close, the difference between the original cost of the contract and the value at the close date is recorded as a realized gain (loss) in the Consolidated Statement of Operations.
52 OPPENHEIMER FLEXIBLE STRATEGIES FUND
| | | | |
| | |
6. Risk Exposures and the Use of Derivative Instruments (Continued) | | |
The Fund has entered into forward contracts with the obligation to purchase specified foreign currencies in the future at a currently negotiated forward rate in order to take a positive investment perspective on the related currency. These forward contracts seek to increase exposure to foreign exchange rate risk.
The Fund has entered into forward contracts with the obligation to purchase specified foreign currencies in the future at a currently negotiated forward rate in order to decrease exposure to foreign exchange rate risk associated with foreign currency denominated securities held by the Fund.
The Fund has entered into forward contracts with the obligation to sell specified foreign currencies in the future at a currently negotiated forward rate in order to take a negative investment perspective on the related currency. These forward contracts seek to increase exposure to foreign exchange rate risk.
The Fund has entered into forward contracts with the obligation to sell specified foreign currencies in the future at a currently negotiated forward rate in order to decrease exposure to foreign exchange rate risk associated with foreign currency denominated securities held by the Fund.
During the six months ended April 30, 2014, the Fund had daily average contract amounts on forward contracts to buy and sell of $147,511,263 and $86,826,935, respectively.
Additional associated risk to the Fund includes counterparty credit risk. Counterparty credit risk arises from the possibility that the counterparty to a forward contract will default and fail to perform its obligations to the Fund.
Futures Contracts
A futures contract is a commitment to buy or sell a specific amount of a commodity, financial instrument or currency at a negotiated price on a stipulated future date. The Fund may buy and sell futures contracts and may also buy or write put or call options on these futures contracts. Futures contracts and options thereon are generally entered into on a regulated futures exchange and cleared through a clearinghouse associated with the exchange.
Upon entering into a futures contract, the Fund is required to deposit either cash or securities (initial margin) in an amount equal to a certain percentage of the contract value in an account registered in the futures commission merchant’s name. Subsequent payments (variation margin) are paid to or from the futures commission merchant each day equal to the daily changes in the contract value. Such payments are recorded as unrealized gains and losses. Should the Fund fail to make requested variation margin payments, the futures commission merchant can gain access to the initial margin to satisfy the Fund’s payment obligations.
Futures contracts are reported on a schedule following the Consolidated Statement of Investments. Securities held by a futures commission merchant to cover initial margin requirements on open futures contracts are noted in the Consolidated Statement of Investments. Cash held by a futures commission merchant to cover initial margin requirements on open futures contracts and the receivable and/or payable for the daily mark to market for the variation margin are noted in the Consolidated Statement of Assets and Liabilities. The net change in unrealized appreciation and depreciation is reported in the
53 OPPENHEIMER FLEXIBLE STRATEGIES FUND
|
NOTESTOCONSOLIDATED FINANCIAL STATEMENTS Unaudited / Continued |
|
| 6. Risk Exposures and the Use of Derivative Instruments (Continued) |
Consolidated Statement of Operations. Realized gains (losses) are reported in the Consolidated Statement of Operations at the closing or expiration of futures contracts.
The Fund has sold futures contracts on various bonds and notes to decrease exposure to interest rate risk.
The Fund has purchased futures contracts, which have values that are linked to the price movement of the related commodities, in order to increase exposure to commodity risk.
During the six months ended April 30, 2014, the Fund had an ending monthly average market value of $509,457 and $20,429,504 on futures contracts purchased and sold, respectively.
Additional associated risks of entering into futures contracts (and related options) include the possibility that there may be an illiquid market where the Fund is unable to liquidate the contract or enter into an offsetting position and, if used for hedging purposes, the risk that the price of the contract will correlate imperfectly with the prices of the Fund’s securities.
Option Activity
The Fund may buy and sell put and call options, or write put and call options. When an option is written, the Fund receives a premium and becomes obligated to sell or purchase the underlying security, currency or other underlying financial instrument at a fixed price, upon exercise of the option.
Options can be traded through an exchange or through a privately negotiated arrangement with a dealer in an OTC transaction. Options traded through an exchange are generally cleared through a clearinghouse (such as The Options Clearing Corporation). The difference between the premium received or paid, and market value of the option, is recorded as unrealized appreciation or depreciation. The net change in unrealized appreciation or depreciation is reported in the Consolidated Statement of Operations. When an option is exercised, the cost of the security purchased or the proceeds of the security sale are adjusted by the amount of premium received or paid. Upon the expiration or closing of the option transaction, a gain or loss is reported in the Consolidated Statement of Operations.
The Fund has purchased put options on currencies to decrease exposure to foreign exchange rate risk. A purchased put option becomes more valuable as the price of the underlying financial instrument depreciates relative to the strike price.
The Fund has purchased call options on treasury and/or euro futures to increase exposure to interest rate risk. A purchased call option becomes more valuable as the price of the underlying financial instrument appreciates relative to the strike price.
The Fund has purchased call options on individual equity securities and/or equity indexes to increase exposure to equity risk. A purchased call option becomes more valuable as the price of the underlying financial instrument appreciates relative to the strike price.
During the six months ended April 30, 2014, the Fund had an ending monthly average market value of $1,903,150 and $11,537 on purchased call options and purchased put options, respectively.
Options written, if any, are reported in a schedule following the Consolidated Statement of Investments and as a liability in the Consolidated Statement of Assets and Liabilities.
54 OPPENHEIMER FLEXIBLE STRATEGIES FUND
| | | | |
| | |
6. Risk Exposures and the Use of Derivative Instruments (Continued) | | |
Securities held in collateral accounts to cover potential obligations with respect to outstanding written options are noted in the Consolidated Statement of Investments.
The risk in writing a call option is that the market price of the security increases and if the option is exercised, the Fund must either purchase the security at a higher price for delivery or, if the Fund owns the underlying security, give up the opportunity for profit. The risk in writing a put option is that the Fund may incur a loss if the market price of the security decreases and the option is exercised. The risk in buying an option is that the Fund pays a premium whether or not the option is exercised. The Fund also has the additional risk that there may be an illiquid market where the Fund is unable to close the contract.
Additional associated risks to the Fund include counterparty credit risk and liquidity risk.
As of April 30, 2014, the Fund had no outstanding written options.
Swap Contracts
The Fund may enter into swap contract agreements with a counterparty to exchange a series of cash flows based on either specified reference rates, the price or volatility of asset or non-asset references, or the occurrence of a credit event, over a specified period. Swaps can be executed in a bi-lateral privately negotiated arrangement with a dealer in an OTC transaction (“OTC swaps”) or executed on a regulated market. Certain swaps, regardless of the venue of their execution, are required to be cleared through a clearinghouse (“cleared swaps”). Swap contracts may include interest rate, equity, debt, index, total return, credit default, currency, and volatility swaps.
Swap contracts are reported on a schedule following the Consolidated Statement of Investments. Daily changes in the value of cleared swaps are reported as variation margin receivable or payable on the Consolidated Statement of Assets and Liabilities. The values of OTC swap contracts are aggregated by positive and negative values and disclosed separately on the Consolidated Statement of Assets and Liabilities. The unrealized appreciation (depreciation) related to the change in the valuation of the notional amount of the swap is combined with the accrued interest due to (owed by) the Fund, if any, at termination or settlement. The net change in this amount during the period is included on the Consolidated Statement of Operations. The Fund also records any periodic payments received from (paid to) the counterparty, including at termination, under such contracts as realized gain (loss) on the Consolidated Statement of Operations.
Swap contract agreements are exposed to the market risk factor of the specific underlying reference rate or asset. Swap contracts are typically more attractively priced compared to similar investments in related cash securities because they isolate the risk to one market risk factor and eliminate the other market risk factors. Investments in cash securities (for instance bonds) have exposure to multiple risk factors (credit and interest rate risk). Because swaps have embedded leverage, they can expose the Fund to substantial risk in the isolated market risk factor.
Credit Default Swap Contracts. A credit default swap is a contract that enables an investor to buy or sell protection against a defined-issuer credit event, such as the issuer’s failure to make timely payments of interest or principal on a debt security, bankruptcy or restructuring. The Fund may enter into credit default swaps either by buying or selling protection on a corporate issuer, sovereign issuer, or a basket or index of issuers (the “reference asset”).
55 OPPENHEIMER FLEXIBLE STRATEGIES FUND
|
NOTESTOCONSOLIDATED FINANCIAL STATEMENTS Unaudited / Continued |
|
| 6. Risk Exposures and the Use of Derivative Instruments (Continued) |
The buyer of protection pays a periodic fee to the seller of protection based on the notional amount of the swap contract. The seller of protection agrees to compensate the buyer of protection for future potential losses as a result of a credit event on the reference asset. The contract effectively transfers the credit event risk of the reference asset from the buyer of protection to the seller of protection.
The ongoing value of the contract will fluctuate throughout the term of the contract based primarily on the credit risk of the reference asset. If the credit quality of the reference asset improves relative to the credit quality at contract initiation, the buyer of protection may have an unrealized loss greater than the anticipated periodic fee owed. This unrealized loss would be the result of current credit protection being cheaper than the cost of credit protection at contract initiation. If the buyer elects to terminate the contract prior to its maturity, and there has been no credit event, this unrealized loss will become realized. If the contract is held to maturity, and there has been no credit event, the realized loss will be equal to the periodic fee paid over the life of the contract.
If there is a credit event, the buyer of protection can exercise its rights under the contract and receive a payment from the seller of protection equal to the notional amount of the swap less the market value of specified debt securities issued by the reference asset. Upon exercise of the contract the difference between such value and the notional amount is recorded as realized gain (loss) and is included on the Consolidated Statement of Operations.
The Fund has sold credit protection through credit default swaps to increase exposure to the credit risk of individual issuers and/or indexes of issuers that are either unavailable or considered to be less attractive in the bond market.
The Fund has purchased credit protection through credit default swaps to take an outright negative investment perspective on the credit risk of an individual issuer or basket or index of issuers as opposed to decreasing its credit risk exposure related to debt securities of such issuer(s) held by the Fund.
For the six months ended April 30, 2014, the Fund had ending monthly average notional amounts of $171,690,037 and $25,000,000 on credit default swaps to buy protection and credit default swaps to sell protection, respectively.
Additional associated risks to the Fund include counterparty credit risk and liquidity risk.
Total Return Swap Contracts. A total return swap is an agreement between counterparties to exchange periodic payments based on the value of asset or non-asset references. One cash flow is typically based on a non-asset reference (such as an interest rate) and the other on the total return of a reference asset (such as a security or a basket of securities or securities index). The total return of the reference asset typically includes appreciation or depreciation on the reference asset, plus any interest or dividend payments.
Total return swap contracts are exposed to the market risk factor of the specific underlying financial instrument or index. Total return swaps are less standard in structure than other types of swaps and can isolate and/or include multiple types of market risk factors including equity risk, credit risk, and interest rate risk.
56 OPPENHEIMER FLEXIBLE STRATEGIES FUND
| | | | |
|
| 6. Risk Exposures and the Use of Derivative Instruments (Continued) | | |
The Fund has entered into total return swaps on various equity securities or indexes to increase exposure to equity risk. These equity risk related total return swaps require the Fund to pay a floating reference interest rate, and an amount equal to the negative price movement of securities or an index (expressed as a percentage) multiplied by the notional amount of the contract. The Fund will receive payments equal to the positive price movement of the same securities or index (expressed as a percentage) multiplied by the notional amount of the contract and, in some cases, dividends paid on the securities.
The Fund has entered into total return swaps on various equity securities or indexes to decrease exposure to equity risk. These equity risk related total return swaps require the Fund to pay an amount equal to the positive price movement of securities or an index (expressed as a percentage) multiplied by the notional amount of the contract and, in some cases, dividends paid on the securities. The Fund will receive payments of a floating reference interest rate and an amount equal to the negative price movement of the same securities or index (expressed as a percentage) multiplied by the notional amount of the contract.
For the six months ended April 30, 2014, the Fund had ending monthly average notional amounts of $6,168,894 and $2,967,048 on total return swaps which are long the reference asset and total return swaps which are short the reference asset, respectively.
Additional associated risks to the Fund include counterparty credit risk and liquidity risk.
Swaption Transactions
The Fund may enter into a swaption contract which grants the purchaser the right, but not the obligation, to enter into a swap transaction at preset terms detailed in the underlying agreement within a specified period of time. The purchaser pays a premium to the swaption writer who bears the risk of unfavorable changes in the preset terms on the underlying swap.
Purchased swaptions are reported as a component of investments in the Consolidated Statement of Investments and the Consolidated Statement of Assets and Liabilities. Written swaptions are reported on a schedule following the Consolidated Statement of Investments and their value is reported as a separate asset or liability line item in the Consolidated Statement of Assets and Liabilities. The net change in unrealized appreciation or depreciation on written swaptions is separately reported in the Consolidated Statement of Operations. When a swaption is exercised, the cost of the swap is adjusted by the amount of premium paid or received. Upon the expiration or closing of an unexercised swaption contract, a gain or loss is reported in the Consolidated Statement of Operations for the amount of the premium paid or received.
The Fund generally will incur a greater risk when it writes a swaption than when it purchases a swaption. When the Fund writes a swaption it will become obligated, upon exercise of the swaption, according to the terms of the underlying agreement. Swaption contracts written by the Fund do not give rise to counterparty credit risk prior to exercise as they obligate the Fund, not its counterparty, to perform. When the Fund purchases a swaption
57 OPPENHEIMER FLEXIBLE STRATEGIES FUND
| | |
NOTES TO CONSOLIDATED FINANCIAL STATEMENTS Unaudited / Continued | | |
| | |
| 6. Risk Exposures and the Use of Derivative Instruments (Continued) | | |
it only risks losing the amount of the premium it paid if the swaption expires unexercised. However, when the Fund exercises a purchased swaption there is a risk that the counterparty will fail to perform or otherwise default on its obligations under the swaption contract.
The Fund has purchased swaptions which gives it the option to enter into an interest rate swap in which it pays a fixed interest rate and receives a floating interest rate in order to decrease exposure to interest rate risk. A purchased swaption of this type becomes more valuable as the reference interest rate increases relative to the preset interest rate.
During the six months ended April 30, 2014, the Fund had an ending monthly average market value of $7,923,465 on purchased swaptions.
Counterparty Credit Risk. Derivative positions are subject to the risk that the counterparty will not fulfill its obligation to the Fund. The Fund intends to enter into derivative transactions with counterparties that the Manager believes to be creditworthy at the time of the transaction.
The Fund’s risk of loss from counterparty credit risk on OTC derivatives is generally limited to the aggregate unrealized gain netted against any collateral held by the Fund. For OTC options purchased, the Fund bears the risk of loss of the amount of the premiums paid plus the positive change in market values net of any collateral held by the Fund should the counterparty fail to perform under the contracts. Options written by the Fund do not typically give rise to counterparty credit risk, as options written generally obligate the Fund and not the counterparty to perform.
To reduce counterparty risk with respect to OTC transactions, the Fund has entered into master netting arrangements, established within the Fund’s International Swap and Derivatives Association, Inc. (“ISDA”) master agreements, which allow the Fund to make (or to have an entitlement to receive) a single net payment in the event of default (close-out netting) for outstanding payables and receivables with respect to certain OTC positions in swaps, options, swaptions, and forward currency exchange contracts for each individual counterparty. In addition, the Fund may require that certain counterparties post cash and/or securities in collateral accounts to cover their net payment obligations for those derivative contracts subject to ISDA master agreements. If the counterparty fails to perform under these contracts and agreements, the cash and/or securities will be made available to the Fund.
As of April 30, 2014, the Fund has required certain counterparties to post collateral of $6,106,787.
ISDA master agreements include credit related contingent features which allow counterparties to OTC derivatives to terminate derivative contracts prior to maturity in the event that, for example, the Fund’s net assets decline by a stated percentage or the Fund fails to meet the terms of its ISDA master agreements, which would cause the Fund to accelerate payment of any net liability owed to the counterparty.
For financial reporting purposes, the Fund does not offset derivative assets and derivative liabilities that are subject to netting arrangements in the Consolidated Statement of Assets and Liabilities. Bankruptcy or insolvency laws of a particular jurisdiction may impose restrictions on or prohibitions against the right of offset in bankruptcy, insolvency or other events.
58 OPPENHEIMER FLEXIBLE STRATEGIES FUND
| | |
| | |
| 6. Risk Exposures and the Use of Derivative Instruments (Continued) | | |
The Fund’s risk of loss from counterparty credit risk on exchange-traded derivatives cleared through a clearinghouse and for cleared swaps is generally considered lower than as compared to OTC derivatives. However, counterparty credit risk exists with respect to initial and variation margin deposited/paid by the Fund that is held in futures commission merchant, broker and/or clearinghouse accounts for such exchange-traded derivatives and for cleared swaps.
With respect to cleared swaps, such transactions will be submitted for clearing, and if cleared, will be held in accounts at futures commission merchants or brokers that are members of clearinghouses. While brokers, futures commission merchants and clearinghouses are required to segregate customer margin from their own assets, in the event that a broker, futures commission merchant or clearinghouse becomes insolvent or goes into bankruptcy and at that time there is a shortfall in the aggregate amount of margin held by the broker, futures commission merchant or clearinghouse for all its customers, U.S. bankruptcy laws will typically allocate that shortfall on a pro-rata basis across all the broker’s, futures commission merchant’s or clearinghouse’s customers, potentially resulting in losses to the Fund.
There is the risk that a broker, futures commission merchant or clearinghouse will decline to clear a transaction on the Fund’s behalf, and the Fund may be required to pay a termination fee to the executing broker with whom the Fund initially enters into the transaction. Clearinghouses may also be permitted to terminate cleared swaps at any time. The Fund is also subject to the risk that the broker or futures commission merchant will improperly use the Fund’s assets deposited/paid as initial or variation margin to satisfy payment obligations of another customer. In the event of a default by another customer of the broker or futures commission merchant, the Fund might not receive its variation margin payments from the clearinghouse, due to the manner in which variation margin payments are aggregated for all customers of the broker/futures commission merchant.
Collateral and margin requirements differ by type of derivative. Margin requirements are established by the broker, futures commission merchant or clearinghouse for exchange-traded and cleared derivatives, including cleared swaps. Brokers, futures commission merchants and clearinghouses can ask for margin in excess of the regulatory minimum, or increase the margin amount, in certain circumstances.
Collateral terms are contract specific for OTC derivatives. For derivatives traded under an ISDA master agreement, the collateral requirements are typically calculated by netting the mark to market amount for each transaction under such agreement and comparing that amount to the value of any collateral currently pledged by the Fund or the counterparty.
For financial reporting purposes, cash collateral that has been pledged to cover obligations of the Fund, if any, is reported separately on the Consolidated Statement of Assets and Liabilities as cash pledged as collateral. Non-cash collateral pledged by the Fund, if any, is noted in the Consolidated Statement of Investments. Generally, the amount of collateral due from or to a party must exceed a minimum transfer amount threshold (e.g. $250,000) before a transfer has to be made. To the extent amounts due to the Fund from its counterparties are not fully collateralized, contractually or otherwise, the Fund bears the risk of loss from counterparty nonperformance.
59 OPPENHEIMER FLEXIBLE STRATEGIES FUND
|
NOTESTOCONSOLIDATED FINANCIAL STATEMENTS Unaudited / Continued |
|
| 6. Risk Exposures and the Use of Derivative Instruments (Continued) |
The following table presents by counterparty the Fund’s OTC derivative assets net of the related collateral posted for the benefit of the Fund at April 30, 2014:
| | | | | | | | | | | | | | | | | | | | |
| | | | | | Gross Amounts Not Offset in the Consolidated Statement of Assets & Liabilities | | | | |
| | | | | | | | | | | | |
| Counterparty | | Gross Amount of Assets in the Consolidated Statement of Assets & Liabilities* | | | Financial Instruments Available for Offset | | | Financial Instruments Collateral Received** | | | Cash Collateral Received** | | | Net Amount | |
| |
| Barclays Bank plc | | $ | 10,189 | | | $ | — | | | $ | (10,189 | ) | | $ | — | | | $ | — | |
| Goldman Sachs Group, Inc. (The) | | | 118,386 | | | | (118,386 | ) | | | — | | | | — | | | | — | |
| JPMorgan Chase Bank NA | | | 6,115,712 | | | | (532,723 | ) | | | (5,582,989 | ) | | | — | | | | — | |
| Royal Bank of Scotland plc (The) | | | 71,587 | | | | (71,587 | ) | | | — | | | | — | | | | — | |
| | | | |
| | $ | 6,315,874 | | | $ | (722,696 | ) | | $ | (5,593,178 | ) | | $ | — | | | $ | — | |
| | | | |
* OTC derivatives are reported gross on the Consolidated Statement of Assets and Liabilities. Exchange traded options and margin related to cleared swaps and futures are excluded from these reported amounts.
** Reported collateral posted for the benefit of the Fund within this table is limited to the net outstanding amount due from an individual counterparty. The collateral posted for the benefit of the Fund may exceed these amounts.
The following table presents by counterparty the Fund’s OTC derivative liabilities net of the related collateral pledged by the Fund at April 30, 2014:
| | | | | | | | | | | | | | | | | | | | |
| | | | | | Gross Amounts Not Offset in the Consolidated Statement of Assets & Liabilities | | | | |
| | | | | | | | | | | | |
| Counterparty | | Gross Amount of Liabilities in the Consolidated Statement of Assets & Liabilities* | | | Financial Instruments Available for Offset | | | Financial Instruments Collateral Pledged** | | | Cash Collateral Pledged** | | | Net Amount | |
| |
| Bank of America NA | | $ | (197,376 | ) | | $ | — | | | $ | — | | | $ | 56,627 | | | $ | (140,749 | ) |
| Deutsche Bank AG | | | (825,004 | ) | | | — | | | | — | | | | — | | | | (825,004 | ) |
| Goldman Sachs Group, Inc. (The) | | | (1,185,777 | ) | | | 118,386 | | | | — | | | | 580,000 | | | | (487,391 | ) |
| JPMorgan Chase Bank NA | | | (532,723 | ) | | | 532,723 | | | | — | | | | — | | | | — | |
| Morgan Stanley Capital Services, Inc. | | | (318,731 | ) | | | — | | | | — | | | | 70,000 | | | | (248,731 | ) |
| Royal Bank of Scotland plc (The) | | | (116,602 | ) | | | 71,587 | | | | — | | | | | | | | (45,015 | ) |
| | | | |
| | $ | (3,176,213 | ) | | $ | 722,696 | | | $ | — | | | $ | 706,627 | | | $ | (1,746,890 | ) |
| | | | |
* OTC derivatives are reported gross on the Consolidated Statement of Assets and Liabilities. Exchange traded options and margin related to cleared swaps and futures are excluded from these reported amounts.
** Reported collateral pledged within this table is limited to the net outstanding amount due from the Fund. The securities pledged as collateral by the Fund as reported on the Consolidated Statements of investments may exceed these amounts.
60 OPPENHEIMER FLEXIBLE STRATEGIES FUND
|
|
| 6. Risk Exposures and the Use of Derivative Instruments (Continued) |
The following table presents the valuations of derivative instruments by risk exposure as reported within the Consolidated Statement of Assets and Liabilities as of April 30, 2014:
| | | | | | | | | | | | |
| | | Asset Derivatives | | | Liability Derivatives | |
| | | | | | |
Derivatives Not Accounted for as Hedging Instruments | | Consolidated Statement of Assets and Liabilities Location | | Value | | | Consolidated Statement of Assets and Liabilities Location | | Value | |
| |
| Credit contracts | | Swaps, at value | | $ | 573,539 | | | Swaps, at value | | $ | 1,388,181 | |
| Equity contracts | | | | | | | | Swaps, at value | | | 330,319 | |
| Interest rate contracts | | | | | | | | Variation margin payable | | | 62,341 | * |
| Foreign exchange contracts | | Unrealized appreciation on foreign currency exchange contracts | | | 232,254 | | | Unrealized depreciation on foreign currency exchange contracts | | | 1,457,713 | |
| Equity contracts | | Investments, at value | | | 157,500 | ** | | | | | | |
| Interest rate contracts | | Investments, at value | | | 5,978,831 | ** | | | | | | |
| | | | | | | | | | | | |
| Total | | | | $ | 6,942,124 | | | | | $ | 3,238,554 | |
| | | | | | | | | | | | |
*Includes only the current day’s variation margin. Prior variation margin movements have been reflected in cash on the Consolidated Statement of Assets and Liabilities upon receipt or payment.
**Amounts relate to purchased option contracts and purchased swaption contracts.
The effective of derivative instruments on the Consolidated Statement of Operations is as follows:
| | | | | | | | | | | | | | | | | | | | |
| Amount of Realized Gain or (Loss) Recognized on Derivatives | |
| |
Derivatives Not Accounted for as Hedging Instruments | | Investment from unaffiliated companies* | | | Closing and expiration of futures contracts | | | Foreign currency transactions | | | Swap contracts | | | Total | |
| |
Commodity contracts | | $ | — | | | $ | (618,146 | ) | | $ | — | | | $ | — | | | $ | (618,146 | ) |
Credit contracts | | | — | | | | — | | | | — | | | | (278,490 | ) | | | (278,490 | ) |
Equity contracts | | | 1,183,614 | | | | — | | | | — | | | | 2,860,182 | | | | 4,043,796 | |
Foreign exchange contracts | | | — | | | | — | | | | 2,319,422 | | | | — | | | | 2,319,422 | |
Interest rate contracts | | | (723,956 | ) | | | (1,054,548 | ) | | | — | | | | — | | | | (1,778,504 | ) |
| | | | |
Total | | $ | 459,658 | | | $ | (1,672,694 | ) | | $ | 2,319,422 | | | $ | 2,581,692 | | | $ | 3,688,078 | |
| | | | |
* Includes purchased option contracts, purchased swaption contracts, written option contracts exercised and written swaption contracts exercised, if any.
61 OPPENHEIMER FLEXIBLE STRATEGIES FUND
| | |
NOTES TO CONSOLIDATED FINANCIAL STATEMENTS Unaudited / Continued | | |
| | |
| 6. Risk Exposures and the Use of Derivative Instruments (Continued) | | |
| | | | | | | | | | | | | | | | | | | | |
| Amount of Change in Unrealized Gain or (Loss) Recognized on Derivatives | |
| |
Derivatives Not Accounted for as Hedging Instruments | | Investments* | | | Futures
contracts | | | Translation of
assets and
liabilities
denominated in
foreign
currencies | | | Swap contracts | | | Total | |
| |
Commodity contracts | | $ | — | | | $ | 606,479 | | | $ | — | | | $ | — | | | $ | 606,479 | |
Credit contracts | | | — | | | | — | | | | — | | | | (2,074,494 | ) | | | (2,074,494 | ) |
Equity contracts | | | (1,657,196 | ) | | | — | | | | — | | | | (1,468,994 | ) | | | (3,126,190 | ) |
Foreign exchange contracts | | | (8,760 | ) | | | — | | | | (743,655 | ) | | | — | | | | (752,415 | ) |
Interest rate contracts | | | (3,016,568 | ) | | | 412,402 | | | | — | | | | — | | | | (2,604,166 | ) |
| | | | |
Total | | $ | (4,682,524 | ) | | $ | 1,018,881 | | | $ | (743,655 | ) | | $ | (3,543,488 | ) | | $ | 7,950,786 | |
| | | | |
*Includes purchased option contracts and purchased swaption contracts, if any.
7. Restricted Securities
As of April 30, 2014, investments in securities included issues that are restricted. A restricted security may have a contractual restriction on its resale and is valued under methods approved by the Board of Trustees as reflecting fair value. Securities that are restricted are marked with an applicable footnote on the Consolidated Statement of Investments. Restricted securities are reported on a schedule following the Consolidated Statement of Investments.
8. Pending Litigation
Since 2009, seven class action lawsuits have been pending in the U.S. District Court for the District of Colorado against OppenheimerFunds, Inc. (“OFI”), OppenheimerFunds Distributor, Inc., the Fund’s principal underwriter and distributor (the “Distributor”), and certain funds (but not including the Fund) advised by OFI Global Asset Management, Inc. and distributed by the Distributor (the “Defendant Funds”). The lawsuits also name as defendants certain officers and current and former trustees of the respective Defendant Funds. The lawsuits raise claims under federal securities law and allege, among other things, that the disclosure documents of the respective Defendant Funds contained misrepresentations and omissions and that the respective Defendant Funds’ investment policies were not followed. The plaintiffs in these actions seek unspecified damages, equitable relief and awards of attorneys’ fees and litigation expenses. The Defendant Funds’ Boards of Trustees have also engaged counsel to represent the Funds and the present and former Independent Trustees named in those suits. On March 5, 2014, the parties in six of these lawsuits executed stipulations and agreements of settlement resolving those actions. The settlements are subject to a variety of contingencies, including approval by the court. The settlements do not resolve a seventh outstanding lawsuit relating to Oppenheimer Rochester California Municipal Fund.
62 OPPENHEIMER FLEXIBLE STRATEGIES FUND
| | | | |
|
| 8. Pending Litigation (Continued) | | |
Other class action and individual lawsuits have been filed since 2008 in various state and federal courts against OFI and certain of its affiliates by investors seeking to recover investments they allegedly lost as a result of the “Ponzi” scheme run by Bernard L. Madoff and his firm, Bernard L. Madoff Investment Securities, LLC (“BLMIS”). Plaintiffs in these suits allege that they suffered losses as a result of their investments in several funds managed by an affiliate of OFI and assert a variety of claims, including breach of fiduciary duty, fraud, negligent misrepresentation, unjust enrichment, and violation of federal and state securities laws and regulations, among others. They seek unspecified damages, equitable relief and awards of attorneys’ fees and litigation expenses. Neither the Distributor, nor any of the Oppenheimer mutual funds, their independent trustees or directors are named as defendants in these lawsuits. None of the Oppenheimer mutual funds invested in any funds or accounts managed by Madoff or BLMIS. On February 28, 2011, a stipulation of partial settlement of three groups of consolidated putative class action lawsuits relating to these matters was filed in the U.S. District Court for the Southern District of New York. On August 19, 2011, the court entered an order and final judgment approving the settlement as fair, reasonable and adequate. In September 2011, certain parties filed notices of appeal from the court’s order approving the settlement. The settlement does not resolve other outstanding lawsuits against OFI and its affiliates relating to BLMIS.
OFI believes the lawsuits and appeals described above are without legal merit and, with the exception of actions it has settled, is defending against them vigorously. While it is premature to render any opinion as to the outcome in these lawsuits, or whether any costs that the Defendant Funds may bear in defending the suits might not be reimbursed by insurance, OFI believes that these suits should not impair the ability of OFI or the Distributor to perform their respective duties to the Fund, and that the outcome of all of the suits together should not have any material effect on the operations of any of the Oppenheimer mutual funds.
63 OPPENHEIMER FLEXIBLE STRATEGIES FUND
| | |
PORTFOLIO PROXY VOTING POLICIESAND PROCEDURES; UPDATES TO CONSOLIDATED STATEMENTS OF INVESTMENTS Unaudited | | |
| | |
The Fund has adopted Portfolio Proxy Voting Policies and Procedures under which the Fund votes proxies relating to securities (“portfolio proxies”) held by the Fund. A description of the Fund’s Portfolio Proxy Voting Policies and Procedures is available (i) without charge, upon request, by calling the Fund toll-free at 1.800.CALL OPP (225.5677), (ii) on the Fund’s website at oppenheimerfunds.com, and (iii) on the SEC’s website at www.sec.gov. In addition, the Fund is required to file Form N-PX, with its complete proxy voting record for the 12 months ended June 30th, no later than August 31st of each year. The Fund’s voting record is available (i) without charge, upon request, by calling the Fund toll-free at 1.800.CALL OPP (225.5677), and (ii) in the Form N-PX filing on the SEC’s website at www.sec.gov.
The Fund files its complete schedule of portfolio holdings with the SEC for the first quarter and the third quarter of each fiscal year on Form N-Q. The Fund’s Form N-Q filings are available on the SEC’s website at www.sec.gov. Those forms may be reviewed and copied at the SEC’s Public Reference Room in Washington, D.C. Information on the operation of the Public Reference Room may be obtained by calling 1-800-SEC-0330.
Householding—Delivery of Shareholder Documents
This is to inform you about OppenheimerFunds’ “householding” policy. If more than one member of your household maintains an account in a particular fund, OppenheimerFunds will mail only one copy of the fund’s prospectus (or, if available, the fund’s summary prospectus), annual and semiannual report and privacy policy. The consolidation of these mailings, called householding, benefits your fund through reduced mailing expense, and benefits you by reducing the volume of mail you receive from OppenheimerFunds. Householding does not affect the delivery of your account statements.
Please note that we will continue to household these mailings for as long as you remain an OppenheimerFunds shareholder, unless you request otherwise. If you prefer to receive multiple copies of these materials, please call us at 1.800.CALL-OPP (225-5677). You may also notify us in writing or via email. We will begin sending you individual copies of the prospectus (or, if available, the summary prospectus), reports and privacy policy within 30 days of receiving your request to stop householding.
64 OPPENHEIMER FLEXIBLE STRATEGIES FUND
OPPENHEIMER FLEXIBLE STRATEGIES FUND
| | |
| Trustees and Officers | | Brian F. Wruble, Chairman of the Board of Trustees and Trustee |
| | David K. Downes, Trustee |
| | Matthew P. Fink, Trustee |
| | Edmund P. Giambastiani, Jr., Trustee |
| | Mary F. Miller, Trustee |
| | Joel W. Motley, Trustee |
| | Joanne Pace, Trustee |
| | Joseph M. Wikler, Trustee |
| | Peter I. Wold, Trustee |
| | William F. Glavin, Jr., Trustee, President and Principal Executive Officer |
| | Michelle Borré, Vice President |
| | Arthur S. Gabinet, Secretary and Chief Legal Officer |
| | Christina M. Nasta, Vice President and Chief Business Officer |
| | Mary Ann Picciotto, Chief Compliance Officer and Chief Anti-Money |
| | Laundering Officer |
| | Brian W. Wixted, Treasurer and Principal Financial & Accounting Officer |
| |
| Manager | | OFI Global Asset Management, Inc. |
| |
| Sub-Adviser | | OppenheimerFunds, Inc. |
| |
| Distributor | | OppenheimerFunds Distributor, Inc. |
| |
| Transfer and Shareholder | | OFI Global Asset Management, Inc. |
| Servicing Agent | | |
| |
| Sub-Transfer Agent | | Shareholder Services, Inc. |
| | DBA OppenheimerFunds Services |
| |
| Independent Registered | | KPMG LLP |
| Public Accounting Firm | | |
| |
| Legal Counsel | | Kramer Levin Naftalis & Frankel LLP |
| |
| | The consolidated financial statements included herein have been taken from the records of the Fund without examination of those records by the independent registered public accounting firm. |
© 2014 OppenheimerFunds, Inc. All rights reserved.
65 OPPENHEIMER FLEXIBLE STRATEGIES FUND
PRIVACY POLICY NOTICE
As an Oppenheimer fund shareholder, you are entitled to know how we protect your personal information and how we limit its disclosure.
Information Sources
We obtain nonpublic personal information about our shareholders from the following sources:
| — | | Applications or other forms |
| — | | When you create a user ID and password for online account access |
| — | | When you enroll in eDocs Direct, our electronic document delivery service |
| — | | Your transactions with us, our affiliates or others |
| — | | A software program on our website, often referred to as a “cookie,” which indicates which parts of our site you’ve visited |
| — | | When you set up challenge questions to reset your password online |
If you visit oppenheimerfunds.com and do not log on to the secure account information areas, we do not obtain any personal information about you. When you do log on to a secure area, we do obtain your user ID and password to identify you. We also use this information to provide you with products and services you have requested, to inform you about products and services that you may be interested in and assist you in other ways.
We do not collect personal information through our website unless you willingly provide it to us, either directly by email or in those areas of the website that request information. In order to update your personal information (including your mailing address, email address and phone number) you must first log on and visit your user profile.
If you have set your browser to warn you before accepting cookies, you will receive the warning message with each cookie. You can refuse cookies by turning them off in your browser. However, doing so may limit your access to certain sections of our website.
We use cookies to help us improve and manage our website. For example, cookies help us recognize new versus repeat visitors to the site, track the pages visited, and enable some special features on the website. This data helps us provide a better service for our website visitors.
Protection of Information
We do not disclose any non-public personal information (such as names on a customer list) about current or former customers to anyone, except as permitted by law.
Disclosure of Information
We send your financial advisor (as designated by you) copies of confirmations, account statements and other documents reporting activity in your fund accounts. We may also use details about you and your investments to help us, our financial service affiliates, or firms that jointly market their financial products and services with ours, to better serve your investment needs or suggest financial services or educational material that may be of interest to you. If this requires us to provide you with an opportunity to “opt in” or “opt out” of such information sharing with a firm not affiliated with us, you will receive notification on how to do so, before any such sharing takes place.
Right of Refusal
We will not disclose your personal information to unaffiliated third parties (except as permitted by law), unless we first offer you a reasonable opportunity to refuse or “opt out” of such disclosure.
66 OPPENHEIMER FLEXIBLE STRATEGIES FUND
Internet Security and Encryption
In general, the email services provided by our website are encrypted and provide a secure and private means of communication with us. To protect your own privacy, confidential and/or personal information should only be communicated via email when you are advised that you are using a secure website.
As a security measure, we do not include personal or account information in non-secure emails, and we advise you not to send such information to us in non-secure emails. Instead, you may take advantage of the secure features of our website to encrypt your email correspondence. To do this, you will need to use a browser that supports Secure Sockets Layer (SSL) protocol.
We do not guarantee or warrant that any part of our website, including files available for download, are free of viruses or other harmful code. It is your responsibility to take appropriate precautions, such as use of an anti-virus software package, to protect your computer hardware and software.
| — | | All transactions, including redemptions, exchanges and purchases, are secured by SSL and 128-bit encryption. SSL is used to establish a secure connection between your PC and OppenheimerFunds’ server. It transmits information in an encrypted and scrambled format. |
| — | | Encryption is achieved through an electronic scrambling technology that uses a “key” to code and then decode the data. Encryption acts like the cable converter box you may have on your television set. It scrambles data with a secret code so that no one can make sense of it while it is being transmitted. When the data reaches its destination, the same software unscrambles the data. |
| — | | You can exit the secure area by either closing your browser, or for added security, you can use the Log Out button before you close your browser. |
Other Security Measures
We maintain physical, electronic and procedural safeguards to protect your personal account information. Our employees and agents have access to that information only so that they may offer you products or provide services, for example, when responding to your account questions.
How You Can Help
You can also do your part to keep your account information private and to prevent unauthorized transactions. If you obtain a user ID and password for your account, do not allow it to be used by anyone else. Also, take special precautions when accessing your account on a computer used by others.
Who We Are
This joint notice describes the privacy policies of the Oppenheimer funds, OppenheimerFunds, Inc., and each of its investment adviser subsidiaries, OppenheimerFunds Distributor, Inc. and OFI Global Trust Co. It applies to all Oppenheimer fund accounts you presently have, or may open in the future, using your Social Security number—whether or not you remain a shareholder of our funds. This notice was last updated November 2013. In the event it is updated or changed, we will post an updated notice on our website at oppenheimerfunds.com. If you have any questions about these privacy policies, write to us at P.O. Box 5270, Denver, CO 80217-5270, email us by clicking on the Contact Us section of our website at oppenheimerfunds.com or call us at 1.800.CALL OPP (225.5677).
67 OPPENHEIMER FLEXIBLE STRATEGIES FUND
THIS PAGE INTENTIONALLY LEFT BLANK.
68 OPPENHEIMER FLEXIBLE STRATEGIES FUND
THIS PAGE INTENTIONALLY LEFT BLANK.
69 OPPENHEIMER FLEXIBLE STRATEGIES FUND
THIS PAGE INTENTIONALLY LEFT BLANK.
70 OPPENHEIMER FLEXIBLE STRATEGIES FUND
THIS PAGE INTENTIONALLY LEFT BLANK.
71 OPPENHEIMER FLEXIBLE STRATEGIES FUND

Table of Contents
Class A Shares
AVERAGE ANNUAL TOTAL RETURNS AT 4/30/14
| | | | | | | | | | | | |
| | | Class A Shares of the Fund | | | | | | |
| | | Without Sales
Charge | | With Sales
Charge | | | | Russell 2000
Index | | Russell 2500 Index | | Russell 2500 Value Index |
6-Month | | 6.94% | | 0.78% | | | | 3.08% | | 5.20% | | 6.97% |
1-Year | | 23.78 | | 16.67 | | | | 20.50 | | 20.78 | | 20.03 |
5-Year | | 17.29 | | 15.91 | | | | 19.84 | | 21.22 | | 20.89 |
10-Year | | 8.32 | | 7.68 | | | | 8.67 | | 9.71 | | 9.47 |
Performance data quoted represents past performance, which does not guarantee future results. The investment return and principal value of an investment in the Fund will fluctuate so that an investor’s shares, when redeemed, may be worth more or less than their original cost. Fund returns include changes in share price, reinvested distributions, and a 5.75% maximum applicable sales charge except where “without sales charge” is indicated. Current performance may be lower or higher than the performance quoted. Returns do not consider capital gains or income taxes on an individual’s investment. Returns for periods of less than one year are cumulative and not annualized. For performance data current to the most recent month-end, visit oppenheimerfunds.com or call 1.800.CALL OPP (225.5677).
2 OPPENHEIMER SMALL- & MID- CAP VALUE FUND
Fund Performance Discussion
The Fund’s Class A shares (without sales charge) produced a cumulative total return of 6.94% during the reporting period. In comparison, the Russell 2500 Value Index (the “Index”) returned 6.97% during the same period. The Fund outperformed the Index within the industrials, financials and health care sectors due largely to stronger relative stock selection. The Fund underperformed the Index in the consumer discretionary and energy sectors due to less favorable stock selection and in the consumer staples sector where an overweight position and weaker relative stock selection detracted.
MARKET OVERVIEW
The global economy finished 2013 with slow and steady growth throughout the developed world. U.S. growth improved during the reporting period driven by continued strength in manufacturing, reasonable employment gains and moderating housing activity. In May 2013, market volatility picked up measurably as remarks from former Federal Reserve (“Fed”) Chairman Ben Bernanke indicated a possible tapering of the Fed’s asset purchase program if the economy continued to show improvement. However, when the Fed actually announced in December that it would reduce its asset purchases by $10 billion a month from $85 billion to $75 billion, its decision to “taper” was met with relative calm in financial markets.
In January 2014, investors worried that ongoing downturns in the emerging markets might dampen the U.S. economic recovery, leading to renewed volatility in stock and bond markets. In addition, over the first four months of 2014, financial headlines were full of discussion of Fed policy, turmoil in Ukraine, and the implications of a slowdown in China. The U.S. continued
to grow at a moderate pace, but slowed over the first quarter of 2014. The Eurozone also grew at a slightly faster pace than 2013, but has continued to struggle with very low inflation and weak bank lending. The Fed continued its program of “tapering” asset purchases by $10 billion per month for the first three months of the year, bringing their current monthly purchases to $55 billion in March (in January 2014, Janet Yellen was confirmed as next Fed chairman).
FUND REVIEW
Top performing holdings for the Fund this reporting period included Delta Air Lines, Inc., Lazard Ltd. and Pepco Holdings, Inc. Delta Air Lines, the second largest airline in the United States by passenger volume, topped earnings expectations over the first half of the reporting period due mostly to lower than expected operating costs – partially related to falling jet fuel prices during the spring months. Over the second half of the reporting period, Delta reported quarterly results ahead
3 OPPENHEIMER SMALL- & MID- CAP VALUE FUND
of Wall Street expectations, driven by strong revenue growth in both the domestic market and in Latin America. The management team also guided to an improvement in 2014 operating margins, which helped push up analyst earnings expectations, providing the tailwind for share price gains. Lazard, the Fund’s largest holding at period end, is a boutique investment bank focused on mergers & acquisitions, restructuring, and asset management. The firm beat third-quarter earnings estimates on the back of better than expected mergers & acquisitions results and strong revenues in its asset management division. Lazard also refinanced a portion of its long-term debt at a significantly lower rate, which is expected to be accretive to future earnings. Pepco Holdings is a holding company that distributes electricity and natural gas through Potomac Electric Power Company (PEPCO), Delmarva Power and Atlantic City Electric in Delaware, Maryland, New Jersey and Washington, D.C. Shares of Pepco rallied strongly towards the end of the period after Exelon Corp. announced plans to acquire the company.
Detractors from performance included NCR Corp., GameStop Corp. and ITT Educational Services, Inc. NCR makes financial transaction machines and software. After performing positively for most of 2013, NCR took a pause during the fourth quarter as the firm announced disappointing revenue growth. The market also reacted negatively to NCR’s announced acquisition of Digital Insight, a leading provider of customer-facing digital banking software, due to concerns over the size
of the premium that NCR paid. Towards the end of the reporting period, the company released positive first quarter results, but declined on lower guidance for 2014. We have maintained our position in this company at period end. Shares of GameStop, a retailer of video games and computer entertainment software, fell sharply in January after management lowered earnings guidance. This guidance stemmed from an unfavorable change in the sales mix, with a strong increase in lower margin hardware displacing sales of higher margin software. However, as a new generation of video gaming consoles gain traction, we believe GameStop’s high margin software sales should increase, and we continue to hold our position in this company. ITT Educational Services, a provider of postsecondary degree programs in the United States, released weak fourth quarter 2013 results due largely to charges associated with losses under its private student loan programs. We exited our position during the reporting period.
STRATEGY & OUTLOOK
We remain optimistic about the economy and believe that, although there may be bumps along the road, the U.S. is on a path to sustainable recovery. As part of that view, we believe investment back into growth opportunities will benefit industrials, innovation and cyclical improvements should positively impact information technology, and attractive investment opportunities exist
4 OPPENHEIMER SMALL- & MID- CAP VALUE FUND
within health care. Conversely, we remain less sanguine about the outlook for materials. While we believe that global growth — particularly in emerging economies — may not decelerate further, we also believe it is unlikely to pick-up significantly in the near- to mid-term. Additionally, we remain cautious about the outlook for stocks with similar characteristics to bonds, such as real estate investment trusts (REITs) and utilities, as these would typically react negatively to any rise in interest rates. Management behavior towards the use of free cash flow guides our investment decisions, and our search for companies poised for an unanticipated acceleration in return on invested capital is our constant imperative.
| | |
 | |  |
| | Laton Spahr, CFA Portfolio Manager |
While many investors focus on a short-term view when considering potential investments, the Fund utilizes in-depth fundamental research to identify companies that we believe are poised for an unanticipated acceleration in return on invested capital over a multi-year time horizon. We believe this longer-term approach provides a more comprehensive outlook of potential investments by focusing on all three financial statements — income statement, balance sheet and statement of cash flows — and aids in finding companies whose generation and use of free cash flow we deem as yet to be fully reflected in the current stock price.
| | |
 | |  |
| | Eric Hewitt Portfolio Manager |
5 OPPENHEIMER SMALL- & MID- CAP VALUE FUND
Top Holdings and Allocations
| | | | |
TOP TEN COMMON STOCK HOLDINGS | |
Lazard Ltd., Cl. A | | | 2.5% | |
Eaton Corp. plc | | | 2.2 | |
Delta Air Lines, Inc. | | | 2.1 | |
Reinsurance Group of America, Inc., Cl. A | | | 1.9 | |
Newell Rubbermaid, Inc. | | | 1.9 | |
Boston Scientific Corp. | | | 1.5 | |
Timken Co. | | | 1.5 | |
Omnicare, Inc. | | | 1.4 | |
Synopsys, Inc. | | | 1.4 | |
NCR Corp. | | | 1.4 | |
Portfolio holdings and allocations are subject to change. Percentages are as of April 30, 2014, and are based on net assets. For more current Fund holdings, please visit oppenheimerfunds.com. | |
| | | | |
TOP TEN COMMON STOCK INDUSTRIES | |
Commercial Banks | | | 8.5% | |
Insurance | | | 7.3 | |
Capital Markets | | | 6.0 | |
Oil, Gas & Consumable Fuels | | | 5.8 | |
Machinery | | | 5.2 | |
Electrical Equipment | | | 4.4 | |
Household Durables | | | 4.0 | |
Health Care Equipment & Supplies | | | 3.9 | |
Real Estate Investment Trusts (REITs) | | | 3.7 | |
Multi-Utilities | | | 3.3 | |
Portfolio holdings and allocations are subject to change. Percentages are as of April 30, 2014, and are based on net assets. | |
SECTOR ALLOCATION
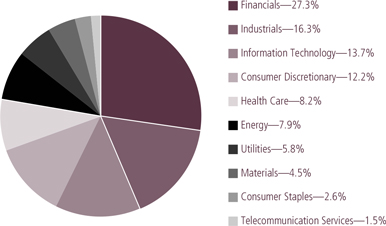
Portfolio holdings and allocations are subject to change. Percentages are as of April 30, 2014, and are based on the total market value of common stocks.
6 OPPENHEIMER SMALL- & MID- CAP VALUE FUND
Share Class Performance
AVERAGE ANNUAL TOTAL RETURNS WITHOUT SALES CHARGE AS OF 4/30/14
| | | | | | | | | | | | | | | | | | | | |
| | | Inception Date | | | 6-Month | | | 1-Year | | | 5-Year | | | 10-Year | |
Class A (QVSCX) | | | 1/3/89 | | | | 6.94% | | | | 23.78% | | | | 17.29% | | | | 8.32% | |
Class B (QSCBX) | | | 9/1/93 | | | | 6.50% | | | | 22.75% | | | | 16.33% | | | | 7.79% | |
Class C (QSCCX) | | | 9/1/93 | | | | 6.54% | | | | 22.85% | | | | 16.38% | | | | 7.48% | |
Class I (QSCIX) | | | 2/28/12 | | | | 7.15% | | | | 24.33% | | | | 17.57% | * | | | N/A | |
Class N (QSCNX) | | | 3/1/01 | | | | 6.81% | | | | 23.46% | | | | 16.98% | | | | 8.00% | |
Class Y (QSCYX) | | | 10/24/05 | | | | 7.17% | | | | 24.22% | | | | 17.68% | | | | 6.63% | * |
| | | | | | | | | | | | | | | | | | | | |
AVERAGE ANNUAL TOTAL RETURNS WITH SALES CHARGE AS OF 4/30/14 | |
| | | Inception Date | | | 6-Month | | | 1-Year | | | 5-Year | | | 10-Year | |
Class A (QVSCX) | | | 1/3/89 | | | | 0.78% | | | | 16.67% | | | | 15.91% | | | | 7.68% | |
Class B (QSCBX) | | | 9/1/93 | | | | 1.50% | | | | 17.75% | | | | 16.11% | | | | 7.79% | |
Class C (QSCCX) | | | 9/1/93 | | | | 5.54% | | | | 21.85% | | | | 16.38% | | | | 7.48% | |
Class I (QSCIX) | | | 2/28/12 | | | | 7.15% | | | | 24.33% | | | | 17.57% | * | | | N/A | |
Class N (QSCNX) | | | 3/1/01 | | | | 5.81% | | | | 22.46% | | | | 16.98% | | | | 8.00% | |
Class Y (QSCYX) | | | 10/24/05 | | | | 7.17% | | | | 24.22% | | | | 17.68% | | | | 6.63% | * |
* Shows performance since inception.
Performance data quoted represents past performance, which does not guarantee future results. The investment return and principal value of an investment in the Fund will fluctuate so that an investor’s shares, when redeemed, may be worth more or less than their original cost. Current performance may be lower or higher than the performance quoted. Returns do not consider capital gains or income taxes on an individual’s investment. For performance data current to the most recent month-end, visit oppenheimerfunds.com or call 1.800.CALL OPP (225.5677). Fund returns include changes in share price, reinvested distributions, and the applicable sales charge: for Class A shares, the current maximum initial sales charge of 5.75%; for Class B shares, the contingent deferred sales charge of 5% (1-year) and 2% (5-year); and for Class C and N shares, the 1% contingent deferred sales charge for the 1-year period. There is no sales charge for Class I and Class Y shares. Because Class B shares convert to Class A shares 72 months after purchase, the 10-year return for Class B shares uses Class A performance for the period after conversion. Returns for periods of less than one year are cumulative and not annualized.
The Fund’s performance is compared to that of the Russell 2000 Index, the Russell 2500 Index and the Russell 2500 Value Index. The Russell 2000 Index is an unmanaged index of small-capitalization stocks. The Russell 2500 Index measures the performance of the small to mid-cap segment of the U.S. equity universe, commonly referred to as “smid” cap. The Russell 2500 Value Index measures the performance of the small to mid-cap value segment of the U.S. equity universe. It includes those Russell 2500 Index companies with lower price-to-book ratios and lower forecasted growth values. The Indices are unmanaged and cannot be purchased directly by investors. While index comparisons may be useful to provide a benchmark for the Fund’s performance, it must be noted that the Fund’s investments are not
7 OPPENHEIMER SMALL- & MID- CAP VALUE FUND
limited to the investments comprising the Index. Index performance includes reinvestment of income, but does not reflect transaction costs, fees, expenses or taxes. Index performance is shown for illustrative purposes only as a benchmark for the Fund’s performance, and does not predict or depict performance of the Fund. The Fund’s performance reflects the effects of the Fund’s business and operating expenses.
The Fund’s investment strategy and focus can change over time. The mention of specific fund holdings does not constitute a recommendation by OppenheimerFunds, Inc. or its affiliates.
Before investing in any of the Oppenheimer funds, investors should carefully consider a fund’s investment objectives, risks, charges and expenses. Fund prospectuses and summary prospectuses contain this and other information about the funds, and may be obtained by asking your financial advisor, visiting oppenheimerfunds.com, or calling 1.800.CALL OPP (225.5677). Read prospectuses and summary prospectuses carefully before investing.
Shares of Oppenheimer funds are not deposits or obligations of any bank, are not guaranteed by any bank, are not insured by the FDIC or any other agency, and involve investment risks, including the possible loss of the principal amount invested.
8 OPPENHEIMER SMALL- & MID- CAP VALUE FUND
Fund Expenses
Fund Expenses. As a shareholder of the Fund, you incur two types of costs: (1) transaction costs, which may include sales charges (loads) on purchase payments, contingent deferred sales charges on redemptions; and (2) ongoing costs, including management fees; distribution and service fees; and other Fund expenses. These examples are intended to help you understand your ongoing costs (in dollars) of investing in the Fund and to compare these costs with the ongoing costs of investing in other mutual funds.
The examples are based on an investment of $1,000.00 invested at the beginning of the period and held for the entire 6-month period ended April 30, 2014.
Actual Expenses. The first section of the table provides information about actual account values and actual expenses. You may use the information in this section for the class of shares you hold, together with the amount you invested, to estimate the expense that you paid over the period. Simply divide your account value by $1,000.00 (for example, an $8,600.00 account value divided by $1,000.00 = 8.60), then multiply the result by the number in the first section under the heading entitled “Expenses Paid During Period” to estimate the expenses you paid on your account during this period.
Hypothetical Example for Comparison Purposes. The second section of the table provides information about hypothetical account values and hypothetical expenses based on the Fund’s actual expense ratio for each class of shares, and an assumed rate of return of 5% per year for each class before expenses, which is not the actual return. The hypothetical account values and expenses may not be used to estimate the actual ending account balance or expenses you paid for the period. You may use this information to compare the ongoing costs of investing in the Fund and other funds. To do so, compare this 5% hypothetical example for the class of shares you hold with the 5% hypothetical examples that appear in the shareholder reports of the other funds.
Please note that the expenses shown in the table are meant to highlight your ongoing costs only and do not reflect any transactional costs, such as front-end or contingent deferred sales charges (loads). Therefore, the “hypothetical” section of the table is useful in comparing ongoing costs only, and will not help you determine the relative total costs of owning different funds. In addition, if these transactional costs were included, your costs would have been higher.
9 OPPENHEIMER SMALL- & MID- CAP VALUE FUND
| | | | | | | | | | | | |
| Actual | | Beginning
Account Value
November 1, 2013 | | | Ending
Account Value
April 30, 2014 | | | Expenses
Paid During
6 Months Ended
April 30, 2014 | |
Class A | | $ | 1,000.00 | | | $ | 1,069.40 | | | $ | 6.07 | |
Class B | | | 1,000.00 | | | | 1,065.00 | | | | 10.24 | |
Class C | | | 1,000.00 | | | | 1,065.40 | | | | 9.93 | |
Class I | | | 1,000.00 | | | | 1,071.50 | | | | 3.91 | |
Class N | | | 1,000.00 | | | | 1,068.10 | | | | 7.56 | |
Class Y | | | 1,000.00 | | | | 1,071.70 | | | | 3.91 | |
| | | |
Hypothetical (5% return before expenses) | | | | | | | | | |
Class A | | | 1,000.00 | | | | 1,018.94 | | | | 5.92 | |
Class B | | | 1,000.00 | | | | 1,014.93 | | | | 9.99 | |
Class C | | | 1,000.00 | | | | 1,015.22 | | | | 9.69 | |
Class I | | | 1,000.00 | | | | 1,021.03 | | | | 3.82 | |
Class N | | | 1,000.00 | | | | 1,017.50 | | | | 7.38 | |
Class Y | | | 1,000.00 | | | | 1,021.03 | | | | 3.82 | |
Expenses are equal to the Fund’s annualized expense ratio for that class, multiplied by the average account value over the period, multiplied by 181/365 (to reflect the one-half year period). Those annualized expense ratios, excluding indirect expenses from affiliated funds, based on the 6-month period ended April 30, 2014 are as follows:
| | | | | | |
| Class | | Expense Ratios | | | |
Class A | | | 1.18 | % | | |
Class B | | | 1.99 | | | |
Class C | | | 1.93 | | | |
Class I | | | 0.76 | | | |
Class N | | | 1.47 | | | |
Class Y | | | 0.76 | | | |
The expense ratios reflect voluntary and/or contractual waivers and/or reimbursements of expenses by the Fund’s Manager and Transfer Agent. Some of these undertakings may be modified or terminated at any time, as indicated in the Fund’s prospectus. The “Financial Highlights” tables in the Fund’s financial statements, included in this report, also show the gross expense ratios, without such waivers or reimbursements and reduction to custodian expenses, if applicable.
10 OPPENHEIMER SMALL- & MID- CAP VALUE FUND
| | | | |
| |
| STATEMENT OF INVESTMENTS April 30, 2014 Unaudited | | |
| | | | | | | | | | | | |
| | | Shares | | | | | Value | | | |
| | | |
Common Stocks—98.7% | | | | | | | | | | | | |
| | | |
Consumer Discretionary—12.0% | | | | | | | | | | | | |
| | | |
Auto Components—1.9% | | | | | | | | | | | | |
BorgWarner, Inc. | | | 273,070 | | | | | $ | 16,968,570 | | | |
| | | |
Dana Holding Corp. | | | 677,800 | | | | | | 14,349,026 | | | |
| | | | | | | | | | | | |
| | | | | | | | | 31,317,596 | | | |
| | | |
| Diversified Consumer Services—1.8% | | | |
Apollo Education Group, Inc.1 | | | 451,660 | | | | | | 13,034,908 | | | |
| | | |
H&R Block, Inc. | | | 607,250 | | | | | | 17,258,045 | | | |
| | | | | | | | | | | | |
| | | | | | | | | 30,292,953 | | | |
| | | |
Household Durables—4.0% | | | | | | | | | | | | |
Leggett & Platt, Inc. | | | 376,440 | | | | | | 12,369,819 | | | |
| | | |
Lennar Corp., Cl. A | | | 317,420 | | | | | | 12,249,238 | | | |
| | | |
Newell Rubbermaid, Inc. | | | 1,032,510 | | | | | | 31,088,876 | | | |
| | | |
PulteGroup, Inc. | | | 580,260 | | | | | | 10,670,981 | | | |
| | | | | | | | | | | | |
| | | | | | | | | 66,378,914 | | | |
| | | | | | | | | | | | |
| | | |
Leisure Products—0.6% | | | | | | | | | | | | |
Hasbro, Inc. | | | 187,390 | | | | | | 10,355,171 | | | |
| | | | | | | | | | | | |
| | | |
Media—2.4% | | | | | | | | | | | | |
Cinemark Holdings, Inc. | | | 258,050 | | | | | | 7,643,441 | | | |
| | | |
Gannett Co., Inc. | | | 300,170 | | | | | | 8,155,619 | | | |
| | | |
Interpublic Group of Cos., Inc. (The) | | | 493,720 | | | | | | 8,600,603 | | | |
| | | |
National CineMedia, Inc. | | | 576,023 | | | | | | 8,749,789 | | | |
| | | |
Regal Entertainment Group, Cl. A | | | 367,480 | | | | | | 6,908,624 | | | |
| | | | | | | | | | | | |
| | | | | | | | | 40,058,076 | | | |
| | | | | | | | | | | | |
| | | |
Specialty Retail—1.3% | | | | | | | | | | | | |
GameStop Corp., Cl. A | | | 366,722 | | | | | | 14,551,529 | | | |
| | | |
Office Depot, Inc.1 | | | 1,837,215 | | | | | | 7,514,209 | | | |
| | | | | | | | | | | | |
| | | | | | | | | 22,065,738 | | | |
| | | |
Consumer Staples—2.5% | | | | | | | | | | | | |
| | | |
Beverages—0.6% | | | | | | | | | | | | |
Cott Corp. | | | 1,326,060 | | | | | | 10,767,607 | | | |
| | | | | | | | | | | | |
| | | |
Food Products—0.7% | | | | | | | | | | | | |
B&G Foods, Inc. | | | 184,205 | | | | | | 6,041,924 | | | |
| | | |
J.M. Smucker Co. (The) | | | 60,320 | | | | | | 5,831,738 | | | |
| | | | | | | | | | | | |
| | | | | | | | | 11,873,662 | | | |
| | | | | | | | | | |
| | | Shares | | | | | Value | |
Tobacco—1.2% | | | | | | | | | | |
Lorillard, Inc. | | | 336,234 | | | | | $ | 19,979,024 | |
| | | | | | | | | | |
Energy—7.8% | | | | | | | | | | |
Energy Equipment & Services—2.0% | | | | | | | | | | |
Diamond Offshore Drilling, Inc. | | | 228,910 | | | | | | 12,500,775 | |
Noble Corp. plc | | | 443,310 | | | | | | 13,658,381 | |
Oceaneering International, Inc. | | | 98,795 | | | | | | 7,239,698 | |
| | | | | | | | | | |
| | | | | | | | | 33,398,854 | |
| | | | | | | | | | |
Oil, Gas & Consumable Fuels—5.8% | | | | | | | | | | |
Cameco Corp. | | | 674,650 | | | | | | 14,363,298 | |
Cimarex Energy Co. | | | 86,780 | | | | | | 10,337,234 | |
EQT Corp. | | | 115,210 | | | | | | 12,556,738 | |
HollyFrontier Corp. | | | 196,750 | | | | | | 10,347,082 | |
Kodiak Oil & Gas Corp.1 | | | 632,550 | | | | | | 8,039,711 | |
QEP Resources, Inc. | | | 201,200 | | | | | | 6,174,828 | |
Southwestern Energy Co.1 | | | 175,253 | | | | | | 8,391,114 | |
Tesoro Corp. | | | 184,080 | | | | | | 10,361,863 | |
Whiting Petroleum Corp.1 | | | 212,560 | | | | | | 15,669,923 | |
| | | | | | | | | | |
| | | | | | | | | 96,241,791 | |
| | | | | | | | | | |
Financials—27.0% | | | | | | | | | | |
Capital Markets—6.0% | | | | | | | | | | |
Federated Investors, Inc., Cl. B | | | 261,769 | | | | | | 7,470,887 | |
Invesco Ltd. | | | 650,324 | | | | | | 22,897,908 | |
Lazard Ltd., Cl. A | | | 875,526 | | | | | | 41,193,498 | |
Legg Mason, Inc. | | | 251,412 | | | | | | 11,788,709 | |
Raymond James Financial, Inc. | | | 337,790 | | | | | | 16,788,163 | |
| | | | | | | | | | |
| | | | | | | | | 100,139,165 | |
| | | | | | | | | | |
Commercial Banks—8.5% | | | | | | | | | | |
Associated Banc-Corp. | | | 474,530 | | | | | | 8,328,001 | |
Bank of the Ozarks, Inc. | | | 179,910 | | | | | | 10,776,609 | |
Boston Private Financial Holdings, Inc. | | | 552,040 | | | | | | 6,906,020 | |
CIT Group, Inc. | | | 423,000 | | | | | | 18,210,150 | |
East West Bancorp, Inc. | | | 525,090 | | | | | | 18,120,856 | |
First NBC Bank Holding Co.1 | | | 350,850 | | | | | | 10,911,435 | |
Huntington Bancshares, Inc. | | | 1,963,700 | | | | | | 17,987,492 | |
KeyCorp | | | 1,322,770 | | | | | | 18,042,583 | |
11 OPPENHEIMER SMALL- & MID- CAP VALUE FUND
| | | | |
| |
STATEMENT OF INVESTMENTS Unaudited / Continued | | |
| | | | | | | | |
| | | Shares | | | | Value | |
| | | | | | | | | |
Commercial Banks (Continued) | |
| | | | | | | | | |
OFG Bancorp | | | 378,135 | | | $ | 6,450,983 | |
| | | | | | | | | |
SunTrust Banks, Inc. | | | 366,350 | | | | 14,016,551 | |
| | | | | | | | | |
TCF Financial Corp. | | | 765,815 | | | | 12,023,296 | |
| | | | | | | | |
| | | | 141,773,976 | |
| | | | | |
| | | | | | | | | |
Consumer Finance—1.1% | | | | | | | | |
SLM Corp. | | | 726,810 | | | | 18,715,357 | |
| | | | | | | | |
| | | | | | | | | |
Insurance—7.3% | | | | | | | | |
Everest Re Group Ltd. | | | 46,580 | | | | 7,361,037 | |
| | | | | | | | | |
Fidelity National Financial, Inc., Cl. A | | | 464,151 | | | | 14,936,379 | |
| | | | | | | | | |
Genworth Financial, Inc., Cl. A1 | | | 1,042,020 | | | | 18,600,057 | |
| | | | | | | | | |
Lincoln National Corp. | | | 274,410 | | | | 13,311,629 | |
| | | | | | | | | |
Reinsurance Group of America, Inc., Cl. A | | | 416,260 | | | | 31,931,305 | |
| | | | | | | | | |
Unum Group | | | 488,850 | | | | 16,239,597 | |
| | | | | | | | | |
Validus Holdings Ltd. | | | 526,750 | | | | 19,526,623 | |
| | | | | | | | |
| | | | 121,906,627 | |
| | | | | |
| | | | | | | | | |
Real Estate Investment Trusts (REITs)—3.7% | |
Aviv REIT, Inc. | | | 399,070 | | | | 10,531,457 | |
| | | | | | | | | |
CubeSmart | | | 225,260 | | | | 4,189,836 | |
| | | | | | | | | |
Equity Lifestyle Properties, Inc. | | | 251,730 | | | | 10,539,935 | |
| | | | | | | | | |
LaSalle Hotel Properties | | | 383,474 | | | | 12,685,320 | |
| | | | | | | | | |
Omega Healthcare Investors, Inc. | | | 472,861 | | | | 16,446,106 | |
| | | | | | | | | |
Retail Opportunity Investments Corp. | | | 402,027 | | | | 6,287,702 | |
| | | | | | | | |
| | | | 60,680,356 | |
| | | | | |
| | | | | | | | | |
Thrifts & Mortgage Finance—0.4% | |
Essent Group Ltd.1 | | | 382,590 | | | | 7,211,822 | |
| | | | | | | | |
| | | | | | | |
| | | | | | | | | |
Health Care—8.1% | | | | | | | | |
| | | | | | | | | |
Health Care Equipment & Supplies—3.9% | |
Boston Scientific Corp.1 | | | 2,030,237 | | | | 25,601,289 | |
| | | | | | | | | |
Cooper Cos., Inc. (The) | | | 32,200 | | | | 4,247,502 | |
| | | | | | | | | |
Teleflex, Inc. | | | 207,417 | | | | 21,175,201 | |
| | | | | | | | | | |
| | | | | | Shares | | | | Value | |
| | | |
| | Health Care Equipment & Supplies (Continued) | |
| | | |
| | Zimmer Holdings, Inc. | | | 145,820 | | | $ | 14,115,376 | |
| | | | | | | | | | |
| | | | | | 65,139,368 | |
| | | |
| | Health Care Providers & Services—3.0% | |
| | Humana, Inc. | | | 162,210 | | | | 17,802,548 | |
| | | |
| | Omnicare, Inc. | | | 395,961 | | | | 23,468,608 | |
| | | |
| | Universal Health Services, Inc., Cl. B | | | 100,591 | | | | 8,227,338 | |
| | | | | | | | | | |
| | | | | | 49,498,494 | |
| | | |
| | Health Care Technology—0.7% | |
| | MedAssets, Inc.1 | | | 489,360 | | | | 11,172,089 | |
| | | | | | | | | | |
| | | |
| | Pharmaceuticals—0.5% | | | | | | | | |
| | Hospira, Inc.1 | | | 196,970 | | | | 9,021,226 | |
| | | | | | | | | | |
| | | |
| | Industrials—16.1% | | | | | | | | |
| | | |
| | Aerospace & Defense—1.4% | | | | | | | | |
| | L-3 Communications Holdings, Inc. | | | 122,930 | | | | 14,182,434 | |
| | | |
| | Raytheon Co. | | | 89,170 | | | | 8,513,952 | |
| | | | | | | | | | |
| | | | | | 22,696,386 | |
| | | | | | | |
| | | |
| | Airlines—2.1% | | | | | | | | |
| | Delta Air Lines, Inc. | | | 952,422 | | | | 35,077,702 | |
| | | | | | | | | | |
| | | |
| | Building Products—0.5% | | | | | | | | |
| | Masco Corp. | | | 434,886 | | | | 8,736,860 | |
| | | | | | | | | | |
| | | |
| | Commercial Services & Supplies—1.3% | |
| | ACCO Brands Corp.1 | | | 1,523,540 | | | | 9,339,300 | |
| | | |
| | Deluxe Corp. | | | 231,210 | | | | 12,704,990 | |
| | | | | | | | | | |
| | | | | | 22,044,290 | |
| | | | | | | |
| | | |
| | Construction & Engineering—0.4% | |
| | Chicago Bridge & Iron Co. NV | | | 88,520 | | | | 7,087,796 | |
| | | | | | | | | | |
| | | |
| | Electrical Equipment—4.4% | | | | | | | | |
| | Eaton Corp. plc | | | 504,810 | | | | 36,669,398 | |
| | | |
| | Hubbell, Inc., Cl. B | | | 129,510 | | | | 15,245,917 | |
| | | |
| | Rockwell Automation, Inc. | | | 173,920 | | | | 20,727,786 | |
| | | | | | | | | | |
| | | | | | 72,643,101 | |
| | | | | | | |
| | | |
| | | Machinery—5.2% | | | | | | | | |
| | | Oshkosh Corp. | | | 349,180 | | | | 19,382,982 | |
| | |
| | | | |
| | | Parker Hannifin Corp. | | | 180,100 | | | | 22,851,088 | |
| | |
| | | | |
| | | Pentair Ltd. | | | 209,730 | | | | 15,580,842 | |
| | | | |
| | | Sun Hydraulics Corp. | | | 105,640 | | | | 4,318,563 | |
12 OPPENHEIMER SMALL- & MID- CAP VALUE FUND
| | | | | | | | | | |
| | | | Shares | | | | Value | | | |
Machinery (Continued) | | | |
Timken Co. | | | 404,420 | | | $ | 25,510,813 | | | |
| | | | | | | | | | |
| | | | | | | 87,644,288 | | | |
| | | | | | | | | | |
Trading Companies & Distributors—0.8% | | | | | | | |
HD Supply Holdings, Inc.1 | | | 492,860 | | | | 12,705,931 | | | |
| | | | | | | | | | |
Information Technology—13.6% | | | |
Electronic Equipment, Instruments, & Components—1.7% | | | |
Anixter International, Inc. | | | 162,219 | | | | 15,894,218 | | | |
Dolby Laboratories, Inc., Cl. A1 | | | 300,320 | | | | 11,967,752 | | | |
| | | | | | | | | | |
| | | | | | | 27,861,970 | | | |
| | | | | | | | | | |
Internet Software & Services—0.5% | | | |
IAC/InterActiveCorp | | | 128,960 | | | | 8,547,469 | | | |
| | | | | | | | | | | |
IT Services—2.4% | | | | | | | | | | |
Sapient Corp.1 | | | 611,730 | | | | 9,952,847 | | | |
VeriFone Systems, Inc.1 | | | 441,330 | | | | 14,758,075 | | | |
Western Union Co. | | | 925,570 | | | | 14,688,796 | | | |
| | | | | | | | | | |
| | | | | | | 39,399,718 | | | |
| | | | | | | | | | |
Semiconductors & Semiconductor Equipment—3.2% | | | |
Analog Devices, Inc. | | | 240,250 | | | | 12,322,422 | | | |
Microchip Technology, Inc. | | | 144,849 | | | | 6,886,121 | | | |
ON Semiconductor Corp.1 | | | 1,139,460 | | | | 10,722,319 | | | |
Skyworks Solutions, Inc.1 | | | 281,680 | | | | 11,562,964 | | | |
Spansion, Inc., Cl. A1 | | | 673,690 | | | | 12,011,893 | | | |
| | | | | | | | | | |
| | | | 53,505,719 | | | |
| | | | | | | |
Software—2.9% | | | | | | | | | | |
CA, Inc. | | | 546,400 | | | | 16,468,496 | | | |
Citrix Systems, Inc.1 | | | 145,820 | | | | 8,648,584 | | | |
Synopsys, Inc.1 | | | 618,030 | | | | 23,250,289 | | | |
| | | | | | | | | | |
| | | | 48,367,369 | | | |
| | | | | | | |
Technology Hardware, Storage & Peripherals—2.9% | | | |
NCR Corp.1 | | | 761,740 | | | | 23,240,687 | | | |
Seagate Technology plc | | | 244,540 | | | | 12,857,913 | | | |
| | | | | | | | | | |
| | | | | | | | | | |
| | | | | | | | |
| | | | Shares | | | | Value | |
Technology Hardware, Storage & Peripherals (Continued) | |
Western Digital Corp. | | | 142,360 | | | $ | 12,546,187 | |
| | | | | | | | |
| | | | 48,644,787 | |
| | | | | | | | | |
Materials—4.5% | | | | | | | | |
Chemicals—1.4% | | | | | | | | |
PPG Industries, Inc. | | | 73,000 | | | | 14,134,260 | |
Westlake Chemical Corp. | | | 125,140 | | | | 8,909,968 | |
| | | | | | | | |
| | | | 23,044,228 | |
| | | | | | | | | |
Containers & Packaging—1.2% | | | | | | | | |
Ball Corp. | | | 261,770 | | | | 14,708,856 | |
Rock-Tenn Co., Cl. A | | | 62,280 | | | | 5,954,591 | |
| | | | | | | | |
| | | | 20,663,447 | |
| | | | | |
| | |
Metals & Mining—1.1% | | | | | | | | |
Nucor Corp. | | | 146,470 | | | | 7,579,822 | |
Steel Dynamics, Inc. | | | 565,350 | | | | 10,328,945 | |
| | | | | | | | |
| | | | 17,908,767 | |
| | | | | |
| | |
Paper & Forest Products—0.8% | | | | | | | | |
Louisiana-Pacific Corp.1 | | | 789,420 | | | | 12,938,594 | |
| | | | | | | | | |
Telecommunication Services—1.4% | |
Diversified Telecommunication Services—1.4% | |
Frontier Communications Corp. | | | 1,981,160 | | | | 11,787,902 | |
Windstream Holdings, Inc. | | | 1,356,990 | | | | 12,307,899 | |
| | | | | | | | |
| | | | 24,095,801 | |
| | | | | |
| | |
Utilities—5.7% | | | | | | | | |
Electric Utilities—1.5% | | | | | | | | |
Entergy Corp. | | | 166,982 | | | | 12,106,195 | |
Pepco Holdings, Inc. | | | 481,430 | | | | 12,883,067 | |
| | | | | | | | |
| | | | 24,989,262 | |
| | | | | |
| |
Gas Utilities—0.9% | | | | | | | | |
Questar Corp. | | | 625,360 | | | | 15,183,741 | |
| | | | | | | | |
Multi-Utilities—3.3% | | | | | | | | |
Alliant Energy Corp. | | | 237,730 | | | | 13,902,450 | |
Ameren Corp. | | | 273,360 | | | | 11,292,502 | |
Avista Corp. | | | 221,550 | | | | 7,122,833 | |
DTE Energy Co. | | | 211,560 | | | | 16,531,298 | |
13 OPPENHEIMER SMALL- & MID- CAP VALUE FUND
|
|
| STATEMENT OF INVESTMENTS Unaudited / Continued |
| | | | | | | | |
| | | | Shares | | | | Value | |
Multi-Utilities (Continued) | |
Vectren Corp. | | | 148,272 | | | $ | 6,015,395 | |
| | | | | | | | |
| | | | 54,864,478 | |
| | | | | | | | |
Total Common Stocks (Cost $1,331,062,327) | | | | | | | 1,646,639,570 | |
| | | | | | | | |
Investment Company—1.1% | | | | | | | | |
Oppenheimer Institutional Money Market Fund, Cl. E, 0.08%2,3 (Cost $17,761,767) | | | 17,761,767 | | | | 17,761,767 | |
Total Investments, at Value (Cost $1,348,824,094) | | | 99.8 | % | | | 1,664,401,337 | |
Assets in Excess of Other Liabilities | | | 0.2 | | | | 3,111,585 | |
| | | | |
Net Assets | | | 100.0 | % | | $ | 1,667,512,922 | |
| | | | |
Footnotes to Statement of Investments
1. Non-income producing security.
2. Is or was an affiliate, as defined in the Investment Company Act of 1940, at or during the period ended April 30, 2014, by virtue of the Fund owning at least 5% of the voting securities of the issuer or as a result of the Fund and the issuer having the same investment adviser. Transactions during the period in which the issuer was an affiliate are as follows:
| | | | | | | | | | | | | | | | |
| | | Shares
October 31, 2013 | | | Gross
Additions | | | Gross
Reductions | | | Shares
April 30, 2014 | |
Oppenheimer Institutional Money Market Fund, Cl. E | | | 28,250,948 | | | | 155,385,506 | | | | 165,874,687 | | | | 17,761,767 | |
| | | | |
| | | | | | | | | Value | | | Income | |
Oppenheimer Institutional Money Market Fund, Cl. E | | | $ | 17,761,767 | | | $ | 7,611 | |
3. Rate shown is the 7-day yield as of April 30, 2014.
See accompanying Notes to Financial Statements.
14 OPPENHEIMER SMALL- & MID- CAP VALUE FUND
| | |
| |
STATEMENTOF ASSETS AND LIABILITIES APRIL 30, 2014 UNAUDITED | | |
| | | | |
| |
Assets | | | | |
Investments, at value—see accompanying statement of investments: | | | | |
Unaffiliated companies (cost $1,331,062,327) | | $ | 1,646,639,570 | |
Affiliated companies (cost $17,761,767) | | | 17,761,767 | |
| | | | |
| | | 1,664,401,337 | |
| |
Cash | | | 500,003 | |
| |
Receivables and other assets: | | | | |
Investments sold | | | 9,094,328 | |
Shares of beneficial interest sold | | | 891,417 | |
Dividends | | | 888,730 | |
Other | | | 214,411 | |
| | | | |
Total assets | | | 1,675,990,226 | |
| |
Liabilities | | | | |
Payables and other liabilities: | | | | |
Investments purchased | | | 4,914,633 | |
Shares of beneficial interest redeemed | | | 2,675,796 | |
Trustees’ compensation | | | 517,647 | |
Distribution and service plan fees | | | 333,565 | |
Shareholder communications | | | 16,556 | |
Other | | | 19,107 | |
| | | | |
Total liabilities | | | 8,477,304 | |
| |
Net Assets | | $ | 1,667,512,922 | |
| | | | |
|
| |
| |
Composition of Net Assets | | | | |
Par value of shares of beneficial interest | | $ | 383,509 | |
| |
Additional paid-in capital | | | 1,671,433,818 | |
| |
Accumulated net investment income | | | 332,414 | |
| |
Accumulated net realized loss on investments | | | (320,214,062) | |
| |
Net unrealized appreciation on investments | | | 315,577,243 | |
| | | | |
Net Assets | | $ | 1,667,512,922 | |
| | | | |
15 OPPENHEIMER SMALL- & MID- CAP VALUE FUND
| | |
| |
STATEMENTOF ASSETS AND LIABILITIES Unaudited / Continued | | |
| | | | |
Net Asset Value Per Share | | | | |
Class A Shares: | | | | |
Net asset value and redemption price per share (based on net assets of $1,154,349,370 and 25,544,489 shares of beneficial interest outstanding) | | $ | 45.19 | |
Maximum offering price per share (net asset value plus sales charge of 5.75% of offering price) | | $ | 47.95 | |
Class B Shares: | | | | |
| Net asset value, redemption price (excludes applicable contingent deferred sales charge) and offering price per share (based on net assets of $44,676,888 and 1,174,489 shares of beneficial interest outstanding) | | $ | 38.04 | |
Class C Shares: | | | | |
| Net asset value, redemption price (excludes applicable contingent deferred sales charge) and offering price per share (based on net assets of $285,272,490 and 7,487,649 shares of beneficial interest outstanding) | | $ | 38.10 | |
| Class I Shares: | | | | |
| Net asset value, redemption price and offering price per share (based on net assets of $211,129 and 4,597 shares of beneficial interest outstanding) | | $ | 45.93 | |
Class N Shares: | | | | |
| Net asset value, redemption price (excludes applicable contingent deferred sales charge) and offering price per share (based on net assets of $130,516,667 and 3,006,236 shares of beneficial interest outstanding) | | $ | 43.42 | |
Class Y Shares: | | | | |
| Net asset value, redemption price and offering price per share (based on net assets of $52,486,378 and 1,133,466 shares of beneficial interest outstanding) | | $ | 46.31 | |
See accompanying Notes to Financial Statements.
16 OPPENHEIMER SMALL- & MID- CAP VALUE FUND
| | | | |
| |
STATEMENTOF OPERATIONS For the Six Months Ended April 30, 2014 Unaudited | | |
| | | | | | |
Investment Income | | | | | | |
Dividends: | | | | | | |
Unaffiliated companies (net of foreign withholding taxes of $44,597) | | $ | 16,625,252 | | | |
Affiliated companies | | | 7,611 | | | |
| | | | | | | |
Interest | | | 129 | | | |
| | | | | | |
Total investment income | | | 16,632,992 | | | |
| | |
| | | | | | | |
Expenses | | | | | | |
Management fees | | | 5,669,766 | | | |
| | | | | | | |
Distribution and service plan fees: | | | | | | |
Class A | | | 1,412,665 | | | |
Class B | | | 233,291 | | | |
Class C | | | 1,395,246 | | | |
Class N | | | 323,324 | | | |
| | | | | | | |
Transfer and shareholder servicing agent fees: | | | | | | |
Class A | | | 1,376,624 | | | |
Class B | | | 88,975 | | | |
Class C | | | 324,264 | | | |
Class I | | | 15 | | | |
Class N | | | 175,752 | | | |
Class Y | | | 16,787 | | | |
| | | | | | | |
Shareholder communications: | | | | | | |
Class A | | | 5,884 | | | |
Class B | | | 457 | | | |
Class C | | | 1,611 | | | |
Class I | | | 20 | | | |
Class N | | | 169 | | | |
Class Y | | | 107 | | | |
| | | | | | | |
Trustees’ compensation | | | 18,615 | | | |
| | | | | | | |
Custodian fees and expenses | | | 4,573 | | | |
| | | | | | | |
Other | | | 76,776 | | | |
| | | |
Total expenses | | | 11,124,921 | | | |
Less waivers and reimbursements of expenses | | | (31,181 | ) | | |
| | | |
Net expenses | | | 11,093,740 | | | |
| | | | | | | |
Net Investment Income | | | 5,539,252 | | | |
| | | | | | | |
Realized and Unrealized Gain | | | | | | |
Net realized gain on investments | | | 56,486,684 | | | |
| | | | | | | |
Net change in unrealized appreciation/depreciation on investments | | | 47,605,103 | | | |
| | | | | | | |
Net Increase in Net Assets Resulting from Operations | | $ | 109,631,039 | | | |
| | | |
See accompanying Notes to Financial Statements.
17 OPPENHEIMER SMALL- & MID- CAP VALUE FUND
| | | | |
| |
STATEMENTSOF CHANGES IN NET ASSETS | | |
| | | | | | | | |
| | | Six Months Ended
April 30, 2014
(Unaudited) | | | Year Ended
October 31, 2013 | |
Operations | | | | | | | | |
Net investment income | | $ | 5,539,252 | | | $ | 7,137,698 | |
Net realized gain | | | 56,486,684 | | | | 369,113,955 | |
Net change in unrealized appreciation/depreciation | | | 47,605,103 | | | | 78,759,113 | |
Net increase in net assets resulting from operations | | | 109,631,039 | | | | 455,010,766 | |
| | |
| | | | | | | | | |
Dividends and/or Distributions to Shareholders | | | | | | | | |
Dividends from net investment income: | | | | | | | | |
Class A | | | (9,844,580 | ) | | | (840,861) | |
Class B | | | (29,938 | ) | | | — | |
Class C | | | (528,030 | ) | | | — | |
Class I | | | (1,652 | ) | | | — | |
Class N | | | (661,671 | ) | | | — | |
Class Y | | | (687,010 | ) | | | (235,182) | |
| | | (11,752,881 | ) | | | (1,076,043) | |
| | |
| | | | | | | | | |
Beneficial Interest Transactions | | | | | | | | |
Net increase (decrease) in net assets resulting from beneficial interest transactions: | | | | | | | | |
Class A | | | (75,052,658 | ) | | | (84,634,225) | |
Class B | | | (7,198,227 | ) | | | (18,908,898) | |
Class C | | | (8,647,907 | ) | | | (32,813,044) | |
Class I | | | 114,520 | | | | 76,697 | |
Class N | | | (7,628,006 | ) | | | (41,636,313) | |
Class Y | | | 38,056 | | | | (29,512,040) | |
| | | (98,374,222 | ) | | | (207,427,823) | |
| | |
| | | | | | | | | |
Net Assets | | | | | | | | |
| Total increase (decrease) | | | (496,064 | ) | | | 246,506,900 | |
| Beginning of period | | | 1,668,008,986 | | | | 1,421,502,086 | |
| | |
| End of period (including accumulated net investment income of $332,414 and $6,546,043, respectively) | | $ | 1,667,512,922 | | | $ | 1,668,008,986 | |
| | | | | | | | |
| | | | | | | | |
| | | | | | | | |
See accompanying Notes to Financial Statements.
18 OPPENHEIMER SMALL- & MID- CAP VALUE FUND
| | | | | | | | | | | | | | | | | | | | | | | | |
| Class A | | Six Months
Ended
April 30, 2014
(Unaudited) | | | Year Ended
October 31,
2013 | | | Year Ended
October 31,
2012 | | | Year Ended
October 31,
2011 | | | Year Ended
October 29,
20101 | | | Year Ended
October 31,
2009 | |
Per Share Operating Data | | | | | | | | | | | | | | | | | | | | | | | | |
Net asset value, beginning of period | | | $ 42.63 | | | | $ 31.33 | | | | $ 30.05 | | | | $ 29.44 | | | | $ 24.35 | | | | $ 19.90 | |
Income (loss) from investment operations: | | | | | | | | | | | | | | | | | | | | | | | | |
Net investment income (loss)2 | | | 0.18 | | | | 0.24 | | | | 0.07 | | | | 0.03 | | | | (0.03) | | | | 0.03 | |
Net realized and unrealized gain | | | 2.75 | | | | 11.09 | | | | 1.21 | | | | 0.58 | | | | 5.12 | | | | 4.43 | |
Total from investment operations | | | 2.93 | | | | 11.33 | | | | 1.28 | | | | 0.61 | | | | 5.09 | | | | 4.46 | |
Dividends and/or distributions to shareholders: | | | | | | | | | | | | | | | | | | | | | | | | |
Dividends from net investment income | | | (0.37) | | | | (0.03) | | | | 0.00 | | | | 0.00 | | | | 0.00 | | | | 0.00 | |
Tax return of capital distribution | | | 0.00 | | | | 0.00 | | | | 0.00 | | | | 0.00 | | | | 0.00 | | | | (0.01) | |
Total dividends and/or distributions to shareholders | | | (0.37) | | | | (0.03) | | | | 0.00 | | | | 0.00 | | | | 0.00 | | | | (0.01) | |
Net asset value, end of period | | | $ 45.19 | | | | $ 42.63 | | | | $ 31.33 | | | | $ 30.05 | | | | $ 29.44 | | | | $ 24.35 | |
| | | | |
Total Return, at Net Asset Value3 | | | 6.94% | | | | 36.16% | | | | 4.26% | | | | 2.07% | | | | 20.90% | | | | 22.43% | |
Ratios/Supplemental Data | | | | | | | | | | | | | | | | | | | | | | | | |
Net assets, end of period (in thousands) | | | $ 1,154,349 | | | | $ 1,162,455 | | | | $ 938,427 | | | | $ 1,250,055 | | | | $ 1,573,085 | | | | $ 1,604,830 | |
Average net assets (in thousands) | | | $ 1,160,354 | | | | $ 1,013,781 | | | | $ 1,099,549 | | | | $ 1,527,052 | | | | $ 1,642,391 | | | | $ 1,421,837 | |
Ratios to average net assets:4 | | | | | | | | | | | | | | | | | | | | | | | | |
Net investment income (loss) | | | 0.83% | | | | 0.65% | | | | 0.24% | | | | 0.11% | | | | (0.13)% | | | | 0.13% | |
Total expenses5 | | | 1.18% | | | | 1.27% | | | | 1.31% | | | | 1.26% | | | | 1.29% | | | | 1.46% | |
| Expenses after payments, waivers and/or reimbursements and reduction to custodian expenses | | | 1.18% | | | | 1.27% | | | | 1.26% | | | | 1.25% | | | | 1.28% | | | | 1.32% | |
Portfolio turnover rate | | | 17% | | | | 128% | | | | 54% | | | | 89% | | | | 71% | | | | 99% | |
19 OPPENHEIMER SMALL- & MID- CAP VALUE FUND
| | |
| |
| FINANCIAL HIGHLIGHTS Continued | | |
1. October 29, 2010 represents the last business day of the Fund’s reporting period.
2. Per share amounts calculated based on the average shares outstanding during the period.
3. Assumes an initial investment on the business day before the first day of the fiscal period, with all dividends and distributions reinvested in additional shares on the reinvestment date, and redemption at the net asset value calculated on the last business day of the fiscal period. Sales charges are not reflected in the total returns. Total returns are not annualized for periods less than one full year. Returns do not reflect the deduction of taxes that a shareholder would pay on fund distributions or the redemption of fund shares.
4. Annualized for periods less than one full year.
5. Total expenses including indirect expenses from affiliated fund were as follows:
| | | | | | | | |
| | Six Months Ended April 30, 2014 | | | 1.18 | % | | |
| | Year Ended October 31, 2013 | | | 1.27 | % | | |
| | Year Ended October 31, 2012 | | | 1.31 | % | | |
| | Year Ended October 31, 2011 | | | 1.27 | % | | |
| | Year Ended October 29, 2010 | | | 1.29 | % | | |
| | Year Ended October 31, 2009 | | | 1.47 | % | | |
See accompanying Notes to Financial Statements.
20 OPPENHEIMER SMALL- & MID- CAP VALUE FUND
| | | | | | | | | | | | | | | | | | | | | | | | |
| Class B | | Six Months
Ended
April 30,
2014
(Unaudited) | | | Year Ended
October 31,
2013 | | | Year Ended
October 31,
2012 | | | Year Ended
October 31,
2011 | | | Year Ended
October 29,
20101 | | | Year Ended
October 31,
2009 | |
| |
Per Share Operating Data | | | | | | | | | | | | | | | | | | | | | | | | |
Net asset value, beginning of period | | $ | 35.74 | | | $ | 26.48 | | | $ | 25.60 | | | $ | 25.29 | | | $ | 21.08 | | | $ | 17.37 | |
| |
Income (loss) from investment operations: | | | | | | | | | | | | | | | | | | | | | | | | |
Net investment income (loss)2 | | | 0.01 | | | | (0.08) | | | | (0.15) | | | | (0.20) | | | | (0.22) | | | | (0.12) | |
Net realized and unrealized gain | | | 2.31 | | | | 9.34 | | | | 1.03 | | | | 0.51 | | | | 4.43 | | | | 3.84 | |
| | | | |
Total from investment operations | | | 2.32 | | | | 9.26 | | | | 0.88 | | | | 0.31 | | | | 4.21 | | | | 3.72 | |
| |
Dividends and/or distributions to shareholders: | | | | | | | | | | | | | | | | | | | | | | | | |
Dividends from net investment income | | | (0.02) | | | | 0.00 | | | | 0.00 | | | | 0.00 | | | | 0.00 | | | | 0.00 | |
Tax return of capital distribution | | | 0.00 | | | | 0.00 | | | | 0.00 | | | | 0.00 | | | | 0.00 | | | | (0.01) | |
| | | | |
Total dividends and/or distributions to shareholders | | | (0.02) | | | | 0.00 | | | | 0.00 | | | | 0.00 | | | | 0.00 | | | | (0.01) | |
| |
Net asset value, end of period | | $ | 38.04 | | | $ | 35.74 | | | $ | 26.48 | | | $ | 25.60 | | | $ | 25.29 | | | $ | 21.08 | |
| | | | |
|
| |
Total Return, at Net Asset Value3 | | | 6.50% | | | | 34.97% | | | | 3.44% | | | | 1.23% | | | | 19.97% | | | | 21.44% | |
| |
Ratios/Supplemental Data | | | | | | | | | | | | | | | | | | | | | | | | |
Net assets, end of period (in thousands) | | $ | 44,677 | | | $ | 48,927 | | | $ | 53,204 | | | $ | 85,100 | | | $ | 123,847 | | | $ | 135,576 | |
| |
Average net assets (in thousands) | | $ | 47,114 | | | $ | 48,518 | | | $ | 67,022 | | | $ | 113,687 | | | $ | 131,255 | | | $ | 123,578 | |
| |
Ratios to average net assets:4 | | | | | | | | | | | | | | | | | | | | | | | | |
Net investment income (loss) | | | 0.04% | | | | (0.25)% | | | | (0.57)% | | | | (0.71)% | | | | (0.91)% | | | | (0.67)% | |
Total expenses5 | | | 2.08% | | | | 2.35% | | | | 2.37% | | | | 2.30% | | | | 2.31% | | | | 2.49% | |
| Expenses after payments, waivers and/or reimbursements and reduction to custodian expenses | | | 1.99% | | | | 2.15% | | | | 2.09% | | | | 2.08% | | | | 2.07% | | | | 2.13% | |
| |
Portfolio turnover rate | | | 17% | | | | 128% | | | | 54% | | | | 89% | | | | 71% | | | | 99% | |
21 OPPENHEIMER SMALL- & MID- CAP VALUE FUND
| | |
| |
| FINANCIAL HIGHLIGHTS Continued | | |
1. October 29, 2010 represents the last business day of the Fund’s reporting period.
2. Per share amounts calculated based on the average shares outstanding during the period.
3. Assumes an initial investment on the business day before the first day of the fiscal period, with all dividends and distributions reinvested in additional shares on the reinvestment date, and redemption at the net asset value calculated on the last business day of the fiscal period. Sales charges are not reflected in the total returns. Total returns are not annualized for periods less than one full year. Returns do not reflect the deduction of taxes that a shareholder would pay on fund distributions or the redemption of fund shares.
4. Annualized for periods less than one full year.
5. Total expenses including indirect expenses from affiliated fund were as follows:
| | | | | | | | |
| | Six Months Ended April 30, 2014 | | | 2.08 | % | | |
| | Year Ended October 31, 2013 | | | 2.35 | % | | |
| | Year Ended October 31, 2012 | | | 2.37 | % | | |
| | Year Ended October 31, 2011 | | | 2.31 | % | | |
| | Year Ended October 29, 2010 | | | 2.31 | % | | |
| | Year Ended October 31, 2009 | | | 2.50 | % | | |
See accompanying Notes to Financial Statements.
22 OPPENHEIMER SMALL- & MID- CAP VALUE FUND
| | | | | | | | | | | | | | | | | | | | | | | | | | |
| Class C | | Six Months
Ended
April 30,
2014
(Unaudited) | | | Year Ended
October 31,
2013 | | | Year Ended
October 31,
2012 | | | Year Ended
October 31,
2011 | | | Year Ended
October 29,
20101 | | | Year Ended
October 31,
2009 | | | |
|
Per Share Operating Data | | | | | | | | | | | | | | | | | | | | | | | | | | |
Net asset value, beginning of period | | $ | 35.83 | | | $ | 26.52 | | | $ | 25.64 | | | $ | 25.32 | | | $ | 21.10 | | | $ | 17.38 | | | |
|
Income (loss) from investment operations: | | | | | | | | | | | | | | | | | | | | | | | | | | |
Net investment income (loss)2 | | | 0.01 | | | | (0.04) | | | | (0.14) | | | | (0.18) | | | | (0.21) | | | | (0.11) | | | |
Net realized and unrealized gain | | | 2.33 | | | | 9.35 | | | | 1.02 | | | | 0.50 | | | | 4.43 | | | | 3.84 | | | |
| | | |
Total from investment operations | | | 2.34 | | | | 9.31 | | | | 0.88 | | | | 0.32 | | | | 4.22 | | | | 3.73 | | | |
|
Dividends and/or distributions to shareholders: | | | | | | | | | | | | | | | | | | | | | | | | | | |
Dividends from net investment income | | | (0.07) | | | | 0.00 | | | | 0.00 | | | | 0.00 | | | | 0.00 | | | | 0.00 | | | |
Tax return of capital distribution | | | 0.00 | | | | 0.00 | | | | 0.00 | | | | 0.00 | | | | 0.00 | | | | (0.01) | | | |
| | | |
Total dividends and/or distributions to shareholders | | | (0.07) | | | | 0.00 | | | | 0.00 | | | | 0.00 | | | | 0.00 | | | | (0.01) | | | |
|
Net asset value, end of period | | $ | 38.10 | | | $ | 35.83 | | | $ | 26.52 | | | $ | 25.64 | | | $ | 25.32 | | | $ | 21.10 | | | |
| | | |
|
|
Total Return, at Net Asset Value3 | | | 6.54% | | | | 35.10% | | | | 3.43% | | | | 1.26% | | | | 20.00% | | | | 21.48% | | | |
|
|
Ratios/Supplemental Data | | | | | | | | | | | | | | | | | | | | | | | | | | |
Net assets, end of period (in thousands) | | $ | 285,273 | | | $ | 276,676 | | | $ | 234,237 | | | $ | 285,735 | | | $ | 334,710 | | | $ | 322,950 | | | |
|
Average net assets (in thousands) | | $ | 282,324 | | | $ | 252,028 | | | $ | 258,974 | | | $ | 336,244 | | | $ | 336,938 | | | $ | 291,243 | | | |
|
Ratios to average net assets:4 | | | | | | | | | | | | | | | | | | | | | | | | | | |
Net investment income (loss) | | | 0.08% | | | | (0.13)% | | | | (0.56)% | | | | (0.67)% | | | | (0.89)% | | | | (0.62)% | | | |
Total expenses5 | | | 1.93% | | | | 2.05% | | | | 2.08% | | | | 2.03% | | | | 2.07% | | | | 2.24% | | | |
| Expenses after payments, waivers and/or reimbursements and reduction to custodian expenses | | | 1.93% | | | | 2.05% | | | | 2.06% | | | | 2.02% | | | | 2.04% | | | | 2.08% | | | |
|
Portfolio turnover rate | | | 17% | | | | 128% | | | | 54% | | | | 89% | | | | 71% | | | | 99% | | | |
23 OPPENHEIMER SMALL- & MID- CAP VALUE FUND
| | | | |
| |
| FINANCIAL HIGHLIGHTS Continued | | |
| | |
| | 1. October 29, 2010 represents the last business day of the Fund’s reporting period. |
| | 2. Per share amounts calculated based on the average shares outstanding during the period. |
| | 3. Assumes an initial investment on the business day before the first day of the fiscal period, with all dividends and distributions reinvested in additional shares on the reinvestment date, and redemption at the net asset value calculated on the last business day of the fiscal period. Sales charges are not reflected in the total returns. Total returns are not annualized for periods less than one full year. Returns do not reflect the deduction of taxes that a shareholder would pay on fund distributions or the redemption of fund shares. |
| | 4. Annualized for periods less than one full year. |
| | 5. Total expenses including indirect expenses from affiliated fund were as follows: |
| | | | | | | | |
| | Six Months Ended April 30, 2014 | | | 1.93 | % | | |
| | Year Ended October 31, 2013 | | | 2.05 | % | | |
| | Year Ended October 31, 2012 | | | 2.08 | % | | |
| | Year Ended October 31, 2011 | | | 2.04 | % | | |
| | Year Ended October 29, 2010 | | | 2.07 | % | | |
| | Year Ended October 31, 2009 | | | 2.25 | % | | |
See accompanying Notes to Financial Statements.
24 OPPENHEIMER SMALL- & MID- CAP VALUE FUND
| | | | | | | | | | | | |
| | | Six Months
Ended
April 30, | | | Year Ended Period Ended | |
| Class I | | 2014
(Unaudited) | | | October 31,
2013 | | | October 31,
20121 | |
| |
Per Share Operating Data | | | | | | | | | | | | |
Net asset value, beginning of period | | $ | 43.64 | | | $ | 31.88 | | | $ | 32.90 | |
| |
| Income (loss) from investment operations: | | | | | | | | | | | | |
| Net investment income2 | | | 0.22 | | | | 0.49 | | | | 0.21 | |
| Net realized and unrealized gain (loss) | | | 2.86 | | | | 11.27 | | | | (1.23) | |
| | | | |
Total from investment operations | | | 3.08 | | | | 11.76 | | | | (1.02) | |
| |
| Dividends and/or distributions to shareholders: | | | | | | | | | | | | |
| Dividends from net investment income | | | (0.79 | ) | | | 0.00 | | | | 0.00 | |
Tax return of capital distribution | | | 0.00 | | | | 0.00 | | | | 0.00 | |
| Total dividends and/or distributions to shareholders | | | (0.79 | ) | | | 0.00 | | | | 0.00 | |
| |
Net asset value, end of period | | $ | 45.93 | | | $ | 43.64 | | | $ | 31.88 | |
| | | | |
| |
Total Return, at Net Asset Value3 | | | 7.15 | % | | | 36.85 | % | | | (3.07)% | |
| |
Ratios/Supplemental Data | | | | | | | | | | | | |
Net assets, end of period (in thousands) | | $ | 211 | | | $ | 95 | | | $ | 10 | |
| |
Average net assets (in thousands) | | $ | 102 | | | $ | 35 | | | $ | 422 | |
| |
Ratios to average net assets:4 | | | | | | | | | | | | |
Net investment income | | | 1.00% | | | | 1.23% | | | | 0.99% | |
Total expenses5 | | | 0.76% | | | | 0.77% | | | | 0.74% | |
| Expenses after payments, waivers and/or reimbursements and reduction to custodian expenses | | | 0.76% | | | | 0.77% | | | | 0.74% | |
| |
Portfolio turnover rate | | | 17% | | | | 128% | | | | 54% | |
1. For the period from February 28, 2012 (inception of offering) to October 31, 2012.
2. Per share amounts calculated based on the average shares outstanding during the period.
3. Assumes an initial investment on the business day before the first day of the fiscal period, with all dividends and distributions reinvested in additional shares on the reinvestment date, and redemption at the net asset value calculated on the last business day of the fiscal period. Sales charges are not reflected in the total returns. Total returns are not annualized for periods less than one full year. Returns do not reflect the deduction of taxes that a shareholder would pay on fund distributions or the redemption of fund shares.
4. Annualized for periods less than one full year.
5. Total expenses including indirect expenses from affiliated fund were as follows:
| | | | | | | | |
| | Six Months Ended April 30, 2014 | | | 0.76 | % | | |
| | Year Ended October 31, 2013 | | | 0.77 | % | | |
| | Period Ended October 31, 2012 | | | 0.74 | % | | |
See accompanying Notes to Financial Statements.
25 OPPENHEIMER SMALL- & MID- CAP VALUE FUND
| | | | |
| |
| FINANCIAL HIGHLIGHTS Continued | | |
| | | | | | | | | | | | | | | | | | | | | | | | |
| Class N | | Six Months
Ended
April 30,
2014
(Unaudited) | | | Year Ended
October 31,
2013 | | | Year Ended
October 31,
2012 | | | Year Ended
October 31,
2011 | | | Year Ended
October 29,
20101 | | | Year Ended
October 31,
2009 | |
| |
| Per Share Operating Data | | | | | | | | | | | | | | | | | | | | | | | | |
Net asset value, beginning of period | | $ | 40.87 | | | $ | 30.09 | | | $ | 28.94 | | | $ | 28.44 | | | $ | 23.58 | | | $ | 19.31 | |
| |
Income (loss) from investment operations: | | | | | | | | | | | | | | | | | | | | | | | | |
Net investment income (loss)2 | | | 0.11 | | | | 0.14 | | | | (0.02) | | | | (0.05) | | | | (0.10) | | | | (0.02) | |
Net realized and unrealized gain | | | 2.65 | | | | 10.64 | | | | 1.17 | | | | 0.55 | | | | 4.96 | | | | 4.30 | |
| | | | |
Total from investment operations | | | 2.76 | | | | 10.78 | | | | 1.15 | | | | 0.50 | | | | 4.86 | | | | 4.28 | |
| |
Dividends and/or distributions to shareholders: | | | | | | | | | | | | | | | | | | | | | | | | |
Dividends from net investment income | | | (0.21) | | | | 0.00 | | | | 0.00 | | | | 0.00 | | | | 0.00 | | | | 0.00 | |
Tax return of capital distribution | | | 0.00 | | | | 0.00 | | | | 0.00 | | | | 0.00 | | | | 0.00 | | | | (0.01) | |
| | | | |
Total dividends and/or distributions to shareholders | | | (0.21) | | | | 0.00 | | | | 0.00 | | | | 0.00 | | | | 0.00 | | | | (0.01) | |
| |
Net asset value, end of period | | $ | 43.42 | | | $ | 40.87 | | | $ | 30.09 | | | $ | 28.94 | | | $ | 28.44 | | | $ | 23.58 | |
| | | | |
| |
Total Return, at Net Asset Value3 | | | 6.81% | | | | 35.79% | | | | 3.97% | | | | 1.76% | | | | 20.61% | | | | 22.19% | |
| |
Ratios/Supplemental Data | | | | | | | | | | | | | | | | | | | | | | | | |
Net assets, end of period (in thousands) | | $ | 130,517 | | | $ | 130,267 | | | $ | 132,365 | | | $ | 176,002 | | | $ | 224,132 | | | $ | 218,401 | |
| |
Average net assets (in thousands) | | $ | 130,630 | | | $ | 129,674 | | | $ | 154,101 | | | $ | 213,872 | | | $ | 227,923 | | | $ | 192,372 | |
| |
Ratios to average net assets:4 | | | | | | | | | | | | | | | | | | | | | | | | |
Net investment income (loss) | | | 0.54% | | | | 0.39% | | | | (0.05)% | | | | (0.17)% | | | | (0.38)% | | | | (0.09)% | |
Total expenses5 | | | 1.47% | | | | 1.53% | | | | 1.59% | | | | 1.54% | | | | 1.62% | | | | 1.86% | |
| Expenses after payments, waivers and/or reimbursements and reduction to custodian expenses | | | 1.47% | | | | 1.53% | | | | 1.55% | | | | 1.53% | | | | 1.52% | | | | 1.54% | |
| |
Portfolio turnover rate | | | 17% | | | | 128% | | | | 54% | | | | 89% | | | | 71% | | | | 99% | |
26 OPPENHEIMER SMALL - & MID- CAP VALUE FUND
1. October 29, 2010 represents the last business day of the Fund’s reporting period.
2. Per share amounts calculated based on the average shares outstanding during the period.
3. Assumes an initial investment on the business day before the first day of the fiscal period, with all dividends and distributions reinvested in additional shares on the reinvestment date, and redemption at the net asset value calculated on the last business day of the fiscal period. Sales charges are not reflected in the total returns. Total returns are not annualized for periods less than one full year. Returns do not reflect the deduction of taxes that a shareholder would pay on fund distributions or the redemption of fund shares.
4. Annualized for periods less than one full year.
5. Total expenses including indirect expenses from affiliated fund were as follows:
| | | | | | | | |
| | Six Months Ended April 30, 2014 | | | 1.47 | % | | |
| | Year Ended October 31, 2013 | | | 1.53 | % | | |
| | Year Ended October 31, 2012 | | | 1.59 | % | | |
| | Year Ended October 31, 2011 | | | 1.55 | % | | |
| | Year Ended October 29, 2010 | | | 1.62 | % | | |
| | Year Ended October 31, 2009 | | | 1.87 | % | | |
See accompanying Notes to Financial Statements.
27 OPPENHEIMER SMALL - & MID- CAP VALUE FUND
| | |
| |
| FINANCIAL HIGHLIGHTS Continued | | |
| | |
| | | | | | | | | | | | | | | | | | | | | | | | |
| Class Y | | Six Months
Ended
April 30,
2014
(Unaudited) | | | Year Ended
October 31,
2013 | | | Year Ended
October 31,
2012 | | | Year Ended
October 31,
2011 | | | Year Ended
October 29,
20101 | | | Year Ended
October 31,
2009 | |
| |
Per Share Operating Data | | | | | | | | | | | | | | | | | | | | | | | | |
Net asset value, beginning of period | | $ | 43.81 | | | $ | 32.20 | | | $ | 30.78 | | | $ | 30.08 | | | $ | 24.79 | | | $ | 20.18 | |
| |
Income (loss) from investment operations: | | | | | | | | | | | | | | | | | | | | | | | | |
Net investment income2 | | | 0.28 | | | | 0.34 | | | | 0.19 | | | | 0.12 | | | | 0.06 | | | | 0.12 | |
Net realized and unrealized gain | | | 2.82 | | | | 11.40 | | | | 1.23 | | | | 0.58 | | | | 5.23 | | | | 4.50 | |
| | | | |
Total from investment operations | | | 3.10 | | | | 11.74 | | | | 1.42 | | | | 0.70 | | | | 5.29 | | | | 4.62 | |
| |
Dividends and/or distributions to shareholders: | | | | | | | | | | | | | | | | | | | | | | | | |
Dividends from net investment income | | | (0.60 | ) | | | (0.13 | ) | | | 0.00 | | | | 0.00 | | | | 0.00 | | | | 0.00 | |
Tax return of capital distribution | | | 0.00 | | | | 0.00 | | | | 0.00 | | | | 0.00 | | | | 0.00 | | | | (0.01) | |
| | | | |
Total dividends and/or distributions to shareholders | | | (0.60 | ) | | | (0.13 | ) | | | 0.00 | | | | 0.00 | | | | 0.00 | | | | (0.01) | |
| |
Net asset value, end of period | | $ | 46.31 | | | $ | 43.81 | | | $ | 32.20 | | | $ | 30.78 | | | $ | 30.08 | | | $ | 24.79 | |
| | | | |
|
| |
Total Return, at Net Asset Value3 | | | 7.17% | | | | 36.55% | | | | 4.62% | | | | 2.33% | | | | 21.34% | | | | 22.91% | |
| |
Ratios/Supplemental Data | | | | | | | | | | | | | | | | | | | | | | | | |
Net assets, end of period (in thousands) | | $ | 52,486 | | | $ | 49,589 | | | $ | 63,259 | | | $ | 100,231 | | | $ | 101,045 | | | $ | 76,153 | |
| |
Average net assets (in thousands) | | $ | 51,484 | | | $ | 50,572 | | | $ | 85,178 | | | $ | 102,025 | | | $ | 120,886 | | | $ | 76,732 | |
| |
Ratios to average net assets:4 | | | | | | | | | | | | | | | | | | | | | | | | |
Net investment income | | | 1.24% | | | | 0.91% | | | | 0.60% | | | | 0.35% | | | | 0.21% | | | | 0.57% | |
Total expenses5 | | | 0.76% | | | | 0.98% | | | | 0.92% | | | | 1.00% | | | | 0.91% | | | | 0.93% | |
| Expenses after payments, waivers and/or reimbursements and reduction to custodian expenses | | | 0.76% | | | | 0.98% | | | | 0.92% | | | | 0.99% | | | | 0.90% | | | | 0.92% | |
| |
Portfolio turnover rate | | | 17% | | | | 128% | | | | 54% | | | | 89% | | | | 71% | | | | 99% | |
28 OPPENHEIMER SMALL- & MID- CAP VALUE FUND
1. October 29, 2010 represents the last business day of the Fund’s reporting period.
2. Per share amounts calculated based on the average shares outstanding during the period.
3. Assumes an initial investment on the business day before the first day of the fiscal period, with all dividends and distributions reinvested in additional shares on the reinvestment date, and redemption at the net asset value calculated on the last business day of the fiscal period. Sales charges are not reflected in the total returns. Total returns are not annualized for periods less than one full year. Returns do not reflect the deduction of taxes that a shareholder would pay on fund distributions or the redemption of fund shares.
4. Annualized for periods less than one full year.
5. Total expenses including indirect expenses from affiliated fund were as follows:
| | | | | | | | |
| | Six Months Ended April 30, 2014 | | | 0.76 | % | | |
| | Year Ended October 31, 2013 | | | 0.98 | % | | |
| | Year Ended October 31, 2012 | | | 0.92 | % | | |
| | Year Ended October 31, 2011 | | | 1.01 | % | | |
| | Year Ended October 29, 2010 | | | 0.91 | % | | |
| | Year Ended October 31, 2009 | | | 0.94 | % | | |
See accompanying Notes to Financial Statements.
29 OPPENHEIMER SMALL- & MID- CAP VALUE FUND
| | |
| |
| NOTES TO | | |
| FINANCIAL STATEMENTS April 30, 2014 Unaudited | | |
1. Significant Accounting Policies
Oppenheimer Small- & Mid- Cap Value Fund (the “Fund”) is registered under the Investment Company Act of 1940, as amended, as a diversified open-end management investment company. The Fund’s investment objective is to seek capital appreciation. The Fund’s investment adviser is OFI Global Asset Management, Inc. (“OFI Global” or the “Manager”), a wholly-owned subsidiary of OFI. The Manager has entered into a sub-advisory agreement with OFI, as of the same effective date.
The Fund offers Class A, Class C, Class I, Class N and Class Y shares, and previously offered Class B shares for new purchase through June 29, 2012. Subsequent to that date, no new purchases of Class B shares are permitted, however reinvestment of dividend and/or capital gain distributions and exchanges of Class B shares into and from other Oppenheimer funds will be allowed. Class A shares are sold at their offering price, which is normally net asset value plus a front-end sales charge. Class C and Class N shares are sold, and Class B shares were sold, without a front-end sales charge but may be subject to a contingent deferred sales charge (“CDSC”). Class N shares are sold only through retirement plans. Retirement plans that offer Class N shares may impose charges on those accounts. Class I and Class Y shares are sold to certain institutional investors or intermediaries without either a front-end sales charge or a CDSC, however, the intermediaries may impose charges on their accountholders who beneficially own Class I and Class Y shares. All classes of shares have identical rights and voting privileges with respect to the Fund in general and exclusive voting rights on matters that affect that class alone. Earnings, net assets and net asset value per share may differ due to each class having its own expenses, such as transfer and shareholder servicing agent fees and shareholder communications, directly attributable to that class. Class A, B, C and N shares have separate distribution and/or service plans under which they pay fees. Class I and Class Y shares do not pay such fees. Class B shares will automatically convert to Class A shares 72 months after the date of purchase.
The following is a summary of significant accounting policies consistently followed by the Fund.
Investment in Oppenheimer Institutional Money Market Fund. The Fund is permitted to invest daily available cash balances in an affiliated money market fund. The Fund may invest the available cash in Class E shares of Oppenheimer Institutional Money Market Fund (“IMMF”) to seek current income while preserving liquidity. IMMF is a registered open-end management investment company, regulated as a money market fund under the Investment Company Act of 1940, as amended. The Manager is the investment adviser of IMMF, and the Sub-Adviser provides investment and related advisory services to IMMF. When applicable, the Fund’s investment in IMMF is included in the Statement of Investments. Shares of IMMF are valued at their net asset value per share. As a shareholder, the Fund is subject to its proportional share of IMMF’s Class E expenses, including its management fee. The Manager will waive fees and/or reimburse Fund expenses in an amount equal to the indirect management fees incurred through the Fund’s investment in IMMF.
30 OPPENHEIMER SMALL- & MID- CAP VALUE FUND
1. Significant Accounting Policies (Continued)
Allocation of Income, Expenses, Gains and Losses. Income, expenses (other than those attributable to a specific class), gains and losses are allocated on a daily basis to each class of shares based upon the relative proportion of net assets represented by such class. Operating expenses directly attributable to a specific class are charged against the operations of that class.
Federal Taxes. The Fund intends to comply with provisions of the Internal Revenue Code applicable to regulated investment companies and to distribute substantially all of its investment company taxable income to shareholders. Therefore, no federal income or excise tax provision is required. The Fund files income tax returns in U.S. federal and applicable state jurisdictions. The statute of limitations on the Fund’s tax return filings generally remain open for the three preceding fiscal reporting period ends.
During the fiscal year ended October 31, 2013, the Fund utilized $344,664,676 of capital loss carryforward to offset capital gains realized in that fiscal year. Details of the fiscal year ended October 31, 2013 capital loss carryforwards are included in the table below. Capital loss carryforwards with no expiration, if any, must be utilized prior to those with expiration dates. Capital losses with no expiration will be carried forward to future years if not offset by gains.
| | | | |
Expiring | |
2017 | | $ | 374,199,244 | |
As of April 30, 2014, it is estimated that the capital loss carryforwards would be $317,712,560 expiring by 2017. The estimated capital loss carryforward represents the carryforward as of the end of the last fiscal year, increased or decreased by capital losses or gains realized in the first six months of the current fiscal year. During the six months ended April 30, 2014, it is estimated that the Fund will utilize $56,486,684 of capital loss carryforward to offset realized capital gains.
Net investment income (loss) and net realized gain (loss) may differ for financial statement and tax purposes. The character of dividends and distributions made during the fiscal year from net investment income or net realized gains may differ from their ultimate characterization for federal income tax purposes. Also, due to timing of dividends and distributions, the fiscal year in which amounts are distributed may differ from the fiscal year in which the income or net realized gain was recorded by the Fund.
The aggregate cost of securities and other investments and the composition of unrealized appreciation and depreciation of securities and other investments for federal income tax purposes as of April 30, 2014 are noted in the following table. The primary difference between book and tax appreciation or depreciation of securities and other investments, if applicable, is attributable to the tax deferral of losses or tax realization of financial statement unrealized gain or loss.
31 OPPENHEIMER SMALL- & MID- CAP VALUE FUND
| | | | |
| |
| NOTES TO FINANCIAL STATEMENTS Unaudited / Continued | | |
1. Significant Accounting Policies (Continued)
| | | | |
Federal tax cost of securities | | | $ 1,350,993,771 | |
| | | | |
Gross unrealized appreciation | | | $ 323,106,377 | |
Gross unrealized depreciation | | | (9,698,811) | |
| | | | |
Net unrealized appreciation | | | $ 313,407,566 | |
| | | | |
Trustees’ Compensation. The Fund has adopted an unfunded retirement plan (the “Plan”) for the Fund’s independent trustees. Benefits are based on years of service and fees paid to each trustee during their period of service. The Plan was frozen with respect to adding new participants effective December 31, 2006 (the “Freeze Date”) and existing Plan Participants as of the Freeze Date will continue to receive accrued benefits under the Plan. Active independent trustees as of the Freeze Date have each elected a distribution method with respect to their benefits under the Plan. During the six months ended April 30, 2014, the Fund’s projected benefit obligations, payments to retired trustees and accumulated liability were as follows:
| | | | |
Projected Benefit Obligations Increased | | $ | 5,620 | |
Payments Made to Retired Trustees | | | 60,229 | |
Accumulated Liability as of April 30, 2014 | | | 358,223 | |
The Board of Trustees has adopted a compensation deferral plan for independent trustees that enables trustees to elect to defer receipt of all or a portion of the annual compensation they are entitled to receive from the Fund. For purposes of determining the amount owed to the Trustee under the plan, deferred amounts are treated as though equal dollar amounts had been invested in shares of the Fund or in other Oppenheimer funds selected by the Trustee. The Fund purchases shares of the funds selected for deferral by the Trustee in amounts equal to his or her deemed investment, resulting in a Fund asset equal to the deferred compensation liability. Such assets are included as a component of “Other” within the asset section of the Statement of Assets and Liabilities. Deferral of trustees’ fees under the plan will not affect the net assets of the Fund, and will not materially affect the Fund’s assets, liabilities or net investment income per share. Amounts will be deferred until distributed in accordance with the compensation deferral plan.
Dividends and Distributions to Shareholders. Dividends and distributions to shareholders, which are determined in accordance with income tax regulations and may differ from U.S. generally accepted accounting principles, are recorded on the ex-dividend date. Income distributions, if any, are declared and paid quarterly. Capital gain distributions, if any, are declared and paid annually.
The tax character of distributions is determined as of the Fund’s fiscal year end. Therefore, a portion of the Fund’s distributions made to shareholders prior to the Fund’s fiscal year end may ultimately be categorized as a tax return of capital.
Investment Income. Dividend income is recorded on the ex-dividend date or upon ex-dividend notification in the case of certain foreign dividends where the ex-dividend date may
32 OPPENHEIMER SMALL- & MID- CAP VALUE FUND
1. Significant Accounting Policies (Continued)
have passed. Non-cash dividends included in dividend income, if any, are recorded at the fair market value of the securities received. Interest income is recognized on an accrual basis. Discount and premium, which are included in interest income on the Statement of Operations, are amortized or accreted daily.
Custodian Fees. “Custodian fees and expenses” in the Statement of Operations may include interest expense incurred by the Fund on any cash overdrafts of its custodian account during the period. Such cash overdrafts may result from the effects of failed trades in portfolio securities and from cash outflows resulting from unanticipated shareholder redemption activity. The Fund pays interest to its custodian on such cash overdrafts, to the extent they are not offset by positive cash balances maintained by the Fund, at a rate equal to the Federal Funds Rate plus 0.50%. The “Reduction to custodian expenses” line item, if applicable, represents earnings on cash balances maintained by the Fund during the period. Such interest expense and other custodian fees may be paid with these earnings.
Security Transactions. Security transactions are recorded on the trade date. Realized gains and losses on securities sold are determined on the basis of identified cost.
Indemnifications. The Fund’s organizational documents provide current and former trustees and officers with a limited indemnification against liabilities arising in connection with the performance of their duties to the Fund. In the normal course of business, the Fund may also enter into contracts that provide general indemnifications. The Fund’s maximum exposure under these arrangements is unknown as this would be dependent on future claims that may be made against the Fund. The risk of material loss from such claims is considered remote.
Other. The preparation of financial statements in conformity with accounting principles generally accepted in the United States of America requires management to make estimates and assumptions that affect the reported amounts of assets and liabilities and disclosure of contingent assets and liabilities at the date of the financial statements and the reported amounts of increases and decreases in net assets from operations during the reporting period. Actual results could differ from those estimates.
2. Securities Valuation
The Fund calculates the net asset value of its shares as of the close of the New York Stock Exchange (the “Exchange”), normally 4:00 P.M. Eastern time, on each day the Exchange is open for trading.
The Fund’s Board has adopted procedures for the valuation of the Fund’s securities and has delegated the day-to-day responsibility for valuation determinations under those procedures to the Manager. The Manager has established a Valuation Committee which is responsible for determining a “fair valuation” for any security for which market quotations are not “readily available.” The Valuation Committee’s fair valuation determinations are subject to review, approval and ratification by the Fund’s Board at its next regularly scheduled meeting covering the calendar quarter in which the fair valuation was determined.
33 OPPENHEIMER SMALL- & MID- CAP VALUE FUND
| | | | |
| |
| NOTES TO FINANCIAL STATEMENTS Unaudited / Continued | | |
2. Securities Valuation (Continued)
Valuation Methods and Inputs
Securities are valued using unadjusted quoted market prices, when available, as supplied primarily by third party pricing services or dealers.
The following methodologies are used to determine the market value or the fair value of the types of securities described below:
Securities traded on a registered U.S. securities exchange (including exchange-traded derivatives other than futures and futures options) are valued based on the last sale price of the security reported on the principal exchange on which it is traded, prior to the time when the Fund’s assets are valued. In the absence of a sale, the security is valued at the last sale price on the prior trading day, if it is within the spread of the current day’s closing “bid” and “asked” prices, and if not, at the current day’s closing bid price. A security of a foreign issuer traded on a foreign exchange, but not listed on a registered U.S. securities exchange, is valued based on the last sale price on the principal exchange on which the security is traded, as identified by the third party pricing service used by the Manager, prior to the time when the Fund’s assets are valued. If the last sale price is unavailable, the security is valued at the most recent official closing price on the principal exchange on which it is traded. If the last sales price or official closing price for a foreign security is not available, the security is valued at the mean between the bid and asked price per the exchange or, if not available from the exchange, obtained from two dealers. If bid and asked prices are not available from either the exchange or two dealers, the security is valued by using one of the following methodologies (listed in order of priority): (1) using a bid from the exchange, (2) the mean between the bid and asked price as provided by a single dealer, or (3) a bid from a single dealer.
Shares of a registered investment company that are not traded on an exchange are valued at that investment company’s net asset value per share.
Corporate and government debt securities (of U.S. or foreign issuers) and municipal debt securities, event-linked bonds, loans, mortgage-backed securities, collateralized mortgage obligations, and asset-backed securities are valued at the mean between the “bid” and “asked” prices utilizing evaluated prices obtained from third party pricing services or broker-dealers who may use matrix pricing methods to determine the evaluated prices.
Short-term money market type debt securities with a remaining maturity of sixty days or less are valued at cost adjusted by the amortization of discount or premium to maturity (amortized cost), which approximates market value. Short-term debt securities with a remaining maturity in excess of sixty days are valued at the mean between the “bid” and “asked” prices utilizing evaluated prices obtained from third party pricing services or broker-dealers.
A description of the standard inputs that may generally be considered by the third party pricing vendors in determining their evaluated prices is provided below.
34 OPPENHEIMER SMALL- & MID- CAP VALUE FUND
2. Securities Valuation (Continued)
| | |
| Security Type | | Standard inputs generally considered by third-party pricing vendors |
| Corporate debt, government debt, municipal, mortgage-backed and asset-backed securities | | Reported trade data, broker-dealer price quotations, benchmark yields, issuer spreads on comparable securities, the credit quality, yield, maturity, and other appropriate factors. |
Loans | | Information obtained from market participants regarding reported trade data and broker-dealer price quotations. |
Event-linked bonds | | Information obtained from market participants regarding reported trade data and broker-dealer price quotations. |
If a market value or price cannot be determined for a security using the methodologies described above, or if, in the “good faith” opinion of the Manager, the market value or price obtained does not constitute a “readily available market quotation,” or a significant event has occurred that would materially affect the value of the security the security is fair valued either (i) by a standardized fair valuation methodology applicable to the security type or the significant event as previously approved by the Valuation Committee and the Fund’s Board or (ii) as determined in good faith by the Manager’s Valuation Committee. The Valuation Committee considers all relevant facts that are reasonably available, through either public information or information available to the Manager, when determining the fair value of a security. Fair value determinations by the Manager are subject to review, approval and ratification by the Fund’s Board at its next regularly scheduled meeting covering the calendar quarter in which the fair valuation was determined. Those fair valuation standardized methodologies include, but are not limited to, valuing securities at the last sale price or initially at cost and subsequently adjusting the value based on: changes in company specific fundamentals, changes in an appropriate securities index, or changes in the value of similar securities which may be further adjusted for any discounts related to security-specific resale restrictions. When possible, such methodologies use observable market inputs such as unadjusted quoted prices of similar securities, observable interest rates, currency rates and yield curves. The methodologies used for valuing securities are not necessarily an indication of the risks associated with investing in those securities nor can it be assured that the Fund can obtain the fair value assigned to a security if it were to sell the security.
To assess the continuing appropriateness of security valuations, the Manager, or its third party service provider who is subject to oversight by the Manager, regularly compares prior day prices, prices on comparable securities, and sale prices to the current day prices and challenges those prices exceeding certain tolerance levels with the third party pricing service or broker source. For those securities valued by fair valuations, whether through a standardized fair valuation methodology or a fair valuation determination, the Valuation Committee reviews and affirms the reasonableness of the valuations based on such methodologies and fair valuation determinations on a regular basis after considering all relevant information that is reasonably available.
Classifications
Each investment asset or liability of the Fund is assigned a level at measurement date based on the significance and source of the inputs to its valuation. Various data inputs are used in determining the value of each of the Fund’s investments as of the reporting period end. These
35 OPPENHEIMER SMALL- & MID- CAP VALUE FUND
|
|
| NOTESTO FINANCIAL STATEMENTS Unaudited / Continued |
|
| 2. Securities Valuation (Continued) |
data inputs are categorized in the following hierarchy under applicable financial accounting standards:
1) Level 1-unadjusted quoted prices in active markets for identical assets or liabilities (including securities actively traded on a securities exchange)
2) Level 2-inputs other than unadjusted quoted prices that are observable for the asset or liability (such as unadjusted quoted prices for similar assets and market corroborated inputs such as interest rates, prepayment speeds, credit risks, etc.)
3) Level 3-significant unobservable inputs (including the Manager’s own judgments about assumptions that market participants would use in pricing the asset or liability).
The inputs used for valuing securities are not necessarily an indication of the risks associated with investing in those securities.
The table below categorizes amounts that are included in the Fund’s Statement of Assets and Liabilities as of April 30, 2014 based on valuation input level:
| | | | | | | | | | | | | | | | |
| | | Level 1—
Unadjusted
Quoted Prices | | | Level 2—
Other Significant
Observable
Inputs | | | Level 3—
Significant
Unobservable
Inputs | | | Value
| |
Assets Table | |
Investments, at Value: | |
Common Stocks | | | | | | | | | | | | | | | | |
Consumer Discretionary | | $ | 200,468,448 | | | $ | — | | | $ | — | | | $ | 200,468,448 | |
Consumer Staples | | | 42,620,293 | | | | — | | | | — | | | | 42,620,293 | |
Energy | | | 129,640,645 | | | | — | | | | — | | | | 129,640,645 | |
Financials | | | 450,427,303 | | | | — | | | | — | | | | 450,427,303 | |
Health Care | | | 134,831,177 | | | | — | | | | — | | | | 134,831,177 | |
Industrials | | | 268,636,354 | | | | — | | | | — | | | | 268,636,354 | |
Information Technology | | | 226,327,032 | | | | — | | | | — | | | | 226,327,032 | |
Materials | | | 74,555,036 | | | | — | | | | — | | | | 74,555,036 | |
Telecommunication Services | | | 24,095,801 | | | | — | | | | — | | | | 24,095,801 | |
Utilities | | | 95,037,481 | | | | — | | | | — | | | | 95,037,481 | |
Investment Company | | | 17,761,767 | | | | — | | | | — | | | | 17,761,767 | |
| | | | |
Total Assets | | $ | 1,664,401,337 | | | $ | — | | | $ | — | | | $ | 1,664,401,337 | |
| | | | |
Currency contracts and forwards, if any, are reported at their unrealized appreciation/ depreciation at measurement date, which represents the change in the contract’s value from trade date. Futures, if any, are reported at their variation margin at measurement date, which represents the amount due to/from the Fund at that date. All additional assets and liabilities included in the above table are reported at their market value at measurement date.
36 OPPENHEIMER SMALL- & MID- CAP VALUE FUND
3. Shares of Beneficial Interest
The Fund has authorized an unlimited number of $0.01 par value shares of beneficial interest of each class. Transactions in shares of beneficial interest were as follows:
| | | | | | | | | | | | | | | | |
| | | Six Months Ended April 30, 2014 | | | Year Ended October 31, 2013 | |
| | | Shares | | | Amount | | | Shares | | | Amount | |
Class A | | | | | | | | | | | | | | | | |
Sold | | | 2,027,746 | | | $ | 89,660,661 | | | | 6,012,410 | | | $ | 229,492,865 | |
Dividends and/or distributions reinvested | | | 215,221 | | | | 9,283,133 | | | | 24,509 | | | | 781,094 | |
Redeemed | | | (3,969,618 | ) | | | (173,996,452 | ) | | | (8,720,933 | ) | | | (314,908,184) | |
| | | | |
Net decrease | | | (1,726,651 | ) | | $ | (75,052,658 | ) | | | (2,684,014 | ) | | $ | (84,634,225) | |
| | | | |
|
| | |
Class B | | | | | | | | | | | | | | | | |
Sold | | | 27,130 | | | $ | 1,000,610 | | | | 155,683 | | | $ | 4,980,576 | |
Dividends and/or distributions reinvested | | | 754 | | | | 28,854 | | | | — | | | | — | |
Redeemed | | | (222,316 | ) | | | (8,227,691 | ) | | | (796,309 | ) | | | (23,889,474) | |
| | | | |
Net decrease | | | (194,432 | ) | | $ | (7,198,227 | ) | | | (640,626 | ) | | $ | (18,908,898) | |
| | | | |
| | | | |
| | | | | | | | | | | | | | | | | |
Class C | | | | | | | | | | | | | | | | |
Sold | | | 512,579 | | | $ | 19,051,519 | | | | 1,168,428 | | | $ | 36,821,008 | |
Dividends and/or distributions reinvested | | | 12,199 | | | | 448,951 | | | | — | | | | — | |
Redeemed | | | (758,540 | ) | | | (28,148,377 | ) | | | (2,280,794 | ) | | | (69,634,052) | |
| | | | |
Net decrease | | | (233,762 | ) | | $ | (8,647,907 | ) | | | (1,112,366 | ) | | $ | (32,813,044) | |
| | | | |
| | | | |
| | | | | | | | | | | | | | | | | |
Class I | | | | | | | | | | | | | | | | |
Sold | | | 3,879 | | | $ | 181,043 | | | | 2,119 | | | $ | 86,602 | |
Dividends and/or distributions reinvested | | | 32 | | | | 1,410 | | | | — | | | | — | |
Redeemed | | | (1,501 | ) | | | (67,933 | ) | | | (236 | ) | | | (9,905) | |
| | | | |
Net increase | | | 2,410 | | | $ | 114,520 | | | | 1,883 | | | $ | 76,697 | |
| | | | |
| | | | |
| | | | | | | | | | | | | | | | | |
Class N | | | | | | | | | | | | | | | | |
Sold | | | 340,561 | | | $ | 14,394,601 | | | | 726,988 | | | $ | 25,913,549 | |
Dividends and/or distributions reinvested | | | 14,237 | | | | 591,930 | | | | — | | | | — | |
Redeemed | | | (535,759 | ) | | | (22,614,537 | ) | | | (1,938,822 | ) | | | (67,549,862) | |
| | | | |
Net decrease | | | (180,961 | ) | | $ | (7,628,006 | ) | | | (1,211,834 | ) | | $ | (41,636,313) | |
| | | | |
| | | | |
| | | | | | | | | | | | | | | | | |
Class Y | | | | | | | | | | | | | | | | |
Sold | | | 155,114 | | | $ | 7,044,561 | | | | 408,620 | | | $ | 15,453,039 | |
Dividends and/or distributions reinvested | | | 12,742 | | | | 566,279 | | | | 5,962 | | | | 194,843 | |
Redeemed | | | (166,329 | ) | | | (7,572,784 | ) | | | (1,247,131 | ) | | | (45,159,922) | |
| | | | |
Net increase (decrease) | | | 1,527 | | | $ | 38,056 | | | | (832,549 | ) | | $ | (29,512,040) | |
| | | | |
37 OPPENHEIMER SMALL- & MID- CAP VALUE FUND
| | | | |
| |
| NOTES TO FINANCIAL STATEMENTS Unaudited / Continued | | |
4. Purchases and Sales of Securities
The aggregate cost of purchases and proceeds from sales of securities, other than short-term obligations and investments in IMMF, for the six months ended April 30, 2014 were as follows:
| | | | | | | | |
| | | Purchases | | | Sales | |
Investment securities | | $ | 279,667,584 | | | $ | 385,124,324 | |
5. Fees and Other Transactions with Affiliates
Management Fees. Under the investment advisory agreement, the Fund pays the Manager a management fee based on the daily net assets of the Fund at an annual rate as shown in the following table:
| | | | |
| Fee Schedule | | | |
Up to $400 million | | | 0.80 | % |
Next $400 million | | | 0.75 | |
Next $1.2 billion | | | 0.60 | |
Next $4 billion | | | 0.58 | |
Over $6 billion | | | 0.56 | |
Sub-Adviser Fees. The Manager has retained the Sub-Adviser to provide the day-to-day portfolio management of the Fund. Under the Sub-Advisory Agreement, the Manager pays the Sub-Adviser an annual fee in monthly installments, equal to a percentage of the investment management fee collected by the Manager from the Fund, which shall be calculated after any investment management fee waivers. The fee paid to the Sub-Adviser is paid by the Manager, not by the Fund.
Transfer Agent Fees. OFI Global (the “Transfer Agent”) serves as the transfer and shareholder servicing agent for the Fund. The Fund pays the Transfer Agent a fee based on annual net assets. Fees incurred by the Fund with respect to these services are detailed in the Statement of Operations.
Sub-Transfer Agent Fees. The Transfer Agent has retained Shareholder Services, Inc., a wholly-owned subsidiary of OFI (the “Sub-Transfer Agent”), to provide the day-to-day transfer agent and shareholder servicing of the Fund. Under the Sub-Transfer Agency Agreement, the Transfer Agent pays the Sub-Transfer Agent an annual fee in monthly installments, equal to a percentage of the transfer agent fee collected by the Transfer Agent from the Fund, which shall be calculated after any applicable fee waivers. The fee paid to the Sub-Transfer Agent is paid by the Transfer Agent, not by the Fund.
Distribution and Service Plan (12b-1) Fees. Under its General Distributor’s Agreement with the Fund, OppenheimerFunds Distributor, Inc. (the “Distributor”) acts as the Fund’s principal underwriter in the continuous public offering of the Fund’s classes of shares.
Distribution and Service Plan for Class A Shares. The Fund has adopted a Distribution and Service Plan (the “Plan”) for Class A shares. Under the Plan, the Fund pays a service fee
38 OPPENHEIMER SMALL- & MID- CAP VALUE FUND
5. Fees and Other Transactions with Affiliates (Continued)
to the Distributor at an annual rate of 0.25% of the daily net assets of Class A shares. The Distributor currently uses all of those fees to pay dealers, brokers, banks and other financial institutions periodically for providing personal services and maintenance of accounts of their customers that hold Class A shares. Under the Plan, the Fund may also pay an asset-based sales charge to the Distributor. However, the Fund’s Board has currently set the rate at zero. Fees incurred by the Fund under the Plan are detailed in the Statement of Operations.
Distribution and Service Plans for Class B, Class C and Class N Shares. The Fund has adopted Distribution and Service Plans (the “Plans”) for Class B, Class C and Class N shares under Rule 12b-1 of the Investment Company Act of 1940 to compensate the Distributor for its services in connection with the distribution of those shares and servicing accounts. Under the Plans, the Fund pays the Distributor an annual asset-based sales charge of 0.75% on Class B and Class C shares daily net assets and 0.25% on Class N shares daily net assets. The Distributor also receives a service fee of 0.25% per year under each plan. If either the Class B, Class C or Class N plan is terminated by the Fund or by the shareholders of a class, the Board of Trustees and its independent trustees must determine whether the Distributor shall be entitled to payment from the Fund of all or a portion of the service fee and/or asset-based sales charge in respect to shares sold prior to the effective date of such termination. Fees incurred by the Fund under the Plans are detailed in the Statement of Operations. The Distributor determines its uncompensated expenses under the Plans at calendar quarter ends. The Distributor’s aggregate uncompensated expenses under the Plans at March 31, 2014 were as follows:
| | | | |
Class C | | $ | 9,606,758 | |
Class N | | | 4,914,475 | |
Sales Charges. Front-end sales charges and contingent deferred sales charges (“CDSC”) do not represent expenses of the Fund. They are deducted from the proceeds of sales of Fund shares prior to investment or from redemption proceeds prior to remittance, as applicable. The sales charges retained by the Distributor from the sale of shares and the CDSC retained by the Distributor on the redemption of shares is shown in the following table for the period indicated.
| | | | | | | | | | | | | | | | | | | | |
| Six Months Ended | | Class A Front-End
Sales Charges
Retained by
Distributor | | | Class A
Contingent
Deferred Sales
Charges
Retained by
Distributor | | | Class B
Contingent
Deferred Sales
Charges
Retained by
Distributor | | | Class C
Contingent
Deferred Sales
Charges
Retained by
Distributor | | | Class N
Contingent
Deferred Sales
Charges
Retained by
Distributor | |
April 30, 2014 | | | $193,928 | | | | $3,414 | | | | $20,960 | | | | $4,649 | | | | $259 | |
Waivers and Reimbursements of Expenses. The Manager will waive fees and/or reimburse Fund expenses in an amount equal to the indirect management fees incurred through the Fund’s investment in IMMF. During the six months ended April 30, 2014, the Manager waived fees and/or reimbursed the Fund $9,408 for IMMF management fees.
39 OPPENHEIMER SMALL- & MID- CAP VALUE FUND
NOTES TO FINANCIAL STATEMENTS Unaudited / Continued
5. Fees and Other Transactions with Affiliates (Continued)
The Transfer Agent has contractually agreed to limit transfer and shareholder servicing agent fees for Classes B, C, N and Y shares to 0.35% of average annual net assets per class and for Class A shares to 0.30% of average annual net assets of the class.
During the six months ended April 30, 2014, the Transfer Agent waived transfer and shareholder servicing agent fees as follows:
Some of these undertakings may be modified or terminated at any time; some may not be modified or terminated until after one year from the date of the current prospectus, as indicated therein.
6. Pending Litigation
Since 2009, seven class action lawsuits have been pending in the U.S. District Court for the District of Colorado against OppenheimerFunds, Inc. (“OFI”), OppenheimerFunds Distributor, Inc., the Fund’s principal underwriter and distributor (the “Distributor”), and certain funds (but not including the Fund) advised by OFI Global Asset Management, Inc. and distributed by the Distributor (the “Defendant Funds”). The lawsuits also name as defendants certain officers and current and former trustees of the respective Defendant Funds. The lawsuits raise claims under federal securities law and allege, among other things, that the disclosure documents of the respective Defendant Funds contained misrepresentations and omissions and that the respective Defendant Funds’ investment policies were not followed. The plaintiffs in these actions seek unspecified damages, equitable relief and awards of attorneys’ fees and litigation expenses. The Defendant Funds’ Boards of Trustees have also engaged counsel to represent the Funds and the present and former Independent Trustees named in those suits. On March 5, 2014, the parties in six of these lawsuits executed stipulations and agreements of settlement resolving those actions. The settlements are subject to a variety of contingencies, including approval by the court. The settlements do not resolve a seventh outstanding lawsuit relating to Oppenheimer Rochester California Municipal Fund.
Other class action and individual lawsuits have been filed since 2008 in various state and federal courts against OFI and certain of its affiliates by investors seeking to recover investments they allegedly lost as a result of the “Ponzi” scheme run by Bernard L. Madoff and his firm, Bernard L. Madoff Investment Securities, LLC (“BLMIS”). Plaintiffs in these suits allege that they suffered losses as a result of their investments in several funds managed by an affiliate of OFI and assert a variety of claims, including breach of fiduciary duty, fraud, negligent misrepresentation, unjust enrichment, and violation of federal and state securities laws and regulations, among others. They seek unspecified damages, equitable relief and awards of attorneys’ fees and litigation expenses. Neither the Distributor, nor any of the Oppenheimer mutual funds, their independent trustees or directors are named as defendants in these lawsuits. None of the Oppenheimer mutual funds invested in any funds or accounts managed by Madoff or BLMIS. On February 28, 2011, a stipulation of partial settlement of three groups of consolidated putative class action lawsuits relating to these matters was filed
40 OPPENHEIMER SMALL- & MID- CAP VALUE FUND
6. Pending Litigation (Continued)
in the U.S. District Court for the Southern District of New York. On August 19, 2011, the court entered an order and final judgment approving the settlement as fair, reasonable and adequate. In September 2011, certain parties filed notices of appeal from the court’s order approving the settlement. The settlement does not resolve other outstanding lawsuits against OFI and its affiliates relating to BLMIS.
OFI believes the lawsuits and appeals described above are without legal merit and, with the exception of actions it has settled, is defending against them vigorously. While it is premature to render any opinion as to the outcome in these lawsuits, or whether any costs that the Defendant Funds may bear in defending the suits might not be reimbursed by insurance, OFI believes that these suits should not impair the ability of OFI or the Distributor to perform their respective duties to the Fund, and that the outcome of all of the suits together should not have any material effect on the operations of any of the Oppenheimer mutual funds.
41 OPPENHEIMER SMALL- & MID- CAP VALUE FUND
| | |
| |
PORTFOLIO PROXY VOTING POLICIES AND PROCEDURES; UPDATES TO STATEMENTS OF INVESTMENTS Unaudited | | |
| | |
The Fund has adopted Portfolio Proxy Voting Policies and Procedures under which the Fund votes proxies relating to securities (“portfolio proxies”) held by the Fund. A description of the Fund’s Portfolio Proxy Voting Policies and Procedures is available (i) without charge, upon request, by calling the Fund toll-free at 1.800.CALL OPP (225.5677), (ii) on the Fund’s website at oppenheimerfunds.com, and (iii) on the SEC’s website at www.sec.gov. In addition, the Fund is required to file Form N-PX, with its complete proxy voting record for the 12 months ended June 30th, no later than August 31st of each year. The Fund’s voting record is available (i) without charge, upon request, by calling the Fund toll-free at 1.800.CALL OPP (225.5677), and (ii) in the Form N-PX filing on the SEC’s website at www.sec.gov.
The Fund files its complete schedule of portfolio holdings with the SEC for the first quarter and the third quarter of each fiscal year on Form N-Q. The Fund’s Form N-Q filings are available on the SEC’s website at www.sec.gov. Those forms may be reviewed and copied at the SEC’s Public Reference Room in Washington, D.C. Information on the operation of the Public Reference Room may be obtained by calling 1-800-SEC-0330.
Householding—Delivery of Shareholder Documents
This is to inform you about OppenheimerFunds’ “householding” policy. If more than one member of your household maintains an account in a particular fund, OppenheimerFunds will mail only one copy of the fund’s prospectus (or, if available, the fund’s summary prospectus), annual and semiannual report and privacy policy. The consolidation of these mailings, called householding, benefits your fund through reduced mailing expense, and benefits you by reducing the volume of mail you receive from OppenheimerFunds. Householding does not affect the delivery of your account statements.
Please note that we will continue to household these mailings for as long as you remain an OppenheimerFunds shareholder, unless you request otherwise. If you prefer to receive multiple copies of these materials, please call us at 1.800.CALL-OPP (225-5677). You may also notify us in writing or via email. We will begin sending you individual copies of the prospectus (or, if available, the summary prospectus), reports and privacy policy within 30 days of receiving your request to stop householding.
42 OPPENHEIMER SMALL- & MID- CAP VALUE FUND
| | |
| |
| OPPENHEIMER SMALL- & MID- CAP VALUE FUND | | |
| | |
| Trustees and Officers | | Brian F. Wruble, Chairman of the Board of Trustees and Trustee |
| | David K. Downes, Trustee |
| | Matthew P. Fink, Trustee |
| | Edmund P. Giambastiani, Jr., Trustee |
| | Mary F. Miller, Trustee |
| | Joel W. Motley, Trustee |
| | Joanne Pace, Trustee |
| | Joseph M. Wikler, Trustee |
| | Peter I. Wold, Trustee |
| | William F. Glavin, Jr., Trustee, President and Principal Executive Officer |
| | Laton Spahr, Vice President |
| | Eric Hewitt, Vice President |
| | Arthur S. Gabinet, Secretary and Chief Legal Officer |
| | Christina M. Nasta, Vice President and Chief Business Officer |
| | Mary Ann Picciotto, Chief Compliance Officer and Chief Anti-Money Laundering Officer |
| | Brian W. Wixted, Treasurer and Principal Financial & Accounting Officer |
| |
| Manager | | OFI Global Asset Management, Inc. |
| |
| Sub-Adviser | | OppenheimerFunds, Inc. |
| |
| Distributor | | OppenheimerFunds Distributor, Inc. |
| |
| Transfer and Shareholder | | OFI Global Asset Management, Inc. |
| Servicing Agent | | |
| |
| Sub-Transfer Agent | | Shareholder Services, Inc. |
| | DBA OppenheimerFunds Services |
| |
| Independent Registered | | KPMGLLP |
| Public Accounting Firm | | |
| |
| Legal Counsel | | Kramer Levin Naftalis & Frankel LLP |
| |
| | The financial statements included herein have been taken from the records of the Fund without examination of those records by the independent registered public accounting firm. |
© 2014 OppenheimerFunds, Inc. All rights reserved.
43 OPPENHEIMER SMALL- & MID- CAP VALUE FUND
As an Oppenheimer fund shareholder, you are entitled to know how we protect your personal information and how we limit its disclosure.
Information Sources
We obtain nonpublic personal information about our shareholders from the following sources:
| • | | Applications or other forms |
| • | | When you create a user ID and password for online account access |
| • | | When you enroll in eDocs Direct, our electronic document delivery service |
| • | | Your transactions with us, our affiliates or others |
| • | | A software program on our website, often referred to as a “cookie,” which indicates which parts of our site you’ve visited |
| • | | When you set up challenge questions to reset your password online |
If you visit oppenheimerfunds.com and do not log on to the secure account information areas, we do not obtain any personal information about you. When you do log on to a secure area, we do obtain your user ID and password to identify you. We also use this information to provide you with products and services you have requested, to inform you about products and services that you may be interested in and assist you in other ways.
We do not collect personal information through our website unless you willingly provide it to us, either directly by email or in those areas of the website that request information. In order to update your personal information (including your mailing address, email address and phone number) you must first log on and visit your user profile.
If you have set your browser to warn you before accepting cookies, you will receive the warning message with each cookie. You can refuse cookies by turning them off in your browser. However, doing so may limit your access to certain sections of our website.
We use cookies to help us improve and manage our website. For example, cookies help us recognize new versus repeat visitors to the site, track the pages visited, and enable some special features on the website. This data helps us provide a better service for our website visitors.
Protection of Information
We do not disclose any non-public personal information (such as names on a customer list) about current or former customers to anyone, except as permitted by law.
Disclosure of Information
We send your financial advisor (as designated by you) copies of confirmations, account statements and other documents reporting activity in your fund accounts. We may also use details about you and your investments to help us, our financial service affiliates, or firms that jointly market their financial products and services with ours, to better serve your investment needs or suggest financial services or educational material that may be of interest to you. If this requires us to provide you with an opportunity to “opt in” or “opt out” of such information sharing with a firm not affiliated with us, you will receive notification on how to do so, before any such sharing takes place.
Right of Refusal
We will not disclose your personal information to unaffiliated third parties (except as permitted by law), unless we first offer you a reasonable opportunity to refuse or “opt out” of such disclosure.
44 OPPENHEIMER SMALL- & MID- CAP VALUE FUND
Internet Security and Encryption
In general, the email services provided by our website are encrypted and provide a secure and private means of communication with us. To protect your own privacy, confidential and/or personal information should only be communicated via email when you are advised that you are using a secure website.
As a security measure, we do not include personal or account information in non-secure emails, and we advise you not to send such information to us in non-secure emails. Instead, you may take advantage of the secure features of our website to encrypt your email correspondence. To do this, you will need to use a browser that supports Secure Sockets Layer (SSL) protocol.
We do not guarantee or warrant that any part of our website, including files available for download, are free of viruses or other harmful code. It is your responsibility to take appropriate precautions, such as use of an anti-virus software package, to protect your computer hardware and software.
| • | | All transactions, including redemptions, exchanges and purchases, are secured by SSL and 128-bit encryption. SSL is used to establish a secure connection between your PC and OppenheimerFunds’ server. It transmits information in an encrypted and scrambled format. |
| • | | Encryption is achieved through an electronic scrambling technology that uses a “key” to code and then decode the data. Encryption acts like the cable converter box you may have on your television set. It scrambles data with a secret code so that no one can make sense of it while it is being transmitted. When the data reaches its destination, the same software unscrambles the data. |
| • | | You can exit the secure area by either closing your browser, or for added security, you can use the Log Out button before you close your browser. |
Other Security Measures
We maintain physical, electronic and procedural safeguards to protect your personal account information. Our employees and agents have access to that information only so that they may offer you products or provide services, for example, when responding to your account questions.
How You Can Help
You can also do your part to keep your account information private and to prevent unauthorized transactions. If you obtain a user ID and password for your account, do not allow it to be used by anyone else. Also, take special precautions when accessing your account on a computer used by others.
Who We Are
This joint notice describes the privacy policies of the Oppenheimer funds, OppenheimerFunds, Inc., and each of its investment adviser subsidiaries, OppenheimerFunds Distributor, Inc. and OFI Global Trust Co. It applies to all Oppenheimer fund accounts you presently have, or may open in the future, using your Social Security number—whether or not you remain a shareholder of our funds. This notice was last updated November 2013. In the event it is updated or changed, we will post an updated notice on our website at oppenheimerfunds.com. If you have any questions about these privacy policies, write to us at P.O. Box 5270, Denver, CO 80217-5270, email us by clicking on the Contact Us section of our website at oppenheimerfunds.com or call us at 1.800.CALL OPP (225.5677).
45 OPPENHEIMER SMALL- & MID- CAP VALUE FUND
THIS PAGE INTENTIONALLY LEFT BLANK.
46 OPPENHEIMER SMALL- & MID- CAP VALUE FUND
THIS PAGE INTENTIONALLY LEFT BLANK.
47 OPPENHEIMER SMALL- & MID- CAP VALUE FUND

Item 2. Code of Ethics.
Not applicable to semiannual reports.
Item 3. Audit Committee Financial Expert.
Not applicable to semiannual reports.
Item 4. Principal Accountant Fees and Services.
Not applicable to semiannual reports.
Item 5. Audit Committee of Listed Registrants
Not applicable.
Item 6. Schedule of Investments.
a) Not applicable. The complete schedule of investments is included in Item 1 of this Form N-CSR.
b) Not applicable.
Item 7. Disclosure of Proxy Voting Policies and Procedures for Closed-End Management Investment Companies.
Not applicable.
Item 8. Portfolio Managers of Closed-End Management Investment Companies.
Not applicable.
Item 9. Purchases of Equity Securities by Closed-End Management Investment Company and Affiliated Purchasers.
Not applicable.
Item 10. Submission of Matters to a Vote of Security Holders.
The Fund’s Governance Committee Provisions with Respect to Nominations of Directors/Trustees to the Respective Boards
None
Item 11. Controls and Procedures.
Based on their evaluation of the registrant’s disclosure controls and procedures (as defined in rule 30a-3(c) under the Investment Company Act of 1940 (17 CFR 270.30a-3(c)) as of 4/30/2014, the registrant’s principal executive officer and principal financial officer found the registrant’s disclosure controls and procedures to provide reasonable assurances that information required to be disclosed by the registrant in the reports that it files under the Securities Exchange Act of 1934 (a) is accumulated and communicated to registrant’s management, including its principal executive officer and principal financial officer, to allow timely decisions regarding required disclosure, and (b) is recorded, processed, summarized and reported, within the time periods specified in the rules and forms adopted by the U.S. Securities and Exchange Commission.
There have been no changes in the registrant’s internal controls over financial reporting that occurred during the registrant’s second fiscal quarter of the period covered by this report that have materially affected, or are reasonably likely to materially affect, the registrant’s internal control over financial reporting.
Item 12. Exhibits.
(a) (1) Not applicable to semiannual reports.
| | (2) | Exhibits attached hereto. |
| (b) | Exhibit attached hereto. |
SIGNATURES
Pursuant to the requirements of the Securities Exchange Act of 1934 and the Investment Company Act of 1940, the registrant has duly caused this report to be signed on its behalf by the undersigned, thereunto duly authorized.
Oppenheimer Quest for Value Funds
| | |
| By: | | /s/ William F. Glavin, Jr. |
| | William F. Glavin, Jr. |
| | Principal Executive Officer |
| |
| Date: | | 6/9/2014 |
Pursuant to the requirements of the Securities Exchange Act of 1934 and the Investment Company Act of 1940, this report has been signed below by the following persons on behalf of the registrant and in the capacities and on the dates indicated.
| | |
| By: | | /s/ William F. Glavin, Jr. |
| | William F. Glavin, Jr. |
| | Principal Executive Officer |
| |
| Date: | | 6/9/2014 |
| | |
By: | | /s/ Brian W. Wixted |
| | Brian W. Wixted |
| | Principal Financial Officer |
| |
| Date: | | 6/9/2014 |